|
VERSABANK
|
|||
|
Date: August 30, 2023
|
By:
|
/s/ Shawn Clarke
|
|
|
Name: Shawn Clarke
|
|||
|
Title: Chief Financial Officer
|
|||
| Exhibit
No.
|
|
Description
|
|
|
||
| 99.1 |
|
|
| 99.2 |
|
|
| 99.3 |
|
|
| 99.4 |
|
|
| 99.5 |
|
|
| 99.6 |
|
Exhibit 99.1

Interim Consolidated Financial Statements
July 31, 2023
(Unaudited)
VERSABANK
Consolidated Balance Sheets
(Unaudited)
| (thousands of Canadian dollars) |
||||||||||||
| July 31 |
October 31 |
July 31 |
||||||||||
| As at |
2023 |
2022 |
2022 |
|||||||||
| Assets |
||||||||||||
| Cash |
$ | 87,726 | $ | 88,581 | $ | 84,214 | ||||||
| Securities (note 4) |
182,944 | 141,564 | 133,682 | |||||||||
| Loans, net of allowance for credit losses (note 5) |
3,661,672 | 2,992,678 | 2,814,121 | |||||||||
| Other assets (note 6) |
48,503 | 43,175 | 43,326 | |||||||||
| $ | 3,980,845 | $ | 3,265,998 | $ | 3,075,343 | |||||||
| Liabilities and Shareholders' Equity |
||||||||||||
| Deposits |
$ | 3,328,017 | $ | 2,657,540 | $ | 2,475,063 | ||||||
| Subordinated notes payable (note 7) |
101,585 | 104,951 | 98,706 | |||||||||
| Other liabilities (note 8) |
186,200 | 152,832 | 154,926 | |||||||||
| 3,615,802 | 2,915,323 | 2,728,695 | ||||||||||
| Shareholders' equity: |
||||||||||||
| Share capital (note 9) |
228,191 | 239,629 | 241,321 | |||||||||
| Contributed surplus |
2,339 | 1,612 | 1,189 | |||||||||
| Retained earnings |
134,461 | 109,335 | 104,071 | |||||||||
| Accumulated other comprehensive income |
52 | 99 | 67 | |||||||||
| 365,043 | 350,675 | 346,648 | ||||||||||
| $ | 3,980,845 | $ | 3,265,998 | $ | 3,075,343 | |||||||
The accompanying notes are an integral part of these interim Consolidated Financial Statements.
VERSABANK
Consolidated Statements of Income and Comprehensive Income
(Unaudited)
| (thousands of Canadian dollars, except per share amounts) |
||||||||||||||||
| for the three months ended |
for the nine months ended |
|||||||||||||||
| July 31 |
July 31 |
July 31 |
July 31 |
|||||||||||||
| 2023 |
2022 |
2023 |
2022 |
|||||||||||||
| Interest income: |
||||||||||||||||
| Loans |
$ | 56,206 | $ | 33,165 | $ | 153,765 | $ | 83,151 | ||||||||
| Other |
3,883 | 1,012 | 9,480 | 1,594 | ||||||||||||
| 60,089 | 34,177 | 163,245 | 84,745 | |||||||||||||
| Interest expense: |
||||||||||||||||
| Deposits and other |
33,725 | 12,727 | 85,100 | 26,435 | ||||||||||||
| Subordinated notes |
1,435 | 1,388 | 4,333 | 4,121 | ||||||||||||
| 35,160 | 14,115 | 89,433 | 30,556 | |||||||||||||
| Net interest income |
24,929 | 20,062 | 73,812 | 54,189 | ||||||||||||
| Non-interest income |
1,930 | 1,177 | 5,650 | 3,951 | ||||||||||||
| Total revenue |
26,859 | 21,239 | 79,462 | 58,140 | ||||||||||||
| Provision for credit losses (note 5) |
171 | 166 | 793 | 246 | ||||||||||||
| 26,688 | 21,073 | 78,669 | 57,894 | |||||||||||||
| Non-interest expenses: |
||||||||||||||||
| Salaries and benefits |
7,453 | 6,768 | 24,139 | 19,577 | ||||||||||||
| General and administrative |
4,446 | 5,519 | 10,888 | 13,162 | ||||||||||||
| Premises and equipment |
980 | 929 | 2,913 | 2,880 | ||||||||||||
| 12,879 | 13,216 | 37,940 | 35,619 | |||||||||||||
| Income before income taxes |
13,809 | 7,857 | 40,729 | 22,275 | ||||||||||||
| Income tax provision (note 10) |
3,806 | 2,137 | 11,046 | 6,046 | ||||||||||||
| Net income |
$ | 10,003 | $ | 5,720 | $ | 29,683 | $ | 16,229 | ||||||||
| Other comprehensive income (loss): |
||||||||||||||||
| Items that may subsequently be reclassified to net income: Foreign exchange gain (loss) on translation of foreign operations |
(42 | ) | 24 | (47 | ) | 71 | ||||||||||
| Comprehensive income |
$ | 9,961 | $ | 5,744 | $ | 29,636 | $ | 16,300 | ||||||||
| Basic and diluted income per common share (note 11) |
$ | 0.38 | $ | 0.20 | $ | 1.10 | $ | 0.56 | ||||||||
The accompanying notes are an integral part of these interim Consolidated Financial Statements.
VERSABANK
Consolidated Statements of Changes in Shareholders’ Equity
(Unaudited)
| (thousands of Canadian dollars) |
||||||||||||||||
| for the three months ended |
for the nine months ended |
|||||||||||||||
| July 31 |
July 31 |
July 31 |
July 31 |
|||||||||||||
| 2023 |
2022 |
2023 |
2022 |
|||||||||||||
| Common shares (note 9): |
||||||||||||||||
| Balance, beginning of the period |
$ | 215,233 | $ | 227,674 | $ | 225,982 | $ | 227,674 | ||||||||
| Purchased and cancelled during the period |
(689 | ) | - | (11,438 | ) | - | ||||||||||
| Balance, end of the period |
$ | 214,544 | $ | 227,674 | $ | 214,544 | $ | 227,674 | ||||||||
| Preferred shares (note 9): |
||||||||||||||||
| Series 1 preferred shares |
||||||||||||||||
| Balance, beginning and end of the period |
$ | 13,647 | $ | 13,647 | $ | 13,647 | $ | 13,647 | ||||||||
| Total share capital |
$ | 228,191 | $ | 241,321 | $ | 228,191 | $ | 241,321 | ||||||||
| Contributed surplus: |
||||||||||||||||
| Balance, beginning of the period |
$ | 2,147 | $ | 765 | $ | 1,612 | $ | 145 | ||||||||
| Stock-based compensation (note 9) |
192 | 424 | 727 | 1,044 | ||||||||||||
| Balance, end of the period |
$ | 2,339 | $ | 1,189 | $ | 2,339 | $ | 1,189 | ||||||||
| Retained earnings: |
||||||||||||||||
| Balance, beginning of the period |
$ | 125,398 | $ | 99,285 | $ | 109,335 | $ | 90,644 | ||||||||
| Adjustment for purchased and cancelled common shares |
(45 | ) | - | (1,854 | ) | - | ||||||||||
| Net income |
10,003 | 5,720 | 29,683 | 16,229 | ||||||||||||
| Dividends paid on common and preferred shares |
(895 | ) | (934 | ) | (2,703 | ) | (2,802 | ) | ||||||||
| Balance, end of the period |
$ | 134,461 | $ | 104,071 | $ | 134,461 | $ | 104,071 | ||||||||
| Accumulated other comprehensive income: |
||||||||||||||||
| Balance, beginning of the period |
$ | 94 | $ | 43 | $ | 99 | $ | (4 | ) | |||||||
| Other comprehensive income (loss) |
(42 | ) | 24 | (47 | ) | 71 | ||||||||||
| Balance, end of the period |
$ | 52 | $ | 67 | $ | 52 | $ | 67 | ||||||||
| Total shareholders' equity |
$ | 365,043 | $ | 346,648 | $ | 365,043 | $ | 346,648 | ||||||||
The accompanying notes are an integral part of these interim Consolidated Financial Statements.
VERSABANK
Consolidated Statements of Cash Flows
(Unaudited)
| (thousands of Canadian dollars) |
|||||||||
| for the nine months ended |
|||||||||
| July 31 |
July 31 |
||||||||
| 2023 |
2022 |
||||||||
| Cash provided by (used in): |
|||||||||
| Operations: |
|||||||||
| Net income |
$ | 29,683 | $ | 16,229 | |||||
| Adjustments to determine net cash flows: |
|||||||||
| Items not involving cash: |
|||||||||
| Provision for credit losses | 793 | 246 | |||||||
| Stock-based compensation | 727 | 1,044 | |||||||
| Income tax provision | 11,046 | 6,046 | |||||||
| Interest income | (163,245 | ) | (84,745 | ) | |||||
| Interest expense | 89,433 | 30,556 | |||||||
| Amortization |
1,348 | 1,431 | |||||||
| Accretion of discount on securities | (126 | ) | (255 | ) | |||||
| Foreign exchange rate change on assets and liabilities | (667 | ) | 3,300 | ||||||
| Interest received |
157,430 | 77,970 | |||||||
| Interest paid |
(68,786 | ) | (24,919 | ) | |||||
| Income taxes paid |
(13,276 | ) | (5,207 | ) | |||||
| Change in operating assets and liabilities: |
|||||||||
| Securities |
(42,155 | ) | (133,427 | ) | |||||
| Loans |
(664,618 | ) | (704,607 | ) | |||||
| Deposits |
651,238 | 617,589 | |||||||
| Change in other assets and liabilities |
33,997 | 19,426 | |||||||
| 22,822 | (179,323 | ) | |||||||
| Purchase of investment: |
|||||||||
| Purchase of property and equipment |
(350 | ) | (746 | ) | |||||
| (350 | ) | (746 | ) | ||||||
| Financing: |
|||||||||
| Purchase and cancellation of common shares |
(13,292 | ) | - | ||||||
| Dividends paid |
(2,703 | ) | (2,802 | ) | |||||
| Repayment of lease obligations |
(527 | ) | (469 | ) | |||||
| (16,522 | ) | (3,271 | ) | ||||||
| Change in cash |
5,950 | (183,340 | ) | ||||||
| Effect of exchange rate changes on cash |
(6,805 | ) | (3,969 | ) | |||||
| Cash, beginning of the period |
88,581 | 271,523 | |||||||
| Cash, end of the period |
$ | 87,726 | $ | 84,214 | |||||
The accompanying notes are an integral part of these interim Consolidated Financial Statements.
| 1. | Reporting entity: |
VersaBank (the “Bank”) operates as a Schedule I bank under the Bank Act (Canada) and is regulated by the Office of the Superintendent of Financial Institutions Canada (“OSFI”). The Bank, whose shares trade on the Toronto Stock Exchange and Nasdaq Stock Exchange, provides commercial lending and banking services to select niche markets in Canada and the United States, as well as cybersecurity services and banking and financial technology development services through the operations of its wholly owned subsidiary DRT Cyber Inc. (“DRTC”). The Bank is incorporated and domiciled in Canada, and maintains its registered office at Suite 2002, 140 Fullarton Street, London, Ontario, Canada, N6A 5P2.
| 2. | Basis of preparation: |
a) Statement of compliance:
These interim Consolidated Financial Statements have been prepared in accordance with International Financial Reporting Standards (“IFRS”) as issued by the International Accounting Standards Board (“IASB”) and have been prepared in accordance with International Accounting Standard (“IAS”) 34 – Interim Financial Reporting and do not include all of the information required for full annual financial statements. These interim Consolidated Financial Statements should be read in conjunction with the Bank’s audited Consolidated Financial Statements for the year ended October 31, 2022.
The interim Consolidated Financial Statements for the three and nine months ended July 31, 2023 and 2022 were approved by the Audit Committee of the Board of Directors on August 28, 2023.
b) Basis of measurement:
These interim Consolidated Financial Statements have been prepared on the historical cost basis except the investment in Canada Stablecorp Inc. (note 6) and an interest rate swap (note 12), which are measured at fair value in the Consolidated Balance Sheets.
c) Functional and presentation currency:
These interim Consolidated Financial Statements are presented in Canadian dollars, which is the Bank’s functional currency. Functional currency is also determined for each of the Bank’s subsidiaries, and items included in the interim financial statements of the subsidiaries are measured using their functional currency.
d) Use of estimates and judgements:
In preparing these interim Consolidated Financial Statements, management has exercised judgement and developed estimates in applying accounting policies and generating reported amounts of assets and liabilities at the date of the financial statements and income and expenses during the reporting periods. Areas where judgement was applied include assessing significant changes in credit risk on financial assets and in the selection of relevant forward-looking information in assessing the Bank’s allowance for expected credit losses on its financial assets as described in note 5 – Loans. Estimates are applied in the determination of the allowance for expected credit losses on financial assets, the fair value of stock options granted as described in note 9, the fair value of the investment in Canada Stablecorp Inc. as described in note 6, and the measurement of deferred taxes as described in note 10. It is reasonably possible, on the basis of existing knowledge, that actual results may vary from those expected in the development of these estimates. This could result in material adjustments to the carrying amounts of assets and/or liabilities affected in the future.
Available forward-looking information, including forecast macroeconomic indicator and industry performance trend data continues to be influenced by a number of factors, including, but not limited to, higher interest rates and inflation trends, consumer spending trends, the strength of household balance sheets, housing prices, the strength of the labour market as well as geo-political risk resulting from the crisis in Ukraine and the impact of the crisis on global supply chains. The dynamic nature of these macroeconomic factors and activities and their influence on the available forward looking information results in the assumptions, judgements and estimates made by management in the preparation of these interim Consolidated Financial Statements being subject to some uncertainty.
Estimates and their underlying assumptions are reviewed on an ongoing basis. Revisions to accounting estimates are applied prospectively once they are known.
| 3. | Significant accounting policies and future accounting changes: |
The accounting policies applied by the Bank in these interim Consolidated Financial Statements are the same as those applied by the Bank as at and for the year ended October 31, 2022 and are detailed in note 3 of the Bank’s 2022 audited Consolidated Financial Statements. During the current fiscal year, the Bank updated or incorporated the following significant accounting policies:
Derivative instruments:
Derivatives are reported as other assets when they have a positive fair value and as other liabilities when they have a negative fair value. Derivatives may be embedded in other financial instruments. Derivatives embedded in other financial instruments are valued as separate derivatives when: the economic characteristics and risks associated are not clearly and closely related to those of the host contract; the terms of the embedded derivative would meet the definition of a derivative if it was a stand-alone, independent instrument; and the combined contract is not held for trading or designated at fair value through profit or loss. For financial statement disclosure purposes, embedded derivatives are combined with the host contract.
Hedge accounting:
The Bank has elected, as permitted, to apply the hedge accounting requirements of IAS 39. Interest rate swap agreements are entered into for asset liability management purposes. When hedge accounting criteria are met, derivative contracts are accounted for as described below.
To meet the criteria for hedge accounting, the Bank documents all relationships between hedging instruments and hedged items, how hedge effectiveness is assessed, as well as its risk management objective and strategy for undertaking various hedge transactions. This process includes linking all derivatives to specific assets or liabilities on the Consolidated Balance Sheet. The Bank also formally assesses, both at the inception of the hedge and on an ongoing basis, whether the derivatives that are used in hedging transactions are effective in offsetting changes in fair values or cash flows of the hedged items.
There are three main types of hedges: (i) fair value hedges, (ii) cash flow hedges and (iii) net investment hedges.
The Bank has only fair value hedges outstanding. In a fair value hedge, the change in the fair value of the hedging derivative is recognized in non-interest income in the Consolidated Statements of Income and Comprehensive Income. The change in the fair value of the hedged item attributable to hedge risk is recorded as part of the carrying value of the hedged item (basis adjustment) and is also recognized in non-interest income in the Consolidated Statements of Income and Comprehensive Income. The Bank utilizes fair value hedges primarily to convert fixed rate financial assets to floating rate financial assets. The primary financial instruments designated in fair value hedging relationships are loans. If the derivative expires or is sold, terminated, no longer meets the criteria for hedge accounting, or the designation is revoked, hedge accounting is discontinued. Any basis adjustment up to that point made to a hedged item for which the effective interest method is used is amortized to the Consolidated Statements of Income and Comprehensive Income as part of the recalculated effective interest rate of the item over its remaining term. If the hedged item is derecognized, the unamortized fair value is recognized immediately in the Consolidated Statements of Income and Comprehensive Income.
In fair value hedges, ineffectiveness arises to the extent that the change in fair value of the hedging items differs from the change in fair value of the hedge risk in the hedged item. Any hedge ineffectiveness is measured and recorded in non-interest income in the Consolidated Statements of Income and Comprehensive Income.
Derivative contracts which do not qualify for hedge accounting are marked-to-market and the resulting net gains or losses are recognized in non-interest income in the Consolidated Statement of Income and Comprehensive Income.
| 4. | Securities: |
As at July 31, 2023, the Bank held securities totalling $182.9 million ( October 31, 2022 - $141.6 million), comprised of a Government of Canada Treasury Bill for $181.8 million with a face value of $182.0 million at maturity on August 3, 2023, yielding 4.89%, and a Government of Canada Bond for $990,000 with a face value totaling $1.0 million, yielding 4.73%, with a 3.75% coupon and maturing on May 1, 2025.
| 5. | Loans, net of allowance for credit losses: |
The Bank organizes its lending portfolio into the following four broad asset categories: Point-of-Sale Loans and Leases, Commercial Real Estate Mortgages, Commercial Real Estate Loans, and Public Sector and Other Financing. These categories have been established in the Bank’s proprietary, internally developed asset management system and have been designed to catalogue individual lending assets as a function primarily of their key risk drivers, the nature of the underlying collateral, and the applicable market segment.
The Point-of-Sale Loans and Leases (“POS Financing”) asset category is comprised of Point of Sale Loan and Lease Receivables acquired from the Bank’s broad network of origination and servicing partners in Canada and the US as well as Warehouse Loans that provide bridge financing to the Bank’s origination and servicing partners for the purpose of accumulating and seasoning practical volumes of individual loans and leases prior to the Bank purchasing the cashflow receivables derived from same.
The Commercial Real Estate Mortgages (“CRE Mortgages”) asset category is comprised primarily of Residential Construction, Term, Insured and Land Mortgages. All of these loans are business-to-business loans with the underlying credit risk exposure being primarily consumer in nature given that the vast majority of the loans are related to properties that are designated primarily for residential use. The portfolio benefits from diversity in its underlying security in the form of a broad range of such collateral properties.
The Commercial Real Estate Loans (“CRE Loans”) asset category is comprised primarily of Condominium Corporation Financing loans.
The Public Sector and Other Financing (“PSOF”) asset category is comprised primarily of Public Sector Loans and Leases, a small balance of Corporate Loans and Leases and Single Family Residential Conventional and Insured Mortgages.
Summary of loans and allowance for credit losses:
| (thousands of Canadian dollars) |
||||||||||||
| July 31 |
October 31 |
July 31 |
||||||||||
| 2023 |
2022 |
2022 |
||||||||||
| Point-of-sale loans and leases |
$ | 2,776,126 | $ | 2,220,894 | $ | 1,998,993 | ||||||
| Commercial real estate mortgages |
810,630 | 710,369 | 755,042 | |||||||||
| Commercial real estate loans |
9,298 | 13,165 | 13,510 | |||||||||
| Public sector and other financing |
49,627 | 35,452 | 35,605 | |||||||||
| 3,645,681 | 2,979,880 | 2,803,150 | ||||||||||
| Allowance for credit losses |
(2,697 | ) | (1,904 | ) | (1,699 | ) | ||||||
| Accrued interest |
18,688 | 14,702 | 12,670 | |||||||||
| Total loans, net of allowance for credit losses |
$ | 3,661,672 | $ | 2,992,678 | $ | 2,814,121 | ||||||
The following table provides a summary of loan amounts, expected credit loss allowance amounts, and expected loss rates by lending asset category:
| As at July 31, 2023 |
As at October 31, 2022 |
|||||||||||||||||||||||||||||||
| (thousands of Canadian dollars) |
Stage 1 |
Stage 2 |
Stage 3 |
Total |
Stage 1 |
Stage 2 |
Stage 3 |
Total |
||||||||||||||||||||||||
| Point-of-sale loans and leases |
$ | 2,770,509 | $ | 5,617 | $ | - | $ | 2,776,126 | $ | 2,215,388 | $ | 5,227 | $ | 279 | $ | 2,220,894 | ||||||||||||||||
| ECL allowance |
646 | - | - | 646 | 545 | - | - | 545 | ||||||||||||||||||||||||
| EL % |
0.02 | % | 0.00 | % | 0.00 | % | 0.02 | % | 0.02 | % | 0.00 | % | 0.00 | % | 0.02 | % | ||||||||||||||||
| Commercial real estate mortgages |
$ | 746,771 | $ | 48,752 | $ | 15,107 | $ | 810,630 | $ | 599,113 | $ | 111,256 | $ | - | $ | 710,369 | ||||||||||||||||
| ECL allowance |
1,655 | 251 | - | 1,906 | 1,150 | 137 | - | 1,287 | ||||||||||||||||||||||||
| EL % |
0.22 | % | 0.51 | % | 0.00 | % | 0.24 | % | 0.19 | % | 0.12 | % | 0.00 | % | 0.18 | % | ||||||||||||||||
| Commercial real estate loans |
$ | 9,298 | $ | - | $ | - | $ | 9,298 | $ | 13,165 | $ | - | $ | - | $ | 13,165 | ||||||||||||||||
| ECL allowance |
50 | - | - | 50 | 54 | - | - | 54 | ||||||||||||||||||||||||
| EL % |
0.54 | % | 0.00 | % | 0.00 | % | 0.54 | % | 0.41 | % | 0.00 | % | 0.00 | % | 0.41 | % | ||||||||||||||||
| Public sector and other financing |
$ | 45,060 | $ | 4,567 | $ | - | $ | 49,627 | $ | 35,273 | $ | 179 | $ | - | $ | 35,452 | ||||||||||||||||
| ECL allowance |
74 | 21 | - | 95 | 17 | 1 | - | 18 | ||||||||||||||||||||||||
| EL % |
0.16 | % | 0.46 | % | 0.00 | % | 0.19 | % | 0.05 | % | 0.56 | % | 0.00 | % | 0.05 | % | ||||||||||||||||
| Total loans |
$ | 3,571,638 | $ | 58,936 | $ | 15,107 | $ | 3,645,681 | $ | 2,862,939 | $ | 116,662 | $ | 279 | $ | 2,979,880 | ||||||||||||||||
| Total ECL allowance |
2,425 | 272 | - | 2,697 | 1,766 | 138 | - | 1,904 | ||||||||||||||||||||||||
| Total EL % |
0.07 | % | 0.46 | % | 0.00 | % | 0.07 | % | 0.06 | % | 0.12 | % | 0.00 | % | 0.06 | % | ||||||||||||||||
The Bank’s maximum exposure to credit risk is the carrying value of its financial assets. The Bank holds security against the majority of its loans in the form of mortgage interests over property, other registered securities over assets, guarantees or cash reserves on loan and lease receivables included in the POS Financing portfolio (see note 8).
Allowance for credit losses
The Bank must maintain an allowance for expected credit losses (“ECL”) that is adequate, in management’s opinion, to absorb all credit related losses in the Bank’s lending and treasury portfolios. Under IFRS 9, the Bank’s ECL is estimated using the expected credit loss methodology and is comprised of expected credit losses recognized on both performing loans, and non-performing, or impaired loans even if no actual loss event has occurred.
Assessment of significant increase in credit risk (“SICR”)
At each reporting date, the Bank assesses whether or not there has been a SICR for loans since initial recognition by comparing, at the reporting date, the risk of default occurring over the remaining expected life against the risk of default at initial recognition.
SICR is a function of the loan’s internal risk rating assignment, internal watchlist status, loan review status and delinquency status which are updated as necessary in response to changes including, but not limited to, changes in macroeconomic and/or market conditions, changes in a borrower’s credit risk profile, and changes in the strength of the underlying security, including guarantor status, if a guarantor exists.
Quantitative models may not always be able to capture all reasonable and supportable information that may indicate a SICR. As a result, qualitative factors may be considered to supplement such a gap.
Examples include changes in adjudication criteria for a particular group of borrowers or asset categories or changes in portfolio composition as well as changes in Canadian and US macroeconomic trends attributable to changes in monetary policy, inflation, employment rates, consumer behaviour and geo-political risks.
Expected credit loss model - Estimation of expected credit losses
Expected credit losses are an estimate of a loan’s expected cash shortfalls discounted at the effective interest rate, where a cash shortfall is the difference between the contractual cash flows that are due to the Bank and the cash flows that the Bank actually expects to receive. The ECL calculation is a function of the credit risk parameters; probability of default, loss given default, and exposure at default associated with each loan, sensitized to future market and macroeconomic conditions through the incorporation of forward-looking information derived from multiple economic forecast scenarios, including baseline, upside, and downside scenarios.
The Bank’s ECL model develops contractual cashflow profiles for loans as a function of a number of underlying assumptions and a broad range of input variables. The expected cashflow schedules are subsequently derived from the contractual cashflow schedules, adjusted for incremental default amounts, forgone interest, and recovery amounts. The finalized contractual and expected cashflow schedules are subsequently discounted at the effective interest rate to determine the expected cash shortfall or expected credit losses for each individual loan or other financial instrument.
The ECL model estimates 12 months of expected credit losses for performing loans that have not experienced a SICR since initial recognition and estimates lifetime expected credit losses on performing loans that have experienced a SICR since initial recognition. Further, individual allowances are estimated for loans that are determined to be credit impaired.
Loans or other financial instruments that have not experienced a SICR since initial recognition are designated as stage 1, while loans or other financial instruments that have experienced a SICR since initial recognition are designated as stage 2, and loans or other financial instruments that are determined to be credit impaired are designated as stage 3.
Individual allowances are estimated for loans or other financial instruments that are determined to be credit impaired and that have been designated as stage 3. A loan or other financial instrument is classified as credit impaired when the Bank becomes aware that, before taking into consideration collateral or credit enhancements, all of, or a portion of the contractual cashflows associated with the loan or other financial instrument may be impacted and as a result may not be realized by the Bank under the repayment schedule set out in the contractual terms associated with the loan or other financial instrument. Loans or other financial instruments for which interest or principal is contractually past due 90 days are automatically recognized as stage 3, however in estimating expected credit losses for stage 3 loans or other financial instruments, management takes into consideration whether the loan or other financial instrument is fully secured or is in the process of collection and whether collection efforts are reasonably expected to result in repayment of the loan or other financial instrument.
Forward-looking Information
The Bank incorporates the impact of future economic conditions, or more specifically forward-looking information into the estimation of expected credit losses at the credit risk parameter level. This is accomplished via the credit risk parameter models and proxy datasets that the Bank utilizes to develop probability of default (“PD”), and loss given default (“LGD”), term structure forecasts for its loans. The Bank has sourced credit risk modeling systems and forecast macroeconomic scenario data from Moody’s Analytics, a third-party service provider for the purpose of computing forward-looking credit risk parameters under multiple macroeconomic scenarios that consider both market-wide and idiosyncratic factors and influences. These systems are used in conjunction with the Bank’s internally developed ECL models. Given that the Bank has experienced very limited historical loan losses and, therefore, does not have available statistically significant loss data inventory for use in developing internal, forward looking expected credit loss trends, the use of unbiased, third-party forward-looking credit risk parameter modeling systems is particularly important for the Bank in the context of the estimation of expected credit losses.
The Bank utilizes macroeconomic indicator data derived from multiple macroeconomic scenarios in order to mitigate volatility in the estimation of expected credit losses, as well as to satisfy the IFRS 9 requirement that future economic conditions are to be based on an unbiased, probability-weighted assessment of possible future outcomes. More specifically, the macroeconomic indicators set out in the macroeconomic scenarios are used as inputs for the credit risk parameter models utilized by the Bank to sensitize the individual PD and LGD term structure forecasts to the respective macroeconomic trajectory set out in each of the scenarios (see Expected Credit Loss Sensitivity below). Currently the Bank utilizes upside, downside and baseline forecast macroeconomic scenarios, and assigns discrete weights to each for use in the estimation of its reported ECL. The Bank has also applied expert credit judgement, where appropriate, to reflect, amongst other items, uncertainty in the Canadian and US macroeconomic environments.
The macroeconomic indicator data utilized by the Bank for the purpose of sensitizing PD and LGD term structure data to forward economic conditions include, but are not limited to: GDP, the Canadian national unemployment rate, long term interest rates, the consumer price index, the S&P/TSX Index and the price of oil. These specific macroeconomic indicators were selected in an attempt to ensure that the spectrum of fundamental macroeconomic influences on the key drivers of the credit risk profile of the Bank’s balance sheet, including but not limited to: corporate, consumer and real estate market dynamics; corporate, consumer and SME borrower performance; geography; as well as collateral value volatility, are appropriately captured and incorporated into the Bank’s forward macroeconomic sensitivity analysis.
Key assumptions driving the base case macroeconomic forecast trends this quarter include: interest rates straining household finances but wage growth continues to support consumer spending; higher interest rates cause housing prices to continue to retreat, albeit modestly; real GDP slows measurably by the end of 2023 but a recession is avoided and unemployment increases only modestly due to the strength of the labour market; inflation continues to decline but lingers and results in the Bank of Canada undertaking a protracted process to returning to a neutral policy rate in late 2025; the impact of the crisis in Ukraine on global commodity prices and trade continues to diminish; public health restrictions do not return even as new COVID-19 case counts occasionally spike; and, supply-chain stress continues to ease.
Management developed ECL estimates using credit risk parameter term structure forecasts sensitized to individual baseline, upside and downside forecast macroeconomic scenarios, each weighted at 100%, and subsequently computed the variance of each to the Bank’s reported ECL as at July 31, 2023 in order to assess the alignment of the Bank’s reported ECL with the Bank’s credit risk profile, and further, to assess the scope, depth and ultimate effectiveness of the credit risk mitigation strategies that the Bank has applied to its lending portfolios.
Expected credit loss sensitivity:
The following table presents the sensitivity of the Bank’s estimated ECL to a range of individual macroeconomic scenarios, that in isolation may not reflect the Bank’s actual expected ECL exposure, as well as the variance of each to the Bank’s reported ECL as at July 31, 2023:
| (thousands of Canadian dollars) |
||||||||||||||||
| Reported |
100 | % | 100 | % | 100 | % | ||||||||||
| ECL |
Upside |
Baseline |
Downside |
|||||||||||||
| Allowance for expected credit losses |
$ | 2,697 | $ | 1,751 | $ | 2,242 | $ | 3,117 | ||||||||
| Variance from reported ECL |
(946 | ) | (455 | ) | 420 | |||||||||||
| Variance from reported ECL (%) |
(35 | %) | (17 | %) | 16 | % | ||||||||||
The following table provides a reconciliation of the Bank’s ECL allowance by lending asset category for the three months ended July 31, 2023:
| (thousands of Canadian dollars) |
Stage 1 |
Stage 2 |
Stage 3 |
Total |
||||||||||||
| Point-of-sale loans and leases |
||||||||||||||||
| Balance at beginning of period |
$ | 627 | $ | - | $ | - | $ | 627 | ||||||||
| Transfer in (out) to Stage 1 |
52 | (52 | ) | - | - | |||||||||||
| Transfer in (out) to Stage 2 |
(85 | ) | 85 | - | - | |||||||||||
| Transfer in (out) to Stage 3 |
- | - | - | - | ||||||||||||
| Net remeasurement of loss allowance |
52 | (33 | ) | - | 19 | |||||||||||
| Loan originations |
- | - | - | - | ||||||||||||
| Derecognitions and maturities |
- | - | - | - | ||||||||||||
| Provision for (recovery of) credit losses |
19 | - | - | 19 | ||||||||||||
| Write-offs |
- | - | - | - | ||||||||||||
| Recoveries |
- | - | - | - | ||||||||||||
| Balance at end of period |
$ | 646 | $ | - | $ | - | $ | 646 | ||||||||
| Commercial real estate mortgages |
||||||||||||||||
| Balance at beginning of period |
$ | 1,647 | $ | 120 | $ | - | $ | 1,767 | ||||||||
| Transfer in (out) to Stage 1 |
14 | (14 | ) | - | - | |||||||||||
| Transfer in (out) to Stage 2 |
(106 | ) | 106 | - | - | |||||||||||
| Transfer in (out) to Stage 3 |
- | - | - | - | ||||||||||||
| Net remeasurement of loss allowance |
138 | 44 | - | 182 | ||||||||||||
| Loan originations |
56 | - | - | 56 | ||||||||||||
| Derecognitions and maturities |
(94 | ) | (5 | ) | - | (99 | ) | |||||||||
| Provision for (recovery of) credit losses |
8 | 131 | - | 139 | ||||||||||||
| Write-offs |
- | - | - | - | ||||||||||||
| Recoveries |
- | - | - | - | ||||||||||||
| Balance at end of period |
$ | 1,655 | $ | 251 | $ | - | $ | 1,906 | ||||||||
| Commercial real estate loans |
||||||||||||||||
| Balance at beginning of period |
$ | 59 | $ | - | $ | - | $ | 59 | ||||||||
| Transfer in (out) to Stage 1 |
- | - | - | - | ||||||||||||
| Transfer in (out) to Stage 2 |
- | - | - | - | ||||||||||||
| Transfer in (out) to Stage 3 |
- | - | - | - | ||||||||||||
| Net remeasurement of loss allowance |
(5 | ) | - | - | (5 | ) | ||||||||||
| Loan originations |
- | - | - | - | ||||||||||||
| Derecognitions and maturities |
(4 | ) | - | - | (4 | ) | ||||||||||
| Provision for (recovery of) credit losses |
(9 | ) | - | - | (9 | ) | ||||||||||
| Write-offs |
- | - | - | - | ||||||||||||
| Recoveries |
- | - | - | - | ||||||||||||
| Balance at end of period |
$ | 50 | $ | - | $ | - | $ | 50 | ||||||||
| Public sector and other financing |
||||||||||||||||
| Balance at beginning of period |
$ | 70 | $ | 3 | $ | - | $ | 73 | ||||||||
| Transfer in (out) to Stage 1 |
- | - | - | - | ||||||||||||
| Transfer in (out) to Stage 2 |
(8 | ) | 8 | - | - | |||||||||||
| Transfer in (out) to Stage 3 |
- | - | - | - | ||||||||||||
| Net remeasurement of loss allowance |
(4 | ) | 10 | - | 6 | |||||||||||
| Loan originations |
16 | - | - | 16 | ||||||||||||
| Derecognitions and maturities |
- | - | - | - | ||||||||||||
| Provision for (recovery of) credit losses |
4 | 18 | - | 22 | ||||||||||||
| Write-offs |
- | - | - | - | ||||||||||||
| Recoveries |
- | - | - | - | ||||||||||||
| Balance at end of period |
$ | 74 | $ | 21 | $ | - | $ | 95 | ||||||||
| Total balance at end of period |
$ | 2,425 | $ | 272 | $ | - | $ | 2,697 | ||||||||
The following table provides a reconciliation of the Bank’s ECL allowance by lending asset category for the three months ended July 31, 2022:
| (thousands of Canadian dollars) |
Stage 1 |
Stage 2 |
Stage 3 |
Total |
||||||||||||
| Point-of-sale loans and leases |
||||||||||||||||
| Balance at beginning of period |
$ | 419 | $ | - | $ | - | $ | 419 | ||||||||
| Transfer in (out) to Stage 1 |
16 | (16 | ) | - | - | |||||||||||
| Transfer in (out) to Stage 2 |
(45 | ) | 45 | - | - | |||||||||||
| Transfer in (out) to Stage 3 |
- | - | - | - | ||||||||||||
| Net remeasurement of loss allowance |
138 | (29 | ) | - | 109 | |||||||||||
| Loan originations |
- | - | - | - | ||||||||||||
| Derecognitions and maturities |
- | - | - | - | ||||||||||||
| Provision for (recovery of) credit losses |
109 | - | - | 109 | ||||||||||||
| Write-offs |
- | - | - | - | ||||||||||||
| Recoveries |
- | - | - | - | ||||||||||||
| Balance at end of period |
$ | 528 | $ | - | $ | - | $ | 528 | ||||||||
| Commercial real estate mortgages |
||||||||||||||||
| Balance at beginning of period |
$ | 948 | $ | 101 | $ | - | $ | 1,049 | ||||||||
| Transfer in (out) to Stage 1 |
16 | (16 | ) | - | - | |||||||||||
| Transfer in (out) to Stage 2 |
(88 | ) | 88 | - | - | |||||||||||
| Transfer in (out) to Stage 3 |
- | - | - | - | ||||||||||||
| Net remeasurement of loss allowance |
49 | (38 | ) | - | 11 | |||||||||||
| Loan originations |
64 | - | - | 64 | ||||||||||||
| Derecognitions and maturities |
(10 | ) | (18 | ) | - | (28 | ) | |||||||||
| Provision for (recovery of) credit losses |
31 | 16 | - | 47 | ||||||||||||
| Write-offs |
- | - | - | - | ||||||||||||
| Recoveries |
- | - | - | - | ||||||||||||
| Balance at end of period |
$ | 979 | $ | 117 | $ | - | $ | 1,096 | ||||||||
| Commercial real estate loans |
||||||||||||||||
| Balance at beginning of period |
$ | 40 | $ | - | $ | - | $ | 40 | ||||||||
| Transfer in (out) to Stage 1 |
- | - | - | - | ||||||||||||
| Transfer in (out) to Stage 2 |
- | - | - | - | ||||||||||||
| Transfer in (out) to Stage 3 |
- | - | - | - | ||||||||||||
| Net remeasurement of loss allowance |
9 | - | - | 9 | ||||||||||||
| Loan originations |
- | - | - | - | ||||||||||||
| Derecognitions and maturities |
- | - | - | - | ||||||||||||
| Provision for (recovery of) credit losses |
9 | - | - | 9 | ||||||||||||
| Write-offs |
- | - | - | - | ||||||||||||
| Recoveries |
- | - | - | - | ||||||||||||
| Balance at end of period |
$ | 49 | $ | - | $ | - | $ | 49 | ||||||||
| Public sector and other financing |
||||||||||||||||
| Balance at beginning of period |
$ | 24 | $ | 1 | $ | - | $ | 25 | ||||||||
| Transfer in (out) to Stage 1 |
- | - | - | - | ||||||||||||
| Transfer in (out) to Stage 2 |
- | - | - | - | ||||||||||||
| Transfer in (out) to Stage 3 |
- | - | - | - | ||||||||||||
| Net remeasurement of loss allowance |
1 | - | - | 1 | ||||||||||||
| Loan originations |
- | - | - | - | ||||||||||||
| Derecognitions and maturities |
- | - | - | - | ||||||||||||
| Provision for (recovery of) credit losses |
1 | - | - | 1 | ||||||||||||
| Write-offs |
- | - | - | - | ||||||||||||
| Recoveries |
- | - | - | - | ||||||||||||
| Balance at end of period |
$ | 25 | $ | 1 | $ | - | $ | 26 | ||||||||
| Total balance at end of period |
$ | 1,581 | $ | 118 | $ | - | $ | 1,699 | ||||||||
The following table provides a reconciliation of the Bank’s ECL allowance by lending asset category for the nine months ended July 31, 2023:
| (thousands of Canadian dollars) |
Stage 1 |
Stage 2 |
Stage 3 |
Total |
||||||||||||
| Point-of-sale loans and leases |
||||||||||||||||
| Balance at beginning of period |
$ | 545 | $ | - | $ | - | $ | 545 | ||||||||
| Transfer in (out) to Stage 1 |
122 | (122 | ) | - | - | |||||||||||
| Transfer in (out) to Stage 2 |
(257 | ) | 257 | - | - | |||||||||||
| Transfer in (out) to Stage 3 |
- | - | - | - | ||||||||||||
| Net remeasurement of loss allowance |
236 | (135 | ) | - | 101 | |||||||||||
| Loan originations |
- | - | - | - | ||||||||||||
| Derecognitions and maturities |
- | - | - | - | ||||||||||||
| Provision for (recovery of) credit losses |
101 | - | - | 101 | ||||||||||||
| Write-offs |
- | - | - | - | ||||||||||||
| Recoveries |
- | - | - | - | ||||||||||||
| Balance at end of period |
$ | 646 | $ | - | $ | - | $ | 646 | ||||||||
| Commercial real estate mortgages |
||||||||||||||||
| Balance at beginning of period |
$ | 1,150 | $ | 137 | $ | - | $ | 1,287 | ||||||||
| Transfer in (out) to Stage 1 |
93 | (93 | ) | - | - | |||||||||||
| Transfer in (out) to Stage 2 |
(224 | ) | 224 | - | - | |||||||||||
| Transfer in (out) to Stage 3 |
- | (13 | ) | 13 | - | |||||||||||
| Net remeasurement of loss allowance |
560 | 6 | (13 | ) | 553 | |||||||||||
| Loan originations |
205 | - | - | 205 | ||||||||||||
| Derecognitions and maturities |
(129 | ) | (10 | ) | - | (139 | ) | |||||||||
| Provision for (recovery of) credit losses |
505 | 114 | - | 619 | ||||||||||||
| Write-offs |
- | - | - | - | ||||||||||||
| Recoveries |
- | - | - | - | ||||||||||||
| Balance at end of period |
$ | 1,655 | $ | 251 | $ | - | $ | 1,906 | ||||||||
| Commercial real estate loans |
||||||||||||||||
| Balance at beginning of period |
$ | 54 | $ | - | $ | - | $ | 54 | ||||||||
| Transfer in (out) to Stage 1 |
- | - | - | - | ||||||||||||
| Transfer in (out) to Stage 2 |
- | - | - | - | ||||||||||||
| Transfer in (out) to Stage 3 |
- | - | - | - | ||||||||||||
| Net remeasurement of loss allowance |
- | - | - | - | ||||||||||||
| Loan originations |
- | - | - | - | ||||||||||||
| Derecognitions and maturities |
(4 | ) | - | - | (4 | ) | ||||||||||
| Provision for (recovery of) credit losses |
(4 | ) | - | - | (4 | ) | ||||||||||
| Write-offs |
- | - | - | - | ||||||||||||
| Recoveries |
- | - | - | - | ||||||||||||
| Balance at end of period |
$ | 50 | $ | - | $ | - | $ | 50 | ||||||||
| Public sector and other financing |
||||||||||||||||
| Balance at beginning of period |
$ | 17 | $ | 1 | $ | - | $ | 18 | ||||||||
| Transfer in (out) to Stage 1 |
- | - | - | - | ||||||||||||
| Transfer in (out) to Stage 2 |
(8 | ) | 8 | - | - | |||||||||||
| Transfer in (out) to Stage 3 |
- | - | - | - | ||||||||||||
| Net remeasurement of loss allowance |
6 | 12 | - | 18 | ||||||||||||
| Loan originations |
59 | - | - | 59 | ||||||||||||
| Derecognitions and maturities |
- | - | - | - | ||||||||||||
| Provision for (recovery of) credit losses |
57 | 20 | - | 77 | ||||||||||||
| Write-offs |
- | - | - | - | ||||||||||||
| Recoveries |
- | - | - | - | ||||||||||||
| Balance at end of period |
$ | 74 | $ | 21 | $ | - | $ | 95 | ||||||||
| Total balance at end of period |
$ | 2,425 | $ | 272 | $ | - | $ | 2,697 | ||||||||
The following table provides a reconciliation of the Bank’s ECL allowance by lending asset category for the nine months ended July 31, 2022:
| (thousands of Canadian dollars) |
Stage 1 |
Stage 2 |
Stage 3 |
Total |
||||||||||||
| Point-of-sale loans and leases |
||||||||||||||||
| Balance at beginning of period |
$ | 275 | $ | - | $ | - | $ | 275 | ||||||||
| Transfer in (out) to Stage 1 |
68 | (68 | ) | - | - | |||||||||||
| Transfer in (out) to Stage 2 |
(130 | ) | 130 | - | - | |||||||||||
| Transfer in (out) to Stage 3 |
- | - | - | - | ||||||||||||
| Net remeasurement of loss allowance |
315 | (62 | ) | - | 253 | |||||||||||
| Loan originations |
- | - | - | - | ||||||||||||
| Derecognitions and maturities |
- | - | - | - | ||||||||||||
| Provision for (recovery of) credit losses |
253 | - | - | 253 | ||||||||||||
| Write-offs |
- | - | - | - | ||||||||||||
| Recoveries |
- | - | - | - | ||||||||||||
| Balance at end of period |
$ | 528 | $ | - | $ | - | $ | 528 | ||||||||
| Commercial real estate mortgages |
||||||||||||||||
| Balance at beginning of period |
$ | 980 | $ | 134 | $ | - | $ | 1,114 | ||||||||
| Transfer in (out) to Stage 1 |
38 | (38 | ) | - | - | |||||||||||
| Transfer in (out) to Stage 2 |
(92 | ) | 92 | - | - | |||||||||||
| Transfer in (out) to Stage 3 |
- | - | - | - | ||||||||||||
| Net remeasurement of loss allowance |
(48 | ) | (49 | ) | - | (97 | ) | |||||||||
| Loan originations |
224 | - | - | 224 | ||||||||||||
| Derecognitions and maturities |
(123 | ) | (22 | ) | - | (145 | ) | |||||||||
| Provision for (recovery of) credit losses |
(1 | ) | (17 | ) | - | (18 | ) | |||||||||
| Write-offs |
- | - | - | - | ||||||||||||
| Recoveries |
- | - | - | - | ||||||||||||
| Balance at end of period |
$ | 979 | $ | 117 | $ | - | $ | 1,096 | ||||||||
| Commercial real estate loans |
||||||||||||||||
| Balance at beginning of period |
$ | 45 | $ | - | $ | - | $ | 45 | ||||||||
| Transfer in (out) to Stage 1 |
- | - | - | - | ||||||||||||
| Transfer in (out) to Stage 2 |
- | - | - | - | ||||||||||||
| Transfer in (out) to Stage 3 |
- | - | - | - | ||||||||||||
| Net remeasurement of loss allowance |
4 | - | - | 4 | ||||||||||||
| Loan originations |
- | - | - | - | ||||||||||||
| Derecognitions and maturities |
- | - | - | - | ||||||||||||
| Provision for (recovery of) credit losses |
4 | - | - | 4 | ||||||||||||
| Write-offs |
- | - | - | - | ||||||||||||
| Recoveries |
- | - | - | - | ||||||||||||
| Balance at end of period |
$ | 49 | $ | - | $ | - | $ | 49 | ||||||||
| Public sector and other financing |
||||||||||||||||
| Balance at beginning of period |
$ | 16 | $ | 3 | $ | - | $ | 19 | ||||||||
| Transfer in (out) to Stage 1 |
- | - | - | - | ||||||||||||
| Transfer in (out) to Stage 2 |
- | - | - | - | ||||||||||||
| Transfer in (out) to Stage 3 |
- | - | - | - | ||||||||||||
| Net remeasurement of loss allowance |
10 | (2 | ) | - | 8 | |||||||||||
| Loan originations |
- | - | - | - | ||||||||||||
| Derecognitions and maturities |
(1 | ) | - | - | (1 | ) | ||||||||||
| Provision for (recovery of) credit losses |
9 | (2 | ) | - | 7 | |||||||||||
| Write-offs |
- | - | - | - | ||||||||||||
| Recoveries |
- | - | - | - | ||||||||||||
| Balance at end of period |
$ | 25 | $ | 1 | $ | - | $ | 26 | ||||||||
| Total balance at end of period |
$ | 1,581 | $ | 118 | $ | - | $ | 1,699 | ||||||||
| 6. | Other assets: |
| (thousands of Canadian dollars) |
||||||||||||
| July 31 |
October 31 |
July 31 |
||||||||||
| 2023 |
2022 |
2022 |
||||||||||
| Accounts receivable |
$ | 3,177 | $ | 3,774 | $ | 3,744 | ||||||
| Prepaid expenses and other |
14,017 | 10,213 | 10,010 | |||||||||
| Property and equipment |
6,687 | 6,868 | 6,965 | |||||||||
| Right-of-use assets |
3,602 | 4,122 | 4,296 | |||||||||
| Deferred tax asset |
2,641 | 2,128 | 2,248 | |||||||||
| Interest rate swap |
1,118 | - | - | |||||||||
| Investment (note 6a) |
953 | 953 | 953 | |||||||||
| Goodwill |
5,754 | 5,754 | 5,754 | |||||||||
| Intangible assets (note 6b) |
10,554 | 9,363 | 9,356 | |||||||||
| $ | 48,503 | $ | 43,175 | $ | 43,326 | |||||||
| a) |
In February 2021, the Bank acquired an 11% investment in Canada Stablecorp Inc. (“Stablecorp”) for cash consideration of $953,000. The Bank has made an irrevocable election to designate this investment at fair value through other comprehensive income at initial recognition and any future changes in the fair value of the investment will be recognized in other comprehensive income (loss). Amounts recorded in other comprehensive income (loss) will not be reclassified to profit and loss at a later date. |
| b) |
As at July 31, 2023, total intangible assets were $10.6 million ( October 31, 2022 - $9.4 million), which includes, $7.7 million ( October 31, 2022 - $6.2 million) in development costs that have been capitalized. |
| 7. | Subordinated notes payable: |
| (thousands of Canadian dollars) |
||||||||||||
| July 31 |
October 31 |
July 31 |
||||||||||
| 2023 |
2022 |
2022 |
||||||||||
| Issued March 2019, unsecured, non-viability contingent capital compliant, subordinated notes payable, principal amount of $5.0 million, $500,000 is held by related party (note 14), effective interest rate of 10.41%, maturing March 2029. |
$ | 4,916 | $ | 4,908 | $ | 4,906 | ||||||
| Issued April 2021, unsecured, non-viability contingent capital compliant, subordinated notes payable, principal amount of US $75.0 million, effective interest rate of 5.38%, maturing |
96,669 | 100,043 | 93,800 | |||||||||
| $ | 101,585 | $ | 104,951 | $ | 98,706 | |||||||
| 8. | Other liabilities: |
| (thousands of Canadian dollars) |
||||||||||||
| July 31 |
October 31 |
July 31 |
||||||||||
| 2023 |
2022 |
2022 |
||||||||||
| Accounts payable and other |
$ | 7,265 | $ | 7,662 | $ | 8,317 | ||||||
| Current income tax liability |
4,527 | 5,797 | 3,157 | |||||||||
| Deferred tax liability |
659 | 786 | 769 | |||||||||
| Lease obligations |
3,944 | 4,471 | 4,644 | |||||||||
| Cash collateral and amounts held in escrow |
9,657 | 8,006 | 10,992 | |||||||||
| Cash reserves on loan and lease receivables |
160,148 | 126,110 | 127,047 | |||||||||
| $ | 186,200 | $ | 152,832 | $ | 154,926 | |||||||
| 9. | Share capital: |
a) Common shares:
At July 31, 2023, there were 25,924,424 ( October 31, 2022 - 27,245,782) common shares outstanding.
On August 5, 2022, the Bank received approval from the Toronto Stock Exchange (“TSX”) to proceed with a Normal Course Issuer Bid (“NCIB”) for its common shares. Further, on September 21, 2022, the Bank received approval from the Nasdaq to proceed with a NCIB for its common shares. Pursuant to the NCIB, the Bank may purchase for cancellation up to 1,700,000 of its common shares representing approximately 9.54% of its public float. The Bank’s directors and management believe that the market price of the Bank’s common shares does not reflect the value of the business and its future prospects, and further, reflects a material discount to book value; as such, the purchase of common shares for cancellation at such time is a prudent corporate measure and represents an attractive investment for the Bank.
The Bank was eligible to make purchases commencing on August 17, 2022 and ending on August 16, 2023, or such earlier date as the Bank may complete its purchases pursuant to the NCIB. The purchases will be made by the Bank through the facilities of the TSX and alternate trading systems and in accordance with the rules of the TSX or such alternate trading systems, as applicable, and the prices that the Bank will pay for any common shares will be the market price of such shares at the time of purchase. The Bank will make no purchases of common shares other than open market purchases. All shares purchased under the NCIB will be cancelled.
For the quarter ended July 31, 2023, the Bank purchased and cancelled 79,562 common shares for $734,000, reducing the Bank’s Common Share capital value by $689,000 and retained earnings by $45,000.
For the nine month period ended July 31, 2023, the Bank purchased and cancelled 1,321,358 common shares for $13.3 million, reducing the Bank’s Common Share capital value by $11.4 million and retained earnings by $1.9 million.
b) Preferred shares:
At July 31, 2023, there were 1,461,460 ( October 31, 2022 - 1,461,460) Series 1 preferred shares outstanding. These shares are Basel III compliant, non-cumulative rate reset preferred shares and include non-viability contingent capital (“NVCC”) provisions. As a result, these shares qualify as Additional Tier 1 Capital (see note 15).
c) Stock options
Stock option transactions during the three and nine month periods ended July 31, 2023 and 2022:
| for the three months ended |
for the nine months ended |
|||||||||||||||||||||||||||||||
| July 31, 2023 |
July 31, 2022 |
July 31, 2023 |
July 31, 2022 |
|||||||||||||||||||||||||||||
| Weighted |
Weighted |
Weighted |
Weighted |
|||||||||||||||||||||||||||||
| Number of |
average |
Number of |
average |
Number of |
average |
Number of |
average |
|||||||||||||||||||||||||
| options |
exercise price |
options |
exercise price |
options |
exercise price |
options |
exercise price |
|||||||||||||||||||||||||
| Outstanding, beginning of period |
952,776 | $ | 15.53 | 953,730 | $ | 15.53 | 965,766 | $ | 15.53 | 40,000 | $ | 7.00 | ||||||||||||||||||||
| Granted |
- | - | - | - | 1,500 | 15.90 | 913,730 | 15.90 | ||||||||||||||||||||||||
| Exercised |
- | - | - | - | - | - | - | - | ||||||||||||||||||||||||
| Forfeited/cancelled |
(26,000 | ) | 15.90 | - | - | (40,490 | ) | 15.90 | - | - | ||||||||||||||||||||||
| Expired |
- | - | - | - | - | - | - | - | ||||||||||||||||||||||||
| Outstanding, end of period |
926,776 | $ | 15.52 | 953,730 | $ | 15.53 | 926,776 | $ | 15.52 | 953,730 | $ | 15.53 | ||||||||||||||||||||
For the three and nine month periods ended July 31, 2023, the Bank recognized $192,000 ( July 31, 2022 - $424,000) and $727,000 ( July 31, 2022 - $1.0 million) in compensation expense related to the estimated fair value of options granted.
| 10. | Income tax provision: |
Income tax provision for the three and nine months ended July 31, 2023 was $3.8 million ( July 31, 2022 - $2.1 million) and $11.0 million ( July 31, 2022 - $6.0 million) respectively. The current quarter and year to date income tax provisions reflects a deferred tax asset, not previously recognized, associated with DRTC’s non-capital loss carryforwards which is anticipated to be applied to future taxable earnings as well as lower non-deductible expenses over the comparatives. The Bank’s combined statutory federal and provincial income tax rate is approximately 27% (2022 - 27%). The effective rate is affected by certain items not being taxable or deductible for income tax purposes.
| 11. | Income per common share: |
| (thousands of Canadian dollars, except shares outstanding and per share amounts) |
||||||||||||||||
| for the three months ended |
for the nine months ended |
|||||||||||||||
| July 31 |
July 31 |
July 31 |
July 31 |
|||||||||||||
| 2023 |
2022 |
2023 |
2022 |
|||||||||||||
| Net income |
$ | 10,003 | $ | 5,720 | $ | 29,683 | $ | 16,229 | ||||||||
| Less: dividends on preferred shares |
(247 | ) | (247 | ) | (741 | ) | (741 | ) | ||||||||
| 9,756 | 5,473 | 28,942 | 15,488 | |||||||||||||
| Weighted average number of common shares outstanding |
25,957,755 | 27,441,082 | 26,386,915 | 27,441,082 | ||||||||||||
| Income per common share: |
$ | 0.38 | $ | 0.20 | $ | 1.10 | $ | 0.56 | ||||||||
Common shares associated with the Series 1 NVCC preferred shares are contingently issuable shares and would only have a dilutive impact upon issuance. There are 40,000 outstanding employee stock options that are dilutive; however, the impact on the Bank’s income per share calculation is de minimis.
| 12. | Derivative instruments: |
At July 31, 2023, the Bank had an outstanding contract established for asset liability management purposes to swap between fixed and floating interest rates with a notional amount totalling $15.5 million ( October 31, 2022 - $nil), of which $15.5 million ( October 31, 2022 - $nil) qualified for hedge accounting. The Bank enters into interest rate swap contracts for its own account exclusively and does not act as an intermediary in this market. As required under the accounting standard relating to hedges, at July 31, 2023, $1.1 million ( October 31, 2022 - $nil) relating to this contract was included in other assets and the offsetting amount included in the carrying values of the assets to which they relate. Approved counterparties are limited to major Canadian chartered banks.
| 13. | Commitments and contingencies: |
The amount of credit-related commitments represents the maximum amount of additional credit that the Bank could be obligated to extend.
| (thousands of Canadian dollars) |
||||||||||||
| July 31 |
October 31 |
July 31 |
||||||||||
| 2023 |
2022 |
2022 |
||||||||||
| Loan commitments |
$ | 341,679 | $ | 382,851 | $ | 315,757 | ||||||
| Letters of credit |
82,847 | 60,273 | 58,732 | |||||||||
| $ | 424,526 | $ | 443,124 | $ | 374,489 | |||||||
| 14. |
Related party transactions: |
The Bank’s Board of Directors and Senior Executive Officers represent key management personnel and are related parties. At July 31, 2023, amounts due from these related parties totalled $1.5 million ( October 31, 2022 - $1.3 million) and an amount due from a corporation controlled by key management personnel totalled $2.7 million ( October 31, 2022 - $3.9 million). The interest rates charged on loans and advances to related parties are based on mutually agreed-upon terms. Interest income earned on the above loans for the three and nine months ended July 31, 2023, was $26,000 ( July 31, 2022 - $24,000) and $75,000 ( July 31, 2022 - $71,000) respectively. There were no specific provisions for credit losses associated with loans issued to key management personnel ( October 31, 2022 - $nil), and all loans issued to key management personnel were current as at July 31, 2023. $500,000 of the Bank’s $5.0 million subordinated notes payable, issued in March 2019, are held by a related party (note 7).
| 15. | Capital management: |
| a) |
Overview: |
The Bank’s policy is to maintain a strong capital base so as to retain investor, creditor and market confidence as well as to support the future growth and development of the business. The impact of the level of capital held on shareholders’ return is an important consideration, and the Bank recognizes the need to maintain a balance between the higher returns that may be possible with greater leverage and the advantages and security that may be afforded by a more robust capital position.
OSFI sets and monitors capital requirements for the Bank. Capital is managed in accordance with policies and plans that are regularly reviewed and approved by the Board of Directors and that take into account, amongst other items, forecasted capital requirements and current and anticipated financial market conditions.
The goal is to maintain adequate regulatory capital for the Bank to be considered well capitalized, protect consumer deposits and provide capacity to support organic growth as well as to capitalize on strategic opportunities that do not otherwise require accessing the public capital markets, all the while providing a satisfactory return to shareholders. The Bank’s regulatory capital is comprised of share capital, retained earnings and unrealized gains and losses on fair value through other comprehensive income securities (Common Equity Tier 1 capital), preferred shares (Additional Tier 1 capital) and subordinated notes (Tier 2 capital).
The Bank monitors its capital adequacy and related capital ratios on a daily basis and has policies setting internal targets and thresholds for its capital ratios. These capital ratios consist of the leverage ratio and the risk-based capital ratios.
The Bank makes use of the Standardized Approach for credit risk as prescribed by OSFI and, therefore, may include eligible ECL allowance amounts in its Tier 2 capital, up to a maximum of 1.25% of its credit risk-weighted assets calculated under the Standardized Approach.
During the period ended July 31, 2023, there were no material changes in the Bank’s management of capital.
| b) |
Risk-based capital ratios: |
The Basel Committee on Banking Supervision has published the Basel III rules on capital adequacy and liquidity (“Basel III”). OSFI requires that all Canadian banks must comply with the Basel III standards on an “all-in” basis for the purpose of determining their risk-based capital ratios. Required minimum regulatory capital ratios are a 7.0% Common Equity Tier 1 capital ratio (“CET1”), an 8.5% Tier 1 capital ratio and a 10.5% Total capital ratio, all of which include a 2.50% capital conservation buffer.
OSFI also requires banks to measure capital adequacy in accordance with guidelines for determining risk- adjusted capital and risk-weighted assets including off-balance sheet credit instruments as specified in the Basel III regulations. Based on the deemed credit risk for each type of asset, both on and off-balance sheet assets of the Bank are assigned a weighting ranging between 0% to 150% to determine the Bank’s risk- weighted equivalent assets and its risk-based capital ratios.
The Bank’s risk-based capital ratios are calculated as follows:
| (thousands of Canadian dollars) |
||||||||
| July 31 |
October 31 |
|||||||
| 2023 |
2022 |
|||||||
| Common Equity Tier 1 (CET1) capital |
||||||||
| Directly issued qualifying common share capital |
$ | 214,544 | $ | 225,982 | ||||
| Contributed surplus |
2,339 | 1,612 | ||||||
| Retained earnings |
134,461 | 109,335 | ||||||
| Accumulated other comprehensive income |
52 | 99 | ||||||
| CET1 before regulatory adjustments |
351,396 | 337,028 | ||||||
| Regulatory adjustments applied to CET1 |
(11,502 | ) | (11,371 | ) | ||||
| Common Equity Tier 1 capital |
$ | 339,894 | $ | 325,657 | ||||
| Additional Tier 1 capital |
||||||||
| Directly issued qualifying Additional Tier 1 instruments |
$ | 13,647 | $ | 13,647 | ||||
| Total Tier 1 capital |
$ | 353,541 | $ | 339,304 | ||||
| Tier 2 capital |
||||||||
| Directly issued Tier 2 capital instruments |
$ | 103,827 | $ | 107,367 | ||||
| Tier 2 capital before regulatory adjustments |
103,827 | 107,367 | ||||||
| Eligible stage 1 and stage 2 allowance |
2,697 | 1,904 | ||||||
| Total Tier 2 capital |
$ | 106,524 | $ | 109,271 | ||||
| Total regulatory capital |
$ | 460,065 | $ | 448,575 | ||||
| Total risk-weighted assets |
$ | 3,047,172 | $ | 2,714,902 | ||||
| Capital ratios |
||||||||
| CET1 capital ratio |
11.15 | % | 12.00 | % | ||||
| Tier 1 capital ratio |
11.60 | % | 12.50 | % | ||||
| Total capital ratio |
15.10 | % | 16.52 | % | ||||
As at July 31, 2023 and October 31, 2022, the Bank exceeded all of the minimum Basel III regulatory capital requirements prescribed by OSFI.
| c) |
Leverage ratio: |
The leverage ratio, which is prescribed under the Basel III Accord, is a supplementary measure to the risk-based capital requirements and is defined as the ratio of Tier 1 capital to the Bank’s total exposures. The Basel III minimum leverage ratio is 3.0%. The Bank’s leverage ratio is calculated as follows:
| (thousands of Canadian dollars) |
||||||||
| July 31 |
October 31 |
|||||||
| 2023 |
2022 |
|||||||
| On-balance sheet assets |
$ | 3,980,845 | $ | 3,265,998 | ||||
| Assets amounts adjusted in determining the Basel III |
||||||||
| Tier 1 capital |
(11,502 | ) | (11,371 | ) | ||||
| Total on-balance sheet exposures |
3,969,343 | 3,254,627 | ||||||
| Total off-balance sheet exposure at gross notional amount |
$ | 424,526 | $ | 443,124 | ||||
| Adjustments for conversion to credit equivalent amount |
(247,001 | ) | (251,101 | ) | ||||
| Total off-balance sheet exposures |
177,525 | 192,023 | ||||||
| Tier 1 capital |
353,541 | 339,304 | ||||||
| Total exposures |
4,146,868 | 3,446,650 | ||||||
| Leverage ratio |
8.53 | % | 9.84 | % | ||||
As at July 31, 2023 and October 31, 2022, the Bank was in compliance with the leverage ratio prescribed by OSFI.
| 16. |
Interest rate risk position: |
The Bank is subject to interest rate risk, which is the risk that a movement in interest rates could negatively impact net interest margin, net interest income and the economic value of assets, liabilities and shareholders’ equity. The following table provides the duration difference between the Bank’s assets and liabilities and the potential after-tax impact of a 100 basis point shift in interest rates on the Bank’s earnings during a 12 month period.
| (thousands of Canadian dollars) |
||||||||||||||||
| July 31, 2023 |
October 31, 2022 |
|||||||||||||||
| Increase 100 bps |
Decrease 100 bps |
Increase 100 bps |
Decrease 100 bps |
|||||||||||||
| Increase (decrease): |
||||||||||||||||
| Impact on projected net interest income during a 12 month period |
$ | 5,114 | $ | (5,123 | ) | $ | 4,304 | $ | (4,261 | ) | ||||||
| Duration difference between assets and liabilities in months |
(2.3 | ) | 1.4 | |||||||||||||
| 17. |
Fair value of financial instruments: |
Fair values are based on management’s best estimates of market conditions and valuation policies at a certain point in time. The estimates are subjective and involve particular assumptions and judgement and, as such, may not be reflective of future fair values. The Bank’s loans and deposits lack an available market as they are not typically exchanged and, therefore, the book value of these instruments is not necessarily representative of amounts realizable upon immediate settlement. See note 18 of the October 31, 2022 audited Consolidated Financial Statements for more information on fair values.
| (thousands of Canadian dollars) |
||||||||||||||||
| As at |
July 31, 2023 |
October 31, 2022 |
||||||||||||||
| Carrying |
Fair |
Carrying |
Fair |
|||||||||||||
| (thousands of Canadian dollars) |
Value |
Value |
Value |
Value |
||||||||||||
| Assets |
||||||||||||||||
| Cash |
$ | 87,726 | $ | 87,726 | $ | 88,581 | $ | 88,581 | ||||||||
| Securities |
182,944 | 182,944 | 141,564 | 141,564 | ||||||||||||
| Loans |
3,661,672 | 3,636,974 | 2,992,678 | 2,963,676 | ||||||||||||
| Other |
5,248 | 5,248 | 4,727 | 4,727 | ||||||||||||
| Liabilities |
||||||||||||||||
| Deposits |
$ | 3,328,017 | $ | 3,238,741 | $ | 2,657,540 | $ | 2,561,421 | ||||||||
| Subordinated notes payable |
101,585 | 103,827 | 104,951 | 107,367 | ||||||||||||
| Other |
181,014 | 181,014 | 146,249 | 146,249 | ||||||||||||
| 18. | Operating segmentation: |
The Bank has established two reportable operating segments, those being Digital Banking and DRTC (cybersecurity services). The two operating segments are strategic business operations providing distinct products and services to different markets and are separately managed as a function of the distinction in the nature of each business. The following summarizes the operations of each of the reportable segments:
Digital Banking – The Bank employs a branchless business-to-business model using its proprietary financial technology to address underserved segments in the Canadian and US banking markets. VersaBank obtains its deposits and provides the majority of its loans and leases electronically via innovative deposit and lending solutions for financial intermediaries.
DRTC (cybersecurity services and banking and financial technology development) – Leveraging its internally developed IT security software and capabilities, VersaBank established a wholly owned subsidiary, DRT Cyber Inc., to pursue significant large-market opportunities in cybersecurity and develop innovative solutions to address the rapidly growing volume of cyber threats challenging financial institutions, multi-national corporations and government entities.
The basis for the determination of the reportable segments is a function primarily of the systematic, consistent process employed by the Bank’s chief operating decision maker, the Chief Executive Officer, and the Chief Financial Officer in reviewing and interpreting the operations and performance of each segment. The accounting policies applied to these segments are consistent with those employed in the preparation of the Bank’s Consolidated Financial Statements, as disclosed in note 3 of the Bank’s 2022 audited Consolidated Financial Statements.
Performance is measured based on segment net income, as included in the Bank’s internal management reporting. Management has determined that this measure is the most relevant in evaluating segment results and in the allocation of resources.
The following table sets out the results of each reportable operating segment as at and for the three and nine months ended July 31, 2023 and 2022:
| (thousands of Canadian dollars) |
||||||||||||||||||||||||||||||||
| for the three months ended |
July 31, 2023 |
July 31, 2022 |
||||||||||||||||||||||||||||||
| Digital |
DRTC |
Eliminations/ |
Consolidated |
Digital |
DRTC |
Eliminations/ |
Consolidated |
|||||||||||||||||||||||||
| Banking |
Adjustments |
Banking |
Adjustments |
|||||||||||||||||||||||||||||
| Net interest income |
$ | 24,929 | $ | - | $ | - | $ | 24,929 | $ | 20,062 | $ | - | $ | - | $ | 20,062 | ||||||||||||||||
| Non-interest income |
101 | 2,020 | (191 | ) | 1,930 | 12 | 1,206 | (41 | ) | 1,177 | ||||||||||||||||||||||
| Total revenue |
25,030 | 2,020 | (191 | ) | 26,859 | 20,074 | 1,206 | (41 | ) | 21,239 | ||||||||||||||||||||||
| Provision for (recovery of) credit losses |
171 | - | - | 171 | 166 | - | - | 166 | ||||||||||||||||||||||||
| 24,859 | 2,020 | (191 | ) | 26,688 | 19,908 | 1,206 | (41 | ) | 21,073 | |||||||||||||||||||||||
| Non-interest expenses: |
||||||||||||||||||||||||||||||||
| Salaries and benefits |
5,891 | 1,562 | - | 7,453 | 5,600 | 1,168 | - | 6,768 | ||||||||||||||||||||||||
| General and administrative |
4,257 | 380 | (191 | ) | 4,446 | 5,217 | 343 | (41 | ) | 5,519 | ||||||||||||||||||||||
| Premises and equipment |
610 | 370 | - | 980 | 610 | 319 | - | 929 | ||||||||||||||||||||||||
| 10,758 | 2,312 | (191 | ) | 12,879 | 11,427 | 1,830 | (41 | ) | 13,216 | |||||||||||||||||||||||
| Income (loss) before income taxes |
14,101 | (292 | ) | - | 13,809 | 8,481 | (624 | ) | - | 7,857 | ||||||||||||||||||||||
| Income tax provision |
3,999 | (193 | ) | - | 3,806 | 2,099 | 38 | - | 2,137 | |||||||||||||||||||||||
| Net income (loss) |
$ | 10,102 | $ | (99 | ) | $ | - | $ | 10,003 | $ | 6,382 | $ | (662 | ) | $ | - | $ | 5,720 | ||||||||||||||
| Total assets |
$ | 3,971,781 | $ | 25,485 | $ | (16,421 | ) | $ | 3,980,845 | $ | 3,076,611 | $ | 21,796 | $ | (23,064 | ) | $ | 3,075,343 | ||||||||||||||
| Total liabilities |
$ | 3,609,832 | $ | 29,123 | $ | (23,153 | ) | $ | 3,615,802 | $ | 2,725,820 | $ | 24,794 | $ | (21,919 | ) | $ | 2,728,695 | ||||||||||||||
| (thousands of Canadian dollars) |
||||||||||||||||||||||||||||||||
| for the nine months ended |
July 31, 2023 |
July 31, 2022 |
||||||||||||||||||||||||||||||
| Digital |
DRTC |
Eliminations/ |
Consolidated |
Digital |
DRTC |
Eliminations/ |
Consolidated |
|||||||||||||||||||||||||
| Banking |
Adjustments |
Banking |
Adjustments |
|||||||||||||||||||||||||||||
| Net interest income |
$ | 73,812 | $ | - | $ | - | $ | 73,812 | $ | 54,189 | $ | - | $ | - | $ | 54,189 | ||||||||||||||||
| Non-interest income |
225 | 5,999 | (574 | ) | 5,650 | 14 | 4,061 | (124 | ) | 3,951 | ||||||||||||||||||||||
| Total revenue |
74,037 | 5,999 | (574 | ) | 79,462 | 54,203 | 4,061 | (124 | ) | 58,140 | ||||||||||||||||||||||
| Provision for (recovery of) credit losses |
793 | - | - | 793 | 246 | - | - | 246 | ||||||||||||||||||||||||
| 73,244 | 5,999 | (574 | ) | 78,669 | 53,957 | 4,061 | (124 | ) | 57,894 | |||||||||||||||||||||||
| Non-interest expenses: |
||||||||||||||||||||||||||||||||
| Salaries and benefits |
19,505 | 4,634 | - | 24,139 | 16,625 | 2,952 | - | 19,577 | ||||||||||||||||||||||||
| General and administrative |
10,250 | 1,212 | (574 | ) | 10,888 | 12,460 | 826 | (124 | ) | 13,162 | ||||||||||||||||||||||
| Premises and equipment |
1,845 | 1,068 | - | 2,913 | 1,851 | 1,029 | - | 2,880 | ||||||||||||||||||||||||
| 31,600 | 6,914 | (574 | ) | 37,940 | 30,936 | 4,807 | (124 | ) | 35,619 | |||||||||||||||||||||||
| Income (loss) before income taxes |
41,644 | (915 | ) | - | 40,729 | 23,021 | (746 | ) | - | 22,275 | ||||||||||||||||||||||
| Income tax provision |
11,779 | (733 | ) | - | 11,046 | 5,805 | 241 | - | 6,046 | |||||||||||||||||||||||
| Net income (loss) |
$ | 29,865 | $ | (182 | ) | $ | - | $ | 29,683 | $ | 17,216 | $ | (987 | ) | $ | - | $ | 16,229 | ||||||||||||||
| Total assets |
$ | 3,971,781 | $ | 25,485 | $ | (16,421 | ) | $ | 3,980,845 | $ | 3,076,611 | $ | 21,796 | $ | (23,064 | ) | $ | 3,075,343 | ||||||||||||||
| Total liabilities |
$ | 3,609,832 | $ | 29,123 | $ | (23,153 | ) | $ | 3,615,802 | $ | 2,725,820 | $ | 24,794 | $ | (21,919 | ) | $ | 2,728,695 | ||||||||||||||
The Bank has operations in the US, through both its Digital Banking and DRTC businesses, however as at July 31, 2023, substantially all of the Bank’s earnings and assets are based in Canada.
| 19. | Comparative balances: |
Certain comparative balances have been reclassified to conform with the financial statement presentation adopted in the current period.
Exhibit 99.2
Management’s Discussion and Analysis
This management’s discussion and analysis (“MD&A”) of operations and financial condition for the third quarter of fiscal 2023, dated August 28, 2023, should be read in conjunction with the unaudited interim consolidated financial statements for the period ended July 31, 2023, which have been prepared in accordance with International Financial Reporting Standards (“IFRS”). This MD&A should also be read in conjunction with VersaBank’s MD&A and Audited Consolidated Financial Statements for the year ended October 31, 2022, which are available on VersaBank’s website at www.versabank.com, SEDAR at www.sedar.com and EDGAR at www.sec.gov/edgar.shtml. Except as discussed below, all other factors discussed and referred to in the MD&A for the year ended October 31, 2022, remain substantially unchanged. All currency amounts in this document are in Canadian dollars unless otherwise indicated.
|
Cautionary Note Regarding Forward-Looking Statements |
2 |
|
About VersaBank |
3 |
|
Overview of Performance |
4 |
|
Selected Financial Highlights |
7 |
|
Business Outlook |
8 |
|
Financial Review – Earnings |
12 |
|
Financial Review – Balance Sheet |
18 |
|
Off-Balance Sheet Arrangements |
29 |
|
Related Party Transactions |
29 |
|
Capital Management and Capital Resources |
30 |
|
Results of Operating Segments |
32 |
|
Summary of Quarterly Results |
34 |
|
Non-GAAP and Other Financial Measures |
35 |
|
Significant Accounting Policies and Use of Estimates and Judgements |
37 |
|
Controls and Procedures |
38 |
| VersaBank – Q3 2023 MD&A | 1 |
Cautionary Note Regarding Forward-Looking Statements
VersaBank’s public communications often include written or oral forward-looking statements. Statements of this type are included in this document and may be included in other filings and with Canadian securities regulators or the US Securities and Exchange Commission, or in other communications. All such statements are made pursuant to the “safe harbor” provisions of, and are intended to be forward-looking statements under, the United States Private Securities Litigation Reform Act of 1995 and any applicable Canadian securities legislation. The statements in this management’s discussion and analysis that relate to the future are forward-looking statements. By their very nature, forward-looking statements involve inherent risks and uncertainties, both general and specific, many of which are out of VersaBank’s control. Risks exist that predictions, forecasts, projections, and other forward-looking statements will not be achieved. Readers are cautioned not to place undue reliance on these forward-looking statements as a number of important factors could cause actual results to differ materially from the plans, objectives, expectations, estimates and intentions expressed in such forward-looking statements. These factors include, but are not limited to, the strength of the Canadian and US economy in general and the strength of the local economies within Canada and the US in which VersaBank conducts operations; the effects of changes in monetary and fiscal policy, including changes in interest rate policies of the Bank of Canada and the US Federal Reserve; global commodity prices; the effects of competition in the markets in which VersaBank operates; inflation; capital market fluctuations; the timely development and introduction of new products in receptive markets; the impact of changes in the laws and regulations pertaining to financial services; changes in tax laws; technological changes; unexpected judicial or regulatory proceedings; unexpected changes in consumer spending and savings habits; the impact of wars or conflicts including the crisis in Ukraine and the impact of the crisis on global supply chains and markets; the impact of potential new variants of COVID-19; the possible effects on our business of terrorist activities; natural disasters and disruptions to public infrastructure, such as transportation, communications, power or water supply; and VersaBank’s anticipation of and success in managing the risks implicated by the foregoing. For a detailed discussion of certain key factors that may affect VersaBank’s future results, please see VersaBank’s annual MD&A for the year ended October 31, 2022.
The foregoing list of important factors is not exhaustive. When relying on forward-looking statements to make decisions, investors and others should carefully consider the foregoing factors and other uncertainties and potential events. The forward-looking information contained in the management’s discussion and analysis is presented to assist VersaBank shareholders and others in understanding VersaBank’s financial position and may not be appropriate for any other purposes. Except as required by securities law, VersaBank does not undertake to update any forward-looking statement that is contained in this management’s discussion and analysis or made from time to time by VersaBank or on its behalf.
| VersaBank – Q3 2023 MD&A | 2 |
About VersaBank
VersaBank (the “Bank”) adopted an electronic branchless model in 1993, becoming the world’s first branchless financial institution and obtains its deposits and the majority of its loans and leases digitally. It holds a Canadian Schedule 1 chartered bank licence and is regulated by the Office of the Superintendent of Financial Institutions (“OSFI”). In addition to its core Digital Banking operations, VersaBank has established cybersecurity services and banking and financial technology development operations through its wholly owned subsidiary, DRT Cyber Inc. (“DRTC”). VersaBank’s Common Shares trade on the Toronto Stock Exchange and Nasdaq under the symbol VBNK. Its Series 1 Preferred Shares trade on the Toronto Stock Exchange under the symbol VBNK.PR.A.
VersaBank is focused on increasing earnings by concentrating on underserved markets that support more attractive pricing for its products, leveraging existing distribution channels to deliver its financial products to these chosen markets and expanding its diverse deposit gathering network that provides efficient access to a range of low-cost deposit sources in order to maintain a low cost of funds.
The underlying drivers of VersaBank’s performance trends for the current and comparative periods are set out in the following sections of this MD&A.
| VersaBank – Q3 2023 MD&A | 3 |
Overview of Performance
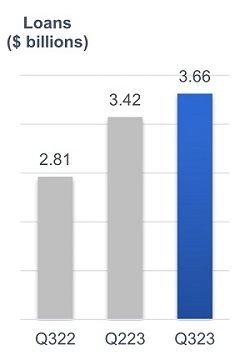 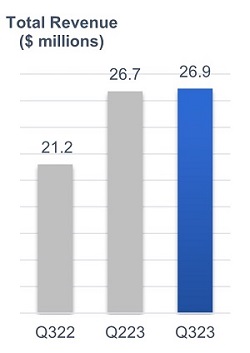 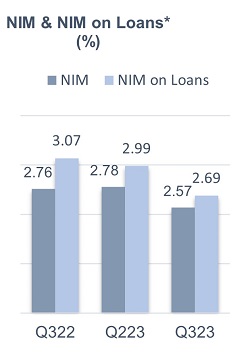
|
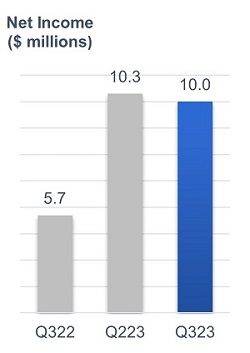 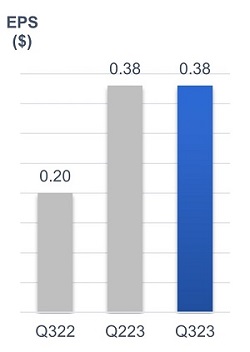 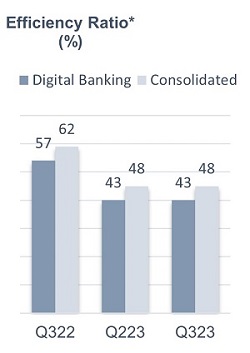
|
* See definition in the "Non-GAAP and Other Financial Measures" section below.
Q3 2023 vs Q2 2023
| ► |
Loans increased 7% to $3.66 billion, driven primarily by continued strong growth in the Bank’s Point-of-Sale Loans and Leases (“POS Financing”) portfolio, which increased 9%; |
| ► |
Total revenue increased 1% to $26.9 million and was comprised of net interest income of $24.9 million and non-interest income of $1.9 million, the latter derived primarily from the revenue contribution of DRT Cyber Inc., (“DRTC”), which includes the gross margin generated by its cybersecurity component Digital Boundary Group’s cybersecurity services business; |
| VersaBank – Q3 2023 MD&A | 4 |
| ► |
Net interest margin (NIM) on loans decreased 30 bps to 2.69% due primarily to higher rates paid on term deposits during the quarter amidst temporarily elevated rates in the term deposit market in Canada, which were impacted by the period of liquidity concerns related to the US banking sector. NIM decreased 21 bps to 2.57%; |
| ► |
Provision for credit losses as a percentage of average loans was 0.02% compared to 0.03% last quarter with the trend attributable primarily to changes in the forward-looking information used by VersaBank in its credit risk models and changes in the Bank’s lending asset mix; |
| ► |
Non-interest expenses increased 1% to $12.9 million as a function primarily of higher professional fees attributable to the continuing regulatory approval process associated with VersaBank’s acquisition of a US bank and seasonal corporate activities specific to the quarter, offset partially by lower salary and benefits amounts attributable to estimates associated with performance-based obligations; |
| ► |
Efficiency ratio for the Digital Banking operations (excluding DRTC) was unchanged at 43%; |
| ► |
Net income before taxes increased 1% as a function of higher revenue attributable primarily to strong loan growth and cost control which resulted in non-interest expenses remaining essentially flat this quarter; |
| ► |
Net income decreased 3% to $10.0 million attributable to the impact of a $530,000 deferred tax asset recognized in the previous quarter associated with DRTC’s non-capital loss carryforwards; and, |
| ► |
Earnings per share (“EPS”) was unchanged at $0.38 per share, benefitting from a lower number of common shares outstanding in the current quarter as a result of the purchase and cancellation of common shares under the Bank’s Normal Course Issuer Bid (“NCIB”). |
Q3 2023 vs Q3 2022
| ► |
Loans increased 30% to $3.66 billion, driven primarily by strong growth in the POS Financing portfolio, which increased 39%; |
| ► |
Total revenue increased 26%, driven by higher net interest income attributable substantially to strong loan growth and higher non-interest income derived primarily from the revenue contribution of DRTC; |
| ► |
NIM on loans decreased 38 bps due to higher cost of funds attributable primarily to higher rates paid on term deposits during the quarter amidst temporarily elevated rates in the term deposit market in Canada, which were impacted by the period of liquidity concerns related to the US banking sector and a shift in the Bank’s funding mix, offset partially by higher yields earned on the Bank’s lending assets; |
| ► |
Provision for credit losses as a percentage of average loans was 0.02% compared to 0.03% last year with the trend attributable primarily to changes in the forward-looking information used by VersaBank in its credit risk models, offset partially by changes in the Bank’s lending asset mix; |
| ► |
Non-interest expenses decreased 3% as a function primarily of lower capital tax expense attributable to a shift in the provincial allocation of the Bank’s loan and deposit originations and lower insurance premiums relative to the premiums paid during the comparative period attributable to VersaBank’s listing on the Nasdaq in September 2021, offset partially by higher salary and benefits expense attributable to higher staffing levels to support expanded business activity across VersaBank and higher costs attributable to the continuing regulatory approval process associated with VersaBank’s acquisition of a US bank; |
| VersaBank – Q3 2023 MD&A | 5 |
| ► |
Efficiency ratio for Digital Banking operations (excluding DRTC) improved to 43% attributable to revenue growth (25%) and a decline in non-interest expenses (6%) over the same period; and, |
| ► |
Net income and EPS increased 75% and 90% as a function primarily of higher revenue and lower non-interest expenses. The EPS trend was also impacted by the common shares that were purchased and cancelled through the Bank’s NCIB. |
Q3 YTD 2023 vs Q3 YTD 2022
| ► |
Loans increased 30% to $3.66 billion, driven by strong growth in the POS Financing portfolio, which increased 39% during the period; |
| ► |
Total revenue increased 37%, driven primarily by higher net interest income attributable substantially to strong loan growth as well as higher non-interest income derived primarily from the revenue contribution of DRTC and NIM expansion; |
| ► |
NIM on loans decreased 15 bps attributable primarily to a shift in the Bank’s funding mix, while NIM increased 8 bps due primarily to higher yields earned on the Bank’s lending assets, offset partially by higher cost of funds; |
| ► |
Provision for credit losses as a percentage of average loans was 0.03% compared to 0.01% a year ago attributable primarily to lending asset growth and changes in the forward-looking information used by VersaBank in its credit risk models, offset partially by changes in the Bank’s lending asset mix; |
| ► |
Non-interest expenses increased 7% as a function primarily of higher salary and benefits amounts attributable to higher staffing levels to support expanded business activity across the Bank, higher general annual compensation adjustments and higher professional fees attributable to the continuing regulatory approval process associated with the Bank’s acquisition of a US bank, offset partially by lower capital tax expense and lower insurance premiums relative to the premiums paid during the comparative period; |
| ► |
Efficiency ratio for Digital Banking operations (excluding DRTC) improved to 43% as a function of revenue growth (37%) outpacing non-interest expense growth (2%) over the same period; and, |
| ► |
Net income and EPS increased 83% and 96% respectively as a function primarily of higher revenue offset partially by higher non-interest expenses. The EPS trend was also impacted by the purchase and cancellation of common shares under the Bank’s NCIB. |
| VersaBank – Q3 2023 MD&A | 6 |
Selected Financial Highlights
|
(unaudited) |
for the three months ended |
for the nine months ended |
||||||||||||||
|
July 31 |
July 31 |
July 31 |
July 31 |
|||||||||||||
|
(thousands of Canadian dollars, except per share amounts) |
2023 |
2022 |
2023 |
2022 |
||||||||||||
|
Results of operations |
||||||||||||||||
|
Interest income |
$ | 60,089 | $ | 34,177 | $ | 163,245 | $ | 84,745 | ||||||||
|
Net interest income |
24,929 | 20,062 | 73,812 | 54,189 | ||||||||||||
|
Non-interest income |
1,930 | 1,177 | 5,650 | 3,951 | ||||||||||||
|
Total revenue |
26,859 | 21,239 | 79,462 | 58,140 | ||||||||||||
|
Provision for credit losses |
171 | 166 | 793 | 246 | ||||||||||||
|
Non-interest expenses |
12,879 | 13,216 | 37,940 | 35,619 | ||||||||||||
|
Digital Banking |
10,758 | 11,427 | 31,600 | 30,936 | ||||||||||||
|
DRTC |
2,312 | 1,830 | 6,914 | 4,807 | ||||||||||||
|
Net income |
10,003 | 5,720 | 29,683 | 16,229 | ||||||||||||
|
Income per common share: |
||||||||||||||||
|
Basic |
$ | 0.38 | $ | 0.20 | $ | 1.10 | $ | 0.56 | ||||||||
|
Diluted |
$ | 0.38 | $ | 0.20 | $ | 1.10 | $ | 0.56 | ||||||||
|
Dividends paid on preferred shares |
$ | 247 | $ | 247 | $ | 741 | $ | 741 | ||||||||
|
Dividends paid on common shares |
$ | 648 | $ | 687 | $ | 1,962 | $ | 2,061 | ||||||||
|
Yield* |
6.19 | % | 4.70 | % | 6.02 | % | 4.13 | % | ||||||||
|
Cost of funds* |
3.62 | % | 1.94 | % | 3.30 | % | 1.49 | % | ||||||||
|
Net interest margin* |
2.57 | % | 2.76 | % | 2.72 | % | 2.64 | % | ||||||||
|
Net interest margin on loans* |
2.69 | % | 3.07 | % | 2.89 | % | 3.04 | % | ||||||||
|
Return on average common equity* |
11.15 | % | 6.57 | % | 11.24 | % | 6.36 | % | ||||||||
|
Book value per common share* |
$ | 13.55 | $ | 12.14 | $ | 13.55 | $ | 12.14 | ||||||||
|
Efficiency ratio* |
48 | % | 62 | % | 48 | % | 61 | % | ||||||||
|
Efficiency ratio - Digital Banking* |
43 | % | 57 | % | 43 | % | 57 | % | ||||||||
|
Return on average total assets* |
1.00 | % | 0.75 | % | 1.07 | % | 0.75 | % | ||||||||
|
Provision for credit losses as a % of average loans* |
0.02 | % | 0.03 | % | 0.03 | % | 0.01 | % | ||||||||
|
as at |
||||||||||||||||
|
Balance Sheet Summary |
||||||||||||||||
|
Cash |
$ | 87,726 | $ | 84,214 | $ | 87,726 | $ | 84,214 | ||||||||
|
Securities |
182,944 | 133,682 | 182,944 | 133,682 | ||||||||||||
|
Loans, net of allowance for credit losses |
3,661,672 | 2,814,121 | 3,661,672 | 2,814,121 | ||||||||||||
|
Average loans |
3,540,564 | 2,632,199 | 3,327,175 | 2,458,586 | ||||||||||||
|
Total assets |
3,980,845 | 3,075,343 | 3,980,845 | 3,075,343 | ||||||||||||
|
Deposits |
3,328,017 | 2,475,063 | 3,328,017 | 2,475,063 | ||||||||||||
|
Subordinated notes payable |
101,585 | 98,706 | 101,585 | 98,706 | ||||||||||||
|
Shareholders' equity |
365,043 | 346,648 | 365,043 | 346,648 | ||||||||||||
|
Capital ratios** |
||||||||||||||||
|
Risk-weighted assets |
$ | 3,047,172 | $ | 2,568,678 | $ | 3,047,172 | $ | 2,568,678 | ||||||||
|
Common Equity Tier 1 capital |
339,894 | 321,386 | 339,894 | 321,386 | ||||||||||||
|
Total regulatory capital |
460,065 | 437,912 | 460,065 | 437,912 | ||||||||||||
|
Common Equity Tier 1 (CET1) ratio |
11.15 | % | 12.51 | % | 11.15 | % | 12.51 | % | ||||||||
|
Tier 1 capital ratio |
11.60 | % | 13.04 | % | 11.60 | % | 13.04 | % | ||||||||
|
Total capital ratio |
15.10 | % | 17.05 | % | 15.10 | % | 17.05 | % | ||||||||
|
Leverage ratio |
8.53 | % | 10.38 | % | 8.53 | % | 10.38 | % | ||||||||
|
* See definition in "Non-GAAP and Other Financial Measures" section below. |
|||||||||
|
** Capital management and leverage measures are in accordance with OSFI's Capital Adequacy Requirements and Basel III Accord. |
| VersaBank – Q3 2023 MD&A | 7 |
Business Outlook
VersaBank is active in underserved banking markets in Canada and the US in which its innovative, value added digital banking products command more attractive pricing for its lending products, and further, continues to develop and expand its diverse deposit gathering network that provides efficient access to a range of low-cost deposit sources. In addition, VersaBank remains highly committed to, and focused on, further developing and enhancing its technology advantage, a key component of its value proposition that not only provides efficient access to VersaBank’s chosen underserved lending and deposit markets, but also delivers superior financial products and better customer service to its clients.
Management continues to monitor geo-political, economic and financial market risk precipitated by the conflict in Ukraine, as well as recent events in the US banking sector and the potential impact on VersaBank’s business. At this time, management has not identified any material direct or indirect risk exposure to VersaBank resulting from the conflict or the challenges experienced by the US banking sector in early calendar 2023 and will continue to assess the relevant data and information as it becomes available.
While VersaBank does not provide guidance on specific performance metrics, the commentary provided below discusses aspects of VersaBank’s business and certain anticipated trends related to same that, in management’s view, could potentially impact future performance.
Pending acquisition of Stearns Bank Holdingford
| ► |
The Bank continues to advance the process seeking approval of its proposed acquisition of OCC-chartered US bank, Stearns Bank Holdingford N.A., and expects a decision with respect to approval of its application from US regulators during autumn 2023. If favourable, the Bank will proceed toward completion of the acquisition as soon as possible, subject to Canadian regulatory (OSFI) approval. |
Lending Assets
| ► |
Canadian Point-of-Sale Financing: Consumer spending and business investment in Canada are expected to slow during the last quarter of 2023 due primarily to the impact of higher interest rates; however, the economic slowdown is expected to be short lived, with only modest layoffs and a moderate increase in unemployment. It remains management’s view that any impact of a slower economy on the POS Financing portfolio over the remainder of fiscal 2023 will be substantially outweighed by the impact of onboarding new origination partners and the continued expansion of business with existing partners. Considering the above and combined with what is historically a seasonally stronger period for the POS Financing business, management expects POS portfolio growth in the second half of 2023 to be moderately higher than growth achieved in the first half of the year; |
|
► |
US Receivable Purchase Program (“RPP”): Despite higher interest rates, stubborn inflation and high energy prices in the US, the US labour market remains strong evidenced by continued, healthy job and wage growth which, combined with the expectation that the federal funds rate is at or nearing the peak of the Federal Reserve’s tightening cycle will continue to support healthy consumer spending. Management views the current trajectory of the US economy to be favourable in the context of continued, stable demand for durable goods, which is expected to continue to drive demand for transportation and manufacturing equipment purchases. Additionally, despite high mortgage rates, record-low levels of available inventory of new homes is expected to continue to stimulate single-family home construction which in turn is anticipated to support demand for construction equipment in the near term. Management believes that the anticipated US macroeconomic and industry trends described above will continue to support growth in the Bank’s RPP portfolio through the remainder of fiscal 2023; and, |
| VersaBank – Q3 2023 MD&A | 8 |
| ► |
Commercial Real Estate (Business-to-Business Loans with Credit Risk Exposure Predominantly Related to Residential Properties): Management anticipates modest deceleration in the growth of its residential construction and term financing products. Notwithstanding the effective risk mitigation strategies that are employed in managing the Bank’s Commercial Real Estate (“CRE”) portfolios, including working with well-established, well-capitalized partners and maintaining modest loan-to-value ratios on individual transactions, management continues to take a cautionary stance with respect to its broader CRE portfolios due to the anticipation of volatility in CRE asset valuations in the current and anticipated interest rate environment and the potential impact of same on borrowers’ ability to service debt, as well as due to concerns related to inflation and higher input costs, which continue to have the potential to drive higher construction costs. |
Credit Quality
| ► |
VersaBank lends to underserved markets that support more attractive pricing for its lending products but typically exhibit a lower-than-average risk profile generally as a function of the lower inherent risk associated with the underlying collateral assets and/or the structure of VersaBank’s offered financing arrangements; |
| ► |
Based on available forward-looking macroeconomic and industry data as well as the Bank’s historical credit experience, current underwriting governance, and general expectations for credit performance management anticipates that credit risk in its portfolio may continue to increase modestly over the remainder of fiscal 2023 as a function primarily of a prolonged, elevated interest rate environment in both Canada and the US, the ability of consumers and businesses to service debt in such an environment as well as the effect of elevated inflation in both Canada and the US. Notwithstanding the above, the anticipated economic slowdown attributable primarily to both higher rates and inflation is expected to be short lived and potentially result in only modest layoffs and a moderate increase in unemployment with higher wages and what remains of consumer savings supporting households in adjusting to higher interest payments without eradicating spending. Further, management expects that the lower risk profile of VersaBank’s unique business to business lending portfolio, which is a function of VersaBank’s prudent underwriting practices, structured lending products and focus on underserved financing markets within which it has a wealth of experience, will contribute to mitigating any escalation in forward credit risk in the Bank’s lending portfolio; and, |
| VersaBank – Q3 2023 MD&A | 9 |
| ► |
VersaBank has sourced credit risk modeling systems and forecast macroeconomic scenario data from Moody’s Analytics, a third-party service provider, for the purpose of computing forward-looking credit risk parameters under multiple macroeconomic scenarios that consider both market-wide and idiosyncratic factors and influences. These credit risk modeling systems are used in conjunction with VersaBank’s internally developed expected credit loss (“ECL”) models. Given that the Bank has experienced very limited historical losses and, therefore, does not have available statistically significant loss data inventory for use in developing internal, forward looking expected credit loss trends, the use of unbiased, third-party forward-looking credit risk parameter modeling systems is particularly important for the Bank in the context of the estimation of expected credit losses. |
Funding and Liquidity
| ► |
Management expects that commercial deposit volumes raised via VersaBank’s Trustee Integrated Banking (“TIB”) program will continue to grow over the remainder of fiscal 2023 as a function of increased volumes of consumer and commercial bankruptcy and proposal restructuring proceedings, attributable primarily to the impact of a higher interest rate environment and sticky inflation. In addition, VersaBank continues to pursue a number of initiatives to grow and expand its well-established, diverse deposit broker network through which it sources personal deposits, consisting primarily of guaranteed investment certificates. The Bank’s current deposit channels remain an efficient, reliable and diversified source of funding providing ample access to reasonably priced deposits in volumes that comfortably support the Bank’s liquidity requirements. Substantially all of the Bank’s deposit volumes raised through these channels are eligible for CDIC insurance; |
| ► |
Management anticipates that liquidity levels will remain reasonably consistent over the remainder of fiscal 2023 as the Bank continues to fund anticipated balance sheet growth across each of its lines of business. Further, management will continue to deploy cash into low risk, government securities with the objective of earning a more favourable yield on its available liquidity; and, |
| ► |
Management believes that VersaBank has one of the lowest liquidity risk profiles among North American banks attributable to the quality, stability and stickiness of its deposit base. All of VersaBank’s deposits are sourced through existing, third-party distribution channels, specifically wealth management firms that distribute the Bank’s term deposit products and Trustee in Bankruptcy firms that distribute the Bank’s demand and term deposit products. The Bank does not accept deposits directly from individuals and does not offer high interest-bearing demand deposit products that are accessible to the public via the internet. |
Earnings and Capital
| ► |
Earnings growth in the remainder of fiscal 2023 is expected to be a function primarily of anticipated organic balance sheet growth from Digital Banking operations, specifically attributable to the Bank’s POS Financing and RPP businesses in Canada and the US respectively as well as incremental earnings contributions from DRTC; |
| VersaBank – Q3 2023 MD&A | 10 |
| ► |
Net interest income growth for fiscal 2023 is expected to be a function primarily of growth in VersaBank’s POS and RPP businesses in Canada and the US respectively, disciplined liquidity management and the expectation that growth in the TIB program over the remainder of fiscal 2023 and further expansion of the Bank’s diverse deposit broker network will have a favourable impact on cost of funds; |
| ► |
Non-interest income growth for fiscal 2023 is expected to be a function primarily of DRTC revenue growth derived from its suite of cybersecurity services; |
| ► |
VersaBank’s capital ratios remain comfortably in excess of regulatory minimums. Management is of the view that VersaBank’s current capital levels are sufficient to accommodate balance sheet growth contemplated for fiscal 2023. Notwithstanding the above, management will continue to closely monitor the capital markets to identify opportunities for VersaBank to raise additional regulatory capital on attractive terms in order to position VersaBank to support a potentially more robust growth profile in the future; |
| ► |
Management does not anticipate increasing VersaBank’s dividends over the fourth quarter of fiscal 2023 to ensure that it continues to have adequate regulatory capital available to support contemplated balance sheet growth as well as specific business development initiatives for earnings growth currently contemplated over the same timeframe and remain in compliance with its established regulatory capital ratio targets and thresholds; and, |
| ► |
During the fourth quarter of fiscal 2022, VersaBank received approval from the TSX and Nasdaq to proceed with a NCIB for its common shares through which the Bank may purchase for cancellation up to 1,700,000 of its common shares, representing approximately 9.54% of its public float. The Bank had purchased and cancelled 1,516,658 shares under the NCIB as at July 31, 2023. |
There is potential that VersaBank may not realize or achieve the anticipated performance trends set out above as a function of a number of factors and variables including, but not limited to, the strength of the Canadian and US economies in general and the strength of the local economies in which VersaBank conducts operations; the effects of changes in monetary and fiscal policy, including changes in the interest rate policies of the Bank of Canada and the US Federal Reserve; global commodity prices; the effects of competition in the markets in which VersaBank operates; inflation; capital market fluctuations; the timely development and introduction of new products in receptive markets; the ability of VersaBank to grow its business and execute its strategy in the US market; the impact of changes in the laws and regulations regulating financial services; the impact of wars or conflicts including the crisis in Ukraine; the recent events in the US banking sector; and the impact of potential new variants of COVID-19 or a new pandemic-causing virus on the global economy. Please see “Cautionary Note Regarding Forward-Looking Statements” on page 2 of this MD&A.
| VersaBank – Q3 2023 MD&A | 11 |
Financial Review – Earnings
Total Revenue
Total revenue, which consists of net interest income and non-interest income increased 1% to $26.9 million compared to the last quarter and increased 26% compared to the same period a year ago. Total revenue for the nine months ended July 31, 2023 increased 37% to $79.5 million compared to the same period a year ago.
Net Interest Income
|
(thousands of Canadian dollars) |
||||||||||||||||||||||||||||||||
|
For the three months ended: |
For the nine months ended: |
|||||||||||||||||||||||||||||||
|
July 31 |
April 30 |
July 31 |
July 31 |
July 31 |
||||||||||||||||||||||||||||
|
2023 |
2023 |
Change |
2022 |
Change |
2023 |
2022 |
Change |
|||||||||||||||||||||||||
|
Interest income |
||||||||||||||||||||||||||||||||
|
Point-of-sale loans and leases |
$ | 38,013 | $ | 34,257 | 11 | % | $ | 21,132 | 80 | % | $ | 104,230 | $ | 51,591 | 102 | % | ||||||||||||||||
|
Commercial real estate mortgages |
17,705 | 15,958 | 11 | % | 11,665 | 52 | % | 48,073 | 30,590 | 57 | % | |||||||||||||||||||||
|
Commercial real estate loans |
161 | 166 | (3 | %) | 181 | (11 | %) | 503 | 552 | (9 | %) | |||||||||||||||||||||
|
Public sector and other financing |
327 | 323 | 1 | % | 187 | 75 | % | 959 | 418 | 129 | % | |||||||||||||||||||||
|
Other |
3,883 | 2,891 | 34 | % | 1,012 | 284 | % | 9,480 | 1,594 | 495 | % | |||||||||||||||||||||
|
Interest income |
$ | 60,089 | $ | 53,595 | 12 | % | $ | 34,177 | 76 | % | $ | 163,245 | $ | 84,745 | 93 | % | ||||||||||||||||
|
Interest expense |
||||||||||||||||||||||||||||||||
|
Deposit and other |
$ | 33,725 | $ | 27,534 | 22 | % | $ | 12,727 | 165 | % | $ | 85,100 | $ | 26,435 | 222 | % | ||||||||||||||||
|
Subordinated notes |
1,435 | 1,452 | (1 | %) | 1,388 | 3 | % | 4,333 | 4,121 | 5 | % | |||||||||||||||||||||
|
Interest expense |
$ | 35,160 | $ | 28,986 | 21 | % | $ | 14,115 | 149 | % | $ | 89,433 | $ | 30,556 | 193 | % | ||||||||||||||||
|
Net interest income |
$ | 24,929 | $ | 24,609 | 1 | % | $ | 20,062 | 24 | % | $ | 73,812 | $ | 54,189 | 36 | % | ||||||||||||||||
|
Non-interest income |
$ | 1,930 | $ | 2,076 | (7 | %) | $ | 1,177 | 64 | % | $ | 5,650 | $ | 3,951 | 43 | % | ||||||||||||||||
|
Total revenue |
$ | 26,859 | $ | 26,685 | 1 | % | $ | 21,239 | 26 | % | $ | 79,462 | $ | 58,140 | 37 | % | ||||||||||||||||
Q3 2023 vs Q2 2023
Net interest income increased 1% to $24.9 million as a function primarily of:
| ► |
Higher interest income earned on higher lending asset balances; and, |
| ► |
Redeployment of available cash into higher yielding, low risk securities. |
Offset partially by:
| ► |
Higher interest expense attributable to higher deposit balances. |
| VersaBank – Q3 2023 MD&A | 12 |
Q3 2023 vs Q3 2022
Net interest income increased 24% as a function primarily of:
| ► |
Higher interest income earned on higher lending asset balances; and, |
| ► |
Redeployment of available cash into higher yielding, low risk securities. |
Offset partially by:
| ► |
Higher interest expense attributable to higher deposit balances; and, |
| ► |
Changes in the Bank’s funding mix. |
Q3 YTD 2023 vs Q3 YTD 2022
Net interest income increased 36% to $73.8 million as a function primarily of the variables and trends discussed in the year over year trend above.
Net Interest Margin
|
(thousands of Canadian dollars) |
||||||||||||||||||||||||||||||||
|
For the three months ended: |
For the nine months ended: |
|||||||||||||||||||||||||||||||
|
July 31 |
April 30 |
July 31 |
July 31 |
July 31 |
||||||||||||||||||||||||||||
|
2023 |
2023 |
Change |
2022 |
Change |
2023 |
2022 |
Change |
|||||||||||||||||||||||||
|
Interest income |
$ | 60,089 | $ | 53,595 | 12 | % | $ | 34,177 | 76 | % | $ | 163,245 | $ | 84,745 | 93 | % | ||||||||||||||||
|
Interest expense |
35,160 | 28,986 | 21 | % | 14,115 | 149 | % | 89,433 | 30,556 | 193 | % | |||||||||||||||||||||
|
Net interest income |
24,929 | 24,609 | 1 | % | 20,062 | 24 | % | 73,812 | 54,189 | 36 | % | |||||||||||||||||||||
|
Average assets |
$ | 3,855,119 | $ | 3,630,542 | 6 | % | $ | 2,883,745 | 34 | % | $ | 3,623,422 | $ | 2,745,215 | 32 | % | ||||||||||||||||
|
Yield* |
6.19 | % | 6.05 | % | 2 | % | 4.70 | % | 32 | % | 6.02 | % | 4.13 | % | 46 | % | ||||||||||||||||
|
Cost of funds* |
3.62 | % | 3.27 | % | 11 | % | 1.94 | % | 87 | % | 3.30 | % | 1.49 | % | 121 | % | ||||||||||||||||
|
Net interest margin* |
2.57 | % | 2.78 | % | (8 | %) | 2.76 | % | (7 | %) | 2.72 | % | 2.64 | % | 3 | % | ||||||||||||||||
|
Average gross loans |
$ | 3,525,286 | $ | 3,313,415 | 6 | % | $ | 2,622,677 | 34 | % | $ | 3,312,781 | $ | 2,449,729 | 35 | % | ||||||||||||||||
|
Net interest margin on loans* |
2.69 | % | 2.99 | % | (10 | %) | 3.07 | % | (12 | %) | 2.89 | % | 3.04 | % | (5 | %) | ||||||||||||||||
|
* See definition in "Non-GAAP and Other Financial Measures" section below. |
Q3 2023 vs Q2 2023
Net interest margin decreased 21 bps as a function primarily of:
| ► |
Higher cost of funds attributable to higher rates paid on term deposits during the quarter amidst temporarily elevated rates in the term deposit market in Canada, which were impacted by the period of liquidity concerns related to the US banking sector. |
Offset partially by:
| ► |
Higher yields earned on the Bank’s lending and treasury assets. |
| VersaBank – Q3 2023 MD&A | 13 |
Q3 2023 vs Q3 2022
Net interest margin decreased 19 bps as a function primarily of:
| ► |
Higher cost of funds attributable primarily to higher rates paid on term deposits during the quarter amidst temporarily elevated rates in the term deposit market in Canada, which were impacted by the period of liquidity concerns related to the US banking sector; and, |
|
► |
Changes in the Bank’s funding mix. |
Offset partially by:
| ► |
Higher yields earned on the Bank’s lending and treasury assets. |
Q3 YTD 2023 vs Q3 YTD 2022
Net interest margin increased 8 bps as a function primarily of:
| ► |
Higher yields earned on the Bank’s lending and treasury assets. |
Offset partially by:
| ► |
Higher cost of funds. |
Non-Interest Income
Non-interest income is comprised of revenue generated by DRTC which includes the gross profit of Digital Boundary Group, (“DBG”) as well as income derived from miscellaneous transaction fees not directly attributable to lending assets.
Non-interest income for the quarter was $1.9 million compared to $2.1 million last quarter and $1.2 million for the same period a year ago. The quarter over quarter and year over year trends were a function primarily of the timing of client engagements.
Non-interest income for the nine months ended July 31, 2023 was $5.7 million compared to $4.0 million for the same period a year ago. The year over year trend was a function primarily of higher client engagements and continued improvements in operational efficiency achieved by DBG over the course of the period.
| VersaBank – Q3 2023 MD&A | 14 |
Provision for Credit Losses
|
(thousands of Canadian dollars) |
||||||||||||||||||||
|
For the three months ended: |
For the nine months ended: |
|||||||||||||||||||
|
July 31 |
April 30 |
July 31 |
July 31 |
July 31 |
||||||||||||||||
|
2023 |
2023 |
2022 |
2023 |
2022 |
||||||||||||||||
|
Provision for (recovery of) credit losses: |
||||||||||||||||||||
|
Point-of-sale loans and leases |
$ | 19 | $ | 44 | $ | 109 | $ | 101 | $ | 253 | ||||||||||
|
Commercial real estate mortgages |
139 | 176 | 47 | 619 | (18 | ) | ||||||||||||||
|
Commercial real estate loans |
(9 | ) | 2 | 9 | (4 | ) | 4 | |||||||||||||
|
Public sector and other financing |
22 | 15 | 1 | 77 | 7 | |||||||||||||||
|
Provision for (recovery of) credit losses |
$ | 171 | $ | 237 | $ | 166 | $ | 793 | $ | 246 | ||||||||||
Q3 2023 vs Q2 2023
VersaBank recorded a provision for credit losses in the amount of $171,000 in the current quarter compared to a provision for credit losses in the amount of $237,000 last quarter as a function primarily of:
| ► |
Changes in the forward-looking information used by VersaBank in its credit risk models; and, |
| ► |
Changes in the Bank’s lending asset mix. |
Offset partially by:
| ► |
Higher lending asset balances. |
Q3 2023 vs Q3 2022
VersaBank recorded a provision for credit losses in the amount of $171,000 in the current quarter compared to a provision for credit losses in the amount of $166,000 last year as a function primarily of:
| ► |
Higher lending asset balances; and, |
| ► |
Changes in the forward-looking information used by VersaBank in its credit risk models. |
Offset partially by:
| ► |
Changes in the Bank’s lending asset mix. |
Q3 YTD 2023 vs Q3 YTD 2022
VersaBank recorded a provision for credit losses in the amount of $793,000 in the current period compared to a provision for credit losses in the amount of $246,000 in the comparative period as a function primarily of the items discussed in the year over year trend above.
| VersaBank – Q3 2023 MD&A | 15 |
Non-Interest Expenses
|
(thousands of Canadian dollars) |
||||||||||||||||||||||||||||||||
|
For the three months ended: |
For the nine months ended: |
|||||||||||||||||||||||||||||||
|
July 31 |
April 30 |
July 31 |
July 31 |
July 31 |
||||||||||||||||||||||||||||
|
2023 |
2023 |
Change |
2022 |
Change |
2023 |
2022 |
Change |
|||||||||||||||||||||||||
|
Salaries and benefits |
$ | 7,453 | $ | 8,429 | (12 | %) | $ | 6,768 | 10 | % | $ | 24,139 | $ | 19,577 | 23 | % | ||||||||||||||||
|
General and administrative |
4,446 | 3,316 | 34 | % | 5,519 | (19 | %) | 10,888 | 13,162 | (17 | %) | |||||||||||||||||||||
|
Premises and equipment |
980 | 981 | 0 | % | 929 | 5 | % | 2,913 | 2,880 | 1 | % | |||||||||||||||||||||
|
Total non-interest expenses |
$ | 12,879 | $ | 12,726 | 1 | % | $ | 13,216 | (3 | %) | $ | 37,940 | $ | 35,619 | 7 | % | ||||||||||||||||
|
Efficiency Ratio |
47.95 | % | 47.69 | % | 1 | % | 62.23 | % | (23 | %) | 47.75 | % | 61.26 | % | (22 | %) | ||||||||||||||||
Q3 2023 vs Q2 2023
Non-interest expenses increased 1% to $12.9 million as a function primarily of:
| ► |
Higher professional fees attributable to the continuing regulatory approval process associated with VersaBank’s acquisition of a US bank and seasonal corporate activities specific to the quarter. |
Offset partially by:
| ► |
Lower salary and benefits amounts attributable to lower estimates related to performance based obligations. |
Q3 2023 vs Q3 2022
Non-interest expenses decreased 3% as a function primarily of:
| ► |
Lower capital tax expense attributable to a shift in the provincial allocation of the Bank’s loan and deposit originations; and, |
| ► |
Lower insurance premiums relative to the premiums paid during the comparative period attributable to VersaBank’s listing on the Nasdaq in September 2021. |
Offset partially by:
| ► |
Higher salary and benefits expense attributable to higher staffing levels to support expanded business activity across VersaBank and higher costs attributable to the continuing regulatory approval process associated with VersaBank’s acquisition of a US bank. |
| VersaBank – Q3 2023 MD&A | 16 |
Q3 YTD 2023 vs Q3 YTD 2022
Non-interest expenses increased 7% as a function primarily of:
| ► |
Higher salary and benefits expense attributable to higher staffing levels to support expanded business activity across VersaBank as well as higher general, annual compensation adjustments; and, |
| ► |
Higher costs related to VersaBank’s acquisition of a US bank, noted above. |
Offset partially by:
| ► |
Lower capital tax expense attributable to a shift in the provincial allocation of the Bank’s loan and deposit originations; and, |
| ► |
Lower insurance premiums relative to the premiums paid during the comparative period attributable to VersaBank’s listing on the Nasdaq in September 2021. |
Income Tax Provision
VersaBank’s year to date effective tax rate is approximately 27% compared with 30% for fiscal 2022. The tax rate is impacted by certain items not being taxable or deductible for income tax purposes. The lower tax rate in the current period reflects the impact of deferred tax assets recognized in the current period associated with DRTC’s non-capital loss carryforwards which are anticipated to be applied to future taxable earnings as well as lower non-deductible expenses. Provision for income taxes for the current quarter was $3.8 million compared to $3.5 million last quarter and $2.1 million for the same period a year ago.
Provision for income taxes for the nine months ended July 31, 2023 was $11.0 million compared to $6.0 million for the same period a year ago.
| VersaBank – Q3 2023 MD&A | 17 |
Financial Review – Balance Sheet
|
(thousands of Canadian dollars) |
||||||||||||||||||||
|
July 31 |
April 30 |
July 31 |
||||||||||||||||||
|
2023 |
2023 |
Change |
2022 |
Change |
||||||||||||||||
|
Total assets |
$ | 3,980,845 | $ | 3,729,393 | 7 | % | $ | 3,075,343 | 29 | % | ||||||||||
|
Cash and securities |
270,670 | 263,313 | 3 | % | 217,896 | 24 | % | |||||||||||||
|
Loans, net of allowance for credit losses |
3,661,672 | 3,419,455 | 7 | % | 2,814,121 | 30 | % | |||||||||||||
|
Deposits |
3,328,017 | 3,108,218 | 7 | % | 2,475,063 | 34 | % | |||||||||||||
Total Assets
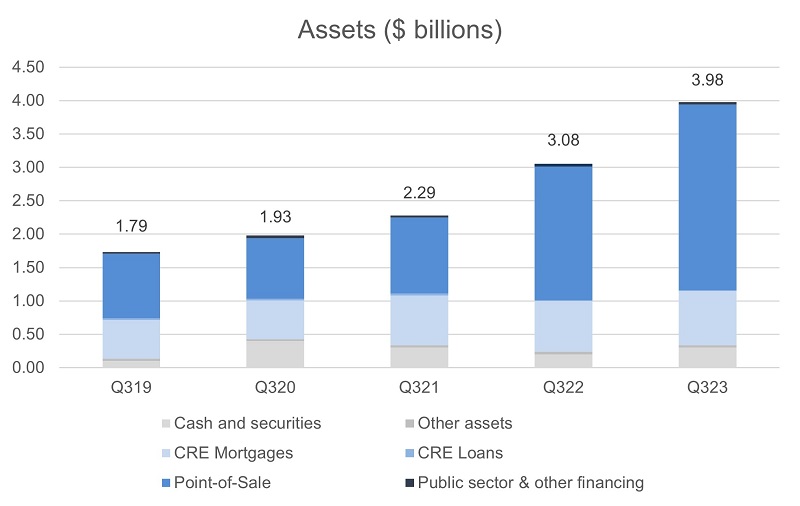
Total assets as at July 31, 2023, were $3.98 billion compared to $3.73 billion last quarter and $3.08 billion a year ago. The quarter over quarter and year over year trends were a function primarily of growth in VersaBank’s lending portfolios, in particular the POS Financing portfolio.
Cash and securities
Cash and securities, which are held primarily for liquidity purposes, were $270.7 million or 7% of total assets as at July 31, 2023, compared to $263.3 million or 7% of total assets last quarter and $217.9 million or 7% of total assets a year ago.
| VersaBank – Q3 2023 MD&A | 18 |
As at July 31, 2023, the Bank held securities totalling $182.9 million (October 31, 2022 - $141.6 million) which were comprised of:
| ► |
Government of Canada Treasury Bill for $181.8 million with a face value totaling $182.0 million, yielding 4.89%, and which matured on August 3, 2023: and, |
| ► |
Government of Canada Bond for $990,000 with a face value totaling $1.0 million, yielding 4.73%, with a 3.75% coupon and maturing on May 1, 2025. |
Loans
|
(thousands of Canadian dollars) |
||||||||||||||||||||
|
July 31 |
April 30 |
July 31 |
||||||||||||||||||
|
2023 |
2023 |
Change |
2022 |
Change |
||||||||||||||||
|
Point-of-sale loans and leases |
$ | 2,776,126 | $ | 2,538,917 | 9 | % | $ | 1,998,993 | 39 | % | ||||||||||
|
Commercial real estate mortgages |
810,630 | 807,828 | 0 | % | 755,042 | 7 | % | |||||||||||||
|
Commercial real estate loans |
9,298 | 11,996 | (22 | %) | 13,510 | (31 | %) | |||||||||||||
|
Public sector and other financing |
49,627 | 46,350 | 7 | % | 35,605 | 39 | % | |||||||||||||
| 3,645,681 | 3,405,091 | 7 | % | 2,803,150 | 30 | % | ||||||||||||||
|
Allowance for credit losses |
(2,697 | ) | (2,526 | ) | (1,699 | ) | ||||||||||||||
|
Accrued interest |
18,688 | 16,890 | 12,670 | |||||||||||||||||
|
Total loans, net of allowance for credit losses |
$ | 3,661,672 | $ | 3,419,455 | 7 | % | $ | 2,814,121 | 30 | % | ||||||||||
VersaBank organizes its lending portfolio into the following four broad asset categories: Point-of-Sale Loans & Leases, Commercial Real Estate Mortgages, Commercial Real Estate Loans, and Public Sector and Other Financing. These categories have been established in VersaBank’s proprietary, internally developed asset management system and have been designed to catalogue individual lending assets as a function primarily of their key risk drivers, the nature of the underlying collateral, and the applicable market segment.
The Point-of-Sale Loans and Leases (“POS Financing”) asset category is comprised of Point-of-Sale Loan and Lease Receivables acquired from VersaBank’s broad network of origination and servicing partners in Canada and the US as well as Warehouse Loans that provide bridge financing to VersaBank’s origination and servicing partners for the purpose of accumulating and seasoning practical volumes of individual loans and leases prior to VersaBank purchasing the cashflow receivables derived from same.
The Commercial Real Estate Mortgages (“CRE Mortgages”) asset category is comprised primarily of Residential Construction, Term, Insured and Land Mortgages. All of these loans are business-to-business loans with the underlying credit risk exposure being primarily consumer in nature given that the vast majority (approximately 90% as at July 31, 2023) of the loans are related to properties that are designated primarily for residential use. The portfolio benefits from diversity in its underlying security in the form of a broad range of such collateral properties.
The Commercial Real Estate Loans (“CRE Loans”) asset category is comprised primarily of Condominium Corporation Financing loans.
| VersaBank – Q3 2023 MD&A | 19 |
The Public Sector and Other Financing (“PSOF”) asset category is comprised primarily of Public Sector Loans and Leases, a small balance of Corporate Loans and Leases and Single Family Residential Conventional and Insured Mortgages. VersaBank has de-emphasized Corporate lending and continues to monitor the public sector space in anticipation of more robust demand for Federal, Provincial and Municipal infrastructure and other project financings.
Q3 2023 vs Q2 2023
Loans increased 7% to $3.66 billion as a function primarily of:
| ► |
Growth of 9% in POS Financing portfolio balances attributable primarily to strong demand for home improvement/HVAC and transportation equipment receivable financing in the current period. |
Q3 2023 vs Q3 2022
Loans increased 30% as a function primarily of:
|
► |
Growth of 39% in POS Financing portfolio balances; and, |
|
► |
Growth of 7% in CRE Mortgage portfolio balances. |
Residential Mortgage Exposures
In accordance with the Office of the Superintendent of Financial Institutions (“OSFI”) Guideline B-20 – Residential Mortgage Underwriting Practices and Procedures, additional information is provided regarding VersaBank’s residential mortgage exposure. For the purposes of the Guideline, a residential mortgage is defined as a loan to an individual that is secured by residential property (one-to-four-unit dwellings) and includes home equity lines of credit (HELOCs).
The Bank’s exposure to residential mortgages as at July 31, 2023, was $4.3 million compared to $3.7 million last quarter and $2.9 million a year ago. The Bank did not have any HELOCs outstanding as at July 31, 2023, last quarter or a year ago.
Credit Quality and Allowance for Credit Losses
VersaBank closely monitors its lending portfolio, the portfolio’s underlying borrowers, as well as its origination partners in order to ensure that management maintains good visibility on credit trends that could provide an early warning indication of the emergence of any elevated risk in VersaBank’s lending portfolio.
| VersaBank – Q3 2023 MD&A | 20 |
Allowance for Credit Losses
The Bank must maintain an allowance for expected credit losses or ECL allowance that is adequate, in management’s opinion, to absorb all credit related losses in the Bank’s lending and treasury portfolios. Under IFRS 9 the Bank’s ECL allowance is estimated using the expected credit loss methodology and is comprised of expected credit losses recognized on both performing loans, and non-performing, or impaired loans even if no actual loss event has occurred.
|
(thousands of Canadian dollars) |
||||||||||||||||||||
|
July 31 |
April 30 |
July 31 |
||||||||||||||||||
|
2023 |
2023 |
Change |
2022 |
Change |
||||||||||||||||
|
ECL allowance by lending asset: |
||||||||||||||||||||
|
Point-of-sale loans and leases |
$ | 646 | $ | 627 | 3 | % | $ | 528 | 22 | % | ||||||||||
|
Commercial real estate mortgages |
1,906 | 1,767 | 8 | % | 1,096 | 74 | % | |||||||||||||
|
Commercial real estate loans |
50 | 59 | (15 | %) | 49 | 2 | % | |||||||||||||
|
Public sector and other financing |
95 | 73 | 30 | % | 26 | 265 | % | |||||||||||||
|
Total ECL allowance |
$ | 2,697 | $ | 2,526 | 7 | % | $ | 1,699 | 59 | % | ||||||||||
|
(thousands of Canadian dollars) |
||||||||||||||||||||
|
July 31 |
April 30 |
July 31 |
||||||||||||||||||
|
2023 |
2023 |
Change |
2022 |
Change |
||||||||||||||||
|
ECL allowance by stage: |
||||||||||||||||||||
|
ECL allowance stage 1 |
$ | 2,425 | $ | 2,403 | 1 | % | $ | 1,581 | 53 | % | ||||||||||
|
ECL allowance stage 2 |
272 | 123 | 121 | % | 118 | 131 | % | |||||||||||||
|
ECL allowance stage 3 |
- | - | - | |||||||||||||||||
|
Total ECL allowance |
$ | 2,697 | $ | 2,526 | 7 | % | $ | 1,699 | 59 | % | ||||||||||
Q3 2023 vs Q2 2023
VersaBank’s ECL allowance as at July 31, 2023, was $2.70 million compared to $2.53 million last quarter as a function primarily of:
| ► |
Higher lending asset balances. |
Offset partially by:
| ► |
Changes in the forward-looking information used by VersaBank in its credit risk models; and, |
| ► |
Changes in the Bank’s lending asset mix. |
| VersaBank – Q3 2023 MD&A | 21 |
Q3 2023 vs Q3 2022
VersaBank’s ECL allowance as at July 31, 2023, was $2.70 million compared to $1.70 million a year ago as a function primarily of:
| ► |
Higher lending asset balances; and, |
| ► |
Changes in the forward-looking information used by VersaBank in its credit risk models. |
Offset partially by:
| ► |
Changes in the Bank’s lending asset mix. |
Assessment of significant increase in credit risk (“SICR”)
At each reporting date, the Bank assesses whether or not there has been a SICR for loans since initial recognition by comparing, at the reporting date, the risk of default occurring over the remaining expected life against the risk of default at initial recognition.
SICR is a function of the loan’s internal risk rating assignment, internal watchlist status, loan review status and delinquency status which are updated as necessary in response to changes including, but not limited to, changes in macroeconomic and/or market conditions, changes in a borrower’s credit risk profile, and changes in the strength of the underlying security, including guarantor status, if a guarantor exists.
Quantitative models may not always be able to capture all reasonable and supportable information that may indicate a SICR. As a result, qualitative factors may be considered to supplement such a gap.
Examples include changes in adjudication criteria for a particular group of borrowers or asset categories or changes in portfolio composition as well as changes in Canadian and US macroeconomic trends attributable to changes in monetary policy, inflation, employment rates, consumer behaviour and geo-political risks.
Forward-Looking Information
The Bank incorporates the impact of future economic conditions, or more specifically forward-looking information into the estimation of expected credit losses at the credit risk parameter level. This is accomplished via the credit risk parameter models and proxy datasets that the Bank utilizes to develop probability of default (“PD”), and loss given default (“LGD”), term structure forecasts for its loans. The Bank has sourced credit risk modeling systems and forecast macroeconomic scenario data from Moody’s Analytics, a third-party service provider for the purpose of computing forward-looking credit risk parameters under multiple macroeconomic scenarios that consider both market-wide and idiosyncratic factors and influences. These systems are used in conjunction with the Bank’s internally developed ECL models. Given that the Bank has experienced very limited historical loan losses and, therefore, does not have available statistically significant loss data inventory for use in developing internal, forward looking expected credit loss trends, the use of unbiased, third-party forward-looking credit risk parameter modeling systems is particularly important for the Bank in the context of the estimation of expected credit losses.
| VersaBank – Q3 2023 MD&A | 22 |
The Bank utilizes macroeconomic indicator data derived from multiple macroeconomic scenarios in order to mitigate volatility in the estimation of expected credit losses, as well as to satisfy the IFRS 9 requirement that future economic conditions are to be based on an unbiased, probability-weighted assessment of possible future outcomes. More specifically, the macroeconomic indicators set out in the macroeconomic scenarios are used as inputs for the credit risk parameter models utilized by the Bank to sensitize the individual PD and LGD term structure forecasts to the respective macroeconomic trajectory set out in each of the scenarios (see Expected Credit Loss Sensitivity below). Currently the Bank utilizes upside, downside and baseline forecast macroeconomic scenarios, and assigns discrete weights to each for use in the estimation of its reported ECL. The Bank has also applied expert credit judgement, where appropriate, to reflect, amongst other items, uncertainty in the Canadian and US macroeconomic environments.
The macroeconomic indicator data utilized by the Bank for the purpose of sensitizing PD and LGD term structure data to forward economic conditions include, but are not limited to: GDP, the Canadian national unemployment rate, long term interest rates, the consumer price index, the S&P/TSX Index and the price of oil. These specific macroeconomic indicators were selected in an attempt to ensure that the spectrum of fundamental macroeconomic influences on the key drivers of the credit risk profile of the Bank’s balance sheet, including: corporate, consumer and real estate market dynamics; corporate, consumer and SME borrower performance; geography; as well as collateral value volatility, are appropriately captured and incorporated into the Bank’s forward macroeconomic sensitivity analysis.
Key assumptions driving the base case macroeconomic forecast trends this quarter include: interest rates straining household finances but wage growth continues to support consumer spending; higher interest rates cause housing prices to continue to retreat, albeit modestly; real GDP slows measurably by the end of 2023 but a recession is avoided and unemployment increases only modestly due to the strength of the labour market; inflation continues to decline but lingers and results in the Bank of Canada undertaking a protracted process to returning to a neutral policy rate in late 2025; the impact of the crisis in Ukraine on global commodity prices and trade continues to diminish; public health restrictions do not return even as new COVID-19 case counts occasionally spike; and, supply-chain stress continues to ease.
Management developed ECL estimates using credit risk parameter term structure forecasts sensitized to individual baseline, upside and downside forecast macroeconomic scenarios, each weighted at 100%, and subsequently computed the variance of each to the Bank’s reported ECL as at July 31, 2023 in order to assess the alignment of the Bank’s reported ECL with the Bank’s credit risk profile, and further, to assess the scope, depth and ultimate effectiveness of the credit risk mitigation strategies that the Bank has applied to its lending portfolios (see Expected Credit Loss Sensitivity below).
| VersaBank – Q3 2023 MD&A | 23 |
A summary of the key forecast macroeconomic indicator data trends utilized by VersaBank for the purpose of sensitizing lending asset credit risk parameter term structure forecasts to forward looking information, which in turn are used in the estimation of VersaBank’s reported ECL, as well as in the assessment of same are presented in the charts below.
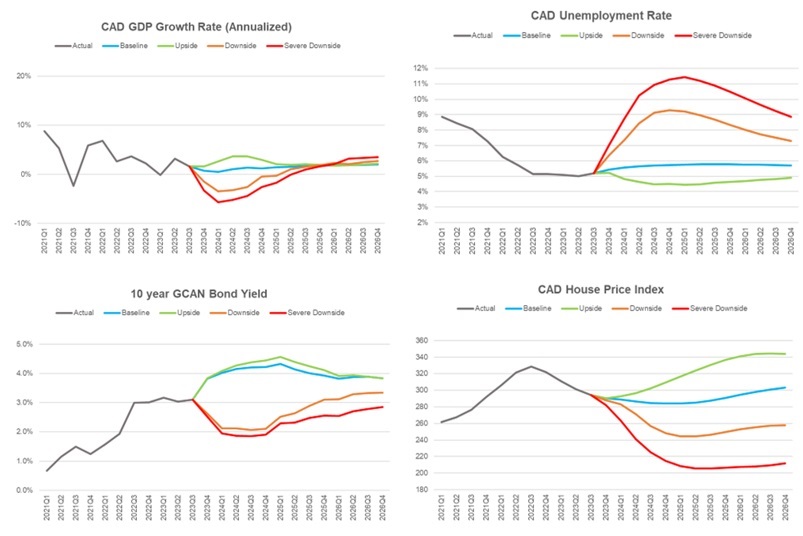
Expected Credit Loss Sensitivity:
The following table presents the sensitivity of the Bank’s estimated ECL to a range of individual forecast macroeconomic scenarios, that in isolation may not reflect the Bank’s actual expected ECL exposure, as well as the variance of each to the Bank’s reported ECL as at July 31, 2023:
|
(thousands of Canadian dollars) |
||||||||||||||||
|
Reported |
100 | % | 100 | % | 100 | % | ||||||||||
|
ECL |
Upside |
Baseline |
Downside |
|||||||||||||
|
Allowance for expected credit losses |
$ | 2,697 | $ | 1,751 | $ | 2,242 | $ | 3,117 | ||||||||
|
Variance from reported ECL |
(946 | ) | (455 | ) | 420 | |||||||||||
|
Variance from reported ECL (%) |
(35 | %) | (17 | %) | 16 | % | ||||||||||
The uncertainty associated with the directionality, velocity and magnitude of both interest rates and inflation as well as the general uncertainty associated with the broader Canadian and US economies may result in VersaBank’s estimated ECL amounts exhibiting some future volatility which in turn may result in the Bank recognizing higher provisions for credit losses in the coming quarters.
| VersaBank – Q3 2023 MD&A | 24 |
Considering the analysis set out above and based on management’s review of the loan and credit data comprising VersaBank’s lending portfolio, combined with management’s interpretation of the available forecast macroeconomic and industry data, management is of the view that its reported ECL allowance represents a reasonable proxy for potential, future losses.
Deposits
VersaBank has established three core funding channels, those being personal deposits, commercial deposits, and cash reserves retained from VersaBank’s POS Financing origination partners that are classified as other liabilities, which are discussed in the Other Assets and Liabilities section below.
|
(thousands of Canadian dollars) |
||||||||||||||||||||
|
July 31 |
April 30 |
July 31 |
||||||||||||||||||
|
2023 |
2023 |
Change |
2022 |
Change |
||||||||||||||||
|
Commercial deposits |
$ | 603,583 | $ | 583,622 | 3 | % | $ | 591,092 | 2 | % | ||||||||||
|
Personal deposits |
2,724,434 | 2,524,596 | 8 | % | 1,883,971 | 45 | % | |||||||||||||
|
Total deposits |
$ | 3,328,017 | $ | 3,108,218 | 7 | % | $ | 2,475,063 | 34 | % | ||||||||||
Personal deposits, consisting principally of guaranteed investment certificates are sourced primarily through a well-established and well-diversified deposit broker network that the Bank continues to grow and expand across Canada.
Commercial deposits are sourced primarily via specialized operating accounts made available to insolvency professionals (“Trustees”) in the Canadian insolvency industry. The Bank developed customized banking software for use by Trustees that integrates banking services with the market-leading software platform used in the administration of consumer bankruptcy and proposal restructuring proceedings.
Substantially all of the Bank’s Personal and Commercial deposits sourced through these channels are eligible for CDIC insurance.
Q3 2023 vs Q2 2023
Deposits increased 7% to $3.3 billion as a function primarily of:
| ► |
Higher personal deposits attributable to VersaBank increasing activity in its broker market network to fund balance sheet growth, and: |
| ► |
Higher commercial deposits attributable to an increase in the volume of consumer and commercial bankruptcy and proposal restructuring proceedings. |
Q3 2023 vs Q3 2022
Deposits increased 34% as a function primarily of the variables and trends set out above.
| VersaBank – Q3 2023 MD&A | 25 |
Subordinated Notes Payable
|
(thousands of Canadian dollars) |
||||||||||||
|
July 31 |
April 30 |
July 31 |
||||||||||
|
2023 |
2023 |
2022 |
||||||||||
|
Issued March 2019, unsecured, non-viability contingent capital compliant, subordinated notes payable, principal amount of $5.0 million, effective interest rate of 10.41%, maturing March 2029. |
$ | 4,916 | $ | 4,913 | $ | 4,906 | ||||||
|
Issued April 2021, unsecured, non-viability contingent capital compliant, subordinated notes payable, principal amount of US $75.0 million, effective interest rate of 5.38%, maturing May 2031. |
96,669 | 99,619 | 93,800 | |||||||||
| $ | 101,585 | $ | 104,532 | $ | 98,706 | |||||||
Subordinated notes payable, net of issue costs, were $101.6 million as at July 31, 2023, compared to $104.5 million last quarter and $98.7 million a year ago. The quarter over quarter and year over year trends were a function primarily of changes in the USD/CAD foreign exchange spot rate in the current quarter.
Other Assets and Liabilities
Other Assets
|
(thousands of Canadian dollars) |
||||||||||||||||||||
|
July 31 |
April 30 |
July 31 |
||||||||||||||||||
|
2023 |
2023 |
Change |
2022 |
Change |
||||||||||||||||
|
Accounts receivable |
$ | 3,177 | $ | 3,070 | 3 | % | $ | 3,744 | (15 | %) | ||||||||||
|
Prepaid expenses and other |
14,017 | 13,593 | 3 | % | 10,010 | 40 | % | |||||||||||||
|
Property and equipment |
6,687 | 6,833 | (2 | %) | 6,965 | (4 | %) | |||||||||||||
|
Right-of-use assets |
3,602 | 3,775 | (5 | %) | 4,296 | (16 | %) | |||||||||||||
|
Deferred tax asset |
2,641 | 2,269 | 16 | % | 2,248 | 17 | % | |||||||||||||
|
Interest rate swap |
1,118 | 103 | 985 | % | - | |||||||||||||||
|
Investment |
953 | 953 | 0 | % | 953 | 0 | % | |||||||||||||
|
Goodwill |
5,754 | 5,754 | 0 | % | 5,754 | 0 | % | |||||||||||||
|
Intangible assets |
10,554 | 10,275 | 3 | % | 9,356 | 13 | % | |||||||||||||
|
Total other assets |
$ | 48,503 | $ | 46,625 | 4 | % | $ | 43,326 | 12 | % | ||||||||||
Q3 2023 vs Q2 2023
Other assets increased 4% to $48.5 million as a function primarily of:
| ► |
Higher accounts receivable attributable primarily to the normal course timing of general corporate receivables |
| ► |
Higher prepaid expenses and other attributable primarily to normal course timing of general corporate prepaid expenses; |
| VersaBank – Q3 2023 MD&A | 26 |
| ► |
Improved valuation on the interest rate swap entered into by the Bank in the first quarter of fiscal 2023 for asset and liability management purposes attributable to the increase in forward rates over the course of the current quarter; |
| ► |
Higher intangible assets attributable primarily to the capitalization of compensation costs and various development costs directly related to the Bank’s business development initiatives; and, |
| ► |
Higher deferred tax asset attributable primarily to the Bank recognizing deferred tax assets associated with future non-capital loss carryforwards which are anticipated to be applied to future taxable earnings. |
Offset partially by:
| ► |
Lower capitalized assets attributable to amortization. |
Q3 2023 vs Q3 2022
Other assets increased 12% as a function primarily of:
| ► |
Higher prepaid expenses and other attributable primarily to normal course timing of general corporate prepaids expenses; |
| ► |
Improved valuation on the interest rate swap entered into by the Bank in the first quarter of fiscal 2023 for asset and liability management purposes attributable to the increase in forward rates over the course of the current quarter; |
| ► |
Higher intangible assets attributable primarily to the capitalization of compensation costs and various development costs directly related to the Bank’s business development initiatives; and, |
| ► |
Higher deferred tax asset attributable primarily to the Bank recognizing deferred tax assets associated with future non-capital loss carryforwards which are anticipated to be applied to future taxable earnings. |
Offset partially by:
| ► |
Lower accounts receivable attributable primarily to the normal course timing of general corporate receivables; and, |
| ► |
Lower capitalized assets attributable to amortization. |
Other Liabilities
|
(thousands of Canadian dollars) |
||||||||||||||||||||
|
July 31 |
April 30 |
July 31 |
||||||||||||||||||
|
2023 |
2023 |
Change |
2022 |
Change |
||||||||||||||||
|
Accounts payable and other |
$ | 7,265 | $ | 4,045 | 80 | % | $ | 8,317 | (13 | %) | ||||||||||
|
Current income tax liability |
4,527 | 2,773 | 63 | % | 3,157 | 43 | % | |||||||||||||
|
Deferred tax liability |
659 | 681 | (3 | %) | 769 | (14 | %) | |||||||||||||
|
Lease obligations |
3,944 | 4,120 | (4 | %) | 4,644 | (15 | %) | |||||||||||||
|
Cash collateral and amounts held in escrow |
9,657 | 6,746 | 43 | % | 10,992 | (12 | %) | |||||||||||||
|
Cash reserves on loan and lease receivables |
160,148 | 141,759 | 13 | % | 127,047 | 26 | % | |||||||||||||
|
Total other liabilities |
$ | 186,200 | $ | 160,124 | 16 | % | $ | 154,926 | 20 | % | ||||||||||
| VersaBank – Q3 2023 MD&A | 27 |
Q3 2023 vs Q2 2023
Other liabilities increased 16% to $186.2 million as a function primarily of:
| ► |
Higher cash reserve balances attributable to higher POS Financing portfolio balances; |
| ► |
Higher cash collateral and amounts held in escrow; |
| ► |
Higher accounts payable attributable primarily to the normal course timing of general corporate payables; and, |
| ► |
Higher income tax payable amounts attributable primarily to the normal course payment of current year tax instalments. |
Q3 2023 vs Q3 2022
Other liabilities increased 20% as a function primarily of:
| ► |
Higher cash reserve balances attributable to higher POS Financing portfolio balances; and, |
| ► |
Higher income tax payable amounts attributable primarily to the normal course payment of current year tax instalments. |
Offset partially by:
| ► |
Lower accounts payable attributable primarily to the normal course timing of general corporate payables; and, |
| ► |
Lower cash collateral and amounts held in escrow attributable primarily to normal course transactions. |
Shareholders’ Equity
Shareholders’ equity was $365.0 million as at July 31, 2023, compared to $356.5 million last quarter and $346.6 million a year ago.
At July 31, 2023, there were 25,924,424 common shares outstanding compared to 26,003,986 common shares outstanding last quarter and 27,441,082 common shares outstanding a year ago.
Q3 2023 vs Q2 2023 vs Q3 2022
Shareholders’ equity increased 2% compared to last quarter and 5% compared to a year ago as a function primarily of:
| ► |
Higher retained earnings attributable to net income earned over the period. |
Offset partially by:
| ► |
Purchase and cancellation of common shares through the Bank’s NCIB; and, |
| ► |
Payment of dividends. |
VersaBank’s book value per common share as at July 31, 2023 was $13.55 compared to $13.19 last quarter and $12.14 a year ago. The quarter over quarter and year over year trends were a function primarily of higher retained earnings attributable to net income earned in the current quarter and the purchase and cancellation of common shares below book value per share through the Bank’s NCIB, offset partially by the payment of dividends over the same period.
| VersaBank – Q3 2023 MD&A | 28 |
See note 9 to the unaudited interim consolidated financial statements for additional information relating to share capital.
Stock-Based Compensation
Stock options are accounted for using the fair value method which recognizes the fair value of the stock option over the applicable vesting period as an increase in salaries and benefits expense with the same amount being recorded in contributed surplus. VersaBank recognized compensation expense for the current quarter totaling $192,000 compared to $192,000 last quarter and $424,000 for the same period a year ago, relating to the estimated fair value of stock options granted. The recognized compensation expense for the nine-month period ended July 31, 2023, totaled $727,000 compared to $1.0 million for the same period a year ago. See note 9 to the unaudited interim consolidated financial statements for additional information relating to stock options.
Updated Share Information
As at August 28, 2023, there were no changes since July 31, 2023 in the number of common shares, Series 1 preferred shares, and common share options outstanding.
Off-Balance Sheet Arrangements
As at July 31, 2023, VersaBank had an outstanding derivative contract established for asset liability management purposes to swap between fixed and floating interest rates with a notional amount totalling $15.5 million that qualified for hedge accounting. The Bank enters into interest rate swap contracts for its own account exclusively and does not act as an intermediary in this market.
As at July 31, 2023, VersaBank did not have any significant off-balance sheet arrangements other than an interest rate swap contract, loan commitments and letters of credit attributable to normal course business activities. See notes 12 and 13 to the unaudited interim consolidated financial statements for more information.
Related Party Transactions
VersaBank’s Board of Directors and senior executive officers represent key management personnel. See note 14 to the unaudited interim consolidated financial statements for additional information on related party transactions and balances.
| VersaBank – Q3 2023 MD&A | 29 |
Capital Management and Capital Resources
The table below presents VersaBank’s regulatory capital position, risk-weighted assets and regulatory capital and leverage ratios for the current and comparative periods.
|
(thousands of Canadian dollars) |
||||||||||||||||||||
|
July 31 |
April 30 |
July 31 |
||||||||||||||||||
|
2023 |
2023 |
Change |
2022 |
Change |
||||||||||||||||
|
Common Equity Tier 1 capital |
$ | 339,894 | $ | 331,614 | 2 | % | $ | 321,386 | 6 | % | ||||||||||
|
Total Tier 1 capital |
$ | 353,541 | $ | 345,261 | 2 | % | $ | 335,033 | 6 | % | ||||||||||
|
Total Tier 2 capital |
$ | 106,524 | $ | 109,361 | (3 | %) | $ | 102,879 | 4 | % | ||||||||||
|
Total regulatory capital |
$ | 460,065 | $ | 454,622 | 1 | % | $ | 437,912 | 5 | % | ||||||||||
|
Total risk-weighted assets |
$ | 3,047,172 | $ | 2,957,933 | 3 | % | $ | 2,568,678 | 19 | % | ||||||||||
|
Capital ratios |
||||||||||||||||||||
|
CET1 capital ratio |
11.15 | % | 11.21 | % | (1 | %) | 12.51 | % | (11 | %) | ||||||||||
|
Tier 1 capital ratio |
11.60 | % | 11.67 | % | (1 | %) | 13.04 | % | (11 | %) | ||||||||||
|
Total capital ratio |
15.10 | % | 15.37 | % | (2 | %) | 17.05 | % | (11 | %) | ||||||||||
|
Leverage ratio |
8.53 | % | 8.83 | % | (3 | %) | 10.38 | % | (18 | %) | ||||||||||
VersaBank reports its regulatory capital ratios using the Standardized approach for calculating risk-weighted assets, as defined under Basel III, which may require VersaBank to carry more capital for certain credit exposures compared to requirements under the Advanced Internal Ratings Based (“AIRB”) methodology. As a result, regulatory capital ratios of banks that utilize the Standardized approach are not directly comparable with the large Canadian banks that employ the AIRB methodology.
OSFI requires that all Canadian banks must comply with the Basel III standards on an “all-in” basis for purposes of determining their risk-based capital ratios. Required minimum regulatory capital ratios are a 7.0% Common Equity Tier 1 (“CET1”) capital ratio, an 8.5% Tier 1 capital ratio and a 10.5% total capital ratio, all of which include a 2.5% capital conservation buffer.
The quarter over quarter and year over year trends exhibited by VersaBank’s reported regulatory capital levels, regulatory capital ratios and leverage ratio were a function primarily of retained earnings growth, the purchase and cancellation of common shares through the Bank’s NCIB, and changes to VersaBank’s risk-weighted asset balances and composition.
For more information regarding capital management, please see note 15 to VersaBank’s July 31, 2023, unaudited interim Consolidated Financial Statements as well as the Capital Management and Capital Resources section of VersaBank’s MD&A for the year ended October 31, 2022.
| VersaBank – Q3 2023 MD&A | 30 |
Liquidity
The unaudited Consolidated Statement of Cash Flows for the nine months ended July 31, 2023, shows cash provided by operations in the amount of $22.8 million compared to cash used by operations in the amount of $179.3 million for the same period last year. The trend in the current period was a function primarily of inflows from operations and deposits raised exceeding the timing of maturing of securities and cash outflows to fund loans. The comparative period trend was a function primarily of the Bank using existing liquidity to fund loans and invest in higher yielding short-term securities. Based on factors such as liquidity requirements and opportunities for investment in loans and securities, VersaBank may manage the amount of deposits it raises and loans it funds in ways that result in the balances of these items giving rise to either negative or positive cash flow from operations. VersaBank will continue to fund its operations and meet contractual obligations as they become due using cash on hand and by closely managing its flow of deposits.
Interest Rate Sensitivity
The table below presents the duration difference between VersaBank’s assets and liabilities and the potential after-tax impact of a 100-basis point shift in interest rates on VersaBank’s earnings during a 12-month period if no remedial actions are taken. As at July 31, 2023, the duration difference between assets and liabilities was (2.3) months compared to 1.4 months as at October 31, 2022. As at July 31, 2023, VersaBank’s assets would reprice faster than its liabilities in the event of a future change in interest rates.
|
(thousands of Canadian dollars) |
||||||||||||||||
|
July 31, 2023 |
October 31, 2022 |
|||||||||||||||
|
Increase 100 bps |
Decrease 100 bps |
Increase 100 bps |
Decrease 100 bps |
|||||||||||||
|
Increase (decrease): |
||||||||||||||||
|
Impact on projected net interest income during a 12 month period |
$ | 5,114 | $ | (5,123 | ) | $ | 4,304 | $ | (4,261 | ) | ||||||
|
Duration difference between assets and liabilities in months |
(2.3 | ) | 1.4 | |||||||||||||
Contractual Obligations
As at July 31, 2023, VersaBank had an outstanding contract established for asset liability management purposes to swap between fixed and floating interest rates with a notional amount totalling $15.5 million which qualified for hedge accounting. There have been no other significant changes in contractual obligations as disclosed in VersaBank’s MD&A and Audited Consolidated Financial Statements for the year ended October 31, 2022.
| VersaBank – Q3 2023 MD&A | 31 |
Results of Operating Segments
|
(thousands of Canadian dollars) |
||||||||||||||||||||||||||||||||||||||||||||||||
|
for the three months ended |
July 31, 2023 |
April 30, 2023 |
July 31, 2022 |
|||||||||||||||||||||||||||||||||||||||||||||
|
Digital |
DRTC |
Eliminations/ |
Consolidated |
Digital |
DRTC |
Eliminations/ |
Consolidated |
Digital |
DRTC |
Eliminations/ |
Consolidated |
|||||||||||||||||||||||||||||||||||||
|
Banking |
Adjustments |
Banking |
Adjustments |
Banking |
Adjustments |
|||||||||||||||||||||||||||||||||||||||||||
|
Net interest income |
$ | 24,929 | $ | - | $ | - | $ | 24,929 | $ | 24,609 | $ | - | $ | - | $ | 24,609 | $ | 20,062 | $ | - | $ | - | $ | 20,062 | ||||||||||||||||||||||||
|
Non-interest income |
101 | 2,020 | (191 | ) | 1,930 | 122 | 2,146 | (192 | ) | 2,076 | 12 | 1,206 | (41 | ) | 1,177 | |||||||||||||||||||||||||||||||||
|
Total revenue |
25,030 | 2,020 | (191 | ) | 26,859 | 24,731 | 2,146 | (192 | ) | 26,685 | 20,074 | 1,206 | (41 | ) | 21,239 | |||||||||||||||||||||||||||||||||
|
Provision for (recovery of) credit losses |
171 | - | - | 171 | 237 | - | - | 237 | 166 | - | - | 166 | ||||||||||||||||||||||||||||||||||||
| 24,859 | 2,020 | (191 | ) | 26,688 | 24,494 | 2,146 | (192 | ) | 26,448 | 19,908 | 1,206 | (41 | ) | 21,073 | ||||||||||||||||||||||||||||||||||
|
Non-interest expenses: |
||||||||||||||||||||||||||||||||||||||||||||||||
|
Salaries and benefits |
5,891 | 1,562 | - | 7,453 | 6,930 | 1,499 | - | 8,429 | 5,600 | 1,168 | - | 6,768 | ||||||||||||||||||||||||||||||||||||
|
General and administrative |
4,257 | 380 | (191 | ) | 4,446 | 3,131 | 377 | (192 | ) | 3,316 | 5,217 | 343 | (41 | ) | 5,519 | |||||||||||||||||||||||||||||||||
|
Premises and equipment |
610 | 370 | - | 980 | 612 | 369 | - | 981 | 610 | 319 | - | 929 | ||||||||||||||||||||||||||||||||||||
| 10,758 | 2,312 | (191 | ) | 12,879 | 10,673 | 2,245 | (192 | ) | 12,726 | 11,427 | 1,830 | (41 | ) | 13,216 | ||||||||||||||||||||||||||||||||||
|
Income (loss) before income taxes |
14,101 | (292 | ) | - | 13,809 | 13,821 | (99 | ) | - | 13,722 | 8,481 | (624 | ) | - | 7,857 | |||||||||||||||||||||||||||||||||
|
Income tax provision |
3,999 | (193 | ) | - | 3,806 | 3,991 | (532 | ) | - | 3,459 | 2,099 | 38 | - | 2,137 | ||||||||||||||||||||||||||||||||||
|
Net income (loss) |
$ | 10,102 | $ | (99 | ) | $ | - | $ | 10,003 | $ | 9,830 | $ | 433 | $ | - | $ | 10,263 | $ | 6,382 | $ | (662 | ) | $ | - | $ | 5,720 | ||||||||||||||||||||||
|
Total assets |
$ | 3,971,781 | $ | 25,485 | $ | (16,421 | ) | $ | 3,980,845 | $ | 3,719,592 | $ | 25,559 | $ | (15,758 | ) | $ | 3,729,393 | $ | 3,076,611 | $ | 21,796 | $ | (23,064 | ) | $ | 3,075,343 | |||||||||||||||||||||
|
Total liabilities |
$ | 3,609,832 | $ | 29,123 | $ | (23,153 | ) | $ | 3,615,802 | $ | 3,366,614 | $ | 29,057 | $ | (22,797 | ) | $ | 3,372,874 | $ | 2,725,820 | $ | 24,794 | $ | (21,919 | ) | $ | 2,728,695 | |||||||||||||||||||||
|
(thousands of Canadian dollars) |
||||||||||||||||||||||||||||||||
|
for the nine months ended |
July 31, 2023 |
July 31, 2022 |
||||||||||||||||||||||||||||||
|
Digital Banking |
DRTC |
Eliminations/ |
Consolidated |
Digital Banking |
DRTC |
Eliminations/ |
Consolidated |
|||||||||||||||||||||||||
|
Adjustments |
Adjustments |
|||||||||||||||||||||||||||||||
|
Net interest income |
$ | 73,812 | $ | - | $ | - | $ | 73,812 | $ | 54,189 | $ | - | $ | - | $ | 54,189 | ||||||||||||||||
|
Non-interest income |
225 | 5,999 | (574 | ) | 5,650 | 14 | 4,061 | (124 | ) | 3,951 | ||||||||||||||||||||||
|
Total revenue |
74,037 | 5,999 | (574 | ) | 79,462 | 54,203 | 4,061 | (124 | ) | 58,140 | ||||||||||||||||||||||
|
Provision for (recovery of) credit losses |
793 | - | - | 793 | 246 | - | - | 246 | ||||||||||||||||||||||||
| 73,244 | 5,999 | (574 | ) | 78,669 | 53,957 | 4,061 | (124 | ) | 57,894 | |||||||||||||||||||||||
|
Non-interest expenses: |
||||||||||||||||||||||||||||||||
|
Salaries and benefits |
19,505 | 4,634 | - | 24,139 | 16,625 | 2,952 | - | 19,577 | ||||||||||||||||||||||||
|
General and administrative |
10,250 | 1,212 | (574 | ) | 10,888 | 12,460 | 826 | (124 | ) | 13,162 | ||||||||||||||||||||||
|
Premises and equipment |
1,845 | 1,068 | - | 2,913 | 1,851 | 1,029 | - | 2,880 | ||||||||||||||||||||||||
| 31,600 | 6,914 | (574 | ) | 37,940 | 30,936 | 4,807 | (124 | ) | 35,619 | |||||||||||||||||||||||
|
Income (loss) before income taxes |
41,644 | (915 | ) | - | 40,729 | 23,021 | (746 | ) | - | 22,275 | ||||||||||||||||||||||
|
Income tax provision |
11,779 | (733 | ) | - | 11,046 | 5,805 | 241 | - | 6,046 | |||||||||||||||||||||||
|
Net income (loss) |
$ | 29,865 | $ | (182 | ) | $ | - | $ | 29,683 | $ | 17,216 | $ | (987 | ) | $ | - | $ | 16,229 | ||||||||||||||
|
Total assets |
$ | 3,971,781 | $ | 25,485 | $ | (16,421 | ) | $ | 3,980,845 | $ | 3,076,611 | $ | 21,796 | $ | (23,064 | ) | $ | 3,075,343 | ||||||||||||||
|
Total liabilities |
$ | 3,609,832 | $ | 29,123 | $ | (23,153 | ) | $ | 3,615,802 | $ | 2,725,820 | $ | 24,794 | $ | (21,919 | ) | $ | 2,728,695 | ||||||||||||||
| VersaBank – Q3 2023 MD&A | 32 |
Digital Banking Operations
Q3 2023 vs Q2 2023
Net income increased 3% to $10.1 million as a function primarily of higher revenues attributable to strong loan growth and the redeployment of available cash into higher yielding, low risk securities, as well as lower provision for credit losses offset partially by modestly higher non-interest expenses.
Q3 2023 vs Q3 2022
Net income increased 58% as a function primarily of higher revenue attributable to strong loan growth and the redeployment of available cash into higher yielding, low risk securities as well as lower non-interest expenses offset partially by higher provision for credit losses.
Q3 YTD 2023 vs Q3 YTD 2022
Net income increased 73% as a function primarily of higher revenue attributable to strong loan growth and the redeployment of available cash into higher yielding, low risk securities offset partially by higher provision for credit losses and higher non-interest expenses.
DRTC (Cybersecurity Services and Banking and Financial Technology Development)
Q3 2023 vs Q2 2023
DRTC recorded a net loss of $99,000 compared to net income of $433,000 attributable primarily to the recognition of a $530,000 deferred tax asset in the comparative period associated with DRTC’s non-capital loss carryforwards which are anticipated to be applied to future taxable earnings.
DRTC’s DBG services revenue and gross profit decreased 8% and 6% to $2.4 million and $1.8 million respectively as a function of lower service engagements in the current quarter. DBG’s gross profit amounts are included in DRTC’s consolidated revenue which is reflected in non-interest income in VersaBank’s consolidated statements of income and comprehensive income.
Q3 2023 vs Q3 2022
DRTC recorded a net loss of $99,000 compared to a net loss of $662,000 as a function primarily of higher revenues attributable to higher gross profit from DBG that was offset by higher non-interest expenses attributable to higher salary and benefits expense due to higher staffing levels established to support expanded business activity.
DBG revenue increased 10% as a function of higher service engagements in the current quarter while gross profit increased 52% as a function primarily of improvements in operational efficiency achieved by DBG over the course of the year.
| VersaBank – Q3 2023 MD&A | 33 |
Q3 YTD 2023 vs Q3 YTD 2022
DRTC recorded a net loss of $182,000 compared to a net loss of $987,000 attributable primarily to higher revenues and gross profit from DBG offset by higher non-interest expenses attributable to higher salary and benefits expense due to higher staffing levels established to support expanded business activity. The favourable trend in the current period also reflects the impact of the recognition of a deferred tax asset in the second quarter of fiscal 2023 associated with DRTC’s non-capital loss carryforwards which are anticipated to be applied to future taxable earnings.
DBG revenue increased 4% as a function of higher service work volume in the current period while gross profit increased 34% as a function primarily of improvements in operational efficiency achieved by DBG over the course of the year.
Summary of Quarterly Results
|
(thousands of Canadian dollars, |
||||||||||||||||||||||||||||||||
|
except per share amounts) |
2023 |
2022 |
2021 |
|||||||||||||||||||||||||||||
|
Q3 |
Q2 |
Q1 |
Q4 |
Q3 |
Q2 |
Q1 |
Q4 |
|||||||||||||||||||||||||
|
Results of operations: |
||||||||||||||||||||||||||||||||
|
Interest income |
$ | 60,089 | $ | 53,595 | $ | 49,561 | $ | 42,072 | $ | 34,177 | $ | 25,848 | $ | 24,720 | $ | 23,924 | ||||||||||||||||
|
Yield on assets (%) |
6.19 | % | 6.05 | % | 5.78 | % | 5.26 | % | 4.70 | % | 4.15 | % | 4.06 | % | 4.04 | % | ||||||||||||||||
|
Interest expense |
35,160 | 28,986 | 25,287 | 19,595 | 14,115 | 8,606 | 7,835 | 7,778 | ||||||||||||||||||||||||
|
Cost of funds (%) |
3.62 | % | 3.27 | % | 2.95 | % | 2.45 | % | 1.94 | % | 1.38 | % | 1.29 | % | 1.31 | % | ||||||||||||||||
|
Net interest income |
24,929 | 24,609 | 24,274 | 22,477 | 20,062 | 17,242 | 16,885 | 16,146 | ||||||||||||||||||||||||
|
Net interest margin (%) |
2.57 | % | 2.78 | % | 2.83 | % | 2.81 | % | 2.76 | % | 2.77 | % | 2.77 | % | 2.73 | % | ||||||||||||||||
|
Net interest margin on loans (%) |
2.69 | % | 2.99 | % | 3.03 | % | 3.03 | % | 3.07 | % | 3.11 | % | 3.23 | % | 3.31 | % | ||||||||||||||||
|
Non-interest income |
1,930 | 2,076 | 1,644 | 1,775 | 1,177 | 1,393 | 1,381 | 2,090 | ||||||||||||||||||||||||
|
Total revenue |
26,859 | 26,685 | 25,918 | 24,252 | 21,239 | 18,635 | 18,266 | 18,236 | ||||||||||||||||||||||||
|
Provision for (recovery of) credit losses |
171 | 237 | 385 | 205 | 166 | 78 | 2 | (279 | ) | |||||||||||||||||||||||
|
Non-interest expenses |
12,879 | 12,726 | 12,335 | 13,774 | 13,216 | 11,767 | 10,636 | 10,377 | ||||||||||||||||||||||||
|
Efficiency ratio |
48 | % | 48 | % | 48 | % | 57 | % | 62 | % | 63 | % | 58 | % | 57 | % | ||||||||||||||||
|
Efficiency ratio - Digital Banking |
43 | % | 43 | % | 42 | % | 51 | % | 57 | % | 58 | % | 56 | % | 56 | % | ||||||||||||||||
|
Tax provision |
3,806 | 3,459 | 3,781 | 3,844 | 2,137 | 1,847 | 2,062 | 2,228 | ||||||||||||||||||||||||
|
Net income |
$ | 10,003 | $ | 10,263 | $ | 9,417 | $ | 6,429 | $ | 5,720 | $ | 4,943 | $ | 5,566 | $ | 5,910 | ||||||||||||||||
|
Income per share |
||||||||||||||||||||||||||||||||
|
Basic |
$ | 0.38 | $ | 0.38 | $ | 0.34 | $ | 0.23 | $ | 0.20 | $ | 0.17 | $ | 0.19 | $ | 0.24 | ||||||||||||||||
|
Diluted |
$ | 0.38 | $ | 0.38 | $ | 0.34 | $ | 0.23 | $ | 0.20 | $ | 0.17 | $ | 0.19 | $ | 0.24 | ||||||||||||||||
|
Return on average common equity |
11.15 | % | 12.07 | % | 10.79 | % | 7.32 | % | 6.57 | % | 5.92 | % | 6.58 | % | 8.07 | % | ||||||||||||||||
|
Return on average total assets |
1.00 | % | 1.13 | % | 1.07 | % | 0.77 | % | 0.75 | % | 0.75 | % | 0.87 | % | 0.96 | % | ||||||||||||||||
The financial results for each of the last eight quarters are summarized above. Key drivers of VersaBank’s quarter over quarter performance trends for the current reporting period were:
| ► |
Lending asset growth attributable primarily to growth in the POS Financing portfolio; |
| ► |
Lower NIM as a function of higher cost of funds offset partially by higher yields earned on the Bank’s lending and treasury assets; |
| ► |
Lower provision for credit losses attributable primarily to changes in the forward-looking information used by VersaBank in its credit risk models in the current quarter and changes to the Bank’s lending asset mix offset partially by higher lending asset balances; and, |
| ► |
Higher non-interest expenses due primarily to higher professional fees attributable to the continuing regulatory approval process associated with VersaBank’s acquisition of a US bank and seasonal corporate activities specific to the quarter offset partially by lower salary and benefits amounts attributable to estimates associated with performance-based obligations. |
| VersaBank – Q3 2023 MD&A | 34 |
Non-GAAP and Other Financial Measures
Non-GAAP and other financial measures are not standardized financial measures under the financial reporting framework used to prepare the financial statements of the Bank to which these measures relate. These measures may not be comparable to similar financial measures disclosed by other issuers. The Bank uses these financial measures to assess its performance and as such believes these financial measures are useful in providing readers with a better understanding of how management assesses the Bank’s performance.
Non-GAAP Measures
Return on Average Common Equity is defined as annualized net income less amounts relating to preferred share dividends, divided by average common shareholders’ equity which is average shareholders’ equity less amounts relating to preferred shares recorded in equity.
|
for the three months ended |
for the nine months ended |
|||||||||||||||
|
July 31 |
July 31 |
July 31 |
July 31 |
|||||||||||||
|
(thousands of Canadian dollars) |
2023 |
2022 |
2023 |
2022 |
||||||||||||
|
Return on average common equity |
||||||||||||||||
|
Net income |
$ | 10,003 | $ | 5,720 | $ | 29,683 | $ | 16,229 | ||||||||
|
Preferred share dividends |
(247 | ) | (247 | ) | (741 | ) | (741 | ) | ||||||||
|
Adjusted net income |
9,756 | 5,473 | 28,942 | 15,488 | ||||||||||||
|
Annualized adjusted net income |
38,706 | 21,714 | 38,695 | 20,707 | ||||||||||||
|
Average common equity |
$ | 347,135 | $ | 330,445 | $ | 344,213 | $ | 325,791 | ||||||||
|
Return on average common equity |
11.15 | % | 6.57 | % | 11.24 | % | 6.36 | % | ||||||||
Book Value per Common Share is defined as Shareholders’ Equity less amounts relating to preferred shares recorded in equity, divided by the number of common shares outstanding.
|
as at |
||||||||
|
July 31 |
July 31 |
|||||||
|
(thousands of Canadian dollars, except shares outstanding and per share amounts) |
2023 |
2022 |
||||||
|
Book value per common share |
||||||||
|
Common equity |
$ | 351,396 | $ | 333,001 | ||||
|
Shares outstanding |
25,924,424 | 27,441,082 | ||||||
|
Book value per common share |
$ | 13.55 | $ | 12.14 | ||||
| VersaBank – Q3 2023 MD&A | 35 |
Return on Average Total Assets is defined as annualized net income less amounts relating to preferred share dividends, divided by average total assets.
|
for the three months ended |
for the nine months ended |
|||||||||||||||
|
July 31 |
July 31 |
July 31 |
July 31 |
|||||||||||||
|
(thousands of Canadian dollars) |
2023 |
2022 |
2023 |
2022 |
||||||||||||
|
Return on average total assets |
||||||||||||||||
|
Net income |
$ | 10,003 | $ | 5,720 | $ | 29,683 | $ | 16,229 | ||||||||
|
Preferred share dividends |
(247 | ) | (247 | ) | (741 | ) | (741 | ) | ||||||||
|
Adjusted net income |
9,756 | 5,473 | 28,942 | 15,488 | ||||||||||||
|
Annualized adjusted net income |
38,706 | 21,714 | 38,695 | 20,707 | ||||||||||||
|
Average Assets |
$ | 3,855,119 | $ | 2,883,745 | $ | 3,623,422 | $ | 2,745,215 | ||||||||
|
Return on average total assets |
1.00 | % | 0.75 | % | 1.07 | % | 0.75 | % | ||||||||
Other Financial Measures
Yield is calculated as interest income (as presented in the Consolidated Statements of Comprehensive Income) divided by average total assets. Yield does not have a standardized meaning prescribed by IFRS and, therefore, may not be comparable to similar measures presented by other financial institutions.
Cost of Funds is calculated as interest expense (as presented in the Consolidated Statements of Comprehensive Income) divided by average total assets. Cost of funds does not have a standardized meaning prescribed by IFRS and, therefore, may not be comparable to similar measures presented by other financial institutions.
Net Interest Margin or Spread are calculated as net interest income divided by average total assets. Net interest margin or spread does not have a standardized meaning prescribed by IFRS and, therefore, may not be comparable to similar measures presented by other financial institutions.
Net Interest Margin on Loans is calculated as net interest income adjusted for the impact of cash. securities and other assets, divided by average gross loans. This metric does not have a standardized meaning prescribed by IFRS and, therefore, may not be comparable to similar measures presented by other financial institutions.
Efficiency Ratio is calculated as non-interest expenses from consolidated operations as a percentage of total revenue (as presented in the interim Consolidated Statements of Comprehensive Income). This ratio does not have a standardized meaning prescribed by IFRS and, therefore, may not be comparable to similar measures presented by other financial institutions.
Efficiency Ratio Digital Banking is calculated as non-interest expenses from the Digital Banking operations as a percentage of total revenue from the Digital Banking operations. This ratio does not have a standardized meaning prescribed by IFRS and, therefore, may not be comparable to similar measures presented by other financial institutions.
| VersaBank – Q3 2023 MD&A | 36 |
Provision for (Recovery of) Credit Losses as a Percentage of Average Total Loans captures the provision for (recovery of) credit losses (as presented in the interim Consolidated Statements of Comprehensive Income) as a percentage of VersaBank’s average loans, net of allowance for credit losses. This percentage does not have a standardized meaning prescribed by IFRS and, therefore, may not be comparable to similar measures presented by other financial institutions.
Basel III Common Equity Tier 1, Tier 1, Total Capital Adequacy and Leverage Ratios are determined in accordance with guidelines issued by the Office of the Superintendent of Financial Institutions (Canada) (OSFI).
Significant Accounting Policies and Use of Estimates and Judgements
Significant accounting policies and use of estimates and judgements are detailed in note 2 and note 3 of VersaBank’s 2022 Audited Consolidated Financial Statements. There have been no material changes in accounting policies since October 31, 2022, except as noted below.
During the current year VersaBank updated or incorporated the following significant accounting policies:
Derivative instruments:
Derivatives are reported as other assets when they have a positive fair value and as other liabilities when they have a negative fair value. Derivatives may be embedded in other financial instruments. Derivatives embedded in other financial instruments are valued as separate derivatives when: the economic characteristics and risks associated are not clearly and closely related to those of the host contract; the terms of the embedded derivative would meet the definition of a derivative if it was a stand-alone, independent instrument; and the combined contract is not held for trading or designated at fair value through profit or loss. For financial statement disclosure purposes, embedded derivatives are combined with the host contract.
Hedge accounting:
The Bank has elected, as permitted, to apply the hedge accounting requirements of IAS 39. Interest rate swap agreements are entered into for asset liability management (“ALM”) purposes. When hedge accounting criteria are met, derivative contracts are accounted for as described below.
To meet the criteria for hedge accounting, the Bank documents all relationships between hedging instruments and hedged items, how hedge effectiveness is assessed, as well as its risk management objective and strategy for undertaking various hedge transactions. This process includes linking all derivatives to specific assets or liabilities on the Consolidated Statements of Financial Position. The Bank also formally assesses, both at the inception of the hedge and on an ongoing basis, whether the derivatives that are used in hedging transactions are effective in offsetting changes in fair values or cash flows of the hedged items.
There are three main types of hedges: (i) fair value hedges, (ii) cash flow hedges and (iii) net investment hedges.
| VersaBank – Q3 2023 MD&A | 37 |
The Bank has only fair value hedges outstanding. In a fair value hedge, the change in the fair value of the hedging derivative is recognized in non-interest income in the Consolidated Statements of Income and Comprehensive Income. The change in the fair value of the hedged item attributable to the risk hedged is recorded as part of the carrying value of the hedged item (basis adjustment) and is also recognized in non-interest income in the Consolidated Statements of Income and Comprehensive Income. The Bank utilizes fair value hedges primarily to convert fixed rate financial assets to floating rate financial assets. The primary financial instruments designated in fair value hedging relationships are loans. If the derivative expires or is sold, terminated, no longer meets the criteria for hedge accounting, or the designation is revoked, hedge accounting is discontinued. Any basis adjustment up to that point made to a hedged item for which the effective interest method is used is amortized to the Consolidated Statements of Income and Comprehensive Income as part of the recalculated effective interest rate of the item over its remaining term. If the hedged item is derecognized, the unamortized fair value is recognized immediately in the Consolidated Statements of Income and Comprehensive Income.
In fair value hedges, ineffectiveness arises to the extent that change in fair value of the hedging items differs from the change in fair value of the hedge risk in the hedged item. Any hedge ineffectiveness is measured and recorded in non-interest income in the Consolidated Statements of Income and Comprehensive Income.
Derivative contracts which do not qualify for hedge accounting are marked-to-market and the resulting net gains or losses are recognized in non-interest income in the Consolidated Statement of Income.
Controls and Procedures
During the quarter ended July 31, 2023, there were no changes in VersaBank’s internal controls over financial reporting, that have materially affected, or are reasonably likely to materially affect VersaBank’s internal controls over financial reporting.
| VersaBank – Q3 2023 MD&A | 38 |
Exhibit 99.3

For Immediate Release: August 30, 2023
Attention: Business Editors
VERSABANK REPORTS CONTINUED STRONG RESULTS FOR THIRD QUARTER 2023 HIGHLIGHTED BY 75% YEAR-OVER-YEAR GROWTH IN NET INCOME AND 90% YEAR-OVER-YEAR GROWTH IN EPS
– Digital Banking Operations Increasingly Benefitting from Operating Leverage with Continued Strong Growth in Loan Portfolio –
All amounts are unaudited and in Canadian dollars and are based on financial statements prepared in compliance with International Accounting Standard 34 Interim Financial Reporting, unless otherwise noted. Our third quarter 2023 (“Q3 2023”) unaudited Interim Consolidated Financial Statements for the period ended July 31, 2023 and Management’s Discussion and Analysis ("MD&A"), are available online at www.versabank.com/investor-relations, SEDAR at www.sedar.com and EDGAR at www.sec.gov/edgar.shtml. Supplementary Financial Information will also be available on our website at www.versabank.com/investor-relations.
LONDON, ON/CNW – VersaBank (“VersaBank” or the “Bank”) (TSX: VBNK; NASDAQ: VBNK), a North American leader in business-to-business digital banking, as well as technology solutions for cybersecurity, today reported its results for the third quarter of fiscal 2023 ended July 31, 2023. All figures are in Canadian dollars unless otherwise stated.
CONSOLIDATED AND SEGMENTED FINANCIAL SUMMARY
|
(unaudited) |
As at or for the three months ended |
As at or for the nine months ended |
||||||||||||||||||||||||||||||
|
(thousands of Canadian dollars, except per share amounts) |
July 31 2023 |
April 30 2023 |
Change |
July 31 2022 |
Change |
July 31 2023 |
July 31 2022 |
Change |
||||||||||||||||||||||||
|
Financial results |
||||||||||||||||||||||||||||||||
|
Total revenue |
$ | 26,859 | $ | 26,685 | 1 | % | $ | 21,239 | 26 | % | $ | 79,462 | $ | 58,140 | 37 | % | ||||||||||||||||
|
Cost of funds(1) |
3.62 | % | 3.27 | % | 11 | % | 1.94 | % | 87 | % | 3.30 | % | 1.49 | % | 121 | % | ||||||||||||||||
|
Net interest margin(1) |
2.57 | % | 2.78 | % | (8 | %) | 2.76 | % | (7 | %) | 2.72 | % | 2.64 | % | 3 | % | ||||||||||||||||
|
Net interest margin on loans(1) |
2.69 | % | 2.99 | % | (10 | %) | 3.07 | % | (12 | %) | 2.89 | % | 3.04 | % | (5 | %) | ||||||||||||||||
|
Net income |
10,003 | 10,263 | (3 | %) | 5,720 | 75 | % | 29,683 | 16,229 | 83 | % | |||||||||||||||||||||
|
Net income per common share basic and diluted |
0.38 | 0.38 | 0 | % | 0.20 | 90 | % | 1.10 | 0.56 | 96 | % | |||||||||||||||||||||
|
Balance sheet and capital ratios |
||||||||||||||||||||||||||||||||
|
Total assets |
$ | 3,980,845 | $ | 3,729,393 | 7 | % | $ | 3,075,343 | 29 | % | $ | 3,980,845 | $ | 3,075,343 | 29 | % | ||||||||||||||||
|
Book value per common share(1) |
13.55 | 13.19 | 3 | % | 12.14 | 12 | % | 13.55 | 12.14 | 12 | % | |||||||||||||||||||||
|
Common Equity Tier 1 (CET1) capital ratio |
11.15 | % | 11.21 | % | (1 | %) | 12.51 | % | (11 | %) | 11.15 | % | 12.51 | % | (11 | %) | ||||||||||||||||
|
Total capital ratio |
15.10 | % | 15.37 | % | (2 | %) | 17.05 | % | (11 | %) | 15.10 | % | 17.05 | % | (11 | %) | ||||||||||||||||
|
Leverage ratio |
8.53 | % | 8.83 | % | (3 | %) | 10.38 | % | (18 | %) | 8.53 | % | 10.38 | % | (18 | %) | ||||||||||||||||
|
(1) See definitions under ‘Non-GAAP and Other Financial Measures' in the Q3 2023 Management’s Discussion and Analysis. |
|
(thousands of Canadian dollars) |
|||||||||||||||||||||||||||||||||||||||||||||||
|
for the three months ended |
July 31, 2023 |
April 30, 2023 |
July 31, 2022 |
||||||||||||||||||||||||||||||||||||||||||||
|
Digital |
DRTC |
Eliminations/ |
Consolidated |
Digital |
DRTC |
Eliminations/ |
Consolidated |
Digital |
DRTC |
Eliminations/ |
Consolidated |
||||||||||||||||||||||||||||||||||||
|
Banking |
Adjustments |
Banking |
Adjustments |
Banking |
Adjustments |
||||||||||||||||||||||||||||||||||||||||||
|
Net interest income |
$ | 24,929 | $ | - | $ | - | $ | 24,929 | $ | 24,609 | $ | - | $ | - | $ | 24,609 | $ | 20,062 | $ | - | $ | - | $ | 20,062 | |||||||||||||||||||||||
|
Non-interest income |
101 | 2,020 | (191 | ) | 1,930 | 122 | 2,146 | (192 | ) | 2,076 | 12 | 1,206 | (41 | ) | 1,177 | ||||||||||||||||||||||||||||||||
|
Total revenue |
25,030 | 2,020 | (191 | ) | 26,859 | 24,731 | 2,146 | (192 | ) | 26,685 | 20,074 | 1,206 | (41 | ) | 21,239 | ||||||||||||||||||||||||||||||||
|
Provision for (recovery of) credit losses |
171 | - | - | 171 | 237 | - | - | 237 | 166 | - | - | 166 | |||||||||||||||||||||||||||||||||||
| 24,859 | 2,020 | (191 | ) | 26,688 | 24,494 | 2,146 | (192 | ) | 26,448 | 19,908 | 1,206 | (41 | ) | 21,073 | |||||||||||||||||||||||||||||||||
|
Non-interest expenses: |
|||||||||||||||||||||||||||||||||||||||||||||||
|
Salaries and benefits |
5,891 | 1,562 | - | 7,453 | 6,930 | 1,499 | - | 8,429 | 5,600 | 1,168 | - | 6,768 | |||||||||||||||||||||||||||||||||||
|
General and administrative |
4,257 | 380 | (191 | ) | 4,446 | 3,131 | 377 | (192 | ) | 3,316 | 5,217 | 343 | (41 | ) | 5,519 | ||||||||||||||||||||||||||||||||
|
Premises and equipment |
610 | 370 | - | 980 | 612 | 369 | - | 981 | 610 | 319 | - | 929 | |||||||||||||||||||||||||||||||||||
| 10,758 | 2,312 | (191 | ) | 12,879 | 10,673 | 2,245 | (192 | ) | 12,726 | 11,427 | 1,830 | (41 | ) | 13,216 | |||||||||||||||||||||||||||||||||
|
Income (loss) before income taxes |
14,101 | (292 | ) | - | 13,809 | 13,821 | (99 | ) | - | 13,722 | 8,481 | (624 | ) | - | 7,857 | ||||||||||||||||||||||||||||||||
|
Income tax provision |
3,999 | (193 | ) | - | 3,806 | 3,991 | (532 | ) | - | 3,459 | 2,099 | 38 | - | 2,137 | |||||||||||||||||||||||||||||||||
|
Net income (loss) |
$ | 10,102 | $ | (99 | ) | $ | - | $ | 10,003 | $ | 9,830 | $ | 433 | $ | - | $ | 10,263 | $ | 6,382 | $ | (662 | ) | $ | - | $ | 5,720 | |||||||||||||||||||||
|
Total assets |
$ | 3,971,781 | $ | 25,485 | $ | (16,421 | ) | $ | 3,980,845 | $ | 3,719,592 | $ | 25,559 | $ | (15,758 | ) | $ | 3,729,393 | $ | 3,076,611 | $ | 21,796 | $ | (23,064 | ) | $ | 3,075,343 | ||||||||||||||||||||
|
Total liabilities |
$ | 3,609,832 | $ | 29,123 | $ | (23,153 | ) | $ | 3,615,802 | $ | 3,366,614 | $ | 29,057 | $ | (22,797 | ) | $ | 3,372,874 | $ | 2,725,820 | $ | 24,794 | $ | (21,919 | ) | $ | 2,728,695 | ||||||||||||||||||||
HIGHLIGHTS FOR THE THIRD QUARTER OF FISCAL 2023
Consolidated
|
● |
Consolidated total revenue increased 26% year-over-year and 1% sequentially to a record $26.9 million, driven by higher net interest income resulting primarily from continuing strong loan growth and increased contribution from DRT Cyber Inc. (“DRTC”) year-over-year; |
|
|
● |
Consolidated net income increased 75% year-over-year and decreased 3% sequentially to $10.0 million. The year-over-year increase was primarily due to higher revenue, which was driven primarily by strong loan growth (30%) as non-interest expenses declined (3%), as well as an increased contribution from DRTC. The sequential decrease was primarily due to temporary compression of net interest margin resulting from higher rates paid on term deposits during the quarter amidst temporarily elevated rates in the term deposit market in Canada, which were impacted by the period of liquidity concerns related to the US banking sector, as well as a smaller recognition of a deferred tax asset related to DRT Cyber compared to the outsized amount in the second quarter of 2023; |
|
|
● |
Consolidated earnings per share increased 90% year-over-year to $0.38 due to higher net income, as well as the positive impact of the purchase and cancellation of VersaBank’s common shares through its Normal Course Issuer Bid (“NCIB”). Consolidated earnings per share was unchanged sequentially; |
|
|
● |
The Bank purchased and cancelled 79,562 common shares under its NCIB in the current quarter, bringing the total number of common shares purchased through the NCIB as at July 31, 2023 to 1,516,658; and, |
|
|
● |
The Bank continues to advance the process seeking approval of its proposed acquisition of OCC-chartered US bank, Stearns Bank Holdingford N.A., and expects a decision with respect to approval of its application from US regulators during autumn 2023. If favourable, the Bank will proceed toward completion of the acquisition as soon as possible, subject to Canadian regulatory (OSFI) approval. |
Digital Banking Operations
|
● |
Loans increased 30% year-over-year and 7% sequentially to a record $3.66 billion, driven primarily by growth in the Bank’s Point-of-Sale (“POS”) Financing portfolio, which increased 39% year-over-year and 9% sequentially; |
|
|
● |
Total revenue increased 25% year-over-year and 1% sequentially to a record $25.0 million, driven primarily by growth of the POS Financing portfolio, which was offset by the temporary compression of net interest margin as described below; |
|
|
● |
Net interest margin on loans decreased 38 bps, or 12%, year-over-year and decreased 30 bps, or 10%, sequentially to 2.69%. Net interest margin on loans was dampened by higher rates paid on term deposits during the quarter amidst temporarily elevated rates in the term deposit market in Canada, which were impacted by the period of liquidity concerns related to the US banking sector; |
|
● |
Net interest margin decreased 19 bps year-over-year, or 7%, and decreased 21 bps, or 8%, sequentially to 2.57%; |
|
|
● |
Provision for credit losses as a percentage of average loans remained negligible at 0.02%, compared with a 12-quarter average of -0.01%, which remains among the lowest of the publicly traded Canadian Schedule I (federally licensed) Banks; and, |
|
● |
Efficiency ratio (excluding DRTC) improved year-over-year to 43% (down from 57%) attributable to revenue growth (25%) and a decline non-interest expense (6%) over the same period. On a sequential basis, efficiency ratio was unchanged. |
DRTC’s Cybersecurity Services Operations (Digital Boundary Group)
|
● |
Revenue for the Cybersecurity Services component of DRTC (Digital Boundary Group, or DBG) increased 10% year-over-year to $2.4 million due to higher service engagements, while gross profit increased 52% to $1.8 million due to improved operational efficiency. Sequentially, however, revenue and gross profit for Digital Boundary Group decreased 8% and 6%, respectively, due to lower service engagements. DBG’s gross profit amounts are included in DRTC’s consolidated revenue which is reflected in non-interest income in VersaBank’s consolidated statements of income and comprehensive income. DBG remained profitable on a standalone basis within DRTC. |
MANAGEMENT COMMENTARY
“The third quarter of fiscal 2023 was once again highlighted by strong growth in profitability as we increasingly benefited from the operating leverage in our business with the steady expansion of our loan portfolio,” said David Taylor, President and Chief Executive Officer, VersaBank. “30% year-over-year growth in our loan portfolio, driven predominantly by expansion of our innovative Point-of-Sale Financing portfolio, generated 75% year-over-year growth in net income, which, with our continued participation in our share buyback program, drove a 90% year-over-year increase in earnings per share for the quarter, and a 96% year-over-year increase for the year to date.”
“VersaBank’s unique branchless, partner-based, digital banking model continues to prove itself in terms of operating leverage, efficiency, return on common equity and risk mitigation that remain unmatched in the North American banking industry. As we continue to experience strong and steady growth in our Canadian loan portfolio, we look forward to the significant additional upside from the broad launch of our innovative Receivable Purchase Program in the United States should we receive approval for our proposed acquisition of a national, OCC-chartered bank. We continue to progress towards a decision by US regulators, which we are optimistic will be received during autumn of this year. And we continue to be encouraged by the receptiveness of the market to our unique financing alternative by both current and prospective US partners under our initial limited roll out.”
FINANCIAL REVIEW
Consolidated
Net Income – Net income for the third quarter of fiscal 2023 was $10.0 million, or $0.38 per common share (basic and diluted), compared with $10.3 million, or $0.38 per common share (basic and diluted) last quarter and $5.7 million, or $0.20 per common share (basic and diluted), for the same period of fiscal 2022. The year-over-year increase was due primarily to higher revenue, which was driven by strong loan growth, increased contribution from DRTC, as well as lower non-interest expense attributable to various cost control activities. Net income for the third quarter was dampened by compression of net interest margin during the quarter resulting from higher rates paid on term deposits during the quarter amidst temporarily elevated rates in the term deposit market in Canada, which were impacted by the period of liquidity concerns related to the US banking sector. In addition to lower net interest margin, the slight sequential decrease in net income was also due to the smaller recognition of a deferred tax asset related to DRTC compared to the outsized amount in the second quarter of 2023.
Capital – At July 31, 2023, VersaBank’s total regulatory capital was $460 million compared with $455 million last quarter and $438 million a year ago. The Bank’s total capital ratio at July 31, 2023 was 15.10%, compared 15.37% last quarter and 17.05% a year ago, due primarily to growth in the Bank’s loan portfolio as it deployed excess capital into income generating assets.
Digital Banking Operations
Net Interest Margin – Net interest margin (or spread) for the quarter was 2.57% compared to 2.78% last quarter and 2.76% for the same period of fiscal 2022. The year-over-year and sequential decreases were due primarily to the temporary compression of net interest margin on loans due to higher rates paid on term deposits during the quarter amidst temporarily elevated rates in the term deposit market in Canada, which were impacted by the period of liquidity concerns related to the US banking sector. The year-over-year decrease was also impacted by a shift in the Bank’s funding mix.
Net Interest Margin on Loans – Net interest margin on loans for the quarter was 2.69% compared to 2.99% last quarter, and 3.07% for the same period of fiscal 2022. The year-over-year and sequential decreases were due primarily to the variables discussed in the Net Interest Margin section above. Year-to-date net interest margin on loans was 2.89% compared to 3.04% for the same period a year ago.
Net Interest Income – Net interest income for the quarter increased to a record $24.9 million from $24.6 million last quarter and $20.1 million for the same period of fiscal 2022. The increases were due primarily to higher net interest income earned on higher lending assets and the redeployment of available cash into higher-yielding, low-risk securities offset, partially by higher interest expense attributable to higher deposit balances.
Non-Interest Expenses – Non-interest expenses for the quarter were $10.8 million compared with $10.7 million last quarter and $11.4 million for the same period of fiscal 2022. The year-over-year decrease was due primarily to lower capital tax expense attributable to a shift in the provincial allocation of the Bank’s loan and deposit originations and lower insurance premiums relative to the premiums paid during the comparative period attributable to VersaBank’s listing on the Nasdaq in September 2021, offset partially by higher salary and benefits expense attributable to higher staffing levels to support expanded business activity across VersaBank and higher costs attributable to the continuing regulatory approval process associated with VersaBank’s acquisition of a US bank. The slight sequential increase was due primarily to higher professional fees attributable to the continuing regulatory approval process associated with VersaBank’s acquisition of a US bank and seasonal corporate activities specific to the quarter, offset partially by lower salary and benefits amounts attributable to lower estimates related to performance-based obligations.
Provision for/Recovery of Credit Losses – Provision for credit losses for the quarter was $171,000 compared to a provision for credit losses of $237,000 last quarter and a provision for credit losses of $166,000 for the same period of fiscal 2022. The sequential decrease was due primarily to changes in the forward-looking information used by the Bank in its credit risk models and changes in the Bank’s lending asset mix, offset partially by higher lending asset balances. The year-over-year increase was due primarily to higher lending asset balances and changes in the forward-looking information used by the Bank in its credit risk models, offset partially by and changes in the Bank’s lending asset mix. Provision for credit losses as a percentage of average loans was 0.02%, compared with a 12-quarter average of -0.01%.
Credit Quality – The Bank’s allowance for expected credit losses, (“ECL”) at July 31, 2023 was $2.7 million compared with $2.5 million last quarter and $1.7 million a year ago. The sequential and year-over-year increases were due primarily to the factors set out in the Provision for/Recovery of Credit Losses section above. VersaBank’s Provision for Credit Losses ratio continues to be one of the lowest in the Canadian banking industry, reflecting the very low risk profile of the Bank’s lending portfolio, enabling it to generate superior net interest margins by offering innovative, high-value deposit and lending solutions that address unmet needs in the banking industry through a highly efficient partner model. Given that the vast majority of the Bank’s CRE portfolio is composed of loans and mortgages for residential use properties, it has very limited exposure to the commercial real estate market.
Lending Operations: POS Financing – POS Financing portfolio balances for the quarter increased 9% sequentially and 39% year-over-year to $2.8 billion due primarily to continued strong demand for home improvement/HVAC and transportation equipment receivable financing.
Lending Operations: Commercial Lending – The Commercial Lending portfolio for the quarter increased 1% sequentially and 8% year-over-year to $870 million.
Deposit Funding – Cost of funds for the third quarter was 3.62%, an increase of 35 bps sequentially and 168 bps year-over-year due primarily to higher rates paid on term deposits during the quarter with the year-over-year increase also impacted by a shift in the Bank’s funding mix. Management expects that commercial deposit volumes raised via VersaBank’s Trustee Integrated Banking program will continue to grow over the remainder of fiscal 2023 due to increased volumes of consumer and commercial bankruptcy and proposal restructuring proceedings, due primarily to the impact of a higher interest rate environment. In addition, VersaBank continues to pursue growth and expansion of its well-established, diverse deposit broker network through which it sources personal deposits, consisting primarily of guaranteed investment certificates (term deposits). The Bank’s current deposit channels remain an efficient, reliable and diversified source of funding providing ample access to reasonably priced deposits in volumes that comfortably support the Bank’s liquidity requirements. Substantially all of the Bank’s deposit volumes raised through these channels are eligible for CDIC insurance.
DRTC (Cybersecurity Services and Banking and Financial Technology Development)
DRTC revenue (including that from services provided to the Digital Banking operations) decreased 6% sequentially and increased 67% year-over-year to $2.0 million, due primarily to the timing of service engagements. DRTC recorded a net loss of $99,000 compared to net income of $433,000 last quarter and a net loss of $662,000 a year ago. The year-over-year improvement was due primarily to higher revenues attributable to higher gross profit from DBG, which was partially offset by higher non-interest expenses attributable to higher salary and benefits expense due to higher staffing levels established to support expanded business activity. The sequential decrease was due primarily to the recognition of an outsized $530,000 deferred tax asset in the comparative period associated with DRTC’s non-capital loss carry forwards which are anticipated to be applied to future taxable earnings.
DBG revenue decreased 8% sequentially while gross profit decreased 6% due to lower service engagements in the current quarter. DRTC’s DBG revenue increased 10% year-over-year to $2.4 million due to higher service engagements, while gross profit increased 52% to $1.8 million due to improved operational efficiency in the current quarter. DBG’s gross profit amounts are included in DRTC’s consolidated revenue which is reflected in non-interest income in VersaBank’s consolidated statements of income and comprehensive income.
FINANCIAL HIGHLIGHTS
|
(unaudited) |
for the three months ended |
for the nine months ended |
||||||||||||||
|
July 31 |
July 31 |
July 31 |
July 31 |
|||||||||||||
|
(thousands of Canadian dollars, except per share amounts) |
2023 |
2022 |
2023 |
2022 |
||||||||||||
|
Results of operations |
||||||||||||||||
|
Interest income |
$ | 60,089 | $ | 34,177 | $ | 163,245 | $ | 84,745 | ||||||||
|
Net interest income |
24,929 | 20,062 | 73,812 | 54,189 | ||||||||||||
|
Non-interest income |
1,930 | 1,177 | 5,650 | 3,951 | ||||||||||||
|
Total revenue |
26,859 | 21,239 | 79,462 | 58,140 | ||||||||||||
|
Provision for credit losses |
171 | 166 | 793 | 246 | ||||||||||||
|
Non-interest expenses |
12,879 | 13,216 | 37,940 | 35,619 | ||||||||||||
|
Digital Banking |
10,758 | 11,427 | 31,600 | 30,936 | ||||||||||||
|
DRTC |
2,312 | 1,830 | 6,914 | 4,807 | ||||||||||||
|
Net income |
10,003 | 5,720 | 29,683 | 16,229 | ||||||||||||
|
Income per common share: |
||||||||||||||||
|
Basic |
$ | 0.38 | $ | 0.20 | $ | 1.10 | $ | 0.56 | ||||||||
|
Diluted |
$ | 0.38 | $ | 0.20 | $ | 1.10 | $ | 0.56 | ||||||||
|
Dividends paid on preferred shares |
$ | 247 | $ | 247 | $ | 741 | $ | 741 | ||||||||
|
Dividends paid on common shares |
$ | 648 | $ | 687 | $ | 1,962 | $ | 2,061 | ||||||||
|
Yield* |
6.19 | % | 4.70 | % | 6.02 | % | 4.13 | % | ||||||||
|
Cost of funds* |
3.62 | % | 1.94 | % | 3.30 | % | 1.49 | % | ||||||||
|
Net interest margin* |
2.57 | % | 2.76 | % | 2.72 | % | 2.64 | % | ||||||||
|
Net interest margin on loans* |
2.69 | % | 3.07 | % | 2.89 | % | 3.04 | % | ||||||||
|
Return on average common equity* |
11.15 | % | 6.57 | % | 11.24 | % | 6.36 | % | ||||||||
|
Book value per common share* |
$ | 13.55 | $ | 12.14 | $ | 13.55 | $ | 12.14 | ||||||||
|
Efficiency ratio* |
48 | % | 62 | % | 48 | % | 61 | % | ||||||||
|
Efficiency ratio - Digital Banking* |
43 | % | 57 | % | 43 | % | 57 | % | ||||||||
|
Return on average total assets* |
1.00 | % | 0.75 | % | 1.07 | % | 0.75 | % | ||||||||
|
Provision for credit losses as a % of average loans* |
0.02 | % | 0.03 | % | 0.03 | % | 0.01 | % | ||||||||
|
as at |
||||||||||||||||
|
Balance Sheet Summary |
||||||||||||||||
|
Cash |
$ | 87,726 | $ | 84,214 | $ | 87,726 | $ | 84,214 | ||||||||
|
Securities |
182,944 | 133,682 | 182,944 | 133,682 | ||||||||||||
|
Loans, net of allowance for credit losses |
3,661,672 | 2,814,121 | 3,661,672 | 2,814,121 | ||||||||||||
|
Average loans |
3,540,564 | 2,632,199 | 3,327,175 | 2,458,586 | ||||||||||||
|
Total assets |
3,980,845 | 3,075,343 | 3,980,845 | 3,075,343 | ||||||||||||
|
Deposits |
3,328,017 | 2,475,063 | 3,328,017 | 2,475,063 | ||||||||||||
|
Subordinated notes payable |
101,585 | 98,706 | 101,585 | 98,706 | ||||||||||||
|
Shareholders' equity |
365,043 | 346,648 | 365,043 | 346,648 | ||||||||||||
|
Capital ratios** |
||||||||||||||||
|
Risk-weighted assets |
$ | 3,047,172 | $ | 2,568,678 | $ | 3,047,172 | $ | 2,568,678 | ||||||||
|
Common Equity Tier 1 capital |
339,894 | 321,386 | 339,894 | 321,386 | ||||||||||||
|
Total regulatory capital |
460,065 | 437,912 | 460,065 | 437,912 | ||||||||||||
|
Common Equity Tier 1 (CET1) ratio |
11.15 | % | 12.51 | % | 11.15 | % | 12.51 | % | ||||||||
|
Tier 1 capital ratio |
11.60 | % | 13.04 | % | 11.60 | % | 13.04 | % | ||||||||
|
Total capital ratio |
15.10 | % | 17.05 | % | 15.10 | % | 17.05 | % | ||||||||
|
Leverage ratio |
8.53 | % | 10.38 | % | 8.53 | % | 10.38 | % | ||||||||
|
* See definitions under ‘Non-GAAP and Other Financial Measures' in the Q3 2023 Management’s Discussion and Analysis. |
|||||||||||||||
|
** Capital management and leverage measures are in accordance with OSFI's Capital Adequacy Requirements and Basel III Accord. |
About VersaBank
VersaBank is a Canadian Schedule I chartered (federally licensed) bank with a difference. VersaBank became the world’s first fully digital financial institution when it adopted its highly efficient business-to-business model in 1993 using its proprietary state-of-the-art financial technology to profitably address underserved segments of the Canadian banking market in the pursuit of superior net interest margins while mitigating risk. VersaBank obtains all of its deposits and provides the majority of its loans and leases electronically, with innovative deposit and lending solutions for financial intermediaries that allow them to excel in their core businesses. In addition, leveraging its internally developed IT security software and capabilities, VersaBank established wholly owned, Washington, DC-based subsidiary, DRT Cyber Inc. to pursue significant large-market opportunities in cyber security and develop innovative solutions to address the rapidly growing volume of cyber threats challenging financial institutions, multi-national corporations and government entities on a daily basis.
VersaBank’s Common Shares trade on the Toronto Stock Exchange (“TSX”) and Nasdaq under the symbol VBNK. Its Series 1 Preferred Shares trade on the TSX under the symbol VBNK.PR.A.
Forward-Looking Statements
VersaBank’s public communications often include written or oral forward-looking statements. Statements of this type are included in this document and may be included in other filings and with Canadian securities regulators or the US Securities and Exchange Commission, or in other communications. All such statements are made pursuant to the “safe harbor” provisions of, and are intended to be forward-looking statements under, the United States Private Securities Litigation Reform Act of 1995 and any applicable Canadian securities legislation. The statements in this management’s discussion and analysis that relate to the future are forward-looking statements. By their very nature, forward-looking statements involve inherent risks and uncertainties, both general and specific, many of which are out of VersaBank’s control. Risks exist that predictions, forecasts, projections, and other forward-looking statements will not be achieved. Readers are cautioned not to place undue reliance on these forward-looking statements as a number of important factors could cause actual results to differ materially from the plans, objectives, expectations, estimates and intentions expressed in such forward-looking statements. These factors include, but are not limited to, the strength of the Canadian and US economy in general and the strength of the local economies within Canada and the US in which VersaBank conducts operations; the effects of changes in monetary and fiscal policy, including changes in interest rate policies of the Bank of Canada and the US Federal Reserve; global commodity prices; the effects of competition in the markets in which VersaBank operates; inflation; capital market fluctuations; the timely development and introduction of new products in receptive markets; the impact of changes in the laws and regulations pertaining to financial services; changes in tax laws; technological changes; unexpected judicial or regulatory proceedings; unexpected changes in consumer spending and savings habits; the impact of wars or conflicts including the crisis in Ukraine and the impact of the crisis on global supply chains and markets; the impact of potential new variants of COVID-19; the possible effects on our business of terrorist activities; natural disasters and disruptions to public infrastructure, such as transportation, communications, power or water supply; and VersaBank’s anticipation of and success in managing the risks implicated by the foregoing. For a detailed discussion of certain key factors that may affect VersaBank’s future results, please see VersaBank’s annual MD&A for the year ended October 31, 2022.
The foregoing list of important factors is not exhaustive. When relying on forward-looking statements to make decisions, investors and others should carefully consider the foregoing factors and other uncertainties and potential events. The forward-looking information contained in the management’s discussion and analysis is presented to assist VersaBank shareholders and others in understanding VersaBank’s financial position and may not be appropriate for any other purposes. Except as required by securities law, VersaBank does not undertake to update any forward-looking statement that is contained in this management’s discussion and analysis or made from time to time by VersaBank or on its behalf.
Conference Call
VersaBank will be hosting a conference call and webcast today, Wednesday, August 30, 2023, at 9:00 a.m. (EDT) to discuss its third quarter results, featuring a presentation by David Taylor, President & CEO, and other VersaBank executives, followed by a question and answer period.
Dial-in Details
| Toll-free dial-in number: | 1 (888) 664-6392 (Canada/US) |
| Local dial-in number: | (416) 764-8659 |
Please call between 8:45 a.m. and 8:55 a.m. (EDT).
To join the conference call by telephone without operator assistance, you may register and enter your phone number in advance at https://emportal.ink/3rLc7HG to receive an instant automated call back.
Webcast Access: For those preferring to listen to the conference call via the Internet, a webcast of Mr. Taylor’s presentation will be available via the internet, accessible here https://app.webinar.net/X4D8Z7Pa7pq or from the Bank’s web site.
Instant Replay
| Toll-free dial-in number: | 1 (888) 390-0541 (Canada/US) |
| Local dial-in number: | (416) 764-8677 |
| Passcode: | 344926# |
| Expiry Date: | September 30th, 2023, at 11:59 p.m. (EDT) |
The archived webcast presentation will also be available via the Internet for 90 days following the live event at https://app.webinar.net/X4D8Z7Pa7pq and on the Bank’s web site.
FOR FURTHER INFORMATION, PLEASE CONTACT:
|
LodeRock Advisors Lawrence Chamberlain (416) 519-4196 lawrence.chamberlain@loderockadvisors.com |
Visit our website at: www.versabank.com
Follow VersaBank on Facebook, Instagram, LinkedIn and X (formerly Twitter)
Exhibit 99.4

For Immediate Release: August 30, 2023
Attention: Business Editors
VERSABANK DECLARES DIVIDENDS
LONDON, ON/CNW - VersaBank (the “Bank”) (TSX: VBNK; NASDAQ: VBNK) today announced that cash dividends in the amount of CAD $0.025 per Common Share of the Bank and CAD $0.1693 per Series 1 Preferred Share of the Bank, have been declared for the quarter ending October 31, 2023, payable as of October 31, 2023, to shareholders of record at the close of business on October 6, 2023.
The dividends to which this notice relates are eligible dividends for tax purposes.
About VersaBank
VersaBank is a Canadian Schedule I chartered (federally licensed) bank with a difference. VersaBank became the world’s first fully digital financial institution when it adopted its highly efficient business-to-business model in 1993 using its proprietary state-of-the-art financial technology to profitably address underserved segments of the Canadian banking market in the pursuit of superior net interest margins while mitigating risk. VersaBank obtains all of its deposits and provides the majority of its loans and leases electronically, with innovative deposit and lending solutions for financial intermediaries that allow them to excel in their core businesses. In addition, leveraging its internally developed IT security software and capabilities, VersaBank established wholly owned, Washington, DC-based subsidiary, DRT Cyber Inc. to safeguard its digital infrastructure and to pursue significant large-market opportunities in cyber security and develop innovative solutions to address the rapidly growing volume of cyber threats challenging financial institutions, multi-national corporations and government entities on a daily basis.
VersaBank’s Common Shares trade on the Toronto Stock Exchange (“TSX”) and Nasdaq under the symbol VBNK. Its Series 1 Preferred Shares trade on the TSX under the symbol VBNK.PR.A.
FOR FURTHER INFORMATION, PLEASE CONTACT:
LodeRock Advisors
Lawrence Chamberlain
(416) 519-4196
lawrence.chamberlain@loderockadvisors.com
Visit our website at: www.versabank.com
Follow VersaBank on Facebook, Instagram, LinkedIn and X (formerly Twitter)
Exhibit 99.5

FORM 52-109F2
CERTIFICATION OF INTERIM FILINGS
FULL CERTIFICATE
I, David R. Taylor, President & Chief Executive Officer of VersaBank, certify the following:
|
1. |
Review: I have reviewed the interim financial statements and interim MD&A (together, the “interim filings”) of VersaBank (the “issuer”) for the interim period ended July 31, 2023. |
|
2. |
No misrepresentations: Based on my knowledge, having exercised reasonable diligence, the interim filings do not contain any untrue statement of a material fact or omit to state a material fact required to be stated or that is necessary to make a statement not misleading in light of the circumstances under which it was made, with respect to the period covered by the interim filings. |
|
3. |
Fair presentation: Based on my knowledge, having exercised reasonable diligence, the interim financial statements together with the other financial information included in the interim filings fairly present in all material respects the financial condition, financial performance and cash flows of the issuer, as of the date of and for the periods presented in the interim filings. |
|
4. |
Responsibility: The issuer’s other certifying officer(s) and I are responsible for establishing and maintaining disclosure controls and procedures (DC&P) and internal control over financial reporting (ICFR), as those terms are defined in National Instrument 52-109 Certification of Disclosure in Issuers’ Annual and Interim Filings, for the issuer. |
|
5. |
Design: Subject to the limitations, if any, described in paragraphs 5.2 and 5.3, the issuer’s other certifying officer(s) and I have, as at the end of the period covered by the interim filings |
|
(a) |
designed DC&P, or caused it to be designed under our supervision, to provide reasonable assurance that |
|
(i) |
material information relating to the issuer is made known to us by others, particularly during the period in which the interim filings are being prepared; and |
|
(ii) |
information required to be disclosed by the issuer in its annual filings, interim filings or other reports filed or submitted by it under securities legislation is recorded, processed, summarized and reported within the time periods specified in securities legislation; and |
|
(b) |
designed ICFR, or caused it to be designed under our supervision, to provide reasonable assurance regarding the reliability of financial reporting and the preparation of financial statements for external purposes in accordance with the issuer’s GAAP. |
|
5.1 |
Control framework: The control framework the issuer’s other certifying officer(s) and I used to design the issuer’s ICFR is Internal Control – Integrated Framework, issued by the Committee of Sponsoring Organizations of the Treadway Commission. |
|
5.2 |
N/A |
|
5.3 |
N/A |
|
6. |
Reporting changes in ICFR: The issuer has disclosed in its interim MD&A any change in the issuer’s ICFR that occurred during the period beginning on May 1, 2023 and ended on July 31, 2023 that has materially affected, or is reasonably likely to materially affect, the issuer’s ICFR. |
Date: August 30, 2023
/s/ David R. Taylor
___________________
David R. Taylor
President &
Chief Executive Officer
Exhibit 99.6
FORM 52-109F2
CERTIFICATION OF INTERIM FILINGS
FULL CERTIFICATE
I, Shawn Clarke, Chief Financial Officer of VersaBank, certify the following:
|
1. |
Review: I have reviewed the interim financial statements and interim MD&A (together, the “interim filings”) of VersaBank (the “issuer”) for the interim period ended July 31, 2023. |
|
2. |
No misrepresentations: Based on my knowledge, having exercised reasonable diligence, the interim filings do not contain any untrue statement of a material fact or omit to state a material fact required to be stated or that is necessary to make a statement not misleading in light of the circumstances under which it was made, with respect to the period covered by the interim filings. |
|
3. |
Fair presentation: Based on my knowledge, having exercised reasonable diligence, the interim financial statements together with the other financial information included in the interim filings fairly present in all material respects the financial condition, financial performance and cash flows of the issuer, as of the date of and for the periods presented in the interim filings. |
|
4. |
Responsibility: The issuer’s other certifying officer(s) and I are responsible for establishing and maintaining disclosure controls and procedures (DC&P) and internal control over financial reporting (ICFR), as those terms are defined in National Instrument 52-109 Certification of Disclosure in Issuers’ Annual and Interim Filings, for the issuer. |
|
5. |
Design: Subject to the limitations, if any, described in paragraphs 5.2 and 5.3, the issuer’s other certifying officer(s) and I have, as at the end of the period covered by the interim filings |
|
(a) |
designed DC&P, or caused it to be designed under our supervision, to provide reasonable assurance that |
|
(i) |
material information relating to the issuer is made known to us by others, particularly during the period in which the interim filings are being prepared; and |
|
(ii) |
information required to be disclosed by the issuer in its annual filings, interim filings or other reports filed or submitted by it under securities legislation is recorded, processed, summarized and reported within the time periods specified in securities legislation; and |
|
(b) |
designed ICFR, or caused it to be designed under our supervision, to provide reasonable assurance regarding the reliability of financial reporting and the preparation of financial statements for external purposes in accordance with the issuer’s GAAP. |
|
5.1 |
Control framework: The control framework the issuer’s other certifying officer(s) and I used to design the issuer’s ICFR is Internal Control – Integrated Framework, issued by the Committee of Sponsoring Organizations of the Treadway Commission. |
|
5.2 |
N/A |
|
5.3 |
N/A |
|
6. |
Reporting changes in ICFR: The issuer has disclosed in its interim MD&A any change in the issuer’s ICFR that occurred during the period beginning on May 1, 2023 and ended on July 31, 2023 that has materially affected, or is reasonably likely to materially affect, the issuer’s ICFR. |
Date: August 30, 2023
/s/ Shawn Clarke
____________________
Shawn Clarke
Chief Financial Officer