UNITED STATES
SECURITIES AND EXCHANGE COMMISSION
Washington, D.C. 20549
FORM 10-K
(Mark one)
| ☒ |
ANNUAL REPORT PURSUANT TO SECTION 13 OR 15(d) OF THE SECURITIES EXCHANGE ACT OF 1934 |
For the fiscal year ended: March 25, 2023
or
| ☐ |
TRANSITION REPORT PURSUANT TO SECTION 13 OR 15(d) OF THE SECURITIES EXCHANGE ACT OF 1934 |
For the transition period from ______to ______
Commission File Number: 000-03905
TRANSCAT, INC.
(Exact name of registrant as specified in its charter)
| Ohio |
16-0874418 |
|
| (State or other jurisdiction of incorporation or organization) |
(I.R.S. Employer Identification No.) |
35 Vantage Point Drive, Rochester, New York 14624
(Address of principal executive offices) (Zip Code)
(585) 352-7777
(Registrant’s telephone number, including area code)
Securities registered pursuant to Section 12(b) of the Act:
| Title of each class |
Trading Symbol |
Name of each exchange on which registered |
||
| Common Stock, $0.50 par value |
TRNS |
Nasdaq Global Market |
Securities registered pursuant to Section 12(g) of the Act:
None
Indicate by check mark if the registrant is a well-known seasoned issuer, as defined in Rule 405 of the Securities Act. Yes ☐ No ☒
Indicate by check mark if the registrant is not required to file reports pursuant to Section 13 or Section 15(d) of the Act. Yes ☐ No ☒
Indicate by check mark whether the registrant: (1) has filed all reports required to be filed by Section 13 or 15(d) of the Securities Exchange Act of 1934 during the preceding 12 months (or for such shorter period that the registrant was required to file such reports), and (2) has been subject to such filing requirements for the past 90 days. Yes ☒ No ☐
Indicate by check mark whether the registrant has submitted electronically every Interactive Data File required to be submitted pursuant to Rule 405 of Regulation S-T (§232.405 of this chapter) during the preceding 12 months (or for such shorter period that the registrant was required to submit such files). Yes ☒ No ☐
Indicate by check mark whether the registrant is a large accelerated filer, an accelerated filer, a non-accelerated filer, a smaller reporting company or an emerging growth company. See the definitions of “large accelerated filer,” “accelerated filer,” “smaller reporting company” and “emerging growth company” in Rule 12b-2 of the Exchange Act.
| Large accelerated filer ☐ |
Accelerated filer ☒ |
| Non-accelerated filer ☐ |
Smaller reporting company ☐ |
| Emerging growth company ☐ |
If an emerging growth company, indicate by check mark if the registrant has elected not to use the extended transition period for complying with any new or revised financial accounting standards provided pursuant to Section 13(a) of the Exchange Act. ☐
Indicate by check mark whether the registrant has filed a report on and attestation to its management’s assessment of the effectiveness of its internal control over financial reporting under Section 404(b) of the Sarbanes-Oxley Act (15 U.S.C. 7262(b)) by the registered public accounting firm that prepared or issued its audit report. ☒
If securities are registered pursuant to Section 12(b) of the Act, indicate by check mark whether the financial statements of the registrant included in the filing reflect the correction of an error to previously issued financial statements. ☐
Indicate by check mark whether any of those error corrections are restatements that required a recovery analysis of incentive-based compensation received by any of the registrant’s executive officers during the relevant recovery period pursuant to §240.10D-1(b). ☐
Indicate by check mark whether the registrant is a shell company (as defined in Rule 12b-2 of the Act). Yes ☐ No ☒
The aggregate market value of the voting and non-voting common equity held by non-affiliates of the registrant on September 23, 2022 (the last business day of the registrant’s most recently completed second fiscal quarter) was approximately $488.1 million. The market value calculation was determined using the closing sale price of the registrant’s common stock on September 23, 2022, as reported on the Nasdaq Global Market.
The number of shares of common stock of the registrant outstanding as of June 1, 2023 was 7,642,916.
DOCUMENTS INCORPORATED BY REFERENCE
Portions of the registrant’s definitive proxy statement relating to the Annual Meeting of Shareholders to be held on September 6, 2023 have been incorporated by reference into Part III, Items 10, 11, 12, 13 and 14 of this report.
CAUTIONARY NOTE REGARDING FORWARD-LOOKING STATEMENTS
Forward-Looking Statements. This report contains “forward-looking statements” within the meaning of the Private Securities Litigation Reform Act of 1995. Forward-looking statements relate to expectations, estimates, beliefs, assumptions and predictions of future events and are identified by words such as “anticipates,” “believes,” “estimates,” “expects,” “goal,” “seek,” “strategy,” “target,” “intends,” “could,” “may,” “will,” “would,” “tends,” and other similar words. Forward-looking statements are not statements of historical fact and thus are subject to risks, uncertainties and other factors that could cause actual results to differ materially from historical results or those expressed in such forward-looking statements. You should evaluate forward-looking statements in light of important risk factors and uncertainties that may affect our operating and financial results and our ability to achieve our financial objectives. These factors include, but are not limited to, general economic conditions applicable to our business, inflationary impacts, the impact of widespread public health crises, the highly competitive nature of the industries in which we compete and in the nature of our two business segments, the concentration of Service segment customers in the life science and other FDA-regulated and industrial manufacturing industries, the significant competition we face in our Distribution segment, any impairment of our goodwill or intangible assets, tariffs and trade relations, our ability to successfully complete and integrate business acquisitions, cybersecurity risks, the risk of significant disruptions in our information technology systems, our ability to recruit, train and retain quality employees, skilled technicians and senior management, fluctuations in our operating results, our ability to achieve or maintain adequate utilization and pricing rates for our technical service providers, the prices we are able to charge for our services in our Service segment, competition in the rental market, our ability to adapt our technology, reliance on our enterprise resource planning system, technology updates, supply chain delays or disruptions, the risks related to current and future indebtedness, foreign currency rate fluctuations, risks related to our intellectual property, adverse weather events or other catastrophes or natural disasters, the volatility of our stock price, the relatively low trading volume of our common stock, changes in tax rates, changes in accounting standards, legal requirements and listing standards, and legal and regulatory risks related to our international operations. These risk factors and uncertainties are more fully described by us under the heading “Risk Factors” in Item IA. of Part I of this report. You should not place undue reliance on our forward-looking statements. Except as required by law, we undertake no obligation to update, correct or publicly announce any revisions to any of the forward-looking statements contained in this report, whether as a result of new information, future events or otherwise.
BUSINESS OVERVIEW
Transcat, Inc. (“Transcat”, the “Company,” “we” or “us”) is a leading provider of accredited calibration services, enterprise asset management services, and value-added distributor of professional grade handheld test, measurement and control instrumentation. We are focused on providing services and products to highly regulated industries, particularly the life science industry, which includes pharmaceutical, biotechnology, medical device and other FDA-regulated businesses. Additional industries served include FAA-regulated businesses, including aerospace and defense industrial manufacturing; energy and utilities, including oil and gas and alternative energy; and other industries that require accuracy in their processes, confirmation of the capabilities of their equipment, and for which the risk of failure is very costly.
We conduct our business through two operating segments: service (“Service”) and distribution (“Distribution”). See Note 7 to our Consolidated Financial Statements in this report for financial information for these segments. We concentrate on attracting new customers in each segment, retaining existing customers and cross-selling to customers to increase our total revenue. We serve approximately 30,000 customers through our Service and Distribution segments, with approximately 20% to 25% of those customers transacting with us through both of our business segments.
Through our Service segment, we offer calibration, repair, inspection, analytical qualifications, preventative maintenance, consulting and other related services, a majority of which are processed through our proprietary asset management system, CalTrak® and our online customer portal, C3®. Our Service model is flexible, and we cater to our customers’ needs by offering a variety of services and solutions including permanent and periodic onsite services, mobile calibration services, pickup and delivery and in-house services. As of the end of our fiscal year ended March 25, 2023 (“fiscal year 2023”), we operated twenty-seven calibration service centers (“Calibration Service Centers”) strategically located across the United States, Puerto Rico, Canada and Ireland. We also serve our customers onsite at their facilities for daily, weekly or longer-term periods. In addition, we have several imbedded customer-site locations that we refer to as “client-based labs,” where we provide calibration services, and in some cases other related services, exclusively for the customer and where we reside and work every day. We also have a fleet of mobile calibration laboratories that can provide service at customer sites which may not have the space or utility capabilities we require to service their equipment.
Through the Company’s acquisition strategy, we have been focused on building out our Services segment by entering adjacent and complimentary markets. This has been demonstrated by the acquisitions of Elite Calibration, LLC ("Elite"), Galium Limited (d/b/a Complete Calibrations) ("Complete Calibrations"), e2b Calibration ("e2b"), and Charlton Jeffmont Inc., Raitz Inc. and Toolroom Calibration Inc. d/b/a Alliance Calibration ("Alliance") in fiscal year 2023, and the acquisitions of Tangent Labs, LLC ("Tangent"), Cal OpEx Limited (d/b/a Transcat Ireland) which owns all of the issued and outstanding capital stock of its U.S. based subsidiary, Cal OpEx Inc. (d/b/a NEXA EAM), a Delaware corporation (collectively, "NEXA"), and Upstate Metrology Inc. ("Upstate Metrology") in our fiscal year ended March 26, 2022 ("fiscal year 2022").
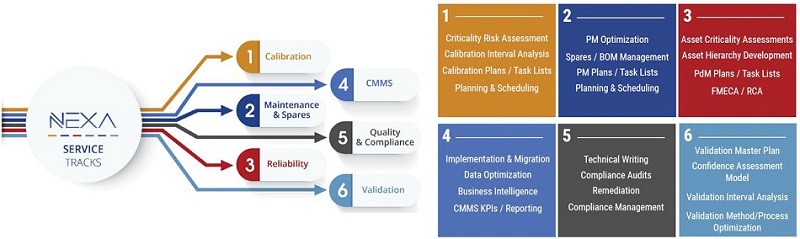
NEXA provides asset management services to the biopharmaceutical industry by leveraging its six service tracks: (i) calibration, (ii) maintenance and spare, (iii) reliability, (iv) computerized maintenance management systems solutions (“CMMS”), (v) quality and compliance, and (vi) validation. By delivering these services, NEXA is able to provide unique value to their end customers in managing their asset portfolios, avoiding asset downtime and helping to accelerate delivery of their life changing products to market, ultimately driving significant cost savings and improved reliability. This NEXA suite of services, combined with the existing Transcat service offerings, provides a very comprehensive and robust value proposition to existing and new customers, which allows us to manage the complexity that is tied to doing business in these highly regulated industries.
All of our Calibration Service Centers have obtained ISO/IEC 17025:2017 scopes of accreditation. Our accreditations are the cornerstone of our quality program, which we believe is among the best in the industry. Our dedication to quality is highly valued by businesses that operate in the industries we serve, particularly those in life science and other regulated industries, and our accreditations provide our customers with confidence that they will receive a consistent and uniform service, regardless of which of our service centers completes the service.
Through our Distribution segment, we sell and rent national and proprietary brand instruments to customers globally. Through our website, in-house sales team and printed and digital marketing materials, we offer access to more than 140,000 test, measurement and control instruments, including products from approximately 550 leading brands. Most instruments we sell and rent require calibration service to ensure that they maintain the most precise measurements. By having the capability to calibrate these instruments at the time of sale and at regular post-sale intervals, we can give customers a value-added service that most of our competitors are unable to provide. Calibrating before shipping means the customer can place their instruments into service immediately upon receipt, reducing downtime. Other value-added options we offer through our Distribution segment include equipment kitting (which is especially valued in the power generation sector), equipment rentals and used equipment sales.
Our commitment to quality goes beyond the services and products we deliver. Our sales, customer service and support teams provide expert advice, application assistance and technical support to our customers. Since calibration is an intangible service, our customers rely on us to uphold high standards and provide integrity in our people and processes.
Our customers include leading manufacturers in the life science/pharmaceutical, energy, defense, aerospace and industrial process control sectors. We believe our customers do business with us because of our integrity and commitment to quality service, our broad range of product and service offerings, our proprietary asset management system, CalTrak®, and our online customer portal, C3®. In our fiscal years 2023 and 2022, no customer or controlled group of customers accounted for 5% or more of our total revenue. The loss of any single customer would not have a material adverse effect on our business, cash flows, balance sheet, or results of operations.
Transcat was incorporated in Ohio in 1964. We are headquartered in Rochester, New York. Our executive offices are located at 35 Vantage Point Drive, Rochester, New York 14624. Our telephone number is 585-352-7777. Our website is www.transcat.com. Information available on our website is not a part of, and is not incorporated into, this Annual Report on Form 10-K. We trade on the Nasdaq Global Market under the ticker symbol “TRNS”.
OUR STRATEGY
Our two operating segments are highly complementary in that their offerings are of value to customers within the same industries. Our strategy is to leverage the complementary nature of our operating segments in ways that add value for all customers who select Transcat as their source for test and measurement equipment and/or calibration and laboratory instrument services. We strive to differentiate ourselves within the markets we serve and build barriers to competitive entry by offering a broad range of products and services and by integrating these solutions in a value-added manner to benefit our customers’ operations.
During fiscal year 2023, we continued our commitment to capital, people and leadership investments, advancing our “Operational Excellence” initiative. This initiative is resulting in increased productivity and operational efficiency and further differentiation from our competitors as we leverage technology, automation, and process improvements to enhance our effectiveness and our customers’ experiences. We also continued Transcat University’s build-a-tech program. This program attracts fresh talent to the organization and provides training and career advancement opportunities for our existing employees. Our Operational Excellence initiative is a multi-year, ever-evolving program designed to create an infrastructure that supports our strategic goals over a longer timeframe.
Within the Service segment, our strategy is to drive double-digit revenue growth through both organic expansion and acquisitions. We have adopted an integrated sales model to drive sales and capitalize on the cross-selling opportunities between our two segments, especially leveraging our Distribution relationships to develop new Service relationships. We leverage these relationships with our unique value proposition which resonates strongly with customers who rely on accredited calibration services and/or laboratory instrument services to maintain the integrity of their processes and/or meet the demands of regulated business environments. Our customer base values our superior quality programs and requires precise measurement capability in their processes to minimize risk, waste and defects. We execute this strategy by leveraging our quality programs, metrology expertise, geographical footprint, qualified technicians, breadth of capabilities, and tailored service delivery options. Together, this allows us to meet the most rigorous quality demands of our most highly regulated customers while simultaneously being nimble enough to meet their business needs.
We expect to continue to grow our Service business organically by taking market share from other third-party providers and original equipment manufacturers (“OEMs”), as well as by targeting the outsourcing of in-house calibration labs as multi-year client-based lab contracts. We believe an important element in taking market share is our ability to expand into new technical capabilities and adjacent service solutions that are in demand by our current and target customer base.
The other component to our Service growth strategy is acquisitions. There are three drivers of our acquisition strategy: geographic expansion, increased capabilities and infrastructure leverage. The majority of our acquisition opportunities have been in the $500 thousand to $10 million annual revenue range, and we are disciplined in our approach to selecting target companies. One focus of our Operational Excellence initiative is to strengthen our acquisition integration process, allowing us to capitalize on acquired sales and cost synergies at a faster pace.
Our Distribution segment strategy is to be the premier distributor and rental source of leading test and measurement equipment while also providing cross-selling opportunities for our Service segment. Through our vendor relationships we have access to more than 140,000 products, which we market to our existing and prospective customers both with and without value-added service options that are unique to Transcat. In addition to offering pre-shipment value-added services, we offer our customers the options of renting selected test and measurement equipment or buying used equipment, furthering our ability to answer all of our customers’ test and measurement equipment needs. We continuously evaluate our offerings to add new in-demand vendors or products, or remove less relevant vendors and products. Our equipment rental business continues to be a strong growth segment for us and helps support our distribution and service segment growth strategies. Having new, used and rental equipment further differentiates us from our Service segment competitors.
We see these various methods of meeting our Distribution customers’ needs as a way to differentiate ourselves and to diversify this segment’s customer base from its historically niche market. This differentiation and diversification strategy has been deliberately instituted in recent years as a means to mitigate the effect of price-driven competition and to lessen the impact that any particular industry or market will have on the overall performance of this segment.
As part of our growth strategy, we completed four acquisitions during our fiscal year 2023 and three acquisitions during our fiscal year 2022:
| ● | Effective February 2, 2023, Transcat acquired substantially all of the assets of Elite, a California based provider of pipette calibration services. | |
| ● |
Effective September 28, 2022, Transcat purchased all of the outstanding capital stock of Complete Calibrations, an Irish company. Complete Calibrations is an ISO 17025 accredited calibration company specializing in calibration services for the life sciences industry. |
|
| ● | Effective September 27, 2022, Transcat acquired substantially all of the assets of e2b, an Ohio based provider of calibration services. | |
| ● | Effective May 31, 2022, Transcat acquired substantially all of the assets of Alliance, an Ohio based provider of calibration services. | |
| ● |
Effective December 31, 2021, Transcat purchased all of the outstanding membership units of Tangent, a privately-held company. Tangent provides in-house and on-site calibrations of precision measurement and control instrumentation to customers in the life science, aerospace and other regulated industries, and has lab locations in Indianapolis, Indiana and Huntsville, Alabama. |
| ● |
Effective August 31, 2021, Transcat purchased all of the outstanding capital stock of NEXA. NEXA provides calibration optimization and other technical solutions to improve asset and reliability management programs to pharmaceutical, biotechnology, and medical device companies worldwide. |
| ● |
Effective April 29, 2021, Transcat acquired substantially all of the assets of Upstate Metrology, a New York based provider of calibration services. |
Our acquisition strategy primarily targets service businesses that expand our geographic reach, increase the depth and/or breadth of our service capabilities and expertise and leverage our infrastructure. The table below illustrates the strategic drivers for the acquisitions described above:
| Geographic |
Increased |
Leveraged |
|
| Elite | ✓ | ||
| Complete Calibrations | ✓ | ✓ | |
| e2b | ✓ | ✓ | |
| Alliance | ✓ | ✓ | |
| Tangent |
✓ |
✓ |
|
| NEXA |
✓ |
✓ |
|
| Upstate Metrology |
✓ |
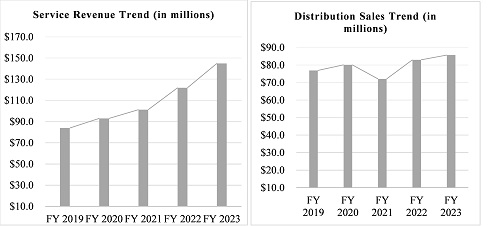
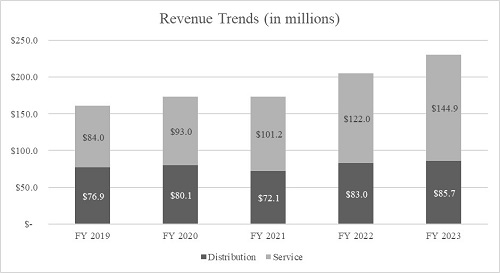
We believe our combined Service and Distribution segment offerings, experience, technical expertise and integrity create a unique and compelling value proposition for our customers, and we intend to continue to grow our business through organic revenue growth and business acquisitions. We consider the attributes of our Service segment, which include higher gross margins and recurring revenue streams from customers in regulated industries to be more compelling and scalable than our legacy Distribution segment. For this reason, we expect our Service segment to be the primary source of revenue and earnings growth in future fiscal years. The charts below illustrate Service, Distribution and consolidated revenue over the past five years:
SEGMENTS
Service Segment
Calibration. Calibration is the act of comparing a unit or instrument of unknown value to a standard of known value and reporting the result in some specifically defined form. After the calibration has been completed, a decision is made, based on rigorously defined parameters, regarding what, if anything, should be done to the unit to conform to the required standards or specifications. The decision may be to adjust, optimize or repair a unit; limit the use, range or rating of a unit; scrap the unit; or leave the unit as is. The purpose of calibration is to significantly reduce the risk of product or process failures caused by inaccurate measurements. In addition to its being an element of quality control and risk management, calibration improves an operation’s productivity and efficiency to optimal levels by assuring accurate, reliable instruments and processes.
The need for calibration is often driven by regulation, which identifies a requirement for quality calibration and laboratory instrument services as a critical component of a company’s business operation. We specifically target industries and companies that are regulated by the U.S. FDA, FAA or other regulatory bodies. As a result of the various levels of regulation within our target industries, our customers’ calibration and laboratory instrument service sourcing decisions are generally made based on the provider’s quality systems, accreditation, reliability, trust, customer service and documentation of services. To maintain our competitive position in this segment, we maintain internationally recognized third-party accredited quality systems, further detailed in the section entitled “Service Quality” below, and provide our customers with access to proprietary asset management software solutions, which offer tools to manage their internal calibration programs and provide them with visibility to their service records.
Through our Service segment, we perform recurring periodic calibrations (typically ranging from three-month to twenty-four month intervals) on new and customer-owned instruments. We perform approximately 800,000 calibrations annually and can address a significant majority of the items requested to be calibrated with our in-house capabilities. For customers’ calibration needs in less common and highly specialized disciplines, we subcontract some calibrations to third-party vendors that have unique or proprietary capabilities. While typically representing approximately 13% to 15% of our Service segment revenue, we believe the management of these items is highly valued by our customers and providing this service has enabled us to continue our pursuit of having the broadest calibration offerings in these targeted markets. We regularly review outsourced services to identify opportunities for in-house capability expansion.
Continuous Improvement. Through NEXA we provide technical, consulting, and staffing solutions in the US, Canada, Ireland, Europe, and Asia Pacific to improve asset management programs for our most highly-regulated customers, especially those in the pharmaceutical, biotechnology, and medical device industries. NEXA offers six service tracks that support the creation or optimization of our client’s enterprise asset management program. Whether a facility is in preconstruction, operational or decommissioning stage, NEXA’s experienced teams can deliver results in all phases of the asset lifecycle. NEXA’s full suite of services or combination solutions are customizable to meet our customer’s unique needs.
Other Services. We provide other services to our customers such as inspection, repair and consulting services, which appeal to customers across all sectors in our customer base. These are generally value-added services and allow us to provide “one-stop shopping” for our customers.
Service Value Proposition. Our calibration services strategy encompasses multiple ways to manage a customer’s calibration and laboratory instrument service needs:
| ● |
We offer an “Integrated Calibration Service Solution” that provides a complete wrap-around service, which can be delivered in the following ways: |
| ● |
in-house services: services are performed at one of our twenty-seven Calibration Service Centers (often accompanied by pick-up and delivery services); |
|
| ● |
periodic onsite services: Transcat technicians travel to a customer’s location, including aboard vessels docked at shipyards, and provide bench-top or in-line calibration or laboratory services on predetermined service cycles; |
|
| ● |
client-based-laboratory services: Transcat establishes and manages a calibration service program within a customer’s facility; and |
|
| ● |
mobile calibration services: services are completed on a customer’s property within one of our mobile calibration units. |
| ● |
For companies that maintain an internal calibration operation, we can provide: |
| ● |
calibration of their primary calibration assets, also called “standards”; and |
|
| ● |
overflow capability, either onsite or at one of our Calibration Service Centers, during periods of high demand. |
| ● |
Enterprise Asset Management |
| ● |
Calibration – criticality risk assessment; calibration interval analysis; calibration plans/task lists; planning and scheduling. |
|
| ● |
Maintenance and Spares – PM optimization; spares/BOM management; PM plans/task lists; planning and scheduling. |
|
| ● |
Reliability – asset criticality assessments; asset hierarchy development; PdM plans/task lists; FMECA/RCA. |
|
| ● |
CMMS – implementation and migration; data optimization; business intelligence; CMMS KPIs/reporting. |
|
| ● |
Quality and Compliance – technical writing; compliance audits; remediation; compliance management. |
|
| ● |
Validation – validation master plan; confidence assessment model; validation interval analysis; validation method/process optimization. |
Inclusive with all the above services, we provide total program management including logistics, remediation and consultation services when needed.
We strive to provide the broadest accredited calibration offering to our targeted markets, which includes certification of our technicians pursuant to the American Society for Quality standards, complete calibration management encompassing the entire metrology function, and access to our complementary service and product offerings. We believe our calibration services are of the highest technical and quality levels, with broad ranges of accreditation.
Our compliance services strategy is to identify and establish long-term relationships with life science research and development and manufacturing customers who require analytical qualifications, validation, remediation and/or preventative maintenance services. In most cases, these customers are life science companies, including pharmaceutical and biotechnology companies engaged in research and development and manufacturing, which are subject to extensive government regulation. The services we provide to these regulated customers are typically a critical component of the customer’s overall compliance program. Because many laboratory instrument service customers operate in regulated industries, these same customers typically also require accredited calibration services. This requirement allows a natural synergy between our laboratory instrument and calibration services. Our strategy includes cross-selling our services within our customer accounts to maximize our revenue opportunities with each customer.
Proprietary Asset Management Software. CalTrak® is our proprietary documentation and asset management software which is used to integrate and manage both the workflow of our Calibration Service Centers and our customers’ assets. With CalTrak®, we are able to provide our customers with timely and consistent calibration service while optimizing our own efficiencies. CalTrak® has been validated to U.S. federal regulations 21 CFR Part 820.75 and 21 CFR Part 11, as applicable. This validation is important to pharmaceutical and other FDA-regulated industries where federal regulations can be particularly stringent.
Additionally, C3® provides our customers with web-based asset management capability and a safe and secure off-site archive of calibration and other service records that can be accessed 24 hours a day through our secure password-protected website. C3® stands for Compliance, Control and Cost, and we see these as the major areas of focus for our clients within the regulatory environment as it relates to instrument calibration. We specifically designed C3® to assist our customers in increasing efficiency, driving compliance to quality system and enhancing control of instrumentation, all while bringing their overall metrology costs down. Understanding the regulated environments that our clients operate within, we customized the platform to allow for single system of record utilization via capabilities that allow clients to track and manage instruments maintained internally in addition to instruments supported by Transcat. C3® is validated to 21 CFR Part 820.75 and 21 CFR Part 11 to meet stringent FDA requirements.
Through CalTrak® and C3®, each customer calibration is tracked and automatically cross-referenced to the assets used to perform the calibration, providing traceability.
Service Marketing and Sales. Under our integrated sales model, we have both inside and outside sales teams that seek to acquire new customers in our targeted markets by leveraging our unique value proposition, including our broad geographic footprint and comprehensive suite of services. We target regulated, enterprise customers with multiple manufacturing operations throughout North America and Europe. We leverage our ability to manage the complete life cycle of instrumentation from purchase of calibrated equipment to long-term service and maintenance requirements. Connecting all the dots by using new and used product sales, rentals, and repair and calibration services is the goal of our marketing and sales initiatives. We also have a team of customer success managers focused on delivering ever-increasing value for our existing customers. We utilize print media, trade shows and web-based initiatives to market our services to customers and prospective customers with a strategic focus in the highly regulated industries including life science and other FDA-regulated industries, aerospace and defense, energy and utilities, and chemical manufacturing. We also target industrial manufacturing and other industries that appreciate the value of quality calibrations.
Service Competition. The calibration services industry is highly fragmented and is composed of companies ranging from internationally recognized and accredited OEMs to non-accredited sole proprietors as well as companies that perform their own calibrations in-house, resulting in a tremendous range of service levels and capabilities. A large percentage of calibration companies are small businesses that generally do not have a range of capabilities as broad as ours. There are also several companies with whom we compete that have national or regional operations.
We differentiate ourselves from our competitors by demonstrating our commitment to quality, expanding upon the largest 17025 scope of accreditation and calibration capabilities of any commercial calibration laboratory that are tailored to the markets we serve, leveraging a geographical footprint that spans North America and Puerto Rico providing a comprehensive suite of services that spans many disciplines and hundreds of manufacturers which is not limited to certain product lines or brands. Our unique ability to bundle our products with our compliance and calibration services also provides a high level of differentiation from our competitors. As one of the only North American compliance and calibration service providers who also distributes product, our customers can seamlessly replace instruments that cannot be calibrated or are otherwise deemed to be at end of life. Our close knowledge of the products we distribute also allows our service staff to consult and advise customers on what products are best suited for their in-house calibration needs. We also believe that our proprietary software is a key differentiator from our competitors. CalTrak® and C3® are utilized by our customers in an integrated manner, providing a competitive barrier as customers realize synergies and efficiencies as a result of this integration.
Competition for laboratory instrument services is composed of both small local and regional service providers and large multi-national OEMs. We believe we are generally financially stronger, service a larger customer base and are typically able to offer a larger suite of services than many of the small local and regional competitors. The large OEMs may offer specialized services and brand-specific expertise which we do not offer, but they are generally focused on providing specialized services only for their proprietary brands and product lines, rather than servicing an array of brands and product lines as we do. We believe our competitive advantages in the laboratory instrument services market are our financial and technical resources, turnaround time, and flexibility to react quickly to customers’ needs. The breadth of our suite of laboratory instrument service, combined with our calibration service offerings, also differentiates us from our competitors by allowing us to be our customers’ one-source accredited services provider for their entire calibration and compliance programs.
Service Quality. The accreditation process is the only system currently in existence that validates measurement competence. To ensure that the quality and consistency of our calibrations are consistent with the global metrology network, designed to standardize measurements worldwide, we have sought and achieved international levels of quality and accreditation to provide uniformity across all locations with advanced levels of training for our technical staff. Our Calibration Service Centers are accredited to ISO/IEC 17025:2017 by ANSI-ASQ National Accreditation Board (“ANAB”) and other accrediting bodies. These accrediting bodies are International Laboratory Accreditation Cooperation Mutual Recognition Arrangement (“ILAC MRA”) signatories, are proficient in the technical aspects of the chemistry and physics that underlie metrology, and provide an objective, third-party, internationally accepted evaluation of the quality, consistency, and competency of our calibration processes. Accreditation also requires that all measurement standards used for accredited measurements have a fully documented path, known as Metrological Traceability, through the National Institute of Standards and Technology or the National Research Council (the National Measurement Institutes for the United States and Canada, respectively), or to other national or international standards bodies, or to measurable conditions created in our Calibration Service Centers, or accepted fundamental and/or natural physical constants, ratio type of calibration, or by comparison to consensus standards, all inclusive of measurement uncertainties.
The importance of this international oversight to our customers is the assurance that our service documentation will be accepted worldwide, removing one of the barriers to trade that they may experience if using a calibration laboratory provider whose accrediting body is not an ILAC MRA signatory. To provide the widest range of services to our customers in our target markets, our ISO/IEC 17025:2017 accreditations extend across many technical disciplines, including working-level and reference-level capabilities. We believe our scope of accreditation to ISO/IEC 17025:2017 to be the broadest for the industries we serve.
To reinforce our belief in the importance of calibration quality, we are leveraging a branding campaign for our Service segment that is centered around three simple words – “Calibrated by Transcat®”. We believe we have established a strong, differentiated brand that has a deep and meaningful association with quality, compliance and control. We want the phrase “Calibrated by Transcat®” to be synonymous with risk reduction and quality compliance.
Acquired calibration labs might use other quality registration systems. We continually evaluate when to integrate acquired quality systems with the focus on minimizing business disruptions and disruptions to our customers while maintaining our commitment to quality.
Our scopes of accreditation can be found at http://www.transcat.com/calibration-services/accreditation/calibration-lab-certificates.
Distribution Segment
Distribution Summary. We distribute professional grade test, measurement and control instrumentation throughout North America and internationally. Our customers use test and measurement instruments to ensure that their processes, and ultimately their end products, are within specification. Utilization of such diagnostic instrumentation also allows for continuous improvement processes to be in place, increasing the accuracies of their measurements. The industrial test and measurement instrumentation market, in those geographic areas where we predominately operate, has historically been serviced by broad-based national equipment distributors and niche or specialty-focused organizations such as Transcat. We offer value-added services such as calibration/certification of equipment purchases, equipment rentals, used equipment for sale, and equipment kitting.
We believe that a customer chooses a distributor based on a number of different criteria, including product availability, price, ease of doing business, timely delivery and accuracy of orders, consistent product quality, technical competence of the representative serving them and availability of value-added services. The decision to buy is generally made by plant engineers, quality managers, or their purchasing personnel, and products are typically obtained from one or more distributors as replacements, upgrades, or for expansion of manufacturing and research and development facilities. As a result, sales to Distribution customers are somewhat unpredictable and potentially non-recurring. Our online presence, including our website and e-newsletters, master catalog, supplemental mailings, and other sales and marketing activities are designed to create interest and maintain a constant presence in front of our customers to ensure we receive the order when they are ready to purchase.
We provide our customers with value-added services, including technical support, to ensure our customers receive the right product for their application, and more comprehensive instrument suitability studies to customers in regulated industries who are concerned about the technical uncertainties that their testing or in-process instruments may bring to a process. We consider our biggest value-added service for our Distribution customers is the option to have calibration service performed on their new product purchases prior to shipment, allowing them to place newly acquired equipment directly into service upon receipt, saving downtime. We also offer online procurement, credit card payment options, same day shipment of in-stock items, kitted products, the option to rent, training programs and a variety of custom product offerings. Items are regularly added to and deleted from our product offerings on the basis of customer demand, recommendations of suppliers, sales volumes and other factors. Because of the breadth of our product and service offerings, we are often a “one-stop shop” for our customers who gain operational efficiency by dealing with just one distributor for most or all of their test and measurement instrumentation needs.
We continue to focus on higher margin channels such as rentals to bolster profitability in the Distribution segment. To remain competitive, we are focusing on brand consolidation along with inventory investments to support our overall strategy of being a value-added distributor that supports our customers and Service segment. Additional areas of focus include consumable products within the life science market which is intended to offset competitive pressures in our legacy distribution business.
Distribution Marketing and Sales. We market, create demand and sell to our customers through multiple direct sales channels including our website, digital and print advertising, proactive outbound sales and an inbound call center. Our outbound and inbound sales teams are staffed with technically trained personnel who are available to help guide product selection. Our website serves as a sales channel for our products and services, and provides search capability, detailed product information, in-stock availability, selection guides, demo videos and downloadable product specification sheets. We have made investments in our website to implement the latest marketing technologies which allow us to provide an intuitive customer experience, with simple product comparison and quoting, ease at checkout and automated post-order follow-up. We also operate and maintain several industry-specific service websites, obtained through recent acquisitions. For example, the URL www.pipettes.com was obtained in connection with the acquisition of TTE Laboratories, Inc. (now known as pipettes.com). Pipettes.com focuses on selling pipettes, pipette supplies and related services to customers.
We use a multichannel approach to reach our customers and prospective customers including our master catalog, periodic supplemental catalogs, website, e-newsletters, and other direct sales and marketing programs. Our digital marketing strategy includes ongoing investment in search engine optimization, application-specific digital content, pay-per-click search engine advertising, and product listings on online marketplaces such as Amazon and Google Shopping. We continue to invest in back-end technologies designed to provide a seamless customer experience across all our marketing channels.
As a result of strong relationships with our product vendors and our historical marketing program results, we have the opportunity to carry out co-branded marketing initiatives, aimed at our existing customers and our prospective customer base, for which we receive cooperative advertising support. These co-branded marketing initiatives typically feature specific vendors, new products or targeted product categories and take the form of direct mailers, web-based initiatives or outbound sales efforts.
Distribution Competition. The distribution market for industrial test and measurement instrumentation is fragmented and highly competitive. Our competitors range from large national distributors and manufacturers that sell directly to customers to small local distributors and online distributors. Key competitive factors typically include customer service and support, quality, lead time, inventory availability, brand recognition and price. To address our customers’ needs for technical support and product application assistance, we employ a staff of highly trained technical sales specialists. In order to maintain this competitive advantage, technical training is an integral part of developing our sales staff. To differentiate ourselves from competitors, we offer pre-shipment calibration or performance data reports which allow customers to receive our products and immediately place them into service, saving them downtime and money.
Online distributors, including Amazon which typically sells lower price-point products, have become prominent competitors for sales of handheld test and measurement equipment, competing primarily on price. While online competitors lack the value-added services we offer in our Distribution segment, they have been successful in capturing some market share in the worldwide market for test and measurement instruments. To stay ahead of growing competition from these online distributors and in keeping with the general trend of increased use of e-commerce, we continue to invest in our digital platform including a well-indexed website with improved design and functionality. In addition, we have diversified our offerings by expanding the brands and product lines that we offer and adding higher gross margin equipment rentals and used equipment sales, which we believe makes Transcat unique among our competitors.
Distribution Suppliers and Purchasing. We believe that effective purchasing is a key element to maintaining and enhancing our position as a provider of high-quality test and measurement instruments. We frequently evaluate our purchase requirements and suppliers’ offerings to obtain products at the best possible cost. We obtain our products from approximately 550 suppliers of brand name and private-labeled equipment. In fiscal year 2023, our top 10 vendors accounted for approximately 60% of our aggregate Distribution sales. In fiscal year 2023, lead times for the supply of products from our vendors was still challenging as the backlog increased year-over-year.
We plan our product mix and inventory stock to best serve the anticipated needs of our customers, whose individual purchases vary in size. We can usually ship our top selling products to our customers the same day they are ordered.
Distribution Vendor Rebates. We have agreements with certain product vendors that provide for rebates based on meeting a specified cumulative level of purchases and/or incremental distribution sales. These rebates are recorded as a reduction of cost of distribution sales. Purchase rebates are calculated and recorded quarterly based upon our volume of purchases with specific vendors during the quarter. Point of sale rebate programs that are based on year-over-year sales performance on a calendar year basis are recorded as earned, on a quarterly basis, based upon the estimated level of annual achievement. Point of sale rebate programs that are based on year-over-year sales performance on a quarterly basis are recorded as earned in the respective quarter. During fiscal year 2022, the volume of our Distribution sales resulted in an increase in the rebates earned from our vendors. During fiscal year 2023, we saw a decrease in the rebates offered by our vendors. The Company recorded vendor rebates of $0.6 million and $1.0 million in fiscal years 2023 and 2022, respectively, as a reduction of cost of distribution sales.
Distribution Operations. Our Distribution operations primarily take place at our 48,500 square-foot facility in Rochester, New York which includes 17,000 square feet of warehouse space. The Rochester location also serves as our corporate headquarters, houses our customer service, sales and administrative functions, and is a Calibration Service Center. We also have two smaller warehouse facilities. Our Wisconsin warehouse fulfills orders for certain large industrial scales and our Houston, Texas warehouse fulfills orders for used equipment and rental equipment. In fiscal year 2023, we shipped approximately 30,000 product orders.
Distribution Backlog. Distribution orders include orders for instruments that we routinely stock in our inventory, customized products, and other products ordered less frequently, which we do not stock. Pending product shipments are primarily backorders, but also include products that are requested to be calibrated in one of our Calibration Service Centers prior to shipment, orders required by the customer to be shipped complete or at a future date, and other orders awaiting final credit or management review prior to shipment. Our total backlog was $8.1 million and $7.7 million as of March 25, 2023 and March 26, 2022, respectively.
CUSTOMER SERVICE AND SUPPORT
Key elements of our customer service approach are our business development sales team, outbound sales team, account management team, inbound sales and customer service organization. To ensure the quality of service provided, we monitor our customer service through customer surveys, call monitoring and daily statistical reports.
Customers may place orders via:
| ● |
Mail to Transcat, Inc., 35 Vantage Point Drive, Rochester, NY 14624; |
| ● |
Telephone at 1-800-828-1470; |
| ● |
Email at sales@transcat.com; |
| ● |
Online at www.transcat.com; or |
| ● |
Fax at 1-800-395-0543 |
INFORMATION REGARDING EXPORT SALES
In fiscal year 2023, approximately 10% of our total revenue resulted from sales to customers outside the United States. Of those export sales in fiscal year 2023, approximately 7% were denominated in U.S. dollars, 69% were denominated in Canadian dollars and 24% were denominated in Euros. Our revenue is subject to the customary risks of operating in an international environment, including the potential imposition of trade or foreign exchange restrictions, tariff and other tax increases, fluctuations in exchange rates and unstable political situations, any one or more of which could have a material adverse effect on our business, cash flows, balance sheet or results of operations. See “Foreign Currency” in Item 7A. of Part II and Note 7 to our Consolidated Financial Statements in this report for further details.
INFORMATION SYSTEMS
We utilize a turnkey enterprise software solution from Infor, Inc. (“Infor”) called Application Plus to manage our business and operations segments. This software includes a suite of fully integrated modules to manage our business functions, including customer service, warehouse management, inventory management, financial management, customer relations management and business intelligence. This solution is a fully mature business package and has been subject to more than 20 years of refinement. We utilize customer relationship management (“CRM”) software offered by SalesForce.com, Inc., which is strategically partnered with Infor, allowing us to fully integrate the CRM software with our Infor enterprise software.
We also utilize CalTrak®, our proprietary document and asset management system, to manage documentation, workflow and customers’ assets within and amongst most of our Calibration Service Centers. In addition to functioning as an internal documentation, workflow, and asset management system, CalTrak®, through C3®, provides customers with web-based calibration cycle management service and access to documentation relating to services completed by Transcat. Certain recent acquisitions utilize either third-party or their own proprietary calibration management systems. We continually evaluate when to integrate these acquired systems with a focus on obtaining operational synergies while imposing minimal disruption to customers.
INTELLECTUAL PROPERTY
We have federally registered trademarks for Transcat®, CalTrak®, C3® and Procision® which we consider to be of material importance to our business. The registrations for these trademarks are in good standing with the U.S. Patent & Trademark Office. Our CalTrak® trademark is also registered in Canada for one class with the Canada Intellectual Property Office and in Puerto Rico. Our trademark registrations must be renewed at various times, and we intend to renew our trademarks, as necessary, for the foreseeable future.
In addition, we own www.transcat.com, www.transcat.ca and pipettes.com among other Internet domain names. As with phone numbers, we do not have, and cannot acquire any property rights to an Internet address. The regulation of domain names in the United States and in other countries is also subject to change. Regulatory bodies could establish additional top-level domains, appoint additional domain name registrars or modify the requirements for holding domain names. As a result, we might not be able to maintain our domain names or obtain comparable domain names, which could harm our business.
SEASONALITY
Our business has certain historical seasonal factors. Historically, our fiscal third and fourth quarters have been stronger than our fiscal first and second quarters due to the operating cycles of our industrial sector customers. Our Distribution segment has historically been strongest in our third fiscal quarter while Service has historically been strongest in our fourth fiscal quarter.
FISCAL YEAR
We operate on a 52/53-week fiscal year, ending the last Saturday in March. In a 52-week fiscal year, each of the four quarters is a 13-week period. In a 53-week fiscal year, the last quarter is a 14-week period. Fiscal years 2023 and 2022 each consisted of 52 weeks. Fiscal year 2024 which ends on March 30, 2024 (“fiscal year 2024”) will have 53 weeks.
ENVIRONMENTAL MATTERS
We believe that we are in compliance with federal, state, and local provisions relating to the protection of the environment, and that continued compliance will not have any material effect on our capital expenditures, earnings, or competitive position.
HUMAN CAPITAL MANAGEMENT
As of March 25, 2023, we had 1,030 employees, 899 of whom were employed in the United States and 131 employed outside the United States. None of our employees are covered by collective bargaining agreements or work councils. Overall, we consider our employee relations to be good and believe our culture to be central to the success of the Company.
Health and Safety The health and safety of our employees is of utmost importance to us. We are enhancing our Safety Program with additional training and internal risk and hazard assessments. We conduct policy and procedure reviews to ensure compliance with health and safety guidelines and regulatory requirements. We provide protective gear (e.g., eye protection, masks, and gloves) as required by applicable standards and as appropriate. Our goal is to achieve a level of work-related injuries as close to zero as possible through continuous investment in our safety program.
Hiring Practices We seek to recruit and hire the most qualified people for our open positions without regard to protected status (age, color, creed, disability, domestic violence victim status, gender identity, genetic predisposition or carrier status, marital status, national origin, pregnancy, race religion, sex, sexual orientation, status as a protected veteran or as a member of any other protected group or status).
Diversity and Inclusion Recognizing and respecting our employees’ backgrounds and experiences, and our international presence, we strive to maintain a diverse workforce and inclusive work environment everywhere we operate. Our diversity and inclusion principles are reflected in our employee training, in particular with respect to our policies against harassment and bullying and the elimination of bias in the workplace.
Wellness Our Calibrated Wellness Program prioritizes our employees’ well-being and is designed to enhance their health. Our program includes wellness resources, health education, pharmaceutical cost guidance, and a no-cost Employee Assistance Program, which includes worldwide access to visits with mental health care providers. Our program also incentivizes health and well-being by providing reduced health insurance premiums for employees who complete certain actions that encourage health and wellness.
Compensation and Benefits Our compensation and benefits program is designed to attract and reward individuals who demonstrate the ability and desire to enhance our workplace culture, support our values, drive our operational and strategic goals, and create long-term value for our shareholders.
We provide employees with competitive compensation packages that include base salary and may also include annual incentive bonuses and/or long-term incentive awards, depending upon the employee’s position. We believe that a compensation program with both short-term and long-term incentive awards provides fair and competitive compensation and aligns employee and shareholder interests. In addition to cash and equity compensation, we also offer employees benefits including health (medical, dental and vision), life, and disability insurance, paid time off, paid parental leave, tuition benefits, and a 401(k) plan.
AVAILABLE INFORMATION
We file Annual Reports on Form 10-K, Quarterly Reports on Form 10-Q, Current Reports on Form 8-K, proxy statements and other information with the Securities and Exchange Commission (“SEC”). Our filings with the SEC are available on the SEC’s website at www.sec.gov. We also maintain a website at www.transcat.com. We make available, free of charge, in the Investor Relations section of our website, documents we file with or furnish to the SEC, including our Annual Reports on Form 10-K, Quarterly Reports on Form 10-Q, Current Reports on Form 8-K and any amendments to those reports. We make this information available as soon as reasonably practicable after we electronically file such materials with, or furnish such information to, the SEC. The information found on our website is not part of this or any other report we file with, or furnish to, the SEC. Copies of such documents are available in print at no charge to any shareholder who makes a request. Such requests should be made to our corporate secretary at our corporate headquarters, 35 Vantage Point Drive, Rochester, New York 14624.
You should carefully consider the following risks and all other information included in this report. The risks and uncertainties described below and elsewhere in this report are not the only ones facing our business. If any of the following risks were to actually occur, our business, financial condition or results of operations would likely suffer.
Macroeconomic and Business Risks
Adverse changes in economic and market conditions, including rising inflation, or uncertainty about future market conditions, may result in increased costs of operations and negatively impact the credit and securities markets generally, which could have a material adverse effect on our results of operations and the market price of our common stock. Our results of operations and the implementation of our business strategy could be materially and adversely affected by general conditions in the U.S. and global economy, including financial and economic conditions that are outside of our control. We are subject to risks arising from adverse changes in general economic market conditions, including supply chain delays or interruptions, labor shortages, wage pressures, rising inflation, volatility in the banking industry, geopolitical events, global health crises, including epidemics and pandemics such as the COVID-19 pandemic, or interruptions and other force majeure events.
Inflation has accelerated in the U.S. and globally due in part to global supply chain issues, a rise in energy prices, and strong consumer demand. An inflationary environment can increase our cost of labor as well as our energy and other operating costs which may have a material adverse impact on our financial results. In addition, economic conditions could impact and reduce the number of customers who purchase our products or services as credit becomes more expensive or unavailable. Although interest rates have increased and are expected to increase further, inflation may continue. Further, increased interest rates could have a negative effect on the securities markets generally which may, in turn, have a material adverse effect on the market price of our common stock. Further, uncertainty about future economic conditions could negatively affect our current and prospective customers causing them to delay purchase of services or test and measurement instruments. Poor economic conditions could materially and adversely impact our business, financial condition, operating results and cash flows.
The impact of widespread public health crises, pandemics or other epidemics is difficult to predict and could materially and adversely affect our business and results of operations. Any adverse widespread public health developments in locations where we conduct business, as well as any governmental restrictive measures implemented to control such outbreaks and consumer responses to such outbreaks, could have a material adverse impact on our business and results of operations. These impacts, which are highly uncertain and cannot be accurately predicted, could be significant and long term. Further, any actions taken to mitigate any health crises could lead to an economic recession. For example, the COVID-19 pandemic and the efforts to control it caused significantly increased economic uncertainty, inflationary pressure in the U.S. and globally, supply chain disruptions, volatility in the capital markets, a decline in consumer confidence, changes in consumer behavior, significant economic deterioration, and an increasingly competitive labor market.
The ultimate impact of the COVID-19 pandemic or any other widespread public health crisis on our business and results of operations will depend on, among other things, the severity and length of the health crisis, the duration, effectiveness and extent of the mitigation measures and actions designed to contain the outbreak, the emergence, contagiousness and threat of new and different strains of the disease, the availability and efficacy of vaccines and effective treatments, public acceptance of vaccines and treatments for the disease, if any, changes in customer and consumer behavior as a result of the crisis, as well as the resulting economic conditions and how quickly and to what extent normal economic and operating conditions resume, all of which are highly uncertain. Such extraordinary events and their aftermaths can cause investor fear and panic, which could further materially and adversely affect our operations, the economies in which we operate, and the financial markets generally in ways that cannot necessarily be predicted.
The effects of the COVID-19 pandemic, or any future public health crisis, and mitigation measures taken in response, could have a material and adverse impact on our business and results of operations and may amplify many of the other risk factors disclosed elsewhere in this "Item 1A. Risk Factors."
The industries in which we compete are highly competitive, and we may not be able to compete successfully. Within our Service segment, we provide calibration services and compete in an industry that is highly fragmented and is composed of companies ranging from internationally recognized and accredited corporations to non-accredited sole proprietors, resulting in a tremendous range of service levels and capabilities. Also, within our Service segment, we provide compliance services and compete in an industry that is composed of both small local and regional service providers and large multi-national companies who are also OEMs. Within our Service segment, some of our larger competitors may have broader service capabilities and may have greater name recognition than us. Some manufacturers of the products we sell may also offer calibration and compliance services for their products.
Within our Distribution segment, we compete with numerous companies, including several major manufacturers and distributors. Most of our products are available from several sources and our customers tend to have relationships with several distributors. Competitors in the product distribution industry could also obtain exclusive rights to market particular products, which we would then be unable to market. Manufacturers could also increase their efforts to sell directly to end-users and bypass distributors like us. Industry consolidation among distributors, the unavailability of products, whether due to our inability to gain access to products or interruptions in supply from manufacturers, or the emergence of new competitors could also increase competition and adversely affect our business or results of operations.
In each of the industries in which we compete, some of our competitors have greater financial and other resources than we do, which could allow them to compete more successfully. In the future, we may be unable to compete successfully and competitive pressures may reduce our sales.
Our Service segment has a concentration of customers in the life science and other FDA-regulated and industrial manufacturing industries. A number of our Service segment customers operate in the life science, pharmaceutical and other FDA-regulated or industrial manufacturing industries. This concentration of our customer base affects our overall risk profile, since a significant portion of our customers would be similarly affected by changes in economic, political, regulatory, and other industry conditions. An abrupt or unforeseen change in conditions in these industries could adversely affect customer demand for our services, which could have a material adverse effect on our financial results.
We face significant competition in our Distribution segment, including from suppliers and web-based distributors. We may not be able to compete successfully. We face substantial and increased competition throughout the world, especially in our Distribution segment. The competition is changing, with certain of our vendors engaging directly with customers and web-based distributors continuing to be a presence with increasing their market share. Some of our competitors are much larger than us. Changes in the competitive landscape pose new challenges that could adversely affect our ability to compete. Entry or expansion of other vendors into this market may establish competitors that have larger customer bases and substantially greater financial and other resources with which to pursue marketing and distribution of products. Their current customer base and relationships, as well as their relationships and ability to negotiate with manufacturers, may also provide them with a competitive advantage. Additionally, our vendors who decide to sell directly to customers, may choose to not to sell to us or to provide products to us on less favorable and more costly terms, any of which could have a material and adverse impact on our results of operations. If we are unable to effectively compete with our current and future competitors, our ability to sell products could be harmed and could result in a negative impact on our Distribution segment. Any erosion of our competitive position could have a material adverse effect on our business, results of operations, and financial condition.
Any impairment of goodwill or intangible assets could negatively impact our results of operations. Our goodwill and intangible assets are subject to an impairment test on an annual basis and are also tested whenever events and circumstances indicate that goodwill and/or intangible assets may be impaired. Any excess goodwill and/or indefinite-lived intangible assets value resulting from the impairment test must be written-off in the period of determination. Intangible assets (other than goodwill and indefinite-lived intangible assets) are amortized over the useful life of such assets. In addition, from time to time, we may acquire or make an investment in a business that will require us to record goodwill based on the purchase price and the value of the acquired tangible and intangible assets. We may subsequently experience unforeseen issues with the businesses we acquire, which may adversely affect the anticipated returns of the business or value of the intangible assets and trigger an evaluation of the recoverability of the recorded goodwill and intangible assets for such business. Future determinations of significant write-offs of goodwill or intangible assets because of an impairment test or any accelerated amortization of other intangible assets could have a material negative impact on our results of operations and financial condition.
Tariffs imposed by the U.S. and other countries, as well as changing trade relations, could have a material adverse effect on our business and results of operations. Changes in U.S. and foreign governments’ trade policies have resulted in, and may continue to result in, tariffs on imports into and exports from the U.S. Tariffs on certain products can increase our costs of doing business. If we are unable to recover these costs, our profit margins may be negatively impacted. Diminished trade relations between the U.S. and other countries, as well as any escalation of tariffs, could have a material adverse effect on our financial performance and results of operations.
Risks Related to Acquisitions
We may not successfully integrate business acquisitions. We completed four acquisitions during fiscal year 2023 and three acquisitions during fiscal year 2022. If we fail to accurately assess and successfully integrate any recent or future business acquisitions, we may not achieve the anticipated benefits, which could result in lower revenues, unanticipated operating expenses, reduced profitability and dilution of our book value per share. Successful integration of acquisitions involves many challenges, including:
| ● |
The difficulty of integrating acquired operations and personnel with our existing operations; |
| ● |
Implementation or remediation of controls, procedures, and policies at the acquired company; |
| ● |
Integration of the acquired company’s accounting and other administrative systems; |
| ● |
In the case of foreign acquisitions, the need to integrate operations across different cultures and languages and to address the particular economic, currency, political, and regulatory risks associated with specific countries; |
| ● |
Currency and regulatory risks associated with operations in foreign countries; |
| ● |
The difficulty of developing and marketing new products and services; |
| ● |
The diversion of our management’s attention as a result of evaluating, negotiating and integrating acquisitions; |
| ● |
Our exposure to unforeseen liabilities of acquired companies; and |
| ● |
The loss of key employees of an acquired operation. |
In addition, an acquisition could adversely impact cash flows and/or operating results, and dilute shareholder interests, for many reasons, including:
| ● |
Charges to our income to reflect the impairment of acquired intangible assets, including goodwill; |
| ● |
Contingent consideration payments; |
| ● |
Agreements to provide indemnification for certain potential liabilities; |
| ● |
Interest costs and debt service requirements for any debt incurred in connection with an acquisition or new business venture; and |
| ● |
Any issuance of securities in connection with an acquisition or new business venture that dilutes or lessens the rights of our current shareholders. |
If the integration of any or all of our acquisitions or future acquisitions is not successful, it could have a material adverse impact on our operating results and stock price.
Our future business acquisition efforts may not be successful, which may limit our growth or adversely affect our results of operations, and financing of any future acquisitions could result in shareholder dilution and/or increase our leverage. Business acquisitions are an important part of our growth strategy. If we identify an appropriate acquisition candidate, we may not be able to successfully negotiate terms or finance the acquisition. If economic downturns or other matters of national or global concern continue for an extensive period of time or recur, our ability to pursue and consummate potential acquisitions could be materially adversely affected. In addition, to successfully complete targeted acquisitions, we may issue additional equity securities that could dilute our stockholders’ ownership, or we may incur additional debt, which could increase our leverage and our risk of default under our existing credit facility. If we fail to successfully acquire businesses, our growth and results of operations could be materially and adversely affected.
Operational Risks
Cybersecurity incidents could adversely affect our business by causing a disruption to our operations, a compromise or corruption of our confidential information and/or damage to our business relationships, all of which could negatively impact our business, results of operations or financial condition. We rely extensively on information technology (“IT”) systems, some of which are provided by third parties, to support our business activities, including for orders and the storage, processing and transmission of our electronic, business-related, information assets used in or necessary to conduct business. The data we store and process may include customer payment information, personal information concerning our employees, confidential financial information and other types of sensitive business-related information. Numerous and evolving cybersecurity threats pose potential risks to the security of our IT systems, networks and services, as well as the confidentiality, availability and integrity of our data. Some of our office personnel work in remote environments which may exacerbate various cybersecurity risks to our business, including an increased risk of phishing and other social engineering attacks, and an increased risk of unauthorized dissemination of sensitive personal, proprietary or other confidential information. Global cybersecurity threats can range from uncoordinated individual attempts to gain unauthorized access to our IT systems to sophisticated and targeted measures known as advanced persistent threats. The techniques used in these attacks change frequently and may be difficult to detect for periods of time and we may face difficulties in anticipating and implementing adequate preventative measures. While we employ comprehensive measures to prevent, detect, address and mitigate these threats (including access controls, data encryption, vulnerability assessments, management training, continuous monitoring of our IT networks and systems and maintenance of backup and protective systems), cybersecurity incidents, depending on their nature and scope, could potentially result in the misappropriation, destruction, corruption or unavailability of critical data or proprietary information and the disruption of business operations. The potential consequences of a material cybersecurity incident include reputational damage, compromised employee, customer, or third-party information, litigation with third parties, regulatory actions, and increased cybersecurity protection and remediation costs, which in turn could adversely affect our business and results of operations. We maintain insurance intended to cover certain cybersecurity events, but such insurance may not cover all risks and losses that we experience. In addition, the laws and regulations governing security of data on IT systems and otherwise held by companies is evolving and adding layers of complexity in the form of new requirements and increasing costs of attempting to protect IT systems and data and complying with new cybersecurity regulations.
If we experience a significant disruption in, or breach in security of, our IT systems, or if we fail to implement new systems and software successfully, our business could be adversely affected. Our IT systems may be susceptible to damage, disruptions or shutdowns due to power outages, hardware failures, telecommunication failures, user errors, catastrophes or other unforeseen events. Our IT systems also may experience interruptions, delays or cessations of service or produce errors in connection with system integration, software upgrades or system migration work that takes place from time to time. In addition, technology resources may be strained due to our remote users. If we were to experience a prolonged system disruption in the IT systems that involve our interactions with customers or suppliers, it could result in the loss of sales and customers and significant incremental costs, which could adversely affect our business.
Our revenue and ability to achieve our stated corporate objectives depends on our senior management and our ability to retain recruit, train and retain quality employees. Our success is dependent on our senior management and our ability to attract, retain and motivate qualified personnel, especially skilled service technicians. Competition for senior management is intense, and we may not be successful in attracting and retaining key personnel. Qualified skilled service technicians are in high demand and are subject to competing offers. The ability to meet our labor needs while controlling costs associated with hiring and training new employees is subject to external factors such as unemployment levels and prevailing wage rates. The loss of services of any member of our senior management team or key employees, and the inability to attract and retain other qualified personnel, especially skilled service technicians, could affect our ability to achieve our stated corporate objectives and could adversely impact our business and results of operations.
We expect that our quarterly results of operations will fluctuate. Such fluctuations could cause our stock price to decline. A large portion of our expenses for our Service segment, including expenses for facilities, equipment and personnel are relatively fixed. Accordingly, if revenues decline or do not grow as we anticipate, we may not be able to correspondingly reduce our expenses in any particular quarter. Our quarterly revenues and operating results have fluctuated in the past and are likely to do so in the future. Historically, our fiscal third and fourth quarters have been stronger than our fiscal first and second quarters due to industrial operating cycles. Fluctuations in industrial demand for products we sell and services we provide could cause our revenues and operating results to fluctuate. If our operating results in some quarters fail to meet the expectations of stock market analysts and investors, our stock price may decline.
The profitability of our subsidiary, NEXA, depends to a large extent on our ability to achieve or maintain adequate utilization and pricing rates for our technical service providers. In our Service segment our subsidiary, NEXA, provides all of its services in the technical, consulting and staffing solutions market by providing services to improve asset management programs for customers in the life science, pharmaceutical and other FDA-regulated or industrial manufacturing industries. The profitability of NEXA depends in part on ensuring that our technical service providers maintain adequate utilization rates (i.e., the percentage of our provider’s working hours devoted to billable activities). Our utilization rates are affected by a number of factors, including:
| ● |
The number, scope and timing of ongoing client engagements; |
| ● |
The timing of the commencement, completion and termination of engagements, which in many cases is unpredictable; |
| ● |
Our ability to continually secure new business engagements; |
| ● |
Our ability to transition technical service providers promptly from completed projects to new assignments, and to engage newly-hired technical service providers quickly in revenue-generating activities; |
| ● |
Our ability to forecast demand for our services and thereby maintain appropriate headcount in each of our geographies and workforces; |
| ● |
Unanticipated changes in the scope of client engagements; |
| ● |
Our need to devote time and resources to sales, training, professional development and other non-billable activities; |
| ● |
Our ability to retain key colleagues and consulting professionals; |
| ● |
Conditions affecting the life sciences industry; and |
| ● |
General financial and economic conditions. |
If the utilization rate for our technical service providers declines, our revenues, profit margin and profitability could decline, and our results of operations could be materially adversely affected.
The profitability of our Service segment, including the NEXA business, depends in part on the prices we are able to charge for our services. The prices we charge for our services, including the NEXA business, are affected by a number of factors, including:
| ● |
Clients’ perception of our ability to add value through our services; |
| ● |
The market demand for the services we provide; |
| ● |
Our ability to develop new services and the introduction of new services by competitors; |
| ● |
The pricing policies of our competitors; |
| ● |
The extent to which our clients develop in-house or other capabilities to perform the services that they might otherwise purchase from us; and |
| ● |
General financial and economic conditions. |
If we are unable to achieve and maintain adequate rates for our services, our profit margin and profitability could decline, and our results of operations could be materially adversely affected.
If we do not effectively compete in the rental test and measurement equipment market, our operating results may be adversely affected. We compete in the rental market on the basis of a number of factors, including equipment availability, price, service and reliability. Some of our competitors may offer similar equipment for rent at lower prices and may offer more extensive servicing, or financing options. In addition, if the supply of rental equipment available on the market significantly increases, demand for and pricing of our rental products could be adversely impacted lowering our gross margins on rentals. Further, customers confronting competing budget priorities and more limited resources could lead to less demand for rental equipment and increased pressure on pricing. Failure to adequately forecast the adoption of and demand for equipment may cause us not to meet our customers’ rental equipment requirements and may adversely affect our operating results.
If we fail to adapt our technology to meet customer needs and preferences, the demand for our products and services may diminish. Our future success will depend on our ability to develop services and solutions that keep pace with technological change, evolving industry standards and changing customer preferences in the markets we serve. For example, we sell our products and services to customers in several industries that may experience rapid technological changes, new product introductions, and evolving industry standards, including the life science, pharmaceutical and other FDA-regulated or industrial manufacturing industries. We cannot be sure that we will be successful in adapting existing or developing new technology or services in a timely or cost-effective manner or that the solutions we do develop will be successful in the marketplace. Our failure to keep pace with changes in technology, industry standards and customer preferences in the markets we serve could diminish our ability to retain and attract customers and retain our competitive position, which could adversely impact our business and results of operations.
We rely on our CalTrak®, Application Plus (our enterprise resource planning system) and other management information systems for inventory management, distribution, workflow, accounting and other functions. If our CalTrak®, Application Plus or other management information systems fail to adequately perform these functions, experience an interruption in their operation or a security breach, our business and results of operations could be adversely affected. The efficient operation of our business depends on our management information systems. We rely on our CalTrak®, Application Plus and other management information systems to effectively manage accounting and financial functions, customer service, warehouse management, order entry, order fulfillment, inventory replenishment, documentation, asset management, and workflow. Our management information systems are vulnerable to damage or interruption from computer viruses or hackers, natural or man-made disasters, vandalism, terrorist attacks, power loss, or other computer systems, internet, telecommunications or data network failures. Any such interruptions to our management information systems could disrupt our business and could result in decreased revenues, increased overhead costs, excess inventory and product shortages, causing our business and results of operations to suffer. In addition, our management information systems are vulnerable to security breaches. Our security measures or those of our third-party service providers may fail to detect or prevent such security breaches. Security breaches could result in the unauthorized publication of our confidential business or proprietary information, the unauthorized release of customer, vendor, or employee data and payment information, the violation of privacy or other laws, and the exposure to litigation, any of which could harm our business and results of operations.
Our enterprise resource planning system (“ERP”) is aging and may not be capable of integrating management information systems that we use or are used by companies we acquire, and we may experience issues from any implementation of a new ERP or be required to operate some management information systems separately from our ERP. We have an ERP to assist with the collection, storage, management and interpretation of data from our business activities to support future growth and to integrate significant processes. Although we use current versions of software and have support agreements in place, due to the age of our ERP it may not be capable of integrating management information systems that we use or are used by companies we acquire. We anticipate that a new ERP will be required to be implemented sometime in the future. ERP implementations are complex and time-consuming and involve substantial expenditures on system software and implementation activities, as well as changes in business processes. Our ERP system is critical to our ability to accurately maintain books and records, record transactions, provide important information to our management and prepare our consolidated financial statements. ERP implementations also require the transformation of business and financial processes in order to reap the benefits of the ERP system; any such transformation involves risks inherent in the conversion to a new computer system, including loss of information and potential disruption to our normal operations. Any disruptions, delays or deficiencies in the design and implementation of a new ERP system could adversely affect our ability to process orders, provide services and customer support, send invoices and track payments, fulfill contractual obligations or otherwise operate our business. Additionally, if the ERP system does not operate as intended, the effectiveness of our internal control over financial reporting could be adversely affected or our ability to assess it adequately could be delayed.
We depend on manufacturers to supply inventory to our Distribution segment and if our vendors fail to provide desired products to us, increase prices, or fail to timely deliver products, or if supply chain delays, interruptions, or product shortages occur, our revenue and gross profit could suffer. Similar to other distributors in our industry, we occasionally experience supplier shortages and are unable to purchase our desired volume of products. Our ability to offer a wide variety of products to our customers is dependent upon our ability to obtain adequate product supply from manufacturers and other suppliers. Any disruption in our sources of supply, particularly of the most commonly sold items, could result in a loss of revenues, reduced margins, and damage to our relationships with customers. Supply shortages may occur as a result of unanticipated increases in demand or difficulties in production or delivery. In addition, we may be adversely impacted by disruptions within our supply chain network. Such disruptions may result from weather-related events, natural disasters, international trade disputes or trade policy changes or restrictions, tariffs or import-related taxes, third-party strikes, lock-outs, work stoppages or slowdowns, shortages of supply chain labor and truck drivers, shipping capacity constraints, military conflicts, acts of terrorism, public health issues (including pandemics or quarantines), civil unrest or other factors beyond our control. For example, in fiscal year 2023, our supply chains have been and may continue to be negatively impacted by the COVID-19 pandemic and general economic factors such as rising inflation. When shortages occur, our suppliers often allocate products among distributors. The loss of, or a substantial decrease in the availability of, products from our suppliers or the loss of key supplier arrangements could adversely impact our financial condition, operating results, and cash flows, as well as our ability to benefit from ongoing supply chain initiatives.
Due to current global supply chain disruptions, we may experience increased difficulties in obtaining products at stable pricing levels. As a result, we may need to restructure or change some of our product lines in the future. We cannot provide any assurance that particular products, or product lines, will be available to us, or available in quantities sufficient to meet customer demand. If we are unable to enter into and maintain satisfactory distribution arrangements with leading manufacturers, if we are unable to maintain an adequate supply of products, or if manufacturers do not regularly invest in, introduce to us, and/or make new products available to us for distribution, our Distribution segment sales could suffer materially. This is of particular significance to our Distribution segment business because the products we sell are often only available from one source. Any limits to product access could materially and adversely affect our Distribution segment business.
Our future success may be affected by our current and future indebtedness. Under our credit agreement, as of March 25, 2023, we owed $49.1 million to our secured creditor, a commercial bank, including $6.4 million borrowed under a $15.0 million term loan to fund acquisitions and provide additional working capital. We may borrow additional funds in the future to support our growth and working capital needs. We are required to meet financial tests on a quarterly basis and comply with other covenants customary in secured financings. Although we believe that we will continue to comply with such covenants, if we do not remain in compliance with such covenants, our lender may demand immediate repayment of amounts outstanding. Furthermore, we are dependent on credit from manufacturers of our products to fund our inventory purchases. If our debt burden increases to high levels, such manufacturers may restrict our credit. Our cash requirements will depend on numerous factors, including the rate of growth of our revenues, the timing and levels of products purchased, payment terms, and credit limits from manufacturers, the timing and level of our accounts receivable collections and our ability to manage our business profitably. Our ability to satisfy our existing obligations, whether or not under our secured credit facility, will depend upon our future operating performance, which may be impacted by prevailing economic conditions and financial, business, and other factors described in this report, many of which are beyond our control.
We face risks associated with foreign currency rate fluctuations. We currently transact a portion of our business in foreign currencies, namely the Canadian dollar and the Euro. During fiscal years 2023 and 2022, approximately 10% of our total revenues were denominated in Canadian dollars and Euros. Conducting business in currencies other than U.S. dollars subjects us to fluctuations in currency exchange rates that could have a negative impact on our reported operating results. Fluctuations in the value of the U.S. dollar relative to the Canadian dollar and the Euro impact our revenues, cost of revenues and operating margins and result in foreign currency transaction gains and losses. During fiscal year 2023, the value of the U.S. dollar relative to one Canadian dollar and to one Euro ranged from 1.25 to 1.39 and from 0.90 to 1.04, respectively.
We continually utilize short-term foreign exchange forward contracts to reduce the risk that future earnings denominated in Canadian dollars would be adversely affected by changes in currency exchange rates. However, this strategy does not eliminate our exposure. If there is a significant or prolonged downturn in the Canadian dollar or the Euro, it could have an adverse impact on our business and financial condition.
Our inability to adequately enforce and protect our intellectual property or defend against assertions of infringement could prevent or restrict our ability to compete. We rely on intellectual property in order to maintain a competitive advantage. Our inability to defend against the unauthorized use of these assets could have an adverse effect on our results of operations and financial condition. Litigation may be necessary to protect our intellectual property rights or defend against claims of infringement. This litigation could result in significant costs and divert our management’s focus away from operations.
Hurricanes, other adverse weather events, national or regional catastrophes or natural disasters could negatively affect the local economies we serve or disrupt our operations, which could have an adverse effect on our business or results of operations. Our market areas include the Gulf Coast and Mid-Atlantic regions of the United States, and Puerto Rico, which are susceptible to hurricanes. Such weather events can disrupt our operations, result in damage to our properties and negatively affect the local economies in which we operate. Future hurricanes could result in damage to certain of our facilities and the equipment located at such facilities, or equipment on rent with customers in those areas. Even if our properties suffer no direct damage from such events, the operations of our customers could be disrupted, and our supply chain impacted. In addition, climate change could lead to an increase in intensity or occurrence of hurricanes or other adverse weather events, including severe winter storms. Future occurrences of these events, as well as regional or national catastrophes or natural disasters, and their effects may adversely impact our business or results of operations.
Risks Related to our Stock
Our stock price may be volatile. The stock market, from time to time, has experienced significant price and volume fluctuations that are both related and unrelated to the operating performance of companies. Our stock may be affected by market volatility and by our own performance. The following factors, among others, may have a significant effect on the market price of our common stock:
| ● |
Developments in our relationships with current or future manufacturers of products we distribute; |
|
| ● |
Announcements by us or our competitors of significant acquisitions, strategic partnerships, joint ventures or capital commitments; |
|
| ● |
Litigation or governmental proceedings or announcements involving us or our industry; |
|
| ● |
Economic and other external factors, such as inflation, recession, disasters or other national or global crises; |
|
| ● | Public health issues including pandemics and epidemics, such as the COVID-19 pandemic; | |
| ● |
Sales of our common stock or other securities in the open market; |
|
| ● |
Repurchases of our common stock on the open market or in privately-negotiated transactions; |
|
| ● |
Period-to-period fluctuations in our operating results; and |
|
| ● |
Our ability to satisfy our debt obligations. |
The relatively low trading volume of our common stock may limit your ability to sell your shares. Although our shares of common stock are listed on the Nasdaq Global Market, we have historically experienced a relatively low trading volume of approximately 44,700 shares a day. If our low trading volume continues in the future, holders of our shares may have difficulty selling shares of our common stock in the manner or at a price that they desire.
If significant existing shareholders sell large numbers of shares of our common stock, our stock price could decline. The market price of our common stock could decline if a large number of our shares are sold in the public market by our existing shareholders or as a result of the perception that such sales could occur. Due to the relatively low trading volume of our common stock, the sale of a large number of shares of our common stock may significantly depress the price of our common stock.
Regulatory Risks
Tax rates applicable to us may change. Tax legislation initiatives could adversely affect our net earnings and tax liabilities. We are subject to the tax laws and regulations of the United States federal, state and local governments, as well as foreign jurisdictions. From time to time, various legislative initiatives may be enacted that could adversely affect our tax positions. Tax laws and regulations are extremely complex and subject to varying interpretations. The Tax Cuts and Jobs Act of 2017 (the “Tax Act”) made broad and complex changes to the U.S. tax code, including, but not limited to reducing the Federal corporate income tax rate from 35% to 21%. Any additional modifications to key aspects of the tax code could materially affect our tax obligations and negatively impact our effective tax rate. Although we believe that our tax positions are sound and consistent with applicable laws, regulations and existing precedent, there can be no assurance that our tax positions will not be challenged by relevant tax authorities or that we would be successful in any such challenge.
Changes in accounting standards, legal requirements and the Nasdaq Global Market listing standards, or our ability to comply with any existing requirements or standards, could adversely affect our operating results. Extensive reforms relating to public company financial reporting, corporate governance and ethics, the Nasdaq Global Market listing standards and oversight of the accounting profession have been implemented over the past several years and continue to evolve. Compliance with these rules, regulations and standards that have resulted from such reforms has increased our accounting and legal costs and has required significant management time and attention. In the event that additional rules, regulations or standards are implemented or any of the existing rules, regulations or standards to which we are subject undergoes additional material modification, we could be forced to spend significant financial and management resources to ensure our continued compliance, which could have an adverse effect on our results of operations. In addition, although we believe we are in full compliance with all such existing rules, regulations and standards, should we be or become unable to comply with any of such rules, regulations and standards, as they presently exist or as they may exist in the future, our results of operations could be adversely affected and the market price of our common stock could decline.
Our international operations expose us to legal and regulatory risks, which could have a material effect on our business. Our international operations are governed by various U.S. laws and regulations, including the Foreign Corrupt Practices Act (“FCPA”), and other foreign anti-bribery laws. The FCPA generally prohibits companies and their intermediaries from making improper payments to foreign government officials for the purpose of obtaining or retaining business. Any alleged or actual violations of these or other relevant regulations may subject us to government scrutiny, severe criminal or civil sanctions and other liabilities and could negatively affect our business, reputation, operating results and financial condition.
ITEM 1B. UNRESOLVED STAFF COMMENTS
None.
The following table presents the leased and owned properties that are material to our business as of March 25, 2023:
| Approximate |
|||||
| Property |
Location |
Square Footage |
|||
| Corporate Headquarters, Calibration Service Center and Distribution Center |
Rochester, NY |
48,500 | |||
| Calibration Service Center and Headquarters for Canadian Operations |
Montreal, QC |
27,500 | |||
| Calibration Service Center, Rental and Used Equipment Distribution Center |
Houston, TX |
22,300 | |||
| Calibration Service Center |
Denver, CO |
19,400 | |||
| Calibration Service Center |
Los Angeles, CA |
18,200 | |||
| Calibration Service Center |
Toronto, ON |
16,900 | |||
| Calibration Service Center |
Philadelphia, PA |
14,000 | |||
| Calibration Service Center |
Cleveland, OH |
13,800 | |||
| Calibration Service Center |
Milford, MA |
12,100 | |||
| Calibration Service Center |
Dayton, OH |
12,000 | |||
| Calibration Service Center |
Boston, MA |
8,900 | |||
| Calibration Service Center |
Indianapolis, IN |
7,600 | |||
| Calibration Service Center |
Palm Beach, FL |
7,600 | |||
| Calibration Service Center |
Portland, OR |
7,000 | |||
| Calibration Service Center |
Cincinnati, OH |
5,900 | |||
| Calibration Service Center |
St. Louis, MO |
5,600 | |||
| Calibration Service Center |
San Diego, CA |
5,500 | |||
| Calibration Service Center |
Charlotte, NC |
4,900 | |||
| Calibration Service Center |
Chesapeake, VA |
4,600 | |||
| Calibration Service Center |
Phoenix, AZ |
4,200 | |||
| Calibration Service Center |
Ottawa, ON |
4,000 | |||
| Calibration Service Center |
Decatur, AL |
1,700 | |||
| Calibration Service Center |
San Juan, PR |
1,600 | |||
| Calibration Service Center |
Cork, Ireland |
1,600 | |||
| Mobile Service Unit and Offices |
Pittsburgh, PA |
6,300 | |||
| United Scale & Engineering: |
|||||
| Calibration Service Center and Warehouse |
New Berlin, WI |
16,000 | |||
| Calibration Service Center and Warehouse |
Madison, WI |
6,000 | |||
| Calibration Service Center |
Green Bay, WI |
3,300 | |||
| Spectrum Technologies Inc. (“STI”): |
|||||
| Calibration Service Center and Warehouse |
Paxinos, PA |
14,500 | |||
We believe that our properties are in good condition, are well maintained and are generally suitable and adequate to carry on our business in its current form.
From time to time we are a party to or otherwise involved in legal proceedings arising out of the normal course of business. Management does not believe that there is any pending or threatened proceeding against us, which, if determined adversely, would have a material adverse effect on our business, results of operations or financial condition.
ITEM 4. MINE SAFETY DISCLOSURES
Not applicable.
ITEM 5. MARKET FOR REGISTRANT’S COMMON EQUITY, RELATED STOCKHOLDER MATTERS AND ISSUER PURCHASES OF EQUITY SECURITIES
Our common stock is traded on the Nasdaq Global Market under the symbol “TRNS”. As of June 1, 2023, we had approximately 500 shareholders of record.
DIVIDENDS
Our credit agreement, as amended, limits our ability to pay cash dividends to $3.0 million in any fiscal year. We have not declared any cash dividends since our inception and have no current plans to pay any dividends in the foreseeable future.
ITEM 7. MANAGEMENT’S DISCUSSION AND ANALYSIS OF FINANCIAL CONDITION AND RESULTS OF OPERATIONS
The following discussion and analysis of financial condition and results of operations should be read in conjunction with our financial statements and related notes appearing elsewhere in this annual report. In addition to historical information, the following discussion and analysis includes forward looking statements that involve risks, uncertainties and assumptions. Our actual results and the timing of events could differ materially from those anticipated in these forward-looking statements as a result of a variety of factors, including those discussed in “Risk Factors” and elsewhere in this annual report. See the discussion under “Forward Looking Statements” beginning on page 1 of this annual report
OVERVIEW
Operational Overview. We are a leading provider of accredited calibration services, enterprise asset management services, and value-added distributor of professional grade handheld test, measurement and control instrumentation.
We operate our business through two reportable business segments, Service and Distribution, which offer a comprehensive range of services and products to the same customer base.
Our strength in our Service segment is based upon our wide range of disciplines, our investment in quality systems and our ability to provide accredited calibrations to customers in highly-regulated targeted market segments. Our services range from the calibration and repair of a single unit to managing a customer’s entire calibration program. We believe our Service segment offers an opportunity for long-term growth and the potential for continuing revenue from established customers with regular calibration cycles and recurring laboratory instrument service requirements.
Our Service segment has shown consistent revenue growth over the past several years, ending fiscal year 2023 with its 56th consecutive quarter of year-over-year growth. This segment has benefited from both organic growth as well as acquisitions over those 56 quarters. The business acquisitions that we made have been heavily focused on expanding our service capabilities, increasing our geographic reach and leveraging our Calibration Service Centers and other infrastructure to create operational synergies.
Our Service segment revenue growth was 18.8% for fiscal year 2023 from fiscal year 2022, and included a combination of organic growth and acquisition related revenue. The Service segment gross margin increased by 30 basis points. Service segment gross profit and gross margin increases were primarily due to improved productivity offset by increased start-up costs from new client-based lab implementations.
In our Distribution segment, we sell and offer for rent, professional grade handheld test and measurement instruments. Because we specialize in professional grade handheld test and measurement instruments, as opposed to a wide array of industrial products, our sales and customer service personnel can provide value-added technical assistance to our customers to aid them in determining what product best meets their particular application requirements. We have expertise in the procurement and sale of used equipment, furthering our ability to add value for our customers. We also have a higher-end electronic test and measurement equipment rental business that augments our organically grown test and measurement equipment rental business. Through our website and sales teams, customers can place orders for test and measurement instruments and can elect to have their purchased instruments calibrated and certified by our Calibration Service Centers before shipment as well as on regular post-purchase intervals. Pre-shipment calibration and certification allows our customers to place newly purchased instruments into service immediately upon receipt.
Sales in our Distribution segment are generally not consumable items but are instruments purchased as replacements, upgrades or for expansion of manufacturing or research and development facilities. As such, this segment can be heavily impacted by changes in the economic environment. As customers increase or decrease capital and discretionary spending, our Distribution sales will typically be directly impacted.
In fiscal year 2023, Distribution segment sales increased by 3.3%. This increase in sales primarily due to increased demand for rental orders.
The Distribution segment gross margin in fiscal year 2023 increased by 180 basis points. The increase in segment gross margin was primarily due to a favorable mix of products sold and strong demand for our higher-margin rentals business.
Initiatives implemented within this segment include adding new in-demand vendors and product lines, expanding the number of SKUs that we offer with and without pre-shipment calibration and offering equipment rental and used equipment options. Management believes this diversification strategy will mitigate the impact that any particular industry or sector will have on the overall performance of this segment as well as help to further differentiate us from our competitors going forward.
Financial Overview. In evaluating our results for fiscal year 2023, investors should consider that we operate on a 52/53-week fiscal year, ending the last Saturday in March. In a 52-week fiscal year, each of the four quarters is a 13-week period. In a 53-week fiscal year, the last quarter is a 14-week period. Fiscal years 2023 and 2022 each consisted of 52 weeks.
A discussion regarding our financial condition and results of operations for the fiscal year ended March 26, 2022 and year-to-year comparisons between fiscal year 2022 and fiscal year 2021, which are not included in this Form 10-K, can be found under “Management’s Discussion and Analysis of Financial Condition and Results of Operations” in Part II, Item 7 of the Company’s Annual Report on Form 10-K for the fiscal year ended March 26, 2022 and are incorporated by reference herein.
Total revenue for fiscal year 2023 was $230.6 million. This represented an increase of $25.6 million or 12.5% versus total revenue of $205.0 million for fiscal year 2022. Total revenue increased due to increases in both Service revenue and Distribution sales increases.
Service revenue was $144.9 million in fiscal year 2023, an increase of $22.9 million or 18.8%. Service revenue accounted for 62.8% of our total revenue during fiscal year 2023. Of our Service revenue in fiscal year 2023, 86.2% was generated by our Calibration Service Centers and enterprise asset management services while 12.6% was generated through subcontracted third-party vendors, compared with 84.0% and 14.5%, respectively, in fiscal year 2022. The remainder of our Service revenue in each period was derived from freight charges.
Distribution sales were $85.7 million in fiscal year 2023, an increase of $2.7 million or 3.3%. Distribution sales accounted for 37.2% of our total revenue in fiscal year 2023.
Sales to domestic customers comprised 92.1% of total Distribution sales in fiscal year 2023, while 6.6% were to Canadian customers and 1.3% were to customers in other international markets.
Total gross profit was $68.4 million in fiscal year 2023 compared to $58.4 million in fiscal year 2022, an increase of $9.9 million or 17.0%. Total gross margin was 29.6%, which is a 110 basis point increase versus fiscal year 2022. Service gross margin was 32.2% in fiscal year 2023 compared with 31.9% in fiscal year 2022, a 30 basis point increase. Distribution gross margin was 25.3% in fiscal year 2023 compared with 23.5% in fiscal year 2022, a 180 basis point increase. This increase in service gross margin in fiscal year 2023 was primarily the result of improved productivity offset by increased start-up costs from new client-based lab implementations. The increase in Distribution segment gross margin was primarily due to a favorable mix of products sold and strong demand for our higher-margin rentals business.
Operating expenses were $52.1 million, or 22.6% of total revenue, in fiscal year 2023 compared with $44.3 million, or 21.6% of total revenue, in fiscal year 2022. Operating income was $16.2 million, or 7.0% of total revenue, in fiscal year 2023 compared with $14.1 million, or 6.9% of total revenue, in fiscal year 2022. The year-over-year increase in selling, marketing and warehouse expenses was due to increased expenses related to recent acquisitions, especially acquisition related amortization expense, and higher incentive-based employee costs due to higher sales. The year-over-year increase in general and administrative expenses was due to by incremental expenses from acquired businesses (including stock expense), increased payroll costs for new employees and continued investments in technology.
Net income for fiscal year 2023 was $10.7 million compared with $11.4 million in fiscal year 2022, a $0.7 million decrease. Diluted earnings per share for fiscal year 2023 was $1.40 compared with $1.50 for fiscal year 2022, a $0.10 per diluted share decrease.
CRITICAL ACCOUNTING POLICIES AND ESTIMATES
Use of Estimates. The preparation of our Consolidated Financial Statements in accordance with accounting principles generally accepted in the United States (“GAAP”) requires that we make estimates and assumptions that affect the reported amounts of assets and liabilities, and the disclosure of contingent assets and liabilities at the date of the financial statements and the reported amounts of revenues and expenses during the reporting period. Significant estimates and assumptions are used for, but not limited to, allowance for doubtful accounts and returns, inventory reserves, estimated levels of achievement for performance-based restricted stock units, fair value of stock options, depreciable lives of fixed assets, estimated lives of major catalogs and intangible assets, and the valuation of assets acquired, liabilities assumed and consideration transferred in business acquisitions. Future events and their effects cannot be predicted with certainty; accordingly, our accounting estimates require the exercise of judgment. The accounting estimates used in the preparation of our Consolidated Financial Statements will change as new events occur, as more experience is acquired, as additional information is obtained, and as our operating environment changes. Our estimates are evaluated on an ongoing basis and are drawn from historical experience and other assumptions that we believe to be reasonable under the circumstances. Actual results could differ from those estimates. Such changes and refinements in estimation methodologies are reflected in reported results of operations in the period in which the changes are made and, if material, their effects are disclosed in the Notes to our Consolidated Financial Statements.
The following items in our Consolidated Financial Statements require significant estimation or judgment:
Accounts Receivable. Accounts receivable represent amounts due from customers in the ordinary course of business. These amounts are recorded net of the allowance for doubtful accounts and returns in the Consolidated Balance Sheets. The allowance for doubtful accounts is based upon the expected collectability of accounts receivable. We apply a specific formula to our accounts receivable aging, which may be adjusted on a specific account basis where the formula may not appropriately reserve for loss exposure. After all attempts to collect a receivable have failed, the receivable is written-off against the allowance for doubtful accounts. A returns reserve is calculated based upon the historical rate of returns applied to revenues over a specific timeframe. The returns reserve will increase or decrease as a result of changes in the level of revenues and/or the historical rate of returns. Management believes that the allowances are appropriate to cover anticipated losses under current conditions. However, unexpected changes or deterioration in economic conditions could materially change these expectations.
Inventory. Inventory consists of products purchased for resale and is valued at the lower of cost or net realizable value. Costs are determined using the average cost method of inventory valuation. Inventory is reduced by a reserve for items not saleable at or above cost by applying a specific loss factor, based on historical experience and current demand, to specific categories of our inventory. Inventory is at risk of obsolescence if economic conditions change. Relevant economic conditions include changing consumer demand, customer preferences or increasing competition. We believe these risks are largely mitigated because our inventory typically turns several times per year. We evaluate the adequacy of the reserve on a quarterly basis.
Business Acquisitions. We apply the acquisition method of accounting for business acquisitions. Under the acquisition method, identifiable assets acquired, liabilities assumed and consideration transferred are measured at their acquisition-date fair value. We use a valuation hierarchy to determine the fair values used. Historically, we have relied, in part, upon the use of reports from third-party valuation specialists to assist in the estimation of fair values. Purchase price allocations are subject to revision within the measurement period, not to exceed one year from the date of acquisition. The fair value of contingent consideration is determined at each reporting period with changes reflected in the statement of operations. Administration costs to acquire a business may include, but are not limited to, fees for accounting, legal and valuation services and are recorded as incurred in our Consolidated Statement of Income.
Goodwill and Intangible Assets. Goodwill represents the excess of the purchase price over the values assigned to the underlying net assets of an acquired business and is not amortized. As of March 25, 2023, we had $69.4 million of recorded goodwill.
Intangible assets, namely customer base and covenants not to compete, represent an allocation of purchase price to identifiable intangible assets of an acquired business. These intangible assets are amortized over their estimated useful lives and are reviewed for impairment if and when indicators are present.
We test goodwill for impairment for each reporting unit on an annual basis during the fourth quarter of each fiscal year or immediately if conditions indicate that such impairment could exist. We estimate the fair value of our reporting units using the fair market value measurement requirement. We have the option to perform a qualitative assessment to determine if it is more likely than not that the fair value of a reporting unit has declined below its carrying value. This assessment considers various financial, macroeconomic, industry and segment specific qualitative factors. Based on the results of our qualitative impairment testing, we have determined that it was more likely than not that the fair values exceeded the carrying values of goodwill for each reporting unit and there were no impairments as of each of March 25, 2023 and March 26, 2022.
Intangible assets are evaluated for impairment when events or changes in business circumstances indicate that the carrying amount of the assets may not be fully recoverable. In the event a trigger is identified, the carrying value of the asset group is compared to the undiscounted cash flows from that asset group. There were no intangible asset impairment indicators identified during the years ended March 25, 2023 or March 26, 2022.
Income Taxes. We record deferred income taxes for the effects of timing differences between financial and tax reporting. These differences relate primarily to accrued expenses, bad debt reserves, inventory reserves, operating leases, goodwill and intangible assets, depreciation and amortization and stock-based compensation. We base our deferred income taxes, accrued income taxes and provision for income taxes upon income, statutory tax rates, the legal structure of our Company, interpretation of tax laws and tax planning opportunities available to us in the various jurisdictions in which we operate. We file income tax returns in the U.S. federal jurisdiction, various states, Canada and Ireland. We are regularly audited by federal, state and foreign tax authorities, but a number of years may elapse before an uncertain tax position, for which we have unrecognized tax benefits, is audited and finally resolved. From time to time, these audits result in assessments of additional tax. If a loss is determined to be probable as a result of an audit, an accrual is established.
We apply a more-likely-than-not threshold to the recognition and derecognition of uncertain tax positions. Accordingly, we recognize the amount of tax benefit that has a greater than 50% likelihood of being ultimately realized upon settlement. Future changes in judgments and estimates related to the expected ultimate resolution of uncertain tax positions will affect income in the quarter of such change. While it is often difficult to predict the final outcome or the timing of resolution of any particular uncertain tax position, we believe that our unrecognized tax benefits reflect the most likely outcome.
Stock-Based Compensation. We measure the cost of services received in exchange for all equity awards granted, including stock options and restricted stock units, based on the fair market value of the award as of the grant date. The Company uses the Black-Scholes option pricing model to estimate the fair value of stock options granted. The application of this pricing model involves assumptions that require judgment and are sensitive in the determination of compensation expense. The fair market value of our common stock on the date of each option grant is determined based on the most recent closing price on our primary trading stock exchange, currently the NASDAQ Global Market.
We record compensation cost related to unvested equity awards by recognizing, on a straight-line basis, the unamortized grant date fair value over the remaining service period for awards expected to vest. In accordance with Accounting Standards Updates (“ASU”) 2016-09, excess tax benefits for share-based award activity are reflected in the Consolidated Statement of Income as a component of the provision for income taxes. Excess tax benefits are realized benefits from tax deductions for exercised awards in excess of the deferred tax asset attributable to stock-based compensation costs for such awards. We did not capitalize any stock-based compensation costs as part of an asset. We estimate forfeiture rates based on our historical experience.
We grant timed-based and performance-based restricted stock units as a component of executive and key employee compensation. These restricted stock units are either time vested or vest following the third fiscal year from the date of grant subject to cumulative diluted earnings per share growth targets over the eligible period. Compensation cost ultimately recognized for these restricted stock units will equal the grant-date fair market value of the unit that coincides with the actual outcome of the performance conditions. On an interim basis, we record compensation cost based on the expected level of achievement of the performance conditions. The expense relating to the time vested restricted stock units is recognized on a straight-line basis over the requisite service period for the entire award.
Stock options vest either immediately or over a period of up to five years using a straight-line basis, and expire either five years or ten years from the date of grant. The expense relating to options is recognized on a straight-line basis over the requisite service period for the entire award.
See Note 6 to our Consolidated Financial Statements for further disclosure regarding our stock-based compensation.
Post-retirement Health Care Plans. The Company has a defined benefit post-retirement health care plan which provides long-term care insurance benefits, medical and dental insurance benefits, and medical premium reimbursement benefits to eligible retired corporate officers and their eligible spouses.
For accounting purposes, the defined benefit post-retirement health care plan requires assumptions to estimate the projected and accumulated benefit obligations, including the following variables: discount rate; certain employee-related factors, such as retirement age and mortality; and health care cost trend rates. These and other assumptions affect the annual expense and obligations recognized for the underlying plans. Our assumptions reflect our historical experiences and management's best judgment regarding future expectations.
Increasing the assumed health care cost trend rate by one percentage point would increase the accumulated post-retirement benefit obligation and the annual net periodic post-retirement benefit cost by $0.1 million. A one percentage point decrease in the healthcare cost trend would decrease the accumulated post-retirement benefit obligation and the annual net periodic post-retirement benefit cost by $0.1 million.
Recently Issued Accounting Pronouncements. In the normal course of business, management evaluates all new accounting pronouncements issued by the Financial Accounting Standards Board (“FASB”) to determine the potential impact they may have on our consolidated financial statements. For a discussion of the newly issued accounting pronouncements see “Recently Issued Accounting Pronouncements” under Note 1 to the Consolidated Financial Statements included in Item 8 of Part II of this report.
RESULTS OF OPERATIONS
The following table sets forth, for fiscal years 2023 and 2022, the components of our Consolidated Statements of Income.
| FY 2023 |
FY 2022 |
|||||||
| As a Percentage of Total Revenue: |
||||||||
| Service Revenue |
62.8 | % | 59.5 | % | ||||
| Distribution Sales |
37.2 | % | 40.5 | % | ||||
| Total Revenue |
100.0 | % | 100.0 | % | ||||
| Gross Profit Percentage: |
||||||||
| Service Gross Profit |
32.2 | % | 31.9 | % | ||||
| Distribution Gross Profit |
25.3 | % | 23.5 | % | ||||
| Total Gross Profit |
29.6 | % | 28.5 | % | ||||
| Selling, Marketing and Warehouse Expenses |
10.7 | % | 10.1 | % | ||||
| General and Administrative Expenses |
11.9 | % | 11.5 | % | ||||
| Total Operating Expenses |
22.6 | % | 21.6 | % | ||||
| Operating Income |
7.0 | % | 6.9 | % | ||||
| Interest and Other Expenses, net |
1.2 | % | 0.5 | % | ||||
| Income Before Provision for Income Taxes |
5.8 | % | 6.4 | % | ||||
| Provision for Income Taxes |
1.2 | % | 0.9 | % | ||||
| Net Income |
4.6 | % | 5.6 | % | ||||
FISCAL YEAR ENDED MARCH 25, 2023 COMPARED TO FISCAL YEAR ENDED MARCH 26, 2022 (dollars in thousands):
Revenue:
| Fiscal Year Ended |
||||||||||||||||
| March 25, |
March 26, |
Change |
||||||||||||||
| 2023 |
2022 |
$ |
% |
|||||||||||||
| Revenue: |
||||||||||||||||
| Service |
$ | 144,883 | $ | 122,005 | $ | 22,878 | 18.8 | % | ||||||||
| Distribution |
85,686 | 82,954 | 2,732 | 3.3 | % | |||||||||||
| Total |
$ | 230,569 | $ | 204,959 | $ | 25,610 | 12.5 | % | ||||||||
Total revenue was $230.6 million in fiscal year 2023 compared to $205.0 million in fiscal year 2022, an increase of $25.6 million or 12.5%.
Service revenue, which accounted for 62.8% and 59.5% of our total revenue in fiscal years 2023 and 2022, respectively, increased $22.9 million, or 18.8% from fiscal year 2022 to fiscal year 2023. This year-over-year growth includes a combination of organic and acquisition-related revenue growth.
This year-over-year increase also reflected increased demand from the life sciences and other highly-regulated end markets in fiscal year 2023 and included $10.6 million of incremental revenue from acquisitions. Excluding acquired revenue of $10.6 million, the Service segment organic revenue increased by 10.0%.
Our fiscal years 2023 and 2022 Service revenue growth in relation to prior fiscal year quarter comparisons, was as follows:
| FY 2023 |
FY 2022 |
|||||||||||||||||||||||
| Q4 |
Q3 |
Q2 |
Q1 |
Q4 |
Q3 |
Q2 |
Q1 |
|||||||||||||||||
| Service Revenue Growth |
14.7% |
19.0% |
19.4% |
22.9% |
19.6% |
22.1% |
20.4% |
20.0% | ||||||||||||||||
Within any year, while we add new customers, we also have customers from the prior year whose service orders may not repeat for any number of factors. Among those factors are variations in the timing of periodic calibrations and other services, customer capital expenditures and customer outsourcing decisions. Because the timing of Service segment orders can vary on a quarter-to-quarter basis, we believe a trailing twelve-month trend provides a better indication of the progress of this segment.
The growth in fiscal year 2023 and fiscal year 2022 reflected both organic growth and acquisitions. The growth in Service segment revenue in fiscal year 2023 includes revenue from Alliance, e2b and Complete Calibration. The growth in Service segment revenue in fiscal year 2022 includes revenue from NEXA and Tangent.
The following table presents the trailing twelve-month Service segment revenue for each quarter in fiscal years 2023 and 2022 as well as the trailing twelve-month revenue growth as a comparison to that of the prior fiscal year period:
| FY 2023 |
FY 2022 |
|||||||||||||||||||||||||||||||
| Q4 |
Q3 |
Q2 |
Q1 |
Q4 |
Q3 |
Q2 |
Q1 |
|||||||||||||||||||||||||
| Trailing Twelve-Month: |
||||||||||||||||||||||||||||||||
| Service Revenue |
$ | 144,883 | $ | 139,787 | $ | 134,047 | $ | 128,324 | $ | 122,005 | $ | 116,315 | $ | 110,854 | $ | 105,864 | ||||||||||||||||
| Service Revenue Growth |
18.8 | % | 20.2 | % | 20.9 | % | 21.2 | % | 20.5 | % | 19.5 | % | 17.2 | % | 13.1 | % | ||||||||||||||||
Our strategy has been to focus our investments in the core electrical, temperature, pressure, physical/dimensional and radio frequency/microwave calibration disciplines. We expect to subcontract approximately 13% to 15% of our Service revenue to third-party vendors for calibration beyond our chosen scope of capabilities. We continually evaluate our outsourcing needs and make capital investments, as deemed necessary, to add more in-house capabilities and reduce the need for third-party vendors. Capability expansion through business acquisitions is another way that we seek to reduce the need for outsourcing. The following table presents the source of our Service revenue and the percentage of Service revenue derived from each source for each quarter during fiscal years 2023 and 2022:
| FY 2023 |
FY 2022 |
|||||||||||||||||||||||||||||||
| Q4 |
Q3 |
Q2 |
Q1 |
Q4 |
Q3 |
Q2 |
Q1 |
|||||||||||||||||||||||||
| In-House |
86.9 | % | 86.2 | % | 86.2 | % | 85.4% |
85.4 | % | 84.1 | % | 83.2 | % | 83.1% |
||||||||||||||||||
| Outsourced |
11.9 | % | 12.6 | % | 12.6 | % | 13.2% |
13.1 | % | 14.4 | % | 15.3 | % | 15.4% |
||||||||||||||||||
| Freight Billed to Customers |
1.2 | % | 1.2 | % | 1.2 | % | 1.4% |
1.5 | % | 1.5 | % | 1.5 | % | 1.5% |
||||||||||||||||||
| 100.0 | % | 100.0 | % | 100.0 | % | 100.0% |
100.0 | % | 100.0 | % | 100.0 | % | 100.0% |
|||||||||||||||||||
Our Distribution sales accounted for 37.2% and 40.5% of our total revenue in fiscal years 2023 and 2022, respectively. Distribution sales increased $2.7 million, or 3.3% in fiscal year 2023 compared to fiscal year 2022. This increase in sales was primarily due to strong demand for rental orders. The increase in sales in fiscal year 2023 were all organic. The change in fiscal year 2022 versus fiscal year 2021 reflected both organic and an easier comparison to fiscal year 2021, which was adversely impacted by the COVID-19 pandemic. Our fiscal years 2023 and 2022 Distribution sales growth in relation to prior fiscal year quarter comparisons were as follows:
| FY 2023 |
FY 2022 |
|||||||||||||||||||||||||||||||
| Q4 |
Q3 |
Q2 |
Q1 |
Q4 |
Q3 |
Q2 |
Q1 |
|||||||||||||||||||||||||
| Distribution Sales Growth |
5.1% |
3.7% |
1.6% |
2.7% |
7.2% |
7.2% |
22.2% |
27.0% |
||||||||||||||||||||||||
Distribution sales orders include orders for instruments that we routinely stock in our inventory, customized products, and other products ordered less frequently, which we do not stock. Backorders are the total dollar value of orders received for which revenue has not yet been recognized. Pending product shipments are primarily backorders, but also include the total dollar value of products that are requested to be calibrated in our service centers prior to shipment, orders required by the customer to be shipped complete or at a future date, and other orders awaiting final credit or management review prior to shipment. Management uses pending product shipments and backorders as measures of our future business performance and financial performance within the distribution segment.
Our total pending product shipments increased $0.4 million, or 4.6%, at the end of fiscal year 2023 compared to the end of fiscal year 2022. Backorders at the end of fiscal year 2023 were $6.9 million, compared to $6.4 million at the end of fiscal year 2022. The year-over-year increase in pending product shipments was a result of the disruption to the supply of products as well as increased orders.
The following table presents the percentage of total pending product shipments that were backorders at the end of each quarter in fiscal years 2023 and 2022 and our historical trend of total pending product shipments:
| FY 2023 |
FY 2022 |
|||||||||||||||||||||||||||||||
| Q4 |
Q3 |
Q2 |
Q1 |
Q4 |
Q3 |
Q2 |
Q1 |
|||||||||||||||||||||||||
| Total Pending Product Shipments |
$8,101 |
$9,543 |
$9,116 |
$9,034 |
$7,747 |
$8,943 |
$7,707 |
$8,272 |
||||||||||||||||||||||||
| % of Pending Product Shipments that were Backorders |
84.8% |
78.4% |
80.8% |
78.1% |
83.2% |
80.5% |
77.2% |
77.5% |
||||||||||||||||||||||||
Gross Profit:
| Fiscal Year Ended |
||||||||||||||||
| March 25, |
March 26, |
Change |
||||||||||||||
| 2023 |
2022 |
$ |
% |
|||||||||||||
| Gross Profit: |
||||||||||||||||
| Service |
$ | 46,638 | $ | 38,921 | $ | 7,717 | 19.8 | % | ||||||||
| Distribution |
21,717 | 19,518 | 2,199 | 11.3 | % | |||||||||||
| Total |
$ | 68,355 | $ | 58,439 | $ | 9,916 | 17.0 | % | ||||||||
Total gross profit in fiscal year 2023 was $68.4 million compared to $58.4 million in fiscal year 2022, an increase of $9.9 million or 17.0%. As a percentage of total revenue, total gross margin was 29.6% in fiscal year 2023 compared to 28.5% in fiscal year 2022, a 110 basis point increase.
Service gross profit was $46.6 million, an increase of $7.7 million, or 19.8%, from fiscal year 2022 to fiscal year 2023. Our annual and quarterly Service segment gross margins are a function of several factors. Our organic Service revenue growth provides some incremental gross margin growth by leveraging certain fixed costs of this segment. The mix of services provided to customers may also affect gross margins in any given period. Service gross margin increased by 30 basis points in fiscal year 2023 versus fiscal year 2022. This increase in service gross margin in fiscal year 2023 was the result of improved productivity offset by increased start-up costs from new client-based lab implementations.
The following table presents the quarterly historical trend of our Service gross margin as a percent of Service revenue:
| FY 2023 |
FY 2022 |
|||||||||||||||||||||||
| Q4 |
Q3 |
Q2 |
Q1 |
Q4 |
Q3 |
Q2 |
Q1 |
|||||||||||||||||
| Service Gross Margin |
34.0% |
30.0% |
32.6% |
32.0% |
33.1% |
29.7% |
32.9% |
31.8% |
||||||||||||||||
Our Distribution gross margin includes net sales less the direct cost of inventory sold and the direct costs of equipment rental revenues, primarily depreciation expense for the fixed assets in our rental equipment pool, as well as the impact of rebates and cooperative advertising income we receive from vendors, freight billed to customers, freight expenses and direct shipping costs. During fiscal year 2023, we saw a decrease in the rebates offered by our vendors. We recorded vendor rebates of $0.6 million and $1.0 million in fiscal years 2023 and 2022, respectively, as a reduction of cost of Distribution sales. In general, our Distribution gross margin can vary based upon the mix of products sold, price discounting, the timing of periodic vendor rebates offered and cooperative advertising programs from suppliers.
The following table reflects the quarterly historical trend of our Distribution gross margin as a percent of Distribution sales:
| FY 2023 |
FY 2022 |
|||||||||||||||||||||||
| Q4 |
Q3 |
Q2 |
Q1 |
Q4 |
Q3 |
Q2 |
Q1 |
|||||||||||||||||
| Distribution Gross Margin |
25.2% |
26.2% |
24.9% |
25.0% |
24.5% |
22.5% |
23.5% |
23.6% |
||||||||||||||||
Distribution segment gross margin increased 180 basis points in fiscal year 2023 compared to fiscal year 2022. The increase in segment gross margin was primarily due to a favorable mix of products sold, strong demand for our higher-margin products sold and rented.
Operating Expenses:
| Fiscal Year Ended |
||||||||||||||||
| March 25, |
March 26, |
Change |
||||||||||||||
| 2023 |
2022 |
$ |
% |
|||||||||||||
| Operating Expenses: |
||||||||||||||||
| Selling, Marketing and Warehouse |
$ | 24,761 | $ | 20,649 | $ | 4,112 | 19.9 | % | ||||||||
| General and Administrative |
27,346 | 23,647 | 3,699 | 15.6 | % | |||||||||||
| Total |
$ | 52,107 | $ | 44,296 | $ | 7,811 | 17.6 | % | ||||||||
Total operating expenses were $52.1 million in fiscal year 2023 compared to $44.3 million in fiscal year 2022. This represented an increase of $7.8 million, or 17.6%, compared to fiscal year 2022. As a percentage of total revenue, operating expenses increased 100 basis points from 21.6% in fiscal year 2022 to 22.6% in fiscal year 2023. The year-over-year increase in selling, marketing and warehouse expenses is due to increased expenses related to recent acquisitions, especially acquisition related amortization expense, and higher incentive-based employee costs due to higher sales. The increase in general and administrative expenses includes incremental expenses related to acquired companies, increased payroll costs for new employees and continued investments in technology.
Provision for Income Taxes:
| Fiscal Year Ended |
||||||||||||||||
| March 25, |
March 26, |
Change |
||||||||||||||
| 2023 |
2022 |
$ |
% |
|||||||||||||
| Provision for Income Taxes |
$ | 2,799 | $ | 1,810 | $ | 989 | 54.6% |
|||||||||
Our effective tax rate for fiscal years 2023 and 2022 was 20.8% and 13.7%, respectively. The increase in tax rate is due to the lower discrete tax benefits from share-based compensation activity. Our provision for income taxes is affected by discrete items that may occur in any given period but are not consistent from year to year. The discrete benefits related to share-based compensation activity in fiscal years 2023 and 2022 were $0.4 million and $1.4 million, respectively. We continue to evaluate our tax provision on a quarterly basis and adjust, as deemed necessary, our effective tax rate given changes in facts and circumstances expected in the future.
We expect to receive certain federal, state, Canadian and Irish tax credits in future years. We also expect to receive discrete tax benefits related to share-based compensation awards in fiscal year 2024. As such, we expect our effective tax rate in fiscal year 2024 to be between 21.0% and 23.0%.
Net Income:
| Fiscal Year Ended |
||||||||||||||||
| March 25, | March 26, | Change | ||||||||||||||
| 2023 |
2022 |
$ |
% |
|||||||||||||
| Net Income |
$ | 10,688 | $ | 11,380 | $ | (692 | ) | (6.1)% |
||||||||
Net income for fiscal year 2023 decreased by $0.7 million or 6.1% compared to fiscal year 2022. As a percentage of revenue, net income was 4.6% in fiscal year 2023, down from 5.6% in fiscal year 2022. This year-over-year change reflects higher operating income discussed offset by higher interest expense and a higher provision for income taxes.
Adjusted EBITDA:
In addition to reporting net income, a GAAP measure, we present Adjusted EBITDA (earnings before interest, income taxes, depreciation and amortization, non-cash stock compensation expense, acquisition related transaction expenses, non-cash loss on sale of building, and restructuring expense), which is a non-GAAP measure. Our management believes Adjusted EBITDA is an important measure of our operating performance because it allows management, investors and others to evaluate and compare the performance of our core operations from period to period by removing the impact of the capital structure (interest), tangible and intangible asset base (depreciation and amortization), taxes, stock-based compensation expense and other items, which is not always commensurate with the reporting period in which it is included. As such, our management uses Adjusted EBITDA as a measure of performance when evaluating our business segments and as a basis for planning and forecasting. Adjusted EBITDA is also commonly used by rating agencies, lenders and other parties to evaluate our credit worthiness.
Adjusted EBITDA is not a measure of financial performance under GAAP and is not calculated through the application of GAAP. As such, it should not be considered as a substitute or alternative for the GAAP measure of net income and, therefore, should not be used in isolation of, but in conjunction with, the GAAP measure. Adjusted EBITDA, as presented, may produce results that vary from the GAAP measure and may not be comparable to a similarly defined non-GAAP measure used by other companies.
| Fiscal Year Ended |
||||||||
| March 25, |
March 26, |
|||||||
| 2023 |
2022 |
|||||||
| Net Income |
$ | 10,688 | $ | 11,380 | ||||
| + Interest Expense |
2,417 | 810 | ||||||
| + Other Expense |
344 | 143 | ||||||
| + Tax Provision |
2,799 | 1,810 | ||||||
| Operating Income |
16,248 | 14,143 | ||||||
| + Depreciation & Amortization |
10,955 | 9,077 | ||||||
| + Transaction Expense |
185 | 902 | ||||||
| + Other Expense |
(344 | ) | (143 | ) | ||||
| + Noncash Stock Compensation |
3,377 | 2,328 | ||||||
| Adjusted EBITDA |
$ | 30,421 | $ | 26,307 | ||||
During fiscal year 2023, Adjusted EBITDA was $30.4 million, an increase of $4.1 million or 15.6% compared to fiscal year 2022. As a percentage of revenue, Adjusted EBITDA was 13.2% during fiscal year 2023 versus 12.8% during fiscal year 2022, a 40 basis point increase. The increase in Adjusted EBITDA during fiscal year 2023 was primarily driven by the increase in operating income, depreciation and amortization expense and non-cash stock compensation expense.
Adjusted Diluted Earnings Per Share:
In addition to reporting Diluted Earnings Per Share, a GAAP measure, we present Adjusted Diluted Earnings Per Share (net income plus acquisition related amortization expense, acquisition related transaction expenses, acquisition related stock-based compensation, acquisition amortization of backlog and restructuring expense, on a diluted per share basis), which is a non-GAAP measure. Our management believes Adjusted Diluted Earnings Per Share is an important measure of our operating performance because it provides a basis for comparison of our business operations between current, past and future periods by excluding items that we do not believe are indicative of our core operating performance.
Adjusted Diluted Earnings Per Share is not a measure of financial performance under GAAP and is not calculated through the application of GAAP. As such, it should not be considered as a substitute or alternative for the GAAP measure of Diluted Earnings Per Share and, therefore, should not be used in isolation of, but in conjunction with, the GAAP measure. Adjusted Diluted Earnings Per Share, as presented, may produce results that vary from the GAAP measure and may not be comparable to a similarly defined non-GAAP measure used by other companies.
| Fiscal Year Ended |
||||||||
| March 25, |
March 26, |
|||||||
| 2023 |
2022 |
|||||||
| Net Income |
$ | 10,688 | $ | 11,380 | ||||
| + Amortization of Intangible Assets |
4,454 | 3,394 | ||||||
| + Acquisition Amortization of Backlog |
- | 490 | ||||||
| + Acquisition Deal Costs |
1,018 | 1,458 | ||||||
| + Income Tax Effect @ 25% |
(1,368 | ) | (1,335 | ) | ||||
| Adjusted Net Income |
14,792 | 15,387 | ||||||
| Average Diluted Shares Outstanding |
7,645 | 7,589 | ||||||
| Diluted Earnings Per Share – GAAP |
$ | 1.40 | $ | 1.50 | ||||
| Adjusted Diluted Earnings Per Share |
$ | 1.93 | $ | 2.03 | ||||
LIQUIDITY AND CAPITAL RESOURCES
We expect that foreseeable liquidity and capital resource requirements will be met through anticipated cash flows from operations and borrowings from our Revolving Credit Facility (as defined below).
On July 7, 2021, we entered into the Second Amended and Restated Credit Facility Agreement (the “2021 Credit Agreement”) with Manufacturers and Traders Trust Company (“M&T”), that amended and restated in its entirety the Company’s Amended and Restated Credit Facility Agreement dated as of October 30, 2017, as amended by Amended and Restated Credit Facility Agreement Amendment 1 dated December 10, 2018 and Amended and Restated Credit Facility Agreement Amendment 2 (“Amendment Two”) dated May 18, 2020 (as amended, the “Prior Credit Agreement”).
The 2021 Credit Agreement increased the revolving credit commitment (the “Revolving Credit Commitment”) from $40.0 million to $80.0 million, with a letter of credit subfacility increased from $2.0 million to $10.0 million, and extended the term of the Revolving Credit Commitment to June 2026. The 2021 Credit Agreement amended the definition of Applicable Margin (formerly Applicable Rate under the Prior Credit Agreement), which is based upon our then current leverage ratio and is used to determine interest charges on outstanding and unused borrowings under the revolving credit facility; the amendments reduced the Applicable Margins payable at the two highest leverage ratio levels. The 2021 Credit Agreement also amended the definition of Permitted Acquisitions, that is, acquisitions which are permitted under, and may be financed with proceeds of, the revolving credit facility, including increasing the aggregate purchase price for acquisitions consummated in any fiscal year from $1.0 million to $65.0 million during fiscal year 2022 and $50.0 million during fiscal year 2023 and any subsequent fiscal year, and adding an aggregate purchase price of $40.0 million for acquisitions consummated at any time during the term of the 2021 Credit Agreement related to businesses with a principal place of business located in the United Kingdom or the European Union.
In addition, the 2021 Credit Agreement provides that, assuming no event of default, restricted payments up to $25.0 million (increased from $10.0 million in the Prior Credit Agreement) in the aggregate and $10.0 million (increased from $3.0 million in the Prior Credit Agreement) in any single fiscal year may be used by us to repurchase our shares and pay dividends. The 2021 Credit Agreement modified the leverage ratio and fixed charge coverage ratio covenants with which we are required to comply. The 2021 Credit Agreement also reduced the London Interbank Offered Rate ("LIBOR") floor from 1.0% to 0.25% and included a mechanism for adoption of a different benchmark rate upon the discontinuation of LIBOR. The 2021 Credit Agreement also reduced the fixed interest rate on our term loan in the amount of $15.0 million (the “2018 Term Loan”) from 4.15% to 3.90%.
The 2021 Credit Agreement superseded in its entirety, the Prior Credit Agreement. Amendment Two to the Prior Credit Agreement had previously extended the term of the revolving credit facility to October 20, 2022 and increased the revolving credit commitment to $40.0 million.
Amendment Two had modified the definition of the applicable rate used to determine interest charges on outstanding and unused borrowings under the revolving credit facility and it amended the definition of permitted acquisitions to amend borrowings available under the revolving credit facility for acquisitions. In addition, Amendment Two had amended the definition of restricted payments to exclude amounts up to $2.5 million during each fiscal year used to pay certain employee tax obligations associated with share-based payment and stock option activity, and modified certain restrictions to our ability to repurchase our shares and pay dividends. Amendment Two also had modified the leverage ratio and fixed charge coverage ratio covenants with which we were required to comply and limited capital expenditures to $5.5 million for fiscal year 2021. Amendment Two also had established a LIBOR floor of 1.0% and included a mechanism for adoption of a different benchmark rate in the event LIBOR was discontinued.
As of March 25, 2023, $80.0 million was available under the revolving credit facility, of which $42.7 million was outstanding and included in long-term debt on the Consolidated Balance Sheets. During fiscal year 2023 and 2022 we used $9.1 million and $29.8 million, respectively, for business acquisitions.
As of March 25, 2023, $6.4 million was outstanding on the 2018 Term Loan, of which $2.2 million was included in current liabilities on the Consolidated Balance Sheets with the remainder included in long-term debt. The 2018 Term Loan requires total repayments (principal plus interest) of $0.2 million per month through December 2025.
Pursuant to the Prior Credit Agreement, we were required to comply with a fixed charge ratio covenant and a leverage ratio covenant, which were modified by the 2021 Credit Agreement. The allowable leverage ratio under the Prior Credit Agreement for the first quarter of fiscal year 2022 was a maximum multiple of 4.0 of total debt outstanding compared to EBITDA and non-cash stock-based compensation expense for the preceding four consecutive fiscal quarters. The Prior Credit Agreement also had provided that the trailing twelve-month pro forma EBITDA of an acquired business was included in the allowable leverage calculation. After the first quarter of fiscal year 2022, pursuant to the 2021 Credit Agreement, the allowable leverage ratio is a maximum multiple of 3.0. We were in compliance with all loan covenants and requirements during fiscal years 2023 and 2022. Our leverage ratio, as defined in the 2021 Credit Agreement, was 1.60 at March 25, 2023, compared with 1.74 at March 26, 2022.
Interest on the revolving credit facility continues to accrue, at our election, at either the variable one-month LIBOR or a fixed rate for a designated period at the LIBOR corresponding to such period (subject to a 1.0% floor during the first quarter of fiscal year 2022 and a 0.25% floor for subsequent periods), in each case, plus a margin. Interest on outstanding borrowings under the 2018 Term Loan accrued at a fixed rate of 4.15% during the first quarter of fiscal year 2022 and accrued or will accrue at a fixed rate of 3.90% over the term of the loan for subsequent periods. Unused fees accrue based on the average daily amount of unused credit available on the revolving credit facility. Interest rate margins and unused fees are determined on a quarterly basis based upon our calculated leverage ratio.
On March 27, 2020, the Coronavirus Aid, Relief and Economic Security (“CARES”) Act was enacted. The CARES Act included a provision that allows the Company to defer the employer portion of social security payroll tax payments that would have been paid between the enactment date and December 31, 2020, with 50% payable by December 31, 2021 and 50% payable by December 31, 2022. During fiscal year 2021, the Company deferred $2.0 million of employer social security payroll taxes. The Company repaid $1.0 million of the deferred amounts and during each of fiscal year 2023 and fiscal year 2022.
Cash Flows: The following table is a summary of our Consolidated Statements of Cash Flows (dollars in thousands):
| Fiscal Year Ended |
||||||||
| March 25, |
March 26, |
|||||||
| 2023 |
2022 |
|||||||
| Cash Provided by (Used in): |
||||||||
| Operating Activities |
$ | 16,951 | $ | 17,618 | ||||
| Investing Activities |
$ | (18,513 | ) | $ | (39,851 | ) | ||
| Financing Activities |
$ | 876 | $ | 23,694 | ||||
Operating Activities: Net cash provided by operating activities was $17.0 million during fiscal year 2023 compared to $17.6 million during fiscal year 2022. The year-over-year decrease in cash provided by operations is primarily the result of changes in net working capital (defined as current assets less current liabilities). The significant working capital fluctuations were as follows:
| ● |
Receivables: Accounts receivable increased by a net amount of $5.0 million during fiscal year 2023, inclusive of $0.8 million of accounts receivable acquired as part of four acquisitions completed during the period. Accounts receivable increased by a net amount of $5.7 million during fiscal year 2022, inclusive of $2.8 million of accounts receivable acquired as part of three acquisitions completed during the period. The year-over-year change reflects the timing of collections. The following table illustrates our days sales outstanding as of March 25, 2023 and March 26, 2022: |
| As of |
||||||||
| March 25, |
March 26, |
|||||||
| 2023 |
2022 |
|||||||
| Net Sales, for the last two fiscal months |
$ | 46,679 | $ | 42,005 | ||||
| Accounts Receivable, net |
$ | 44,698 | $ | 39,737 | ||||
| Days Sales Outstanding |
57 | 57 | ||||||
| ● |
Inventory: Our inventory strategy includes making appropriate large quantity, high dollar purchases with key manufacturers for various reasons, including maximizing on-hand availability of key products, expanding the number of SKUs stocked in anticipation of customer demand, reducing backorders for products with long lead times and optimizing vendor purchase and sales volume discounts. As a result, inventory levels may vary from quarter-to-quarter based on the timing of these large orders in relation to our quarter end. |
Our inventory balance increased $4.2 million during fiscal year 2023. Our inventory balance increased $1.1 million during fiscal year 2022. The year-over-year change is a result of strategic inventory purchases during fiscal year 2023.
| ● |
Accounts Payable: Changes in accounts payable may or may not correlate with changes in inventory balances at any given quarter end due to the timing of vendor payments for inventory, as well as the timing of payments for outsourced Service vendors and capital expenditures. |
Accounts payable increased $1.7 million during fiscal year 2023, inclusive of $0.1 million of accounts payable acquired during the period. Accounts payable increased by $1.9 million during fiscal year 2022. The variance is largely due to the timing of inventory and capital expenditure purchases and other payments in the respective periods.
| ● |
Accrued Compensation and Other Current Liabilities: Accrued compensation and other current liabilities include, among other things, amounts paid to employees for non-equity performance-based compensation. At the end of any particular period, the amounts accrued for such compensation may vary due to many factors including, but not limited to, changes in expected performance levels, the performance measurement period, and the timing of payments to employees. |
During fiscal year 2023, accrued compensation and other liabilities decreased by $1.2 million, primarily due to reduced accrued incentives. During fiscal year 2022, accrued compensation and other liabilities increased by $1.0 million, inclusive of $0.5 million of accrued compensation and other liabilities acquired as part of three acquisitions completed during the period.
| ● |
Income Taxes Payable: In any given period, net working capital may be affected by the timing and amount of income tax payments. During fiscal year 2023, income taxes payable was consistent with the prior year. During fiscal year 2022, income taxes payable decreased by $0.4 million. The year-over-year difference is due to timing of income tax payments. |
Investing Activities: During fiscal year 2023, we invested $9.4 million in capital expenditures that was used primarily for customer-driven expansion of Service segment capabilities and capacity and our rental business.
During fiscal year 2022, we invested $10.2 million in capital expenditures that was used primarily for customer-driven expansion of Service segment capabilities and our rental business.
During fiscal year 2023, we used $9.1 million for business acquisitions. During fiscal year 2022, we used $29.8 million for business acquisitions.
During each of fiscal year 2023 and fiscal year 2022, no contingent consideration or other holdback amounts were paid related to a business acquisition.
Financing Activities: During fiscal year 2023, $2.8 million was borrowed from our revolving line of credit and $0.7 million in cash was generated from the issuance of common stock. In addition, we used $2.1 million for scheduled repayments of our term loan and $0.4 million for the “net” awarding of certain share awards to cover employee tax-withholding obligations for share award and stock option activity in fiscal year 2023, which is shown as a repurchase of shares of our common stock on our Consolidated Statements of Cash Flows.
During fiscal year 2022, $31.0 million was borrowed from the revolving line of credit and $1.5 million in cash was generated from the issuance of our common stock. In addition, we used $2.1 million for scheduled repayments of our term loan and $6.7 million for the “net” award of certain share awards to cover tax-withholding obligations for share award activity in the period which are shown as a repurchase of shares of our common stock on our Consolidated Statements of Cash Flows.
Recent Events
Effective March 27, 2023, we purchased all of the outstanding capital stock of TIC-MS, Inc. (“TIC-MS”), a Missouri based provider of calibration services. This transaction aligned with a key component of our acquisition strategy of targeting businesses that expand the depth and breadth of our Service capabilities. The total purchase price paid for TIC-MS was approximately $9.8 million, of which $2.9 million was paid in cash, including $0.5 million place in escrow for certain post-closing adjustments and indemnification claims, if any, and the issuance of 77,387 shares of our common stock valued at approximately $6.8 million. Pursuant to the purchase agreement, the purchase price will be subject to reduction by up to $0.5 million if a key customer relationship is not retained.
OUTLOOK
As we think ahead into fiscal year 2024, despite macroeconomic uncertainty that looms over the business world, we expect another year of growth and margin expansion across our Service channels. Our business continues to benefit from a predominately life science-oriented market, driven by high levels of regulation and recurring revenue streams, along with a growing rentals business that tends to perform well throughout various economic cycles including more challenged economic environments. In the year ahead, we expect organic Service revenue growth in the high single-digits and gross margin improvement to continue. We are investing in our high-growth NEXA business as well as new client-based labs, which will support additional organic revenue growth and margin expansion in the second half of the year but will temporarily weigh on year-over-year gross margin expansion in the first quarter of fiscal year 2024.
Accretive acquisitions that strengthen our fundamental value proposition will be a key component of our go-forward strategy. Our robust and diverse acquisition pipeline enables opportunities for us to expand addressable markets and increase our capabilities like we did with NEXA and the pipettes business.
We have generated consistent margin improvement over the past several years and we believe the improvement will continue. Automation of our calibration processes and overall process improvement will be key enablers to future margin expansion. We anticipate demonstrating more selling, general and administrative expense leverage in the second half of fiscal year 2024. We believe the Service segment has substantial runway ahead for growth, both organically and through acquisitions. We have a long history of generating sustainable value for our shareholders and providing a dynamic, rewarding workplace for our team.
We expect our income tax rate to range between 21.0% and 23.0% in fiscal year 2024. This estimate includes Federal, various state, Canadian and Irish income taxes and reflects the discrete tax accounting associated with share-based payment awards. Although the tax rate is consistent with recent years, there will be a difference in calendarization of the tax benefit from vesting of share-based payments in fiscal year 2024. These benefits are normally realized in the first quarter, but in fiscal year 2024, we will see the benefit in the second quarter, due to a timing difference of when the awards were made. In the first quarter of fiscal year 2023, this benefit positively impacted the tax rate by approximately 13% and we would expect a similar impact in second quarter of fiscal year 2024.
ITEM 7A. QUANTITATIVE AND QUALITATIVE DISCLOSURES ABOUT MARKET RISK
Our exposure to changes in interest rates results from our borrowing activities. In the event interest rates were to move by 1%, our yearly interest expense would increase or decrease by approximately $0.4 million assuming our average borrowing levels remained constant. As of March 25, 2023, $80.0 million was available under our revolving credit facility, of which $42.7 million was outstanding and included in long-term debt on the Consolidated Balance Sheets. As described above under “Liquidity and Capital Resources,” we also have a $15.0 million (original principal) term loan. The 2018 Term Loan is considered a fixed interest rate loan. As of March 25, 2023, $6.4 million was outstanding on the 2018 Term Loan and was included in long-term debt and current portion of long-term debt on the Consolidated Balance Sheets. The 2018 Term Loan requires total (principal and interest) repayments of $0.2 million per month.
At our option, we borrow from our revolving credit facility at the variable one-month LIBOR or at a fixed rate for a designated period at the LIBOR (subject to a 1.0% floor during the first quarter of fiscal year 2022 and a 0.25% floor for subsequent periods) corresponding to such period, in each case, plus a margin. Our interest rate margin is determined on a quarterly basis based upon our calculated leverage ratio. Our interest rate during fiscal year 2023 for our revolving credit facility ranged from 1.6% to 6.5%. Interest on outstanding borrowings on the 2018 Term Loan accrued at a fixed rate of 4.15% over the term of the loan during the first quarter of fiscal year 2022 and 3.90% over the term of the loan for subsequent periods. Our revolving credit facility includes a mechanism for adoption of a different benchmark rate upon the discontinuation of LIBOR. On March 25, 2023, we had no hedging arrangements in place for our revolving credit facility to limit our exposure to upward movements in interest rates.
FOREIGN CURRENCY
Approximately 90% of our total revenues for each of fiscal years 2023 and 2022 were denominated in U.S. dollars, with the remainder denominated in Canadian dollars and Euros. A 10% change in the value of the Canadian dollar to the U.S. dollar and the Euro to the U.S. dollar would impact our revenue by approximately 1%. We monitor the relationship between the U.S. and Canadian currencies and the U.S. and Euro currencies on a monthly basis and adjust sales prices for products and services sold in Canadian dollars or Euros as we believe to be appropriate.
We continually utilize short-term foreign exchange forward contracts to reduce the risk that future earnings denominated in Canadian dollars would be adversely affected by changes in currency exchange rates. We do not apply hedge accounting and therefore the net change in the fair value of the contracts, which totaled a gain of $0.4 million and a loss of less than $0.1 million during fiscal year 2023 and 2022, respectively, was recognized as a component of other expense in the Consolidated Statements of Income. The change in the fair value of the contracts is offset by the change in fair value on the underlying accounts receivables denominated in Canadian dollars being hedged. On March 25, 2023, we had a foreign exchange contract, which matured in April 2023, outstanding in the notional amount of $2.5 million. The foreign exchange contract was renewed in April 2023 and continues to be in place. We do not use hedging arrangements for speculative purposes.
ITEM 8. FINANCIAL STATEMENTS AND SUPPLEMENTARY DATA
INDEX TO FINANCIAL STATEMENTS
Management’s Annual Report on Internal Control over Financial Reporting
Our management is responsible for establishing and maintaining adequate internal control over financial reporting. Our internal control system was designed to provide reasonable assurance regarding the reliability of financial reporting and the preparation of financial statements for external purposes in accordance with generally accepted accounting principles in the United States of America. In designing and evaluating our internal control system, we recognize that any controls and procedures, no matter how well designed and operated, can provide only reasonable, not absolute, assurance of achieving the desired control objectives and that the effectiveness of any system has inherent limitations including, but not limited to, the possibility of human error and the circumvention or overriding of controls and procedures. Management, including the principal executive officer and the principal financial officer, is required to apply judgment in evaluating the cost-benefit relationship of possible controls and procedures. Because of the inherent limitations in a cost-effective control system, misstatements due to error or fraud may occur and not be detected in a timely manner.
An evaluation was performed under the supervision and with the participation of our management, including our principal executive officer and our principal financial officer, of the effectiveness of the design and operation of our procedures and internal control over financial reporting using the framework and criteria described in the Internal Control-Integrated Framework (2013) issued by the Committee of Sponsoring Organizations of the Treadway Commission. Based on this evaluation, our management, including our principal executive officer and our principal financial officer, concluded that our internal control over financial reporting was effective in providing reasonable assurance regarding the reliability of financial reporting and the preparation of our financial statements for external purposes in accordance with generally accepted accounting principles as of March 25, 2023.
Freed Maxick CPAs, P.C., our independent registered public accounting firm, has audited and reported on the consolidated financial statements of the Company and the Company’s internal control over financial reporting, as stated in their report included in this Annual Report on Form 10-K.
Report of Independent Registered Public Accounting Firm
To the Board of Directors and Shareholders
Transcat, Inc.
Rochester, New York
Opinions on the Financial Statements and Internal Control Over Financial Reporting
We have audited the accompanying consolidated balance sheets of Transcat, Inc. and subsidiaries (the Company) as of March 25, 2023 and March 26, 2022, and the related consolidated statements of income, comprehensive income, cash flows and changes in shareholders' equity for each of the three years in the period ended March 25, 2023, and the related notes to the consolidated financial statements (collectively, the financial statements). We also have audited the Company’s internal control over financial reporting as of March 25, 2023, based on criteria established in Internal Control — Integrated Framework issued by the Committee of Sponsoring Organizations of the Treadway Commission in 2013.
In our opinion, the financial statements referred to above present fairly, in all material respects, the financial position of the Company as of March 25, 2023 and March 26, 2022, and the results of its operations and its cash flows for each of the years in the three-year period ended March 25, 2023, in conformity with accounting principles generally accepted in the United States of America. Also in our opinion, the Company maintained, in all material respects, effective internal control over financial reporting as of March 25, 2023, based on criteria established in Internal Control — Integrated Framework issued by the Committee of Sponsoring Organizations of the Treadway Commission in 2013.
Basis for Opinions
The Company's management is responsible for these financial statements, for maintaining effective internal control over financial reporting, and for its assessment of the effectiveness of internal control over financial reporting, included in Management’s Annual Report on Internal Control over Financial Reporting. Our responsibility is to express an opinion on the Company's financial statements and an opinion on the company's internal control over financial reporting based on our audits. We are a public accounting firm registered with the Public Company Accounting Oversight Board (United States) (PCAOB) and are required to be independent with respect to the Company in accordance with U.S. federal securities laws and the applicable rules and regulations of the Securities and Exchange Commission and the PCAOB.
We conducted our audits in accordance with the standards of the PCAOB. Those standards require that we plan and perform the audits to obtain reasonable assurance about whether the financial statements are free of material misstatement, whether due to error or fraud, and whether effective internal control over financial reporting was maintained in all material respects.
Our audits of the financial statements included performing procedures to assess the risks of material misstatement of the financial statements, whether due to error or fraud, and performing procedures that respond to those risks. Such procedures included examining, on a test basis, evidence regarding the amounts and disclosures in the financial statements. Our audits also included evaluating the accounting principles used and significant estimates made by management, as well as evaluating the overall presentation of the financial statements. Our audit of internal control over financial reporting included obtaining an understanding of internal control over financial reporting, assessing the risk that a material weakness exists, and testing and evaluating the design and operating effectiveness of internal control based on the assessed risk. Our audits also included performing such other procedures as we considered necessary in the circumstances. We believe that our audits provide a reasonable basis for our opinions.
Definition and Limitations of Internal Control Over Financial Reporting
A company's internal control over financial reporting is a process designed to provide reasonable assurance regarding the reliability of financial reporting and the preparation of financial statements for external purposes in accordance with generally accepted accounting principles. A company's internal control over financial reporting includes those policies and procedures that (1) pertain to the maintenance of records that, in reasonable detail, accurately and fairly reflect the transactions and dispositions of the assets of the company; (2) provide reasonable assurance that transactions are recorded as necessary to permit preparation of financial statements in accordance with generally accepted accounting principles, and that receipts and expenditures of the company are being made only in accordance with authorizations of management and directors of the company; and (3) provide reasonable assurance regarding prevention or timely detection of unauthorized acquisition, use or disposition of the company's assets that could have a material effect on the financial statements.
Because of its inherent limitations, internal control over financial reporting may not prevent or detect misstatements. Also, projections of any evaluation of effectiveness to future periods are subject to the risk that controls may become inadequate because of changes in conditions, or that the degree of compliance with the policies or procedures may deteriorate.
Critical Audit Matters
The critical audit matters communicated below are matters arising from the current period audit of the financial statements that were communicated or required to be communicated to the audit committee and that: (1) relate to accounts or disclosures that are material to the financial statements and (2) involved our especially challenging, subjective or complex judgments. The communication of critical audit matters does not alter in any way our opinion on the financial statements, taken as a whole, and we are not, by communicating the critical audit matters below, providing separate opinions on the critical audit matters or on the accounts or disclosures to which they relate.
Business Combinations
Critical Audit Matter Description
As discussed in Notes 1 and 9 to the consolidated financial statements, during the year ended March 25, 2023, the Company completed multiple business combinations for an aggregate purchase of approximately $9.9 million. The Company applied the acquisition method of accounting for the acquisitions. Under this method, identifiable assets acquired, liabilities assumed, and consideration transferred are measured at their acquisition-date fair value. Assumptions used include the weighted-average cost of capital, risk free rate, asset volatility, customer attrition, as well as forecasted revenue and EBITDA. Aggregate intangible assets and goodwill represented an allocation of purchase price in the amount of $3.6 million and $5.1 million, respectively. As a result of a business combination in the prior year the Company is still obligated under a contingent consideration arrangement where the potential payout is up to $7,125,000.
The Company’s determination of the fair value of assets acquired and contingent consideration related to a prior acquisition is based upon assumptions of the future performance of the acquisitions and other factors. Due to the subjectivity involved we identified the fair value estimate of assets acquired and contingent consideration as a critical audit matter, which required a higher degree of auditor judgement as well as the use of professionals with specialized skill and knowledge. If, as a result of remeasurement, the value of the contingent consideration changes, any charges or income will be included in the Company’s Consolidated Statements of Income.
How the Critical Audit Matter Was Addressed in the Audit
Our audit procedures related to the estimation of fair value of assets acquired and contingent consideration associated with the business combinations included the following, among others:
| ● |
We obtained an understanding of the process and assumptions used by management to develop the estimate of the fair value of assets acquired and consideration transferred and reassessment of contingent consideration. |
|
| ● |
We obtained an understanding of management’s controls and tested the operating effectiveness of the controls. |
|
| ● |
We engaged an internal valuation specialist to test certain assumptions and approaches used. |
|
| ● |
We tested management’s measurement of fair value, including testing of the completeness and accuracy of source information used, mathematical accuracy of management’s calculations, and evaluated reasonableness and consistency of methodology and assumption. |
/s/ Freed Maxick CPAs, P.C.
We have served as the Company's auditor since 2012.
Rochester, New York
June 6, 2023
CONSOLIDATED STATEMENTS OF INCOME
(In Thousands, Except Per Share Amounts)
| For the Fiscal Years Ended |
||||||||||||
| March 25, |
March 26, |
March 27, |
||||||||||
| 2023 |
2022 |
2021 |
||||||||||
| Service Revenue |
$ | 144,883 | $ | 122,005 | $ | 101,274 | ||||||
| Distribution Sales |
85,686 | 82,954 | 72,061 | |||||||||
| Total Revenue |
230,569 | 204,959 | 173,335 | |||||||||
| Cost of Service Revenue |
98,245 | 83,084 | 70,579 | |||||||||
| Cost of Distribution Sales |
63,969 | 63,436 | 56,638 | |||||||||
| Total Cost of Revenue |
162,214 | 146,520 | 127,217 | |||||||||
| Gross Profit |
68,355 | 58,439 | 46,118 | |||||||||
| Selling, Marketing and Warehouse Expenses |
24,761 | 20,649 | 17,743 | |||||||||
| General and Administrative Expenses |
27,346 | 23,647 | 17,302 | |||||||||
| Total Operating Expenses |
52,107 | 44,296 | 35,045 | |||||||||
| Operating Income |
16,248 | 14,143 | 11,073 | |||||||||
| Interest and Other Expenses, net |
2,761 | 953 | 1,091 | |||||||||
| Income Before Provision for Income Taxes |
13,487 | 13,190 | 9,982 | |||||||||
| Provision for Income Taxes |
2,799 | 1,810 | 2,191 | |||||||||
| Net Income |
$ | 10,688 | $ | 11,380 | $ | 7,791 | ||||||
| Basic Earnings Per Share |
$ | 1.42 | $ | 1.52 | $ | 1.05 | ||||||
| Average Shares Outstanding |
7,551 | 7,496 | 7,423 | |||||||||
| Diluted Earnings Per Share |
$ | 1.40 | $ | 1.50 | $ | 1.03 | ||||||
| Average Shares Outstanding |
7,645 | 7,589 | 7,548 | |||||||||
See accompanying notes to consolidated financial statements.
CONSOLIDATED STATEMENTS OF COMPREHENSIVE INCOME
(In Thousands)
| For the Fiscal Years Ended |
||||||||||||
| March 25, |
March 26, |
March 27, |
||||||||||
| 2023 |
2022 |
2021 |
||||||||||
| Net Income |
$ | 10,688 | $ | 11,380 | $ | 7,791 | ||||||
| Other Comprehensive (Loss) Income: |
||||||||||||
| Currency Translation Adjustment |
(918 | ) | (207 | ) | 662 | |||||||
| Other, net of tax effects of $14, $(146) and $36 for the years ended March 25, 2023, March 26, 2022 and March 27, 2021 respectively. |
(49 | ) | 425 | (103 | ) | |||||||
| Total Other Comprehensive (Loss) Income |
(967 | ) | 218 | 559 | ||||||||
| Comprehensive Income |
$ | 9,721 | $ | 11,598 | $ | 8,350 | ||||||
See accompanying notes to consolidated financial statements.
CONSOLIDATED BALANCE SHEETS
(In Thousands, Except Share and Per Share Amounts)
| March 25, |
March 26, |
|||||||
| 2023 |
2022 |
|||||||
| ASSETS |
||||||||
| Current Assets: |
||||||||
| Cash |
$ | 1,531 | $ | 1,396 | ||||
| Accounts Receivable, less allowance for doubtful accounts of $457 and $460 as of March 25, 2023 and March 26, 2022, respectively |
44,698 | 39,737 | ||||||
| Other Receivables |
506 | 558 | ||||||
| Inventory, net |
16,929 | 12,712 | ||||||
| Prepaid Expenses and Other Current Assets |
3,935 | 5,301 | ||||||
| Total Current Assets |
67,599 | 59,704 | ||||||
| Property and Equipment, net |
29,064 | 26,439 | ||||||
| Goodwill |
69,360 | 65,074 | ||||||
| Intangible Assets, net |
13,799 | 14,692 | ||||||
| Right to Use Assets, net |
14,876 | 11,026 | ||||||
| Other Assets |
1,051 | 827 | ||||||
| Total Assets |
$ | 195,749 | $ | 177,762 | ||||
| LIABILITIES AND SHAREHOLDERS' EQUITY |
||||||||
| Current Liabilities: |
||||||||
| Accounts Payable |
$ | 15,869 | $ | 14,171 | ||||
| Accrued Compensation and Other Current Liabilities |
10,201 | 11,378 | ||||||
| Current Portion of Long-Term Debt |
2,248 | 2,161 | ||||||
| Total Current Liabilities |
28,318 | 27,710 | ||||||
| Long-Term Debt |
46,869 | 46,291 | ||||||
| Deferred Tax Liabilities, net |
6,538 | 6,724 | ||||||
| Lease Liabilities |
12,960 | 9,194 | ||||||
| Other Liabilities |
1,434 | 1,667 | ||||||
| Total Liabilities |
96,119 | 91,586 | ||||||
| Shareholders' Equity: |
||||||||
| Common Stock, par value $0.50 per share, 30,000,000 shares authorized; 7,562,604 and 7,529,078 shares issued and outstanding as of March 25, 2023 and March 26, 2022, respectively |
3,781 | 3,765 | ||||||
| Capital in Excess of Par Value |
27,886 | 23,900 | ||||||
| Accumulated Other Comprehensive Loss |
(1,200 | ) | (233 | ) | ||||
| Retained Earnings |
69,163 | 58,744 | ||||||
| Total Shareholders' Equity |
99,630 | 86,176 | ||||||
| Total Liabilities and Shareholders' Equity |
$ | 195,749 | $ | 177,762 | ||||
See accompanying notes to consolidated financial statements.
CONSOLIDATED STATEMENTS OF CASH FLOWS
(In Thousands)
| For the Fiscal Years Ended |
||||||||||||
| March 25, |
March 26, |
March 27, |
||||||||||
| 2023 |
2022 |
2021 |
||||||||||
| Cash Flows from Operating Activities: |
||||||||||||
| Net Income |
$ | 10,688 | $ | 11,380 | $ | 7,791 | ||||||
| Adjustments to Reconcile Net Income to Net Cash |
||||||||||||
| Provided by Operating Activities: |
||||||||||||
| Loss on Disposal of Property and Equipment |
88 | 88 | 136 | |||||||||
| Deferred Income Taxes |
(186 | ) | 559 | 176 | ||||||||
| Depreciation and Amortization |
10,955 | 9,567 | 7,580 | |||||||||
| Provision for Accounts Receivable and Inventory Reserves |
74 | 34 | 636 | |||||||||
| Stock-Based Compensation Expense |
3,377 | 2,329 | 1,513 | |||||||||
| Changes in Assets and Liabilities, net of acquisitions: |
||||||||||||
| Accounts Receivable and Other Receivables |
(5,226 | ) | (3,392 | ) | (1,796 | ) | ||||||
| Inventory |
(3,377 | ) | (122 | ) | 2,724 | |||||||
| Prepaid Expenses and Other Current Assets |
1,119 | (2,960 | ) | (725 | ) | |||||||
| Accounts Payable |
1,600 | 1,901 | 329 | |||||||||
| Accrued Compensation and Other Current Liabilities |
(2,161 | ) | (1,113 | ) | 4,943 | |||||||
| Income Taxes Payable |
- | (653 | ) | 332 | ||||||||
| Net Cash Provided by Operating Activities |
16,951 | 17,618 | 23,639 | |||||||||
| Cash Flows from Investing Activities: |
||||||||||||
| Purchase of Property and Equipment |
(9,414 | ) | (10,152 | ) | (6,617 | ) | ||||||
| Proceeds from Sale of Property and Equipment |
10 | 109 | 17 | |||||||||
| Business Acquisitions, net of cash acquired |
(9,109 | ) | (29,808 | ) | (3,551 | ) | ||||||
| Net Cash Used in Investing Activities |
(18,513 | ) | (39,851 | ) | (10,151 | ) | ||||||
| Cash Flows from Financing Activities: |
||||||||||||
| Proceeds from (Repayment of) Revolving Credit Facility, net |
2,786 | 31,005 | (8,801 | ) | ||||||||
| Repayments of Term Loan |
(2,121 | ) | (2,114 | ) | (1,982 | ) | ||||||
| Issuance of Common Stock |
658 | 1,486 | 1,177 | |||||||||
| Repurchase of Common Stock |
(447 | ) | (6,683 | ) | (3,049 | ) | ||||||
| Net Cash Provided by (Used In) Financing Activities |
876 | 23,694 | (12,655 | ) | ||||||||
| Effect of Exchange Rate Changes on Cash |
821 | (625 | ) | (772 | ) | |||||||
| Net Increase in Cash |
135 | 836 | 61 | |||||||||
| Cash at Beginning of Fiscal Year |
1,396 | 560 | 499 | |||||||||
| Cash at End of Fiscal Year |
$ | 1,531 | $ | 1,396 | $ | 560 | ||||||
| Supplemental Disclosures of Cash Flow Activity: |
||||||||||||
| Cash paid during the fiscal year for: |
||||||||||||
| Interest |
$ | 2,263 | $ | 780 | $ | 860 | ||||||
| Income Taxes |
$ | 1,116 | $ | 3,900 | $ | 1,759 | ||||||
| Supplemental Disclosure of Non-Cash Investing and Financing Activities: |
||||||||||||
| Common stock issued for acquisitions |
$ | 145 | $ | 2,368 | $ | - | ||||||
| Assets acquired and liabilities assumed in business combinations: |
||||||||||||
| Contingent consideration related to NEXA acquisition |
$ | - | $ | 153 | $ | - | ||||||
| Accrued holdback consideration related to acquisitions |
$ | 590 | $ | - | $ | - | ||||||
See accompanying notes to consolidated financial statements.
CONSOLIDATED STATEMENTS OF CHANGES IN SHAREHOLDERS’ EQUITY
(In Thousands, Except Per Share Amounts)
| Capital |
||||||||||||||||||||||||
| Common Stock |
In |
Accumulated |
||||||||||||||||||||||
| Issued |
Excess |
Other |
||||||||||||||||||||||
| $0.50 Par Value |
of Par |
Comprehensive |
Retained |
|||||||||||||||||||||
| Shares |
Amount |
Value |
Income (Loss) |
Earnings |
Total |
|||||||||||||||||||
| Balance as of March 28, 2020 |
7,381 | $ | 3,691 | $ | 17,929 | $ | (1,010 | ) | $ | 46,477 | $ | 67,087 | ||||||||||||
| Issuance of Common Stock |
57 | 29 | 1,148 | - | - | 1,177 | ||||||||||||||||||
| Repurchase of Common Stock |
(81 | ) | (41 | ) | (1,253 | ) | - | (1,755 | ) | (3,049 | ) | |||||||||||||
| Stock-Based Compensation |
101 | 50 | 1,463 | - | - | 1,513 | ||||||||||||||||||
| Other Comprehensive Income |
- | - | - | 559 | - | 559 | ||||||||||||||||||
| Net Income |
- | - | - | - | 7,791 | 7,791 | ||||||||||||||||||
| Balance as of March 27, 2021 |
7,458 | 3,729 | 19,287 | (451 | ) | 52,513 | 75,078 | |||||||||||||||||
| Issuance of Common Stock |
127 | 64 | 3,790 | - | - | 3,854 | ||||||||||||||||||
| Repurchase of Common Stock |
(111 | ) | (56 | ) | (1,478 | ) | - | (5,149 | ) | (6,683 | ) | |||||||||||||
| Stock-Based Compensation |
55 | 28 | 2,301 | - | - | 2,329 | ||||||||||||||||||
| Other Comprehensive Income |
- | - | - | 218 | - | 218 | ||||||||||||||||||
| Net Income |
- | - | - | - | 11,380 | 11,380 | ||||||||||||||||||
| Balance as of March 26, 2022 |
7,529 | 3,765 | 23,900 | (233 | ) | 58,744 | 86,176 | |||||||||||||||||
| Issuance of Common Stock |
14 | 6 | 797 | - | - | 803 | ||||||||||||||||||
| Repurchase of Common Stock |
(7 | ) | (3 | ) | (175 | ) | - | (269 | ) | (447 | ) | |||||||||||||
| Stock-Based Compensation |
26 | 13 | 3,364 | - | - | 3,377 | ||||||||||||||||||
| Other Comprehensive Loss |
- | - | - | (967 | ) | - | (967 | ) | ||||||||||||||||
| Net Income |
- | - | - | - | 10,688 | 10,688 | ||||||||||||||||||
| Balance as of March 25, 2023 |
7,562 | $ | 3,781 | $ | 27,886 | $ | (1,200 | ) | $ | 69,163 | $ | 99,630 | ||||||||||||
See accompanying notes to consolidated financial statements.
NOTES TO CONSOLIDATED FINANCIAL STATEMENTS
NOTE 1 – GENERAL
Description of Business: Transcat, Inc. (“Transcat,” “we,” “us,” “our” or the “Company”) is a leading provider of accredited calibration services, enterprise asset management services, and value-added distributor of professional grade handheld test, measurement and control instrumentation. The Company is focused on providing services and products to highly regulated industries, particularly the life science industry, which includes pharmaceutical, biotechnology, medical device and other FDA-regulated businesses. Additional industries served include industrial manufacturing; energy and utilities, including oil and gas; chemical manufacturing; FAA-regulated businesses, including aerospace and defense and other industries that require accuracy in their processes, confirmation of the capabilities of their equipment, and for which the risk of failure is very costly.
Principles of Consolidation: The consolidated financial statements of Transcat include the accounts of Transcat and the Company’s wholly-owned subsidiaries, Transcat Canada, Inc., WTT Real Estate Acquisition, LLC, Cal OpEx Limited (d/b/a Transcat Ireland), Cal OpEx Inc. (d/b/a NEXA EAM) and Tangent Labs LLC. All intercompany balances and transactions have been eliminated in consolidation.
Use of Estimates: The preparation of Transcat’s Consolidated Financial Statements in accordance with accounting principles generally accepted in the United States (“GAAP”) requires that the Company make estimates and assumptions that affect the reported amounts of assets and liabilities, and the disclosure of contingent assets and liabilities at the date of the financial statements, and the reported amounts of revenues and expenses during the reporting period. Significant estimates and assumptions are used for, but not limited to, allowance for doubtful accounts and returns, inventory reserves, estimated levels of achievement for performance-based restricted stock units, fair value of stock options, depreciable lives of fixed assets, estimated lives of major catalogs and intangible assets, fair value of the goodwill reporting units, and the valuation of assets acquired, liabilities assumed and consideration transferred in business acquisitions. Future events and their effects cannot be predicted with certainty; accordingly, accounting estimates require the exercise of judgment. The accounting estimates used in the preparation of the Consolidated Financial Statements may change as new events occur, as more experience is acquired, as additional information is obtained and as the operating environment changes. Actual results could differ from those estimates. Such changes and refinements in estimation methodologies are reflected in reported results of operations in the period in which the changes are made and, if material, their effects are disclosed in the Notes to the Consolidated Financial Statements.
Fiscal Year: Transcat operates on a 52/53-week fiscal year, ending the last Saturday in March. In a 52-week fiscal year, each of the four quarters is a 13-week period. In a 53-week fiscal year, the last quarter is a 14-week period. The fiscal years ended March 25, 2023 ("fiscal year 2023"), March 26, 2022 ("fiscal year 2022") and March 27, 2021 ("fiscal year 2021") all consisted of 52 weeks.
Accounts Receivable: Accounts receivable represent amounts due from customers in the ordinary course of business. These amounts are recorded net of the allowance for doubtful accounts and returns in the Consolidated Balance Sheets. The allowance for doubtful accounts is based upon the expected collectability of accounts receivable. The Company applies a specific formula to its accounts receivable aging, which may be adjusted on a specific account basis where the formula may not appropriately reserve for loss exposure. After all attempts to collect a receivable have failed, the receivable is written-off against the allowance for doubtful accounts. The returns reserve is calculated based upon the historical rate of returns applied to revenues over a specific timeframe. The returns reserve will increase or decrease as a result of changes in the level of revenue and/or the historical rate of returns.
Inventory: Inventory consists of products purchased for resale and is valued at the lower of average cost or net realizable value. Costs are determined using the average cost method of inventory valuation. The Company performs physical inventory counts and cycle counts on inventory throughout the year and adjusts the recorded balance to reflect the results. Inventory is reduced by a reserve for items not saleable at or above cost by applying a specific loss factor, based on historical experience, to specific categories of inventory. The Company evaluates the adequacy of the reserve on a quarterly basis. The Company had reserves for inventory losses totaling $0.3 million and $0.5 million at March 25, 2023 and March 26, 2022, respectively.
Property and Equipment, Depreciation and Amortization: Property and equipment are stated at cost. Depreciation and amortization are computed under the straight-line method over the following estimated useful lives:
| Years |
|||
| Machinery, Equipment and Software |
2 – 15 | ||
| Rental Equipment |
5 – 8 | ||
| Furniture and Fixtures |
3 – 10 | ||
| Leasehold Improvements |
2 – 12 |
Property and equipment determined to have no value are written off at their then remaining net book value. The Company capitalizes certain costs, including internal payroll costs incurred in the procurement and development of computer software used for internal purposes. Leasehold improvements are amortized under the straight-line method over the estimated useful life or the lease term, whichever is shorter. Maintenance and repairs are expensed as incurred. See Note 2 for further information on property and equipment.
Business Acquisitions: The Company applies the acquisition method of accounting for business acquisitions. Under the acquisition method, identifiable assets acquired, liabilities assumed and consideration transferred are measured at their acquisition-date fair value. The Company uses a valuation hierarchy, as further described under Fair Value of Financial Instruments below, to determine the fair values. Historically, we have relied, in part, upon the use of reports from third-party valuation specialists to assist in the estimation of fair values. Purchase price allocations are subject to revision within the measurement period, not to exceed one year from the date of acquisition. Costs to acquire a business may include, but are not limited to, fees for accounting, legal and valuation services, and are expensed as incurred in the Consolidated Statements of Income.
Goodwill and Intangible Assets: Goodwill represents the excess of the purchase price over the fair values of the underlying net assets of an acquired business. The Company tests goodwill for impairment for each reporting unit on an annual basis during the fourth quarter of its fiscal year, or immediately if conditions indicate that such impairment could exist. The Company is permitted, but not required, to qualitatively assess indicators of a reporting unit’s fair value to determine whether it is necessary to perform the two-step goodwill impairment test. If a quantitative test is deemed necessary, a discounted cash flow analysis is prepared to estimate fair value. The Company determined that no impairment was indicated as of March 25, 2023 and March 26, 2022.
The Company estimates the fair value of its reporting units using the fair market value measurement requirement. Intangible assets are evaluated for impairment when events or changes in business circumstances indicate that the carrying amount of the assets may not be fully recoverable. A summary of changes in the Company’s goodwill and intangible assets is as follows (amounts in thousands):
| Goodwill |
Intangible Assets |
|||||||||||||||||||||||
| Distribution |
Service |
Total |
Distribution |
Service |
Total |
|||||||||||||||||||
| Net Book Value as of March 28, 2020 |
$ | 11,454 | $ | 30,086 | $ | 41,540 | $ | 1,297 | $ | 6,680 | $ | 7,977 | ||||||||||||
| Additions |
4 | 1,075 | 1,079 | - | 2,030 | 2,030 | ||||||||||||||||||
| Amortization |
- | - | - | (377 | ) | (2,161 | ) | (2,538 | ) | |||||||||||||||
| Currency Translation Adjustment |
- | 653 | 653 | - | 44 | 44 | ||||||||||||||||||
| Net Book Value as of March 27, 2021 |
11,458 | 31,814 | 43,272 | 920 | 6,593 | 7,513 | ||||||||||||||||||
| Additions |
- | 21,749 | 21,749 | - | 11,060 | 11,060 | ||||||||||||||||||
| Amortization |
- | - | - | (273 | ) | (3,611 | ) | (3,884 | ) | |||||||||||||||
| Currency Translation Adjustment |
- | 53 | 53 | - | 3 | 3 | ||||||||||||||||||
| Net Book Value as of March 26, 2022 |
11,458 | 53,616 | 65,074 | 647 | 14,045 | 14,692 | ||||||||||||||||||
| Additions |
- | 5,094 | 5,094 | - | 3,576 | 3,576 | ||||||||||||||||||
| Measurement Period Adjustments |
- | (203 | ) | (203 | ) | - | - | - | ||||||||||||||||
| Amortization |
- | - | - | (199 | ) | (4,255 | ) | (4,454 | ) | |||||||||||||||
| Currency Translation Adjustment |
- | (605 | ) | (605 | ) | - | (15 | ) | (15 | ) | ||||||||||||||
| Net Book Value as of March 25, 2023 |
$ | 11,458 | $ | 57,902 | $ | 69,360 | $ | 448 | $ | 13,351 | $ | 13,799 | ||||||||||||
The intangible assets are being amortized on an accelerated basis over their estimated useful lives of up to 15 years. Amortization expense relating to intangible assets is expected to be $3.8 million in fiscal year 2024, $3.2 million in fiscal year 2025, $2.4 million in fiscal year 2026, $1.1 million in fiscal year 2027 and $0.8 million in fiscal year 2028.
Catalog Costs: Transcat capitalizes the cost of each master catalog mailed and amortizes the cost over the respective catalog’s estimated productive life. The Company reviews response results from catalog mailings on a continuous basis, and if warranted, modifies the period over which costs are recognized. The Company amortizes the cost of each master catalog over an eighteen-month period and amortizes the cost of each catalog supplement over a three-month period. Total unamortized catalog costs, included as a component of prepaid expenses and other current assets on the Consolidated Balance Sheets, were $0.1 million as of both March 25, 2023 and March 26, 2022.
Deferred Taxes: The Company recognizes deferred tax assets and liabilities for the expected future tax consequences of temporary differences between the consolidated financial statement carrying amounts and the tax bases of its assets and liabilities. Deferred income tax assets and liabilities are measured using enacted tax rates expected to apply to taxable income in the years in which those temporary differences are expected to be recovered or settled. The effect on deferred tax assets and liabilities of a change in income tax rates is recognized in the Consolidated Statements of Income in the period that includes the enactment date. The Company establishes valuation allowances if it believes that it is more-likely-than-not that some or all of its deferred tax assets will not be realized. See Note 4 for further discussion on income taxes.
Fair Value of Financial Instruments: Transcat has determined the fair value of debt and other financial instruments using a valuation hierarchy. The hierarchy, which prioritizes the inputs used in measuring fair value, consists of three levels. Level 1 uses observable inputs such as quoted prices in active markets; Level 2 uses inputs other than quoted prices in active markets that are either directly or indirectly observable; and Level 3, which is defined as unobservable inputs in which little or no market data exists, requires the Company to develop its own assumptions. The carrying amount of debt on the Consolidated Balance Sheets approximates fair value due to variable interest rate pricing on a portion of the debt with the balance bearing an interest rate approximating current market rates, and the carrying amounts for cash, accounts receivable and accounts payable approximate fair value due to their short-term nature. Investment assets, which fund the Company’s non-qualified deferred compensation plan, consist of mutual funds and are valued based on Level 1 inputs. At each of March 25, 2023 and March 26, 2022, investment assets totaled $0.2 million and are included as a component of other assets (non-current) on the Consolidated Balance Sheets.
Stock-Based Compensation: The Company measures the cost of services received in exchange for all equity awards granted, including stock options and restricted stock units, based on the fair market value of the award as of the grant date. The Company records compensation cost related to unvested equity awards by recognizing, on a straight-line basis, the unamortized grant date fair value over the remaining service period for awards expected to vest. Excess tax benefits for share-based award activity are reflected in the Consolidated Statements of Income as a component of the provision for income taxes. Excess tax benefits are realized benefits from tax deductions for exercised awards in excess of the deferred tax asset attributable to stock-based compensation costs for such awards. The Company did not capitalize any stock-based compensation costs as part of an asset. The Company estimates forfeiture rates based on its historical experience. During fiscal years 2023, 2022 and 2021, the Company recorded non-cash stock-based compensation cost in the amount of $3.4 million, $2.3 million and $1.5 million, respectively, in the Consolidated Statements of Income.
Revenue Recognition: Distribution sales are recorded when an order’s title and risk of loss transfers to the customer, which is generally upon shipment. The Company recognizes the majority of its Service revenue based upon when the calibration or other activity is performed and then shipped and/or delivered to the customer. The majority of the Company’s revenue generating activities have a single performance obligation and are recognized at the point in time when control transfers and/or our obligation has been fulfilled. Some Service revenue is generated from managing customers’ calibration programs in which the Company recognizes revenue over time using the output method-time elapsed as this portrays the transfer of control to the customer. Revenue is measured as the amount of consideration the Company expects to receive in exchange for product shipped or services performed. Sales taxes and other taxes billed and collected from customers are excluded from revenue. The Company generally invoices its customers for freight, shipping, and handling charges. Freight billed to customers is included in revenue. Shipping and handling is not included in revenue. Provisions for customer returns are provided for in the period the related revenue is recorded based upon historical data.
Under Topic 606 “Revenue from Contracts with Customers”, we use judgments that could potentially impact both the timing of our satisfaction of performance obligations and our determination of transaction prices used in determining revenue recognized. Such judgments include considerations in determining our transaction prices and when our performance obligations are satisfied for our standard product sales that include general payment terms that are between net 30 and 90 days.
Revenue recognized from prior period performance obligations for fiscal year 2023 was immaterial. As of March 25, 2023, the Company had no unsatisfied performance obligations for contracts with an original expected duration of greater than one year. Pursuant to Topic 606, the Company applied the practical expedient with respect to disclosure of the deferral and future expected timing of revenue recognition for transaction price allocated to remaining performance obligations. Deferred revenue, unbilled revenue and deferred contract costs recorded on our Consolidated Balance Sheets as of March 25, 2023 and March 26, 2022 were immaterial. See Note 7 for disaggregated revenue information.
Vendor Rebates: Vendor rebates are generally based on specified cumulative levels of purchases and/or incremental distribution sales and are recorded as a reduction of cost of distribution sales. Purchase rebates are calculated and recorded quarterly based upon the volume of purchases with specific vendors during the quarter. Point of sale rebate programs that are based on year-over-year sales performance on a calendar year basis are recorded as earned, on a quarterly basis, based upon the expected level of annual achievement. Point of sale rebate programs that are based on year-over-year sales performance on a quarterly basis are recorded as earned in the respective quarter. The Company recorded vendor rebates of $0.6 million, $1.0 million and $0.7 million in fiscal years 2023, 2022 and 2021, respectively, as a reduction of cost of distribution sales.
Cooperative Advertising Income: The Company participates in co-op advertising programs with certain of its vendors. The Company records cash consideration received from these vendors for advertising as a reduction of cost of distribution sales. The Company recorded consideration in the amount of $1.0 million, $0.8 million and $0.6 million in fiscal years 2023, 2022 and 2021, respectively, in connection with these programs.
Advertising Costs: Advertising costs, other than catalog costs, are expensed as they are incurred and are included in Selling, Marketing and Warehouse Expenses in the Consolidated Statements of Income. Advertising costs were approximately $1.2 million, $1.1 million and $0.9 million in fiscal years 2023, 2022 and 2021, respectively.
Shipping and Handling Costs: Freight expense and direct shipping costs are included in the cost of revenue. These costs totaled approximately $2.9 million, $2.7 million and $2.4 million in fiscal years 2023, 2022 and 2021, respectively. Direct handling costs, the majority of which represent direct compensation of employees who pick, pack, and prepare merchandise for shipment to customers, are reflected in selling, marketing and warehouse expenses. Direct handling costs were approximately $0.7 million, $0.8 million and $0.8 million in fiscal years 2023, 2022 and 2021, respectively.
Foreign Currency Translation and Transactions: The accounts of Cal OpEx Limited (d/b/a Transcat Ireland), an Irish company, and Transcat Canada Inc., both of which are wholly-owned subsidiaries of the Company, are maintained in the local currencies, the Euro and the Canadian dollar, respectively, and have been translated to U.S. dollars. Accordingly, the amounts representing assets and liabilities have been translated at the period-end rates of exchange and related revenue and expense accounts have been translated at an average rate of exchange during the period. Gains and losses arising from translation of Cal OpEx Limited’s and Transcat Canada Inc.’s financial statements into U.S. dollars are recorded directly to the accumulated other comprehensive loss component of shareholders’ equity.
Transcat records foreign currency gains and losses on business transactions denominated in foreign currency. The net foreign currency loss was $0.7 million in fiscal year 2023, a gain of $0.1 million in fiscal year 2022 and a loss of less than $0.1 million in fiscal year 2021. The Company continually utilizes short-term foreign exchange forward contracts to reduce the risk that its future earnings denominated in Canadian dollars would be adversely affected by changes in currency exchange rates. The Company does not apply hedge accounting and therefore the net change in the fair value of the contracts, which totaled a gain of $0.4 million, a loss of less than $0.1 million and a loss of less than $0.1 million in fiscal year 2023, 2022 and 2021, respectively, was recognized as a component of Interest and Other Expenses, net in the Consolidated Statements of Income. The change in the fair value of the contracts is offset by the change in fair value on the underlying accounts receivables denominated in Canadian dollars being hedged. On March 25, 2023, the Company had a foreign exchange contract, which matured in April 2022, outstanding in the notional amount of $2.5 million. This contract was subsequently renewed and remains in place. The Company does not use hedging arrangements for speculative purposes.
Other Comprehensive Income: Other comprehensive income is composed of currency translation adjustments, unrecognized prior service costs from post retirement plan, net of tax, and unrealized gains or losses on other assets, net of tax.
The Company determines the expense and obligations for its post-retirement plans using assumptions related to discount rates, expected long-term rates of return on invested plan assets, and certain other factors. The Company determines the fair value of plan assets and benefit obligations as of the end of each fiscal year. The unrecognized portion of the gain or loss on plan assets is included in the consolidated balance sheets as a component of accumulated other comprehensive loss in shareholders’ equity and is recognized into the plans’ expense over time. See Note 5 for further discussion on the Company’s post retirement plan.
The Company has a non-qualified deferred compensation plan for the benefit of certain management employees and non-employee directors. Investment assets, which fund the Company’s non-qualified deferred compensation plan, consist of mutual funds. The unrecognized portion of the gain or loss on plan assets is included in the Consolidated Statements of Income.
At March 25, 2023, accumulated other comprehensive loss consisted of cumulative currency translation losses of $1.1 million, unrecognized prior service costs, net of tax, of $0.1 million and an unrealized gain on other assets, net of tax, of less than $0.1 million.
At March 26, 2022, accumulated other comprehensive loss consisted of cumulative currency translation gains of $0.1 million, unrecognized prior service costs, net of tax, of $0.1 million and an unrealized gain on other assets, net of tax, of less than $0.1 million.
Earnings per Share: Basic earnings per share of common stock are computed based on the weighted average number of shares of common stock outstanding during the period. Diluted earnings per share of common stock reflect the assumed conversion of stock options and unvested restricted stock units using the treasury stock method in periods in which they have a dilutive effect. In computing the per share effect of assumed conversion, proceeds received from the exercise of options and unvested restricted stock units are considered to have been used to purchase shares of common stock at the average market prices during the period, and the resulting net additional shares of common stock are included in the calculation of average shares of common stock outstanding.
For each of fiscal years 2023, 2022 and 2021, the net additional common stock equivalents had a $(0.02) per share effect on the calculation of dilutive earnings per share. The average shares outstanding used to compute basic and diluted earnings per share are as follows (amounts in thousands):
| Fiscal Year Ended |
||||||||||||
| March 25, |
March 26, |
March 27, |
||||||||||
| 2023 |
2022 |
2021 |
||||||||||
| Average Shares Outstanding – Basic |
7,551 | 7,496 | 7,423 | |||||||||
| Effect of Dilutive Common Stock Equivalents |
94 | 93 | 125 | |||||||||
| Average Shares Outstanding – Diluted |
7,645 | 7,589 | 7,548 | |||||||||
| Anti-dilutive Common Stock Equivalents |
160 | 111 | - | |||||||||
Shareholders’ Equity: During fiscal years 2023, 2022 and 2021, the Company repurchased and subsequently retired less than 0.1 million shares, 0.1 million shares and 0.1 million shares, respectively, of its common stock. The Company allows its employees the option of satisfying the employee tax withholding obligations with either cash or a net share repurchase. The repurchase of shares was for the net awarding of certain share awards to cover employee tax-withholding obligations for share award and stock option activity, totaling $0.4 million in fiscal year 2023, $6.7 million in fiscal year 2022 and $3.1 million in fiscal year 2021. There were no stock option redemptions during fiscal year 2023, fiscal year 2022 or fiscal year 2021.
Recently Issued Accounting Pronouncements:
Credit Losses
In June 2016, the Financial Accounting Standard Board (“FASB”) issued ASU 2016-13, Financial Instruments - Credit Losses (Topic 326), which significantly changes how entities will measure credit losses for most financial assets and certain other instruments that are not measured at fair value through net income. The ASU replaces the “incurred loss” model with an “expected credit loss” model that requires entities to estimate an expected lifetime credit loss on financial assets, including trade accounts receivable. The ASU is effective for fiscal years, and interim periods within those fiscal years, beginning after December 15, 2022. Allowance for doubtful accounts is the most significant item for the Company under this ASU. As credit losses from the Company’s trade receivables have not historically been significant, the Company anticipates that the adoption of the ASU will not have a material impact on its consolidated financial statements.
Reclassification of Amounts: Certain reclassifications of financial information for prior fiscal years have been made to conform to the presentation for the current fiscal year.
NOTE 2 – PROPERTY AND EQUIPMENT
Property and equipment consists of (amounts in thousands):
| March 25, |
March 26, |
|||||||
| 2023 |
2022 |
|||||||
| Machinery, Equipment and Software |
$ | 59,689 | $ | 55,220 | ||||
| Rental Equipment |
10,000 | 8,214 | ||||||
| Furniture and Fixtures |
2,933 | 2,788 | ||||||
| Leasehold Improvements |
8,191 | 7,222 | ||||||
| Total Property and Equipment |
80,813 | 73,444 | ||||||
| Less: Accumulated Depreciation and Amortization |
(51,749 | ) | (47,005 | ) | ||||
| Total Property and Equipment, net |
$ | 29,064 | $ | 26,439 | ||||
Total depreciation and amortization expense relating to property and equipment amounted to $6.5 million, $5.7 million and $5.0 million in fiscal years 2023, 2022 and 2021, respectively.
NOTE 3 – LONG-TERM DEBT
On July 7, 2021, we entered into the Second Amended and Restated Credit Facility Agreement (the “2021 Credit Agreement”) with Manufacturers and Traders Trust Company (“M&T”), that amended and restated in its entirety the Company’s Amended and Restated Credit Facility Agreement dated as of October 30, 2017, as amended by Amended and Restated Credit Facility Agreement Amendment 1 dated December 10, 2018 and Amended and Restated Credit Facility Agreement Amendment 2 (“Amendment Two”) dated May 18, 2020 (as amended, the “Prior Credit Agreement”).
The 2021 Credit Agreement increased the revolving credit commitment (the “Revolving Credit Commitment”) from $40.0 million to $80.0 million, with a letter of credit subfacility increased from $2.0 million to $10.0 million, and extended the term of the Revolving Credit Commitment to June 2026. The 2021 Credit Agreement amended the definition of Applicable Margin (formerly Applicable Rate under the Prior Credit Agreement), which is based upon the Company’s then current leverage ratio and is used to determine interest charges on outstanding and unused borrowings under the revolving credit facility; the amendments reduced the Applicable Margins payable at the two highest leverage ratio levels. The 2021 Credit Agreement also amended the definition of Permitted Acquisitions, that is, acquisitions which are permitted under, and may be financed with proceeds of, the revolving credit facility, including increasing the aggregate purchase price for acquisitions consummated in any fiscal year from $1.0 million to $65.0 million during fiscal year 2022 and $50.0 million during fiscal year 2023 and any subsequent fiscal year, and adding an aggregate purchase price of $40.0 million for acquisitions consummated at any time during the term of the 2021 Credit Agreement related to businesses with a principal place of business located in the United Kingdom or the European Union.
In addition, the 2021 Credit Agreement provides that, assuming no event of default, restricted payments up to $25.0 million (increased from $10.0 million in the Prior Credit Agreement) in the aggregate and $10.0 million (increased from $3.0 million in the Prior Credit Agreement) in any single fiscal year may be used by us to repurchase our shares and pay dividends. The 2021 Credit Agreement modified the leverage ratio and fixed charge coverage ratio covenants with which we are required to comply. The 2021 Credit Agreement also reduced the London Interbank Offered Rate (“LIBOR”) floor from 1.0% to 0.25% and included a mechanism for adoption of a different benchmark rate upon the discontinuation of LIBOR. The 2021 Credit Agreement also reduced the fixed interest rate on our term loan in the amount of $15.0 million (the “2018 Term Loan”) from 4.15% to 3.90%.
The 2021 Credit Agreement superseded in its entirety, the Prior Credit Agreement. Amendment Two to the Prior Credit Agreement had previously extended the term of the revolving credit facility to October 20, 2022 and increased the revolving credit commitment to $40.0 million.
Amendment Two had modified the definition of the applicable rate used to determine interest charges on outstanding and unused borrowings under the revolving credit facility and it amended the definition of permitted acquisitions to amend borrowings available under the revolving credit facility for acquisitions. In addition, Amendment Two had amended the definition of restricted payments to exclude amounts up to $2.5 million during each fiscal year used to pay certain employee tax obligations associated with share-based payment and stock option activity, and modified certain restrictions to the Company’s ability to repurchase its shares and pay dividends. Amendment Two also had modified the leverage ratio and fixed charge coverage ratio covenants with which the Company was required to comply and limited capital expenditures to $5.5 million for fiscal year 2021. Amendment Two also had established a LIBOR floor of 1.0% and included a mechanism for adoption of a different benchmark rate in the event LIBOR was discontinued.
As of March 25, 2023, $80.0 million was available under the revolving credit facility, of which $42.7 million was outstanding and included in long-term debt on the Consolidated Balance Sheets. During fiscal year 2023, $9.1 million was used for four business acquisitions.
As of March 25, 2023, $6.4 million was outstanding on the 2018 Term Loan, of which $2.2 million was included in current liabilities on the Consolidated Balance Sheets with the remainder included in long-term debt. The 2018 Term Loan requires total repayments (principal plus interest) of $0.2 million per month through December 2025.
Interest and Other Costs: Interest on outstanding borrowings under the revolving credit facility accrue, at Transcat’s election, at either the variable one-month LIBOR or a fixed rate for a designated period at the LIBOR corresponding to such period (subject to a 1.0% floor during the first quarter of fiscal year 2022 and a 0.25% floor for subsequent periods), in each case, plus a margin. Interest on outstanding borrowings under the 2018 Term Loan accrued at a fixed rate of 4.15% over the term of the loan during the first quarter of fiscal year 2022 and accrued or will accrue at a fixed rate of 3.90% over the term of the loan for subsequent periods. Unused fees accrue based on the average daily amount of unused credit available on the revolving credit facility. Interest rate margins and unused fees are determined on a quarterly basis based upon the Company’s calculated leverage ratio. The Company’s interest rate for the revolving credit facility for fiscal year 2023 ranged from 1.6% to 6.5%.
Covenants: The 2021 Credit Agreement has certain covenants with which the Company must comply, including a fixed charge ratio covenant and a leverage ratio covenant. The Company was in compliance with all loan covenants and requirements during fiscal years 2023 and 2022. Our leverage ratio, as defined in the 2021 Credit Agreement, was 1.60 at March 25, 2023, compared with 1.74 at March 26, 2022.
Pursuant to the Prior Credit Agreement, we were required to comply with a fixed charge ratio covenant and a leverage ratio covenant, which were modified by the 2021 Credit Agreement. The allowable leverage ratio under the Prior Credit Agreement for the first quarter of fiscal year 2022 was a maximum multiple of 4.0 of total debt outstanding compared to EBITDA and non-cash stock-based compensation expense for the preceding four consecutive fiscal quarters. The Prior Credit Agreement also had provided that the trailing twelve-month pro forma EBITDA of an acquired business was included in the allowable leverage calculation. After the first quarter of fiscal year 2022, pursuant to the 2021 Credit Agreement, the allowable leverage ratio is a maximum multiple of 3.0.
Other Terms: The Company has pledged all of its U.S. tangible and intangible personal property, the equity interests of its U.S.-based subsidiaries, and a majority of the common stock of Transcat Canada Inc. as collateral security for the loans made under the revolving credit facility.
NOTE 4 – INCOME TAXES
Transcat’s income before income taxes on the Consolidated Statements of Income is as follows (amounts in thousands):
| FY 2023 |
FY 2022 |
FY 2021 |
||||||||||
| United States |
$ | 9,879 | $ | 10,417 | $ | 9,187 | ||||||
| Foreign |
3,608 | 2,773 | 795 | |||||||||
| Total |
$ | 13,487 | $ | 13,190 | $ | 9,982 | ||||||
The provision for income taxes for fiscal years 2023, 2022 and 2021 is as follows:
| FY 2023 |
FY 2022 |
FY 2021 |
||||||||||
| Current Tax Provision: |
||||||||||||
| Federal |
$ | 1,938 | $ | 414 | $ | 1,449 | ||||||
| State |
652 | 240 | 428 | |||||||||
| Foreign |
395 | 752 | 103 | |||||||||
| $ | 2,985 | $ | 1,406 | $ | 1,980 | |||||||
| Deferred Tax (Benefit) Provision: |
||||||||||||
| Federal |
$ | (334 | ) | $ | 456 | $ | 96 | |||||
| State |
(258 | ) | (10 | ) | (22 | ) | ||||||
| Foreign |
406 | (42 | ) | 137 | ||||||||
| $ | (186 | ) | $ | 404 | $ | 211 | ||||||
| Provision for Income Taxes |
$ | 2,799 | $ | 1,810 | $ | 2,191 | ||||||
A reconciliation of the income tax provision computed by applying the statutory U.S. federal income tax rate and the income tax provision reflected in the Consolidated Statements of Income is as follows (amounts in thousands):
| FY 2023 |
FY 2022 |
FY 2021 |
||||||||||
| Federal Income Tax at Statutory Rate |
$ | 2,832 | $ | 2,770 | $ | 2,096 | ||||||
| State Income Taxes, net of federal benefit |
311 | 172 | 282 | |||||||||
| Foreign Taxes and Federal, State and Foreign Tax Credits |
(56 | ) | (127 | ) | 9 | |||||||
| Tax Impact of Equity Awards |
(416 | ) | (1,395 | ) | (274 | ) | ||||||
| Non-Deductible Acquisition Costs |
6 | 206 | - | |||||||||
| GILTI and 78 Gross Up |
83 | 161 | - | |||||||||
| Other, net |
39 | 23 | 78 | |||||||||
| Total |
$ | 2,799 | $ | 1,810 | $ | 2,191 | ||||||
| March 25, |
March 26, |
|||||||
| 2023 |
2022 |
|||||||
| Deferred Tax Assets: |
||||||||
| Accrued Liabilities |
$ | 362 | $ | 384 | ||||
| Lease Liabilities |
1,916 | 2,622 | ||||||
| Performance-Based Stock Award Grants |
720 | 443 | ||||||
| Inventory Reserves |
70 | 100 | ||||||
| Non-Qualified Deferred Compensation Plan |
62 | 92 | ||||||
| Post-Retirement Health Care Plans |
323 | 333 | ||||||
| Stock-Based Compensation |
570 | 225 | ||||||
| Capitalized Inventory Costs |
214 | 158 | ||||||
| Other |
314 | 233 | ||||||
| Total Deferred Tax Assets |
$ | 4,551 | $ | 4,590 | ||||
| Deferred Tax Liabilities: |
||||||||
| Goodwill and Intangible Assets |
$ | (3,504 | ) | $ | (3,812 | ) | ||
| Right of Use Assets |
(1,957 | ) | (2,623 | ) | ||||
| Depreciation |
(5,462 | ) | (4,767 | ) | ||||
| Other |
(166 | ) | (112 | ) | ||||
| Total Deferred Tax Liabilities |
$ | (11,089 | ) | $ | (11,314 | ) | ||
| Net Deferred Tax Liabilities |
$ | (6,538 | ) | $ | (6,724 | ) | ||
The Company files income tax returns in the U.S. federal jurisdiction, various states, Canada and Ireland. The Company is no longer subject to examination by U.S. federal income tax authorities for fiscal years 2019 and prior, by state tax authorities for fiscal years 2017 and prior, by Canadian tax authorities for fiscal years 2017 and prior, and by Ireland tax authorities for calendar years 2018 and prior. There are no income tax years currently under examination by the Internal Revenue Service, Canadian and Irish tax authorities. One U.S. state has selected Transcat for analysis, the results of this analysis will determine if further action is required. The Company's foreign subsidiary undistributed earnings are considered to be permanently reinvested.
During fiscal years 2023, 2022 and 2021, there were no uncertain tax positions. No interest or penalties related to uncertain tax positions were recognized in fiscal years 2023, 2022 and 2021 or were accrued at March 25, 2023 and March 26, 2022.
The Company’s effective tax rate for fiscal years 2023, 2022 and 2021 was 20.8%, 13.7% and 21.9%, respectively. The tax rate is affected by recurring items, such as state income taxes and tax credits, which the Company expects to be fairly consistent in the near term. It is also affected by discrete items that may occur in any given year but are not consistent from year to year. The discrete benefits related to share-based compensation awards in each of fiscal years 2023, 2022 and 2021 were $0.4 million, $1.4 million and $0.3 million, respectively.
The Company expects to receive certain federal, state and Canadian tax credits in future years. The Company also expects to receive discrete tax benefits related to share-based compensation awards in fiscal year 2024. As such, it expects its effective tax rate in fiscal year 2024 to be between 21.0% and 23.0%.
NOTE 5 – EMPLOYEE BENEFIT PLANS
Defined Contribution Plan. All of Transcat’s U.S. based employees are eligible to participate in a defined contribution plan, the Long-Term Savings and Deferred Profit Sharing Plan (the “Plan”), provided they meet certain qualifications. In fiscal years 2023 and 2022, the Company matched 50% of the first 6% of pay that eligible employees contribute to the Plan. In response to the COVID-19 pandemic, the Company suspended the employer match to the Plan for the first six months of fiscal year 2021. In the second six months of fiscal year 2021, the Company matched 50% of the first 6% of pay that eligible employees contribute to the Plan.
In the long-term savings portion of the Plan (the “401K Plan”), plan participants are entitled to a distribution of their vested account balance upon termination of employment or retirement. Plan participants are fully vested in their contributions while Company contributions are fully vested after three years of service. The Company’s matching contributions to the 401K Plan were approximately $1.2 million, $1.1 million and $0.4 million in fiscal years 2023, 2022 and 2021, respectively.
In the deferred profit sharing portion of the Plan, Company contributions are made at the discretion of the Company’s Board of Directors. The Company made no profit sharing contributions in fiscal years 2023, 2022 and 2021.
Employee Stock Purchase Plan. The Company has an Employee Stock Purchase Plan (the “ESPP”) that allows for eligible employees as defined in the ESPP to purchase common shares of the Company through payroll deductions at a price that is 85% of the closing market price on the second last business day of each calendar month (the “Investment Date”). 650,000 shares can be purchased under the ESPP. The difference between the closing market price on the Investment Date and the price paid by employees is recorded as a general and administrative expense in the accompanying Consolidated Statements of Income. The expense related to the ESPP was less than $0.1 million in each of fiscal years 2023, 2022 and 2021.
Non-Qualified Deferred Compensation Plan. The Company has available a non-qualified deferred compensation plan (the “NQDC Plan”) for directors and officers. Participants are fully vested in their contributions. At its discretion, the Company may elect to match employee contributions, subject to legal limitations in conjunction with the 401K Plan, which fully vest after three years of service. During fiscal years 2023, 2022 and 2021, the Company did not match any employee contributions. Participant accounts are adjusted to reflect performance, whether positive or negative, of selected investment options chosen by each participant during the deferral period. In the event of bankruptcy, the assets of the NQDC Plan are available to satisfy the claims of the Company’s general creditors. The liability for compensation deferred under the NQDC Plan was $0.2 million as of both March 25, 2023 and March 26, 2022, and is included as a component of other liabilities (non-current) on the Consolidated Balance Sheets.
Post-retirement Health Care Plans. The Company has a defined benefit post-retirement health care plan which provides long-term care insurance benefits, medical and dental insurance benefits and medical premium reimbursement benefits to eligible retired corporate officers and their eligible spouses (the “Officer Plan”).
The change in the post-retirement benefit obligation is as follows (amounts in thousands):
| FY 2023 |
FY 2022 |
FY 2021 |
||||||||||
| Post-retirement benefit obligation, at beginning of fiscal year |
$ | 1,326 | $ | 1,831 | $ | 1,509 | ||||||
| Service cost |
17 | 96 | 84 | |||||||||
| Interest cost |
45 | 52 | 48 | |||||||||
| Plan Amendments |
193 | - | - | |||||||||
| Benefits paid |
(136 | ) | (125 | ) | (95 | ) | ||||||
| Actuarial (gain) loss |
(179 | ) | (528 | ) | 285 | |||||||
| Post-retirement benefit obligation, at end of fiscal year |
1,266 | 1,326 | 1,831 | |||||||||
| Fair value of plan assets, at end of fiscal year |
- | - | - | |||||||||
| Funded status, at end of fiscal year |
$ | (1,266 | ) | $ | (1,326 | ) | $ | (1,831 | ) | |||
| Accumulated post-retirement benefit obligation, at end of fiscal year |
$ | 1,266 | $ | 1,326 | $ | 1,831 | ||||||
The accumulated post-retirement benefit obligation is included as a component of other liabilities (non-current) in the Consolidated Balance Sheets. The components of net periodic post-retirement benefit cost and other amounts recognized in other comprehensive income are as follows (amounts in thousands):
| FY 2023 |
FY 2022 |
FY 2021 |
||||||||||
| Net periodic post-retirement benefit cost: |
||||||||||||
| Service cost |
$ | 17 | $ | 96 | $ | 84 | ||||||
| Interest cost |
45 | 52 | 48 | |||||||||
| Amortization of prior service cost |
1 | 1 | 1 | |||||||||
| 63 | 149 | 133 | ||||||||||
| Benefit obligations recognized in other comprehensive income: |
||||||||||||
| Amortization of prior service cost |
(1 | ) | (1 | ) | (1 | ) | ||||||
| Prior service cost |
193 | - | - | |||||||||
| Net actuarial (gain) loss |
(185 | ) | (583 | ) | 233 | |||||||
| 7 | (584 | ) | 232 | |||||||||
| Total recognized in net periodic benefit cost and other comprehensive income |
$ | 70 | $ | (435 | ) | $ | 365 | |||||
| Amount recognized in accumulated other comprehensive income, at end of fiscal year: |
||||||||||||
| Unrecognized prior service cost |
$ | 163 | $ | 156 | $ | 739 | ||||||
The prior service cost is amortized over the average remaining life expectancy of active participants in the Officer Plan. The estimated prior service cost that will be amortized from accumulated other comprehensive income into net periodic post-retirement benefit cost during fiscal year 2024 is less than $0.1 million.
The post-retirement benefit obligation was computed by an independent third-party actuary. Assumptions used to determine the post-retirement benefit obligation and the net periodic postretirement benefit cost were as follows:
| March 25, |
March 26, |
|||||||
| 2023 |
2022 |
|||||||
| Weighted average discount rate |
4.9 | % | 3.6 | % | ||||
| Medical care cost trend rate: |
||||||||
| Trend rate assumed for next year |
7.8 | % | 7.0 | % | ||||
| Ultimate trend rate |
4.0 | % | 3.8 | % | ||||
| Year that rate reaches ultimate trend rate |
2075 | 2075 | ||||||
| Dental care cost trend rate: |
||||||||
| Trend rate assumed for next year and remaining at that level thereafter |
3.5 | % | 3.0 | % | ||||
Benefit payments are funded by the Company as needed. Payments toward the cost of a retiree’s medical and dental coverage are initially determined as a percentage of a base coverage plan in the year of retirement and are limited to increase at a rate of no more than 50% of the annual increase in medical and dental costs, as defined in the plan document. The following benefit payments, which reflect expected future service, as appropriate, are expected to be paid as follows (amounts in thousands):
| Fiscal Year |
Amount |
|||
| 2024 |
$ | 121 | ||
| 2025 |
113 | |||
| 2026 |
80 | |||
| 2027 |
92 | |||
| 2028 |
109 | |||
| Thereafter |
$ | 751 | ||
Increasing the assumed health care cost trend rate by one percentage point would increase the accumulated post-retirement benefit obligation and the annual net periodic post-retirement benefit cost by $0.1 million. A one percentage point decrease in the healthcare cost trend would decrease the accumulated post-retirement benefit obligation and the annual net periodic post-retirement benefit cost by $0.1 million.
NOTE 6 – STOCK-BASED COMPENSATION
In September 2021, the Transcat, Inc. 2021 Stock Incentive Plan (the “2021 Plan”) was approved by shareholders and became effective. The 2021 Plan replaced the Transcat, Inc. 2003 Incentive Plan (the “2003 Plan”). Shares available for grant under the 2021 Plan include any shares remaining available for issuance under the 2003 Plan and any shares that are subject to outstanding awards under the 2003 Plan that are subsequently canceled, expired, forfeited, or otherwise not issued or are settled in cash. The 2021 Plan provides for, among other awards, grants of restricted stock units and stock options to directors, officers and key employees at the fair market value at the date of grant. At March 25, 2023, 0.7 million shares of common stock were available for future grant under the 2021 Plan.
The Company receives an excess tax benefit related to restricted stock vesting and stock options exercised and redeemed. The discrete benefits related to share-based compensation and stock option activity in fiscal years 2023, 2022 and 2021 were $0.4 million, $1.4 million and $0.3 million, respectively.
Restricted Stock Units: The Company grants time-based and performance-based restricted stock units as a component of executive and key employee compensation. Expense for restricted stock unit grants is recognized on a straight-line basis for the service period of the stock award based upon fair value of the award on the date of grant. The fair value of the restricted stock unit grants is the quoted market price for the Company’s common stock on the date of grant. These restricted stock units are either time vested, or vest following the third fiscal year from the date of grant subject to cumulative diluted earnings per share targets over the eligible period.
The Company’s non-employee directors receive an annual grant of restricted stock units valued at $50,000 that vest after one year. The fiscal year 2023, fiscal year 2022 and fiscal year 2021 restricted stock unit grants to non-employee directors were made in September 2022, September 2021 and September 2020, respectively.
Compensation cost ultimately recognized for performance-based restricted stock units will equal the grant date fair market value of the unit that coincides with the actual outcome of the performance conditions. On an interim basis, the Company records compensation cost based on the estimated level of achievement of the performance conditions. The expense relating to the time vested restricted stock units is recognized on a straight-line basis over the requisite service period for the entire award.
During fiscal year 2023, 19,000 shares of time-vested restricted stock units were granted and 11,000 shares of performance-based restricted stock units were granted. During fiscal year 2022, 30,000 shares of time-vested restricted stock units were granted and 15,000 shares of performance-based restricted stock units were granted. During fiscal year 2021, 80,000 shares of time-vested restricted stock units were granted.
The following table summarizes the restricted stock units vested and shares issued during fiscal years 2023, 2022 and 2021 (amounts in thousands, except per unit data):
| Total |
Grant Date |
Number |
|||||||||||||||
| Number |
Fair |
Target |
Of |
Date |
|||||||||||||
| Date |
Measurement |
of Units |
Value |
Level |
Shares |
Shares |
|||||||||||
| Granted |
Period |
Granted |
Per Unit |
Achieved |
Issued |
Issued |
|||||||||||
| April 2018 |
April 2018 – March 2020 |
1 | $ | 15.65 | Time Vested |
1 | April 2020 |
||||||||||
| April 2017 |
April 2017 – March 2020 |
62 | $ | 12.90 | 79% |
49 | May 2020 |
||||||||||
| July 2020 |
July 2020 |
1 | $ | 27.08 | Time Vested |
1 | July 2020 |
||||||||||
| September 2019 |
September 2019 – September 2020 |
18 | $ | 22.77 | Time Vested |
18 | September 2020 |
||||||||||
| October 2018 |
October 2018 – September 2020 |
1 | $ | 20.81 | Time Vested |
1 | October 2020 |
||||||||||
| January 2021 |
January 2021 |
3 | $ | 34.68 | Time Vested |
3 | January 2021 |
||||||||||
| May 2018 |
April 2018 – March 2021 |
29 | $ | 15.30 | Time Vested |
29 | March 2021 |
||||||||||
| April 2018 |
April 2018 – March 2021 |
1 | $ | 15.65 | Time Vested |
1 | April 2021 |
||||||||||
| May 2018 |
April 2018 – March 2021 |
29 | $ | 15.30 | 64% | 19 | May 2021 |
||||||||||
| September 2020 |
September 2020 – September 2021 |
14 | $ | 28.52 | Time Vested |
14 | September 2021 |
||||||||||
| October 2018 |
October 2018 – September 2021 |
1 | $ | 20.81 | Time Vested |
1 | October 2021 |
||||||||||
| April 2019 |
April 2019 – March 2022 |
20 | $ | 23.50 | Time Vested |
20 | March 2022 |
||||||||||
| April 2019 |
April 2019 – March 2022 |
20 | $ | 23.50 | 82% | 16 | May 2022 |
||||||||||
| July 2022 |
July 2022 |
1 | $ | 59.33 | Time Vested | 1 | July 2022 |
||||||||||
| September 2021 |
September 2021 – September 2022 |
7 | $ | 66.09 | Time Vested | 7 | September 2022 |
||||||||||
| September 2022 |
September 2022 |
1 | $ | 73.30 | Time Vested | 1 | September 2022 |
||||||||||
| October 2018 |
October 2018 – September 2022 |
1 | $ | 20.81 | Time Vested | 1 | October 2022 |
||||||||||
The following table summarizes the non-vested restricted stock units outstanding as of March 25, 2023 (amounts in thousands, except per unit data):
| Total |
Grant Date |
Estimated |
|||||||
| Number |
Fair |
Level of |
|||||||
| Date |
Measurement |
of Units |
Value |
Achievement at |
|||||
| Granted |
Period |
Granted |
Per Unit |
March 25, 2023 |
|||||
| October 2018 |
October 2018 – September 2027 |
6 | $ | 20.81 | Time Vested |
||||
| April 2020 |
April 2020 – March 2023 |
2 | $ | 26.25 | Time Vested |
||||
| July 2020 |
July 2020 – July 2023 |
26 | $ | 27.08 | Time Vested |
||||
| September 2020 |
September 2020 – July 2023 |
4 | $ | 28.54 | Time Vested |
||||
| September 2020 |
September 2020 – July 2023 |
5 | $ | 29.76 | Time Vested |
||||
| September 2020 |
September 2020 – September 2023 |
3 | $ | 29.76 | Time Vested |
||||
| May 2021 |
May 2021 – May 2024 |
1 | $ | 54.21 | Time Vested |
||||
| June 2021 |
June 2021 – March 2024 |
10 | $ | 53.17 | 133% of target level |
||||
| June 2021 |
June 2021 – March 2024 |
11 | $ | 53.17 | Time Vested |
||||
| September 2021 |
September 2021 – September 2024 |
4 | $ | 67.76 | Time Vested |
||||
| January 2022 |
January 2022 – March 2024 |
1 | $ | 90.92 | 133% of target level |
||||
| January 2022 |
January 2022 – March 2024 |
1 | $ | 90.92 | Time Vested |
||||
| January 2022 |
January 2022 – January 2025 |
1 | $ | 90.41 | Time Vested |
||||
| March 2022 |
March 2022 – March 2025 |
1 | $ | 76.31 | Time Vested |
||||
| May 2022 |
May 2022 - March 2025 |
11 | $ | 63.17 | 52% of target level |
||||
| May 2022 |
May 2022 - March 2025 |
12 | $ | 63.17 | Time Vested |
||||
| August 2022 |
August 2022 - August 2025 |
1 | $ | 78.04 | Time Vested |
||||
| September 2022 |
September 2022 – September 2023 |
5 | $ | 73.80 | Time Vested |
||||
| December 2022 |
December 2022 - December 2025 |
1 | $ | 81.26 | Time Vested |
||||
| December 2022 |
December 2022 - December 2025 |
1 | $ | 67.48 | Time Vested |
||||
Total expense relating to restricted stock units, based on grant date fair value and the achievement criteria, was $2.0 million, $1.6 million and $1.4 million in fiscal years 2023, 2022 and 2021, respectively. Unearned compensation totaled $1.9 million as of March 25, 2023 which is expected to be realized over a period of three years.
Stock Options: The Company grants stock options to employees and directors with an exercise price equal to the quoted market price of the Company’s stock at the date of the grant. The fair value of stock options is estimated using the Black-Scholes option pricing formula that requires assumptions for expected volatility, expected dividends, the risk-free interest rate and the expected term of the option. Expense for stock options is recognized on a straight-lined basis over the requisite service period for each award. Options vest either immediately or over a period of up to five years using a straight-line basis and expire either five years or ten years from the date of grant.
We calculate the fair value of the stock options granted using the Black-Scholes model. The following weighted-average assumptions were used to value options granted during fiscal years 2023, 2022 and 2021:
| FY 2023 |
FY 2022 |
FY 2021 |
||||||||||
| Risk-Free Interest Rate |
2.65 | % | 1.01 | % | 0.22 | % | ||||||
| Volatility Factor |
37.62 | % | 30.22 | % | 25.83 | % | ||||||
| Expected Term (in Years) |
4.58 | 6.25 | 3.25 | |||||||||
| Annual Dividend Rate |
0.00 | % | 0.00 | % | 0.00 | % | ||||||
We calculate expected volatility for stock options by taking an average of historical volatility over the expected term. The computation of expected term was determined based on safe harbor rules, giving consideration to the contractual terms of the stock-based awards and vesting schedules. The interest rate for periods within the contractual life of the award is based on the U.S. Treasury yield in effect at the time of grant. We assume no expected dividends. Under FASB ASC Topic 718, “Compensation – Stock Compensation”, the Company has elected to account for forfeitures as they occur.
During fiscal year 2023, the Company granted options for 46,000 shares of common stock in the aggregate to Company employees that vest over three years and an option for 10,000 shares of common stock to a new member of the Board of Directors that vests over five years.
During fiscal year 2022, the Company granted an option for 10,000 shares of common stock each to two new members (20,000 shares in the aggregate) of the Board of Directors that vest over five years, an option for 2,000 shares of common stock each to five employees (10,000 shares in the aggregate) that vests over three years, an option for 90,000 shares of common stock in the aggregate to employees during an acquisition that vests over five years and an option for 6,000 shares of common stock to a Company employee that vests over three years.
During fiscal year 2021, the Company granted an option for 5,000 shares of common stock to a Company employee that vests over three years and an option for 15,000 shares of common stock to an employee that immediately vested.
The expense related to all stock option awards was $1.4 million in fiscal year 2023, $0.7 million in fiscal year 2022 and $0.1 million in fiscal year 2021.
The following table summarizes the Company’s options for fiscal years 2023, 2022 and 2021 (amounts in thousands, except per option data):
| Weighted | ||||||||||||||||
| Weighted |
Average |
|||||||||||||||
| Average |
Remaining |
|||||||||||||||
| Number |
Exercise |
Contractual |
Aggregate |
|||||||||||||
| Of |
Price Per |
Term |
Intrinsic |
|||||||||||||
| Options |
Option |
(in Years) |
Value |
|||||||||||||
| Outstanding as of March 28, 2020 |
150 | $ | 14.63 | |||||||||||||
| Granted |
20 | 27.48 | ||||||||||||||
| Exercised |
(45 | ) | 18.01 | |||||||||||||
| Outstanding as of March 27, 2021 |
125 | 15.47 | ||||||||||||||
| Granted |
131 | 61.29 | ||||||||||||||
| Exercised |
(85 | ) | 12.00 | |||||||||||||
| Forfeited |
(6 | ) | 24.10 | |||||||||||||
| Outstanding as of March 26, 2022 |
165 | 53.27 | ||||||||||||||
| Granted |
56 | 62.46 | ||||||||||||||
| Exercised |
(4 | ) | 6.19 | |||||||||||||
| Forfeited |
- | - | ||||||||||||||
| Outstanding as of March 25, 2023 |
217 | 56.25 | 7 | $ | 6,628 | |||||||||||
| Exercisable as of March 25, 2023 |
30 | $ | 56.23 | 8 | $ | 917 | ||||||||||
The aggregate intrinsic value in the table above represents the total pre-tax intrinsic value (the difference between the Company’s closing stock price on the last trading day of fiscal year 2023 and the exercise price, multiplied by the number of in-the-money stock options) that would have been received by the option holders had all holders exercised their options on March 25, 2023. The amount of aggregate intrinsic value will change based on the fair market value of the Company’s common stock.
Total unrecognized compensation cost related to non-vested stock options as of March 25, 2023 was $1.9 million, which is expected to be recognized over a period of three years. The aggregate intrinsic value of stock options exercised in fiscal years 2023, 2022 and 2021 was $0.3 million, $5.3 million and $1.6 million, respectively. Cash received from the exercise of options in fiscal years 2023, 2022 and 2021 was $0.1 million, $1.0 million and $0.8 million, respectively.
NOTE 7 – SEGMENT AND GEOGRAPHIC DATA
The basis for determining our operating segments is the manner in which financial information is used in monitoring our operations. Transcat has two reportable segments: Service and Distribution. Through our Service segment, we offer calibration, repair, inspection, analytical qualifications, preventative maintenance, consulting and other related services. Through our Distribution segment, we sell and rent national and proprietary brand instruments to customers globally. The Company has no inter-segment sales. We believe that reporting performance at the operating income level is the best indicator of segment performance. The following table presents segment and geographic data for fiscal years 2023, 2022 and 2021 (dollars in thousands):
| FY 2023 |
FY 2022 |
FY 2021 |
||||||||||
| Revenue: |
||||||||||||
| Service |
$ | 144,883 | $ | 122,005 | $ | 101,274 | ||||||
| Distribution |
85,686 | 82,954 | 72,061 | |||||||||
| Total |
230,569 | 204,959 | 173,335 | |||||||||
| Gross Profit: |
||||||||||||
| Service |
46,638 | 38,921 | 30,695 | |||||||||
| Distribution |
21,717 | 19,518 | 15,423 | |||||||||
| Total |
68,355 | 58,439 | 46,118 | |||||||||
| Operating Expenses: |
||||||||||||
| Service (1) |
35,216 | 28,107 | 20,254 | |||||||||
| Distribution (1) |
16,891 | 16,189 | 14,791 | |||||||||
| Total |
52,107 | 44,296 | 35,045 | |||||||||
| Operating Income: |
||||||||||||
| Service |
11,422 | 10,814 | 10,441 | |||||||||
| Distribution |
4,826 | 3,329 | 632 | |||||||||
| Total |
16,248 | 14,143 | 11,073 | |||||||||
| Unallocated Amounts: |
||||||||||||
| Interest and Other Expense, net |
2,761 | 953 | 1,091 | |||||||||
| Provision for Income Taxes |
2,799 | 1,810 | 2,191 | |||||||||
| Total |
5,560 | 2,763 | 3,282 | |||||||||
| Net Income |
$ | 10,688 | $ | 11,380 | $ | 7,791 | ||||||
| Total Assets: |
||||||||||||
| Service |
$ | 118,568 | $ | 109,472 | ||||||||
| Distribution |
52,340 | 46,107 | ||||||||||
| Unallocated |
24,841 | 22,183 | ||||||||||
| Total |
$ | 195,749 | $ | 177,762 | ||||||||
Continued on next page
| FY 2023 |
FY 2022 |
FY 2021 |
||||||||||
| Depreciation and Amortization (2): |
||||||||||||
| Service |
$ | 8,800 | $ | 7,543 | $ | 5,597 | ||||||
| Distribution |
2,155 | 2,024 | 1,983 | |||||||||
| Total |
$ | 10,955 | $ | 9,567 | $ | 7,580 | ||||||
| Capital Expenditures: |
||||||||||||
| Service |
$ | 5,569 | $ | 7,885 | $ | 4,236 | ||||||
| Distribution |
3,845 | 2,267 | 2,381 | |||||||||
| Total |
$ | 9,414 | $ | 10,152 | $ | 6,617 | ||||||
| Geographic Data: |
||||||||||||
| Revenues to Unaffiliated Customers (3): |
||||||||||||
| United States (4) |
$ | 207,143 | $ | 187,165 | $ | 159,270 | ||||||
| Canada |
16,468 | 14,623 | 13,040 | |||||||||
| Other International |
6,958 | 3,171 | 1,025 | |||||||||
| Total |
$ | 230,569 | $ | 204,959 | $ | 173,335 | ||||||
| Property and Equipment: |
||||||||||||
| United States (4) |
$ | 24,721 | $ | 22,042 | $ | 19,897 | ||||||
| Canada |
4,326 | 4,397 | 2,306 | |||||||||
| Other International |
17 | - | - | |||||||||
| Total |
$ | 29,064 | $ | 26,439 | $ | 22,203 | ||||||
| (1) |
Operating expense allocations between segments are based on actual amounts, a percentage of revenues, headcount, and management’s estimates. |
| (2) |
Including amortization of catalog costs and intangible assets. |
| (3) |
Revenues are attributed to the countries based on the destination of a product shipment or the location where service is rendered. |
| (4) |
United States includes Puerto Rico. |
NOTE 8 – COMMITMENTS
Leases:
The Company determines if an arrangement is a lease at inception. Our lease agreements generally contain lease and non-lease components. Historically, non-lease components such as utilities have been immaterial. Payments under our lease arrangements are primarily fixed. Lease assets and liabilities are recognized at the present value of the future lease payments at the lease commencement date. The interest rate used to determine the present value of the future lease payments is our incremental borrowing rate, because the interest rate implicit in our leases is not readily determinable. Our incremental borrowing rate is estimated to approximate the interest rate on a collateralized basis with similar terms and payments, and in economic environments where the leased asset is located. Our lease terms include periods under options to extend or terminate the lease when it is reasonably certain that we will exercise that option.
Transcat leases facilities, equipment, and vehicles under various non-cancelable operating leases. As of March 25, 2023, the remaining lease terms on our operating leases range from approximately one year to fifteen years, and include any renewal and/or termination options that are reasonably certain to be exercised by the Company. There is no transfer of title or option to purchase the leased assets upon expiration. The weighted average discount rate for fiscal year 2023, 2022 and 2021 was 3.90%, 4.15% and 4.15%, respectively. The weighted average remaining lease term is approximately eleven years. Short-term leases are leases having a term of 12 months or less. The Company recognizes short-term leases on an as incurred basis and does not record a related lease asset or liability for such leases. Short-term lease expense was immaterial in fiscal years 2023, 2022. and 2021.
The components of lease expense for the current and prior-year comparative periods were as follows (dollars in thousands):
| FY 2023 |
FY 2022 |
FY 2021 |
||||||||||
| Operating lease cost |
$ | 4,730 | $ | 3,687 | $ | 3,206 | ||||||
| Variable lease cost |
$ | 608 | $ | 619 | $ | 577 | ||||||
| Total lease cost |
$ | 5,338 | $ | 4,306 | $ | 3,783 | ||||||
Supplemental cash flow information related to leases was as follows:
| FY 2023 |
FY 2022 |
FY 2021 |
||||||||||
| Cash paid for amounts included in the measurement of lease liabilities: |
||||||||||||
| Operating cash flow from operating leases |
$ | 440 | $ | 2,207 | $ | 2,153 | ||||||
| Right to Use Assets obtained in exchange for lease liabilities |
$ | 4,519 | $ | 3,874 | $ | 2,945 | ||||||
Total rental expense was approximately $5.3 million, $4.3 million and $3.8 million in fiscal years 2023, 2022 and 2021, respectively. The minimum future annual rental payments under the non-cancelable leases at March 25, 2023 are as follows (in millions):
| Fiscal Year |
Amount | |||
| 2024 |
$ | 4.3 | ||
| 2025 |
3.2 | |||
| 2026 |
2.6 | |||
| 2027 |
1.9 | |||
| 2028 |
1.4 | |||
| Thereafter |
7.8 | |||
| Total minimum lease payments |
$ | 21.2 | ||
| Less: Imputed interest |
5.9 | |||
| Present value of remaining lease payments |
$ | 15.3 |
Term Loan:
Effective December 2018, the Company has term loan repayments (principal plus interest) of $0.2 million per month through December 2025. Principal payments relating to the 2018 Term Loan will be $2.2 million in fiscal year 2024, $2.3 million in fiscal year 2025 and $1.8 million in fiscal year 2026.
Contingent Consideration:
In connection with the acquisition of NEXA, there are potential earn-out payments of up to $7.5 million over the four-year period following the closing of the transaction based upon NEXA achieving certain annual revenue and EBITDA goals. If achieved, the earn-out payments will be made in shares of common stock unless certain criteria is met for cash payment. As of August 31, 2021 and March 26, 2022, the estimated fair value for the contingent earn-out payments was $0.2 million and included in the preliminary purchase price allocation in Note 9. During the second quarter of fiscal year 2023, the Company reduced the contingent consideration down to zero. As a result of remeasurement, the change was included in the Company’s Consolidated Statements of Income. There were no remeasurement adjustments during the second half of fiscal year 2023.
NOTE 9 – BUSINESS ACQUISITIONS
Elite: Effective February 2, 2023, Transcat acquired substantially all of the assets of Elite Calibration LLC (“Elite”), a California based provider of calibration services. This transaction aligned with a key component of the Company’s acquisition strategy of targeting businesses that can leverage the Company’s already existing operating infrastructure.
All the goodwill related to the Elite acquisition has been allocated to the Service segment. Amortization of goodwill related to the Elite acquisition is deductible for tax purposes.
The total purchase price for the assets of Elite was approximately $0.9 million, of which $0.8 million was paid in cash. Pursuant to the asset purchase agreement, the Company held back $0.1 million of the purchase price for certain potential post-closing adjustments. The following is a summary of the purchase price allocation, in the aggregate, to the fair value, based on Level 3 inputs, of Elite’s assets and liabilities acquired on February 2, 2023 (in thousands):
| Goodwill |
$ | 820 | ||
| Plus: Accounts Receivable |
62 | |||
| Total Purchase Price |
$ | 882 |
From the date of acquisition through the end of fiscal year 2023, Elite has contributed revenue of $0.1 million. Since this operation was integrated immediately into our existing operations, its separate operating income in undeterminable.
Complete Calibrations: Effective September 28, 2022, Transcat purchased all of the outstanding capital stock of Galium Limited (d/b/a Complete Calibrations) ("Complete Calibrations"), an Irish company. This transaction aligned with a key component of the Company’s acquisition strategy of targeting businesses that expand the depth and breadth of the Company’s Service capabilities.
All the goodwill related to the Complete Calibrations acquisition has been allocated to the Service segment. Amortization of goodwill related to the Complete Calibrations acquisition is not deductible for tax purposes. The goodwill is primarily attributable to the workforce acquired, as well as operational synergies and other intangibles that do not qualify for separate recognition.
The total purchase price paid for Complete Calibrations was approximately $1.2 million in cash. In connection with this transaction, the Company also entered into a Technology License Agreement with Calibration Robots Limited, an Irish company and related party to Complete Calibrations, for the use of their proprietary robotics in completing calibrations. The Technology License Agreement includes transactional royalties in the amount of 3 Euros (approximately $3.23) per calibration performed by technology covered under this license agreement, with a royalty term of up to ten years commencing from the earlier of (i) the date on which cumulative revenue earned from technology covered under this license agreement equals 0.75 million Euros (approximately $0.81 million), and (ii) March 28, 2024. In addition to the transactional royalties, as long as a key employee is employed by the Company, there is an annual royalty fee of 0.1 million Euros (approximately $0.11 million). For purposes of this paragraph, we used a conversion rate of 1.0762 to convert Euro to U.S. dollar as of March 25, 2023.
The following is a summary of the purchase price allocation, in the aggregate, to the fair value, based on Level 3 inputs, of Complete Calibrations’ assets and liabilities acquired on September 28, 2022 (in thousands):
| Goodwill |
$ | 1,123 | ||
| Plus: Cash |
10 | |||
| Inventory |
44 | |||
| Total Purchase Price |
$ | 1,177 |
From the date of acquisition through the end of fiscal year 2023, Complete Calibrations has contributed revenue of $0.2 million and operating loss of less than $0.1 million.
e2b: Effective September 27, 2022, Transcat acquired substantially all of the assets of e2b Calibration (“e2b”), an Ohio based provider of calibration services. This transaction aligned with a key component of the Company’s acquisition strategy of targeting businesses that expand the depth and breadth of the Company’s Service capabilities.
The e2b goodwill is primarily attributable to the workforce acquired, as well as operational synergies and other intangibles that do not qualify for separate recognition. All the goodwill and intangible assets relating to the e2b acquisition has been allocated to the Service segment. Intangible assets related to the e2b acquisition are being amortized for financial reporting purposes on an accelerated basis over the estimated useful life of up to fifteen years and are deductible for tax purposes. Amortization of goodwill related to the e2b acquisition is deductible for tax purposes.
The total purchase price paid for the assets of e2b was approximately $3.1 million in cash. Pursuant to the asset purchase agreement, $0.9 million of the purchase price was placed in escrow for certain potential post-closing adjustments. During the third quarter of fiscal year 2023, $0.6 million of the escrow was released to the sellers. As of March 25, 2023, $0.3 million remains in escrow.
The following is a summary of the purchase price allocation, in the aggregate, to the fair value, based on Level 3 inputs, of e2b’s assets and liabilities acquired on September 27, 2022 (in thousands):
| Goodwill |
$ | 1,367 | ||
| Intangible Assets – Customer Base & Contracts |
746 | |||
| Intangible Assets – Covenant Not to Compete |
396 | |||
| 2,509 | ||||
| Plus: Accounts Receivable |
361 | |||
| Other Current Assets |
24 | |||
| Property and Equipment |
326 | |||
| Less: Current Liabilities |
(121 | ) | ||
| Total Purchase Price |
$ | 3,099 |
From the date of acquisition through the end of fiscal year 2023, e2b has contributed revenue of $1.8 million and operating income of $0.3 million, which includes the negative impact of amortization of the acquired intangible assets.
Alliance: Effective May 31, 2022, Transcat acquired substantially all of the assets of Charlton Jeffmont Inc., Raitz Inc. and Toolroom Calibration Inc. d/b/a Alliance Calibration (“Alliance”), an Ohio based provider of calibration services. This transaction aligned with a key component of the Company’s acquisition strategy of targeting businesses that expand the depth and breadth of the Company’s service capabilities.
The Alliance goodwill is primarily attributable to the workforce acquired, as well as operational synergies and other intangibles that do not qualify for separate recognition. All the goodwill and intangible assets relating to the Alliance acquisition has been allocated to the Service segment. Intangible assets related to the Alliance acquisition are being amortized for financial reporting purposes on an accelerated basis over the estimated useful life of up to fifteen years and are deductible for tax purposes. Amortization of goodwill related to the Alliance acquisition is deductible for tax purposes.
The purchase price for Alliance was approximately $4.7 million and was paid with $4.0 million in cash and the issuance of 2,284 shares of our common stock valued at $0.1 million. Pursuant to the asset purchase agreement, the Company held back $0.5 million of the purchase price for certain potential post-closing adjustments, and the purchase price will be subject to reduction by $0.5 million if a key customer relationship is not retained.
The following is a summary of the purchase price allocation, in the aggregate, to the fair value, based on Level 3 inputs, of Alliance’s assets and liabilities acquired on May 31, 2022 (in thousands):
| Goodwill |
$ | 1,783 | ||
| Intangible Assets – Customer Base & Contracts |
2,320 | |||
| Intangible Assets – Covenant Not to Compete |
114 | |||
| 4,217 | ||||
| Plus: Accounts Receivable |
343 | |||
| Property and Equipment |
170 | |||
| Less: Current Liabilities |
(27 | ) | ||
| Total Purchase Price |
$ | 4,703 |
From the date of acquisition through the end of fiscal year 2023, Alliance has contributed revenue of $2.0 million and operating income of $0.3 million, which includes the negative impact of amortization of the acquired intangible assets.
Tangent: Effective December 31, 2021, Transcat purchased all the outstanding membership units of Tangent Labs, LLC, a privately held company (“Tangent”). Tangent provides in-house and on-site calibrations of precision measurement and control instrumentation to customers in the life science, aerospace and other regulated industries, and has lab locations in Indianapolis, Indiana and Huntsville, Alabama. This transaction aligned with a key component of the Company’s strategy of acquiring local capabilities in attractive geographies.
The Tangent goodwill is primarily attributable to the workforce acquired, as well as operational synergies and other intangibles that do not qualify for separate recognition. All the goodwill and intangible assets relating to the Tangent acquisition has been allocated to the Service segment. Intangible assets related to the Tangent acquisition are being amortized for financial reporting purposes on an accelerated basis over the estimated useful life of up to fifteen years and are deductible for tax purposes. Amortization of goodwill related to the Tangent acquisition is not deductible for tax purposes.
The purchase price for Tangent was approximately $8.9 million, all paid in cash, and is subject to certain customary holdback provisions and a portion of which was placed in escrow to secure the sellers’ obligations in the event that a key employee terminates employment with Tangent on or before the first anniversary of the closing of the transaction. $7.9 million was paid in cash and $1.0 million of the purchase price has been put into escrow for indemnification claims, if any.
During the second quarter of fiscal year 2023, the key employee terminated their employment with the Company. As a result, the Company took $0.2 million out of the escrow account and it was recorded as a gain in the Company's Consolidated Statement of Income. During the second quarter of fiscal year 2023, an amendment to the Membership Unit Purchase Agreement was entered into which allows the sellers to earn the remaining $0.3 million in the escrow account based on revenue and gross profit during the period of October 2022 to September 2023. During the fourth quarter of fiscal year 2023, the Company determined that they would not hit the gross profit target and recorded a gain of $0.2 million in the Company’s Consolidated Statement of Income
During the second quarter of fiscal year 2023, a measurement period adjustment was recorded to recognize the fair value of Property and Equipment acquired, with a corresponding reduction to Goodwill. There was no remeasurement period adjustment in the second half of fiscal year 2023. The following is a summary of the purchase price allocation, in the aggregate, to the fair value, based on Level 3 inputs, of Tangent’s assets and liabilities acquired on December 31, 2021 (in thousands):
| Goodwill |
$ | 5,385 | ||
| Intangible Assets – Customer Base & Contracts |
4,150 | |||
| Intangible Assets – Covenant Not to Compete |
220 | |||
| 9,755 | ||||
| Plus: Cash |
26 | |||
| Accounts Receivable |
187 | |||
| Other Current Assets |
16 | |||
| Property and Equipment |
203 | |||
| Less: Current Liabilities |
(68 | ) | ||
| Deferred Tax Liability |
(1,195 | ) | ||
| Total Purchase Price |
$ | 8,924 |
During fiscal year 2023, Tangent contributed revenue of $2.4 million and operating income of $0.3 million, which includes the negative impact of amortization of the acquired intangible assets.
NEXA: Effective August 31, 2021, Transcat purchased all of the outstanding capital stock of Cal OpEx Limited (d/b/a Transcat Ireland), a private Irish company, which owns all of the issued and outstanding capital stock of its U.S.-based subsidiary, Cal OpEx Inc. (d/b/a NEXA EAM), a Delaware corporation (collectively, “NEXA”). NEXA provides calibration optimization and other technical solutions to improve asset and reliability management programs to pharmaceutical, biotechnology, and medical device companies worldwide. This transaction aligned with a key component of the Company’s acquisition strategy of targeting businesses that expand the depth and breadth of the Company’s Service capabilities.
The NEXA goodwill is primarily attributable to the workforce acquired, as well as operational synergies and other intangibles that do not qualify for separate recognition. All of the goodwill and intangible assets relating to the NEXA acquisition has been allocated to the Service segment. Intangible assets related to the NEXA acquisition are being amortized for financial reporting purposes on an accelerated basis over the estimated useful life of up to five years and are deductible for tax purposes. Amortization of goodwill related to the NEXA acquisition is not deductible for tax purposes.
The purchase price for NEXA was approximately $26.2 million and was paid with $23.9 million in cash and the issuance of 34,943 shares of our common stock valued at $2.4 million. Additionally, there are potential earn-out payments of up to $7.5 million over the four-year period following the closing of the transaction based upon NEXA achieving certain annual revenue and EBITDA goals. If achieved, the earn-out payments will also be made in shares of common stock unless certain criteria is met for cash payment. As of August 31, 2021 and March 26, 2022, the estimated fair value for the contingent earn-out payments, classified as Level 3 in the fair value hierarchy, was $0.2 million and included in the purchase price allocation below. This amount was calculated using a Geometric Brownian motion distribution that was then used in a Monte Carlo simulation model. Assumptions used in the Monte Carlo simulation model included: 1) weighted-average cost of capital of 6.60%, 2) risk-free interest rate of 0.58%, 3) asset volatility of 20.00%, and 4) forecasted revenue and EBITDA. This contingent consideration is remeasured quarterly. If, as a result of remeasurement, the value of the contingent consideration changes, any charges or income will be included in the Company’s Consolidated Statements of Income.
During the second quarter of fiscal year 2023, the Company reduced the contingent consideration down to zero. As a result of remeasurement, the change was included in the Company’s Consolidated Statements of Income. There were no remeasurement adjustments during the second half of fiscal year 2023. During the calendar year 2022 (the first measurement period), NEXA did not achieve the EBITDA goals in the agreement and no earn-out payments were made. $0.1 million of the purchase price has been put into escrow for indemnification claims, if any.
The following is a summary of the purchase price allocation, in the aggregate, to the fair value, based on Level 3 inputs, of NEXA’s assets and liabilities acquired on August 31, 2021 (in thousands):
| Goodwill |
$ | 15,679 | ||
| Intangible Assets – Customer Base & Contracts |
5,600 | |||
| Intangible Assets – Backlog |
490 | |||
| Intangible Assets – Covenant Not to Compete |
600 | |||
| 22,369 | ||||
| Plus: Cash |
3,732 | |||
| Accounts Receivable |
2,434 | |||
| Non-Current Assets |
38 | |||
| Less: Current Liabilities |
(572 | ) | ||
| Deferred Tax Liability |
(1,769 | ) | ||
| Total Purchase Price |
$ | 26,232 |
During fiscal year 2023, NEXA contributed revenue of $13.2 million and operating income of less than $0.1 million, which includes the negative impact of amortization of the acquired intangible assets.
Upstate Metrology: Effective April 29, 2021, Transcat acquired substantially all of the assets of Upstate Metrology Inc. (“Upstate Metrology”), a New York based provider of calibration services. This transaction aligned with a key component of the Company’s acquisition strategy of targeting businesses that can leverage the Company’s already existing operating infrastructure.
All the goodwill related to the Upstate Metrology acquisition has been allocated to the Service segment. Amortization of goodwill related to the Upstate Metrology acquisition is deductible for tax purposes.
The total purchase price for the assets of Upstate Metrology was approximately $0.9 million. The following is a summary of the purchase price allocation, in the aggregate, to the fair value, based on Level 3 inputs, of Upstate Metrology’s assets and liabilities acquired on April 29, 2021 (in thousands):
| Goodwill |
$ | 483 | ||
| Plus: Current Assets |
189 | |||
| Non-Current Assets |
270 | |||
| Less: Current Liabilities |
(11 | ) | ||
| Total Purchase Price |
$ | 931 |
Since this operation was integrated immediately into our existing operations, its separate contributed revenue and operating income is undeterminable.
BioTek: Effective December 16, 2020, Transcat acquired substantially all of the assets of BioTek Services, Inc. (“BioTek”), a Virginia based provider of pipette calibration services. This transaction aligned with a key component of the Company’s acquisition strategy of targeting businesses that expand the depth and breadth of the Company’s Service capabilities. BioTek’s focus on pipettes complements the current offerings Transcat provides to the life science sector.
All of the goodwill and intangible assets relating to the BioTek acquisition has been allocated to the Service segment. Intangible assets related to the BioTek acquisition are being amortized for financial reporting purposes on an accelerated basis over the estimated useful life of up to 10 years and are deductible for tax purposes. Amortization of goodwill related to the BioTek acquisition is deductible for tax purposes.
The total purchase price for the assets of BioTek was approximately $3.5 million. $0.4 million of the purchase price had been put into escrow for indemnification claims, if any. This escrow was released during the fourth quarter of fiscal year 2022. The following is a summary of the purchase price allocation, in the aggregate, to the fair value, based on Level 3 inputs, of BioTek’s assets and liabilities acquired during the period presented (in thousands):
| Goodwill |
$ | 1,063 | ||
| Intangible Assets – Customer Base & Contracts |
1,930 | |||
| Intangible Assets – Covenant Not to Compete |
100 | |||
| 3,093 | ||||
| Plus: Current Assets |
406 | |||
| Non-Current Assets |
8 | |||
| Total Purchase Price |
$ | 3,507 |
The results of acquired businesses are included in Transcat’s consolidated operating results as of the dates the businesses were acquired. The following unaudited pro forma information presents the Company’s results of operations as if the acquisitions of Elite, Complete Calibration, e2b, Alliance, Tangent, NEXA, Upstate Metrology and BioTek had occurred at the beginning of fiscal year 2021. The pro forma results do not purport to represent what the Company’s results of operations actually would have been if the transactions had occurred at the beginning of the period presented or what the Company’s operating results will be in future periods.
| (Unaudited) |
||||||||||||
| Fiscal Year Ended |
||||||||||||
| March 25, |
March 26, |
March 27, |
||||||||||
| (in thousands except per share information) |
2023 |
2022 |
2021 |
|||||||||
| Total Revenue |
$ | 233,098 | $ | 217,000 | $ | 189,730 | ||||||
| Net Income |
$ | 11,419 | $ | 12,052 | $ | 6,901 | ||||||
| Basic Earnings Per Share |
$ | 1.51 | $ | 1.61 | $ | 0.93 | ||||||
| Diluted Earnings Per Share |
$ | 1.49 | $ | 1.59 | $ | 0.91 | ||||||
Certain of the Company’s acquisition agreements include provisions for contingent consideration and other holdback amounts. The Company accrues for contingent consideration and holdback provisions based on their estimated fair value at the date of acquisition. As of March 25, 2023, no contingent consideration and $0.6 million of other holdback amounts were unpaid and reflected in current liabilities on the Consolidated Balance Sheets. As of March 26, 2022, $0.2 million of contingent consideration and $0.1 million of other holdback amounts were unpaid and reflected in current liabilities on the Consolidated Balance Sheets. During fiscal years 2023, 2022 and 2021, no contingent consideration or other holdback amounts were paid.
During fiscal years 2023, 2022 and 2021, acquisition costs of $0.2 million, $0.9 million and less than $0.1 million were recorded as incurred as general and administrative expenses in the Consolidated Statements of Income.
NOTE 10 SUBSEQUENT EVENT
Effective March 27, 2023, Transcat purchased all of the outstanding capital stock of TIC-MS, Inc. (“TIC-MS”), a Missouri based provider of calibration services. This transaction aligned with a key component of the Company’s acquisition strategy of targeting businesses that expand the depth and breadth of the Company’s Service capabilities. The total purchase price paid for TIC-MS was approximately $9.8 million, of which $2.9 million was paid in cash, including $0.5 million placed in escrow for certain post-closing adjustments and indemnification claims, if any, and the issuance of 77,387 shares of our common stock valued at approximately $6.8 million. Pursuant to the purchase agreement, the purchase price will be subject to reduction by up to $0.5 million if a key customer relationship is not retained.
The purchase price allocation has not been finalized, due to the timing of the acquisition and the filing date of this Annual Report on Form 10-K. Therefore, the allocation of the purchase price to the assets acquired and liabilities assumed, including values to be recognized for goodwill and other intangible assets, will be disclosed in the Quarterly Report on Form 10-Q for the fiscal quarter ending June 24, 2023. The pro forma results of operations from the TIC-MS acquisition will be disclosed in the Quarterly Report on Form 10-Q for the fiscal quarter ending June 24, 2023. The goodwill related to TIC-MS is not expected to be deductible for income tax purposes. All of the goodwill and intangible assets relating to the TIC-MS acquisition will be allocated to the Service segment.
ITEM 9. CHANGES IN AND DISAGREEMENTS WITH ACCOUNTANTS ON ACCOUNTING AND FINANCIAL DISCLOSURE
None.
ITEM 9A. CONTROLS AND PROCEDURES
(a) Conclusion Regarding the Effectiveness of Disclosure Controls and Procedures. Our principal executive officer and our principal financial officer evaluated our disclosure controls and procedures (as defined in the Securities Exchange Act of 1934, as amended, (“Exchange Act”) Rules 13a-15(e) and 15d-15(e)) as of the end of the period covered by this report. Disclosure controls and procedures are designed to ensure that information required to be disclosed in our reports filed under the Exchange Act is recorded, processed, summarized and reported within the time periods specified in the Securities and Exchange Commission’s rules and forms and that such information is accumulated and communicated to our principal executive officer and principal financial officer to allow timely decisions regarding required disclosure. Based on this evaluation, our principal executive officer and our principal financial officer concluded that our disclosure controls and procedures were effective as of such date.
(b) Management’s Annual Report on Internal Control over Financial Reporting. Management's report on internal control over financial reporting and the attestation report of our independent registered public accounting firm on our internal control over financial reporting are set forth in Item 8 of this Annual Report on Form 10-K and are incorporated by reference herein.
(c) Changes in Internal Control over Financial Reporting. There has been no change in our internal control over financial reporting that occurred during the last fiscal quarter covered by this annual report (our fourth fiscal quarter) that has materially affected, or is reasonably likely to materially affect, our internal control over financial reporting.
Not applicable.
ITEM 9C. DISCLOSURE REGARDING FOREIGN JURISDICTIONS THAT PREVENT INSPECTIONS ITEM 10.
Not applicable.
DIRECTORS, EXECUTIVE OFFICERS AND CORPORATE GOVERNANCE
The information required by this Item 10 is incorporated herein by reference from our proxy statement for our 2023 Annual Meeting of Shareholders under the headings "Proposal One: Election of Directors," "Corporate Governance" and "Executive Officers and Senior Management," which proxy statement will be filed pursuant to Regulation 14A within 120 days after the March 25, 2023 fiscal year end.
ITEM 11. EXECUTIVE COMPENSATION
The information required by this Item 11 is incorporated herein by reference from our proxy statement for our 2023 Annual Meeting of Shareholders under the headings "Compensation Discussion and Analysis," "Director Compensation," "Compensation Committee Report," "CEO Pay Ratio," and "Pay Versus Performance," which proxy statement will be filed pursuant to Regulation 14A within 120 days after the March 25, 2023 fiscal year end.
ITEM 12. SECURITY OWNERSHIP OF CERTAIN BENEFICIAL OWNERS AND MANAGEMENT AND RELATED STOCKHOLDER MATTERS
With the exception of the information presented in the table below, the information required by this Item 12 is incorporated herein by reference from our proxy statement for our 2023 Annual Meeting of Shareholders under the headings "Security Ownership of Certain Beneficial Owners" and "Security Ownership of Management," which proxy statement will be filed pursuant to Regulation 14A within 120 days after the March 25, 2023 fiscal year end.
Securities Authorized for Issuance Under Equity Compensation Plans as of March 25, 2023:
Equity Compensation Plan Information
(In Thousands, Except Per Share Amounts)
| Number of |
||||||||||||
| securities |
||||||||||||
| Number of |
remaining available |
|||||||||||
| securities to be |
for future issuance |
|||||||||||
| issued upon |
under equity |
|||||||||||
| exercise of |
compensation plans |
|||||||||||
| outstanding options |
Weighted-average |
(excluding |
||||||||||
| and restricted stock |
exercise price of |
securities reflected |
||||||||||
| Plan category |
units |
outstanding options |
in column (a)) |
|||||||||
| (a) |
(b) |
(c) |
||||||||||
| Equity compensation plans approved by security holders |
323 | (1) | $ | 56.25 | (2) | 781 | (3) | |||||
| Equity compensation plans not approved by security holders |
- | - | - | |||||||||
| Total |
323 | (1) | $ | 56.25 | (2) | 781 | (3) | |||||
| (1) |
Includes time-vested restricted stock units and performance-based restricted stock units granted to officers and key employees pursuant to our 2003 Plan and 2021 Incentive Plan. See Note 6 to our Consolidated Financial Statements in Item 8 of Part II. |
|
| (2) |
The weighted-average exercise price does not take into account the shares issuable upon vesting of outstanding restricted stock units, which do not have an exercise price. |
|
| (3) |
There are 112 shares available for grant pursuant to our ESPP. |
ITEM 13. CERTAIN RELATIONSHIPS AND RELATED TRANSACTIONS, AND DIRECTOR INDEPENDENCE
The information required by this Item 13 is incorporated herein by reference from our proxy statement for our 2023 Annual Meeting of Shareholders under the headings “Corporate Governance” and “Certain Relationships and Related Transactions,” which proxy statement will be filed pursuant to Regulation 14A within 120 days after the March 25, 2023 fiscal year end.
ITEM 14. PRINCIPAL ACCOUNTANT FEES AND SERVICES
The information required by this Item 14 is incorporated herein by reference from our proxy statement for our 2023 Annual Meeting of Shareholders under the heading “Proposal Three: Ratification of Selection of our Independent Registered Public Accounting Firm,” which proxy statement will be filed pursuant to Regulation 14A within 120 days after the March 25, 2023 fiscal year end.
ITEM 15. EXHIBITS AND FINANCIAL STATEMENT SCHEDULES
| (a) |
See Index to Financial Statements included in Item 8 of Part II of this report. |
| (b) |
Exhibits. |
Index to Exhibits
| (3) |
Articles of Incorporation and Bylaws |
|
| 3.1(a) |
||
| 3.1(b) |
||
| 3.1(c) |
||
| 3.1(d) |
||
| 3.2 |
||
| (4) |
Instruments Defining the Rights of Security Holders |
| 4.1 |
| (10) |
Material contracts |
|
| # |
10.1 |
|
| # |
10.2 |
|
| # |
10.3 |
|
| # |
10.4 |
|
| # |
10.5 |
|
| # |
10.6 |
|
| # |
10.7 |
|
| # |
10.8 |
|
| # |
10.9 |
|
| # |
10.10 |
|
| # |
10.11 |
|
| # |
10.12 |
|
| # |
10.13 |
|
| # |
10.14 |
Form of Award Notice for Non-Qualified Stock Options granted pursuant to the Transcat, Inc. 2021 Stock Incentive Plan is incorporated herein by reference from Exhibit 10.1 to the Company’s Quarterly Report on Form 10-Q for the quarter ended June 25, 2022. |
| 10.15 |
||
| 10.16 |
||
| 10.17 |
||
| 10.18 |
| 10.19 | Lease Agreement between Gallina Development Corporation and Transcat, Inc. dated November 28, 2017, is incorporated herein by reference from Exhibit 10.19 to the Company’s Annual Report on Form 10-K for the year ended March 31, 2018. | |
| 10.20 | Lease Agreement between AK Leasehold I, LLC and Transcat, Inc. dated May 21, 2019, is incorporated herein by reference from Exhibit 10.1 to the Company’s Current Report on Form 8-K filed on May 28, 2019. | |
| # |
10.21 |
|
| # |
10.22 |
|
| # |
10.23 |
|
| # |
10.24 |
|
| 10.25 |
||
| 10.26 |
||
| (21) |
Subsidiaries of the registrant |
|
| * |
21.1 |
|
| (23) |
Consents of experts and counsel |
|
| * |
23.1 |
|
| (31) |
Rule 13a-14(a)/15d-14(a) Certifications |
|
| * |
31.1 |
Certification of Chief Executive Officer Pursuant to Section 302 of the Sarbanes-Oxley Act of 2002 |
| * |
31.2 |
Certification of Chief Financial Officer Pursuant to Section 302 of the Sarbanes-Oxley Act of 2002 |
| (32) |
Section 1350 Certifications |
|
| ** |
32.1 |
Certification Pursuant to Section 906 of the Sarbanes-Oxley Act of 2002 |
| (101) |
Interactive Data File |
| * |
101.INS Inline XBRL Instance Document |
| * |
101.SCH Inline XBRL Taxonomy Extension Schema Document |
| * |
101.CAL Inline XBRL Taxonomy Extension Calculation Linkbase Document |
| * |
101.DEF Inline XBRL Taxonomy Extension Definition Linkbase Document |
| * |
101.LAB Inline XBRL Taxonomy Extension Label Linkbase Document |
| * |
101.PRE Inline XBRL Taxonomy Extension Presentation Linkbase Document |
| * |
(104) Cover Page Interactive Data File (formatted as Inline XBRL and contained in Exhibit 101) |
| * |
Exhibit filed with this report. |
|
| ** | Furnished with this report. | |
| # |
Management contract or compensatory plan or arrangement. |
ITEM 16. FORM 10-K SUMMARY Pursuant to the requirements of Section 13 or 15(d) of the Securities Exchange Act of 1934, the registrant has duly caused this report to be signed on its behalf by the undersigned, thereunto duly authorized.
None.
| TRANSCAT, INC. |
|
| Date: June 6, 2023 |
/s/ Lee D. Rudow |
| By: |
Lee D. Rudow |
| President and Chief Executive Officer |
|
Pursuant to the requirements of the Securities Exchange Act of 1934, this report has been signed below by the following persons on behalf of the registrant and in the capacities and on the dates indicated.
| Date |
Signature |
Title |
||
| June 6, 2023 | /s/ Lee D. Rudow |
Director, President and Chief Executive Officer |
||
| Lee D. Rudow |
(Principal Executive Officer) |
|||
| June 6, 2023 | /s/ Thomas L. Barbato |
Senior Vice President of Finance and |
||
| Thomas L. Barbato | Chief Financial Officer |
|||
| (Principal Financial Officer) |
||||
| June 6, 2023 | /s/ Scott D. Deverell |
Controller and Principal Accounting Officer |
||
| Scott D. Deverell |
(Principal Accounting Officer) |
|||
| June 6, 2023 | /s/ Gary J. Haseley |
Chairman of the Board of Directors |
||
| Gary J. Haseley |
||||
| June 6, 2023 | /s/ Craig D. Cairns |
Director |
||
| Craig D. Cairns |
||||
| June 6, 2023 | /s/ Oksana Dominach |
Director |
||
| Oksana Dominach |
||||
| June 6, 2023 | /s/ Charles P. Hadeed |
Director |
||
| Charles P. Hadeed |
||||
| June 6, 2023 | /s/ Richard J. Harrison |
Director |
||
| Richard J. Harrison |
||||
| June 6, 2023 | /s/ Mbago M. Kaniki |
Director |
||
| Mbago M. Kaniki |
||||
| June 6, 2023 | /s/ Cynthia Langston |
Director |
||
| Cynthia Langston |
||||
| June 6, 2023 | /s/ Paul D. Moore |
Director |
||
| Paul D. Moore |
Exhibit 21.1
SUBSIDIARIES
|
Subsidiary |
Jurisdiction |
|
Transcat Canada, Inc. |
Canada |
|
WTT Real Estate Acquisition, LLC |
New York |
|
Cal OpEx Limited |
Ireland |
|
Cal OpEx Inc. |
Delaware |
| Tangent Labs LLC | Indiana |
|
TIC-MS, LLC |
Delaware |
Exhibit 23.1
CONSENT OF INDEPENDENT REGISTERED PUBLIC ACCOUNTING FIRM
Transcat, Inc.
Rochester, NY
We consent to the incorporation by reference in the Registration Statements on Form S-8 (Registration Nos. 333-109985, 333-191438 and 333-191631) and Form S-3 (Registration No. 333-250135, 333-260217 and 333-272069) of Transcat, Inc. of our report dated June 6, 2023 relating to the consolidated financial statements and the effectiveness of internal control over financial reporting of Transcat, Inc., which appear in this Form 10-K of Transcat, Inc. for the year ended March 25, 2023.
/s/ Freed Maxick CPAs P.C.
Rochester, New York
June 6, 2023
Exhibit 31.1
CERTIFICATION OF CHIEF EXECUTIVE OFFICER PURSUANT TO
SECTION 302 OF THE SARBANES-OXLEY ACT OF 2002
I, Lee D. Rudow, President and Chief Executive Officer of Transcat, Inc., certify that:
1. I have reviewed this annual report on Form 10-K of Transcat, Inc.;
2. Based on my knowledge, this report does not contain any untrue statement of a material fact or omit to state a material fact necessary to make the statements made, in light of the circumstances under which such statements were made, not misleading with respect to the period covered by this report;
3. Based on my knowledge, the financial statements, and other financial information included in this report, fairly present in all material respects the financial condition, results of operations and cash flows of the registrant as of, and for, the periods presented in this report;
4. The registrant’s other certifying officer and I are responsible for establishing and maintaining disclosure controls and procedures (as defined in Exchange Act Rules 13a-15(e) and 15d-15(e)) and internal control over financial reporting (as defined in Exchange Act Rules 13a-15(f) and 15d-15(f)) for the registrant and have:
(a) designed such disclosure controls and procedures, or caused such disclosure controls and procedures to be designed under our supervision, to ensure that material information relating to the registrant, including its consolidated subsidiaries, is made known to us by others within those entities, particularly during the period in which this report is being prepared;
(b) designed such internal control over financial reporting, or caused such internal control over financial reporting to be designed under our supervision, to provide reasonable assurance regarding the reliability of financial reporting and the preparation of financial statements for external purposes in accordance with generally accepted accounting principles;
(c) evaluated the effectiveness of the registrant’s disclosure controls and procedures and presented in this report our conclusions about the effectiveness of the disclosure controls and procedures, as of the end of the period covered by this report based on such evaluation; and
(d) disclosed in this report any change in the registrant’s internal control over financial reporting that occurred during the registrant’s most recent fiscal quarter (the registrant’s fourth fiscal quarter in the case of an annual report) that has materially affected, or is reasonably likely to materially affect, the registrant’s internal control over financial reporting; and
5. The registrant’s other certifying officer and I have disclosed, based on our most recent evaluation of internal control over financial reporting, to the registrant’s auditors and the audit committee of the registrant’s board of directors (or persons performing the equivalent functions):
(a) all significant deficiencies and material weaknesses in the design or operation of internal control over financial reporting which are reasonably likely to adversely affect the registrant’s ability to record, process, summarize and report financial information; and
(b) any fraud, whether or not material, that involves management or other employees who have a significant role in the registrant’s internal control over financial reporting.
|
Date: June 6, 2023 |
/s/ Lee D. Rudow |
|
Lee D. Rudow |
|
|
President and Chief Executive Officer (Principal Executive Officer) |
Exhibit 31.2
CERTIFICATION OF CHIEF FINANCIAL OFFICER PURSUANT TO
SECTION 302 OF THE SARBANES-OXLEY ACT OF 2002
I, Thomas L. Barbato, Senior Vice President of Finance and Chief Financial Officer of Transcat, Inc., certify that:
1. I have reviewed this annual report on Form 10-K of Transcat, Inc.;
2. Based on my knowledge, this report does not contain any untrue statement of a material fact or omit to state a material fact necessary to make the statements made, in light of the circumstances under which such statements were made, not misleading with respect to the period covered by this report;
3. Based on my knowledge, the financial statements, and other financial information included in this report, fairly present in all material respects the financial condition, results of operations and cash flows of the registrant as of, and for, the periods presented in this report;
4. The registrant’s other certifying officer and I are responsible for establishing and maintaining disclosure controls and procedures (as defined in Exchange Act Rules 13a-15(e) and 15d-15(e)) and internal control over financial reporting (as defined in Exchange Act Rules 13a-15(f) and 15d-15(f)) for the registrant and have:
(a) designed such disclosure controls and procedures, or caused such disclosure controls and procedures to be designed under our supervision, to ensure that material information relating to the registrant, including its consolidated subsidiaries, is made known to us by others within those entities, particularly during the period in which this report is being prepared;
(b) designed such internal control over financial reporting, or caused such internal control over financial reporting to be designed under our supervision, to provide reasonable assurance regarding the reliability of financial reporting and the preparation of financial statements for external purposes in accordance with generally accepted accounting principles;
(c) evaluated the effectiveness of the registrant’s disclosure controls and procedures and presented in this report our conclusions about the effectiveness of the disclosure controls and procedures, as of the end of the period covered by this report based on such evaluation; and
(d) disclosed in this report any change in the registrant’s internal control over financial reporting that occurred during the registrant’s most recent fiscal quarter (the registrant’s fourth fiscal quarter in the case of an annual report) that has materially affected, or is reasonably likely to materially affect, the registrant’s internal control over financial reporting; and
5. The registrant’s other certifying officer and I have disclosed, based on our most recent evaluation of internal control over financial reporting, to the registrant’s auditors and the audit committee of the registrant’s board of directors (or persons performing the equivalent functions):
(a) all significant deficiencies and material weaknesses in the design or operation of internal control over financial reporting which are reasonably likely to adversely affect the registrant’s ability to record, process, summarize and report financial information; and
(b) any fraud, whether or not material, that involves management or other employees who have a significant role in the registrant’s internal control over financial reporting.
|
Date: June 6, 2023 |
/s/ Thomas L. Barbato |
| Thomas L. Barbato | |
|
Senior Vice President of Finance and Chief Financial Officer (Principal Financial Officer) |
Exhibit 32.1
CERTIFICATION PURSUANT TO
SECTION 906 OF THE SARBANES-OXLEY ACT OF 2002
In connection with this annual report on Form 10-K of Transcat, Inc., Lee D. Rudow, the Chief Executive Officer of Transcat, Inc., and Thomas L. Barbato, the Chief Financial Officer of Transcat, Inc. certify, pursuant to Section 906 of the Sarbanes-Oxley Act of 2002, to the best of their knowledge, that:
|
1. |
This annual report on Form 10-K for the fiscal year ended March 25, 2023 fully complies with the requirements of Section 13(a) or 15(d) of the Securities Exchange Act of 1934; and |
|
2. |
The information contained in this annual report on Form 10-K for the fiscal year ended March 25, 2023 fairly presents, in all material respects, the financial condition and results of operations of Transcat, Inc. |
|
Date: June 6, 2023 |
/s/ Lee D. Rudow |
|
Lee D. Rudow |
|
|
President and Chief Executive Officer (Principal Executive Officer) |
|
Date: June 6, 2023 |
/s/ Thomas L. Barbato |
|
Thomas L. Barbato |
|
|
Senior Vice President of Finance and Chief Financial Officer (Principal Financial Officer) |