UNITED STATES
SECURITIES AND EXCHANGE COMMISSION
WASHINGTON, D.C. 20549
Form 10-K
| ☒ |
ANNUAL REPORT PURSUANT TO SECTION 13 OR 15(d) OF THE SECURITIES EXCHANGE ACT OF 1934 |
For the fiscal year ended March 31, 2023
OR
| ☐ |
TRANSITION REPORT PURSUANT TO SECTION 13 OR 15(d) OF THE SECURITIES EXCHANGE ACT OF 1934 |
For the Transition Period from to
Commission file number 000-19672
| American Superconductor Corporation (Exact Name of Registrant as Specified in Its Charter) |
| Delaware |
04-2959321 |
| (State or Other Jurisdiction of Incorporation or Organization) |
(IRS Employer Identification Number) |
|
|
|
| 114 East Main Street Ayer, Massachusetts |
01432 |
| (Address of Principal Executive Offices) |
(Zip Code) |
Registrant’s telephone number, including area code:
(978) 842-3000
Securities registered pursuant to Section 12(b) of the Act:
| Title of each class |
Trading Symbol(s) |
Name of each exchange on which registered |
| Common Stock, $0.01 par value per share |
AMSC |
Nasdaq Global Select Market |
| Securities registered pursuant to Section 12(g) of the Act: None |
Indicate by checkmark if the registrant is a well-known seasoned issuer, as defined in Rule 405 of the Securities Act. Yes ☐ No ☒
Indicate by checkmark if the registrant is not required to file reports pursuant to Section 13 or Section 15(d) of the Act. Yes ☐ No ☒
Indicate by check mark whether the registrant (1) has filed all reports required to be filed by Section 13 or 15(d) of the Securities Exchange Act of 1934 during the preceding 12 months (or for such shorter period that the registrant was required to file such reports), and (2) has been subject to such filing requirements for the past 90 days. Yes ☒ No ☐
Indicate by check mark whether the registrant has submitted electronically every Interactive Data File required to be submitted pursuant to Rule 405 of Regulation S-T (§ 232.405 of this chapter) during the preceding 12 months (or for such shorter period that the registrant was required to submit such files). Yes ☒ No ☐
Indicate by checkmark whether the registrant is a large accelerated filer, an accelerated filer, a non-accelerated filer, a smaller reporting company, or an emerging growth company. See the definitions of “large accelerated filer,” “accelerated filer,” “smaller reporting company,” and "emerging growth company" in Rule 12b-2 of the Exchange Act.
| Large accelerated filer |
☐ |
|
Accelerated filer |
☒ |
|
|
|
|
|
|
| Non-accelerated filer |
☐ |
Smaller reporting company |
☒ |
|
|
|
|
|
|
|
|
|
|
|
Emerging growth company |
☐ |
If an emerging growth company, indicate by check mark if the registrant has elected not to use the extended transition period for complying with any new or revised financial accounting standards provided pursuant to Section 13(a) of the Exchange Act. ☐
Indicate by check mark whether the registrant has filed a report on and attestation to its management’s assessment of the effectiveness of its internal control over financial reporting under Section 404(b) of the Sarbanes-Oxley Act (15 U.S.C. 7262(b)) by the registered public accounting firm that prepared or issued its audit report. ☒
If securities are registered pursuant to Section 12(b) of the Act, indicate by check mark whether the financial statements of the registrant included in the filing reflect the correction of an error to previously issued financial statements. ☐
Indicate by check mark whether any of those error corrections are restatements that required a recovery analysis of incentive-based compensation received by any of the registrant’s executive officers during the relevant recovery period pursuant to §240.10D-1(b). ☐
Indicate by checkmark whether the registrant is a shell company (as defined in Rule 12b-2 of the Act). Yes ☐ No ☒
The aggregate market value of the registrant’s Common Stock held by non-affiliates of the registrant on September 30, 2022, based on the closing price of the shares of Common Stock on the Nasdaq Global Select Market on that date ($4.38 per share) was $122.5 million.
Number of shares outstanding of the registrant’s Common Stock, as of May 29, 2023 was 29,595,446.
DOCUMENTS INCORPORATED BY REFERENCE
Portions of the definitive proxy statement for the annual meeting of stockholders scheduled to be held on August 11, 2023, to be filed with the Securities and Exchange Commission (the “SEC”), are incorporated by reference in answer to Part III of this Form 10-K.
AMERICAN SUPERCONDUCTOR CORPORATION
INDEX
| Item |
|
Page |
| PART I |
||
| 1. |
||
|
|
|
|
| 1A. |
||
|
|
|
|
| 1B. |
||
|
|
|
|
| 2. |
||
|
|
|
|
| 3. |
||
|
|
|
|
| 4. |
||
| PART II |
||
| 5. |
||
|
|
|
|
| 6. |
||
|
|
|
|
| 7. |
Management’s Discussion and Analysis of Financial Condition and Results of Operations |
|
|
|
|
|
| 7A. |
||
|
|
|
|
| 8. |
||
|
|
|
|
| 9. |
Changes in and Disagreements With Accountants on Accounting and Financial Disclosure |
|
|
|
|
|
| 9A. |
||
|
|
|
|
| 9B. |
||
| 9C. | Disclosure Regarding Foreign Jurisdictions that Prevent Inspections | 66 |
| PART III |
||
| 10. |
||
|
|
|
|
| 11. |
||
|
|
|
|
| 12. |
Security Ownership of Certain Beneficial Owners and Management and Related Stockholder Matters |
|
|
|
|
|
| 13. |
Certain Relationships and Related Transactions and Director Independence |
|
|
|
|
|
| 14. |
||
| PART IV |
||
| 15. |
||
| 16. | Form 10-K Summary | 68 |
This Annual Report on Form 10-K contains forward-looking statements within the meaning of Section 21E of the Securities Exchange Act of 1934, as amended (the “Exchange Act”). Any statements in this Annual Report that relate to future events or conditions, including without limitation, the statements in Part I, “Item 1A. Risk Factors” and in Part II under “Item 7. Management’s Discussion and Analysis of Financial Condition and Results of Operations” and located elsewhere herein regarding industry prospects, our addressable markets, our competitive position, the benefits of our acquisitions, the ongoing impact of the COVID-19 pandemic on our business, financial results and financial condition, expectations for when our products become operational, capabilities and potential uses of our products, steps taken to enhance liquidity, or our prospective results of operations or financial position, may be deemed to be forward-looking statements. Without limiting the foregoing, the words “believes,” “anticipates,” “plans,” “expects,” and similar expressions are intended to identify forward-looking statements. Such forward-looking statements represent management’s current expectations and are inherently uncertain. There are a number of important factors that could materially impact the value of our common stock or cause actual results to differ materially from those indicated by such forward-looking statements. Such factors include the important factors discussed under the caption “Risk Factors” in Part 1. Item 1A of this Form 10-K for the fiscal year ended March 31, 2023, which among others, could cause actual results to differ materially from those indicated by forward-looking statements made herein and presented elsewhere by management from time to time. Any such forward-looking statements represent management’s estimates as of the date of this Annual Report on Form 10-K. While we may elect to update such forward-looking statements at some point in the future, we disclaim any obligation to do so, even if subsequent events cause our views to change. These forward-looking statements should not be relied upon as representing our views as of any date subsequent to the date of this Annual Report on Form 10-K.
American Superconductor®, Amperium®, AMSC®, D-VAR®, PowerModule™, D-VAR VVO®, PQ-IVR®, SeaTitan®, Gridtec™ Solutions, Windtec™ Solutions, Smarter, Cleaner...Better Energy™, Orchestrate the Rhythm and Harmony of Power on the Grid™, actiVAR®, armorVAR™, NEPSI™, Neeltran™ and SafetyLOCK™ are trademarks or registered trademarks of American Superconductor Corporation or our subsidiaries. We reserve all of our rights with respect to our trademarks or registered trademarks regardless of whether they are so designated in this Annual Report on Form 10-K by an ® or ™ symbol. All other brand names, product names, trademarks or service marks appearing in this Annual Report on Form 10-K are the property of their respective holders.
PART I
| BUSINESS |
Overview
American Superconductor Corporation (together with its subsidiaries, “AMSC®” or the “Company”) was founded on April 9, 1987. At AMSC, we believe that our creativity can meet today’s challenges and help us progress to a better future. That means using future-facing technologies to harmonize the world’s desire for decarbonization and clean energy with the need for more reliable, effective and efficient power delivery. Already, our transformative power solutions are moving the world forward.
We are a leading system provider of megawatt-scale power resiliency solutions that Orchestrate the Rhythm and Harmony of Power on the Grid™, and protect and expand the capability of the Navy’s fleet. Our system level products leverage the Company’s proprietary “smart materials” and “smart software and controls” to provide enhanced resiliency and improved performance of megawatt-scale power flow.
Right now, we are powering the evolution of a grid that is fit for the future: a more reliable and resilient grid that can incorporate renewable energy sources and our pioneering products, software and control solutions are creating more cost-effective ways for renewables to deliver a cleaner, less carbon-intensive tomorrow. This exciting energy future also depends on computer chips, batteries and fuel cells that are built from silicon, lithium and carbon. All of these building blocks must be mined, processed and assembled. Industrial manufacturers of these essential materials as well as semiconductor manufacturers must be able to power their factories in ways that scale without adding complexity or size. Our voltage compensators, capacitors, transformers and rectifiers can power the energy-intensive factories of the future while reducing the risk of costly power interruptions that could hinder this journey to a better future.
What's more, in an age of increasing global tensions, we are helping to move U.S. Navy ships into the future by installing protection systems that help them stay hidden from our enemies. We help protect and expand the capability of the U.S. Navy surface fleet with advanced superconductor-based systems that provide superior performance advantages to the traditional methods of mine field protection. We see the nascent business serving the Navy as an extension of what we do with our Grid business – this ship is a microcosm of the grid. Our products help manage power with a purpose.
In the wind power market, we enable manufacturers to field highly competitive wind turbines through our advanced power electronics and control system products, engineering, and support services. Our power grid and wind products and services provide exceptional reliability, security, efficiency, and affordability to our customers.
Our power system solutions help to improve energy efficiency, alleviate power capacity and other constraints, improve system resiliency, and increase the adoption of renewable energy generation. Demand for our solutions is driven by: the growing needs for modernized grids that improve power reliability, security, and quality, the U.S. Navy’s effort to upgrade in-board power systems to support fleet electrification, and the need for increased renewable sources of electricity, such as wind and solar energy. Concerns about these factors have led to increased spending by corporations and the military, as well as supportive government regulations and initiatives on local, state and national levels, including renewable portfolio standards, tax incentives, and international treaties. We estimate that the total annual addressable global market for our products and solutions is nearly $9 billion.
Our Company’s addressable market is driven by (i) the nearly $500 billion investment in renewables to update the aging grid for better support in the adoption of intermittent renewable power sources, (ii) the nearly $100 billion investment in the mining and processing of materials as well as the $160 billion investment in semiconductor capacity—both of which are driven by the electrification of transportation, the need to prioritize energy security and bolster domestic supply chains—and (iii) the over $30 billion investment by the U.S. federal government in U.S. military ship systems and capabilities to help ensure performance and security amid geopolitical uncertainty.
Market opportunities
We provide solutions that address four key drivers of our business:
| • | the global demand for renewable energy; |
| • | the global demand for materials for the electrification of transportation, in particular for - electric vehicles; |
| • | the global demand for semiconductors, driven by the electrification of everything; and |
| • | the electrification of the Naval fleet to enhance capability. |
This all requires an electric grid that is fit for the future.
The Global Demand for Renewables:
We design wind turbines and provide electrical control systems for inside the turbine, that control the wind turbine’s voltage, current, frequency, pitch and yaw. At the substation level, we provide interconnection solutions that allows wind farms to meet utility’s grid code requirements for voltage, power factor and dynamic performance of the plant during unforeseen system disturbances, by utilizing our dynamic voltage management solutions as well as our static voltage management solutions and harmonic filters. We provide field service and spare parts to our global installed base of over 17GW.
The Global Demand for Materials and Electric Vehicles:
We provide transformation, rectification, voltage management and harmonic filtering systems at the substation level that manage input power from the grid and control power for the operation of large-scale industrial equipment such as furnaces, chemical plants, or semiconductor fabrication plants. Our capabilities to control and convert power help ensure continuous flow of stable high-quality power for our customers.
The Global Demand for Semiconductors:
We provide sag mitigation systems, which are a substation level power conditioning system. These systems protect and isolate the factory’s critical processes from power system events that could otherwise trip these sensitive processes causing severe disruptions and loss of a customer’s manufactured products. These systems monitor the semiconductor fabrication plant’s incoming electric supply very closely and react in sub-cycle time frames to mitigate voltage sags and swells to provide a conditioned power to the processes. These sag mitigation systems can include both our dynamic and static voltage management as well as our harmonic filter solutions which are specifically designed to improve the facility's overall power factor and harmonic compliance needs.
The Electrification of the Navy Fleet:
We provide advanced ship protection systems, that are designed to help fleets increase system efficiencies, enhance warfare capabilities, and boost reliability, performance, and security. We are developing additional solutions for this important market which may include power management and power generation similar to what we do for electric grids.
Our power system products address the renewable power generation and electrical grid and power infrastructure markets:
| • | Transmission grid. We provide complete systems that enable electric utilities and renewable energy project developers to connect and transmit power with exceptional efficiency, reliability, security and affordability. We provide planning services that allow us to identify power grid congestion, poor power quality, and other risks, which help us determine how our solutions can improve network performance. These services often lead to sales of our grid interconnection solutions and power quality systems for wind farms and solar power plants. |
| • | Distribution grid. We provide a direct-connect power quality system that is installed on the primary distribution network in communities, business parks, or wherever enhanced power quality is beneficial and is designed to increase the reliability and resiliency of the distribution grid to serve the needs of modern energy consumers. Our systems save utilities time and money by avoiding costly options to strengthen the distribution grid. Our offerings also serve industrial customers looking to power the energy-intensive factories of the future without the risk of costly power interruptions. These industrial customers utilize our voltage compensators, capacitors, harmonic filters, transformers and rectifiers. |
| • | Urban Grid Infrastructure. We design systems to increase the reliability, security and capacity of the urban grid infrastructure. Today, many urban substations are not networked and can only power a small section of a city. Our power dense technology based on proprietary smart materials allows for the inter-connection of substations, controlling the high fault currents that naturally result from such interconnections. If one substation is compromised, other substations help increase capacity and reliability. Our system allows instantaneous power outage recovery, potentially doubling to quadrupling a city’s reliability and resiliency while minimizing grid investment. We design systems that leverage existing grid assets while protecting cities against storms, outages, and cyber- and physical attacks. |
| • | Marine protection systems. We sell advanced degaussing systems to the U.S. Navy. Our degaussing system creates a magnetic signature around a ship to mask the ship against sea mines and torpedoes. Our degaussing system is comprised of much smaller, lighter and higher performing HTS cable coils eliminating an estimated 50-80% of the system weight and reducing overall energy consumption versus copper-based degaussing systems. |
| • | Solar Power. Our solutions enable the grid to handle more distributed generation in the form of rooftop solar. Our products are designed to allow the existing grid to handle more renewable capacity. |
| • | Wind Power. Our solutions enable manufacturers to field wind turbines with exceptional power output, reliability, and affordability. We supply advanced power electronics and control systems, license our highly engineered wind turbine designs, and provide extensive customer support services to wind turbine manufacturers. Our design portfolio includes a broad range of drive trains and power ratings of 2 megawatts (“MW”) and higher. We provide a broad range of power electronics and software-based control systems that are highly integrated and designed for optimized performance, efficiency, and grid compatibility. |
Our fiscal year begins on April 1 and ends on March 31. When we refer to a particular fiscal year, we are referring to the fiscal year beginning on April 1 of that same year. For example, fiscal 2022 refers to the fiscal year that began on April 1, 2022. Other fiscal years follow similarly.
Competitive strengths
We believe our competitive strengths position us well to execute on our growth plans in the markets we serve.
| • | Differentiated technologies. Our products leverage the Company’s proprietary smart materials and smart software and controls to provide enhanced resiliency and improved performance of megawatt-scale power flow. Conventional conductors of electricity, such as aluminum and copper wire, lose energy due to resistance. Using a compound of yttrium barium copper oxide (“YBCO”), we manufacture and provide high-temperature superconductor ("HTS") wire that can conduct many times more electricity than conventional conductors with minimal power loss. Our proprietary Amperium® superconductor wire was engineered to allow us to tailor the product via laminations to meet the electrical and mechanical performance requirements of widely varying end-use applications, including power cables and fault current limiters for the Grid market. Our PowerModule™ power converters are based on proprietary software and hardware combinations and are used in a broad array of applications, including our D-VAR® grid interconnection and voltage control systems, as well as our wind turbine electrical control systems. Our unique proprietary cooler technology enables our ship protection systems ("SPS") to perform in harsh environmental conditions in a quiet and efficient manner. |
| • | Turnkey systems. We have developed full system solutions that we sell directly to customers. This business model leverages our applications expertise, drives value beyond our power electronic and our superconductor based products, and enables us to recognize revenue and take ownership over the marketing and sales of the full systems. Industrial manufacturers of these essential materials must be able to power their factories in ways that scale without adding complexity or size. |
| • | Scalable, low-cost manufacturing platform. Our manufacturing of proprietary wind turbine electrical control systems and power electronics products are primarily assembly operations with minimal fixed costs. We can increase the production of these products at costs that we believe are low relative to our competitors. Our proprietary manufacturing technique for Amperium superconductor wire is modular in nature, which allows us to expand manufacturing capacity at a relatively low incremental cost and differentiate ourselves from solutions assembled in the field. |
| • | Robust patent position and engineering expertise. We have a robust portfolio of awarded patents and patent applications worldwide and have rights through exclusive and non-exclusive licenses to additional patents and patent applications worldwide. We believe our technology and manufacturing knowledge base, customer and product expertise and patent portfolio provide a strong competitive position. |
| • | Unique solutions for the markets we serve. We believe we provide wind turbine manufacturers with a unique and integrated approach for wind turbine design and engineering, customer support services and power electronics and control systems. We also believe we are the only company in the world that is able to provide transmission planning services, grid interconnection and voltage control systems, as well as superconductor-based distribution systems for power grid operators. This unique scope of supply provides us with greater insight into our customers’ evolving needs and greater cross-selling opportunities. |
Strategy
Building on these competitive strengths, we plan to focus on driving revenue growth and enhancing our operating results through the objectives defined below.
| • | Provide solutions from power generation to delivery. From the generation source to the distribution system, we focus on providing best-in-class engineering, support services, technologies and solutions that make the world’s power supplies smarter, cleaner and more resilient. |
| • | Focus on “megawatt-scale” power offerings. Our research, product development, and sales efforts focus on megawatt-scale offerings ranging from designs of power electronics for large wind turbine platforms to systems that stabilize power flows, integrate renewable power into the grid and carry power to and from transmission and distribution substations. |
| • | Product innovation. We have a strong record of developing unique solutions for megawatt-scale power applications and intend to continue our focus on investing in innovation. Recently, our product development efforts have included our Resilient Electric Grid ("REG") system for the transmission electricity grid, SPS for the U.S. Navy, and D-VAR Volt Var Optimization (“VVO”) for the distribution electricity grid. |
| • | Provide resiliency and protection capabilities. Our products provide resiliency and protection capabilities that support an evolving power grid and protect the navy fleet from rising global threats. |
| • | Pursue Emerging Overseas Markets and Serve Key Markets Locally. We focus our sales efforts on overseas markets that are investing aggressively in renewable energy and power grid projects. As part of our strategy, we serve our key target markets with local sales and field service personnel, which enables us to understand market dynamics and more effectively anticipate customer needs while also reducing response time. We currently serve target markets such as Australia, Canada, India, South Korea, Japan, Singapore, South Africa, the United Kingdom, Jordan, Mexico, Spain and the United States. |
Grid market overview
It is widely believed that the electricity grids around the world require modernization through widespread technology upgrades if they are to maintain reliability while solving rapidly evolving challenges such as more frequent severe weather, threats of physical- and cyber-attacks, expanded renewable generation (both large and small scale) and new types of customer loads such as electric vehicles. In fact, a series of reports written by the Electric Power Research Institute ("EPRI") in 2016 emphasize the need for increased resiliency, flexibility and connectivity in electric grids. According to the EPRI reports, the number of geophysical, meteorological, hydrological, and climatological events in the U.S. rose to an all-time high of 247 events in 2010 – up from approximately 200 in 2009 and less than 200 in all years combined from 1980 to 2010. Available data further indicate that the existing U.S. electrical grid has been stressed by U.S. wind power generation increasing from 6 Gigawatts ("GW") in 2003 to approximately 142.9 GW in 2022, and photovoltaics ("PV") power generation increasing from almost zero in 2003 to approximately 125.9 GW as of the end of 2022.
Growth in both wind power and PV is expected to continue with the vast majority of such intermittent generation sources unsupported by energy storage, placing stress on the power grid. Finally, the Edison Electric Institute estimates that the number of electric vehicles on the road in the U.S. is projected to reach 18.7 million in 2030, up from more than 1.0 million at the end of 2018. These facts and the dependence on the safety, security and economy of the electricity grid have prompted broad recognition worldwide of the need to modernize and enhance the reliability and security of power grids.
The Biden Administration’s energy plan could positively impact the demand for our new energy power systems solutions. The energy plan intends to reform and extend the tax incentives that generate energy efficiency and clean energy jobs as well as to develop financing mechanisms that leverage private sector dollars to maximize investment in the clean energy revolution. We plan to seek to collaborate with top tier wind turbine manufacturers to provide new wind farm connectivity to the U.S. power grid.
The Biden Administration also intends to spur the installation of millions of solar panels – including utility-scale, rooftop, and community solar systems. Our systems are primarily focused on addressing renewable energy installations for project developers and wind turbine manufacturers. Because solar power is dynamic and intermittently variable in nature, distribution grids will need to enhance their network’s capabilities to accommodate this new resource, while maintaining efficiency and power quality for their customers. Our system offers electric utilities superior power quality, environmental benefits, and significant cost-savings over traditional solutions.
The Biden Administration's energy policy also focuses on the next generation of electric grid transmission and distribution, which has been the heart of our long-term growth strategy. We believe our new energy power systems products are well suited to address this enormous challenge.
The Inflation Reduction Act of 2022 (the “Inflation Reduction Act”) was enacted in August 2022, in part, to address the challenges of climate change. The Inflation Reduction Act is expected to result in the investment of $369 billion in climate solutions and environmental justice. The goal of the Inflation Reduction Act is to reduce emissions by 40 percent by 2030 while restoring U.S. credibility to lead climate action on the global stage.
The Creating Helpful Incentives to Produce Semiconductors and Science Act of 2022 (the “CHIPS Act of 2022”), also was enacted in August 2022 and is intended to enable the re-shoring of critical manufacturing capability to the U.S., which is expected to be beneficial to our business. The CHIPS for America Fund, provides $52.7 billion of funding for the development of U.S. manufacturing, research and development (R&D), and workforce development programs. From this $52.7 billion, $39 billion is allocated to be spent on financial assistance to build, develop, or modernize domestic semiconductor facilities in order to bolster U.S. leadership in the semiconductor industry.
We believe we are well positioned to seize the numerous opportunities presented by the Inflation Reduction Act and the CHIPS Act of 2022.
Power grid operators worldwide face various challenges, including:
| • | Resiliency. As our electricity mix changes with the proliferation of renewables and distributed generation, so does the need to strengthen the electric grid. New technologies such as the addition of electric vehicles on U.S. roads and urbanization create new challenges for power grid operators. |
| • | Stability. Power grid operators are confronting power quality and stability issues arising from intermittent renewable energy sources and from the capacity limitations of transmission and overhead distribution lines and underground cables. |
| • | Reliability. Traditional transmission lines and cables often reach their reliable voltage stability limit well below their thermal threshold. Driving more power through a power grid when some lines and cables are operating above their voltage stability limit during times of peak demand can cause either unacceptably low voltage in the power grid (a brownout) or risk of a sudden, uncontrollable voltage collapse (a blackout). |
| • | Capacity. The traditional way to enable increases in power grid capacity without losing voltage stability is to install more overhead power lines and underground cables. However, permitting new transmission and distribution lines can take 10 years or more due to various public policy issues, such as environmental, aesthetic, and health concerns. In urban and metropolitan areas, installing additional conventional underground copper cables is similarly challenging, since many existing underground corridors carrying power distribution cables are already filled to their physical capacity and cannot accommodate any additional conventional cables. In addition, adding new conduits requires excavation to expand existing corridors or create new corridors, which are costly and disruptive undertakings. |
| • | Efficiency. Most overhead lines and underground cables use traditional conductors such as copper and aluminum, which lose power due to electrical resistance. At transmission voltage, electrical losses average about 7% in the United States and other developed nations, but can exceed 20% in some locations due to the distance of the line, quality of the conductor, and the power grid’s architecture and characteristics, among other factors. |
| • | Security. Catastrophic equipment failures caused by aging equipment, physical and cyber events, and weather-related disasters can leave entire sections of an urban environment without power for hours or days. It can be difficult to recover from extended power outages in urban load centers, worsening situations where the personal safety of residents and the economic health of businesses are threatened. |
Our solutions for the power quality and grid infrastructure market
We address these challenges in the grid market by providing services and solutions designed to increase the power grid’s capacity, resiliency, reliability, security and efficiency. Our solutions orchestrate the rhythm of power on the grid. Our solutions include:
| • | D-VAR® Systems. Our D-VAR system consists of power electronics and other static components used for controlling power flow and voltage in the AC transmission system. Our D-VAR system aims to increase controllability and power transferability of a network, which allows more effective utilization of existing assets, and reduces the need for new transmission lines and facilities to increase electricity availability. The power that flows through AC networks comprises both real power, measured in watts, and reactive power, measured in Volt Amp Reactive (“VARs”). In simple terms, reactive power is required to support voltage in the power network. D-VAR systems can provide the reactive power needed to stabilize voltage on the grid. These systems also can be used to connect wind farms and solar power plants to the power grid seamlessly as well as to protect certain industrial facilities against voltage swells and sags. Our D-VAR sales process begins with our group of experienced transmission planners working with power grid operators, renewable energy developers, and industrial system operators to identify power grid constraints and determine how our solutions might improve network performance. These services often lead to sales of grid interconnection solutions for wind farms and solar power plants, and power quality systems for utilities and heavy industrial operations. |
| • | actiVAR® Systems. Our actiVAR system is a fast-switching medium-voltage reactive compensation solution that utilizes passive, fast-switching, and transient-free switching devices. The actiVAR mitigates voltage sags and reduces large inrush currents associated with starting large medium-voltage motors across-the-line. Large motors require significant amounts of reactive power to start. The flow of VARs across the power system network results in voltage sags which cause power quality issues to nearby utility customers, as well as a reduction in the motors ability to start. Traditional solutions to solve these problems utilize complex and costly adjustable speed drives and synchronous transfer switchgear solutions. The actiVAR replaces these items at a fraction of the cost. The solution is prevalent in the pump and compressors stations utilized in industrial trades. Our actiVAR sales process begins with the engineering and procurement companies during feasibility studies. We identify viable projects for this solution and assist with performance and rating calculations, which eventually lead to the adaption and purchase of the actiVAR solution. |
| • | armorVAR™ Systems. Our armorVAR system consists of conventionally switched medium-voltage metal-enclosed capacitor banks and harmonic filters banks. These systems are installed for reactive compensation, power factor correction, loss reduction, utility bill savings, and mitigation of common power quality concerns related to power converter-based generation and load devices. They are utilized in all industries including renewables, industrial, utility, commercial, mining, and petro-chemical industries. Our armorVAR systems also support the base VAR requirements of renewable power plants and can include fully integrated D-VAR and D-VAR VVO® solutions to form more advanced hybrid solutions that are more economical and easier to install. |
| • |
Transformers and DC Rectifiers. Our custom transformers and rectifiers combine to form power electronic systems which consists of heavy-duty industrial rectifier transformers and direct current (DC) rectifiers. These systems are installed to produce DC power for electrolytic, furnace, and special processes. They are utilized in all industries including renewables, industrial, chemical, mining, and petro-chemical industries. Our power electronic systems also support renewable wind/solar power plants and can include fully integrated D-VAR and D-VAR VVO actiVAR®, armorVAR™ solutions that are more economical and easier to install to form a complete power solution engineered to the client's specification. |
| • | D-VAR VVO®. Our D-VAR VVO serves the distribution power grid market. VVO is designed to be a direct-connect 15 kilovolt class power quality system for a utility's distribution network to optimally control voltage as distribution networks are increasingly impacted by distributed generation, such as roof top and community solar. We believe VVO has the potential to save utilities time and money by avoiding costly options to increase the reliability and resiliency of the distribution grid and to allow utilities to build a “plug 'n play” network to serve the demands of modern energy consumers. Our VVO target markets are electric distribution grids incorporating distributed generation, including where utility grid modernization attributes such as the following are applicable: mandated efficiency upgrades, mass adoption of rooftop solar, community solar, utility-owned micro-grids, variable load conditions on the distribution grid and voltage regulations alternatives. |
| • | REG Systems. Our REG system has two primary applications that increase the reliability and the capacity of the urban infrastructure. For applications focused on reliability improvement, the REG system is used in a “ring” or “loop” configuration to interconnect nearby urban substations. This enables urban utilities to share transmission connections and excess station capacity, while controlling the high fault currents that naturally result from such interconnections, providing protection against the adverse effects that follow the loss of critical substation facilities in urban areas. We believe a utility installing our REG system could double or quadruple its reliability (e.g. N-1 to N-2, or greater) by networking substations, which is a solution that utilities would generally not consider when using conventional technology in urban settings due to its disruptive nature and economic disadvantages. For applications focused on capacity improvement, the REG system can be used in a “branch” configuration. In this application, the REG system connects an existing large urban substation with a new, much smaller, and more simplified substation within the city at a lower cost. The smaller urban substation does not need large power transformers and takes up much less space, thereby significantly reducing real estate, construction, and other related costs in the urban area. The key component to the REG system is a breakthrough cable system that combines very high-power handling capacity with fault current limiting characteristics - features that are attributable to our proprietary Amperium HTS wire. |
Marine market overview
Defense spending has increased over the past six years as the U.S. military moves to rebuild and retool for competition against other great powers. In April 2022, the U.S. Navy’s 2022 shipbuilding plan covering government fiscal years 2023 to 2052, calls for a larger modernized, sustainable and lethal Navy. For a description of risks related to our government contracts, see Part I, Item 1A, “Risk Factors – Our contracts with the U.S. government are subject to audit, modification or termination by the U.S. government and include certain other provisions in favor of the government. The continued funding of such contracts remains subject to annual congressional appropriation, which, if not approved, could reduce our revenue and lower or eliminate our profit.
On November 1, 2022, the Navy’s fleet numbered 292 battle force ships—aircraft carriers, submarines, surface combatants, amphibious ships, combat logistics ships, and some support ships. As of April 17, 2023, the Navy included 296 battle force ships.
Since WWII, the Navy fleet has protected its warfare vessels with copper-based degaussing systems. Our HTS-based degaussing system provides world class mine protection while reducing the weight of the degaussing system by an estimated 50-80%, and reducing energy consumption.
We believe that our HTS systems are an enabling technology for the Navy in its mission to create an all-electric ship (Super Ship). Our HTS-based SPS degaussing system has been designed into the San Antonio-class amphibious warfare ship platform, with the first system delivered in January 2022 to be deployed on the USS Fort Lauderdale. AMSC and the U.S. Navy continue to collaborate on AMSC’s advanced HTS-based ship protection systems. The core components of the ship protection system are common and transferable to other applications being targeted for ship implementation.
Navy fleets worldwide face various challenges, including:
| • | Power Capacity. Today’s Navy continues to see increased demand for more power applied from both on and off the ship (shore power). This need is driven by many factors, including the continued development of high-power density advanced weapons systems and sensors. Many power dense applications that naval engineers are working on today are already relying on the independent development of improved power distribution systems for their implementation. Free Electron Lasers, High Power Radar, Laser Self Defense Systems, Electro Magnetic Rail Guns and Active Denial (Directed Energy) systems are just a few of the Navy applications that we believe will demand higher capacity and more efficient energy transfer before deployment to a platform in the fleet can be realized. |
| • | Space and Weight Limitations. Advances in sensors and weapons for modern ship applications are expected to drive the need for new power solutions to be light and compact, for weapons’ power draw to be more efficiently cooled and for easing installation on new ships and enabling upgrades on existing ones. |
| • | Efficiency. Increased power demands for routine (peace time) operations are straining the conventional copper-based power cable systems that are currently used. The copper cables are very heavy, cumbersome, and hard to handle. The weight of the cables requires a coordinated effort between a crew on the pier and a crew on the ship. In many instances, handling these cables requires the use of a crane or a boom truck to extend them from the pier-side power substations up to the ship’s connection point. More efficient, compact, lighter weight power transfer and distribution systems are expected to be required for tomorrow’s Navy to satisfy its future mission requirements. |
Our solutions for the marine market
Each Navy ship can be thought of as having its own power grid. We provide advanced ship protection systems, power management, and power generation systems that are designed to help fleets increase system efficiencies, enhance warfare capabilities, and boost reliability, performance and security. Our systems support the Navy’s mission to “electrify the fleet”. Our systems allow for the ship to generate a large amount of electrical power and distribute the power through an in-board power system to a propulsion motor by way of a much smaller, lighter, and higher performing HTS cable system, enabling a more advanced, reliable, and secure solution with a smaller footprint. Our solutions include:
| • | Ship Protection Systems. The primary focus of our SPS has been degaussing systems. These systems reduce a naval ship’s magnetic signature, making it much more difficult for a mine to detect and damage a ship. Traditionally made of heavy copper wire, degaussing is required on all U.S. Navy combat ships. Our HTS advanced degaussing system is lightweight, compact, and often outperforms its conventional counterpart. This HTS system is estimated to enable 50-80% reduction in total degaussing system weight, offering significant potential for fuel savings or options to add different payloads. The core components of a degaussing system are transferable to other applications being targeted for ship implementation. Our SPS has been designed into the San Antonio class of amphibious assault vessels, which was first delivered in January 2022 to be deployed on the USS Fort Lauderdale. We are also seeking opportunities to propagate SPS throughout the surface fleet, creating the potential for a relatively long-term revenue stream. Additionally, we are developing a deployable mine countermeasure solution to enhance U.S. Navy capability to manage the threat of minefields. |
| • | In Board Power Delivery Systems. We are working on expanding HTS technology into the fleet through a variety of applications, including in board power flow and management. Our HTS power cables enable high density energy transfer at unsurpassed efficiency levels in a compact, lightweight package. |
| • | Power Generation Systems. We are also working on expanding HTS technology into the fleet through a variety of applications including power generation and electric propulsion. The same HTS technology used in SPS and in board power delivery systems when applied to rotating machines results in high power density motors and generators. This enables dramatically more power to be produced in the same machinery space used for conventional systems, which in turn affords the Navy additional power for high energy density weapons without significant structural changes to the ship. |
| • | Propulsion systems. Our development work in power generation systems for the Navy extends to HTS-based electric power propulsion. In board power delivery systems and power generation systems, when applied to high power density motors, enable the transition to electric propulsion. This is expected to make new ships more fuel-efficient. Our technology and systems allow the Navy to free up space for additional war-fighting capability. |
Wind market overview
The global energy mix is transitioning towards an increasing amount of renewable energy, including wind power. Wind power is unlimited in supply and its generation is a zero-emission process. Wind power has become a major pillar of power supply throughout the world. Wind power is expected to play a key role in the achievement of the objectives of the Paris Climate Change agreement and the Sustainable Development Goals.
According to GlobalData, a research firm, approximately 85 GW of wind generation capacity were added worldwide in calendar 2022, as compared to 91 GW in calendar 2021. GlobalData anticipates that more than 88 GW of additional capacity will be added in 2023.
According to GlobalData, annual wind installations in India for calendar 2022 were 2.5 GW and for calendar 2023 are estimated to be 2.9 GW.
Several factors are expected to drive the future growth in the wind power market, including substantial government incentives and mandates that have been established globally, technological improvements, turbine cost reductions, the development of the offshore wind market, and increasing cost competitiveness with existing power generation technologies. Technological advances, declining turbine production cost and fluctuating prices for some fossil fuels continue to increase the competitiveness of wind versus traditional power generation technologies.
Our solutions for the wind market
We address the challenges of the wind power market by designing and engineering wind turbines, providing extensive support services to wind turbine manufacturers, and manufacturing and selling critical components for wind turbines.
| • | Electrical Control Systems. We provide full electrical control systems (“ECS”) to manufacturers of wind turbines designed by us. Our ECS regulate voltage, control power flows and maximize wind turbine efficiency, among other functions. To date, we have shipped core electrical components and complete ECS sufficient to power over 17,000 Megawatts (“MW”) of wind power. We believe our ECS represent approximately 5-10% of a wind turbine’s bill of materials. |
| • | Wind Turbine Designs. We design and develop entire state-of-the-art onshore and offshore wind turbines with power ratings of 2 MWs and higher for manufacturers who are in the business of producing wind turbines or who plan to enter the business of manufacturing wind turbines. These customers typically pay us licensing fees, and in some cases royalties, for wind turbine designs, and purchase from us the ECS needed to operate the wind turbines. |
| • | Customer Support Services. We provide extensive customer support services to wind turbine manufacturers. These services range from providing designs for customers’ wind turbine manufacturing plants to establishing and localizing their supply chains and training their employees on proper wind turbine installation and maintenance. We believe these services enable customers to accelerate their entry into the wind turbine manufacturing market and lower the cost of their wind turbine platforms. |
Our approach to the wind energy markets allows our customers to use our world-class turbine engineering capabilities while minimizing their research and development costs. These services and our advanced ECS provide our customers with the ability to produce standardized or next-generation wind turbines at scale for their local market or the global market quickly and cost-effectively. Our team of highly experienced engineers works with clients to customize turbine designs specifically tailored to local markets while providing ongoing access to field services support and future technological advances.
Customers
We serve customers globally through a localized sales and field service presence in our core target markets. We have served over 100 customers in the grid market since our inception, including Commonwealth Edison, YMC Incorporated, the U.S. Navy, SSE plc in the United Kingdom, Consolidated Power Projects (Pty) Ltd in South Africa, Fuji Bridex in Singapore, Vestas Wind Systems A/S in Denmark, and Ergon Energy in Australia. Additionally, our sales personnel in the United States are supported by manufacturers' sales representatives. We have designed wind turbines for and licensed wind turbine designs to wind turbine manufacturing customers including Inox Wind Limited ("Inox") in India and Doosan Heavy Industries (“Doosan”) in South Korea.
In fiscal 2022, Fuji Bridex Pte Ltd accounted for 15% of our total revenues. In fiscal 2021, Fuji Bridex Pte Ltd accounted for 14% of our total revenues. No other customer accounted for more than 10% of our total revenues in each of fiscal 2022 and 2021.
Facilities and Manufacturing
Our primary facilities and their primary functions are as follows:
| • | Ayer, Massachusetts — Corporate headquarters; Grid segment manufacturing, and research and development |
| • | Westminster, Massachusetts — Grid segment manufacturing |
| • | Pewaukee, Wisconsin — Grid segment research and development |
| • | Richland, Washington — Grid segment research and development |
| • | Klagenfurt, Austria —Wind segment engineering, research and development, and customer support |
| • | Queensbury, New York — Grid segment manufacturing |
| • | New Milford, Connecticut — Grid segment manufacturing |
Our global footprint also includes sales and/or field service offices in Australia, India, South Korea, the United Kingdom and McLean, VA.
The principal raw materials used in the manufacture of the Company’s products are nickel, silver, yttruim, copper, brass, and stainless steel. Major components are insulated gate bi-polar transistors, heatsinks, inductors, enclosures, transformers, and printed circuit boards. Most of these raw materials are available from multiple sources in the United States and world markets. Generally, the Company believes that adequate alternative sources are available for the majority of its key raw material and purchased component needs, however, the Company is dependent on a single or limited number of suppliers for certain materials and components.
Sales and Marketing
Our strategy is to serve customers locally in our core target markets through a direct sales force operating out of sales offices worldwide. In addition, we utilize manufacturers’ sales representatives in the United States and Canada to market our products to utilities in North America. The sales force also leverages business development staff for our various offerings as well as our team of wind turbine engineers and power grid transmission planners, all of whom help to ensure that we have an in-depth understanding of customer needs and provide cost-effective solutions for those needs.
Segments
We segment our operations into two market-facing business units: Grid and Wind. We believe this market-centric structure enables us to more effectively anticipate and meet the needs of power generation project developers, the Navy's ship protection systems, electric utilities and wind turbine manufacturers.
Competition
We face competition in various aspects of our technology and product development. We believe that competitive performance in the marketplace depends upon several factors, including technical innovation, range of products and services, product quality and reliability, customer service and technical support.
We face competition from other companies offering FACTS systems similar to our D-VAR products. These include adaptive VAR compensators, Dynamic voltage restorers (“DVRs”), and STATCOMs produced by ABB, Siemens, Mitsubishi, and Ingeteam, and battery-based uninterruptable power supply (“UPS”) systems offered by various companies around the world.
We face competition from other companies offering medium-voltage metal-enclosed power capacitor banks and harmonic filter banks for use on electric power systems similar to our NEPSITM products. These include Controllix PowerSide, Elgin Power Solutions, Scott Engineering and QVARx.
We face competition from other companies offering DC power supply systems similar to our NeeltranTM products. These include SCR Controlled Rectifiers, IGBT-controlled choppers produced by ABB, Siemens, Friem Dynapower, and Nidec offering systems around the world.
With our HTS-based REG product, we are offering a new approach that provides alternatives to utilities for power system design. Therefore, we believe that we compete with traditional approaches such as new full-sized substations, overhead and underground transmission, and urban power transformers.
We believe we are currently the only company that can offer HTS-based SPS products that have been fully qualified for use aboard U.S. Navy surface combatants. Therefore, the primary competition for our SPS products is currently coming from defense contractors that provide the copper-based systems that our lighter, more efficient HTS versions have been developed to replace. Companies such as Ultra EMS, L3 Harris, and Raytheon have the bulk of the copper-based business today.
Our power module conversion equipment and our electrical control systems are designed and integrated into our wind turbine designs in a way to achieve maximum performance of the turbine. Typically, we are the exclusive provider of the power module conversion equipment and electrical control systems for our wind turbine designs. As a result, our power conversion equipment and electrical control systems see limited competition. Other companies that serve the wind turbine components industry include ABB and Emerson. We also face indirect competition in the wind energy market from global manufacturers of wind turbines, such as Siemens Gamesa, General Electric, Vestas and Suzlon. We face competition for the supply of wind turbine engineering design services from design engineering firms such as Aerovide and W2E.
Patents, licenses and trade secrets
Patent Background
An important part of our business strategy is to develop a strong worldwide patent position in all of our technology areas. Our intellectual property (“IP”) portfolio includes both patents we own and patents we license from others. We devote substantial resources to building a strong patent position. Together with the international counterparts of our patents and patent applications, we own a robust portfolio of patents and patent applications worldwide and have rights through exclusive and non-exclusive licenses. We believe that our current patent position, together with our ability to obtain licenses from other parties to the extent necessary, will provide us with sufficient proprietary rights to develop and sell our products. However, for the reasons described below, we cannot assure you that this will be the case.
Despite the strength of our patent position, a number of U.S. and foreign patents and patent applications of third parties relate to our current products, to products we are developing, or to technology we are now using in the development or production of our products. We may need to acquire licenses to those patents, contest the scope or validity of those patents, or design around patented processes or products as necessary. If companies holding patents or patent applications that we need to license are competitors, we believe our patent portfolio will improve our ability to enter into license or cross-license arrangements with these companies. We have already successfully negotiated cross-licenses with several competitors.
Failure to obtain all necessary patents, licenses and other IP rights upon reasonable terms could significantly reduce the scope of our business and have a material adverse effect on our results of operations. We do not now know the likelihood of successfully contesting the scope or validity of patents held by others. In any event, we could incur substantial costs in challenging the patents of other companies. Moreover, third parties could challenge some of our patents or patent applications, and we could incur substantial costs in defending the scope and validity of our own patents or patent applications whether or not a challenge is ultimately successful.
Grid Patents
We have received patents and filed numerous additional patent applications on power quality and reliability systems, including our D-VAR products. Our products are covered by patents and patents pending worldwide on both our systems and power converter products. The patents and applications focus on inventions that significantly improve product performance and reduce product costs, thereby providing a competitive advantage.
HTS Patents
Since the discovery of high temperature superconductors in 1986, rapid technical advances have characterized the HTS industry, which in turn have resulted in a large number of patents, including overlapping patents, relating to superconductivity. As a result, the patent situation in the field of HTS technology and products is unusually complex. We have obtained licenses to patents and patent applications covering some HTS materials. We currently have non-exclusive rights to a fundamental U.S. patent (U.S. 8,060,169 B1) covering 2G and similar HTS wire and applications and may elect in the future to allow our rights under this license to lapse. However, we may have to obtain additional licenses to HTS materials.
We are focusing on the production of our Amperium wire, and we intend to continue to maintain a leadership position in 2G HTS wire through a combination of patents, licenses and proprietary expertise. In addition to our owned patents and patent applications in 2G HTS wire, we have obtained licenses from (i) MIT for the MOD process we use to deposit the YBCO layer, and (ii) Alcatel-Lucent on the YBCO material.
We have extensive patents and patents pending covering applications of HTS wire, such as HTS fault current limiting technology including our fault current limiting cable, HTS rotating machines and ship protection systems. Since the superconductor rotating machine and the fault current limiting cable applications are relatively new, we believe that we have a particularly strong patent position in these areas. At present, we believe we have the world’s broadest and most fundamental patent position in superconductor rotating machines technology. We have also filed a series of patents on our concept for our proprietary fault current limiting technology. However, there can be no assurance that that these patents will be sufficient to assure our freedom of action in these fields without further licensing from others. See Part I, Item 1A, “Risk Factors,” for more information regarding the status of the commercialization of our Amperium wire products.
Wind Patents
Under our Windtec™ Solutions brand, we design a variety of wind turbine systems and license these designs, including expertise and patent rights, to third parties for an upfront fee, plus in some cases, future royalties. Our wind turbine designs are covered by patents and patents pending worldwide on wind turbine technology. We have patent coverage on the unique design features of our blade pitch control system, which ensures optimal aerodynamic flow conditions on the turbine blades and improves system efficiency and performance. The pitch system includes a patented SafetyLOCK™ feature that causes the blades to rotate to a feathered position to prevent the rotor blades from spinning during a fault.
Trade Secrets
Some of the important technology used in our operations and products is not covered by any patent or patent application owned by or licensed to us. However, we take steps to maintain the confidentiality of this technology by requiring all employees and all consultants to sign confidentiality agreements and by limiting access to confidential information. We cannot provide any assurance that these measures will prevent the unauthorized disclosure or use of that information. In addition, we cannot provide any assurance that others, including our competitors, will not independently develop the same or comparable technology that is one of our trade secrets.
Human Capital
We aim to provide a safe and positive work environment for our employees that emphasizes respect for individuals and high standards of integrity. The health and safety of our employees is of utmost importance to us. Recognizing and respecting our global presence, we strive to maintain a diverse and inclusive workforce everywhere we operate. As of March 31, 2023, we employed 328 persons. None of our employees is represented by a labor union.
We believe our employees are the foundation of our success and that our future growth depends, in part, on our ability to continue to attract and retain the best and brightest talent, including key management professionals, scientists, engineers, researchers, manufacturing personnel, and marketing and sales professionals. In order for us to attract the best talent, we provide a collaborative, inclusive and innovative work environment, competitive compensation, and opportunities for our employees to grow. We are focused on continuing to build an inclusive culture that inspires leadership, encourages innovative thinking, and supports the development and advancement of all.
Our human capital management objectives include attracting, incentivizing, and integrating our existing and future employees. We strive to attract and retain talented employees by offering competitive compensation and benefits that support their health and financial well-being. We use a combination of fixed and variable pay including base salary, bonuses, performance awards and stock-based compensation. The principal purposes of our equity incentive plans are to attract, retain and motivate employees through the granting of stock-based compensation awards. We offer employees benefits that vary by country and are designed to address local laws and cultures and to be competitive in the marketplace.
Available information
Our internet address is www.amsc.com. We are not including the information contained in our website as part of, or incorporating it by reference into, this document. We make available, free of charge, through our website our annual reports on Form 10-K, quarterly reports on Form 10-Q, current reports on Form 8-K and amendments to these reports filed or furnished pursuant to Section 13(a) or 15(d) of the Exchange Act, as soon as reasonably practicable after we electronically file such materials with, or furnish such materials to, the SEC.
We intend to disclose on our website any amendments to, or waivers of, our Code of Business Conduct and Ethics that are required to be disclosed pursuant to the SEC or the rules of the Nasdaq Stock Market, LLC.
Information about our Executive Officers
The table and biographical summaries set forth below contain information with respect to our executive officers as of the date of this filing:
| Name |
|
Age |
|
Position |
| Daniel P. McGahn |
|
51 |
|
President, Chief Executive Officer and Chairman |
| John W. Kosiba, Jr. |
|
50 |
|
Senior Vice President, Chief Financial Officer and Treasurer |
Daniel P. McGahn joined us in December 2006 and has been chief executive officer and a member of our board of directors since June 2011 and chairman of the board since July 2018. He previously served as president and chief operating officer from December 2009 to June 2011, as senior vice president and general manager of our AMSC Superconductors business unit from April 2008 until December 2009, as vice president of our AMSC Superconductors business unit from March 2007 to April 2008 and as vice president of strategic planning and development from December 2006 to March 2007. From 2003 to 2006, Mr. McGahn served as executive vice president and chief marketing officer of Konarka Technologies. We believe Mr. McGahn’s qualifications to sit on our board of directors include his extensive experience with our company, including serving as our president since 2009, experience in the power electronics industry and strategic planning expertise gained while working in senior management as a consultant for other public and private companies.
John W. Kosiba, Jr. has served as senior vice president, chief financial officer and treasurer since April 4, 2017. Mr. Kosiba joined us as managing director, finance operations, in June 2010. He then served as vice president, finance operations, from September 2011 to May 2013. Prior to his appointment as senior vice president and chief financial officer, Mr. Kosiba served most recently as senior vice president, Gridtec solutions and finance operations, where he was responsible for (i) overseeing finance and accounting operations, budgeting, strategic planning and financial planning and analysis for the company, and (ii) managing the day-to-day business operations of our Gridtec solutions’ business segment. From January 2008 until June 2010, Mr. Kosiba served as division director and controller of Amphenol Aerospace, a division of Amphenol Corporation and a manufacturer of interconnect products for the military, commercial aerospace and industrial markets. In this role, Mr. Kosiba was responsible for overseeing finance, accounting, budgeting, audit and all aspects of financial planning and analysis for the division.
| RISK FACTORS |
Risks Related to Our Financial Performance
We have a history of operating losses, which may continue in the future. Our operating results may fluctuate significantly from quarter to quarter and may fall below expectations in any particular fiscal quarter.
We were not profitable in fiscal 2022 and have recorded net losses for the last three fiscal years. We may not be profitable in fiscal 2023 or future years.
There is currently substantial uncertainty in our business, which makes it difficult to evaluate our business and future prospects. In addition, our operating results historically have been difficult to predict and have at times fluctuated from quarter to quarter due to a variety of factors, many of which are outside of our control. As a result of all of these factors, comparing our operating results on a period-to-period basis may not be meaningful, and you should not rely on our past results as an indication of our future performance. In addition, we have in the past provided, and may continue to, provide public guidance on our expected operating and financial results for future periods. Such guidance is comprised of forward-looking statements subject to the risks and uncertainties described in this Annual Report on Form 10-K and in our other public filings and statements. Our actual results may not always be in line with or exceed the guidance we have provided. If our revenue or operating results fall below the expectations of investors or any securities analysts that follow our company in any period or we do not meet our guidance, the trading price of our common stock would likely decline.
Our operating expenses do not always vary directly with revenue and may be difficult to adjust in the short term. As a result, if revenue for a particular quarter is below our expectations, we may not be able to proportionately reduce operating expenses for that quarter, and therefore such a revenue shortfall would have a disproportionate effect on our operating results for that quarter.
We have a history of negative operating cash flows, and we may require additional financing in the future, which may not be available to us.
At March 31, 2023, we had approximately $25.7 million of cash, cash equivalents and restricted cash, and during the fiscal year ended March 31, 2023, we used $22.5 million in cash for our operating activities. We have historically experienced net losses. We plan to continue to closely monitor our expenses and, if required, will further reduce operating costs and capital spending to enhance liquidity.
Our liquidity is highly dependent on our ability to profitably grow our revenues, control our operating costs, and secure additional financing, if required. We may require additional capital to conduct our business and adequately respond to future business challenges or opportunities, including, but not limited to, the need to develop new products or enhance existing products, maintain or expand research and development projects, collateralize performance bonds or letters of credit, acquire new businesses or assets, and the need to build inventory or to invest other cash to support business growth. In order to raise additional capital, we may offer shares of our common stock or other securities convertible into or exchangeable for our common stock. To the extent that we raise additional capital through the sale of equity or convertible debt securities, the ownership interest of each of our existing stockholders will be diluted, and the terms of these securities may include liquidation or other preferences that adversely affect the rights of our common stockholders.
In the event that additional liquidity is required, there can be no assurance that such financing would be available or, if available, that such financing could be obtained upon terms acceptable to us, which would have a material adverse effect on our business, financial condition and prospects.
In addition, the Company maintains the majority of its cash and cash equivalents in accounts with major U.S. and multi-national financial institutions, and our deposits at certain of these institutions exceed insured limits. Market conditions can impact the viability of these institutions. In the event of failure of any of the financial institutions where we maintain our cash and cash equivalents, there can be no assurance that we will be able to access uninsured funds in a timely manner or at all.
We may be required to issue performance bonds or provide letters of credit, which restricts our ability to access any cash used as collateral for the bonds or letters of credit.
While we have been required to provide performance bonds in the form of surety bonds or other forms of security and letters of credit in the past, the size of the bonds and letters of credit was not material. In recent years, we have entered into contracts that require us to post bonds and to deliver letters of credit of significant magnitude, such as our prior $5.0 million irrevocable letter of credit (secured by a $5.0 million deposit in an escrow account) as part of the agreement with Commonwealth Edison Company (“ComEd”) to install the Resilient Electric Grid (“REG”) system in Chicago. Similarly, in many other instances, we have been required to deposit cash in escrow accounts as collateral for these instruments, which is unavailable to us for general use for significant periods of time. Should we be unable to obtain performance bonds or letters of credit in the future, significant future potential revenue could become unavailable to us. Further, should our working capital situation deteriorate, we would not be able to access the restricted cash to meet working capital requirements.
Changes in exchange rates could adversely affect our results of operations.
Currency exchange rate fluctuations could have an adverse effect on our revenues and results of operations, and we could experience losses with respect to hedging activities. In fiscal 2022, 45% of our revenues were recognized from sales outside of the United States. In addition, approximately 10% of our revenues in fiscal 2022 were derived under sales contracts where prices were denominated in the Euro. Unfavorable currency fluctuations could require us to increase prices to foreign customers, which could result in a lesser number of orders, and therefore lower revenues, from such customers. Alternatively, if we do not adjust the prices for our products in response to unfavorable currency fluctuations, our results of operations could be adversely affected. In addition, most sales made by our foreign subsidiaries are denominated in the currency of the country in which these products are sold, and the currency they receive in payment for such sales could be less valuable at the time of receipt as a result of exchange rate fluctuations. However, we cannot be certain that our efforts will be adequate to protect us against significant currency fluctuations or that such efforts will not expose us to additional exchange rate risks.
If we fail to maintain proper and effective internal control over financial reporting, our ability to produce accurate and timely financial statements could be impaired and may lead investors and other users to lose confidence in our financial data.
Maintaining effective internal control over financial reporting is necessary for us to produce reliable financial statements. If material weaknesses or significant deficiencies in our internal control over financial reporting are discovered or occur in the future, our consolidated financial statements may contain material misstatements and we could be required to restate our financial results.
If we are unable to maintain effective internal controls, we may not have adequate, accurate or timely financial information, and we may be unable to meet our reporting obligations or comply with the requirements of the SEC or the Sarbanes-Oxley Act of 2002, which could result in the imposition of sanctions, including the inability of registered broker dealers to make a market in our common stock, or an investigation by regulatory authorities. Any such action or other negative results caused by our inability to meet our reporting requirements or to comply with legal and regulatory requirements or by our disclosure of an accounting, reporting or control issue could adversely affect the trading price of our securities and our business. Significant deficiencies or material weaknesses in our internal control over financial reporting could also reduce our ability to obtain financing or could increase the cost of any financing we obtain.
Risks Related to Our Operations
We may not realize all of the sales expected from our backlog of orders and contracts.
We cannot assure you that we will realize the revenue we expect to generate from our backlog in the periods we expect to realize such revenue, or at all.
In addition, the backlog of orders, if realized, may not result in profitable revenue. Backlog represents the value of contracts and purchase orders received for which delivery is expected in the next twelve months. Our customers have the right under some circumstances and with some penalties or consequences to terminate, reduce or defer firm orders that we have in backlog. In addition, our government contracts are subject to the risks described below. If our customers terminate, reduce or defer firm orders, we may be protected from certain costs and losses, but our sales will nevertheless be adversely affected, and we may not generate the revenue we expect.
Although we strive to maintain ongoing relationships with our customers, there is an ongoing risk that they may cancel orders or reschedule orders due to fluctuations in their business needs or purchasing budgets.
This has had, and may continue to have, an adverse effect on our ability to grow our revenues. In addition, current and future suppliers may be less likely to grant us credit, resulting in a negative impact on our working capital and cash flows.
Our contracts with the U.S. government are subject to audit, modification or termination by the U.S. government and include certain other provisions in favor of the government. The continued funding of such contracts remains subject to annual congressional appropriation, which, if not approved, could reduce our revenue and lower or eliminate our profit.
As a company that contracts with the U.S. government, we are subject to financial audits and other reviews by the U.S. government of our costs and performance, accounting, and general business practices relating to these contracts. Based on the results of these audits, the U.S. government may adjust our contract-related costs and fees. We cannot be certain that adjustments arising from government audits and reviews would not have a material adverse effect on our results of operations.
Our U.S. government contracts customarily contain other provisions that give the government substantial rights and remedies, many of which are not typically found in commercial contracts, including provisions that allow the government to:
|
|
• |
obtain certain rights to the intellectual property that we develop under the contract; |
|
|
• |
decline to award future contracts if actual or apparent organizational conflicts of interest are discovered, or to impose organizational conflict mitigation measures as a condition of eligibility for an award; |
|
|
• |
suspend or debar us from doing business with the government or a specific government agency; and |
|
|
• |
pursue criminal or civil remedies under the False Claims Act, False Statements Act and similar remedy provisions unique to government contracting. |
All of our U.S. government contracts, as well as certain of our contracts with third parties that are dependent on U.S. government contracts, can be terminated by the U.S. government for its convenience. Termination-for-convenience provisions typically provide only for our recovery of costs incurred or committed, and for settlement of expenses and profit on work completed prior to termination. In addition to the right of the U.S. government to terminate its contracts with us, U.S. government contracts are conditioned upon the continuing approval by the U.S. Congress of the necessary spending to honor such contracts. Congress often appropriates funds for a program on a fiscal year basis even though contract performance may take more than one year. Consequently, at the beginning of many major governmental programs, contracts often may not be fully funded, and additional monies are then committed to the contract only if, as and when appropriations are made by the U.S. Congress for future fiscal years. In addition, government shutdowns could prevent or delay such contracts from being funded. Failure by the U.S. Congress to further suspend or increase the debt ceiling could delay or result in the loss of contracts for the procurement of our products and services, and we may be asked or required to continue to perform for some period of time on certain of our U.S. government contracts, even if the U.S. government is unable to make timely payments.
We cannot be certain that our U.S. government contracts, or our contracts with third parties that relate to projects for the U.S. government will not be terminated or suspended in the future. The U.S. government’s termination of, or failure to fully fund, one or more of our contracts would have a negative impact on our operating results and financial condition. Further, in the event that any of our government contracts are terminated for cause, it could affect our ability to obtain future government contracts which could, in turn, seriously harm our ability to develop our technologies and products.
The COVID-19 pandemic continues to evolve. At times, our suppliers have experienced some production disruption due to the COVID-19 pandemic and certain of our customers have been adversely impacted as well, which have collectively adversely impacted our business, financial condition and results of operations. As a result, we have been experiencing delays or difficulty sourcing products and some inflationary pressure in our supply chains, which have started to and could continue to negatively affect our business and financial results. The extent to which the COVID-19 pandemic continues to impact our business, liquidity, results of operations and financial condition will depend on future developments, which are highly uncertain and cannot be predicted with confidence, including the duration of the pandemic, the location, duration and magnitude of future waves of infection, new mutations of the virus, timing, effectiveness and adoption of vaccines, travel restrictions and social distancing in the United States and other countries, the duration and extent of future business closures or business disruptions and the effectiveness of actions taken to contain and treat the disease. Other future pandemics or health crises may cause similar disruptions and adversely impact our business, financial condition and results of operations.
Changes in U.S. government defense spending could negatively impact our financial position, results of operations, liquidity and overall business.
We have several contracts with the U.S. government, including defense-related programs with the U.S. Department of Defense. Changes in U.S. government defense spending for various reasons, including as a result of potential changes in policy positions or priorities that may result from the U.S. presidential and congressional elections, could negatively impact our results of operations, financial condition and liquidity. Our programs are subject to U.S. government policies, budget decisions and appropriation processes which are driven by numerous factors including: (1) geopolitical events; (2) macroeconomic conditions; and (3) the ability of the U.S. government to enact relevant legislation, such as appropriations bills. In recent years, U.S. government appropriations have been affected by larger U.S. government budgetary issues and related legislation. In prior years, the U.S. government has been unable to timely complete its budget process before the end of its fiscal year, resulting in governmental shut-downs or providing only enough funds for U.S. government agencies to continue operating at prior-year levels. Significant changes in U.S. government defense spending or changes in U.S. government priorities, policies and requirements could have a material adverse effect on our results of operations, financial condition and liquidity.
We rely upon third-party suppliers for the components and subassemblies of many of our Grid and Wind products, making us vulnerable to supply shortages and price fluctuations, which could harm our business.
Many of our components and subassemblies are currently manufactured for us by a limited number of qualified suppliers. Any interruption in the supply of components or subassemblies, or our inability to obtain substitute components or subassemblies from alternate sources at acceptable prices in a timely manner, could impair our ability to meet the demand of our customers, which would have an adverse effect on our business and operating results.
In order to minimize costs and time to market, we have and will continue to identify local suppliers that meet our quality standards to produce certain of our subassemblies and components. These efforts may not be successful. In addition, any event that negatively impacts our supply, including, among others, wars, terrorist activities, cyberattacks, natural disasters and outbreaks of infectious disease, including the COVID-19 pandemic, could delay or suspend shipments of products or the release of new products or could result in the delivery of inferior products. Our revenues from the affected products would decline or we could incur losses until such time as we are able to restore our production processes or put in place alternative contract manufacturers or suppliers. Even though we carry business interruption insurance policies, we may suffer losses as a result of business interruptions that exceed the coverage available under our insurance policies.
Uncertainty surrounding our prospects and financial condition may have an adverse effect on our customer and supplier relationships.
Our relationships with our customers and suppliers are predicated on the belief that we will continue to operate. Our customers, particularly in the utility industry, are generally risk averse and may not enter into sales contracts with us if there is uncertainty regarding our ability to support working capital needs of large-scale projects.
We have not manufactured our Amperium wire in commercial quantities, and a failure to manufacture our Amperium wire in commercial quantities at acceptable cost and quality levels would substantially limit our future revenue and profit potential.
As part of our effort to increase manufacturing efficiency, we moved from our former manufacturing facility located in Devens, Massachusetts to our smaller-scale leased facility located in Ayer, Massachusetts. However, we have not yet manufactured our Amperium wire in commercial quantities at our Ayer facility or any other facility. Failure to successfully produce commercial quantities of HTS wire with an acceptable yield and cost could adversely affect our ability to meet customer demand for our products and could increase the cost of production versus projections, both of which could adversely impact our operating and financial results.
Our success is dependent upon attracting and retaining qualified personnel and our inability to do so could significantly damage our business and prospects.
We have attracted a highly skilled management team and specialized workforce, including scientists, engineers, researchers, manufacturing, personnel, and marketing and sales professionals. Hiring and retaining good personnel for our business is challenging, and highly qualified technical personnel are likely to remain a limited resource for the foreseeable future. We may not be able to hire the necessary personnel to implement our business strategy. In addition, we may need to provide higher compensation or more training to our personnel than we currently anticipate. Moreover, any officer or employee can terminate his or her relationship with us at any time. Losing the services of any of our executive officers or key employees could materially and adversely impact our business.
A significant portion of our Wind segment revenues are derived from a single customer. If this customer’s business is negatively affected, it could adversely impact our business.
A significant portion of our Wind segment revenues are derived from Inox. Revenues from Inox are supported by a supply contract to purchase, and a license to make, use and supply, wind turbine ECS. Inox has been active in the new central and state government auction regime in India and has a cumulative order book of over 1.4 GW. However, we cannot predict if and how successful Inox will be in executing on these orders or in obtaining new orders under the new central and state auction regime. In addition, Inox’s ability to perform under the supply contract has been and may continue to be hampered by the prolonged impacts of the COVID-19 pandemic. Any failure by Inox to succeed under this regime, or any delay in Inox’s ability to deliver its wind turbines, could result in fewer ECS shipments to Inox. Inox has historically failed to post letters of credit and take delivery of forecasted ECS quantities.
Our success in addressing the wind energy market is dependent on the manufacturers that license our designs.
Because an important element of our strategy for addressing the wind energy market involves the license of our wind turbine designs to manufacturers of those systems, the financial benefits to us from our products for the wind energy market are dependent on the success of these manufacturers in selling wind turbines based on our designs. We may not be able to enter into marketing or distribution arrangements with third parties on financially acceptable terms, or at all, and third parties may not be successful in selling our products or applications incorporating our products.
Our business and operations would be adversely impacted in the event of a failure or security breach of our or any critical third parties' information technology infrastructure and networks.
We rely upon the capacity, reliability, and security of information technology hardware and software infrastructure and networks (collectively, "IT Systems"), and our ability to expand and update IT Systems in response to our changing needs. We manage certain IT Systems but also rely on IT Systems and various products and services provided by critical third-party vendors and others in the supply chain. We also collect and store sensitive and confidential information in the ordinary course of our business. Any failure to manage, expand, or update our IT Systems or any disruption to or failure in the operation of such IT Systems could harm our business. In addition, the costs associated with updating and securing our IT Systems are likely to increase as such security measures become more complex, which may harm our operating results and financial condition.
Despite our implementation of security measures, all IT Systems are vulnerable to disruption, compromise and damage from computer viruses, bugs or vulnerabilities, natural disasters, human error, intentional conduct, cyberattacks, unauthorized access and other similar disruptions. Our business is also subject to break-ins, sabotage, and intentional acts of vandalism by third parties as well as employees. Our business activities in China may increase our risks to such breaches. We cannot guarantee the security or protection of any IT Systems. Threat actors, such as ransomware groups, are becoming increasingly sophisticated in using techniques that are designed to circumvent controls, evade detection and remove or obfuscate forensic evidence. As a result, we and our third-party providers may be unable to timely or effectively anticipate, detect, or recover from cyberattacks in the future. We also face increased cyber risk due to the number of our and others' employees who are (and may continue to be) working remotely.
Any failure, accident, security breach, or cyberattack to our IT Systems or those of third parties upon which we rely could result in disruptions to our operations, loss, damage or compromise to our data, or inappropriate disclosure of confidential information. Any or all of the foregoing could harm our reputation, result in substantial remediation and compliance costs, lead to lost revenues and business opportunities, lead to regulatory investigations and litigation, and related fines or penalties, increase our insurance premiums and have other materially adverse effects on our business and results. Our insurance policies may not cover, or may be insufficient to cover, any or all costs, losses and liability associated with any cyberattacks, security incidents or other disruptions.
Failure to comply with evolving data privacy and data protection laws and regulations or to otherwise protect personal data, may adversely impact our business and financial results.
We are subject to many rapidly evolving privacy and data protection laws and regulations in the United States, Europe and around the world. This requires us to operate in a complex environment where there are significant constraints on how we can process personal data across our business. For example, European General Data Protection Regulation (the “GDPR”), which became effective in May 2018, has established stringent data protection requirements for companies doing business in or handling personal data of individuals in the European Union. The GDPR imposes obligations on data controllers and processors including the requirement to maintain a record of their data processing and to implement policies and procedures as part of their mandated privacy governance framework. Breaches of the GDPR could result in substantial fines, which in some cases could be up to four percent of our worldwide revenue. In addition, a breach of the GDPR or other data privacy or data protection laws or regulations could result in regulatory investigations, reputational damage, orders to cease/change our use of data, enforcement notices, as well potential civil claims including class action type litigation. There is a risk that we may be subject to fines and penalties, litigation and reputational harm if we fail to properly process or protect the data or privacy of third parties or comply with the GDPR, and other laws that have been enacted, such as the Massachusetts Data Privacy Law including The Safeguards Regulations, the California Consumer Privacy Act and other applicable data privacy and data protection regimes.
Many of our revenue opportunities are dependent upon subcontractors and other business collaborators.
Many of the revenue opportunities for our business involve projects, such as the installation of superconductor cables in power grids and electrical system hardware in wind turbines, in which we collaborate with other companies, including suppliers of cryogenic systems, manufacturers of electric power cables and manufacturers of wind turbines. As a result, most of our current and planned revenue-generating projects involve business collaborators on whose performance our revenue is dependent. If these business collaborators fail to deliver their products or perform their obligations on a timely basis or fail to generate sufficient demand for the systems they manufacture, our revenue from the project may be delayed or decreased, and we may not be successful in selling our products.
If we fail to implement our business strategy successfully, our financial performance could be harmed.
Our future financial performance and success are dependent in large part upon our ability to implement our business strategy successfully. Our business strategy envisions several initiatives, including driving revenue growth and enhancing operating results by increasing customer adoption of our products by targeting high-growth segments with commercial and system-level products. We may not be able to implement our business strategy successfully or achieve the anticipated benefits of our business plan. If we are unable to do so, our long-term growth and profitability may be adversely affected. Even if we are able to implement some or all of the initiatives of our business plan successfully, our operating results may not improve to the extent we anticipate, or at all. In addition, to the extent we have misjudged the nature and extent of industry trends or our competition, we may have difficulty in achieving our strategic objectives. Any failure to implement our business strategy successfully may adversely affect our business, financial condition and results of operations. In addition, we may decide to alter or discontinue certain aspects of our business strategy at any time.
Our ability to implement our business strategy could also be affected by a number of factors beyond our control, such as increased competition, legal developments, government regulation, general economic conditions, including as a result of the COVID-19 pandemic and the ongoing war between Russia and Ukraine, or increased operating costs or expenses.
Problems with product quality or product performance may cause us to incur warranty expenses and may damage our market reputation and prevent us from achieving increased sales and market share.
Consistent with customary practice in our industry, we guarantee our products and/or services to be free from defects in material and workmanship under normal use and service. We generally provide a one- to three-year warranty on our products, commencing upon installation. A provision is recorded upon revenue recognition to cost of revenues for estimated warranty expense based on historical experience. The possibility of future product failures or issues related to services we provided could cause us to incur substantial expenses to repair or replace defective products or re-perform such services potentially in excess of our reserves. Furthermore, widespread product failures may damage our market reputation and reduce our market share and cause sales to decline.
Many of our customers outside of the United States may be either directly or indirectly related to governmental entities, and we could be adversely affected by violations of the United States Foreign Corrupt Practices Act and similar worldwide anti-bribery laws outside the United States.
The U.S. Foreign Corrupt Practices Act and similar worldwide anti-bribery laws in non-U.S. jurisdictions generally prohibit companies and their intermediaries from making improper payments to non-U.S. officials for the purpose of obtaining or retaining business. Many of our customers outside of the United States are, either directly or indirectly, related to governmental entities and are therefore subject to such anti-bribery laws. Our policies mandate compliance with these anti-bribery laws. We operate in many parts of the world that have experienced governmental corruption to some degree, and in certain circumstances strict compliance with anti-bribery laws may conflict with local customs and practices. Our internal control policies and procedures may not always protect us from reckless or criminal acts committed by our employees or agents. Violations of these laws, or allegations of such violations, could disrupt our business and result in a material adverse effect on our business, results of operations and financial condition.
We have had limited success marketing and selling our superconductor products and system-level solutions, and our failure to more broadly market and sell our products and solutions could lower our revenue and cash flow.
To date, we have had limited success marketing and selling our superconductor products and system-level solutions. Once our products and solutions are ready for widespread commercial use, we will have to develop a marketing and sales organization that will effectively demonstrate the advantages of our products over more traditional products, competing superconductor products and other technologies. We may not be successful in our efforts to market this technology and we may not be able to establish an effective sales and distribution organization.
We may decide to enter into arrangements with third parties for the marketing or distribution of our products, including arrangements in which our products, such as Amperium wire, are included as a component of a larger product, such as a power cable system. By entering into marketing and sales alliances, the financial benefits to us of commercializing our products will be dependent on the efforts of others.
We may acquire additional complementary businesses or technologies, which may require us to incur substantial costs for which we may never realize the anticipated benefits.
Our recent acquisitions have required substantial integration and management efforts. As a result of any additional acquisition we pursue, management’s attention and resources may be further diverted from our other businesses. An acquisition may also involve the payment of a significant purchase price, which could reduce our cash position or dilute our stockholders and require significant transaction-related expenses.
Achieving the benefits of any acquisition involves additional risks, including:
|
|
• |
difficulty assimilating acquired operations, technologies and personnel; |
|
|
• |
inability to retain management and other key personnel of the acquired business; |
|
|
• |
changes in management or other key personnel that may harm relationships with the acquired business’s customers and employees; |
|
|
• |
unforeseen liabilities of the acquired business; |
|
|
• |
diversion of management’s and employees’ attention from other business matters as a result of the integration process; |
|
|
• |
mistaken assumptions about volumes, revenues and costs associated with the acquired business, including synergies; |
|
|
• |
limitations on rights to indemnity from the seller; |
|
|
• |
mistaken assumptions about the overall costs of equity or debt used to finance the acquisition; and |
|
|
• |
unforeseen difficulties operating in new product areas, with new customers, or in new geographic areas. |
We cannot provide any assurance that we will realize any of the anticipated benefits of any acquisition, including our NEPSI Acquisition completed in October 2020, and Neeltran, Inc. acquisition completed in May 2021, and if we fail to realize these anticipated benefits, our operating performance could suffer.
We or third parties on whom we depend may be adversely affected by natural disasters, including events resulting from climate change, and our business continuity and disaster recovery plans may not adequately protect us or our value chain from such events.
Natural disasters (including, but not limited to tornadoes, earthquakes, fires, storms, floods, droughts and extreme temperatures) and chronic changes in the physical environment could severely disrupt our operations and have a material adverse effect on our business, results of operations, financial condition and prospects. Climate change may increase the frequency or intensity of such events. If a natural disaster, power outage, or other event, including human acts such as terrorism, occurred that prevented us from fully utilizing our value chain or facilities, that damaged critical infrastructure, such as the manufacturing facilities on which we rely, or that otherwise disrupted operations, it may be difficult or, in certain cases, impossible for us to continue our business for a substantial period of time. The disaster recovery and business continuity plans we have in place may prove inadequate in the event of a serious disaster or similar event. We may incur substantial expenses as a result of the limited nature of our disaster recovery and business continuity plans, which could have a material adverse effect on our business.
In addition, changes in climate change-related laws or regulations, including laws relating to greenhouse gas emissions, could lead to new or additional compliance requirements and expenditures, and subject us to additional operational costs and restrictions, including increased energy and raw material costs and other compliance requirements which could negatively impact our reputation, business, capital expenditures, results of operations and financial position.
Risks Related to Our Markets
Adverse changes in domestic and global economic conditions could adversely affect our operating results.
We have become increasingly subject to the risks arising from adverse changes in domestic and global economic conditions, including as a result of political instability in the United States. In recent years, financial markets have been volatile and the state of both the domestic and global economies has been uncertain. Political instability in the United States, such as the failure to increase the federal debt ceiling, could lead to further financial market volatility and harm the economy. Adverse credit conditions in the future could have a negative impact on our ability to execute on future strategic activities. In addition, if credit is difficult to obtain in the future, some customers may delay or reduce purchases. Similarly, inflationary pressures have increased and may increase our costs or force us to increase prices for our products. In particular, in fiscal 2021 and 2022, we experienced substantial inflationary pressure in our supply chain. These events have resulted or could in the future result in higher product costs, reductions in sales of our products, longer sales cycles, slower adoption of new technologies, increased accounts receivable and inventory write-offs and increased price competition. We also purchase large amounts of commodity-based raw materials. Prevailing prices for such commodities are subject to fluctuations due to changes in supply and demand and a variety of additional factors beyond our control, such as global political and economic conditions. Any of these events would likely harm our business, results of operations and financial condition.
Our international operations are subject to risks that we do not face in the United States, which could have an adverse effect on our operating results.
In recent years, a substantial amount of our consolidated revenues were recognized from customers outside of the United States. For example, 45% of our revenues in fiscal 2022 and 38% of our revenues in fiscal 2021 were recognized from sales outside the United States. We also manufacture certain of our products and purchase a portion of our raw materials and components from suppliers in other foreign countries. The ongoing war between Ukraine and Russia has caused increased raw material costs and material shortages and, as a result, adversely impacted certain of our suppliers. Our international operations are subject to a variety of risks that we do not face in the United States, including:
| • |
potentially longer payment cycles for sales in foreign countries and difficulties in collecting accounts receivable; |
| • | difficulties in staffing and managing our foreign offices and the increased travel, infrastructure and legal compliance costs associated with multiple international locations; |
| • | additional withholding taxes or other taxes on our foreign income and repatriated cash, and tariffs or other restrictions on foreign trade or investment, including export duties and quotas, trade and employment restrictions; |
| • | imposition of, or unexpected adverse changes in, foreign laws or regulatory requirements; |
| • | increased exposure to foreign currency exchange rate risk; |
| • | reduced protection for intellectual property rights in some countries; and |
| • | natural disasters, pandemics, political unrest, war or acts of terrorism. |
Trade tensions between the U.S. and China, the U.S. and Russia, as well as those between the U.S. and Canada, Mexico and other countries have been escalating in recent years. For example, in March 2022, the U.S. and other countries imposed broad-based sanction programs against Russia, Belarus, the Crimea Region of Ukraine, the so-called Donetsk People's Republic and the so-called Luhansk People's Republic. The United States, the European Union, the United Kingdom and other countries may implement additional sanctions, export controls or other measures against Russia, Belarus and other countries, regions, officials, individuals or industries in the respective territories. Such sanctions and other measures, as well as the existing and potential further responses from Russia or other countries to such sanctions, tensions and military actions, could adversely affect the global economy and financial markets and could adversely affect our business, financial condition and results of operations.
We cannot predict whether the United States or any other country will impose new quotas, tariffs, taxes or other trade barriers upon the importation or exportation of our products or gauge the effect that new barriers would have on our financial position or results of operations. These new tariffs or any additional tariffs or other trade barriers may cause our costs to increase, our products to be less competitive, and our business, results of operations and financial position to be materially adversely affected.
Our overall success in international markets depends, in part, upon our ability to succeed in differing legal, regulatory, economic, social and political conditions. We may not be successful in developing and implementing policies and strategies that will be effective in managing these risks in each country where we do business or conduct operations. Our failure to manage these risks successfully could harm our international operations and reduce our international sales, thus lowering our total revenue and increasing losses.
Our products face competition, which could limit our ability to acquire or retain customers.
The markets for our products are competitive and many of our competitors have substantially greater financial resources and research and development, manufacturing and marketing capabilities than we do. In addition, as our target markets develop, other large industrial companies may enter these fields and compete with us.
We face competition from other companies offering FACTS systems similar to our D-VAR products. These include adaptive VAR compensators, Dynamic voltage restorers (“DVRs”), and STATCOMs produced by ABB, Siemens, Mitsubishi, RXHK, NR Electric Co,. and Ingeteam, and battery-based uninterruptible power supply (“UPS”) systems offered by various companies around the world.
We face competition from other companies offering medium-voltage metal-enclosed power capacitor banks and harmonic filter banks for use on electric power systems similar to our NEPSI products. These include Controllix PowerSide, Elgin Power Solutions (formally Gilbert), Scott Engineering and QVARx.
We face competition from other companies offering DC power supply systems similar to our Neeltran products. These include Scr Controlled Rectifiers, IGBT controlled choppers produced by ABB, Siemens, Friem Dynapower, and Nidec offering systems around the world.
With our HTS-based REG product, we are offering a new approach that provides alternatives to utilities for power system design. Therefore, we believe that we compete with traditional approaches such as new full-sized substations, overhead and underground transmission, and urban power transformers.
We believe we are currently the only company that can offer HTS-based SPS products that have been fully qualified for use aboard U.S. Navy surface combatants. Therefore, the primary competition for our SPS products is currently coming from defense contractors that provide the copper-based systems that our lighter, more efficient HTS versions have been developed to replace. Companies such as L3 Harris, Raytheon, and Ultra have the bulk of the copper-based business today.
As the HTS wire, superconductor electric motors and generators, and power electronic systems markets develop, other large industrial companies may enter those fields and compete with us. If we are unable to compete successfully, it may harm our business, which in turn may limit our ability to acquire or retain customers.
With respect to our Wind business, other companies that serve the wind turbine components industry include ABB, Hopewind, and Semikron. We also face indirect competition in the wind energy market from global manufacturers of wind turbines, such as Siemens Gamesa, General Electric, Vestas and Suzlon. We face competition for the supply of wind turbine engineering design services from design engineering firms such as Aerovide and W2E.
The competition in these markets could adversely affect our operating results by reducing the volume of the products we sell or the prices we can charge. These competitors may be able to respond more rapidly than us to new or emerging technologies or changes in customer requirements. They may also devote greater resources to the development, promotion and sale of their products than we do. Our success depends significantly upon our ability to enhance our products and technologies and to develop and introduce, on a timely and cost-effective basis, new products and features that meet changing customer requirements and incorporate technological enhancements. If we are unable to develop new products and enhance functionalities or technologies to adapt to these changes, our business will suffer. We can provide no assurance that we will continue to effectively compete against our current competitors or additional companies that may enter our markets.
We have operations in, and depend on sales in, emerging markets, including India, and global conditions could negatively affect our operating results or limit our ability to expand our operations outside of these markets. Changes in India’s political, social, regulatory and economic environment may affect our financial performance.
We have operations in India. Our financial performance depends upon our ability to carry on our operations and sell our products in markets such as India, as well as other emerging markets around the world. We are, and will continue to be, subject to financial, political, economic and business risks in connection with our operations and sales in these emerging markets. In addition to the business risks inherent in developing and servicing these markets, economic conditions may be more volatile, legal and regulatory systems less developed and predictable, and the possibility of various types of adverse governmental action more pronounced in emerging markets. In addition, inflation, fluctuations in currency and interest rates, competitive factors, civil unrest, public health emergencies and labor problems could affect our revenues, expenses and results of operations. Our operations could also be adversely affected by acts of war, terrorism or the threat of any of these events as well as government actions such as controls on imports, exports and prices, tariffs, new forms of taxation, or changes in fiscal regimes and increased government regulation in the countries in which we operate or service customers. Unexpected or uncontrollable events or circumstances in any of these markets could have a material adverse effect on our financial results and cash flows.
Our financial performance could be affected by the political and social environment in India. In recent years, India has experienced civil unrest and terrorism and has been involved in conflicts with neighboring countries. The potential for hostilities between India and Pakistan has been high in light of tensions related to recent terrorist incidents in India and the unsettled nature of the regional geopolitical environment, including events in and related to Afghanistan and Iraq.
With respect to our activities in all emerging markets, we may be impacted by issues with managing foreign sales operations, including long payment cycles, potential difficulties in accounts receivable collection and, especially from significant customers, fluctuations in the timing and amount of orders. The adverse effect of any of these issues on our business could be increased due to the concentration of our business with a small number of customers. Operations in foreign countries also expose us to risks relating to difficulties in enforcing our proprietary rights, currency fluctuations and adverse or deteriorating economic conditions. For example, the ongoing war between Ukraine and Russia has caused increased raw material costs and material shortages for, and, adversely impacted, certain of our suppliers. If we experience problems with obtaining registrations, compliance with foreign country or applicable U.S. laws, or if we experience difficulties in payments or intellectual property matters in foreign jurisdictions, or if significant political, economic or regulatory changes occur, our results of operations would be adversely affected.
Our success depends upon the commercial adoption of the REG system, which is currently limited, and a widespread commercial market for our products may not develop.
To date, there has been no widespread commercial use of the REG system. It is uncertain whether a robust commercial market for those new and unproven products will ever develop.
In addition, we believe in-grid demonstrations of REG systems are necessary to convince utilities and power grid operators of the benefits of this technology. Even if a project is funded, completion of projects can be delayed as a result of other factors. It is possible that the market demands we currently anticipate for our REG system will not develop and that they will never achieve widespread commercial acceptance. In such event, we would not be able to implement our strategy, and our results of operations could be reduced or eliminated. Even if a commercial market for our REG systems were to develop, commercial terms requested by utilities and power grid operators relating to bonding requirements, limitations of liability, warranty periods, or other contractual provisions, may not be acceptable to us, which could impede our ability to enter into contractual arrangements for the sale of our REG system.
Industry consolidation could result in more powerful competitors and fewer customers.
Competitors in the industries in which we operate are consolidating. If our competitors consolidate, they likely will increase their market share, gain economies of scale that enhance their ability to compete with us and/or acquire additional products and technologies that could displace our product offerings. Our customer base also is undergoing consolidation. Consolidation within our customers’ industries could affect our customers and their relationships with us. If one of our competitors’ customers acquires any of our customers, we may lose that business. Additionally, if our customers become larger and more concentrated, they could exert pricing pressure on all suppliers, including us. If we were to lose market share or customers or face pricing pressure due to consolidation of our customers, our results of operations and financial condition could be adversely affected.
The increasing focus on environmental sustainability and social initiatives could increase our costs, and inaction could harm our reputation and adversely impact our financial results.
There has been increasing public focus by investors, customers, environmental activists, the media and governmental and nongovernmental organizations on a variety of environmental, social and other sustainability matters. If we are not effective in addressing environmental, social and other sustainability matters affecting our business, or setting and meeting relevant sustainability goals, our reputation and financial results may suffer. We may experience increased costs in order to execute upon any sustainability goals and measure achievement of those goals, which could have an adverse impact on our business and financial condition. While we may at times engage in voluntary initiatives (such as voluntary disclosures, certifications, or goals, among others) to improve our ESG profile, such initiatives may be costly and may not have the desired effect. Moreover, we may not be able to successfully complete such initiatives due to factors that are within or outside of our control. Even if this is not the case, our actions may subsequently be determined to be insufficient by various stakeholders, and we may be subject to investor or regulator engagement on our ESG efforts, even if such initiatives are currently voluntary. Certain market participants, including major institutional investors and capital providers, use third-party benchmarks and scores to assess companies’ ESG profiles in making investment or voting decisions. We have limited and in some instances no visibility or control over these scores or their underlying methodologies. Unfavorable ESG ratings could lead to increased negative investor sentiment towards us or our industry, which could negatively impact our share price as well as our access to and cost of capital. To the extent ESG matters negatively impact our reputation, it may also impede our ability to compete as effectively to attract and retain employees or customers, which may adversely impact our operations. In addition, this emphasis on environmental, social, and other sustainability matters has resulted and may result in the adoption of new laws and regulations, including new reporting requirements. If we fail to comply with new laws, regulations, or reporting requirements, our reputation and business could be adversely impacted.
Growth of the wind energy market depends largely on the availability and size of government subsidies, economic incentives and legislative programs designed to support the growth of wind energy.
At present, the cost of wind energy exceeds the cost of conventional power generation in many locations around the world. Various governments have used different policy initiatives to encourage or accelerate the development and adoption of wind energy and other renewable energy sources. Renewable energy policies are in place in the European Union, certain countries in Asia, including India, China, Japan and South Korea, and many of the states in Australia and the United States. Examples of government sponsored financial incentives include capital cost rebates, feed-in tariffs, tax credits, net metering and other incentives to end-users, distributors, system integrators and manufacturers of wind energy products to promote the use of wind energy and to reduce dependency on other forms of energy. In the United States, various legislation and regulations designed to support the growth of wind energy have been implemented or proposed by the federal government, such as the Production Tax Credit for Renewable Energy (“PTC”) and the Clean Power Plan. Governments, including the U.S. government, may decide to reduce or eliminate these economic incentives, or curtail legislative programs supportive of wind energy technologies for political, financial or other reasons. Any reductions in, or eliminations of, government subsidies, economic incentives or favorable legislative programs before the wind energy industry reaches a sufficient scale to be cost-effective in a non-subsidized marketplace could reduce demand for our products and adversely affect our business prospects and results of operations.
Lower prices for other fuel sources may reduce the demand for wind energy development, which could have a material adverse effect on our ability to grow our Wind business.
The wind energy market is affected by the price and availability of other fuels, including nuclear, coal, natural gas and oil, as well as other sources of renewable energy. To the extent renewable energy, particularly wind energy, becomes less cost-competitive due to reduced government targets, increases in the cost of wind energy, as a result of new regulations, and incentives that favor alternative renewable energy, cheaper alternatives or otherwise, demand for wind energy and other forms of renewable energy could decrease. Slow growth or a long-term reduction in the demand for renewable energy could have a material adverse effect on our ability to grow our Wind business.
Risks Related to Our Technologies
We may be unable to adequately prevent disclosure of trade secrets and other proprietary information.
We rely on trade secrets to protect our proprietary technologies, especially where we do not believe patent protection is appropriate or obtainable. However, trade secrets are difficult to protect. We rely, in part, on confidentiality agreements with our employees, contractors, consultants, outside scientific collaborators and other advisors to protect our trade secrets and other proprietary information. These agreements may not effectively prevent disclosure of confidential information and may not provide an adequate remedy in the event of unauthorized disclosure of confidential information. In addition, others may independently discover our trade secrets or independently develop processes or products that are similar or identical to our trade secrets and courts outside the United States may be less willing to protect trade secrets. Costly and time-consuming litigation could be necessary to enforce and determine the scope of our proprietary rights, and failure to obtain or maintain trade secret protection could adversely affect our competitive business position.
Our patents may not provide meaningful protection for our technology, which could result in us losing some or all of our market position.
We own or have licensing rights under many patents and pending patent applications. However, the patents that we own or license may not provide us with meaningful protection of our technologies and may not prevent our competitors from using similar technologies for a variety of reasons, such as:
| • |
the patent applications that we or our licensors file may not result in patents being issued; |
| • |
any patents issued may be challenged by third parties; and |
| • |
others may independently develop similar technologies not protected by our patents or design around the patented aspects of any technologies we develop. |
Moreover, we could incur substantial litigation costs in defending the validity of or enforcing our own patents. We also rely on trade secrets and proprietary know-how to protect our intellectual property. However, our confidentiality agreements and other safeguards may not provide meaningful protection for our trade secrets and other proprietary information. If the patents that we own or license or our trade secrets and proprietary know-how fail to protect our technologies, our market position may be adversely affected.
There are a number of technological challenges that must be successfully addressed before our superconductor products can gain widespread commercial acceptance, and our inability to address such technological challenges could adversely affect our ability to acquire customers for our products.
Many of our superconductor products are in the early stages of commercialization, while others are still under development. There are a number of technological challenges that we must successfully address to complete our development and commercialization efforts for superconductor products. We will also need to improve the performance and reduce the cost of our Amperium wire to expand the number of commercial applications for it. We may be unable to meet such technological challenges or to sufficiently improve the performance and reduce the costs of our Amperium wire. Delays in development, as a result of technological challenges or other factors, may result in the introduction or commercial acceptance of our superconductor products later than anticipated.
Third parties have or may acquire patents that cover the materials, processes and technologies we use or may use in the future to manufacture our Amperium products, and our success depends on our ability to license such patents or other proprietary rights.
We expect that some or all of the HTS materials, processes and technologies we use in designing and manufacturing our products are or will become covered by patents issued to other parties, including our competitors. The owners of these patents may refuse to grant licenses to us, or may be willing to do so only on terms that we find commercially unreasonable. If we are unable to obtain these licenses, we may have to contest the validity or scope of those patents or re-engineer our products to avoid infringement claims by the owners of these patents. It is possible that we will not be successful in contesting the validity or scope of a patent, or that we will not prevail in a patent infringement claim brought against us. Even if we are successful in such a proceeding, we could incur substantial costs and diversion of management resources in prosecuting or defending such a proceeding.
Our technology and products could infringe intellectual property rights of others, which may require costly litigation and, if we are not successful, could cause us to pay substantial damages and disrupt our business.
In recent years, there has been significant litigation involving patents and other intellectual property rights in many technology-related industries. There may be patents or patent applications in the United States or other countries that are pertinent to our products or business of which we are not aware. The technology that we incorporate into and use to develop and manufacture our current and future products, including the technologies we license, may be subject to claims that they infringe the patents or proprietary rights of others. The success of our business will also depend on our ability to develop new technologies without infringing or misappropriating the proprietary rights of others. Third parties may allege that we infringe patents, trademarks or copyrights, or that we misappropriated trade secrets. These allegations could result in significant costs and diversion of the attention of management. If a successful claim were brought against us and we are found to infringe a third party’s intellectual property rights, we could be required to pay substantial damages, including treble damages if it is determined that we have willfully infringed such rights, or be enjoined from using the technology deemed to be infringing, or using, making or selling products deemed to be infringing. If we have supplied infringing products or technology to third parties, we may be obligated to indemnify these third parties for damages they may be required to pay to the patent holder and for any losses they may sustain as a result of the infringement. In addition, we may need to attempt to license the intellectual property right from such third party or spend time and money to design around or avoid the intellectual property. Any such license may not be available on reasonable terms, or at all. An adverse determination may subject us to significant liabilities and/or disrupt our business.
Risks Related to Our Common Stock
Our common stock has experienced, and may continue to experience, market price and volume fluctuations, which may prevent our stockholders from selling our common stock at a profit and could lead to costly litigation against us that could divert our management’s attention.
The market price of our common stock has historically experienced volatility and may continue to experience such volatility in the future. Factors such as our financial performance, liquidity requirements, technological achievements by us and our competitors, the establishment of development or strategic relationships with other companies, strategic acquisitions, new customer orders and contracts, and our introduction of commercial products may have a significant effect on the market price of our common stock. The stock market in general, and the stock of high technology companies, in particular, have, in recent years, experienced extreme price and volume fluctuations, which are often unrelated to the performance or condition of particular companies. Such broad market fluctuations have and could continue to adversely affect the market price of our common stock. Due to these factors, the price of our common stock may decline, and investors may be unable to resell their shares of our common stock for a profit. Following periods of volatility in the market price of a particular company’s securities, securities class action litigation has often been brought against that company. In the past, we have been subject to a number of class action lawsuits which were filed against us on behalf of certain purchasers of our common stock. If we become subject to additional litigation of this kind in the future, it could result in additional litigation costs, a damages award against us and the further diversion of our management’s attention.
General Risk Factors
Unfavorable results of legal proceedings could have a material adverse effect on our business, operating results and financial condition.
From time to time, we may become subject to legal proceedings and claims that arise in or outside the ordinary course of business. Results of legal proceedings cannot be predicted with certainty. Our insurance coverage may be insufficient, our assets may be insufficient to cover any amounts that exceed our insurance coverage, and we may have to pay damage awards or otherwise may enter into settlement arrangements in connection with such claims. Any such payments or settlement arrangements in legal proceedings could have a material adverse effect on our business, operating results or financial condition. Regardless of merit, legal proceedings could result in substantial costs and significantly and adversely impact our reputation and divert management’s attention and resources, which could have a material adverse effect on our business, operating results or financial condition. In addition, such lawsuits may make it more difficult to finance our operations.
| UNRESOLVED STAFF COMMENTS |
Not applicable.
| PROPERTIES |
Our corporate headquarters and Grid manufacturing operations are located in a leased 88,000-square-foot facility in Ayer, Massachusetts. Additionally, we have Grid manufacturing operations located in a leased 77,500 square-foot facility in Westminster, Massachusetts as well as an owned 35,000 square-foot facility in Queensbury, New York and an owned 85,000 square-foot facility in New Milford, Connecticut.
We also occupy leased facilities located in Australia, Austria, India, Wisconsin, Washington and the United Kingdom with a combined total of approximately 72,000 square feet of space. These leases have varying expiration dates through November 2027 which can generally be terminated at our request after a six-month advance notice. These locations focus primarily on research and development, sales and/or field service and do not have significant leases or physical presence. We believe all of these facilities are well-maintained and suitable for their intended uses.
The following table summarizes information regarding our significant properties, as of March 31, 2023:
| Location |
Supporting |
Square footage |
Owned/Leased |
|||
| United States |
||||||
| Ayer, Massachusetts |
Corporate & Grid Segment |
88,000 | Leased |
|||
| Westminster, Massachusetts |
Grid Segment |
77,500 | Leased |
|||
| Queensbury, New York |
Grid Segment |
35,000 | Owned |
|||
| New Milford, Connecticut |
Grid Segment |
85,000 | Owned |
|||
| LEGAL PROCEEDINGS |
We are not party to any material legal proceedings.
| MINE SAFETY DISCLOSURES |
Not Applicable.
PART II
| MARKET FOR REGISTRANT’S COMMON EQUITY, RELATED STOCKHOLDER MATTERS AND ISSUER PURCHASES OF EQUITY SECURITIES |
Market Information
Our common stock has been listed on the Nasdaq Global Select Market under the symbol “AMSC” since 1991.
Holders
The number of holders of record of our common stock on May 29, 2023 was 175.
Dividend Policy
We have never paid cash dividends on our common stock. We currently intend to retain earnings, if any, to fund the development and growth of our business and do not anticipate paying cash dividends for the foreseeable future. Payment of future cash dividends, if any, will be at the discretion of our board of directors after taking into account various factors, including our financial condition, operating results, current and anticipated cash needs and plans for expansion.
Stock Performance Graph
The following graph compares the cumulative total stockholder return on our common stock from March 31, 2018 to March 31, 2023 with the cumulative total return of (i) the Nasdaq Composite Index and (ii) the Nasdaq Electrical Components & Equipment Index.
This graph assumes the investment of $100.00 on March 31, 2018 in our common stock, the Nasdaq Composite Index and the Nasdaq Electrical Components & Equipment Index, and assumes any dividends are reinvested. Measurement points are March 31, 2018; March 31, 2019; March 31, 2020; March 31, 2021; March 31, 2022; and March 31, 2023.
COMPARISON OF 5 YEAR CUMULATIVE TOTAL RETURN
Among American Superconductor Corporation,
the Nasdaq Composite Index and the Nasdaq Electrical Components & Equipment Index
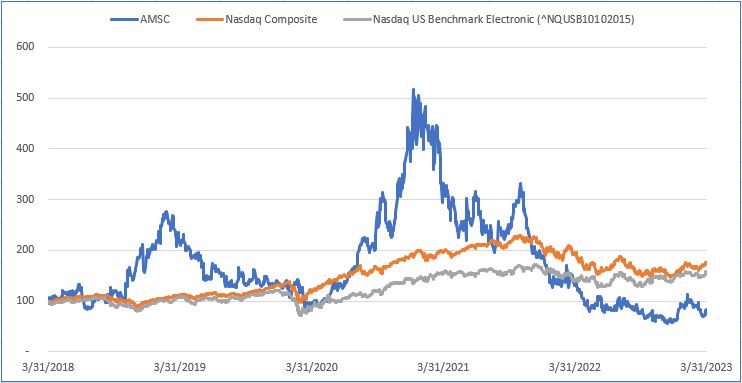
| Fiscal year ended March 31, |
||||||||||||
| Company/Index |
2018 |
2019 |
2020 |
2021 |
2022 |
2023 |
||||||
| American Superconductor Corporation |
100.00 |
220.96 |
94.16 |
325.77 |
130.76 |
84.36 |
||||||
| Nasdaq Composite Index |
100.00 |
111.71 |
116.65 |
198.48 |
191.21 |
176.12 |
||||||
| Nasdaq Electrical Components & Equipment Index |
100.00 |
107.33 |
82.52 |
155.74 |
139.45 |
156.80 |
||||||
| RESERVED |
| MANAGEMENT DISCUSSION AND ANALYSIS OF FINANCIAL CONDITION AND RESULTS OF OPERATIONS |
Executive Overview
We are a leading system provider of megawatt-scale power resiliency solutions that Orchestrate the Rhythm and Harmony of Power on the Grid™, and protect and expand the capability of our Navy's fleet. Our solutions enhance the performance of the power grid, protect our Navy’s fleet, and lower the cost of wind power. In the power grid market, we enable electric utilities, industrial facilities, and renewable energy project developers to connect, transmit and distribute smarter, cleaner and better power through our transmission planning services and power electronics and superconductor-based systems. In the wind power market, we enable manufacturers to field highly competitive wind turbines through our advanced power electronics and control system products, engineering, and support services. Our power grid and wind products and services provide exceptional reliability, security, efficiency and affordability to our customers.
Our power system solutions help to improve energy efficiency, alleviate power grid capacity constraints, improve system resiliency, and increase the adoption of renewable energy generation. Demand for our solutions is driven by the growing needs for modernized smart grids that improve power reliability, security and quality, the U.S. Navy's effort to upgrade in-board power systems to support fleet electrification, and the need for increased renewable sources of electricity, such as wind and solar energy. Concerns about these factors have led to increased spending by corporations and the military, as well as supportive government regulations and initiatives on local, state, and national levels, including renewable portfolio standards, tax incentives and international treaties.
We manufacture products using two proprietary core technologies: PowerModule™ programmable power electronic converters and our Amperium® high temperature superconductor ("HTS") wires. These technologies and our system-level solutions are protected by a broad and deep intellectual property portfolio consisting of hundreds of patents and licenses worldwide.
We operate our business under two market-facing business units: Grid and Wind. We believe this market-centric structure enables us to more effectively anticipate and meet the needs of power generation project developers, the Navy's ship protection systems, electric utilities and wind turbine manufacturers.
| • | Grid. Through our Gridtec™ Solutions, our Grid business segment enables electric utilities and renewable energy project developers to connect, transmit and distribute power with exceptional efficiency, reliability, security and affordability. We provide transmission planning services that allow us to identify power grid congestion, poor power quality, and other risks, which help us determine how our solutions can improve network performance. These services often lead to sales of our grid interconnection solutions for wind farms and solar power plants, power quality systems and transmission and distribution cable systems. We also sell ship protection products to the U.S. Navy through our Grid business segment. |
| • | Wind. Through our Windtec™ Solutions, our Wind business segment enables manufacturers to field wind turbines with exceptional power output, reliability and affordability. We supply advanced power electronics and control systems, license our highly engineered wind turbine designs, and provide extensive customer support services to wind turbine manufacturers. Our design portfolio includes a broad range of drivetrains and power ratings of 2 MW and higher. We provide a broad range of power electronics and software-based control systems that are highly integrated and designed for optimized performance, efficiency, and grid compatibility. |
Our fiscal year begins on April 1 and ends on March 31. When we refer to a particular fiscal year, we are referring to the fiscal year beginning on April 1 of that same year. For example, fiscal 2022 refers to the fiscal year beginning on April 1, 2022. Other fiscal years follow similarly.
On October 31, 2018, we entered into a Subcontract Agreement with Commonwealth Edison Company (“ComEd”) (the “Subcontract Agreement”) for the manufacture and installation of the Company’s resilient electric grid ("REG") system within ComEd’s electric grid in Chicago, Illinois (the “Project”), which became effective on June 20, 2019. Under the terms of the Subcontract Agreement, we agreed, among other things, to provide the REG system and to supervise ComEd’s installation of the REG system in Chicago. As part of our separate cost sharing arrangement with DHS under the Prime Contract, we received funding provided by DHS in connection with the Subcontract Agreement of approximately $10.0 million, which represents the total amount of revenue we recognized over the term of the Subcontract Agreement and includes $1.0 million that we agreed to reimburse ComEd for costs incurred by ComEd while undertaking its tasks under the Subcontract Agreement (the “Reimbursement Amount”). In addition, we were required to deliver an irrevocable letter of credit in the amount of $5.0 million to secure certain Company obligations under the Subcontract Agreement, which we did, and deposited $5.0 million in an escrow account as collateral to secure such letter of credit. This irrevocable letter of credit was terminated and the full $5.0 million was returned from escrow to us during the fiscal year ended March 31, 2023.
We are experiencing substantial inflationary pressure in our supply chain and some delays in sourcing materials needed for our products, resulting in some production disruption both of which have increased our cost of revenues and decreased gross margin. Changes in macroeconomic and market conditions arising from the COVID-19 pandemic, or for other reasons, such as the ongoing war between Russia and Ukraine, inflation, rising interest rates, instability of financial institutions, political instability in the United States, including failure to raise the federal debt ceiling, labor force availability, sourcing, material delays and global supply chain disruptions could have a material adverse effect on our business, financial condition and results of operation.
From time-to-time we may undertake restructuring activities in order to align our global organization in a manner that we believe will better position us to achieve our long-term goals. In January 2023, we undertook a reduction in force that involved approximately 5% of our global workforce. This restructuring will cause us to incur $1.0 million of cash expense and is expected to result in annualized cost savings of approximately $5 million, beginning in fiscal 2023.
In February 2023, we completed the process of determining and verifying our eligibility and amount of payroll tax credits known as the Employee Retention Credit (“ERC”) under the CARES Act which Congress enacted as part of the Taxpayer Certainty and Disaster Tax Relief Act of 2020. This resulted in filing certain amended payroll tax forms for eligible quarters in 2020 and 2021, which, in the aggregate, totaled $3.3 million. We have accordingly recognized a receivable in prepaid expenses and other current assets and a benefit to cost of revenues and operating expenses in the quarter ended March 31, 2023.
Results of Operations
Fiscal Years Ended March 31, 2023 and March 31, 2022
Revenues
Total revenues decreased by 2% to $106.0 million in fiscal 2022 from $108.4 million in fiscal 2021. Our revenues are summarized as follows (in thousands):
| Fiscal Years Ended March 31, |
||||||||
| 2023 |
2022 |
|||||||
| Revenues: |
||||||||
| Grid |
$ | 94,631 | $ | 98,876 | ||||
| Wind |
11,353 | 9,559 | ||||||
| Total |
$ | 105,984 | $ | 108,435 | ||||
Revenues in our Grid business unit are derived from our D-VAR product sales, NEPSI product sales, Neeltran product sales, HTS wire sales, ship protection systems ("SPS"), government-sponsored electric utility projects and other prototype development contracts. We also engineer, install and commission our products on a turnkey-basis for some customers. The Grid business unit accounted for 89% of total revenues in fiscal 2022 and 91% in fiscal 2021. Grid revenues decreased 4% to $94.6 million in fiscal 2022 from $98.9 million in fiscal 2021. The decrease in revenues was driven by lower D-VAR revenues than in the prior year period.
Revenues in our Wind business unit are derived from wind turbine electrical control systems and core components, wind turbine license and development contracts, service contracts and consulting arrangements. Our Wind business unit accounted for 11% of total revenues in fiscal 2022 and 9% in fiscal 2021. Revenues in the Wind business unit increased 19% to $11.4 million in fiscal 2022 from $9.6 million in fiscal 2021. The increase over the prior year period was primarily driven by shipments of electrical control systems ("ECS") to INOX in fiscal 2022, compared to fiscal 2021.
Cost of Revenues and Gross Margin
Cost of revenues increased by 3% to $97.5 million in fiscal 2022, compared to $94.9 million in fiscal 2021. Gross margin decreased to 8% in fiscal 2022 from 12% in fiscal 2021. The decrease in gross margin in fiscal 2022 was due to an unfavorable product mix, inflation pressure in our supply chain, and additional expenses incurred to complete and deliver certain projects from the preacquisition Neeltran backlog. Included in cost of revenues is a $1.8 million benefit from the ERC recognized in fiscal 2022. Cost of revenues in fiscal 2022 and fiscal 2021 includes total amortization expense of less than $0.1 million as a result of the acquired backlog intangible assets from our acquisitions of Northeast Power Systems, Inc. and related assets ("NEPSI") and Neeltran, Inc. and related assets ("Neeltran").
Operating Expenses
Research and development
Research and development (“R&D”) expenses decreased by 14% to $9.0 million, or 8% of revenue in fiscal 2022, compared to $10.5 million, or 10% of revenue, in fiscal 2021. Included in R&D is a $0.7 million benefit from the ERC recognized in fiscal 2022. The decrease in R&D expenses is primarily a result of lower total compensation expense.
Selling, general, and administrative
Selling, general and administrative (“SG&A”) expenses increased by 4% to $28.7 million, or 27% of revenue in fiscal 2022 from $27.5 million, or 25% of revenue, in fiscal 2021. Included in SG&A is a $0.8 million benefit from the ERC recognized in fiscal 2022.
Amortization of acquisition related intangibles
We recorded $2.7 million in fiscal 2022 and $2.5 million in fiscal 2021 in amortization expense related to our core technology and know-how, customer relationships, and other intangible assets. The increase in amortization expense is primarily a result of the Neeltran acquisition.
Operating loss
Our operating loss is summarized as follows (in thousands):
| Fiscal Years Ended March 31, |
||||||||
| 2023 |
2022 |
|||||||
| Operating income (loss): |
||||||||
| Grid |
$ | (24,615 | ) | $ | (20,725 | ) | ||
| Wind |
(2,547 | ) | (1,554 | ) | ||||
| Unallocated corporate expenses |
(5,847 | ) | 1,190 | |||||
| Total |
$ | (33,009 | ) | $ | (21,089 | ) | ||
The Grid segment generated an operating loss of $24.6 million in fiscal 2022 and $20.7 million in fiscal 2021. The increase in the Grid business unit operating loss was due to lower gross margins driven by a less favorable product mix and additional expenses incurred to deliver on the Neeltran acquired backlog. In addition, Grid segment operating loss includes a $3.3 million benefit from the ERC that was recognized in fiscal 2022.
The Wind segment generated an operating loss of $2.5 million in fiscal 2022 and $1.6 million in fiscal 2021. The increase in the Wind business unit operating loss was due to lower gross margins in fiscal 2022, compared to fiscal 2021.
Unallocated corporate expenses in fiscal 2022 consisted of a loss on contingent consideration of $0.1 million, stock-based compensation expense of $4.7 million and a restructuring charge of $1.0 million. Unallocated corporate expenses in fiscal 2021 consisted of a gain on contingent consideration of $5.9 million offset by stock-based compensation expense of $4.7 million.
Interest income, net
Interest income, net was $0.3 million in fiscal 2022 compared to $0.1 million for fiscal 2021. The increase in interest income, net, was due to increased interest rates in fiscal 2022.
China dissolution
China dissolution expense was $1.9 million in fiscal 2022 compared to no activity in fiscal 2021. The China dissolution expense during fiscal 2022, was driven by the liquidation of our China entity, resulting in a foreign currency loss from the cumulative translation release of $1.9 million in fiscal 2022 in which there was no similar transaction in fiscal 2021.
Other expense, net
Other expense, net was $0.1 million in fiscal 2022, compared to other expense, net of less than $0.1 million in fiscal 2021. The increase in other expense was driven by the impacts of fluctuations in foreign currencies in fiscal 2022.
Income Taxes
We recorded an income tax expense of $0.2 million in fiscal 2022 compared to income tax benefit of $1.8 million in fiscal 2021. The increase in income tax expense is a result of purchase accounting for the acquired intangible assets and the resulting deferred tax liability from the NEPSI Acquisition in the prior year. The Company recorded a deferred tax liability of $2.3 million, primarily for the difference in book and tax basis on the intangible assets acquired in fiscal 2021. As a result, the Company was able to benefit from additional deferred tax assets and therefore released a corresponding valuation allowance of $2.3 million during the fiscal year ended March 31, 2022. The tax benefit was offset during fiscal 2021 by income tax expense in foreign jurisdictions.
Net loss
Net loss was $35.0 million in fiscal 2022, compared to net loss of $19.2 million in fiscal 2021. The increase in net loss was driven primarily by lower gross margins, the impact of the China dissolution in fiscal 2022 and partially offset by the ERC benefit.
Please refer to the “Risk Factors” section in Part I, Item 1A, for a discussion of certain factors that may affect our future results of operations and financial condition.
Non-GAAP Measures
Generally, a non-GAAP financial measure is a numerical measure of a company’s performance, financial position or cash flow that either excludes or includes amounts that are not normally excluded or included in the most directly comparable measure calculated and presented in accordance with generally accepted accounting principles in the United States (“GAAP”). The non-GAAP measures included in this Form 10-K, however, should be considered in addition to, and not as a substitute for or superior to the comparable measure prepared in accordance with GAAP.
We define non-GAAP net loss as net loss before stock-based compensation, amortization of acquisition-related intangibles, acquisition costs, changes in fair value of contingent consideration, China dissolution, ERC tax benefit, and other non-cash or unusual charges. We believe non-GAAP net loss assists management and investors in comparing our performance across reporting periods on a consistent basis by excluding these non-cash charges and other items that we do not believe are indicative of our core operating performance. In addition, we use non-GAAP net loss as a factor to evaluate the effectiveness of our business strategies. A reconciliation of GAAP to non-GAAP net loss is set forth in the table below (in thousands, except per share data):
| Year ended March 31, |
||||||||
| 2023 |
2022 |
|||||||
| Net loss |
$ | (35,041 | ) | $ | (19,193 | ) | ||
| Stock-based compensation |
4,729 | 4,661 | ||||||
| Amortization of acquisition-related intangibles |
2,784 | 2,623 | ||||||
| Acquisition costs |
- | 681 | ||||||
| Change in fair value of contingent consideration |
70 | (5,850 | ) | |||||
| China dissolution |
1,921 | — | ||||||
| ERC tax benefit |
(3,283 | ) | — | |||||
| Non-GAAP net loss |
(28,820 | ) | (17,078 | ) | ||||
| Non-GAAP net loss per share |
$ | (1.03 | ) | $ | (0.63 | ) | ||
| Weighted average shares outstanding - basic and diluted |
27,848 | 27,203 | ||||||
We incurred non-GAAP net losses of $28.8 million or $1.03 per share for fiscal 2022, compared to $17.1 million, or $0.63 per share, for fiscal 2021. The increase in non-GAAP net loss in fiscal 2022 compared to fiscal 2021 was due to a higher operating loss driven by lower gross margins.
Liquidity and Capital Resources
We have experienced recurring operating losses and as of March 31, 2023 had an accumulated deficit of $1,055.5 million.
Our cash requirements depend on numerous factors, including the successful completion of our product development activities, our ability to commercialize our REG and ship protection system solutions, the rate of customer and market adoption of our products, collecting receivables according to established terms, the continued availability of U.S. government funding during the product development phase of our superconductor-based products and whether Inox is successful in executing on Solar Energy Corporation of India Limited orders or in obtaining additional orders under the new central and state auction regime. We continue to closely monitor our expenses and, if required, expect to reduce our operating and capital spending to enhance liquidity
In February 2021, we filed a shelf registration statement on Form S-3 that will expire in February 2024 (the “Form S-3”). The Form S-3 allows us to offer and sell from time-to-time up to $250 million of common stock, debt securities, warrants or units comprised of any combination of these securities. The Form S-3 is intended to provide us flexibility to conduct registered sales of our securities, subject to market conditions, in order to fund our future capital needs. The terms of any future offering under the Form S-3 will be established at the time of such offering and will be described in a prospectus supplement filed with the SEC prior to the completion of any such offering.
At March 31, 2023, we had cash, cash equivalents and restricted cash of $25.7 million, compared to $49.5 million at March 31, 2022, a decrease of $23.8 million. As of March 31, 2023, we had approximately $1.9 million of cash, cash equivalents and restricted cash in foreign bank accounts. Our cash, cash equivalents and restricted cash are summarized as follows (in thousands):
| March 31, 2023 |
March 31, 2022 |
|||||||
| Cash and cash equivalents |
$ | 23,360 | $ | 40,584 | ||||
| Restricted cash |
2,315 | 8,902 | ||||||
| Total cash, cash equivalents and restricted cash |
$ | 25,675 | $ | 49,486 | ||||
Net cash used in operating activities was $22.5 million and $19.0 million in fiscal 2022 and 2021, respectively. The increase in net cash used in operations in fiscal 2022 compared to fiscal 2021 was driven primarily by purchases of inventory and decreased cash collections in fiscal 2022.
Net cash used in investing activities was $1.5 million and $7.2 million in fiscal 2022 and 2021, respectively. The decrease in net cash used in investing activities in fiscal 2022 compared to fiscal 2021 was due primarily to the Neeltran acquisition in fiscal 2021, in which no similar transaction occurred in fiscal 2022.
Net cash provided by financing activities was $0.2 million and $0.1 million in fiscal 2022 and 2021, respectively. The increase in net cash provided by financing activities in fiscal 2022 compared to fiscal 2021 was primarily due to the repurchase of treasury stock in fiscal 2021, in which no similar transaction occurred in fiscal 2022.
.
At March 31, 2023, we had $0.6 million of restricted cash included in long-term assets and $1.7 million of restricted cash in short-term assets. At March 31, 2022, we had $6.1 million of restricted cash included in long-term assets and $2.8 million of restricted cash in short-term assets. These amounts included in restricted cash primarily represent collateral deposits to secure surety bonds and letters of credit for various customer contracts. These deposits are held in interest bearing accounts. The restricted cash held in escrow in long-term assets at the end of March 31, 2022 securing the letter of credit with Com Ed on the REG project was released back to us in the fourth quarter of fiscal 2022.
We are a party to many contractual obligations involving commitments to make payments to third parties. These obligations impact our short-term and long-term liquidity and capital resource needs. Certain contractual obligations are reflected on the consolidated balance sheet as of March 31, 2023, while others are considered future commitments. We have various contractual arrangements, under which we have committed to purchase certain minimum quantities of goods or services on an annual basis. For information regarding our other contractual obligations, refer to Note 12, "Contingent Consideration," Note 14, "Debt," Note 15, "Leases" and Note 17, "Commitments and Contingencies" to our consolidated financial statements included elsewhere in this Annual Report on Form 10-K.
We believe we have sufficient available liquidity to fund our operations and capital expenditures for the next twelve months. In addition, we may seek to raise additional capital, which could be in the form of loans, convertible debt or equity, to fund our operating requirements and capital expenditures. Our liquidity is highly dependent on our ability to increase revenues, control our operating costs, and our ability to raise additional capital, if necessary. There can be no assurance that we will be able to raise additional capital on favorable terms or at all, or execute on any other means of improving our liquidity as described above. Additionally, the impact of the COVID-19 pandemic or other sources of instability, including the ongoing war between Russia and Ukraine, instability of financial institutions and political instability in the United States, on the global financial markets may reduce our ability to raise additional capital, if necessary, which could negatively impact our liquidity. We also continue to closely monitor our expenses and, if required, we intend to reduce our operating and capital spending to enhance liquidity.
Legal Proceedings
From time to time, we are involved in legal and administrative proceedings and claims of various types. We record a liability in our consolidated financial statements for these matters when a loss is known or considered probable and the amount can be reasonably estimated. We review these estimates each accounting period as additional information is known and adjust the loss provision when appropriate. If a matter is both probable to result in liability and the amounts of loss can be reasonably estimated, we estimate and disclose the possible loss or range of loss to the extent necessary to make the consolidated financial statements not misleading. If the loss is not probable or cannot be reasonably estimated, a liability is not recorded in our consolidated financial statements.
Recent Accounting Pronouncements
In June 2016, the FASB issued ASU 2016-13, Financial Instruments-Credit Losses (Topic 326): Measurement of Credit Losses on Financial Instruments. The amendments in ASU 2016-13 provide more decision-useful information about the expected credit losses on financial instruments and other commitments to extend credit held by a reporting entity at each reporting date. Following the release of ASU 2019-10 in November 2019, the new effective date, as long as we remain a smaller reporting company, would be annual reporting periods beginning after December 15, 2022. We evaluated the impact of the adoption of ASU 2016-13, and we do not expect it to have a material impact on our consolidated financial statements.
In October 2021, the FASB issued ASU 2021-08, Business Combinations (Topic 805): Accounting for Contract Assets and Contract Liabilities from Contracts with Customers. The amendments in ASU 2021-08 will improve the accounting for acquired revenue contracts with customers in a business combination. Following the release of ASU 2021-08 in October 2021, the new effective date will be annual reporting periods beginning after December 15, 2022. We evaluated the impact of the adoption of ASU 2021-08, and we do not expect it to have a material impact on our consolidated financial statements.
In November 2021, the FASB issued ASU 2021-10, Government Assistance (Topic 832): Disclosures by Business Entities about Government Assistance. The amendments in ASU 2021-10 will improve financial reporting by requiring disclosures that increase the transparency of transactions with government accounted for by applying a grant or contribution accounting model by analogy. Following the release of ASU 2021-10 in November 2021, the new effective date will be annual reporting periods beginning after December 15, 2021. As of April 1, 2022, we adopted ASU 2021-10 and noted no material impact on our consolidated financial statements.
We do not believe that, outside of those disclosed here, there are any other recently issued accounting pronouncements that will have a material impact on our consolidated financial statements.
Critical Accounting Policies and Estimates
The preparation of consolidated financial statements requires that we make estimates and judgments that affect the reported amounts of assets, liabilities, revenue and expenses, and related disclosure of contingent assets and liabilities. We base our estimates on historical experience and various other assumptions that are believed to be reasonable under the circumstances, the results of which form the basis for making judgments about the carrying values of assets and liabilities that are not readily apparent from other sources. Actual results may differ under different assumptions or conditions. Our accounting policies that involve the most significant judgments and estimates are as follows:
Revenue recognition
For certain arrangements, such as contracts to perform research and development, prototype development contracts and certain customized product sales, we record revenues using the over-time method, measured by the relationship of costs incurred to total estimated contract costs. Over-time revenue recognition accounting is predominantly used on certain turnkey power systems installations for electric utilities and long-term prototype development contracts with the U.S. government. In addition, some contracts contain an element of variable consideration, including liquidated damages and/or penalties, which requires payment to the customer in the event that delivery timelines or milestones are not met. We estimate the total consideration payable by the customer when the contracts contain variable consideration provisions, based on the most likely amount anticipated to be recognized for transferring the promised goods or services. As a result, we may constrain revenue to the extent that a significant reversal in the amount of cumulative revenue recognized will not occur when the uncertainty associated with the variable consideration is subsequently resolved.
Significant judgement is required to estimate the total expected costs and variable consideration for projects that typically have a timeline of 12-24 months. Any increase or decrease in estimated costs to complete a performance obligation without a corresponding change to the contract price could impact the calculation of cumulative revenue to date and gross profit on the project. Similar, if we recognize revenue based upon our current estimate of variable consideration, and our estimate is later adjusted, we may be required to increase or decrease cumulative revenue to date and gross profit on the project. Factors that may result in a change to our estimate include delays in manufacturing, unforeseen engineering problems, the performance of subcontractors and material suppliers, among others.
We have a long history of working with multiple types of projects and preparing cost estimates, and we rely on the expertise of key personnel to prepare what we believe are reasonable best estimates given available facts and circumstances. Due to the nature of the work involved, however, judgment is involved to estimate the total costs to complete, and the amounts estimated could have a material impact on the revenue we recognize in each accounting period. We cannot estimate unforeseen events and circumstances which may result in actual results being materially different from previous estimates.
See Note 4, “Revenue Recognition,” for additional information.
Business Acquisitions
We account for acquisitions using the purchase method of accounting in accordance with ASC 805, Business Combinations. The purchase price for each acquisition is allocated to the assets acquired and liabilities assumed based on their estimated fair values at the date of acquisition. The excess purchase price over the estimated fair value of the net assets acquired is recorded as goodwill. Intangible assets, if identified, are also recorded.
Determining the fair value of certain assets and liabilities assumed is judgmental in nature and often involves the use of significant estimates and assumptions as well as the use of specialists as needed. The Company utilizes management estimates and an independent third-party valuation firm to assist in determining the fair values of assets acquired, including intangible assets and liabilities assumed. The primary intangible assets acquired include customer relationship and trade names. Intangible assets are initially valued using a methodology commensurate with the intended use of the asset. The fair value of customer relationships is measured using the multi-period excess earnings method (“MPEEM”). The fair value of the trade names is measured using a relief-from-royalty (“RFR”) approach. The basis for future sales projections for both the MPEEM and RFR are based on internal revenue forecasts which the Company believes represents reasonable market participant assumptions. The future cash flows are discounted using an applicable discount rate. The key uncertainties in the calculations, as applicable, are the selection of an appropriate royalty rate, assumptions used in developing estimates of future cash flows, including revenue growth and expense forecasts, assumed customer attrition rates, as well as perceived risks associated with those forecasts in determining the discount rate. There is inherent uncertainty in forecasted cash flows and therefore, actual results may differ and could result in a subsequent impairment charge of acquired intangibles and/or goodwill.
The consideration for our acquisitions may include future payments that are contingent upon the occurrence of a particular event. We record a contingent consideration obligation for such contingent consideration payments at fair value on the acquisition date. We estimate the fair value of contingent consideration obligations through valuation models that incorporate probability adjusted assumptions related to the achievement of the milestones and the likelihood of making related payments. Significant judgment is employed in determining these assumptions as of the acquisition date and for each subsequent period. Accordingly, future business and economic conditions, as well as changes in any of the assumptions described above, can materially impact the fair value of contingent consideration recorded at each reporting period. See Note 3, "Acquisitions," for additional information.
Valuation of long-lived assets
We periodically evaluate our long-lived assets, consisting principally of fixed and amortizable intangible assets for potential impairment. We evaluate our long-lived assets whenever events or circumstances suggest that the carrying amount of an asset or group of assets may not be recoverable from the estimated undiscounted future cash flows.
Our judgments regarding the existence of impairment indicators are based on market and operational performance. Indicators of potential impairment include:
| • |
a significant change in the manner in which an asset group is used; |
| • |
a significant decrease in the market value of an asset group; |
| • |
identification of other impaired assets within a reporting unit; |
| • |
a significant adverse change in its business or the industry in which it is sold; |
| • |
a current period operating cash flow loss combined with a history of operating or cash flow losses or a projection or forecast that demonstrates continuing losses associated with the asset group; and |
| • |
significant advances in our technologies that require changes in our manufacturing process. |
We evaluate recoverability of long-lived assets and definite-lived intangible assets by estimating the undiscounted future cash flows associated with the expected uses and disposition of those assets. When those comparisons indicate that the carrying value of those assets is greater than the undiscounted cash flows, we recognize an impairment loss for the amount that the carrying value exceeds the fair value. The Company has not made any material changes to the method of evaluating for impairment during the last three years. There were no indicators requiring further impairment testing on our long-lived assets during the fiscal years ended March 31, 2023 or 2022.
Goodwill
Goodwill represents the excess of cost over net assets of acquired businesses that are consolidated. We perform our annual assessment of goodwill on February 28th of each fiscal year and whenever events or changes in circumstances or a triggering event indicate that the carrying amount may not be recoverable. An entity is permitted to first assess qualitatively whether it is necessary to perform a goodwill impairment test. Significant judgment is required to determine if an indication of impairment has taken place. Factors to be considered include the following: adverse change in operating results, decline in strategic business plans, significantly lower future cash flows, and sustainable declines in market data such as market capitalization. The quantitative impairment test is required only if the entity concludes that it is more likely than not that a reporting unit’s fair value is less than its carrying amount. We determine the fair value of a reporting unit, using a methodology which combines an income approach, using a discounted cash flow method, with a market approach. The income approach includes estimates and assumptions about revenue growth rates, operating margins and terminal growth rates, discounted by an estimated weighted-average cost of capital derived from other publicly-traded companies that are similar but not identical from an operational and economic standpoint. These estimates are based on historical experiences, our projects of future operating activity and our weighted-average cost of capital. A significant change in events, circumstances or any of these assumptions could adversely affect these estimates, which could result in an impairment.
We performed our annual assessment of goodwill on February 28, 2023 and noted no triggering events from the analysis date to March 31, 2023 and determined that there was no impairment to goodwill. See Note 5, “Goodwill,” for further information regarding our goodwill valuation assumptions.
Income taxes
Our provision for income taxes is comprised of a current and a deferred portion. The current income tax provision is calculated as the estimated taxes payable or refundable on tax returns for the current fiscal year. The deferred income tax provision is calculated for the estimated future tax effects attributable to temporary differences and carryforwards using expected tax rates in effect in the years during which the differences are expected to reverse. All deferred tax assets and liabilities are presented as non-current in the Consolidated Balance Sheet.
We regularly assess our ability to realize our deferred tax assets. Assessments of the realization of deferred tax assets require that management consider all available evidence, both positive and negative, and make significant judgments about many factors, including the amount and likelihood of future taxable income. Based on all the available evidence, we have recorded valuation allowances to reduce our deferred tax assets to the amount that is more likely than not to be realizable due to the taxable losses that have been incurred since our inception and uncertainty around our future profitability.
Accounting for income taxes requires a two-step approach to recognizing and measuring uncertain tax positions. The first step is to evaluate the tax position for recognition by determining if, based on the technical merits, it is more likely than not that the position will be sustained upon audit, including resolution of related appeals or litigation processes, if any. The second step is to measure the tax benefit as the largest amount that is more than 50% likely of being realized upon ultimate settlement. We reevaluate these uncertain tax positions on a quarterly basis. This evaluation is based on factors including, but not limited to, changes in facts or circumstances, changes in tax law, effectively settled issues under audit and new audit activity. Any changes in these factors could result in the recognition of a tax benefit or an additional charge to the tax provision. See Note 13, “Income Taxes,” of our consolidated financial statements for further information regarding our income tax assumptions and expenses.
| QUANTITATIVE AND QUALITATIVE DISCLOSURES ABOUT MARKET RISK |
This item is not required for smaller reporting companies.
| FINANCIAL STATEMENTS AND SUPPLEMENTARY DATA |
Report of Independent Registered Public Accounting Firm
To the Stockholders and Board of Directors of American Superconductor Corporation
Opinion on the Financial Statements
We have audited the accompanying consolidated balance sheets of American Superconductor Corporation and its subsidiaries (the Company) as of March 31, 2023 and 2022, the related consolidated statements of operations, comprehensive income (loss), stockholders' equity and cash flows for the years then ended, and the related notes to the consolidated financial statements (collectively, the financial statements). In our opinion, the financial statements present fairly, in all material respects, the financial position of the Company as of March 31, 2023 and 2022, and the results of its operations and its cash flows for the years then ended, in conformity with accounting principles generally accepted in the United States of America.
We have also audited, in accordance with the standards of the Public Company Accounting Oversight Board (United States) (PCAOB), the Company's internal control over financial reporting as of March 31, 2023, based on criteria established in Internal Control — Integrated Framework issued by the Committee of Sponsoring Organizations of the Treadway Commission in 2013, and our report dated May 31, 2023 expressed an unqualified opinion on the effectiveness of the Company's internal control over financial reporting.
Basis for Opinion
These financial statements are the responsibility of the Company’s management. Our responsibility is to express an opinion on the Company’s financial statements based on our audits. We are a public accounting firm registered with the PCAOB and are required to be independent with respect to the Company in accordance with U.S. federal securities laws and the applicable rules and regulations of the Securities and Exchange Commission and the PCAOB.
We conducted our audits in accordance with the standards of the PCAOB. Those standards require that we plan and perform the audits to obtain reasonable assurance about whether the financial statements are free of material misstatement, whether due to error or fraud. Our audits included performing procedures to assess the risks of material misstatement of the financial statements, whether due to error or fraud, and performing procedures that respond to those risks. Such procedures included examining, on a test basis, evidence regarding the amounts and disclosures in the financial statements. Our audits also included evaluating the accounting principles used and significant estimates made by management, as well as evaluating the overall presentation of the financial statements. We believe that our audits provide a reasonable basis for our opinion.
Critical Audit Matters
The critical audit matters communicated below are matters arising from the current period audit of the financial statements that were communicated or required to be communicated to the audit committee and that: (1) relate to accounts or disclosures that are material to the financial statements and (2) involve especially challenging, subjective or complex judgments. The communication of critical audit matters does not alter in any way our opinion on the financial statements, taken as a whole, and we are not, by communicating the critical audit matters below, providing separate opinions on the critical audit matters or on the accounts or disclosures to which they relate.
Revenue Recognition
As described in Notes 2 and 4 of the consolidated financial statements, a significant portion of the Company’s revenue is generated pursuant to nonstandard written contractual arrangements to design, develop, and/or manufacture products, and to provide related technical and other services according to the specifications of the customers. Because of the uniqueness of the terms and conditions in the customer contracts, there is significant analysis, and at times significant judgments, that are made by management when evaluating the contracts for proper revenue recognition. The Company’s performance obligations under these contractual agreements are satisfied over time. For performance obligations satisfied over time, revenue is generally recognized by measuring progress through costs incurred to date relative to total estimated costs at completion, which requires management to estimate both total expected project costs and expected gross margin, including evaluating customer change orders, to determine the appropriate amount of revenue to recognize, which can require significant management judgment.
We identified revenue recognition pertaining to customer contracts satisfied over time as a critical audit matter as there are significant judgments exercised by management in determining revenue recognition. Given the high degree of management judgment involved in analyzing the terms and conditions of the Company’s unique customer contracts and the various management estimates that are used in the revenue calculations, the audit effort required to evaluate management’s judgments in determining revenue recognition for the Company’s contracts was extensive and required a high degree of auditor judgment.
Our audit procedures related to revenue recognition included the following, among others:
| ● |
We obtained an understanding of the relevant controls related to revenue recognition and tested controls specific to management’s analysis of customer contract terms and application of relevant accounting guidance as well as determination of significant assumptions used in computing revenue for design and operating effectiveness, |
| ● |
We selected a sample of contracts with customers and related revenue transactions and performed the following audit procedures: |
| o |
Obtained customer contract, related invoices, purchase orders, and management revenue recognition analysis for each testing selection, to evaluate if relevant contractual terms and transaction price were appropriately considered by management and conclusions on revenue recognition method were in accordance with the relevant accounting guidance; and |
| o |
Evaluated management’s estimations of total contract cost and contract profit by assessing actual costs to date against projections made throughout the course of the contract term. |
Goodwill Impairment
As described in Notes 2 and 5 to the consolidated financial statements, the Company’s goodwill balance was $43.5 million as of March 31, 2023. Management tests goodwill for impairment, at the reporting unit level, as of February 28 of each fiscal year, or more frequently if events or changes in circumstances indicate the asset might be impaired. To test goodwill for impairment, management compares the estimated fair value of each reporting unit with the carrying amount of each reporting unit, including the recorded goodwill. In estimating the fair value of each reporting unit, management uses a methodology which combines an income approach, using a discounted cash flows method, with a market approach, using a peer-based guideline company method based on the average of published multiples of earnings of comparable entities with similar operations and economic characteristics.
We identified the goodwill impairment assessment for the Company’s reporting units with material goodwill as a critical audit matter because of the significant estimates and assumptions used by management when estimating the fair value of the these reporting units, including management’s forecasts of revenue and expense growth rates and management’s selection of the discount rates for the income approaches and management’s estimates of the multiples of earnings of comparable entities with similar operations and economic characteristics for the market approaches. Auditing management’s estimates and assumptions involved a high degree of auditor judgment and increased audit effort, including the use of our fair value specialists, due to the impact these assumptions have on the goodwill impairment assessment.
Our audit procedures related to the assessment of goodwill impairment included the following, among others:
| ● | We obtained an understanding of the relevant controls relating to management's goodwill impairment assessment and tested such controls for design and operating effectiveness, including controls over management's review of the significant assumptions used in the estimate of fair value, such as forecasted revenue growth rates, gross margin, and selected discount rates. | |
| ● |
We evaluated the reasonableness of management's forecasts of revenue and expense growth rates, including comparing projections to historical results. |
| ● |
We tested the underlying data used by management in their development of forecasts of revenue and expense growth rates for accuracy and completeness. |
| ● |
We evaluated the reasonableness of management's selection of comparable entities with similar operations and economic characteristics. |
|
| ● | With the assistance of our valuation specialists, we evaluated the reasonableness of the Company's valuation methodology and significant assumptions by: |
| o |
Evaluating the reasonableness of the discount rate and multiples of earnings by comparing the underlying source information to publicly available market data and verifying the accuracy of the calculations. |
| o |
Evaluating the appropriateness of the valuation methods used by management and testing their mathematical accuracy. |
/s/ RSM US LLP
We have served as the Company's auditor since 2013.
Boston, Massachusetts
May 31, 2023
AMERICAN SUPERCONDUCTOR CORPORATION
PART I — FINANCIAL INFORMATION
ITEM 1. FINANCIAL STATEMENTS
CONSOLIDATED BALANCE SHEETS
(In thousands)
| March 31, |
March 31, |
|||||||
| 2023 |
2022 |
|||||||
| ASSETS |
||||||||
| Current assets: |
||||||||
| Cash and cash equivalents |
$ | 23,360 | $ | 40,584 | ||||
| Accounts receivable |
30,665 | 20,280 | ||||||
| Inventory |
36,986 | 23,666 | ||||||
| Prepaid expenses and other current assets |
13,429 | 7,052 | ||||||
| Restricted cash |
1,733 | 2,754 | ||||||
| Total current assets |
106,173 | 94,336 | ||||||
| Property, plant and equipment, net |
12,309 | 13,656 | ||||||
| Intangibles, net |
8,527 | 11,311 | ||||||
| Right-of-use asset |
2,857 | 3,502 | ||||||
| Goodwill |
43,471 | 43,471 | ||||||
| Restricted cash |
582 | 6,148 | ||||||
| Deferred tax assets |
1,114 | 1,224 | ||||||
| Other assets |
528 | 239 | ||||||
| Total assets |
$ | 175,561 | $ | 173,887 | ||||
| LIABILITIES AND STOCKHOLDERS' EQUITY |
||||||||
| Current liabilities: |
||||||||
| Accounts payable and accrued expenses |
$ | 38,383 | $ | 29,140 | ||||
| Lease liability, current portion |
808 | 740 | ||||||
| Debt, current portion |
75 | 72 | ||||||
| Contingent consideration |
1,270 | 1,200 | ||||||
| Deferred revenue, current portion |
43,572 | 22,812 | ||||||
| Total current liabilities |
84,108 | 53,964 | ||||||
| Deferred revenue, long term portion |
7,188 | 7,222 | ||||||
| Lease liability, long term portion |
2,184 | 2,900 | ||||||
| Deferred tax liabilities |
243 | 297 | ||||||
| Debt, long-term portion |
15 | 90 | ||||||
| Other liabilities |
26 | 25 | ||||||
| Total liabilities |
93,764 | 64,498 | ||||||
| Commitments and contingencies (Note 17) |
||||||||
| Stockholders' equity: |
||||||||
| Common stock, $0.01 par value, 75,000,000 shares authorized; 29,937,119 and 28,919,990 shares issued and 29,539,488 and 28,522,359 shares outstanding at March 31, 2023 and 2022, respectively |
299 | 289 | ||||||
| Additional paid-in capital |
1,139,113 | 1,133,536 | ||||||
| Treasury stock, at cost, 397,631 at March 31, 2023 and 2022, respectively |
(3,639 | ) | (3,639 | ) | ||||
| Accumulated other comprehensive income (loss) |
1,571 | (291 | ) | |||||
| Accumulated deficit |
(1,055,547 | ) | (1,020,506 | ) | ||||
| Total stockholders' equity |
81,797 | 109,389 | ||||||
| Total liabilities and stockholders' equity |
$ | 175,561 | $ | 173,887 | ||||
The accompanying notes are an integral part of the consolidated financial statements.
AMERICAN SUPERCONDUCTOR CORPORATION
CONSOLIDATED STATEMENTS OF OPERATIONS
(In thousands, except per share data)
| Fiscal Year Ended March 31, |
||||||||
| 2023 |
2022 |
|||||||
| Revenues |
$ | 105,984 | $ | 108,435 | ||||
| Cost of revenues |
97,463 | 94,943 | ||||||
| Gross profit |
8,521 | 13,492 | ||||||
| Operating expenses: |
||||||||
| Research and development |
8,966 | 10,470 | ||||||
| Selling, general and administrative |
28,700 | 27,494 | ||||||
| Amortization of acquisition related intangibles |
2,746 | 2,467 | ||||||
| Change in fair value on contingent consideration |
70 | (5,850 | ) | |||||
| Restructuring |
1,048 | — | ||||||
| Total operating expenses |
41,530 | 34,581 | ||||||
| Operating loss |
(33,009 | ) | (21,089 | ) | ||||
| Interest income, net |
252 | 75 | ||||||
| China dissolution |
(1,921 | ) | - | |||||
| Other expense, net |
(148 | ) | (28 | ) | ||||
| Loss before income tax expense (benefit) |
(34,826 | ) | (21,042 | ) | ||||
| Income tax expense (benefit) |
215 | (1,849 | ) | |||||
| Net loss |
$ | (35,041 | ) | $ | (19,193 | ) | ||
| Net loss per common share |
||||||||
| Basic |
$ | (1.26 | ) | $ | (0.71 | ) | ||
| Diluted |
$ | (1.26 | ) | $ | (0.71 | ) | ||
| Weighted average number of common shares outstanding |
||||||||
| Basic |
27,848 | 27,203 | ||||||
| Diluted |
27,848 | 27,203 | ||||||
The accompanying notes are an integral part of the consolidated financial statements.
AMERICAN SUPERCONDUCTOR CORPORATION
CONSOLIDATED STATEMENTS OF COMPREHENSIVE INCOME (LOSS)
(In thousands)
| Fiscal Year Ended March 31, |
||||||||
| 2023 |
2022 |
|||||||
| Net loss |
$ | (35,041 | ) | $ | (19,193 | ) | ||
| Other comprehensive (loss) gain, net of tax: |
||||||||
| China dissolution |
1,921 | - | ||||||
| Foreign currency translation loss |
(59 | ) | (14 | ) | ||||
| Total other comprehensive (loss) gain, net of tax |
1,862 | (14 | ) | |||||
| Comprehensive loss |
$ | (33,179 | ) | $ | (19,207 | ) | ||
The accompanying notes are an integral part of the consolidated financial statements.
AMERICAN SUPERCONDUCTOR CORPORATION
CONSOLIDATED STATEMENTS OF STOCKHOLDERS’ EQUITY
(In thousands)
| Common Stock |
Additional |
Accumulated Other |
Total |
|||||||||||||||||||||||||
| Number of Shares |
Par Value |
Paid-in |
Treasury |
Comprehensive Income (Loss) |
Accumulated Deficit |
Stockholders' Equity |
||||||||||||||||||||||
| Balance at March 31, 2021 |
27,988 | $ | 280 | $ | 1,121,495 | $ | (3,593 | ) | $ | (277 | ) | $ | (1,001,313 | ) | $ | 116,592 | ||||||||||||
| Issuance of common stock - ESPP |
28 | — | $ | 241 | — | — | — | $ | 241 | |||||||||||||||||||
| Issuance of common stock - Bonus payments |
158 | 2 | 2,278 | — | — | — | 2,280 | |||||||||||||||||||||
| Issuance of common stock - restricted shares |
404 | 4 | (4 | ) | — | — | — | — | ||||||||||||||||||||
| Stock-based compensation expense |
— | — | 4,661 | — | — | — | 4,661 | |||||||||||||||||||||
| Issuance of stock for 401(k) match |
40 | — | 481 | — | — | — | 481 | |||||||||||||||||||||
| Issuance of common stock - Neeltran acquisition |
302 | 3 | 4,384 | — | — | — | 4,387 | |||||||||||||||||||||
| Repurchase of treasury stock |
— | — | — | (46 | ) | — | — | (46 | ) | |||||||||||||||||||
| Cumulative translation adjustment |
— | — | — | — | (14 | ) | — | (14 | ) | |||||||||||||||||||
| Net loss |
— | — | — | — | — | (19,193 | ) | (19,193 | ) | |||||||||||||||||||
| Balance at March 31, 2022 |
28,920 | $ | 289 | $ | 1,133,536 | $ | (3,639 | ) | $ | (291 | ) | $ | (1,020,506 | ) | $ | 109,389 | ||||||||||||
| Issuance of common stock - ESPP |
60 | 1 | 234 | — | — | — | 235 | |||||||||||||||||||||
| Issuance of common stock - restricted shares |
827 | 8 | (8 | ) | — | — | — | — | ||||||||||||||||||||
| Stock-based compensation expense |
— | — | 4,729 | — | — | — | 4,729 | |||||||||||||||||||||
| Issuance of stock for 401(k) match |
130 | 1 | 622 | — | — | — | 623 | |||||||||||||||||||||
| Cumulative translation adjustment |
— | — | — | — | 1,862 | — | 1,862 | |||||||||||||||||||||
| Net loss |
— | — | — | — | — | (35,041 | ) | (35,041 | ) | |||||||||||||||||||
| Balance at March 31, 2023 |
29,937 | $ | 299 | $ | 1,139,113 | $ | (3,639 | ) | $ | 1,571 | $ | (1,055,547 | ) | $ | 81,797 | |||||||||||||
| ) | ) | |||||||||||||||||||||||||||
The accompanying notes are an integral part of the consolidated financial statements.
AMERICAN SUPERCONDUCTOR CORPORATION
CONSOLIDATED STATEMENTS OF CASH FLOWS
(In thousands)
| Fiscal Year Ended March 31, |
||||||||
| 2023 |
2022 |
|||||||
| Cash flows from operating activities: |
||||||||
| Net loss |
$ | (35,041 | ) | $ | (19,193 | ) | ||
| Adjustments to reconcile net loss to net cash used in operations: |
||||||||
| Depreciation and amortization |
5,361 | 5,341 | ||||||
| Stock-based compensation expense |
4,729 | 4,661 | ||||||
| Provision for excess and obsolete inventory |
1,467 | 1,902 | ||||||
| Deferred income taxes |
24 | (2,403 | ) | |||||
| Change in fair value of contingent consideration |
70 | (5,850 | ) | |||||
| China dissolution |
1,921 | — | ||||||
| Non-cash interest income |
— | (49 | ) | |||||
| Other non-cash items |
600 | 525 | ||||||
| Unrealized foreign exchange gain on cash and cash equivalents |
(226 | ) | (186 | ) | ||||
| Changes in operating asset and liability accounts: |
||||||||
| Accounts receivable |
(10,360 | ) | (3,760 | ) | ||||
| Inventory |
(14,796 | ) | (3,307 | ) | ||||
| Prepaid expenses and other current assets |
(5,757 | ) | (420 | ) | ||||
| Accounts payable and accrued expenses |
8,660 | 4,695 | ||||||
| Deferred revenue |
20,863 | (933 | ) | |||||
| Net cash used in operating activities |
(22,485 | ) | (18,977 | ) | ||||
| Cash flows from investing activities: |
||||||||
| Purchase of property, plant and equipment |
(1,236 | ) | (938 | ) | ||||
| Cash paid for acquisition, net of cash received |
— | (11,479 | ) | |||||
| Proceeds from the maturity of marketable securities |
— | 5,189 | ||||||
| Change in other assets |
(281 | ) | 65 | |||||
| Net cash used in investing activities |
(1,517 | ) | (7,163 | ) | ||||
| Cash flows from financing activities: |
||||||||
| Repurchase of treasury stock |
— | (46 | ) | |||||
| Repayment of debt |
(73 | ) | (53 | ) | ||||
| Proceeds from exercise of employee stock options and ESPP |
235 | 241 | ||||||
| Net cash provided by financing activities |
162 | 142 | ||||||
| Effect of exchange rate changes on cash, cash equivalents and restricted cash |
29 | (55 | ) | |||||
| Net decrease in cash, cash equivalents and restricted cash |
(23,811 | ) | (26,053 | ) | ||||
| Cash, cash equivalents and restricted cash at beginning of year |
49,486 | 75,539 | ||||||
| Cash, cash equivalents and restricted cash at end of year |
$ | 25,675 | $ | 49,486 | ||||
| Supplemental schedule of cash flow information: |
||||||||
| Cash paid for income taxes, net of refunds |
350 | $ | 531 | |||||
| Non-cash investing and financing activities |
||||||||
| Issuance of common stock in connection with the purchase of Neeltran, Inc. |
— | 4,387 | ||||||
| Issuance of common stock to settle liabilities |
623 | 2,761 | ||||||
The accompanying notes are an integral part of the consolidated financial statements.
1. Nature of the Business and Operations and Liquidity
Nature of the Business and Operations
American Superconductor Corporation (together with its subsidiaries, “AMSC®” or the “Company”) was founded on April 9, 1987. The Company is a leading system provider of megawatt-scale power resiliency solutions that Orchestrate the Rhythm and Harmony of Power on the Grid™ and protect and expand the capability of the Navy's fleet. The Company’s products leverage its proprietary “smart materials” and “smart software and controls” to provide enhanced resiliency and improved performance of megawatt-scale power flow.
The Company’s consolidated financial statements have been prepared on a going concern basis in accordance with United States generally accepted accounting principles (“GAAP”) and the Securities and Exchange Commission’s (“SEC”) instructions to Form 10-K. The going concern basis of presentation assumes that the Company will continue operations and will be able to realize its assets and discharge its liabilities and commitments in the normal course of business.
Liquidity
The Company has historically experienced recurring operating losses and as of March 31, 2023, the Company had an accumulated deficit of $1,055.5 million. In addition, the Company has historically experienced recurring negative operating cash flows. At March 31, 2023, the Company had cash and cash equivalents of $23.4 million. Cash used in operations for the year ended March 31, 2023 was $22.5 million.
In February 2021, the Company filed a shelf registration statement on Form S-3 that will expire in February 2024 (the “Form S-3”). The Form S-3 allows the Company to offer and sell from time-to-time up to $250 million of common stock, debt securities, warrants or units comprised of any combination of these securities. The Form S-3 is intended to provide the Company flexibility to conduct registered sales of the Company's securities, subject to market conditions, in order to fund the Company's future capital needs. The terms of any future offering under the Form S-3 will be established at the time of such offering and will be described in a prospectus supplement filed with the SEC prior to the completion of any such offering.
The Company is experiencing substantial inflationary pressure in its supply chain and some delays in sourcing materials needed for its products resulting in some disruption, both of which have increased the Company's cost of revenues and decreased gross margin. Changes in macroeconomic conditions arising from the COVID-19 pandemic or for other reasons, such as ongoing war between Russia and Ukraine, inflation, rising interest rates, instability of financial institutions and political instability in the United States, including failure to raise the federal debt ceiling, labor force availability, sourcing, material delays and global supply chain disruptions could have a material adverse effect on the Company's business, financial condition and results of operation.
From time-to-time the Company may undertake restructuring activities in order to align the global organization in a manner that the Company believes will better position it to achieve its long-term goals. In January 2023, the Company undertook a reduction in force that involved approximately 5% of the global workforce. This restructuring will cause the Company to incur $1.0 million of cash expense and is expected to result in annualized cost savings of approximately $5 million, beginning in fiscal 2023.
2. Summary of Significant Accounting Policies
Basis of Consolidation
The consolidated financial statements include the accounts of the Company and its wholly-owned subsidiaries. All significant intercompany balances and transactions are eliminated.
Use of Estimates
The preparation of financial statements in conformity with GAAP requires management to make estimates and assumptions that affect the reported amounts of assets and liabilities, disclosure of contingent assets and liabilities at the date of the financial statements and the reported amounts of revenue and expenses during the reporting period. The Company bases its estimates on historical experience and various other factors believed to be reasonable under the circumstances, the results of which form the basis for making judgments about the carrying value of assets and liabilities that are not readily apparent from other sources. On an ongoing basis, the Company evaluates its estimates, including those related to revenue recognition, collectability of receivables, realizability of inventory, goodwill and intangible assets, contingent consideration, warranty provisions, stock-based compensation, tax reserves, and deferred tax assets. Provisions for depreciation are based on their estimated useful lives using the straight-line method. Some of these estimates can be subjective and complex and, consequently, actual results may differ from these estimates under different assumptions or conditions. While for any given estimate or assumption made by the Company’s management there may be other estimates or assumptions that are reasonable, the Company believes that, given the current facts and circumstances, it is unlikely that applying any such other reasonable estimate or assumption would materially impact the financial statements.
Cash Equivalents
Cash equivalents consist of highly liquid instruments with maturities of three months or less that are regarded as high quality, low risk investments and are measured using such inputs as quoted prices, and are classified within Level 1 of the valuation hierarchy. Cash equivalents consist principally of certificates of deposits and money market accounts.
Accounts Receivable
Accounts receivable consist of amounts owed by commercial companies and government agencies. Accounts receivable are stated net of allowances for doubtful accounts. The Company’s accounts receivable relate principally to a limited number of customers. As of March 31, 2023, Anovion LLC and Fuji Bridex PTE Ltd accounted for approximately 21% and 15% of the Company's accounts receivable balance, respectively, with no other customers accounting for greater than 10% of the balance. As of March 31, 2022, Fuji Bridex PTE Ltd accounted for approximately 31% of the Company's accounts receivable balance, with no other customers accounting for greater than 10% of the balance. Changes in the financial condition or operations of the Company’s customers may result in delayed payments or non-payments which would adversely impact its cash flows from operating activities and/or its results of operations. As such, the Company may require collateral, advanced payment or other security based upon the customer history and/or creditworthiness. In determining the allowance for doubtful accounts, the Company evaluates the collectability of accounts receivable based primarily on the probability of recoverability based on historical collection and write-off experience, the age of past due receivables, specific customer circumstances, and current economic trends. If the financial condition of the Company’s customers were to deteriorate, resulting in an impairment of their ability to make payment, additional allowances may be required. Failure to accurately estimate the losses for doubtful accounts and ensure that payments are received on a timely basis could have a material adverse effect on the Company’s business, financial condition, results of operations, and cash flows.
Inventory
Inventories include material, direct labor and related manufacturing overhead, and are stated at the lower of cost, determined on a first-in, first-out basis, or net realizable value determined as the estimated selling prices in the ordinary course of business, less reasonably predictable costs of completion, disposal and transportation. The Company records inventory when it takes delivery and title to the product according to the terms of each supply contract.
Program costs may be deferred and recorded as inventory on contracts on which costs are incurred in excess of approved contractual amounts and/or funding, if future recovery of the costs is deemed probable.
At each balance sheet date, the Company evaluates its ending inventories for excess quantities and obsolescence. Inventories that management considers excess or obsolete are reserved. Management considers forecasted demand in relation to the inventory on hand, competitiveness of product offerings, market conditions and product life cycles when determining excess and obsolescence and net realizable value adjustments. Once inventory is written down and a new cost basis is established, it is not written back up if demand increases.
For the fiscal years ended March 31, 2023 and 2022, the Company recorded inventory reserves of approximately $1.5 million and $1.9 million, respectively, based on evaluating its ending inventory on hand for excess quantities and obsolescence.
Leases
Leases include all agreements in which the Company obtains control of a physical asset. Leases are captured on the balance sheet as both a right of use asset and associated lease liability and are valued based on the commencement of the Company's control of the asset, after being discounted by its incremental borrowing rate. The Company's lease portfolio is made up primarily of real estate leases for its various offices, but also include items such as vehicles, IT equipment and other miscellaneous tools and equipment needed for manufacturing. The Company's incremental borrowing rate was determined through an analysis to identify what rates it could obtain if the Company were to secure external financing for similar transactions, and includes considerations of both the market and its current credit ratings. An analysis is performed annually, or upon execution of any individually material agreement, to ensure that the rates being applied to newly acquired leases are still accurate.
The majority of the Company's leases are classified as operating leases, and therefore the expense is captured in income from operations each period.
We have elected to exclude all leases of less than twelve months from the balance sheet presentation. We have also elected a policy in which we will not segregate lease components from non-lease components, so in the event we execute an agreement which includes a non-lease component our asset and liability recorded to the balance sheet will include the value of that non-lease component as well. This policy will be applied to all classifications of leases.
Property, Plant and Equipment
Property, plant and equipment are carried at cost less accumulated depreciation and amortization. The Company accounts for depreciation and amortization using the straight-line method to allocate the cost of property, plant and equipment over their estimated useful lives as follows:
| Asset Classification |
Estimated Useful Life in Years |
||
| Machinery and equipment |
3-10 | ||
| Furniture and fixtures |
3-5 | ||
| Leasehold improvements |
Shorter of the estimated useful life or the remaining lease term |
Expenditures for maintenance and repairs are expensed as incurred. Upon retirement or other disposition of assets, the costs and related accumulated depreciation are eliminated from the accounts and the resulting gain or loss is reflected in operating expenses.
Valuation of Long-Lived Assets
The Company periodically evaluates its long-lived assets, consisting principally of fixed assets and amortizable intangible assets, for potential impairment. In accordance with the applicable accounting guidance for the treatment of long-lived assets, the Company reviews the carrying value of its long-lived assets or asset group that is held and used, including intangible assets subject to amortization, for impairment whenever events and circumstances indicate that the carrying value of the assets may not be recoverable. Under the held and used approach, the asset or asset group to be tested for impairment should represent the lowest level for which identifiable cash flows are largely independent of the cash flows of other groups of assets and liabilities. The Company evaluates its long-lived assets whenever events or circumstances suggest that the carrying amount of an asset or group of assets may not be recoverable from the estimated undiscounted future cash flows.
There were no indicators requiring impairment testing on the Company's long-lived assets during the fiscal years ended March 31, 2023 and 2022.
Goodwill
Goodwill represents the excess of cost over net assets of acquired businesses that are consolidated. The Company performs its annual assessment of goodwill on February 28th of each fiscal year and whenever events or changes in circumstances or a triggering event indicate that the carrying amount may not be recoverable. Determining whether a triggering event has occurred often involves significant judgment from management. An entity is permitted to first assess qualitatively whether it is necessary to perform a goodwill impairment test. The quantitative impairment test is required only if the entity concludes that it is more likely than not that a reporting unit’s fair value is less than its carrying amount. The Company determines the fair value of a reporting unit, using a methodology which combines an income approach, using a discounted cash flow method, with a market approach. In evaluating whether it is more likely than not that the fair value of a reporting unit is less than its carrying amount, an entity should consider the totality of all relevant events or circumstances that affect the fair value or carrying amount of a reporting unit. If the carrying value of a reporting unit exceeds the reporting unit’s fair value, then an impairment charge is recognized reducing the goodwill by the excess of the carrying amount over the fair value, not to exceed the total amount of the goodwill allocated to the that reporting unit. See Note 5, "Goodwill" for further information and discussion.
The Company performed its annual assessment of goodwill on February 28, 2023 and noted no triggering events from the analysis date to March 31, 2023 and determined that there was no impairment to goodwill. Additionally, there was no impairment identified for the fiscal year ended March 31, 2022 based on the assessment performed in the prior fiscal year.
Revenue Recognition
Revenue contracts are defined as an arrangement that creates enforceable rights and obligations of both parties where collection of the contract price is deemed probable. The Company records revenue based on a five-step model which includes confirmation of contract existence, identifying the performance obligations, determining the transaction price, allocating the contract transaction price to the performance obligations, and recognizing the revenue when (or as) control of goods or services is transferred to the customer. The transfer of control can occur at the time of delivery, installation or post-installation where applicable.
The Company's equipment and system product line includes certain contracts which do not meet the requirements of an exchange transaction and therefore do not fall within the scope of ASC 606. As these non-exchange transaction contracts are considered grant revenue and do not fall within any specific accounting literature, the Company follows guidance within ASC 606 by analogy to recognize grant revenue over time.
For certain arrangements, such as contracts to perform research and development, prototype development contracts and certain customized product sales, the Company records revenues using the over-time method, measured by the relationship of costs incurred to total estimated contract costs. Over-time revenue recognition accounting is predominantly used on certain turnkey power systems installations for electric utilities and long-term prototype development contracts with the U.S. government. The Company follows this method when any of the three following criteria are met: when the customer receives the benefits as they are performed, control transfers to the customer as the work is performed, or there is no alternative use to the Company and there is an enforceable right to payment through the life of the contract. However, the ability to reliably estimate total costs at completion is challenging, especially on long-term prototype development contracts, and could result in future changes in contract estimates. For contracts where reasonably dependable estimates of the revenues and costs cannot be made, the Company follows the point in time method.
The Company enters into sales arrangements that may provide for multiple performance obligations to a customer. Sales of certain products may include extended warranty and support or service packages, and at times include performance bonds. As these contracts progress, the Company continually assesses the probability of a payout from the performance bond. Should the Company determine that such a payout is likely, the Company would record a liability. The Company would reduce revenue to the extent a liability is recorded. In addition, the Company enters into licensing arrangements that include training services.
Performance obligations are separated into more than one unit of accounting when (1) the delivered element(s) have value to the customer on a stand-alone basis, and (2) the Company's promise to transfer the goods or services to the customer is separately identifiable from other promises in the contract. In general, revenues are separated between the different product shipments which have stand-alone value, and the various services to be provided. Revenue for product shipments is generally recognized at a point in time where control of the product is transferred to the customer, while revenues for the services are generally recognized over the period of performance. The Company identifies all goods and/or services that are to be delivered separately under a sales arrangement and allocates the transaction price to each distinct performance obligation using the respective standalone selling price ("SSP") which is determined primarily using the cost plus expected margin approach for products and a relief from royalty method for licenses. Revenue allocated to each performance obligation is recognized when, or as, the performance obligation is satisfied. The Company reviews SSP and the related margins at least annually.
The Company’s license agreements provide either for the payment of contractually determined paid-up front license fees or milestone based payments in consideration for the grant of rights to manufacture and/or sell products using its patented technologies or know-how. Some of these agreements provide for the release of the licensee from past and future intellectual property infringement claims. When the Company can determine that it has no further obligations other than the grant of the license and that the Company has fully transferred the technology know-how, the Company recognizes the revenue under a point in time model. In other license arrangements, the Company may also agree to provide training services to transfer the technology know-how. In these arrangements, the Company has determined that the licenses have no standalone value to the customer and are not separable from training services as the Company can only fully transfer the technology know-how through the training component. Accordingly, the Company accounts for these arrangements as a single unit of accounting, and recognizes revenue over the period of its performance using the over-time method. Costs for these arrangements are expensed as incurred.
Existing customers are subject to ongoing credit evaluations based on payment history and other factors. If it is determined that collectability of any portion of the contract value is not probable, an analysis of variable consideration will be performed using either the most likely amount or expected value method to determine the amount of revenue that must be constrained until the scenario causing the variability has been resolved. For contractual arrangements that involve variable consideration, the Company recognizes revenue for these amounts upon reaching the constraining event successfully. The Company does not generally provide for extended payment terms or provide its customers with a right of return.
Infrequently, the Company receives requests from customers to hold product being purchased from us for a valid business purpose. The Company recognizes revenues for such arrangements provided the transaction meets, at a minimum, the following criteria: a valid business purpose for the arrangement exists; risk of ownership of the purchased product has been transferred to the buyer; there is a fixed delivery date that is reasonable and consistent with the buyer’s business purpose; the product is ready for shipment; there are no continuing performance obligation in regards to the purchased product and these products have been segregated from the Company's inventories and cannot be used to fill other orders received. Revenue for the fiscal year ended March 31, 2023 included $0.6 million from such held transactions. Revenues for the fiscal year ended March 31, 2022 included $1.2 million from such held transactions.
The Company has elected to record taxes collected from customers on a net basis and does not include tax amounts in revenue or costs of revenue.
The Company’s contract assets and liabilities primarily relate to the timing differences between cash received from a customer in connection with contractual rights to invoicing and the timing of revenue recognition following completion of performance obligations. The Company's accounts receivable balance is made up entirely of customer contract related balances.
Business Acquisitions
The Company accounts for acquisitions using the purchase method of accounting in accordance with ASC 805, Business Combinations. The purchase price for each acquisition is allocated to the assets acquired and liabilities assumed based on their estimated fair values at the date of acquisition. Intangible assets, if identified, are also recorded at fair value. The excess purchase price over the estimated fair value of the net assets acquired is recorded as goodwill.
Determining the fair value of certain assets and liabilities assumed is judgmental in nature and often involves the use of significant estimates and assumptions as well as the use of specialists as needed.
The consideration for its acquisitions may include future payments that are contingent upon the occurrence of a particular event. The Company records a contingent consideration obligation for such contingent consideration payments at fair value on the acquisition date. The Company estimates the fair value of contingent consideration obligations through valuation models that incorporate probability adjusted assumptions related to the achievement of the milestones and the likelihood of making related payments. Each period the Company revalues the contingent consideration obligations associated with the acquisition to fair value and records changes in the fair value within the operating expenses in its consolidated statements of operations. Increases or decreases in the fair value of the contingent consideration obligations can result from changes in assumed revenue risk premium and volatility, as well as changes in the stock price and assumed probability with respect to the attainment of certain financial and operational metrics, among others. Significant judgment is employed in determining these assumptions as of the acquisition date and for each subsequent period. Accordingly, future business and economic conditions, as well as changes in any of the assumptions described above, can materially impact the fair value of contingent consideration recorded at each reporting period. See Note 3, "Acquisitions," for additional information.
Product Warranty
Warranty obligations are incurred in connection with the sale of the Company’s products. The Company provides assurance-type warranties on all product sales for a term of typically one to three years, and extended service-type warranties at the customers’ option for an additional term ranging up to four additional years. The Company accrues for the estimated warranty costs for assurance warranties at the time of sale based on historical warranty experience plus any known or expected changes in warranty exposure. For all extended service-type warranties, the Company recognizes the revenue ratably over time during the effective period of the service. The costs incurred to provide for these warranty obligations are estimated and recorded as an accrued liability at the time of sale. Future warranty costs are estimated based on historical performance rates and related costs to repair given products. The accounting estimate related to product warranty involves judgment in determining future estimated warranty costs. Should actual performance rates or repair costs differ from estimates, revision to the estimated warranty liability would be required.
Research and Development Costs
Research and development costs are expensed as incurred.
Income Taxes
The Company’s provision for income taxes is comprised of a current and a deferred portion. The current income tax provision is calculated as the estimated taxes payable or refundable on tax returns for the current fiscal year. The deferred income tax provision is calculated for the estimated future tax effects attributable to temporary differences and carry-forwards using expected tax rates in effect in the years during which the differences are expected to reverse.
Deferred income taxes are recognized for the tax consequences in future fiscal years of differences between the tax bases of assets and liabilities and their financial reporting amounts at each fiscal year end based on enacted tax laws and statutory tax rates applicable to the periods in which the differences are expected to affect taxable income. Valuation allowances are established when necessary to reduce net deferred tax assets to the amount expected to be realized. The Company has provided a valuation allowance against its U.S. and Romania deferred income tax assets since the Company believes that it is more likely than not that these deferred tax assets are not currently realizable due to uncertainty around profitability in the future.
Accounting for income taxes requires a two-step approach to recognizing and measuring uncertain tax positions. The first step is to evaluate the tax position for recognition by determining if, based on the technical merits, it is more likely than not that the position will be sustained upon audit, including resolution of related appeals or litigation processes, if any. The second step is to measure the tax benefit as the largest amount that is more than 50% likely of being realized upon ultimate settlement. The Company reevaluates these uncertain tax positions on a quarterly basis. This evaluation is based on factors including, but not limited to, changes in facts or circumstances, changes in tax law, effectively settled issues under audit and new audit activity. Any changes in these factors could result in the recognition of a tax benefit or an additional charge to the tax provision. The Company includes interest and penalties related to gross unrecognized tax benefits within the provision for income taxes. See Note 14, “Income Taxes,” for further information regarding its income tax assumptions and expenses.
Stock-Based Compensation
The Company accounts for stock-based payment transactions using a fair value-based method and recognizes the related expense in the results of operations.
Stock-based compensation is estimated at the grant date based on the fair value of the award and is recognized as expense over the requisite service period of the award. The fair value of restricted stock awards is determined by reference to the fair market value of the Company’s common stock on the date of grant. The Company uses the Black-Scholes option pricing model to estimate the fair value of option awards with service and performance conditions. For awards with service conditions only, the Company recognizes compensation cost on a straight-line basis over the requisite service/vesting period. For awards with performance conditions, estimates of compensation cost are made based on the probable outcome of the performance conditions. The cumulative effect of changes in the probability outcomes are recorded in the period in which the changes occur.
Determining the appropriate fair value model and related assumptions requires judgment, including estimating stock price volatilities of the Company’s common stock and expected terms. The expected volatility rates are estimated based on historical and implied volatilities of the Company’s common stock. The expected term represents the average time that the options that vest are expected to be outstanding based on the vesting provisions and the Company’s historical exercise, cancellation and expiration patterns.
The Company estimates pre-vesting forfeitures when recognizing compensation expense based on historical and forward-looking factors. Changes in estimated forfeiture rates and differences between estimated forfeiture rates and actual experience may result in significant, unanticipated increases or decreases in stock-based compensation expense from period to period. The termination of employment of certain employees who hold large numbers of stock-based awards may also have a significant, unanticipated impact on forfeiture experience and, therefore, on stock-based compensation expense. The Company will update these assumptions on at least an annual basis and on an interim basis if significant changes to the assumptions are warranted.
The Company accounts for share-based payments made to non-employees in the same manner as other share-based payments for employees, with the measurement being based on the fair value at the grant date. The non-employee share based payments will be included within the Company's stock compensation currently reported.
Computation of Net Loss per Common Share
Basic net loss per share (“EPS”) is computed by dividing net loss by the weighted-average number of common shares outstanding for the period. Diluted EPS is computed by dividing the net loss by the weighted-average number of common shares and dilutive common equivalent shares outstanding during the period, calculated using the treasury stock method. Common equivalent shares include the effect of restricted stock, exercise of stock options and warrants and contingently issuable shares. For the fiscal years ended March 31, 2023 and 2022, common equivalent shares of 1,421,771, and 1,495,402, respectively, were not included in the calculation of diluted EPS as they were considered antidilutive. Of these, 1.0 million relate to shares tied to the derivative liability for which the contingency has not yet been met. The following table reconciles the numerators and denominators of the EPS calculation for the fiscal years ended March 31, 2023 and 2022 (in thousands except per share amounts):
| Fiscal year ended March 31, |
||||||||
| 2023 |
2022 |
|||||||
| Numerator: |
||||||||
| Net loss |
$ | (35,041 | ) | $ | (19,193 | ) | ||
| Denominator: |
||||||||
| Weighted-average shares of common stock outstanding |
29,038 | 28,293 | ||||||
| Weighted-average shares subject to repurchase |
(1,190 | ) | (1,090 | ) | ||||
| Shares used in per-share calculation ― basic |
27,848 | 27,203 | ||||||
| Shares used in per-share calculation ― diluted |
27,848 | 27,203 | ||||||
| Net loss per share ― basic |
$ | (1.26 | ) | $ | (0.71 | ) | ||
| Net loss per share ― diluted |
$ | (1.26 | ) | $ | (0.71 | ) | ||
Foreign Currency Translation
The functional currency of all the Company’s foreign subsidiaries is the U.S. dollar, except for AMSC Austria, for which the local currency (Euro) is the functional currency. The assets and liabilities of AMSC Austria are translated into U.S. dollars at the exchange rate in effect at the balance sheet date and income and expense items are translated at average rates for the period. Cumulative translation adjustments are excluded from net loss and shown as a separate component of stockholders’ equity. Net foreign currency gains and losses are included in other income (expense), net on the consolidated statements of operations was $0.1 million and less than $0.1 million, for the fiscal years ended March 31, 2023 and 2022, respectively. The Company has no restrictions on the foreign exchange activities of its foreign subsidiaries, including the payment of dividends and other distributions.
Risks and Uncertainties
The preparation of financial statements in conformity with GAAP requires management to make estimates and assumptions that affect the reported amounts of assets and liabilities and disclosures of contingent assets and liabilities at the date of the financial statements and the reported amounts of revenues and expenses during the reporting period. Actual results could materially differ from those estimates and would impact future results of operations and cash flows.
The Company invests its available cash in high credit, quality financial instruments and invests primarily in investment-grade marketable securities, including, but not limited to, government obligations, money market funds and corporate debt instruments.
Several of the Company’s government contracts are being funded incrementally, and as such, are subject to the future authorization, appropriation, and availability of government funding. The Company has a history of successfully obtaining financing under incrementally-funded contracts with the U.S. government and it expects to continue to obtain additional contract modifications in the year ending March 31, 2024 and beyond as incremental funding is authorized and appropriated by the government.
Contingencies
From time to time, the Company may be involved in legal and administrative proceedings and claims of various types. The Company records a liability in its consolidated financial statements for these matters when a loss is known or considered probable and the amount can be reasonably estimated. Management reviews these estimates in each accounting period as additional information is known and adjusts the loss provision when appropriate. If the loss is not probable or cannot be reasonably estimated, a liability is not recorded in the consolidated financial statements. If, with respect to a matter, it is not both probable to result in liability and the amount of loss cannot be reasonably estimated, an estimate of possible loss or range of loss is disclosed unless such an estimate cannot be made. The Company does not recognize gain contingencies until they are realized. Legal costs incurred in connection with loss contingencies are expensed as incurred. See Note 17, “Commitments and Contingencies,” for further information.
Disclosure of Fair Value of Financial Instruments
The Company’s financial instruments consist principally of cash and cash equivalents, accounts receivable, accounts payable, accrued expenses, and derivatives. The carrying amounts of cash and cash equivalents, accounts receivable, short-term debt, accounts payable, and accrued expenses due to their short nature approximate fair value at March 31, 2023 and 2022. The estimated fair values have been determined through information obtained from market sources and management estimates. Changes in fair value are recorded to other income (expense), net. The fair value for the contingent consideration is estimated using a Monte Carlo simulation and subject to revaluation at each balance sheet date. The fair value for the warrant arrangements was historically estimated by management based on various assumptions in a lattice model and was subject to revaluation at each balance sheet date. The Company classifies the estimates used to fair value these instruments as Level 3 inputs. See Note 6, “Fair Value Measurements” for a full discussion on fair value measurements.
3. Acquisitions
2021 Acquisition of Neeltran
On May 6, 2021, the Company entered into a Purchase and Sale Agreement (the "Real Property Purchase Agreement") and a Stock Purchase Agreement (the "Neeltran Stock Purchase Agreement") with the selling equity holders named therein.
Pursuant to the terms of the Neeltran Stock Purchase Agreement, the Company purchased all of the issued and outstanding shares of capital stock of Neeltran, Inc., a Connecticut corporation ("Neeltran") and Neeltran International, Inc., a Connecticut corporation ("International") for $1.0 million in cash and 301,556 shares of the Company's common stock, $.01 par value per share ("AMSC Shares"), that were paid and issued, respectively, to the Neeltran selling stockholders (the "Neeltran Acquisition"). The Company also paid $1.1 million to International selling stockholders to pay off previous loans made by them to Neeltran.
Also on May 6, 2021, pursuant to the terms of the Real Property Purchase Agreement, the Company's wholly-owned Connecticut limited liability company, AMSC Husky LLC ("AMSC Husky"), purchased the real property that serves as Neeltran's headquarters for $4.3 million, of which (a) $2.4 million was paid in immediately available funds by AMSC Husky to the owners of such real property, and (b) $1.9 million was paid directly to TD Bank as full payment for the outstanding indebtedness secured by the mortgage on such real property.
Additionally, the Company paid approximately $7.6 million, including $1.9 million of indebtedness secured by the mortgage on the real property as described above, directly to Neeltran lenders at closing to extinguish outstanding Neeltran indebtedness to third parties. The total purchase price of $16.4 million includes cash paid, the fair value of the AMSC Shares issued at closing and the debt payoff on behalf of the sellers as follows (in millions):
| Cash payment |
$ | 4.4 | ||
| Issuance of 301,556 shares of Company's common stock |
4.4 | |||
| Debt payment to third party lenders on behalf of sellers |
7.6 | |||
| Total consideration |
$ | 16.4 |
The Neeltran Acquisition completed by the Company during the fiscal year ended March 31, 2022, has been accounted for under the purchase method of accounting in accordance with ASC 805, Business Combinations. The Company allocated the purchase price to the assets acquired and liabilities assumed at their estimated fair values as of the date of Neeltran Acquisition. The excess of the purchase price paid by the Company over the estimated fair value of net assets acquired has been recorded as goodwill. As Neeltran was previously a private company, the adoption of Accounting Standards Codification 842 ("ASC 842") was completed as part of the Neeltran Acquisition. See Note 16 "Leases" for further details. Neeltran had previously adopted Accounting Standards Codification 606, Revenue from Contracts with Customers ("ASC 606") as part of prior year audited financial statements.
The following table summarizes the allocation of the purchase price based on the estimated fair value of the assets acquired and liabilities assumed in connection with the Neeltran Acquisition (in millions):
| Cash and short-term investments |
$ | 0.5 | ||
| Net working capital (excluding inventory and deferred revenue) |
(0.9 | ) | ||
| Inventory |
9.0 | |||
| Property, plant and equipment |
6.5 | |||
| Deferred revenue |
(10.0 | ) | ||
| Deferred tax liability |
(2.3 | ) | ||
| Net tangible assets/(liabilities) |
2.8 | |||
| Backlog |
0.1 | |||
| Trade names and trademarks |
1.2 | |||
| Customer relationships |
3.5 | |||
| Net identifiable intangible assets/(liabilities) |
4.8 | |||
| Goodwill |
8.8 | |||
| Total purchase consideration |
$ | 16.4 |
Inventory includes a $0.6 million adjustment to step up the inventory balance to fair value consistent with the purchase price allocation. The fair value was based on the estimated selling price of the inventory, less the remaining manufacturing and selling cost and a normal profit margin on those manufacturing and selling efforts. The inventory step up adjustment increased cost of revenue by $0.6 million in the twelve month period ended March 31, 2022 as the inventory was sold. This increase is not reflected in the pro forma condensed consolidated statements of operations because it does not have a continuing impact beyond the first year.
Backlog of $0.1 million was evaluated using the multi period excess earnings method under the income approach. The contracts with customers do not provide for any guarantees to source all future requirements from the Company. The amortization method being utilized is economic consumption estimated over a two year period with the expense being allocated to cost of revenues.
Customer relationships of $3.5 million relates to customers currently under contract and was determined based on a multi period excess earnings method under the income approach. The method of amortization being utilized is the economic consumption over 7 years with the expense being allocated to selling, general and administrative ("SG&A").
Trade names and trademarks of $1.2 million were reviewed using the assumption that the Company would continue to utilize the Neeltran trade name indefinitely. The relief from royalty method was utilized using a 1% royalty rate on revenues with a 24.5% discount rate over 15 years.
The goodwill represents the value associated with the acquired workforce and expected synergies related to the Neeltran Acquisition. Goodwill resulting from the Neeltran Acquisition was assigned to the Company's Grid business segment. Goodwill recognized in the Neeltran Acquisition is not deductible for tax purposes.
Unaudited Pro Forma Operating Results
| Twelve Months Ended March 31, |
||||||||
| 2023 |
2022 |
|||||||
| Revenues |
$ | 105,984 | $ | 111,265 | ||||
| Operating loss |
(33,022 | ) | (20,975 | ) | ||||
| Net loss |
$ | (35,056 | ) | $ | (19,355 | ) | ||
| Net loss per common share |
||||||||
| Basic |
$ | (1.26 | ) | $ | (0.71 | ) | ||
| Diluted |
$ | (1.26 | ) | $ | (0.71 | ) | ||
| Shares - basic |
27,848 | 27,234 | ||||||
| Shares - diluted |
27,848 | 27,234 | ||||||
The pro forma amounts include the historical operating results of the Company, and Neeltran, with appropriate adjustments that give effect to acquisition related costs, income taxes, intangible amortization resulting from the Neeltran Acquisition and certain conforming accounting policies of the Company. The pro forma amounts are not necessarily indicative of the operating results that would have occurred if the Neeltran Acquisition and related transactions had been completed at the beginning of the applicable periods presented. In addition, the pro forma amounts are not necessarily indicative of operating results in future periods.
On October 1, 2020 (the “NEPSI Acquisition Date”), the Company entered into a Stock Purchase Agreement (the “NEPSI Stock Purchase Agreement”) with the selling stockholders named therein. Pursuant to the terms of the Stock Purchase Agreement and concurrently with entering into such agreement, the Company acquired all of the issued and outstanding (i) shares of capital stock of Northeast Power Systems, Inc., a New York corporation (“NEPSI”), and (ii) membership interests of Northeast Power Realty, LLC, a New York limited liability company, which holds the real property that serves as NEPSI’s headquarters (the "NEPSI Acquisition"). NEPSI is a U.S.-based global provider of medium-voltage metal-enclosed power capacitor banks and harmonic filter banks for use on electric power systems. NEPSI is a wholly-owned subsidiary of the Company and is operated by its Grid business unit. The purchase price was $26.0 million in cash and 873,657 restricted shares of common stock of the Company. As part of the transaction, the selling stockholders may receive up to an additional 1,000,000 shares of common stock of the Company upon the achievement of certain specified revenue objectives during varying periods of up to four years following closing of the NEPSI Acquisition.
4. Revenue Recognition
The Company’s revenues in its Grid segment are derived primarily through enabling the transmission and distribution of power, providing planning services that allow it to identify power grid needs and risks, and developing ship protection systems for the U.S. Navy. The Company’s revenues in its Wind segment are derived primarily through supplying advanced power electronics and control systems, licensing its highly engineered wind turbine designs, and providing extensive customer support services to wind turbine manufacturers. The Company records revenue based on a five-step model in accordance with ASC 606. For its customer contracts, the Company identifies the performance obligations, determines the transaction price, allocates the contract transaction price to the performance obligations, and recognizes the revenue when (or as) control of goods or services is transferred to the customer. As of March 31, 2023, 80% of revenue was recognized at the point in time when control transferred to the customer, with the remainder being recognized over time. In the fiscal year ended March 31, 2022, 76% of revenue was recognized at the point in time when control transferred to the customer, with the remainder being recognized over time.
In the Company's equipment and system product line, each contract with a customer summarizes each product sold to a customer, which typically represents distinct performance obligations. A contract's transaction price is allocated to each distinct performance obligation using the respective standalone selling price which is determined primarily using the cost plus expected margin approach and recognized as revenue when, or as, the performance obligation is satisfied. The majority of the Company’s product sales transfer control to the customer in line with the contracted delivery terms and revenue is recorded at the point in time when title and risk transfer to the customer, as the Company has determined that this is the point in time that control transfers to the customer.
The Company's equipment and system product line includes certain contracts which do not meet the requirements of an exchange transaction and therefore do not fall within the scope of ASC 606. As these non-exchange transaction contracts are considered grant revenue and do not fall within any specific accounting literature, the Company follows guidance within ASC 606 by analogy to recognize grant revenue over time. In the year ended March 31, 2023, the Company recorded no grant revenue. There was $1.1 million in grant revenue recorded in the year ended March 31, 2022, which is included in the Company's Grid revenue.
In the Company's service and technology development product line, there are several different types of transactions and each begins with a contract with a customer that summarizes each product sold to a customer, which typically represents distinct performance obligations. The technology development transactions are primarily for activities that have no alternative use and for which a profit can be expected throughout the life of the contract. In these cases, the revenue is recognized over time, but in the instances where the profit cannot be assured throughout the entire contract then the revenue is recognized at a point in time. Each contract's transaction price is allocated to each distinct performance obligation using the respective standalone selling price which is determined primarily using the cost plus expected margin approach. The ongoing service transactions are for service contracts that provide benefit to the customer simultaneously as the Company performs its obligations, and therefore this revenue is recognized ratably over time throughout the effective period of these contracts. The transaction prices on these contracts are allocated based on an adjusted market approach which is re-assessed annually for reasonableness. The field service transactions include contracts for delivery of goods and completion of services made at the customer's requests, which are not deemed satisfied until the work has been completed and/or the requested goods have been delivered, so all of this revenue is recognized at the point in time when the control changes, and at allocated prices based on the adjusted market approach driven by standard price lists. The royalty transactions are related to certain contract terms on transactions in the Company's equipment and systems product line based on activity as specified in the contracts. The transaction prices of these agreements are calculated based on an adjusted market approach as specified in the contract. The Company reports royalty revenue for usage-based royalties when the sales have occurred. In circumstances when collectability is not assured and a contract does not exist under ASC 606, revenue is deferred until a non-refundable payment has been received for substantially all the amount that is due and there are no further remaining performance obligations.
The Company's service contracts can include a purchase order from a customer for specific goods in which each item is a distinct performance obligation satisfied at a point in time at which control of the goods is transferred to the customer which occurs based on the contracted delivery terms or when the requested service work has been completed. The transaction price for these goods is allocated based on the adjusted market approach considering similar transactions under similar circumstances. Service contracts are also derived from ongoing maintenance contracts and extended service-type warranty contracts. In these transactions, the Company is contracted to provide an ongoing service over a specified period of time. As the customer is consuming the benefits as the service is being provided the revenue is recognized over time ratably.
The Company’s policy is to not accept volume discounts, product returns, or rebates and allowances within its contracts. In the event a contract was approved with any of these terms, it would be evaluated for variable consideration, estimated and recorded as a reduction of revenue in the same period the related product revenue was recorded.
The Company provides assurance-type warranties on all product sales for a term of typically one to three years, and extended service-type warranties at the customers’ option for an additional term ranging up to four additional years. The Company accrues for the estimated warranty costs for assurance warranties at the time of sale based on historical warranty experience plus any known or expected changes in warranty exposure. For all extended service-type warranties, the Company recognizes the revenue ratably over time during the effective period of the services.
The Company records revenue net of sales tax, value added tax, excise tax and other taxes collected concurrent with revenue-producing activities. The Company has elected to recognize the cost for freight and shipping when control over the products sold passes to customers and revenue is recognized. The Company has elected to recognize incremental costs of obtaining a contract as expense when incurred except in contracts where the amortization period would exceed twelve months; in such cases the long term amount will be assessed for materiality. The Company has elected to not adjust the promised amount of consideration for the effects of a significant financing component if the period of financing is twelve months or less.
The Company monitors costs to meet its obligations on its customer contracts. When it is evident that there is a loss expected on a contract, a contract loss is accrued in the period. During the year ended March 31, 2023, several long-term contracts that were acquired from Neeltran were impacted by higher than planned costs due to required design changes and the impact of inflation on material costs, resulting in an increase to the contract loss accrual of $2.7 million in the year ended March 31, 2023 which negatively impacted the Company's gross margins.
The Company’s contracts with customers do not typically include extended payment terms and may include milestone billing over the life of the contract. Payment terms vary by contract type and type of customer and generally range from 30 to 60 days from delivery.
The following tables disaggregate the Company’s revenue by product line and by shipment destination:
| Year Ended March 31, 2023 |
||||||||
| Product Line: |
Grid |
Wind |
||||||
| Equipment and systems |
$ | 88,311 | $ | 9,282 | ||||
| Services and technology development |
6,320 | 2,071 | ||||||
| Total |
$ | 94,631 | $ | 11,353 | ||||
| Region: |
||||||||
| Americas |
$ | 67,664 | $ | 19 | ||||
| Asia Pacific |
20,326 | 11,199 | ||||||
| EMEA |
6,641 | 135 | ||||||
| Total |
$ | 94,631 | $ | 11,353 | ||||
| Year Ended March 31, 2022 |
||||||||
| Product Line: |
Grid |
Wind |
||||||
| Equipment and systems |
$ | 91,704 | $ | 6,169 | ||||
| Services and technology development |
7,172 | 3,390 | ||||||
| Total |
$ | 98,876 | $ | 9,559 | ||||
| Region: |
||||||||
| Americas |
$ | 73,955 | $ | 145 | ||||
| Asia Pacific |
19,397 | 9,346 | ||||||
| EMEA |
5,524 | 68 | ||||||
| Total |
$ | 98,876 | $ | 9,559 | ||||
In the fiscal years ended March 31, 2023, and 2022, 45% and 38% of the Company’s revenues, respectively, were recognized from sales outside the United States. The Company maintains operations in Austria and the United States and sales and service support centers around the world.
As of March 31, 2023 and March 31, 2022, the Company’s contract assets and liabilities primarily relate to the timing differences between cash received from a customer in connection with contractual rights to invoicing and the timing of revenue recognition following completion of performance obligations. The Company's accounts receivable balance is made up entirely of customer contract related balances. Changes in the Company’s contract assets, which are included in “Unbilled Accounts Receivable” and “Deferred program costs” (see Note 7, “Accounts Receivable” and Note 8, “Inventory” for a reconciliation to the condensed consolidated balance sheet) and contract liabilities, which are included in the current portion and long term portion of “deferred revenue” in the Company’s condensed consolidated balance sheets, are as follows:
| Unbilled AR |
Deferred Program Costs |
Contract Liabilities |
||||||||||
| Beginning balance as of March 31, 2022 |
$ | 6,492 | $ | 858 | $ | 30,034 | ||||||
| Increases for costs incurred to fulfill performance obligations |
— | 2,476 | — | |||||||||
| Increase (decrease) due to customer billings |
(14,373 | ) | — | 77,489 | ||||||||
| Decrease due to cost recognition on completed performance obligations |
— | (1,189 | ) | — | ||||||||
| Increase (decrease) due to recognition of revenue based on transfer of control of performance obligations |
17,839 | — | (56,643 | ) | ||||||||
| Other changes and foreign currency exchange impact |
— | (9 | ) | (120 | ) | |||||||
| Ending balance as of March 31, 2023 |
$ | 9,958 | $ | 2,136 | $ | 50,760 | ||||||
| Unbilled AR |
Deferred Program Costs |
Contract Liabilities |
||||||||||
| Beginning balance as of March 31, 2021 |
$ | 5,765 | $ | 977 | $ | 21,257 | ||||||
| Increases for balances acquired |
— | 634 | 10,048 | |||||||||
| Increases for costs incurred to fulfill performance obligations |
— | 4,814 | — | |||||||||
| Increase (decrease) due to customer billings |
(16,125 | ) | — | 68,895 | ||||||||
| Decrease due to cost recognition on completed performance obligations |
— | (5,551 | ) | — | ||||||||
| Increase (decrease) due to recognition of revenue based on transfer of control of performance obligations |
16,852 | — | (70,141 | ) | ||||||||
| Other changes and foreign currency exchange impact |
— | (16 | ) | (25 | ) | |||||||
| Ending balance as of March 31, 2022 |
$ | 6,492 | $ | 858 | $ | 30,034 | ||||||
The Company’s remaining performance obligations represent the unrecognized revenue value of the Company’s contractual commitments. The Company’s performance obligations may vary significantly each reporting period based on the timing of major new contractual commitments. As of March 31, 2023, the Company had outstanding performance obligations on existing contracts under ASC 606 to be recognized in the next twelve months of approximately $125.7 million. There are also approximately $31.7 million of outstanding performance obligations to be recognized over a period of thirteen to sixty months. The remaining performance obligations are subject to customer actions and therefore the timing of revenue recognition cannot be reasonably estimated.
The following table sets forth customers who represented 10% or more of the Company’s total revenues for the years ended March 31, 2023 and 2022:
| Year Ended |
|||||||||
| Reportable |
March 31, |
||||||||
| Segment |
2023 |
2022 |
|||||||
| Fuji Bridex Pte Ltd |
Grid |
15 | % | 14 | % | ||||
5. Goodwill
The guidance under ASC 805-30 provides for the recognition of goodwill on the acquisition date measured as the excess of the aggregate consideration transferred over the net of the acquisition date amounts of net assets acquired and liabilities assumed. The Company's goodwill balance relates to the Neeltran Acquisition in fiscal 2021, the NEPSI Acquisition in fiscal 2020, and Infinia Technology Corporation in fiscal 2017 and is reported in the Grid business segment.
Goodwill represents the difference between the purchase price and the fair value of the identifiable tangible and intangible net assets when accounted for using the purchase method of accounting. Goodwill is not amortized but reviewed for impairment. Goodwill is reviewed annually on February 28th and whenever events or changes in circumstances indicate that the carrying value of the goodwill might not be recoverable.
The following table provides a roll forward of the changes in the Company's Grid business segment goodwill balance:
|
Goodwill |
||||
| March 31, 2021 | $ | 34,634 | ||
| Neeltran Acquisition | 8,837 | |||
| March 31, 2022 |
$ | 43,471 | ||
| Less impairment loss |
- | |||
| March 31, 2023 |
$ | 43,471 | ||
The Company performed its annual assessment of goodwill on February 28, 2023 and noted no triggering events from the analysis date to March 31, 2023 and determined that there was no impairment to goodwill. Additionally, no impairment resulted from the assessment performed in the fiscal year ended March 31, 2022.
6. Fair Value Measurements
A valuation hierarchy for disclosure of the inputs to valuation used to measure fair value has been established. This hierarchy prioritizes the inputs into three broad levels as follows:
| Level 1 |
- |
Inputs are unadjusted quoted prices in active markets for identical assets or liabilities that the Company has the ability to access at the measurement date. |
|
|
|
|
| Level 2 |
- |
Inputs include quoted prices for similar assets and liabilities in active markets, quoted prices for identical or similar assets or liabilities in markets that are not active, inputs other than quoted prices that are observable for the asset or liability, and inputs that are derived principally from or corroborated by observable market data by correlation or other means (market corroborated inputs). |
|
|
|
|
| Level 3 |
- |
Unobservable inputs that reflect the Company’s assumptions that market participants would use in pricing the asset or liability. The Company develops these inputs based on the best information available, including its own data. |
The Company provides a gross presentation of activity within Level 3 measurement roll-forward and details of transfers in and out of Level 1 and 2 measurements. A change in the hierarchy of an investment from its current level is reflected in the period during which the pricing methodology of such investment changes. Disclosure of the transfer of securities from Level 1 to Level 2 or Level 3 is made in the event that the related security is significant to total cash and investments. The Company did not have any transfers of assets and liabilities from Level 1, Level 2 or Level 3 of the fair value measurement hierarchy during the year ended March 31, 2023.
A financial asset’s or liability’s classification within the hierarchy is determined based on the lowest level input that is significant to the fair value measurement.
Valuation Techniques
Cash Equivalents
Cash equivalents consist of highly liquid instruments with maturities of three months or less that are regarded as high quality, low risk investments and are measured using such inputs as quoted prices, and are classified within Level 1 of the valuation hierarchy. Cash equivalents consist principally of certificates of deposits and money market accounts.
Contingent Consideration
Contingent consideration relates to the earnout payment for the NEPSI Acquisition. See Note 3 "Acquisitions" and Note 12, "Contingent Consideration" for further discussion. The Company relied on a Monte Carlo simulation pricing method to determine the fair value of the contingent consideration on the NEPSI Acquisition Date and will continue to revalue the fair value of the contingent consideration at each subsequent balance sheet date until the final settlement date, with the resulting gain or loss recorded in operating expenses.
The following table provides the assets and liabilities carried at fair value on a recurring basis, measured as of March 31, 2023 and 2022 (in thousands):
| Total Carrying Value |
Quoted Prices in Active Markets (Level 1) |
Significant Other Observable Inputs (Level 2) |
Significant Unobservable Inputs (Level 3) |
|||||||||||||
| March 31, 2023: |
||||||||||||||||
| Assets: |
||||||||||||||||
| Cash equivalents |
$ | 7,913 | $ | 7,913 | $ | — | $ | — | ||||||||
| Derivative liabilities: |
||||||||||||||||
| Contingent Consideration |
$ | 1,270 | $ | — | $ | — | $ | 1,270 | ||||||||
| Total Carrying |
Quoted Prices in Active Markets (Level 1) |
Significant Other Observable Inputs (Level 2) |
Significant Unobservable Inputs (Level 3) |
|||||||||||||
| March 31, 2022: |
||||||||||||||||
| Assets: |
||||||||||||||||
| Cash equivalents |
$ | 17,641 | $ | 17,641 | $ | — | $ | — | ||||||||
| Derivative liabilities: |
||||||||||||||||
| Contingent Consideration |
$ | 1,200 | $ | — | $ | — | $ | 1,200 | ||||||||
The table below reflects the activity for the Company’s major classes of liabilities measured at fair value on a recurring basis (in thousands):
| Acquisition Contingent Consideration |
||||
| Balance at March 31, 2021 |
$ | 7,050 | ||
| Change in fair value |
(5,850 | ) | ||
| Balance at March 31, 2022 |
$ | 1,200 | ||
| Change in fair value |
70 | |||
| Balance at March 31, 2023 |
$ | 1,270 | ||
7. Accounts Receivable
Accounts receivable at March 31, 2023 and March 31, 2022 consisted of the following (in thousands):
| March 31, 2023 |
March 31, 2022 |
|||||||
| Accounts receivable (billed) |
$ | 20,707 | $ | 13,788 | ||||
| Accounts receivable (unbilled) |
9,958 | 6,492 | ||||||
| Accounts receivable |
$ | 30,665 | $ | 20,280 | ||||
8. Inventory
Inventory, net of reserves, at March 31, 2023 and March 31, 2022 consisted of the following (in thousands):
| March 31, 2023 |
March 31, 2022 |
|||||||
| Raw materials |
$ | 16,654 | $ | 11,020 | ||||
| Work-in-process |
15,200 | 10,462 | ||||||
| Finished goods |
2,996 | 1,326 | ||||||
| Deferred program costs |
2,136 | 858 | ||||||
| Inventory |
$ | 36,986 | $ | 23,666 | ||||
The Company recorded inventory reserves of $1.5 million and $1.9 million for the fiscal years ended March 31, 2023 and 2022, respectively. These reserves were based on evaluating its inventory on hand for excess quantities and obsolescence.
Deferred program costs as of March 31, 2023 and March 31, 2022 primarily represent costs incurred on programs accounted for upon completion of the project when control has transferred to the customer before revenue and costs will be recognized.
9. Prepaid and Other Current Assets
During fiscal 2022, the Company conducted an analysis as to whether it was entitled to employee retention credits (“ERC”) under the CARES Act as amended by the Taxpayer Certainty and Disaster Tax Relief Act of 2020 and the American Plan Act of 2021. Based on the analysis, the Company determined that it was entitled to an ERC of approximately $3.3 million related to payroll taxes paid in the first and second quarters of 2021 and the first quarter of 2020. The Company determined it met all the criteria required under the gross receipts test of the applicable Internal Revenue Service regulations related to ERCs.
As accounting for payroll tax credits are not within the scope of ASC 740, Income Taxes, the Company has chosen to account for the ERCs by analogizing to the International Accounting Standards Board IAS 20, Accounting for Government Grants and Disclosure of Government Assistance. In accordance with IAS 20, an entity recognizes government grants only when there is reasonable assurance that the entity will comply with the conditions attached to them and the grants will be received. The Company evaluated its eligibility for the ERC and determined that it met all the criteria to claim a refundable tax credit against the employer portion of Social Security taxes for up to 70% of the qualified wages the Company paid to employees for the three month periods ended March 31, 2021 and June 30, 2021 and for up to 50% of the qualified wages the Company paid to employees for the three month period ended March 31, 2020.
The Company recorded a $3.3 million receivable in Prepaid expenses and other current assets and a benefit of $1.8 million to Cost of revenues, $0.8 million to SG&A and $0.7 million to Research and development in the fiscal year ended March 31, 2023 for the ERC that is expected to be received based on the amended filings.
10. Property, Plant and Equipment
The cost and accumulated depreciation of property and equipment at March 31, 2023 and 2022 are as follows (in thousands):
| March 31, 2023 |
March 31, 2022 |
|||||||
| Land |
$ | 980 | $ | 980 | ||||
| Construction in progress - equipment |
748 | 573 | ||||||
| Buildings |
5,416 | 5,270 | ||||||
| Equipment and software |
43,156 | 43,668 | ||||||
| Finance lease - right of use asset |
1 | 8 | ||||||
| Furniture and fixtures |
1,535 | 1,379 | ||||||
| Leasehold improvements |
6,815 | 6,634 | ||||||
| Property, plant and equipment, gross |
58,651 | 58,512 | ||||||
| Less accumulated depreciation |
(46,342 | ) | (44,856 | ) | ||||
| Property, plant and equipment, net |
$ | 12,309 | $ | 13,656 | ||||
Depreciation expense was $2.6 million and $2.7 million, for the fiscal years ended March 31, 2023 and 2022, respectively.
11. Intangible Assets
Intangible assets at March 31, 2023 and 2022 consisted of the following (in thousands):
| 2023 |
2022 |
|||||||||||||||||||||||||||
| Gross Amount |
Accumulated Amortization |
Net Book Value |
Gross Amount |
Accumulated Amortization |
Net Book Value |
Estimated Useful Life |
||||||||||||||||||||||
| Licenses |
$ | 3,610 | $ | (3,610 | ) | $ | — | $ | 3,610 | $ | (3,610 | ) | $ | — | 7 | |||||||||||||
| Backlog |
681 | (675 | ) | 6 | 681 | (631 | ) | 50 | 2 | |||||||||||||||||||
| Trade names and trademarks |
1,800 | - | 1,800 | 1,800 | - | 1,800 | Indefinite |
|||||||||||||||||||||
| Customer relationships |
9,600 | (4,980 | ) | 4,620 | 9,600 | (2,723 | ) | 6,877 | 7 | |||||||||||||||||||
| Core technology and know-how |
5,970 | (3,869 | ) | 2,101 | 5,970 | (3,386 | ) | 2,584 | 5-10 | |||||||||||||||||||
| Intangible assets |
$ | 21,661 | $ | (13,134 | ) | $ | 8,527 | $ | 21,661 | $ | (10,350 | ) | $ | 11,311 | ||||||||||||||
The Company recorded intangible amortization expense of $2.8 million and $2.5 million, for the fiscal years ended March 31, 2023 and 2022, respectively. Additionally, the Company recorded less than $0.1 million and $0.2 million related to intangible amortization related to backlog that is reported in cost of revenues for the fiscal years ended March 31, 2023, and 2022, respectively.
Expected future amortization expense related to intangible assets is as follows (in thousands):
| Fiscal years ending March 31, |
Total |
|||
| 2024 |
$ | 2,158 | ||
| 2025 |
1,648 | |||
| 2026 |
1,221 | |||
| 2027 |
1,085 | |||
| Thereafter |
615 | |||
| Total |
$ | 6,727 | ||
The Company's intangible assets relate entirely to the Grid business segment operations in the United States.
12. Accounts Payable and Accrued Expenses
Accounts payable and accrued expenses at March 31, 2023 and March 31, 2022 consisted of the following (in thousands):
| March 31, 2023 |
March 31, 2022 |
|||||||
| Accounts payable |
$ | 13,935 | $ | 13,192 | ||||
| Accrued inventories in-transit |
2,267 | 2,212 | ||||||
| Accrued other miscellaneous expenses |
3,870 | 2,824 | ||||||
| Accrued contract loss |
3,464 | 778 | ||||||
| Advanced deposits |
5,653 | 3,021 | ||||||
| Accrued compensation |
5,430 | 4,642 | ||||||
| Income taxes payable |
409 | 405 | ||||||
| Accrued product warranty |
2,638 | 2,066 | ||||||
| Accrued restructuring |
717 | - | ||||||
| Total |
$ | 38,383 | $ | 29,140 | ||||
The Company generally provides a one to three year warranty on its products, commencing upon installation. A provision is recorded upon revenue recognition to cost of revenues for estimated warranty expense based on historical experience.
Product warranty activity was as follows (in thousands):
| Fiscal Years Ended March 31, |
||||||||
| 2023 |
2022 |
|||||||
| Balance at beginning of period |
$ | 2,066 | $ | 2,053 | ||||
| Acquired Warranty Obligation |
- | 248 | ||||||
| Change in accruals for warranties during the period |
2,276 | 618 | ||||||
| Settlements during the period |
(1,704 | ) | (853 | ) | ||||
| Balance at end of period |
$ | 2,638 | $ | 2,066 | ||||
13. Contingent Consideration
Contingent Consideration
The Company evaluated the NEPSI Acquisition earnout payment set forth in the Stock Purchase Agreement (see Note 3, "Acquisitions" for further details), which may require settlement in the Company's common stock, and determined the contingent consideration qualified for liability classification and derivative treatment under ASC 815, Derivatives and Hedging. As a result, for each period, the fair value of the contingent consideration will be remeasured and the resulting gain or loss will be recognized in operating expenses until the share amount is fixed.
The following is a summary of the key assumptions used in a Monte Carlo simulation to calculate the fair value of the contingent consideration related to the NEPSI Acquisition:
| Fiscal Year 2022 |
March 31, 2023 |
December 31, 2022 |
September 30, 2022 |
June 30, 2022 |
||||||||||||
| Revenue risk premium |
5.30 | % | 5.30 | % | 5.20 | % | 6.60 | % | ||||||||
| Revenue volatility |
25 | % | 25 | % | 25 | % | 30 | % | ||||||||
| Stock Price |
$4.91 | $3.68 | $4.38 | $5.18 | ||||||||||||
| Payment delay (days) |
80 | 80 | 80 | 80 | ||||||||||||
| Fair value (millions) |
$1.3 | $0.9 | $1.1 | $1.4 | ||||||||||||
| Fiscal Year 2021 |
March 31, 2022 |
December 31, 2021 |
September 30, 2021 |
June 30, 2021 |
||||||||||||
| Revenue risk premium |
6.50 | % | 6.60 | % | 6.60 | % | 6.60 | % | ||||||||
| Revenue volatility |
33 | % | 33 | % | 30 | % | 30 | % | ||||||||
| Stock Price |
$ | 7.61 | $ | 10.88 | $ | 14.58 | $ | 17.39 | ||||||||
| Payment delay (days) |
80 | 80 | 80.00 | 80.00 | ||||||||||||
| Fair value (millions) |
$ | 1.2 | $ | 2.6 | $ | 4.7 | $ | 7.2 | ||||||||
The Company recorded a net loss of $0.1 million for the increase in the fair value of the contingent consideration in the twelve months ended March 31, 2023. The change in the fair value of the Company's contingent consideration for the earnout payment on the NEPSI Acquisition resulted in a gain of $5.9 million in the year ended March 31, 2022.
14. Income Taxes
(Loss) income before income taxes for the fiscal years ended March 31, 2023, and 2022 are provided in the table as follows (in thousands):
| Fiscal years ended March 31, |
||||||||
| 2023 |
2022 |
|||||||
| Income/(Loss) before income tax expense: |
||||||||
| U.S. |
$ | (33,924 | ) | $ | (21,639 | ) | ||
| Foreign |
(902 | ) | 597 | |||||
| Total |
$ | (34,826 | ) | $ | (21,042 | ) | ||
The components of income tax expense (benefit) attributable to continuing operations consist of the following (in thousands):
| Fiscal years ended March 31, |
||||||||
| 2023 |
2022 |
|||||||
| Current |
||||||||
| Federal |
$ | 62 | $ | 252 | ||||
| Foreign |
129 | 302 | ||||||
| Total current |
191 | 554 | ||||||
| Deferred |
||||||||
| Federal |
(54 | ) | (2,270 | ) | ||||
| Foreign |
78 | (133 | ) | |||||
| Total deferred |
24 | (2,403 | ) | |||||
| Income tax expense (benefit) |
$ | 215 | $ | (1,849 | ) | |||
The reconciliation between the statutory federal income tax rate and the Company’s effective income tax rate is shown below.
| Fiscal years ended March 31, |
||||||||
| 2023 |
2022 |
|||||||
| Statutory federal income tax rate |
(21 | )% | (21 | )% | ||||
| State income taxes, net of federal benefit |
(2 | ) | 4 | |||||
| Foreign income tax rate differential |
0 | 1 | ||||||
| True-up of NOLs |
34 | 81 | ||||||
| Other |
1 | (8 | ) | |||||
| Valuation allowance |
(9 | ) | (66 | ) | ||||
| Effective income tax rate |
1 | % | (9 | )% | ||||
The following is a summary of the principal components of the Company’s deferred tax assets and liabilities (in thousands):
| March 31, 2023 |
March 31, 2022 |
|||||||
| Deferred tax assets: |
||||||||
| Net operating loss carryforwards |
$ | 163,674 | $ | 171,274 | ||||
| Research and development and other tax credit carryforwards |
13,837 | 13,464 | ||||||
| Capitalized research and development costs |
2,186 | - | ||||||
| Accruals and reserves |
5,644 | 5,366 | ||||||
| Fixed assets and intangible assets |
638 | 565 | ||||||
| Other |
1,993 | 1,432 | ||||||
| Gross deferred tax assets |
187,972 | 192,101 | ||||||
| Valuation allowance |
(183,567 | ) | (186,618 | ) | ||||
| Total deferred tax assets |
4,405 | 5,483 | ||||||
| Deferred tax liabilities: |
||||||||
| Amortization |
(2,011 | ) | (2,721 | ) | ||||
| Other |
(1,523 | ) | (1,835 | ) | ||||
| Total deferred tax liabilities |
(3,534 | ) | (4,556 | ) | ||||
| Net deferred tax assets |
$ | 871 | $ | 927 | ||||
Under the Tax Cuts and Jobs Act of 2017, taxpayers are required to capitalize and amortize expenses related for research and experimental as classified under Section 174 beginning in 2022. Amortization recovery for such costs are five years for domestic expenditures and fifteen for foreign expenditures. As of March 31, 2023, the Company had approximately $9.2 million of research and experimental expenses that had been capitalized under Section 174.
The Company has provided a full valuation allowance against its net deferred income tax assets in the U.S. and Romania since it is more likely than not that its deferred tax assets will not be realizable. After consideration of all the available evidence, both positive and negative, the Company has determined that a $183.6 million valuation allowance at March 31, 2023 is necessary to reduce the deferred tax assets to the amount that will more likely than not be realized which is a $3.1 million decrease from the $186.6 valuation allowance as of March 31, 2022.
At March 31, 2023, the Company had aggregate net operating loss carryforwards in the U.S. for federal and state income tax purposes of approximately $718.9 million and $204.2 million, respectively, which expire in the years ending March 31, 2024 through 2040. For U.S. federal tax purpose, approximately $101.7 million of federal net operating losses have an indefinite carryforward period. Included in the U.S. net operating loss are $3.5 million of acquired losses from Power Quality Systems, Inc. and $0.3 million of acquired losses from Infinia Technology Corporation. Research and development and other tax credit carryforwards amounting to approximately $11.1 million and $3.5 million are available to offset federal and state income taxes, respectively, and will expire in the years ending through 2040.
During the year ended March 31, 2023, AMSC China was dissolved, so all deferred tax assets for AMSC China have been written off as of March 31, 2023. The Company had established a full valuation allowance against its deferred tax assets in China as the future tax benefit was not expected to reverse in the foreseeable future.
As of March 31, 2023, AMSC Romania has aggregate net operating loss carryforwards of approximately $0.7 million, which will begin to expire at March 31, 2028.
The total amount of undistributed foreign earnings available to be repatriated at March 31, 2023 was $1.9 million resulting in the recording of a $0.2 million deferred tax liability for foreign withholding taxes.
The Company has not recorded a deferred tax asset for the temporary difference associated with the excess of the tax greater than the book basis in its Romanian subsidiary as the future tax benefit is not expected to reverse in the foreseeable future.
Accounting for income taxes requires a two-step approach to recognizing and measuring uncertain tax positions. The first step is to evaluate the tax position for recognition by determining if, based on the technical merits, it is more likely than not that the position will be sustained upon audit, including resolution of related appeals or litigation processes, if any. The second step is to measure the tax benefit as the largest amount that is more than 50% likely of being realized upon ultimate settlement. The Company reevaluates these uncertain tax positions on a quarterly basis. This evaluation is based on factors including, but not limited to, changes in facts or circumstances, changes in tax law, effectively settled issues under audit and new audit activity. Any changes in these factors could result in the recognition of a tax benefit or an additional charge to the tax provision. The Company did not identify any uncertain tax positions at March 31, 2023. The Company did not have any gross unrecognized tax benefits at March 31, 2023 or 2022.
There were no reversals of uncertain tax positions in the fiscal years ended March 31, 2023 and 2022.
The Company accounts for interest and penalties related to uncertain tax positions as part of its provision for federal and state income taxes. Any unrecognized tax benefits, if recognized, would favorably affect its effective tax rate in any future period. The Company does not expect that the amounts of unrecognized benefits will change significantly within the next twelve months.
The Company conducts business globally and, as a result, its subsidiaries file income tax returns in the U.S. federal jurisdiction and various state and foreign jurisdictions. Major tax jurisdictions include the U.S. and Austria. All U.S. income tax filings for fiscal years ended March 31, 1996 through 2022 remain open and subject to examination.
All fiscal years from the fiscal year ended March 31, 2021 through 2023 remain open and subject to examination in Austria. Tax filings in Romania for the fiscal years ended March 31, 2018 through 2023 remain open and subject to examination.
15. Debt
As part of the Neeltran Acquisition, the Company identified four equipment financing agreements that Neeltran had entered into prior to the acquisition on May 6, 2021. The Company determined to account for these agreements as a debt transaction and recorded current and long-term debt liabilities of $0.1 million each during the twelve months ended March 31, 2022. The current and long-term debt balance is $0.1 million and less than $0.1 million, respectively, as of March 31, 2023.
16. Leases
The Company determines whether a contract is or contains a lease at inception of a contract. The Company defines a lease as a contract, or part of a contract, that conveys the right to control the use of identified property or equipment (an identified asset) for a period of time in exchange for consideration. Control over the use of the identified asset means that the Company have both the right to obtain substantially all of the economic benefits from the use of the asset and the right to direct the use of the asset.
The discount rate was calculated using an incremental borrowing rate based on an assessment prepared by the Company through the use of Company credit ratings, consideration of its lease populations potential risk to its total capital structure, and a market rate for a collateralized loan for its risk profile, calculated by a third party.
Following the Neeltran Acquisition, the Company evaluated all open Neeltran contracts at the date of the acquisition to determine if any applied under ASC 842 as Neeltran, a private company, had deferred adopting ASC 842 prior to the Neeltran Acquisition, as permitted. The Company identified nine lease contracts with terms greater than twelve months and evaluated them under ASC 842 guidance. As part of the implementation, the Company identified one lease contract that classified as a financing lease. The Company does not expect a material impact to the financial statements on an ongoing basis resulting from the adoption of the ASC 842 standard for the Neeltran business and Neeltran will follow the existing policies below.
Operating Leases
All significant lease arrangements are recognized at lease commencement. Operating lease right–of-use assets and lease liabilities are recognized at commencement. The operating lease right-of-use asset includes any lease payments related to initial direct cost and prepayments and excludes any lease incentives. Lease expense is recognized on a straight-line basis over the lease term. The Company enters into a variety of operating lease agreements through the normal course of its business, but primarily real estate leases to support its operations. The real estate lease agreements generally provide for fixed minimum rental payments and the payment of real estate taxes and insurance. Many of these real estate leases have one or more renewal options that allow the Company, at its discretion, to renew the lease for varying periods up to five years or to terminate the lease. Only renewal options or termination rights that the Company believed were likely to be exercised were included in the lease calculations.
The Company also enters into leases for vehicles, IT equipment and service agreements, and other leases related to its manufacturing operations that are also included in the right-of-use assets and lease liability accounts if they are for a term of longer than twelve months. However, many of these leases are either short-term in nature or immaterial. The Company has made the policy election to exclude short-term leases from the balance sheet.
Finance Leases
As part of the adoption of ASC 842 at Neeltran, the Company identified one lease contract that is classified as a financing lease. In February 2020, Neeltran entered into a contract to lease a copy machine for an initial term of 39 months, or through May 2023. The Company concluded that the lease should be classified and accounted for as a finance lease as the total value of the lease payments are greater than fair value of the asset. Accordingly, on May 6, 2021, the Company recognized a finance lease right-of-use asset and a finance lease liability of $13.2 thousand on the Neeltran opening balance sheet. As of March 31, 2023, the right-of-use asset related to the finance lease was $1.0 thousand, net of accumulated amortization of $12.2 thousand, and is included in the property and equipment, net on the Company's consolidated balance sheet.
Finance lease right-of-use assets and lease liabilities are recognized similar to an operating lease, at the lease commencement date or the date the lessor makes the leased asset available for use. Finance lease right-of-use assets are generally amortized on a straight-line basis over the lease term, and the carrying amount of the finance lease liabilities are (1) accreted to reflect interest using the incremental borrowing rate if the rate implicit in the lease is not readily determinable, and (2) reduced to reflect lease payments made during the period. Amortization expense for finance lease right-of-use assets and interest accretion on finance lease liabilities are recorded to depreciation expense and interest expense, respectively in the Company's consolidated statement of operations.
Supplemental balance sheet information related to leases at March 31, 2023 and 2022 are as follows:
| March 31, 2023 |
March 31, 2022 |
|||||||
| Leases: |
||||||||
| Right-of-use assets - Financing |
1 | 8 | ||||||
| Right-of-use assets - Operating |
2,857 | 3,502 | ||||||
| Total right-of-use assets |
$ | 2,858 | $ | 3,510 | ||||
| Lease liabilities - ST Financing |
1 | 7 | ||||||
| Lease liabilities - ST Operating |
807 | 740 | ||||||
| Lease liabilities - LT Financing |
- | 1 | ||||||
| Lease liabilities - LT Operating |
2,184 | 2,900 | ||||||
| Total lease liabilities |
$ | 2,992 | $ | 3,648 | ||||
| Weighted-average remaining lease term |
3.95 | 4.93 | ||||||
| Weighted-average discount rate |
6.46 | % | 6.36 | % | ||||
The costs related to the Company's finance lease are not material. The costs related to the Company's operating leases for the fiscal years ended March 31, 2023 and 2022, are as follows (in thousands):
| Year ended |
Year ended |
|||||||
| March 31, 2023 |
March 31, 2022 |
|||||||
| Operating Lease: |
||||||||
| Operating lease costs - fixed |
$ | 1,026 | $ | 944 | ||||
| Operating lease costs - variable |
156 | 134 | ||||||
| Short-term lease costs |
127 | 258 | ||||||
| Total lease costs |
$ | 1,309 | $ | 1,336 | ||||
The Company’s estimated minimum future lease obligations under the Company's leases are as follows:
| Operating Leases |
||||
| Year ended March 31, |
||||
| 2024 |
$ | 972 | ||
| 2025 |
781 | |||
| 2026 |
720 | |||
| 2027 |
580 | |||
| 2028 |
357 | |||
| Total minimum lease payments |
3,410 | |||
| Less: interest |
(418 | ) | ||
| Present value of lease liabilities |
$ | 2,992 | ||
17. Stockholders’ Equity
Stock-Based Compensation Plans
As of March 31, 2023, the Company had two active stock plans: the Amended and Restated 2007 Director Stock Plan (the “2007 Director Plan”) and the 2022 Stock Incentive Plan (the "2022 Plan"). On August 2, 2022, the Company's stockholders approved the 2022 Plan and amendments to the Company's 2007 Director Plan. The 2022 Plan authorizes the issuance of 1,150,000 shares of common stock. The amendment to the 2007 Director Plan increased the total number of shares of common stock authorized for issuance under the 2007 Director Plan from 280,000 shares to 430,000 shares.
The 2022 Plan provides for the grant of incentive stock options intended to qualify under Section 422 of the IRC of 1986, as amended, nonstatutory stock options, stock appreciation rights, restricted stock, restricted stock units and other stock-based awards. In the case of options, the exercise price is no less than the fair market value of the common stock, as determined by (or in a manner approved by) the Board of Directors, on the date of grant. The contractual life of options is generally 10 years. Options generally vest over a 3-5 year period while restricted stock generally vests over a 3 year period. The 2022 Plan replaced the Company’s 2007 Stock Incentive Plan, as amended (the “2007 Plan”). No further awards are granted under the 2007 Plan following effectiveness of the 2022 Plan; however, the terms and conditions of the 2007 Plan continue to govern any outstanding awards granted thereunder.
The 2007 Director Plan provides for the grant of nonstatutory stock options and stock awards to members of the Board of Directors who are not also employees of the Company ("outside directors"). Under the terms of the 2007 Director Plan, each outside director is granted an option to purchase shares of common stock with an aggregate grant date value equal to $40,000 upon his or her initial election to the Board with an exercise price equal to the fair market value of the Company’s common stock on the date of the grant. These options vest in equal annual installments over a two-year period. In addition, each outside director is granted an award of shares of common stock on the third business day following the last day of each fiscal year with an aggregate value equal to $50,000 using the closing price of the Company's common stock two business days following the last day of each fiscal year, subject to proration for any partial fiscal year of service.
As of March 31, 2023, the 2022 Plan had 654,610 shares available for future issuance, and the 2007 Director Plan had 176,471 shares available for future issuance. Additionally, any shares which are subject to awards previously granted under the 2007 Plan that are forfeited or lapse unexercised and which following the effectiveness of the 2022 Plan are not issued under the 2007 Plan will become available for issuance under the 2022 Plan.
Stock-Based Compensation
The components of stock-based compensation for the years ended March 31, 2023 and 2022 were as follows (in thousands):
| Fiscal years ended March 31, |
||||||||
| 2023 |
2022 |
|||||||
| Stock options |
$ | 32 | $ | 3 | ||||
| Restricted stock and stock awards |
4,656 | 4,615 | ||||||
| Employee stock purchase plan |
41 | 43 | ||||||
| Total stock-based compensation expense |
$ | 4,729 | $ | 4,661 | ||||
The estimated fair value of the Company’s stock-based awards, less expected annual forfeitures, is amortized over the awards’ service period. The total unrecognized compensation cost for unvested outstanding stock options was less than $0.1 million for the fiscal year ended March 31, 2023. The total unrecognized compensation cost for unvested outstanding restricted stock was $4.7 million for the fiscal year ended March 31, 2023. This expense will be recognized over a weighted-average expense period of approximately 1.7 years.
The following table summarizes stock-based compensation expense by financial statement line item for the fiscal years ended March 31, 2023 and 2022 (in thousands):
| Fiscal years ended March 31, |
||||||||
| 2023 |
2022 |
|||||||
| Cost of revenues |
$ | 283 | $ | 209 | ||||
| Research and development |
865 | 820 | ||||||
| Selling, general and administrative |
3,581 | 3,632 | ||||||
| Total |
$ | 4,729 | $ | 4,661 | ||||
The following table summarizes the information concerning currently outstanding and exercisable employee and non-employee options:
| Options / Shares |
Weighted-Average Exercise Price |
Weighted-Average Remaining Contractual Term |
Aggregate Intrinsic Value (thousands) |
|||||||||||||
| Outstanding at March 31, 2022 |
98,013 | $ | 28.22 | |||||||||||||
| Granted |
20,564 | 5.92 | ||||||||||||||
| Exercised |
— | — | ||||||||||||||
| Canceled/forfeited |
(37,572 | ) | 40.42 | |||||||||||||
| Outstanding at March 31, 2023 |
81,005 | $ | 16.90 | 3.4 | - | |||||||||||
| Exercisable at March 31, 2023 |
60,441 | $ | 20.63 | 1.4 | - | |||||||||||
| Fully vested and expected to vest at March 31, 2023 |
80,274 | $ | 17.00 | 3.3 | - | |||||||||||
The Company granted 20,564 stock options under the 2007 Director Plan during the fiscal year ended March 31, 2023. The Company did not grant any stock options during the fiscal year ended March 31, 2022. The stock options granted during the fiscal year ended March 31, 2023 will vest over 2 years. The weighted average assumptions used in the Black Scholes valuation model for stock options granted during the fiscal year ended March 31, 2023 are as follows:
| Fiscal year ended March 31, |
Fiscal year ended March 31, |
|||||||
| 2023 |
2022 |
|||||||
| Expected volatility |
71.4 | % | N/A | |||||
| Risk-free interest rate |
3.1 | % | N/A | |||||
| Expected life (years) |
6.14 | N/A | ||||||
| Dividend yield |
None |
N/A | ||||||
The following table summarizes the restricted stock activity for the year ended March 31, 2023:
| Shares |
Weighted Average Grant Date Fair Value |
Intrinsic Aggregate Value (thousands) |
||||||||||
| Outstanding at March 31, 2022 |
1,102,166 | $ | 9.62 | |||||||||
| Granted |
914,306 | 4.84 | ||||||||||
| Vested |
(460,973 | ) | 9.02 | |||||||||
| Forfeited |
(77,500 | ) | 10.39 | |||||||||
| Outstanding at March 31, 2023 |
1,477,999 | $ | 6.81 | $ | 7,257 | |||||||
The total fair value of restricted stock that was granted during the fiscal years ended March 31, 2023 and 2022 was $4.7 million and $8.2 million, respectively. The total fair value of restricted stock that vested during the fiscal years ended March 31, 2023 and 2022 was $2.6 million and $7.6 million, respectively.
There were 200,000 performance-based restricted shares awarded during the fiscal year ended March 31, 2023 for which the performance conditions are deemed probable to be met and the expense is being recorded over a three-year vesting period. There were 76,500 performance-based restricted shares awarded during the fiscal year ended March 31, 2022 for which the performance conditions are deemed probable to be met and the expense is being recorded over a three-year vesting period.
The remaining shares awarded vest upon the passage of time. For awards that vest upon the passage of time, expense is being recorded over the vesting period.
Employee Stock Purchase Plan
The Company maintains the 2000 Employee Stock Purchase Plan, as amended (the "ESPP") which provides employees with the opportunity to purchase shares of common stock at a price equal to the market value of the common stock at the end of the offering period, less a 15% purchase discount. As of March 31, 2023, the ESPP had 99,906 shares available for future issuance. The Company recognized less than $0.1 million of compensation expense for both the fiscal years ended March 31, 2023 and 2022, related to the ESPP.
18. Commitments and Contingencies
Purchase Commitments
The Company periodically enters into non-cancelable purchase contracts in order to ensure the availability of materials to support production of its products. Purchase commitments represent enforceable and legally binding agreements with suppliers to purchase goods or services. The Company periodically assesses the need to provide for impairment on these purchase contracts and records a loss on purchase commitments when required.
Lease Commitments
During the years ended March 31, 2023 and 2022, all lease costs were recorded in selling, general and administrative expense. See Note 15, "Leases" for further details.
Legal Contingencies
From time to time, the Company is involved in legal and administrative proceedings and claims of various types. The Company records a liability in its consolidated financial statements for these matters when a loss is known or considered probable and the amount can be reasonably estimated. The Company reviews these estimates each accounting period as additional information is known and adjusts the loss provision when appropriate. If a matter is both probable to result in a liability and the amounts of loss can be reasonably estimated, the Company estimates and discloses the possible loss or range of loss to the extent necessary to make the consolidated financial statements not misleading. If the loss is not probable or cannot be reasonably estimated, a liability is not recorded in its consolidated financial statements.
Other
The Company enters into long-term construction contracts with customers that require the Company to obtain performance bonds. The Company is required to deposit an amount equivalent to some or all the face amount of the performance bonds into an escrow account until the termination of the bond. When the performance conditions are met, amounts deposited as collateral for the performance bonds are returned to the Company. In addition, the Company has various contractual arrangements in which minimum quantities of goods or services have been committed to be purchased on an annual basis.
As of March 31, 2023, the Company had $0.6 million of restricted cash included in long-term assets and $1.7 million of restricted cash in current assets. These amounts included in restricted cash primarily represent deposits to secure letters of credit for various supply contracts or collateral deposits. These deposits are held in interest bearing accounts.
19. Employee Benefit Plans
The Company has implemented a defined contribution plan (the “Plan”) under Section 401(k) of the IRC. Any contributions made by the Company to the Plan are discretionary. The Company has a stock match program under which the Company matched, in the form of Company common stock, 50% of the first 6% of eligible contributions. The Company recorded expenses of $0.6 million for the fiscal year ended March 31, 2023 and $0.5 million for the fiscal year ended March 31, 2022, and recorded corresponding charges to additional paid-in capital related to this program.
20. Restructuring
The Company accounts for charges resulting from operational restructuring actions in accordance with ASC Topic 420, Exit or Disposal Cost Obligations (“ASC 420”) and ASC Topic 712, Compensation—Nonretirement Postemployment Benefits (“ASC 712”). In accounting for these obligations, the Company is required to make assumptions related to the amounts of employee severance, benefits, and related costs and the time period over which leased facilities will remain vacant, sublease terms, sublease rates and discount rates. Estimates and assumptions are based on the best information available at the time the obligation arises. These estimates are reviewed and revised as facts and circumstances dictate; changes in these estimates could have a material effect on the amount accrued on the consolidated balance sheet.
On January 24, 2023, Daniel P. McGahn, President, CEO and Chairman of the Board, approved a plan to reduce the Company’s global workforce by approximately 5%, effective as of such date. The purpose of the workforce reduction was to reduce operating expenses to better align with the Company’s current revenues. In fiscal 2022, the Company recorded restructuring charges of $1.0 million as a result of this reduction in force, which was comprised of severance pay. All amounts related to these restructuring activities are expected to be paid by March 31, 2024.
The following table presents restructuring charges and cash payments during the year ended March 31, 2023 (in thousands):
| Severance pay and benefits |
||||
| Accrued restructuring balance at April 1, 2022 |
$ | — | ||
| Charges to operations |
1,048 | |||
| Cash payments |
(331 | ) | ||
| Accrued restructuring balance at March 31, 2023 |
$ | 717 | ||
All restructuring charges discussed above are included within restructuring in the Company’s consolidated statements of operations. The Company includes accrued restructuring within accounts payable and accrued expenses in the consolidated balance sheets. There was no restructuring activity in the year ended March 31, 2022.
21. Business Segments
The Company reports its financial results in two reportable business segments: Grid and Wind. In accordance with ASC 280, Segment Reporting, we aggregate four operating segments into one reporting segment for financial reporting purposes due to their similar operating and financial characteristics. Our operating segments reflect the way in which internally-reported financial information is used to make decisions and allocate resources.
Through the Company’s power grid offerings, the Grid business segment enables electric utilities, industrial facilities, and renewable energy project developers to connect, transmit and distribute smarter, cleaner and better power through its transmission planning services, power electronics, and superconductor-based systems. The sales process is enabled by transmission planning services that allow it to identify power grid congestion, poor power quality and other risks, which helps the Company determine how its solutions can improve network performance. These services often lead to sales of grid interconnection solutions for wind farms and solar power plants, power quality systems, and transmission and distribution cable systems. The Company also sells ship protection products to the U.S. Navy through its Grid business segment.
Through the Company’s wind power offerings, the Wind business segment enables manufacturers to field highly competitive wind turbines through its advanced power electronics and control system products, engineered designs, and support services. The Company supplies advanced power electronics and control systems, licenses its highly engineered wind turbine designs, and provides extensive customer support services to wind turbine manufacturers. The Company’s design portfolio includes a broad range of drive trains and power ratings of 2 megawatts ("MWs") and higher. The Company provides a broad range of power electronics and software-based control systems that are highly integrated and designed for optimized performance, efficiency, and grid compatibility.
The operating results for the two business segments are as follows (in thousands):
| Fiscal Years Ended March 31, |
||||||||
| 2023 |
2022 |
|||||||
| Revenues: |
||||||||
| Grid |
$ | 94,631 | $ | 98,876 | ||||
| Wind |
11,353 | 9,559 | ||||||
| Total |
$ | 105,984 | $ | 108,435 | ||||
| Fiscal Years Ended March 31, |
||||||||
| 2023 |
2022 |
|||||||
| Operating income (loss): |
||||||||
| Grid |
$ | (24,615 | ) | $ | (20,725 | ) | ||
| Wind |
(2,547 | ) | (1,554 | ) | ||||
| Unallocated corporate expenses |
(5,847 | ) | 1,190 | |||||
| Total |
$ | (33,009 | ) | $ | (21,089 | ) | ||
Total assets for the two business segments as of March 31, 2023 and March 31, 2022 are as follows (in thousands):
| March 31, 2023 |
March 31, 2022 |
|||||||
| Grid |
$ | 135,296 | $ | 114,053 | ||||
| Wind |
14,361 | 9,866 | ||||||
| Corporate assets |
25,904 | 49,968 | ||||||
| Total |
$ | 175,561 | $ | 173,887 | ||||
The accounting policies of the business segments are the same as those for the consolidated Company. The Company’s business segments have been determined in accordance with the Company’s internal management structure, which is organized based on operating activities. The Company evaluates performance based upon several factors, of which the primary financial measures are segment revenues and segment operating loss. The disaggregated financial results of the segments reflect allocation of certain functional expense categories consistent with the basis and manner in which Company management internally disaggregates financial information for the purpose of assisting in making internal operating decisions. In addition, certain corporate expenses which the Company does not believe are specifically attributable or allocable to either of the two business segments have been excluded from the segment operating loss.
Unallocated corporate expenses primarily consist of a loss on contingent consideration of $0.1 million, stock-based compensation expense of $4.7 million and a restructuring charge of $1.0 million in the fiscal year ended March 31, 2023. Unallocated corporate expenses primarily consist of a gain on contingent consideration of $5.9 million offset by stock-based compensation expense of $4.7 million in the year ended March 31, 2022.
Geographic information about property, plant and equipment associated with particular regions is as follows (in thousands):
| March 31, |
||||||||
| 2023 |
2022 |
|||||||
| North America |
$ | 12,125 | $ | 13,446 | ||||
| Europe |
141 | 166 | ||||||
| Asia Pacific |
43 | 44 | ||||||
| Total |
$ | 12,309 | $ | 13,656 | ||||
22. Recent Accounting Pronouncements
In June 2016, the FASB issued ASU 2016-13, Financial Instruments-Credit Losses (Topic 326): Measurement of Credit Losses on Financial Instruments. The amendments in ASU 2016-13 will provide more decision-useful information about the expected credit losses on financial instruments and other commitments to extend credit held by a reporting entity at each reporting date. The ASU is effective for annual reporting periods beginning after December 15, 2019, including interim periods within that year. Following the release of ASU 2019-10 in November 2019, the new effective date, as long as the Company remains a smaller reporting company, would be annual reporting periods beginning after December 15, 2022. The Company evaluated the impact of the adoption of ASU 2016-13, and does not expect it to have a material impact on its consolidated financial statements.
In October 2021, the FASB issued ASU 2021-08, Business Combinations (Topic 805): Accounting for Contract Assets and Contract Liabilities from Contracts with Customers. The amendments in ASU 2021-08 will improve the accounting for acquired revenue contracts with customers in a business combination. Following the release of ASU 2021-08 in October 2021, the new effective date will be annual reporting periods beginning after December 15, 2022. The Company evaluated the impact of the adoption of ASU 2021-08, and does not expect it to have a material impact on its consolidated financial statements.
In November 2021, the FASB issued ASU 2021-10, Government Assistance (Topic 832): Disclosures by Business Entities about Government Assistance. The amendments in ASU 2021-10 will improve financial reporting by requiring disclosures that increase the transparency of transactions with government accounted for by applying a grant or contribution accounting model by analogy. Following the release of ASU 2021-10 in November 2021, the new effective date is annual reporting periods beginning after December 15, 2021. As of April 1, 2022, the Company adopted ASU 2021-10 and noted no material impact on its consolidated financial statements.
23. Subsequent Events
The Company has performed an evaluation of subsequent events through the time of filing this Annual Report on Form 10-K with the SEC, and has determined that there are no such events to report.
| CHANGES IN AND DISAGREEMENTS WITH ACCOUNTANTS ON ACCOUNTING AND FINANCIAL DISCLOSURE |
None.
| CONTROLS AND PROCEDURES |
Evaluation of Disclosure Controls and Procedures
Our management, with the participation of our Chief Executive Officer and Chief Financial Officer, evaluated the effectiveness of our disclosure controls and procedures as of March 31, 2023. The term “disclosure controls and procedures,” as defined in Rules 13a-15(e) and 15d-15(e) under the Exchange Act, means controls and other procedures of a company that are designed to ensure that information required to be disclosed by a company in the reports that it files or submits under the Exchange Act is recorded, processed, summarized and reported, within the time periods specified in the SEC’s rules and forms. Disclosure controls and procedures include, without limitation, controls and procedures designed to ensure that information required to be disclosed by a company in the reports that it files or submits under the Exchange Act is accumulated and communicated to the company’s management, including its principal executive and principal financial officers, as appropriate, to allow timely decisions regarding required disclosure. Management recognizes that any controls and procedures, no matter how well designed and operated, can provide only reasonable assurance of achieving their objectives and management necessarily applies its judgment in evaluating the cost-benefit relationship of possible controls and procedures.
Based on the evaluation of our disclosure controls and procedures as of March 31, 2023, our Chief Executive Officer and Chief Financial Officer concluded that, as of such date, our disclosure controls and procedures were effective at the reasonable assurance level.
Management’s Report on Internal Control over Financial Reporting
Management is responsible for establishing and maintaining adequate internal control over our financial reporting. Internal control over financial reporting is defined in Rules 13a–15(f) and 15d–15(f) under the Exchange Act as a process designed by, or under the supervision of, a company’s chief executive officer and chief financial officer, and effected by the board of directors, management and other personnel, to provide reasonable assurance regarding the reliability of financial reporting and the preparation of financial statements for external purposes in accordance with generally accepted accounting principles, and includes those policies and procedures that:
(1) Pertain to the maintenance of records that, in reasonable detail, accurately and fairly reflect the transactions and dispositions of assets;
(2) Provide reasonable assurance that transactions are recorded as necessary to permit preparation of financial statements in accordance with generally accepted accounting principles, and that receipts and expenditures are being made only in accordance with authorizations of management and directors; and
(3) Provide reasonable assurance regarding prevention or timely detection of unauthorized acquisition, use or disposition of assets that could have a material effect on the financial statements.
Under the supervision and with the participation of our management, including our Chief Executive Officer and Chief Financial Officer, an evaluation was conducted of the effectiveness of our internal control over financial reporting as of March 31, 2023 based on the Committee of Sponsoring Organizations of the Treadway Commission’s Internal Control – Integrated Framework (2013 Edition). Based on this evaluation, management concluded that our internal control over financial reporting was effective as of March 31, 2023.
The effectiveness of our internal control over financial reporting as of March 31, 2023 has been audited by RSM US LLP, an independent registered public accounting firm, as stated in their report which is included herein.
Changes in Internal Control over Financial Reporting
During the quarter ended March 31, 2023, we completed the process of incorporating the internal controls of Neeltran, Inc. and Neeltran International, Inc. (the "Neeltran Acquisition") into our internal control over financial reporting and extending our Section 404 compliance program under the Sarbanes-Oxley Act of 2002 and the applicable rules and regulations under such Act to include the Neeltran Acquisition. Except for the foregoing, there were no changes to our internal control over financial reporting (as defined in Rules 13a-15(f) and 15d-15(f) under the Exchange Act) during the fiscal quarter ended March 31, 2023 that have materially affected, or are reasonably likely to materially affect, our internal control over financial reporting.
Report of Independent Registered Public Accounting Firm
To the Stockholders and the Board of Directors of American Superconductor Corporation
Opinion on the Internal Control Over Financial Reporting
We have audited American Superconductor Corporation's (the Company) internal control over financial reporting as of March 31, 2023, based on criteria established in Internal Control — Integrated Framework issued by the Committee of Sponsoring Organizations of the Treadway Commission in 2013. In our opinion, the Company maintained, in all material respects, effective internal control over financial reporting as of March 31, 2023, based on criteria established in Internal Control — Integrated Framework issued by the Committee of Sponsoring Organizations of the Treadway Commission in 2013.
We have also audited, in accordance with the standards of the Public Company Accounting Oversight Board (United States) (PCAOB), the consolidated balance sheets of the Company as of March 31, 2023 and 2022, the related consolidated statements of operations, comprehensive income (loss), stockholders' equity and cash flows for the years then ended, and the related notes to the consolidated financial statements of the Company and our report dated May 31, 2023 expressed an unqualified opinion.
Basis for Opinion
The Company’s management is responsible for maintaining effective internal control over financial reporting and for its assessment of the effectiveness of internal control over financial reporting in the accompanying Management’s Report on Internal Control over Financial Reporting. Our responsibility is to express an opinion on the Company’s internal control over financial reporting based on our audit. We are a public accounting firm registered with the PCAOB and are required to be independent with respect to the Company in accordance with U.S. federal securities laws and the applicable rules and regulations of the Securities and Exchange Commission and the PCAOB.
We conducted our audit in accordance with the standards of the PCAOB. Those standards require that we plan and perform the audit to obtain reasonable assurance about whether effective internal control over financial reporting was maintained in all material respects. Our audit included obtaining an understanding of internal control over financial reporting, assessing the risk that a material weakness exists, and testing and evaluating the design and operating effectiveness of internal control based on the assessed risk. Our audit also included performing such other procedures as we considered necessary in the circumstances. We believe that our audit provides a reasonable basis for our opinion.
Definition and Limitations of Internal Control Over Financial Reporting
A company's internal control over financial reporting is a process designed to provide reasonable assurance regarding the reliability of financial reporting and the preparation of financial statements for external purposes in accordance with generally accepted accounting principles. A company's internal control over financial reporting includes those policies and procedures that (1) pertain to the maintenance of records that, in reasonable detail, accurately and fairly reflect the transactions and dispositions of the assets of the company; (2) provide reasonable assurance that transactions are recorded as necessary to permit preparation of financial statements in accordance with generally accepted accounting principles, and that receipts and expenditures of the company are being made only in accordance with authorizations of management and directors of the company; and (3) provide reasonable assurance regarding prevention or timely detection of unauthorized acquisition, use or disposition of the company's assets that could have a material effect on the financial statements.
Because of its inherent limitations, internal control over financial reporting may not prevent or detect misstatements. Also, projections of any evaluation of effectiveness to future periods are subject to the risk that controls may become inadequate because of changes in conditions, or that the degree of compliance with the policies or procedures may deteriorate.
/s/ RSM US LLP
Boston, Massachusetts
May 31, 2023
| OTHER INFORMATION |
None.
| DISCLOSURE REGARDING FOREIGN JURISDICTIONS THAT PREVENT INSPECTIONS |
Not applicable.
PART III
| DIRECTORS, EXECUTIVE OFFICERS AND CORPORATE GOVERNANCE |
The response to this item is contained in part under the caption “Executive Officers” in Part I of this Annual Report on Form 10-K, and in part in our Proxy Statement for the Annual Meeting of Stockholders to be held in 2023 (the “2023 Proxy Statement”) in the sections “Corporate Governance — Members of the Board,” “Corporate Governance — Code of Business Conduct and Ethics,” “Corporate Governance —Board Committees” and “Corporate Governance — Board Committees — Audit Committee,” “Corporate Governance — Director Nomination Process”, “Corporate Governance — Board Determination of Independence”, which sections are incorporated herein by reference.
| EXECUTIVE COMPENSATION |
The sections of the 2023 Proxy Statement titled “Information About Executive and Director Compensation,” “Information About Executive and Director Compensation — Compensation Committee Interlocks and Insider Participation” and “Information About Executive and Director Compensation — Compensation Committee Report” are incorporated herein by reference.
| SECURITY OWNERSHIP OF CERTAIN BENEFICIAL OWNERS AND MANAGEMENT AND RELATED STOCKHOLDER MATTERS |
The sections of the 2023 Proxy Statement titled “Stock Ownership of Certain Beneficial Owners and Management” and “Information about Executive Officer and Director Compensation — Securities Authorized for Issuance Under our Equity Compensation Plans” are incorporated herein by reference.
| CERTAIN RELATIONSHIPS AND RELATED TRANSACTIONS, AND DIRECTOR INDEPENDENCE |
The sections of the 2023 Proxy Statement titled “Certain Relationships and Related Transactions” and “Corporate Governance — Board Determination of Independence” and “Corporate Governance — Board Committees” are incorporated herein by reference.
| PRINCIPAL ACCOUNTANT FEES AND SERVICES |
Our independent registered public accounting firm is RSM US LLP, Boston, MA, Auditor ID: 49.
The section of the 2023 Proxy Statement titled “Ratification of Selection of Independent Registered Public Accounting Firm (Proposal 2)” is incorporated herein by reference.
PART IV
| EXHIBITS AND FINANCIAL STATEMENT SCHEDULES |
(a) Document filed as part of this Annual Report on Form 10-K:
1. Financial Statements
The following financial statements of American Superconductor Corporation, supplemental information and report of independent registered public accounting firm required by this item are included in Item 8, “Financial Statements and Supplementary Data,” in this Form 10-K:
2. Financial Statement Schedules
All schedules are omitted because they are not applicable, not required or the required information is shown in the consolidated financial statements or notes thereto.
3. Exhibits Required by Item 601 of Regulation S-K under the Exchange Act.
See (b) Exhibits.
(b) Exhibits
The list of Exhibits filed as a part of this Annual Report on Form 10-K is set forth on the Exhibit Index immediately following Item 16, “Form 10-K Summary”, and is incorporated herein by reference.
None.
EXHIBIT INDEX
|
|
|
|
|
Incorporated by Reference |
||||||||
| Exhibit Number |
|
Exhibit Description |
|
Form |
|
File No. |
|
Exhibit |
|
Filing Date |
|
Filed/Furnished Herewith |
| 10.12+ | 2022 Stock Incentive Plan. | 8-K | 000-19672 | 10.1 | 8/5/2022 | |||||||
| 10.13+ | Form of Time-Based Restricted Stock Agreement Under 2022 Stock Incentive Plan. | 8-K | 000-19672 | 10.2 | 8/5/2022 | |||||||
| 10.14+ | Form of Performance-Based Restricted Stock Agreement Under 2022 Stock Incentive Plan. | 8-K | 000-19672 | 10.3 | 8/5/2022 | |||||||
| 10.15+ | Form of Option Agreement Under 2022 Stock Incentive Plan. | 8-K | 000-19672 | 10.4 | 8/5/2022 | |||||||
| 10.16+ |
|
|
10-K/A |
|
333-43647 |
|
10.11 |
|
6/7/2018 |
|
|
|
| 10.17+ |
|
|
8-K |
|
000-19672 |
|
10.2 |
|
5/24/2011 |
|
|
|
| 10.18+ |
|
|
8-K |
|
000-19672 |
|
10.1 |
|
4/4/2017 |
|
|
|
| 10.19+ |
|
|
10-Q |
|
000-19672 |
|
10.1 |
|
11/7/2017 |
|
|
|
|
|
|
|
|
Incorporated by Reference |
||||||||
| Exhibit Number |
|
Exhibit Description |
|
Form |
|
File No. |
|
Exhibit |
|
Filing Date |
|
Filed/Furnished Herewith |
| + |
Management contract or compensatory plan or arrangement required to be filed as an Exhibit to this Form 10-K. |
| ^ | Portions of this exhibit have been omitted pursuant to Item 601(b)(10)(iv) of Regulation S-K. |
| * |
Filed herewith. |
| ** |
Furnished herewith. |
SIGNATURES
Pursuant to the requirements of Section 13 or 15(d) of the Securities Exchange Act of 1934, the registrant has duly caused this report to be signed on its behalf by the undersigned, thereunto duly authorized.
|
|
AMERICAN SUPERCONDUCTOR CORPORATION |
|
|
|
|
|
|
|
|
|
|
|
|
|
|
BY: |
/S/ Daniel P. McGahn |
|
|
|
|
Daniel P. McGahn Chairman of the Board, President, and Chief Executive Officer |
|
| Date: May 31, 2023 | |||
Pursuant to the requirements of the Securities Exchange Act of 1934, this report has been signed below by the following persons on behalf of the registrant and in the capacities and on the dates indicated.
| Name |
|
Title |
|
Date |
|
|
|
|
|
|
| /S/ Daniel P. McGahn |
|
Chairman of the Board, President, Chief Executive Officer, and Director (Principal Executive Officer) |
|
May 31, 2023 |
| Daniel P. McGahn |
|
|
||
|
|
|
|
|
|
| /S/ John W. Kosiba, Jr. |
|
Senior Vice President, Chief Financial Officer and Treasurer |
|
May 31, 2023 |
| John W. Kosiba, Jr. |
|
(Principal Financial and Accounting Officer) |
|
|
|
|
|
|
|
|
| /S/ Arthur H. House |
|
Lead Independent Director of the Board |
|
May 31, 2023 |
| Arthur H. House |
|
|
||
|
|
|
|
|
|
| /S/ Laura A. Dambier |
|
Director |
|
May 31, 2023 |
| Laura A. Dambier |
|
|
||
|
|
|
|
|
|
| /S/ Margaret D. Klein | Director | May 31, 2023 | ||
| Margaret D. Klein | ||||
| /S/ Barbara g. Littlefield |
Director |
|
May 31, 2023 | |
| Barbara G. Littlefield |
|
|
||
|
|
|
|
|
|
| /S/ David R. Oliver, Jr. |
|
Director |
|
May 31, 2023 |
| David R. Oliver, Jr. |
|
|
Exhibit 21.1
Subsidiaries
AMSC Australia Pty Ltd – incorporated in Australia
AMSC Husky LLC - formed in Connecticut
AMSC India Private Limited – incorporated in India
AMSC Austria GmbH – incorporated in Austria
AMSC United Kingdom Limited – incorporated in the United Kingdom
ASC Securities Corp. – incorporated in Massachusetts
Infinia Technology Corporation - incorporated in Delaware
American Superconductor Korea Co., Ltd. – incorporated in South Korea
American Superconductor Romania S.R.L. – incorporated in Romania
Neeltran, Inc. - incorporated in Connecticut
Northeast Power Realty, LLC - formed in New York
Northeast Power Systems, Inc. - incorporated in New York
Exhibit 23.1
Consent of Independent Registered Public Accounting Firm
We consent to the incorporation by reference in Registration Statements on Form S-3 (No. 333-253611) and Form S-8 (No. 333-145685, 333-170286, 333-183075, 333-197971, 333-213850, 333-233531, 333-266727 and 333-266728) of our reports dated May 31, 2023, relating to the consolidated financial statements of American Superconductor Corporation and its subsidiaries (the Company), and the effectiveness of the Company's internal control over financial reporting, appearing in this Annual Report on Form 10-K of the Company for the year ended March 31, 2023.
/s/ RSM US LLP
Boston, Massachusetts
May 31, 2023
Exhibit 31.1
AMERICAN SUPERCONDUCTOR CORPORATION
CERTIFICATIONS
I, Daniel P. McGahn, certify that:
|
1. |
I have reviewed this Annual Report on Form 10-K of American Superconductor Corporation; |
|
2. |
Based on my knowledge, this report does not contain any untrue statement of a material fact or omit to state a material fact necessary to make the statements made, in light of the circumstances under which such statements were made, not misleading with respect to the period covered by this report; |
|
3. |
Based on my knowledge, the financial statements, and other financial information included in this report, fairly present in all material respects the financial condition, results of operations and cash flows of the registrant as of, and for, the periods presented in this report; |
|
4. |
The registrant’s other certifying officer and I are responsible for establishing and maintaining disclosure controls and procedures (as defined in Exchange Act Rules 13a-15(e) and 15d-15(e)) and internal control over financial reporting (as defined in Exchange Act Rules 13a-15(f) and 15d-15(f)) for the registrant and have: |
|
a) |
Designed such disclosure controls and procedures, or caused such disclosure controls and procedures to be designed under our supervision, to ensure that material information relating to the registrant, including its consolidated subsidiaries, is made known to us by others within those entities, particularly during the period in which this report is being prepared; |
|
b) |
Designed such internal control over financial reporting, or caused such internal control over financial reporting to be designed under our supervision, to provide reasonable assurance regarding the reliability of financial reporting and the preparation of financial statements for external purposes in accordance with generally accepted accounting principles; |
|
c) |
Evaluated the effectiveness of the registrant’s disclosure controls and procedures and presented in this report our conclusions about the effectiveness of the disclosure controls and procedures, as of the end of the period covered by this report based on such evaluation; and |
|
d) |
Disclosed in this report any change in the registrant’s internal control over financial reporting that occurred during the registrant’s most recent fiscal quarter (the registrant’s fourth fiscal quarter in the case of an annual report) that has materially affected, or is reasonably likely to materially affect, the registrant’s internal control over financial reporting; and |
|
5. |
The registrant’s other certifying officer and I have disclosed, based on our most recent evaluation of internal control over financial reporting, to the registrant’s auditors and the audit committee of the registrant’s board of directors (or persons performing the equivalent functions): |
|
a) |
All significant deficiencies and material weaknesses in the design or operation of internal control over financial reporting which are reasonably likely to adversely affect the registrant’s ability to record, process, summarize and report financial information; and |
|
b) |
Any fraud, whether or not material, that involves management or other employees who have a significant role in the registrant’s internal control over financial reporting. |
|
Date: |
May 31, 2023 |
By: |
/s/ Daniel P. McGahn |
|
|
|
|
Daniel P. McGahn |
|
|
|
|
Chief Executive Officer |
Exhibit 31.2
AMERICAN SUPERCONDUCTOR CORPORATION
CERTIFICATIONS
I, John W. Kosiba, Jr., certify that:
|
1. |
I have reviewed this Annual Report on Form 10-K of American Superconductor Corporation; |
|
2. |
Based on my knowledge, this report does not contain any untrue statement of a material fact or omit to state a material fact necessary to make the statements made, in light of the circumstances under which such statements were made, not misleading with respect to the period covered by this report; |
|
3. |
Based on my knowledge, the financial statements, and other financial information included in this report, fairly present in all material respects the financial condition, results of operations and cash flows of the registrant as of, and for, the periods presented in this report; |
|
4. |
The registrant’s other certifying officer and I are responsible for establishing and maintaining disclosure controls and procedures (as defined in Exchange Act Rules 13a-15(e) and 15d-15(e)) and internal control over financial reporting (as defined in Exchange Act Rules 13a-15(f) and 15d-15(f)) for the registrant and have: |
|
a) |
Designed such disclosure controls and procedures, or caused such disclosure controls and procedures to be designed under our supervision, to ensure that material information relating to the registrant, including its consolidated subsidiaries, is made known to us by others within those entities, particularly during the period in which this report is being prepared; |
|
b) |
Designed such internal control over financial reporting, or caused such internal control over financial reporting to be designed under our supervision, to provide reasonable assurance regarding the reliability of financial reporting and the preparation of financial statements for external purposes in accordance with generally accepted accounting principles; |
|
c) |
Evaluated the effectiveness of the registrant’s disclosure controls and procedures and presented in this report our conclusions about the effectiveness of the disclosure controls and procedures, as of the end of the period covered by this report based on such evaluation; and |
|
d) |
Disclosed in this report any change in the registrant’s internal control over financial reporting that occurred during the registrant’s most recent fiscal quarter (the registrant’s fourth fiscal quarter in the case of an annual report) that has materially affected, or is reasonably likely to materially affect, the registrant’s internal control over financial reporting; and |
|
5. |
The registrant’s other certifying officer and I have disclosed, based on our most recent evaluation of internal control over financial reporting, to the registrant’s auditors and the audit committee of the registrant’s board of directors (or persons performing the equivalent functions): |
|
a) |
All significant deficiencies and material weaknesses in the design or operation of internal control over financial reporting which are reasonably likely to adversely affect the registrant’s ability to record, process, summarize and report financial information; and |
|
b) |
Any fraud, whether or not material, that involves management or other employees who have a significant role in the registrant’s internal control over financial reporting. |
|
Date: |
May 31, 2023 |
By: |
/s/ John W. Kosiba, Jr. |
|
|
|
|
John W. Kosiba, Jr. |
|
|
|
|
Chief Financial Officer |
Exhibit 32.1
AMERICAN SUPERCONDUCTOR CORPORATION
CERTIFICATION PURSUANT TO
18 U.S.C. SECTION 1350,
AS ADOPTED PURSUANT TO
SECTION 906 OF THE SARBANES-OXLEY ACT OF 2002
In connection with the Annual Report on Form 10-K of American Superconductor Corporation (the “Company”) for the period ended March 31, 2023 as filed with the Securities and Exchange Commission on the date hereof (the “Report”), the undersigned, Daniel P. McGahn, Chief Executive Officer of the Company, hereby certifies, pursuant to 18 U.S.C. Section 1350, as adopted pursuant to Section 906 of the Sarbanes-Oxley Act of 2002, that, to my knowledge:
|
(1) |
The Report fully complies with the requirements of Section 13(a) or 15(d) of the Securities Exchange Act of 1934; and |
|
(2) |
The information contained in the Report fairly presents, in all material respects, the financial condition and results of operations of the Company. |
|
Date: |
May 31, 2023 |
By: |
/s/ Daniel P. McGahn |
|
|
|
|
Daniel P. McGahn |
|
|
|
|
Chief Executive Officer |
Exhibit 32.2
AMERICAN SUPERCONDUCTOR CORPORATION
CERTIFICATION PURSUANT TO
18 U.S.C. SECTION 1350,
AS ADOPTED PURSUANT TO
SECTION 906 OF THE SARBANES-OXLEY ACT OF 2002
In connection with the Annual Report on Form 10-K of American Superconductor Corporation (the “Company”) for the period ended March 31, 2023 as filed with the Securities and Exchange Commission on the date hereof (the “Report”), the undersigned, John W. Kosiba, Jr., Chief Financial Officer of the Company, hereby certifies, pursuant to 18 U.S.C. Section 1350, as adopted pursuant to Section 906 of the Sarbanes-Oxley Act of 2002, that, to my knowledge:
|
(1) |
The Report fully complies with the requirements of Section 13(a) or 15(d) of the Securities Exchange Act of 1934; and |
|
(2) |
The information contained in the Report fairly presents, in all material respects, the financial condition and results of operations of the Company. |
|
Date: |
May 31, 2023 |
By: |
/s/ John W. Kosiba, Jr. |
|
|
|
|
John W. Kosiba, Jr. |
|
|
|
|
Chief Financial Officer |