Document
Fellow Shareholders, July 31, 2025
In Q2, Platform revenue grew 18% YoY, surpassing our outlook, due in part to strong performance in video advertising and the successful acquisition of Frndly. We have recently expanded our relationships with Amazon and Wurl, and we will continue to deepen our integrations with all major DSPs (demand-side platforms) to drive ad demand. We are raising our full-year 2025 outlook for Platform revenue to $4.075 billion and Adjusted EBITDA to $375 million. With improving Adjusted EBITDA and strong Free Cash Flow, we are announcing a stock repurchase program authorizing the purchase of up to $400 million of our Class A common stock. This initiative, along with our net share settlement program, is intended to help offset dilution from employee equity-based compensation and reflects our continued commitment to delivering long-term shareholder value by growing Free Cash Flow per share.
Q2 2025 Key Results
•Total net revenue was $1,111 million, up 15% year over year (YoY)
•Platform revenue was $975 million, up 18% YoY
•Gross profit was $498 million, up 17% YoY
•Streaming Hours were 35.4 billion, up 5.2 billion hours YoY
•The Roku Channel remained the #2 app on our platform in the U.S. by engagement
|
|
|
|
|
|
|
|
|
|
|
|
|
|
|
|
|
|
|
|
|
|
|
|
|
|
|
|
|
|
|
|
|
|
|
|
| Summary Financials ($ in millions) |
Q2 24 |
|
Q3 24 |
|
Q4 24 |
|
Q1 25 |
|
Q2 25 |
|
YoY % |
| *Platform revenue |
$824.3 |
|
$908.2 |
|
$1,035.3 |
|
$880.8 |
|
$975.5 |
|
18% |
| Devices revenue |
143.8 |
|
154.0 |
|
165.7 |
|
139.9 |
|
135.6 |
|
(6)% |
| Total net revenue |
968.2 |
|
1,062.2 |
|
1,201.0 |
|
1,020.7 |
|
1,111.0 |
|
15% |
| Platform gross profit |
439.9 |
|
491.8 |
|
559.9 |
|
464.3 |
|
497.7 |
|
13% |
| Devices gross profit (loss) |
(15.2) |
|
(11.7) |
|
(47.4) |
|
(19.3) |
|
0.0 |
|
nm |
| Total gross profit |
424.7 |
|
480.1 |
|
512.6 |
|
445.0 |
|
497.7 |
|
17% |
| Platform gross margin % |
53.4 |
% |
|
54.2 |
% |
|
54.1 |
% |
|
52.7 |
% |
|
51.0 |
% |
|
(2.3) |
pts |
| Devices gross margin % |
(10.6) |
% |
|
(7.6) |
% |
|
(28.6) |
% |
|
(13.8) |
% |
|
0.0 |
% |
|
10.5 |
pts |
| Total gross margin % |
43.9 |
% |
|
45.2 |
% |
|
42.7 |
% |
|
43.6 |
% |
|
44.8 |
% |
|
0.9 |
pts |
| Research and development |
175.5 |
|
178.8 |
|
185.4 |
|
184.6 |
|
178.0 |
|
1% |
| Sales and marketing |
221.7 |
|
237.0 |
|
271.9 |
|
223.7 |
|
243.3 |
|
10% |
| General and administrative |
98.8 |
|
100.0 |
|
94.4 |
|
94.5 |
|
99.7 |
|
1% |
| Total operating expenses |
495.9 |
|
515.8 |
|
551.7 |
|
502.8 |
|
521.0 |
|
5% |
| Loss from operations |
(71.2) |
|
(35.8) |
|
(39.1) |
|
(57.7) |
|
(23.3) |
|
67% |
*Adjusted EBITDA A |
43.6 |
|
98.2 |
|
77.5 |
|
56.0 |
|
78.2 |
|
79% |
| Adjusted EBITDA margin % |
4.5 |
% |
|
9.2 |
% |
|
6.5 |
% |
|
5.5 |
% |
|
7.0 |
% |
|
2.5 |
pts |
| Cash flow from operations (TTM) |
332.3 |
|
155.1 |
|
218.0 |
|
310.1 |
|
396.4 |
|
19% |
*Free cash flow (TTM) A |
317.9 |
|
157.3 |
|
203.2 |
|
298.4 |
|
392.0 |
|
23% |
|
|
|
|
|
|
|
|
|
|
|
|
| Outlook ($ in millions) |
Q3 2025E |
|
FY 2025E |
|
A Refer to the reconciliations at the end of this Letter. |
| Total net revenue |
$1,205 |
|
$4,650 |
|
B Reconciling items between net income and non-GAAP Adjusted EBITDA consist of: stock-based compensation of approx. $105M for Q3 and $395M for 2025, depreciation and amortization of approx. $15M for Q3 and $60M for 2025, and other income of approx. $20M for Q3 and $100M for 2025. |
| Total gross profit |
$520 |
|
$2,030 |
|
| Net income |
$10 |
|
$20 |
|
Adjusted EBITDA B |
$110 |
|
$375 |
|
* Key Performance Metric (KPM)
|
|
|
Roku Q2 2025 Shareholder Letter |
1
Platform
Platform revenue was $975 million, up 18% YoY, and above our outlook. The outperformance was driven by video advertising and our recent acquisition of Frndly, which contributed approximately 1.8 points of growth. Platform gross margin came in at 51%, in line with our outlook.
Advertising Activities
The YoY growth of video advertising on our platform grew faster than overall Platform revenue and also the U.S. OTT and digital ad markets1. This strong performance reflects the results of our ongoing work to expand and diversify ad demand. Over the past two years, we have deepened integrations with third-party partners and DSPs to meet enterprise clients where they want to transact. We also launched Roku Ads Manager to better serve SMBs (small and medium-sized businesses).
In June, we announced an integration with Amazon DSP that will connect Amazon advertisers with users on the Roku platform across major streaming apps, including The Roku Channel. We also enhanced our programmatic capabilities through a deeper integration with Wurl’s DSP and an expanded partnership with Unity via Roku Exchange. These efforts build upon existing demand and measurement partnerships with The Trade Desk, Yahoo, iSpot, INCRMNTL, and others. With our innovative ad products and logged-in user base of more than half of all U.S. broadband households, we make it possible for advertisers to achieve incremental reach, measure campaign efficiency, and ultimately drive performance.
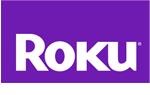
We are making ad buying on Roku easier for the biggest brands in the world and, with Roku Ads Manager, for SMBs. We see a significant opportunity to serve digital-first, performance advertisers, and capture incremental ad dollars beyond traditional TV in digital budgets. For example, DTC (direct-to-consumer) brand fatty15 turned to Roku to drive sales in a crowded space amidst social media clutter. By uploading existing creative assets to Roku Ads Manager and enabling shoppable overlays through Action Ads and our Shopify integration, fatty15 achieved a conversion rate from cart adds of more than 30%.
DTC brand fatty15 used Roku Ads Manager and Shopify to drive a >30% conversion rate from cart adds.
We are always working to make advertising on the Roku platform easier – particularly by simplifying the process and reducing the cost of TV asset creation. Last quarter, we highlighted how Roku Ads Manager client Rollo (a shipping platform) used our integration with Spaceback to leverage their top-performing social posts
1 2Q25 SMI (Standard Media Index) data; OTT: over-the-top
|
|
|
Roku Q2 2025 Shareholder Letter |
2
into video assets for TV streaming. Spaceback recently received industry recognition for this campaign, winning a Programmatic Impact Award from AdExchanger for their creative use of emerging technology.
Streaming Services Distribution Activities
Growth in our streaming services distribution activities was driven primarily by an increase in Premium Subscription sign-ups, as well as the continued impact of last year’s price increases across our subscription-based services, and the close of our acquisition of Frndly. Recently, we made it possible for viewers to log into their Paramount+ and HBO Max Premium Subscriptions outside of The Roku Channel. We expect features like this to enhance the appeal of Premium Subscriptions with our viewers.
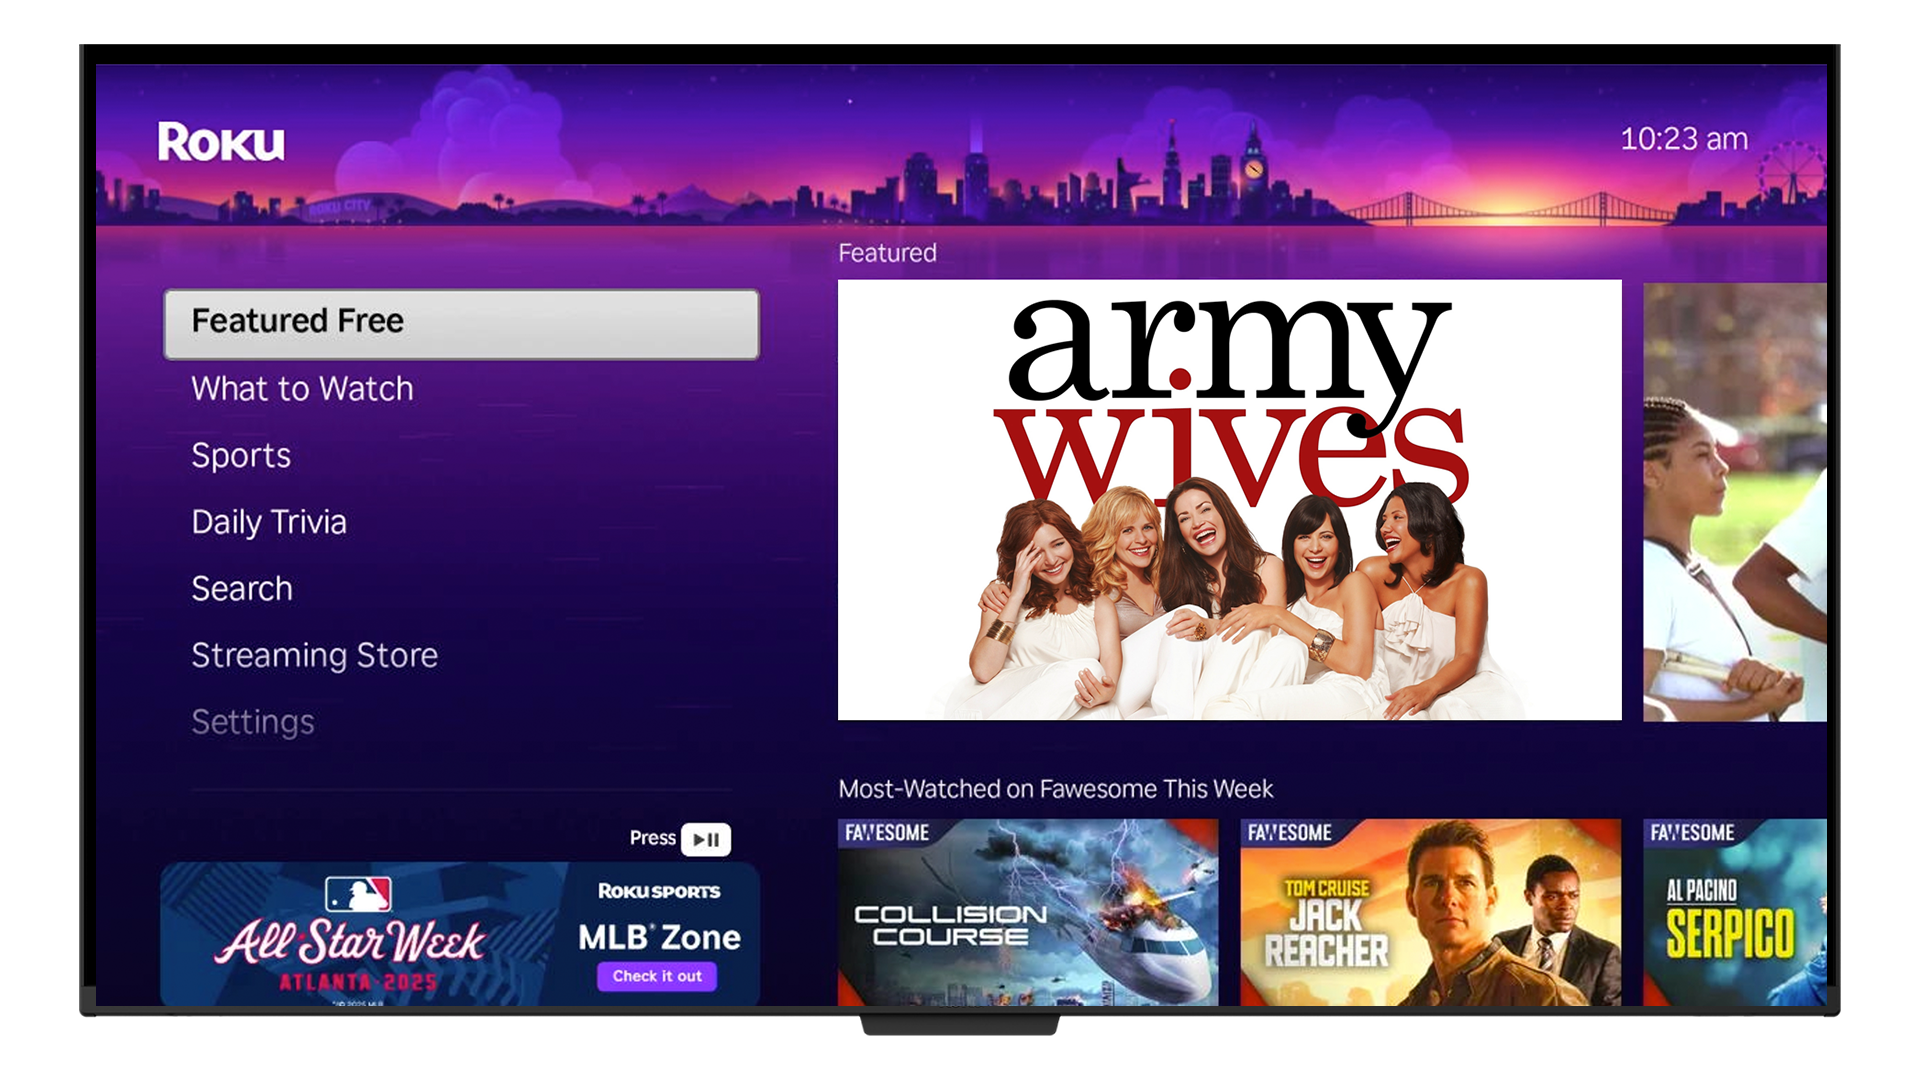
Roku-billed subscriptions continued to grow as we leveraged both the scale and the power of the Roku platform, especially via our Home Screen. Features that viewers use everyday, like our platform-wide search, AI-powered content row, and Live TV guide are helping to drive growth in Roku-billed subscription sign-ups. In addition, we create high-impact opportunities around events and tentpole content, like TV and movie premieres. For the season two premiere of “Andor,” we partnered with Disney to build a custom fan experience on our Home Screen, which helped drive both Disney+ viewers and sign-ups. For Streaming Day (our May 20 anniversary of the launch of our first streaming player), we promoted SVOD2 services across the Roku Experience, generating sign-ups for more than 20 Premium Subscription and DTC partners. These campaigns are strong demonstrations of the value we deliver to both our content partners and viewers.
Our Streaming Day campaign drove sign ups for more than 20 Premium Subscription and DTC partners.
The Roku Channel
The Roku Channel continued its strong performance. Once again, the app was #2 on our platform in the U.S. by engagement and the #3 app globally by reach. It also maintained its high position on Nielsen’s The GaugeTM ranking for June, representing 5.4% of all TV streaming time in the U.S.
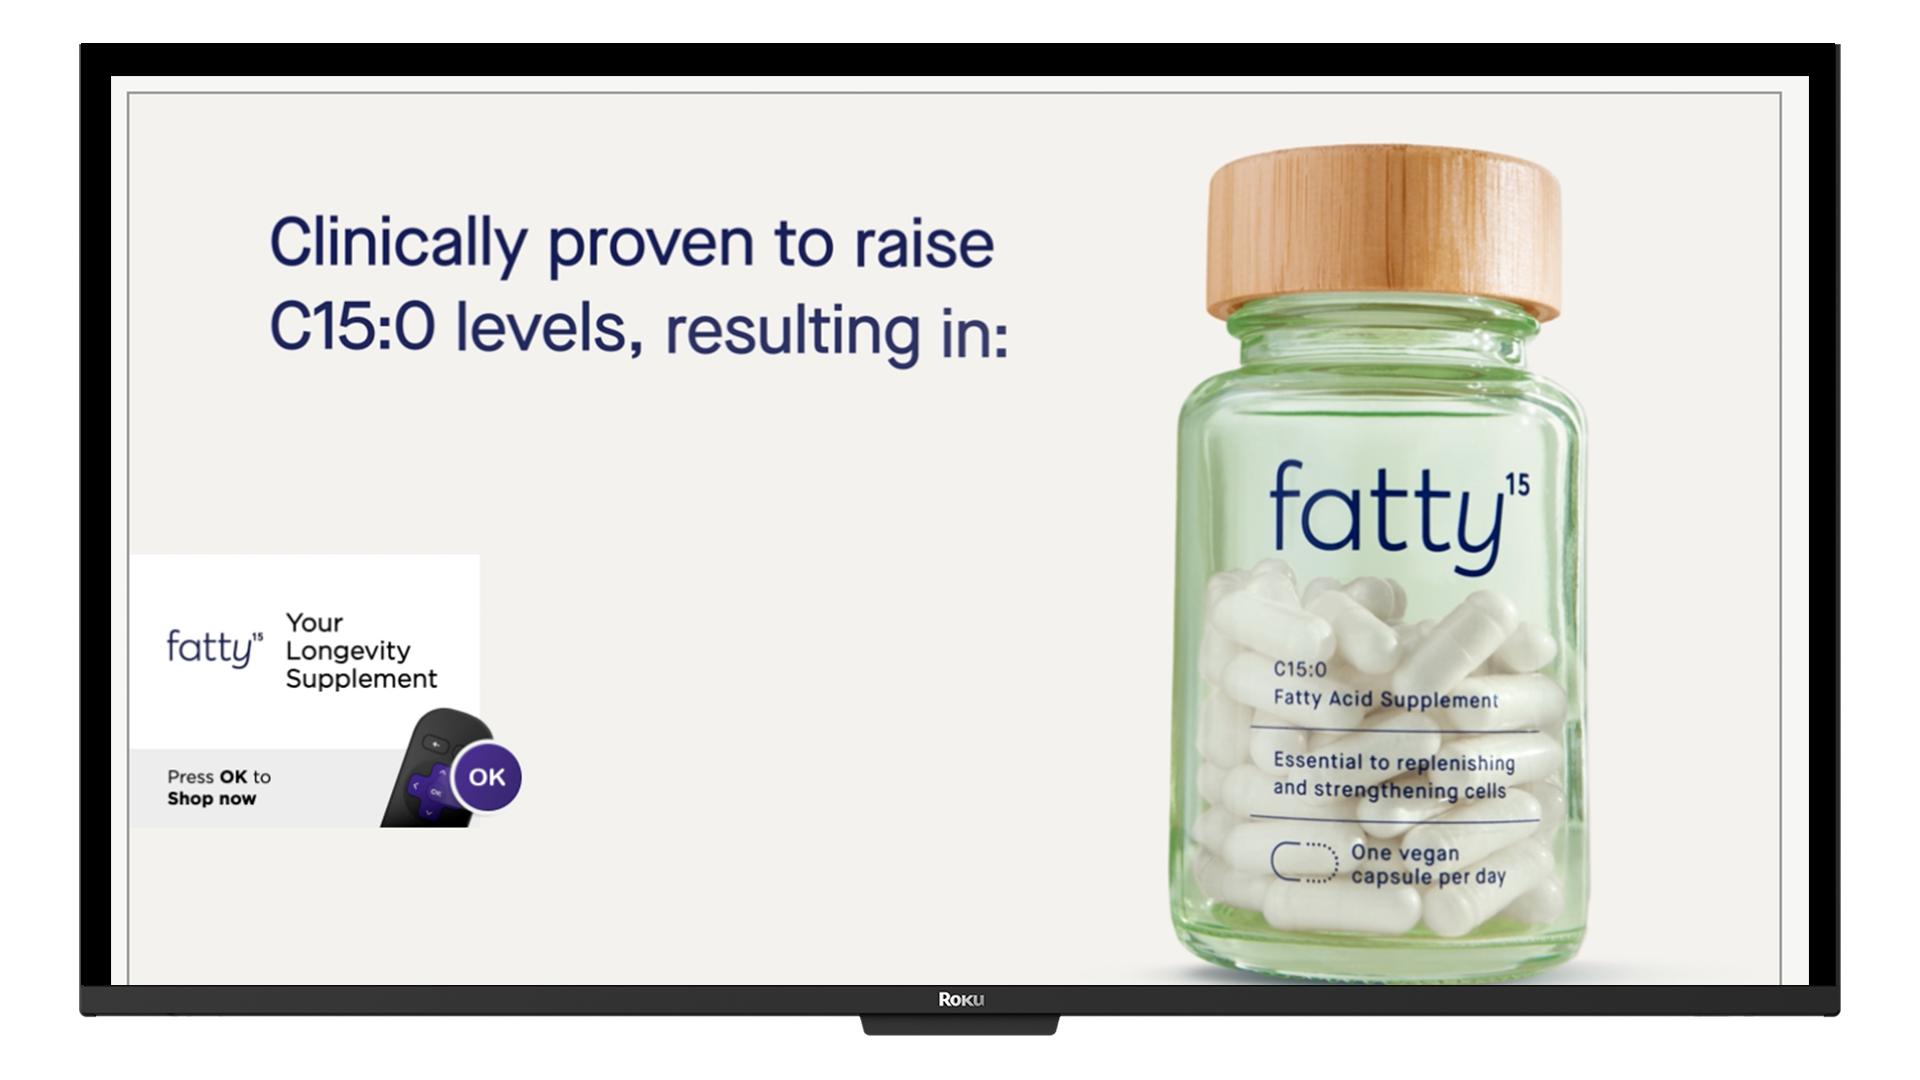
The Roku Channel’s growth is fueled by the seamless integration of content discovery touchpoints throughout the Roku Experience. In addition to modern day hits, our tools also surface long-tail favorites. For instance, in Q2, with features like Featured Free on our Home Screen, we propelled shows like “Married… With Children,” “Las Vegas,” and “Army Wives” to be top-performing series by views in April, May, and June, respectively. This illustrates the unique power of our platform. We don’t just deliver content; we guide audiences to new and old favorites, amplifying reach and engagement for our partners and The Roku Channel.
2 SVOD: subscription video on demand
|
|
|
Roku Q2 2025 Shareholder Letter |
3
Highlighted within Featured Free, “Army Wives” was a top-performing title on The Roku Channel in June.
We highlight sports across the Roku platform, including through our Sports Experience, which makes it easy to find and stream live sports. For the second year, The Roku Channel is the exclusive home of MLB Sunday Leadoff. Average reach is up more than 40% across the first seven MLB Sunday Leadoff games, and we’ve secured season-long sponsorships with Corona, T-Mobile, and Geico.
Expanding our partnership with MLB, we launched our first Roku Original with MLB Studios: “Going, Going, Gone: The Magic of the Home Run.” This documentary premiered on the heels of this year’s Home Run Derby and MLB All Star Game, each an everlasting part of sports culture. Our Roku Originals continue to earn industry recognition, including our first Sports Emmy win for “NFL Draft: The Pick Is In,” a compelling behind-the-scenes documentary produced in collaboration with NFL Films and Skydance Sports.
Devices
Devices revenue was $136 million, down 6% YoY, and slightly above our outlook. Devices gross profit was break-even, and gross margin was also better than our outlook, primarily due to the timing of inbound TV units that shifted from Q2 to the second half of 2025. We continue to grow our penetration, and our streaming devices now reach more U.S. households than the top 10 MVPDs and vMVPDs combined3.
We maintained our leadership as the #1 selling TV OS in the U.S., Canada, and Mexico. In the U.S., our share of TV units sold continues to exceed that of the #2 and #3 selling TV operating systems combined4. In July, we announced that we will bring our Roku-branded TVs (designed, made, and sold by Roku) to Canada, where they will be available exclusively at Best Buy Canada. The new lineup will include QLED 4K models ranging from 50” to 75”, with smaller sizes available in 4K and HD, featuring a premium design and our easy-to-use interface.
This spring, we launched our new device lineup, including our most compact and efficient players yet, the Roku® Streaming Stick® and Roku Streaming Stick Plus. These new models are 35% smaller than other brands and powered directly by the TV, eliminating the need for a separate power adapter for a wall outlet. Our innovations in portability and power-efficiency have significantly reduced BOM (bill of materials) costs while helping us maintain the performance and speed our users expect. The new devices also continue to receive strong product reviews. The Streaming Stick was named best streaming box in GQ’s 2025 Tech Awards, and
3 nScreenMedia. MVPD: multichannel video programming distributor (e.g. Comcast or Charter); vMVPD: virtual MVPD (e.g. YouTube TV or Hulu + Live TV).
4 Source: Circana, LLC, Retail Tracking Service, US, CA, and MX, Smart TV by Software Service, Unit Sales, January – June 2025
|
|
|
Roku Q2 2025 Shareholder Letter |
4
the Streaming Stick Plus was named best streaming device overall by Tom’s Guide. And within our new lineup of Roku-branded TVs, Cord Cutter News says the 2025 Roku Pro Series TV “brings a host of upgrades that elevate it above its predecessors, delivering a compelling package of performance, sound, and connectivity that rivals even pricier competitors.”
Outlook
For Q3, we estimate total net revenue of approximately $1.2 billion, representing 13% YoY growth. Within that, Platform revenue is expected to grow 16% YoY with a gross margin of approximately 51%. Devices revenue is projected to decline about 3% YoY with a gross margin in negative mid-teens. These trends are expected to result in total gross profit of approximately $520 million and Adjusted EBITDA of roughly $110 million for the quarter.
For the full year, we are raising our outlook for Platform revenue to $4.075 billion and Adjusted EBITDA to $375 million, supported by continued momentum in our Platform business. For Platform revenue, this represents YoY growth of 16%. Based on current trends in advertising activities and streaming services distribution, we anticipate full-year Platform gross margin of approximately 52%. Devices revenue is expected to be slightly down, mostly due to tariffs. We expect Devices gross profit will be roughly in line with 2024 levels.
We remain confident in our strategy. Our investments and execution are delivering results by continuing to grow broadband household penetration, ad demand, and subscriptions. Our monetization initiatives position Roku to sustain double digit Platform revenue growth while increasing profitability.
Happy Streaming™!
Anthony Wood, Founder and CEO, and Dan Jedda, CFO and COO
Conference Call Webcast – July 31, 2025 at 2 p.m. PT
The Company will host a webcast of its conference call to discuss the Q2 2025 results at 2 p.m. Pacific Time / 5 p.m. Eastern Time on July 31, 2025. Participants may access the live webcast in listen-only mode on the Roku investor relations website at www.roku.com/investor. An archived webcast of the conference call will also be available at www.roku.com/investor after the call.
Stock Repurchase Program
Our board of directors has approved a stock repurchase program with authorization to purchase up to $400 million of our Class A common stock through December 31, 2026. This stock repurchase program underscores our commitment to reduce dilution and preserve shareholder value while enhancing EPS (earnings per share) and Free Cash Flow per share over time. Repurchases under the program may be made from time to time in the open market or through other means, with the amount and timing of repurchases to be determined at our discretion, depending on a variety of factors, including general market conditions, the trading price of our Class A common stock, corporate and regulatory requirements, the availability of funds, other investment opportunities, and other considerations we deem relevant. Open market repurchases will be structured to occur in accordance with applicable federal securities laws, including within the pricing and volume requirements of Rule 10b-18 under the Securities Exchange Act of 1934, as amended (the Exchange Act). We may also, from time to time, enter into trading plans adopted in accordance with Rule 10b5-1 of the Exchange Act to facilitate stock repurchases. We are not obligated to acquire any particular amount of Class A common stock, and the stock repurchase program may be modified, suspended, or terminated at any time.
We expect to fund repurchases with existing cash and cash equivalents and short-term investments. As of June 30, 2025, we had cash and cash equivalents and short-term investments of $2.3 billion.
About Roku, Inc.
Roku pioneered streaming on TV. We connect users to the content they love, enable content publishers to build and monetize large audiences, and provide advertisers with unique capabilities to engage consumers. Roku-made TVs, Roku TV™ models, Roku streaming players, and TV-related audio devices are available in various countries around the world through direct retail sales and/or licensing arrangements with TV OEM brands. Roku Smart Home products are sold exclusively in the United States. Roku also operates The Roku
|
|
|
Roku Q2 2025 Shareholder Letter |
5
Channel, the home of free and premium entertainment with exclusive access to Roku Originals, and the #2 app on our platform in the U.S. by streaming hours. The Roku Channel is available in the United States, Canada, Mexico, and the United Kingdom. Roku is headquartered in San Jose, Calif., U.S.A.
Roku, Roku TV, Streaming Stick, the Roku logo, FRNDLY, “HAPPY STREAMING” and other trade names, trademarks or service marks of Roku appearing in this shareholder letter are the property of Roku or its affiliates. Trade names, trademarks and service marks of other companies appearing in this shareholder letter are the property of their respective holders.
|
|
|
|
|
|
|
Investor Relations
Conrad Grodd
cgrodd@roku.com
|
Media
Kelli Raftery
kraftery@roku.com
|
Use of Non-GAAP Measures
In addition to financial information prepared in accordance with generally accepted accounting principles in the United States (GAAP), this shareholder letter includes certain non-GAAP financial measures. These non-GAAP measures include Adjusted EBITDA and Free Cash Flow (FCF). In order for our investors to be better able to compare our current results with those of previous periods, we have included a reconciliation of GAAP to non-GAAP financial measures in the tables at the end of this letter. The Adjusted EBITDA reconciliation excludes total other income, net, stock-based compensation expense, depreciation and amortization, restructuring charges, and income tax (benefit) expense from the net income (loss) of the period, and the FCF reconciliation excludes capital expenditures and effects of exchange rates from the cash flow from operations of the period, in each case where applicable. We believe these non-GAAP financial measures are useful as a supplement in evaluating our ongoing operational performance and enhancing an overall understanding of our past financial performance. However, these non-GAAP financial measures have limitations, and should not be considered in isolation or as a substitute for our GAAP financial information.
Forward-Looking Statements
This shareholder letter contains “forward-looking” statements within the meaning of the federal securities laws. Statements contained herein that are not historical facts are considered forward-looking statements and can be identified by terms such as “anticipate,” “believe,” “continue,” “could,” “estimate,” “expect,” “may,” "plan,” “seek,” “should,” “will,” “would” or similar expressions and the negatives of those terms. Such forward-looking statements are based on our current beliefs, assumptions and information available to us and involve known and unknown risks, uncertainties and other factors that may cause our actual results to be materially different from any future results expressed or implied by the forward-looking statements. These statements include those related to the growth of our scale; our ability to leverage the Roku Experience to drive growth; the growth and performance of The Roku Channel; our initiatives to grow Platform revenue, Adjusted EBITDA, and Free Cash Flow; the impact of features like our content row in growing video ad reach and subscription sign-ups; our ability to expand our performance and measurement capabilities through strategic partnerships and innovative products; our advertising initiatives, including Ads Manager and our integrations with third party DSPs and other partners; the timing, funding sources for, and amount of purchases under our stock repurchase program and our expectations for the program; the performance and competitiveness of our new device lineup and features; our focus on our strategic priorities and initiatives; our expectations regarding macro environment impacts, including tariffs; our financial outlook for the third quarter of 2025 and full year 2025 and our qualitative color on our business in 2025 and beyond; the impact of our monetization initiatives, including our path to increasing profitability; and our overall business trajectory. Important risks and factors related to such statements are contained in the reports we have filed with the Securities and Exchange Commission, including our most recent Annual Report on Form 10-K and Quarterly Report on Form 10-Q. Except as required by law, we assume no obligation to update these forward-looking statements as the result of new information, future events or otherwise.
|
|
|
Roku Q2 2025 Shareholder Letter |
6
ROKU, INC.
CONDENSED CONSOLIDATED STATEMENTS OF OPERATIONS
(in thousands, except per share data)
(unaudited)
|
|
|
|
|
|
|
|
|
|
|
|
|
|
|
|
|
|
|
|
|
|
|
|
|
Three Months Ended |
|
Six Months Ended |
|
June 30, 2025 |
|
June 30, 2024 |
|
June 30, 2025 |
|
June 30, 2024 |
| Net revenue: |
|
|
|
|
|
|
|
| Platform |
$ |
975,471 |
|
|
$ |
824,333 |
|
|
$ |
1,856,288 |
|
|
$ |
1,579,268 |
|
| Devices |
135,567 |
|
|
143,846 |
|
|
275,422 |
|
|
270,380 |
|
| Total net revenue |
1,111,038 |
|
|
968,179 |
|
|
2,131,710 |
|
|
1,849,648 |
|
| Cost of revenue: |
|
|
|
|
|
|
|
Platform (1) |
477,795 |
|
|
384,454 |
|
|
894,301 |
|
|
745,020 |
|
Devices (1) |
135,585 |
|
|
159,025 |
|
|
294,706 |
|
|
291,637 |
|
| Total cost of revenue |
613,380 |
|
|
543,479 |
|
|
1,189,007 |
|
|
1,036,657 |
|
| Gross profit (loss): |
|
|
|
|
|
|
|
| Platform |
497,676 |
|
|
439,879 |
|
|
961,987 |
|
|
834,248 |
|
| Devices |
(18) |
|
|
(15,179) |
|
|
(19,284) |
|
|
(21,257) |
|
| Total gross profit |
497,658 |
|
|
424,700 |
|
|
942,703 |
|
|
812,991 |
|
| Operating expenses: |
|
|
|
|
|
|
|
Research and development (1) |
178,017 |
|
|
175,481 |
|
|
362,596 |
|
|
355,940 |
|
Sales and marketing (1) |
243,256 |
|
|
221,656 |
|
|
466,949 |
|
|
423,780 |
|
General and administrative (1) |
99,718 |
|
|
98,806 |
|
|
194,221 |
|
|
176,550 |
|
| Total operating expenses |
520,991 |
|
|
495,943 |
|
|
1,023,766 |
|
|
956,270 |
|
| Loss from operations |
(23,333) |
|
|
(71,243) |
|
|
(81,063) |
|
|
(143,279) |
|
| Other income, net: |
|
|
|
|
|
|
|
| Interest expense |
(460) |
|
|
— |
|
|
(893) |
|
|
— |
|
| Other income, net |
28,466 |
|
|
28,129 |
|
|
46,115 |
|
|
54,075 |
|
| Total other income, net |
28,006 |
|
|
28,129 |
|
|
45,222 |
|
|
54,075 |
|
| Income (loss) before income taxes |
4,673 |
|
|
(43,114) |
|
|
(35,841) |
|
|
(89,204) |
|
| Income tax benefit |
(5,830) |
|
|
(9,161) |
|
|
(18,913) |
|
|
(4,396) |
|
| Net income (loss) |
$ |
10,503 |
|
|
$ |
(33,953) |
|
|
$ |
(16,928) |
|
|
$ |
(84,808) |
|
|
|
|
|
|
|
|
|
| Net income (loss) per share — basic and diluted |
$ |
0.07 |
|
|
$ |
(0.24) |
|
|
$ |
(0.12) |
|
|
$ |
(0.59) |
|
|
|
|
|
|
|
|
|
|
|
|
|
|
|
|
|
| Weighted-average common shares outstanding — basic |
146,888 |
|
|
144,339 |
|
|
146,545 |
|
|
144,045 |
|
| Weighted-average common shares outstanding — diluted |
149,675 |
|
|
144,339 |
|
|
146,545 |
|
|
144,045 |
|
(1) Stock-based compensation was allocated as follows:
|
|
|
|
|
|
|
|
|
|
|
|
|
|
|
|
|
|
|
|
|
|
|
|
| Cost of revenue, platform |
$ |
341 |
|
|
$ |
282 |
|
|
$ |
725 |
|
|
$ |
696 |
|
| Cost of revenue, devices |
38 |
|
|
139 |
|
|
108 |
|
|
1,038 |
|
| Research and development |
32,961 |
|
|
33,365 |
|
|
68,819 |
|
|
70,955 |
|
| Sales and marketing |
30,486 |
|
|
31,431 |
|
|
65,272 |
|
|
63,952 |
|
| General and administrative |
20,814 |
|
|
23,179 |
|
|
45,210 |
|
|
46,387 |
|
| Total stock-based compensation |
$ |
84,640 |
|
|
$ |
88,396 |
|
|
$ |
180,134 |
|
|
$ |
183,028 |
|
|
|
|
Roku Q2 2025 Shareholder Letter |
7
ROKU, INC.
CONDENSED CONSOLIDATED BALANCE SHEETS
(in thousands, except par value data)
(unaudited)
|
|
|
|
|
|
|
|
|
|
|
|
|
As of |
|
June 30,
2025 |
|
December 31,
2024 |
| Assets |
|
|
|
| Current assets: |
|
|
|
| Cash and cash equivalents |
$ |
2,253,276 |
|
|
$ |
2,160,236 |
|
Accounts receivable, net of allowances of $52,054 and $72,657 as of June 30, 2025 and December 31, 2024, respectively |
628,475 |
|
|
812,510 |
|
| Inventories |
112,695 |
|
|
158,271 |
|
| Prepaid expenses and other current assets |
163,826 |
|
|
103,146 |
|
| Total current assets |
3,158,272 |
|
|
3,234,163 |
|
| Property and equipment, net |
193,765 |
|
|
213,690 |
|
| Operating lease right-of-use assets |
285,516 |
|
|
304,505 |
|
| Content assets, net |
197,416 |
|
|
237,321 |
|
| Intangible assets, net |
64,496 |
|
|
27,501 |
|
| Goodwill |
309,406 |
|
|
161,519 |
|
| Other non-current assets |
73,084 |
|
|
125,234 |
|
| Total Assets |
$ |
4,281,955 |
|
|
$ |
4,303,933 |
|
| Liabilities and Stockholders’ Equity |
|
|
|
| Current liabilities: |
|
|
|
| Accounts payable |
$ |
165,963 |
|
|
$ |
273,985 |
|
| Accrued liabilities |
818,597 |
|
|
852,799 |
|
| Deferred revenue, current portion |
123,628 |
|
|
105,718 |
|
| Total current liabilities |
1,108,188 |
|
|
1,232,502 |
|
| Deferred revenue, non-current portion |
25,192 |
|
|
25,050 |
|
| Operating lease liability, non-current portion |
481,779 |
|
|
512,706 |
|
| Other long-term liabilities |
76,244 |
|
|
40,938 |
|
| Total Liabilities |
1,691,403 |
|
|
1,811,196 |
|
| Stockholders’ Equity: |
|
|
|
| Common stock, $0.0001 par value |
15 |
|
|
15 |
|
| Additional paid-in capital |
4,033,004 |
|
|
3,921,432 |
|
| Accumulated other comprehensive income (loss) |
1,434 |
|
|
(1,737) |
|
| Accumulated deficit |
(1,443,901) |
|
|
(1,426,973) |
|
| Total stockholders’ equity |
2,590,552 |
|
|
2,492,737 |
|
| Total Liabilities and Stockholders’ Equity |
$ |
4,281,955 |
|
|
$ |
4,303,933 |
|
|
|
|
Roku Q2 2025 Shareholder Letter |
8
ROKU, INC.
CONDENSED CONSOLIDATED STATEMENTS OF CASH FLOWS
(in thousands)
(unaudited)
|
|
|
|
|
|
|
|
|
|
|
|
|
Six Months Ended |
|
June 30, 2025 |
|
June 30, 2024 |
| Cash flows from operating activities: |
|
|
|
| Net loss |
$ |
(16,928) |
|
|
$ |
(84,808) |
|
| Adjustments to reconcile net loss to net cash provided by operating activities: |
|
|
|
| Depreciation and amortization |
32,073 |
|
|
32,280 |
|
| Stock-based compensation expense |
180,134 |
|
|
183,028 |
|
| Amortization of right-of-use assets |
23,836 |
|
|
23,767 |
|
| Amortization and write-off of content assets |
101,003 |
|
|
108,022 |
|
| Foreign currency remeasurement (gains) losses |
(112) |
|
|
2,385 |
|
| Change in fair value of strategic investment in convertible promissory notes |
3,100 |
|
|
(3,634) |
|
| Change in fair value of contingent consideration |
491 |
|
|
— |
|
| Impairment of assets |
2,870 |
|
|
11,506 |
|
| Provision for doubtful accounts |
1,414 |
|
|
4,344 |
|
| Other items, net |
358 |
|
|
(1,489) |
|
| Changes in operating assets and liabilities: |
|
|
|
| Accounts receivable |
189,024 |
|
|
142,463 |
|
| Inventories |
45,576 |
|
|
(4,222) |
|
| Prepaid expenses and other current assets |
(21,115) |
|
|
(25,012) |
|
| Content assets and liabilities, net |
(91,361) |
|
|
(91,226) |
|
| Other non-current assets |
5,864 |
|
|
(17,279) |
|
| Accounts payable |
(114,583) |
|
|
(108,606) |
|
| Accrued liabilities |
(48,955) |
|
|
(66,715) |
|
| Operating lease liabilities |
(38,523) |
|
|
(27,751) |
|
| Other long-term liabilities |
(6,797) |
|
|
320 |
|
| Deferred revenue |
1,096 |
|
|
(7,284) |
|
| Net cash provided by operating activities |
248,465 |
|
|
70,089 |
|
| Cash flows from investing activities: |
|
|
|
| Purchases of property and equipment |
(3,053) |
|
|
(1,547) |
|
| Purchase of business, net of cash acquired |
(95,090) |
|
|
— |
|
| Purchase of strategic investments |
(7,000) |
|
|
— |
|
| Repayment of convertible promissory note |
10,000 |
|
|
— |
|
| Net cash used in investing activities |
(95,143) |
|
|
(1,547) |
|
| Cash flows from financing activities: |
|
|
|
| Proceeds from equity issued under incentive plans |
2,946 |
|
|
8,679 |
|
| Taxes paid related to net share settlement of equity awards |
(71,508) |
|
|
(41,623) |
|
| Net cash used in financing activities |
(68,562) |
|
|
(32,944) |
|
| Net increase in cash, cash equivalents and restricted cash |
84,760 |
|
|
35,598 |
|
| Effect of exchange rate changes on cash, cash equivalents and restricted cash |
7,877 |
|
|
(4,002) |
|
| Cash, cash equivalents and restricted cash—beginning of period |
2,160,639 |
|
|
2,066,604 |
|
| Cash, cash equivalents and restricted cash—end of period |
$ |
2,253,276 |
|
|
$ |
2,098,200 |
|
|
|
|
Roku Q2 2025 Shareholder Letter |
9
|
|
|
|
|
|
|
|
|
|
|
|
|
Six Months Ended |
|
June 30, 2025 |
|
June 30, 2024 |
| Cash, cash equivalents and restricted cash at end of period: |
|
|
|
| Cash and cash equivalents |
$ |
2,253,276 |
|
|
$ |
2,058,465 |
|
| Restricted cash, current |
— |
|
|
39,735 |
|
|
|
|
|
| Cash, cash equivalents and restricted cash—end of period |
$ |
2,253,276 |
|
|
$ |
2,098,200 |
|
| Supplemental disclosures of cash flow information: |
|
|
|
| Cash paid for interest |
$ |
347 |
|
|
$ |
61 |
|
| Cash paid for income taxes |
$ |
10,123 |
|
|
$ |
6,702 |
|
| Supplemental disclosures of non-cash investing and financing activities: |
|
|
|
| Non-cash contingent consideration for business combination |
$ |
65,815 |
|
|
$ |
— |
|
| Unpaid portion of property and equipment purchases |
$ |
368 |
|
|
$ |
69 |
|
|
|
|
Roku Q2 2025 Shareholder Letter |
10
ROKU, INC.
NON-GAAP INFORMATION
(in thousands)
(unaudited)
Reconciliation of Net loss to Adjusted EBITDA:
|
|
|
|
|
|
|
|
|
|
|
|
|
|
|
|
|
|
|
|
|
|
|
|
|
Three Months Ended |
|
Six Months Ended |
|
June 30, 2025 |
|
June 30, 2024 |
|
June 30, 2025 |
|
June 30, 2024 |
| Net income (loss) |
$ |
10,503 |
|
|
$ |
(33,953) |
|
|
$ |
(16,928) |
|
|
$ |
(84,808) |
|
| Total other income, net |
(28,006) |
|
|
(28,129) |
|
|
(45,222) |
|
|
(54,075) |
|
| Stock-based compensation |
84,640 |
|
|
88,396 |
|
|
180,134 |
|
|
183,028 |
|
| Depreciation and amortization |
16,881 |
|
|
15,807 |
|
|
32,073 |
|
|
32,280 |
|
Restructuring charges (1) |
— |
|
|
10,682 |
|
|
3,064 |
|
|
12,478 |
|
| Income tax benefit |
(5,830) |
|
|
(9,161) |
|
|
(18,913) |
|
|
(4,396) |
|
| Adjusted EBITDA |
$ |
78,188 |
|
|
$ |
43,642 |
|
|
$ |
134,208 |
|
|
$ |
84,507 |
|
(1) The restructuring charges for the three months ended June 30, 2025 were not significant, and the restructuring charges for the six months ended June 30, 2025 primarily include asset impairment charges of $2.9 million and facilities exit costs of $0.2 million. Restructuring charges for the three and six months ended June 30, 2024 primarily include asset impairment charges of $10.7 million and $11.5 million, respectively.
Free Cash Flow (TTM):
|
|
|
|
|
|
|
|
|
|
|
|
|
|
|
|
|
|
|
|
|
|
|
|
|
|
|
|
|
|
|
Q2 24 |
|
Q3 24 |
|
Q4 24 |
|
Q1 25 |
|
Q2 25 |
| Net cash provided by operating activities |
$ |
332,304 |
|
|
$ |
155,080 |
|
|
$ |
218,045 |
|
|
$ |
310,094 |
|
|
$ |
396,421 |
|
| Less: Purchases of property and equipment |
(11,850) |
|
|
(6,123) |
|
|
(5,061) |
|
|
(6,320) |
|
|
(6,567) |
|
| Add/(Less): Effect of exchange rate changes on cash, cash equivalents and restricted cash |
(2,537) |
|
|
8,392 |
|
|
(9,746) |
|
|
(5,328) |
|
|
2,133 |
|
| Free Cash Flow (TTM) |
$ |
317,917 |
|
|
$ |
157,349 |
|
|
$ |
203,238 |
|
|
$ |
298,446 |
|
|
$ |
391,987 |
|
|
|
|
Roku Q2 2025 Shareholder Letter |
11