Document
|
|
|
|
|
|
|
|
|
|
|
|
|
|
|
|
|
|
|
|
|
|
|
|
|
|
|
| Fellow Shareholders, |
|
|
|
|
|
|
|
May 1, 2025 |
In Q1 we grew Platform revenue 17%, in line with our outlook, with contributions from both video advertising and streaming services distribution activities. Our scale in the U.S. exceeds half of broadband households and continues to grow. Beginning with our Home Screen, we continue to enhance the Roku Experience to improve content discovery for viewers, which is increasing engagement, ad reach, and subscriptions. In the U.S., The Roku Channel is now the #2 app on our platform by engagement. We remain focused on our initiatives to grow Platform revenue, Adjusted EBITDA, and Free Cash Flow. While we continue to monitor the macro environment, we reaffirm our outlook for full-year 2025 Platform revenue of $3.950 billion and Adjusted EBITDA of $350 million.
Q1 2025 Key Results
•Total net revenue was $1,021 million, up 16% year over year (YoY)
•Platform revenue was $881 million, up 17% YoY
•Gross profit was $445 million, up 15% YoY
•Streaming Hours were 35.8 billion, up 5.1 billion hours YoY
•The Roku Channel was the #2 app on the platform in the U.S. by engagement
|
|
|
|
|
|
|
|
|
|
|
|
|
|
|
|
|
|
|
|
|
|
|
|
|
|
|
|
|
|
|
|
|
|
|
|
| Summary Financials ($ in millions) |
Q1 24 |
|
Q2 24 |
|
Q3 24 |
|
Q4 24 |
|
Q1 25 |
|
YoY % |
| *Platform revenue |
$754.9 |
|
$824.3 |
|
$908.2 |
|
$1,035.3 |
|
$880.8 |
|
17% |
| Devices revenue |
126.5 |
|
143.8 |
|
154.0 |
|
165.7 |
|
139.9 |
|
11% |
| Total net revenue |
881.5 |
|
968.2 |
|
1,062.2 |
|
1,201.0 |
|
1,020.7 |
|
16% |
| Platform gross profit |
394.4 |
|
439.9 |
|
491.8 |
|
559.9 |
|
464.3 |
|
18% |
| Devices gross profit (loss) |
(6.1) |
|
(15.2) |
|
(11.7) |
|
(47.4) |
|
(19.3) |
|
nm |
| Total gross profit |
388.3 |
|
424.7 |
|
480.1 |
|
512.6 |
|
445.0 |
|
15% |
| Platform gross margin % |
52.2 |
% |
|
53.4 |
% |
|
54.2 |
% |
|
54.1 |
% |
|
52.7 |
% |
|
0.5 |
pts |
| Devices gross margin % |
(4.8) |
% |
|
(10.6) |
% |
|
(7.6) |
% |
|
(28.6) |
% |
|
(13.8) |
% |
|
(9.0) |
pts |
| Total gross margin % |
44.1 |
% |
|
43.9 |
% |
|
45.2 |
% |
|
42.7 |
% |
|
43.6 |
% |
|
(0.4) |
pts |
| Research and development |
180.5 |
|
175.5 |
|
178.8 |
|
185.4 |
|
184.6 |
|
2% |
| Sales and marketing |
202.1 |
|
221.7 |
|
237.0 |
|
271.9 |
|
223.7 |
|
11% |
| General and administrative |
77.7 |
|
98.8 |
|
100.0 |
|
94.4 |
|
94.5 |
|
22% |
| Total operating expenses |
460.3 |
|
495.9 |
|
515.8 |
|
551.7 |
|
502.8 |
|
9% |
| Loss from operations |
(72.0) |
|
(71.2) |
|
(35.8) |
|
(39.1) |
|
(57.7) |
|
20% |
*Adjusted EBITDA A |
40.9 |
|
43.6 |
|
98.2 |
|
77.5 |
|
56.0 |
|
37% |
| Adjusted EBITDA margin % |
4.6 |
% |
|
4.5 |
% |
|
9.2 |
% |
|
6.5 |
% |
|
5.5 |
% |
|
0.9 |
pts |
| Cash flow from operations (TTM) |
456.0 |
|
332.3 |
|
155.1 |
|
218.0 |
|
310.1 |
|
(32)% |
*Free cash flow (TTM) A |
426.8 |
|
317.9 |
|
157.3 |
|
203.2 |
|
298.4 |
|
(30)% |
|
|
|
|
|
|
|
|
|
|
|
|
| Outlook ($ in millions) |
Q2 2025E |
|
FY 2025E |
|
A - Refer to the reconciliation of Net loss to Adjusted EBITDA and Cash flow from operations to Free Cash Flow at the end of this Letter. |
| Total net revenue |
$1,070 |
|
$4,550 |
|
| Total gross profit |
$465 |
|
$1,975 |
|
B - Reconciling items between net loss and non-GAAP Adjusted EBITDA consist of: stock-based compensation of approx. $100M for Q2 and $410M for 2025, depreciation and amortization of approx. $15M for Q2 and $60M for 2025, and other income of approx. $20M for Q2 and $90M for 2025. |
| Net income (loss) |
$(25) |
|
$(30) |
|
Adjusted EBITDA B |
$70 |
|
$350 |
|
* Key Performance Metric (KPM)
|
|
|
| Roku Q1 2025 Shareholder Letter |
1
Platform
In Q1, Platform revenue was $881 million, up 17% YoY, and Platform gross margin was 52.7%. Platform revenue was in line with our expectations, with both video advertising and streaming services distribution activities growing faster than overall Platform revenue.
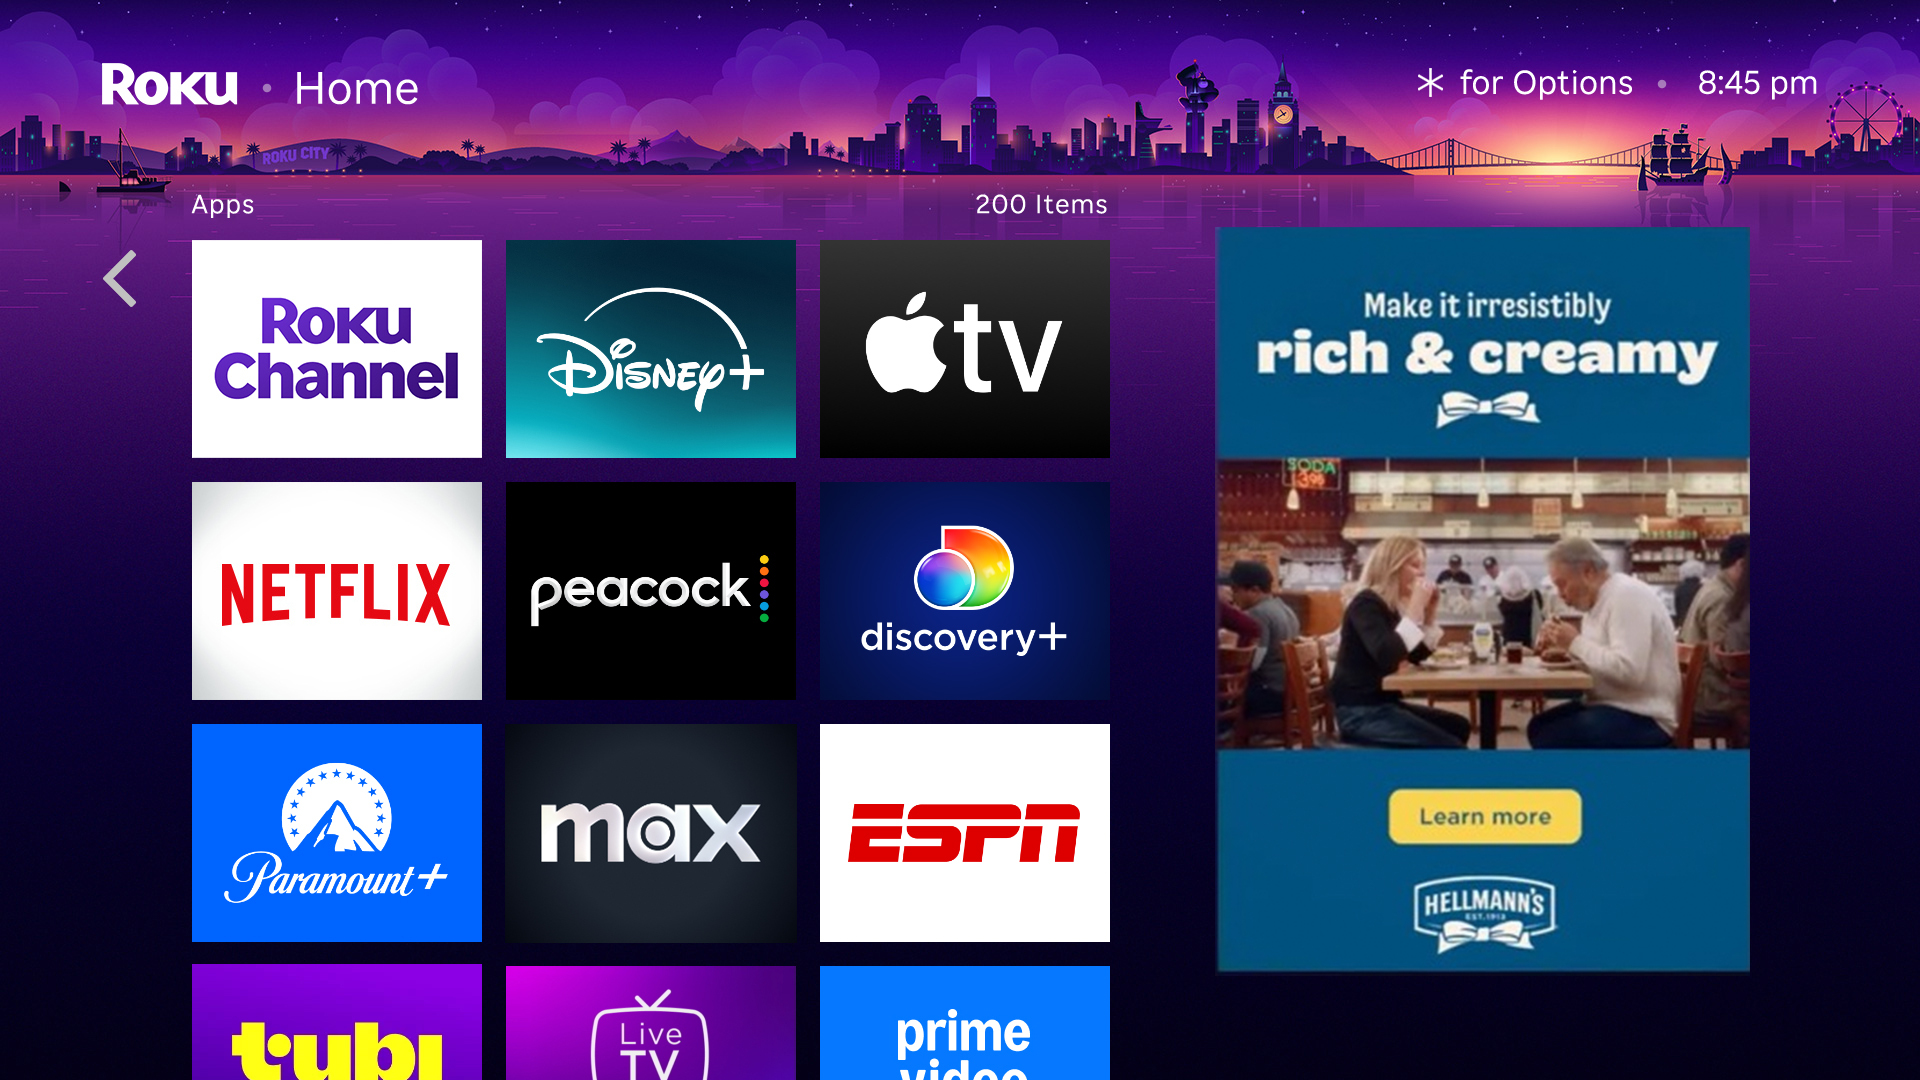
The Roku Experience
The Roku Experience (our user experience) begins with our Home Screen and includes all the features that Roku builds and operates to engage, delight, and help our viewers find great entertainment. As we continue to iterate and improve the Roku Experience, we are seeing increased viewer engagement, greater ad reach, and growth in subscriptions. One of our most powerful new features has been our personalized, AI-driven content row, where we highlight TV shows and movies from across the Roku platform. More than a third of Streaming Households in the U.S. streamed monthly from our content row in Q1, and the row is helping to grow daily video ad reach and subscription sign-ups1.
The content row on our Home Screen helps grow video ad reach and subscriptions.
The Roku Channel
The Roku Channel achieved a significant milestone in Q1, becoming the #2 app on our platform in the U.S. by engagement and maintaining its #3 position globally2 by both reach and engagement, with Streaming Hours growing 84% YoY. We continue to drive this tremendous growth by leveraging the Roku Experience to recommend relevant content, along with our broad content offering. In Q1, more than 85% of Streaming Hours on The Roku Channel originated from features of the Roku Experience other than a Roku Channel app tile, with the content row on our Home Screen driving the most hours of any entry point.
We also continue to attract advertiser interest through our Roku Originals. Airbnb sponsored the romantic comedy “This Time Next Year,” and Miller Lite sponsored the launch of our new sports talk show, “Women’s Sports Now.” Additionally, we featured our first shoppable “Roku Recipes” execution for Hellmann's/Best Foods Mayo in partnership with Walmart – showing viewers how to make the sandwich from the iconic scene in "When Harry Met Sally," as seen in the brand’s Super Bowl spot.
1 Ad reach and subscription growth based on A/B testing from Jan 23-Mar 4. Full rollout in late Q1.
2 Global ranking is based on aggregate streaming of all apps streamed on the Roku platform across all markets in which the Roku platform is available.
|
|
|
| Roku Q1 2025 Shareholder Letter |
2
Our first shoppable “Roku Recipes” execution for Hellmann’s, in partnership with Walmart Connect
Streaming Services Distribution Activities
In Q1, streaming services distribution activities growth was driven primarily by Premium Subscription sign-ups and the continued impact of last year's price increases across our subscription-based services. We have tens of millions of Roku-billed subscriptions. Drivers of subscriptions include our ability to merchandise and market in the Roku Experience, our billing service, and viewers’ increased interest in streaming and bundles. Our TV streaming leadership in both scale and engagement, along with our focus on improving and expanding the Roku Experience, creates significant opportunity for us to expand and enhance our subscriptions offering even further.
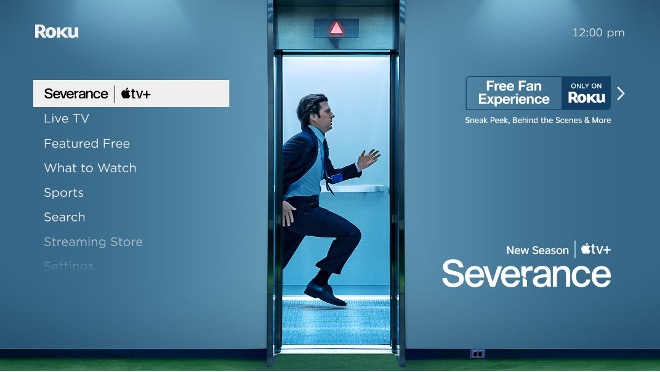
Our Home Screen has a unique power to attract, engage, and retain audiences due to its position as the lead-in for TV for U.S. households with a total of more than 125 million people every day3. In Q1, Apple partnered with us to create a fan experience on our Home Screen for its hit show “Severance,” in advance of the highly anticipated second season. This partnership made the entire first season available free without advertisements on The Roku Channel—expanding reach for a show previously limited to paid subscribers only. The fan experience also included a preview of season two, behind-the-scenes content, and the opportunity to receive three free months of Apple TV+. The successful campaign helped drive both engagement and viewers, including first-time Apple TV+ subscribers.
3 As of Q4 2024
|
|
|
| Roku Q1 2025 Shareholder Letter |
3
The fan experience on the Roku Home Screen drove reach and engagement for “Severance” on Apple TV+.
We announced today in a separate press release that we have entered into an agreement to acquire Frndly TV, a subscription streaming service that offers over 50 live TV channels, on-demand video, and cloud-based DVR for an affordable price. Frndly TV’s growth and expertise in direct-to-consumer subscription services make it a valuable addition to Roku, and we believe our expertise in recommending relevant content to viewers will help Frndly TV attract, engage, and retain more subscribers. This acquisition is intended to support our focus on growing Platform revenue and Roku-billed subscriptions.
Advertising Activities
In Q1, advertising activities across our platform – excluding the Media & Entertainment vertical – outperformed the U.S. OTT ad market and grew faster than overall Platform revenue. With more than half of U.S. broadband households and our expanding ad product offering, we provide marketers the reach and visual impact of traditional TV with the performance of digital advertising.
We continue to expand our performance and measurement capabilities through strategic partnerships. For example, the integration between the Roku Data Cloud and Adobe Real-Time Customer Data Platform helps advertisers and publishers to discover, activate, and measure high-value audiences. We also have a partnership with INCRMNTAL that delivers advanced AI-powered measurement to quantify campaign impact beyond traditional attribution models, providing advertisers with more accurate ROI on CTV.
We’ve also integrated Spaceback with our self-service ad platform, Roku Ads Manager, to enable small and medium-sized businesses (SMBs) to efficiently repurpose social media content for CTV, reducing production costs and complexity to make advertising on TV more accessible. For example, Rollo, a shipping platform, extended its impact to the TV screen, without spending money on expensive TV assets. Rollo used Spaceback to create streaming video assets based on their top-performing social posts and then used Roku Ads Manager to enable viewers to click on ads directly from the TV screen. The campaign reached 700,000 households while reducing cost per site visit by 76% compared to CTV ads on non-Roku platforms.
We are making ad buying on Roku easier for the biggest brands in the world and, with Roku Ads Manager, for SMBs. This comprehensive solution provides advertisers with more choices for how they buy Roku Media – whether it be through direct IO (insertion order), a preferred DSP (demand-side platform) partner, or self-service. These initiatives collectively expand and diversify the advertisers we can serve, strengthening our competitive position and helping us drive sustained Platform revenue growth.
|
|
|
| Roku Q1 2025 Shareholder Letter |
4
Devices
Devices revenue of $140 million was above our outlook, up 11% YoY and driven by higher-than-expected unit sales of Roku-branded TVs and players. Devices gross profit was $(19) million, representing margin of (14)% as a result of promotional activity continuing from the holiday season.
In Q1, we maintained our leadership as the #1 selling TV OS in the U.S., Canada, and Mexico. In the U.S., the Roku TV OS represented nearly 40% of TV units sold, which is greater than those of the #2 and #3 selling TV operating systems combined4.
We recently unveiled our new device lineup, which contains both new and upgraded products that will be available in the coming months. Our refreshed lineup of Roku-branded TVs (designed, made, and sold by Roku) has new features for enhanced picture and sound quality, like improved contrast and color accuracy, faster app launches, and deeper bass. We’re also launching an all-new product reference design: the Roku TV Smart Projector, which will be available for all Roku TV OEM partners to build and sell. Our two new streaming players, the Roku Streaming Stick and Roku Streaming Stick Plus, are innovatively designed for both portability and power-efficiency. These new players are 35% smaller than other brands and powered directly by the TV, providing a clutter-free experience (no separate power adaptor is needed).
The new Roku streaming player lineup
We’re also bringing new devices to our markets outside the U.S. Our new streaming players, the Roku Streaming Stick and Roku Streaming Stick Plus, will be available in Canada, Mexico, Central and South America, as well as the U.K. Additionally, in Mexico, Hyundai Electronics, one of the leading consumer electronics companies in Latin America, announced the launch of an all-new Hyundai Roku TV lineup.
Outlook
While there is more macro uncertainty than normal, we are providing our best outlook based on our current visibility and what we are observing in our business.
4 Source: Circana, LLC, Retail Tracking Service, US, CA, and MX, TV by Software Service, Unit Sales, Jan – March 2025
|
|
|
| Roku Q1 2025 Shareholder Letter |
5
For Q2, we estimate total net revenue of approximately $1.070 billion, representing 11% YoY growth. Within that, Platform revenue is expected to grow 14% YoY with a gross margin of roughly 51%. Devices revenue is projected to decline about 10% YoY with a gross margin of negative 10%. These trends translate to an expected total gross profit of approximately $465 million and Adjusted EBITDA of approximately $70 million for the quarter.
For the full year, we are reaffirming our Platform revenue outlook of $3.950 billion and Adjusted EBITDA of $350 million. Due to evolving dynamics in our advertising product mix, we anticipate full-year Platform gross margin to be approximately 52%. While tariff-related impacts to our Devices segment remain difficult to predict, we expect Devices revenue and gross profit loss to remain consistent with 2024 levels.
We remain vigilant and adaptable as market conditions evolve. While uncertainty remains, we are confident in our strategy and continue to see a path to achieving positive operating income in 2026.
Thank you for your support, and Happy Streaming™!
Anthony Wood, Founder and CEO, and Dan Jedda, CFO
Conference Call Webcast – May 1, 2025 at 2 p.m. PT
The Company will host a webcast of its conference call to discuss the Q1 2025 results at 2 p.m. Pacific Time / 5 p.m. Eastern Time on May 1, 2025. Participants may access the live webcast in listen-only mode on the Roku investor relations website at www.roku.com/investor. An archived webcast of the conference call will also be available at www.roku.com/investor after the call.
About Roku, Inc.
Roku pioneered streaming to the TV. We connect viewers to the streaming content they love, enable content publishers to build and monetize large audiences, and provide advertisers with unique capabilities to engage consumers. Roku streaming players and TV-related audio devices are available in the U.S. and in select countries through direct retail sales and licensing arrangements with service operators. Roku TV™ models are available in the U.S. and in select countries through licensing arrangements with TV OEM brands. Roku Smart Home products, including cameras, video doorbells, lighting, plugs, and more are available in the U.S. Roku is headquartered in San Jose, Calif. U.S.A.
Roku, Roku TV, Streaming Stick, the Roku logo, the purple fabric tag design, purple d-pad design and other trade names, trademarks or service marks of Roku appearing in this shareholder letter are the property of Roku. Trade names, trademarks and service marks of other companies appearing in this shareholder letter are the property of their respective holders.
|
|
|
|
|
|
|
Investor Relations
Conrad Grodd
cgrodd@roku.com
|
Media
Kelli Raftery
kraftery@roku.com
|
|
|
|
| Roku Q1 2025 Shareholder Letter |
6
Use of Non-GAAP Measures
In addition to financial information prepared in accordance with generally accepted accounting principles in the United States (GAAP), this shareholder letter includes certain non-GAAP financial measures. These non-GAAP measures include Adjusted EBITDA and Free Cash Flow (FCF). In order for our investors to be better able to compare our current results with those of previous periods, we have included a reconciliation of GAAP to non-GAAP financial measures in the tables at the end of this letter. The Adjusted EBITDA reconciliation excludes total other income, net, stock-based compensation expense, depreciation and amortization, restructuring charges, and income tax (benefit) expense from the net loss of the period, and the FCF reconciliation excludes capital expenditures and effects of exchange rates from the cash flow from operations of the period, in each case where applicable. We believe these non-GAAP financial measures are useful as a supplement in evaluating our ongoing operational performance and enhancing an overall understanding of our past financial performance. However, these non-GAAP financial measures have limitations, and should not be considered in isolation or as a substitute for our GAAP financial information.
Forward-Looking Statements
This shareholder letter contains “forward-looking” statements within the meaning of the federal securities laws. Statements contained herein that are not historical facts are considered forward-looking statements and can be identified by terms such as “anticipate,” “believe,” “continue,” “could,” “estimate,” “expect,” “may,” "plan,” “seek,” “should,” “will,” “would” or similar expressions and the negatives of those terms. Such forward-looking statements are based on our current beliefs, assumptions and information available to us and involve known and unknown risks, uncertainties and other factors that may cause our actual results to be materially different from any future results expressed or implied by the forward-looking statements. These statements include those related to the growth of our scale in the U.S.; our enhancement of the Roku Experience; our ability to leverage the Roku Experience to drive growth; our initiatives to grow Platform revenue, Adjusted EBITDA, and Free Cash Flow; the impact of our content row in growing video ad reach and subscription sign-ups; our ability to attract advertiser interest through Roku Originals; our ability to expand our performance and measurement capabilities through strategic partnerships; our advertising initiatives; our planned new device lineup and features; our planned international expansion for our new devices; the impact of our acquisition of Frndly TV; our focus on our strategic priorities; our expectations regarding macro environment impacts; our focus on operational discipline; our financial outlook for the second quarter of 2025 and full year 2025, and our qualitative color on our business in 2025 and beyond; our path to achieving positive operating income in 2026; and our overall business trajectory. Important risks and factors related to such statements are contained in the reports we have filed with the Securities and Exchange Commission, including our most recent Annual Report on Form 10-K and Quarterly Report on Form 10-Q. Except as required by law, we assume no obligation to update these forward-looking statements as the result of new information, future events or otherwise.
|
|
|
| Roku Q1 2025 Shareholder Letter |
7
ROKU, INC.
CONDENSED CONSOLIDATED STATEMENTS OF OPERATIONS
(in thousands, except per share data)
(unaudited)
|
|
|
|
|
|
|
|
|
|
|
|
|
|
|
|
|
Three Months Ended |
|
|
|
March 31, 2025 |
|
March 31, 2024 |
|
|
|
|
| Net revenue: |
|
|
|
|
|
|
|
| Platform |
$ |
880,817 |
|
|
$ |
754,935 |
|
|
|
|
|
| Devices |
139,855 |
|
|
126,534 |
|
|
|
|
|
| Total net revenue |
1,020,672 |
|
|
881,469 |
|
|
|
|
|
| Cost of revenue: |
|
|
|
|
|
|
|
Platform (1) |
416,506 |
|
|
360,566 |
|
|
|
|
|
Devices (1) |
159,121 |
|
|
132,612 |
|
|
|
|
|
| Total cost of revenue |
575,627 |
|
|
493,178 |
|
|
|
|
|
| Gross profit (loss): |
|
|
|
|
|
|
|
| Platform |
464,311 |
|
|
394,369 |
|
|
|
|
|
| Devices |
(19,266) |
|
|
(6,078) |
|
|
|
|
|
| Total gross profit |
445,045 |
|
|
388,291 |
|
|
|
|
|
| Operating expenses: |
|
|
|
|
|
|
|
Research and development (1) |
184,579 |
|
|
180,459 |
|
|
|
|
|
Sales and marketing (1) |
223,693 |
|
|
202,124 |
|
|
|
|
|
General and administrative (1) |
94,503 |
|
|
77,744 |
|
|
|
|
|
| Total operating expenses |
502,775 |
|
|
460,327 |
|
|
|
|
|
| Loss from operations |
(57,730) |
|
|
(72,036) |
|
|
|
|
|
| Other income, net: |
|
|
|
|
|
|
|
| Interest expense |
(433) |
|
|
(10) |
|
|
|
|
|
| Other income, net |
17,649 |
|
|
25,956 |
|
|
|
|
|
| Total other income, net |
17,216 |
|
|
25,946 |
|
|
|
|
|
| Loss before income taxes |
(40,514) |
|
|
(46,090) |
|
|
|
|
|
| Income tax (benefit) expense |
(13,083) |
|
|
4,765 |
|
|
|
|
|
| Net loss |
$ |
(27,431) |
|
|
$ |
(50,855) |
|
|
|
|
|
|
|
|
|
|
|
|
|
| Net loss per share — basic and diluted |
$ |
(0.19) |
|
|
$ |
(0.35) |
|
|
|
|
|
|
|
|
|
|
|
|
|
|
|
|
|
|
|
|
|
| Weighted-average common shares outstanding — basic and diluted |
146,197 |
|
|
143,751 |
|
|
|
|
|
|
|
|
|
|
|
|
|
(1) Stock-based compensation was allocated as follows:
|
|
|
|
|
|
|
|
|
|
|
|
|
|
|
|
| Cost of revenue, platform |
$ |
384 |
|
|
$ |
414 |
|
|
|
|
|
| Cost of revenue, devices |
70 |
|
|
899 |
|
|
|
|
|
| Research and development |
35,858 |
|
|
37,590 |
|
|
|
|
|
| Sales and marketing |
34,786 |
|
|
32,521 |
|
|
|
|
|
| General and administrative |
24,396 |
|
|
23,208 |
|
|
|
|
|
| Total stock-based compensation |
$ |
95,494 |
|
|
$ |
94,632 |
|
|
|
|
|
|
|
|
| Roku Q1 2025 Shareholder Letter |
8
ROKU, INC.
CONDENSED CONSOLIDATED BALANCE SHEETS
(in thousands, except par value data)
(unaudited)
|
|
|
|
|
|
|
|
|
|
|
|
|
As of |
|
March 31,
2025 |
|
December 31,
2024 |
| Assets |
|
|
|
| Current assets: |
|
|
|
| Cash and cash equivalents |
$ |
2,256,153 |
|
|
$ |
2,160,236 |
|
Accounts receivable, net of allowances of $50,240 and $72,657 as of March 31, 2025 and December 31, 2024, respectively |
650,187 |
|
|
812,510 |
|
| Inventories |
135,297 |
|
|
158,271 |
|
| Prepaid expenses and other current assets |
105,404 |
|
|
103,146 |
|
| Total current assets |
3,147,041 |
|
|
3,234,163 |
|
| Property and equipment, net |
203,619 |
|
|
213,690 |
|
| Operating lease right-of-use assets |
292,146 |
|
|
304,505 |
|
| Content assets, net |
227,862 |
|
|
237,321 |
|
| Intangible assets, net |
23,976 |
|
|
27,501 |
|
| Goodwill |
161,519 |
|
|
161,519 |
|
| Other non-current assets |
123,711 |
|
|
125,234 |
|
| Total Assets |
$ |
4,179,874 |
|
|
$ |
4,303,933 |
|
| Liabilities and Stockholders’ Equity |
|
|
|
| Current liabilities: |
|
|
|
| Accounts payable |
$ |
194,576 |
|
|
$ |
273,985 |
|
| Accrued liabilities |
788,758 |
|
|
852,799 |
|
| Deferred revenue, current portion |
115,839 |
|
|
105,718 |
|
| Total current liabilities |
1,099,173 |
|
|
1,232,502 |
|
| Deferred revenue, non-current portion |
25,122 |
|
|
25,050 |
|
| Operating lease liability, non-current portion |
496,084 |
|
|
512,706 |
|
| Other long-term liabilities |
33,786 |
|
|
40,938 |
|
| Total Liabilities |
1,654,165 |
|
|
1,811,196 |
|
| Stockholders’ Equity: |
|
|
|
| Common stock, $0.0001 par value |
15 |
|
|
15 |
|
| Additional paid-in capital |
3,980,854 |
|
|
3,921,432 |
|
| Accumulated other comprehensive loss |
(756) |
|
|
(1,737) |
|
| Accumulated deficit |
(1,454,404) |
|
|
(1,426,973) |
|
| Total stockholders’ equity |
2,525,709 |
|
|
2,492,737 |
|
| Total Liabilities and Stockholders’ Equity |
$ |
4,179,874 |
|
|
$ |
4,303,933 |
|
|
|
|
| Roku Q1 2025 Shareholder Letter |
9
ROKU, INC.
CONDENSED CONSOLIDATED STATEMENTS OF CASH FLOWS
(in thousands)
(unaudited)
|
|
|
|
|
|
|
|
|
|
|
|
|
Three Months Ended |
|
March 31, 2025 |
|
March 31, 2024 |
| Cash flows from operating activities: |
|
|
|
| Net loss |
$ |
(27,431) |
|
|
$ |
(50,855) |
|
| Adjustments to reconcile net loss to net cash provided by operating activities: |
|
|
|
| Depreciation and amortization |
15,192 |
|
|
16,473 |
|
| Stock-based compensation expense |
95,494 |
|
|
94,632 |
|
| Amortization of right-of-use assets |
11,575 |
|
|
11,876 |
|
| Amortization of content assets |
48,044 |
|
|
47,891 |
|
| Foreign currency remeasurement losses |
243 |
|
|
997 |
|
| Change in fair value of strategic investment in convertible promissory notes |
6,284 |
|
|
(574) |
|
| Impairment of assets |
2,870 |
|
|
851 |
|
| Provision for (recoveries of) doubtful accounts |
1,285 |
|
|
(7) |
|
| Other items, net |
(425) |
|
|
(748) |
|
| Changes in operating assets and liabilities: |
|
|
|
| Accounts receivable |
161,122 |
|
|
99,500 |
|
| Inventories |
22,974 |
|
|
(2,402) |
|
| Prepaid expenses and other current assets |
(12,381) |
|
|
6,665 |
|
| Content assets and liabilities, net |
(43,113) |
|
|
(50,059) |
|
| Other non-current assets |
2,790 |
|
|
(4,763) |
|
| Accounts payable |
(79,459) |
|
|
919 |
|
| Accrued liabilities |
(57,984) |
|
|
(109,591) |
|
| Operating lease liabilities |
(18,783) |
|
|
(12,704) |
|
| Other long-term liabilities |
242 |
|
|
170 |
|
| Deferred revenue |
10,193 |
|
|
(1,588) |
|
| Net cash provided by operating activities |
138,732 |
|
|
46,683 |
|
| Cash flows from investing activities: |
|
|
|
| Purchases of property and equipment |
(1,931) |
|
|
(672) |
|
| Purchase of strategic investments |
(7,000) |
|
|
— |
|
| Net cash used in investing activities |
(8,931) |
|
|
(672) |
|
| Cash flows from financing activities: |
|
|
|
| Proceeds from equity issued under incentive plans |
2,436 |
|
|
8,262 |
|
| Taxes paid related to net share settlement of equity awards |
(38,508) |
|
|
(22,206) |
|
| Net cash used in financing activities |
(36,072) |
|
|
(13,944) |
|
| Net increase in cash, cash equivalents and restricted cash |
93,729 |
|
|
32,067 |
|
| Effect of exchange rate changes on cash, cash equivalents and restricted cash |
2,188 |
|
|
(2,230) |
|
| Cash, cash equivalents and restricted cash—beginning of period |
2,160,639 |
|
|
2,066,604 |
|
| Cash, cash equivalents and restricted cash—end of period |
$ |
2,256,556 |
|
|
$ |
2,096,441 |
|
|
|
|
| Roku Q1 2025 Shareholder Letter |
10
|
|
|
|
|
|
|
|
|
|
|
|
|
Three Months Ended |
|
March 31, 2025 |
|
March 31, 2024 |
| Cash, cash equivalents and restricted cash at end of period: |
|
|
|
| Cash and cash equivalents |
$ |
2,256,153 |
|
|
$ |
2,055,728 |
|
| Restricted cash, current |
403 |
|
|
40,713 |
|
|
|
|
|
| Cash, cash equivalents and restricted cash—end of period |
$ |
2,256,556 |
|
|
$ |
2,096,441 |
|
| Supplemental disclosures of cash flow information: |
|
|
|
| Cash paid for interest |
$ |
28 |
|
|
$ |
29 |
|
| Cash paid for income taxes |
$ |
2,162 |
|
|
$ |
2,144 |
|
| Supplemental disclosures of non-cash investing and financing activities: |
|
|
|
| Unpaid portion of property and equipment purchases |
$ |
36 |
|
|
$ |
86 |
|
|
|
|
| Roku Q1 2025 Shareholder Letter |
11
NON-GAAP INFORMATION
(in thousands)
(unaudited)
Reconciliation of Net loss to Adjusted EBITDA:
|
|
|
|
|
|
|
|
|
|
|
|
|
|
|
|
|
Three Months Ended |
|
|
|
March 31, 2025 |
|
March 31, 2024 |
|
|
|
|
| Net loss |
$ |
(27,431) |
|
|
$ |
(50,855) |
|
|
|
|
|
| Total other income, net |
(17,216) |
|
|
(25,946) |
|
|
|
|
|
| Stock-based compensation |
95,494 |
|
|
94,632 |
|
|
|
|
|
| Depreciation and amortization |
15,192 |
|
|
16,473 |
|
|
|
|
|
Restructuring charges (1) |
3,064 |
|
|
1,796 |
|
|
|
|
|
| Income tax (benefit) expense |
(13,083) |
|
|
4,765 |
|
|
|
|
|
| Adjusted EBITDA |
$ |
56,020 |
|
|
$ |
40,865 |
|
|
|
|
|
(1) Restructuring charges for the three months ended March 31, 2025 include asset impairment charges of $2.9 million and facilities exit costs of $0.2 million. Restructuring charges for the three months ended March 31, 2024 include severance and related charges of $0.9 million, asset impairment charges of $0.9 million, and facilities exit costs of less than $0.1 million.
Free Cash Flow (TTM):
|
|
|
|
|
|
|
|
|
|
|
|
|
|
|
|
|
|
|
|
|
|
|
|
|
|
|
|
|
|
|
Q1 24 |
|
Q2 24 |
|
Q3 24 |
|
Q4 24 |
|
Q1 25 |
| Net cash provided by operating activities |
$ |
455,951 |
|
|
$ |
332,304 |
|
|
$ |
155,080 |
|
|
$ |
218,045 |
|
|
$ |
310,094 |
|
| Less: Purchases of property and equipment |
(29,048) |
|
|
(11,850) |
|
|
(6,123) |
|
|
(5,061) |
|
|
(6,320) |
|
| Add/(Less): Effect of exchange rate changes on cash, cash equivalents and restricted cash |
(149) |
|
|
(2,537) |
|
|
8,392 |
|
|
(9,746) |
|
|
(5,328) |
|
| Free Cash Flow (TTM) |
$ |
426,754 |
|
|
$ |
317,917 |
|
|
$ |
157,349 |
|
|
$ |
203,238 |
|
|
$ |
298,446 |
|
|
|
|
| Roku Q1 2025 Shareholder Letter |
12