Document
|
|
|
|
|
|
|
|
|
|
|
|
|
|
|
|
|
|
|
|
|
|
|
|
|
|
|
|
|
|
| Fellow Shareholders, |
November 1, 2023 |
|
|
|
|
|
|
|
|
We delivered a strong quarter. Active Account net adds accelerated quarter over quarter, and for the first time Streaming Hours surpassed 100 billion on a trailing 12-month basis. We grew total net revenue 20% YoY through strong performance in content distribution and video advertising, along with unit sales of Roku-branded TVs, which launched in March 2023. This strong top-line growth, in addition to cost reductions and measures we announced in September to further reduce our YoY OpEx growth rate, enabled us to deliver positive Adjusted EBITDA. We remain committed to achieving positive adjusted EBITDA for full year 2024 with continued improvements after that. We will balance this commitment with investments to further expand our scale, engagement, and monetization.
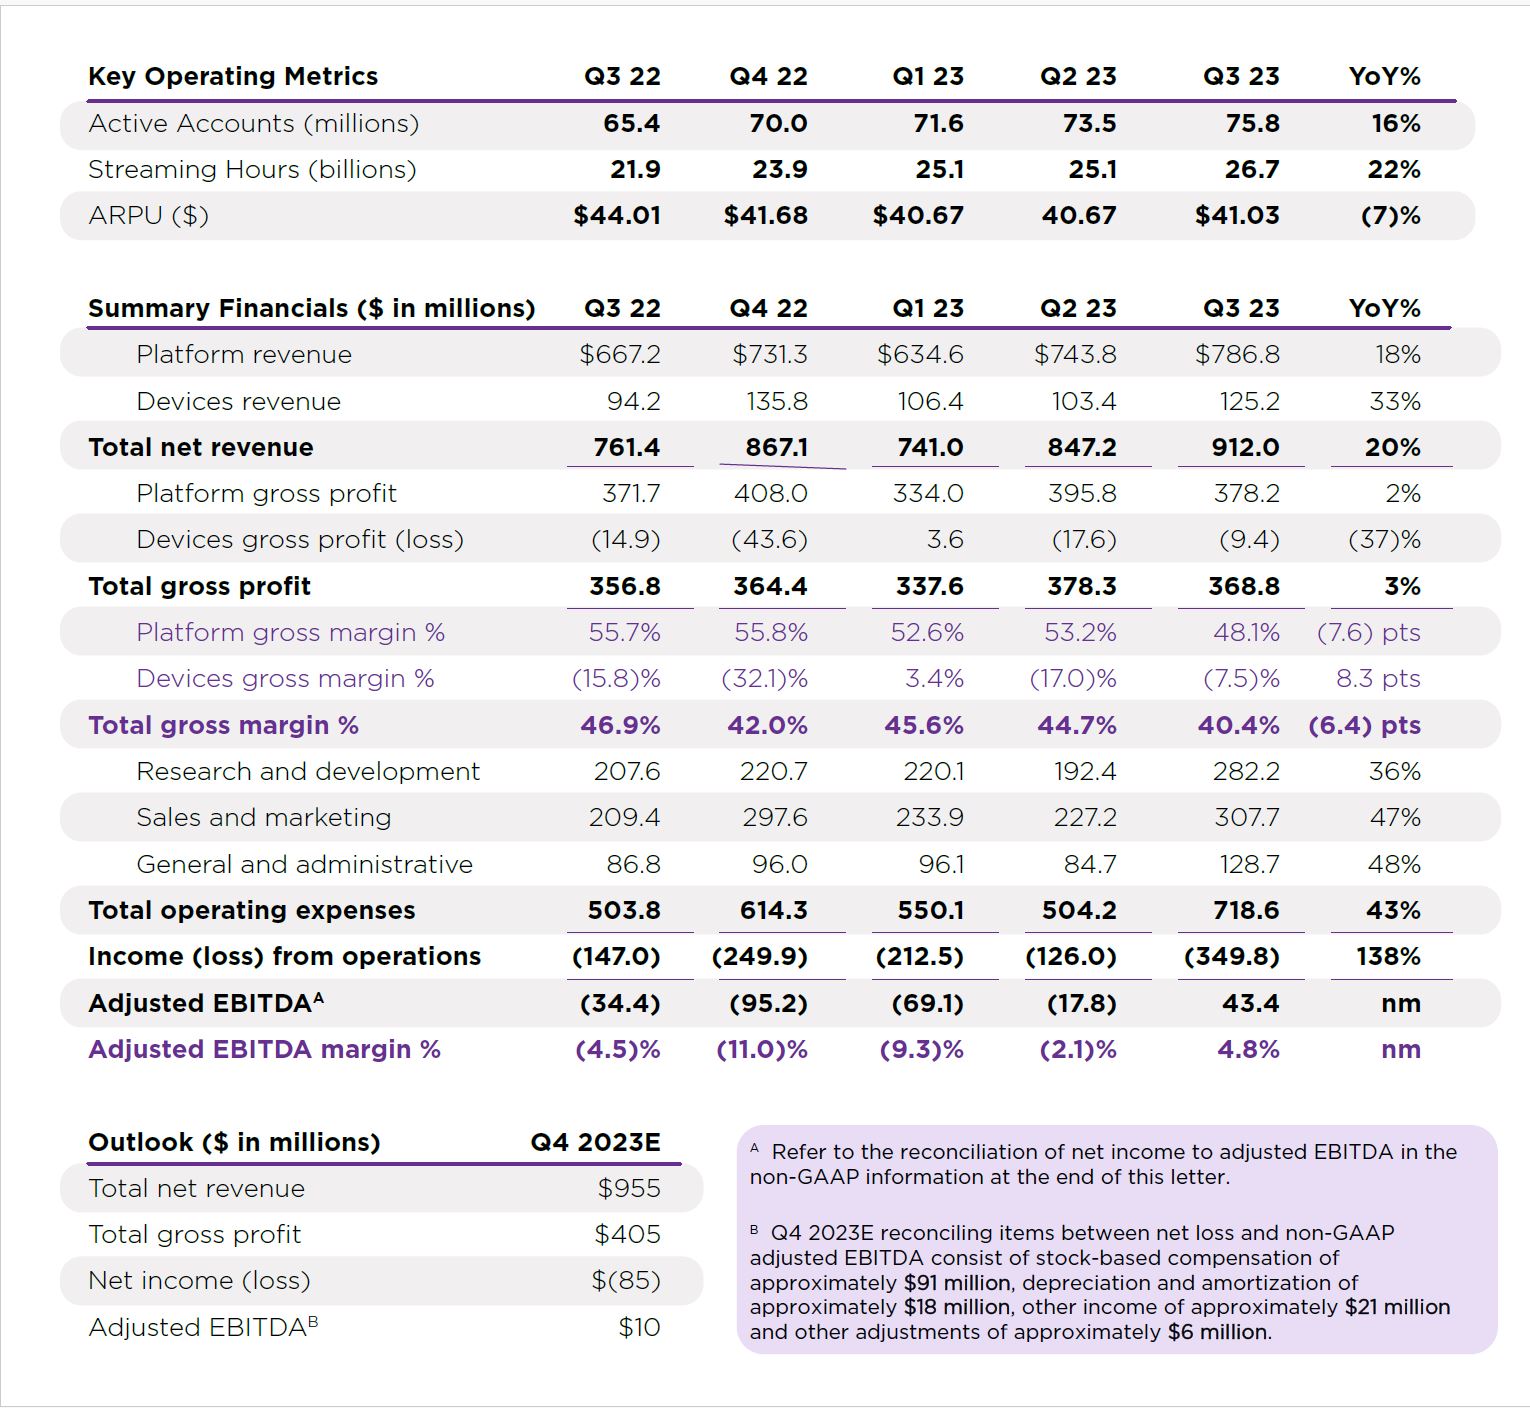
Q3 2023 Key Results
•Total net revenue was $912 million, up 20% year over year (YoY)
•Platform revenue was $787 million, up 18% YoY
•Gross profit was $369 million, up 3% YoY; up 22% YoY excluding restructuring charges1
•Active Accounts were 75.8 million, a net increase of 2.3 million Active Accounts from Q2 2023
•Streaming Hours were 26.7 billion, up 4.9 billion hours YoY
•Average Revenue Per User (ARPU) was $41.03 (trailing 12-month basis), down 7% YoY
•Adjusted EBITDA was $43 million
1 Refer to the Reconciliation of Gross Profit to Non-GAAP Gross Profit table at the end of this Letter
|
|
|
| Roku Q3 2023 Shareholder Letter |
1
Market-Leading Scale
The first phase of Roku’s business model is to build scale by enabling households to watch TV with the best experience using Roku streaming devices, including licensed Roku TV models, Roku-branded TVs (designed, made, and sold by Roku), and Roku streaming players. In Q3, Roku grew Active Accounts to 75.8 million globally. Sequential net adds of 2.3 million accelerated quarter over quarter (QoQ). In the U.S., we are approaching half of broadband households.
A consumer focus on value drove YoY growth in overall TV unit sales in the U.S. Roku TV unit sales grew significantly faster than the industry, and in Q3, the Roku operating system (OS) was again the #1 selling TV OS in the U.S. We continued to achieve YoY share gains across the full range of TV screen sizes, but particularly in the larger-screen segment (often the primary TV in the home), which had the largest increase.
Internationally, we continue to grow our footprint and deepen our presence in key markets. In Mexico, the Roku OS was the #1 selling TV OS. We continue to expand our TV partnerships, with RCA as a new Roku TV partner and new Roku TV models with Philips and Sharp in Mexico. Building on our expansion in Latin America, we announced Roku TV models with Caixun in Chile. In the U.K., we announced Roku TV models with JVC at Currys stores, Polaroid at Asda stores, and Sharp at numerous retailers.
Our recently launched Roku-branded TVs (the first TVs designed, made, and sold by Roku) continue to receive industry accolades. Popular Science named the Roku Plus Series the “Best Overall” TV. Forbes called the Roku Plus Series TV “one of the best value TVs on the market,” stating that “Roku has done an amazing job of building a solid panel that will tick all the boxes for most homes.” And ZDNet said, “Roku’s first-ever TV is shockingly capable for the price you pay.” Our Smart Home product offering is also receiving strong reviews, with our Home Monitoring System winning a Good Housekeeping 2023 Home Renovation Award in the “Smartest Home Tech” category. We recently added support for our Smart Home Video Doorbell so that users with a Camera subscription can now view recorded footage on any TV powered by the Roku OS.
Driving Engagement
Globally, our viewers streamed 26.7 billion hours in Q3, representing 3.9 Streaming Hours per Active Account per day, up 5% YoY. We continue to grow engagement while viewing hours on traditional TV decline. Global Streaming Hours on the Roku platform grew 22% YoY, while viewing hours on traditional TV in the U.S. fell 15% YoY (Nielsen). On a trailing 12-month basis, we surpassed 100 billion Streaming Hours for the first time.
Consumer Experience
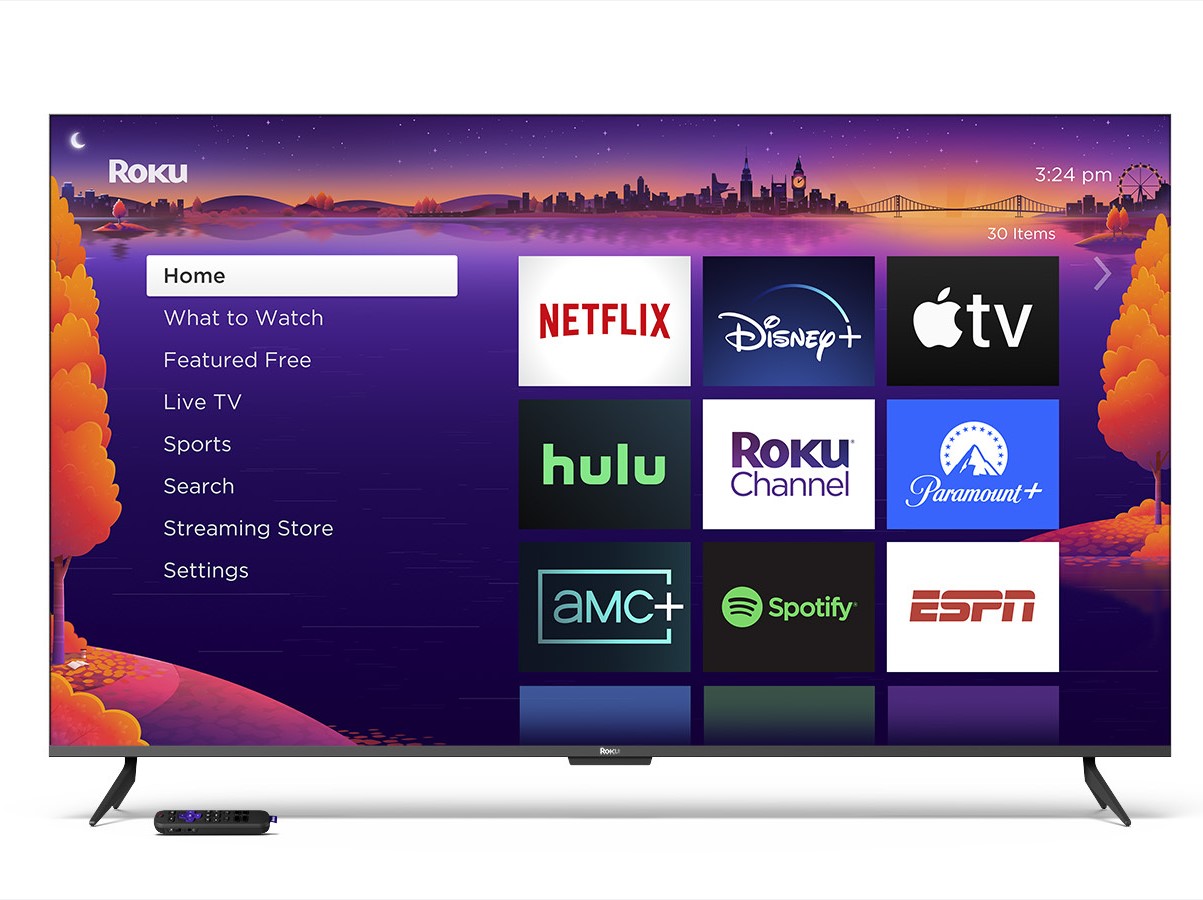
The core of our consumer experience is to make it easy for viewers to find content that they want to watch. With our platform, which has massive scale and deep engagement, we are able to surface great entertainment to viewers throughout the streaming experience, and this begins with our Home Screen Menu (left-hand navigation). In Q3, Streaming Hours originating from the Home Screen Menu grew more than 90% YoY.
|
|
|
| Roku Q3 2023 Shareholder Letter |
2
Our Home Screen Menu (left-hand navigation) contains features such as Live TV and Sports
to make it easy for viewers to find content that they want to watch.
We announced new platform features in October with a focus on further personalizing the streaming experience. Highlights include a new “favoriting” feature that allows users to track their favorite sports teams’ events in one row in the Sports Experience; streamlined browsing in Live TV with the ability to personalize the order of the 400+ channels, including grouping by category (Movies, News, Music, etc.); and more ways to customize TV picture settings.
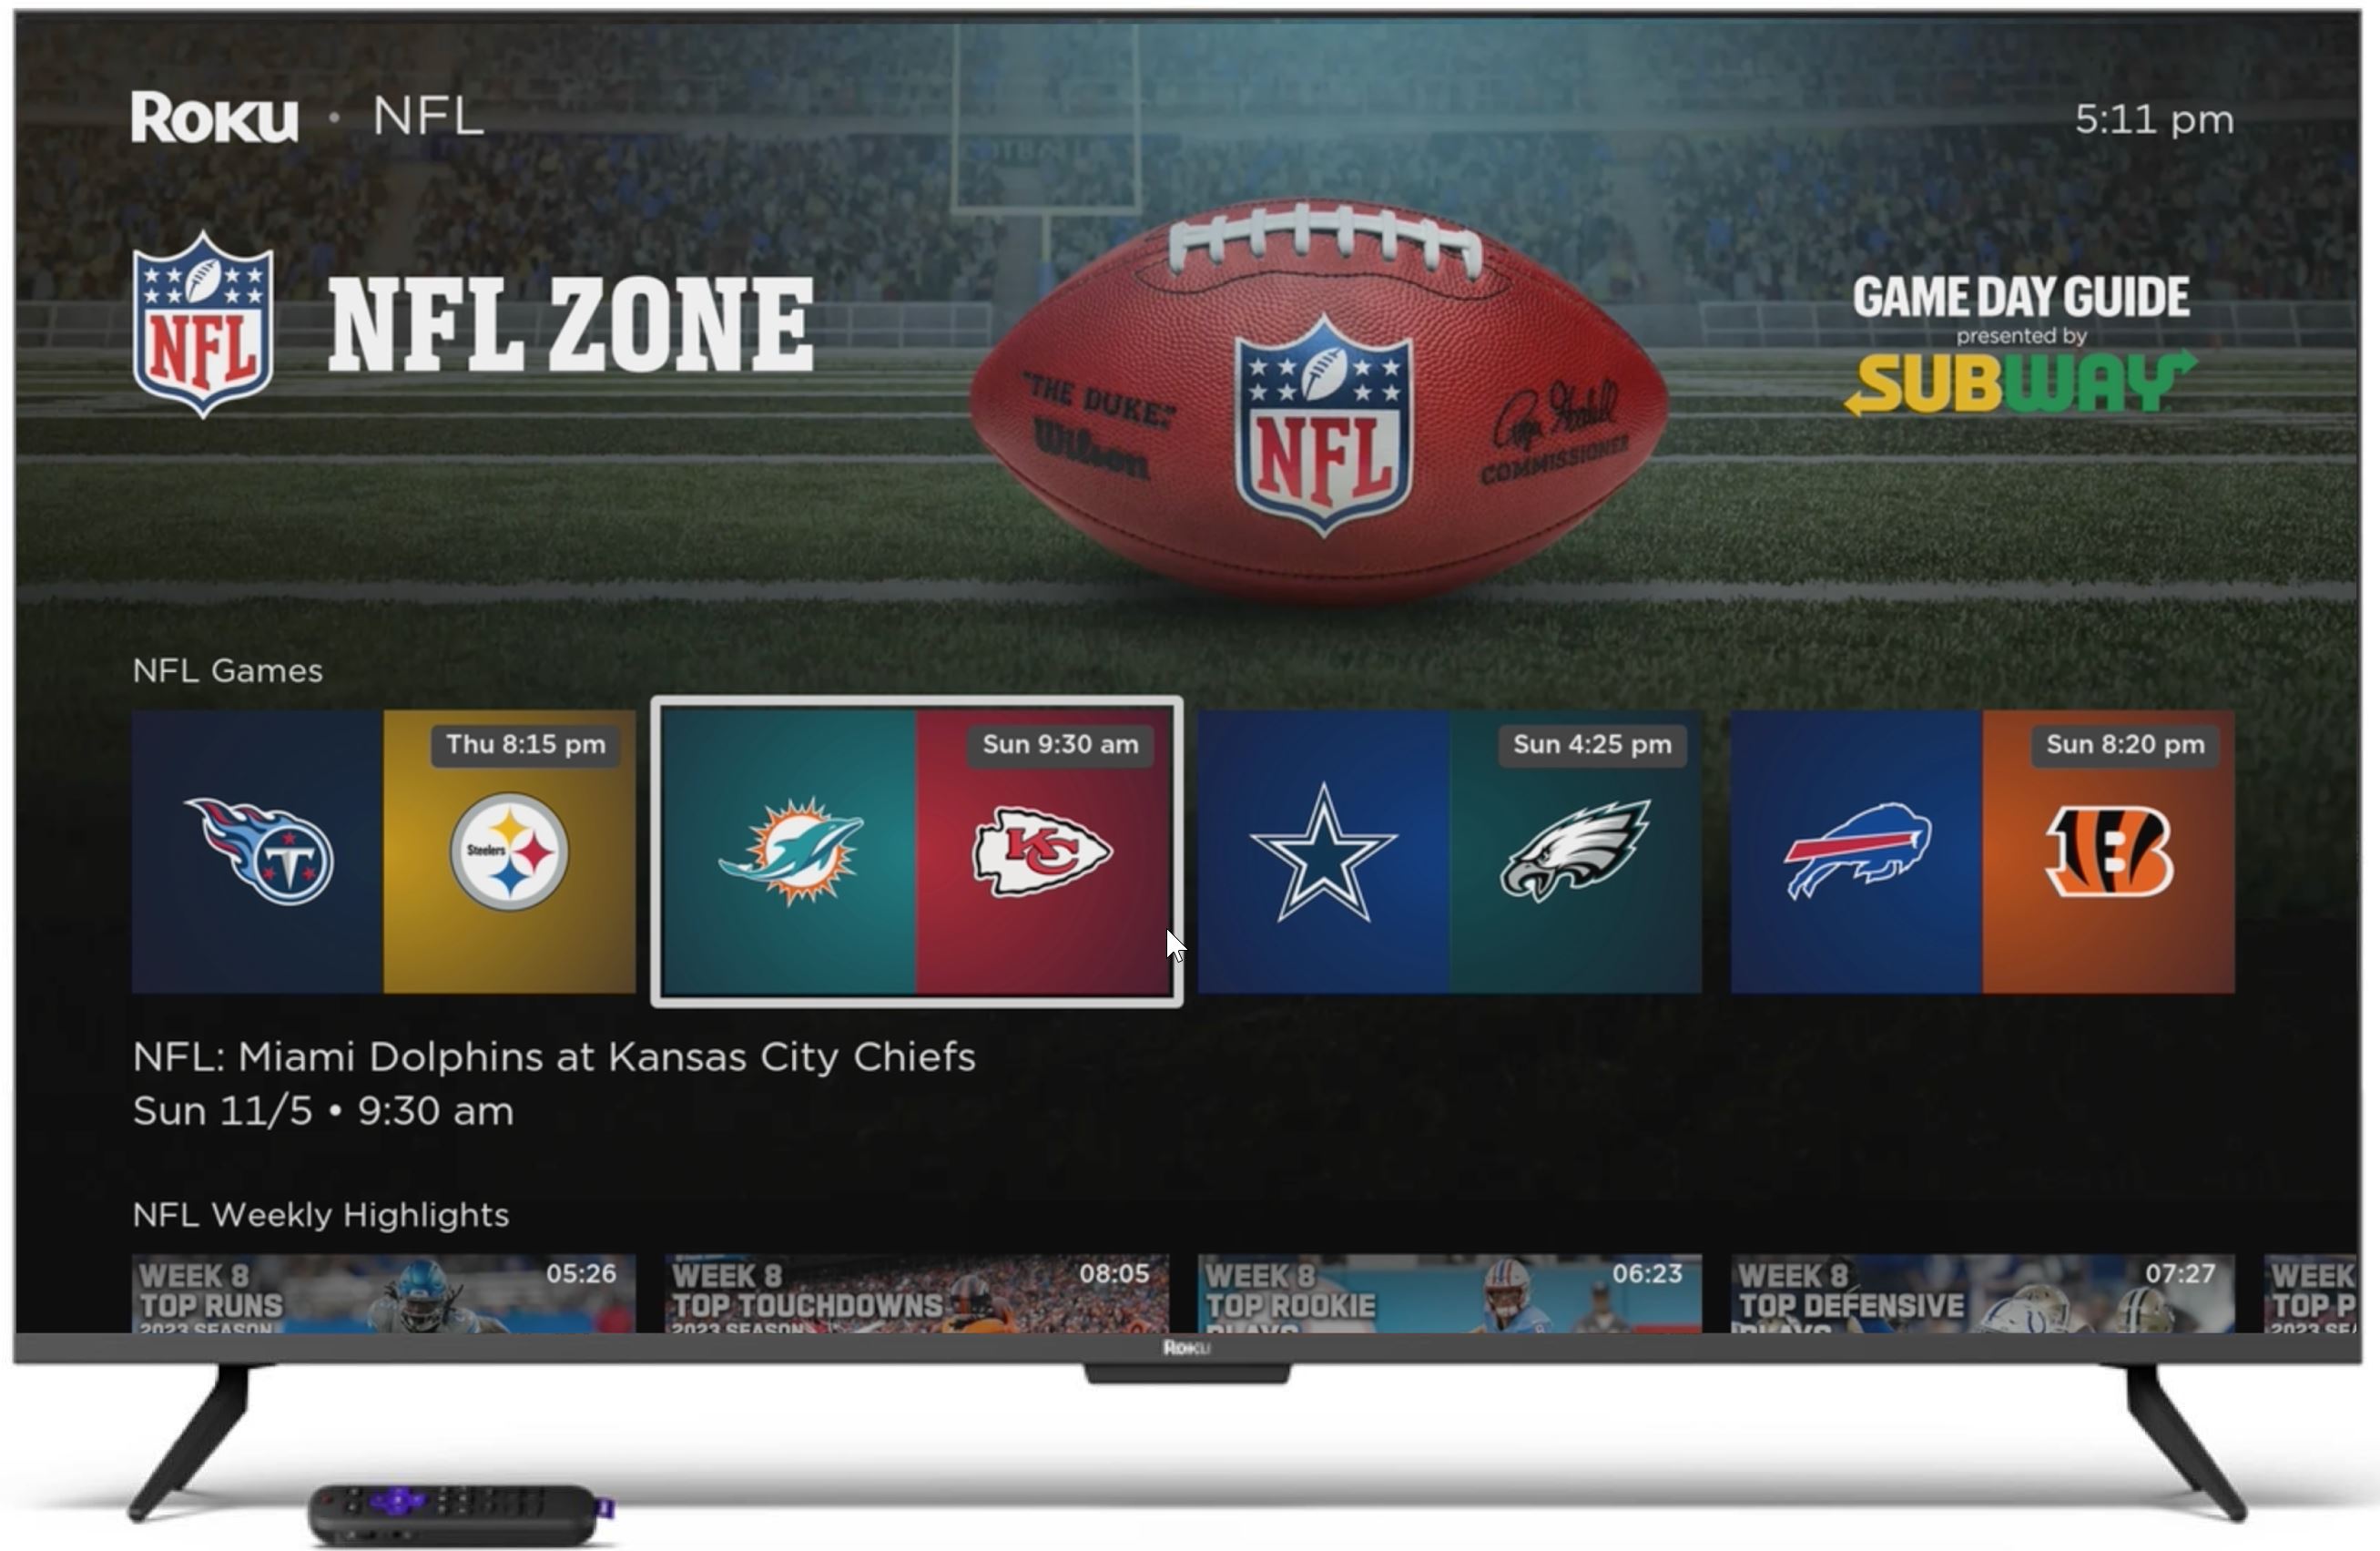
Across the industry, live sports are becoming more fragmented as programming continues to shift from traditional TV to TV streaming. To aid sports discovery on the Roku platform, last year we launched the Roku Sports Experience, which viewers can easily access by clicking “Sports” on our Home Screen Menu (or saying “sports” into the Roku Voice Remote). Just in time for the NFL season, we expanded our content distribution relationship with the NFL to create the first league-branded zone within the Roku Sports Experience, creating a centralized location to find NFL games, the NFL App and NFL Channel (a FAST2 channel), and watch game previews and highlights. We also signed Subway, an NFL Official Marketing Partner, as the first featured NFL Zone advertiser. The NFL Zone is a blueprint for additional league-branded zones we aim to create within the Roku Sports Experience.
2 FAST: free ad-supported linear streaming TV, does not include on-demand content.
|
|
|
| Roku Q3 2023 Shareholder Letter |
3
The NFL Zone provides fans with a centralized location for games, previews, highlights, and more.
The Roku Channel
In Q3, The Roku Channel was again a top-five app on the platform by both reach and engagement, with Streaming Hours up more than 50% YoY. Additionally, Nielsen reported The Roku Channel remains a top-10 TV streaming app and represented nearly 3% of all TV streaming in September, which is comparable to the engagement that Paramount+, Peacock, and Max each receive across all streaming distribution platforms3.
The Roku Channel offers viewers a broad array of great entertainment through
Live TV4, AVOD5, and Premium Subscriptions. We continue to bolster our Live TV offering across key programming categories, giving viewers more quality options and offering content partners another opportunity to ensure their entertainment finds a large and engaged audience. In Q3, we added new sports FAST channels including FIFA+, DraftKings Network, and CBS Sports HQ. We also added local news FAST channels from FOX and CBS, which join ABC and NBC to provide our audiences with access to local and national news content from the four major U.S. broadcast networks. Additionally, MrBeast, a popular YouTuber, launched his first FAST channel on The Roku Channel, and we added FAST channels from NBCUniversal with classic shows like “Saved By the Bell,” “Murder, She Wrote,” and “Magnum P.I.”
Roku Originals create content exclusivity that both advertisers and viewers value, particularly in non-scripted programming. Sponsors of Roku Originals include marquee brands such as Airbnb. We created the Roku Original “NFL Draft: The Pick Is In” in partnership with NFL Films and Skydance Sports, and in Q3, it was the #1 documentary film on The Roku Channel by both reach and engagement. We’ve greenlit a second installment for the 2024 NFL Draft. We renewed “Morimoto’s Sushi Master,” the first-ever competition series focused on the art of sushi-making, for a second season, and we will bring the holiday special “A Very Demi Holiday Special,” starring superstar Demi Lovato, exclusively to The Roku Channel in early December. While we invest in Roku Originals, the foundation of our content spend remains third-party licensed content.
3 September 2023 report of The GaugeTM
4 Live TV consists of 400+ FAST channels
5 AVOD: ad-supported video on demand
|
|
|
| Roku Q3 2023 Shareholder Letter |
4
We showcase entertainment from The Roku Channel in relevant areas throughout our platform to drive reach and engagement. For instance, the Emmy-nominated sports and entertainment talk show “The Rich Eisen Show” is accessible from our Sports experience and Live TV guide. These features have driven half of the program’s reach and nearly a third of its engagement. Additionally, “The Rich Eisen Show” attracts a variety of sponsors including Dave & Buster’s and Peacock, demonstrating how our consumer experience can benefit our viewers, content partners, and advertisers — and thus Roku.
Monetization
Platform revenue was $787 million in Q3, up 18% YoY, reflecting strong contributions from both content distribution and video advertising, offset by lower M&E (media and entertainment) promotional spend. Platform Gross Margin was 48%, down five percentage points QoQ, driven primarily by a $62 million restructuring charge related to the removal of select licensed and produced content from The Roku Channel. Excluding the restructuring charge, Platform Gross Margin would have been 56%, a three percentage point increase QoQ6. ARPU was $41.03 (on a trailing 12-month basis), down 7% YoY but up 1% QoQ.
We generate Platform revenue primarily from the sale of digital advertising (including direct and programmatic video advertising, M&E promotional spending, and related services), as well as content distribution (including subscription and transactional revenue). In Q3, content distribution activities grew faster than Platform revenue, benefiting from increased subscription sign-ups along with recent price increases from SVOD7 partners.
In Q3, the macro environment continued to pressure the overall U.S. advertising market, with ad spend on traditional linear TV down 12% YoY, and traditional TV ad scatter down 27% YoY (according to SMI). Conversely, we saw continued signs of rebound: In Q3, the YoY growth of video advertising on the Roku platform outperformed both the overall ad market and the linear TV ad market in the U.S.
Our positive ad momentum is driven, in part, by diversifying demand sources of advertisers on our platform and expanding partnerships. We are now integrated with 30+ programmatic partners, and spending on the Roku platform through automated third-party demand sources grew meaningfully YoY in Q3. This is a result of our ability to tap into new budgets from existing advertisers while growing the number of new advertisers, including SMBs (small- and medium-sized businesses). We are also driving growth through expanding partnerships. Spotify partnered with Roku as its first TV streaming partner to introduce video ads in the Spotify app on Roku devices. And we are further differentiating our ad offering among marketers with innovative products that are exclusive to the Roku platform. Walmart’s latest campaign leveraged a Roku City integration and our shoppable ads to create curated carts with celebrities Patrick Mahomes, Becky G, and Barbie. Carnival Cruise Line was the first travel brand to appear in Roku City, highlighting their new ship, the Jubilee. As we continue to expand the monetization opportunities on our platform, we will balance this with an unrelenting focus on providing the best TV streaming experience for our viewers.
6 Refer to the Reconciliation of Platform Gross Profit to Non-GAAP Platform Gross Profit table at the end of this Letter
7 SVOD: subscription video on demand
|
|
|
| Roku Q3 2023 Shareholder Letter |
5
Outlook
We had a solid rebound in video ads in Q3 and we expect the YoY growth rate of video ads in Q4 to be similar. However, we remain cautious amid an uncertain macro environment and an uneven ad market recovery. Additionally, we will face difficult YoY growth rate comparisons in content distribution and M&E which will challenge the YoY growth rate of platform revenue in Q4.
That said, we have significant scale and engagement, and we expect to grow ad share. We will continue to operate our business with discipline to defend margins, with a focus on driving positive free cash flow over time. While we have made the difficult decision to reduce headcount, we will invest in high ROI initiatives to maintain our competitive position. For Q4, we expect total net revenue of roughly $955 million, total gross profit of roughly $405 million, and Adjusted EBITDA of $10 million. And, as we indicated earlier, we remain committed to positive Adjusted EBITDA for full year 2024, with continued improvements after that.
Thank you for your support, and Happy Streaming™!
Anthony Wood, Founder and CEO, and Dan Jedda, CFO
|
|
|
| Roku Q3 2023 Shareholder Letter |
6
Conference Call Webcast – November 1, 2023, at 2 p.m. PT
Roku will host a webcast of its conference call to discuss the Q3 2023 results at 2 p.m. Pacific Time / 5 p.m. Eastern Time on November 1, 2023. Participants may access the live webcast in listen-only mode on the Roku investor relations website at www.roku.com/investor. An archived webcast of the conference call will also be available at www.roku.com/investor after the call.
Segment Reporting Change
Effective as of the fourth quarter of fiscal 2022, we reorganized reportable segments to better align with management’s reporting of information reviewed by our Chief Operating Decision Maker, our CEO, for each segment. Our segment and related financial information was recast to reflect the following changes; we renamed the Player segment to the Devices segment, which now includes licensing arrangements with service operators and TV brands in addition to sales of streaming players, audio products, smart home products and services, and starting in 2023, Roku-branded TV sales. All financial information, current and historical, is recast based on the reorganized segments.
About Roku, Inc.
Roku pioneered streaming on TV. We connect users to the content they love, enable content publishers to build and monetize large audiences, and provide advertisers with unique capabilities to engage consumers. Roku TV™ models, Roku streaming players and TV-related audio devices, are available in various countries around the world through direct retail sales and/or licensing arrangements with TV OEM brands. Roku-branded TVs and Roku Smart Home products are sold exclusively in the United States. Roku also operates The Roku Channel, the home of free and premium entertainment with exclusive access to Roku Originals. The Roku Channel is available in the United States, Canada, Mexico, and the United Kingdom. Roku is headquartered in San Jose, Calif., U.S.A.
Roku, Roku TV, the Roku logo and other trade names, trademarks or service marks of Roku appearing in this shareholder letter are trademarks or registered trademarks of Roku, Inc. Trade names, trademarks and service marks of other companies appearing in this shareholder letter are the property of their respective holders.
Investor Relations Media
Conrad Grodd Stephanie Tackach
cgrodd@roku.com stackach@roku.com
|
|
|
| Roku Q3 2023 Shareholder Letter |
7
Use of Non-GAAP Measures
In addition to financial information prepared in accordance with generally accepted accounting principles in the United States (GAAP), this shareholder letter includes certain non-GAAP financial measures. These non-GAAP measures include Adjusted EBITDA. In order for our investors to be better able to compare our current results with those of previous periods, we have included a reconciliation of GAAP to non-GAAP financial measures in the tables at the end of this letter. The Adjusted EBITDA reconciliation adjusts the related GAAP financial measure to exclude other income (expense), net, stock-based compensation expense, depreciation and amortization, restructuring charges, and income tax (benefit)/expense where applicable. The non-GAAP Platform Gross Margin and non-GAAP Total gross margin reconciliations exclude the impact of our Q3 restructuring charges. We believe these non-GAAP financial measures are useful as a supplement in evaluating our ongoing operational performance and enhancing an overall understanding of our past financial performance. However, these non-GAAP financial measures have limitations, and should not be considered in isolation or as a substitute for our GAAP financial information.
Forward-Looking Statements
This shareholder letter contains “forward-looking” statements that are based on our beliefs and assumptions and on information currently available to us. Forward-looking statements include all statements that are not historical facts and can be identified by terms such as “anticipate,” “believe,” “continue,” “could,” “design,” “estimate,” “expect,” “may,” “plan,” “seek,” “should,” “will,” “would” or similar expressions and the negatives of those terms. Forward-looking statements involve known and unknown risks, uncertainties and other factors that may cause our actual results, performance or achievements to be materially different from any future results, performance or achievements expressed or implied by the forward-looking statements. Forward-looking statements represent our beliefs and assumptions only as of the date of this letter. These statements include those related to our ability to create and grow engagement and monetization opportunities; the continued success of Roku streaming devices, including our Roku TV program, Roku-branded TVs, and Roku streaming players; our continued growth into key international markets; our ability to diversify demand sources of advertisers on our platform and to expand partnerships; our ability to innovate; dynamics in the ad market; our ability to grow as the ad market recovers; trends in consumer demand; our ability to provide a positive TV streaming experience for our viewers; the shift of TV and TV advertising to streaming, including with respect to the fragmentation of live sports; our scale and ability to grow; the functionality and benefits of ongoing enhancements to our platform functionality; the growth, advantages and content slate of The Roku Channel, including our live TV offering; our content investments; the value of, including sponsorship opportunities associated with, Roku Originals; the benefits and capabilities of our advertising platform; our advertising sales and commitments; macro uncertainties and pressure on consumers; signs of recovery in the ad market; pressures on M&E spend in the second half of the year; our financial outlook for the fourth quarter of 2023; our commitment to positive Adjusted EBITDA for full year 2024 and continued improvements thereafter; our qualitative color on our business in 2023 and beyond; and our overall business trajectory. Except as required by law, we assume no obligation to update these forward-looking statements publicly, or to update the reasons actual results could differ materially from those anticipated in the forward-looking statements, even if new information becomes available in the future. Further information on factors that could cause actual results to differ materially from the results anticipated by our forward-looking statements is included in the reports we have filed with the Securities and Exchange Commission, including our Annual Report on Form 10-K for the year ended December 31, 2022. Additional information also will be available in our Quarterly Report on Form 10-Q for the quarter ended September 30, 2023. All information provided in this shareholder letter and in the tables attached hereto is as of November 1, 2023, and we undertake no duty to update this information unless required by law.
|
|
|
| Roku Q3 2023 Shareholder Letter |
8
ROKU, INC.
CONDENSED CONSOLIDATED STATEMENTS OF OPERATIONS
(in thousands, except per share data)
(unaudited)
|
|
|
|
|
|
|
|
|
|
|
|
|
|
|
|
|
|
|
|
|
|
|
|
|
Three Months Ended |
|
Nine Months Ended |
|
September 30, 2023 |
|
September 30, 2022 |
|
September 30, 2023 |
|
September 30, 2022 |
| Net Revenue: |
|
|
|
|
|
|
|
| Platform |
$ |
786,785 |
|
|
$ |
667,217 |
|
|
$ |
2,165,238 |
|
|
$ |
1,980,180 |
|
| Devices |
125,233 |
|
|
94,156 |
|
|
334,956 |
|
|
279,298 |
|
| Total net revenue |
912,018 |
|
|
761,373 |
|
|
2,500,194 |
|
|
2,259,478 |
|
| Cost of Revenue: |
|
|
|
|
|
|
|
| Platform (1) |
408,554 |
|
|
295,550 |
|
|
1,057,151 |
|
|
856,396 |
|
| Devices (1) |
134,641 |
|
|
109,036 |
|
|
358,352 |
|
|
326,339 |
|
| Total cost of revenue |
543,195 |
|
|
404,586 |
|
|
1,415,503 |
|
|
1,182,735 |
|
| Gross Profit (Loss): |
|
|
|
|
|
|
|
| Platform |
378,231 |
|
|
371,667 |
|
|
1,108,087 |
|
|
1,123,784 |
|
| Devices |
(9,408) |
|
|
(14,880) |
|
|
(23,396) |
|
|
(47,041) |
|
| Total gross profit |
368,823 |
|
|
356,787 |
|
|
1,084,691 |
|
|
1,076,743 |
|
| Operating Expenses: |
|
|
|
|
|
|
|
| Research and development (1) |
282,201 |
|
|
207,608 |
|
|
694,673 |
|
|
568,243 |
|
| Sales and marketing (1) |
307,694 |
|
|
209,364 |
|
|
768,805 |
|
|
540,857 |
|
| General and administrative (1) |
128,717 |
|
|
86,804 |
|
|
309,422 |
|
|
248,635 |
|
| Total operating expenses |
718,612 |
|
|
503,776 |
|
|
1,772,900 |
|
|
1,357,735 |
|
| Loss from Operations |
(349,789) |
|
|
(146,989) |
|
|
(688,209) |
|
|
(280,992) |
|
| Other Income (Expense), Net: |
|
|
|
|
|
|
|
| Interest expense |
(10) |
|
|
(1,157) |
|
|
(695) |
|
|
(3,273) |
|
| Other income, net |
22,912 |
|
|
27,914 |
|
|
66,012 |
|
|
30,152 |
|
| Total other income, net |
22,902 |
|
|
26,757 |
|
|
65,317 |
|
|
26,879 |
|
| Loss Before Income Taxes |
(326,887) |
|
|
(120,232) |
|
|
(622,892) |
|
|
(254,113) |
|
| Income tax expense |
3,184 |
|
|
1,951 |
|
|
8,378 |
|
|
6,697 |
|
| Net Loss |
$ |
(330,071) |
|
|
$ |
(122,183) |
|
|
$ |
(631,270) |
|
|
$ |
(260,810) |
|
|
|
|
|
|
|
|
|
| Net loss per share — basic and diluted |
$ |
(2.33) |
|
|
$ |
(0.88) |
|
|
$ |
(4.47) |
|
|
$ |
(1.90) |
|
|
|
|
|
|
|
|
|
|
|
|
|
|
|
|
|
| Weighted-average common shares outstanding — basic and diluted |
141,877 |
|
|
138,571 |
|
|
141,087 |
|
|
136,997 |
|
|
|
|
|
|
|
|
|
(1) Stock-based compensation was allocated as follows:
|
|
|
|
|
|
|
|
|
|
|
|
|
|
|
|
|
|
|
|
|
|
|
|
| Cost of revenue, platform |
$ |
368 |
|
|
$ |
280 |
|
|
$ |
1,056 |
|
|
$ |
882 |
|
| Cost of revenue, devices |
810 |
|
|
815 |
|
|
2,426 |
|
|
1,819 |
|
| Research and development |
37,314 |
|
|
40,511 |
|
|
110,801 |
|
|
107,130 |
|
| Sales and marketing |
34,421 |
|
|
34,480 |
|
|
99,785 |
|
|
86,308 |
|
| General and administrative |
18,392 |
|
|
22,964 |
|
|
63,288 |
|
|
59,515 |
|
| Total stock-based compensation |
$ |
91,305 |
|
|
$ |
99,050 |
|
|
$ |
277,356 |
|
|
$ |
255,654 |
|
|
|
|
| Roku Q3 2023 Shareholder Letter |
9
ROKU, INC.
CONDENSED CONSOLIDATED BALANCE SHEETS
(in thousands, except par value data)
(unaudited)
|
|
|
|
|
|
|
|
|
|
|
|
|
As of |
|
September 30, 2023 |
|
December 31, 2022 |
| Assets |
|
|
|
| Current Assets: |
|
|
|
| Cash and cash equivalents |
$ |
2,003,408 |
|
|
$ |
1,961,956 |
|
| Restricted cash |
40,713 |
|
— |
|
Accounts receivable, net of allowances of $25,080 and $40,191 as of |
720,398 |
|
|
760,793 |
|
| September 30, 2023 and December 31, 2022, respectively |
|
|
|
| Inventories |
105,374 |
|
|
106,747 |
|
| Prepaid expenses and other current assets |
101,108 |
|
|
135,383 |
|
| Total current assets |
2,971,001 |
|
|
2,964,879 |
|
| Property and equipment, net |
278,723 |
|
|
335,031 |
|
| Operating lease right-of-use assets |
410,585 |
|
|
521,695 |
|
| Content assets, net |
238,015 |
|
|
292,766 |
|
| Intangible assets, net |
45,662 |
|
|
58,881 |
|
| Goodwill |
161,519 |
|
|
161,519 |
|
| Other non-current assets |
85,274 |
|
|
77,830 |
|
| Total Assets |
$ |
4,190,779 |
|
|
$ |
4,412,601 |
|
| Liabilities and Stockholders’ Equity |
|
|
|
| Current Liabilities: |
|
|
|
| Accounts payable |
$ |
312,279 |
|
|
$ |
164,800 |
|
| Accrued liabilities |
797,229 |
|
|
750,810 |
|
| Current portion of long-term debt |
— |
|
|
79,985 |
|
| Deferred revenue, current portion |
98,236 |
|
|
87,678 |
|
| Total current liabilities |
1,207,744 |
|
|
1,083,273 |
|
| Deferred revenue, non-current portion |
22,556 |
|
|
28,210 |
|
| Operating lease liability, non-current portion |
600,047 |
|
|
584,651 |
|
| Other long-term liabilities |
52,965 |
|
|
69,911 |
|
| Total Liabilities |
1,883,312 |
|
|
1,766,045 |
|
| Stockholders’ Equity: |
|
|
|
| Common stock, $0.0001 par value |
14 |
|
|
14 |
|
| Additional paid-in capital |
3,526,915 |
|
|
3,234,860 |
|
| Accumulated other comprehensive income (loss) |
(166) |
|
|
(292) |
|
| Accumulated deficit |
(1,219,296) |
|
|
(588,026) |
|
| Total stockholders’ equity |
2,307,467 |
|
|
2,646,556 |
|
| Total Liabilities and Stockholders’ Equity |
$ |
4,190,779 |
|
|
$ |
4,412,601 |
|
|
|
|
| Roku Q3 2023 Shareholder Letter |
10
ROKU, INC.
CONDENSED CONSOLIDATED STATEMENTS OF CASH FLOWS
(in thousands)
(unaudited)
|
|
|
|
|
|
|
|
|
|
|
|
|
Nine Months Ended |
|
September 30, 2023 |
|
September 30, 2022 |
| Cash flows from operating activities: |
|
|
|
| Net Loss |
$ |
(631,270) |
|
|
$ |
(260,810) |
|
| Adjustments to reconcile net loss to net cash from operating activities: |
|
|
|
| Depreciation and amortization |
53,047 |
|
|
36,415 |
|
| Stock-based compensation expense |
277,356 |
|
|
255,654 |
|
| Amortization of right-of-use assets |
45,137 |
|
|
40,354 |
|
| Amortization of content assets |
154,801 |
|
|
163,121 |
|
| Foreign currency remeasurement (gains) losses |
3,469 |
|
|
(12,152) |
|
| Change in fair value of the Strategic Investment |
(3,734) |
|
|
(3,556) |
|
| Impairment of assets |
235,165 |
|
|
— |
|
| Provision for doubtful accounts |
1,977 |
|
|
469 |
|
| Other items, net |
(872) |
|
|
(258) |
|
| Changes in operating assets and liabilities: |
|
|
|
| Accounts receivable |
38,416 |
|
|
32,186 |
|
| Inventories |
1,373 |
|
|
(68,976) |
|
| Prepaid expenses and other current assets |
16,003 |
|
|
5,221 |
|
| Content assets and liabilities, net |
(191,481) |
|
|
(229,745) |
|
| Other non-current assets |
5,448 |
|
|
(2,118) |
|
| Accounts payable |
174,784 |
|
|
29,550 |
|
| Accrued liabilities |
70,217 |
|
|
27,254 |
|
| Operating lease liabilities |
(14,301) |
|
|
(20,516) |
|
| Other long-term liabilities |
(910) |
|
|
465 |
|
| Deferred revenue |
4,904 |
|
|
11,884 |
|
| Net cash provided by operating activities |
239,529 |
|
|
4,442 |
|
| Cash flows from investing activities: |
|
|
|
| Purchases of property and equipment |
(79,099) |
|
|
(96,318) |
|
| Purchase of Strategic Investment |
(10,000) |
|
|
(40,000) |
|
| Net cash used in investing activities |
(89,099) |
|
|
(136,318) |
|
| Cash flows from financing activities: |
|
|
|
| Repayments of borrowings |
(80,000) |
|
|
(7,500) |
|
| Proceeds from equity issued under incentive plans |
14,699 |
|
|
17,592 |
|
| Net cash provided by (used in) financing activities |
(65,301) |
|
|
10,092 |
|
| Net increase (decrease) in cash, cash equivalents and restricted cash |
85,129 |
|
|
(121,784) |
|
| Effect of exchange rate changes on cash, cash equivalents and restricted cash |
(2,964) |
|
|
(5,535) |
|
| Cash, cash equivalents and restricted cash —beginning of period |
1,961,956 |
|
|
2,147,670 |
|
| Cash, cash equivalents and restricted cash —end of period |
$ |
2,044,121 |
|
|
$ |
2,020,351 |
|
|
|
|
| Roku Q3 2023 Shareholder Letter |
11
|
|
|
|
|
|
|
|
|
|
|
|
|
Nine Months Ended |
|
September 30, 2023 |
|
September 30, 2022 |
| Cash, cash equivalents and restricted cash at end of period: |
|
|
|
| Cash and cash equivalents |
$ |
2,003,408 |
|
|
$ |
2,018,616 |
|
| Restricted cash, current |
40,713 |
|
|
— |
|
| Restricted cash, non-current |
— |
|
|
1,735 |
|
| Cash, cash equivalents and restricted cash —end of period |
$ |
2,044,121 |
|
|
$ |
2,020,351 |
|
| Supplemental disclosures of cash flow information: |
|
|
|
| Cash paid for interest |
$ |
886 |
|
|
$ |
2,537 |
|
| Cash paid for income taxes |
$ |
5,027 |
|
|
$ |
6,644 |
|
| Supplemental disclosures of non-cash investing and financing activities: |
|
|
|
| Unpaid portion of property and equipment purchases |
$ |
1,129 |
|
|
$ |
23,410 |
|
|
|
|
| Roku Q3 2023 Shareholder Letter |
12
NON-GAAP INFORMATION
(in thousands)
(unaudited)
RECONCILIATION OF NET LOSS TO ADJUSTED EBITDA
|
|
|
|
|
|
|
|
|
|
|
|
|
|
|
|
|
|
|
|
|
|
|
|
|
Three Months Ended |
|
Nine Months Ended |
|
September 30, 2023 |
|
September 30, 2022 |
|
September 30, 2023 |
|
September 30, 2022 |
| Reconciliation of Net Loss to Adjusted EBITDA: |
|
|
|
|
| Net Loss |
$ |
(330,071) |
|
|
$ |
(122,183) |
|
|
$ |
(631,270) |
|
|
$ |
(260,810) |
|
| Other income, net |
(22,902) |
|
|
(26,757) |
|
|
(65,317) |
|
|
(26,879) |
|
| Stock-based compensation |
91,305 |
|
|
99,050 |
|
|
277,356 |
|
|
255,654 |
|
| Depreciation and amortization |
18,866 |
|
|
13,495 |
|
|
53,047 |
|
|
36,396 |
|
Restructuring charges (1) |
283,048 |
|
|
— |
|
|
314,364 |
|
|
— |
|
| Income tax expense |
3,184 |
|
|
1,951 |
|
|
8,378 |
|
|
6,697 |
|
| Adjusted EBITDA |
$ |
43,430 |
|
|
$ |
(34,444) |
|
|
$ |
(43,442) |
|
|
$ |
11,058 |
|
(1) Restructuring charges for the three months ended September 30, 2023 include severance and related charges of $50.4 million, facilities exit costs of $1.9 million and asset impairment charges of $230.8 million.
Restructuring charges for the nine months ended September 30, 2023 include severance and related charges of $75.7 million, facilities exit costs of $3.5 million, and assets impairment charge of $235.2 million.
RECONCILIATION OF GROSS PROFIT TO NON-GAAP GROSS PROFIT
|
|
|
|
|
|
|
|
|
|
|
|
|
|
|
|
|
|
|
|
|
|
|
|
|
Three Months Ended |
|
|
|
|
|
September 30, 2023 |
|
September 30, 2022 |
|
Change $ |
|
Change % |
| Total gross profit |
368,823 |
|
|
356,787 |
|
|
12,036 |
|
|
3 |
% |
| Restructuring charges in Total gross profit |
65,966 |
|
|
— |
|
|
65,966 |
|
|
nm |
| Non-GAAP Total gross profit |
434,789 |
|
|
356,787 |
|
|
78,002 |
|
|
22 |
% |
| Non-GAAP Total gross margin % |
48 |
% |
|
47 |
% |
|
|
|
|
RECONCILIATION OF PLATFORM GROSS PROFIT TO NON-GAAP PLATFORM GROSS PROFIT
|
|
|
|
|
|
|
|
|
|
|
|
|
|
|
|
|
|
|
|
|
|
|
|
|
Three Months Ended |
|
|
|
|
|
September 30, 2023 |
|
September 30, 2022 |
|
Change $ |
|
Change % |
| Platform gross profit |
378,231 |
|
|
371,667 |
|
|
6,564 |
|
|
2 |
% |
| Restructuring charges in Cost of revenue, platform |
62,760 |
|
|
— |
|
|
62,760 |
|
|
nm |
| Non-GAAP Platform gross profit |
440,991 |
|
|
371,667 |
|
|
69,324 |
|
|
19 |
% |
| Non-GAAP Platform gross margin % |
56 |
% |
|
56 |
% |
|
|
|
|
Quarterly streaming hours published vs. revised streaming hours (billions) 0b 2b 4b 6b 8b 10b 12b 14b 2017 q1 2017 q2 2017 q3 2017 q4 2018 q1 2018 q2 2018 q3 2018 q4 2019 q1 2019 q2 2019 q3 2019 q4 2020 q1 published streaming hours revised streaming ho
|
|
|
| Roku Q3 2023 Shareholder Letter |
13