0001421461false2023FYP1YP4YP1YP5Yhttp://fasb.org/us-gaap/2023#PropertyPlantAndEquipmentNethttp://fasb.org/us-gaap/2023#PropertyPlantAndEquipmentNethttp://fasb.org/us-gaap/2023#PropertyPlantAndEquipmentNethttp://fasb.org/us-gaap/2023#PropertyPlantAndEquipmentNethttp://fasb.org/us-gaap/2023#OtherLiabilitiesCurrenthttp://fasb.org/us-gaap/2023#OtherLiabilitiesCurrenthttp://fasb.org/us-gaap/2023#OtherLiabilitiesCurrenthttp://fasb.org/us-gaap/2023#OtherLiabilitiesCurrenthttp://fasb.org/us-gaap/2023#OperatingLeaseLiabilityNoncurrenthttp://fasb.org/us-gaap/2023#OperatingLeaseLiabilityNoncurrenthttp://fasb.org/us-gaap/2023#FinanceLeaseLiabilityNoncurrenthttp://fasb.org/us-gaap/2023#FinanceLeaseLiabilityNoncurrent00014214612023-01-012023-12-3100014214612023-06-30iso4217:USD00014214612024-02-29xbrli:shares0001421461ipi:TrioMember2023-10-012023-12-3100014214612023-12-3100014214612022-12-31iso4217:USDxbrli:shares0001421461us-gaap:MineralMember2023-01-012023-12-310001421461us-gaap:MineralMember2022-01-012022-12-310001421461us-gaap:MineralMember2021-01-012021-12-310001421461us-gaap:CargoAndFreightMember2023-01-012023-12-310001421461us-gaap:CargoAndFreightMember2022-01-012022-12-310001421461us-gaap:CargoAndFreightMember2021-01-012021-12-310001421461ipi:WarehouseandHandlingMember2023-01-012023-12-310001421461ipi:WarehouseandHandlingMember2022-01-012022-12-310001421461ipi:WarehouseandHandlingMember2021-01-012021-12-3100014214612022-01-012022-12-3100014214612021-01-012021-12-310001421461us-gaap:CommonStockMember2020-12-310001421461us-gaap:AdditionalPaidInCapitalMember2020-12-310001421461us-gaap:RetainedEarningsMember2020-12-3100014214612020-12-310001421461us-gaap:RetainedEarningsMember2021-01-012021-12-310001421461us-gaap:AdditionalPaidInCapitalMember2021-01-012021-12-310001421461us-gaap:CommonStockMember2021-01-012021-12-310001421461us-gaap:CommonStockMember2021-12-310001421461us-gaap:AdditionalPaidInCapitalMember2021-12-310001421461us-gaap:RetainedEarningsMember2021-12-3100014214612021-12-310001421461us-gaap:RetainedEarningsMember2022-01-012022-12-310001421461us-gaap:AdditionalPaidInCapitalMember2022-01-012022-12-310001421461us-gaap:CommonStockMember2022-01-012022-12-310001421461us-gaap:TreasuryStockCommonMember2022-01-012022-12-310001421461us-gaap:CommonStockMember2022-12-310001421461us-gaap:TreasuryStockCommonMember2022-12-310001421461us-gaap:AdditionalPaidInCapitalMember2022-12-310001421461us-gaap:RetainedEarningsMember2022-12-310001421461us-gaap:RetainedEarningsMember2023-01-012023-12-310001421461us-gaap:AdditionalPaidInCapitalMember2023-01-012023-12-310001421461us-gaap:CommonStockMember2023-01-012023-12-310001421461us-gaap:CommonStockMember2023-12-310001421461us-gaap:TreasuryStockCommonMember2023-12-310001421461us-gaap:AdditionalPaidInCapitalMember2023-12-310001421461us-gaap:RetainedEarningsMember2023-12-31ipi:Facilityipi:Reporting_Segments0001421461us-gaap:RestrictedStockMember2023-01-012023-12-310001421461us-gaap:RestrictedStockMember2022-01-012022-12-310001421461us-gaap:RestrictedStockMember2021-01-012021-12-310001421461us-gaap:EmployeeStockOptionMember2023-01-012023-12-310001421461us-gaap:EmployeeStockOptionMember2022-01-012022-12-310001421461us-gaap:EmployeeStockOptionMember2021-01-012021-12-310001421461us-gaap:LandMember2023-12-310001421461us-gaap:LandMember2022-12-310001421461us-gaap:LandImprovementsMember2023-12-310001421461us-gaap:LandImprovementsMember2022-12-310001421461us-gaap:MiningPropertiesAndMineralRightsMember2023-12-310001421461us-gaap:MiningPropertiesAndMineralRightsMember2022-12-310001421461us-gaap:BuildingAndBuildingImprovementsMember2023-12-310001421461us-gaap:BuildingAndBuildingImprovementsMember2022-12-310001421461us-gaap:MachineryAndEquipmentMember2023-12-310001421461us-gaap:MachineryAndEquipmentMember2022-12-310001421461us-gaap:VehiclesMember2023-12-310001421461us-gaap:VehiclesMember2022-12-310001421461us-gaap:OfficeEquipmentMember2023-12-310001421461us-gaap:OfficeEquipmentMember2022-12-310001421461ipi:RightOfUseAssetsMember2023-12-310001421461ipi:RightOfUseAssetsMember2022-12-310001421461us-gaap:BreedingAndProductionAnimalsMember2023-12-310001421461us-gaap:BreedingAndProductionAnimalsMember2022-12-310001421461us-gaap:ConstructionInProgressMember2023-12-310001421461us-gaap:ConstructionInProgressMember2022-12-310001421461ipi:WestFacilityMember2023-10-012023-12-310001421461ipi:OilFieldServicesMember2023-01-012023-12-310001421461srt:MinimumMember2023-12-310001421461srt:MaximumMember2023-12-31xbrli:pure00014214612019-05-012019-05-310001421461us-gaap:RoyaltyAgreementsMember2023-12-310001421461us-gaap:RoyaltyAgreementsMember2022-12-310001421461us-gaap:UseRightsMember2023-12-310001421461us-gaap:UseRightsMember2022-12-310001421461us-gaap:RevolvingCreditFacilityMember2022-07-310001421461us-gaap:RevolvingCreditFacilityMember2022-08-020001421461srt:MinimumMemberus-gaap:SecuredOvernightFinancingRateSofrOvernightIndexSwapRateMemberus-gaap:RevolvingCreditFacilityMember2023-01-012023-12-310001421461us-gaap:SecuredOvernightFinancingRateSofrOvernightIndexSwapRateMembersrt:MaximumMemberus-gaap:RevolvingCreditFacilityMember2023-01-012023-12-310001421461us-gaap:RevolvingCreditFacilityMember2023-01-012023-12-310001421461us-gaap:RevolvingCreditFacilityMember2022-01-012022-12-310001421461us-gaap:RevolvingCreditFacilityMember2021-01-012021-12-310001421461us-gaap:RevolvingCreditFacilityMember2023-12-310001421461us-gaap:RevolvingCreditFacilityMember2021-12-310001421461us-gaap:RevolvingCreditFacilityMember2022-12-310001421461ipi:PaycheckProtectionProgramLoanMember2020-04-012020-04-300001421461ipi:PaycheckProtectionProgramLoanMember2021-06-012021-06-300001421461ipi:SeriesBSeniorNotesMember2021-06-012021-06-300001421461srt:MinimumMemberus-gaap:MeasurementInputRiskFreeInterestRateMember2023-12-310001421461us-gaap:MeasurementInputRiskFreeInterestRateMembersrt:MaximumMember2023-12-3100014214612022-09-012022-09-300001421461ipi:PotashMemberipi:PotashMember2023-01-012023-12-310001421461ipi:TrioMemberipi:PotashMember2023-01-012023-12-310001421461ipi:OilFieldServicesMemberipi:PotashMember2023-01-012023-12-310001421461ipi:PotashMemberus-gaap:IntersegmentEliminationMember2023-01-012023-12-310001421461ipi:PotashMember2023-01-012023-12-310001421461ipi:PotashMemberipi:TrioMember2023-01-012023-12-310001421461ipi:TrioMemberipi:TrioMember2023-01-012023-12-310001421461ipi:OilFieldServicesMemberipi:TrioMember2023-01-012023-12-310001421461us-gaap:IntersegmentEliminationMemberipi:TrioMember2023-01-012023-12-310001421461ipi:TrioMember2023-01-012023-12-310001421461ipi:WaterProductMemberipi:PotashMember2023-01-012023-12-310001421461ipi:TrioMemberipi:WaterProductMember2023-01-012023-12-310001421461ipi:OilFieldServicesMemberipi:WaterProductMember2023-01-012023-12-310001421461us-gaap:IntersegmentEliminationMemberipi:WaterProductMember2023-01-012023-12-310001421461ipi:WaterProductMember2023-01-012023-12-310001421461ipi:SaltMemberipi:PotashMember2023-01-012023-12-310001421461ipi:TrioMemberipi:SaltMember2023-01-012023-12-310001421461ipi:OilFieldServicesMemberipi:SaltMember2023-01-012023-12-310001421461us-gaap:IntersegmentEliminationMemberipi:SaltMember2023-01-012023-12-310001421461ipi:SaltMember2023-01-012023-12-310001421461ipi:MagnesiumChlorideMemberipi:PotashMember2023-01-012023-12-310001421461ipi:TrioMemberipi:MagnesiumChlorideMember2023-01-012023-12-310001421461ipi:OilFieldServicesMemberipi:MagnesiumChlorideMember2023-01-012023-12-310001421461ipi:MagnesiumChlorideMemberus-gaap:IntersegmentEliminationMember2023-01-012023-12-310001421461ipi:MagnesiumChlorideMember2023-01-012023-12-310001421461ipi:BrinesMemberipi:PotashMember2023-01-012023-12-310001421461ipi:TrioMemberipi:BrinesMember2023-01-012023-12-310001421461ipi:OilFieldServicesMemberipi:BrinesMember2023-01-012023-12-310001421461ipi:BrinesMemberus-gaap:IntersegmentEliminationMember2023-01-012023-12-310001421461ipi:BrinesMember2023-01-012023-12-310001421461us-gaap:ProductAndServiceOtherMemberipi:PotashMember2023-01-012023-12-310001421461ipi:TrioMemberus-gaap:ProductAndServiceOtherMember2023-01-012023-12-310001421461ipi:OilFieldServicesMemberus-gaap:ProductAndServiceOtherMember2023-01-012023-12-310001421461us-gaap:ProductAndServiceOtherMemberus-gaap:IntersegmentEliminationMember2023-01-012023-12-310001421461us-gaap:ProductAndServiceOtherMember2023-01-012023-12-310001421461us-gaap:MineralMemberipi:PotashMember2023-01-012023-12-310001421461ipi:TrioMemberus-gaap:MineralMember2023-01-012023-12-310001421461ipi:OilFieldServicesMemberus-gaap:MineralMember2023-01-012023-12-310001421461us-gaap:IntersegmentEliminationMember2023-01-012023-12-310001421461ipi:PotashMemberipi:PotashMember2022-01-012022-12-310001421461ipi:TrioMemberipi:PotashMember2022-01-012022-12-310001421461ipi:OilFieldServicesMemberipi:PotashMember2022-01-012022-12-310001421461ipi:PotashMemberus-gaap:IntersegmentEliminationMember2022-01-012022-12-310001421461ipi:PotashMember2022-01-012022-12-310001421461ipi:PotashMemberipi:TrioMember2022-01-012022-12-310001421461ipi:TrioMemberipi:TrioMember2022-01-012022-12-310001421461ipi:OilFieldServicesMemberipi:TrioMember2022-01-012022-12-310001421461us-gaap:IntersegmentEliminationMemberipi:TrioMember2022-01-012022-12-310001421461ipi:TrioMember2022-01-012022-12-310001421461ipi:WaterProductMemberipi:PotashMember2022-01-012022-12-310001421461ipi:TrioMemberipi:WaterProductMember2022-01-012022-12-310001421461ipi:OilFieldServicesMemberipi:WaterProductMember2022-01-012022-12-310001421461us-gaap:IntersegmentEliminationMemberipi:WaterProductMember2022-01-012022-12-310001421461ipi:WaterProductMember2022-01-012022-12-310001421461ipi:SaltMemberipi:PotashMember2022-01-012022-12-310001421461ipi:TrioMemberipi:SaltMember2022-01-012022-12-310001421461ipi:OilFieldServicesMemberipi:SaltMember2022-01-012022-12-310001421461us-gaap:IntersegmentEliminationMemberipi:SaltMember2022-01-012022-12-310001421461ipi:SaltMember2022-01-012022-12-310001421461ipi:MagnesiumChlorideMemberipi:PotashMember2022-01-012022-12-310001421461ipi:TrioMemberipi:MagnesiumChlorideMember2022-01-012022-12-310001421461ipi:OilFieldServicesMemberipi:MagnesiumChlorideMember2022-01-012022-12-310001421461ipi:MagnesiumChlorideMemberus-gaap:IntersegmentEliminationMember2022-01-012022-12-310001421461ipi:MagnesiumChlorideMember2022-01-012022-12-310001421461ipi:BrinesMemberipi:PotashMember2022-01-012022-12-310001421461ipi:TrioMemberipi:BrinesMember2022-01-012022-12-310001421461ipi:OilFieldServicesMemberipi:BrinesMember2022-01-012022-12-310001421461ipi:BrinesMemberus-gaap:IntersegmentEliminationMember2022-01-012022-12-310001421461ipi:BrinesMember2022-01-012022-12-310001421461us-gaap:ProductAndServiceOtherMemberipi:PotashMember2022-01-012022-12-310001421461ipi:TrioMemberus-gaap:ProductAndServiceOtherMember2022-01-012022-12-310001421461ipi:OilFieldServicesMemberus-gaap:ProductAndServiceOtherMember2022-01-012022-12-310001421461us-gaap:ProductAndServiceOtherMemberus-gaap:IntersegmentEliminationMember2022-01-012022-12-310001421461us-gaap:ProductAndServiceOtherMember2022-01-012022-12-310001421461us-gaap:MineralMemberipi:PotashMember2022-01-012022-12-310001421461ipi:TrioMemberus-gaap:MineralMember2022-01-012022-12-310001421461ipi:OilFieldServicesMemberus-gaap:MineralMember2022-01-012022-12-310001421461us-gaap:IntersegmentEliminationMember2022-01-012022-12-310001421461ipi:PotashMemberipi:PotashMember2021-01-012021-12-310001421461ipi:TrioMemberipi:PotashMember2021-01-012021-12-310001421461ipi:OilFieldServicesMemberipi:PotashMember2021-01-012021-12-310001421461ipi:PotashMemberus-gaap:IntersegmentEliminationMember2021-01-012021-12-310001421461ipi:PotashMember2021-01-012021-12-310001421461ipi:PotashMemberipi:TrioMember2021-01-012021-12-310001421461ipi:TrioMemberipi:TrioMember2021-01-012021-12-310001421461ipi:OilFieldServicesMemberipi:TrioMember2021-01-012021-12-310001421461us-gaap:IntersegmentEliminationMemberipi:TrioMember2021-01-012021-12-310001421461ipi:TrioMember2021-01-012021-12-310001421461ipi:WaterProductMemberipi:PotashMember2021-01-012021-12-310001421461ipi:TrioMemberipi:WaterProductMember2021-01-012021-12-310001421461ipi:OilFieldServicesMemberipi:WaterProductMember2021-01-012021-12-310001421461us-gaap:IntersegmentEliminationMemberipi:WaterProductMember2021-01-012021-12-310001421461ipi:WaterProductMember2021-01-012021-12-310001421461ipi:SaltMemberipi:PotashMember2021-01-012021-12-310001421461ipi:TrioMemberipi:SaltMember2021-01-012021-12-310001421461ipi:OilFieldServicesMemberipi:SaltMember2021-01-012021-12-310001421461us-gaap:IntersegmentEliminationMemberipi:SaltMember2021-01-012021-12-310001421461ipi:SaltMember2021-01-012021-12-310001421461ipi:MagnesiumChlorideMemberipi:PotashMember2021-01-012021-12-310001421461ipi:TrioMemberipi:MagnesiumChlorideMember2021-01-012021-12-310001421461ipi:OilFieldServicesMemberipi:MagnesiumChlorideMember2021-01-012021-12-310001421461ipi:MagnesiumChlorideMemberus-gaap:IntersegmentEliminationMember2021-01-012021-12-310001421461ipi:MagnesiumChlorideMember2021-01-012021-12-310001421461ipi:BrinesMemberipi:PotashMember2021-01-012021-12-310001421461ipi:TrioMemberipi:BrinesMember2021-01-012021-12-310001421461ipi:OilFieldServicesMemberipi:BrinesMember2021-01-012021-12-310001421461ipi:BrinesMemberus-gaap:IntersegmentEliminationMember2021-01-012021-12-310001421461ipi:BrinesMember2021-01-012021-12-310001421461us-gaap:ProductAndServiceOtherMemberipi:PotashMember2021-01-012021-12-310001421461ipi:TrioMemberus-gaap:ProductAndServiceOtherMember2021-01-012021-12-310001421461ipi:OilFieldServicesMemberus-gaap:ProductAndServiceOtherMember2021-01-012021-12-310001421461us-gaap:ProductAndServiceOtherMemberus-gaap:IntersegmentEliminationMember2021-01-012021-12-310001421461us-gaap:ProductAndServiceOtherMember2021-01-012021-12-310001421461us-gaap:MineralMemberipi:PotashMember2021-01-012021-12-310001421461ipi:TrioMemberus-gaap:MineralMember2021-01-012021-12-310001421461ipi:OilFieldServicesMemberus-gaap:MineralMember2021-01-012021-12-310001421461us-gaap:IntersegmentEliminationMember2021-01-012021-12-310001421461us-gaap:RestrictedStockMember2023-12-310001421461us-gaap:EmployeeStockOptionMember2023-12-310001421461us-gaap:RestrictedStockMemberipi:KeyEmployeesMemberipi:ServiceBasedVestingMember2023-01-012023-12-310001421461us-gaap:RestrictedStockMembersrt:DirectorMemberipi:ServiceBasedVestingMember2023-01-012023-12-310001421461us-gaap:RestrictedStockMemberipi:ServiceBasedVestingMember2023-01-012023-12-310001421461us-gaap:RestrictedStockMemberipi:ServiceBasedVestingMember2022-01-012022-12-310001421461us-gaap:RestrictedStockMemberipi:ServiceBasedVestingMember2021-01-012021-12-310001421461ipi:A2023Memberus-gaap:RestrictedStockMemberipi:ExecutiveMemberOneMemberipi:ServiceAndMarketConditionBasedVestingMember2023-01-012023-12-310001421461ipi:A2023Memberipi:ExecutiveMemberTwoMemberus-gaap:RestrictedStockMemberipi:ServiceAndMarketConditionBasedVestingMember2023-01-012023-12-310001421461us-gaap:RestrictedStockMemberipi:A2022Memberipi:ExecutiveMemberOneMemberipi:ServiceAndMarketConditionBasedVestingMember2023-01-012023-12-310001421461ipi:ExecutiveMemberTwoMemberus-gaap:RestrictedStockMemberipi:A2022Memberipi:ServiceAndMarketConditionBasedVestingMember2023-01-012023-12-310001421461us-gaap:RestrictedStockMemberipi:A2021Memberipi:ExecutiveMemberOneMemberipi:ServiceAndMarketConditionBasedVestingMember2023-01-012023-12-310001421461ipi:ExecutiveMemberTwoMemberus-gaap:RestrictedStockMemberipi:A2021Memberipi:ServiceAndMarketConditionBasedVestingMember2023-01-012023-12-310001421461ipi:A2020Memberus-gaap:RestrictedStockMembersrt:ExecutiveOfficerMemberipi:ServiceAndMarketConditionBasedVestingMember2023-01-012023-12-310001421461us-gaap:RestrictedStockMemberipi:ServiceAndMarketConditionBasedVestingMember2023-01-012023-12-310001421461us-gaap:RestrictedStockMemberipi:ServiceAndMarketConditionBasedVestingMember2022-01-012022-12-310001421461us-gaap:RestrictedStockMemberipi:ServiceAndMarketConditionBasedVestingMember2021-01-012021-12-310001421461us-gaap:RestrictedStockMemberipi:ServiceAndMarketConditionBasedVestingMember2023-12-310001421461us-gaap:RestrictedStockMemberipi:ServiceAndMarketConditionBasedVestingMember2022-12-310001421461us-gaap:RestrictedStockMemberipi:ServiceAndMarketConditionBasedVestingMember2021-12-310001421461us-gaap:RestrictedStockMember2022-12-310001421461us-gaap:EmployeeStockOptionMember2022-12-310001421461us-gaap:EmployeeStockOptionMember2023-01-012023-12-310001421461ipi:WaterRightsMember2022-03-012022-03-31utr:aft0001421461ipi:ProtestantsExpeditedInterSeProceedingMember2017-01-012017-12-310001421461ipi:WaterRightsMember2018-01-012018-12-310001421461ipi:WaterRightsMember2021-03-012021-03-310001421461ipi:WaterRightsMember2022-09-012022-09-300001421461ipi:WaterRightsMember2023-12-310001421461ipi:WaterRightsMember2022-12-310001421461us-gaap:CorporateDebtSecuritiesMember2023-12-310001421461us-gaap:USTreasuryAndGovernmentMember2023-12-310001421461us-gaap:CorporateDebtSecuritiesMember2022-12-310001421461us-gaap:USTreasuryAndGovernmentMember2022-12-310001421461ipi:EquityInvestmentWDVGLMember2021-12-310001421461ipi:EquityInvestmentWDVGLMember2022-12-310001421461ipi:EquityInvestmentWDVGLMember2023-12-310001421461ipi:EquityInvestmentWDVGLMember2022-07-310001421461ipi:EquityInvestmentOvationMember2023-12-310001421461ipi:EquityInvestmentOvationMember2022-12-310001421461ipi:EquityInvestmentOvationMember2021-12-310001421461ipi:EquityInvestmentOvationMember2023-01-012023-12-310001421461us-gaap:MineralMemberus-gaap:OperatingSegmentsMemberipi:PotashMember2023-01-012023-12-310001421461ipi:TrioMemberus-gaap:MineralMemberus-gaap:OperatingSegmentsMember2023-01-012023-12-310001421461ipi:OilFieldServicesMemberus-gaap:MineralMemberus-gaap:OperatingSegmentsMember2023-01-012023-12-310001421461us-gaap:MineralMemberus-gaap:IntersegmentEliminationMember2023-01-012023-12-310001421461us-gaap:CargoAndFreightMemberus-gaap:OperatingSegmentsMemberipi:PotashMember2023-01-012023-12-310001421461ipi:TrioMemberus-gaap:CargoAndFreightMemberus-gaap:OperatingSegmentsMember2023-01-012023-12-310001421461ipi:OilFieldServicesMemberus-gaap:CargoAndFreightMemberus-gaap:OperatingSegmentsMember2023-01-012023-12-310001421461us-gaap:CargoAndFreightMemberus-gaap:IntersegmentEliminationMember2023-01-012023-12-310001421461us-gaap:OperatingSegmentsMemberipi:WarehouseandHandlingMemberipi:PotashMember2023-01-012023-12-310001421461ipi:TrioMemberus-gaap:OperatingSegmentsMemberipi:WarehouseandHandlingMember2023-01-012023-12-310001421461ipi:OilFieldServicesMemberus-gaap:OperatingSegmentsMemberipi:WarehouseandHandlingMember2023-01-012023-12-310001421461us-gaap:IntersegmentEliminationMemberipi:WarehouseandHandlingMember2023-01-012023-12-310001421461us-gaap:OperatingSegmentsMemberipi:PotashMember2023-01-012023-12-310001421461ipi:TrioMemberus-gaap:OperatingSegmentsMember2023-01-012023-12-310001421461ipi:OilFieldServicesMemberus-gaap:OperatingSegmentsMember2023-01-012023-12-310001421461us-gaap:MineralMemberus-gaap:OperatingSegmentsMemberipi:PotashMember2022-01-012022-12-310001421461ipi:TrioMemberus-gaap:MineralMemberus-gaap:OperatingSegmentsMember2022-01-012022-12-310001421461ipi:OilFieldServicesMemberus-gaap:MineralMemberus-gaap:OperatingSegmentsMember2022-01-012022-12-310001421461us-gaap:MineralMemberus-gaap:IntersegmentEliminationMember2022-01-012022-12-310001421461us-gaap:CargoAndFreightMemberus-gaap:OperatingSegmentsMemberipi:PotashMember2022-01-012022-12-310001421461ipi:TrioMemberus-gaap:CargoAndFreightMemberus-gaap:OperatingSegmentsMember2022-01-012022-12-310001421461ipi:OilFieldServicesMemberus-gaap:CargoAndFreightMemberus-gaap:OperatingSegmentsMember2022-01-012022-12-310001421461us-gaap:CargoAndFreightMemberus-gaap:IntersegmentEliminationMember2022-01-012022-12-310001421461us-gaap:OperatingSegmentsMemberipi:WarehouseandHandlingMemberipi:PotashMember2022-01-012022-12-310001421461ipi:TrioMemberus-gaap:OperatingSegmentsMemberipi:WarehouseandHandlingMember2022-01-012022-12-310001421461ipi:OilFieldServicesMemberus-gaap:OperatingSegmentsMemberipi:WarehouseandHandlingMember2022-01-012022-12-310001421461us-gaap:IntersegmentEliminationMemberipi:WarehouseandHandlingMember2022-01-012022-12-310001421461us-gaap:OperatingSegmentsMemberipi:PotashMember2022-01-012022-12-310001421461ipi:TrioMemberus-gaap:OperatingSegmentsMember2022-01-012022-12-310001421461ipi:OilFieldServicesMemberus-gaap:OperatingSegmentsMember2022-01-012022-12-310001421461us-gaap:MineralMemberus-gaap:OperatingSegmentsMemberipi:PotashMember2021-01-012021-12-310001421461ipi:TrioMemberus-gaap:MineralMemberus-gaap:OperatingSegmentsMember2021-01-012021-12-310001421461ipi:OilFieldServicesMemberus-gaap:MineralMemberus-gaap:OperatingSegmentsMember2021-01-012021-12-310001421461us-gaap:MineralMemberus-gaap:IntersegmentEliminationMember2021-01-012021-12-310001421461us-gaap:CargoAndFreightMemberus-gaap:OperatingSegmentsMemberipi:PotashMember2021-01-012021-12-310001421461ipi:TrioMemberus-gaap:CargoAndFreightMemberus-gaap:OperatingSegmentsMember2021-01-012021-12-310001421461ipi:OilFieldServicesMemberus-gaap:CargoAndFreightMemberus-gaap:OperatingSegmentsMember2021-01-012021-12-310001421461us-gaap:CargoAndFreightMemberus-gaap:IntersegmentEliminationMember2021-01-012021-12-310001421461us-gaap:OperatingSegmentsMemberipi:WarehouseandHandlingMemberipi:PotashMember2021-01-012021-12-310001421461ipi:TrioMemberus-gaap:OperatingSegmentsMemberipi:WarehouseandHandlingMember2021-01-012021-12-310001421461ipi:OilFieldServicesMemberus-gaap:OperatingSegmentsMemberipi:WarehouseandHandlingMember2021-01-012021-12-310001421461us-gaap:IntersegmentEliminationMemberipi:WarehouseandHandlingMember2021-01-012021-12-310001421461us-gaap:OperatingSegmentsMemberipi:PotashMember2021-01-012021-12-310001421461ipi:TrioMemberus-gaap:OperatingSegmentsMember2021-01-012021-12-310001421461ipi:OilFieldServicesMemberus-gaap:OperatingSegmentsMember2021-01-012021-12-310001421461us-gaap:MineralMemberus-gaap:OperatingSegmentsMember2023-01-012023-12-310001421461us-gaap:MineralMemberus-gaap:OperatingSegmentsMember2022-01-012022-12-310001421461us-gaap:MineralMemberus-gaap:OperatingSegmentsMember2021-01-012021-12-31ipi:marketsipi:customer0001421461us-gaap:GeographicConcentrationRiskMemberus-gaap:SalesRevenueNetMembercountry:US2023-01-012023-12-310001421461us-gaap:GeographicConcentrationRiskMemberus-gaap:SalesRevenueNetMembercountry:US2022-01-012022-12-310001421461us-gaap:GeographicConcentrationRiskMemberus-gaap:SalesRevenueNetMembercountry:US2021-01-012021-12-3100014214612022-02-2800014214612023-12-122023-12-120001421461us-gaap:SubsequentEventMember2024-01-022024-01-020001421461us-gaap:ValuationAllowanceOfDeferredTaxAssetsMember2020-12-310001421461us-gaap:ValuationAllowanceOfDeferredTaxAssetsMember2021-01-012021-12-310001421461us-gaap:ValuationAllowanceOfDeferredTaxAssetsMember2021-12-310001421461us-gaap:InventoryValuationReserveMember2020-12-310001421461us-gaap:InventoryValuationReserveMember2021-01-012021-12-310001421461us-gaap:InventoryValuationReserveMember2021-12-310001421461us-gaap:AllowanceForCreditLossMember2020-12-310001421461us-gaap:AllowanceForCreditLossMember2021-01-012021-12-310001421461us-gaap:AllowanceForCreditLossMember2021-12-310001421461us-gaap:ValuationAllowanceOfDeferredTaxAssetsMember2022-01-012022-12-310001421461us-gaap:ValuationAllowanceOfDeferredTaxAssetsMember2022-12-310001421461us-gaap:InventoryValuationReserveMember2022-01-012022-12-310001421461us-gaap:InventoryValuationReserveMember2022-12-310001421461us-gaap:AllowanceForCreditLossMember2022-01-012022-12-310001421461us-gaap:AllowanceForCreditLossMember2022-12-310001421461us-gaap:ValuationAllowanceOfDeferredTaxAssetsMember2023-01-012023-12-310001421461us-gaap:ValuationAllowanceOfDeferredTaxAssetsMember2023-12-310001421461us-gaap:InventoryValuationReserveMember2023-01-012023-12-310001421461us-gaap:InventoryValuationReserveMember2023-12-310001421461us-gaap:AllowanceForCreditLossMember2023-01-012023-12-310001421461us-gaap:AllowanceForCreditLossMember2023-12-3100014214612023-10-012023-12-31
UNITED STATES
SECURITIES AND EXCHANGE COMMISSION
Washington, D.C. 20549
FORM 10-K
|
|
|
|
|
|
|
|
|
|
|
|
| ☒ |
Annual Report Pursuant to Section 13 or 15(d) of the Securities Exchange Act of 1934 |
For the fiscal year ended December 31, 2023
|
|
|
|
|
|
| or |
| ☐ |
Transition Report Pursuant to Section 13 or 15(d) of the Securities Exchange Act of 1934 |
For the transition period from to
Commission File Number: 001-34025
INTREPID POTASH, INC.
(Exact Name of Registrant as Specified in its Charter)
|
|
|
|
|
|
Delaware |
26-1501877 |
(State or other jurisdiction of
incorporation or organization) |
(I.R.S. Employer
Identification No.) |
| 707 17th Street, Suite 4200 |
|
| Denver, |
|
| Colorado |
80202 |
(Address of principal executive offices) |
(Zip Code) |
(303) 296-3006
(Registrant's telephone number, including area code)
Securities registered pursuant to Section 12(b) of the Act:
|
|
|
|
|
|
|
|
|
Title of each class |
Trading Symbol |
Name of each exchange on which registered |
Common Stock, par value $0.001 per share |
IPI |
New York Stock Exchange |
Securities registered pursuant to Section 12(g) of the Act: None
Indicate by check mark if the registrant is a well-known seasoned issuer, as defined in Rule 405 of the Securities Act. Yes ¨ No x
Indicate by check mark if the registrant is not required to file reports pursuant to Section 13 or 15(d) of the Act. Yes ¨ No x
Indicate by check mark whether the registrant (1) has filed all reports required to be filed by Section 13 or 15(d) of the Securities Exchange Act of 1934 during the preceding 12 months (or for such shorter period that the registrant was required to file such reports), and (2) has been subject to such filing requirements for the past 90 days. Yes x No ¨
Indicate by check mark whether the registrant has submitted electronically every Interactive Data File required to be submitted pursuant to Rule 405 of Regulation S-T (§ 232.405 of this chapter) during the preceding 12 months (or for such shorter period that the registrant was required to submit and post such files.) Yes x No ¨
Indicate by check mark whether the registrant is a large accelerated filer, an accelerated filer, a non-accelerated filer, smaller reporting company, or an emerging growth company. See the definitions of "large accelerated filer," "accelerated filer," "smaller reporting company," and "emerging growth company" in Rule 12b-2 of the Exchange Act.
|
|
|
|
|
|
|
|
|
|
|
|
|
|
|
|
|
|
|
|
|
|
|
|
| Large accelerated filer |
¨ |
Accelerated filer |
x |
Non-accelerated filer |
¨ |
|
|
| Smaller reporting company |
¨ |
Emerging growth company |
¨ |
|
|
|
|
If an emerging growth company, indicate by check mark if the registrant has elected not to use the extended transition period for complying with any new or revised financial accounting standards provided pursuant to Section 13(a) of the Exchange Act. ¨
Indicate by check mark whether the registrant has filed a report on and attestation to its management's assessment of the effectiveness of its internal control over financial reporting under Section 404(b) of the Sarbanes-Oxley Act (15 U.S.C. 7262(b)) by the registered public accounting firm that prepared or issued its audit report. x
If securities are registered pursuant to Section 12(b) of the Act, indicate by check mark whether the financial statements of the registrant included in the filing reflect the correction of an error to previously issued financial statements. ☐
Indicate by check mark whether any of those error corrections are restatements that required a recovery analysis of incentive-based compensation received by any of the registrant's executive officers during the relevant recovery period pursuant to Section 240.10D-1(b). ☐
Indicate by check mark whether the registrant is a shell company (as defined by Rule 12b-2 of the Act).
Yes ☐ No x The aggregate market value of the registrant's common stock held by non-affiliates of the registrant, based upon the closing sale price of the common stock on June 30, 2023, the last trading day of the registrant's most recently completed second fiscal quarter, of $22.69 per share as reported on the New York Stock Exchange was $247 million. Shares of common stock held by each director and executive officer and by each person who owns 10% or more of the registrant's outstanding common stock and is believed by the registrant to be in a control position were excluded. The determination of affiliate status for this purpose is not a conclusive determination of affiliate status for any other purposes.
As of February 29, 2024, the registrant had 13,141,035 shares of common stock, par value $0.001, outstanding.
DOCUMENTS INCORPORATED BY REFERENCE
Certain information required by Part III of this report is incorporated by reference from portions of the registrant's definitive proxy statement relating to its 2024 annual meeting of stockholders to be filed within 120 days after December 31, 2023.
INTREPID POTASH, INC.
TABLE OF CONTENTS
PART I
Unless the context otherwise requires, the following definitions apply throughout this Annual Report on Form 10-K (the "Annual Report"):
•"Intrepid," "our," "we," or "us" means Intrepid Potash, Inc. and its consolidated subsidiaries.
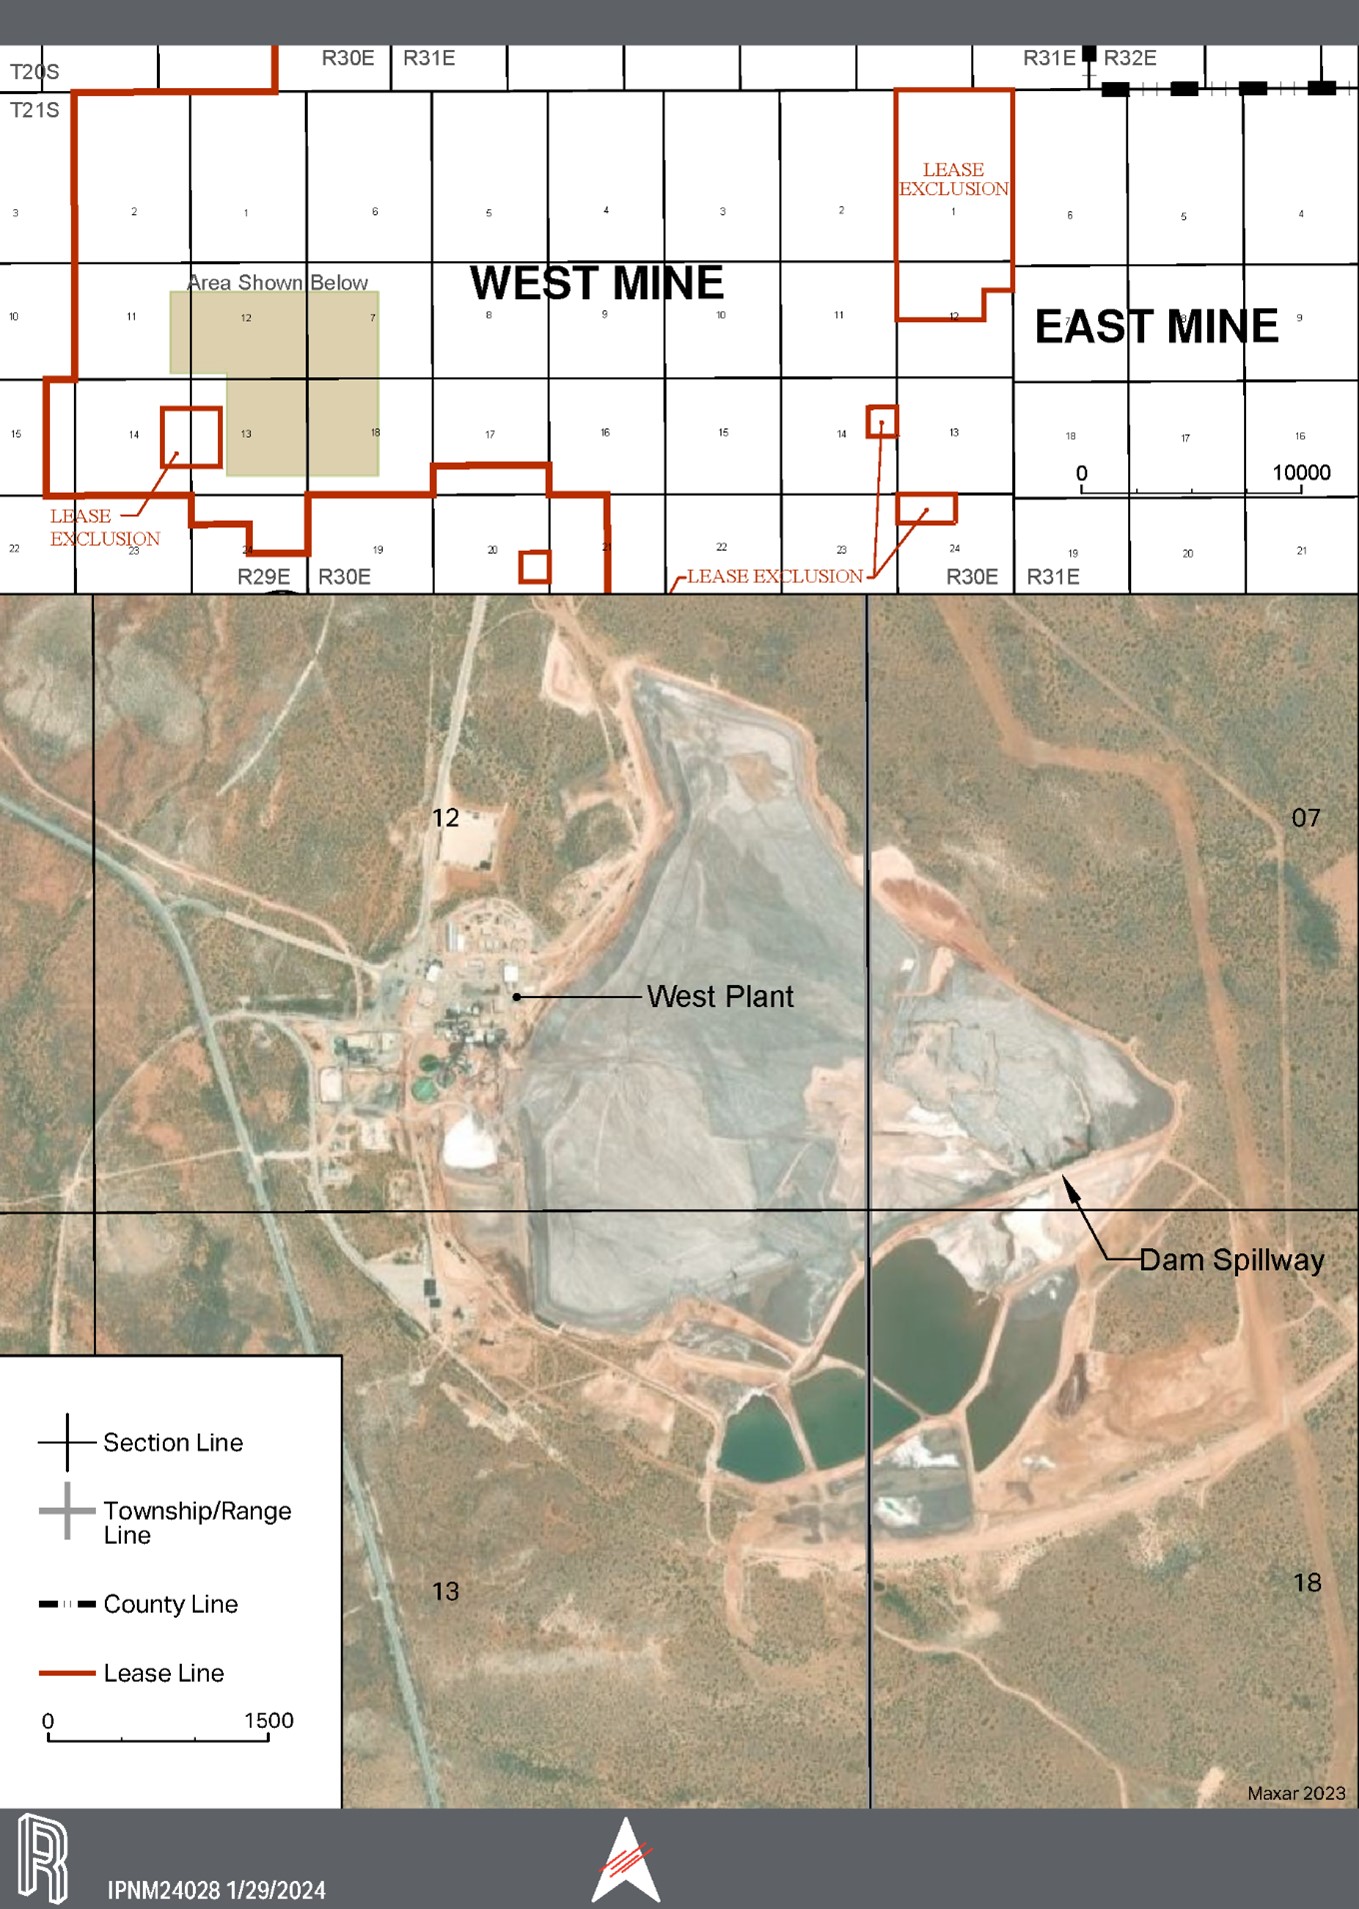
•"East," "North," and "HB" mean our three operating facilities in Carlsbad, New Mexico. "Moab" means our operating facility in Moab, Utah. "Wendover" means our operating facility in Wendover, Utah. "West" means our previous operating facility in Carlsbad, New Mexico, which has been in care-and-maintenance since mid‑2016. "Intrepid South" refers to certain land, water rights, and other related assets in southeast New Mexico which we acquired from Dinwiddie Cattle Company in May 2019. You can find more information about our facilities in Item 2 of this Annual Report.
•"Ton" means a short ton, or a measurement of mass equal to 2,000 pounds.
To supplement our consolidated financial statements, which are presented in this Annual Report and which are prepared and presented in accordance with generally accepted accounting principles ("GAAP"), we use "average net realized sales price per ton," which is a non‑GAAP financial measure to monitor and evaluate our performance. You can find more information about average net realized sales price per ton, including a reconciliation of this measure to the most comparable GAAP measure, in Item 7. Management's Discussion and Analysis of Financial Condition and Results of Operations under the heading "Non-GAAP Financial Measure."
CAUTIONARY NOTE REGARDING FORWARD‑LOOKING STATEMENTS
This Annual Report contains forward‑looking statements within the meaning of the Securities Exchange Act of 1934, as amended (the "Exchange Act"), and the Securities Act of 1933, as amended. These forward‑looking statements are made pursuant to the safe harbor provisions of the Private Securities Litigation Reform Act of 1995. All statements in this Annual Report other than statements of historical fact are forward‑looking statements. Forward-looking statements include, but are not limited to, statements about, among other things, our future results of operations and financial position, our business strategy and plans, our environmental, safety and governance ("ESG") initiatives and our objectives for future operations. In some cases, you can identify these statements by forward‑looking words, such as "estimate," "expect," "anticipate," "project," "plan," "intend," "believe," "forecast," "foresee," "likely," "may," "should," "goal," "target," "might," "will," "could," "predict," and "continue." Forward‑looking statements are only predictions based on our current knowledge, expectations, and projections about future events.
These forward-looking statements are subject to a number of risks, uncertainties, and assumptions, including the following:
•changes in the price, demand, or supply of our products and services;
•challenges and legal proceedings related to our water rights;
•our ability to successfully identify and implement any opportunities to grow our business whether through expanded sales of water, Trio®, byproducts, and other non-potassium related products or other revenue diversification activities;
•the costs of, and our ability to successfully execute, any strategic projects;
•declines or changes in agricultural production or fertilizer application rates;
•declines in the use of potassium-related products or water by oil and gas companies in their drilling operations;
•our ability to prevail in outstanding legal proceedings against us;
•our ability to comply with the terms of our revolving credit facility, including the underlying covenants;
•further write-downs of the carrying value of assets, including inventories;
•circumstances that disrupt or limit production, including operational difficulties or variances, geological or geotechnical variances, equipment failures, environmental hazards, and other unexpected events or problems;
•changes in reserve estimates;
•currency fluctuations;
•adverse changes in economic conditions or credit markets;
•the impact of governmental regulations, including environmental and mining regulations, the enforcement of those regulations, and governmental policy changes;
•adverse weather events, including events affecting precipitation and evaporation rates at our solar solution mines;
•increased labor costs or difficulties in hiring and retaining qualified employees and contractors, including workers with mining, mineral processing, or construction expertise;
•changes in the prices of raw materials, including chemicals, natural gas, and power;
•our ability to obtain and maintain any necessary governmental permits or leases relating to current or future operations;
•interruptions in rail or truck transportation services, or fluctuations in the costs of these services;
•our inability to fund necessary capital investments;
•the impact of global health issues and other global disruptions on our business, operations, liquidity, financial condition and results of operations; and
•the other risks, uncertainties, and assumptions described in Item 1A. Risk Factors in this Annual Report.
In addition, new risks emerge from time to time. It is not possible for our management to predict all risks that may cause actual results to differ materially from those contained in any forward-looking statements we may make.
In light of these risks, uncertainties, and assumptions, the future events and trends discussed in this Annual Report may not occur and actual results could differ materially and adversely from those anticipated or implied in these forward-looking statements. As a result, you should not place undue reliance on these forward-looking statements. We undertake no obligation to publicly update any forward-looking statements, except as required by law.
ITEM 1.BUSINESS
General
We are a diversified mineral company that delivers potassium, magnesium, sulfur, salt, and water products essential for customer success in agriculture, animal feed and the oil and gas industry. We are the only U.S. producer of muriate of potash (sometimes referred to as potassium chloride or potash), which is applied as an essential nutrient for healthy crop development, utilized in several industrial applications, and used as an ingredient in animal feed. In addition, we produce a specialty fertilizer, Trio®, which delivers three key nutrients, potassium, magnesium, and sulfur, in a single particle. We also provide water, magnesium chloride, brine and various oilfield products and services.
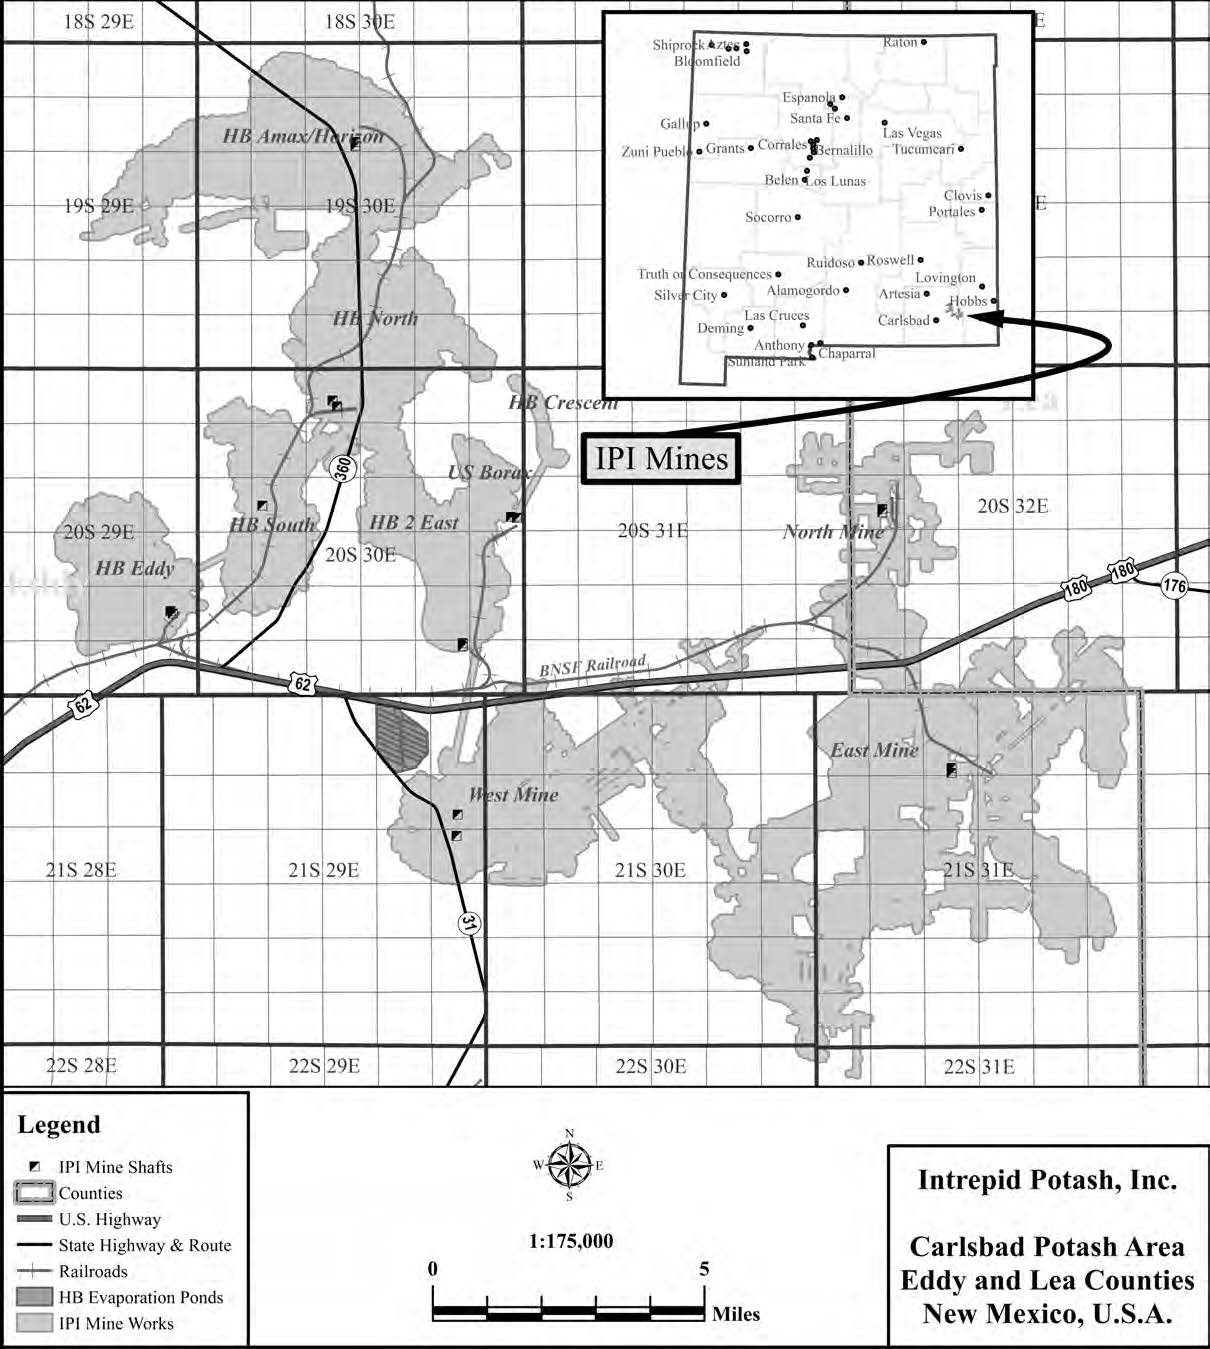
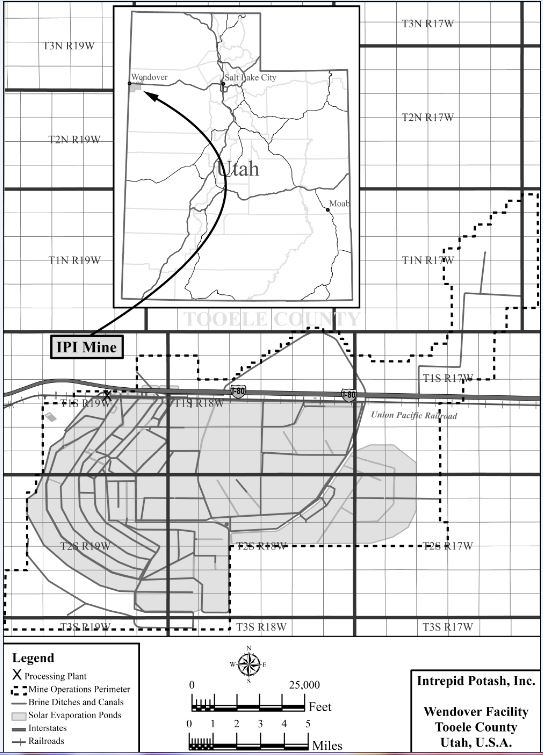
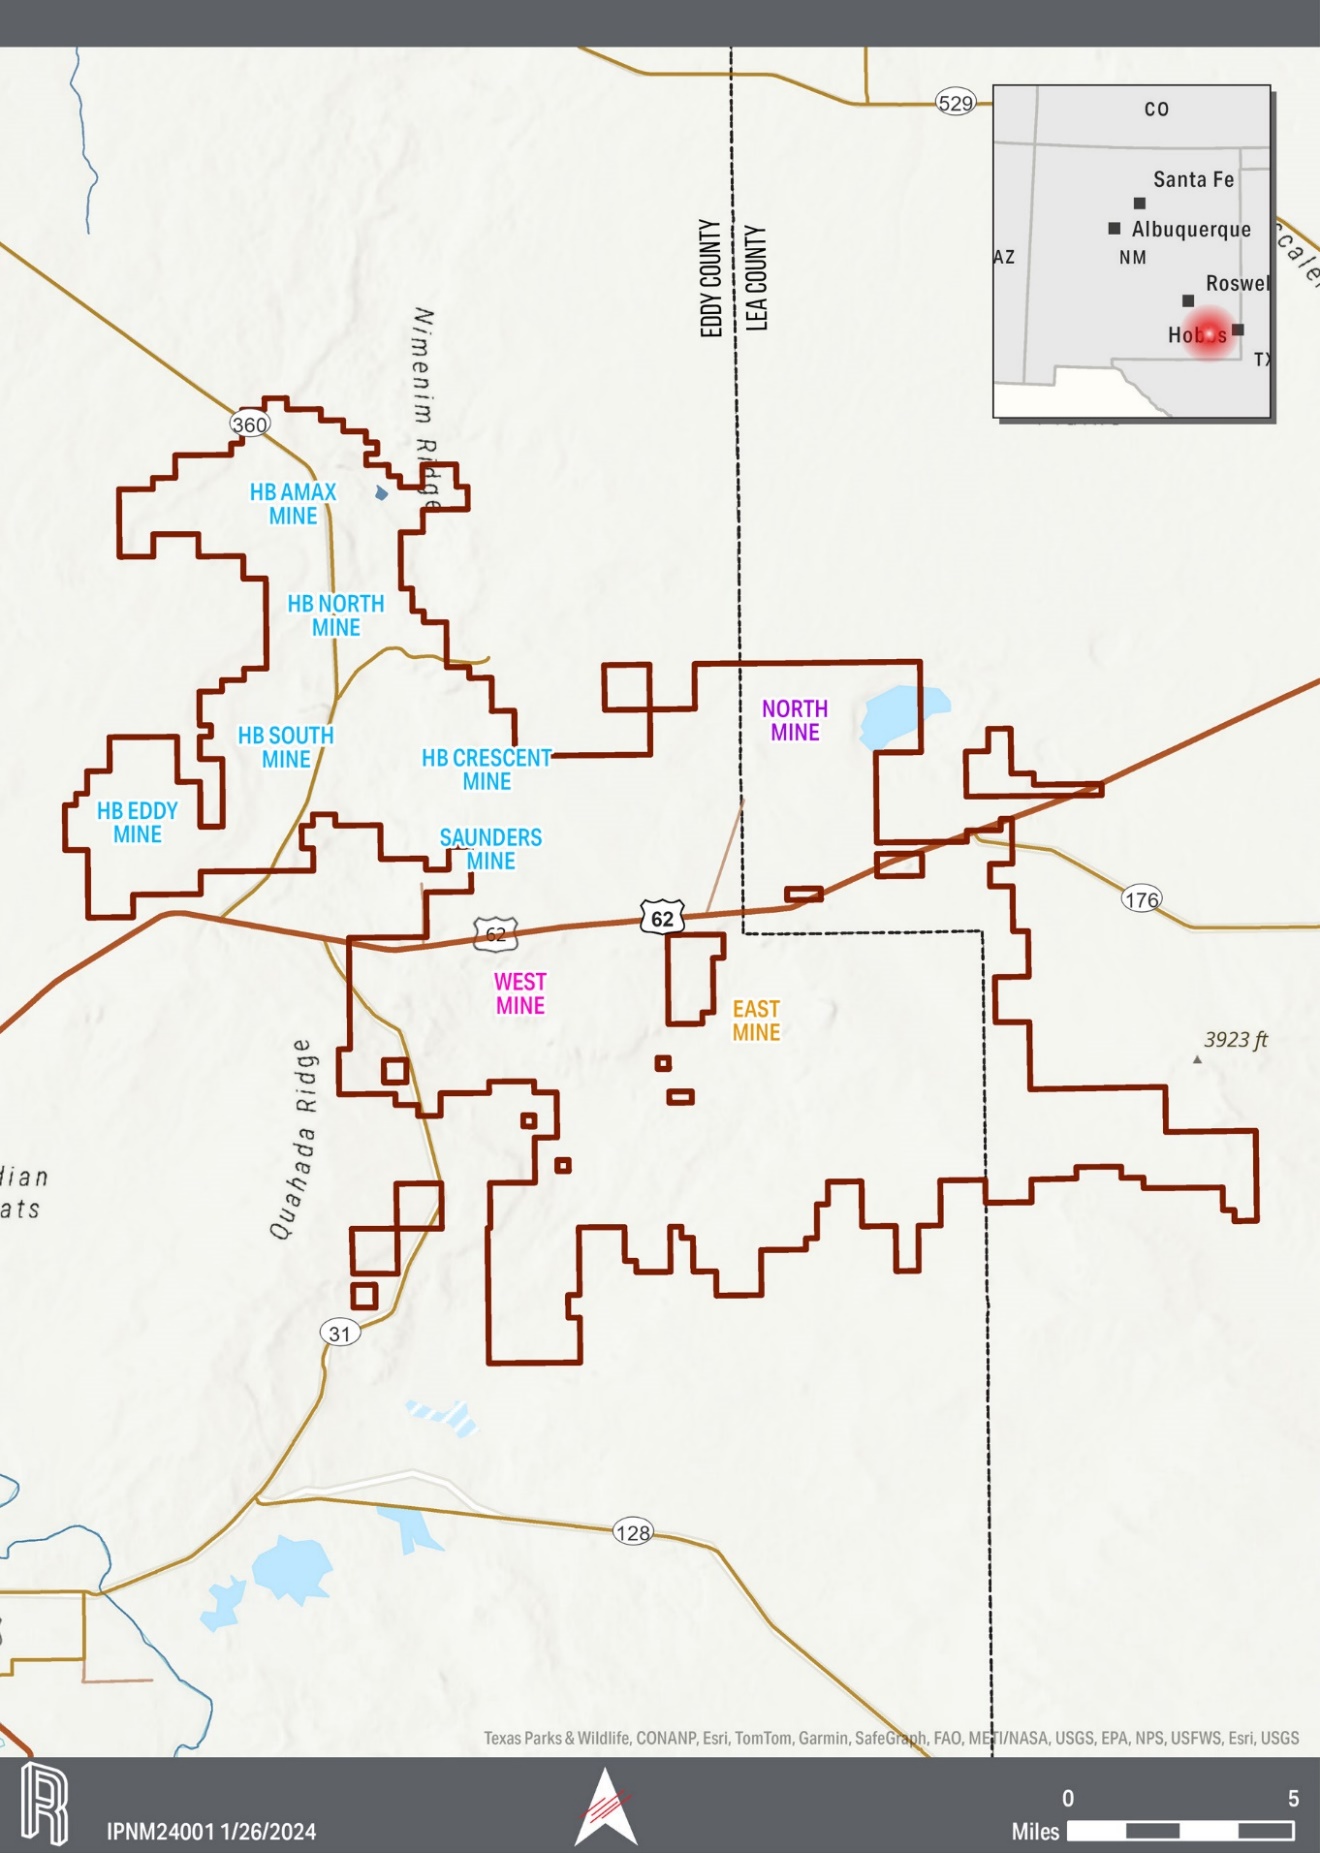
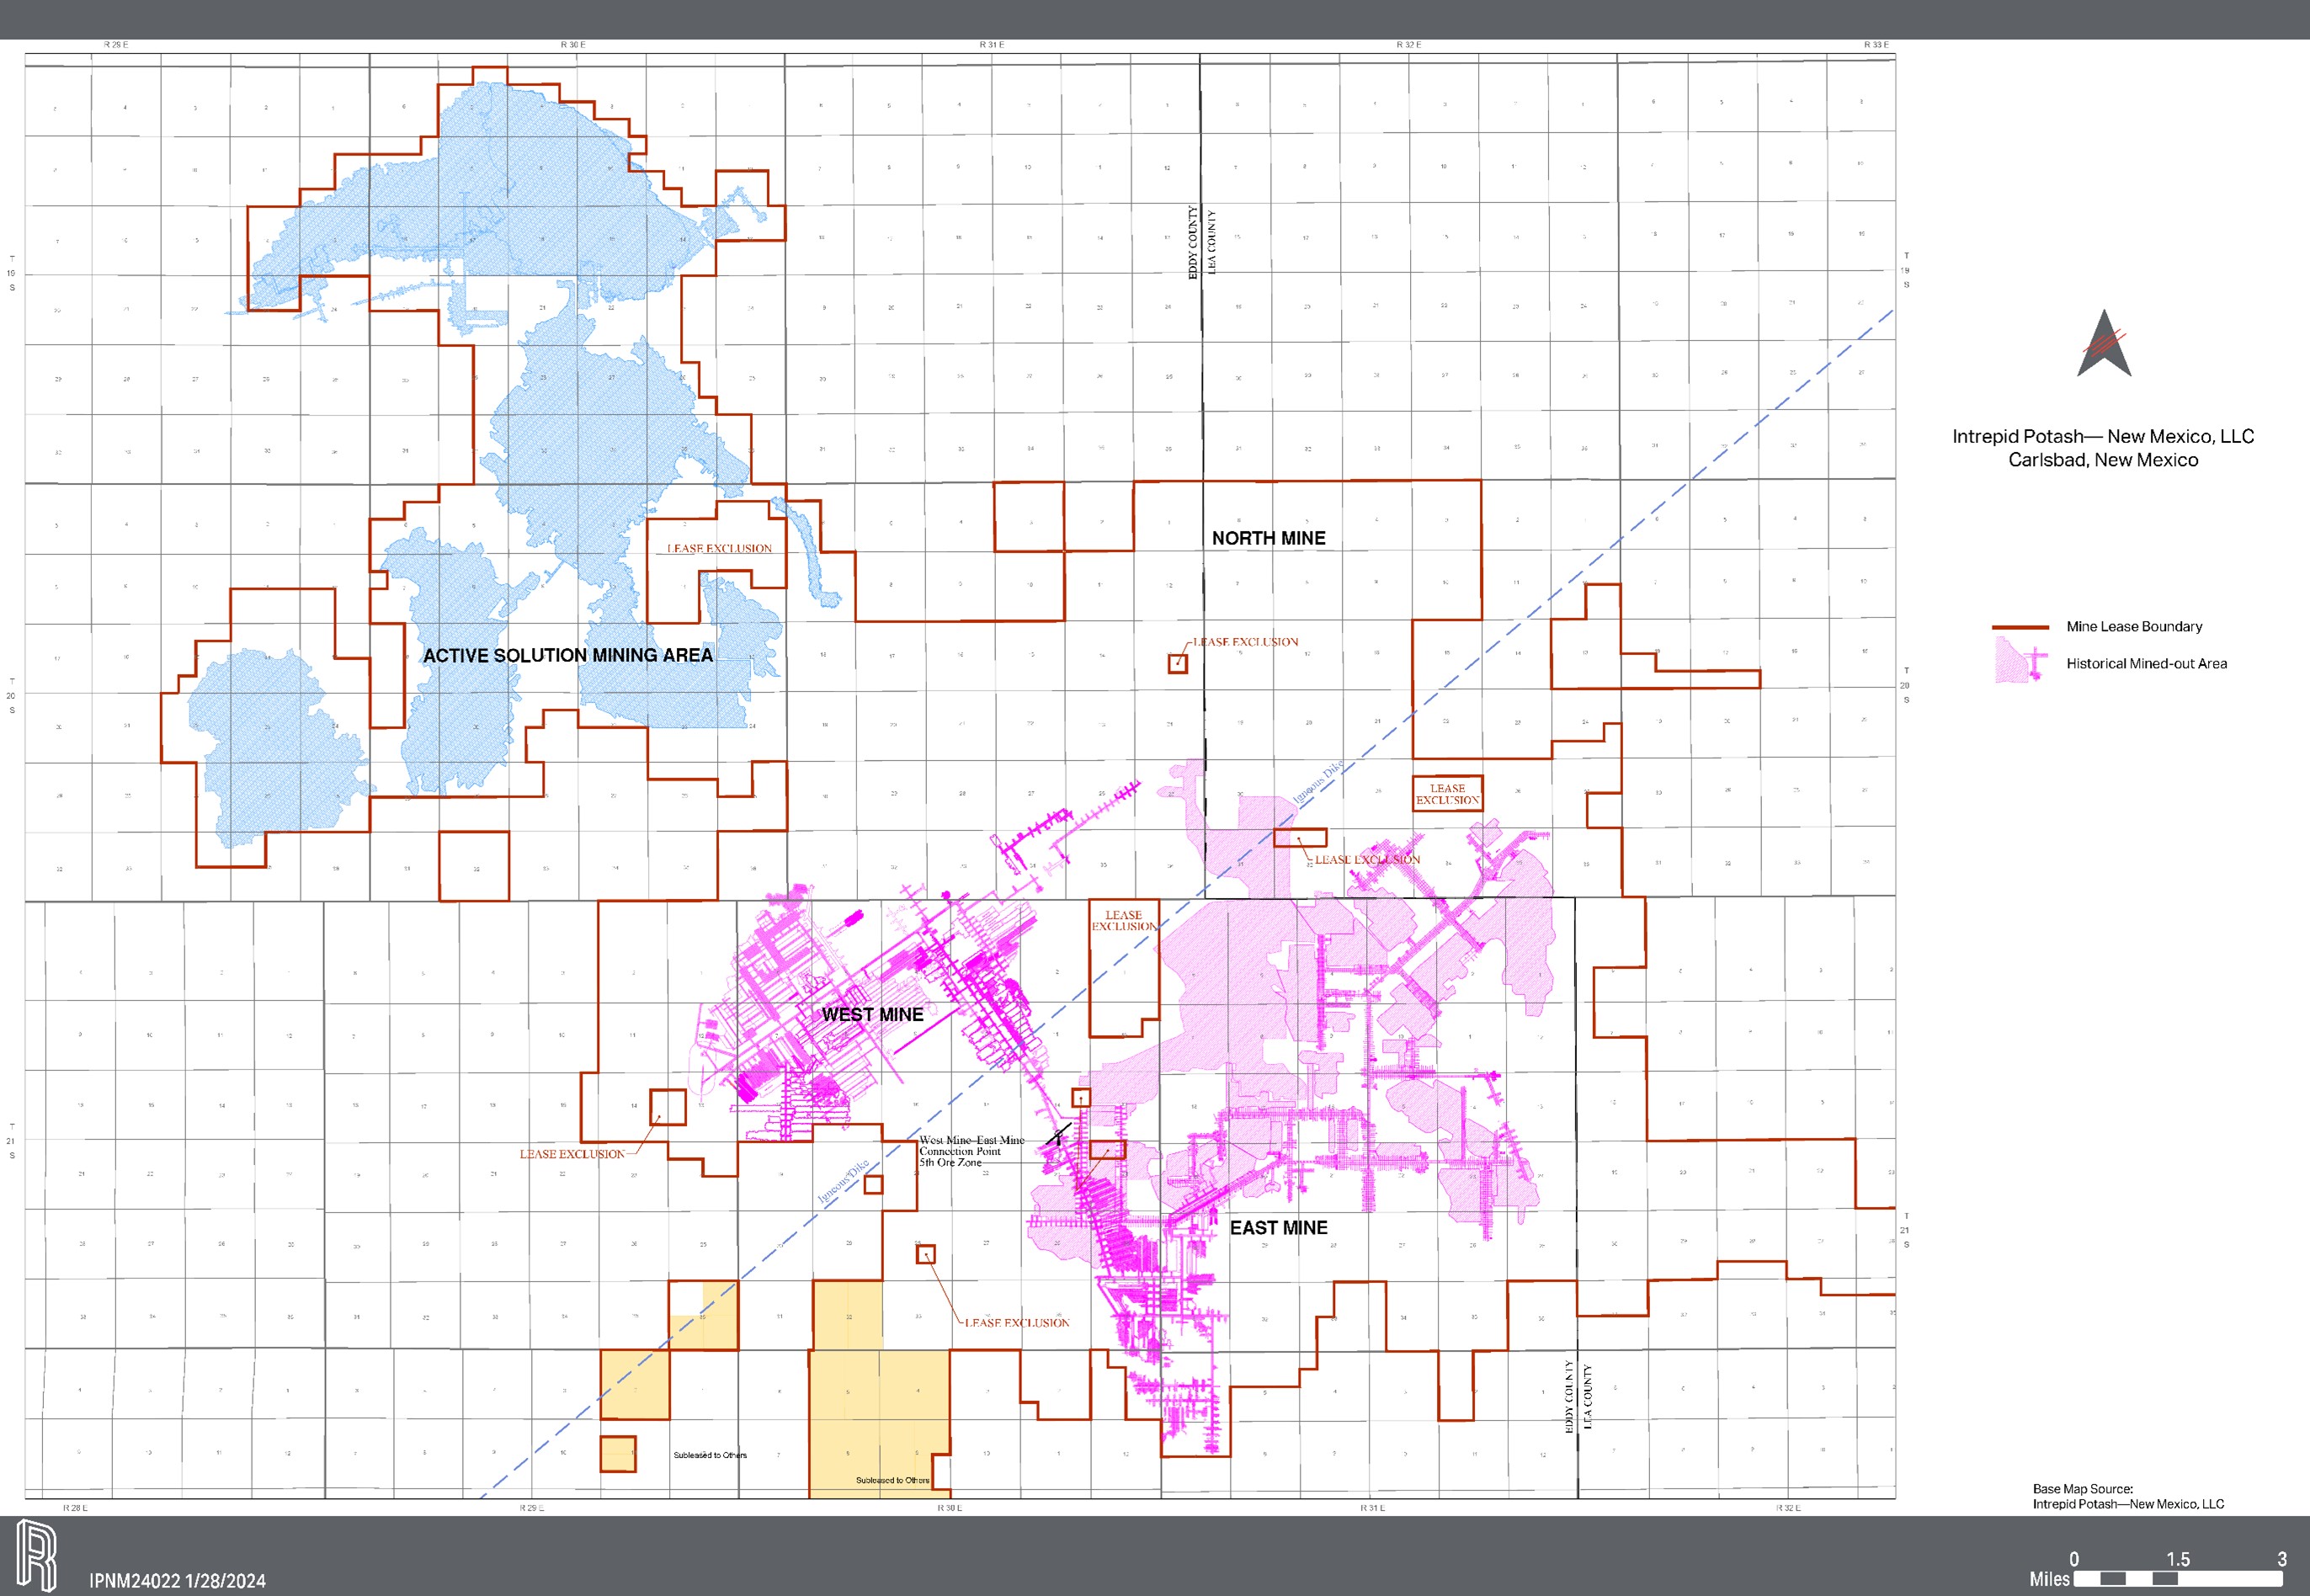
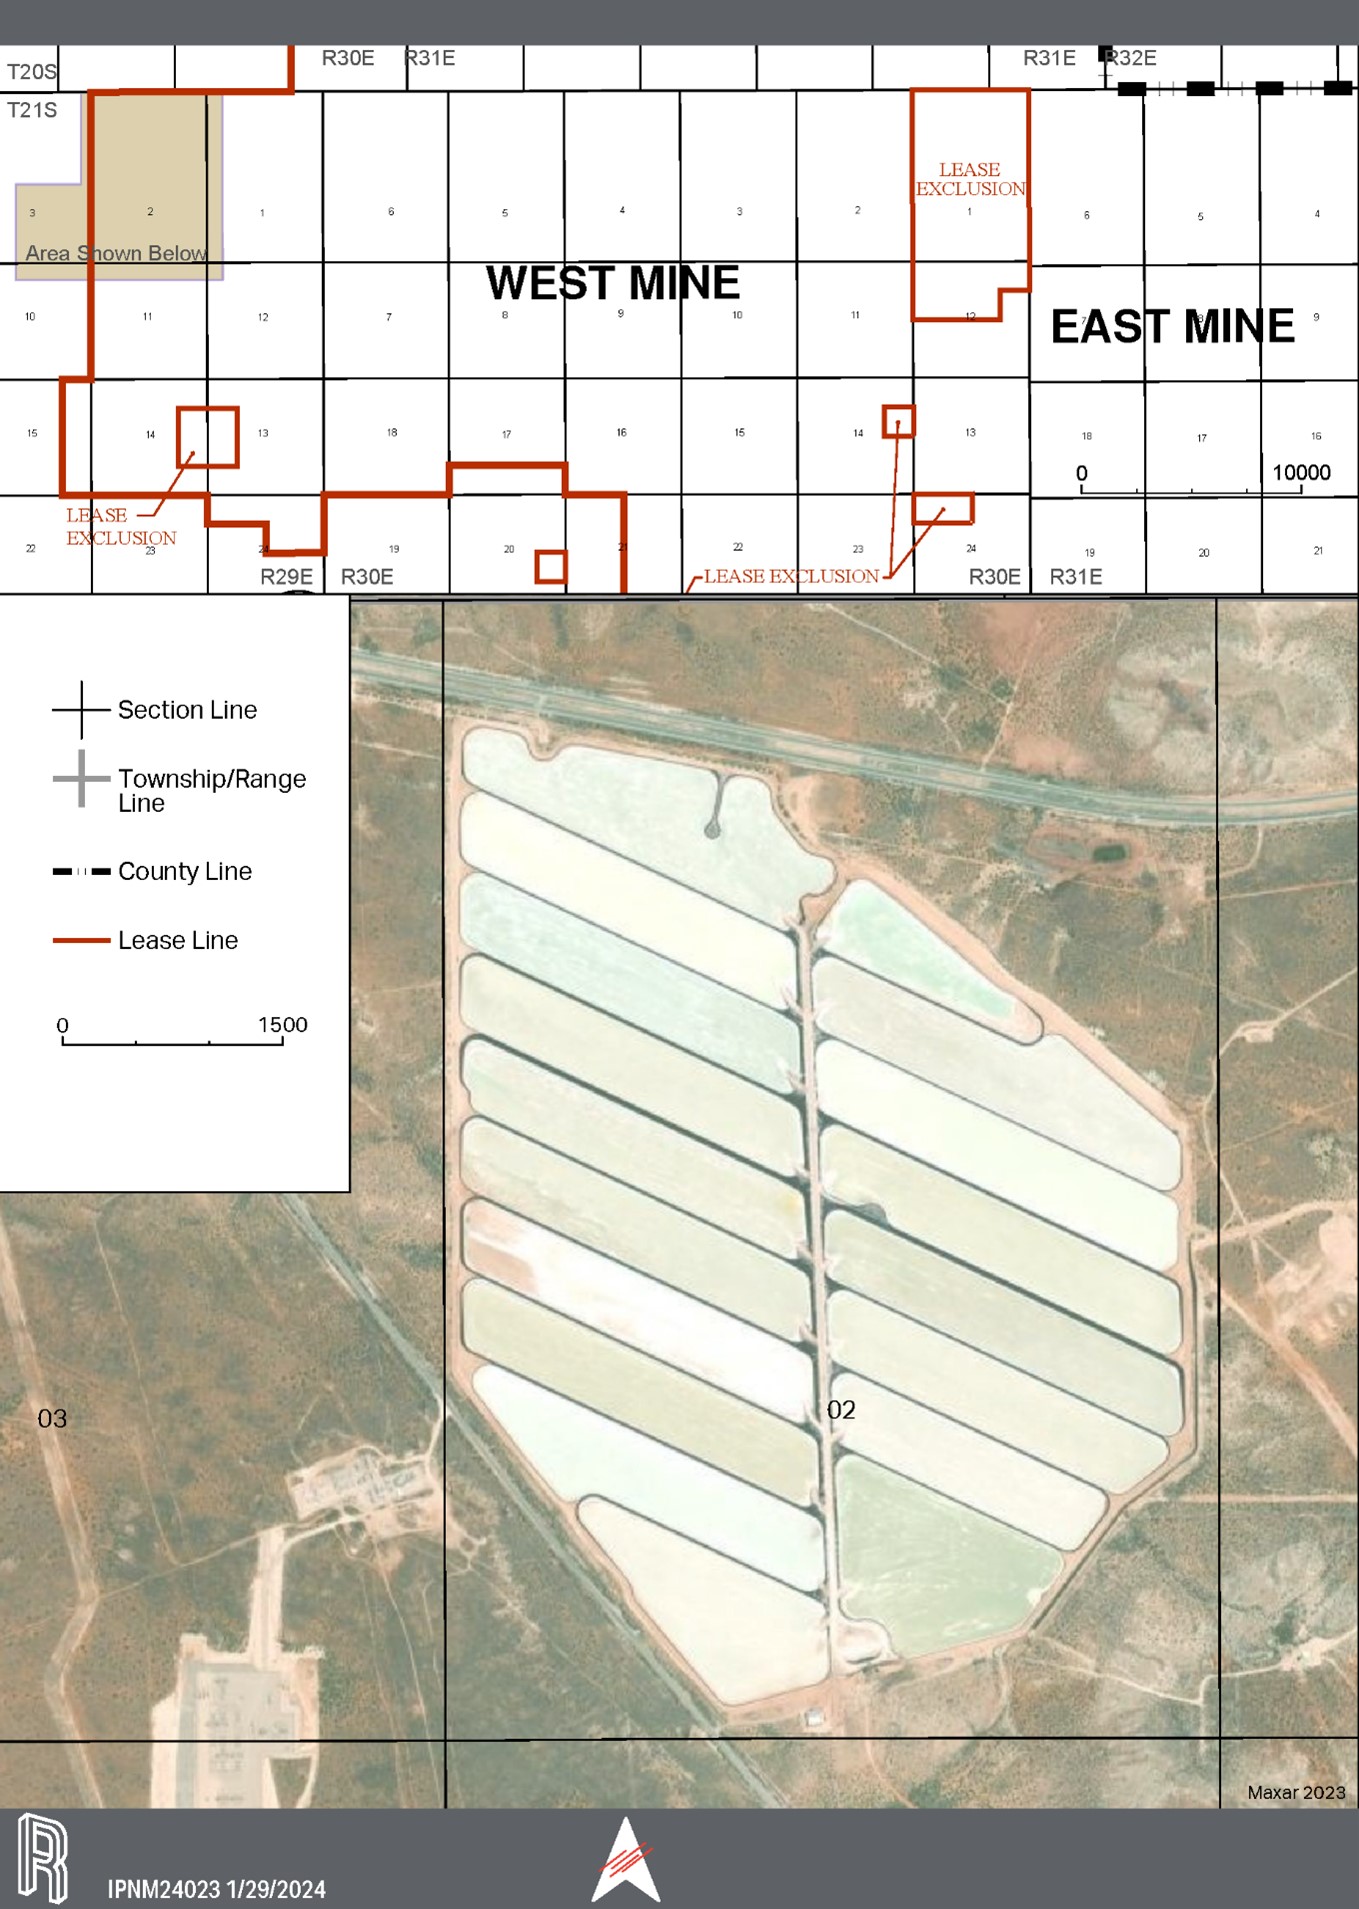
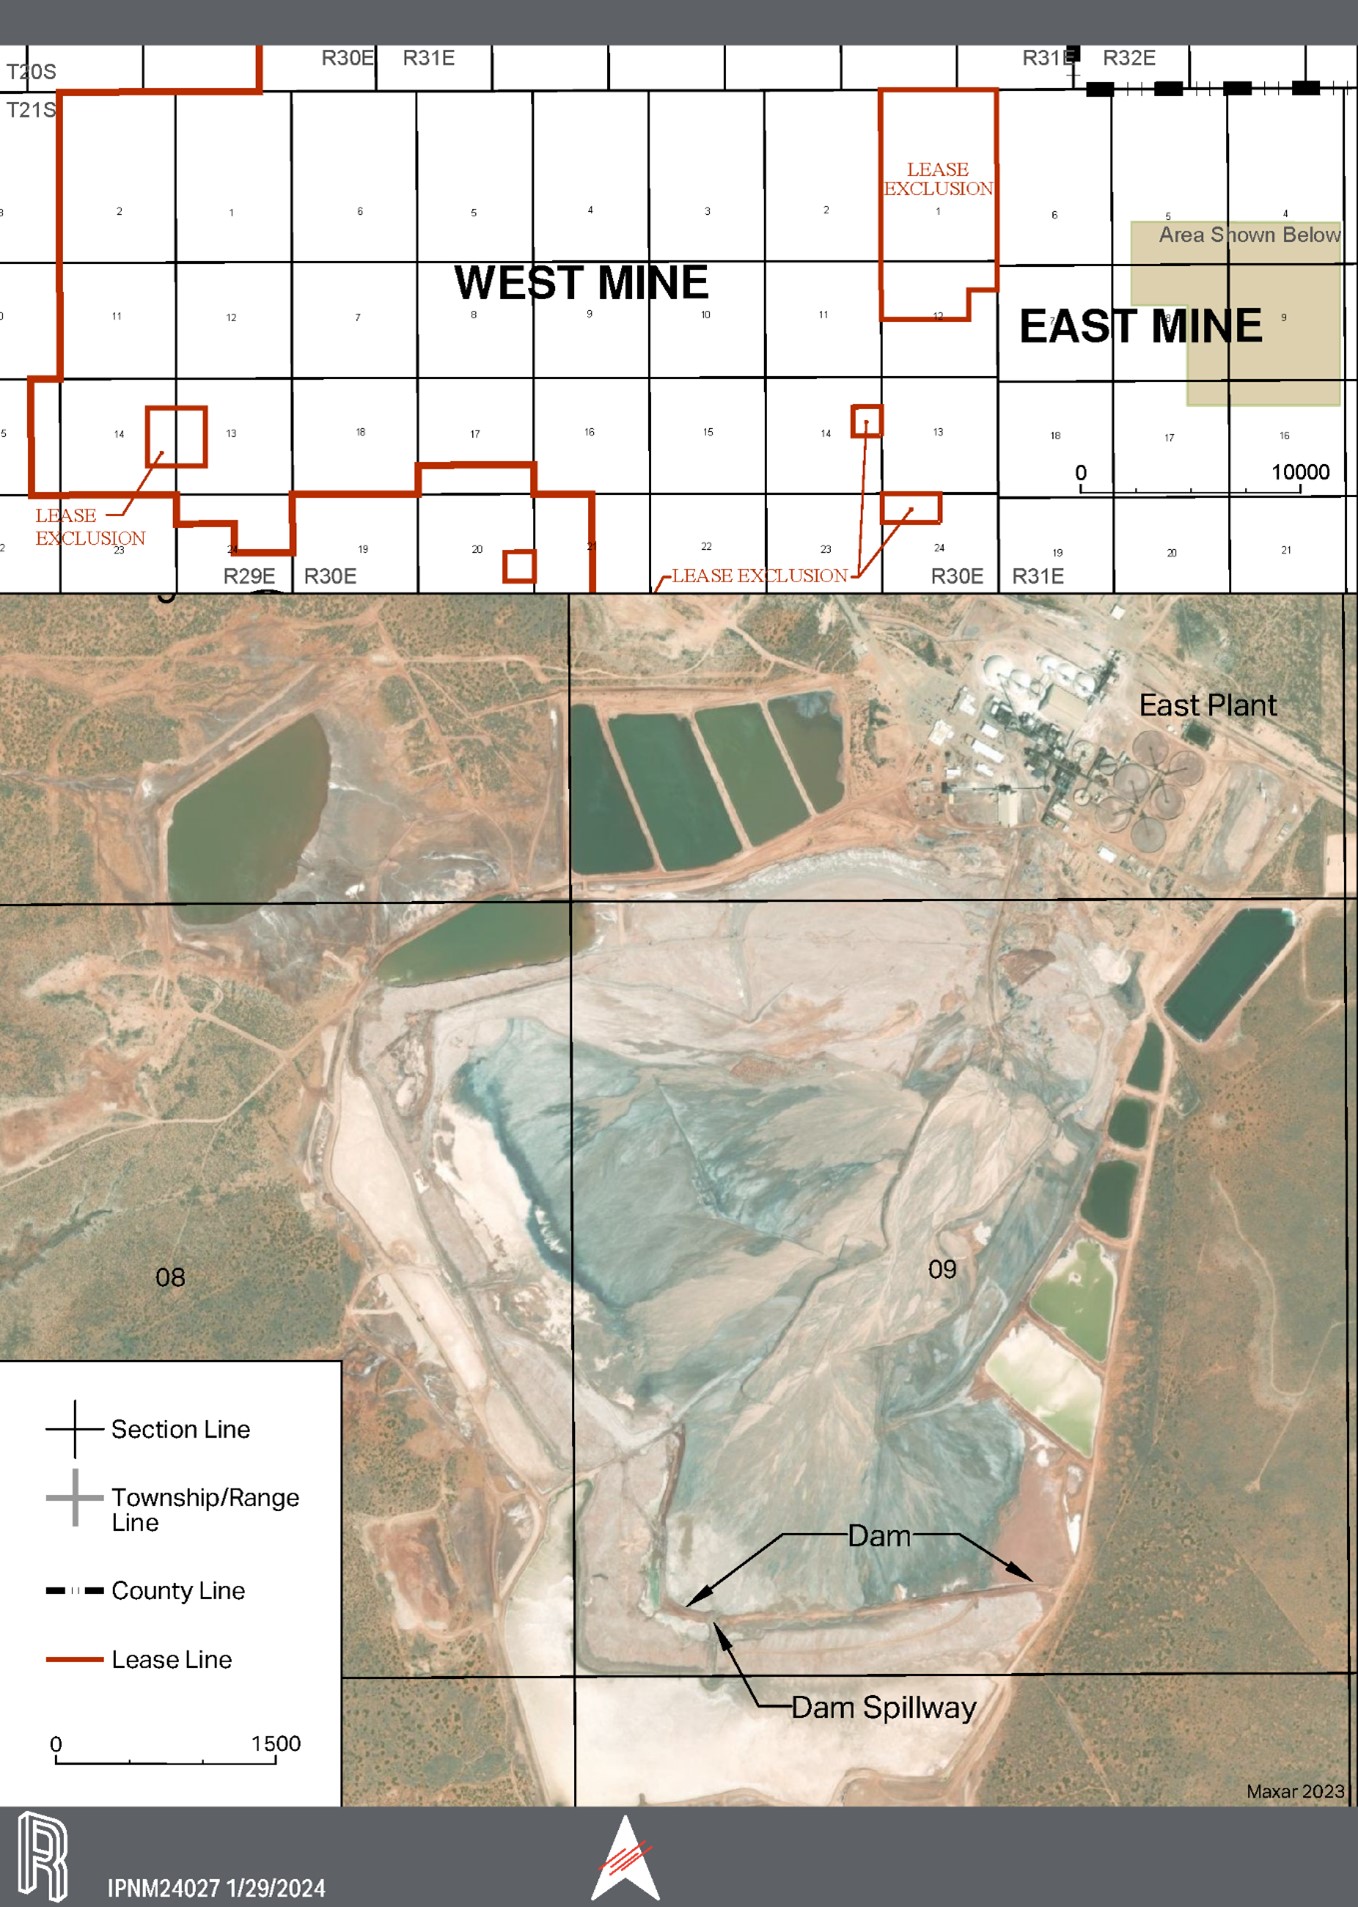
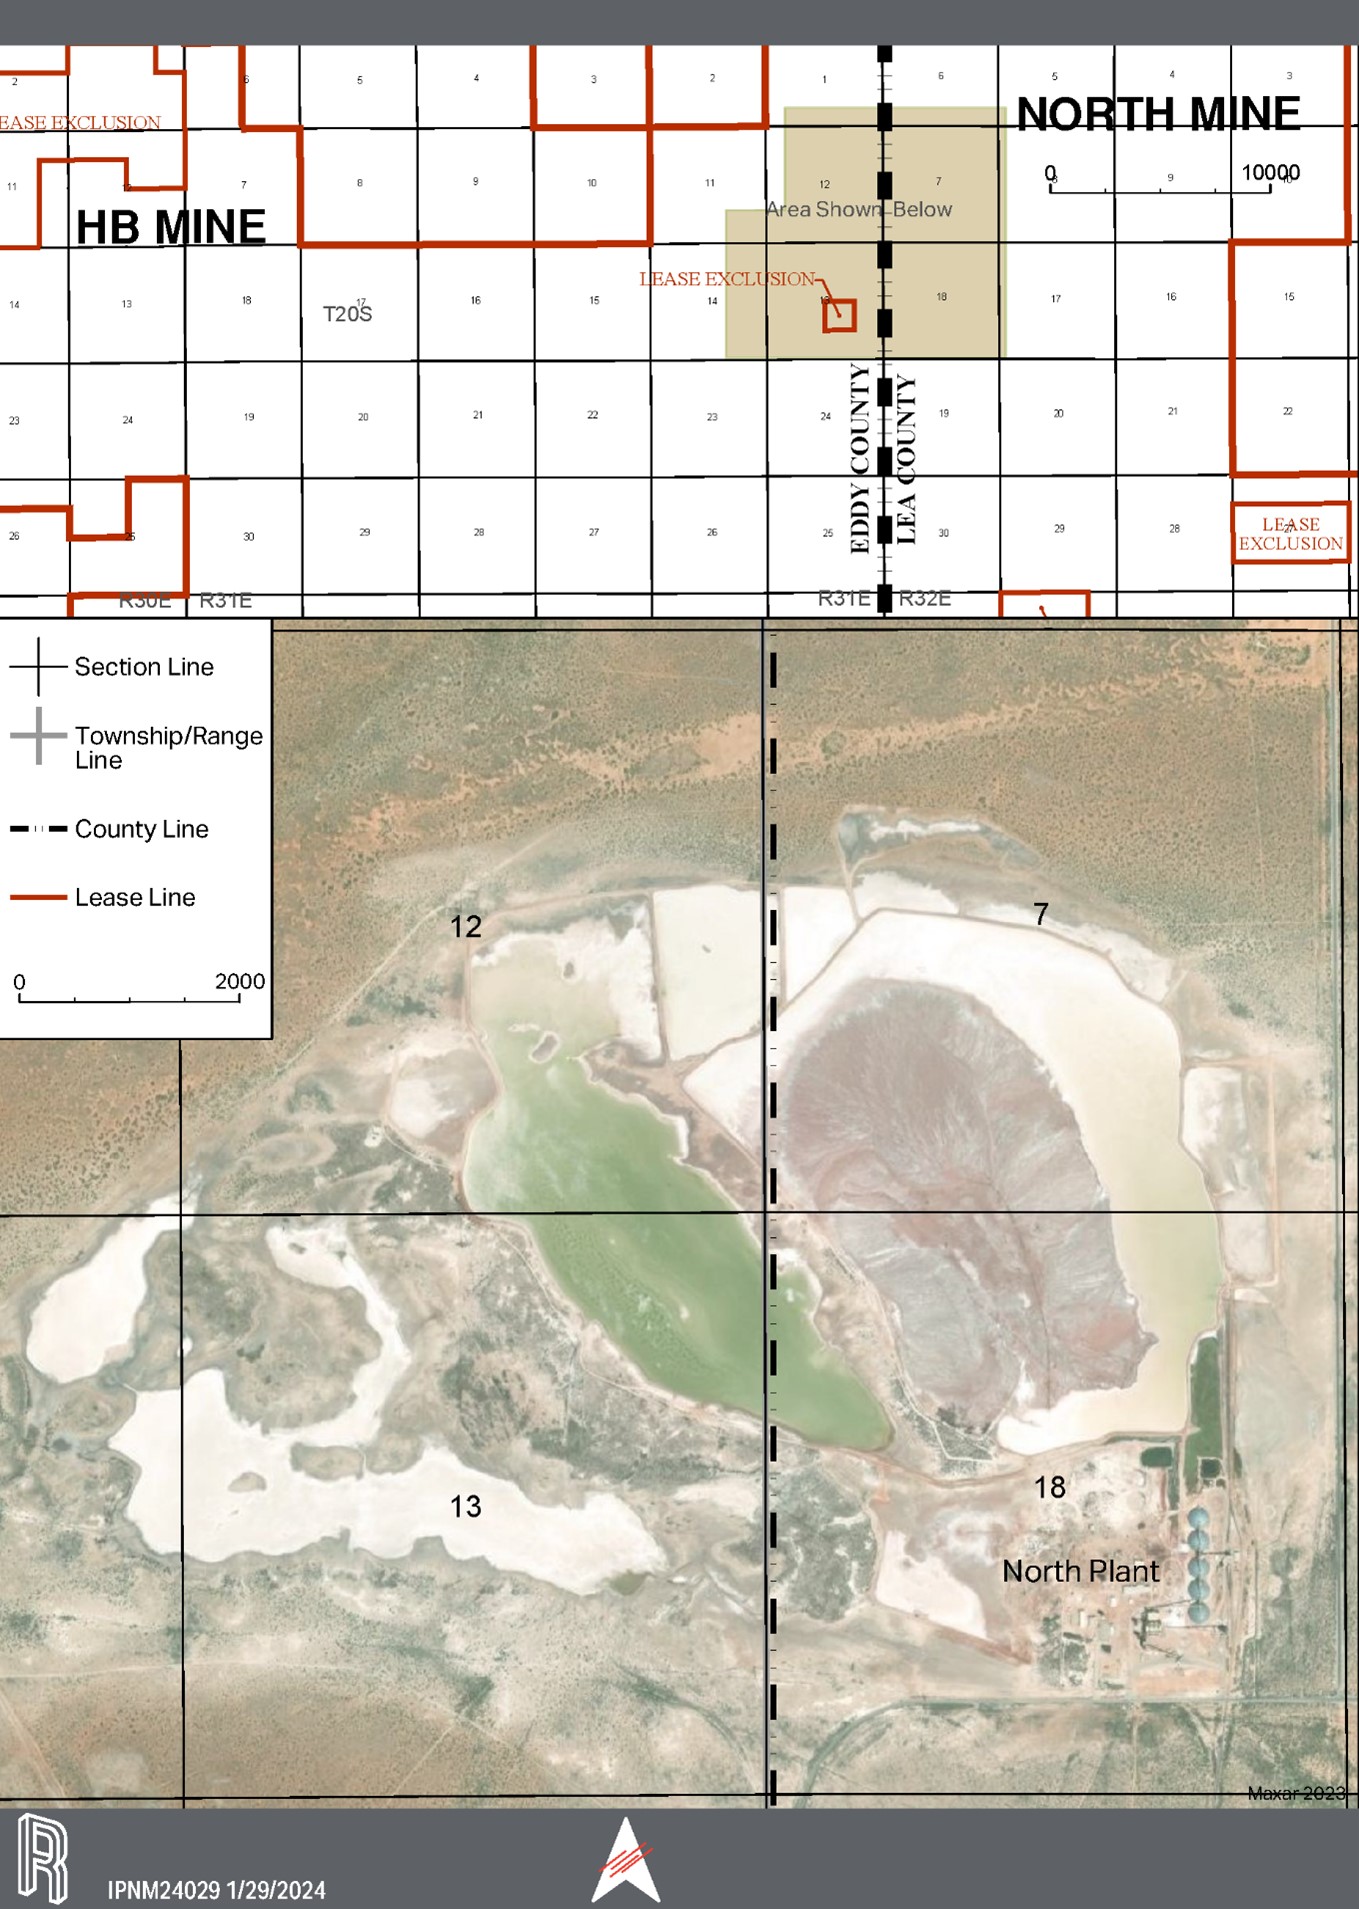
Our extraction and production operations are conducted entirely in the continental U.S. We produce potash from three solution mining facilities: our HB solution mine in Carlsbad, New Mexico, our solution mine in Moab, Utah and our brine recovery mine in Wendover, Utah. We also operate our North compaction facility in Carlsbad, New Mexico, which compacts and granulates product from the HB mine. We produce Trio® from our conventional underground East mine in Carlsbad, New Mexico.
We have permitted, licensed, declared and partially adjudicated water rights in New Mexico. We sell a portion of water from these water rights to support oil and gas development in the Permian Basin near our Carlsbad facilities. We continually work to expand water sales.
In May 2019, we acquired certain land, water rights, state grazing leases for cattle, and other related assets from Dinwiddie Cattle Company. We refer to these assets and operations as "Intrepid South." Due to the strategic location of Intrepid South, part of our long-term operating strategy is selling small parcels of land, including restricted use agreements of surface or subsurface rights to customers, where such sales provide a solution to a customer's operations in the oil and gas industry.
Our principal offices are located at 707 17th Street, Suite 4200, Denver, Colorado 80202, and our telephone number is (303) 296-3006. Intrepid was incorporated in Delaware in 2007.
Our Products and Services
Our three primary products are potash, Trio®, and water. We also sell salt, magnesium chloride, brines, and water that are derived as part of our mining processes. Product sales as a percentage of total sales for the last three years were as follows:
|
|
|
|
|
|
|
|
|
|
|
|
|
|
|
|
|
|
|
|
|
|
|
Year Ended December 31, |
|
|
2023 |
|
2022 |
|
2021 |
| Potash |
|
47 |
% |
|
50 |
% |
|
48 |
% |
Trio® |
|
35 |
% |
|
34 |
% |
|
34 |
% |
| Water |
|
5 |
% |
|
7 |
% |
|
8 |
% |
| Salt |
|
4 |
% |
|
3 |
% |
|
4 |
% |
| Magnesium Chloride |
|
3 |
% |
|
2 |
% |
|
3 |
% |
| Brines |
|
3 |
% |
|
2 |
% |
|
1 |
% |
| Other |
|
3 |
% |
|
2 |
% |
|
2 |
% |
| Total |
|
100 |
% |
|
100 |
% |
|
100 |
% |
Potash
We sell potash into three primary markets: the agricultural market as a fertilizer input, the animal feed market as a nutrient supplement, and the industrial market as a component in drilling and fracturing fluids for oil and gas wells and an input to other industrial processes. Potash is sold in different product sizes, such as granular, standard, and fine standard. The agricultural market predominately uses granular-sized potash, while the industrial and animal feed markets mostly use standard- and fine standard-sized product. We have the flexibility to produce all of our product in a granular form, which decreases our dependence on sales of any one particular size of potash and any particular market.
We manage sales and marketing operations centrally. This allows us to evaluate the product needs of our customers and then centrally determine which of our production facilities is best suited, typically based on geographic location, to use to fill customer orders in a manner designed to realize the highest average net realized sales price per ton. Average net realized sales price per ton is a non-GAAP measure that we calculate as sales less byproduct sales and freight costs and then divided by product sales tons. We also monitor product inventory levels and overall production costs centrally.
During 2023, we supplied approximately 0.4% of global annual potassium consumption and approximately 2.6% of the U.S.'s annual potassium consumption. Substantially all of our potash is sold in the U.S. Our domestic potash sales are geographically concentrated in the central and western U.S. Weather, planting conditions and farmer economics all affect fertilizer sales. For more information, please see "Seasonality."
Trio®
Trio® is our specialty fertilizer that is low in chloride and delivers potassium, sulfur, and magnesium in a single particle. This unique combination of nutrients makes Trio® an attractive fertilizer across diverse crops and geographies. We produce Trio® in premium, granular, standard, and fine standard sizes for sale both domestically and internationally.
Oilfield Solutions
Oil and gas activity and development in southeast New Mexico drives demand for our water and other oilfield related products and services.
We have permitted, licensed, declared and partially adjudicated water rights in New Mexico under which we sell water primarily for industrial uses in the oil and gas services industry.
In May 2019, we acquired Intrepid South, from which we sell products and services to support oil and gas development in the Permian Basin in southeast New Mexico. Our other oilfield related products and service offerings include, but are not limited to, caliche, right-of-way agreements, surface damages and easements, and a produced water royalty. Due to the strategic location of Intrepid South, part of our long-term operating strategy is selling small parcels of land, including restricted use agreements of surface or subsurface rights, to customers, where such sales provide a solution to a customer's operations in the oil and gas industry.
Byproducts
We also sell salt, magnesium chloride, brines, and water that are derived as part of our mining processes. Our salt is used in a variety of markets including animal feed, industrial applications, pool salt, and the treatment of roads and walkways for ice melting or to manage road conditions. Magnesium chloride is typically used as a road treatment agent for both deicing and dedusting. Our brines contain salt and potassium and are used primarily by the oil and gas industry to support well workover and completion activities. When the water that we sell was previously used in the production process for potash or Trio®, it is considered a byproduct of the underlying product. We continue to work to expand sales of byproducts, particularly to serve the oil and gas markets near our operating facilities. Sales of byproducts are accounted for within the segment that produced the byproduct. In each of the last three years, the potash segment accounted for the majority of our byproduct sales.
Production Facilities
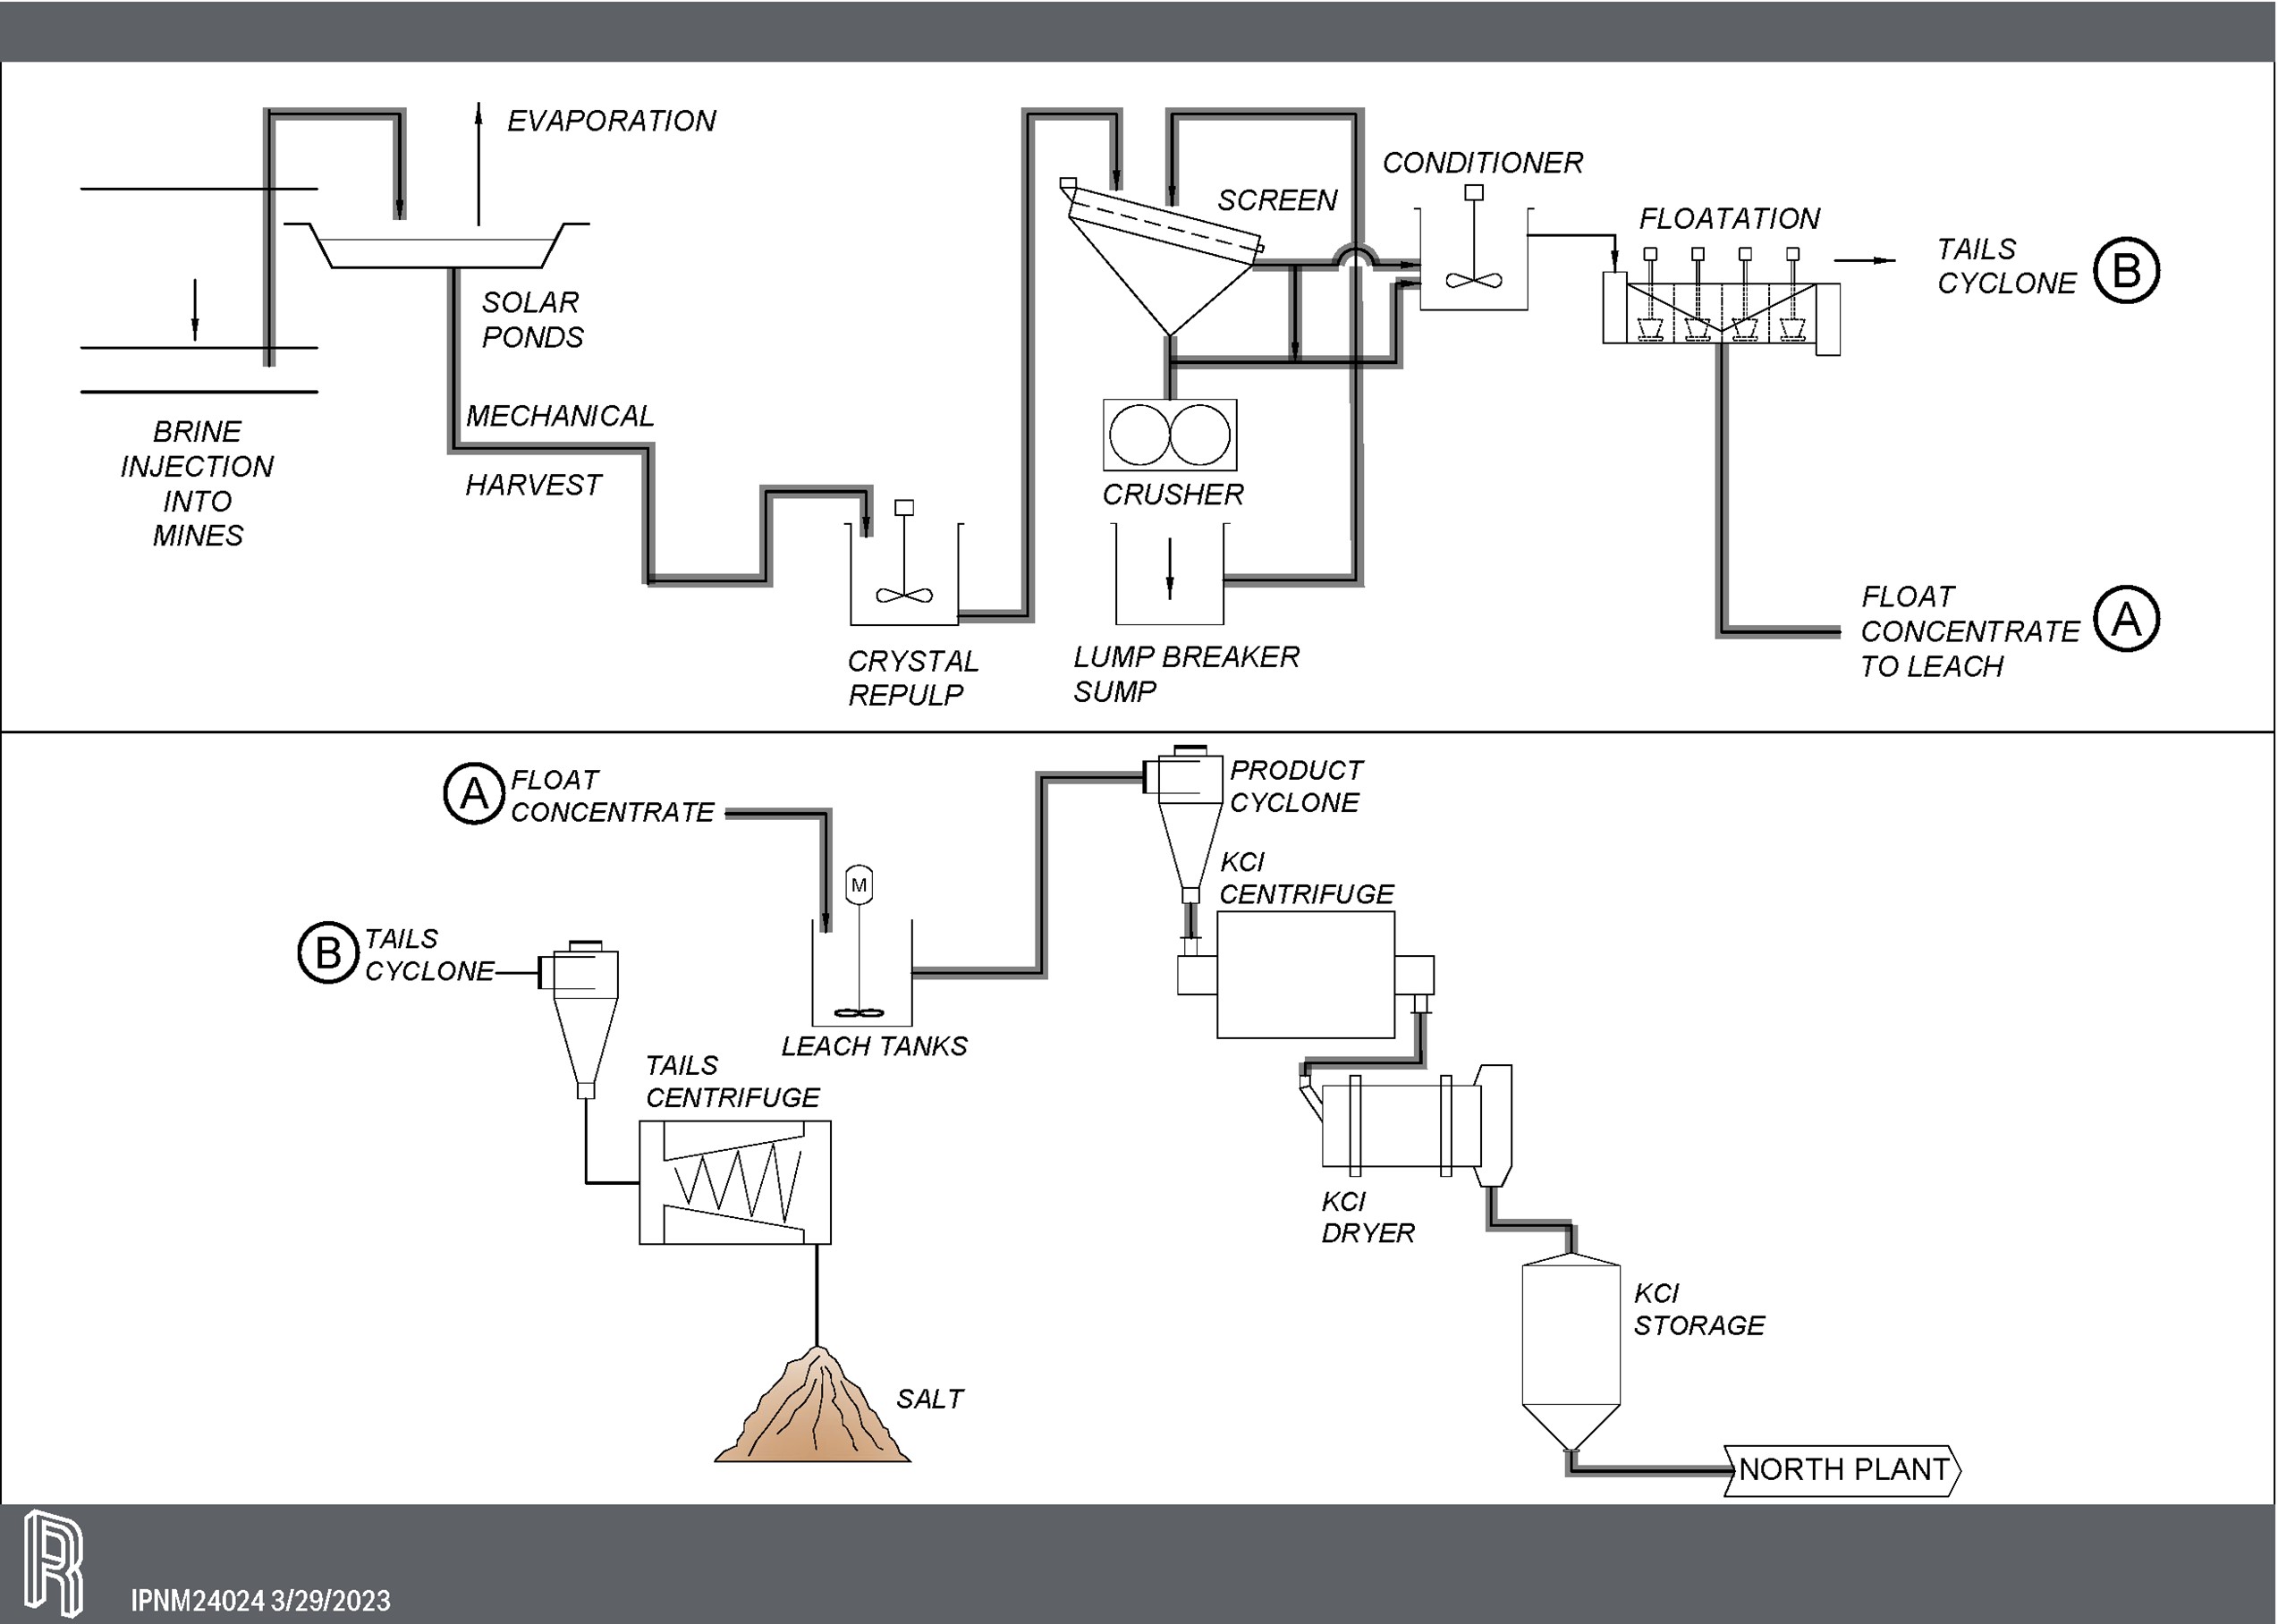
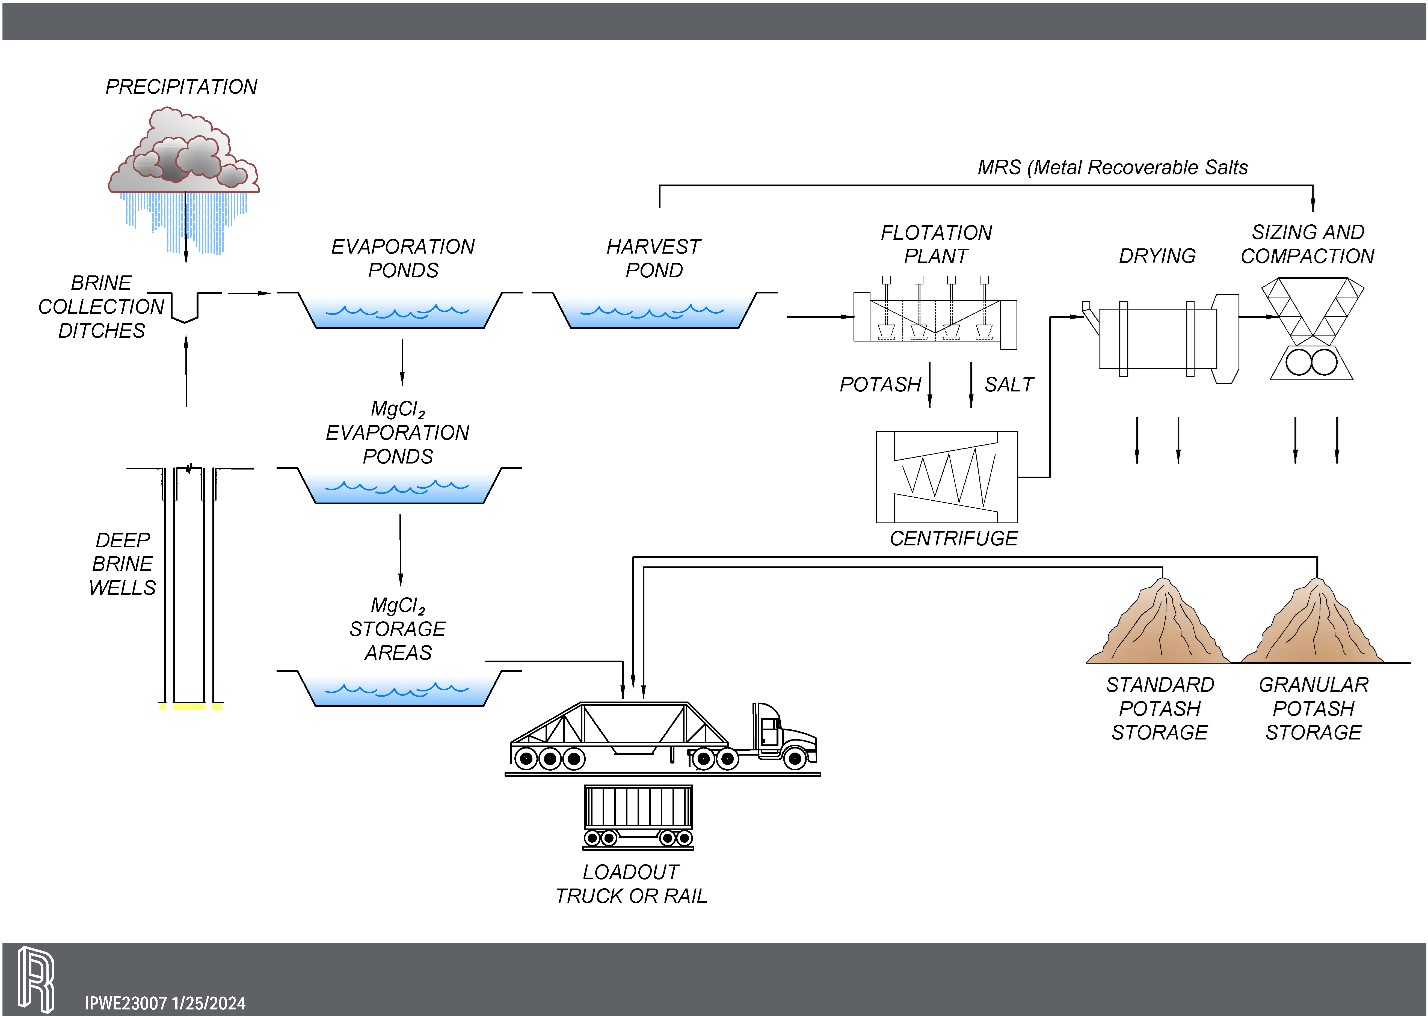
We produce potash from three solar evaporation solution mining facilities: our HB solution mine in Carlsbad, New Mexico, a solution mine in Moab, Utah, and a brine recovery mine in Wendover, Utah. We also operate our North compaction facility in Carlsbad, New Mexico, which compacts and granulates product from the HB mine. Solution mining is a process by which potash is extracted from mineralized beds by injecting a salt-saturated brine into a potash ore body and recovering a brine that contains potash and other minerals. The brine is brought to the surface for mineral recovery through solar evaporation. For solar evaporation, the brine is placed in ponds and solar energy is used to evaporate water thus crystallizing out the potash and minerals contained in the brine. The resulting mineral evaporates are then processed to separate the minerals for sale. Solution mining does not require employees or machines to be underground.
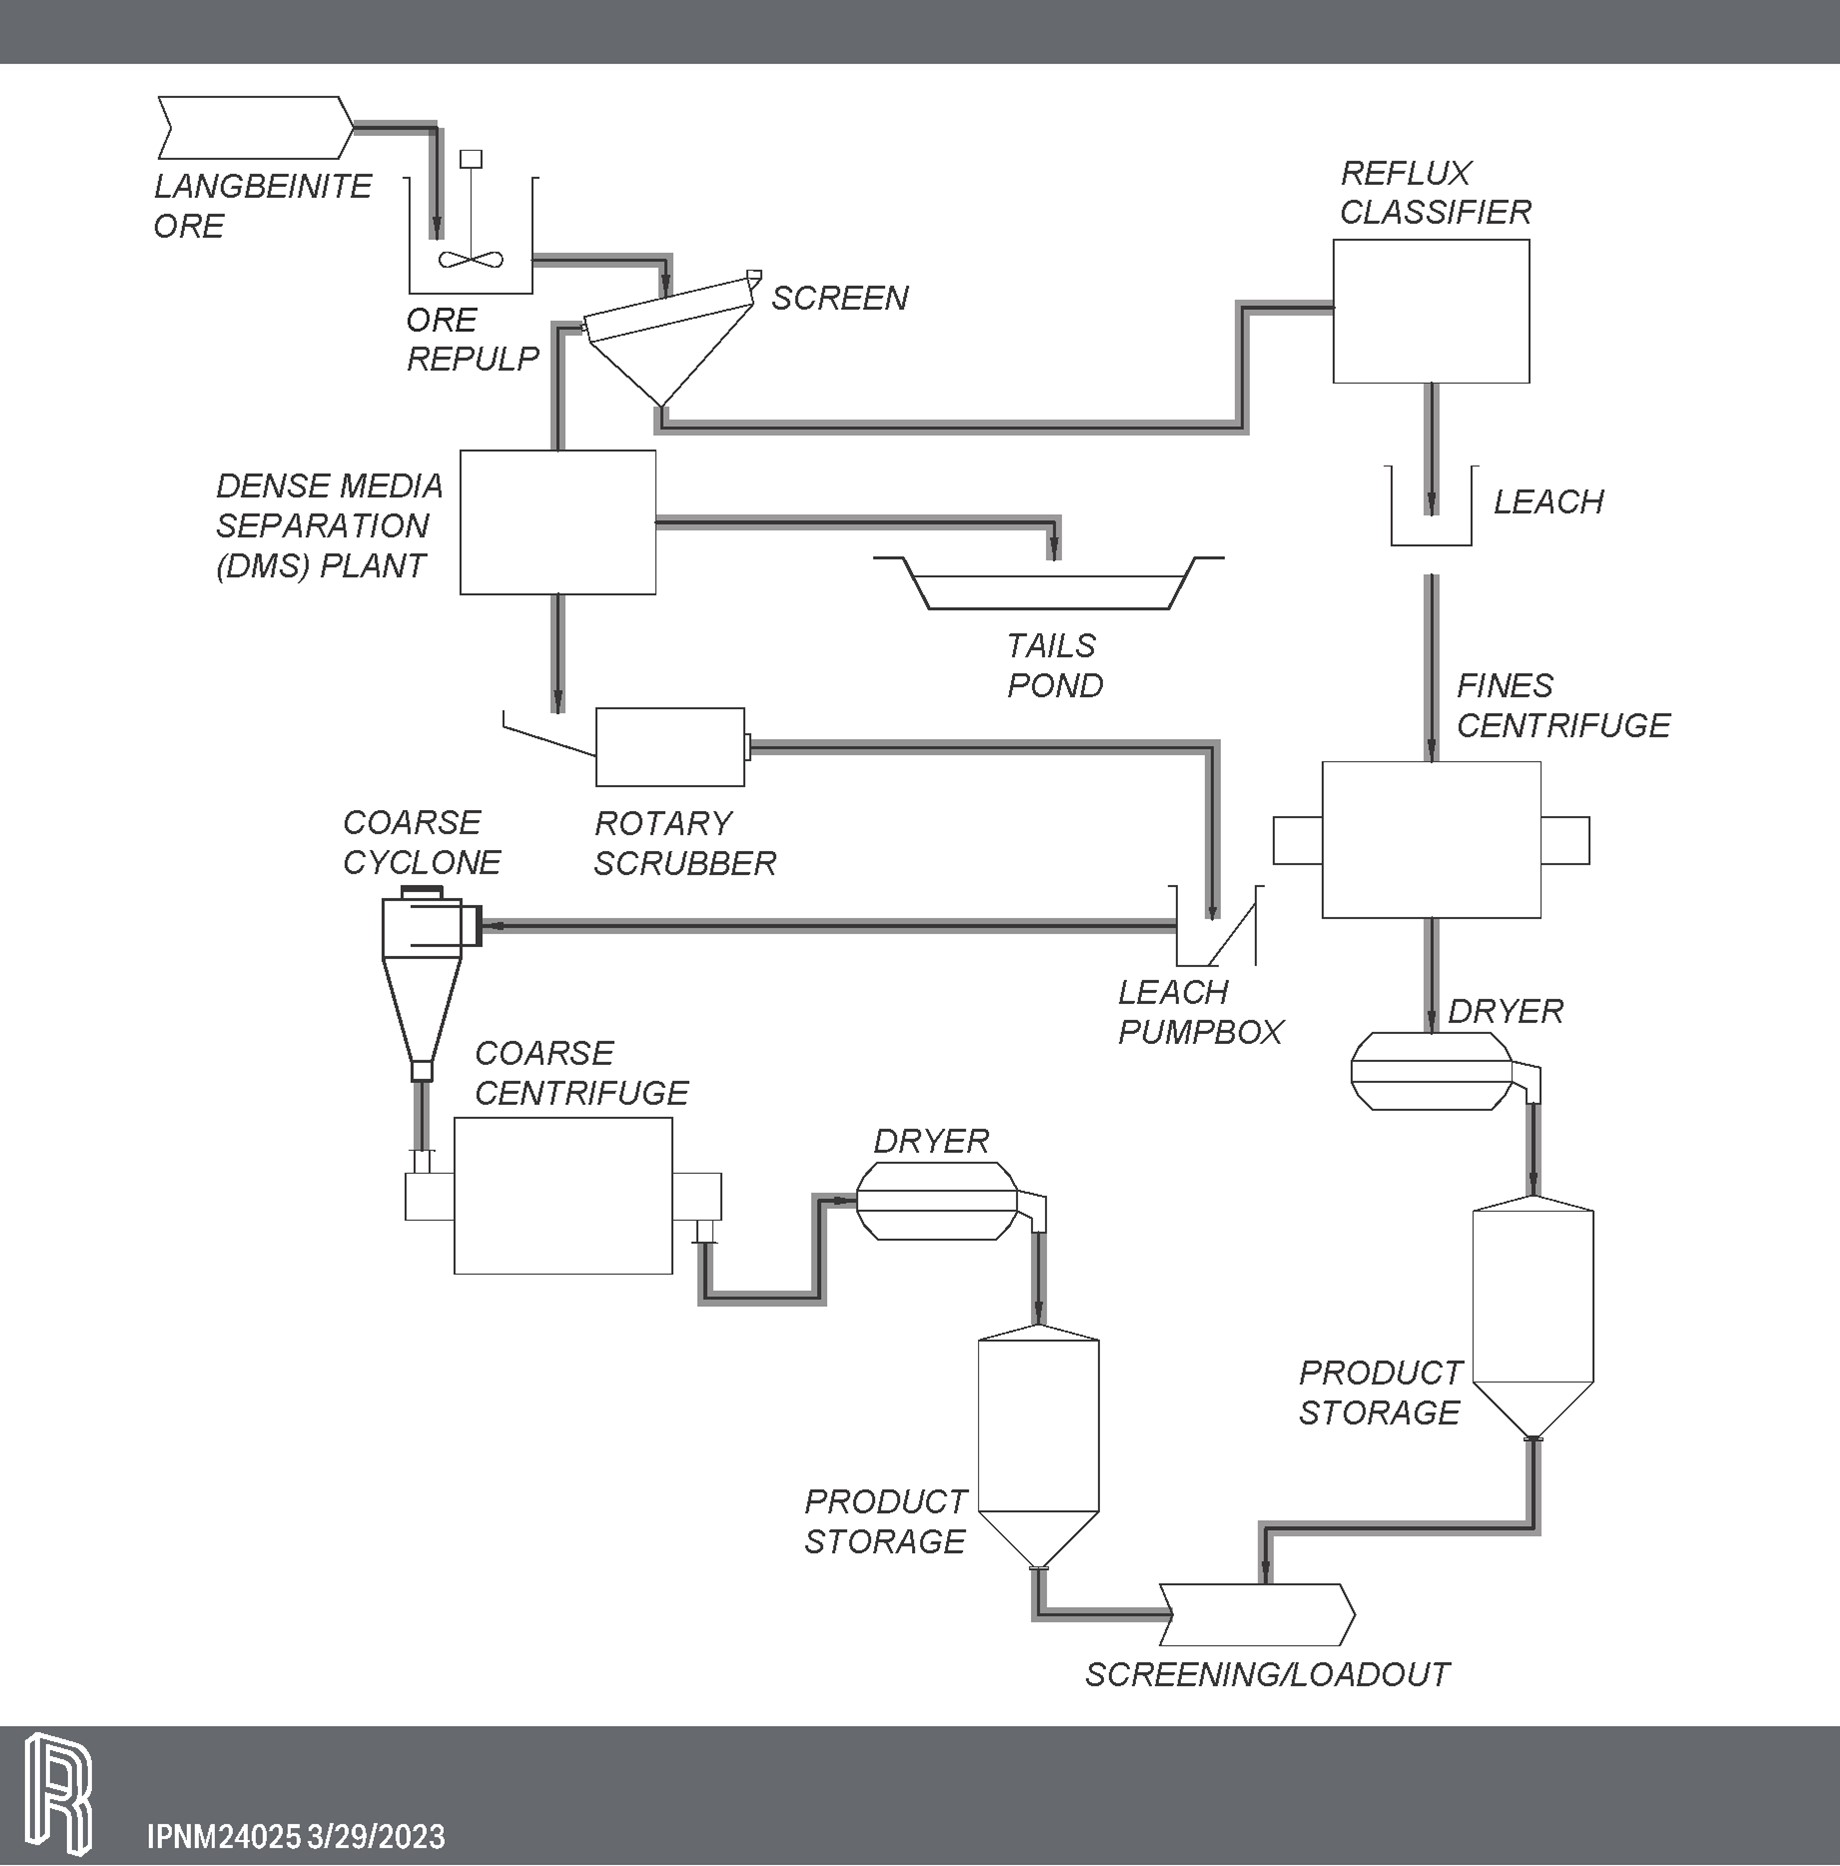
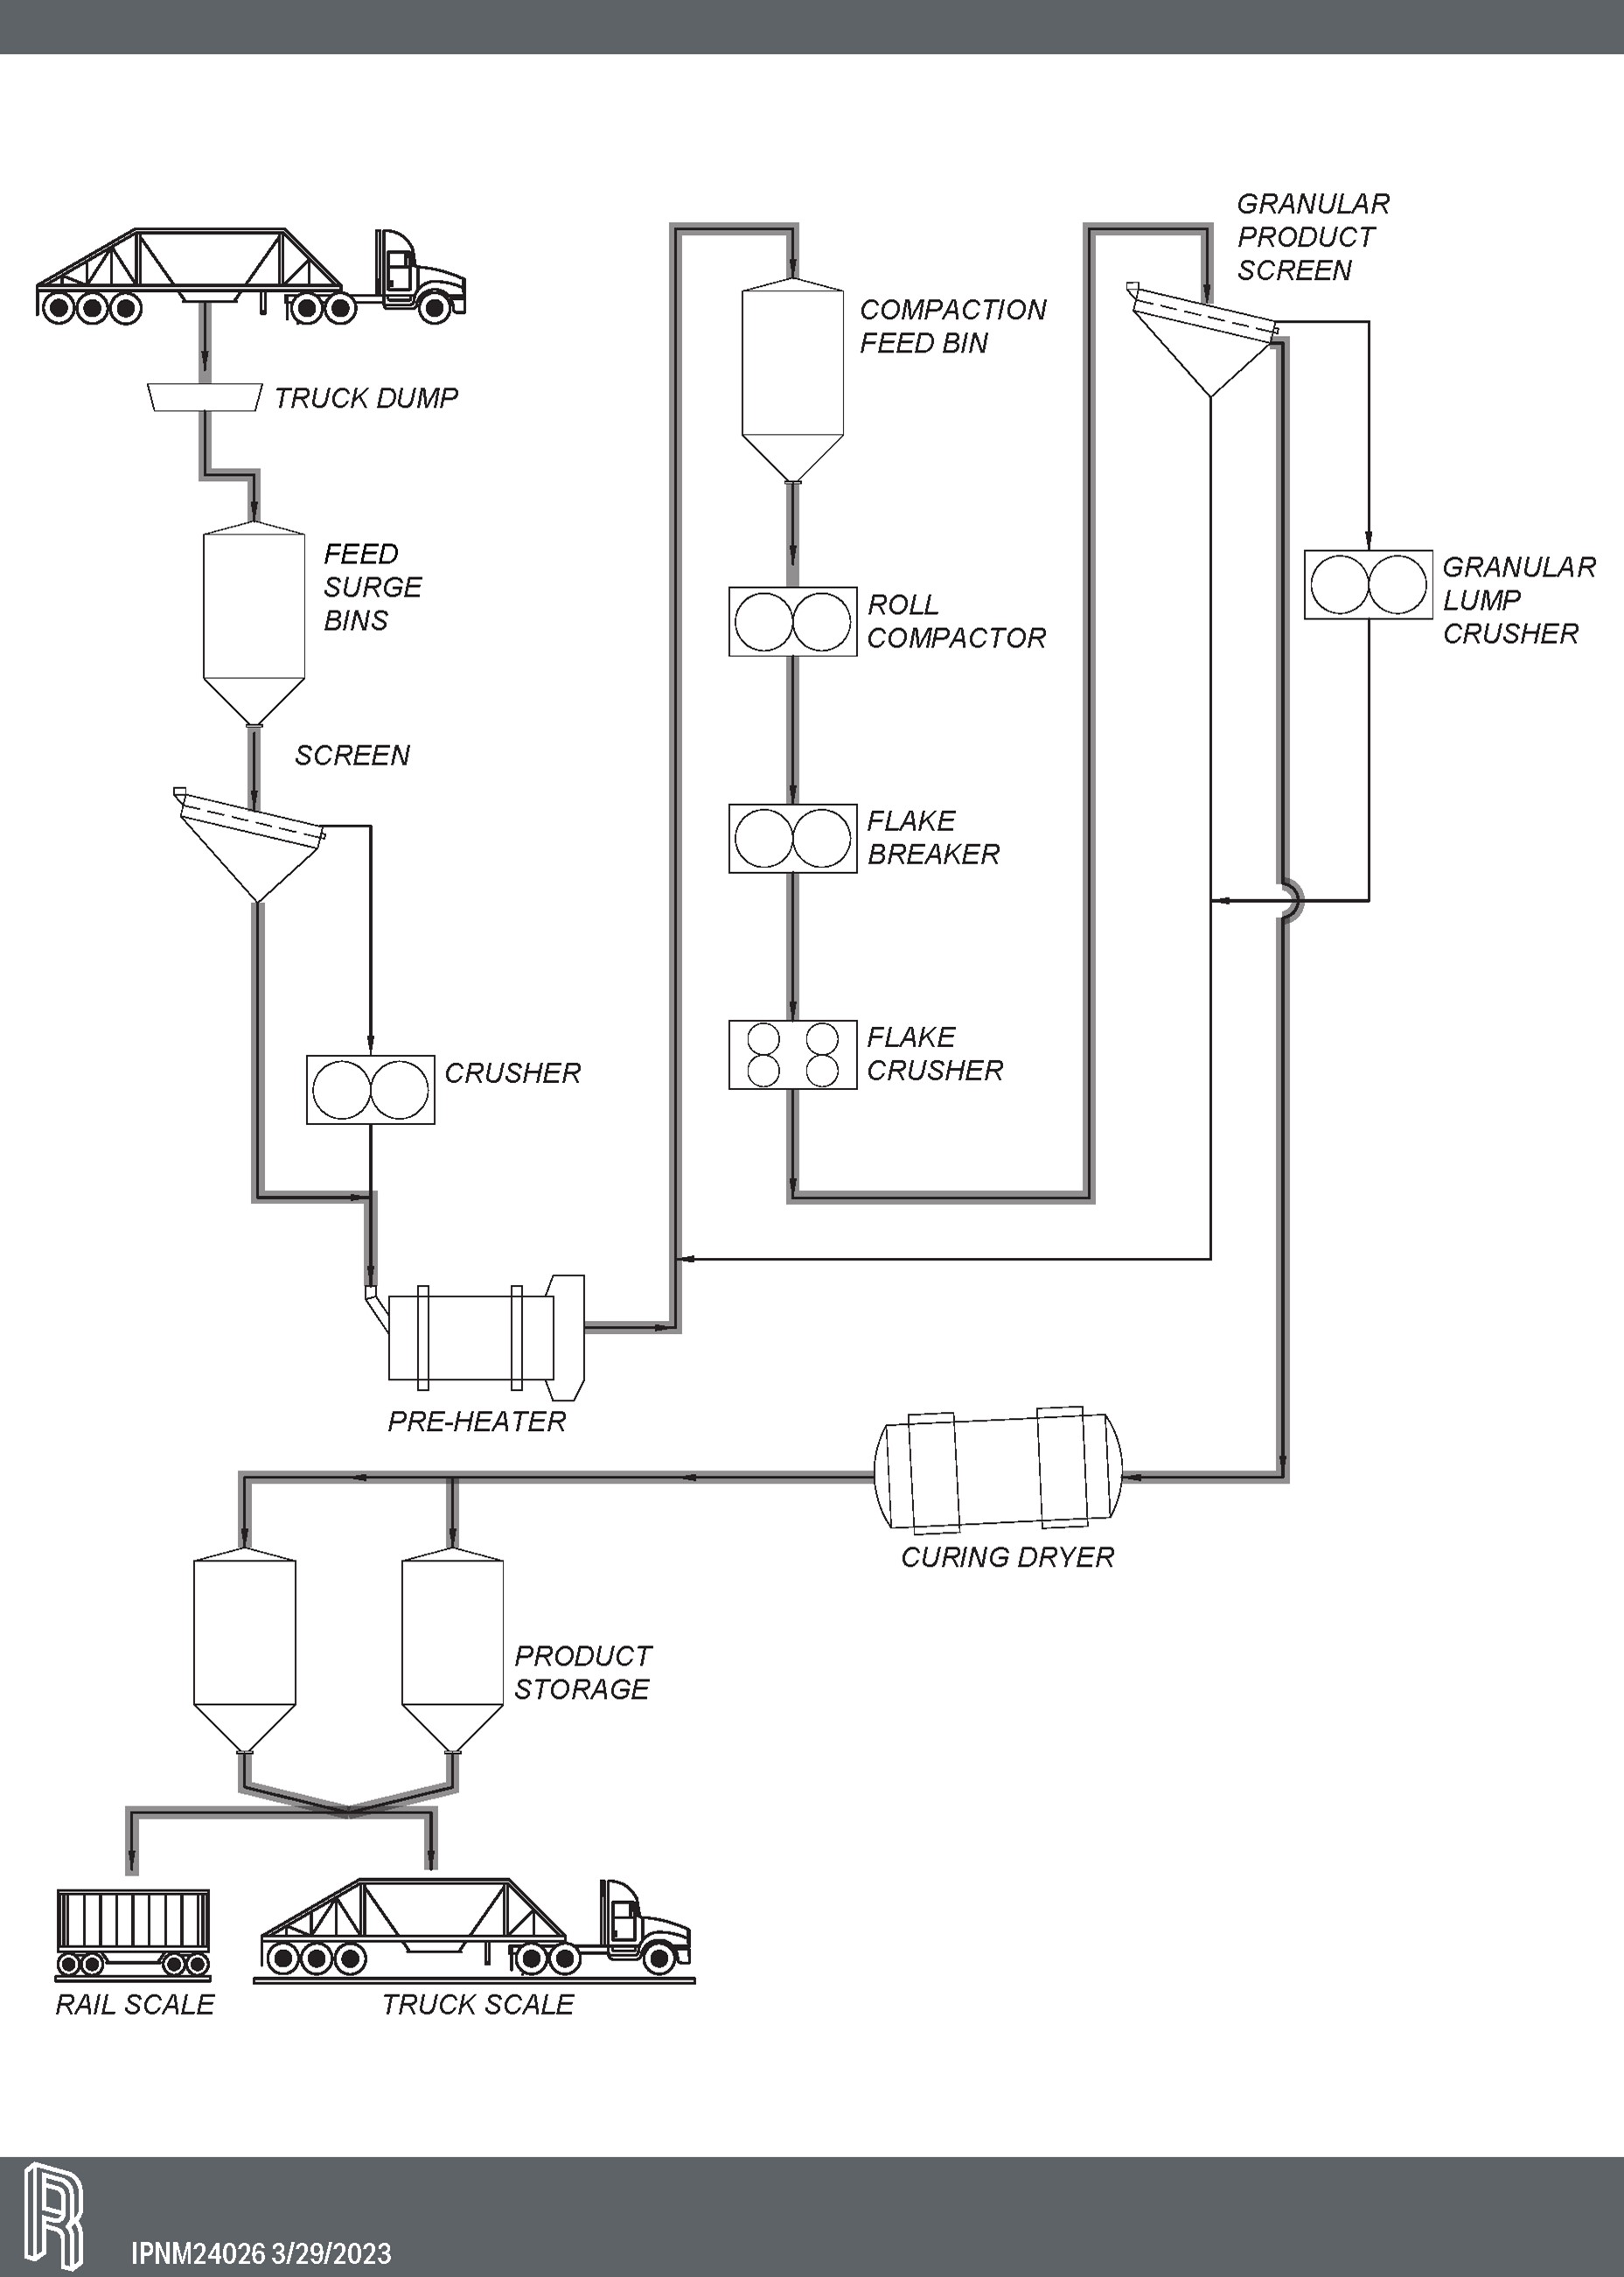
We produce Trio® from our conventional underground East mine in Carlsbad, New Mexico. A conventional underground mine uses a mechanical method of extracting minerals from underground. Underground mining consists of multiple shafts or entry points and a network of tunnels to provide access to minerals and conveyance systems to transport materials to the surface. Underground mining machines are used to remove the ore and a series of pillars are left behind to provide the appropriate level of ground support to ensure safe access and mining.
We have a current estimated annual designed productive capacity of approximately 365,000 tons of potash from our solar evaporation solution mines. We also have an estimated annual designed productive capacity of 400,000 tons of Trio®.
Our annual production rates for potash and Trio® are less than our estimated productive capacity. Actual production is affected by operating rates, the grade of ore mined, recoveries, mining rates, evaporation rates, product pricing, product demand, and the amount of development work that we perform. Therefore, as with other producers in our industry, our production results tend to be lower than reported productive capacity.
We also have water pipelines and reservoir ponds that we use to deliver water to our New Mexico facilities and to customers. When we acquired Intrepid South in May 2019, we increased our water rights and water delivery infrastructure.
Industry Overview
Potash and Trio®
Fertilizer serves a fundamental role in global agriculture by providing essential crop nutrients that help sustain both crop yield and quality. The three primary nutrients required for plant growth are nitrogen, phosphate, and potassium. There are no known substitutes for these nutrients. A proper balance of each of the three nutrients is necessary to maximize their effectiveness in crop growth. Potassium helps regulate plants' physiological functions and improves plant durability, providing crops with protection from drought, disease, parasites, and cold weather. Unlike nitrogen and phosphate, the potassium contained in naturally occurring potash does not require additional chemical conversion to be used as a plant nutrient.
In addition to the primary nutrients, which are required in the greatest quantities in crop nutrition, important secondary nutrients such as sulfur and magnesium are also essential in crop nutrition. Intrepid's Trio® product contains the primary nutrient potassium and two secondary nutrients, sulfur and magnesium.
Historically, population growth and global economic conditions drive long-term global fertilizer demand. Sustained per capita income growth and agricultural policies in the developing world and other geopolitical factors, such as temporary disruptions in fertilizer trade related to government intervention and changes in the buying patterns of key fertilizer consuming countries, also affect global fertilizer demand. Annual demand variations are affected by planted acreage, agricultural commodity yields and prices, inventories of grains and oilseeds, application rates of fertilizer, weather patterns, and farm sector income. Volatility in agricultural commodity prices may impact farmer fertilizer buying decisions. We expect these key variables to continue to have an impact on global fertilizer demand for the foreseeable future.
Nameplate production capacities that exceed demand historically shape the world potash market. A few potash companies have controlled a significant portion of this capacity, which was magnified in early 2018 with the merger of two Canadian producers. Generally, these larger producers have managed production levels to approximate world demand. The world potash market experienced a significant decrease in production rates in 2022, due to sanctions on Belarusian potash and Russia's invasion of Ukraine. In 2022, global production decreased approximately 10 million metric tonnes, compared to record production of approximately 71 million metric tonnes in 2021. Global production increased in 2023 to an estimated 67 million metric tonnes and is expected to be approximately 70 million metric tonnes in 2024, due to improving production in Belarus and increased production in Canada and other countries. With planned production expansions anticipated in future years, potash pricing will likely depend on the larger producers' ability to continue to manage the supply and demand balance through decreased utilization rates. Increases in world fertilizer demand, due mainly to population growth and limitations on arable land, are expected to eventually lessen the burden on producers, although recent increases in productive capacities and the continued progress of key expansion projects, specifically BHP's approval of the Jansen Stage 1 project, which expects first production in late 2026, add additional uncertainty to the long-term supply and demand balance for the potash market.
The volume of potash imports to the U.S. further impacts the potash market. A change in the volume of imports could result in a material change to potash prices in the U.S. The U.S. imposed sanctions on Belarusian potash imports, which took effect in April 2022. Belarusian potash historically accounted for approximately 7% of annual demand in the U.S. In response to these sanctions, other foreign suppliers increased the volume of potash imports to the U.S. The overall effect of these sanctions on the potash market remains uncertain.
The world's potash production is heavily focused on a few producers within a handful of countries. Twenty commercial potash deposits produce almost all of the world's potash. According to S&P Global Commodity Insights and data published by potash mining companies, six countries accounted for approximately 87% of the world's aggregate potash production during 2023. During the same period, the top nine potash producing countries supplied approximately 95% of the world's potash production. Two major Canadian producers participate in the Canpotex marketing group that supplied approximately 34% of global potash production in 2023. Russia accounted for 17% and Belarus accounted for 11% of global potash production in 2023.
Oilfield Solutions
The most productive region in the U.S. for oil production is the Permian Basin, which spans from west Texas to southeastern New Mexico. As of January 2024, the Permian Basin produced approximately 6.0 million barrels of oil per day. For comparison, the next most productive region in the U.S. produced approximately 1.3 million barrels of oil per day. In addition to producing wells, the Permian Basin also had approximately 800 drilled but uncompleted wells as of December 2023.
The majority of oil and gas wells drilled in the U.S., including the Permian Basin, are hydraulically fractured horizontal wells, which account for the record amount of fossil fuels produced in the U.S. in recent years. The use of horizontal drilling in oil and gas production allows a well to remain in contact with the targeted formation thereby increasing production compared to vertically drilled wells. Horizontal drilling has resulted in longer wells, with some horizontal drilling sections reaching several miles long.
The increase in horizontal drilling has resulted in an increase in the use of fresh water. A single hydraulically fracked well has the potential to use millions of gallons of fresh water. In the frac process, water and sand are used to move proppant and other frac additives into the targeted rock formation. Fresh water is important in the fracking process, as impurities in the water can impact the overall effectiveness of the frac. Pipelines transport most water used in fracking to the frac site, where it is stored in ponds or storage tanks.
While fresh water remains a key input for many fracs, operators have switched to using more recycled/produced water when completing wells. We believe this change is due to water conservation efforts, a move towards more environmentally friendly operations, and an increase in the amount of produced water available for fracking. By recycling and using produced water, operators are able to reduce fresh water purchases and decrease the cost of transporting and disposing of produced water into disposal wells.
In evaluating the hydraulic fluid to use for frac operations, oil and gas operators consider whether to use produced or fresh water and consider the weight of the fluid used. Operators are using more heavy brines as heavier fluids can drill through salt formations more effectively than lighter weight alternatives.
Competition and Competitive Strategy
We sell our potash and Trio® into commodity markets in which delivered price and the ability to timely deliver high quality products are essential. We are a competitive producer in the industry because of our ability to timely deliver high quality potash and Trio® products with specific particle sizes and with specific potassium oxide contents. In the potash market, we compete with larger Canadian potash producers and, to a lesser extent, producers located in Russia, Chile, Germany, and Israel. For Trio®, we compete with one other producer of langbeinite as well as producers of other specialty nutrients and blended products. The competitive market for our water resources includes other water right holders, which include companies, farmers, and ranchers operating in or near the Permian Basin in New Mexico.
Some of our direct and potential competitors may have significant advantages over us, including greater name recognition, longer operating histories, pre-existing relationships with current or potential customers, significantly greater financial, marketing and other resources, ownership of more diverse assets and products, and/or access to less expensive mining assets, any of which could allow them to respond more quickly to new or changing opportunities.
Our competitive strategy is focused on the following:
•Maximizing potash gross margin and optimizing potash production. All of our potash production comes from solar solution mines, which carry fewer fixed costs than our conventional potash mines. Our per-ton costs are lower for solution mining than conventional mining as solar solution mining requires less labor, energy, and equipment. Additionally, we are advantageously located close to the markets we serve, with the North American market demand being significantly larger than our production capacity; therefore, we are able to selectively participate in the markets that we believe will provide the highest average net realized sales price per ton. We also maximize our gross margin by leveraging our freight advantage to key geographies, improving our diverse customer and market base, and developing our flexible marketing approach. We have optimization and expansion opportunities at our solution mining facilities, that, over time, could reduce our per-ton costs and increase our potash production.
•Maximizing Trio® gross margin and optimizing Trio® production. We are working to optimize our production process to produce more granular-sized product, which is preferred by most markets. Our sales and marketing approach is focused on domestic and select international markets and includes crop nutrition education and increased marketing efforts targeting organic agriculture and high-value specialty crop markets. We currently operate our Trio® facility at a reduced production level and expect to continue to do so for the foreseeable future.
•Expanding offerings of oilfield solutions. We intend to continue our expansion of water and brine sales, particularly to serve the oil and gas markets near our operating plants in New Mexico. We have water rights from which we sell water for commercial uses in the oil and gas services industry. We also use a portion of our water rights to produce heavy brines for use in the oil and gas industry. Additionally, as described above, in May 2019, we acquired certain land, water rights, federal and state grazing leases for cattle, and other related assets from Dinwiddie Cattle Company in the Permian Basin which we operate as Intrepid South. We expect to increase the amount of water available for sale from Intrepid South over the next few years through permitting additional water rights and infrastructure investments. Our other oilfield related products and services include, but are not limited to, surface use and right-of-way agreements, a produced water royalty agreement, and caliche sales. Given the location of Intrepid South, part of our long-term operating strategy is selling small parcels of land, including through the use of restricted use agreements for surface or subsurface rights, to customers.
•Continuing diversification of byproducts and services. We recover magnesium chloride, salt, brines, and water byproducts during the production of potash and Trio®. These byproducts diversify our portfolio of product and service offerings. As we continue to explore and evaluate opportunities to diversify our revenue sources, we may enter into new or complementary businesses that expand our current product and service offerings, including an expansion into oil and natural gas exploration and production, or into new products or services in our current industry or other industries.
Competitive Strengths
•U.S.-based producer. We are the only producer of potash in the U.S. We are located in a market that consumes significantly more potash than we can currently produce on an annual basis. Our geographic location provides us with a transportation advantage over our competitors for shipping our product to customers. In general, this allows us to obtain a higher average net realized sales price per ton than our competitors, who ship their products across longer distances to consuming markets, which increases their costs and reduces their gross margin. Our location allows us to target sales to the markets in which we have the greatest transportation advantage, maximizing our average net realized sales price per ton. Our access to strategic rail destination points and our location along major agricultural trucking routes also supports this advantage.
As a U.S. producer, we enjoy a significantly lower total production tax and royalty burden than our principal competitors, which operate primarily in Saskatchewan, Canada. The Saskatchewan tax system for potash producers includes a capital tax and several potash mineral taxes, none of which are imposed on us as a U.S. producer. We currently pay an average royalty rate of approximately 4.9% for our potash and Trio® sales less their related freight costs, which compares favorably to that of our competitors in Canada. The relative tax and royalty advantage for U.S. producers becomes more pronounced when profits per ton increase due primarily to the profit tax component of the Saskatchewan potash mineral tax.
•Solar evaporation operations. All our potash production comes from solar solution mines. Solar evaporation is a cost-efficient production method because it significantly reduces our labor force and energy consumption, which are two of the largest costs of production. Our understanding and application of low-cost solution mining, combined with our reserves being located where a favorable climate for evaporation exists, make solar solution mining difficult for other producers to replicate. We also have significant reserves for future expansion of our solution mining operations.
•Diversity in Secondary Nutrient Markets. Given the greater scarcity of langbeinite relative to potash, its agronomic suitability for certain chloride-sensitive soils and crops, and the addition of key secondary nutrients in sulfur and magnesium, we believe there is a market for Trio® outside of our core potash markets. We also believe that there is a market for Trio® beyond the U.S., although freight expense and competition from substitute products have made this a difficult market to penetrate. We also offer Organic Materials Review Institute ("OMRI") listed potash and Trio® products that provide essential minerals for growing certified organic crops.
•Water rights. Water rights in New Mexico are real property rights, which authorize a water right owner to use a specific amount of water, diverted from a specific location, for a specific purpose of use, in a specific place. Water rights are limited to the amount of water put to beneficial use. In New Mexico, the New Mexico Office of the State Engineer (“OSE”) administers water rights. The validity of water rights is ultimately confirmed or denied by a court in an adjudication proceeding. Prior to an adjudication, a water right may be acquired through the OSE’s permitting or licensing process. If a water right existed before the OSE had authority to issue permits, a water rights owner may file a declaration with the OSE. The OSE issues permits for both surface and groundwater appropriations. These permits are inchoate rights, which allow a permittee to put the water to beneficial use as prescribed by the agency. Once the OSE confirms that water diversion works have been completed and water has been put to beneficial use, the water right is licensed. A declaration is made when water was put to beneficial use either before New Mexico adopted its current water code in 1907 for surface water declarations, or before the OSE declared an underground water basin for groundwater declarations. A water right claimant must apply to the OSE for a permit to make changes to a water right, including changes in the place or purpose of use. The validity of water rights is ultimately confirmed or denied by courts in an adjudication process. We have permitted, licensed, declared and partially adjudicated water rights in New Mexico under which we sell water primarily for commercial uses in the oil and gas services industry. We continue to work to expand sales of water, especially to support oil and gas development in the Permian Basin near our Carlsbad facilities. The Intrepid South property increased the total water rights available for sale in and around the Delaware Basin, a sub-basin of the Permian Basin. This has expanded our relationships with oil and gas producers, which we may be able to use to expand sales of our industrial potash products, byproducts, and services.
•Diversity of potash markets. We sell potash into three different markets—the agricultural, feed and industrial markets. In 2023, these markets represented approximately 74%, 23%, and 3%, of potash sales, respectively, and during 2022, these markets represented approximately 69%, 23%, and 8%, of our potash sales, respectively. The agricultural market supplies crop nutrients to farmers producing a wide range of crops in different geographies and the animal feed market supplies feed manufacturers with key nutrients for a wide range of feed blends into various markets such as pet food and cattle feed. Sales into industrial markets have historically supported drilling activities in oil and gas, although the use of lower-cost potash substitutes in recent years has reduced our sales into those markets.
•Marketing flexibility. We have the ability to convert all of our standard-sized potash product into granular-sized product as market conditions warrant. We produce Trio® in premium, granular, standard and fine standard sizes. This provides us with increased marketing flexibility as well as decreased dependence on any one particular market.
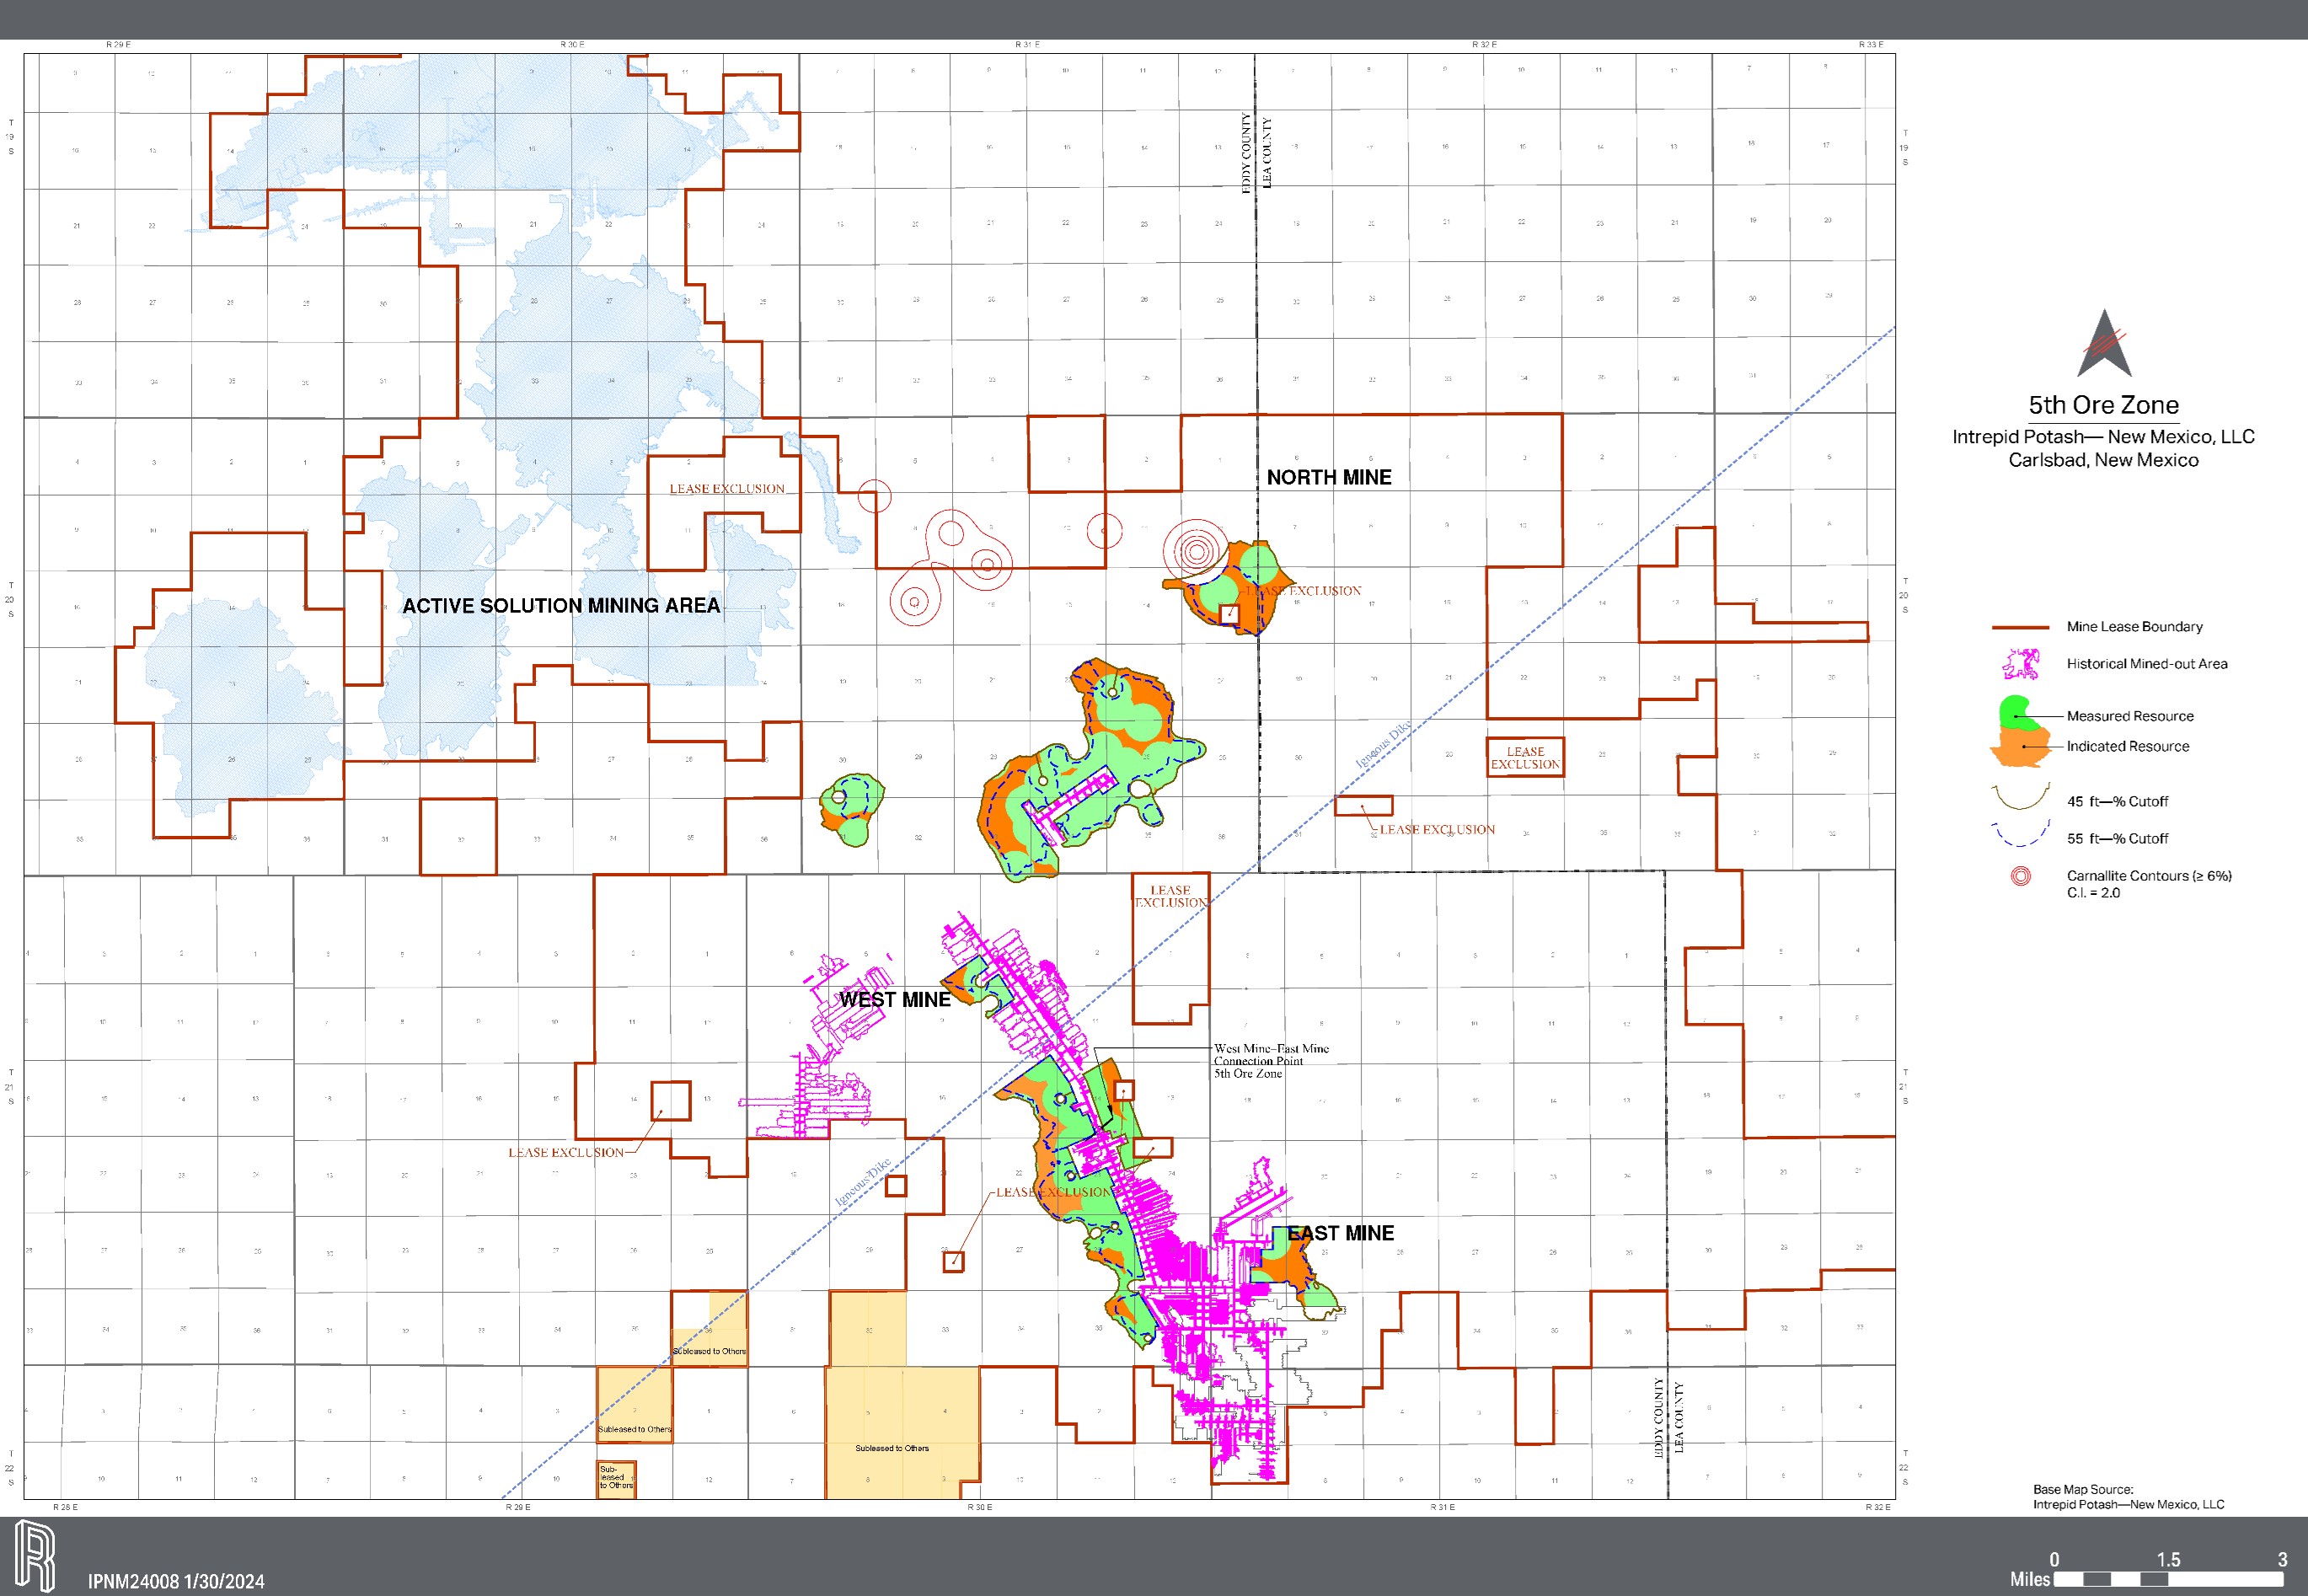
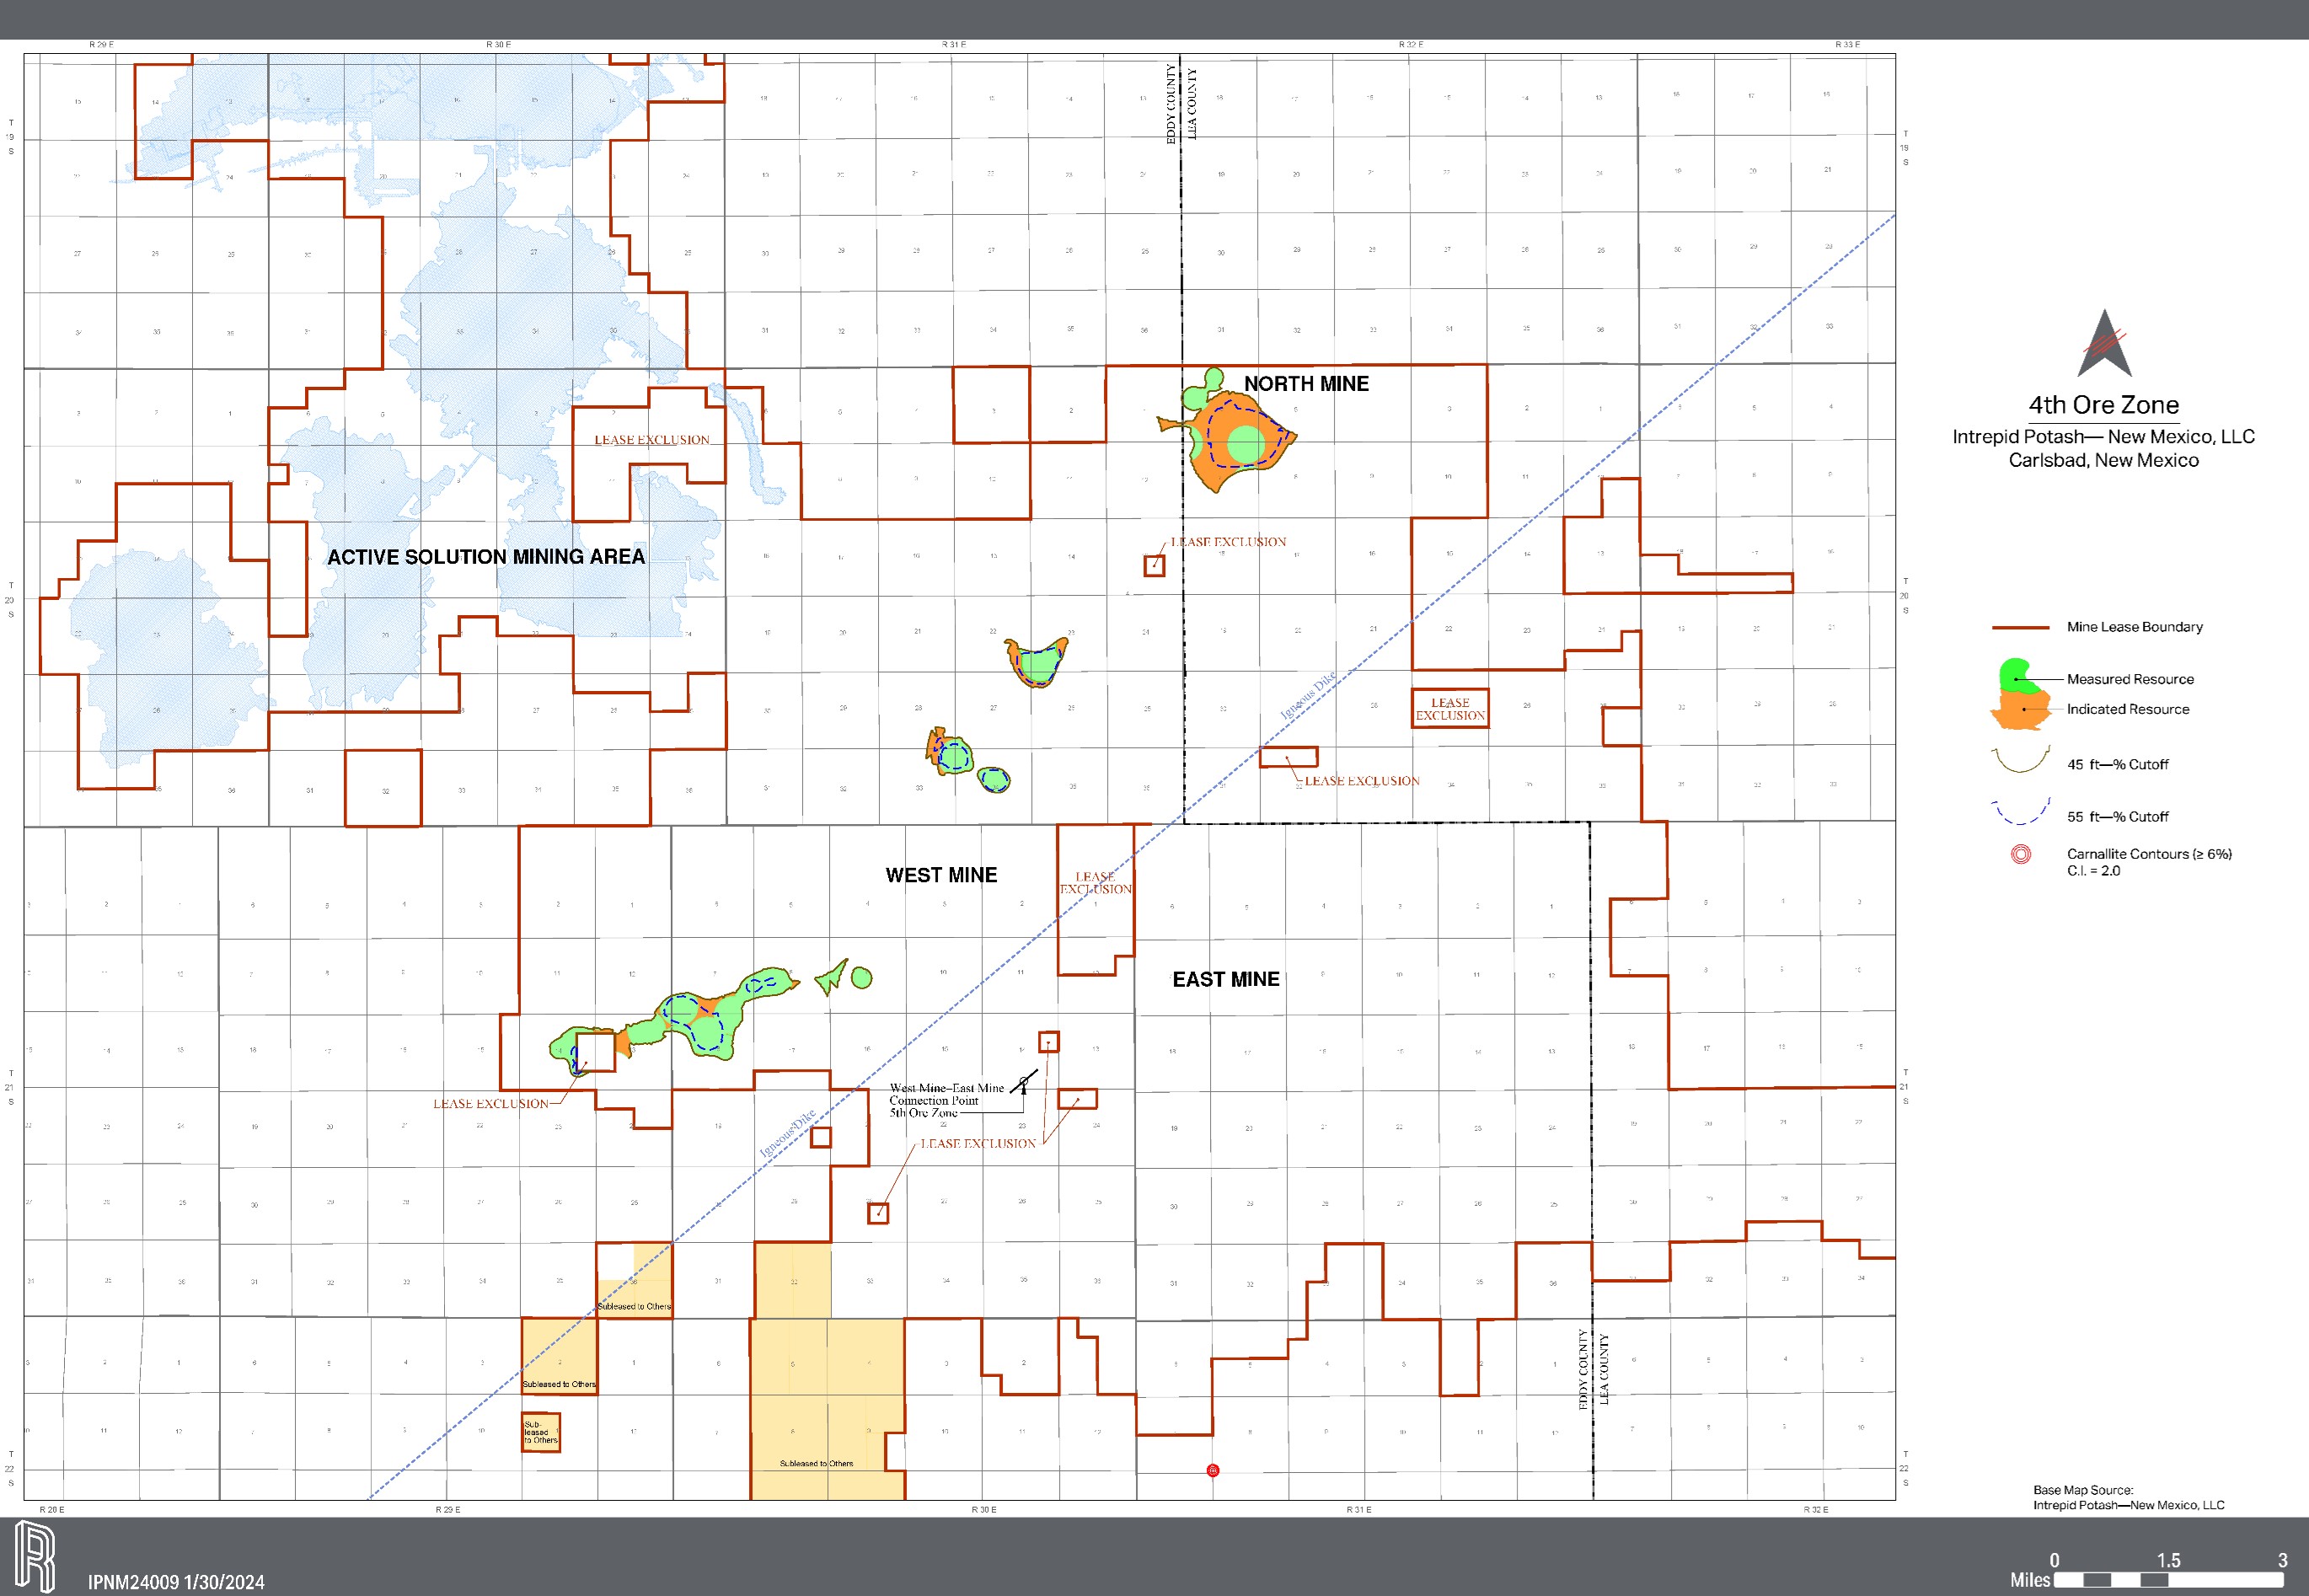
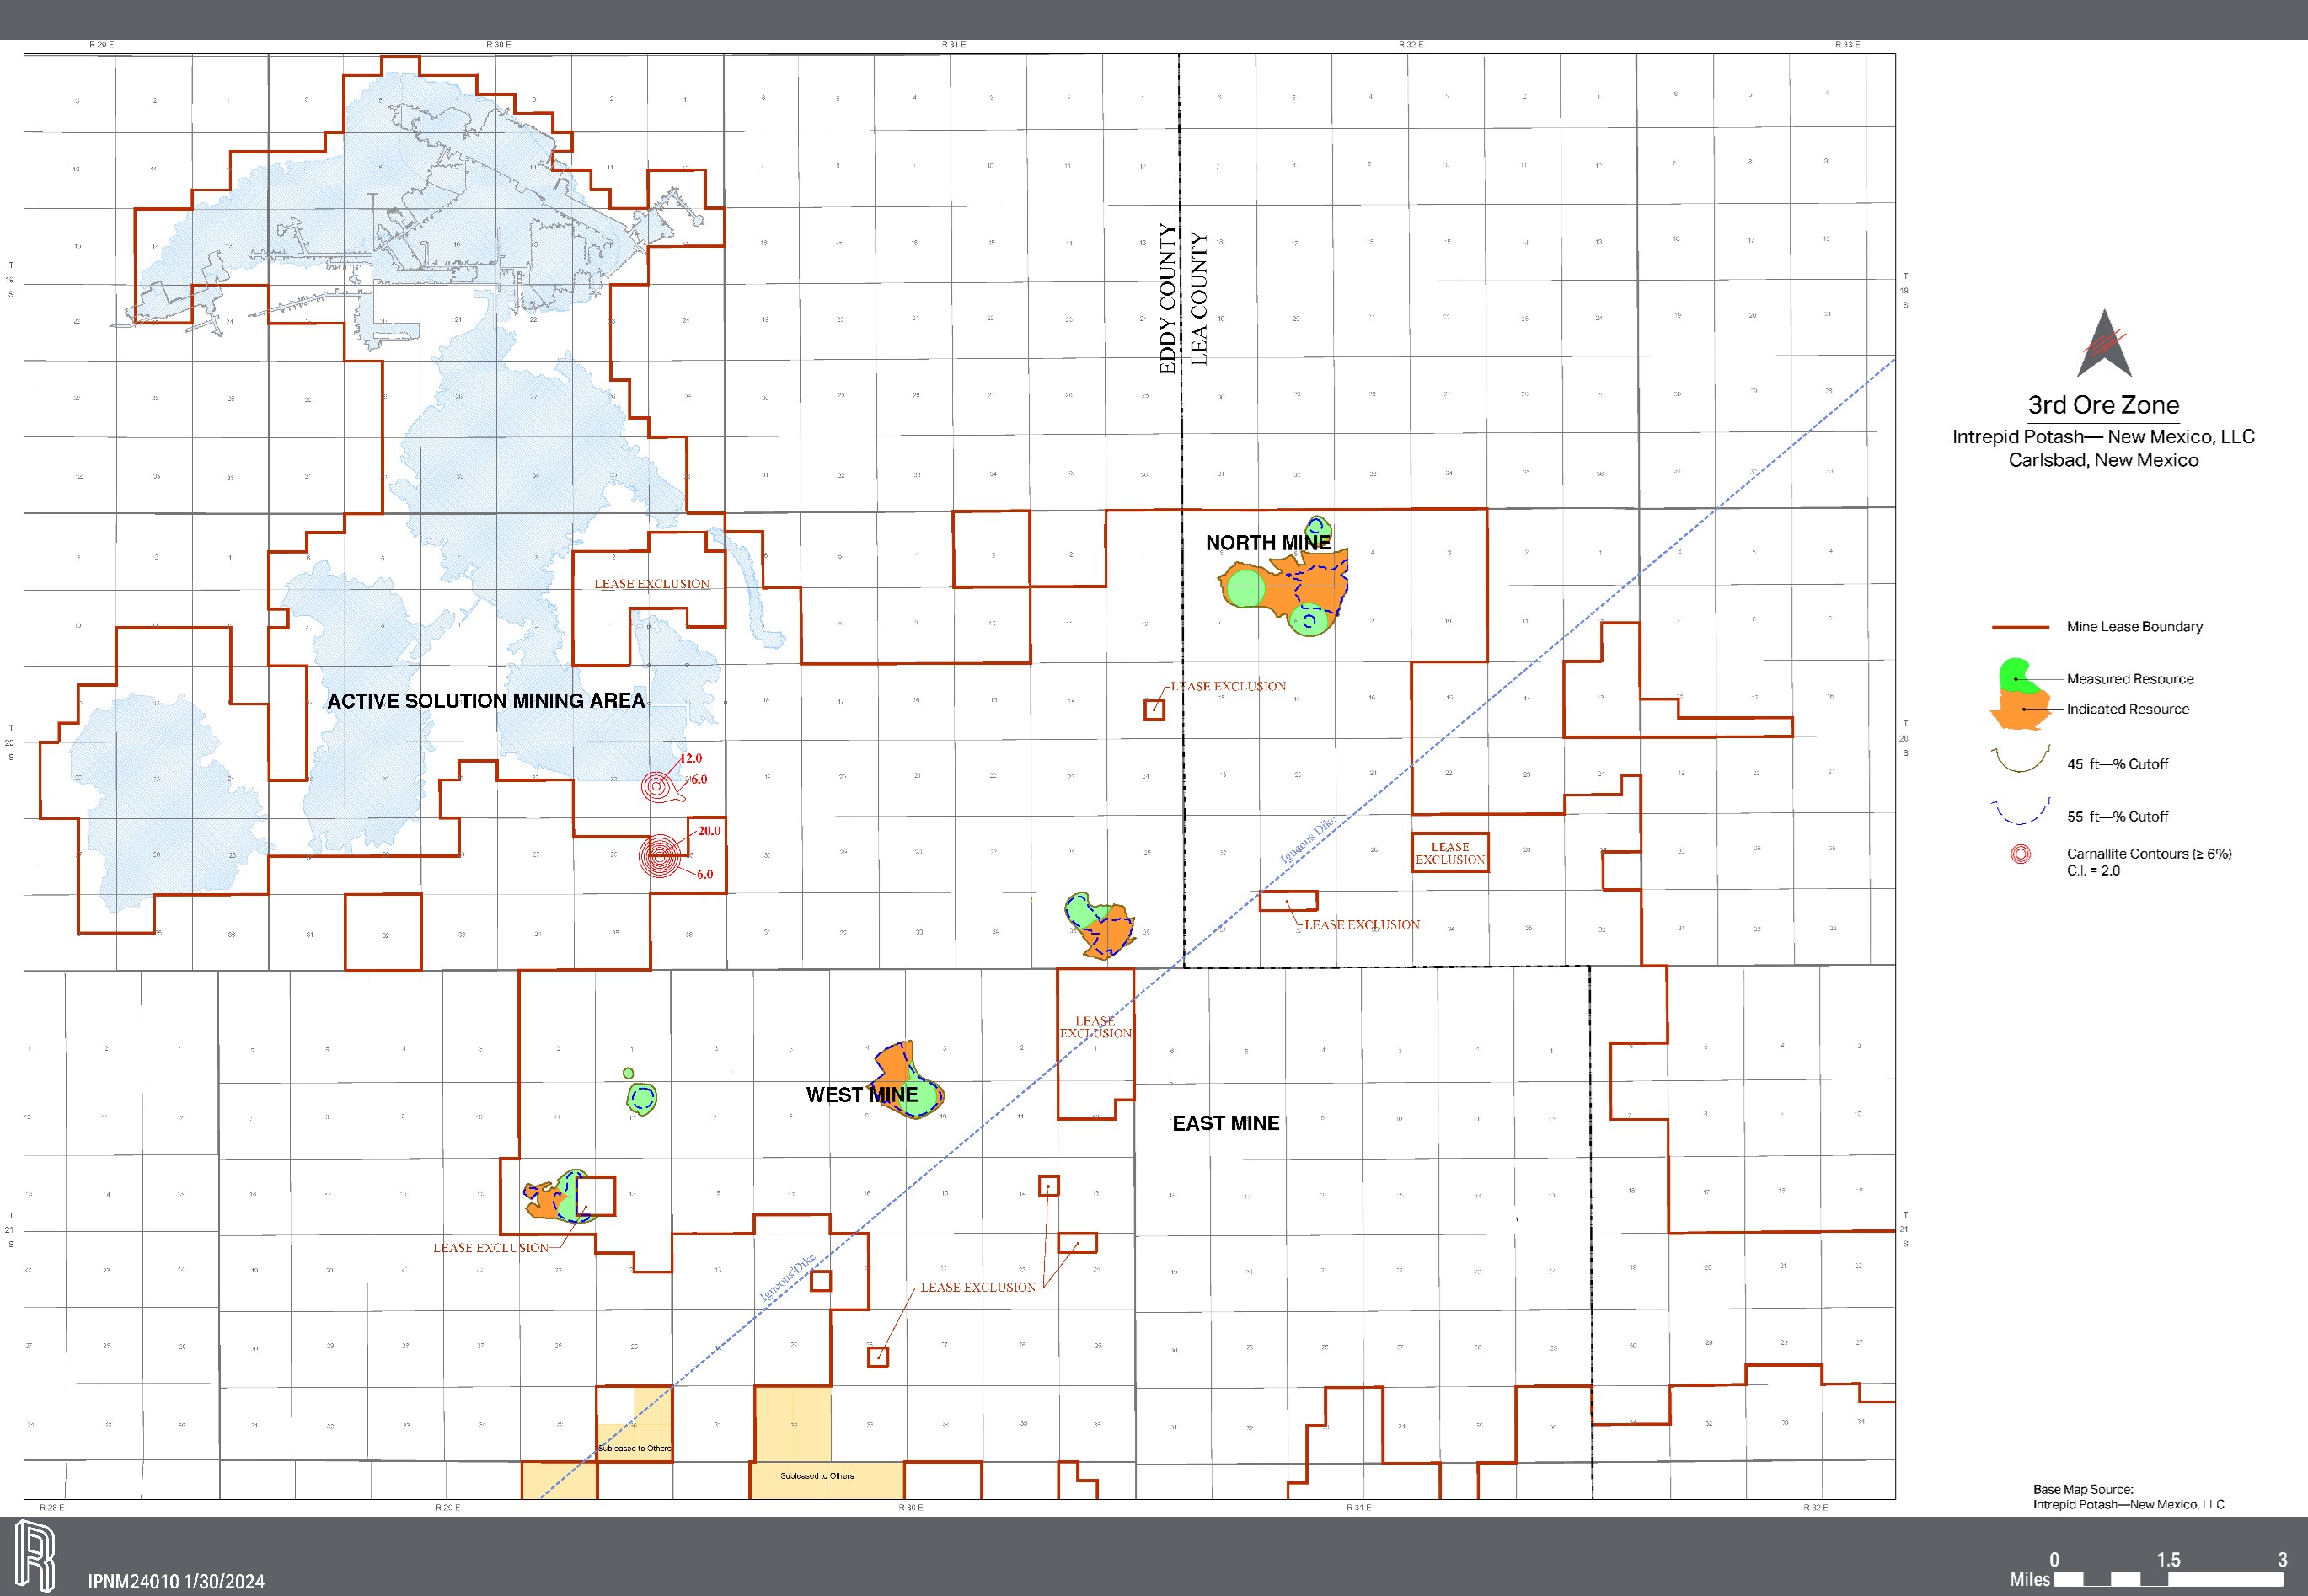
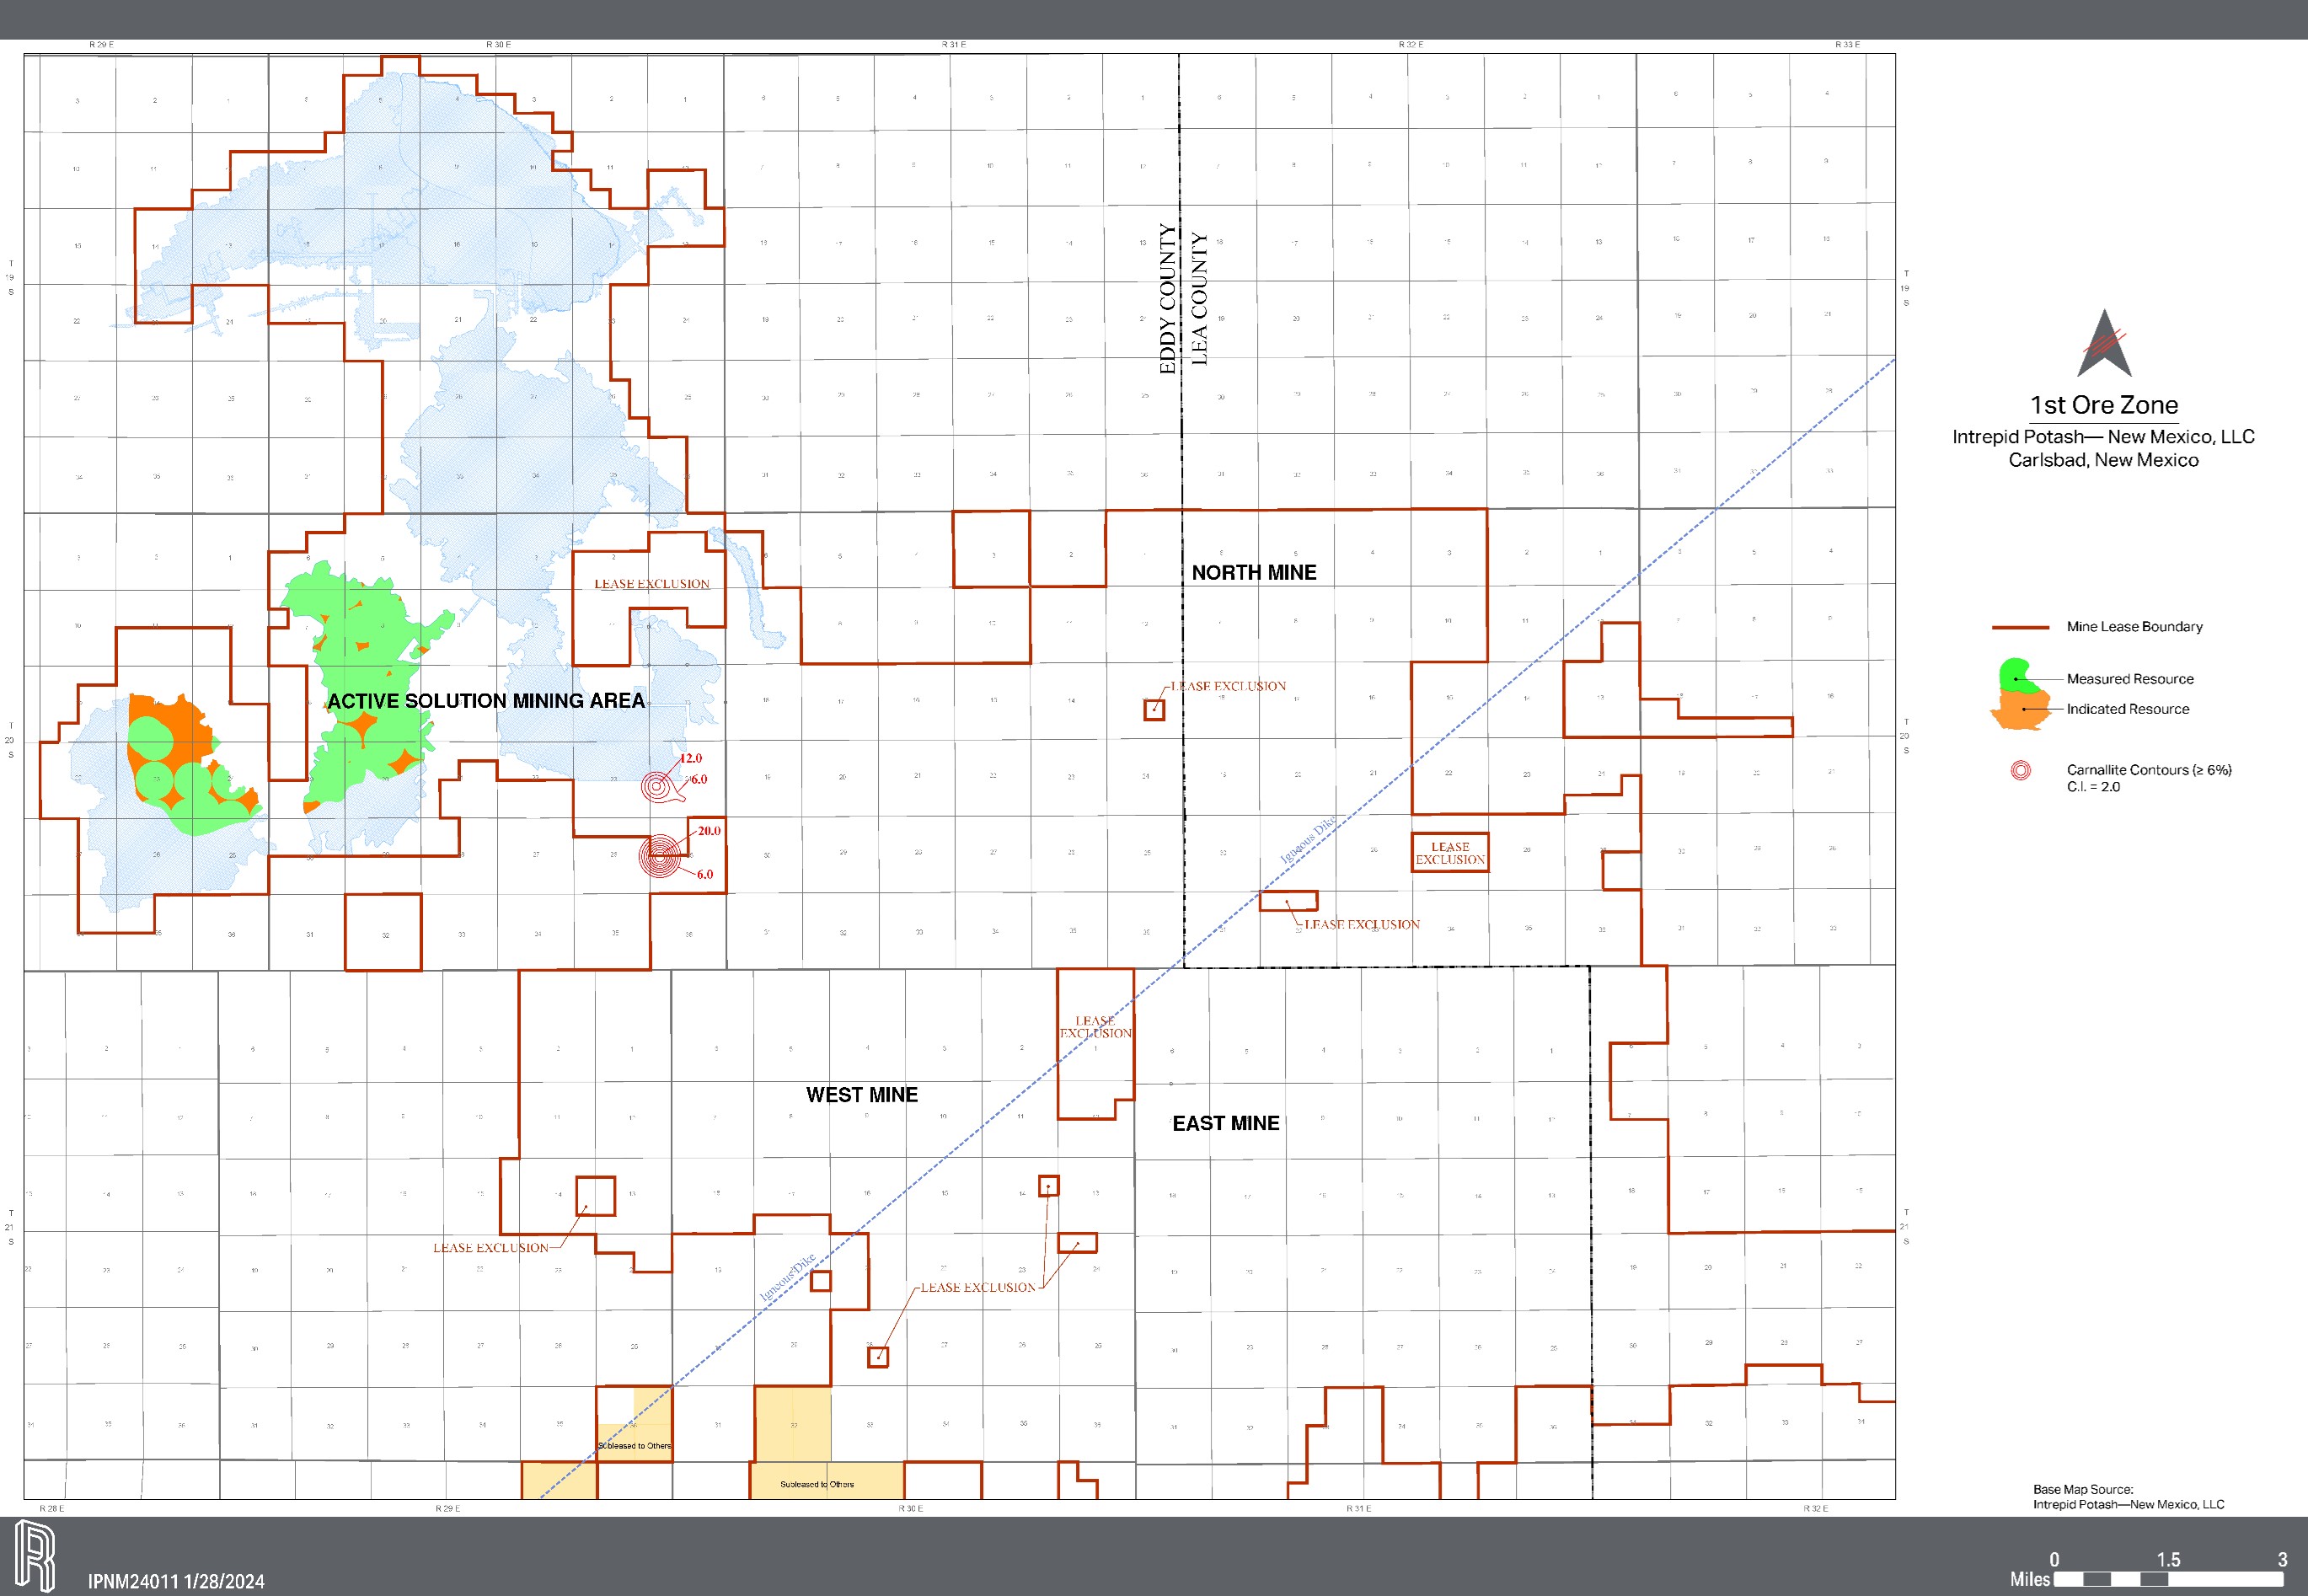
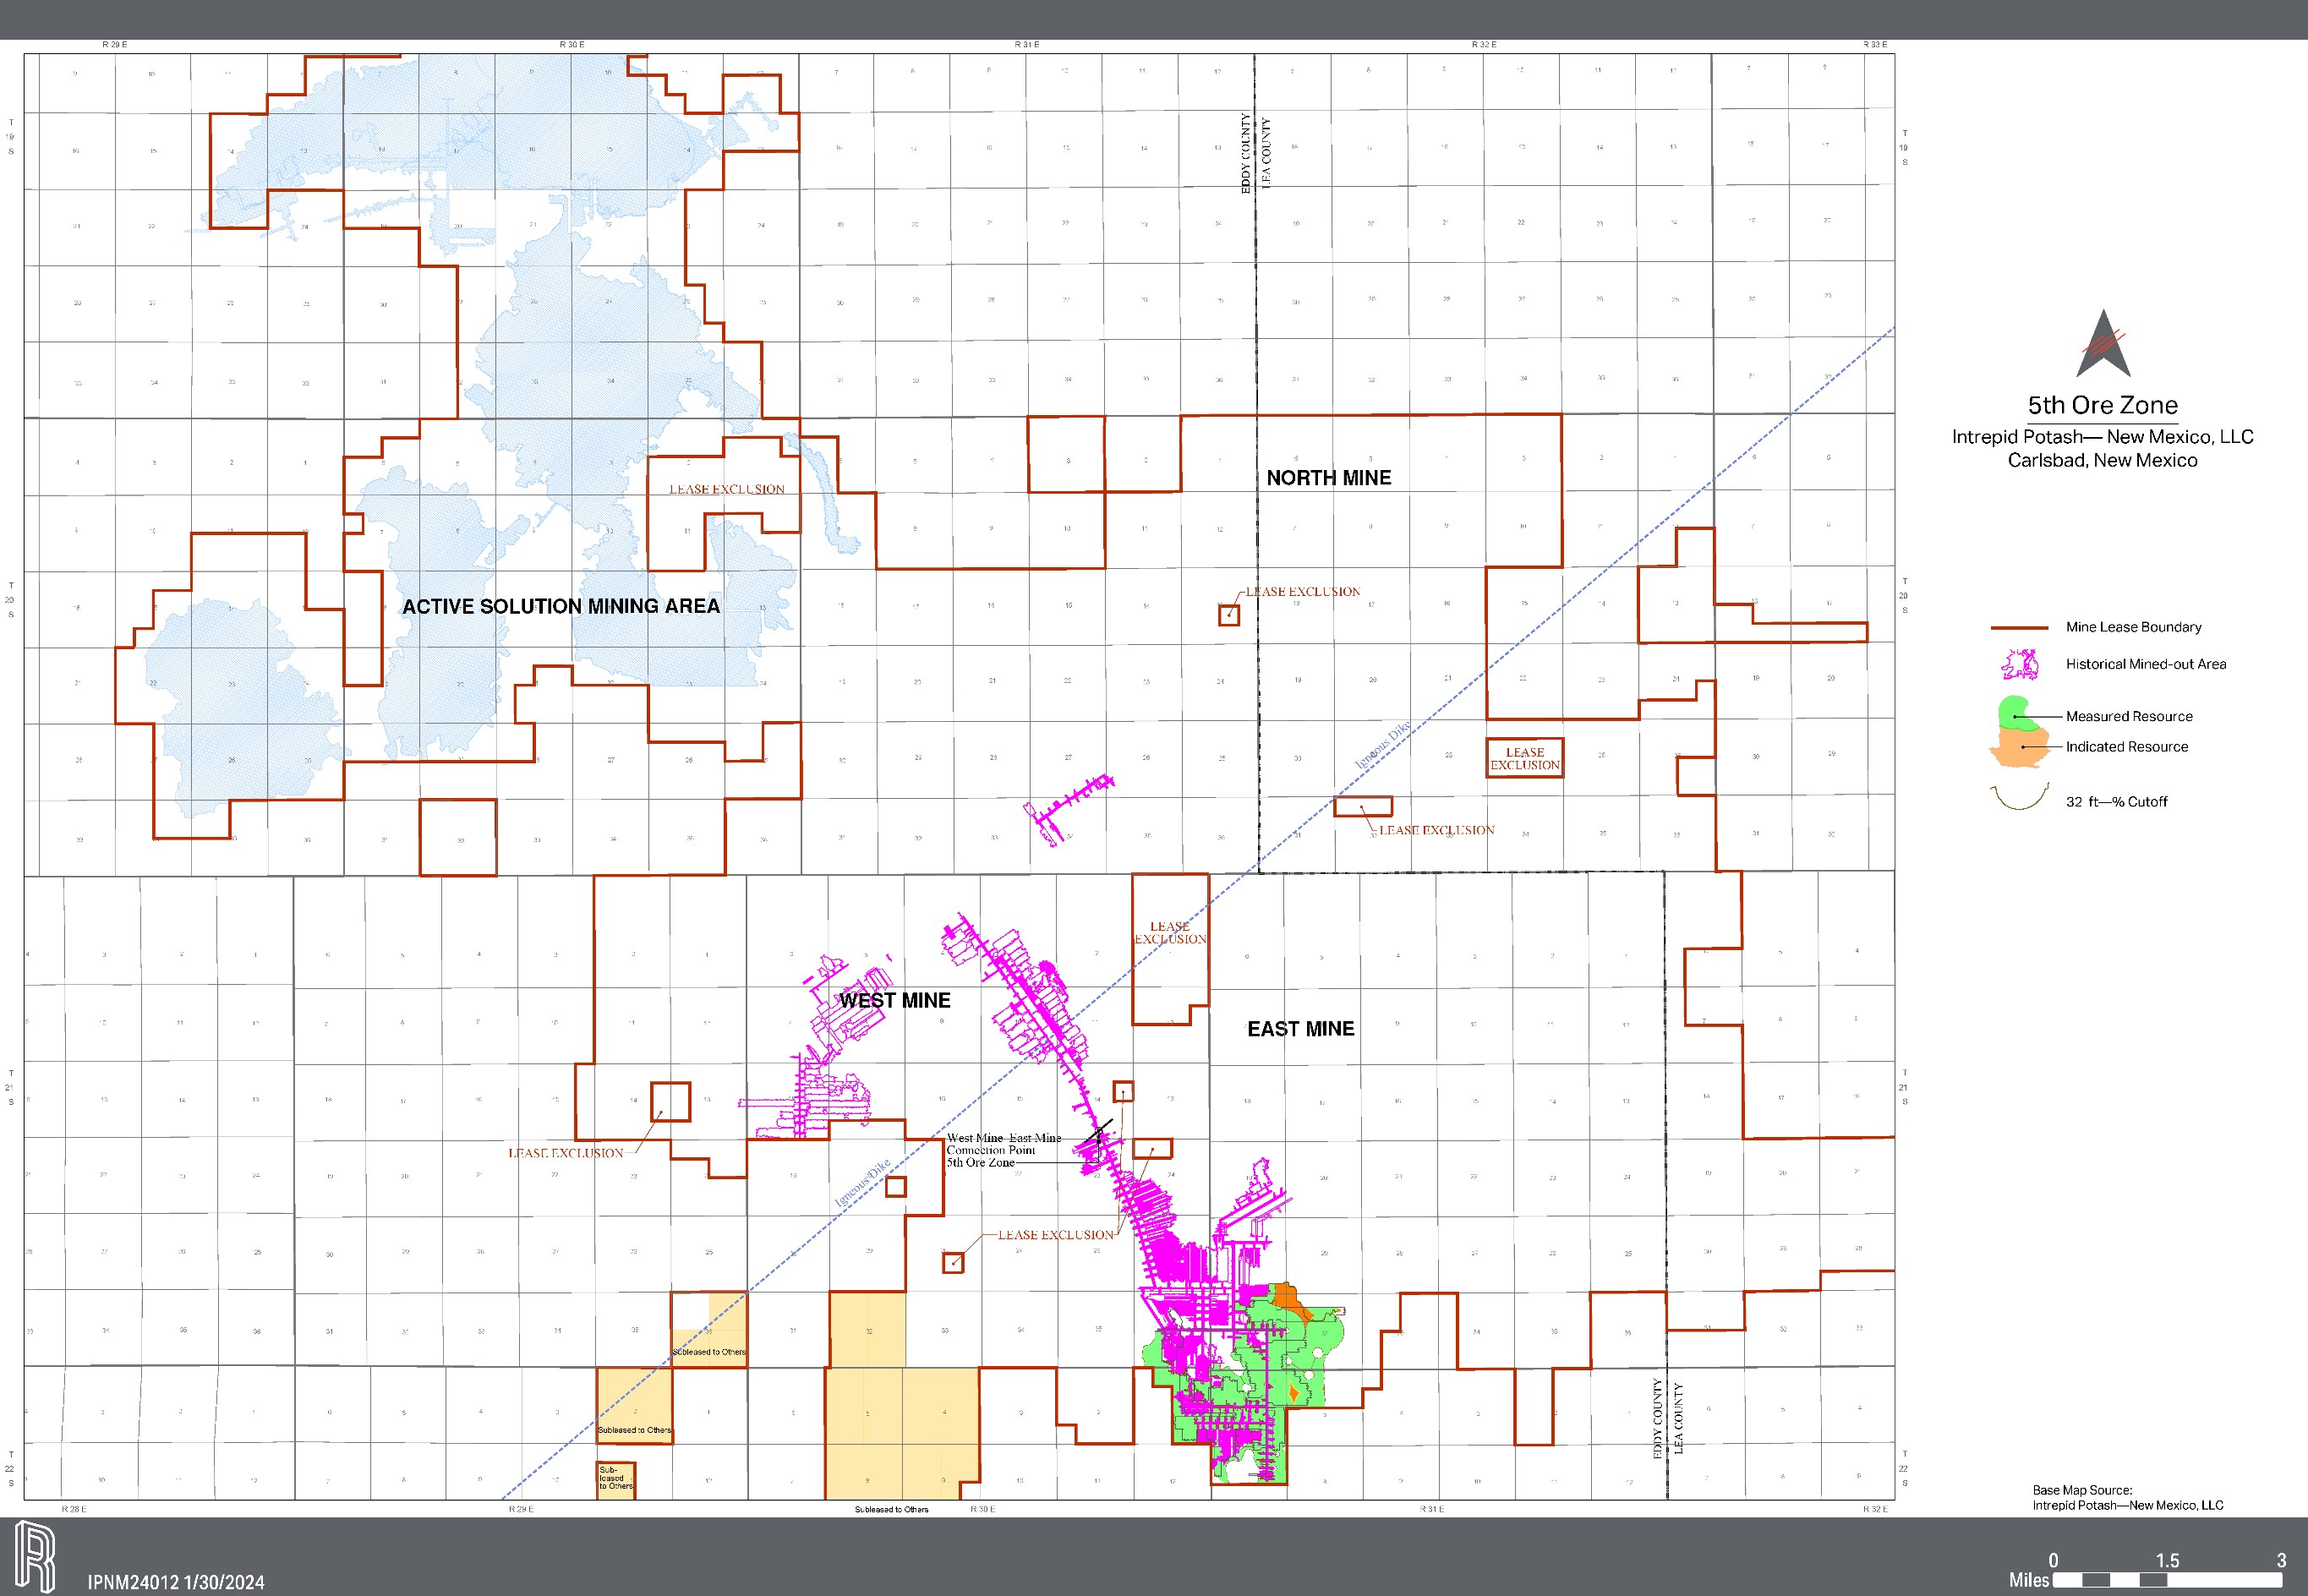
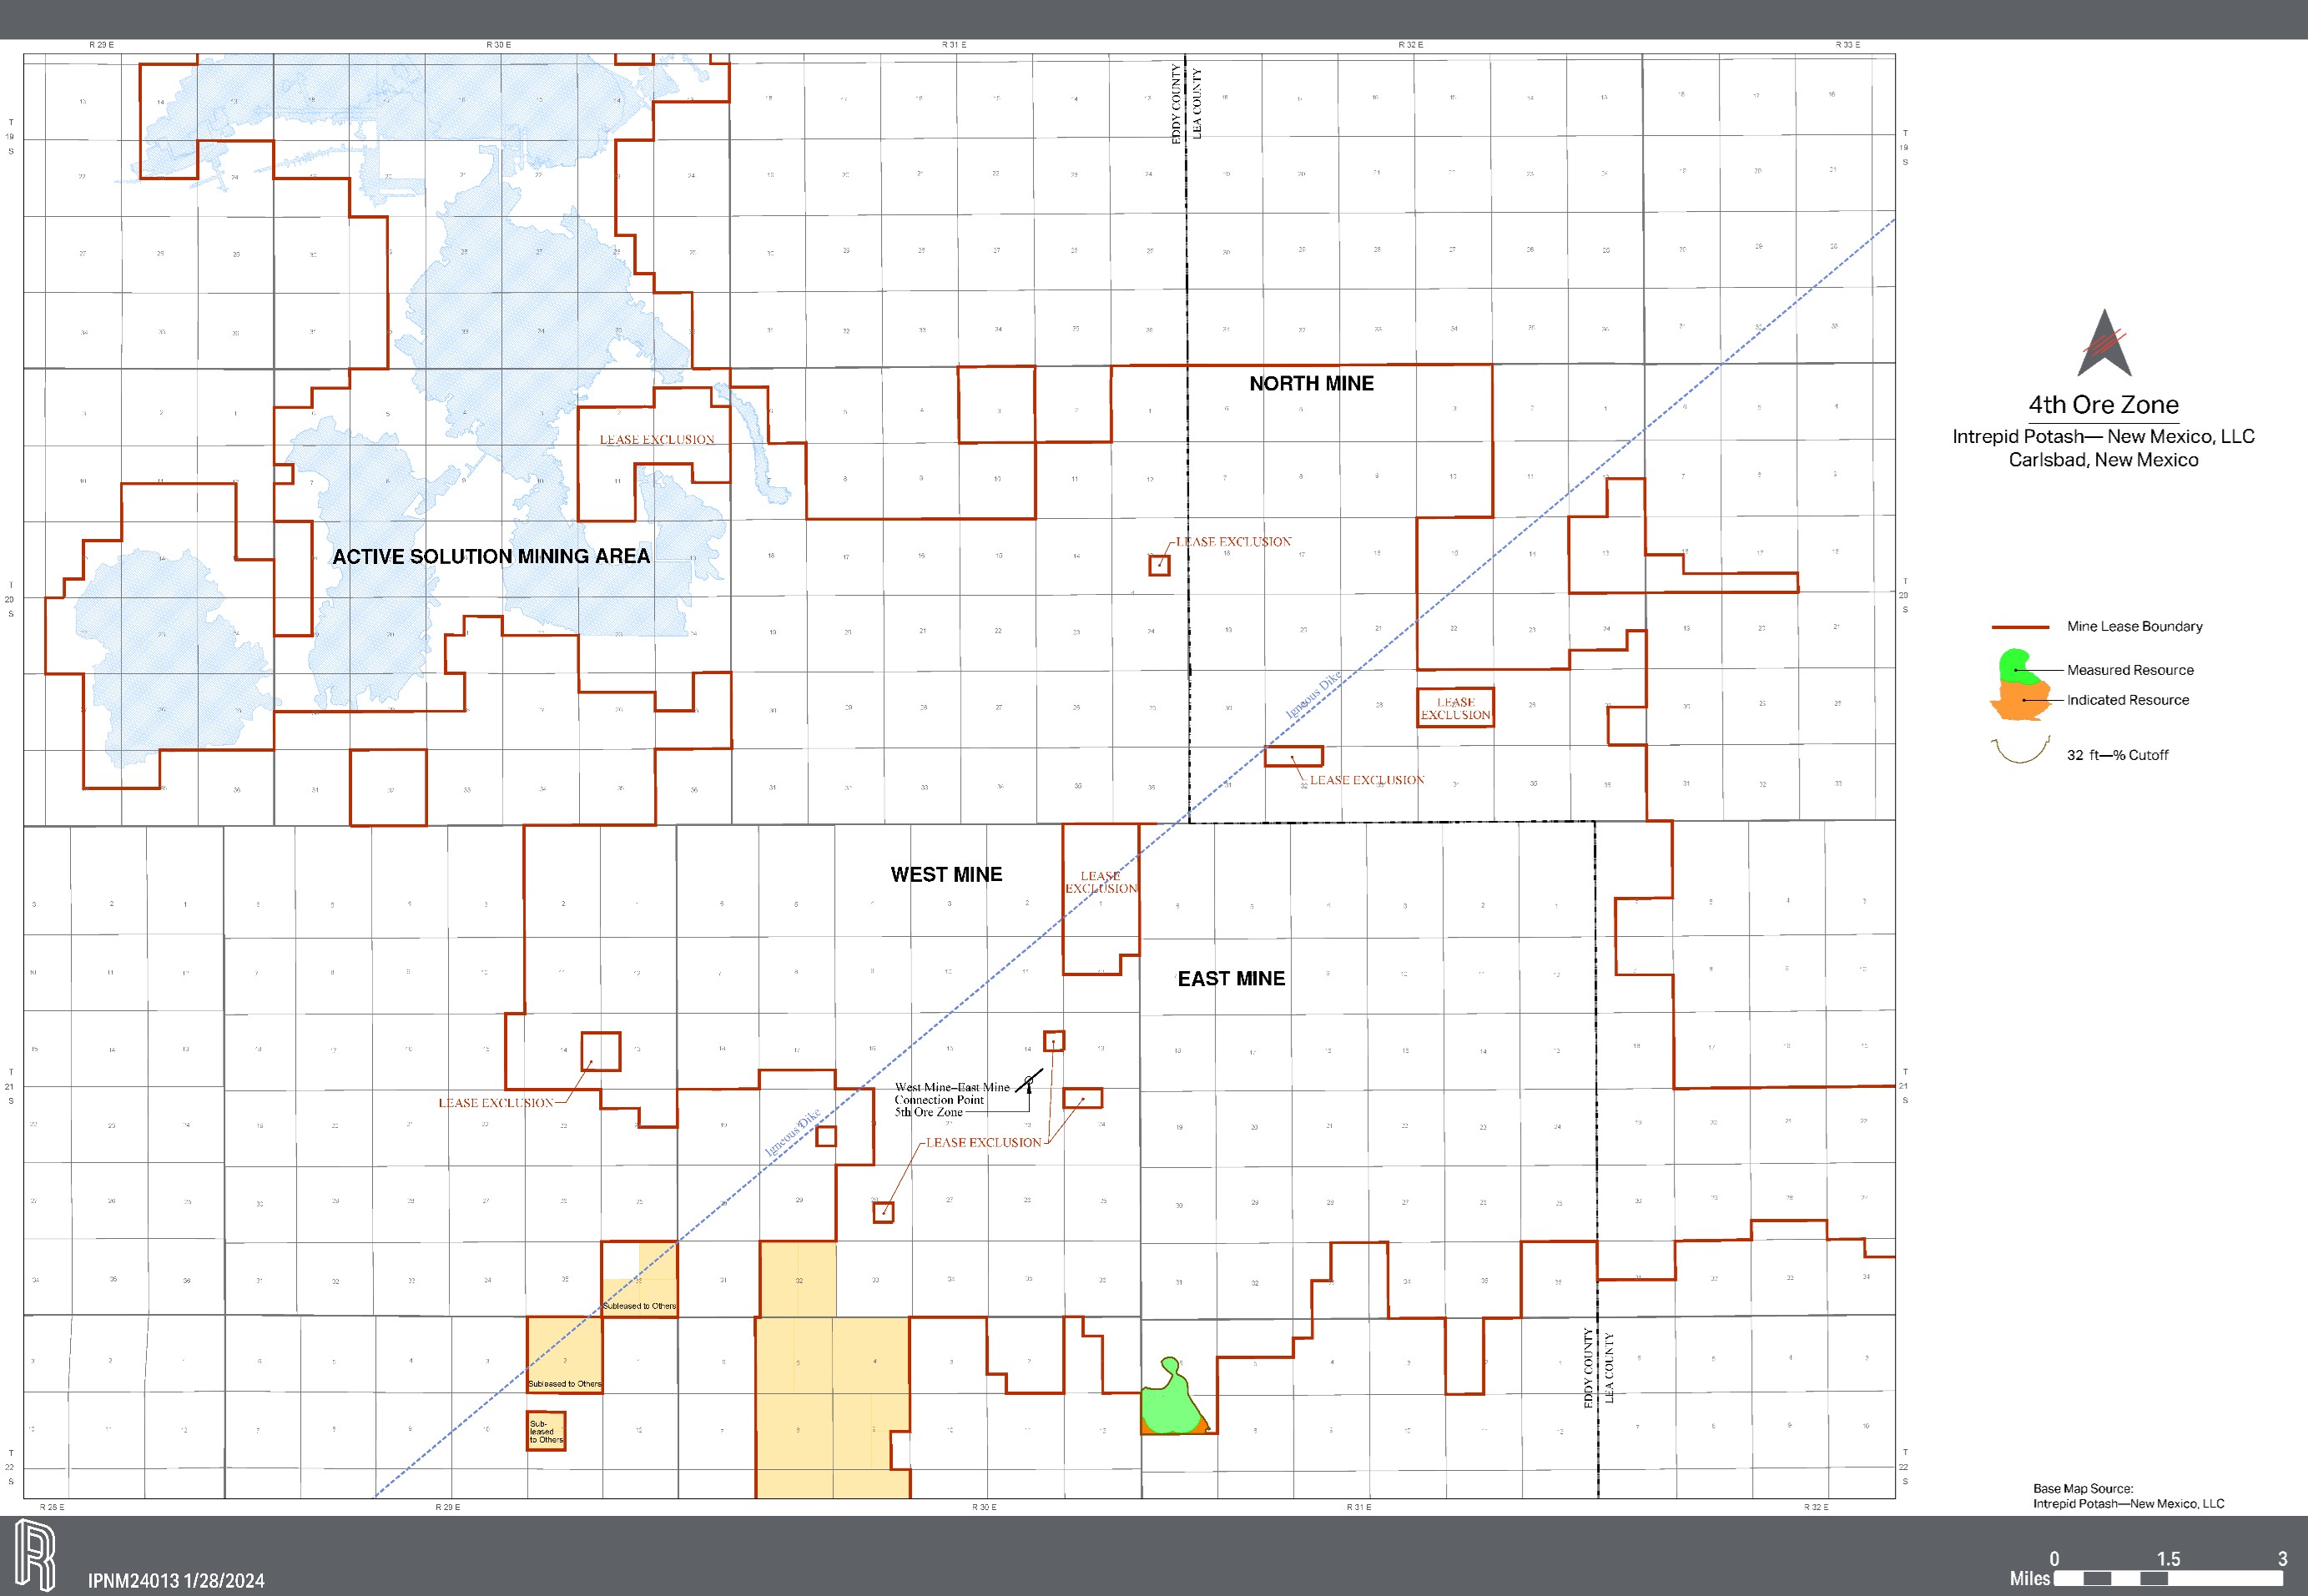
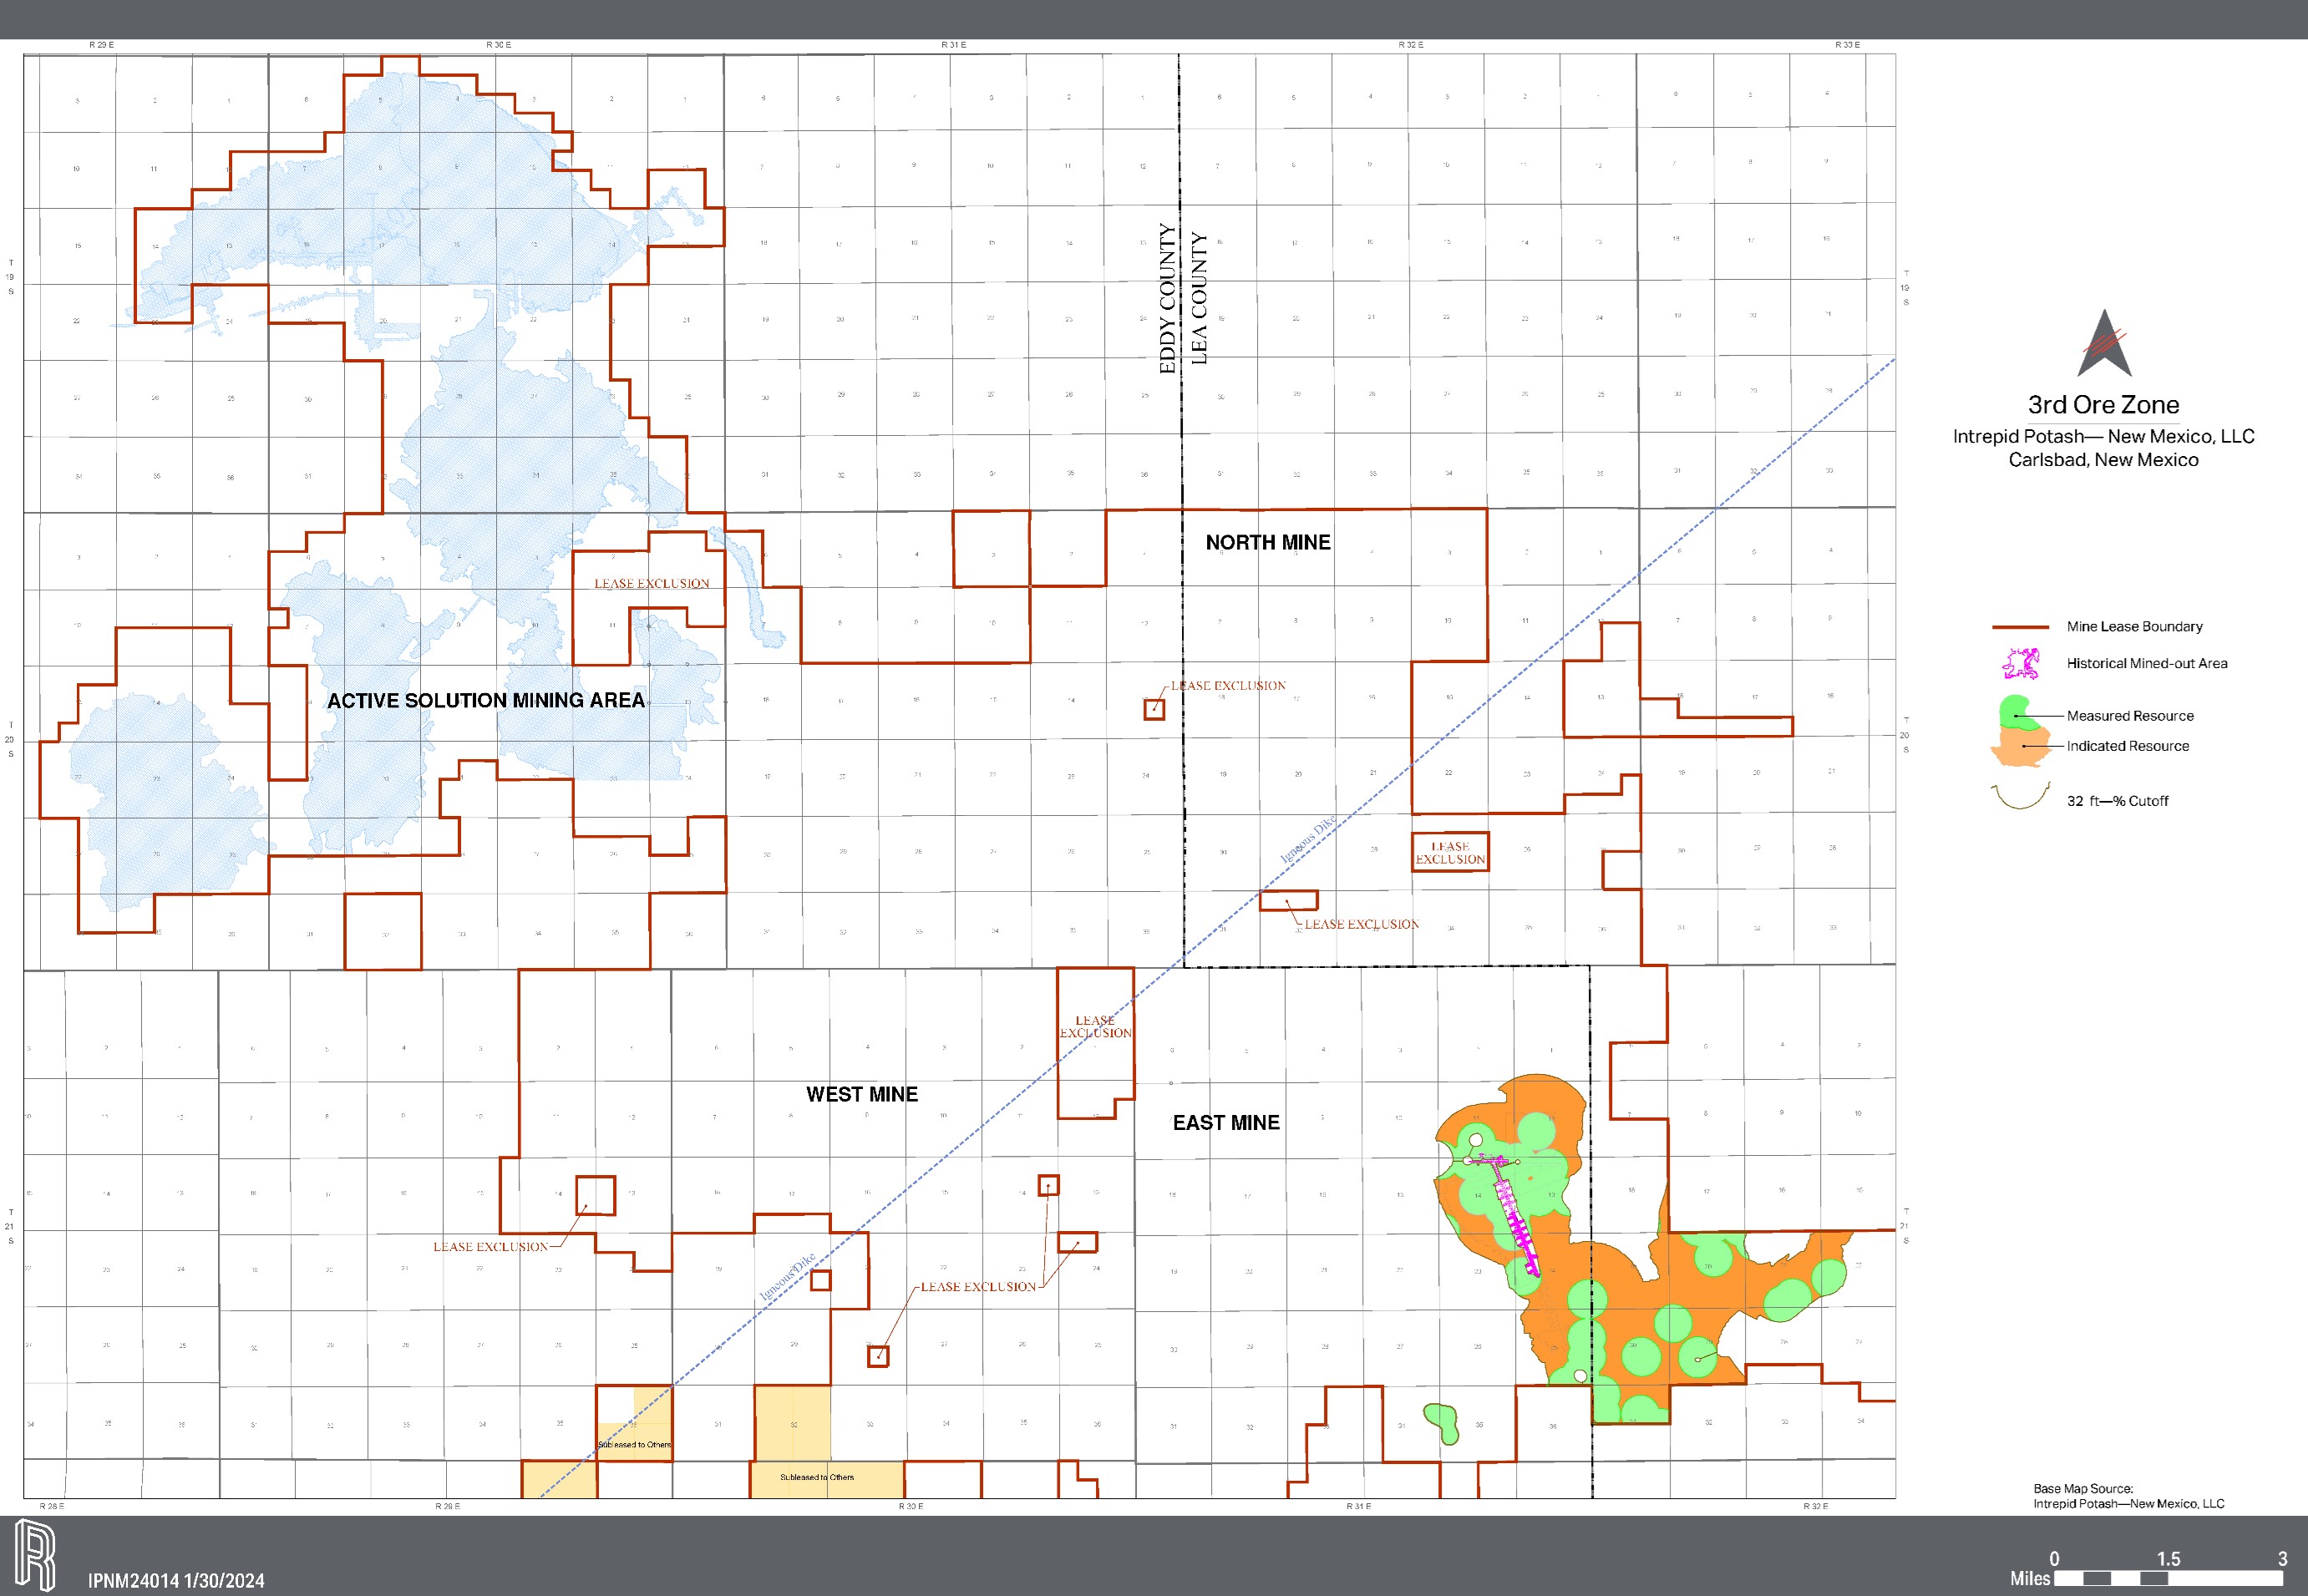
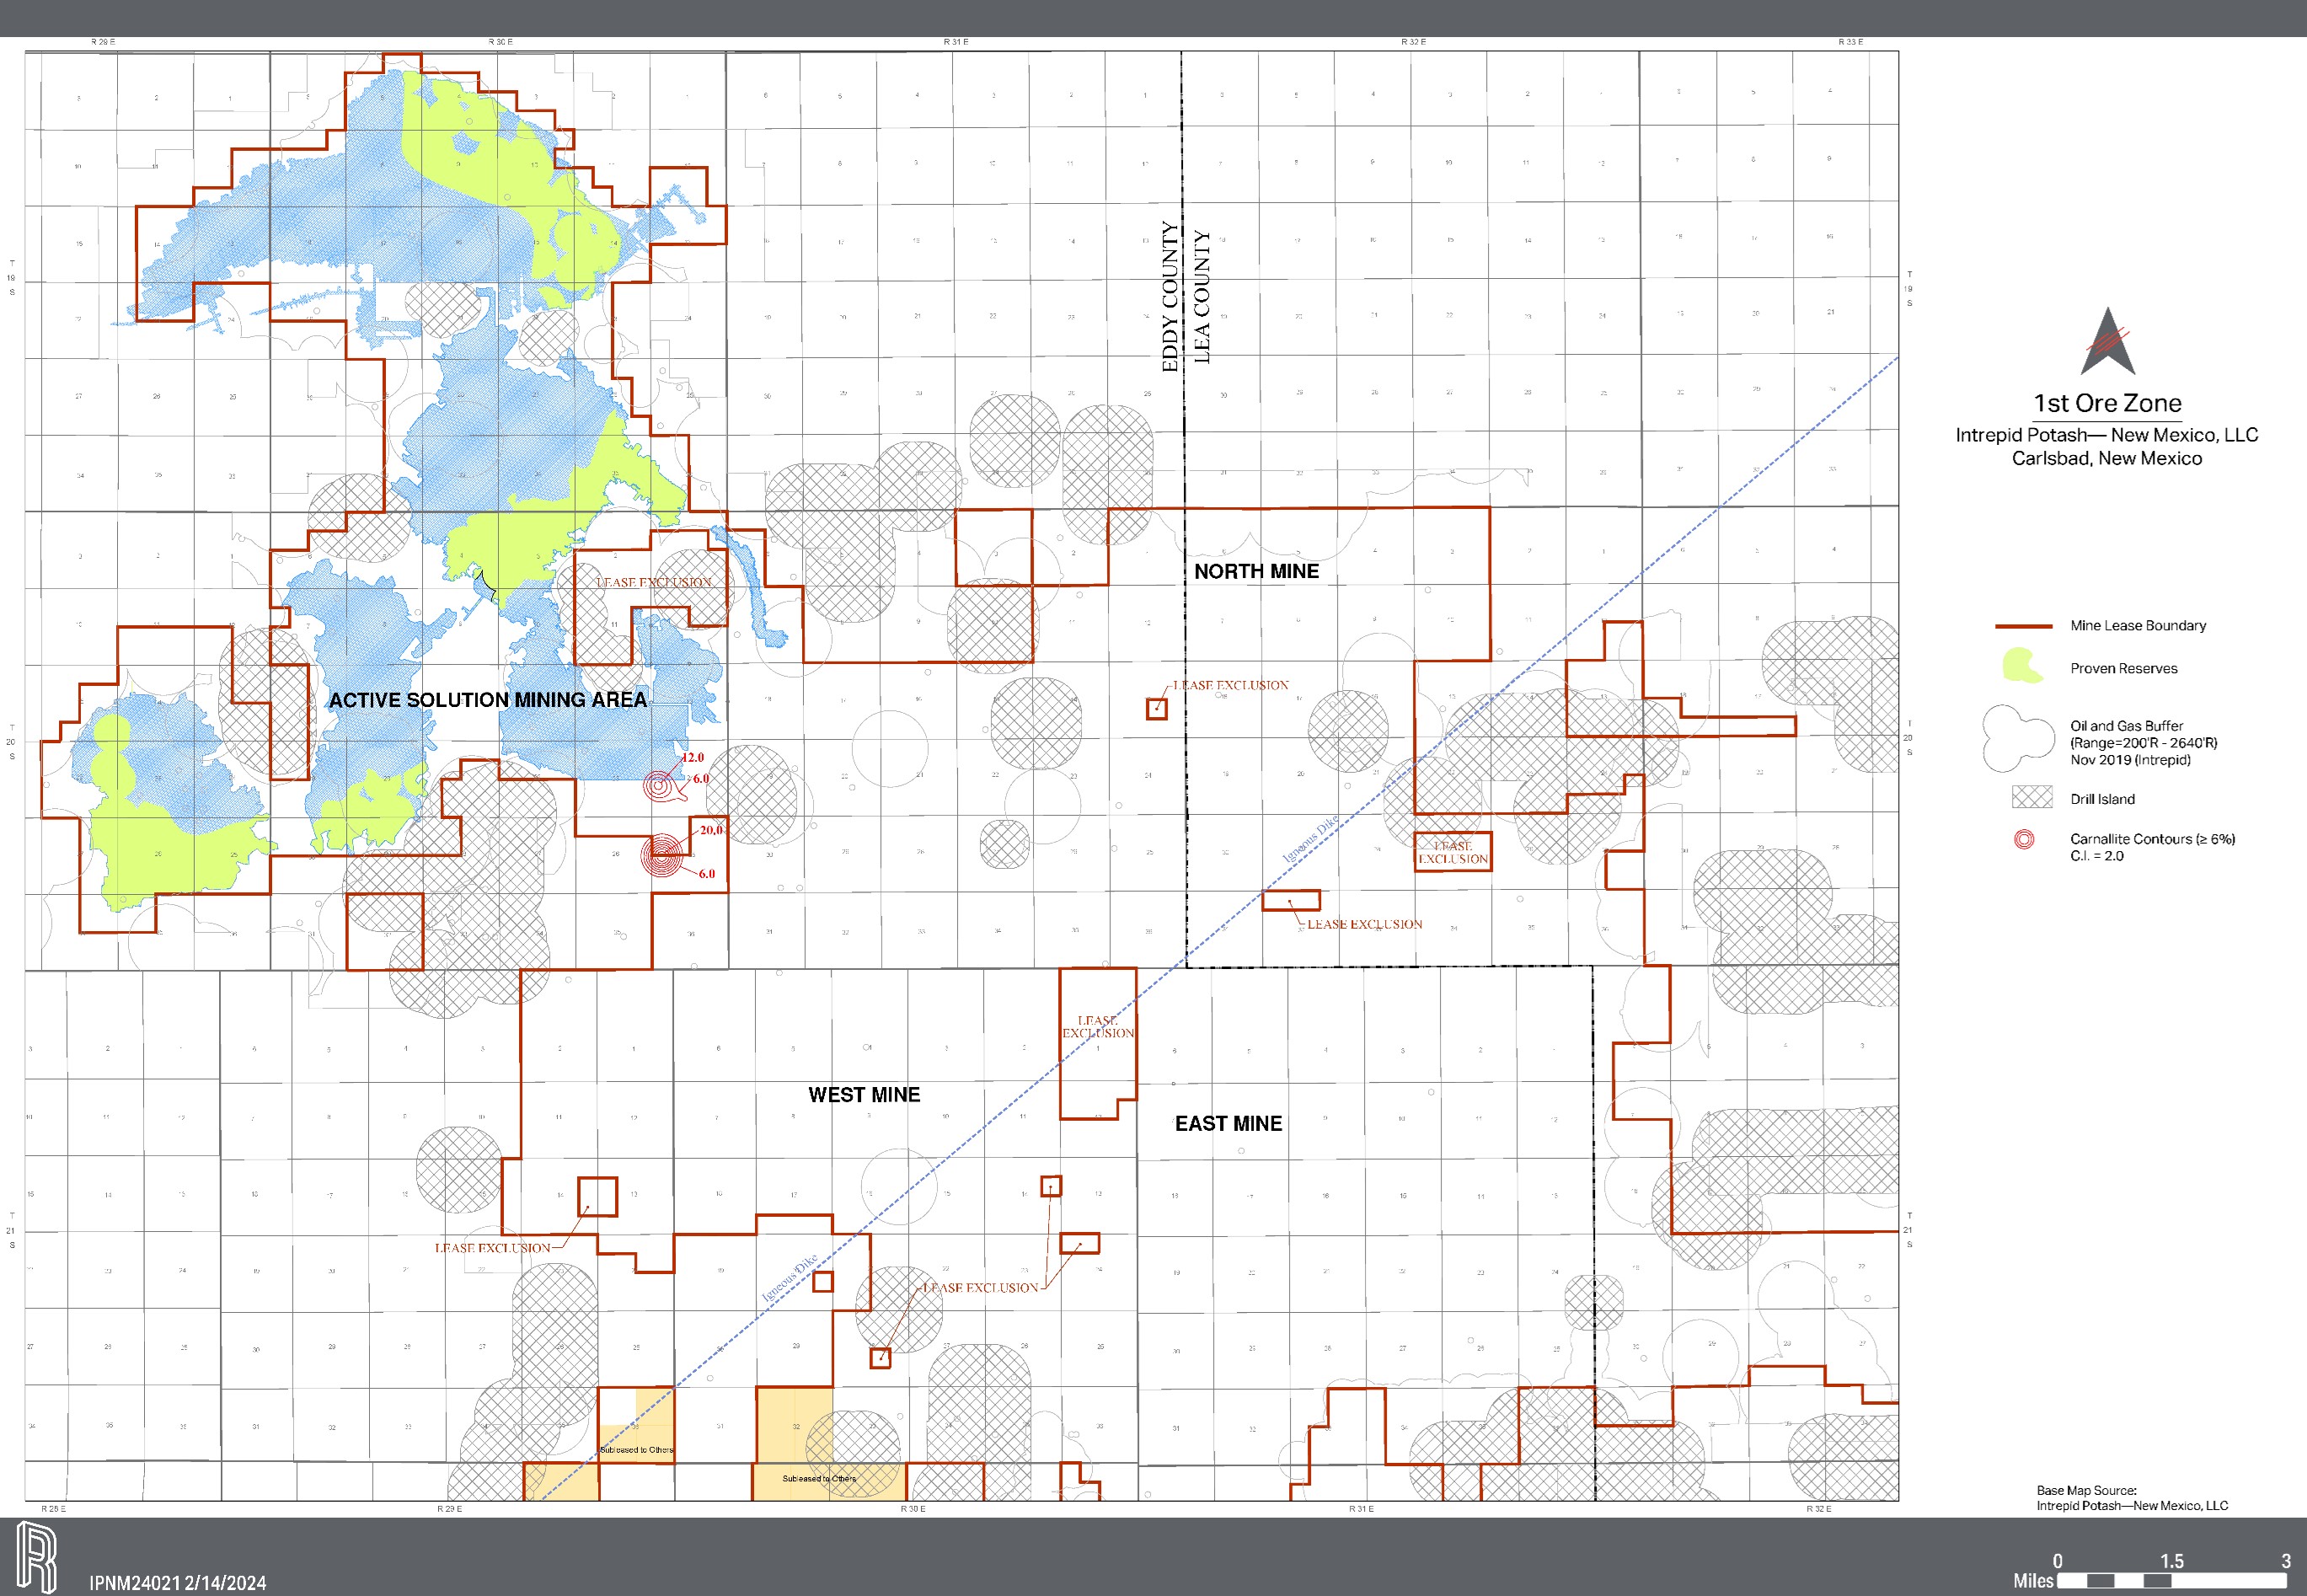
•Significant mineral reserve and resource life. Our potash reserves and resources have substantial years of reserve life and resource life. Reserve life is based on the current mine plan and estimated at 25 years for all our potash facilities. Resource life at our potash facilities ranges from 33 years to over 100 years. In addition to our reserves, we have water rights and access to additional mineralized areas of potash for potential future exploitation. In December 2023, we recorded an impairment of our long-lived assets at our East facility of $31.9 million, which included a $2.3 million impairment of our mineral rights at our East mine. As such, we no longer show mineral reserves at our East mine, and only include a mineral resource estimate. Additional information regarding our mineral reserves and resource estimates can be found in Item 2. Properties and in the updated Technical Report Summaries included with this filing.
•Existing facilities and infrastructure. Constructing a new potash production facility requires substantial time and extensive capital investment in mining, milling, and infrastructure to extract, process, store, and ship product. Our operations already have significant facilities and infrastructure in place. We also have the ability to expand our business using existing installed infrastructure, in less time and with lower expenditures than would be required to construct entirely new mines.
Seasonality
The month-to-month seasonality of our agricultural sales is somewhat moderated due to the variety of crops, industries, distribution strategies, and geographies that we serve. There is a seasonal sales pattern for potash sold into the agricultural market. Over the last three years, approximately 80% of our total annual potash sales volumes occurred in January through May, in anticipation for the spring application season, and September through November, in anticipation of the fall application season. The specific timing of when farmers apply potash remains highly weather dependent and varies across the numerous growing regions within the U.S. Marketing programs of potash producers and storage volumes closer to the farm gate significantly influence the timing of potash sales.
The sales pattern for Trio® sold into the domestic agricultural market is also seasonal. Over the last three years, our domestic Trio® sales volume has been highest in February through May, as Trio® products are typically applied to crops in the U.S. during the spring planting season. Demand for the spring planting season generally runs from December to May, when we have sold approximately 60% of our annual domestic Trio® volumes over the past three years.
We observed fertilizer dealers in North America instituting practices that are designed to reduce the risk of changes in the price of fertilizer products through consignment-type programs. These programs tend to make the timing of the spring and fall seasonal demand profile less predictable within the season. Further, through technological advances, farmers in the U.S. are more efficient in planting and harvesting their crops, which has compressed the application seasons.
Our quarterly and yearly financial results can also vary from one year to the next due to weather‑related shifts in planting schedules and purchasing patterns.
Because all of our potash production comes from our solar solution mines, our potash production is also seasonal. Our solar solution mines suspend potash production activities from early spring through late summer, the peak solar evaporation period. Accordingly, we manage our inventories during the low demand periods of the year in order to ensure timely product availability during the peak sales seasons, as well as during the summer evaporation period when we are not producing potash. Our sales volumes are highest during the spring and our working capital requirements are highest just before the start of the spring season, as a result of the seasonality of fertilizer demand.
Demand of our oilfield products and services is highly correlated to oil and gas exploration activities and can vary from quarter to quarter and year to year.
Major Customers
Within the agricultural market, we supply a diversified customer base of distributors, cooperatives, retailers, and dealers, which in turn supply farmers producing a wide range of crops in different geographies. We sell into the industrial and feed markets through sales to distributors and directly to end users. For water, we sell to a diverse set of customers through a combination of spot sales and a multi-year contract. For brine, we sell to a diverse set of customers in the spot market.
In 2023 and 2022, we had one customer, Bill Barr & Company, Inc., which accounted for more than 10% of our total consolidated revenues. In 2021, no customer accounted for more than 10% of our total consolidated revenues.
Environmental, Safety, and Health Matters
We are subject to federal, state, and local environmental, safety, and health laws that regulate, among other things; (1) soil, air, and water quality standards for our facilities; (2) disposal, storage, and management of hazardous and solid wastes; (3) post-mining land reclamation and closure; (4) conditions of mining and production operations; (5) employee and contractor safety and occupational health; and (6) product content and labeling. We employ and consult with professionals who assist in monitoring our compliance with these laws and who work with management to ensure that appropriate strategies and processes are in place to promote a culture that prioritizes safety and environmental responsibility.
In 2023, we had approximately $2.6 million of capital investments and reclamation projects, and $1.2 million in other expenses, relating to environmental compliance, environmental studies, and remediation efforts. We expect to spend $2.0 million to $3.0 million for environmental related capital and reclamation projects in both 2024 and 2025. Future capital expenditures are subject to uncertainties, including changes to environmental laws. Material expenditures could be required in the future to fulfill environmental compliance requirements, either new or existing. We anticipate a focus on environmental issues will result in increased future investments for environmental controls at our operations. See Item 1A. Risk Factors “Risks Related to Our Business - Environmental laws and regulations could subject us to significant liability and require us to incur additional costs.”
Product Registration Requirements
We are required to register fertilizer products with each U.S. state and foreign country where products are sold. Each brand and grade of commercial fertilizer must be registered appropriately before being offered for sale, sold, or distributed. In most cases, these product registrations impose specific requirements relating to guaranteed analysis, product labeling, and regular reporting of sales.
Some U.S. states require similar registration and reporting for feed grade products. Industrial-grade products typically do not require registration or reporting.
Operating Requirements and Government Regulations
Permits
We are subject to numerous environmental laws and regulations, including laws and regulations regarding land use and reclamation; release of emissions to the atmosphere; release of contaminants to water; preservation of plant and animal life; and the generation, treatment, storage, disposal, and handling of hazardous substances and wastes. These laws include the Clean Air Act ("CAA"); the Clean Water Act ("CWA"); the Resource Conservation and Recovery Act ("RCRA"); the Comprehensive Environmental Response, Compensation, and Liability Act ("CERCLA"); the Toxic Substances Control Act ("TSCA"); and various other federal, state, and local laws and regulations. Violations can result in substantial penalties, court orders to install pollution‑control equipment, civil and criminal sanctions, permit revocations, and facility shutdowns. Environmental laws and regulations may impose joint and several liability, without regard to fault, for cleanup costs on potentially responsible parties who have released, disposed of, or arranged for release or disposal of hazardous substances in the environment.
We hold numerous environmental, mining, and other permits or approvals authorizing operations at each of our facilities. Our operations are subject to permits for, among other things, extraction of salt and brine, discharges of process materials and waste to air and water, injection of brine, and appropriation of water. Some of our proposed activities may require waste storage permits. A decision by a government agency to deny or delay issuing a new, modified, or renewed permit or approval, or to revoke or substantially modify an existing permit or approval, could limit or prevent us from mining at these properties. In addition, changes to environmental and mining regulations or permit requirements could limit our ability to continue operations at the affected facility. In many cases, environmental permits and approvals are also required for an expansion of, or changes to, our operations. As a condition to procuring the necessary permits and approvals, we may be required to comply with financial assurance regulatory requirements. The purpose of these requirements is to assure the government that sufficient company funds will be available for the ultimate reclamation, closure, and post-closure care at our facilities. We obtain bonds as financial assurance for these obligations. These bonds require annual payment and renewal.
We believe we are in compliance with existing regulatory programs, permits, and approvals where non-compliance could have a material adverse effect on our operating results or financial condition. In 2016, the OSE determined that our East tailing impoundment embankments are considered jurisdictional dams. We continue to work with the OSE's Dam Safety Bureau to determine the hazard level of our dams and the OSE to determine required dam modifications associated with this determination. We may be required to spend a significant amount of capital to bring the impoundments into compliance with requirements for jurisdictional dams or modify our operations to no longer use impoundments that may qualify as jurisdictional dams.
Occasionally governmental agencies notify us of noncompliance with certain environmental laws, regulations, permits, or approvals. For example, although designated as zero discharge facilities under the applicable water quality laws and regulations, our East, North, and Moab facilities at times may experience some water and brine discharges during periods of significant rainfall or due to other circumstances. We have implemented several initiatives to address discharge issues, including the reconstruction or modification of certain impoundments, increasing evaporation, and reducing process water usage and discharges and improved management systems. State and federal officials are aware of these issues and have visited the sites to review our corrective efforts and action plans.
Air and Drinking Water
In the ordinary course of our business, we receive notices from the New Mexico Environment Department of alleged air or drinking water quality control violations. Upon receipt of these notices, we evaluate the matter and take any required corrective actions. In some cases, we may be required to pay civil penalties for these notices of violation. The Utah Division of Air Quality conducts periodic compliance inspections at our Moab and Wendover facilities and affirms our compliance with applicable approval orders.
Safety and Health Regulation and Programs
Some of our facilities are subject to the Federal Mine Safety and Health Act of 1977 ("MSHA"), the Occupational Safety and Health Act ("OSHA"), related state statutes and regulations, or a combination of these laws.
Our conventional underground mines and related surface facilities in New Mexico are subject to MSHA jurisdiction. In accordance with MSHA, these facilities are regularly inspected by MSHA personnel. Item 4 and Exhibit 95.1 to this Annual Report provide information concerning certain mine safety violations.
As part of our ongoing safety programs, we collaborate with MSHA and the New Mexico Bureau of Mine Safety to identify and implement accident prevention techniques and practices. A trained mine rescue team services our New Mexico facilities. This team is ready to respond to on-site incidents or assist in local incidents, if needed. In addition, our New Mexico facilities participate in a basin agreement with other natural resource and hazardous waste facilities to provide mine rescue support.
Our Utah facilities and our HB mine and plant are subject to OSHA jurisdiction. We provide all OSHA required training and other certifications to our employees at these facilities.
Remediation at Intrepid Facilities
Many of our current facilities have been in operation for a number of years. Our and our predecessors' operations involved the historical use and handling of potash, salt, related potash and salt byproducts, process tailings, hydrocarbons and other regulated substances. Some of these operations resulted, or may have resulted, in soil, surface water, or groundwater contamination. At some locations, there are areas where process waste, building materials (including asbestos‑containing transite), and ordinary trash may have been disposed or buried, and have since been properly closed and maintained.
At some of our facilities, spills or other releases of regulated substances may have occurred or could potentially occur, possibly requiring us to undertake or fund cleanup efforts under CERCLA or state laws governing cleanup or disposal of hazardous and solid waste.
We work closely with government authorities to obtain the appropriate permits to address identified site conditions. For example, buildings located at our facilities in Utah and New Mexico have a type of siding that contains asbestos. We have adopted programs to encapsulate and stabilize portions of the siding through use of an adhesive spray and to remove the siding, replacing it with an asbestos-free material. We have trained asbestos abatement crews that handle and dispose of the asbestos‑containing siding and related materials. We have a permitted asbestos landfill in Utah and have worked closely with Utah officials to address asbestos‑related issues at our Moab mine.
Reclamation Obligations
Mining and processing of potash generates residual materials that must be managed both during the operation of the facility and upon facility reclamation and closure. Potash tailings, consisting primarily of salt and fine sediments that remain after potash is removed from ore during processing, are stored in surface disposal sites. Some of these tailing materials may also include other contaminants, such as lead, that were introduced as reagents during historic processing methods. These tailings materials may require additional management and could result in the imposition of additional disposal and reclamation requirements. For example, at least one of our New Mexico mining facilities may have legacy issues regarding lead in a tailings pile that occurred from production methods utilized prior to our acquisition of these assets. During the life of the tailings management areas, we have incurred, and will continue to incur, significant costs to manage potash residual materials in accordance with environmental laws, regulations and permit requirements. Additional legal and permit requirements will take effect when these facilities are closed.
Our surface permits require us to reclaim property disturbed areas of our facilities. Our operations in Utah and New Mexico have specific obligations related to reclamation of the land after mining and processing operations are concluded. The discounted present value of our estimated reclamation costs for our facilities as of December 31, 2023, is approximately $30.4 million, which is reflected in our audited financial statements found elsewhere in this Annual Report. Various permits and authorization documents negotiated with or issued by the appropriate governmental authorities include these estimated reclamation costs on an undiscounted basis.
It is difficult to estimate and predict the potential actual costs and liabilities associated with remediation and reclamation. Additionally, it is possible that we could be identified in the future as a potentially responsible party for additional remediation and reclamation costs, either as a result of changes in existing laws and regulations or as a result of the identification of additional matters subject to remediation and/or reclamation obligations or liabilities.
Royalties
The potash, langbeinite, water, and byproducts we produce and sell from leased land may be subject to royalty payments. We produce and sell products from leased land owned by the U.S., the States of New Mexico and Utah, and private landowners. The terms of the royalty payments are determined at the time of the issuance or renewal of leases. Some royalties are determined as a fixed percentage of revenue and others vary based upon ore grade. Additionally, some of our leases are subject to overriding royalty interest payments paid to various owners. In 2023, we paid $11.1 million in federal, state, and private royalties.
The royalty rates on our state and federal leases in New Mexico are currently set at various rates from 2.0% to 5.0%. The royalty rates on our state and federal leases in Utah are currently set at rates from 3.0% to 5.0%. The royalty rates for the private leaseholds are between 5.0% and 8.0%. In 2023, for certain water sales we paid an $0.11 per barrel sold royalty to the State of New Mexico.
Human Capital Resources
Headcount
We believe that our employees and contractors are significant contributors to the current and future success of Intrepid. Our ability to attract, retain, and motivate qualified personnel is critical to our operations. The skills, experience and industry knowledge of key employees significantly benefit our operations and performance. We value our relationships with our employees and consider our relationships with them to be good. As of December 31, 2023, we had a total of 485 employees. Our workforce is experienced, providing invaluable expertise and insight into our operations.
|
|
|
|
|
|
|
|
|
| Location |
Number of Employees |
Average Tenure
(in years) |
| Denver |
50 |
5 |
| Moab |
60 |
9 |
| New Mexico |
316 |
8 |
| Wendover |
59 |
12 |
We have a collective bargaining agreement with a labor organization representing our hourly employees in Wendover, Utah, which expires on May 31, 2026. This agreement was negotiated between us and the United Steel, Paper and Forestry, Rubber, Manufacturing, Energy, Allied Industrial and Service Workers International Union, Local 867, and became effective on June 1, 2023.
Employee Development and Training
We believe in providing opportunities for employees to continue to develop and grow their careers. We offer our employees a tuition reimbursement program and ongoing support for continuing education for professional certifications and other credentials. We also provide a comprehensive career path program for our hourly employees that outlines the proficiencies necessary for each job level and sets forth the development steps to progress through various job levels.
Competitive Pay and Benefits
We have structured our compensation programs to balance incentive earnings for both short-term and long-term performance goals. We provide employee wages that are competitive and consistent with employee positions, skill levels, experience, knowledge, and geographic location. We align our executives' long-term equity compensation with our shareholders' interests by linking realizable pay with stock performance.
We are also committed to providing comprehensive benefit options to our employees. We offer benefits that will allow our employees and their families to live healthier and more secure lives. Our employee benefits include health insurance, telemedicine, an employee assistance program, paid and unpaid leave, life insurance, short-term disability insurance and a retirement savings plan with a company match. We also offer a variety of voluntary benefits that allow employees to select the options that meet their needs, including flexible time-off, adoption assistance, prescription savings solutions, and a wellness program.
Diversity, Equity, and Inclusion
Diversity, equity, and inclusion are core values to Intrepid. These values are reflected across our operations, including, but not limited to, recruitment, promotion, transfer, leaves of absence, compensation, opportunities for career support and advancement, job performance and other relevant job-related criteria. We consider the value of diversity in our approach to hiring and advancement. We create opportunities available to all employees to develop their talents in order to maximize our and their success. We seek to create an environment that cultivates a sense of belonging by encouraging employees to continue to educate themselves about each other’s experiences. We strive to promote the respect and dignity of all persons. We believe it is important to foster education, communication and understanding about diversity, equity, inclusion and belonging. Finally, in line with our commitment to diversity, equity and inclusion, we expect recruiters operating on our behalf to provide us with a diverse pool of candidates for job positions.
Health and Safety
The health and safety of our employees is our highest priority and is embodied in our operating philosophy. We are committed to providing a safe, functional, and effective work environment for anyone who comes to our properties.
Environmental, Social, and Governance
We are committed to providing consistent returns to our shareholders while being a good corporate citizen that values the welfare of our employees, the communities in which we operate, the customers we serve, and the world. In prioritizing, improving, and managing our environmental, social, and governance (“ESG”) goals, we will create long-term value for our investors. We have made ESG initiatives a priority for our management team and are committed to providing focused reporting on the ESG issues that are the most relevant to our business and stakeholders. We published our Inaugural Sustainability Report in 2023 to clearly disclose the goals and metrics related to our ESG programs, as we believe this information will allow our stakeholders to be informed about our progress. We intend to publish a sustainability report annually. We encourage you to read our Inaugural Sustainability Report to learn more about our strategy, efforts, and goals relating to ESG initiatives.
Commitment to the Environment (Protecting Our Resources)
We rely on the environments, resources and ecosystems that comprise and surround our locations. Working closely with our communities, we make it a priority to protect the natural resources at and surrounding our operations. We have developed a comprehensive set of policies and procedures regarding emissions, energy, water use, and waste management that guide our operations and uphold our commitment to the environment.
–Solar solution mining potash - All our potash is currently produced from solar solution mining, one of the most environmentally friendly and energy efficient mining techniques. In this process, we inject a naturally occurring, salt saturated brine solution into underground caverns or previously shuttered mine workings. This brine selectively dissolves the remaining potash, which is then pumped back to the surface and into evaporation ponds. During the spring and summer months, the brine naturally evaporates, leaving only the salt and potash solids in the ponds, which we then process into the products we sell. By using solar energy, we do not need to burn natural gas or coal to evaporate our brine ponds.
–Salt laydown at the Bonneville Salt Flats - We are committed to helping maintain the environments in which we operate, one of which is the Bonneville Salt Flats near our Wendover, Utah mine. Since 2005, we have donated nearly seven million tons of salt to the Bureau of Land Management ("BLM") that has been deposited on the racetrack to help preserve this unique attraction in northwest Utah. We drilled an additional brackish well in 2021 to increase the brine available for this salt laydown project.
–We are the only OMRI-listed potash and langbeinite producer in the U.S. We became OMRI-listed in 2007 for our langbeinite, or Trio® product, and in 2018 for our potash products at our Moab and Wendover operating facilities. We are also registered in the Organic Input Material Program, through the California Department of Food and Agriculture, a program that registers fertilizers approved for use in organic crop and food production.
–We work closely with the BLM and other government and regulatory agencies to preserve historical sites near our operations such as the Maroon Cliffs in Carlsbad, New Mexico and petroglyphs near our Utah operations. We also work with and have supported agencies dedicated to studying and protecting endangered species near our operations, such as the sand dune lizards in New Mexico.
Our Social Impact (Getting Involved Within the Community)
We support and promote the health, safety, and well-being of our employees, and are committed to creating a diverse, equitable, and inclusive work environment that enables our employees to thrive. We are committed to being a responsible community member and contribute to the communities in which we operate.
Our New Mexico operations have partnered with the United Way of Carlsbad and South Eddy County since 2004, participating in a variety of community-focused events and activities such as United Way's annual Day of Caring event. We encourage all our employees to volunteer in their communities and we offer all our full-time employees three paid volunteer days each year to support either a charitable organization of their choosing or participate in an Intrepid sponsored volunteer project.
As previously mentioned, we are committed to a recruitment and hiring process that emphasizes and embraces diversity. We believe a diverse workforce leads to greater collaboration, innovation, and improves shareholder returns and we celebrate the great value the differences in our people bring to our organization. We support a variety of organizations within our communities including the Women's Leadership Foundation, a Colorado based organization with the goal of opening more board of director positions to women leaders in Colorado and beyond.
Our Commitment to Safety
We conduct monthly safety audits across all our locations to inform our employees and provide a thoughtful approach to safety that increases the safe execution of all tasks. The data from these safety audits is collected to analyze where, what, and why gaps exist, and to provide meaningful information that results in safer work for our employees. Through our audits and dialogue, we educate ourselves and understand existing potential hazards, create best practices to address these hazards, and address areas to be improved. Prior to each task, employees are required to: assemble the proper personal protection equipment, tools, permits, etc., ensure the area is safe for employees and contractors, discuss the task with all stakeholders, and understand how the task is related to the overall business.
Our East Mine operation in Carlsbad, New Mexico received the National 2020 and 2021 Sentinels of Safety Award in the large underground nonmetal category. The Sentinels of Safety Award is presented by the National Mining Association each year to recognize the outstanding safety achievements of mining operations across a variety of categories.
Governance (Honest Business Practices)
We develop and implement robust, sound, and effective corporate governance practices. Since our inception, we have placed the highest emphasis on conducting our business with honesty, trust, and integrity, and we expect all of our employees to adhere to these standards. We continuously strive to create a corporate culture of honesty, integrity, and trust.
The policies we have developed are intended to:
–Maintain and communicate our core values and the legal requirements applicable to good business conduct and ethical behavior.
–Annual refresher training on company policies, values, laws, and handling a variety of potential company-related issues and situations.
–Resources for employees to report any suspected violations of our company policies, including an anonymous employee hotline via phone and internet.
–Provide clear and well-defined procedures by which employees can easily obtain information, ask questions, and, if necessary, report any suspected violations of any of our business ethics policies.
–Maintain and communicate a Code of Business Conduct and Ethics which clearly articulates the Company’s values, culture, and practices.
Available Information
We file or furnish with the U.S. Securities and Exchange Commission (the "SEC") reports, including our Annual Reports on Form 10-K, Quarterly Reports on Form 10-Q, Current Reports on Form 8-K, proxy statements, and any amendments to these reports filed or furnished pursuant to Section 13(a) or Section 15(d) of the Exchange Act. These reports are available free of charge on our website at www.intrepidpotash.com as soon as reasonably practicable after they are electronically filed with or furnished to the SEC. These reports can also be obtained at www.sec.gov.
We routinely post important information about us and our business, including information about upcoming investor presentations, on our website, www.intrepidpotash.com, under the Investor Relations tab. We encourage investors and other interested parties to enroll on our website to receive automatic email alerts or Really Simple Syndication (RSS) feeds regarding new postings. The information found on, or that can be accessed through, our website is not part of this or any other report we file with, or furnish to, the SEC.
ITEM 1A.RISK FACTORS
You should carefully consider the following risk factors. Our future performance is subject to a variety of risks and uncertainties that could materially and adversely affect our business, financial condition, and results of operations, and the trading price of our common stock. We may be subject to other risks and uncertainties not presently known to us. See "Cautionary Note Regarding Forward-Looking Statements."
Summary Risk Factors
Below is a summary of some of the principal risks that could adversely affect our business, operations and financial results:
Risks Related to Our Business
•Our potash and Trio® sales are subject to price and demand volatility resulting from periodic imbalances of supply and demand, which could negatively affect our results of operations.
•We may not be successful in our efforts to sustain or expand water sales due to the status of our water rights, challenges to our water rights, changes in the demand for water in the areas around our facilities, restrictions on water use, or other events, which could adversely impact our financial condition and results of operations.
•A decline in oil and gas drilling could decrease our revenue.
•We may alter or expand our operations or continue to pursue acquisitions, which could adversely affect our business if we are unable to manage any expansion or acquisition effectively.
•Competitors' aggressive pricing or operating strategies could adversely affect our sales and results of operations.
•The seasonal demand for our products, and the resulting variations in our cash flows from quarter to quarter, could have an adverse effect on our results of operations and working capital requirements.
•Our Trio® profitability could be affected by market entrants or the introduction of langbeinite alternatives.
•International sales could present risks to our business.
•If potash or Trio® prices decline, or oil and gas activity declines, we could be required to record write-downs of our long-lived and indefinite-lived assets, which could adversely affect our results of operations and financial condition.
•If we are required to write down the value of our inventories, our financial condition and results of operations would be adversely affected.
•Weakening of foreign currencies against the U.S. dollar could lead to lower domestic potash prices, which would adversely affect our results of operations. Currency fluctuations could cause our results of operations to fluctuate.
•Our business depends on skilled and experienced workers, and our inability to find and retain quality workers could have an adverse effect on our development and results of operations.
•Increases in the prices of energy and other important materials used in our business, or disruptions to their supply, could adversely impact our sales, results of operations, or financial condition.
•Increased costs could affect our per-ton profitability.
•A shortage of railcars or trucks for transporting our products, increased transit times, or interruptions in railcar or truck transportation could result in customer dissatisfaction, loss of sales, higher transportation or equipment costs, or disruptions in production.
•We rely on our management personnel for the development and execution of our business strategy, and the loss of one or more members of our management team could harm our business.
•We have less product diversification than nearly all of our competitors, which could have an adverse effect on our financial condition and results of operations.
•Heavy precipitation or low evaporation rates at our solar solution mines could impact our potash production at those facilities, which could adversely affect our sales and results of operations.
•Inflows of water into our langbeinite mine from heavy rainfall or groundwater could result in increased costs and production downtime and could require us to abandon the mine, any of which could adversely affect our results of operations.
•A significant disruption to our information technology systems could adversely affect our business and operating results.
•Our business may be adversely affected by union activities.
Risks Related to Our Industry
•Changes in the agricultural industry could exacerbate the cyclical nature of the prices and demand for our products or adversely affect the markets for our products.
•Mining is a complex process that frequently experiences production disruptions, which could adversely affect our results of operations.
•Mining is an inherently hazardous industry, and accidents could result in significant costs or production delays.
•The grade of ore that we mine could vary from our projections due to the complex geology and mineralogy of reserves, which could adversely affect our production and our results of operations.
•If the assumptions underlying our reserve estimates are inaccurate or if future events cause us to negatively adjust our previous assumptions, the quantities and value of our reserves, and in turn our financial condition and results of operations, could be adversely affected.
•Existing and further oil and gas development in the Designated Potash Area could impair our potash reserves, which could adversely affect our financial condition or results of operations.
•The mining business is capital intensive, and our inability to fund necessary or desirable capital expenditures could have an adverse effect on our growth and profitability.
Risks Related to Financial Position, Indebtedness and Additional Capital Needs
•The execution of strategic projects could require more time and money than we expect, which could adversely affect our results of operations and financial condition.
•Future indebtedness could adversely affect our financial condition and impair our ability to operate our business.
•Adverse conditions in the domestic and global economy and disruptions in the financial markets could negatively affect our results of operations and financial condition.
•Market upheavals due to military actions, pandemics, terrorist attacks, other catastrophic events, or economic repercussions from those events could reduce our sales or increase our costs.
•The loss of, or substantial decline in revenue from larger customers or certain industries could have a material adverse effect on our revenues, profitability, and liquidity.
Risks Related to Compliance, Regulatory and Legal
•Changes in laws and regulations affecting our business, or changes in enforcement practices, could adversely affect our financial condition or results of operations.
•If we are unable to obtain and maintain the required permits, governmental approvals, and leases necessary for our operations, our business could be adversely affected.
•Anti-corruption laws and regulations could subject us to significant liability and require us to incur costs.
Risks Related to the Environment and Climate
•Physical effects of climate change, and climate change legislation, could have a negative effect on us and our customers, and, in turn, our results of operations.
•Environmental laws and regulations could subject us to significant liability and require us to incur additional costs.
Risks Related to Our Common Stock
•The price of our common stock may be volatile, and you could lose all or part of your investment.
•The future issuance and sale of additional shares of our common stock, or by our announcement that the issuances and sales may occur, may adversely affect the market price of our common stock.
•We do not anticipate paying cash dividends on our common stock.
•Provisions in our charter documents and Delaware law may delay or prevent a third party from acquiring us.
•We may issue additional securities, including securities that are senior in right of dividends, liquidation, and voting to our common stock, without your approval, which would dilute your existing ownership interests.
Risks Related to Our Business
Our potash and Trio® sales are subject to price and demand volatility resulting from periodic imbalances of supply and demand, which could negatively affect our results of operations.
The market for potash and Trio® is cyclical, and the prices and demand for potash and Trio® can fluctuate significantly. Periods of high demand, increasing profits, and high-capacity utilization lead to new plant investment and increased production. This growth continues until the market is over-saturated, leading to decreased prices and lower-capacity utilization until the cycle repeats. Despite supply disruptions from the Russia-Ukraine conflict in 2022 and 2023, global productive capacity remains higher than demand and significant brownfield and greenfield expansion projects are in progress. As a result of these factors, the prices and demand for potash can be volatile. This volatility can reduce profit margins and negatively affect our results of operations. We sell most of our potash and Trio® into the spot market in the U.S. In addition, potash and Trio® do not have active hedge markets like many other commodities have. As a result, we do not have protection from this price and demand volatility.
We may not be successful in our efforts to sustain or expand water sales due to the status of our water rights, challenges to our water rights, changes in the demand for water in the areas around our facilities, restrictions on water use, or other events, which could adversely impact our financial condition and results of operations.
We have permitted, licensed, declared and partially adjudicated water rights in New Mexico under which we sell water primarily for industrial uses such as in the oil and gas services industry. We continue to work to expand sales of water, especially to support oil and gas development in the Permian Basin near our New Mexico facilities. If there are changes in state or federal regulations regarding oil and gas production or water usage, this could materially impact our ability to monetize our water rights. Third parties regularly challenge our applications to the OSE to change our water rights permits so that we are authorized to sell water to oil and gas producers. We may not be successful in our efforts to obtain the requisite permit changes. In many cases, sales of water require governmental permits or approvals. A decision to deny, delay, revoke, or modify a permit or approval could prevent us from selling water, increase the cost to provide water, or result in our having to refund prepayments that we have received for future water sales. If oil or gas prices decline, if oil and gas development in the Permian Basin decreases, or if demand for fresh water in the Permian Basin declines for other reasons, the demand for water under our water rights could be adversely affected. In addition, we could be required to expend capital to meet customer needs. Any of these events could adversely impact our financial condition and results of operations.
Water rights in New Mexico are subject to a stated place of withdrawal, purpose and place of use. Some of our water right permits, declarations and licenses were originally issued for uses relating to our mining operations. To sell water under these rights for oil and gas development, we must apply for a permit from the OSE to change the point of diversion, purpose and/or place of use of the underlying water rights. The OSE reviews such applications and makes a determination as to the validity of the right and, will approve the proposed change if it determines the requested change will not impair existing water rights, will not be contrary to the conservation of water within the state, and will not be detrimental to the public welfare of the state. In some situations, the OSE can issue a preliminary authorization for the change, which allows for the proposed change to go into effect immediately while pending further administrative review. Such authorizations for water sales are often subject to repayment if the underlying water rights were ultimately found to be invalid. Third parties may protest an application to change a point of diversion, purpose or place of use or a preliminary authorization at minimal cost and frequently do so. Once protested, an administrative process begins, whereby the OSE will ultimately determine if the subject application or preliminary authorization will impair existing water rights, will be contrary to the conservation of water within the state or will be detrimental to the public welfare of the state. The OSE’s findings can be appealed to a New Mexico district court. A significant portion of our water sales are being made under leases issued by the OSE. Additionally, some of our water rights are permitted water rights for which we still need to provide proof of completion of works and proof of beneficial use to the OSE. Please see Note 14 of the Notes to Consolidated Financial Statements for an update on challenges to our water rights.
We may face political and regulatory issues relating to the potential use of the maximum amount of our rights. Any decrease in our water rights could materially impact our ability to monetize our water rights.
A decline in oil and gas drilling could decrease our revenue.
A portion of our revenue comes from the sale of water, brines, and potassium chloride for use in oil and gas development. We also generate revenue from the sale of caliche, a produced water royalty, and various surface use agreements with operators. A decline in oil and gas drilling, especially in the Permian Basin, could reduce our sales of water, brines, and potassium chloride and result in reduced revenue from our other oilfield related offerings. For example, the decline in oil and gas drilling in 2020 due to restrictions implemented by local, state and federal authorities in response to the COVID-19 pandemic and the resulting impacts of these restrictions on the global economy as a whole, reduced our sales of water, brine, and potassium chloride and revenue for other oilfield related offerings into industrial markets in 2020 and the first quarter of 2021. In addition, oil and gas developers are regularly looking for ways to use more produced water instead of fresh water in oil and gas development and operations. Also, there are other products available that have some of the same clay-inhibiting properties as our potassium chloride. These alternative products could temporarily or permanently replace some of our sales of water or potassium chloride. We also have other oilfield product and service offerings, such as caliche and brine products, the sales of which were negatively impacted by the decline in oil and gas development in 2020, and may be further impacted in the future by declines in oil and gas development.
We may alter or expand our operations or continue to pursue acquisitions, which could adversely affect our business if we are unable to manage any expansion or acquisition effectively.
We continue to look for opportunities designed to maximize the value of our existing assets, such as through increased production and sales of water, salt, and brine. For example, in 2019 we purchased water and real property assets in southeastern New Mexico, which we refer to as Intrepid South, in an effort to expand our water sales and other revenue from the oil and gas industry. We may also enter into new or complementary businesses that expand our product offerings beyond our existing assets, which may include leveraging our existing oil and gas businesses in southeast New Mexico and expand into additional oil and gas midstream and upstream activities.
For instance, as part of this strategy, in May 2020, we acquired an 11% equity stake in the W.D. Von Gonten Laboratories, a global industry leader in drilling and completion chemistry and a strong supporter of the use of potassium chloride in oil and gas drilling and completion activities. We may also expand into new products or services in our current industry or other industries. Ultimately, we may be unsuccessful in implementing any alteration of our activities or expansion initiatives. Further, we may not be able to fully realize any anticipated benefits of these initiatives. Any expansion initiatives may require significant capital investments and those investments may not produce our expected returns.
As part of our growth strategy, we may consider the acquisition of other companies or assets that complement or expand our business. We may not be able to successfully identify suitable acquisition opportunities, prevail against competing potential acquirers, negotiate appropriate acquisition terms, obtain necessary financing, complete proposed acquisitions, successfully integrate acquired businesses or assets into our existing operations, or expand into new markets. An acquisition may require us to use a significant portion of available cash or may result in significant dilution to our stockholders. We may be required to assume unanticipated liabilities or contingencies as part of an acquisition, or we may face substantial costs, delays, or other problems as part of the integration process. In addition, acquired businesses or assets may not achieve the desired effects or otherwise perform as we expect. We may not realize the synergies that we expect to achieve. Additionally, while we execute these acquisitions and related integration activities, our attention may be diverted from our ongoing operations, which could have a negative impact on our business.
Any of these items could negatively impact our financial condition and results of operations.
Competitors' aggressive pricing or operating strategies could adversely affect our sales and results of operations.
The potassium-fertilizer industry is concentrated, with a small number of producers accounting for the majority of global production. Many of these producers have significantly larger operations and more resources than we do. These larger producers may have greater leverage in pricing negotiations with customers and transportation providers. They also have a broader product portfolio, which may allow them to offer rebates or bundle products to offer discounts or incentives to gain a competitive advantage. Competitors may also be able to mine their potash or langbeinite at a lower cost due to economies of scale or other competitive advantages. In addition, they may decide to pursue aggressive pricing or operating strategies that disrupt the global and U.S. markets. These disruptions could cause lower prices or demand for our product, which would adversely affect our sales and results of operations.
The seasonal demand for our products, and the resulting variations in our cash flows from quarter to quarter, could have an adverse effect on our results of operations and working capital requirements.
The fertilizer business is seasonal. With respect to domestic sales, we typically experience increased sales during the North American spring and fall application seasons. The degree of seasonality can change significantly from one year to the next due to weather-related shifts in planting schedules and purchasing patterns. We and our customers generally build inventories during low-demand periods of the year to ensure timely product availability during high-demand periods, resulting in increased working capital requirements just before the start of these seasons. If we are unable to accurately predict the timing of demand for our products due to variations in seasonality from year to year, our results of operations and working capital could be adversely affected. Similarly, if we do not have adequate storage capacity to manage varying inventory needs, we may need to reduce production or lower the price at which we sell product, either of which would adversely affect our results of operations.
In mid-2016, we transitioned our East mine to Trio®-only, resulting in an increased supply of Trio®. Previously, Trio® was supply-constrained, which meant that we did not see as much seasonality with respect to purchases as we did for potash. As purchasers have gained increased confidence in our ability to supply this product closer to the traditional spring application season in the U.S., these purchasers have moved to more of a just-in-time purchasing model. As a result, we now experience more traditional seasonality with respect to our domestic Trio® sales, which exposes us to inventory and demand risks similar to those with respect to our potash.
We market Trio® in various countries around the world, all of which have different climates and fertilizer-application patterns. As a result, seasonality in our international Trio® sales may develop, which could cause volatility in our results of operations.
Our Trio® profitability could be affected by market entrants or the introduction of langbeinite alternatives.
Langbeinite is produced by us and one other company from a single resource located in Carlsbad, New Mexico. Additional competition in the market for langbeinite and comparable products exists and could increase in the future. Other companies could seek to create and market chemically similar alternatives to langbeinite, some of which could be superior to langbeinite, or less costly to produce. In addition, companies sometimes blend several nutrients to obtain a product with similar agronomic benefits as langbeinite.
The market for langbeinite and our Trio® sales could be affected by the success of these and other products that are competitive with langbeinite, which could adversely affect the viability of our Trio® business and our results of operations and financial condition. Further, recent increases in the supply of langbeinite by us and the other producer may continue to pressure the sales price of Trio®.
International sales could present risks to our business.
Sales of Trio® into international markets often require more resources and management attention than domestic sales and may subject us to economic, regulatory, and political risks that are different from those in the U.S. These risks include accounts receivable collection; the need to adapt marketing and sales efforts for specific countries; new and different sources of competition; disputes and losses associated with overseas shipping; tariffs, export controls, and trade duties; additional time and effort to obtain product certifications; adverse tax consequences; restrictions on the transfer of funds; changes in legal and regulatory requirements or import policies including sanctions; compliance with potentially unfamiliar local laws and customs; and political and economic instability. International sales may also be subject to fluctuations in currency exchange rates, which could increase the price of our products outside the U.S. and expose us to foreign currency exchange rate risk. Certain international markets require significant time and effort on the part of management to develop relationships and gain market acceptance for our products. Overall, there are additional logistical requirements associated with international sales, which may increase the time between production and our ability to recognize related revenue. Our failure to manage any of these risks successfully could harm our future international operations and our overall business.
If potash or Trio® prices decline, or oil and gas activity declines, we could be required to record write-downs of our long-lived and indefinite-lived assets, which could adversely affect our results of operations and financial condition.
We evaluate our long-lived assets for impairment when events or changes in circumstances indicate that the related carrying amount may not be recoverable. Impairment is considered to exist if an asset's total estimated future cash flows on an undiscounted basis are less than the carrying amount of the related asset. An impairment loss is measured and recorded based on the discounted estimated future cash flows.
In 2023, we recorded total impairment charges to our long-lived assets and mineral properties of $43.3 million. We recorded impairment charges of $31.9 million related to our long-lived assets and mineral property assets at our East mine. We determined that sufficient indicators of potential impairment existed because higher Trio® production costs and lower realized Trio® prices led to negative gross margins for our Trio® segment. We also recorded impairment charges of $9.9 million related to our long-lived assets that are in care and maintenance at our West mine, and $1.5 million related to certain assets in our oilfield solutions segment.
We also have certain indefinite-lived intangible assets that we evaluate for impairment at least annually or more frequently when events or changes in circumstances indicate the fair value may have changed. An impairment loss is measured and recorded based on the current fair value of the asset.
After recording impairment charges to our long-lived assets in the fourth quarter of 2023, we believe the carrying values of our long-lived assets and our indefinite-lived intangible assets were realizable as of the balance sheet dates. However, future events could cause us to conclude otherwise. These future events could include further significant and sustained declines in potash or Trio® prices, further significant or sustained declines in water prices and demand, or higher production and operating costs. Further, based on our analysis of the profitability of any of our facilities, we may decide to terminate or suspend operations at additional facilities. These events could require a further write-down of the carrying value of our assets, which would adversely affect our results of operations and financial condition.
If we are required to write down the value of our inventories, our financial condition and results of operations would be adversely affected.
We carry our inventories at the lower of cost or net realizable value. In periods when the market prices for our products fall below our cost to produce them and the lower prices are not expected to be temporary, we are required to write down the value of our inventories. Any write-down of our inventory would adversely affect our financial condition and results of operations, possibly materially. We recorded $6.5 million of lower of cost or net realizable value adjustments in 2023, $3.8 million in our Trio® segment, and $2.7 million in our potash segment.
Weakening of foreign currencies against the U.S. dollar could lead to lower domestic potash prices, which would adversely affect our results of operations. Currency fluctuations could cause our results of operations to fluctuate.
The U.S. imports the majority of its potash, including from Canada, Russia and other countries. If the local currencies for foreign suppliers strengthen in comparison to the U.S. dollar, foreign suppliers realize a smaller margin in their local currencies unless they increase their nominal U.S. dollar prices. Strengthening of these local currencies therefore tends to support higher U.S. potash prices as the foreign suppliers attempt to maintain their margins.
However, if these local currencies weaken in comparison to the U.S. dollar, foreign suppliers may lower prices to increase sales volume while again maintaining a margin in their local currency. Changes in the strength of the U.S. dollar compared to other currencies could cause our sales prices and results of operations to decrease or fluctuate significantly.
Our business depends on skilled and experienced workers, and our inability to find and retain quality workers could have an adverse effect on our development and results of operations.
The success of our business depends on our ability to attract and retain skilled managers, engineers, and other workers. At times, we may not be able to find or retain qualified workers. In particular, the labor market around Carlsbad, New Mexico, is competitive and employee turnover is generally high. In that market, we compete for experienced workers with several other employers, including natural resource and hazardous waste facilities, oil and gas producers, and another producer of langbeinite. If we are unable to attract and retain quality workers, the development and growth of our business could suffer, or we could be required to raise wages to keep our employees, hire less qualified workers, or incur higher training costs. These risks may be exacerbated in times when we need to reduce our workforce due to economic conditions. The occurrence of any of these events could have an adverse effect on our results of operations. For example, in mid-2016, we idled our West mine and transitioned our East mine to Trio®-only, resulting in our laying off a significant number of skilled employees in New Mexico. This may make it more difficult for us to re-hire skilled employees in the future.
Increases in the prices of energy and other important materials used in our business, or disruptions to their supply, could adversely impact our sales, results of operations, or financial condition.
Natural gas, electricity, chemicals, diesel, and gasoline are key materials that we purchase and use in the production of our products. The prices of these commodities are volatile.
Our sales and profitability are impacted by the price and availability of these materials. A significant increase in the price of these materials that is not recovered through an increase in the price of our products, or an extended interruption in the supply of these materials to our production facilities, could adversely affect our results of operations or financial condition. In addition, high natural gas or other fuel costs could increase input costs for end-users of our products, which could cause them to spend less on our products.
Increased costs could affect our per-ton profitability.
A substantial portion of our operating costs is comprised of fixed costs that do not vary based on production levels. These fixed costs include labor and benefits, base energy usage, property taxes, insurance, maintenance expenditures, and depreciation. Any increase in fixed costs or decrease in production generally increases our per-ton costs and correspondingly decreases our per-ton operating margin. We operate our East Plant at less than full capacity in order to curtail our Trio® production to match expected demand and manage inventory levels. A significant increase in costs at any of our facilities could have an adverse effect on our profitability and cash flows, particularly during periods of lower potash and Trio® prices.
A shortage of railcars or trucks for transporting our products, increased transit times, or interruptions in railcar or truck transportation could result in customer dissatisfaction, loss of sales, higher transportation or equipment costs, or disruptions in production.
We rely heavily upon truck and rail transportation to deliver our products to our customers. In addition, the cost of transportation is an important component of the price of our products. A shortage of trucks or railcars for carrying product or increased transit times due to accidents, highway or railway disruptions, congestion, high or compressed demand, labor disputes, adverse weather, natural disasters, changes to transportation systems, or other events could prevent us from making timely delivery to our customers or lead to higher transportation costs. As a result, we could experience customer dissatisfaction or a loss of sales. Similarly, disruption within the transportation systems could negatively affect our ability to obtain the supplies and equipment necessary to produce our products. We may also have difficulty obtaining access to vessels to deliver our products to overseas customers.
We rely on our management personnel for the development and execution of our business strategy, and the loss of one or more members of our management team could harm our business.
Our management personnel have significant relevant industry and company-specific experience. Our senior management team has developed and implemented first-of-their-kind processes and other innovative ideas that are important to our business. If we are unable to retain these individuals, our operations could be disrupted and we may be unable to achieve our business strategies and grow effectively. We do not currently maintain "key person" life insurance on any of our management personnel.
We have less product diversification than nearly all of our competitors, which could have an adverse effect on our financial condition and results of operations.
A significant portion of our revenue comes from the sale of potash and langbeinite, whereas nearly all of our competitors are diversified, primarily into nitrogen- or phosphate-based fertilizer businesses or other chemical or industrial businesses. In addition, a majority of our sales are to customers in the U.S., and generally these customers are concentrated in key geographies where we have a freight advantage. As a result, we could be impacted more acutely by factors affecting our industry or the regions in which we operate than we would if our business was more diversified and our sales more global. A decrease in the demand for potash and langbeinite would have an adverse effect on our financial condition and results of operations. Similarly, in periods when production exceeds demand, the price at which we sell our potash and langbeinite and our sales volumes would likely fall, which would adversely affect our results of operations and financial condition more than our diversified competitors.
Heavy precipitation or low evaporation rates at our solar solution mines could impact our potash production at those facilities, which could adversely affect our sales and results of operations.
All of our potash production comes from our solar solution mines. These facilities use solar evaporation ponds to form potash crystals from brines. Weather conditions at these facilities could negatively impact potash production. For example, heavy rainfall in September and October, just after the evaporation season ends, can reduce the amount of potash we produce in that year or the following year by causing the potash crystals to dissolve and consume pond capacity. Similarly, lower‑than‑average temperatures or higher-than-average seasonal rainfall would reduce evaporation rates and therefore impact production. We experienced significant rainfall in the summer of 2019 at our Wendover facility which reduced the product available for sale in 2020. Similarly, our HB facility experienced a higher-than-average seasonal rainfall in the summer of 2021, which led to fewer tons available for sale in the second half of 2021 and in the spring of 2022. If we experience heavy rainfall or low evaporation rates at any of our solar solution mines, we would have less potash available for sale, and our sales and results of operations would be adversely affected. Reduced potash available for sale could also affect our ability to produce and sell byproducts such as salt and magnesium chloride.
Inflows of water into our langbeinite mine from heavy rainfall or groundwater could result in increased costs and production downtime and could require us to abandon the mine, any of which could adversely affect our results of operations.
Major weather events such as heavy rainfall can result in water inflows into our underground, langbeinite mine. The presence of water-bearing strata in many underground mines carries the risk of water inflows into the mines. If we experience water inflows at our langbeinite mine, our employees could be injured and our equipment and mine shafts could be seriously damaged. We could be forced to shut down the mine temporarily, potentially resulting in significant production delays, and we could spend substantial funds to repair or replace damaged equipment. Inflows may also destabilize the mine shafts over time, resulting in safety hazards for employees and potentially leading to the permanent abandonment of the mine.
A significant disruption to our information technology systems could adversely affect our business and operating results.
We rely on a variety of information technology and automated operating systems to manage or support our operations. We depend on our information technology systems for a variety of functions, including, but not limited to, financial reporting, inventory management, procurement, invoicing and email. We also have access to, and we create and store, sensitive data, including our proprietary business information and that of our customers, and personally identifiable information of our employees. The proper functioning of these systems and the security of this data is critical to the efficient operation and management of our business. In addition, these systems could require modifications or upgrades as a result of technological changes or growth in our business. These changes could be costly and disruptive to our operations and could impose substantial demands on management time. Our systems, and those of third-party providers, also could be vulnerable to damage or disruption caused by catastrophic events, power outages, natural disasters, computer system or network failures, viruses or malware, physical or electronic break-ins, unauthorized access, and cyber-attacks. Although we take steps to secure our systems and electronic information, these cybersecurity measures may not be adequate. Any security breaches could compromise our networks and the information stored on them could be improperly accessed, disclosed, lost or stolen. Any such access, disclosure or other loss of information could disrupt our operations and the services we provide to customers, damage our reputation or our relationships with our customers or result in legal claims or proceedings, any of which could adversely affect our business, reputation, and operating results.
Our business may be adversely affected by union activities.
Hourly employees at our Wendover facility are represented by a labor union. These employees represent approximately 9% of our total workforce. Our current collective bargaining agreement with the union, which became effective on June 1, 2023, expires on May 31, 2026. Although we believe that our relations with our unionized employees are good, we may not be successful in negotiating a new collective bargaining agreement as a result of general economic, financial, competitive, legislative, political, and other factors beyond our control.
Any new agreement could result in a significant increase in our labor costs. In addition, a breakdown in negotiations or failure to timely enter into a new collective bargaining agreement could materially disrupt our Wendover operations.
From time to time, efforts have been made to unionize employees at our other facilities. Additional unionization efforts could disrupt our business, consume management attention, or increase our operating costs. In addition, if these efforts were successful, we could experience increased labor costs, an increased risk of work stoppages, and limits on our flexibility to run our business in the most efficient manner to remain competitive.
Risks Related to Our Industry
Changes in the agricultural industry could exacerbate the cyclical nature of the prices and demand for our products or adversely affect the markets for our products.
Farmers attempt to apply the optimum amounts of fertilizer to maximize their economic returns. A farmer's decision about the application rate for each fertilizer, or the decision to forgo the application of a fertilizer, particularly potash and Trio®, varies from year to year depending on several factors. These factors include crop types, crop prices, weather patterns, fertilizer and other crop input costs, and the level of crop nutrients remaining in the soil following the previous harvest. Farmers are more likely to increase application rates of fertilizers when crop prices are relatively high, fertilizer and other crop input costs are relatively low, or the level of crop nutrients remaining in the soil is relatively low. Conversely, farmers are likely to reduce application of fertilizers when farm economics are weak or declining or the level of crop nutrients remaining in the soil is relatively high. This variability in application rates can impact the cyclical nature of the prices and demand for our products. In addition, farmers may buy and apply potash or Trio® in excess of current crop needs, which results in a build-up of potassium in the soil that can be used by crops in subsequent crop years. If this occurs, demand for our products could be delayed to future periods.
State and federal governmental policies, including farm and ethanol subsidies and commodity support programs, may also influence the number of acres planted, the mix of crops planted, and the use of fertilizers. In addition, there are various city, county, and state initiatives to regulate the use and application of fertilizers due to various environmental concerns. If U.S. agricultural production or fertilizer use decreases significantly due to one or more of these factors, our results of operations could be adversely affected.
Mining is a complex process that frequently experiences production disruptions, which could adversely affect our results of operations.
The process of mining is complex. Production delays can occur due to equipment failures, unusual or unexpected geological conditions, environmental hazards, acts of nature, and other unexpected events or problems. Furthermore, production is dependent upon the maintenance and geotechnical structural integrity of our tailings and storage ponds. The amounts that we are required to spend on maintenance and repairs may be significant.
Our East mine, surface, and support facilities are over 50 years old. As mining progresses at an underground mine, operations typically move further away from the shafts and, despite modernization through sustaining capital, fixed assets may require increased repair or refurbishment. These conditions increase the exposure to higher operating costs or the increased probability of incidents.
Mining is an inherently hazardous industry, and accidents could result in significant costs or production delays.
Mining is hazardous and involves various risks and hazards that can result in serious accidents. If accidents or unforeseen events occur, or if our safety procedures are not followed or are ineffective, we could be subject to liabilities arising out of personal injuries or death, our operations could be interrupted, or we could be required to shut down or abandon affected facilities. Accidents could cause us to expend significant amounts to remediate safety issues or repair damaged facilities.
Existing or expanded oil and gas development near our mines could result in methane gas leaking from an oil and gas well into our mines. We test our mines regularly for methane gas. Unlike coal mines, our mines are not constructed or equipped to deal with methane gas. Any intrusion of methane gas into our mines could cause a fire or an explosion resulting in loss of life or significant property damage or could require the suspension of all mining operations until the completion of extensive modifications and re-equipping of the mine. The costs of modifying our mines and equipment could make it uneconomical to reopen our mines. You can find more information about the co-development of potash and oil and gas resources near our New Mexico facilities under the risk factor below entitled "-Existing and further oil and gas development in the Designated Potash Area could impair our potash reserves, which could adversely affect our financial condition or results of operations." Ore bodies have complex geology.
The grade of ore that we mine could vary due to the complex geology and mineralogy of our reserves, which could adversely affect our production and our results of operations.
Our production is affected by the mineral content and other mineralogy of the ore. Our projections of ore grade may not be accurate. There are numerous uncertainties inherent in estimating ore grade, including many factors beyond our control. As the grade of our remaining ore reserves decreases over time, we need to process more ore to produce the same amount of saleable-grade product, increasing our costs and slowing our production. In addition, there are few opportunities to acquire more reserves in the areas around our current operations. If we are unable to process more ore to maintain current production levels, if the processing of more ore materially increases our costs, or if our ore grade projections are not accurate, our results of operations would be adversely affected.
If the assumptions underlying our reserve estimates are inaccurate or if future events cause us to negatively adjust our previous assumptions, the quantities and value of our reserves, and in turn our financial condition and results of operations, could be adversely affected.
There are numerous uncertainties inherent in estimating our potash and langbeinite reserves. As a result, our reserve estimates necessarily depend upon several assumptions, including the following:
•geologic and mining conditions, which may not be fully identified by available exploration data and may differ from our experiences in areas where we currently mine or operate;
•future potash and Trio® prices, operating costs, capital expenditures, royalties, severance and excise taxes, and development and reclamation costs;
•future mining technology improvements;
•the effects of governmental regulation; and
•variations in mineralogy.
In addition, because reserves are estimates built on various assumptions, they cannot be audited for the purpose of verifying exactness. It is only after extraction that reserve estimates can be compared to actual values to adjust estimates of the remaining reserves. If any of the assumptions that we make in connection with our reserve estimates are incorrect, the amounts of potash and langbeinite that we can economically recover from our mines could be significantly lower than our reserve estimates. In addition, we periodically review the assumptions underlying our reserve estimates. If future events cause us to negatively adjust our previous assumptions, our reserve estimates could be adversely affected. In any of these events, our financial condition and results of operations could be adversely affected.
We updated our mineral reserves and resources as of December 31, 2023, and we determined we do not have any mineral reserves at our East facility because the mineral deposit could not be economically extracted.
Existing and further oil and gas development in the Designated Potash Area could impair our potash reserves, which could adversely affect our financial condition or results of operations.
The U.S. Department of the Interior ("DOI") regulates the co-development of federal mineral resources-both potash and oil and gas-on federal lands in what the DOI has designated as the Designated Potash Area. This 497,000-acre region outside of Carlsbad, New Mexico, includes all of our New Mexico operations and facilities. In 2012, the DOI issued an updated order that provides guidance to the BLM and industry on the co-development of these resources. See Order 3324 issued by the Secretary of the Interior on December 4, 2012 ("2012 Secretary's Order").
It is possible that oil and gas drilling in the Designated Potash Area could limit our ability to mine valuable potash and langbeinite reserves or mineralized deposits because of setbacks from oil and gas wells and the establishment of unminable buffer areas around oil or gas wells. It is also possible that the BLM could determine that the size of these unminable buffer areas should be larger than they are currently, which could impact our ability to mine our reserves. We review applications for permits to drill oil and gas wells as they are publicly disclosed by the BLM and the State of New Mexico. When appropriate, we protest applications for drilling permits that we believe should not be drilled consistent with the operative federal and state rules and that could impair our ability to mine our reserves or put at risk the safety of our employees. We may not prevail in these protests or be able to prevent wells from being drilled in the vicinity of our reserves. If, notwithstanding our protests and appeals, a sufficient number of wells are drilled through or near our reserves, our reserves could be significantly impaired, which could adversely affect our financial condition or results of operations.
The mining business is capital intensive and our inability to fund necessary or desirable capital expenditures could have an adverse effect on our growth and profitability.
The mining business is capital intensive. We may find it necessary or desirable to make significant capital expenditures in the future to sustain or expand our existing operations and may not have, or have access to, the financial resources to pursue these expenditures. If costs associated with capital expenditures increase or if our earnings decrease significantly or we do not have access to the capital markets, we could have difficulty funding any necessary or desirable capital expenditures at an acceptable rate or at all. This could limit the expansion of our production or make it difficult for us to sustain our existing operations at optimal levels.
Increased costs for capital expenditures could also have an adverse effect on the profitability of our existing operations and returns from our most recent strategic projects.
Risks Related to Financial Position, Indebtedness and Additional Capital Needs
The execution of strategic projects could require more time and money than we expect, which could adversely affect our results of operations and financial condition.
From time to time, we invest in strategic projects. The completion of these projects could require significantly more time and money than we expect. In some cases, the construction or commissioning processes could force us to slow or shut down normal operations at the affected facility for a period of time, which would cause lower production volume and higher production costs per ton. In addition, our management team and other employees may be required to spend a significant amount of time addressing strategic projects, which could mean that our normal operations receive less time and attention. As we proceed with one or more of these strategic projects, we may not realize the expected benefits despite substantial investments, they may cost significantly more than we expect, or we may encounter additional risks that we did not initially anticipate.
Future indebtedness could adversely affect our financial condition and impair our ability to operate our business.
As of December 31, 2023, we had $4 million in outstanding borrowings under a revolving credit facility that allows us to borrow up to $150 million. This credit facility expires in 2027. In the future, we may be unable to obtain new financing or refinancing on acceptable terms, or at all. In addition, we may incur additional indebtedness in the future. The agreements governing the credit facility restrict, but do not prohibit, us from incurring additional indebtedness.
Future indebtedness could have important consequences, including the following:
•limiting our ability to borrow additional money or sell additional shares of common stock to fund our working capital, capital expenditures, and debt service requirements;
•limiting our flexibility in planning for, or reacting to, changes in our business;
•being more highly leveraged than some of our competitors, which could place us at a competitive disadvantage;
•being vulnerable to a downturn in our business or the economy;
•requiring us to dedicate a substantial portion of our cash flows from operations to the repayment of our indebtedness, thereby reducing the availability of our cash flows for other purposes; and
•adversely affecting our business and financial condition if we default on or are unable to service our indebtedness, are unable to refinance such indebtedness on favorable terms or are unable to obtain additional financing, as needed.
Our debt agreement contains financial and other restrictive covenants. For example, the agreement includes financial covenants that require us to maintain a maximum leverage ratio (as these ratios are defined under the agreement). For more information about financial covenants, see Item 7. "Management's Discussion and Analysis of Financial Condition and Results of Operations - Liquidity and Capital Resources."
These covenants could limit our ability to engage in activities that are in our long-term best interests. Our failure to comply with these covenants would result in an event of default that, if not waived, could result in the acceleration of all outstanding indebtedness. The credit facility is secured by substantially all of our assets. As such, an event of default could also result in our lenders foreclosing on some or all of our assets.
Adverse conditions in the domestic and global economy and disruptions in the financial markets could negatively affect our results of operations and financial condition.
Global and domestic economic volatility and uncertainty, for example, as a result of rising interest rates, a recession or fear of a recession, global trade uncertainties, international conflicts, epidemics or other significant health concerns, and inflation, can create uncertainty for farmers and customers in the geographic areas where we sell our products. If farmers reduce, delay, or forgo their potash and Trio® purchases because of economic volatility or uncertainties the results of our operations would be adversely affected. Moreover, volatility and disruptions in the financial markets could limit our customers' ability to obtain adequate financing or credit to purchase and pay for our products, which would decrease our sales volume and increase our risk of non-payment by customers. Changes in governmental banking, monetary, and fiscal policies to restore liquidity and increase credit availability may not be effective. It is difficult to determine the extent of economic and financial market problems and the many ways in which they could negatively affect our customers and business. In addition, if we are required to raise additional capital or obtain additional credit during an economic downturn, we could be unable to do so on favorable terms or at all.
Market upheavals due to military actions, pandemics, terrorist attacks, other catastrophic events, or economic repercussions from those events could reduce our sales or increase our costs.
Actual or threatened armed conflicts, terrorist attacks, military or trade disruptions, or other catastrophic events, including pandemics and other public health crises, affecting the areas where we or our competitors do business could disrupt the global market for potassium-based products. As a result, our competitors may increase their sales efforts in our geographic markets and pricing of our products could suffer. If this occurs, we could lose sales to our competitors or be forced to lower our prices. In addition, due to concerns related to terrorism or the potential use of certain fertilizers as explosives, local, state, and federal governments could implement new regulations impacting the production, transportation, sale, or use of potassium-based products. These new regulations could result in lower sales or higher costs.
The loss or substantial decline in revenue from larger customers or certain industries could have a material adverse effect on our revenues, profitability, and liquidity.
Despite diversification across multiple industries, including agricultural, industrial, and feed, larger customers, at times, comprise a significant portion of our sales revenue. For example, in 2023, one customer in our potash and Trio® segments accounted for approximately 12%, or $33.4 million, of our total consolidated revenues. In 2022, this same customer accounted for approximately 10%, or $35.0 million of our total consolidated revenues. If we experience a significant decline in sales from our larger customers or in certain industries, it may be difficult to replace those sales which could have a material effect on our results of operations.
Risks Related to Compliance, Regulatory and Legal Issues
Changes in laws and regulations affecting our business, or changes in enforcement practices, could adversely affect our financial condition or results of operations.
We are subject to numerous federal, state and local laws and regulations covering a wide variety of business practices. Changes in these laws or regulations could require us to modify our operations, objectives, or reporting practices in ways that adversely impact our financial condition or results of operations. In addition, new laws and regulations, including economic sanctions, or new interpretations of or enforcement practices with respect to existing laws and regulations, could similarly impact our business.
For example, we are subject to significant regulation under MSHA and OSHA. High-profile mining accidents could prompt governmental authorities to enact new laws and regulations that apply to our operations or to more strictly enforce existing laws and regulations. See also “Environmental laws and regulations could subject us to significant liability and require us to incur additional costs.”
If we are unable to obtain and maintain the required permits, governmental approvals, and leases necessary for our operations, our business could be adversely affected.
We hold numerous environmental, mining, safety, and other permits and governmental approvals authorizing and regulating the operations at each of our facilities. An agency's decision to deny or delay a new or renewed permit or approval, or to revoke or substantially modify an existing permit or approval, could prevent or limit us from continuing our operations at the affected facility, which could have an adverse effect on our business, financial condition, and results of operations. In addition, we could be required to expend significant amounts to obtain, or come into compliance with, these permits, approvals, and leases, or we could be required to make significant capital investments to modify or suspend our operations at one or more of our facilities.
Any expansion of our existing operations would require us to secure the necessary environmental and other permits and approvals. We may not be able to obtain these permits and approvals in a timely manner or at all. In addition, under certain circumstances, the federal government must consider and study a project's likely environmental impacts. Based on the federal government's evaluation, it could require an environmental assessment or an environmental impact statement in order to approve a project or permit, which could result in significant time delays and costs. Furthermore, many of our operations occur on land that is leased from federal and state government authorities. Expansion of our existing operations could require securing additional federal and state leases. We may not be able to obtain or renew these leases on favorable terms or at all. In addition, our existing leases generally require us to commence mining operations within a specified time frame and to continue mining in order to retain the lease. The loss or non-renewal of a lease could adversely affect our ability to mine the associated reserves.
Also, certain of our existing leases require us to make royalty payments based on the revenue generated by the potash, langbeinite, water, or byproducts that we extract from the leased land. The royalty rates are subject to change whenever we renew our leases, which could lead to significant increases in these rates. As of December 31, 2023 approximately 17% of our state, federal and private lease acres at our New Mexico facilities (including leases at the HB and North mines) and 22% of our state and federal lease acres at our Utah operations will be up for renewal within the next five years. Increases in royalty rates would reduce our profit margins and, if the increases were significant, would adversely affect our results of operations. Reporting of royalties is subject to periodic audits by federal and state officials. The Office of Natural Resources Revenue ("ONRR") completed their draft audit report of our New Mexico royalty reporting in September 2019.
As of February 2024, we are continuing to progress on the audit in cooperation with ONRR.
Anti-corruption laws and regulations could subject us to significant liability and require us to incur costs.
As a result of our international sales, we are subject to the U.S. Foreign Corrupt Practices Act (the "FCPA") and other laws that prohibit improper payments or offers of payments to foreign governments and their officials for the purpose of obtaining or retaining business. Our international activities create the risk of unauthorized payments or offers of payments in violation of the FCPA or other anti-corruption laws by one of our employees, consultants, sales agents, or distributors even though these persons are not always subject to our control. Although we have implemented policies and training designed to promote compliance with these laws, these persons may take actions in violation of our policies. Any violations of the FCPA or other anti-corruption laws could result in significant civil or criminal penalties and have an adverse effect on our reputation.
Risks Related to the Environment and Climate
Physical effects of climate change, and climate change legislation, could have a negative effect on us and our customers, and, in turn, our results of operations.
The impact of climate change on our operations and our customers’ operations remains variable and uncertain. The physical effects of climate change could have an adverse effect on us and our customers as experts believe that climate change may be associated with more extreme weather conditions. These effects could include, but may not be limited to, changes in regional weather patterns, including drought and rainfall levels, timing and duration of wintry precipitation and snow events, water availability, sea levels, storm patterns and intensities and temperature levels, including increased volatility in seasonal temperatures via excessively hot or cold temperatures. These extreme weather conditions could vary by geographic location.
Severe climate change could have an adverse effect on our costs, production, or sales, especially with respect to our solar operations, which require hot, arid summer weather conditions. Prolonged periods of precipitation or cooler weather during the evaporation season could reduce evaporation rates, leading to decreases in our production levels. Similarly, drought or decreased mountain snowfall and associated freshwater run-off could change brine levels, impacting our mineral harvesting process at our Wendover facility. The occurrence of these events at our solar operations could lead to decreased production levels, increased operating costs and require us to make significant additional capital expenditures. Furthermore, weather conditions have historically caused volatility in the agricultural industry and, as a result, in our results of operations, by causing crop failures or significantly reduced harvests, which can adversely affect application rates, demand for our products and our customers’ creditworthiness. Weather conditions can also lead to drought or wildfires, which could adversely impact growers’ crop yields and the uptake of our products, which would reduce the need for application of our products for the following planting season, which could result in lower demand for our products and negatively impact the prices of our products. Finally, salt and magnesium chloride sales into the deicing market and our ability to utilize certain water rights for sale into oil and gas markets may be adversely affected by weather conditions in our markets. Any prolonged change in weather patterns in our markets, as a result of climate change or otherwise, could have a material impact on the results of our operations.
In recent years, the U.S. Congress considered legislation to reduce emissions of greenhouse gases (“GHGs”). Such initiatives could restrict our or our customers’ operations, require us or our customers to make changes in our respective businesses that would increase our operating costs, reduce our efficiency or limit our output, require us to make capital improvements to our facilities, increase our energy, raw material and transportation costs or limit their availability, or otherwise materially adversely affect our financial condition and results of operations. In addition, a number of states are addressing GHG emissions, primarily through the development of emission inventories or regional GHG cap and trade programs. Depending on the particular program, we and our customers could be required to control GHG emissions or to purchase and surrender allowances for GHG emissions resulting from our operations.
Independent of Congress, the Environmental Protection Agency ("EPA") has adopted regulations controlling GHG emissions under its existing authority under the CAA. For example, following its findings that emissions of GHGs present an endangerment to human health and the environment because such emissions contributed to warming of the earth’s atmosphere and other climate changes, the EPA has adopted regulations under existing provisions of the CAA that, among other things, establish construction and operating permit reviews for GHG emissions from certain large stationary sources that are already potential major sources for conventional pollutants. In addition, the EPA has adopted rules requiring the monitoring and reporting of GHG emissions from specified production, processing, transmission and storage facilities in the U.S. on an annual basis.
Further, in December 2015, over 190 countries, including the U.S., reached an agreement to reduce global GHG emissions, also known as the Paris Agreement. The Paris Agreement entered into force in November 2016 after more than 170 nations, including the U.S., ratified or otherwise indicated their intent to be bound by the agreement. After previously withdrawing, the U.S. rejoined the Paris Agreement in January 2021. The U.S. and other countries' actions to implement the mandates of the Paris Agreement or otherwise impose regulations on our industry or our customers’ industries aimed at reducing GHG emissions could have an adverse effect on our business.
It is possible that future legislation or regulation addressing climate change, including in response to the Paris Agreement or any new international agreements, could adversely affect our operations, energy, raw material and transportation costs, results of operations, liquidity or capital resources, and these effects could be material or adversely impact us. In addition, to the extent climate change restrictions imposed in countries where our competitors operate, such as Canada, Russia, and Belarus, are less stringent than in the U.S., our competitors could gain cost or other competitive advantages over us.
We have also made certain public statements regarding our commitment to the environment and our focus on protecting the environments, resources, and ecosystems surrounding our locations. Although we intend to work closely with communities and make it a priority to protect the natural resources surrounding our operation, we may be required to expend significant resources to do so, which could increase our operational costs. Further, there can be no assurance of the extent to which our goals will be achieved, or that any future investments we make in furtherance of achieving such target and goal will meet investor expectations or legal standards, if any, regarding sustainability performance. Moreover, we may determine that it is in the best interest of our Company and our stockholders to prioritize other business, social, governance or sustainable investments over the achievement of our current plans based on economic, technological developments, regulatory and social factors, business strategy or pressure from investors, activist groups or other stakeholders. If we are unable to meet these commitments, then we could incur adverse publicity and reaction from investors, activist groups or other stakeholders, which could adversely impact the perception of us and our products and services by current and potential customers, as well as investors, which could in turn adversely impact our results of operations. Failure to adapt to or comply with regulatory requirements or investor or stakeholder expectations and standards could negatively impact our reputation, ability to do business with certain partners, and harm our business.
Environmental laws and regulations could subject us to significant liability and require us to incur additional costs.
We are subject to many environmental, safety, and health laws and regulations, including laws and regulations relating to mine safety, mine land reclamation, remediation of hazardous substance releases, and discharges into the soil, air, and water.
Our operations, as well as those of our predecessors, have involved the use and handling of regulated substances, hydrocarbons, potash, salt, related potash and salt byproducts, and process tailings. These operations resulted, or may have resulted, in soil, surface water, and groundwater contamination. At some locations, salt-processing waste, building materials (including asbestos-containing material), and ordinary trash may have been disposed of or buried in areas that have since been closed and covered with soil and other materials.
We could incur significant liabilities under environmental remediation laws such as CERCLA due to the ownership or operations in our current or former facilities, adjacent or nearby third-party facilities, or off-site disposal locations. Under CERCLA and similar state laws, in some circumstances liability may be imposed without regard to fault or legality of conduct and one party may be required to bear more than its proportional share of cleanup costs at a site. Liability under these laws involves inherent uncertainties.
We are also subject to federal and state environmental laws that regulate discharges of pollutants and contaminants into the environment, such as the CWA and the CAA. For example, our water disposal processes rely on dikes and reclamation ponds that could breach or leak, resulting in a possible prohibited release into the environment. Moreover, although the North and East mines in New Mexico and the Moab mine in Utah are designated as zero discharge facilities under the applicable water quality laws and regulations, these mines could experience some water discharges during significant rainfall events.
We expect that we will be required to continue to invest in environmental controls at our facilities and that these expenses could be significant. In addition, violations of environmental, safety, and health laws could subject us to civil and, in some cases, criminal sanctions. We could also be required to invest in additional equipment, facilities, or employees, or could incur significant liabilities, due to any of the following:
•changes in the interpretation of environmental laws;
•modifications or amendments to current environmental laws;
•the issuance of more stringent environmental laws; and
•malfunctioning process or pollution control equipment.
The mining and processing of potash and langbeinite also generate residual materials that must be managed both during the operation of the facility and upon facility closure. For example, potash tailings, consisting primarily of salt, iron, and clay, are stored in surface disposal sites and require management. At least one of our New Mexico facilities, the HB mine, may have issues regarding lead in the tailings pile as a result of previous owners' operations. During the life of the tailings management areas, we have incurred and will continue to incur significant costs to manage potash residual materials in accordance with environmental laws and regulations and permit requirements.
As a potash producer, we currently are exempt from certain State of New Mexico mining laws related to reclamation obligations. If this exemption were to be eliminated or restricted, we could be required to incur significant expenses related to reclamation at our New Mexico facilities.
For more information about environmental, safety and health matters affecting our business, see "Business-Environmental, Safety, and Health Matters."
Risks Related to our Common Stock
The price of our common stock may be volatile, and you could lose all or part of your investment.
The market price of our common stock has experienced, and may continue to experience, volatility. For example, during 2023, the market price of our common stock ranged between $17.23 and $34.51. These fluctuations may continue because of numerous factors, including, but not limited to, the following:
▪our operating performance and the performance of our competitors;
▪the public's reaction to our press releases, other public announcements, or filings with the SEC;
▪changes in earnings estimates or recommendations by research analysts who follow us or other companies in our industry;
▪variations in general economic, market, and political conditions;
▪changes in commodity prices or foreign currency exchange rates;
▪substantial sales of common stock by us in connection with future acquisitions or capital raising activities;
▪actions of our current stockholders, including sales of common stock by our directors and executive officers;
▪the arrival or departure of key personnel;
▪other developments affecting us, our industry, or our competitors; and
▪the other risks described in this Annual Report.
Our financial position, cash flows, results of operations, and stock price could be materially adversely affected if commodity prices decline. In addition, in recent years the stock market has experienced extreme price and volume fluctuations. This volatility has had a significant effect on the market prices of securities issued by many companies for reasons unrelated to their operating performance. Our stock price may experience extreme volatility due to uncertainty regarding, among other things, commodity prices. These market fluctuations may materially and adversely affect our stock price, regardless of our operating results.
Our stock is currently listed on the NYSE. For continued listing, we are required to meet specified listing standards, including a minimum stock price, market capitalization, and stockholders’ equity. If we are unable to meet the NYSE’s listing standards the NYSE would delist our common stock. At that point, it is possible that our common stock could be quoted on the over-the-counter bulletin board or the pink sheets. This could have negative consequences, including reduced liquidity for stockholders; reduced trading levels for our common stock; limited availability of market quotations or analyst coverage of our common stock; stricter trading rules for brokers trading our common stock; and reduced access to financing alternatives for us. We also would be subject to greater state securities regulation if our common stock was no longer listed on a national securities exchange. Volatility of our common stock may make it difficult for you to resell shares of our common stock when you want or at attractive prices.
The future issuance and sale of additional shares of our common stock or an announcement that the issuances and sales may occur, may adversely affect the market price of our common stock.
We cannot predict the size of future issuances or sales of shares of our common stock in connection with future acquisitions or capital raising activities, or the effect, if any, that the issuances or sales may have on the market price of our common stock. The issuance and sale of substantial amounts of shares of our common stock or an announcement that the issuances and sales may occur, could adversely affect the market price of our common stock.
We do not anticipate paying cash dividends on our common stock.
We currently intend to retain earnings to reinvest for future operations and growth of our business and do not anticipate paying any cash dividends on our common stock. Accordingly, realization of any gain on our common stock will depend on the appreciation of the price of the shares of our common stock, which may never occur. However, our Board of Directors, in its discretion, may decide to declare a dividend at an appropriate time in the future, subject to the terms of our revolving credit agreement. A decision to pay a dividend would depend upon, among other factors, our results of operations, financial condition, and cash requirements and the terms of our revolving credit agreement at the time a payment is considered.
Provisions in our charter documents and Delaware law may delay or prevent a third party from acquiring us.
We are a Delaware corporation and the anti-takeover provisions of Delaware law impose various barriers to the ability of a third party to acquire control of us, even if a change of control would be beneficial to our existing stockholders. In addition, our current certificate of incorporation and bylaws contain several provisions that may make it more difficult for a third party to acquire control of us without the approval of our Board of Directors. These provisions may make it more difficult or expensive for a third party to acquire a majority of our outstanding common stock. Among other things, these provisions:
•allow our Board of Directors to create and issue preferred stock with rights senior to those of our common stock without prior stockholder approval, except as may be required by NYSE rules;
•do not permit cumulative voting in the election of directors, which would otherwise allow less than a majority of stockholders to elect director candidates;
•prohibit stockholders from calling special meetings of stockholders;
•prohibit stockholders from acting by written consent, thereby requiring all stockholder actions to be taken at a meeting of our stockholders;
•require vacancies and newly created directorships on the Board of Directors to be filled only by affirmative vote of a majority of the directors then serving on the Board;
•establish advance notice requirements for submitting nominations for election to the Board of Directors and for proposing matters that can be acted upon by stockholders at a meeting; and
•classify our Board of Directors so that only some of our directors are elected each year.
These provisions also may delay, prevent, or deter a merger, acquisition, tender offer, proxy contest, or other transaction that might otherwise result in our stockholders receiving a premium over the market price of the common stock they own.
We may issue additional securities, including securities that are senior in right of dividends, liquidation, and voting to our common stock, without your approval, which would dilute your existing ownership interests.
Our Board of Directors may issue shares of preferred stock or additional shares of common stock without the approval of our stockholders, except as may be required by NYSE rules. Our Board of Directors may approve the issuance of preferred stock with terms that are senior to our common stock in right of dividends, liquidation, or voting. Our issuance of additional common shares or other equity securities of equal or senior rank will have the following effects:
•our pre-existing stockholders’ proportionate ownership interest in us will decrease;
•the relative voting strength of each previously outstanding common share may diminish; and
•the market price of the common stock may decline.
ITEM 1B.UNRESOLVED STAFF COMMENTS
None.
ITEM 1C.CYBERSECURITY
Cybersecurity Risk Management and Strategy
We take cybersecurity seriously and have developed a cybersecurity program that consists of processes, policies, and controls for assessing, identifying, managing, and responding to material risks from these threats. Our cybersecurity program is integrated within our broader risk management function that identifies, monitors, and mitigates business, operational, financial, and legal risks.
Our processes include controls that our Director of Information Technology and our Technology Department implement, which seek to protect our company, assets, information, and our employees from cyber threats, and provide regular education for our employees.
For example, as part of our cybersecurity program, we have implemented controls that are designed to prohibit unauthorized access to our systems. These include password requirements, onboarding and termination processes, multi-factor authentication, and other condition-based access controls. We also use external controls and security systems that identify and prevent malicious activity or unauthorized access on an ongoing basis such as firewalls, endpoint protection, intrusion detection, and email security, among others.
In addition, our intrusion detection systems identify patterns of behavior consistent with attack methods, as well as other anomalous behavior on our network. This technology acts autonomously to block activities deemed to be high risk. Our endpoint protection system is monitored twenty-four hours a day, seven days a week, by a third-party service provider who investigates every alert and remotely resolves issues such as removal of malware, blocking malicious activity, or by quarantining systems from the network if necessary.
We recognize that cybersecurity incidents are often a result of employees’ actions, including responding to phishing emails, opening malicious attachments, or visiting compromised websites. Therefore, another aspect of our cybersecurity program focuses on preventing such incidents by way of strong email security, web browsing protection systems, and by providing regular education and communication to our employees to increase their cybersecurity awareness of how to detect and respond to cyber threats. We periodically assess our employees’ awareness level of these risks by conducting periodic phishing tests.
In the event of an incident, meaning a compromise is not contained by our security systems and has the potential to adversely impact the organization, we have a structured Incident Response Plan in place that is based on National Institute of Standards and Technology (NIST) guidelines that provide rules for communicating incidents to management based on defined categorizations of the incident, as well as an orderly process for addressing and documenting the incident. As part of our business continuity and disaster recovery strategy, we have a strong backup and off-site data replication process, including an air-gap data vault solution for replication of backups of critical systems. Restorations from these systems are tested on a quarterly basis.
We use external third parties to perform annual security assessments such as penetration testing and vulnerability scans for both our internal network and critical online systems. We currently do not have any formal processes to oversee or identify cybersecurity risks associated with third-party service providers but our Director of Information Technology generally evaluates such risks.
Governance
Our Board of Directors, in coordination with the Audit Committee, oversees our risk management program, including the management of cyber threats. The Board of Directors and senior management are actively involved in reviewing our information security and cybersecurity strategies and updating as risks evolve.
Our Board of Directors and our Audit Committee each receive annual presentations and reports from our Director of Information Technology on developments in the cybersecurity space, including risk management practices, evolving standards, vulnerability assessments, third-party and independent reviews, the threat environment, technological trends, and information security issues encountered by our peers and third parties. In addition, on an annual basis, our Board of Directors and the Audit Committee discuss our approach to overseeing cybersecurity threats with our Director of Information Technology and other members of senior management to better assess our approach to cyber threats.
When a threat or other issue is identified, our Director of Information Technology will notify the senior management team and initiate the appropriate response plan based on the criticality of the threat or issue. Our Director of Information Technology along with our management team, which includes our Chief Executive Officer, Chief Financial Officer, and General Counsel, will coordinate to execute the appropriate response plan and will also investigate any issue to determine whether an incident is material, requiring disclosure to shareholders in SEC filings. Our Board of Directors and our Audit Committee also receive prompt and timely information regarding any cybersecurity risk and ongoing updates regarding any such risk.
Our Director of Information Technology has thirty years of experience in information technology, which includes the past nineteen years managing Intrepid's information technology infrastructure, business applications, compliance programs, and cybersecurity systems. Although our management team and Audit Committee receive information regarding our cybersecurity program and help assess our strategy based on their knowledge of our business and industry, no member of the management team or Audit Committee has technology or cybersecurity expertise. Certain members of the Audit Committee have experience with cybersecurity programs and implementing cybersecurity procedures as leaders of businesses and through their service on other boards. Risks from cybersecurity threats have not materially affected our company, including our business strategy, results of operations, or financial condition. While we believe our approach to cybersecurity is reasonable, given the rapidly evolving nature of cybersecurity incidents, there can be no assurance that the controls we have designed and implemented will be sufficient in preventing future incidents or attacks.
ITEM 2.PROPERTIES
Overview of Properties
Our extraction and production operations are conducted entirely in the continental U.S. We produce potash from three solution mining facilities: our HB solution mine in Carlsbad, New Mexico, our solution mine in Moab, Utah and our brine recovery mine in Wendover, Utah. We also operate our North compaction facility in Carlsbad, New Mexico, which compacts and granulates product from the HB mine. We produce Trio® from our conventional underground East mine in Carlsbad, New Mexico. We also have the West facility, which is a conventional underground potash mine that is not in operation and is in care-and-maintenance mode.
We operate Intrepid South located in Lea County in southeastern New Mexico, which is comprised of 21,834 surface acres, 27,858 acres of BLM grazing leases and 10,400 acres of pending State of New Mexico grazing leases.
We conduct most of our mining operations on properties that we lease from states or the federal government. These leases generally contain stipulations that require us to commence mining operations within a specified term and continue mining to retain the lease.
The stipulations on our leases are subject to periodic readjustment by the applicable state government and the federal government. The lease stipulations could change in the future, which could impact the economics of our operations. Our federal leases are for indefinite terms subject to readjustment of the lease stipulations, including the royalty payable to the federal government, every 20 years. Our leases with the State of New Mexico are issued for terms of 10 years and for as long thereafter as potash is produced in commercial quantities and are subject to readjustment of the lease stipulations, including the royalty payable to the state. Our leases with the State of Utah are for terms of 10 years subject to extension and possible readjustment of the lease by the State of Utah. Our leases for our Moab mine are operated as a unit under a unit agreement with the State of Utah, which extends the terms of all of the leases as long as operations are conducted on any portion of the leases. The term of the state leases for our Moab mine is currently extended until 2024 or so long as potash is being produced. As of December 31, 2023, approximately 17% of our state, federal, and private lease acres at our New Mexico facilities will be up for renewal within the next five years, and 22% of our state and federal lease acres at our Utah operations will be up for renewal within the next five years.
The following tables provide a summary of our mineral resources and reserves. Additional information is provided in the Individual Property Disclosures below.
|
|
|
|
|
|
|
|
|
|
|
|
|
|
|
|
|
|
|
|
|
|
|
|
|
|
|
|
|
|
|
|
|
|
|
|
|
|
|
|
|
|
|
|
|
|
|
|
|
|
|
| Summary of Mineral Resources in Millions of Tons of Sylvinite and Langbeinite as of December 31, 2023. Based on $450/potash product ton mine site and $470/langbeinite product ton mine site. |
|
|
Measured Mineral Resources |
|
Indicated Mineral Resources |
|
Measured + Indicated Mineral Resources |
|
Inferred Mineral Resources |
|
|
Amount (Mt) |
|
Grade (%K2O) |
|
Amount (Mt) |
|
Grade (%K2O) |
|
Amount (Mt) |
|
Grade (%K2O) |
|
Amount (Mt) |
|
Grade (%K2O) |
| Sylvinite |
|
|
|
|
|
|
|
|
|
|
|
|
|
|
|
|
| New Mexico |
|
|
|
|
|
|
|
|
|
|
|
|
|
|
|
|
| IPNM |
|
289.0 |
|
16.0 |
|
164.0 |
|
14.0 |
|
453.0 |
|
15.0 |
|
— |
|
— |
| Utah |
|
|
|
|
|
|
|
|
|
|
|
|
|
|
|
|
| Moab |
|
97.0 |
|
26.0 |
|
190.0 |
|
25.0 |
|
287.0 |
|
25.0 |
|
38.0 |
|
23.0 |
| Wendover |
|
— |
|
— |
|
175.0 |
|
0.5 |
|
175.0 |
|
0.5 |
|
1,358.0 |
|
0.5 |
| Total |
|
386.0 |
|
18.5 |
|
529.0 |
|
13.5 |
|
915.0 |
|
15.6 |
|
1,396.0 |
|
1.1 |
|
|
|
|
|
|
|
|
|
|
|
|
|
|
|
|
|
| Langbeinite |
|
|
|
|
|
|
|
|
|
|
|
|
|
|
|
|
| New Mexico |
|
|
|
|
|
|
|
|
|
|
|
|
|
|
|
|
| IPNM |
|
72.0 |
|
10.0 |
|
60.0 |
|
10.0 |
|
132.0 |
|
10.0 |
|
— |
|
— |
| Total |
|
72.0 |
|
10.0 |
|
60.0 |
|
10.0 |
|
132.0 |
|
10.0 |
|
— |
|
— |
|
|
|
|
|
|
|
|
|
|
|
|
|
|
|
|
|
|
|
|
|
|
|
|
|
|
|
|
|
|
|
|
|
|
|
|
|
|
|
|
|
|
|
|
|
|
|
|
|
|
|
| Summary of Mineral Resources in Millions of Tons of Sylvinite and Langbeinite as of December 31, 2022. Based on $406/potash product ton mine site and $425/langbeinite product ton mine site. |
|
|
Measured Mineral Resources |
|
Indicated Mineral Resources |
|
Measured + Indicated Mineral Resources |
|
Inferred Mineral Resources |
|
|
Amount (Mt) |
|
Grade (%K2O) |
|
Amount (Mt) |
|
Grade (%K2O) |
|
Amount (Mt) |
|
Grade (%K2O) |
|
Amount (Mt) |
|
Grade (%K2O) |
| Sylvinite |
|
|
|
|
|
|
|
|
|
|
|
|
|
|
|
|
| New Mexico |
|
|
|
|
|
|
|
|
|
|
|
|
|
|
|
|
| IPNM |
|
370.0 |
|
15.0 |
|
200.0 |
|
14.0 |
|
570.0 |
|
14.6 |
|
— |
|
— |
| Utah |
|
|
|
|
|
|
|
|
|
|
|
|
|
|
|
|
| Moab |
|
113.0 |
|
26.0 |
|
190.0 |
|
25.0 |
|
303.0 |
|
25.4 |
|
38.0 |
|
23.0 |
| Wendover |
|
— |
|
— |
|
250.0 |
|
0.5 |
|
250.0 |
|
0.5 |
|
1,360.0 |
|
0.5 |
| Total |
|
483.0 |
|
17.6 |
|
640.0 |
|
12.0 |
|
1,123.0 |
|
14.4 |
|
1,398.0 |
|
1.1 |
|
|
|
|
|
|
|
|
|
|
|
|
|
|
|
|
|
| Langbeinite |
|
|
|
|
|
|
|
|
|
|
|
|
|
|
|
|
| New Mexico |
|
|
|
|
|
|
|
|
|
|
|
|
|
|
|
|
| IPNM |
|
50.0 |
|
10.0 |
|
60.0 |
|
10.0 |
|
110.0 |
|
10.0 |
|
— |
|
— |
| Total |
|
50.0 |
|
10.0 |
|
60.0 |
|
10.0 |
|
110.0 |
|
10.0 |
|
— |
|
— |
The material assumptions and criteria used for the mineral resource estimates are discussed in more detail in Section 11 of the respective Technical Report Summaries filed as Exhibits 96.1 through 96.3 to this Annual Report.
|
|
|
|
|
|
|
|
|
|
|
|
|
|
|
|
|
|
|
|
|
|
|
|
|
|
|
|
|
|
|
|
|
|
|
|
|
|
|
|
|
|
|
|
|
|
|
|
|
|
|
|
|
|
|
|
|
|
|
|
|
|
|
|
|
|
|
|
|
|
|
|
|
|
|
| Summary of Mineral Reserves in Millions of Product Tons of Potash as of December 31, 2023, and 2022. Based on $360/potash product ton mine site for 2023, and $325/potash product ton mine site for 2022. |
|
|
Proven Mineral Reserves |
|
Probable Mineral Reserves |
|
Total Mineral Reserves |
|
|
Amount (Mt) |
|
In Situ
Grade (%K2O)
|
|
Amount (Mt) |
|
In Situ
Grade (%K2O)
|
|
Amount (Mt) |
|
In Situ
Grade (%K2O)
|
|
|
2023 |
|
2022 |
|
2023 |
|
2022 |
|
2023 |
|
2022 |
|
2023 |
|
2022 |
|
2023 |
|
2022 |
|
2023 |
|
2022 |
| Sylvinite |
|
|
|
|
|
|
|
|
|
|
|
|
|
|
|
|
|
|
|
|
|
|
|
|
New Mexico1 |
|
|
|
|
|
|
|
|
|
|
|
|
|
|
|
|
|
|
|
|
|
|
|
|
| IPNM |
|
4.0 |
|
4.3 |
|
22.9 |
|
21.7 |
|
— |
|
0.2 |
|
— |
|
19.1 |
|
4.0 |
|
4.5 |
|
22.9 |
|
21.6 |
| Utah |
|
|
|
|
|
|
|
|
|
|
|
|
|
|
|
|
|
|
|
|
|
|
|
|
Moab1 |
|
2.3 |
|
1.8 |
|
28.3 |
|
27.2 |
|
0.3 |
|
0.6 |
|
28.9 |
|
27.8 |
|
2.6 |
|
2.4 |
|
28.4 |
|
27.3 |
Wendover2 |
|
— |
|
— |
|
— |
|
— |
|
1.7 |
|
1.7 |
|
0.5 |
|
0.5 |
|
1.7 |
|
1.7 |
|
0.5 |
|
0.5 |
| Total |
|
6.3 |
|
6.1 |
|
25.3 |
|
23.3 |
|
2.0 |
|
2.5 |
|
5.9 |
|
8.5 |
|
8.3 |
|
8.6 |
|
20.0 |
|
19.0 |
|
|
|
|
|
|
|
|
|
|
|
|
|
|
|
|
|
|
|
|
|
|
|
|
|
1 - In situ grade corresponds to the amount of K2O in the contact area of the caverns |
2 - In situ grade corresponds to the amount of K2O in the brines |
|
|
|
|
|
|
|
|
|
|
|
|
|
|
|
|
|
|
|
|
|
|
|
|
|
|
|
|
|
|
|
|
|
|
|
|
|
|
|
|
|
|
|
|
|
|
|
|
|
|
|
|
|
|
|
|
|
|
|
|
|
|
|
|
|
|
|
|
|
|
|
|
|
|
|
| Summary of Mineral Reserves in Millions of Product Tons of Langbeinite as of December 31, 2023, and 2022. Based on $340/langbeinite product ton mine site for 2022. |
|
|
Proven Mineral Reserves |
|
Probable Mineral Reserves |
|
Total Mineral Reserves |
|
|
Amount (Mt) |
|
In Situ
Grade (%K2O)
|
|
Amount (Mt) |
|
In Situ
Grade (%K2O)
|
|
Amount (Mt) |
|
In Situ
Grade (%K2O)
|
|
|
2023 |
|
2022 |
|
2023 |
|
2022 |
|
2023 |
|
2022 |
|
2023 |
|
2022 |
|
2023 |
|
2022 |
|
2023 |
|
2022 |
| Langbeinite |
|
|
|
|
|
|
|
|
|
|
|
|
|
|
|
|
|
|
|
|
|
|
|
|
New Mexico1 |
|
|
|
|
|
|
|
|
|
|
|
|
|
|
|
|
|
|
|
|
|
|
|
|
| IPNM |
|
— |
|
4.6 |
|
— |
|
8.6 |
|
— |
|
1.2 |
|
— |
|
9.1 |
|
— |
|
5.8 |
|
— |
|
8.7 |
| Total |
|
— |
|
4.6 |
|
— |
|
8.6 |
|
— |
|
1.2 |
|
— |
|
9.1 |
|
— |
|
5.8 |
|
— |
|
8.7 |
1 - In situ grade corresponds to the amount of K2O in the langbeinite ore |
We are not reporting any langbeinite reserves as of December 31, 2023, only langbeinite resources because, in the opinion of the Qualified Person, none of the langbeinite resources are economically mineable.
As noted, we have relatively long-lived proven and probable potash reserves and consequently expect to conduct limited and focused additional exploration in the coming five years. We plan to drill core holes in areas near our Carlsbad, New Mexico, facility, in order to further define the ore body. Development of the solution mine and brine evaporation operations is expected to be enhanced by the drilling of additional wells and flooding of new solution mine caverns. Although not in our current plans, we also have opportunities to rehabilitate the shafts at the currently idled North mine and additional surface infrastructure to accelerate mining of conventional reserves.
Our leased office space in Denver, Colorado, is approximately 26,000 square feet and has a term expiring on January 31, 2025. We lease approximately 1,400 square feet of office space in Albuquerque, New Mexico, which has a term expiring on May 31, 2027.
We believe that all of our present facilities are adequate for our current needs and that additional space is available for future expansion on acceptable terms.
Individual Property Disclosure - New Mexico
Overview
Our New Mexico operations ("IPNM") consists of our HB Solar Solution, East, West, and North Mines and are located in southeastern New Mexico in Eddy and Lea Counties in the Carlsbad Potash District ("CPD"). The location is further defined by the boundary of the Known Potash Leasing Area ("KPLA"). This BLM managed area consists of that part of the KPLA where the co-development guidelines for oil and gas and potash are in effect for federal lands under the 2012 Secretary's Order issued on December 4, 2012. The 2012 Secretary's Order revises and supersedes a previous Order issued in 1986 and corrected in 1987. The 2012 Secretary’s Order does not alter the boundaries of the area. The area also contains state lands that are managed by the State of New Mexico under the New Mexico Oil Conservation Division Order R‐111‐P ("R-111-P"). In general, the stated objective of the 2012 Secretary’s Order and R‐111‐P is to prevent waste of petroleum and mineral resources and maximize the economic recovery of oil, gas, and potash minerals in the area.
The geology of the potash‐bearing beds of the Carlsbad area is well documented. Overall, the potash‐bearing beds may be described as bedded sedimentary rocks, deposited across the Delaware Basin and Northwest Shelf backreef from the Capitan Reef. The Carlsbad area falls within the Delaware Basin, part of the Permian Basin. The Delaware Basin has a maximum width of approximately 100 miles and a length of approximately 150 miles, extending from north of Carlsbad, New Mexico, to Pecos County, Texas.
The Permian Age sequence comprises the Ochoan, Guadalupe, Leonard, and Wolfcamp series in order of increasing age. Laterally extensive, evaporite beds containing deposits of halite, sylvite, langbeinite, kainite, carnallite, and other evaporite minerals are found within the Ochoan Series, whose top ranges from a depth of 2,000 feet near the Texas State line to approximately 200 feet below surface north of Carlsbad. Mining occurs in the Salado Formation which contains 12 potash ore zones, of which six have been or are currently being mined.
Sylvinite is currently being mined using solution methods in the 1st and 3rd ore zone. Historically, sylvinite has been conventionally underground mined in the 1st, 3rd, 5th, 7th, and 10th ore zones. Mechanical mining of langbeinite is currently occurring in the 3rd and 5th ore zones at the East Mine. Langbeinite is prevalent in the 3rd and 4th ore zones in the southern part of the Delaware Basin, and occurs mixed with sylvite in the 5th ore zone.
The property includes two operating mines, the East Underground and HB Solution Mines, one idled mine, the West Mine and the North Mine which was shut down in the early 1980’s. The property is located in Eddy and Lea Counties, near Carlsbad, New Mexico.
The two mining methods currently in practice at IPNM are high‐extraction mechanical underground room‐and‐pillar mining and solution mining. Mechanical mining is well suited to bedded deposits. All potash production at IPNM comes from the HB Solar Solution Mine in the 1st and 3rd ore zones. Trio® production is from langbeinite mined using room‐and‐pillar mechanical mining methods at the East Mine in the 3rd, 4th, and 5th ore zones. Historically, potash was sourced from the West Mine 5th, 7th, and 10th ore zones. Approximately 300 people are employed at IPNM.
The IPNM properties are pledged as collateral for our revolving credit facility. During 2023, we recorded impairment charges of $41.8 million related to our IPNM material properties. After the impairment, at December 31, 2023 the net book value of our IPNM material properties was $175.2 million. Various surety bonds are currently in place for approximately $6.2 million.
IPNM has all necessary operating permits and is in production, both underground and solution mining, and through permit reporting maintains environmental compliance. Environmental studies are conducted for major project expansions and modifications to any operations. The most recent Environmental Audit was completed in 2015 for the expansion of the HB In Situ Solution Mining project to include the solution mining of the abandoned AMAX potash mine. The work referenced the initial Environment Impact Study ("EIS") for the HB In Situ Solar Solution Mining Project.
East Mine and Plant
The East Mine is a high‐extraction, mechanical room‐and‐pillar mine. Potash was the primary product extracted from the mine until mining progressed to the mixed langbeinite and potash ore in the 5th ore zone. The mixed ore was processed into two products: potash sourced from the sylvinite portion of the mixed ore, and Trio® sourced from the langbeinite portion of the mixed ore. The East Mine plant was converted to a langbeinite‐only operation in April 2016 and potash is no longer produced from the East Mine. The maximum productive capacity of the plant is 400,000 tons of Trio® concentrate annually.
There are five active sections within the East Mine, the operations of which consist of miner and shuttle car loading onto a belt conveyor. Each mining section produces approximately 240,000 tons of run‐of‐mine ore each year. The long‐range production balanced with sales projections results in a long‐term annual production of 1.2 million tons of ore for 250,000 tons of Trio® annually.
During 2003 and 2004, we modified the East Plant to allow dual processing to recover the K2O value from both the sylvite and langbeinite fractions of the ore. Langbeinite, marketed as Trio®, is recovered using dense media separation and a fine langbeinite recovery circuit. Currently approximately one million tons per year of ore is processed at a rate of 300 tons per hour. The ore is crushed, screened, pulped, and rescreened. Coarse material is forwarded to the dense media separation ("DMS") circuit. The DMS concentrate is water leached, debrined, and dried. We separate the coarse product into the three Trio® products. We recover fine material from the screening process using gravity separation, leaching, debrining, and drying. We upgrade fine material to premium product using pelletization.
HB Mine and Plant
Historical room‐and-pillar mining operations at the HB complex recovered about 70% of the ore, leaving approximately 30% of the ore available for secondary recovery in pillars plus what can be recovered beyond the limits of the conventional mine works. Mining at the HB Solar Solution Mine recovers potash by injecting saturated saline NaCl brine into the old mine works to create underground leach lakes. Over time, the solution enriched with potash is pumped to the surface to solar evaporation ponds. Selective solar evaporation leaves behind a potash‐enriched salt that is collected using scrapers, pumped, and processed at the HB Plant. The solution mine comprises six injection wells, five extraction wells, and three monitoring wells.
In 2012, IPNM commenced filling the HB solar evaporation ponds. The extraction brine sourced from the mined‐out areas of the 1st ore zones of the former underground workings of portions of HB Eddy, HB South, HB North, and HB Crescent, collectively referred to as the HB Mine, contains approximately 21.7% NaCl and 7.0% KCl. The brine is collected and crystallized in 18 solar evaporation ponds. The HB flotation mill processes the harvested potash and salts from the solar evaporation ponds. Following the separation of KCl, the HB Solar Solution Mine also recovers significant quantities of NaCl.
The North Plant provides classification, compaction, quality control, and load‐out services for production from the HB Solar Solution Mine. Belly dump trucks unload HB product into a dump pocket. We then send the material to surge bins. The product is screened, preheated, weighed, and sent to a compactor feed bin. Material is fed to the roll compactor, and resulting flakes are further reduced in size with the subsequent flake breaker and crusher. Product is then screened and sent to the curing dryer and screened once again before being sent to final product storage. The product is shipped to market in trucks or rail cars.
West Mine
The West Mine is a high‐extraction, mechanical room‐and‐pillar mine that was idled in July 2016 and placed in care‐and‐maintenance mode. The mine was last operated in the 5th, 7th, and 10th ore zones.
North Mine and Compaction Plant
The North Mine operated from 1957 to 1982 when it was idled, mainly due to low potash prices and a change in the mineralogy of the readily accessible remaining reserves which negatively impacted mineral processing. Although the mining and processing equipment has been removed, the mine shafts remain open. The compaction facility at the North Mine is where the HB potash product is granulated, stored, and shipped. The North Facility receives compactor feed from the HB Solar Solution Mine via truck and converts the compactor feed to finished granular‐sized product and standard‐sized product.
We anticipate the need to construct a new sylvite processing facility to handle the higher insoluble and higher carnallitic ores that are contained in the 8th and 10th ore zones. A new processing plant is expected to have a plant recovery of 75%, which is supported by the metallurgical test work done on the 10th ore zone ore by Tetra Tech in 2009 in support of Phase 1 of the North Mine Reopening Feasibility Study.
Leases and Permits
We control the right to mine approximately 143,000 acres in New Mexico. Of that acreage, we lease 32,000 acres from the State of New Mexico, 106,000 acres from the federal government through the Bureau of Land Management (“BLM”), and 280 acres from private owners. We own 4,700 surface acres near the mine site, adjacent to the federal and state mining leases. Most mining operations are on properties leased from the State of New Mexico or the federal government. These leases generally contain stipulations that require us to commence mining operations within a specified term and to continue mining to retain the lease. The stipulations on our leases are subject to periodic readjustment by the State of New Mexico and the federal government. Federal leases are for indefinite terms subject to readjustment of the lease stipulations, including the royalty payable to the federal government, every 20 years. Royalty payments equal a percentage of product sales less freight. Most of our leases with the federal government stipulate a five percent royalty rate. However, certain federal leases contain a sliding scale royalty rate of a minimum of two percent and up to a maximum of five percent based on the grade of ore extracted under the lease. In 2023, IPNM paid royalties of $5.9 million to the federal government.
Our leases with the State of New Mexico are issued for terms of 10 years and for as long thereafter as potash is produced in commercial quantities and are subject to readjustment of the lease stipulations, including the royalty payable to the state. Royalty payments equal a percentage of product sales less freight. Our leases with the State of New Mexico stipulate a five percent royalty rate. In 2023, IPNM paid royalties of $1.8 million to the State of New Mexico.
History of Operations
Potash was first discovered in southwest New Mexico in 1925 in Eddy County, New Mexico, in Snowden McSweeney Well No. I on a V. H. McNutt permit near the center of the portion of the KPLA. Commercial potash shipments began in 1931. The mines have had numerous owners beginning with the U.S. Potash Company’s ownership of the West Mine from 1929 to 1956. Intrepid Mining, the predecessor to Intrepid, acquired the mines, excluding the Amax Mine, from Mississippi Potash, Inc. in 2004. Intrepid acquired the lease to the Amax Mine in 2012. A full ownership history for each mine is included in Section 5 of the technical summary report in Exhibit 96.1 to this Annual Report.
Mineral Resource and Reserves Comparison to Prior Year
We engaged RESPEC, a qualified firm and independent of Intrepid, to prepare a technical report summary for our IPNM material properties as of December 31, 2023 because changes in our cost of production resulted in material changes in the mineral reserves and mineral resources estimates from the revised technical report summary prepared as of December 31, 2021 for the New Mexico properties. As of December 31, 2023, we no longer show mineral reserves for our East mine because, in the opinion of the Qualified Person, none of the langbeinite resources are economically mineable. The technical report summary for the IPNM material properties as of December 31, 2023 is included with this Annual Report on Form 10-K.
Mineral Resource and Reserves
Overview
We continue ongoing exploration as a part of our operational long‐term planning. Exploration includes the drilling of core holes from the surface and underground, and the collection of channel samples, which are collected as mining advances. We provided RESPEC their dataset beginning in 2007. Since that time, we have added multiple data points by reassessing several drillholes. Our potash reserves are also identified from gamma ray geophysical logs in oil and gas wells. We estimate and quantify bed thickness and potash grade with input from 2,928 sample points. Extensive work was completed with geophysical tools in collaboration with the United States Geologic Survey ("USGS") to determine and verify potash grades from gamma logs. The dataset is from oil and gas wells, surface core holes, underground core holes, channel samples, shaft samples, and roof bolt holes. The key sample types include 7,209 drillholes and channel samples and are broken down by mining zone.
The characterization of the hydrogeology was completed for the HB In Situ Solution Mine by AECCOM in 2011 and is included as part of the publicly available EIS. The study confirmed the availability of water for the initial flooding of the solution mines at a pumping rate ranging from 177 to 1,440 gallons per minute.
Mineral Resource
The exploration drillhole and channel sample data were compiled to form the database, which serves as the basis for estimating the resources. As part of evaluating the mineral resource, we evaluated and reviewed the geologic setting and bed assignments. Of the data within the lease boundary, all data points contribute bed thickness, and several have assay information. The geology was modeled using Carlson Software (2020). A basic inverse distance squared algorithm was used with a search radius of ¾ mile to prepare the 100‐foot by 100‐foot grids for bed thickness and grade.
The search radius was applied for Measured and Indicated Resources of ¼ mile and ¾ mile, respectively. Where data is dense, the nearest 25 data points were used to assign values for the grid block. The grids were multiplied by each other to compile a grade‐thickness ("GT") grid within the lease boundaries held by IPNM. The base grid was adjusted for each ore type cutoff. Key assumptions and parameters for resource estimation are listed in the tables below.
The classification of cutoff in terms of GT in units of feet-percent was defined in the Secretaries Order dated October 21, 1986 for mechanically mined potash deposits. The criteria are not dependent on thickness or grade, but on the product of the thickness and grade. To evaluate the viability of mining the IPNM mechanically mined resources, a break‐even cutoff GT was established. Inputs to the estimation of the break‐even cutoff analysis are cost of goods sold, product sale price, mill recovery, and nominal grade.
The cutoff for solution mining in flooded abandoned underground potash mines is a function of the grade of the brine being extracted which results in enough product tons to cover the cost of production. The cutoff grade for resources of abandoned underground sylvinite is not a parameter for use in the estimation of solution mining resources but does establish an operational minimum limit for the brine grade reserves. The solution mining resources are the pillars remaining after mining and the fringe boundary of the mine. Resources could also be unmined ore left behind to provide geotechnical support. An operational limit of the flood elevation establishes the cutoff between resource and reserve for this deposit. When mining using solution methods in proximity to other mines, or other underground mines not within the control of IPNM, the critical factor in establishing a flood elevation is to keep adjoining properties dry or to protect structures such as shafts.
|
|
|
|
|
|
|
|
|
|
|
|
|
|
|
|
|
|
|
|
|
|
|
|
|
|
|
|
|
|
|
|
|
| IPNM—Summary Mineral Resources in Millions of Tons of Sylvinite effective December 31, 2023. Based on $450/product ton mine site. |
|
|
Resources |
|
Mechanical
Mining Cutoff 2
(ft%K2O)
|
|
Processing
Recovery (%) |
|
|
Sylvinite 1
(Mt)
|
|
Grade (%K2O) |
|
Contained K2O
(Mt)
|
|
|
|
|
|
|
|
|
| Measured mineral resources |
|
289 |
|
16 |
|
45 |
|
54-64 |
|
75-85 |
| Indicated mineral resources |
|
164 |
|
14 |
|
24 |
|
54-64 |
|
75-85 |
| Measured + Indicated resources |
|
453 |
|
15 |
|
69 |
|
|
|
|
| Inferred mineral resources |
|
— |
|
— |
|
— |
|
|
|
|
|
|
|
|
|
|
|
|
|
|
|
| IPNM—Summary Mineral Resources in Millions of Tons of Sylvinite effective December 31, 2022. Based on $406/product ton mine site. |
|
|
Resources |
|
Mechanical
Mining Cutoff 2
(ft%K2O)
|
|
Processing
Recovery (%) |
|
|
Sylvinite 1
(Mt)
|
|
Grade (%K2O) |
|
Contained K2O
(Mt)
|
|
|
|
|
|
|
|
|
| Measured mineral resources |
|
370 |
|
15 |
|
56 |
|
45-59 |
|
75-85 |
| Indicated mineral resources |
|
200 |
|
14 |
|
29 |
|
45-59 |
|
75-85 |
| Measured + Indicated resources |
|
570 |
|
15 |
|
85 |
|
|
|
|
| Inferred mineral resources |
|
— |
|
|
|
— |
|
|
|
|
1 Sylvinite is a mixed evaporite containing NaCl and KCl. |
2 Solution mining resource cutoff for flooded old working is the mining extents boundary. |
| Mineral Resources were prepared by RESPEC, a qualified firm for the estimate and independent of Intrepid. |
| Mineral Resources are reported exclusive of Mineral Reserves. |
| Mineral Resources are reported using Inverse Distance Squared estimation methods. |
Mt = million tons, % = percent K2O = potassium oxide, ft = feet |
|
|
|
|
|
|
|
|
|
|
|
|
|
|
|
|
|
|
|
|
|
|
|
|
|
|
|
|
|
|
|
|
|
|
|
|
|
|
|
|
|
|
|
|
|
|
|
|
|
|
|
|
|
|
|
|
|
|
|
|
|
|
|
|
|
|
|
|
|
|
|
|
|
|
|
|
|
|
|
|
|
|
|
|
|
|
|
|
|
|
|
|
|
|
|
|
|
|
|
|
|
|
|
|
|
|
|
|
|
|
|
|
|
|
|
|
| IPNM—Summary of Mineral Resource in Millions of Tons of Langbeinite Mineralized Rock in Place effective December 31, 2023. Based on $470/product ton mine site. |
|
|
Resources |
|
Mechanical
Mining Cutoff
(ft%K2O)
|
|
Processing
Recovery (%) |
|
|
Langbeinite Mineralized Rock (Mt) |
|
Grade (%K2O) |
|
Contained K2O
(Mt)
|
|
|
|
|
|
|
|
|
|
|
|
|
|
|
|
|
|
|
|
| Measured mineral resources |
|
72 |
|
10 |
|
7 |
|
25 |
|
68 |
| Indicated mineral resources |
|
60 |
|
10 |
|
6 |
|
25 |
|
68 |
| Measured + Indicated resources |
|
132 |
|
10 |
|
13 |
|
|
|
|
| Inferred mineral resources |
|
— |
|
— |
|
— |
|
|
|
|
|
|
|
|
|
|
|
|
|
|
|
| IPNM—Summary of Mineral Resource in Millions of Tons of Langbeinite Mineralized Rock in Place effective December 31, 2022. Based on $425/product ton mine site. |
|
|
Resources |
|
Mechanical
Mining Cutoff
(ft%K2O)
|
|
Processing
Recovery (%) |
|
|
Langbeinite Mineralized Rock (Mt) |
|
Grade (%K2O) |
|
Contained K2O
(Mt)
|
|
|
|
|
|
|
|
|
| Measured mineral resources |
|
50 |
|
10 |
|
5 |
|
32 |
|
68 |
| Indicated mineral resources |
|
60 |
|
10 |
|
6 |
|
32 |
|
68 |
| Measured + Indicated resources |
|
110 |
|
10 |
|
11 |
|
|
|
|
| Inferred mineral resources |
|
— |
|
|
|
— |
|
|
|
|
| Mineral Resources were prepared by RESPEC, a qualified firm for the estimate and independent of Intrepid. |
| Mineral Resources are reported exclusive of Mineral Reserves. |
Mt = million tons, % = percent, K2O = potassium oxide, ft = feet |
The material assumptions and criteria used for the IPNM mineral resource estimates are discussed in more detail in Section 11 of the Technical Report Summary in Exhibit 96.1 to this Annual Report.
Mineral Reserve
Mineral reserves that are to be mined using mechanical methods are estimated by the application of a detailed mine plan for the measured and indicated resources within the boundaries of the cutoff GT for reserves. The plan sets the basis for the estimation of annual production of product. The income from product sales and the operating and capital costs to mine the resource is fundamental to the cash flow used to establish economic viability.
Mineral reserves that are mined using solution mining methods are not subject to the traditional application of a cutoff grade, and instead operational limitations are considered. An operational limit of the flood elevation establishes the cutoff between resource and reserve for this deposit.
By definition, modifying factors are the factors applied to indicated and measured mineral resources and then evaluated in order to establish the economic viability of mineral reserves. These factors for IPNM include mechanical and solution mining parameters; mineral processing; oil and gas drill islands and well locations; economic cutoff GT; deleterious minerology; and lease boundaries.
Mechanically Mined Reserves
We are not reporting any langbeinite reserves as of December 31, 2023, only langbeinite resources because, in the opinion of the Qualified Person, none of the langbeinite resources are economically mineable. Modeling indicates a cutoff of 64 feet-percent K2O for the high‐insoluble sylvinite resources in the 8th and 10th ore zones, which requires the capital investment of a new plant and refurbishment of shafts. A cutoff of 54 feet-percent K2O is indicated for the West Mine sylvinite resources which requires the processing plant, mine equipment, and associated infrastructure to be rehabilitated.
Solution Mined Reserves
Breakeven Cutoff for solution mined reserves is shown in the table below:
|
|
|
|
|
|
|
|
|
|
|
|
|
|
|
|
|
|
|
|
|
|
|
|
|
|
|
|
|
|
|
|
|
| IPNM—Summary of Potash Mineral Reserves effective December 31, 2023. Based on $360/product ton mine site |
|
|
In-Place KCl (Mt) |
|
In Situ Grade1 (%K2O) |
|
Product2
(Mt)
|
|
Brine Cutoff Grade3
(%K2O)
|
|
Processing Recovery (%) |
|
|
|
|
|
|
|
|
|
|
|
|
| Proven Mineral Reserves |
|
5.3 |
|
22.9 |
|
4.0 |
|
3.0 |
|
85 |
| Probable Mineral Reserves |
|
— |
|
— |
|
— |
|
— |
|
— |
| Total Mineral Reserves |
|
5.3 |
|
22.9 |
|
4.0 |
|
|
|
|
|
|
|
|
|
|
|
|
|
|
|
| IPNM—Summary of Potash Mineral Reserves effective December 31, 2022. Based on $325/product ton mine site |
|
|
In-Place KCl (Mt) |
|
In Situ Grade1 (%K2O) |
|
Product4
(Mt)
|
|
Brine Cutoff Grade3
(%K2O)
|
|
Processing Recovery (%) |
|
|
|
|
|
|
|
|
|
|
|
|
| Proven Mineral Reserves |
|
5.4 |
|
21.7 |
|
4.3 |
|
2.0 |
|
85 |
| Probable Mineral Reserves |
|
0.3 |
|
19.1 |
|
0.2 |
|
2.0 |
|
85 |
| Total Mineral Reserves |
|
5.7 |
|
21.6 |
|
4.5 |
|
|
|
|
1 In situ grade is the amount of K2O in the contact area of the caverns and is used to calculate the In-Place KCl. |
2 Product is calculated by multiplying In-Place KCl by: dissolution factor of 96%, areal recovery of 100%, geologic factor of 94.2%, plant recovery of 85%, cavern loss factor of 98%, and a product purity factor of 103%, and a handling loss factor of 97%. |
3 Brine cutoff grade is the amount of K2O in the extracted brine necessary to cover the costs of production. |
4 Product is calculated by multiplying In-Place KCl by: dissolution factor of 96%, areal recovery of 100%, geologic factor of 94.2%, plant recovery of 85%, cavern loss factor of 98%, and a product purity factor of (1/.95). |
| Mineral Reserves were prepared effective December 31, 2023, and 2022, by RESPEC, a qualified firm for the estimate and independent of Intrepid. |
| Mineral Reserves are reported exclusive of Mineral Resources. |
Mt = million tons, % = percent, K2O = potassium oxide, ft = feet, ROM = Run-of-Mine |
We are not reporting any langbeinite reserves as of December 31, 2023, only langbeinite resources because, in the opinion of the Qualified Person, none of the langbeinite resources are economically mineable. The table below shows the Breakeven Cutoff for mechanically mined langbeinite reserves as of December 31, 2022.
|
|
|
|
|
|
|
|
|
|
|
|
|
|
|
|
|
|
|
|
|
|
|
|
|
|
|
|
|
|
|
|
|
|
|
|
|
|
|
|
|
|
|
|
|
|
|
|
|
|
|
|
|
|
|
|
|
|
|
|
|
|
|
|
|
|
|
|
|
|
|
|
|
|
|
|
|
|
|
|
|
|
|
|
|
|
|
|
|
|
|
|
|
|
|
|
|
|
|
|
|
| IPNM—Summary of Langbeinite Mineral Reserves effective December 31, 2022. Based on $340/product ton mine site. |
|
|
ROM Ore1
(Mt)
|
|
In Situ
Grade2
(Diluted)
(%K2O)
|
|
Product3
(Mt)
|
|
Cutoff Grade (ft%K2O) |
|
Processing Recovery (%) |
|
|
|
|
|
|
|
|
|
|
|
|
| Proven Mineral Reserves |
|
17.3 |
|
8.6 |
|
4.6 |
|
43 |
|
68 |
| Probable Mineral Reserves |
|
4.2 |
|
9.1 |
|
1.2 |
|
43 |
|
68 |
| Total Mineral Reserves |
|
21.5 |
|
8.7 |
|
5.8 |
|
|
|
|
1 ROM Ore is reported based on a detailed conventional mine plan adjusted for random impurities of 10%. |
2 In situ grade (diluted) is the amount of K2O in the ore body with consideration for dilution occurring during mining. |
3 Product tons are calculated by multiplying ROM Ore by: In-Situ Grade (Diluted)/22.70%, plant recovery of 68%, and a product purity factor of (1/.944). In-situ Grade (Diluted) is divided by 22.70% to convert K2O grade to pure langbeinite by mass. |
| Mineral Reserves were prepared effective December 31, 2023, and 2022, by RESPEC, a qualified firm for the estimate and independent of Intrepid. |
| Mineral Reserves are reported exclusive of Mineral Resources. |
Mt = million tons, % = percent, K2O = potassium oxide, ft = feet, ROM = Run-of-Mine |
Additional information regarding the methodology and key assumptions used to calculate the IPNM mineral reserve can be found in Section 12 of the technical report summary in Exhibit 96.1 to this Annual Report.
Internal Controls
IPNM has an internal protocol that provides for well‐defined, safe practices. IPNM has standard operating procedures ("SOP's") in place for logging and sampling core from underground and surface core drilling. According to the SOP’s, the geologist uses gamma ray to initially select the sample interval prior to prepping the sample for analysis. The samples are assayed at the on‐site laboratory. The site laboratory has the capability to conduct X‐ray Diffraction ("XRD"), Total Organic Carbon, and flame photometry laboratory techniques. The mineral analysis for all core and channel samples is analyzed with the XRD. A sample of approximately 300–500 grams is collected. The sample is split down to around 100 g and run through a grinding mill to reduce the size down to approximately 100 mesh. A sample is weighed out to five grams and put into a micronizing mill that reduces the particle size to ~10 microns and pressed into a sample holder. The sample is inserted into the instrument and a diffraction pattern is retrieved. The diffraction pattern is then analyzed using the Rietveld refinement software, reporting weight percent of solid mineral in the sample. The sample preparation, security, and laboratory analytical procedures are conventional industry practice and are adequate for the reporting of resources and reserves.
Individual Property Disclosure - Moab
Overview
The Moab property is in a unique high‐altitude desert landscape formed from the sandstone of ancient seafloors and sand dunes. Elevations range from 3,900 feet (ft) to 4,400 ft above mean sea level. The property is located approximately 20 miles west of Moab, Utah, which is 234 miles southeast of Salt Lake City, Utah. The Colorado River runs north–south along the eastern boundary of the property. The Moab property covers approximately 14,100 acres of land.
Moab’s potash leases include 10,100 acres from the State of Utah and approximately 200 acres from the U.S. through the BLM. Moab owns approximately 3,800 surface acres overlying and adjacent to portions of the mining leases with the State of Utah.
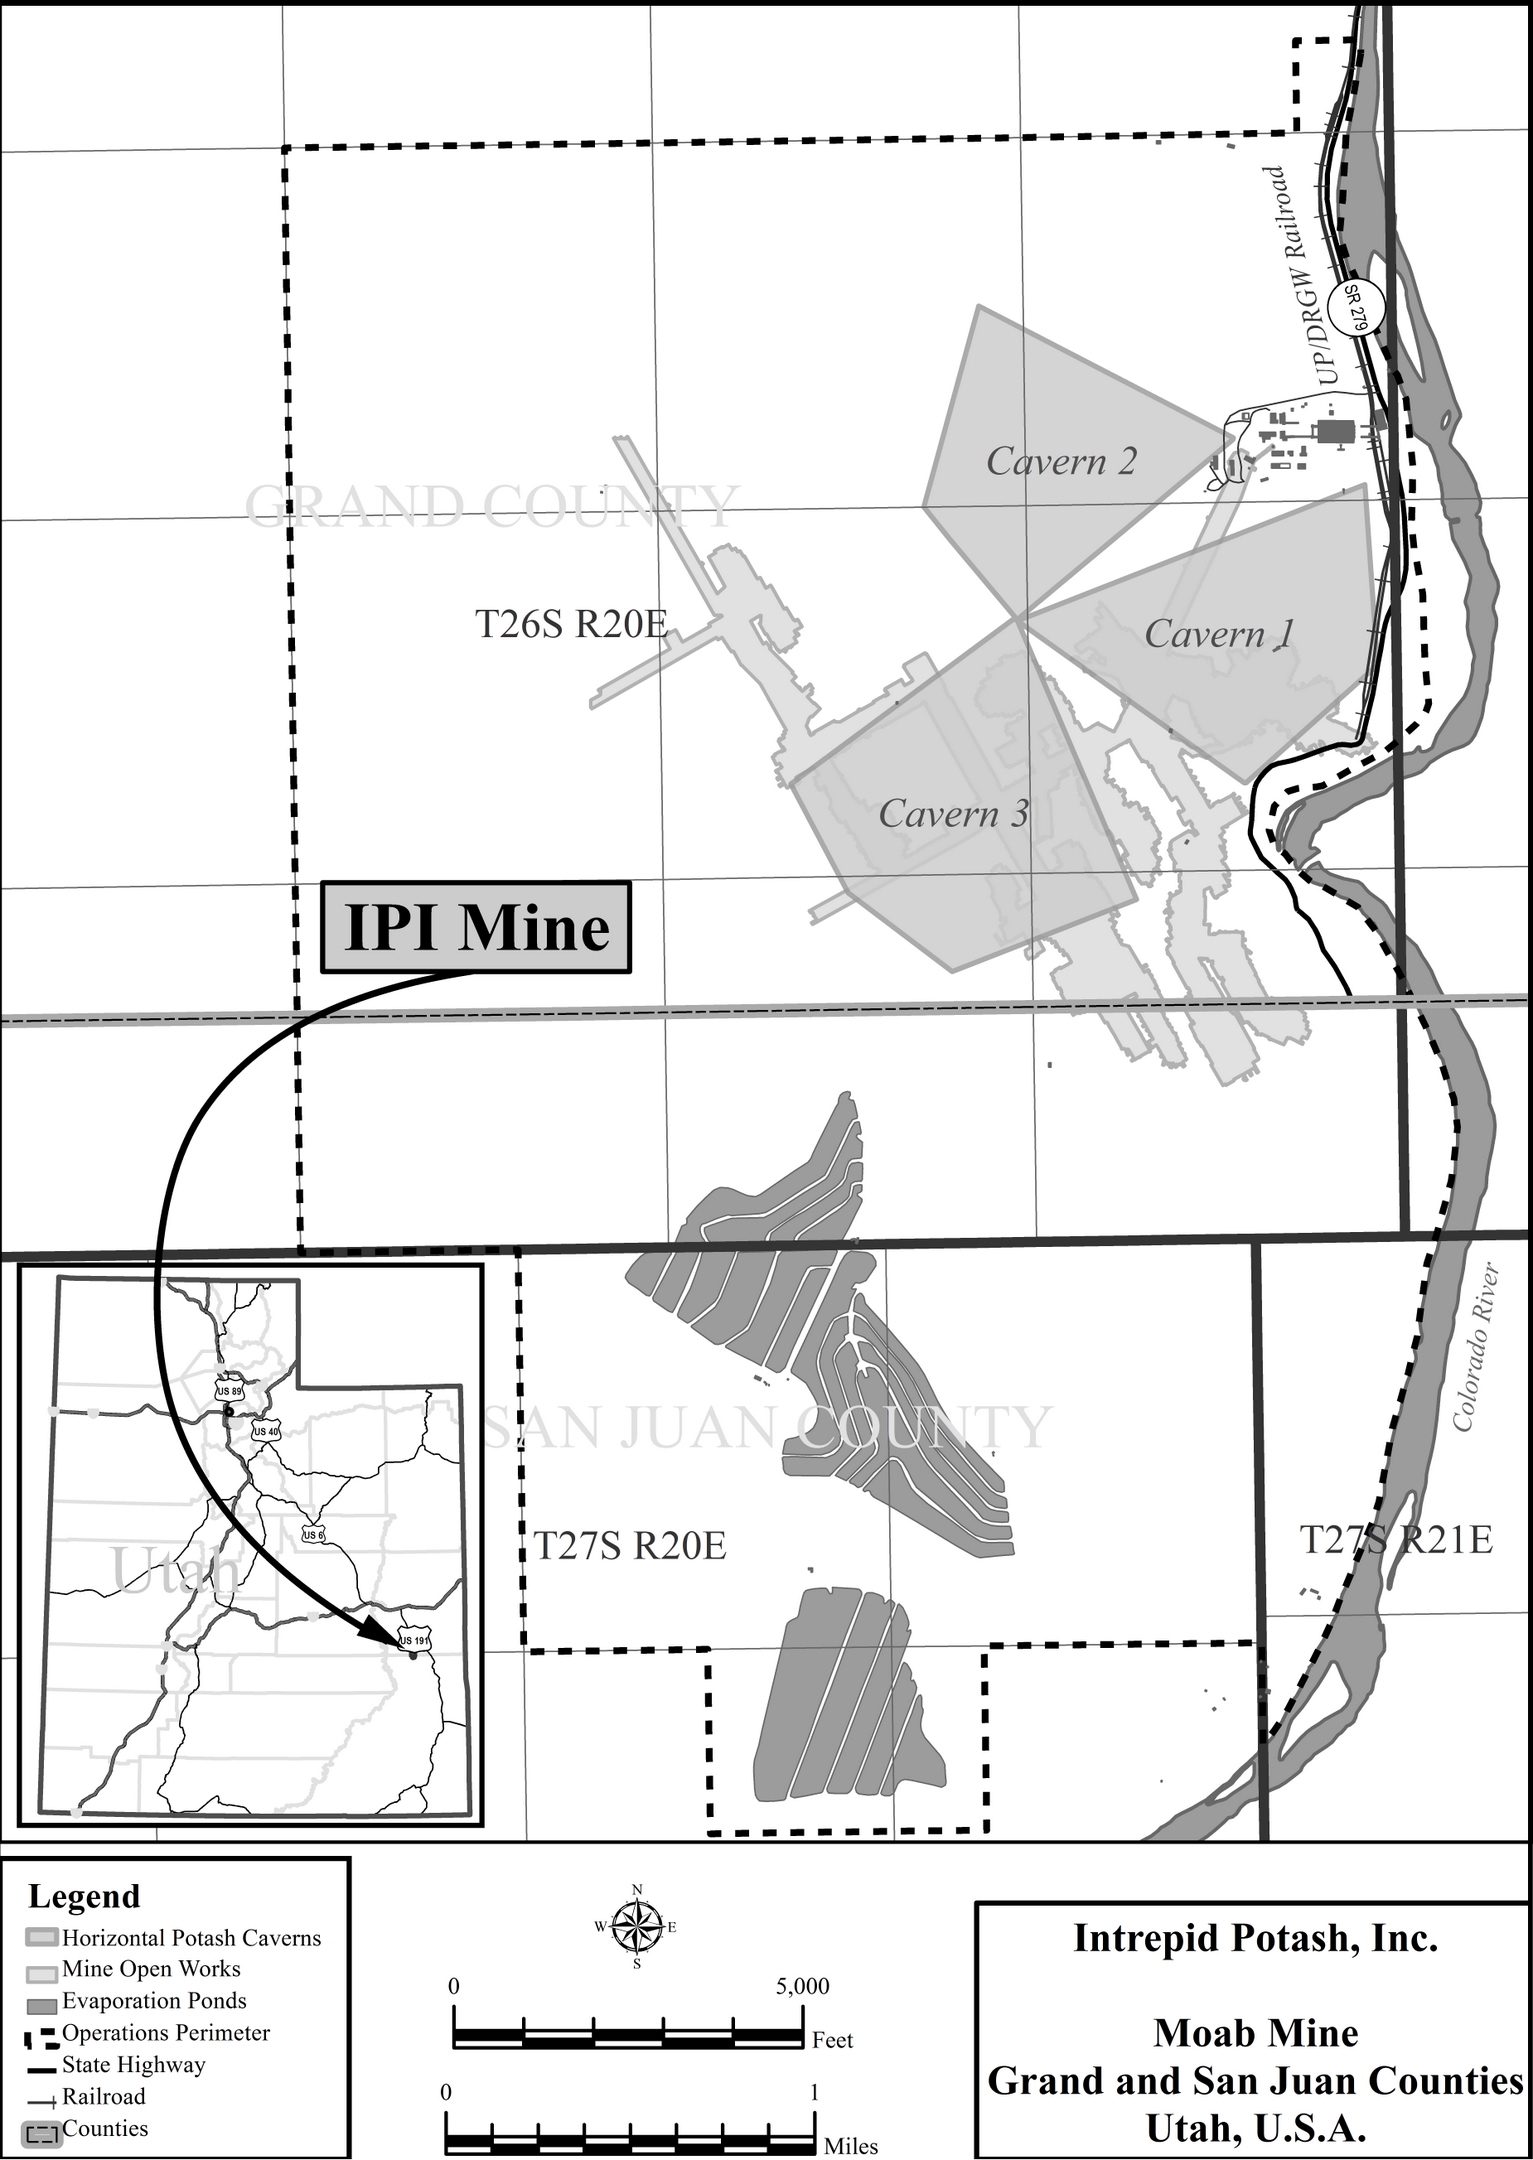
The depositional history of eastern Utah’s vast salt and potash resources begins during the regionally arid Pennsylvanian Period, 330–310 million years ago. An immense block of the Earth’s crust, in what is today western Colorado, was thrust upward to form the Uncompahgre Highlands and identified as the westernmost expression of the Ancestral Rocky Mountains. As is common throughout geologic history, dramatic uplift was coupled with subsidence in an adjoining area. The subsequent topographical basin was inundated by seawater as it subsided. Throughout the Pennsylvanian Period, sea levels rose and fell. With each retreat of the sea, the Paradox Basin, as it is called, became devoid of fresh sea water, allowing the process of evaporation to dominate which resulted in widespread precipitation of chloride minerals. This retreat/inflow cycle is known to have occurred a minimum of 29 times, with each marked by a specific and predictable sequence of sedimentary deposition. This series of depositional cycles is collectively known as the Paradox Formation. Potash is documented to exist in 17 of the 29 cycles, and it is from these formational cycles that commercial production of potash occurs. Of these 17, two are principally targeted by us for commercial potash production: Bed 5 and Bed 9.
Moab commercially produces potash from two zones, referred to as Bed 5 and Bed 9. These beds are part of a thick sequence of evaporite cycles predominantly composed of halite interspersed with sedimentary layers of black shale and anhydrite. Within Beds 5 and 9, the sylvinite is bounded above and below by occurrences of halite. Sylvite and halite are both water‐soluble by nature. By using water already saturated with sodium, it is possible to selectively dissolve a greater amount of the potassium chloride ore.
Mining at the Moab property is by the solution mining technique referred to as “selective solution mining.” Selective solution mining dissolves only the KCl component of the sylvinite and leaves the sodium chloride component underground. KCl production is a function of brine grade and the well extraction rate and is limited by the solar ponds’ evaporation rate. Brine grade is a function of retention time within each bed.
Mining by solution methods ends with the delivery of the brine to the evaporation ponds. Mineral processing begins with pond sequencing to enhance crystallization of the potash. The crystals remaining in the ponds after solar evaporation are harvested and processed through the mill where the potash is separated from other salts, then concentrated by flotation. The concentrates are then dried, compacted, and screened into premium grades of white potash. We ship the product to market in trucks or rail cars.
Both potash and salt products are processed at the plant facility at a rate of 400 to 1,200 tons per day. The Moab property exhibits the normal results of a surface salt-based operation and is in good working condition. A new compaction facility was installed in 2010.
Access to the property is predominantly via state highway 191 and state road 279, locally referred to as Potash Road. A Union Pacific/Denver and Rio Grande Western Railroad rail spur services the property. The nearest town to the Moab property is Moab, Utah (with an estimated population of about 5,300). Salt Lake City, Utah (population of 200,500) and Grand Junction, Colorado (population of 67,000), are located approximately 240 and 120 miles to the west and east, respectively, by road, and are the nearest major industrial and commercial airline terminals. Moab also has a commercial airline terminal with scheduled flights to Salt Lake City and other nearby cities depending on the season.
The nearby Colorado River provides the Moab mining operation with make‐up water under existing water rights with the State of Utah for a water supply of nine cubic feet per second. The Moab mine has been in operation as a solution mine since 1970 and, as a result, has the infrastructure and available personnel. The mining operation is accessible by a paved county road and accessible by rail. Electric power is fed from local utilities to a recently upgraded substation. The local area population is sufficient to support the Moab mine.
The Moab property is pledged as collateral for our revolving credit facility. We have a reclamation bond in place for approximately $7.5 million. There are no other significant encumbrances to the Moab property, including current and future permitting requirements and associated timelines, permit conditions, and violations and fines. As of December 31, 2023, the net book value of our material Moab property was $79.5 million. There are no significant factors and risks that may affect access, title, or the right or ability to perform work on the Moab property. The Moab property holds numerous environmental and other permits and governmental approvals authorizing the operations at the facility.
Leases and Permits
At our Moab facility, we lease approximately 10,100 acres from the State of Utah and approximately 200 acres from the federal government through the BLM. We own approximately 3,800 surface acres overlying and adjacent to portions of acres leased from the State of Utah. These leases generally contain stipulations that require us to commence mining operations within a specified term and to continue mining to retain the leases.
Our lease with the federal government is for an indefinite term subject to readjustment of the lease stipulations, including the royalty payable to the federal government. Royalty payments equal a percentage of product sales less freight. The current royalty rate stipulated in the federal lease is five percent. In 2023, Moab made no royalty payments to the federal government.
Our Moab leases with the State of Utah are for terms of 10 years subject to extension and possible readjustment of the lease stipulations, including the royalty payable to the State of Utah. Our Moab leases with the State of Utah are operated as a unit under a unit agreement with the State of Utah, which extends the terms of all the Moab state leases as long as operations are conducted on any portion of these state leases. Our Moab leases with the State of Utah are currently extended until 2024 or so long as potash is being produced and stipulate royalty rates of five percent. In 2023, Moab paid $2.5 million of royalties to the State of Utah.
History of Operations
Texasgulf, Inc. began conventional underground mining in 1964, but various mining problems caused management to convert to a system combining solution mining and solar evaporation in 1971. Prior to 1970, approximately 6.5 million tons of sylvinite ore were mined and from that, 1.7 million tons of potash produced. Mining was by continuous miners and made difficult by the irregular floor, gas, and high rock temperatures. The height mined was typically eight feet. The dip of the ore was such that maintaining the miners in the seam was difficult. The seam floor rolls and folds resulted in an irregular mine plan with many large areas left unmined as pillars. In some areas, secondary mining resulted in high extraction.
We purchased the Moab Salt operation in 1999. In 2000, we drilled two new recovery wells to revitalize production from Bed 5. Production from Bed 5 had declined from near 100,000 tons in 1994 to 60,000 tons in 1999. After completion of the two new recovery wells, the brine concentration improved, and production increased to near 100,000 tons in 2001. Maintaining production at or near the target rate of 100,000 tons per year was difficult from Bed 5 because of declining product concentration. It was believed that solution mining over the prior 32 years had solution mined most of the remnant pillars in the old workings and that active solution mining was restricted to the updip faces of the mine ribs.
We evaluated methods to enhance the production rate and decided to develop solution mining in Bed 9. Bed 9 is located 800 to 1,000 feet below Bed 5 and is of higher KCl content. Bed 9 had not been solution mined previously, although, some test mining was completed by the prior owners in the late‐1960s. A novel method of solution mining was adopted for recovery of potash from Bed 9. Moab Salt‐27 and Moab Salt‐28 were drilled “horizontally” in 2002 in Bed 9 to connect and provide pathways for the liquor injected in Moab Salt‐27 to contact the sylvinite and differentially dissolve the sylvite before being lifted from Moab Salt‐28.
Currently, Moab Salt‐29 connects Moab Salt‐27 and ‐28 and serves as an alternative to Moab Salt‐27 for injection.
Mineral Resource and Reserves Comparison to Prior Year
We engaged RESPEC, a qualified firm and independent of Intrepid, to prepare a technical report summary for our Moab material property as of December 31, 2023 because changes in our cost of production and recent capital investments resulted in material changes in the mineral reserves and mineral resources estimates from the revised technical report summary prepared as of December 31, 2021 for the Moab property. The technical report summary for the Moab material property as of December 31, 2023 is included with this Annual Report on Form 10-K.
Mineral Resource and Reserves
Overview
The ore resource model created from the exploration and sampling database in 2007 serves as the basis for this evaluation. Personal inspection of the properties has occurred over the years by the QP, with the most recent inspection done on May 17, 2021. The inspection began with a tour of the tailings lake then the solar evaporating ponds. In addition, the injection and extraction wellfields, processing plant, product packaging and shipping areas were all inspected. During the site visit, harvesting was occurring, and the plant was operating. The plant is typically idle during the peak evaporation season from June 1 to September 1.
Mineral Resource
The property was evaluated using exploration drillhole and channel sample data to form the database that serves as the basis for estimating the resources. The geologic setting was evaluated, and zone assignments reviewed. All the core holes used in this resource estimation report both bed thickness and grade values that lie within the mine lease boundary. As an exception to this, the two potash exploration wells, Wells 28 and IPI‐037, which report bed thicknesses with no assay data, are included in the resource estimate for thickness modeling.
The rationale for the measured, indicated, and inferred limits is based on industry practice in the potash industry. Measured resources are within ¼ of a mile (1,320 feet) of a hole, conveying the highest level of confidence. In addition, the indicated resources are selected to be within ¾ of a mile (3,960 feet) of a hole and the inferred resources are selected to be within 1½ miles (7,920 feet) of a hole. Indicated tons exclude measured tons, inferred tons exclude the indicated and measured tons. This convention is considered reasonable for the geologic characteristics of the Cane Creek potash deposit.
The mineral resource for the Cane Creek Mine was estimated using Carlson Software 2020 ("Carlson 2020"), a commercially available geology and mine modeling software package. The resources within the property were segregated in the model into 100‐feet by 100‐feet blocks. The resource estimates included in this report are based on the 2018 modeling.
A deterministic estimate of the potash mineral resource was made using the inverse distance squared method. Invoking the theory that closer samples should be better predictors than those further away, the method assigns weights to samples inversely proportional to the separation distance between the estimation point and the sample point. The inverse distance squared method is useful for providing unbiased estimates of the overall resources.
The block grade and heights were generated within a 1.9‐mile search radius. The 1.9‐mile search radius was selected to capture more than one core hole in estimating block values in the areas of interest. The maximum number of drill holes for block estimation was limited to the 20 nearest drill holes. Inverse distance squared behaves as an exact interpolator. When calculating a block value, the weights assigned to the data points are fractions, and the sum of all the weights is equal to 1.0. An average unit density of 130 pounds per cubic foot was used to convert in‐place volume to tons. NaCl (salt) is not reported.
The proportion of the mineral deposit that is considered a resource depends on the following key factors: deposit thickness, deposit grade, and geologic factors. Areas where a bed thickness and potassium oxide (K2O) grade do not meet a 3‐foot and 18.95% K2O cutoff are excluded from the resource. The minimum thickness cutoff is used because sufficient recovery in thin beds by selective solution mining has not been demonstrated and because of difficulties in locating/maintaining horizontal holes within the bed. The grade cutoff is used because of the difficulty in selective mining in beds with less than 30% KCl content (18.95% K2O).
The gross in‐place sylvinite tonnage for each resource block was calculated by multiplying the net area of the block by the thickness of the bed and the density. The measured, indicated, and inferred Mineral Resource tonnages were estimated within the prescribed radius from the sampling location.
The mineral resources for Bed 5 have been estimated using the end of year 2018 geologic model. Measured, indicated, and inferred resources were estimated by sampling blocks within a 1,320‐feet, 3,960‐feet, and 7,920‐feet radius of influence, respectively, from a sample location (drill hole).
The resource estimate for Bed 9 is based on cored intervals and assay data from 21 holes (19 with grade and thickness). A similar methodology used for the Bed 5 resource estimation was used in the resource estimate for Bed 9.
|
|
|
|
|
|
|
|
|
|
|
|
|
|
|
|
|
|
|
|
|
|
|
|
|
|
|
|
|
|
|
|
|
| Moab—Summary of Mineral Resources in Millions of Tons of Sylvinite in Place effective December 31, 2023 Based on $450/product ton mine site |
|
|
Resources |
|
|
|
|
|
|
Sylvinite1
(Mt)
|
|
Grade
(%K2O)
|
|
Contained
K2O (Mt)
|
|
Cutoff 2 |
|
Processing Recovery (%) |
|
|
|
|
|
|
| Measured mineral resources |
|
97 |
|
26 |
|
25 |
|
Minimum of 3-ft and 18.95%K2O |
|
83 |
| Indicated mineral resources |
|
190 |
|
25 |
|
47 |
|
Minimum of 3-ft and 18.95%K2O |
|
83 |
| Measured + Indicated mineral resources |
|
287 |
|
25 |
|
72 |
|
|
|
|
| Inferred mineral resources |
|
38 |
|
23 |
|
9 |
|
Minimum of 3-ft and 18.95%K2O |
|
83 |
| Moab—Summary of Mineral Resources in Millions of Tons of Sylvinite in Place effective December 31, 2022 Based on $406/product ton mine site |
|
|
Resources |
|
|
|
|
|
|
Sylvinite1
(Mt)
|
|
Grade
(%K2O)
|
|
Contained
K2O (Mt)
|
|
Cutoff 2 |
|
Processing Recovery (%) |
|
|
|
|
|
|
| Measured mineral resources |
|
113 |
|
26 |
|
30 |
|
Minimum of 3-ft and 18.95%K2O |
|
83 |
| Indicated mineral resources |
|
190 |
|
25 |
|
47 |
|
Minimum of 3-ft and 18.95%K2O |
|
83 |
| Measured + Indicated mineral resources |
|
303 |
|
25 |
|
77 |
|
|
|
|
| Inferred mineral resources |
|
38 |
|
23 |
|
9 |
|
Minimum of 3-ft and 18.95%K2O |
|
83 |
1 Sylvinite is a mixed evaporite containing NaCl and KCl. Pure KCl equates to 63.17% K2O by mass. |
2 Solution mining resource cutoff for flooded old workings is the mining extents boundary. |
| Mineral Resources were prepared by RESPEC, a qualified firm for the estimate and independent of Intrepid. |
| Mineral Resources are reported exclusive of Mineral Reserves. |
| Mineral Resources are reported using Inverse Distance Squared estimation methods. |
Mt = million tons, % = percent, K2O = potassium oxide, ft = feet |
Additional information regarding the methodology and key assumptions used to calculate the Moab mineral resource can be found in Section 11 of the technical report summary in Exhibit 96.2 to this Annual Report.
Mineral Reserve
Mineral reserves that are mined using solution mining methods are not subject to the traditional application of a cutoff grade but instead of operational limitations. By definition, modifying factors are the factors applied to a mine plan for the indicated and measured mineral resources and then evaluated in order to establish the economic viability of mineral reserves. The factors for Moab are solution mining parameters, mineral processing, and lease boundaries are shown below.
The reserve estimate is based on a mine plan developed for the Cane Creek Mine. The estimate is based on the geologic model and assigned thicknesses and grades for the flooded old mine workings updip boundary (Bed 5) mapped to the decline curve and the individual caverns (Bed 9).
The mine plan for Bed 5 was determined using a study developed to estimate the area of reserves that have been depleted through solution mining inside and around the perimeter of the old mine workings, with the exception of a large pillar within the perimeter. As such, this perimeter area has been excluded from the reserve estimates for Bed 5. Reserves were estimated for updip and horizontal areas outside of the perimeter. The mineral reserves were estimated as the difference between the reserves from the resource area and the net KCl tons extracted since 2001.
Although Bed 5 resources can be solution mined with additional horizontal caverns, the reserves estimate only focuses on the net reserves remaining in the old mine as the planned horizontal caverns in Bed 9 are more than enough to support the required mine life for this report.
The mine plan for Bed 9 includes the three existing operating caverns and three additional planned caverns. Estimate of the reserves within the current and future well system area uses grade and thickness drillhole data and production to date. No estimate was made of the ore tons, average thickness, and average grade for the previously solution‐mined areas from Bed 9, only the equivalent tons of K2O and KCl were estimated. To date, about 1,110,000 tons of KCl have been mined from Bed 9. The modifying factors required to convert the in‐place tons into reserve tons are the same as those listed for Bed 5 with the exception of the dissolution factor. The Bed 9 dissolution factor was estimated using a concentration of 7.42% KCl by weight.
|
|
|
|
|
|
|
|
|
|
|
|
|
|
|
|
|
|
|
|
|
|
|
|
|
|
|
|
|
|
|
|
|
| Moab—Summary of Potash Mineral Reserves effective December 31, 2023. Based on $360/product ton mine site. |
|
|
In-Place KCl (Mt) |
|
In Situ Grade1
(%K2O)
|
|
Product
(Mt)2
|
|
Brine Cutoff
Grade3
(%K2O)
|
|
Processing Recovery (%) |
|
|
|
|
|
|
|
|
|
|
|
|
| Proven Mineral Reserves |
|
3.1 |
|
28.3 |
|
2.3 |
|
2.5 |
|
83.0 |
| Probable Mineral Reserves |
|
0.4 |
|
28.9 |
|
0.3 |
|
2.5 |
|
83.0 |
| Total Mineral Reserves |
|
3.5 |
|
28.4 |
|
2.6 |
|
|
|
|
|
|
|
|
|
|
|
|
|
|
|
| Moab—Summary of Potash Mineral Reserves effective December 31, 2022. Based on $325/product ton mine site. |
|
|
In-Place KCl (Mt) |
|
In Situ Grade1
(%K2O)
|
|
Product
(Mt)4
|
|
Brine Cutoff
Grade3
(%K2O)
|
|
Processing Recovery (%) |
|
|
|
|
|
|
|
|
|
|
|
|
| Proven Mineral Reserves |
|
2.5 |
|
27.2 |
|
1.8 |
|
1.9 |
|
83.0 |
| Probable Mineral Reserves |
|
0.8 |
|
27.8 |
|
0.6 |
|
1.9 |
|
83.0 |
| Total Mineral Reserves |
|
3.3 |
|
27.3 |
|
2.4 |
|
|
|
|
1 In situ grade is the amount of K2O in the remaining pillars of old works and is used to calculate In-Place KCL. |
2 Product tons are calculated by multiplying the In-Place KCl by: dissolution factor of 89%, areal recovery of 100%, geologic factor of 94%, plant recovery of 86%, handling loss factor of 97.5%, and product purity of 104% (1/0.96). |
3 Brine cutoff grade is the amount of K2O in the extracted brine necessary to cover the cash costs of production. |
4 Product tons are calculated by multiplying the In-Place KCl by: dissolution factor of 89%, areal recovery of 94%, geologic factor of 94%, plant recovery of 83%, and product purity of 1/95%. |
| Mineral Reserves were prepared by RESPEC., a qualified firm for the estimate and independent of Intrepid. |
| Mineral Reserves are reported exclusive of Mineral Resources. |
Mt = million tons, % = percent, K2O = potassium oxide, ft = feet |
Additional information regarding the methodology and key assumptions used to calculate the Moab mineral reserve can be found in Section 12 of the technical report summary in Exhibit 96.2 to this Annual Report.
Internal Controls
Moab has an internal protocol that provides for well‐defined, safe practices. Moab has SOPs in place for gamma‐ray logging, core handling, and sample collection. The cores are collected and analyzed for ore zone identification. Cores are compared to the gamma‐ray log to determine sampling intervals.
Duplicate samples are collected with one sample sent to the on‐site lab and the other stored with the corresponding core box from which the sample was sourced.
Individual Property Disclosure - Wendover
Overview
The Wendover operation is located near the Nevada-Utah border along the western edge of Utah’s Great Salt Lake Desert and is situated within the Bonneville Salt Flats ("BSF"). The BSF is an enclosed-subbasin that contains 150 square miles of salt crust. Because the basin is closed topographically and has no outlet, loss of water is ultimately through evaporation. The BSF was formed through the prolonged accumulation of evaporite minerals in conjunction with periodic lacustrine events. There are three aquifers known to exist beneath the BSF, in descending order, the shallow-brine aquifer, the alluvial-fan aquifer, and the deep-brine aquifer. We produce potash from the shallow-brine aquifer and the deep-brine aquifer. The climate in western Utah is arid with low precipitation and low relative humidity. Average rainfall is five inches and average evaporation is eighty inches.
We produce potash at the Wendover facility through solar evaporation of naturally occurring brines collected from the sedimentary basin adjacent to the processing facility via brine collection ditches and extraction wells. The potash content of the collected brine is concentrated by solar evaporation in a series of ponds to the point that solids are precipitated and can be collected. The precipitated solids are primarily sylvinite, a combination of NaCl and KCl. Harvested solid salts are hauled to the processing facility, where grinding and flotation processes are used to concentrate KCl. The concentrate is then leached with freshwater to remove most of the remaining NaCl. KCl is then dried, sized, and stored for shipment. Potash, NaCl, MgCL2, and metal recovery salt are shipped by truck and rail via Interstate 80 and the Union Pacific Railroad.
The Wendover potash operation is located in the westernmost part of Tooele County, Utah. The plant facilities and offices are located approximately three miles east of Wendover, Utah, on old US Highway 40. The site is approximately three miles east of the Nevada border and is primarily located south of Interstate 80, although portions of the site are located north of Interstate 80. The area of the Wendover mine operation is shown below. The facility, collection ditches, and evaporation systems cover approximately 91,600 acres (approximately 141 square miles). The majority of the ditch collection system is located to the south and east of the processing facilities.
A robust set of infrastructure is in place for Wendover. Natural gas, electricity, and water have historically been readily available and are expected to continue into the future. Process materials are readily available in the greater Salt Lake Area. All infrastructure for the operation is located approximately three miles east of Wendover, Utah, on old US Highway 40. Interstate 80 bisects the property. The Union Pacific Railroad runs next to the operations. The majority of personnel live and work in Wendover, Utah or West Wendover, Nevada, approximately three to six miles from the operation. The Wendover Airport is located near the operations, although most commercial flights serve the Salt Lake City Airport, which is approximately 115 miles from the operation.
We have operated the property continuously since 2004. The property exhibits the normal results of a surface salt-based operation and is in good working condition. We installed a new compaction facility in 2010, and a new product warehouse in 2012. We use monitoring wells drilled in October 2005 to evaluate brine quality in the shallow-brine aquifer.
The Wendover property is pledged as collateral for our revolving credit facility. The only other significant encumbrance is a reclamation bond of $8.9 million to cover the cost of site reclamation. There are no other significant encumbrances to the property, including current and future permitting requirements and associated timelines, permit conditions, and violations and fines. As of December 31, 2023, the net book value of our material Wendover property was $42.2 million. There are no significant factors and risks that may affect access, title, or the right or ability to perform work on the property. Wendover holds numerous environmental and other permits and governmental approvals authorizing the operations at the facility.
Leases and Permits
We own approximately 57,500 acres of the Wendover site. The BLM and the State of Utah own approximately 34,000 acres of the Wendover site, which we lease (excluding lands used for highway and utility purposes).
We hold leases from the federal government that include 25,900 acres adjoining the Wendover property to the east. Our Wendover federal leases have an indefinite term subject to readjustment of the lease stipulations, including the royalty payable to the federal government. Royalty payments equal a percentage of product sales less freight. The current royalty rate stipulated in the federal leases is three percent.
In 2023, Wendover made $0.3 million in royalty payments to the federal government.
The State of Utah owns several state land trust sections within the Wendover property site boundaries. We lease approximately 8,100 acres of property from the State of Utah under special use and mineral leases. The Wendover state leases are interspersed among our property and the Wendover federal leases. The Wendover state leases are for an indefinite term subject to readjustment of the lease stipulations, including the royalty payable to the State of Utah. Royalty payments equal a percentage of product sales less freight. The current royalty rate stipulated in our Wendover state leases is four percent. In 2023, Wendover made $0.1 million in royalty payments to the State of Utah.
History of Operations
The Bonneville area was recognized in the early 1900s as a source for potash. The original operation was known as the Salduro Works, which operated until 1918 and then closed due to a decline in potash demand. The original Salduro Works was responsible for acquiring lands on which a system of collection ditches was constructed. In the mid‐1930s, Bonneville Limited acquired more land to the west of the original property and constructed primary harvest ponds and additional infrastructure to support the mining operations. Between 1961 and 1963, various potash leases were acquired from the federal and state governments. Kaiser Aluminum & Chemical Corporation acquired Bonneville Limited in 1963. The property, including the ponds, processing operation, and lease land, was acquired by Reilly Industries, Inc. from Kaiser Aluminum & Chemical Corporation in 1988. Intrepid acquired the property from Reilly Industries, Inc. in April 2004.
Mineral Resource and Reserves Comparison to Prior Year
We engaged RESPEC, a qualified firm and independent of Intrepid, to prepare a technical report summary for our Wendover material property as of December 31, 2023 because changes in our cost of production resulted in material changes in the mineral reserves and mineral resources estimates from the revised technical report summary prepared as of December 31, 2021 for the Wendover property. The technical report summary for the Wendover material property as of December 31, 2023 is included with this Annual Report on Form 10-K.
Mineral Resource and Reserves
Overview
The ore resource model used to determine resources and reserves was created from a database of brine sampling data in 2007 and includes brine samples from the active mining horizon. The QP's most recent inspection was on May 19, 2021 and included the potash plant, evaporation ponds, wellheads, and ditches.
No traditional drilling exploration has taken place in Wendover. We monitor KCl grade from 27 wells that were drilled in October 2005. We sample these wells at least yearly to evaluate brine quality in the shallow-brine aquifer. Samples are evaluated at the on-site lab with full analysis capabilities, including X-ray fluorescence. Additional information on exploration can be found in Section 7 of the technical summary report in Exhibit 96.3 to this Annual Report.
Mineral Resource
Estimates for potash resources were based on KCl brine concentration, porosity, and aquifer thickness from historical reports and brine monitoring data. Cutoff grade assumptions are based on historic cost data sourced from operations. Product sales prices used in the cutoff grade analyses are based on historical sales and marketing results and forward-looking pricing provided by Intrepid marketing and compared to third party sources.
Resource estimates for shallow-brine aquifer were based on the difference between historic well data collected between 1965 and 1967 and current monitoring data with consideration of the cutoff grade. There has been no change in trend of KCl grade to the primary pond or in potash production with brine grade held steady at approximately 0.97% for 60 years without declining.
Resource estimates for the deep-brine aquifer were based on current deep-well draw-down, pumping rates, and historical brine concentration variations. This resource is classified as an indicated resource due to the hydrological uncertainty of the aquifer and is expected to support production for at least 25 years.
|
|
|
|
|
|
|
|
|
|
|
|
|
|
|
|
|
|
|
|
|
|
|
|
|
|
|
|
|
|
|
|
|
| Wendover—Summary of Mineral Resources in Millions of Tons of Sylvinite as of December 31, 2023. Based on $450/product ton mine site. |
|
|
Resources |
|
|
|
Processing Recovery
(%) |
|
|
K2O Brine 1
(Mt)
|
|
Grade
(%K2O)
|
|
Contained K2O2
(Mt)
|
|
Cutoff 3
(%K2O)
|
|
|
|
|
|
|
|
| Measured mineral resources |
|
— |
|
— |
|
— |
|
|
|
|
| Indicated mineral resources |
|
175 |
|
0.5 |
|
0.9 |
|
0.23 |
|
85 |
| Measured + Indicated mineral resources |
|
175 |
|
0.5 |
|
0.9 |
|
0.23 |
|
|
| Inferred mineral resources |
|
1,358 |
|
0.5 |
|
6.8 |
|
0.23 |
|
85 |
| Wendover—Summary of Mineral Resources in Millions of Tons of Sylvinite as of December 31, 2022. Based on $406/product ton mine site. |
|
|
Resources |
|
|
|
Processing Recovery
(%) |
|
|
K2O Brine 1
(Mt)
|
|
Grade
(%K2O)
|
|
Contained K2O2
(Mt)
|
|
Cutoff 3
(%K2O)
|
|
|
|
|
|
|
|
| Measured mineral resources |
|
— |
|
— |
|
|
|
|
|
|
| Indicated mineral resources |
|
250 |
|
0.5 |
|
1.2 |
|
0.19 |
|
85 |
| Measured + Indicated mineral resources |
|
250 |
|
0.5 |
|
1.2 |
|
0.19 |
|
|
| Inferred mineral resources |
|
1,360 |
|
0.5 |
|
6.8 |
|
0.19 |
|
85 |
1 K2O Brine is the recovered KCl bearing brine in solution at average concentrations by weight. |
2 Contained K2O is calculated by multiplying K2O Brine by the Grade. |
3 Solution mining resource cutoff is the grade at which production covers operating costs. |
| Mineral Resources were prepared RESPEC, a qualified firm for the estimate and independent of Intrepid. |
| Mineral Resources are reported exclusive of Mineral Reserves. |
Mineral Resources are reported using Inverse Distance Squared (ID2) estimation methods. |
Mt = million tons, % = percent, K2O = potassium oxide, ft = feet |
Additional information regarding the methodology and key assumptions used to calculate the Wendover mineral resource can be found in Section 11 of the technical report summary in Exhibit 96.3 to this Annual Report.
Mineral Reserve
Key assumptions for the mineral reserve estimates include KCl grade, thickness, geometry, and hydrogeological properties of the aquifer, presence of geologic anomalies that distort the aquifer, impurities that impact solubility or the surface concentration, separation, crystallization, or packaging process, and the cost of goods sold and estimated final price of the product. Due to its history of operations, infrastructure is mature and the processing and cost factors are well understood. Recovery estimates are based on past, current, and anticipated future performance and supported by laboratory or metallurgical testing of the plant feed.
|
|
|
|
|
|
|
|
|
|
|
|
|
|
|
|
|
|
|
|
|
|
|
|
|
|
|
|
|
|
|
|
|
| Wendover—Summary of Potash Mineral Reserves effective December 31, 2023. Based on $360/product ton mine site. |
|
|
Brine 1
(Mt)
|
|
In Situ Grade 2 (%K2O) |
|
Product 3
(Mt)
|
|
Cutoff 4
(%K2O)
|
|
Processing Recovery (%) |
|
|
|
|
|
|
|
|
|
|
|
|
| Proven Mineral Reserves |
|
|
|
|
|
|
|
|
|
|
| Probable Mineral Reserves |
|
832 |
|
0.5 |
|
1.7 |
|
0.3 |
|
85 |
| Total Mineral Reserves |
|
832 |
|
0.5 |
|
1.7 |
|
0.3 |
|
|
|
|
|
|
|
|
|
|
|
|
|
| Wendover—Summary of Potash Mineral Reserves effective December 31, 2022. Based on $325/product ton mine site. |
|
|
Brine 1
(Mt)
|
|
In Situ Grade 2 (%K2O) |
|
Product 3
(Mt)
|
|
Cutoff 4
(%K2O)
|
|
Processing Recovery (%) |
|
|
|
|
|
|
|
|
|
|
|
|
| Proven Mineral Reserves |
|
|
|
|
|
|
|
|
|
|
| Probable Mineral Reserves |
|
820 |
|
0.5 |
|
1.7 |
|
0.3 |
|
85 |
| Total Mineral Reserves |
|
820 |
|
0.5 |
|
1.7 |
|
0.3 |
|
|
1 Brine advanced through the pond system. |
2 In-situ grade is the amount of K2O contained in the brine. |
3 Potash Product tons are calculated by multiplying Brine by: the In-Situ Grade divided by 63.17% K2O/KCl conversion factor, an overall pond recovery factor of 30%, processing recovery of 85%, a handling loss factor of 97%, and a product purity factor of 105%. |
4 Solution mining reserve cutoff is the grade at which production covers operating costs. |
| Mineral Reserves were prepared RESPEC, a qualified firm for the estimate and independent of Intrepid. |
| Mineral Reserves are reported exclusive of Mineral Resources, on a 100% basis |
Mineral Reserves are reported using Inverse Distance Squared (ID2) estimation methods. |
| Mt = million tons, % = percent, K2O = potassium oxide, ft = feet |
Additional information regarding the methodology and key assumptions used to calculate the Wendover mineral reserve can be found in Section 12 of the technical report summary in Exhibit 96.3 to this Annual Report.
Internal Controls
Our Wendover operations have internal quality assurance and quality control procedures for sample collection. Monitoring wells are sampled at least yearly to evaluate brine quality in the shallow-brine aquifer. During the evaporation season, we collect daily brine samples at brine advancement points. We sample brackish ponds and transfer pumps weekly. We evaluate samples at an on-site lab with full analysis capabilities, including X-ray fluorescence.
Production
Our facilities have a current estimated annual productive capacity of approximately 365,000 tons of potash, and approximately 400,000 tons of langbeinite, based on current designs. Our annual production rates are less than our estimated productive capacity. Actual production is affected by operating rates, the grade of ore mined, recoveries, mining rates, evaporation rates, product pricing, and the amount of development work that we perform. Therefore, as with other producers in our industry, our production results tend to be lower than reported productive capacity.
Our production capabilities and capital improvements at our facilities are described in more detail below, along with our historical production of our primary products and byproducts for the years ended December 31, 2023, 2022, and 2021.
Solution Mines
•Potash ore at HB is mined from idled original mine workings in the Carlsbad, New Mexico, area.
•The HB mine has a current estimated productive capacity of 180,000 tons annually. Potash produced from our HB mine is shipped by truck to the North facility for compaction.
•Potash ore at the Moab facility is mined from two stacked ore zones: the original mine workings in Potash 5 and the horizontal caverns in Potash 9.
•The Moab mine has a current estimated productive capacity of approximately 110,000 tons of potash annually.
•Potash at Wendover facility is produced primarily from brine containing salt, potash, and magnesium chloride that is collected in ditches from the shallow aquifers of the West Desert. These materials are also collected from a deeper aquifer by means of deep-brine wells.
•The Wendover facility has a current estimated productive capacity of approximately 75,000 tons of potash annually.
Conventional Underground Mines
•Sylvite and langbeinite ore at our Carlsbad locations occurs in a stacked ore body containing at least 10 different mineralized zones, seven of which contain proven and probable reserves.
•The East mine has a current estimated productive capacity of approximately 400,000 tons of Trio® annually, based on current design. The East mine was converted to a Trio®-only operation in April 2016 and potash is no longer produced from the East mine.
•The West mine was idled in July 2016 and placed in care-and-maintenance mode. When operational, it has an estimated productive capacity of approximately 400,000 tons of red potash annually.
Compaction Facility
•The North facility receives compactor feed from the HB mine via truck and converts the compactor feed to finished granular-sized product and standard-sized product.
Our Development Assets
We have development opportunities in our New Mexico facilities with the acceleration of production from our reserves and mineralized deposits of potash, and the potential construction of additional production facilities in the region. We also own the leases on two idled mines near Carlsbad: the AMAX/Horizon mine and the North mine.
AMAX/Horizon Mine
•We acquired the potash leases associated with the AMAX/Horizon mine in October 2012. The AMAX/Horizon mine was in continuous operation between 1952 and 1993. This mine, similar to the HB mine, may be a viable candidate for solution mining similar to our HB mine.
•We obtained state and federal permits in 2015 to utilize these leases for solution mining. These permits may need to be updated if we decide to operate this facility. We expect to utilize the HB evaporation ponds and processing mill for the AMAX/Horizon mine. We have not yet made a decision to proceed with this potential development project; however, we may perform future work to determine if this idled underground mine is a viable solution mining opportunity.
North Mine
•The North mine operated from 1957 to 1982 when it was idled mainly due to low potash prices and mineralogy changes which negatively impacted mineral processing at the facilities. Although the mining and processing equipment has been removed, the mine shafts remain open. The compaction facility at the North mine is where we granulate, store, and ship potash produced from the HB mine. Two abandoned mine shafts, rail access, storage facilities, water rights, utilities and leases covering potash deposits, are already in place. As part of our long-term mine planning efforts, we may choose to evaluate our strategic development options with respect to the shafts at the North mine and their access to mineralized deposits of potash.
Our Production of Potash and Trio®
One product ton of potash contains approximately 0.60 tons of K2O when produced at our Moab and Wendover facilities and approximately 0.60 or 0.62 tons of K2O when produced at our HB facility. One product ton of langbeinite produced at our East facility contains approximately 0.22 tons of K2O. The following table summarizes production of our primary products at each of our facilities for each of the years ended December 31, 2023, 2022, and 2021:
|
|
|
|
|
|
|
|
|
|
|
|
|
|
|
|
|
|
|
|
|
|
|
|
|
|
|
|
|
|
|
|
|
|
|
|
|
|
|
|
|
|
|
|
|
|
|
|
|
|
|
|
|
|
|
|
|
| (tons in thousands) |
|
Year Ended December 31, |
|
|
2023 |
|
2022 |
|
2021 |
|
|
Ore Production |
|
Mill Feed Grade1 |
|
Finished Product |
|
Ore Production |
|
Mill Feed Grade1 |
|
Finished Product |
|
Ore Production |
|
Mill Feed Grade1 |
|
Finished Product |
| Potash |
|
|
|
|
|
|
|
|
|
|
|
|
|
|
|
|
|
|
|
|
|
|
|
|
|
|
|
|
|
|
|
|
|
|
|
|
|
|
|
|
|
|
|
|
|
|
|
|
|
|
|
|
|
|
|
|
| HB |
|
717 |
|
11.3% |
|
90 |
|
672 |
|
13.7% |
|
114 |
|
746 |
|
13.6% |
|
117 |
| Moab |
|
429 |
|
17.2% |
|
95 |
|
504 |
|
16.9% |
|
105 |
|
648 |
|
15.0% |
|
118 |
| Wendover |
|
247 |
|
12.5% |
|
39 |
|
296 |
|
13.6% |
|
51 |
|
338 |
|
13.3% |
|
52 |
|
|
1,393 |
|
|
|
224 |
|
1,472 |
|
|
|
270 |
|
1,732 |
|
|
|
287 |
| Langbeinite |
|
|
|
|
|
|
|
|
|
|
|
|
|
|
|
|
|
|
| East |
|
1,285 |
|
7.3% |
|
216 |
|
1,348 |
|
7.8% |
|
226 |
|
1,057 |
|
8.6% |
|
228 |
| Total Primary Products |
|
|
|
440 |
|
|
|
|
|
496 |
|
|
|
|
|
515 |
1 Mill feed grade shown is as percent of K2O. Mill feed grade is a measurement of the amount of mineral contained in an ore as a percentage of the total weight of the ore. For potash it is often represented as a percent of potassium oxide (K2O) or percent potassium chloride (KCl).
Water and Byproduct Production
We have permitted, licensed, declared and partially adjudicated water rights in New Mexico under which we sell water primarily to support oil and gas operations and developments in the Permian Basin near our Carlsbad facilities. During the extraction of potash and Trio®, we recover marketable salt, magnesium chloride, water, and brine containing salt and potassium from our mining processes. Our salt is used in a variety of markets including animal feed, industrial applications, pool salt, and the treatment of roads and walkways for ice melting or to manage road conditions. Magnesium chloride is typically used as a road treatment agent for both deicing and dedusting. Our brines are used primarily by the oil and gas industry to support well development and completion activities.
ITEM 3.LEGAL PROCEEDINGS
ITEM 4.MINE SAFETY DISCLOSURES
We are committed to providing a safe and healthy work environment. The objectives of our safety programs are to eliminate workplace accidents and incidents, preserve employee health, and comply with all safety- and health-based laws. In order to achieve these objectives, we train employees on safe work practices; establish, follow, and improve safety standards; involve employees in safety processes; openly communicate safety matters with employees; and record, report, and investigate accidents, incidents, and losses to help avoid recurrence. As part of our ongoing safety programs, we collaborate with MSHA and the New Mexico Bureau of Mine Safety to identify and implement accident prevention techniques and practices.
Our East, West, and North facilities in New Mexico are subject to regulation by MSHA under the Federal Mine Safety and Health Act of 1977 and the New Mexico Bureau of Mine Safety. MSHA inspects these facilities on a regular basis and issues various citations and orders when it believes a violation has occurred under federal law. Our Utah and HB facilities are subject to regulation by OSHA and, therefore, are not required to be included in the information provided in Exhibit 95.1.
PART II
ITEM 5.MARKET FOR REGISTRANT'S COMMON EQUITY, RELATED STOCKHOLDER MATTERS AND ISSUER PURCHASES OF EQUITY SECURITIES
Market Information
Our common stock is traded on the NYSE under the symbol "IPI". As of February 29, 2024, we had 77 record holders of our common stock based upon information provided by our transfer agent.
Performance Graph—Comparison of Cumulative Return
The graph below compares the cumulative total stockholder return on our common stock with the cumulative total stockholder return on the S&P 500 Index, the Dow Jones U.S. Basic Materials Index, and a peer group for the period beginning on December 31, 2018, through December 31, 2023, assuming an initial investment of $100 and the reinvestment of dividends. The peer group consisted of The Mosaic Company, Compass Minerals International, Inc., and Nutrien Ltd.
|
|
|
|
|
|
|
|
|
|
|
|
|
|
|
|
|
|
|
|
|
|
|
|
|
IPI |
|
Peer Group |
|
S&P 500 |
|
Dow Jones U.S. Basic Materials |
| December 31, 2018 |
$ |
100.00 |
|
|
$ |
100.00 |
|
|
$ |
100.00 |
|
|
$ |
100.00 |
|
| December 31, 2019 |
$ |
104.23 |
|
|
$ |
97.93 |
|
|
$ |
131.47 |
|
|
$ |
119.76 |
|
| December 31, 2020 |
$ |
92.88 |
|
|
$ |
103.82 |
|
|
$ |
155.65 |
|
|
$ |
141.70 |
|
| December 31, 2021 |
$ |
164.35 |
|
|
$ |
166.39 |
|
|
$ |
200.29 |
|
|
$ |
181.07 |
|
| December 31, 2022 |
$ |
111.04 |
|
|
$ |
170.01 |
|
|
$ |
163.98 |
|
|
$ |
167.35 |
|
| December 31, 2023 |
$ |
91.88 |
|
|
$ |
136.87 |
|
|
$ |
207.04 |
|
|
$ |
185.77 |
|
Dividends
We currently intend to retain earnings to reinvest for future operations and growth of our business and do not anticipate paying any cash dividends on our common stock. However, our Board of Directors, in its discretion, may decide to declare a dividend at an appropriate time in the future, subject to the terms of our revolving credit agreement. A decision to pay a dividend would depend upon, among other factors, our results of operations, financial condition, and cash requirements and the terms of our revolving credit agreement at the time a payment is considered.
Purchases of Equity Securities by the Issuer
|
|
|
|
|
|
|
|
|
|
|
|
|
|
|
|
|
|
|
|
|
|
|
|
|
|
|
| Issuer Purchases of Equity Securities |
| Period |
|
(a)
Total Number of Shares Purchased1 |
|
(b)
Average Price Paid Per Share |
|
(c)
Total Number of Shares Purchased as Part of Publicly Announced Plans or Programs |
|
(d)
Maximum Number (or Approximate Dollar Value) of Shares that May Yet Be Purchased Under the Plan or Programs2
|
| October 1, 2023, through October 31, 2023 |
|
— |
|
$— |
|
— |
|
$12,987,860 |
| November 1, 2023, through November 30, 2023 |
|
— |
|
$— |
|
— |
|
$12,987,860 |
| December 1, 2023, through December 31, 2023 |
|
7,472 |
|
$23.33 |
|
— |
|
$12,987,860 |
| Total |
|
7,472 |
|
$23.33 |
|
— |
|
$12,987,860 |
1 Represents shares of common stock we withheld as a payment of withholding taxes due upon vesting of restricted stock held by our employees.
2 Represents the dollar value of remaining availability under the $35 million share repurchase program approved by the Board of Directors in February 2022. Under the share repurchase program, we may repurchase shares from time to time in the open market or in privately negotiated transactions. The timing, volume and nature of share repurchases, if any, will be at our sole discretion and will be dependent on market conditions, liquidity, applicable securities laws, and other factors. We may suspend or discontinue the share repurchase program at any time. During 2023, we did not purchase any shares under the share repurchase program.
ITEM 6.RESERVED
ITEM 7.MANAGEMENT'S DISCUSSION AND ANALYSIS OF FINANCIAL CONDITION
AND RESULTS OF OPERATIONS
This Management's Discussion and Analysis should be read in conjunction with the accompanying consolidated financial statements and related notes contained in "Item 8. Financial Statements and Supplemental Data" of this Annual Report.
This Management's Discussion and Analysis contains forward‑looking statements that involve risks, uncertainties, and assumptions as described under the heading "Cautionary Note Regarding Forward‑Looking Statements," in Part I of this Annual Report. Our actual results could differ materially from those anticipated by these forward‑looking statements as a result of many factors, including those discussed under "Item 1A. Risk Factors" and elsewhere in this Annual Report.
A discussion of the changes in our results of operations between the years ended December 31, 2022 and December 31, 2021 has been omitted from this Annual Report on Form 10-K but may be found in Item 7. Management's Discussion and Analysis of Financial Condition and Results of Operations of our Annual Report on Form 10-K for the year ended December 31, 2022, filed with the SEC on March 7, 2023, which is available free of charge on the SEC's website at www.sec.gov and our corporate website (www.intrepidpotash.com).
Overview
We are a diversified mineral company that delivers potassium, magnesium, sulfur, salt, and water products essential for customer success in agriculture, animal feed and the oil and gas industry. We are the only U.S. producer of muriate of potash (sometimes referred to as potassium chloride or potash), which is applied as an essential nutrient for healthy crop development, utilized in several industrial applications, and used as an ingredient in animal feed. In addition, we produce a specialty fertilizer, Trio®, which delivers three key nutrients, potassium, magnesium, and sulfur, in a single particle. We also provide water, magnesium chloride, brine and various oilfield products and services.
Our extraction and production operations are conducted entirely in the continental United States. We produce potash from three solution mining facilities: our HB solution mine in Carlsbad, New Mexico, our solution mine in Moab, Utah and our brine recovery mine in Wendover, Utah. We also operate our North compaction facility in Carlsbad, New Mexico, which compacts and granulates product from the HB mine. We produce Trio® from our conventional underground East mine in Carlsbad, New Mexico. Until mid-2016, we also produced potash from our East and West mines in Carlsbad, New Mexico.
We have permitted, licensed, declared and partially adjudicated water rights in New Mexico. We sell a portion of water from these water rights to support oil and gas operations and development in the Permian Basin. We continually work to expand our sales of water.
In May 2019, we acquired certain land, water rights, federal and state grazing leases for cattle, and other related assets from Dinwiddie Cattle Company. We refer to these assets and operations as "Intrepid South." Due to the strategic location of Intrepid South, part of our long-term operating strategy is selling small parcels of land to other companies, where such sales provide a solution to a company's need.
We have three segments: potash, Trio®, and oilfield solutions. We account for the sale of byproducts as revenue in the potash or Trio® segment based on which segment generated the byproduct. For each of the years ended December 31, 2023, 2022, and 2021, a majority of our byproduct sales were accounted for in the potash segment.
Significant Business Trends and Activities
Our financial results have been, or are expected to be, impacted by several significant trends and activities, including impacts from global health issues, such as the COVID-19 pandemic, and other global disruptions. Given the dynamic nature of such disruptions, we cannot reasonably estimate the impacts of such disruptions, if any, on our financial condition, results of operations, liquidity or cash flows in the future. We expect that any such disruptions may have a material effect on revenue growth, financial condition, liquidity, and overall profitability in future reporting periods. Please see further discussion under "Item 1A. Risk Factors."
We expect that the trends described below may continue to impact our results of operations, cash flows, and financial position.
•Potash pricing and demand. In 2023, potash remained a significant driver of our profitability, comprising 47% of our total sales. Our average net realized sales price for potash decreased in 2023 to $466 per ton compared to $713 per ton for 2022. Agricultural pricing peaked at $800 per ton in April 2022 as a result of sanctions on Belarusian potash and concerns about global potash supply due to Russia's invasion of Ukraine. Prices started to decrease in the fall of 2022 as global potash production rates improved. Agricultural potash pricing was $480 per ton at the beginning of 2023 and decreased from there. Despite the declining potash price, demand remained strong throughout 2023 with two good application seasons in the spring and fall supported by above average commodity prices. In January 2024, a winter-fill agricultural potash program was announced decreasing the list price to $385 per ton in January 2024 during a ten-day order window, before the list price increased by $30 per ton. We saw a good response to the program and expect distributors will continue to layer in tons as the 2024 spring season continues, with most distributors targeting minimal carryover inventory to end the spring. We expect to realize the increased price after the order window on certain spot sales in the first quarter of 2024. Our price expectations could be affected by, among other things, weather, planting decisions, rail car availability, commodity price decreases and the price and availability of other potassium products. As a smaller producer relative to the overall market, domestic pricing of our potash is influenced principally by the price established by our competitors. The interaction of global potash supply and demand, ocean, land, and barge freight rates, currency fluctuations, and crop commodity values and outlook, also influence pricing.
•Trio® pricing and demand. Our average net realized sales price for Trio® decreased to $321 per ton in 2023, compared to $479 per ton in 2022, as Trio® price generally followed price decreases in potash. After the January 2024 price announcement for potash, we maintained our posted Trio® price of $330 per ton for premium Trio®, $320 per ton for granular and $290 per ton for standard Trio®, which is approximately $75 per ton below the price levels in January 2023. We've seen good subscription for the 2024 spring season and similar to past years we expect distributors to target minimal carryover inventory into summer. Our ability to realize the increased prices may be affected by, among other things, weather, planting decisions, rail car availability, commodity price decreases, and the price and availability of other potassium products.
Overall average net realized sales price per ton for Trio® will continue to be impacted by the percentage of international sales, particularly to offshore markets. Competition from lower cost alternatives and freight costs continue to negatively impact our average net realized sales price per ton to offshore markets. We plan to continue a price-over-volume strategy internationally by focusing on those international markets where we obtain the highest average net realized sales price per ton and thus the highest margin.
We experience seasonality in domestic Trio® demand, with more purchases coming in the first and second quarters in advance of the spring application season in the U.S. In turn, we generally have increased inventory levels in the third and fourth quarters in anticipation of expected demand for the following year. We continue to operate our facilities at reduced production levels that approximate expected demand and allow us to manage inventory levels.
•Water sales. Water sales decreased in 2023 to $15.2 million, compared to $22.4 million in 2022. The decrease is attributable to fewer fracs on our South Ranch and more fresh water used at our HB facility to improve injection rates while we complete the second phase of our new HB injection pipeline. In addition to fewer fracs on our South Ranch in 2023, we purchased less water for resale resulting in fewer sales but also a corresponding decrease in costs. In 2023, we purchased $1.4 million of water for resale compared to $6.4 million in 2022. We continue to see certain operators switch to using exclusively recycled water or a combination of fresh water and recycled water when completing wells. We believe this change is due to the growing focus on water conservation efforts, environmentally responsible operations and the large amounts of produced water that is present in certain basins and formations, such as the Delaware Basin in southeast New Mexico. By recycling and reusing produced water, operators are able to reduce freshwater purchases and decrease the cost of transporting and disposing of produced water into disposal wells.
An update to legal proceedings concerning our water rights is contained in Note 14 to our audited consolidated financial statements included in "Item 8. Financial Statements and Supplementary Data" of this Annual Report.
•Byproduct sales. Byproduct sales increased to $30.6 million in 2023 compared to $26.7 million in 2022, driven primarily by a $1.7 million increase in magnesium chloride sales at our Wendover facility due to increased pricing. Byproduct brine sales into oil and gas markets in southeast New Mexico increased $0.9 million during 2023 as we successfully implemented multiple per-barrel price increases in 2023 while continuing to grow sales volumes. Byproduct water and salt sales both increased $0.7 million compared to the prior year.
•Strategic Focus on our Solar Solution Mining Facilities. Key current and future projects include:
◦We successfully commissioned the Eddy Shaft Brine Extraction Project in October 2023 at our HB Solar Solution Mine. This project targets a significant, high-grade brine pool in the Eddy Cavern that is estimated to contain approximately 270 million gallons of brine at an expected grade of over 9% potassium chloride (“KCl”). Access to this brine pool immediately increases the brine available to our pond system and we expect to see incremental production contributions starting in the second half of 2024.
◦We continue to work through the permitting and contracting processes for the replacement extraction well at our HB Solar Solution Mine and expect the well will be commissioned in the second quarter of 2024. This new extraction well is designed to have a long-term operational life and will initially target approximately 330 million gallons of high-grade brine from the Eddy Cavern at HB, with this additional brine being at lower depths than the Eddy Shaft project can access.
◦Phase Two of the HB Injection Pipeline Project is the installation of an in-line pigging system to clean the pipeline and remove scaling to help ensure more consistent flow rates. We continue to work through the permitting requirements with commissioning expected in the first half of 2024, assuming we have no further delays in permitting. Upon Phase 2 commissioning, we expect our brine injection rates to be the highest in company history, which is key for maximizing brine availability and residence time.
◦We started construction on a new primary pond in Wendover to increase the brine evaporative area, which will result in two primary ponds when complete. Similar to our caverns at Moab and HB, the primary ponds at Wendover serve as the brine storage area, and adding another primary pond will help us meet our goals of maximizing brine availability, increasing our brine grade, and improving our production. We expect this project to be commissioned in the third quarter of 2024.
•Diversification of products and services. Our revenue from brine and other oilfield products and services recorded in our oilfield solutions segment increased by $0.6 million in 2023, compared to 2022, mainly driven by an increase in brine sales at Intrepid South. Brine sales from our HB facility are recorded as byproduct revenue in our potash segment. Our total brine sales and byproduct brine sales were $8.3 million during 2023, compared to $6.1 million during 2022.
We continue to progress on a sand mine opportunity at Intrepid South and have received all necessary permits to begin construction and full operation. We are currently evaluating the market and our options, including the potential to add a strategic partner.
Consolidated Results
|
|
|
|
|
|
|
|
|
|
|
|
|
|
|
|
|
| (in thousands) |
|
Year Ended December 31, |
|
|
2023 |
|
2022 |
|
|
Sales1 |
|
$ |
279,083 |
|
|
$ |
337,568 |
|
|
|
|
|
|
|
|
|
|
| Cost of Goods Sold |
|
$ |
187,278 |
|
|
$ |
152,276 |
|
|
|
|
|
|
|
|
|
|
| Gross Margin |
|
$ |
36,846 |
|
|
$ |
141,408 |
|
|
|
|
|
|
|
|
|
|
| (Loss) Income Before Income Taxes |
|
(44,062) |
|
|
96,509 |
|
|
|
| Income Tax Benefit (Expense) |
|
8,389 |
|
|
(24,289) |
|
|
|
| Net (Loss) Income |
|
$ |
(35,673) |
|
|
$ |
72,220 |
|
|
|
|
|
|
|
|
|
|
Average Net Realized Sales Price per Ton2 |
|
|
|
|
|
|
| Potash |
|
$ |
466 |
|
|
$ |
713 |
|
|
|
Trio® |
|
$ |
321 |
|
|
$ |
479 |
|
|
|
1Sales include sales of byproducts which were $30.6 million and $26.7 million for the years ended December 31, 2023 and 2022, respectively.
2Average net realized sales price per ton is a non-GAAP measure. More information about this non-GAAP measure is below under the heading "Non-GAAP Financial Measure."
Consolidated Results for the Years Ended December 31, 2023, and 2022
Sales
Our total sales decreased $58.5 million, or 17% in 2023, compared to 2022, as potash segment sales decreased $35.5 million, Trio® segment sales decreased $15.6 million, and our oilfield solutions segment sales decreased $7.4 million.
Our total potash segment sales decreased $35.5 million during 2023, compared to 2022, driven by a decrease of $37.4 million in potash sales. Our potash sales decreased as our potash average net realized sales price per ton decreased 35%, partially offset by a 16% increase in tons of potash sold. Generally strong crop prices supported good potash demand during 2023. Potash prices peaked during the second quarter of 2022 and have steadily declined in each succeeding quarter as global production rates and product availability improved. The decrease in potash sales during 2023 was partially offset by an increase of $1.9 million in potash segment byproduct sales. The increase in potash segment byproduct sales was due to increased byproduct magnesium chloride sales and increased byproduct brine sales. Our byproduct magnesium chloride sales increased as we realized higher prices during 2023, compared to 2022. Our byproduct brine sales increased due to continuing strong oil and gas activities near our facilities in New Mexico during 2023.
Our total Trio® segment sales decreased by $15.6 million during 2023, compared to 2022, driven by a decrease of $17.6 million in Trio® sales. Our Trio® average net realized sales price per ton decreased 33% during 2023, partially offset by a 16% increase in tons of Trio® sold. Similar to potash, Trio® prices have declined in each succeeding quarter after peaking during the second quarter of 2022. Generally strong crop prices and lower Trio® prices drove good demand for Trio®. The decrease in Trio® sales was partially offset by an increase of $2.0 million in Trio® segment byproduct sales during 2023, as our Trio® byproduct water sales increased as a larger portion of our total water sales was byproduct water used in our Trio® production process.
Our oilfield solutions segment sales decreased by $7.4 million in 2023, compared to 2022, mainly driven by a decrease of $7.9 million in water sales during 2023. Water sales decreased as we purchased $5.0 million less in third-party water for resale in 2023, compared to 2022, and we used more water at our HB facility to improve injection rates while we complete the second phase of our new HB injection pipeline.
Cost of Goods Sold
Our total cost of goods sold increased $35.0 million, or 23%, in 2023, compared to 2022. Our potash segment cost of goods increased $20.9 million, or 27%, and our Trio® segment cost of goods sold increased $19.7 million, or 36%, partially offset by a decrease of $5.6 million, or 27%, in our oilfield solutions segment cost of goods sold.
Our potash segment cost of goods sold mainly increased due to selling 16% more tons of potash in 2023, compared to 2022. In addition to selling more tons of potash in 2023, our weighted average carrying cost per ton increased as production labor costs, including contract labor and benefits, increased in 2023. We also produced fewer tons of potash during 2023 compared to 2022 and, because most of our production costs are fixed, a decrease in tons produced causes our weighted average price per ton to increase.
Our Trio® segment cost of goods sold increased in 2023 compared to 2022 as we sold 16% more tons of Trio® in 2023, and our weighted average carrying costs increased as we incurred more production labor expenses and produced fewer tons compared to the prior year.
Our oilfield solutions segment cost of goods sold decreased in 2023, as we purchased $5.0 million less in third-party water for resale in 2023, compared to 2022.
Lower of Cost or Net Realizable Value Inventory Adjustments
During 2023, we recorded lower of cost or net realizable value inventory adjustments of $6.5 million as our weighted average carrying costs for certain potash and Trio® products exceeded our expected selling price for those products. As discussed above, our average net realized sales price per ton for potash and Trio® declined during 2023, and our weighted average carrying costs for potash and Trio® increased during 2023. We did not record any lower of cost or net realizable value inventory adjustments during 2022.
Gross Margin
Our gross margin percentage decreased to 13% in 2023, compared to 42% in 2022. The decrease was driven primarily by a decrease in sales revenue due to decreases in our average net realized sales price per ton for both potash and Trio®, increases in both potash and Trio® cost of goods sold, and recording lower of cost or net realizable value inventory adjustments during 2023.
Selling and Administrative Expense
In 2023, selling and administrative expenses increased $0.6 million or 2% from 2023. The increase in 2023 was due mainly to increases in labor and benefits expense as a result of salary increases given to employees in April 2023.
Impairment of Long-Lived Assets
During the year ended December 31, 2023, we recorded total impairment charges of $43.3 million. During the year ended December 31, 2022, we recorded no impairment charges.
In the fourth quarter of 2023, given the decrease in our gross margin for our Trio® segment we determined that sufficient indicators of potential impairment of our Trio® segment long-lived assets existed. We performed a recoverability test and determined that the carrying value of our Trio® segment long-lived assets was not recoverable. We engaged a third-party valuation firm to determine the fair value of our Trio® segment assets. The fair value of our Trio® segment assets was primarily determined using the expected proceeds received in an orderly sale of the individual assets. The carrying value of our Trio® segment asset group exceeded its fair value, and we recorded an impairment charge of $31.9 million.
Our long-lived assets at our West facility have been in care and maintenance since July 2016. Given the length of time since the assets were placed in care and maintenance, we engaged a third-party valuation firm to determine if the fair value of the West assets supports the carrying value of those assets. The fair value of the West assets was determined using the expected proceeds received in an orderly sale of the individual assets. The carrying value of the West assets exceeded the fair value of those assets, and we recorded an impairment charge of $9.9 million during the fourth quarter of 2023.
Finally, during 2023, we recorded impairment charges of $1.5 million related to certain assets in our Oilfield Solutions Segment, specifically certain water recycling equipment and an investment in a non-operating interest in an oil and gas investment.
Loss on Sale or Disposal of Assets
During 2023, we recorded a $0.8 million loss on the sale or disposal of assets in the normal course of business, compared to a loss of $7.5 million during 2022. During the fourth quarter of 2022, we worked on drilling a new extraction well for our HB solar solution mine. During the drilling process, the planned well failed and we expensed approximately $6.2 million of costs related to the project.
In addition, we also incurred approximately $1.2 million in losses related to the disposal of various other assets in the normal course of business.
Other Operating Expense
In 2023, we recognized other operating expense of $2.2 million compared to $4.7 million in 2022. During 2023, we recorded an additional $1.0 million for fines and penalties related to a trespass on federal surface minerals at Intrepid South. We settled this trespass issue with the BLM during 2023, and the matter is now closed. We also recorded $0.5 million of additions in our allowance for obsolete inventory, $0.5 million in care and maintenance expenses and we accrued $0.4 million related to a potential violation of one of our environmental permits.
During 2022, we recorded $1.8 million of additions in our allowance for obsolete inventory, accrued $1.7 million for fines and penalties related to a trespass on federal surface minerals at Intrepid South, $1.6 million related to potential underpayment of royalties found during an ongoing royalty audit by the Department of the Interior's Office of Natural Resources Revenue ("ONRR") and care and maintenance expenses of $0.6 million.
Income Tax
During 2023 we recorded income tax benefit of $8.4 million compared to an income tax expense of $24.3 million in 2022. During 2023, we recorded a $1.1 million valuation allowance against certain state net operating loss carryforwards due to a change in the forecast of the amount of the loss carryforwards that may be used before expiration.
Net Income
Our 2023 net income decreased $107.9 million to a net loss of $35.7 million. The decrease was primarily due to the decreased gross margins in our potash and Trio® segments and the impairment expense recorded in 2023.
Potash Segment Results
|
|
|
|
|
|
|
|
|
|
|
|
|
|
|
|
|
|
|
Year Ended December 31, |
| (in thousands) |
|
2023 |
|
2022 |
|
|
Sales1 |
|
$ |
155,920 |
|
|
$ |
191,378 |
|
|
|
| Less: Freight costs |
|
14,753 |
|
|
14,780 |
|
|
|
| Warehousing and handling costs |
|
5,957 |
|
|
5,305 |
|
|
|
| Cost of goods sold |
|
97,452 |
|
|
76,524 |
|
|
|
| Lower of cost or NRV inventory adjustments |
|
2,709 |
|
|
— |
|
|
|
|
|
|
|
|
|
|
| Gross Margin |
|
$ |
35,049 |
|
|
$ |
94,769 |
|
|
|
Depreciation, Depletion, and Amortization Incurred2 |
|
$ |
28,378 |
|
|
$ |
26,572 |
|
|
|
| Potash Sales Volumes (tons in thousands) |
|
258 |
|
|
222 |
|
|
|
| Potash Production Volumes (tons in thousands) |
|
224 |
|
|
270 |
|
|
|
Average Potash Net Realized Sales Price per Ton3 |
|
$ |
466 |
|
|
$ |
713 |
|
|
|
1Potash segment sales include byproduct sales which were $24.7 million and $22.8 million for the years ended December 31, 2023, and 2022, respectively.
2Depreciation, depletion, and amortization incurred excludes depreciation, depletion, and amortization amounts absorbed in or (relieved from) inventory.
3Average net realized sales price per ton is a non-GAAP measure. More information about this non-GAAP measure is below under the heading "Non-GAAP Financial Measure."
Potash Segment Results for the Years Ended December 31, 2023, and 2022
Our total potash segment sales in 2023 decreased $35.5 million, or 19%, compared to 2022, as potash sales recorded in the potash segment decreased 22%, partially offset by an 8% increase in potash segment byproduct sales.
Potash sales recorded in the potash segment decreased $37.4 million, or 22%, in 2023 compared to 2022, as our potash average net realized sales price per ton decreased 35%, partially offset by a 16% increase in potash tons sold. Potash prices peaked during the second quarter of 2022 and steadily declined in each succeeding quarter as global production rates and product availability improved.
Our potash tons sold increased in 2023, as supporting farm commodity prices and lower potash prices continued to drive solid demand.
Potash segment byproduct sales increased $1.9 million, or 8%, in 2023 compared to 2022, due to a $1.7 million increase in byproduct magnesium chloride sales, a $0.9 million increase in byproduct brine sales, a $0.7 million increase in potash byproduct salt sales, partially offset by a decrease of $1.3 million in potash byproduct water sales. Our byproduct magnesium chloride sales increased as we realized higher prices during 2023, compared to 2022. Our byproduct brine sales increased due to continuing strong oil and gas activities near our facilities in New Mexico during 2023. Our byproduct salt sales increased due to strong demand from feed and industrial salt customers and higher realized pricing during 2023. Our potash byproduct water sales decreased as we had less byproduct water to sell because we used more water at our HB facility to improve injection rates as we work to complete the second phase of our new HB injection pipeline.
Potash cost of goods sold increased $20.9 million, or 27%, in 2023, compared to 2022, mainly due to a 16% increase in potash tons sold. In addition, our weighted average carrying cost per ton increased mainly due to a 15%, or $3.8 million increase in production labor, contract labor, and benefits expenses in 2023. Our total tons of potash produced decreased 17% in 2023, compared to 2022, which also increased our per ton production costs. Because most of our production costs are fixed, decreases in tons produced result in higher per ton costs.
Potash segment freight expenses were virtually unchanged in 2023, compared to 2022, even though we sold 16% more tons of potash. Increases in potash freight expense from selling more tons of potash in 2023 were offset by a decrease in freight expense associated with our potash byproduct salt sales. Our freight expense is impacted by the rates charged by carriers, geographic distribution of our products and by the proportion of customers arranging for and paying their own freight costs.
We produced 17% fewer tons of potash during 2023 compared to 2022, due to reduced brine grades at our HB and Wendover facilities.
During 2023, we recorded $2.7 million in lower of cost or net realizable value inventory adjustments as our weighted average carry cost per ton exceeded our expected net realizable value per potash ton. As discussed above, our potash average net realized sales price per ton decreased during 2023 while our weighted average carrying cost per ton increased in 2023. We did not record any lower of cost or net realizable value inventory adjustments during 2022.
Our potash segment gross margin decreased $59.7 million in 2023, compared to 2022, due to the $35.5 million decrease in potash segment sales, increased cost of goods sold expense, and recording lower of cost or net realizable value inventory adjustments, as discussed above.
Our long-lived assets at our West facility have been in care and maintenance since July 2016. Given the length of time since the assets were placed in care and maintenance, we engaged a third-party valuation firm to determine if the fair value of the West assets supports the carrying value of those assets. The fair value of the West assets was determined using the expected proceeds received in an orderly sale of the individual assets. The carrying value of the West assets exceeded the fair value of those assets, and we recorded an impairment charge of $9.9 million during the fourth quarter of 2023.
Potash Segment - Additional Information
The table below shows our potash sales mix for 2023, and 2022.
|
|
|
|
|
|
|
|
|
|
|
|
|
|
|
|
|
|
|
Year Ended December 31, |
|
|
2023 |
|
2022 |
|
|
| Agricultural |
|
74 |
% |
|
69 |
% |
|
|
| Industrial |
|
3 |
% |
|
8 |
% |
|
|
| Feed |
|
23 |
% |
|
23 |
% |
|
|
Trio® Segment Results
|
|
|
|
|
|
|
|
|
|
|
|
|
|
|
|
|
|
|
Year Ended December 31, |
| (in thousands) |
|
2023 |
|
2022 |
|
|
Sales1 |
|
$ |
102,182 |
|
|
$ |
117,826 |
|
|
|
| Less: Freight costs |
|
23,211 |
|
|
19,661 |
|
|
|
Warehousing and handling costs |
|
4,875 |
|
|
4,442 |
|
|
|
Cost of goods sold |
|
74,308 |
|
|
54,600 |
|
|
|
Lower of cost or NRV inventory adjustments |
|
3,783 |
|
|
— |
|
|
|
|
|
|
|
|
|
|
| Gross (Deficit) Margin |
|
$ |
(3,995) |
|
|
$ |
39,123 |
|
|
|
Depreciation, Depletion, and Amortization incurred2 |
|
$ |
6,288 |
|
|
$ |
4,370 |
|
|
|
| Sales Volumes (tons in thousands) |
|
228 |
|
|
197 |
|
|
|
| Production Volumes (tons in thousands) |
|
216 |
|
|
226 |
|
|
|
Average Net Realized Sales Price per Ton3 |
|
$ |
321 |
|
|
$ |
479 |
|
|
|
1Trio® segment sales include byproduct sales which were $5.8 million and $3.9 million for the years ended December 31, 2023, and 2022, respectively.
2Depreciation, depletion, and amortization incurred excludes depreciation, depletion, and amortization amounts absorbed in or (relieved from) inventory.
3Average net realized sales price per ton is a non-GAAP measure. More information about this non-GAAP measure is below under the heading "Non-GAAP Financial Measure."
Trio® Segment Results for the Years Ended December 31, 2023, and 2022
Our total Trio® segment sales decreased $15.6 million, or 13%, in 2023, as compared to 2022, as Trio® sales decreased $17.6 million, or 15%, partially offset by a $2.0 million increase, or 51%, in Trio® segment byproduct sales.
Our 2023 Trio® sales decreased $17.6 million, or 15%, in 2023, as compared to 2022, as our average net realized sales price per ton decreased 33%, partially offset by a 16% increase in Trio® tons sold. Similar to potash, Trio® prices peaked during the second quarter of 2022, and steadily declined in each succeeding quarter as global production rates and product availability of potassium fertilizers improved. Our increase in tons sold in 2023 benefited from the reduced sales volumes we experienced in the second half of 2022, as customers delayed purchases in anticipation of lower price levels combined with overall strong commodity prices throughout 2023. Our Trio® byproduct sales increased $2.0 million in 2023 due to an increase in byproduct water sales.
Trio® freight costs increased 18% in 2023, compared to 2022, mainly related to a 16% increase in Trio® tons sold. Our freight expense is impacted by the geographic distribution of our Trio® sales and by the proportion of customers arranging for and paying their own freight costs. Generally, our Trio® freight expense is higher than our potash freight expense because we sell potash to regional customers located closer to our production facilities.
Our Trio® segment cost of goods sold increased 36% in 2023, compared to 2022, driven by a 16% increase in Trio® tons sold combined with an increase in our per-ton production costs. We also began 2023 with a higher average cost per ton of inventory compared to 2022. Our Trio® production costs increased in 2023, compared to the prior year, due to a 6%, or $1.8 million, increase in labor and benefits, a 12%, or $1.8 million, increase in operating and maintenance supplies, a 49%, or $1.8 million increase in depreciation due to increased capital investments, and a 61%, or $1.0 million increase in property taxes and insurance, partially offset by a 22%, or $1.0 million decrease in royalty expense due to decreased sales revenue.
We recorded $3.8 million in lower of cost or net realizable value inventory adjustments in 2023, due to increased carrying costs of our Trio® inventory and lower realized prices compared to 2022.
Our Trio® segment gross margin decreased $43.1 million in 2023, compared 2022, due to the factors discussed above.
In the fourth quarter of 2023, given the decrease in our gross margin for our Trio® segment we determined that sufficient indicators of potential impairment of our Trio® segment long-lived assets existed. We performed a recoverability test and determined that the carrying value of our Trio® segment long-lived assets was not recoverable. We engaged a third-party valuation firm to determine the fair value of our Trio® segment assets. The fair value of our Trio® segment assets was primarily determined using the expected proceeds received in an orderly sale of the individual assets. The carrying value of our Trio® segment asset group exceeded its fair value of those assets, and we recorded an impairment charge of $31.9 million.
Trio® Segment - Additional Information
The table below shows the percentage of total Trio® sales that were sold internationally in the past three years.
|
|
|
|
|
|
|
|
|
|
|
|
|
|
|
|
|
United States |
|
Export |
| For the year ended December 31, 2023 |
|
86 |
% |
|
14 |
% |
| For the year ended December 31, 2022 |
|
82 |
% |
|
18 |
% |
| For the year ended December 31, 2021 |
|
92 |
% |
|
8 |
% |
Oilfield Solutions Segment Results
|
|
|
|
|
|
|
|
|
|
|
|
|
|
|
|
|
|
|
Year Ended December 31, |
| (in thousands) |
|
2023 |
|
2022 |
|
|
| Sales |
|
$ |
21,310 |
|
|
$ |
28,668 |
|
|
|
|
|
|
|
|
|
|
| Less: Cost of goods sold |
|
15,518 |
|
|
21,152 |
|
|
|
| Gross Margin |
|
$ |
5,792 |
|
|
$ |
7,516 |
|
|
|
| Depreciation, Depletion, and Amortization incurred |
|
$ |
3,849 |
|
|
$ |
3,298 |
|
|
|
Oilfield Solutions Segment Results for the Years Ended December 31, 2023, and 2022
Our oilfield solutions segment sales decreased 26% in 2023, compared to 2022. Water sales decreased $7.9 million in 2023 to $9.6 million, and revenue from right-of-way agreements, surface damages and easements decreased $0.7 million. Brine sales increased $1.4 million, and produced water disposal royalties increased $0.1 million during 2023, compared to 2022.
Water sales decreased as we purchased $5.0 million less in third-party water for resale in 2023, compared to 2022 and we used more water at our HB facility to improve injection rates while we complete the second phase of our new HB injection pipeline. Brine sales increased $1.4 million as we sold increased volumes of brine at a higher per-barrel price in 2023, compared to 2022. Oilfield solutions sales are highly correlated to oil and gas activities near our facilities in New Mexico and oil prices continued to support oil and gas exploration activities in the Permian Basin near our Intrepid South property in southeast New Mexico during 2023.
Cost of goods sold decreased 27% in 2023, compared to 2022, primarily due to a $5.0 million decrease in third-party water purchased for resale. We incurred $0.6 million in increased labor and benefits expenses and a $0.6 million increase in depreciation related to new infrastructure placed in service in 2023, compared to 2022. These increased costs were partially offset by a $0.5 million decrease in royalty expense in 2023, compared to 2022, due to reduced water sales.
Gross margin decreased $1.7 million, or 23%, in 2023 compared to 2022, due to the factors described above.
Specific Factors Affecting Our Results
Sales
Our gross sales are derived from the sales of potash, Trio®, water, salt, magnesium chloride, brine water and various other products and services offered to oil and gas producers. Total sales are determined by the quantities of product we sell and the sales prices we realize. For potash, Trio® and salt, we quote prices to customers both on a delivered basis and on the basis of pick-up at our plants and warehouses. Freight costs are incurred on most of our potash, Trio® and salt sales, but some customers arrange and pay for their own freight directly. When we arrange and pay for freight, our quotes and billings are based on expected freight costs to the points of delivery. When we calculate our potash and Trio® average net realized sales price per ton, we deduct any freight costs included in sales before dividing by the number of tons sold. We believe the deduction of freight costs provides a more representative measure of our performance in the market due to variations caused by ongoing changes in the proportion of customers paying for their own freight, the geographic distribution of our products, and freight rates. Freight rates have been increasing, and if we are unable to pass the increased freight costs on to the customer, our average net realized sales price per ton is negatively affected. We manage our sales and marketing operations centrally and we work to achieve the highest average net realized sales price per ton we can by evaluating the product needs of our customers and associated logistics and then determining which of our production facilities can best satisfy these needs.
The volume of product we sell is determined by demand for our products and by our production capabilities. We operate our potash and Trio® facilities at production levels that approximate expected demand and consider current inventory levels and expect to continue to do so for the foreseeable future.
Our water sales and other products and services offered through our oilfield solutions segment are driven by demand from oil and gas exploration companies drilling in the Permian Basin. As such, demand for our water and other products and services is generally stronger during a cyclical expansion of oil and gas drilling. Likewise, a cyclical contraction of oil and gas drilling may decrease demand for our water.
Cost of Goods Sold
Our cost of goods sold reflects the costs to produce our products. Many of our production costs are largely fixed and, consequently, our cost of sales per ton on a facility-by-facility basis tends to move inversely with the number of tons we produce, within the context of normal production levels. Our principal production costs include labor and employee benefits, maintenance materials, contract labor, and materials for operating or maintenance projects, natural gas, electricity, operating supplies, chemicals, depreciation and depletion, royalties, and leasing costs. Some elements of our cost structure associated with contract labor, consumable operating supplies, reagents, and royalties are variable, but such elements make up a smaller component of our cost base. Our costs often vary from period to period based on the fluctuation of inventory, sales, and production levels at our facilities.
Our production costs per ton are also impacted when our production levels change, due to factors such as changes in the grade of ore delivered to the plant, levels of mine development, plant operating performance, and downtime. We expect that our labor and contract labor costs in Carlsbad, New Mexico, will continue to be influenced most directly by the demand for labor in the local region where we compete for labor with another fertilizer company, companies in the oil and gas industry, and a nuclear waste processing and storage facility.
We pay royalties to federal, state, and private lessors under our mineral leases. These payments typically equal a percentage of sales (less freight) of minerals extracted and sold under the applicable lease. In some cases, federal royalties for potash are paid on a sliding scale that varies with the grade of ore extracted. Our average royalty rate was 4.9%, 4.8%, and 4.7% in 2023, 2022, and 2021, respectively.
We incur costs to transfer water from our water source to our customers' facilities. Our operating costs depend on the distance and amount of water we must transfer. For water sold from certain of our water sources, we pay the State of New Mexico $0.11 per barrel of water sold. Additionally, water rights in New Mexico are subject to a stated point of diversion, purpose and place of use, and many of our water rights were originally issued for uses relating to our mining operations, or in the case of the water rights at Intrepid South, for agricultural uses. To sell water commercially under these rights, we must apply for a permit from the OSE to change point of diversion, purpose and/or place of use of the underlying water rights. Third parties often protest our applications and the decisions made by the OSE concerning the changes to our water rights permits. As we have worked to sell more water commercially, we have incurred significant legal expenses associated with defending our water rights as they proceed through adjudication and obtaining water permits and approvals.
Income Taxes
We are a subchapter C corporation and are therefore, subject to U.S. federal and state income taxes on our taxable income. We recognize deferred tax assets and liabilities for the tax effect of temporary differences between the financial statement and tax basis of recorded assets and liabilities at enacted tax rates in effect when the related taxes are expected to be settled or realized. We also reduce deferred tax assets by a valuation allowance if it is more likely than not that some portion or all of the deferred tax assets will not be realized. In determining how much of a valuation allowance to recognize we consider our projections of future taxable income. All available evidence, both positive and negative, that may affect the realizability of deferred tax assets is identified and considered in determining the appropriate amount of the valuation allowance. We have concluded a valuation allowance of $3.2 million was required as of December 31, 2023, and $2.0 million as of December 31, 2022.
The amount of valuation allowance increased in 2023 as compared to 2022, due to a change in the forecast of the amount of state net operating losses that may be used before expiration. Our effective tax rate for the years ended December 31, 2023, 2022, and 2021 was 19.0%, 25.2%, and (509.9)%, respectively. Our effective income tax rates are impacted primarily by changes in the underlying tax rates in jurisdictions in which we are subject to income tax, the need for a valuation allowance or release, and permanent differences between book and tax income for the period, including the benefit associated with the estimated effect of the percentage depletion deduction and the expense for the estimated effect of the disallowed deduction for officers' compensation.
The effective tax rate for the year ended December 31, 2023, differs from the U.S. federal statutory rate primarily due to the change in the valuation allowance. The effective tax rate for the years ended December 31, 2022, and 2021, differs from the U.S. federal statutory rate due to state income taxes, and the change in valuation allowance, respectively.
During the year ended December 31, 2023, we recognized $8.5 million of deferred federal tax benefit, $0.1 million of deferred state tax expense, and $0.1 million of current state income tax expense. During the year ended December 31, 2022, we recognized $19.4 million of deferred federal tax expense, $3.9 million of deferred state tax expense and $1.0 million of current state income tax expense. For the year ended December 31, 2021, we recognized $157.3 million deferred federal tax benefit, $51.7 million of deferred state tax benefit and $0.2 million of current state income tax expense.
The estimated statutory income tax rates that are applied to our current and deferred income tax calculations are impacted most significantly by the states in which we conduct business. Changing business conditions for normal business transactions and operations as well as changes to state tax rate and apportionment laws potentially alter our apportionment of income among the states for income tax purposes. These changes in apportionment laws result in changes in the calculation of our current and deferred income taxes, including the valuation of our deferred tax assets and liabilities. The effects of any such changes are recorded in the period of the adjustment. These adjustments can increase or decrease the net deferred tax asset on the balance sheet and impact the corresponding deferred tax benefit or deferred tax expense on the income statement.
A valuation allowance is recognized for deferred tax assets if it is more likely than not that a portion or all of the net deferred tax assets will not be realized. In making such a determination, we consider all available positive and negative evidence, including future reversals of existing taxable temporary differences, projected future taxable income, tax-planning strategies, and results of recent operations. As of December 31, 2023, we were in a cumulative three-year income position. The cumulative three-year income position is significant positive evidence when evaluating the realizability of our deferred tax assets. Additionally, industry trends and forecasts as well as internal forecasts of future business show sustained amounts of taxable income. Thus, we have concluded it is more likely than not that most of our $197.4 million of deferred tax assets will be realized.
Liquidity and Capital Resources
Our operations have primarily been funded from cash on hand, cash generated by operations, and proceeds from debt and equity offerings. During 2023, we generated $43.2 million in cash flows from operating activities and we ended the year with $4.1 million of cash and cash equivalents, compared with $18.5 million at December 31, 2022.
As of December 31, 2023, we had $146.0 million available to borrow under our credit facility, $4.0 million in outstanding borrowings, and no outstanding letters of credit. With the remaining availability under our credit facility and expected cash generated from operations, we believe we have sufficient liquidity to meet our obligations for the next twelve months.
We continue to monitor our future sources and uses of cash and anticipate that we will adjust our capital allocation strategies, as determined by our Board of Directors. We may, at any time we deem conditions favorable, attempt to improve our liquidity position by accessing debt or equity markets in accordance with our existing revolving credit agreement. We may also raise capital in the future through the issuance of additional equity or debt securities, subject to prevailing market conditions. However, there is no assurance that we will be able to successfully raise additional capital on acceptable terms or at all.
The following summarizes our cash flow activity for the years ended December 31, 2023, and 2022:
|
|
|
|
|
|
|
|
|
|
|
|
|
|
|
|
|
|
|
Year ended December 31, |
|
|
2023 |
|
2022 |
|
|
|
|
(In thousands) |
| Cash flows provided by operating activities |
|
$ |
43,229 |
|
|
$ |
88,821 |
|
|
|
| Cash flows used in investing activities |
|
$ |
(59,554) |
|
|
$ |
(79,179) |
|
|
|
| Cash flows provided by (used in) financing activities |
|
$ |
1,892 |
|
|
$ |
(27,704) |
|
|
|
Our revolving credit agreement contains restrictions on our ability to declare and pay dividends. The terms of our credit facility prohibit us from declaring and paying a dividend unless availability under the credit facility after giving effect to the dividend and during a specified period before the dividend is more than $15 million.
Operating Activities
Total cash provided by operating activities for the year ended December 31, 2023, was $43.2 million, a decrease of $45.6 million compared with the year ended December 31, 2022. The decrease was mainly driven by decreased potash and Trio® net realized sales prices. Prior year operating cash flows included a $32.6 million refund paid in September 2022 of a customer's prepayment for future water deliveries.
Investing Activities
Total cash used in investing activities decreased $19.6 million in 2023, compared to 2022, primarily a result of an $11.6 million decrease in purchases of investments compared to the prior year. In 2022, we invested $13.0 million of cash in investment grade, short-term debt instruments. Additions to property, plant, equipment, and mineral properties also decreased $3.5 million in 2023, compared to the prior year. Proceeds from the redemption/maturity of investments increased $3.5 million in 2023, compared to 2022.
Financing Activities
Total cash flows provided by financing activities increased $29.6 million in 2023, as compared to 2022. During 2022, we paid $22.0 million under a share repurchase program. We did not repurchase any shares in 2023. Proceeds from borrowings on the credit facility (net of repayments) increased $4.0 million and employee tax withholding paid for restricted shares upon vesting decreased $3.3 million in 2023, compared to the prior year. We did not have any outstanding borrowings under our credit facility in 2022.
Share Repurchase Program
In February 2022, our Board of Directors approved a $35 million share repurchase program. Under the share repurchase program, we may repurchase shares from time to time in the open market or in privately negotiated transactions. The timing, volume and nature of share repurchases is at our sole discretion and is dependent on market conditions, liquidity, applicable securities laws, and other factors. We may suspend or discontinue the share repurchase program at any time. We made no repurchases of shares for the twelve months ended December 31, 2023. For the twelve months ended December 31, 2022, we repurchased 608,657 shares with a total cost of $22.0 million, or a weighted average price per share of $36.17. As of December 31, 2023, we have approximately $13.0 million of remaining availability under the share repurchase program.
Credit Facility
In August 2022, we and certain of our subsidiaries entered into the Second Amended and Restated Credit Agreement with a syndicate of lenders with the Bank of Montreal, as administrative agent, which provides for a revolving credit facility. The agreement amended our existing revolving credit facility to, among other things, increase the amount available under the facility from $75 million to $150 million, extend the maturity date to August 4, 2027, and transition from LIBOR (London Interbank Offered Rate) to SOFR (Secured Overnight Financing Rate) as a reference rate for borrowings under the credit agreement. Borrowings under the amended credit facility bear interest at SOFR plus an applicable margin of 1.50% to 2.25% per annum, based on our leverage ratio as calculated in accordance with the amended agreement governing the revolving credit facility. Borrowings under the revolving credit facility are secured by substantially all of our current and non-current assets, and the obligations under the credit facility are unconditionally guaranteed by several of our subsidiaries.
We occasionally borrow and repay amounts under the facility for near-term working capital needs or other purposes and may do so in the future. For the year ended December 31, 2023, we made $9.0 million in borrowings and $5.0 million in repayments under the facility. For the year ended December 31, 2022, we made no borrowings and made no repayments under the facility. As of December 31, 2023, we had $4.0 million in borrowings outstanding and no outstanding letters of credit under the facility. As of December 31, 2022, we had no borrowings outstanding and $1.0 million in an outstanding letter of credit under the facility. We had $146.0 million available under the facility as of December 31, 2023.
We were in compliance with the applicable covenants under the facility as of December 31, 2023.
Capital Investments
During 2023, we paid cash of $65.1 million to acquire property, plant, equipment, and mineral properties.
We expect to make capital investments in 2024 of $40 million to $50 million. We anticipate spending approximately $20 million to $25 million on sustaining capital projects in 2024, with the remainder of our estimated spending on opportunity projects, which include the completion of phase two of our new HB injection pipeline project, a new extraction well at our HB mine, and a new primary pond at our Wendover facility. We may adjust our investment plans as our expectations for 2024 change. We anticipate our 2024 operating plans and capital programs will be funded out of operating cash flows and existing cash. We may also use our revolving credit facility, to the extent available, to fund capital investments.
Critical Accounting Estimates
Our discussion and analysis of our financial condition and results of operations are based upon our consolidated financial statements, which have been prepared in accordance with GAAP. The preparation of the consolidated financial statements in conformity with GAAP requires management to make estimates and assumptions that affect the amounts reported in our financial statements. Actual results could differ from our estimates and assumptions, and these differences could result in material changes to our financial statements.
Our significant accounting policies are further described in Note 2 to our audited consolidated financial statements included in "Item 8. Financial Statements and Supplemental Data" of this Annual Report. We believe the following accounting policies include a higher degree of subjective and complex judgments in their application and are most critical to aid in fully understanding and evaluating our reported financial condition and results of operations.
Recoverability of Long-Lived Assets
We evaluate our long-lived assets for impairment when events or changes in circumstances indicate that the related carrying amount may not be recoverable. An impairment is potentially considered to exist if an asset group's total estimated net future cash flows on an undiscounted basis are less than the carrying amount of the related asset. An impairment loss is measured and recorded based on the excess of the carrying amount of long-lived assets over its estimated fair value.
In 2023, we recorded an impairment charge for long-lived assets and mineral properties at two of our facilities in New Mexico. The impairment charge equals the difference between the carrying value of the assets or asset group and the estimated fair value of the assets or asset group. We estimated the fair value of mineral properties using a discounted cash flow technique and we used the estimated fair value of the other assets using estimated proceeds received in an orderly sale of these assets. Significant estimates used in the estimated fair values include inputs to arrive at estimated net cash flows, such as product selling prices, volumes of product sold, and production costs. Estimated proceeds received in an orderly sale of an asset have a high degree of subjectivity and actual proceeds received in an orderly sale of assets may vary from the estimates used, which may result in further impairment charges.
Reserves and Resources
We prepare our reserves and resources estimates in accordance with SEC requirements. We have prepared these reserve and resources estimates and they have been reviewed and independently determined by mine consultants. We express tons of potash and langbeinite in resources and reserves in terms of expected finished tons of product to be realized, net of estimated losses. Market price fluctuations of potash or Trio®, as well as increased production costs or reduced recovery rates, could render resources and reserves containing relatively lower grades of mineralization uneconomic to exploit and might result in a reduction of resources and reserves. We updated our mineral reserves and resources as of December 31, 2023, and we determined we do not have any mineral reserves at our East facility because the mineral deposit could not be economically extracted. All mineral deposits at our East facility are categorized as a mineral resource. A mineral reserve is defined as that part of a mineral deposit which can be economically and legally extracted. A mineral resource refers to a concentration or occurrence of material deposits of economic interest.
We deplete our mineral properties using the units-of-production method. Under this method, we determine a depletion rate for one ton of finished product by dividing the total mineral properties net balance by the number expected finished tons of product, which is obtained from the resources and reserve estimates. Depletion expense is calculated by multiplying the number of tons of product produced by the depletion rate per ton.
Income Taxes
We are a subchapter C corporation and therefore are subject to U.S. federal and state income taxes. We recognize income taxes under the asset and liability method. Deferred tax assets and liabilities are recognized for the estimated future tax consequences attributable to differences between the financial statement carrying amounts of assets and liabilities and their respective tax bases. Deferred tax assets and liabilities are measured using the enacted tax rates expected to apply to taxable income in the periods in which the deferred tax liability or asset is expected to be settled or realized. We record a valuation allowance if it is deemed more likely than not that our deferred income tax assets will not be realized in full; such determinations are subject to ongoing assessment.
Non-GAAP Financial Measure
To supplement our consolidated financial statements, which are prepared and presented in accordance with GAAP, from time to time we use "average net realized sales price per ton," which is a non-GAAP financial measure. This non-GAAP financial measure should not be considered in isolation or as a substitute for, or superior to, the financial information prepared and presented in accordance with GAAP. In addition, because the presentation of this non-GAAP financial measure varies among companies, our presentation of this non-GAAP financial measure may not be comparable to similarly titled measures used by other companies.
We believe average net realized sales price per ton provides useful information to investors for analysis of our business. We use this non-GAAP financial measure as one of our tools in comparing period-over-period performance on a consistent basis and when planning, forecasting, and analyzing future periods. We believe this non-GAAP financial measure is used by professional research analysts and others in the valuation, comparison, and investment recommendations of companies in the potash mining industry. Many investors use the published research reports of these professional research analysts and others in making investment decisions.
We calculate average net realized sales price per ton for each of potash and Trio®. Average net realized sales price per ton for potash is calculated as potash segment sales less potash segment byproduct sales and potash freight costs and then dividing that difference by the number of tons of potash sold in the period. Likewise, average net realized sales price per ton for Trio® is calculated as Trio® segment sales less Trio® segment byproduct sales and Trio® freight costs and then dividing that difference by Trio® tons sold. We consider average net realized sales price per ton to be useful, and believe it to be useful for investors, because it shows our potash and Trio® average per-ton pricing without the effect of certain transportation and delivery costs. When we arrange transportation and delivery for a customer, we include in revenue and in freight costs the costs associated with transportation and delivery. However, some of our customers arrange for and pay their own transportation and delivery costs, in which case these costs are not included in our revenue and freight costs. We use average net realized sales price per ton as a key performance indicator to analyze potash and Trio® sales and price trends.
Below is a reconciliation of average net realized sales price per ton for potash and Trio® to the most directly comparable GAAP measure for the years ended December 31, 2023, and 2022 (in thousands, except per ton amounts):
|
|
|
|
|
|
|
|
|
|
|
|
|
|
|
|
|
|
|
Potash Segment |
|
|
2023 |
|
2022 |
|
|
| Total Segment Sales |
|
$ |
155,920 |
|
|
$ |
191,378 |
|
|
|
| Less: Segment byproduct sales |
|
24,714 |
|
|
22,807 |
|
|
|
| Potash freight costs |
|
10,911 |
|
|
10,336 |
|
|
|
| Subtotal |
|
$ |
120,295 |
|
|
$ |
158,235 |
|
|
|
|
|
|
|
|
|
|
| Divided by: |
|
|
|
|
|
|
| Potash tons sold (in thousands) |
|
258 |
|
|
222 |
|
|
|
| Average net realized sales price per ton |
|
$ |
466 |
|
|
$ |
713 |
|
|
|
|
|
|
|
|
|
|
|
|
|
|
|
|
|
|
|
|
|
|
Trio® Segment |
|
|
2023 |
|
2022 |
|
|
Total Segment Sales |
|
$ |
102,182 |
|
|
$ |
117,826 |
|
|
|
| Less: Segment byproduct sales |
|
5,838 |
|
|
3,864 |
|
|
|
Trio® freight costs |
|
23,211 |
|
|
19,661 |
|
|
|
Subtotal |
|
$ |
73,133 |
|
|
$ |
94,301 |
|
|
|
|
|
|
|
|
|
|
| Divided by: |
|
|
|
|
|
|
Trio® Tons sold (in thousands) |
|
228 |
|
|
197 |
|
|
|
| Average net realized sales price per ton |
|
$ |
321 |
|
|
$ |
479 |
|
|
|
ITEM 7A.QUANTITATIVE AND QUALITATIVE DISCLOSURES ABOUT MARKET RISK
Our operations may be impacted by commodity prices, geographic concentration, changes in interest rates, and foreign currency exchange rates.
Commodity Prices
Potash, Trio®, and water are commodities but are not traded on any commodity exchange. As such, direct hedging of future prices cannot be undertaken. For potash and Trio®, we generally do not enter into long-term sales contracts for these products, so prices vary for each particular transaction depending on the market into which we are selling and the individual bids that we receive. For water sales, a portion of our sales are under a long-term agreement where the price per barrel of water is fixed. This agreement allows for the parties to periodically review and adjust the price per barrel of water to the prevailing market price.
Our sales and profitability are determined principally by the price of potash, Trio®, and water. Potash and Trio® sales and profitability are also influenced, to a lesser extent, by the price of natural gas and other commodities used in production. The price of potash and Trio® is influenced by agricultural demand, global and domestic supply, competing specialty fertilizers, and the prices of agricultural commodities. Decreases in agricultural demand, increases in supply, or decreases in agricultural commodity prices could reduce our agricultural potash and Trio® sales. The price of water is influenced by demand from the oil and gas operators in the Permian Basin. Natural gas and oil price declines may result in a reduction in drilling activity, which could reduce our sales of water.
Our costs and capital investments are subject to market movements in other commodities such as natural gas, electricity, steel, and chemicals.
Interest Rate Fluctuations
Balances outstanding under the amended $150 million credit facility bear interest at SOFR plus an applicable margin of 1.50% to 2.25% per annum, based on our leverage ratio as calculated in accordance with the amended agreement governing the revolving credit facility. Borrowings under the revolving credit facility are secured by substantially all of our current and non-current assets, and the obligations under the credit facility are unconditionally guaranteed by several of our subsidiaries. As of December 31, 2023, we had $4.0 million in borrowings outstanding on this facility and no outstanding letters of credit under the facility.
Geographic Concentration
Our mines, facilities, and many of our customers are concentrated in the western half of U.S. and are, therefore, affected by weather and other conditions in this region.
Foreign Exchange Rate Fluctuations
We typically do not have balances of accounts receivable denominated in currencies other than U.S. dollars and, as a result, we do not have a direct foreign exchange risk. We do, however, have an indirect foreign exchange risk due to the industry in which we operate.
Specifically, the U.S. imports the majority of its potash, including from Canada, Russia, and other countries. If the local currencies for foreign suppliers strengthen in comparison to the U.S. dollar, foreign suppliers realize a smaller margin in their local currencies unless they increase their nominal U.S. dollar prices. Strengthening of these local currencies therefore tends to support higher U.S. potash prices as the foreign suppliers attempt to maintain their margins. However, if local currencies weaken in comparison to the U.S. dollar, foreign suppliers may choose to lower prices proportionally to increase sales volume while again maintaining a margin in their local currency.
ITEM 8.FINANCIAL STATEMENTS AND SUPPLEMENTARY DATA
Report of Independent Registered Public Accounting Firm
To the Stockholders and the Board of Directors
Intrepid Potash, Inc.:
Opinions on the Consolidated Financial Statements and Internal Control Over Financial Reporting
We have audited the accompanying consolidated balance sheets of Intrepid Potash, Inc. and subsidiaries (the Company) as of December 31, 2023 and 2022, the related consolidated statements of operations, stockholders’ equity, and cash flows for each of the years in the three-year period ended December 31, 2023, and the related notes and financial statement schedule II (collectively, the consolidated financial statements). We also have audited the Company’s internal control over financial reporting as of December 31, 2023, based on criteria established in Internal Control – Integrated Framework (2013) issued by the Committee of Sponsoring Organizations of the Treadway Commission.
In our opinion, the consolidated financial statements referred to above present fairly, in all material respects, the financial position of the Company as of December 31, 2023 and 2022, and the results of its operations and its cash flows for each of the years in the three-year period ended December 31, 2023, in conformity with U.S. generally accepted accounting principles. Also in our opinion, the Company maintained, in all material respects, effective internal control over financial reporting as of December 31, 2023 based on criteria established in Internal Control – Integrated Framework (2013) issued by the Committee of Sponsoring Organizations of the Treadway Commission.
Basis for Opinions
The Company’s management is responsible for these consolidated financial statements, for maintaining effective internal control over financial reporting, and for its assessment of the effectiveness of internal control over financial reporting, included in the accompanying Management's Report on Internal Control over Financial Reporting. Our responsibility is to express an opinion on the Company’s consolidated financial statements and an opinion on the Company’s internal control over financial reporting based on our audits. We are a public accounting firm registered with the Public Company Accounting Oversight Board (United States) (PCAOB) and are required to be independent with respect to the Company in accordance with the U.S. federal securities laws and the applicable rules and regulations of the Securities and Exchange Commission and the PCAOB.
We conducted our audits in accordance with the standards of the PCAOB. Those standards require that we plan and perform the audits to obtain reasonable assurance about whether the consolidated financial statements are free of material misstatement, whether due to error or fraud, and whether effective internal control over financial reporting was maintained in all material respects.
Our audits of the consolidated financial statements included performing procedures to assess the risks of material misstatement of the consolidated financial statements, whether due to error or fraud, and performing procedures that respond to those risks. Such procedures included examining, on a test basis, evidence regarding the amounts and disclosures in the consolidated financial statements. Our audits also included evaluating the accounting principles used and significant estimates made by management, as well as evaluating the overall presentation of the consolidated financial statements. Our audit of internal control over financial reporting included obtaining an understanding of internal control over financial reporting, assessing the risk that a material weakness exists, and testing and evaluating the design and operating effectiveness of internal control based on the assessed risk. Our audits also included performing such other procedures as we considered necessary in the circumstances. We believe that our audits provide a reasonable basis for our opinions.
Definition and Limitations of Internal Control Over Financial Reporting
A company’s internal control over financial reporting is a process designed to provide reasonable assurance regarding the reliability of financial reporting and the preparation of financial statements for external purposes in accordance with generally accepted accounting principles. A company’s internal control over financial reporting includes those policies and procedures that (1) pertain to the maintenance of records that, in reasonable detail, accurately and fairly reflect the transactions and dispositions of the assets of the company; (2) provide reasonable assurance that transactions are recorded as necessary to permit preparation of financial statements in accordance with generally accepted accounting principles, and that receipts and expenditures of the company are being made only in accordance with authorizations of management and directors of the company; and (3) provide reasonable assurance regarding prevention or timely detection of unauthorized acquisition, use, or disposition of the company’s assets that could have a material effect on the financial statements.
Because of its inherent limitations, internal control over financial reporting may not prevent or detect misstatements. Also, projections of any evaluation of effectiveness to future periods are subject to the risk that controls may become inadequate because of changes in conditions, or that the degree of compliance with the policies or procedures may deteriorate.
Critical Audit Matters
The critical audit matters communicated below are matters arising from the current period audit of the consolidated financial statements that were communicated or required to be communicated to the audit committee and that: (1) relate to accounts or disclosures that are material to the consolidated financial statements and (2) involved our especially challenging, subjective, or complex judgments. The communication of critical audit matters does not alter in any way our opinion on the consolidated financial statements, taken as a whole, and we are not, by communicating the critical audit matters below, providing separate opinions on the critical audit matters or on the accounts or disclosures to which they relate.
Realizability of deferred tax assets
As discussed in Notes 2 and 13 to the consolidated financial statements, the Company records a valuation allowance if it is deemed more likely than not deferred tax assets will not be realized in full. The ultimate realization of deferred tax assets is dependent upon the generation of certain types of future taxable income during the periods in which those temporary differences become deductible. In making this assessment, the Company considers the scheduled reversal of deferred tax liabilities, their ability to carry back the deferred tax assets, projected future taxable income, and tax planning strategies. The Company analyzes its valuation allowance using historical and projected future operating results. As of December 31, 2023, the Company had gross deferred tax assets of $197.4 million and a related valuation allowance of $3.2 million.
We identified the evaluation of the realizability of the Company’s deferred tax assets as a critical audit matter. This evaluation required especially challenging auditor judgment to assess the Company’s estimated future taxable income over the period in which the deferred tax assets will generally reverse. Specifically, the Company’s assumptions of projected future taxable income were based primarily on prices for products subject to market volatility and forecasted sales volumes. Changes in these assumptions could have a significant impact on the realization of the Company’s deferred tax assets and the amount of the valuation allowance.
The following are the primary procedures we performed to address this critical audit matter. We evaluated the design and tested the operating effectiveness of certain internal controls related to the Company’s income tax process. This included controls related to the development of assumptions in determining the projected future taxable income, including the development of prices for products and forecasted sales volumes. We assessed the data used in the pricing assumptions used by the Company by comparing them to publicly available pricing data and existing contractual arrangements. We compared the forecasted sales volumes to historical sales volumes, and we compared the Company’s historical forecasted sales volumes to actual sales volumes to assess the Company’s ability to accurately forecast.
Impairment of long-lived assets
As discussed in Note 2 to the consolidated financial statements, the Company evaluates its long-lived assets for impairment when events or changes in circumstances indicate that the related carrying amount may not be recoverable. As discussed in Note 6, during the fourth quarter of 2023, the gross margin of the Trio® segment decreased and the Company determined that sufficient indicators of potential impairment of the Trio® segment long-lived assets existed. The Company engaged a third-party valuation firm to determine the fair value of the Trio® segment assets. The carrying value of the Trio® segment asset group exceeded its fair value, and the Company recognized impairment charges of $31.9 million. Additionally, given the length of time since the West facility had been placed in care and maintenance, the Company engaged a third-party valuation firm to determine the fair value of the West assets. The carrying value of the West asset group exceeded its fair value, and the Company recognized impairment charges of $9.9 million. The fair value of the Trio® segment assets and the West assets were determined primarily using the expected proceeds received in an orderly sale of individual assets.
We identified the evaluation of the fair value of certain assets included in the impairment of the Trio® segment and West assets as a critical audit matter. Challenging and subjective auditor judgment was required in assessing the liquidation factors used to develop the orderly liquidation values as there is not a liquid secondary market for certain specialized assets. The evaluation of the liquidation factors required specialized skills and knowledge.
The following are the primary procedures we performed to address this critical audit matter. We evaluated the design and tested the operating effectiveness of certain internal controls related to the Company’s long-lived asset impairment process. This included a control related to the Company’s determination of the liquidation factors used to develop the orderly liquidation values for certain assets.
We involved valuation professionals with specialized skills and knowledge, who assisted in:
•evaluating whether the valuation techniques used by the Company to develop the fair value for certain assets were reasonable and consistent with common valuation practice given the nature of the assets
•assessing the Company’s orderly liquidation values by developing independent estimates of the orderly liquidation values using third-party data and independently developed liquidation factors and comparing the amounts to the Company’s estimates.
/s/ KPMG LLP
We have served as the Company's auditor since 2007.
Denver, Colorado
March 7, 2024
INTREPID POTASH, INC.
CONSOLIDATED BALANCE SHEETS
(In thousands, except share and per share amounts)
|
|
|
|
|
|
|
|
|
|
|
|
|
|
|
|
|
December 31, |
|
|
2023 |
|
2022 |
| ASSETS |
|
|
|
|
| Cash and cash equivalents |
|
$ |
4,071 |
|
|
$ |
18,514 |
|
| Short-term investments |
|
2,970 |
|
|
5,959 |
|
| Accounts receivable: |
|
|
|
|
| Trade, net |
|
22,077 |
|
|
26,737 |
|
| Other receivables, net |
|
1,374 |
|
|
790 |
|
|
|
|
|
|
| Inventory, net |
|
114,252 |
|
|
114,816 |
|
| Other current assets |
|
7,200 |
|
|
4,863 |
|
| Total current assets |
|
151,944 |
|
|
171,679 |
|
| Property, plant, equipment, and mineral properties, net |
|
358,249 |
|
|
375,630 |
|
| Water rights |
|
19,184 |
|
|
19,184 |
|
| Long-term parts inventory, net |
|
30,231 |
|
|
24,823 |
|
| Long-term investments |
|
6,627 |
|
|
9,841 |
|
| Other assets, net |
|
8,016 |
|
|
7,294 |
|
| Non-current deferred tax asset, net |
|
194,223 |
|
|
185,752 |
|
| Total Assets |
|
$ |
768,474 |
|
|
$ |
794,203 |
|
|
|
|
|
|
| LIABILITIES AND STOCKHOLDERS' EQUITY |
|
|
|
|
|
|
|
|
|
| Accounts payable |
|
$ |
12,848 |
|
|
$ |
18,645 |
|
|
|
|
|
|
| Income taxes payable |
|
40 |
|
|
8 |
|
| Accrued liabilities |
|
19,061 |
|
|
16,212 |
|
| Accrued employee compensation and benefits |
|
7,254 |
|
|
6,975 |
|
| Other current liabilities |
|
7,265 |
|
|
7,036 |
|
|
|
|
|
|
|
|
|
|
|
| Total current liabilities |
|
46,468 |
|
|
48,876 |
|
|
|
|
|
|
| Advances on credit facility |
|
4,000 |
|
|
— |
|
|
|
|
|
|
| Asset retirement obligation |
|
30,077 |
|
|
26,564 |
|
| Operating lease liabilities |
|
741 |
|
|
2,206 |
|
| Finance lease liabilities |
|
1,451 |
|
|
— |
|
| Other non-current liabilities |
|
1,309 |
|
|
1,479 |
|
| Total Liabilities |
|
84,046 |
|
|
79,125 |
|
|
|
|
|
|
| Commitments and Contingencies |
|
|
|
|
|
|
|
|
|
Common stock, $0.001 par value; 40,000,000 shares authorized: |
|
|
|
|
and 12,807,316 and 12,687,822 shares outstanding |
|
|
|
|
| at December 31, 2023 and 2022, respectively |
|
13 |
|
|
13 |
|
| Additional paid-in capital |
|
665,637 |
|
|
660,614 |
|
|
|
|
|
|
| Retained earnings |
|
40,790 |
|
|
76,463 |
|
| Less treasury stock, at cost |
|
(22,012) |
|
|
(22,012) |
|
| Total Stockholders' Equity |
|
684,428 |
|
|
715,078 |
|
| Total Liabilities and Stockholders' Equity |
|
$ |
768,474 |
|
|
$ |
794,203 |
|
See accompanying notes to these consolidated financial statements.
INTREPID POTASH, INC.
CONSOLIDATED STATEMENTS OF OPERATIONS
(In thousands, except share and per share amounts)
|
|
|
|
|
|
|
|
|
|
|
|
|
|
|
|
|
|
|
|
|
|
|
Year Ended December 31, |
|
|
2023 |
|
2022 |
|
2021 |
| Sales |
|
$ |
279,083 |
|
|
$ |
337,568 |
|
|
$ |
270,332 |
|
| Less: |
|
|
|
|
|
|
| Freight costs |
|
37,635 |
|
|
34,137 |
|
|
37,892 |
|
| Warehousing and handling costs |
|
10,832 |
|
|
9,747 |
|
|
9,282 |
|
| Cost of goods sold |
|
187,278 |
|
|
152,276 |
|
|
161,421 |
|
| Lower of cost or net realizable value inventory adjustments |
|
6,492 |
|
|
— |
|
|
— |
|
| Costs associated with abnormal production |
|
— |
|
|
— |
|
|
5,973 |
|
| Gross Margin |
|
36,846 |
|
|
141,408 |
|
|
55,764 |
|
|
|
|
|
|
|
|
| Selling and administrative |
|
32,423 |
|
|
31,799 |
|
|
23,998 |
|
|
|
|
|
|
|
|
| Accretion of asset retirement obligation |
|
2,140 |
|
|
1,961 |
|
|
1,858 |
|
|
|
|
|
|
|
|
| Impairment of long-lived assets |
|
43,288 |
|
|
— |
|
|
— |
|
| Loss (gain) on sale or disposal of assets |
|
807 |
|
|
7,470 |
|
|
(2,542) |
|
| Other operating expense |
|
2,157 |
|
|
4,738 |
|
|
178 |
|
| Operating (Loss) Income |
|
(43,969) |
|
|
95,440 |
|
|
32,272 |
|
|
|
|
|
|
|
|
| Other Income (Expense) |
|
|
|
|
|
|
| Equity in earnings of unconsolidated entities |
|
(486) |
|
|
689 |
|
|
— |
|
| Interest expense, net |
|
— |
|
|
(101) |
|
|
(1,468) |
|
| Interest income |
|
298 |
|
|
176 |
|
|
— |
|
| Other income |
|
95 |
|
|
305 |
|
|
48 |
|
Gain on extinguishment of debt |
|
— |
|
|
— |
|
|
10,113 |
|
| (Loss) Income Before Income Taxes |
|
(44,062) |
|
|
96,509 |
|
|
40,965 |
|
|
|
|
|
|
|
|
| Income Tax Benefit (Expense) |
|
8,389 |
|
|
(24,289) |
|
|
208,869 |
|
| Net (Loss) Income |
|
$ |
(35,673) |
|
|
$ |
72,220 |
|
|
$ |
249,834 |
|
|
|
|
|
|
|
|
| Weighted Average Shares Outstanding: |
|
|
|
|
|
|
| Basic |
|
12,760,937 |
|
|
13,151,752 |
|
|
13,098,871 |
|
| Diluted |
|
12,760,937 |
|
|
13,452,233 |
|
|
13,391,362 |
|
| (Loss) Income Per Share: |
|
|
|
|
|
|
| Basic |
|
$ |
(2.80) |
|
|
$ |
5.49 |
|
|
$ |
19.07 |
|
| Diluted |
|
$ |
(2.80) |
|
|
$ |
5.37 |
|
|
$ |
18.66 |
|
See accompanying notes to these consolidated financial statements.
INTREPID POTASH, INC.
CONSOLIDATED STATEMENTS OF STOCKHOLDERS' EQUITY
(In thousands, except share amounts)
|
|
|
|
|
|
|
|
|
|
|
|
|
|
|
|
|
|
|
|
|
|
|
|
|
|
|
|
|
|
|
|
|
|
|
|
|
|
|
|
|
|
|
Common Stock |
|
Treasury Stock |
|
Additional Paid-in Capital |
|
|
|
Retained Earnings (Accumulated) Deficit |
|
Total Stockholders' Equity |
|
|
Shares |
|
Amount |
|
|
|
|
|
| Balance, December 31, 2020 |
|
13,049,820 |
|
|
$ |
13 |
|
|
$ |
— |
|
|
$ |
656,837 |
|
|
|
|
$ |
(245,591) |
|
|
$ |
411,259 |
|
|
|
|
|
|
|
|
|
|
|
|
|
|
|
|
|
|
|
|
|
|
|
|
|
|
|
|
|
|
|
| Net income |
|
— |
|
|
— |
|
|
— |
|
|
— |
|
|
|
|
249,834 |
|
|
249,834 |
|
| Stock-based compensation |
|
— |
|
|
— |
|
|
— |
|
|
3,012 |
|
|
|
|
— |
|
|
3,012 |
|
Vesting of restricted shares, net of common stock
used to fund employee income tax withholding
due upon vesting |
|
90,844 |
|
|
— |
|
|
— |
|
|
(791) |
|
|
|
|
— |
|
|
(791) |
|
| Exercise of stock options |
|
8,651 |
|
|
— |
|
|
— |
|
|
89 |
|
|
|
|
— |
|
|
89 |
|
| Balance, December 31, 2021 |
|
13,149,315 |
|
|
13 |
|
|
— |
|
|
659,147 |
|
|
|
|
4,243 |
|
|
663,403 |
|
|
|
|
|
|
|
|
|
|
|
|
|
|
|
|
| Net income |
|
— |
|
|
— |
|
|
— |
|
|
— |
|
|
|
|
72,220 |
|
|
72,220 |
|
| Stock-based compensation |
|
— |
|
|
— |
|
|
— |
|
|
6,152 |
|
|
|
|
— |
|
|
6,152 |
|
| Purchase of treasury stock |
|
(608,657) |
|
|
— |
|
|
(22,012) |
|
|
— |
|
|
|
|
— |
|
|
(22,012) |
|
Vesting of restricted shares, net of common stock
used to fund employee income tax withholding
due upon vesting |
|
136,446 |
|
|
— |
|
|
— |
|
|
(4,795) |
|
|
|
|
— |
|
|
(4,795) |
|
| Exercise of stock options |
|
10,718 |
|
|
— |
|
|
— |
|
|
110 |
|
|
|
|
— |
|
|
110 |
|
| Balance, December 31, 2022 |
|
12,687,822 |
|
|
13 |
|
|
(22,012) |
|
|
660,614 |
|
|
|
|
76,463 |
|
|
715,078 |
|
|
|
|
|
|
|
|
|
|
|
|
|
|
|
|
|
|
|
|
|
|
|
|
|
|
|
|
|
|
|
|
|
|
|
|
|
|
|
|
|
|
|
|
|
|
| Net loss |
|
— |
|
|
— |
|
|
— |
|
|
— |
|
|
|
|
(35,673) |
|
|
(35,673) |
|
| Stock-based compensation |
|
— |
|
|
— |
|
|
— |
|
|
6,534 |
|
|
|
|
— |
|
|
6,534 |
|
|
|
|
|
|
|
|
|
|
|
|
|
|
|
|
Vesting of restricted shares, net of common stock
used to fund employee income tax withholding
due upon vesting |
|
119,494 |
|
|
— |
|
|
— |
|
|
(1,511) |
|
|
|
|
— |
|
|
(1,511) |
|
|
|
|
|
|
|
|
|
|
|
|
|
|
|
|
| Balance, December 31, 2023 |
|
12,807,316 |
|
|
$ |
13 |
|
|
$ |
(22,012) |
|
|
$ |
665,637 |
|
|
|
|
$ |
40,790 |
|
|
$ |
684,428 |
|
See accompanying notes to these consolidated financial statements.
INTREPID POTASH, INC.
CONSOLIDATED STATEMENTS OF CASH FLOWS
(In thousands)
|
|
|
|
|
|
|
|
|
|
|
|
|
|
|
|
|
|
|
|
|
|
|
Year Ended December 31, |
|
|
2023 |
|
2022 |
|
2021 |
| Cash Flows from Operating Activities: |
|
|
|
|
|
|
| Adjustments to reconcile net (loss) income to net cash provided by operating activities: |
|
|
|
|
|
|
| Net (loss) income |
|
$ |
(35,673) |
|
|
$ |
72,220 |
|
|
$ |
249,834 |
|
|
|
|
|
|
|
|
|
|
|
|
|
|
|
| Depreciation, depletion, and amortization |
|
39,078 |
|
|
34,711 |
|
|
35,635 |
|
| Amortization of intangible assets |
|
322 |
|
|
322 |
|
|
322 |
|
| Accretion of asset retirement obligation |
|
2,140 |
|
|
1,961 |
|
|
1,858 |
|
| Amortization of deferred financing costs |
|
301 |
|
|
265 |
|
|
314 |
|
| Stock-based compensation |
|
6,534 |
|
|
6,152 |
|
|
3,012 |
|
| Reserve for obsolescence |
|
509 |
|
|
1,750 |
|
|
2,108 |
|
| Allowance for doubtful accounts |
|
110 |
|
|
— |
|
|
— |
|
| Impairment of long-lived assets |
|
43,288 |
|
|
— |
|
|
— |
|
| Loss (gain) on disposal of assets |
|
807 |
|
|
7,470 |
|
|
(2,542) |
|
| Equity in earnings of unconsolidated entities |
|
486 |
|
|
(689) |
|
|
— |
|
| Distribution of earnings from unconsolidated entities |
|
452 |
|
|
— |
|
|
— |
|
| Gain on extinguishment of debt |
|
— |
|
|
— |
|
|
(10,113) |
|
| Lower of cost or net realizable value inventory adjustments |
|
6,492 |
|
|
— |
|
|
— |
|
|
|
|
|
|
|
|
| Changes in operating assets and liabilities: |
|
|
|
|
|
|
| Trade accounts receivable, net |
|
4,550 |
|
|
8,673 |
|
|
(12,615) |
|
| Other receivables, net |
|
(701) |
|
|
140 |
|
|
589 |
|
|
|
|
|
|
|
|
| Inventory, net |
|
(11,861) |
|
|
(33,283) |
|
|
7,358 |
|
| Other current assets |
|
(3,857) |
|
|
191 |
|
|
(1,974) |
|
| Deferred tax assets, net |
|
(8,471) |
|
|
23,323 |
|
|
(209,075) |
|
Accounts payable, accrued liabilities, and accrued employee
compensation and benefits |
|
1,284 |
|
|
(3,596) |
|
|
13,456 |
|
| Income tax payable |
|
32 |
|
|
(33) |
|
|
42 |
|
| Operating lease liabilities |
|
(1,735) |
|
|
(2,025) |
|
|
(2,508) |
|
| Other liabilities |
|
(858) |
|
|
(28,731) |
|
|
3,366 |
|
| Net cash provided by operating activities |
|
43,229 |
|
|
88,821 |
|
|
79,067 |
|
|
|
|
|
|
|
|
| Cash Flows from Investing Activities: |
|
|
|
|
|
|
| Additions to property, plant, equipment, mineral properties and other assets |
|
(65,060) |
|
|
(68,696) |
|
|
(19,789) |
|
|
|
|
|
|
|
|
| Proceeds from sale of property, plant, equipment, and mineral properties |
|
125 |
|
|
58 |
|
|
6,042 |
|
| Purchase of investments |
|
(1,415) |
|
|
(13,047) |
|
|
(1,076) |
|
| Proceeds from redemptions/maturities of investments |
|
6,000 |
|
|
2,506 |
|
|
— |
|
| Other investing, net |
|
796 |
|
|
— |
|
|
— |
|
| Net cash used in investing activities |
|
(59,554) |
|
|
(79,179) |
|
|
(14,823) |
|
|
|
|
|
|
|
|
| Cash Flows from Financing Activities: |
|
|
|
|
|
|
|
|
|
|
|
|
|
| Repayment of long-term debt |
|
— |
|
|
— |
|
|
(15,000) |
|
| Debt prepayment costs |
|
— |
|
|
— |
|
|
(505) |
|
|
|
|
|
|
|
|
| Proceeds from borrowings on credit facility |
|
9,000 |
|
|
— |
|
|
— |
|
| Repayments of borrowings on credit facility |
|
(5,000) |
|
|
— |
|
|
(29,817) |
|
| Payments of financing lease |
|
(597) |
|
|
— |
|
|
(1,258) |
|
| Capitalized debt costs |
|
— |
|
|
(1,007) |
|
|
— |
|
| Employee tax withholding paid for restricted shares upon vesting |
|
(1,511) |
|
|
(4,795) |
|
|
(791) |
|
| Repurchases of common stock |
|
— |
|
|
(22,012) |
|
|
— |
|
| Proceeds from exercise of stock options |
|
— |
|
|
110 |
|
|
89 |
|
| Net cash provided by (used in) financing activities |
|
1,892 |
|
|
(27,704) |
|
|
(47,282) |
|
|
|
|
|
|
|
|
| Net Change in Cash, Cash Equivalents, and Restricted Cash |
|
(14,433) |
|
|
(18,062) |
|
|
16,962 |
|
| Cash, Cash Equivalents, and Restricted Cash, beginning of period |
|
19,084 |
|
|
37,146 |
|
|
20,184 |
|
| Cash, Cash Equivalents, and Restricted Cash, end of period |
|
$ |
4,651 |
|
|
$ |
19,084 |
|
|
$ |
37,146 |
|
|
|
|
|
|
|
|
| Supplemental disclosure of cash flow information |
|
|
|
|
|
|
| Net cash paid during the period for: |
|
|
|
|
|
|
| Interest |
|
$ |
411 |
|
|
$ |
113 |
|
|
$ |
875 |
|
| Income taxes |
|
$ |
179 |
|
|
$ |
1,015 |
|
|
$ |
193 |
|
| Accrued purchases for property, plant, equipment, and mineral properties |
|
$ |
4,578 |
|
|
$ |
8,532 |
|
|
$ |
2,192 |
|
See accompanying notes to these consolidated financial statements.
INTREPID POTASH, INC.
NOTES TO CONSOLIDATED FINANCIAL STATEMENTS
"Intrepid," "our," "we," or "us" means Intrepid Potash, Inc. and its consolidated subsidiaries.
Note 1— COMPANY BACKGROUND
We are a diversified mineral company that delivers potassium, magnesium, sulfur, salt, and water products essential for customer success in agriculture, animal feed and the oil and gas industry. We are the only U.S. producer of muriate of potash (sometimes referred to as potassium chloride or potash), which is applied as an essential nutrient for healthy crop development, utilized in several industrial applications, and used as an ingredient in animal feed. In addition, we produce a specialty fertilizer, Trio®, which delivers three key nutrients, potassium, magnesium, and sulfate, in a single particle. We also provide water, magnesium chloride, brine and various oilfield products and services.
Our extraction and production operations are conducted entirely in the continental U.S. We produce potash from three solution mining facilities: our HB solution mine in Carlsbad, New Mexico, our solution mine in Moab, Utah and our brine recovery mine in Wendover, Utah. We also operate our North compaction facility in Carlsbad, New Mexico, which compacts and granulates product from the HB mine. We produce Trio® from our conventional underground East mine in Carlsbad, New Mexico.
We have permitted, licensed, declared and partially adjudicated water rights in New Mexico. We sell a portion of water from these water rights to support oil and gas development in the Permian Basin. We continually work to expand water sales.
In May 2019, we acquired certain land, water rights, federal and state grazing leases for cattle, and other related assets from Dinwiddie Cattle Company. We refer to these assets and operations as "Intrepid South." Due to the strategic location of Intrepid South, part of our long-term operating strategy is selling small parcels of land, including restricted use agreements of surface or subsurface rights, to customers, where such sales provide a solution to a customer's operations in the oil and gas industry.
We have three segments: potash, Trio®, and oilfield solutions. We account for the sales of byproducts as revenue in the potash or Trio® segment, based on which segment generates the byproduct. For each of the years ended December 31, 2023, 2022, and 2021, a majority of our byproduct sales were accounted for in the potash segment.
We manage sales and marketing operations centrally. This allows us to evaluate the product needs of our customers and then centrally determine which of our production facilities to use to fill customer orders in a manner designed to realize the highest average net realized sales price per ton. Average net realized sales price per ton is a non-GAAP measure that we calculate for each of potash and Trio® as segment sales less segment byproduct sales and segment freight costs, divided by the number of tons of product sold in the period. We also monitor product inventory levels and overall production costs centrally.
Note 2— SUMMARY OF SIGNIFICANT ACCOUNTING POLICIES
Basis of Presentation—Our consolidated financial statements include our accounts and those of our wholly-owned subsidiaries. All intercompany balances and transactions have been eliminated in consolidation.
Use of Estimates—The preparation of financial statements requires management to make estimates and assumptions that affect the reported amounts of assets and liabilities, the disclosure of contingent assets and liabilities as of the date of the financial statements, and the reported amounts of revenues and expenses during the reporting period. We base our estimates on historical experience and on various other assumptions that are believed to be reasonable under the circumstances. Accordingly, actual results may differ significantly from these estimates under different assumptions or conditions.
Significant estimates include, but are not limited to, those for proven and probable mineral reserves, the related present value of estimated future net cash flows, useful lives of plant assets, asset retirement obligations, normal inventory production levels, inventory valuations, the valuation of equity awards, revenue from products we sell to customers where the price is variable, the valuation of receivables, estimated future net cash flows used in long-lived assets impairment analysis, the related valuation of our long-lived assets, valuation of our deferred tax assets and estimated blended income tax rates utilized in the current and deferred income tax calculations. There are numerous uncertainties inherent in estimating quantities of proven and probable reserves, projecting future rates of production, and the timing of development expenditures. Future mineral prices may vary significantly from the prices in effect at the time the estimates are made, as may estimates of future operating costs.
The estimate of proven and probable mineral reserves, the related present value of estimated future cash flows, and useful lives of plant assets can affect various other items including depletion, the net carrying value of our mineral properties, the useful lives of related property, plant, and equipment, depreciation expense, and estimates associated with recoverability of long-lived assets and asset retirement obligations. Specific to income tax items, we experience fluctuations in the valuation of the deferred tax assets and liabilities due to changing income tax rates and the blend of state tax rates.
Revenue Recognition—We account for revenue in accordance with Accounting Standards Codification ("ASC") Topic 606 Revenue from Contracts with Customers ("ASC 606"). Under ASC 606, we recognize revenue when control of the promised goods or services is transferred to customers in an amount that reflects the consideration we expect to be entitled in exchange for those goods or services.
Performance Obligations: A performance obligation is a promise in a contract to transfer a distinct good or service to the customer and is the unit of account in ASC 606. The contract's transaction price is allocated to the performance obligations and recognized as revenue when the performance obligations are satisfied. Substantially all our contracts are of a short-term nature and contain a single performance obligation because the sale is for one type of product and shipping and handling charges are accounted for as a fulfillment cost and are not considered to be a separate performance obligation. The performance obligation is satisfied when control of the product is transferred to the customer, which typically occurs when we ship mineral products or deliver water from our facility to the customer. We account for substantially all of our revenue from sales to customers at a single point in time.
Contract Estimates: In certain circumstances, we may sell products to customers where the sales price is variable. For variable consideration sales, we estimate the sales price we expect to realize at contract inception based on the facts and circumstances for each sale, including historical experience, and recognize revenue to the extent it is probable that a subsequent change in estimate will not result in a significant revenue reversal compared to the cumulative revenue recognized once the uncertainty is resolved. We update variable consideration estimates at each reporting date for any changes in facts and circumstances and adjust financial information as necessary in the period the change is identified.
Contract Balances: The timing of revenue recognition, billings, and cash collection may result in contract assets or contract liabilities. For certain contracts, the customer has agreed to pay us before we have satisfied our performance obligations. Customer payments received before we have satisfied our performance obligations are accounted for as a contract liability.
Disaggregation of Revenue: We present disaggregation of revenue by products which we believe best depicts how the nature, amount, timing and uncertainty of revenue and cash flows are affected by economic conditions.
Inventory and Long-Term Parts Inventory—Inventory consists of product and byproduct stocks that are ready for sale; mined ore; potash in evaporation ponds, which is considered work-in-process; and parts and supplies inventory. Product and byproduct inventory cost is determined using the lower of weighted average cost or estimated net realizable value and includes direct costs, maintenance, operational overhead, depreciation, depletion, and equipment lease costs applicable to the production process. Direct costs, maintenance, and operational overhead include labor and associated benefits.
We evaluate our production levels and costs to determine if any should be deemed abnormal and therefore excluded from inventory costs and expensed directly during the applicable period. The assessment of normal production levels is judgmental and unique to each period. We model normal production levels and evaluate historical ranges of production by operating plant in assessing what is deemed to be normal. Each production operation typically shuts down periodically for planned maintenance activities. The costs of maintenance turnarounds at our facilities are considered part of production costs and are absorbed into inventory in the period incurred.
Parts inventory, including critical spares not expected to be used within a period of one year is classified as non-current. Parts and supply inventory cost is determined using the lower of average acquisition cost or estimated replacement cost. Detailed reviews are performed related to the net realizable value of parts inventory, giving consideration to quality, slow-moving items, obsolescence, excessive levels, and other factors. Parts inventories that have not turned over in more than a year, excluding parts classified as critical spares, are reviewed for obsolescence and, if deemed appropriate, are included in the determination of an allowance for obsolescence.
Property, Plant, Equipment, Mineral Properties, and Development Costs—Property, plant, and equipment are stated at historical cost. Expenditures for property, plant, and equipment relating to new assets or improvements are capitalized, provided the expenditure extends the useful life of an asset or extends the asset's functionality. Property, plant, and equipment are depreciated under the straight-line method using estimated useful lives. The estimated useful lives of property, plant, and equipment are evaluated periodically as changes in estimates occur. No depreciation is taken on assets classified as construction in progress until the asset is placed into service.
Gains and losses are recorded upon retirement, sale, or disposal of assets. Maintenance and repair costs are recognized as period costs when incurred. Capitalized interest, to the extent of debt outstanding, is calculated and capitalized on assets that are being constructed, drilled, or built or that are otherwise classified as construction in progress.
Mineral properties and development costs, which are referred to collectively as mineral properties, include acquisition costs, the cost of drilling production wells, and the cost of other development work, all of which are capitalized. Exploration costs include geological and geophysical work performed on areas that do not yet have proven and probable reserves declared. These costs are expensed as incurred. Depletion of mineral properties is calculated using the units-of-production method over the estimated life of the relevant ore body. The lives of reserves used for accounting purposes are shorter than current reserve life determinations due to uncertainties inherent in long-term estimates. These reserve life estimates have been prepared by us and reviewed and independently determined by mine consultants. Tons of potash and langbeinite in the proven and probable reserves are expressed in terms of expected finished tons of product to be realized, net of estimated losses. Market price fluctuations of potash or Trio®, as well as increased production costs or reduced recovery rates, could render proven and probable reserves containing relatively lower grades of mineralization uneconomic to exploit and might result in a reduction of reserves. In addition, the provisions of our mineral leases, including royalty provisions, are subject to periodic readjustment by the state and federal government, which could affect the economics of our reserve estimates. Significant changes in the estimated reserves could have a material impact on our results of operations and financial position.
Recoverability of Long-Lived Assets—We evaluate our long-lived assets for impairment when events or changes in circumstances indicate that the related carrying amount may not be recoverable. An impairment is potentially considered to exist if an asset group's total estimated net future cash flows on an undiscounted basis are less than the carrying amount of the related asset. An impairment loss is measured and recorded based on the excess of the carrying amount of long-lived assets over its estimated fair value. Changes in significant assumptions underlying future cash flow estimates or fair values of asset groups may have a material effect on our financial position and results of operations. Sales price is a significant element of any cash flow estimate, particularly for higher cost operations. Other assumptions we estimate include, among other things, the economic life of the asset, sales volume, inflation, raw materials costs, cost of capital, tax rates, and capital spending.
Factors we generally will consider important and which could trigger an impairment review of the carrying value of long-lived assets include the following:
•significant underperformance relative to expected operating results or operating losses
•significant changes in the manner of use of assets or the strategy for our overall business
•the denial or delay of necessary permits or approvals that would affect the utilization of our tangible assets
•underutilization of our tangible assets
•discontinuance of certain products by us or our customers
•a decrease in estimated mineral reserves
•significant negative industry or economic trends
Intangible Assets—Water rights are accounted for as indefinite-lived intangible assets. We test indefinite-lived intangible assets for impairment at least annually on October 1, and more frequently if circumstances require. We use a qualitative assessment to determine whether it is more likely than not that the fair value of the unamortized intangible asset is less than its carrying value. If our qualitative assessment indicates it is more likely than not that the fair value of the unamortized assets is less than its carrying value, we estimate the fair value of the unamortized asset and record an impairment loss based on the excess of the carrying amount of the unamortized intangible asset over its estimated fair value. Fair value is estimated using quoted market prices, if available. If quoted market prices are not available, the estimated fair value is based on various valuation techniques, including the discounted value of estimated future cash flows. Changes in significant assumptions underlying fair value estimates may have a material effect on our financial position and results of operations.
We also have finite-lived intangible assets consisting of contractual agreements. These intangible assets are amortized over the period of estimated benefit using the straight-line method. No significant residual value is estimated for our finite-lived intangible assets. We estimate the useful life of intangible assets considering various factors, including but not limited to, the expected use of the asset, the expected life of other assets the intangible asset may relate, any legal, regulatory, contractual provisions, or relevant economic factors that may limit the use of the intangible asset. We evaluate the remaining useful lives of intangible assets each reporting period to determine if a revision to the asset's remaining life is necessary. Changes in significant assumptions underlying useful lives may have a material effect on our financial position and results of operations.
We evaluate our finite-lived intangible assets for impairment when events or changes in circumstances indicate that the related carrying amount may not be recoverable. Such circumstances may include but are not limited to (1) significant adverse changes in the manner the asset is used, or (2) significant adverse changes in legal factors or economic conditions, including adverse actions by regulatory authorities.
Asset Retirement Obligations—Reclamation costs are initially recorded as a liability associated with the asset to be reclaimed or abandoned, based on applicable inflation assumptions and discount rates. The accretion of this discounted liability is recognized as expense over the life of the related assets, and the liability is periodically adjusted to reflect changes in the estimates of either the timing or amount of the reclamation and abandonment costs.
Leases—We determine if an arrangement is a lease or contains a lease at inception. Operating and finance lease liabilities are recognized based on the present value of the remaining lease payments, discounted using the discount rate for the lease at the commencement date. If readily determinable, we use the implicit rate in the lease to determine the present value of future lease payments. If the implicit rate is not readily determinable, we use an incremental borrowing rate based on information available at the commencement date to determine the present value of future lease payments. Operating right-of-use ("ROU") assets and finance lease assets are generally recognized based on the amount of the initial measurement of the lease liability. Lease expense for operating lease payments is recognized on a straight-line basis over the lease term. For finance leases, interest expense is recognized on the lease liability and the ROU asset is amortized over the lease term. We account for lease and non-lease components as a single lease component, and we do not apply the requirements of ASC Topic 842 to short-term leases with a term of one year or less at inception.
Income Taxes—We are a subchapter C corporation and, therefore, are subject to U.S. federal and state income taxes. We recognize income taxes under the asset and liability method. Deferred tax assets and liabilities are recognized for the estimated future tax consequences attributable to differences between the financial statement carrying amounts of assets and liabilities and their respective tax bases. Deferred tax assets and liabilities are measured using the enacted tax rates expected to apply to taxable income in the periods in which the deferred tax liability or asset is expected to be settled or realized. We record a valuation allowance if it is deemed more likely than not that our deferred income tax assets will not be realized in full. These determinations are subject to ongoing assessment.
Cash and Cash Equivalents and Investments—Cash and cash equivalents consist of cash and liquid investments with an original maturity of three months or less.
We classify our investments in debt securities, which include U.S treasury and government agency obligations, and corporate bonds and notes, as held-to-maturity investments because we have the intent and ability to hold these investments to maturity. Our held to maturity investments are carried at amortized cost.
We use the equity method of accounting for investments in limited partnerships where we own more than 3% of the limited partnership, as required by the Securities and Exchange Commission. Under this method of accounting, we record our share of the net earnings or losses of the investee in the "Other Income (Expense)" section of our Consolidated Statements of Operations.
We record equity investments without a readily determinable fair value using the measurement alternative of cost, with adjustments for observable changes in prices resulting from orderly transactions for the identical or similar investments of the same issuer, or impairment.
Fair Value of Financial Instruments—Our financial instruments include cash and cash equivalents, restricted cash, accounts receivable, refundable income taxes, accounts payable and current accrued liabilities. These instruments are carried at cost, which approximates fair value due to the short-term maturities of the instruments. Allowances for doubtful accounts are recorded against the accounts receivable balance to estimate net realizable value. Amounts outstanding under our secured credit facility are carried at cost, which approximates fair value, due to the short-term nature of the borrowings.
Earnings per Share—Basic net income or loss per common share of stock is calculated by dividing net income or loss available to common stockholders by the weighted average basic common shares outstanding for the respective period.
Diluted net income per common share of stock is calculated by dividing net income by the weighted average diluted common shares outstanding, which includes the effect of potentially dilutive securities. Potentially dilutive securities for the diluted earnings or loss per share calculation consist of awards of restricted shares, performance units, and non‑qualified stock options. The dilutive effect of stock-based compensation arrangements is computed using the treasury‑stock method. Following the lapse of the vesting period of restricted shares, the shares are considered issued and therefore are included in the number of issued and outstanding shares for purposes of these calculations. When we report a net loss, all potentially dilutive securities are considered anti-dilutive and are excluded from the dilutive loss per share calculation.
Treasury Stock —Repurchases of our common stock are accounted for at cost and are recorded as treasury stock.
Stock‑Based Compensation—We account for stock-based compensation by recording expense using the fair value of the awards at the time of grant. We have recorded compensation expense associated with the issuance of restricted shares, performance units, and non-qualified stock options, all of which are subject to service conditions and in some cases subject to operational performance or market-based conditions. We recognize expense associated with such awards over the service period associated with each grant. For awards with service only conditions we recognize expense using the straight-line recognition method over the requisite service period of the award, which is generally the vesting period of the award. We recognize expense for awards with service and operational performance conditions using the accelerated recognition method over the requisite service period of the award, which is generally the vesting period of the award. We recognize expense associated with awards that contain both a service condition and a market condition using the accelerated recognition method over the requisite service period of the award, which is generally the longer of the explicit service period or the derived service period (expected date the market condition is estimated to be achieved).
Recently Adopted Accounting Standards—In June 2016, the Financial Accounting Standards Board ("FASB") issued Accounting Standards Update ("ASU") No. 2016-13, as amended by ASU No. 2019-04 and ASU No. 2019-10, Financial Instruments - (Topic 326): Measurement of Credit Losses on Financial Instruments ("ASC Topic 326"), which we adopted on January 1, 2020. ASC Topic 326 changed the way entities recognized impairment of many financial assets by requiring immediate recognition of estimated credit losses expected to occur over their remaining life. Because our trade receivables are short-term in nature, the adoption of this new standard did not have a material impact on our consolidated financial statements.
In December 2019, the FASB issued ASU 2019-12, Income Taxes (Topic 740): Simplifying the Accounting for Income Taxes, which simplifies the accounting for income taxes by removing certain exceptions to the general principles in Topic 740 and amending existing guidance to improve consistent application. The adoption of this standard did not have a material impact on our consolidated financial statements.
Pronouncements Issued But Not Yet Adopted—In December 2023, the FASB issued ASU 2023-09, "Income Taxes (Topic 740): Improvements to Income Tax Disclosures" ("ASU 2023-09"). ASU 2023-09 requires that an entity disclose specific categories in the effective tax rate reconciliation as well as provide additional information for reconciling items that meet a quantitative threshold, certain disclosures of state versus federal income tax expenses and taxes paid. ASC 2023-09 is effective for fiscal years beginning after December 15, 2024. We are currently evaluating the guidance and expect it to only impact disclosures with no impact to results of operations, cash flows and financial condition.
In November 2023, the FASB issued ASU 2023-07, "Segment Reporting (Topic 280): Improvements to Reportable Segment Disclosures" ("ASU 2023-07"). This new guidance: (i) introduces a requirement to disclose significant segment expenses regularly provided to the chief operating decision maker ("CODM"), (ii) extends certain annual disclosures to interim periods, (iii) clarifies disclosure requirements for single reportable segment entities, (iv) permits more than one measure of segment profit or loss to be reported under certain conditions, and (v) requires disclosure of the title and position of the CODM. The standard is effective for fiscal years beginning after December 15, 2023, and interim periods within fiscal years beginning after December 15, 2024. Early adoption is permitted. The guidance applies retrospectively to all periods presented in the financial statements. We are currently evaluating the guidance and expect it to only impact disclosures with no impact to results of operations, cash flows and financial condition.
Note 3— EARNINGS PER SHARE
Basic earnings per share is computed by dividing net income or loss by the weighted-average number of shares of common stock outstanding during the period. For purposes of determining diluted earnings per share, basic weighted-average common shares outstanding is adjusted to include potentially dilutive securities, including restricted stock, stock options, and performance units. The treasury-stock method is used to measure the dilutive impact of potentially dilutive shares. Potentially dilutive shares are excluded from the diluted weighted-average shares outstanding computation in periods in which they have an anti-dilutive effect. The following table shows the calculation of basic and diluted earnings (loss) per share (in thousands, except per share amounts):
|
|
|
|
|
|
|
|
|
|
|
|
|
|
|
|
|
|
|
|
|
|
|
Year Ended December 31, |
|
|
2023 |
|
2022 |
|
2021 |
| Net (loss) income |
|
$ |
(35,673) |
|
|
$ |
72,220 |
|
|
$ |
249,834 |
|
|
|
|
|
|
|
|
| Basic weighted average common shares outstanding |
|
12,761 |
|
|
13,152 |
|
|
13,099 |
|
| Add: Dilutive effect restricted common stock |
|
— |
|
|
191 |
|
|
221 |
|
| Add: Dilutive effect of stock options outstanding |
|
— |
|
|
109 |
|
|
71 |
|
|
|
|
|
|
|
|
| Diluted weighted average common shares outstanding |
|
12,761 |
|
|
13,452 |
|
|
13,391 |
|
|
|
|
|
|
|
|
| (Loss) earnings per share: |
|
|
|
|
|
|
| Basic |
|
$ |
(2.80) |
|
|
$ |
5.49 |
|
|
$ |
19.07 |
|
| Diluted |
|
$ |
(2.80) |
|
|
$ |
5.37 |
|
|
$ |
18.66 |
|
The following table shows anti-dilutive shares excluded from the calculation of diluted earnings (loss) per share (in thousands):
|
|
|
|
|
|
|
|
|
|
|
|
|
|
|
|
|
|
|
|
|
|
|
Year Ended December 31, |
|
|
2023 |
|
2022 |
|
2021 |
| Anti-dilutive effect of restricted shares |
|
348 |
|
|
63 |
|
|
57 |
|
| Anti-dilutive effect of stock options outstanding |
|
273 |
|
|
— |
|
|
156 |
|
|
|
|
|
|
|
|
Note 4— CASH, CASH EQUIVALENTS AND RESTRICTED CASH
Total cash, cash equivalents and restricted cash, as shown on the consolidated statements of cash flows are included in the following accounts at December 31, 2023, 2022, and 2021 (in thousands):
|
|
|
|
|
|
|
|
|
|
|
|
|
|
|
|
|
|
|
Year Ended December 31, |
|
2023 |
|
2022 |
|
2021 |
| Cash and cash equivalents |
$ |
4,071 |
|
|
$ |
18,514 |
|
|
$ |
36,452 |
|
| Restricted cash included in "Other current assets" |
25 |
|
|
25 |
|
|
175 |
|
| Restricted cash included in "Other assets, net" |
555 |
|
|
545 |
|
|
519 |
|
| Total cash, cash equivalents, and restricted cash shown in the statement of cash flows |
$ |
4,651 |
|
|
$ |
19,084 |
|
|
$ |
37,146 |
|
Restricted cash included in "Other assets, net" on the balance sheet at December 31, 2023, 2022, and 2021 represents amounts whose use is restricted by contractual agreements with the BLM or the State of Utah as security to fund future reclamation obligations at our sites. Restricted cash included in "Other current assets" on the balance sheet at December 31, 2023 and 2022 represents cash deposits with supply vendors.
Note 5— INVENTORY AND LONG-TERM PARTS INVENTORY
The following summarizes our inventory, recorded at the lower of weighted average cost or estimated net realizable value as of December 31, 2023, and 2022, respectively (in thousands):
|
|
|
|
|
|
|
|
|
|
|
|
|
|
|
|
|
December 31, |
|
|
2023 |
|
2022 |
| Finished goods product inventory |
|
$ |
66,033 |
|
|
$ |
74,777 |
|
| In-process inventory |
|
28,044 |
|
|
24,767 |
|
| Total product inventory |
|
94,077 |
|
|
99,544 |
|
| Current parts inventory, net |
|
20,175 |
|
|
15,272 |
|
| Total current inventory, net |
|
114,252 |
|
|
114,816 |
|
| Long-term parts inventory, net |
|
30,231 |
|
|
24,823 |
|
| Total inventory, net |
|
$ |
144,483 |
|
|
$ |
139,639 |
|
During the year ended December 31, 2023, we recorded $6.5 million in charges for lower of weighted average cost or estimated net realizable value on our finished goods product inventory. During the years ended December 31, 2022 and 2021, we recorded no charges for lower of weighted average cost or estimated net realizable value on our finished goods product inventory.
Parts inventories are shown net of any required allowances. During the years ended December 31, 2023, 2022, and 2021, we recorded reserves for obsolete parts inventory of $0.5 million, $1.8 million and $2.1 million, respectively.
Note 6— PROPERTY, PLANT, EQUIPMENT, AND MINERAL PROPERTIES
"Property, plant, equipment, and mineral properties, net" were comprised of the following (in thousands):
|
|
|
|
|
|
|
|
|
|
|
|
|
|
|
|
|
|
|
|
|
December 31, |
|
|
|
|
2023 |
|
2022 |
|
|
|
|
| Land |
|
$ |
24,136 |
|
|
$ |
24,136 |
|
|
|
|
|
| Ponds and land improvements |
|
91,333 |
|
|
73,501 |
|
|
|
|
|
| Mineral properties and development costs |
|
159,775 |
|
|
146,333 |
|
|
|
|
|
| Buildings and plant |
|
90,150 |
|
|
89,014 |
|
|
|
|
|
| Machinery and equipment |
|
297,494 |
|
|
288,345 |
|
|
|
|
|
| Vehicles |
|
7,332 |
|
|
7,399 |
|
|
|
|
|
| Office equipment and leasehold improvements |
|
10,150 |
|
|
10,436 |
|
|
|
|
|
| Operating lease ROU assets |
|
5,274 |
|
|
5,908 |
|
|
|
|
|
| Breeding stock |
|
315 |
|
|
329 |
|
|
|
|
|
| Construction in progress |
|
23,942 |
|
|
47,188 |
|
|
|
|
|
| Total property, plant, equipment, and mineral properties, gross |
|
$ |
709,901 |
|
|
$ |
692,589 |
|
|
|
|
|
| Less: accumulated depreciation, depletion, and amortization |
|
(351,652) |
|
|
(316,959) |
|
|
|
|
|
| Total property, plant, equipment, and mineral properties, net |
|
$ |
358,249 |
|
|
$ |
375,630 |
|
|
|
|
|
We incurred the following expenses for depreciation, depletion, and amortization of ROU assets, including expenses capitalized into inventory, for the following periods (in thousands):
|
|
|
|
|
|
|
|
|
|
|
|
|
|
|
|
|
|
|
|
|
|
|
Year Ended December 31, |
|
|
2023 |
|
2022 |
|
2021 |
| Depreciation |
|
$ |
34,307 |
|
|
$ |
29,805 |
|
|
$ |
29,447 |
|
| Depletion |
|
3,190 |
|
|
3,168 |
|
|
3,979 |
|
| Amortization of ROU assets |
|
1,581 |
|
|
1,738 |
|
|
2,209 |
|
| Total incurred |
|
$ |
39,078 |
|
|
$ |
34,711 |
|
|
$ |
35,635 |
|
During the year ended December 31, 2023, we recorded total impairment charges of $43.3 million, as discussed in more detail below. During the year ended December 31, 2022, we recorded no impairment charges.
In the fourth quarter of 2023, given the decrease in our gross margin for our Trio® segment we determined that sufficient indicators of potential impairment of our Trio® segment long-lived assets existed. We performed a recoverability test and determined that the carrying value of our Trio® segment long-lived assets was not recoverable. We engaged a third-party valuation firm to determine the fair value of our Trio® segment assets. The fair value of our Trio® segment assets was primarily determined using the expected proceeds received in an orderly sale of the individual assets. The carrying value of our Trio® segment asset group exceeded its fair value, and we recorded an impairment charge of $31.9 million.
Our long-lived assets at our West facility have been in care and maintenance since July 2016. Given the length of time since the assets were placed in care and maintenance, we engaged a third-party valuation firm to determine if the fair value of the West assets supports the carrying value of those assets. The fair value of the West assets was determined using the expected proceeds received in an orderly sale of the individual assets. The carrying value of the West assets exceeded the fair value and we recorded an impairment charge of $9.9 million during the fourth quarter of 2023.
Finally, during 2023, we recorded impairment charges of $1.5 million related to certain assets in our Oilfield Solutions Segment, specifically certain water recycling equipment and an investment in a non-operating interest in an oil and gas investment.
Note 7— LEASES
We determine if an arrangement is a lease or contains a lease at inception. We have operating leases for mining equipment, trucks, rail cars, and office space. Our operating leases have remaining leases terms ranging from less than one year to four years. Our finance leases have remaining terms ranging from less than one year to five years. Leases recorded on the balance sheet consist of the following (amounts in thousands):
|
|
|
|
|
|
|
|
|
|
|
|
|
|
|
|
|
|
|
|
|
| Leases |
|
Classification on the Balance Sheet |
|
Balance, December 31, 2023 |
|
Balance, December 31, 2022 |
| Assets |
|
|
|
|
|
|
| Operating lease ROU assets, net |
|
Property, plant, equipment, and mineral properties, net |
|
$ |
2,031 |
|
|
$ |
3,663 |
|
| Finance lease ROU assets, net |
|
Property, plant, equipment, and mineral properties, net |
|
$ |
2,609 |
|
|
$ |
— |
|
| Liabilities |
|
|
|
|
|
|
| Current operating lease liabilities |
|
Other current liabilities |
|
$ |
1,387 |
|
|
$ |
1,608 |
|
| Current finance lease liability |
|
Other current liabilities |
|
$ |
961 |
|
|
$ |
— |
|
| Non-current operating lease liabilities |
|
Operating lease liabilities |
|
$ |
741 |
|
|
$ |
2,206 |
|
| Non-current finance lease liabilities |
|
Finance lease liabilities |
|
$ |
1,451 |
|
|
$ |
— |
|
|
|
|
|
|
|
|
Other information related to lease term and discount rate is as follows:
|
|
|
|
|
|
|
|
|
|
|
|
|
|
|
|
|
December 31, 2023 |
|
December 31, 2022 |
| Weighted average remaining lease term - operating leases |
|
1.7 years |
|
2.5 years |
| Weighted average remaining lease term - finance leases |
|
2.3 years |
|
0.0 years |
|
|
|
|
|
| Weighted average discount rate - operating leases |
|
5.7 |
% |
|
5.4 |
% |
| Weighted average discount rate - finance leases |
|
8.5 |
% |
|
— |
% |
The components of lease expense are as follows (amounts in thousands):
|
|
|
|
|
|
|
|
|
|
|
|
|
|
|
|
|
|
|
|
|
|
|
For the Year Ended December 31, 2023 |
|
For the Year Ended December 31, 2022 |
|
For the Year Ended December 31, 2021 |
| Operating lease expense |
|
$ |
1,667 |
|
|
$ |
1,904 |
|
|
$ |
2,370 |
|
| Short-term lease expense |
|
122 |
|
|
150 |
|
|
122 |
|
| Total lease expense |
|
$ |
1,789 |
|
|
$ |
2,054 |
|
|
$ |
2,492 |
|
Supplemental cash flow information related to leases was as follows (amounts in thousands):
|
|
|
|
|
|
|
|
|
|
|
|
|
|
|
|
|
For the Year Ended December 31, 2023 |
|
For the Year Ended December 31, 2022 |
| Cash paid for amounts included in the measurement of lease liabilities |
|
|
|
|
| Operating cash flows from operating leases |
|
$ |
1,724 |
|
|
$ |
1,889 |
|
| Operating cash flows from finance leases |
|
139 |
|
|
— |
|
| Financing cash flows from finance leases |
|
597 |
|
|
— |
|
|
|
|
|
|
| Right-of-Use Assets exchanged for new operating lease liabilities |
|
48 |
|
|
2,305 |
|
| Right-of-Use Assets exchanged for new finance lease liabilities |
|
3,009 |
|
|
— |
|
As of December 31, 2023, maturities of lease liabilities are summarized as follows (amounts in thousands):
|
|
|
|
|
|
|
|
|
|
|
|
|
|
|
|
|
|
|
|
|
| Years Ending December 31, |
|
Operating Leases |
|
Finance Leases |
|
Total |
| 2024 |
|
$ |
1,471 |
|
|
$ |
1,104 |
|
|
$ |
2,575 |
|
| 2025 |
|
618 |
|
|
810 |
|
|
1,428 |
|
| 2026 |
|
114 |
|
|
644 |
|
|
758 |
|
| 2027 |
|
40 |
|
|
67 |
|
|
107 |
|
| 2028 |
|
— |
|
|
39 |
|
|
39 |
|
|
|
|
|
|
|
|
| Total future minimum lease payments |
|
$ |
2,243 |
|
|
2,664 |
|
|
4,907 |
|
| Less - amount representing interest |
|
115 |
|
|
252 |
|
|
367 |
|
| Present value of future minimum lease payments |
|
$ |
2,128 |
|
|
2,412 |
|
|
4,540 |
|
| Less - current lease obligations |
|
1,387 |
|
|
961 |
|
|
2,348 |
|
| Long-term lease obligations |
|
$ |
741 |
|
|
$ |
1,451 |
|
|
$ |
2,192 |
|
Note 8— INTANGIBLE ASSETS
We have water rights, recorded at $19.2 million at December 31, 2023, and 2022. Our water rights have indefinite lives and are not amortized. We evaluate our water rights at least annually as of October 1 for impairment, or more frequently if circumstances require.
We have other intangible assets recorded at $6.4 million as of December 31, 2023 and 2022. We account for the other intangible assets as finite-lived intangible assets and amortize those intangible assets over the period of estimated benefit, using the straight-line method. As of December 31, 2023, the weighted-average remaining amortization period for the other intangible assets was 15.3 years. These intangible assets are included in "Other assets, net" on the consolidated balance sheets.
As of December 31, 2023, and December 31, 2022, we have the following amounts recorded for intangible assets (amounts in thousands):
|
|
|
|
|
|
|
|
|
|
|
|
|
|
|
|
|
|
|
|
|
|
|
|
|
|
|
|
|
|
|
|
|
December 31, 2023 |
|
December 31, 2022 |
|
|
| Finite-lived intangible assets: |
|
Gross Carrying Amount |
|
Accumulated Amortization |
|
Gross Carrying Amount |
|
Accumulated Amortization |
|
|
|
|
Produced water disposal royalty agreements |
|
$ |
2,694 |
|
|
$ |
(630) |
|
|
$ |
2,694 |
|
|
$ |
(495) |
|
|
|
|
|
Surface damage and easement agreements |
|
3,723 |
|
|
(871) |
|
|
3,723 |
|
|
(685) |
|
|
|
|
|
Total |
|
$ |
6,417 |
|
|
$ |
(1,501) |
|
|
$ |
6,417 |
|
|
$ |
(1,180) |
|
|
|
|
|
|
|
|
|
|
|
|
|
|
|
|
|
|
| Indefinite-lived intangible assets: |
|
|
|
|
|
|
|
|
|
|
|
|
Water rights |
|
$ |
19,184 |
|
|
|
|
$ |
19,184 |
|
|
|
|
|
|
|
Total amortization of intangible assets for the years ended December 31, 2023, 2022, and 2021 was $0.3 million. We estimate the annual amortization expense of intangible assets will be $0.3 million for each of the next five years.
Note 9— DEBT
Credit Facility—In August 2022, we and certain of our subsidiaries entered into the Second Amended and Restated Credit Agreement with a syndicate of lenders with the Bank of Montreal, as administrative agent, which provides for a revolving credit facility. The agreement amended our existing revolving credit facility to, among other things, increase the amount available under the facility from $75 million to $150 million, extend the maturity date to August 4, 2027, and transition from LIBOR (London Interbank Offered Rate) to SOFR (Secured Overnight Financing Rate) as a reference rate for borrowings under the credit agreement. Borrowings under the amended credit facility bear interest at SOFR plus an applicable margin of 1.50% to 2.25% per annum, based on our leverage ratio as calculated in accordance with the amended agreement governing the revolving credit facility. Borrowings under the revolving credit facility are secured by substantially all of our current and non-current assets, and the obligations under the credit facility are unconditionally guaranteed by several of our subsidiaries.
We occasionally borrow and repay amounts under the facility for near-term working capital needs or other purposes and may do so in the future. For the year ended December 31, 2023, we made $9.0 million in borrowings and made $5.0 million in repayments under the facility. For the year ended December 31, 2022, we made no borrowings and made no repayments under the facility. For the year ended December 31, 2021, we made no borrowings and made $29.8 million in repayments under the facility. As of December 31, 2023, we had $4.0 million in borrowings outstanding and no outstanding letters of credit under the facility. As of December 31, 2022, and 2021, we had no borrowings outstanding and $1.0 million in an outstanding letter of credit under the facility. We had $146.0 million available under the facility as of December 31, 2023.
We were in compliance with the applicable covenants under the facility as of December 31, 2023.
PPP Loan—In April 2020, we received a $10 million loan under the CARES Act Paycheck Protection Program (the "PPP"). We submitted our application for forgiveness of the full amount of the loan in November 2020. In June 2021, we received notice that the SBA had remitted funds to our bank to fully repay our PPP loan and accrued interest. Accordingly, we recognized a gain of $10.1 million related to the forgiveness of the PPP loan and the associated accrued interest on the loan.
Senior Notes—In June 2021 we repaid the remaining $15.0 million of principal outstanding on our Series B Senior Notes and satisfied all obligations under the related Note Purchase Agreement. In connection with this repayment, the Company paid in aggregate approximately $15.6 million, which consisted of (i) $15.0 million of remaining aggregate principal amount of Series B Senior Notes, (ii) approximately $0.1 million of accrued interest and (iii) a "make-whole" premium of $0.5 million. As a result of the repayment, the Note Purchase Agreement was terminated.
Interest Expense—Interest expense is recorded net of any capitalized interest associated with investments in capital projects. We incurred gross interest expense of $0.8 million, $0.4 million, and $1.5 million for the years ended December 31, 2023, 2022, and 2021, respectively.
Amounts included in interest expense for the years ended December 31, 2023, 2022, and 2021 (in thousands) are as follows:
|
|
|
|
|
|
|
|
|
|
|
|
|
|
|
|
|
|
|
|
Year ended December 31, |
|
2023 |
|
2022 |
|
2021 |
|
| Interest expense on borrowings |
$ |
275 |
|
|
$ |
— |
|
|
$ |
654 |
|
|
| Commitment fee on unused credit facility |
226 |
|
|
155 |
|
|
70 |
|
|
| Make-whole payments |
— |
|
|
— |
|
|
505 |
|
|
| Amortization of deferred financing costs |
301 |
|
|
265 |
|
|
314 |
|
|
| Gross interest expense |
802 |
|
|
420 |
|
|
1,543 |
|
|
| Less capitalized interest |
802 |
|
|
319 |
|
|
75 |
|
|
| Interest expense, net |
$ |
— |
|
|
$ |
101 |
|
|
$ |
1,468 |
|
|
Note 10— ASSET RETIREMENT OBLIGATION
We recognize an estimated liability for future costs associated with the closure and reclamation of our mining properties. A liability for the fair value of an asset retirement obligation and a corresponding increase to the carrying value of the related long-lived asset are recorded as the mining operations occur or the assets are acquired.
Our asset retirement obligation is based on the estimated cost to close and reclaim the mining operations, the economic life of the properties, and federal and state regulatory requirements. The liability is discounted using credit adjusted risk-free rate estimates at the time the liability is incurred or when there are upward revisions to estimated costs. The credit adjusted risk-free rates used to discount our abandonment liabilities range from 6.9% to 12.0%. Revisions to the liability occur due to construction of new or expanded facilities, changes in estimated abandonment costs or economic lives, changes in the estimated timing of the reclamation activities or if federal or state regulators enact new requirements regarding the abandonment or reclamation of mines.
Following is a table of the changes to our asset retirement obligations for the following periods (in thousands):
|
|
|
|
|
|
|
|
|
|
|
|
|
|
|
|
|
|
|
|
|
|
|
Year Ended December 31, |
|
|
2023 |
|
2022 |
|
2021 |
| Asset retirement obligation, at beginning of period |
|
$ |
26,864 |
|
|
$ |
27,024 |
|
|
$ |
23,872 |
|
| Liabilities settled |
|
(197) |
|
|
(1,533) |
|
|
— |
|
| Liabilities incurred |
|
— |
|
|
297 |
|
|
— |
|
| Changes in estimated obligations |
|
1,552 |
|
|
(885) |
|
|
1,294 |
|
| Accretion of discount |
|
2,140 |
|
|
1,961 |
|
|
1,858 |
|
| Total asset retirement obligation, at end of period |
|
$ |
30,359 |
|
|
$ |
26,864 |
|
|
$ |
27,024 |
|
| Less current portion of asset retirement obligation |
|
$ |
(282) |
|
|
$ |
(300) |
|
|
$ |
— |
|
| Long-term portion of asset retirement obligation |
|
$ |
30,077 |
|
|
$ |
26,564 |
|
|
$ |
27,024 |
|
We estimate approximately $7.8 million in asset retirement payments may occur in the next five years.
Note 11— REVENUE
Revenue Recognition—Under ASC 606, we recognize revenue when control of the promised goods or services is transferred to customers in an amount that reflects the consideration we expect to be entitled in exchange for those goods or services.
Contract Balances—As of December 31, 2023, and 2022, we had $2.3 million and $2.4 million of contract liabilities, respectively, of which $1.0 million and $0.9 million were current as of December 31, 2023 and 2022, respectively, and included in "Other current liabilities" on the consolidated balance sheets. Customer advances received before we have satisfied our performance obligations are accounted for as a contract liability (sometimes referred to in practice as deferred revenue).
As of December 31, 2021, our contract liability balance primarily consisted of prepayments from a customer for future water deliveries under the terms of a water sales agreement. In August 2022, our customer notified us that they were terminating the water sales agreement and in September 2022 we refunded the customer's prepayment balance of $32.6 million. See Note 14—Commitments and Contingencies below for additional information regarding our water rights and repayment of the customer's prepayment balance.
Our contract liability activity for the years ended December 31, 2023, 2022, and 2021 is shown below (in thousands):
|
|
|
|
|
|
|
|
|
|
|
|
|
|
|
|
|
|
|
|
|
|
|
Year Ended December 31, |
|
|
2023 |
|
2022 |
|
2021 |
| Beginning balance |
|
$ |
2,374 |
|
|
$ |
33,788 |
|
|
$ |
30,419 |
|
| Additions |
|
1,030 |
|
|
1,823 |
|
|
4,310 |
|
| Refund of prepayments |
|
— |
|
|
(32,579) |
|
|
— |
|
| Recognized as revenue during period from the beginning balance |
|
(1,101) |
|
|
(658) |
|
|
(941) |
|
| Ending balance |
|
$ |
2,303 |
|
|
$ |
2,374 |
|
|
$ |
33,788 |
|
Disaggregation of Revenue—The table below shows the disaggregation of revenue by product and reconciles disaggregated revenue to segment revenue for the years ended December 31, 2023, 2022, and 2021. We believe the disaggregation of revenue by products best depicts how the nature, amount, timing and uncertainty of revenue and cash flows are affected by economic conditions (in thousands):
|
|
|
|
|
|
|
|
|
|
|
|
|
|
|
|
|
|
|
|
|
|
|
|
|
|
|
|
|
|
|
|
|
|
|
Year Ended December 31, 2023 |
| Product |
|
Potash Segment |
|
Trio® Segment |
|
Oilfield Solutions Segment |
|
Intersegment Eliminations |
|
Total |
| Potash |
|
$ |
131,206 |
|
|
$ |
— |
|
|
$ |
— |
|
|
$ |
(329) |
|
|
$ |
130,877 |
|
Trio® |
|
— |
|
|
96,344 |
|
|
— |
|
|
— |
|
|
96,344 |
|
| Water |
|
297 |
|
|
5,316 |
|
|
9,569 |
|
|
— |
|
|
15,182 |
|
| Salt |
|
11,973 |
|
|
522 |
|
|
— |
|
|
— |
|
|
12,495 |
|
| Magnesium Chloride |
|
8,161 |
|
|
— |
|
|
— |
|
|
— |
|
|
8,161 |
|
| Brines |
|
4,283 |
|
|
— |
|
|
4,056 |
|
|
— |
|
|
8,339 |
|
| Other |
|
— |
|
|
— |
|
|
7,685 |
|
|
— |
|
|
7,685 |
|
| Total Revenue |
|
$ |
155,920 |
|
|
$ |
102,182 |
|
|
$ |
21,310 |
|
|
$ |
(329) |
|
|
$ |
279,083 |
|
|
|
|
|
|
|
|
|
|
|
|
|
|
|
|
|
|
|
|
|
|
|
|
|
|
|
|
|
|
|
|
|
|
|
|
Year Ended December 31, 2022 |
| Product |
|
Potash Segment |
|
Trio® Segment |
|
Oilfield Solutions Segment |
|
Intersegment Eliminations |
|
Total |
| Potash |
|
$ |
168,571 |
|
|
$ |
— |
|
|
$ |
— |
|
|
$ |
(304) |
|
|
$ |
168,267 |
|
Trio® |
|
— |
|
|
113,962 |
|
|
— |
|
|
— |
|
|
113,962 |
|
| Water |
|
1,637 |
|
|
3,302 |
|
|
17,510 |
|
|
— |
|
|
22,449 |
|
| Salt |
|
11,270 |
|
|
562 |
|
|
— |
|
|
— |
|
|
11,832 |
|
| Magnesium Chloride |
|
6,472 |
|
|
— |
|
|
— |
|
|
— |
|
|
6,472 |
|
| Brines |
|
3,428 |
|
|
— |
|
|
2,670 |
|
|
— |
|
|
6,098 |
|
| Other |
|
— |
|
|
— |
|
|
8,488 |
|
|
— |
|
|
8,488 |
|
| Total Revenue |
|
$ |
191,378 |
|
|
$ |
117,826 |
|
|
$ |
28,668 |
|
|
$ |
(304) |
|
|
$ |
337,568 |
|
|
|
|
|
|
|
|
|
|
|
|
|
|
|
|
|
|
|
|
|
|
|
|
|
|
|
|
|
|
|
|
|
|
|
|
Year Ended December 31, 2021 |
| Product |
|
Potash Segment |
|
Trio® Segment |
|
Oilfield Solutions Segment |
|
Intersegment Eliminations |
|
Total |
| Potash |
|
$ |
130,460 |
|
|
$ |
— |
|
|
$ |
— |
|
|
$ |
(247) |
|
|
$ |
130,213 |
|
Trio® |
|
— |
|
|
91,125 |
|
|
— |
|
|
— |
|
|
91,125 |
|
| Water |
|
2,050 |
|
|
4,355 |
|
|
15,594 |
|
|
— |
|
|
21,999 |
|
| Salt |
|
9,592 |
|
|
578 |
|
|
— |
|
|
— |
|
|
10,170 |
|
| Magnesium Chloride |
|
7,847 |
|
|
— |
|
|
— |
|
|
— |
|
|
7,847 |
|
| Brines |
|
1,802 |
|
|
— |
|
|
1,129 |
|
|
— |
|
|
2,931 |
|
| Other |
|
— |
|
|
— |
|
|
6,047 |
|
|
— |
|
|
6,047 |
|
| Total Revenue |
|
$ |
151,751 |
|
|
$ |
96,058 |
|
|
$ |
22,770 |
|
|
$ |
(247) |
|
|
$ |
270,332 |
|
Note 12— COMPENSATION PLANS
Cash Bonus Programs—We use cash bonus programs under which our employees may be eligible to receive cash bonuses based on corporate, department, location, or individual performance or other events or accomplishments. We accrue cash bonus expense related to the current year's performance and we expect to pay in March 2024 a cash bonus to our employees under our 2023 bonus program. We met our performance metrics related to our 2022 cash bonus program and paid a cash bonus in March 2023. We met our performance metrics related to our 2021 cash bonus program and paid a cash bonus in March 2022.
Equity Incentive Compensation Plan—Our Board of Directors and stockholders adopted a long-term incentive compensation plan called the Intrepid Potash, Inc. Amended and Restated Equity Incentive Plan (the "Plan"). We have issued restricted shares, common stock, performance units, and non-qualified stock option awards under the Plan. As of December 31, 2023, 340,924 restricted shares and options to purchase 273,206 shares of common stock were outstanding. As of December 31, 2023, approximately 1.0 million shares of common stock remained available for issuance under the Plan. Total compensation expense related to the Plan was $6.5 million, $6.2 million, and $3.0 million, for the years ended December 31, 2023, 2022, and 2021, respectively. As of December 31, 2023, there was $5.6 million of total remaining unrecognized compensation expense that is expected to be recognized over a weighted-average period of 1.3 years. When restricted shares and performance units vest and when stock options are exercised, new shares are issued and considered outstanding for financial statement purposes.
Restricted Shares
•Restricted Shares with Service Conditions—Under the Plan, the Compensation Committee of the Board of Directors (the "Compensation Committee") has granted restricted shares of common stock to members of the Board of Directors, executive officers, and other key employees. The restricted shares contain service conditions associated with continued employment or service. The restricted shares provide voting and regular dividend rights to the holders of the awards.
In 2023, the Compensation Committee granted 130,975 restricted shares to executives and key employees under the Plan as part of our annual equity award program. The awards vest over three years, subject to continued employment or service.
In 2023, the Compensation Committee granted 22,226 restricted shares to non-employee members of the Board of Directors. The restricted shares vest one year after the date of grant, subject to continued service.
We use the closing price of our common stock on the grant date as the grant date fair value for these awards. We record compensation expense monthly using the straight-line recognition method over the vesting period of the award. The weighted-average grant date fair value per share for restricted shares with service conditions issued in 2023, 2022, and 2021 was $25.11, $66.07, and $37.49, respectively.
•Restricted Shares with Service and Market Conditions— Under the Plan in March 2023, the Compensation Committee granted restricted shares of common stock with service and market conditions to certain members of our executive team as part of their annual compensation package. The grants vest over three years from the grant date if the volume-weighted average share closing price for 20 consecutive days has met one of the applicable price achievement targets; provided, however, that no vesting would occur if the volume-weighted average closing price for 20 consecutive days has not met one or more applicable price achievement goals on or before March 17, 2026. The share price achievement goals of these awards have not been met as of December 31, 2023.
Under the Plan in March 2023, the Compensation Committee also granted restricted shares of common stock with service and market conditions to another member of our executive team as part of his annual compensation package. This grant vests over two years from the quarter ended in which the volume-weighted average share closing price for 20 consecutive trading days has met one of the applicable price achievement targets; provided, however, that no vesting would occur if the volume-weighted average closing price for 20 consecutive trading days has not met one or more applicable price achievement goals on or before March 17, 2027. The share price achievement goal for this award has not been met as of December 31, 2023.
Under the Plan in March 2022, the Compensation Committee granted restricted shares of common stock with service and market conditions to certain members of our executive team as part of their annual compensation package.
The grants vest over three years from the quarter ended in which the volume-weighted average share closing price for 20 consecutive days has met one of the applicable price achievement targets; provided, however, that no vesting would occur if the volume-weighted average closing price for 20 consecutive days has not met one or more applicable price achievement goals on or before March 17, 2025. The share price achievement goals of these awards were met in 2022, and 1,737 shares vested in 2023.
Under the Plan in March 2022, the Compensation Committee granted restricted shares of common stock with service and market conditions to a member of our executive team as part of his annual compensation package. This grant vests over two years from the quarter ended in which the volume-weighted average share closing price for 20 consecutive trading days has met one of the applicable price achievement targets; provided, however, that no vesting would occur if the volume-weighted average closing price for 20 consecutive trading days has not met one or more applicable price achievement goals on or before March 17, 2026. The share price achievement goals of these awards were met in 2022, and 14,512 shares vested in 2023.
Under the Plan in March 2021, the Compensation Committee granted restricted shares of common stock with service and market conditions to certain members of our executive team as part of their annual compensation package. The grants vest over three years on the grant date anniversary; provided, however, that no vesting would occur if the volume-weighted average closing price for 20 consecutive trading days has not met one or more applicable price achievement goals on or before March 11, 2024. The share price achievement goals of these awards were met in 2021, and 886 shares vested in 2023.
Under the plan in 2021, the Compensation Committee granted restricted shares of common stock with service and market conditions to a member of our executive team as part of his annual compensation package. The 2021 grant vests over two years from the quarter ended in which the volume weighted average share closing price for 20 consecutive trading days has met one of the applicable price achievement targets; provided, however, that no vesting would occur if the volume-weighted average closing price for 20 consecutive trading days has not met one or more applicable price achievement goals on or before December 23, 2026. The market conditions for this award were met in 2022, and 24,152 shares vested during 2023.
During 2023, share price achievement targets were met for shares granted to a member of the executive team in 2020 and 47,259 shares vested in 2023.
We used a Monte Carlo simulation valuation model to estimate the fair value of these awards on the grant date. We record compensation expense monthly using the accelerated recognition method over the longer of the explicit or derived service period of the award. The weighted-average grant date fair value per share of restricted shares with service and market conditions issued in 2023, 2022, and 2021, was $24.96, $62.32 and $23.76, respectively.
Valuation models require the input of highly subjective assumptions, including the expected volatility of the price of the underlying stock. We used the following assumptions to compute the weighted-average grant date fair market value of restricted stock with service and market conditions granted in 2023, 2022, and 2021:
|
|
|
|
|
|
|
|
|
|
|
|
|
|
|
|
|
|
|
|
|
|
|
2023 |
|
2022 |
|
2021 |
| Closing stock price on grant date |
|
$ |
26.05 |
|
|
$ |
66.33 |
|
|
$ |
42.03 |
|
| Risk free interest rate |
|
3.6 |
% |
|
2.2 |
% |
|
1.1 |
% |
| Dividend yield |
|
— |
% |
|
— |
% |
|
— |
% |
| Estimated volatility |
|
82.9 |
% |
|
79.8 |
% |
|
89.0 |
% |
| Expected life |
|
3.8 years |
|
6.0 years |
|
5.5 years |
A summary of all activity relating to our restricted shares for the year ended December 31, 2023, is presented below:
|
|
|
|
|
|
|
|
|
|
|
|
|
|
|
|
|
|
|
Weighted Average
Grant-Date
Fair Value |
|
|
Shares |
|
| Restricted shares of common stock, beginning of period |
|
300,268 |
|
|
$ |
40.25 |
|
| Granted with service only condition |
|
153,201 |
|
|
$ |
25.11 |
|
|
|
|
|
|
| Granted with service and market conditions |
|
94,142 |
|
|
$ |
24.96 |
|
| Vested, service only condition |
|
(89,225) |
|
|
$ |
20.30 |
|
| Vested, service and market conditions |
|
(88,546) |
|
|
$ |
29.70 |
|
| Forfeited, service only condition |
|
(21,828) |
|
|
$ |
38.14 |
|
| Forfeited, service and market conditions |
|
(7,088) |
|
|
$ |
56.45 |
|
|
|
|
|
|
| Restricted shares of common stock, end of period |
|
340,924 |
|
|
$ |
36.98 |
|
Non-Qualified Stock Option Activity
We have not granted any non-qualified stock options to our employees since 2018. A summary of all stock option activity for the year ended December 31, 2023, is as follows:
|
|
|
|
|
|
|
|
|
|
|
|
|
|
|
|
|
|
|
|
|
|
|
|
|
|
|
|
|
Shares |
|
Weighted Average Exercise Price |
|
Aggregate Intrinsic Value1 |
|
Weighted Average Remaining Contractual Life |
Outstanding non-qualified stock
options, beginning of period |
|
273,206 |
|
|
$29.04 |
|
|
|
|
| Granted |
|
— |
|
|
$— |
|
|
|
|
| Exercised |
|
— |
|
|
$— |
|
|
|
|
| Forfeited |
|
— |
|
|
$— |
|
|
|
|
| Expired |
|
— |
|
|
$— |
|
|
|
|
Outstanding non-qualified stock
options, end of period |
|
273,206 |
|
|
$29.04 |
|
$948,054 |
|
3.7 |
|
|
|
|
|
|
|
|
|
Vested or expected to vest,
end of period |
|
273,206 |
|
|
$29.04 |
|
$948,054 |
|
3.7 |
|
|
|
|
|
|
|
|
|
Exercisable non-qualified
stock options, end of period |
|
273,206 |
|
|
$29.04 |
|
$948,054 |
|
3.7 |
1The intrinsic value of a stock option is the amount by which the market value exceeds the exercise price as of the end of the period presented.
No stock options were exercised during 2023. The total intrinsic value of exercised options to purchase stock during 2022 was $0.6 million. The total intrinsic value of exercised options to purchase stock during 2021 was immaterial.
Note 13— INCOME TAXES
We account for income taxes in accordance with ASC Topic 740, Income Taxes. This standard requires the recognition of deferred tax assets and liabilities for the tax effect of temporary differences between the financial statement and tax basis of recorded assets and liabilities at enacted tax rates in effect when the related taxes are expected to be settled or realized. We recognize income taxes in each of the tax jurisdictions where we conduct business. The effect on deferred tax assets and liabilities of a change in tax rates is recognized in income in the period that includes the enactment date.
A summary of the provision for income taxes is as follows (in thousands):
|
|
|
|
|
|
|
|
|
|
|
|
|
|
|
|
|
|
|
|
|
|
|
Year Ended December 31, |
|
|
2023 |
|
2022 |
|
2021 |
| Current portion of income tax expense (benefit): |
|
|
|
|
|
|
| Federal |
|
$ |
— |
|
|
$ |
— |
|
|
$ |
— |
|
| State |
|
82 |
|
|
966 |
|
|
206 |
|
| Deferred portion of income tax expense (benefit): |
|
|
|
|
|
|
| Federal |
|
(8,538) |
|
|
19,430 |
|
|
(157,348) |
|
| State |
|
67 |
|
|
3,893 |
|
|
(51,727) |
|
| Total income tax (benefit) expense |
|
$ |
(8,389) |
|
|
$ |
24,289 |
|
|
$ |
(208,869) |
|
A reconciliation of the federal statutory income tax rate of 21% to our effective rate is as follows (in thousands, except percentages):
|
|
|
|
|
|
|
|
|
|
|
|
|
|
|
|
|
|
|
|
|
|
|
Year Ended December 31, |
|
|
2023 |
|
2022 |
|
2021 |
| Federal taxes at statutory rate |
|
$ |
(9,253) |
|
|
$ |
20,267 |
|
|
$ |
8,603 |
|
| Add: |
|
|
|
|
|
|
| State taxes, net of federal benefit |
|
(1,274) |
|
|
5,406 |
|
|
1,278 |
|
|
|
|
|
|
|
|
| Change in valuation allowance |
|
1,121 |
|
|
— |
|
|
(215,910) |
|
| PPP loan forgiveness |
|
— |
|
|
— |
|
|
(2,115) |
|
| Change in federal and state tax rates |
|
238 |
|
|
(125) |
|
|
138 |
|
| Officers' Compensation |
|
848 |
|
|
546 |
|
|
195 |
|
| Percentage depletion |
|
(282) |
|
|
(827) |
|
|
(463) |
|
| Other |
|
213 |
|
|
(978) |
|
|
(595) |
|
| Net (benefit) expense as calculated |
|
$ |
(8,389) |
|
|
$ |
24,289 |
|
|
$ |
(208,869) |
|
|
|
|
|
|
|
|
| Effective tax rate |
|
19.0 |
% |
|
25.2 |
% |
|
(509.9) |
% |
Our effective tax rate for the years ended December 31, 2023, differs from the U.S. federal statutory rate due to the change in our valuation allowance. Our effective tax rates for the years ended December 31, 2022, and 2021, differs from the U.S. federal statutory rate due to state income taxes and the change in our valuation allowance, respectively.
As of December 31, 2023, and 2022, we had gross deferred tax assets of $197.4 million and $187.8 million, respectively. During the year ended December 31, 2023, our deferred tax assets increased primarily from impairments booked against our property, plant, equipment, and mineral properties. Included in gross deferred tax assets as of December 31, 2023, were approximately $201.4 million of federal net operating loss carryforwards, which expire beginning in 2034, and approximately $271.9 million of state net operating loss carryforwards, the majority of which begin to expire in 2033. Also included are $1.9 million of federal research and development credits which begin to expire in 2031. The federal loss carryforward could be subject to examination by the tax authorities within three years after the carryforward is utilized, while the state net operating loss carryforwards could be subject to examination by the tax authorities generally within three and four years after the carryforward is utilized, depending on jurisdiction.
Significant components of our deferred tax assets and liabilities were as follows (in thousands):
|
|
|
|
|
|
|
|
|
|
|
|
|
|
|
|
|
December 31, |
|
|
2023 |
|
2022 |
|
|
|
| Deferred tax assets (liabilities): |
|
|
|
|
| Property, plant, equipment and mineral properties, net |
|
$ |
127,368 |
|
|
$ |
119,919 |
|
| Federal and state net operating loss carryforwards |
|
55,486 |
|
|
53,440 |
|
| Asset retirement obligation |
|
7,768 |
|
|
7,409 |
|
| Deferred revenue |
|
1,869 |
|
|
607 |
|
| Other |
|
3,017 |
|
|
4,540 |
|
| Federal R&D credits |
|
1,870 |
|
|
1,870 |
|
|
|
|
|
|
|
|
|
|
|
|
|
|
|
|
|
|
|
|
|
| Total deferred tax assets |
|
197,378 |
|
|
187,785 |
|
| Valuation allowance |
|
(3,155) |
|
|
(2,033) |
|
| Deferred tax asset, net |
|
$ |
194,223 |
|
|
$ |
185,752 |
|
In assessing the need for a valuation allowance, we consider whether it is more likely than not that some portion or all of the deferred tax assets will not be realized. We evaluate our ability to realize the tax benefits associated with deferred tax assets by analyzing the relative impact of all the available positive and negative evidence regarding our forecasted taxable income using both historical and projected future operating results, the reversal of existing taxable temporary differences, taxable income in prior carryback years, as permitted by regulation, and the availability of tax planning strategies. In determining how much of a valuation allowance to recognize we primarily consider our projections of future taxable income. All available evidence, both positive and negative, that may affect the realizability of deferred tax assets is identified and considered in determining the appropriate amount of the valuation allowance. The ultimate realization of deferred tax assets is dependent upon the generation of certain types of future taxable income during the periods in which those temporary differences become deductible. Assumptions of expected future taxable income are based primarily on prices and forecasted sales volumes which are subject to market volatility. In making this assessment, we consider the scheduled reversal of deferred tax liabilities, our ability to carry back the deferred tax asset, projected future taxable income, and tax planning strategies.
As of December 31, 2023, we were in a cumulative three-year income position. The cumulative three-year income position is significant positive evidence when evaluating the realizability of our deferred tax assets. Additionally, industry trends and forecasts as well as internal forecasts of future business show sustained amounts of taxable income. Thus, we have concluded that it is more likely than not that most of our $197.4 million of deferred tax assets will be realized. During 2023, our valuation allowance increased as our forecast changed regarding the amount of state net operating losses that will be used before expiration. Our deferred tax assets, net of the valuation allowance at December 31, 2023, and 2022, were $194.2 million and $185.8 million, respectively.
The estimated statutory income tax rates that are applied to our current and deferred income tax calculations are impacted most significantly by the tax jurisdictions in which we conduct business. Changing business conditions for normal business transactions and operations, as well as changes to state tax rates and apportionment laws, potentially alter the apportionment of income among the states for income tax purposes. These changes to apportionment laws result in changes in the calculation of our current and deferred income taxes, including the valuation of our deferred tax assets and liabilities. The effects of any such changes are recorded in the period of the adjustment. Such adjustments can increase or decrease the net deferred tax asset on the balance sheet and impact the corresponding deferred tax benefit or deferred tax expense on the statement of operations.
A decrease of our state tax rate decreases the value of its deferred tax asset, resulting in additional deferred tax expense being recorded on the income statement. Conversely, an increase in our state income tax rate would increase the value of the deferred tax asset, resulting in an increase in our deferred tax benefit. Because of the magnitude of the temporary differences between our book and tax basis in the assets, relatively small changes in the state tax rate may have a pronounced impact on the value of our net deferred tax asset.
Each quarter we evaluate the need for a liability for uncertain tax positions. At December 31, 2023, and 2022, we had no items that required disclosure in accordance with FASB guidance on accounting for uncertainty in income taxes.
We operate, and accordingly file income tax returns, in the U.S. federal jurisdiction and various U.S. state jurisdictions. With few exceptions, we are no longer subject to income tax audits that could result in an assessment for years prior to 2020.
Note 14— COMMITMENTS AND CONTINGENCIES
Reclamation Deposits and Surety Bonds—As of December 31, 2023, and 2022, we had $26.8 million and $24.6 million, respectively, of security placed principally with the State of Utah and the Bureau of Land Management for eventual reclamation of its various facilities. Of this total requirement, as of December 31, 2023, and 2022, $0.5 million consisted of long-term restricted cash deposits reflected in "Other" long-term assets on the balance sheet, and $26.3 million and $24.1 million, respectively, was secured by surety bonds issued by an insurer. The surety bonds are held in place by an annual fee paid to the issuer.
We may be required to post additional security to fund future reclamation obligations as reclamation plans are updated or as governmental entities change requirements.
Legal—We are subject to claims and legal actions in the ordinary course of business. We expense legal costs as incurred. While there are uncertainties in predicting the outcome of any claim or legal action, except as noted below, we believe the ultimate resolution of these claims or actions is not reasonably likely to have a material adverse effect on our financial condition, results of operations, or cash flows.
Water Rights
In March 17, 2022, following an expedited inter se proceeding, a court entered a subfile order and partial final judgment and decree ("Order") determining the validity of our claim to 20,000 acre feet of Pecos River surface water rights. The Order found that our predecessors in interest had forfeited all but approximately 5,800 acre feet of water per year, and that of the remaining 5,800 acre feet of water that had not been forfeited, all but 150 acre feet of water had been abandoned prior to 2017. The Order limited our right to 150 acre fee per annum of water for industrial-salt processing use. We appealed the Order to the New Mexico Court of Appeals ("NMCA"), which, on July 7, 2023, affirmed the Order. On November 17, 2023, we filed a request for the New Mexico Supreme Court ("NMSC") to reconsider and review the NMCA's decision to affirm the Order's abandonment determination. The NMSC agreed to review the NMCA's abandonment determination on February 7, 2024.
In 2017 and 2018 the New Mexico Office of the State Engineer (“OSE”) had granted us preliminary authorizations to sell approximately 5,700 acre feet of water per year from our Pecos River water rights. The preliminary authorizations allowed for water sales to begin immediately, subject to repayment if the underlying water rights are ultimately found to be invalid. If our appeal of the adjudication court's ruling is unsuccessful, we may have to repay for the water we sold under the preliminary authorizations. Repayment of this water can be up to two times the amount of water removed from the river. Repayment is customarily made in-kind over a period of time but can take other forms including cash repayment. If we are not able to repay in-kind due to the lack of remaining water rights or logistical constraints, we may need to purchase water to meet this repayment or be subject to a cash repayment. We cannot reasonably estimate the potential volume, timing, or form of repayment, if any, and have not recorded a loss contingency in our statement of operations related to this legal matter.
In March 2021, we received notice from a customer of a default under the terms of a long-term sales contract because we have not been able to deliver water to diversion points specified in the contract. We had relied primarily upon our Pecos River water rights to deliver water under this contract, the majority of which are currently unavailable due to the factors discussed above. Under this contract we have received quarterly installments of approximately $3.9 million for the future delivery of water to the customer. In April 2021, we agreed to suspend the second quarter and future quarterly installments due from the customer as we continued to work to resolve the issue. In December 2021, we amended our long-term sales agreement with the customer due to our inability to deliver water. In the amendment, we agreed to suspend all rights and obligations of both parties under the agreement until July 1, 2022. During the suspension period, we had no obligation to deliver water and our customer has no obligation to take water, if available, or make quarterly payments to us. In August 2022, the customer notified us that they were terminating the long-term sales contract and in September 2022, we refunded the $32.6 million outstanding contract liability we had with this customer. See Note 11—Revenue above for additional information.
In August 2021, NGL Energy Partners (NGL), our partner in the Joint Marketing Agreement (“JMA”) that was entered into in May 2019, filed suit against us alleging, amongst other items, we overcharged the JMA for various operating costs and that we used third party water to service certain fracs when JMA water should have been used in those fracs. On June 22, 2022, the parties entered into a settlement agreement and the lawsuit was dismissed with prejudice on June 29, 2022.
The settlement did not have a material impact on our results of operations and the JMA was terminated effective May 1, 2022.
As of December 31, 2023, we have estimated contingent liabilities recorded in "Other current liabilities" on the consolidated balance sheets of $3.4 million, mainly related to the potential underpayment of royalties in 2012 to 2016 and potential royalties on water revenues in 2019 to 2022. As of December 31, 2022 we had estimated contingent liabilities recorded in "Other current liabilities" on the consolidated balance sheets of $4.2 million, mainly related to a trespass issue at Intrepid South and the potential underpayment of royalties in 2012 to 2016.
We are subject to other claims and legal actions in the ordinary course of business. Legal costs are expensed as incurred. While there are uncertainties in predicting the outcome of any claim or legal action, we believe that the ultimate resolution of these other claims or actions is not reasonably likely to have a material adverse effect on our financial condition, results of operations, or cash flows.
Note 15— FAIR VALUE MEASUREMENTS
We measure our financial assets and liabilities in accordance with Accounting Standards Codification ("ASC") Topic 820, Fair Value Measurements and Disclosures. ASC Topic 820 defines fair value as the price that would be received to sell an asset or paid to transfer a liability (an exit price) in an orderly transaction between market participants at the measurement date. The topic establishes market or observable inputs as the preferred sources of values, followed by assumptions based on hypothetical transactions in the absence of market inputs. The topic also establishes a hierarchy for grouping these assets and liabilities based upon the lowest level of input that is significant to the fair value measurement. The definition of each input is described below:
•Level 1—Quoted prices in active markets for identical assets and liabilities.
•Level 2—Quoted prices in active markets for similar assets and liabilities, quoted prices for identical or similar instruments in markets that are not active, and model‑derived valuations whose inputs are observable or whose significant value drivers are observable.
•Level 3—Significant inputs to the valuation model that are unobservable.
The classification of fair value measurement within the hierarchy is based upon the lowest level of input that is significant to the measurement.
Other financial instruments consist primarily of cash equivalents, accounts receivable, refundable income taxes, accounts payable, accrued liabilities, and, if any, advances under our credit facility. With the exception of investment securities, we believe cost approximates fair value for our financial instruments because of the short-term nature of these instruments.
Cash Equivalents—As of December 31, 2023, and December 31, 2022, we had cash equivalents of $0.5 million and $1.7 million, respectively.
Held-to-Maturity Investments—As of December 31, 2023 and 2022, we owned debt investment securities classified as held-to-maturity because we have the intent and ability to hold these investments to maturity. Our held-to-maturity debt investment securities consist of investment grade corporate bonds and U.S. government issued bonds.
Our held-to-maturity investments at December 31, 2023 and 2022, are carried at amortized cost and consist of the following (amounts in thousands):
|
|
|
|
|
|
|
|
|
|
|
|
|
|
|
|
|
|
|
|
|
|
|
|
|
|
|
|
|
As of December 31, 2023 |
|
|
Amortized Cost |
|
Gross Unrealized Gains |
|
Gross Unrealized Losses |
|
Fair Value |
| Short-term |
|
|
|
|
|
|
|
|
| Corporate bonds |
|
$ |
991 |
|
|
$ |
— |
|
|
$ |
(9) |
|
|
$ |
982 |
|
| Government bonds |
|
1,979 |
|
|
— |
|
|
(13) |
|
|
1,966 |
|
| Total |
|
$ |
2,970 |
|
|
$ |
— |
|
|
$ |
(22) |
|
|
$ |
2,948 |
|
| Long-term |
|
|
|
|
|
|
|
|
| Corporate bonds |
|
$ |
— |
|
|
$ |
— |
|
|
$ |
— |
|
|
$ |
— |
|
| Government bonds |
|
954 |
|
|
1 |
|
|
(4) |
|
|
951 |
|
| Total |
|
$ |
954 |
|
|
$ |
1 |
|
|
$ |
(4) |
|
|
$ |
951 |
|
|
|
|
|
|
|
|
|
|
|
|
|
|
|
|
|
|
|
|
|
|
|
|
|
|
|
|
|
|
As of December 31, 2022 |
|
|
Amortized Cost |
|
Gross Unrealized Gains |
|
Gross Unrealized Losses |
|
Fair Value |
| Short-term |
|
|
|
|
|
|
|
|
| Corporate bonds |
|
$ |
3,992 |
|
|
$ |
— |
|
|
$ |
(24) |
|
|
$ |
3,968 |
|
| Government bonds |
|
1,967 |
|
|
— |
|
|
(18) |
|
|
1,949 |
|
| Total |
|
$ |
5,959 |
|
|
$ |
— |
|
|
$ |
(42) |
|
|
$ |
5,917 |
|
| Long-term |
|
|
|
|
|
|
|
|
| Corporate bonds |
|
$ |
499 |
|
|
$ |
— |
|
|
$ |
(10) |
|
|
$ |
489 |
|
| Government bonds |
|
1,935 |
|
|
— |
|
|
(26) |
|
|
1,909 |
|
| Total |
|
$ |
2,434 |
|
|
$ |
— |
|
|
$ |
(36) |
|
|
$ |
2,398 |
|
Equity Investments without a Readily Determinable Fair Value—As of December 31, 2023, 2022, and 2021, we had a $3.5 million non-controlling interest in W.D. Von Gonten Laboratories ("WDVGL"). This investment is an equity investment without a readily determinable fair value and is recorded at cost with adjustments for observable changes in prices resulting from orderly transactions for the identical or a similar investment of the same issuer, or impairment (a Level 3 input), and is included in "Other assets, net" on the Consolidated Balance Sheets. We did not record any adjustments to the $3.5 million carrying value of the investment during 2023, 2022 or 2021.
In July 2022, WDVGL entered into a purchase agreement with another company (“Acquiror”), a foreign issuer whose shares are traded on the Nasdaq Capital Market (“Nasdaq”). Under the terms of the purchase agreement, WDVGL would be combined with the consulting business owned by W.D. Von Gonten (“Consulting”) to form a new entity, W.D. Von Gonten Engineering, LLC (“Engineering”), and Acquiror would then purchase Engineering in a majority stock transaction at an agreed upon selling price. Stock received from the sale of Engineering would be distributed to investors in WDVGL and Consulting.
Acquiror delivered equity shares and a nominal amount of cash to WDVGL for purchase of Engineering in July 2022, with the number of shares equal to the selling price divided by an assumed $10 share price. At the time the purchase agreement was signed, the Acquiror was working to file restated financial statements for the fiscal years ending December 31, 2018, 2019 and 2020. On April 27, 2023, Acquiror disclosed it had not been able to file its Annual Report on Form 20-F for the fiscal year ended December 31, 2021 with the SEC by April 25, 2023, which was the deadline set by the Nasdaq Hearings Panel in connection with a delisting proceeding, and Acquiror's shares were subsequently delisted from Nasdaq. Acquiror also disclosed on April 27, 2023 that it has shifted its focus to filing audited financial statements with the SEC for the fiscal years ended December 31, 2020, 2021 and 2022 to regain compliance with Nasdaq listing standards before the end of 2023.
Pursuant to the purchase agreement with Engineering, if the Acquiror did not file current financial statements with the SEC by June 30, 2023, Engineering had the option to terminate the purchase agreement, beginning on July 1, 2023. Although Acquiror did not file current financial statements by June 30, 2023, Engineering agreed to proceed with the purchase agreement to allow Acquiror additional time to file updated financial statements.
On December 29, 2023, Acquiror disclosed it had filed its audited financial statements for the years ended December 31, 2022, 2021, and 2020, with the SEC.
We have not impaired our investment in WDVGL because our share of the estimated selling price of Engineering exceeds the carrying value of our investment in WDVGL. We continue to monitor the investment for impairment. If the purchase transaction is not finalized, we may need to impair our investment in WDVGL.
Equity Method Investments—We have committed to invest $4.0 million in cash as a limited partner for a 16% interest in PEP Ovation, LP ("Ovation"), of which we had invested $2.0 million, $3.2 million and $1.1 million of cash as of December 31, 2023, 2022, and 2021, respectively. This investment is accounted for under the equity method whereby we recognize our proportional share of the income or loss from our investment in Ovation on a one-quarter lag and is included in "Long-term investments" on the Condensed Consolidated Balance Sheets. For the year ended December 31, 2023, our proportional share of Ovation's net loss was $0.5 million.
Note 16— EMPLOYEE BENEFITS
401(k) Plan
We maintain a savings plan qualified under Internal Revenue Code Sections 401(a) and 401(k). The 401(k) Plan is available to eligible employees of our consolidated entities. Employees may contribute amounts as allowed by the U.S. Internal Revenue Service to the 401(k) Plan (subject to certain restrictions) in before-tax contributions. In January 2018, we increased the matching contributions on a dollar-for-dollar basis up to a maximum of 5% of the employee's base compensation. Our contributions to the 401(k) Plan in the following periods were (in thousands):
|
|
|
|
|
|
|
|
|
|
|
Contributions |
| Year Ended December 31, 2023 |
|
$ |
2,057 |
|
| Year Ended December 31, 2022 |
|
$ |
1,760 |
|
| Year Ended December 31, 2021 |
|
$ |
1,633 |
|
Note 17— BUSINESS SEGMENTS
Our operations are organized into three segments: potash, Trio®, and oilfield solutions. The reportable segments are determined by management based on several factors including the types of products and services sold, production processes, markets served and the financial information available for our chief operating decision maker. We evaluate performance based on the gross margins of the respective business segments and do not allocate corporate selling and administrative expenses, among others, to the respective segments.
Intersegment sales prices are market-based and are eliminated in the "Other" column. Information for each segment is provided in the tables that follow (in thousands).
|
|
|
|
|
|
|
|
|
|
|
|
|
|
|
|
|
|
|
|
|
|
|
|
|
|
|
|
|
|
|
|
|
| Year Ended December 31, 2023 |
|
Potash |
|
Trio® |
|
Oilfield Solutions |
|
Other |
|
Consolidated |
Sales1 |
|
$ |
155,920 |
|
|
$ |
102,182 |
|
|
$ |
21,310 |
|
|
$ |
(329) |
|
|
$ |
279,083 |
|
| Less: Freight costs |
|
14,753 |
|
|
23,211 |
|
|
— |
|
|
(329) |
|
|
37,635 |
|
Warehousing and handling costs |
|
5,957 |
|
|
4,875 |
|
|
— |
|
|
— |
|
|
10,832 |
|
Cost of goods sold |
|
97,452 |
|
|
74,308 |
|
|
15,518 |
|
|
— |
|
|
187,278 |
|
Lower of cost or NRV inventory adjustments |
|
2,709 |
|
|
3,783 |
|
|
— |
|
|
— |
|
|
6,492 |
|
|
|
|
|
|
|
|
|
|
|
|
| Gross Margin (Deficit) |
|
$ |
35,049 |
|
|
$ |
(3,995) |
|
|
$ |
5,792 |
|
|
$ |
— |
|
|
$ |
36,846 |
|
Depreciation, depletion, and amortization incurred2 |
|
$ |
28,378 |
|
|
$ |
6,288 |
|
|
$ |
3,849 |
|
|
$ |
885 |
|
|
$ |
39,400 |
|
|
|
|
|
|
|
|
|
|
|
|
| Year Ended December 31, 2022 |
|
Potash |
|
Trio® |
|
Oilfield Solutions |
|
Other |
|
Consolidated |
Sales1 |
|
$ |
191,378 |
|
|
$ |
117,826 |
|
|
$ |
28,668 |
|
|
$ |
(304) |
|
|
$ |
337,568 |
|
| Less: Freight costs |
|
14,780 |
|
|
19,661 |
|
|
— |
|
|
(304) |
|
|
34,137 |
|
Warehousing and handling costs |
|
5,305 |
|
|
4,442 |
|
|
— |
|
|
— |
|
|
9,747 |
|
Cost of goods sold |
|
76,524 |
|
|
54,600 |
|
|
21,152 |
|
|
— |
|
|
152,276 |
|
|
|
|
|
|
|
|
|
|
|
|
|
|
|
|
|
|
|
|
|
|
|
| Gross Margin |
|
$ |
94,769 |
|
|
$ |
39,123 |
|
|
$ |
7,516 |
|
|
$ |
— |
|
|
$ |
141,408 |
|
Depreciation, depletion, and amortization incurred2 |
|
$ |
26,572 |
|
|
$ |
4,370 |
|
|
$ |
3,298 |
|
|
$ |
793 |
|
|
$ |
35,033 |
|
|
|
|
|
|
|
|
|
|
|
|
| Year Ended December 31, 2021 |
|
Potash |
|
Trio® |
|
Oilfield Solutions |
|
Other |
|
Consolidated |
Sales1 |
|
$ |
151,751 |
|
|
$ |
96,058 |
|
|
$ |
22,770 |
|
|
$ |
(247) |
|
|
$ |
270,332 |
|
| Less: Freight costs |
|
17,483 |
|
|
20,656 |
|
|
— |
|
|
(247) |
|
|
37,892 |
|
Warehousing and handling costs |
|
5,169 |
|
|
4,113 |
|
|
— |
|
|
— |
|
|
9,282 |
|
Cost of goods sold |
|
87,281 |
|
|
54,847 |
|
|
19,293 |
|
|
— |
|
|
161,421 |
|
|
|
|
|
|
|
|
|
|
|
|
Costs associated with abnormal production and other |
|
5,973 |
|
|
— |
|
|
— |
|
|
— |
|
|
5,973 |
|
| Gross Margin (Deficit) |
|
$ |
35,845 |
|
|
$ |
16,442 |
|
|
$ |
3,477 |
|
|
$ |
— |
|
|
$ |
55,764 |
|
Depreciation, depletion, and amortization incurred2 |
|
$ |
26,828 |
|
|
$ |
5,477 |
|
|
$ |
2,996 |
|
|
$ |
656 |
|
|
$ |
35,957 |
|
1 Segment sales include the sales of byproducts generated during the production of potash and Trio®.
2 Depreciation, depletion, and amortization incurred for potash and Trio® excludes depreciation, depletion, and amortization absorbed in or (relieved from) inventory.
The following table shows the reconciliation of reportable segment sales to consolidated sales and the reconciliation of segment gross margins to consolidated income before taxes (in thousands):
|
|
|
|
|
|
|
|
|
|
|
|
|
|
|
|
|
|
|
|
|
|
|
Year Ended December 31, |
|
|
2023 |
|
2022 |
|
2021 |
| Total sales for reportable segments |
|
$ |
279,412 |
|
|
$ |
337,872 |
|
|
$ |
270,579 |
|
| Elimination of intersegment sales |
|
(329) |
|
|
(304) |
|
|
(247) |
|
| Total consolidated sales |
|
$ |
279,083 |
|
|
$ |
337,568 |
|
|
$ |
270,332 |
|
|
|
|
|
|
|
|
| Total gross margin for reportable segments |
|
$ |
36,846 |
|
|
$ |
141,408 |
|
|
$ |
55,764 |
|
| Elimination of intersegment sales |
|
(329) |
|
|
(304) |
|
|
(247) |
|
| Elimination of intersegment expenses |
|
329 |
|
|
304 |
|
|
247 |
|
| Unallocated amounts: |
|
|
|
|
|
|
| Selling and administrative |
|
32,423 |
|
|
31,799 |
|
|
23,998 |
|
| Impairment of long-lived assets |
|
43,288 |
|
|
— |
|
|
— |
|
| Loss (gain) on disposal of assets |
|
807 |
|
|
7,470 |
|
|
(2,542) |
|
| Accretion of asset retirement obligation |
|
2,140 |
|
|
1,961 |
|
|
1,858 |
|
| Other operating expense |
|
2,157 |
|
|
4,738 |
|
|
178 |
|
| Equity in loss/(earnings) of unconsolidated entities |
|
486 |
|
|
(689) |
|
|
— |
|
| Interest expense, net |
|
— |
|
|
101 |
|
|
1,468 |
|
| Gain on extinguishment of debt |
|
— |
|
|
— |
|
|
(10,113) |
|
| Interest income |
|
(298) |
|
|
(176) |
|
|
— |
|
| Other non-operating income |
|
(95) |
|
|
(305) |
|
|
(48) |
|
| (Loss) income before income taxes |
|
$ |
(44,062) |
|
|
$ |
96,509 |
|
|
$ |
40,965 |
|
Total assets are not presented for each reportable segment as they are not reviewed by, nor otherwise regularly provided to, the chief operating decision maker.
Note 18— CONCENTRATION OF CREDIT RISK
Credit risk represents the loss that would be recognized at the reporting date if counterparties failed completely to perform as contracted. Concentrations of credit risk, whether on- or off-balance sheet, that arise from financial instruments exist for counterparties when they have similar economic characteristics that would cause their ability to meet contractual obligations to be similarly affected by changes in economic or other conditions.
Our products are marketed for sale into three primary markets. These markets are the agricultural market as a fertilizer, the industrial market as a component in drilling fluids for oil and gas exploration, and the animal feed market as a nutrient. Credit risks associated with the collection of accounts receivable are primarily related to the impact of external factors on our customers. Our customers are distributors and end-users whose creditworthiness and ability to meet their payment obligations will be affected by factors in their industries and markets. Those factors include soil nutrient levels, crop prices, weather, the type of crops planted, changes in diets, growth in population, the amount of land under cultivation, fuel prices and consumption, oil and gas drilling and completion activity, the demand for biofuels, government policy, and the relative value of currencies. Our industrial sales are significantly influenced by oil and gas drilling activity.
In 2023 and 2022, we had one customer in our potash and Trio® segments that accounted for approximately $33.4 million and $35.0 million of our total consolidated revenues, respectively. See Item 1A. "Risks Related to Financial Position, Indebtedness and Additional Capital Needs - The loss or substantial decline in revenue from larger customers or certain industries could have a material adverse effect on our revenues, profitability, and liquidity."
In 2021, no customer accounted for more than 10% of our sales.
In each of the last three years ended December 31, 2023, 2022, and 2021, 95%, 94%, and 97%, respectively, of our total sales were sold to customers located in the U.S. All of our long-lived assets are located in the U.S.
We maintain cash accounts with several financial institutions. At times, the balances in the accounts may exceed the $250,000 balance insured by the Federal Deposit Insurance Corporation.
Note 19— FINANCIAL INFORMATION FOR SUBSIDIARY GUARANTORS
OF POSSIBLE FUTURE PUBLIC DEBT
Intrepid Potash, Inc., as the parent company, has no independent assets or operations, and operations are conducted solely through its subsidiaries. Cash generated from operations is held at the parent company level as cash on hand and short- and long-term investments. Cash and cash equivalents totaled $4.1 million and $18.5 million at December 31, 2023, and 2022, respectively. In the event that one or more of our wholly-owned operating subsidiaries guarantee public debt securities in the future, those guarantees will be full and unconditional and will constitute the joint and several obligations of the subsidiary guarantors. Our other subsidiaries are minor. There are no restrictions on our ability to obtain cash dividends or other distributions of funds from the subsidiary guarantors, except those imposed by applicable law.
Note 20— SHARE REPURCHASE PROGRAM
In February of 2022, our Board of Directors approved a $35 million share repurchase program. Under the share repurchase program, we may repurchase shares from time to time in the open market or in privately negotiated transactions. The timing, volume and nature of share repurchases, if any, will be at our sole discretion and will be dependent on market conditions, liquidity, applicable securities laws, and other factors. We may suspend or discontinue the share repurchase program at any time.
We made no repurchases of shares of our common stock for the twelve months ended December 31, 2023. In 2022, we repurchased 608,657 shares of our common stock and paid $22.0 million under the share repurchase program.
As of December 31, 2023, we have approximately $13.0 million of remaining availability under the share repurchase program.
Note 21.— SUBSEQUENT EVENT
On December 12, 2023, we entered into the Third Amendment of Cooperative Development Agreement (the “Amendment”) with XTO Holdings, LLC (“XTO Holdings”) and XTO Delaware Basin, LLC, as successors in interest to BOPCO, L.P. (“XTO Delaware Basin,” and together with XTO Holdings, “XTO”). The Amendment had an effective date of January 1, 2024 (“Amendment Date”). The Amendment further amends that certain Cooperative Development Agreement, by and between us, BOPCO, L.P. and the other parties thereto, effective as of February 28, 2011 (as amended, including by the Amendment, the “CDA”), which was executed for the purpose of cooperative development of certain lands for potassium and oil and gas. The Cooperative Development Agreement restricts and limits the rights of us and XTO, as successors in interest to BOPCO, L.P. to explore and develop their respective interests, including limitations on the location of wells. We and XTO entered into the Amendment in an effort to further the cooperation, remove the restrictions and limitations, and allow for the efficient co-development of resources within the Designated Potash Area (“DPA”) consistent with the United States Secretary of the Interior Order 3324.
Pursuant to the Amendment, among other things, we agree to support and not oppose XTO’s development and operation of XTO’s oil and gas interests within the DPA. As consideration under the Amendment, on December 12, 2023 we received an initial payment of $5.0 million, which is included in "Accrued liabilities" on the December 31, 2023 Consolidated Balance Sheet.
On January 2, 2024, we received an additional $45.0 million initial payment from XTO. The Amendment also provides that we shall receive an additional one-time payment equal to $50.0 million as an “Access Fee,” which XTO will pay within 90 days upon the earlier occurrence of (i) the approval of the first new or expanded drilling island within a specific area to be used by XTO or (ii) within seven (7) years of the anniversary of the Amendment Date. XTO is also required to pay additional amounts to Intrepid as an “Access Realization Fee,” up to a maximum amount of $100.0 million, in the event of certain additional drilling activities by XTO. The CDA also contains other customary representations, warranties, covenants, and dispute resolution provisions.
For the twelve months ended December 31, 2023, we have recorded no revenue associated with the Amendment.
SCHEDULE II - VALUATION AND QUALIFYING ACCOUNTS
|
|
|
|
|
|
|
|
|
|
|
|
|
|
|
|
|
|
|
|
|
|
|
|
|
|
|
|
|
(In thousands) |
| Description |
|
Balance at Beginning of Year |
|
Charged to Costs and Expenses |
|
Deductions |
|
Balance at End of Year |
|
|
|
|
|
|
|
|
|
|
|
|
|
|
|
|
|
|
|
|
|
|
|
|
|
|
|
|
|
|
|
|
|
|
|
|
|
|
|
|
|
|
|
|
|
|
|
|
|
|
|
|
|
|
|
|
|
|
|
|
|
|
|
|
|
|
|
|
|
|
|
|
|
|
|
|
|
|
|
|
|
|
|
|
|
|
|
|
|
|
|
|
|
|
|
|
|
|
|
|
|
|
|
|
|
|
|
|
|
|
|
|
|
|
|
|
|
|
|
|
|
|
|
|
|
|
|
|
|
|
|
|
|
|
|
|
|
|
|
|
|
|
|
|
|
|
|
|
|
|
|
|
|
|
|
|
|
|
|
|
|
|
|
|
|
|
|
|
|
|
|
|
|
|
|
|
|
|
|
|
|
|
|
|
|
|
|
|
|
| For the Year Ended December 31, 2021 |
|
|
|
|
|
|
|
|
| Allowances deducted from assets |
|
|
|
|
|
|
|
|
| Deferred tax assets - valuation allowance |
|
217,943 |
|
|
— |
|
|
(215,910) |
|
|
2,033 |
|
| Reserve for parts inventory obsolescence |
|
1,050 |
|
|
2,108 |
|
|
— |
|
|
3,158 |
|
| Allowance for doubtful accounts and other receivables |
|
555 |
|
|
— |
|
|
— |
|
|
555 |
|
| Total allowances deducted from assets |
|
$ |
219,548 |
|
|
$ |
2,108 |
|
|
$ |
(215,910) |
|
|
$ |
5,746 |
|
|
|
|
|
|
|
|
|
|
| For the Year Ended December 31, 2022 |
|
|
|
|
|
|
|
|
| Allowances deducted from assets |
|
|
|
|
|
|
|
|
| Deferred tax assets - valuation allowance |
|
2,033 |
|
|
— |
|
|
— |
|
|
2,033 |
|
| Reserve for parts inventory obsolescence |
|
3,158 |
|
|
1,750 |
|
|
(3,646) |
|
|
1,262 |
|
| Allowance for doubtful accounts and other receivables |
|
555 |
|
|
— |
|
|
— |
|
|
555 |
|
| Total allowances deducted from assets |
|
$ |
5,746 |
|
|
$ |
1,750 |
|
|
$ |
(3,646) |
|
|
$ |
3,850 |
|
|
|
|
|
|
|
|
|
|
| For the Year Ended December 31, 2023 |
|
|
|
|
|
|
|
|
| Allowances deducted from assets |
|
|
|
|
|
|
|
|
| Deferred tax assets - valuation allowance |
|
2,033 |
|
|
1,121 |
|
|
— |
|
|
3,154 |
|
| Reserve for parts inventory obsolescence |
|
1,262 |
|
|
509 |
|
|
(856) |
|
|
915 |
|
| Allowance for doubtful accounts and other receivables |
|
555 |
|
|
110 |
|
|
— |
|
|
665 |
|
| Total allowances deducted from assets |
|
$ |
3,850 |
|
|
$ |
1,740 |
|
|
$ |
(856) |
|
|
$ |
4,734 |
|
|
|
|
|
|
|
|
|
|
ITEM 9.CHANGES IN AND DISAGREEMENTS WITH ACCOUNTANTS ON ACCOUNTING
AND FINANCIAL DISCLOSURE
None.
ITEM 9A.CONTROLS AND PROCEDURES
Evaluation of Disclosure Controls and Procedures
We maintain "disclosure controls and procedures." Our disclosure controls and procedures are designed to ensure that information required to be disclosed by us in reports that we file or submit under the Exchange Act is recorded, processed, summarized, and reported within the time periods specified in SEC rules and forms. Our disclosure controls and procedures are also designed to ensure that this information is accumulated and communicated to our management, including our principal executive officer and principal financial officer, as appropriate, to allow timely decisions regarding required disclosure. Under the supervision and with the participation of our management, including our principal executive officer and principal financial officer, we conducted an evaluation of our disclosure controls and procedures as of December 31, 2023. Based on this evaluation, our principal executive officer and principal financial officer have concluded that our disclosure controls and procedures were effective as of December 31, 2023, at the reasonable assurance level.
Management's Report on Internal Control over Financial Reporting
Our management is responsible for establishing and maintaining adequate "internal control over financial reporting." Our internal control over financial reporting is a process designed to provide reasonable assurance regarding the reliability of financial reporting and the preparation of financial statements for external purposes in accordance with GAAP. Under the supervision and with the participation of our management, including our principal executive officer and principal financial officer, we conducted an evaluation of the effectiveness of our internal control over financial reporting as of December 31, 2023, based on the criteria established in Internal Control—Integrated Framework issued by the Committee of Sponsoring Organizations of the Treadway Commission (COSO) in 2013.
Based on the results of our evaluation, our management concluded that our internal control over financial reporting was effective as of December 31, 2023.
The effectiveness of our internal control over financial reporting as of December 31, 2023, has been audited by KPMG LLP, our independent registered public accounting firm, as stated in their report which appears herein.
Changes in Internal Control over Financial Reporting
There were no changes in our internal control over financial reporting that occurred during the three months ended December 31, 2023, that materially affected, or are reasonably likely to materially affect, our internal control over financial reporting.
Inherent Limitations on Effectiveness of Controls
Our management, including our principal executive officer and principal financial officer, do not expect that our disclosure controls or our internal control over financial reporting will prevent all errors and all fraud. A control system, no matter how well conceived and operated, can provide only reasonable, not absolute, assurance that the objectives of the control system are met. Further, the design of a control system must reflect the fact that there are resource constraints, and the benefits of controls must be considered relative to their costs. Because of the inherent limitations in all control systems, no evaluation of controls can provide absolute assurance that all control issues and instances of fraud, if any, within Intrepid have been detected. These inherent limitations include the realities that judgments in decision-making can be faulty, and that breakdowns can occur because of a simple error or mistake. Additionally, controls can be circumvented by the individual acts of some persons, by collusion of two or more people, or by management override of the controls. The design of any system of controls also is based in part upon certain assumptions about the likelihood of future events, and there can be no assurance that any design will succeed in achieving its stated goals under all potential future conditions. Over time, controls may become inadequate because of changes in conditions, or the degree of compliance with policies or procedures may deteriorate. Because of the inherent limitations in a cost-effective control system, misstatements due to error or fraud may occur and not be detected.
ITEM 9B.OTHER INFORMATION
During the three months ended December 31, 2023, no director or officer of the Company adopted, modified or terminated a "Rule 10b5-1 trading arrangement" or "non-Rule 10b5-1 trading arrangement" as each term is defined in Item 408 of Regulation S-K.
ITEM 9C.DISCLOSURE REGARDING FOREIGN JURISDICTIONS THAT PREVENT INSPECTIONS ITEM 10.DIRECTORS, EXECUTIVE OFFICERS AND CORPORATE GOVERNANCE
None
PART III
Information required by this item will be included in the proxy statement for our 2024 annual stockholders' meeting and is incorporated by reference into this Annual Report.
ITEM 11.EXECUTIVE COMPENSATION
Information required by this item will be included in the proxy statement for our 2024 annual stockholders' meeting and is incorporated by reference into this Annual Report.
ITEM 12.SECURITY OWNERSHIP OF CERTAIN BENEFICIAL OWNERS AND MANAGEMENT AND RELATED STOCKHOLDER MATTERS
Information required by this item will be included in the proxy statement for our 2024 annual stockholders' meeting and is incorporated by reference into this Annual Report.
ITEM 13.CERTAIN RELATIONSHIPS AND RELATED TRANSACTIONS,
AND DIRECTOR INDEPENDENCE
Information required by this item will be included in the proxy statement for our 2024 annual stockholders' meeting and is incorporated by reference into this Annual Report.
ITEM 14.PRINCIPAL ACCOUNTANT FEES AND SERVICES ITEM 15.EXHIBITS, FINANCIAL STATEMENT SCHEDULES
Information required by this item will be included in the proxy statement for our 2024 annual stockholders' meeting and is incorporated by reference into this Annual Report.
PART IV
(a) Financial Statements, Financial Statement Schedules and Exhibits
The following are filed as a part of this Annual Report:
(1) Financial Statements
Management's Report on Internal Control over Financial Reporting
Report of Independent Registered Accounting Firm (KPMG LLP, Denver, CO Auditor Firm ID 185)
Consolidated Balance Sheets as of December 31, 2023, and 2022
Consolidated Statements of Operations for the years ended December 31, 2023, 2022, and 2021
Consolidated Statements of Stockholders' Equity for the years ended December 31, 2023, 2022, and 2021
Consolidated Statements of Cash Flows for the years ended December 31, 2023, 2022, and 2021
Notes to Consolidated Financial Statements
(2) Financial Statement Schedule
|
|
|
|
|
|
|
|
|
| Schedule |
|
Schedule Description |
| Schedule II |
|
Schedule of Valuation and Qualifying Accounts |
Schedule II is filed as part of this Annual Report and is set forth immediately following the Notes to the Consolidated Financial Statements referred to above. All other financial statement schedules have been omitted because they are not required, are not applicable, or the information is included in the consolidated financial statements or notes thereto.
(3) Exhibits
The following exhibits are filed or incorporated by reference in this report:
|
|
|
|
|
|
|
|
|
|
|
|
|
|
|
|
|
|
|
|
|
|
Incorporated by Reference from the Below-Listed Form (Each Filed under SEC File Number 001-34025) |
| Exhibit Number |
|
Exhibit Description |
|
Form |
Filing Date |
|
|
Restated Certificate of Incorporation of Intrepid Potash, Inc. |
|
8-K |
April 25, 2008 |
|
|
Certificate of Amendment to Restated Certificate of Incorporation of Intrepid Potash, Inc. |
|
8-K |
May 26, 2016 |
|
|
Certificate of Amendment to Restated Certificate of Incorporation of Intrepid Potash, Inc. |
|
8-K |
August 14, 2020 |
|
|
Amended and Restated Bylaws of Intrepid Potash, Inc. |
|
8-K |
June 25, 2015 |
|
|
Description of Registrant's Securities |
|
10-K |
March 7, 2023 |
|
|
Form of Indemnification Agreement with each director and officer |
|
8-K |
April 25, 2008 |
|
|
Director Designation and Voting Agreement, dated as of April 25, 2008, by and among Intrepid Potash, Inc., Harvey Operating and Production Company, Intrepid Production Corporation, and Potash Acquisition, LLC |
|
8-K |
May 1, 2008 |
|
|
Registration Rights Agreement, dated as of April 25, 2008, by and among Intrepid Potash, Inc., Harvey Operating & Production Company, Intrepid Production Corporation, and Potash Acquisition, LLC |
|
8-K |
May 1, 2008 |
|
|
Acknowledgment and Relinquishment, dated as of December 19, 2011, by and among Intrepid Potash, Inc., Harvey Operating and Production Company, Intrepid Production Corporation, and Potash Acquisition, LLC |
|
10-K |
February 16, 2012 |
|
|
Amended and Restated Credit Agreement, dated as of August 1, 2019, by and among Intrepid Potash, Inc., the subsidiaries party thereto, Bank of Montreal, as administrative agent, swing line lender, lead arranger, and book runner, and the lenders party thereto. |
|
8-K |
August 1, 2019 |
|
|
|
|
|
|
|
|
|
|
|
|
|
|
|
|
|
|
|
|
First Amended and Restated Credit Agreement, dated as of April 17, 2020, by and among Intrepid Potash, Inc., the subsidiaries party thereto, Bank of Montreal, as administrative agent, swing line lender, lead arranger, and book runner, and the lenders party thereto. |
|
8-K |
April 23, 2020 |
|
|
Second Amendment to Amended and Restated Credit Agreement, dated as of August 4, 2022, among Intrepid Potash, Inc., the subsidiaries party thereto, the lenders party thereto, and Bank of Montreal as administrative agent. |
|
8-K |
August 9, 2022 |
|
|
Amended and Restated Employment Agreement, dated as of May 19, 2010, by and between Intrepid Potash, Inc. and Robert P. Jornayvaz III+ |
|
8-K |
May 19, 2010 |
|
|
Amendment to Employment Agreement, dated February 23, 2011, by and between Intrepid Potash, Inc. and Robert P. Jornayvaz III+ |
|
8-K |
March 1, 2011 |
|
|
Second Amendment to Employment Agreement, dated as of February 14, 2013, by and between Intrepid Potash, Inc. and Robert P. Jornayvaz III+ |
|
8-K |
February 19, 2013 |
|
|
Third Amendment to Employment Agreement, dated as of March 22, 2016, by and between Intrepid Potash, Inc. and Robert P. Jornayvaz III+ |
|
8-K |
March 23, 2016 |
|
|
Fourth Amendment to Employment Agreement, dated as of March 12, 2019, by and between Intrepid Potash, Inc. and Robert P. Jornayvaz III+ |
|
8-K |
March 15, 2019 |
|
|
Amended and Restated Employment Agreement, dated as of May 19, 2010, by and between Intrepid Potash, Inc. and Hugh E. Harvey, Jr.+ |
|
8-K |
May 19, 2010 |
|
|
Intrepid Potash, Inc. Amended and Restated Equity Incentive Plan+ |
|
8-K |
May 23, 2022 |
|
|
Form of Restricted Stock Agreement under Intrepid Potash, Inc. Amended and Restated Equity Incentive Plan+ |
|
10-K |
March 2, 2021 |
|
|
Form of Stock Option Agreement under Intrepid Potash, Inc. Amended and Restated Equity Incentive Plan+ |
|
10-K |
March 2, 2021 |
|
|
Intrepid Potash, Inc. Amended and Restated Short-Term Incentive Plan+ |
|
8-K |
May 26, 2016 |
|
|
Form of Change-of-Control Severance Agreement with Robert P. Jornayvaz III and Hugh E. Harvey, Jr.+ |
|
10-Q |
November 3, 2011 |
|
|
Form of Noncompete Agreement with executives other than Robert P. Jornayvaz III+ |
|
10-K |
February 28, 2017 |
|
|
Form of Retention Agreement+ |
|
10-K |
March 12, 2019 |
|
|
Aircraft Dry Lease, dated as of January 9, 2009, by and between Intrepid Potash, Inc. and Intrepid Production Holdings LLC |
|
8-K |
January 12, 2009 |
|
|
First Amendment to Aircraft Dry Lease, dated as of September 1, 2014, by and between Intrepid Potash, Inc. and Intrepid Production Holdings LLC |
|
8-K |
August 18, 2014 |
|
|
Aircraft Dry Lease, dated as of September 1, 2014, by and between Intrepid Potash, Inc. and Odyssey Adventures, LLC |
|
8-K |
August 18, 2014 |
|
|
Retirement and Separation Agreement, dated February 8, 2023, between Intrepid Potash, Inc. and Brian Stone |
|
8-K |
February 10, 2023 |
|
|
Cooperative Development Agreement, effective as of February 28, 2011, among Intrepid Potash, Inc., Intrepid Potash-New Mexico, LLC, BOPCO, L.P. and the other parties thereto (as amended prior to the Amendment). |
|
8-K |
December 13, 2023 |
|
|
Third Amendment of Cooperative Development Agreement, effective as of January 1, 2024, among Intrepid Potash, Inc., Intrepid Potash-New Mexico, LLC, XTO Holdings, LLC and XTO Delaware Basin, LLC |
|
8-K |
December 13, 2023 |
|
|
List of Subsidiaries |
|
* |
|
|
|
Consent of KPMG LLP |
|
* |
|
|
|
Consent of RESPEC LLC |
|
* |
|
|
|
Certification of Principal Executive Officer pursuant to Exchange Act Rules 13a-14(a) and 15d-14(a) |
|
* |
|
|
|
Certification of Principal Financial Officer pursuant to Exchange Act Rules 13a-14(a) and 15d-14(a) |
|
* |
|
|
|
Certification of Principal Executive Officer pursuant to 18 U.S.C. Section 1350, as adopted pursuant to Section 906 of the Sarbanes-Oxley Act of 2002 |
|
** |
|
|
|
|
|
|
|
|
|
|
|
|
|
|
|
|
|
|
|
|
|
Certification of Principal Financial Officer pursuant to 18 U.S.C. Section 1350, as adopted pursuant to Section 906 of the Sarbanes-Oxley Act of 2002 |
|
** |
|
|
|
Mine Safety Disclosure Exhibit |
|
* |
|
|
|
Technical Report Summary of the 2023 Estimated Resources and Reserves at Intrepid Potash - New Mexico |
|
* |
|
|
|
Technical Report Summary of the 2023 Estimated Resources and Reserves at Intrepid Potash - Moab |
|
* |
|
|
|
Technical Report Summary of the 2023 Estimated Resources and Reserves at Intrepid Potash - Wendover |
|
* |
|
|
|
Intrepid Potash, Inc. Incentive Compensation Recovery Policy |
|
* |
|
|
|
Transition Services Agreement, dated as of April 25, 2008, by and between Intrepid Potash, Inc., Intrepid Oil & Gas, LLC, and Intrepid Potash-Moab, LLC |
|
8-K |
May 1, 2008 |
|
|
Extension and Amendment to Transition Services Agreement dated July 14, 2009, to be effective as of April 25, 2009, between Intrepid Potash, Inc. and Intrepid Oil & Gas, LLC |
|
10-Q |
August 7, 2009 |
|
|
Third Amendment to Transition Services Agreement dated March 26, 2010, between Intrepid Potash, Inc. and Intrepid Oil & Gas, LLC |
|
10-Q |
May 5, 2010 |
|
|
Fourth Amendment to Transition Services Agreement dated March 25, 2011, between Intrepid Potash, Inc. and Intrepid Oil and Gas, LLC |
|
10-Q |
May 5, 2011 |
|
|
Sixth Amendment to Transition Services Agreement dated April 3, 2013, between Intrepid Potash, Inc. and Intrepid Oil & Gas, LLC |
|
10-Q |
May 2, 2013 |
|
|
Seventh Amendment to Transition Services Agreement dated March 24, 2015, between Intrepid Potash, Inc. and Intrepid Oil & Gas, LLC |
|
10-Q
|
April 28, 2015 |
|
|
Eighth Amendment to Transition Services Agreement dated March 22, 2017, between Intrepid Potash, Inc. and Intrepid Oil & Gas, LLC |
|
10-Q |
May 2, 2017 |
|
|
Ninth Amendment to Transition Services Agreement dated February 20, 2019, between Intrepid Potash, Inc. and Intrepid Oil & Gas, LLC. |
|
10-K |
March 12, 2019 |
| 101.INS |
|
Inline XBRL Instance Document - the instance document does not appear in the Interactive Data File because its XBRL tags are embedded with the Inline XBRL document. |
|
* |
|
| 101.SCH |
|
Inline XBRL Taxonomy Extension Schema Document |
|
* |
|
| 101.CAL |
|
Inline XBRL Taxonomy Extension Calculation Linkbase Document |
|
* |
|
| 101.DEF |
|
Inline XBRL Taxonomy Extension Definition Linkbase Document |
|
* |
|
| 101.LAB |
|
Inline XBRL Taxonomy Extension Label Linkbase Document |
|
* |
|
| 101.PRE |
|
Inline XBRL Taxonomy Extension Presentation Linkbase Document |
|
* |
|
| 104 |
|
Cover Page Interactive Date File (embedded within the Inline XBRL document and contained in Exhibit. |
|
|
|
* Filed herewith
** Furnished herewith
+ Management contract or compensatory plan or arrangement
† Schedules and exhibits have been omitted pursuant to Item 601(a)(5) of Regulation S_K. The Company hereby undertakes to supplementally furnish copies of any omitted schedules and exhibits to the SEC upon request.
# Certain portions of the exhibit have been omitted pursuant to Item 601(b)(10) of Regulation S-K. The omitted information is not material and is the type of information that the registrant treats as private or confidential. The Company hereby undertakes to furnish supplemental copies of the unredacted exhibit upon request by the SEC.
ITEM 16.FORM 10-K SUMMARY
Not applicable.
SIGNATURES
Pursuant to the requirements of Section 13 or 15(d) of the Securities Exchange Act of 1934, the registrant has duly caused this report to be signed on its behalf by the undersigned, thereunto duly authorized.
|
|
|
|
|
|
|
|
|
|
|
INTREPID POTASH, INC.
(Registrant) |
|
|
|
| March 7, 2024 |
|
/s/ Robert P. Jornayvaz III |
|
|
Robert P. Jornayvaz III - Executive Chairman of the Board and Chief Executive Officer
(Principal Executive Officer and Duly Authorized Officer) |
Pursuant to the requirements of the Securities Exchange Act of 1934, this report has been signed below by the following persons on behalf of the registrant and in the capacities and on the dates indicated.
|
|
|
|
|
|
|
|
|
|
|
|
|
|
|
| Signature |
|
Title |
|
Date |
|
|
|
|
|
/s/ Robert P. Jornayvaz III |
|
Executive Chairman of the Board
and Chief Executive Officer |
|
March 7, 2024 |
Robert P. Jornayvaz III |
|
|
|
|
|
|
|
|
|
/s/ Matthew D. Preston |
|
Chief Financial Officer (Principal Financial Officer) |
|
March 7, 2024 |
Matthew D. Preston |
|
|
|
|
|
|
|
|
|
/s/ Chris A. Elliott |
|
Director |
|
March 7, 2024 |
Chris A. Elliott |
|
|
|
|
|
|
|
|
|
/s/ Lori A. Lancaster |
|
Director |
|
March 7, 2024 |
| Lori A. Lancaster |
|
|
|
|
|
|
|
|
|
/s/ Mary E. McBride |
|
Director |
|
March 7, 2024 |
| Mary E. McBride |
|
|
|
|
|
|
|
|
|
/s/ William M. Zisch |
|
Director |
|
March 7, 2024 |
| William M. Zisch |
|
|
|
|
|
|
|
|
|
/s/ Barth E. Whitham |
|
Lead Director |
|
March 7, 2024 |
| Barth E. Whitham |
|
|
|
|
EX-21.1
2
ipi12312023exhibit211.htm
EX-21.1
Document
Exhibit 21.1
LIST OF SUBSIDIARIES
|
|
|
|
|
|
Name |
State of Organization |
| Intrepid Potash-Moab, LLC |
Delaware |
| Intrepid Potash-New Mexico, LLC |
New Mexico |
| Intrepid Potash-Wendover, LLC |
Colorado |
| Moab Gas Pipeline, LLC |
Colorado |
| Intrepid Aviation LLC |
Colorado |
| 203 E. Florence, LLC |
Delaware |
| Intrepid Acquisition Sponsor, LLC |
Delaware |
| Intrepid Acquisition Corporation I, LLC |
Delaware |
|
|
|
|
|
|
EX-23.1
3
ipi12312023exhibit231.htm
EX-23.1
Document
Exhibit 23.1
Consent of Independent Registered Public Accounting Firm
We consent to the incorporation by reference in the registration statement (No. 333-266602) on Form S-3 and registration statements (Nos. 333-266585, 333-233057, 333-218423, 333-211650, and 333-150444) on Form S-8 of our report dated March 7, 2024, with respect to the consolidated financial statements and financial statement schedule II of Intrepid Potash, Inc. and the effectiveness of internal control over financial reporting.
/s/ KPMG LLP
Denver, Colorado
March 7, 2024
EX-23.2
4
ipi12312023exhibit232.htm
EX-23.2
Document
Exhibit 23.2
CONSENT OF QUALIFIED PERSON
RESPEC LLC ("RESPEC"), in connection with the Annual Report on Form 10-K for the year ended December 31, 2023 (the “Form 10-K”) of Intrepid Potash, Inc. (the “Company”), hereby consents to:
•the public filing by the Company and use of (i) the technical report titled “Technical Report Summary of the 2023 Estimated Resources and Reserves at Intrepid Potash-New Mexico” with an effective date of December 31, 2023 and dated February 14, 2024, (ii) the technical report titled “Technical Report Summary of the 2023 Estimated Resources and Reserves at Intrepid Potash-Moab” with an effective date of December 31, 2023 and dated February 14, 2024, and (iii) the technical report titled “Technical Report Summary of the 2023 Estimated Resources and Reserves at Intrepid Potash-Wendover” with an effective date of December 31, 2023 and dated February 14, 2024 (collectively, the “Technical Report Summaries”), in each case that were prepared in accordance with Subpart 1300 of Regulation S-K promulgated by the U.S. Securities and Exchange Commission (the “Commission”), as exhibits to this Form 10-K and incorporated by reference therein;
•the incorporation by reference of the Technical Report Summaries into the Company's Registration Statements on Form S-8 (Nos. 333-150444, 333-211650, 333-218423, 333-233057 and 333-266585) (collectively, the “Registration Statements”);
•the use of and references to our name, including our status as an expert or “qualified person” (as defined in Subpart 1300 of Regulation S-K promulgated by the Commission), in connection with the Form 10-K, the Registration Statements and the Technical Report Summaries; and
•any extracts from or a summary of the Technical Report Summaries of 2023 Estimated Resources and Reserves in the Form 10-K and incorporated by reference in the Registration Statements and the use of any information derived, summarized, quoted, or referenced from the Technical Report Summaries, or portions thereof, that was prepared by the Company, that we supervised the preparation of, and/or that was reviewed and approved by us, that is included or incorporated by reference in the Form 10-K and the Registration Statements.
RESPEC is responsible for authoring, and this consent pertains to, the Technical Report Summaries of the 2023 Estimated Resources and Reserves. RESPEC certifies that it has read the Form 10-K and that it fairly and accurately represents the information in the Technical Report Summaries for which it is responsible.
By: /s/ Susan B. Patton
Name: Susan B. Patton, P.E.
Title: Principal
Grand Junction, Colorado
March 7, 2024
EX-31.1
5
ipi12312023exhibit311.htm
EX-31.1
Document
Exhibit 31.1
CERTIFICATION OF PRINCIPAL EXECUTIVE OFFICER
PURSUANT TO 15 U.S.C. SECTION 7241, AS
ADOPTED PURSUANT TO SECTION 302 OF THE SARBANES-OXLEY ACT OF 2002
I, Robert P. Jornayvaz III, certify that:
1.I have reviewed this annual report on Form 10-K of Intrepid Potash, Inc.;
2.Based on my knowledge, this report does not contain any untrue statement of a material fact or omit to state a material fact necessary to make the statements made, in light of the circumstances under which such statements were made, not misleading with respect to the period covered by this report;
3.Based on my knowledge, the financial statements, and other financial information included in this report, fairly present in all material respects the financial condition, results of operations and cash flows of the registrant as of, and for, the periods presented in this report;
4.The registrant's other certifying officer and I are responsible for establishing and maintaining disclosure controls and procedures (as defined in Exchange Act Rules 13a-15(e) and 15d-15(e)) and internal control over financial reporting (as defined in Exchange Act Rules 13a-15(f) and 15d-15(f)) for the registrant and have:
a)Designed such disclosure controls and procedures, or caused such disclosure controls and procedures to be designed under our supervision, to ensure that material information relating to the registrant, including its consolidated subsidiaries, is made known to us by others within those entities, particularly during the period in which this report is being prepared;
b)Designed such internal control over financial reporting, or caused such internal control over financial reporting to be designed under our supervision, to provide reasonable assurance regarding the reliability of financial reporting and the preparation of financial statements for external purposes in accordance with generally accepted accounting principles;
c)Evaluated the effectiveness of the registrant's disclosure controls and procedures and presented in this report our conclusions about the effectiveness of the disclosure controls and procedures, as of the end of the period covered by this report based on such evaluation; and
d)Disclosed in this report any change in the registrant's internal control over financial reporting that occurred during the registrant's most recent fiscal quarter (the registrant's fourth fiscal quarter in the case of an annual report) that has materially affected, or is reasonably likely to materially affect, the registrant's internal control over financial reporting; and
5.The registrant's other certifying officer and I have disclosed, based on our most recent evaluation of internal control over financial reporting, to the registrant's auditors and the audit committee of the registrant's Board of Directors (or persons performing the equivalent functions):
a) All significant deficiencies and material weaknesses in the design or operation of internal control over financial reporting which are reasonably likely to adversely affect the registrant's ability to record, process, summarize and report financial information; and
b) Any fraud, whether or not material, that involves management or other employees who have a significant role in the registrant's internal control over financial reporting.
|
|
|
|
|
|
|
|
|
Dated: March 7, 2024 |
|
/s/ Robert P. Jornayvaz III |
|
|
Robert P. Jornayvaz III
Executive Chairman of the Board, and Chief Executive Officer
|
EX-31.2
6
ipi12312023exhibit312.htm
EX-31.2
Document
Exhibit 31.2
CERTIFICATION OF PRINCIPAL FINANCIAL OFFICER
PURSUANT TO 15 U.S.C. SECTION 7241, AS
ADOPTED PURSUANT TO SECTION 302 OF THE SARBANES-OXLEY ACT OF 2002
I, Matthew D. Preston, certify that:
1.I have reviewed this annual report on Form 10-K of Intrepid Potash, Inc.;
2.Based on my knowledge, this report does not contain any untrue statement of a material fact or omit to state a material fact necessary to make the statements made, in light of the circumstances under which such statements were made, not misleading with respect to the period covered by this report;
3.Based on my knowledge, the financial statements, and other financial information included in this report, fairly present in all material respects the financial condition, results of operations and cash flows of the registrant as of, and for, the periods presented in this report;
4.The registrant's other certifying officer and I are responsible for establishing and maintaining disclosure controls and procedures (as defined in Exchange Act Rules 13a-15(e) and 15d-15(e)) and internal control over financial reporting (as defined in Exchange Act Rules 13a-15(f) and 15d-15(f)) for the registrant and have:
a)Designed such disclosure controls and procedures, or caused such disclosure controls and procedures to be designed under our supervision, to ensure that material information relating to the registrant, including its consolidated subsidiaries, is made known to us by others within those entities, particularly during the period in which this report is being prepared;
b)Designed such internal control over financial reporting, or caused such internal control over financial reporting to be designed under our supervision, to provide reasonable assurance regarding the reliability of financial reporting and the preparation of financial statements for external purposes in accordance with generally accepted accounting principles;
c)Evaluated the effectiveness of the registrant's disclosure controls and procedures and presented in this report our conclusions about the effectiveness of the disclosure controls and procedures, as of the end of the period covered by this report based on such evaluation; and
d)Disclosed in this report any change in the registrant's internal control over financial reporting that occurred during the registrant's most recent fiscal quarter (the registrant's fourth fiscal quarter in the case of an annual report) that has materially affected, or is reasonably likely to materially affect, the registrant's internal control over financial reporting; and
5.The registrant's other certifying officer and I have disclosed, based on our most recent evaluation of internal control over financial reporting, to the registrant's auditors and the audit committee of the registrant's Board of Directors (or persons performing the equivalent functions):
a) All significant deficiencies and material weaknesses in the design or operation of internal control over financial reporting which are reasonably likely to adversely affect the registrant's ability to record, process, summarize and report financial information; and
b) Any fraud, whether or not material, that involves management or other employees who have a significant role in the registrant's internal control over financial reporting.
|
|
|
|
|
|
|
|
|
Dated: March 7, 2024 |
|
/s/ Matthew D. Preston |
|
|
Matthew D. Preston
Chief Financial Officer
|
EX-32.1
7
ipi12312023exhibit321.htm
EX-32.1
Document
Exhibit 32.1
CERTIFICATION OF
PRINCIPAL EXECUTIVE OFFICER
PURSUANT TO 18 U.S.C. SECTION 1350,
AS ADOPTED PURSUANT TO SECTION 906 OF THE SARBANES-OXLEY ACT OF 2002
In connection with the filing of the Annual Report on Form 10-K for the year ended December 31, 2023 (the "Report"), of Intrepid Potash, Inc. (the "Registrant") with the Securities and Exchange Commission and pursuant to 18 U.S.C. Section 1350, as adopted pursuant to Section 906 of the Sarbanes-Oxley Act of 2002, I, Robert P. Jornayvaz III, Executive Chairman of the Board, President and Chief Executive Officer of the Registrant, certify that to the best of my knowledge:
1.The Report fully complies with the requirements of Section 13(a) or 15(d) of the Securities Exchange Act of 1934, as amended (the "Exchange Act"); and
2.The information contained in the Report fairly presents, in all material respects, the financial condition and results of operations of the Registrant.
|
|
|
|
|
|
|
|
|
Dated: March 7, 2024 |
|
/s/ Robert P. Jornayvaz III |
|
|
Robert P. Jornayvaz III
Executive Chairman of the Board, and Chief Executive Officer
|
This certification is furnished with this Report pursuant to Section 906 of the Sarbanes-Oxley Act of 2002 and will not, except to the extent required by such Act, be deemed filed by the Registrant for purposes of Section 18 of the Exchange Act. This certification will not be deemed to be incorporated by reference into any filing under the Securities Act of 1933, as amended, or the Exchange Act, except to the extent that the Registrant specifically incorporates it by reference.
EX-32.2
8
ipi12312023exhibit322.htm
EX-32.2
Document
Exhibit 32.2
CERTIFICATION OF
PRINCIPAL FINANCIAL OFFICER
PURSUANT TO 18 U.S.C. SECTION 1350,
AS ADOPTED PURSUANT TO SECTION 906 OF THE SARBANES-OXLEY ACT OF 2002
In connection with the filing of the Annual Report on Form 10-K for the year ended December 31, 2023 (the "Report"), of Intrepid Potash, Inc. (the "Registrant") with the Securities and Exchange Commission and pursuant to 18 U.S.C. Section 1350, as adopted pursuant to Section 906 of the Sarbanes-Oxley Act of 2002, I, Matthew D. Preston, Chief Financial Officer and Chief Accounting Officer of the Registrant, certify that to the best of my knowledge:
1.The Report fully complies with the requirements of Section 13(a) or 15(d) of the Securities Exchange Act of 1934, as amended (the "Exchange Act"); and
2.The information contained in the Report fairly presents, in all material respects, the financial condition and results of operations of the Registrant.
|
|
|
|
|
|
|
|
|
Dated: March 7, 2024 |
|
/s/ Matthew D. Preston |
|
|
Matthew D. Preston
Chief Financial Officer
|
This certification is furnished with this Report pursuant to Section 906 of the Sarbanes-Oxley Act of 2002 and will not, except to the extent required by such Act, be deemed filed by the Registrant for purposes of Section 18 of the Exchange Act. This certification will not be deemed to be incorporated by reference into any filing under the Securities Act of 1933, as amended, or the Exchange Act, except to the extent that the Registrant specifically incorporates it by reference.
EX-95.1
9
ipi12312023exhibit951.htm
EX-95.1
Document
Exhibit 95.1
The table below provides information for the year ended December 31, 2023, about certain mine safety and health citations issued to Intrepid or its subsidiaries by the Mine Safety and Health Administration (“MSHA”) under the Federal Mine Safety and Health Act of 1977 (the “Mine Act”) and about certain other regulatory matters.
|
|
|
|
|
|
|
|
|
|
|
|
|
|
|
|
|
|
|
|
|
|
|
|
|
|
|
|
|
|
|
|
|
|
|
|
|
|
|
Mine Name and MSHA Identification Number |
Section 104 S&S Citations |
Section 104(b) Orders |
Section 104(d) Citations and Orders |
Section 110(b)(2) Violations |
Section 107(a) Orders |
Total Dollar Value of MSHA Assessments Proposed |
Total Number of Mining-Related Fatalities |
Received Notice of Pattern of Violations Under Section 104(e) |
Received Notice of Potential to Have Pattern under Section 104(e) |
Legal Actions Pending as of the End of the Period |
Legal Actions Initiated During the Period |
Legal Actions Resolved During the Period |
Intrepid Potash East
(29-00170) |
4 |
— |
— |
— |
— |
$11,000 |
— |
— |
— |
10 |
10 |
7 |
Intrepid Potash West
(29-00175) |
1 |
— |
— |
— |
— |
$2,492 |
— |
— |
— |
2 |
2 |
1 |
Intrepid Potash North
(29-02028) |
— |
— |
— |
— |
— |
$3,210 |
— |
— |
— |
2 |
3 |
3 |
Below are additional details about the information provided in the table above:
•General - In general, the number of citations and orders will vary depending on the size of the mine, the individual inspector assigned to the mine, and the specific mine characteristics. Citations and orders can be contested and appealed and, in that process, are often reduced in severity and amount and are sometimes vacated.
•MSHA Identification Numbers - MSHA assigns an identification number to each mine and may or may not assign separate identification numbers to related facilities. We provide the information in the table by MSHA identification number.
•Section 104 Significant and Substantial (“S&S”) Citations - These citations are issued for alleged violations of a mining safety standard or regulation where there exists a reasonable likelihood that the hazard contributed to or will result in an injury or illness of a reasonably serious nature.
•Section 104(b) Orders - These orders are issued for alleged failure to totally abate the subject matter of a Section 104(a) citation within the period specified in the citation.
•Section 104(d) Citations and Orders - These citations and orders are issued for an alleged unwarrantable failure (i.e., aggravated conduct constituting more than ordinary negligence) to comply with a mining safety standard or regulation.
•Section 110(b)(2) Violations - These violations are issued, and penalties are assessed, for flagrant violations (i.e., a reckless or repeated failure to make reasonable efforts to eliminate a known violation that substantially and proximately caused, or reasonably could have been expected to cause, death or serious bodily injury).
•Section 107(a) Orders - These orders are issued for an imminent danger to immediately remove miners.
•Total Dollar Value of MSHA Assessments Proposed - Proposed assessments issued during the period do not necessarily relate to the citations or orders issued by MSHA during that period or to the pending legal actions reported in the table.
•Notice of Pattern of Violations Under Section 104(e); Notice of Potential to Have Pattern under Section 104(e) - These notices are issued for a pattern of violation of mandatory health or safety standards or for the potential to have such a pattern.
•Legal Actions Pending, Initiated, and Resolved - The Federal Mine Safety and Health Review Commission (the “Commission”) is an independent adjudicative agency that provides administrative trial and appellate review of legal disputes arising under the Mine Act. Each legal action is assigned a docket number by the Commission and may have as its subject matter one or more citations, orders, penalties, or complaints.
The table below summarizes the types of legal actions that were pending as of December 31, 2023:
|
|
|
|
|
|
|
|
|
|
|
|
|
|
|
|
|
|
|
|
|
|
|
|
Mine Name and MSHA Identification Number |
Contests of Citations and Orders |
Contests of Proposed Penalties |
Complaints for Compensation |
Complaints of Discharge, Discrimination or Interference |
Applications for Temporary Relief |
Appeals of Judges’ Decisions or Orders |
Total |
Intrepid Potash East
(29-00170) |
10 |
— |
— |
— |
— |
— |
10 |
Intrepid Potash West
(29-00175) |
2 |
— |
— |
— |
— |
— |
2 |
Intrepid Potash North
(29-02028) |
2 |
— |
— |
— |
— |
— |
2 |
•Contests of Citations and Orders relate to challenges by operators, miners or miners' representatives to the issuance of a citation or order issued by MSHA.
•Contests of Proposed Penalties (Petitions for Assessment of Penalties) are administrative proceedings challenging a civil penalty that MSHA has proposed for the violation contained in a citation or order.
•Complaints for Compensation are filed by miners entitled to compensation when a mine is closed by certain withdrawal orders issued by MSHA for the purpose of determining the amount of compensation, if any, due miners idled by the orders.
•Complaints of Discharge, Discrimination or Interference involve a miner's allegation that he or she has suffered a wrong by the operator because he or she engaged in some type of activity protected under the Mine Act, such as making a safety complaint, or that he or she has suffered discrimination and lost his or her position.
EX-96.1
10
exhibit961eoy2023technical.htm
EX-96.1
Document
Technical Report Summary
of the
2023 Estimated Resources and Reserves at Intrepid Potash-New Mexico
Prepared for:
Intrepid Potash–New Mexico, LLC
Revised Report Date:
February 14, 2024
Effective Date:
December 31, 2023
Prepared by:
660 Rood Avenue, Suite A
Grand Junction, Colorado 81501
|
|
|
|
|
|
2023 Estimated Resources and Reserves at Intrepid Potash-New Mexico
Prepared for Intrepid Potash, Inc.
February 14, 2024 |
ii |
Date and Signature Page
This report titled “Technical Report Summary of the 2023 Estimated Resources and Reserves at Intrepid Potash-New Mexico” is effective as of December 31, 2023, and was prepared and signed by RESPEC Company, LLC, acting as a Qualified Person Firm.
Signed and Dated February 14, 2024.
signed/ RESPEC Company, LLC
Susan B Patton, PE
Principal
On behalf of RESPEC Company, LLC
|
|
|
|
|
|
2023 Estimated Resources and Reserves at Intrepid Potash-New Mexico
Prepared for Intrepid Potash, Inc.
February 14, 2024 |
iii |
Technical Report Summary
of the
2023 Estimated Resources and Reserves at Intrepid Potash-New Mexico
Table of Contents
|
|
|
|
|
|
2023 Estimated Resources and Reserves at Intrepid Potash-New Mexico
Prepared for Intrepid Potash, Inc.
February 14, 2024 |
iv |
|
|
|
|
|
|
2023 Estimated Resources and Reserves at Intrepid Potash-New Mexico
Prepared for Intrepid Potash, Inc.
February 14, 2024 |
v |
|
|
|
|
|
|
2023 Estimated Resources and Reserves at Intrepid Potash-New Mexico
Prepared for Intrepid Potash, Inc.
February 14, 2024 |
vi |
List of Tables
|
|
|
|
|
|
2023 Estimated Resources and Reserves at Intrepid Potash-New Mexico
Prepared for Intrepid Potash, Inc.
February 14, 2024 |
vii |
List of Figures
|
|
|
|
|
|
2023 Estimated Resources and Reserves at Intrepid Potash-New Mexico
Prepared for Intrepid Potash, Inc.
February 14, 2024 |
viii |
List of Abbreviations
|
|
|
|
|
|
| ° |
degree |
| % |
percent |
| AMAX |
AMAX/Horizon Mine |
| APR |
Annual Percentage Rate |
| BLM |
United States Bureau of Land Management |
| BNSF |
Burlington Northern Santa Fe |
| CFR |
Code of Federal Regulations |
| CL |
Competitive Lease |
| COGS |
cost of goods sold |
| CPD |
Carlsbad Potash District |
| DMS |
dense media separation |
| DOI |
United States Department of Interior |
| EA |
Environmental Audit |
| EIS |
Environmental Impact Statement |
| EOY |
end of year |
| F |
Fahrenheit |
| FR |
Federal Register |
| ft |
feet or foot |
ft3 |
cubic foot |
| ft% |
feet-percent |
| g |
grams |
g/cm3 |
grams per cubic centimeter |
| gpm |
gallons per minute |
| GT |
grade thickness |
| hp |
horsepower |
ID2 |
inverse distance squared |
| Intrepid |
Intrepid Potash, Inc. |
| IPNM |
Intrepid Potash–New Mexico, LLC |
K2O |
potassium oxide |
K2SO4 ·2MgSO4 |
langbeinite |
| KCl |
sylvite or potassium chloride |
| KPLA |
Known Potash Leasing Area |
| LOM |
Life-of-Mine |
| NMED |
New Mexico Environmental Department |
| M |
million |
| MOP |
Muriate of Potash |
| MSHA |
Mine Safety and Health Administration |
| msl |
mean sea level |
| mm |
millimeter |
|
|
|
|
|
|
2023 Estimated Resources and Reserves at Intrepid Potash-New Mexico
Prepared for Intrepid Potash, Inc.
February 14, 2024 |
ix |
|
|
|
|
|
|
| Mt |
million tons |
| Mtpy |
million tons per year |
| NaCl |
halite |
| NCL |
Non-Competitive Lease |
| NPV |
Net Present Value |
| NAD |
North American Datum |
| OSHA |
Occupational Safety and Health Administration |
| PFD |
process flow diagrams |
| PRL |
Preference Rights Lease |
| QP |
Qualified Person |
| RC |
reflux classifier |
| REC |
Recognized Environmental Concerns |
| RESPEC |
RESPEC Company LLC |
| SEC |
United States Securities Exchange Commission |
| SME |
Society for Mining, Metallurgy & Exploration |
| SOE |
statement of earnings |
| SOP |
standard operating procedure |
| t |
ton |
| TOC |
Total Organic Carbon |
| tph |
tons per hour |
| tpy |
tons per year |
| TSF |
Tailings Storage Facility |
| US |
United States |
| USGS |
United States Geological Survey |
| WIPP |
Waste Isolation Pilot Plant |
| XRD |
X-ray Diffraction |
|
|
|
|
|
|
2023 Estimated Resources and Reserves at Intrepid Potash-New Mexico
Prepared for Intrepid Potash, Inc.
February 14, 2024 |
1 |
1.0Executive Summary
RESPEC Company, LLC. was commissioned by Intrepid Potash, Inc. (Intrepid) to prepare the 2023 Technical Report Summary (TRS) filed as Exhibit 96.1 with the Intrepid Potash 10-K for End of Year (EOY) 2023 for the Intrepid Potash-New Mexico (IPNM) property. See Table 2-1 for previous TRS filings for the property. This report updates resource and reserve tables and updates the cash flow and economic analysis. The resources and reserves are estimated according to United States (US) Securities and Exchange Commission (SEC) S-K 1300 regulations.
1.1Property Description and Ownership
The property includes two operating mines, the East Underground mine and the HB Solar Solution Mines (HB Mine), the idled West Mine, and the North Mine which was shut down in the early 1980’s. The property is located in Eddy and Lea Counties, near Carlsbad, New Mexico.
The East Plant processes the underground room-and-pillar-mined langbeinite ore into Trio®. The long-term underground mining plan is undecided and therefore previously reported reserves have been reestablished as resources. The HB Plant produces Muriate of Potash (MOP) from the solution mine brine. Solution mining of the 1st and 3rd ore zones in previously mined-out areas of the property is planned to continue long term.
1.2Geology and Mineralization
The geology of the potash-bearing beds of the Carlsbad area has been well documented. Overall, the potash-bearing beds may be described as bedded sedimentary rocks, deposited across the Delaware Basin and Northwest Shelf backreef from the Capitan Reef.
1.3Status of Exploration, Development and Operations
The property has been in continuous operation by IPNM since 2004. Confirmation drilling, channel sampling, and mine development are an integral part of the mine operations.
|
|
|
|
|
|
2023 Estimated Resources and Reserves at Intrepid Potash-New Mexico
Prepared for Intrepid Potash, Inc.
February 14, 2024 |
2 |
1.4Mineral Resource Estimates
The resource model created from the database of exploration and sampling data served as the basis for the mineral resource estimate. The sampling data includes channel samples from the active mining horizon. The resources reported as mineralized rock in place, exclusive of mineral reserves effective December 31, 2023, are shown in Table 1-1 and Table 1-2.
Table 1-1. Mineral Resource Estimate Summary effective December 31, 2023
|
|
|
|
|
|
|
|
|
|
|
|
|
|
|
|
|
|
| IPNM - Summary of Mineral Resources in millions of tons of Sylvinite in Place effective December 31, 2023, based on $450/Product Ton Mine Site |
|
Resources |
|
|
|
Sylvinite1 |
Grade |
Contained K2O |
Mining Cutoff2 |
Processing Recovery |
|
(Mt) |
(%K2O) |
(Mt) |
(ft-%K2O) |
(%) |
| Measured Mineral Resources |
289 |
16 |
45 |
54-64 |
75-85 |
| Indicated Mineral Resources |
164 |
14 |
24 |
54-64 |
75-85 |
| Measured + Indicated Mineral Resources |
453 |
15 |
69 |
|
|
| Inferred Mineral Resources |
|
|
|
|
|
1Sylvinite is a mixed evaporite containing NaCl and KCl. |
2Solution mining resource cutoff for flooded old working is the mining extents boundary. |
| Mineral Resources were prepared by RESPEC, a qualified firm for the estimate and independent of Intrepid Potash, for EOY 2023. |
| Mineral Resources are reported exclusive of Mineral Reserves, on a 100% basis. |
Mt = million tons, % = percentage, K2O = potassium oxide, ft = feet |
Table 1-2. Mineral Resource Estimate Summary effective December 31, 2023
|
|
|
|
|
|
|
|
|
|
|
|
|
|
|
|
|
|
| IPNM - Summary of Mineral Resources in millions of tons of Langbeinite Mineralized Rock in Place effective December 31, 2023 based on $470/Product Ton Mine Site |
|
Resources |
|
|
|
Langbeinite Mineralized Rock |
Grade |
Contained K2O |
Mining Cutoff |
Processing Recovery |
|
(Mt) |
(%K2O) |
(Mt) |
(ft-%K2O) |
(%) |
| Measured Mineral Resources |
72 |
10 |
7 |
25 |
68 |
| Indicated Mineral Resources |
60 |
10 |
6 |
25 |
68 |
| Measured + Indicated Mineral Resources |
132 |
10 |
13 |
|
|
| Inferred Mineral Resources |
|
|
|
|
|
| Mineral Resources were prepared by RESPEC, a qualified firm for the estimate and independent of Intrepid Potash, for EOY 2023. |
| Mineral Resources are reported exclusive of Mineral Reserves, on a 100% basis. |
Mt = million tons, % = percentage, K2O = potassium oxide, ft = feet |
|
|
|
|
|
|
2023 Estimated Resources and Reserves at Intrepid Potash-New Mexico
Prepared for Intrepid Potash, Inc.
February 14, 2024 |
3 |
1.5Mineral Reserve Estimates
Using the mineral resource grids, applying a reserve cut-off and modifying factors to a 25-year detailed mine plan reserves for the HB mine were estimated. Table 1-3 shows the estimated reserve summaries in product tons effective December 31, 2023.
Table 1-3. IPNM Mineral Reserve Estimate Summary effective December 31, 2023
|
|
|
|
|
|
|
|
|
|
|
|
|
|
|
|
|
|
| IPNM - Summary of Potash Mineral Reserves effective December 31, 2023 based on $360/Product Ton Mine Site |
|
Reserves |
|
|
|
In-Place KCl |
In-Situ Grade1 |
Product2 |
Brine Cutoff Grade3 |
Processing Recovery |
|
(Mt) |
(%K2O) |
(Mt) |
(%K2O) |
(%) |
| Proven Mineral Reserves |
5.3 |
22.9 |
4.0 |
3.0 |
85 |
| Probable Mineral Reserves |
|
|
|
|
|
| Total Mineral Reserves |
5.3 |
22.9 |
4.0 |
|
|
1In-situ grade is the amount of K2O in the contact area of the caverns and is used to calculate the In-Place KCl. |
2Product is calculated by multiplying In-Place KCl by: dissolution factor of 96%, areal recovery of 100%, geologic factor of 94.2%, plant recovery of 85%, cavern loss factor of 98%, a product purity factor of 103%, and a handling loss factor of 97%. |
3Brine cutoff grade is the amount of K2O in the extracted brine necessary to cover the cash costs of production. |
| Mineral Reserves were prepared by RESPEC, a qualified firm for the estimate and independent of Intrepid Potash, for EOY 2023. |
| Mineral Reserves are reported exclusive of Mineral Resources, on a 100% basis. |
Mt = million tons, % = percent, K2O = potassium oxide, ft = feet |
1.6Summary of Capital and Operating Cost Estimates
Operating cash cost per ton of product is estimated from actual operating data to average $228. A reduction of $44 per ton for by-product revenue results in a cost of $184 per ton.
Capital investment necessary to complete the HB 25-year mine plans include a system to remove concentrated magnesium brine from the evaporation pond network, pipeline upgrades, and well infrastructure to bring the AMAX/Horizon Mine (AMAX) into solution mining production. Capital is introduced in Year 25 for reclamation requirements if mining were to end in the 25th year. This investment is in addition to the sustaining capital requirements.
1.7Economic Analysis
The Net Present Value (NPV) at 8% Annual Percentage Rate (APR) for the before- and after-tax estimated cash flow is positive. The sensitivity to product price and operating cost for an 8% APR was evaluated. Varying costs and sales price plus and minus 10% results in a positive NPV for all options.
1.8Permitting Requirements
The mines are in operation and necessary state and federal operating permits are in place.
|
|
|
|
|
|
2023 Estimated Resources and Reserves at Intrepid Potash-New Mexico
Prepared for Intrepid Potash, Inc.
February 14, 2024 |
4 |
1.9Conclusions and Recommendations
The QP recommends that IPNM continue planning for the challenges in solution mining with the presence of low levels of carnallite. No additional exploration work is recommended beyond the ongoing confirmation drilling.
|
|
|
|
|
|
2023 Estimated Resources and Reserves at Intrepid Potash-New Mexico
Prepared for Intrepid Potash, Inc.
February 14, 2024 |
5 |
2.0Introduction
This document was prepared to report the IPNM mineral resources in terms of in-situ tons and reserves in terms of saleable product at IPNM under the SEC S-K 1300 rules (2018). The Society for Mining, Metallurgy & Exploration (SME) Guide for Reporting Exploration Information, Mineral Resources and Mineral Reserves (SME 2017) (The SME Guide) supplements the modifying factors used to convert mineral resources to mineral reserves. Previous TRS’s filed for the property are listed in Table 2-1.
2.1Terms of Reference
According to 17 Code of Federal Regulations (CFR) § 229.1301 (2021), the following definitions are included for reference:
An inferred mineral resource is that part of a mineral resource for which quantity and grade or quality are estimated on the basis of limited geological evidence and sampling. An inferred mineral resource has the lowest level of geological confidence of all mineral resources, which prevents the application of the modifying factors in a manner useful for evaluation of economic viability. An inferred mineral resource, therefore, may not be converted to a mineral reserve.
An indicated mineral resource is that part of a mineral resource for which quantity and grade or quality are estimated on the basis of adequate geological evidence and sampling. An indicated mineral resource has a lower level of confidence than the level of confidence of a measured mineral resource and may only be converted to a probable mineral reserve. As used in this subpart, the term adequate geological evidence means evidence that is sufficient to establish geological and grade or quality continuity with reasonable certainty.
A measured mineral resource is that part of a mineral resource for which quantity and grade or quality are estimated on the basis of conclusive geological evidence and sampling. As used in this subpart, the term conclusive geological evidence means evidence that is sufficient to test and confirm geological and grade or quality continuity.
Modifying factors are the factors that a qualified person must apply to indicated and measured mineral resources and then evaluate in order to establish the economic viability of mineral reserves. A qualified person must apply and evaluate modifying factors to convert measured and indicated mineral resources to proven and probable mineral reserves. These factors include but are not restricted to mining; processing; metallurgical; infrastructure; economic; marketing; legal; environmental compliance; plans, negotiations, or agreements with local individuals or groups; and governmental factors.
|
|
|
|
|
|
2023 Estimated Resources and Reserves at Intrepid Potash-New Mexico
Prepared for Intrepid Potash, Inc.
February 14, 2024 |
6 |
A probable mineral reserve is the economically mineable part of an indicated and, in some cases, a measured mineral resource.
A proven mineral reserve is the economically mineable part of a measured mineral resource. For a proven mineral reserve, the qualified person has a high degree of confidence in the results obtained from the application of the modifying factors and in the estimates of tonnage and grade or quality. A proven mineral reserve can only result from conversion of a measured mineral resource.
Throughout this report, reserves are presented in tons of K2O and potassium chloride (KCl). Historically, assay data have been reported in terms of %K2O and reserves in equivalent tons of K2O. Sylvite is KCl and, in many historical reports, reserve tons or product tons are recorded in terms of tons of KCl. Pure KCl equates to 63.17% K2O by mass. To convert tonnages from K2O to KCl, multiply by 1.583.
2.2Sources of Information
Previously completed reserve estimations under SEC Guide 7 (2008) rules for this property and TRS’s reporting mineral resources and mineral reserves under the SEC S-K 1300 rules are listed in Table 2-1.
2.3Personal Inspection
Personal inspection of the properties has occurred over the years by the QP. The most recent inspection of the property took place on November 6 and 7, 2019. The inspection included an underground and surface visit to the East, West, and HB Mines.
|
|
|
|
|
|
2023 Estimated Resources and Reserves at Intrepid Potash-New Mexico
Prepared for Intrepid Potash, Inc.
February 14, 2024 |
7 |
Table 2-1. Summary of Reserve Reports
|
|
|
|
|
|
|
|
|
|
|
|
|
|
|
|
Effective
EOY |
Title |
Notes |
Reference |
| 2006 |
Determination of Reserves for IPNM of the Carlsbad East and West Mines |
Included North Mine reserves hoisted through the West Mine Facilities. |
Agapito 2007 |
| 2007 |
Determination of Estimated Proven and Probable Reserves for the Planned HB Solution Mine for Intrepid Mining, LLC |
|
Agapito 2008 |
| 2008 |
Reserve Update for the Carlsbad HB, East and West Mines for Intrepid Potash, Inc. |
|
Agapito 2009 |
| 2009 |
Determination of Estimated Proven and Probable Reserves at Intrepid Potash–New Mexico, LLC |
|
Agapito 2010 |
| 2010 |
Determination of Estimated Proven and Probable Reserves at Intrepid Potash–New Mexico, LLC |
AAI updated the reserve estimate by adjusting for the mined-out areas of the LOMP. |
Agapito 2011 |
| 2011 |
Determination of Estimated Proven and Probable Reserves at Intrepid Potash–New Mexico, LLC |
Reserve estimate as of EOY 2011 based on depletion by extraction of the IPNM’s LOMP. |
Agapito 2012 |
| 2012 |
Determination of Estimated Proven and Probable Reserves at Intrepid Potash–New Mexico, LLC |
New deposit information, lease boundaries, and an updated LOMP were incorporated into the reserve estimate. |
Agapito 2013 |
| 2013 |
Determination of Estimated Proven and Probable Reserves at Intrepid Potash–New Mexico, LLC |
EOY 2012 estimate was updated to account for depletion by extraction for 2013. |
Agapito 2014 |
| 2014 |
Determination of Estimated Proven and Probable Reserves at Intrepid Potash–New Mexico, LLC |
EOY 2012 estimate was updated to account for depletion by extraction for the 2013 and 2014 reserve estimate. |
Agapito 2015 |
| 2015 |
End-of-Year 2015 Intrepid Potash, Inc. Reserve for the Carlsbad HB Solar Solution, East and West Mines Intrepid Potash–New Mexico, LLC |
Updated lease maps, geologic database as of June 24, 2015, monthly lease reports, production maps, planning maps, and financial documents including sales and costs associated with the HB Solar Solution, West, and East Mines. |
Agapito 2016 |
| 2016 |
End-of-Year 2016 Intrepid Potash, Inc. Reserve for the Carlsbad HB Solar Solution, East and West Mines Intrepid Potash–New Mexico, LLC |
Depletion by extraction in the 1st, 3rd, 5th, and 7th ore zones from the 2015 EOY. |
Agapito 2017 |
| 2017 |
End-of-Year 2017 Intrepid Potash, Inc. Reserve for the Carlsbad HB Solar Solution, East and West Mines |
Conventional extraction of langbeinite at the IPNM East Mine 5th ore zone and solution extraction in the 1st and 3rd ore zones at the IPNM HB Solar Solution Mine with updated economic cutoff grades and drill island impacts. |
Agapito 2018 |
| 2018 |
2018 Determination of Estimated Proven and Probable Reserves for the Carlsbad HB Solar Solution, East and West Mines |
Updated lease maps, geologic database as of July 7, 2018, monthly lease reports, production maps, planning maps, and financial documents including sales and costs associated with the IPNM HB Solar Solution, West, and East Mines. |
Agapito 2019 |
| 2019 |
2019 Determination of Estimated Proven and Probable Reserves for the Carlsbad HB Solar Solution, East and West Mines |
Extraction, cutoff changes due to economic parameters, new exploration and channel sample data, drill islands, and financial data. |
Agapito 2020 |
| 2020 |
2020 Determination of Estimated Proven and Probable Reserves for the Carlsbad HB Solar Solution, East and West Mines |
Depletion by extraction in the 1st, 3rd, 5th, and 7th ore zones 2020 EOY. |
Agapito 2021 |
| 2021 |
Technical Report Summary, 2021 Estimated Resources and Reserves at Intrepid Potash-New Mexico |
Resources and reserves for all applicable zones EOY 2021 |
Agapito 2022 |
| 2021 |
Technical Report Summary, REVISED 2021 Estimated Resources and Reserves at Intrepid Potash-New Mexico |
Added clarification to resource and reserve estimation methodology, added detail to the operating cost and cash flow methodology |
RESPEC 2023 |
|
|
|
|
|
|
|
|
|
|
2023 Estimated Resources and Reserves at Intrepid Potash-New Mexico
Prepared for Intrepid Potash, Inc.
February 14, 2024 |
8 |
3.0Property Description
3.1Location and Area of the Property
The IPNM Carlsbad HB Solar Solution, East, West, and North Mines are located in southeastern New Mexico in Eddy and Lea Counties in the Carlsbad Potash District (CPD), as shown in Figure 3-1. The location is further defined by the boundary of the Known Potash Leasing Area (KPLA) as shown in Figure 3-2. This United States Bureau of Land Management (BLM) managed area consists of that part of the district where the co-development guidelines for oil and gas and potash are in effect for federal lands under the Secretary’s Order 3324 dated December 4, 2012 (Federal Register [FR] 2012-29393). This order revises and supersedes the Order of the Secretary of the Interior, dated October 28, 1986 (51 FR 39425), and corrected on August 26, 1987 (52 FR 32171). The 2012 Secretary’s Order does not alter the boundaries of the area. The area also contains state lands that are managed by the state under the New Mexico Oil Conservation Division Order R-111-P (State of New Mexico Energy, Mineral, and Natural Resources 1988). In general, the stated objective of the Secretary’s Order and R-111-P is to prevent waste of petroleum and mineral resources and maximize the economic recovery of oil, gas, and potash minerals in the area.
3.2Mineral Rights
IPNM controls the right to mine approximately 143,000 acres in New Mexico. Of that acreage, 32,000 acres are leased from the State of New Mexico, 106,000 acres are leased from the United States government through the BLM, and 280 acres of mineral rights are leased from private owners. IPNM owns 4,700 surface acres near the mine site, adjacent to the federal and state mining leases. Most mining operations are on properties leased from the state or the federal government. These leases generally contain stipulations that require IPNM to commence mining operations within a specified term and continue mining to retain the lease. The stipulations on IPNM leases are subject to periodic readjustment by the applicable state government and the federal government. Federal leases are for indefinite terms subject to readjustment of the lease stipulations, including the royalty payable to the federal government, every 20 years. Leases with the State of New Mexico are issued for terms of 10 years and for as long thereafter as potash is produced in commercial quantities and are subject to readjustment of the lease stipulations, including the royalty payable to the state. Table 3-1 lists the leases and the terms.
3.3Significant Encumbrances
There are no significant encumbrances on the property. Various reclamation bonds totaling $6.2M are in place as of December 31, 2023.
|
|
|
|
|
|
2023 Estimated Resources and Reserves at Intrepid Potash-New Mexico
Prepared for Intrepid Potash, Inc.
February 14, 2024 |
9 |
Figure 3-1. Location Map for the IPNM HB, East, West, and North Mines near Carlsbad, New Mexico
|
|
|
|
|
|
2023 Estimated Resources and Reserves at Intrepid Potash-New Mexico
Prepared for Intrepid Potash, Inc.
February 14, 2024 |
10 |
Figure 3-2. Location Map Depicting the Secretary’s Order for the Potash Area
|
|
|
|
|
|
2023 Estimated Resources and Reserves at Intrepid Potash-New Mexico
Prepared for Intrepid Potash, Inc.
February 14, 2024 |
11 |
Table 3-1. Property Lease Details
|
|
|
|
|
|
|
|
|
|
|
|
|
|
|
|
|
|
|
|
|
|
|
|
|
|
|
|
|
|
|
|
|
|
|
|
| Federal Land Lease Number |
Lease Type |
Mine |
Date |
Royalty Rate |
Acres
(BLM)
|
Readjustment Due |
Amount
Paid
|
Date
Paid
|
| NMNM 029268401 |
Potassium PRL |
East |
1966 |
|
2,546 |
12/1/2026 |
$10,184.00 |
12/7/2022 |
| NMNM 012181001 |
Potassium PRL |
HB |
1965 |
5% Leased Deposits |
640 |
1/1/2025 |
$2,560.00 |
7/8/2019 |
| NMNM 005728701 |
Potassium PRL |
East |
1968 |
|
2,461 |
1/1/2024 |
$17,234.00 |
12/7/2022 |
| NMNM 002362301 |
Potassium PRL |
HB |
1962 |
5% Leased Deposits |
400 |
2/1/2042 |
$1,600.00 |
7/8/2019 |
| NMNM 001654001 |
Potassium PRL |
West |
1960 |
|
120 |
4/1/2040 |
$480.00 |
12/7/2022 |
| NMNM 001474201 |
Potassium PRL |
East |
1963 |
|
640 |
8/1/2043 |
$2,560.00 |
12/7/2022 |
| NMNM 000685901 |
Potassium PRL |
East |
1953 |
|
2,554 |
10/26/2033 |
$10,210.00 |
12/7/2022 |
| NMNM 000610101 |
Potassium PRL |
West |
1958 |
|
1,200 |
2/1/2038 |
$4,800.00 |
12/7/2022 |
| NMNM 0554864 |
Potassium PRL |
East |
1953 |
|
1,250 |
2/24/2033 |
$5,004.00 |
12/7/2022 |
| NMNM 0554863 |
Potassium PRL |
East |
1953 |
|
200 |
2/24/2033 |
$800.00 |
12/7/2022 |
| NMNM 0554862 |
Pot Fringe Acre NCL |
East |
1953 |
|
480 |
2/24/2033 |
$1,920.00 |
12/7/2022 |
| NMNM 0220116 |
Potassium CL |
HB |
1961 |
5% Leased Deposits |
2,552 |
12/1/2041 |
$10,208.00 |
7/8/2019 |
| NMNM 0184150 |
Potassium PRL |
West |
1949 |
|
240 |
11/30/2029 |
$960.00 |
12/7/2022 |
| NMNM 0184149 |
Potassium PRL |
West |
1955 |
|
80 |
1/1/2035 |
$320.00 |
12/7/2022 |
| NMNM 0135065 |
Pot Fringe Acre NCL |
HB |
1961 |
5%+1cent mrt |
200 |
6/1/2041 |
$800.00 |
7/8/2019 |
| NMNM 131012 |
Pot Fringe Acre NCL |
East |
2016 |
|
1,320 |
3/1/2036 |
$4,092.00 |
12/7/2022 |
| NMNM 131011 |
Pot Fringe Acre NCL |
East |
2016 |
|
2,000 |
3/1/2036 |
$8,000.00 |
12/7/2022 |
| NMNM 131010 |
Pot Fringe Acre NCL |
East |
2016 |
|
1,280 |
3/1/2036 |
$5,120.00 |
12/7/2022 |
| NMNM 120103 |
Pot Fringe Acre NCL |
East |
2012 |
|
1,920 |
10/1/2032 |
$7,680.00 |
12/7/2022 |
| NMNM 120102 |
Pot Fringe Acre NCL |
West |
2012 |
|
1,560 |
10/1/2032 |
$6,240.00 |
12/7/2022 |
| NMNM 120101 |
Pot Fringe Acre NCL |
East |
2012 |
|
2,240 |
10/1/2032 |
$8,960.00 |
12/7/2022 |
| NMNM 118970 |
Potassium CL |
East |
2008 |
|
320 |
1/1/2028 |
$1,280.00 |
12/7/2022 |
| NMNM 118969 |
Potassium CL |
East |
2008 |
|
320 |
1/1/2028 |
$1,280.00 |
12/7/2022 |
| NMNM 113457 |
Pot Fringe Acre NCL |
HB |
2012 |
5% Leased Deposits |
560 |
10/1/2032 |
$2,240.00 |
7/8/2019 |
| NMNM 113456 |
Pot Fringe Acre NCL |
HB |
2012 |
5% Leased Deposits |
2,480 |
10/1/2032 |
$9,920.00 |
7/8/2019 |
| NMNM 113455 |
Pot Fringe Acre NCL |
HB |
2012 |
5% Leased Deposits |
2,401 |
10/1/2032 |
$9,604.00 |
7/8/2019 |
| NMNM 112199 |
Pot Fringe Acre NCL |
HB |
2007 |
Sliding Scale (POT); 5% Lang |
434 |
2/1/2027 |
$1,704.00 |
7/8/2019 |
| NMNM 110949 |
Pot Fringe Acre NCL |
East |
2004 |
|
1,918 |
12/1/2024 |
$7,672.00 |
12/7/2022 |
| NMNM 0088285 |
Pot Fringe Acre NCL |
HB |
1960 |
5%+1cent mrt |
120 |
8/1/2040 |
$480.00 |
7/8/2019 |
| NMNM 080707 |
Pot Fringe Acre NCL |
East |
1963 |
|
2,520 |
8/1/2043 |
$10,080.00 |
|
12/7/2022 |
| NMNM 0070607 |
Pot Fringe Acre NCL |
West |
1960 |
|
552 |
2/1/2040 |
$2,208.00 |
|
12/7/2022 |
| NMNM 0063880 |
Pot Fringe Acre NCL |
West |
1959 |
|
120 |
7/1/2039 |
$480.00 |
|
12/7/2022 |
| NMNM 054619 |
Pot Fringe Acre NCL |
East |
1983 |
|
2,092 |
3/1/2043 |
$8,368.00 |
|
12/7/2022 |
| NMNM 0050249A |
Potassium PRL |
HB |
1963 |
Sliding Scale (POT) |
920 |
9/1/2043 |
$3,680.00 |
|
7/8/2019 |
| NMNM 047021 |
Pot Fringe Acre NCL |
East |
1982 |
|
1,105 |
7/1/2042 |
$4,424.00 |
|
12/7/2022 |
| NMNM 0045410 |
Potassium PRL |
East |
1958 |
|
2,438 |
6/1/2038 |
$9,756.00 |
|
12/7/2022 |
| NMNM 041639 |
Pot Fringe Acre NCL |
East |
1981 |
|
120 |
7/1/2041 |
$480.00 |
|
12/7/2022 |
| NMNM 040362 |
Pot Fringe Acre NCL |
East |
1980 |
|
280 |
12/1/2040 |
$1,120.00 |
|
12/7/2022 |
| NMNM 040071 |
Potassium CL |
North |
1980 |
|
2,080 |
5/1/2040 |
$8,320.00 |
|
12/7/2022 |
| NMNM 0036791 |
Potassium CL |
HB |
1957 |
5% Leased Deposits |
1,840 |
10/1/1037 |
$7,360.00 |
|
7/8/2019 |
| NMNM 0035383 |
Potassium CL |
East |
1958 |
|
2,400 |
1/1/2038 |
$9,600.00 |
|
12/7/2022 |
| NMNM 0033696A |
Potassium PRL |
East |
1958 |
|
1,241 |
3/1/2038 |
$4,514.00 |
|
12/7/2022 |
| NMNM 0033696 |
Potassium PRL |
West |
1958 |
|
960 |
3/1/2038 |
$3,840.00 |
|
12/7/2022 |
| NMNM 028916 |
Pot Fringe Acre NCL |
West |
1963 |
|
880 |
8/1/2043 |
$3,520.00 |
|
12/7/2022 |
| NMNM 028915 |
Potassium PRL |
East |
1958 |
|
118 |
6/1/2038 |
$472.00 |
|
12/7/2022 |
| NMNM 025234 |
Potassium PRL |
West |
1949 |
|
80 |
11/30/2029 |
$320.00 |
|
12/7/2022 |
| NMNM 025233 |
Potassium PRL |
West |
1952 |
|
1,600 |
1/2/2032 |
$6,400.00 |
|
12/7/2022 |
| NMNM 025232 |
Potassium PRL |
West |
1951 |
|
1,600 |
7/6/2031 |
$6,400.00 |
|
12/7/2022 |
| NMNM 024522 |
Pot Fringe Acre NCL |
West |
1982 |
|
800 |
3/1/2042 |
$3,200.00 |
|
12/7/2022 |
| NMNM 018417 |
Pot Fringe Acre NCL |
East |
1952 |
|
160 |
1/9/2032 |
$640.00 |
|
12/7/2022 |
| NMNM 0015064C |
Potassium PRL |
East |
1953 |
|
1,049 |
10/25/2033 |
$4,200.00 |
|
12/7/2022 |
| NMNM 0015064B |
Potassium PRL |
East |
1953 |
|
1,280 |
10/26/2033 |
$5,120.00 |
|
12/7/2022 |
| NMNM 0015064A |
Potassium PRL |
East |
1953 |
|
1,600 |
10/26/2033 |
$6,400.00 |
|
12/7/2022 |
|
|
|
|
|
|
2023 Estimated Resources and Reserves at Intrepid Potash-New Mexico
Prepared for Intrepid Potash, Inc.
February 14, 2024 |
12 |
|
|
|
|
|
|
|
|
|
|
|
|
|
|
|
|
|
|
|
|
|
|
|
|
|
|
|
|
|
|
|
|
|
|
|
|
| Federal Land Lease Number |
Lease Type |
Mine |
Date |
Royalty Rate |
Acres
(BLM)
|
Readjustment Due |
Amount
Paid
|
Date
Paid
|
| NMNM 013933 |
Pot Fringe Acre NCL |
HB |
1971 |
5% Leased Deposits |
80 |
10/1/2031 |
$320.00 |
|
7/8/2019 |
| NMNM 013932 |
Pot Fringe Acre NCL |
West |
1974 |
|
640 |
11/1/2034 |
$2,560.00 |
|
12/7/2022 |
| NMNM 012763 |
Pot Fringe Acre NCL |
HB |
1971 |
5% Leased Deposits |
160 |
6/1/2031 |
$640.00 |
|
7/8/2019 |
| NMNM 0011777 |
Pot Fringe Acre NCL |
North |
1952 |
1% ORRI |
1,118 |
1/9/2032 |
$4,472.00 |
|
12/7/2022 |
| NMNM 0011776 |
Pot Fringe Acre NCL |
North |
1952 |
1% ORRI |
2,559 |
1/9/2032 |
10,240.00 |
|
12/7/2022 |
| NMNM 0007005 |
Potassium PRL |
West |
1952 |
|
2,073 |
1/2/2032 |
$8,296.00 |
|
12/7/2022 |
| NMNM 0003468 |
Pot Fringe Acre NCL |
West |
1958 |
|
960 |
7/1/2038 |
$3,840.00 |
|
12/7/2022 |
| NMLC 007186801 |
Potassium PRL |
East |
1955 |
|
1,938 |
9/1/2035 |
$7,756.00 |
|
12/7/2022 |
| NMLC 007014101 |
Potassium PRL |
HB |
1959 |
5%+1cent mrt |
439 |
1/1/2039 |
$1,756.00 |
|
7/8/2019 |
| NMLC 006839701 |
Potassium PRL |
North |
1952 |
1% ORRI |
1,920 |
1/9/2032 |
$7,680.00 |
|
12/7/2022 |
| NMLC 006602601 |
Potassium PRL |
HB |
1955 |
5% + 1cent mrt |
200 |
9/1/2035 |
$800.00 |
|
7/8/2019 |
| NMLC 006569301 |
Potassium PRL |
West |
1958 |
|
560 |
2/1/2038 |
$2,240.00 |
|
12/7/2022 |
| NMLC 006556601 |
Potassium PRL |
HB |
1951 |
5% Leased Deposits; 1.0987% ORRI |
720 |
9/28/2031 |
$2,880.00 |
|
7/8/2019 |
| NMLC 006528601 |
Potassium PRL |
North |
1952 |
1% ORRI |
2,554 |
1/9/2032 |
$10,216.00 |
|
12/7/2022 |
| NMLC 006527501 |
Potassium PRL |
North |
1952 |
1% ORRI |
2,551 |
1/9/2032 |
$10,204.00 |
|
12/7/2022 |
| NMLC 006508101 |
Potassium PRL |
HB |
1950 |
Sliding Scale (POT); 1.0987% ORRI |
560 |
12/6/2030 |
$2,240.00 |
|
7/8/2019 |
| NMLC 006184701 |
Potassium PRL |
West |
1951 |
1.0987% ORRI |
1,275 |
7/6/2031 |
$5,104.00 |
|
12/7/2022 |
| NMLC 0050063F |
Potassium PRL |
HB |
1939 |
5% Leased Deposits; 1.0987% ORRI |
2,358 |
4/15/2039 |
$9,436.00 |
|
7/8/2019 |
| NMLC 0050063B |
Potassium PRL |
HB |
1939 |
5% Leased Deposits; 1.0987% ORRI |
2,560 |
4/15/2039 |
$10,240.00 |
|
7/8/2019 |
| NMLC 0046729D |
Pot Fringe Acre NCL |
HB |
1933 |
5% Leased Deposits; 1.0987% ORRI |
2,560 |
1/18/2033 |
$10,240.00 |
|
7/8/2019 |
| NMLC 0046729C |
Pot Fringe Acre NCL |
HB |
1933 |
5% Leased Deposits; 1.0987% ORRI |
2,280 |
1/18/2033 |
$9,120.00 |
|
7/8/2019 |
| NMLC 0046729A |
Pot Fringe Acre NCL |
HB |
1933 |
5% Leased Deposits; 1.0987% ORRI |
2,559 |
1/18/2033 |
$10,236.00 |
|
7/8/2019 |
| NMLC 0044752 |
Pot Fringe Acre NCL |
HB |
1956 |
5% Lang |
240 |
9/1/2036 |
$960.00 |
|
7/8/2019 |
| NMLC 0043636C |
Pot Fringe Acre NCL |
West |
1932 |
|
920 |
6/20/2032 |
$3,680.00 |
|
12/7/2022 |
| NMLC 0043636B |
Pot Fringe Acre NCL |
West |
1932 |
|
2,312 |
6/20/2032 |
$9,248.00 |
|
12/7/2022 |
| NMLC 0043636A |
Pot Fringe Acre NCL |
West |
1932 |
|
1,044 |
6/20/2032 |
$4,180.00 |
|
12/7/2022 |
| NMLC 0036092C |
Pot Fringe Acre NCL |
West |
1929 |
|
2,559 |
11/21/2029 |
$10,240.00 |
|
12/7/2022 |
| NMLC 0036092B |
Pot Fringe Acre NCL |
West |
1929 |
|
2,026 |
11/21/2029 |
$8,104.00 |
|
12/7/2022 |
| NMLC 0036092A |
Pot Fringe Acre NCL |
West |
1929 |
|
2,437 |
11/21/2029 |
$9,748.00 |
|
12/7/2022 |
|
|
|
|
|
|
|
|
|
|
|
|
|
|
|
|
|
|
|
|
|
|
|
|
|
|
|
| State of New Mexico Land Lease Number |
Lease Type |
|
Issue Date |
|
Acres
(State)
|
|
Amount Paid |
Date Paid |
| HP00050001 |
Potash |
|
2005 |
|
3,200 |
|
$3,200 |
|
5/17/2023 |
| HP00250000 |
Potash |
|
2012 |
|
640 |
|
$10,640 |
|
9/20/2023 |
| HP00260000 |
Potash |
|
2012 |
|
640 |
|
$1,140 |
|
9/20/2023 |
| HP00270000 |
Potash |
|
2012 |
|
1,680 |
|
$2,180 |
|
9/20/2023 |
| HP00280000 |
Potash |
|
2010 |
|
80 |
|
$580 |
|
7/6/2023 |
| HP00290000 |
Potash |
|
2009 |
|
640 |
|
$10,640 |
|
11/28/2023 |
| HP00480000 |
Potash |
|
2012 |
|
1,200 |
|
$11,200 |
|
10/4/2023 |
| HP00490000 |
Potash |
|
2012 |
|
1,450 |
|
$11,450 |
|
9/20/2023 |
| HP00500000 |
Potash |
|
2012 |
|
2,280 |
|
$12,280 |
|
10/4/2023 |
| HP00510000 |
Potash |
|
2012 |
|
960 |
|
$10,961 |
|
9/20/2023 |
| HP00520000 |
Potash |
|
2012 |
|
1,435 |
|
$11,436 |
|
10/4/2023 |
| M006510011 |
Potash |
|
1936 |
|
17,486 |
|
$1,749 |
|
11/28/2023 |
| NOTE—Coordinate System: Shifted from North American Datum (NAD) 27 New Mexico State Plane North to Local Mine Grid |
|
|
|
|
|
|
|
|
|
| PRL = Preference Rights Lease; CL = Competitive Lease; NCL = Non-Competitive Lease |
|
|
|
|
|
|
|
|
|
|
|
|
|
|
|
2023 Estimated Resources and Reserves at Intrepid Potash-New Mexico
Prepared for Intrepid Potash, Inc.
February 14, 2024 |
13 |
3.4Significant Factors
There are no significant factors or risks that may affect access, title, or the right or ability to perform work on the property.
|
|
|
|
|
|
2023 Estimated Resources and Reserves at Intrepid Potash-New Mexico
Prepared for Intrepid Potash, Inc.
February 14, 2024 |
14 |
4.0Accessibility
4.1Topography, Elevation, and Vegetation
The topography is explained in the HB Mine Environmental Impact Statement (EIS) (United States Department of Interior [DOI] 2012) as a karst topography with sinkholes, caves, and enclosed depressions. The topography is the result of the dissolution of evaporite deposits in the subsurface. The vegetation cover in the permit area is typical of the Pecos Valley on the eastern edge of the Guadalupe Mountains. The area is dominated by desert scrub, mesquite upland scrub, and grasslands (DOI 2012). The mines are located at an approximate surface elevation of 3,500-ft mean sea level (msl).
4.2Property Access
The mining facilities are accessible by both road and rail as shown in Figure 4-1. Adequate infrastructure is in place to meet production requirements. Shipment of product is by truck and rail via paved United States Highway 180-W and the Burlington Northern Santa Fe (BNSF) rail link. The area is served by small air carriers at the Cavern City Terminal located in Carlsbad, New Mexico. Airports are located in Midland, Texas and El Paso, Texas, approximately 125 and 200 miles from the property, respectively.
4.3Climate
The climate is generally mild with an average temperature of 62.4 degrees Fahrenheit (°F). The precipitation, as rainfall during the monsoon season from May to September, averages 13.4 inches. Average annual snowfall is 3 inches (US Climate Data 2020). The weather is favorable to conducting solar evaporation. Operations continue throughout the year without significant weather disruption.
4.4Infrastructure Availability
IPNM has sufficient water rights, reliable electric power, and a robust supply chain. IPNM competes with other industries in the Carlsbad area for qualified labor. Layoffs in market downturns may make it more difficult to re-hire personnel as needed.
|
|
|
|
|
|
2023 Estimated Resources and Reserves at Intrepid Potash-New Mexico
Prepared for Intrepid Potash, Inc.
February 14, 2024 |
15 |
Figure 4-1. Mine Locations showing Property Access
|
|
|
|
|
|
2023 Estimated Resources and Reserves at Intrepid Potash-New Mexico
Prepared for Intrepid Potash, Inc.
February 14, 2024 |
16 |
5.0History
Potash was first discovered in southwest New Mexico in 1925 in Eddy County, New Mexico, in Snowden McSweeney Well No. I on a V. H. McNutt permit near the center of the portion of what is now the KPLA. Commercial shipments began in 1931. The ownership history is listed in Table 5-1.
Table 5-1. Mine Ownership History
|
|
|
|
|
|
|
|
|
|
|
|
| Property |
Owner |
Date |
| East Mine |
Kerr-McGee Chemical Corporation |
1961–1985 |
|
New Mexico Potash Corporation (Trans Resources, Inc.) |
1985–1996 |
|
Mississippi Potash Inc. |
1996–2004 |
|
Intrepid Potash, Inc. (Intrepid Mining- NM, LLC) |
2004–Present |
|
|
|
| West Mine |
U. S. Potash Company |
1929–1956 |
|
U.S. Borax and Chemical Corporation |
1956–1968 |
|
U.S. Potash and Chemical |
1968–1970 |
|
Continental American Royalty Corporation |
1970–1972 |
|
Teledyne |
1972–1974 |
|
Mississippi Chemical Company (MCC) |
1974–1996 |
|
Mississippi Potash, Inc. (MPI) (a subsidiary of MCC) |
1996–2004 |
|
Intrepid Potash, Inc. (Intrepid Mining - NM, LLC) |
2004–Present |
|
|
|
| North Mine |
National Potash Company (Freeport Sulphur Company) |
1957–1982 |
|
New Mexico Potash Corporation (Trans Resources Inc.) |
1982 |
|
Mississippi Chemical Corporation |
1985–1988 |
|
Mississippi Chemical Corporation |
1992–1996 |
|
Mississippi Potash Inc. |
1996–2004 |
|
Intrepid Potash, Inc. (Intrepid Mining- NM, LLC) |
2004–Present |
|
|
|
| AMAX Mine |
Southwest Potash Corporation |
1948 |
|
AMAX Potash |
1986–1992 |
|
Horizon Gold (Horizon Potash) |
1992–1995 |
|
Intrepid Potash, Inc. (Intrepid Mining - NM, LLC) |
2012–Present |
|
|
|
| HB Mine |
Potash Corp of America |
1934–1967 |
|
Ideal Basic |
1967–1985 |
|
Lundberg Industries |
1985–1987 |
|
Trans-Resource (Eddy Potash) |
1987–1996 |
|
Mississippi Potash, Inc. |
1996–2004 |
|
|
|
|
Intrepid Potash, Inc. (Intrepid Mining NM, LLC) |
2004–Present |
|
|
|
|
|
|
|
|
|
2023 Estimated Resources and Reserves at Intrepid Potash-New Mexico
Prepared for Intrepid Potash, Inc.
February 14, 2024 |
17 |
6.0Geologic Setting
The term “potash” is a generic term describing potassium in combination with chloride, sulfates, or nitrates. Potassium is one of the key nutrients for plants in fertilizer with nitrogen and phosphorus. Potash-bearing evaporites are typically formed as the result of evaporation of brine in basins with restricted outlets. Potash zones are found near the top of halite beds because potash is precipitated from the concentrated brines found at the end of the evaporation sequence. Important natural and commercial soluble potassium salts are sylvite (KCl) and langbeinite, a potassium magnesium double salt (K2SO4 ·2MgSO4) (Barker and Austin 1999).
6.1Deposit Type
The geology of the potash-bearing beds of the Carlsbad area has been well documented. Overall, the potash-bearing beds may be described as bedded sedimentary rocks, deposited across the Delaware Basin and Northwest Shelf backreef from the Capitan Reef. The depositional sequences that developed in the Salado Formation consist of repetitive cycles that can be recognized by changes in mineralogy, sedimentary textures, and structures. Two types of cycles are differentiated Type I and Type II. A complete Type I cycle ranges in thickness from 3 ft to 33- ft and consists of (in ascending order):
•A basal, mixed siliciclastic and carbonate mudstone
•Laminated to massive anhydrite-polyhalite
•Halite
•Halite with mud (argillaceous halite)
Type II is a thinner, less complete sequence and consists of halite that grades upward into argillaceous halite (Lowenstein 1988). The anhydrite-polyhalite beds are laterally continuous over large distances and are used as marker beds for correlation. Potash beds are not included in these sequences because potash is secondary and formed later than the basic depositional sequence.
6.2Regional Geology
The Carlsbad area falls within the Delaware Basin of Permian Age. The Delaware Basin has a maximum width of approximately 100 miles and a length of approximately 150 miles, extending from north of Carlsbad, New Mexico, to Pecos County, Texas.
The Permian Age sequence comprises the Ochoan, Guadalupe, Leonard, and Wolfcamp series in order of increasing age (Linn and Adams 1966). Laterally extensive, evaporite beds containing deposits of halite, sylvite, langbeinite, kainite, carnallite, and other evaporite minerals are found within the Ochoan Series, whose top ranges from a depth of 2,000 ft near the Texas State line to approximately 200 ft below surface north of Carlsbad.
|
|
|
|
|
|
2023 Estimated Resources and Reserves at Intrepid Potash-New Mexico
Prepared for Intrepid Potash, Inc.
February 14, 2024 |
18 |
The Ochoan Series is divided into four formations as follows, in order of increasing depth (Vine 1963):
•Dewey Lake Red Beds, which consist of 200 to 250 ft of fine-grained sandstone, siltstone, and shale of low permeability that is absent west of the Pecos River.
•Rustler Formation, which consists of approximately 350 ft of dolomite and anhydrite beds that outcrop along the Pecos River west of the potash area.
•Salado Formation, which was originally called the Upper Castile Formation and was separated from the underlying Castile based on a potash content of more than 1% K2O (Kroenlein 1939). The Salado Formation contains 12 potash zones, of which 6 have been or are currently being mined.
•Castile Formation, which is laterally bounded by the Guadalupian Age Capitan Reef limestones that define the Delaware Basin and consists of calcite-banded anhydrite and halite formed in a deep-water environment (Cheeseman 1978).
The Salado Formation thickness ranges from 1,200 ft to 2,300 ft and consists of an unnamed Upper Member, the McNutt Potash Member, and an unnamed Lower Member. Much of the variation in thickness is due to removal of halite by dissolution. It is an evaporite sequence dominated by 650 to 1,300 ft of halite and argillaceous halite and contains over 42 informally named or numbered marker beds in addition to 11 numbered potash zones within the McNutt Potash Member (Table 6-1). Figure 6-1 shows the zones in a cross section through the Property.
|
|
|
|
|
|
2023 Estimated Resources and Reserves at Intrepid Potash-New Mexico
Prepared for Intrepid Potash, Inc.
February 14, 2024 |
19 |
Table 6-1. The Potash Zones in the McNutt Potash Member
|
|
|
|
|
|
|
|
|
|
|
|
|
|
|
|
| Marker Bed |
Thickness (ft) |
Approximate Depth from Top of Salado (ft) |
Lithology |
| MB103 |
20 |
180 |
Anhydrite |
| MB109 |
20 |
320 |
Anhydrite, finely crystalline, interbedded with stringers of halite, polyhalite and mudstone |
| Vaca Triste |
10 |
540 |
Siltstone and silty mudstone interbedded with halite |
| MB117 |
|
|
Polyhalite |
| MB119 |
|
|
Polyhalite |
| MB120 |
|
|
Anhydrite |
| MB121 |
|
|
Polyhalite |
| MB122 |
|
|
Polyhalite |
| Union Anhydrite |
15-20 |
760 |
Anhydrite, finely crystalline with stringers of halite |
| MB123 |
5-10 |
845 |
Halite and polyhalite |
| MB124 |
5-10 |
870 |
Anhydrite, finely crystalline laminated. May have stringers of mudstone |
| MB125 |
|
|
Polyhalite |
| MB126 |
|
|
Polyhalite |
| MB134 |
10-15 |
1,260 |
Anhydrite |
| MB136 |
10-15 |
1,340 |
Anhydrite. May have interbeds of halite or polyhalite |
| MB142 |
15 |
1,550 |
Anhydrite with interbeds of halite and stringers of mudstone |
| Cowden Anhydrite |
20 |
1,700 |
Anhydrite, finely crystalline, laminated. May have thin interbeds of magnesite and mudstone. Divided into two beds by intervening halite in SE Eddy County |
| Source: Backman (1984); Griswold (1982) |
6.3Property Geology
Sylvinite is currently being mined using solution methods in the 1st and 3rd ore zone. Historically, sylvinite has been conventionally underground mined in the 1st, 3rd, 5th, 7th, and 10th ore zones.
Mechanical mining of langbeinite is currently occurring in the 3rd and 5th ore zones at the East Mine. Langbeinite is prevalent in the 3rd and 4th ore zones in the southern part of the Delaware Basin, part of the Permian Basin, and occurs mixed with sylvite in the 5th ore zone.
The property stratigraphic column is shown in Figure 6-2.
|
|
|
|
|
|
2023 Estimated Resources and Reserves at Intrepid Potash-New Mexico
Prepared for Intrepid Potash, Inc.
February 14, 2024 |
20 |
6.3.1East Mine
Historically, the East Mine primarily mined sylvinite in the 10th ore zone. Current mining is predominantly taking place on the 5th mixed and 3rd langbeinite ore zones. The 5th ore zone is a mixed ore consisting of variable amounts of K2O as langbeinite and sylvite. The 5th ore zone, predominant in langbeinite, is mined and blended with the 3rd langbeinite ore. The common minerals found at the mine are halite, sylvite, clay (montmorillonite), sulfate minerals, and carnallite. The eastern sections of the mine have large deposits of carnallite and kieserite. The 10th ore zone is also characterized by isolated pods of barren clays. These clay pods range in size from a few square feet to several hundred thousand square feet. The location of these pods is random, and there is no known practical method of predicting their location.
6.3.2West Mine
The potash deposits at the West Mine consist of mixed sylvite (KCl) and halite (NaCl) in two distinct zones within one of the flat-lying halite beds. This bed is located near the middle of the Salado Formation. Thin zones of enriched potash-bearing minerals are located within the 150-ft deposit.
Mining activities most recently took place in the 5th, 7th, and 10th ore zones. In most parts of the deposit, the vertical change from ore to barren salt is abrupt, while the lateral transition at the edges of the ore body is gradual. Barren masses of halite, known as “salt horses,” are scattered irregularly throughout the ore body. The ore is an intimate intergrowth of crystalline NaCl and KCl in various proportions, with sylvite typically less than 35% by weight. Sylvite is milky or faintly bluish gray but is often stained red by iron oxide around the crystals. Halite commonly is clear, grayish, or orange/yellow with occasional red staining. Blue halite is occasionally found associated with the sylvite.
6.3.3North Mine
In the vicinity of the North Mine, the 10th ore zone is encountered at depths of between approximately 1,400 and 1,900 ft below ground surface. The 10th ore zone consists of two sylvinite beds separated by a halite unit. The lower member, or zone 10C, is the target ore bed for the North Mine and may vary in thickness from 3 to 8 ft.
|
|
|
|
|
|
2023 Estimated Resources and Reserves at Intrepid Potash-New Mexico
Prepared for Intrepid Potash, Inc.
February 14, 2024 |
21 |
Figure 6-1. Carlsbad Potash District Regional Cross Section (Lewis 2007)
|
|
|
|
|
|
2023 Estimated Resources and Reserves at Intrepid Potash-New Mexico
Prepared for Intrepid Potash, Inc.
February 14, 2024 |
22 |
Figure 6-2. Typical Stratigraphic Column of the Ochoan (Warren 2018)
6.3.4HB Solar Solution Mine
The HB Mine, which was formerly owned by the Eddy Potash, Co., and mined on the 1st and 3rd ore zones (Barker and Austin 1999), has been flooded and is currently being solution mined with brines to obtain potash from the remaining pillars.
6.4Mineralization
In the Carlsbad Area, the potassium minerals, in order of decreasing abundance, are polyhalite, sylvite, carnallite, langbeinite, kainite, and leonite. Other potassium minerals occur only in minor amounts in association with the principal potassium minerals listed previously. The mineralogy of the zones found in the Carlsbad Area are summarized in Table 6-2.
|
|
|
|
|
|
2023 Estimated Resources and Reserves at Intrepid Potash-New Mexico
Prepared for Intrepid Potash, Inc.
February 14, 2024 |
23 |
Table 6-2. Carlsbad Area Minerals and Their Compositions
|
|
|
|
|
|
|
|
|
|
|
|
|
|
|
|
|
|
|
|
|
|
|
|
|
|
|
|
|
|
|
|
| Ore Zone |
Closest Marker Bed |
Approximate Bed Depth
(ft-bgs)
|
Bed Thickness
(ft)
|
Clay
Content
(%)
|
Mineralogy |
Mineability and Status |
| Above Ore Zone |
Below Ore Zone |
| Eleventh |
Vaca Triste |
MB117 |
|
|
|
Mostly carnallite, minor silvite and leonite |
Not commercial |
| Tenth |
MB119 |
MB120 |
700 |
5–12 |
5–7 |
Sylvite |
Second best in District; in production |
| Ninth |
MB120 |
MB121 |
|
|
|
Carnallite, kieserite, minor sylvite |
Not commercial |
| Eighth |
MB122 |
Union |
|
|
6–7 |
Sylvite |
Moderate size; unmined |
| Seventh |
Union |
|
|
5–9 |
3–4 |
Sylvite |
Formerly mined; standby |
| Sixth |
Union |
|
|
|
|
Carnallite, kieserite, etc. |
Not commercial |
| Fifth |
Union |
MB123 |
800 |
4.7–5 |
1 |
Sylvite and langbeinite |
In production |
| Fourth |
MB 124 |
|
850 |
4 |
|
Langbeinite and sylvite |
Principal source of langbeinite; in production |
| Third |
MB 124 |
|
865 |
|
|
Sylvite |
In production for solution mining |
| Second |
MB 124 |
MB125 |
|
|
|
Carnallite, kieserite, etc. |
Not commercial |
| First |
MB125 |
MB126 |
900 |
8–14 |
2 |
Sylvite |
Long-time producer; currently flooded with brine for solution mining |
| Source: Barker and Austin (1993); Swales (1966); Pierce (1936); Haworth (1949); Bruhn and Miller (1954); Jones et al. (1954); Kirby (1974); Herne and McGuire (2001) |
The minerals listed above can be described as follows (Schaller and Henderson 1932):
•Polyhalite is the most abundant potassium mineral in the Carlsbad Area. Beds of nearly pure polyhalite have thicknesses up to 8 ft and beds a foot or more thick are numerous.
•Sylvite often has a dark red or reddish-brown color due to hematite inclusions. Sylvite without the inclusions is a milky white color. Sylvite is typically mixed with halite and where clay is present in the mixture, it is in bands distinct from the sylvite.
•Carnallite is massive and compact showing no crystal faces. Crystals where seen are typically less than 1 millimeter (mm) in diameter. It occurs in small blebs with halite and sylvite.
•Langbeinite is found in distinct tetrahedral crystals that reach sizes up to ¾ inch. It is typically associated with halite and sylvite and often some kieserite. It has a distinct pink color in most samples and has a higher compressive strength than sylvite.
•Kainite is massive with poorly developed fibrous fracture surfaces and has a characteristic honey-yellow color. It is found in narrow bands between sylvite and langbeinite and is apparently a result of a reaction between the two.
•Leonite is typically found in small quantities in mixtures of other minerals, notably kainite and sylvite. Its color ranges from colorless to pale yellow. It is also found with
|
|
|
|
|
|
2023 Estimated Resources and Reserves at Intrepid Potash-New Mexico
Prepared for Intrepid Potash, Inc.
February 14, 2024 |
24 |
polyhalite and anhydrite, but the relationship is unclear. It has also been found as a secondary replacement for kieserite.
6.5Geologic Structure
The potash-bearing beds in the Carlsbad Area may be affected by several types of anomalies:
•“Salt horses” (Gunn and Hills 1978)
•“Mud horses” (Simmons 2013)
•Dissolution and collapse anomalies (“breccia chimneys”)
•Igneous dykes
The presence of high concentrations of non-economic evaporite minerals, insolubles, or geologic disturbances that influence the normal character of the potash-bearing beds is considered an “anomaly” and may be unsuitable for mining. These anomalies range from localized features significantly less than a square kilometer to disturbances that are regional (i.e., several square kilometers in extent).
|
|
|
|
|
|
2023 Estimated Resources and Reserves at Intrepid Potash-New Mexico
Prepared for Intrepid Potash, Inc.
February 14, 2024 |
25 |
7.0Exploration
7.1Exploration Other than Drilling
No exploration other than confirmation drilling has been performed.
7.2Drilling Exploration
Intrepid partakes in ongoing exploration as a part of operational long-term planning. Core holes are drilled from the surface and underground, and channel samples are collected as mining advances. Intrepid provided the QP their dataset beginning in 2007. Since that time, multiple data points have been added and several drillholes were reassessed. Potash is also identified from gamma ray geophysical logs in oil and gas wells. Bed thickness and potash grade are estimated and quantified with input from 2,928 sample points. Extensive work was completed with geophysical tools in collaboration with the United States Geologic Survey (USGS) (Nelson 2007) to determine and verify potash grades from gamma logs (Lewis 2006). The sample database for this exploration work is shown in Table 7-1. The dataset is from oil and gas wells, surface core holes, underground core holes, channel samples, shaft samples, and roof bolt holes. The key sample types include 7,209 drillholes and channel samples and are broken down by mining zone. Figure 7-1 shows the exploration drillhole and channel sample locations and regional topography. The dataset used for this reserve evaluation is shown in Table 7-2.
Table 7-1. Data Sample Sets—All Available Holes
|
|
|
|
|
|
|
|
|
|
|
|
|
|
|
|
|
|
|
|
|
|
|
|
|
|
|
|
|
|
|
|
| Ore Zone |
Oil/Gas
Wells
|
Surface Core Holes |
Underground Core Holes |
Channel Samples |
Shaft |
Roof Bolt |
Total
Samples
|
|
|
|
|
|
|
|
|
| Zone 2 |
— |
2 |
— |
— |
— |
— |
2 |
| Zone 3 |
478 |
560 |
57 |
73 |
3 |
— |
1,171 |
| Zone 3A |
— |
1 |
— |
— |
— |
— |
1 |
| Zone 4 |
480 |
544 |
62 |
5 |
3 |
— |
1,094 |
| Zone 4A |
— |
2 |
— |
— |
— |
— |
2 |
| Zone 5 |
488 |
572 |
114 |
2,014 |
4 |
42 |
3,234 |
| Zone 7 |
484 |
611 |
89 |
805 |
4 |
7 |
2,000 |
| Zone 8 |
492 |
613 |
53 |
— |
3 |
— |
1,161 |
| Zone 9 |
— |
1 |
— |
— |
— |
— |
1 |
| Zone 10C |
506 |
843 |
7 |
181 |
3 |
— |
1,540 |
| Total |
2,928 |
3,749 |
382 |
3,078 |
20 |
49 |
10,206 |
|
|
|
|
|
|
2023 Estimated Resources and Reserves at Intrepid Potash-New Mexico
Prepared for Intrepid Potash, Inc.
February 14, 2024 |
26 |
Figure 7-1. Base Map, Lease Lines and Drillholes
|
|
|
|
|
|
2023 Estimated Resources and Reserves at Intrepid Potash-New Mexico
Prepared for Intrepid Potash, Inc.
February 14, 2024 |
27 |
Table 7-2. Data Sample Sets—Resource Evaluation Dataset
|
|
|
|
|
|
|
|
|
|
|
|
|
|
|
|
|
|
|
|
| Ore Zone |
Oil/Gas Wells |
Core Holes |
Channel Samples |
Total Samples |
|
|
|
|
|
| Zone 3 |
463 |
542 |
73 |
1,078 |
| Zone 4 |
469 |
619 |
12 |
1,100 |
| Zone 5 |
482 |
651 |
1,979 |
3,112 |
| Zone 7 |
480 |
609 |
831 |
1,920 |
| Zone 8 |
476 |
576 |
2 |
1,054 |
| Zone 10 |
486 |
729 |
183 |
1,398 |
|
|
|
|
|
7.3Characterization of Hydrogeology Data
The characterization of the hydrogeology was completed for the HB Solar Solution Mine by AECCOM in 2011 and is included as part of the publicly available EIS (DOI 2012). The study confirmed the availability of water for the initial flooding of the solution mines at a pumping rate ranging from 177 to 1,440 gallons per minute (gpm).
7.4Characterization of Geotechnical Data
Not applicable.
|
|
|
|
|
|
2023 Estimated Resources and Reserves at Intrepid Potash-New Mexico
Prepared for Intrepid Potash, Inc.
February 14, 2024 |
28 |
8.0Sample Preparation
IPNM has standard operating procedures (SOP) in place for logging and sampling core from underground and surface core drilling. According to the SOP’s, the geologist uses gamma ray to initially select the sample interval prior to prepping the sample for analysis. The samples are assayed at the on-site laboratory. The site laboratory has the capability to conduct X-ray Diffraction (XRD), Total Organic Carbon (TOC), and flame photometry laboratory techniques.
The mineral analysis for all core and channel samples is analyzed with the XRD. A sample of approximately 300–500 grams (g) is collected. The sample is split down to around 100 g and run through a grinding mill to reduce the size down to approximately –100 mesh. A sample is weighed out to 5 g and put into a micronizing mill that reduces the particle size to ~10 microns and pressed into a sample holder. The sample is inserted into the instrument and a diffraction pattern is retrieved. The diffraction pattern is then analyzed using the Rietveld refinement software, reporting weight percent of solid mineral in the sample.
The sample preparation, security, and laboratory analytical procedures are conventional industry practice and are adequate for the reporting of resources and reserves.
|
|
|
|
|
|
2023 Estimated Resources and Reserves at Intrepid Potash-New Mexico
Prepared for Intrepid Potash, Inc.
February 14, 2024 |
29 |
9.0Data Verification
Due to the proximity of the location to the DOI Waste Isolation Pilot Plant (WIPP) site, and the intensive oil and gas drilling in the Permian Basin, there is geologic data publicly available for comparison. Data was also verified for beds with an extraction history by reconciling actual mining with the planned mining based on geologic modeling from the exploration database.
9.1Data Verification Procedure
The property has been producing for many years. Mining and processing of the ore to successfully marketed products is verification of the exploration data.
9.2Limitations on Verification
There are no limitations on the verification.
9.3Adequacy of the Data
It is the opinion of the Qualified Person (QP) that the data is adequate for the determination of resources and reserves. The deposit has historically and continues to be mined with plans based on the data.
|
|
|
|
|
|
2023 Estimated Resources and Reserves at Intrepid Potash-New Mexico
Prepared for Intrepid Potash, Inc.
February 14, 2024 |
30 |
10.0Mineral Processing and Metallurgical Testing
IPNM has a long history of processing ores on-site. Recovery estimates are based on past plant performance, current performance, and anticipated future performance based on laboratory or metallurgical testing of the anticipated plant feed. Over time, the appropriate capital modifications to the plants have been made to accommodate changes in ore feed and market requirements.
10.1Adequacy of the Data
It is the opinion of the QP that the data is adequate for the determination of resources and reserves. The deposit has historically and continues to be processed successfully.
|
|
|
|
|
|
2023 Estimated Resources and Reserves at Intrepid Potash-New Mexico
Prepared for Intrepid Potash, Inc.
February 14, 2024 |
31 |
11.0Mineral Resource Estimates
According to 17 CFR § 229.1301 (2021), the following definitions of mineral resource categories are included for reference:
An inferred mineral resource is that part of a mineral resource for which quantity and grade or quality are estimated on the basis of limited geological evidence and sampling. An inferred mineral resource has the lowest level of geological confidence of all mineral resources, which prevents the application of the modifying factors in a manner useful for evaluation of economic viability. An inferred mineral resource, therefore, may not be converted to a mineral reserve.
An indicated mineral resource is that part of a mineral resource for which quantity and grade or quality are estimated on the basis of adequate geological evidence and sampling. An indicated mineral resource has a lower level of confidence than the level of confidence of a measured mineral resource and may only be converted to a probable mineral reserve. As used in this subpart, the term adequate geological evidence means evidence that is sufficient to establish geological and grade or quality continuity with reasonable certainty.
A measured mineral resource is that part of a mineral resource for which quantity and grade or quality are estimated on the basis of conclusive geological evidence and sampling. As used in this subpart, the term conclusive geological evidence means evidence that is sufficient to test and confirm geological and grade or quality continuity.
11.1Key Assumptions, Parameters and Methods
The exploration drillhole and channel sample data were compiled to form the database that serves as the basis for estimating the resources. The geologic setting was evaluated, and bed assignments reviewed. Of the data within the lease boundary, all data points contribute bed thickness, and several have assay information.
The geology was modeled using Carlson Software (2020). A basic inverse distance-squared (ID2) algorithm was used with a search radius of ¾ mile to prepare the 100-ft x 100-ft grids for bed thickness and grade. The search radius was applied for Measured and Indicated Resources of ¼ mile and ¾ mile, respectively. Where data is dense, the nearest 25 data points were used to assign values for the grid block. The grids were multiplied by each other to compile a grade-thickness (GT) grid within the lease boundaries held by IPNM. The base grid was adjusted for each ore type cutoff. Key assumptions and parameters for resource estimation are listed in Table 11-1.
The classification of cutoff in terms of GT in units of ft% was defined in the Secretaries Order dated October 21, 1986 (51 FR 39425) for mechanically mined potash deposits. The criteria
|
|
|
|
|
|
2023 Estimated Resources and Reserves at Intrepid Potash-New Mexico
Prepared for Intrepid Potash, Inc.
February 14, 2024 |
32 |
Table 11-1. Parameter Assumptions
|
|
|
|
|
|
|
|
|
|
|
|
|
Resources |
| Measured |
Indicated |
| Proximity to sample point |
1,320 ft (1/4 mile) |
3,960 ft (3/4 mile) |
| GT for sylvinite mechanical mining |
54 ft% K2O |
GT for high-insoluble sylvinite mechanical mining* |
64 ft% K2O |
| GT for langbeinite mechanical mining |
25 ft% K2O |
| Flood elevation HB South |
2,525 ft |
| Flood Elevation HB North |
2,325 ft |
| Flood Elevation HB Eddy |
2,675 ft |
| Flood Elevation HB AMAX |
2,500 ft |
| Carnallite content mechanical mining |
Less than 6% |
| Mineability |
Reasonably expected to be feasible to mine |
*High-insoluble sylvinite zones 8 and 10 |
are not dependent on thickness or grade, but on the product of the thickness and grade. To evaluate the viability of mining the IPNM mechanically mined resources, a cutoff GT was established. Inputs to the estimation of the cutoff analysis are cost of goods sold, product sale price, mill recovery, and nominal grade. The cutoff for solution mining in flooded abandoned underground potash mines is a function of the grade of the brine being extracted which results in enough product tons to just cover the cost of production.
The estimated cost of goods sold (COGS) and sales price used in the cutoff evaluation are outlined in Table 11-2.
Intrepid has a long history of sales and marketing of their products. Sales are managed for all properties through the corporate office. Intrepid provided the historical demand and sales pricing through the statements of earnings (SOE) from 2012 to 2023. Forward-looking pricing was provided by Intrepid marketing. The product sale prices selected for analysis of cutoff grade are shown in Table 11-2. These values are 25% greater than the product sales price for the reserve estimate.
Table 11-2. Cost of Goods Sold and Sales Price Assumptions
|
|
|
|
|
|
|
|
|
|
|
|
|
|
|
|
|
|
|
|
| Product |
Sale Price |
Freight |
Net Sales Price |
Cost of Goods Sold |
|
|
|
|
|
| Langbeinite |
$470/t |
$90/t |
$380/t |
$272/t |
|
|
|
|
|
| Sylvite Solution Mining |
$450/t |
$30/t |
$420/t |
$184/t |
|
|
|
|
|
| Sylvite Mechanical Mining |
$450/t |
$30/t |
$420/t |
$272/t |
|
|
|
|
|
Economic modeling indicates cutoff grades at the IPNM East Mine of 25 ft %K2O for langbeinite resource. Modeling also indicates a cutoff of 64 ft% K2O for the high-insoluble
|
|
|
|
|
|
2023 Estimated Resources and Reserves at Intrepid Potash-New Mexico
Prepared for Intrepid Potash, Inc.
February 14, 2024 |
33 |
sylvinite resources in the 8th and 10th zones, which requires the capital investment of a new plant and refurbishment of shafts. A cutoff of 54 ft% K2O is indicated for the West sylvinite resources which requires the processing plant, mine equipment, and associated infrastructure to be rehabilitated. Cutoff grades are listed in Table 11-3.
Table 11-3. Cutoff Grade Analysis for Mechanical Mining
|
|
|
|
|
|
|
|
|
|
|
|
|
|
|
|
|
|
|
|
|
|
|
|
|
|
|
|
| Ore Mineral |
Pure Mineral
(%)
|
Nominal Grade Cutoffs
(% K2O)
|
Nominal Grade Cutoffs
(% KCl or Lang)
|
Mill Recovery
(%)
|
Grade-Thickness Cutoff1
(ft%)
|
Applicable Ore Zones |
| Carlsbad East Mine |
|
|
|
|
|
East–3, 4 and 5, West–4 |
|
|
|
|
|
|
Langbeinite2 |
22.70% |
5.2% |
23.0% |
68% |
25 |
| Carlsbad West/North Mine |
|
|
|
|
|
|
|
|
|
|
|
|
High-Insolubles Sylvite with CAPEX Burden |
|
|
|
|
|
|
| 63.17% |
14.4% |
22.8% |
75% |
64 |
8 and 10 |
| Carlsbad West Mine |
|
|
|
|
|
West–3, 4, 5, 7 North–3 and 4 |
|
|
|
|
|
|
Sylvinite with CAPEX Burden |
63.17% |
11.8% |
18.7% |
80% |
54 |
1Equivalent to 5.0-ft-thick ore at nominal grades in the East Mine and 4.5-ft-thick ore at nominal grades in the West and North Mines. |
2All langbeinite is processed at the East Plant. |
|
|
|
|
| CAPEX = capital expenditure |
By definition, the cutoff grade is the grade that determines the destination of the material during mining. The cutoff grade for resources of abandoned underground sylvinite is not a parameter for use in the estimation of solution mining resources but does establish an operational minimum limit for the brine grade reserves. The solution mining resources are the pillars remaining after mining and the fringe boundary of the mine. Resources could also be unmined sylvinite left behind to provide geotechnical support. An operational limit of the flood elevation establishes the cutoff between resource and reserve for this deposit. When mining using solution methods in proximity to other mines, or other underground mines not within the control of IPNM, the critical factor in establishing a flood elevation is to keep adjoining properties dry or to protect structures such as shafts.
Resource maps for sylvinite by zones 10, 8, 7, 5, 4, 3, and 1 are included in Figures 11-1 through 11-7, respectively. The langbeinite mineral resource maps for zones 5, 4, and 3 are included in Figures 11-8 through 11-10.
|
|
|
|
|
|
2023 Estimated Resources and Reserves at Intrepid Potash-New Mexico
Prepared for Intrepid Potash, Inc.
February 14, 2024 |
34 |
Figure 11-1. 10th Ore Zone Mineral Resources, Sylvinite Ore
|
|
|
|
|
|
2023 Estimated Resources and Reserves at Intrepid Potash-New Mexico
Prepared for Intrepid Potash, Inc.
February 14, 2024 |
35 |
Figure 11-2. 8th Ore Zone Mineral Resources, Sylvinite Ore
|
|
|
|
|
|
2023 Estimated Resources and Reserves at Intrepid Potash-New Mexico
Prepared for Intrepid Potash, Inc.
February 14, 2024 |
36 |
Figure 11-3. 7th Ore Zone Mineral Resources, Sylvinite Ore
|
|
|
|
|
|
2023 Estimated Resources and Reserves at Intrepid Potash-New Mexico
Prepared for Intrepid Potash, Inc.
February 14, 2024 |
37 |
Figure 11-4. 5th Ore Zone Mineral Resources, Sylvinite Ore
|
|
|
|
|
|
2023 Estimated Resources and Reserves at Intrepid Potash-New Mexico
Prepared for Intrepid Potash, Inc.
February 14, 2024 |
38 |
Figure 11-5. 4th Ore Zone Mineral Resources, Sylvinite Ore
|
|
|
|
|
|
2023 Estimated Resources and Reserves at Intrepid Potash-New Mexico
Prepared for Intrepid Potash, Inc.
February 14, 2024 |
39 |
Figure 11-6. 3rd Ore Zone Mineral Resources, Sylvinite Ore
|
|
|
|
|
|
2023 Estimated Resources and Reserves at Intrepid Potash-New Mexico
Prepared for Intrepid Potash, Inc.
February 14, 2024 |
40 |
Figure 11-7. 1st Ore Zone Mineral Resources, Sylvinite Ore
|
|
|
|
|
|
2023 Estimated Resources and Reserves at Intrepid Potash-New Mexico
Prepared for Intrepid Potash, Inc.
February 14, 2024 |
41 |
Figure 11-8. 5th Ore Zone Mineral Resources, Langbeinite Ore
|
|
|
|
|
|
2023 Estimated Resources and Reserves at Intrepid Potash-New Mexico
Prepared for Intrepid Potash, Inc.
February 14, 2024 |
42 |
Figure 11-9. 4th Ore Zone Mineral Resources, Langbeinite Ore
|
|
|
|
|
|
2023 Estimated Resources and Reserves at Intrepid Potash-New Mexico
Prepared for Intrepid Potash, Inc.
February 14, 2024 |
43 |
Figure 11-10. 3rd Ore Zone Mineral Resources, Langbeinite Ore
|
|
|
|
|
|
2023 Estimated Resources and Reserves at Intrepid Potash-New Mexico
Prepared for Intrepid Potash, Inc.
February 14, 2024 |
44 |
11.2Mineral Resource Estimate
The estimate of measured and indicated mineral resources effective December 31, 2023, extracted from the application of the resource cutoffs to the geologic model is listed in Table 11-4 and Table 11-5.
Table 11-4. Mineral Resource Estimate Summary effective December 31, 2023
|
|
|
|
|
|
|
|
|
|
|
|
|
|
|
|
|
|
| IPNM - Summary of Mineral Resources in millions of tons of Sylvinite in Place effective December 31, 2023, based on $450/product ton mine site |
|
Resources |
|
|
|
Sylvinite1 |
Grade |
Contained K2O |
Mining Cutoff2 |
Processing Recovery |
|
(Mt) |
(%K2O) |
(Mt) |
(ft-%K2O) |
(%) |
| Measured Mineral Resources |
289 |
16 |
45 |
54-64 |
75-85 |
| Indicated Mineral Resources |
164 |
14 |
24 |
54-64 |
75-85 |
| Measured + Indicated Mineral Resources |
453 |
15 |
69 |
|
|
| Inferred Mineral Resources |
|
|
|
|
|
1Sylvinite is a mixed evaporite containing NaCl and KCl. |
2Solution mining resource cutoff for flooded old working is the mining extents boundary. |
| Mineral Resources were prepared by RESPEC, a qualified firm for the estimate and independent of Intrepid Potash, for EOY 2023. |
| Mineral Resources are reported exclusive of Mineral Reserves, on a 100% basis. |
Mt = million tons, % = percentage, K2O = potassium oxide, ft = feet |
Table 11-5. Mineral Resource Estimate Summary effective December 31, 2023
|
|
|
|
|
|
|
|
|
|
|
|
|
|
|
|
|
|
| IPNM - Summary of Mineral Resources in millions of tons of Langbeinite Mineralized Rock in Place effective December 31, 2023, based on $470/Product Ton Mine Site |
|
Resources |
|
|
|
Langbeinite Mineralized Rock |
Grade |
Contained K2O |
Mining Cutoff |
Processing Recovery |
|
(Mt) |
(%K2O) |
(Mt) |
(ft-%K2O) |
(%) |
| Measured Mineral Resources |
72 |
10 |
7 |
25 |
68 |
| Indicated Mineral Resources |
60 |
10 |
6 |
25 |
68 |
| Measured + Indicated Mineral Resources |
132 |
10 |
13 |
|
|
| Inferred Mineral Resources |
|
|
|
|
|
| Mineral Resources were prepared by RESPEC, a qualified firm for the estimate and independent of Intrepid Potash, for EOY 2023. |
| Mineral Resources are reported exclusive of Mineral Reserves, on a 100% basis. |
Mt = million tons, % = percentage, K2O = potassium oxide, ft = feet |
|
|
|
|
|
|
2023 Estimated Resources and Reserves at Intrepid Potash-New Mexico
Prepared for Intrepid Potash, Inc.
February 14, 2024 |
45 |
11.3Discussion of Future Work
IPNM has historically and is currently producing from this property. There are no relevant technical or economic factors that need to be resolved.
|
|
|
|
|
|
2023 Estimated Resources and Reserves at Intrepid Potash-New Mexico
Prepared for Intrepid Potash, Inc.
February 14, 2024 |
46 |
12.0Mineral Reserve Estimates
Mineral reserves that are to be mined using mechanical methods are estimated by the application of a detailed mine plan for the measured and indicated resources within the boundaries of the cutoff GT for reserves. The plan sets the basis for the estimation of annual production of product. The income from product sales and the operating and capital costs to mine the resource is fundamental to the cash flow used to establish economic viability.
Mineral reserves that are mined using solution mining methods are not subject to the traditional application of a cutoff grade but instead of operational limitations. An operational limit of the flood elevation establishes the cutoff between resource and reserve for this deposit.
According to 17 CFR § 229.1301 (2021), the following definitions are included for reference:
A probable mineral reserve is the economically mineable part of an indicated and, in some cases, a measured mineral resource.
A proven mineral reserve is the economically mineable part of a measured mineral resource. For a proven mineral reserve, the qualified person has a high degree of confidence in the results obtained from the application of the modifying factors and in the estimates of tonnage and grade or quality. A proven mineral reserve can only result from conversion of a measured mineral resource.
12.1Key Assumptions, Parameters, and Methods
By definition, modifying factors are the factors applied to indicated and measured mineral resources and then evaluated in order to establish the economic viability of mineral reserves. These factors for IPNM include mechanical and solution mining parameters; mineral processing; oil and gas drill islands and well locations; economic cutoff GT; deleterious minerology; and lease boundaries.
Intrepid has a long history of sales and marketing of their products. Sales are managed for all properties through the corporate office. Intrepid provided the historical demand and sales pricing through their SOEs from 2012 to 2023. Potash market is discussed in Section 16. The product sales price selected for Reserve evaluation is shown in Table 12-1.
Table 12-1. Product Sales Price (Reserves)
|
|
|
|
|
|
|
|
|
|
|
|
|
|
|
|
|
|
|
|
| Product |
Sale Price |
Freight |
Net Sales Price |
Cost of Goods Sold |
|
|
|
|
|
Sylvite |
$360/t |
$30/t |
$330/t |
$184/t |
|
|
|
|
|
Cutoff grade for brine production is listed in Table 12-2.
|
|
|
|
|
|
2023 Estimated Resources and Reserves at Intrepid Potash-New Mexico
Prepared for Intrepid Potash, Inc.
February 14, 2024 |
47 |
12.2Mineral Reserves Estimate
The mine plan boundary determines the technical feasibility of mining the reserves for zones. The mine plan layout for the solution mining is a flood elevation indicating the limit of the fluid injection boundary. The proven and probable reserves are included in Table 12-3 and are shown in Figure 12-1 for ore zone 1, respectively.
Table 12-2. Cutoff for Solution Mined Reserves
|
|
|
|
|
|
|
|
| 5-Yr Basis (2024-2028) |
|
Total production costs ($M) |
$179.0 |
|
Net revenue from byproducts ($M) |
($35.0) |
|
| Total Cost ($M) |
$144 |
|
| Potash |
|
Price per ton less shipping ($/ton) |
$330 |
|
Tons sold |
784,000 |
Net potash sales ($) |
$258,720,000 |
| Cutoff Analysis |
|
Breakeven tons (tonnage to cover the costs) |
438,158 |
Net concentration of production brine (% KCl) |
8.40 |
|
Cutoff net concentration (% KCl) |
4.7 |
|
Cutoff net concentration (% K2O) |
3.0 |
|
|
|
Table 12-3. Mineral Reserve Estimate effective December 31, 2023
|
|
|
|
|
|
|
|
|
|
|
|
|
|
|
|
|
|
| IPNM -Summary of Potash Mineral Reserves effective December 31, 2023 based on $360/Product Ton Mine Site |
|
Reserves |
|
|
|
In-Place KCl |
In-Situ
Grade1
|
Product2 |
Brine Cutoff Grade3 |
Processing Recovery |
|
(Mt) |
(%K2O) |
(Mt) |
(%K2O) |
(%) |
| Proven Mineral Reserves |
5.3 |
22.9 |
4.0 |
3.0 |
85 |
| Probable Mineral Reserves |
|
|
|
|
|
| Total Mineral Reserves |
5.3 |
22.9 |
4.0 |
3.0 |
|
1In-situ grade is the amount of K2O in the contact area of the caverns and is used to calculate the In-Place KCl. |
2Product is calculated by multiplying In-Place KCl by: dissolution factor of 96%, areal recovery of 100%, geologic factor of 94.2%, plant recovery of 85%, cavern loss factor of 98%, a product purity factor of 103%, and a handling loss factor of 97%. |
3Brine cutoff grade is the amount of K2O in the extracted brine necessary to cover the cash costs of production. |
| Mineral Reserves were prepared by RESPEC, a qualified firm for the estimate and independent of Intrepid Potash, for EOY 2023. |
| Mineral Reserves are reported exclusive of Mineral Resources, on a 100% basis. |
Mt = million tons, % = percent, K2O = potassium oxide, ft = feet |
|
|
|
|
|
|
2023 Estimated Resources and Reserves at Intrepid Potash-New Mexico
Prepared for Intrepid Potash, Inc.
February 14, 2024 |
48 |
12.3Risk Factors
Mineral reserves are an estimate from sparse data sampling points in a geologic setting that can be highly variable. The risk of material changes to the geologic interpretation is tempered by the application of the anomaly factor and the long history of mining in this deposit. Costs are subject to impact by the broader economy and can be impacted by the weather and other natural forces. A change in rules or regulations can result in unanticipated cost increases.
|
|
|
|
|
|
2023 Estimated Resources and Reserves at Intrepid Potash-New Mexico
Prepared for Intrepid Potash, Inc.
February 14, 2024 |
49 |
Figure 12-1. 1st Ore Zone Mineral Reserves, Sylvinite Ore
|
|
|
|
|
|
2023 Estimated Resources and Reserves at Intrepid Potash-New Mexico
Prepared for Intrepid Potash, Inc.
February 14, 2024 |
50 |
13.0Mining Methods
The two mining methods currently in practice at IPNM are high-extraction mechanical underground room-and-pillar mining and solution mining. Mechanical mining is well suited to bedded deposits. All MOP production at IPNM comes from the HB Solar Solution Mine in the 1st and 3rd ore zones. Trio® production is from langbeinite mined using room-and-pillar mechanical mining methods at the East Mine in the 3rd, 4th, and 5th ore zones. Historically, MOP was sourced from the West Mine 5th, 7th, and 10th ore zones. Approximately 315 people are employed at the property.
The East Mine is a high-extraction, mechanical room-and-pillar mine. Potash was the primary product until mining progressed to the mixed langbeinite and potash ore in the 5th ore zone. The mixed ore was processed into two products: MOP sourced from the sylvinite portion of the mixed ore, and Trio® sourced from the langbeinite portion of the mixed ore. The East Mine plant was converted to a langbeinite-only operation in April 2016 and potash is no longer produced from the East Mine. The maximum productive capacity of the plant is 400,000 t of Trio® concentrate annually.
There are five active sections with a miner and a shuttle car loading onto a belt conveyor. Each mining section produces approximately 240,000 t of run-of-mine ore each year. The long-range production balanced with sales projections results in a long-term annual production of 1.2 Mt of ore for 250,000 t of Trio®.
Historical room-and pillar-mining operations at the HB Mine recovered about 70% of the ore, leaving approximately 30% of the ore available for secondary recovery in pillars plus what can be recovered beyond the limits of the conventional mine works. Mining at the HB Solar Solution Mine recovers potash by injecting saturated saline NaCl brine into the old mine works to create underground leach lakes. Over time, the solution becomes enriched with potash and is pumped to the surface to solar evaporation ponds. Selective solar evaporation leaves behind a potash-enriched salt that is collected using scrapers, pumped, and processed at the HB Plant. The solution mine comprises six injection wells, five extraction wells, and three monitoring wells.
The North Mine operated from 1957 to 1982 when it was idled, mainly due to low potash prices and a change in the mineralogy of the readily accessible remaining reserves which negatively impacted mineral processing. Although the mining and processing equipment has been removed, the mine shafts remain open. The compaction facility at the North Mine is where the HB potash product is granulated, stored, and shipped. The North Facility receives compactor feed from the HB Solar Solution Mine via truck and converts the compactor feed to finished granular-sized product and standard-sized product.
The extents of the mine plan for this reserve estimate is shown in Figure 13-1 and included in tabular format in Table 13-1. The life of the resources and reserves at IPNM exceeds 25 years.
|
|
|
|
|
|
2023 Estimated Resources and Reserves at Intrepid Potash-New Mexico
Prepared for Intrepid Potash, Inc.
February 14, 2024 |
51 |
Figure 13-1. Underground and Solution Mining Extents
|
|
|
|
|
|
2023 Estimated Resources and Reserves at Intrepid Potash-New Mexico
Prepared for Intrepid Potash, Inc.
February 14, 2024 |
52 |
Table 13-1. IPNM 25-Year Mine Plan
|
|
|
|
|
|
|
|
|
|
|
|
|
|
|
|
|
|
|
|
|
|
|
|
|
|
|
|
|
|
|
|
| Calendar Year |
Plan Year |
MOP |
| R |
S |
T |
U |
V |
W |
| Brine Extracted (Gallons) |
Brine Grade
(%K2O)
|
K2O
(Tons)
|
Product KCl
(Tons)
|
Handling Losses (Tons) |
MOP
(Tons)
|
| 2024 |
Year 1 |
325,000,000 |
5.42 |
77,400 |
126,300 |
3,300 |
123,000 |
| 2025 |
Year 2 |
450,000,000 |
5.26 |
104,100 |
169,900 |
4,900 |
165,000 |
| 2026 |
Year 3 |
450,000,000 |
5.38 |
106,400 |
173,600 |
5,600 |
168,000 |
| 2027 |
Year 4 |
450,000,000 |
5.28 |
104,400 |
170,400 |
5,400 |
165,000 |
| 2028 |
Year 5 |
450,000,000 |
5.20 |
102,900 |
167,900 |
4,900 |
163,000 |
| 2029 |
Year 6 |
450,000,000 |
5.62 |
111,200 |
181,500 |
5,500 |
176,000 |
| 2030 |
Year 7 |
450,000,000 |
5.61 |
110,900 |
181,000 |
5,000 |
176,000 |
| 2031 |
Year 8 |
450,000,000 |
5.61 |
110,900 |
181,000 |
5,000 |
176,000 |
| 2032 |
Year 9 |
450,000,000 |
5.61 |
110,900 |
181,000 |
5,000 |
176,000 |
| 2033 |
Year 10 |
450,000,000 |
5.55 |
109,700 |
179,000 |
5,000 |
174,000 |
| 2034 |
Year 11 |
450,000,000 |
5.44 |
107,500 |
175,400 |
5,400 |
170,000 |
| 2035 |
Year 12 |
450,000,000 |
5.40 |
106,900 |
174,500 |
5,500 |
169,000 |
| 2036 |
Year 13 |
450,000,000 |
5.34 |
105,600 |
172,300 |
5,300 |
167,000 |
| 2037 |
Year 14 |
450,000,000 |
5.22 |
103,100 |
168,300 |
5,300 |
163,000 |
| 2038 |
Year 15 |
450,000,000 |
5.09 |
100,600 |
164,200 |
5,200 |
159,000 |
| 2039 |
Year 16 |
450,000,000 |
5.03 |
99,400 |
162,200 |
5,200 |
157,000 |
| 2040 |
Year 17 |
450,000,000 |
4.99 |
98,800 |
161,200 |
5,200 |
156,000 |
| 2041 |
Year 18 |
450,000,000 |
4.93 |
97,500 |
159,100 |
5,100 |
154,000 |
| 2042 |
Year 19 |
450,000,000 |
4.90 |
96,900 |
158,100 |
5,100 |
153,000 |
| 2043 |
Year 20 |
450,000,000 |
4.90 |
96,900 |
158,100 |
5,100 |
153,000 |
| 2044 |
Year 21 |
450,000,000 |
4.90 |
96,900 |
158,100 |
5,100 |
153,000 |
| 2045 |
Year 22 |
450,000,000 |
4.90 |
96,900 |
158,100 |
5,100 |
153,000 |
| 2046 |
Year 23 |
450,000,000 |
4.90 |
96,900 |
158,100 |
5,100 |
153,000 |
| 2047 |
Year 24 |
450,000,000 |
4.90 |
96,900 |
158,100 |
5,100 |
153,000 |
| 2048 |
Year 25 |
450,000,000 |
4.87 |
96,300 |
157,200 |
4,200 |
153,000 |
|
|
|
|
|
|
|
|
|
|
|
|
|
|
|
|
| Extraction brine density - 1.24 |
| KCl plant recovery - 85% |
| Product purity - 97% |
| Pure KCl equates to 63.17% K2O by mass |
| Handling losses - Varies (2.6%-3.2%) |
| T = R*(S/100)*1.24*8.34/2000*0.85 |
| U = T/0.6317/0.97 |
| V = U*Handling losses |
| W = U-V |
|
|
|
|
|
|
2023 Estimated Resources and Reserves at Intrepid Potash-New Mexico
Prepared for Intrepid Potash, Inc.
February 14, 2024 |
53 |
14.0Processing and Recovery Methods
All IPNM ores are processed on-site. There are two active processing plants: the East Plant and HB Plant. The West Plant was idled in 2016. The North Compactor was completed in early 2013 and is used to granulate, store, and ship product from the HB Plant.
Declining ore grades coupled with market conditions have resulted in IPNM shuttering much of it sylvite capacity in the previous years. Historically, the East Plant produced white sylvite by evaporative crystallization and langbeinite (K2SO4·2MgSO4) by dense media separation of the coarse fraction (+20 mesh) of ore mined from the 3rd, 4th, and 5th ore zones. In 2016, sylvite production permanently ceased and the East Plant became a langbeinite-only producer. Langbeinite recoveries have since improved to as high as 72%.
14.1HB Processing Facility
In 2012, IPNM commenced filling the HB solar evaporation ponds (Figure 14-1). The extraction brine sourced from the mined-out areas of the 1st ore zones of the former underground workings of portions of HB Eddy, HB South, HB North, and the HB Crescent, collectively referred to as the HB Mine, contains approximately 21.7% NaCl and 7.0% KCl. The brine is collected and crystallized in 18 solar evaporation ponds. The HB flotation mill processes the harvested potash and salts from the solar evaporation ponds.
Conditioned injectate, made with NaCl-saturated brine, is injected to create underground leach lakes in the lower portions of abandoned subsurface mine workings. The solution mine comprises six injection wells, five extraction wells, and three monitoring/extraction wells.
The simplified process flow diagram (PFD) is shown in Figure 14-2. NaCl-saturated brine is injected into the mines producing about 450 million gallons of brine at an estimated grade of 8.0% KCl and 20% NaCl. The evaporation ponds concentrate and crystallize the brine to produce about 680,000 tpy of crystal at 15–18% K2O (24–30% KCl) with the remainder being largely halite. The crystals are mechanically harvested, re-pulped in double-saturated brine and pumped to the HB processing facility.
|
|
|
|
|
|
2023 Estimated Resources and Reserves at Intrepid Potash-New Mexico
Prepared for Intrepid Potash, Inc.
February 14, 2024 |
54 |
Figure 14-1. HB Evaporation Ponds
|
|
|
|
|
|
2023 Estimated Resources and Reserves at Intrepid Potash-New Mexico
Prepared for Intrepid Potash, Inc.
February 14, 2024 |
55 |
Figure 14-2. HB Process Flow Diagram
|
|
|
|
|
|
2023 Estimated Resources and Reserves at Intrepid Potash-New Mexico
Prepared for Intrepid Potash, Inc.
February 14, 2024 |
56 |
The crystals are statically screened with the oversize processed through a crusher and recycled. The screened crystal is combined with reagents and fed to flotation cells. The rougher flotation concentrate is forwarded to the agitated leach tank.
The leached solids are at a product grade of >95.5% KCl with 60.5% K2O. The solids are dried, sampled, and conveyed to storage bins prior to transfer to the North Plant for compaction and shipment to sales.
14.2Langbeinite Processing Facility
The East Plant was modified in 2003–2004 to allow dual processing to recover the K2O value from both the sylvite and langbeinite fractions of the ore. In 2016, the sylvite circuit was permanently closed. Langbeinite, marketed as the fertilizer Trio® brand of products, is recovered using dense media separation and a fine langbeinite recovery circuit. A simplified process flow diagram is included as Figure 14-3.
Currently about 1 million tpy (Mtpy) of ore is processed at a rate of 300 tph. The ore is crushed, screened, pulped, and rescreened. Coarse material is forwarded to the dense media separation (DMS) circuit. The DMS concentrate is water leached, debrined, and dried. The coarse product is separated into the three Trio® products. Fine material from the screening process is recovered using gravity separation, leaching, debrining, and drying. Fine material is upgraded to premium product using pelletization.
14.3North Compaction Plant
The North Plant provides classification, compaction, quality control, and load-out services for production from the HB Solar Solution Mine. A simplified flow diagram for the North Compaction Plant is presented in Figure 14-4.
Belly dump trucks unload HB product into a dump pocket. The material is then sent to surge bins. The product is screened, preheated, weighed, and sent to a compactor feed bin.
Material is screened to produce standard product or fed to the roll compactor, and resulting flakes are further reduced in size with the subsequent flake breaker and crusher to produce granular product. Product is then screened and sent to the curing dryer and screened once again before being sent to final product storage.
The product is shipped to market in trucks or rail cars.
14.4Tailings Facilities
There are three tailings storage facilities (TSF) at IPNM: East, West, and North.
The East TSF is shown in Figure 14-5. The New Mexico State Engineer in the Dam Safety Bureau required IPNM to evaluate as-built conditions and stability of the East TSF due to the lack
|
|
|
|
|
|
2023 Estimated Resources and Reserves at Intrepid Potash-New Mexico
Prepared for Intrepid Potash, Inc.
February 14, 2024 |
57 |
Figure 14-3. East Plant Process Simplified Flow Diagram
of original construction calculations and drawings. IPNM completed the required geotechnical evaluation assessment in 2018. Based on that evaluation, a conceptual improvement plan was developed to buttress slopes greater than 26 ft in height and to add a 3-ft lift to the crest of the facility to achieve minimum compliance requirements.
The West TSF, in Figure 14-6, is permitted for tailings disposal from the West Plant. The plant is currently not in operation. NaCl from the facility is used to condition the injectate stream for the HB Solar Solution Mine.
The North TSF in Figure 14-7 is only used to handle excess brine/water and has ample capacity.
|
|
|
|
|
|
2023 Estimated Resources and Reserves at Intrepid Potash-New Mexico
Prepared for Intrepid Potash, Inc.
February 14, 2024 |
58 |
Figure 14-4. North Plant Simplified Process Flow Diagram
|
|
|
|
|
|
2023 Estimated Resources and Reserves at Intrepid Potash-New Mexico
Prepared for Intrepid Potash, Inc.
February 14, 2024 |
59 |
Figure 14-5. East Tailings Storage Facility
|
|
|
|
|
|
2023 Estimated Resources and Reserves at Intrepid Potash-New Mexico
Prepared for Intrepid Potash, Inc.
February 14, 2024 |
60 |
Figure 14-6. West Tailings Storage Facility (HB Brine Recirculation)
|
|
|
|
|
|
2023 Estimated Resources and Reserves at Intrepid Potash-New Mexico
Prepared for Intrepid Potash, Inc.
February 14, 2024 |
61 |
Figure 14-7. North Tailings Storage Facility (inactive)
|
|
|
|
|
|
2023 Estimated Resources and Reserves at Intrepid Potash-New Mexico
Prepared for Intrepid Potash, Inc.
February 14, 2024 |
62 |
15.0Infrastructure
The IPNM mines have a robust infrastructure in place. IPNM has adequate water rights at each of the mine properties. All of the mining operations are accessible by paved state or county highways and are accessible by rail. All of the operations obtain electric power from local utilities fed to recently upgraded substations. The infrastructure layout is shown in Figure 15-1.
|
|
|
|
|
|
2023 Estimated Resources and Reserves at Intrepid Potash-New Mexico
Prepared for Intrepid Potash, Inc.
February 14, 2024 |
63 |
Figure 15-1. Layout of the Infrastructure
|
|
|
|
|
|
2023 Estimated Resources and Reserves at Intrepid Potash-New Mexico
Prepared for Intrepid Potash, Inc.
February 14, 2024 |
64 |
16.0Market Studies
Price projections are based on a combination of historic pricing trends and expectations of future potash consumption and production. Intrepid uses a variety of sources including, but not limited to, industry reports, company announcements, third-party market studies, and internal estimates when establishing a forecasted price. Intrepid compares its historic realized pricing to widely available benchmark prices, specifically the Midwest Warehouse potash price and the U.S. New Orleans Louisiana (“NOLA”) Barge Market potash price, to establish a historic price differential which it uses when analyzing future price expectations.
|
|
|
|
|
|
2023 Estimated Resources and Reserves at Intrepid Potash-New Mexico
Prepared for Intrepid Potash, Inc.
February 14, 2024 |
65 |
17.0Environmental Studies, Permitting, and Plans
IPNM holds numerous environmental, mining, safety, and other permits and governmental approvals authorizing the operations at each of the facilities. Operations are subject to permits for, among other things, extraction of salt and brine, discharges of process materials and waste to air and surface water, and injection of brine. IPNM is obligated to reclaim and remediate disturbed lands when they cease operations.
17.1Environmental Studies
IPNM has all necessary operating permits and is in production, both underground and solution mining, and through the permit reporting maintains environmental compliance. Environmental studies are conducted for major project expansions. The most recent Environmental Audit (EA) was completed in 2015 for the expansion of the HB In-situ Solution Mining project to include the solution mining of the abandoned AMAX potash mine. The work referenced the initial EIS for the HB In-Situ Solar Solution Mining Project EIS (DOI 2012).
17.2Waste and Tailings Disposal, Site Monitoring, and Water Management During and After Mine Closure
The property has three tailings’ impoundments, one of which is in current operation, that were described in Section 14. Tailings brine water is recycled for use in processing plants and solution wells. At closure, the tailings piles will dry and form a very hard, stable crust. No recontouring or revegetation of tailings piles are anticipated because the hard crust will provide adequate slope stability. The perimeter dikes will be stabilized for long-term integrity. Precipitation on the pile will dissolve some of the salt as it moves down into the brine pond, but is not anticipated to be saturated when it exits the pile. The tailings areas will be fenced off to minimize public access. No other reclamation of the tailings piles is necessary at closure.
17.3Permitting Status and Reclamation Bonds
The permitting status of each of the major permits is listed in Table 17-1. Bonds for mine closure and groundwater discharge are currently at a value of $4.475 million.
17.4Agreements with Local Individuals
There are no specific agreements with local individuals or groups.
17.5Closure Plans
Closure plans include the repurposing, demolition, and removal of surface infrastructure and safely securing shafts for public safety. Mine operations and closure plans are periodically filed with the BLM. The proposed methods of abandonment are designed to protect unmined
|
|
|
|
|
|
2023 Estimated Resources and Reserves at Intrepid Potash-New Mexico
Prepared for Intrepid Potash, Inc.
February 14, 2024 |
66 |
Table 17-1. Permitting Status
|
|
|
|
|
|
|
|
|
|
|
|
|
|
|
|
|
|
|
|
|
|
|
|
|
|
|
|
| Common Name |
Issuing Agency |
Permit ID |
Effective Date |
Expiration Date |
Bond Value |
Note |
|
|
|
|
|
|
|
| Air Permit |
New Mexico Environment Department (NMED) Air Quality Bureau |
Title V Air Operating Permit
P009-R3M1 (East Plant) |
24-Apr-20 |
4-Apr-25 |
None |
Title V operating permits have a 5-year permit term; renewal is required to be submitted 12 months prior to expiration. |
| Air Permit |
NMED Air Quality Bureau |
Title V Air Operating Permit
P261-R1 (North Compaction Plant [NSR 0321-M8], West Floatation Plant [NSR 0421-M5, 0421-M5R1], HB Plant [NSR 4332-M21R3])
|
6-Nov-19 |
1-Nov-24 |
None |
Title V operating permits have a 5-year permit term; renewal is required to be submitted 12 months prior to expiration. Permit renewal was submitted to NMED on 4/21/2023 |
| Groundwater Discharge Permit |
New Mexico Environment: Department Ground Water Bureau (Water Quality Control Commission Regulations) |
Discharge Permit
No.: DP-1681
|
10-Jul-15 |
10-Jul-20 |
$3,349,000 |
Application for renewal submitted January 2020; still awaiting new permit. Existing permit remains in effect until agency issues the renewed permit. Current bond amount is shown. Intrepid provided an updated Mine Reclamation and Closure Plan Cost Estimate to NMED GWB in June 2021 for the amount of $4.475MM. Awaiting NMED acceptance before updating bond. Bond currently held by NMED and covered in joint bonding arrangement with the Bureau of Land Management. |
| West/HB Plant Liquid Waste Permit |
NMED Health Bureau |
Permit No. 008609 |
25-Sep-18 |
Good for the life of the system. |
None |
HB reclaim |
| West/HB Plant Liquid Waste Permits |
NMED Health Bureau |
Permit No. 004446, 004447, 004448, 004449, 004450, 004451, 004452, 004453 |
1-Sep-18 |
Good for the life of the system. |
None |
Various West/HB liquid waste permits |
| East Plant Liquid Waste Permits |
NMED Health Bureau |
Permit No. 004437, 004438, 004439, 004440, 004441, 004442, 004444, 004445 |
1-Sep-18 |
Good for the life of the system. |
None |
Various East Plant liquid waste permits. |
| East Plant Liquid Waste Permit |
NMED Health Bureau |
Permit No. 004439 |
14-Jun-19 |
Good for the life of the system. |
None |
East Loadout tank 3A |
| East Plant Liquid Waste Permit |
NMED Health Bureau |
Permit No. 009340 |
4-Sep-19 |
Good for the life of the system. |
None |
East Leachfield LF1A |
| North Plant Liquid Waste Permits |
NMED Health Bureau |
Permit No. 004454, 004455, 004457, 004458 |
1-Sep-18 |
Good for the life of the system. |
None |
Various North Plant liquid waste permits |
| Radioactive Devices |
NMED Radiation Control Bureau |
|
7-Oct-19 |
30-Nov-24 |
None |
|
| Waterfowl Hazing Plan and Reporting |
Bureau of Land Management – Carlsbad Field Office |
HB Project Solar Evaporation Ponds, Stepped Avian Monitoring and Mitigation Plan |
1-Jan-12 |
None |
None |
Intrepid New Mexico submits quarterly reports on its activities |
| Storm Water Pollution Prevention Plan |
N/A |
|
|
|
|
|
| SPCC Plan |
N/A |
|
|
|
|
|
| Good Housekeeping Practices Plan |
NMED Air Quality Bureau |
West, North and HB Good Housekeeping Practices Plan required by Title V Air Operating Permit P261-R1 |
6-Nov-19 |
1-Nov-24 |
None |
|
| Good Housekeeping Practices Plan |
NMED Air Quality Bureau |
East Good Housekeeping Practices Plan required by Title V Operating Permit P009-R3M1 |
24-Apr-20 |
4-Apr-25 |
None |
|
| CAM Plan |
NMED Air Quality Bureau |
West North and HB Compliance Assurance Monitoring Plan required by Title V Air Operating Permit P261-R1 |
Same as Title V permit |
Same as Title V permit |
None |
|
| CAM Plan |
NMED Air Quality Bureau |
East Compliance Assurance Monitoring Plan required by Title V Air Operating Permit P009-R3M1 |
Same as Title V permit |
Same as Title V permit |
None |
|
| Federal Explosives License |
Bureau of Alcohol, Tobacco, and Firearms |
Permit #5-NM-015-33-9J-00293 |
|
1-Sep-25 |
None |
License covers shell crackers for shotguns. Used to control or scare away waterfowl from the ponds at all sites. This license is for all of Intrepid New Mexico. |
| Solid and Hazardous Waste Management Plan |
Self Written |
|
|
Updated plan internally January 2021. |
|
[Not a permit; HB Solar is a very small quantity generator]. |
|
|
|
|
|
|
2023 Estimated Resources and Reserves at Intrepid Potash-New Mexico
Prepared for Intrepid Potash, Inc.
February 14, 2024 |
67 |
|
|
|
|
|
|
|
|
|
|
|
|
|
|
|
|
|
|
|
|
|
| Mine Operations and Closure Plans |
Bureau of Land Management – Carlsbad Field Office |
HB Solar Mine Operations and Closure Plan |
31-May-21 |
31-May-31 |
$415,000 |
Intrepid NM provided an updated Mine Reclamation and Closure Plan and Closure Cost Estimate for HB to NMED GWB and concurrently with the BLM in June 2021 for the amount of $4.475MM. It is our understanding that NMED and BLM have an MOU that will allow Intrepid NM to have one bond jointly. Awaiting NMED and BLM acceptance before updating the bond. |
| Mine Operations and Closure Plans |
Bureau of Land Management – Carlsbad Field Office |
East Mine Operations and Closure Plan
North Mine Operations and Closure Plan
West Mine Operations and Closure Plan |
2012
2013
2013 |
|
|
Intrepid submitted draft Operations and Closure Plans to BLM. Those applications have not been approved and earlier plans remain in effect. Intrepid is working to provide revised Operations and Closure Plans to the BLM for these mines. |
| Well Permits |
NM Office of State Engineer |
Injection, Extraction, and Rustler Wells |
1-Mar-12 |
|
None |
Permit status is undetermined at this time. |
|
|
|
|
|
|
2023 Estimated Resources and Reserves at Intrepid Potash-New Mexico
Prepared for Intrepid Potash, Inc.
February 14, 2024 |
68 |
recoverable reserves and other resources. While each mine area has specific detailed closure requirements, the major closure steps include closure of shafts and relief wells, tailings stabilization, asbestos removal, building demolition, reclamation of building footprints; reclamation of other areas, disposal of any contaminated soils, reclamation of landfills, reclamation of roads, and remediation of Recognized Environmental Concerns (REC).
Upon completion of solution mining operations at the HB Mine, all structures, wells, pipelines, and ancillary equipment located on Federal, State, and Intrepid fee land will be abandoned, demolished, razed, and hauled to an appropriately permitted local landfill for proper disposal.
17.6Adequacy of Current Plans and Compliance
It is the QP’s opinion that the current plans are adequate to address any issues related to environmental compliance, permitting, and local individuals or groups.
|
|
|
|
|
|
2023 Estimated Resources and Reserves at Intrepid Potash-New Mexico
Prepared for Intrepid Potash, Inc.
February 14, 2024 |
69 |
18.0Capital and Operating Costs
18.1Capital Cost Estimate
Capital items necessary to complete the mine plan include the treatment extension for the management of bitterns from the HB Plant and the pipeline and injection/extraction wells for the AMAX extension of the HB Solar Solution Mine. The mine reclamation capital costs are included for 2024 through 2028. Intrepid has provided the mining costs history and sales data since 2007 and budgeted capital costs. With the West Mine taken offline, many of the capital items were recovered from the West Mine for use in the East Mine, reducing the amount of new capital required to sustain East Mine operations. The reclamation cost is included in year 2048 as $44.2 million. Work beyond Year 26 is allocated to Year 25 to establish contracting. The sustaining capital is outlined in the budget and includes major equipment replacement. Capital costs are shown in Table 18-1.
Table 18-1. Major Remediation and Capital Cost Estimate
|
|
|
|
|
|
|
|
|
|
|
|
|
|
|
|
|
|
|
|
| Year Number |
Year |
Remediation |
Sustaining Capital |
Capital |
| 1 |
2024 |
$250,000 |
$7,000,000 |
$5,000,000 |
| 2 |
2025 |
$900,000 |
$7,000,000 |
$12,500,000 |
| 3 |
2026 |
$2,921,500 |
$7,000,000 |
$13,000,000 |
| 4 |
2027 |
$1,325,000 |
$7,000,000 |
|
| 5 |
2028 |
$1,325,000 |
$7,000,000 |
$12,500,000 |
| 6 |
2029 |
|
$7,000,000 |
|
| 7 |
2030 |
|
$7,000,000 |
|
| 8 |
2031 |
|
$7,000,000 |
|
| 9 |
2032 |
|
$7,000,000 |
|
| 10 |
2033 |
|
$7,000,000 |
|
| 11 |
2034 |
|
$7,000,000 |
|
| 12 |
2035 |
|
$7,000,000 |
|
| 13 |
2036 |
|
$7,000,000 |
|
| 14 |
2037 |
|
$7,000,000 |
|
| 15 |
2038 |
|
$7,000,000 |
|
| 16 |
2039 |
|
$7,000,000 |
|
| 17 |
2040 |
|
$7,000,000 |
|
| 18 |
2041 |
|
$7,000,000 |
|
| 19 |
2042 |
|
$7,000,000 |
|
| 20 |
2043 |
|
$7,000,000 |
|
| 21 |
2044 |
|
$7,000,000 |
|
| 22 |
2045 |
|
$7,000,000 |
|
| 23 |
2046 |
|
$7,000,000 |
|
| 24 |
2047 |
|
$7,000,000 |
|
| 25 |
2048 |
$44,220,211 |
$7,000,000 |
|
|
|
|
|
|
|
2023 Estimated Resources and Reserves at Intrepid Potash-New Mexico
Prepared for Intrepid Potash, Inc.
February 14, 2024 |
70 |
18.2Operating Cost Estimate
Intrepid provided the mining costs history and sales data since 2007. The cash operating cost including warehouse, handling, and royalty is provided in Table 18-1. These costs are subject to vary with changes in production. Cash production costs do not include interest, depreciation, depletion, or income taxes. A by-product credit of $44 per ton is applicable.
Table 18-2. Unit Mining Cost
|
|
|
|
|
|
|
|
|
|
|
|
| Cost Category |
Cost ($/Product Ton) |
Cost Distribution |
| Labor |
108 |
|
47 |
% |
| Maintenance Supplies |
20 |
|
9 |
% |
| Operating Supplies Including Reagents |
13 |
|
8 |
% |
| Natural Gas, Electricity and Fuel |
19 |
|
6 |
% |
| Leases, Property Tax, Insurance, etc. |
29 |
|
13 |
% |
| Subtotal |
189 |
|
83 |
% |
| Warehouse |
13 |
|
6 |
% |
| Royalties |
17 |
|
7 |
% |
| Environmental Remediation and Other |
10 |
|
4 |
% |
| Cost of Goods Sold |
228 |
|
100 |
% |
18.3Accuracy Discussion
Because the operating costs are based on historical actual expenses, the cost estimates are at an accuracy of at least +/- 15%.
Capital costs are based on actual bids or recent purchases of capital items plus an inflation factor. The capital costs estimates are at an accuracy of at least +/- 25% and contingency levels are less than 25%.
Reclamation costs are based on the most recent reclamation bond update and asset retirement obligations and are estimated to be accurate to at least +/- 15%.
|
|
|
|
|
|
2023 Estimated Resources and Reserves at Intrepid Potash-New Mexico
Prepared for Intrepid Potash, Inc.
February 14, 2024 |
71 |
19.0Economic Analysis
To evaluate the viability of mining the IPNM mines’ reserves, an economic analysis was conducted. Annual revenue and production cost schedules were used to build a projected cash flow to accompany the mine plan. The costs and sales price parameters were assumed to be in constant US dollars.
19.1Key Assumptions, Parameters, and Methods
The property has a long history of operation at this location. The assumption list for the economic analysis is shown in Table 19-1.
Table 19-1. Economic Analysis Assumptions
|
|
|
|
|
|
|
|
| Parameter |
Assumption |
| Potash Sale Price (mine site) |
$360/t |
| Shipping Potash |
$30/t |
| Average Potash Production Target (25-yr avg.) |
161,120 tpy |
| Interest Rate |
0–12% APR |
| Income Taxes (State and Federal) |
26% |
|
|
19.2Economic Analysis
For a property in operation, the economic viability may be implied. The cash flow was developed using the mine plan and is listed in Table 19-2. The after-tax cash flow is listed in Table 19-3. The cashflows are shown graphically in Figures 19-1 and 19-2 for pre- and after-tax, respectively. Annual ore production, ore grade and tons of product produced used in both the pre-tax and after-tax cash flow analyses are taken from the annual life of mine production schedule as shown in Section 13: Mining Methods included in this Technical Report Summary. The annual life of mine production schedule provides the calculation of product tons resulting from tons of ore mined and the associated grade of ore mined. The East Mine has a remediation cost of $17.6 M not included in the HB Mine reserves cash flow.
19.3Sensitivity Analysis
NPV sensitivity analyses were run using variants in commodity price and operating costs for the pre-tax cash flow. The results of the sensitivity analysis are shown in Table 19-4 and graphically in Figure 19-3.
19.4Discussion
Economic analysis using the price and cost assumptions shows the operation is expected to continue to be profitable over the reserve life.
|
|
|
|
|
|
2023 Estimated Resources and Reserves at Intrepid Potash-New Mexico
Prepared for Intrepid Potash, Inc.
February 14, 2024 |
72 |
Table 19-2. Estimated Pre-Tax Cash Flow
|
|
|
|
|
|
|
|
|
|
|
|
|
|
|
|
|
|
|
Five-Year Periods |
| Item |
2024 - 2028 |
2029 - 2033 |
2034 - 2038 |
2039 - 2043 |
2044 - 2048 |
|
|
|
|
|
|
| Tons of product production |
784,000 |
878,000 |
828,000 |
773,000 |
765,000 |
|
|
|
|
|
|
| Potash Sales price per ton mine site |
$360 |
|
$360 |
|
$360 |
|
$360 |
|
$360 |
|
| Transportation cost per ton |
$30 |
|
$30 |
|
$30 |
|
$30 |
|
$30 |
|
| Net sales price per ton |
$330 |
|
$330 |
|
$330 |
|
$330 |
|
$330 |
|
|
|
|
|
|
|
| Period net revenue |
$258,720,000 |
|
$289,740,000 |
|
$273,240,000 |
|
$255,090,000 |
|
$252,450,000 |
|
|
|
|
|
|
|
| Cost per product ton, excluding depreciation |
$189 |
|
$169 |
|
$177 |
|
$187 |
|
$189 |
|
| Warehouse & Handling per product ton |
$13 |
|
$13 |
|
$13 |
|
$13 |
|
$13 |
|
| Royalties per product ton |
$17 |
|
$17 |
|
$17 |
|
$17 |
|
$17 |
|
| Environmental remediation and other non-inventory costs |
$10 |
|
$8 |
|
$8 |
|
$9 |
|
$9 |
|
| Less byproduct revenues |
($44) |
|
($39) |
|
($41) |
|
($45) |
|
($45) |
|
| Operating costs per production ton, excluding depreciation |
$184 |
|
$167 |
|
$174 |
|
$181 |
|
$183 |
|
|
|
|
|
|
|
| Less period operating costs, excluding depreciation |
($144,592,183) |
|
($146,577,277) |
|
($143,400,308) |
|
($139,905,642) |
|
($139,397,327) |
|
| Less period capital |
($78,000,000) |
|
($35,000,000) |
|
($35,000,000) |
|
($35,000,000) |
|
($35,000,000) |
|
| Less period remediation |
($6,721,500) |
|
- |
|
- |
|
- |
|
($44,220,211) |
|
| Estimated period pre-tax cashflow |
$29,406,317 |
|
$108,162,723 |
|
$94,839,692 |
|
$80,184,358 |
|
$33,832,462 |
|
|
|
|
|
|
|
2023 Estimated Resources and Reserves at Intrepid Potash-New Mexico
Prepared for Intrepid Potash, Inc.
February 14, 2024 |
73 |
Table 19-3. Estimated After-Tax Cash Flow
|
|
|
|
|
|
|
|
|
|
|
|
|
|
|
|
|
|
|
Five-Year Periods |
| Item |
2024 - 2028 |
2029 - 2033 |
2034 - 2038 |
2039 - 2043 |
2044 - 2048 |
|
|
|
|
|
|
| Tons of product production |
784,000 |
878,000 |
828,000 |
773,000 |
765,000 |
|
|
|
|
|
|
| Potash Sales price per ton mine site |
$360 |
|
$360 |
|
$360 |
|
$360 |
|
$360 |
|
| Transportation cost per ton |
$30 |
|
$30 |
|
$30 |
|
$30 |
|
$30 |
|
| Net sales price per ton |
$330 |
|
$330 |
|
$330 |
|
$330 |
|
$330 |
|
|
|
|
|
|
|
| Period net revenue |
$258,720,000 |
|
$289,740,000 |
|
$273,240,000 |
|
$255,090,000 |
|
$252,450,000 |
|
|
|
|
|
|
|
| Cost per product ton, excluding depreciation |
$189 |
|
$169 |
|
$177 |
|
$187 |
|
$189 |
|
| Warehouse & Handling per product ton |
$13 |
|
$13 |
|
$13 |
|
$13 |
|
$13 |
|
| Royalties per product ton |
$17 |
|
$17 |
|
$17 |
|
$17 |
|
$17 |
|
| Environmental remediation and other non-inventory costs |
$10 |
|
$8 |
|
$8 |
|
$9 |
|
$9 |
|
| Depreciation and Depletion |
$89 |
|
$82 |
|
$87 |
|
$93 |
|
$94 |
|
| Less byproduct revenues |
($44) |
|
($39) |
|
($41) |
|
($45) |
|
($45) |
|
| Total Operating Costs |
$274 |
|
$249 |
|
$261 |
|
$274 |
|
$276 |
|
|
|
|
|
|
|
| Total operating costs |
($214,651,097) |
|
($218,647,582) |
|
($215,470,613) |
|
($211,975,947) |
|
($211,467,632) |
|
|
|
|
|
|
|
| Estimated Pre-tax Income |
$44,068,903 |
|
$71,092,418 |
|
$57,769,387 |
|
$43,114,053 |
|
$40,982,368 |
|
|
|
|
|
|
|
| Estimated Taxes at 26% |
($11,457,915) |
|
($18,484,029) |
|
($15,020,041) |
|
($11,209,654) |
|
($10,655,416) |
|
| Estimated After Tax Income |
$32,610,988 |
|
$52,608,389 |
|
$42,749,346 |
|
$31,904,399 |
|
$30,326,952 |
|
|
|
|
|
|
|
| Add back Depreciation and Depletion |
$70,058,914 |
|
$72,070,305 |
|
$72,070,305 |
|
$72,070,305 |
|
$72,070,305 |
|
| Less Capital |
($78,000,000) |
|
($35,000,000) |
|
($35,000,000) |
|
($35,000,000) |
|
($35,000,000) |
|
| Less Remediation |
($6,721,500) |
|
- |
|
- |
|
- |
|
($44,220,211) |
|
| After-Tax Cash Flow |
$17,948,402 |
|
$89,678,694 |
|
$79,819,651 |
|
$68,974,704 |
|
$23,177,046 |
|
|
|
|
|
|
|
2023 Estimated Resources and Reserves at Intrepid Potash-New Mexico
Prepared for Intrepid Potash, Inc.
February 14, 2024 |
74 |
Figure 19-1. Estimated Pre-Tax Cash Flow
Figure 19-2. Estimated After-Tax Cash Flow
|
|
|
|
|
|
2023 Estimated Resources and Reserves at Intrepid Potash-New Mexico
Prepared for Intrepid Potash, Inc.
February 14, 2024 |
75 |
Table 19-4. NPV Pre-Tax Estimate
|
|
|
|
|
|
|
|
| Interest Rate |
NPV |
| (% APR) |
($M) |
| 0 |
$346 |
| 5 |
$195 |
| 8 |
$143 |
| 10 |
$119 |
| 12 |
$100 |
Table 19-5. NPV After-Tax Estimate
|
|
|
|
|
|
|
|
| Interest Rate |
NPV |
| (% APR) |
($M) |
| 0 |
$280 |
| 5 |
$156 |
| 8 |
$114 |
| 10 |
$94 |
| 12 |
$79 |
Figure 19-3. Pre-Tax NPV Sensitivities (APR 8%)
|
|
|
|
|
|
2023 Estimated Resources and Reserves at Intrepid Potash-New Mexico
Prepared for Intrepid Potash, Inc.
February 14, 2024 |
76 |
Figure 19-4. After-Tax NPV Sensitivities (APR 8%)
|
|
|
|
|
|
2023 Estimated Resources and Reserves at Intrepid Potash-New Mexico
Prepared for Intrepid Potash, Inc.
February 14, 2024 |
77 |
20.0Adjacent Properties
In preparing the report, the QP indicated that the Intrepid Potash operations and The Mosaic Company operations, although mining in the same geologic deposit, each has its own plants and infrastructure and are entirely independent of each other. It is the qualified person’s opinion that The Mosaic Company operations are not material in relation to Intrepid.
|
|
|
|
|
|
2023 Estimated Resources and Reserves at Intrepid Potash-New Mexico
Prepared for Intrepid Potash, Inc.
February 14, 2024 |
78 |
21.0Other Relevant Data and Information
The Mine Safety and Health Administration (MSHA) is the governing agency for IPNM’s underground mines and related surface facilities in New Mexico. As required, these operations are regularly inspected by MSHA personnel. The HB Plant is governed by the Occupational Safety and Health Administration (OSHA).
|
|
|
|
|
|
2023 Estimated Resources and Reserves at Intrepid Potash-New Mexico
Prepared for Intrepid Potash, Inc.
February 14, 2024 |
79 |
22.0Interpretation and Conclusions
RESPEC’s QP review and resource and reserve estimations were performed to obtain a reasonable assurance of the estimates from the data provided by Intrepid and IPNM. The QP believes the findings are reasonable and realistic and have been developed using accepted engineering practices.
As with all geologic estimations, there is a level of risk and uncertainty because of sparse data. These estimates are considered reliable based on the historical success of mining operations recovering langbeinite and potash from this deposit. There is more uncertainty in future mining of the ore zones that have not been historically mined.
|
|
|
|
|
|
2023 Estimated Resources and Reserves at Intrepid Potash-New Mexico
Prepared for Intrepid Potash, Inc.
February 14, 2024 |
80 |
23.0Recommendations
The QP recommends that IPNM continue planning for the challenges in solution mining with the presence of low levels of carnallite and plan for the expansion pipeline to the AMAX mine. The property is in operation, and no additional work is recommended.
|
|
|
|
|
|
2023 Estimated Resources and Reserves at Intrepid Potash-New Mexico
Prepared for Intrepid Potash, Inc.
February 14, 2024 |
81 |
24.0References
Agapito (2007), “Determination of Estimated Proven and Probable Reserves at Intrepid Potash—New Mexico, LLC,” report prepared for Intrepid Potash, December 12, 19 pp.
Agapito (2008), “Determination of Estimated Proven and Probable Reserves for the Planned HB Solution Mine for Intrepid Mining, LLC,” report prepared for Intrepid Potash, March 14, 25 pp.
Agapito (2009), “Reserve Update for the Carlsbad HB, East and West Mines for Intrepid Potash, Inc.,” report prepared for Intrepid Potash, Inc., February 27, 29 pp.
Agapito (2010), “Determination of Estimated Proven and Probable Reserves at Intrepid Potash—New Mexico, LLC,” report prepared for Intrepid Potash, Inc., February 4, 34 pp.
Agapito (2011), “Determination of Estimated Proven and Probable Reserves at Intrepid Potash—New Mexico, LLC,” report prepared for Intrepid Potash, Inc., February 1, 34 pp.
Agapito (2012), “Determination of Estimated Proven and Probable Reserves at Intrepid Potash—New Mexico, LLC,” report prepared for Intrepid Potash, Inc., January 27, 32 pp.
Agapito (2013), “Determination of Estimated Proven and Probable Reserves at Intrepid Potash—New Mexico, LLC,” report prepared for Intrepid Potash, Inc., February 11, 38 pp.
Agapito (2014), “Determination of Estimated Proven and Probable Reserves at Intrepid Potash—New Mexico, LLC,” report prepared for Intrepid Potash, Inc., January 28, 42 pp.
Agapito (2015), “Determination of Estimated Proven and Probable Reserves at Intrepid Potash—New Mexico, LLC,” report prepared for Intrepid Potash, Inc., January 22, 43 pp.
Agapito (2016), “End-of-Year 2015 Intrepid Potash, Inc. Reserve for the Carlsbad HB Solar Solution, East and West Mines Intrepid Potash—New Mexico, LLC,” report prepared for Intrepid Potash, Inc., January 25, 35 pp.
Agapito (2017), “End-of-Year 2016 Intrepid Potash, Inc. Reserve for the Carlsbad HB Solar Solution, East and West Mines Intrepid Potash—New Mexico, LLC,” report prepared for Intrepid Potash, Inc., February 1, 44 pp.
Agapito (2018), “End-of-Year 2017 Intrepid Potash, Inc. Reserve for the Carlsbad HB Solar Solution, East and West Mines,” report prepared for Intrepid Potash, Inc., January 21, 43 pp.
Agapito (2019), “2018 Determination of Estimated Proven and Probable Reserves for the Carlsbad HB Solar Solution, East and West Mines,” report prepared for Intrepid Potash Inc., February 14, 36 pp,
|
|
|
|
|
|
2023 Estimated Resources and Reserves at Intrepid Potash-New Mexico
Prepared for Intrepid Potash, Inc.
February 14, 2024 |
82 |
Agapito (2020), “2019 Determination of Estimated Proven and Probable Reserves for the Carlsbad HB Solar Solution, East and West Mines,” report prepared for Intrepid Potash Inc., January 24, 2020, 67 pp.
Agapito (2021), “Determination of Estimated Proven and Probable Reserves for the Carlsbad HB Solar Solution, East and West Mines,” report prepared for Intrepid Potash Inc., January 24, 2021, 67 pp.
Agapito (2022), “2021 Estimated Resources and Reserves at Intrepid Potash-New Mexico” prepared for Intrepid Potash, February 18, https://www.sec.gov/Archives/edgar/data/1421461/000142146122000011/ipi12312021exhibit961a.htm
Backman, G. O. (1984), “Regional Geology of Ochoan Evaporites, Northern Part of Delaware Basin,” Circular 184, Socorro, NM: New Mexico Bureau of Mines and Mineral Resources, 25 pp.
Barker, J. M. and G. S. Austin (1993), “Economic Geology of the Carlsbad Potash District, New Mexico,” Guidebook 44th Field Conference, Carlsbad Region, New Mexico and West Texas, New Mexico Geological Society, pp. 283–291.
Barker, J and G. Austin (1999), “Overview of the Carlsbad potash district, New Mexico,” New Mexico Bureau of Mines & Mineral Resources, Circular 207, pp. 7–16.
Bruhn, H. H. and E. H. Miller (1954), “Potash Mining Methods,” Mining Engineering, June, pp. 608–612.
Carlson Software (2020), “Carlson Geology,” available at <https://www.carlsonsw.com/product/ carlson-geology>.
Cheeseman, R. J. (1978), "Geology and Oil/Potash Resources of Delaware Basin, Eddy and Lea Counties, New Mexico," Circular 159, Socorro, NM: New Mexico Bureau of Mines and Mineral Resources (NMBMMR), pp. 7–14.
CFR (2021), “Disclosure by Registrants Engaged in Mining Operations,” § 229.1301, last amended September 1, available at <eCFR :: 17 CFR Part 229 Subpart 229.1300 -- Disclosure by Registrants Engaged in Mining Operations>.
Federal Register (2012), “Oil, Gas, and Potash Leasing and Development Within the Designated Potash Area of Eddy and Lea Counties, NM,” available at <https://www.federalregister. gov/documents/2012/12/04/2012-29393/oil-gas-and-potash-leasing-and-development- within-the-designated-potash-area-of-eddy-and-lea>, 77 FR 71814, December 4, 5 pp.
Federal Register (1986), “Appendix A, Guidance for Managing the Secretary’s Potash Area,” available at <https://www.nm.blm.gov/cfo/HBIS/docs/o_Appendix_A.pdf>, 51 FR 39425, October 28, 48 pp.
|
|
|
|
|
|
2023 Estimated Resources and Reserves at Intrepid Potash-New Mexico
Prepared for Intrepid Potash, Inc.
February 14, 2024 |
83 |
Griswold, G. G. (1982), “Geologic Overview of the Carlsbad Potash-Mining District,” Circular 182, Socorro, NM: New Mexico Bureau of Mines and Mineral Resources, pp. 17–22.
Gunn, R. C. M. and J. M. Hills (1978), “Geology of the Tenth Potash Ore Zone: Permian Salado Formation, Carlsbad District, New Mexico,” Open File Report 146, Socorro, NM: New Mexico Bureau of Mines and Mineral Resources (NMBMMR), 43 pp.
Haworth, R. G. (1949), “Mining Potash Ores in Carlsbad Area,” American Institute of Mining and Metallurgical Engineers, Mining Transactions, 184:381–382.
Herne, V. and T. McGuire (2001), “Mississippi Potash, Inc.’s Underground Operations,” Underground Mining Methods, (Hustrulid, W. A. and R. L. Bullock, eds.), Littleton, CO: SME, pp. 137–141.
Jones, C. L., C. G. Bowles and A. E. Disbrow (2001), “Generalized Columnar Section and Radioactivity Log, Carlsbad District,” Open File Map, USGS, 1 sheet.
Kirby, R. E. (1974), “Mine Modernization at AMAX’s Carlsbad Property,” Preprint 74-AU-302, Salt Lake City: Society of Mining Engineers of AIME, 22 pp.
Kroenlein, G. A., (1939), "Salt, Potash and Anhydrite in Castile Formation of Southeast New Mexico," Bull. American Association of Petroleum Geologists, 25(11):1682–1693.
Lewis, J. P. (2006), “Evaluation of Potash Content in the Conoco Phillips Peakview II Well,” Eddy County, New Mexico: Intrepid Mining LLC, Denver, Colorado, 10 pp.
Lewis, J. P. (2007), “Carlsbad Xsec.jpg,” retrieved from FTP Site, accessed November 15.
Linn and Adams (1966),"Barren Halite Zones in Potash Deposits Carlsbad, New Mexico," Second Symposium on Salt, Cleveland, OH: Northern Ohio Geological Society, Inc., pp. 59–69.
Lowenstein, T. K. (1988), "Origin of Depositional Cycles in a Permian 'Saline Giant': The Salado (McNutt Zone) Evaporites of New Mexico and Texas," 100:592–608.
Nelson, Philip H. (2007), “Evaluation of Potash Grade with Gamma-ray Logs,” USGS OFR 2007-1292, 14 pp.
Pierce, C. A. (1936), “Drilling and Blasting Practice of the United States Potash Company at Carlsbad, New Mexico,” Technical Publication No. 672, New York: American Institute of Mining and Metallurgical Engineers, Inc., 10 pp.
RESPEC (2023) “Technical Report Summary, REVISED 2021 Estimated Resources and Reserves at Intrepid Potash-New Mexico” prepared for Intrepid Potash, November 27, 111 pp.
Schaller, W. T. and E. P. Henderson (1932), “Mineralogy of Drill Cores from the Potash Field of New Mexico and Texas,” Geological Survey Bull. 833, Washington, DC: US Government Printing Office, 124 pp.
|
|
|
|
|
|
2023 Estimated Resources and Reserves at Intrepid Potash-New Mexico
Prepared for Intrepid Potash, Inc.
February 14, 2024 |
84 |
SEC (2008), “Industry Guides,” OMB Number 3235-0069, 33 pp.
SEC (2018), 17 CFR parts 229, 230, 239, and 249; Release Nos. 33-10570, 34-84509; File No. S7-10-16; RIN 3235-AL81; Modernization of Property Disclosures for Mining Registrants, October 31, 453 pp.
Simmons, P. (2013), "The Carlsbad Potash Basin, Carlsbad, New Mexico," The Mineralogical Record, 44:13–49.
SME (2017), “A Guide for Reporting Exploration Information, Minerals Resources, and Mineral Reserves,” July 17, 97 pp.
State of New Mexico Energy, Mineral, and Natural Resources (1988), New Mexico Oil and Gas Division Case No. 9316, Order No. R-111-P.
Swales, J. M. (1966)” Shaft Sinking and Underground Development at the Kermac Potash Mine,” Mining Engineering, December, pp. 69–72.
US Climate Data (2020), https://www.usclimatedata.com/climate/carlsbad/new-mexico/united-states/usnm0046 (accessed December 11, 2019).
United States Department of Interior (2012), “HB In-Situ Solution Mine Project Final Environmental Impact Statement,” DOI-BLM-NM-P020-2011-498-EIS.
Vine, J. D. (1963), “Surface Geology of the Nash Draw Quadrangle Eddy County New Mexico,” Geological Survey Bulletin 1141-B, Washington, DC; US Government Printing Office, 46 pp.
Warren, J. (2018), “Polyhalite: Geology of an Alternate Low-Chloride Potash Fertilizer,” Salty Matters, July 31, https://www.saltworkconsultants.com/downloads/39%20 Poly halite.pdf (accessed October 2, 2019).
|
|
|
|
|
|
2023 Estimated Resources and Reserves at Intrepid Potash-New Mexico
Prepared for Intrepid Potash, Inc.
February 14, 2024 |
85 |
25.0Reliance on Information
The QP relied on lease holdings and permitting status provided by Intrepid and IPNM for this reserve evaluation.
EX-96.2
11
exhibit962eoy2023technical.htm
EX-96.2
Document
Technical Report Summary
of the
2023 Estimated Resources and Reserves at Intrepid Potash-Moab
Prepared for:
Intrepid Potash–Moab, LLC
Revised Report Date:
February 14, 2024
Effective Date:
December 31, 2023
Prepared by:
660 Rood Avenue, Suite A
Grand Junction, Colorado 81501
|
|
|
|
|
|
2023 Estimated Resources and Reserves at Intrepid Potash-Moab
Prepared for Intrepid Potash, Inc.
February 14, 2024 |
i |
Date and Signature Page
This report titled “Technical Report Summary of the 2023 Estimated Resources and Reserves at Intrepid Potash-Moab” is effective as of December 31, 2023, and was prepared and signed by RESPEC Company, LLC, acting as a Qualified Person Firm.
Signed and Dated February 14, 2024.
signed RESPEC Company, LLC
Susan B Patton, PE
On behalf of RESPEC Company, LLC
|
|
|
|
|
|
2023 Estimated Resources and Reserves at Intrepid Potash-Moab
Prepared for Intrepid Potash, Inc.
February 14, 2024 |
ii |
Technical Report Summary
of the
2023 Estimated Resources and Reserves at Intrepid Potash-Moab
Table of Contents
|
|
|
|
|
|
2023 Estimated Resources and Reserves at Intrepid Potash-Moab
Prepared for Intrepid Potash, Inc.
February 14, 2024 |
iii |
|
|
|
|
|
|
2023 Estimated Resources and Reserves at Intrepid Potash-Moab
Prepared for Intrepid Potash, Inc.
February 14, 2024 |
iv |
|
|
|
|
|
|
|
|
|
|
|
|
|
|
|
|
|
|
|
|
|
|
|
|
|
|
|
|
|
|
|
|
|
|
|
|
|
|
|
|
|
|
|
|
|
|
|
|
|
|
|
|
|
|
|
|
|
|
|
|
|
|
|
|
|
|
|
|
|
|
|
|
|
|
|
|
|
|
|
|
|
|
|
|
|
|
|
|
|
|
|
|
|
|
|
|
|
|
|
|
|
|
|
| 17.5 |
Adequacy of Current Plans and Compliance |
|
|
|
|
|
|
|
|
|
|
|
|
|
|
|
|
|
|
|
|
|
|
|
|
|
|
|
|
|
|
|
|
|
|
|
|
|
|
|
|
|
|
|
|
|
|
|
|
|
|
|
|
|
|
|
|
|
|
|
|
|
|
|
|
|
|
|
|
|
|
|
|
|
|
|
|
|
|
|
|
|
|
|
|
|
|
|
|
|
|
|
|
|
|
|
|
|
|
|
|
|
|
|
|
|
|
|
|
|
|
|
|
|
|
|
|
|
|
|
|
|
|
|
|
|
|
|
2023 Estimated Resources and Reserves at Intrepid Potash-Moab
Prepared for Intrepid Potash, Inc.
February 14, 2024 |
v |
List of Tables
|
|
|
|
|
|
2023 Estimated Resources and Reserves at Intrepid Potash-Moab
Prepared for Intrepid Potash, Inc.
February 14, 2024 |
vi |
List of Figures
|
|
|
|
|
|
2023 Estimated Resources and Reserves at Intrepid Potash-Moab
Prepared for Intrepid Potash, Inc.
February 14, 2024 |
vii |
List of Abbreviations
|
|
|
|
|
|
| ° |
degree |
| % |
percent |
| APR |
Annual Percentage Rate |
| BLM |
United States Bureau of Land Management |
| CFR |
Code of Federal Regulations |
| cfs |
cubic feet per second |
| CMC |
carboxy-methyl cellulose |
| DRGW |
Denver and Rio Grande Western Railroad |
| DSM |
Dutch State Mines |
| EOY |
end of year |
| F |
Fahrenheit |
| ft |
feet or foot |
| gpm |
gallons per minute |
| Intrepid |
Intrepid Potash, Inc. |
| Intrepid-Moab |
Intrepid Potash–Moab, LLC |
| IRR |
Internal Rate of Return |
K2O |
potassium oxide |
| KCl |
sylvite or potassium chloride |
| M |
million |
| Ma |
mega annum (one-million years) |
| mm |
millimeter |
| MOP |
Muriate of Potash |
| MSL |
mean sea level |
| mm |
millimeter |
| Mt |
million tons |
| NaCl |
sodium chloride |
| NPV |
Net Present Value |
| NaCl |
halite |
| % |
percent |
| PFD |
process flow diagrams |
| QP |
Qualified Person |
| RESPEC |
RESPEC Company, LLC |
| SEC |
United States Securities Exchange Commission |
| SITLA |
Utah School and Institutional Lands Administration |
| SME |
Society for Mining, Metallurgy & Exploration |
|
|
|
|
|
|
2023 Estimated Resources and Reserves at Intrepid Potash-Moab
Prepared for Intrepid Potash, Inc.
February 14, 2024 |
viii |
|
|
|
|
|
|
| SOE |
statement of earnings |
| t |
ton |
| tpd |
tons per day |
| tpy |
tons per year |
| TRS |
Technical Report Summary |
|
|
|
|
|
|
2023 Estimated Resources and Reserves at Intrepid Potash-Moab
Prepared for Intrepid Potash, Inc.
February 14, 2024 |
1 |
1.0Executive Summary
RESPEC Company, LLC (RESPEC) was commissioned by Intrepid Potash, Inc. (Intrepid) to prepare the 2023 Technical Report Summary (TRS) for the Intrepid Potash–Moab, LLC (Intrepid-Moab) property. Previous TRS’s for the property are listed in Table 2-1. Resources and reserves are estimated according to United States (US) Securities and Exchange Commission (SEC) S-K 1300 regulations.
1.1Property Description and Ownership
Intrepid-Moab’s Cane Creek Mine is located approximately 20 miles west of Moab, Utah, which is 234 miles southeast of Salt Lake City, Utah. The Colorado River runs north–south along the eastern operations boundary. Intrepid-Moab’s property covers an area of approximately 14,100 acres of land. Intrepid-Moab’s potash leases include 10,100 acres from the State of Utah and approximately 200 acres from the US federal government through the U.S. Bureau of Land Management (BLM).
1.2Geology and Mineralization
The depositional history of eastern Utah’s vast salt and potash resources begins during the regionally arid Pennsylvanian Period, 330–310 million years ago. An immense block of the Earth’s crust, in what is today western Colorado, was thrust upward to form the Uncompahgre Highlands and identified as the westernmost expression of the Ancestral Rocky Mountains. As is common throughout geologic history, dramatic uplift was coupled with subsidence in an adjoining area. The subsequent topographical basin was inundated by seawater as it subsided. Throughout the Pennsylvanian Period, sea levels rose and fell. With each retreat of the sea, the Paradox Basin, as it is called, became devoid of fresh sea water, allowing the process of evaporation to dominate which resulted in widespread precipitation of chloride minerals. This retreat/inflow cycle is known to have occurred a minimum of 29 times, with each marked by a specific and predictable sequence of sedimentary deposition. This series of depositional cycles is collectively known as the Paradox Formation. Potash is documented to exist in 17 of the 29 cycles, and it is from these formational cycles that commercial production of potash occurs.
1.3Status of Exploration, Development and Operations
The property has been in continuous operation by Intrepid-Moab since 1999. Confirmation drilling and mine development are an integral part of the mine operations.
1.4Mineral Resource Estimates
The resource model created from the exploration and sampling database served as the basis for the mineral resource estimate. The resources reported as mineralized rock in place, exclusive of mineral reserves effective December 31, 2023, are shown in Table 1-1.
|
|
|
|
|
|
2023 Estimated Resources and Reserves at Intrepid Potash-Moab
Prepared for Intrepid Potash, Inc.
February 14, 2024 |
2 |
Table 1-1. Sylvinite In Situ Mineral Resource Estimate effective December 31, 2023
|
|
|
|
|
|
|
|
|
|
|
|
|
|
|
|
|
|
| Moab - Sylvinite Mineral Resource Estimate effective December 31, 2023 based on $450/Product Ton Mine Site |
|
Resources |
|
|
| Beds 5 & 9 |
Sylvinite1 |
Grade |
Contained K2O |
Cutoff2 |
Processing Recovery |
|
(Mt) |
(%K2O) |
(Mt) |
|
(%) |
| Measured Mineral Resources |
97 |
26 |
25 |
Minimum of 3-ft and 18.95% K2O |
83 |
| Indicated Mineral Resources |
190 |
25 |
47 |
Minimum of 3-ft and 18.95% K2O |
83 |
| Measured + Indicated Mineral Resources |
287 |
25 |
72 |
|
|
| Inferred Mineral Resources |
38 |
23 |
9 |
Minimum of 3-ft and 18.95% K2O |
83 |
1Sylvinite is a mixed evaporite containing NaCl and KCl. Pure KCl equates to 63.17% K2O by mass. |
2Solution mining resource cutoff for flooded old working is the mining extents boundary. |
| Mineral Resources were prepared by RESPEC, a qualified firm for the estimate and independent of Intrepid Potash, for EOY 2023. |
| Mineral Resources are reported exclusive of Mineral Reserves, on a 100% basis. |
Mt = million tons, % = percentage, K2O = potassium oxide, ft = feet |
1.5Mineral Reserve Estimates
Using the mineral resource grids and applying modifying factors to a 25-year cavern mining plan EOY 2023 reserves were estimated. Table 1-2 shows the estimated reserve summaries for EOY 2023.
|
|
|
|
|
|
2023 Estimated Resources and Reserves at Intrepid Potash-Moab
Prepared for Intrepid Potash, Inc.
February 14, 2024 |
3 |
Table 1-2. Potash Mineral Reserve Estimate effective December 31, 2023
|
|
|
|
|
|
|
|
|
|
|
|
|
|
|
|
|
|
| Moab - Potash Mineral Reserve Estimate effective December 31, 2023, based on $360/Product Ton Mine Site |
|
Reserves |
|
|
| Beds 5 and 9 |
In-Place KCl |
In-Situ Grade1 |
Product2 |
Brine Cutoff Grade3 |
Processing Recovery |
|
(Mt) |
(%K2O) |
(Mt) |
(%K2O) |
(%) |
| Proven Mineral Reserves |
3.1 |
28.3 |
2.3 |
2.5 |
83 |
| Probable Mineral Reserves |
0.4 |
28.9 |
0.3 |
2.5 |
83 |
| Total Mineral Reserves |
3.5 |
28.4 |
2.6 |
|
|
1In-situ grade is the amount of K2O in the remaining pillars of the old works and is used to calculate the In-Place KCl. |
2Product tons are calculated by multiplying In-Place KCl by: dissolution factor of 89%, areal recovery of 100%, geologic factor of 94%, plant recovery of 86%, handling loss factor of 97.5%, and product purity of 104% (1/0.96). |
3Brine cutoff grade is the amount of K2O in the extracted brine necessary to cover the cash costs of production. |
| Mineral Reserves were prepared by RESPEC, a qualified firm for the estimate and independent of Intrepid Potash, for EOY 2023. |
| Mineral Reserves are reported exclusive of Mineral Resources, on a 100% basis. |
Mt = million tons, % = percentage, K2O = potassium oxide |
1.6Summary of Capital and Operating Cost Estimates
The operating cost per potash product ton from solution mining is estimated at $198/t for the next 5 years with a credit for the byproducts of $26/ton of potash. The estimated potash operating cost is $172/ton for the 25-Year Mine Plan.
Capital investment necessary to complete the mine plan includes $3M for well rehabilitation, the development of additional caverns at a cost of $10M. This investment is in addition to the ongoing sustaining capital requirements and occurs approximately every 10 years. Reclamation costs in Year 25 are estimated to be $9.6M.
1.7Economic Analysis
The Net Present Value (NPV) at 8% Annual Percentage Rate (APR) for the before- and after-tax estimated cash flow is positive. The sensitivity to product price and operating cost for an 8% APR was evaluated. Varying costs and sales price plus and minus 10% the NPV remains positive.
1.8Permitting
The mines are in operation and necessary state and federal operating permits are in place.
1.9Conclusions and Recommendations
There are significant potash resources within the area under the control of Intrepid-Moab such that the property can support an average 102,800 ton per year (tpy) production rate for the foreseeable future.
|
|
|
|
|
|
2023 Estimated Resources and Reserves at Intrepid Potash-Moab
Prepared for Intrepid Potash, Inc.
February 14, 2024 |
4 |
2.0Introduction
2.1Purpose and Basis of Report
This document was prepared to report the Intrepid-Moab mineral resources in terms of in-situ tons and reserves in terms of saleable product at Intrepid-Moab under the SEC S-K 1300 rules (2018). The Society for Mining, Metallurgy & Exploration (SME) Guide for Reporting Exploration Information, Mineral Resources and Mineral Reserves (SME 2017) (The SME Guide) supplements the modifying factors used to convert mineral resources to mineral reserves. Previous TRS’s filed for the property are listed in Table 2-1.
2.2Terms of Reference
According to 17 Code of Federal Regulations (CFR) § 229.1301 (2021), the following definitions are included for reference:
An inferred mineral resource is that part of a mineral resource for which quantity and grade or quality are estimated on the basis of limited geological evidence and sampling. An inferred mineral resource has the lowest level of geological confidence of all mineral resources, which prevents the application of the modifying factors in a manner useful for evaluation of economic viability. An inferred mineral resource, therefore, may not be converted to a mineral reserve.
An indicated mineral resource is that part of a mineral resource for which quantity and grade or quality are estimated on the basis of adequate geological evidence and sampling. An indicated mineral resource has a lower level of confidence than the level of confidence of a measured mineral resource and may only be converted to a probable mineral reserve. As used in this subpart, the term adequate geological evidence means evidence that is sufficient to establish geological and grade or quality continuity with reasonable certainty.
A measured mineral resource is that part of a mineral resource for which quantity and grade or quality are estimated on the basis of conclusive geological evidence and sampling. As used in this subpart, the term conclusive geological evidence means evidence that is sufficient to test and confirm geological and grade or quality continuity.
Modifying factors are the factors that a qualified person must apply to indicated and measured mineral resources and then evaluate in order to establish the economic viability of mineral reserves. A qualified person must apply and evaluate modifying factors to convert measured and indicated mineral resources to proven and probable mineral reserves. These factors include but are not restricted to mining; processing; metallurgical; infrastructure; economic; marketing; legal; environmental compliance; plans, negotiations, or agreements with local individuals or groups; and governmental factors.
|
|
|
|
|
|
2023 Estimated Resources and Reserves at Intrepid Potash-Moab
Prepared for Intrepid Potash, Inc.
February 14, 2024 |
5 |
A probable mineral reserve is the economically mineable part of an indicated and, in some cases, a measured mineral resource.
A proven mineral reserve is the economically mineable part of a measured mineral resource. For a proven mineral reserve, the qualified person has a high degree of confidence in the results obtained from the application of the modifying factors and in the estimates of tonnage and grade or quality. A proven mineral reserve can only result from conversion of a measured mineral resource.
Throughout the report, reserves are presented in tons of K2O and KCl. Historically, assay data have been reported in terms of % K2O and reserves in equivalent tons of K2O. Sylvite is potassium chloride (KCl) and, in many historical reports, reserve tons or product tons are recorded in terms of tons of KCl. Pure KCl equates to 63.17% K2O by mass.
2.3Sources of Information
Previously completed reserve estimations under SEC Guide 7 (2008) rules for this property and TRS’s reporting mineral resources and mineral reserves under the SEC S-K 1300 rules are listed in Table 2-1.
|
|
|
|
|
|
2023 Estimated Resources and Reserves at Intrepid Potash-Moab
Prepared for Intrepid Potash, Inc.
February 14, 2024 |
6 |
Table 2-1. Summary of Reports
|
|
|
|
|
|
|
|
|
|
|
|
| Effective EOY |
Title |
Reference |
| 2007 |
2007 Resource and Reserve Estimate for Solution Mine at Cane Creek Mine |
Agapito 2007a |
| 2007 |
Determination of Estimated Proven and Probable Reserves at Intrepid Potash—Moab, LLC |
Agapito 2007b |
| 2009 |
Determination of Estimated Proven and Probable Potash Reserves at Intrepid Potash—Moab, LLC |
Agapito 2010 |
| 2012 |
Determination of Estimated Proven and Probable Potash Reserves at Intrepid Potash—Moab, LLC |
Agapito 2013 |
| 2015 |
Determination of Estimated Proven and Probable Potash Reserves at Intrepid Potash—Moab, LLC |
Agapito 2016 |
| 2018 |
2018 Determination of Estimated Proven and Probable Reserves at Intrepid Potash—Moab, LLC |
Agapito 2019 |
| 2021 |
Technical Report Summary, 2021 Estimated Resources and Reserves at Intrepid Potash-Moab |
Agapito 2022 |
| 2021 |
Technical Report Summary, REVISED 2021 Estimated Resources and Reserves for Intrepid Potash–Moab |
RESPEC 2023 |
2.4Personal Inspection
Personal inspection of the properties has occurred over the years by the QP. The most recent inspection by the QP took place on May 17, 2021. The inspection began with a tour of the tailings lake then the solar evaporating ponds. In addition, the wellfields (injection and extraction), processing plant, product packaging and shipping areas were all inspected. During the site visit, harvesting was occurring, and the plant was operating. The plant is typically idle during the peak evaporation season from June 1 to September 1.
|
|
|
|
|
|
2023 Estimated Resources and Reserves at Intrepid Potash-Moab
Prepared for Intrepid Potash, Inc.
February 14, 2024 |
7 |
3.0Property Description
3.1Location and Area of the Property
Intrepid-Moab’s Cane Creek Mine is located approximately 20 miles west of Moab, Utah, which is 234 miles southeast of Salt Lake City, Utah (Figure 3-1). The Colorado River runs north–south along the eastern operations boundary. Intrepid-Moab’s property covers an area of approximately 14,100 acres of land.
3.2Mineral Rights
Intrepid leases approximately 10,100 acres from the State of Utah and approximately 200 acres from the U.S. federal government through the BLM. Intrepid-Moab owns approximately 3,800 surface acres overlying and adjacent to portions of the mining leases with the State of Utah as shown in Figure 3-2 and as described in the lease and property access in Table 3-1.
3.3Significant Encumbrances
There are no significant encumbrances to the property, including current and future permitting requirements and associated timelines, permit conditions, and violations and fines.
3.4Significant Factors
There are no significant factors and risks that may affect access, title, or the right or ability to perform work on the property.
|
|
|
|
|
|
2023 Estimated Resources and Reserves at Intrepid Potash-Moab
Prepared for Intrepid Potash, Inc.
February 14, 2024 |
8 |
Figure 3-1. Intrepid-Moab Location Map
|
|
|
|
|
|
2023 Estimated Resources and Reserves at Intrepid Potash-Moab
Prepared for Intrepid Potash, Inc.
February 14, 2024 |
9 |
Figure 3-2. Intrepid-Moab Lease Map
|
|
|
|
|
|
2023 Estimated Resources and Reserves at Intrepid Potash-Moab
Prepared for Intrepid Potash, Inc.
February 14, 2024 |
10 |
Table 3-1. Leases and Property Rights
|
|
|
|
|
|
|
|
|
|
|
|
|
|
|
|
|
|
|
|
|
|
|
|
|
|
|
|
|
|
|
|
|
|
|
|
| Federal Land Lease Number |
Lessee |
Lease Type |
Mine |
Date |
Royalty Rate |
Readjustment Due |
Acres
(BLM)
|
Amount
Paid
|
|
|
|
|
|
|
|
|
|
UTU0143659 |
Intrepid Potash-Moab, LLC |
Pot Fringe Acre NC Lse |
Moab |
1959 |
Minimum royalty $3/acre |
8/1/2039 |
200 |
|
| State of Utah Land Lease Number |
Lessee |
Lease Type |
Mine |
Date |
End Date |
Rental Period |
Acres
(SITLA)
|
Rental
Amount
|
|
|
|
|
|
|
|
|
|
ML9638 |
Intrepid Potash-Moab, LLC |
Potash |
Moab |
1955 |
12/31/2024 |
1/1/2024–12/31/2024 |
440 |
$1,760 |
|
ML11800 |
Intrepid Potash-Moab, LLC |
Potash |
Moab |
1956 |
12/31/2024 |
1/1/2024–12/31/2024 |
699 |
$2,796 |
|
ML52611OBA |
Intrepid Potash-Moab, LLC |
Potash |
Moab |
2013 |
9/30/2023 |
9/3/2023–9/02/2024 |
3,030 |
$35,310 |
|
UO486ST |
Intrepid Potash-Moab, LLC |
Potash |
Moab |
1959 |
12/31/2024 |
1/1/2024–12/31/2024 |
818 |
$3,276 |
|
UO10797ST |
Intrepid Potash-Moab, LLC |
Potash |
Moab |
1959 |
12/31/2024 |
1/1/2024–12/31/2024 |
2,040 |
$8,160 |
|
UO13167ST |
Intrepid Potash-Moab, LLC |
Potash |
Moab |
1960 |
12/31/2024 |
1/1/2024–12/31/2024 |
1,800 |
$7,200 |
|
UO13223ST |
Intrepid Potash-Moab, LLC |
Potash |
Moab |
1960 |
12/31/2024 |
1/1/2024–12/31/2024 |
238 |
$956 |
|
UO16133ST |
Intrepid Potash-Moab, LLC |
Potash |
Moab |
1960 |
12/31/2024 |
1/1/2024–12/31/2024 |
885 |
$3,540 |
|
UO18249ST |
Intrepid Potash-Moab, LLC |
Potash |
Moab |
1960 |
12/31/2024 |
1/1/2024–12/31/2024 |
180 |
$724 |
|
| SITLA = Utah School and Institutional Lands Trust Administration |
| NOTE—Coordinate System: Utah South Zone State Plane, NAD83 |
|
|
|
|
|
|
|
|
|
|
|
|
|
|
|
2023 Estimated Resources and Reserves at Intrepid Potash-Moab
Prepared for Intrepid Potash, Inc.
February 14, 2024 |
11 |
4.0Accessibility
4.1Topography, Elevation, and Vegetation
The Intrepid-Moab property is a unique high-altitude desert landscape formed from the sandstone of ancient seafloors and sand dunes. Elevations range from 3,900 feet (ft) to 4,400 ft above mean sea level (MSL).
The sandy loam soil supports sparse perennial bunchgrasses such as galleta, alkali sacaton, three-awn, inland saltgrass, Indian ricegrass, and sand dropseed. Native plants include cold hardy agave, cactus, and yucca.
4.2Property Access
Access to the property is predominantly via state highway 191 and state road 279, locally referred to as Potash Road. A Union Pacific/Denver and Rio Grande Western Railroad (DRGW) rail spur services the property. The nearest town to the Intrepid Potash-Moab property is Moab, Utah (with an estimated population of about 5,300). Salt Lake City, Utah (population of 200,500) and Grand Junction, Colorado (population of 67,000), are located approximately 240 and 120 miles to the west and east, respectively, by road, and are the nearest major industrial and commercial airline terminals. Moab also has a commercial airline terminal with scheduled flights to Salt Lake City. Figure 4-1 shows the means of access to the property.
4.3Climate
Average temperatures range between a low of approximately 10 degrees Fahrenheit (°F) during winter months and a high of approximately 100°F during summer months. The area experiences about 300 days of sunshine and an average of 5 percent (%) relative humidity. The semi-arid climate experiences an annual rainfall at the mine site of about 7.3 inches, distributed evenly throughout the year. Most precipitation occurs in late summer and early autumn months. Much of this precipitation comes in the form of sudden summer thunderstorms and is lost in runoff to the Colorado River. The climate is favorable for year-round solution mining operations. The precipitation history has been recorded on site since 1988 and is included in Figure 4-2.
4.4Infrastructure Availability
The nearby Colorado River provides the Intrepid-Moab mining operation with make-up water under existing water rights with the State of Utah for a water supply of 9 cubic feet per second (cfs).
The Intrepid-Moab mine has been in operation (solution mining) since 1970 and, as a result, has the infrastructure and available personnel. The local area population is sufficient to support the Intrepid-Moab mine.
|
|
|
|
|
|
2023 Estimated Resources and Reserves at Intrepid Potash-Moab
Prepared for Intrepid Potash, Inc.
February 14, 2024 |
12 |
Figure 4-1. Property Access
|
|
|
|
|
|
2023 Estimated Resources and Reserves at Intrepid Potash-Moab
Prepared for Intrepid Potash, Inc.
February 14, 2024 |
13 |
Figure 4-2. Site Precipitation Record
|
|
|
|
|
|
2023 Estimated Resources and Reserves at Intrepid Potash-Moab
Prepared for Intrepid Potash, Inc.
February 14, 2024 |
14 |
5.0History
Conventional underground mining began in Bed 5 in 1964 by Texasgulf, Inc. (Texasgulf), but various mining problems caused a conversion to a system combining solution mining and solar evaporation in 1971. Prior to 1970, approximately 6.5 million tons (Mt) of sylvinite ore was mined and from that, 1.7 Mt of potash produced. Mining was by continuous miners and made difficult by the irregular floor, gas, and high rock temperatures. The height mined was typically 8 ft. The dip of the ore was such that maintaining the miners in the seam was difficult. The seam floor rolls and folds resulted in an irregular mine plan with many large areas left unmined as pillars. In some areas, secondary mining resulted in high extraction.
The Moab Salt operation was purchased by Intrepid in 1999. In 2000, Intrepid-Moab drilled two new recovery wells to revitalize production from Bed 5. Production from Bed 5 had declined from near 100,000 t in 1994 to 60,000 t in 1999 (see Figure 5-1). After completion of the two new recovery wells, the brine concentration improved, and production increased to near 100,000 t in 2001. Maintaining production at or near the target rate of 100,000 tpy was difficult from Bed 5 because of declining product concentration. It was believed that solution mining over the prior 32 years had solution mined most of the remnant pillars in the old workings and that active solution mining was restricted to the updip faces of the mine ribs.
Figure 5-1. Historical Product Tons of KCl from Beds 5 and 9
|
|
|
|
|
|
2023 Estimated Resources and Reserves at Intrepid Potash-Moab
Prepared for Intrepid Potash, Inc.
February 14, 2024 |
15 |
Methods to enhance the production rate were evaluated by Intrepid-Moab and resulted in the decision to develop solution mining in Bed 9. Bed 9 is located 800 to 1,000 ft below Bed 5 and is of higher KCl content. Bed 9 had not been solution mined previously, although, some test mining was completed by the prior owners in the late-1960s. A novel method of solution mining was adopted for recovery of potash from Bed 9. Moab Salt-27 and Moab Salt-28 were drilled “horizontally” in 2002 in Bed 9 to connect and provide pathways for the liquor injected in Moab Salt-27 to contact the sylvinite and differentially dissolve the sylvite before being lifted from Moab Salt-28. Currently, Moab Salt-29 connects Moab Salt-27 and -28 and serves as an alternative to Moab Salt-27 for injection. Figure 5-1 presents the total (Beds 5 and 9) historical potash production KCl tons from 1965 to 2023.
|
|
|
|
|
|
2023 Estimated Resources and Reserves at Intrepid Potash-Moab
Prepared for Intrepid Potash, Inc.
February 14, 2024 |
16 |
6.0Geologic Setting
6.1Regional Geology
The depositional history of eastern Utah’s vast salt and potash resources begins during the regionally arid Pennsylvanian Period, 330–310 million years ago. An immense block of the Earth’s crust, in what is today western Colorado, was thrust upward to form the Uncompahgre Highlands and identified as the westernmost expression of the Ancestral Rocky Mountains. As is common throughout geologic history, dramatic uplift was coupled with subsidence in an adjoining area. In this instance, the adjacent landscape to the southwest experienced significant down-warping. The subsequent topographical basin was inundated by seawater as it subsided. Throughout the Pennsylvanian Period, sea levels rose and fell with stunning regularity as reflected by Pennsylvanian strata worldwide. With each retreat of the sea, the Paradox Basin, as it is called, became devoid of fresh sea water, allowing the process of evaporation to dominate which resulted in widespread precipitation of chloride minerals. This retreat/inflow cycle is known to have occurred a minimum of 29 times, with each marked by a specific and predictable sequence of sedimentary deposition. This series of depositional cycles is collectively known as the Paradox Formation. Potash is documented to exist in 17 of the 29 cycles, and it is from these formational cycles that commercial production of potash occurs.
The Paradox Formation is bounded above by the Honaker Trail Formation and by the Pinkerton Trail Formation below. Collectively, these three units form the Hermosa Group and provide a comprehensive record of Pennsylvanian deposition within the Paradox Basin. Along the northeastern and eastern margins, the Hermosa Group is undifferentiated due to the considerable amount of uninterrupted alluvial fan and fluvial clastics sourced from the Uncompahgre Highlands.
The majority of the Paradox Basin lies in southeastern Utah and far southwestern Colorado, with minor extents into northwestern New Mexico and northeastern Arizona (Figure 6-1). The elongate, northwest–southeast trending basin is roughly 100 miles wide by 200 miles long and is broadly defined by the lateral extent of the formation for which it is named. The Paradox Basin gradually shallows to the southwest generating thickness patterns for Pennsylvanian sediments that are strongly asymmetric when viewed along a northeast to southwest transect (Figure 6-2). Along the northeast basin margin that abuts the Uncompahgre Highlands, thicknesses can exceed 18,000 ft, with compositions of coarse sandstones and clastic detritus eroded off the adjacent highlands. A short distance southwest, at roughly the basin center, exists the evaporite sequences described above. Continuing southwest, the Basin thins gradually with an increasing prevalence of carbonate rocks indicative of a shallow marine depositional environment.
Exploration of the carbonate sequences mentioned above and their potential as hydrocarbon reservoirs in the southern Paradox Basin, led petroleum geologists to informally subdivide the Paradox Formation into five vertically sequenced zones that include, from bottom to top, the Alkali Gulch, Barker Creek, Akah, Desert Creek, and Ismay zones. The five zones are
|
|
|
|
|
|
2023 Estimated Resources and Reserves at Intrepid Potash-Moab
Prepared for Intrepid Potash, Inc.
February 14, 2024 |
17 |
Figure 6-1. Regional Paradox Basin (after Doelling 1985)
|
|
|
|
|
|
2023 Estimated Resources and Reserves at Intrepid Potash-Moab
Prepared for Intrepid Potash, Inc.
February 14, 2024 |
18 |
Figure 6-2. Paradox Basin Cross Section (after Stevenson and Barrs 1986)
defined by marker beds at their top and/or base that, in many instances, correlate well with equivalent beds in the central basin. These shelf carbonate cycles, like their evaporite counterparts to the north, record a regular rise and fall of sea levels. Similarities beyond the shared marker beds are few; nevertheless, many of the designated zones and their given name may be used when grouping evaporite cycles. Figure 6-3 illustrates how the depositional cycles identified by Hite (1960) correlate with the five named zones.
|
|
|
|
|
|
2023 Estimated Resources and Reserves at Intrepid Potash-Moab
Prepared for Intrepid Potash, Inc.
February 14, 2024 |
19 |
Figure 6-3. Evaporite Cycles, 29 Cycles, 5 Zones (after Hite 1960)
6.2Local Geology
Locally, the documented stratigraphy ranges from Paleoproterozoic (2,500–1,500 mega annum [Ma]) igneous and metamorphic rocks to the surficial Mesozoic Era sedimentary units which form the majestic arches and monoliths commonly associated with nearby national parks. The following section describes this stratigraphic succession, beginning with the deepest occurring units and ascending through to those exposed at the surface.
The oldest, and deepest, rock unit within the Intrepid lease boundary is often referred to as the ‘Precambrian Basement Complex.’ This unit is Early- to Mid-Proterozoic in age and likely composed of biotite-quartz monzonite, a feldspathic gneiss and/or schist, or a related variety of coarse granitic rock based on surface outcrops to the east and through deep drillholes
|
|
|
|
|
|
2023 Estimated Resources and Reserves at Intrepid Potash-Moab
Prepared for Intrepid Potash, Inc.
February 14, 2024 |
20 |
located within the Paradox Basin (Joesting et al. 1966). Resting unconformably upon the Precambrian Basement is a series of Cambrian and Devonian sedimentary and meta-sedimentary units with an aggregate thickness ranging from 1,100 to 1,800 ft. These are, from oldest to youngest, the Tintic Quartzite, the Ophir Formation, the Maxfield Limestone, the Lynch Dolomite, and the Ignacio Quartzite. Next, the Mississippian Leadville Limestone ranges in thickness from 500 to 700 ft. The upper surface of Mississippian strata was exposed for a considerable time prior to further deposition and is therefore marked by substantial karstic erosional features. The subsequent Pennsylvanian Era was ushered in by deposition of the widespread Molas Formation. When present, the Molas Formation is composed of limestone, shale, dolomite, and sandstone that ranges in thickness from 0 to 150 ft.
Continuing up through the sequence, the Pennsylvanian Pinkerton Trail consists of varied rock types, but is dominated by gray, fossiliferous limestone, and gray-black, marine shales with a thickness up to 200 ft. Analysis of drill core recovered from the central Paradox Basin indicate the uppermost part of the Pinkerton Trail contains several thick beds composed of anhydrite. In terms of deposition, these beds are an indicator of increasing aridity and pose as a chronological precursor to the evaporitic deposits of the overlying Paradox Formation. Stratigraphically, the anhydrite beds serve as useful geologic markers for delineating formation boundaries.
Resting conformably upon the Pinkerton Trail is the unit of economic interest, the Paradox Formation. The depositional thickness of the Paradox exceeds 7,000 ft in the center of the Lisbon Valley anticline (Hite 1978) and gradually thins toward the west where it either pinches out entirely or interfingers with shallow-marine carbonate sequences of chronological equivalency. The Paradox Formation records multiple depositional cycles driven by climatic oscillations and their coincident sea level fluctuations throughout the middle Pennsylvanian Era. As large glacial events began in the polar regions, global sea levels fell, thereby restricting the flow of fresh sea water into the Paradox Basin from the open sea to the west. It was during these periods that evaporation dominated, resulting in prolific precipitation of evaporite minerals. Following each glacial maximum, as temperatures and sea levels rose, the isolated brines of the Paradox Basin were inundated with fresh sea water. These interglacial periods are marked by deposition of organic-rich black shale.
The late-Pennsylvanian Honaker Trail Formation conformably overlies the Paradox Formation and is the uppermost member of the Hermosa Group. Like the Pinkerton Trail, the Honaker Trail primarily consists of marine carbonates and shale, with the added presence of fluvial and eolian sandstones. Within the Intrepid lease boundary, the Honaker Trail-Paradox contact is placed at the top of the uppermost halite bed of the Paradox Formation. The Honaker Trail is further differentiated from the Paradox Formation by the generally recognized color differences between the red-, brown-, and buff-colored strata of the Honaker Trail and the predominantly gray, black, and occasional orange of the Paradox. The upper Honaker Trail marks the filling of the structural Paradox Basin. By the late-Pennsylvanian Age, an uninterrupted, low-relief slope extended from the topographic high of the Uncompahgre Highlands westward to the seashore in central Utah. In the central basin, the Honaker Trail has an average thickness of 0–5,000 ft.
|
|
|
|
|
|
2023 Estimated Resources and Reserves at Intrepid Potash-Moab
Prepared for Intrepid Potash, Inc.
February 14, 2024 |
21 |
Continuing up sequence, the Late Pennsylvanian-Permian Cutler Formation is predominantly composed of arkosic sandstones and conglomerates. Because the source of clastic material continued from the Uncompahgre Highlands throughout the Permian, the Cutler exhibits a general fining-westward of clast and grain size as distance from the highlands increases. As was true with the Pennsylvanian Hermosa Group, the depositional zone immediately adjacent to the Uncompahgre Highlands accumulated a thick homogeneous succession of coarse conglomerates and sandstones, leading the Cutler Formation in this area to be termed undifferentiated. However, with added westward distance from the high-relief source area, the Cutler becomes easily subdivided and is then referred to as the Cutler Group. Within the Intrepid lease boundary, the Cutler Group usually contains, in ascending order, the Lower Cutler Beds, the Cedar Mesa Sandstone, the Organ Rock Formation, and the White Rim Sandstone. Typical thickness of the Cutler Group in this area ranges from 0 to 8,000 ft.
Continuing up sequence, the brown to deeply reddish-colored Moenkopi and Chinle Formations of Triassic age are largely composed of mudstones, siltstones, and sandstones. The early-Jurassic Wingate Sandstone is a prominent cliff-forming unit whose large-scale cross-bedding marks a period of eolian deposition. The Wingate is capped by the Kayenta Sandstone, a ledge and bench-forming unit deposited by fluvial processes. The mid-Jurassic Navajo Sandstone marks yet another eolian period of deposition and may be up to 740 ft thick. The Navajo is bounded above by the San Rafael Group, which may or may not contain its basal Dewey Bridge Member. The Dewey Bridge Member, if present, is overlain by the reddish-orange Entrada Sandstone. Within the Intrepid lease boundary, one is not likely to encounter competent layers younger than the Entrada Sandstone, however, isolated occurrences of the late-Jurassic Morrison Formation may be found.
Perhaps the most significant aspect of local geology is the degree of structural deformation caused by the buoyancy of Paradox Formation salts. Soon after the thick evaporite sequences were deposited, the increasing load of overlying sediments caused lateral and vertical migration of the lower density salt bodies. Local upward movement predominantly occurred along elongate, northwest-trending zones resulting in large anticlines cored by rising salt. Vertical extension of overlying strata along the limbs of some anticlines has resulted in normal faulting and fault block rotation, as well as extremely high-angle bedding, and in some instances, overturned beds.
The soluble nature of the rising salt makes it particularly susceptible to dissolution by groundwater, which eventually leads to the collapse of overlying sedimentary layers. The Cane Creek anticline, which dominates the landscape of Intrepid-Moab’s property, is one such structure.
6.3Property Geology
Intrepid-Moab’s mine operation boundary includes 7,656 acres straddling the Cane Creek anticline and is centered roughly 5 miles southwest of the town of Moab, Utah. The Cane Creek anticline is one of a series of northwest-trending anticlines with salt at the core that make up the fold fault belt of the north and northeast part of the Paradox Basin. Intrepid-Moab’s property overlies the Paradox Basin salts, which are up to 7,000 ft thick. The Colorado River
|
|
|
|
|
|
2023 Estimated Resources and Reserves at Intrepid Potash-Moab
Prepared for Intrepid Potash, Inc.
February 14, 2024 |
22 |
runs approximately north–south along the eastern property boundary. The Intrepid-Moab property is a high-altitude desert landscape formed of sedimentary rock units, originally deposited in a wide range of environments and processes. Actual elevations range from 3,900 ft to 4,400 ft MSL.
Within the Intrepid lease boundary, the Paradox Formation consists primarily of halite rock with occasional potash salts and smaller amounts of anhydrite, dolomite, silty dolomite, limestone, siltstone, and shale. Hite (1960) identified 29 depositional cycles within the Paradox Formation. A typical evaporite cycle consists of, in ascending order, basal anhydrite, dolomite, carbon-rich black mudstone, dolomite, anhydrite, and finally halite (Figure 6-4). A singular evaporite cycle is often referred to as a ‘bed’ (i.e., there are 29 beds). When potash occurs, it often overlies the halite to form the top of the cycle, or it may be interbedded within the halite. Each cycle is marked, top and bottom, by sharp contacts interpreted as disconformities. The potash-bearing ore, sylvinite, is a mixture of sylvite or potassium chloride (KCl) and halite or sodium chloride (NaCl).
Figure 6-4. Evaporative Cycle (after Fillmore 2010)
6.4Significant Mineralized Zones
Potash is documented to exist in 17 of the 29 evaporite cycles that comprise the Paradox Formation. Of these 17, two are principally targeted by Intrepid for commercial potash production: Bed 5 and Bed 9. Figure 6-5 stratigraphically illustrates the presence of potash beds 5 and 9 when depicted via a gamma-ray log.
|
|
|
|
|
|
2023 Estimated Resources and Reserves at Intrepid Potash-Moab
Prepared for Intrepid Potash, Inc.
February 14, 2024 |
23 |
Figure 6-5. Stratigraphic Type Section (from Intrepid 2007)
Based on locally recovered drill core, geophysical logs, and on historical mining data, Bed 5 has an average thickness of 10.24 ft. Average depth to the top of Bed 5 is 3,113 ft and the average K2O grade is 22.98%. Likewise, Bed 9 has an average thickness of 8.1 ft, an average depth of 4,013 ft, and an average K2O grade of 29.75%. Although K2O, or potassium oxide, is not the preferred chemical form used in commercial consumption, potash grades are typically reported as ‘K2O equivalent’ to allow for a standard unit of comparison. In addition, it should be noted that K2O is approximately 83% potassium by weight, whereas KCl is 52% potassium by weight. Thus, KCl provides less potassium than an equal amount of K2O.
6.5Mineral Deposit
Evaporite cycles within the Paradox Formation exhibit a lateral extent of over 11,000 square miles in southeastern Utah and southwestern Colorado (Hite 1960). The Pennsylvanian-age Paradox Formation records multiple episodes of evaporitic deposition, predominantly consisting of massive, crystalline halite with economically attractive occurrences of potash. Deposition of the evaporites occurred in a vast, flat basin resulting in each additional layer, or bed, being originally deposited in a horizontally planar orientation. Subsequent deposition of overlying sediments provided enough lithostatic pressure to initiate lateral and vertical migration of the more buoyant salt deposits. In many instances, salt flowed toward linear subsurface structures, such as a fault, and then upward to form what is known as a salt wall. The rising salt typically forms an anticline in overlying strata with surficial expressions of 30 to
|
|
|
|
|
|
2023 Estimated Resources and Reserves at Intrepid Potash-Moab
Prepared for Intrepid Potash, Inc.
February 14, 2024 |
24 |
75 miles long and 2 to 4 miles wide (Doelling 1985). This collection of northwest-trending, elongate structures is referred to as the Paradox Basin fold and fault belt. Due to the highly deformed nature of the evaporite deposits, it is not uncommon to encounter very high-angle and even overturned strata in exploratory drillholes. The Intrepid lease area is in the southwestern portion of the fold and fault belt where broad salt anticlines are more common than high-angle salt walls. Local examples of these domal salt-cored anticlines include the Big Flat, Cane Creek, and Lisbon Valley anticlines. Because strata within the Intrepid lease boundary have experienced considerably less movement of salt bodies compared to areas to the northeast, the potash deposits of economic interest are significantly less deformed and therefore more suitable for economic extraction.
Intrepid-Moab commercially produces potash from two zones, referred to as Bed 5 and Bed 9. These beds are part of a thick sequence of evaporite cycles predominantly composed of halite interspersed with sedimentary layers of black shale and anhydrite. Within Beds 5 and 9, the sylvinite is bounded above and below by occurrences of halite. Sylvite and halite are both water-soluble by nature. By using water already saturated with sodium, it is possible to selectively dissolve a greater amount of the potassium chloride ore. The term ‘potash’ is used to describe a number of potassium-bearing compounds. Of these, the mineral sylvite commands the greatest economic interest. Sylvite is commonly found mixed with halite, or sodium-chloride (NaCl), to form the mineral sylvinite. Sylvinite is known to have a K2O content of up to 62% in its purest form.
|
|
|
|
|
|
2023 Estimated Resources and Reserves at Intrepid Potash-Moab
Prepared for Intrepid Potash, Inc.
February 14, 2024 |
25 |
7.0Exploration
7.1Exploration Other than Drilling
No exploration other than drilling has taken place.
7.2Drilling Exploration
Exploration information is available from cored holes, drilled holes with geophysical logs, and from the experience gained from mining within Bed 5. The data has been collected over many years, but primarily prior to commencement of underground mining in 1964. The corehole data was collected by Behre Dolbear & Company, Inc. (1961) for the original pre-mining feasibility studies. The original source data, such as assay data sheets, are generally not available. Comprehensive and detailed reports are available and form the basis of this report. Tables 7-1 and 7-2 list the corehole location, elevation, depth intervals, thickness, and grade for holes in Beds 5 and 9, respectively. The locations of the exploration holes are shown on a map in Figure 7-1.
The bed thicknesses listed in Tables 7-1 and 7-2 are from drillholes as reported by Intrepid-Moab, the QP, or referenced sources; mining experience in the underground mine indicates that the seam thickness varies significantly over short distances. In the area of the Cane Creek anticline, the base of the seam is contorted, with areas where overthrusting is evident. In such areas, the apparent bed thickness can be significantly overestimated, and Intrepid-Moab and the QP have used professional judgement to modify those thicknesses. For example, in Cane Creek 14, Bed 9 thickness was estimated to be 40 ft from the gamma log. However, the core assay indicates a thickness of 11.8 ft, but the source assay data are not available. It is possible that the core may have intersected a fault.
Potash is easily identified in the gamma log. In four cases, estimates of bed thickness and potash grade are based on geophysical logs. This reflects the high level of confidence in the logs and is particularly important because it provides a Bed 9 thickness in the area of active solution mining to the north of the data provided by Cane Creek 8 and Well 19. For more detail on estimating grade from gamma logs, see Nelson (2007) and Schlumberger (1989).
No usable exploration data are available from within the Bed 5 old mine workings. The floor structure has been used for flow direction estimation, but no channel sampling or bed thickness data were used. Albertson (1972) lists the grade and bed thicknesses in panels and mains for the old workings. Although data from the recently drilled wells into the old workings of Bed 5 indicate that additional resource could be located at the roof of the old workings, no attempt has been made to estimate this resource.
The QP elected to exclude data from the geophysical logs and data from Government White Cloud 1. This hole is located approximately 4,000 ft north of the north lease boundary and 16,000 ft from the nearest cored hole. Bed 9 is reported to be 13 ft thick, and Bed 5 is 9 ft thick. Data from this hole was not used because it strongly influences the estimates of bed thickness in areas to the north where data are sparse.
|
|
|
|
|
|
2023 Estimated Resources and Reserves at Intrepid Potash-Moab
Prepared for Intrepid Potash, Inc.
February 14, 2024 |
26 |
There are a limited number of holes that contain the thickness and grade values outside the property boundary. Such holes are desirable to provide control of grade and thickness beyond the existing data points. Artificial holes, designated Agapito1 through Agapito10, located outside the property boundary, were assigned zero thickness and grade for Beds 5 and 9. These artificial holes do not influence the grade and thickness within the existing drillholes nor influence the reserve within the mine plan. The artificial holes were created to conservatively estimate the resource within the property limits, recognizing that there is no known limit to the extent of Beds 5 and 9.
|
|
|
|
|
|
2023 Estimated Resources and Reserves at Intrepid Potash-Moab
Prepared for Intrepid Potash, Inc.
February 14, 2024 |
27 |
Table 7-1. Grade and Thickness Data for Bed 5
|
|
|
|
|
|
|
|
|
|
|
|
|
|
|
|
|
|
|
|
|
|
|
|
|
|
|
|
|
|
|
|
|
|
|
|
|
|
|
|
|
|
|
|
| Operator |
|
Elevation (ft) |
Total Depth (ft) |
Collar Coordinates |
Top
(ft)
|
Base
(ft)
|
Assay Thickness (ft) |
K2O Grade
(%)
|
Data Source* |
| Well Name |
Easting
(ft)
|
Northing (ft) |
| Delhi-Taylor Oil Corp. |
Cane Creek 1 |
3,964 |
2,805 |
2,526,652 |
675,049 |
2,678.4 |
2,690.8 |
12.33 |
27.56 |
|
1 |
| Delhi-Taylor Oil Corp. |
Cane Creek 2 |
4,223 |
2,968 |
2,522,913 |
672,932 |
2,764.3 |
2,780.2 |
15.87 |
28.69 |
|
1 |
| Delhi-Taylor Oil Corp. |
Cane Creek 3 |
4,115 |
3,378 |
2,522,011 |
680,646 |
3,244.6 |
3,249.8 |
5.23 |
24.13 |
|
1 |
| Delhi-Taylor Oil Corp. |
Cane Creek 4 |
4,127 |
4,297 |
2,523,864 |
668,532 |
2,658.2 |
2,662.7 |
4.50 |
24.89 |
|
1 |
| Delhi-Taylor Oil Corp. |
Cane Creek 5 |
4,148 |
3,653 |
2,528,066 |
668,040 |
2,617.8 |
2,623.2 |
5.42 |
27.75 |
|
1 |
| Delhi-Taylor Oil Corp. |
Cane Creek 6 |
4,563 |
4,082 |
2,519,798 |
675,445 |
3,175.0 |
3,187.5 |
12.50 |
25.37 |
|
2, 3 |
| Delhi-Taylor Oil Corp. |
Cane Creek 6W |
4,564 |
4,014 |
2,519,798 |
675,445 |
3,207.6 |
3,216.8 |
8.73 |
29.56 |
|
1 |
| Delhi-Taylor Oil Corp. |
Cane Creek 7 |
4,215 |
3,553 |
2,532,098 |
671,106 |
2,715.5 |
2,728.1 |
12.60 |
8.41 |
|
3 |
| Delhi-Taylor Oil Corp. |
Cane Creek 8 |
4,049 |
4,080 |
2,525,307 |
678,492 |
3,140.7 |
3,147.7 |
7.02 |
27.45 |
|
1 |
| Delhi-Taylor Oil Corp. |
Cane Creek 9 |
4,275 |
3,851 |
2,524,410 |
676,115 |
3,044.8 |
3,061.9 |
17.10 |
26.30 |
1 |
| Delhi-Taylor Oil Corp. |
Cane Creek 10 |
4,239 |
3,719 |
2,525,456 |
672,215 |
2,881.8 |
2,899.0 |
17.23 |
28.00 |
1 |
| Delhi-Taylor Oil Corp. |
Cane Creek 11-A |
4,571 |
4,314 |
2,517,119 |
680,144 |
3,415.5 |
3,431.4 |
15.89 |
24.04 |
|
1, 3 |
| Delhi-Taylor Oil Corp. |
Cane Creek 12 |
4,412 |
3,996 |
2,516,867 |
677,146 |
3,192.0 |
3,202.0 |
10.00 |
28.76 |
|
1, 2 |
| Delhi-Taylor Oil Corp. |
Cane Creek 13 |
4,342 |
4,025 |
2,519,273 |
670,115 |
3,199.0 |
3,202.0 |
3.00 |
10.00 |
1 |
| Delhi-Taylor Oil Corp. |
Cane Creek 14 |
4,394 |
4,265 |
2,520,679 |
672,576 |
3,292.8 |
3,303.7 |
10.87 |
27.84 |
|
1, 3 |
| Delhi-Taylor Oil Corp. |
Cane Creek 15 |
4,168 |
3,220 |
2,526,092 |
669,419 |
2,977.5 |
2,987.3 |
9.83 |
27.88 |
|
1, 3 |
| Delhi-Taylor Oil Corp. |
Cane Creek 17 |
4,101 |
3,928 |
2,532,165 |
672,825 |
3,052.8 |
3,060.4 |
7.60 |
19.77 |
|
1, 3 |
| Texasgulf |
Cane Creek 18 |
4,040 |
3,830 |
2,526,389 |
680,533 |
3,542.9 |
3,553.9 |
11.00 |
21.05 |
|
3 |
| Texasgulf |
Federal 1X |
4,196 |
8,005 |
2,528,063 |
671,389 |
2,449.3 |
2,461.3 |
12.00 |
29.22 |
|
1, 2 |
| Texasgulf |
Test Well 17 |
3,991 |
3,533 |
2,528,501 |
678,540 |
3,472.0 |
3,483.0 |
11.00 |
22.00 |
8 |
| Texasgulf |
Test Well 18 |
4,001 |
3,522 |
2,528,508 |
678,589 |
3,488.0 |
3,498.0 |
10.00 |
21.50 |
8 |
| Texasgulf |
Well 19 |
3,961 |
4,192 |
2,528,421 |
677,817 |
3,326.0 |
3,336.5 |
10.45 |
19.90 |
7 |
| Texasgulf |
Well 21 |
3,996 |
3,560 |
2,527,998 |
679,249 |
3,554.5 |
3,560.4 |
5.87 |
12.70 |
4 |
| Texasgulf |
Well 22 |
4,010 |
3,603 |
2,527,338 |
679,700 |
3,553.3 |
3,574.0 |
20.69 |
20.87 |
|
5 |
| Texasgulf |
Well 23 |
4,011 |
3,842 |
2,527,840 |
680,492 |
3,789.4 |
3,798.0 |
8.51 |
21.65 |
|
6 |
| Intrepid Mining |
26-30 |
4,549 |
6,530 |
2,519,875 |
675,082 |
3,123.8 |
3,137.7 |
14.10 |
20.96 |
|
9 |
| Intrepid Mining |
IM-031 |
4,400 |
4,100 |
2,524,734 |
674,335 |
3,081.5 |
3,090.0 |
8.60 |
28.86 |
|
9 |
| Intrepid Mining |
IM-035 |
4,274 |
3,003 |
2,524,657 |
672,216 |
2,851.3 |
2,865.5 |
11.20 |
29.54 |
|
9 |
| Intrepid Mining |
IPI-037V |
4,133 |
4,145 |
2,523,134 |
678,195 |
3,045.8 |
3,055.7 |
9.9 |
22.45 |
|
9 |
| Intrepid Mining |
IPI-038C |
4,075 |
4,540 |
2,525,432 |
680,580 |
|
|
0.0 |
|
9 |
| Intrepid Mining |
IPI-039H |
4,064 |
8,477 |
2,522,032 |
680,613 |
3,593.2 |
3,601.8 |
8.60 |
8.50 |
9 |
| Intrepid Mining |
IPI-041C |
4,159 |
3,695 |
2,523,054 |
668,790 |
2,765.4 |
2,772.5 |
7.00 |
22.00 |
9 |
| Intrepid Mining |
IPI-042H |
4,133 |
5,218 |
2,523,095 |
678,210 |
3,031.9 |
3,041.2 |
9.30 |
21.50 |
9 |
| Intrepid Mining |
IPI-043C |
4,240 |
3,951 |
2,522,192 |
673,170 |
2,835.8 |
2,847.1 |
11.40 |
20.00 |
9 |
| Intrepid Mining |
IPI-044C |
3,975 |
5,000 |
2,525,903 |
683,564 |
3,823.0 |
3,836.8 |
13.70 |
22.30 |
9 |
|
|
|
|
|
|
|
|
|
|
|
| Notes: |
| NS = no survey data. |
| *Sources: |
1.Behre Dolbear & Co. (1961). |
2.Texasgulf Sulphur Company, Potash Occurrences in the Paradox Basin, K.J. Kutz, June 24, 1966. |
3.Recapitulation sheets submitted to Hugh Harvey from Bob Hite, April 1, 1998. |
4.Texasgulf Chemicals, Geology of Well 21, letter from D.A. Gahr to J.H. Huizingh, October 29, 1982. |
5.Texasgulf Chemicals, Geology of Well 22, letter from D.A. Gahr to J.H. Huizingh, October 29, 1982. |
6.Texasgulf Chemicals, Geology of Well 23, letter from D.A. Gahr to J.H. Huizingh, October 29, 1982. |
7.Texasgulf Chemicals, Cane Creek Solution Mining Hole No. 19, memo from K.J. Kutz to K.O. Linn, September 10, 1979. |
8.Texasgulf Chemicals, Geology of Wells 17 and 18, memo from E.L. Follis to C.H. Huff, August 18, 1976. |
9.Drilled by Intrepid |
|
|
|
|
|
|
|
|
|
|
|
|
|
|
|
|
|
2023 Estimated Resources and Reserves at Intrepid Potash-Moab
Prepared for Intrepid Potash, Inc.
February 14, 2024 |
28 |
Figure 7-1. Plan View of Property Showing Drilling and Sample Locations
|
|
|
|
|
|
2023 Estimated Resources and Reserves at Intrepid Potash-Moab
Prepared for Intrepid Potash, Inc.
February 14, 2024 |
29 |
Table 7-2. Grade and Thickness Data for Bed 9
|
|
|
|
|
|
|
|
|
|
|
|
|
|
|
|
|
|
|
|
|
|
|
|
|
|
|
|
|
|
|
|
|
|
|
|
|
|
|
|
| Operator |
Well Name |
Elevation (ft) |
Total Depth
(ft) |
Collar Coordinates |
Top
(ft)
|
Base
(ft)
|
Assay Thickness (ft) |
K2O
Grade
(%)
|
|
Easting
(ft)
|
Northing (ft) |
| Delhi-Taylor Oil Corp. |
Cane Creek 9 |
4,275 |
3,851 |
2,524,410 |
676,115 |
4,002.90 |
4,016.00 |
13.0 |
26.50 |
| Delhi-Taylor Oil Corp. |
Cane Creek 8 |
4,049 |
4,080 |
2,525,307 |
678,492 |
3,945.36 |
3,949.87 |
5.0 |
19.90 |
| Delhi-Taylor Oil Corp. |
Cane Creek 6 |
4,538 |
4,085 |
2,519,798 |
675,445 |
3,931.70 |
3,941.00 |
8.0 |
26.00 |
| Delhi-Taylor Oil Corp. |
Cane Creek 5 |
4,148 |
3,653 |
2,528,066 |
668,040 |
3,554.33 |
3,569.75 |
14.9 |
28.00 |
| Delhi-Taylor Oil Corp. |
Cane Creek 17 |
4,124 |
3,928 |
2,532,165 |
672,825 |
3,901.00 |
3,913.00 |
10.7 |
30.40 |
| Delhi-Taylor Oil Corp. |
Cane Creek 14 |
4,368 |
4,265 |
2,520,679 |
672,576 |
4,265.00 |
4,273.00 |
11.8 |
33.10 |
| Delhi-Taylor Oil Corp. |
Cane Creek 12 |
4,412 |
3,996 |
2,516,867 |
677,146 |
3,973.88 |
3,983.60 |
9.7 |
30.80 |
| Delhi-Taylor Oil Corp. |
Cane Creek 10 |
4,239 |
3,719 |
2,525,456 |
672,215 |
3,696.00 |
3,711.00 |
12.9 |
31.60 |
| Texasgulf |
Well 19 |
3,961 |
4,192 |
2,528,421 |
677,817 |
4,132.44 |
4,138.50 |
6.0 |
31.60 |
| Texasgulf |
Federal 1-X |
4,196 |
8,005 |
2,528,063 |
671,389 |
3,302.46 |
3,309.54 |
6.0 |
34.80 |
| Utah Southern Oil Company |
Frank Shafer 1 |
3,954 |
5,000 |
2,527,349 |
676,033 |
3,763.00 |
3,772.50 |
8.9 |
30.00 |
| Delhi-Taylor Oil Corp. |
Cane Creek 4 |
4,127 |
|
2,523,864 |
668,530 |
|
|
0.0 |
|
| Delhi-Taylor Oil Corp. |
Cane Creek 7 |
4,215 |
|
2,532,099 |
671,107 |
|
|
0.0 |
|
| Moab Salt |
Well 28 |
4,021 |
6,896 |
2,528,070 |
680,176 |
4,980.00 |
4,998.50 |
6.2 |
37.50 |
| Intrepid Mining |
26-30 |
4,549 |
6,530 |
2519875 |
675,082 |
3,958.00 |
3,969.84 |
11.8 |
24.40 |
| Intrepid Mining |
IM-031 |
4,400 |
4,100 |
2524734 |
674,335 |
3,861.22 |
3,863.06 |
1.8 |
20.02 |
| Intrepid Mining |
IPI-037V |
4,133 |
4,145 |
2523133.6 |
678,195 |
3,886.78 |
3,882.78 |
8.00 |
31.28 |
| Intrepid Mining |
IPI-038C |
4,075 |
4,540 |
2525431.6 |
680,580 |
4,337.30 |
4,345.80 |
8.50 |
30.30 |
| Intrepid Mining |
IPI-043C |
4,240 |
3,951 |
2522192 |
673,170 |
3,700.40 |
3,711.50 |
10.10 |
30.12 |
| Intrepid Mining |
IPI-044C |
3,975 |
5,000 |
2525903 |
683,564 |
4,589.95 |
4,598.46 |
7.00 |
34.60 |
| Intrepid Mining |
IPI-040H |
4,134 |
6,817 |
2523101 |
678,239 |
4,470.00 |
4,445.01 |
10.20 |
34.26 |
|
|
|
|
|
|
|
|
|
|
|
|
|
|
|
|
2023 Estimated Resources and Reserves at Intrepid Potash-Moab
Prepared for Intrepid Potash, Inc.
February 14, 2024 |
30 |
7.3Characterization of Hydrogeology Data
No hydrogeology data was evaluated.
7.4Characterization of Geotechnical Data
No geotechnical data was evaluated.
|
|
|
|
|
|
2023 Estimated Resources and Reserves at Intrepid Potash-Moab
Prepared for Intrepid Potash, Inc.
February 14, 2024 |
31 |
8.0Sample Preparation
Intrepid-Moab has an internal protocol that provides for well-defined, safe practices and uniform guidelines for gamma-ray logging, core handling, and sample collection. The cores are collected and analyzed for ore zone identification. Cores are compared to the gamma-ray log to determine sampling intervals. Duplicate samples are collected with one sample sent to the on-site lab and the other stored with the corresponding core box from which the sample was sourced.
In the qualified person’s opinion, the sample preparation, security, and laboratory analytical procedures are conventional industry practice and are adequate for the reporting of resources and reserves.
|
|
|
|
|
|
2023 Estimated Resources and Reserves at Intrepid Potash-Moab
Prepared for Intrepid Potash, Inc.
February 14, 2024 |
32 |
9.0Data Verification
The property is and has been in production for many years which verifies the exploration data.
9.1Data Verification Procedure
Exploration data is used as a guide during the construction of the horizontal caverns by directional drilling. The successful construction and operation of the caverns validates the data.
9.2Limitations on Verification
No limitations on the data verification process.
9.3Adequacy of the Data
It is the opinion of the Qualified Person (QP) that the data is adequate for geologic modeling, mine planning, and production. The successful experience with current and historical production validates the data.
|
|
|
|
|
|
2023 Estimated Resources and Reserves at Intrepid Potash-Moab
Prepared for Intrepid Potash, Inc.
February 14, 2024 |
33 |
10.0Mineral Processing and Metallurgical Testing
Solution mining test work was conducted in the early 1970s. This included test ponds, saturation tests, crystal habitat and product size, soil tests, solar evaporation product flotation testing, KCl–NaCl brine shale reaction test, NaCl face blinding test, and clastic strength test salt (Higgins 1970).
The conclusion from the solution mining test work was that solution mining the Cane Creek Potash deposit was feasible but dependent to a great extent on keeping the injection water out of the overlying salt. The test also concluded that the hard anhydrite layer continuous throughout the formation provides a good stable shield against dissolution of the overlying salt (Higgins 1970). Higgins also concluded that it was highly improbable that fluids would be lost to the formation through open fractures.
Between 1975 and 1982, Texasgulf started extensive work on expanding the potash reserves by drilling vertical holes along the periphery of the old mine workings in Bed 5 to test and gain experience in solution mining and to connect newly created cavities with the old workings to extend the life of the mine (Gruschow 2000).
It is the opinion of the QP that the mineral processing data is adequate for purposes of estimating reserves.
|
|
|
|
|
|
2023 Estimated Resources and Reserves at Intrepid Potash-Moab
Prepared for Intrepid Potash, Inc.
February 14, 2024 |
34 |
11.0Mineral Resource Estimates
According to 229.1301 (Item 1301), the following definitions of mineral resource categories are included for reference:
An inferred mineral resource is that part of a mineral resource for which quantity and grade or quality are estimated on the basis of limited geological evidence and sampling. An inferred mineral resource has the lowest level of geological confidence of all mineral resources, which prevents the application of the modifying factors in a manner useful for evaluation of economic viability. An inferred mineral resource, therefore, may not be converted to a mineral reserve.
An indicated mineral resource is that part of a mineral resource for which quantity and grade or quality are estimated on the basis of adequate geological evidence and sampling. An indicated mineral resource has a lower level of confidence than the level of confidence of a measured mineral resource and may only be converted to a probable mineral reserve. As used in this subpart, the term adequate geological evidence means evidence that is sufficient to establish geological and grade or quality continuity with reasonable certainty.
A measured mineral resource is that part of a mineral resource for which quantity and grade or quality are estimated on the basis of conclusive geological evidence and sampling. As used in this subpart, the term conclusive geological evidence means evidence that is sufficient to test and confirm geological and grade or quality continuity.
11.1Key Assumptions, Parameters and Methods
The exploration drillhole and channel sample data were compiled to form the database that serves as the basis for estimating the resources. The geologic setting was evaluated, and zone assignments reviewed. All the core holes used in this resource estimation report both bed thickness and grade values that lie within the mine lease boundary. As an exception to this, the two potash exploration Wells 28 and IPI-037, which report bed thicknesses with no assay data, are included in the resource estimate for thickness modeling.
The rationale for the measured, indicated, and Inferred limits is based on industry practice in the potash industry. Measured resources are within ¼ of a mile (1,320 ft) of a hole, conveying the highest level of confidence. In addition, the indicated resources are selected to be within ¾ of a mile (3,960 ft) of a hole and the inferred resources are selected to be within 1½ miles (7,920 ft) of a hole. Indicated tons exclude measured tons, inferred tons exclude the indicated and measured tons. This convention is considered reasonable for the geologic characteristics of the Cane Creek potash deposit.
The mineral resource for the Cane Creek Mine was estimated using Carlson Software 2020 (Carlson 2020), a commercially available geology and mine modeling software package.
|
|
|
|
|
|
2023 Estimated Resources and Reserves at Intrepid Potash-Moab
Prepared for Intrepid Potash, Inc.
February 14, 2024 |
35 |
The resources within the property were segregated in the model into 100-ft by 100-ft blocks. The resource estimates included in this report are based on the 2018 modeling.
A deterministic estimate of the potash mineral resource was made using the inverse distance-squared (ID2) method. Invoking the theory that closer samples should be better predictors than those further away, the method assigns weights to samples inversely proportional to the separation distance between the estimation point and the sample point. The ID2 method is useful for providing unbiased estimates of the overall resources (Society of Mining, Engineering, and Exploration, Inc. [SME] 1990).
The block grade and heights were generated within a 1.9-mile search radius. The 1.9-mile search radius was selected to capture more than one core hole in estimating block values in the areas of interest. The maximum number of drill holes for block estimation was limited to the 20 nearest drill holes. ID2 behaves as an exact interpolator. When calculating a block value, the weights assigned to the data points are fractions, and the sum of all the weights is equal to 1.0. An average unit density of 130 pounds per cubic foot (pcf) was used to convert in-place volume to tons. NaCl (salt) is not reported.
The proportion of the mineral deposit that is considered a resource depends on the following key factors: deposit thickness, deposit grade, and geologic factors. Areas where a bed thickness and potassium oxide (K2O) grade do not meet a 3-ft and 18.95% K2O cutoff are excluded from the resource. The minimum thickness cutoff is used because sufficient recovery in thin beds by selective solution mining has not been demonstrated and because of difficulties in locating/maintaining horizontal holes within the bed. The grade cutoff is used because of the difficulty in selective mining in beds with less than 30% KCl content (18.95% K2O), as described by Taylor et al. (1967).
11.2Mineral Resource Estimate
The gross in-place sylvinite tonnage for each resource block was calculated by multiplying the net area of the block by the thickness of the bed and the density. The Measured, Indicated, and Inferred Mineral Resource tonnages were estimated within the prescribed radius from the sampling location.
11.2.1Mineral Resource Estimates for Bed 5
The mineral resources for Bed 5 have been estimated using the EOY 2018 geologic model. Measured, Indicated, and Inferred resources were estimated by sampling blocks within a 1,320-ft, 3,960-ft, and 7,920-ft radius of influence (ROI), respectively, from a sample location (drill hole). Grade (% K2O) and thickness block values for the Intrepid-Moab property are presented in Figures 11-1 and 11-2, respectively. The maps show the 100-ft by 100-ft blocks lying both within the area of influence of drill holes containing grade and thickness data and the property boundary. Figure 11-3 shows the Measured, Inferred, and Indicated Mineral Resources for Bed 5. Mineral Resources for Bed 5 are presented exclusive of Reserves in Table 11-1.
|
|
|
|
|
|
2023 Estimated Resources and Reserves at Intrepid Potash-Moab
Prepared for Intrepid Potash, Inc.
February 14, 2024 |
36 |
Figure 11-1. Bed 5% K2O Grade Blocks
|
|
|
|
|
|
2023 Estimated Resources and Reserves at Intrepid Potash-Moab
Prepared for Intrepid Potash, Inc.
February 14, 2024 |
37 |
Figure 11-2. Bed 5 Thickness Blocks
|
|
|
|
|
|
2023 Estimated Resources and Reserves at Intrepid Potash-Moab
Prepared for Intrepid Potash, Inc.
February 14, 2024 |
38 |
Figure 11-3. Mineral Resources for Bed 5
|
|
|
|
|
|
2023 Estimated Resources and Reserves at Intrepid Potash-Moab
Prepared for Intrepid Potash, Inc.
February 14, 2024 |
39 |
Table 11-1. Bed 5 Sylvinite Mineral Resource Estimate effective December 31,2023
|
|
|
|
|
|
|
|
|
|
|
|
|
|
|
|
|
|
| Moab - Bed 5 Sylvinite Mineral Resource Estimate effective December 31, 2023, based on $450/Product Ton Mine Site |
|
Resources |
|
|
| Bed 5 |
Sylvinite1 |
Grade |
Contained K2O |
Cutoff2 |
Processing Recovery |
|
(Mt) |
(%K2O) |
(Mt) |
|
(%) |
| Measured Mineral Resources |
62 |
24 |
15 |
Flooded mine extent |
83 |
| Indicated Mineral Resources |
102 |
22 |
23 |
Flooded mine extent |
83 |
| Measured + Indicated Mineral Resources |
164 |
23 |
38 |
|
|
| Inferred Mineral Resources |
10 |
21 |
2 |
Flooded mine extent |
83 |
1Sylvinite is a mixed evaporite containing NaCl and KCl. |
2Solution mining resource cutoff for flooded old working is the mining extents boundary. |
| Mineral Resources were prepared by RESPEC, a qualified firm for the estimate and independent of Intrepid Potash, for EOY 2023. |
| Mineral Resources are reported exclusive of Mineral Reserves, on a 100% basis. |
Mineral Resources are reported using inverse Distance Squared (ID2) estimation methods. |
Mt = million tons, % = percentage, K2O = potassium oxide |
11.2.2Mineral Resource Estimates for Bed 9
The resource estimate for Bed 9 is based on cored intervals and assay data from 21 holes (19 with grade and thickness). A similar methodology used for the Bed 5 resource estimation was used in the resource estimate for Bed 9. The maps show the 100-ft by 100-ft blocks lying both within the radius of influence of drill holes containing grade and thickness data and the lease boundary. Measured, Indicated, and Inferred resources were estimated by sampling blocks within a 1,320-ft, 3,960-ft and 7,920-ft ROI, respectively, from the drill hole sample point. Bed 9 grade (% K2O) and thickness grids for the property boundary are presented in Figures 11-4 and 11-5, respectively. Figure 11-6 shows ROIs for Measured, Inferred, and Indicated Mineral Resources for Bed 9. Measured, Indicated, and Inferred Mineral Resources for Bed 9 are presented in Table 11-2.
11.3Mineral Resource Summary Bed 5 and Bed 9
Table 11-3 shows the summary of the mineral resources for Beds 5 and 9 for the Cane Creek Mine. Mineral resources are reported exclusive of mineral reserves with an effective date of December 31, 2023.
|
|
|
|
|
|
2023 Estimated Resources and Reserves at Intrepid Potash-Moab
Prepared for Intrepid Potash, Inc.
February 14, 2024 |
40 |
Table 11-2. Bed 9 Sylvinite Mineral Resource Estimate effective December 31, 2023
|
|
|
|
|
|
|
|
|
|
|
|
|
|
|
|
|
|
| Moab - Bed 9 Sylvinite Mineral Resource Estimate effective December 31, 2023, based on $450/Product Ton Mine Site |
|
Resources |
|
|
| Bed 9 |
Sylvinite1 |
Grade |
Contained K2O |
Cutoff2 |
Processing Recovery |
|
(Mt) |
(%K2O) |
(Mt) |
|
(%) |
| Measured Mineral Resources |
35 |
29 |
10 |
Minimum of 3-ft and 18.95% K2O |
83 |
| Indicated Mineral Resources |
88 |
27 |
24 |
Minimum of 3-ft and 18.95% K2O |
83 |
| Measured + Indicated Mineral Resources |
123 |
28 |
34 |
|
|
| Inferred Mineral Resources |
28 |
24 |
7 |
Minimum of 3-ft and 18.95% K2O |
83 |
1Sylvinite is a mixed evaporite containing NaCl and KCl. |
2Solution mining resource cutoff for flooded old working is the mining extents boundary. |
| Mineral Resources are reported exclusive of Mineral Reserves, on a 100% basis. |
| Mineral Resources were prepared by RESPEC, a qualified firm for the estimate and independent of Intrepid Potash, for EOY 2023. |
Mineral Resources are reported using inverse Distance Squared (ID2) estimation methods. |
Mt = million tons, % = percentage, K2O = potassium oxide, ft = feet |
11.4Qualified Persons Opinion – Further Work
No further work is needed to establish the mineral resources. Ongoing extraction from the deposit verifies the resource.
|
|
|
|
|
|
2023 Estimated Resources and Reserves at Intrepid Potash-Moab
Prepared for Intrepid Potash, Inc.
February 14, 2024 |
41 |
Figure 11-4. Bed 9 Resource % K2O Grade Blocks
|
|
|
|
|
|
2023 Estimated Resources and Reserves at Intrepid Potash-Moab
Prepared for Intrepid Potash, Inc.
February 14, 2024 |
42 |
Figure 11-5. Bed 9 Resource Thickness Blocks
|
|
|
|
|
|
2023 Estimated Resources and Reserves at Intrepid Potash-Moab
Prepared for Intrepid Potash, Inc.
February 14, 2024 |
43 |
Figure 11-6. Mineral Resources for Bed 9
|
|
|
|
|
|
2023 Estimated Resources and Reserves at Intrepid Potash-Moab
Prepared for Intrepid Potash, Inc.
February 14, 2024 |
44 |
Table 11-3. Sylvinite Mineral Resource Estimate effective December 31, 2023
|
|
|
|
|
|
|
|
|
|
|
|
|
|
|
|
|
|
| Moab - Sylvinite Mineral Resource Estimate effective December 31, 2023 based on $450/Product Ton Mine Site |
|
Resources |
|
|
| Beds 5 & 9 |
Sylvinite1 |
Grade |
Contained K2O |
Cutoff2 |
Processing Recovery |
|
(Mt) |
(%K2O) |
(Mt) |
|
(%) |
| Measured Mineral Resources |
97 |
26 |
25 |
Minimum of 3-ft and 18.95% K2O |
83 |
| Indicated Mineral Resources |
190 |
25 |
47 |
Minimum of 3-ft and 18.95% K2O |
83 |
| Measured + Indicated Mineral Resources |
287 |
25 |
72 |
|
|
| Inferred Mineral Resources |
38 |
23 |
9 |
Minimum of 3-ft and 18.95% K2O |
83 |
1Sylvinite is a mixed evaporite containing NaCl and KCl. Pure KCl equates to 63.17% K2O by mass. |
2Solution mining resource cutoff for flooded old working is the mining extents boundary. |
| Mineral Resources were prepared by RESPEC, a qualified firm for the estimate and independent of Intrepid Potash, for EOY 2023. |
| Mineral Resources are reported exclusive of Mineral Reserves, on a 100% basis. |
Mt = million tons, % = percentage, K2O = potassium oxide, ft = feet |
|
|
|
|
|
|
2023 Estimated Resources and Reserves at Intrepid Potash-Moab
Prepared for Intrepid Potash, Inc.
February 14, 2024 |
45 |
12.0Mineral Reserve Estimates
Mineral reserves that are mined using solution mining methods are not subject to the traditional application of a cutoff grade but instead of operational limitations. According to 17 CFR § 229.1301 (2021), the following definitions are included for reference:
A probable mineral reserve is the economically mineable part of an indicated and, in some cases, a measured mineral resource.
A proven mineral reserve is the economically mineable part of a measured mineral resource. For a proven mineral reserve, the qualified person has a high degree of confidence in the results obtained from the application of the modifying factors and in the estimates of tonnage and grade or quality. A proven mineral reserve can only result from conversion of a measured mineral resource.
12.1Key Assumptions, Parameters, and Methods
By definition, modifying factors are the factors applied to a mine plan for the indicated and measured mineral resources and then evaluated in order to establish the economic viability of mineral reserves. The factors for Intrepid-Moab are solution mining parameters, mineral processing, and lease boundaries as shown in Table 12-1.
Intrepid has a long history of sales and marketing of their products. Sales are managed for all properties through the corporate office. Intrepid provided the historical demand and sales pricing through the statements of earnings (SOE) from 2007 to 2023. Potash market is further discussed in Section 16.
The product sale prices selected for analysis of brine cutoff grade is $360/product ton and a freight cost of $30/product ton. A cost of goods sold was estimated to be $198/t of product with a $28/ton credit for salt sales for an equivalent operating cost of $170/t. Economic modeling indicates brine grade equivalent to the production tonnage just to cover the cash expenses of 3.9% KCl, or in other words break-even.
The reserve estimate is based on a mine plan developed for the Cane Creek Mine. The estimate is based on the geologic model and assigned thicknesses and grades for the flooded old mine workings updip boundary (Bed 5) mapped to the decline curve and individual caverns (Bed 9). The production plan is included in Section 13. The plan is extended for 25 years. During that time, two to three sets of new caverns will need to be constructed.
12.2Mineral Reserves
12.2.1Mineral Reserve Estimates for Bed 5
Neuman (2000) developed the estimated area of reserves that have been depleted through solution mining inside and around the perimeter of the old mine workings, with the
|
|
|
|
|
|
2023 Estimated Resources and Reserves at Intrepid Potash-Moab
Prepared for Intrepid Potash, Inc.
February 14, 2024 |
46 |
exception of a large pillar within the perimeter. As such, this perimeter area has been excluded
from the reserve estimates for Bed 5. Reserves were estimated for updip and horizontal areas outside of Neuman’s 2000 perimeter. The mineral reserves were estimated as the difference between the reserves from the resource area and the net KCl tons extracted since 2001.
Though Bed 5 resources can be solution mined with additional horizontal caverns, the reserves estimate in this report only focuses on the net reserves remaining in the old mine as the planned horizontal caverns in Bed 9 are more than enough to support the required mine life for this report. The sylvinite volume, tonnage, KCl grade, and average bed thickness within proven and probable reserve areas are included in Table 12-1.
Table 12-1. Potash Reserves Remaining Updip of Solution Mining from Bed 5 Old Workings effective December 31, 2023
|
|
|
|
|
|
|
|
|
|
|
|
|
|
|
|
|
|
| Moab - Potash Reserves Remaining Updip of Solution Mining from Bed 5 Old Workings effective December 31, 2023, based on $360/Product Ton Mine Site |
|
Reserves |
|
|
| Bed 5 |
In-Place KCl |
In-Situ Grade1 |
Product2 |
Brine Cutoff Grade3 |
Processing Recovery |
|
(Mt) |
(%K2O) |
(Mt) |
(%K2O) |
(%) |
| Proven Mineral Reserves |
0.9 |
25.5 |
0.6 |
2.5 |
83 |
| Probable Mineral Reserves |
|
|
|
|
|
| Total Mineral Reserves |
0.9 |
25.5 |
0.6 |
|
|
1In-situ grade is the amount of K2O in the remaining pillars of the old works and is used to calculate the In-Place KCl. |
2Product tons are calculated by multiplying In-Place KCl by: dissolution factor of 89%, areal recovery of 100%, geologic factor of 94%, plant recovery of 86%, handling loss factor 97.5% and product purity of 104% (1/0.96). |
3Brine cutoff grade is the amount of K2O in the extracted brine necessary to cover the cash costs of production. |
| Mineral Reserves were prepared by RESPEC, a qualified firm for the estimate and independent of Intrepid Potash, for EOY 2023. |
| Mineral Reserves are reported exclusive of Mineral Resources, on a 100% basis. |
Mt = million tons, % = percentage, K2O = potassium oxide, ft = feet |
The dissolution factor assumes that the concentration of pregnant brine solution remaining in the caverns will be approximately 7.2% KCl by weight, the average historical value for the Bed 5 cavern.
The volume and tonnage of ore as listed in Table 12-3 represents the reserves from the measured and indicated resource area on the horizontal plane and updip areas of the old workings as shown in Figure 12-1.
12.2.2Mineral Reserve Estimates for Bed 9
Figure 12-2 shows the proven and probable reserves for Bed 9 with three existing operating caverns and three additional planned caverns. Table 12-2 presents an estimate of the reserves within the current and future well system area using grade and thickness drillhole data and production to date. No estimate was made of the ore tons, average thickness, and average grade for the previously solution-mined areas from Bed 9, only the equivalent tons of K2O and
|
|
|
|
|
|
2023 Estimated Resources and Reserves at Intrepid Potash-Moab
Prepared for Intrepid Potash, Inc.
February 14, 2024 |
47 |
KCl were estimated. To date, about 1,110,000 t of KCl have been mined from Bed 9. The modifying factors required to convert the in-place tons into reserve tons are also listed. These factors are the same as those listed for Bed 5 with the exception of the dissolution factor. The Bed 9 dissolution factor was estimated using a concentration of 7.42% KCl by weight.
Table 12-2. Potash Reserve Estimate for the Current and Planned Bed 9 Well System Area effective December 31, 2023
|
|
|
|
|
|
|
|
|
|
|
|
|
|
|
|
|
|
| Moab - Potash Reserve Estimate for the Current and Planned Bed 9 Well System Area effective December 31, 2023, based on $360/Product Ton Mine Site |
|
Reserves |
|
|
| Bed 9 |
In-Place KCl |
In-Situ Grade1 |
Product2 |
Brine Cutoff Grade3 |
Processing Recovery |
|
(Mt) |
(%K2O) |
(Mt) |
(%K2O) |
(%) |
| Proven Mineral Reserves |
2.3 |
29.7 |
1.6 |
2.5 |
83 |
| Probable Mineral Reserves |
0.4 |
28.9 |
0.3 |
2.5 |
83 |
| Total Mineral Reserves |
2.7 |
29.6 |
1.9 |
|
|
1In-situ grade is the amount of K2O in the remaining pillars of the old works and is used to calculate the In-Place KCl. |
2Product tons are calculated by multiplying In-Place KCl by: dissolution factor of 89%, areal recovery of 100%, geologic factor of 94%, plant recovery of 86%, handling losses factor 97.5%, and product purity of 104% (1/0.96). |
3Brine cutoff grade is the amount of K2O in the extracted brine necessary to cover the cash costs of production. |
| Mineral Reserves were prepared by RESPEC, a qualified firm for the estimate and independent of Intrepid Potash, for EOY 2023. |
| Mineral Reserves are reported exclusive of Mineral Resources, on a 100% basis. |
Mt = million tons, % = percentage, K2O = potassium oxide |
12.3Reserve Summary
The estimated Bed 5 and Bed 9 reserves of the Intrepid-Moab property to be mined using in-situ dissolution are shown in Table 12-3.
12.4Qualified Persons Opinion – Further Work
It is the opinion of the QP that no further work is needed to determine reserves. The mine is currently and has been historically successful at production of potash.
|
|
|
|
|
|
2023 Estimated Resources and Reserves at Intrepid Potash-Moab
Prepared for Intrepid Potash, Inc.
February 14, 2024 |
48 |
Figure 12-1. Bed 5 Proven and Probable Reserves
|
|
|
|
|
|
2023 Estimated Resources and Reserves at Intrepid Potash-Moab
Prepared for Intrepid Potash, Inc.
February 14, 2024 |
49 |
Figure 12-2. Bed 9 Proven and Probable Reserves
|
|
|
|
|
|
2023 Estimated Resources and Reserves at Intrepid Potash-Moab
Prepared for Intrepid Potash, Inc.
February 14, 2024 |
50 |
Table 12-3. Potash Mineral Reserve Estimate effective December 31, 2023
|
|
|
|
|
|
|
|
|
|
|
|
|
|
|
|
|
|
| Moab - Potash Mineral Reserve Estimate effective December 31, 2023, based on $360/Product Ton Mine Site |
|
Reserves |
|
|
| Beds 5 and 9 |
In-Place KCl |
In-Situ Grade1 |
Product2 |
Brine Cutoff Grade2 |
Processing Recovery |
|
(Mt) |
(%K2O) |
(Mt) |
(%K2O) |
(%) |
| Proven Mineral Reserves |
3.1 |
28.3 |
2.3 |
2.5 |
83 |
| Probable Mineral Reserves |
0.4 |
28.9 |
0.3 |
2.5 |
83 |
| Total Mineral Reserves |
3.5 |
28.4 |
2.6 |
|
|
1In-situ grade is the amount of K2O in the remaining pillars of the old works and is used to calculate the In-Place KCl. |
2Product tons are calculated by multiplying In-Place KCl by: dissolution factor of 89%, areal recovery of 100%, geologic factor of 94%, plant recovery of 86%, handling loss factor of 97.5%, and product purity of 104% (1/0.96). |
3Brine cutoff grade is the amount of K2O in the extracted brine necessary to cover the cash costs of production. |
| Mineral Reserves were prepared by RESPEC, a qualified firm for the estimate and independent of Intrepid Potash, for EOY 2023. |
| Mineral Reserves are reported exclusive of Mineral Resources, on a 100% basis. |
Mt = million tons, % = percentage, K2O = potassium oxide |
|
|
|
|
|
|
2023 Estimated Resources and Reserves at Intrepid Potash-Moab
Prepared for Intrepid Potash, Inc.
February 14, 2024 |
51 |
13.0Mining Methods
Mining at Intrepid-Moab is by the solution mining technique referred to as “selective solution mining.” Selective solution mining dissolves only the KCl component of the sylvinite and leaves the sodium chloride component underground. Intrepid-Moab employs 60 people.
Brine saturated in NaCl and partially saturated in KCl is injected into either the old mine workings of Bed 5 or the horizontal Bed 9 caverns via injection wells. Brine that is near saturation with KCl (pregnant brine solution) is withdrawn via extraction wells. The old works solution is essentially an underground lake. The horizontal caverns operate under pressure, thus requiring the injection and extraction to take place simultaneously. The pregnant brine solution is piped to shallow evaporation/solar ponds with an aerial expanse of approximately 400 acres.
KCl production is a function of brine grade and the well extraction rate and is limited by the solar ponds’ evaporation rate. Brine grade is a function of retention time within each bed.
13.1Solution Mining Bed 5
The production history for solution mining from the flooded workings in Bed 5 is presented in Figure 13-1. Since 1971, solution mining from Bed 5 has produced approximately 5.5 Mt of KCl.
Figure 13-1. Solution Mining Product Tons of KCl by Bed
|
|
|
|
|
|
2023 Estimated Resources and Reserves at Intrepid Potash-Moab
Prepared for Intrepid Potash, Inc.
February 14, 2024 |
52 |
Since 2015, extracted brine from Bed 5 is a mixture of KCl from both beds and therefore, it is not possible to determine exactly how much of each bed’s KCl is being produced. For this estimation, the assumption is made that all injected KCl is extracted on an annual basis. Therefore, Bed 5 KCl production is the difference in KCl extracted from the wells and Bed 9 injection. Extraction brine is currently sourced from seven wells.
Future production plans for the Intrepid-Moab operation include continued production from Bed 5 and Bed 9. In 2023, Bed 5 contributed approximately 6% of the total KCl produced by the Intrepid-Moab operation. Table 13-1 summarizes the net KCl tons sent to the evaporation ponds per year by bed from 2001 to 2023. Detailed allocation of where tons have been recovered within the footprint of the old workings is not possible with the available data.
|
|
|
|
|
|
2023 Estimated Resources and Reserves at Intrepid Potash-Moab
Prepared for Intrepid Potash, Inc.
February 14, 2024 |
53 |
Table 13-1. Comparison of Net Extraction KCl Tons for Beds 5 and 9 from 2001 to 2023*
|
|
|
|
|
|
|
|
|
|
|
|
|
|
|
|
|
|
|
|
|
|
|
|
| Year |
Bed 5
(tons)
|
Bed 9
(tons)
|
Total Net of KCl
(tons)
|
Production by Bed 5
(%)
|
Production by Bed 9
(%)
|
|
|
|
|
|
|
| 2001 |
137,486 |
0 |
137,486 |
100.0 |
0.0 |
| 2002 |
139,855 |
0 |
139,855 |
100.0 |
0.0 |
| 2003 |
92,739 |
14,822 |
107,561 |
86.2 |
13.8 |
| 2004 |
101,873 |
20,061 |
121,934 |
83.5 |
16.5 |
| 2005 |
69,318 |
19,440 |
88,758 |
78.1 |
21.9 |
| 2006 |
57,723 |
29,758 |
87,481 |
66.0 |
34.0 |
| 2007 |
64,590 |
30,259 |
94,849 |
68.1 |
31.9 |
| 2008 |
63,816 |
28,044 |
91,860 |
69.5 |
30.5 |
| 2009 |
93,467 |
26,283 |
119,750 |
78.1 |
21.9 |
| 2010 |
82,125 |
31,139 |
113,264 |
72.5 |
27.5 |
| 2011 |
77,789 |
29,952 |
107,741 |
72.2 |
27.8 |
| 2012 |
84,671 |
34,664 |
119,335 |
71.0 |
29.0 |
| 2013 |
71,255 |
44,802 |
116,057 |
61.4 |
38.6 |
| 2014 |
43,238 |
70,463 |
113,701 |
38.0 |
62.0 |
| 2015 |
8,518 |
109,798 |
118,317 |
7.2 |
92.8 |
| 2016 |
28,488 |
68,883 |
97,371 |
29.3 |
70.7 |
| 2017 |
68,153 |
79,131 |
147,285 |
46.3 |
53.7 |
| 2018 |
20,178 |
93,843 |
114,020 |
17.7 |
82.3 |
| 2019 |
1,866 |
72,884 |
74,750 |
2.5 |
97.5 |
| 2020 |
56,033 |
84,098 |
140,131 |
40.0 |
60.0 |
| 2021 |
41,674 |
59,036 |
100,710 |
41.4 |
58.6 |
| 2022 |
17,681 |
66,114 |
83,794 |
41.6 |
58.4 |
| 2023 |
19,434 |
75,366 |
94,800 |
5.8 |
94.2 |
|
1,441,970 |
1,088,840 |
2,530,810 |
|
|
*Tonnages from Intrepid-Moab mass balance table. |
| Annual tons represent annual evaporation cycle (e.g. 2021 = Sept. 2020 - Aug. 2021) |
|
|
|
|
|
|
|
|
|
|
|
|
2023 Estimated Resources and Reserves at Intrepid Potash-Moab
Prepared for Intrepid Potash, Inc.
February 14, 2024 |
54 |
Future recovery of potash from solution mining in the existing Bed 5 cavern is possible from both updip and horizontal locations from the existing mine perimeter and from new Bed 5 horizontal caverns. The estimated solution mine perimeter is shown in Figure 13-2.
13.2Solution Mining Bed 9
Solution mining in Bed 9 began on July 30, 2002, with the drilling of two horizontal wells. An additional well was drilled into this system in 2005. This series of three wells make up Cavern 1. An additional horizontal well was drilled into Cavern 1 in 2012 to stimulate additional production from this cavern. Two new caverns, Caverns 2 and 3, were drilled in 2012–2013 and consist of four wells. Injection into Cavern 2 began in early 2013. Cavern 3 injection began in 2014. Approximately 1.1 M t of KCl have been produced from Bed 9 since 2003. Cavern 4 was drilled in 2023.
The development of horizontal caverns for solution mining in Bed 9 was novel and unprecedented in 2002 in the potash industry when Intrepid-Moab drilled the first wells. The horizontal holes were drilled with the intent of maintaining contact with Bed 9 and developing caverns laterally by selective solution mining. The net KCl tons sent from Bed 9 since 2003 are listed in Table 13-1 and indicate that, on average, 48,000 t of KCl have been extracted per annum. The proportion of tons extracted from Bed 9 is approximately 70% of total extracted tons since 2013. Since 2015, approximately 25% of the extraction from Bed 9 has been injected into the Bed 5 old workings cavern. The estimated solution mine perimeter is shown in Figure 13-2. Additional caverns, 5, 6, 7 and beyond, could be placed in a number of alternative locations as illustrated in Figure 13-2. Mine life is well in excess of 25 years.
|
|
|
|
|
|
2023 Estimated Resources and Reserves at Intrepid Potash-Moab
Prepared for Intrepid Potash, Inc.
February 14, 2024 |
55 |
Table 13-2. 25-Year Mine Plan
|
|
|
|
|
|
|
|
|
|
|
|
|
|
|
|
|
|
|
|
|
|
|
|
|
|
|
|
|
|
|
|
|
|
R |
S |
T |
U |
V |
W |
| Year |
Timing |
Brine Extracted (gallons) |
Brine Grade
(%K2O)
|
K2O
(tons)
|
Product KCl
(tons)
|
Handling Losses (tons) |
MOP
(tons)
|
| 2024 |
Year 1 |
340,000,000 |
4.5 |
66,900 |
110,600 |
2,800 |
107,800 |
| 2025 |
Year 2 |
340,000,000 |
4.4 |
66,500 |
109,900 |
2,700 |
107,200 |
| 2026 |
Year 3 |
340,000,000 |
4.4 |
65,500 |
108,300 |
2,700 |
105,600 |
| 2027 |
Year 4 |
340,000,000 |
4.3 |
65,000 |
107,400 |
2,700 |
104,700 |
| 2028 |
Year 5 |
340,000,000 |
4.3 |
65,000 |
107,400 |
2,700 |
104,700 |
| 2029 |
Year 6 |
340,000,000 |
4.3 |
64,600 |
106,800 |
2,700 |
104,100 |
| 2030 |
Year 7 |
340,000,000 |
4.2 |
63,300 |
104,600 |
2,600 |
102,000 |
| 2031 |
Year 8 |
340,000,000 |
4.2 |
63,600 |
105,100 |
2,600 |
102,500 |
| 2032 |
Year 9 |
340,000,000 |
4.0 |
59,800 |
98,800 |
2,500 |
96,300 |
| 2033 |
Year 10 |
340,000,000 |
3.9 |
59,300 |
98,000 |
2,500 |
95,500 |
| 2034 |
Year 11 |
340,000,000 |
4.2 |
62,400 |
103,100 |
2,600 |
100,500 |
| 2035 |
Year 12 |
340,000,000 |
4.3 |
65,000 |
107,400 |
2,700 |
104,700 |
| 2036 |
Year 13 |
340,000,000 |
4.3 |
65,000 |
107,400 |
2,700 |
104,700 |
| 2037 |
Year 14 |
340,000,000 |
4.3 |
64,600 |
106,800 |
2,700 |
104,100 |
| 2038 |
Year 15 |
340,000,000 |
4.3 |
64,200 |
106,100 |
2,700 |
103,400 |
| 2039 |
Year 16 |
340,000,000 |
4.3 |
64,100 |
106,000 |
2,700 |
103,300 |
| 2040 |
Year 17 |
340,000,000 |
4.2 |
63,600 |
105,100 |
2,600 |
102,500 |
| 2041 |
Year 18 |
340,000,000 |
4.2 |
63,600 |
105,100 |
2,600 |
102,500 |
| 2040 |
Year 19 |
340,000,000 |
4.2 |
63,600 |
105,100 |
2,600 |
102,500 |
| 2041 |
Year 20 |
340,000,000 |
4.2 |
63,600 |
105,100 |
2,600 |
102,500 |
| 2042 |
Year 21 |
340,000,000 |
4.2 |
63,600 |
105,100 |
2,600 |
102,500 |
| 2045 |
Year 22 |
340,000,000 |
4.2 |
63,100 |
104,300 |
2,600 |
101,700 |
| 2046 |
Year 23 |
340,000,000 |
4.2 |
63,100 |
104,300 |
2,600 |
101,700 |
| 2047 |
Year 24 |
340,000,000 |
4.2 |
63,100 |
104,300 |
2,600 |
101,700 |
| 2048 |
Year 25 |
340,000,000 |
4.2 |
63,100 |
104,300 |
2,600 |
101,700 |
| *Numbers rounded for clarity |
|
|
|
|
|
| Extraction brine density - 1.24 |
|
|
|
|
|
| KCl plant recovery - 86% |
|
|
|
|
|
| Product purity - 96% |
Pure KCl equates to 63.17% K2O by mass |
|
|
|
|
| Handling losses - 2.5% |
| T= R*(S/100)*1.24*8.34/2000*0.86 |
| U = T/0.6317/0.96 |
|
|
|
|
|
|
| V = U*0.025 |
|
|
|
|
|
|
| W = U-V |
|
|
|
|
|
|
|
|
|
|
|
|
|
|
|
|
|
|
|
|
|
2023 Estimated Resources and Reserves at Intrepid Potash-Moab
Prepared for Intrepid Potash, Inc.
February 14, 2024 |
56 |
Figure 13-2. Footprint of Underground Workings for 25-Year Plan Bed 5 and Bed 9
|
|
|
|
|
|
2023 Estimated Resources and Reserves at Intrepid Potash-Moab
Prepared for Intrepid Potash, Inc.
February 14, 2024 |
57 |
14.0Processing and Recovery Methods
Mining by solution methods ends with the delivery of the brine to the evaporation ponds. Mineral processing begins with pond sequencing to enhance crystallization of the potash. The crystals remaining in the ponds after solar evaporation are harvested and processed through the mill where the potash is separated from other salts, then concentrated by flotation. The concentrates are then dried, compacted, and screened into premium grades of white potash. Both potash and salt products are processed at the plant facility at a rate of 400 to 1,200 tons per day (tpd).
The Intrepid-Moab processing plant uses nominally 350M gallons per year of river water to produce 350M gallons per year of NaCl-saturated (21% by weight) evaporation pond feed solution at 6.5–7.5% KCl. The injection liquor typically contains 2% KCl and is near NaCl saturation (21%). The evaporation ponds (Figure 14-1) concentrate and crystallize the brine to produce about 530,000 tpy of crystal at 15% K2O (22%-24% KCl) with the remainder being largely halite. As cavern development progresses, the overall production is projected to stay relatively consistent around 102,800 tpy.
A simplified processing flow diagram is included in Figure 14-2. The pond crystals are mechanically harvested, re-pulped in double-saturated brine, and pumped to the processing facility. The crystals are statically screened with the oversize processed through a crusher. The screened crystal is combined with reagents and fed to flotation cells.
The rougher flotation concentrate is sent to the agitated leach tank. The leached solids are at a product grade of 95.5% KCl with 60.5% K2O. The solids are dried, sampled, and conveyed to storage bins prior to the granulation and sizing circuit.
Dried product material is granulated using a roll compactor and resulting flakes are further reduced in size with a crusher. Product is then sent to the curing dryer and screened before being sent to the final product storage. The product is shipped to market in trucks or rail cars.
|
|
|
|
|
|
2023 Estimated Resources and Reserves at Intrepid Potash-Moab
Prepared for Intrepid Potash, Inc.
February 14, 2024 |
58 |
Figure 14-1. Evaporation Ponds at Intrepid-Moab
|
|
|
|
|
|
2023 Estimated Resources and Reserves at Intrepid Potash-Moab
Prepared for Intrepid Potash, Inc.
February 14, 2024 |
59 |
Figure 14-2. Intrepid-Moab Process Flow Diagram
|
|
|
|
|
|
2023 Estimated Resources and Reserves at Intrepid Potash-Moab
Prepared for Intrepid Potash, Inc.
February 14, 2024 |
60 |
15.0Infrastructure
The Intrepid-Moab mine has a robust infrastructure in place. They have adequate water rights on the Colorado River. The mining operation is accessible by a paved county road and accessible by rail. Electric power is fed from local utilities to a recently upgraded substation. The infrastructure layout is shown in Figure 15-1.
|
|
|
|
|
|
2023 Estimated Resources and Reserves at Intrepid Potash-Moab
Prepared for Intrepid Potash, Inc.
February 14, 2024 |
61 |
Figure 15-1. Site Infrastructure Layout
|
|
|
|
|
|
2023 Estimated Resources and Reserves at Intrepid Potash-Moab
Prepared for Intrepid Potash, Inc.
February 14, 2024 |
62 |
16.0Market Studies
Price projections are based on a combination of historic pricing trends and expectations of future potash consumption and production. Intrepid uses a variety of sources including, but not limited to, industry reports, company announcements, third-party market studies, and internal estimates when establishing a forecasted price. Intrepid compares its historic realized pricing to widely available benchmark prices, specifically the Midwest Warehouse potash price and the U.S. New Orleans Louisiana (“NOLA”) Barge Market potash price, to establish a historic price differential which it uses when analyzing future price expectations.
|
|
|
|
|
|
2023 Estimated Resources and Reserves at Intrepid Potash-Moab
Prepared for Intrepid Potash, Inc.
February 14, 2024 |
63 |
17.0Environmental Studies, Permitting, and Plans
Intrepid-Moab holds numerous environmental and other permits and governmental approvals authorizing the operations at the facility. Operations are subject to permits for, among other things, injection and extraction of salt and brine, discharges of process materials and waste to air and surface water, and injection of brine. Intrepid-Moab is obligated to reclaim and remediate disturbed lands when they cease operations.
The solar ponds are lined to prevent brine from leaking into the ground and the Colorado River. A series of cutoff structures (ditches) have been constructed in drainages to intercept any seepage and return potassium-rich brine to the ponds.
17.1Environmental Studies
Hydrologic modeling was conducted to evaluate the impact of potential releases from the solar ponds to the Colorado River. There is limited vertical permeability across the site. Cutoffs with pumps are in place to limit sediment releases during operation.
17.2Waste and Tailings Disposal, Site Monitoring, and Water Management During and After Mine Closure
The property had legacy NaCl waste stored on site from the previous owner. This NaCl is being removed and replaced back into the underground during the solution mining process. The solution mining process in use at the mine does not generate waste. Regular monitoring is conducted per the permit.
17.3Permitting Status and Reclamation Bonds
The property is in active production and holds all necessary permits. The permits and bond are listed in Table 17-1.
17.3Agreements with Local Individuals
There are no specific agreements with local individuals. Hiring is typically done locally if the expertise is available.
17.4Closure Plans
The closure plan includes plugging and abandoning wells, a disposal well to dispose of brine impacted waters followed by complete structure demolition, salt impacted media treatment, and reseeding. The post-mining site will be returned to pre-mine land use consideration. The final reclaimed site will contain no structural evidence of past mining operations.
|
|
|
|
|
|
2023 Estimated Resources and Reserves at Intrepid Potash-Moab
Prepared for Intrepid Potash, Inc.
February 14, 2024 |
64 |
Table 17-1. Permit Status
|
|
|
|
|
|
|
|
|
|
|
|
|
|
|
|
|
|
|
|
|
|
|
|
|
|
|
|
| Common Name |
Issuing Agency |
Permit ID |
Effective Date |
Expiration Date |
Bond Value |
Note |
|
|
|
|
|
|
|
| Air Permit |
Utah Division of Air Quality |
Approval Order #: DAQE-AN102510004-13 |
1-Oct-13 |
None |
|
|
| UIC Permit |
Utah Division of Water Quality |
Underground Injection Control Program
Permit No.: UTU-19-AP-1C3C2E8 |
6-May-15 |
Division to review after 5 years |
$ |
2,143,895 |
Application for renewal submitted July 6, 2020; application renewed in 2023 and bond value updated. |
| Class IIIb Landfill Permit |
Utah Division of Waste Management and Radiation Control |
Waste Management and Radiation Control Board
Permit# 0401R1 |
17-Feb-10 |
21-Jun-2030 |
$ |
200,592 |
Trust created at US Bank; balance as of 11-Nov-23. |
| Radioactive devices |
Utah Division of Waste Management and Radiation Control |
Radioactive Material License No.:
UT 1000019, Amendment #14 |
Revised 13-May-2022 |
31-Oct-2029 |
|
|
| Storm Water Pollution Prevention Plan |
Utah Division of Water Quality |
General Permit No.: UTR000111 |
1-Jan-23 |
31-Dec-28 |
|
The renewal process takes place every 5 years. |
| Spill Prevention, Control and Countermeasure Plan |
Self-issued |
|
Amended
1-Jun-16
|
Review by Jun 1, 2026 |
|
Prepared by JBR Environmental Consultants, Inc., March 2010. |
| Fugitive Dust Control Plan (FDCP) |
Utah Division of Air Quality |
|
Jan-14 |
None |
|
Intrepid maintains the most up to date FDCP onsite dated 2-Feb-2014. |
| Solid and Hazardous Waste Management Plan |
Self-issued |
|
21-Jan-04 |
None |
|
[Not a permit, IPM is a Very Small Quantity Generator] |
| Mine and Reclamation Plan |
Utah Division of Oil Gas and Mining |
Notice of Intentions to Revise Mining Operations
File No.: M/019/005 |
20-Jun-16 |
LOM with periodic reviews every 5 years. Next review due 2026. |
$ |
7,509,000 |
Application for renewal submitted April 30, 2021—awaiting approval |
| Stockpile Dam |
Utah Division of Water Rights |
Emergency Action Plan for Dam
ID# UT00438 |
13-Apr-15 |
None |
|
Inspections performed every other year. Revised September 16, 2020, |
|
|
|
|
|
|
|
|
|
|
|
|
|
2023 Estimated Resources and Reserves at Intrepid Potash-Moab
Prepared for Intrepid Potash, Inc.
February 14, 2024 |
65 |
17.5Adequacy of Current Plans and Compliance
It is the opinion of the QP that the current plans are sufficient, and operations are maintaining compliance.
|
|
|
|
|
|
2023 Estimated Resources and Reserves at Intrepid Potash-Moab
Prepared for Intrepid Potash, Inc.
February 14, 2024 |
66 |
18.0Capital and Operating Costs
18.1Capital Cost Estimate
Future capital outlays will be required to maintain production at the Intrepid-Moab mine. The mine plan provided by Intrepid-Moab indicates that additional horizontal well sets are planned similar to wells drilled in 2013. Future needs call for caverns to be drilled approximately every 10 years. With that timing in mind, one cavern was constructed in 2023. The actual timing for construction of the next caverns depends on the performance of the existing caverns. New cavern capital cost is estimated at $10 Million approximately every 10 years. The reclamation cost is included in year 2048 as $9.6Million.
The evaporative capacity of the ponds and the net concentration of the pregnant brine solution in the ponds limit the production rate from the facility. Future plans call for an average production of 102,800 tpy from Beds 5 and 9 combined, which will not require any evaporative pond expansions.
18.2Operating Cost Estimate
Intrepid-Moab has been providing income statements for review since 2007. These income statements serve as the basis for establishing the operating cost as shown in Table 18-1.
Table 18-1. Unit Operating Cost Estimate
|
|
|
|
|
|
|
|
|
|
|
|
| Cost Category |
$/Product Ton |
Cost Distribution |
|
|
|
| Labor including Benefits |
$68 |
34% |
|
|
|
| Maintenance Supplies |
$19 |
10% |
|
|
|
| Operating Supplies including Reagents |
$19 |
17% |
|
|
|
| Natural Gas, Electricity, and Fuel |
$34 |
10% |
|
|
|
| Leases, Property Tax, Insurance etc. |
$29 |
15% |
|
|
|
Subtotal |
$170 |
86% |
|
|
|
| Warehouse and Handling |
$11 |
5% |
|
|
|
| Royalties |
$17 |
8% |
|
|
|
| Environmental remediation and other non-inventory costs |
$1 |
1% |
|
|
|
|
$198 |
100% |
|
|
|
| Less by product revenues |
($26) |
|
|
|
|
Cost of Goods Sold |
$172 |
|
|
|
|
|
|
|
|
|
|
2023 Estimated Resources and Reserves at Intrepid Potash-Moab
Prepared for Intrepid Potash, Inc.
February 14, 2024 |
67 |
18.3Accuracy Discussion
Operating costs, including warehouse, handling and royalty expenses are based on historical actual expenses. The operating costs are at an accuracy of at least +/- 15%.
Our capital costs are based on actual bids or recent purchases of capital items plus an inflation factor. The capital costs estimates are at an accuracy of at least +/- 25% and contingency levels are less than 25%.
Our reclamation costs are based on the most recent reclamation bond update and asset retirement obligations and are estimated to be accurate to at least +/- 15%.
|
|
|
|
|
|
2023 Estimated Resources and Reserves at Intrepid Potash-Moab
Prepared for Intrepid Potash, Inc.
February 14, 2024 |
68 |
19.0Economic Analysis
To evaluate the viability of continued mining of the Intrepid–Moab potash reserves, an economic analysis was conducted. Annual revenue and production cost schedules were used to build a projected cash flow to accompany the mine plan. The costs and sales price parameters were assumed to be in constant US dollars.
19.1Key Assumptions, Parameters, and Methods
The property has a long history of operation at this location. The assumption list for the economic analysis is shown in Table 19-1.
Table 19-1. Economic Analysis Assumptions
|
|
|
|
|
|
|
|
| Parameter |
Assumption |
| Potash Sale Price (mine site) |
$360/t |
| Shipping Potash |
$30/t |
| Potash Production Target |
102,800 tpy |
| Interest Rate |
0–12% APR |
| Income Taxes (State and Federal) |
26% |
19.2Economic Analysis
For a property in operation, the economic viability may be implied. The cash flow was developed using the mine plan and is listed in Table 19-2. The after-tax cash flow is listed in Table 19-3. The cashflows are shown graphically in Figures 19-1 and 19-2 for pre- and after-tax, respectively. Annual ore production, ore grade and tons of product produced used in both the pre-tax and after-tax cash flow analyses are taken from the annual life of mine production schedule as shown in Section 13: Mining Methods included in this Technical Report Summary. The annual life of mine production schedule provides the calculation of product tons resulting from tons of ore mined and the associated grade of ore mined.
19.3Sensitivity Analysis
NPV sensitivity analyses were run using variants in commodity price and operating costs for the pre-tax cash flow. The results of the sensitivity analysis are shown graphically in Figures 19-3 and 19-4 for pre- and after-tax, respectively.
19.4Discussion
Economic analysis using the price and cost assumptions shows the operation is expected to continue to be profitable over the reserve life.
|
|
|
|
|
|
2023 Estimated Resources and Reserves at Intrepid Potash-Moab
Prepared for Intrepid Potash, Inc.
February 14, 2024 |
69 |
Table 19-2. Estimated Pre-Tax Cash Flow
|
|
|
|
|
|
|
|
|
|
|
|
|
|
|
|
|
|
|
Five-Year Periods |
| Item |
2024 - 2028 |
2029 - 2033 |
2034 - 2038 |
2039 - 2043 |
2044 - 2048 |
| Tons of product production |
530,000 |
500,400 |
517,400 |
513,300 |
509,300 |
|
|
|
|
|
|
| Potash Sales price per ton mine site |
$360 |
|
$360 |
|
$360 |
|
$360 |
|
$360 |
|
| Transportation cost per ton |
$30 |
|
$30 |
|
$30 |
|
$30 |
|
$30 |
|
| Net sales price per ton |
$330 |
|
$330 |
|
$330 |
|
$330 |
|
$330 |
|
|
|
|
|
|
|
| Period net revenue |
$174,900,000 |
|
$165,132,000 |
|
$170,742,000 |
|
$169,389,000 |
|
$168,069,000 |
|
|
|
|
|
|
|
| Cost per product ton, excluding depreciation |
$170 |
|
$177 |
|
$173 |
|
$174 |
|
$175 |
|
| Warehouse & Handling per product ton |
$11 |
|
$11 |
|
$11 |
|
$11 |
|
$11 |
|
| Royalties per product ton |
$17 |
|
$17 |
|
$17 |
|
$17 |
|
$17 |
|
| Environmental remediation and other non-inventory costs |
$1 |
|
$1 |
|
$1 |
|
$1 |
|
$1 |
|
| Less byproduct revenues |
($26) |
|
($28) |
|
($27) |
|
($27) |
|
($27) |
|
| Operating costs per production ton, excluding deprecation |
$172 |
|
$178 |
|
$175 |
|
$176 |
|
$177 |
|
|
|
|
|
|
|
| Less period operating costs, excluding depreciation |
($91,007,044) |
|
($88,941,660) |
|
($90,357,060) |
|
($90,015,699) |
|
($89,682,663) |
|
| Less period capital |
($28,000,000) |
|
($25,000,000) |
|
($35,000,000) |
|
($25,000,000) |
|
($35,000,000) |
|
| Less period remediation |
- |
|
- |
|
- |
|
- |
|
($9,648,185) |
|
| Estimated period pre-tax cashflow |
$55,892,956 |
|
$51,190,340 |
|
$45,384,940 |
|
$54,373,301 |
|
$33,738,152 |
|
|
|
|
|
|
|
2023 Estimated Resources and Reserves at Intrepid Potash-Moab
Prepared for Intrepid Potash, Inc.
February 14, 2024 |
70 |
Table 19-3. Estimated After-Tax Cash Flow
|
|
|
|
|
|
|
|
|
|
|
|
|
|
|
|
|
|
|
Five-Year Periods |
| Item |
2024 - 2028 |
2029 - 2033 |
2034 - 2038 |
2039 - 2043 |
2044 - 2048 |
| Tons of product production |
530,000 |
500,400 |
517,400 |
513,300 |
509,300 |
|
|
|
|
|
|
| Potash Sales price per ton mine site |
$360 |
|
$360 |
|
$360 |
|
$360 |
|
$360 |
|
| Transportation cost per ton |
$30 |
|
$30 |
|
$30 |
|
$30 |
|
$30 |
|
| Net sales price per ton |
$330 |
|
$330 |
|
$330 |
|
$330 |
|
$330 |
|
|
|
|
|
|
|
| Period net revenue |
$174,900,000 |
|
$165,132,000 |
|
$170,742,000 |
|
$169,389,000 |
|
$168,069,000 |
|
|
|
|
|
|
|
| Cost per product ton, excluding depreciation |
$170 |
|
$177 |
|
$173 |
|
$174 |
|
$175 |
|
| Warehouse & Handling per product ton |
$11 |
|
$11 |
|
$11 |
|
$11 |
|
$11 |
|
| Royalties per product ton |
$17 |
|
$17 |
|
$17 |
|
$17 |
|
$17 |
|
| Environmental remediation and other non-inventory costs |
$1 |
|
$1 |
|
$1 |
|
$1 |
|
$1 |
|
| Depreciation and Depletion |
$53 |
|
$56 |
|
$54 |
|
$55 |
|
$55 |
|
| Less byproduct revenues |
($26) |
|
($28) |
|
($27) |
|
($27) |
|
($27) |
|
| Total Operating Costs |
$225 |
|
$234 |
|
$229 |
|
$230 |
|
$231 |
|
|
|
|
|
|
|
| Total operating costs |
($119,296,522) |
|
($117,045,350) |
|
($118,460,750) |
|
($118,119,389) |
|
($117,786,353) |
|
|
|
|
|
|
|
| Estimated Pre-tax Income |
$55,603,478 |
|
$48,086,650 |
|
$52,281,250 |
|
$51,269,611 |
|
$50,282,647 |
|
|
|
|
|
|
|
| Estimated Taxes at 26% |
($14,456,904) |
|
($12,502,529) |
|
($13,593,125) |
|
($13,330,099) |
|
($13,073,488) |
|
| Estimated After Tax Income |
$41,146,574 |
|
$35,584,121 |
|
$38,688,125 |
|
$37,939,512 |
|
$37,209,158 |
|
|
|
|
|
|
|
| Add back Depreciation and Depletion |
$28,289,478 |
|
$28,103,690 |
|
$28,103,690 |
|
$28,103,690 |
|
$28,103,690 |
|
| Less Capital |
($28,000,000) |
|
($25,000,000) |
|
($35,000,000) |
|
($25,000,000) |
|
($35,000,000) |
|
| Less Remediation |
- |
|
- |
|
- |
|
- |
|
($9,648,185) |
|
| After-Tax Cash Flow |
$41,436,052 |
|
$38,687,811 |
|
$31,791,815 |
|
$41,043,202 |
|
$20,664,663 |
|
|
|
|
|
|
|
2023 Estimated Resources and Reserves at Intrepid Potash-Moab
Prepared for Intrepid Potash, Inc.
February 14, 2024 |
71 |
Figure 19-1. Estimated Pre-Tax Cash Flow
|
|
|
|
|
|
2023 Estimated Resources and Reserves at Intrepid Potash-Moab
Prepared for Intrepid Potash, Inc.
February 14, 2024 |
72 |
Figure 19-2. Estimated After-Tax Cash Flow
|
|
|
|
|
|
2023 Estimated Resources and Reserves at Intrepid Potash-Moab
Prepared for Intrepid Potash, Inc.
February 14, 2024 |
73 |
Table 19-4. NPV Pre-Tax Estimate
|
|
|
|
|
|
|
|
| Interest Rate |
NPV |
| (% APR) |
($M) |
| 0 |
$241 |
| 5 |
$140 |
| 8 |
$108 |
| 10 |
$93 |
| 12 |
$81 |
Table 19-5. NPV After-Tax Estimate
|
|
|
|
|
|
|
|
| Interest Rate |
NPV |
| (% APR) |
($M) |
| 0 |
$174 |
| 5 |
$102 |
| 8 |
$79 |
| 10 |
$68 |
| 12 |
$59 |
Figure 19-3. Pre-Tax NPV Sensitivities (APR 8%)
|
|
|
|
|
|
2023 Estimated Resources and Reserves at Intrepid Potash-Moab
Prepared for Intrepid Potash, Inc.
February 14, 2024 |
74 |
Figure 19-4. After-Tax NPV Sensitivity (APR 8%)
|
|
|
|
|
|
2023 Estimated Resources and Reserves at Intrepid Potash-Moab
Prepared for Intrepid Potash, Inc.
February 14, 2024 |
75 |
20.0Adjacent Properties
Adjacent properties are not applicable.
|
|
|
|
|
|
2023 Estimated Resources and Reserves at Intrepid Potash-Moab
Prepared for Intrepid Potash, Inc.
February 14, 2024 |
76 |
21.0Other Relevant Data and Information
No additional data or information is included.
|
|
|
|
|
|
2023 Estimated Resources and Reserves at Intrepid Potash-Moab
Prepared for Intrepid Potash, Inc.
February 14, 2024 |
77 |
22.0Interpretation and Conclusions
The QP’s review and resource and reserve estimations were performed to obtain a reasonable assurance of the estimates from the data provided by Intrepid. Based on the foregoing, the QP believes the findings are reasonable and realistic and have been developed using accepted engineering practices.
As with all geologic estimations, there is a level of risk and uncertainty because of sparse data. These estimates are considered reliable based on the historical success of mining operations recovering potash from this deposit. There is more uncertainty in future mining of the ore zones that have not been historically mined.
|
|
|
|
|
|
2023 Estimated Resources and Reserves at Intrepid Potash-Moab
Prepared for Intrepid Potash, Inc.
February 14, 2024 |
78 |
23.0Recommendations
Geophysical data and regional geology suggest that faulting may occur in Beds 5 and 9 in the vicinity of Cane Creek 14 with an orientation parallel to the Cane Creek anticline. The cavern plan accounts for areas where Bed 9 is expected to have excessive dip, bed undulations, or unfavorable geology. These areas are subject to modification as more geologic data is collected and evaluated.
|
|
|
|
|
|
2023 Estimated Resources and Reserves at Intrepid Potash-Moab
Prepared for Intrepid Potash, Inc.
February 14, 2024 |
79 |
24.0References
Agapito Associates, Inc. (2007a), “2007 Resource and Reserve Estimate for Solution Mine at Cane Creek Mine,” prepared for Intrepid Potash, April 24.
Agapito Associates, Inc. (2007b), “Determination of Estimated Proven and Probable Reserves at Intrepid Potash—Moab, LLC,” prepared for Intrepid Potash.
Agapito Associates, Inc. (2010), “Determination of Estimated Proven and Probable Potash Reserves at Intrepid PotashMoab, LLC,” prepared for Intrepid Potash, February 4.
Agapito Associates, Inc. (2013), “Determination of Estimated Proven and Probable Potash Reserves at Intrepid PotashMoab, LLC,” prepared for Intrepid Potash, February 12.
Agapito Associates, Inc. (2016), “Determination of Estimated Proven and Probable Potash Reserves at Intrepid PotashMoab, LLC,” prepared for Intrepid Potash, January 22.
Agapito Associates, Inc. (2019), “2018 Determination of Estimated Proven and Probable Potash Reserves at Intrepid PotashMoab, LLC,” prepared for Intrepid Potash, January 21.,45 pp.
Agapito Associates, Inc., 2021. “Technical Report Summary of Estimated Resources and Reserves at Intrepid Potash-Moab,” prepared for Intrepid Potash, February 18, 83 pp.
Agapito Associates, Inc. (2022), “Technical Report Summary of 2021 Estimated Resources and Reserves at Intrepid Potash-Moab,” prepared for Intrepid Potash, February 23, 64 pp.
Albertson, F. A. (1972), “Special Report on Study of Underground Operations in Solution Mining at Cane Creek Mine,” May.
Behre Dolbear & Company, Inc. (1961), “Estimates—Ore Reserves-Ore Recovery in Mining Development and Mining Plan Underground Capital Requirements and Operating Costs Depreciation on Underground Equipment,” prepared for Texas Gulf Sulphur Company, February.
Carlson Software, Inc. (2015), “Carlson Mining 2015” software package, available at <http://www.carlsonsw.com/>.
CFR (2021), “Disclosure by Registrants Engaged in Mining Operations,” § 229.1301, last amended September 1, available at <eCFR :: 17 CFR Part 229 Subpart 229.1300 -- Disclosure by Registrants Engaged in Mining Operations>
Doelling, H. H. (1985), “Geologic Map of Arches National Park and Vicinity, Grand County, Utah,” Utah Geological Survey, Map 74, scale: 1:50,000.
|
|
|
|
|
|
2023 Estimated Resources and Reserves at Intrepid Potash-Moab
Prepared for Intrepid Potash, Inc.
February 14, 2024 |
80 |
Fillmore (2010), “Geological Evolution of the Colorado Plateau of Eastern Utah and Western Colorado, Including the San Juan River, Natural Bridges, Canyonlands, Arches, and the Book Cliffs,” University of Utah Press, Salt Lake City, 495 pp.
Gruschow, N. (2000), “Cane Creek Potash Mine, Moab, Horizontal Pilot Test Cavern-Leaching Concept,” prepared for Intrepid Mining, LLC, August.
Higgins, R. S. (1970), “Solution Mining Test Work Report for February 1970,” Memorandum prepared for G.W. Gay, Texas Gulf Sulphur Company, March 19.
Hite, Robert J. (1960), “Stratigraphy of the Saline Facies of the Paradox Member of the Hermosa Formation of Southeastern Utah and Southwestern Colorado,” USGS, September 19, 17 pp.
Hite, Robert J. (1968), “Salt Deposits of the Paradox Basin, Southeast Utah and Southwest Colorado,” The Geological Society of America, Inc., Special Paper 88, USGS, Denver, Colorado.
Hite, Robert J. (1978), “The Geology of the Lisbon Valley Potash Deposits,” Open-File Report 78-148, USGS, 24 pp.
Joesting, H. R., J. E. Case and Donald Plouff (1966), “Regional Geophysical Investigations of the Moab-Needles Area, Utah,” Washington: US Government Printing Office, Geological Survey Professional Paper 516-C, 28 pp.
Nelson, Philip H. (2007), “Evaluation of Potash Grade with Gamma-ray Logs,” USGS OFR 2007-1292, 14 pp.
Neuman, Tom (2000a), “Perimeter Mining in the Old Mine,” letter from Neuman Consulting to Hugh Harvey of Intrepid Mining, LLC, September 27.
RESPEC (2023), “Technical Report Summary of REVISED 2021 Estimated Resources and Reserves at Intrepid Potash-Moab,” prepared for Intrepid Potash, November 27, 88 pp.
Schlumberger (1989), Log Interpretations Principles/Applications, SMP-7017, March, 241 pp.
SEC (2008), “Industry Guides,” OMB Number 3235-0069, 33 pp.
Society for Mining, Metallurgy, and Exploration, Inc. (1990), Surface Mining, 2nd Edition, Ed. Bruce A. Kennedy, PT Pelsart Management Services, Jakarta, Indonesia, Cosponsored by Seeley W. Mudd Memorial Fund of AIME, Port City Press, Inc., Baltimore, MD.
Stevenson, G.M. and Barrs, D.L. (1986), “The Paradox: A pull-apart basin of Pennsylvanian age,” in Peterson, J.A., ed., Paleotectonics and Sedimentation in the Rocky Mountain Region, United States: American Association of Petroleum Geologists Memoir 41:513539.
|
|
|
|
|
|
2023 Estimated Resources and Reserves at Intrepid Potash-Moab
Prepared for Intrepid Potash, Inc.
February 14, 2024 |
81 |
Taylor, J. B., M. R. Hunter, G. J. Despault and A. H. Agyako (1967), “Selective Extraction of Potassium Chloride from Saskatchewan Sylninite Ore,” The Canadian Journal of Chemical Engineering, 45:105–109, April.
|
|
|
|
|
|
2023 Estimated Resources and Reserves at Intrepid Potash-Moab
Prepared for Intrepid Potash, Inc.
February 14, 2024 |
82 |
25.0Reliance on Information
The QP relied on information provided by Intrepid and Intrepid-Moab for this reserve evaluation in the legal interpretation of lease agreements and permitting.
EX-96.3
12
exhibit963eoy2023technical.htm
EX-96.3
Document
Technical Report Summary
of the
2023 Estimated Resources and Reserves at Intrepid Potash-Wendover
Prepared for:
Intrepid Potash–Wendover, LLC
Report Date:
February 14, 2024
Effective Date:
December 31, 2023
Prepared by:
660 Rood Avenue, Suite A
Grand Junction, Colorado 81501
|
|
|
|
|
|
2023 Estimated Resources and Reserves at Intrepid Potash-Wendover
Prepared for Intrepid Potash, Inc.
February 14, 2024 |
ii |
Date and Signature Page
This report titled “Technical Report Summary of the 2023 Estimated Resources and Reserves at Intrepid Potash-Wendover” is effective as of December 31, 2023, and was prepared and signed by RESPEC Company, LLC, acting as a Qualified Person Firm.
Signed and Dated February 14, 2024.
Signed RESPEC Company, LLC
Susan B Patton, PE
Principal
On behalf of RESPEC Company, LLC
|
|
|
|
|
|
2023 Estimated Resources and Reserves at Intrepid Potash-Wendover
Prepared for Intrepid Potash, Inc.
February 14, 2024 |
iii |
Technical Report Summary
of the
2023 Estimated Resources and Reserves at Intrepid Potash-Wendover
Table of Contents
|
|
|
|
|
|
2023 Estimated Resources and Reserves at Intrepid Potash-Wendover
Prepared for Intrepid Potash, Inc.
February 14, 2024 |
iv |
|
|
|
|
|
|
2023 Estimated Resources and Reserves at Intrepid Potash-Wendover
Prepared for Intrepid Potash, Inc.
February 14, 2024 |
v |
|
|
|
|
|
|
2023 Estimated Resources and Reserves at Intrepid Potash-Wendover
Prepared for Intrepid Potash, Inc.
February 14, 2024 |
vi |
|
|
|
|
|
|
2023 Estimated Resources and Reserves at Intrepid Potash-Wendover
Prepared for Intrepid Potash, Inc.
February 14, 2024 |
vii |
List of Tables
|
|
|
|
|
|
2023 Estimated Resources and Reserves at Intrepid Potash-Wendover
Prepared for Intrepid Potash, Inc.
February 14, 2024 |
viii |
List of Figures
|
|
|
|
|
|
2023 Estimated Resources and Reserves at Intrepid Potash-Wendover
Prepared for Intrepid Potash, Inc.
February 14, 2024 |
ix |
List of Abbreviations
|
|
|
|
|
|
| ° |
degree |
| % |
percent |
| APR |
Annual Percentage Rate |
| BLM |
United States Bureau of Land Management |
| BSF |
Bonneville Salt Flats |
| CFR |
Code of Federal Regulations |
| CMC |
carboxy-methyl cellulose |
| EOY |
end of year |
| ft |
feet or foot |
ft2 |
square foot |
| gpd |
gallons per day |
| I-80 |
Interstate 80 |
| Intrepid |
Intrepid Potash, Inc. |
| Intrepid-Wendover |
Intrepid Potash–Wendover, LLC |
| IRR |
Internal Rate of Return |
| K |
potassium |
| KCl |
sylvite or potassium chloride |
lb/ft3 |
pounds per cubic foot |
| M |
million |
| Mg |
magnesium |
MgCl2 |
magnesium chloride |
MgCl2•KCl•6H2O |
carnallite |
| MOP |
Muriate of Potash |
| MSL |
mean sea level |
| MRS |
metal recovery salt |
| Mt |
million tons |
| Na |
sodium |
| NaCl |
sodium chloride or halite |
| NPV |
Net Present Value |
| NaCl |
halite |
| % |
percent |
| QP |
Qualified Person |
| RESPEC |
RESPEC Company, LLC |
| SEC |
United States Securities Exchange Commission |
| SME |
Society for Mining, Metallurgy & Exploration |
|
|
|
|
|
|
2023 Estimated Resources and Reserves at Intrepid Potash-Wendover
Prepared for Intrepid Potash, Inc.
February 14, 2024 |
x |
|
|
|
|
|
|
| SOE |
Statement of Earnings |
| t |
ton |
| tpd |
tons per day |
| tpy |
tons per year |
| UPRR |
Union Pacific Railroad |
| YPB |
years before present |
|
|
|
|
|
|
2023 Estimated Resources and Reserves at Intrepid Potash-Wendover
Prepared for Intrepid Potash, Inc.
February 14, 2024 |
1 |
1.0Executive Summary
RESPEC Company, LLC (RESPEC) was commissioned by Intrepid Potash, Inc. (Intrepid) to prepare the 2023 Technical Report Summary (TRS) filed as Exhibit 96.3 with the Intrepid Potash 10-K for End of Year (EOY) 2023 for the Intrepid Potash–Wendover, LLC (Intrepid-Wendover) property. See Table 2-1 for previous TRS filings for the property. Resources and reserves are estimated according to United States (US) Securities and Exchange Commission (SEC) S-K 1300 regulations.
1.1Property Description and Ownership
Intrepid-Wendover owns 57,534 acres located in Township 1 North, Range 18 West; Township 1 South, Ranges 17, 18 and 19 West; Township 2 South, Ranges 18 and 19 West; and Township 3 South, Ranges 18 and 19 West. Approximately 34,070 acres owned by the U.S. Bureau of Land Management (BLM) and the State of Utah are leased to Intrepid-Wendover.
Potash at Intrepid-Wendover is produced through solar evaporation of naturally occurring brines collected from the sedimentary basin adjacent to the processing facility via brine collection ditches and extraction wells. The potash content of the collected brine is concentrated by solar evaporation to the point that solids are precipitated and can be collected. Harvested salts are hauled to the processing facility, where they are dried, sized, and stored for shipment. Potash, metal recovery salt (MRS), halite (NaCl), and magnesium chloride (MgCl2) are shipped by both truck and rail via Interstate 80 (I-80) and the Union Pacific Railroad (UPRR) link.
1.2Geology and Mineralization
Intrepid’s Wendover operation is located near the Nevada–Utah border along the western edge of Utah’s Great Salt Lake Desert and is situated within the Bonneville Salt Flats (BSF). The BSF is an enclosed sub-basin that contains 150 square miles of salt crust.
Intrepid’s Wendover operation produces potash by transporting subsurface potassium-rich brines to the surface where they are exposed to western Utah’s arid climate. The aqueous portion of the brine is removed through evaporation, allowing the evaporite minerals to precipitate and be collected for further processing. Because potash is derived from subsurface brines, the mineral deposit is best represented by characteristics of the aquifer(s) containing the brine.
1.3Status of Exploration, Development, and Operations
The property has been in continuous operation by Intrepid-Wendover since 2004. Brine sampling is an integral part of the mine operations.
1.4Mineral Resource Estimates
The ore resource model created from the database brine sampling data beginning in 2007 serves as the basis for this evaluation. The sampling data includes brine samples from the
|
|
|
|
|
|
2023 Estimated Resources and Reserves at Intrepid Potash-Wendover
Prepared for Intrepid Potash, Inc.
February 14, 2024 |
2 |
active mining horizon. The resources reported, exclusive of mineral reserves effective December 31, 2023, are shown in Table 1-1.
Table 1-1. K2O Brine Mineral Resource Estimate effective December 31, 2023
|
|
|
|
|
|
|
|
|
|
|
|
|
|
|
|
|
|
Wendover - K2O Brine Mineral Resource Estimate effective December 31, 2023 based on $450/Product Ton Mine Site |
|
Resources |
|
|
|
K2O Brine1
(Mt)
|
Grade
(%K2O)
|
Contained K2O2
(Mt)
|
Cutoff3
(%K2O)
|
Processing Recovery
(%) |
| Measured Mineral Resources |
|
|
|
|
|
| Indicated Mineral Resources |
175 |
0.5 |
0.9 |
0.23 |
85 |
| Measured + Indicated Mineral Resources |
175 |
0.5 |
0.9 |
|
|
| Inferred Mineral Resources |
1,358 |
0.5 |
6.8 |
0.23 |
85 |
1K2O Brine is the recovered KCl bearing brine in solution at average concentrations by weight. |
2Contained K2O is calculated by multiplying K2O Brine by the Grade. |
3Solution mining resource cutoff is the grade at which production covers operating costs. |
| Mineral Resources were prepared by RESPEC, a qualified firm for the estimate and independent of Intrepid Potash, for EOY 2023. |
| Mineral Resources are reported exclusive of Mineral Reserves, on a 100% basis. |
Mineral Resources are reported using Inverse Distance Squared (ID2) estimation methods. |
Mt = million tons, % = percent, K2O = potassium oxide |
1.5Mineral Reserve Estimates
Table 1-2 shows the estimated reserve summaries for EOY 2023 with reserves reported exclusive of mineral resources.
Table 1-2. Potash Mineral Reserves effective December 31, 2023
|
|
|
|
|
|
|
|
|
|
|
|
|
|
|
|
|
|
| Wendover - Potash Mineral Reserves effective December 31, 2023 based on $360/Product Ton Mine Site |
|
Reserves |
|
|
|
Brine1
(Mt)
|
In-Situ Grade2
(%K2O)
|
Product3
(Mt)
|
Brine Cutoff Grade4
(%K2O)
|
Processing Recovery
(%) |
| Proven Mineral Reserves |
|
|
|
|
|
| Probable Mineral Reserves |
832 |
0.5 |
1.7 |
0.29 |
85 |
| Total Mineral Reserves |
832 |
0.5 |
1.7 |
|
|
1Brine advanced through the pond system. |
2In-situ grade is the amount of K2O contained in the brine. |
3Potash Product tons are calculated by multiplying Brine by: the In-Situ Grade divided by 63.17% K2O/KCl conversion factor, an overall pond recovery factor of 30%, processing recovery of 85%, a handling loss factor of 97%, and a product purity factor of 105%. |
4Solution mining reserve cutoff is the grade at which production covers operating costs. |
| Mineral Reserves were prepared by RESPEC, a qualified firm for the estimate and independent of Intrepid Potash, for EOY 2023. |
| Mineral Reserves are reported exclusive of Mineral Resources, on a 100% basis. |
Mt = million tons, % = percent, K2O = potassium oxide |
|
|
|
|
|
|
2023 Estimated Resources and Reserves at Intrepid Potash-Wendover
Prepared for Intrepid Potash, Inc.
February 14, 2024 |
3 |
1.6Summary of Capital and Operating Cost Estimates
Operating cost per potash product ton from brine mining is estimated at $286/t for the next 5 years with a credit for the byproducts of $94/ton for an estimated potash operating cost of $192/ton.
No major capital investment is necessary to complete the mine plan. For brine storage and management of pond flows, an investment of approximately $5M in Year 10 and 20 of the plan is included for primary pond work. New deep brine well construction is planned for year 3 of the 25-year plan.
1.7Economic Analysis
The Net Present Value (NPV) at 8% Annual Percentage Rate (APR) for the before- and after-tax estimated cash flow is positive. The sensitivity to product price and operating cost for an 8% APR was evaluated. Varying costs and sales price plus and minus 10% the NPV remains positive.
1.8Permitting Requirements
The mine is in operation and necessary state and federal operating permits are in place.
1.9Conclusions and Recommendations
Estimates are dependent on data obtained from the natural environment. Although the mine has been in operation for many years, factors such as extended drought or natural disasters could influence the estimates. The general spacing between collection ditches is about 2,600 feet (ft), which may require a period of at least 100 years for the ditches to capture all the potash brine between the ditches. A future mining plan with optimized ditch spacing could affect the recovery factor and reserve estimation.
|
|
|
|
|
|
2023 Estimated Resources and Reserves at Intrepid Potash-Wendover
Prepared for Intrepid Potash, Inc.
February 14, 2024 |
4 |
2.0Introduction
2.1Purpose and Basis of Report
This document was prepared to report the Intrepid-Wendover mineral resources in terms of in-situ brine tons and mineral reserves in terms of saleable product at Intrepid-Wendover under the SEC S-K 1300 rules (2018). The Society for Mining, Metallurgy & Exploration (SME) Guide for Reporting Exploration Information, Mineral Resources and Mineral Reserves (SME 2017) (The SME Guide) supplements the modifying factors used to convert mineral resources to mineral reserves. Previous TRS’s filed for the property are listed in Table 2-1.
2.2Terms of Reference
According to 17 Code of Federal Regulations (CFR) § 229.1301 (2021), the following definitions are included for reference:
An inferred mineral resource is that part of a mineral resource for which quantity and grade or quality are estimated on the basis of limited geological evidence and sampling. An inferred mineral resource has the lowest level of geological confidence of all mineral resources, which prevents the application of the modifying factors in a manner useful for evaluation of economic viability. An inferred mineral resource, therefore, may not be converted to a mineral reserve.
An indicated mineral resource is that part of a mineral resource for which quantity and grade or quality are estimated on the basis of adequate geological evidence and sampling. An indicated mineral resource has a lower level of confidence than the level of confidence of a measured mineral resource and may only be converted to a probable mineral reserve. As used in this subpart, the term adequate geological evidence means evidence that is sufficient to establish geological and grade or quality continuity with reasonable certainty.
A measured mineral resource is that part of a mineral resource for which quantity and grade or quality are estimated on the basis of conclusive geological evidence and sampling. As used in this subpart, the term conclusive geological evidence means evidence that is sufficient to test and confirm geological and grade or quality continuity.
Modifying factors are the factors that a qualified person must apply to indicated and measured mineral resources and then evaluate in order to establish the economic viability of mineral reserves. A qualified person must apply and evaluate modifying factors to convert measured and indicated mineral resources to proven and probable mineral reserves. These factors include but are not restricted to mining; processing; metallurgical; infrastructure; economic; marketing; legal; environmental compliance; plans, negotiations, or agreements with local individuals or groups; and governmental factors.
|
|
|
|
|
|
2023 Estimated Resources and Reserves at Intrepid Potash-Wendover
Prepared for Intrepid Potash, Inc.
February 14, 2024 |
5 |
A probable mineral reserve is the economically mineable part of an indicated and, in some cases, a measured mineral resource.
A proven mineral reserve is the economically mineable part of a measured mineral resource. For a proven mineral reserve, the qualified person has a high degree of confidence in the results obtained from the application of the modifying factors and in the estimates of tonnage and grade or quality. A proven mineral reserve can only result from conversion of a measured mineral resource.
Throughout the report, reserves are presented in tons of potassium chloride (KCl).
2.3Personal Inspection
Personal inspection of the properties has occurred over the years by the QP. The most recent inspection of the property took place on May 19, 2021. The inspection included the Intrepid-Wendover potash plant, evaporation ponds, wellheads, and ditches.
2.4Sources of Information
Previously completed reserve estimations and analyses under SEC Guide 7 (SEC 2008) for this property and the TRS under S-K 1300 rules are listed in Table 2-1. Intrepid provided Statements of Earnings (SOE), permitting documentation, and production and monitoring data.
Table 2-1. Summary of Reserve Reports by QP
|
|
|
|
|
|
|
|
|
|
|
|
| Effective EOY |
Title |
Reference |
|
|
|
| 2007 |
Potash Resource Estimation for Intrepid Potash–Wendover LLC |
Agapito 2007a |
| 2007 |
Determination of Estimated Probable Reserves at Intrepid Potash–Wendover, LLC |
Agapito 2007b |
| 2009 |
Determination of Estimated Probable Potash Reserves at Intrepid Potash–Wendover, LLC |
Agapito 2010 |
| 2012 |
Determination of Estimated Probable Potash Reserves at Intrepid Potash–Wendover, LLC |
Agapito 2013 |
| 2015 |
2015 Determination of Estimated Probable Potash Reserves at Intrepid Potash–Wendover, LLC |
Agapito 2016 |
| 2018 |
2018 Determination of Estimated Probable Reserves at Intrepid Potash–Wendover, LLC |
Agapito 2019 |
| 2021 |
Technical Report Summary, 2021 Estimated Resources and Reserves at Intrepid Potash-Wendover |
Agapito 2022 |
| 2021 |
Technical Report Summary, REVISED 2021 Estimated Resources and Reserves at Intrepid Potash-Wendover |
RESPEC 2023 |
|
|
|
|
|
|
|
|
|
2023 Estimated Resources and Reserves at Intrepid Potash-Wendover
Prepared for Intrepid Potash, Inc.
February 14, 2024 |
6 |
3.0Property Description
3.1 Location and Area of the Property
The Intrepid-Wendover potash operation is located in the westernmost part of Tooele County, Utah. The plant facilities and offices are located approximately 3 miles east of Wendover, Utah, on old US Highway 40. The site is approximately 3 miles east of the Nevada border and is primarily located south of I-80, although portions of the site are located north of I-80. The area of the Intrepid-Wendover mine operation is shown on Figure 3-1.
The facility, collection ditches, and evaporation systems cover approximately 91,604 acres (approximately 141 square miles). The majority of the ditch collection system is located to the south and east of the processing facilities.
3.2Mineral Rights
Intrepid-Wendover owns 57,534 acres located in Township 1 North, Range 18 West; Township 1 South, Ranges 17, 18 and 19 West; Township 2 South, Ranges 18 and 19 West; and Township 3 South, Ranges 18 and 19 West. The site boundaries, property ownership, the former and active evaporation ponds, harvest ponds, process facility location; roads, the general distribution of the ditches, and all drillholes and wells are shown on Figure 3-2.
Approximately 34,070 acres owned by the BLM and the State of Utah are leased to Intrepid-Wendover, excluding lands used for highway and utility purposes. The State of Utah owns several state land trust sections within the site boundaries. Intrepid-Wendover holds leases from the federal government that include 25,972 acres adjoining the Intrepid-Wendover property to the east. Intrepid-Wendover also leases 8,098 acres of property from the State of Utah under special use and mineral leases. The state leases are interspersed among the Intrepid-Wendover property and the federal leases. Table 3-1 provides a description of each of the federal and state leases held by Intrepid-Wendover.
3.3Significant Encumbrances
The reclamation bond of $8.9M in place for Intrepid-Wendover is calculated to cover the cost of site reclamation. The bond will be updated in 2024.
|
|
|
|
|
|
2023 Estimated Resources and Reserves at Intrepid Potash-Wendover
Prepared for Intrepid Potash, Inc.
February 14, 2024 |
7 |
Figure 3-1. Location and Lease Area of Intrepid-Wendover Mine Operation
|
|
|
|
|
|
2023 Estimated Resources and Reserves at Intrepid Potash-Wendover
Prepared for Intrepid Potash, Inc.
February 14, 2024 |
8 |
Figure 3-2. Sample Locations Intrepid-Wendover Mine Operation
|
|
|
|
|
|
2023 Estimated Resources and Reserves at Intrepid Potash-Wendover
Prepared for Intrepid Potash, Inc.
February 14, 2024 |
9 |
Table 3-1. Property Lease Details, Intrepid-Wendover
|
|
|
|
|
|
|
|
|
|
|
|
|
|
|
|
|
|
|
|
|
|
|
|
|
|
|
|
|
|
|
|
|
|
|
|
| Privately Owned Lands |
|
|
|
|
|
Acres |
|
| Intrepid Lands |
|
|
|
|
|
57,534 |
|
|
State of Utah
Land Lease
Number
|
Lessee |
Lease Type |
Mine |
Date |
Readjustment
Due
|
Rental Period |
Acres
(SITLA)
|
Rental Amount |
| ML-18959 |
Intrepid Potash |
Potash |
Wendover |
1961 |
1/1/2034 |
1/1/2024–12/31/2024 |
320 |
$3,200 |
|
| ML-18960 |
Intrepid Potash |
Potash |
Wendover |
1961 |
1/1/2034 |
1/1/2024–12/31/2024 |
318 |
$3,190 |
|
| ML-18961 |
Intrepid Potash |
Potash |
Wendover |
1961 |
1/1/2034 |
9/30/2023–9/02/2024 |
640 |
$6,400 |
|
| ML-18962 |
Intrepid Potash |
Potash |
Wendover |
1961 |
1/1/2034 |
1/1/2024–12/31/2024 |
640 |
$6,400 |
|
| ML-18963 |
Intrepid Potash |
Potash |
Wendover |
1961 |
1/1/2034 |
1/1/2024–12/31/2024 |
320 |
$3,200 |
|
| ML-18964 |
Intrepid Potash |
Potash |
Wendover |
1961 |
1/1/2034 |
1/1/2024–12/31/2024 |
160 |
$1,600 |
|
| ML-18965 |
Intrepid Potash |
Potash |
Wendover |
1961 |
1/1/2034 |
1/1/2024–12/31/2024 |
320 |
$3,200 |
|
| ML-18966 |
Intrepid Potash |
Potash |
Wendover |
1961 |
1/1/2034 |
1/1/2024–12/31/2024 |
640 |
$6,400 |
|
| ML-18967 |
Intrepid Potash |
Potash |
Wendover |
1961 |
1/1/2034 |
1/1/2024–12/31/2024 |
320 |
$3,200 |
|
| ML-19781 |
Intrepid Potash |
Potash |
Wendover |
1962 |
1/1/2034 |
1/1/2024–12/31/2024 |
640 |
$6,400 |
|
| ML-19782 |
Intrepid Potash |
Potash |
Wendover |
1962 |
1/1/2034 |
1/1/2024–12/31/2024 |
640 |
$6,400 |
|
| ML-19783 |
Intrepid Potash |
Potash |
Wendover |
1962 |
1/1/2034 |
1/1/2024–12/31/2024 |
640 |
$6,400 |
|
| ML-52989 |
Intrepid Potash |
Potash |
Wendover |
2014 |
12/1/2024 |
12/1/2023–11/30/2024 |
2,500 |
$22,509 |
|
|
|
|
|
|
|
|
8,098 |
|
| Royalty on all state leases is 4% of the gross value of leased substances, 1/1/2023-12/31/2023 - 4.5%, 1/1/2024 through the end of term - 5% |
|
Land Lease
Number
|
Lessee |
Lease
Type
|
Mine |
Date |
Royalty Rate |
Readjustment Due |
Acres
(BLM)
|
Amount Paid |
| UTU-087811 |
Intrepid Wendover Potash LLC |
Potash |
Wendover |
1963 |
30% |
1/1/2043 |
2,551 |
$2,551 |
| UTU-087813 |
Intrepid Wendover Potash LLC |
Potash |
Wendover |
1963 |
30% |
1/1/2043 |
2,560 |
$2,560 |
| UTU-087815 |
Intrepid Wendover Potash LLC |
Potash |
Wendover |
1963 |
30% |
1/1/2043 |
2,558 |
$2,559 |
| UTU-087817 |
Intrepid Wendover Potash LLC |
Potash |
Wendover |
1963 |
30% |
1/1/2043 |
2,519 |
$2,519 |
| UTU-087810 |
Intrepid Wendover Potash LLC |
Potash |
Wendover |
1963 |
30% |
1/1/2043 |
2,527 |
$2,529 |
| UTU-087812 |
Intrepid Wendover Potash LLC |
Potash |
Wendover |
1963 |
30% |
1/1/2043 |
2,489 |
$2,490 |
| UTU-087814 |
Intrepid Wendover Potash LLC |
Potash |
Wendover |
1963 |
30% |
1/1/2043 |
2,120 |
$2,120 |
| UTU-087816 |
Intrepid Wendover Potash LLC |
Potash |
Wendover |
1963 |
30% |
1/1/2043 |
2,319 |
$2,319 |
| UTU-087818 |
Intrepid Wendover Potash LLC |
Potash |
Wendover |
1963 |
30% |
1/1/2043 |
2,557 |
$2,557 |
| UTU-087809 |
Intrepid Wendover Potash LLC |
Potash |
Wendover |
1963 |
30% |
1/1/2043 |
2,500 |
$2,501 |
| UTU-085926 |
Intrepid Wendover Potash LLC |
Potash |
Wendover |
2015 |
30% |
6/1/2035 |
1,272 |
$1,273 |
|
|
|
|
|
|
|
25,972 |
|
Royalty on all federal leases is 3% gross value at point of shipment |
|
|
|
|
|
|
2023 Estimated Resources and Reserves at Intrepid Potash-Wendover
Prepared for Intrepid Potash, Inc.
February 14, 2024 |
10 |
4.0Accessibility
4.1Topography, Elevation, and Vegetation
The topography of the area is flat at an approximate elevation of 4,215-ft mean sea level (MSL). Vegetation is sparse.
4.2Property Access
The Wendover potash operation is located in the westernmost part of Tooele County, Utah, on the BSF. The plant facilities and offices are located approximately 3 miles east of Wendover, Utah, on old U.S. Highway 40. The site is located approximately 3 miles east of the Nevada border and is primarily located south of I-80, although portions of the site are located north of I-80. The area of the Intrepid mine operation is shown on Figure 4-1.
4.3Climate
The climate in western Utah is arid with low precipitation and low relative humidity. Average annual rainfall is 5 inches and average evaporation is 80 inches. Variation from these averages is the primary cause of fluctuations in plant production.
4.4Infrastructure Availability
All infrastructure for the operation is located approximately 3 miles east of Wendover, Utah, on old US Highway 40. US I-80 bisects the property as shown on Figure 4-1.
|
|
|
|
|
|
2023 Estimated Resources and Reserves at Intrepid Potash-Wendover
Prepared for Intrepid Potash, Inc.
February 14, 2024 |
11 |
Figure 4-1. Mine Location showing Property Access
|
|
|
|
|
|
2023 Estimated Resources and Reserves at Intrepid Potash-Wendover
Prepared for Intrepid Potash, Inc.
February 14, 2024 |
12 |
5.0History
The Bonneville area was recognized in the early 1900s as a source for potash. The original operation was known as the Salduro Works, which operated until 1918 and then closed due to a decline in potash demand. The original Salduro Works was responsible for acquiring lands on which a system of collection ditches was constructed. In the mid-1930s, Bonneville Limited acquired more land to the west of the original property and constructed primary harvest ponds and additional infrastructure to support the mining operations. Between 1961 and 1963, various potash leases were acquired from the federal and state governments. Kaiser Aluminum & Chemical Corporation acquired Bonneville Limited in 1963. The property, including the ponds, processing operation, and lease land, was acquired by Reilly Industries, Inc. from Kaiser Aluminum & Chemical Corporation in 1988. Intrepid-Wendover acquired the property from Reilly Industries, Inc. in April 2004.
Figure 5-1 shows the KCl historical brine concentration pumped into the primary pond. Gaps in the figure are due to inadequate pumping data collection. Figure 5-2 shows the production history for the shallow-brine and deep-brine aquifers from 1968 to 2023.
Figure 5-1. Brine Concentration Pumped into Primary Pond 1960–2023
|
|
|
|
|
|
2023 Estimated Resources and Reserves at Intrepid Potash-Wendover
Prepared for Intrepid Potash, Inc.
February 14, 2024 |
13 |
Figure 5-2. Historical KCl Production at Intrepid-Wendover, 1968–2023
6.0Geologic Setting
6.1Regional, Local, and Property Geology
Intrepid’s Wendover operation is located near the Nevada–Utah border along the western edge of Utah’s Great Salt Lake Desert and is situated within the BSF. The BSF is an enclosed sub-basin that contains 150 square miles of salt crust. The average elevation on the playa is about 4,215 ft above MSL with very little to no relief recorded across the site (Lines 1979).
6.1.1Regional Geology
The BSF and the associated potash-bearing brines occur within the Lake Bonneville basin which is part of the larger Basin and Range physiographic province. The Basin and Range province is generally characterized by north-trending ranges and basins developed over the last 20 million years. As the region experienced extension in a generally east–west direction, the brittle upper crust thinned and broke into north-trending blocks, which then either rotated or differentially subsided to produce the basins and ranges. Thinning of the crust was coupled with regional subsidence that in turn, produced the Lake Bonneville basin.
The Lake Bonneville basin has been an area of restricted internal drainage for the last 15 million years, allowing lakes of varying size to exist throughout all or most of this history. However, Lake Bonneville was the youngest and deepest of the large Quaternary lakes to form
|
|
|
|
|
|
2023 Estimated Resources and Reserves at Intrepid Potash-Wendover
Prepared for Intrepid Potash, Inc.
February 14, 2024 |
14 |
within the basin in response to cyclical climate changes. Based on oxygen isotope analyses and carbon dating of sediment core, along with chronologically relatable topographic markers, Lake Bonneville is believed to have existed between 45,000 and 10,000 years before present (YBP) (Oviatt et al. 1992). At the lake’s maximum extent, it covered nearly 20,000 square miles and was more than 9,880 ft deep. The lake reached its geomorphological highstand and began spilling over Red Rock Pass, Idaho, approximately 16,000 YBP. Catastrophic failure of unconsolidated material at Red Rock Pass released a deluge of floodwaters into the Snake River drainage of Idaho at roughly 14,500 YBP. Following this event, typically referred to as the Bonneville Flood Event, Lake Bonneville continued to outflow through Red Rock Pass until 14,000–13,000 YBP. With the termination of the last major ice age, lake levels declined substantially. Ten-thousand YBP is generally considered to mark the end of Lake Bonneville and the birth of its successor, Great Salt Lake (Currey et al. 1984). With the advent of a hotter, drier regional climate beginning roughly 8,000 YBP, the remnants of Lake Bonneville gradually disappeared primarily through evaporation.
The mountain ranges in the western part of the Great Salt Lake Desert are composed mainly of limestone, dolomite, shale, and quartzite of Paleozoic age. Because of block faulting and basin fill, the Paleozoic rocks are several-thousand feet below the land surface in the centers of the basin. The lower part of the fill underlying the BSF is composed mainly of extrusive volcanic rocks and associated sandstone, claystone, ash, and conglomerates of Tertiary age. The upper part of the fill is composed mainly of claystone, limestone, and gypsum of Quaternary age. Most of the sedimentary rocks that fill the basins are of fluvial or lacustrine origin, and much of the deposition took place in basins that predate Lake Bonneville (Lines 1979).
6.1.2Local Geology
The modern Lake Bonneville basin interior is extremely dry, mostly devoid of vegetation, and exhibits very little topographic relief. The lithology of the interior, away from what once were islands and shoreline, is predominantly composed of lacustrine deposits and evaporite minerals, occasionally interbedded with layers of fluvial or fine-grained eolian sediments. Sand and gravel occur more often with increased proximity to the ancient shoreline. Igneous, metamorphic, and sedimentary rocks ranging in age from Cambrian to late-Tertiary form the barren slopes and mountain ranges surrounding the basin and provide eroded detrital material often deposited as alluvial fans (Figure 6-1).
All deposits exposed at the surface of the Bonneville and Pilot Valley playas were deposited by Lake Bonneville or by more recent, very minor lacustrine events. The local surface geology consists of evaporite mineral deposits. Evaporite minerals on the surface of the BSF are concentrated in three lateral zones (Figure 6-2): (1) a carbonate zone composed mainly of authigenic clay-sized carbonate minerals, (2) a sulfate zone composed mainly of authigenic gypsum, and (3) a chloride zone composed of crystalline halite referred to as ‘the salt crust’ (Lines 1979).
|
|
|
|
|
|
2023 Estimated Resources and Reserves at Intrepid Potash-Wendover
Prepared for Intrepid Potash, Inc.
February 14, 2024 |
15 |
The upper 20 ft of the Lake Bonneville deposits underlying the two playas is composed mainly of dark-gray to dark-brown carbonate muds comprised of clay-size calcite, aragonite, and dolomites. Interbedded with the carbonate muds are gypsum evaporite deposits and the crystalline salt crust (Turk 1969). Underlying the carbonate mud layer are lacustrine deposits (0-200 ft thick), mainly composed of fine-grained sediments. When laterally extensive, these lacustrine deposits serve as a confining unit for meteoric fluids. However, the lacustrine deposits often intermingle with alluvial fan-deposited sand and gravel shed from the Silver Mountains to the northwest. Below the lacustrine and alluvial fan deposits, is a relatively thick sequence of volcaniclastics, conglomerates, tuffs, and sandstones known as the Salt Lake Formation (0–500 ft thick). The Salt Lake Formation is late-Miocene to Pliocene in age and formed through the shedding and reworking of sediments from the adjacent mountains as valley fill into the down-dropping graben of the western Great Salt Lake Desert. Interbedded within this layer are fine-grained units predominantly composed of gypsum, limestone, siltstone, and shale. Figure 6-3 illustrates the conceptual stratigraphic setting.
6.1.3Property Geology
Intrepid’s Wendover operations are situated in the western portion of the Great Salt Lake Desert, which itself is located within the Bonneville Lake basin. Because the basin is closed topographically and has no outlet, loss of water is ultimately through evaporation. The Wendover property produces potash from beneath an area termed the BSF. The BSF was formed through the prolonged accumulation of evaporite minerals in conjunction with periodic lacustrine events. Within the property boundary, surface topography is extremely low relief and predominantly composed of evaporitic ‘salt crust.’
|
|
|
|
|
|
2023 Estimated Resources and Reserves at Intrepid Potash-Wendover
Prepared for Intrepid Potash, Inc.
February 14, 2024 |
16 |
Figure 6-1. Geology of the BSF and Pilot Valley Region (after Lines 1979)
|
|
|
|
|
|
2023 Estimated Resources and Reserves at Intrepid Potash-Wendover
Prepared for Intrepid Potash, Inc.
February 14, 2024 |
17 |
Figure 6-2. Salt Crust and Other Geomorphic Features on the BSF, Fall of 1975 (after Lines 1979)
|
|
|
|
|
|
2023 Estimated Resources and Reserves at Intrepid Potash-Wendover
Prepared for Intrepid Potash, Inc.
February 14, 2024 |
18 |
Figure 6-3. Conceptual Stratigraphic Column
Intrepid-Wendover produces potash from the rich saline brines that exist in the subsurface. There are three aquifers known to exist beneath the BSF. These aquifers are, in descending order, the shallow-brine aquifer, the alluvial-fan aquifer, and the deep-brine aquifer. Intrepid produces potash from both the shallow-brine aquifer and the deep-brine aquifer.
6.2Significant Mineralized Zones
The zones of mineralization at Wendover are defined by the presence of potash-rich brines. These brines are known to occur in two out of three local aquifers: the shallow-brine aquifer and the deep-brine aquifer. The third aquifer, which is not potash-bearing and occurs stratigraphically between the other two, is the alluvial-fan aquifer. A cross section is included in Figure 6-4.
The shallow-brine aquifer is a near-surface aquifer and serves as the primary source of potash-rich brine. It is contained in the highly permeable salt and gypsum crust and underlying fractured carbonate muds. The alluvial-fan aquifer, the middle of the three, resides in the sand and gravel interbedded with the lacustrine sediments remnant of Lake Bonneville that underlie the playa deposits of the BSF. The alluvial-fan aquifer is brackish, yet is not a source of potassium salts. The deep-brine aquifer exists within the volcaniclastics and conglomerates of the Salt Lake Formation. This aquifer typically occurs at depths greater than 250–300 ft.
6.3Mineral Deposit
Intrepid’s Wendover operation produces potash by transporting subsurface potassium-rich brines to the surface where they are exposed to western Utah’s arid climate. The aqueous portion of the brine is removed through evaporation, allowing the evaporite minerals to precipitate and be collected for further processing. Because the potash is derived from subsurface brines, the mineral deposit is best represented by characteristics of the aquifer(s) containing the brine.
|
|
|
|
|
|
2023 Estimated Resources and Reserves at Intrepid Potash-Wendover
Prepared for Intrepid Potash, Inc.
February 14, 2024 |
19 |
Figure 6-4. Typical Cross Section of the Brines
The shallow-brine aquifer, as it is called, exists within the near-surface carbonate mud layer. The carbonate mud transitions to the less-permeable lacustrine deposits at 20–30 ft depth. Brine extraction involves excavating a network of ditches, which allow the natural inflow of aquifer fluids, thereby exposing the brine to dry atmospheric conditions.
|
|
|
|
|
|
2023 Estimated Resources and Reserves at Intrepid Potash-Wendover
Prepared for Intrepid Potash, Inc.
February 14, 2024 |
20 |
7.0Exploration
7.1Exploration Other than Drilling
KCl grade monitored from 92 shallow brine wells during the period 1965–1967 by Turk (1969) is included in Table 7-1. A total of 27 monitoring wells were drilled in October 2005 and have been sampled at least yearly to evaluate brine quality in the shallow-brine aquifer. Table 7-2 lists the maximum KCl grade in each shallow aquifer monitoring well for the time period of July 2016 to July 2020.
7.2Drilling Exploration
No traditional drilling exploration has taken place.
7.3Characterization of Hydrology Data
Groundwater occurs in three distinct aquifers in much of the western Great Salt Lake Desert: (1) the deep-brine aquifer, (2) the alluvial-fan aquifer, and (3) the shallow-brine aquifer.
The most extensive aquifer, the deep-brine aquifer, yields brine to wells on the BSF from conglomerate in the lower part of the basin fill. The deep-brine aquifer consists of as much as 840 ft of conglomerate, is confined by its upper few hundred feet of relatively impermeable, lacustrine deposits, and thus, hydraulic connection between the aquifer and playa surfaces is poor (Lines 1979). Aquifer tests indicate that the transmissivity of the deep-brine aquifer in the area of the potash operation averages 13,000 square feet per day (ft2/day), and the storage coefficient is about 4×10⁻⁴. Pumping tests indicate the deep-brine aquifer as a quasi-infinite reservoir. The amount of recharge to the deep-brine aquifer cannot be determined from available data, while discharge is mainly from the well. Concentration of KCl in the deep-brine aquifer ranges from 0.36% to 0.47%, and MgCl2 from 0.43% to 0.69%. Composition of the brine is relatively constant throughout the aquifer.
The alluvial-fan aquifer is composed of sand and gravel alluvial fans along the flanks of the Silver Island Mountains and the Pilot Range. The alluvial fans are interbedded with fine-grained lacustrine deposits which act as confining layers to the alluvial-fan aquifer. The degree of hydraulic connection between the deep-brine aquifer and the alluvial-fan aquifer is unknown. The degree of connection probably varies, as it is dependent on the continuity between the sand and gravel of the alluvial fans and the conglomerates in the basin fill (Lines 1979). No economically mineable potash is contained in the alluvial-fan aquifer.
The shallow-brine aquifer consists of both the near-surface carbonate muds and the crystalline halite and gypsum deposits on the surface of the playas. Sand and gravel of the alluvial fans are interbedded with the near-surface carbonate muds of the playas, and hydraulic connection is good. The average thickness of the shallow-brine aquifer is reported to be about 18 ft (Turk 1969; Shaw Environmental, Inc. 2006).
|
|
|
|
|
|
2023 Estimated Resources and Reserves at Intrepid Potash-Wendover
Prepared for Intrepid Potash, Inc.
February 14, 2024 |
21 |
Table 7-1. Shallow-Brine Aquifer Sampling by Turk (1969)
|
|
|
|
|
|
|
|
|
|
|
|
|
|
|
|
|
|
|
|
|
|
|
|
|
|
|
|
|
|
|
|
| Well No. |
Eastings |
Northings |
Date |
Depth Interval (ft) |
Sampling Method |
Specific
Gravity
|
KCl % |
K1 |
962,676 |
7,442,619 |
7/30/1965 |
0–15.75 |
P |
1.2140 |
1.41 |
K2 |
963,693 |
7,445,090 |
7/30/1965 |
0–20.0 |
BP |
1.2135 |
1.34 |
K3 |
1,018,182 |
7,475,549 |
10/4/1965 |
0–24.4 |
PT |
1.2015 |
1.15 |
K4 |
1,016,238 |
7,475,425 |
9/28/1965 |
0–30.0 |
PT |
1.2020 |
1.06 |
K4A |
1,016,528 |
7,475,487 |
11/9/1965 |
0–23.0 |
BP |
1.1950 |
1.07 |
K5 |
1,014,232 |
7,475,384 |
10/10/1966 |
0–25.0 |
P-10 |
1.2000 |
1.27 |
K6 |
1,018,575 |
7,475,611 |
7/27/1965 |
0–23.0 |
BP |
1.2040 |
1.04 |
K7 |
1,020,772 |
7,475,591 |
6/18/1965 |
0–25.0 |
PT |
1.2035 |
1.48 |
K7A |
1,020,510 |
7,475,560 |
9/2/1965 |
0–25.0 |
BP |
|
1.03 |
K8B |
1,014,864 |
7,481,350 |
11/7/1965 |
0–23.0 |
PT-120 |
1.2035 |
1.18 |
K8C |
1,014,932 |
7,481,655 |
10/4/1965 |
0–23.0 |
PT |
1.2040 |
1.18 |
K9 |
1,014,631 |
7,461,172 |
8/23/1966 |
0–25.0 |
P-10 |
1.2000 |
1.26 |
K10 |
1,012,262 |
7,461,310 |
9/9/1967 |
0–25.0 |
P-10 |
1.1975 |
1.32 |
K10A |
1,012,578 |
7,461,290 |
11/9/1965 |
0–23.0 |
B |
1.1990 |
1.03 |
K11 |
1,009,097 |
7,458,833 |
10/19/1965 |
0–4.3 |
BP |
1.2005 |
1.30 |
K11A |
1,009,356 |
7,458,772 |
7/30/1965 |
0–25.0 |
BP |
1.1990 |
1.17 |
K12 |
1,014,947 |
7,461,132 |
11/15/1965 |
0–25.0 |
PT |
|
1.10 |
K13 |
1,016,921 |
7,461,172 |
6/9/1966 |
– |
|
1.1920 |
1.18 |
K14 |
1,018,551 |
7,460,504 |
6/9/1966 |
– |
BP |
1.1935 |
1.03 |
K14A |
1,018,311 |
7,460,452 |
8/15/1966 |
0–23.0 |
PT-120 |
1.1960 |
1.12 |
K15 |
1,019,524 |
7,469,125 |
7/30/1965 |
0–25.0 |
BP |
1.2055 |
1.10 |
K16 |
1,010,705 |
7,453,473 |
9/30/1965 |
0–25.0 |
PT |
1.2020 |
1.24 |
K17 |
1,003,115 |
7,447,319 |
10/5/1965 |
0–22.0 |
PT-50 |
1.1990 |
1.37 |
K18 |
1,024,728 |
7,475,692 |
11/16/1965 |
0–23.0 |
PT |
|
0.71 |
K19 |
1,022,538 |
7,475,621 |
11/16/1965 |
0–23.0 |
PT-60 |
|
0.64 |
K20 |
1,025,326 |
7,475,621 |
11/16/1965 |
0–23.0 |
PT |
|
0.69 |
K21 |
1,027,262 |
7,475,634 |
9/2/1965 |
0–23.0 |
B |
|
0.67 |
K22 |
1,024,985 |
7,482,526 |
9/15/1967 |
0–25.0 |
B |
1.1970 |
0.72 |
K23 |
1,022,944 |
7,482,518 |
10/19/1965 |
0–3.6 |
BP |
1.2020 |
1.21 |
K24 |
1,020,889 |
7,482,429 |
7/26/1965 |
0–23.0 |
BP |
1.1995 |
1.25 |
K24A |
1,021,199 |
7,482,503 |
10/22/1965 |
0–4.8 |
BP |
1.1970 |
1.26 |
K25 |
1,027,139 |
7,482,509 |
8/14/1966 |
0–23.0 |
PT-90 |
1.1940 |
0.74 |
K26 |
995,027 |
7,455,969 |
8/6/1967 |
0–23.0 |
P-10 |
1.2035 |
1.36 |
K27 |
988,378 |
7,453,641 |
11/8/1965 |
0–23.0 |
B |
1.2100 |
1.04 |
K27A |
988,405 |
7,453,922 |
10/28/1965 |
5.5–9.7 |
BP |
1.2005 |
1.43 |
K28 |
979,130 |
7,454,831 |
9/30/1965 |
0–23.0 |
PT-50 |
1.2005 |
1.07 |
|
|
|
|
|
|
2023 Estimated Resources and Reserves at Intrepid Potash-Wendover
Prepared for Intrepid Potash, Inc.
February 14, 2024 |
22 |
Table 7-1. Shallow-Brine Aquifer Sampling by Turk (1969) (continued)
|
|
|
|
|
|
|
|
|
|
|
|
|
|
|
|
|
|
|
|
|
|
|
|
|
|
|
|
|
|
|
|
| Well No. |
Eastings |
Northings |
Date |
Depth Interval (ft) |
Sampling Method |
Specific
Gravity
|
KCl % |
K29 |
978,860 |
7,455,100 |
7/26/1965 |
0–23.0 |
BP |
1.2095 |
1.26 |
K30 |
964,500 |
7,444,599 |
10/7/1966 |
0–22.0 |
P-10 |
1.2060 |
1.36 |
K31 |
962,939 |
7,445,353 |
6/30/1965 |
0–9.5 |
BP |
1.2230 |
3.28 |
K32 |
963,939 |
7,439,141 |
8/10/1965 |
0–23.0 |
BP |
1.1855 |
0.95 |
K33 |
965,742 |
7,438,629 |
6/15/1966 |
0–23.0 |
BP |
1.2060 |
1.40 |
K33A |
966,064 |
7,438,629 |
10/9/1965 |
15.0–19.4 |
BP |
1.2045 |
1.23 |
K34 |
963,621 |
7,423,385 |
9/11/1965 |
0–23.0 |
PT-60 |
1.1990 |
0.93 |
K34A |
963,601 |
7,423,162 |
10/19/1965 |
0–1.5 |
BP |
1.2095 |
0.87 |
K35 |
963,695 |
7,421,346 |
7/27/1965 |
0–23.0 |
BP |
1.2060 |
1.28 |
K36 |
963,695 |
7,420,909 |
11/6/1965 |
0–23.0 |
PT-60 |
1.2080 |
1.81 |
K37 |
963,459 |
7,418,772 |
10/11/1966 |
0–23.0 |
P-10 |
1.2095 |
1.90 |
K38 |
974,143 |
7,426,651 |
10/11/1966 |
0–23.0 |
P-10 |
1.2060 |
0.99 |
K39 |
982,608 |
7,437,966 |
11/10/1965 |
0–23.0 |
PT-120 |
1.2055 |
1.35 |
K39A |
982,633 |
7,437,696 |
10/29/1965 |
0–23.0 |
B |
1.2070 |
0.78 |
K40 |
982,719 |
7,435,951 |
11/10/1965 |
0–23.0 |
PT-60 |
1.2070 |
1.26 |
K41 |
988,959 |
7,425,422 |
10/11/1966 |
0–23.0 |
P-10 |
1.1980 |
2.14 |
K42 |
991,700 |
7,426,716 |
9/3/1965 |
0–23.0 |
BP |
1.2065 |
2.22 |
K43 |
994,313 |
7,427,862 |
9/3/1965 |
0–23.0 |
BP |
1.2055 |
2.02 |
K43A |
994,083 |
7,427,734 |
9/3/1965 |
0–23.0 |
BP |
1.2050 |
1.85 |
K44 |
995,160 |
7,438,027 |
9/3/1965 |
0–23.0 |
BP |
1.2060 |
2.02 |
K45 |
997,308 |
7,437,814 |
10/11/1966 |
0–23.0 |
P-10 |
1.2020 |
1.93 |
K46 |
1,010,010 |
7,445,601 |
11/5/1965 |
0–23.0 |
PT |
1.1845 |
0.77 |
K47 |
999,172 |
7,429,709 |
11/2/1965 |
5.5–10.5 |
BP |
1.2070 |
1.97 |
K48 |
939,092 |
7,409,800 |
8/6/1967 |
0–23.0 |
P-10 |
1.0990 |
0.67 |
K49 |
940,671 |
7,411,111 |
6/1/1966 |
0–23.0 |
BP |
1.1140 |
0.69 |
K50 |
942,174 |
7,409,400 |
8/24/1966 |
0–23.0 |
PT |
1.2045 |
1.64 |
K51 |
943,715 |
7,410,883 |
6/15/1966 |
0–23.0 |
BP |
1.1715 |
1.60 |
K52 |
947,297 |
7,421,114 |
11/8/1965 |
0–23.0 |
PT-60 |
1.2030 |
0.85 |
K53 |
947,587 |
7,445,048 |
9/15/1967 |
0–23.0 |
P-10 |
1.1360 |
0.73 |
K54 |
945,787 |
7,445,723 |
11/6/1965 |
0–23.0 |
PT-60 |
1.0785 |
0.64 |
K55 |
965,272 |
7,444,266 |
7/28/1965 |
0–23.0 |
BP |
1.2085 |
1.26 |
K56 |
954,139 |
7,436,134 |
5/10/1966 |
0–23.0 |
B |
1.2230 |
3.52 |
K56B |
953,860 |
7,436,227 |
9/15/1965 |
0–23.0 |
PT |
1.1935 |
1.76 |
K57 |
972,539 |
7,408,947 |
10/23/1965 |
0–4.0 |
BP |
1.2095 |
2.65 |
K58 |
979,590 |
7,438,848 |
8/24/1966 |
0–23.0 |
PT |
1.2010 |
1.46 |
|
|
|
|
|
|
2023 Estimated Resources and Reserves at Intrepid Potash-Wendover
Prepared for Intrepid Potash, Inc.
February 14, 2024 |
23 |
Table 7-1. Shallow-Brine Aquifer Sampling by Turk (1969) (concluded)
|
|
|
|
|
|
|
|
|
|
|
|
|
|
|
|
|
|
|
|
|
|
|
|
|
|
|
|
|
|
|
|
| Well No. |
Eastings |
Northings |
Date |
Depth Interval (ft) |
Sampling Method |
Specific
Gravity
|
KCl % |
K59 |
954,000 |
7,417,382 |
8/16/1965 |
0–23.0 |
BP |
1.2115 |
1.00 |
K60 |
952,053 |
7,415,308 |
8/16/1965 |
0–23.0 |
BP |
1.2095 |
0.71 |
K61 |
948,662 |
7,434,882 |
8/24/1966 |
0–23.0 |
PT |
1.2235 |
2.92 |
K62 |
944,462 |
7,421,578 |
10/7/1965 |
10.0–15.0 |
BP |
1.2060 |
1.17 |
K62A |
944,133 |
7,421,447 |
10/7/1965 |
0–23.0 |
PT |
1.2105 |
1.02 |
K63 |
949,842 |
7,448,000 |
10/27/1965 |
5.5–10.5 |
BP |
1.1105 |
0.69 |
K63A |
950,056 |
7,447,821 |
11/22/1965 |
0–19.0 |
PT |
1.1010 |
0.61 |
K64 |
951,631 |
7,430,545 |
11/15/1965 |
0–19.0 |
PT-60 |
- |
1.43 |
K65 |
1,009,347 |
7,429,688 |
8/8/1966 |
0–19.0 |
PT-420 |
1.1355 |
0.31 |
K65A |
1,009,080 |
7,429,673 |
6/24/1966 |
0–19.0 |
B |
1.1350 |
0.30 |
K66 |
1,007,859 |
7,416,856 |
8/10/1966 |
0–19.0 |
PT-420 |
1.1870 |
0.75 |
K66A |
1,007,538 |
7,416,760 |
6/28/1966 |
0–19.0 |
BP |
1.1915 |
0.78 |
K67 |
973,182 |
7,399,280 |
7/3/1966 |
0–19.0 |
B |
1.1685 |
0.70 |
K67A |
972,645 |
7,399,180 |
7/3/1966 |
0–19.0 |
B |
1.1710 |
0.70 |
K68 |
934,533 |
7,398,971 |
8/16/1966 |
0–19.0 |
PT-360 |
1.1255 |
1.23 |
K69 |
958,717 |
7,430,910 |
9/12/1967 |
0–21.0 |
PT-240 |
1.1875 |
0.73 |
K69A |
957,814 |
7,430,955 |
9/13/1967 |
0–10.2 |
PT-80 |
1.1885 |
0.76 |
K70 |
974,455 |
7,440,995 |
9/5/1967 |
0–21.0 |
PT-420 |
1.1995 |
0.86 |
BR1 |
1,011,668 |
7,474,495 |
7/21/1965 |
0–5.5 |
P |
1.2035 |
1.42 |
BR2 |
1,001,536 |
7,464,213 |
7/21/1965 |
0–5.5 |
P |
1.2115 |
1.23 |
BP3 |
963,804 |
7,426,164 |
7/23/1965 |
0–5.5 |
BP |
1.2095 |
0.60 |
| B = Bailed |
P = Pumped |
P-10 = Pumped 10 minutes |
| BP = Bailed or pumped |
PT = Pumping Test |
|
|
|
|
|
|
|
|
|
|
|
|
|
|
|
|
|
|
|
|
|
|
|
2023 Estimated Resources and Reserves at Intrepid Potash-Wendover
Prepared for Intrepid Potash, Inc.
February 14, 2024 |
24 |
Table 7-2. Shallow Well Monitoring Data, June 2016 to July 2020
|
|
|
|
|
|
|
|
|
|
|
|
|
|
|
|
|
|
|
|
|
|
|
|
|
|
|
|
|
|
|
|
|
|
|
|
|
Well
Designation
|
Eastings |
Northings |
Elevation (top
of casing, ft) |
KCl %
2016 |
KCl %
2017 |
KCl %
2018 |
KCl %
2019 |
KCl %
2020 |
| WP-01 |
1,003,634 |
7,419,012 |
4,225 |
0.56 |
0.14 |
0.14 |
n/a |
0.14 |
| WP-02 |
990,917 |
7,419,329 |
4,225 |
0.16 |
0.28 |
0.42 |
n/a |
0.29 |
| WP-03 |
1,003,107 |
7,424,842 |
4,224 |
0.57 |
0.60 |
0.75 |
n/a |
0.74 |
| WP-04 |
1,003,104 |
7,424,592 |
4,224 |
0.50 |
0.61 |
0.69 |
n/a |
0.57 |
| WP-05 |
1,003,104 |
7,424,344 |
4,224 |
0.72 |
0.61 |
0.59 |
n/a |
0.65 |
| WP-07 |
1,013,890 |
7,460,902 |
4,220 |
0.75 |
n/a |
n/a |
n/a |
n/a |
| WP-08 |
1,016,618 |
7,461,428 |
4,220 |
1.00 |
0.90 |
0.94 |
0.99 |
1.09 |
| WP-09 |
979,750 |
7,430,719 |
4,218 |
1.18 |
1.26 |
1.43 |
1.43 |
1.60 |
| WP-10 |
979,747 |
7,430,466 |
4,219 |
0.99 |
0.11 |
1.03 |
1.03 |
1.15 |
| WP-11 |
979,746 |
7,430,170 |
4,218 |
1.25 |
1.25 |
1.26 |
1.39 |
1.41 |
| WP-12 |
979,744 |
7,429,917 |
4,218 |
1.36 |
1.39 |
1.41 |
1.39 |
1.51 |
| WP-13 |
983,472 |
7,440,160 |
4,218 |
0.94 |
0.94 |
1.05 |
0.95 |
1.20 |
| WP-14 |
966,171 |
7,447,321 |
4,218 |
1.05 |
0.98 |
0.96 |
0.88 |
n/a |
| WP-15 |
970,135 |
7,440,579 |
4,218 |
0.65 |
0.66 |
0.79 |
0.57 |
0.71 |
| WP-16 |
970,084 |
7,440,336 |
4,217 |
0.58 |
0.60 |
0.67 |
0.58 |
0.67 |
| WP-17 |
967,219 |
7,417,997 |
4,221 |
0.69 |
0.23 |
0.14 |
0.04 |
0.36 |
| WP-18 |
967,269 |
7,418,241 |
4,220 |
0.78 |
0.27 |
0.14 |
0.10 |
0.56 |
| WP-19 |
966,072 |
7,407,393 |
4,222 |
0.21 |
0.28 |
0.26 |
n/a |
0.30 |
| WP-20 |
947,890 |
7,429,196 |
4,220 |
n/a |
0.88 |
0.83 |
n/a |
0.97 |
| WP-21 |
948,141 |
7,429,202 |
4,220 |
n/a |
0.95 |
0.80 |
0.80 |
0.94 |
| WP-22 |
952,839 |
7,426,086 |
4,221 |
0.54 |
0.61 |
0.68 |
0.73 |
1.08 |
| WP-23 |
959,883 |
7,411,991 |
4,221 |
0.72 |
0.76 |
0.68 |
0.73 |
0.75 |
| WP-24 |
959,883 |
7,411,991 |
4,221 |
0.24 |
0.10 |
0.10 |
0.16 |
0.14 |
| WP-25 |
942,234 |
7,407,710 |
4,223 |
0.16 |
0.38 |
0.40 |
n/a |
0.34 |
| WP-26 |
948,418 |
7,402,492 |
4,222 |
0.17 |
0.50 |
0.40 |
n/a |
0.36 |
| WP-27 |
978,531 |
7,446,381 |
4,216 |
0.94 |
1.07 |
1.01 |
1.10 |
1.15 |
| WP-28 |
997,008 |
7,444,633 |
4,225 |
0.83 |
0.87 |
0.00 |
0.67 |
0.92 |
|
|
|
|
|
|
|
|
|
It is believed that most potash dissolved in the shallow-brine aquifer was from the clay underneath the salt crust (Nolan 1927; Turk 1969). The ultimate source of potash was brought to the Bonneville Basin by slow, lateral subsurface water inflow from adjacent sediments during long-term geologic time. Davis (1967) studied the lateral inflow through the periphery of the salt flats and found that fluid gradients there were less than 0.1 ft per mile. Even if the area had
|
|
|
|
|
|
2023 Estimated Resources and Reserves at Intrepid Potash-Wendover
Prepared for Intrepid Potash, Inc.
February 14, 2024 |
25 |
a transmissivity of 10,000 gallons per day per foot (gpd/ft), only 1,000 gallons per day per mile (gpd/mile) would have moved through the periphery of the salt flats.
Recharge to the shallow-brine aquifer is largely from local rainfall. Brine levels change seasonally induced by brine production. Turk (1969) found that during the period of 1965–1968, more than a 3-ft variation in brine levels occurred at some point on the salt flats. However, during each winter for which there were records, the brine level recovered to the surface. In drier years, the brine level may not recover completely, but winter precipitation can supply significant additional recharge during wet years. Infiltration capacity tests on the playa surface and hydrographs of observation wells indicate that rainfalls in excess of 0.1 inch during the summer and 0.05 inch during the winter recharge the area of thickest salt crust; only high rainfall will recharge very moist clay surfaces.
7.4Characterization of Geotechnical Data
No geotechnical data is applicable to support this mining method.
|
|
|
|
|
|
2023 Estimated Resources and Reserves at Intrepid Potash-Wendover
Prepared for Intrepid Potash, Inc.
February 14, 2024 |
26 |
8.0Sample Preparation
Intrepid-Wendover has internal quality assurance and quality control procedures for sample collection. During the evaporation season, daily brine samples are collected at brine advancement points. Brackish ponds and transfer pumps are sampled weekly. Samples are evaluated at the on-site lab with full analysis capabilities, including X-ray fluorescence (XRF).
In the qualified person’s opinion, the sample preparation, security, and laboratory analytical procedures are conventional industry practice and are adequate for the reporting of resources and reserves.
|
|
|
|
|
|
2023 Estimated Resources and Reserves at Intrepid Potash-Wendover
Prepared for Intrepid Potash, Inc.
February 14, 2024 |
27 |
9.0Data Verification
9.1Data Verification Procedure
The site has been producing for many years. Mining and processing of the brine to successfully marketed products is verification of the deposit data.
9.2Limitations on Verification
There are no limitations on the verification.
9.3Adequacy of the Data
It is the opinion of the Qualified Person (QP) that the data is adequate for the determination of resources and reserves. The brines have historically and continue to be mined with plans based on the data.
|
|
|
|
|
|
2023 Estimated Resources and Reserves at Intrepid Potash-Wendover
Prepared for Intrepid Potash, Inc.
February 14, 2024 |
28 |
10.0Mineral Processing and Metallurgical Testing
Intrepid-Wendover has a long history of processing potash on site. Recovery estimates are based on past plant performance, current performance, and anticipated future performance based on laboratory or metallurgical testing of the anticipated plant feed. Over time, the appropriate capital modifications to the plants have been made to accommodate changes in ore feed and market requirements.
10.1Adequacy of the Data
It is the opinion of the QP that the data is adequate for the determination of resources and reserves. The deposit has historically and continues to be processed into product that is successfully sold on a commercial scale.
|
|
|
|
|
|
2023 Estimated Resources and Reserves at Intrepid Potash-Wendover
Prepared for Intrepid Potash, Inc.
February 14, 2024 |
29 |
11.0Mineral Resource Estimates
This Technical Report Summary provides a mineral resource estimate and classification of resources. Mineral resources that are not mineral reserves do not meet the threshold for reserve modifying factors, such as estimated economic viability, that would allow for conversion to mineral reserves.
According to 17 CFR § 229.1301 (2021), the following definitions of mineral resource categories are included for reference:
An inferred mineral resource is that part of a mineral resource for which quantity and grade or quality are estimated on the basis of limited geological evidence and sampling. An inferred mineral resource has the lowest level of geological confidence of all mineral resources, which prevents the application of the modifying factors in a manner useful for evaluation of economic viability. An inferred mineral resource, therefore, may not be converted to a mineral reserve.
An indicated mineral resource is that part of a mineral resource for which quantity and grade or quality are estimated on the basis of adequate geological evidence and sampling. An indicated mineral resource has a lower level of confidence than the level of confidence of a measured mineral resource and may only be converted to a probable mineral reserve. As used in this subpart, the term adequate geological evidence means evidence that is sufficient to establish geological and grade or quality continuity with reasonable certainty.
A measured mineral resource is that part of a mineral resource for which quantity and grade or quality are estimated on the basis of conclusive geological evidence and sampling. As used in this subpart, the term conclusive geological evidence means evidence that is sufficient to test and confirm geological and grade or quality continuity.
11.1Key Assumptions, Parameters, and Methods
The estimating method for potash resources in the shallow-brine aquifer is based on KCl brine concentration, porosity, and aquifer thickness from historical reports. The brine-monitoring data were compiled to form the database that serves as the basis for estimating the resources.
An analysis was conducted to determine the economic cutoff brine grade. The basis of the analysis averaged costs based on statements or earnings provided by Intrepid and the forecasted long-term sale price of $450/t, 25% greater than the product sales price for the reserve estimate. Intrepid has a long history of sales and marketing of their products. Sales are managed for all properties through the corporate office. Intrepid provided the historical demand and sales pricing through their SOE from 2012 to 2023. Forward-looking pricing was provided by Intrepid marketing (See Section 16).
|
|
|
|
|
|
2023 Estimated Resources and Reserves at Intrepid Potash-Wendover
Prepared for Intrepid Potash, Inc.
February 14, 2024 |
30 |
Table 11-1 lists the production cost, sales revenue, and the calculated cutoff brine grade. The cutoff grade of the brine pumped into the primary pond is estimated to be 0.41 wt% KCl. The brine pumped into the primary pond was assumed to have a grade of 0.79% KCl based on the KCl grade in the mine plan.
Table 11-1. Resource Analysis to Estimate Cutoff KCl Grade
|
|
|
|
|
|
|
|
| 5-Yr Basis (2024-2028) |
|
Total Production Costs ($M) |
91.5 |
Net Revenue from byproducts ($M) |
(30.0) |
| Total Cost ($M) |
61.5 |
|
|
|
|
| Potash Product |
|
Price per ton less shipping ($) |
420 |
|
Production (t) |
320,000 |
|
|
Net potash sales ($M) |
134.4 |
|
|
|
| Cutoff Analysis |
|
Cutoff production (t) |
146,286 |
Average grade pumped into primary pond (% KCl) based on 25 year mine plan |
0.79 |
|
Cutoff grade (% KCl) |
0.36 |
|
Cutoff grade (% K2O) |
0.23 |
|
11.2Mineral Resource Estimate
Resources are estimated by shallow- and deep-brine aquifers. Because of the unconventional nature of the deposit, no measured resources are estimated.
11.2.1Potash Resources in the Shallow-Brine Aquifer
The potash indicated mineral resource in the shallow-brine aquifer was estimated from the difference of the KCl grade monitored from 92 wells during the period 1965–1967 and the current monitoring data with consideration of the cutoff grade derived from cost data sourced from operations data.
The general distribution of KCl in the shallow-aquifer brine during the period 1965–1967 studied by Turk (1969), in which data were mapped based on brine samples collected from 92 monitoring wells, was mapped in Figure 11-1. The data shows that brine quality at each point fluctuates over time, which is likely due to precipitation and evaporation within the Lake Bonneville basin. In order to minimize the number of anomalously low values caused by dilution from antecedent rainfall, only the maximum concentration measured at each well during that
|
|
|
|
|
|
2023 Estimated Resources and Reserves at Intrepid Potash-Wendover
Prepared for Intrepid Potash, Inc.
February 14, 2024 |
31 |
period was used in this estimate. The analysis shows that the area controlled by the 92 monitoring wells is 78.8 square miles, and the average KCl grade throughout the 92 monitoring well control area is 1.26%. Although the current ditch system collects brine from most of the 141-square-mile mining area, there is no systematic monitoring of brine quality across the entire area. For estimation of mineral resources, the actual monitoring well catchment area of 78.8 square miles is utilized.
One important parameter to determine potash content of the shallow-brine aquifer is porosity, which is represented as the non-solid fraction of geologic material in an aquifer. The total porosity of the shallow-brine aquifer averages about 0.45 according to numerous wet and dry bulk density measurements by the Utah State Highway Department (Kaiser Aluminum & Chemical Corporation 1974; Turk 1969). Thus, the brine content in the shallow-brine aquifer is estimated to be about 250 billion gallons, based on the ditch catchment area of 141 square miles, thickness of 18 ft, and porosity (0.45) of the aquifer.
According to Turk (1969), the effective porosity of the shallow-brine aquifer averages about 0.1. The brine from effective porosity represents the static free-draining portion of the brine from total porosity prior to extraction. It does not consider the impact of any groundwater recharge or solute transport which increases the amount of extractable brine above the static free-draining component over time. Therefore, the mineral resource is not calculated based on the effective porosity.
The maximum KCl grade in each of the 27 monitoring wells drilled in October 2005 was mapped with the Kriging gridding method with default linear variogram in the software, Surfer, version 15.4.354 (Golden Software, LLC 2018). The maximum KCl grade in each well that was mapped with the Kriging gridding method is shown in Figure 11-2.
The average KCl grade estimated over the 141-square-mile ditch catchment area was 1.32% for the 1965–1967 data. The average KCl grade estimated over the 141-square-mile ditch catchment area was 0.78% for the 2020 data. The calculated difference in brine concentration through the catchment area (Figure 11-3) indicates that after 57 years of mining, the average KCl grade has declined by 0.54%; this is equivalent to 3.644 Mt of KCl depletion over the ditch catchment area using a 60% recovery factor in the ponds.
There is no change in trend of KCl grade to the primary pond or in potash production. Figure 11-4 shows the average brine grade as it was pumped to the primary pond for years 1962 to 2023. The brine grade has held steady at about 0.97% for 60 years without declining. Annual production of KCl from the shallow-brine aquifer varies from year to year. Figure 11-5 shows the KCl production history of the shallow- and deep-brine aquifers between 1968 and 2023. The average yearly production (67,800 t) was close to the median yearly production (65,000 t), indicating that there has been no clear declining trend for KCl production from 1968 to 2023.
|
|
|
|
|
|
2023 Estimated Resources and Reserves at Intrepid Potash-Wendover
Prepared for Intrepid Potash, Inc.
February 14, 2024 |
32 |
Figure 11-1. Isoconcentration Map of KCl in Shallow-Brine Aquifer 1965–1967
|
|
|
|
|
|
2023 Estimated Resources and Reserves at Intrepid Potash-Wendover
Prepared for Intrepid Potash, Inc.
February 14, 2024 |
33 |
Figure 11-2. Isoconcentration Map of KCl in Shallow-Brine Aquifer 2021
|
|
|
|
|
|
2023 Estimated Resources and Reserves at Intrepid Potash-Wendover
Prepared for Intrepid Potash, Inc.
February 14, 2024 |
34 |
Figure 11-3. Isoconcentration Map of KCl Depletion in Shallow-Brine Aquifer between 1967 and 2021
|
|
|
|
|
|
2023 Estimated Resources and Reserves at Intrepid Potash-Wendover
Prepared for Intrepid Potash, Inc.
February 14, 2024 |
35 |
Figure 11-4. Brine Concentration Pumped into Primary Pond 1960–2023
Figure 11-5. Historical KCl Production at Intrepid-Wendover, 1968–2023
|
|
|
|
|
|
2023 Estimated Resources and Reserves at Intrepid Potash-Wendover
Prepared for Intrepid Potash, Inc.
February 14, 2024 |
36 |
Table 11-2 shows the shallow-brine aquifer potash resource estimate and its calculation methodology.
Table 11-2. Shallow-Brine Aquifer KCl Resource Estimate
|
|
|
|
|
|
|
|
|
|
|
|
| Parameters |
Calculation |
Results |
|
|
|
92 drillhole control indicated area (ft2) (A) |
|
2,152,518,168 |
92 drillhole control inferred area (ft2) (Q) |
|
2,915,597,689 |
Average thickness (ft) (B) |
|
18 |
| Porosity (C) |
|
0.45 |
Average grade (1967) (% KCl) (D) |
|
1.26 |
Brine density (lb/ft3) (E) |
|
72.4 |
Cutoff grade (% KCl) (F) |
|
0.36 |
Recovery factor (G) |
|
60% |
Product purity (H) |
|
95% |
| Plant efficiency |
|
85% |
| Product per year (tpy) (I) |
|
70,000 |
|
|
|
| Resource Calculation (in thousand tons) |
|
|
In-place KCl in 1967 (J) |
J=A*B*C*D/100*E/2000000 |
7,960 |
KCl depletion from 1967 to 2023 (K) |
|
2,029 |
KCl under cutoff grade (L) |
L=(J-K)/D*F |
1,692 |
Remaining in-place KCl above cutoff grade (M) |
M=J-K-L |
4,238 |
Recoverable KCl (N) |
N=M*G |
2,543 |
25-year plan (P) |
|
1,720 |
Indicated resource exclusive of reserve (O) |
O=M-(P/G) |
1,372 |
Inferred resource (R) |
R= Q*B*C*D/100*E/2000000 |
10,772 |
|
|
|
Note that brine quality does fluctuate with time; therefore, both isoconcentration maps in Figures 11-1 and 11-2 must be considered approximations of the actual conditions.
11.2.2Potash Resources in the Deep-Brine Aquifer
Wells drilled into the deep-brine aquifer have been used to add brine to the collection ditches and to offset the fluctuations of brine availability within the brine collection system. Production of the deep-brine wells started in 1948. Brine from the deep-brine aquifer is typically 10% to 20% of the KCl produced. Annual KCl production from the deep-brine aquifer on one occasion reached as high as 78,000 t. As shown in Table 11-3, approximately 575,400 t of KCl have been produced from the deep-brine aquifer from 1968 to 2023.
|
|
|
|
|
|
2023 Estimated Resources and Reserves at Intrepid Potash-Wendover
Prepared for Intrepid Potash, Inc.
February 14, 2024 |
37 |
Table 11-3. Historical Deep Well and Shallow Aquifer Production, 1968–2023
|
|
|
|
|
|
|
|
|
|
|
|
|
|
|
|
Full Calendar Year1 |
KCl
Production
(kt)
|
Deep Aquifer KCl Production
(kt)
|
Shallow Aquifer KCl Production
(kt)
|
| 1968 |
50.0 |
25.5 |
24.5 |
| 1969 |
45.0 |
32.3 |
12.7 |
| 1970 |
102.0 |
31.5 |
70.6 |
| 1971 |
88.0 |
15.3 |
72.7 |
| 1972 |
117.0 |
18.7 |
98.3 |
| 1973 |
88.0 |
14.5 |
73.6 |
| 1974 |
72.0 |
15.3 |
56.7 |
| 1975 |
60.0 |
18.7 |
41.3 |
| 1976 |
50.0 |
19.6 |
30.5 |
| 1977 |
65.0 |
18.7 |
46.3 |
| 1978 |
93.0 |
0.0 |
93.0 |
| 1979 |
42.0 |
0.0 |
42.0 |
| 1980 |
50.0 |
0.0 |
50.0 |
| 1981 |
60.0 |
0.0 |
60.0 |
| 1982 |
90.0 |
0.0 |
90.0 |
| 1983 |
10.0 |
0.0 |
10.0 |
| 1984 |
39.0 |
0.0 |
39.0 |
| 1985 |
82.0 |
0.0 |
82.0 |
| 1986 |
65.0 |
0.0 |
65.0 |
| 1987 |
70.0 |
0.0 |
70.0 |
| 1988 |
45.0 |
0.0 |
45.0 |
| 1989 |
40.0 |
0.0 |
40.0 |
| 1990 |
90.0 |
0.0 |
90.0 |
| 1991 |
45.0 |
0.0 |
45.0 |
| 1992 |
110.0 |
78.2 |
31.8 |
| 1993 |
91.0 |
45.1 |
46.0 |
| 1994 |
101.0 |
15.3 |
85.7 |
| 1995 |
65.0 |
6.8 |
58.2 |
| 1996 |
104.0 |
7.7 |
96.4 |
| 1997 |
66.0 |
6.8 |
59.2 |
| 1998 |
50.0 |
0.0 |
50.0 |
| 1999 |
90.0 |
0.0 |
90.0 |
| 2000 |
40.0 |
0.0 |
40.0 |
| 2001 |
35.0 |
0.0 |
35.0 |
| 2002 |
28.0 |
0.0 |
28.0 |
| 2003 |
46.0 |
0.0 |
46.0 |
| 2004 |
50.0 |
2.0 |
48.0 |
| 2005 |
57.4 |
2.6 |
54.8 |
| 2006 |
54.4 |
3.6 |
50.8 |
| 2007 |
98.5 |
4.1 |
94.4 |
| 2008 |
101.9 |
7.2 |
94.7 |
|
|
|
|
|
|
2023 Estimated Resources and Reserves at Intrepid Potash-Wendover
Prepared for Intrepid Potash, Inc.
February 14, 2024 |
38 |
|
|
|
|
|
|
|
|
|
|
|
|
Table 11-3 (continued) Historical Deep Well and Shallow Aquifer Production, 1968–2023 |
|
|
|
|
Full Calendar Year1 |
KCl
Production
(kt)
|
Deep Aquifer KCl Production
(kt)
|
Shallow Aquifer KCl Production
(kt)
|
| 2009 |
60.7 |
11.2 |
49.5 |
| 2010 |
64.1 |
6.5 |
57.6 |
| 2011 |
84.4 |
9.7 |
74.6 |
| 2012 |
87.6 |
14.1 |
73.5 |
| 2013 |
93.5 |
14.1 |
79.3 |
| 2014 |
97.0 |
16.9 |
80.1 |
| 2015 |
73.7 |
16.1 |
57.5 |
| 2016 |
49.5 |
7.0 |
42.5 |
| 2017 |
78.4 |
14.7 |
63.7 |
| 2018 |
85.5 |
19.2 |
66.2 |
| 2019 |
75.4 |
7.9 |
67.6 |
| 2020 |
59.1 |
14.1 |
45.0 |
| 2021 |
52.0 |
21.0 |
31.0 |
| 2022 |
51.2 |
7.7 |
43.5 |
| 2023 |
39.1 |
5.9 |
33.2 |
| Total |
3,797.2 |
575.4 |
3,221.9 |
The potash resource estimate for the deep-brine aquifer in this report was based on current deep well draw-down, pumping rates, and historical brine concentration variations. The estimated resource for the deep-brine aquifer was classified as indicated resource due to hydrogeologic uncertainty of the aquifer.
Currently five deep wells, DBW-21, DBW-22, DBW-23, DBW-24 (previously named Test Well 1), and DBW-25 are being used at Intrepid-Wendover to aid in brine collection. The location of DBW-22 is close to DBW-13, where an aquifer of 254 vertical feet was encountered. DBW-23 is located near DBW-16 and DBW-10 where transmissivity ranges from 75,000 to 118,000 gpd/ft and the aquifer thickness is 48 ft. The aquifer thickness is approximately 88 ft at DBW-24.
DBW-21 pumped at about 782M gallons per year from 2004 to 2023; DBW-22 pumped at about 684M gallons per year from 2008 to 2023; DBW-23 pumped at about 885M gallons per year from 2009 to 2023; DBW-24 pumped at about 183M gallons per year from 2014 to 2023; and DBW-25 pumped at about 456M gallons per year from 2022 to 2023. Typically the deep-well brine combines with the shallow-aquifer brine in the main collection ditch leading to the primary pond. The brine concentration produced from all deep wells is about 0.42% KCl by weight from 1967 to 2023.
Typically, the deep-brine wells were constructed to a depth of 1,000 to 1,500 ft with a useful life expectancy of approximately 15-20 years with maintenance of the pumps every 2-4
|
|
|
|
|
|
2023 Estimated Resources and Reserves at Intrepid Potash-Wendover
Prepared for Intrepid Potash, Inc.
February 14, 2024 |
39 |
years. The deep-brine wells that are currently abandoned, out of service, or idle include DBW-1 through DBW-17. Figure 11-6 shows the location of the active and abandoned deep wells. A plot of the inferred conglomerate thickness contour is also shown in Figure 11-6.
Figure 11-7 shows the brine well pump history at DBW-21, DBW-22, DBW-23, DBW-24, and DBW-25 up to 2023. Reliable draw-down data are not available in these wells. However, relatively constant pump rates indicate no or slow draw-downs in these wells. Since 2016, flows are monitored by monthly totalizer readings for each well. Figure 11-8 shows KCl grade in the deep-brine aquifer from 1967 to 2023. With the exception of some apparently abnormal data, the KCl brine grade from the deep-brine aquifer has remained constant since 1967. However, there is a slight downward trend in the deep-brine aquifer KCl grade beginning in 2007 (Figure 11-8). This could be due to the lifespan of the currently producing wells of 10 or more years. Figure 11-9 shows KCl grades in the four deep-brine wells that have been monitored since pumping commenced. Over the pumping life of these five wells, KCl brine grades have been relatively constant.
|
|
|
|
|
|
2023 Estimated Resources and Reserves at Intrepid Potash-Wendover
Prepared for Intrepid Potash, Inc.
February 14, 2024 |
40 |
Figure 11-6. Deep-Brine Well Locations Thickness Isopach of Deep-Brine Aquifer
|
|
|
|
|
|
2023 Estimated Resources and Reserves at Intrepid Potash-Wendover
Prepared for Intrepid Potash, Inc.
February 14, 2024 |
41 |
Figure 11-7. DBW-21, DBW-22, DBW-23, DBW-24, and DBW-25 Pump History
Figure 11-8. Historical KCl Grade at Deep-Brine Aquifer
|
|
|
|
|
|
2023 Estimated Resources and Reserves at Intrepid Potash-Wendover
Prepared for Intrepid Potash, Inc.
February 14, 2024 |
42 |
*One outlier greater than 1.2% grade has been removed from the figure.
Figure 11-9. KCl Grades at DBW-21, DBW-22, DBW-23, DBW-24, and DBW-25
Based on well draw-down, pumping rates, and KCl grade records, the deep-brine aquifer is expected to be relied upon to support production of 8,000 tpy of Muriate of Potash (MOP) for at least 25 years. Higher production rates occurred when deep brines were pumped from multiple wells. When three or four wells are pumping at the same time, the production rate has reached more than 14,000 tpy since 2012 (Table 11-3).
11.3Qualified Persons Opinion – Further Work
The QP is of the opinion that no further work is needed to determine the resource.
11.4Resource Statement
Table 11-4 shows the summary of the mineral resources for Intrepid-Wendover effective December 31, 2023, exclusive of mineral reserves.
11.5Discussion
Historical production data shows that total production for the shallow-brine aquifer from 1968 to 2023 was 3.222 Mt. The isoconcentration maps indicate a resource depletion greater than the recorded production from 1968 to 2021. This may be because the recovery factor of 60% used in the KCl depletion calculation is overestimated. It should be noted that the 27 wells drilled in 2005 are a limited sample of the “resource”; therefore, referring these 27 wells across the 137-square-mile catchment area could generate misleading results. Moreover, the estimation errors of the mining catchment area, the variability of the estimated porosity and thickness of the shallow-brine aquifer, and the KCl grade estimations, etc., could all impact the estimate.
|
|
|
|
|
|
2023 Estimated Resources and Reserves at Intrepid Potash-Wendover
Prepared for Intrepid Potash, Inc.
February 14, 2024 |
43 |
Table 11-4. K2O Brine Mineral Resource Estimate effective December 31, 2023
|
|
|
|
|
|
|
|
|
|
|
|
|
|
|
|
|
|
Wendover - K2O Brine Mineral Resource Estimate effective December 31, 2023 based on $450/Product Ton Mine Site |
|
Resources |
|
|
|
K2O Brine1
(Mt)
|
Grade
(%K2O) |
Contained K2O2
(Mt)
|
Cutoff3
(%K2O)
|
Processing Recovery
(%) |
| Measured Mineral Resources |
|
|
|
|
|
| Indicated Mineral Resources |
175 |
0.5 |
0.9 |
0.23 |
85 |
| Measured + Indicated Mineral Resources |
175 |
0.5 |
0.9 |
|
|
| Inferred Mineral Resources |
1,358 |
0.5 |
6.8 |
0.23 |
85 |
1K2O Brine is the recovered KCl bearing brine in solution at average concentrations by weight. |
2Contained K2O is calculated by multiplying K2O Brine by the Grade. |
3Solution mining resource cutoff is the grade at which production covers operating costs. |
| Mineral Resources were prepared by RESPEC, a qualified firm for the estimate and independent of Intrepid Potash, for EOY 2023. |
| Mineral Resources are reported exclusive of Mineral Reserves, on a 100% basis. |
Mineral Resources are reported using Inverse Distance Squared (ID2) estimation methods. |
Mt = million tons, % = percent, K2O = potassium oxide |
|
|
|
|
|
|
2023 Estimated Resources and Reserves at Intrepid Potash-Wendover
Prepared for Intrepid Potash, Inc.
February 14, 2024 |
44 |
12.0Mineral Reserve Estimates
Mineral Reserves at Intrepid-Wendover have been determined by applying current economic criteria that are valid for the Intrepid-Wendover Mine. These criteria limitations have been applied to the resource model to determine which part of the Measured and Indicated Mineral Resource is economically extractable.
12.1Key Assumptions, Parameters, and Methods
The factors influencing the determination of the mineable reserves based on economic success of potash mining at Intrepid-Wendover are:
•KCl grade of the aquifer
•Thickness of the aquifer
•Geometry of the aquifer
•Presence of geologic anomalies that distort the aquifer
•Hydrogeological properties of the aquifer
•Impurities that impact solubility or the surface concentration, separation, crystallization, or packaging process
•Cost of Goods Sold
•Price of the final product
These factors can be grouped as geologic, operational, processing, and cost factors. At Intrepid-Wendover, the infrastructure is mature and the processing and cost factors are well understood. Costs are expected to remain constant with respect to the determination of the reserves. Geologic factors relate to the reserve (grade and thickness), bed geometry (dip and undulations), and geologic anomalies (faults, salt horses, and unknowns). Mining factors include the product concentration and the productivity of the wells (life of wells and total production per well). Additionally, reserves are also estimated using the experience gained from potash mining in the shallow- and deep-brine aquifers to date and the established mining costs and sales.
The long-term product sale price selected for this analysis of cutoff grade is $360/t. Intrepid has a long history of sales and marketing of their products. Refer to Section 16 for the market discussion.
An economic cutoff has been evaluated for estimating reserves as included in Table 12-1.
|
|
|
|
|
|
2023 Estimated Resources and Reserves at Intrepid Potash-Wendover
Prepared for Intrepid Potash, Inc.
February 14, 2024 |
45 |
Table 12-1. Reserve Cutoff Cost Estimate
|
|
|
|
|
|
| 5-Yr Basis (2024-2028) |
Value |
|
|
Total Production Costs ($M) |
91.5 |
Net Revenue from byproducts ($M) |
(30.0) |
|
|
Total Cost ($M) |
61.5 |
|
|
| Potash |
|
|
|
Price per ton less shipping ($) |
330 |
Production (tons) |
320,000 |
Net potash sales ($) |
105,600,000 |
|
|
| Cutoff Analysis |
|
|
|
Cutoff production (t) |
186,000 |
Average grade pumped into primary pond (% KCl) based on data from 27 wells |
0.79 |
Cutoff grade (% KCl) |
0.46 |
Cutoff grade (% K2O) |
0.29 |
12.2Mineral Reserves Estimate
The extent to which Intrepid-Wendover’s potassium resources can be converted to reserves and ultimately economically extracted is a function of:
•The tonnage of potassium-rich mineralized brine within effective porosity
•The tonnage of potassium-rich mineralized brine within the total porosity
•The level of recharge from surface water inflow and rainfall
•The extent to which the recharge can liberate the potassium-rich mineral salts contained within the retained porosity into effective porosity over continued production cycles
12.2.1Mineral Reserve Estimates for the Shallow-Brine Aquifer
It should be noted that not all the potash contained in the shallow-brine aquifer with grades above the cutoff grade could be recovered based on the current mining plan. A portion of the brine from total porosity, in addition to the brine from effective porosity, is considered to be extractable depending on the transient groundwater flow and transport conditions affecting the brine level during extraction. For a conservative estimate, an overall recovery factor of 60% was applied to the reserve estimate for the shallow-brine aquifer on a gross scale. The rationale behind this factor is due to the uncertainty of the recovery of KCl leakage from the unlined pond system and ditch plans.
According to the production records from 1990 to 2005, only a portion of the potash in the captured brine was harvested as the final product. The overall efficiency, which is the
|
|
|
|
|
|
2023 Estimated Resources and Reserves at Intrepid Potash-Wendover
Prepared for Intrepid Potash, Inc.
February 14, 2024 |
46 |
percentage ratio between KCl produced and estimated KCl pumped into the primary pond (based on the known brine flow to the ponds and the KCl grade of that brine), was 34% on average from 1990 to 2005. The low overall efficiency indicates that a large percentage of the KCl introduced into the evaporation ponds remained in the pond system or leaked back into the shallow-brine aquifer. Portions of the “KCl loss” to the pond system and shallow-brine aquifer could be recovered in subsequent years and ultimately sold as product.
The brine-collection ditch capture zone analysis conducted by Shaw Environmental, Inc. (2006) shows that the capture zone for each ditch appears to range between 250 and 500 ft laterally from the ditch. Outside the ditch catchment zone, groundwater in the shallow-brine aquifer is estimated to flow at a maximum rate of 13 ft/year. The general spacing between ditches is about 2,600 ft, which may require a period of at least 100 years for the ditches to capture all the potash brine between the ditches.
Total KCl content over the reserve area (the area of influence of the 92 monitoring wells or 78.8 square miles) was estimated based on 1965–1967 KCl brine grades, average porosity (0.45), and thickness (18 ft) of the shallow-brine aquifer. KCl depletion since 1968 over the 92 drillhole control area was estimated using the KCl production from 1968 to 2023 over the 137-square-mile ditch catchment area and applying a product purity of 95% and process efficiency of 85%. The KCl reserve was adjusted to account for the KCl depletion, the KCl tons below the cutoff grade, and an overall recovery factor of 30%. The total MOP reserve for the shallow-brine aquifer is 1.55 Mt.
12.2.2Mineral Reserve Estimates for the Deep-Brine Aquifer
Based on well draw-down, pumping rates, and KCl grade records, the deep-brine aquifer can be relied upon to support production of 8,000 tpy of MOP for over 25 years.
12.3Qualified Persons Opinion – Further Work
The current mineral reserve estimation for the deep-brine aquifer is based on the production history and aquifer grades. The QP believes that these estimates are conservative and reliable, and no further work is recommended at this time.
12.4Reserve Summary
Table 12-2 shows the summary of the mineral reserves at Intrepid-Wendover. The mineral reserve statement is presented in accordance with the S-K 1300 Rules.
|
|
|
|
|
|
2023 Estimated Resources and Reserves at Intrepid Potash-Wendover
Prepared for Intrepid Potash, Inc.
February 14, 2024 |
47 |
Table 12-2. Potash Mineral Reserves effective December 31, 2023
|
|
|
|
|
|
|
|
|
|
|
|
|
|
|
|
|
|
| Wendover - Potash Mineral Reserves effective December 31, 2023 based on $360/Product Ton Mine Site |
|
Reserves |
|
|
|
Brine1
(Mt)
|
In-Situ Grade2
(%K2O)
|
Product3
(Mt)
|
Brine Cutoff Grade4
(%K2O)
|
Processing Recovery
(%) |
| Proven Mineral Reserves |
|
|
|
|
|
| Probable Mineral Reserves |
832 |
0.5 |
1.7 |
0.29 |
85 |
| Total Mineral Reserves |
832 |
0.5 |
1.7 |
|
|
1Brine advanced through the pond system. |
2In-situ grade is the amount of K2O contained in the brine. |
3Potash Product tons are calculated by multiplying Brine by: the In-Situ Grade divided by 63.17% K2O/KCl conversion factor, an overall pond recovery factor of 30%, processing recovery of 85%, a handling loss factor of 97%, and a product purity factor of 105%. |
4Solution mining reserve cutoff is the grade at which production covers operating costs. |
| Mineral Reserves were prepared by RESPEC, a qualified firm for the estimate and independent of Intrepid Potash, for EOY 2023. |
| Mineral Reserves are reported exclusive of Mineral Resources, on a 100% basis. |
Mt = million tons, % = percent, K2O = potassium oxide |
|
|
|
|
|
|
2023 Estimated Resources and Reserves at Intrepid Potash-Wendover
Prepared for Intrepid Potash, Inc.
February 14, 2024 |
48 |
13.0Mining Methods
Potash at Intrepid-Wendover is produced through solar evaporation of naturally occurring brines collected from the sedimentary basin adjacent to the processing facility via brine collection ditches and extraction wells. The potash content of the collected brine is concentrated by solar evaporation to the point that solids are precipitated and can be collected. Harvested solid salts are hauled to the processing facility, where they are dried, sized, and stored for shipment. Potash, MRS, NaCl, and MgCl2 are shipped by both truck and rail via I-80 and the UPRR.
Brines from the shallow-brine aquifer, drained by gravity, are gathered by a system of collection ditches, which are approximately 20 to 30 ft deep by 9 to 40 ft wide. The total collection ditch system covers a length of 117 miles and annually collects approximately 3.4 billion gallons of brine from the shallow-brine aquifer. Brines pumped from the deep-brine aquifer are used to augment the shallow brine to the collection system.
Collected brines are pumped into a primary pond, and solar energy is utilized to heat the brine so that evaporation may proceed. As the brine is concentrated to a point just short of potash precipitation in the primary pond network, the brine is then transferred into a harvest pond for selective precipitation of the potash crude salt.
As water evaporation continues in the harvest pond, sylvinite, a physical mixture of NaCl and KCl, is precipitated to the pond floor until the brine concentrates to a point where carnallite and other salts start to precipitate. The extra brine is then removed from the harvest pond and transferred to carnallite ponds. The layer of sylvinite salts at the harvest pond floor is mechanically removed with scrapers and hauled to the flotation mill for beneficiation.
Grinding and flotation processes are used to concentrate KCl. The concentrate is then leached with freshwater to remove most of the remaining NaCl. The leached product is filtered and dried. A part of the dried product is compacted to produce a coarse grade of potash. MgCl2 brine, MRS, and salt are retrieved as by-products.
13.1Relevant Hydrogeology
Groundwater occurs in three distinct aquifers in much of the western Great Salt Lake Desert: (1) the deep-brine aquifer, (2) the alluvial-fan aquifer, and (3) the shallow-brine aquifer. Inferred subsurface stratigraphic relationships are shown diagrammatically in Figure 13-1.
|
|
|
|
|
|
2023 Estimated Resources and Reserves at Intrepid Potash-Wendover
Prepared for Intrepid Potash, Inc.
February 14, 2024 |
49 |
Figure 13-1. Intrepid-Wendover Hydrogeologic Setting (after Lines 1979 and Mason 1998)
The most extensive aquifer, the deep-brine aquifer, yields brine to wells on the BSF from conglomerate in the lower part of the basin fill. The deep-brine aquifer consists of as much as 840 ft of conglomerate confined by an upper few hundred feet of relatively impermeable lacustrine deposits. Thus, hydraulic connection between the aquifer and playa surfaces is poor (Lines 1979). Aquifer tests indicate that the transmissivity of the deep-brine aquifer in the area of the potash operation averages 13,000 ft2/day and the storage coefficient is about 4×10⁻⁴. Pumping tests indicate the deep-brine aquifer is a quasi-infinite reservoir. The amount of recharge to the deep-brine aquifer cannot be determined from available data. Discharge is mainly from the wells. Concentration of KCl in the deep-brine aquifer ranges from 0.36% to 0.47%, and MgCl2 from 0.43% to 0.69%. Composition of the brine is relatively constant throughout the aquifer.
The alluvial-fan aquifer is composed of sand and gravel alluvial fans along the flanks of the Silver Island Mountains and the Pilot Range. The alluvial fans are interbedded with fine-grained lacustrine deposits which act as confining layers to the alluvial-fan aquifer. The degree of hydraulic connection between the deep-brine aquifer and the alluvial-fan aquifer is unknown. The degree of connection likely varies, as it is dependent on the continuity between the sand and gravel of the alluvial fans and the conglomerates in the basin fill (Lines 1979). No economic mineable potash is contained in the alluvial-fan aquifer.
|
|
|
|
|
|
2023 Estimated Resources and Reserves at Intrepid Potash-Wendover
Prepared for Intrepid Potash, Inc.
February 14, 2024 |
50 |
The shallow-brine aquifer consists of both the near-surface carbonate muds and the crystalline halite and gypsum deposits on the surface of the playas. The shallow-brine aquifer yields brine to collection ditches and is the main source of KCl for Intrepid’s potash operation on the BSF. Sand and gravel of the alluvial fans are interbedded with the near-surface carbonate muds of the playas, and hydraulic connection is good. The average thickness of the shallow-brine aquifer is reported to be about 18 ft (Turk 1969; Shaw Environmental, Inc. 2006).
It is believed that most potash dissolved in the shallow-brine aquifer was from the clay underneath the salt crust (Nolan 1927; Turk 1969). The ultimate source of potash was brought to the Bonneville Basin by slow, lateral subsurface water inflow from adjacent sediments during long-term geologic time. Davis (1967) studied the lateral inflow through the periphery of the salt flats and found that fluid gradients there were less than 0.1 ft per mile. Even if the area had a transmissivity of 10,000 gpd/ft, only 1,000 gpd/mile would have moved through the periphery of the salt flats. Thus, the amount of lateral inflow is insignificant compared with the brine extraction rates.
Recharge to the shallow-brine aquifer is largely from local rainfall. Brine levels change seasonally and are influenced by brine production. Turk (1969) found that during the period of 1965–1968, more than a 3-ft variation in brine levels occurred throughout the salt flats. However, during each winter for which there were records, the brine level recovered to the surface. In drier years, the brine level may not recover completely, but winter precipitation can supply significant additional recharge during wet years. Infiltration capacity tests on the playa surface and hydrographs of observation wells indicate that rainfall in excess of 0.1 inch during the summer and 0.05 inch during the winter recharge the area of thickest salt crust; only high rainfall will recharge very moist clay surfaces. Turk (1969) examined daily rainfall records in the salt flats from 1966 to 1967 and found that the rainfall available for recharge averages about 2.3 inches per year, roughly half of the total precipitation. A simple water budget study from the period 1990–2006 can verify that rainfall recharge is sufficient for the shallow-brine aquifer to remain at a constant brine level. Average annual rainfall during this period was 4.75 inches; therefore, rechargeable rainfall in the mining area is estimated at more than 7.5 billion gallons. Pumping records for that period show that the annual brine extracted from the shallow-brine aquifer was about 3.4 billion gallons, 55% less than rainfall recharge.
13.2Production Rates, Expected Mine Life, and Mining Dilution and Recovery Factors
Since 1968, approximately 67,000 t of KCl, 31,000 t of NaCl, and 156,000 t of MgCl2 were produced each year. The life expectancy is greater than 25 years. The final mine outline is shown in Figure 13-2. The production schedule is included in Table 13-1.
13.3Equipment Fleet and Personnel Required
The predominant equipment to move the salt from the evaporation ponds to processing plant are scrapers. Personnel requirements are minimal (59 personnel) when compared to conventional mining.
|
|
|
|
|
|
2023 Estimated Resources and Reserves at Intrepid Potash-Wendover
Prepared for Intrepid Potash, Inc.
February 14, 2024 |
51 |
Figure 13-2. Final Mine Outline
|
|
|
|
|
|
2023 Estimated Resources and Reserves at Intrepid Potash-Wendover
Prepared for Intrepid Potash, Inc.
February 14, 2024 |
52 |
Table 13-1. Mine Production Schedule Calendar
|
|
|
|
|
|
|
|
|
|
|
|
|
|
|
|
|
|
|
|
|
|
|
|
|
|
A |
B |
C |
D |
E |
F |
|
|
Brine Volume (Million Gallons) |
Brine Grade
(%K2O) |
K2O
(Tons) |
Product KCl
(Tons) |
Handling Losses (Tons) |
MOP
(Tons) |
| 2024 |
Year 1 |
4,500 |
0.5 |
|
27,800 |
46,300 |
1,300 |
45,000 |
| 2025 |
Year 2 |
6,500 |
0.5 |
|
40,100 |
66,800 |
1,800 |
65,000 |
| 2026 |
Year 3 |
7,000 |
0.5 |
|
43,200 |
72,000 |
2,000 |
70,000 |
| 2027 |
Year 4 |
7,000 |
0.5 |
|
43,200 |
72,000 |
2,000 |
70,000 |
| 2028 |
Year 5 |
7,000 |
0.5 |
|
43,200 |
72,000 |
2,000 |
70,000 |
| 2029 |
Year 6 |
7,000 |
0.5 |
|
43,200 |
72,000 |
2,000 |
70,000 |
| 2030 |
Year 7 |
7,000 |
0.5 |
|
43,200 |
72,000 |
2,000 |
70,000 |
| 2031 |
Year 8 |
7,000 |
0.5 |
|
43,200 |
72,000 |
2,000 |
70,000 |
| 2032 |
Year 9 |
7,000 |
0.5 |
|
43,200 |
72,000 |
2,000 |
70,000 |
| 2033 |
Year 10 |
7,000 |
0.5 |
|
43,200 |
72,000 |
2,000 |
70,000 |
| 2034 |
Year 11 |
7,000 |
0.5 |
|
43,200 |
72,000 |
2,000 |
70,000 |
| 2035 |
Year 12 |
7,000 |
0.5 |
|
43,200 |
72,000 |
2,000 |
70,000 |
| 2036 |
Year 13 |
7,000 |
0.5 |
|
43,200 |
72,000 |
2,000 |
70,000 |
| 2037 |
Year 14 |
7,000 |
0.5 |
|
43,200 |
72,000 |
2,000 |
70,000 |
| 2038 |
Year 15 |
7,000 |
0.5 |
|
43,200 |
72,000 |
2,000 |
70,000 |
| 2039 |
Year 16 |
7,000 |
0.5 |
|
43,200 |
72,000 |
2,000 |
70,000 |
| 2040 |
Year 17 |
7,000 |
0.5 |
|
43,200 |
72,000 |
2,000 |
70,000 |
| 2041 |
Year 18 |
7,000 |
0.5 |
|
43,200 |
72,000 |
2,000 |
70,000 |
| 2042 |
Year 19 |
7,000 |
0.5 |
|
43,200 |
72,000 |
2,000 |
70,000 |
| 2043 |
Year 20 |
7,000 |
0.5 |
|
43,200 |
72,000 |
2,000 |
70,000 |
| 2044 |
Year 21 |
7,000 |
0.5 |
|
43,200 |
72,000 |
2,000 |
70,000 |
| 2045 |
Year 22 |
7,000 |
0.5 |
|
43,200 |
72,000 |
2,000 |
70,000 |
| 2046 |
Year 23 |
7,000 |
0.5 |
|
43,200 |
72,000 |
2,000 |
70,000 |
| 2047 |
Year 24 |
7,000 |
0.5 |
|
43,200 |
72,000 |
2,000 |
70,000 |
| 2048 |
Year 25 |
7,000 |
0.5 |
|
43,200 |
72,000 |
2,000 |
70,000 |
| *Numbers rounded for clarity |
| Sylvinite brine density - 1.16 |
| Overall pond recovery - 30% |
| KCl plant recovery - 85% |
| Product purity - 95% |
| Pure KCl equates to 63.17% K2O by mass |
| Handling losses - 3% |
| C = A*1,000,000*1.16*8.34/2000*(B/100)*0.85*0.3 |
| D = C/0.6317/0.95 |
| E = D*0.03 |
| F = D-E |
|
|
|
|
|
|
2023 Estimated Resources and Reserves at Intrepid Potash-Wendover
Prepared for Intrepid Potash, Inc.
February 14, 2024 |
53 |
14.0Processing and Recovery Methods
The potash content of the collected brine is concentrated by solar evaporation to the point that solids are precipitated and can be collected. Harvested solid salts are hauled to the potash processing facility, where they are dried, sized, and stored for shipment as potash, MRS, and NaCl. MgCl2-rich brines are transferred to the MgCl2 ponds and processed in the Carnallite Plant.
14.1Process Description
The Intrepid-Wendover potash plant processes a nominal 7 billion gallons per year of deep-well and near-surface brines. The combined brines are estimated to contain 0.8–0.9 wt% KCl, 18 wt% NaCl, 4.2 wt% MgCl2 and all brines are near-saturated with gypsum (CaSO4) at 0.5–0.6 wt%. The simplified process flow chart is shown in Figure 14-1.
Figure 14-1. Simplified Process Flow Chart
The first step in processing is the solar evaporation in the pond system (Figure 14-2). The Intrepid-Wendover operation production is weather-dependent, most specifically rainfall. Anecdotally a wet winter increases potash production but produces diluted MgCl2, which limits
|
|
|
|
|
|
2023 Estimated Resources and Reserves at Intrepid Potash-Wendover
Prepared for Intrepid Potash, Inc.
February 14, 2024 |
54 |
production of Road Saver brine. The annual precipitation ranges from 1.6 inches to 10.4 inches with an average of 4.8 inches. Low rainfall levels result in a drop in the lake brine level and result in low flows of brine
Pond operation is challenging. Primary Pond 6, for example, is large providing 7,800 acres for evaporation. Initially when flooded with weak brine, the large pond area allows rapid concentration of the weak brine. Once concentration is reached, the challenge is to not over-concentrate. The operators manage the concentration of KCl by controlling the path of the brine through Primary Pond 6 and therefore, reducing evaporation time. Primary Ponds have a service life of approximately 10 – 20 years due to salt deposition. New Primary Ponds are constructed as necessary to allow for sufficient brine storage and evaporation to support the 25 year mine plan.
The plant data and mass balance vary with the weather, but clearly the pond berms are very permeable, and 65–70% of the KCl pumped into the Primary Pond returns to the lake via leakage. With a mill recovery of 85%, it is estimated that only 30% of the KCl entering the Primary Pond is recovered as final product. Leakage becomes more costly as the brine concentrates. The downstream ponds have clay berms, and Harvest Pond 2 has a liner.
As brine advances towards the Harvest ponds, KCl and MgCl2 concentrations increase, while NaCl is being deposited. Initially halite and gypsum precipitate. By the time the brine has reached the Harvest ponds, the MgCl2 concentration has increased to 5.5%, KCl has climbed to 4.5%, and NaCl has fallen to 6.4%. During preliminary evaporation, almost 3.5 Mt of halite have been removed from the brine. In the Harvest ponds, KCl falls to 3%, NaCl to 1.5%, and MgCl2 rises to 21%. Approximately 265,000 t of crystal are harvested at 28% KCl. The harvesting is conducted for up to 10 months out of the year and 5 days per week, which matches the mill operating schedule.
The brine leaving the Harvest ponds is delivered to the Carnallite ponds. The brine concentrates to about 26% MgCl2, which results in the co-crystallization of halite and carnallite (MgCl2•KCl•6H2O). The crystal production is near 180,000 tpy, including 38,000 tpy of contained KCl. The KCl is separated from the MgCl2 by leaching with a near KCl-saturated combination of mill brine and brackish water. The KCl/NaCl crystal is separated by screening and is either dissolved and returned to the Harvest pond area or is used to create an excavation bed for the next Harvest season. The brine from the Carnallite dissolution step is recycled to the Carnallite ponds. The MgCl2 brine leaving the Carnallite ponds is either returned to the lake via ditch or is forwarded to the MgCl2 ponds to be further concentrated by evaporation and is shipped by truck or rail carloads.
The harvested crystal is delivered to an agitated slurry pit where it is re-pulped in double-saturated brine and pumped to the processing facility. The crystals are statically screened with the oversize processed through a crusher. The screened crystal is combined with reagents and fed to flotation cells.
|
|
|
|
|
|
2023 Estimated Resources and Reserves at Intrepid Potash-Wendover
Prepared for Intrepid Potash, Inc.
February 14, 2024 |
55 |
The rougher flotation concentrate is sent to the agitated leach tank. The leached solids are at a product grade of 95% KCl with 60.5% K2O. The solids are dried, sampled, and conveyed to storage bins prior to the granulation circuit. The dried product is granulated and sent to the final product storage. The product is shipped to market in trucks or rail cars. Typical KCl production is 50,000 to 80,000 tpy.
Figure 14-2. Solar Evaporation Pond Layout
14.2Energy, Water, Process Materials, and Personnel Requirements
Brackish water consumption is estimated at 3.5 billion gallons per year. Solar plants typically have low energy requirements. Process materials are readily available within the greater Salt Lake City area, and personnel are sourced locally and trained as needed.
|
|
|
|
|
|
2023 Estimated Resources and Reserves at Intrepid Potash-Wendover
Prepared for Intrepid Potash, Inc.
February 14, 2024 |
56 |
15.0Infrastructure
A robust set of infrastructure is in place for Intrepid-Wendover. Propane, electricity, and water have historically been readily available and are expected to continue into the future. The layout of the infrastructure is shown in Figure 15-1.
|
|
|
|
|
|
2023 Estimated Resources and Reserves at Intrepid Potash-Wendover
Prepared for Intrepid Potash, Inc.
February 14, 2024 |
57 |
Figure 15-1. Layout of the Infrastructure
|
|
|
|
|
|
2023 Estimated Resources and Reserves at Intrepid Potash-Wendover
Prepared for Intrepid Potash, Inc.
February 14, 2024 |
58 |
16.0Market Studies
Price projections are based on a combination of historic pricing trends and expectations of future potash consumption and production. Intrepid uses a variety of sources including, but not limited to, industry reports, company announcements, third-party market studies, and internal estimates when establishing a forecasted price. Intrepid compares its historic realized pricing to widely available benchmark prices, specifically the Midwest Warehouse potash price and the U.S. New Orleans Louisiana (“NOLA”) Barge Market potash price, to establish a historic price differential which it uses when analyzing future price expectations.
|
|
|
|
|
|
2023 Estimated Resources and Reserves at Intrepid Potash-Wendover
Prepared for Intrepid Potash, Inc.
February 14, 2024 |
59 |
17.0Environmental Studies, Permitting, and Plans
17.1Environmental Studies
An Environmental Assessment for the Intrepid Potash-Wendover Mine and Reclamation Plan Modification was conducted by the BLM (2012).
17.2Waste and Tailings Disposal, Site Monitoring, and Water Management during and after Mine Closure
In a voluntary effort to enhance the salt crust on the BSF, Intrepid-Wendover participates in a salt laydown project by pumping brine north of I-80. There is no tailings disposal on site. Surface and groundwater monitoring follows a state-approved plan.
17.3Permitting Status and Reclamation Bonds
The permitting status and reclamation bond are listed in Table 17-1.
17.4Agreements with Local Individuals
There are no specific agreements in place with local individuals.
17.5Closure Plans
Closure activities include the requirements of filling ditches, removing berms, facility removal, resurveying public lands, and plugging wells.
17.6Adequacy of Current Plans and Compliance
Intrepid-Wendover is in operation and in adherence with local, state, and federal regulations. It is the opinion of the QP that the current plans for environmental compliance, permitting, and addressing issues with local groups are adequate.
|
|
|
|
|
|
2023 Estimated Resources and Reserves at Intrepid Potash-Wendover
Prepared for Intrepid Potash, Inc.
February 14, 2024 |
60 |
Table 17-1. Permitting Status
|
|
|
|
|
|
|
|
|
|
|
|
|
|
|
|
|
|
|
|
|
|
|
|
|
|
|
|
| Common Name |
Issuing Agency |
Permit ID |
Effective Date |
Expiration Date |
Bond Value |
Note |
| Air Permit |
Utah Division of Air Quality |
Approval Order #:
DAQ-2019-009605
(DAQE-AN107420014-19) |
22-Jul-19 |
None |
|
|
| Storm Water Pollution Prevention Plan |
Utah Division of Water Quality |
Permit No.: UTR262329 |
1-Jan-23 |
31-Dec-28 |
|
The renewal process takes place every 5 years. |
| Spill Response Plan |
Self-Issued |
|
Amended
20-Apr-2012
|
Next Review due March 2025 |
|
Prepared by Hill West Environmental, February 2010. |
| Fugitive Dust Control Plan (FDCP) |
Utah Division of Air Quality |
|
29-Jun-15 |
None |
|
|
| Solid and Hazardous Waste Management Plan |
Self-Issued |
|
Dec-12 |
None |
|
[Not a permit, IPW is a Very Small Quantity Generator] |
| Mine and Reclamation Plan |
Utah Division of Oil Gas and Mining |
Notice of Intentions to Revise Mining Operations, File No.: M-0450002 |
11-Dec-14 |
LOM with periodic reviews every 5 years. Next review due 2024. |
$8,904,000 |
|
| XRF license |
Utah Division of Waste Management and Radiation Control |
X-Ray
Registration No. 3084 |
31-Dec-21 |
4-Apr-2024 |
|
Division to inspect every 5 years. |
|
|
|
|
|
|
|
|
|
|
|
|
|
2023 Estimated Resources and Reserves at Intrepid Potash-Wendover
Prepared for Intrepid Potash, Inc.
February 14, 2024 |
61 |
18.0Capital and Operating Costs
18.1Capital Cost Estimate
Major capital has been allocated to the 25 year mine plan. This includes a new DBW in year 3 ($3M) and the addition of Primary Ponds in years 10 and 20 ($5M each). Reclamation costs are included as capital in Year 25 of $8.2M.
18.2Operating Cost Estimate
The operating cost at Intrepid-Wendover based on historic actual expenses, is estimated to be $286/t as shown in Table 18-1. The largest operating cost is labor at 40% of the annual operating cost. Natural gas, electricity, and fuel represents less than 14% of the total operating cost.
Table 18-1. Operating Cost Estimate (next 5 years)
|
|
|
|
|
|
|
|
|
|
|
|
| Cost Category |
Cost ($/Product Ton) |
Cost Distribution |
| Labor |
$113 |
40% |
| Maintenance Supplies |
$29 |
10% |
| Energy and Fuels |
$40 |
14% |
| Operating Supplies |
$43 |
15% |
| Other (Leases, Property Taxes, Insurance, etc.) |
$31 |
11% |
| Subtotal |
$256 |
89% |
| Warehouse and Handling |
$23 |
8% |
| Royalties |
$7 |
2% |
| Environmental remediation and other non-inventory costs |
$1 |
0.40% |
| Operating Cost |
$286 |
100% |
| Less by product revenues |
$(94) |
|
| Cost of Goods Sold |
$192 |
|
18.3Accuracy Discussion
Operating costs, including warehouse, handling and royalty expenses are based on historical actual expenses. Because the costs are based on historical actual expenses, the cost estimates are at an accuracy of at least +/- 15%. Capital costs are based on actual bids or recent purchases of capital items plus an inflation factor. The capital costs estimates are at an accuracy of at least +/- 25% and contingency levels are less than 25%.
The reclamation costs are based on the most recent bonding estimates and the asset retirement obligations.
|
|
|
|
|
|
2023 Estimated Resources and Reserves at Intrepid Potash-Wendover
Prepared for Intrepid Potash, Inc.
February 14, 2024 |
62 |
19.0Economic Analysis
To evaluate the viability of mining the Intrepid-Wendover mines reserves, an economic analysis was conducted. Annual revenue and production cost schedules were used to build a projected cash flow to accompany the mine plan. The costs and sales price parameters were assumed to be in constant US dollars.
19.1Key Assumptions, Parameters, and Methods
The property has a long history of operation at this location. The assumption list for the economic analysis is shown in Table 19-1.
Table 19-1. Economic Analysis Assumptions
|
|
|
|
|
|
|
|
| Parameter |
Assumption |
| Potash Sale Price (mine site) |
$360/t |
| Shipping Potash |
$30/t |
| Potash Production Target |
70,000 tpy |
| Interest Rate |
0–12% APR |
| Income Taxes (State and Federal) |
26% |
19.2Economic Analysis
For a property in operation, economic viability may be implied. The pre-tax cash flow was developed using the production plan continuing as currently operating in Table 19-2. The after-tax cash flow is listed in Table 19-3. The cashflows are shown graphically in Figures 19-1 and 19-2 for pre- and after-tax, respectively. Annual ore production, ore grade and tons of product produced used in both the pre-tax and after-tax cash flow analyses are taken from the annual life of mine production schedule as shown in Section 13: Mining Methods included in this Technical Report Summary. The annual life of mine production schedule provides the calculation of product tons resulting from tons of ore mined and the associated grade of ore mined.
19.3Sensitivity Analysis
NPV sensitivity analyses were run using variants in commodity price and operating costs for the pre-tax cash flow. The results of the sensitivity analysis are shown graphically for pre-tax and after-tax evaluations in Figures 19-1 and 19-2, respectively.
|
|
|
|
|
|
2023 Estimated Resources and Reserves at Intrepid Potash-Wendover
Prepared for Intrepid Potash, Inc.
February 14, 2024 |
63 |
19.4Discussion
The property has consistently operated at a profit and is expected to continue to operate at a profit.
Table 19-2. Estimated Pre-Tax Cash Flow
|
|
|
|
|
|
|
|
|
|
|
|
|
|
|
|
|
|
|
Five-Year Periods |
| Item |
2024 - 2028 |
2029 - 2033 |
2034 - 2038 |
2039 - 2043 |
2044 - 2048 |
|
|
|
|
|
|
| Tons of product production |
320,000 |
350,000 |
350,000 |
350,000 |
350,000 |
|
|
|
|
|
|
| Potash Sales price per ton mine site |
$360 |
|
$360 |
|
$360 |
|
$360 |
|
$360 |
|
| Transportation cost per ton |
$30 |
|
$30 |
|
$30 |
|
$30 |
|
$30 |
|
| Net sales price per ton |
$330 |
|
$330 |
|
$330 |
|
$330 |
|
$330 |
|
|
|
|
|
|
|
| Period net revenue |
$105,600,000 |
|
$115,500,000 |
|
$115,500,000 |
|
$115,500,000 |
|
$115,500,000 |
|
|
|
|
|
|
|
| Cost per product ton, excluding depreciation |
$256 |
|
$240 |
|
$240 |
|
$240 |
|
$240 |
|
| Warehouse & Handling per product ton |
$23 |
|
$22 |
|
$22 |
|
$22 |
|
$22 |
|
| Royalties per product ton |
$7 |
|
$7 |
|
$7 |
|
$7 |
|
$7 |
|
| Environmental remediation and other non-inventory costs |
$1 |
|
$1 |
|
$1 |
|
$1 |
|
$1 |
|
| Less byproduct revenues |
($94) |
|
($86) |
|
($86) |
|
($86) |
|
($86) |
|
| Operating costs per production ton, excluding depreciation |
$192 |
|
$183 |
|
$183 |
|
$183 |
|
$183 |
|
|
|
|
|
|
|
| Less period operating costs, excluding depreciation |
($61,521,487) |
|
($64,058,631) |
|
($64,058,631) |
|
($64,058,631) |
|
($64,058,631) |
|
| Less period capital |
($20,500,000) |
|
($22,500,000) |
|
($17,500,000) |
|
($22,500,000) |
|
($17,500,000) |
|
| Less period remediation |
- |
|
- |
|
- |
|
- |
|
($8,212,250) |
|
| Estimated period pre-tax cashflow |
$23,578,513 |
|
$28,941,369 |
|
$33,941,369 |
|
$28,941,369 |
|
$25,729,119 |
|
|
|
|
|
|
|
2023 Estimated Resources and Reserves at Intrepid Potash-Wendover
Prepared for Intrepid Potash, Inc.
February 14, 2024 |
64 |
Table 19-3. Estimated After-Tax Cash Flow
|
|
|
|
|
|
|
|
|
|
|
|
|
|
|
|
|
|
|
Five-Year Periods |
| Item |
2024 - 2028 |
2029 - 2033 |
2034 - 2038 |
2039 - 2043 |
2044 - 2048 |
|
|
|
|
|
|
| Tons of product production |
320,000 |
350,000 |
350,000 |
350,000 |
350,000 |
|
|
|
|
|
|
| Potash Sales price per ton mine site |
$360 |
|
$360 |
|
$360 |
|
$360 |
|
$360 |
|
| Transportation cost per ton |
$30 |
|
$30 |
|
$30 |
|
$30 |
|
$30 |
|
| Net sales price per ton |
$330 |
|
$330 |
|
$330 |
|
$330 |
|
$330 |
|
|
|
|
|
|
|
| Period net revenue |
$105,600,000 |
|
$115,500,000 |
|
$115,500,000 |
|
$115,500,000 |
|
$115,500,000 |
|
|
|
|
|
|
|
| Cost per product ton, excluding depreciation |
$256 |
|
$240 |
|
$240 |
|
$240 |
|
$240 |
|
| Warehouse & Handling per product ton |
$23 |
|
$22 |
|
$22 |
|
$22 |
|
$22 |
|
| Royalties per product ton |
$7 |
|
$7 |
|
$7 |
|
$7 |
|
$7 |
|
| Environmental remediation and other non-inventory costs |
$1 |
|
$1 |
|
$1 |
|
$1 |
|
$1 |
|
| Depreciation and Depletion |
$74 |
|
$69 |
|
$69 |
|
$69 |
|
$69 |
|
| Less byproduct revenues |
($94) |
|
($86) |
|
($86) |
|
($86) |
|
($86) |
|
| Total Operating Costs |
$266 |
|
$252 |
|
$252 |
|
$252 |
|
$252 |
|
|
|
|
|
|
|
| Total operating costs |
($85,266,074) |
|
($88,184,891) |
|
($88,184,891) |
|
($88,184,891) |
|
($88,184,891) |
|
|
|
|
|
|
|
| Estimated Pre-tax Income |
$20,333,926 |
|
$27,315,109 |
|
$27,315,109 |
|
$27,315,109 |
|
$27,315,109 |
|
|
|
|
|
|
|
| Estimated Taxes at 26% |
($5,286,821) |
|
($7,101,928) |
|
($7,101,928) |
|
($7,101,928) |
|
($7,101,928) |
|
| Estimated After Tax Income |
$15,047,106 |
|
$20,213,181 |
|
$20,213,181 |
|
$20,213,181 |
|
$20,213,181 |
|
|
|
|
|
|
|
| Add back Depreciation and Depletion |
$23,744,587 |
|
$24,126,260 |
|
$24,126,260 |
|
$24,126,260 |
|
$24,126,260 |
|
| Less period Capital |
($20,500,000) |
|
($22,500,000) |
|
($17,500,000) |
|
($22,500,000) |
|
($17,500,000) |
|
| Less period Remediation |
- |
|
- |
|
- |
|
- |
|
($8,212,250) |
|
| After-Tax Cash Flow |
$18,291,693 |
|
$21,839,441 |
|
$26,839,441 |
|
$21,839,441 |
|
$18,627,191 |
|
|
|
|
|
|
|
2023 Estimated Resources and Reserves at Intrepid Potash-Wendover
Prepared for Intrepid Potash, Inc.
February 14, 2024 |
65 |
Table 19-4. NPV Pre-Tax Estimate
|
|
|
|
|
|
|
|
| Interest Rate |
NPV |
| (% APR) |
($M) |
| 0 |
$141 |
| 5 |
$79 |
| 8 |
$59 |
| 10 |
$49 |
| 12 |
$42 |
Table 19-5. NPV After-Tax Estimate
|
|
|
|
|
|
|
|
| Interest Rate |
NPV |
| (% APR) |
($M) |
| 0 |
$107 |
| 5 |
$60 |
| 8 |
$45 |
| 10 |
$38 |
| 12 |
$33 |
|
|
|
|
|
|
2023 Estimated Resources and Reserves at Intrepid Potash-Wendover
Prepared for Intrepid Potash, Inc.
February 14, 2024 |
66 |
Figure 19-1. Pre-Tax NPV Sensitivities (APR 8%)
Figure 19-2. After-Tax NPV Sensitivities (APR 8%)
|
|
|
|
|
|
2023 Estimated Resources and Reserves at Intrepid Potash-Wendover
Prepared for Intrepid Potash, Inc.
February 14, 2024 |
67 |
Figure 19-3. Estimated Pre-Tax Cash Flow
Figure 19-4. Estimated After-Tax Cash Flow
|
|
|
|
|
|
2023 Estimated Resources and Reserves at Intrepid Potash-Wendover
Prepared for Intrepid Potash, Inc.
February 14, 2024 |
68 |
20.0Adjacent Properties
Adjacent properties are not applicable at Intrepid-Wendover.
|
|
|
|
|
|
2023 Estimated Resources and Reserves at Intrepid Potash-Wendover
Prepared for Intrepid Potash, Inc.
February 14, 2024 |
69 |
21.0Other Relevant Data and Information
No additional information is provided.
|
|
|
|
|
|
2023 Estimated Resources and Reserves at Intrepid Potash-Wendover
Prepared for Intrepid Potash, Inc.
February 14, 2024 |
70 |
22.0Interpretation and Conclusions
Estimates are dependent on data obtained from the natural environment. Although the mine has been in operation for many years, factors such as extended drought or natural disasters could influence the estimates. The general spacing between collection ditches is about 2,600 ft, which may require a period of at least 100 years for the ditches to capture all the potash brine between the ditches. A future mining plan with optimized ditch spacing could affect the recovery factor and reserve estimation.
|
|
|
|
|
|
2023 Estimated Resources and Reserves at Intrepid Potash-Wendover
Prepared for Intrepid Potash, Inc.
February 14, 2024 |
71 |
23.0Recommendations
No further work is recommended.
|
|
|
|
|
|
2023 Estimated Resources and Reserves at Intrepid Potash-Wendover
Prepared for Intrepid Potash, Inc.
February 14, 2024 |
72 |
24.0References
Agapito (2007a), “Potash Resource Estimation for Intrepid Potash–Wendover, LLC,” report to Intrepid Potash, 363-10, November, 40 pp.
Agapito (2007b), “Determination of Estimated Probable Reserves at Intrepid Potash–Wendover, LLC,” report to Intrepid Potash, 363-10, November, 40 pp.
Agapito (2010), “Determination of Estimated Probable Potash Reserves at Intrepid Potash–Wendover, LLC,” repot to Intrepid Potash, 363-12, February, 47 pp.
Agapito (2013), “Determination of Estimated Probable Potash Reserves at Intrepid Potash–Wendover, LLC,” report to Intrepid Potash, 363-13, February, 53 pp.
Agapito (2016), “2015 Determination of Estimated Probable Potash Reserves at Intrepid Potash–Wendover, LLC,” report to Intrepid Potash, 363-19, January 22, 66 pp.
Agapito (2019), “2018 Determination of Estimated Probable Reserves at Intrepid Potash–Wendover, LLC,” report to Intrepid Potash, 363-22, January, 65 pp.
Agapito (2021), “Technical Report Summary of 2021 Estimated Resources and Reserves at Intrepid Potash-Wendover, report to Intrepid Potash, 363-28, February, 78 pp.
CFR (2021), “Disclosure by Registrants Engaged in Mining Operations,” § 229.1301, last amended September 1.
Currey, D. R., C. G. Oviatt, and J. E. Czarnomski (1984), “Late Quaternary Geology of Lake Bonneville and Lake Waring,” Geology of Northwest Utah, Southern Idaho, and Northeast Nevada, G. J. Kearns and R. L. Kearns, Jr., (Editors), Utah Geological Association, Publication 13, pp. 227–237.
Davis, S. N. (1967), “Supplementary Report on Brine Production at Bonneville, Utah,” C. E. Bradberry and Associates, Consulting Engineering, private report to Kaiser Aluminum and Chemical Corporation.
Kaiser Aluminum & Chemical Corporation (1974), “Production Plan for Pond System V at Kaiser Aluminum & Chemical Corporation Bonneville Division Wendover, Utah,” submitted to United States Department of the Interior, May 2.
Lines, G. C. (1979), “Hydrology and Surface Morphology of the Bonneville Salt Flats and Pilot Valley Playa, Utah,” United States Government Printing Office, Washington.
Mason (1998), “Hydrology of the Bonneville Salt Flats, Northwestern Utah, and Simulation of Ground-Water Flow and Solute Transport in the Shallow-Brine Aquifer,” U.S. Geological Survey Professional Paper 1585, 120 pp.
|
|
|
|
|
|
2023 Estimated Resources and Reserves at Intrepid Potash-Wendover
Prepared for Intrepid Potash, Inc.
February 14, 2024 |
73 |
Nolan, T. B. (1927), “Potash Brines in the Great Salt Lake Desert, Utah,” U.S. Geologic Survey Bulletin 795-B.
Oviatt, C. G., D. R. Currey, and D. Sack (1992), “Radiocarbon Chronology of Lake Bonneville, Eastern Great Basin, USA, Palaeogeogr. Palaeoclimatol. Palaeoecol. 99:225–241.
RESPEC (2023) Technical Report Summary of REVISED 2021 Estimated Resources and Reserves at Intrepid Potash-Wendover, report to Intrepid Potash, 82 pp.
SEC (2008), “Industry Guides,” OMB Number 3235-0069, 33 pp.
Shaw Environmental, Inc. (2006), “Mine and Reclamation Plan Intrepid Potash-Wendover, LLC Potash Mine,” submitted to Bureau of Land Management State Office-Utah on Behalf of Intrepid Potash-Wendover, LLC, June 15.
SME (2017), “A Guide for Reporting Exploration Information, Minerals Resources, and Mineral Reserves,” July 17, 97 pp.
Turk, L. J. (1969), “Hydrogeology of the Bonneville Salt Flats, Utah: Ph.D. Dissertation,” Stanford University.
US Department of Interior Bureau of Land Management, (2012), Environmental Assessment UT-020-2006-002 “Intrepid Potash Mine and Reclamation Plan (Modification), August 12.
|
|
|
|
|
|
2023 Estimated Resources and Reserves at Intrepid Potash-Wendover
Prepared for Intrepid Potash, Inc.
February 14, 2024 |
74 |
25.0Reliance on Information
The QP relied on information provided by Intrepid and Intrepid-Wendover.
EX-97.1
13
ipi12312023exhibit971.htm
EX-97.1
Document
INTREPID POTASH, INC.
Incentive Compensation Recovery Policy
1.Purpose
The purpose of the Intrepid Potash, Inc. (“Intrepid” or “Company”) Incentive Compensation Recovery Policy (this “Policy”) is to provide for the recovery of certain Incentive-Based Compensation in the event of an Accounting Restatement. This Policy is intended to comply with, and to be administered and interpreted consistent with, Section 10D of the Securities Exchange Act of 1934, as amended (the “Exchange Act”), Rule 10D-1 promulgated under the Exchange Act (“Rule 10D-1”), and Listing Standard 303A.14 adopted by the New York Stock Exchange (“NYSE”) (the “Listing Standards”). Unless otherwise defined in this Policy, capitalized terms shall have the meanings set forth in Section 10 below.
2.Policy for Recovery of Erroneously Awarded Compensation
In the event of an Accounting Restatement, the Company will recover reasonably promptly the amount of any Erroneously Awarded Compensation Received by an Executive Officer during the Recovery Period.
3.Administration
1.1.This Policy shall be administered by the Compensation Committee, except that the Board may determine to act as the administrator or designate another committee of the Board to act as the administrator with respect to any portion of this Policy other than Section 3.3 (the “Administrator”). The Administrator is authorized to interpret and construe this Policy and to make all determinations necessary, appropriate, or advisable for the administration of this Policy.
1.2.The Administrator is authorized to take appropriate steps to implement this Policy and may effect recovery hereunder by: (i) requiring payment to the Company, (ii) set-off, (iii) reducing compensation, or (iv) such other means or combination of means as the Administrator determines to be appropriate.
1.3.The Company need not recover Erroneously Awarded Compensation if and to the extent that the Compensation Committee determines that such recovery is impracticable and not required under Rule 10D-1 and the Listing Standards because: (i) the direct expense paid to a third party to assist in enforcing this Policy would exceed the amount to be recovered after making a reasonable attempt to recover, (ii) recovery would violate home country law adopted prior to November 28, 2022, after obtaining the opinion of home country counsel acceptable to NYSE, or (iii) recovery would likely cause an otherwise tax-qualified broad-based retirement plan to fail the requirements of Section 401(a)(13) or Section 411(a) of the Internal Revenue Code of 1986, as amended, and regulations thereunder.
1.4.Any determinations made by the Administrator under this Policy shall be final and binding on all affected individuals and need not be uniform with respect to each individual covered by this Policy.
1.Other Recovery Rights; Company Claims Any right of recovery pursuant to this Policy is in addition to, and not in lieu of, any other remedies or rights of recovery that may be available to the Company under applicable law or pursuant to the terms of any other compensation recovery policy of the Company that may be in effect from time to time, including in any employment agreement, plan or award agreement, or similar agreement and any other legal remedies available to the Company. Nothing contained in this Policy and no recovery hereunder shall limit any claims, damages, or other legal remedies the Company may have against an individual arising out of or resulting from any actions or omissions by such individual.
2.Reporting and Disclosure
The Company shall file all disclosures with respect to this Policy in accordance with the requirements of federal securities laws.
3.Indemnification Prohibition
Notwithstanding the terms of any indemnification or insurance policy or any contractual arrangement that may be interpreted to the contrary, the Company shall not indemnify any individual with respect to amount(s) recovered under this Policy or claims relating to the enforcement of this Policy, including any payment or reimbursement for the cost of third-party insurance purchased by such individual to fund potential clawback obligations hereunder.
4.Amendment; Termination
The Board or the Compensation Committee may amend or terminate this Policy from time to time in its discretion as it deems appropriate and shall amend this Policy as it deems necessary to comply with applicable law or any rules or standards adopted by a national securities exchange or association on which the Company’s securities are listed; provided, however, that no amendment or termination of this Policy shall be effective to the extent it would cause the Company to violate any federal securities laws, Securities and Exchange Commission rule or the rules or standards of any national securities exchange or association on which the Company’s securities are listed.
5.Successors
This Policy shall be binding and enforceable against all individuals who are or were Executive Officers and their beneficiaries, heirs, executors, administrators, or other legal representatives.
6.Effective Date
This Policy is effective only for Incentive-Based Compensation Received by an Executive Officer on or after the Effective Date.
7.Definitions. For purposes of this Policy, the following terms shall have the meanings set forth below:
1.1.“Accounting Restatement” means an accounting restatement of the Company’s financial statements due to the Company’s material noncompliance with any financial reporting requirement under the securities laws, including any accounting restatement required to correct an error in previously issued financial statements that is material to the previously issued financial statements, or that would result in a material misstatement if the error were corrected in the current period or left uncorrected in the current period.
1.2.“Administrator” has the meaning set forth in Section 3.1 hereof.
1.3.“Board” means the Company’s Board of Directors.
1.4.“Company” means Intrepid Potash, Inc., a Delaware corporation, and its affiliates.
1.5.“Committee” means the Compensation Committee of the Board.
1.6.“Effective Date” means the date this Policy is adopted by the Board.
1.7.“Erroneously Awarded Compensation” means the amount, as determined by the Administrator, of Incentive-Based Compensation received by an Executive Officer that exceeds the amount of Incentive-Based Compensation that would have been received by the Executive Officer had it been determined based on the restated amounts. For Incentive-Based Compensation based on stock price or total shareholder return (“TSR”) the Administrator will determine the amount based on a reasonable estimate of the effect of the Accounting Restatement on the stock price or TSR upon which the Incentive-Based Compensation was received, and the Company will maintain documentation of the determination of that reasonable estimate and provide the documentation to NYSE. In all cases, the amount to be recovered will be calculated without regard to any taxes paid by the Executive Officer with respect of the Erroneously Awarded Compensation.
1.8.“Executive Officers” means the Company’s current and former executive officers as determined by the Administrator in accordance with Rule 10D-1 and the Listing Standards. Generally, Executive Officers include any executive officer designated by the Board as an “officer” under Rule 16a-1(f) under the Exchange Act.
1.9.“Financial Reporting Measure” means (i) any measure that is determined and presented in accordance with the accounting principles used in preparing the Company’s financial statements and any measure derived wholly or in part from such a measure, and (ii) any measure based wholly or in part on the Company’s stock price or total shareholder return. A Financial Reporting Measure need not be presented within the Company’s financial statements or included in a filing with the Securities and Exchange Commission.
1.10.“Incentive-Based Compensation” means any compensation granted, earned, or vested based in whole or in part on the Company’s attainment of a Financial Reporting Measure that was Received by an individual (i) on or after the Effective Date and after such individual began service as an Executive Officer, (ii) who served as an Executive Officer at any time during the performance period for the Incentive-Based Compensation and (iii) while the Company had a listed class of securities on a national securities exchange or association.
1.11. Incentive-Based Compensation is deemed to be “Received” in the Company’s fiscal period during which the Financial Reporting Measure specified in the Incentive-Based Compensation award is attained, even if the payment or grant of such Incentive-Based Compensation occurs after the end of that period.
1.12.“Recovery Period” means the three completed fiscal years immediately preceding the date that the Company is required to prepare the applicable Accounting Restatement and any “transition period” as described under Rule 10D-1 and the Listing Standards. For purposes of this Policy, the “date that the Company is required to prepare the applicable Accounting Restatement” is the earlier to occur of (i) the date the Board, a committee of the Board, or the officer or officers of the Company authorized to take such action if Board action is not required, concludes, or reasonably should have concluded, that the Company is required to prepare an Accounting Restatement, or (ii) the date a court, regulator, or other legally authorized body directs the Company to prepare an Accounting Restatement.
8.Acknowledgement by Executive Officer
Each Executive Officer shall sign and return to the Company an Acknowledgment Form substantially the form attached to this Policy as Exhibit A or in such other form determined by the Administrator, pursuant to which the Executive Officer agrees to be bound by, and comply with, the terms of this Policy.
Exhibit A
INTREPID POTASH, INC.
Incentive Compensation Recovery Policy
ACKNOWLEDGEMENT FORM
I, the undersigned, acknowledge and affirm that I have received and reviewed a copy of the Intrepid Potash, Inc. Incentive Compensation Recovery Policy, and agree that: (i) I am and will continue to be subject to the Intrepid Potash, Inc. Incentive Compensation Recovery Policy, as amended from time to time (the “Policy”), (ii) the Policy will apply to me both during and after my employment with the Company, and (iii) I will abide by the terms of the Policy, including, without limitation, by promptly returning any Erroneously Awarded Compensation to the Company to the extent required by, and in a manner determined by the Administrator and permitted by, the Policy. In the event of any inconsistency between the Policy and the terms of any employment agreement or offer letter to which I am a party, or the terms of any compensation plan, program, or agreement under which any compensation has been granted, awarded, earned or paid, the terms of the Policy shall govern.
Capitalized terms used but not otherwise defined in this Acknowledgement Form shall have the meanings ascribed to such terms in the Policy.
________________________________
Signature
________________________________
Print Name
________________________________
Date