false2024Q2000141344712/31311xbrli:sharesiso4217:USDiso4217:USDxbrli:sharesiso4217:EURxbrli:sharesnxpi:businessxbrli:purenxpi:individual00014134472024-01-012024-06-3000014134472024-07-1900014134472024-04-012024-06-3000014134472023-04-032023-07-0200014134472023-01-012023-07-0200014134472024-06-3000014134472023-12-3100014134472022-12-3100014134472023-07-020001413447us-gaap:CommonStockMember2023-12-310001413447us-gaap:AdditionalPaidInCapitalMember2023-12-310001413447us-gaap:TreasuryStockCommonMember2023-12-310001413447us-gaap:AccumulatedOtherComprehensiveIncomeMember2023-12-310001413447us-gaap:RetainedEarningsMember2023-12-310001413447us-gaap:ParentMember2023-12-310001413447us-gaap:NoncontrollingInterestMember2023-12-310001413447us-gaap:RetainedEarningsMember2024-01-012024-03-310001413447us-gaap:ParentMember2024-01-012024-03-310001413447us-gaap:NoncontrollingInterestMember2024-01-012024-03-3100014134472024-01-012024-03-310001413447us-gaap:AccumulatedOtherComprehensiveIncomeMember2024-01-012024-03-310001413447us-gaap:AdditionalPaidInCapitalMember2024-01-012024-03-310001413447us-gaap:CommonStockMember2024-01-012024-03-310001413447us-gaap:TreasuryStockCommonMember2024-01-012024-03-310001413447us-gaap:CommonStockMember2024-03-310001413447us-gaap:AdditionalPaidInCapitalMember2024-03-310001413447us-gaap:TreasuryStockCommonMember2024-03-310001413447us-gaap:AccumulatedOtherComprehensiveIncomeMember2024-03-310001413447us-gaap:RetainedEarningsMember2024-03-310001413447us-gaap:ParentMember2024-03-310001413447us-gaap:NoncontrollingInterestMember2024-03-3100014134472024-03-310001413447us-gaap:RetainedEarningsMember2024-04-012024-06-300001413447us-gaap:ParentMember2024-04-012024-06-300001413447us-gaap:NoncontrollingInterestMember2024-04-012024-06-300001413447us-gaap:AccumulatedOtherComprehensiveIncomeMember2024-04-012024-06-300001413447us-gaap:AdditionalPaidInCapitalMember2024-04-012024-06-300001413447us-gaap:CommonStockMember2024-04-012024-06-300001413447us-gaap:TreasuryStockCommonMember2024-04-012024-06-300001413447us-gaap:CommonStockMember2024-06-300001413447us-gaap:AdditionalPaidInCapitalMember2024-06-300001413447us-gaap:TreasuryStockCommonMember2024-06-300001413447us-gaap:AccumulatedOtherComprehensiveIncomeMember2024-06-300001413447us-gaap:RetainedEarningsMember2024-06-300001413447us-gaap:ParentMember2024-06-300001413447us-gaap:NoncontrollingInterestMember2024-06-300001413447us-gaap:CommonStockMember2022-12-310001413447us-gaap:AdditionalPaidInCapitalMember2022-12-310001413447us-gaap:TreasuryStockCommonMember2022-12-310001413447us-gaap:AccumulatedOtherComprehensiveIncomeMember2022-12-310001413447us-gaap:RetainedEarningsMember2022-12-310001413447us-gaap:ParentMember2022-12-310001413447us-gaap:NoncontrollingInterestMember2022-12-310001413447us-gaap:RetainedEarningsMember2023-01-012023-04-020001413447us-gaap:ParentMember2023-01-012023-04-020001413447us-gaap:NoncontrollingInterestMember2023-01-012023-04-0200014134472023-01-012023-04-020001413447us-gaap:AccumulatedOtherComprehensiveIncomeMember2023-01-012023-04-020001413447us-gaap:AdditionalPaidInCapitalMember2023-01-012023-04-020001413447us-gaap:CommonStockMember2023-01-012023-04-020001413447us-gaap:TreasuryStockCommonMember2023-01-012023-04-020001413447us-gaap:CommonStockMember2023-04-020001413447us-gaap:AdditionalPaidInCapitalMember2023-04-020001413447us-gaap:TreasuryStockCommonMember2023-04-020001413447us-gaap:AccumulatedOtherComprehensiveIncomeMember2023-04-020001413447us-gaap:RetainedEarningsMember2023-04-020001413447us-gaap:ParentMember2023-04-020001413447us-gaap:NoncontrollingInterestMember2023-04-0200014134472023-04-020001413447us-gaap:RetainedEarningsMember2023-04-032023-07-020001413447us-gaap:ParentMember2023-04-032023-07-020001413447us-gaap:NoncontrollingInterestMember2023-04-032023-07-020001413447us-gaap:AccumulatedOtherComprehensiveIncomeMember2023-04-032023-07-020001413447us-gaap:AdditionalPaidInCapitalMember2023-04-032023-07-020001413447us-gaap:CommonStockMember2023-04-032023-07-020001413447us-gaap:TreasuryStockCommonMember2023-04-032023-07-020001413447us-gaap:CommonStockMember2023-07-020001413447us-gaap:AdditionalPaidInCapitalMember2023-07-020001413447us-gaap:TreasuryStockCommonMember2023-07-020001413447us-gaap:AccumulatedOtherComprehensiveIncomeMember2023-07-020001413447us-gaap:RetainedEarningsMember2023-07-020001413447us-gaap:ParentMember2023-07-020001413447us-gaap:NoncontrollingInterestMember2023-07-020001413447nxpi:DistributorsMember2024-04-012024-06-300001413447nxpi:DistributorsMember2023-04-032023-07-020001413447nxpi:DistributorsMember2024-01-012024-06-300001413447nxpi:DistributorsMember2023-01-012023-07-020001413447nxpi:OriginalEquipmentManufacturersAndElectronicManufacturingServicesMember2024-04-012024-06-300001413447nxpi:OriginalEquipmentManufacturersAndElectronicManufacturingServicesMember2023-04-032023-07-020001413447nxpi:OriginalEquipmentManufacturersAndElectronicManufacturingServicesMember2024-01-012024-06-300001413447nxpi:OriginalEquipmentManufacturersAndElectronicManufacturingServicesMember2023-01-012023-07-020001413447nxpi:OtherMember2024-04-012024-06-300001413447nxpi:OtherMember2023-04-032023-07-020001413447nxpi:OtherMember2024-01-012024-06-300001413447nxpi:OtherMember2023-01-012023-07-020001413447us-gaap:ComputerSoftwareIntangibleAssetMember2024-04-012024-06-300001413447us-gaap:ComputerSoftwareIntangibleAssetMember2023-04-032023-07-020001413447us-gaap:ComputerSoftwareIntangibleAssetMember2024-01-012024-06-300001413447us-gaap:ComputerSoftwareIntangibleAssetMember2023-01-012023-07-020001413447us-gaap:OtherIntangibleAssetsMember2024-04-012024-06-300001413447us-gaap:OtherIntangibleAssetsMember2023-04-032023-07-020001413447us-gaap:OtherIntangibleAssetsMember2024-01-012024-06-300001413447us-gaap:OtherIntangibleAssetsMember2023-01-012023-07-020001413447us-gaap:EmployeeStockOptionMembersrt:MaximumMember2024-01-012024-06-300001413447us-gaap:EmployeeStockOptionMembersrt:MaximumMember2024-04-012024-06-300001413447us-gaap:EmployeeStockOptionMembersrt:MaximumMember2023-01-012023-07-020001413447us-gaap:EmployeeStockOptionMembersrt:MaximumMember2023-04-032023-07-020001413447nxpi:RestrictedStockUnitsPerformanceShareUnitsAndEquityRightsMembersrt:MaximumMember2024-01-012024-06-300001413447nxpi:RestrictedStockUnitsPerformanceShareUnitsAndEquityRightsMembersrt:MaximumMember2024-04-012024-06-300001413447nxpi:RestrictedStockUnitsPerformanceShareUnitsAndEquityRightsMembersrt:MaximumMember2023-04-032023-07-020001413447nxpi:RestrictedStockUnitsPerformanceShareUnitsAndEquityRightsMembersrt:MaximumMember2023-01-012023-07-020001413447nxpi:SSMCMember2024-06-300001413447nxpi:SSMCMember2023-12-310001413447nxpi:TSMCMembernxpi:SSMCMember2024-06-300001413447nxpi:SSMCMember2024-01-012024-06-300001413447nxpi:SSMCMember2023-01-012023-07-020001413447nxpi:WiseroadMember2024-06-300001413447nxpi:WiseroadMember2023-12-310001413447nxpi:SigmaSenseMember2024-06-300001413447nxpi:SigmaSenseMember2023-12-310001413447nxpi:OthersMember2024-06-300001413447nxpi:OthersMember2023-12-310001413447us-gaap:AccumulatedTranslationAdjustmentMember2023-12-310001413447us-gaap:AccumulatedNetGainLossFromDesignatedOrQualifyingCashFlowHedgesMember2023-12-310001413447us-gaap:AccumulatedDefinedBenefitPlansAdjustmentNetUnamortizedGainLossMember2023-12-310001413447us-gaap:AociIncludingPortionAttributableToNoncontrollingInterestMember2023-12-310001413447us-gaap:AccumulatedTranslationAdjustmentMember2024-01-012024-06-300001413447us-gaap:AccumulatedNetGainLossFromDesignatedOrQualifyingCashFlowHedgesMember2024-01-012024-06-300001413447us-gaap:AccumulatedDefinedBenefitPlansAdjustmentNetUnamortizedGainLossMember2024-01-012024-06-300001413447us-gaap:AccumulatedTranslationAdjustmentMember2024-06-300001413447us-gaap:AccumulatedNetGainLossFromDesignatedOrQualifyingCashFlowHedgesMember2024-06-300001413447us-gaap:AccumulatedDefinedBenefitPlansAdjustmentNetUnamortizedGainLossMember2024-06-300001413447us-gaap:AociIncludingPortionAttributableToNoncontrollingInterestMember2024-06-300001413447us-gaap:EmployeeSeveranceMember2024-01-012024-06-300001413447us-gaap:CostOfSalesMember2024-04-012024-06-300001413447us-gaap:CostOfSalesMember2023-04-032023-07-020001413447us-gaap:CostOfSalesMember2024-01-012024-06-300001413447us-gaap:CostOfSalesMember2023-01-012023-07-020001413447us-gaap:ResearchAndDevelopmentExpenseMember2024-04-012024-06-300001413447us-gaap:ResearchAndDevelopmentExpenseMember2023-04-032023-07-020001413447us-gaap:ResearchAndDevelopmentExpenseMember2024-01-012024-06-300001413447us-gaap:ResearchAndDevelopmentExpenseMember2023-01-012023-07-020001413447us-gaap:SellingGeneralAndAdministrativeExpensesMember2024-04-012024-06-300001413447us-gaap:SellingGeneralAndAdministrativeExpensesMember2023-04-032023-07-020001413447us-gaap:SellingGeneralAndAdministrativeExpensesMember2024-01-012024-06-300001413447us-gaap:SellingGeneralAndAdministrativeExpensesMember2023-01-012023-07-020001413447us-gaap:InProcessResearchAndDevelopmentMember2024-06-300001413447us-gaap:InProcessResearchAndDevelopmentMember2023-12-310001413447us-gaap:CustomerRelationshipsMember2024-06-300001413447us-gaap:CustomerRelationshipsMember2023-12-310001413447us-gaap:TechnologyBasedIntangibleAssetsMember2024-06-300001413447us-gaap:TechnologyBasedIntangibleAssetsMember2023-12-310001413447us-gaap:OtherIntangibleAssetsMember2024-06-3000014134472023-01-012023-12-310001413447us-gaap:UnsecuredDebtMembernxpi:FixedRate4.875SeniorUnsecuredNotesMaturingMarch2024Member2024-06-300001413447us-gaap:UnsecuredDebtMembernxpi:FixedRate4.875SeniorUnsecuredNotesMaturingMarch2024Member2023-12-310001413447nxpi:FixedRate27SeniorUnsecuredNotesMaturingMay2025Memberus-gaap:UnsecuredDebtMember2024-06-300001413447nxpi:FixedRate27SeniorUnsecuredNotesMaturingMay2025Memberus-gaap:UnsecuredDebtMember2023-12-310001413447us-gaap:UnsecuredDebtMembernxpi:FixedRate5.350SeniorUnsecuredNotesMaturingMarch2026Member2024-06-300001413447us-gaap:UnsecuredDebtMembernxpi:FixedRate5.350SeniorUnsecuredNotesMaturingMarch2026Member2023-12-310001413447us-gaap:UnsecuredDebtMembernxpi:FixedRate3.875SeniorUnsecuredNotesMaturingJune2026Member2024-06-300001413447us-gaap:UnsecuredDebtMembernxpi:FixedRate3.875SeniorUnsecuredNotesMaturingJune2026Member2023-12-310001413447us-gaap:UnsecuredDebtMembernxpi:FixedRate315SeniorUnsecuredNotesMaturingMay2027Member2024-06-300001413447us-gaap:UnsecuredDebtMembernxpi:FixedRate315SeniorUnsecuredNotesMaturingMay2027Member2023-12-310001413447nxpi:FixedRate44SeniorUnsecuredNotesMaturingJune2027Memberus-gaap:UnsecuredDebtMember2024-06-300001413447nxpi:FixedRate44SeniorUnsecuredNotesMaturingJune2027Memberus-gaap:UnsecuredDebtMember2023-12-310001413447nxpi:FixedRate5.550SeniorUnsecuredNotesMaturingDecember2028Memberus-gaap:UnsecuredDebtMember2024-06-300001413447nxpi:FixedRate5.550SeniorUnsecuredNotesMaturingDecember2028Memberus-gaap:UnsecuredDebtMember2023-12-310001413447nxpi:FixedRate4.3SeniorUnsecuredNotesMaturingJune2029Memberus-gaap:UnsecuredDebtMember2024-06-300001413447nxpi:FixedRate4.3SeniorUnsecuredNotesMaturingJune2029Memberus-gaap:UnsecuredDebtMember2023-12-310001413447us-gaap:UnsecuredDebtMembernxpi:FixedRate34SeniorUnsecuredNotesMaturingMay2030Member2024-06-300001413447us-gaap:UnsecuredDebtMembernxpi:FixedRate34SeniorUnsecuredNotesMaturingMay2030Member2023-12-310001413447us-gaap:UnsecuredDebtMembernxpi:FixedRate25SeniorUnsecuredNotesMaturingMay2031Member2024-06-300001413447us-gaap:UnsecuredDebtMembernxpi:FixedRate25SeniorUnsecuredNotesMaturingMay2031Member2023-12-310001413447us-gaap:UnsecuredDebtMembernxpi:FixedRate265SeniorUnsecuredNotesMaturingFebruary2032Member2024-06-300001413447us-gaap:UnsecuredDebtMembernxpi:FixedRate265SeniorUnsecuredNotesMaturingFebruary2032Member2023-12-310001413447us-gaap:UnsecuredDebtMembernxpi:FixedRate50SeniorUnsecuredNotesMaturingJanuary2033Member2024-06-300001413447us-gaap:UnsecuredDebtMembernxpi:FixedRate50SeniorUnsecuredNotesMaturingJanuary2033Member2023-12-310001413447us-gaap:UnsecuredDebtMembernxpi:FixedRate325SeniorUnsecuredNotesMaturingMay2041Member2024-06-300001413447us-gaap:UnsecuredDebtMembernxpi:FixedRate325SeniorUnsecuredNotesMaturingMay2041Member2023-12-310001413447us-gaap:UnsecuredDebtMembernxpi:FixedRate3125SeniorUnsecuredNotesMaturingFebruary2042Member2024-06-300001413447us-gaap:UnsecuredDebtMembernxpi:FixedRate3125SeniorUnsecuredNotesMaturingFebruary2042Member2023-12-310001413447us-gaap:UnsecuredDebtMembernxpi:FixedRate325SeniorUnsecuredNotesMaturingNovember2051Member2024-06-300001413447us-gaap:UnsecuredDebtMembernxpi:FixedRate325SeniorUnsecuredNotesMaturingNovember2051Member2023-12-310001413447us-gaap:RevolvingCreditFacilityMembernxpi:FloatingRateRevolvingCreditFacilityMaturingAugust2027Member2024-06-300001413447us-gaap:RevolvingCreditFacilityMembernxpi:FloatingRateRevolvingCreditFacilityMaturingAugust2027Member2023-12-310001413447us-gaap:RelatedPartyMember2024-04-012024-06-300001413447us-gaap:RelatedPartyMember2023-04-032023-07-020001413447us-gaap:RelatedPartyMember2024-01-012024-06-300001413447us-gaap:RelatedPartyMember2023-01-012023-07-020001413447us-gaap:RelatedPartyMember2024-06-300001413447us-gaap:RelatedPartyMember2023-12-310001413447us-gaap:FairValueInputsLevel1Memberus-gaap:EstimateOfFairValueFairValueDisclosureMember2024-06-300001413447us-gaap:FairValueInputsLevel1Memberus-gaap:EstimateOfFairValueFairValueDisclosureMember2023-12-310001413447us-gaap:FairValueInputsLevel1Memberus-gaap:MoneyMarketFundsMemberus-gaap:EstimateOfFairValueFairValueDisclosureMember2024-06-300001413447us-gaap:FairValueInputsLevel1Memberus-gaap:MoneyMarketFundsMemberus-gaap:EstimateOfFairValueFairValueDisclosureMember2023-12-310001413447us-gaap:FairValueInputsLevel2Memberus-gaap:EstimateOfFairValueFairValueDisclosureMember2024-06-300001413447us-gaap:FairValueInputsLevel2Memberus-gaap:EstimateOfFairValueFairValueDisclosureMember2023-12-310001413447srt:MinimumMember2024-06-300001413447srt:MaximumMember2024-06-300001413447nxpi:JenniferWuamettMember2024-01-012024-06-300001413447nxpi:JenniferWuamettMember2024-04-012024-06-300001413447nxpi:JenniferWuamettMember2024-06-30
UNITED STATES
SECURITIES AND EXCHANGE COMMISSION
Washington, D.C. 20549
FORM 10-Q
(Mark One)
☒ QUARTERLY REPORT PURSUANT TO SECTION 13 OR 15(d) OF THE SECURITIES EXCHANGE ACT OF 1934
For the quarterly period ended June 30, 2024
or
☐ TRANSITION REPORT PURSUANT TO SECTION 13 OR 15(d) OF THE SECURITIES EXCHANGE ACT OF 1934
For the transition period from to .
Commission File Number: 001-34841
NXP Semiconductors N.V.
(Exact name of registrant as specified in its charter)
|
|
|
|
|
|
|
|
|
Netherlands |
|
98-1144352 |
|
(State or other jurisdiction
of incorporation or organization)
|
|
(I.R.S. employer identification number) |
|
|
|
60 High Tech Campus |
|
5656 AG |
Eindhoven |
|
Netherlands |
|
(Address of principal executive offices) |
|
(Zip code) |
|
|
|
|
|
|
|
|
|
|
|
|
|
+31 |
40 |
2729999 |
(Registrant’s telephone number, including area code) |
Securities registered pursuant to Section 12(b) of the Act:
|
|
|
|
|
|
|
|
|
Title of each class |
Trading symbol(s) |
Name of each exchange on which registered |
Common shares, EUR 0.20 par value |
NXPI |
The Nasdaq Global Select Market |
Indicate by check mark whether the Registrant (1) has filed all reports required to be filed by Section 13 or 15(d) of the Securities Exchange Act of 1934 during the preceding 12 months (or for such shorter period that the Registrant was required to file such reports), and (2) has been subject to such filing requirements for the past 90 days.
Yes ☒ No ☐
Indicate by check mark whether the Registrant has submitted electronically every Interactive Data File required to be submitted pursuant to Rule 405 of Regulation S-T (§232.405 of this chapter) during the preceding 12 months (or for such shorter period that the Registrant was required to submit such files).
Yes ☒ No ☐
Indicate by check mark whether the Registrant is a large accelerated filer, an accelerated filer, a non-accelerated filer, a smaller reporting company, or an emerging growth company. See the definitions of “large accelerated filer,” “accelerated filer,” “smaller reporting company,” and “emerging growth company” in Rule 12b-2 of the Exchange Act.
|
|
|
|
|
|
|
|
|
|
|
|
Large accelerated filer |
☒ |
Accelerated filer |
☐ |
Non-accelerated filer |
☐ |
Smaller reporting company |
☐ |
|
|
Emerging growth company |
☐ |
If an emerging growth company, indicate by check mark if the Registrant has elected not to use the extended transition period for complying with any new or revised financial accounting standards provided pursuant to Section 13(a) of the Exchange Act. ☐
Indicate by check mark whether the Registrant is a shell company (as defined in Rule 12b-2 of the Exchange Act).
Yes ☐ No ☒
As of July 19, 2024, there were 254,732,930 shares of our common stock, €0.20 par value per share, issued and outstanding.
NXP Semiconductors N.V.
Form 10-Q
For the Fiscal Quarter Ended June 30, 2024
TABLE OF CONTENTS
Introduction and Forward Looking Statements
This Form 10-Q and certain information incorporated herein by reference contains forward-looking statements, which are provided under the “safe harbor” protection of the Private Securities Litigation Reform Act of 1995. When used in this Form 10-Q, the words “anticipate”, “believe”, “estimate”, “forecast”, “expect”, “intend”, “plan” and “project” and similar expressions, as they relate to us, our management or third parties, identify forward-looking statements. Forward-looking statements include statements regarding our business strategy, financial condition, results of operations, market data as well as any other statements that are not historical facts. These statements reflect beliefs of our management, as well as assumptions made by our management and information currently available to us. Although we believe that these beliefs and assumptions are reasonable, these statements are subject to numerous factors, risks and uncertainties that could cause actual outcomes and results to be materially different from those projected. These factors, risks and uncertainties expressly qualify all subsequent oral and written forward-looking statements attributable to us or persons acting on our behalf and include, in addition to those listed in our Annual Report on Form 10-K for the year ended December 31, 2023 under Part I, Item 1A. Risk Factors and elsewhere in this Form 10-Q, the following:
•market demand and semiconductor industry conditions;
•our ability to successfully introduce new technologies and products;
•the demand for the goods into which our products are incorporated;
•trade disputes between the U.S. and China, potential increase of barriers to international trade and resulting disruptions to our established supply chains;
•the impact of government actions and regulations, including restrictions on the export of US-regulated products and technology;
•increasing and evolving cybersecurity threats and privacy risks, including theft of sensitive or confidential data;
•our ability to generate sufficient cash, raise sufficient capital or refinance our debt at or before maturity to meet our debt service, research and development and capital investment requirements;
•our ability to accurately estimate demand and match our production capacity accordingly or obtain supplies from third-party producers;
•our access to production from third-party outsourcing partners, and any events that might affect their business or our relationship with them;
•our ability to secure adequate and timely supply of equipment and materials from suppliers;
•our ability to avoid operational problems and product defects and, if such issues were to arise, to correct them quickly;
•our ability to form strategic partnerships and joint ventures and successfully cooperate with our strategic alliance partners;
•our ability to win competitive bid selection processes;
•our ability to develop products for use in our customers’ equipment and products;
•our ability to successfully hire and retain key management and senior product engineers;
•global hostilities, including the invasion of Ukraine by Russia and resulting regional instability, sanctions and any other retaliatory measures taken against Russia, and the continued hostilities and armed conflict in the Middle East, which could adversely impact the global supply chain, disrupt our operations or negatively impact the demand for our products in our primary end markets;
•our ability to maintain good relationships with our suppliers; and
•a change in tax laws could have an effect on our estimated effective tax rates.
We do not assume any obligation to update any forward-looking statements and disclaim any obligation to update our view of any risks or uncertainties described herein or to publicly announce the result of any revisions to the forward-looking statements made in this Form 10-Q, except as required by law.
In addition, this Form 10-Q contains information concerning the semiconductor industry, our end markets and business generally, which is forward-looking in nature and is based on a variety of assumptions regarding the ways in which the semiconductor industry, our end markets and business will develop. We have based these assumptions on information currently available to us, including through the market research and industry reports referred to in this Form 10-Q. If any one or more of these assumptions turn out to be incorrect, actual market results may differ from those predicted. While we do not know what impact any such differences may have on our business, if there are such differences, they could have a material adverse effect on our future results of operations and financial condition, and the trading price of our common stock. Readers are cautioned not to place undue reliance on these forward-looking statements, which speak to results only as of the date the statements were made. Except for any ongoing obligation to disclose material information as required by the United States federal securities laws, NXP does not have any intention or obligation to publicly update or revise any forward-looking statements after we distribute this document, whether to reflect any future events or circumstances or otherwise.
The financial information included in this Form 10-Q is based on United States Generally Accepted Accounting Principles (U.S. GAAP), unless otherwise indicated.
In presenting and discussing our financial position, operating results and cash flows, management uses certain non-U.S. GAAP financial measures. These non-U.S. GAAP financial measures should not be viewed in isolation or as alternatives to the equivalent U.S. GAAP measures and should be used in conjunction with the most directly comparable U.S. GAAP measures. A discussion of non-U.S. GAAP measures included in this Form 10-Q and a reconciliation of such measures to the most directly comparable U.S. GAAP measures are set forth under “Use of Certain Non-U.S. GAAP Financial Measures” contained in this Form 10-Q under Item 2. Management’s Discussion and Analysis of Financial Condition and Results of Operations.
Unless otherwise required, all references herein to “we”, “our”, “us”, “NXP” and the “Company” are to NXP Semiconductors N.V. and its consolidated subsidiaries.
This Form 10-Q includes market data and certain other statistical information and estimates that are based on reports and other publications from industry analysts, market research firms, and other independent sources, as well as management’s own good faith estimates and analyses. NXP believes these third-party reports to be reputable, but has not independently verified the underlying data sources, methodologies or assumptions. The reports and other publications referenced are generally available to the public and were not commissioned by NXP. Information that is based on estimates, forecasts, projections, market research or similar methodologies is inherently subject to uncertainties and actual events or circumstances may differ materially from events and circumstances reflected in this information.
PART I — FINANCIAL INFORMATION
Item 1. Financial Statements
CONDENSED CONSOLIDATED STATEMENTS OF OPERATIONS (Unaudited)
($ in millions, unless otherwise stated)
|
|
|
|
|
|
|
|
|
|
|
|
|
|
|
|
|
|
|
|
|
|
|
|
|
For the three months ended |
|
For the six months ended |
|
June 30, 2024 |
|
July 2, 2023 |
|
June 30, 2024 |
|
July 2, 2023 |
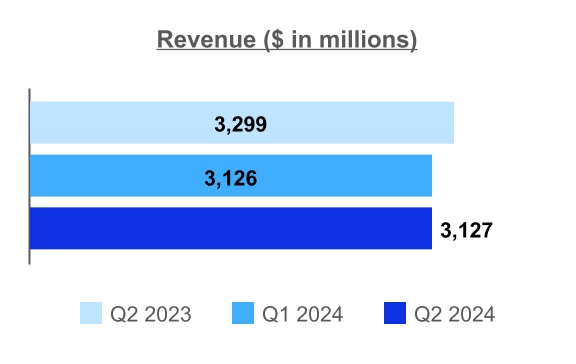
| Revenue |
3,127 |
|
|
3,299 |
|
|
6,253 |
|
|
6,420 |
|
| Cost of revenue |
(1,335) |
|
|
(1,418) |
|
|
(2,678) |
|
|
(2,769) |
|
| Gross profit |
1,792 |
|
|
1,881 |
|
|
3,575 |
|
|
3,651 |
|
| Research and development |
(594) |
|
|
(589) |
|
|
(1,158) |
|
|
(1,166) |
|
| Selling, general and administrative |
(270) |
|
|
(274) |
|
|
(576) |
|
|
(554) |
|
| Amortization of acquisition-related intangible assets |
(28) |
|
|
(81) |
|
|
(79) |
|
|
(166) |
|
| Total operating expenses |
(892) |
|
|
(944) |
|
|
(1,813) |
|
|
(1,886) |
|
| Other income (expense) |
(4) |
|
|
— |
|
|
(10) |
|
|
(3) |
|
| Operating income (loss) |
896 |
|
|
937 |
|
|
1,752 |
|
|
1,762 |
|
| Financial income (expense): |
|
|
|
|
|
|
|
| Extinguishment of debt |
— |
|
|
— |
|
|
— |
|
|
— |
|
| Other financial income (expense) |
(75) |
|
|
(74) |
|
|
(145) |
|
|
(156) |
|
| Income (loss) before income taxes |
821 |
|
|
863 |
|
|
1,607 |
|
|
1,606 |
|
| Benefit (provision) for income taxes |
(154) |
|
|
(158) |
|
|
(295) |
|
|
(276) |
|
| Results relating to equity-accounted investees |
(3) |
|
|
(1) |
|
|
(4) |
|
|
(3) |
|
| Net income (loss) |
664 |
|
|
704 |
|
|
1,308 |
|
|
1,327 |
|
| Less: Net income (loss) attributable to non-controlling interests |
6 |
|
|
6 |
|
|
11 |
|
|
14 |
|
| Net income (loss) attributable to stockholders |
658 |
|
|
698 |
|
|
1,297 |
|
|
1,313 |
|
|
|
|
|
|
|
|
|
| Earnings per share data: |
|
|
|
|
|
|
|
| Net income (loss) per common share attributable to stockholders in $ |
|
|
|
|
|
|
|
| Basic |
2.58 |
|
|
2.69 |
|
|
5.07 |
|
|
5.06 |
|
| Diluted |
2.54 |
|
|
2.67 |
|
|
5.01 |
|
|
5.03 |
|
|
|
|
|
|
|
|
|
| Weighted average number of shares of common stock outstanding during the period (in thousands): |
|
|
|
|
|
|
|
| Basic |
255,478 |
|
|
259,160 |
|
|
256,023 |
|
|
259,369 |
|
| Diluted |
258,732 |
|
|
261,303 |
|
|
258,963 |
|
|
261,278 |
|
See accompanying notes to the Condensed Consolidated Financial Statements
CONDENSED CONSOLIDATED STATEMENTS OF COMPREHENSIVE INCOME
(Unaudited)
($ in millions, unless otherwise stated)
|
|
|
|
|
|
|
|
|
|
|
|
|
|
|
|
|
|
|
|
|
|
|
|
|
For the three months ended |
|
For the six months ended |
|
June 30, 2024 |
|
July 2, 2023 |
|
June 30, 2024 |
|
July 2, 2023 |
| Net income (loss) |
664 |
|
|
704 |
|
|
1,308 |
|
|
1,327 |
|
| Other comprehensive income (loss), net of tax: |
|
|
|
|
|
|
|
| Change in fair value cash flow hedges |
— |
|
|
(13) |
|
|
(8) |
|
|
(10) |
|
| Change in foreign currency translation adjustment |
(16) |
|
|
2 |
|
|
(54) |
|
|
21 |
|
| Change in net actuarial gain (loss) |
2 |
|
|
— |
|
|
2 |
|
|
— |
|
|
|
|
|
|
|
|
|
| Total other comprehensive income (loss) |
(14) |
|
|
(11) |
|
|
(60) |
|
|
11 |
|
| Total comprehensive income (loss) |
650 |
|
|
693 |
|
|
1,248 |
|
|
1,338 |
|
| Less: Comprehensive income (loss) attributable to non-controlling interests |
6 |
|
|
6 |
|
|
11 |
|
|
14 |
|
| Total comprehensive income (loss) attributable to stockholders |
644 |
|
|
687 |
|
|
1,237 |
|
|
1,324 |
|
See accompanying notes to the Condensed Consolidated Financial Statements
CONDENSED CONSOLIDATED BALANCE SHEETS (Unaudited)
($ in millions, unless otherwise stated)
|
|
|
|
|
|
|
|
|
|
|
|
|
|
|
|
|
June 30, 2024 |
|
December 31, 2023 |
| ASSETS |
|
|
|
| Current assets: |
|
|
|
|
Cash and cash equivalents |
2,859 |
|
|
3,862 |
|
|
Short-term deposits |
400 |
|
|
409 |
|
|
Accounts receivable, net |
927 |
|
|
894 |
|
|
|
|
|
|
|
Inventories, net |
2,148 |
|
|
2,134 |
|
|
Other current assets |
546 |
|
|
565 |
|
| Total current assets |
6,880 |
|
|
7,864 |
|
| Non-current assets: |
|
|
|
|
Other non-current assets |
2,290 |
|
|
2,289 |
|
|
Property, plant and equipment, net of accumulated depreciation of $5,902 and $5,660 |
3,289 |
|
|
3,323 |
|
|
Identified intangible assets, net of accumulated amortization of $972 and $1,342 |
796 |
|
|
922 |
|
|
Goodwill |
9,941 |
|
|
9,955 |
|
|
Total non-current assets |
16,316 |
|
|
16,489 |
|
| Total assets |
23,196 |
|
|
24,353 |
|
|
|
|
|
| LIABILITIES AND EQUITY |
|
|
|
| Current liabilities: |
|
|
|
|
Accounts payable |
929 |
|
|
1,164 |
|
|
|
|
|
|
|
Restructuring liabilities-current |
62 |
|
|
92 |
|
|
Other current liabilities |
1,622 |
|
|
1,855 |
|
|
Short-term debt |
499 |
|
|
1,000 |
|
| Total current liabilities |
3,112 |
|
|
4,111 |
|
| Non-current liabilities: |
|
|
|
|
Long-term debt |
9,681 |
|
|
10,175 |
|
|
Restructuring liabilities |
7 |
|
|
9 |
|
|
Deferred tax liabilities |
48 |
|
|
44 |
|
|
Other non-current liabilities |
1,003 |
|
|
1,054 |
|
| Total non-current liabilities |
10,739 |
|
|
11,282 |
|
| Total liabilities |
13,851 |
|
|
15,393 |
|
| Equity: |
|
|
|
|
Non-controlling interests |
327 |
|
|
316 |
|
|
|
|
|
|
|
Stockholders’ equity: |
|
|
|
|
Common stock, par value €0.20 per share: |
56 |
|
|
56 |
|
|
Capital in excess of par value |
14,730 |
|
|
14,501 |
|
|
Treasury shares, at cost: |
|
|
|
|
19,543,790 shares (2023: 17,329,585 shares) |
(3,762) |
|
|
(3,210) |
|
|
Accumulated other comprehensive income (loss) |
30 |
|
|
90 |
|
|
Accumulated deficit |
(2,036) |
|
|
(2,793) |
|
|
Total stockholders’ equity |
9,018 |
|
|
8,644 |
|
| Total equity |
9,345 |
|
|
8,960 |
|
| Total liabilities and equity |
23,196 |
|
|
24,353 |
|
See accompanying notes to the Condensed Consolidated Financial Statements
CONDENSED CONSOLIDATED STATEMENTS OF CASH FLOWS (Unaudited)
($ in millions, unless otherwise stated)
|
|
|
|
|
|
|
|
|
|
|
|
|
For the six months ended |
|
June 30, 2024 |
|
July 2, 2023 |
| Cash flows from operating activities: |
|
|
|
| Net income (loss) |
1,308 |
|
|
1,327 |
|
| Adjustments to reconcile net income (loss) to net cash provided by (used for) operating activities: |
|
|
|
| Depreciation and amortization |
448 |
|
|
564 |
|
| Share-based compensation |
229 |
|
|
201 |
|
| Amortization of discount (premium) on debt, net |
2 |
|
|
1 |
|
| Amortization of debt issuance costs |
3 |
|
|
4 |
|
| Net (gain) loss on sale of assets |
(2) |
|
|
(1) |
|
| (Gain) loss on equity security, net |
5 |
|
|
(5) |
|
|
|
|
|
| Results relating to equity-accounted investees |
4 |
|
|
3 |
|
| Deferred tax expense (benefit) |
(87) |
|
|
(137) |
|
| Changes in operating assets and liabilities: |
|
|
|
| (Increase) decrease in receivables and other current assets |
(15) |
|
|
(158) |
|
| (Increase) decrease in inventories |
(14) |
|
|
(325) |
|
| Increase (decrease) in accounts payable and other liabilities |
(322) |
|
|
(92) |
|
| Decrease (increase) in other non-current assets |
46 |
|
|
— |
|
| Exchange differences |
8 |
|
|
10 |
|
| Other items |
(1) |
|
|
(4) |
|
| Net cash provided by (used for) operating activities |
1,612 |
|
|
1,388 |
|
| Cash flows from investing activities: |
|
|
|
| Purchase of identified intangible assets |
(87) |
|
|
(93) |
|
| Capital expenditures on property, plant and equipment |
(411) |
|
|
(452) |
|
|
|
|
|
| Insurance recoveries received for equipment damage |
2 |
|
|
— |
|
| Proceeds from disposals of property, plant and equipment |
3 |
|
|
1 |
|
|
|
|
|
|
|
|
|
| Proceeds of short-term deposits |
9 |
|
|
— |
|
|
|
|
|
| Purchase of investments |
(34) |
|
|
(62) |
|
| Proceeds from sale of investments |
5 |
|
|
— |
|
|
|
|
|
| Net cash provided by (used for) investing activities |
(513) |
|
|
(606) |
|
| Cash flows from financing activities: |
|
|
|
| Repurchase of long-term debt |
(1,000) |
|
|
— |
|
|
|
|
|
|
|
|
|
|
|
|
|
|
|
|
|
| Dividends paid to common stockholders |
(521) |
|
|
(483) |
|
| Proceeds from issuance of common stock through stock plans |
40 |
|
|
34 |
|
| Purchase of treasury shares and restricted stock unit withholdings |
(613) |
|
|
(313) |
|
| Other, net |
(1) |
|
|
(1) |
|
| Net cash provided by (used for) financing activities |
(2,095) |
|
|
(763) |
|
| Effect of changes in exchange rates on cash positions |
(7) |
|
|
(1) |
|
| Increase (decrease) in cash and cash equivalents |
(1,003) |
|
|
18 |
|
| Cash and cash equivalents at beginning of period |
3,862 |
|
|
3,845 |
|
| Cash and cash equivalents at end of period |
2,859 |
|
|
3,863 |
|
|
|
|
|
|
|
|
|
|
|
|
|
| Supplemental disclosures to the condensed consolidated cash flows |
| Net cash paid during the period for: |
|
|
|
| Interest |
124 |
|
|
140 |
|
| Income taxes, net of refunds |
391 |
|
|
533 |
|
| Net gain (loss) on sale of assets: |
|
|
|
| Cash proceeds from the sale of assets |
3 |
|
|
1 |
|
| Book value of these assets |
(1) |
|
|
— |
|
| Non-cash investing activities: |
|
|
|
| Non-cash capital expenditures |
166 |
|
|
165 |
|
See accompanying notes to the Condensed Consolidated Financial Statements
CONDENSED CONSOLIDATED STATEMENTS OF CHANGES IN EQUITY (Unaudited)
($ in millions, unless otherwise stated)
|
|
|
|
|
|
|
|
|
|
|
|
|
|
|
|
|
|
|
|
|
|
|
|
|
|
|
|
|
|
|
|
|
|
|
|
|
|
|
|
|
|
|
|
|
|
|
|
|
|
|
|
|
|
|
|
|
|
|
Outstanding
number of
shares (in
thousands) |
|
Common
stock |
|
Capital in
excess of
par value |
|
Treasury
shares at
cost |
|
Accumu-
lated
other
compre-
hensive
income
(loss) |
|
Accumu-
lated
deficit |
|
Total
stock-
holders’
equity |
|
Non-
con-
trolling
interests |
|
Total
equity |
| Balance as of December 31, 2023 |
|
257,190 |
|
|
56 |
|
|
14,501 |
|
|
(3,210) |
|
|
90 |
|
|
(2,793) |
|
|
8,644 |
|
|
316 |
|
|
8,960 |
|
| Net income (loss) |
|
|
|
|
|
|
|
|
|
|
|
639 |
|
|
639 |
|
|
5 |
|
|
644 |
|
| Other comprehensive income (loss) |
|
|
|
|
|
|
|
|
|
(46) |
|
|
|
|
(46) |
|
|
|
|
(46) |
|
| Share-based compensation plans |
|
|
|
|
|
118 |
|
|
|
|
|
|
|
|
118 |
|
|
|
|
118 |
|
| Shares issued pursuant to stock awards |
|
228 |
|
|
|
|
|
|
44 |
|
|
|
|
(7) |
|
|
37 |
|
|
|
|
37 |
|
| Treasury shares repurchased and retired |
|
(1,323) |
|
|
|
|
|
|
(303) |
|
|
|
|
|
|
(303) |
|
|
|
|
(303) |
|
Dividends common stock ($1.014 per share) |
|
|
|
|
|
|
|
|
|
|
|
(260) |
|
|
(260) |
|
|
|
|
(260) |
|
Balance as of March 31, 2024 |
|
256,095 |
|
|
56 |
|
|
14,619 |
|
|
(3,469) |
|
|
44 |
|
|
(2,421) |
|
|
8,829 |
|
|
321 |
|
|
9,150 |
|
| Net income (loss) |
|
|
|
|
|
|
|
|
|
|
|
658 |
|
|
658 |
|
|
6 |
|
|
664 |
|
| Other comprehensive income (loss) |
|
|
|
|
|
|
|
|
|
(14) |
|
|
|
|
(14) |
|
|
|
|
(14) |
|
| Share-based compensation plans |
|
|
|
|
|
111 |
|
|
|
|
|
|
|
|
111 |
|
|
|
|
111 |
|
| Shares issued pursuant to stock awards |
|
89 |
|
|
|
|
|
|
17 |
|
|
|
|
(14) |
|
|
3 |
|
|
|
|
3 |
|
| Treasury shares repurchased and retired |
|
(1,208) |
|
|
|
|
|
|
(310) |
|
|
|
|
|
|
(310) |
|
|
|
|
(310) |
|
|
|
|
|
|
|
|
|
|
|
|
|
|
|
|
|
|
|
|
Dividends common stock ($1.014 per share) |
|
|
|
|
|
|
|
|
|
|
|
(259) |
|
|
(259) |
|
|
|
|
(259) |
|
Balance as of June 30, 2024 |
|
254,976 |
|
|
56 |
|
|
14,730 |
|
|
(3,762) |
|
|
30 |
|
|
(2,036) |
|
|
9,018 |
|
|
327 |
|
|
9,345 |
|
|
|
|
|
|
|
|
|
|
|
|
|
|
|
|
|
|
|
|
|
|
|
|
|
|
|
|
|
|
|
|
|
|
|
|
|
|
|
|
|
|
|
|
|
|
|
|
|
|
|
|
|
|
|
|
|
|
|
|
|
|
|
|
|
|
|
|
|
|
|
|
|
|
|
|
|
|
|
|
|
|
|
|
|
|
|
|
|
|
|
|
|
|
|
|
|
|
|
|
|
|
|
|
|
|
|
|
|
|
|
|
|
|
|
|
|
|
|
|
|
|
|
|
|
|
|
|
|
|
|
|
|
|
|
|
|
|
|
|
|
|
|
|
|
|
|
|
|
|
|
|
|
|
|
|
|
|
|
|
|
|
|
|
|
|
|
|
|
|
|
|
|
|
|
|
|
|
|
|
|
|
|
|
|
|
|
|
|
|
|
|
|
|
|
|
|
|
|
|
|
|
|
|
|
|
|
|
|
|
|
|
Outstanding
number of
shares (in
thousands) |
|
Common
stock |
|
Capital in
excess of
par value |
|
Treasury
shares at
cost |
|
Accumu-
lated
other
compre-
hensive
income
(loss) |
|
Accumu-
lated
deficit |
|
Total
stock-
holders’
equity |
|
Non-
con-
trolling
interests |
|
Total
equity |
| Balance as of December 31, 2022 |
|
259,463 |
|
|
56 |
|
|
14,091 |
|
|
(2,799) |
|
|
76 |
|
|
(3,975) |
|
|
7,449 |
|
|
291 |
|
|
7,740 |
|
| Net income (loss) |
|
|
|
|
|
|
|
|
|
|
|
615 |
|
|
615 |
|
|
8 |
|
|
623 |
|
| Other comprehensive income (loss) |
|
|
|
|
|
|
|
|
|
22 |
|
|
|
|
22 |
|
|
|
|
22 |
|
| Share-based compensation plans |
|
|
|
|
|
101 |
|
|
|
|
|
|
|
|
101 |
|
|
|
|
101 |
|
| Shares issued pursuant to stock awards |
|
309 |
|
|
|
|
|
|
61 |
|
|
|
|
(28) |
|
|
33 |
|
|
|
|
33 |
|
Treasury shares repurchased and retired |
|
(37) |
|
|
|
|
|
|
(7) |
|
|
|
|
|
|
(7) |
|
|
|
|
(7) |
|
Dividends common stock ($1.014 per share) |
|
|
|
|
|
|
|
|
|
|
|
(264) |
|
|
(264) |
|
|
|
|
(264) |
|
| Balance as of April 2, 2023 |
|
259,735 |
|
|
56 |
|
|
14,192 |
|
|
(2,745) |
|
|
98 |
|
|
(3,652) |
|
|
7,949 |
|
|
299 |
|
|
8,248 |
|
| Net income (loss) |
|
|
|
|
|
|
|
|
|
|
|
698 |
|
|
698 |
|
|
6 |
|
|
704 |
|
| Other comprehensive income (loss) |
|
|
|
|
|
|
|
|
|
(11) |
|
|
|
|
(11) |
|
|
|
|
(11) |
|
| Share-based compensation plans |
|
|
|
|
|
99 |
|
|
|
|
|
|
|
|
99 |
|
|
|
|
99 |
|
| Shares issued pursuant to stock awards |
|
71 |
|
|
|
|
|
|
13 |
|
|
|
|
(12) |
|
|
1 |
|
|
|
|
1 |
|
| Treasury shares repurchased and retired |
|
(1,681) |
|
|
|
|
|
|
(302) |
|
|
|
|
|
|
(302) |
|
|
|
|
(302) |
|
|
|
|
|
|
|
|
|
|
|
|
|
|
|
|
|
|
|
|
Dividends common stock ($1.014 per share) |
|
|
|
|
|
|
|
|
|
|
|
(262) |
|
|
(262) |
|
|
|
|
(262) |
|
Balance as of July 2, 2023 |
|
258,125 |
|
|
56 |
|
|
14,291 |
|
|
(3,034) |
|
|
87 |
|
|
(3,228) |
|
|
8,172 |
|
|
305 |
|
|
8,477 |
|
|
|
|
|
|
|
|
|
|
|
|
|
|
|
|
|
|
|
|
|
|
|
|
|
|
|
|
|
|
|
|
|
|
|
|
|
|
|
|
|
|
|
|
|
|
|
|
|
|
|
|
|
|
|
|
|
|
|
|
|
|
|
|
|
|
|
|
|
|
|
|
|
|
|
|
|
|
|
|
|
|
|
|
|
|
|
|
|
|
|
|
|
|
|
|
|
|
|
|
|
|
|
|
|
|
|
|
|
|
|
|
|
|
|
|
|
|
|
|
|
|
|
|
|
|
|
|
|
|
|
|
|
|
See accompanying notes to the Condensed Consolidated Financial Statements
NXP SEMICONDUCTORS N.V.
NOTES TO THE UNAUDITED CONDENSED CONSOLIDATED FINANCIAL STATEMENTS
All amounts in millions of $ unless otherwise stated
1 Basis of Presentation and Overview
We prepared our interim condensed consolidated financial statements that accompany these notes in conformity with U.S. generally accepted accounting principles, consistent in all material respects with those applied in our Annual Report on Form 10-K for the year ended December 31, 2023.
We have made estimates and judgments affecting the amounts reported in our condensed consolidated financial statements and the accompanying notes. The actual results that we experience may differ materially from our estimates. The interim financial information is unaudited, but reflects all normal adjustments that are, in our opinion, necessary to provide a fair statement of results for the interim periods presented. This interim information should be read in conjunction with the consolidated financial statements in our Annual Report on Form 10-K for the year ended December 31, 2023.
2 Significant Accounting Policies and Recent Accounting Pronouncements
Significant Accounting Policies
For a discussion of our significant accounting policies see, “Part II – Item 8. Financial Statements and Supplementary Data – Notes to Consolidated Financial Statements – “Significant Accounting Policies” of our Annual Report on Form 10-K for the year ended December 31, 2023. There have been no changes to our significant accounting policies since our Annual Report on Form 10-K for the year ended December 31, 2023.
Recent accounting standards
Accounting standards not yet adopted
In November 2023, the FASB issued ASU 2023-07, Segment Reporting (Topic 280): Improvements to Reportable Segment Disclosures, requiring disclosure of certain incremental segment information on an annual and interim basis, including (among other items) additional disclosure about significant segment expenses and that a public entity that has a single reportable segment provide all the disclosures required by this ASU. ASU 2023-07 is effective for fiscal years beginning after December 15, 2023, and for interim periods within fiscal years beginning after December 15, 2024, with early adoption permitted. We will adopt ASU 2023-07 for our annual periods starting in fiscal year 2024 (and interim periods thereafter) on a retrospective basis and continue to evaluate the impact on our disclosures.
In December 2023, the FASB issued Accounting Standards Update (ASU) 2023-09, Income Taxes (Topic 740): Improvements to Income Tax Disclosures, requiring to disclose annually certain additional disaggregated income tax information related to the effective tax rate reconciliation and income taxes paid, among other items. ASU 2023-09 is effective for fiscal years beginning after December 15, 2024, with early adoption permitted. We will adopt the new requirements starting for our annual period starting in 2025 and continue to evaluate the basis of adoption and impact on our disclosures.
No other new accounting pronouncements were issued or became effective in the period that had, or are expected to have, a material impact on our Consolidated Financial Statements.
3 Acquisitions and Divestments
2024
There were no material acquisitions or divestments during the first six months of 2024.
2023
There were no material acquisitions or divestments during the first six months of 2023.
4 Supplemental Financial Information
Statement of Operations Information:
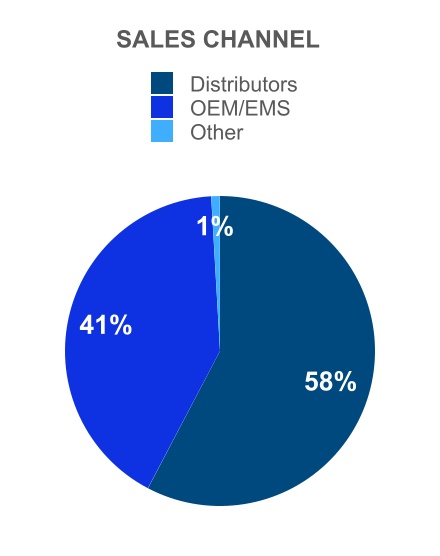
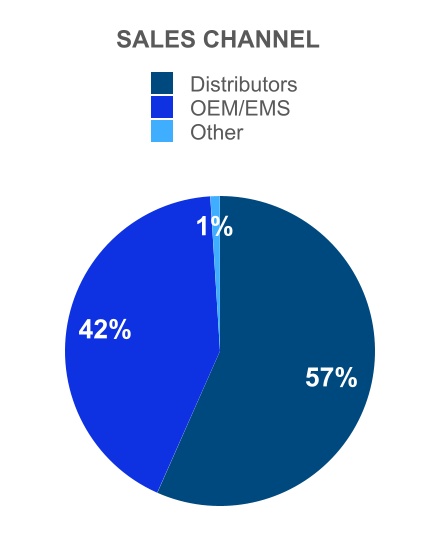
Disaggregation of revenue
The following table presents revenue disaggregated by sales channel:
|
|
|
|
|
|
|
|
|
|
|
|
|
|
|
|
|
|
|
|
|
|
|
|
|
For the three months ended |
|
For the six months ended |
|
June 30, 2024 |
|
July 2, 2023 |
|
June 30, 2024 |
|
July 2, 2023 |
| Distributors |
1,804 |
|
|
1,679 |
|
|
3,543 |
|
|
3,170 |
|
| Original Equipment Manufacturers and Electronic Manufacturing Services |
1,294 |
|
|
1,596 |
|
|
2,649 |
|
|
3,190 |
|
Other |
29 |
|
|
24 |
|
|
61 |
|
|
60 |
|
| Total Revenue |
3,127 |
|
|
3,299 |
|
|
6,253 |
|
|
6,420 |
|
Depreciation, amortization and impairment
|
|
|
|
|
|
|
|
|
|
|
|
|
|
|
|
|
|
|
|
|
|
|
|
|
For the three months ended |
|
For the six months ended |
|
June 30, 2024 |
|
July 2, 2023 |
|
June 30, 2024 |
|
July 2, 2023 |
| Depreciation of property, plant and equipment |
146 |
|
|
162 |
|
|
291 |
|
|
322 |
|
| Amortization of internal use software |
7 |
|
|
5 |
|
|
14 |
|
|
9 |
|
Amortization of other identified intangible assets |
60 |
|
|
114 |
|
|
143 |
|
|
233 |
|
| Total - Depreciation, amortization and impairment |
213 |
|
|
281 |
|
|
448 |
|
|
564 |
|
Effective January 2024, we increased the estimated useful lives of certain manufacturing equipment from 5 to 10 years. This change has resulted in an insignificant increase in gross margin in the first two quarters of 2024 when compared to what would have been the impact using the estimated useful life in place prior to this change.
Financial income and expense
|
|
|
|
|
|
|
|
|
|
|
|
|
|
|
|
|
|
|
|
|
|
|
|
|
For the three months ended |
|
For the six months ended |
|
June 30, 2024 |
|
July 2, 2023 |
|
June 30, 2024 |
|
July 2, 2023 |
| Interest income |
39 |
|
|
43 |
|
|
89 |
|
|
85 |
|
| Interest expense |
(97) |
|
|
(109) |
|
|
(202) |
|
|
(220) |
|
|
|
|
|
|
|
|
|
|
|
|
|
|
|
|
|
|
|
|
|
|
|
|
|
|
|
|
|
|
|
|
|
| Total other financial income/ (expense) |
(17) |
|
|
(8) |
|
|
(32) |
|
|
(21) |
|
Total |
(75) |
|
|
(74) |
|
|
(145) |
|
|
(156) |
|
Earnings per share
The computation of earnings per share (EPS) is presented in the following table:
|
|
|
|
|
|
|
|
|
|
|
|
|
|
|
|
|
|
|
|
|
|
|
|
|
For the three months ended |
|
For the six months ended |
|
June 30, 2024 |
|
July 2, 2023 |
|
June 30, 2024 |
|
July 2, 2023 |
| Net income (loss) |
664 |
|
|
704 |
|
|
1,308 |
|
|
1,327 |
|
| Less: net income (loss) attributable to non-controlling interests |
6 |
|
|
6 |
|
|
11 |
|
|
14 |
|
| Net income (loss) attributable to stockholders |
658 |
|
|
698 |
|
|
1,297 |
|
|
1,313 |
|
|
|
|
|
|
|
|
|
Weighted average number of shares outstanding (after deduction of treasury shares) during the year (in thousands) |
255,478 |
|
|
259,160 |
|
|
256,023 |
|
|
259,369 |
|
| Plus incremental shares from assumed conversion of: |
|
|
|
|
|
|
|
Options 1) |
157 |
|
|
189 |
|
|
165 |
|
|
197 |
|
Restricted Share Units, Performance Share Units and Equity Rights 2) |
3,097 |
|
|
1,954 |
|
|
2,775 |
|
|
1,712 |
|
| Dilutive potential common shares |
3,254 |
|
|
2,143 |
|
|
2,940 |
|
|
1,909 |
|
|
|
|
|
|
|
|
|
Adjusted weighted average number of shares outstanding (after deduction of treasury shares) during the year (in thousands) |
258,732 |
|
|
261,303 |
|
|
258,963 |
|
|
261,278 |
|
|
|
|
|
|
|
|
|
| EPS attributable to stockholders in $: |
|
|
|
|
|
|
|
| Basic net income (loss) |
2.58 |
|
|
2.69 |
|
|
5.07 |
|
|
5.06 |
| Diluted net income (loss) |
2.54 |
|
|
2.67 |
|
|
5.01 |
|
|
5.03 |
1) There were no stock options to purchase shares of NXP’s common stock that were outstanding in Q2 2024 and YTD 2024 (Q2 2023 and YTD 2023: no shares) that were anti-dilutive and were not included in the computation of diluted EPS because the exercise price was greater than the average fair market value of the common stock or the number of shares assumed to be repurchased using the proceeds of unrecognized compensation expense and exercise prices were greater than the weighted average number of shares underlying outstanding stock options.
2) There were no unvested RSUs, PSUs and equity rights that were outstanding in Q2 2024 and YTD 2024 (Q2 2023 and YTD 2023: no shares) that were anti-dilutive and were not included in the computation of diluted EPS because the number of shares assumed to be repurchased using the proceeds of unrecognized compensation expense were greater than the weighted average number of outstanding unvested RSUs, PSUs and equity rights or the performance goal has not been met yet.
Balance Sheet Information
Cash and cash equivalents
At June 30, 2024 and December 31, 2023, our cash balance was $2,859 million and $3,862 million, respectively, of which $241 million and $214 million was held by SSMC, our consolidated joint venture company with TSMC. Under the terms of our joint venture agreement with TSMC, a portion of this cash can be distributed by way of a dividend to us, but 38.8% of the dividend will be paid to our joint venture partner. During both first six months of 2024 and 2023, no dividends were declared by SSMC.
Inventories
Inventories are summarized as follows:
|
|
|
|
|
|
|
|
|
|
|
|
|
June 30, 2024 |
|
December 31, 2023 |
| Raw materials |
103 |
|
|
113 |
|
| Work in process |
1,568 |
|
|
1,633 |
|
| Finished goods |
477 |
|
|
388 |
|
|
2,148 |
|
|
2,134 |
|
The amounts recorded above are net of allowance for obsolescence of $185 million as of June 30, 2024 (December 31, 2023: $189 million).
Equity Investments
At June 30, 2024 and December 31, 2023, the total carrying value of investments in equity securities is summarized as follows:
|
|
|
|
|
|
|
|
|
|
|
|
|
June 30, 2024 |
|
December 31, 2023 |
| Marketable equity securities |
7 |
|
|
12 |
|
| Non-marketable equity securities |
66 |
|
|
55 |
|
| Equity-accounted investments |
117 |
|
|
101 |
|
|
190 |
|
|
168 |
|
The total carrying value of investments in equity-accounted investees is summarized as follows:
|
|
|
|
|
|
|
|
|
|
|
|
|
|
|
|
|
|
|
|
|
|
|
|
|
June 30, 2024 |
|
December 31, 2023 |
|
Shareholding % |
|
Amount |
|
Shareholding % |
|
Amount |
| SMART Growth Fund, L.P. |
8.41 |
% |
|
41 |
|
|
8.41 |
% |
|
42 |
|
| SigmaSense, LLC |
10.64 |
% |
|
31 |
|
|
10.64 |
% |
|
33 |
|
| Others |
— |
|
|
45 |
|
|
— |
|
|
26 |
|
|
|
|
117 |
|
|
|
|
101 |
|
|
|
|
|
|
|
|
|
Results related to equity-accounted investees at the end of each period were as follows:
|
|
|
|
|
|
|
|
|
|
|
|
|
|
|
|
|
|
|
|
|
|
|
|
|
For the three months ended |
|
For the six months ended |
|
June 30, 2024 |
|
July 2, 2023 |
|
June 30, 2024 |
|
July 2, 2023 |
| Company's share in income (loss) |
(3) |
|
|
(1) |
|
|
(5) |
|
|
(3) |
|
| Other results |
— |
|
|
— |
|
|
1 |
|
|
— |
|
|
(3) |
|
|
(1) |
|
|
(4) |
|
|
(3) |
|
Other current liabilities
Other current liabilities at June 30, 2024 and December 31, 2023 consisted of the following:
|
|
|
|
|
|
|
|
|
|
|
|
|
June 30, 2024 |
|
December 31, 2023 |
| Accrued compensation and benefits |
402 |
|
|
500 |
|
| Customer programs |
307 |
|
|
280 |
|
| Income taxes payable |
122 |
|
|
170 |
|
| Dividend payable |
259 |
|
|
261 |
|
| Other |
532 |
|
|
644 |
|
|
1,622 |
|
|
1,855 |
|
Accumulated other comprehensive income (loss)
Total comprehensive income (loss) represents net income (loss) plus the results of certain equity changes not reflected in the condensed consolidated statements of operations. The after-tax components of accumulated other comprehensive income (loss) and their corresponding changes are shown below:
|
|
|
|
|
|
|
|
|
|
|
|
|
|
|
|
|
|
|
|
|
|
|
|
|
Currency
translation
differences |
|
Change in
fair value
cash flow
hedges |
|
Net actuarial
gain/(losses) |
|
Accumulated
Other
Comprehensive
Income (loss) |
| As of December 31, 2023 |
177 |
|
|
1 |
|
|
(88) |
|
|
90 |
|
Other comprehensive income (loss) before
reclassifications |
(54) |
|
|
(20) |
|
|
2 |
|
|
(72) |
|
Amounts reclassified out of accumulated other
comprehensive income (loss) |
— |
|
|
9 |
|
|
— |
|
|
9 |
|
| Tax effects |
— |
|
|
3 |
|
|
— |
|
|
3 |
|
| Other comprehensive income (loss) |
(54) |
|
|
(8) |
|
|
2 |
|
|
(60) |
|
| As of June 30, 2024 |
123 |
|
|
(7) |
|
|
(86) |
|
|
30 |
|
Cash dividends
The following dividends were declared during the first six months of 2024 and 2023 under NXP’s quarterly dividend program:
|
|
|
|
|
|
|
|
|
|
|
|
|
|
|
|
|
|
|
|
|
|
|
|
|
Fiscal Year 2024 |
|
Fiscal Year 2023 |
|
Dividend per share |
|
Amount |
|
Dividend per share |
|
Amount |
| First quarter |
1.014 |
|
|
260 |
|
|
1.014 |
|
|
263 |
|
| Second quarter |
1.014 |
|
|
259 |
|
|
1.014 |
|
|
263 |
|
|
|
|
|
|
|
|
|
|
|
|
|
|
|
|
|
|
|
|
|
|
|
|
|
The dividend declared in the second quarter (not yet paid) is classified in the condensed consolidated balance sheet in other current liabilities as of June 30, 2024 and was subsequently paid on July 10, 2024.
5 Restructuring
At each reporting date, we evaluate our restructuring liabilities, which consist primarily of termination benefits, to ensure that our accruals are still appropriate.
The following table presents the changes in restructuring liabilities in 2024:
|
|
|
|
|
|
|
|
|
|
|
|
|
|
|
|
|
|
|
|
|
|
|
|
|
|
|
|
|
|
|
|
|
|
|
|
|
As of January 1, 2024 |
|
Additions |
|
Utilized |
|
Released |
|
Other
changes |
|
As of June 30, 2024 |
| Restructuring liabilities |
101 |
|
|
18 |
|
|
(45) |
|
|
(4) |
|
|
(1) |
|
|
69 |
|
The total restructuring liability as of June 30, 2024 of $69 million is classified in the consolidated balance sheet under current liabilities ($62 million) and non-current liabilities ($7 million).
The restructuring charges for the six-month period ending June 30, 2024 consist of $17 million for personnel related costs for specific targeted actions, offset by a $4 million release for earlier programs. The restructuring charges for the six-month period ending July 2, 2023 consist of $21 million for personnel related costs for a restructuring program in 2023, offset by a $3 million release for an earlier program.
These restructuring charges recorded in operating income, for the periods indicated, are included in the following line items in the statement of operations:
|
|
|
|
|
|
|
|
|
|
|
|
|
|
|
|
|
|
|
|
|
|
|
|
|
For the three months ended |
|
For the six months ended |
|
June 30, 2024 |
|
July 2, 2023 |
|
June 30, 2024 |
|
July 2, 2023 |
| Cost of revenue |
4 |
|
|
— |
|
|
7 |
|
|
(2) |
|
| Research and development |
4 |
|
|
— |
|
|
7 |
|
|
14 |
|
| Selling, general and administrative |
(2) |
|
|
— |
|
|
(1) |
|
|
6 |
|
|
|
|
|
|
|
|
|
Net restructuring charges |
6 |
|
|
— |
|
|
13 |
|
|
18 |
|
6 Income Tax
Each year NXP makes an estimate of its annual effective tax rate. This estimated annual effective tax rate ("EAETR") is then applied to the year-to-date Income (loss) before income taxes excluding discrete items, to determine the year-to-date benefit (provision) for income taxes. The income tax effects of any discrete items are recognized in the interim period in which they occur. As the year progresses, the Company continually refines the EAETR based upon actual events and the apportionment of our earnings (loss). This continual estimation process periodically may result in a change to our EAETR for the year. When this occurs, we adjust on an accumulated basis the benefit (provision) for income taxes during the quarter in which the change occurs.
Our provision for income taxes for 2024 is based on our EAETR of 17.8%, which is lower than the Netherlands statutory tax rate of 25.8%, primarily due to tax benefits from the Netherlands and foreign tax incentives.
|
|
|
|
|
|
|
|
|
|
|
|
|
|
|
|
|
|
|
|
|
|
|
|
|
For the three months ended |
|
For the six months ended |
|
June 30, 2024 |
|
July 2, 2023 |
|
June 30, 2024 |
|
July 2, 2023 |
| Tax benefit (provision) calculated at EAETR |
(147) |
|
|
(147) |
|
|
(286) |
|
|
(273) |
|
| Discrete tax benefit (provision) items |
(7) |
|
|
(11) |
|
|
(9) |
|
|
(3) |
|
| Benefit (provision) for income taxes |
(154) |
|
|
(158) |
|
|
(295) |
|
|
(276) |
|
|
|
|
|
|
|
|
|
| Effective tax rate |
18.8 |
% |
|
18.3 |
% |
|
18.4 |
% |
|
17.2 |
% |
The effective tax rate of 18.8% for the second quarter of 2024 was higher than the EAETR due to the income tax expense for discrete items of $7 million. The discrete items are primarily related to changes in estimates for previous years, and the impact of foreign currency on income tax related items. In addition to this, there was a recapture of tax expense of $1 million due to a higher EAETR compared to prior quarter.
For the first six months ended 2024 the effective tax rate of 18.4% was higher than 17.8% due to a net result of unfavorable discrete items of $9 million.
The effective tax rate of 18.4% for the first six months of 2024 was higher compared to the rate for the first six months ended 2023 of 17.2% due to a different mix of the benefit (provision) for income taxes in the locations that we operate in, lower foreign tax incentives in the current period as a result of a decrease in qualifying income, newly enacted alternative minimum tax law as per 2024, and also due to the impact of the discrete items in the respective periods.
7 Identified Intangible Assets
Identified intangible assets as of June 30, 2024 and December 31, 2023, respectively, were composed of the following:
|
|
|
|
|
|
|
|
|
|
|
|
|
|
|
|
|
|
|
|
|
|
|
|
|
June 30, 2024 |
|
December 31, 2023 |
|
Gross
carrying
amount |
|
Accumulated
amortization |
|
Gross carrying
amount |
|
Accumulated
amortization |
In-process R&D (IPR&D) 1) |
33 |
|
|
— |
|
|
70 |
|
|
— |
|
|
|
|
|
|
|
|
|
| Customer-related |
791 |
|
|
(377) |
|
|
788 |
|
|
(352) |
|
| Technology-based |
944 |
|
|
(595) |
|
|
1,406 |
|
|
(990) |
|
| Identified intangible assets |
1,768 |
|
|
(972) |
|
|
2,264 |
|
|
(1,342) |
|
|
|
|
|
|
|
|
|
1) IPR&D is not subject to amortization until completion or abandonment of the associated research and development effort. |
The estimated amortization expense for these identified intangible assets for each of the five succeeding years is:
|
|
|
|
|
|
| 2024 (remaining) |
137 |
|
| 2025 |
178 |
|
| 2026 |
97 |
|
| 2027 |
69 |
|
| 2028 |
63 |
|
| Thereafter |
252 |
|
All intangible assets, excluding IPR&D and goodwill, are subject to amortization and have no assumed residual value.
The expected weighted average remaining life of identified intangibles is 5 years as of June 30, 2024 (December 31, 2023: 4 years).
8 Debt
The following table summarizes the outstanding debt as of June 30, 2024 and December 31, 2023:
|
|
|
|
|
|
|
|
|
|
|
|
|
|
|
|
|
|
|
|
|
|
|
|
|
|
|
|
|
|
|
|
|
June 30, 2024 |
|
December 31, 2023 |
|
Maturities |
|
Amount |
|
Interest
rate
|
|
Amount |
|
Interest
rate |
Fixed-rate 4.875% senior unsecured notes |
Mar, 2024 |
|
— |
|
|
4.875 |
|
|
1,000 |
|
|
4.875 |
|
Fixed-rate 2.7% senior unsecured notes |
May, 2025 |
|
500 |
|
|
2.700 |
|
|
500 |
|
|
2.700 |
|
Fixed-rate 5.35% senior unsecured notes |
Mar, 2026 |
|
500 |
|
|
5.350 |
|
|
500 |
|
|
5.350 |
|
Fixed-rate 3.875% senior unsecured notes |
Jun, 2026 |
|
750 |
|
|
3.875 |
|
|
750 |
|
|
3.875 |
|
Fixed-rate 3.15% senior unsecured notes |
May, 2027 |
|
500 |
|
|
3.150 |
|
|
500 |
|
|
3.150 |
|
Fixed-rate 4.40% senior unsecured notes |
Jun, 2027 |
|
500 |
|
|
4.400 |
|
|
500 |
|
|
4.400 |
|
Fixed-rate 5.55% senior unsecured notes |
Dec, 2028 |
|
500 |
|
|
5.550 |
|
|
500 |
|
|
5.550 |
|
Fixed-rate 4.3% senior unsecured notes |
Jun, 2029 |
|
1,000 |
|
|
4.300 |
|
|
1,000 |
|
|
4.300 |
|
Fixed-rate 3.4% senior unsecured notes |
May, 2030 |
|
1,000 |
|
|
3.400 |
|
|
1,000 |
|
|
3.400 |
|
Fixed-rate 2.5% senior unsecured notes |
May, 2031 |
|
1,000 |
|
|
2.500 |
|
|
1,000 |
|
|
2.500 |
|
Fixed-rate 2.65% senior unsecured notes |
Feb, 2032 |
|
1,000 |
|
|
2.650 |
|
|
1,000 |
|
|
2.650 |
|
Fixed-rate 5.0% senior unsecured notes |
Jan, 2033 |
|
1,000 |
|
|
5.000 |
|
|
1,000 |
|
|
5.000 |
|
Fixed-rate 3.25% senior unsecured notes |
May, 2041 |
|
1,000 |
|
|
3.250 |
|
|
1,000 |
|
|
3.250 |
|
Fixed-rate 3.125% senior unsecured notes |
Feb, 2042 |
|
500 |
|
|
3.125 |
|
|
500 |
|
|
3.125 |
|
Fixed-rate 3.25% senior unsecured notes |
Nov, 2051 |
|
500 |
|
|
3.250 |
|
|
500 |
|
|
3.250 |
|
| Floating-rate revolving credit facility (RCF) |
Aug, 2027 |
|
— |
|
|
— |
|
|
— |
|
|
— |
|
| Total principal |
|
|
10,250 |
|
|
|
|
11,250 |
|
|
|
|
|
|
|
|
|
|
|
|
|
Unamortized discounts, premiums and debt
issuance costs |
|
|
(70) |
|
|
|
|
(75) |
|
|
|
Total debt, including unamortized discounts,
premiums, debt issuance costs and fair value
adjustments |
|
|
10,180 |
|
|
|
|
11,175 |
|
|
|
| Current portion of long-term debt |
|
|
(499) |
|
|
|
|
(1,000) |
|
|
|
| Long-term debt |
|
|
9,681 |
|
|
|
|
10,175 |
|
|
|
|
|
|
|
|
|
|
|
|
|
9 Related-Party Transactions
The Company's related parties are the members of the board of directors of NXP Semiconductors N.V., the executive officers of NXP Semiconductors N.V. and equity-accounted investees.
The following table presents the amounts related to revenue and other income and purchase of goods and services incurred in transactions with these related parties:
|
|
|
|
|
|
|
|
|
|
|
|
|
|
|
|
|
|
|
|
|
|
|
|
|
For the three months ended |
|
For the six months ended |
|
June 30, 2024 |
|
July 2, 2023 |
|
June 30, 2024 |
|
July 2, 2023 |
| Revenue and other income |
1 |
|
|
1 |
|
|
2 |
|
|
2 |
|
| Purchase of goods and services |
1 |
|
|
1 |
|
|
2 |
|
|
1 |
|
The following table presents the amounts related to receivable and payable balances with these related parties:
|
|
|
|
|
|
|
|
|
|
|
|
|
June 30, 2024 |
|
December 31, 2023 |
| Receivables |
— |
|
|
1 |
|
| Payables |
3 |
|
|
7 |
|
10 Fair Value Measurements
The following table summarizes the estimated fair value of our financial instruments which are measured at fair value on a recurring basis:
|
|
|
|
|
|
|
|
|
|
|
|
|
|
|
|
|
|
|
|
|
Estimated fair value |
|
Fair value
hierarchy |
|
June 30, 2024 |
|
December 31, 2023 |
| Assets: |
|
|
|
|
|
| Short-term deposits |
1 |
|
400 |
|
|
409 |
|
| Money market funds |
1 |
|
2,033 |
|
|
3,137 |
|
| Marketable equity securities |
1 |
|
7 |
|
|
12 |
|
| Derivative instruments-assets |
2 |
|
2 |
|
|
12 |
|
|
|
|
|
|
|
| Liabilities: |
|
|
|
|
|
|
|
|
|
|
|
|
|
|
|
|
|
|
|
|
|
|
|
| Derivative instruments-liabilities |
2 |
|
(12) |
|
|
(3) |
|
The following methods and assumptions were used to estimate the fair value of financial instruments:
Assets and liabilities measured at fair value on a recurring basis
Investments in short-term deposits, representing liquid assets with original maturity beyond three months and having no significant risk of changes in fair value, are represented at carrying value as reasonable estimates of fair value due to the relatively short period of time between the origination of the instruments and their expected realization. Money market funds (as part of our cash and cash equivalents) and marketable equity securities (as part of other non-current assets) have fair value measurements which are all based on quoted prices in active markets for identical assets or liabilities. For derivatives (as part of other current assets or accrued liabilities) the fair value is based upon significant other observable inputs depending on the nature of the derivative.
Assets and liabilities recorded at fair value on a non-recurring basis
We measure and record our non-marketable equity securities, equity method investments and non-financial assets, such as intangible assets and property, plant and equipment, at fair value when an impairment charge is required.
Assets and liabilities not recorded at fair value on a recurring basis
Financial instruments not recorded at fair value on a recurring basis include non-marketable equity securities and equity method investments that have not been remeasured or impaired in the current period and debt.
As of June 30, 2024, the estimated fair value of current and non-current debt was $9.1 billion ($10.3 billion as of December 31, 2023). The fair value is estimated on the basis of broker-dealer quotes, which are Level 2 inputs. Accrued interest is included under accrued liabilities and not within the carrying amount or estimated fair value of debt.
11 Commitments and Contingencies
Purchase Commitments
The Company maintains purchase commitments with certain suppliers, primarily for raw materials, semi-finished goods and manufacturing services and for some non-production items. Purchase commitments for inventory materials are generally restricted to a forecasted time-horizon as mutually agreed upon between the parties. This forecasted time-horizon can vary for different suppliers. As of June 30, 2024, the Company had purchase commitments of $3,899 million, which are due through 2044.
Legal Proceedings
We are regularly involved as plaintiffs or defendants in claims and litigation relating to a variety of matters such as contractual disputes, personal injury claims, employee grievances and intellectual property litigation. In addition, our acquisitions, divestments and financial transactions sometimes result in, or are followed by, claims or litigation. Some of these claims may possibly be recovered from insurance reimbursements. Although the ultimate disposition of asserted claims cannot be predicted with certainty, it is our belief that the outcome of any such claims, either individually or on a combined basis, will not have a material adverse effect on our consolidated financial position.
However, such outcomes may be material to our condensed consolidated statement of operations for a particular period. The Company records an accrual for any claim that arises whenever it considers that it is probable that it is exposed to a loss contingency and the amount of the loss contingency can be reasonably estimated. The Company does not record a gain contingency until the period in which all contingencies are resolved and the gain is realized or realizable. Legal fees are expensed when incurred.
Motorola Personal Injury Lawsuits
The Company is currently assisting Motorola in the defense of personal injury lawsuits due to indemnity obligations included in the agreement that separated Freescale from Motorola in 2004. The multi-plaintiff Motorola lawsuits are pending in the Circuit Court of Cook County, Illinois. These claims allege a link between working in semiconductor manufacturing clean room facilities and birth defects in 21 individuals. The Motorola suits allege exposures between 1980 and 2005. Each claim seeks an unspecified amount of damages for the alleged injuries; however, legal counsel representing the plaintiffs has indicated they will seek substantial compensatory and punitive damages from Motorola for the entire inventory of claims which, if proven and recovered, the Company considers to be material. A portion of any indemnity due to Motorola will be reimbursed to NXP if Motorola receives an indemnification payment from its insurance coverage. Motorola has potential insurance coverage for many of the years indicated above, but with differing types and levels of coverage, self-insurance retention amounts and deductibles. We are in discussions with Motorola and their insurers regarding the availability of applicable insurance coverage for each of the individual cases. Motorola and NXP have denied liability for these alleged injuries based on numerous defenses.
Legal Proceedings Related Accruals and Insurance Coverage
The Company reevaluates at least on a quarterly basis the claims that have arisen to determine whether any new accruals need to be made or whether any accruals made need to be adjusted based on the most current information available to it and based on its best estimate. Based on the procedures described above, the Company has an aggregate amount of $95 million accrued for potential and current legal proceedings pending as of June 30, 2024, compared to $112 million accrued at December 31, 2023 (without reduction for any related insurance reimbursements). The accruals are included in “Other current liabilities” and in “Other non-current liabilities”. As of June 30, 2024, the Company’s related balance of insurance reimbursements was $67 million (December 31, 2023: $67 million) and is included in “Other non-current assets”.
The Company also estimates the aggregate range of reasonably possible losses in excess of the amount accrued based on currently available information for those cases for which such estimate can be made. The estimated aggregate range requires significant judgment, given the varying stages of the proceedings, the existence of multiple defendants (including the Company) in such claims whose share of liability has yet to be determined, the numerous yet-unresolved issues in many of the claims, and the attendant uncertainty of the various potential outcomes of such claims. Accordingly, the Company’s estimate will change from time to time, and actual losses may be more than the current estimate. As at June 30, 2024, the Company believes that for all litigation pending its potential aggregate exposure to loss in excess of the amount accrued (without reduction for any amounts that may possibly be recovered under insurance programs) could range between $0 and $93 million. Based upon our past experience with these matters, the Company would expect to receive additional insurance reimbursement of up to $70 million on certain of these claims that would partially offset the potential aggregate exposure to loss in excess of the amount accrued.
Item 2. Management’s Discussion and Analysis of Financial Condition and Results of Operations
Management’s Discussion and Analysis (MD&A) should be read in conjunction with our consolidated financial statements and notes and the MD&A in our Annual Report on Form 10-K for the year ended December 31, 2023, and the financial statements and the related notes that appear elsewhere in this document.
Recent Developments
Our Management Team is focused on leading NXP team members to work together and with our customers to create breakthrough technologies that make the connected world better, safer and more secure. The roles and/or individuals within the Management Team change from time to time for various reasons. Recent changes include Torsten Lehmann, Executive Vice President taking an extended medical leave and Henri Ardevol, Executive Vice President transitioning from a business facing role into a strategy role within the Management Team.
Overview
Quarter in Focus
•Revenue was $3.1 billion, down 5.2% percent year-on-year;
•GAAP gross margin was 57.3 percent, and GAAP operating margin was 28.7 percent;
•Non-GAAP gross margin was 58.6 percent, and non-GAAP operating margin was 34.3 percent;
•Cash flow from operations was $761 million, with net capital expenditures on property, plant and equipment of $184 million, resulting in non-GAAP free cash flow of $577 million;
•During the second quarter of 2024, NXP returned capital to shareholders with the payment of $260 million in cash dividends and the repurchase of $310 million of its common shares, for a total capital return of $570 million;
Sequential Results
Q2 2024 compared to Q1 2024
Revenue for the three months ended June 30, 2024 remained flat, $3,127 million compared to $3,126 million for the three months ended March 31, 2024, in line with management's expectations. Within our end markets, the Industrial IoT end market increased $42 million or 7.3% and the Communication Infrastructure & Other end market increased $39 million or 9.8%, which were offset by decreases in the Automotive end market of $76 million or 4.2% and in the Mobile end market of $4 million or 1.1%.
When aggregating all end markets together and reviewing sales channel performance, revenues through NXP's third party distribution partners was $1,804 million, an increase of $65 million or 3.7% compared to the previous period. Revenues through NXP's third party direct OEM and EMS customers was $1,294 million, a decrease of $61 million or 4.5% versus the previous period.
From a geographic perspective, revenue increased quarter-on-quarter in the China region by 8.3%, while revenue decreased in the EMEA region by 9%, in the Asia Pacific region by 1.3% and in the Americas region by 0.9%.
Our gross profit percentage for the three months ended June 30, 2024 of 57.3% was relatively consistent compared with 57.0% for the three months ended March 31, 2024.
Operating income for the three months ended June 30, 2024 was $896 million compared to $856 million for the three months ended March 31, 2024, an increase of $40 million or 4.7%. Lower amortization of acquisition-related intangible assets was the main driver for the sequential decrease.
Results of operations
The following table presents operating results for each of the three- and six-month periods ended June 30, 2024 and July 2, 2023, respectively:
|
|
|
|
|
|
|
|
|
|
|
|
|
|
|
|
|
|
|
|
|
|
|
|
|
|
|
|
|
|
|
|
|
|
|
|
|
|
|
|
|
|
|
|
|
|
|
|
| ($ in millions, unless otherwise stated) |
Q2 2024 |
|
% of Revenue |
|
Q2 2023 |
|
% of Revenue |
|
YTD 2024 |
|
% of Revenue |
|
YTD 2023 |
|
% of Revenue |
|
|
|
|
|
|
|
|
|
|
|
|
|
|
|
|
| Revenue |
3,127 |
|
|
|
|
3,299 |
|
|
|
|
6,253 |
|
|
|
|
6,420 |
|
|
|
| % nominal growth |
(5.2) |
|
|
|
|
(0.4) |
|
|
|
|
(2.6) |
|
|
|
|
(0.4) |
|
|
|
| Gross profit |
1,792 |
|
|
|
|
1,881 |
|
|
|
|
3,575 |
|
|
|
|
3,651 |
|
|
|
| Gross margin |
57.3 |
% |
|
|
|
57.0 |
% |
|
|
|
57.2 |
% |
|
|
|
56.9 |
% |
|
|
| Research and development |
(594) |
|
|
19.0 |
% |
|
(589) |
|
|
17.9 |
% |
|
(1,158) |
|
|
18.5 |
% |
|
(1,166) |
|
|
18.2 |
% |
| Selling, general and administrative |
(270) |
|
|
8.6 |
% |
|
(274) |
|
|
8.3 |
% |
|
(576) |
|
|
9.2 |
% |
|
(554) |
|
|
8.6 |
% |
| Amortization of acquisition-related intangible assets |
(28) |
|
|
0.9 |
% |
|
(81) |
|
|
2.5 |
% |
|
(79) |
|
|
1.3 |
% |
|
(166) |
|
|
2.6 |
% |
| Other income (expense) |
(4) |
|
|
0.1 |
% |
|
— |
|
|
— |
% |
|
(10) |
|
|
0.2 |
% |
|
(3) |
|
|
— |
% |
| Operating income (loss) |
896 |
|
|
28.7 |
% |
|
937 |
|
|
28.4 |
% |
|
1,752 |
|
|
28.0 |
% |
|
1,762 |
|
|
27.4 |
% |
| Financial income (expense) |
(75) |
|
|
2.4 |
% |
|
(74) |
|
|
2.2 |
% |
|
(145) |
|
|
2.3 |
% |
|
(156) |
|
|
2.4 |
% |
| Benefit (provision) for income taxes |
(154) |
|
|
4.9 |
% |
|
(158) |
|
|
4.8 |
% |
|
(295) |
|
|
4.7 |
% |
|
(276) |
|
|
4.3 |
% |
| Results relating to equity-accounted investees |
(3) |
|
|
0.1 |
% |
|
(1) |
|
|
— |
% |
|
(4) |
|
|
0.1 |
% |
|
(3) |
|
|
— |
% |
| Net income (loss) |
664 |
|
|
21.2 |
% |
|
704 |
|
|
21.3 |
% |
|
1,308 |
|
|
20.9 |
% |
|
1,327 |
|
|
20.7 |
% |
| Less: Net income (loss) attributable to non-controlling interests |
6 |
|
|
0.2 |
% |
|
6 |
|
|
0.2 |
% |
|
11 |
|
|
0.2 |
% |
|
14 |
|
|
0.2 |
% |
| Net income (loss) attributable to stockholders |
658 |
|
|
21.0 |
% |
|
698 |
|
|
21.2 |
% |
|
1,297 |
|
|
20.7 |
% |
|
1,313 |
|
|
20.5 |
% |
|
|
|
|
|
|
|
|
|
|
|
|
|
|
|
|
| Diluted earnings per share |
2.54 |
|
|
|
|
2.67 |
|
|
|
|
5.01 |
|
|
|
|
5.03 |
|
|
|
Revenue
Q2 2024 Overview
Q2 2024 compared to Q2 2023
Revenue for the three months ended June 30, 2024 was $3,127 million compared to $3,299 million for the three months ended July 2, 2023, a decrease of $172 million or 5.2%, in line with management’s expectations.
YTD 2024 Overview
YTD 2024 compared to YTD 2023
Revenue for the six months ended June 30, 2024 was $6,253 million compared to $6,420 million for the six months ended July 2, 2023, a decrease of $167 million or 2.6%.
Revenue by end market was as follows:
|
|
|
|
|
|
|
|
|
|
|
|
|
|
|
|
|
|
|
|
|
|
|
|
|
|
|
|
|
|
|
|
|
|
|
|
| ($ in millions, unless otherwise stated) |
Q2 2024 |
|
Q2 2023 |
|
% change |
|
YTD 2024 |
|
YTD 2023 |
|
% change |
| Automotive |
1,728 |
|
|
1,866 |
|
|
(7.4) |
% |
|
3,532 |
|
|
3,694 |
|
|
(4.4) |
% |
| Industrial & IoT |
616 |
|
|
578 |
|
|
6.6 |
% |
|
1,190 |
|
|
1,082 |
|
|
10.0 |
% |
| Mobile |
345 |
|
|
284 |
|
|
21.5 |
% |
|
694 |
|
|
544 |
|
|
27.6 |
% |
| Communication Infrastructure & Other |
438 |
|
|
571 |
|
|
(23.3) |
% |
|
837 |
|
|
1,100 |
|
|
(23.9) |
% |
| Total Revenue |
3,127 |
|
|
3,299 |
|
|
(5.2) |
% |
|
6,253 |
|
|
6,420 |
|
|
(2.6) |
% |
Revenue by sales channel was as follows:
|
|
|
|
|
|
|
|
|
|
|
|
|
|
|
|
|
|
|
|
|
|
|
|
|
|
|
|
|
|
|
|
|
|
|
|
| ($ in millions, unless otherwise stated) |
Q2 2024 |
|
Q2 2023 |
|
% change |
|
YTD 2024 |
|
YTD 2023 |
|
% change |
| Distributors |
1,804 |
|
|
1,679 |
|
|
7.4 |
% |
|
3,543 |
|
|
3,170 |
|
|
11.8 |
% |
| OEM/EMS |
1,294 |
|
|
1,596 |
|
|
(18.9) |
% |
|
2,649 |
|
|
3,190 |
|
|
(17.0) |
% |
| Other |
29 |
|
|
24 |
|
|
20.8 |
% |
|
61 |
|
|
60 |
|
|
1.7 |
% |
| Total Revenue |
3,127 |
|
|
3,299 |
|
|
(5.2) |
% |
|
6,253 |
|
|
6,420 |
|
|
(2.6) |
% |
Revenue by geographic region, which is based on the customer’s shipped-to location was as follows:
|
|
|
|
|
|
|
|
|
|
|
|
|
|
|
|
|
|
|
|
|
|
|
|
|
|
|
|
|
|
|
|
|
|
|
|
| ($ in millions, unless otherwise stated) |
Q2 2024 |
|
Q2 2023 |
|
% change |
|
YTD 2024 |
|
YTD 2023 |
|
% change |
China 1) |
1,098 |
|
|
1,031 |
|
|
6.5 |
% |
|
2,112 |
|
|
1,978 |
|
|
6.8 |
% |
| APAC, excluding China |
898 |
|
|
958 |
|
|
(6.3) |
% |
|
1,808 |
|
|
1,933 |
|
|
(6.5) |
% |
| EMEA (Europe, the Middle East and Africa) |
676 |
|
|
797 |
|
|
(15.2) |
% |
|
1,419 |
|
|
1,522 |
|
|
(6.8) |
% |
| Americas |
455 |
|
|
513 |
|
|
(11.3) |
% |
|
914 |
|
|
987 |
|
|
(7.4) |
% |
| Total Revenue |
3,127 |
|
|
3,299 |
|
|
(5.2) |
% |
|
6,253 |
|
|
6,420 |
|
|
(2.6) |
% |
1) China includes Mainland China and Hong Kong |
|
|
|
|
Q2 2024 compared to Q2 2023
From an end market perspective, NXP experienced growth in its Mobile and Industrial IoT end markets which were offset by declines in the Automotive and the Communication Infrastructure & Other end markets versus the year ago period.
Revenue in the Automotive end market was $1,728 million, a decrease of $138 million or 7.4% versus the year ago period. The decrease in the Automotive end market revenue was attributable to declines in our automotive processors and connectivity products, which were offset by growth in our ADAS – Safety products and advanced analog portfolio.
Revenue in the Industrial & IoT end market was $616 million, an increase of $38 million or 6.6% versus the year-ago period. Within the Industrial & IoT end market the year-on-year increase was across the entire product portfolio, including processors, advanced analog, connectivity and security.
Revenue in the Mobile end market was $345 million, an increase of $61 million or 21.5% versus the year ago period. The increase in the Mobile end market revenue was across the entire product portfolio, including mobile wallet and advanced analog.
Revenue in the Communication Infrastructure & Other end market was $438 million, a decrease of $133 million or 23.3% versus the year ago period. The decrease in the Communication Infrastructure & Other end market revenue was attributable to declines in our secure cards, RF power products and legacy processors.
When aggregating all end markets together, and reviewing sales channel performance, revenues through NXP’s third party distribution partners was $1,804 million, an increase of 7.4% versus the year-ago period. Revenues through direct OEM and EMS customers was $1,294 million, a decrease of 18.9% versus the year ago period.
From a geographic perspective, revenue increased year-on-year in the China region by 6.5%, while revenue decreased in the EMEA region by 15.2%, in the Americas region by 11.3%, and in the Asia Pacific region by 6.3%.
YTD 2024 compared to YTD 2023
From an end market perspective, NXP experienced growth in its Mobile and Industrial & IoT end markets, which were offset by declines in the Communication Infrastructure & Other and the Automotive end markets versus the year ago period.
Revenue in the Automotive end market was $3,532 million, a decrease of $162 million or 4.4% versus the year ago period. The decrease in the Automotive end market revenue was attributable to declines in our automotive processors and connectivity products, which were offset by growth in our advanced analog portfolio and ADAS – Safety products.
Revenue in the Industrial & IoT end market was $1,190 million, an increase of $108 million or 10.0% versus the year ago period. Within the Industrial & IoT end market the year-on-year increase was across the entire product portfolio, including processors, connectivity, advanced analog and security.
Revenue in the Mobile end market was $694 million, an increase of $150 million or 27.6% versus the year ago period. The increase in the Mobile end market revenue was attributable to increases in our mobile wallet and advanced analog products.
Revenue in the Communication Infrastructure & Other end market was $837 million, a decrease of $263 million or 23.9% versus the year ago period. The decrease in revenue of secure cards and RF power products was due to weak end market demand. Legacy processors experienced anticipated end-of-life trends.
When aggregating all end markets together, and reviewing sales channel performance, revenues through NXP’s third party distribution partners was $3,543 million, an increase of 11.8% versus the year-ago period. Revenues through direct OEM and EMS customers was $2,649 million, a decrease of 17.0% versus the year-ago period.
From a geographic perspective, revenue increased year-on-year in the China region by 6.8%, while revenue decreased in the Americas region by 7.4%, in the EMEA region by 6.8% and in the Asia Pacific region by 6.5%.
Gross profit
Q2 2024 compared to Q2 2023
Gross profit for the three months ended June 30, 2024 was $1,792 million, or 57.3% of revenue, compared to $1,881 million, or 57.0% of revenue for the three months ended July 2, 2023, was relatively consistent with revenue and costs, both of which had comparable decreases year on year.
YTD 2024 compared to YTD 2023
Gross profit for the six months ended June 30, 2024 was $3,575 million, or 57.2% of revenue, compared to $3,651 million, or 56.9% of revenue for the six months ended July 2, 2023. was relatively consistent with revenue and costs, both of which had comparable decreases in the year-to-date period.
Operating expenses
Q2 2024 compared to Q2 2023
Operating expenses for the three months ended June 30, 2024 totaled $892 million, or 28.5% of revenue, compared to $944 million, or 28.6% of revenue, for the three months ended July 2, 2023.
YTD 2024 compared to YTD 2023
Operating expenses for the six months ended June 30, 2024 totaled $1,813 million, or 29.0% of revenue, compared to $1,886 million, or 29.4% of revenue, for the six months ended July 2, 2023.
•Research and development
|
|
|
|
|
|
|
|
|
|
|
|
|
|
|
|
|
|
|
|
|
|
|
|
|
|
|
|
|
|
|
|
|
|
|
|
| ($ in millions, unless otherwise stated) |
Q2 2024 |
|
Q2 2023 |
|
% change |
|
YTD 2024 |
|
YTD 2023 |
|
% change |
| Research and development |
594 |
|
|
589 |
|
|
0.8 |
% |
|
1,158 |
|
|
1,166 |
|
|
(0.7) |
% |
| As a percentage of revenue |
19.0 |
% |
|
17.9 |
% |
|
(1.1) |
ppt |
|
18.5 |
% |
|
18.2 |
% |
|
(0.3) |
ppt |
Q2 2024 compared to Q2 2023
R&D costs for the three months ended June 30, 2024 increased by $5 million, or 0.8%, when compared to the three months ended July 2, 2023 mainly driven by higher license fees of $15 million and higher personnel-related costs of $5 million, offset by higher government grants and subsidies of $20 million.
YTD 2024 compared to YTD 2023
R&D costs for the six months ended June 30, 2024 decreased by $8 million, or 0.7%, when compared to the six months ended July 2, 2023 mainly driven by higher government grants and subsidies of $40 million, partly offset by higher license fees of $15 million and higher personnel-related costs of $9 million.
•Selling, general and administrative
|
|
|
|
|
|
|
|
|
|
|
|
|
|
|
|
|
|
|
|
|
|
|
|
|
|
|
|
|
|
|
|
|
|
|
|
| ($ in millions, unless otherwise stated) |
Q2 2024 |
|
Q2 2023 |
|
% change |
|
YTD 2024 |
|
YTD 2023 |
|
% change |
| Selling, general and administrative |
270 |
|
|
274 |
|
|
(1.5) |
% |
|
576 |
|
|
554 |
|
|
4.0 |
% |
| As a percentage of revenue |
8.6 |
% |
|
8.3 |
% |
|
(0.3) |
ppt |
|
9.2 |
% |
|
8.6 |
% |
|
(0.6) |
ppt |
Q2 2024 compared to Q2 2023
SG&A costs for the three months ended June 30, 2024 decreased by $4 million, or 1.5%, when compared to the three months ended July 2, 2023 mainly due to $7 million lower legal expenses.
YTD 2024 compared to YTD 2023
SG&A costs for the six months ended June 30, 2024 increased by $22 million, or 4.0%, when compared to the six months ended July 2, 2023 mainly due to higher personnel-related costs of $8 million and higher legal expenses of $9 million.
•Amortization of acquisition-related intangible assets
|
|
|
|
|
|
|
|
|
|
|
|
|
|
|
|
|
|
|
|
|
|
|
|
|
|
|
|
|
|
|
|
|
|
|
|
| ($ in millions, unless otherwise stated) |
Q2 2024 |
|
Q2 2023 |
|
% change |
|
YTD 2024 |
|
YTD 2023 |
|
% change |
| Amortization of acquisition-related intangible assets |
28 |
|
|
81 |
|
|
(65.4) |
% |
|
79 |
|
|
166 |
|
|
(52.4) |
% |
| As a percentage of revenue |
0.9 |
% |
|
2.5 |
% |
|
1.6 |
ppt |
|
1.3 |
% |
|
2.6 |
% |
|
1.3 |
ppt |
Q2 2024 compared to Q2 2023
Amortization of acquisition-related intangible assets for the three months ended June 30, 2024 decreased by $53 million, or 65.4%, when compared to the three months ended July 2, 2023 mainly due to the effect of certain acquisition-related intangibles becoming fully amortized (with regard to the Marvell and former Freescale acquisitions).
YTD 2024 compared to YTD 2023
Amortization of acquisition-related intangible assets for the six months ended June 30, 2024 decreased by $87 million, or 52.4%, when compared to the six months ended July 2, 2023 mainly due to the effect of certain acquisition-related intangibles becoming fully amortized (with regard to the Marvell and former Freescale acquisitions).
Financial income (expense)
The following table presents the details of financial income and expenses:
|
|
|
|
|
|
|
|
|
|
|
|
|
|
|
|
|
|
|
|
|
|
|
|
| ($ in millions, unless otherwise stated) |
Q2 2024 |
|
Q2 2023 |
|
YTD 2024 |
|
YTD 2023 |
| Interest income |
39 |
|
|
43 |
|
|
89 |
|
|
85 |
|
| Interest expense |
(97) |
|
|
(109) |
|
|
(202) |
|
|
(220) |
|
| Total other financial income/ (expense) |
(17) |
|
|
(8) |
|
|
(32) |
|
|
(21) |
|
| Total |
(75) |
|
|
(74) |
|
|
(145) |
|
|
(156) |
|
Q2 2024 compared to Q2 2023
Financial income (expense) was an expense of $75 million for the three months ended June 30, 2024, compared to an expense of $74 million for the three months ended July 2, 2023. The change in financial income (expense) is attributable to a decrease in interest income of $4 million as a result of lower cash levels. Interest expense decreased by $12 million mainly due to the retirement of the 4.875% senior unsecured notes on March 1, 2024. Other financial income/ (expense) mainly consist of fair value adjustments in equity securities, a loss of $3 million for the three months ended June 30, 2024 versus a profit of $6 million for the three months ended July 2, 2023.
YTD 2024 compared to YTD 2023
Financial income (expense) was an expense of $145 million for the six months ended June 30, 2024, compared to an expense of $156 million for the six months ended July 2, 2023. The change in financial income (expense) is attributable to an increase in interest income of $4 million as a result of higher interest rates.
Interest expense decreased by $18 million mainly due to the retirement of the 4.875% senior unsecured notes on March 1, 2024. Other financial income/ (expense) mainly consist of fair value adjustments in equity securities, a loss of $5 million for the six months ended June 30, 2024 versus a profit of $5 million for the six months ended July 2, 2023.
Benefit (provision) for income taxes
Our provision for income taxes for 2024 is based on our EAETR of 17.8% , which is lower than the Netherlands statutory tax rate of 25.8%, primarily due to tax benefits from the Netherlands and foreign tax incentives.
|
|
|
|
|
|
|
|
|
|
|
|
|
|
|
|
|
|
|
|
|
|
|
|
|
Q2 2024 |
|
Q2 2023 |
|
YTD 2024 |
|
YTD 2023 |
| Tax benefit (provision) calculated at EAETR |
(147) |
|
|
(147) |
|
|
(286) |
|
|
(273) |
|
| Discrete tax benefit (provision) items |
(7) |
|
|
(11) |
|
|
(9) |
|
|
(3) |
|
| Benefit (provision) for income taxes |
(154) |
|
|
(158) |
|
|
(295) |
|
|
(276) |
|
|
|
|
|
|
|
|
|
| Effective tax rate |
18.8 |
% |
|
18.3 |
% |
|
18.4 |
% |
|
17.2 |
% |
Q2 2024 compared to Q2 2023
The effective tax rate of 18.8% for the second quarter of 2024 was higher than the EAETR due to the income tax expense for discrete items of $7 million. The discrete items are primarily related to changes in estimates for previous years, and the impact of foreign currency on income tax related items. In addition to this, there was a recapture of tax expense of $1 million due to a higher EAETR compared to prior quarter.
YTD 2024 compared to YTD 2023
For the first six months ended 2024 the effective tax rate of 18.4% was higher than 17.8% due to an net result of unfavorable discrete items of $9 million.
The effective tax rate of 18.4% for the first six months of 2024 was higher compared to the rate for the first six months ended 2023 of 17.2% due to a different mix of the benefit (provision) for income taxes in the locations that we operate in, lower foreign tax incentives in the current period as a result of a decrease in qualifying income, newly enacted alternative minimum tax law as per 2024, and also due to the impact of the discrete items in the respective periods.
Results Relating to Equity-accounted Investees
Q2 2024 compared to Q2 2023
Results relating to equity-accounted investees amounted to a loss of $3 million for the three months ended June 30, 2024, whereas the three months ended July 2, 2023 results relating to equity-accounted investees amounted to a loss of $1 million.
YTD 2024 compared to YTD 2023
Results relating to equity-accounted investees amounted to a loss of $4 million for the six months ended June 30, 2024, whereas the six months ended July 2, 2023 results relating to equity-accounted investees amounted to a loss of $3 million.
Non-controlling Interests
Q2 2024 compared to Q2 2023
Non-controlling interests are related to the third-party share in the results of consolidated companies, predominantly SSMC. Their share of non-controlling interests amounted to a profit of $6 million for the three months ended June 30, 2024, compared to a profit of $6 million for the three months ended July 2, 2023.
YTD 2024 compared to YTD 2023
Non-controlling interests are related to the third-party share in the results of consolidated companies, predominantly SSMC. Their share of non-controlling interests amounted to a profit of $11 million for the six months ended June 30, 2024, compared to a profit of $14 million for the six months ended July 2, 2023.
Liquidity and Capital Resources
We derive our liquidity and capital resources primarily from our cash flows from operations. We continue to generate strong positive operating cash flows. At the end of the second quarter of 2024, our cash balance was $2,859 million, a decrease of $1,003 million compared to December 31, 2023 having fully retired our $1 billion aggregate principal amount of outstanding 4.875% senior unsecured notes due March 2024. Taking into account the available amount of the Unsecured Revolving Credit Facility of $2,500 million, we had access to $5,359 million of liquidity as of June 30, 2024. We currently use cash to fund operations, meet working capital requirements, for capital expenditures and for potential common stock repurchases, dividends and strategic investments. Based on past performance and current expectations, we believe that our current available sources of funds (including cash and cash equivalents, short-term deposits, RCF Agreement of $2.5 billion, plus anticipated cash generated from operations) will be adequate to finance our operations, working capital requirements, capital expenditures and potential dividends for at least the next twelve months.
|
|
|
|
|
|
|
|
|
|
|
|
| ($ in millions, unless otherwise stated) |
YTD 2024 |
|
YTD 2023 |
| Cash from operations |
1,612 |
|
|
1,388 |
|
| Capital expenditures |
(411) |
|
|
(452) |
|
| Cash to shareholders |
(1,134) |
|
|
(796) |
|
Cash and short-term deposits
At June 30, 2024, our cash and short-term deposits balance was $3,259 million of which $241 million was held by SSMC, our consolidated joint venture company with TSMC. Under the terms of our joint venture agreement with TSMC, a portion of this cash can be distributed by way of a dividend to us, but 38.8% of the dividend will be paid to our joint venture partner.
Capital expenditures
Our cash outflows for capital expenditures were $411 million in the first six months of 2024, compared to $452 million in the first six months of 2023.
Capital return
Under our Quarterly Dividend Program, interim dividends of $1.014 per ordinary share were paid on January 5, 2024 ($261 million), dividends of $1.014 per ordinary share were paid on April 10, 2024 ($260 million) and dividends of $1.014 per ordinary share were paid on July 10, 2024 ($259 million).
In the first six months of 2024 we repurchased approximately $613 million of shares.
Debt
Our total debt, inclusive of aggregate principal, unamortized discounts, premiums, debt issuance costs and fair value adjustments, amounted to $10,180 million as of June 30, 2024, a decrease of $995 million compared to December 31, 2023 ($11,175 million). On March 1, 2024, we fully retired at maturity our $1 billion aggregate principal amount of outstanding 4.875% senior unsecured notes using available cash on balance sheet.
As of June 30, 2024, we had outstanding fixed-rate notes with varying maturities for an aggregate principal amount of $10,250 million (collectively the “Notes”), of which $500 million is payable within 12 months. Future interest payments associated with the Notes total $2,921 million, with $378 million payable within 12 months.
Our net debt position (see section Use of Certain Non-GAAP Financial Measures) at June 30, 2024 amounted to $6,921 million, compared to $6,904 million as of December 31, 2023.
Additional Capital Requirements
Expected working and other capital requirements are described in our Annual Report on Form 10-K for the fiscal year ended December 31, 2023 in Part II, Item 7, “Management’s Discussion and Analysis of Financial Condition and Results of Operations”. At June 30, 2024, other than for changes disclosed in the “Notes to Condensed Consolidated Financial Statements” and “Liquidity and Capital Resources” in this Quarterly Report, there have been no other material changes to our expected working and other capital requirements described in our Annual Report on Form 10-K for the fiscal year ended December 31, 2023.
Cash flows
Our cash and cash equivalents during the first six months of 2024 decreased by $996 million (excluding the effect of changes in exchange rates on our cash position of $(7) million) as follows:
|
|
|
|
|
|
|
|
|
|
|
|
| ($ in millions, unless otherwise stated) |
YTD 2024 |
|
YTD 2023 |
| Net cash provided by (used for) operating activities |
1,612 |
|
|
1,388 |
|
| Net cash (used for) provided by investing activities |
(513) |
|
|
(606) |
|
| Net cash provided by (used for) financing activities |
(2,095) |
|
|
(763) |
|
| Increase (decrease) in cash and cash equivalents |
(996) |
|
|
19 |
|
Cash Flow from Operating Activities
For the first six months of 2024 our operating activities provided $1,612 million in cash. This was primarily the result of net income of $1,308 million, adjustments to reconcile the net income of $602 million and changes in operating assets and liabilities of $(305) million. Adjustments to net income (loss) include offsetting non-cash items, such as depreciation and amortization of $448 million, share-based compensation of $229 million and changes in deferred taxes of $(87) million. Changes in operating assets and liabilities were primarily driven by a $322 million decrease in accounts payable and other liabilities as a result of lower purchase volumes and timing related to payments, $15 million increase in receivables and other current assets due to the linearity of revenue between the two periods, customer mix, and the related timing of cash collection, and $14 million increase in inventories in order to align inventory on hand with expected demand, partially offset by a $46 million decrease in other non-current assets from the application of prepayments used to secure long-term production supply.
For the first six months of 2023 our operating activities provided $1,388 million in cash. This was primarily the result of net income of $1,327 million, adjustments to reconcile the net income of $630 million and changes in operating assets and liabilities of $(575) million. Adjustments to net income (loss) includes offsetting non-cash items, such as depreciation and amortization of $564 million, share-based compensation of $201 million and changes in deferred taxes of $(137) million. Changes in operating assets and liabilities were primarily driven by a $325 million increase in inventories due to increased production levels in order to align inventory on hand with expected demand, $158 million increase in receivables and other current assets due to the linearity of revenue between the two periods, customer mix, and the related timing of cash collection, partially offset by $92 million increase in accounts payable and other liabilities as a result of timing related to payments.
Cash Flow from Investing Activities
Net cash used for investing activities amounted to $513 million for the first six months of 2024 and principally consisted of the cash outflows for capital expenditures of $411 million, $34 million for the purchase of investments (driven primarily by the initial capital contribution of approximately $22 million into European Semiconductor Manufacturing Company (ESMC) GmbH) and $87 million for the purchase of identified intangible assets, including EDA (electronic design automation).
Net cash used for investing activities amounted to $606 million for the first six months of 2023 and principally consisted of the cash outflows for capital expenditures of $452 million, $58 million for the purchase of investments, and $93 million for the purchase of identified intangible assets.
Cash Flow from Financing Activities
Net cash used for financing activities of $2,095 million for the first six months of 2024 was primarily driven by the payment of $1 billion to retire at maturity our outstanding 4.875% senior unsecured notes due March 2024, dividend payment to common stockholders of $521 million, and purchase of treasury shares and restricted stock unit holdings of $613 million, partially offset by the proceeds from the issuance of common stock through stock plans of $40 million.
Net cash used for financing activities of $763 million for the first six months of 2023 was primarily driven by the dividend payment to common stockholders of $483 million and the purchase of treasury shares and restricted stock unit holdings of $313 million, partially offset by the proceeds from the issuance of common stock through stock plans of $33 million.
Information Regarding Guarantors of NXP (unaudited)
Summarized Combined Financial Information for Guarantee of Securities of Subsidiaries
All debt instruments are guaranteed, fully and unconditionally, jointly and severally, by NXP Semiconductors N.V. and issued or guaranteed by NXP USA, Inc., NXP B.V. and NXP LLC, (together, the “Subsidiary Obligors” and together with NXP Semiconductors N.V., the “Obligor Group”). Other than the Subsidiary Obligors, none of the Company’s subsidiaries (together the “Non-Guarantor Subsidiaries”) guarantee the Notes. The Company consolidates the Subsidiary Obligors in its consolidated financial statements and each of the Subsidiary Obligors are wholly owned subsidiaries of the Company.
All of the existing guarantees by the Company rank equally in right of payment with all of the existing and future senior indebtedness of the Obligor Group. There are no significant restrictions on the ability of the Obligor Group to obtain funds from respective subsidiaries by dividend or loan.
The following tables present summarized financial information of the Obligor Group on a combined basis, with intercompany balances and transactions between entities of the Obligor Group eliminated and investments and equity in the earnings of the Non-Guarantor Subsidiaries excluded. The Obligor Group’s amounts due from, amounts due to, and intercompany transactions with Non-Guarantor Subsidiaries have been disclosed below the table, when material.
Summarized Statements of Income
|
|
|
|
|
|
|
For the six months ended |
| ($ in millions) |
June 30, 2024 |
|
|
| Revenue |
3,586 |
|
| Gross Profit |
1,832 |
|
| Operating income |
648 |
|
| Net income |
239 |
|
Summarized Balance Sheets
|
|
|
|
|
|
|
|
|
|
|
|
|
As of |
| ($ in millions) |
June 30, 2024 |
|
December 31, 2023 |
|
|
|
|
| Current assets |
3,249 |
|
|
4,298 |
|
| Non-current assets |
11,828 |
|
|
11,773 |
|
| Total assets |
15,077 |
|
|
16,071 |
|
|
|
|
|
| Current liabilities |
1,284 |
|
|
2,005 |
|
| Non-current liabilities |
10,074 |
|
|
10,566 |
|
| Total liabilities |
11,358 |
|
|
12,571 |
|
|
|
|
|
| Obligor's Group equity |
3,719 |
|
|
3,500 |
|
| Total liabilities and Obligor's Group equity |
15,077 |
|
|
16,071 |
|
NXP Semiconductors N.V. is the head of a fiscal unity for the corporate income tax and VAT that contains the most significant Dutch wholly-owned group companies. The Company is therefore jointly and severally liable for the tax liabilities of the tax entity as a whole, and as such the income tax expense of the Dutch fiscal unity has been included in the Net income of the Obligor Group.
The financial information of the Obligor Group includes sales executed through a Non-Guarantor Subsidiary single-billing entity as a sales agent on behalf of an entity in the Obligor Group. The Obligor Group has sales to non-guarantors (for the six months ended June 30, 2024: $344 million). The Obligor Group has amounts due from equity financing (June 30, 2024: $6,978 million; December 31, 2023: $5,441 million) and due to debt financing (June 30, 2024: $3,141 million; December 31, 2023: $2,346 million) with non-guarantor subsidiaries.
Use of Certain Non-GAAP Financial Measures
Non-GAAP Financial Measures
In addition to providing financial information on a basis consistent with U.S. generally accepted accounting principles (“US GAAP” or “GAAP”), NXP also provides selected financial measures on a non-GAAP basis which are adjusted for specified items. The adjustments made to achieve these non-GAAP financial measures or the non-GAAP financial measures as specified are described below, including the usefulness to management and investors.
In managing NXP’s business on a consolidated basis, management develops an annual operating plan, which is approved by our Board of Directors, using non-GAAP financial measures. In measuring performance against this plan, management considers the actual or potential impacts on these non-GAAP financial measures from actions taken to reduce costs with the goal of increasing our gross margin and operating margin and when assessing appropriate levels of research and development efforts. In addition, management relies upon these non-GAAP financial measures when making decisions about product spending, administrative budgets, and other operating expenses. We believe that these non-GAAP financial measures, when coupled with the GAAP results and the reconciliations to corresponding GAAP financial measures, provide a more complete understanding of the Company’s results of operations and the factors and trends affecting NXP’s business. We believe that they enable investors to perform additional comparisons of our operating results, to assess our liquidity and capital position and to analyze financial performance excluding the effect of expenses unrelated to core operating performance, certain non-cash expenses and share-based compensation expense, which may obscure trends in NXP’s underlying performance. This information also enables investors to compare financial results between periods where certain items may vary independent of business performance, and allow for greater transparency with respect to key metrics used by management.
The presentation of these and other similar items in NXP’s non-GAAP financial results should not be interpreted as implying that these items are non-recurring, infrequent, or unusual. These non-GAAP financial measures are provided in addition to, and not as a substitute for, or superior to, measures of financial performance prepared in accordance with GAAP.
|
|
|
|
|
|
|
|
|
|
|
|
|
|
|
| Non-GAAP Adjustment or Measure |
|
Definition |
|
Usefulness to Management and Investors |
| Purchase price accounting effects |
|
Purchase price accounting ("PPA") effects reflect the fair value adjustments impacting acquisition accounting and other acquisition adjustments charged to the Consolidated Statement of Operations. This typically relates to inventory, property, plant and equipment, as well as intangible assets, such as developed technology and marketing and customer relationships acquired. The PPA effects are recorded within both cost of revenue and operating expenses in our US GAAP financial statements. These charges are recorded over the estimated useful life of the related acquired asset, and thus are generally recorded over multiple years. |
|
We believe that excluding these charges related to fair value adjustments for purposes of calculating certain non-GAAP measures allows the users of our financial statements to better understand the historic and current cost of our products, our gross margin, our operating costs, our operating margin, and also facilitates comparisons to peer companies. |
| Restructuring |
|
Restructuring charges are costs primarily related to employee severance and benefit arrangements. Charges related to restructuring are recorded within both cost of revenue and operating expenses in our US GAAP financial statements |
|
We exclude restructuring charges, including any adjustments to charges recorded in prior periods, for purposes of calculating certain non-GAAP measures because these costs do not reflect our core operating performance. These adjustments facilitate a useful evaluation of our core operating performance and comparisons to past operating results and provide investors with additional means to evaluate expense trends. |
| Share-based compensation |
|
Share-based compensation consists of incentive expense granted to eligible employees in the form of equity based instruments. Charges related to share-based compensation are recorded within both cost of revenue and operating expenses in our US GAAP financial statements. |
|
We exclude charges related to share-based compensation for purposes of calculating certain non-GAAP measures because we believe these charges, which are non-cash, are not representative of our core operating performance as they can fluctuate from period to period based on factors that are not within our control, such as our stock price on the dates share-based grants are issued. We believe these adjustments provide investors with a useful view, through the eyes of management, of our core business model, how management currently evaluates core operational performance, and additional means to evaluate expense trends. |
| Other incidentals |
|
Other incidentals consist of certain items which may be non-recurring, unusual, infrequent or directly related to an event that is distinct and non-reflective of the Company’s core operating performance. These may include such items as process and product transfer costs, certain charges related to acquisitions and divestitures, litigation and legal settlements, costs associated with the exit of a product line, factory or facility, environmental or governmental settlements, and other items of similar nature. |
|
We exclude these certain items which may be non-recurring, unusual, infrequent or directly related to an event that is distinct and non-reflective of the Company’s core operating performance for purposes of calculating certain non-GAAP measures. These adjustments facilitate a useful evaluation of our core operating performance and comparisons to past operating results and provide investors with additional means to evaluate expense trends. |
|
|
|
|
|
|
|
|
|
|
|
|
|
|
|
| Non-GAAP Adjustment or Measure |
|
Definition |
|
Usefulness to Management and Investors |
| Non-GAAP Provision for income taxes |
|
Non-GAAP provision for income taxes is NXP's GAAP provision for income taxes adjusted for the income tax effects of the adjustments to our GAAP measure, including the effects of purchase price accounting (“PPA”), restructuring costs, share-based compensation, other incidental items and certain other adjustments to financial income (expense) items. Additionally, adjustments are made for the income tax effect of any discrete items that occur in the interim period. Discrete items primarily relate to unexpected tax events that may occur as these amounts cannot be forecasted (e.g., the impact of changes in tax law and/or rates, changes in estimates or resolved tax audits relating to prior year tax provisions, the excess or deficit tax effects on share-based compensation, etc.). |
|
The non-GAAP provision for income taxes is used to ascertain and present on a comparable basis NXP's provision for income tax after adjustments, the usefulness of which is described within this table. Additionally, the income tax effects of the adjustments to achieve the noted non-GAAP measures are used to determine NXP's non-GAAP net income (loss) attributable to stockholders and accordingly, our diluted non-GAAP earnings per share attributable to stockholders. |
| Free Cash Flow |
|
Free Cash Flow represents operating cash flow adjusted for net additions to property, plant and equipment. |
|
We believe that free cash flow provides insight into our cash-generating capability and our financial performance, and is an efficient means by which users of our financial statements can evaluate our cash flow after meeting our capital expenditure. |
| Net debt |
|
Net debt represents total debt (short-term and long-term) after deduction of cash and cash equivalents and short-term deposits. |
|
We believe this measure provides investors with useful supplemental information about the financial performance of our business, enables comparison of financial results between periods where certain items may vary independent of business performance, and allow for greater transparency with respect of calculating our net leverage. |
The following are reconciliations of our most comparable US GAAP measures to our non-GAAP measures presented:
|
|
|
|
|
|
|
|
|
|
|
|
|
|
|
|
|
|
| ($ in millions) |
For the three months ended |
|
June 30, 2024 |
|
March 31, 2024 |
|
July 2, 2023 |
| GAAP gross profit |
$ |
1,792 |
|
|
$ |
1,783 |
|
|
$ |
1,881 |
|
| PPA effects |
(12) |
|
|
(12) |
|
|
(14) |
|
| Restructuring |
(4) |
|
|
(3) |
|
|
— |
|
| Share-based compensation |
(15) |
|
|
(15) |
|
|
(13) |
|
| Other incidentals |
(10) |
|
|
(5) |
|
|
(18) |
|
| Non-GAAP gross profit |
$ |
1,833 |
|
|
$ |
1,818 |
|
|
$ |
1,926 |
|
| GAAP Gross Margin |
57.3 |
% |
|
57.0 |
% |
|
57.0 |
% |
| Non-GAAP Gross Margin |
58.6 |
% |
|
58.2 |
% |
|
58.4 |
% |
| GAAP research and development |
$ |
(594) |
|
|
$ |
(564) |
|
|
$ |
(589) |
|
| Restructuring |
(4) |
|
|
(3) |
|
|
— |
|
| Share-based compensation |
(58) |
|
|
(58) |
|
|
(51) |
|
| Other incidentals |
— |
|
|
(1) |
|
|
(1) |
|
| Non-GAAP research and development |
$ |
(532) |
|
|
$ |
(502) |
|
|
$ |
(537) |
|
| GAAP selling, general and administrative |
$ |
(270) |
|
|
$ |
(306) |
|
|
$ |
(274) |
|
| PPA effects |
(1) |
|
|
— |
|
|
— |
|
| Restructuring |
2 |
|
|
(1) |
|
|
— |
|
| Share-based compensation |
(41) |
|
|
(42) |
|
|
(38) |
|
| Other incidentals |
(2) |
|
|
(29) |
|
|
(2) |
|
| Non-GAAP selling, general and administrative |
$ |
(228) |
|
|
$ |
(234) |
|
|
$ |
(234) |
|
| GAAP operating income (loss) |
$ |
896 |
|
|
$ |
856 |
|
|
$ |
937 |
|
|
|
|
|
|
|
|
|
|
|
|
|
|
|
|
|
|
|
|
|
|
|
|
|
|
|
|
|
|
|
|
|
|
|
|
|
|
|
|
|
|
|
|
|
|
|
|
|
|
|
|
|
|
|
|
|
|
|
|
|
| ($ in millions) |
For the three months ended |
|
June 30, 2024 |
|
March 31, 2024 |
|
July 2, 2023 |
| GAAP operating income (loss) |
$ |
896 |
|
|
$ |
856 |
|
|
$ |
937 |
|
| PPA effects |
(41) |
|
|
(63) |
|
|
(95) |
|
| Restructuring |
(6) |
|
|
(7) |
|
|
— |
|
| Share-based compensation |
(114) |
|
|
(115) |
|
|
(102) |
|
| Other incidentals |
(14) |
|
|
(39) |
|
|
(21) |
|
| Non-GAAP operating income (loss) |
$ |
1,071 |
|
|
$ |
1,080 |
|
|
$ |
1,155 |
|
| GAAP Operating Margin |
28.7 |
% |
|
27.4 |
% |
|
28.4 |
% |
| Non-GAAP Operating Margin |
34.3 |
% |
|
34.5 |
% |
|
35.0 |
% |
| GAAP Income tax benefit (provision) |
$ |
(154) |
|
|
$ |
(141) |
|
|
$ |
(158) |
|
| Income tax effect |
15 |
|
|
30 |
|
|
22 |
|
| Non-GAAP Income tax benefit (provision) |
$ |
(169) |
|
|
$ |
(171) |
|
|
$ |
(180) |
|
|
|
|
|
|
|
|
|
|
|
|
|
|
|
|
|
|
|
|
|
|
|
|
|
| ($ in millions) |
For the three months ended |
|
June 30, 2024 |
|
March 31, 2024 |
|
July 2, 2023 |
| Net cash provided by (used for) operating activities |
$ |
761 |
|
|
$ |
851 |
|
|
$ |
756 |
|
| Net capital expenditures on property, plant and equipment |
(184) |
|
|
(224) |
|
|
(200) |
|
| Non-GAAP free cash flow |
$ |
577 |
|
|
$ |
627 |
|
|
$ |
556 |
|
|
|
|
|
|
|
|
|
|
|
|
|
|
|
|
|
|
|
|
|
|
|
|
|
| ($ in millions) |
For the three months ended |
|
June 30, 2024 |
|
March 31, 2024 |
|
July 2, 2023 |
| Long-term debt |
$ |
9,681 |
|
|
$ |
10,178 |
|
|
$ |
10,171 |
|
| Short-term debt |
499 |
|
|
— |
|
|
999 |
|
| Total debt |
10,180 |
|
|
10,178 |
|
|
11,170 |
|
| Less: cash and cash equivalents |
(2,859) |
|
|
(2,908) |
|
|
(3,863) |
|
| Less: short-term deposits |
(400) |
|
|
(400) |
|
|
— |
|
| Net debt |
$ |
6,921 |
|
|
$ |
6,870 |
|
|
$ |
7,307 |
|
|
|
|
|
|
|
Item 3. Quantitative and Qualitative Disclosures About Market Risk
There have been no material changes to the Company’s market risk during the first six months of 2024. For a discussion of the Company’s exposure to market risk, refer to the Company’s market risk disclosures set forth in Part II, Item 7A, “Quantitative and Qualitative Disclosures About Market Risk” in our Annual Report on Form 10-K for the year ended December 31, 2023.
Item 4. Controls and Procedures
Evaluation of Disclosure Controls and Procedures
Our management, with the participation of the Chief Executive Officer and Chief Financial Officer (Certifying Officers), evaluated the effectiveness of the Company's disclosure controls and procedures (as defined in Rules 13a-15(e) or 15d-15(e) promulgated under the Securities Exchange Act of 1934, as amended) on June 30, 2024. Based on that evaluation, the Certifying Officers concluded the Company's disclosure controls and procedures were effective as of June 30, 2024.
Changes in Internal Control Over Financial Reporting
There were no changes in the Company's internal control over financial reporting during the three-month period ended June 30, 2024, which were identified in connection with management's evaluation required by paragraph (d) of Rules 13a-15 and 15d-15 under the Exchange Act that have materially affected, or are reasonably likely to materially affect, our internal control over financial reporting.
PART II — OTHER INFORMATION
Item 1. Legal Proceedings
Not applicable.
Item 1A. Risk Factors
There have been no material changes from the risk factors previously disclosed in our Annual Report on Form 10-K for the year ended December 31, 2023.
Item 2. Unregistered Sales of Equity Securities and Use of Proceeds
Purchases of Equity Securities by the Issuer and Affiliated Purchasers
Our Board has approved the purchase of shares from participants in NXP's equity programs to satisfy participants' tax withholding obligations and this authorization will remain in effect until terminated by the Board. In January 2022, the Board approved the repurchase of shares up to a maximum of $2 billion (the "2022 Share Repurchase Program"). Per June 30, 2024, there was approximately $0.9 billion remaining for the repurchase of shares under the 2022 Share Repurchase Program.
The following share repurchase activity occurred under these programs during the three months ended June 30, 2024:
|
|
|
|
|
|
|
|
|
|
|
|
|
|
|
|
|
|
|
|
|
|
|
|
|
|
|
|
|
|
Period |
Total Number
of Shares
Purchased
|
|
Average Price
Paid per Share |
|
Number of Shares Purchased as Part of Publicly Announced Buy Back Programs |
|
Maximum Number of
Shares That May
Yet Be Purchased
Under the Buy Back Program |
|
Number of Shares Purchased as Trade for Tax (1) |
April 1, 2024 – May 5, 2024 |
521,300 |
|
$239.14 |
|
511,174 |
|
4,321,633 |
|
10,126 |
May 6, 2024 – June 2, 2024 |
369,319 |
|
$269.04 |
|
340,941 |
|
3,758,375 |
|
28,378 |
June 3, 2024 – June 30, 2024 |
317,776 |
|
$271.32 |
|
317,757 |
|
3,480,018 |
|
19 |
Total |
1,208,395 |
|
|
|
1,169,872 |
|
|
|
38,523 |
(1) Reflects shares surrendered by participants to satisfy tax withholding obligations in connection with the Company's equity programs.
Item 5. Other Information
Rule 10b5-1 Trading Plans
On June 6, 2024, Jennifer Wuamett, Executive Vice President, General Counsel, Corporate Secretary and Chief Sustainability Officer of the Company, entered into a Rule 10b5-1 Trading Plan (the “Plan”), pursuant to which a maximum amount of 16,553 common shares of the Company may be sold under the Plan from September 17, 2024 through July 25, 2025. The Plan terminates on the earlier of: (i) July 25, 2025, (ii) the first date on which all trades set forth in the Plan have been executed, or (iii) such date the Plan is otherwise terminated according to its terms.
Other
To date, we have experienced no negative impact to our IT systems related to the CrowdStrike software update.
Item 6. Exhibits
|
|
|
|
|
|
|
|
|
|
|
|
|
|
|
|
Exhibit
Number
|
|
Exhibit Description |
|
|
| 3.1 |
|
|
|
|
31.1* |
|
Rule 13a-14(a) / 15d-14(a) Certification of Chief Executive Officer |
|
|
31.2* |
|
Rule 13a-14(a) / 15d-14(a) Certification of Chief Financial Officer |
|
|
32.1* |
|
Section 1350 Certifications of Chief Executive Officer and Chief Financial Officer |
|
|
| 101 |
|
The following materials from the Company’s Quarterly Report on Form 10-Q for the quarter ended June 30, 2024, formatted in iXBRL (Inline eXtensible Business Reporting Language): (i) Condensed Consolidated Statements of Operations for the three and six months ended June 30, 2024 and July 2, 2023; (ii) Condensed Consolidated Statements of Comprehensive Income for the three and six months ended June 30, 2024 and July 2, 2023; (iii) Condensed Consolidated Balance Sheets as of June 30, 2024 and December 31, 2023; (iv) Condensed Consolidated Statements of Cash Flows for the six months ended June 30, 2024 and July 2, 2023; (v) Condensed Consolidated Statements of Changes in Equity for the three and six months ended June 30, 2024 and July 2, 2023; and (vi) Notes to the Unaudited Condensed Consolidated Financial Statements. |
|
|
| 104 |
|
Cover Page Interactive Data File (formatted as Inline XBRL and contained in Exhibit 101). |
|
|
|
|
|
|
|
|
| * |
Filed or furnished herewith. |
| + |
Indicates management contract or compensatory plan or arrangement. |
|
|
SIGNATURE
Pursuant to the requirements of the Securities Exchange Act of 1934, the registrant has duly caused this report to be signed on its behalf by the undersigned, thereunto duly authorized.
Date: July 23, 2024
|
|
|
|
|
|
| NXP Semiconductors N.V. |
|
|
/s/ William J. Betz |
| Name: William J. Betz, CFO |
|
Exhibit 31.1
CERTIFICATION
I, Kurt Sievers, certify that:
1.I have reviewed this quarterly report on Form 10-Q of NXP Semiconductors N.V.;
2.Based on my knowledge, this report does not contain any untrue statement of a material fact or omit to state a material fact necessary to make the statements made, in light of the circumstances under which such statements were made, not misleading with respect to the period covered by this report;
3.Based on my knowledge, the financial statements, and other financial information included in this report, fairly present in all material respects the financial condition, results of operations and cash flows of the Registrant as of, and for, the periods presented in this report;
4.The Registrant’s other certifying officer and I are responsible for establishing and maintaining disclosure controls and procedures (as defined in Exchange Act Rules 13a-15(e) and 15d-15(e)) and internal control over financial reporting (as defined in Exchange Act Rules 13a-15(f) and 15d-15(f)) for the Registrant and have:
a)Designed such disclosure controls and procedures, or caused such disclosure controls and procedures to be designed under our supervision, to ensure that material information relating to the Registrant, including its consolidated subsidiaries, is made known to us by others within those entities, particularly during the period in which this report is being prepared;
b)Designed such internal control over financial reporting, or caused such internal control over financial reporting to be designed under our supervision, to provide reasonable assurance regarding the reliability of financial reporting and the preparation of financial statements for external purposes in accordance with generally accepted accounting principles;
c)Evaluated the effectiveness of the Registrant’s disclosure controls and procedures and presented in this report our conclusions about the effectiveness of the disclosure controls and procedures, as of the end of the period covered by this report based on such evaluation; and
d)Disclosed in this report any change in the Registrant’s internal control over financial reporting that occurred during the Registrant’s most recent fiscal quarter (the Registrant’s fourth fiscal quarter in the case of an annual report) that has materially affected, or is reasonably likely to materially affect, the Registrant’s internal control over financial reporting; and
5.The Registrant’s other certifying officer and I have disclosed, based on our most recent evaluation of internal control over financial reporting, to the Registrant’s auditors and the audit committee of the Registrant’s board of directors (or persons performing the equivalent functions):
a)All significant deficiencies and material weaknesses in the design or operation of internal control over financial reporting which are reasonably likely to adversely affect the Registrant’s ability to record, process, summarize, and report financial information; and
b)Any fraud, whether or not material, that involves management or other employees who have a significant role in the Registrant’s internal control over financial reporting.
Date: July 23, 2024
|
|
|
|
|
|
|
|
|
| By: |
|
/s/ Kurt Sievers |
|
|
Kurt Sievers |
|
|
President & Chief Executive Officer |
Exhibit 31.2
CERTIFICATION
I, William J. Betz, certify that:
1.I have reviewed this quarterly report on Form 10-Q of NXP Semiconductors N.V.;
2.Based on my knowledge, this report does not contain any untrue statement of a material fact or omit to state a material fact necessary to make the statements made, in light of the circumstances under which such statements were made, not misleading with respect to the period covered by this report;
3.Based on my knowledge, the financial statements, and other financial information included in this report, fairly present in all material respects the financial condition, results of operations and cash flows of the Registrant as of, and for, the periods presented in this report;
4.The Registrant’s other certifying officer and I are responsible for establishing and maintaining disclosure controls and procedures (as defined in Exchange Act Rules 13a-15(e) and 15d-15(e)) and internal control over financial reporting (as defined in Exchange Act Rules 13a-15(f) and 15d-15(f)) for the Registrant and have:
a)Designed such disclosure controls and procedures, or caused such disclosure controls and procedures to be designed under our supervision, to ensure that material information relating to the Registrant, including its consolidated subsidiaries, is made known to us by others within those entities, particularly during the period in which this report is being prepared;
b)Designed such internal control over financial reporting, or caused such internal control over financial reporting to be designed under our supervision, to provide reasonable assurance regarding the reliability of financial reporting and the preparation of financial statements for external purposes in accordance with generally accepted accounting principles;
c)Evaluated the effectiveness of the Registrant’s disclosure controls and procedures and presented in this report our conclusions about the effectiveness of the disclosure controls and procedures, as of the end of the period covered by this report based on such evaluation; and
d)Disclosed in this report any change in the Registrant’s internal control over financial reporting that occurred during the Registrant’s most recent fiscal quarter (the Registrant’s fourth fiscal quarter in the case of an annual report) that has materially affected, or is reasonably likely to materially affect, the Registrant’s internal control over financial reporting; and
5.The Registrant’s other certifying officer and I have disclosed, based on our most recent evaluation of internal control over financial reporting, to the Registrant’s auditors and the audit committee of the Registrant’s board of directors (or persons performing the equivalent functions):
a)All significant deficiencies and material weaknesses in the design or operation of internal control over financial reporting which are reasonably likely to adversely affect the Registrant’s ability to record, process, summarize, and report financial information; and
b)Any fraud, whether or not material, that involves management or other employees who have a significant role in the Registrant’s internal control over financial reporting.
Date: July 23, 2024
|
|
|
|
|
|
|
|
|
| By: |
|
/s/ William J. Betz |
|
|
William J. Betz |
|
|
Chief Financial Officer |
Exhibit 32.1
CERTIFICATIONS OF CHIEF EXECUTIVE OFFICER AND CHIEF FINANCIAL OFFICER
PURSUANT TO
18 U.S.C. SECTION 1350,
AS ADOPTED PURSUANT TO
SECTION 906 OF THE SARBANES-OXLEY ACT OF 2002
I, Kurt Sievers, certify, as of the date hereof, pursuant to 18 U.S.C. Section 1350, as adopted pursuant to Section 906 of the Sarbanes-Oxley Act of 2002, that the Quarterly Report of NXP Semiconductors N.V. on Form 10-Q for the period ended June 30, 2024 fully complies with the requirements of Section 13(a) or 15(d) of the Securities Exchange Act of 1934 and that information contained in such Form 10-Q fairly presents in all material respects the financial condition and results of operations of NXP Semiconductors N.V. at the dates and for the periods indicated.
Date: July 23, 2024
|
|
|
|
|
|
|
|
|
| By: |
|
/s/ Kurt Sievers |
|
|
Kurt Sievers |
|
|
President & Chief Executive Officer |
I, William J. Betz, certify, as of the date hereof, pursuant to 18 U.S.C. Section 1350, as adopted pursuant to Section 906 of the Sarbanes-Oxley Act of 2002, that the Quarterly Report of NXP Semiconductors N.V. on Form 10-Q for the period ended June 30, 2024 fully complies with the requirements of Section 13(a) or 15(d) of the Securities Exchange Act of 1934 and that information contained in such Form 10-Q fairly presents in all material respects the financial condition and results of operations of NXP Semiconductors N.V. at the dates and for the periods indicated.
Date: July 23, 2024
|
|
|
|
|
|
|
|
|
| By: |
|
/s/ William J. Betz |
|
|
William J. Betz |
|
|
Chief Financial Officer |