株探米国株
日本語 英語
エドガーで原本を確認する
false000141240800014124082024-09-042024-09-04

UNITED STATES
SECURITIES AND EXCHANGE COMMISSION
Washington, D.C. 20549
___________________________________
FORM 8-K
___________________________________
CURRENT REPORT
Pursuant to Section 13 or 15(d)
of the Securities Exchange Act of 1934
Date of Report (date of earliest event reported)
September 4, 2024
___________________________________
Phreesia, Inc.
(Exact name of registrant as specified in its charter)
___________________________________
Delaware
(State or other jurisdiction of incorporation or organization)
001-38977
(Commission File Number)
20-2275479
(I.R.S. Employer Identification Number)
1521 Concord Pike, Suite 301 PMB 221
Wilmington, Delaware 19803
(Address of principal executive offices and zip code)

(888) 654-7473
(Registrant's telephone number, including area code)
___________________________________
Check the appropriate box below if the Form 8-K filing is intended to simultaneously satisfy the filing obligation of the registrant under any of the following provisions:
☐    Written communications pursuant to Rule 425 under the Securities Act (17 CFR 230.425)
☐    Soliciting material pursuant to Rule 14a-12 under the Exchange Act (17 CFR 240.14a-12)
☐    Pre-commencement communications pursuant to Rule 14d-2(b) under the Exchange Act (17 CFR 240.14d-2(b))
☐    Pre-commencement communications pursuant to Rule 13e-4(c) under the Exchange Act (17 CFR 240.13e-4(c))
Securities registered pursuant to Section 12(b) of the Act:
Title of each class Trading symbol(s) Name of each exchange on which registered
Common Stock, par value $0.01 per share PHR The New York Stock Exchange
Indicate by check mark whether the registrant is an emerging growth company as defined in Rule 405 of the Securities Act of 1933 (§230.405 of this chapter) or Rule 12b-2 of the Securities Exchange Act of 1934 (§240.12b-2 of this chapter).
Emerging growth company  ☐   
If an emerging growth company, indicate by check mark if the registrant has elected not to use the extended transition period for complying with any new or revised financial accounting standards provided pursuant to Section 13(a) of the Exchange Act. ☐


Item 2.02 Results of Operations and Financial Condition

On September 4, 2024, Phreesia, Inc. (the “Company”) announced its financial results for the fiscal quarter ended July 31, 2024 by issuing a Letter to Stakeholders (the "Letter") and a press release. Copies of the press release and the Letter are furnished as Exhibits 99.1 and 99.2, respectively, to this Current Report on Form 8-K and are incorporated by reference herein.
The information furnished under this Item 2.02 and in the accompanying Exhibit 99.1 and Exhibit 99.2 shall not be deemed “filed” for purposes of Section 18 of the Securities Exchange Act of 1934, as amended (the “Exchange Act”), or incorporated by reference in any filing under the Securities Act of 1933, as amended, or the Exchange Act regardless of any general incorporation language in such filing, unless expressly incorporated by specific reference in such filing.

Item 9.01 Financial Statements and Exhibits
(d) Exhibits.
Exhibit Number Description
104 Cover Page Interactive Data File (embedded within the Inline XBRL document)


SIGNATURE
Pursuant to the requirements of the Securities Exchange Act of 1934, the registrant has duly caused this report to be signed on its behalf by the undersigned hereunto duly authorized.
Date: September 4, 2024 Phreesia, Inc.
By: /s/ Balaji Gandhi
Name: Balaji Gandhi
Title: Chief Financial Officer


EX-99.1 2 phr-ex991q2fy25.htm EX-99.1 Document

Exhibit 99.1
Phreesia Announces Second Quarter Fiscal 2025 Results
ALL-REMOTE COMPANY/WILMINGTON, DE, September 4, 2024 – Phreesia, Inc. (NYSE: PHR) (“Phreesia” or the "Company") announced financial results today for the fiscal second quarter ended July 31, 2024.
"We reached another very important milestone in Phreesia’s evolution by crossing over to positive Free cash flow1 in the fiscal second quarter of 2025,” said CEO and Co-Founder Chaim Indig. “We believe this milestone marks the start of a new era for Phreesia in which we are able to deploy internally generated cash to drive stakeholder value.”
Please visit the Phreesia investor relations website at ir.phreesia.com to view the Company's Q2 Fiscal Year 2025 Stakeholder Letter.
Fiscal Second Quarter Ended July 31, 2024 Highlights
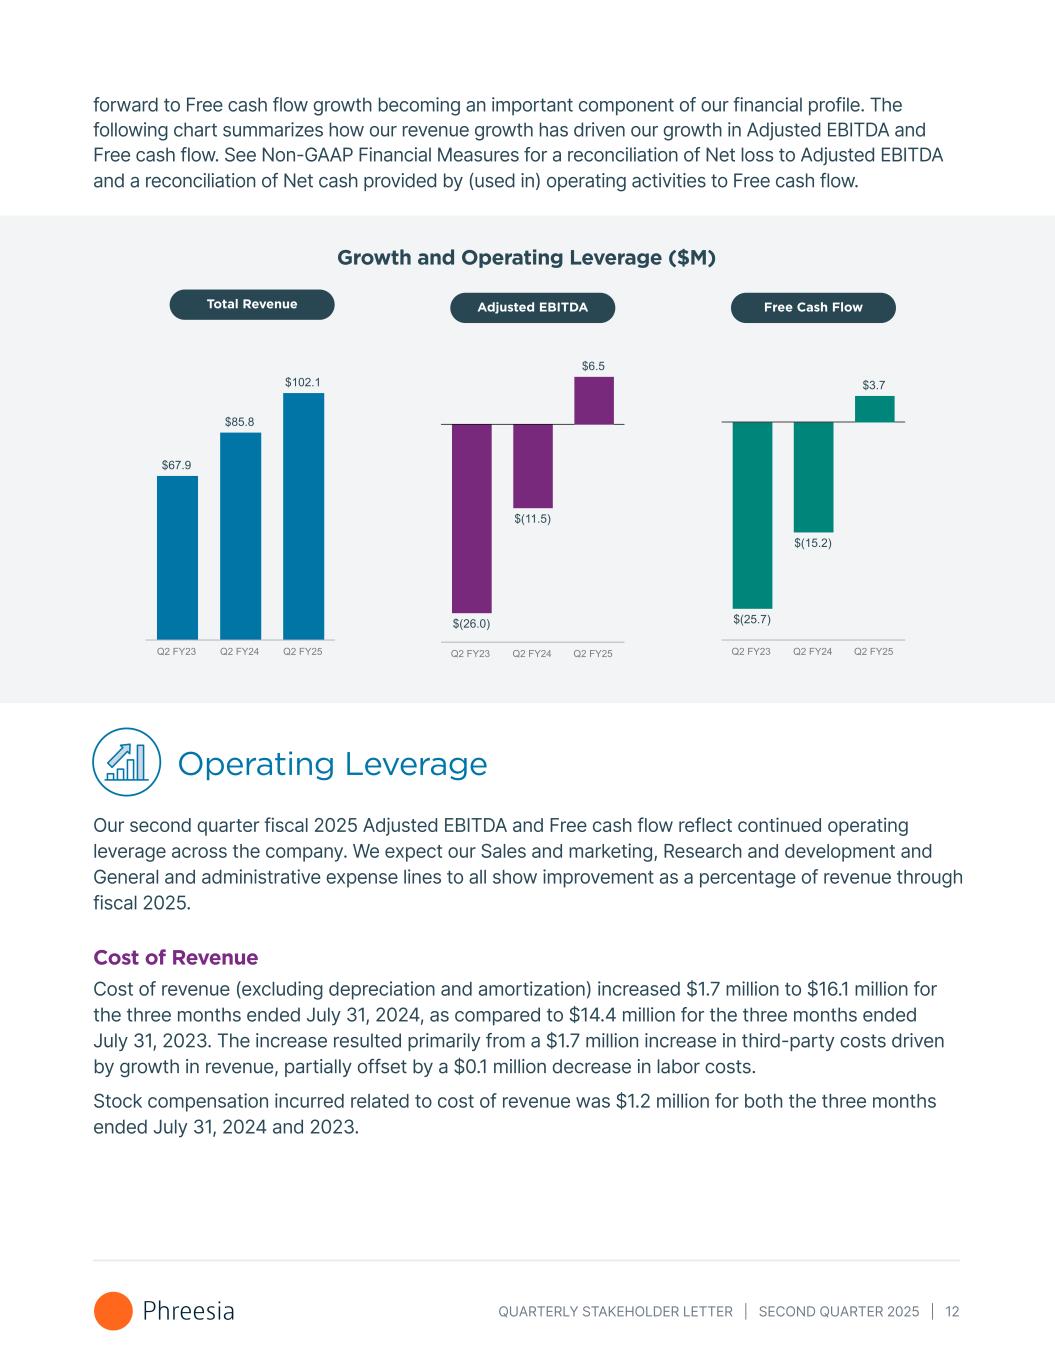
•Total revenue was $102.1 million in the quarter, up 19% year-over-year.
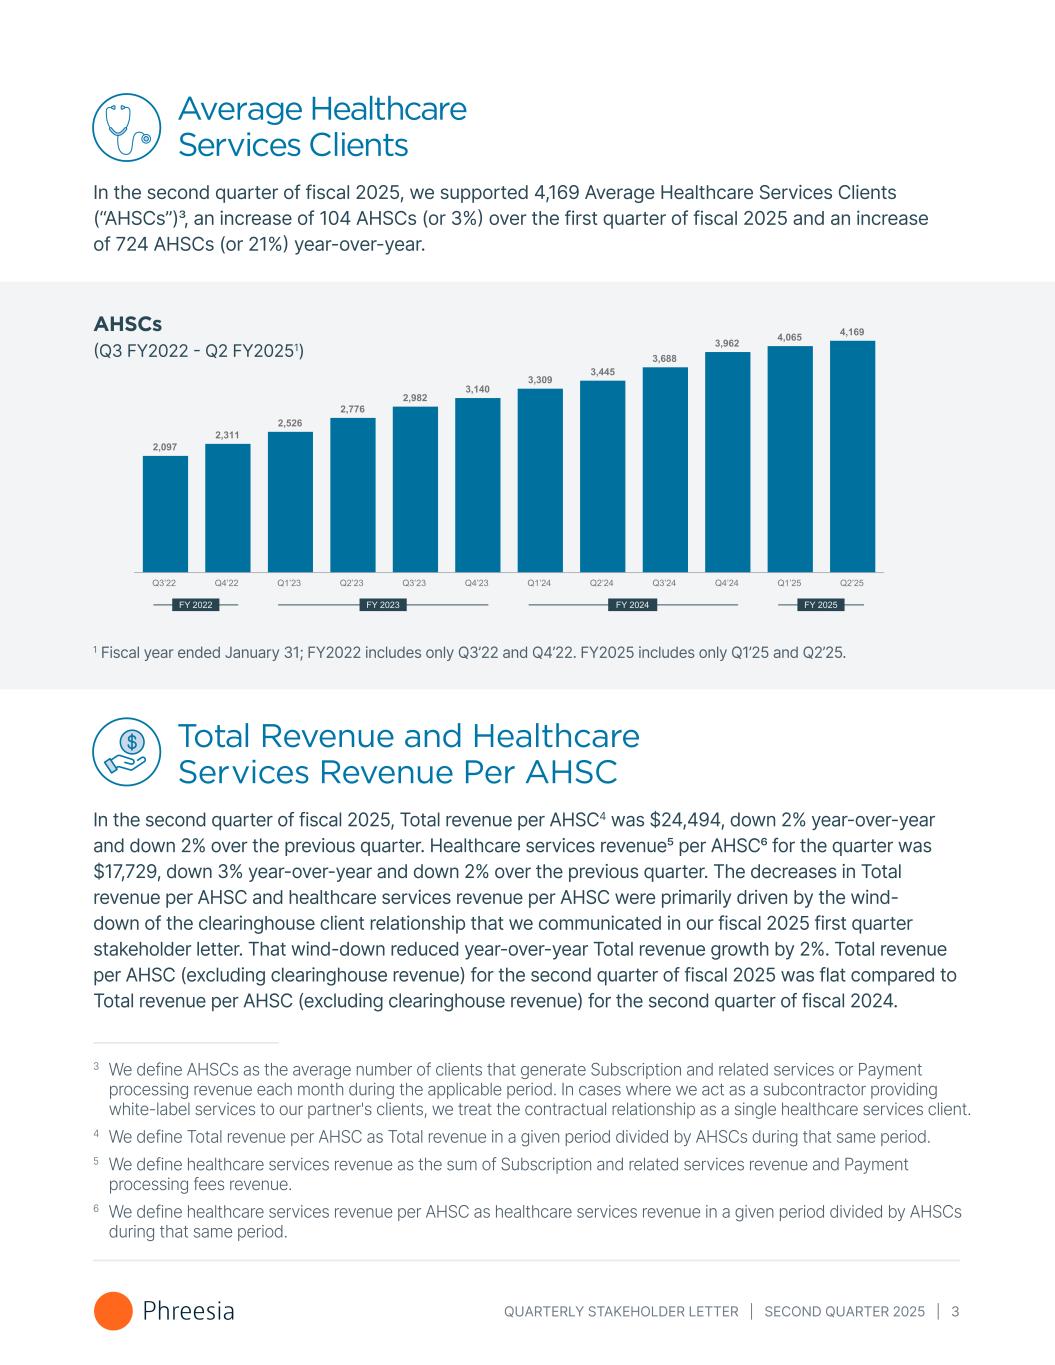
•Average number of healthcare services clients ("AHSCs") was 4,169 in the quarter, up 21% year-over-year.
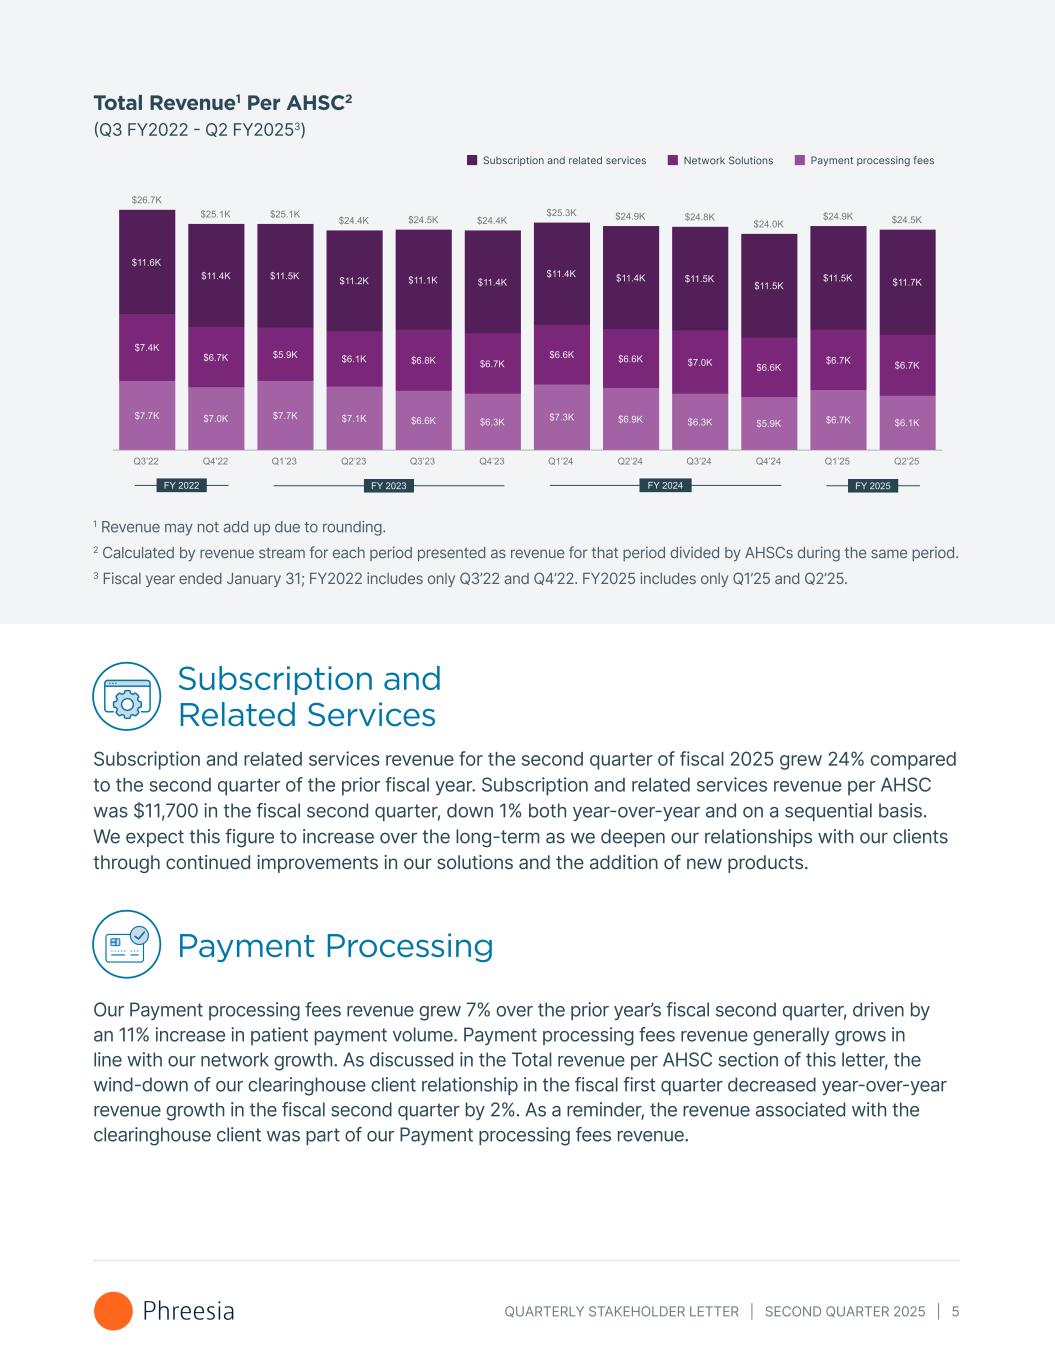
•Total revenue per AHSC was $24,494 in the quarter, down 2% year-over-year. See "Key Metrics" below for additional information.
•Healthcare services revenue per AHSC was $17,729 in the quarter, down 3% year-over-year. See "Key Metrics" below for additional information.
•Net loss was $18.0 million in the quarter compared to net loss of $36.8 million in the same period in the prior year.
•Adjusted EBITDA was $6.5 million in the quarter compared to negative $11.5 million in the same period in the prior year.
•Net cash provided by operating activities was $11.1 million for the three months ended July 31, 2024, as compared to net cash used in operating activities of $9.3 million for the three months ended July 31, 2023.
•Free cash flow was $3.7 million for the three months ended July 31, 2024, as compared to negative $15.2 million for the three months ended July 31, 2023.
•Cash and cash equivalents as of July 31, 2024 was $81.8 million, a decrease of $5.7 million from January 31, 2024 and up $2.3 million from April 30, 2024.
Fiscal Year 2025 and 2026 Outlook
We are maintaining our revenue outlook for fiscal 2025 of $416 million to $426 million, implying year-over-year growth of 17% to 20%.
We are updating our Adjusted EBITDA outlook for fiscal 2025 to a range of $26 million to $31 million from a previous range of $21 million to $26 million. Our outlook reflects our strong performance in the fiscal second quarter and our continued focus on margin improvement.
We expect AHSCs to reach approximately 4,200 for fiscal 2025 compared to 3,601 for fiscal 2024. We expect Total revenue per AHSC to increase in fiscal 2025 compared to the $98,944 we achieved in fiscal 2024.
We expect AHSCs to reach approximately 4,500 in fiscal 2026. Additionally, we expect Total revenue per AHSC in fiscal 2026 to increase from fiscal 2025.
We believe our $81.8 million in cash and cash equivalents as of July 31, 2024, along with cash generated in our normal operations, gives us sufficient flexibility to reach our fiscal 2025 and fiscal 2026 outlook. Additionally, our available borrowing capacity under our credit facility with Capital One provides us with an additional source of capital to pursue future growth opportunities not incorporated into our fiscal 2025 and fiscal 2026 outlook. As of July 31, 2024 we have no borrowings outstanding under our credit facility.
1 During the second quarter of fiscal 2025, our net cash provided by operating activities was $11.1 million and our Free cash flow was $3.7 million. We define Free cash flow as net cash provided by (used in) operating activities less cash paid for capitalized internal-use software development costs and cash paid for purchases of property and equipment. See “Non-GAAP Financial Measures” for a reconciliation of Free cash flow to the closest GAAP measure.


Non-GAAP Financial Measures
We have not reconciled our Adjusted EBITDA outlook to GAAP Net income (loss) because we do not provide an outlook for GAAP Net income (loss) due to the uncertainty and potential variability of Other (income) expense, net and (Benefit from) provision for income taxes, which are reconciling items between Adjusted EBITDA and GAAP Net income (loss). Because we cannot reasonably predict such items, a reconciliation of the non-GAAP financial measure outlook to the corresponding GAAP measure is not available without unreasonable effort. We caution, however, that such items could have a significant impact on the calculation of GAAP Net income (loss). For further information regarding the non-GAAP financial measures included in this press release, including a reconciliation of GAAP to non-GAAP financial measures and an explanation of these measures, please see “Non-GAAP financial measures” below.
Available Information
We intend to use our Company website (including our Investor Relations website) as well as our Facebook, X, LinkedIn and Instagram accounts as a means of disclosing material non-public information and for complying with our disclosure obligations under Regulation FD.
Forward Looking Statements
This press release includes express or implied statements that are not historical facts and are considered forward-looking within the meaning of Section 27A of the Securities Act of 1933, as amended and Section 21E of the Securities Exchange Act of 1934, as amended. Forward-looking statements generally relate to future events or our future financial or operating performance and may contain projections of our future results of operations or of our financial information or state other forward-looking information. These statements include, but are not limited to, statements regarding: our future financial and operating performance, including our revenue, margins, Adjusted EBITDA, cash flows and profitability2; our ability to finance our plans to achieve our fiscal 2025 and fiscal 2026 outlook with our current cash balance and cash generated in the normal course of business; and our outlook for fiscal 2025 and fiscal 2026, including our expectations on AHSCs. In some cases, you can identify forward-looking statements by the following words: “may,” “will,” “could,” “would,” “should,” “expect,” “intend,” “plan,” “anticipate,” “believe,” “estimate,” “predict,” “project,” “potential,” “continue,” “ongoing,” or the negative of these terms or other comparable terminology, although not all forward-looking statements contain these words. Although we believe that the expectations reflected in these forward-looking statements are reasonable, these statements relate to future events or our future operational or financial performance and involve known and unknown risks, uncertainties and other factors that may cause our actual results, performance or achievements to be materially different from any future results, performance or achievements expressed or implied by these forward-looking statements. Furthermore, actual results may differ materially from those described in the forward-looking statements and will be affected by a variety of risks and factors that are beyond our control, including, without limitation, risks associated with: our ability to effectively manage our growth and meet our growth objectives; our focus on the long-term and our investments in growth; the competitive environment in which we operate; our ability to comply with the covenants in our credit agreement with Capital One; changes in market conditions and receptivity to our products and services; our ability to develop and release new products and services and successful enhancements, features and modifications to our existing products and services; our ability to maintain the security and availability of our platform; the impact of cyberattacks, security incidents or breaches impacting our business; changes in laws and regulations applicable to our business model; our ability to make accurate predictions about our industry and addressable market; our ability to attract, retain and cross-sell to healthcare services clients; our ability to continue to operate effectively with a primarily remote workforce and attract and retain key talent; our ability to realize the intended benefits of our acquisitions and partnerships; and difficulties in integrating our acquisitions and investments; and the recent high inflationary environment and other general, market, political, economic and business conditions (including as a result of the warfare and/or political and economic instability in Ukraine, the Middle East or elsewhere). The forward-looking statements contained in this press release are also subject to other risks and uncertainties, including those listed or described in our filings with the Securities and Exchange Commission (“SEC”), including in our Quarterly Report on Form 10-Q for the fiscal quarter ended July 31, 2024 that will be filed with the SEC following this press release. The forward-looking statements in this press release speak only as of the date on which the statements are made. We undertake no obligation to update, and expressly disclaim the obligation to update, any forward-looking statements made in this press release to reflect events or circumstances after the date of this press release or to reflect new information or the occurrence of unanticipated events, except as required by law.
2 We define “profitability,” discussed herein, in terms of Adjusted EBITDA. See ‘Non-GAAP Financial Measures’ for a reconciliation of our Net loss to Adjusted EBITDA.


This press release includes certain non-GAAP financial measures as defined by SEC rules. We have provided a reconciliation of those measures to the most directly comparable GAAP measures, with the exception of our Adjusted EBITDA outlook for the reasons described above.
Conference Call Information
We will hold a conference call on Wednesday September 4, 2024 at 5:00 p.m. Eastern Time to review our fiscal 2025 second quarter financial results. To participate in our live conference call and webcast, please dial (800) 715-9871 (or (646) 307-1963 for international participants) using conference code number 7404611 or visit the “Events & Presentations” section of our Investor Relations website at ir.phreesia.com. A replay of the call will be available via webcast for on-demand listening shortly after the completion of the call, at the same web link, and will remain available for approximately 90 days.
About Phreesia
Phreesia is a trusted leader in patient activation, giving providers, life sciences companies, payers and other organizations tools to help patients take a more active role in their care. Founded in 2005, Phreesia enabled approximately 150 million patient visits in 2023—more than 1 in 10 visits across the U.S.—scale that we believe allows us to make meaningful impact. Offering patient-driven digital solutions for intake, outreach, education and more, Phreesia enhances the patient experience, drives efficiency and improves healthcare outcomes.

Investor Relations Contact:
Balaji Gandhi
Phreesia, Inc.
investors@phreesia.com
(929) 506-4950

Media Contact:
Nicole Gist
Phreesia, Inc.
nicole.gist@phreesia.com
(407) 760-6274


Phreesia, Inc.
Consolidated Balance Sheets
(in thousands, except share and per share data)
July 31, 2024 January 31, 2024
(Unaudited)
Assets
Current:
Cash and cash equivalents $ 81,798  $ 87,520 
Settlement assets 25,320  28,072 
Accounts receivable, net of allowance for doubtful accounts of $1,365 and $1,392 as of July 31, 2024 and January 31, 2024, respectively 61,274  64,863 
Deferred contract acquisition costs 841  768 
Prepaid expenses and other current assets 11,695  14,461 
Total current assets 180,928  195,684 
Property and equipment, net of accumulated depreciation and amortization of $84,295 and $76,859 as of July 31, 2024 and January 31, 2024, respectively 20,955  16,902 
Capitalized internal-use software, net of accumulated amortization of $50,559 and $45,769 as of July 31, 2024 and January 31, 2024, respectively 49,767  46,139 
Operating lease right-of-use assets 1,863  266 
Deferred contract acquisition costs 742  986 
Intangible assets, net of accumulated amortization of $6,666 and $4,925 as of July 31, 2024 and January 31, 2024, respectively 29,884  31,625 
Goodwill 75,845  75,845 
Other assets 2,251  2,879 
Total Assets $ 362,235  $ 370,326 
Liabilities and Stockholders’ Equity
Current:
Settlement obligations $ 25,320  $ 28,072 
Current portion of finance lease liabilities and other debt 7,161  6,056 
Current portion of operating lease liabilities 989  393 
Accounts payable 6,976  8,480 
Accrued expenses 32,668  37,130 
Deferred revenue 21,370  24,113 
Other current liabilities 7,515  5,875 
Total current liabilities 101,999  110,119 
Long-term finance lease liabilities and other debt 7,297  5,400 
Operating lease liabilities, non-current 1,075  134 
Long-term deferred revenue 63  97 
Long-term deferred tax liabilities 390  270 
Other long-term liabilities 76  2,857 
Total Liabilities 110,900  118,877 
Commitments and contingencies
Stockholders’ Equity:
Preferred stock, undesignated, $0.01 par value—$20,000,000 shares authorized as of both July 31, 2024 and January 31, 2024; no shares issued or outstanding as of both July 31, 2024 and January 31, 2024 —  — 
Common stock, $0.01 par value - 500,000,000 shares authorized as of both July 31, 2024 and January 31, 2024; 59,057,170 and 57,709,762 shares issued as of July 31, 2024 and January 31, 2024, respectively 591  577 
Additional paid-in capital 1,076,969  1,039,361 
Accumulated deficit (780,703) (742,969)
Accumulated other comprehensive loss (2) — 
Treasury stock, at cost, 1,355,169 shares as of both July 31, 2024 and January 31, 2024 (45,520) (45,520)
Total Stockholders’ Equity 251,335  251,449 
Total Liabilities and Stockholders’ Equity $ 362,235  $ 370,326 


Phreesia, Inc.
Consolidated Statements of Operations
(Unaudited)
(in thousands, except share and per share data)
 
Three months ended
July 31,
Six months ended
July 31,
2024 2023 2024 2023
Revenue:
Subscription and related services $ 48,612  $ 39,301  $ 95,354  $ 77,188 
Payment processing fees 25,300  23,631  52,360  47,884 
Network solutions 28,203  22,898  55,618  44,603 
Total revenues 102,115  85,830  203,332  169,675 
Expenses:
Cost of revenue (excluding depreciation and amortization) 16,143  14,449  31,866  29,356 
Payment processing expense 16,668  15,852  34,965  31,942 
Sales and marketing 30,184  37,244  62,195  74,657 
Research and development 29,542  27,471  58,423  53,940 
General and administrative 19,497  20,988  38,549  40,865 
Depreciation 3,921  4,244  7,445  8,748 
Amortization 3,382  2,537  6,531  5,023 
Total expenses 119,337  122,785  239,974  244,531 
Operating loss (17,222) (36,955) (36,642) (74,856)
Other (expense) income, net (86) 50  (117)
Interest income, net 46  786  285  1,504 
Total other (expense) income, net (40) 836  168  1,512 
Loss before provision for income taxes (17,262) (36,119) (36,474) (73,344)
Provision for income taxes (750) (648) (1,260) (954)
Net loss $ (18,012) $ (36,767) $ (37,734) $ (74,298)
Net loss per share attributable to common stockholders, basic and diluted $ (0.31) $ (0.68) $ (0.66) $ (1.39)
Weighted-average common shares outstanding, basic and diluted 57,502,959  53,794,060  57,089,232  53,574,584 
(1) Our potential dilutive securities have been excluded from the computation of diluted net loss per share as the effect would be to reduce the net loss per share. Therefore, the weighted-average number of common shares outstanding used to calculate both basic and diluted net loss per share attributable to common stockholders is the same.


Phreesia, Inc.
Consolidated Statements of Comprehensive Loss
(Unaudited)
(in thousands)
 
Three months ended
July 31,
Six months ended
July 31,
2024 2023 2024 2023
Net loss $ (18,012) $ (36,767) $ (37,734) $ (74,298)
Other comprehensive loss, net of tax:
Change in foreign currency translation adjustments, net of tax (3) —  (2) — 
Other comprehensive loss, net of tax (3) —  (2) — 
Comprehensive loss $ (18,015) $ (36,767) $ (37,736) $ (74,298)


Phreesia, Inc.
Consolidated Statements of Cash Flows
(Unaudited)
(in thousands)
  Three months ended
July 31,
Six months ended
July 31,
  2024 2023 2024 2023
Operating activities:
Net loss $ (18,012) $ (36,767) $ (37,734) $ (74,298)
Adjustments to reconcile net loss to net cash provided by (used in) operating activities:
Depreciation and amortization 7,303  6,781  13,976  13,771 
Stock-based compensation expense 16,448  18,648  33,288  35,786 
Amortization of deferred financing costs and debt discount 51  84  112  169 
Cost of Phreesia hardware purchased by customers 334  234  677  650 
Deferred contract acquisition costs amortization 192  280  384  620 
Non-cash operating lease expense 188  109  361  342 
Deferred taxes 56  (75) 119  142 
Changes in operating assets and liabilities:
Accounts receivable 4,976  (832) 3,583  (2,370)
Prepaid expenses and other assets 2,867  (383) 3,281  769 
Deferred contract acquisition costs (213) —  (213) — 
Accounts payable 1,186  568  (1,750) (2,415)
Accrued expenses and other liabilities (1,392) 4,239  (2,547) 6,061 
Lease liabilities (201) (405) (420) (652)
Deferred revenue (2,722) (1,812) (2,777) (1,565)
Net cash provided by (used in) operating activities 11,061  (9,331) 10,340  (22,990)
Investing activities:
Acquisitions, net of cash acquired —  (3,873) —  (3,873)
Capitalized internal-use software (2,976) (5,088) (7,546) (9,820)
Purchases of property and equipment (4,427) (755) (5,303) (2,102)
Net cash used in investing activities (7,403) (9,716) (12,849) (15,795)
Financing activities:
Proceeds from issuance of common stock upon exercise of stock options 219  426  566  675 
Treasury stock to satisfy tax withholdings on stock compensation awards —  (3,775) —  (10,725)
Proceeds from employee stock purchase plan 690  896  1,603  1,863 
Finance lease payments (1,995) (1,983) (3,275) (3,427)
Constructive financing —  1,688  —  1,688 
Principal payments on financing agreements (295) (45) (584) (45)
Debt issuance costs and loan facility fee payments —  (250) (152) (250)
Financing payments of acquisition-related liabilities —  —  (1,364) — 
Net cash used in financing activities (1,381) (3,043) (3,206) (10,221)
Effect of exchange rate changes on cash and cash equivalents (6) —  (7) — 
Net increase (decrease) in cash and cash equivalents 2,271  (22,090) (5,722) (49,006)
Cash and cash equivalents – beginning of period 79,527  149,767  87,520  176,683 
Cash and cash equivalents – end of period $ 81,798  $ 127,677  $ 81,798  $ 127,677 


Supplemental information of non-cash investing and financing information:
Right of use assets acquired in exchange for operating lease liabilities $ 1,194  $ —  $ 1,958  $ — 
Property and equipment acquisitions through finance leases $ 333  $ —  $ 6,862  $ 7,067 
Purchase of property and equipment and capitalized software included in current liabilities $ 1,517  $ 1,509  $ 1,517  $ 1,509 
Capitalized stock-based compensation $ 315  $ 377  $ 663  $ 714 
Issuance of stock to settle liabilities for stock-based compensation $ 1,649  $ 1,924  $ 7,826  $ 7,221 
Issuance of stock as consideration in business combinations $ —  $ 4,676  $ —  $ 4,676 
Issuance of liabilities as consideration in business combinations $ —  $ 91  $ —  $ 91 
Capitalized software acquired through vendor financing $ —  $ 2,047  $ —  $ 2,047 
Cash paid for:
Interest $ 381  $ 296  $ 864  $ 354 
Income taxes $ 417  $ 13  $ 2,010  $ 53 

Non-GAAP Financial Measures
This press release and statements made during the above-referenced webcast may include certain non-GAAP financial measures as defined by SEC rules.
Adjusted EBITDA is a supplemental measure of our performance that is not required by, or presented in accordance with, GAAP. Adjusted EBITDA is not a measurement of our financial performance under GAAP and should not be considered as an alternative to net income or loss or any other performance measure derived in accordance with GAAP, or as an alternative to cash flows from operating activities as a measure of our liquidity. We define Adjusted EBITDA as net income or loss before interest income, net, provision for income taxes, depreciation and amortization, and before stock-based compensation expense and other expense, net.
We have provided below a reconciliation of Adjusted EBITDA to net loss, the most directly comparable GAAP financial measure. We have presented Adjusted EBITDA in this press release and our Quarterly Report on Form 10-Q to be filed after this press release because it is a key measure used by our management and board of directors to understand and evaluate our core operating performance and trends, to prepare and approve our annual budget, and to develop short and long-term operational plans. In particular, we believe that the exclusion of the amounts eliminated in calculating Adjusted EBITDA can provide a useful measure for period-to-period comparisons of our core business. Accordingly, we believe that Adjusted EBITDA provides useful information to investors and others in understanding and evaluating our operating results in the same manner as our management and board of directors. We have not reconciled our Adjusted EBITDA outlook to GAAP Net income (loss) because we do not provide an outlook for GAAP Net income (loss) due to the uncertainty and potential variability of Other (income) expense, net and (Benefit from) provision for income taxes, which are reconciling items between Adjusted EBITDA and GAAP Net income (loss). Because we cannot reasonably predict such items, a reconciliation of the non-GAAP financial measure outlook to the corresponding GAAP measure is not available without unreasonable effort. We caution, however, that such items could have a significant impact on the calculation of GAAP Net income (loss).
Our use of Adjusted EBITDA has limitations as an analytical tool, and you should not consider it in isolation or as a substitute for analysis of our financial results as reported under GAAP. Some of these limitations are as follows:
•Although depreciation and amortization expense are non-cash charges, the assets being depreciated and amortized may have to be replaced in the future, and Adjusted EBITDA does not reflect cash capital expenditure requirements for such replacements or for new capital expenditure requirements;
•Adjusted EBITDA does not reflect: (1) changes in, or cash requirements for, our working capital needs; (2) the potentially dilutive impact of non-cash stock-based compensation; (3) tax payments that may represent a reduction in cash available to us; or (4) interest income, net; and
•Other companies, including companies in our industry, may calculate Adjusted EBITDA or similarly titled measures differently, which reduces its usefulness as a comparative measure.
Because of these and other limitations, you should consider Adjusted EBITDA along with other GAAP-based financial performance measures, including various cash flow metrics, net loss, and our GAAP financial results. The following table presents a reconciliation of Adjusted EBITDA to net loss for each of the periods indicated:


Phreesia, Inc.
Adjusted EBITDA
(Unaudited)
Three months ended
July 31,
Six months ended
July 31,
(in thousands) 2024 2023 2024 2023
Net loss $ (18,012) $ (36,767) $ (37,734) $ (74,298)
Interest income, net (46) (786) (285) (1,504)
Provision for income taxes 750  648  1,260  954 
Depreciation and amortization 7,303  6,781  13,976  13,771 
Stock-based compensation expense 16,448  18,648  33,288  35,786 
Other expense (income), net 86  (50) 117  (8)
Adjusted EBITDA $ 6,529  $ (11,526) $ 10,622  $ (25,299)
We calculate Free cash flow as Net cash provided by (used in) operating activities less capitalized internal-use software development costs and purchases of property and equipment.
Additionally, Free cash flow is a supplemental measure of our performance that is not required by, or presented in accordance with, GAAP. We consider Free cash flow to be a liquidity measure that provides useful information to management and investors about the amount of cash generated by our business that can be used for strategic opportunities, including investing in our business, making strategic investments, partnerships and acquisitions and strengthening our financial position.
The following table presents a reconciliation of Free cash flow from Net cash provided by (used in) operating activities, the most directly comparable GAAP financial measure, for each of the periods indicated:
Phreesia, Inc.
Free cash flow
(Unaudited)
  Three months ended
July 31,
Six months ended
July 31,
(in thousands, unaudited) 2024 2023 2024 2023
Net cash provided by (used in) operating activities $ 11,061  $ (9,331) $ 10,340  $ (22,990)
Less:
Capitalized internal-use software (2,976) (5,088) (7,546) (9,820)
Purchases of property and equipment (4,427) (755) (5,303) (2,102)
Free cash flow $ 3,658  $ (15,174) $ (2,509) $ (34,912)


Phreesia, Inc.
Reconciliation of GAAP and Adjusted Operating Expenses
(Unaudited)
  Three months ended
July 31,
Six months ended
July 31,
(in thousands) 2024 2023 2024 2023
GAAP operating expenses
General and administrative $ 19,497  $ 20,988  $ 38,549  $ 40,865 
Sales and marketing 30,184  37,244  62,195  74,657 
Research and development 29,542  27,471  58,423  53,940 
Cost of revenue (excluding depreciation and amortization) 16,143  14,449  31,866  29,356 
$ 95,366  $ 100,152  $ 191,033  $ 198,818 
Stock compensation included in GAAP operating expenses
General and administrative $ 6,276  $ 5,747  $ 12,485  $ 11,625 
Sales and marketing 5,303  7,111  11,069  13,528 
Research and development 3,629  4,563  7,256  8,441 
Cost of revenue (excluding depreciation and amortization) 1,240  1,227  2,478  2,192 
$ 16,448  $ 18,648  $ 33,288  $ 35,786 
Adjusted operating expenses
General and administrative $ 13,221  $ 15,241  $ 26,064  $ 29,240 
Sales and marketing 24,881  30,133  51,126  61,129 
Research and development 25,913  22,908  51,167  45,499 
Cost of revenue (excluding depreciation and amortization) 14,903  13,222  29,388  27,164 
$ 78,918  $ 81,504  $ 157,745  $ 163,032 
Phreesia, Inc.
Key Metrics
(Unaudited)
Three months ended
July 31,
Six months ended
July 31,
2024 2023 2024 2023
Key Metrics:
Average number of healthcare services clients ("AHSCs") 4,169  3,445  4,117  3,377 
Healthcare services revenue per AHSC $ 17,729  $ 18,268  $ 35,879  $ 37,036 
Total revenue per AHSC $ 24,494  $ 24,914  $ 49,388  $ 50,244 
The definitions of our key metrics are presented below.
•AHSCs. We define AHSCs as the average number of clients that generate subscription and related services or payment processing revenue each month during the applicable period. In cases where we act as a subcontractor providing white-label services to our partner's clients, we treat the contractual relationship as a single healthcare services client. We believe growth in AHSCs is a key indicator of the performance of our business and depends, in part, on our ability to successfully develop and market our solutions to healthcare services organizations that are not yet clients. While growth in AHSCs is an important indicator of expected revenue growth, it also informs our management of the areas of our business that will require further investment to support expected future AHSC growth. For example, as AHSCs increase, we may need to add to our customer support team and invest to maintain effectiveness and performance of our solutions for our healthcare services clients and their patients.
•Healthcare services revenue per AHSC. We define Healthcare services revenue as the sum of subscription and related services revenue and payment processing revenue. We define Healthcare services revenue per AHSC as Healthcare services revenue in a given period divided by AHSCs during that same period. We are focused on continually delivering value to our healthcare services clients and believe that our ability to increase Healthcare services revenue per AHSC is an indicator of the long-term value of our solutions.


•Total revenue per AHSC. We define Total revenue per AHSC as Total revenue in a given period divided by AHSCs during that same period. Our healthcare services clients directly generate subscription and related services and payment processing revenue. Additionally, our relationships with healthcare services clients who subscribe to our solutions give us the opportunity to engage with life sciences companies, health plans and other payer organizations, patient advocacy, public interest and other not-for-profit organizations who deliver direct communication to patients through our solutions. As a result, we believe that our ability to increase Total revenue per AHSC is an indicator of the long-term value of our solutions.

Additional Information
(Unaudited)
Three months ended
July 31,
Six months ended
July 31,
2024 2023 2024 2023
Patient payment volume (in millions) $ 1,093  $ 989  $ 2,259  $ 2,005 
Payment facilitator volume percentage 81  % 82  % 81  % 82  %

•Patient payment volume. We believe that patient payment volume is an indicator of both the underlying health of our healthcare services clients’ businesses and the continuing shift of healthcare costs to patients. We measure patient payment volume as the total dollar volume of transactions between our healthcare services clients and their patients utilizing our payment platform, including via credit and debit cards that we process as a payment facilitator as well as cash and check payments and credit and debit transactions for which we act as a gateway to other payment processors.
•Payment facilitator volume percentage. We define payment facilitator volume percentage as the volume of credit and debit card patient payment volume that we process as a payment facilitator as a percentage of total patient payment volume. Payment facilitator volume is a major driver of our payment processing revenue. Our payment facilitator volume percentage could decline slightly over time should we increase our penetration of enterprise customers that are less likely to use Phreesia as a payment facilitator.

EX-99.2 3 phr-ex992q2fy25stakehold.htm EX-99.2 phr-ex992q2fy25stakehold
Quarterly Stakeholder Letter SECOND QUARTER | FISCAL YEAR 2025


QUARTERLY STAKEHOLDER LETTER | SECOND QUARTER 2025 | 1 1 During the second quarter of fiscal 2025, our cash provided by operating activities was $11.1 million and our Free cash flow was $3.7 million. We calculate Free cash flow as net cash provided by (used in) operating activities less cash paid for capitalized internal-use software development costs and cash paid for purchases of property and equipment. See “Non-GAAP Financial Measures” for a reconciliation of Free cash flow to the closest GAAP measure. SEPTEMBER 4, 2024 Dear Phreesia stakeholders, We hope everyone had a safe, healthy and enjoyable summer. In our second quarter of fiscal 2025, we reached another very important milestone in Phreesia’s evolution by achieving positive Free cash flow1. We believe this milestone marks the start of a new era for Phreesia in which we will be able to deploy internally generated cash to drive stakeholder value. We believe achieving the milestone of positive Free cash flow (though admittedly nominal) demonstrates the ongoing operating leverage and solid unit economics of our business. While the achievement of any milestone does not represent a “finish line,” we believe it is important to acknowledge objectives when achieved. In addition to growing our network and improving the adoption of our current offerings, we are excited about several new solutions we are investing in that we believe will bring us closer to realizing our vision where every person is an active participant in their care. I would like to thank my teammates for their commitment to our mission, vision and values. One of our guiding principles is being good stewards of our capital. We recognize that operational and financial performance allow all of us at Phreesia to continue to pursue our mission and vision for all of our stakeholders. We would also like to thank our investors for their support through our first five years as a public company during unprecedented times. We enter the second half of our first decade as a public company even more excited about the opportunities that lie ahead of us than when we entered the first half. We look forward to updating you on our progress in the second half of fiscal 2025. Chaim Indig Chief Executive Officer and Co-Founder


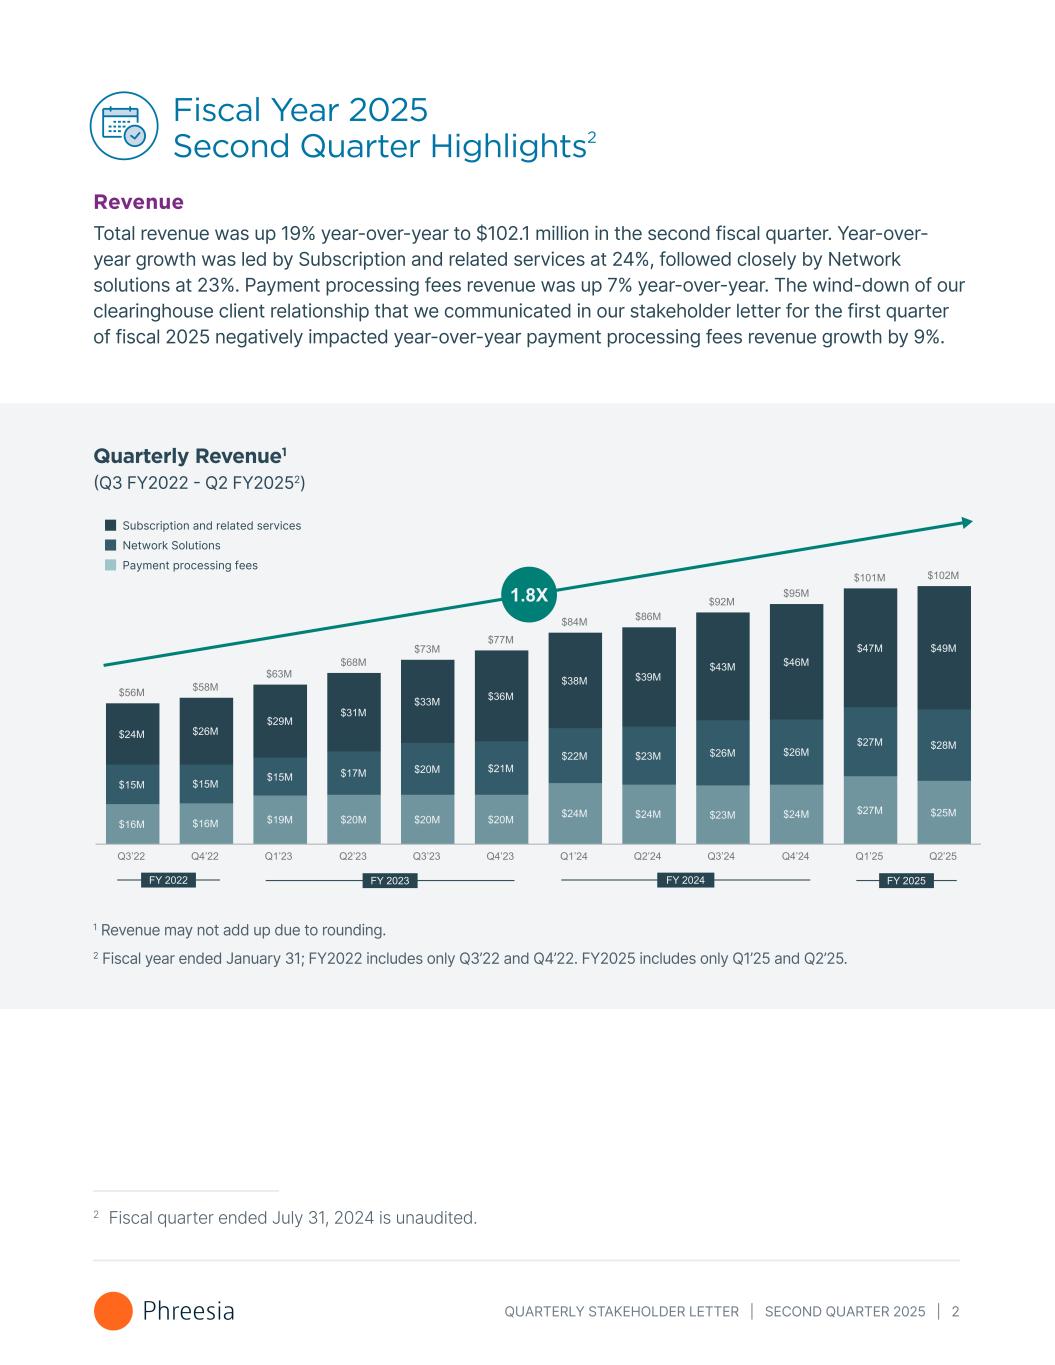
QUARTERLY STAKEHOLDER LETTER | SECOND QUARTER 2025 | 2 Fiscal Year 2025 Second Quarter Highlights2 Revenue Total revenue was up 19% year-over-year to $102.1 million in the second fiscal quarter. Year-over- year growth was led by Subscription and related services at 24%, followed closely by Network solutions at 23%. Payment processing fees revenue was up 7% year-over-year. The wind-down of our clearinghouse client relationship that we communicated in our stakeholder letter for the first quarter of fiscal 2025 negatively impacted year-over-year payment processing fees revenue growth by 9%. 1 Revenue may not add up due to rounding. 2 Fiscal year ended January 31; FY2022 includes only Q3’22 and Q4’22. FY2025 includes only Q1’25 and Q2’25. Subscription and related services Payment processing fees Network Solutions Quarterly Revenue1 (Q3 FY2022 - Q2 FY20252) 2 Fiscal quarter ended July 31, 2024 is unaudited.


QUARTERLY STAKEHOLDER LETTER | SECOND QUARTER 2025 | 3 Average Healthcare Services Clients In the second quarter of fiscal 2025, we supported 4,169 Average Healthcare Services Clients (“AHSCs”)3, an increase of 104 AHSCs (or 3%) over the first quarter of fiscal 2025 and an increase of 724 AHSCs (or 21%) year-over-year. Total Revenue and Healthcare Services Revenue Per AHSC In the second quarter of fiscal 2025, Total revenue per AHSC4 was $24,494, down 2% year-over-year and down 2% over the previous quarter. Healthcare services revenue5 per AHSC6 for the quarter was $17,729, down 3% year-over-year and down 2% over the previous quarter. The decreases in Total revenue per AHSC and healthcare services revenue per AHSC were primarily driven by the wind- down of the clearinghouse client relationship that we communicated in our fiscal 2025 first quarter stakeholder letter. That wind-down reduced year-over-year Total revenue growth by 2%. Total revenue per AHSC (excluding clearinghouse revenue) for the second quarter of fiscal 2025 was flat compared to Total revenue per AHSC (excluding clearinghouse revenue) for the second quarter of fiscal 2024. 1 Fiscal year ended January 31; FY2022 includes only Q3’22 and Q4’22. FY2025 includes only Q1’25 and Q2’25. 3 We define AHSCs as the average number of clients that generate Subscription and related services or Payment processing revenue each month during the applicable period. In cases where we act as a subcontractor providing white-label services to our partner's clients, we treat the contractual relationship as a single healthcare services client. 4 We define Total revenue per AHSC as Total revenue in a given period divided by AHSCs during that same period. 5 We define healthcare services revenue as the sum of Subscription and related services revenue and Payment processing fees revenue. 6 We define healthcare services revenue per AHSC as healthcare services revenue in a given period divided by AHSCs during that same period. AHSCs (Q3 FY2022 - Q2 FY20251)


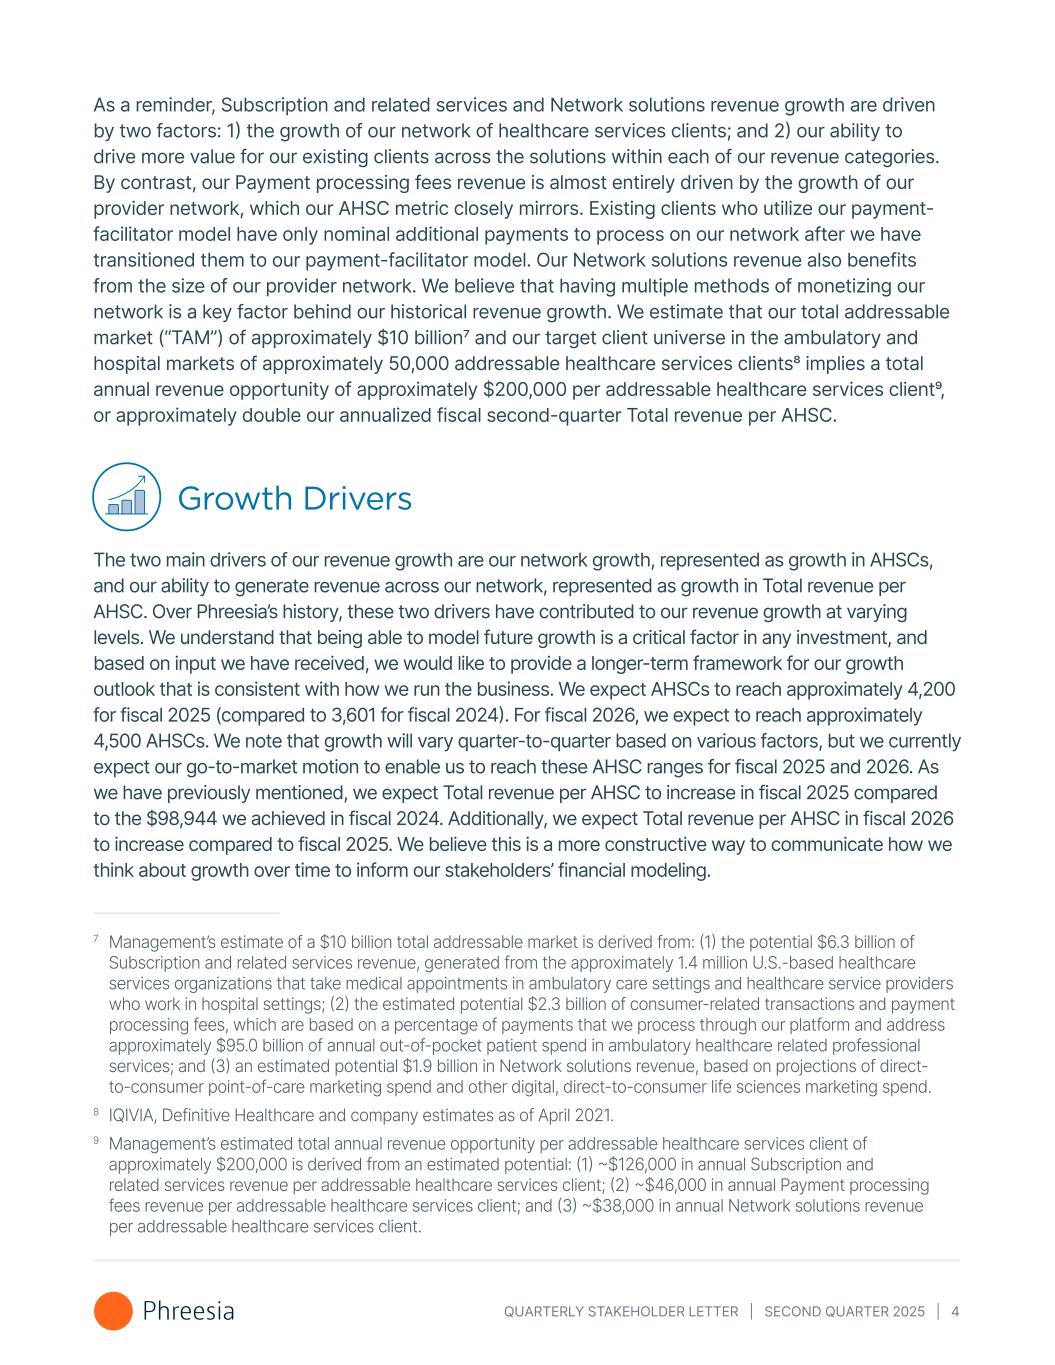
QUARTERLY STAKEHOLDER LETTER | SECOND QUARTER 2025 | 4 As a reminder, Subscription and related services and Network solutions revenue growth are driven by two factors: 1) the growth of our network of healthcare services clients; and 2) our ability to drive more value for our existing clients across the solutions within each of our revenue categories. By contrast, our Payment processing fees revenue is almost entirely driven by the growth of our provider network, which our AHSC metric closely mirrors. Existing clients who utilize our payment- facilitator model have only nominal additional payments to process on our network after we have transitioned them to our payment-facilitator model. Our Network solutions revenue also benefits from the size of our provider network. We believe that having multiple methods of monetizing our network is a key factor behind our historical revenue growth. We estimate that our total addressable market (“TAM”) of approximately $10 billion7 and our target client universe in the ambulatory and hospital markets of approximately 50,000 addressable healthcare services clients8 implies a total annual revenue opportunity of approximately $200,000 per addressable healthcare services client9, or approximately double our annualized fiscal second-quarter Total revenue per AHSC. Growth Drivers The two main drivers of our revenue growth are our network growth, represented as growth in AHSCs, and our ability to generate revenue across our network, represented as growth in Total revenue per AHSC. Over Phreesia’s history, these two drivers have contributed to our revenue growth at varying levels. We understand that being able to model future growth is a critical factor in any investment, and based on input we have received, we would like to provide a longer-term framework for our growth outlook that is consistent with how we run the business. We expect AHSCs to reach approximately 4,200 for fiscal 2025 (compared to 3,601 for fiscal 2024). For fiscal 2026, we expect to reach approximately 4,500 AHSCs. We note that growth will vary quarter-to-quarter based on various factors, but we currently expect our go-to-market motion to enable us to reach these AHSC ranges for fiscal 2025 and 2026. As we have previously mentioned, we expect Total revenue per AHSC to increase in fiscal 2025 compared to the $98,944 we achieved in fiscal 2024. Additionally, we expect Total revenue per AHSC in fiscal 2026 to increase compared to fiscal 2025. We believe this is a more constructive way to communicate how we think about growth over time to inform our stakeholders’ financial modeling. 7 Management’s estimate of a $10 billion total addressable market is derived from: (1) the potential $6.3 billion of Subscription and related services revenue, generated from the approximately 1.4 million U.S.-based healthcare services organizations that take medical appointments in ambulatory care settings and healthcare service providers who work in hospital settings; (2) the estimated potential $2.3 billion of consumer-related transactions and payment processing fees, which are based on a percentage of payments that we process through our platform and address approximately $95.0 billion of annual out-of-pocket patient spend in ambulatory healthcare related professional services; and (3) an estimated potential $1.9 billion in Network solutions revenue, based on projections of direct- to-consumer point-of-care marketing spend and other digital, direct-to-consumer life sciences marketing spend. 8 IQIVIA, Definitive Healthcare and company estimates as of April 2021. 9 Management’s estimated total annual revenue opportunity per addressable healthcare services client of approximately $200,000 is derived from an estimated potential: (1) ~$126,000 in annual Subscription and related services revenue per addressable healthcare services client; (2) ~$46,000 in annual Payment processing fees revenue per addressable healthcare services client; and (3) ~$38,000 in annual Network solutions revenue per addressable healthcare services client.


QUARTERLY STAKEHOLDER LETTER | SECOND QUARTER 2025 | 5 Subscription and Related Services Subscription and related services revenue for the second quarter of fiscal 2025 grew 24% compared to the second quarter of the prior fiscal year. Subscription and related services revenue per AHSC was $11,700 in the fiscal second quarter, down 1% both year-over-year and on a sequential basis. We expect this figure to increase over the long-term as we deepen our relationships with our clients through continued improvements in our solutions and the addition of new products. Payment Processing Our Payment processing fees revenue grew 7% over the prior year’s fiscal second quarter, driven by an 11% increase in patient payment volume. Payment processing fees revenue generally grows in line with our network growth. As discussed in the Total revenue per AHSC section of this letter, the wind-down of our clearinghouse client relationship in the fiscal first quarter decreased year-over-year revenue growth in the fiscal second quarter by 2%. As a reminder, the revenue associated with the clearinghouse client was part of our Payment processing fees revenue. Total Revenue1 Per AHSC2 (Q3 FY2022 - Q2 FY20253) Subscription and related services Network Solutions Payment processing fees 1 Revenue may not add up due to rounding. 2 Calculated by revenue stream for each period presented as revenue for that period divided by AHSCs during the same period. 3 Fiscal year ended January 31; FY2022 includes only Q3’22 and Q4’22. FY2025 includes only Q1’25 and Q2’25.


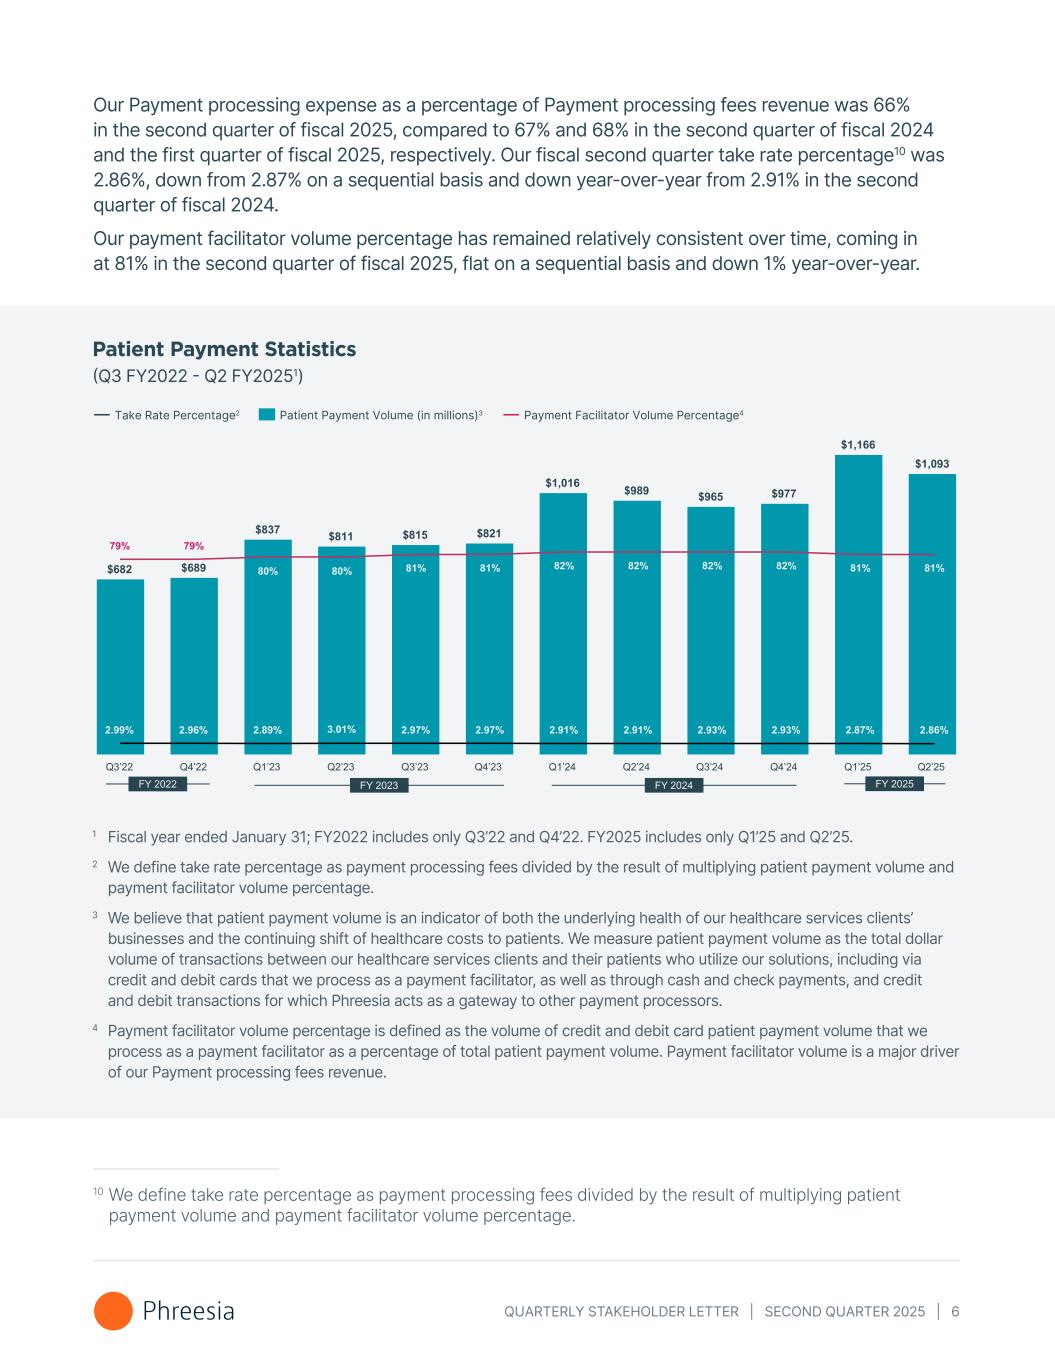
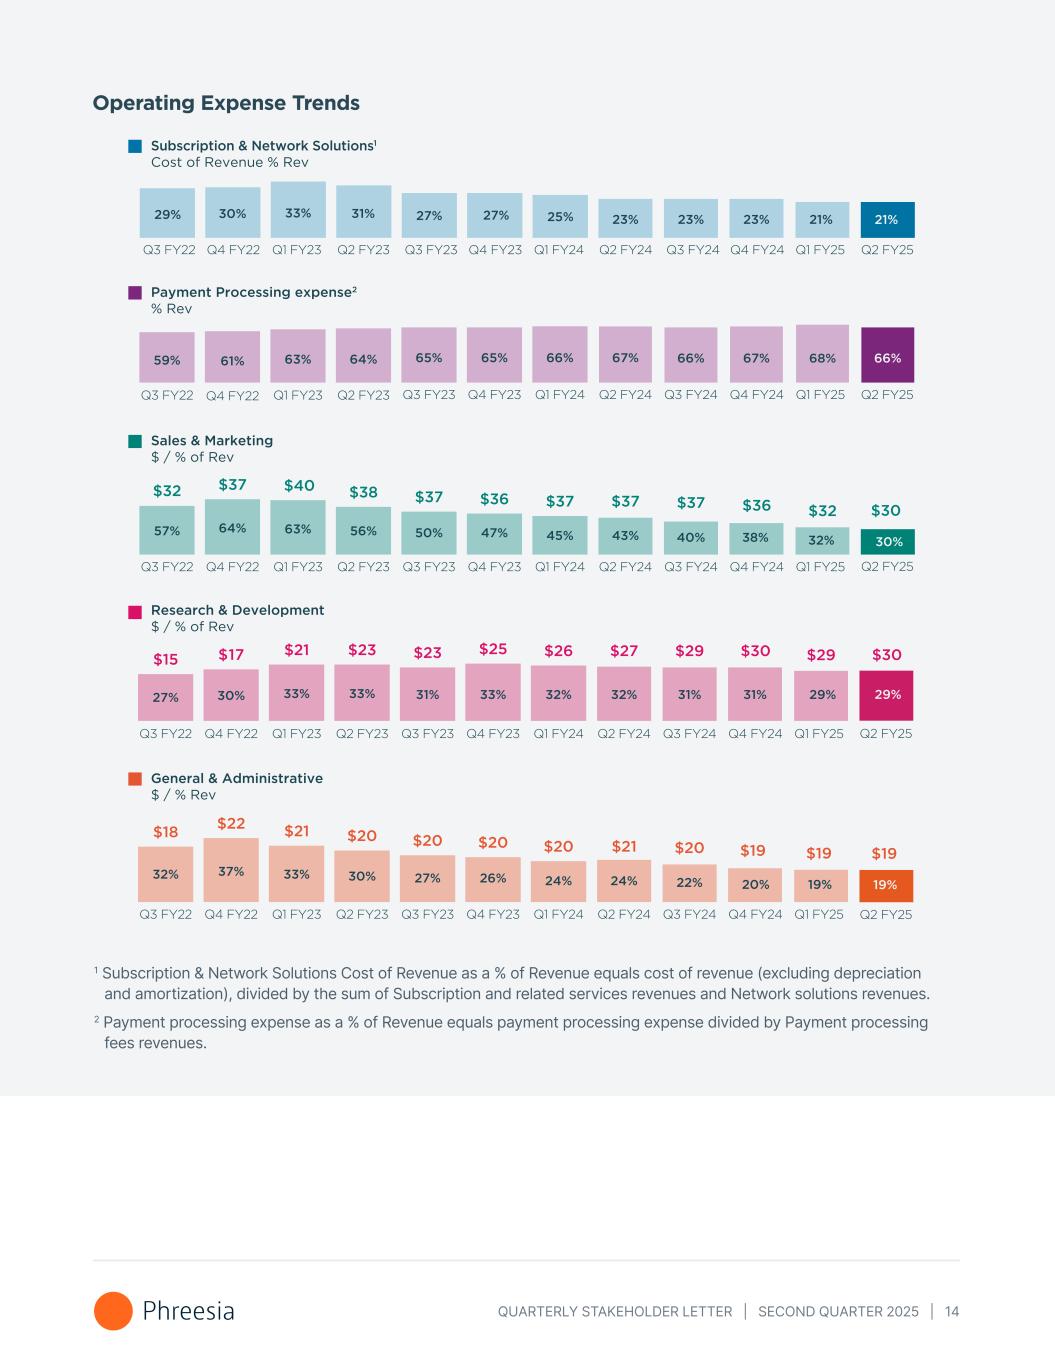
QUARTERLY STAKEHOLDER LETTER | SECOND QUARTER 2025 | 6 Our Payment processing expense as a percentage of Payment processing fees revenue was 66% in the second quarter of fiscal 2025, compared to 67% and 68% in the second quarter of fiscal 2024 and the first quarter of fiscal 2025, respectively. Our fiscal second quarter take rate percentage10 was 2.86%, down from 2.87% on a sequential basis and down year-over-year from 2.91% in the second quarter of fiscal 2024. Our payment facilitator volume percentage has remained relatively consistent over time, coming in at 81% in the second quarter of fiscal 2025, flat on a sequential basis and down 1% year-over-year. Patient Payment Statistics (Q3 FY2022 - Q2 FY20251) 1 Fiscal year ended January 31; FY2022 includes only Q3’22 and Q4’22. FY2025 includes only Q1’25 and Q2’25. 2 We define take rate percentage as payment processing fees divided by the result of multiplying patient payment volume and payment facilitator volume percentage. 3 We believe that patient payment volume is an indicator of both the underlying health of our healthcare services clients’ businesses and the continuing shift of healthcare costs to patients. We measure patient payment volume as the total dollar volume of transactions between our healthcare services clients and their patients who utilize our solutions, including via credit and debit cards that we process as a payment facilitator, as well as through cash and check payments, and credit and debit transactions for which Phreesia acts as a gateway to other payment processors. 4 Payment facilitator volume percentage is defined as the volume of credit and debit card patient payment volume that we process as a payment facilitator as a percentage of total patient payment volume. Payment facilitator volume is a major driver of our Payment processing fees revenue. Payment Facilitator Volume Percentage4Take Rate Percentage2 Patient Payment Volume (in millions)3 10 We define take rate percentage as payment processing fees divided by the result of multiplying patient payment volume and payment facilitator volume percentage.


QUARTERLY STAKEHOLDER LETTER | SECOND QUARTER 2025 | 7 Network Solutions Our Network solutions revenue includes fees for direct communications through our solutions that are designed to educate, engage and activate patients on topics critical to their health. Second quarter fiscal 2025 Network solutions revenue increased 23% compared to the second quarter of fiscal 2024. Healthcare services clients that enable us to generate Network solutions revenue enhance our financial profile. Our team continues to execute well in a competitive market, and we believe that our network and product offerings help differentiate us. Network solutions revenue from our life sciences clients is based largely on the delivery of messages at a contracted price per message to those patients from whom we receive permission. Life Sciences Increasing Vaccination Rates As the industry gears up for another respiratory virus season this fall, we're committed to helping fill gaps in care through our preventive efforts, including educating patients at the point of care. Recent Phreesia research shows that exposure to vaccine-related messaging positively impacts patients’ knowledge, attitudes and behaviors. In a study spanning four years with over 20.2 million pieces of digital vaccine information delivered, 49% of patients said the information was new to them, and 66% found it helpful. 65% said they were likely to discuss vaccines with their doctor. In many cases, these rates were higher among Black, Asian and Hispanic survey respondents. Claims-based conversion analyses showed those exposed to such communications received incremental vaccinations at a rate 2.07 times higher on average than control groups who were not exposed to such information at the point of care. In some cases, exposure to messaging drove vaccine administration rates more than 10 times higher than the control group. These results were presented by our Director of Clinical Content, Christina Suh, MD, MPH, at the National Immunization Conference in August 2024. 2024 MM+M Awards Finalist Healthcare marketing industry trade publication MM+M recently revealed its 2024 MM+M Awards finalists, including Phreesia on its shortlist for its Point-of-Care Marketing award. Now in its 21st year, the medical marketing industry’s premier awards program recognizes the campaigns, organizations and people who created the year’s most compelling and impactful work. Phreesia and Prevent Cancer Foundation’s “Take Charge of Your Breast Health” campaign is among five finalists in the Point-of-Care Marketing category and is the only campaign from a media vendor on the shortlist. Award winners will be announced in October. American Academy of Pediatrics Partnership In the fiscal second quarter, Phreesia collaborated with the American Academy of Pediatrics on a public health campaign to drive awareness around measles, mumps and rubella (“MMR”) vaccination. Beginning in September 2024, Phreesia will deliver 200,000 engagements to parents and guardians of children between the ages of 9 months and 6 years encouraging them to speak to their child’s doctor about the MMR vaccine or have their child complete the vaccine series. These types of partnerships align with our mission of making care easier every day, and give us the opportunity to drive large-scale positive health outcomes.


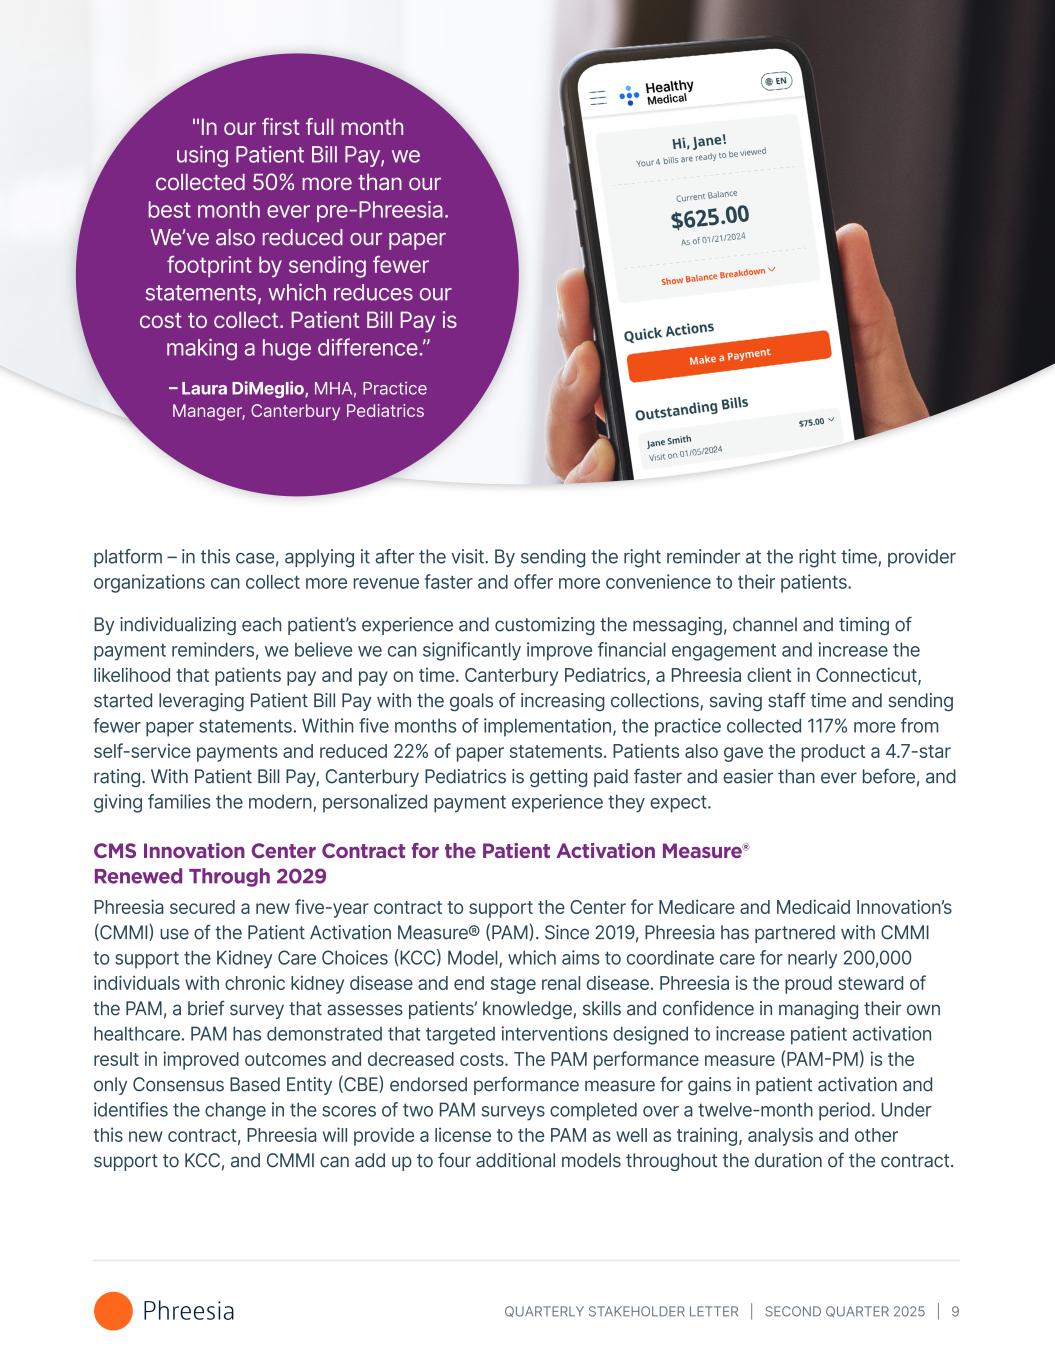
QUARTERLY STAKEHOLDER LETTER | SECOND QUARTER 2025 | 8 Product Update MEDITECH Alliance In May 2024, Phreesia joined the MEDITECH Alliance Program, an ecosystem of partner organizations with proven, successful and interoperable solutions. Through the partnership, MEDITECH customers can leverage Phreesia to deliver a patient-driven registration experience, whether in a hospital-based or ambulatory care setting. Phreesia joined the Alliance Program as an Innovator Partner, providing embedded solutions that can be included in MEDITECH as a Service, and offering integrated solutions for all MEDITECH Expanse customers. MEDITECH’s partnership with Phreesia began through the support of the Access eForms solution, which we acquired in fiscal 2024. We look forward to bringing the full capabilities of the Phreesia platform to the MEDITECH ecosystem in the future. Medication Adherence As mentioned in our fiscal 2024 year-end letter, our Post-Script Engagement product helps bridge the critical gap between prescriptions written and filled. Studies show that between 20-30% of prescriptions are never filled11. As soon as a prescription is written, our Post-Script Engagement product not only reminds patients about their prescription but also assesses their likelihood of filling it, uncovers barriers to adherence and provides patients with curated resources to support their starting and staying on treatment. Since the launch of this Post-Script Engagement product, patients have completed more than 300,000 intent-to-fill assessments. Those results show the top three reasons why patients don’t plan to fill their prescription or are unsure if they will include: 1) they’re not having symptoms or don’t think they need the medication; 2) they’re not sure if they can afford to fill it; and 3) they don’t have enough information about the medication. Additional Phreesia survey data shows that three in five patients have little to no knowledge of patient support programs, and just 3% of eligible patients are using them. Our analyses at the medication, patient and population levels have allowed us to rapidly iterate on our solution. We’ve increased our abilities to share valuable resources and information that address patient concerns at the point of care, such as treatment education and financial assistance programs. This data can also help healthcare organizations tailor their interactions with patients based on an individuals’ unique challenges and help tackle medication adherence barriers earlier on. Patient Bill Pay Most medical bills sent to patients are on paper and difficult to understand. We developed our Patient Bill Pay product with the goal of improving the patient experience and building on our current payment tools that include our payment assurance product. Patient Bill Pay provides patients with an easy- to-read digital bill as soon as claims are adjudicated, removing much of the friction associated with the status quo. Bills are sent immediately via the patient’s preferred channel including text or email. Patient Bill Pay leverages the same intelligent patient activation that drives outcomes on our intake 11 Fischer, MA, Stedman, MR, Lii, J, Vogeli, C, Shrank, WH, et al. Primary medication non-adherence: Analysis of 195,930 electronic prescriptions. Journal of General Internal Medicine. 2010; 25(4): 284–290.


QUARTERLY STAKEHOLDER LETTER | SECOND QUARTER 2025 | 9 platform – in this case, applying it after the visit. By sending the right reminder at the right time, provider organizations can collect more revenue faster and offer more convenience to their patients. By individualizing each patient’s experience and customizing the messaging, channel and timing of payment reminders, we believe we can significantly improve financial engagement and increase the likelihood that patients pay and pay on time. Canterbury Pediatrics, a Phreesia client in Connecticut, started leveraging Patient Bill Pay with the goals of increasing collections, saving staff time and sending fewer paper statements. Within five months of implementation, the practice collected 117% more from self-service payments and reduced 22% of paper statements. Patients also gave the product a 4.7-star rating. With Patient Bill Pay, Canterbury Pediatrics is getting paid faster and easier than ever before, and giving families the modern, personalized payment experience they expect. CMS Innovation Center Contract for the Patient Activation Measure® Renewed Through 2029 Phreesia secured a new five-year contract to support the Center for Medicare and Medicaid Innovation’s (CMMI) use of the Patient Activation Measure® (PAM). Since 2019, Phreesia has partnered with CMMI to support the Kidney Care Choices (KCC) Model, which aims to coordinate care for nearly 200,000 individuals with chronic kidney disease and end stage renal disease. Phreesia is the proud steward of the PAM, a brief survey that assesses patients’ knowledge, skills and confidence in managing their own healthcare. PAM has demonstrated that targeted interventions designed to increase patient activation result in improved outcomes and decreased costs. The PAM performance measure (PAM-PM) is the only Consensus Based Entity (CBE) endorsed performance measure for gains in patient activation and identifies the change in the scores of two PAM surveys completed over a twelve-month period. Under this new contract, Phreesia will provide a license to the PAM as well as training, analysis and other support to KCC, and CMMI can add up to four additional models throughout the duration of the contract. "In our first full month using Patient Bill Pay, we collected 50% more than our best month ever pre-Phreesia. We’ve also reduced our paper footprint by sending fewer statements, which reduces our cost to collect. Patient Bill Pay is making a huge difference.” – Laura DiMeglio, MHA, Practice Manager, Canterbury Pediatrics


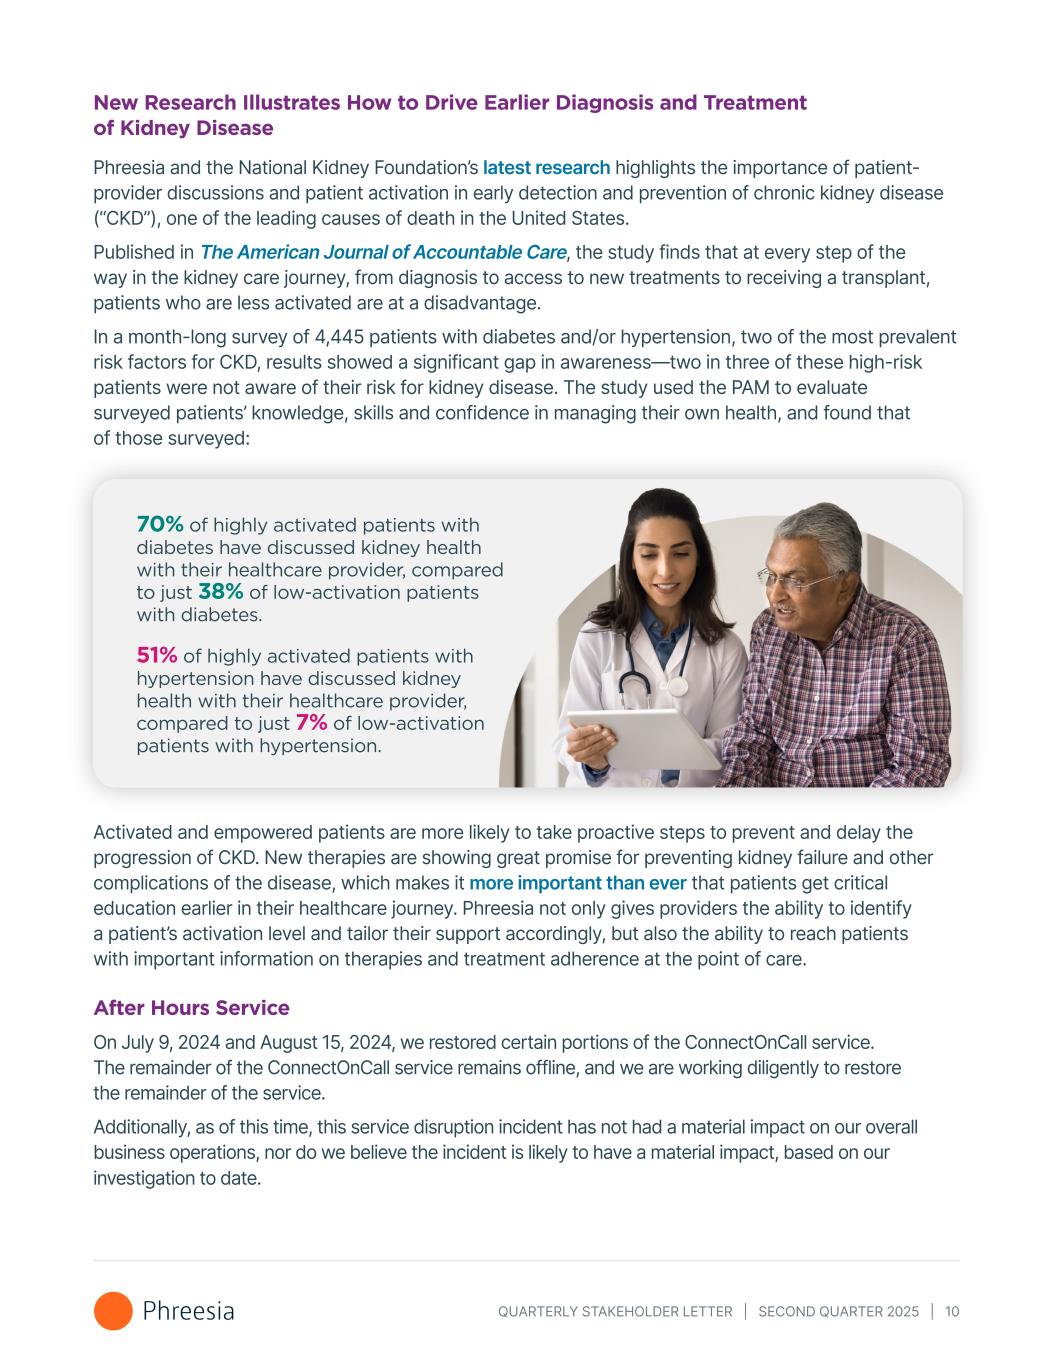
QUARTERLY STAKEHOLDER LETTER | SECOND QUARTER 2025 | 10 New Research Illustrates How to Drive Earlier Diagnosis and Treatment of Kidney Disease Phreesia and the National Kidney Foundation’s latest research highlights the importance of patient- provider discussions and patient activation in early detection and prevention of chronic kidney disease (“CKD”), one of the leading causes of death in the United States. Published in The American Journal of Accountable Care, the study finds that at every step of the way in the kidney care journey, from diagnosis to access to new treatments to receiving a transplant, patients who are less activated are at a disadvantage. In a month-long survey of 4,445 patients with diabetes and/or hypertension, two of the most prevalent risk factors for CKD, results showed a significant gap in awareness—two in three of these high-risk patients were not aware of their risk for kidney disease. The study used the PAM to evaluate surveyed patients’ knowledge, skills and confidence in managing their own health, and found that of those surveyed: 70% of highly activated patients with diabetes have discussed kidney health with their healthcare provider, compared to just 38% of low-activation patients with diabetes. 51% of highly activated patients with hypertension have discussed kidney health with their healthcare provider, compared to just 7% of low-activation patients with hypertension. Activated and empowered patients are more likely to take proactive steps to prevent and delay the progression of CKD. New therapies are showing great promise for preventing kidney failure and other complications of the disease, which makes it more important than ever that patients get critical education earlier in their healthcare journey. Phreesia not only gives providers the ability to identify a patient’s activation level and tailor their support accordingly, but also the ability to reach patients with important information on therapies and treatment adherence at the point of care. After Hours Service On July 9, 2024 and August 15, 2024, we restored certain portions of the ConnectOnCall service. The remainder of the ConnectOnCall service remains offline, and we are working diligently to restore the remainder of the service. Additionally, as of this time, this service disruption incident has not had a material impact on our overall business operations, nor do we believe the incident is likely to have a material impact, based on our investigation to date.


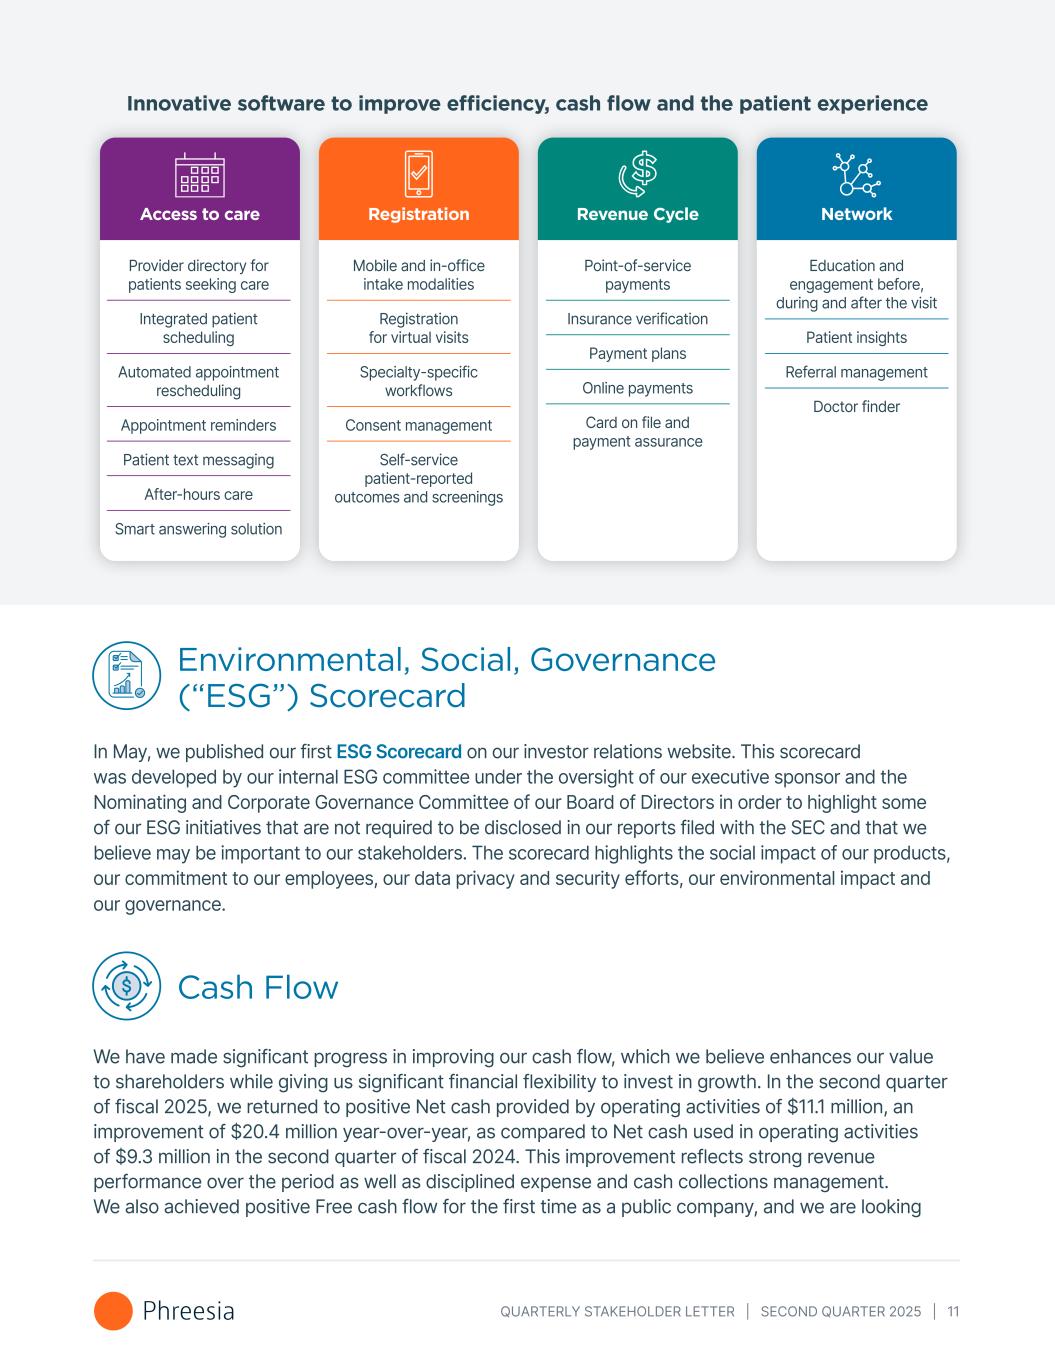
QUARTERLY STAKEHOLDER LETTER | SECOND QUARTER 2025 | 11 Innovative software to improve efficiency, cash flow and the patient experience Access to care Registration Revenue Cycle Network Provider directory for patients seeking care Integrated patient scheduling Automated appointment rescheduling Appointment reminders Patient text messaging After-hours care Smart answering solution Mobile and in-office intake modalities Registration for virtual visits Specialty-specific workflows Consent management Self-service patient-reported outcomes and screenings Point-of-service payments Insurance verification Payment plans Online payments Card on file and payment assurance Education and engagement before, during and after the visit Patient insights Referral management Doctor finder Environmental, Social, Governance (“ESG”) Scorecard In May, we published our first ESG Scorecard on our investor relations website. This scorecard was developed by our internal ESG committee under the oversight of our executive sponsor and the Nominating and Corporate Governance Committee of our Board of Directors in order to highlight some of our ESG initiatives that are not required to be disclosed in our reports filed with the SEC and that we believe may be important to our stakeholders. The scorecard highlights the social impact of our products, our commitment to our employees, our data privacy and security efforts, our environmental impact and our governance. Cash Flow We have made significant progress in improving our cash flow, which we believe enhances our value to shareholders while giving us significant financial flexibility to invest in growth. In the second quarter of fiscal 2025, we returned to positive Net cash provided by operating activities of $11.1 million, an improvement of $20.4 million year-over-year, as compared to Net cash used in operating activities of $9.3 million in the second quarter of fiscal 2024. This improvement reflects strong revenue performance over the period as well as disciplined expense and cash collections management. We also achieved positive Free cash flow for the first time as a public company, and we are looking


QUARTERLY STAKEHOLDER LETTER | SECOND QUARTER 2025 | 12 forward to Free cash flow growth becoming an important component of our financial profile. The following chart summarizes how our revenue growth has driven our growth in Adjusted EBITDA and Free cash flow. See Non-GAAP Financial Measures for a reconciliation of Net loss to Adjusted EBITDA and a reconciliation of Net cash provided by (used in) operating activities to Free cash flow. Operating Leverage Our second quarter fiscal 2025 Adjusted EBITDA and Free cash flow reflect continued operating leverage across the company. We expect our Sales and marketing, Research and development and General and administrative expense lines to all show improvement as a percentage of revenue through fiscal 2025. Cost of Revenue Cost of revenue (excluding depreciation and amortization) increased $1.7 million to $16.1 million for the three months ended July 31, 2024, as compared to $14.4 million for the three months ended July 31, 2023. The increase resulted primarily from a $1.7 million increase in third-party costs driven by growth in revenue, partially offset by a $0.1 million decrease in labor costs. Stock compensation incurred related to cost of revenue was $1.2 million for both the three months ended July 31, 2024 and 2023. Adjusted EBITDA Free Cash FlowTotal Revenue Growth and Operating Leverage ($M)


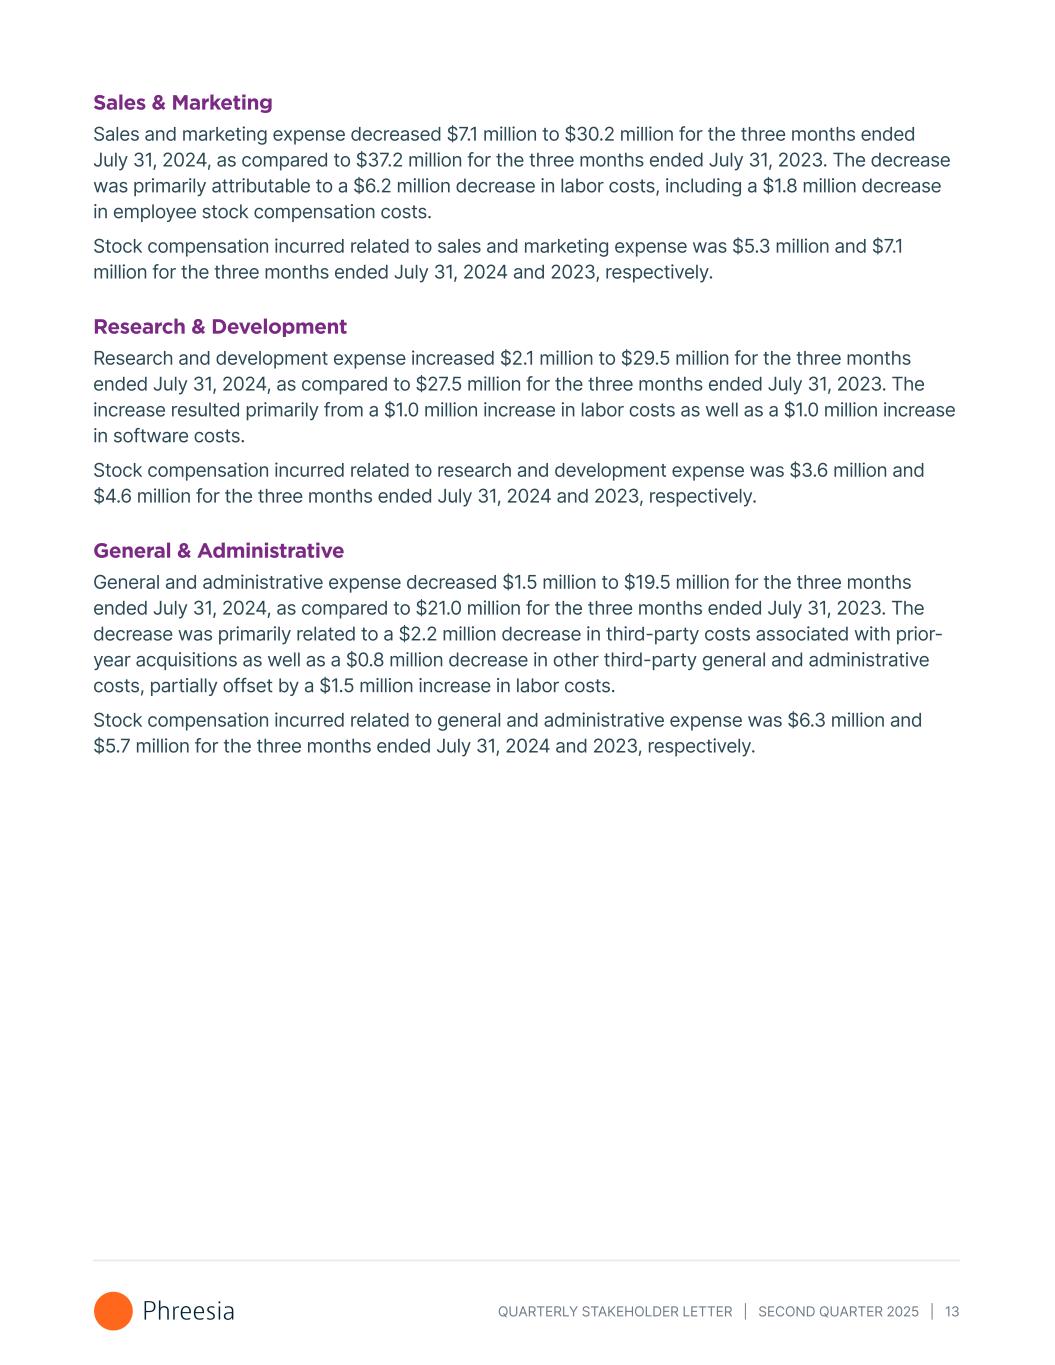
QUARTERLY STAKEHOLDER LETTER | SECOND QUARTER 2025 | 13 Sales & Marketing Sales and marketing expense decreased $7.1 million to $30.2 million for the three months ended July 31, 2024, as compared to $37.2 million for the three months ended July 31, 2023. The decrease was primarily attributable to a $6.2 million decrease in labor costs, including a $1.8 million decrease in employee stock compensation costs. Stock compensation incurred related to sales and marketing expense was $5.3 million and $7.1 million for the three months ended July 31, 2024 and 2023, respectively. Research & Development Research and development expense increased $2.1 million to $29.5 million for the three months ended July 31, 2024, as compared to $27.5 million for the three months ended July 31, 2023. The increase resulted primarily from a $1.0 million increase in labor costs as well as a $1.0 million increase in software costs. Stock compensation incurred related to research and development expense was $3.6 million and $4.6 million for the three months ended July 31, 2024 and 2023, respectively. General & Administrative General and administrative expense decreased $1.5 million to $19.5 million for the three months ended July 31, 2024, as compared to $21.0 million for the three months ended July 31, 2023. The decrease was primarily related to a $2.2 million decrease in third-party costs associated with prior- year acquisitions as well as a $0.8 million decrease in other third-party general and administrative costs, partially offset by a $1.5 million increase in labor costs. Stock compensation incurred related to general and administrative expense was $6.3 million and $5.7 million for the three months ended July 31, 2024 and 2023, respectively.


QUARTERLY STAKEHOLDER LETTER | SECOND QUARTER 2025 | 14 Operating Expense Trends Sales & Marketing $ / % of Rev Q3 FY22 57% $32 Q4 FY22 64% $37 Q1 FY23 63% $40 Q2 FY23 56% $38 Q3 FY23 50% $37 Q4 FY23 47% $36 Q1 FY24 45% $37 Q2 FY24 43% $37 Q3 FY24 40% $37 Q4 FY24 38% $36 Q1 FY25 32% $32 Research & Development $ / % of Rev 27% Q3 FY22 $15 30% Q4 FY22 $17 33% Q1 FY23 $21 33% Q2 FY23 $23 31% Q3 FY23 $23 Q4 FY23 33% $25 Q1 FY24 32% $26 Q2 FY24 32% $27 Q3 FY24 31% $29 Q4 FY24 31% $30 Q1 FY25 29% $29 General & Administrative $ / % Rev Q3 FY22 32% $18 Q4 FY22 37% $22 Q1 FY23 33% $21 Q2 FY23 30% $20 Q3 FY23 27% $20 Q4 FY23 26% $20 Q1 FY24 24% $20 Q2 FY24 24% $21 Q3 FY24 22% $20 Q4 FY24 20% $19 Q1 FY25 19% $19 Payment Processing expense2 % Rev Q3 FY22 Q4 FY22 Q1 FY23 Q2 FY23 Q3 FY23 Q4 FY23 Q1 FY24 Q2 FY24 Q3 FY24 Q4 FY24 59% 61% 63% 64% 65% 65% 66% 67% 66% 67% 68% Q1 FY25 Subscription & Network Solutions1 Cost of Revenue % Rev 29% Q3 FY22 30% Q4 FY22 33% Q1 FY23 31% Q2 FY23 27% Q3 FY23 27% Q4 FY23 25% Q1 FY24 Q2 FY24 Q3 FY24 Q4 FY24 23% Q1 FY25 23% Q2 FY25 23% 21% 21% 66% Q2 FY25 Q2 FY25 30% $30 Q2 FY25 29% $30 Q2 FY25 19% $19 1 Subscription & Network Solutions Cost of Revenue as a % of Revenue equals cost of revenue (excluding depreciation and amortization), divided by the sum of Subscription and related services revenues and Network solutions revenues. 2 Payment processing expense as a % of Revenue equals payment processing expense divided by Payment processing fees revenues.


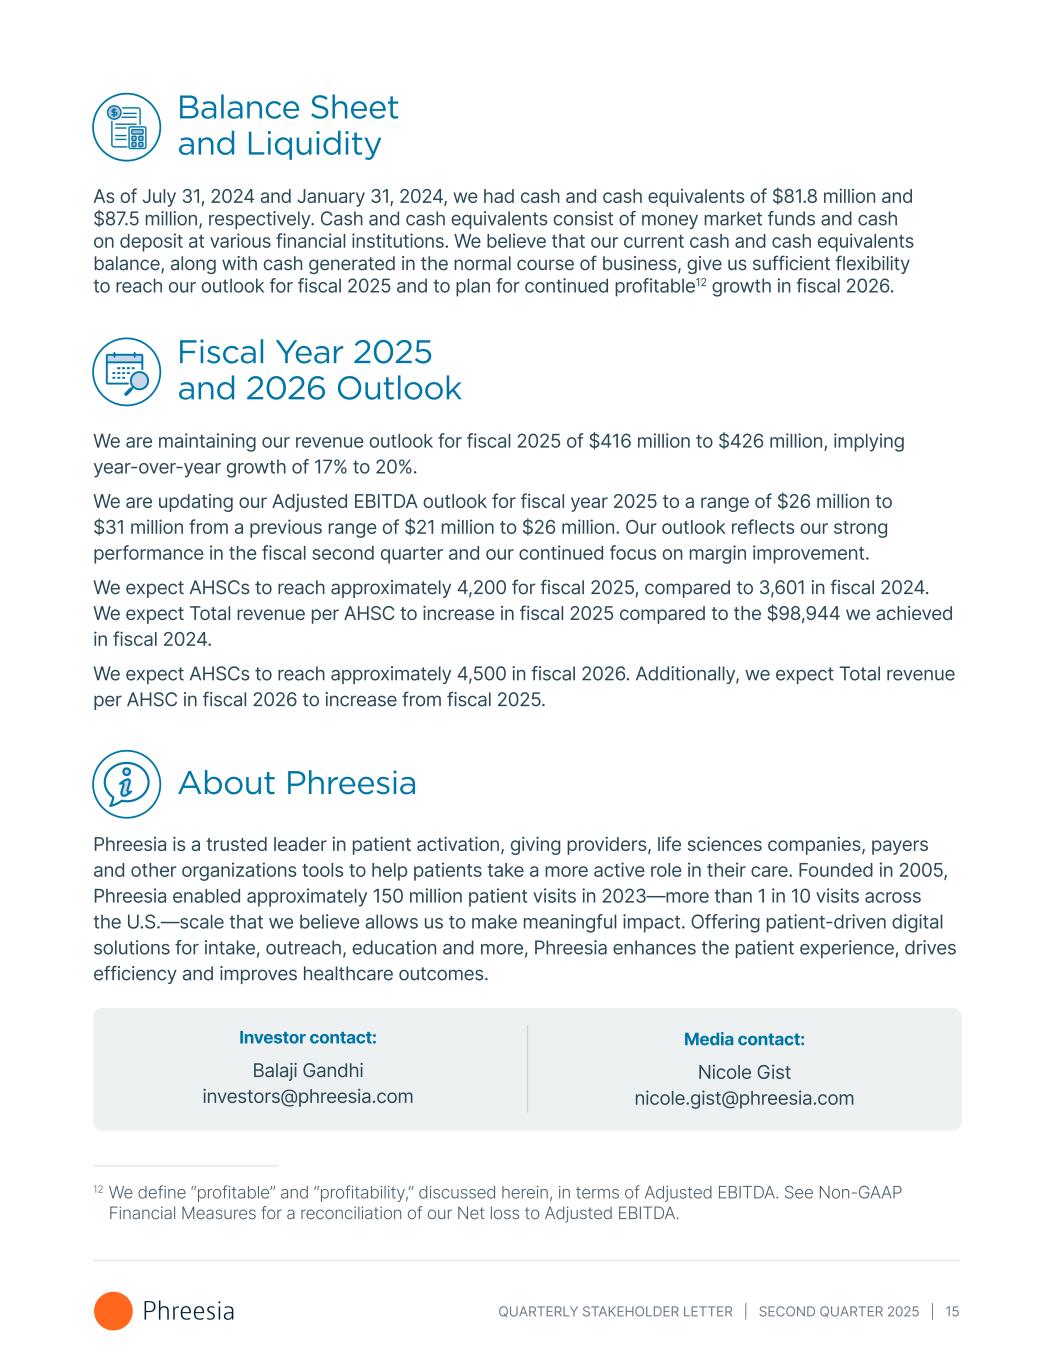
QUARTERLY STAKEHOLDER LETTER | SECOND QUARTER 2025 | 15 Balance Sheet and Liquidity As of July 31, 2024 and January 31, 2024, we had cash and cash equivalents of $81.8 million and $87.5 million, respectively. Cash and cash equivalents consist of money market funds and cash on deposit at various financial institutions. We believe that our current cash and cash equivalents balance, along with cash generated in the normal course of business, give us sufficient flexibility to reach our outlook for fiscal 2025 and to plan for continued profitable12 growth in fiscal 2026. Fiscal Year 2025 and 2026 Outlook We are maintaining our revenue outlook for fiscal 2025 of $416 million to $426 million, implying year-over-year growth of 17% to 20%. We are updating our Adjusted EBITDA outlook for fiscal year 2025 to a range of $26 million to $31 million from a previous range of $21 million to $26 million. Our outlook reflects our strong performance in the fiscal second quarter and our continued focus on margin improvement. We expect AHSCs to reach approximately 4,200 for fiscal 2025, compared to 3,601 in fiscal 2024. We expect Total revenue per AHSC to increase in fiscal 2025 compared to the $98,944 we achieved in fiscal 2024. We expect AHSCs to reach approximately 4,500 in fiscal 2026. Additionally, we expect Total revenue per AHSC in fiscal 2026 to increase from fiscal 2025. About Phreesia Phreesia is a trusted leader in patient activation, giving providers, life sciences companies, payers and other organizations tools to help patients take a more active role in their care. Founded in 2005, Phreesia enabled approximately 150 million patient visits in 2023—more than 1 in 10 visits across the U.S.—scale that we believe allows us to make meaningful impact. Offering patient-driven digital solutions for intake, outreach, education and more, Phreesia enhances the patient experience, drives efficiency and improves healthcare outcomes. Investor contact: Balaji Gandhi investors@phreesia.com Media contact: Nicole Gist nicole.gist@phreesia.com 12 We define “profitable” and “profitability,” discussed herein, in terms of Adjusted EBITDA. See Non-GAAP Financial Measures for a reconciliation of our Net loss to Adjusted EBITDA.


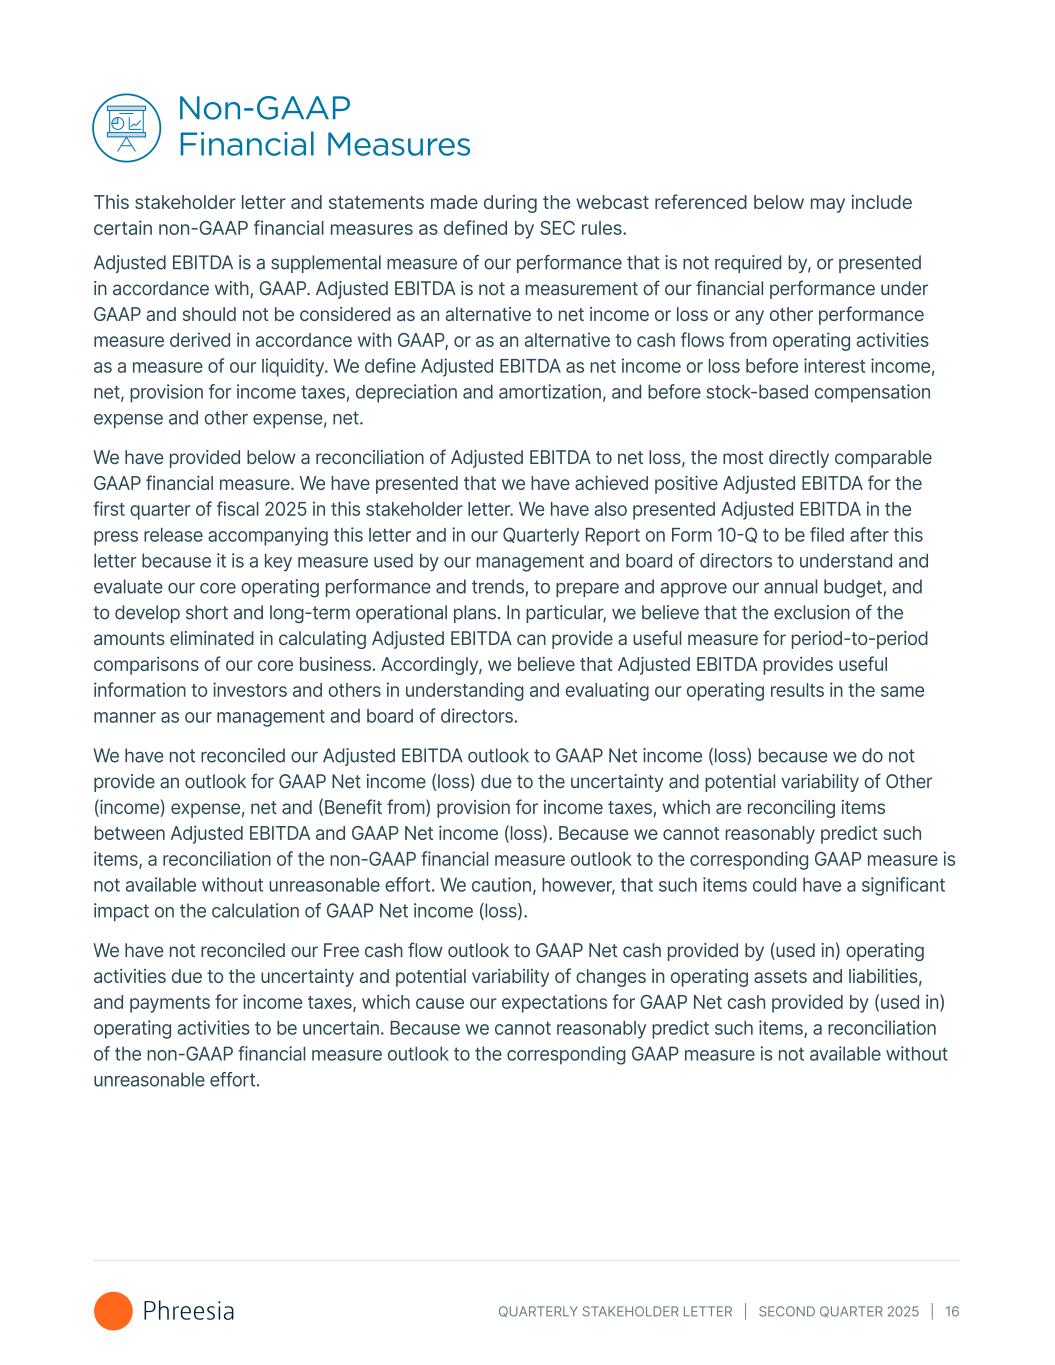
QUARTERLY STAKEHOLDER LETTER | SECOND QUARTER 2025 | 16 Non-GAAP Financial Measures This stakeholder letter and statements made during the webcast referenced below may include certain non-GAAP financial measures as defined by SEC rules. Adjusted EBITDA is a supplemental measure of our performance that is not required by, or presented in accordance with, GAAP. Adjusted EBITDA is not a measurement of our financial performance under GAAP and should not be considered as an alternative to net income or loss or any other performance measure derived in accordance with GAAP, or as an alternative to cash flows from operating activities as a measure of our liquidity. We define Adjusted EBITDA as net income or loss before interest income, net, provision for income taxes, depreciation and amortization, and before stock-based compensation expense and other expense, net. We have provided below a reconciliation of Adjusted EBITDA to net loss, the most directly comparable GAAP financial measure. We have presented that we have achieved positive Adjusted EBITDA for the first quarter of fiscal 2025 in this stakeholder letter. We have also presented Adjusted EBITDA in the press release accompanying this letter and in our Quarterly Report on Form 10-Q to be filed after this letter because it is a key measure used by our management and board of directors to understand and evaluate our core operating performance and trends, to prepare and approve our annual budget, and to develop short and long-term operational plans. In particular, we believe that the exclusion of the amounts eliminated in calculating Adjusted EBITDA can provide a useful measure for period-to-period comparisons of our core business. Accordingly, we believe that Adjusted EBITDA provides useful information to investors and others in understanding and evaluating our operating results in the same manner as our management and board of directors. We have not reconciled our Adjusted EBITDA outlook to GAAP Net income (loss) because we do not provide an outlook for GAAP Net income (loss) due to the uncertainty and potential variability of Other (income) expense, net and (Benefit from) provision for income taxes, which are reconciling items between Adjusted EBITDA and GAAP Net income (loss). Because we cannot reasonably predict such items, a reconciliation of the non-GAAP financial measure outlook to the corresponding GAAP measure is not available without unreasonable effort. We caution, however, that such items could have a significant impact on the calculation of GAAP Net income (loss). We have not reconciled our Free cash flow outlook to GAAP Net cash provided by (used in) operating activities due to the uncertainty and potential variability of changes in operating assets and liabilities, and payments for income taxes, which cause our expectations for GAAP Net cash provided by (used in) operating activities to be uncertain. Because we cannot reasonably predict such items, a reconciliation of the non-GAAP financial measure outlook to the corresponding GAAP measure is not available without unreasonable effort.


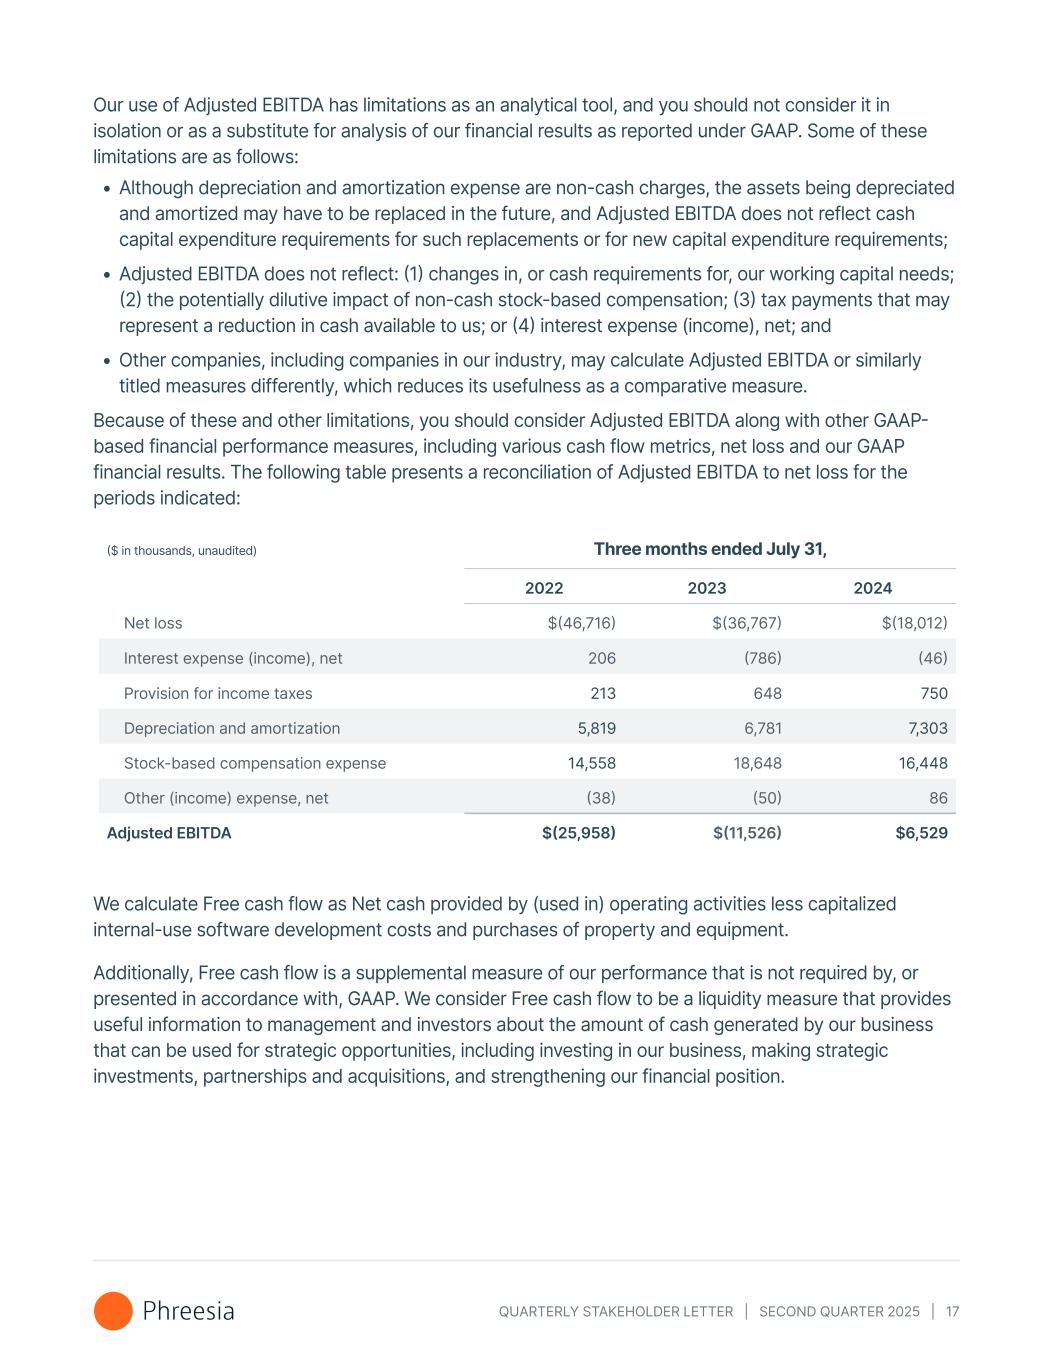
QUARTERLY STAKEHOLDER LETTER | SECOND QUARTER 2025 | 17 Our use of Adjusted EBITDA has limitations as an analytical tool, and you should not consider it in isolation or as a substitute for analysis of our financial results as reported under GAAP. Some of these limitations are as follows: • Although depreciation and amortization expense are non-cash charges, the assets being depreciated and amortized may have to be replaced in the future, and Adjusted EBITDA does not reflect cash capital expenditure requirements for such replacements or for new capital expenditure requirements; • Adjusted EBITDA does not reflect: (1) changes in, or cash requirements for, our working capital needs; (2) the potentially dilutive impact of non-cash stock-based compensation; (3) tax payments that may represent a reduction in cash available to us; or (4) interest expense (income), net; and • Other companies, including companies in our industry, may calculate Adjusted EBITDA or similarly titled measures differently, which reduces its usefulness as a comparative measure. Because of these and other limitations, you should consider Adjusted EBITDA along with other GAAP- based financial performance measures, including various cash flow metrics, net loss and our GAAP financial results. The following table presents a reconciliation of Adjusted EBITDA to net loss for the periods indicated: ($ in thousands, unaudited) Three months ended July 31, 2022 2023 2024 Net loss $(46,716) $(36,767) $(18,012) Interest expense (income), net 206 (786) (46) Provision for income taxes 213 648 750 Depreciation and amortization 5,819 6,781 7,303 Stock-based compensation expense 14,558 18,648 16,448 Other (income) expense, net (38) (50) 86 Adjusted EBITDA $(25,958) $(11,526) $6,529 We calculate Free cash flow as Net cash provided by (used in) operating activities less capitalized internal-use software development costs and purchases of property and equipment. Additionally, Free cash flow is a supplemental measure of our performance that is not required by, or presented in accordance with, GAAP. We consider Free cash flow to be a liquidity measure that provides useful information to management and investors about the amount of cash generated by our business that can be used for strategic opportunities, including investing in our business, making strategic investments, partnerships and acquisitions, and strengthening our financial position.


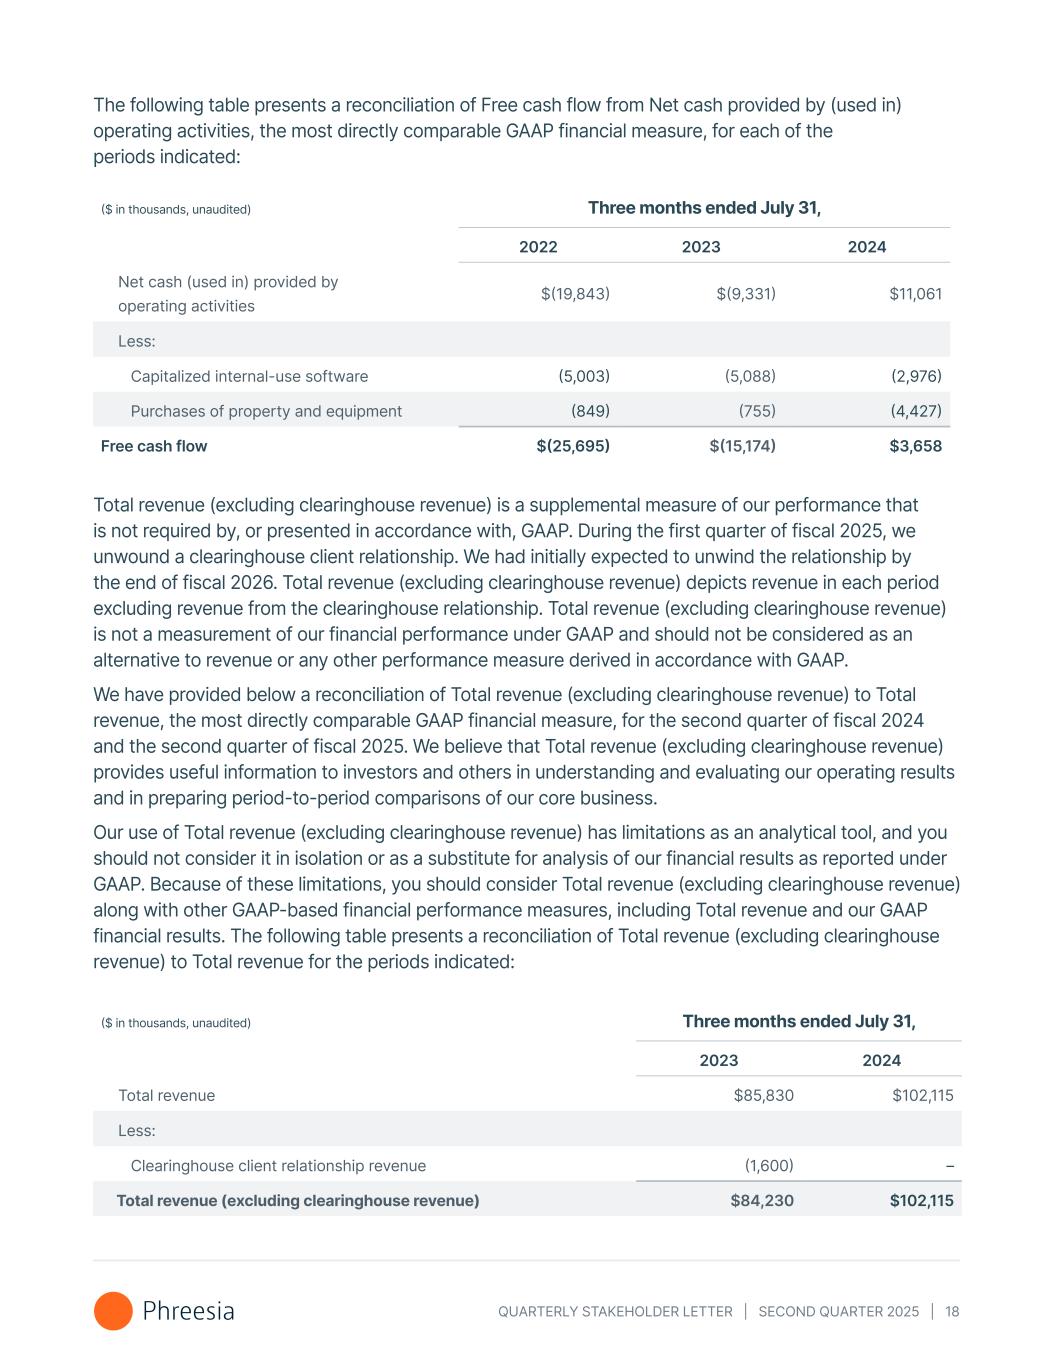
QUARTERLY STAKEHOLDER LETTER | SECOND QUARTER 2025 | 18 The following table presents a reconciliation of Free cash flow from Net cash provided by (used in) operating activities, the most directly comparable GAAP financial measure, for each of the periods indicated: ($ in thousands, unaudited) Three months ended July 31, 2022 2023 2024 Net cash (used in) provided by operating activities $(19,843) $(9,331) $11,061 Less: Capitalized internal-use software (5,003) (5,088) (2,976) Purchases of property and equipment (849) (755) (4,427) Free cash flow $(25,695) $(15,174) $3,658 Total revenue (excluding clearinghouse revenue) is a supplemental measure of our performance that is not required by, or presented in accordance with, GAAP. During the first quarter of fiscal 2025, we unwound a clearinghouse client relationship. We had initially expected to unwind the relationship by the end of fiscal 2026. Total revenue (excluding clearinghouse revenue) depicts revenue in each period excluding revenue from the clearinghouse relationship. Total revenue (excluding clearinghouse revenue) is not a measurement of our financial performance under GAAP and should not be considered as an alternative to revenue or any other performance measure derived in accordance with GAAP. We have provided below a reconciliation of Total revenue (excluding clearinghouse revenue) to Total revenue, the most directly comparable GAAP financial measure, for the second quarter of fiscal 2024 and the second quarter of fiscal 2025. We believe that Total revenue (excluding clearinghouse revenue) provides useful information to investors and others in understanding and evaluating our operating results and in preparing period-to-period comparisons of our core business. Our use of Total revenue (excluding clearinghouse revenue) has limitations as an analytical tool, and you should not consider it in isolation or as a substitute for analysis of our financial results as reported under GAAP. Because of these limitations, you should consider Total revenue (excluding clearinghouse revenue) along with other GAAP-based financial performance measures, including Total revenue and our GAAP financial results. The following table presents a reconciliation of Total revenue (excluding clearinghouse revenue) to Total revenue for the periods indicated: ($ in thousands, unaudited) Three months ended July 31, 2023 2024 Total revenue $85,830 $102,115 Less: Clearinghouse client relationship revenue (1,600) – Total revenue (excluding clearinghouse revenue) $84,230 $102,115


QUARTERLY STAKEHOLDER LETTER | SECOND QUARTER 2025 | 19 Forward-Looking Statements This stakeholder letter includes express or implied statements that are not historical facts and are considered forward-looking within the meaning of Section 27A of the Securities Act of 1933, as amended, and Section 21E of the Securities Exchange Act of 1934, as amended. Forward-looking statements generally relate to future events or our future financial or operating performance and may contain projections of our future results of operations or of our financial information or state other forward-looking information. These statements include, but are not limited to, statements regarding: our future financial and operational performance, including our revenue, margins, Adjusted EBITDA, cash flows and profitability12; our outlook for fiscal 2025 and fiscal 2026, including with respect to Adjusted EBITDA and our expectations on AHSCs, Total revenue per AHSC, and our plans for continued profitable12 growth in fiscal 2025 and fiscal 2026; our ability to start generating Free cash flow in the second half of this fiscal year; the impact of the ConnectOnCall cybersecurity incident on our business; our estimated total addressable market (including any components thereof) and our estimated addressable healthcare services clients; our expected increase in AHSCs during the remainder of fiscal 2025 and fiscal 2026; our expectations regarding growth in Subscription and related services revenue per AHSC over the long-term; our expectations regarding Total revenue per AHSC for the full fiscal year 2025 and fiscal 2026; our ability to finance our plans to achieve our fiscal year outlook with our current cash balance along with cash generated in the normal course of business; our business strategy and operating plans; industry trends and predictions; our anticipated growth and operating leverage; the factors that drive our revenue growth; our expectations regarding solutions under development; and our expectations regarding the growth of our network of clients and partners. In some cases, you can identify forward-looking statements by the following words: “may,” “will,” “could,” “would,” “should,” “expect,” “intend,” “plan,” “anticipate,” “believe,” “estimate,” “predict,” “project,” “potential,” “continue,” “ongoing,” or the negative of these terms or other comparable terminology, although not all forward- looking statements contain these words. Although we believe that the expectations reflected in these forward-looking statements are reasonable, these statements relate to future events or our future operational or financial performance and involve known and unknown risks, uncertainties and other factors that may cause our actual results, performance or achievements to be materially different from any future results, performance or achievements expressed or implied by these forward-looking statements. Furthermore, actual results may differ materially from those described in the forward-looking statements and will be affected by a variety of risks and factors that are beyond our control, including, without limitation, risks associated with: our ability to effectively manage our growth and meet our growth objectives; our focus on the long-term and our investments in growth; the competitive environment in which we operate; our ability to develop and release new products and services and successful enhancements, features and modifications to our existing products and services; changes in market conditions and receptivity to our products and services; our ability to


QUARTERLY STAKEHOLDER LETTER | SECOND QUARTER 2025 | 20 maintain the security and availability of our platform; the impact of cyberattacks, security incidents or breaches impacting our business; changes in laws and regulations applicable to our business model; our ability to make accurate predictions about our industry and addressable market; our ability to attract, retain and cross-sell to healthcare services clients; our ability to continue to operate effectively with a primarily remote workforce and attract and retain key talent; our ability to realize the intended benefits of our acquisitions and partnerships; difficulties in integrating our acquisitions and investments; and the recent high inflationary environment and other general market, political, economic and business conditions (including as a result of the warfare and/or political and economic instability in Ukraine, the Middle East or elsewhere). The forward-looking statements contained in this letter are also subject to other risks and uncertainties, including those listed or described in our filings with the Securities and Exchange Commission (the "SEC"), including in our Quarterly Report on Form 10-Q for the fiscal quarter ended July 31, 2024 that will be filed with the SEC after this letter. The forward-looking statements in this letter speak only as of the date on which the statements are made. We undertake no obligation to update, and expressly disclaim the obligation to update, any forward-looking statements made in this letter to reflect events or circumstances after the date of this letter or to reflect new information or the occurrence of unanticipated events, except as required by law. This letter also includes statistical data, estimates and forecasts that are based on industry publications or other publicly available information, as well as other information based on our internal sources. This information may be based on many assumptions and limitations, and you are cautioned not to give undue weight to such information. We have not independently verified the accuracy or completeness of the information contained in these industry publications and other publicly available information. Conference Call Information We will hold a conference call on September 4, 2024 at 5:00 PM ET to review our 2025 fiscal second quarter financial results. To participate in our live conference call and webcast, please dial (800) 715-9871 (or (646) 307-1963 for international participants) using conference code number 7404611 or visit the “Events & Presentations” section of our Investor Relations website at ir.phreesia.com. A replay of the call will be available via webcast for on-demand listening shortly after the completion of the call, at the same web link, and will remain available for approximately 90 days.