UNITED STATES
SECURITIES AND EXCHANGE COMMISSION
Washington, D.C. 20549
FORM 40-F
☐ |
Registration Statement pursuant to Section 12 of the Securities Exchange Act of 1934 |
or
☒ |
Annual Report pursuant to Section 13(a) or 15(d) of the Securities Exchange Act of 1934 |
For the fiscal year ended December 31, 2024
Commission File Number: 001-39966
NEW FOUND GOLD CORP.
(Exact name of Registrant as specified in its charter)
British Columbia, Canada |
|
1040 |
|
Not Applicable |
(Province or other jurisdiction of |
|
(Primary Standard Industrial |
|
(I.R.S. Employer Identification Number) |
2129 – 1055 West Georgia Street, Vancouver, BC
Canada V6E 3P2
Tel: (604) 977-3214
(Address and telephone number of Registrant’s principal executive offices)
C T Corporation System
28 Liberty Street
New York, New York 10005
Telephone: (212) 894-8940
(Name, address (including zip code) and telephone number (including area code) of agent for service in the United States)
Securities registered or to be registered pursuant to Section 12(b) of the Act:
|
|
|
|
|
Title of each class |
|
Trading Symbol(s) |
|
Name of each exchange on which registered |
Common Shares, no par value |
|
NFGC |
|
The NYSE American LLC |
Securities registered or to be registered pursuant to Section 12(g) of the Act: None
Securities for which there is a reporting obligation pursuant to Section 15(d) of the Act: None
For annual reports, indicate by check mark the information filed with this Form:
☒ Annual Information Form |
☒ Audited Annual Financial Statements |
Indicate the number of outstanding shares of each of the issuer’s classes of capital or common stock as of the close of the period covered by the annual report:
200,457,994 Common Shares outstanding as of December 31, 2024
Indicate by check mark whether the Registrant (1) has filed all reports required to be filed by Section 13 or 15(d) of the Exchange Act during the preceding 12 months (or for such shorter period that the Registrant was required to file such reports) and (2) has been subject to such filing requirements for the past 90 days.
Yes ☒ No ☐
Indicate by check mark whether the Registrant has submitted electronically every Interactive Data File required to be submitted pursuant to Rule 405 of Regulation S-T (§232.405 of this chapter) during the preceding 12 months (or for such shorter period that the Registrant was required to submit such files).
Yes ☒ No ☐
Indicate by check mark whether the Registrant is an emerging growth company as defined in Rule 12b-2 of the Exchange Act.
Emerging growth company ☒
If an emerging growth company that prepares its financial statements in accordance with U.S. GAAP, indicate by check mark if the Registrant has elected not to use the extended transition period for complying with any new or revised financial accounting standards† provided pursuant to Section 13(a) of the Exchange Act. ☐
† The term “new or revised financial accounting standard” refers to any update issued by the Financial Accounting Standards Board to its Accounting Standards Codification after April 5, 2012.
Indicate by check mark whether the registrant has filed a report on and attestation to its management’s assessment of the effectiveness of its internal control over financial reporting under Section 404(b) of the Sarbanes-Oxley Act (15 U.S.C. 7262(b)) by the registered public accounting firm that prepared or issued its audit report. ☐
If securities are registered pursuant to Section 12(b) of the Act, indicate by check mark whether the financial statements of the registrant included in the filing reflect the correction of an error to previously issued financial statements. ☐
Indicate by check mark whether any of those error corrections are restatements that required a recovery analysis of incentive-based compensation received by any of the registrant’s executive officers during the relevant recovery period pursuant to §240.10D-1(b). ☐
FORWARD-LOOKING STATEMENTS
This annual report on Form 40-F (the “Annual Report”) of New Found Gold Corp. (the “Company”) contains “forward-looking information” and “forward-looking statements” (referred to together herein as “forward- looking information”). Forward-looking statements and information can generally be identified by the use of forward-looking terminology such as “may”, “will”, “expect”, “intend”, “estimate”, “anticipate”, “believe”, “continue”, “plans” or similar terminology. Forward-looking statements and information are not historical facts, are made as of the date of this Annual Report, and include, but are not limited to, statements regarding discussions of results from operations (including, without limitation, statements about the Company’s opportunities, strategies, competition, expected activities and expenditures as the Company pursues its business plan, the adequacy of the Company’s available cash resources and other statements about future events or results), performance (both operational and financial) and business prospects, future business plans and opportunities and statements as to management’s expectations with respect to, among other things, the activities contemplated in this Annual Report.
Forward-looking statements included or incorporated by reference in this Annual Report include, without limitation, statements related to the Company’s Queensway Project and the Company’s planned and future exploration on the Queensway Project; the Company’s goals regarding exploration and potential development of its projects; the Company’s future business plans; expectations regarding the ability to raise further capital; the market price of gold; expectations regarding any environmental issues that may affect planned or future exploration and development programs and the potential impact of complying with existing and proposed environmental laws and regulations; the ability to retain and/or maintain any require permits, licenses or other necessary approvals for the exploration or development of its mineral properties; government regulation of mineral exploration and development operations in the Province of Newfoundland and Labrador; the Company’s compensation policy and practices; and the Company’s expected reliance on key management personnel, advisors and consultants (as such term is defined in the Company’s Annual Information Form for the year ended December 31, 2024 (the “Annual Information Form”).
These forward-looking statements involve numerous risks and uncertainties and other factors which may cause the actual results, performance or achievements of New Found to be materially different from any future results, performance or achievements expressed or implied by such forward-looking information. Important factors that may cause actual results to vary include without limitation, the Company may fail to find a commercially viable deposit at any of its mineral properties; there are no mineral resources or mineral reserves on any of the properties in which the Company has an interest; the Company’s plans may be adversely affected by the Company’s reliance on historical data compiled by previous parties involved with its mineral properties; mineral exploration and development are inherently risky; the mineral exploration industry is intensely competitive; additional financing may not be available to the Company when required or, if available, the terms of such financing may not be favorable to the Company; fluctuations in the demand for gold; the Company may not be able to identify, negotiate or finance any future acquisitions successfully, or to integrate such acquisitions with its current business; the Company’s exploration activities are dependent upon the grant of appropriate licenses, concessions, leases, permits and regulatory consents, which may be withdrawn or not granted; the Company’s operations could be adversely affected by possible future government legislation, policies and controls or by changes in applicable laws and regulations; there is no guarantee that title to the properties in which the Company has a material interest will not be challenged or impugned; the Company faces various risks associated with mining exploration that are not insurable or may be the subject of insurance which is not commercially feasible for the Company; the volatility of global capital markets over the past several years has generally made the raising of capital more difficult; economic and other consequences from Russia’s military action against Ukraine and the sanctions imposed in response to that action; inflationary cost pressures may escalate the Company’s operating costs; compliance with environmental regulations can be costly; social and environmental activism can negatively impact exploration, development and mining activities; the success of the Company is largely dependent on the performance of its directors and officers; the Company’s operations may be adversely affected by First Nations land claims; the Company and/or its directors and officers may be subject to a variety of legal proceedings, the results of which may have a material adverse effect on the Company’s business; the Company may be adversely affected if potential conflicts of interests involving its directors and officers are not resolved in favor of the Company; the Company’s future profitability may depend upon the world market prices of gold; dilution from future equity financing could negatively impact holders of the Company’s securities; failure to adequately meet infrastructure requirements could have a material adverse effect on the Company’s business; the Company’s projects now or in the future may be adversely affected by risks outside the control of the Company; the Company is subject to various risks associated with climate change; and other factors discussed under “Risk Factors” in the Company’s Annual Information Form.
2
In making the forward-looking statements in this Annual Report, the Company has applied several material assumptions, including without limitation, the assumptions that: the ability to raise any necessary additional capital on reasonable terms to advance exploration and development of the Company’s mineral properties; future prices of gold and other metal prices; the timing and results of exploration and drilling programs; the demand for, and price of gold; that general business and economic conditions will not change in a material adverse manner; the Company’s ability to procure equipment and operating supplies in sufficient quantities and on a timely basis; the geology of the Queensway Project as described in the Company’s most recent technical report; the accuracy of budgeted exploration and development costs and expenditures; future currency exchange rates and interest rates; operating conditions being favorable such that the Company is able to operate in a safe, efficient and effective manner; the Company’s ability to attract and retain skilled personnel; political and regulatory stability; the receipt of governmental, regulatory and third-party approvals, licenses and permits on favorable terms; obtaining required renewals for existing approvals, licenses and permits on favorable terms; requirements under applicable laws; sustained labor stability; stability in financial and capital goods markets; availability of equipment.
Certain of the risks and assumptions are described in more detail under the heading “Risk Factors” in the Company’s Annual Information Form and in the Company’s audited financial statements and management discussion and analysis for the years ended December 31, 2024 and 2023.
The actual results or performance by the Company could differ materially from those expressed in, or implied by, any forward-looking statements relating to those matters. Accordingly, no assurances can be given that any of the events anticipated by the forward-looking statements will transpire or occur, or if any of them do so, what impact they will have on the results of operations or financial condition of the Company. Except as required by law, the Company is under no obligation, and expressly disclaim any obligation, to update, alter or otherwise revise any forward-looking statement, whether written or oral, that may be made from time to time, whether as a result of new information, future events or otherwise, except as may be required under applicable securities laws.
DIFFERENCES IN UNITED STATES AND CANADIAN REPORTING PRACTICES
The Company is permitted, under a multijurisdictional disclosure system adopted by the United States, to prepare this report in accordance with Canadian disclosure requirements, which are different from those of the United States. The Company prepares its financial statements, which are filed with this Annual Report in accordance with International Financial Reporting Standards as issued by the International Accounting Standards Board.
Disclosure regarding the Company’s mineral properties, including with respect to mineral reserve and mineral resource estimates included in this Annual Report, was prepared in accordance with NI 43-101. NI 43-101 is a rule developed by the Canadian Securities Administrators that establishes standards for all public disclosure an issuer makes of scientific and technical information concerning mineral projects. NI 43-101 differs from the disclosure requirements of the Securities and Exchange Commission (the “SEC”) generally applicable to U.S. companies. Accordingly, information contained in this Annual Report is not comparable to similar information made public by U.S. companies reporting pursuant to SEC disclosure requirements.
INCORPORATED DOCUMENTS
Annual Information Form
The Registrant’s Annual Information Form is filed as Exhibit 99.1 to this Annual Report.
Management’s Discussion and Analysis
The Registrant’s management’s discussion and analysis for the year ended December 31, 2024 (“MD&A”) is filed as Exhibit 99.2 to this Annual Report.
Audited Annual Financial Statements
The Registrant’s financial statements for the years ended December 31, 2024 and 2023 and the auditor’s report thereon are filed as Exhibit 99.3 to this Annual Report.
3
DISCLOSURE CONTROLS AND PROCEDURES
A. Evaluation of disclosure controls and procedures. Disclosure controls and procedures are designed to ensure that (i) information required to be disclosed by the Company in reports that it files or submits to the Commission under the Securities Exchange Act of 1934, as amended (the “Exchange Act”), is recorded, processed, summarized and reported within the time periods specified in applicable rules and forms and (ii) material information required to be disclosed in the Company’s reports filed under the Exchange Act is accumulated and communicated to the Company’s management, including its Chief Executive Officer (“CEO”) and its Chief Financial Officer (“CFO”), as appropriate, to allow for timely decisions regarding required disclosure.
At the end of the period covered by this report, an evaluation was carried out under the supervision of and with the participation of the Company’s management, including the CEO and CFO, of the effectiveness of the design and operation of the Company’s disclosure controls and procedures (as defined in Rule 13a-15(e) and Rule 15d- 15(e) under the Exchange Act). The evaluation included documentation review, enquiries and other procedures considered by management to be appropriate in the circumstances. Based on that evaluation, the Company’s CEO and CFO have concluded that, as of the end of the period covered by this report, the Company’s disclosure controls and procedures were effective.
B. Management’s report on internal control over financial reporting. The Company’s management is responsible for establishing and maintaining effective internal control over financial reporting as defined in Rules 13a-15(f) and 15d-15(f) under the Exchange Act. The Company’s internal control over financial reporting is a process designed to provide reasonable assurance regarding the reliability of the Company’s financial reporting and the preparation of financial statements for external purposes in accordance with International Financial Reporting Standards as issued by the International Accounting Standards Board.
Because of its inherent limitations, internal control over financial reporting may not prevent or detect misstatements. Projections of any evaluation of effectiveness to future periods are subject to the risk that controls may become inadequate because of changes in conditions, or that the degree of compliance with the policies or procedures may deteriorate.
Management assessed the effectiveness of the Company’s internal control over financial reporting as of December 31, 2024, based on the criteria set forth in Internal Control - Integrated Framework (2013) issued by the Committee of Sponsoring Organizations of the Treadway Commission. This evaluation included review of the documentation of controls, evaluation of the design effectiveness of controls, testing of the operating effectiveness of controls and a conclusion on this evaluation. Based on this evaluation, management has concluded that the Company’s internal control over financial reporting was effective as of December 31, 2024.
C. Attestation report of the registered public accounting firm. As an “emerging growth company” under the Jumpstart our Business Startups Act, the Company is exempt from Section 404(b) of the Sarbanes-Oxley Act of 2002, which requires that a public company’s registered public accounting firm provide an attestation report relating to management’s assessment of internal control over financial reporting.
D. Changes in internal control over financial reporting. During the period covered by this Annual Report, no change occurred in the Company’s internal control over financial reporting that has materially affected, or is reasonably likely to materially affect, the Company’s internal control over financial reporting.
The Company’s management, including the CEO and CFO, does not expect that its disclosure controls and procedures or internal controls and procedures will prevent all error and all fraud. A control system, no matter how well conceived and operated, can provide only reasonable, not absolute, assurance that the objectives of the control system are met. Further, the design of a control system must reflect the fact that there are resource constraints, and the benefits of controls must be considered relative to their costs. Because of the inherent limitations in all control systems, no evaluation of controls can provide absolute assurance that all control issues and instances of fraud, if any, within the Company have been detected. These inherent limitations include the realities that judgments in decision-making can be faulty, and that breakdowns can occur because of simple error or mistake. Additionally, controls can be circumvented by the individual acts of some persons, by collusion of two or more people, or by management override of the control. The design of any system of controls also is based in part upon certain assumptions about the likelihood of future events, and there can be no assurance that any design will succeed in achieving its stated goals under all potential future conditions; over time, control may become inadequate because of changes in conditions, or the degree of compliance with the policies or procedures may deteriorate. Because of the inherent limitations in a cost-effective control system, misstatements due to error or fraud may occur and not be detected.
4
NOTICES PURSUANT TO REGULATION BTR
The Company was not required by Rule 104 of Regulation BTR to send any notices to any of its directors or executive officers during the fiscal year ended December 31, 2024.
AUDIT COMMITTEE FINANCIAL EXPERT
The Company’s Board of Directors (the “Board”) has determined that it has at least one audit committee financial expert serving on its Audit Committee. The Board has determined that Vijay Mehta is an audit committee financial expert and is independent, as that term is defined by the Exchange Act and the NYSE American LLC’s (the “NYSE American”) corporate governance standards applicable to the Company.
The Commission has indicated that the designation of a person as an audit committee financial expert does not make such person an “expert” for any purpose, impose on such person any duties, obligations or liability that are greater than those imposed on such person as a member of the Audit Committee and the Board in the absence of such designation and does not affect the duties, obligations or liability of any other member of the Audit Committee or Board.
CODE OF ETHICS
The Board has adopted a written code of business conduct and ethics (the “Code”), by which it and all officers and employees of the Company, including the Company’s principal executive officer, principal financial officer and principal accounting officer or controller, abide. There were no waivers granted in respect of the Code during the fiscal year ended December 31, 2024. The Code is posted on the Company’s website at www.newfoundgold.ca. If there is an amendment to the Code, or if a waiver of the Code is granted to any of Company’s principal executive officer, principal financial officer, principal accounting officer or controller, the Company intends to disclose any such amendment or waiver by posting such information on the Company’s website. Unless and to the extent specifically referred to herein, the information on the Company’s website shall not be deemed to be incorporated by reference in this Annual Report.
PRINCIPAL ACCOUNTANT FEES AND SERVICES
KPMG LLP, Vancouver, British Columbia, Canada, Auditor Firm ID: 85, acted as the Company’s independent registered public accounting firm for the fiscal years ended December 31, 2024 and 2023. See page 60 of the Company’s Annual Information Form, which is attached hereto as Exhibit 99.1, for the total amount billed to the Company by KPMG LLP for services performed in the fiscal years ended December 31, 2024 and 2023 by category of service (for audit fees, audit-related fees, tax fees and all other fees).
AUDIT COMMITTEE PRE-APPROVAL POLICIES AND PROCEDURES
See page 60 of the Company’s Annual Information Form, which is attached hereto as Exhibit 99.1. No audit-related fees, tax fees or other non-audit fees were approved by the Audit Committee pursuant to paragraph (c)(7)(i)(C) of Rule 2-01 of Regulation S-X.
OFF-BALANCE SHEET ARRANGEMENTS
During the year ended December 31, 2024, the Company was not a party to any off-balance-sheet arrangements that have, or are reasonably likely to have, a current or future effect on the financial condition, changes in financial condition, revenues or expenses, results of operations, liquidity, cash requirements or capital resources of the Company.
IDENTIFICATION OF THE AUDIT COMMITTEE
The Board has a separately designated standing Audit Committee established in accordance with section 3(a)(58)(A) of the Exchange Act and satisfies the requirements of Exchange Act Rule 10A-3 (“Rule 10A-3”). As at December 31, 2024, the Company’s Audit Committee was comprised of William Hayden, Paul Huet, and Vijay Mehta, all of whom at such time, in the opinion of the Board, were independent (as determined under Rule 10A-3 of the Exchange Act and the NYSE American Company Guide) and financially literate. As at the date hereof, the Company’s Audit Committee is comprised of William Hayden, Chad Williams, and Vijay Mehta, all of whom, in the opinion of the Board, are independent (as determined under Rule 10A-3 of the Exchange Act and the NYSE American Company Guide) and all of whom are financially literate.
5
CORPORATE GOVERNANCE PRACTICES
The Company’s common shares are listed on the NYSE American. Section 110 of the NYSE American Company Guide permits the NYSE American to consider the laws, customs and practices of foreign issuers and to grant exemptions from NYSE American listing criteria based on these considerations. Below is a description of the significant ways in which the Company’s governance practices differ from those followed by U.S. domestic companies pursuant to NYSE American standards:
Quorum
Section 123 of the NYSE American Company Guide recommends a quorum of not less than one-third of a listed company’s shares issued and outstanding entitled to vote at a meeting of shareholders. The Company’s quorum requirement under its Articles is one person present or represented by proxy who, in the aggregate, holds at least 5% of the issued shares entitled to be voted at the meeting.
Independent Directors
Section 803 of the NYSE American Company Guide requires each issuer to have a sufficient number of independent directors on its Board of Directors such that at least a majority of such directors are independent directors, subject to certain exceptions set forth in Section 801 of the NYSE American Company Guide. As at December 31, 2024, the Board of Directors was comprised of five directors, three of whom were considered independent (as determined under Rule 10A-3 of the Exchange Act and the NYSE American Company Guide), which satisfied the requirements of Section 803 of the NYSE American Company Guide. As at the date hereof, the Board of Directors is comprised of six directors, three of whom remain independent. The Company exists under the provincial laws of British Columbia, Canada, and is governed by the Business Corporations Act (British Columbia), the rules and policies of the TSX Venture Exchange (“TSXV”), and securities legislation in each of the provinces and territories (together, the “Applicable Legislation”). The composition of the Board of Directors is compliant with Applicable Legislation.
Shareholder Approval
Section 711 of the NYSE American Listed Company Guide requires shareholder approval of all equity compensation plans and material revisions to such plans. The definition of “equity compensation plans” includes plans that provide for the delivery of both newly issued and treasury securities, as well as plans that include securities re-acquired in the open market by the issuing company for the purpose of redistribution to employees and directors. The Company will follow the shareholder approval requirements listed in Policy 4.4 of the TSXV Corporate Finance Manual in connection with equity compensation arrangements.
Section 713 of the NYSE American Listed Company Guide requires a listed company to obtain the approval of its shareholders for certain kinds of securities issuances, including private placements that result in the issuance of common shares (or securities convertible into common shares) equal to 20% or more of presently outstanding shares for less than the greater of book or market value of such shares. The Company will follow the shareholder approval requirements listed in Policy 4.1 of the TSXV Corporate Finance Manual in connection with certain securities issuances, including private placements.
In addition, the Company may from time-to-time seek exemption from NYSE American corporate governance requirements under Section 110 of the NYSE American Company Guide, in which case the Company will make any required disclosures of such exemptions. The foregoing is consistent with the laws, customs and practices in Canada.
MINE SAFETY
Not applicable.
6
UNDERTAKING AND CONSENT TO SERVICE OF PROCESS
A. |
Undertaking |
The Company undertakes to make available, in person or by telephone, representatives to respond to inquiries made by the Commission staff, and to furnish promptly, when requested to do so by the Commission staff, information relating to: the securities in relation to which the obligation to file an annual report on Form 40-F arises; or transactions in said securities.
B. |
Consent to Service of Process |
The Company has filed an Appointment of Agent for Service of Process and Undertaking on Form F-X with respect to the class of securities in relation to which the obligation to file this Annual Report arises.
7
EXHIBIT INDEX
Exhibit No. |
|
Description |
|---|---|---|
97 |
|
|
|
|
|
99.1 |
|
Annual Information Form for the year ended December 31, 2024 |
|
|
|
99.2 |
|
Management’s Discussion and Analysis for the year ended December 31, 2024 |
|
|
|
99.3 |
|
Financial Statements for the years ended December 31, 2024 and 2023 |
|
|
|
99.4 |
|
|
|
|
|
99.5 |
|
|
|
|
|
99.6 |
|
|
|
|
|
99.7 |
|
|
|
|
|
99.8 |
|
Consent of KPMG LLP, Independent Registered Public Accounting Firm |
|
|
|
99.9 |
|
|
|
|
|
99.10 |
|
|
|
|
|
99.11 |
|
|
|
|
|
99.12 |
|
|
|
|
|
101 |
|
Interactive Data File (formatted as Inline XBRL) |
|
|
|
104 |
|
Cover Page Interactive Data File (formatted as Inline XBRL and contained in Exhibit 101) |
8
SIGNATURE
Pursuant to the requirements of the Exchange Act, New Found Gold Corp. certifies that it meets all of the requirements for filing on Form 40-F and has duly caused this annual report to be signed on its behalf by the undersigned, thereto duly authorized.
Dated: March 20, 2025
|
NEW FOUND GOLD CORP. |
||
|
|
|
|
|
|
By: |
/s/ Michael Kanevsky |
|
|
|
|
|
|
Name: Michael Kanevsky |
|
|
|
Title: Chief Financial Officer |
|
9
EXHIBIT 97
CLAWBACK POLICY
New Found Gold Corp. (the “Company”) has adopted this Policy in accordance with New York Stock Exchange (“NYSE”) listing requirements.
A. |
Application of Policy |
This Policy applies in the event of any accounting restatement (“Restatement”) due to the Company’s material non-compliance with financial reporting requirements under applicable federal securities laws, in accordance with Rule 10D-1 of the Securities Exchange Act of 1934 (“Rule 10D-1”). This Policy shall apply to Incentive-Based Compensation (as defined below) received on or after October 2, 2023 (the “Effective Date”).
B. |
Executive Officers Subject to the Policy |
The executives of the Company who serve or served as an “executive officer” (as defined under Rule 10D-1) of the Company (the “Executive Officers”) are covered by this Policy. This includes the Company’s current or former principal executive officer, president, principal financial officer, chief accounting officer or controller, any vice-president of the Company in charge of a principal business unit, division or function, and any other current or former officer or person who performs or performed a significant policy-making function for the Company, including executive officers of Company subsidiaries or the Company’s parent, if they perform such policy-making functions. All of these Executive Officers are subject to this Policy, even if an Executive Officer had no responsibility for the financial statement errors which required restatement. The Company’s Board of Directors (the “Board”) determines who shall be an Executive Officer for purposes of this Policy on annual basis.
C. |
Compensation Subject to and Clawback Period of the Policy |
This Policy covers all incentive-based compensation (including any cash or equity compensation) that is granted, earned or vested based wholly or in part upon the attainment of any “financial reporting measure” (“Incentive-Based Compensation”). This Policy applies to any Incentive-Based Compensation “received” by an Executive Officer during the period (the “Clawback Period”) consisting of any of the three completed fiscal years immediately preceding:
| ● | the date that the Company’s Board (or Audit Committee) concludes, or reasonably should have concluded, that the Company is required to prepare a Restatement, or |
| ● | the date that a court, regulator, or other legally authorized body directs the Company to prepare a Restatement. |
In addition, the Clawback Period includes any transition period (that results from a change in the Company’s fiscal year) within or immediately following those three completed fiscal years. However, a transition period between the last day of the Company’s previous fiscal year end and the first day of its new fiscal year that comprises a period of nine to twelve months would be deemed a completed fiscal year.
Financial reporting measures are those that are determined and presented in accordance with the accounting principles used in preparing the Company’s financial statements and any measures derived wholly or in part from such financial information (including non-GAAP measures, stock price and total shareholder return).
1
For purposes of this Policy, Incentive-Based Compensation is deemed “received” in the fiscal period during which the applicable financial reporting measure (as specified in the terms of the award) is attained (the “Performance Period”), even if the payment or grant occurs after the end of that fiscal period. For the avoidance of doubt, the Clawback Period with respect to an Executive Officer applies to Incentive-Based Compensation received by the Executive Officer (a) after beginning services as an Executive Officer (including compensation derived from an award authorized before the individual is newly hired as an Executive Officer, e.g. inducement grants) and (b) if that person served as an Executive Officer at any time during the Performance Period for such Incentive-Based Compensation.
For the avoidance of doubt, Incentive-Based Compensation does not include (i) base annual salary, (ii) compensation which is awarded based solely on service to the Company (e.g. a time-vested award, including time-vesting stock options or restricted share units), or (iii) compensation which is awarded based solely on subjective standards, strategic measures (e.g. completion of a merger) or operational measures (e.g. attainment of a certain market share).
D. |
Amount Required to be Repaid Pursuant to this Policy |
The amount of Incentive-Based Compensation that must be repaid by the Executive Officer (subject to the few limitations discussed below) is the amount of Incentive-Based Compensation received by the Executive Officer that exceeds the amount of Incentive-Based Compensation that otherwise would have been received had it been determined based on the Restatement (the “Recoverable Amount”). Applying this definition, after a Restatement, the Company will recalculate the applicable financial reporting measure and the Recoverable Amount in accordance with SEC and the NYSE rules. The Company will determine whether, based on that financial reporting measure as calculated relying on the original financial statements, the Executive Officer received a greater amount of Incentive-Based Compensation than would have been received applying the recalculated financial measure. Where Incentive- Based Compensation is based only in part on the achievement of a financial reporting measure performance goal, the Company will determine the portion of the original Incentive-Based Compensation based on or derived from the financial reporting measure which was restated and will recalculate the affected portion based on the financial reporting measure as restated to determine the difference between the greater amount based on the original financial statements and the lesser amount that would have been received based on the Restatement. For Incentive- Based Compensation based on stock price or total shareholder return, where the Recoverable Amount is not subject to mathematical recalculation directly from the information in an accounting restatement: (a) the amount shall be based on a reasonable estimate of the effect of the accounting restatement on the stock price or total shareholder return upon which the incentive- based compensation was received; and (b) the Company shall maintain and provide documentation of the determination of that reasonable estimate to the NYSE. The Recoverable Amounts will be calculated on a pre-tax basis to ensure that the Company recovers the full amount of Incentive-Based Compensation that was erroneously awarded. Documentation of the Company’s calculation of the Recoverable Amount shall be maintained, and may be provided to NYSE as required by the NYSE rules.
The Board (or its applicable committee) will take such action as it deems appropriate, in its sole and absolute discretion, reasonably promptly to recover the Recoverable Amount, unless the Company’s committee of independent directors responsible for executive compensation decisions, or in the absence of such a committee, a majority of the independent directors serving on the Board, determines that it would be impracticable to recover such amount because (1) the Company has made a reasonable and documented attempt to recover the Recoverable Amount and has determined that the direct costs of enforcing recovery would exceed the Recoverable Amount, or (2) recovery would likely cause an otherwise tax-qualified retirement plan, under which benefits are broadly available to employees of the Company, to fail to meet the requirements of 26 U.S.C. 401(a)(13) or 26 U.S.C. 411(a) and regulations thereunder, or (3) if the recovery of the incentive-based compensation would, based on an opinion of counsel, violate the home-country laws of the Company.
E. |
Additional Clawback Required by Section 304 of the Sarbanes-Oxley Act of 2002 |
In addition to the provisions described above, if the Company is required to prepare an accounting restatement due to the material noncompliance of the Company, as a result of misconduct, with any financial reporting requirement under the securities laws, then, in accordance with Section 304 of the Sarbanes-Oxley Act of 2002, the Chief Executive Officer and Chief Financial Officer (at the time the financial document embodying such financial reporting requirement was originally issued) shall reimburse the Company for:
2
| ● | any bonus or other incentive-based or equity-based compensation received from the Company during the 12-month period following the first public issuance or filing with the Commission (whichever first occurs) of such financial document; and |
| ● | any profits realized from the sale of securities of the Company during that 12- month period. |
F. |
Crediting of Recovery Amounts |
To the extent that subsections A, B, C and D of this Policy (the “Rule 10D-1 Clawback Requirements”) would provide for recovery of Incentive-Based Compensation recoverable by the Company pursuant to Section 304 of the Sarbanes-Oxley Act, in accordance with subsection E of this Policy (the “Sarbanes-Oxley Clawback Requirements”), and/or any other recovery obligations (including pursuant to employment agreements, or plan awards), the amount such Executive Officer has already reimbursed the Company shall be credited to the required recovery under the Rule 10D-1 Clawback Requirements. Recovery pursuant to the Rule 10D-1 Clawback Requirements does not preclude recovery under the Sarbanes-Oxley Clawback Requirements, to the extent any applicable amounts have not been reimbursed to the Company.
G. |
General Provisions |
This Policy may be amended by the Board or its applicable committee from time to time. Changes to this Policy will be communicated to all persons to whom this Policy applies.
The provisions of this Policy apply to the fullest extent of the law; provided however, to the extent that any provisions of this Policy are found to be unenforceable or invalid under any applicable law, such provision will be applied to the maximum extent permitted, and shall automatically be deemed amended in a manner consistent with its objectives to the extent necessary to conform to any limitations required under applicable law.
This Policy is in addition to (and not in lieu of) any right of repayment, forfeiture or right of offset against any Executive Officer that is required pursuant to any other statutory repayment requirement (regardless of whether implemented at any time prior to or following the adoption of this Policy).
All determinations and decisions made by the Board (or any committee thereof) pursuant to the provisions of this Policy shall be final, conclusive and binding on the Company, its subsidiaries and the persons to whom this Policy applies. If you have questions about the interpretation of this Policy, please contact the Chief Financial Officer of the Company.
3
Exhibit 99.1

NEW FOUND GOLD CORP.
ANNUAL INFORMATION FORM
For the year ended December 31, 2024
Dated: March 20, 2025
TABLE OF CONTENTS
2 |
|||
2 |
|||
2 |
|||
2 |
|||
4 |
|||
4 |
|||
4 |
|||
4 |
|||
4 |
|||
5 |
|||
8 |
|||
9 |
|||
16 |
|||
19 |
|||
19 |
|||
20 |
|||
26 |
|||
30 |
|||
33 |
|||
38 |
|||
43 |
|||
47 |
|||
48 |
|||
48 |
|||
50 |
|||
50 |
|||
50 |
|||
50 |
|||
51 |
|||
51 |
|||
52 |
|||
52 |
|||
53 |
|||
53 |
|||
56 |
|||
56 |
|||
58 |
|||
58 |
|||
58 |
|||
59 |
|||
60 |
|||
60 |
|||
61 |
|||
61 |
|||
61 |
|||
61 |
|||
62 |
|||
SCHEDULE “A” CHARTER OF THE AUDIT COMMITTEE OF NEW FOUND GOLD CORP. |
A-1 |
||
1 |
In this Annual Information Form (“AIF”), “New Found”, “NFG” or the “Company” refers to New Found Gold Corp.
All information contained herein is as at December 31, 2024, unless otherwise stated.
1.1 |
New Found’s financial statements for the fiscal year ended December 31, 2024, were prepared in accordance with International Financial Reporting Standards as issued by the International Accounting Standards Board.
This AIF should be read in conjunction with New Found’s audited financial statements and notes thereto, as well as the management’s discussion and analysis for the years ended December 31, 2024 and 2023. The financial statements and management’s discussion and analysis are available under New Found’s profile on SEDAR+ at www.sedarplus.ca and on the Electronic Data Gathering, Analysis, and Retrieval (EDGAR) website at www.sec.gov of the United States Securities and Exchange Commission (the “SEC”).
1.2 |
All sums of money which are referred to in this AIF are expressed in lawful money of Canada, unless otherwise specified. References to “US$” are to United States Dollars.
1.3 |
This AIF contains “forward-looking information” and “forward-looking statements” (referred to together herein as “forward-looking information”). Forward-looking statements and information can generally be identified by the use of forward-looking terminology such as “may”, “will”, “expect”, “intend”, “estimate”, “anticipate”, “believe”, “continue”, “plans” or similar terminology. Forward-looking statements and information are not historical facts, are made as of the date of AIF, and include, but are not limited to, statements regarding discussions of results from operations (including, without limitation, statements about the Company’s opportunities, strategies, competition, expected activities and expenditures as the Company pursues its business plan, the adequacy of the Company’s available cash resources and other statements about future events or results), performance (both operational and financial) and business prospects, future business plans and opportunities and statements as to management’s expectations with respect to, among other things, the activities contemplated in this AIF.
Forward-looking statements included or incorporated by reference in this AIF include, without limitation, statements related to the Queensway Project (as such term is defined herein) and the Company’s planned and future exploration on the Queensway Project; the completion and timing of the Company’s initial resource estimate and preliminary economic assessment; the Company’s goals regarding exploration and potential development of its projects; the Company’s future business plans; expectations regarding the ability to raise further capital; the market price of gold; expectations regarding any environmental issues that may affect planned or future exploration and development programs and the potential impact of complying with existing and proposed environmental laws and regulations; the ability to retain and/or maintain any require permits, licenses or other necessary approvals for the exploration or development of its mineral properties; government regulation of mineral exploration and development operations in the Province of Newfoundland and Labrador; the Company’s compensation policy and practices; and the Company’s expected reliance on key management personnel, advisors and consultants.
These forward-looking statements involve numerous risks and uncertainties and other factors which may cause the actual results, performance or achievements of New Found to be materially different from any future results, performance or achievements expressed or implied by such forward-looking information.
2
Important factors that may cause actual results to vary include without limitation, the Company may fail to find a commercially viable deposit at any of its mineral properties; there are no mineral resources or mineral reserves on any of the properties in which the Company has an interest; the Company’s plans may be adversely affected by the Company’s reliance on historical data compiled by previous parties involved with its mineral properties; mineral exploration and development are inherently risky; the mineral exploration industry is intensely competitive; additional financing may not be available to the Company when required or, if available, the terms of such financing may not be favourable to the Company; fluctuations in the demand for gold; the Company may not be able to identify, negotiate, finance or receive regulatory approval for any future acquisitions successfully, or to integrate such acquisitions with its current business; the Company’s exploration activities are dependent upon the grant of appropriate licenses, concessions, leases, permits and regulatory consents, which may be withdrawn or not granted; the Company’s operations could be adversely affected by possible future government legislation, policies and controls or by changes in applicable laws and regulations; there is no guarantee that title to the properties in which the Company has a material interest will not be challenged or impugned; the Company faces various risks associated with mining exploration that are not insurable or may be the subject of insurance which is not commercially feasible for the Company; the volatility of global capital markets over the past several years has generally made the raising of capital more difficult; the potential impact of any tariffs, countervailing duties or other trade restrictions; economic and other consequences from Russia’s military action against Ukraine and the sanctions imposed in response to that action; economic and other consequences from the Israel-Hamas war; inflationary cost pressures may escalate the Company’s operating costs; compliance with environmental regulations can be costly; social and environmental activism can negatively impact exploration, development and mining activities; the success of the Company is largely dependent on the performance of its directors and officers; the Company’s operations may be adversely affected by First Nations land claims; the Company and/or its directors and officers may be subject to a variety of legal proceedings, the results of which may have a material adverse effect on the Company’s business; the Company may be adversely affected if potential conflicts of interests involving its directors and officers are not resolved in favour of the Company; the Company’s future profitability may depend upon the world market prices of gold; dilution from future equity financing could negatively impact holders of the Company’s securities; risks related to uninsured or partially insured losses; risks related to compliance with securities laws and listing requirements; failure to adequately meet infrastructure requirements could have a material adverse effect on the Company’s business; the Company’s projects now or in the future may be adversely affected by risks outside the control of the Company; the Company is subject to various risks associated with climate change; and other factors discussed under “Risk Factors”.
In making the forward-looking statements in this AIF, New Found has applied several material assumptions, including without limitation, the assumptions that: the ability to raise any necessary additional capital on reasonable terms to advance exploration and development of the Company’s mineral properties; future prices of gold and other metal prices; the timing and results of exploration and drilling programs; the demand for, and price of gold; that general business and economic conditions will not change in a material adverse manner; the Company’s ability to procure equipment and operating supplies in sufficient quantities and on a timely basis; the geology of the Queensway Project as described in the Technical Report (as such term is defined herein); the accuracy of budgeted exploration and development costs and expenditures; future currency exchange rates and interest rates; operating conditions being favourable such that the Company is able to operate in a safe, efficient and effective manner; the Company’s ability to attract and retain skilled personnel; political and regulatory stability; the receipt of governmental, regulatory, exchange and third-party approvals, licenses and permits on favourable terms; obtaining required renewals for existing approvals, licenses and permits on favourable terms; requirements under applicable laws; sustained labour stability; stability in financial and capital goods markets; and availability of equipment.
Certain of the risks and assumptions are described in more detail under the heading “Risk Factors” herein and in New Found’s audited financial statements and management discussion and analysis for the years ended December 31, 2024 and 2023, available under New Found’s profile on SEDAR+ at www.sedarplus.ca and on EDGAR at www.sec.gov.
The actual results or performance by New Found could differ materially from those expressed in, or implied by, any forward-looking statements relating to those matters. Accordingly, no assurances can be given that any of the events anticipated by the forward-looking statements will transpire or occur, or if any of them do so, what impact they will have on the results of operations or financial condition of the Company. Except as required by law, New Found is under no obligation, and expressly disclaim any obligation, to update, alter or otherwise revise any forward-looking statement, whether written or oral, that may be made from time to time, whether as a result of new information, future events or otherwise, except as may be required under applicable securities laws.
3
2 |
2.1 |
New Found was incorporated under the Business Corporations Act (Ontario) as Palisade Resources Corp. on January 6, 2016. By articles of amendment effective June 20, 2017, the Company’s name was changed to New Found Gold Corp.
On June 23, 2020, the Company continued into British Columbia under the provisions of the Business Corporations Act (British Columbia) (the “BCBCA”). The Company’s head office is located at 1055 West Georgia Street, Suite 2129, Vancouver, British Columbia V6E 3P2, Canada. The Company’s registered office is located at 1133 Melville Street, Suite 3500, The Stack, Vancouver, British Columbia, V6E 4E5, Canada.
New Found does not have any subsidiaries.
3 |
3.1 |
3.1.1 |
General |
New Found is a mineral exploration company involved in the identification, acquisition and exploration of mineral properties primarily in the Province of Newfoundland and Labrador. The Company’s exploration is focused on discovering and delineating gold resources. The Company has one material property: the Queensway Project located in Newfoundland, Canada (the “Queensway Project”, the “Queensway Property”, or the “Property”). At present, the Queensway Project does not have any known mineral resources or reserves.
Since incorporation, the Company has taken the following steps in developing its business: (i) identified and acquired mineral properties with sufficient merit to warrant exploration; (ii) raised funds to progress the Company’s exploration activities on its mineral properties, as described herein; (iii) completed technical reports on the Queensway Project, including the technical report titled “New Found Gold Corp’s Queensway Gold Project in Newfoundland and Labrador, Canada: 2024 Property Expansion And Exploration Update”, with an effective date of 1 November 2024, prepared by D. Roy Eccles, M.Sc., P. Geol. P. Geo. of APEX Geoscience Ltd., Mark K. Jorgensen, B.Sc., QP Metallurgy of Jorgensen Engineering and Technical Services, LLC, and Gary Simmons, B.Sc. QP Metallurgy of GL Simmons Consulting, LLC in compliance with National Instrument 43-101 (“NI 43-101”) (the “Technical Report”); (iv) undertaken exploration programs, including a 650,000 metre drill program, on the Queensway Project; and (v) retained directors, officers and employees with the skills required to successfully operate a public mineral exploration company.
The Company is a reporting issuer in all provinces and territories in Canada and is subject to the reporting requirements of the United States Securities Exchange Act of 1934, as amended (the “Exchange Act”). The Common Shares (as defined herein) of the Company trade on the TSX Venture Exchange (the “TSXV”) under the symbol “NFG” and on the NYSE American stock exchange (the “NYSE American”) under the symbol “NFGC”.
3.2 |
3.2.1 |
Principal Operations |
The Company is a mineral exploration company engaged in the acquisition, exploration and evaluation of resource properties with a focus on gold properties located in the Province of Newfoundland and Labrador, Canada.
3.2.2 |
Competitive Conditions |
The mineral exploration and mining industry is competitive in all phases of exploration, development and production. The Company competes with a number of other entities and individuals in the search for and the acquisition of attractive mineral properties. As a result of this competition, the Company may not be able to acquire attractive properties in the future on terms it considers acceptable. The Company may also encounter competition from other mining companies in efforts to hire experienced mining professionals. Increased competition could adversely affect the Company’s ability to attract necessary funding or acquire suitable properties or prospects for mineral exploration in the future. See “Risk Factors – Competition and Mineral Exploration”.
4
3.2.3 |
Specialized Skills and Knowledge |
Various aspects of the Company’s business require specialized skills and knowledge. Such skills and knowledge include, but are not limited to, expertise related to mineral exploration, geology, drilling, permitting, metallurgy, logistical planning, and implementation of exploration programs, as well as legal compliance, finance, and accounting. The Company expects to rely upon various legal and financial advisors, consultants, and others in the operation and management of its business. See “Risk Factors – Dependence on Management and Key Personnel”.
3.2.4 |
Cycles |
The Company’s mineral exploration activities may be subject to seasonality due to adverse weather conditions including, without limitation, inclement weather, frozen ground and restricted access due to snow, ice, or other weather-related factors. In addition, the mining and mineral exploration business is subject to global economic cycles effecting, among other things, the marketability and price of gold products in the global marketplace.
3.2.5 |
Employees |
As at December 31, 2024, the Company had 62 employees, and at the date of this AIF, the Company has 53 employees. The Company also relies on consultants and contractors to carry on its business activities and, in particular, to supervise and carry-out mineral exploration on its Queensway Project.
3.2.6 |
Environmental Protection |
The Company is currently engaged in exploration activities on its Queensway Project and such activities are subject to various laws, rules, and regulations governing the protection of the environment. Corporate obligations to protect the environment under the various regulatory regimes in which the Company operates may affect the financial position, operational performance, and earnings of the Company. A breach of such legislation may result in imposition of fines and penalties. Management believes all of the Company’s activities are in material compliance with all applicable environmental legislation. See “Risk Factors – Environmental Risks”.
3.2.7 |
Social or Environmental Policies |
The Company is committed to conducting its operations in accordance with sound social and environmental practices. At present, the scale of operations has not required the adoption of formal policies. The Company will re-evaluate this position if and when necessary.
The Company is subject to the laws and regulations relating to environmental matters in all jurisdictions in which it operates, including provisions relating to property reclamation, discharge of hazardous materials and other matters. The Company may also be held liable should environmental problems be discovered that were caused by former owners and operators of its properties. The Company conducts its mineral exploration activities in compliance with applicable environmental protection legislation.
3.3 |
3.3.1 |
Director and Officer Appointments and Resignations |
On April 14, 2022, the Company announced that Craig Roberts resigned as Chief Executive Officer and as a director of the Company, Collin Kettell was appointed as Chief Executive Officer of the Company and Vijay Mehta was appointed as a director of the Company. As part of a planned transition, Craig Roberts continued with the Company as a full-time consultant in the role of Lead Advisor until November 2022.
On June 7, 2022, the Company announced the appointment of Ron Hampton as Chief Development Officer of the Company and the resignation of Dr. Quinton Hennigh as a director of the Company.
On October 11, 2022, the Company announced the appointment of Raymond Threlkeld as an independent member of the Company’s board of directors (the “Board”).
On December 18, 2024, the Company announced that following the annual general meeting of the shareholders, the Board comprised of Paul Huet, Collin Kettell, Vijay Mehta, William Hayden, and Melissa Render.
5
3.3.2 |
Initiation of Maiden Resource and Preliminary Economic Assessment |
On November 6, 2024, the Company announced initiation of work towards a maiden resource estimate, as well as a preliminary economic assessment for the Queensway Project. The Company is currently preparing initial mineral resource estimate with a projected release date in early Q2 2025. The Company intends to use the initial mineral resources to prepare a preliminary economic assessment in late Q2 2025.
3.3.3 |
Royalty Purchase Agreements |
On July 30, 2024 the Company announced that it entered into three royalty purchase agreements (the “Royalty Purchase Agreements”) with arm’s length royalty holders (each a “Vendor” and collectively the “Vendors”) whereby the Company purchased part of each Vendor’s royalty interest. Pursuant to the Royalty Purchase Agreements, the Company purchased, in aggregate, 0.6% of the Vendors’ 1.6% net smelter returns royalty on the Company’s Golden Bullet property (the “Royalty Interests”). Under the terms of the Royalty Purchase Agreements, as consideration for the Royalty Interests, the Company paid $650,000 cash consideration and issued 100,000 Common Shares to each Vendor, for an aggregate cash consideration of $1,950,000 and aggregate share consideration of 300,000 Common Shares. The Company had the right to purchase the remaining 1% net smelter returns royalty from the Vendors for an aggregate price equal to $1,000,000 (the “Repurchase Price”) by November 12, 2024, payable by (i) an aggregate of $100,000 and (ii) an additional $4,950, in the aggregate, per year until the Repurchase Price is satisfied.
On October 15, 2024, the Company announced that the Company purchased the remaining royalty from the Vendors for an aggregate cash consideration of $1,000,000.
3.3.4 |
LabGold Acquisitions |
On July 9, 2024, the Company announced that it completed an acquisition of a 100% interest in Labrador Gold Corp.’s (“LabGold”) Kingsway Project (the “Kingsway Project”), located in Gander, Newfoundland and Labrador, as well as certain related assets of LabGold. Pursuant to the acquisition, the Company issued to LabGold 5,263,157 Common Shares as consideration.
3.3.5 |
ThreeD Settlement Agreement |
On June 6, 2024, the Company announced that it had entered into a settlement agreement (the “Settlement Agreement”) with respect to the lawsuit filed by ThreeD Capital Inc. (“ThreeD”) and 13313366 Ontario Inc. (“131”) and, together with ThreeD, the “Plaintiffs”) against the Company, Palisades Goldcorp Ltd. and Collin Kettell (together, the “Defendants”) in the Ontario Superior Court of Justice. Pursuant to the Settlement Agreement, New Found issued 285,429 Common Shares to ThreeD and 84,571 Common Shares to 131. The Settlement Agreement does not include any admission of liability and provides for fulsome releases by the Plaintiffs to the Defendants.
3.3.6 |
Sky Gold Corp Acquisitions |
In May 2024, New Found completed a purchase agreement with Sky Gold Corp. (“Sky Gold”), whereby New Found completed an acquisition of a 100% interest in certain licenses and mining claims of Sky Gold subject to certain existing royalties, which were assumed by New Found. Pursuant to the agreement, New Found paid $35,000 as consideration.
3.3.7 |
November 2023 $56 Million Bought Deal Financing |
On October 30, 2023, the Company announced it entered into an agreement with BMO Nesbitt Burns Inc. on behalf of a syndicate of underwriters, pursuant to which the underwriters agreed to purchase, on a “bought deal” basis, 7,725,000 Common Shares that qualify as “flow-through shares” (within the meaning of the Income Tax Act (Canada) (the “Tax Act”)) at a price of $7.25 per flow-through Common Share (the “2023 Offering Price”) for aggregate gross proceeds of $56,006,250. The Company granted the underwriters an option to purchase up to an additional 1,158,750 flow-through Common Shares at the 2023 Offering Price for the purpose of covering the underwriters’ over-allocation position.
On November 6, 2023, the Company announced it closed the offering of 7,725,000 flow through Common Shares for aggregate gross proceeds of $56,006,250. These flow-through Common Shares were offered by way of a prospectus supplement dated November 1, 2023, to the 2022 Base Shelf (as defined herein) in each of the provinces and territories of Canada (other than Québec) and were also offered by way of U.S. prospectus supplement contained in the effective Registration Statement (as defined below).
6
3.3.8 |
Participation in Brokered Note Offering by Maritime Resources Corp. |
On August 14, 2023, the Company participated in a brokered note offering completed by Maritime Resources Corp. consisting of the issuance of non‐convertible senior secured notes and common share purchase warrants. The Company subscribed for 2,000 non‐convertible senior secured notes, which mature on August 14, 2025, with a face value of US$1,000 each. These non‐convertible senior secured notes were issued at a 2.0% original issue discount on the principal amount for a gross investment of US$1,960,000 (CAD$2,638,500).
3.3.9 |
Disposal of Lucky Strike Property and Investment in Kirkland Lake Discoveries Corp. |
On May 25, 2023, the Company disposed of its 100% interest in its Lucky Strike project to Kirkland Lake Discoveries Corp. (formerly Warrior Gold Inc.) (“KLD”) for total non-cash consideration comprised of 28,612,500 common shares of KLD (“KLD Shares”) and a 1.0% net smelter return royalty on future production from the mineral claims. The investment represented 32.29% of the issued and outstanding KLD Shares at the time of closing, and as at December 31, 2023. The Company exercised its right to nominate two additional directors to the board of directors of KLD.
Based on assessments of the relevant facts and circumstances, primarily, the Company’s ownership interests, board representation and ability to influence operating, strategic and financing decisions, the Company concluded that it has had significant influence over KLD for the period from May 25, 2023 and has accounted for its investment in KLD as an investment in an associate.
The KLD Shares are listed on the TSXV.
3.3.10 |
December 2022 Flow-Through Public Offering |
On December 7, 2022, the Company announced it entered into an agreement with BMO Nesbitt Burns Inc. on behalf of a syndicate of underwriters, pursuant to which the underwriters agreed to purchase, on a “bought deal” basis, 6,250,000 Common Shares that qualify as “flow-through shares” within the meaning of the Tax Act at a price of $8.00 per flow-through Common Share (the “2022 Offering Price”) for aggregate gross proceeds of $50,000,000. The Company granted the underwriters an option to purchase up to an additional 937,500 flow-through Common Shares at the 2022 Offering Price for the purpose of covering the underwriters’ over-allocation position.
On December 14, 2022, the Company announced it closed the offering of 6,250,000 flow through Common Shares for aggregate gross proceeds of $50,000,000. Eric Sprott participated to maintain his 19.9% interest in the Company. These flow-through Common Shares were offered by way of a prospectus supplement dated December 9, 2022, to the 2022 Base Shelf in each of the provinces and territories of Canada (other than Québec) and were also offered by way of U.S. prospectus supplement contained in the effective Registration Statement.
3.3.11 |
At-The-Market Offering |
On August 26, 2022, the Company announced that it had entered into an equity distribution agreement dated August 26, 2022, providing for an at-the-market equity offering program (“ATM”), with BMO Nesbitt Burns Inc. and Paradigm Capital Inc., as the Canadian agents, and BMO Capital Markets Corp., as the U.S. agent. The intention of the ATM was to allow New Found, through the agents and from time to time, to offer and sell, in Canada and the United States through the facilities of the TSXV and NYSE American, such number of Common Shares as would have an aggregate offering price of up to US$100 million. The sales of Common Shares through the ATM were made pursuant to, and qualified in Canada by, a prospectus supplement dated August, 26, 2022, to the 2022 Base Shelf prospectus and in the U.S. pursuant to a prospectus supplement contained in the effective Registration Statement.
During the twelve months ended December 31, 2022, the Company sold 500,229 Common Shares under the ATM at an average price of $5.097 for gross proceeds of $2,549,677, or net proceeds of $2,489,754, and paid an aggregate commission of $59,923.
During the twelve months ended December 31, 2023, the Company sold 3,552,224 Common Shares under the ATM at an average price of $6.47 for gross proceeds of $22,980,338, or net proceeds of $22,440,215, and paid an aggregate commission of $540,123.
During the twelve months ended December 31, 2024, the Company sold 5,857,242 Common Shares under the ATM at an average price of $4.70 for gross proceeds of $27,522,494, or net proceeds of $26,604,884, and paid an aggregate commission of $917,610. As at September 30, 2024, the ATM was terminated.
7
3.3.12 |
2022 Base Shelf Prospectus |
On July 22, 2022, the Company filed a final short form base shelf prospectus (the “2022 Base Shelf”) and a United States registration statement on Form F-10 (File No. 333-266285) with the SEC (the “Registration Statement”) with respect to offerings of securities of the Company to raise aggregate gross proceeds of up to US$300 million over 25 months.
3.3.13 |
Novo Transaction |
On March 6, 2020, the Company issued 15,000,000 Common Shares to Novo Resources Corp., a TSXV-listed mineral exploration and development corporation (“Novo”), at a subscription price of $1.12 per Common Share, which was paid to the Company by the issuance of 6,944,444 common shares in the capital of Novo. Upon closing of the transaction, Novo owned approximately 15.97% of the Company’s issued and outstanding Common Shares and New Found owned approximately 3.73% of the issued and outstanding common shares of Novo. Pursuant to the terms of the transaction, Novo had the right to appoint a director to the Board (as defined herein) at any time until March 6, 2023, provided that Novo holds no less than 10% of the issued and outstanding Common Shares. In connection with Novo’s right to appoint a director to the Board, Novo appointed Dr. Quinton Hennigh as its director nominee. Dr. Hennigh was elected to the Board on June 17, 2020. On April 27, 2022, Eric Sprott announced that 2176423 Ontario Ltd., a corporation which is beneficially owned by him, acquired 8,250,000 Common Shares from Novo at $8.35 per Common Share for consideration of $68,887,500 in connection with the first tranche closing of the private agreement transaction announced by him on April 12, 2022. A second tranche closed on August 8, 2022, for an additional 6,750,000 Common Shares at $8.45 per Common Share for a total consideration of $125,925,000 for all of Novo’s Common Shares.
3.3.14 |
Recent Events |
On January 20, 2025, the Company announced the appointment of Keith Boyle as Chief Executive Officer of the Company, following the resignation of Collin Kettell from such position.
On February 18, 2025, the Company announced the appointment of Dr. Fiona Childe (Ph.D., P.Geo.) as Vice President, Communications and Corporate Development, Dr. Jared Saunders (Ph.D., CRSP, EP) as Vice President, Sustainability, and Robert Assabgui (P.Eng.) as Study Manager. The Company also announced the resignation of Greg Matheson as Chief Operating Officer, and Ron Hampton as Chief Development Officer.
On March 3, 2025, the Company announced the appointment of Chad Williams to its Board, replacing Collin Kettell, who resigned from the Board.
Since the filling of the last Technical Report (effectively dated November 1, 2024), the Company has completed an additional 23,226 m of diamond drilling as part of a regional exploration program along the most northern segment of the AFZ at Pistachio, Dropkick and early targets in addition to follow up drilling at the recent discovery, Golden Dome, located north of Golden Joint. These drilling activities expand the gold mineralization at Golden Dome (announced February 24, 2025) and Dropkick (announced February 11, 2025).
On December 2, 2024, the Company announced the results of its Phase II Keats Trench channel sampling program, which increased sample density along gold-bearing veins providing information about the variability of the gold mineralization and the assessment of the vein domains that are oblique to the Phase I (announced September 23, 2024) systematic channel sampling grid.
The Company is currently preparing initial mineral resource estimate with a projected release date in early Q2 2025. The Company intends to use the initial mineral resources to prepare a preliminary economic assessment in late Q2 2025.
4 |
The business and operations of New Found are speculative due to the high-risk nature of its business, which is the exploration of mineral properties. The risks listed below are not the only risks and uncertainties that New Found faces. Additional risks and uncertainties not presently known to New Found or that New Found currently considers immaterial may also materially impair its business. These risk factors could materially affect New Found’s business, financial condition and future operating results and could cause actual events to differ materially from those described in forward-looking statements relating to the Company.
If any of the following risks occur, New Found’s business, financial condition and operating results could be materially adversely affected.
8
4.1 |
4.1.1 |
Exploration Stage Company |
The Company is an exploration stage company and cannot give any assurance that a commercially viable deposit, or “reserve,” exists on any properties for which the Company currently has or may have (through potential future joint venture agreements or acquisitions) an interest. Determination of the existence of a reserve depends on appropriate and sufficient exploration work and the evaluation of legal, economic, and environmental factors. If the Company fails to find a commercially viable deposit on any of its properties, its financial condition and results of operations will be materially adversely affected.
4.1.2 |
No Mineral Resources |
Currently, there are no mineral resources (within the meaning of NI 43-101) on any of the properties in which the Company has an interest and the Company cannot give any assurance that any mineral resources will be identified. If the Company fails to identify any mineral resources on any of its properties, its financial condition and results of operations will be materially adversely affected.
4.1.3 |
No Mineral Reserves |
Currently, there are no mineral reserves (within the meaning of NI 43-101) on any of the properties in which the Company has an interest and the Company cannot give any assurance that any mineral reserves will be identified. If the Company fails to identify any mineral reserves on any of its properties, its financial condition and results of operations will be materially adversely affected.
4.1.4 |
Reliability of Historical Information |
The Company has relied on, and the disclosure in the Technical Report is based, in part, upon, historical data compiled by previous parties involved with the mineral claims that form the Queensway Project. To the extent that any of such historical data is inaccurate or incomplete, the Company’s exploration plans may be adversely affected.
4.1.5 |
Mineral Exploration and Development |
Resource exploration and development is a speculative business, characterized by a number of significant risks including, among other things, unprofitable efforts resulting not only from the failure to discover mineral deposits but from finding mineral deposits which, though present, are insufficient in quantity and quality to return a profit from production. The marketability of minerals acquired or discovered by the Company may be affected by numerous factors which are beyond the control of the Company and which cannot be accurately predicted, such as market fluctuations, the proximity and capacity of milling facilities, mineral markets and processing equipment and such other factors as government regulations, including regulations relating to royalties, allowable production, importing and exporting of minerals and environmental protection, the combination of which factors may result in the Company not receiving an adequate return of investment capital.
There is no assurance that the Company’s mineral exploration and any development activities will result in any discoveries of commercial bodies of ore. The long-term profitability of the Company’s operations will in part be directly related to the costs and success of its exploration programs, which may be affected by a number of factors. Substantial expenditures are required to establish mineral resources through drilling and to develop the mining and processing facilities and infrastructure at any site chosen for mining. Although substantial benefits may be derived from the discovery of a major mineralized deposit, no assurance can be given that minerals will be discovered in sufficient quantities to justify commercial operations or that funds required for development can be obtained on a timely basis. Substantial expenditures are required to establish reserves through exploration and drilling, to develop metallurgical processes to extract the metal from the ore and, in the case of new properties, to develop the mining and processing facilities and infrastructure at any site chosen for mining. Although substantial benefits may be derived from the discovery of a major mineralized deposit, no assurance can be given that minerals will be discovered in sufficient quantities and grades to justify commercial operations or that funds required for development can be obtained on a timely basis.
Estimates of reserves, mineral deposits and production costs can also be affected by such factors as environmental permitting regulations and requirements, weather, environmental factors, unforeseen technical difficulties, unusual or unexpected geological formations and work interruptions. In addition, the grade of ore ultimately mined may differ from that indicated by drilling results. Short term factors relating to reserves, such as the need for orderly development of ore bodies or the processing of new or different grades, may also have an adverse effect on mining operations and on the results of operations. Material changes in ore reserves, grades, stripping ratios or recovery rates may affect the economic viability of any project.
9
4.1.6 |
Competition and Mineral Exploration |
The mineral exploration industry is intensely competitive in all of its phases and the Company must compete in all aspects of its operations with a substantial number of large established mining companies with greater liquidity, greater access to credit and other financial resources, newer or more efficient equipment, lower cost structures, more effective risk management policies and procedures and/or greater ability than the Company to withstand losses. The Company’s competitors may be able to respond more quickly to new laws or regulations or emerging technologies or devote greater resources to the expansion of their operations, than the Company can. In addition, current and potential competitors may make strategic acquisitions or establish cooperative relationships among themselves or with third parties. Competition could adversely affect the Company’s ability to acquire suitable new mineral properties or prospects for exploration in the future. Competition could also affect the Company’s ability to raise financing to fund the exploration and development of its properties or to hire qualified personnel. The Company may not be able to compete successfully against current and future competitors, and any failure to do so could have a material adverse effect on the Company’s business, financial condition or results of operations.
4.1.7 |
Additional Funding |
The exploration and development of the Company’s mineral properties will require substantial additional capital. When such additional capital is required, the Company will need to pursue various financing transactions or arrangements, including joint venturing of projects, debt financing, equity financing or other means. Additional financing may not be available when needed or, if available, the terms of such financing might not be favourable to the Company and might involve substantial dilution to existing shareholders. The Company may not be successful in locating suitable financing transactions in the time period required or at all. A failure to raise capital when needed would have a material adverse effect on the Company’s business, financial condition and results of operations. Any future issuance of securities to raise required capital will likely be dilutive to existing shareholders. In addition, debt and other debt financing may involve a pledge of assets and may be senior to interests of equity holders. The Company may incur substantial costs in pursuing future capital requirements, including investment banking fees, legal fees, accounting fees, securities law compliance fees, printing and distribution expenses and other costs.
The ability to obtain needed financing may be impaired by such factors as the capital markets (both generally and in the gold and copper industries in particular), the Company’s status as a new enterprise with a limited history, the location of the Company’s mineral properties, the price of commodities and/or the loss of key management personnel.
4.1.8 |
Acquisition of Additional Mineral Properties |
If the Company loses or abandons its interests in its mineral properties, there is no assurance that it will be able to acquire another mineral property of merit or that such an acquisition would be approved by applicable securities regulatory authorities. There is also no guarantee that applicable securities regulatory authorities will approve the acquisition of any additional properties by the Company, whether by way of an option or otherwise, should the Company wish to acquire any additional properties.
4.1.9 |
Government or Regulatory Approvals |
Exploration and development activities are dependent upon the grant of appropriate licences, concessions, leases, permits and regulatory consents, which may be withdrawn or made subject to limitations. There is no guarantee that, upon completion of any exploration, a mining licence will be granted with respect to exploration territory. There can also be no assurance that any exploration licence will be renewed or if so, on what terms. These licences place a range of past, current and future obligations on the Company. In some cases, there could be adverse consequences for breach of these obligations, ranging from penalties to, in extreme cases, suspension or termination of the relevant licence or related contract.
4.1.10 |
Permits and Government Regulation |
The future operations of the Company may require permits from various federal, state, provincial and local governmental authorities and will be governed by laws and regulations governing prospecting, development, mining, production, export, taxes, labour standards, occupational health, waste disposal, land use, environmental protections, mine safety and other matters.
Although Canada has a favourable legal and fiscal regime for exploration and mining, including a relatively simple system for the acquisition of mineral titles and relatively low tax burden, possible future government legislation, policies and controls relating to prospecting, development, production, environmental protection, mining taxes and labour standards could cause additional expense, capital expenditures, restrictions and delays in the activities of the Company, the extent of which cannot be predicted. Before development and production can commence on any properties, the Company must obtain regulatory and environmental approvals. There is no assurance that such approvals can be obtained on a timely basis or at all.
10
The cost of compliance, with changes in governmental regulations, has the potential to reduce the profitability of operations. The Company is currently in compliance with all material regulations applicable to its exploration activities.
4.1.11 |
Limited Operating History |
The Company has a limited operating history and its mineral properties are exploration stage properties. As such, the Company will be subject to all of the business risks and uncertainties associated with any new business enterprise, including under-capitalization, cash shortages, limitations with respect to personnel, financial and other resources and lack of revenues. The current state of the Company’s mineral properties require significant additional expenditures before any cash flow may be generated. Although the Company possesses an experienced management team, there is no assurance that the Company will be successful in achieving a return on shareholders’ investment and the likelihood of success of the Company must be considered in light of the problems, expenses, difficulties, complications and delays frequently encountered in connection with the establishment of any business. There is no assurance that the Company can generate revenues, operate profitably, or provide a return on investment, or that it will successfully implement its plans.
An investment in the Company’s securities carries a high degree of risk and should be considered speculative by purchasers. There is no assurance that we will be successful in achieving a return on shareholders’ investment and the likelihood of our success must be considered in light of our early stage of operations. You should consider any purchase of the Company’s securities in light of the risks, expenses and problems frequently encountered by all companies in the early stages of their corporate development.
4.1.12 |
Title Risks |
Although the Company has or will receive title opinions for any properties in which it has a material interest, there is no guarantee that title to such properties will not be challenged or impugned. The Company has not conducted surveys on all of the claims in which it holds direct or indirect interests. The Company’s properties may be subject to prior unregistered agreements or transfers or native land claims and title may be affected by unidentified or unknown defects. Title insurance is generally not available for mineral properties and the Company’s ability to ensure that it has obtained secure claims to individual mineral properties or mining concessions may be constrained.
A successful challenge to the Company’s title to a property or to the precise area and location of a property could cause delays or stoppages to the Company’s exploration, development or operating activities without reimbursement to the Company. Any such delays or stoppages could have a material adverse effect on the Company’s business, financial condition and results of operations.
4.1.13 |
Laws and Regulation |
The Company’s exploration activities are subject to extensive federal, provincial and local laws and regulations governing prospecting, development, production, exports, taxes, labour standards, occupational health and safety, mine safety and other matters in all the jurisdictions in which it operates. These laws and regulations are subject to change, can become more stringent and compliance can therefore become more costly. The Company applies the expertise of its management, advisors, employees and contractors to ensure compliance with current laws.
4.1.14 |
Uninsured and Underinsured Risks |
The Company faces and will face various risks associated with mining exploration and the management and administration thereof including those associated with being a public company. Some of these risks are not insurable; some may be the subject of insurance which is not commercially feasible for the Company. Those insurances which are purchased will have exclusions and deductibles which may eliminate or restrict recovery in the event of loss. In some cases, the amount of insurance purchased may not be adequate in amount or in limit.
The Company will undertake intermittent assessments of insurable risk to help ensure that the impact of uninsured/underinsured loss is minimized within reason. Risks may vary from time to time within this intermittent period due to changes in such things as operations operating conditions, laws or the climate which may leave the Company exposed to periods of additional uninsured risk.
In the event risk is uninsurable, at its reasonable and sole discretion, the Company may endeavor to implement policies and procedures, as may be applicable and/or feasible, to reduce the risk of related loss.
11
4.1.15 |
Global Economy Risk |
The volatility of global capital markets, over the past several years has generally made the raising of capital by equity or debt financing more difficult. The Company may be dependent upon capital markets to raise additional financing in the future. As such, the Company is subject to liquidity risks in meeting its operating expenditure requirements and future development cost requirements in instances where adequate cash positions are unable to be maintained or appropriate financing is unavailable.
These factors may impact the ability to raise equity or obtain loans and other credit facilities in the future and on terms favourable to the Company and its management.
In addition, as the Company’s operations expand and reliance on global supply chains increases, the impact of significant geopolitical risk and conflict globally may have a sizeable and unpredictable impact on the Company’s business, financial condition and operations. The ongoing conflict in Ukraine, the Israel-Hamas war, and the global response to these conflicts as it relates to sanctions, trade embargos and military support has resulted in significant uncertainty as well as economic and supply chain disruptions. Should the Israel-Hamas war expand, or the Ukraine conflict continue for an extended period of time, or should other geopolitical disputes and conflicts emerge in other regions, this could result in material adverse effects to the Company.
4.1.16 |
Uncertainty of Trade Policies |
The imposition of tariffs or other trade restrictions, particularly those threatened or imposed by the U.S. and any retaliatory tariffs imposed by Canada, could have significant repercussions for Canadian businesses and the broader economy. Increased costs of goods and services may contribute to inflation and hamper economic growth. The Company can be affected by tariffs and the consequent disruptions in global trade in several ways, including decreased availability of supplies and increases to costs related to changes in foreign exchange rates.
4.1.17 |
Sanctions |
The Company’s business, financial condition and results of operations may be negatively affected by economic and other consequences from Russia’s military action against Ukraine and the sanctions imposed in response to that action.
In late February 2022, Russia launched a large-scale military attack on Ukraine. The invasion significantly amplified already existing geopolitical tensions among Russia, Ukraine, Europe, NATO, and the West, including Canada. In response to the military action by Russia, various countries, including Canada, the United States, the United Kingdom, and European Union issued broad-ranging economic sanctions against Russia. Such sanctions included, among other things, a prohibition on doing business with certain Russian companies, large financial institutions, officials, and oligarchs; a commitment by certain countries and the European Union to remove selected Russian banks from the Society for Worldwide Interbank Financial Telecommunications, or SWIFT, the electronic banking network that connects banks globally; a ban of oil imports from Russia to the United States; and restrictive measures to prevent the Russian Central Bank from undermining the impact of the sanctions. Additional sanctions may be imposed in the future.
Such sanctions (and any future sanctions) and other actions against Russia may adversely impact, among other things, the Russian economy and various sectors of the economy, including but not limited to, financials, energy, metals and mining, engineering and defense and defense-related materials sectors; result in a decline in the value and liquidity of Russian securities; result in boycotts, tariffs, and purchasing and financing restrictions on Russia’s government, companies and certain individuals; weaken the value of the ruble; downgrade the country’s credit rating; freeze Russian securities and/or funds invested in prohibited assets and impair the ability to trade in Russian securities and/or other assets; and have other adverse consequences on the Russian government, economy, companies and region. Further, several large corporations and U.S. states have announced plans to divest interests or otherwise curtail business dealings with certain Russian businesses.
The ramifications of the hostilities and sanctions may not be limited to Russia, Ukraine, and Russian and Ukrainian companies and may spill over to and negatively impact other regional and global economic markets (including Europe, Canada, and the United States), companies in other countries (particularly those that have done business with Russia and Ukraine) and on various sectors, industries and markets for securities and commodities globally, such as oil and natural gas. Accordingly, the actions discussed above and the potential for a wider conflict could increase financial market volatility and cause severe negative effects on regional and global economic markets, industries, and companies. In addition, Russia may take retaliatory actions and other countermeasures, including cyberattacks and espionage against other countries and companies around the world, which may negatively impact such countries and companies.
The extent and duration of the military action or future escalation of such hostilities, the extent and impact of existing and future sanctions, market disruptions, and volatility, and the result of any diplomatic negotiations cannot be predicted.
12
While we expect any direct impacts to our business to be limited, the indirect impacts on the economy and on the mining industry and other industries in general could negatively affect our business and may make it more difficult for us to raise equity or debt financing. In addition, the impact of other current macro-economic factors on our business, which may be exacerbated by the war in Ukraine – including inflation, supply chain constraints and geopolitical events – is uncertain. If these levels of volatility persist or if there is a further economic slowdown, the Company’s operations, the Company’s ability to raise capital could be adversely impacted.
4.1.18 |
Inflation |
The Company’s operating costs could escalate and become uncompetitive due to supply chain disruptions, inflationary cost pressures, equipment limitations, escalating supply costs, commodity prices and additional government intervention through stimulus spending or additional regulations. The Company’s inability to manage costs may impact, among other things, future development decisions, which could have a material adverse impact on the Company’s financial performance.
4.1.19 |
Environmental Risks |
The Company’s activities are subject to extensive laws and regulations governing environment protection. The Company is also subject to various reclamation related conditions. Although the Company closely follows and believes it is operating in compliance with all applicable environmental regulations, there can be no assurance that all future requirements will be obtainable on reasonable terms. Failure to comply may result in enforcement actions causing operations to cease or be curtailed and may include corrective measures requiring capital expenditures. Intense lobbying over environmental concerns by non-governmental organizations has caused some governments to cancel or restrict development of mining projects. Current publicized concern over climate change may lead to carbon taxes, requirements for carbon offset purchases or new regulation. The costs or likelihood of such potential issues to the Company cannot be estimated at this time.
The legal framework governing this area is constantly developing, therefore the Company is unable to fully ascertain any future liability that may arise from the implementation of any new laws or regulations, although such laws and regulations are typically strict and may impose severe penalties (financial or otherwise). The proposed activities of the Company, as with any exploration, may have an environmental impact which may result in unbudgeted delays, damage, loss, and other costs and obligations including, without limitation, rehabilitation, and/or compensation.
There is also a risk that the Company’s operations and financial position may be adversely affected by the actions of environmental groups or any other group or person opposed in general to the Company’s activities and, in particular, the proposed exploration and mining by the Company within the Province of Newfoundland and Labrador.
4.1.20 |
Social and Environmental Activism |
There is an increasing level of public concern relating to the effects of mining on the nature landscape, in communities and on the environment. Certain non-governmental organizations, public interest groups and reporting organizations (“NGOs”) who oppose resource development can be vocal critics of the mining industry. In addition, there have been many instances in which local community groups have opposed resource extraction activities, which have resulted in disruption and delays to the relevant operation.
While the Company seeks to operate in a social responsible manner and believes it has good relationships with local communities in the regions in which it operates, NGOs, or local community organizations could direct adverse publicity against and/or disrupt the operations of the Company in respect of one or more of its properties, regardless of its successful compliance with social and environmental best practices, due to political factors, activities of unrelated third parties on lands in which the Company has an interest, or the Company’s operations specifically. Any such actions and the resulting media coverage could have an adverse effect on the reputation and financial condition of the Company or its relationships with the communities in which it has operations, which could have a material adverse effect on the Company’s business, financial condition, results of operations, cash flows, or prospects.
4.1.21 |
Dependence on Management and Key Personnel |
The success of the Company is currently largely dependent on the performance of its directors and officers. The loss of the services of any of these persons could have a materially adverse effect on the Company’s business and prospects. There is no assurance the Company can maintain the services of its directors, officers, or other qualified personnel required to operate its business. As the Company’s business activity grows, the Company will require additional key financial, administrative, and mining personnel, as well as additional operations staff. There can be no assurance that these efforts will be successful in attracting, training, and retaining qualified personnel as competition for persons with these skill sets increase. If the Company is not successful in attracting, training, and retaining qualified personnel, the efficiency of its operations could be impaired, which could have an adverse impact on the Company’s operations and financial condition.
13
4.1.22 |
First Nations Land Claims |
Certain of the Company’s mineral properties may now or in the future be the subject of First Nations land claims. The legal nature of First Nations land claims is a matter of considerable complexity. The impact of any such claim on the Company’s material interest in the Company’s mineral properties and/or potential ownership interest in the Company’s mineral properties in the future, cannot be predicted with any degree of certainty and no assurance can be given that a broad recognition of First Nations rights in the areas in which the Company’s mineral properties are located, by way of negotiated settlements or judicial pronouncements, would not have an adverse effect on the Company’s activities.
Even in the absence of such recognition, the Company may at some point be required to negotiate with and seek the approval of holders of First Nations interests in order to facilitate exploration and development work on the Company’s mineral properties, there is no assurance that the Company will be able to establish practical working relationships with the First Nations in the area which would allow it to ultimately develop the Company’s mineral properties.
4.1.23 |
Claims and Legal Proceedings |
The Company and/or its directors and officers may be subject to a variety of civil or other legal proceedings, with or without merit. From time to time in the ordinary course of its business, the Company may become involved in various legal proceedings, including commercial, employment and other litigation and claims, as well as governmental and other regulatory investigations and proceedings. Such matters can be time-consuming, divert management’s attention and resources and cause the Company to incur significant expenses. Furthermore, because litigation is inherently unpredictable, the results of any such actions may have a material adverse effect on the Company’s business, operating results or financial condition. See Section 11 – Legal Proceedings and Regulatory Actions.
4.1.24 |
Conflicts of Interest |
Most of the Company’s directors and officers do not devote their full time to the affairs of the Company. All of the directors and some of the officers of the Company are also directors, officers and shareholders of other natural resource or public companies, and as a result they may find themselves in a position where their duty to another company conflicts with their duty to the Company. Although the Company has policies which address such potential conflicts and the BCBCA has provisions governing directors in the event of such a conflict, none of the Company’s constating documents or any of its other agreements contain any provisions mandating a procedure for addressing such conflicts of interest. There is no assurance that any such conflicts will be resolved in favour of the Company. If any such conflicts are not resolved in favour of the Company, the Company may be adversely affected.
4.1.25 |
Gold and Metal Prices |
If the Company’s mineral properties are developed from exploration properties to full production properties, the majority of our revenue will be derived from the sale of gold. Therefore, the Company’s future profitability will depend upon the world market prices of the gold for which it is exploring. The price of gold and other metals are affected by numerous factors beyond the Company’s control, including levels of supply and demand, global or regional consumptive patterns, sales by government holders, metal stock levels maintained by producers and others, increased production due to new mine developments and improved mining and production methods, speculative activities related to the sale of metals, availability and costs of metal substitutes. Moreover, gold prices are also affected by macroeconomic factors such as expectations regarding inflation, interest rates and global and regional demand for, and supply of, gold as well as general global economic conditions. These factors may have an adverse effect on the Company’s exploration, development and production activities, as well as on its ability to fund those activities.
4.1.26 |
Negative Cash Flow from Operating Activities |
The Company has no history of earnings and had negative cash flow from operating activities since inception. The Company’s mineral properties are in the exploration stage and there are no known mineral resources or reserves and the proposed exploration programs on the Company’s mineral properties are exploratory in nature. Significant capital investment will be required to achieve commercial production from the Company’s existing projects. There is no assurance that any of the Company’s mineral properties will generate earnings, operate profitably, or provide a return on investment in the future. Accordingly, the Company will be required to obtain additional financing in order to meet its future cash commitments.
14
4.1.27Going Concern Risk
The Company’s financial statements have been prepared assuming the Company will continue on a going-concern basis and do not include adjustments to amounts and classifications of assets and liabilities that might be necessary should the Company be unable to continue operations. The ability of the Company to continue as a going concern depends upon its ability to develop profitable operations and to continue to raise adequate financing. Management is actively targeting sources of additional financing through alliances with financial, exploration and mining entities, or other business and financial transactions which would assure continuation of the Company’s operations and exploration programs. In order for the Company to meet its liabilities as they come due and to continue its operations, the Company is solely dependent upon its ability to generate such financing. These items give rise to material uncertainties that cast significant doubt as to the Company’s ability to continue as a going concern.
4.1.28Reporting Issuer Status
The Company is subject to reporting requirements under applicable securities law, the listing requirements of the TSXV and NYSE American and other applicable securities rules and regulations. Compliance with these requirements can increase legal and financial compliance costs, make some activities more difficult, time-consuming or costly, and increase demand on existing systems and resources. Among other things, the Company is required to file annual, quarterly and current reports with respect to its business and results of operations and maintain effective disclosure controls and procedures and internal controls over financial reporting. In order to maintain and, if required, improve disclosure controls and procedures and internal controls over financial reporting to meet this standard, significant resources and management oversight is required. As a result, management’s attention may be diverted from other business concerns, which could harm the Company’s business and results of operations. The Company may need to hire additional employees to comply with these requirements in the future, which would increase its costs and expenses.
Failure to comply with these requirements can have numerous adverse consequences including, but not limited to, the Company’s inability to file required periodic reports on a timely basis, loss of market confidence, delisting of its securities and/or governmental or private actions against the Company. There can be no assurance that the Company will be able to comply with all of these requirements or that the cost of such compliance will not prove to be a substantial competitive disadvantage vis-à-vis privately-held and larger public competitors.
4.1.29 |
Risks Associated with Acquisitions |
If appropriate opportunities present themselves, the Company may acquire mineral claims, material interests in other mineral claims, and companies that the Company believes are strategic. The Company currently has no understandings, commitments or agreements with respect to any material acquisition, other than as described in this AIF, and no other material acquisition is currently being pursued. There can be no assurance that the Company will be able to identify, negotiate or finance future acquisitions successfully, or to integrate such acquisitions with its current business. The process of integrating an acquired Company or mineral claims into the Company may result in unforeseen operating difficulties and expenditures and may absorb significant management attention that would otherwise be available for ongoing development of the Company’s business. Future acquisitions could result in potentially dilutive issuances of equity securities, the incurrence of debt, contingent liabilities, and/or amortization expenses related to goodwill and other intangible assets, which could materially adversely affect the Company’s business, results of operations and financial condition.
4.1.30 |
Force Majeure |
The Company’s projects now or in the future may be adversely affected by risks outside the control of the Company, including the price of gold on world markets, labour unrest, civil disorder, war, subversive activities or sabotage, fires, floods, explosions, or other catastrophes, pandemics, epidemics, or quarantine restrictions.
4.1.31 |
Infrastructure |
Exploration, development and processing activities depend, to one degree or another, on adequate infrastructure. Reliable roads, bridges, power sources and water supply are important elements of infrastructure, which affect access, capital and operating costs. The lack of availability on acceptable terms or the delay in the availability of any one or more of these items could prevent or delay exploration or development of the Company’s mineral properties. If adequate infrastructure is not available in a timely manner, there can be no assurance that the exploration or development of the Company’s mineral properties will be commenced or completed on a timely basis, if at all.
Furthermore, unusual or infrequent weather phenomena, sabotage, government or other interference in the maintenance or provision of necessary infrastructure could adversely affect our operations.
15
Exploration operations depend on adequate infrastructure. In particular, reliable power sources, water supply, transportation and surface facilities are necessary to explore and develop mineral projects. Failure to adequately meet these infrastructure requirements or changes in the cost of such requirements could affect the Company’s ability to carry out exploration and future development operations and could have a material adverse effect on the Company’s business, financial condition, results of operations, cash flows, or prospects.
4.1.32 |
Climate Change Risks |
The Company acknowledges climate change as an international and community concern and it supports and endorses various initiatives for voluntary actions consistent with international initiatives on climate change. However, in addition to voluntary actions, governments are moving to introduce climate change legislation and treaties at the international, national, state/provincial, and local levels. Where legislation already exists, regulation relating to emission levels and energy efficiency is becoming more stringent. Some of the costs associated with reducing emissions can be offset by increased energy efficiency and technological innovation. However, if the current regulatory trend continues, the Company expects that this could result in increased costs at some of its operations in the future.
The Company and the mining industry are facing continued geotechnical challenges, which could adversely impact the Company’s production and profitability. Unanticipated adverse geotechnical and hydrological conditions, such as landslides, floods, seismic activity, droughts, and pit wall failures, may occur in the future and such events may not be detected in advance. Geotechnical instabilities and adverse climatic conditions can be difficult to predict and are often affected by risks and hazards outside of the Company’s control, such as severe weather and considerable rainfall. Geotechnical failures could result in limited or restricted access to mine sites, suspension of operations, government investigations, increased monitoring costs, remediation costs, loss of ore, and other impacts, which could cause one or more of the Company’s projects to be less profitable than currently anticipated and could result in a material adverse effect on the Company’s business results of operations and financial position.
4.1.33 |
Information Systems and Cyber Security |
The Company’s operations depend on information technology (“IT”) systems. These IT systems could be subject to network disruptions caused by a variety of sources, including computer viruses, security breaches and cyber-attacks, as well as disruptions resulting from incidents such as cable cuts, damage to physical plants, natural disasters, terrorism, fire, power loss, vandalism, and theft.
The Company’s operations also depend on the timely maintenance, upgrade and replacement of networks, equipment, IT systems and software, as well as pre-emptive expenses to mitigate the risks of failures. Any of these and other events could result in information system failures, delays and/or increase in capital expenses. The failure of information systems or a component of information systems could, depending on the nature of any such failure, adversely impact the Company’s reputation and results of operations.
Although to date the Company has not experienced any material losses relating to cyber-attacks or other information security breaches, there can be no assurance that the Company will not incur such losses in the future. The Company’s risk and exposure to these matters cannot be fully mitigated because of, among other things, the evolving nature of these threats. As a result, cyber security and the continued development and enhancement of controls, processes and practices designed to protect systems, computers, software, data, and networks from attack, damage or unauthorized access remain a priority. As cyber threats continue to evolve, the Company may be required to expend additional resources to continue to modify or enhance protective measures or to investigate and remediate any security vulnerabilities.
4.2 |
4.2.1 |
Speculative Nature of Investment Risk |
An investment in the Company’s securities carries a high degree of risk and should be considered as a speculative investment. The Company has no history of earnings, limited cash reserves, a limited operating history, has not paid dividends, and is unlikely to pay dividends in the immediate or near future. The likelihood of success of the Company must be considered in light of the problems, expenses, difficulties, complications and delays frequently encountered in connection with the establishment of any business. An investment in the Company’s securities may result in the loss of an investor’s entire investment. Only potential investors who are experienced in high-risk investments and who can afford to lose their entire investment should consider an investment in the Company.
4.2.2 |
Price may not Represent the Company’s Performance or Intrinsic Fair Value |
The market price of a publicly-traded stock is affected by many variables not directly related to the corporate performance of the Company, including the market in which it is traded, the strength of the economy generally, the availability of the attractiveness of alternative investments, and the breadth of the public market for the stock.
16
The effect of these and other factors on the market price of the Common Shares on the TSXV and the NYSE American in the future cannot be predicted.
4.2.3 |
Securities or Industry Analysts |
The trading market for the Common Shares could be influenced by research and reports that industry and/or securities analysts may publish about the Company, its business, the market, or its competitors. The Company does not have any control over these analysts and cannot assure that such analysts will cover the Company or provide favourable coverage. If any of the analysts who may cover the Company’s business change their recommendation regarding the Company’s stock adversely, or provide more favourable relative recommendations about its competitors, the stock price would likely decline. If any analysts who may cover the Company’s business were to cease coverage or fail to regularly publish reports on the Company, it could lose visibility in the financial markets, which in turn could cause the stock price or trading volume to decline.
4.2.4 |
Price Volatility of Publicly Traded Securities |
The Common Shares are listed on the TSXV and NYSE American. Securities of mineral exploration and development companies have experienced substantial volatility in the past, often based on factors unrelated to the companies’ financial performance or prospects. These factors include macroeconomic developments in North America and globally and market perceptions of the attractiveness of particular industries.
The price of the Common Shares is also likely to be significantly affected by short-term changes in gold or other mineral prices or in the Company’s financial condition or results of operations. Other factors unrelated to the Company’s performance that may affect the price of the Common Shares include the following: the extent of analytical coverage available to investors concerning the Company’s business may be limited if investment banks with research capabilities do not follow the Company; lessening in trading volume and general market interest in the Common Shares may affect an investor’s ability to trade significant numbers of Common Shares; the size of the Company’s public float may limit the ability of some institutions to invest in the Common Shares; and a substantial decline in the price of the Common Shares that persists for a significant period of time could cause the Common Shares to be delisted from such exchange, further reducing market liquidity. As a result of any of these factors, the market price of the Common Shares at any given point in time may not accurately reflect the Company’s long-term value. Securities class action litigation often has been brought against companies following periods of volatility in the market price of their securities. New Found may in the future be the target of similar litigation. Securities litigation could result in substantial costs and damages and divert management’s attention and resources.
The market price of the Common Shares is affected by many other variables which are not directly related to the Company’s success and are, therefore, not within New Found’s control. These include other developments that affect the market for all resource sector securities, the breadth of the public market for the Company’s Common Shares, the effect of the dual-listing of the Common Shares including the ability to buy and sell Common Shares in two places, different market conditions in different capital markets, different prevailing trading prices, and the attractiveness of alternative investments. The effect of these and other factors on the market price of the Common Shares is expected to make the price of the Common Shares volatile in the future, which may result in losses to investors.
4.2.5 |
Dilution |
Future sales or issuances of equity securities could decrease the value of the Common Shares, dilute shareholders’ voting power and reduce future potential earnings per Common Share. New Found may sell additional equity securities in future offerings (including through the sale of securities convertible into Common Shares) and may issue additional equity securities to finance the Company’s operations, development, exploration, acquisitions or other projects. New Found cannot predict the size of future sales and issuances of equity securities or the effect, if any, that future sales and issuances of equity securities will have on the market price of the Common Shares. Common Share sales or issuances of a substantial number of equity securities, or the perception that such sales could occur, may adversely affect prevailing market prices for the Common Shares. With any additional sale or issuance of equity securities, investors will suffer dilution of their voting power and may experience dilution in the Company’s earnings per Common Share.
4.2.6 |
Dividends |
To date, the Company has not paid any dividends on the outstanding Common Shares. Any decision to pay dividends on the Common Shares of the Company will be made by the Board on the basis of the Company’s earnings, financial requirements and other conditions. See “Dividends and Distributions”.
17
4.2.7 |
Exchange Listings |
The Company may fail to meet the continued listing requirements for the Common Shares to be listed on the TSXV and/or the NYSE American. If the TSXV or the NYSE American, as applicable, delists the Common Shares from trading on its respective exchange, the Company could face significant material adverse consequences, including: a limited availability of market quotations for the Common Shares; a determination the Common Shares are a “penny stock” which will require brokers trading in the Common Shares to follow more stringent rules and possibly resulting in a reduced level of trading activity in the secondary market for the Common Shares; a limited amount of news and analysts coverage for the Company; and a decreased ability to issue additional securities or obtain additional financing in the future.
4.2.8 |
The Sarbanes-Oxley Act |
The Company may fail to maintain adequate internal control over financial reporting pursuant to the requirements of the Sarbanes-Oxley Act (“SOX”). Management has documented and tested its internal control procedures in order to satisfy the requirements of Section 404 of the SOX. The SOX requires an annual assessment by management of the effectiveness of the Company’s internal control over financial reporting. The Company may fail to maintain the adequacy of its internal control over financial reporting as such standards are modified, supplemented or amended from time to time, and the Company may not be able to conclude, on an ongoing basis, that it has effective internal control over financial reporting in accordance with Section 404 of the SOX. The Company’s failure to satisfy the requirements of Section 404 of the SOX on an ongoing, timely basis could result in the loss of investor confidence in the reliability of its financial statements, which in turn could harm the Company’s business and negatively impact the trading price or the market value of its securities. In addition, any failure to implement required new or improved controls, or difficulties encountered in their implementation, could harm the Company’s operating results or cause it to fail to meet its reporting obligations. If the Company expands, the challenges involved in implementing appropriate internal control over financial reporting will increase and will require that the Company continues to monitor its internal control over financial reporting. Although the Company intends to expend time and incur costs, as necessary, to ensure ongoing compliance, it cannot be certain that it will be successful in complying with Section 404 of the SOX.
4.2.9 |
U.S. Federal Income Tax |
The Company may be a “passive foreign investment company” (“PFIC”), which may have adverse U.S. federal income tax consequences for U.S. investors. U.S. investors should be aware that they could be subject to certain adverse U.S. federal income tax consequences in the event that we are classified as a “passive foreign investment company” for U.S. federal income tax purposes. The determination of whether we are a PFIC for a taxable year depends, in part, on the application of complex U.S. federal income tax rules, which are subject to differing interpretations, and the determination will depend on the composition of our income, expenses and assets from time to time and the nature of the activities performed by our officers and employees. Prospective investors should carefully read the tax discussion in any applicable prospectus for more information and consult their own tax advisers regarding the likelihood and consequences of the Company being treated as a PFIC for U.S. federal income tax purposes, including the advisability of making certain elections that may mitigate certain possible adverse U.S. federal income tax consequences but may result in an inclusion in gross income without receipt of such income.
4.2.10 |
Foreign Private Issuer |
The Company is a foreign private issuer under applicable U.S. federal securities laws and, therefore, is not required to comply with all of the periodic disclosure and current reporting requirements of the Exchange Act and related rules and regulations. As a result, the Company does not file the same reports that a U.S. domestic issuer would file with the SEC, although it will be required to file with or furnish to the SEC the continuous disclosure documents that the Company is required to file in Canada under Canadian securities laws. In addition, the Company’s officers, directors and principal shareholders are exempt from the reporting and “short swing” profit recovery provisions of Section 16 of the Exchange Act. Therefore, the Company’s securityholders may not know on as timely a basis when its officers, directors and principal shareholders purchase or sell securities of the Company as the reporting periods under the corresponding Canadian insider reporting requirements are longer. In addition, as a foreign private issuer, the Company is exempt from the proxy rules under the Exchange Act. We are also exempt from Regulation FD, which prohibits issuers from making selective disclosures of material non-public information. While we expect to comply with the corresponding requirements relating to proxy statements and disclosure of material non-public information under Canadian securities laws, these requirements differ from those under the Exchange Act and Regulation FD and shareholders should not expect to receive in every case the same information at the same time as such information is provided by U.S. domestic companies.
18
4.2.11 |
Foreign Private Issuer Status |
In order to maintain its current status as a foreign private issuer, 50% or more of the Company’s Common Shares must be directly or indirectly owned of record by non-residents of the United States unless the Company also satisfies one of the additional requirements necessary to preserve this status. The Company may in the future lose its foreign private issuer status if a majority of the Common Shares are owned of record in the United States and the Company fails to meet the additional requirements necessary to avoid loss of foreign private issuer status. The regulatory and compliance costs to the Company under U.S. federal securities laws as a U.S. domestic issuer may be significantly more than the costs the Company incurs as a Canadian foreign private issuer eligible to use the multijurisdictional disclosure system (“MJDS”). If the Company is not a foreign private issuer, it would not be eligible to use the MJDS or other foreign issuer forms and would be required to file periodic and current reports and registration statements on U.S. domestic issuer forms with the SEC, which are more detailed and extensive than the forms available to a foreign private issuer.
4.2.12 |
Enforcing Judgments in U.S. Courts |
As the Company is a Canadian corporation and most of its directors and officers reside in Canada, it may be difficult or impossible for investors in the United States to effect service or to realize on judgments obtained in the United States predicated upon the civil liability provisions of the U.S. federal securities laws. A judgment of a U.S. court predicated solely upon such civil liabilities may be enforceable in Canada by a Canadian court if the U.S. court in which the judgment was obtained had jurisdiction, as determined by the Canadian court, in the matter. Investors should not assume that Canadian courts: (i) would enforce judgments of U.S. courts obtained in actions against the Company or such persons predicated upon the civil liability provisions of the U.S. federal securities laws or the securities or blue-sky laws of any state within the United States, or (ii) would enforce, in original actions, liabilities against the Company or such persons predicated upon the U.S. federal securities laws or any such state securities or blue-sky laws. Similarly, some of the Company’s directors and officers are residents of countries other than Canada and all or a substantial portion of the assets of such persons are located outside Canada. As a result, it may be difficult or impossible for Canadian investors to initiate a lawsuit within Canada against these persons. In addition, it may not be possible for Canadian investors to collect from these persons judgments obtained in courts in Canada predicated on the civil liability provisions of securities legislation of certain of the provinces and territories of Canada. It may also be difficult or impossible for Canadian investors to succeed in a lawsuit in the United States based solely on violations of Canadian securities law.
5 |
5.1 |
The Company commissioned APEX Geoscience Ltd. (“APEX”), Jorgensen Engineering and Technical Services, LLC (“Jorgensen Engineering”) and GL Simmons Consulting, LLC (“GL Simmons”) to prepare the Technical Report in compliance with NI 43-101 for its 100% owned Queensway Project, located near Gander, Newfoundland, Canada. The Technical Report documents all data and data collection procedures for the Queensway Project up until November 1, 2024. The Technical Report is titled “NI 43-101 Technical Report, New Found Gold Corp’s Queensway Gold Project in Newfoundland and Labrador, Canada: 2024 Property Expansion and Exploration Update.” The effective date of the Technical Report is November 1, 2024 (the “Effective Date”).
The Qualified Persons for the Technical Report are Roy Eccles, M.Sc., P. Geol., P. Geo., of APEX, Mark Jorgensen, B.Sc., QP Metallurgy of Jorgensen Engineering and Gary Simmons, B.Sc., QP Metallurgy of GL Simmons (each, a “Qualified Person” or “QP”). All authors are Qualified Persons as defined in NI 43-101 and are “independent” of the Company and the Queensway Project as defined in NI 43-101. Apart from Section 13 of the Technical Report, Mr. Eccles takes responsibility for all sections of the Technical Report; Mr. Jorgensen and Mr. Simmons take responsibility for Section 13 of the Technical Report. All three authors have completed Qualified Person site inspections at the Queensway Project: Mr. Eccles on January 12-13, 2023, Mr. Simmons on October 19, 2023, and Mr. Jorgensen on November 29, 2023.
The scientific and technical information in this section relating to the Queensway Project is derived from, and in some instances is a direct extract from, and is based on the assumptions, qualifications and procedures set out in, the Technical Report. Such assumptions, qualifications and procedures are not fully described in this AIF and the following summary does not purport to be a complete summary of the Technical Report. Reference should be made to the full text of the Technical Report, which is available for review under NFG’s profile on SEDAR+ at www.sedarplus.com and on EDGAR at www.sec.gov. Capitalized terms used but not otherwise defined in this section have the meanings given to such terms in the Technical Report.
The technical content disclosed in this section was reviewed and approved by the authors of the Technical Report, each a Qualified Person as defined in NI 43-101.
19
5.2 |
The Queensway Project comprises 7,024 claims within 103 mineral licences and encompasses an area of 175,600 ha. The Trans-Canada Highway transects the northern Queensway Project and extends from approximately 15 km west of the Town of Gander to Appleton, NL, and south to the Bay d’Espoir Highway (Route 360). The approximate centre of the Queensway Project is UTM, Zone 21N, NAD83: 651000 m Easting, 5408000 m Northing. The licences can be separated spatially into 6 separate, contiguous and non-contiguous groups of licences, or blocks, that include two large contiguous blocks (Queensway North (“QWN”) and Queensway South (“QWS”)) and 4 smaller non-contiguous blocks (Twin Ponds (“TP”), Ten Mile-Duder Lake, Bellman’s Pond, and Little Rocky Brook) all north of QWN.
The Queensway Project can be accessed by commercial airlines to the Gander International Airport and by vehicle from the Town of Gander via the Trans-Canada Highway which passes through the QWN and the TP blocks. The Queensway Project can also be accessed by secondary highways, gravel access roads, All Terrain Vehicle trails, the NL T’Railway, winter roads, and by boat along the shores of Gander Lake. The Queensway Project can also be accessed by helicopter from bases at the towns of Appleton and Gander, NL, and from small craft float planes based at the international airport in Gander.
The nearest seaports are north of the Trans-Canada Highway at the towns of Lewisporte and Botwood, NL, which are approximately 40 and 70 km, respectively, by road from the Town of Glenwood, NL. Both port locations have established harbour facilities and developable capabilities. The deep-water port at Botwood was the export location for Cu-Pb-Zn concentrates from the former ASARCO Buchans Mines.
5.2.1 |
Ownership |
Most of the Queensway Project claims (92.2%) are fully owned by NFG (n=6,473 claims within 99 mineral licences). Additionally, 7.8% of the Queensway Project claims (n=551 claims within 5 mineral licences) are currently owned by separate licence holders and are subject to NFG satisfying conditions of the VOA Option Agreement (as defined below).
The licences were acquired by New Found through 1) online map staking with the Government of NL, 2) the successful completion of a series of option agreements (9 option agreements), and 3) some of the licences were originally acquired by Palisade Resources Corp, which was renamed NFG in June 2017.
On July 9, 2024, NFG acquired 100% interest in LabGold’s Kingsway Project. Pursuant to the acquisition, NFG issued to LabGold 5,263,157 Common Shares as consideration for the purchased assets.
On May 17, 2024, NFG acquired 100% interest in 3 mineral licences previously held by Sky Gold. Pursuant to the acquisition, NFG purchased the licences for $35,000.
In addition, five licences are currently owned by separate licence holders and are subject to NFG satisfying conditions of an option agreement (the “VOA Option Agreement”) between Aidan O’Neil, Suraj Amarnani, Josh Vann and VOA Exploration Inc. (collectively, the “Optionors”) and New Found.
With respect to the nature and extent of NFG’s mineral rights interest at the Queensway Project,
Table 1 shows that the Queensway Project can be separated into 4 general groups based solely on the title of the licence holder. A total of 7.8% of the claims that make up the Queensway Property are not owned by NFG but rather by separate licence holders and are subject to a single Option Agreement – the VOA Option – between NFG and the current property owners (Aidan O’Neil, Suraj Amarnani, and Josh Vann). The descriptions of the 4 groups – based on the title of the licence holder is summarized as follows:
| ● | 92.2% of the claims that make up the Queensway Project are fully owned by NFG. They consist of 6,473 claims within 98 mineral licences in QWN, QWS, TP, Bellman’s Pond, and Little Rocky Brook. |
| ● | 4.83% of the claims as part of the VOA Option Agreement owned by Aidan O’Neil. They consist of 339 claims within 2 mineral licences at Ten Mile-Duder Lake and QWN. |
| ● | 2.99% of the claims as part of the VOA Option Agreement owned by Suraj Amarnani. They consist of 210 claims within 2 mineral licences at TP and QWN. |
| ● | 0.03% of the claims as part of the VOA Option Agreement owned by Josh Vann. They consist of 2 claims within 1 mineral licence at Ten Mile-Duder Lake. |
20
Table 1 - Queensway Project mineral licence description and status (reported by blocks of contiguous licences/claims). The VOA Option Agreement licences, Labrador Gold Corp., and Sky Gold Corp. licences are highlighted in grey, blue, and green.
A) Queensway North Block
|
|
|
|
|
|
No. of |
|
Area |
|
|
|
Issued |
|
Renewal |
|
Report Due |
|
Annual |
|
Expenses |
|
NSR |
|
NSR |
|
Licence No. |
|
Title Holder |
|
Location |
|
Claims |
|
(km2) |
|
Status |
|
Date |
|
Date |
|
Date |
|
Due |
|
Due Date |
|
(%) |
|
(%) |
|
006821M |
|
New Found Gold Corp. |
|
Gander River, Central NL |
|
2 |
0.50 |
Issued |
1999-05-17 |
2025-05-19 |
2026-07-16 |
|
$ |
358.75 |
|
2029-05-17 |
|
2.5 |
1 |
||||||
007984M |
|
New Found Gold Corp. |
|
Glenwood, Central NL |
|
50 |
|
12.50 |
|
Issued |
|
1998-11-13 |
|
2024-11-13 |
|
2025-01-13 |
|
|
N/A |
|
N/A |
|
0.4 |
|
0 |
022216M |
|
New Found Gold Corp. |
|
Glenwood, Central NL |
|
6 |
|
1.50 |
|
Issued |
|
2014-06-12 |
|
2029-06-12 |
|
2025-08-11 |
|
$ |
2,685.01 |
|
2033-06-12 |
|
0 |
|
0 |
022491M |
|
New Found Gold Corp. |
|
Gander Lake Area, Central NL |
|
12 |
|
3.00 |
|
Issued |
|
2014-11-06 |
|
2024-11-06 |
|
2026-01-05 |
|
$ |
7,821.03 |
|
2033-11-06 |
|
1.6 |
|
1 |
023720M |
|
New Found Gold Corp. |
|
Glenwood, Central NL |
|
4 |
|
1.00 |
|
Issued |
|
2001-12-31 |
|
2024-12-31 |
|
2026-03-02 |
|
$ |
4,861.69 |
|
2027-12-31 |
|
1 |
|
0 |
023721M |
|
New Found Gold Corp. |
|
Glenwood, Central NL |
|
2 |
|
0.50 |
|
Issued |
|
2001-12-31 |
|
2024-12-31 |
|
2026-03-02 |
|
$ |
4,124.62 |
|
2027-12-31 |
|
1 |
|
0 |
023804M |
|
New Found Gold Corp. |
|
Glenwood, Central NL |
|
12 |
|
3.00 |
|
Issued |
|
2001-02-19 |
|
2025-02-19 |
|
2025-04-21 |
|
$ |
9,549.76 |
|
2027-02-19 |
|
0 |
|
0 |
023860M |
|
New Found Gold Corp. |
|
Joe Batts Brook, Central NL |
|
11 |
|
2.75 |
|
Issued |
|
2016-04-07 |
|
2026-04-07 |
|
2026-06-08 |
|
$ |
12,967.14 |
|
2034-04-07 |
|
0.6 |
|
0 |
023861M |
|
New Found Gold Corp. |
|
Joe Batts Pond, Central NL |
|
16 |
|
4.00 |
|
Issued |
|
2016-04-07 |
|
2026-04-07 |
|
2026-06-08 |
|
$ |
18,861.30 |
|
2034-04-07 |
|
1 |
|
0 |
023862M |
|
New Found Gold Corp. |
|
Joe Batts Brook, Central NL |
|
4 |
|
1.00 |
|
Issued |
|
2016-04-07 |
|
2026-04-07 |
|
2026-06-08 |
|
$ |
4,715.32 |
|
2034-04-07 |
|
0.6 |
|
0 |
023863M |
|
New Found Gold Corp. |
|
Joe Batts Brook, Central NL |
|
11 |
|
2.75 |
|
Issued |
|
2016-04-07 |
|
2026-04-07 |
|
2026-06-08 |
|
$ |
12,967.14 |
|
2034-04-07 |
|
1 |
|
0 |
023864M |
|
New Found Gold Corp. |
|
Joe Batts Brook, Central NL |
|
3 |
|
0.75 |
|
Issued |
|
2016-04-07 |
|
2026-04-07 |
|
2026-06-08 |
|
$ |
3,536.49 |
|
2034-04-07 |
|
1 |
|
0 |
023866M |
|
New Found Gold Corp. |
|
Joe Batts Brook, Central NL |
|
4 |
|
1.00 |
|
Issued |
|
2016-04-07 |
|
2026-04-07 |
|
2026-06-08 |
|
$ |
2,698.66 |
|
2034-04-07 |
|
1 |
|
0.5 |
023874M |
|
New Found Gold Corp. |
|
Joe Batts Brook, Central NL |
|
8 |
|
2.00 |
|
Issued |
|
2016-04-11 |
|
2026-04-13 |
|
2026-06-10 |
|
$ |
9,430.64 |
|
2034-04-11 |
|
1.6 |
|
1 |
023875M |
|
New Found Gold Corp. |
|
Joe Batts Pond, Central NL |
|
3 |
|
0.75 |
|
Issued |
|
2016-04-12 |
|
2026-04-13 |
|
2025-06-11 |
|
$ |
2,697.76 |
|
2032-04-12 |
|
1.6 |
|
1 |
023881M |
|
New Found Gold Corp. |
|
Joe Batts Brook, Central NL |
|
7 |
|
1.75 |
|
Issued |
|
2016-04-21 |
|
2026-04-21 |
|
2025-06-20 |
|
$ |
344.78 |
|
2031-04-21 |
|
1.6 |
|
1 |
023916M |
|
New Found Gold Corp. |
|
Gander Lake Area, Central NL |
|
4 |
|
1.00 |
|
Issued |
|
2016-05-05 |
|
2026-05-05 |
|
2026-07-06 |
|
$ |
4,715.32 |
|
2034-05-05 |
|
1.6 |
|
1 |
023940M |
|
New Found Gold Corp. |
|
Gander River, Central NL |
|
44 |
|
11.00 |
|
Issued |
|
2016-05-09 |
|
2026-05-11 |
|
2025-07-08 |
|
N/A |
|
2033-05-09 |
|
0 |
|
0 |
|
023962M |
|
New Found Gold Corp. |
|
The Outflow, Central NL |
|
9 |
|
2.25 |
|
Issued |
|
2016-05-19 |
|
2026-05-19 |
|
2025-07-18 |
|
$ |
10,290.02 |
|
2034-05-19 |
|
0 |
|
0 |
023987M |
|
New Found Gold Corp. |
|
Joe Batts Pond Area, Central NL |
|
11 |
|
2.75 |
|
Issued |
|
2016-06-07 |
|
2026-06-08 |
|
2026-08-06 |
|
$ |
7,421.32 |
|
2034-06-07 |
|
1.6 |
|
1 |
024026M |
|
New Found Gold Corp. |
|
Joe Batts Pond Area, Central NL |
|
6 |
|
1.50 |
|
Issued |
|
2016-06-30 |
|
2026-06-30 |
|
2025-08-29 |
|
$ |
4,048.00 |
|
2034-06-30 |
|
1.6 |
|
1 |
024031M |
|
New Found Gold Corp. |
|
Joe Batts Pond Area, Central NL |
|
6 |
|
1.50 |
|
Issued |
|
2016-06-30 |
|
2026-06-30 |
|
2025-08-29 |
|
$ |
295.52 |
|
2031-06-30 |
|
1.6 |
|
1 |
024112M |
|
New Found Gold Corp. |
|
Gander River, Central NL |
|
4 |
|
1.00 |
|
Issued |
|
2016-08-25 |
|
2026-08-25 |
|
2024-10-24 |
|
$ |
4,800.00 |
|
2032-08-25 |
|
1.5 |
|
0.5 |
024136M |
|
New Found Gold Corp. |
|
Gander River Area, Central NL |
|
25 |
|
6.25 |
|
Issued |
|
2016-09-13 |
|
2026-09-14 |
|
2025-11-12 |
|
$ |
4,577.07 |
|
2033-09-13 |
|
0.4 |
|
0 |
024138M |
|
New Found Gold Corp. |
|
Gander Lake, Central NL |
|
21 |
|
5.25 |
|
Issued |
|
2016-09-15 |
|
2026-09-15 |
|
2025-11-14 |
|
$ |
13,686.81 |
|
2033-09-15 |
|
0 |
|
0 |
024139M |
|
New Found Gold Corp. |
|
Gander Lake, Central NL |
|
30 |
|
7.50 |
|
Issued |
|
2016-09-15 |
|
2026-09-15 |
|
2025-11-14 |
|
$ |
5,492.49 |
|
2033-09-15 |
|
1.6 |
|
1 |
024140M |
|
New Found Gold Corp. |
|
Joe Batts Pond, Central NL |
|
2 |
|
0.50 |
|
Issued |
|
2016-09-15 |
|
2026-09-15 |
|
2025-11-14 |
|
$ |
366.17 |
|
2033-09-15 |
|
1.6 |
|
1 |
024141M |
|
New Found Gold Corp. |
|
Joe Batts Pond Area, Central NL |
|
2 |
|
0.50 |
|
Issued |
|
2016-09-15 |
|
2026-09-15 |
|
2025-11-14 |
|
$ |
366.17 |
|
2033-09-15 |
|
1.6 |
|
1 |
024264M |
|
New Found Gold Corp. |
|
Joe Batts Pond Area, Central NL |
|
4 |
|
1.00 |
|
Issued |
|
2016-10-24 |
|
2026-10-26 |
|
2025-12-23 |
|
$ |
732.33 |
|
2033-10-24 |
|
0.4 |
|
0 |
024265M |
|
New Found Gold Corp. |
|
Appleton, Central NL |
|
12 |
|
3.00 |
|
Issued |
|
2016-10-24 |
|
2026-10-26 |
|
2025-12-23 |
|
$ |
7,821.03 |
|
2033-10-24 |
|
0.4 |
|
0 |
024266M |
|
New Found Gold Corp. |
|
Joe Batts Pond, Central NL |
|
128 |
|
32.00 |
|
Issued |
|
2016-10-24 |
|
2026-10-26 |
|
2025-12-23 |
|
$ |
23,434.62 |
|
2033-10-24 |
|
0.4 |
|
0 |
024268M |
|
New Found Gold Corp. |
|
Millers Brook, Central NL |
|
56 |
|
14.00 |
|
Issued |
|
2016-10-24 |
|
2026-10-26 |
|
2025-12-23 |
|
$ |
36,498.14 |
|
2033-10-24 |
|
1.6 |
|
1 |
024997M |
|
New Found Gold Corp. |
|
Glenwood Area, Central NL |
|
21 |
|
5.25 |
|
Issued |
|
2017-04-27 |
|
2027-04-27 |
|
2026-06-26 |
|
$ |
14,167.99 |
|
2034-04-27 |
|
0 |
|
0 |
025008M |
|
New Found Gold Corp. |
|
Gander Lake, Central NL |
|
13 |
|
3.25 |
|
Issued |
|
2017-05-04 |
|
2027-05-04 |
|
2026-07-03 |
|
$ |
15,324.80 |
|
2034-05-04 |
|
1 |
|
0 |
026074M |
|
New Found Gold Corp. |
|
Joe Batts Brook, Central NL |
|
3 |
|
0.75 |
|
Issued |
|
2018-05-31 |
|
2028-05-31 |
|
2026-07-30 |
|
$ |
2,636.49 |
|
2034-05-31 |
|
2.2 |
|
1 |
027636M |
|
New Found Gold Corp. |
|
Gander River, Central NL |
|
110 |
|
27.50 |
|
Issued |
|
2016-10-24 |
|
2026-10-26 |
|
2024-12-23 |
|
$ |
132,000.00 |
|
2033-10-24 |
|
1 |
|
0 |
027637M |
|
New Found Gold Corp. |
|
Gander River, Central NL |
|
154 |
|
38.50 |
|
Issued |
|
2016-10-24 |
|
2026-10-26 |
|
2024-12-23 |
|
$ |
91,572.04 |
|
2028-10-24 |
|
1 |
|
0 |
030714M |
|
New Found Gold Corp. |
|
King's Point, Gander Lake |
|
8 |
|
2.00 |
|
Issued |
|
2020-05-02 |
|
2025-05-02 |
|
2026-07-01 |
|
$ |
2,324.47 |
|
2033-05-02 |
|
1 |
|
0 |
035197M |
|
Aidan ONeil |
|
South Pond |
|
130 |
|
32.50 |
|
Issued |
|
2022-11-10 |
|
2027-11-10 |
|
2025-01-09 |
|
$ |
5,165.81 |
|
2025-11-10 |
|
0 |
|
0 |
035198M |
|
Suraj Amarnani |
|
Fourth Pond |
|
168 |
|
42.00 |
|
Issued |
|
2022-11-10 |
|
2027-11-10 |
|
2025-01-09 |
|
$ |
94,483.67 |
|
2031-11-10 |
|
0 |
|
0 |
035204M |
|
New Found Gold Corp. |
|
Gander River, Central NL |
|
3 |
|
0.75 |
|
Issued |
|
2022-11-10 |
|
2027-11-10 |
|
2025-01-09 |
|
$ |
710.00 |
|
2031-11-10 |
|
1 |
|
0 |
035209M |
|
New Found Gold Corp. |
|
South Pond, Central NL |
|
2 |
|
0.50 |
|
Issued |
|
2022-11-10 |
|
2027-11-10 |
|
2025-01-09 |
|
$ |
29.15 |
|
2025-11-10 |
|
0 |
|
0 |
035681M |
|
New Found Gold Corp. |
|
The Outflow, Central NL |
|
4 |
|
1.00 |
|
Issued |
|
2023-03-16 |
|
2028-03-16 |
|
2026-05-15 |
|
$ |
109.76 |
|
2028-03-16 |
|
0 |
|
0 |
n=43 licences |
|
|
|
Totals |
|
1,135 |
|
283.75 |
|
|
|
|
|
|
|
|
|
|
|
|
|
|
|
|
|
21
Table 1 continued.
B) Queensway South Block
|
|
|
|
|
No. of |
|
Area |
|
|
|
Issued |
|
Renewal |
|
Report Due |
|
Annual |
|
Expenses |
|
NSR |
|
NSR |
||
Licence No. |
|
Title Holder |
|
Location |
|
Claims |
|
(km2) |
|
Status |
|
Date |
|
Date |
|
Date |
|
Due |
|
Due Date |
|
(%) |
|
(%) |
|
022236M |
|
New Found Gold Corp. |
|
Southwest Gander River, Central NL |
|
5 |
|
1.25 |
|
Issued |
|
2014-06-12 |
2029-06-12 |
2024-08-12 |
|
$ |
39.49 |
|
2025-06-12 |
|
1 |
|
0.5 |
||
022260M |
|
New Found Gold Corp. |
|
Southwest Gander River, Central NL |
|
1 |
|
0.25 |
|
Issued |
|
2014-06-13 |
|
2029-06-13 |
|
2025-08-12 |
|
$ |
643.08 |
|
2026-06-13 |
|
1 |
|
0.5 |
022342M |
|
New Found Gold Corp. |
|
Southwest Gander River, Central NL |
|
1 |
|
0.25 |
|
Issued |
|
2014-08-25 |
|
2024-08-25 |
|
2025-10-24 |
|
$ |
144.84 |
|
2026-08-25 |
|
1 |
|
0.5 |
023239M |
|
New Found Gold Corp. |
|
Pauls Pond, Central NL |
|
2 |
|
0.50 |
|
Issued |
|
2015-08-12 |
|
2025-08-12 |
|
2025-10-13 |
|
$ |
1,600.08 |
|
2027-08-12 |
|
1 |
|
0.5 |
023495M |
|
New Found Gold Corp. |
|
Northwest Gander River, Central NL |
|
5 |
|
1.25 |
|
Issued |
|
2015-11-19 |
|
2025-11-19 |
|
2026-01-19 |
|
$ |
479.97 |
|
2025-11-19 |
|
1 |
|
0.5 |
023498M |
|
New Found Gold Corp. |
|
Northwest Gander River, Central NL |
|
8 |
|
2.00 |
|
Issued |
|
2015-11-19 |
|
2025-11-19 |
|
2026-01-19 |
|
$ |
732.12 |
|
2025-11-19 |
|
1 |
|
0.5 |
024435M |
|
New Found Gold Corp. |
|
Greenwood Pond, Central NL |
|
7 |
|
1.75 |
|
Issued |
|
2016-11-21 |
|
2026-11-23 |
|
2026-01-20 |
|
$ |
2,872.25 |
|
2026-11-21 |
|
1 |
|
0.5 |
024436M |
|
New Found Gold Corp. |
|
Greenwood Pond, Central NL |
|
3 |
|
0.75 |
|
Issued |
|
2016-11-21 |
|
2026-11-23 |
|
2026-01-20 |
|
$ |
96.41 |
|
2026-11-21 |
|
1 |
|
0.5 |
024557M |
|
New Found Gold Corp. |
|
Bear Pond, Central NL |
|
250 |
|
62.50 |
|
Issued |
|
2016-12-12 |
|
2026-12-14 |
|
2025-02-10 |
|
$ |
7,226.71 |
|
2024-12-12 |
|
1 |
|
0 |
024558M |
|
New Found Gold Corp. |
|
Great Gull River, Central NL |
|
239 |
|
59.75 |
|
Issued |
|
2016-12-12 |
|
2026-12-14 |
|
2025-02-10 |
|
$ |
6,884.46 |
|
2024-12-12 |
|
1 |
|
0 |
024559M |
|
New Found Gold Corp. |
|
Northwest Gander River, Central NL |
|
256 |
|
64.00 |
|
Issued |
|
2016-12-12 |
|
2026-12-14 |
|
2025-02-10 |
|
$ |
15,237.34 |
|
2024-12-12 |
|
1 |
|
0 |
024560M |
|
New Found Gold Corp. |
|
Careless Brook, Central NL |
|
121 |
|
30.25 |
|
Issued |
|
2016-12-12 |
|
2026-12-14 |
|
2026-02-10 |
|
$ |
11,097.19 |
|
2025-12-12 |
|
1 |
|
0 |
024561M |
|
New Found Gold Corp. |
|
Eastern Pond, Central NL |
|
256 |
|
64.00 |
|
Issued |
|
2016-12-12 |
|
2026-12-14 |
|
2026-02-10 |
|
$ |
122,488.98 |
|
2025-12-12 |
|
1 |
|
0 |
024562M |
|
New Found Gold Corp. |
|
Hussey Pond, Central NL |
|
241 |
|
60.25 |
|
Issued |
|
2016-12-12 |
|
2026-12-14 |
|
2025-02-10 |
|
$ |
14,317.32 |
|
2024-12-12 |
|
1 |
|
0 |
024563M |
|
New Found Gold Corp. |
|
Eastern Pond, Central NL |
|
236 |
|
59.00 |
|
Issued |
|
2016-12-12 |
|
2026-12-14 |
|
2025-02-10 |
|
$ |
6,793.68 |
|
2024-12-12 |
|
1 |
|
0 |
024565M |
|
New Found Gold Corp. |
|
Gander Lake, Central NL |
|
12 |
|
3.00 |
|
Issued |
|
2016-12-12 |
|
2026-12-14 |
|
2026-02-10 |
|
$ |
1,762.25 |
|
2025-12-12 |
|
1 |
|
0 |
024566M |
|
New Found Gold Corp. |
|
Gander Lake, Central NL |
|
125 |
|
31.25 |
|
Issued |
|
2016-12-12 |
|
2026-12-14 |
|
2025-02-10 |
|
$ |
10,813.58 |
|
2024-12-12 |
|
1 |
|
0 |
024567M |
|
New Found Gold Corp. |
|
Gander Lake, Central NL |
|
106 |
|
26.50 |
|
Issued |
|
2016-12-12 |
|
2026-12-14 |
|
2025-02-10 |
|
$ |
9,023.39 |
|
2024-12-12 |
|
1 |
|
0 |
024568M |
|
New Found Gold Corp. |
|
Birch Pond, Central NL |
|
254 |
|
63.50 |
|
Issued |
|
2016-12-12 |
|
2026-12-14 |
|
2025-02-10 |
|
$ |
7,289.42 |
|
2024-12-12 |
|
1 |
|
0 |
024569M |
|
New Found Gold Corp. |
|
Southwest Gander River, Central NL |
|
221 |
|
55.25 |
|
Issued |
|
2016-12-12 |
|
2026-12-14 |
|
2025-02-10 |
|
$ |
19,505.91 |
|
2024-12-12 |
|
1 |
|
0 |
024570M |
|
New Found Gold Corp. |
|
Dennis Brook, Central NL |
|
117 |
|
29.25 |
|
Issued |
|
2016-12-12 |
|
2026-12-14 |
|
2025-02-10 |
|
$ |
3,117.21 |
|
2024-12-12 |
|
1 |
|
0 |
024571M |
|
New Found Gold Corp. |
|
Winter Brook, Central NL |
|
153 |
|
38.25 |
|
Issued |
|
2016-12-12 |
|
2026-12-14 |
|
2026-02-10 |
|
$ |
47,155.68 |
|
2025-12-12 |
|
1 |
|
0 |
025766M |
|
New Found Gold Corp. |
|
Pauls Pond, Central NL |
|
163 |
|
40.75 |
|
Issued |
|
2016-12-12 |
|
2026-12-14 |
|
2025-02-10 |
|
$ |
4,539.43 |
|
2024-12-12 |
|
1 |
|
0 |
027379M |
|
New Found Gold Corp. |
|
Gander Outflow, Central NL |
|
6 |
|
1.50 |
|
Issued |
|
2020-08-22 |
|
2025-08-22 |
|
2024-10-21 |
|
$ |
1,230.10 |
|
2024-08-22 |
|
3 |
|
1.5 |
030710M |
|
New Found Gold Corp. |
|
Little Dead Wolf Pond |
|
144 |
|
36.00 |
|
Issued |
|
2020-05-02 |
|
2025-05-02 |
|
2025-07-01 |
|
$ |
34,731.62 |
|
2027-05-02 |
|
1 |
|
0 |
030711M |
|
New Found Gold Corp. |
|
Gander Outflow, Central NL |
|
44 |
|
11.00 |
|
Issued |
|
2020-05-02 |
|
2025-05-02 |
|
2024-07-01 |
|
$ |
23,302.26 |
|
2026-05-02 |
|
2 |
|
1 |
030716M |
|
New Found Gold Corp. |
|
Third Berry Hill Pond |
|
224 |
|
56.00 |
|
Issued |
|
2020-05-02 |
|
2025-05-02 |
|
2025-07-01 |
|
$ |
47,522.32 |
|
2027-05-02 |
|
1 |
|
0 |
030722M |
|
New Found Gold Corp. |
|
Hunt's Pond |
|
149 |
|
37.25 |
|
Issued |
|
2020-05-02 |
|
2025-05-02 |
|
2025-07-01 |
|
$ |
30,010.98 |
|
2027-05-02 |
|
0 |
|
0 |
030726M |
|
New Found Gold Corp. |
|
Joe's Feeder Cove |
|
5 |
|
1.25 |
|
Issued |
|
2020-05-02 |
|
2025-05-02 |
|
2025-07-01 |
|
$ |
897.44 |
|
2030-05-02 |
|
1 |
|
0 |
030727M |
|
New Found Gold Corp. |
|
Dead Wolf Brook |
|
195 |
|
48.75 |
|
Issued |
|
2020-05-02 |
|
2025-05-02 |
|
2025-07-01 |
|
$ |
41,369.89 |
|
2027-05-02 |
|
1 |
|
0 |
030733M |
|
New Found Gold Corp. |
|
Rocky Brook |
|
173 |
|
43.25 |
|
Issued |
|
2020-05-02 |
|
2025-05-02 |
|
2025-07-01 |
|
$ |
36,702.51 |
|
2027-05-02 |
|
1 |
|
0 |
030737M |
|
New Found Gold Corp. |
|
Caribou Lake |
|
247 |
|
61.75 |
|
Issued |
|
2020-05-02 |
|
2025-05-02 |
|
2025-07-01 |
|
$ |
52,401.86 |
|
2027-05-02 |
|
1 |
|
0 |
030739M |
|
New Found Gold Corp. |
|
Great Gull River |
|
224 |
|
56.00 |
|
Issued |
|
2020-05-02 |
|
2025-05-02 |
|
2025-07-01 |
|
$ |
40,675.13 |
|
2027-05-02 |
|
1 |
|
0 |
030740M |
|
New Found Gold Corp. |
|
Ribbon Ponds |
|
1 |
|
0.25 |
|
Issued |
|
2020-05-02 |
|
2025-05-02 |
|
2025-07-01 |
|
$ |
198.64 |
|
2027-05-02 |
|
0 |
|
0 |
030741M |
|
New Found Gold Corp. |
|
Southwest Gander River Cove |
|
2 |
|
0.50 |
|
Issued |
|
2020-05-02 |
|
2025-05-02 |
|
2025-07-01 |
|
$ |
1,136.80 |
|
2029-05-02 |
|
1 |
|
0 |
030742M |
|
New Found Gold Corp. |
|
Steeles Brook |
|
32 |
|
8.00 |
|
Issued |
|
2020-05-02 |
|
2025-05-02 |
|
2025-07-01 |
|
$ |
5,810.74 |
|
2027-05-02 |
|
1 |
|
0 |
030745M |
|
New Found Gold Corp. |
|
Dead Wolf Brook |
|
101 |
|
25.25 |
|
Issued |
|
2020-05-02 |
|
2025-05-02 |
|
2025-07-01 |
|
$ |
21,427.48 |
|
2027-05-02 |
|
1 |
|
0 |
030746M |
|
New Found Gold Corp. |
|
Southwest Islands View |
|
3 |
|
0.75 |
|
Issued |
|
2020-05-02 |
|
2025-05-02 |
|
2025-07-01 |
|
$ |
1,609.79 |
|
2030-05-02 |
|
1 |
|
0 |
030747M |
|
New Found Gold Corp. |
|
Owl Pond |
|
37 |
|
9.25 |
|
Issued |
|
2020-05-02 |
|
2025-05-02 |
|
2025-07-01 |
|
$ |
7,849.66 |
|
2027-05-02 |
|
1 |
|
0 |
030748M |
|
New Found Gold Corp. |
|
Southwest Pond |
|
140 |
|
35.00 |
|
Issued |
|
2020-05-02 |
|
2025-05-02 |
|
2025-07-01 |
|
$ |
29,701.44 |
|
2027-05-02 |
|
1 |
|
0 |
030752M |
|
New Found Gold Corp. |
|
Miguel's Lake |
|
78 |
|
19.50 |
|
Issued |
|
2020-05-02 |
|
2025-05-02 |
|
2025-07-01 |
|
$ |
16,547.95 |
|
2027-05-02 |
|
1 |
|
0 |
030753M |
|
New Found Gold Corp. |
|
Gander Lake |
|
3 |
|
0.75 |
|
Issued |
|
2020-05-02 |
|
2025-05-02 |
|
2025-07-01 |
|
$ |
974.79 |
|
2029-05-02 |
|
1 |
|
0 |
030754M |
|
New Found Gold Corp. |
|
Little Gander Lake |
|
172 |
|
43.00 |
|
Issued |
|
2020-05-02 |
|
2025-05-02 |
|
2025-07-01 |
|
$ |
36,490.34 |
|
2027-05-02 |
|
0 |
|
0 |
030755M |
|
New Found Gold Corp. |
|
Rocky Brook |
|
30 |
|
7.50 |
|
Issued |
|
2020-05-02 |
|
2025-05-02 |
|
2025-07-01 |
|
$ |
6,364.60 |
|
2027-05-02 |
|
0 |
|
0 |
030756M |
|
New Found Gold Corp. |
|
Southwest Pond |
|
88 |
|
22.00 |
|
Issued |
|
2020-05-02 |
|
2025-05-02 |
|
2025-07-01 |
|
$ |
18,669.49 |
|
2027-05-02 |
|
1 |
|
0 |
030763M |
|
New Found Gold Corp. |
|
Rocky Brook |
|
45 |
|
11.25 |
|
Issued |
|
2020-05-02 |
|
2025-05-02 |
|
2025-07-01 |
|
$ |
9,546.89 |
|
2027-05-02 |
|
0 |
|
0 |
030765M |
|
New Found Gold Corp. |
|
Berry Hill Brook |
|
124 |
|
31.00 |
|
Issued |
|
2020-05-02 |
|
2025-05-02 |
|
2025-07-01 |
|
$ |
26,307.00 |
|
2027-05-02 |
|
0 |
|
0 |
030768M |
|
New Found Gold Corp. |
|
Gander Lake Prime |
|
149 |
|
37.25 |
|
Issued |
|
2020-05-02 |
|
2025-05-02 |
|
2025-07-01 |
|
$ |
41,695.49 |
|
2026-05-02 |
|
1 |
|
0 |
030771M |
|
New Found Gold Corp. |
|
Northwest Gander River |
|
37 |
|
9.25 |
|
Issued |
|
2020-05-02 |
|
2025-05-02 |
|
2025-07-01 |
|
$ |
7,849.66 |
|
2027-05-02 |
|
1 |
|
0 |
030783M |
|
New Found Gold Corp. |
|
Little Dead Wolf Brook |
|
41 |
|
10.25 |
|
Issued |
|
2020-05-02 |
|
2025-05-02 |
|
2025-07-01 |
|
$ |
9,888.86 |
|
2027-05-02 |
|
0 |
|
0 |
035087M |
|
New Found Gold Corp. |
|
Gander Lake Prime |
|
2 |
|
0.50 |
|
Issued |
|
2022-10-13 |
|
2027-10-13 |
|
2025-12-12 |
|
$ |
235.85 |
|
2029-10-13 |
|
0 |
|
0 |
035338M |
|
New Found Gold Corp. |
|
Gillingham’s Pond |
|
53 |
|
13.25 |
|
Issued |
|
2023-01-05 |
|
2028-01-05 |
|
2025-03-06 |
|
$ |
10,692.88 |
|
2026-01-05 |
|
0 |
|
0 |
036670M |
|
New Found Gold Corp. |
|
Careless Brook, Central NL |
|
6 |
|
1.50 |
|
Issued |
|
2023-10-26 |
|
2028-10-26 |
|
2025-12-25 |
|
$ |
1,210.52 |
|
2026-10-26 |
|
0 |
|
0 |
n=53 licences |
|
|
|
Totals |
|
5,337 |
|
1,334.25 |
|
|
|
|
|
|
|
|
|
|
|
|
|
|
|
|
|
22
Table 1 continued.
The VOA Option Agreement licences are highlighted in grey.
C) Twin Ponds Block
Licence No. |
|
Title Holder |
|
Location |
|
No. of |
|
Area |
|
Status |
|
Issued Date |
|
Renewal Date |
|
Report Due |
|
Annual |
|
Expenses |
|
NSR |
|
NSR |
|
024270M |
|
New Found Gold Corp. |
|
Island Pond, Central NL |
|
107 |
|
26.75 |
|
Issued |
|
2016-10-24 |
|
2026-10-26 |
|
2024-12-23 |
|
$ |
50,987.79 |
|
2028-10-24 |
|
1.6 |
|
1 |
024274M |
|
New Found Gold Corp. |
|
Twin Ponds, Central NL |
|
77 |
|
19.25 |
|
Issued |
|
2016-10-24 |
|
2026-10-26 |
|
2024-12-23 |
|
$ |
34,380.34 |
|
2028-10-24 |
|
1.6 |
|
1 |
035048M |
|
Suraj Amarnani |
|
Twin Ponds |
|
42 |
|
10.50 |
|
Issued |
|
2022-09-29 |
|
2027-09-29 |
|
2024-11-28 |
|
$ |
1,658.89 |
|
2025-09-29 |
|
0 |
|
0 |
n=3 licences |
|
|
|
Totals |
|
226 |
|
56.50 |
|
|
|
|
|
|
|
|
|
|
|
|
|
|
|
|
|
D) Ten Mile—Duder Lake Block
Licence No. |
|
Title Holder |
|
Location |
|
No. of |
|
Area |
|
Status |
|
Issued Date |
|
Renewal Date |
|
Report Due |
|
Annual |
|
Expenses |
|
NSR |
|
NSR |
|
035047M |
|
Aidan ONeil |
|
Ten Mile-Duder Lake |
|
209 |
|
52.25 |
|
Issued |
|
2022-09-29 |
|
2027-09-29 |
|
2024-11-28 |
|
$ |
8,279.87 |
|
2025-09-29 |
|
0 |
|
0 |
035050M |
|
Josh Vann |
|
Ten Mile Lake |
|
2 |
|
0.50 |
|
Issued |
|
2022-09-29 |
|
2027-09-29 |
|
2024-11-28 |
|
$ |
29.15 |
|
2025-09-29 |
|
0 |
|
0 |
n=2 licences |
|
|
|
Totals |
|
211 |
|
52.75 |
|
|
|
|
|
|
|
|
|
|
|
|
|
|
|
|
|
F) Bellman's Pond Block
Licence No. |
|
Title Holder |
|
Location |
|
No. of |
|
Area |
|
Status |
|
Issued Date |
|
Renewal Date |
|
Report Due |
|
Annual |
|
Expenses |
|
NSR |
|
NSR |
|||||||||||||||||||||||
030775M |
New Found Gold Corp. |
|
Bellman's Pond |
|
1 |
|
0.25 |
|
Issued |
|
2020-05-02 |
|
2025-05-02 |
|
2025-07-01 |
|
$ |
73.18 |
|
2025-05-02 |
|
0 |
|
0 |
|||||||||||||||||||||||
G) Little Rocky Brook Block
Licence No. |
|
Title Holder |
|
Location |
|
No. of |
|
Area |
|
Status |
|
Issued Date |
|
Renewal Date |
|
Report Due |
|
Annual |
|
Expenses |
|
NSR |
|
NSR |
|
030777M |
|
New Found Gold Corp. |
|
Little Rocky Pond, Gander River |
|
114 |
|
28.50 |
|
Issued |
|
2020-05-02 |
|
2025-05-02 |
|
2025-07-01 |
|
$ |
9,882.70 |
|
2025-05-02 |
|
0 |
|
0 |
H) Summary of all blocks
No. of licences 103
No. of claims 7,024
Area (km2) 1,756.00
23
5.2.2 |
Mineral Tenure and Ownership |
Mineral rights in the Province of Newfoundland and Labrador are managed by the Mineral Lands Division (the “Mineral Lands Division”) of the Department of Industry, Energy, and Technology (the “IET”), which coordinates map-staking of Crown mineral licences through the online Mineral Lands Administration Portal. Within the area of a mineral licence there are separate mineral claims, up to 256 coterminous claims per licence area.
With respect to mineral licence maintenance in Newfoundland and Labrador, NFG must abide by two financial obligations to maintain the licences in good standing:
1. |
Minimum expenditures for ongoing assessment, in which the province requires licence-holders to spend a minimum amount on their exploration activities each year. These minimum expenditure commitments increase with time, as summarized in Table 2. |
NFG’s minimum exploration expenditure obligation for the entire Queensway Project is $104,408.86 in 2024 (at the Effective Date) and $1,505,946.54 in 2025. With the current drilling program scheduled to continue throughout 2024, and with ongoing surface reconnaissance and mapping activities, the money NFG spends on exploration will exceed the required minimum.
In each year of the mineral licence validity, the minimum annual assessment work must be completed by the anniversary date with an assessment report submitted within 60 days of the anniversary date. Excess assessment work expenditures are credited to the licence and can be carried forward to satisfy the expenditure requirements in future years.
Any mineral licence holder who intends to conduct an exploration program must obtain an exploration approval from the IET before the activity can commence.
2. |
Licence renewal fees are required every 5 years to year 20 and every year after that, if kept in good standing, from the date when the claim was first staked. |
Table 3 shows the renewal fee per claim for each of the five-year intervals. These fees are due every five years from Year 5 through Year 20, and then annually from Year 21 onward. NFG’s annual renewal fees is $15,800 for the licenses that reach their renewal date in 2024; and $80,175 for the licenses that reach their renewal date in 2025.
Table 2 - Minimum expenditures for mineral claims in Newfoundland and Labrador.
Year |
|
Required Expenditure |
|
|
1 |
|
$ |
200.00/Claim |
|
2 |
|
$ |
250.00/Claim |
|
3 |
|
$ |
300.00/Claim |
|
4 |
|
$ |
350.00/Claim |
|
5 |
|
$ |
400.00/Claim |
|
6 to 10 |
|
|
$600.00/Claim |
|
11 to 15 |
|
|
$900.00/Claim |
|
16 to 20 |
|
|
$1,200.00/Claim |
|
21 to 25 |
|
|
$2,000.00/Claim |
|
26 to 30 |
|
|
$2,500.00/Claim |
|
31 Onward |
|
|
$3,000.00/Claim |
|
Table 3 - Renewal fees for mineral claims in Newfoundland and Labrador.
Year |
|
Renewal Fee |
|
|
5 |
|
$ |
25.00/Claim |
|
10 |
|
$ |
50.00/Claim |
|
15 |
|
$ |
100.00/Claim |
|
20 Onward |
|
$ |
200.00/Claim |
|
24
5.2.3 |
Surface Rights |
Title to the surface rights in Newfoundland and Labrador is necessary to be obtained only to develop a mineral resource under a mining lease. Surface rights to perform non-ground destructive and/or ground-destructive exploration work in permitted areas is obtained through exploration approvals from the IET, under a mineral licence.
NFG does not own title to surface rights on the Queensway Project except for the Core Yard at Appleton. On an as-needed basis, NFG negotiates agreements that allow exploration activities to be conducted on property owned and administered by others:
| ● | The province of Newfoundland and Labrador, which administers Crown Lands, |
| ● | The municipalities of Appleton and Glenwood, |
| ● | Property owners of residential properties in Appleton and Glenwood and of cottages and cabins, granted or licence to occupy, outside municipal boundaries. |
In addition to stipulating the times when NFG can conduct work, and the nature of the work that is permitted, these agreements also specify NFG’s responsibility for restoring land to an acceptable condition following field activities.
For activities on Crown Lands, approval is required from the Mineral Lands Division. The primary focus of these applications and approvals is to prevent or minimize adverse impacts on the environment, fish, and wildlife, as summarized below in “Permits, Licencing, Environmental Assessment and Significant Factors”.
If the Queensway Project advances to the mine production stage, NFG would need to obtain surface rights by applying for a surface lease to the IET, accompanied by a legal survey. Surface leases are issued by the Minister of IET in consultation with the Minister appointed to administer the Lands Act.
5.2.4 |
Royalties |
Seventy-eight of the 103 Queensway Project mineral licences (76%) are currently subject to a net smelter return royalty; the other 25 licences are not subject to any royalty. Some royalties were formed within agreements between NFG and the various individuals and companies that optioned their mineral rights to NFG in return for financial compensation that included net smelter return royalties. Others arise from financing provided by GoldSpot Discoveries Corp. (“GoldSpot”) in 2019. All claims acquired after the NFG-GoldSpot agreement execution date and contiguous to the NFG-GoldSpot agreement original claims are also subject to a 1% net smelter return royalty to GoldSpot less royalties at their time of acquisition.
Currently, the net smelter return royalties range from 0.4% to 3.0% for the 78 licences subject to a net smelter return royalty. Many of NFG’s option and financing agreements have included a buy-back provision that allows the Company to reduce the net smelter return royalty by making a lump-sum payment to the holder of the royalty. NFG has already exercised the buy-back option on some of its agreements. Were NFG to exercise its buy-back rights, the net smelter return royalties would range between 0.5% and 1.5% for the 28 licences that are subject to a net smelter return royalty.
Royalties associated with the NFG-LabGold purchase agreement state that mineral licences 027636M, 207637M and 035204M are subject to a 1% NSR plus $1 per ounce of gold in the ‘indicated mineral resource’ and ‘measured mineral resource’ categories, as defined by CIM definition standards. In addition, an advance royalty of $50,000 per annum will be payable, at the election of the royalty holder, in cash or common shares, commencing on March 3, 2026, and continuing each year thereafter until commencement of commercial production.
5.2.5 |
Option Agreements (the VOA Option) |
In addition to the mineral licences staked by NFG, the Queensway Project also includes optioned claim packages that were negotiated by NFG from 2016 through 2018 under nine separate and completed option agreements. These option agreements granted mineral rights to NFG in return for a combination of scheduled lump-sum payments, Common Shares and net smelter return royalties to various individual and company optionors.
As of September 2021, when the last of the option payments was made with respect to the nine option agreements, NFG had met all the conditions and earned 100% ownership of the associated mineral licences.
25
On November 2, 2022, NFG executed the VOA Option Agreement with the Optionors. The VOA Option Agreement grants NFG exclusive right and option to acquire a 100% title and interest in a property defined by five mineral licences: 035047M and 035197M, 035048M and 035198M, and 035050M, owned by Aidan O’Neil, Suraj Amarnani, and Josh Vann respectively (the “VOA Option”).
In connection with the grant of the VOA Option, NFG has the right to enter onto and occupy the optioned property to conduct activities as contemplated in the VOA Option Agreement.
For NFG to exercise the VOA Option, NFG must 1) issue an aggregate of 487,078 Common Shares (the “VOA Share Issuances”) and 2) make aggregate cash payments of $2,350,000 (the “VOA Cash Payments”) to the Optionors.
Upon NFG completing the VOA Cash Payments and the VOA Share Issuances, NFG will immediately be deemed to have exercised the VOA Option and acquired a 100% interest in the property free and clear of all encumbrances with no further action required by it resulting in the Optionors’ interest in the property being immediately transferred to NFG. The terms of the VOA Option Agreement do not include any mandatory work commitments, advanced royalty payments, or granting of royalties.
5.2.6 |
Permits, Licencing, Environmental Assessment and Significant Factors |
NFG is responsible for obtaining all permits in accordance with the laws of Newfoundland and Labrador to conduct exploration activities at the Queensway Project. Exploration activities require approval from the Mineral Lands Division. These specify the activities that are allowed in the area; they are typically valid for one to two years and can be renewed or amended if required.
Mineral licences 024557M, 024558M, 024561M, 024563M, 024568M, and 024570M, all of which lie in the south of QWS, are restricted from exploration activities from mid-May to early-July as this area is a spring habitat for Newfoundland caribou.
Mineral licence 035198M in QWN encloses two known archaeological sites and covers a portion of the Gander River which has high archaeological potential. As such, the Provincial Archaeology Office recommends a 100 m buffer along the Gander River, and 50 m buffers around the two known sites. The two known archaeological sites in the Universal Transverse Mercator Zone 21N NAD83 are:
1. |
662938 m Easting, 5435800 m Northing, and |
2. |
670038 m Easting, 5439265 m Northing. |
The Qualified Person is not aware of any other restrictions to NFG’s exploration activities, which can generally be conducted year-round once the necessary approvals have been received from the Mineral Lands Division, and/or from the relevant municipal governments and individual property owners.
To conclude and to the best of the Qualified Person’s knowledge, there are no environmental liabilities, significant factors or risks that may affect access, or the right or ability of NFG to perform exploration work on the Queensway Project.
With respect to obtaining additional permits, the Qualified Person has no reason to assume that the Company would not be granted additional exploration approvals and other permits to advance the Queensway Project. With respect to title, mineral licences: 035047M and 035197M, 035048M and 035198M, and 035050M are owned by Aidan O’Neil, Suraj Amarnani, and Josh Vann respectively. Hence, NFG mineral rights ownership of these licence areas and the mineral occurrences that may occur within them are subject to successful completion of conditions of the VOA Option Agreement in place (see “Option Agreements” above).
5.3 |
Historical mineral exploration has occurred in the Queensway Project area since the 1950s with early focus on base metals through to the 1970s. This shifted to gold with the discovery of the gold prospect at Jonathan’s Pond in the early 1980s. From the 1980s through the mid-2010s, dozens of prospectors and companies conducted exploration programs that included prospecting and rock sampling, geological mapping, surface sampling of till, soil, stream sediment and lake sediment, trenching and channel sampling, geophysics, and drilling. Several gold prospects were discovered in the Queensway area because of these historical exploration programs.
By 2012, 14 different companies had drilled 246 holes with a total of 29,593 m of drill core on NFG’s QWN and QWS blocks, and north, south, and west of Gander Lake. The historical exploration campaigns in the Queensway Project area provide indications of gold mineralization, with gold grades above 100 ppm in mineralized boulders, till samples, and drillhole intercepts. Fourteen and 25 historical gold prospects were discovered in NFG’s QWS and QWN blocks, respectively. The historical exploration generally occurred along and adjacent to the two linear mineralized trends associated with the Appleton Fault Zone (the “AFZ”) and the Joe Batt’s Pond Fault Zone (the “JBPFZ”).
26
Historical work completed by Labrador Gold Corp. consists of geological mapping, prospecting, and geochemical sampling of rock (2,512 samples), soils (12,145 samples), and till (535 samples). Gold in bedrock sampling led to the discovery of four occurrences, Big Vein, Golden Glove, Knobby, and HM. Geophysical surveys conducted on the Property included numerous ground geophysical surveys. Since 2020, Labrador Gold Corp. conducted diamond drilling (341 holes totaling 91,420 m), rotary air blasting (154 holes totaling 8,382 m), and reverse circulation (6 holes totaling 434 m) at the Big Vein, Doyle Zone-Pristine, Midway, Dropkick, Golden Glove, Knobby, Peter Easton, CSAMT and HM prospects, and to test geochemical gold anomalies in areas with no bedrock exposure. The Big Vein-Big Vein Southwest, Doyle Zone, and Dropkick zone occur in proximity to the AFZ and show similar gold mineralization, geological, alteration, and structural characteristics.
The QP includes a summary of select historical exploration work programs that include gold-specific historical gold assays and/or gold-related information in Table 4 below.
The compilation in Table 4 includes historical exploration work that occurs 1) within-property, 2) off-property, and/or 3) may include work that occurred on licences that overlap with the current NFG land position. Hence, and to further assist the reader on deciphering within-property and off-property exploration results, the QP presents the general spatial location of the exploration work programs in Figure 1.
Several historical assessment reports filed with the provincial government have historically referred to the Queensway Property area as:
| ● | The Linear Property, a reference to the long linear trend formed by many showings and prospects along both the AFZ and the JBPFZ. |
| ● | The Gander Gold property, a reference to Gander Lake and Gander River (including its extensions, NW Gander River and SW Gander River, on the south side of Gander Lake) along which much of the early exploration work was done. |
LabGold’s Kingsway Project and Sky Gold’s Mustang Property, both of which were acquired 100% by NFG in 2024, bolsters the overall number of historical till, soil, rock, and drilling work completed within the Queensway Property.
27
Figure 1 – Location of historical exploration programs conducted by companies other than NFG. The location names
accompany the names used by various companies and prospectors listed in Table 4. Within Property exploration work is
highlighted in red text.
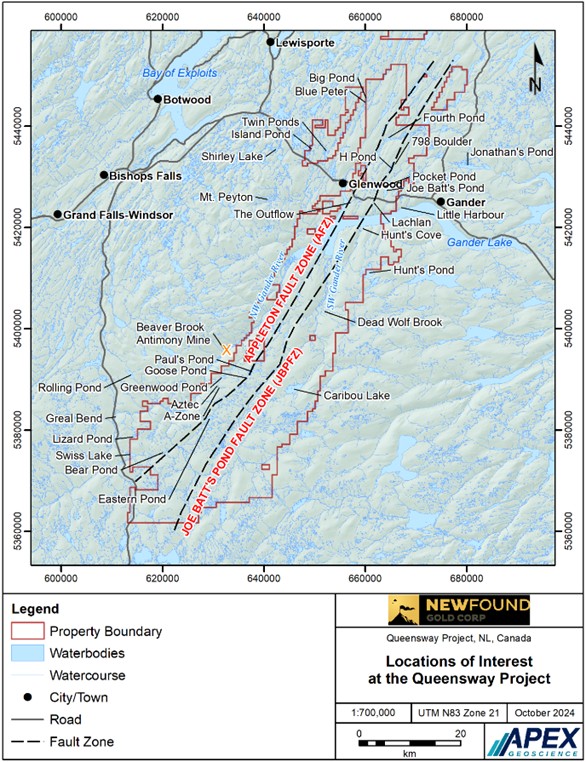
28
Table 4 - Summary of select historical exploration work conducted by companies other than NFG. The compilation is limited to work that includes notable gold assays and results. Within Property work is highlighted in red text on the accompanying Figure 1.
Years |
Companies |
Optionor / Prospector |
Location |
Pros-pecting |
Map-ping |
Rock samp-ling |
Geo-physics |
Trench |
Drill- |
Notable gold assays |
|
1955-1956 |
Newfoundland and Labrador Corporation |
|
Caribou Lake |
x |
x |
x |
First documented exploration work |
||||
1980-1982 |
Westfield Minerals |
|
Jonathan's Pond |
x |
x |
x |
Blackwood discovery follow-up; 2.12-3.55 ppm (trenches) |
||||
1987-1988 |
Noranda |
|
Gander Lake Outflow |
x |
x |
x |
x |
5-28 ppm (outcrop samples); 1.5-2 ppm (trench samples); 1.1-4.5 ppm (drillholes) |
|||
Appleton |
|||||||||||
|
|||||||||||
1988-1990 |
Noranda Exploration |
|
Twin Ponds |
x |
x |
x |
x |
2.45 ppm (pan concentrate); 441 ppm (thin vein in trench) |
|||
Big Pond |
|||||||||||
Blue Peter |
|||||||||||
1990-1991 |
Manor Resources |
|
Twin Ponds |
x |
x |
x |
x |
2 ppm (soil sample) |
|||
1992-1994 |
Gander River Minerals |
|
AFZ |
x |
x |
x |
2.3 m @ 14.8 ppm (drillhole) |
||||
Noranda Exploration |
|||||||||||
1995-2004 |
|
L.L. Chan |
Paul's Pond |
x |
x |
7.68 ppm (till) |
|||||
Greenwood Pond |
|||||||||||
1997-1998 |
|
P. Crocker |
AFZ |
x |
x |
153.4 ppm (grab sample) |
|||||
D. Barbour |
|||||||||||
R. Churchill |
|||||||||||
1997-2001 |
Altius Minerals |
Forex Resources |
Aztec Trend |
x |
x |
x |
2.1 ppm (grab sample) |
||||
Cornerstone Resources |
Greenwood Pond |
||||||||||
|
Paul's Pond |
||||||||||
1998-2016 |
Krinor Resources |
A. & K. Keats |
AFZ |
x |
Discovery of Dome prospect |
||||||
P. Dimmell |
|||||||||||
1999-2000 |
United Carina |
|
AFZ |
x |
x |
x |
x |
Several drillhole intervals with gold grades above 10 ppm. |
|||
7984M |
|||||||||||
1999-2001 |
Cornerstone Resources |
|
Paul's Pond |
x |
x |
x |
0.8 − 2.1 ppm (grab samples) |
||||
2000-2002 |
|
C. Reid |
AFZ to JBPFZ |
x |
VG noted near Gander Lake |
||||||
7179M |
|||||||||||
2000-2009 |
|
L. & E. Quinlan |
AFZ |
x |
x |
Discovered Lachlan prospect; 61 ppm (grab sample) |
|||||
Joe Batt's Pond |
|||||||||||
JBPFZ |
|||||||||||
2002 |
Grayd Resources |
Fortis GeoServices |
Greenwood Pond |
x |
x |
x |
x |
10.9 ppm (grab sample) |
|||
2002-2005 |
Candente Resources |
|
Greenwood Pond |
x |
x |
x |
>1,000 ppm (quartz boulders); 1.0 m @ 6.1 ppm (drillhole); 0.8 m @ 15.7 ppm (drillhole) |
||||
Paul's Pond |
|||||||||||
Goose Pond |
|||||||||||
2002-2005 |
Crosshair Exploration |
|
Big Pond |
x |
x |
x |
x |
x |
40 − 50 ppm (trench samples) |
||
and Mining |
Dan's Pond |
||||||||||
|
Island Pond |
||||||||||
2003 |
Candente Resources |
|
AFZ |
x |
x |
x |
0.4 m @ 7.2 ppm (drillhole); 2 m @ 3.2 ppm (drillhole) |
||||
2003-2006 |
Paragon Minerals |
KriASK Syndicate |
JBPFZ |
x |
x |
x |
x |
x |
1x0.5 m boulder with 798 ppm Au gives the 798 Zone its name; 22.6 ppm (trench sample); 4 |
||
Rubicon Minerals |
H-Pond |
||||||||||
|
Pocket Pond |
||||||||||
2004-2005 |
Spruce Ridge Resources |
|
Gander Lake |
x |
x |
x |
1.2 ppm (trench sample) |
||||
Little Harbour |
|||||||||||
2004-2005 |
Crosshair Exploration |
|
Paul's Pond |
x |
x |
x |
x |
x |
10 − 15 ppm (trench samples); 0.35 m @ 7.1 ppm (drillhole); 0.5 m @ 4.3 ppm (drillhole) |
||
and Mining |
|||||||||||
|
|||||||||||
2005-2014 |
|
R. & E. Quinlan |
AFZ to JBPFZ |
x |
x |
18.7 ppm (grab sample); 20+ surface samples >1 ppm |
|||||
Quinlan Prospecting |
12652M |
||||||||||
2007-2008 |
Paragon Minerals |
|
AFZ |
x |
Last drilling on AFZ pre-NFG; 0.9 m @ 2.5 ppm (drillhole); 3.6 m @ 3.2 ppm (drillhole); 1.2 m @ 5.8 ppm (drillhole) |
||||||
Rubicon Minerals |
|||||||||||
|
|||||||||||
|
|||||||||||
2007-2010 |
|
J. Sceviour |
Paul's Pond |
x |
x |
Surface float samples above 0.2 ppm |
|||||
2011-2012 |
Soldi Ventures |
|
AFZ |
x |
5.4m @ 9.8 ppm (drillhole); 7.1m @ 12.4 ppm (drillhole) |
||||||
2011-2012 |
Metals Creek Resources |
|
Gander Lake |
x |
x |
x |
59.4 ppm (grab sample); 26.8m @ 0.3 ppm (trench) |
||||
2020-2024 |
Labrador Gold Corp. |
|
Kingsway |
x |
x |
x |
x |
x |
x |
501 drillholes defining 9 gold prospects |
29
5.4 |
The tectonostratigraphic setting of the Queensway Project occurs within the Dunnage (mainly Exploits Subzone) and Gander zones of the Newfoundland Appalachian orogen. A poly-deformed fold and thrust belt that overprints Ordovician ophiolitic and marine carbonate/siliciclastic rocks, Silurian shallow marine/ terrestrial sequences, and Silurian magmatic rocks. The bedrock geology is comprised of Middle Ordovician sedimentary rocks of the Outflow and Hunt’s Cove formations (Davidsville Group) and the Main Point Formation (Hamilton Sound Group).
Gold prospects within the Queensway area are mostly concentrated along the AFZ and the JBPFZ, two major fault zones that run southwest-to-northeast through the project area. Second-order brittle faults such as the Keats-Baseline Fault Zone are also known to host gold mineralization.
Gold at the Queensway Project typically occurs as coarse grains of free visible gold in quartz-carbonate veins that are brecciated, massive-vuggy, laminated, or have a closely spaced stockwork texture. High-grade gold mineralization, above 10 ppm Au, typically has a strong correlation between gold and quartz-carbonate veins associated with complex networks of brittle fault zones aligned with regional deformation zones. High-grade gold mineralization has not been observed outside of the main vein arrays.
Gold mineralization is often associated with arsenic-bearing accessory minerals, in addition to antimony and tungsten. An alteration halo around most of the gold-rich veins is associated with the changes in the mineralogy of white mica.
5.4.1 |
Regional Geology |
Newfoundland lies in the Appalachian orogen, which extends from Scandinavia in the north to Georgia, U.S., to the south. The Orogen provides a cross-section and record of the formation and destruction of the Pre-Cambrian to early Paleozoic Iapetus Ocean which took place over 5 orogenic events that included the:
1. |
Taconic orogeny (500-455 Ma) |
2. |
Penobscot orogeny (485-478 Ma) |
3. |
Salinic orogeny (430-425 Ma) |
4. |
Acadian orogeny (420-390 Ma) |
5. |
Neoacadian orogeny (390-350 Ma). |
The Appalachian orogen (325-260 Ma) contains the vestiges of the Early Paleozoic Iapetus Ocean, which formerly separated the Laurentian and Gondwanan continents, and formed during collision events that created the super-continent, Pangaea. The tectonostratigraphic setting is divided into four litho-tectonic facies, from west to east - the Humber, Dunnage, Gander, and Avalon zones based on structural, faunal, geochronological, and stratigraphic relationships. The Queensway Project is in the Dunnage (mainly) and Gander zones, as described in the text that follows.
The Gander Zone is defined by distinct poly-deformed, middle Cambrian to Tremadocian quartz-rich metapsammites and metapelites of the Gander Group which represent the continental margin sediments of Ganderia. Ganderia is interpreted to be a small ribbon continent that rifted from Gondwana during the middle Cambrian. Gander Zone rocks are mostly restricted to the Meelpaeg, Gander Lake and Mount Cormack subzones in the Newfoundland Appalachians. Parts of the Queensway Project is underlain by Gander Lake and Mount Cormack Subzone rocks.
The Dunnage Zone consists of a collage of Cambro-Ordovician ophiolitic, intra-oceanic arc, back arc and associated marine sedimentary rocks of both Laurentian and Gondwanan affinity. The zone is sub-divided into the Notre Dame (Peri-Laurentian) and Exploits (Peri-Gondwanan) subzones based on differences in their geologic/structural evolution, fauna, and isotopic characteristics. The Mekwe’jit Line (former Red Indian Line) is a major, late Ordovician suture which separates the Notre Dame Subzone in the west from the Exploits Subzone to the east. Most of the Queensway Project lies in the Exploits Subzone of the Newfoundland Appalachians.
30
5.4.2 |
Property Geology |
The Queensway Project constitutes a poly-deformed fold and thrust belt that overprints Ordovician ophiolitic and marine carbonate/siliciclastic rocks, Silurian shallow marine/ terrestrial sequences, and Silurian magmatic rocks. the AFZ and the JBPFZ are major structures that transect the belt and are spatially associated with epizonal-gold mineralization. Sandeman and Honsberger propose three evolutionary models for the faults as follows: 1) east-vergent back thrusts; 2) late normal faults; or 3) overturned west-vergent thrusts reactivated as a normal fault (Sandeman, H.A.I and Honsberger, I. (2023): Gold Mineralization at the Valentine Lake, Moosehead, Queensway and Kingsway Projects; Geological Association of Canada Newfoundland and Labrador Section 2023 fall field trip, September 29 – October 1, 2023, 63 p (“Sandeman and Honsberger 2023”)).
The Appleton Fault’s hangingwall and footwall have contrasting rock-types and structural style. The following text briefly describes the distribution and spatial relationships of the various rock types in the AFZ footwall and hanging wall domains.
Most of the Queensway Project resides between the Appleton Fault footwall and the Gander River Ultramafic Belt (“GRUB”) Line. Easternmost exposures are characterized by the Gander River Ultramafic Complex (“GRUC”). Rocks include peridotite, pyroxenite, tonalite, serpentinite, talc, mafic volcanics and mafic derived volcaniclastics. Its structural base is flanked against Gander Group rocks to the east along the GRUB Line. GRUC rocks are unconformably overlain to the west by shallow to deep marine rocks of the Middle Ordovician Davidsville Group. These rocks consist of fossiliferous sandstone/limy siltstone, conglomerate, greywacke, siltstone, and mudstone.
Westernmost exposures between the Appleton Fault and the Dog Bay Line are more diverse and structurally complex. The Main Point Formation, Badger Group equivalent rocks (uncertain relationship), Indian Islands Group, and Ten Mile Lake Formation are imbricated with the Davidsville Group. The Main Point Formation includes deep-marine graphitic shales and mudstone seated above the Davidsville Group. Recent studies suggest Badger Group-equivalent rocks (conglomerate, sandstone/greywacke, siltstone/mudstone) overly the Main Point Formation (Sandeman and Honsberger 2023). These rocks are overlain by Silurian shallow marine to terrestrial rocks of the Indian Islands Group (limestone, siltstone, micaceous sandstone) and Ten Mile Lake Formation (micaceous sandstone and siltstone). The projected trace of the Dog Bay Line and Indian Islands Group/Ten Mile Lake Formation are spatially associated with mafic, intermediate, and felsic intrusive rocks of the Mount Peyton Intrusive Suite.
5.4.3 |
Mineralization |
Gold mineralization at the Queensway Project typically occurs as coarse grains of free visible gold in multiphase quartz-carbonate veins that are brecciated, massive-vuggy, laminated, or that have a closely spaced stockwork texture.
Arsenopyrite (AsFeS) is commonly observed to occur in conjunction with gold. Boulangerite (Pb5Sb4S11), a lead-antimony sulfosalt, is often associated with chalcopyrite (CuFeS2) in intervals of high-grade gold mineralization, however, it is much less common than arsenopyrite. Disseminated host rock pyrite/arsenopyrite mineralization is spatially associated with veining.
High-grade gold mineralization, above 10 ppm Au, typically occurs in closely spaced quartz veins associated with fault and fracture zones. High-grade gold mineralization has not been observed outside of the main vein arrays. The quartz vein textures, and mineral associations are interpreted to be indicative of an orogenic epizonal gold system.
Gold-bearing quartz veins occur in brittle faults with varying orientations that are most commonly discordant to the regional northeast trending foliation and stratigraphy. High-grade gold domains are controlled by the intersection of cross-cutting faults and their vein constituents. Dominant orientations for both vein sets and high-grade shoots have been recognized and are important interpretations for exploration targeting.
5.4.4 |
Mineralized Zones |
NFG’s exploration programs, supplemented by historical work, has identified several mineralized gold zones in QWN and QWS blocks. The gold zones are characterized by:
| ● | Strong gold mineralization in quartz-carbonate veins associated with complex networks of brittle fault zones aligned with regional deformation zones. |
| ● | A gold association with arsenic-bearing minerals, in addition to antimony and tungsten. |
| ● | An alteration halo around most of the gold-rich veins that is associated with the changes in the mineralogy of white micas. |
31
These include:
1. |
The northern part of the AFZ in QWN, where the fault zone exploits the contact between a black shale interbedded with grey siltstone and greywacke in the west and a sequence of interbedded shale and greywacke in the east. Along the 9.5 km length of this mineralized zone, surface reconnaissance and trenching has established over 20 prospects, 19 of which have been drilled by NFG, including Keats, which is the most extensively drilled of the Queensway prospects. |
Mineralization is hosted in a network of brittle faults adjacent to the AFZ and crosscutting the NE-striking stratigraphy. These faults and associated gold-bearing vein arrays tend to strike approximately E-W or N-S and have moderate to steep dips. The full down-dip depth has not yet been established along the entire trend but is at least 450 m as defined by drilling at the Keats prospect.
2. |
The northern part of the JBPFZ in QWN, from Gander Lake to north of H-Pond, located approximately 5 km east and running parallel to the AFZ. Along the 12.5 km strike length of this zone, surface reconnaissance and trenching has established 10 prospects, 5 of which have been drilled by NFG. |
Mineralization is hosted in ductile, brittle deformation zones and associated irregular vein arrays that run parallel to the SW-striking, steeply west-dipping stratigraphy. Currently, the down-dip depth is not established along the trend but is at least 150-200 m as defined by drilling at the Pocket Pond and 1744 prospects.
3. |
A series of gold prospects (Figure 2) located on along the AFZ in the QWS Block that include: |
(a) |
Mineralized shear zones with gold associated with quartz veining and accessory sulphide minerals in greywacke and siltstone that is locally analogous to the gold discoveries made along the AFZ at QWN (e.g., Nebula, Devil’s Trench, Devils Pond South, Camp), |
(b) |
Gold hosted in siltstone that is intruded by a swarm of diorite-gabbroic dykes that has not been recognized at QWN (e.g., Astronaut, Nova, Goose), and |
(c) |
Epithermal fault zone gold mineralization defined sinter and hydrothermal breccia (e.g., Aztec). |
5.4.5 |
Deposit Types |
The Queensway Project is classified as an orogenic gold deposit, a deposit type that occurs throughout the world and includes some of the richest known gold deposits (Gardner, M. (2021): Geology Corner: The nuts and bolts of feasibility studies on gold, Canadian Mining Journal, January 14, 2021). Canadian orogenic gold deposit examples include 1) Campbell-Red Lake district, northern Ontario, 2) Porcupine-Destor Fault Zone, Timmins, Ontario, and 3) Cadillac-Larder Lake Fault Zone, eastern Ontario and Val d’Or mining district, Québec.
Orogenic gold deposits are understood to be created during continental plate collisions, when pressures and temperatures cause rocks to undergo metamorphism and dehydrate. Gold-bearing fluids are driven from the rocks and percolate through fissures and cracks. As these fluids migrate upwards, their temperature and pressure drop, causing gold, which is hard to keep in solution, to precipitate, often within quartz veins.
Conditions that cause gold to precipitate from fluids can occur deep in the crust, where temperatures and pressures are high, and the rocks are ductile. At depths of 20 km or more, metamorphism is described as granulite facies. Orogenic gold deposits can also form closer to the surface, where rocks are brittle and metamorphism is weaker, in the greenschist facies. The brittle or ductile nature of the host rock and the intensity of metamorphism give rise to different styles of gold mineralization in orogenic gold deposits, with different associated minerals. The style of mineralization observed at Queensway, with arsenic, antimony and tungsten often being associated with gold, is consistent with greenschist facies metamorphism at depths that are described in the technical literature as being epizonal to mesozonal.
The geological setting and the style of gold mineralization observed at Queensway are like those reported for the Meguma Supergroup, in Nova Scotia, Canada. NFG has also noted striking similarities between drill core samples from Queensway and core from the Fosterville Mine in the Castlemaine - Bendigo region in Australia.
32
5.5 |
NFG has conducted exploration activities at the Queensway Project between 2016 and 2024 that include prospecting and rock sampling, soil sampling, till sampling, trenching and channel sampling, and diamond drilling programs. Ground geochemical work within the boundaries of the Queensway Project has resulted in the collection of 1,250 till samples, 27,518 soil samples, 9,019 rock samples, and 3,352 trench channel samples. The samples were analyzed for gold at commercial, independent, and accredited laboratories. As of the Effective Date, over 80% of the samples have been assayed (some results are pending).
In 2016, NFG initiated gold exploration at the Queensway Project with a till sampling program along a portion of the JBPFZ in QWN. In 2017, NFG conducted regional prospecting and trenching along the JBPFZ following up on results from the initial till program, leading to the discovery of the 1744-Glass gold prospect. Other exploration studies included a detailed geological/structural study of the trenched areas, and an electromagnetic and magnetic airborne geophysical survey.
In 2018, exploration work included an interpretation of the newly acquired geophysical data (contracted to GoldSpot), a regional and detailed geological/structural study focused primarily in QWN (contracted to GoldSpot), regional prospecting and trenching along the JBPFZ in QWN, and regional till and targeted soil surveys at QWS. Satellite imagery was collected over the project area in late spring and early summer of 2018.
In 2019, limited exploration was conducted while a project-wide review of data was done in preparation for NFG’s first drilling program. In the fall of 2019, a culvert was replaced, and roads were upgraded between North and South Herman’s Pond along the AFZ to improve the ability of diamond drill rigs to access the area. The first diamond drilling conducted by NFG occurred in late fall of 2019.
In 2020, exploration work included detailed till sampling programs in conjecture with regional prospecting at QWS and TP, resampling and mapping of historic gold showings around Greenwood Pond and Paul’s Pond at QWS, regional geological/structural mapping at QWS, and a trenching program focused along the AFZ at QWN, which led to the discovery of the Golden Joint Hanging Wall (formerly EllieAnna) gold showing. One additional trench was dug at QWS near Eastern Pond. An airborne geophysical survey (gravity) was conducted over QWN in early 2020.
In 2021, NFG conducted further detailed prospecting along underexplored segments of the AFZ and JBPFZ at QWN, leading to the discovery of the Big Dave gold-in-float showing. Other exploration work included regional prospecting, focused on the underexplored southern extents of QWS, till sampling along the northern segment of the JBPFZ at QWN and in various areas at QWS. Targeted soil surveys took place along the AFZ at QWN and Eastern Pond Brook at QWS in addition to trenching programs targeting various areas at QWS. Other exploration studies include an electromagnetic magnetic HELITEM2 airborne geophysical survey (contracted to CGG Canada Services Ltd.) over newly acquired licenses, a LiDAR and photogrammetry survey at QWN (contracted to RPM Aerial Services), hyperspectral satellite imagery covering a portion of QWS and further interpretation of the 2017 electromagnetic and magnetic airborne geophysical survey.
In 2022, exploration work included detailed prospecting and soil surveys over several areas in QWS, a regional till survey and prospecting over the Narrows area at QWS, and trenching accompanied by detailed geological/structural mapping of the trenched exposures in various areas at QWS. This exploration program at QWS led to the discovery of Bernard’s Pond area including the Devil’s Trench South gold showing which was subsequently drill-tested later in 2022. Other exploration studies included a regional geological/structural mapping study focused on the shorelines of Gander Lake and an interpretation of the 2021 hyperspectral satellite imagery (contracted to Perry Remote Sensing LLC).
In 2023, NFG conducted regional and targeted prospecting over newly acquired licenses (Fourth Pond, TP, and Ten Mile Lake, areas as part of the VOA Option) and other underexplored areas at QWN. Prospecting also targeted segments of the GRUB Line in the east at QWN. Other exploration activities included targeted prospecting in QWS, this work covered the underexplored and remote areas of Golden Elbow and Dead Wolf Brook. Detailed soil surveys were also completed over the northern segment of the AFZ at VOA (Fourth Pond area), GRUB Line areas in QWN, and across various regions at QWS. Trenching accompanied by detailed geological/structural mapping covered the northern segment of the AFZ at VOA (Fourth Pond area) and Keats gold prospect at QWN, in addition to various target areas at QWS. Regional geological/structural mapping also targeted various areas at QWN including the King’s Point-Outflow regions along the AFZ, and the region from Logan-Lachlan south to the north shore of Gander Lake along the JPBFZ in addition to the Narrows area at QWS.
The exploration program in 2023 led to the discovery of several new areas of gold mineralization in QWS, particularly in the Greenwood Pond and Bernards Pond (e.g. Camp Zone) regions. Surface exploration also identified new showings at QWN along the north shore of Gander Lake/ southern extension of the JBPFZ and Outflow- King’s Point regions along the AFZ. Several geophysical programs were conducted in 2023 and include a regional seismic survey across the AFZ and JBPFZ at QWN (contracted to HiSeis of Subiaco, Australia), ground and drone based magnetic geophysical surveys over Paul’s Pond at QWS (contracted to Pioneer Exploration and Simcoe Geoscience), and a property wide LiDAR and Orthophoto survey (contracted to Eagle Mapping Ltd.).
33
Additional technical studies completed were a geochemical interpretation of 2022 NFG soils (contracted to Heberlein Geoscience), a geomorphology/surficial geology mapping study at QWN (contracted to Palmer) and a 3D inversion (contracted to TechnoImaging) and interpretation of magnetic and electromagnetic data over Golden Elbow at QWS (contracted to Fathom Geophysics).
In January and February of 2024, NFG completed targeted soil surveys over the GRUB Line in QWN and the Transmission Line area in QWS which had started in late 2023. Other exploration studies in early 2024 include a drone-based magnetic survey completed over Greenwood Pond, Camp and Devils Pond South areas in QWS (contracted to Rosor Exploration).
Since NFG’s previous technical report, the Company completed additional exploration in 2024 including rock sampling at QWN and QWS, as well as trenching and channel sampling at the Keats prospect.
Current surface exploration analytical result highlights include:
| ● | Most rock samples assay below 1 ppm Au. At QWN, 3.1% of the samples assayed between 1 and 30 ppm Au, and 0.37% had between 30 and 1,131 ppm Au (highest value from the Big Dave prospect along the AFZ). At QWS, 3.57% yielded between 1 and 30 ppm Au, and 0.11% had between 30 and 479 ppm Au (the highest value from float sample at the Camp prospect). Five per cent of the rock samples collected from TP, Little Rocky Brook, and Bellman’s Pond assayed between 1.22 and 15.79 ppm Au. |
| ● | Most till samples assayed below 1 ppm Au. The highest gold analytical values (>30 ppm Au) were from till samples collected within the QWN and QWS blocks. |
| ● | Soil sample grids have been used to define areas of elevated gold and other elements in soil. Most soil samples have between 0.00005 and 0. 947 ppm Au (over 99%). Four soil samples yielded over 1 ppm Au to a maximum of 2.27 ppm Au. |
| ● | Most trench channel samples assayed below 1 ppm Au. Previous highlights from the QWN block include 18.9 ppm Au at the K2 prospect, and 4 samples from the Glass prospect trenches yielded over 11 ppm Au and up to 14.6 ppm Au. In the QWS block, the Paul’s Pond prospect trenches yielded samples with 51.5 and 42.4 ppm Au. |
| ● | During August to November 2023, NFG undertook a major excavation effort at the Keats trench where the Company removed overburden to expose a 200 m long by 70 m wide area that roughly corresponds to the known surface expression of the high-grade segment of the Keats-Baseline Fault Zone. An ongoing detailed mapping and channel sampling program is being conducted by NFG with current results from the channel sampling returning several intercepts of gold mineralization, including one sample of 1,808 ppm Au over 0.98 m. Additional assay results are still pending. |
With respect to geophysical survey work, during 2023 and 2024, NFG completed,
| ● | A geophysical integration study in the Paul’s Pond prospect area involving the collection and interpretation of two joint magnetics and VLF-EM surveys that highlighted a large magnetized lithological unit and various conductive southwest-northeast trending lineation’s stretching the extent of the area thought to be lithological contacts or faults. |
| ● | A 3D seismic survey covering a 46 square-km block (5.8 km by 8.0 km) along the larger extent of the Appleton and JBP fault zones in the QWN block. Detailed interpretive work is ongoing. |
| ● | A drone-based magnetics survey over the Greenwood and Bernards Pond areas, covering roughly 1,470 line-km that provides a lithological and structural foundation of a large portion of QWS block. |
Based on data from surface reconnaissance and mapping studies, surface till and grab rock prospecting samples, trench channel rock samples, and geophysical surveys, NFG has identified several mineralized prospects along the AFZ and the JBPFZ in the QWN and QWS blocks.
34
Figure 3 - Gold prospects and zones within the Queensway Property. Detailed prospects are presented for Queensway North and Queensway South blocks in Figure 3 and Figure 4.
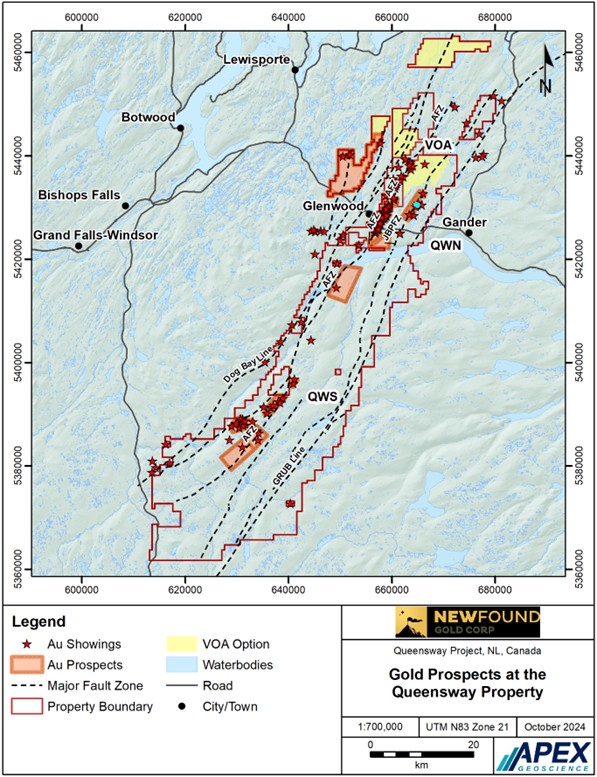
35
Figure 4 - Gold prospects and zones within the Queensway North Block.
36
Figure 5 - Gold prospects and zones within the Queensway South Block.
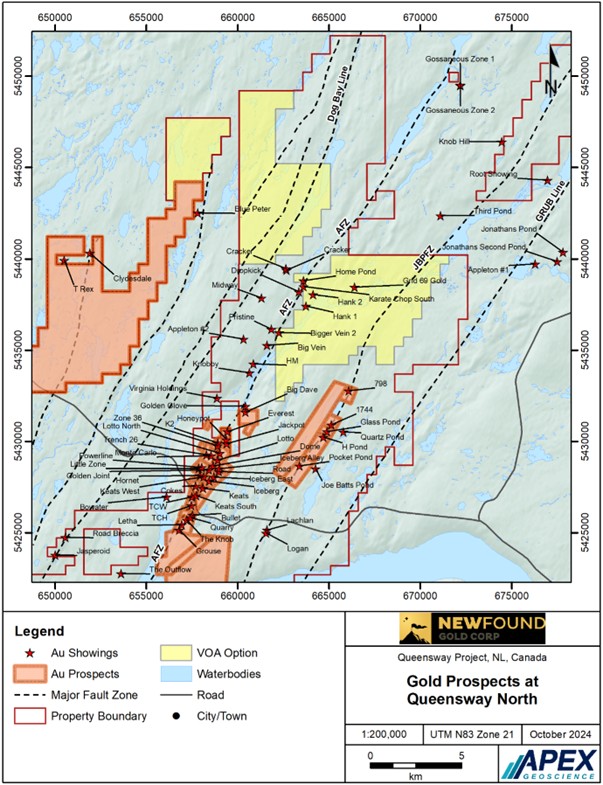
37
5.6 |
To the Effective Date, NFG has completed a total of 2,388 diamond drillholes for a total of 583,000 m at the Queensway Project (Table 5) and assayed a total of 536,402 samples from 2,329 drillholes at independent laboratories. Assay results for the remaining 29 drillholes are pending. A summary of drill core sample gold assays used to document this section, for each drilled prospect, is presented in Table 6.
A general summary of NFG gold prospects associated with the 2019-2024 drill program is presented under heading “Mineralized Zones”. Since NFGs previous technical report, NFG has either discovered-by-drilling, or drill-advanced, the following gold prospects:
| ● | Queensway North Prospect Drilling Updates: Dome, Everest, Golden Joint, Honeypot, Iceberg, Iceberg Alley, Jackpot, Keats South, Keats West, Lotto North, Monte Carlo Road and Big Vein (Big Vein was already discovered by LabGold. |
| ● | Queensway North Drilling Discoveries: Golden Dome, and Pistachio. |
38
Table 5 - Summary of drillholes from NFG’s diamond drilling program.
A) Queensway North |
2019 |
2020 |
2021 |
2022 |
2023 |
Jan 1 - Nov 1 2024 |
Total |
||||||||
|---|---|---|---|---|---|---|---|---|---|---|---|---|---|---|---|
Prospect |
Block |
No. of |
Length |
No. of |
Length |
No. of |
Length |
No. of |
Length |
No. of |
Length |
No. of |
Length |
No. of |
Length |
798 |
QWN |
|
|
|
|
2 |
469 |
|
|
|
|
|
|
2 |
469 |
1744 |
QWN |
2 |
522 |
|
|
23 |
7,309 |
3 |
1,155 |
|
|
|
|
28 |
8,986 |
Big Dave |
QWN |
|
|
|
|
|
|
24 |
7,792 |
|
|
|
|
24 |
7,792 |
Big Vein |
QWN |
|
|
|
|
|
|
|
|
|
|
4 |
1,258 |
4 |
1,258 |
Cokes |
QWN |
|
|
|
|
12 |
3,790 |
18 |
4,918 |
38 |
6,243 |
7 |
665 |
75 |
15,616 |
Dome |
QWN |
2 |
116 |
5 |
993 |
5 |
1,107 |
13 |
4,117 |
4 |
1,212 |
1 |
431 |
30 |
7,976 |
Dropkick |
QWN |
|
|
|
|
|
|
|
|
|
|
1 |
392 |
1 |
392 |
Everest |
QWN |
|
|
|
|
|
|
15 |
4,594 |
14 |
3,643 |
9 |
2,854 |
38 |
11,091 |
Gambit |
QWN |
|
|
|
|
|
|
|
|
3 |
552 |
|
|
3 |
552 |
Gander Outflow |
QWN |
|
|
|
|
|
|
2 |
1,345 |
|
|
10 |
1,760 |
12 |
3,105 |
Glass |
QWN |
4 |
879 |
|
|
|
|
2 |
679 |
|
|
|
|
6 |
1,558 |
Golden Bullet |
QWN |
|
|
|
|
|
|
2 |
898 |
1 |
308 |
|
|
3 |
1,206 |
Golden Dome |
QWN |
|
|
|
|
|
|
|
|
|
|
1 |
578 |
1 |
578 |
Golden Glove |
QWN |
|
|
|
|
|
|
|
|
|
|
2 |
739 |
2 |
739 |
Golden Joint |
QWN |
|
|
|
|
51 |
17,224 |
22 |
5,834 |
30 |
3,977 |
2 |
840 |
105 |
27,876 |
Green Mantle |
QWN |
|
|
|
|
|
|
|
|
|
|
2 |
352 |
2 |
352 |
H Pond |
QWN |
|
|
|
|
|
|
|
|
4 |
1,373 |
|
|
4 |
1,373 |
Honeypot |
QWN |
|
|
|
|
|
|
10 |
2,611 |
28 |
5,099 |
17 |
2,966 |
55 |
10,676 |
Iceberg |
QWN |
|
|
|
|
4 |
1,788 |
8 |
2,111 |
117 |
31,894 |
|
|
129 |
35,793 |
Iceberg Alley |
QWN |
|
|
|
|
|
|
1 |
353 |
27 |
3,781 |
10 |
2,042 |
38 |
6,176 |
Iceberg East |
QWN |
|
|
|
|
|
|
6 |
2,038 |
89 |
16,904 |
4 |
2,768 |
99 |
21,710 |
Jackpot |
QWN |
|
|
|
|
|
|
9 |
2,682 |
60 |
10,663 |
14 |
3,841 |
83 |
17,185 |
K2 |
QWN |
|
|
|
|
5 |
1,129 |
18 |
4,725 |
102 |
17,178 |
23 |
4,438 |
148 |
27,471 |
K2 West |
QWN |
|
|
|
|
|
|
|
|
5 |
1,030 |
|
|
5 |
1,030 |
Keats |
QWN |
2 |
469 |
41 |
8,767 |
195 |
54,935 |
84 |
24,495 |
38 |
4,372 |
1 |
1,162 |
361 |
94,200 |
Keats North |
QWN |
|
|
|
|
|
|
76 |
20,478 |
45 |
6,073 |
|
|
121 |
26,551 |
Keats South |
QWN |
|
|
|
|
13 |
4,585 |
46 |
23,967 |
25 |
5,006 |
12 |
10,228 |
96 |
43,787 |
Keats West |
QWN |
|
|
|
|
2 |
748 |
67 |
15,228 |
86 |
14,833 |
12 |
3,237 |
167 |
34,046 |
Kings Point |
QWN |
|
|
|
|
|
|
|
|
5 |
787 |
|
|
5 |
787 |
Knob |
QWN |
|
|
|
|
14 |
2,664 |
24 |
3,621 |
|
|
|
|
38 |
6,286 |
Knobby |
QWN |
|
|
|
|
|
|
|
|
|
|
8 |
2,678 |
8 |
2,678 |
Little Zone |
QWN |
|
|
6 |
769 |
|
|
|
|
19 |
3,881 |
3 |
1,272 |
28 |
5,922 |
Lonely Mountain |
QWN |
|
|
|
|
|
|
|
|
3 |
567 |
|
|
3 |
567 |
Lotto |
QWN |
|
|
13 |
3,032 |
45 |
13,405 |
34 |
8,444 |
4 |
1,174 |
|
|
96 |
26,055 |
Lotto North |
QWN |
|
|
|
|
4 |
674 |
42 |
10,487 |
33 |
7,167 |
7 |
2,388 |
86 |
20,715 |
Monte Carlo |
QWN |
|
|
|
|
|
|
22 |
4,781 |
80 |
16,834 |
13 |
3,847 |
115 |
25,462 |
Pistachio |
QWN |
|
|
|
|
|
|
|
|
|
|
4 |
1,493 |
4 |
1,493 |
Pocket Pond |
QWN |
|
|
|
|
42 |
9,677 |
4 |
1,052 |
8 |
1,789 |
|
|
54 |
12,518 |
Powerline |
QWN |
|
|
|
|
3 |
595 |
9 |
1,832 |
43 |
8,033 |
2 |
916 |
57 |
11,376 |
Pristine |
QWN |
|
|
|
|
|
|
|
|
|
|
1 |
412 |
1 |
412 |
Road |
QWN |
|
|
2 |
429 |
2 |
508 |
2 |
595 |
9 |
2,121 |
13 |
2,971 |
28 |
6,625 |
Rocket |
QWN |
|
|
|
|
2 |
492 |
29 |
6,064 |
5 |
769 |
6 |
950 |
42 |
8,275 |
TCH |
QWN |
|
|
|
|
4 |
969 |
5 |
1,921 |
|
|
|
|
9 |
2,891 |
TCW |
QWN |
|
|
|
|
|
|
14 |
3,321 |
8 |
2,210 |
|
|
22 |
5,531 |
Whiskey Pocket |
QWN |
|
|
|
|
2 |
449 |
25 |
8,161 |
|
|
|
|
27 |
8,609 |
|
Totals |
10 |
1,985 |
67 |
13,989 |
430 |
122,517 |
636 |
180,299 |
933 |
179,472 |
189 |
57,481 |
2,265 |
555,745 |
39
B) Queensway South |
2019 |
2020 |
2021 |
2022 |
2023 |
Jan 1 - Nov 1 2024 |
Total |
||||||||
|---|---|---|---|---|---|---|---|---|---|---|---|---|---|---|---|
Prospect |
Block |
No. of |
Length |
No. of |
Length |
No. of |
Length |
No. of |
Length |
No. of |
Length |
No. of |
Length |
No. of |
Length |
Astronaut |
QWS |
|
|
|
|
|
|
2 |
718 |
8 |
2,117 |
|
|
10 |
2,835 |
Aztec |
QWS |
|
|
|
|
|
|
2 |
739 |
|
|
|
|
2 |
739 |
Devil's Pond S/Camp |
QWS |
|
|
|
|
|
|
3 |
438 |
|
|
6 |
1,458 |
9 |
1,896 |
Devil's Trench |
QWS |
|
|
|
|
|
|
4 |
551 |
|
|
|
|
4 |
551 |
Eastern Pond |
QWS |
|
|
|
|
|
|
1 |
407 |
9 |
1,934 |
|
|
10 |
2,341 |
Golden Elbow |
QWS |
|
|
|
|
|
|
|
|
3 |
906 |
|
|
3 |
906 |
Goose |
QWS |
|
|
|
|
|
|
5 |
743 |
|
|
|
|
5 |
743 |
Greenwood |
QWS |
|
|
|
|
|
|
6 |
756 |
|
|
|
|
6 |
756 |
Mars |
QWS |
|
|
|
|
|
|
|
|
|
|
8 |
871 |
8 |
871 |
Nebula |
QWS |
|
|
|
|
|
|
2 |
448 |
4 |
690 |
|
|
6 |
1,138 |
Nova |
QWS |
|
|
|
|
|
|
4 |
1,103 |
7 |
1,118 |
|
|
11 |
2,221 |
Paul's Pond |
QWS |
|
|
|
|
|
|
4 |
1,352 |
3 |
900 |
|
|
7 |
2,252 |
Potato Trench |
QWS |
|
|
|
|
|
|
|
|
|
|
5 |
1,096 |
5 |
1,096 |
Till Raft |
QWS |
|
|
|
|
|
|
|
|
3 |
714 |
|
|
3 |
714 |
|
Totals |
0 |
0 |
0 |
0 |
0 |
0 |
33 |
7,255 |
37 |
8,379 |
19 |
3,425 |
89 |
19,059 |
C) VOA Option areas |
2019 |
2020 |
2021 |
2022 |
2023 |
Jan 1 - Nov 1 2024 |
Total |
||||||||
|---|---|---|---|---|---|---|---|---|---|---|---|---|---|---|---|
Prospect |
Block |
No. of |
Length |
No. of |
Length |
No. of |
Length |
No. of |
Length |
No. of |
Length |
No. of |
Length |
No. of |
Length |
69 Zone |
VOA |
|
|
|
|
|
|
|
|
4 |
972 |
|
|
4 |
972 |
BD Pond |
VOA |
|
|
|
|
|
|
|
|
1 |
350 |
|
|
1 |
350 |
Bigger Vein |
VOA |
|
|
|
|
|
|
|
|
2 |
700 |
|
|
2 |
700 |
Bigger Vein 2 |
VOA |
|
|
|
|
|
|
|
|
1 |
600 |
|
|
1 |
600 |
Fork in the Road |
VOA |
|
|
|
|
|
|
|
|
2 |
285 |
|
|
2 |
285 |
Hank 1 |
VOA |
|
|
|
|
|
|
|
|
7 |
1,360 |
|
|
7 |
1,360 |
Hank 2 |
VOA |
|
|
|
|
|
|
|
|
1 |
441 |
1 |
402 |
2 |
843 |
Hank 3 |
VOA |
|
|
|
|
|
|
|
|
2 |
507 |
|
|
2 |
507 |
Home Pond |
VOA |
|
|
|
|
|
|
|
|
3 |
515 |
|
|
3 |
515 |
Karate Chop South |
VOA |
|
|
|
|
|
|
|
|
3 |
555 |
|
|
3 |
555 |
|
Totals |
0 |
0 |
0 |
0 |
0 |
0 |
0 |
0 |
26 |
6,285 |
1 |
402 |
27 |
6,687 |
D) Twin Ponds |
|
2019 |
2020 |
2021 |
2022 |
2023 |
Jan 1 - Nov 1 2024 |
Total |
|||||||
|---|---|---|---|---|---|---|---|---|---|---|---|---|---|---|---|
Prospect |
Block |
No. of |
Length |
No. of |
Length |
No. of |
Length |
No. of |
Length |
No. of |
Length |
No. of |
Length |
No. of |
Length |
Twin Ponds |
TP |
|
|
|
|
|
|
7 |
1,508 |
|
|
|
|
7 |
1,508 |
|
2019 |
2020 |
2021 |
2022 |
2023 |
Jan 1 - Nov 1 2024 |
Total |
||||||||
|---|---|---|---|---|---|---|---|---|---|---|---|---|---|---|---|
Queensway Property Totals |
10 |
1,985 |
67 |
13,989 |
430 |
122,517 |
676 |
189,063 |
996 |
194,137 |
209 |
61,308 |
2,388 |
583,000 |
|
40
Table 6 - Summary of drill core sample gold assays
A) Queensway North
|
|
Assay Certificate Completion Year |
|
|||||
|---|---|---|---|---|---|---|---|---|
Prospect |
Block |
2019 |
2020 |
2021 |
2022 |
2023 |
Jan 1 - Nov 1 2024 |
Total Samples Assayed* |
798 |
QWN |
|
|
127 |
|
|
|
127 |
1744 |
QWN |
|
504 |
2,495 |
1,849 |
|
|
4,848 |
Big Dave |
QWN |
|
|
|
7,366 |
604 |
|
7,970 |
Big Vein |
QWN |
|
|
|
|
|
700 |
700 |
Cokes |
QWN |
|
|
2,247 |
3,490 |
9,462 |
983 |
16,182 |
Dome |
QWN |
14 |
90 |
2,357 |
4,010 |
711 |
656 |
7,838 |
Everest |
QWN |
|
|
|
628 |
7,549 |
2,938 |
11,115 |
Gambit |
QWN |
|
|
|
|
619 |
|
619 |
Gander Outflow |
QWN |
|
|
|
|
1,262 |
1,795 |
3,057 |
Glass |
QWN |
|
854 |
7 |
224 |
|
|
1,085 |
Golden Bullet |
QWN |
|
|
|
|
1,266 |
|
1,266 |
Golden Dome |
QWN |
|
|
|
|
|
620 |
620 |
Golden Glove |
QWN |
|
|
|
|
|
837 |
837 |
Golden Joint |
QWN |
|
|
10,189 |
9,756 |
4,717 |
296 |
24,958 |
H Pond |
QWN |
|
|
|
|
629 |
4 |
633 |
Honeypot |
QWN |
|
|
|
|
6,581 |
2,597 |
9,178 |
Iceberg |
QWN |
|
|
1,381 |
446 |
31,067 |
3,429 |
36,323 |
Iceberg Alley |
QWN |
|
|
|
|
2,743 |
2,844 |
5,587 |
Iceberg East |
QWN |
|
|
|
1,878 |
16,945 |
1,975 |
20,798 |
Jackpot |
QWN |
|
|
|
|
12,673 |
3,463 |
16,136 |
K2 |
QWN |
|
|
365 |
880 |
20,916 |
5,900 |
28,061 |
K2 West |
QWN |
|
|
|
|
1,102 |
|
1,102 |
Keats |
QWN |
27 |
1,848 |
38,214 |
32,429 |
12,935 |
1,071 |
86,524 |
Keats North |
QWN |
|
|
|
12,540 |
10,454 |
795 |
23,789 |
Keats South |
QWN |
|
|
412 |
20,481 |
9,452 |
5,945 |
36,290 |
Keats West |
QWN |
|
|
|
6,743 |
22,246 |
4,279 |
33,268 |
Kings Point |
QWN |
|
|
|
|
|
875 |
875 |
Knob |
QWN |
|
|
2,039 |
|
3,385 |
|
5,424 |
Knobby |
QWN |
|
|
|
|
|
1,541 |
1,541 |
Little Zone |
QWN |
|
769 |
21 |
|
4,168 |
1,375 |
6,333 |
Lonely Mountain |
QWN |
|
|
|
|
614 |
|
614 |
Lotto |
QWN |
|
1,513 |
8,484 |
12,673 |
1,556 |
139 |
24,365 |
Lotto North |
QWN |
|
|
378 |
6,479 |
10,409 |
1,772 |
19,038 |
Monte Carlo |
QWN |
|
|
|
417 |
20,111 |
3,834 |
24,362 |
Pistachio |
QWN |
|
|
|
|
|
383 |
383 |
Pocket Pond |
QWN |
|
|
3,410 |
2,063 |
971 |
|
6,444 |
Powerline |
QWN |
|
|
|
797 |
9,519 |
20 |
10,336 |
Road |
QWN |
|
|
454 |
983 |
2,111 |
2,394 |
5,942 |
Rocket |
QWN |
|
|
525 |
2,961 |
2,813 |
950 |
7,249 |
TCH |
QWN |
|
|
464 |
7,230 |
1,471 |
|
9,165 |
TCW |
QWN |
|
|
|
2,945 |
2,955 |
|
5,900 |
Whiskey Pocket |
QWN |
|
|
132 |
1,077 |
|
|
1,209 |
|
Totals |
41 |
5,578 |
73,701 |
140,345 |
234,016 |
54,410 |
508,091 |
41
B) Queensway South
|
|
Assay Certificate Completion Year |
|
|||||
|---|---|---|---|---|---|---|---|---|
Prospect |
Block |
2019 |
2020 |
2021 |
2022 |
2023 |
Jan 1 - Nov 1 2024 |
Total Samples Assayed* |
Astronaut |
QWS |
|
|
|
|
3223 |
|
3223 |
Aztec |
QWS |
|
|
|
|
789 |
|
789 |
Devil’s Pond S/Camp |
QWS |
|
|
|
|
445 |
1642 |
2087 |
Devil’s Trench |
QWS |
|
|
|
86 |
515 |
|
601 |
Eastern Pond |
QWN |
|
|
|
|
2236 |
288 |
2524 |
Golden Elbow |
QWS |
|
|
|
|
997 |
|
997 |
Goose |
QWS |
|
|
|
485 |
349 |
|
834 |
Greenwood |
QWS |
|
|
|
824 |
|
|
824 |
Mars |
QWS |
|
|
|
|
|
884 |
884 |
Nebula |
QWS |
|
|
|
|
1261 |
27 |
1288 |
Nova |
QWS |
|
|
|
326 |
2150 |
|
2476 |
Paul's Pond |
QWS |
|
|
|
864 |
1661 |
6 |
2531 |
Potato Trench |
QWS |
|
|
|
|
|
1224 |
1224 |
Till Raft |
QWS |
|
|
|
|
723 |
21 |
744 |
|
Totals |
0 |
0 |
0 |
2585 |
14349 |
4092 |
21026 |
B) VOA Option areas
|
|
Assay Certificate Completion Year |
|
|||||
|---|---|---|---|---|---|---|---|---|
Prospect |
Block |
2019 |
2020 |
2021 |
2022 |
2023 |
Jan 1 - Nov 1 2024 |
Total Samples Assayed* |
69 Zone |
VOA |
|
|
|
|
987 |
|
987 |
BD Pond |
VOA |
|
|
|
|
|
248 |
248 |
Bigger Vein |
VOA |
|
|
|
|
|
650 |
650 |
Bigger Vein 2 |
VOA |
|
|
|
|
|
542 |
542 |
Fork in the Road |
VOA |
|
|
|
|
101 |
149 |
250 |
Hank 1 |
VOA |
|
|
|
|
312 |
679 |
991 |
Hank 2 |
VOA |
|
|
|
|
|
556 |
556 |
Hank 3 |
VOA |
|
|
|
|
|
310 |
310 |
Home Pond |
VOA |
|
|
|
|
|
525 |
525 |
Karate Chop South |
VOA |
|
|
|
|
464 |
2 |
466 |
|
Totals |
0 |
0 |
0 |
0 |
1864 |
3661 |
5525 |
D) Twin Ponds
|
|
Assay Certificate Completion Year |
|
|||||
|---|---|---|---|---|---|---|---|---|
Prospect |
Block |
2019 |
2020 |
2021 |
2022 |
2023 |
Jan 1 - Nov 1 2024 |
Total Samples Assayed* |
Twin Ponds |
TP |
|
|
|
1760 |
|
|
1760 |
|
2019 |
2020 |
2021 |
2022 |
2023 |
Jan 1 - Nov 1 2024 |
Total Samples* |
|---|---|---|---|---|---|---|---|
Queensway Property Totals |
41 |
5,578 |
73,701 |
144,690 |
250,229 |
62,163 |
536,402 |
42
NFG’s most significant gold intercepts in the Queensway Project occur along the northern part of the AFZ within the QWN block where drilling has identified numerous gold zones that collectively include the Keats, Keats North, Cokes, Iceberg, Iceberg East, Iceberg Alley, Keats West, Road, Golden Joint, Powerline, Dome, Lotto, Monte Carlo, Lotto North, K2, Jackpot, Honeypot, Everest, Knob, Grouse, and Trans-Canada Highway prospects. The fault zone exploits the contact between a black shale interbedded with grey siltstone and greywacke in the west and a sequence of interbedded shale and greywacke in the east. Mineralization is also hosted in a network of brittle faults adjacent to the AFZ and crosscutting the northeast-striking stratigraphy.
While significant untested gaps still exist, NFG has defined a 6 km long mineralized strike area along the AFZ within the QWN block called the Appleton Fault Zone Mineralized Envelope. Mineralized zones within this mineralized envelope have been discovered on the east and west sides of the AFZ. The fault damage zone has an apparent width extent of 400 m, or 200 m on each side of the AFZ, and in certain places extends 500 m outward from the fault. In addition, gold prospects are defined to occur along offshoot faults associated with the AFZ. For example, the Keats, Iceberg, and Iceberg East prospects are associated with the Keats-Baseline Fault Zone, which splays outward in a northeast direction from the AFZ. Ongoing through 2024, the Company has been conducting a deep drilling program testing the Keats Baseline Fault Zone – AFZ structural corridor. NFG also commenced drilling within the newly acquired Labrador Gold Corp.’s Kingsway Project.
NFG exploration in the northern part of the JBPFZ in the QWN block, has established 10 prospects, 5 of which have been drilled by NFG. Gold mineralization is hosted in ductile-to-brittle deformation zones and associated irregular vein arrays that run parallel to the southwest-striking, steeply northwest-dipping stratigraphy.
NFG has located a series of gold prospects along the AFZ in the QWS block that include 1) mineralized shear zones with gold associated with quartz veining and accessory sulphide minerals in greywacke and siltstone that is locally analogous to the gold discoveries made along the northern portion of the AFZ (e.g., Nebula, Devil’s Trench, Devils Pond South, Camp), 2) gold hosted in siltstone that is intruded by a swarm of gabbroic dykes that has not been recognized at QWN (e.g., Astronaut, Nova, Goose), and 3) epithermal fault zone gold mineralization defined sinter and hydrothermal breccia (e.g., Aztec).
5.7 |
5.7.1 |
Sample Collection |
Till samples were collected and prepared with the goal of analyzing the number and size of gold grains. In the field, samples were screened using an 8 mm sieve to remove pebbles. Approximately 13 kg of the fine material, less than 8 mm, along with 1 kg of the coarse material, the pebbles greater than 8 mm, was packed in a heavy-duty plastic bag and sealed with a cable tie. The -8 mm fraction was used for analysis of gold content, while the +8 mm pebbles were used to log lithology. Till samples were shipped to Overburden Drilling Management (“ODM”) who created a concentrate.
Soil samples were acquired by NFG geologists using a “Dutch Auger” to penetrate down to and sample the B-soil horizon. NFG soil sampling programs also utilized the mass spectrometer Halo mineral identifier on soil samples to determine if the Halo system could recognize alteration halos. Since July 2022, the soil samples were dried and sieved at site. The soil samples were bagged, labelled, and shipped to the laboratories for analysis at Eastern Analytical Ltd. (“Eastern Analytical”) in Springdale, NL and ALS Canada Ltd. (“ALS”) in Vancouver, BC.
Rock samples are defined as surface outcrop and float samples, and trench channel samples, that were collected in the field by NFG geologists. Rock grab samples and trench channel samples were placed in heavy duty plastic bags, which were then labelled, sealed, and transported by NFG geologists to NFG’s core facility in Gander, NL. At the core facility, the samples’ labels were checked, and the samples were amalgamated into larger bags for transportation of the rock samples, by NFG employees, to the laboratories, that include over the life cycle of the project: Eastern Analytical; ALS, which includes rock preparation labs in multiple Canadian jurisdictions and ALS’ Vancouver analytical laboratory in Vancouver, BC; MSALABS in Val-d’Or, QC; and SGS Canada Inc. (“SGS”) in Burnaby, BC.
HQ and NQ -sized diamond drill core is transported in sealed core boxes from the NFG prospects and drill sites by NFG employees to the Company’s primary core facility in Gander, NL where the core is logged and analysed by non-destructive mass spectrometer Halo hyperspectral mineral identifier measurements prior to sampling. Once logging is completed, the drill core is transferred to a separate cutting section within the core facility.
The drill core samples are 0.3 to 1 m in core length. The HQ and NQ core is sawn in half by diamond saw blades, in which half the core is collected in plastic sample bags for transportation to the laboratories, and the other half is re-orientated into its original position in the core boxes for archival core storage at NFG’s archive core facility in Appleton Business Park in Appleton, NL. Where necessary due to poor core competency, a hydraulic splitter may be used. At the core facility, the samples labels were checked, and the samples were amalgamated into larger bags for transportation of the core samples by NFG employees to the laboratories: Eastern Analytical, ALS, MSALABS, and SGS.
43
5.7.2 |
Sample Security |
The procedures for establishing an auditable chain of custody for every sample, and for ensuring the integrity of samples between the project site and the laboratory, are the same as in previous years.
The collection, packaging, transport, and receipt of samples were conducted under a strict and traceable chain of custody (“CoC”). The collection and packaging of samples for shipping was undertaken by contractors of NFG under the supervision of NFG’s Chief Operating Officer (“COO”), Greg Matheson (P. Geo.). Samples were collected and stored in a dedicated area in the core shack under constant surveillance during the day, which is secured by lock and key at night and under video surveillance. A CoC document was created by the sample processing manager that includes a list of sample numbers and signature lines for the courier and NFG representative, confirming the state of the shipment. For shipment, samples were inventoried before being placed in rice bags, which were secured with a cable tie. The samples were then placed in shipping bins that were labelled with the shipping information and numbered security seals.
All sample transport handling, tracking, and CoC documentation is supervised by NFG personnel. At present, all ALS samples are shipped by commercial courier on a regular basis. NFG contractors delivered the sample bins to the shipping courier along with the CoC form. The CoC was signed and returned to NFG for scanning and cataloguing. The sample shipment was virtually dispatched in the MX Database by NFG sample processing manager for tracking and the laboratory was notified of the incoming shipment. Upon receipt by the laboratory, NFG’s COO and database geologist were informed, and the samples were logged in and checked against NFG’s submittal form and chain of custody document for any discrepancies.
5.7.3 |
Preparation and Analysis |
NFG has historically used a variety of independent, commercial, and accredited laboratories that include Eastern Analytical, ALS, Activation Laboratories Ltd. (“ActLabs”), SGS, ODM, and MSALABS. Chronologically, the general sample preparation and analytical workflow includes:
| ● | Prior to May 2018, all NFG samples were transported directly to the Eastern Analytical laboratory in Springdale, NL. |
| ● | Since May 2018, and in addition to Eastern Analytical, the samples were also prepared by ALS laboratories in Thunder Bay, ON, Timmins, ON, Sudbury, ON, Winnipeg, MB, and Moncton, NB prior to being analysed by fire assay at ALS, in Vancouver B.C. The rock and core samples are also analysed using a 4-acid multi-element ICP/MS package (ALS method code ME-ICP61 and ME-MS61) and a pycnometer for specific gravity (ALS method code OA-GRA08b) for drill core samples only at ALS in Vancouver. |
| ● | NFG paused sending samples to Eastern Analytical in October 2021. In May 2023, NFG resumed sending rock samples to Eastern Analytical. |
| ● | From May 2022 to June 2024, NFG submitted approximately half of the drill core samples for gold determination by PhotonAssayTM at MSALABS in Val-d’Or, QC. The core samples were also analysed using a 4-acid multi-element ICP/MS package (ALS method code ME-ICP61 and ME-MS61). |
| ● | Since June 2024, NFG submits 100% of the drill core samples for gold determination by PhotonAssayTM or screened metallic at ALS laboratories in Thunder Bay, ON. Select samples are analysed using a 4-acid multi-element ICP/MS package (ALS method code ME-ICP61 and ME-MS61). |
| ● | Since January 2024 and in addition to ALS’s multi-element ICP-MS package, all rock and drill core samples are also analysed by Photon Assay™ at ALS in Thunder Bay, ON. |
| ● | Other intermittent analytical work was conducted at ActLabs in Ancaster, ON (till multi-element analysis), ODM in Nepean, ON (till heavy-mineral concentrates), and SGS in Burnaby, BC (check analytical laboratory). |
44
5.7.4 |
Laboratory Accreditation |
Eastern Analytical, ActLabs, ALS, MSALABS, and SGS are commercially accredited labs that are independent of NFG. The predominant labs that performed rock and drill core fire assays (Eastern Analytical and ALS) are both accredited for fire assay determinations to the requirements of ISO/IEC 17025:2017. Eastern Analytical is accredited by the Canadian Association for Laboratory Accreditation Inc. and ALS by the Standards Council of Canada. SGS is also accredited to ISO/IEC 17025:2017.
The labs that performed multi-element ICP analyses (Eastern Analytical, ALS and ActLabs) are ISO-accredited for multi-element analytical methods.
MSALABS operates numerous laboratories worldwide and maintains ISO-17025 accreditation for many metal determination methods. The first PhotonAssayTM results for the Queensway Project were released in January 2022, a small set of 69 samples from two drillholes. These were completed at the Intertek Genalysis laboratory in Perth, Australia, where the PhotonAssayTM method is accredited to ISO/IEC 17025 (2017) by the National Association of Testing Authorities, Australia. MSALABS deployed a PhotonAssayTM unit in Val-d’Or, Quebec, in March 2022. MSA Val-d’Or received ISO/IEC 17025 (2017) accreditation on August 30, 2023, for the gamma ray analysis (PhotonAssay™) of samples for gold.
ALS does not currently have accreditation for the PhotonAssay™ method at their Thunder Bay, ON laboratory. They do however have ISO/IEC 17025 (2017) accreditation for gamma ray analysis of samples for gold at their Australian labs with this method, including the Canning Vale lab in Perth, WA. ALS is accredited under ISO/IEC 17025 (2017) for fire assay analysis at their Vancouver, BC facility.
5.7.5 |
Laboratory Sample Preparation |
Till samples: ODM created a concentrate of the till samples provided by NFG. Prior to 2019, the concentrates were created using a screening and tabling procedure. After 2019, they were created using ODM’s Heavy Mineral Concentrate preparation procedure. The gold content of each sample was estimated from the number of gold grains found in the concentrate and their size. The shape and texture of the grains were also recorded, and the mineralogy of the associated heavy minerals was described.
Soil samples: At Eastern Analytical, the soil samples were dried and sieved through 80 mesh (-180 µm) prior to gold analysis. At NFG, the soil samples were dried and screened through 80 mesh.
Eastern Analytical Rock and Core Sample Preparation: Eastern Analytical crushed to 80% less than 2 mm, pulverized to 95% less than 106 μm, and selected 30 g and 40 g aliquots for analyses by fire assay and screen fire assays, respectively.
ALS Rock and Core Sample Preparation: The NFG samples for analysis by Photon Assay™ were prepared at ALS Thunder Bay, ON. The entire sample is crushed in a Boyd Mk 4 crusher to 70% passing -10 mesh (2 mm; Method Code CRU-31). For non-visible gold (“VG”) samples, the sample is riffle split into an approximately 500 g jar, with the remainder stored as reject. For VG samples, total number of required jars is estimated based on weight, then all material is riffle split until no sample remains.
Samples selected for multi-element have the first jar (if more than one jar was prepared) pulverized to 85% passing -200 mesh (75 μm) using an LM2 ring-mill pulveriser (PUL-32m) and collected in the master pulp bag. A split of 150g is taken from the master pulp and shipped to ALS Vancouver, BC for analysis.
The NFG samples previously shipped for fire assay, were prepared at ALS, Sudbury, ON, Thunder Bay, ON, Timmins, ON, Winnipeg, MB or Moncton, NB. A split of the pulp was forwarded to ALS, Vancouver, BC, for routine fire assay and multi-element ICP. For samples submitted for screened fire assay (“SFA”) (ALS method Au-SCR24C), samples are screened in Sudbury; the entire plus fraction is shipped to ALS, Vancouver, BC, along with approximately 200 grams of the fine fraction.
For routine or non-mineralized samples (expected less than 1 ppm Au), assay preparation procedures at ALS involved crushing of the entire sample in a Boyd Mk 4 crusher to 70% passing -10 mesh (2 mm; Method Code CRU-31). A 1,000-g aliquot was collected by standard riffle split and the remainder was bagged and stored as coarse reject. This aliquot was pulverized to 85% passing -200 mesh (75 μm) using an LM2 ring-mill pulveriser (PUL-21) and collected in the master pulp bag. From this bag, 100–140 g was scooped using the laboratory split sample envelope and sent to the analytical facility in Vancouver to be analysed by fire assay and the multi-element analytical method.
For the SFA procedure, if the sample was 3 kg or less in weight, the entire sample was crushed in a Boyd Mk 4 or Terminator jaw crusher to 70% passing 10 mesh (2 mm; ALS Method Code CRU-21). Excess material has been stored as a coarse reject. The crushed sample was pulverized in an LM2 pulveriser (ALS Method Code PUL-21) to 85% passing 200 mesh (75 μm) using bowls with a capacity of 1 kg.
45
MSALABS Rock and Core Sample Preparation: The NFG samples were crushed, distributed into plastic jars, and assayed at MSALABS, Val-d’Or, QC. For all samples, the entire sample is crushed in a TM Terminator jaw crusher or Rocklabs Smart BOYD jaw crusher to 70% passing -10 mesh (2 mm). For non-VG samples, the sample is either riffle split in the case of the Terminator crusher being used, or rotary split automatically by the Boyd crusher, into a single approximately 500 g jar, with the remainder stored as reject. For VG samples, the sample is manually scooped into approximately 500 g jars until no sample remains.
5.7.6 |
Quality Assurance and Quality Control |
NFG inserted quality assurance and quality control (“QA-QC”) samples once into every 10 NFG samples on average, that included Sample Blanks, OREAS Certified Reference Materials (“CRMs”), and core duplicate samples. The Sample Blank material is quartz sandstone from the Botwood Group at Peter’s River Quarry in central Newfoundland. Between 500-600 g of Sample Blank material is submitted to the laboratory for each blank insertion within the sample stream for routine fire assay. Approximately 3 kg of blank material is submitted for each blank insertion of those samples that are submitted for SFA. The CRMs were purchased from Ore Research and Exploration Pty Ltd. and represent certified, homogenous quality control material that is distributed in sealed packets. In addition, NFG conducted lab-check assays and completed a comparison between conventional screen fire assays and PhotonAssayTM analyses. Finally, the laboratories conducted pulp duplicate and coarse reject duplicate analyses.
NFG has commissioned Analytical Solutions Ltd. (“Analytical Solutions”) to design and review the QA-QC program at the Queensway Project. The QA-QC protocols and interpretation of results are performed by NFG under the direction of Lynda Bloom, P. Geo. Quality Control data are evaluated on receipt from the laboratories for failures. Appropriate action is taken if assay results for CRMs and blanks fall outside allowed tolerances. All results stated have passed NFG’s quality control protocols. The Qualified Person has reviewed the QA-QC work conducted by Analytical Solutions and concludes that NFG’s QA-QC program is consistent with industry best practices.
The QP has reviewed the sampling and analytical procedures, and QA-QC work that was completed by LabGold at the Kingsway Project (now part of NFGs QWN block) as presented in Tettelaar (2024).
In the QP’s opinion the procedures for sample preparation, analysis and security for till, soil, rock, and drill core are reasonable and meet the industry standards for exploration best practices (CIM, 2018). The laboratories, including Bureau Veritas Ltd., SGS Canada Inc., Eastern Analytical Ltd., ALS Canada Ltd., and Overburden Drilling Management Ltd. are reputable, commercial, and independent Canadian labs that are accredited in accordance with International Standard ISO/IEC 17025:2017.
In the QP’s opinion the scope, extent, and purpose of the QA-QC procedures were reasonable and effective within LabGold’s early-stage exploration work programs. QA-QC protocols included the insertion of duplicate samples (n=404 for soil and drill chip samples), Certified Reference Material (“CRM”) sample standards (n=3,089 for rock, soil, and drill chip/core analytical samples), and blank samples (n=1,794 blanks) into the analytical sample stream. The duplicate samples analyses show good field sample collection and sample preparation protocols were used, and the sampling and analytical precision were reproducible. The CRM analytical results provide assurance of the accuracy of the data. The sample blanks show there is minimal contamination. A portion of the diamond drill core pulp material was assayed at a secondary laboratory (n=1,927 pulp samples) and demonstrated no apparent bias in the gold assay results between the two laboratories. No property-specific geological standards were prepared or included in the sampling programs.
In summary, the QP believes the LabGold legacy data, including soil, rock, and core sampling and analytical data, are of value to NFG and the Queensway Project. Verification procedures such as re-sampling of LabGold’s archived drill cores and twinning of drillholes will allow NFG to audit the legacy data to enable the company to accept responsibility for its use within the program and within any future mineral resource studies.
During the site inspection, the QP discussed logging protocols, density measurements, sampling procedures and QA-QC measures with the NFG team. All-in-all, the Company, and the on-site team, has used the appropriate methodologies with respect to sample preparation, analyses and security to ensure the integrity of the data.
5.7.7 |
Data Verification |
NFG’s Queensway Project is an early-stage exploration project, and this report presents a summary of the Company’s exploration programs through to the Effective Date. The primary datasets involve 1) historical exploration results, and 2) NFG’s exploration programs including till, soil, rock, and drill core sample collection and analytical work.
46
The QP has not validated all historical mineral occurrences within, and adjacent to, the Queensway Project; rather the QP is dependent on the Government of Newfoundland and Labrador geologists and staff that have meticulously compiled the mineral occurrences through a series of compilation efforts originating in 1976 and maintained to the present. Historical drillhole information was provided to the QP by NFG’s management team during the onset of the report preparation in December 2022. These data were originally compiled by NFG from numerous assessment reports. The only method currently available for the QP to validate the historical drill locations and complementary information is by comparing the historical drillhole information against the publicly available government GIS database, and hardcopy assessment reports related to the historical projects. Historical soil, rock, till, trench channel, stream sediment and lake sediment sampling and gold assay datasets were provided to the QP by NFG’s management team as csv files during the onset of the report preparation. The data were only partially validated by the QP by comparing the data in the electronic dataset versus the publicly available, hardcopy assessment reports.
The QP validated the surface geochemical sample assays by comparing NFG electronic assay data against the hard copy laboratory certificates. In addition, the location of some of the anomalous surface geochemical assay data was validated in comparison to the historical mineral occurrences. The QP communicated any errors to NFG within the surface geochemical databases, who in-turn, made the appropriate revisions.
The geological QP validated the NFG drillhole collar database by independently documenting the collar locations of 6 random drillholes during a QP site inspection. All drill core assay data were exported from NFG’s MX-Deposit software and divided into smaller assay datasets that were based on individual prospects. The assay files were then validated by the QP against the hardcopy laboratory certificates. There were no gold assay errors. The QP communicated any errors to NFG within the drillhole collar/assay databases, who in-turn, made the appropriate revisions.
The QP validated the laboratory density measurements by comparing the electronic data file provided by NFG against the hard copy laboratory certificates. No errors were observed.
All three Technical Report authors have completed Qualified Person site inspections at the Queensway Project: most recently, Mr. Eccles on January 12-13, 2023, Mr. Simmons on October 19, 2023, and Mr. Jorgensen on November 29, 2023.
The QP has reviewed historical exploration information associated with the Queensway Project, and surrounding area, and concludes that the survey information yields valid information as related to the geology of the Queensway Project and are therefore sufficient to be used in background geological interpretations.
The QP has reviewed the adequacy of NFG’s sample preparation, security, and analytical procedures and found no significant issues or inconsistencies that would cause one to question the validity of the data. The exploration work was conducted in accordance with CIM Mineral Exploration Best Practice Guidelines (2018). The analytical work was conducted at independent, commercial, and accredited laboratories that used reasonable gold standard sampling practices and analytical methods.
With respect to QA-QC work, NFG has properly utilized and interpreted CRMs, Sample Blanks, core duplicates, pulp duplicates, coarse reject duplicates, and check-lab assays. Additionally, NFG has conducted a robust comparison between conventional screen fire assays and PhotonAssayTM analyses that provides a reasonable and sufficient level of confidence in the PhotonAssayTM technique. The review of the QA-QC results enables the QP to form the opinion that the NFG exploration data is of reasonable quality, minimal contamination occurred during sample preparation and at the laboratories, and the analytical results are repeatable with good precision and accuracy.
5.8 |
Metallurgical test work completed to date for the Queensway Project includes an evaluation of the Keats, Golden Joint, Lotto, Iceberg and Iceberg East mineralized zones.. Four Master Composites (Keats 1, Keats 2, Lotto, and Iceberg) were assembled using 148 Variability Composites generated from approximately 1,350 m of drill core with a combined weight of 4,800 kg. A Master Composite was not prepared from the Golden Joint Variability Composites due to the lack of sufficient mass for testing.
The tested mineralized zones contain significant free-milling gold that is amenable to both gravity and leach extraction. Free gold grains greater than 150 microns in size were observed predominantly in the quartz veins located throughout the tested zones. Positive gold extraction percentages were achieved using gravity separation and conventional carbon-in-leach technologies. The Variability Composite samples were subjected to gravity gold extraction at a target grind of 212 µm, gravity tails were reground to target grinds of 75 µm and 37 µm, then treated by carbon-in-leach for 24 hours. The average gold weighted extraction percentage from the mineralized zones ranged between 90.0% and 96.9% when reduced to a product size of 75 µm. Lower gold extractions were observed for some Variability Composite samples that had lower gold head grades and contained elevated levels of arsenic.
47
Comminution test work indicated that the tested material had an SMC breakage test to determine A x b index values of between 59.4 and 65.9 (average 63%) and a Bond Work Index of between 16.2 and 18.3 kWh/t (average 18 kWh/t).
The test work demonstrates that conventional gravity separation and carbon-in-leach are well-suited extraction methods for gold mineralization of the prospects tested to date at the Queensway Project. The results of the comminution test work indicate that the mineralized material would be amenable to a conventional SAG/Ball milling circuit and would have moderate grinding requirements in a secondary ball mill.
The metallurgical test work that has been completed to date has identified samples from numerous vein structures across different sections of the mineralized zone from surface to depth. The sample analysis has included lithology, vein structure, mineralogy, QEMSCAN mineral abundance, ICP elemental assay, gravity gold extraction, comminution characteristics, preg-rob characteristics, carbon and sulfur speciation, cyanide gold extraction, and flocculation and filtration characteristics. Alternative process schemes have been tested including carbon flotation and sulfide flotation, followed by concentrate regrind and intensive cyanide leaching of the concentrate for final gold extraction. These alternate flowsheets did not appear to improve overall gold extraction.
Due to the number of samples and the comprehensive nature of the analysis, future test opportunities are limited and the risk to predicted gold extraction minimized. Table 7 identifies the risks associated with gold extraction and mineral processing.
Metallurgical test work is continuing on other adjacent resources and results are pending.
Table 7 - Risks associated with gold extraction and mineral processing.
Risk Description |
|
Likelihood |
|
Consequence Rating |
|
Risk |
|---|---|---|---|---|---|---|
The full effect of preg-rob materials in the mineralized zones may be higher than tested |
|
Unlikely |
|
Moderate |
|
Low |
Refractory gold found in arsenopyrite/pyrite may be higher than tested |
|
Unlikely |
|
Moderate |
|
Low |
Reagent consumptions have not been optimized |
|
Likely |
|
Low |
|
Low |
Gravity gold recovery is overestimated |
|
Likely |
|
Low |
|
Low |
5.9 |
NFG has yet to conduct mineral resource estimation work at the Queensway Project.
5.10 |
In the Technical Report, a two-phase work program is recommended with an estimated total cost of CDN$72.1 million with a 10% contingency. A summary of the program with cost estimates is presented in Table 8.
Phase 1 work recommendations are estimated to cost $36.7 million with a 10% contingency, and include 1) geophysical surveys in the QWN and QWS blocks, 2) surface exploration work including exploratory work and advanced trench rock sampling in the QWN and QWS blocks, 3) a Phase 1 drill program that consists of step-out and infill drilling to further define and delineate the gold mineralization at known prospects in the QWN and QWS block, target delineation drilling at the QWS, VOA, and TP blocks to follow-up on recent exploration programs that yielded favourable geological interpretations, and exploratory drilling along the APZ and JPBFZ to test targets identified through surface exploration work programs and specifically at the former LabGold Kingsway Project (now the north portion of QWN block), and 4) ongoing metallurgical test work to evaluate reagent consumptions, comminution characteristics, and gravity gold recovery.
Advancement to the Phase 2 work recommendations is contingent on the positive results of the Phase 1 work programs. The Phase 2 work program is estimated to cost approximately $35.4 million with a 10% contingency, and includes 1) diamond drilling for infill, step-out, and exploration drilling in conjunction with the initiation of Reverse Circulation drilling to expedite core production rates for metallurgical test work, 2) advanced metallurgical test work with flowsheet optimization studies, 3) continue with environmental baseline and community consultation, and initiate marketing and possible mine planning studies in consideration of Modifying Factors, and 4) maiden mineral resource estimate technical reporting that is prepared in accordance with Canadian Institute of Mining, Metallurgy and Petroleum definition standards and best practice guidelines (2014, 2019) and NI 43-101.
48
Table 8 - Future work recommendations.
|
|
|
|
||||
|
|
|
Estimated |
||||
Phase |
|
Item |
|
Description |
|
cost $CDN |
|
|
|
Geophysical surveys |
|
Induced Polarization in the QWN and QWS blocks. Data processing, interpretation, and modelling |
|
$ |
200,000 |
|
|
|
|
|
|
|
|
|
|
Regional Surface exploration |
|
Regional prospecting and till and soil geochemical sampling programs, and trench and channel rock sampling programs at QWN and QWS. |
|
$ |
1,000,000 |
|
|
|
|
|
|
|
|
Phase 1 |
|
Advanced Surface Exploration |
|
Trenching, mapping and sampling of Iceberg, Keats West and Lotto. |
|
$ |
6,000,000 |
|
|
|
|
|
|
|
|
|
|
Diamond drill program 1 |
|
Step-out, Infill, and exploratory drilling, and analytical work, at the QWN, QWS, and TP blocks (approximately 70,000 m) |
|
$ |
25,000,000 |
|
|
|
|
|
|
|
|
|
|
Metallurgical test work |
|
Ongoing metallurgical test work to evaluate reagent consumptions, comminution characteristics, and gravity gold recovery. |
|
$ |
1,200,000 |
|
|
Diamond/RC drill program 2 |
|
Infill and step-out drilling at QWN and QWS; exploratory drilling along the Appleton and JBP fault zones (approximately 85,000 m) |
|
$ |
30,000,000 |
|
|
|
|
|
|
|
|
Phase 2 |
|
Metallurgical test work |
|
Advancement of metallurgical test work with flowsheet optimization studies. |
|
$ |
1,500,000 |
|
|
|
|
|
|
|
|
|
|
Modifying factors |
|
Initiate environmental, marketing, mine planning, and community consultation studies in consideration of modifying factors. |
|
$ |
350,000 |
|
|
|
|
|
|
|
|
|
|
Technical Reports |
|
Technical reporting that includes 3-D geological modelling, mineral resource estimation(s), and preliminary economic assessments. |
|
$ |
300,000 |
|
|
|
|
Sub-total (Phase 1) |
|
$ |
33,400,000 |
|
|
|
|
Sub-total (Phase 2) |
|
$ |
32,150,000 |
|
|
|
|
Sub-total (Phase 1 and Phase 2) |
|
$ |
65,550,000 |
|
|
|
|
Contingency (10%) |
|
$ |
6,555,000 |
|
|
|
|
Total estimated exploration work cost |
|
$ |
72,105,000 |
49
6 |
6.1 |
The Company has not, since the date of its incorporation, declared or paid any dividends or other distributions on its Common Shares, and does not currently have a policy with respect to the payment of dividends or other distributions. The Company does not currently pay dividends and does not intend to pay dividends in the foreseeable future. The declaration and payment of any dividends in the future is at the discretion of the Board and will depend on numerous factors, including compliance with applicable laws, financial performance, working capital requirements of the Company and its subsidiaries, and such other factors as its directors consider appropriate. There can be no assurance that the Company will pay dividends under any circumstances. See “Risk Factors – Risks Related to the Company – Dividends”.
7 |
7.1 |
The Company’s authorized share capital consists of an unlimited number of Common Shares without par value (the “Common Shares”). As at December 31, 2024, there were 200,457,994 Common Shares issued and outstanding. As of the date of this AIF, there are 200,607,994 Common Shares issued and outstanding and 9,911,500 Common Shares issuable upon exercise of outstanding stock options (“Options”).
All of the Common Shares rank equally as to voting rights, participation in a distribution of the assets of the Company on a liquidation, dissolution or winding-up of the Company and entitlement to any dividends declared by the Company. The holders of the Common Shares are entitled to receive notice of, and to attend and vote at, all meetings of shareholders (other than meetings at which only holders of another class or series of shares are entitled to vote). Each Common Share carries the right to one vote. In the event of the liquidation, dissolution or winding-up of the Company, or any other distribution of the assets of the Company among its shareholders for the purpose of winding-up its affairs, the holders of the Common Shares will be entitled to receive, on a pro rata basis, all of the assets remaining after the payment by the Company of all of its liabilities. The holders of Common Shares are entitled to receive dividends as and when declared by the Board in respect of the Common Shares on a pro rata basis. The Common Shares do not have pre-emptive rights, conversion rights or exchange rights and are not subject to redemption, retraction purchase for cancellation or surrender provisions. There are no sinking or purchase fund provisions, no provisions permitting or restricting the issuance of additional securities or any other material restrictions, and there are no provisions which are capable of requiring a security holder to contribute additional capital.
Any alteration of the rights, privileges, restrictions and conditions attaching to the Common Shares under the Company’s Articles must be approved by at least two-thirds of the Common Shares voted at a meeting of the Company’s shareholders.
50
8 |
8.1 |
New Found’s Common Shares are currently listed for trading through the facilities of the TSXV under the symbol “NFG” and on the NYSE American under the symbol “NFGC”. No other securities of New Found are traded or quoted on any marketplace.
During the most recently completed financial year, the Common Shares traded on the TSXV as follows, based on information available from the TMX Group:
TSX VENTURE EXCHANGE | |||
|---|---|---|---|
Month |
Volume |
High ($) |
Low ($) |
January 2024 |
2,326,272 |
4.87 |
4.08 |
February 2024 |
1,892,015 |
4.67 |
4.12 |
March 2024 |
3,565,415 |
5.19 |
4.10 |
April 2024 |
4,926,935 |
5.71 |
4.86 |
May 2024 |
2,970,286 |
5.35 |
4.63 |
June 2024 |
4,382,366 |
4.80 |
3.81 |
July 2024 |
7,612,741 |
4.98 |
3.59 |
August 2024 |
5,127,307 |
4.23 |
3.21 |
September 2024 |
5,394,897 |
3.89 |
3.25 |
October 2024 |
5,155,041 |
3.89 |
3.03 |
November 2024 |
8,026,203 |
3.32 |
2.11 |
December 2024 |
5,678,258 |
2.65 |
2.21 |
During the most recently completed financial year, the Common Shares traded on the NYSE American as follows, based on information available from NYSE American:
NYSE AMERICAN | |||
|---|---|---|---|
Month |
Volume |
High (US$) |
Low (US$) |
January 2024 |
4,351,522 |
3.66 |
3.02 |
February 2024 |
4,156,021 |
3.47 |
3.04 |
March 2024 |
6,982,802 |
3.86 |
3.03 |
April 2024 |
9,403,757 |
4.15 |
3.52 |
May 2024 |
6,451,617 |
4.07 |
3.39 |
June 2024 |
5,976,949 |
3.56 |
2.77 |
July 2024 |
13,915,973 |
3.65 |
2.59 |
August 2024 |
11,565,018 |
3.19 |
2.27 |
September 2024 |
11,399,684 |
2.89 |
2.40 |
October 2024 |
11,390,045 |
2.81 |
2.19 |
November 2024 |
13,308,775 |
2.44 |
1.51 |
December 2024 |
8,871,114 |
1.88 |
1.52 |
51
8.2 |
The following table summarizes the securities issued by the Company during the most recently completed financial year, involving securities that are not listed on the TSXV or NYSE American:
Issue Date |
Type of Security |
Number Issued |
Issue Price |
Exercise Price ($) |
Description of Issuance |
|---|---|---|---|---|---|
February 20, 2024 |
Options |
200,000 |
N/A |
4.59 |
Options issued to certain employees and directors pursuant to the Company’s stock option plan. |
May 6, 2024 |
Options |
40,000 |
N/A |
4.78 |
Options issued to a consultant of the Company pursuant to the Company’s stock option plan. |
9SECURITIES SUBJECT TO CONTRACTUAL RESTRICTION ON TRANSFER
The following table summarizes the securities issued by the Company during the most recently completed financial year, involving securities that are subject to a contractual restriction on transfer; and the percentage that number represents of the outstanding securities of that class for the Company’s most recently completed financial year:
Type of Security |
Number of securities subject to a contractual restriction on transfer |
Percentage of issued and outstanding securities of that class |
|---|---|---|
Common Shares |
69,583 (1) |
0.03% |
Note:
| (1) | Subject to a property option agreement pursuant to which the holder of the securities must not trade the securities before November 1, 2025. |
52
10 |
10.1 |
The name, province or state of residence, positions held with the Company, and principal occupation within the five preceding years of each director and executive officer of New Found as at the date of this AIF are as follows:
Name and Residence |
|
Position(s) and |
|
Principal Occupation(s) |
|
Director Since |
|
Number and |
|---|---|---|---|---|---|---|---|---|
PAUL HUET |
|
Chairman and Director |
|
Chairman, New Found (December 2024 – present); Director, Chairman, and Chief Executive Officer, Culico Metals Inc. (April 2024 - present); Chief Executive Officer, Americas Gold and Silver Corporation (November 2024 – present); Director, Chairman, and Chief Executive Officer, Karora Resources Inc. (November 2018 - August 2024); Director, 1911 Gold Corporation (May 2018 - August 2020). All of the foregoing companies are mineral exploration and development companies. |
|
December 17, 2024 |
|
Nil |
KEITH BOYLE |
|
Chief Executive Officer and Director |
|
Chief Executive Officer, New Found (January 2025 – present); Chief Operating Officer, Reunion Gold Corp. (August 2023- July 2024); Chief Operating Officer, Superior Gold Corp. (April 2019 – August 2021). All of the foregoing companies are mineral exploration and development companies. |
|
January 20, 2025 |
|
Nil |
MELISSA RENDER |
|
President and Director |
|
President and Director, New Found (December 2024 – present) VP Exploration, New Found (January 11, 2022 – December 2024); former Senior Project Geologist, Elko Mining Group; former Senior Project Geologist, TMAC Resources Inc.; former Gold Exploration Consultant, Kinross Gold Corp.; former Gold Exploration Consultant, Chalice Gold Mines Ltd.; former Gold Exploration Consultant, McEwen Mining Inc.; former Gold Exploration Consultant Warrior Gold Inc.; former Gold Exploration Consultant, New Found Gold Corp. All of the foregoing companies are mineral exploration and development companies. |
|
December 17, 2024 |
|
2,000 (0.00%) |
53
Name and Residence |
|
Position(s) and Office(s) with New Found |
|
Principal Occupation(s) During Past Five Years |
|
Director Since |
|
Number and Percentage of Common Shares Held as of date of this AIF |
|---|---|---|---|---|---|---|---|---|
VIJAY MEHTA |
|
Director |
|
Co-Founder, Arkview Capital LLC (January 2020 – present); Managing Director and Member of Investment Committee, Ziff Brothers Investments (2016 – 2019); Investment Professional, Ziff Brothers Investments (2010 – 2019). Arkview Capital is a private equity fund and Ziff Brothers Investments is a family office investment firm. |
|
April 13, 2022 |
|
Nil |
WILLIAM HAYDEN |
|
Director |
|
Director, Ivanhoe Mines Ltd. (March 2007 - present); Director, Trilogy Metals Inc. (June 2015-present); Director of Nevada King Gold Corp. (June 2022-present), Director, Palisades Gold Corp. (June 2022 – October 2024). All of the foregoing companies are mineral exploration and development companies. |
|
December 17, 2024 |
|
Nil |
CHAD WILLIAMS |
|
Director |
|
Director, New Found (March 2025 – present); Chairman and Founder, Red Cloud Mining Capital Inc. (September 2011- present); Chairman, Mines D’Or Orbec Inc. (February 2020 - present); Chairman and Director, Honey Badger Silver Inc. (August 2020 – present); Director, Karora Resources Inc. (January 2020 – August 2024); Chairman, Blue Thunder Mining Corporation (June 2017 to present); former Director, Silver Storm Mining Ltd. (September 2019 – September 2022); former Director, Koryx Copper Inc. (October 2020 - February 2022); Chairman and Director, Seven Aces Limited (September 2019 – August 2020) |
|
March 3, 2025 |
|
Nil |
54
Name and Residence |
|
Position(s) and Office(s) with New Found |
|
Principal Occupation(s) During Past Five Years |
|
Director Since |
|
Number and Percentage of Common Shares Held as of date of this AIF |
|---|---|---|---|---|---|---|---|---|
MICHAEL KANEVSKY |
|
Chief Financial Officer |
|
CFO, New Found (2019- present); CFO, Golden Planet Mining Corp.; former CFO, Mexican Gold Mining Corp; former CFO, Palisades Goldcorp Ltd. All of the foregoing companies are mineral exploration and development companies. |
|
- |
|
Nil |
JARED SAUNDERS |
|
Vice President, Sustainability |
|
Vice President, of Sustainability, New Found (February 18, 2025 - present); Director of Environment & Regulatory Affairs, New Found (September 2023 - February 2025); Environmental Superintendent, Vale Newfoundland & Labrador Ltd. (January 2022 - September 2023); Environmental Supervisor - Vale Newfoundland & Labrador Ltd. (March 2014 - January 2022) |
|
- |
|
Nil |
FIONA CHRISTINA CHILDE |
|
Vice President, Communications and Corporate Development |
|
Vice President Communications and Corporate Development, New Found (February 18, 2025 - present); Mining Industry Consultant (January 2016 - February 2025); Vice President Corporate Development and Communications, Sanu Gold Corporation (August 2022 - February 2024) |
|
- |
|
Nil |
55
As at March 20, 2025, the directors and executive officers of the Company as a group beneficially owned, or controlled or directed, directly or indirectly, an aggregate of 2,000 Common Shares of the Company, representing approximately 0.00% of the issued and outstanding Common Shares of the Company.
10.2 |
The term of office for each director of New Found expires at the next annual general meeting of shareholders of the Company.
The members of Board committees are appointed by the Board of Directors as soon as possible following each annual general meeting of shareholders of the Company.
The officers of New Found are appointed by the Board of Directors and hold office for such period and on such terms as the Board of Directors may determine.
10.3 |
The committees of the Board and the directors serving on each of the committees are described below:
10.4 |
Audit Committee |
10.4.1 |
Overview |
The Company has formed an audit committee (the “Audit Committee”) comprised of William Hayden (Chair), Chad Williams, and Vijay Mehta, all of whom are “financially literate” and “independent” as such terms are defined in National Instrument 52-110 – Audit Committees (“NI 52-110”).
The Audit Committee provides assistance to the Board in fulfilling its obligations relating to the integrity of the internal financial controls and financial reporting of the Company. The external auditors of the Company report directly to the Audit Committee. The Audit Committee’s primary duties and responsibilities include: (i) reviewing and reporting to the Board on the annual audited financial statements (including the auditor’s report thereon) and unaudited interim financial statements and any related management’s discussion and analysis, if any, and other financial disclosure related thereto that may be required to be reviewed by the Audit Committee pursuant to applicable legal and regulatory requirements; (ii) reviewing material changes in accounting policies and significant changes in accounting practices and their impact on the financial statements; (iii) overseeing the audit function, including engaging in required discussions with the Company’s external auditor and reviewing a summary of the annual audit plan at least annually, overseeing the independence of the Company’s external auditor, overseeing the Company’s internal auditor, and pre-approving any non-audit services to the Company; (iv) reviewing and discussing with management the appointment of key financial executives and recommending qualified candidates to the Board; (v) reviewing with management and the Company’s external auditors, at least annually, the integrity of the internal controls over financial reporting and disclosure; (vi) reviewing management reports related to legal or compliance matters that may have a material impact on the Company and the effectiveness of the Company’s compliance policies; and (vii) establishing whistleblowing procedures and investigating any complaints or concerns it deems necessary.
The full text of the Audit Committee Charter is attached to this AIF as Schedule “A”.
10.4.2 |
Relevant Education and Experience |
Each member of the Audit Committee has adequate education and experience that is relevant to their performance as an Audit Committee member and, in particular, the requisite education and experience that have provided the member with:
(a) |
an understanding of the accounting principles used by the Company to prepare its financial statements and the ability to assess the general application of those principles in connection with estimates, accruals and reserves; |
(b) |
experience preparing, auditing, analyzing or evaluating financial statements that present a breadth and level of complexity of accounting issues that are generally comparable to the breadth and complexity of issues that can reasonably be expected to be raised by the Company’s financial statements or experience actively supervising individuals engaged in such activities; and |
(c) |
an understanding of internal controls and procedures for financial reporting. |
56
William Hayden
William Hayden is a geologist with over 38 years of experience in the mineral exploration industry, with much of it gained in Africa, America, and the Asia-Pacific region. Mr. Hayden has worked in a management capacity with several exploration and mining companies in Australia and internationally since 1986. Mr. Hayden has over 25 years’ experience with financial disclosure, legal and regulatory compliance, and risk management. He has served on various audit committees throughout his career, and was a long-standing audit committee member of Ivanhoe Mines Ltd.
Vijay Mehta
Mr. Mehta graduated summa cum laude from the University of Pennsylvania’s Huntsman Program and earned an MBA from the Harvard Business School, where he was named a Baker Scholar. Mr. Mehta is a co-founder of Arkview Capital, a private equity fund that invests in diversity-oriented companies, where he is directly involved in compensation decisions. Prior to founding Arkview, Mr. Mehta was a Managing Director and member of the Investment Committee at Ziff Brothers Investments with broad responsibilities across the investment portfolio and also worked at private equity fund, Texas Pacific Group and investment bank, Morgan Stanley.
Chad Williams
Mr. Williams is the Chairman and Founder of Red Cloud Mining Capital Inc. He has extensive experience in mining finance and management, having previously held the positions of CEO of Victoria Gold Corp. and Head of Mining Investment Banking at Blackmont Capital Inc., and was a highly ranked mining analyst at TD Bank and other Canadian brokerage firms.
10.4.3 |
Pre-Approval Policies and Procedures |
The Audit Committee mandate requires that the Audit Committee pre-approve any retainer of the auditor of the Company to perform any non-audit services to the Company that it deems advisable in accordance with applicable legal and regulatory requirements and policies and procedures of the Board. The Audit Committee is permitted to delegate pre-approval authority to one of its members; however, the decision of any member of the Audit Committee to whom such authority has been delegated must be presented to the full Audit Committee at its next scheduled meeting.
10.4.4 |
Reliance on Certain Exemptions |
At no time since the commencement of the Company’s most recently completed financial year has the Company relied on the exemption in section 2.4 of NI 52-110 (De Minimis Non-audit Services), the exemption in section 3.2 of NI 52-110 (Initial Public Offerings), the exemption in subsection 3.3(2) of NI 52-110 (Controlled Companies), the exemption in section 3.4 of NI 52-110 (Events Outside Control of Member), the exemption in section 3.5 of NI 52-110 (Death, Disability or Resignation of Audit Committee Member), the exemption in section 3.6 of NI 52-110 (Temporary Exemption for Limited and Exceptional Circumstances) or an exemption from NI 52-110, in whole or in part, granted under Part 8 of NI 52-110 (Exemptions).
10.4.5 |
External Auditor Service Fees by Category |
The fees billed by the Company’s external auditors in each of the last two fiscal years for audit and non-audit related services provided to the Company or its subsidiaries (if any) were as follows:
Financial Year Ending |
|
Audit Fees |
|
Audit Related Fees (1) |
|
Tax Fees (2) |
|
All Other Fees (3) |
||||
December 31, 2024 (4) |
|
$ |
332,660 |
|
$ |
Nil |
|
$ |
Nil |
|
$ |
Nil |
December 31, 2024 (5) |
|
$ |
Nil |
|
$ |
Nil |
|
$ |
6,200 |
|
$ |
Nil |
December 31, 2023 (4) |
|
$ |
287,281 |
|
$ |
Nil |
|
$ |
Nil |
|
$ |
Nil |
December 31, 2023 (5) |
|
$ |
117,453 |
|
$ |
18,360 |
|
$ |
4,590 |
|
$ |
26,826 |
Notes:
(1) |
Fees charged for assurance and related services that are reasonably related to the performance of an audit, and not included under Audit Fees. |
(2) |
Fees charged for tax compliance, tax advice and tax planning services. |
(3) |
Fees for services other than disclosed in any other column. |
(4) |
Fees charged by KPMG LLP, Chartered Professional Accountants. |
(5) |
Fees charged by Crowe MacKay LLP, Chartered Professional Accountants. |
On July 31, 2023, New Found appointed KPMG LLP, Chartered Professional Accountants, as the auditor of the Company. At the request of the Company, Crowe MacKay LLP resigned as the auditor of the Company. There were no reportable events, as such term is defined in National Instrument 51-102 – Continuous Disclosure Obligations (“NI 51-102”) between New Found and Crowe MacKay LLP. New Found filed the required reporting package in accordance with NI 51-102 on August 1, 2023.
57
10.5 |
The Company has formed a nominating and corporate governance committee (the “Nominating and Corporate Governance Committee”) comprised of Vijay Mehta (Chair), Chad Williams and William Hayden. William Hayden, Chad Williams and Vijay Mehta are considered “independent”, pursuant to NI 52-110. In consultation with the Board, the Nominating and Corporate Governance Committee identifies and recommends to the Board potential nominees for election or re-election to the Board as well as individual directors to serve as members and chairs of each committee. The Nominating and Corporate Governance Committee establishes and reviews with the Board the appropriate skills and characteristics required of members of the Board, taking into consideration the Board’s short-term needs and long-term succession plans. In addition, the Nominating and Corporate Governance Committee develops, and annually updates, a long-term plan for the Board’s composition, taking into consideration the characteristics of independence, age, skills, experience and availability of service to the Company of its members, as well as opportunities, risks, and strategic direction of the Company.
10.6 |
The Company has formed a Compensation Committee comprised of Chad Williams (Chair), William Hayden and Vijay Mehta. William Hayden, Chad Williams and Vijay Mehta are considered “independent”, pursuant to NI 52-110.
Each member of the Compensation Committee has business and other experience which is relevant to their position as a member of the Compensation Committee. By virtue of their differing professional backgrounds, business experience, knowledge of the Company’s industry, knowledge of corporate governance practices and, where appropriate, service on compensation committees of other reporting issuers and experience interacting with external consultants and advisors, the members of the Compensation Committee are able to make decisions on the suitability of the Company’s compensation policies and practices.
The charter of the Compensation Committee provides that it is responsible for, among other things, the following matters:
| ● | reviewing and approving corporate goals and objectives relevant to the compensation of the CEO and other executive officers, evaluating the performance of the CEO and the other executive officers in light of those goals and objectives and approving their annual compensation levels, including salaries, bonuses, and stock option grants based on such evaluation; and |
| ● | reviewing the compensation of directors for service on the Board and its committees and recommending to the Board the annual Board member compensation package, including retainer, committee member and chair retainers, Board and committee meeting attendance fees and any other form of compensation, such as stock option grants or stock awards. |
While the Board is ultimately responsible for determining all forms of compensation to be awarded to the CEO, other executive officers and directors, the Compensation Committee will when appropriate review the Company’s compensation philosophy, policies, plans and guidelines and recommend any changes to the Board.
10.7 |
The Company has formed a Technical Committee comprised of Melissa Render (Chair), Paul Huet, and William Hayden. William Hayden is considered “independent”, pursuant to NI 52-110. Each of Melissa Render and Paul Huet is not considered “independent”, pursuant to NI 52-110.
The purpose of the Technical Committee is to provide assurance to the Board as to the operational performance and operating risks of the Company, regarding those areas where technical understanding is required:
| ● | exploration, permitting, development, execution, and construction, operation of mining activities, security, and supply chain management; |
| ● | resources and reserves on the Company’s mineral resource properties; |
| ● | operating and production plans for proposed and existing operating mines; |
| ● | project and operations readiness; |
| ● | major commercial commitments; and |
| ● | ensuring the Company implements best-in-class property development and operating practices. |
58
The charter of the Technical Committee provides that it is responsible for, among other things, the following matters:
| ● | review and assess the reporting of all operating activities (to include exploration, mining, development, execution, construction, security, and supply chain management) and in the Committee’s discretion, make recommendations to the Board for consideration; |
| ● | review risk management procedures and monitor risks in all operating activities; |
| ● | review the effectiveness of the reporting of technical and operating matters; |
| ● | assess the adequacy of strategic planning, forecasting, and budgeting; |
| ● | assess legal and regulatory compliance of technical and operating matters; |
| ● | engage third-party technical consultants, where necessary; |
| ● | assess the performance of key operating personnel and operating teams; |
| ● | advise the CEO when required on specific M&A opportunities as requested by the CEO or directed by the Board; |
| ● | report and make recommendations to the Board on all technical and operating matters including material proposals, material contracts, and major commercial arrangements with potential key contractors and service providers; and |
| ● | perform such other duties as may be assigned by the Board from time to time or as may be required by applicable regulatory authorities or legislation. |
10.8 |
None of the Company’s directors or executive officers is, as of the date of this AIF, or was within 10 years before the date of this AIF, a director, chief executive officer or chief financial officer of any company (including the Company) that (a) was subject to a cease trade order, an order similar to a cease trade order or an order that denied the relevant issuer access to any exemption under securities legislation, that was in effect for a period or more than 30 consecutive days (an “Order”) that was issued while the director or executive officer was acting in the capacity as director, chief executive officer or chief financial officer of such issuer, or (b) was subject to an Order that was issued after the director or executive officer ceased to be a director, chief executive officer or chief financial officer and which resulted from an event that occurred while that person was acting in the capacity as director, chief executive officer or chief financial officer.
Except as disclosed below, none of the Company’s directors or executive officers, nor, to its knowledge, any shareholder holding a sufficient number of its securities to affect materially the control of the Company (a) is, as at the date of this AIF, or has been within the 10 years before the date of this AIF, a director or executive officer of any company (including the Company) that, while that person was acting in that capacity, or within a year of that person ceasing to act in that capacity, became bankrupt, made a proposal under any legislation relating to bankruptcy or insolvency or was subject to or instituted any proceedings, arrangement or compromise with creditors or had a receiver, receiver manager or trustee appointed to hold its assets, or (b) has, within the 10 years before the date of this AIF, become bankrupt, made a proposal under any legislation relating to bankruptcy or insolvency, or become subject to or instituted any proceedings, arrangement or compromise with creditors, or had a receiver, receiver manager or trustee appointed to hold the assets of such director, executive officer or shareholder.
Mr. Boyle was an officer of Chieftain Metals Inc. (“CMI”) and Chieftain Metals Corp. (“CMC” and together with CMI, the “Chieftain”) from February 7, 2011 to September 8, 2016. An application was made by West Face Capital Inc., as agent (“WFCI”), for an order under subsection 243(1) of the Bankruptcy and Insolvency Act (Canada) and section 101 of the Courts of Justice Act (Ontario) appointing Grant Thornton Limited as receiver, without security, of all the assets, undertakings and properties of Chieftain. WFCI acts as the investment adviser to West Face Long Term Opportunities Global Master L.P. (the “Lender”). The Lender is the largest secured creditor of Chieftain. The order was granted on September 6, 2016 and trading was suspended thereafter.
None of the Company’s directors or executive officers, nor, to its knowledge, any shareholder holding a sufficient number of its securities to affect materially the control of the Company, has been subject to (a) any penalties or sanctions imposed by a court relating to securities legislation or by a securities regulatory authority or has entered into a settlement agreement with a securities regulatory authority, or (b)
59
any other penalties or sanctions imposed by a court or regulatory body that would likely be considered important to a reasonable investor in making an investment decision.
The information contained in this AIF as to ownership of securities of the Company, corporate cease trade orders, bankruptcies, penalties or sanctions, and existing or potential conflicts of interest, not being within the knowledge of the Company, has been provided by each director and executive officer of the Company individually.
10.9 |
To the best of the Company’s knowledge, there are no existing or potential material conflicts of interest between the Company and any of its directors or officers as of the date hereof. However, certain of the Company’s directors and officers are, or may become, directors or officers of other companies with businesses which may conflict with its business. Accordingly, conflicts of interest may arise which could influence these individuals in evaluating possible acquisitions or in generally acting on the Company’s behalf. See also “Risk Factors – Conflicts of Interest”.
Pursuant to the BCBCA, directors and officers of the Company are required to act honestly and in good faith with a view to the best interests of the Company.
Generally, as a matter of practice, directors who have disclosed a material interest in any contract or transaction that the Board is considering will not take part in any Board discussion respecting that contract or transaction. If on occasion such directors do participate in the discussions, they will refrain from voting on any matters relating to matters in which they have disclosed a material interest. In appropriate cases, the Company will establish a special committee of independent directors to review a matter in which directors or officers may have a conflict.
11 |
Other than described below, to the Company’s knowledge, there are no legal proceedings or regulatory actions material to the Company to which it is a party, or has been a party to, or of which any of its property is the subject matter of, or was the subject matter of, since the beginning of the financial year ended December 31, 2024, and no such proceedings or actions are known by the Company to be contemplated.
On November 15, 2019, ThreeD and 131. each entered into share purchase agreements with Palisades (the “Share Purchase Agreements”) under which Palisades agreed to purchase the 13,500,000 Common Shares owned by ThreeD and the 4,000,000 Common Shares owned by 131 for $0.08 per Common Share. The transactions closed on November 20, 2019. As a private company with restrictions on the transfer of its Common Shares, the Company had to approve the proposed transfer, which it did by a consent resolution of the Board.
On March 10, 2020, the Plaintiffs filed a statement of claim in the Ontario Superior Court of Justice against Collin Kettell, Palisades Goldcorp Ltd. (“Palisades”) and the Company (the “ThreeD Claim”). Pursuant to the ThreeD Claim, the Plaintiffs challenged the validity of the sale of 17,500,000 Common Shares by the Plaintiffs to Palisades on November 20, 2019.
ThreeD and 131 claimed that at the time of negotiation and execution of the Share Purchase Agreements, Palisades and Mr. Kettell were aware of positive drill results from the Company’s 2019 drill program and the results were not disclosed to ThreeD and 131 to their detriment. Palisades and Mr. Kettell strongly denied ThreeD and 131’s allegations. ThreeD and 131 made specific claims for (a) recission of the Share Purchase Agreements on the basis of oppression or unfair prejudice; (b) or alternatively, damages in the amount of $21,000,000 for the alleged improper actions by ThreeD and 131, (c) a declaration that Palisades and Collin Kettell, as shareholder or director and/or officer of the Company, acted in a manner that is oppressive, unfairly prejudicial or unfairly disregarded their interests, (d) a declaration that Palisades and Collin Kettell engaged in insider trading contrary to section 138 of the Securities Act (Ontario), (e) unjust enrichment and (f) interests and costs. Palisades and Mr. Kettell refuted each of the specific claims made by the Plaintiffs.
The Company filed a statement of defence in response to the ThreeD Claim on June 12, 2020, pursuant to which, among other things, the Company denied that it was a proper party to the ThreeD Claim and the allegations against it therein, including because no relief was claimed against the Company in paragraph 1 of the ThreeD Claim.
In early 2022, the Plaintiffs formally amended their statement of claim to increase the amount claimed to $229,000,000 and to advance a direct claim of oppressive conduct against the Company. While continuing to deny any and all liability to the Plaintiffs, the Company amended its defence to include specific denials of the new allegations of oppressive conduct against it. The parties completed an additional round of examinations for discovery in January 2023, following which the Plaintiffs set the action down for trial.
60
On June 5, 2024, the Company entered into a Settlement Agreement, pursuant to which the Plaintiffs received a total of 3,750,000 Common Shares from the Defendants. Palisades transferred 2,607,434 Common Shares to ThreeD and 772,566 Common Shares to 131. The Company issued 285,429 Common Shares to ThreeD and 84,571 Common Shares to 131 with a total value of $1,750,100 recorded in the condensed interim statement of loss and comprehensive loss for the nine months ended September 30, 2024. The Settlement Agreement resolves the lawsuit completely, does not include any admission of liability and provides for fulsome releases by the Plaintiffs to the Defendants.
The lawsuit was dismissed on consent on July 9, 2024.
12 |
Except as disclosed in this AIF, to the knowledge of the Company, no director or executive officer, or person or company that beneficially owns, or controls and directs, directly or indirectly, more than 10 percent of the any class or series of the voting securities of the Company, or any associate or affiliate of the foregoing, have had any material interest, direct or indirect, in any transaction within the three most recently completed financial years or during the current financial year prior to the date of this AIF that has materially affected or is reasonably expected to materially affect the Company.
Certain directors and/or executive officers have been granted stock options of the Company and has received consulting fees for services provided to New Found.
13 |
New Found’s transfer agent and registrar is Computershare Investor Services Inc. at its principal office in Vancouver, British Columbia.
14 |
Except for material contracts entered into in the ordinary course of business, the Company’s stock option plan is the only material contract to which New Found is a party to or entered into in the financial year ended December 31, 2024, or subsequently prior to the date of this AIF, or material contract entered into prior to the beginning of the financial year ended December 31, 2024, which remain in effect as at the date of this AIF.
Stock Option Plan
New Found has a stock option plan pursuant to which the Board may grant Options to any director, senior officer, management company, employee or consultant of the Company (including any subsidiary of the Company), as the Board may determine, exercisable to acquire Common Shares up to a maximum of 10% of the issued and outstanding Common Shares at the time of grant. Every Option granted has a term not exceeding 10 years after the date of grant. There are currently 9,911,510 Options issued and outstanding as at the date of this AIF.
Outside of the above, New Found is not aware of any material contracts of the Company that were entered into (a) within the last financial year and up to the date of this AIF, or (b) before the last financial year but still in effect, and that is required to be filed under Part 12 of NI 51-102 or that would be required to be filed under 51-102 but for the fact that it was previously filed.
15 |
Information of a scientific or technical nature in respect of the Queensway Project is included in this AIF based upon the Technical Report with an effective date of November 1, 2024, prepared by D. Roy Eccles, M.Sc., P. Geol. P Geo. of APEX Geoscience Ltd., Mark K. Jorgensen, B.Sc., QP Metallurgy of Jorgensen Engineering and Technical Services, LLC and Gary Simmons, B.Sc., QP Metallurgy of GL Simmons Consulting, LLC, each a “Qualified Person” as defined under NI 43-101.
To the best of the Company’s knowledge, after reasonable inquiry, as of the date hereof, the aforementioned individuals and their respective firms do not beneficially own, directly or indirectly, any Common Shares.
The technical content disclosed in this AIF, other than the technical content disclosed in Section 5 hereof, was reviewed and approved by Melissa Render, P. Geo., President of the Company and Qualified Person as defined in NI 43-101. To the knowledge of the Company, Melissa Render is the registered or beneficial owner, directly or indirectly, of less than one percent of the outstanding Common Shares.
61
KPMG LLP, the auditor of the Company’s audited financial statements as of and for the years ended December 31, 2023 and 2024, has confirmed that that they are independent of the Company within the meaning of the relevant rules and related interpretations prescribed by the relevant professional bodies in Canada and any applicable legislation or regulations and also that they are independent accountants with respect to the Company under all relevant US professional and regulatory standards.
16 |
Additional information relating to New Found may be found under New Found’s profile on SEDAR+ at www.sedarplus.ca and on EDGAR at www.sec.gov.
Additional information, including directors’ and officers’ remuneration and indebtedness, principal holders of New Found’s securities and securities authorized for issuance under equity compensation plans, is contained in New Found’s information circular for its most recent annual meeting of securityholders that involved the election of directors. Additional financial information in relation to New Found is provided in the Company’s audited financial statements and management’s discussion and analysis for the years ended December 31, 2024 and 2023.
62
CHARTER OF THE AUDIT COMMITTEE OF NEW FOUND GOLD CORP.
1.ROLE AND OBJECTIVE
The Audit Committee (the “Committee”) is appointed by and reports to the Board of Directors (the “Board”) of New Found Gold Corp. (the “Corporation”). The Committee assists the Board in fulfilling its oversight responsibilities relating to financial accounting and reporting process and internal controls for the Corporation.
The Committee and its membership shall to the best of its ability, knowledge and acting reasonably, meet all applicable legal, regulatory and listing requirements, including, without limitation, those of any stock exchange on which the Corporation’s shares are listed, the Business Corporations Act (British Columbia) (the “Act”), and all applicable securities regulatory authorities.
2.COMPOSITION
3.MEETINGS
A-1
4.RESOURCES AND AUTHORITY
5.RESPONSIBILITIES
A.Chair
To carry out its oversight responsibilities, the Chair of the Committee shall undertake the following:
A-2
B.The Committee
The Committee has the authority to conduct any investigation appropriate to its responsibilities, and it may request the Independent Auditor as well as any officer of the Corporation, or outside counsel for the Corporation, to attend a meeting of the Committee or to meet with any members of, or advisors to, the Committee. The Committee shall have unrestricted access to the books and records of the Corporation and has the authority to retain, at the expense of the Corporation, special legal, accounting, or other consultants or experts to assist in the performance of the Committee’s duties.
The Committee is hereby delegated the duties and powers specified in Section 225 of the Act and, without limiting these duties and powers, the Committee will carry out the following responsibilities:
Financial Accounting and Reporting Process and Internal Controls
A-3
Independent Auditor
Other Responsibilities
A-4
Appendix A
Policy for Approval of Non-Audit Services
1. |
In the event that New Found Gold Corp. (the “Corporation”) or a subsidiary of the Corporation wishes to retain the services of the Corporation’s Independent Auditor for services other than the annual audit (e.g. tax compliance, tax advice or tax planning, to meet the requirements of a regulatory filing or due diligence, to receive advice on various matters, etc.), the Chief Financial Officer of the Corporation shall consult with the Audit Committee of the Board of Directors (the “Committee”), who shall have the authority to approve or disapprove such non-audit services. The Chair of the Committee has the authority to approve or disapprove such non-audit services on behalf of the Committee, and shall advise Committee of such pre-approvals no later than the time of the next meeting of the Committee following such pre-approval having been given. |
2. |
The Committee, or the Chair of the Committee, as appropriate, shall confer with the Independent Auditor regarding the nature of the services to be provided and shall not approve any services that would be considered to impair the independence of the Independent Auditor. For greater clarity, the following is a non-exhaustive list of the categories of non-audit services that would be considered to impair the independence of the Independent Auditor: |
(a) |
bookkeeping or other services related to or requiring management decisions in connection with the Corporation’s accounting records or financial statements; |
(b) |
financial information systems design and implementation; |
(c) |
appraisal or valuation services, fairness opinion or contributions-in-kind reports; |
(d) |
actuarial services; |
(e) |
internal audit outsourcing services; |
(f) |
management functions; |
(g) |
human resources; |
(h) |
broker or dealer, investment adviser or investment banking services; |
(i) |
legal services; |
(j) |
expert services unrelated to the audit; and |
(k) |
any other service that the Canadian Public Accountability Board or any other applicable regulatory authority determines is impermissible. |
3. |
The Chief Financial Officer of the Corporation shall maintain a record of non-audit services approved by the Chair of the Committee or the Committee for each fiscal year and provide a report to the Committee any services pre-approved since the last report, at each meeting and no less frequently than on a quarterly basis. |
4. |
In accordance with the requirements set forth under the “Exemption for minimal non-audit services” provided by Section 2.3(4) of National Instrument 52-110 — Audit Committees, whereby the Independent Auditor has commenced a service and: |
(a) |
the Corporation or the subsidiary entity of the Corporation, as the case may be, and the Independent Auditor did not recognize the services as non-audit services at the time of the engagement; |
(b) |
once recognized as non-audit services, the services are promptly brought to the attention of the Committee and approved by the Committee prior to the completion of the audit; and |
(c) |
the aggregate fees for the non-audit services not previously approved are immaterial in comparison to the aggregate fees paid by the Corporation to the Corporation’s Independent Auditor during the financial year in which the services are provided, such services shall be exempted from the requirements for pre-approval of non-audit services set out in this Policy. |
A-5
Exhibit 99.2

|
Management’s Discussion and Analysis For the years ended December 31, 2024 and 2023 |
|
The following discussion is management’s assessment and analysis of the results and financial condition of New Found Gold Corp. (the “Company” or “NFG”) and should be read in conjunction with the accompanying audited financial statements and related notes. The financial data was prepared using accounting policies consistent with International Financial Reporting Standards (“IFRS”) as issued by the International Accounting Standards Board ("IASB") and all figures are reported in Canadian dollars unless otherwise indicated. Please refer to the cautionary note regarding forward-looking statements and information within this Management’s Discussion & Analysis (“MD&A”) and the Risks Factors discussed in the Company’s most recent Annual Information Form on file with the Canadian provincial securities, regulatory authorities and Form 40-F on file with the U.S. Securities and Exchange Commission (the “SEC”).
This MD&A contains forward-looking information and forward-looking statements, within the meaning of the U.S. Private Securities Litigation Reform Act of 1995 and forward-looking information within the meaning of applicable Canadian securities legislation, (collectively, “forward-looking statements”), that involve numerous risks and uncertainties. The Company continually seeks to minimize its exposure to business risks, but by the nature of its business and exploration activities and size, will always have some risk. These risks are not always quantifiable due to their uncertain nature. Should one or more of these risks and uncertainties, including those described under the headings “Risks and Uncertainties” and “Cautionary Notes Regarding Forward-Looking Statements” materialize, or should underlying assumptions prove incorrect, then actual results may vary materially from those expressed or implied in forward-looking statements. The effective date of this report is March 20, 2025.
The technical content disclosed in this MD&A was reviewed and approved by Melissa Render, P. Geo., President, and a Qualified Person as defined under National Instrument 43-101. Ms. Render consents to the publication of this MD&A, by NFG. The scientific and technical information in this MD&A relating to the Queensway Project is derived from, and in some instances is a direct extract from, and is based on the assumptions, qualifications and procedures set out in, the report entitled “NI 43-101 Technical Report New Found Gold Corp.’s Queensway Gold Project in Newfoundland and Labrador, Canada: 2024 Property Expansion and Exploration Update” with an effective date November 1, 2024, prepared by Dr. Roy Eccles, M.Sc., P.Geol., P.Geo of Apex Geoscience, Mark K. Jorgensen, B.Sc., QP Metallurgy of Jorgensen Engineering and Technical Services, LLC and Gary Simmons, B.SC., QP Metallurgy of GL Simmons Consulting, LLC in accordance with National Instrument 43-101 – Standards of Disclosure for Mineral Projects (“NI 43-101”) (the “Queensway Technical Report”). Reference should be made to the full text of the Queensway Technical Report, which is available for review under the Company’s profile on SEDAR+ at www.sedarplus.ca.
Description of Business
The Company was incorporated on January 6, 2016, under the Business Corporations Act (Ontario). On June 23, 2020, the Company continued as a British Columbia corporation under the Business Corporation Act in the province of British Columbia. The Company’s head office is located at is Suite 2129, 1055 West Georgia Street, Vancouver, British Columbia V6E 3P2, and its registered office is located at Suite 3500, The Stack, 1133 Melville Street, Vancouver, British Columbia V6E 4E5. On August 11, 2020, the Company completed an initial public offering and listed on the TSX Venture Exchange under the symbol “NFG”. On September 29, 2021, the Company also listed its shares on the NYSE American stock exchange under the symbol “NFGC”.
The Company is a mineral exploration company engaged in the acquisition, exploration and evaluation of resource properties with a focus on gold properties located in Newfoundland and Labrador, Canada. The Company’s principal objective is to explore and develop the Queensway Project, which is located near Gander, Newfoundland and to identify other properties worthy of investment and exploration. For the purpose of NI 43-101, the Queensway Project is the Company’s only material property.
The Queensway Project is comprised of 103 mineral licences, including 7,024 claims comprising 175,600 ha of land located near Gander, Newfoundland and Labrador. The Queensway Project is accessible by main access roads including the Trans-Canada Highway (“TCH”) that passes through the northern portion of the project and has high voltage electric transmission lines running through the project area. The Queensway Project is divided into two blocks, Queensway North (“QWN”) which is designated to the claim group north of Gander Lake and Queensway South (“QWS”) which is the property portion located south of Gander Lake.
As of the date of this MD&A, the Company’s Board of Directors consisted of the following: Paul Huet (Chairman), Keith Boyle, Vijay Mehta, Melissa Render, William Hayden and Chad Williams.
Additional information relating to the Company is available on the Company’s website at www.newfoundgold.ca.
- 1 -
|
Management’s Discussion and Analysis For the years ended December 31, 2024 and 2023 |
|
Project Summary
Queensway Project, Newfoundland
Ownership
The Queensway project consists of licences that were acquired by New Found through 1) online map staking with the Government of NL, 2) the successful completion of a series of option agreements (9 option agreements), 3) licences originally acquired by Palisades Resources Corp., which was renamed NFG in June 2017 and 4) purchase agreements.
In addition, five licences are currently owned by separate licence holders and are subject to NFG satisfying conditions of an option agreement (the “VOA Option Agreement”) between Aidan O’Neil, Suraj Amarnani, Josh Vann and VOA Exploration Inc. (collectively, the “Optionors”) and New Found.
On April 21, 2024, the Company entered into a property purchase agreement with Labrador Gold Corp. (“LabGold”) to acquire a 100% interest in LabGold’s Kingsway Project, located near Gander, Newfoundland and Labrador, as well as certain related assets of LabGold (the “Transaction”). The Transaction closed on July 9, 2024. Pursuant to the acquisition, the Company issued 5,263,157 common shares to LabGold with a value of $20,000,000. The Company paid $438,541 in professional and filing fees in connection with the Transaction. This acquisition resulted in expansion of the project by 7,775ha and gaining approximately 13.5km of strike along the Appleton Fault Zone.
Under the terms of the original Kingsway Option Agreement, the optionors would receive an Expenditure Target Payment of $750,000 upon completion of an aggregate of $30,000,000 of exploration expenditures being incurred on the property. During the year ended December 31, 2024, the Company incurred certain exploration expenditures and having met the remaining expenditure target on the property paid $750,000 to the optionors.
In May 2024, New Found also completed a purchase agreement with Sky Gold Corp. expanding the project by 4,800 ha.
On July 29, 2024, the Company entered into three royalty purchase agreements (the “Royalty Purchase Agreements”) with arm’s length royalty holders (together, the “Vendors” and each, a “Vendor”) to purchase part of each Vendor’s royalty interest in aggregate, 0.6% of the Vendors’ 1.6% net smelter returns royalty underlying several zones at the Company’s Queensway project (the “Royalty Interests”). The transaction closed on August 8, 2024. Pursuant to the acquisition, the Company paid aggregate cash consideration of $1,950,000 and aggregate share consideration of 300,000 common shares with a combined value of $1,011,000 to the Vendors. The Company paid $63,620 in professional fees in connection with the royalty purchases.
The Company also had the right to purchase the remaining 1.0% net smelter returns royalty from the Vendors for an aggregate price equal to $1,000,000 (the “Repurchase Price”) by November 12, 2024, payable by (i) an aggregate of $100,000 and (ii) an additional $4,950, in the aggregate, per year until the Repurchase Price has been satisfied. During the year ended December 31, 2024, the Company purchased the remaining 1.0% net smelter returns royalty from the Vendors for $1,000,000 in aggregate in cash, of which $666,667 was paid subsequent to December 31, 2024, which fully satisfied the Repurchase Price. The Company also paid $16,225 in professional fees in connection with the purchase.
- 2 -
|
Management’s Discussion and Analysis For the years ended December 31, 2024 and 2023 |
The optioned lands also carry various net smelter royalties which are summarized in the table below.
Queensway Project mineral licence description and status (reported by blocks of contiguous licences/claims)
| A) | Queensway North Block |
|
|
|
|
|
|
|
|
|
|
|
|
|
|
|
|
|
|
Annual |
|
|
|
|
|
NSR |
|
|
|
|
|
|
|
|
|
|
|
|
|
|
|
|
|
|
|
Maximum |
|
|
|
NSR |
|
Buyback |
|
|
|
|
|
|
|
No. of |
|
Area |
|
|
|
Issued |
|
Renewal |
|
Report Due |
|
Expenses |
|
Expenses |
|
Royality |
|
Provision |
|
Licence No. |
|
Title Holder |
|
Location |
|
Claims |
|
(km²) |
|
Status |
|
Date |
|
Date |
|
Date |
|
Due |
|
Due Date |
|
(%) |
|
(%) |
|
006821M |
|
New Found Gold Corp. |
|
Gander River, Central NL |
|
2 |
|
0.50 |
|
Issued |
|
1999-05-17 |
|
2025-05-19 |
|
2026-07-16 |
|
$ |
358.75 |
|
2029-05-17 |
|
2.5 |
|
1 |
007984M |
|
New Found Gold Corp. |
|
Glenwood, Central NL |
|
50 |
|
12.50 |
|
Issued |
|
1998-11-13 |
|
2024-11-13 |
|
2025-01-13 |
|
|
N/A |
|
N/A |
|
0.4 |
|
0 |
022216M |
|
New Found Gold Corp. |
|
Glenwood, Central NL |
|
6 |
|
1.50 |
|
Issued |
|
2014-06-12 |
|
2029-06-12 |
|
2025-08-11 |
|
$ |
2,685.01 |
|
2033-06-12 |
|
0 |
|
0 |
022491M |
|
New Found Gold Corp. |
|
Gander Lake Area, Central NL |
|
12 |
|
3.00 |
|
Issued |
|
2014-11-06 |
|
2024-11-06 |
|
2026-01-05 |
|
$ |
7,821.03 |
|
2033-11-06 |
|
1.6 |
|
1 |
023720M |
|
New Found Gold Corp. |
|
Glenwood, Central NL |
|
4 |
|
1.00 |
|
Issued |
|
2001-12-31 |
|
2024-12-31 |
|
2026-03-02 |
|
$ |
4,861.69 |
|
2027-12-31 |
|
1 |
|
0 |
023721M |
|
New Found Gold Corp. |
|
Glenwood, Central NL |
|
2 |
|
0.50 |
|
Issued |
|
2001-12-31 |
|
2024-12-31 |
|
2026-03-02 |
|
$ |
4,124.62 |
|
2027-12-31 |
|
1 |
|
0 |
023804M |
|
New Found Gold Corp. |
|
Glenwood, Central NL |
|
12 |
|
3.00 |
|
Issued |
|
2001-02-19 |
|
2025-02-19 |
|
2025-04-21 |
|
$ |
9,549.76 |
|
2027-02-19 |
|
0 |
|
0 |
023860M |
|
New Found Gold Corp. |
|
Joe Batts Brook, Central NL |
|
11 |
|
2.75 |
|
Issued |
|
2016-04-07 |
|
2026-04-07 |
|
2026-06-08 |
|
$ |
12,967.14 |
|
2034-04-07 |
|
0.6 |
|
0 |
023861M |
|
New Found Gold Corp. |
|
Joe Batts Pond, Central NL |
|
16 |
|
4.00 |
|
Issued |
|
2016-04-07 |
|
2026-04-07 |
|
2026-06-08 |
|
$ |
18,861.30 |
|
2034-04-07 |
|
1 |
|
0 |
023862M |
|
New Found Gold Corp. |
|
Joe Batts Brook, Central NL |
|
4 |
|
1.00 |
|
Issued |
|
2016-04-07 |
|
2026-04-07 |
|
2026-06-08 |
|
$ |
4,715.32 |
|
2034-04-07 |
|
0.6 |
|
0 |
023863M |
|
New Found Gold Corp. |
|
Joe Batts Brook, Central NL |
|
11 |
|
2.75 |
|
Issued |
|
2016-04-07 |
|
2026-04-07 |
|
2026-06-08 |
|
$ |
12,967.14 |
|
2034-04-07 |
|
1 |
|
0 |
023864M |
|
New Found Gold Corp. |
|
Joe Batts Brook, Central NL |
|
3 |
|
0.75 |
|
Issued |
|
2016-04-07 |
|
2026-04-07 |
|
2026-06-08 |
|
$ |
3,536.49 |
|
2034-04-07 |
|
1 |
|
0 |
023866M |
|
New Found Gold Corp. |
|
Joe Batts Brook, Central NL |
|
4 |
|
1.00 |
|
Issued |
|
2016-04-07 |
|
2026-04-07 |
|
2026-06-08 |
|
$ |
2,698.66 |
|
2034-04-07 |
|
1 |
|
0.5 |
023874M |
|
New Found Gold Corp. |
|
Joe Batts Brook, Central NL |
|
8 |
|
2.00 |
|
Issued |
|
2016-04-11 |
|
2026-04-13 |
|
2026-06-10 |
|
$ |
9,430.64 |
|
2034-04-11 |
|
1.6 |
|
1 |
023875M |
|
New Found Gold Corp. |
|
Joe Batts Pond, Central NL |
|
3 |
|
0.75 |
|
Issued |
|
2016-04-12 |
|
2026-04-13 |
|
2025-06-11 |
|
$ |
2,697.76 |
|
2032-04-12 |
|
1.6 |
|
1 |
023881M |
|
New Found Gold Corp. |
|
Joe Batts Brook, Central NL |
|
7 |
|
1.75 |
|
Issued |
|
2016-04-21 |
|
2026-04-21 |
|
2025-06-20 |
|
$ |
344.78 |
|
2031-04-21 |
|
1.6 |
|
1 |
023916M |
|
New Found Gold Corp. |
|
Gander Lake Area, Central NL |
|
4 |
|
1.00 |
|
Issued |
|
2016-05-05 |
|
2026-05-05 |
|
2026-07-06 |
|
$ |
4,715.32 |
|
2034-05-05 |
|
1.6 |
|
1 |
023940M |
|
New Found Gold Corp. |
|
Gander River |
|
44 |
|
11.00 |
|
Issued |
|
2016-05-09 |
|
2026-05-11 |
|
2025-07-08 |
|
|
N/A |
|
2033-05-09 |
|
0 |
|
0 |
023962M |
|
New Found Gold Corp. |
|
The Outflow, Central NL |
|
9 |
|
2.25 |
|
Issued |
|
2016-05-19 |
|
2026-05-19 |
|
2025-07-18 |
|
$ |
10,290.02 |
|
2034-05-19 |
|
0 |
|
0 |
023987M |
|
New Found Gold Corp. |
|
Joe Batts Pond Area, Central NL |
|
11 |
|
2.75 |
|
Issued |
|
2016-06-07 |
|
2026-06-08 |
|
2026-08-06 |
|
$ |
7,421.32 |
|
2034-06-07 |
|
1.6 |
|
1 |
024026M |
|
New Found Gold Corp. |
|
Joe Batts Pond Area, Central NL |
|
6 |
|
1.50 |
|
Issued |
|
2016-06-30 |
|
2026-06-30 |
|
2025-08-29 |
|
$ |
4,048.00 |
|
2034-06-30 |
|
1.6 |
|
1 |
024031M |
|
New Found Gold Corp. |
|
Joe Batts Pond Area, Central NL |
|
6 |
|
1.50 |
|
Issued |
|
2016-06-30 |
|
2026-06-30 |
|
2025-08-29 |
|
$ |
295.52 |
|
2031-06-30 |
|
1.6 |
|
1 |
024112M |
|
New Found Gold Corp. |
|
Gander River |
|
4 |
|
1.00 |
|
Issued |
|
2016-08-25 |
|
2026-08-25 |
|
2024-10-24 |
|
$ |
4,800.00 |
|
2032-08-25 |
|
1.5 |
|
0.5 |
024136M |
|
New Found Gold Corp. |
|
Gander River Area, Central NL |
|
25 |
|
6.25 |
|
Issued |
|
2016-09-13 |
|
2026-09-14 |
|
2025-11-12 |
|
$ |
4,577.07 |
|
2033-09-13 |
|
0.4 |
|
0 |
024138M |
|
New Found Gold Corp. |
|
Gander Lake, Central NL |
|
21 |
|
5.25 |
|
Issued |
|
2016-09-15 |
|
2026-09-15 |
|
2025-11-14 |
|
$ |
13,686.81 |
|
2033-09-15 |
|
0 |
|
0 |
024139M |
|
New Found Gold Corp. |
|
Gander Lake, Central NL |
|
30 |
|
7.50 |
|
Issued |
|
2016-09-15 |
|
2026-09-15 |
|
2025-11-14 |
|
$ |
5,492.49 |
|
2033-09-15 |
|
1.6 |
|
1 |
024140M |
|
New Found Gold Corp. |
|
Joe Batts Pond, Central NL |
|
2 |
|
0.50 |
|
Issued |
|
2016-09-15 |
|
2026-09-15 |
|
2025-11-14 |
|
$ |
366.17 |
|
2033-09-15 |
|
1.6 |
|
1 |
024141M |
|
New Found Gold Corp. |
|
Joe Batts Pond Area, Central NL |
|
2 |
|
0.50 |
|
Issued |
|
2016-09-15 |
|
2026-09-15 |
|
2025-11-14 |
|
$ |
366.17 |
|
2033-09-15 |
|
1.6 |
|
1 |
024264M |
|
New Found Gold Corp. |
|
Joe Batts Pond Area, Central NL |
|
4 |
|
1.00 |
|
Issued |
|
2016-10-24 |
|
2026-10-26 |
|
2025-12-23 |
|
$ |
732.33 |
|
2033-10-24 |
|
0.4 |
|
0 |
024265M |
|
New Found Gold Corp. |
|
Appleton, Central NL |
|
12 |
|
3.00 |
|
Issued |
|
2016-10-24 |
|
2026-10-26 |
|
2025-12-23 |
|
$ |
7,821.03 |
|
2033-10-24 |
|
0.4 |
|
0 |
024266M |
|
New Found Gold Corp. |
|
Joe Batts Pond, Central NL |
|
128 |
|
32.00 |
|
Issued |
|
2016-10-24 |
|
2026-10-26 |
|
2025-12-23 |
|
$ |
23,434.62 |
|
2033-10-24 |
|
0.4 |
|
0 |
024268M |
|
New Found Gold Corp. |
|
Millers Brook, Central NL |
|
56 |
|
14.00 |
|
Issued |
|
2016-10-24 |
|
2026-10-26 |
|
2025-12-23 |
|
$ |
36,498.14 |
|
2033-10-24 |
|
1.6 |
|
1 |
024997M |
|
New Found Gold Corp. |
|
Glenwood Area, Central NL |
|
21 |
|
5.25 |
|
Issued |
|
2017-04-27 |
|
2027-04-27 |
|
2026-06-26 |
|
$ |
14,167.99 |
|
2034-04-27 |
|
0 |
|
0 |
025008M |
|
New Found Gold Corp. |
|
Gander Lake, Central NL |
|
13 |
|
3.25 |
|
Issued |
|
2017-05-04 |
|
2027-05-04 |
|
2026-07-03 |
|
$ |
15,324.80 |
|
2034-05-04 |
|
1 |
|
0 |
026074M |
|
New Found Gold Corp. |
|
Joe Batts Brook, Central NL |
|
3 |
|
0.75 |
|
Issued |
|
2018-05-31 |
|
2028-05-31 |
|
2026-07-30 |
|
$ |
2,636.49 |
|
2034-05-31 |
|
2.2 |
|
1 |
027636M |
|
New Found Gold Corp. |
|
Gander River |
|
110 |
|
27.50 |
|
Issued |
|
2016-10-24 |
|
2026-10-26 |
|
2024-12-23 |
|
$ |
132,000.00 |
|
2033-10-24 |
|
1 |
|
0 |
027637M |
|
New Found Gold Corp. |
|
Gander River |
|
154 |
|
38.50 |
|
Issued |
|
2016-10-24 |
|
2026-10-26 |
|
2024-12-23 |
|
$ |
91,572.04 |
|
2028-10-24 |
|
1 |
|
0 |
030714M |
|
New Found Gold Corp. |
|
King’s Point, Gander Lake |
|
8 |
|
2.00 |
|
Issued |
|
2020-05-02 |
|
2025-05-02 |
|
2026-07-01 |
|
$ |
2,324.47 |
|
2033-05-02 |
|
1 |
|
0 |
035197M |
|
Aidan ONeil |
|
South Pond |
|
130 |
|
32.50 |
|
Issued |
|
2022-11-10 |
|
2027-11-10 |
|
2025-01-09 |
|
$ |
5,165.81 |
|
2025-11-10 |
|
0 |
|
0 |
035198M |
|
Suraj Amarnani |
|
Fourth Pond |
|
168 |
|
42.00 |
|
Issued |
|
2022-11-10 |
|
2027-11-10 |
|
2025-01-09 |
|
$ |
94,483.67 |
|
2031-11-10 |
|
0 |
|
0 |
035204M |
|
New Found Gold Corp. |
|
Gander River |
|
3 |
|
0.75 |
|
Issued |
|
2022-11-10 |
|
2027-11-10 |
|
2025-01-09 |
|
$ |
710.00 |
|
2031-11-10 |
|
1 |
|
0 |
035209M |
|
New Found Gold Corp. |
|
Sout Pond |
|
2 |
|
0.50 |
|
Issued |
|
2022-11-10 |
|
2027-11-10 |
|
2025-01-09 |
|
$ |
29.15 |
|
2025-11-10 |
|
0 |
|
0 |
035681M |
|
New Found Gold Corp. |
|
The Outflow, Central NL |
|
4 |
|
1.00 |
|
Issued |
|
2023-03-16 |
|
2028-03-16 |
|
2026-05-15 |
|
$ |
109.76 |
|
2028-03-16 |
|
0 |
|
0 |
n=43 licences |
|
|
|
Totals |
|
1,135 |
|
283.75 |
|
|
|
|
|
|
|
|
|
|
|
|
|
|
|
|
|
- 3 -
|
Management’s Discussion and Analysis For the years ended December 31, 2024 and 2023 |
| B) | Queensway South Block |
|
|
|
|
|
|
|
|
|
|
|
|
|
|
|
|
|
|
|
|
|
|
|
|
|
NSR |
|
|
|
|
|
|
|
|
|
|
|
|
|
|
|
|
|
|
Annual |
|
|
|
NSR |
|
Buyback |
|
|
|
|
|
|
|
No. of |
|
Area |
|
|
|
|
|
|
|
Report Due |
|
Maximum |
|
Expenses Due |
|
Royality |
|
Provision |
|
Licence No. |
|
Title Holder |
|
Location |
|
Claims |
|
(km²) |
|
Status |
|
Issued Date |
|
Renewal Date |
|
Date |
|
Expenses Due |
|
Date |
|
(%) |
|
(%) |
|
022236M |
|
New Found Gold Corp. |
|
Southwest Gander River, Central NL |
|
5 |
|
1.25 |
|
Issued |
|
2014-06-12 |
|
2029-06-12 |
|
2024-08-12 |
|
$ |
39.49 |
|
2025-06-12 |
|
1 |
|
0.5 |
022260M |
|
New Found Gold Corp. |
|
Southwest Gander River, Central NL |
|
1 |
|
0.25 |
|
Issued |
|
2014-06-13 |
|
2029-06-13 |
|
2025-08-12 |
|
$ |
643.08 |
|
2026-06-13 |
|
1 |
|
0.5 |
022342M |
|
New Found Gold Corp. |
|
Southwest Gander River, Central NL |
|
1 |
|
0.25 |
|
Issued |
|
2014-08-25 |
|
2024-08-25 |
|
2025-10-24 |
|
$ |
144.84 |
|
2026-08-25 |
|
1 |
|
0.5 |
023239M |
|
New Found Gold Corp. |
|
Pauls Pond, Central NL |
|
2 |
|
0.50 |
|
Issued |
|
2015-08-12 |
|
2025-08-12 |
|
2025-10-13 |
|
$ |
1,600.08 |
|
2027-08-12 |
|
1 |
|
0.5 |
023495M |
|
New Found Gold Corp. |
|
Northwest Gander River, Central NL |
|
5 |
|
1.25 |
|
Issued |
|
2015-11-19 |
|
2025-11-19 |
|
2026-01-19 |
|
$ |
479.97 |
|
2025-11-19 |
|
1 |
|
0.5 |
023498M |
|
New Found Gold Corp. |
|
Northwest Gander River, Central NL |
|
8 |
|
2.00 |
|
Issued |
|
2015-11-19 |
|
2025-11-19 |
|
2026-01-19 |
|
$ |
732.12 |
|
2025-11-19 |
|
1 |
|
0.5 |
024435M |
|
New Found Gold Corp. |
|
Greenwood Pond, Central NL |
|
7 |
|
1.75 |
|
Issued |
|
2016-11-21 |
|
2026-11-23 |
|
2026-01-20 |
|
$ |
2,872.25 |
|
2026-11-21 |
|
1 |
|
0.5 |
024436M |
|
New Found Gold Corp. |
|
Greenwood Pond, Central NL |
|
3 |
|
0.75 |
|
Issued |
|
2016-11-21 |
|
2026-11-23 |
|
2026-01-20 |
|
$ |
96.41 |
|
2026-11-21 |
|
1 |
|
0.5 |
024557M |
|
New Found Gold Corp. |
|
Bear Pond, Central NL |
|
250 |
|
62.50 |
|
Issued |
|
2016-12-12 |
|
2026-12-14 |
|
2025-02-10 |
|
$ |
7,226.71 |
|
2024-12-12 |
|
1 |
|
0 |
024558M |
|
New Found Gold Corp. |
|
Great Gull River, Central NL |
|
239 |
|
59.75 |
|
Issued |
|
2016-12-12 |
|
2026-12-14 |
|
2025-02-10 |
|
$ |
6,884.46 |
|
2024-12-12 |
|
1 |
|
0 |
024559M |
|
New Found Gold Corp. |
|
Northwest Gander River, Central NL |
|
256 |
|
64.00 |
|
Issued |
|
2016-12-12 |
|
2026-12-14 |
|
2025-02-10 |
|
$ |
15,237.34 |
|
2024-12-12 |
|
1 |
|
0 |
024560M |
|
New Found Gold Corp. |
|
Careless Brook, Central NL |
|
121 |
|
30.25 |
|
Issued |
|
2016-12-12 |
|
2026-12-14 |
|
2026-02-10 |
|
$ |
11,097.19 |
|
2025-12-12 |
|
1 |
|
0 |
024561M |
|
New Found Gold Corp. |
|
Eastern Pond, Central NL |
|
256 |
|
64.00 |
|
Issued |
|
2016-12-12 |
|
2026-12-14 |
|
2026-02-10 |
|
$ |
122,488.98 |
|
2025-12-12 |
|
1 |
|
0 |
024562M |
|
New Found Gold Corp. |
|
Hussey Pond, Central NL |
|
241 |
|
60.25 |
|
Issued |
|
2016-12-12 |
|
2026-12-14 |
|
2025-02-10 |
|
$ |
14,317.32 |
|
2024-12-12 |
|
1 |
|
0 |
024563M |
|
New Found Gold Corp. |
|
Eastern Pond, Central NL |
|
236 |
|
59.00 |
|
Issued |
|
2016-12-12 |
|
2026-12-14 |
|
2025-02-10 |
|
$ |
6,793.68 |
|
2024-12-12 |
|
1 |
|
0 |
024565M |
|
New Found Gold Corp. |
|
Gander Lake, Central NL |
|
12 |
|
3.00 |
|
Issued |
|
2016-12-12 |
|
2026-12-14 |
|
2026-02-10 |
|
$ |
1,762.25 |
|
2025-12-12 |
|
1 |
|
0 |
024566M |
|
New Found Gold Corp. |
|
Gander Lake, Central NL |
|
125 |
|
31.25 |
|
Issued |
|
2016-12-12 |
|
2026-12-14 |
|
2025-02-10 |
|
$ |
10,813.58 |
|
2024-12-12 |
|
1 |
|
0 |
024567M |
|
New Found Gold Corp. |
|
Gander Lake, Central NL |
|
106 |
|
26.50 |
|
Issued |
|
2016-12-12 |
|
2026-12-14 |
|
2025-02-10 |
|
$ |
9,023.39 |
|
2024-12-12 |
|
1 |
|
0 |
024568M |
|
New Found Gold Corp. |
|
Birch Pond, Central NL |
|
254 |
|
63.50 |
|
Issued |
|
2016-12-12 |
|
2026-12-14 |
|
2025-02-10 |
|
$ |
7,289.42 |
|
2024-12-12 |
|
1 |
|
0 |
024569M |
|
New Found Gold Corp. |
|
Southwest Gander River, Central NL |
|
221 |
|
55.25 |
|
Issued |
|
2016-12-12 |
|
2026-12-14 |
|
2025-02-10 |
|
$ |
19,505.91 |
|
2024-12-12 |
|
1 |
|
0 |
024570M |
|
New Found Gold Corp. |
|
Dennis Brook, Central NL |
|
117 |
|
29.25 |
|
Issued |
|
2016-12-12 |
|
2026-12-14 |
|
2025-02-10 |
|
$ |
3,117.21 |
|
2024-12-12 |
|
1 |
|
0 |
024571M |
|
New Found Gold Corp. |
|
Winter Brook, Central NL |
|
153 |
|
38.25 |
|
Issued |
|
2016-12-12 |
|
2026-12-14 |
|
2026-02-10 |
|
$ |
47,155.68 |
|
2025-12-12 |
|
1 |
|
0 |
025766M |
|
New Found Gold Corp. |
|
Pauls Pond, Central NL |
|
163 |
|
40.75 |
|
Issued |
|
2016-12-12 |
|
2026-12-14 |
|
2025-02-10 |
|
$ |
4,539.43 |
|
2024-12-12 |
|
1 |
|
0 |
027379M |
|
New Found Gold Corp. |
|
Gander Outflow |
|
6 |
|
1.50 |
|
Issued |
|
2020-08-22 |
|
2025-08-22 |
|
2024-10-21 |
|
$ |
1,230.10 |
|
2024-08-22 |
|
3 |
|
1.5 |
030710M |
|
New Found Gold Corp. |
|
Little Dead Wolf Pond |
|
144 |
|
36.00 |
|
Issued |
|
2020-05-02 |
|
2025-05-02 |
|
2025-07-01 |
|
$ |
34,731.62 |
|
2027-05-02 |
|
1 |
|
0 |
030711M |
|
New Found Gold Corp. |
|
Gander Outflow |
|
44 |
|
11.00 |
|
Issued |
|
2020-05-02 |
|
2025-05-02 |
|
2024-07-01 |
|
$ |
23,302.26 |
|
2026-05-02 |
|
2 |
|
1 |
030716M |
|
New Found Gold Corp. |
|
Third Berry Hill Pond |
|
224 |
|
56.00 |
|
Issued |
|
2020-05-02 |
|
2025-05-02 |
|
2025-07-01 |
|
$ |
47,522.32 |
|
2027-05-02 |
|
0 |
|
0 |
030722M |
|
New Found Gold Corp. |
|
Hunt’s Pond |
|
149 |
|
37.25 |
|
Issued |
|
2020-05-02 |
|
2025-05-02 |
|
2025-07-01 |
|
$ |
30,010.98 |
|
2027-05-02 |
|
1 |
|
0 |
030726M |
|
New Found Gold Corp. |
|
Joe’s Feeder Cove |
|
5 |
|
1.25 |
|
Issued |
|
2020-05-02 |
|
2025-05-02 |
|
2025-07-01 |
|
$ |
897.44 |
|
2030-05-02 |
|
1 |
|
0 |
030727M |
|
New Found Gold Corp. |
|
Dead Wolf Brook |
|
195 |
|
48.75 |
|
Issued |
|
2020-05-02 |
|
2025-05-02 |
|
2025-07-01 |
|
$ |
41,369.89 |
|
2027-05-02 |
|
1 |
|
0 |
030733M |
|
New Found Gold Corp. |
|
Rocky Brook |
|
173 |
|
43.25 |
|
Issued |
|
2020-05-02 |
|
2025-05-02 |
|
2025-07-01 |
|
$ |
36,702.51 |
|
2027-05-02 |
|
1 |
|
0 |
030737M |
|
New Found Gold Corp. |
|
Caribou Lake |
|
247 |
|
61.75 |
|
Issued |
|
2020-05-02 |
|
2025-05-02 |
|
2025-07-01 |
|
$ |
52,401.86 |
|
2027-05-02 |
|
1 |
|
0 |
030739M |
|
New Found Gold Corp. |
|
Great Gull River |
|
224 |
|
56.00 |
|
Issued |
|
2020-05-02 |
|
2025-05-02 |
|
2025-07-01 |
|
$ |
40,675.13 |
|
2027-05-02 |
|
1 |
|
0 |
030740M |
|
New Found Gold Corp. |
|
Ribbon Ponds |
|
1 |
|
0.25 |
|
Issued |
|
2020-05-02 |
|
2025-05-02 |
|
2025-07-01 |
|
$ |
198.64 |
|
2027-05-02 |
|
0 |
|
0 |
030741M |
|
New Found Gold Corp. |
|
Southwest Gander River Cove |
|
2 |
|
0.50 |
|
Issued |
|
2020-05-02 |
|
2025-05-02 |
|
2025-07-01 |
|
$ |
1,136.80 |
|
2029-05-02 |
|
1 |
|
0 |
030742M |
|
New Found Gold Corp. |
|
Steeles Brook |
|
32 |
|
8.00 |
|
Issued |
|
2020-05-02 |
|
2025-05-02 |
|
2025-07-01 |
|
$ |
5,810.74 |
|
2027-05-02 |
|
1 |
|
0 |
030745M |
|
New Found Gold Corp. |
|
Dead Wolf Brook |
|
101 |
|
25.25 |
|
Issued |
|
2020-05-02 |
|
2025-05-02 |
|
2025-07-01 |
|
$ |
21,427.48 |
|
2027-05-02 |
|
1 |
|
0 |
030746M |
|
New Found Gold Corp. |
|
Southwest Islands View |
|
3 |
|
0.75 |
|
Issued |
|
2020-05-02 |
|
2025-05-02 |
|
2025-07-01 |
|
$ |
1,609.79 |
|
2030-05-02 |
|
1 |
|
0 |
030747M |
|
New Found Gold Corp. |
|
Owl Pond |
|
37 |
|
9.25 |
|
Issued |
|
2020-05-02 |
|
2025-05-02 |
|
2025-07-01 |
|
$ |
7,849.66 |
|
2027-05-02 |
|
1 |
|
0 |
030748M |
|
New Found Gold Corp. |
|
Southwest Pond |
|
140 |
|
35.00 |
|
Issued |
|
2020-05-02 |
|
2025-05-02 |
|
2025-07-01 |
|
$ |
29,701.44 |
|
2027-05-02 |
|
1 |
|
0 |
030752M |
|
New Found Gold Corp. |
|
Miguel’s Lake |
|
78 |
|
19.50 |
|
Issued |
|
2020-05-02 |
|
2025-05-02 |
|
2025-07-01 |
|
$ |
16,547.95 |
|
2027-05-02 |
|
1 |
|
0 |
030753M |
|
New Found Gold Corp. |
|
Gander Lake |
|
3 |
|
0.75 |
|
Issued |
|
2020-05-02 |
|
2025-05-02 |
|
2025-07-01 |
|
$ |
974.79 |
|
2029-05-02 |
|
1 |
|
0 |
030754M |
|
New Found Gold Corp. |
|
Little Gander Lake |
|
172 |
|
43.00 |
|
Issued |
|
2020-05-02 |
|
2025-05-02 |
|
2025-07-01 |
|
$ |
36,490.34 |
|
2027-05-02 |
|
0 |
|
0 |
030755M |
|
New Found Gold Corp. |
|
Rocky Brook |
|
30 |
|
7.50 |
|
Issued |
|
2020-05-02 |
|
2025-05-02 |
|
2025-07-01 |
|
$ |
6,364.60 |
|
2027-05-02 |
|
0 |
|
0 |
030756M |
|
New Found Gold Corp. |
|
Southwest Pond |
|
88 |
|
22.00 |
|
Issued |
|
2020-05-02 |
|
2025-05-02 |
|
2025-07-01 |
|
$ |
18,669.49 |
|
2027-05-02 |
|
1 |
|
0 |
030763M |
|
New Found Gold Corp. |
|
Rocky Brook |
|
45 |
|
11.25 |
|
Issued |
|
2020-05-02 |
|
2025-05-02 |
|
2025-07-01 |
|
$ |
9,546.89 |
|
2027-05-02 |
|
0 |
|
0 |
030765M |
|
New Found Gold Corp. |
|
Berry Hill Brook |
|
124 |
|
31.00 |
|
Issued |
|
2020-05-02 |
|
2025-05-02 |
|
2025-07-01 |
|
$ |
26,307.00 |
|
2027-05-02 |
|
0 |
|
0 |
030768M |
|
New Found Gold Corp. |
|
Gander Lake Prime |
|
149 |
|
37.25 |
|
Issued |
|
2020-05-02 |
|
2025-05-02 |
|
2025-07-01 |
|
$ |
41,695.49 |
|
2026-05-02 |
|
1 |
|
0 |
030771M |
|
New Found Gold Corp. |
|
Northwest Gander River |
|
37 |
|
9.25 |
|
Issued |
|
2020-05-02 |
|
2025-05-02 |
|
2025-07-01 |
|
$ |
7,849.66 |
|
2027-05-02 |
|
1 |
|
0 |
030783M |
|
New Found Gold Corp. |
|
Little Dead Wolf Brook |
|
41 |
|
10.25 |
|
Issued |
|
2020-05-02 |
|
2025-05-02 |
|
2025-07-01 |
|
$ |
9,888.86 |
|
2027-05-02 |
|
0 |
|
0 |
035087M |
|
New Found Gold Corp. |
|
Gander Lake Prime |
|
2 |
|
0.50 |
|
Issued |
|
2022-10-13 |
|
2027-10-13 |
|
2025-12-12 |
|
$ |
235.85 |
|
2029-10-13 |
|
0 |
|
0 |
035338M |
|
New Found Gold Corp. |
|
Gillingham’s Pond |
|
53 |
|
13.25 |
|
Issued |
|
2023-01-05 |
|
2028-01-05 |
|
2025-03-06 |
|
$ |
10,692.88 |
|
2026-01-05 |
|
0 |
|
0 |
036670M |
|
New Found Gold Corp. |
|
Careless Brook, Central NL |
|
6 |
|
1.50 |
|
Issued |
|
2023-10-26 |
|
2028-10-26 |
|
2025-12-25 |
|
$ |
1,210.52 |
|
2026-10-26 |
|
0 |
|
0 |
n=53 licences |
|
|
|
Totals |
|
5,337 |
|
1,334.25 |
|
|
|
|
|
|
|
|
|
|
|
|
|
|
|
|
|
C) |
Twin Ponds Block |
|
|
|
|
|
|
|
|
|
|
|
|
|
|
|
|
|
|
Annual |
|
|
|
|
|
NSR |
|
|
|
|
|
|
|
|
|
|
|
|
|
|
|
|
|
|
|
Maximum |
|
|
|
NSR |
|
Buyback |
|
|
|
|
|
|
|
|
|
|
|
|
|
Issued |
|
Renewal |
|
Report Due |
|
Expenses |
|
Expenses Due |
|
Royality |
|
Provision |
|
Licence No. |
|
Title Holder |
|
Location |
|
No. of Claims |
|
Area (km²) |
|
Status |
|
Date |
|
Date |
|
Date |
|
Due |
|
Date |
|
(%) |
|
(%) |
|
024270M |
|
New Found Gold Corp. |
|
Island Pond, Central NL |
|
107 |
|
26.75 |
|
Issued |
|
2016-10-24 |
|
2026-10-26 |
|
2024-12-23 |
|
$ |
50,987.79 |
|
2028-10-24 |
|
1.6 |
|
1 |
024274M |
|
New Found Gold Corp. |
|
Twin Ponds, Central NL |
|
77 |
|
19.25 |
|
Issued |
|
2016-10-24 |
|
2026-10-26 |
|
2024-12-23 |
|
$ |
34,380.34 |
|
2028-10-24 |
|
1.6 |
|
1 |
035048M |
|
Suraj Amarnani |
|
Twin Ponds |
|
42 |
|
10.50 |
|
Issued |
|
2022-09-29 |
|
2027-09-29 |
|
2024-11-28 |
|
$ |
1,658.89 |
|
2025-09-29 |
|
0 |
|
0 |
n=3 licences |
|
|
|
Totals |
|
226 |
|
56.50 |
|
|
|
|
|
|
|
|
|
|
|
|
|
|
|
|
|
- 4 -
|
Management’s Discussion and Analysis For the years ended December 31, 2024 and 2023 |
D) |
Ten Mile Duder Lake Block |
|
|
|
|
|
|
|
|
|
|
|
|
|
|
|
|
|
|
Annual |
|
|
|
|
|
NSR |
|
|
|
|
|
|
|
|
|
|
|
|
|
|
|
|
|
|
|
Maximum |
|
|
|
NSR |
|
Buyback |
|
|
|
|
|
|
|
|
|
|
|
|
|
|
|
Renewal |
|
Report |
|
Expenses |
|
Expenses |
|
Royality |
|
Provision |
|
Licence No. |
|
Title Holder |
|
Location |
|
No. of Claims |
|
Area (km²) |
|
Status |
|
Issued Date |
|
Date |
|
Due Date |
|
Due |
|
Due Date |
|
(%) |
|
(%) |
|
035047M |
|
Aidan ONeil |
|
Ten Mile-Duder Lake |
|
209 |
|
52.25 |
|
Issued |
|
2022-09-29 |
|
2027-09-29 |
|
2024-11-28 |
|
$ |
8,279.87 |
|
2025-09-29 |
|
0 |
|
0 |
035050M |
|
Josh Vann |
|
Ten Mile Lake |
|
2 |
|
0.50 |
|
Issued |
|
2022-09-29 |
|
2027-09-29 |
|
2024-11-28 |
|
$ |
29.15 |
|
2025-09-29 |
|
0 |
|
0 |
n=2 licences |
|
|
|
Totals |
|
211 |
|
52.75 |
|
|
|
|
|
|
|
|
|
|
|
|
|
|
|
|
|
E) |
Bellman’s Pond Block |
|
|
|
|
|
|
|
|
|
|
|
|
|
|
|
|
|
|
Annual |
|
|
|
|
|
NSR |
|
|
|
|
|
|
|
|
|
|
|
|
|
|
|
|
|
|
|
Maximum |
|
|
|
NSR |
|
Buyback |
|
|
|
|
|
|
|
|
|
|
|
|
|
|
|
Renewal |
|
Report |
|
Expenses |
|
Expenses |
|
Royality |
|
Provision |
|
Licence No. |
|
Title Holder |
|
Location |
|
No. of Claims |
|
Area (km²) |
|
Status |
|
Issued Date |
|
Date |
|
Due Date |
|
Due |
|
Due Date |
|
(%) |
|
(%) |
|
030775M |
|
New Found Gold Corp. |
|
Bellman’s Pond |
|
1 |
|
0.25 |
|
Issued |
|
2020-05-02 |
|
2025-05-02 |
|
2025-07-01 |
|
$ |
73.18 |
|
2025-05-02 |
|
0 |
|
0 |
n=1 licence |
|
|
|
Totals |
|
1 |
|
0.25 |
|
|
|
|
|
|
|
|
|
|
|
|
|
|
|
|
|
F) |
Little Rocky Brook Block |
|
|
|
|
|
|
|
|
|
|
|
|
|
|
|
|
|
|
Annual |
|
|
|
|
|
NSR |
|
|
|
|
|
|
|
|
|
|
|
|
|
|
|
|
|
|
|
Maximum |
|
|
|
NSR |
|
Buyback |
|
|
|
|
|
|
|
|
|
|
|
|
|
|
|
Renewal |
|
Report |
|
Expenses |
|
Expenses |
|
Royalty |
|
Provision |
|
Licence No. |
|
Title Holder |
|
Location |
|
No. of Claims |
|
Area (km²) |
|
Status |
|
Issued Date |
|
Date |
|
Due Date |
|
Due |
|
Due Date |
|
(%) |
|
(%) |
|
030777M |
|
New Found Gold Corp. |
|
Little Rocky Pond, Gander River |
|
114 |
|
28.50 |
|
Issued |
|
2020-05-02 |
|
2025-05-02 |
|
2025-07-01 |
|
$ |
9,882.70 |
|
2025-05-02 |
|
0 |
|
0 |
n=1 licence |
|
|
|
Totals |
|
114 |
|
28.50 |
|
|
|
|
|
|
|
|
|
|
|
|
|
|
|
|
|
- 5 -
|
Management’s Discussion and Analysis For the years ended December 31, 2024 and 2023 |
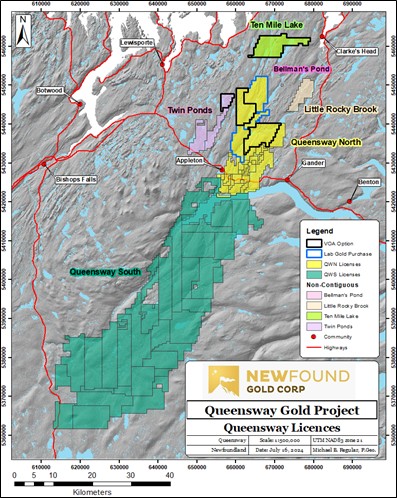
Queensway Project – Claim Groups
- 6 -
|
Management’s Discussion and Analysis For the years ended December 31, 2024 and 2023 |
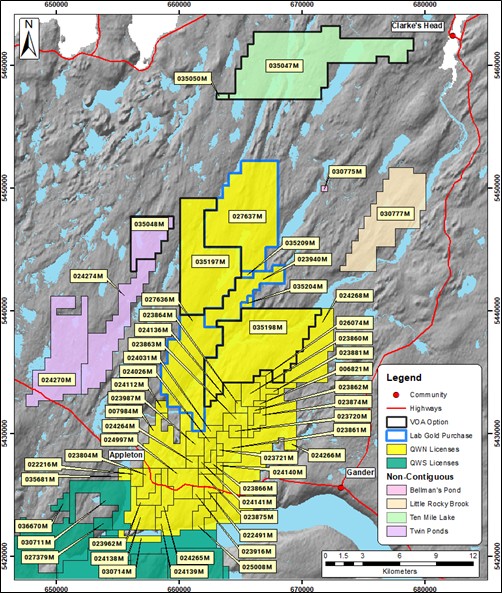
Queensway Project – Queensway North mineral licences, and the separate licences of Twin Ponds, Ten Mile-Duder Lake, South Pond, Bellman’s Pond, and Little Rocky Brook
- 7 -
|
Management’s Discussion and Analysis For the years ended December 31, 2024 and 2023 |
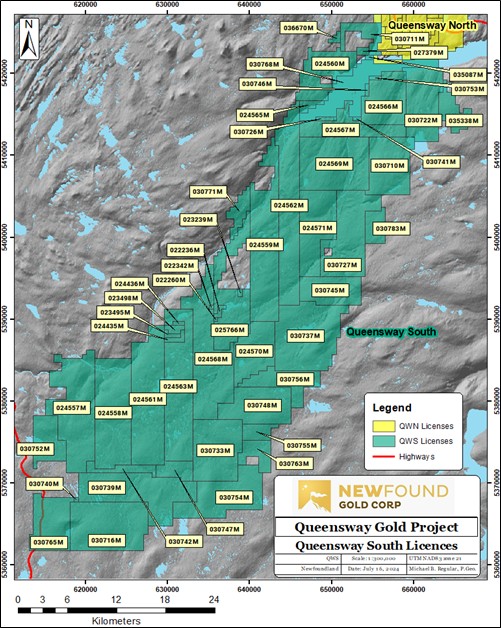
Queensway Project – Queensway South mineral licences
- 8 -
|
Management’s Discussion and Analysis For the years ended December 31, 2024 and 2023 |
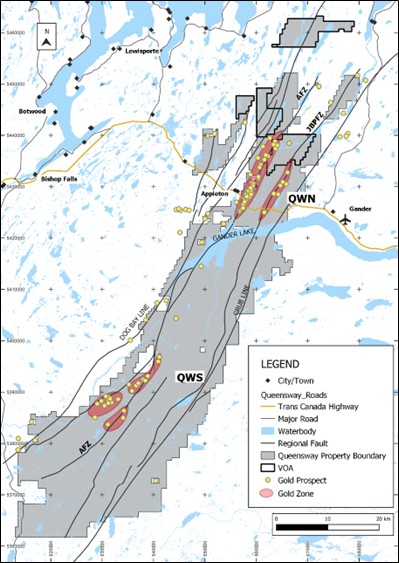
Queensway Project – Locations of Gold Prospects
- 9 -
|
Management’s Discussion and Analysis For the years ended December 31, 2024 and 2023 |
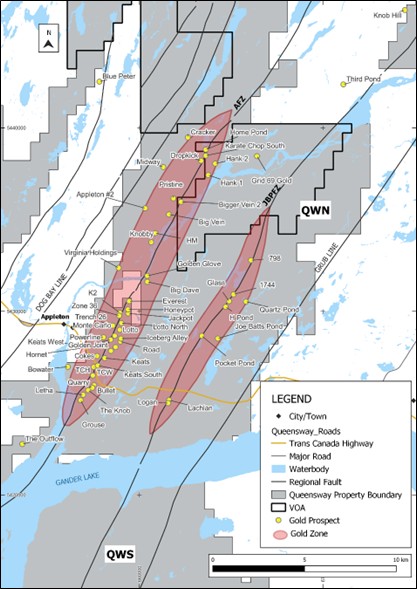
Queensway Project – Queensway North Gold Prospects
- 10 -
|
Management’s Discussion and Analysis For the years ended December 31, 2024 and 2023 |
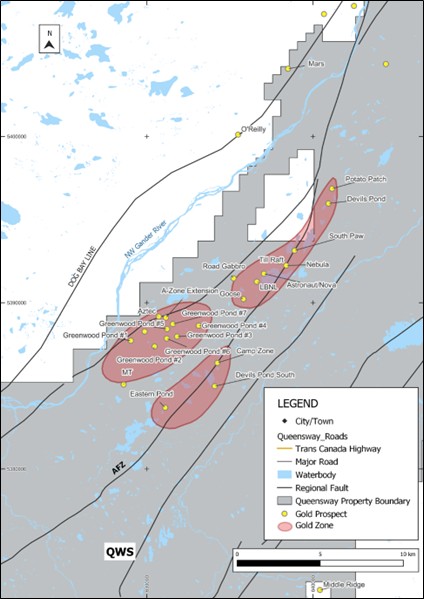
Queensway Project – Queensway South Gold Prospects
- 11 -
|
Management’s Discussion and Analysis For the years ended December 31, 2024 and 2023 |
Environmental and Exploration Permitting
NFG is responsible for obtaining all permits in accordance with the laws of Newfoundland and Labrador to conduct exploration activities at the Queensway Property. Exploration activities require approval from the Mineral Lands Division of the province’s Department of Industry, Energy, and Technology. These specify the activities that are allowed in the area; they are typically valid for one year and can be renewed.
The different permits and licence requirements in the province of Newfoundland and Labrador can include:
| 1. | Exploration Approvals: An Exploration Approval Permit enables an exploration company to conduct prospecting, rock and soil geochemistry, line cutting, trenching, bulk sampling, airborne and/or ground geophysical surveys, fuel storage, ATV usage, diamond drilling, etc. |
| 2. | Water Use Licence: Activities that require water to be drawn from surface waterways or from aquifers require a Water Use Licence. These are typically valid for five years and can be renewed. These permits are no longer needed for drilling and trenching activities. |
| 3. | Licence to Occupy: Required if a camp location was to be used for a period longer than that which was allowed as part of the Exploration Approval Permit. This permit is obtained from the Provincial Department of Crown lands. These are typically valid for five years and can be renewed. |
| 4. | Section 39 Permit: When field activities occur within a Protected Public Water Supply Area (PPWSA), restoration requirements and constraints on field activities are stipulated in a “Section 39 Permit” that is typically valid for one year and can be renewed. |
| 5. | Section 48 Permit: If exploration activities include stream crossings and/or fording, or any work in and around any body of water, the Water Resources Management Division must be contacted to obtain a Section 48 Permit to Alter a Water Body under the Water Resources Act, 2002. |
| 6. | Forestry Permits: NFG shall contact the nearest Forest Management District Office to obtain the following permits prior to commencing any activity as required. |
| a. | A commercial harvesting permit before the start of the exploration program if trees must be cut for access to exploration sites on Crown lands. |
| b. | An operating permit if operations are to take place on forest land during the forest fire season (May-September). |
| c. | During the forest fire season, a permit to burn must be obtained to ignite a fire on or within 300 m of forest land. NFG has never needed this permit. |
| 7. | Development Permit: Any activity that meets the definition of development under the Urban and Rural Planning Act, 2000, within a municipal planning area/boundary will require application and permit from the Municipality. |
The table below summarizes the permits, licences, and approvals that have currently been granted to NFG:
| ● | Exploration Approvals (prefixed with E). |
| ● | Water Use Licences (prefixed with WUL). |
| ● | PPWSA Section 39 Permits (prefixed with PRO). |
| ● | Section 48 Permits to Alter a Water Body (prefixed with ALT). |
| ● | Other environmental permits |
.
- 12 -
|
Management’s Discussion and Analysis For the years ended December 31, 2024 and 2023 |
Mineral licences 024557M, 024558M, 024561M, 024563M, 024568M, and 024570M, all of which lie in the south of Queensway South, are restricted from exploration activities from mid-May to early-July as this area is a spring habitat for Newfoundland caribou.
Mineral licence 035198M in Queensway North encloses two known archaeological sites and covers a portion of the Gander River which has high archaeological potential. As such, the Provincial Archaeology Office recommends a 100 m buffer along the Gander River, and 50 m buffers around the two known sites. The two known archaeological sites in UTM Zone 21N NAD83 are: 1) 662938 m Easting, 5435800.33 m Northing and 2) 670038.33 m Easting, 5439264.60 m Northing.
With respect to title, mineral licences: 035047M and 035197M, 035048M and 035198M, and 035050M are owned by Aidan O’Neil, Suraj Amarnani, and Josh Vann respectively. Hence, NFG mineral rights ownership of these licence areas and the mineral occurrences that may occur within them are subject to successful completion of conditions of a single Option Agreement in place.
Project Infrastructure
The main access roads include the TCH that passes through the southern portion of the Appleton Fault Zone (“AFZ”) / Joe Batts Pond Fault Zone (“JBPFZ”) claim areas on the QWN, and the Northwest Gander (“NWG”) road that extends along the western portion of the property from the TCH just west of Glenwood, to the south and west of Gander Lake on QWS.
Gravel woods access roads originally built for the forestry industry, such as the AFZ access, the JBPFZ access, the JBP road and the roads to the east of the steel bridge across the NWG River and across the bridge to the east of the Southwest Gander River extend through most of the property, with areas in the extreme SE and SW the most difficult to access. The SW area is best accessed by woods roads from Route 360, the Baie D’Espoir highway, that leaves the TCH at Bishop’s Falls, approximately 70km to the west of Glenwood.
Transportation availability includes the international airport at Gander which has bush plane and helicopter bases, a helicopter base in Appleton and shipping through the ports of Lewisporte and Botwood, 25km and 70km to the west respectively, and north of the TCH, both with good harbours although problems with winter shipping due to sea and pack ice.
Electricity is available from the NL provincial grid, which has three transmission lines through the Queensway Project as follows:
| 1) | A 350 kV HVdc direct current line which passes through the approximate centre of QWS licences; |
| 2) | Two 138 kV HVac transmission lines to the north of the TCH crossing the AFZ and JBPFZ trends on the QWN licences; |
| 3) | And a 69 kV HVac transmission line that approximately parallels the TCH to the north across the AFZ and JBPFZ trends on the QWN licences and follows the TCH and secondary routes. |
Historical Work
There has been over 29,200 metres of core in 238 holes drilled historically on the Queensway Project by Noranda, Rubicon and various operators from the mid 1980’s through to 2012. Historical core drilling has primarily occurred north of Gander Lake along the two principal fault structures the AFZ and JBPFZ; the exploration drilling has been spread out amongst individual zones with drilling along 5km of the AFZ targeting the Lotto, Powerline, Cokes, Keats, Dome, Trench 26, Road, Knob, Letha, and Grouse zones. Drilling at the JBPFZ has focussed along 3km targeting the Pocket Pond and H-Pond zones and one drill hole targeting the 798 Zone. Significantly lesser number of drill holes have also targeted zones south of Gander Lake including the Pauls Pond showing, Aztec and A-Zone extension, and the Goose zone.
Throughout the 1980’s through mid-2000’s various operators and prospectors have completed surface geochemical sampling including tills, soils, and rock samples. This amounts to roughly 2,500 till samples, over 14,000 soil samples and 6,000 rock samples spread across the large district scale project with concentrations of work around the many showings in the Queensway license group. This work has identified a number of gold-in-soil or gold-in-till anomalies that have led to surface gold discoveries or have yet to be explained with follow up exploration. Several locations throughout the project have defined surface float samples containing high grade gold mineralization some of which have led to surface gold occurrences while other locations have not been adequately explored to trace them to source.
- 13 -
|
Management’s Discussion and Analysis For the years ended December 31, 2024 and 2023 |
Various historical ground geophysical surveys have been conducted throughout the Queensway Project with most of this work concentrated either along the AFZ, JBPFZ, or in the region of the Pauls Pond and Greenwood Pond showings in the QWS claim group. Over 50 different geophysical surveys including VLF, EM, MAG and IP have covered ground-based grids throughout the Queensway Project. Various anomalies have been identified and often limited follow up exploration has occurred.
A significant number of surface trenches have been conducted at the project with over 330 trenches completed to date. Many of the historical trenches have targeted soil and till anomalies with only some of these reaching bedrock; often the trenches not reaching bedrock have left both soil and till anomalies unexplained and open for further interpretation and exploration.
Project Geology
The Queensway Project is located within the Exploits subzone of the Dunnage zone and lies just to the west of the Gander River Ultramafic Complex (“GRUC”) fault, which is the Dunnage-Gander zones boundary. See figure below:
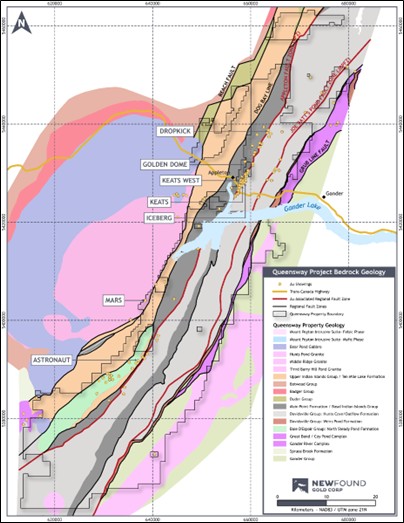
Queensway Project – Geological context of the Queensway Project Geological map modified from Colman-Sadd et al., 1990.
- 14 -
|
Management’s Discussion and Analysis For the years ended December 31, 2024 and 2023 |
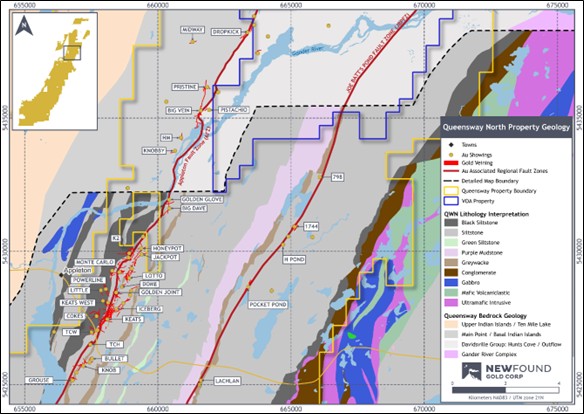
Queensway Project- Integrated geological map of lithology, shear zones and gold showings in Queensway North
It mostly comprises Cambrian to Silurian meta-sedimentary rocks of the Davidsville group (Williams et al., 1988; Colman-Sadd et al., 1990; Valverde-Vaquero et al., 2006; van Staal, 2007; O’Reilly et al., 2010). The Davidsville group is divided into the Outflow Formation and the Hunt’s Cove Formation. The property south of Gander Lake also includes the boundary between the Davidsville and Indian Island groups. The latter mainly comprises Silurian siliciclastic rocks, intruded by the Mount Peyton Intrusive suite.
There are over 100 gold showings/occurrences on and around the Queensway Project however the most notable mineralized zones in the Queensway Project are the JBPFZ which includes the H-Pond, Pocket Pond, Glass, Logan, and Lachlan showings and the AFZ which includes the Keats, Iceberg, Keats West, K2, Lotto, Golden Joint, Jackpot, Honeypot and Monte Carlo showings.
A number of gold mineralized occurrences also occur within the QWS claim group including the Greenwood Pond, Hornet, North Pauls Pond, Aztec, Goose, Road Gabbro and LBNL showings.
Recent Exploration
Queensway Drill Program
On August 17, 2020, the Company announced it had initiated a 100,000 m HQ-size diamond drilling program at the Queensway Project. The Company announced on January 6, 2021, that it had increased the drilling program started in 2020 to a total of 200,000 m; this program was further expanded on October 15, 2021, to 400,000 m, followed by another extension to 500,000 m on January 3, 2023, and then to 650,000 m on January 4, 2024.
- 15 -
|
Management’s Discussion and Analysis For the years ended December 31, 2024 and 2023 |
In 2020, the Company completed 67 drill holes for a total of 13,593 m that expanded the Keats Zone and lead to the discovery of Lotto and Golden Joint zones.
In 2021, the Company completed an additional 424 drill holes totalling 115,852 m largely focused on expanding Keats, Golden Joint, Lotto, 1744, and Pocket Pond zones.
In 2022, a total of 188,717 m was completed in 677 holes that lead to the discoveries of Keats North, Keats West, Lotto North and further expanded Keats, Golden Joint, and Lotto zones in addition to continued systematic testing along the AFZ. The Company also completed a regional diamond drilling program designed to test high-priority targets at both Twin Ponds and QWS projects; both programs are the first phase of drilling completed by the Company. The QWS program targeted an area 50 km south of the Keats Zone with a high concentration of gold anomalies surrounding the southern extension of the AFZ. This program generated encouraging results with twenty-seven holes returning significant gold mineralization and 10 holes across 4 targets containing visible gold. The exploration drilling program was designed to test a variety of targets in and around Pauls Pond, Goose, Eastern Pond, and Greenwood #2 prospects and resulted in the discovery of the Pauls Pond and Devil’s Pond trends.
In 2023, a total of 196,115 m was completed in 1,001 holes that lead to several discoveries including Iceberg, Iceberg East, K2, Monte Carlo, Jackpot, and Honeypot. Drilling rapidly expanded on these new discoveries, in addition to extending Keats West, Golden Joint, and Keats. Notably the strike length of the Keats-Baseline Fault Zone was extended to 1.9 km with the addition of Iceberg and Iceberg East discoveries. Regional exploration programs included the completion of a first pass drilling program on the newly optioned VOA ground that covers the northern extension of the AFZ testing 10 target areas. This program identified multiple areas with anomalous gold for follow-up drilling. A second phase of drilling at QWS was also completed, wrapping up in early 2024 and included follow-up work at the Pauls Pond trend in addition to testing a number of new target areas. This program successfully expanded mineralization at Astronaut and Nova in the Pauls Pond area to depth and identified a new zone near Bernards Pond named “Camp Zone”. Other notable programs in 2023 include the completion of the 3D seismic data acquisition by HiSeis and the excavation of the Keats trench. The Company has received the seismic data, consultant interpretations and targeting products and are in part, guiding deeper drilling programs. Trenching of the near-surface high-grade segment of the Keats Zone finished in October 2023, along with preliminary mapping.
In 2024, a total of 92,093 m in 268 holes was drilled. These meters focused on expansion and further definition of K2, Jackpot and Honeypot zones. In addition, drilling focused on testing deep targets as part of a deep drilling program following the completion of the 3D seismic data interpretation which generated a multitude of deep targets. Deep drilling discovered several regions of epizonal gold mineralization well below the currently defined footprint of the gold system at Queensway North along the AFZ up to 820 m vertical depth.
In July 2024, the Company completed the acquisition of the Kingsway Project, expanding the Queensway Project to the northeast to over 22 km along the Appleton Fault Zone. In August 2024, the Company initiated its first drilling program with early success expanding mineralization near Big Vein, Pistachio, and Dropkick zones. Surface trenching of Iceberg also commenced in early July 2024, exposing 220 m by 150 m wide area of bedrock corresponding to a core segment of the Iceberg Zone which will allow for a detailed analysis of the geological and structural models currently defined through drilling. The Keats detailed channel sampling and mapping program were also completed providing grade variability information across a high-grade segment of the Keats Zone, while also assessing areas of mineralization oblique to the drilling orientation.
The Company is currently working on its initial resource estimate with a projected release date in early Q2 2025, followed by a preliminary economic assessment in late Q2 2025.
- 16 -
|
Management’s Discussion and Analysis For the years ended December 31, 2024 and 2023 |
Queensway Project summary of drillholes from diamond drilling programs
A) Queensway North
|
|
|
|
2019 |
|
2020 |
|
2021 |
|
2022 |
|
2023 |
|
2024 |
|
Q1 |
|
2024 |
|
Q2 |
|
2024 |
|
Q3 |
|
2024 |
|
Q4 |
|
Total |
||||||||||||
Prospect |
|
Block |
|
No. of Holes |
|
Length (m) |
|
No. of Holes |
|
Length (m) |
|
No. of Holes |
|
Length (m) |
|
No. of Holes |
|
Length (m) |
|
No. of Holes |
|
Length (m) |
|
No. of Holes |
|
Length (m) |
|
No. of Holes |
|
Length (m) |
|
No. of Holes |
|
Length (m) |
|
No. of Holes |
|
Length (m) |
|
No. of Holes |
|
Length (m) |
798 |
|
QWN |
|
— |
|
— |
|
— |
|
— |
|
2 |
|
469 |
|
— |
|
— |
|
— |
|
— |
|
— |
|
— |
|
— |
|
— |
|
— |
|
— |
|
— |
|
— |
|
2 |
|
469 |
1744 |
|
QWN |
|
2 |
|
522 |
|
— |
|
— |
|
23 |
|
7,066 |
|
3 |
|
1,398 |
|
— |
|
— |
|
— |
|
— |
|
— |
|
— |
|
— |
|
— |
|
— |
|
— |
|
28 |
|
8,986 |
Big Dave |
|
QWN |
|
— |
|
— |
|
— |
|
— |
|
— |
|
— |
|
24 |
|
7,792 |
|
— |
|
— |
|
— |
|
— |
|
— |
|
— |
|
— |
|
— |
|
— |
|
— |
|
24 |
|
7,792 |
Big Vein |
|
QWN |
|
— |
|
— |
|
— |
|
— |
|
— |
|
— |
|
— |
|
— |
|
— |
|
— |
|
— |
|
— |
|
— |
|
— |
|
1 |
|
317 |
|
1 |
|
440 |
|
2 |
|
757 |
Cokes |
|
QWN |
|
— |
|
— |
|
— |
|
— |
|
11 |
|
3,395 |
|
19 |
|
5,313 |
|
38 |
|
6,243 |
|
7 |
|
665 |
|
— |
|
— |
|
— |
|
— |
|
1 |
|
507 |
|
76 |
|
16,123 |
Dome |
|
QWN |
|
2 |
|
116 |
|
5 |
|
993 |
|
5 |
|
1,107 |
|
13 |
|
4,117 |
|
4 |
|
1,212 |
|
— |
|
— |
|
— |
|
— |
|
1 |
|
431 |
|
— |
|
— |
|
30 |
|
7,976 |
Dropkick |
|
QWN |
|
— |
|
— |
|
— |
|
— |
|
— |
|
— |
|
— |
|
— |
|
— |
|
— |
|
— |
|
— |
|
— |
|
— |
|
— |
|
— |
|
2 |
|
403 |
|
2 |
|
403 |
Everest |
|
QWN |
|
— |
|
— |
|
— |
|
— |
|
— |
|
— |
|
15 |
|
4,594 |
|
14 |
|
3,643 |
|
— |
|
— |
|
— |
|
— |
|
9 |
|
2,854 |
|
— |
|
— |
|
38 |
|
11,091 |
Gambit |
|
QWN |
|
— |
|
— |
|
— |
|
— |
|
— |
|
— |
|
— |
|
— |
|
3 |
|
552 |
|
— |
|
— |
|
— |
|
— |
|
— |
|
— |
|
— |
|
— |
|
3 |
|
552 |
Gander Outflow |
|
QWN |
|
— |
|
— |
|
— |
|
— |
|
— |
|
— |
|
2 |
|
1,345 |
|
— |
|
— |
|
10 |
|
1,760 |
|
— |
|
— |
|
— |
|
— |
|
— |
|
— |
|
12 |
|
3,105 |
Glass |
|
QWN |
|
4 |
|
879 |
|
— |
|
— |
|
— |
|
— |
|
2 |
|
679 |
|
— |
|
— |
|
— |
|
— |
|
— |
|
— |
|
— |
|
— |
|
— |
|
— |
|
6 |
|
1,558 |
Golden Bullet |
|
QWN |
|
— |
|
— |
|
— |
|
— |
|
— |
|
— |
|
1 |
|
572 |
|
2 |
|
634 |
|
— |
|
— |
|
— |
|
— |
|
— |
|
— |
|
— |
|
— |
|
3 |
|
1,206 |
Golden Glove |
|
QWN |
|
— |
|
— |
|
— |
|
— |
|
— |
|
— |
|
— |
|
— |
|
— |
|
— |
|
— |
|
— |
|
— |
|
— |
|
2 |
|
739 |
|
— |
|
— |
|
2 |
|
739 |
Golden Joint |
|
QWN |
|
— |
|
— |
|
— |
|
— |
|
49 |
|
16,018 |
|
24 |
|
7,040 |
|
30 |
|
3,977 |
|
— |
|
— |
|
— |
|
— |
|
— |
|
— |
|
3 |
|
1,518 |
|
106 |
|
28,553 |
Green Mantle |
|
QWN |
|
— |
|
— |
|
— |
|
— |
|
— |
|
— |
|
— |
|
— |
|
— |
|
— |
|
— |
|
— |
|
— |
|
— |
|
2 |
|
352 |
|
— |
|
— |
|
2 |
|
352 |
H Pond |
|
QWN |
|
— |
|
— |
|
— |
|
— |
|
— |
|
— |
|
— |
|
— |
|
4 |
|
1,373 |
|
— |
|
— |
|
— |
|
— |
|
— |
|
— |
|
— |
|
— |
|
4 |
|
1,373 |
Honeypot |
|
QWN |
|
— |
|
— |
|
— |
|
— |
|
— |
|
— |
|
10 |
|
2,611 |
|
28 |
|
5,099 |
|
8 |
|
1,292 |
|
9 |
|
1,674 |
|
— |
|
— |
|
— |
|
— |
|
55 |
|
10,676 |
Iceberg |
|
QWN |
|
— |
|
— |
|
— |
|
— |
|
4 |
|
1,365 |
|
8 |
|
2,111 |
|
117 |
|
29,393 |
|
— |
|
— |
|
— |
|
1,887 |
|
— |
|
1,037 |
|
— |
|
— |
|
129 |
|
35,793 |
Iceberg Alley |
|
QWN |
|
— |
|
— |
|
— |
|
— |
|
— |
|
— |
|
1 |
|
353 |
|
27 |
|
3,673 |
|
5 |
|
817 |
|
5 |
|
1,333 |
|
— |
|
— |
|
— |
|
— |
|
38 |
|
6,176 |
Iceberg East |
|
QWN |
|
— |
|
— |
|
— |
|
— |
|
— |
|
— |
|
6 |
|
1,774 |
|
89 |
|
16,760 |
|
2 |
|
1,480 |
|
1 |
|
986 |
|
— |
|
— |
|
2 |
|
1,202 |
|
100 |
|
22,202 |
Jackpot |
|
QWN |
|
— |
|
— |
|
— |
|
— |
|
— |
|
— |
|
9 |
|
2,562 |
|
60 |
|
10,783 |
|
4 |
|
1,299 |
|
10 |
|
2,328 |
|
1 |
|
337 |
|
— |
|
— |
|
84 |
|
17,309 |
K2 |
|
QWN |
|
— |
|
— |
|
— |
|
— |
|
5 |
|
1,129 |
|
17 |
|
4,477 |
|
103 |
|
17,426 |
|
23 |
|
4,438 |
|
— |
|
— |
|
— |
|
— |
|
— |
|
— |
|
148 |
|
27,471 |
K2 West |
|
QWN |
|
— |
|
— |
|
— |
|
— |
|
— |
|
— |
|
— |
|
— |
|
5 |
|
1,030 |
|
— |
|
— |
|
— |
|
— |
|
— |
|
— |
|
— |
|
— |
|
5 |
|
1,030 |
Keats |
|
QWN |
|
2 |
|
469 |
|
41 |
|
8,370 |
|
194 |
|
51,247 |
|
85 |
|
24,179 |
|
38 |
|
7,661 |
|
— |
|
— |
|
— |
|
— |
|
— |
|
1,128 |
|
1 |
|
1,162 |
|
361 |
|
94,217 |
Keats North |
|
QWN |
|
— |
|
— |
|
— |
|
— |
|
— |
|
— |
|
74 |
|
20,141 |
|
47 |
|
6,410 |
|
— |
|
— |
|
— |
|
— |
|
— |
|
— |
|
— |
|
— |
|
121 |
|
26,551 |
Keats West |
|
QWN |
|
— |
|
— |
|
— |
|
— |
|
2 |
|
748 |
|
67 |
|
14,127 |
|
86 |
|
15,201 |
|
6 |
|
528 |
|
3 |
|
1,465 |
|
2 |
|
1,750 |
|
1 |
|
227 |
|
167 |
|
34,046 |
Keats South |
|
QWN |
|
— |
|
— |
|
— |
|
— |
|
12 |
|
4,091 |
|
47 |
|
24,461 |
|
25 |
|
5,006 |
|
— |
|
— |
|
4 |
|
3,261 |
|
6 |
|
2,493 |
|
2 |
|
1,733 |
|
96 |
|
41,046 |
Kings Point |
|
QWN |
|
— |
|
— |
|
— |
|
— |
|
— |
|
— |
|
— |
|
— |
|
5 |
|
787 |
|
— |
|
— |
|
— |
|
— |
|
— |
|
— |
|
— |
|
— |
|
5 |
|
787 |
Knob |
|
QWN |
|
— |
|
— |
|
— |
|
— |
|
14 |
|
2,664 |
|
24 |
|
3,621 |
|
— |
|
— |
|
— |
|
— |
|
— |
|
— |
|
— |
|
— |
|
— |
|
— |
|
38 |
|
6,286 |
Knobby |
|
QWN |
|
— |
|
— |
|
— |
|
— |
|
— |
|
— |
|
— |
|
— |
|
— |
|
— |
|
— |
|
— |
|
— |
|
— |
|
6 |
|
1,962 |
|
2 |
|
886 |
|
8 |
|
2,848 |
Rocket |
|
QWN |
|
— |
|
— |
|
— |
|
— |
|
2 |
|
492 |
|
29 |
|
6,064 |
|
5 |
|
769 |
|
6 |
|
950 |
|
— |
|
— |
|
— |
|
— |
|
— |
|
— |
|
42 |
|
8,275 |
Little Zone |
|
QWN |
|
— |
|
— |
|
6 |
|
769 |
|
— |
|
— |
|
— |
|
— |
|
19 |
|
3,881 |
|
2 |
|
151 |
|
1 |
|
1,121 |
|
— |
|
— |
|
— |
|
— |
|
28 |
|
5,922 |
Lonely Mountain |
|
QWN |
|
— |
|
— |
|
— |
|
— |
|
— |
|
— |
|
— |
|
— |
|
3 |
|
567 |
|
— |
|
— |
|
— |
|
— |
|
— |
|
— |
|
— |
|
— |
|
3 |
|
567 |
Lotto |
|
QWN |
|
— |
|
— |
|
13 |
|
3,032 |
|
45 |
|
13,405 |
|
34 |
|
8,444 |
|
4 |
|
1,018 |
|
— |
|
— |
|
— |
|
156 |
|
— |
|
— |
|
— |
|
— |
|
96 |
|
26,055 |
Lotto North |
|
QWN |
|
— |
|
— |
|
— |
|
— |
|
4 |
|
674 |
|
42 |
|
10,406 |
|
33 |
|
7,248 |
|
2 |
|
931 |
|
4 |
|
1,334 |
|
— |
|
— |
|
— |
|
— |
|
85 |
|
20,592 |
Monte Carlo |
|
QWN |
|
— |
|
— |
|
— |
|
— |
|
— |
|
— |
|
21 |
|
4,664 |
|
81 |
|
16,951 |
|
3 |
|
1,185 |
|
10 |
|
2,662 |
|
— |
|
— |
|
— |
|
— |
|
115 |
|
25,462 |
Pistachio |
|
QWN |
|
— |
|
— |
|
— |
|
— |
|
— |
|
— |
|
— |
|
— |
|
— |
|
— |
|
— |
|
— |
|
— |
|
— |
|
3 |
|
1,094 |
|
4 |
|
1,323 |
|
7 |
|
2,418 |
Pocket Pond |
|
QWN |
|
— |
|
— |
|
— |
|
— |
|
42 |
|
9,677 |
|
4 |
|
1,052 |
|
8 |
|
1,789 |
|
— |
|
— |
|
— |
|
— |
|
— |
|
— |
|
— |
|
— |
|
54 |
|
12,518 |
Powerline |
|
QWN |
|
— |
|
— |
|
— |
|
— |
|
3 |
|
595 |
|
9 |
|
1,832 |
|
43 |
|
8,033 |
|
— |
|
— |
|
— |
|
— |
|
— |
|
— |
|
3 |
|
1,043 |
|
58 |
|
11,504 |
Pristine |
|
QWN |
|
— |
|
— |
|
— |
|
— |
|
— |
|
— |
|
— |
|
— |
|
— |
|
— |
|
— |
|
— |
|
— |
|
— |
|
— |
|
— |
|
1 |
|
412 |
|
1 |
|
412 |
Road |
|
QWN |
|
— |
|
— |
|
2 |
|
429 |
|
1 |
|
284 |
|
3 |
|
819 |
|
9 |
|
2,121 |
|
12 |
|
2,135 |
|
— |
|
— |
|
2 |
|
1,414 |
|
— |
|
— |
|
29 |
|
7,203 |
TCH (Trans Canada Highway) |
|
QWN |
|
— |
|
— |
|
— |
|
— |
|
2 |
|
449 |
|
25 |
|
8,161 |
|
— |
|
— |
|
— |
|
— |
|
— |
|
— |
|
— |
|
— |
|
— |
|
— |
|
27 |
|
8,609 |
TCW (Trans Canada West) |
|
QWN |
|
— |
|
— |
|
— |
|
— |
|
— |
|
— |
|
14 |
|
3,321 |
|
8 |
|
2,210 |
|
— |
|
— |
|
— |
|
— |
|
— |
|
— |
|
— |
|
— |
|
22 |
|
5,531 |
Whiskey Pocket |
|
QWN |
|
— |
|
— |
|
— |
|
— |
|
4 |
|
969 |
|
5 |
|
1,921 |
|
— |
|
— |
|
— |
|
— |
|
— |
|
— |
|
— |
|
— |
|
— |
|
— |
|
9 |
|
2,891 |
|
|
Totals |
|
10 |
|
1,985 |
|
67 |
|
13,593 |
|
424 |
|
115,845 |
|
637 |
|
179,951 |
|
938 |
|
181,451 |
|
90 |
|
17,632 |
|
47 |
|
18,208 |
|
35 |
|
15,908 |
|
23 |
|
10,857 |
|
2,271 |
|
555,430 |
B) Queensway South
|
|
|
|
2019 |
|
2020 |
|
2021 |
|
2022 |
|
2023 |
|
2024 |
|
Q1 |
|
2024 |
|
Q2 |
|
2024 |
|
Q3 |
|
2024 |
|
Q4 |
|
Total |
||||||||||||
Prospect |
|
Block |
|
No. of Holes |
|
Length (m) |
|
No. of Holes |
|
Length (m) |
|
No. of Holes |
|
Length (m) |
|
No. of Holes |
|
Length (m) |
|
No. of Holes |
|
Length (m) |
|
No. of Holes |
|
Length (m) |
|
No. of Holes |
|
Length (m) |
|
No. of Holes |
|
Length (m) |
|
No. of Holes |
|
Length (m) |
|
No. of Holes |
|
Length (m) |
Astronaut |
|
QWS |
|
— |
|
— |
|
— |
|
— |
|
— |
|
— |
|
2 |
|
718 |
|
8 |
|
2,117 |
|
— |
|
— |
|
— |
|
— |
|
— |
|
— |
|
— |
|
— |
|
10 |
|
2,835 |
Aztec |
|
QWS |
|
— |
|
— |
|
— |
|
— |
|
— |
|
— |
|
2 |
|
739 |
|
— |
|
— |
|
— |
|
— |
|
— |
|
— |
|
— |
|
— |
|
— |
|
— |
|
2 |
|
739 |
Bernards Pond |
|
QWS |
|
— |
|
— |
|
— |
|
— |
|
— |
|
— |
|
3 |
|
438 |
|
— |
|
— |
|
6 |
|
1,458 |
|
— |
|
— |
|
— |
|
— |
|
— |
|
— |
|
9 |
|
1,896 |
Devil’s Trench |
|
QWS |
|
— |
|
— |
|
— |
|
— |
|
— |
|
— |
|
4 |
|
551 |
|
— |
|
— |
|
— |
|
— |
|
— |
|
— |
|
— |
|
— |
|
— |
|
— |
|
4 |
|
551 |
Eastern Pond |
|
QWS |
|
— |
|
— |
|
— |
|
— |
|
— |
|
— |
|
1 |
|
407 |
|
9 |
|
1,934 |
|
— |
|
— |
|
— |
|
— |
|
— |
|
— |
|
— |
|
— |
|
10 |
|
2,341 |
Golden Elbow |
|
QWS |
|
— |
|
— |
|
— |
|
— |
|
— |
|
— |
|
— |
|
— |
|
3 |
|
906 |
|
— |
|
— |
|
— |
|
— |
|
— |
|
— |
|
— |
|
— |
|
3 |
|
906 |
Goose |
|
QWS |
|
— |
|
— |
|
— |
|
— |
|
— |
|
— |
|
5 |
|
743 |
|
— |
|
— |
|
— |
|
— |
|
— |
|
— |
|
— |
|
— |
|
— |
|
— |
|
5 |
|
743 |
Greenwood |
|
QWS |
|
— |
|
— |
|
— |
|
— |
|
— |
|
— |
|
6 |
|
756 |
|
— |
|
— |
|
— |
|
— |
|
— |
|
— |
|
— |
|
— |
|
— |
|
— |
|
6 |
|
756 |
Mars |
|
QWS |
|
— |
|
— |
|
— |
|
— |
|
— |
|
— |
|
— |
|
— |
|
— |
|
— |
|
8 |
|
871 |
|
— |
|
— |
|
— |
|
— |
|
— |
|
— |
|
8 |
|
871 |
Nebula |
|
QWS |
|
— |
|
— |
|
— |
|
— |
|
— |
|
— |
|
2 |
|
448 |
|
4 |
|
690 |
|
— |
|
— |
|
— |
|
— |
|
— |
|
— |
|
— |
|
— |
|
6 |
|
1,138 |
Nova |
|
QWS |
|
— |
|
— |
|
— |
|
— |
|
— |
|
— |
|
4 |
|
1,103 |
|
7 |
|
1,118 |
|
— |
|
— |
|
— |
|
— |
|
— |
|
— |
|
— |
|
— |
|
11 |
|
2,221 |
Paul’s Pond |
|
QWS |
|
— |
|
— |
|
— |
|
— |
|
— |
|
— |
|
4 |
|
1,352 |
|
3 |
|
900 |
|
— |
|
— |
|
— |
|
— |
|
— |
|
— |
|
— |
|
— |
|
7 |
|
2,252 |
Potato Trench |
|
QWS |
|
— |
|
— |
|
— |
|
— |
|
— |
|
— |
|
— |
|
— |
|
— |
|
— |
|
5 |
|
1,096 |
|
— |
|
— |
|
— |
|
— |
|
— |
|
— |
|
5 |
|
1,096 |
Till Raft |
|
QWS |
|
— |
|
— |
|
— |
|
— |
|
— |
|
— |
|
— |
|
— |
|
3 |
|
714 |
|
— |
|
— |
|
— |
|
— |
|
— |
|
— |
|
— |
|
— |
|
3 |
|
714 |
|
|
Totals |
|
— |
|
— |
|
— |
|
— |
|
— |
|
— |
|
33 |
|
7,255 |
|
37 |
|
8,379 |
|
— |
|
— |
|
— |
|
— |
|
— |
|
— |
|
— |
|
— |
|
89 |
|
19,059 |
C) VOA
|
|
|
|
2019 |
|
2020 |
|
2021 |
|
2022 |
|
2023 |
|
2024 |
|
Q1 |
|
2024 |
|
Q2 |
|
2024 |
|
Q3 |
|
2024 |
|
Q4 |
|
Total |
||||||||||||
Prospect |
|
Block |
|
No. of Holes |
|
Length (m) |
|
No. of Holes |
|
Length (m) |
|
No. of Holes |
|
Length (m) |
|
No. of Holes |
|
Length (m) |
|
No. of Holes |
|
Length (m) |
|
No. of Holes |
|
Length (m) |
|
No. of Holes |
|
Length (m) |
|
No. of Holes |
|
Length (m) |
|
No. of Holes |
|
Length (m) |
|
No. of Holes |
|
Length (m) |
69 Zone |
|
VOA |
|
— |
|
— |
|
— |
|
— |
|
— |
|
— |
|
— |
|
— |
|
4 |
|
972 |
|
— |
|
— |
|
— |
|
— |
|
— |
|
— |
|
— |
|
— |
|
4 |
|
972 |
BD Pond |
|
VOA |
|
— |
|
— |
|
— |
|
— |
|
— |
|
— |
|
— |
|
— |
|
1 |
|
350 |
|
— |
|
— |
|
— |
|
— |
|
— |
|
— |
|
— |
|
— |
|
1 |
|
350 |
Bigger Vein |
|
VOA |
|
— |
|
— |
|
— |
|
— |
|
— |
|
— |
|
— |
|
— |
|
2 |
|
700 |
|
— |
|
— |
|
— |
|
— |
|
— |
|
— |
|
— |
|
— |
|
2 |
|
700 |
Bigger Vein 2 |
|
VOA |
|
— |
|
— |
|
— |
|
— |
|
— |
|
— |
|
— |
|
— |
|
1 |
|
600 |
|
— |
|
— |
|
— |
|
— |
|
— |
|
— |
|
— |
|
— |
|
1 |
|
600 |
Fork in the Road |
|
VOA |
|
— |
|
— |
|
— |
|
— |
|
— |
|
— |
|
— |
|
— |
|
2 |
|
285 |
|
— |
|
— |
|
— |
|
— |
|
— |
|
— |
|
— |
|
— |
|
2 |
|
285 |
Hank1 |
|
VOA |
|
— |
|
— |
|
— |
|
— |
|
— |
|
— |
|
— |
|
— |
|
7 |
|
1,360 |
|
— |
|
— |
|
— |
|
— |
|
— |
|
— |
|
— |
|
— |
|
7 |
|
1,360 |
Hank2 |
|
VOA |
|
— |
|
— |
|
— |
|
— |
|
— |
|
— |
|
— |
|
— |
|
1 |
|
441 |
|
1 |
|
402 |
|
— |
|
— |
|
— |
|
— |
|
— |
|
— |
|
2 |
|
843 |
Hank3 |
|
VOA |
|
— |
|
— |
|
— |
|
— |
|
— |
|
— |
|
— |
|
— |
|
2 |
|
507 |
|
— |
|
— |
|
— |
|
— |
|
— |
|
— |
|
— |
|
— |
|
2 |
|
507 |
Home Pond |
|
VOA |
|
— |
|
— |
|
— |
|
— |
|
— |
|
— |
|
— |
|
— |
|
3 |
|
515 |
|
— |
|
— |
|
— |
|
— |
|
— |
|
— |
|
— |
|
— |
|
3 |
|
515 |
Karate Chop South |
|
VOA |
|
— |
|
— |
|
— |
|
— |
|
— |
|
— |
|
— |
|
— |
|
3 |
|
555 |
|
— |
|
— |
|
— |
|
— |
|
— |
|
— |
|
— |
|
— |
|
3 |
|
555 |
|
|
Totals |
|
— |
|
— |
|
— |
|
— |
|
— |
|
— |
|
— |
|
— |
|
26 |
|
6,285 |
|
1 |
|
402 |
|
— |
|
— |
|
— |
|
— |
|
— |
|
— |
|
27 |
|
6,687 |
D) Twin Ponds
|
|
|
|
2019 |
|
2020 |
|
2021 |
|
2022 |
|
2023 |
|
2024 |
|
Q1 |
|
2024 |
|
Q2 |
|
2024 |
|
Q3 |
|
2024 |
|
Q4 |
|
Total |
||||||||||||
Prospect |
|
Block |
|
No. of Holes |
|
Length (m) |
|
No. of Holes |
|
Length (m) |
|
No. of Holes |
|
Length (m) |
|
No. of Holes |
|
Length (m) |
|
No. of Holes |
|
Length (m) |
|
No. of Holes |
|
Length (m) |
|
No. of Holes |
|
Length (m) |
|
No. of Holes |
|
Length (m) |
|
No. of Holes |
|
Length (m) |
|
No. of Holes |
|
Length (m) |
Twin Ponds |
|
TP |
|
— |
|
— |
|
— |
|
— |
|
— |
|
— |
|
7 |
|
1,509 |
|
— |
|
— |
|
— |
|
— |
|
— |
|
— |
|
— |
|
— |
|
— |
|
— |
|
7 |
|
1,509 |
Queensway Property Total |
|
10 |
|
1,985 |
|
67 |
|
13,593 |
|
424 |
|
115,845 |
|
677 |
|
188,714 |
|
1,001 |
|
196,115 |
|
110 |
|
21,460 |
|
47 |
|
18,208 |
|
35 |
|
15,908 |
|
23 |
|
10,857 |
|
2,394 |
|
582,685 |
||
- 17 -
|
Management’s Discussion and Analysis For the years ended December 31, 2024 and 2023 |
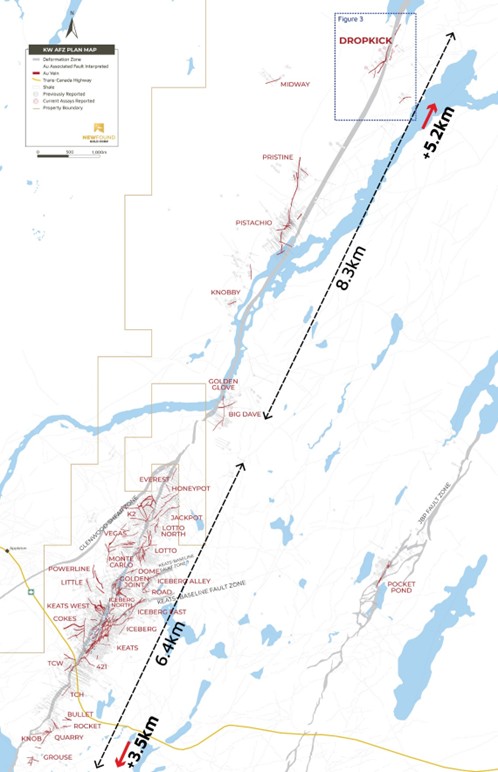
Queensway Project – Queensway North-AFZ plan map (February 11, 2025)
- 18 -
|
Management’s Discussion and Analysis For the years ended December 31, 2024 and 2023 |
Keats Zone Drilling
To date, the Company has focused significant drilling efforts at the Keats Zone where a discovery hole in late 2019 (NFGC-19-01 reporting 92.9 g/t Au over 19.00 m) was drilled. In August 2020, as follow-up to the 2019 drill program, NFGC began incrementally stepping out with diamond drilling from NFGC-19-01 identifying a brittle fault zone known as the “Keats-Baseline” (“KBFZ”) that has an east-northeast strike (N55°E) and dips to the southeast at approximately 60°. This brittle fault zone lies to the east of the AFZ and runs slightly oblique to it. The KBFZ forms an extensive damage zone that controls the development of a complex network of brittle, high-grade gold vein arrays that are epizonal in character. Several significant gold assay intercepts have been encountered within multiple individual zones at Keats.
From 2021 to 2023 the Keats Zone steadily increased in both strike and depth extent; it is now defined over 575 m of strike and a selection of highlight intervals with release dates are summarized in the table below. When connected through to the recent discoveries at Iceberg and Iceberg-East, that are interpreted to be hosted by the KBFZ, this mineralized corridor spans a strike length of 1.9 km, with a maximum tested vertical depth of 820 m in the southern extents of the Keats Zone.
In 2023, the Company focussed on a shallow step-out program utilizing a barge-mounted drill situated on South Hermans Pond to reach the upper portions of the Keats Zone that was not reachable by land. Drilling extended the mineralization to surface and confirmed the near-surface continuation of the Keats Main Zone (reported on March 26, 2024).
On July 11, 2024, the Company announced results from its first few deep holes testing targets derived from the initial 3D seismic interpretation. At the southern extent of the Keats Baseline Fault Zone (‘KBFZ’) two deep holes were completed. NFGC-24-2112 intersected four distinct gold-bearing intervals throughout a total downhole length of 258 m. These intervals range in vertical depth from 585-770 m. The mineralization encountered at depth exhibits the same characteristics as the AFZ gold system at surface with broad quartz vein domains, visible gold mineralization, accessory minerals arsenopyrite, boulangerite, chalcopyrite, NH4 white mica alteration halos, and extensive deformation. Highlight intervals include 11.0 g/t Au over 2.65 m from 773 m, including a high-grade assay of 57.1 g/t Au over 0.50 m, 1.98 g/t Au over 2.05 m, 2.17 g/t Au over 4.70 m and 1.69 g/t Au over 3.50 m, extending 25 m downhole from 915 m, and 7.66 g/t Au over 2.70 m, including a high-grade assay of 28.5 g/t Au over 0.65 m from 1,016 m downhole.
Additional results were reported on October 31, 2024, from the ongoing deep drilling program testing the KBFZ-AFZ structural corridor, consisting of both new deep grid holes from surface and through a series of wedges targeting deep mineralization at Keats South. Highlights include NFGC-24-2135 which intersected 13.7 g/t Au over 4.85 m at a vertical depth of 500 m, including 40.6 g/t Au over 1.50 m. Wedge hole NFGC-24-2112-W1 intercepted 23.3 g/t Au over 2.20 m at a vertical depth of 645 m, a step out from the previously released parent hole NFGC-24-2112 which included an upper zone of 11.0 g/t Au over 2.65 m starting from a vertical depth of 585 m and a deeper zone of 7.66 g/t Au over 2.70 m starting from a vertical depth of 770 m.
To date, the deep drilling program has successfully demonstrated that the gold mineral system continues to depth expanding the gold mineralized footprint to 820 m vertical. The implementation of wedging and directional drilling improved efficiency of follow-up testing on the deep mineralization with the last of these results for the time being expected in late Q1 2025.
On September 23, 2024, the Company announced the results of the first phase of channel sampling from the Keats Trench followed by Phase II results on December 2, 2024. The trenching program was designed to expose a 200 m by 70 m wide high-grade surface expression of the Keats Main Zone. The Keats trench has provided important information that has validated the current geological model. Before the Keats trench, the Keats Zone had only ever been observed in drill core and modelled in 3D. This trenching revealed an extensive network of veins associated with the Keats-Baseline Fault Zone and channel lines confirmed good high-grade continuity and provided significant information about grade variability across veins. Highlights of the Phase I and II channel sampling programs can be found in the table below.
2024 assay results have been reported in press releases dated March 26, 2024, July 11, 2024, September 23, 2024, October 31, 2024 and December 2, 2024. All previous and 2024 press releases can be found under the Company’s profile on SEDAR+ at www.sedarplus.ca.
- 19 -
|
Management’s Discussion and Analysis For the years ended December 31, 2024 and 2023 |
Highlighted assay values and drill hole locations from Keats drilling are shown in the tables below:
Hole No. |
|
From (m) |
|
To (m) |
|
Length (m) |
|
Au (g/t) |
|
Zone |
|
True Width (%) |
|
Date Released |
NFGC-19-01 |
|
95.00 |
|
115.50 |
|
20.50 |
|
86.17 |
|
Keats Main |
|
40-70 |
|
01/28/2020 |
Including |
|
96.00 |
|
115.00 |
|
19.00 |
|
92.86 |
|
Keats Main |
|
40-70 |
|
01/28/2020 |
Including |
|
105.00 |
|
111.00 |
|
6.00 |
|
285.20 |
|
Keats Main |
|
40-70 |
|
01/28/2020 |
NFGC-20-26 |
|
44.70 |
|
73.85 |
|
29.15 |
|
11.80 |
|
Keats Main |
|
70-95 |
|
11/16/2020 |
Including |
|
67.00 |
|
73.85 |
|
6.85 |
|
44.50 |
|
Keats Main |
|
70-95 |
|
11/16/2020 |
Including |
|
73.50 |
|
73.85 |
|
0.35 |
|
824.00 |
|
Keats Main |
|
70-95 |
|
11/16/2020 |
NFGC-20-74 |
|
44.00 |
|
46.00 |
|
2.00 |
|
32.27 |
|
Keats Main |
|
70-95 |
|
04/07/2021 |
NFGC-20-74 AND |
|
81.70 |
|
85.75 |
|
4.05 |
|
45.59 |
|
Keats Main |
|
70-95 |
|
04/07/2021 |
NFGC-21-80 |
|
49.45 |
|
88.50 |
|
39.05 |
|
25.80 |
|
Keats Main |
|
70-95 |
|
03/10/2021 |
Including |
|
62.70 |
|
72.80 |
|
10.10 |
|
58.50 |
|
Keats Main |
|
40-70 |
|
03/10/2021 |
Including |
|
78.65 |
|
88.50 |
|
9.85 |
|
39.50 |
|
Keats Main |
|
70-95 |
|
03/10/2021 |
NFGC-21-80 |
|
93.15 |
|
95.45 |
|
2.30 |
|
41.60 |
|
Keats Main |
|
70-95 |
|
03/10/2021 |
NFGC-21-118 |
|
211.15 |
|
224.80 |
|
13.65 |
|
61.80 |
|
Keats Main |
|
40-70 |
|
03/16/2021 |
Including |
|
212.10 |
|
213.05 |
|
0.95 |
|
565.00 |
|
Keats Main |
|
70-95 |
|
03/16/2021 |
NFGC-21-182 |
|
285.85 |
|
321.25 |
|
35.40 |
|
106.20 |
|
Keats Main |
|
Unknown |
|
05/21/2021 |
Including |
|
291.00 |
|
316.60 |
|
25.60 |
|
146.25 |
|
Keats Main |
|
Unknown |
|
05/21/2021 |
Including |
|
291.00 |
|
292.00 |
|
1.00 |
|
10.18 |
|
Keats Main |
|
Unknown |
|
05/21/2021 |
Including |
|
296.45 |
|
298.45 |
|
2.00 |
|
747.89 |
|
Keats Main |
|
Unknown |
|
05/21/2021 |
Including |
|
302.00 |
|
312.00 |
|
10.00 |
|
219.43 |
|
Keats Main |
|
Unknown |
|
05/21/2021 |
Including |
|
315.00 |
|
316.00 |
|
1.00 |
|
15.87 |
|
Keats Main |
|
Unknown |
|
05/21/2021 |
NFGC-21-204 |
|
244.45 |
|
252.50 |
|
8.05 |
|
21.36 |
|
Keats Main |
|
40-70 |
|
06/15/2021 |
Including |
|
248.80 |
|
249.65 |
|
0.85 |
|
184.73 |
|
Keats Main |
|
40-70 |
|
06/15/2021 |
NFGC-21-204 |
|
283.15 |
|
296.00 |
|
12.85 |
|
14.92 |
|
Keats Main |
|
10-40 |
|
06/15/2021 |
Including |
|
284.10 |
|
285.00 |
|
0.90 |
|
134.96 |
|
Keats Main |
|
10-40 |
|
06/15/2021 |
Including |
|
289.15 |
|
290.80 |
|
1.65 |
|
25.25 |
|
Keats Main |
|
10-40 |
|
06/15/2021 |
Including |
|
291.80 |
|
292.65 |
|
0.85 |
|
12.05 |
|
Keats Main |
|
10-40 |
|
06/15/2021 |
NFGC-21-360 |
|
260.80 |
|
266.00 |
|
5.20 |
|
61.50 |
|
Keats Main |
|
40-70 |
|
10/14/2021 |
Including |
|
260.80 |
|
263.50 |
|
2.70 |
|
117.15 |
|
Keats Main |
|
40-70 |
|
10/14/2021 |
NFGC-21-413A |
|
463.05 |
|
467.55 |
|
4.50 |
|
28.20 |
|
Keats FW |
|
40-70 |
|
01/26/2022 |
Including |
|
463.05 |
|
465.00 |
|
1.95 |
|
61.62 |
|
Keats FW |
|
40-70 |
|
01/26/2022 |
NFGC-23-1130 |
|
102.70 |
|
111.00 |
|
8.30 |
|
17.83 |
|
421 |
|
40-70 |
|
09/20/2023 |
Including |
|
102.70 |
|
103.35 |
|
0.65 |
|
66.96 |
|
421 |
|
40-70 |
|
09/20/2023 |
Including |
|
108.00 |
|
111.00 |
|
3.00 |
|
44.33 |
|
421 |
|
40-70 |
|
09/20/2023 |
- 20 -
|
Management’s Discussion and Analysis For the years ended December 31, 2024 and 2023 |
NFGC-23-1182 |
|
185.45 |
|
194.35 |
|
8.90 |
|
11.50 |
|
Keats S |
|
Unknown |
|
07/24/2023 |
Including |
|
187.00 |
|
188.00 |
|
1.00 |
|
80.80 |
|
Keats S |
|
Unknown |
|
07/24/2023 |
NFGC-24-2112 |
|
772.05 |
|
774.70 |
|
2.65 |
|
10.98 |
|
|
|
Unknown |
|
07/11/2024 |
Including |
|
772.75 |
|
773.25 |
|
0.50 |
|
57.12 |
|
|
|
Unknown |
|
07/11/2024 |
And |
|
915.40 |
|
917.45 |
|
2.05 |
|
1.98 |
|
|
|
Unknown |
|
07/11/2024 |
And |
|
919.25 |
|
923.95 |
|
4.70 |
|
2.17 |
|
Keats S Deep |
|
Unknown |
|
07/11/2024 |
And |
|
936.70 |
|
940.20 |
|
3.50 |
|
1.69 |
|
|
|
Unknown |
|
07/11/2024 |
And |
|
1,016.50 |
|
1,019.20 |
|
2.70 |
|
7.66 |
|
|
|
Unknown |
|
07/11/2024 |
Including |
|
1,017.65 |
|
1,018.30 |
|
0.65 |
|
28.48 |
|
|
|
Unknown |
|
07/11/2024 |
NFGC-24-21354 |
|
561.65 |
|
566.50 |
|
4.85 |
|
13.68 |
|
Keats-AFZ Deep |
|
Unknown |
|
10/31/2024 |
Including |
|
563.55 |
|
565.05 |
|
1.50 |
|
40.56 |
|
|
|
Unknown |
|
10/31/2024 |
NFGC-24-2112-W14 |
|
850.70 |
|
852.90 |
|
2.20 |
|
23.31 |
|
Keats South Deep |
|
Unknown |
|
10/31/2024 |
Including |
|
852.10 |
|
852.90 |
|
0.80 |
|
61.30 |
|
Keats South Deep |
|
Unknown |
|
10/31/2024 |
NFGC-24-2112-W34 |
|
988.65 |
|
995.85 |
|
7.20 |
|
1.97 |
|
|
|
Unknown |
|
10/31/2024 |
NFGC-24-2135 |
|
561.65 |
|
566.50 |
|
4.85 |
|
13.68 |
|
Keats-AFZ Deep |
|
Unknown |
|
10/31/2024 |
Including |
|
563.55 |
|
565.05 |
|
1.50 |
|
40.56 |
|
|
|
Unknown |
|
10/31/2024 |
Infill veining in secondary structures with multiple orientations crosscutting the primary host structures are commonly observed in drill core which could result in additional uncertainty in true width. As of March 1, 2023, composite intervals reported carry a minimum weighted average of 1 g/t Au diluted over a minimum core length of 2 m with a maximum of 4 m consecutive dilution when at depths above 200 m vertical depth and 2 m consecutive dilution when below 200 m vertical depth. Prior to this date, all composites allowed for 2 m consecutive dilution. Prior to February 18, 2022, all composite intervals were selected visually. Included high-grade intercepts are reported as any consecutive interval with grades greater than 10 g/t Au. Grades have not been capped in the averaging and intervals are reported as drill thickness. *Drill hole was extended.
Hole No. |
|
Azimuth (°) |
|
Dip (°) |
|
Length (m) |
|
UTM E |
|
UTM N |
|
Prospect |
NFGC-19-01 |
|
302 |
|
-44 |
|
199 |
|
658227 |
|
5427454 |
|
Keats |
NFGC-20-26 |
|
300 |
|
-45 |
|
269 |
|
658151 |
|
5427444 |
|
Keats |
NFGC-20-74 |
|
300 |
|
-45 |
|
238 |
|
658229 |
|
5427491 |
|
Keats |
NFGC-21-80 |
|
300 |
|
-45 |
|
200 |
|
658239 |
|
5427486 |
|
Keats |
NFGC-21-118 |
|
300 |
|
-45 |
|
660 |
|
658189 |
|
5427285 |
|
Keats |
NFGC-21-182 |
|
300 |
|
-48 |
|
377 |
|
658182 |
|
5427196 |
|
Keats |
NFGC-21-204 |
|
297 |
|
-56 |
|
412 |
|
658145 |
|
5427194 |
|
Keats |
NFGC-21-360 |
|
299 |
|
-46 |
|
359 |
|
658011 |
|
5427180 |
|
Keats |
NFGC-21-413A |
|
296 |
|
-57 |
|
515 |
|
658086 |
|
5427134 |
|
Keats |
NFGC-23-1130 |
|
300 |
|
-45 |
|
203 |
|
657777 |
|
5427034 |
|
Keats S |
NFGC-23-1182 |
|
332 |
|
-45 |
|
322 |
|
657775 |
|
5426945 |
|
Keats S |
NFGC-24-2112 |
|
320 |
|
-50 |
|
1157 |
|
657840 |
|
5426411 |
|
Keats S |
NFGC-24-2135 |
|
119 |
|
-69 |
|
929 |
|
657670 |
|
5427896 |
|
Keats West |
Highlighted assay values and channel locations from Keats channel sampling are shown in the tables below:
Hole No. |
|
From (m) |
|
To (m) |
|
Interval (m) |
|
Au (g/t) |
|
Zone |
|
True Width (%) |
|
Release Date |
KM-24-01-11 |
|
14.93 |
|
16.98 |
|
2.05 |
|
10.87 |
|
|
|
|
|
07/11/2024 |
Including |
|
15.43 |
|
16.18 |
|
0.75 |
|
27.80 |
|
|
|
|
|
07/11/2024 |
And |
|
22.59 |
|
25.15 |
|
2.56 |
|
26.23 |
|
|
|
|
|
07/11/2024 |
Including |
|
24.15 |
|
25.15 |
|
1.00 |
|
60.84 |
|
Keats Trench |
|
70-95 |
|
07/11/2024 |
- 21 -
|
Management’s Discussion and Analysis For the years ended December 31, 2024 and 2023 |
And |
|
30.03 |
|
34.91 |
|
4.88 |
|
7.35 |
|
|
|
|
|
07/11/2024 |
Including |
|
30.03 |
|
30.93 |
|
0.90 |
|
37.65 |
|
|
|
|
|
07/11/2024 |
And |
|
48.23 |
|
50.9 |
|
2.67 |
|
35.61 |
|
|
|
|
|
07/11/2024 |
Including |
|
48.23 |
|
49.08 |
|
0.85 |
|
108.74 |
|
|
|
|
|
07/11/2024 |
KM-24-01-12 |
|
20.77 |
|
25.98 |
|
5.21 |
|
214.97 |
|
|
|
|
|
07/11/2024 |
Including |
|
20.77 |
|
21.67 |
|
0.90 |
|
14.72 |
|
Keats Trench |
|
70-95 |
|
07/11/2024 |
And |
|
22.58 |
|
24.18 |
|
1.60 |
|
688.66 |
|
|
|
|
|
07/11/2024 |
And Including |
|
22.58 |
|
23.58 |
|
1.00 |
|
1,088.00 |
|
|
|
|
|
07/11/2024 |
KM-24-01-13 |
|
32.58 |
|
39.13 |
|
6.55 |
|
27.70 |
|
|
|
|
|
07/11/2024 |
Including |
|
33.23 |
|
33.98 |
|
0.75 |
|
37.14 |
|
Keats Trench |
|
70-95 |
|
07/11/2024 |
Including |
|
35.68 |
|
36.23 |
|
0.55 |
|
263.48 |
|
|
|
|
|
07/11/2024 |
KM-24-01-15 |
|
50.77 |
|
53.02 |
|
2.25 |
|
9.73 |
|
Keats Trench |
|
70-95 |
|
07/11/2024 |
Including |
|
51.32 |
|
52.07 |
|
0.75 |
|
27.76 |
|
|
|
|
|
07/11/2024 |
KM-24-01-16 |
|
17.5 |
|
31.2 |
|
13.7 |
|
10.38 |
|
|
|
|
|
07/11/2024 |
Including |
|
19.25 |
|
20.2 |
|
0.95 |
|
128.71 |
|
|
|
|
|
07/11/2024 |
And |
|
44.25 |
|
70.84 |
|
26.59 |
|
13.41 |
|
|
|
|
|
07/11/2024 |
Including |
|
54.89 |
|
57.34 |
|
2.45 |
|
63.41 |
|
Keats Trench |
|
70-95 |
|
07/11/2024 |
Including |
|
58.34 |
|
63 |
|
4.66 |
|
13.61 |
|
|
|
|
|
07/11/2024 |
Including |
|
63.98 |
|
67.04 |
|
3.06 |
|
28.28 |
|
|
|
|
|
07/11/2024 |
Including |
|
69.94 |
|
70.84 |
|
0.90 |
|
12.46 |
|
|
|
|
|
07/11/2024 |
KM-24-01-17 |
|
18.33 |
|
32.4 |
|
14.07 |
|
3.77 |
|
|
|
|
|
07/11/2024 |
Including |
|
25.8 |
|
27 |
|
1.20 |
|
16.82 |
|
|
|
|
|
07/11/2024 |
Including |
|
27.85 |
|
28.6 |
|
0.75 |
|
10.88 |
|
Keats Trench |
|
70-95 |
|
07/11/2024 |
And |
|
39.97 |
|
51.59 |
|
11.62 |
|
33.57 |
|
|
|
|
|
07/11/2024 |
Including |
|
48.36 |
|
51.59 |
|
3.23 |
|
119.31 |
|
|
|
|
|
07/11/2024 |
Hole No. |
|
From (m) |
|
To (m) |
|
Interval (m) |
|
Au (g/t) |
|
Zone |
|
True Width (%) |
|
Date Released |
And |
|
56.7 |
|
62.37 |
|
5.67 |
|
19.04 |
|
|
|
|
|
07/11/2024 |
Including |
|
59.39 |
|
61.77 |
|
2.38 |
|
43.62 |
|
|
|
|
|
07/11/2024 |
And |
|
73.66 |
|
78.76 |
|
5.10 |
|
300.36 |
|
|
|
|
|
07/11/2024 |
Including |
|
73.66 |
|
74.47 |
|
0.81 |
|
32.74 |
|
|
|
|
|
07/11/2024 |
Including |
|
76.22 |
|
77.86 |
|
1.64 |
|
907.44 |
|
|
|
|
|
07/11/2024 |
And Including |
|
76.22 |
|
77.02 |
|
0.80 |
|
1,808.00 |
|
|
|
|
|
07/11/2024 |
KM-24-01-18 |
|
35.85 |
|
52.45 |
|
16.6 |
|
38.88 |
|
|
|
|
|
07/11/2024 |
Including |
|
38.35 |
|
41.45 |
|
3.10 |
|
44.53 |
|
Keats Trench |
|
70-95 |
|
07/11/2024 |
Including |
|
44.6 |
|
46.8 |
|
2.20 |
|
221.00 |
|
|
|
|
|
07/11/2024 |
KM-24-01-32 |
|
1.75 |
|
8.9 |
|
7.15 |
|
14.78 |
|
|
|
|
|
02/12/2025 |
Including |
|
2.65 |
|
3.35 |
|
0.70 |
|
126.01 |
|
Keats Trench |
|
85-95 |
|
02/12/2025 |
KM-24-01-35 |
|
0 |
|
3.9 |
|
3.90 |
|
10.37 |
|
|
|
|
|
02/12/2025 |
Including |
|
0 |
|
1.3 |
|
1.30 |
|
14.23 |
|
Keats Trench |
|
80-90 |
|
02/12/2025 |
Including |
|
3.35 |
|
3.9 |
|
0.55 |
|
22.49 |
|
|
|
|
|
02/12/2025 |
KM-24-01-37 |
|
0 |
|
2 |
|
2.00 |
|
39.57 |
|
Keats Trench |
|
90-100 |
|
02/12/2025 |
Including |
|
0 |
|
0.5 |
|
0.50 |
|
157.75 |
|
|
|
|
|
02/12/2025 |
KM-24-01-39 |
|
0 |
|
2.8 |
|
2.80 |
|
11.53 |
|
Keats Trench |
|
90-100 |
|
02/12/2025 |
Including |
|
1.6 |
|
2.1 |
|
0.50 |
|
50.49 |
|
|
|
|
|
02/12/2025 |
KM-24-01-43 |
|
5.9 |
|
10.55 |
|
4.65 |
|
10.25 |
|
|
|
|
|
02/12/2025 |
Including |
|
7.6 |
|
9 |
|
1.40 |
|
32.10 |
|
Keats Trench |
|
75-85 |
|
02/12/2025 |
KM-24-01-45 |
|
0 |
|
4.95 |
|
4.95 |
|
73.63 |
|
|
|
|
|
02/12/2025 |
Including |
|
0 |
|
2.25 |
|
2.25 |
|
158.74 |
|
Keats Trench |
|
85-95 |
|
02/12/2025 |
KM-24-01-47 |
|
0.8 |
|
3.1 |
|
2.30 |
|
26.85 |
|
|
|
|
|
02/12/2025 |
- 22 -
|
Management’s Discussion and Analysis For the years ended December 31, 2024 and 2023 |
Including |
|
1.55 |
|
2.05 |
|
0.50 |
|
115.51 |
|
Keats Trench |
|
90-100 |
|
02/12/2025 |
KM-24-01-48 |
|
0.75 |
|
5.6 |
|
4.85 |
|
12.19 |
|
|
|
|
|
02/12/2025 |
Including |
|
0.75 |
|
1.55 |
|
0.80 |
|
64.37 |
|
Keats Trench |
|
90-100 |
|
02/12/2025 |
KM-24-01-49 |
|
0.9 |
|
13.6 |
|
12.70 |
|
6.00 |
|
|
|
|
|
02/12/2025 |
Including |
|
1.3 |
|
1.85 |
|
0.55 |
|
111.22 |
|
Keats Trench |
|
90-100 |
|
02/12/2025 |
KM-24-01-50 |
|
0 |
|
2.35 |
|
2.35 |
|
54.25 |
|
|
|
|
|
02/12/2025 |
Including |
|
0.55 |
|
1.6 |
|
1.05 |
|
120.76 |
|
Keats Trench |
|
85-95 |
|
02/12/2025 |
Hole No. |
|
From (m) |
|
To (m) |
|
Interval (m) |
|
Au (g/t) |
|
Zone |
|
True Width (%) |
|
Date Released |
KM-24-01-53 |
|
0 |
|
6.95 |
|
6.95 |
|
147.98 |
|
|
|
|
|
02/12/2025 |
Including |
|
0 |
|
3.6 |
|
3.60 |
|
267.38 |
|
Keats Trench |
|
90-100 |
|
02/12/2025 |
Including |
|
6.3 |
|
6.95 |
|
0.65 |
|
93.66 |
|
|
|
|
|
02/12/2025 |
KM-24-01-54 |
|
0 |
|
2.8 |
|
2.80 |
|
192.00 |
|
|
|
|
|
02/12/2025 |
Including |
|
0.65 |
|
2.8 |
|
2.15 |
|
249.13 |
|
Keats Trench |
|
90-100 |
|
02/12/2025 |
KM-24-01-55 |
|
0.3 |
|
3.15 |
|
2.85 |
|
220.67 |
|
|
|
|
|
02/12/2025 |
Including |
|
0.3 |
|
0.95 |
|
0.65 |
|
139.73 |
|
Keats Trench |
|
90-100 |
|
02/12/2025 |
Including |
|
1.7 |
|
3.15 |
|
1.45 |
|
368.83 |
|
|
|
|
|
02/12/2025 |
KM-24-01-56 |
|
0 |
|
2.85 |
|
2.85 |
|
330.71 |
|
|
|
|
|
02/12/2025 |
Including |
|
0 |
|
2.25 |
|
2.25 |
|
418.12 |
|
Keats Trench |
|
90-100 |
|
02/12/2025 |
KM-24-01-57 |
|
1.65 |
|
12.95 |
|
11.30 |
|
2.44 |
|
Keats Trench |
|
85-95 |
|
02/12/2025 |
KM-24-01-59 |
|
1 |
|
12.55 |
|
11.55 |
|
58.62 |
|
|
|
|
|
02/12/2025 |
Including |
|
2.8 |
|
3.53 |
|
0.73 |
|
258.82 |
|
|
|
|
|
02/12/2025 |
Including |
|
6.63 |
|
7.48 |
|
0.85 |
|
400.00 |
|
Keats Trench |
|
80-90 |
|
02/12/2025 |
Including |
|
10.05 |
|
10.75 |
|
0.70 |
|
119.32 |
|
|
|
|
|
02/12/2025 |
Including |
|
11.4 |
|
11.9 |
|
0.50 |
|
53.15 |
|
|
|
|
|
02/12/2025 |
KM-24-01-60 |
|
0 |
|
14.2 |
|
14.20 |
|
22.09 |
|
|
|
|
|
02/12/2025 |
Including |
|
8.4 |
|
12.2 |
|
3.80 |
|
70.86 |
|
Keats Trench |
|
80-90 |
|
02/12/2025 |
KM-24-01-61 |
|
1.2 |
|
18.35 |
|
17.15 |
|
9.81 |
|
|
|
|
|
02/12/2025 |
Including |
|
11.85 |
|
15.8 |
|
3.95 |
|
38.42 |
|
Keats Trench |
|
75-85 |
|
02/12/2025 |
KM-24-01-62 |
|
0 |
|
2.4 |
|
2.40 |
|
27.61 |
|
Keats Trench |
|
80-90 |
|
02/12/2025 |
KM-24-01-63 |
|
0 |
|
14.55 |
|
14.55 |
|
36.63 |
|
|
|
|
|
02/12/2025 |
Including |
|
3.9 |
|
4.55 |
|
0.65 |
|
26.45 |
|
Keats Trench |
|
65-75 |
|
02/12/2025 |
Including |
|
6.4 |
|
8.2 |
|
1.80 |
|
266.21 |
|
|
|
|
|
02/12/2025 |
KM-24-01-64 |
|
0.6 |
|
4.65 |
|
4.05 |
|
455.33 |
|
Keats Trench |
|
55-65 |
|
02/12/2025 |
KM-24-01-65 |
|
0 |
|
5.81 |
|
5.81 |
|
16.77 |
|
|
|
|
|
02/12/2025 |
Including |
|
0.93 |
|
2.72 |
|
1.79 |
|
39.34 |
|
Keats Trench |
|
70-80 |
|
02/12/2025 |
Including |
|
4.72 |
|
5.43 |
|
0.71 |
|
10.09 |
|
|
|
|
|
02/12/2025 |
KM-24-01-66 |
|
1.5 |
|
5.53 |
|
4.03 |
|
136.85 |
|
|
|
|
|
02/12/2025 |
Including |
|
2.35 |
|
5.53 |
|
3.18 |
|
172.49 |
|
Keats Trench |
|
60-70 |
|
02/12/2025 |
KM-24-01-68 |
|
0 |
|
4.4 |
|
4.40 |
|
83.10 |
|
Keats Trench |
|
50-60 |
|
02/12/2025 |
- 23 -
|
Management’s Discussion and Analysis For the years ended December 31, 2024 and 2023 |
Channel No. |
|
Azimuth (°) |
|
Length (m) |
|
Channel Start UTM E |
|
Channel Start UTM N |
KM-24-01-11 |
|
118 |
|
58.87 |
|
658138 |
|
5427526 |
KM-24-01-12 |
|
118 |
|
91.4 |
|
658140 |
|
5427533 |
KM-24-01-13 |
|
118 |
|
91.08 |
|
658144 |
|
5427539 |
KM-24-01-15 |
|
118 |
|
96.35 |
|
658161 |
|
5427548 |
KM-24-01-16 |
|
118 |
|
90.07 |
|
658169 |
|
5427552 |
KM-24-01-17 |
|
118 |
|
91.63 |
|
658173 |
|
5427558 |
KM-24-01-18 |
|
118 |
|
77.2 |
|
658180 |
|
5427563 |
KM-24-01-32 |
|
121 |
|
8.9 |
|
658143 |
|
5427500 |
KM-24-01-35 |
|
35 |
|
5.3 |
|
658147 |
|
5427490 |
KM-24-01-37 |
|
68 |
|
0.95 |
|
658141 |
|
5427503 |
KM-24-01-39 |
|
122 |
|
9.3 |
|
658142 |
|
5427520 |
KM-24-01-43 |
|
117 |
|
24.05 |
|
658150 |
|
5427506 |
KM-24-01-45 |
|
166 |
|
4.95 |
|
658170 |
|
5427524 |
KM-24-01-47 |
|
119 |
|
4 |
|
658179 |
|
5427531 |
KM-24-01-48 |
|
121 |
|
5.6 |
|
658182 |
|
5427535 |
KM-24-01-49 |
|
119 |
|
13.6 |
|
658182 |
|
5427541 |
KM-24-01-50 |
|
151 |
|
5.3 |
|
658134 |
|
5427523 |
KM-24-01-53 |
|
119 |
|
6.95 |
|
658209 |
|
5427537 |
KM-24-01-54 |
|
177 |
|
2.8 |
|
658219 |
|
5427537 |
KM-24-01-55 |
|
183 |
|
3.15 |
|
658221 |
|
5427537 |
KM-24-01-56 |
|
184 |
|
2.85 |
|
658223 |
|
5427536 |
KM-24-01-57 |
|
118 |
|
16.8 |
|
658185 |
|
5427548 |
KM-24-01-59 |
|
62 |
|
14.05 |
|
658203 |
|
5427544 |
KM-24-01-60 |
|
62 |
|
15.2 |
|
658205 |
|
5427542 |
KM-24-01-61 |
|
62 |
|
20.1 |
|
658205 |
|
5427539 |
KM-24-01-62 |
|
167 |
|
2.4 |
|
658225 |
|
5427536 |
KM-24-01-63 |
|
126 |
|
15.7 |
|
658216 |
|
5427530 |
KM-24-01-64 |
|
119 |
|
5.5 |
|
658230 |
|
5427525 |
KM-24-01-65 |
|
300 |
|
8.92 |
|
658240 |
|
5427524 |
KM-24-01-66 |
|
297 |
|
9.4 |
|
658243 |
|
5427525 |
KM-24-01-68 |
|
119 |
|
5.6 |
|
658227 |
|
5427525 |
- 24 -
|
Management’s Discussion and Analysis For the years ended December 31, 2024 and 2023 |
The latest drilling results are shown on the long section, plan map, and cross sections below:
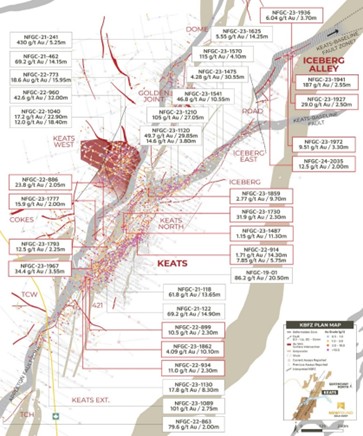
Queensway Project – Keats area plan view map (March 26, 2024)
- 25 -
|
Management’s Discussion and Analysis For the years ended December 31, 2024 and 2023 |
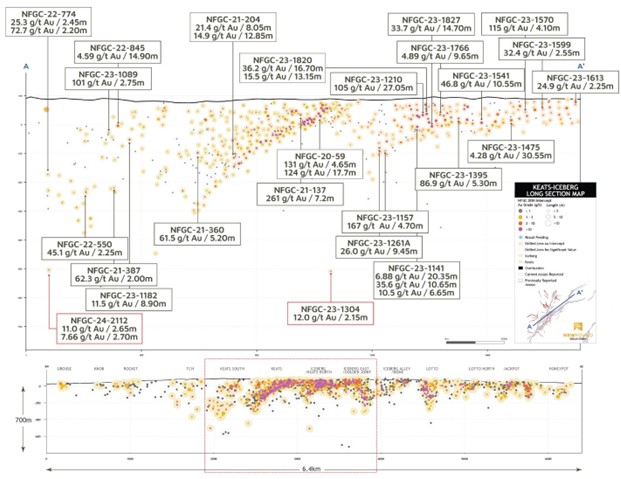
Queensway Project – Long section of Iceberg, Keats Main and TCH zones, looking northwest (July 11, 2024)
- 26 -
|
Management’s Discussion and Analysis For the years ended December 31, 2024 and 2023 |
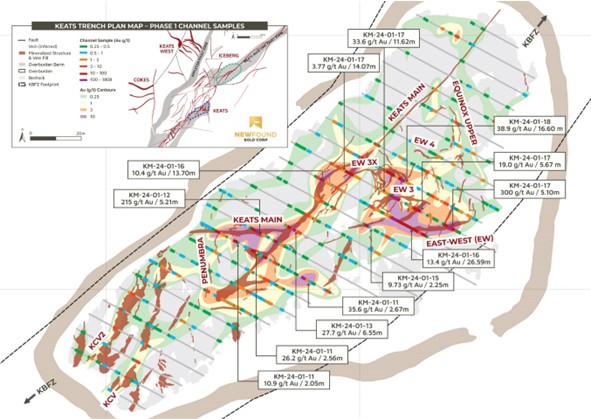
Queensway Project – Keats Trench plan view map with Phase I channel sample results (September 23, 2024)
- 27 -
|
Management’s Discussion and Analysis For the years ended December 31, 2024 and 2023 |
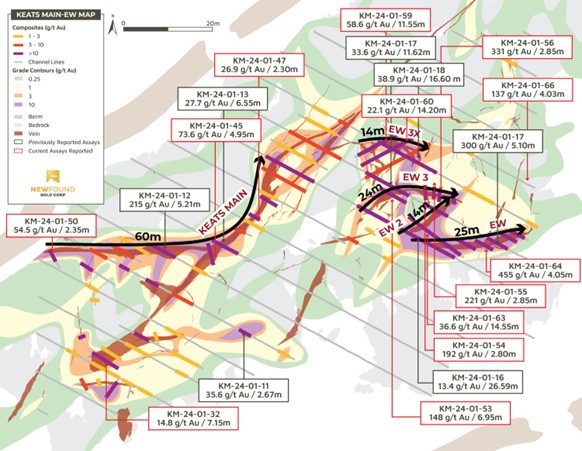
Queensway Project – Keats Trench plan view map with Phase II channel sample results (December 2, 2024)
- 28 -
|
Management’s Discussion and Analysis For the years ended December 31, 2024 and 2023 |
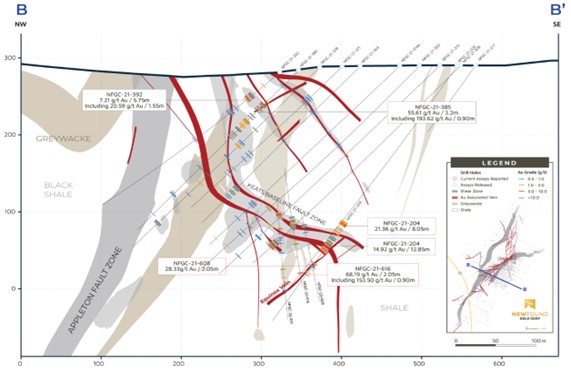
Queensway Project – Keats Cross-Section (B-B’), Looking NE, +/- 12.5m (October 18, 2022)

Queensway Project – Keats Cross-Section (A-A’), Looking NE, +/- 25m (July 11, 2024)
- 29 -
|
Management’s Discussion and Analysis For the years ended December 31, 2024 and 2023 |
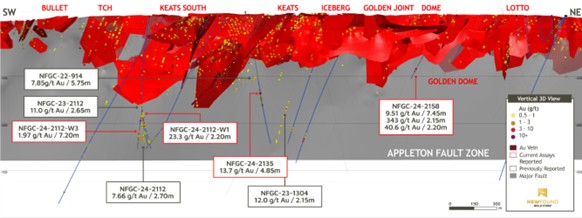
Queensway Project - Bullet to Lotto vertical 3D view of the east side of the AFZ (looking northwest (October 31, 2024)
Iceberg and Iceberg East Drilling
On March 1, 2023, the Company announced the discovery of a new zone, “Iceberg”. This zone is found along the highly prolific Keats-Baseline Fault Zone (“KBFZ”), the structure that is host to the Keats Main Zone. Iceberg shares a similar orientation to Keats Main and is comprised of a multitude of intersecting veins concentrating high-grade gold mineralization. The geological characteristics of Iceberg are nearly identical to those observed at Keats Main and the Company’s current interpretation is that Iceberg is the eastern continuation of Keats Main that has been displaced by faulting.
This new discovery has expanded rapidly, and step-out drilling has continued to intersect high-grade gold along strike to the east, which is an area now known as Iceberg East. Drilling reported on February 14, 2024, expanded the Iceberg-Iceberg East segment to over a strike length of 665 m, spotlighting the continued strength of the gold system within the KBFZ that includes Keats, Iceberg, and Iceberg East – a corridor that now spans 1.9 km in strike length. The high-grade gold mineralization at Iceberg-Iceberg East starts at surface and is currently extended to a vertical depth of 170 m.
Results reported in Q1 2024 both expanded and infilled the eastern extent of Iceberg East in addition to near-surface gaps along strike, a selection of highlight intervals from this drilling are summarized in the table below (February 14, 2014). These intervals are all located nearly 500 m east of the AFZ and start at vertical depths ranging between 30-50 m.
Also reported in Q1 2024 (March 26, 2024) was a new zone, now named “Iceberg Alley”. This new zone was intersected as part of a targeted program following the eastern continuation of the Keats-Iceberg-Iceberg East corridor along the high-grade KBFZ. Based on the fault characteristics observed at Iceberg Alley, as well as the zone’s orientation, intensity, and width of the damage zone, the Company’s preliminary interpretation indicates that it is another displaced segment of the KBFZ, in a northward direction. Additional drilling is planned at Iceberg Alley to expand on this new discovery in addition to gaining a better understanding of its structural relationship to the KBFZ mineralization.
- 30 -
|
Management’s Discussion and Analysis For the years ended December 31, 2024 and 2023 |
Drilling at Iceberg pivoted to infilling gaps, extending the high-grade to surface, and testing the opposing vein orientations to the main east-northeast striking orientation of the Keats-Baseline Fault Zone. Results of this program were reported on March 13, 2024, and a selection of highlight results from this program are summarized in the table below. The high-grade domain at Iceberg occurs where there is a confluence of high-grade gold veins and associated structures. These holes were drilled from the west to the east to better test this secondary set of gold veins that are partly controlling the high-grade mineralization in this segment of the Keats-Baseline Fault Zone (‘KBFZ’) and to gain a better understanding of their orientations and true widths.
The Company is pleased with the ongoing success and rapid expansion of both the Iceberg and Iceberg East zones; mineralization ranges in true width from 10-40 m, intervals received have demonstrated good continuity of the high-grade along strike and to depth, and the KBFZ remains open in all directions. Exploration will continue to further define these domains of high-grade while also focussing on expansion drilling both along strike and to depth. Minimal exploration work has been completed below 200 m vertical depth with the deepest drilling completed to date intersecting the structure and gold mineralization at 270 m vertical.
The Iceberg surface trenching program commenced in early July 2024 removing between 1-12 meters of overburden that covers the projection of the Iceberg Zone at the bedrock surface. The excavation was completed in October 2024 exposing 220 m of strike length over a 105 m wide area. Preliminary mapping was completed in Q4 2024, and detailed mapping and channel sampling will commence in Q2 2025.
2024 assay results have been reported in press releases dated February 14, 2024, March 13, 2024, July 3, 2024, and July 11, 2024. All previous and 2024 press releases can be found under the Company’s profile on SEDAR+ at www.sedarplus.ca.
- 31 -
|
Management’s Discussion and Analysis For the years ended December 31, 2024 and 2023 |
Highlighted assay values and drill hole locations from Iceberg and Iceberg East drilling are shown in the tables below:
Hole No. |
|
From (m) |
|
To (m) |
|
Length (m) |
|
Au (g/t) |
|
Zone |
|
True Width (%) |
|
Date Released |
NFGC-23-1120 |
|
53.55 |
|
57.35 |
|
3.80 |
|
14.60 |
|
Iceberg |
|
70-95 |
|
03/13/2023 |
Including |
|
55.75 |
|
56.70 |
|
0.95 |
|
54.50 |
|
Iceberg |
|
70-95 |
|
03/13/2023 |
And |
|
63.20 |
|
93.05 |
|
29.85 |
|
49.65 |
|
Iceberg |
|
70-95 |
|
03/13/2023 |
Including |
|
63.70 |
|
64.75 |
|
1.05 |
|
56.11 |
|
Iceberg |
|
70-95 |
|
03/13/2023 |
Including |
|
65.75 |
|
66.95 |
|
1.20 |
|
19.63 |
|
Iceberg |
|
70-95 |
|
03/13/2023 |
Including |
|
67.55 |
|
68.55 |
|
1.00 |
|
31.90 |
|
Iceberg |
|
70-95 |
|
03/13/2023 |
Including |
|
73.10 |
|
77.45 |
|
4.35 |
|
183.28 |
|
Iceberg |
|
70-95 |
|
03/13/2023 |
Including |
|
78.85 |
|
80.35 |
|
1.50 |
|
31.13 |
|
Iceberg |
|
70-95 |
|
03/13/2023 |
Including |
|
83.75 |
|
84.55 |
|
0.80 |
|
14.65 |
|
Iceberg |
|
70-95 |
|
03/13/2023 |
Including |
|
85.55 |
|
86.40 |
|
0.85 |
|
25.50 |
|
Iceberg |
|
70-95 |
|
03/13/2023 |
Including |
|
90.10 |
|
93.05 |
|
2.95 |
|
158.00 |
|
Iceberg |
|
70-95 |
|
03/13/2023 |
NFGC-23-1141 |
|
109.25 |
|
129.60 |
|
20.35 |
|
6.88 |
|
Iceberg |
|
40-70 |
|
04/04/2023 |
Including |
|
117.00 |
|
117.60 |
|
0.60 |
|
10.65 |
|
Iceberg |
|
40-70 |
|
04/04/2023 |
Including |
|
121.40 |
|
121.80 |
|
0.40 |
|
73.10 |
|
Iceberg |
|
40-70 |
|
04/04/2023 |
Including |
|
126.10 |
|
126.55 |
|
0.45 |
|
25.70 |
|
Iceberg |
|
40-70 |
|
04/04/2023 |
Including |
|
128.60 |
|
129.60 |
|
1.00 |
|
66.30 |
|
Iceberg |
|
40-70 |
|
04/04/2023 |
And |
|
138.85 |
|
149.50 |
|
10.65 |
|
35.58 |
|
Iceberg |
|
40-70 |
|
04/04/2023 |
Including |
|
138.85 |
|
140.35 |
|
1.50 |
|
232.40 |
|
Iceberg |
|
40-70 |
|
04/04/2023 |
Including |
|
143.35 |
|
144.10 |
|
0.75 |
|
20.20 |
|
Iceberg |
|
40-70 |
|
04/04/2023 |
And |
|
205.35 |
|
212.00 |
|
6.65 |
|
10.47 |
|
Iceberg |
|
10-40 |
|
04/04/2023 |
Including |
|
206.00 |
|
206.70 |
|
0.70 |
|
32.00 |
|
Iceberg |
|
10-40 |
|
04/04/2023 |
Including |
|
209.50 |
|
211.10 |
|
1.60 |
|
24.55 |
|
Iceberg |
|
10-40 |
|
04/04/2023 |
NFGC-23-1235 |
|
103.00 |
|
116.35 |
|
13.35 |
|
7.56 |
|
Iceberg East |
|
70-95 |
|
02/14/2024 |
Including |
|
105.70 |
|
106.50 |
|
0.80 |
|
91.75 |
|
Iceberg East |
|
70-95 |
|
02/14/2024 |
NFGC-23-1261A |
|
237.55 |
|
247.00 |
|
9.45 |
|
25.98 |
|
Iceberg |
|
40-70 |
|
06/08/2023 |
Including |
|
237.55 |
|
238.50 |
|
0.95 |
|
10.11 |
|
Iceberg |
|
40-70 |
|
06/08/2023 |
Including |
|
239.80 |
|
240.40 |
|
0.60 |
|
372.37 |
|
Iceberg |
|
40-70 |
|
06/08/2023 |
NFGC-23-1274 |
|
80.70 |
|
88.25 |
|
7.55 |
|
15.45 |
|
Iceberg East |
|
70-95 |
|
06/28/2023 |
Including |
|
81.35 |
|
84.20 |
|
2.85 |
|
28.00 |
|
Iceberg East |
|
70-95 |
|
06/28/2023 |
Including |
|
87.30 |
|
88.25 |
|
0.95 |
|
29.60 |
|
Iceberg East |
|
70-95 |
|
06/28/2023 |
NFGC-23-1304* |
|
768.40 |
|
770.55 |
|
2.15 |
|
3.27 |
|
|
|
Unknown |
|
07/11/2024 |
Including |
|
768.40 |
|
768.75 |
|
0.35 |
|
13.45 |
|
|
|
Unknown |
|
07/11/2024 |
And |
|
829.85 |
|
832.00 |
|
2.15 |
|
12.01 |
|
Iceberg-AFZ Deep |
|
Unknown |
|
07/11/2024 |
Including |
|
829.85 |
|
830.45 |
|
0.60 |
|
41.97 |
|
|
|
Unknown |
|
07/11/2024 |
And |
|
842.60 |
|
845.00 |
|
2.40 |
|
1.01 |
|
|
|
Unknown |
|
07/11/2024 |
And |
|
960.30 |
|
962.65 |
|
2.35 |
|
1.16 |
|
|
|
Unknown |
|
07/11/2024 |
NFGC-23-1306 |
|
141.95 |
|
146.75 |
|
4.80 |
|
33.07 |
|
Iceberg |
|
40-70 |
|
07/05/2023 |
Including |
|
141.95 |
|
142.90 |
|
0.95 |
|
160.50 |
|
Iceberg |
|
40-70 |
|
07/05/2023 |
And |
|
153.15 |
|
157.45 |
|
4.30 |
|
39.23 |
|
Iceberg |
|
70-95 |
|
07/05/2023 |
Including |
|
153.15 |
|
154.05 |
|
0.90 |
|
175.00 |
|
Iceberg |
|
70-95 |
|
07/05/2023 |
And |
|
162.00 |
|
188.25 |
|
26.25 |
|
1.26 |
|
Iceberg |
|
40-70 |
|
07/05/2023 |
Including |
|
187.60 |
|
188.25 |
|
0.65 |
|
11.50 |
|
Iceberg |
|
40-70 |
|
07/05/2023 |
And |
|
204.15 |
|
224.40 |
|
20.25 |
|
9.72 |
|
Iceberg |
|
40-70 |
|
07/05/2023 |
Including |
|
204.15 |
|
205.50 |
|
1.35 |
|
130.48 |
|
Iceberg |
|
40-70 |
|
07/05/2023 |
NFGC-23-1312 |
|
94.75 |
|
122.55 |
|
27.80 |
|
14.54 |
|
Iceberg |
|
70-95 |
|
07/05/2023 |
Including |
|
99.80 |
|
101.05 |
|
1.25 |
|
214.40 |
|
Iceberg |
|
70-95 |
|
07/05/2023 |
Including |
|
104.95 |
|
105.95 |
|
1.00 |
|
66.00 |
|
Iceberg |
|
70-95 |
|
07/05/2023 |
- 32 -
|
Management’s Discussion and Analysis For the years ended December 31, 2024 and 2023 |
Including |
|
120.10 |
|
120.50 |
|
0.40 |
|
36.20 |
|
Iceberg |
|
70-95 |
|
07/05/2023 |
And |
|
127.30 |
|
132.60 |
|
5.30 |
|
34.59 |
|
Iceberg |
|
70-95 |
|
07/05/2023 |
Including |
|
127.85 |
|
128.95 |
|
1.10 |
|
161.14 |
|
Iceberg |
|
70-95 |
|
07/05/2023 |
NFGC-23-1475 |
|
62.00 |
|
92.55 |
|
30.55 |
|
4.28 |
|
Iceberg East |
|
10-40 |
|
09/13/2023 |
Including |
|
66.00 |
|
66.45 |
|
0.45 |
|
15.85 |
|
Iceberg East |
|
10-40 |
|
09/13/2023 |
Including |
|
67.10 |
|
67.80 |
|
0.70 |
|
19.00 |
|
Iceberg East |
|
10-40 |
|
09/13/2023 |
Including |
|
70.10 |
|
71.05 |
|
0.95 |
|
76.46 |
|
Iceberg East |
|
10-40 |
|
09/13/2023 |
NFGC-23-1541 |
|
85.85 |
|
96.40 |
|
10.55 |
|
46.81 |
|
Iceberg East |
|
70-95 |
|
09/13/2023 |
Including |
|
88.55 |
|
89.20 |
|
0.65 |
|
20.13 |
|
Iceberg East |
|
70-95 |
|
09/13/2023 |
Including |
|
90.45 |
|
94.85 |
|
4.40 |
|
104.01 |
|
Iceberg East |
|
70-95 |
|
09/13/2023 |
NFGC-23-1625 |
|
33.45 |
|
47.70 |
|
14.25 |
|
5.55 |
|
Iceberg East |
|
40-70 |
|
02/14/2024 |
Including |
|
38.15 |
|
39.15 |
|
1.00 |
|
48.60 |
|
Iceberg East |
|
40-70 |
|
02/14/2024 |
NFGC-23-1746 |
|
50.80 |
|
58.15 |
|
7.35 |
|
42.80 |
|
Iceberg |
|
40-70 |
|
03/13/2024 |
Including |
|
51.60 |
|
53.40 |
|
1.80 |
|
172.02 |
|
Iceberg |
|
40-70 |
|
03/13/2024 |
NFGC-23-1914 |
|
29.00 |
|
41.80 |
|
12.80 |
|
13.86 |
|
Iceberg |
|
70-95 |
|
03/13/2024 |
Including |
|
31.60 |
|
32.20 |
|
0.60 |
|
27.90 |
|
Iceberg |
|
70-95 |
|
03/13/2024 |
Including |
|
33.85 |
|
35.40 |
|
1.55 |
|
69.10 |
|
Iceberg |
|
70-95 |
|
03/13/2024 |
Including |
|
40.50 |
|
41.00 |
|
0.50 |
|
61.40 |
|
Iceberg |
|
40-70 |
|
03/13/2024 |
And |
|
51.25 |
|
53.65 |
|
2.40 |
|
14.69 |
|
Iceberg |
|
40-70 |
|
03/13/2024 |
Including |
|
52.20 |
|
53.00 |
|
0.80 |
|
42.30 |
|
Iceberg |
|
40-70 |
|
03/13/2024 |
- 33 -
|
Management’s Discussion and Analysis For the years ended December 31, 2024 and 2023 |
Infill veining in secondary structures with multiple orientations crosscutting the primary host structures are commonly observed in drill core which could result in additional uncertainty in true width. As of March 1, 2023, composite intervals reported carry a minimum weighted average of 1 g/t Au diluted over a minimum core length of 2 m with a maximum of 4 m consecutive dilution when at depths above 200 m vertical depth and 2 m consecutive dilution when below 200 m vertical depth. Prior to this date, all composites allowed for 2 m consecutive dilution. Included high-grade intercepts are reported as any consecutive interval with grades greater than 10 g/t Au. Grades have not been capped in the averaging and intervals are reported as drill thickness. *Drill hole was extended.
Hole No. |
|
Azimuth (°) |
|
Dip (°) |
|
Length (m) |
|
UTM E |
|
UTM N |
|
Prospect |
NFGC-23-1120 |
|
300 |
|
-45 |
|
191 |
|
658443 |
|
5427794 |
|
Iceberg |
NFGC-23-1141 |
|
300 |
|
-45 |
|
297 |
|
658488 |
|
5427769 |
|
Iceberg |
NFGC-23-1235 |
|
300 |
|
-45 |
|
198 |
|
658680 |
|
5427948 |
|
Iceberg East |
NFGC-23-1261A |
|
297 |
|
-45.5 |
|
395 |
|
658447 |
|
5427649 |
|
Iceberg |
NFGC-23-1274 |
|
300 |
|
-45 |
|
407 |
|
658750 |
|
5428022 |
|
Iceberg East |
NFGC-23-1304 |
|
300 |
|
-45 |
|
1,247 |
|
658432 |
|
5427632 |
|
Iceberg |
NFGC-23-1306 |
|
300 |
|
-45 |
|
290 |
|
658505 |
|
5427759 |
|
Iceberg |
NFGC-23-1312 |
|
300 |
|
-45 |
|
260 |
|
658527 |
|
5427805 |
|
Iceberg |
NFGC-23-1475 |
|
220 |
|
-67 |
|
180 |
|
658681 |
|
5428034 |
|
Iceberg East |
NFGC-23-1541 |
|
300 |
|
-62 |
|
150 |
|
658615 |
|
5427931 |
|
Iceberg East |
NFGC-23-1625 |
|
300 |
|
-73 |
|
83 |
|
658824 |
|
5428123 |
|
Iceberg East |
NFGC-23-1746 |
|
119 |
|
-45 |
|
107 |
|
658456 |
|
5427887 |
|
Iceberg |
NFGC-23-1914 |
|
16 |
|
-45 |
|
86 |
|
658534 |
|
5427895 |
|
Iceberg |
- 34 -
|
Management’s Discussion and Analysis For the years ended December 31, 2024 and 2023 |
The latest drilling results from Iceberg are shown on the plan map, long-section, and cross-section below:

Queensway Project – Plan view map of Iceberg area (March 13, 2024)
- 35 -
|
Management’s Discussion and Analysis For the years ended December 31, 2024 and 2023 |

Queensway Project – Long section of Keats Main, Iceberg, and Iceberg East zones, looking northwest (March 13, 2024)
- 36 -
|
Management’s Discussion and Analysis For the years ended December 31, 2024 and 2023 |

Queensway Project – Keats West to Iceberg cross-section view, +/-12.5m, looking northwest (August 9, 2023)
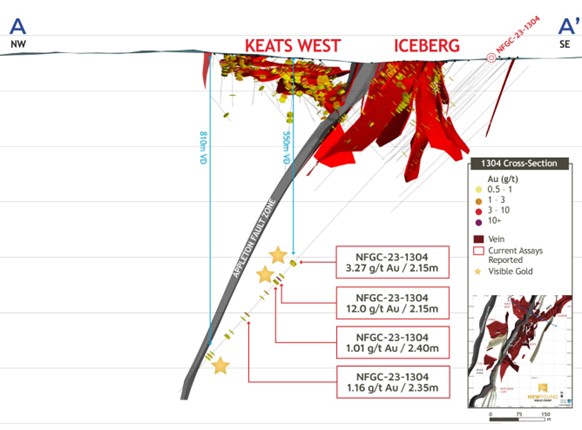
Queensway Project - 3D cross-section of NFGC-24-1304 (+/- 25m, looking northeast) (July 11, 2024)
- 37 -
|
Management’s Discussion and Analysis For the years ended December 31, 2024 and 2023 |
Golden Dome
Deep drilling targeting a prospective area between the Golden Joint and Dome zones intersected high-grade gold mineralization over a nearly 30 m down-hole interval as demonstrated by several high-grade intercepts with a cumulative length of 11.80 m including 343 g/t Au over 2.15 m (which contained a 1,230 g/t Au sample over 0.60 m core length), 9.51 g/t Au over 7.45 m, and 40.6 g/t Au over 2.20 m in NFGC-24-2158. This broad interval of high-grade mineralization with a cumulative length of 11.80 m is a new zone called “Golden Dome” and is located within a previously untested gap in drilling that spans a length of at least 500 m partway between Golden Joint and Dome. This highlight intercept occurs 200 m below existing drilling at Dome.
These preliminary results suggest that this zone is part of a larger mineralized structural network connecting Dome to Golden Joint having a combined strike length of 750 m and extending to depths of up to 375 m. Results from follow-up drilling announced February 24, 2025, intersected 148 g/t Au over 4.10 m and 41.3 g/t Au over 2.40 m in NFGC-24-2188 and 22.4 g/t Au over 2.00 m in NFGC-24-2199 18 m and 92 m along strike respectively. This step-out drilling has defined a multi-vein gold system that is currently defined over a 170 m by 140 m area and open along strike. Mineralization starts at vertical depth of 300 m.
Expansion drilling is required as Golden Dome has growth potential in all directions.
2024 and 2025 assay results have been reported in press releases dated October 31, 2024, and February 24, 2025. All press releases can be found under the Company’s profile on SEDAR+ at www.sedarplus.ca.
Highlighted assay values and drill hole locations from Golden Dome are shown in the tables below:
Hole No. |
|
From (m) |
|
To (m) |
|
Interval (m) |
|
Au (g/t) |
|
Zone |
|
True Width % |
|
Date Released |
NFGC-24-2158 |
|
482.10 |
|
489.55 |
|
7.45 |
|
9.51 |
|
|
|
|
|
|
Including |
|
482.10 |
|
482.80 |
|
0.70 |
|
27.78 |
|
|
|
|
|
|
Including |
|
487.40 |
|
489.00 |
|
1.60 |
|
25.53 |
|
|
|
|
|
|
And |
|
492.35 |
|
494.50 |
|
2.15 |
|
343.12 |
|
Golden Dome |
|
Unknown |
|
10/31/2024 |
Including |
|
493.00 |
|
493.60 |
|
0.60 |
|
1,229.00 |
|
|
|
|
|
|
And |
|
511.00 |
|
513.20 |
|
2.20 |
|
40.59 |
|
|
|
|
|
|
Including |
|
511.00 |
|
511.80 |
|
0.80 |
|
109.22 |
|
|
|
|
|
|
NFGC-24-2188 |
|
457.00 |
|
459.40 |
|
2.40 |
|
41.30 |
|
|
|
|
|
|
Including |
|
458.00 |
|
459.40 |
|
1.40 |
|
70.43 |
|
|
|
|
|
|
And4 |
|
504.65 |
|
508.75 |
|
4.10 |
|
148.38 |
|
Golden Dome |
|
Unknown |
|
02/24/2025 |
Including |
|
504.65 |
|
506.55 |
|
1.90 |
|
319.58 |
|
|
|
|
|
|
And Including |
|
504.65 |
|
505.25 |
|
0.60 |
|
911.00 |
|
|
|
|
|
|
NFGC-24-2199 |
|
523.00 |
|
525.00 |
|
2.00 |
|
22.41 |
|
Golden Dome |
|
Unknown |
|
02/24/2025 |
Including |
|
523.00 |
|
524.00 |
|
1.00 |
|
44.80 |
|
|
|
|
|
|
Infill veining in secondary structures with multiple orientations crosscutting the primary host structures are commonly observed in drill core which could result in additional uncertainty in true width. Composite intervals reported carry a minimum weighted average of 1 g/t Au diluted over a minimum core length of 2 m with a maximum of 4 m consecutive dilution when at depths above 200 m vertical depth and 2m consecutive dilution when below 200 m vertical depth. Prior to this date, all composites allowed for 2 m consecutive dilution. Included high-grade intercepts are reported as any consecutive interval with grades greater than 10 g/t Au. Grades have not been capped in the averaging and intervals are reported as drill thickness.
Hole No. |
|
Azi (°) |
|
Dip (°) |
|
Length (m) |
|
UTM E |
|
UTM N |
|
Prospect |
NFGC-24-2158 |
|
300 |
|
-45 |
|
578 |
|
658854 |
|
5428376 |
|
Dome |
NFGC-24-2188 |
|
298 |
|
-45 |
|
604 |
|
658859 |
|
5428383 |
|
Road |
NFGC-24-2199 |
|
294 |
|
-45 |
|
716 |
|
658882 |
|
5428465 |
|
Road |
- 38 -
|
Management’s Discussion and Analysis For the years ended December 31, 2024 and 2023 |
The latest drilling results from Golden Dome are shown on the plan map and in the 3D image below:
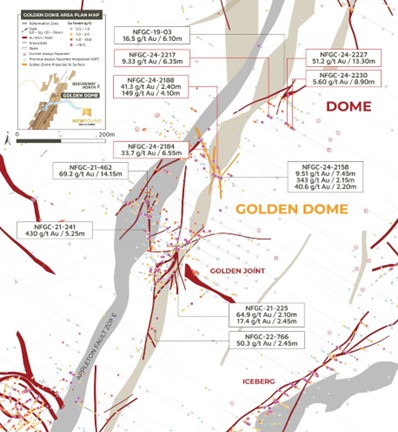
Queensway Project - Location of Golden Dome, plan view map (February 24, 2025)
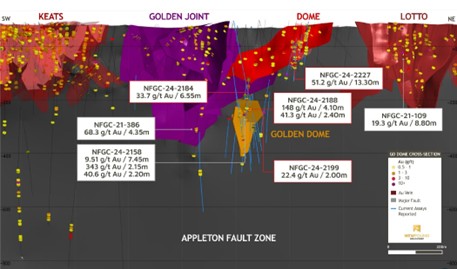
Queensway Project - Location of Golden Dome, 3D view looking west (February 24, 2025)
- 39 -
|
Management’s Discussion and Analysis For the years ended December 31, 2024 and 2023 |
Keats North Drilling
Reconnaissance drilling working in the highly prospective region between the Keats Main and Golden Joint zones (“Keats North”) intersected significant mineralization, now named the “515 Zone”, returning initial intercepts of 9.21 g/t Au over 2.15 m and 43.9 g/t Au over 3.85 m in NFGC-22-515 (reported on April 13, 2022) approximately 440 m north of the Keats Main Zone. Following this discovery, reconnaissance drilling in this region identified additional near-surface high-grade gold mineralization with the intercept of 275 g/t Au over 2.15 m in NFGC-22-538 (reported on May 4, 2022) which occurs at a vertical depth of 22 m adjacent to the AFZ and is approximately 65 m north of the Keats Zone.
On August 2, 2022, the company announced results from continued exploration in the Keats North target region defining multiple high-grade veins that define a corridor over a strike length of approximately 630 m by 150 m wide linking up the north end of Keats with the 515 Zone. A selection of noteworthy intervals in these veins are summarized in the table below.
Exploration drilling throughout 2022 at the Keats North prospect successfully defined this complex network of gold-bearing veins and associated structures to depths of up to 200 m vertical. These significant intervals along with many others occur largely within and around the Umbra, Penumbra, and Enigma structures, see figure below, however, others fall outside into new structural splays; these zones remain open at depth. Umbra and Penumbra structures strike north-south and can be traced through the Keats North prospect and play an important role in concentrating gold at Keats North and the northeast end of the Keats Main zone.
All previous and 2024 press releases can be found under the Company’s profile on SEDAR+ at www.sedarplus.ca.
- 40 -
|
Management’s Discussion and Analysis For the years ended December 31, 2024 and 2023 |
Highlighted assay values and drill hole locations from Keats North drilling are shown in the tables below:
Hole No. |
|
From (m) |
|
To (m) |
|
Length (m) |
|
Au (g/t) |
|
Zone |
|
True Width (%) |
|
Date Released |
NFGC-22-515 |
|
209.00 |
|
212.85 |
|
3.85 |
|
43.93 |
|
Keats N |
|
10-40 |
|
04/13/2022 |
Including |
|
209.00 |
|
210.65 |
|
1.65 |
|
75.97 |
|
Keats N |
|
10-40 |
|
04/13/2022 |
Including |
|
211.35 |
|
212.35 |
|
1.00 |
|
43.10 |
|
Keats N |
|
10-40 |
|
04/13/2022 |
NFGC-22-538 |
|
32.45 |
|
34.60 |
|
2.15 |
|
275.04 |
|
Keats N |
|
40-70 |
|
05/04/2022 |
Including |
|
33.10 |
|
33.90 |
|
0.80 |
|
738.00 |
|
Keats N |
|
40-70 |
|
05/04/2022 |
NFGC-22-580 |
|
52.00 |
|
54.20 |
|
2.20 |
|
24.05 |
|
Keats N |
|
70-95 |
|
08/02/2022 |
Including |
|
53.20 |
|
53.70 |
|
0.50 |
|
105.50 |
|
Keats N |
|
70-95 |
|
08/02/2022 |
NFGC-22-586 |
|
48.00 |
|
50.00 |
|
2.00 |
|
40.59 |
|
Keats N |
|
40-70 |
|
08/02/2022 |
Including |
|
49.45 |
|
50.00 |
|
0.55 |
|
147.50 |
|
Keats N |
|
40-70 |
|
08/02/2022 |
NFGC-22-665 |
|
46.60 |
|
52.35 |
|
5.75 |
|
18.95 |
|
Keats N |
|
40-70 |
|
09/01/2022 |
Including |
|
48.25 |
|
48.85 |
|
0.60 |
|
162.50 |
|
Keats N |
|
40-70 |
|
09/01/2022 |
NFGC-22-728 |
|
249.20 |
|
251.20 |
|
2.00 |
|
116.93 |
|
Keats N |
|
40-70 |
|
12/05/2022 |
Including |
|
250.15 |
|
250.80 |
|
0.65 |
|
358.07 |
|
Keats N |
|
40-70 |
|
12/05/2022 |
Infill veining in secondary structures with multiple orientations crosscutting the primary host structures are commonly observed in drill core which could result in additional uncertainty in true width. As of March 1, 2023, composite intervals reported carry a minimum weighted average of 1 g/t Au diluted over a minimum core length of 2 m with a maximum of 4 m consecutive dilution when at depths above 200 m vertical depth and 2 m consecutive dilution when below 200 m vertical depth. Prior to this date, all composites allowed for 2 m consecutive dilution. Prior to February 18, 2022, all composite intervals were selected visually. Included high-grade intercepts are reported as any consecutive interval with grades greater than 10 g/t Au. Grades have not been capped in the averaging and intervals are reported as drill thickness.
Hole No. |
|
Azimuth (°) |
|
Dip (°) |
|
Length (m) |
|
UTM E |
|
UTM N |
|
Prospect |
NFGC-22-515 |
|
299 |
|
-45.5 |
|
281 |
|
658344 |
|
5428026 |
|
Keats North |
NFGC-22-538 |
|
300 |
|
-45 |
|
386 |
|
658193 |
|
5427710 |
|
Keats North |
NFGC-22-580 |
|
300 |
|
-45 |
|
110 |
|
658188 |
|
5427698 |
|
Keats North |
NFGC-22-586 |
|
300 |
|
-45 |
|
332 |
|
658162 |
|
5427669 |
|
Keats North |
NFGC-22-665 |
|
300 |
|
-45 |
|
159 |
|
658226 |
|
5427762 |
|
Keats North |
NFGC-22-728 |
|
300 |
|
-45 |
|
260 |
|
658237 |
|
5427597 |
|
Keats North |
- 41 -
|
Management’s Discussion and Analysis For the years ended December 31, 2024 and 2023 |
A selection of highlight drilling results is shown in the inclined 3D image below for Keats North:
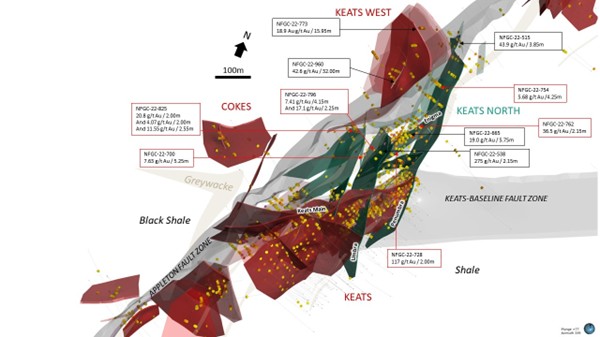
Queensway Project – Keats, Keats West, and Keats North inclined 3D plan view map (December 5, 2022)
Keats West Drilling
A combination of reconnaissance drilling and targeted drilling looking for the potential extension of the Penumbra vein in the hanging wall to the AFZ (west side) led to the discovery of the Keats West Zone intersecting significant mineralization in NFGC-22-533 reporting 8.70 g/t Au over 6.75 m (reported on May, 4, 2022) followed by 17.9 g/t Au over 4.20 m in NFGC-22-681 and 10.4 g/t Au over 10.50 m in NFGC-22-686 (reported on September 27, 2022).
Ongoing exploration drilling at Keats West has uncovered a significant structure that is interpreted to be a thrust fault that dips gently to the south-southwest and hosts both low and high-grade gold mineralization over a considerable thickness with cumulative widths ranging from 10-50 m. This fault zone occurs on the west side of the AFZ, is hosted by an interbedded sequence of black siltstone, siltstone, and greywacke, and consists of a series of stacked veins that contain the gold mineralization and represents an important new discovery for the Company. A selection of significant intervals is presented in the table below.
The mineralization style is epizonal and typical of the other gold prospects found along this segment of the AFZ. Drilling has quickly expanded this system now having intersected significant mineralization over an area that is 315m wide x 305m long, with mineralization starting at surface. All intercepts to date occur above 130 m vertical depth and ongoing step-out and infill drilling continue to exhibit good continuity of both low and high-grade mineralization within the host structure.
Q1 2024 results from a step-out drilling program into the westernmost extent of the Keats West zone, intercepted significant gold mineralization. All three holes were reported on February 22, 2024 (see a selection of highlights in the table below) and hit the structure shallowly starting between 2 m and 35 m vertical depth, indicating strong near-surface continuity of high-grade gold mineralization over a strike length of 315 m at Keats West.
Infill drilling at Keats West is required to better define the continuity of grade and the controls on the gold mineralization within the host fault in addition to deeper drilling below the existing mineralized footprint.
- 42 -
|
Management’s Discussion and Analysis For the years ended December 31, 2024 and 2023 |
2024 assay results have been reported in press releases dated February 22, 2024. All previous and 2024 press releases can be found under the Company’s profile on SEDAR+ at www.sedarplus.ca.
Highlighted assay values and drill hole locations from Keats West drilling are shown in the tables below:
Hole No. |
|
From (m) |
|
To (m) |
|
Length (m) |
|
Au (g/t) |
|
Zone |
|
True Width (%) |
|
Date Released |
NFGC-22-686 |
|
100.50 |
|
111.00 |
|
10.50 |
|
10.36 |
|
Keats W |
|
70-95 |
|
09/27/2022 |
Including |
|
101.30 |
|
102.55 |
|
1.25 |
|
43.84 |
|
Keats W |
|
70-95 |
|
09/27/2022 |
Including |
|
103.05 |
|
103.45 |
|
0.40 |
|
88.20 |
|
Keats W |
|
70-95 |
|
09/27/2022 |
NFGC-22-833 |
|
11.00 |
|
22.40 |
|
11.40 |
|
3.25 |
|
Keats W |
|
40-70 |
|
03/21/2023 |
And |
|
30.00 |
|
65.00 |
|
35.00 |
|
2.41 |
|
Keats W |
|
40-70 |
|
03/21/2023 |
And |
|
74.00 |
|
91.35 |
|
17.35 |
|
1.61 |
|
Keats W |
|
40-70 |
|
03/21/2023 |
NFGC-22-945 |
|
78.10 |
|
100.60 |
|
22.50 |
|
10.05 |
|
Keats W |
|
70-95 |
|
03/21/2023 |
Including |
|
88.15 |
|
88.80 |
|
0.65 |
|
12.55 |
|
Keats W |
|
70-95 |
|
03/21/2023 |
Including |
|
90.00 |
|
91.00 |
|
1.00 |
|
12.95 |
|
Keats W |
|
70-95 |
|
03/21/2023 |
Including |
|
93.70 |
|
94.85 |
|
1.15 |
|
14.24 |
|
Keats W |
|
70-95 |
|
03/21/2023 |
Including |
|
95.65 |
|
96.00 |
|
0.35 |
|
16.10 |
|
Keats W |
|
70-95 |
|
03/21/2023 |
Including |
|
99.95 |
|
100.60 |
|
0.65 |
|
221.00 |
|
Keats W |
|
70-95 |
|
03/21/2023 |
NFGC-22-960 |
|
145.00 |
|
177.00 |
|
32.00 |
|
42.64 |
|
Keats W |
|
10-40 |
|
11/28/2022 |
Including |
|
151.35 |
|
152.30 |
|
0.95 |
|
14.05 |
|
Keats W |
|
10-40 |
|
11/28/2022 |
Including |
|
156.65 |
|
157.55 |
|
0.90 |
|
86.60 |
|
Keats W |
|
10-40 |
|
11/28/2022 |
Including |
|
159.40 |
|
161.30 |
|
1.90 |
|
24.06 |
|
Keats W |
|
10-40 |
|
11/28/2022 |
Including |
|
162.05 |
|
162.95 |
|
0.90 |
|
29.68 |
|
Keats W |
|
10-40 |
|
11/28/2022 |
Including |
|
163.75 |
|
164.35 |
|
0.60 |
|
24.50 |
|
Keats W |
|
10-40 |
|
11/28/2022 |
Including |
|
165.70 |
|
167.00 |
|
1.30 |
|
16.26 |
|
Keats W |
|
10-40 |
|
11/28/2022 |
Including |
|
170.50 |
|
173.10 |
|
2.60 |
|
121.57 |
|
Keats W |
|
10-40 |
|
11/28/2022 |
Including |
|
173.70 |
|
177.00 |
|
3.30 |
|
241.54 |
|
Keats W |
|
10-40 |
|
11/28/2022 |
NFGC-22-1010 |
|
30.80 |
|
34.45 |
|
3.65 |
|
2.29 |
|
Keats W |
|
40-70 |
|
07/19/2023 |
And |
|
46.00 |
|
56.25 |
|
10.25 |
|
1.54 |
|
Keats W |
|
40-70 |
|
07/19/2023 |
Including |
|
55.75 |
|
56.25 |
|
0.50 |
|
10.70 |
|
Keats W |
|
40-70 |
|
07/19/2023 |
And |
|
96.85 |
|
140.25 |
|
43.40 |
|
4.43 |
|
Keats W |
|
40-70 |
|
07/19/2023 |
Including |
|
96.85 |
|
98.00 |
|
1.15 |
|
25.83 |
|
Keats W |
|
40-70 |
|
07/19/2023 |
Including |
|
102.80 |
|
103.75 |
|
0.95 |
|
16.40 |
|
Keats W |
|
40-70 |
|
07/19/2023 |
Including |
|
111.00 |
|
111.50 |
|
0.50 |
|
10.50 |
|
Keats W |
|
40-70 |
|
07/19/2023 |
Including |
|
126.55 |
|
127.55 |
|
1.00 |
|
69.30 |
|
Keats W |
|
40-70 |
|
07/19/2023 |
NFGC-22-1027 |
|
6.70 |
|
18.40 |
|
11.70 |
|
5.05 |
|
Keats W |
|
70-95 |
|
07/19/2023 |
Including |
|
15.80 |
|
17.05 |
|
1.25 |
|
13.79 |
|
Keats W |
|
70-95 |
|
07/19/2023 |
NFGC-22-1028 |
|
52.00 |
|
81.45 |
|
29.45 |
|
2.47 |
|
Keats W |
|
70-95 |
|
12/06/2023 |
Including |
|
64.05 |
|
65.65 |
|
1.60 |
|
15.84 |
|
Keats W |
|
70-95 |
|
12/06/2023 |
And |
|
86.00 |
|
107.30 |
|
21.30 |
|
1.39 |
|
Keats W |
|
70-95 |
|
12/06/2023 |
And |
|
166.80 |
|
169.50 |
|
2.70 |
|
66.00 |
|
Keats W |
|
70-95 |
|
12/06/2023 |
Including |
|
167.85 |
|
168.50 |
|
0.65 |
|
271.01 |
|
Keats W |
|
70-95 |
|
12/06/2023 |
NFGC-22-1040 |
|
40.40 |
|
63.30 |
|
22.90 |
|
17.23 |
|
Keats W |
|
70-95 |
|
04/25/2023 |
Including |
|
45.85 |
|
47.45 |
|
1.60 |
|
162.12 |
|
Keats W |
|
70-95 |
|
04/25/2023 |
Including |
|
49.45 |
|
49.95 |
|
0.50 |
|
18.82 |
|
Keats W |
|
70-95 |
|
04/25/2023 |
Including |
|
58.50 |
|
59.00 |
|
0.50 |
|
161.66 |
|
Keats W |
|
70-95 |
|
04/25/2023 |
Including |
|
61.95 |
|
62.65 |
|
0.70 |
|
14.18 |
|
Keats W |
|
70-95 |
|
04/25/2023 |
And |
|
69.65 |
|
88.05 |
|
18.40 |
|
12.00 |
|
Keats W |
|
70-95 |
|
04/25/2023 |
Including |
|
71.25 |
|
72.10 |
|
0.85 |
|
12.00 |
|
Keats W |
|
70-95 |
|
04/25/2023 |
Including |
|
72.55 |
|
73.30 |
|
0.75 |
|
57.67 |
|
Keats W |
|
70-95 |
|
04/25/2023 |
Including |
|
80.10 |
|
80.50 |
|
0.40 |
|
93.75 |
|
Keats W |
|
70-95 |
|
04/25/2023 |
- 43 -
|
Management’s Discussion and Analysis For the years ended December 31, 2024 and 2023 |
Including |
|
82.50 |
|
82.85 |
|
0.35 |
|
53.36 |
|
Keats W |
|
70-95 |
|
04/25/2023 |
Including |
|
85.75 |
|
87.30 |
|
1.55 |
|
47.87 |
|
Keats W |
|
70-95 |
|
04/25/2023 |
NFGC-23-1129 |
|
14.95 |
|
57.30 |
|
42.35 |
|
3.29 |
|
Keats W |
|
70-95 |
|
09/27/2023 |
Including |
|
31.15 |
|
32.00 |
|
0.85 |
|
11.35 |
|
Keats W |
|
70-95 |
|
09/27/2023 |
Including |
|
34.00 |
|
35.00 |
|
1.00 |
|
11.10 |
|
Keats W |
|
70-95 |
|
09/27/2023 |
NFGC-23-1155 |
|
55.55 |
|
90.30 |
|
34.75 |
|
1.53 |
|
Keats W |
|
10-40 |
|
04/25/2023 |
NFGC-23-1708 |
|
5.70 |
|
49.50 |
|
43.80 |
|
3.20 |
|
Keats W |
|
70-95 |
|
02/22/2024 |
Including |
|
12.70 |
|
13.50 |
|
0.80 |
|
12.25 |
|
Keats W |
|
70-95 |
|
02/22/2024 |
Including |
|
34.00 |
|
35.20 |
|
1.20 |
|
34.47 |
|
Keats W |
|
70-95 |
|
02/22/2024 |
Including |
|
37.50 |
|
38.05 |
|
0.55 |
|
12.10 |
|
Keats W |
|
70-95 |
|
02/22/2024 |
Including |
|
49.15 |
|
49.50 |
|
0.35 |
|
25.40 |
|
Keats W |
|
70-95 |
|
02/22/2024 |
NFGC-23-1765 |
|
3.30 |
|
26.50 |
|
23.20 |
|
3.49 |
|
Keats W |
|
70-95 |
|
02/22/2024 |
Including |
|
12.90 |
|
13.35 |
|
0.45 |
|
10.50 |
|
Keats W |
|
70-95 |
|
02/22/2024 |
And |
|
14.30 |
|
15.00 |
|
0.70 |
|
15.95 |
|
Keats W |
|
70-95 |
|
02/22/2024 |
Infill veining in secondary structures with multiple orientations crosscutting the primary host structures are commonly observed in drill core which could result in additional uncertainty in true width. As of March 1, 2023, composite intervals reported carry a minimum weighted average of 1 g/t Au diluted over a minimum core length of 2 m with a maximum of 4 m consecutive dilution when at depths above 200 m vertical depth and 2m consecutive dilution when below 200 m vertical depth. Prior to this date, all composites allowed for 2 m consecutive dilution. Included high-grade intercepts are reported as any consecutive interval with grades greater than 10 g/t Au. Grades have not been capped in the averaging and intervals are reported as drill thickness.
Hole No. |
|
Azimuth (°) |
|
Dip (°) |
|
Length (m) |
|
UTM E |
|
UTM N |
|
Prospect |
NFGC-22-686 |
|
70 |
|
-60 |
|
206 |
|
658053 |
|
5427905 |
|
Keats West |
NFGC-22-833 |
|
120 |
|
-45.5 |
|
221 |
|
658033 |
|
5428032 |
|
Keats West |
NFGC-22-945 |
|
58 |
|
-47 |
|
237 |
|
657949 |
|
5427794 |
|
Keats West |
NFGC-22-960 |
|
120 |
|
-45 |
|
378 |
|
657980 |
|
5427948 |
|
Keats West |
NFGC-22-1010 |
|
115 |
|
-45 |
|
309 |
|
657920 |
|
5428041 |
|
Keats West |
NFGC-22-1027 |
|
115 |
|
-45 |
|
210 |
|
657876 |
|
5428065 |
|
Keats West |
NFGC-22-1028 |
|
49 |
|
-53 |
|
227 |
|
657992 |
|
5427768 |
|
Keats West |
NFGC-22-1040 |
|
56 |
|
-53 |
|
206 |
|
657952 |
|
5427847 |
|
Keats West |
NFGC-23-1129 |
|
357 |
|
-45 |
|
170 |
|
657989 |
|
5427886 |
|
Keats West |
NFGC-23-1155 |
|
203 |
|
-61 |
|
179 |
|
658124 |
|
5427975 |
|
Keats West |
NFGC-23-1708 |
|
55 |
|
-55 |
|
86 |
|
658098 |
|
5428023 |
|
Keats West |
NFGC-23-1765 |
|
65 |
|
-67 |
|
68 |
|
657879 |
|
5428036 |
|
Keats West |
- 44 -
|
Management’s Discussion and Analysis For the years ended December 31, 2024 and 2023 |
The latest drilling results for Keats West are shown in the images below:
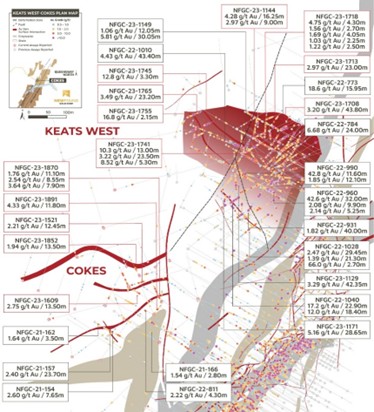
Queensway Project – Keats West area plan map (February 22, 2024)
- 45 -
|
Management’s Discussion and Analysis For the years ended December 31, 2024 and 2023 |
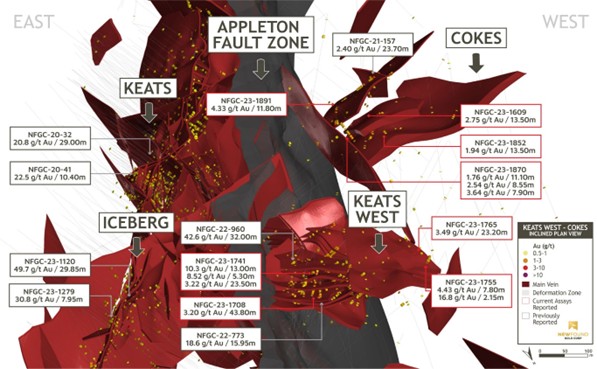
Queensway Project – Keats West inclined 3D view with main veins plotted only, looking south (February 22, 2024)
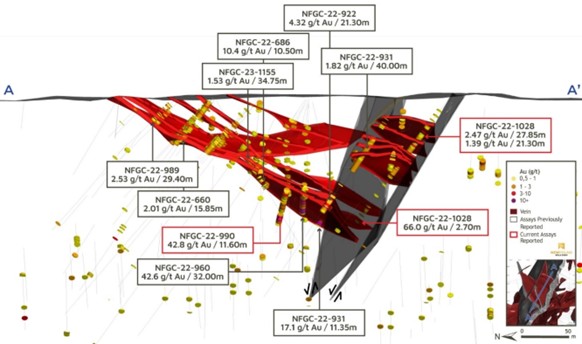
Queensway Project – Keats West cross-section (+/- 25m, looking southeast). (December 6, 2023)
- 46 -
|
Management’s Discussion and Analysis For the years ended December 31, 2024 and 2023 |
Cokes Drilling
At Cokes, a historic showing located 300 m southwest of Keats West on the west side of the AFZ, the Company completed a first-pass program in 2021 which returned the highlight interval of 2.40 g/t over 23.70 m in NFGC-21-157. Recently completed follow-up drilling successfully expanded the mineralized zone through a combination of grid and targeted drilling.
This program defined a low-angle and south-dipping gold mineralized structure that is very similar in orientation to the nearby Keats West Zone. Several significant intervals were received and are summarized in the table below, that together span a domain 65 m wide by 90 m long.
Additional drilling is required to understand the mineralizing controls in this area and to expand on this new discovery.
2024 assay results have been reported in press releases dated February 22, 2024. All previous and 2024 press releases can be found under the Company’s profile on SEDAR+ at www.sedarplus.ca.
Highlighted assay values and drill hole locations from Cokes drilling are shown in the tables below:
Hole No. |
|
From (m) |
|
To (m) |
|
Length (m) |
|
Au (g/t) |
|
Zone |
|
True Width (%) |
|
Date Released |
NFGC-21-157 |
|
10.00 |
|
33.70 |
|
23.70 |
|
2.40 |
|
Cokes |
|
40-70 |
|
07/06/2021 |
Including |
|
20.60 |
|
24.75 |
|
4.15 |
|
6.43 |
|
Cokes |
|
40-70 |
|
07/06/2021 |
And |
|
55.20 |
|
68.35 |
|
13.15 |
|
1.69 |
|
Cokes |
|
Unknown |
|
07/06/2021 |
And |
|
105.00 |
|
109.50 |
|
4.50 |
|
2.04 |
|
Cokes |
|
10-40 |
|
07/06/2021 |
NFGC-23-1521 |
|
38.60 |
|
51.05 |
|
12.45 |
|
2.21 |
|
Cokes |
|
40-70 |
|
02/22/2024 |
And |
|
56.25 |
|
62.00 |
|
5.75 |
|
1.37 |
|
Cokes |
|
40-70 |
|
02/22/2024 |
NFGC-23-1609 |
|
39.90 |
|
53.40 |
|
13.50 |
|
2.75 |
|
Cokes |
|
10-40 |
|
02/22/2024 |
NFGC-23-1852 |
|
17.10 |
|
30.60 |
|
13.50 |
|
1.94 |
|
Cokes |
|
70-95 |
|
02/22/2024 |
NFGC-23-1870 |
|
15.45 |
|
26.55 |
|
11.10 |
|
1.76 |
|
Cokes |
|
Unknown |
|
02/22/2024 |
And |
|
36.60 |
|
45.15 |
|
8.55 |
|
2.54 |
|
Cokes |
|
Unknown |
|
02/22/2024 |
And |
|
49.20 |
|
57.10 |
|
7.90 |
|
3.64 |
|
Cokes |
|
70-95 |
|
02/22/2024 |
NFGC-23-1891 |
|
35.60 |
|
47.40 |
|
11.80 |
|
4.33 |
|
Cokes |
|
70-95 |
|
02/22/2024 |
Infill veining in secondary structures with multiple orientations crosscutting the primary host structures are commonly observed in drill core which could result in additional uncertainty in true width. As of March 1, 2023, composite intervals reported carry a minimum weighted average of 1 g/t Au diluted over a minimum core length of 2 m with a maximum of 4 m consecutive dilution when at depths above 200 m vertical depth and 2 m consecutive dilution when below 200 m vertical depth. Prior to this date, all composites allowed for 2 m consecutive dilution. Prior to February 18, 2022, all composite intervals were selected visually. Included high-grade intercepts are reported as any consecutive interval with grades greater than 10 g/t Au. Grades have not been capped in the averaging and intervals are reported as drill thickness.
Hole No. |
|
Azimuth (°) |
|
Dip (°) |
|
Length (m) |
|
UTM E |
|
UTM N |
|
Prospect |
NFGC-21-157 |
|
120 |
|
-45 |
|
167 |
|
657642 |
|
5427535 |
|
Cokes |
NFGC-23-1521 |
|
75 |
|
-45 |
|
251 |
|
657706 |
|
5427645 |
|
Cokes |
NFGC-23-1609 |
|
120 |
|
-49 |
|
200 |
|
657706 |
|
5427643 |
|
Cokes |
NFGC-23-1852 |
|
335 |
|
-45 |
|
87 |
|
657734 |
|
5427674 |
|
Cokes |
NFGC-23-1870 |
|
334 |
|
-45 |
|
95 |
|
657792 |
|
5427603 |
|
Cokes |
NFGC-23-1891 |
|
37 |
|
-69 |
|
143 |
|
657772 |
|
5427571 |
|
Cokes |
- 47 -
|
Management’s Discussion and Analysis For the years ended December 31, 2024 and 2023 |
Lotto Zone Drilling
The Company has reported several significant gold assay intervals from the Lotto Zone starting with its first drill hole NFGC-20-17 reporting 16.3 g/t Au over 2.20 m, 41.2 g/t Au over 4.75 m, and a third interval of 25.4 g/t Au over 5.15 m (reported on October 2, 2020). Following this result, the Lotto Main vein has been systematically tested and expanded by subsequent highlight intercepts summarized in the table below.
The Lotto Zone is comprised of a north-south striking, steeply east-dipping vein (“Lotto Main Vein”) located approximately 200 m east of the AFZ and drilling to date on the Lotto Main Vein has confirmed good continuity of a high-grade lens that is interpreted to plunge steeply to the northeast in addition to defining new corridors of high-grade gold contained within the vein.
Continued exploration drilling has expanded the Lotto Main Vein high-grade gold domain to 225 m vertical depth and a strike length of 220 m. This vein has been intersected at depths of up to 325 m vertical and remains open at depth and along strike.
Other veins of note occur between the Lotto Main Vein and the AFZ in a region known as the Lotto Footwall (FW) these include “Sunday” and “Tuesday” veins. A selection of highlight intervals is summarized in the table below.
Additional infill and step-out drilling is required at Lotto.
2024 assay results have been reported in press releases dated April 17, 2024. All previous and 2024 press releases can be found under the Company’s profile on SEDAR+ at www.sedarplus.ca.
Highlighted assay values and drill hole locations from Lotto drilling are shown in the tables below:
Hole No. |
|
From (m) |
|
To (m) |
|
Length (m) |
|
Au (g/t) |
|
Zone |
|
True Width (%) |
|
Date Released |
NFGC-20-17 |
|
29.80 |
|
32.00 |
|
2.20 |
|
16.30 |
|
Lotto Main |
|
40-70 |
|
01/14/2021 |
And |
|
35.25 |
|
40.00 |
|
4.75 |
|
41.20 |
|
Lotto Main |
|
40-70 |
|
10/02/2020 |
Including |
|
35.25 |
|
36.90 |
|
1.65 |
|
108.70 |
|
Lotto Main |
|
40-70 |
|
10/02/2020 |
And |
|
56.95 |
|
70.75 |
|
13.80 |
|
10.10 |
|
Lotto Main |
|
40-70 |
|
10/02/2020 |
Including |
|
56.95 |
|
62.10 |
|
5.15 |
|
25.40 |
|
Lotto Main |
|
40-70 |
|
10/02/2020 |
Including |
|
61.00 |
|
61.80 |
|
0.80 |
|
138.30 |
|
Lotto Main |
|
40-70 |
|
10/02/2020 |
NFGC-20-44 |
|
238.55 |
|
245.05 |
|
6.50 |
|
18.10 |
|
Sunday |
|
70-95 |
|
01/14/2021 |
Including |
|
242.10 |
|
245.05 |
|
2.95 |
|
38.70 |
|
Sunday |
|
70-95 |
|
01/14/2021 |
NFGC-21-109 |
|
152.70 |
|
161.50 |
|
8.80 |
|
19.34 |
|
Lotto Main |
|
70-95 |
|
03/23/2021 |
Including |
|
154.20 |
|
157.40 |
|
3.20 |
|
51.31 |
|
Lotto Main |
|
70-95 |
|
03/23/2021 |
NFGC-21-201 |
|
196.65 |
|
208.15 |
|
11.50 |
|
150.28 |
|
Lotto Main |
|
70-95 |
|
06/23/2021 |
Including |
|
197.25 |
|
198.85 |
|
1.60 |
|
30.17 |
|
Lotto Main |
|
70-95 |
|
06/23/2021 |
Including |
|
205.00 |
|
207.45 |
|
2.45 |
|
683.14 |
|
Lotto Main |
|
70-95 |
|
06/23/2021 |
NFGC-21-233 |
|
169.20 |
|
171.85 |
|
2.65 |
|
111.36 |
|
Lotto Main |
|
40-70 |
|
09/08/2021 |
NFGC-21-311 |
|
294.65 |
|
297.45 |
|
2.80 |
|
76.81 |
|
Lotto Main |
|
70-95 |
|
09/08/2021 |
Including |
|
294.65 |
|
296.55 |
|
1.90 |
|
112.51 |
|
Lotto Main |
|
70-95 |
|
09/08/2021 |
NFGC-22-552 |
|
87.95 |
|
89.95 |
|
2.00 |
|
89.50 |
|
Tuesday |
|
70-95 |
|
06/08/2022 |
Including |
|
88.35 |
|
88.75 |
|
0.40 |
|
442.00 |
|
Tuesday |
|
70-95 |
|
06/08/2022 |
NFGC-22-673 |
|
206.15 |
|
210.00 |
|
3.85 |
|
151.87 |
|
Lotto Main |
|
10-40 |
|
09/13/2022 |
Including |
|
206.15 |
|
208.90 |
|
2.75 |
|
211.71 |
|
Lotto Main |
|
10-40 |
|
09/13/2022 |
NFGC-22-684 |
|
211.45 |
|
226.40 |
|
14.95 |
|
12.98 |
|
Lotto Main |
|
10-40 |
|
09/13/2022 |
Including |
|
216.30 |
|
217.00 |
|
0.70 |
|
25.30 |
|
Lotto Main |
|
10-40 |
|
09/13/2022 |
Including |
|
224.30 |
|
226.40 |
|
2.10 |
|
72.35 |
|
Lotto Main |
|
10-40 |
|
09/13/2022 |
- 48 -
|
Management’s Discussion and Analysis For the years ended December 31, 2024 and 2023 |
Infill veining in secondary structures with multiple orientations crosscutting the primary host structures are commonly observed in drill core which could result in additional uncertainty in true width. As of March 1, 2023, composite intervals reported carry a minimum weighted average of 1 g/t Au diluted over a minimum core length of 2 m with a maximum of 4 m consecutive dilution when at depths above 200 m vertical depth and 2 m consecutive dilution when below 200 m vertical depth. Prior to this date, all composites allowed for 2 m consecutive dilution. Prior to February 18, 2022, all composite intervals were selected visually. Included high-grade intercepts are reported as any consecutive interval with grades greater than 10 g/t Au. Grades have not been capped in the averaging and intervals are reported as drill thickness.
Hole No. |
|
Azimuth (°) |
|
Dip (°) |
|
Length (m) |
|
UTM E |
|
UTM N |
|
Prospect |
NFGC-20-17 |
|
300 |
|
-45 |
|
354 |
|
658931 |
|
5428990 |
|
Lotto |
NFGC-20-44 |
|
300 |
|
-45 |
|
298 |
|
658956 |
|
5429030 |
|
Lotto |
NFGC-21-89 |
|
300 |
|
-45 |
|
294 |
|
658968 |
|
5429052 |
|
Lotto |
NFGC-21-109 |
|
300 |
|
-45 |
|
252 |
|
659012 |
|
5428912 |
|
Lotto |
NFGC-21-201 |
|
300 |
|
-45 |
|
241 |
|
659058 |
|
5428890 |
|
Lotto |
NFGC-21-233 |
|
298 |
|
-45.5 |
|
342 |
|
659024 |
|
5428935 |
|
Lotto |
NFGC-21-311 |
|
299 |
|
-45.5 |
|
321 |
|
659107 |
|
5428914 |
|
Lotto |
NFGC-22-552 |
|
300 |
|
-45 |
|
201 |
|
658833 |
|
5429014 |
|
Lotto |
NFGC-22-673 |
|
263 |
|
-68 |
|
258 |
|
658990 |
|
5429097 |
|
Lotto |
NFGC-22-684 |
|
258 |
|
-69 |
|
237 |
|
658983 |
|
5429072 |
|
Lotto |
- 49 -
|
Management’s Discussion and Analysis For the years ended December 31, 2024 and 2023 |
The latest results from the Lotto and Lotto North zones are shown in the long section, plan map, and Lotto cross-section below:
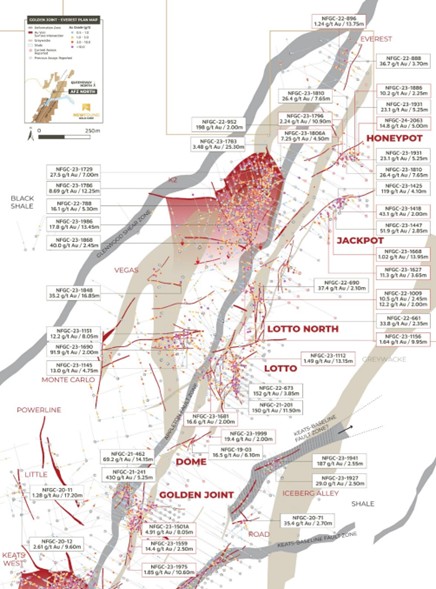
Queensway Project – Golden Joint to Honeypot area plan map (April 17, 2024)
- 50 -
|
Management’s Discussion and Analysis For the years ended December 31, 2024 and 2023 |
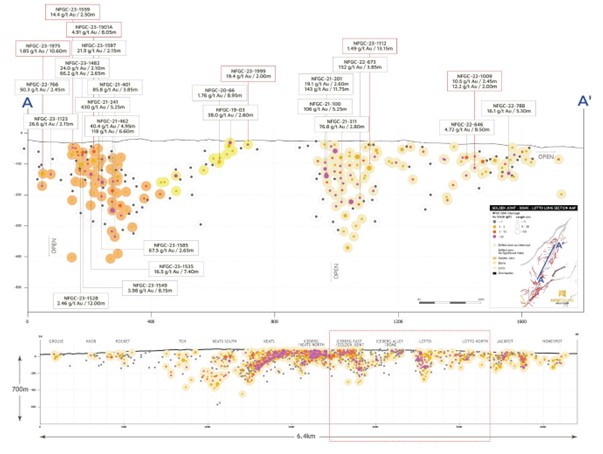
Queensway Project – Lotto- Lotto North zones long section, looking northwest (April 17, 2024)
- 51 -
|
Management’s Discussion and Analysis For the years ended December 31, 2024 and 2023 |
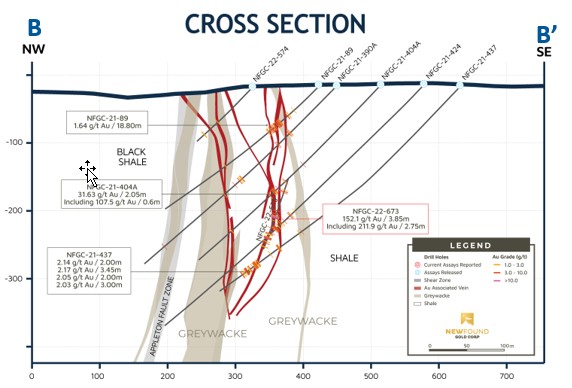
Queensway Project – Lotto cross-section, +/- 12.5m, looking northeast (September 13, 2022)
- 52 -
|
Management’s Discussion and Analysis For the years ended December 31, 2024 and 2023 |
Lotto North Drilling
The Lotto North prospect is adjacent (north) to the Lotto prospect in QWN on the east side of the AFZ. Systematic grid drilling testing along the eastern side of the AFZ north of Lotto identified this new gold-bearing structural zone in November 2022 first reporting 33.8 g/t Au over 2.35 m in NFGC-22-661, 37.4 g/t Au over 2.10 m in NFGC-22-690 and 22.2 g/t Au over 2.20 m in NFGC-22-717.
Continued exploration drilling at Lotto North has defined a series of AFZ-typical epizonal-style gold-bearing veins contained within a north-south striking brittle fault zone immediately north of the Lotto prospect. Drilling has expanded the Lotto North gold mineralization and host structure over a strike length of 340 m and to a vertical depth of 200 m where it starts at surface. The Lotto North structure remains open at depth and is likely the same structure that hosts the Lotto Main vein but has been offset by late faulting in this region. A selection of highlight intervals can be found in the table below.
When combined with the Lotto Main Zone, these high-grade gold-bearing structures have been drill-defined over a total strike length of 630 m.
2024 assay results have been reported in press releases dated April 17, 2024. All previous and 2024 press releases can be found under the Company’s profile on SEDAR+ at www.sedarplus.ca.
Highlighted assay values and drill hole locations from Lotto North drilling are shown in the tables below:
Hole No. |
|
From (m) |
|
To (m) |
|
Length (m) |
|
Au (g/t) |
|
Zone |
|
True Width (%) |
|
Date Released |
NFGC-22-646 |
|
71.80 |
|
80.30 |
|
8.50 |
|
4.72 |
|
Lotto N |
|
40-70 |
|
01/10/2023 |
Including |
|
71.80 |
|
72.55 |
|
0.75 |
|
38.50 |
|
Lotto N |
|
40-70 |
|
01/10/2023 |
NFGC-22-661 |
|
74.65 |
|
77.00 |
|
2.35 |
|
33.79 |
|
Lotto N |
|
40-70 |
|
11/02/2022 |
Including |
|
74.95 |
|
75.30 |
|
0.35 |
|
225.00 |
|
Lotto N |
|
40-70 |
|
11/02/2022 |
NFGC-22-690 |
|
69.45 |
|
71.55 |
|
2.10 |
|
37.36 |
|
Lotto N |
|
70-95 |
|
11/02/2022 |
Including |
|
70.15 |
|
70.85 |
|
0.70 |
|
109.00 |
|
Lotto N |
|
70-95 |
|
11/02/2022 |
NFGC-22-788 |
|
120.70 |
|
126.00 |
|
5.30 |
|
16.12 |
|
Lotto N |
|
40-70 |
|
01/10/2023 |
Including |
|
122.00 |
|
123.55 |
|
1.55 |
|
49.63 |
|
Lotto N |
|
40-70 |
|
01/10/2023 |
NFGC-22-895 |
|
174.65 |
|
179.20 |
|
4.55 |
|
7.20 |
|
Lotto N |
|
70-95 |
|
05/10/2023 |
Including |
|
178.60 |
|
179.20 |
|
0.60 |
|
32.56 |
|
Lotto N |
|
70-95 |
|
05/10/2023 |
NFGC-22-940 |
|
80.25 |
|
83.80 |
|
3.55 |
|
11.13 |
|
Lotto N |
|
70-95 |
|
05/10/2023 |
Including |
|
82.15 |
|
82.80 |
|
0.65 |
|
51.70 |
|
Lotto N |
|
70-95 |
|
05/10/2023 |
Infill veining in secondary structures with multiple orientations crosscutting the primary host structures are commonly observed in drill core which could result in additional uncertainty in true width. As of March 1, 2023, composite intervals reported carry a minimum weighted average of 1 g/t Au diluted over a minimum core length of 2 m with a maximum of 4 m consecutive dilution when at depths above 200 m vertical depth and 2 m consecutive dilution when below 200 m vertical depth. Prior to this date, all composites allowed for 2 m consecutive dilution. Included high-grade intercepts are reported as any consecutive interval with grades greater than 10 g/t Au. Grades have not been capped in the averaging and intervals are reported as drill thickness.
- 53 -
|
Management’s Discussion and Analysis For the years ended December 31, 2024 and 2023 |
Hole No. |
|
Azimuth (°) |
|
Dip (°) |
|
Length (m) |
|
UTM E |
|
UTM N |
|
Prospect |
NFGC-22-646 |
|
300 |
|
-45 |
|
429 |
|
659079 |
|
5429391 |
|
Lotto North |
NFGC-22-661 |
|
285 |
|
-45 |
|
396 |
|
659079 |
|
5429391 |
|
Lotto North |
NFGC-22-690 |
|
270 |
|
-42 |
|
264 |
|
659083 |
|
5429446 |
|
Lotto North |
NFGC-22-788 |
|
240 |
|
-45 |
|
261 |
|
659068 |
|
5429627 |
|
Lotto North |
NFGC-22-895 |
|
70 |
|
-45 |
|
243 |
|
658848 |
|
5429213 |
|
Lotto North |
NFGC-22-940 |
|
90 |
|
-45 |
|
135 |
|
658986 |
|
5429329 |
|
Lotto North |
Jackpot Drilling
On June 22, 2023, the Company announced the discovery of a new zone, “Jackpot” located 600 m north of Lotto North and 280 m east of the AFZ with the discovery hole of 95.7 g/t Au over 3.25 m in NFGC-23-1292 at 20 m vertical depth. This hole was drilled as part of a targeted program testing an area of interest between Lotto North and Everest.
Follow-up drilling designed to efficiently determine the orientation of the vein for continued expansion intercepted multiple near-surface high-grade intervals occurring at vertical depths ranging from 20-40 m.
Continued expansion drilling has determined that Jackpot is an east-west striking, steeply south-dipping high-grade structure with characteristics similar to the neighbouring Lotto Zone. Additional results received indicate strong high-grade continuity and are presented in the table below.
Reported in Q1 were the outstanding assay results that were received from initial drilling designed to determine the extent of the near-surface high-grade mineralization at Jackpot, increasing the down-plunge extent of the high-grade domain to 155 m. A selection of highlight intervals from this drilling can be found in the table below.
The Jackpot structure demonstrates strong continuity of gold mineralization that plunges to the southwest and covers an area averaging 75 m wide and 250 m long that remains open at depth.
2024 assay results have been reported in a press release dated April 17, 2024. All previous and 2024 press releases can be found under the Company’s profile on SEDAR+ at www.sedarplus.ca.
- 54 -
|
Management’s Discussion and Analysis For the years ended December 31, 2024 and 2023 |
Highlighted assay values and drill hole locations from Jackpot drilling are shown in the tables below:
Hole No. |
|
From (m) |
|
To (m) |
|
Length (m) |
|
Au (g/t) |
|
Zone |
|
True Width (%) |
|
Date Released |
NFGC-23-1292 |
|
27.45 |
|
30.70 |
|
3.25 |
|
95.71 |
|
Jackpot |
|
70-95 |
|
06/22/2023 |
Including |
|
27.45 |
|
28.30 |
|
0.85 |
|
352.58 |
|
Jackpot |
|
70-95 |
|
06/22/2023 |
Including |
|
29.80 |
|
30.70 |
|
0.90 |
|
12.37 |
|
Jackpot |
|
70-95 |
|
06/22/2023 |
And |
|
202.55 |
|
212.55 |
|
10.00 |
|
1.88 |
|
Everest |
|
40-70 |
|
06/22/2023 |
NFGC-23-1423 |
|
20.40 |
|
23.10 |
|
2.70 |
|
146.67 |
|
Jackpot |
|
70-95 |
|
09/05/2023 |
Including |
|
20.40 |
|
22.50 |
|
2.10 |
|
188.10 |
|
Jackpot |
|
70-95 |
|
09/05/2023 |
Including |
|
21.40 |
|
21.80 |
|
0.40 |
|
699.00 |
|
Jackpot |
|
70-95 |
|
09/05/2023 |
Including |
|
22.10 |
|
22.50 |
|
0.40 |
|
241.00 |
|
Jackpot |
|
70-95 |
|
09/05/2023 |
NFGC-23-1425 |
|
36.90 |
|
41.00 |
|
4.10 |
|
118.73 |
|
Jackpot |
|
40-70 |
|
09/05/2023 |
Including |
|
36.90 |
|
39.00 |
|
2.10 |
|
229.71 |
|
Jackpot |
|
40-70 |
|
09/05/2023 |
NFGC-23-1447 |
|
59.20 |
|
62.05 |
|
2.85 |
|
51.93 |
|
Jackpot |
|
70-95 |
|
10/18/2023 |
Including |
|
59.20 |
|
61.10 |
|
1.90 |
|
77.82 |
|
Jackpot |
|
70-95 |
|
10/18/2023 |
NFGC-23-1488 |
|
108.20 |
|
117.65 |
|
9.45 |
|
3.01 |
|
Jackpot |
|
40-70 |
|
10/18/2023 |
Including |
|
110.00 |
|
110.70 |
|
0.70 |
|
25.70 |
|
Jackpot |
|
40-70 |
|
10/18/2023 |
NFGC-23-1505 |
|
76.75 |
|
79.75 |
|
3.00 |
|
18.93 |
|
Jackpot |
|
70-95 |
|
10/18/2023 |
Including |
|
78.90 |
|
79.75 |
|
0.85 |
|
61.78 |
|
Jackpot |
|
70-95 |
|
10/18/2023 |
NFGC-23-1523 |
|
79.25 |
|
86.00 |
|
6.75 |
|
18.23 |
|
Jackpot |
|
70-95 |
|
11/14/2023 |
Including |
|
79.25 |
|
80.80 |
|
1.55 |
|
73.76 |
|
Jackpot |
|
70-95 |
|
11/14/2023 |
NFGC-23-1627 |
|
156.85 |
|
160.50 |
|
3.65 |
|
11.27 |
|
Jackpot |
|
70-95 |
|
04/17/2024 |
Including |
|
159.95 |
|
160.50 |
|
0.55 |
|
67.60 |
|
Jackpot |
|
70-95 |
|
04/17/2024 |
Infill veining in secondary structures with multiple orientations crosscutting the primary host structures are commonly observed in drill core which could result in additional uncertainty in true width. As of March 1, 2023, composite intervals reported carry a minimum weighted average of 1 g/t Au diluted over a minimum core length of 2 m with a maximum of 4 m consecutive dilution when at depths above 200 m vertical depth and 2 m consecutive dilution when below 200 m vertical depth. Prior to this date, all composites allowed for 2 m consecutive dilution. Included high-grade intercepts are reported as any consecutive interval with grades greater than 10 g/t Au. Grades have not been capped in the averaging and intervals are reported as drill thickness.
Hole No. |
|
Azimuth (°) |
|
Dip (°) |
|
Length (m) |
|
UTM E |
|
UTM N |
|
Prospect |
NFGC-23-1292 |
|
300 |
|
-45 |
|
249 |
|
659421 |
|
5429886 |
|
Jackpot |
NFGC-23-1423 |
|
0 |
|
-71 |
|
72 |
|
659418 |
|
5429888 |
|
Jackpot |
NFGC-23-1425 |
|
270 |
|
-72 |
|
74 |
|
659417 |
|
5429884 |
|
Jackpot |
NFGC-23-1447 |
|
340 |
|
-62 |
|
99 |
|
659393 |
|
5429840 |
|
Jackpot |
NFGC-23-1488 |
|
14 |
|
-60 |
|
177 |
|
659394 |
|
5429803 |
|
Jackpot |
NFGC-23-1505 |
|
355 |
|
-48 |
|
111 |
|
659372 |
|
5429801 |
|
Jackpot |
NFGC-23-1523 |
|
12 |
|
-65 |
|
138 |
|
659413 |
|
5429830 |
|
Jackpot |
NFGC-23-1627 |
|
356 |
|
-60 |
|
189 |
|
659369 |
|
5429743 |
|
Jackpot |
- 55 -
|
Management’s Discussion and Analysis For the years ended December 31, 2024 and 2023 |
The latest results from Jackpot Zone are shown in the long section below:
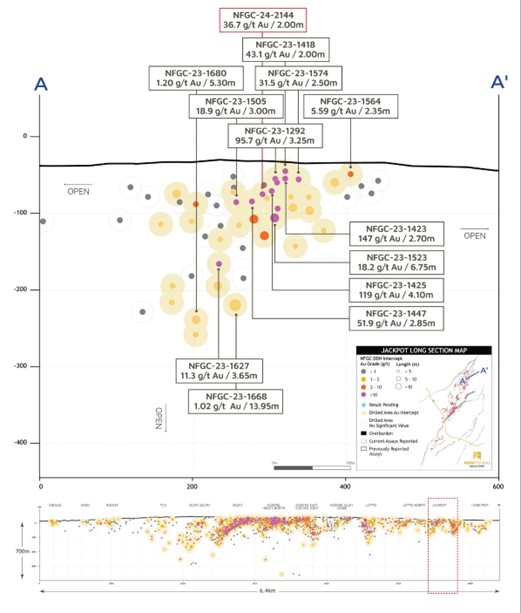
Queensway Project – Jackpot long section, looking north (October 24, 2024)
Honeypot Drilling
On January 10, 2024, the Company announced the discovery of a new zone, “Honeypot”, located 230 m north of Jackpot and 1.3 km north of Lotto. This discovery was made as a result of a follow-up drill program testing a mineralized fault that was initially identified by grid drilling. A near-surface, brittle fault structure was intersected exhibiting characteristics similar to other epizonal high-grade, gold bearing faults that occur along this segment of the AFZ. Honeypot has a similar east-northeast striking and steeply dipping orientation to the neighbouring Jackpot Zone. Gold found at Honeypot is hosted within a primary fault that has been drill-defined over a strike length of 280 m and to a depth of 190 m. The high-grade domain shows good continuity as demonstrated by several of the highlight intervals summarized in the table below.
- 56 -
|
Management’s Discussion and Analysis For the years ended December 31, 2024 and 2023 |
2024 assay results have been reported in a press release dated January 10, 2024 and October 24, 2024. All previous and 2024 press releases can be found under the Company’s profile on SEDAR+ at www.sedarplus.ca.
Highlighted assay values and drill hole locations from Honeypot drilling are shown in the tables below:
Hole No. |
|
From (m) |
|
To (m) |
|
Length (m) |
|
Au (g/t) |
|
Zone |
|
True Width (%) |
|
Date Released |
NFGC-23-1796 |
|
79.80 |
|
90.70 |
|
10.90 |
|
3.67 |
|
Honeypot |
|
70-95 |
|
04/17/2024 |
Including |
|
80.35 |
|
80.90 |
|
0.55 |
|
25.60 |
|
Honeypot |
|
70-95 |
|
04/17/2024 |
NFGC-23-1806A |
|
57.70 |
|
62.20 |
|
4.50 |
|
7.25 |
|
Honeypot |
|
70-95 |
|
04/17/2024 |
Including |
|
57.70 |
|
58.60 |
|
0.90 |
|
12.05 |
|
Honeypot |
|
70-95 |
|
04/17/2024 |
Including |
|
59.05 |
|
60.00 |
|
0.95 |
|
17.15 |
|
Honeypot |
|
70-95 |
|
04/17/2024 |
NFGC-23-1810 |
|
122.85 |
|
130.50 |
|
7.65 |
|
26.35 |
|
Honeypot |
|
70-95 |
|
01/10/2024 |
Including |
|
123.60 |
|
125.40 |
|
1.80 |
|
101.72 |
|
Honeypot |
|
70-95 |
|
01/10/2024 |
Including |
|
126.30 |
|
126.75 |
|
0.45 |
|
24.06 |
|
Honeypot |
|
70-95 |
|
01/10/2024 |
NFGC-23-1828 |
|
168.00 |
|
182.70 |
|
14.70 |
|
2.05 |
|
Honeypot |
|
70-95 |
|
01/10/2024 |
NFGC-23-1908 |
|
191.05 |
|
200.10 |
|
9.05 |
|
1.41 |
|
Honeypot |
|
40-70 |
|
01/10/2024 |
NFGC-23-1931 |
|
208.00 |
|
213.25 |
|
5.25 |
|
23.05 |
|
Honeypot |
|
40-70 |
|
01/10/2024 |
Including |
|
208.75 |
|
209.20 |
|
0.45 |
|
71.42 |
|
Honeypot |
|
40-70 |
|
01/10/2024 |
Including |
|
210.10 |
|
211.10 |
|
1.00 |
|
67.99 |
|
Honeypot |
|
40-70 |
|
01/10/2024 |
Including |
|
211.80 |
|
212.80 |
|
1.00 |
|
11.39 |
|
Honeypot |
|
40-70 |
|
01/10/2024 |
NFGC-24-2063 |
|
167.35 |
|
172.35 |
|
5.00 |
|
14.83 |
|
Honeypot |
|
Unknown |
|
04/17/2024 |
Including |
|
167.35 |
|
168.25 |
|
0.90 |
|
70.06 |
|
Honeypot |
|
Unknown |
|
04/17/2024 |
NFGC-24-21192 |
|
159.90 |
|
166.05 |
|
6.15 |
|
5.20 |
|
Honeypot |
|
40-70 |
|
10/24/2024 |
Including |
|
159.90 |
|
160.55 |
|
0.65 |
|
15.32 |
|
Honeypot |
|
40-70 |
|
10/24/2024 |
Including |
|
162.85 |
|
163.60 |
|
0.75 |
|
11.93 |
|
Honeypot |
|
40-70 |
|
10/24/2024 |
NFGC-24-21291 |
|
83.70 |
|
87.80 |
|
4.10 |
|
8.44 |
|
Honeypot |
|
70-95 |
|
10/24/2024 |
Including |
|
86.80 |
|
87.80 |
|
1.00 |
|
23.59 |
|
Honeypot |
|
70-95 |
|
10/24/2024 |
NFGC-24-21441 |
|
56.00 |
|
58.00 |
|
2.00 |
|
36.74 |
|
Jackpot |
|
70-95 |
|
10/24/2024 |
Including |
|
56.00 |
|
57.00 |
|
1.00 |
|
73.31 |
|
Jackpot |
|
70-95 |
|
10/24/2024 |
Infill veining in secondary structures with multiple orientations crosscutting the primary host structures are commonly observed in drill core which could result in additional uncertainty in true width. As of March 1, 2023, composite intervals reported carry a minimum weighted average of 1 g/t Au diluted over a minimum core length of 2 m with a maximum of 4 m consecutive dilution when at depths above 200 m vertical depth and 2 m consecutive dilution when below 200 m vertical depth. Prior to this date, all composites allowed for 2 m consecutive dilution. Included high-grade intercepts are reported as any consecutive interval with grades greater than 10 g/t Au. Grades have not been capped in the averaging and intervals are reported as drill thickness.
Hole No. |
|
Azimuth (°) |
|
Dip (°) |
|
Length (m) |
|
UTM E |
|
UTM N |
|
Prospect |
NFGC-23-1796 |
|
351 |
|
-63 |
|
116 |
|
659435 |
|
5430057 |
|
Honeypot |
NFGC-23-1806A |
|
293 |
|
-57 |
|
92 |
|
659437 |
|
5430057 |
|
Honeypot |
NFGC-23-1810 |
|
297 |
|
-50 |
|
170 |
|
659521 |
|
5430060 |
|
Honeypot |
NFGC-23-1828 |
|
299 |
|
-45.5 |
|
230 |
|
659565 |
|
5430035 |
|
Honeypot |
NFGC-23-1908 |
|
300 |
|
-58 |
|
219 |
|
659566 |
|
5430034 |
|
Honeypot |
NFGC-23-1931 |
|
301 |
|
-63.5 |
|
240 |
|
659567 |
|
5430033 |
|
Honeypot |
NFGC-24-2063 |
|
282 |
|
-71.5 |
|
200 |
|
659554 |
|
5430100 |
|
Honeypot |
NFGC-24-2119 |
|
335 |
|
-57 |
|
200 |
|
659565 |
|
5430036 |
|
Honeypot |
NFGC-24-2129 |
|
338 |
|
-52 |
|
137 |
|
659554 |
|
5430101 |
|
Honeypot |
NFGC-24-2144 |
|
305 |
|
-47.5 |
|
337 |
|
659426 |
|
5429856 |
|
Jackpot |
- 57 -
|
Management’s Discussion and Analysis For the years ended December 31, 2024 and 2023 |
Results from Honeypot are shown in the long section below:
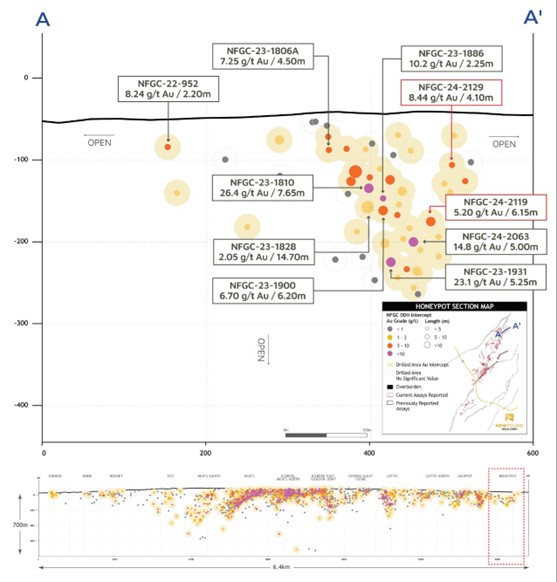
Queensway Project – Honeypot long section, looking north (October 24, 2024)
- 58 -
|
Management’s Discussion and Analysis For the years ended December 31, 2024 and 2023 |
K2 Drilling
On January 10, 2023, the Company reported the intersection of broad gold mineralization west of the AFZ and in close proximity to the Zone 36 prospect during systematic drilling stepping north of Lotto North. This interval graded 3.63 g/t Au over 9.50 m in NFGC-22-816. In light of the recent discovery at Keats West, the first major discovery made west of the AFZ, exploration drilling had shifted to targeting two structures identified in a lineament study that had orientations similar to the KBFZ. This work led to the discoveries of K2 and Monte Carlo announced on May 10, 2023. The K2 Fault is located 725 m north of Lotto on the west side of the AFZ, adjacent to Zone 36.
Ongoing exploration at K2 has identified a significant structural zone made up of multiple structures and crosscutting vein orientations, that currently has a defined mineralized footprint of 490 m long by 395 m wide. The gold mineralization begins at surface and has been drill-defined down to a maximum vertical depth of 250 m, where it remains open and untested. Much of the gold at K2 is found in the “K2 Main” structure (shown in red in the figure below), a low-angle gold-bearing fault zone starting at surface that dips 30-40° to the southeast which shares a similar dip to Keats West and strike to the Keats-Baseline Fault Zone. This complex network of associated structures forms a mineralized damage zone that averages 65 m in thickness.
The K2 structure is interpreted as the master structure whereas the previously discussed “Zone 36” is a related vein occurring in close proximity that was originally exposed in trenching.
One such vein constituent of the greater K2 structure is “Stibnite” vein that has returned several significant intervals, a selection of which are summarized in the table below. Stibnite is a near-surface high-grade vein that has been traced over a current strike length of 105 m. This vein contains significant amounts of stibnite, an antimony-bearing sulphide mineral as reflected by the antimony assay results of 0.95% Sb over 12.95 m in NFGC-23-1303, and 0.04% Sb over 3.90 m in NFGC-23-1391. This is the first time this mineral association has been observed at Queensway North.
The network of cross-cutting veins form thick domains of gold mineralization which is well demonstrated by several highlight intervals hosted by the K2 Main structure including 5.58 g/t Au over 12.35 m in NFGC-23-1733 located just 29 m from surface, 3.23 g/t Au over 17.65 m, 1.45 g/t Au over 17.25 m and 1.60 g/t Au over 10.45 m in NFGC-23-1552, located a further 220 m down-dip, and 5.28 g/t Au over 10.75 m in NFGC-23-1626 situated 230 m along strike (all reported on November 8, 2023).
Deep drilling at K2 reported in July 2024, designed to test both the deep extension of the K2 Main gold structure and a seismic target in a region where the Glenwood Shear Zone (‘GSZ’) is interpreted to intersect the AFZ was successful in both extending the K2 structure to depth and identifying a new zone immediately west of the AFZ in close proximity to the GSZ. NFGC-24-2094 intersected at a vertical depth of 296 m, a domain with an increased percentage of mineralized stacked quartz veinlets transitioning to thicker and more massive stylolitic veins, typical of the K2 mineralization style. This interval of 13 m starts at 334 m downhole and grades 1.11 g/t Au over 2.30 m, with anomalous gold throughout. This is interpreted to be the deep down-dip extension of the K2 Zone, extending it by 220 m down-dip. This same hole identified a broad low-grade domain in the hanging wall to the AFZ near the AFZ-GSZ intersection comprised of a significant deformation zone with an abundance of quartz veinlets grading 1.50 g/t Au over 7.00 m at a vertical depth of 555 m.
K2 has been drill-defined to a maximum depth of 296 m vertical, where it remains open and untested. K2 also indicates high-grade potential, and exploration drilling is required to further define these high-grade gold-bearing cross-cutting structures and where they interact with the main K2 Main.
2024 assay results have been reported in press releases January 31, 2024, April 10, 2024, and July 11, 2024. All previous and 2024 press releases can be found under the Company’s profile on SEDAR+ at www.sedarplus.ca.
- 59 -
|
Management’s Discussion and Analysis For the years ended December 31, 2024 and 2023 |
Highlighted assay values and drill hole locations from K2 drilling are shown in the tables below:
Hole No. |
|
From (m) |
|
To (m) |
|
Length (m) |
|
Au (g/t) |
|
Zone |
|
True Width (%) |
|
Date Released |
NFGC-22-898 |
|
176.00 |
|
187.00 |
|
11.00 |
|
3.00 |
|
K2 |
|
40-70 |
|
05/10/2023 |
Including |
|
182.20 |
|
183.00 |
|
0.80 |
|
14.80 |
|
K2 |
|
40-70 |
|
05/10/2023 |
NFGC-22-928 |
|
16.40 |
|
38.35 |
|
21.95 |
|
2.22 |
|
K2 |
|
40-70 |
|
11/29/2023 |
Including |
|
27.50 |
|
28.50 |
|
1.00 |
|
19.71 |
|
K2 |
|
40-70 |
|
11/29/2023 |
And |
|
46.45 |
|
58.00 |
|
11.55 |
|
1.92 |
|
K2 |
|
70-95 |
|
11/29/2023 |
NFGC-22-986 |
|
43.70 |
|
62.50 |
|
18.80 |
|
1.44 |
|
K2 |
|
10-40 |
|
05/10/2023 |
NFGC-23-1303 |
|
22.35 |
|
35.30 |
|
12.95 |
|
4.50 |
|
K2 |
|
70-95 |
|
08/28/2023 |
Including |
|
23.20 |
|
24.35 |
|
1.15 |
|
21.12 |
|
K2 |
|
70-95 |
|
08/28/2023 |
Including |
|
25.00 |
|
25.45 |
|
0.45 |
|
12.05 |
|
K2 |
|
70-95 |
|
08/28/2023 |
NFGC-23-1426 |
|
29.05 |
|
51.00 |
|
21.95 |
|
1.77 |
|
K2 |
|
70-95 |
|
11/29/2023 |
NFGC-23-1552 |
|
222.20 |
|
239.85 |
|
17.65 |
|
3.23 |
|
K2 |
|
40-70 |
|
11/29/2023 |
Including |
|
227.55 |
|
228.30 |
|
0.75 |
|
25.20 |
|
K2 |
|
40-70 |
|
11/29/2023 |
And |
|
246.10 |
|
256.55 |
|
10.45 |
|
1.60 |
|
K2 |
|
40-70 |
|
11/29/2023 |
And |
|
266.05 |
|
283.30 |
|
17.25 |
|
1.45 |
|
K2 |
|
10-40 |
|
11/29/2023 |
NFGC-23-1626 |
|
28.30 |
|
39.05 |
|
10.75 |
|
5.28 |
|
K2 |
|
70-95 |
|
11/29/2023 |
Including |
|
37.65 |
|
39.05 |
|
1.40 |
|
30.88 |
|
K2 |
|
70-95 |
|
11/29/2023 |
NFGC-23-1630 |
|
58.20 |
|
66.10 |
|
7.90 |
|
4.92 |
|
K2 |
|
70-95 |
|
01/31/2024 |
Including |
|
58.20 |
|
58.55 |
|
0.35 |
|
26.50 |
|
K2 |
|
70-95 |
|
01/31/2024 |
And |
|
129.75 |
|
153.20 |
|
23.45 |
|
1.82 |
|
K2 |
|
70-95 |
|
01/31/2024 |
NFGC-23-1636 |
|
264.60 |
|
281.00 |
|
16.40 |
|
2.79 |
|
K2 |
|
70-95 |
|
11/29/2023 |
Including |
|
265.25 |
|
266.00 |
|
0.75 |
|
10.28 |
|
K2 |
|
70-95 |
|
11/29/2023 |
Including |
|
270.70 |
|
271.50 |
|
0.80 |
|
10.18 |
|
K2 |
|
70-95 |
|
11/29/2023 |
NFGC-23-1647 |
|
204.30 |
|
207.00 |
|
2.70 |
|
27.68 |
|
K2 |
|
Unknown |
|
04/10/2024 |
Including |
|
205.00 |
|
205.60 |
|
0.60 |
|
124.50 |
|
K2 |
|
Unknown |
|
04/10/2024 |
And |
|
223.80 |
|
237.65 |
|
13.85 |
|
3.26 |
|
K2 |
|
70-95 |
|
04/10/2024 |
Including |
|
223.80 |
|
224.55 |
|
0.75 |
|
24.50 |
|
K2 |
|
70-95 |
|
04/10/2024 |
NFGC-23-1729 |
|
55.20 |
|
62.20 |
|
7.00 |
|
27.49 |
|
K2 |
|
70-95 |
|
01/31/2024 |
Including |
|
55.20 |
|
55.70 |
|
0.50 |
|
370.00 |
|
K2 |
|
70-95 |
|
01/31/2024 |
NFGC-23-1733 |
|
35.30 |
|
47.65 |
|
12.35 |
|
5.58 |
|
K2 |
|
70-95 |
|
11/29/2023 |
- 60 -
|
Management’s Discussion and Analysis For the years ended December 31, 2024 and 2023 |
Including |
|
35.30 |
|
36.20 |
|
0.90 |
|
19.95 |
|
K2 |
|
70-95 |
|
11/29/2023 |
Including |
|
40.70 |
|
41.45 |
|
0.75 |
|
13.86 |
|
K2 |
|
70-95 |
|
11/29/2023 |
Including |
|
46.75 |
|
47.65 |
|
0.90 |
|
29.47 |
|
K2 |
|
70-95 |
|
11/29/2023 |
NFGC-23-1783 |
|
10.40 |
|
35.70 |
|
25.30 |
|
3.48 |
|
K2 |
|
40-70 |
|
01/31/2024 |
Including |
|
10.40 |
|
11.00 |
|
0.60 |
|
12.50 |
|
K2 |
|
40-70 |
|
01/31/2024 |
Including |
|
12.90 |
|
13.20 |
|
0.30 |
|
42.30 |
|
K2 |
|
40-70 |
|
01/31/2024 |
And |
|
55.00 |
|
57.40 |
|
2.40 |
|
21.96 |
|
K2 |
|
70-95 |
|
01/31/2024 |
Including |
|
56.00 |
|
56.40 |
|
0.40 |
|
130.50 |
|
K2 |
|
70-95 |
|
01/31/2024 |
NFGC-23-1786 |
|
29.45 |
|
41.70 |
|
12.25 |
|
8.69 |
|
K2 |
|
70-95 |
|
01/31/2024 |
Including |
|
29.45 |
|
30.15 |
|
0.70 |
|
18.54 |
|
K2 |
|
70-95 |
|
01/31/2024 |
Including |
|
30.75 |
|
31.40 |
|
0.65 |
|
90.69 |
|
K2 |
|
70-95 |
|
01/31/2024 |
Including |
|
32.25 |
|
33.25 |
|
1.00 |
|
13.40 |
|
K2 |
|
70-95 |
|
01/31/2024 |
NFGC-23-1904 |
|
72.35 |
|
90.80 |
|
18.45 |
|
3.14 |
|
K2 |
|
10-40 |
|
01/31/2024 |
Including |
|
86.60 |
|
87.45 |
|
0.85 |
|
17.40 |
|
K2 |
|
10-40 |
|
01/31/2024 |
And |
|
145.30 |
|
162.05 |
|
16.75 |
|
1.00 |
|
K2 |
|
Unknown |
|
01/31/2024 |
NFGC-23-1951 |
|
179.00 |
|
194.65 |
|
15.65 |
|
1.71 |
|
K2 |
|
70-95 |
|
04/10/2024 |
NFGC-23-1986 |
|
85.85 |
|
88.35 |
|
2.50 |
|
16.01 |
|
K2 |
|
70-95 |
|
04/10/2024 |
Including |
|
85.85 |
|
86.15 |
|
0.30 |
|
130.14 |
|
K2 |
|
70-95 |
|
04/10/2024 |
And |
|
167.70 |
|
181.15 |
|
13.45 |
|
17.77 |
|
K2 |
|
40-70 |
|
04/10/2024 |
Including |
|
172.15 |
|
174.30 |
|
2.15 |
|
93.96 |
|
K2 |
|
40-70 |
|
04/10/2024 |
Including |
|
180.80 |
|
181.15 |
|
0.35 |
|
17.02 |
|
K2 |
|
40-70 |
|
04/10/2024 |
NFGC-23-1997 |
|
233.15 |
|
237.75 |
|
4.60 |
|
12.69 |
|
K2 |
|
Unknown |
|
04/10/2024 |
Including |
|
233.15 |
|
234.10 |
|
0.95 |
|
32.36 |
|
K2 |
|
Unknown |
|
04/10/2024 |
Including |
|
234.65 |
|
235.15 |
|
0.50 |
|
27.10 |
|
K2 |
|
Unknown |
|
04/10/2024 |
And |
|
243.40 |
|
290.60 |
|
47.20 |
|
1.23 |
|
K2 |
|
70-95 |
|
04/10/2024 |
NFGC-23-2004 |
|
152.20 |
|
172.00 |
|
19.80 |
|
1.27 |
|
K2 |
|
70-95 |
|
04/10/2024 |
NFGC-24-2010 |
|
53.70 |
|
74.00 |
|
20.30 |
|
2.90 |
|
K2 |
|
70-95 |
|
04/10/2024 |
Including |
|
60.90 |
|
61.25 |
|
0.35 |
|
24.34 |
|
K2 |
|
70-95 |
|
04/10/2024 |
Including |
|
62.00 |
|
62.35 |
|
0.35 |
|
10.54 |
|
K2 |
|
70-95 |
|
04/10/2024 |
NFGC-24-2094 |
|
594.20 |
|
601.20 |
|
7.00 |
|
1.50 |
|
Deep Seismic Target |
|
Unknown |
|
07/11/2024 |
Infill veining in secondary structures with multiple orientations crosscutting the primary host structures are commonly observed in drill core which could result in additional uncertainty in true width. Composite intervals reported carry a minimum weighted average of 1 g/t Au diluted over a minimum core length of 2 m with a maximum of 4 m consecutive dilution when above 200 m vertical depth and 2 m consecutive dilution when below 200 m vertical depth. Included high-grade intercepts are reported as any consecutive interval with grades greater than 10 g/t Au. Grades have not been capped in the averaging and intervals are reported as drill thickness.
- 61 -
|
Management’s Discussion and Analysis For the years ended December 31, 2024 and 2023 |
Hole No. |
|
Azimuth (°) |
|
Dip (°) |
|
Length (m) |
|
UTM E |
|
UTM N |
|
Prospect |
NFGC-22-898 |
|
260 |
|
-44 |
|
230 |
|
658965 |
|
5429766 |
|
K2 |
NFGC-22-928 |
|
300 |
|
-45 |
|
206 |
|
659051 |
|
5429922 |
|
K2 |
NFGC-22-986 |
|
330 |
|
-45 |
|
308 |
|
658965 |
|
5429767 |
|
K2 |
NFGC-23-1303 |
|
345 |
|
-60 |
|
227 |
|
658956 |
|
5430041 |
|
K2 |
NFGC-23-1426 |
|
345 |
|
-45 |
|
98 |
|
659082 |
|
5430012 |
|
K2 |
NFGC-23-1552 |
|
300 |
|
-45 |
|
338 |
|
659160 |
|
5429773 |
|
K2 |
NFGC-23-1626 |
|
345 |
|
-45 |
|
130 |
|
658893 |
|
5429932 |
|
K2 |
NFGC-23-1630 |
|
345 |
|
-64 |
|
176 |
|
659018 |
|
5429881 |
|
K2 |
NFGC-23-1647 |
|
300 |
|
-45 |
|
260 |
|
659100 |
|
5429749 |
|
K2 |
NFGC-23-1636 |
|
300 |
|
-47 |
|
296 |
|
659139 |
|
5429668 |
|
K2 |
NFGC-23-1729 |
|
0 |
|
-45 |
|
110 |
|
659064 |
|
5429990 |
|
K2 |
NFGC-23-1733 |
|
0 |
|
-45 |
|
110 |
|
659104 |
|
5429987 |
|
K2 |
NFGC-23-1783 |
|
20 |
|
-50 |
|
95 |
|
659052 |
|
5430044 |
|
K2 |
NFGC-23-1786 |
|
75 |
|
-45 |
|
131 |
|
659091 |
|
5430008 |
|
K2 |
NFGC-23-1904 |
|
17 |
|
-58 |
|
206 |
|
658913 |
|
5429819 |
|
K2 |
NFGC-23-1951 |
|
48 |
|
-46 |
|
245 |
|
658843 |
|
5429662 |
|
K2 |
NFGC-23-1986 |
|
39 |
|
-46 |
|
194 |
|
658867 |
|
5429772 |
|
K2 |
NFGC-23-1997 |
|
60 |
|
-45.5 |
|
302 |
|
658829 |
|
5429766 |
|
K2 |
NFGC-23-2004 |
|
77 |
|
-51 |
|
239 |
|
658829 |
|
5429765 |
|
K2 |
NFGC-24-2010 |
|
13 |
|
-45 |
|
167 |
|
658900 |
|
5429829 |
|
K2 |
NFGC-24-2094 |
|
62 |
|
-67 |
|
641 |
|
658671 |
|
5429398 |
|
K2 |
- 62 -
|
Management’s Discussion and Analysis For the years ended December 31, 2024 and 2023 |
Results from K2 are shown in plan map, 3D view, cross-section, and long section below:
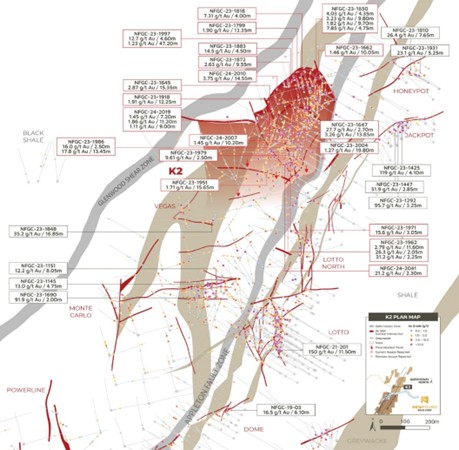
Queensway Project – K2 area plan map (April 10, 2024)
- 63 -
|
Management’s Discussion and Analysis For the years ended December 31, 2024 and 2023 |
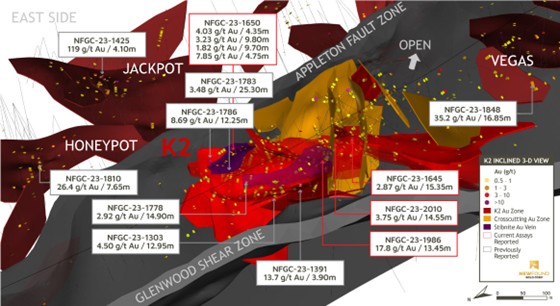
Queensway Project – K2 inclined 3D view, looking southeast (April 10, 2024)
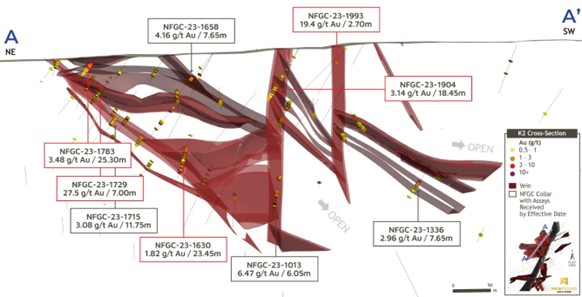
Queensway Project – K2 3D cross-section, +/-25m, looking southeast (January 31, 2024)
- 64 -
|
Management’s Discussion and Analysis For the years ended December 31, 2024 and 2023 |
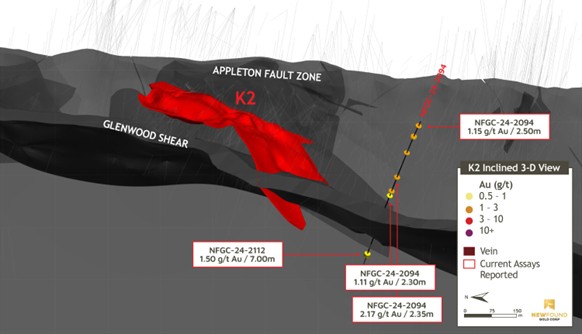
Queensway Project- Inclined 3D view of K2 with only the K2 Main structure visible and NFGC-24-2094 (July 11, 2024)
- 65 -
|
Management’s Discussion and Analysis For the years ended December 31, 2024 and 2023 |
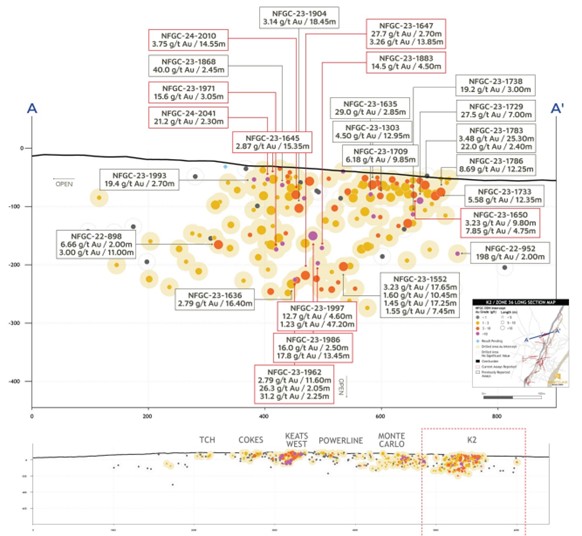
Queensway Project – K2 long section, looking north (April 10, 2024)
- 66 -
|
Management’s Discussion and Analysis For the years ended December 31, 2024 and 2023 |
Monte Carlo, Powerline, and Vegas Drilling
On May 10, 2023, the Company announced another new discovery on the west side of the AFZ a further 850 m south of K2, a zone now named “Monte Carlo”. The discovery high-grade results of 12.3 g/t Au over 8.05 m in NFGC-23-1151 and 13.0 g/t Au over 4.75 m in NFGC-23-1145 were found to be hosted by an east-west striking brittle fault zone.
Targeted follow-up drilling has since intersected multiple high-grade gold intervals which are summarized in the table below. The Monte Carlo structure has a strike length of 520 m with a depth extent of 160 m vertical while the high-grade segment spans 185 m of strike.
Exploration work at Monte Carlo has focussed on expanding the highest-grade segment of the fault down dip.
On February 29, 2024, the Company introduced the discovery of a new zone now named “Vegas” which is located midway between the Monte Carlo and K2 zones on the west side of the AFZ. The high-grade highlight intercept from Vegas of 35.2 g/t Au over 16.85 m in NFGC-23-1848 includes an elevated high-grade sample running 1,910 g/t Au over 0.30 m that exhibits significant visible gold over a 3 cm length. Vegas was discovered through reconnaissance grid drilling and subsequent, follow-up drilling has had difficulty expanding on these high-grade results.
Also announced on February 29, 2024, the Company introduced the “Powerline” Zone which was discovered through reconnaissance grid drilling (West Grid) on the west side of the AFZ a further 800 metres south of Monte Carlo. Drilling encountered a broad gold mineralized shallowly northeast-dipping shear zone with characteristics similar to the neighbouring Keats West Zone. Powerline was first intercepted by grid drilling that returned the highlight intervals of 3.32 g/t Au over 7.00 m and 1.85 m over 6.30 m in NFGC-23-1321. Targeted follow-up drilling intercepted 1.80 g/t Au over 10.55 m in NFGC-23-1884, found 50 m along strike of the initial discovery. Highly anomalous and low-grade mineralization has been defined over a current strike length of 350 m at Powerline and testing has only occurred at shallow depths.
2024 assay results have been reported in a press release dated February 29, 2024. All previous and 2024 press releases can be found under the Company’s profile on SEDAR+ at www.sedarplus.ca.
- 67 -
|
Management’s Discussion and Analysis For the years ended December 31, 2024 and 2023 |
Highlighted assay values and drill hole locations from Monte Carlo, Powerline and Vegas are shown in the tables below:
Hole No. |
|
From (m) |
|
To (m) |
|
Length (m) |
|
Au (g/t) |
|
Zone |
|
True Width (%) |
|
Date Released |
NFGC-22-1064 |
|
86.55 |
|
88.55 |
|
2.00 |
|
25.77 |
|
Monte Carlo |
|
70-95 |
|
02/29/2024 |
Including |
|
87.40 |
|
87.90 |
|
0.50 |
|
92.51 |
|
Monte Carlo |
|
70-95 |
|
02/29/2024 |
NFGC-23-1135 |
|
49.30 |
|
55.55 |
|
6.25 |
|
7.49 |
|
Monte Carlo |
|
70-95 |
|
10/11/2023 |
Including |
|
49.30 |
|
49.65 |
|
0.35 |
|
40.00 |
|
Monte Carlo |
|
70-95 |
|
10/11/2023 |
Including |
|
54.30 |
|
55.05 |
|
0.75 |
|
33.00 |
|
Monte Carlo |
|
70-95 |
|
10/11/2023 |
NFGC-23-1145 |
|
61.80 |
|
66.55 |
|
4.75 |
|
13.04 |
|
Monte Carlo |
|
70-95 |
|
05/10/2023 |
Including |
|
61.80 |
|
62.35 |
|
0.55 |
|
79.90 |
|
Monte Carlo |
|
70-95 |
|
05/10/2023 |
Including |
|
64.15 |
|
64.55 |
|
0.40 |
|
20.10 |
|
Monte Carlo |
|
70-95 |
|
05/10/2023 |
NFGC-23-1151 |
|
63.25 |
|
71.30 |
|
8.05 |
|
12.21 |
|
Monte Carlo |
|
40-70 |
|
05/10/2023 |
Including |
|
65.00 |
|
65.60 |
|
0.60 |
|
51.30 |
|
Monte Carlo |
|
40-70 |
|
05/10/2023 |
Including |
|
67.70 |
|
68.10 |
|
0.40 |
|
111.00 |
|
Monte Carlo |
|
40-70 |
|
05/10/2023 |
NFGC-23-1321 |
|
46.00 |
|
53.00 |
|
7.00 |
|
3.32 |
|
Powerline |
|
40-70 |
|
02/29/2024 |
NFGC-23-1673 |
|
59.45 |
|
66.70 |
|
7.25 |
|
6.87 |
|
Monte Carlo |
|
40-70 |
|
02/29/2024 |
Including |
|
61.00 |
|
62.25 |
|
1.25 |
|
27.76 |
|
Monte Carlo |
|
40-70 |
|
02/29/2024 |
NFGC-23-1683 |
|
36.20 |
|
38.25 |
|
2.05 |
|
23.52 |
|
Monte Carlo |
|
70-95 |
|
10/11/2023 |
Including |
|
36.20 |
|
36.75 |
|
0.55 |
|
80.95 |
|
Monte Carlo |
|
70-95 |
|
10/11/2023 |
And |
|
51.55 |
|
54.25 |
|
2.70 |
|
18.85 |
|
Monte Carlo |
|
70-95 |
|
10/11/2023 |
Including |
|
52.00 |
|
52.35 |
|
0.35 |
|
131.10 |
|
Monte Carlo |
|
70-95 |
|
10/11/2023 |
NFGC-23-1690 |
|
166.75 |
|
168.75 |
|
2.00 |
|
91.86 |
|
Monte Carlo |
|
40-70 |
|
10/11/2023 |
Including |
|
166.75 |
|
167.85 |
|
1.10 |
|
166.89 |
|
Monte Carlo |
|
40-70 |
|
10/11/2023 |
NFGC-23-1848 |
|
89.70 |
|
106.55 |
|
16.85 |
|
35.24 |
|
Vegas |
|
70-95 |
|
02/29/2024 |
Including |
|
97.40 |
|
97.70 |
|
0.30 |
|
1,910.00 |
|
Vegas |
|
70-95 |
|
02/29/2024 |
NFGC-23-1884 |
|
43.00 |
|
53.55 |
|
10.55 |
|
1.80 |
|
Powerline |
|
40-70 |
|
02/29/2024 |
Infill veining in secondary structures with multiple orientations crosscutting the primary host structures are commonly observed in drill core which could result in additional uncertainty in true width. As of March 1, 2023, composite intervals reported carry a minimum weighted average of 1 g/t Au diluted over a minimum core length of 2 m with a maximum of 4m consecutive dilution when at depths above 200 m vertical depth and 2 m consecutive dilution when below 200 m vertical depth. Prior to this date, all composites allowed for 2 m consecutive dilution. Included high-grade intercepts are reported as any consecutive interval with grades greater than 10 g/t Au. Grades have not been capped in the averaging and intervals are reported as drill thickness.
Hole No. |
|
Azimuth (°) |
|
Dip (°) |
|
Length (m) |
|
UTM E |
|
UTM N |
|
Prospect |
NFGC-22-1064 |
|
330 |
|
-50 |
|
137 |
|
658589 |
|
5429172 |
|
Monte Carlo |
NFGC-23-1135 |
|
332 |
|
-45 |
|
185 |
|
658657 |
|
5429192 |
|
Monte Carlo |
NFGC-23-1145 |
|
5 |
|
-42 |
|
173 |
|
658659 |
|
5429192 |
|
Monte Carlo |
NFGC-23-1151 |
|
300 |
|
-45 |
|
164 |
|
658657 |
|
5429196 |
|
Monte Carlo |
NFGC-23-1321 |
|
75 |
|
-45 |
|
251 |
|
658152 |
|
5428428 |
|
Golden Joint |
NFGC-23-1673 |
|
0 |
|
-70 |
|
110 |
|
658680 |
|
5429208 |
|
Monte Carlo |
NFGC-23-1683 |
|
0 |
|
-45 |
|
80 |
|
658625 |
|
5429206 |
|
Monte Carlo |
NFGC-23-1690 |
|
25 |
|
-45 |
|
219 |
|
658618 |
|
5429078 |
|
Monte Carlo |
NFGC-23-1848 |
|
200 |
|
-75 |
|
146 |
|
658656 |
|
5429521 |
|
Monte Carlo |
NFGC-23-1884 |
|
30 |
|
-54.5 |
|
75 |
|
658212 |
|
5428391 |
|
Golden Joint |
- 68 -
|
Management’s Discussion and Analysis For the years ended December 31, 2024 and 2023 |
The latest results from Monte Carlo, Powerline, and Vegas zones are shown in the images below:
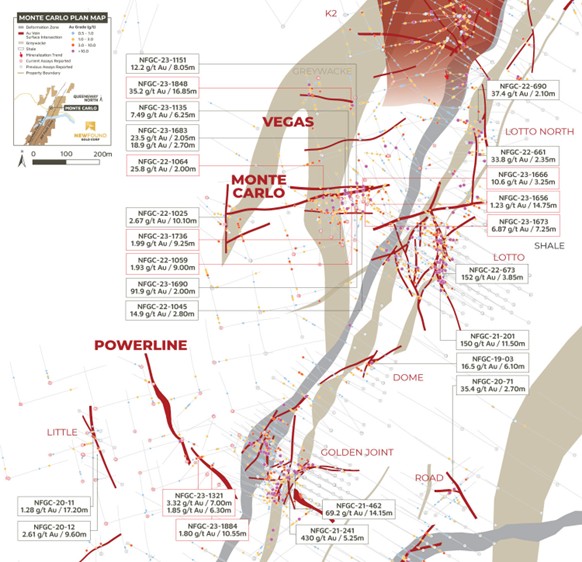
Queensway Project – Powerline to K2 plan view map (February 29, 2024)
- 69 -
|
Management’s Discussion and Analysis For the years ended December 31, 2024 and 2023 |
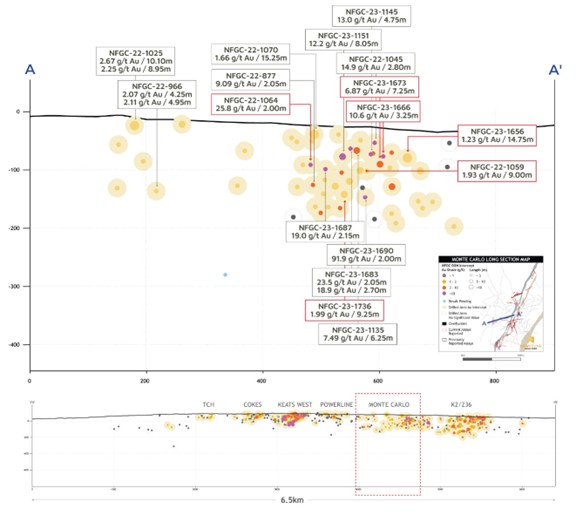
Queensway Project – Monte Carlo long section, looking northwest (February 29, 2024)
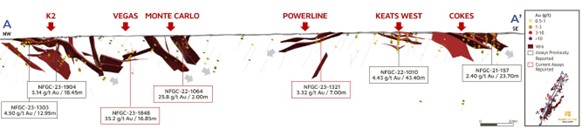
Queensway Project – 3D Cross-Section of AFZ West (looking east, +/- 35m) (February 29, 2024)
- 70 -
|
Management’s Discussion and Analysis For the years ended December 31, 2024 and 2023 |
Golden Joint Drilling
On June 30, 2021, the Company announced the discovery of a new high-grade zone in the footwall of the AFZ approximately 1 km north of Keats named the “Golden Joint” with initial highlight intervals of 10.4 g/t Au over 4.85 m in NFGC-21-171 and 430 g/t Au over 5.25 m in NFGC-21-241. Continued step-out drilling at Golden Joint rapidly expanded the zone and selection of significant intervals are summarized in the table below.
The Golden Joint prospect is comprised of two sub-parallel vein systems (Main Zone and HW Zone) and is located between the Keats and Lotto zones. Golden Joint Main Zone, consists of an approximately north-south striking, steeply west-dipping quartz vein and associated brittle fault in the footwall to the AFZ, whereas the HW Zone forms a network of stock-work style veining that is largely constrained to a thick bed of greywacke and is more distal to the AFZ. The Golden Joint Main vein carries high-grade gold mineralization and has a vertical depth of 305 m, and a strike length of 250 m. The vein has been intersected at depths as great as 385 m and remains open down-dip.
Drilling to date at the Golden Joint Hanging Wall (“HW”) Zone, located immediately east of the Golden Joint Main Zone has extended the zone over a strike length of 185 m and to a vertical depth of 150 m. A selection of highlight intervals is summarized in the table below.
A drilling program at Golden Joint utilizing a barge drill was recently completed that was designed to test the upper 100 m of the Golden Joint Zone that was not reachable from land. This program successfully expanded the Golden Joint Zone to surface and initial results received indicate strong continuity of high-grade gold to surface. The remainder of the program results were received in Q1 2024 and reported on April 17, 2024.
Golden Joint is drill defined from surface down to a vertical depth of 385 m, future exploration will focus on expanding mineralization to depth utilizing the seismic data, where it remains open.
2024 assay results have been reported in a press release dated April 17, 2024. All previous and 2024 press releases can be found under the Company’s profile on SEDAR+ at www.sedarplus.ca.
- 71 -
|
Management’s Discussion and Analysis For the years ended December 31, 2024 and 2023 |
Highlighted assay values and drill hole locations from Golden Joint drilling are shown in the tables below:
Hole No. |
|
From (m) |
|
To (m) |
|
Length (m) |
|
Au (g/) |
|
Zone |
|
True Width (%) |
|
Date Released |
NFGC-21-171 |
|
223.45 |
|
228.30 |
|
4.85 |
|
10.36 |
|
Golden Joint Main |
|
40-70 |
|
06/30/2021 |
Including |
|
225.00 |
|
226.00 |
|
1.00 |
|
41.26 |
|
Golden Joint Main |
|
40-70 |
|
06/30/2021 |
NFGC-21-225 |
|
136.9 |
|
139.00 |
|
2.10 |
|
64.94 |
|
Golden Joint HW |
|
40-70 |
|
09/30/2021 |
Including |
|
136.9 |
|
137.65 |
|
0.75 |
|
135.66 |
|
Golden Joint HW |
|
40-70 |
|
09/30/2021 |
Including |
|
138.00 |
|
139.00 |
|
1.00 |
|
34.52 |
|
Golden Joint HW |
|
40-70 |
|
06/30/2021 |
And |
|
143.00 |
|
145.45 |
|
2.45 |
|
17.43 |
|
Golden Joint HW |
|
70-95 |
|
09/30/2021 |
Including |
|
143.85 |
|
144.85 |
|
1.00 |
|
42.55 |
|
Golden Joint HW |
|
70-95 |
|
09/30/2021 |
NFGC-21-274 |
|
164.65 |
|
166.75 |
|
2.10 |
|
33.10 |
|
Golden Joint HW |
|
10-40 |
|
01/06/2022 |
Including |
|
164.65 |
|
165.80 |
|
1.15 |
|
48.41 |
|
Golden Joint HW |
|
10-40 |
|
01/06/2022 |
NFGC-21-307B |
|
349.40 |
|
353.90 |
|
4.50 |
|
16.35 |
|
Golden Joint Main |
|
40-70 |
|
09/30/2021 |
Including |
|
351.00 |
|
353.90 |
|
2.90 |
|
24.59 |
|
Golden Joint Main |
|
40-70 |
|
09/30/2021 |
Including |
|
351.00 |
|
351.45 |
|
0.45 |
|
16.06 |
|
Golden Joint Main |
|
40-70 |
|
09/30/2021 |
Including |
|
352.90 |
|
353.90 |
|
1.00 |
|
63.82 |
|
Golden Joint Main |
|
40-70 |
|
09/30/2021 |
NFGC-21-322 |
|
271.65 |
|
275.90 |
|
4.25 |
|
15.32 |
|
Golden Joint Main |
|
40-70 |
|
09/30/2021 |
Including |
|
272.35 |
|
274.75 |
|
2.40 |
|
25.78 |
|
Golden Joint Main |
|
40-70 |
|
09/30/2021 |
NFGC-21-386 |
|
424.75 |
|
429.10 |
|
4.35 |
|
68.27 |
|
Golden Joint Main |
|
70-95 |
|
01/06/2022 |
Including |
|
426.60 |
|
427.50 |
|
0.90 |
|
320.65 |
|
Golden Joint Main |
|
70-95 |
|
01/06/2022 |
NFGC-21-401 |
|
450.15 |
|
454.00 |
|
3.85 |
|
85.77 |
|
Golden Joint Main |
|
10-40 |
|
01/19/2022 |
Including |
|
450.15 |
|
450.70 |
|
0.55 |
|
594.00 |
|
Golden Joint Main |
|
10-40 |
|
01/19/2022 |
NFGC-21-462 |
|
325.75 |
|
339.90 |
|
14.15 |
|
69.15 |
|
Golden Joint Main |
|
10-40 |
|
03/24/2022 |
Including |
|
325.75 |
|
330.70 |
|
4.95 |
|
40.36 |
|
Golden Joint Main |
|
10-40 |
|
03/24/2022 |
Including |
|
326.30 |
|
327.25 |
|
0.95 |
|
182.50 |
|
Golden Joint Main |
|
10-40 |
|
03/24/2022 |
Including |
|
328.10 |
|
328.45 |
|
0.35 |
|
37.90 |
|
Golden Joint Main |
|
10-40 |
|
05/31/2022 |
Including |
|
333.30 |
|
339.90 |
|
6.60 |
|
117.85 |
|
Golden Joint Main |
|
10-40 |
|
03/24/2022 |
Including |
|
333.30 |
|
334.25 |
|
0.95 |
|
96.1 |
|
Golden Joint Main |
|
10-40 |
|
03/24/2022 |
Including |
|
335.85 |
|
337.15 |
|
1.30 |
|
190.63 |
|
Golden Joint Main |
|
10-40 |
|
03/24/2022 |
Including |
|
338.00 |
|
339.90 |
|
1.90 |
|
228.03 |
|
Golden Joint Main |
|
10-40 |
|
03/24/2022 |
NFGC-22-766 |
|
206.85 |
|
209.30 |
|
2.45 |
|
50.30 |
|
Golden Joint Main |
|
40-70 |
|
01/24/2023 |
Including |
|
207.20 |
|
208.15 |
|
0.95 |
|
129.50 |
|
Golden Joint Main |
|
40-70 |
|
01/24/2023 |
NFGC-23-1123 |
|
150.55 |
|
152.70 |
|
2.15 |
|
26.55 |
|
Golden Joint HW |
|
40-70 |
|
10/23/2023 |
Including |
|
150.55 |
|
150.85 |
|
0.30 |
|
190.24 |
|
Golden Joint HW |
|
40-70 |
|
10/23/2023 |
NFGC-23-1482 |
|
15.90 |
|
18.00 |
|
2.10 |
|
24.01 |
|
Golden Joint Main |
|
70-95 |
|
10/23/2023 |
Including |
|
17.00 |
|
17.35 |
|
0.35 |
|
140.00 |
|
Golden Joint Main |
|
70-95 |
|
10/23/2023 |
And |
|
44.70 |
|
47.35 |
|
2.65 |
|
66.16 |
|
Golden Joint Main |
|
70-95 |
|
10/23/2023 |
Including |
|
45.95 |
|
46.80 |
|
0.85 |
|
194.00 |
|
Golden Joint Main |
|
70-95 |
|
10/23/2023 |
NFGC-23-1535 |
|
116.50 |
|
123.90 |
|
7.40 |
|
16.54 |
|
Golden Joint Main |
|
10-40 |
|
10/23/2023 |
Including |
|
116.50 |
|
117.10 |
|
0.60 |
|
165.13 |
|
Golden Joint Main |
|
10-40 |
|
10/23/2023 |
Including |
|
122.15 |
|
122.75 |
|
0.60 |
|
13.09 |
|
Golden Joint Main |
|
10-40 |
|
10/23/2023 |
Including |
|
123.50 |
|
123.90 |
|
0.40 |
|
29.08 |
|
Golden Joint Main |
|
10-40 |
|
10/23/2023 |
NFGC-23-1585 |
|
85.95 |
|
88.60 |
|
2.65 |
|
67.48 |
|
Golden Joint Main |
|
10-40 |
|
10/23/2023 |
Including |
|
85.95 |
|
87.60 |
|
1.65 |
|
107.98 |
|
Golden Joint Main |
|
10-40 |
|
10/23/2023 |
Infill veining in secondary structures with multiple orientations crosscutting the primary host structures are commonly observed in drill core which could result in additional uncertainty in true width. As of March 1, 2023, composite intervals reported carry a minimum weighted average of 1 g/t Au diluted over a minimum core length of 2 m with a maximum of 4 m consecutive dilution when at depths above 200 m vertical depth and 2m consecutive dilution when below 200 m vertical depth. Prior to this date, all composites allowed for 2 m consecutive dilution. Prior to February 18, 2022, all composite intervals were selected visually. Included high-grade intercepts are reported as any consecutive interval with grades greater than 10 g/t Au. Grades have not been capped in the averaging and intervals are reported as drill thickness.
- 72 -
|
Management’s Discussion and Analysis For the years ended December 31, 2024 and 2023 |
Hole No. |
|
Azimuth (°) |
|
Dip (°) |
|
Length (m) |
|
UTM E |
|
UTM N |
|
Prospect |
NFGC-21-171 |
|
300 |
|
-45 |
|
338 |
|
658546 |
|
5428356 |
|
Golden Joint |
NFGC-21-225 |
|
298 |
|
-45.5 |
|
321 |
|
658545 |
|
5428328 |
|
Golden Joint |
NFGC-21-274 |
|
294 |
|
-49 |
|
552 |
|
658616 |
|
5428373 |
|
Golden Joint |
NFGC-21-307B |
|
298 |
|
-47 |
|
477 |
|
658593 |
|
5428358 |
|
Golden Joint |
NFGC-21-322 |
|
299 |
|
-46 |
|
342 |
|
658570 |
|
5428313 |
|
Golden Joint |
NFGC-21-386 |
|
298.5 |
|
-46.5 |
|
582 |
|
658634 |
|
5428306 |
|
Golden Joint |
NFGC-21-401 |
|
298.5 |
|
-46.5 |
|
492 |
|
658612 |
|
5428318 |
|
Golden Joint |
NFGC-21-462 |
|
298 |
|
-47.5 |
|
486 |
|
658590 |
|
5428331 |
|
Golden Joint |
NFGC-22-766 |
|
230 |
|
-45 |
|
327 |
|
658523 |
|
5428283 |
|
Golden Joint |
NFGC-23-1123 |
|
32 |
|
-45 |
|
240 |
|
658351 |
|
5428136 |
|
Golden Joint |
NFGC-23-1482 |
|
150 |
|
-66 |
|
92 |
|
658404 |
|
5428350 |
|
Golden Joint |
NFGC-23-1535 |
|
88 |
|
-60 |
|
149 |
|
658360 |
|
5428358 |
|
Golden Joint |
NFGC-23-1585 |
|
355 |
|
-44 |
|
189 |
|
658502 |
|
5428380 |
|
Golden Joint |
- 73 -
|
Management’s Discussion and Analysis For the years ended December 31, 2024 and 2023 |
The latest results from the Golden Joint prospect are shown in the long section, plan map, and cross-section below:
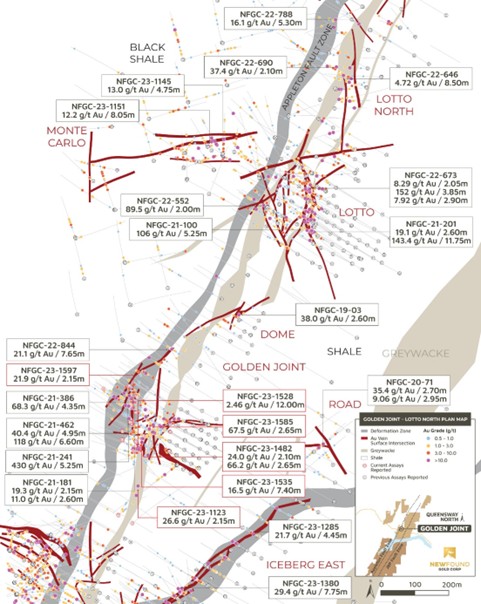
Queensway Project – Golden Joint – Lotto North plan map (October 23, 2023)
- 74 -
|
Management’s Discussion and Analysis For the years ended December 31, 2024 and 2023 |
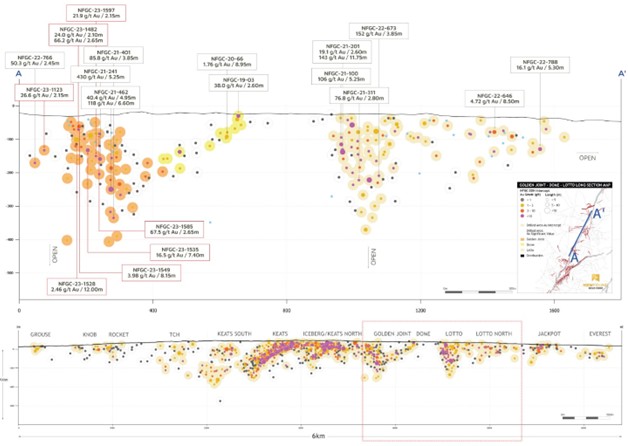
Queensway Project – Golden Joint – Lotto North long section, looking northwest (October 23, 2023)
- 75 -
|
Management’s Discussion and Analysis For the years ended December 31, 2024 and 2023 |
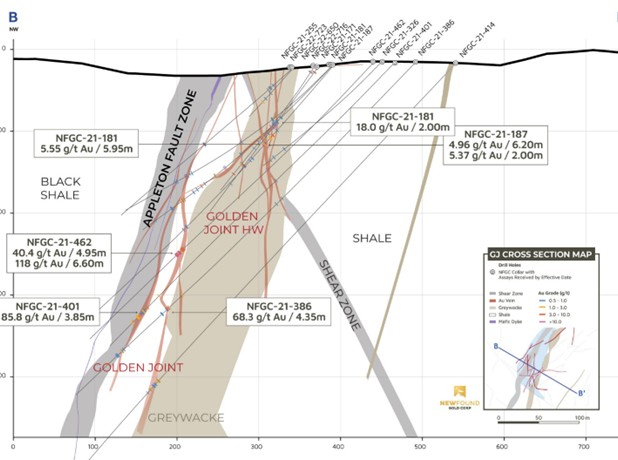
Queensway Project – Golden Joint cross-section, +/- 12.5m, looking northeast (February 16, 2023)
TCH, Knob (Rocket Vein) and Grouse Drilling
The Trans-Canada Highway (TCH) prospect is located between Keats and Knob.
On January 18, 2023, the Company announced results from its drilling at the TCH prospect where systematic reconnaissance grid drilling south of the Trans-Canada highway along the eastern side of the AFZ identified a new gold-bearing zone called “TCH (Trans Canada Highway)” with intercepts of 79.6 g/t Au over 2.00 m in NFGC-22-863, 10.5 g/t Au over 2.45 m in NFGC-22-642, and 1.02 g/t Au over 10.70 m in NFGC-22-703. This structure is located in the footwall to the AFZ and has been intersected over a strike length of 190m and down to a vertical depth of 300 m.
At the TCH prospect, mineralization has been identified in structures located in both the hangingwall (TCW) and footwall (TCH) of the AFZ. Epizonal-style veining is associated with significant brittle faulting and silicification in the siltstones.
Also announced on January 18, 2023, were results from targeted drilling at the Knob prospect which identified a new vein now called “Rocket” located 100 m to the northeast. The highlight interval of 12.6 g/t Au over 4.45 m in NFGC-22-704 was intersected at a vertical depth of 65 m. Subsequent follow-up drilling expanded on this discovery intersecting 49.5 g/t Au over 2.30 m in NFGC-22-704 48 m along strike (reported on June 20, 2023).
- 76 -
|
Management’s Discussion and Analysis For the years ended December 31, 2024 and 2023 |
Further north, exploration at Knob-Quarry, targeting a series of approximately east-west striking structures similar in orientation to the KBFZ, identified significant gold mineralization hosted in and around the greywacke, a coarser-grained sedimentary rock that occurs at Queensway interbedded with the shales and adjacent to the AFZ, with highlight interval NFGC-22-906 returning 20.2 g/t Au over 3.35 m (reported on June 20, 2023). This interval is located 150 m from surface and 250 m east of the AFZ.
The Knob zone is a historical discovery with mineralization hosted within an east-west striking structure largely constrained to greywacke which has been traced over a strike length of 160 m and has seen minimal modern-day drilling. Limited drilling has been completed in the Knob prospect area due to other drilling priorities. No immediate follow-up work is scheduled at this time.
On September 20, 2023, the Company announced the results of a first pass program at the Grouse Zone located 2 km south of Keats, a historic showing discovered by trenching and tested by limited drilling in the early 2000s. This initial program identified significant gold mineralization akin to the Knob Zone consisting of massive to stockwork-style quartz veins developed within and around a thick bed of greywacke hosted by an east-west striking fault zone located 300 m east of the AFZ. Highlight intervals of this program include 3.56 g/t Au over 4.90 m in NFGC-22-1005, 1.34 g/t Au over 9.70 m in NFGC-22-1047, and 2.32 g/t Au over 5.55 m in NFGC-22-1053, along with the presence of visible gold and several additional significant intervals. Mineralization has been identified over an area 100 m along strike, starting near surface and reaching a depth of 80 m.
The Grouse Zone is now the southernmost gold zone drilled at Queensway North. Measuring from Grouse north to the Everest Zone spans 6.1 km of strike where high-grade gold mineralization has been identified through near-surface drilling, indicating that the gold mineralization footprint of the AFZ continues a full 2.7 km south of Keats.
All previous and 2024 press releases can be found under the Company’s profile on SEDAR+ at www.sedarplus.ca.
- 77 -
|
Management’s Discussion and Analysis For the years ended December 31, 2024 and 2023 |
Highlighted assay values and drill hole locations from TCH and Rocket (Knob) drilling are shown in the tables below:
Hole No. |
|
From (m) |
|
To (m) |
|
Length (m) |
|
Au (g/t) |
|
Zone |
|
True Width (%) |
|
Date Released |
NFGC-21-142 |
|
81.00 |
|
86.00 |
|
5.00 |
|
5.12 |
|
Knob |
|
10-40 |
|
05/31/2022 |
Including |
|
81.00 |
|
81.85 |
|
0.85 |
|
22.10 |
|
Knob |
|
10-40 |
|
05/31/2022 |
NFGC-22-642 |
|
303.45 |
|
305.90 |
|
2.45 |
|
10.45 |
|
TCH |
|
40-70 |
|
01/18/2023 |
Including |
|
303.80 |
|
304.35 |
|
0.55 |
|
14.46 |
|
TCH |
|
40-70 |
|
01/18/2023 |
Including |
|
305.40 |
|
305.90 |
|
0.50 |
|
32.43 |
|
TCH |
|
40-70 |
|
01/18/2023 |
NFGC-22-704 |
|
86.60 |
|
91.05 |
|
4.45 |
|
12.63 |
|
Rocket |
|
70-95 |
|
01/18/2023 |
Including |
|
88.00 |
|
88.45 |
|
0.45 |
|
118.50 |
|
Rocket |
|
70-95 |
|
01/18/2023 |
NFGC-22-863 |
|
427.10 |
|
429.10 |
|
2.00 |
|
79.62 |
|
TCH |
|
Unknown |
|
01/18/2023 |
Including |
|
427.10 |
|
427.80 |
|
0.70 |
|
226.46 |
|
TCH |
|
Unknown |
|
01/18/2023 |
NFGC-22-885 |
|
278.60 |
|
280.80 |
|
2.20 |
|
7.06 |
|
TCH |
|
70-95 |
|
01/18/2023 |
Including |
|
279.50 |
|
280.20 |
|
0.70 |
|
22.01 |
|
TCH |
|
70-95 |
|
01/18/2023 |
NFGC-22-906 |
|
192.95 |
|
196.30 |
|
3.35 |
|
20.15 |
|
Knob |
|
Unknown |
|
06/20/2023 |
Including |
|
192.95 |
|
193.25 |
|
0.30 |
|
215.00 |
|
Knob |
|
Unknown |
|
06/20/2023 |
NFGC-22-950 |
|
23.50 |
|
25.80 |
|
2.30 |
|
49.45 |
|
Rocket |
|
70-95 |
|
06/20/2023 |
Including |
|
24.90 |
|
25.40 |
|
0.50 |
|
227.00 |
|
Rocket |
|
70-95 |
|
06/20/2023 |
NFGC-22-1005 |
|
16.60 |
|
21.50 |
|
4.90 |
|
3.56 |
|
Grouse |
|
70-95 |
|
09/20/2023 |
Including |
|
18.25 |
|
18.80 |
|
0.55 |
|
17.41 |
|
Grouse |
|
70-95 |
|
09/20/2023 |
And |
|
43.85 |
|
45.85 |
|
2.00 |
|
8.51 |
|
Grouse |
|
10-40 |
|
09/20/2023 |
Including |
|
43.85 |
|
44.85 |
|
1.00 |
|
17.01 |
|
Grouse |
|
10-40 |
|
09/20/2023 |
And |
|
50.40 |
|
52.60 |
|
2.20 |
|
6.77 |
|
Grouse |
|
10-40 |
|
09/20/2023 |
Including |
|
51.20 |
|
51.75 |
|
0.55 |
|
19.14 |
|
Grouse |
|
10-40 |
|
09/20/2023 |
Infill veining in secondary structures with multiple orientations crosscutting the primary host structures are commonly observed in drill core which could result in additional uncertainty in true width. As of March 1, 2023, composite intervals reported carry a minimum weighted average of 1 g/t Au diluted over a minimum core length of 2 m with a maximum of 4 m consecutive dilution when at depths above 200 m vertical depth and 2 m consecutive dilution when below 200 m vertical depth. Prior to this date, all composites allowed for 2 m consecutive dilution. Prior to February 18, 2022, all composite intervals were selected visually. Included high-grade intercepts are reported as any consecutive interval with grades greater than 10 g/t Au. Grades have not been capped in the averaging and intervals are reported as drill thickness.
Hole No. |
|
Azimuth (°) |
|
Dip (°) |
|
Length (m) |
|
UTM E |
|
UTM N |
|
Prospect |
NFGC-21-142 |
|
0 |
|
-45 |
|
220 |
|
657138 |
|
5425717 |
|
Knob |
NFGC-22-642 |
|
300 |
|
-45 |
|
500 |
|
657636 |
|
5426511 |
|
TCH (Trans Canada Highway) |
NFGC-22-704 |
|
100 |
|
-50 |
|
107 |
|
657192 |
|
5425868 |
|
Rocket |
NFGC-22-863 |
|
300 |
|
-45 |
|
472 |
|
657573 |
|
5426335 |
|
TCH (Trans Canada Highway) |
NFGC-22-885 |
|
120 |
|
-70 |
|
329 |
|
657272 |
|
5426509 |
|
TCW (Trans Canada West) |
NFGC-22-906 |
|
165 |
|
-45 |
|
335 |
|
657285 |
|
5425980 |
|
Rocket |
NFGC-22-950 |
|
120 |
|
-45 |
|
185 |
|
657218 |
|
5425818 |
|
Knob |
NFGC-22-1005 |
|
200 |
|
-45 |
|
128 |
|
656814 |
|
5425185 |
|
Knob |
- 78 -
|
Management’s Discussion and Analysis For the years ended December 31, 2024 and 2023 |
The latest results from the TCH, Knob (Rocket Vein) and Grouse are shown the plan map below:
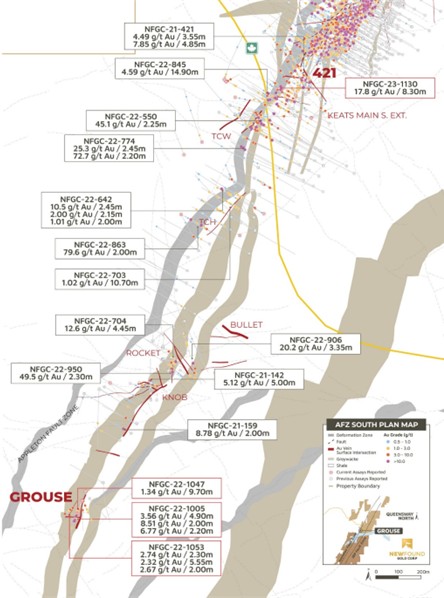
Queensway Project – Knob to Keats Main South plan map (September 20, 2023)
- 79 -
|
Management’s Discussion and Analysis For the years ended December 31, 2024 and 2023 |
Big Vein and Pistachio Drilling
Big Vein is located 8.3 km northeast of the Keats Zone immediately west of the AFZ.
Originally discovered by the previous operator, Labrador Gold, the Big Vein prospect consists of a north-northeast trending series of quartz-carbonate veins characterized by vuggy quartz and stylolitic texture. Pyrite, arsenopyrite, lesser chalcopyrite, and rare stibnite and boulangerite are associated with gold mineralization. Veining is hosted in shales and interbedded mudstone-siltstone-sandstone. The Big Vein has defined zones of gold mineralization up to 700 m along strike, and from surface up to 400 m vertical depth and is open along strike and down dip. The true width of these zones is not known but is estimated to be at least 2-20 m wide, with the widest interval representing the Big Vein zone.
New Found Gold announced on October 24, 2024 the results of its first few holes completed in the Big Vein region and specifically, highlight intervals from drilling completed 150 m to the north at what is now known as “Pistachio.” At Pistachio, 105 g/t Au over 2.10 m and 10.4 g/t Au over 4.45 m in NFGC-24-2153 was intersected by the Company in a follow-up program targeting two historic intervals of high-grade gold which included 5.17 g/t Au over 7.00 m in K-23-271 and 4.68 g/t Au over 5.00 m in K-23-278. These historic intervals at Pistachio are 40 m and 65 m down plunge of NFGC-24-2153. These initial results represent some of the most significant gold intercepts drilled to date at Kingsway.
The Pistachio Zone consists of a series of quartz veins containing visible gold hosted by a greenish siltstone unit that is spatially associated with a high-grade gold and stibnite-bearing fault zone. The historic drilling into this area was limited, and the zone remains open down plunge and to depth. Follow-up drilling is ongoing to expand on these initial high-grade intervals and improve understanding of the structural orientations.
2024 assay results have been reported in a press release dated October 24, 2024. All previous and 2024 press releases can be found under the Company’s profile on SEDAR+ at www.sedarplus.ca.
Highlighted assay values and drill hole locations from Pistachio drilling are shown in the tables below:
Hole No. |
|
From (m) |
|
To (m) |
|
Interval (m) |
|
Au (g/t) |
|
True Width (%) |
|
Zone |
|
Date Released |
NFGC-24-21531 |
|
218.80 |
|
223.25 |
|
4.45 |
|
10.36 |
|
70-95 |
% |
|
|
|
Including |
|
221.50 |
|
222.35 |
|
0.85 |
|
35.17 |
|
70-95 |
% |
|
|
|
And2 |
|
243.45 |
|
245.55 |
|
2.10 |
|
104.62 |
|
Unknown |
|
Pistachio |
|
10/24/2024 |
Including |
|
243.95 |
|
244.70 |
|
0.75 |
|
290.73 |
|
Unknown |
|
|
|
|
And4 |
|
316.20 |
|
320.95 |
|
4.75 |
|
2.26 |
|
Unknown |
|
|
|
|
Infill veining in secondary structures with multiple orientations crosscutting the primary host structures are commonly observed in drill core which could result in additional uncertainty in true width. Composite intervals reported carry a minimum weighted average of 1 g/t Au diluted over a minimum core length of 2 m with a maximum of 4 m consecutive dilution when at depths above 200 m vertical depth and 2 m consecutive dilution when below 200 m vertical depth. Prior to this date, all composites allowed for 2 m consecutive dilution. Included high-grade intercepts are reported as any consecutive interval with grades greater than 10 g/t Au. Grades have not been capped in the averaging and intervals are reported as drill thickness.
Hole No. |
|
Azi (°) |
|
Dip (°) |
|
Length (m) |
|
UTM E |
|
UTM N |
|
Prospect |
NFGC-24-2153 |
|
291 |
|
-52 |
|
374 |
|
661926 |
|
5435250 |
|
Pistachio |
- 80 -
|
Management’s Discussion and Analysis For the years ended December 31, 2024 and 2023 |
The latest results from Pistachio (Big Vein area) are shown the plan map below:
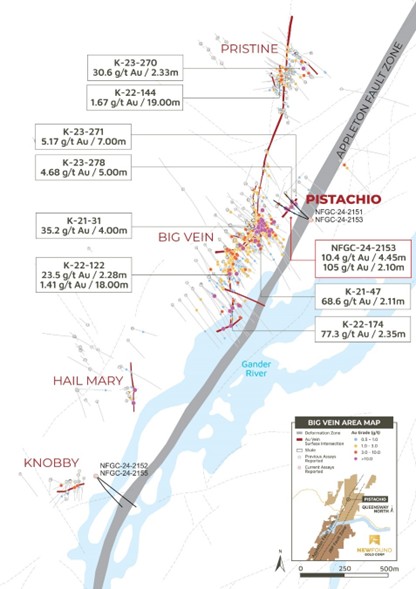
Queensway Project - Knobby to Pristine plan map with the location of Big Vein and Pistachio zones
- 81 -
|
Management’s Discussion and Analysis For the years ended December 31, 2024 and 2023 |
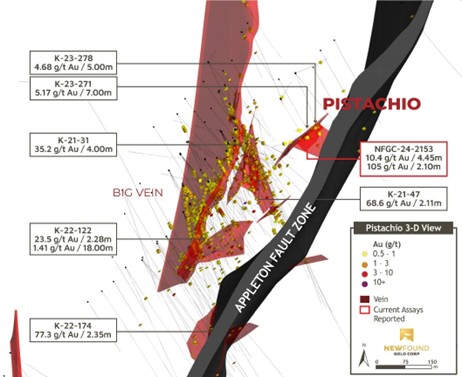
Queensway Project - Big Vein and Pistachio zones 3D inclined view
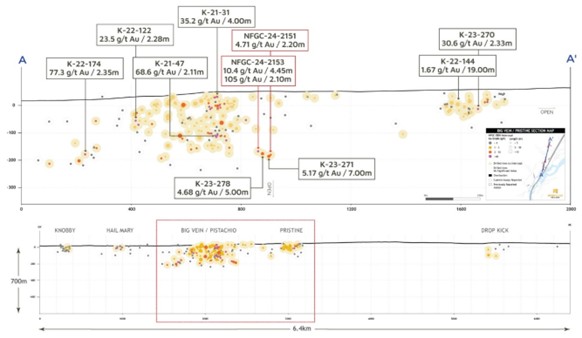
Queensway Project - Big Vein to Pristine longitudinal section (looking northwest)
- 82 -
|
Management’s Discussion and Analysis For the years ended December 31, 2024 and 2023 |
Dropkick Drilling
Originally discovered by the previous operator, Labrador Gold, the Dropkick prospect is the most northern gold discovery found to date along the highly prospective AFZ. Dropkick is located 11 km northeast of the Keats Zone immediately west of the AFZ.
Announced on February 11, 2025, were the Company’s first received drill results from a step-out program that demonstrated the high-grade potential of the Dropkick Zone. The highlight intervals of 89.5 g/t Au over 5.85 m in NFGC-24-2197 and 26.2 g/t Au over 16.15 m in NFGC-24-2193, spaced 25 m apart expanded the Dropkick Zone 75 m along strike to the southwest. These intervals are the most significant high-grade results intercepted to date on the Kingsway block that now forms the most northern extent of the Queensway Project along the AFZ.
Dropkick Zone now spans a strike length of 535 m. Gold mineralization starts at surface, extends to 200 m vertical depth and exhibits characteristics similar to the primary discovery area consisting of free coarse gold contained in fault-fill quartz veins hosted by an interbedded sequence of siltstones and sandstones.
Future drilling will target the expansion of the Dropkick Zone as this structure has limited testing and is open along strike and to depth.
2025 assay results have been reported in a press release dated February 11, 2025. All previous press releases can be found under the Company’s profile on SEDAR+ at www.sedarplus.ca.
Highlighted assay values and drill hole locations from Dropkick drilling are shown in the tables below:
Hole No. |
|
From (m) |
|
To (m) |
|
Interval (m) |
|
Au (g/t) |
|
True Width (%) |
|
Zone |
NFGC-24-21934 |
|
283.85 |
|
300.00 |
|
16.15 |
|
26.15 |
|
Unknown |
|
Dropkick |
Including |
|
296.00 |
|
296.35 |
|
0.35 |
|
1,128.00 |
|
Unknown |
|
|
NFGC-24-21974 |
|
304.85 |
|
310.70 |
|
5.85 |
|
89.48 |
|
Unknown |
|
|
Including |
|
306.60 |
|
307.60 |
|
1.00 |
|
514.09 |
|
Unknown |
|
Dropkick |
And Including |
|
306.60 |
|
307.00 |
|
0.40 |
|
1,067.00 |
|
Unknown |
|
|
4True widths are unknown at this time. Infill veining in secondary structures with multiple orientations crosscutting the primary host structures are commonly observed in drill core which could result in additional uncertainty in true width. Composite intervals reported carry a minimum weighted average of 1 g/t Au diluted over a minimum core length of 2 m with a maximum of 4 m consecutive dilution when above 200 m vertical depth and 2 m consecutive dilution when below 200 m vertical depth. Included high-grade intercepts are reported as any consecutive interval with grades greater than 10 g/t Au. Grades have not been capped in the averaging and intervals are reported as drill thickness.
Hole No. |
|
Azimuth (°) |
|
Dip (°) |
|
Length (m) |
|
UTM E |
|
UTM N |
|
Prospect |
NFGC-24-2193 |
|
125 |
|
-45 |
|
419 |
|
663035 |
|
5438087 |
|
Dropkick |
NFGC-24-2197 |
|
130 |
|
-46.5 |
|
356 |
|
663035 |
|
5438087 |
|
Dropkick |
- 83 -
|
Management’s Discussion and Analysis For the years ended December 31, 2024 and 2023 |
The latest results from Pistachio (Big Vein area) are shown the plan map below:
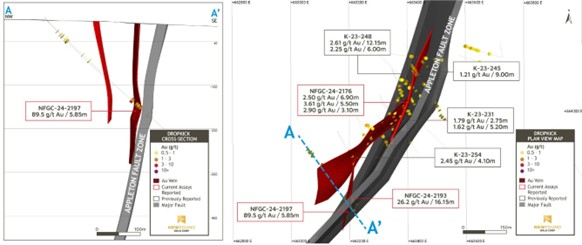
Queensway North – 3D Seismic Program
On March 7, 2023, the Company announced the commencement of a 3D seismic survey being conducted by HiSeis, an Australian-based leader in 3D seismic technology, responsible for conducting similar surveys at numerous projects globally for the mining sector, including at Agnico Eagle’s Fosterville Mine. This is the first survey of its kind to be conducted on the island of Newfoundland and one of the first in North America. Its implementation will not only aid in the geologic understanding of the Queensway Project but of the entire central Newfoundland gold belt.
The survey was planned to cover an area 5.8 km wide and spanning 8 km of strike length along the AFZ and JBPFZ, encompassing known significant mineralized zones such as Keats, Keats West, Iceberg, Golden Joint and Lotto, as well as large areas that remain undrilled. This technology provides high-resolution penetration up to 3 km below surface, with a coarser resolution to 8 km depth.
Drilling completed by the Company to date has primarily focused shallowly on the first 200 m from surface and within a 200 m window on either side of the AFZ. By collecting seismic data across the known zones, the Company will be able to effectively train a 3D dataset, with the goal of identifying similar-looking, prospective zones both outside of this narrow window and at depth.
On August 21, 2023, the Company reported that the seismic program acquisition phase had been completed and the program had moved into its final phase of data cleaning, compilation, and interpretation. The survey utilized approximately 20,000 energy source points spaced at 12.5 m intervals along 260 km of source lines, as well as approximately 25,000 geophone receiver stations, generating 3D seismic data across a 47 km2 grid. Source lines were spaced at 100 m intervals and perpendicular receiver lines were constructed at 100 m interims to optimize resolution from 200-1,000 m in depth, with good resolution penetrating to 3,000 m.
The Company is now in possession of the final data products as announced on March 4, 2024, and is currently working with the data. The survey has provided good imagery to a depth of 2.7 km and the preliminary seismic interpretation has successfully outlined structures and geological features that align with known gold-bearing structures closer to surface. Additionally, lineaments are visible in the product at depth that could represent new and untested structures. Ongoing interpretation, reprocessing and targeting will continue throughout the lifespan of the project as new data derived from drilling is used to continuously refine and validate the 3D seismic interpretation for increased targeting effectiveness.
Based on the initial results of the seismic survey, the Company has completed deep drilling that has collected deep geological information that is being used to understand the features visible in the seismic data.
- 84 -
|
Management’s Discussion and Analysis For the years ended December 31, 2024 and 2023 |
The details of the seismic program have been reported in press releases on March 7, 2023, June 26, 2023, August 21, 2023, and March 4, 2024, found under the Company’s profile on SEDAR+ at www.sedarplus.ca.
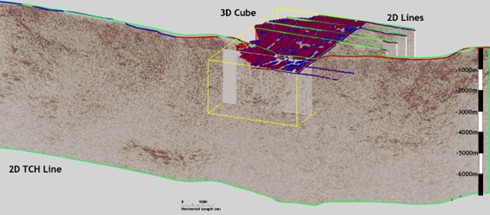
Queensway Project – Extents of the 3D cube and 2D seismic lines (March 4,2024)
- 85 -
|
Management’s Discussion and Analysis For the years ended December 31, 2024 and 2023 |
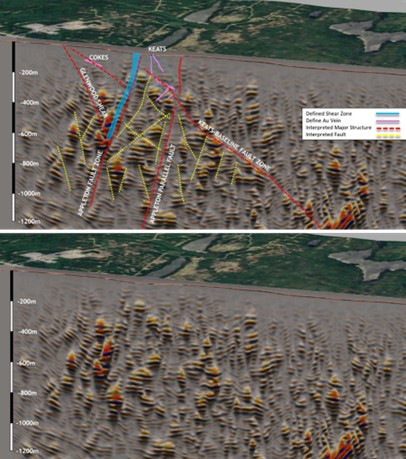
Queensway Project - Keats 3D cube cross-section (Pre-SDM and Pseudo Relief, looking north), Top: With interpretation, Bottom: Without interpretation
- 86 -
|
Management’s Discussion and Analysis For the years ended December 31, 2024 and 2023 |
Regional Exploration – Queensway South
Starting in June 2020, the Company initiated a field reconnaissance program within the QWS mineral licenses. The objective of this program was to conduct geological mapping, structural analysis, prospecting and the collection of C horizon till samples to be processed for gold grain analysis. This work has continued each field season through to 2023 and has evolved to include soil sampling and trenching. The goal of these field programs has been to aid in the development of drilling targets for testing in an inaugural diamond drill program which began in 2022.
Highlight results from these field activities include the results from the 2020 field program detailed till survey which were reported August 27, 2020, where the Company announced it had found a new fertile gold region 45 km south of the current QWN drill targets.
The Eastern Pond target is comprised of two areas where recent till results have shown highly anomalous total gold grain counts including a high percentage of pristine gold grains and yielded several sub-crop samples up to 15.0 g/t Au.
One till sample yielded 216 gold grains, 163 (75%) of them classified as pristine. A second cluster of samples yielded up to 155 gold grains with 127 (82%) of these classified as pristine. The pristine morphology of these grains indicates that they have not travelled far from their bedrock source.
To date the Eastern Pond target is defined by sub-crop and till sample results over an approximately 4 km of strike length. Five other gold in till anomalies have been discovered to date within QWS and warrant follow up exploration including Pauls Pond.
At Pauls Pond, an area located approximately 50 km south of the Keats Zone, continued prospecting, till and soil sampling, and trenching identified an area with a high concentration of gold anomalies on both sides of the interpreted extension of the AFZ.
In August 2022, a diamond drill was mobilized to the Pauls Pond area to test drill-ready targets generated from the previous field programs, this was the first ever drilling program conducted by NFGC at QWS. This program consisted of 7,255 m drilled in 33 holes over 7 target areas including Aztec, Bernards Pond, Devils Trench, Eastern Pond, Goose, Greenwood, and Pauls Pond.
Twenty-seven of thirty-three drill holes hit significant gold mineralization while ten drill holes contained visible gold across four target areas in this initial drill program. Several new discoveries were made along an 18.5 km corridor that were prioritized due to the amount of gold found in the surficial environment; specific targets tested occur on both sides of the AFZ and exhibit a combination of favourable characteristics including elevated Au-in-grab, till, and soil samples.
At Pauls Pond, seventeen drillholes were completed leading to three new discoveries: “Astronaut”, “Nova”, and “Nebula”, as well as the expansion of the historic “Goose” zone. Astronaut and Nova are parallel structures located west of the AFZ that have been traced over 1,600 m and 250 m of strike length, respectively. At Astronaut and Nova, eight out of nine holes drilled contained visible gold, including highlight interval of 19.0 g/t Au over 3.15 m in NFGC-QS-22-20. The Company believes these two zones connect through to the Goose zone, which if confirmed would expand this mineralized corridor to 2.5 km in strike length.
Nebula, the third discovery in the Pauls Pond area, is located on the east side of the AFZ and drill testing of a prominent Au-in-soil anomaly with two holes identified significant mineralization that is associated with a near-surface shear zone that returned an initial highlight result of 3.70 g/t Au over 4.30 m in NFGC-QS-22-25.
On the east side of the AFZ drill testing of two trenched Au-in soil and till anomalies led to two new discoveries, “Devils Pond” and “Devils Pond South”. These zones are located 12 km apart and all drillholes at both targets intersected broad domains of highly anomalous gold including highlight intervals of 0.47 g/t Au over 8.00 m and 0.37 g/t Au over 28.00 m in NFGC-QS-22-15 at Devils Pond and 1.01 g/t Au over 8.80 m in NFGC-QS-22-30 at Devils Pond South.
- 87 -
|
Management’s Discussion and Analysis For the years ended December 31, 2024 and 2023 |
On July 26, 2023, the Company announced the commencement of a Phase II diamond drilling program consisting of approximately 10,000 m to follow up on results of its inaugural 2022 program and test new targets along an 18.5 km long stretch of the AFZ at QWS. This drilling campaign continued into early 2024 and a total of 11,804 m were completed the results of which are summarized in the Company’s latest technical report. Notably, drilling extended the mineralization at the Astronaut and Nova zones in the Pauls Pond area and led to a new discovery in the Bernards Pond area, now named “Camp Zone”. The Camp prospect is defined as multiple gold-bearing shear zones in the Davidsville siltstone immediately east of the AFZ, a similar stratigraphic position to the other discoveries made at QWN. The mineralized shear zones are defined by domains of high strain and an increased density of stylolitic quartz veins that comprise significant concentrations of arsenopyrite and pyrite. Visible gold was observed in several veins.
All previous and 2024 press releases can be found under the Company’s profile on SEDAR+ at www.sedarplus.ca in addition to the latest technical report.
Highlighted assay values and drill hole locations from the Queensway South drilling are shown in the tables below:
Hole No. |
|
From (m) |
|
To (m) |
|
Interval (m) |
|
Au (g/t) |
|
Zone |
|
Date Released |
NFGC-QS-22-18 |
|
183.00 |
|
190.10 |
|
7.10 |
|
2.13 |
|
Astronaut |
|
05/25/2023 |
Including* |
|
186.00 |
|
189.70 |
|
3.70 |
|
3.85 |
|
|
|
05/25/2023 |
NFGC-QS-22-19 |
|
197.00 |
|
207.00 |
|
10.00 |
|
1.03 |
|
|
|
05/25/2023 |
Including* |
|
199.90 |
|
201.95 |
|
2.05 |
|
4.29 |
|
Astronaut |
|
05/25/2023 |
Including^ |
|
199.90 |
|
200.55 |
|
0.65 |
|
11.47 |
|
|
|
05/25/2023 |
NFGC-QS-22-20 |
|
227.45 |
|
232.30 |
|
4.85 |
|
12.35 |
|
|
|
05/25/2023 |
Including* |
|
227.45 |
|
230.60 |
|
3.15 |
|
18.95 |
|
Astronaut |
|
05/25/2023 |
Including^ |
|
229.10 |
|
229.85 |
|
0.75 |
|
72.60 |
|
|
|
05/25/2023 |
NFGC-QS-22-21 |
|
37.00 |
|
52.20 |
|
15.20 |
|
0.81 |
|
Nova |
|
05/25/2023 |
Including* |
|
37.00 |
|
46.50 |
|
9.50 |
|
1.09 |
|
|
|
05/25/2023 |
NFGC-QS-22-22 |
|
206.15 |
|
209.70 |
|
3.55 |
|
5.17 |
|
|
|
05/25/2023 |
Including* |
|
207.30 |
|
209.30 |
|
2.00 |
|
8.88 |
|
Astronaut |
|
05/25/2023 |
Including^ |
|
208.30 |
|
209.30 |
|
1.00 |
|
14.69 |
|
|
|
05/25/2023 |
NFGC-QS-22-25* |
|
18.55 |
|
22.85 |
|
4.30 |
|
3.70 |
|
|
|
05/25/2023 |
Including |
|
18.55 |
|
21.60 |
|
3.05 |
|
4.92 |
|
Nebula |
|
05/25/2023 |
Including |
|
22.25 |
|
22.85 |
|
0.60 |
|
1.29 |
|
|
|
05/25/2023 |
NFGC-QS-22-30 |
|
70.00 |
|
78.80 |
|
8.80 |
|
1.01 |
|
Devils Pond South |
|
05/25/2023 |
Including* |
|
72.00 |
|
78.80 |
|
6.80 |
|
1.17 |
|
|
|
05/25/2023 |
NFGC-QS-24-85* |
|
11.00 |
|
13.00 |
|
2.00 |
|
3.06 |
|
|
|
18/04/2024 |
NFGC-QS-24-85* |
|
15.65 |
|
17.75 |
|
2.10 |
|
1.13 |
|
Camp |
|
18/04/2024 |
NFGC-QS-24-85* |
|
141.10 |
|
143.70 |
|
2.60 |
|
1.44 |
|
|
|
18/04/2024 |
NFGC-QS-24-88* |
|
175.70 |
|
178.00 |
|
2.30 |
|
3.06 |
|
Camp |
|
18/04/2024 |
Including^ |
|
175.70 |
|
176.05 |
|
0.35 |
|
18.27 |
|
|
|
18/04/2024 |
NFGC-QS-24-89* |
|
28.1 |
|
30.65 |
|
2.55 |
|
1.01 |
|
Camp |
|
18/04/2024 |
NFGC-QS-24-89* |
|
207 |
|
223.8 |
|
16.8 |
|
1.2 |
|
|
|
18/04/2024 |
At Queensway South, host structures are interpreted to be steeply dipping and true widths are unknown at this time, additional drilling is required to assess the true width of intersected vein structures. Composite intervals reported carry a minimum weighted average of 0.25 g/t Au diluted over a minimum core length of 2 m with a maximum of 4m consecutive dilution. Included high-grade intercepts are reported as any consecutive interval with grades greater than 1 g/t Au. *Composite intervals reported carry a minimum weighted average of 1 g/t Au diluted over a minimum core length of 2 m with a maximum of 4 m consecutive dilution. ^Included high-grade intercepts are reported as any consecutive interval with grades greater than 10 g/t Au. Grades have not been capped in the averaging and intervals are reported as drill thickness.
- 88 -
|
Management’s Discussion and Analysis For the years ended December 31, 2024 and 2023 |
Hole No. |
|
Azimuth (°) |
|
Dip (°) |
|
Length (m) |
|
UTM E |
|
UTM N |
|
Prospect |
NFGC-QS-22-18 |
|
125 |
|
-45 |
|
335 |
|
636772 |
|
5391456 |
|
Pauls Pond |
NFGC-QS-22-19 |
|
125 |
|
-45 |
|
290 |
|
636528 |
|
5391234 |
|
Pauls Pond |
NFGC-QS-22-20 |
|
125 |
|
-45 |
|
383 |
|
636731 |
|
5391485 |
|
Pauls Pond |
NFGC-QS-22-21 |
|
125 |
|
-45 |
|
275 |
|
636434 |
|
5391138 |
|
Pauls Pond |
NFGC-QS-22-22 |
|
125 |
|
-45 |
|
272 |
|
636333 |
|
5391070 |
|
Pauls Pond |
NFGC-QS-22-25 |
|
135 |
|
-45 |
|
218 |
|
638312 |
|
5392358 |
|
Pauls Pond |
NFGC-QS-22-30 |
|
115 |
|
-45 |
|
101 |
|
634043 |
|
5385020 |
|
Devils Pond South |
NFGC-QS-24-85 |
|
130 |
|
-45 |
|
203 |
|
634299 |
|
5386323 |
|
Bernards Pond |
NFGC-QS-24-88 |
|
300 |
|
-45 |
|
254 |
|
634334 |
|
5386131 |
|
Bernards Pond |
NFGC-QS-24-89 |
|
100 |
|
-45 |
|
257 |
|
633991 |
|
5386415 |
|
Bernards Pond |
- 89 -
|
Management’s Discussion and Analysis For the years ended December 31, 2024 and 2023 |
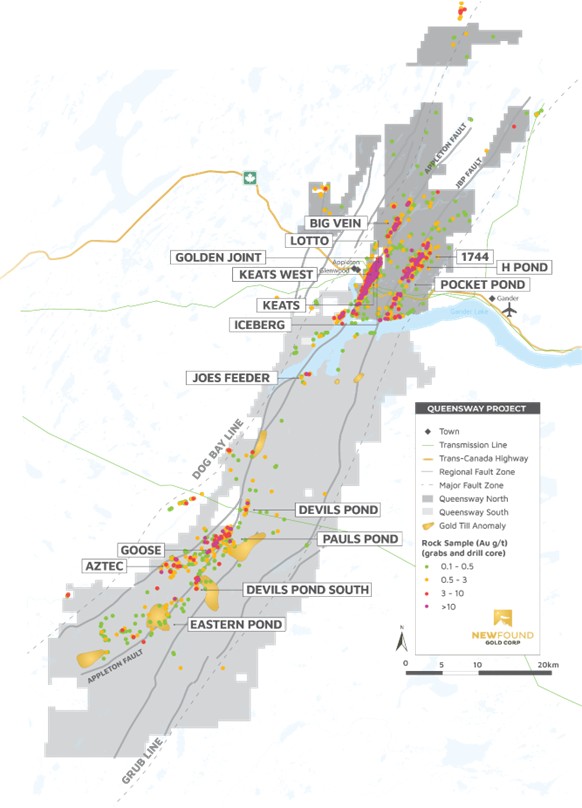
Queensway Project: Gold occurrences in rocks and tills and major prospects
- 90 -
|
Management’s Discussion and Analysis For the years ended December 31, 2024 and 2023 |
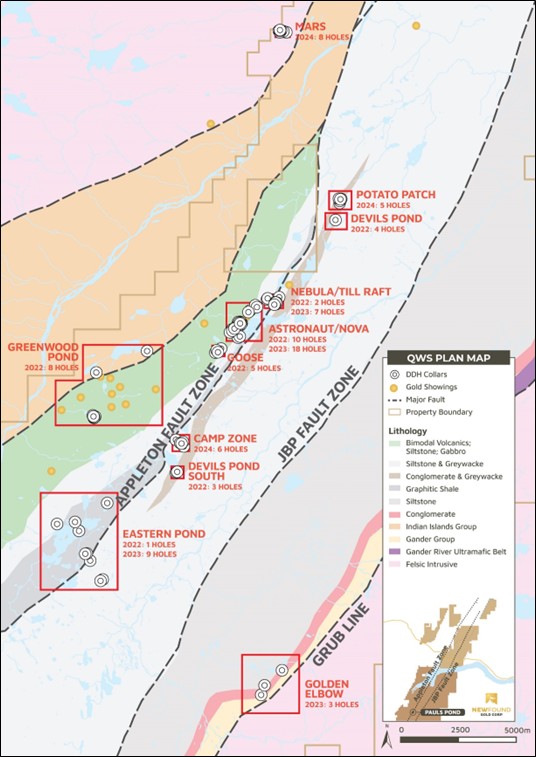
Regional drill targets at QWS
- 91 -
|
Management’s Discussion and Analysis For the years ended December 31, 2024 and 2023 |
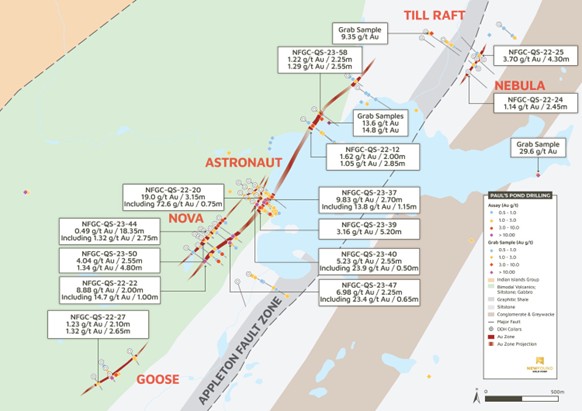
Queensway Project - Goose – Nebula plan view map
- 92 -
|
Management’s Discussion and Analysis For the years ended December 31, 2024 and 2023 |

Queensway Project – Bernards Pond area plan view map
Regional Exploration – VOA Option
In November 2022, the Company entered into an option agreement which added approximately 6.1 km of strike on the AFZ. Beginning in early 2023 a regional exploration program was launched which involved first-pass soil sampling, mapping, and prospecting with the intention of identifying drill-targets for testing in Q3 2023. A first phase of drilling was completed in early 2024 consisting of 6,687 m in 27 holes testing 10 different target areas.
Several new gold prospects were identified during this inaugural drill program identifying low-grade to highly anomalous gold in several structures adjacent to the AFZ. This program both confirmed a similar style of epizonal mineralization and geology as seen further south along the AFZ near the QWN discoveries and identified multiple gold zones. The recently acquired Kingsway mineral licenses will enable access along strike of these structures close to the AFZ for follow-up.
- 93 -
|
Management’s Discussion and Analysis For the years ended December 31, 2024 and 2023 |
Details of the VOA program can be found in the latest technical report.
Hole No. |
|
From (m) |
|
To (m) |
|
Interval (m) |
|
Au (g/t) |
|
Zone |
|
Release Date |
NFGC-VO-23-07 |
|
31.00 |
|
33.00 |
|
2.00 |
|
0.27 |
|
Karate Chop South |
|
18/04/2024 |
NFGC-VO-23-08 |
|
80.00 |
|
84.00 |
|
4.00 |
|
0.65 |
|
|
|
18/04/2024 |
Including |
|
82.00 |
|
83.00 |
|
1.00 |
|
1.05 |
|
|
|
18/04/2024 |
And |
|
145.00 |
|
151.00 |
|
6.00 |
|
0.28 |
|
|
|
18/04/2024 |
And |
|
160.00 |
|
162.00 |
|
2.00 |
|
0.36 |
|
|
|
18/04/2024 |
And |
|
167.00 |
|
170.05 |
|
3.05 |
|
0.46 |
|
|
|
18/04/2024 |
Including |
|
168.00 |
|
168.40 |
|
0.40 |
|
1.18 |
|
|
|
18/04/2024 |
And |
|
184.00 |
|
188.00 |
|
4.00 |
|
0.37 |
|
Karate Chop South |
|
18/04/2024 |
And |
|
199.90 |
|
207.30 |
|
7.40 |
|
0.24 |
|
|
|
18/04/2024 |
Including |
|
201.65 |
|
202.65 |
|
1.00 |
|
1.02 |
|
|
|
18/04/2024 |
And |
|
220.00 |
|
224.00 |
|
4.00 |
|
0.21 |
|
|
|
18/04/2024 |
And |
|
233.00 |
|
244.00 |
|
11.00 |
|
0.41 |
|
|
|
18/04/2024 |
Including |
|
233.60 |
|
234.50 |
|
0.90 |
|
1.25 |
|
|
|
18/04/2024 |
And |
|
247.00 |
|
249.20 |
|
2.20 |
|
0.10 |
|
|
|
18/04/2024 |
NFGC-VO-23-11 |
|
81.00 |
|
87.00 |
|
6.00 |
|
0.12 |
|
Bigger Vein |
|
18/04/2024 |
NFGC-VO-23-13* |
|
46.90 |
|
49.45 |
|
2.55 |
|
2.42 |
|
|
|
18/04/2024 |
Including |
|
46.90 |
|
48.55 |
|
1.65 |
|
3.73 |
|
|
|
18/04/2024 |
And |
|
78.75 |
|
80.85 |
|
2.10 |
|
0.33 |
|
Bigger Vein |
|
18/04/2024 |
Including |
|
79.40 |
|
80.00 |
|
0.60 |
|
1.07 |
|
|
|
18/04/2024 |
NFGC-VO-23-15 |
|
138.95 |
|
142.70 |
|
3.75 |
|
0.42 |
|
Hank1 |
|
18/04/2024 |
Including |
|
140.30 |
|
141.00 |
|
0.70 |
|
1.18 |
|
|
|
18/04/2024 |
NFGC-VO-23-17 |
|
94.40 |
|
100.50 |
|
6.10 |
|
0.10 |
|
Hank1 |
|
18/04/2024 |
NFGC-VO-23-19 |
|
330.90 |
|
335.40 |
|
4.50 |
|
0.27 |
|
|
|
18/04/2024 |
And |
|
340.25 |
|
345.50 |
|
5.25 |
|
0.19 |
|
|
|
18/04/2024 |
And |
|
359.00 |
|
361.00 |
|
2.00 |
|
0.11 |
|
Hank2 |
|
18/04/2024 |
And |
|
390.30 |
|
392.60 |
|
2.30 |
|
0.11 |
|
|
|
18/04/2024 |
NFGC-VO-23-20 |
|
212.85 |
|
220.50 |
|
7.65 |
|
0.20 |
|
|
|
18/04/2024 |
And |
|
244.80 |
|
247.25 |
|
2.45 |
|
0.20 |
|
Bigger Vein 2 |
|
18/04/2024 |
And |
|
252.20 |
|
259.45 |
|
7.25 |
|
0.21 |
|
|
|
18/04/2024 |
NFGC-VO-23-22 |
|
79.15 |
|
81.45 |
|
2.30 |
|
0.13 |
|
Hank1 |
|
18/04/2024 |
NFGC-VO-23-23 |
|
76.75 |
|
79.40 |
|
2.65 |
|
0.21 |
|
|
|
18/04/2024 |
And |
|
85.00 |
|
87.00 |
|
2.00 |
|
0.19 |
|
|
|
18/04/2024 |
And |
|
138.80 |
|
163.60 |
|
24.80 |
|
0.28 |
|
|
|
18/04/2024 |
Including* |
|
151.60 |
|
154.00 |
|
2.40 |
|
1.15 |
|
|
|
18/04/2024 |
Including |
|
151.60 |
|
153.30 |
|
1.70 |
|
1.52 |
|
Home Pond |
|
18/04/2024 |
Including |
|
161.15 |
|
161.85 |
|
0.70 |
|
1.33 |
|
|
|
18/04/2024 |
And |
|
167.65 |
|
184.15 |
|
16.50 |
|
0.40 |
|
|
|
18/04/2024 |
Including* |
|
167.65 |
|
169.95 |
|
2.30 |
|
1.66 |
|
|
|
18/04/2024 |
Including |
|
167.65 |
|
169.15 |
|
1.50 |
|
2.53 |
|
|
|
18/04/2024 |
And |
|
189.75 |
|
196.70 |
|
6.95 |
|
0.19 |
|
|
|
18/04/2024 |
NFGC-VO-23-25 |
|
136.00 |
|
138.70 |
|
2.70 |
|
0.34 |
|
Hank1 |
|
18/04/2024 |
Including |
|
138.15 |
|
138.70 |
|
0.55 |
|
1.27 |
|
|
|
18/04/2024 |
NFGC-VO-24-27 |
|
320.15 |
|
322.70 |
|
2.55 |
|
0.33 |
|
Hank2 |
|
18/04/2024 |
- 94 -
|
Management’s Discussion and Analysis For the years ended December 31, 2024 and 2023 |
At Queensway North VOA Option, host structures are interpreted to be steeply dipping and true widths are unknown at this time, additional drilling is required to assess the true width of intersected vein structures. Composite intervals reported carry a minimum weighted average of 0.25 g/t Au diluted over a minimum core length of 2 m with a maximum of 4 m consecutive dilution. Included high-grade intercepts are reported as any consecutive interval with grades greater than 1 g/t Au. *Composite intervals reported carry a minimum weighted average of 1 g/t Au diluted over a minimum core length of 2 m with a maximum of 4 m consecutive dilution. ^Included high-grade intercepts are reported as any consecutive interval with grades greater than 10 g/t Au. Grades have not been capped in the averaging and intervals are reported as drill thickness.
Hole No. |
|
Azimuth (°) |
|
Dip (°) |
|
UTME |
|
UTMN |
|
Length (m) |
|
Prospect |
NFGC-VO-23-07 |
|
310 |
|
-45 |
|
663666 |
|
5438377 |
|
165 |
|
Karate Chop South |
NFGC-VO-23-08 |
|
310 |
|
-45 |
|
663727 |
|
5438397 |
|
249 |
|
Karate Chop South |
NFGC-VO-23-11 |
|
100 |
|
-45 |
|
662116 |
|
5435667 |
|
308 |
|
Bigger Vein |
NFGC-VO-23-13 |
|
140 |
|
-45 |
|
662097 |
|
5435593 |
|
392 |
|
Bigger Vein |
NFGC-VO-23-15 |
|
80 |
|
-45 |
|
663713 |
|
5437590 |
|
198 |
|
Hank1 |
NFGC-VO-23-17 |
|
110 |
|
-60 |
|
663713 |
|
5437591 |
|
222 |
|
Hank1 |
NFGC-VO-23-19 |
|
140 |
|
-45 |
|
663978 |
|
5438236 |
|
441 |
|
Hank2 |
NFGC-VO-23-20 |
|
100 |
|
-45 |
|
662104 |
|
5436002 |
|
600 |
|
Bigger Vein 2 |
NFGC-VO-23-22 |
|
140 |
|
-45 |
|
663710 |
|
5437594 |
|
249 |
|
Hank1 |
NFGC-VO-23-23 |
|
110 |
|
-45 |
|
663522 |
|
5438849 |
|
251 |
|
Home Pond |
NFGC-VO-23-25 |
|
155 |
|
-67 |
|
663711 |
|
5437596 |
|
156 |
|
Hank1 |
NFGC-VO-24-27 |
|
140 |
|
-45 |
|
663896 |
|
5438144 |
|
402 |
|
Hank2 |
- 95 -
|
Management’s Discussion and Analysis For the years ended December 31, 2024 and 2023 |
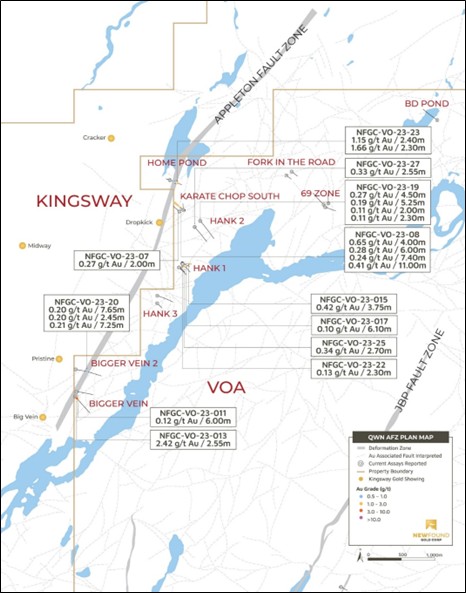
Queensway Project – VOA Option area plan view map (April 18, 2024)
- 96 -
|
Management’s Discussion and Analysis For the years ended December 31, 2024 and 2023 |
Phase I and Phase II Metallurgy
On April 3, 2024, the Company announced results from its Phase I metallurgical testing commenced in 2023 which focused on three mineralized zones – Keats Main, Golden Joint, and Lotto. A total of 116 Variability Composites were generated from approximately 1,000 meters of drill core with a combined weight of 3,400 kilograms, from which three Master Composites were assembled.
Weighted average gold extraction on all 116 Variability Composite samples, broken out by the five cross sections, ranged from 90% to 96%. Gold extractions were achieved using both gravity separation and conventional carbon-in-leach (CIL) on the gravity tails. Gold extraction across the three zones tested in Phase I demonstrates similar metallurgical characteristics and achieved similar extractions from both gravity and CIL.
Phase II followed and was announced on November 1, 2024, focused on Iceberg and Iceberg East. A total of 46 Variability Composites were generated from approximately 340 meters of drill core with a combined weight of 1,400 kilograms, from which one Master Composite was assembled. Weighted average gold extraction from all 46 Variability Composite samples broken out by the ten cross section lines, shown below on the plan map, averaged 96.9%. Gold extractions were achieved using both gravity separation and conventional carbon-in-leach (CIL) on the gravity tails.
These results compare well with the Phase I metallurgical test results which showed the weighted average gold extraction ranging from 90.1% to 96.7% for Keats Main, Golden Joint and Lotto. Lower gold extraction values in both phases of test work were realized for individual Variability Composite samples that had gold head assay values of less than 2 grams per tonne.
The Company is currently undertaking additional metallurgical testing focused on Keats West with composites having been selected and shipped to Base Metallurgical Laboratory Ltd and results anticipated in Q2 2025.
2024 MET results have been reported in press releases dated April 3, 2024 and November 1, 2024. All 2024 press releases can be found under the Company’s profile on SEDAR+ at www.sedarplus.ca.
MET values are shown in the tables below:
|
|
Nominal |
|
Calculated |
|
Gravity |
|
CIL |
|
Weighted |
|
|
Grind |
|
Head |
|
Concentrate |
|
Extraction |
|
Overall |
Mineralized Zone |
|
(microns) |
|
Grade |
|
Extraction |
|
(Of Remaining) |
|
Extraction |
|
|
|
|
(gpt) |
|
(%) |
|
(%) |
|
(%) |
Iceberg |
|
75 |
|
19.5 |
|
68.2 |
|
90.3 |
|
96.9 |
Keats Main - 1,2,3 |
|
75 |
|
15.4 |
|
84.2 |
|
76.1 |
|
96.3 |
Keats Main - 4 |
|
75 |
|
5.8 |
|
52.3 |
|
83.5 |
|
92.2 |
Keats Main - 5 |
|
75 |
|
16.4 |
|
75.1 |
|
87.2 |
|
96.7 |
Lotto |
|
75 |
|
9.2 |
|
81.0 |
|
73.6 |
|
95.0 |
Golden Joint |
|
75 |
|
5.2 |
|
66.3 |
|
70.5 |
|
90.1 |
Queensway Project – Weighted Averages Leach Test Results (November 1, 2024)
- 97 -
|
Management’s Discussion and Analysis For the years ended December 31, 2024 and 2023 |
The latest MET type sample sections are shown in the plan map below:
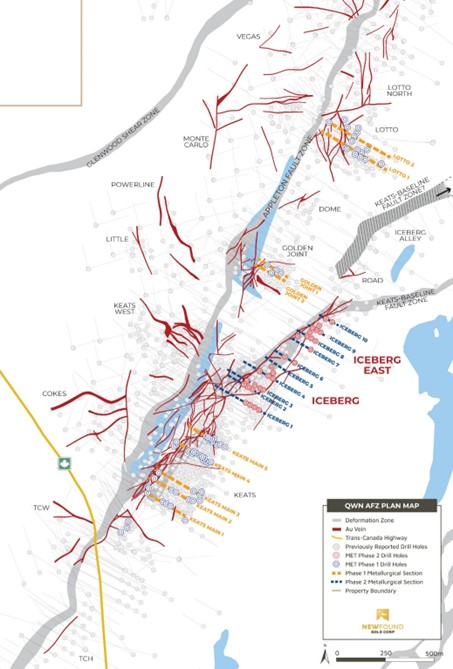
Queensway Project- Plan view map of metallurgical type-sections from the Phase II metallurgical testing program (November 1, 2024)
- 98 -
|
Management’s Discussion and Analysis For the years ended December 31, 2024 and 2023 |
Sampling, Sub-sampling and Laboratory
All drilling recovers HQ core. The drill core is split in half using a diamond saw or a hydraulic splitter for rare intersections with incompetent core.
A geologist examines the drill core and marks out the intervals to be sampled and the cutting line. Sample lengths are mostly 1.0 meter and adjusted to respect lithological and/or mineralogical contacts and isolate narrow (<1.0 m) veins or other structures that may yield higher grades.
Technicians saw the core along the defined cutting line. One-half of the core is kept as a witness sample and the other half is submitted for analysis. Individual sample bags are sealed and placed into totes, which are then sealed and marked with the contents.
New Found has submitted samples for gold determination by fire assay to ALS Canada Ltd. (“ALS”) and by photon assay to MSALABS (“MSA”) since June 2022. As of February 2024, gold analysis at ALS has been performed by photon assay. ALS and MSA operate under a commercial contract with New Found.
Drill core samples are shipped to ALS for sample preparation in Sudbury, Ontario, Thunder Bay, Ontario, or Moncton, New Brunswick. ALS is an ISO-17025 accredited laboratory for the fire assay method.
Drill core samples are also submitted to MSA in Val-d’Or, Quebec. MSA operates numerous laboratories worldwide and maintains ISO-17025 accreditation for many metal determination methods. MSA is an ISO-17025 accredited laboratory for the photon assay method.
At ALS for fire assay, the entire sample is crushed to approximately 70% passing 2 mm. A 3,000-g split is pulverized. “Routine” samples do not have visible gold (VG) identified and are not within a mineralized zone. Routine samples are assayed for gold by 30-g fire assay with an inductively-couple plasma spectrometry (ICP) finish. If the initial 30-g fire assay gold result is over 1 g/t, the remainder of the 3,000-g split is screened at 106 microns for screened metallics assay. For the screened metallics assay, the entire coarse fraction (sized greater than 106 microns) is fire-assayed, and two splits of the fine fraction (sized less than 106 microns) are fire-assayed. The three assays are combined on a weight-averaged basis. Samples that have VG identified or fall within a mineralized interval are automatically submitted for screened metallic assay for gold.
Samples submitted to ALS beginning in February 2024, received gold analysis by photon assay whereby the entire sample is crushed to approximately 70% passing 2 mm mesh. The sample is then riffle split and transferred into jars. For “routine” samples that do not have VG identified and are not within a mineralized zone, one (300-500g) jar is analyzed by photon assay. If the jar assays greater than 0.8 g/t, the remaining crushed material is weighed into multiple jars and submitted for photon assay.
For samples that have VG identified, the entire crushed sample is riffle split and weighed into multiple jars that are submitted for photon assay. The assays from all jars are combined on a weight-averaged basis.
At MSA, the entire sample is crushed to approximately 70% passing 2 mm. For “routine” samples that do not have VG identified and are not within a mineralized zone, the samples are riffle split to fill one 450 g jar for photon assay. If the jar assays greater than 0.8 g/t, the remaining crushed material is weighed into multiple jars and submitted for photon assay.
For samples that have VG identified, the entire crushed sample is weighed into multiple jars and submitted for photon assay. The assays from all jars are combined on a weight-averaged basis.
All samples prepared at ALS or MSA are also analyzed for a multi-element ICP package (ALS method code ME-ICP61) at ALS Vancouver.
- 99 -
|
Management’s Discussion and Analysis For the years ended December 31, 2024 and 2023 |
Drill program design, Quality Assurance/Quality Control, and interpretation of results are performed by qualified persons employing a rigorous Quality Assurance/Quality Control program consistent with industry best practices. Standards and blanks account for a minimum of 10% of the samples in addition to the laboratory’s internal quality assurance programs.
Quality Control data are evaluated on receipt from the laboratories for failures. Appropriate action is taken if assay results for standards and blanks fall outside allowed tolerances. All results stated have passed New Found’s quality control protocols.
New Found’s quality control program also includes submission of the second half of the core for approximately 2% of the drilled intervals. In addition, approximately 1% of sample pulps for mineralized samples are submitted for re-analysis to a second ISO-accredited laboratory for check assays.
The Company does not recognize any factors of drilling, sampling, or recovery that could materially affect the accuracy or reliability of the assay data disclosed.
The assay data disclosed in this press release have been verified by the Company’s Qualified Person against the original assay certificates.
The Company notes that it has not completed any economic evaluations of its Queensway Project and that the Queensway Project does not have any resources or reserves.
- 100 -
|
Management’s Discussion and Analysis For the years ended December 31, 2024 and 2023 |
The schedules below summarize the carrying costs of acquisition and exploration costs incurred to date for each exploration and evaluation asset that the Company is continuing to explore as at December 31, 2024 and 2023:
|
|
Newfoundland |
||||
|
|
Queensway |
|
Other |
|
Total |
Year ended December 31, 2024 |
|
$ |
|
$ |
|
$ |
Exploration and evaluation assets |
|
|
|
|
|
|
Balance as at December 31, 2023 |
|
9,014,478 |
|
78,709 |
|
9,093,187 |
Additions: |
|
|
|
|
|
|
Acquisition costs – Kingsway Project |
|
20,088,541 |
|
— |
|
20,088,541 |
Expenditure target payment – Kingsway Project |
|
750,000 |
|
— |
|
750,000 |
Acquisition costs – royalty purchases |
|
4,040,844 |
|
— |
|
4,040,844 |
Acquisition costs – other claims |
|
481,863 |
|
35,499 |
|
517,362 |
Claim staking and license renewal costs |
|
15,250 |
|
300 |
|
15,550 |
Balance as at December 31, 2024 |
|
34,390,976 |
|
114,508 |
|
34,505,484 |
|
|
|
|
|
|
|
Exploration and evaluation expenditures |
|
|
|
|
|
|
Cumulative exploration expense - December 31, 2023 |
|
215,285,192 |
|
574,857 |
|
215,860,049 |
Assays |
|
6,006,877 |
|
— |
|
6,006,877 |
Drilling |
|
23,828,589 |
|
— |
|
23,828,589 |
Environmental studies |
|
971,923 |
|
— |
|
971,923 |
Geochemistry |
|
134,971 |
|
— |
|
134,971 |
Geophysics |
|
723,154 |
|
— |
|
723,154 |
Imagery and mapping |
|
175,145 |
|
350 |
|
175,495 |
Metallurgy |
|
1,315,279 |
|
— |
|
1,315,279 |
Office and general |
|
706,448 |
|
— |
|
706,448 |
Other |
|
870,615 |
|
— |
|
870,615 |
Permitting |
|
636,745 |
|
— |
|
636,745 |
Preliminary economic assessment |
|
62,608 |
|
— |
|
62,608 |
Property taxes, mining leases and rent |
|
87,166 |
|
— |
|
87,166 |
Reclamation |
|
1,739,648 |
|
— |
|
1,739,648 |
Resource estimate |
|
354,155 |
|
— |
|
354,155 |
Salaries and consulting |
|
9,721,226 |
|
488 |
|
9,721,714 |
Seismic survey |
|
117,583 |
|
— |
|
117,583 |
Supplies and equipment |
|
1,517,546 |
|
— |
|
1,517,546 |
Travel and accommodations |
|
680,142 |
|
— |
|
680,142 |
Technical reports |
|
95,206 |
|
— |
|
95,206 |
Trenching |
|
2,932,976 |
|
— |
|
2,932,976 |
Exploration cost recovery |
|
(115,500) |
|
— |
|
(115,500) |
|
|
52,562,502 |
|
838 |
|
52,563,340 |
Cumulative exploration expense –December 31, 2024 |
|
267,847,694 |
|
575,695 |
|
268,423,389 |
- 101 -
|
Management’s Discussion and Analysis For the years ended December 31, 2024 and 2023 |
|
|
Newfoundland |
|
|
|
|
||
|
|
Queensway |
|
Other |
|
Ontario |
|
Total |
Year ended December 31, 2023 |
|
$ |
|
$ |
|
$ |
|
$ |
Exploration and evaluation assets |
|
|
|
|
|
|
|
|
Balance as at December 31, 2022 |
|
8,616,693 |
|
47,916 |
|
272,000 |
|
8,936,609 |
Additions |
|
|
|
|
|
|
|
|
Acquisition costs |
|
381,220 |
|
30,793 |
|
— |
|
412,013 |
Claim staking and license renewal costs |
|
16,565 |
|
— |
|
— |
|
16,565 |
Disposals |
|
|
|
|
|
|
|
|
Disposal of exploration and evaluation assets |
|
— |
|
— |
|
(264,000) |
|
(264,000) |
Impairment of exploration and evaluation assets |
|
— |
|
— |
|
(8,000) |
|
(8,000) |
Balance as at December 31, 2023 |
|
9,014,478 |
|
78,709 |
|
— |
|
9,093,187 |
|
|
|
|
|
|
|
|
|
Exploration and evaluation expenditures |
|
|
|
|
|
|
|
|
Cumulative exploration expense - December 31, 2022 |
|
121,302,318 |
|
539,998 |
|
3,428,034 |
|
125,270,350 |
Assays |
|
16,102,874 |
|
14,515 |
|
— |
|
16,117,389 |
Drilling |
|
41,121,168 |
|
— |
|
— |
|
41,121,168 |
Environmental studies |
|
1,280,147 |
|
— |
|
— |
|
1,280,147 |
Geochemistry |
|
857,555 |
|
— |
|
— |
|
857,555 |
Geophysics |
|
814,877 |
|
— |
|
— |
|
814,877 |
Imagery and mapping |
|
644,205 |
|
9,932 |
|
— |
|
654,137 |
Metallurgy |
|
950,855 |
|
— |
|
— |
|
950,855 |
Office and general |
|
855,902 |
|
— |
|
144 |
|
856,046 |
Other |
|
590,575 |
|
— |
|
— |
|
590,575 |
Permitting |
|
225,162 |
|
— |
|
— |
|
225,162 |
Property taxes, mining leases and rent |
|
143,010 |
|
— |
|
5,915 |
|
148,925 |
Reclamation |
|
2,122,598 |
|
— |
|
— |
|
2,122,598 |
Salaries and consulting |
|
13,243,577 |
|
10,103 |
|
13,850 |
|
13,267,530 |
Seismic survey |
|
8,118,668 |
|
— |
|
— |
|
8,118,668 |
Supplies and equipment |
|
4,438,579 |
|
— |
|
480 |
|
4,439,059 |
Technical reports |
|
55,025 |
|
— |
|
— |
|
55,025 |
Travel and accommodations |
|
1,481,399 |
|
309 |
|
155 |
|
1,481,863 |
Trenching |
|
982,148 |
|
— |
|
— |
|
982,148 |
Exploration cost recovery |
|
(45,450) |
|
— |
|
— |
|
(45,450) |
|
|
93,982,874 |
|
34,859 |
|
20,544 |
|
94,038,277 |
Cumulative exploration expense – December 31, 2023 |
|
215,285,192 |
|
574,857 |
|
3,448,578 |
|
219,308,627 |
Overall Performance and Results of Operations
Total assets decreased to $74,019,011 at December 31, 2024, from $84,579,493 at December 31, 2023, primarily as a result of a decrease in cash of $31,567,261, investments of $2,670,573, sales taxes recoverable of $1,089,698 and investment in Kirkland Lake Discoveries Corp. of $1,335,494, partially offset by an increase in exploration and evaluation assets of $25,412,297. The most significant assets at December 31, 2024 were exploration and evaluation assets of $34,505,484 (December 31, 2023: $9,093,187), cash of $22,317,548 (December 31, 2023: $53,884,809), sales taxes recoverable of $2,209,948 (December 31, 2023: $3,299,646), investment in Kirkland Lake Discoveries Corp. of $1,525,756 (December 31, 2023: $2,861,250), property and equipment of $7,938,149 (December 31, 2023: $7,638,608) and secured notes of $2,817,554 (December 31, 2023: $2,454,300). Cash decreased by $31,567,261 during the year ended December 31, 2024 primarily as a result of cash used in operating activities of $55,683,060 and purchases of exploration and evaluation assets of $3,853,119, partially offset by gross proceeds from the issuance of common shares in the Company’s prospectus offerings of $27,522,494 net of share issue costs of $924,657, proceeds from the disposal of investments of $1,097,814 and proceeds from stock options exercised of $862,500.
- 102 -
|
Management’s Discussion and Analysis For the years ended December 31, 2024 and 2023 |
Three months ended December 31, 2024 and 2023
During the three months ended December 31, 2024, loss from operating activities decreased by $5,554,440 to $16,841,023 compared to $22,395,463 for the three months ended December 31, 2023. The decrease in loss from operating activities is largely due to:
- |
A decrease of $5,071,919 in exploration and evaluation expenditures. Exploration and evaluation expenditures were $15,413,220 for the three months ended December 31, 2024 compared to $20,485,139 for the three months ended December 31, 2023. The Company completed approximately 32,062 meters of drilling in 74 holes at its Queensway project and incurred costs in connection with trenching of the Lotto Zone to examine bedrock surface geology during the three months ended December 31, 2024 compared to completing approximately 34,304 meters of drilling in 211 holes at its Queensway project and incurring higher costs in connection with the Company’s 3D seismic survey program and trenching of the Keats Main zone during the three months ended December 31, 2023. |
Other items
For the three months ended December 31, 2024, other income was $3,433,429 compared to $1,851,166 for the three months ended December 31, 2023. The $1,582,263 increase is largely due to:
- |
A decrease of $1,000,237 in impairment of equity investment. Impairment of equity investment was $Nil for the three months ended December 31, 2024 compared to $1,000,237 for the three months ended December 31, 2023. The Company recognized an impairment of $1,000,237 in connection with its equity interest in Kirkland Lake Discoveries Corp during the three months ended December 31, 2023. |
- |
A decrease of $474,530 in Part XII.6 tax. Part XII.6 tax was $109,590 for the three months ended December 31, 2024 compared to $584,120 for the three months ended December 31, 2023. The Company incurred $109,590 in Part XII.6 tax in respect of unspent flow-through proceeds renounced in year 1 under the Look-Back Rule in accordance with the Income Tax Act of Canada during the three months ended December 31, 2024. |
- 103 -
|
Management’s Discussion and Analysis For the years ended December 31, 2024 and 2023 |
The Company recorded loss and comprehensive loss of $13,407,594 or $0.07 basic and diluted loss per share for the three months ended December 31, 2024 (December 31, 2023: $20,544,297 or $0.11 basic and diluted loss per share).
Summary of Quarterly Results
|
|
2024 |
|
2023 |
||||||||||||
|
|
Dec. 31 |
|
Sep. 30 |
|
Jun. 30 |
|
Mar. 31 |
|
Dec. 31 |
|
Sep. 30 |
|
Jun. 30 |
|
Mar. 31 |
|
|
$ |
|
$ |
|
$ |
|
$ |
|
$ |
|
$ |
|
$ |
|
$ |
Revenues |
|
— |
|
— |
|
— |
|
— |
|
— |
|
— |
|
— |
|
— |
Loss and comprehensive loss for the period |
|
(13,407,594) |
(2) |
(11,583,666) |
(3) |
(12,094,882) |
(4) |
(13,182,212) |
(5) |
(20,544,297) |
(6) |
(18,627,388) |
(7) |
(24,294,494) |
(8) |
(22,408,819) |
Loss per Common Share Basic(1) |
|
(0.07) |
|
(0.06) |
|
(0.06) |
|
(0.07) |
|
(0.11) |
|
(0.11) |
|
(0.15) |
|
(0.14) |
Loss per Common Share Diluted(1) |
|
(0.07) |
|
(0.06) |
|
(0.06) |
|
(0.07) |
|
(0.11) |
|
(0.11) |
|
(0.15) |
|
(0.14) |
| (1) | Per share amounts are rounded to the nearest cent, therefore aggregating quarterly amounts may not reconcile to year-to-date per share amounts. |
| (2) | Increase in loss and comprehensive loss from prior quarter primarily driven by an increase in exploration and evaluation expenditures of $2,552,101, partially offset by a decrease in interest income of $234,976, an increase in foreign exchange gain of $257,672 and an increase in settlement of flow-through share premium liability of $141,322. |
| (3) | Decrease in loss and comprehensive loss from prior quarter primarily driven by a decrease in settlement of legal claim of $1,750,100, a decrease in unrealized losses on investments of $702,051 and an increase in settlement of flow-through share premium liability of $689,701, partially offset by an increase in exploration and evaluation expenditures of $2,733,381. |
| (4) | Decrease in loss and comprehensive loss from prior quarter primarily driven by a decrease in exploration and evaluation expenditures of $4,033,525 and a decrease in share-based compensation of $475,407, partially offset by an increase in salaries and consulting of $379,015, a decrease in settlement of flow-through share premium liability of $907,350, settlement of legal claim of $1,750,100 and an increase in unrealized losses on investments of $435,708. |
| (5) | Decrease in loss and comprehensive loss from prior quarter primarily driven by a decrease in exploration and evaluation expenditures of $6,323,876 and a decrease in impairment of equity investment of $1,000,237, partially offset by an increase in share-based compensation of $344,292. |
| (6) | Decrease in loss and comprehensive loss from prior quarter primarily driven by a decrease in exploration and evaluation expenditures of $6,460,073 and a decrease in unrealized losses on investments of $1,525,529, partially offset by a decrease in settlement of flow-through share premium of $3,968,911 and an increase in impairment of equity investment of $1,000,237. |
| (7) | Increase in loss and comprehensive loss from prior quarter primarily driven by an increase in exploration and evaluation expenditures of $1,984,071, an increase in salaries and consulting of $382,246, an increase in unrealized losses on investments of $1,052,805, partially offset by a decrease in gain on sale of exploration and evaluation assets of $4,217,935. |
| (8) | Decrease in loss and comprehensive loss from prior quarter primarily driven by an increase in gain on sale of exploration and evaluation assets of $4,217,935, an increase in settlement of flow-through share premium of $1,478,775, a decrease in unrealized losses on investments of $1,382,266 and a decrease in professional fees of $382,614, partially offset by an increase in exploration and evaluation expenditures of $3,314,356. |
Year ended December 31, 2024 and 2023
During the year ended December 31, 2024, loss from operating activities decreased by $43,150,646 to $60,316,924 compared to $103,467,570 for the year ended December 31, 2023. The decrease in loss from operating activities is largely due to:
| - | A decrease of $41,474,937 in exploration and evaluation expenditures. Exploration and evaluation expenditures were $52,563,340 for the year ended December 31, 2024 compared to $94,038,277 for the year ended December 31, 2023. The Company completed approximately 92,923 meters of drilling in 288 holes and trenching of the Iceberg and Lotto zones to examine bedrock surface geology during the year ended December 31, 2024 compared to completing approximately 195,899 meters of drilling in 1,006 holes at its Queensway project and incurred higher costs in connection with its 3D seismic survey program and trenching of the Keats Main zone during the year ended December 31, 2023. |
- 104 -
|
Management’s Discussion and Analysis For the years ended December 31, 2024 and 2023 |
| - | A decrease of $563,126 in corporate development and investor relations. Corporate development and investor relations was $711,506 for the year ended December 31, 2024 compared to $1,274,632 for the year ended December 31, 2023. The decrease is due to less corporate development and investor relations activities undertaken during the year ended December 31, 2024. |
| - | A decrease of $521,518 in share-based compensation. Share-based compensation was $889,045 the year ended December 31, 2024 compared to $1,410,563 for the year ended December 31, 2023. The decrease is due to 240,000 stock options granted and the continued vesting of previously granted stock options with a value of $889,045 during the year ended December 31, 2024 compared to no stock options granted and the continued vesting of previously granted stock options with a value of $1,410,563 during the year ended December 31, 2023. |
Other items
For the year ended December 31, 2024, other income was $10,048,570 compared to $23,576,807 for the year ended December 31, 2023. The $13,528,237 decrease is largely due to:
| - | A decrease of $10,506,206 in settlement of flow-through share premium liability. Settlement of flow-through share premium liability was $12,426,322 as a result of less qualifying Canadian exploration expenses incurred for the year ended December 31, 2024 compared to $22,932,528 for the year ended December 31, 2023. The Company incurred $45,500,423 of Qualifying Canadian exploration expenses and derecognized $12,426,322 of its flow-through premium liability the year ended December 31, 2024. |
| - | A decrease of $4,217,935 in gain on sale of exploration and evaluation assets. The Company did not sell any exploration and evaluation assets during the year ended December 31, 2024 compared to a recognized gain of $4,217,935 on the sale of its Lucky Strike project for total non-cash consideration having a fair value of $4,657,482 during the year ended December 31, 2023. |
| - | An increase of $1,750,100 in settlement of legal claim. The Company issued 370,000 common shares with a value of $1,750,100 during the year ended December 31, 2024 pursuant to a settlement agreement resolving the lawsuit that was filed against the Company by ThreeD Capital Inc. and 1313366 Ontario Inc. |
| - | An increase of $380,877 in realized losses on disposal of investments. Realized losses on disposal of investments was $380,877 for the year ended December 31, 2024 compared to $Nil for the year ended December 31, 2023. The Company disposed of certain investments for proceeds of $1,097,814 and recognized a loss in relation to the disposal of $380,877 during the year ended December 31, 2024. |
| - | An increase of $510,727 in loss from equity investment. Loss from equity investment in Kirkland Lake Discoveries Corp was $1,306,722 for the year ended December 31, 2024 compared to $795,995 for the year ended December 31, 2023. The increase is due to the Company’s share of comprehensive loss for the year ended December 31, 2024 from its equity investment in Kirkland Lake Discoveries Corp. compared to the period from May 25, 2023 to December 31, 2023. |
- 105 -
|
Management’s Discussion and Analysis For the years ended December 31, 2024 and 2023 |
The decrease in other income was partially offset by:
| - | A decrease in unrealized losses on investments of $2,887,181. Unrealized losses on investments were $1,191,882 for the year ended December 31, 2024 compared to $4,079,063 in unrealized losses on investments for the year ended December 31, 2023. The decrease is due to changes in the fair values of investments held at December 31, 2024 and 2023. |
| - | A decrease of $1,000,237 in impairment of equity investment. Impairment of equity investment was $Nil for the year ended December 31, 2024 compared to $1,000,237 for the year ended December 31, 2024. The Company recognized an impairment of $1,000,237 in connection with its equity investment in Kirkland Lake Discoveries Corp. during the year ended December 31, 2023. |
The Company recorded loss and comprehensive loss of $50,268,354 or $0.26 basic and diluted loss per share for the year ended December 31, 2024 (December 31, 2023: $79,890,763 or $0.45 basic and diluted loss per share).
- 106 -
|
Management’s Discussion and Analysis For the years ended December 31, 2024 and 2023 |
SELECTED ANNUAL INFORMATION
Selected annual information from the audited financial statements for the years ended December 31, 2024, 2023 and 2022 is presented in the table below. The financial data below has been prepared in accordance with IFRS and is reported in Canadian dollars.
|
|
December 31, 2024 |
|
December 31, 2023 |
|
December 31, 2022 |
Selected Annual Financial Information |
|
$ |
|
$ |
|
$ |
Total Assets |
|
74,019,011 |
|
84,579,493 |
|
110,687,512 |
Operating expenses(1) |
|
(6,864,539) |
|
(8,018,730) |
|
(8,806,960) |
Share-based compensation |
|
(889,045) |
|
(1,410,563) |
|
(8,489,387) |
Exploration and evaluation expenditures |
|
(52,563,340) |
|
(94,038,277) |
|
(71,420,546) |
Impairment of exploration and evaluation assets |
|
— |
|
(8,000) |
|
— |
Loss from equity investment |
|
(1,306,722) |
|
(795,995) |
|
— |
Impairment of equity investment |
|
— |
|
(1,000,237) |
|
— |
Realized (losses) on disposal of investments |
|
(380,877) |
|
— |
|
(4,675,084) |
Unrealized (losses) on investments |
|
(1,191,882) |
|
(4,079,063) |
|
(14,938,953) |
Settlement of flow-through premium liability |
|
12,426,322 |
|
22,932,528 |
|
17,165,846 |
Settlement of legal claim |
|
(1,750,100) |
|
— |
|
— |
Gain on sale of exploration and evaluation assets |
|
— |
|
4,217,935 |
|
12,161 |
Net loss comprehensive loss |
|
(50,268,354) |
|
(79,890,763) |
|
(89,989,659) |
Loss per share – basic and diluted |
|
(0.26) |
|
(0.45) |
|
(0.54) |
(1) |
Operating expenses is comprised of corporate development & investor relations, depreciation, office & sundry, professional fees, salaries and consulting, transfer agent & regulatory fees, and travel. |
Liquidity and Capital Resources
As at December 31, 2024, the Company had cash of $22,317,548 to settle current liabilities of $7,378,986.
The Company does not currently have a recurring source of revenue and has historically incurred negative cash flows from operating activities. As at December 31, 2024, the Company has a working capital surplus, calculated as current assets less current liabilities, of $22,372,424, consisting primarily of cash, and negative cash flow from operating activities of $55,683,060 for the year ended December 31, 2024.
The Company’s exploration and evaluation assets presently have no proven or probable reserves, and on the basis of information to date, it has not yet determined whether these properties contain economically recoverable resources. The recoverability of amounts shown for exploration and evaluation assets are dependent upon the existence of economically recoverable reserves, the ability of the Company to obtain necessary financing to complete the development of those reserves and upon future profitable production.
Although the Company presently has sufficient financial resources to cover its existing obligations and operating costs, the Company expects to require further funding to fund its planned programs for the next year. Management is actively targeting sources of additional financing including through the issuance of shares, which would assure continuation of the Company’s operations and exploration programs. In order for the Company to meet its liabilities as they come due and to continue its operations, the Company is solely dependent upon its ability to generate such financing. Although the Company has been successful in the past in generating financing, there is no assurance it will be able to do so in the future. These items cast significant doubt as to the Company’s ability to continue as a going concern.
The sources of funds currently available to the Company for its acquisition and exploration projects are solely from equity financing. The Company does not have bank debt or banking credit facilities in place as at the date of this report.
- 107 -
|
Management’s Discussion and Analysis For the years ended December 31, 2024 and 2023 |
As at December 31, 2024, the Company had the following contractual obligations:
Contractual obligations |
|
Total $ |
|
1 Year $ |
|
1-3 Years $ |
|
4-5 Years $ |
|
After 5 Years $ |
Accounts payable and accrued liabilities |
|
7,325,203 |
|
7,325,203 |
|
— |
|
— |
|
— |
Lease obligations |
|
287,075 |
|
49,329 |
|
24,168 |
|
26,064 |
|
187,514 |
Total contractual obligations (i) |
|
7,612,278 |
|
7,374,532 |
|
24,168 |
|
26,064 |
|
187,514 |
(i) |
Amounts shown in the table are undiscounted. |
Property Option Agreement
On November 2, 2022, the Company entered into a definitive property option agreement to acquire a 100% interest in five mineral licenses located near Gander, Newfoundland. Under the terms of this agreement, the Company may exercise the option by issuing an aggregate of 487,078 common shares in the capital the Company and making aggregate cash payments of $2,350,000 to the optionors as follows:
· |
$200,000 (paid) and 39,762 common shares (issued) on the later of (i) staking confirmation date as defined in the Option Agreement and (ii) the receipt of the TSX-Venture Exchange’s approval; |
· |
$200,000 (paid) and 39,762 common shares (issued) on or before November 2, 2023; |
· |
$250,000 (paid) and 69,583 common shares (issued) on or before November 2, 2024; |
· |
$300,000 and 89,463 common shares on or before November 2, 2025; |
· |
$600,000 and 129,224 common shares on or before November 2, 2026; and |
· |
$800,000 and 119,284 common shares on or before November 2, 2027. |
Kingsway Project
The Kingsway Project carries a 1.0% NSR payable to the royalty holders upon commencement of commercial production.
The Company will also pay to the royalty holders $1 per ounce of gold contained within the property in the indicated mineral resource and measured mineral resource categories (the “Resource Payment”) as defined by the Canadian Institute of Mining, Metallurgy and Petroleum, and established in a National Instrument 43-101 – Standards of Disclosure for Mineral Projects or like technical report for the development of the property. The Resource Payment is payable upon the commencement of commercial production.
An advance royalty payment of $50,000 per year will be payable commencing on March 3, 2026 and continuing each year until the commencement of commercial production. Any advance royalties paid will be deducted from the royalty payable after commencement of commercial production.
At-the-Market Distributions (“ATM”) Program
In August 2022, the Company filed a prospectus supplement to its short form base shelf prospectus, pursuant to which the Company may, at its discretion and from time-to-time, sell common shares of the Company for aggregate gross proceeds of up to US$100,000,000. The sale of common shares is to be made through “at-the-market distributions” ("ATM"), as defined in the Canadian Securities Administrators’ National Instrument 44-102 Shelf Distributions, directly on the TSX Venture Exchange and the NYSE American stock exchange.
- 108 -
|
Management’s Discussion and Analysis For the years ended December 31, 2024 and 2023 |
Assuming net proceeds of the maximum of US$100,000,000 (less commissions) on or before the expiry of the prospectus on August 22, 2024, the Company intended to use the net proceeds of the offering as follows:
|
|
Intended Use of Proceeds |
|
|
(Estimated) |
Uses of Funds: |
|
$ |
Exploration and drilling at the Queensway Project and commissioning of mineral resource estimate |
|
US$51,000,000 to US$85,000,000 |
General, corporate and administrative expenses |
|
US$10,000,000 to US$15,000,000 |
Total Uses |
|
US$100,000,000 (less commission) |
During the year ended December 31, 2024, the Company sold 5,857,242 (2023 - 3,552,224) common shares of the Company under the ATM program at an average price of $4.70 (2023 – $6.47) for gross proceeds of $27,522,494 (2023 - $22,980,338) or net proceeds of $26,607,687 (2023 - $22,440,215), and paid an aggregate commission of $914,807 (2023 - $540,123).
At December 31, 2024, the Company has completed $53,052,510 of the ATM program and used the gross proceeds of the offering as follows:
|
|
Actual Use of Proceeds |
Uses of Funds: |
|
$ |
Exploration and drilling at the Queensway Project and commissioning of mineral resource estimate |
|
20,613,856 |
General, corporate and administrative expenses (including commissions) |
|
15,523,814 |
Working capital to fund ongoing operations |
|
16,914,840 |
Gross ATM proceeds |
|
53,052,510 |
As at December 31, 2024, the ATM has expired.
Prior Financings
November 6, 2023 Financing – Net Proceeds of $53,028,996
On November 6, 2023, the Company completed a bought-deal prospectus offering of 7,725,000 flow-through common shares at a price of $7.25 per common share for gross proceeds of $56,006,250. The Company paid share issuance costs of $2,977,254 in cash, of which $2,357,908 was paid to the underwriters. The premium received on the flow-through shares issued was determined to be $15,295,500.
|
|
Intended Use of |
|
|
|
Over/(Under)- |
|
|
Proceeds |
|
Actual Use of |
|
Expenditure at |
|
|
(Estimated) |
|
Proceeds |
|
December 31, 2023 |
Uses of Funds: |
|
$ |
|
$ |
|
$ |
Queensway Project work program |
|
56,006,250 |
|
56,006,250 |
|
— |
Total Uses |
|
56,006,250 |
|
56,006,250 |
|
— |
Outstanding Share Data
During the year ended December 31, 2024, the Company sold 5,857,242 common shares of the Company under the ATM program at an average price of $4.70 for gross proceeds of $27,522,494 or net proceeds of $26,607,687, and paid an aggregate commission of $914,807.
On November 1, 2024, the Company issued 69,583 common shares with a value of $215,707 pursuant to the acquisition of exploration and evaluation assets in accordance with the terms of certain property option agreements.
- 109 -
|
Management’s Discussion and Analysis For the years ended December 31, 2024 and 2023 |
On August 8, 2024, the Company issued 300,000 common shares with a value of $1,011,000 pursuant to the acquisition of certain royalty interests.
On July 9, 2024, the Company issued 5,263,157 common shares to LabGold with a value of $20,000,000 pursuant to the acquisition of the Kingsway Project.
On June 26, 2024, the Company issued 370,000 common shares with a value of $1,750,100 pursuant to a legal claim settlement agreement.
During the year ended December 31, 2024, 1,725,000 stock options were exercised at a weighted average exercise price of $0.50 per share for gross proceeds of $862,500.
Subsequent to December 31, 2024, 125,000 stock options with an exercise price of $1.40 per share were exercised for gross proceeds of $175,000, and 25,000 stock options with an exercise price of $1.075 were exercised for gross proceeds of $26,875.
Subsequent to December 31, 2024, 75,000 stock options with a weighted-average exercise price of $5.36 per share were forfeited and 420,250 stock options with a weighted-average exercise price of $7.08 per share expired.
As at December 31, 2024, there were 200,457,994 common shares issued and outstanding. As of the date of this report, there were 200,607,994 common shares issued and outstanding.
As at December 31, 2024, there were 10,556,750 stock options and no warrants outstanding. As at the date of this report, there were 9,911,500 stock options and no warrants outstanding.
Related Party Transactions
All transactions with related parties have occurred in the normal course of operations and on terms and conditions that are similar to those of transactions with unrelated parties and are measured at the amount of consideration paid or received. A summary of the Company’s related party transactions with corporations having similar directors and officers is as follows:
|
|
Year ended December 31, |
||
|
|
2024 |
|
2023 |
|
|
$ |
|
$ |
Amounts paid to EarthLabs Inc. (i) for exploration and evaluation |
|
18,000 |
|
18,000 |
Amounts paid to Notz Capital Corp. (ii) for corporate development and investor relations |
|
177,310 |
|
104,637 |
(i)EarthLabs Inc. is a related entity having the following common former director and officer to the Company: Denis Laviolette, Director and President.
(ii)Notz Capital Corp. is a related entity of the director.
There are no ongoing contractual commitments resulting from these transactions with related parties.
- 110 -
|
Management’s Discussion and Analysis For the years ended December 31, 2024 and 2023 |
Key management personnel compensation
Key management personnel include those persons having authority and responsibility for planning, directing and controlling the activities of the Company as a whole. The Company has determined that key management personnel consist of executive and non-executive members of the Company’s Board of Directors and corporate officers.
|
|
Salaries and |
|
Share-based |
|
|
|
Year ended |
|
|
Consulting |
|
compensation |
|
Bonus |
|
December 31, 2024 |
|
|
$ |
|
$ |
|
$ |
|
$ |
Executive Chairman and Chief Executive Officer |
|
388,800 |
|
— |
|
129,600 |
|
518,400 |
President |
|
15,000 |
|
— |
|
— |
|
15,000 |
Former President |
|
261,917 |
|
— |
|
90,720 |
|
352,637 |
Chief Financial Officer |
|
116,640 |
|
— |
|
38,880 |
|
155,520 |
Chief Operating Officer |
|
270,220 |
|
— |
|
84,240 |
|
354,460 |
Chief Development Officer |
|
336,960 |
|
96,083 |
|
112,320 |
|
545,363 |
Non-executive directors |
|
83,440 |
|
— |
|
— |
|
83,440 |
Former non-executive directors |
|
138,580 |
|
— |
|
— |
|
138,580 |
Total |
|
1,611,557 |
|
96,083 |
|
455,760 |
|
2,163,400 |
|
|
Salaries and |
|
Share-based |
|
|
|
Year ended |
|
|
Consulting |
|
compensation |
|
Bonus |
|
December 31, 2023 |
|
|
$ |
|
$ |
|
$ |
|
$ |
Executive Chairman and Chief Executive Officer |
|
388,800 |
|
— |
|
129,600 |
|
518,400 |
President |
|
272,160 |
|
— |
|
90,720 |
|
362,880 |
Chief Financial Officer |
|
116,640 |
|
— |
|
38,880 |
|
155,520 |
Chief Operating Officer |
|
252,720 |
|
— |
|
84,240 |
|
336,960 |
Chief Development Officer |
|
336,960 |
|
235,560 |
|
112,320 |
|
684,840 |
Non-executive directors |
|
216,000 |
|
— |
|
— |
|
216,000 |
Total |
|
1,583,280 |
|
235,560 |
|
455,760 |
|
2,274,600 |
As at December 31, 2024, there was $56,040 payable to key management personnel in respect of key management compensation and expense reimbursements included in accounts payable and accrued liabilities (December 31, 2023 - $18,888). The amounts are unsecured, non-interest bearing and without fixed terms of repayment.
Under the terms of their management agreements, certain officers of the Company are entitled to 18 months of base pay in the event of their agreements being terminated without cause.
Risks and Uncertainties
The risks and uncertainties described in this section are considered by management to be the most important in the context of the Company's business. The risks and uncertainties below are not inclusive of all the risks and uncertainties the Company may be subject to and other risks may exist. The Company is in the business of acquiring, exploring and evaluating gold properties. It is exposed to a number of risks and uncertainties that are common to other gold mining companies. The industry is capital intensive at all stages and is subject to variations in commodity prices, market sentiment, inflation and other risks.
- 111 -
|
Management’s Discussion and Analysis For the years ended December 31, 2024 and 2023 |
Exploration Stage Company
The Company is an exploration stage company and cannot give any assurance that a commercially viable deposit, or “reserve,” exists on any properties for which the Company currently has or may have (through potential future joint venture agreements or acquisitions) an interest. Determination of the existence of a reserve depends on appropriate and sufficient exploration work and the evaluation of legal, economic, and environmental factors. If the Company fails to find a commercially viable deposit on any of its properties, its financial condition and results of operations will be materially adversely affected.
No Mineral Resources
Currently, there are no mineral resources (within the meaning of NI 43-101) on any of the properties in which the Company has an interest and the Company cannot give any assurance that any mineral resources will be identified. If the Company fails to identify any mineral resources on any of its properties, its financial condition and results of operations will be materially adversely affected.
Reliability of Historical Information
The Company has relied on, and the disclosure in the Queensway Technical Report is based, in part, upon, historical data compiled by previous parties involved with the Queensway Project. To the extent that any of such historical data is inaccurate or incomplete, the Company’s exploration plans may be adversely affected.
Mineral Exploration and Development
Resource exploration and development is a speculative business, characterized by a number of significant risks including, among other things, unprofitable efforts resulting not only from the failure to discover mineral deposits but from finding mineral deposits which, though present, are insufficient in quantity and quality to return a profit from production. The marketability of minerals acquired or discovered by the Company may be affected by numerous factors which are beyond the control of the Company and which cannot be accurately predicted, such as market fluctuations, the proximity and capacity of milling facilities, mineral markets and processing equipment and such other factors as government regulations, including regulations relating to royalties, allowable production, importing and exporting of minerals and environmental protection, the combination of which factors may result in the Company not receiving an adequate return of investment capital. There is no assurance that the Company’s mineral exploration and any development activities will result in any discoveries of commercial bodies of ore.
The long-term profitability of the Company’s operations will in part be directly related to the costs and success of its exploration programs, which may be affected by a number of factors. Substantial expenditures are required to establish reserves through drilling and to develop the mining and processing facilities and infrastructure at any site chosen for mining. Substantial expenditures are required to establish ore reserves through exploration and drilling, to develop metallurgical processes to extract the metal from the ore and, in the case of new properties, to develop the mining and processing facilities and infrastructure at any site chosen for mining. Although substantial benefits may be derived from the discovery of a major mineralized deposit, no assurance can be given that minerals will be discovered in sufficient quantities and grades to justify commercial operations or that funds required for development can be obtained on a timely basis.
- 112 -
|
Management’s Discussion and Analysis For the years ended December 31, 2024 and 2023 |
Estimates of reserves, mineral deposits and production costs can also be affected by such factors as environmental permitting regulations and requirements, weather, environmental factors, unforeseen technical difficulties, unusual or unexpected geological formations and work interruptions. In addition, the grade of ore ultimately mined may differ from that indicated by drilling results. Short term factors relating to reserves, such as the need for orderly development of ore bodies or the processing of new or different grades, may also have an adverse effect on mining operations and on the results of operations. Material changes in ore reserves, grades, stripping ratios or recovery rates may affect the economic viability of any project.
Competition and Mineral Exploration
The mineral exploration industry is intensely competitive in all of its phases and the Company must compete in all aspects of its operations with a substantial number of large established mining companies with greater liquidity, greater access to credit and other financial resources, newer or more efficient equipment, lower cost structures, more effective risk management policies and procedures and/or greater ability than the Company to withstand losses.
The Company's competitors may be able to respond more quickly to new laws or regulations or emerging technologies or devote greater resources to the expansion of their operations, than the Company can. In addition, current and potential competitors may make strategic acquisitions or establish cooperative relationships among themselves or with third parties. Competition could adversely affect the Company's ability to acquire suitable new mineral properties or prospects for exploration in the future. Competition could also affect the Company's ability to raise financing to fund the exploration and development of its properties or to hire qualified personnel. The Company may not be able to compete successfully against current and future competitors, and any failure to do so could have a material adverse effect on the Company's business, financial condition or results of operations.
Additional Funding
The exploration and development of the Company’s mineral properties will require substantial additional capital. When such additional capital is required, the Company will need to pursue various financing transactions or arrangements, including joint venturing of projects, debt financing, equity financing or other means. Additional financing may not be available when needed or, if available, the terms of such financing might not be favorable to the Company and might involve substantial dilution to existing shareholders. The Company may not be successful in locating suitable financing transactions in the time period required or at all. A failure to raise capital when needed would have a material adverse effect on the Company’s business, financial condition and results of operations. Any future issuance of securities to raise required capital will likely be dilutive to existing shareholders. In addition, debt and other debt financing may involve a pledge of assets and may be senior to interests of equity holders. The Company may incur substantial costs in pursuing future capital requirements, including investment banking fees, legal fees, accounting fees, securities law compliance fees, printing and distribution expenses and other costs.
The ability to obtain needed financing may be impaired by such factors as the capital markets (both generally and in the gold and copper industries in particular), the Company’s status as a new enterprise with a limited history, the location of the Company’s mineral properties, the price of commodities and/or the loss of key management personnel.
Permits and Government Regulation
The future operations of the Company may require permits from various federal, state, provincial and local governmental authorities and will be governed by laws and regulations governing prospecting, development, mining, production, export, taxes, labour standards, occupational health, waste disposal, land use, environmental protections, mine safety and other matters.
- 113 -
|
Management’s Discussion and Analysis For the years ended December 31, 2024 and 2023 |
Although Canada has a favorable legal and fiscal regime for exploration and mining, including a relatively simple system for the acquisition of mineral titles and relatively low tax burden, possible future government legislation, policies and controls relating to prospecting, development, production, environmental protection, mining taxes and labour standards could cause additional expense, capital expenditures, restrictions and delays in the activities of the Company, the extent of which cannot be predicted. Before development and production can commence on any properties, the Company must obtain regulatory and environmental approvals. There is no assurance that such approvals can be obtained on a timely basis or at all. The cost of compliance, with changes in governmental regulations, has the potential to reduce the profitability of operations. The Company is currently in compliance with all material regulations applicable to its exploration activities.
Limited Operating History
The Company has a limited operating history and its mineral properties are exploration stage properties. As such, the Company will be subject to all of the business risks and uncertainties associated with any new business enterprise, including under-capitalization, cash shortages, limitations with respect to personnel, financial and other resources and lack of revenues.
The current state of the Company’s mineral properties require significant additional expenditures before any cash flow may be generated. Although the Company possesses an experienced management team, there is no assurance that the Company will be successful in achieving a return on shareholders’ investment and the likelihood of success of the Company must be considered in light of the problems, expenses, difficulties, complications and delays frequently encountered in connection with the establishment of any business. There is no assurance that the Company can generate revenues, operate profitably, or provide a return on investment, or that it will successfully implement its plans.
An investment in the Company’s securities carries a high degree of risk and should be considered speculative by purchasers. There is no assurance that we will be successful in achieving a return on shareholders’ investment and the likelihood of our success must be considered in light of our early stage of operations. You should consider any purchase of the Company’s securities in light of the risks, expenses and problems frequently encountered by all companies in the early stages of their corporate development.
Title Risks
Although the Company has or will receive title opinions for any properties in which it has a material interest, there is no guarantee that title to such properties will not be challenged or impugned. The Company has not conducted surveys on all of the claims in which it holds direct or indirect interests. The Company’s properties may be subject to prior unregistered agreements or transfers or native land claims and title may be affected by unidentified or unknown defects. Title insurance is generally not available for mineral properties and the Company's ability to ensure that it has obtained secure claims to individual mineral properties or mining concessions may be constrained.
A successful challenge to the Company’s title to a property or to the precise area and location of a property could cause delays or stoppages to the Company’s exploration, development or operating activities without reimbursement to the Company. Any such delays or stoppages could have a material adverse effect on the Company’s business, financial condition and results of operations.
- 114 -
|
Management’s Discussion and Analysis For the years ended December 31, 2024 and 2023 |
Laws and Regulation
The Company’s exploration activities are subject to extensive federal, provincial and local laws and regulations governing prospecting, development, production, exports, taxes, labour standards, occupational health and safety, mine safety and other matters in all the jurisdictions in which it operates. These laws and regulations are subject to change, can become more stringent and compliance can therefore become more costly. The Company applies the expertise of its management, advisors, employees and contractors to ensure compliance with current laws.
Uninsured and Underinsured Risks
The Company faces and will face various risks associated with mining exploration and the management and administration thereof. Some of these risks are not insurable; some may be the subject of insurance which is not commercially feasible for the Company. Those insurances which are purchased will have exclusions and deductibles which may eliminate or restrict recovery in the event of loss. In some cases, the amount of insurance purchased may not be adequate in amount or in limit. The Company will undertake intermittent assessments of insurable risk to help ensure that the impact of uninsured/underinsured loss is minimized within reason.
Risks may vary from time to time within this intermittent period due to changes in such things as operations operating conditions, laws or the climate which may leave the Company exposed to periods of additional uninsured risk. In the event risk is uninsurable, at its reasonable and sole discretion, the Company may endeavor to implement policies and procedures, as may be applicable and/or feasible, to reduce the risk of related loss.
Global Economy Risk
The volatility of global capital markets over the past several years has generally made the raising of capital by equity or debt financing more difficult. The Company may be dependent upon capital markets to raise additional financing in the future. As such, the Company is subject to liquidity risks in meeting its operating expenditure requirements and future development cost requirements in instances where adequate cash positions are unable to be maintained or appropriate financing is unavailable.
- 115 -
|
Management’s Discussion and Analysis For the years ended December 31, 2024 and 2023 |
These factors may impact the ability to raise equity or obtain loans and other credit facilities in the future and on terms favourable to the Company and its management.
In addition, as the Company’s operations expand and reliance on global supply chains increases, the impact of significant geopolitical risk and conflict globally may have a sizeable and unpredictable impact on the Company’s business, financial condition and operations. The ongoing conflict in Ukraine, the Israel-Hamas war, and the global response to these conflicts as it relates to sanctions, trade embargos and military support has resulted in significant uncertainty as well as economic and supply chain disruptions. Should the Israel-Hamas war expand, or the Ukraine conflict continue for an extended period of time, or should other geopolitical disputes and conflicts emerge in other regions, this could result in material adverse effects to the Company.
Uncertainty of Trade Policies
The imposition of trade tariffs, particularly by the U.S., or other trade restrictions could have significant repercussions for Canadian businesses, and the broader economy. Increased costs of goods and services may contribute to inflation. These tariffs, and any changes to these tariffs or imposition of any new tariffs, taxes or import or export restrictions or prohibitions, could have a material adverse effect on the Company’s business.
Furthermore, there is a risk that the tariffs imposed by the U.S. on other countries will trigger a broader global trade war which could have a material adverse effect on the Canadian, U.S. and global economies. Overall, trade policy restrictions create financial uncertainty for companies, disrupt trade relationships, and put downward pressure on economic growth.
Sanctions
In late February 2022, Russia launched a large-scale military attack on Ukraine. The invasion significantly amplified already existing geopolitical tensions among Russia, Ukraine, Europe, NATO and the West, including Canada. In response to the military action by Russia, various countries, including Canada, the United States, the United Kingdom and European Union issued broad-ranging economic sanctions against Russia. Such sanctions included, among other things, a prohibition on doing business with certain Russian companies, large financial institutions, officials and oligarchs; a commitment by certain countries and the European Union to remove selected Russian banks from the Society for Worldwide Interbank Financial Telecommunications, or SWIFT, the electronic banking network that connects banks globally; a ban of oil imports from Russia to the United States; and restrictive measures to prevent the Russian Central Bank from undermining the impact of the sanctions. Additional sanctions may be imposed in the future.
Such sanctions (and any future sanctions) and other actions against Russia may adversely impact, among other things, the Russian economy and various sectors of the economy, including but not limited to, financials, energy, metals and mining, engineering and defense and defense-related materials sectors; result in a decline in the value and liquidity of Russian securities; result in boycotts, tariffs, and purchasing and financing restrictions on Russia’s government, companies and certain individuals; weaken the value of the ruble; downgrade the country’s credit rating; freeze Russian securities and/or funds invested in prohibited assets and impair the ability to trade in Russian securities and/or other assets; and have other adverse consequences on the Russian government, economy, companies and region. Further, several large corporations and U.S. states have announced plans to divest interests or otherwise curtail business dealings with certain Russian businesses.
The ramifications of the hostilities and sanctions may not be limited to Russia, Ukraine and Russian and Ukrainian companies and may spill over to and negatively impact other regional and global economic markets (including Europe, Canada and the United States), companies in other countries (particularly those that have done business with Russia and Ukraine) and on various sectors, industries and markets for securities and commodities globally, such as oil and natural gas. Accordingly, the actions discussed above and the potential for a wider conflict could increase financial market volatility and cause severe negative effects on regional and global economic markets, industries, and companies.
In addition, Russia may take retaliatory actions and other countermeasures, including cyberattacks and espionage against other countries and companies around the world, which may negatively impact such countries and companies.
The extent and duration of the military action or future escalation of such hostilities, the extent and impact of existing and future sanctions, market disruptions and volatility, and the result of any diplomatic negotiations cannot be predicted.
- 116 -
|
Management’s Discussion and Analysis For the years ended December 31, 2024 and 2023 |
While we expect any direct impacts to our business to be limited, the indirect impacts on the economy and on the mining industry and other industries in general could negatively affect our business and may make it more difficult for us to raise equity or debt financing.
In addition, the impact of other current macro-economic factors on our business, which may be exacerbated by the war in Ukraine – including inflation, supply chain constraints and geopolitical events – is uncertain. If these levels of volatility persist or if there is a further economic slowdown, the Company's operations, the Company's ability to raise capital could be adversely impacted.
Environmental Risks
The Company’s activities are subject to extensive laws and regulations governing environment protection. The Company is also subject to various reclamation related conditions. Although the Company closely follows and believes it is operating in compliance with all applicable environmental regulations, there can be no assurance that all future requirements will be obtainable on reasonable terms. Failure to comply may result in enforcement actions causing operations to cease or be curtailed and may include corrective measures requiring capital expenditures. Intense lobbying over environmental concerns by non-governmental organizations has caused some governments to cancel or restrict development of mining projects. Current publicized concern over climate change may lead to carbon taxes, requirements for carbon offset purchases or new regulation. The costs or likelihood of such potential issues to the Company cannot be estimated at this time.
The legal framework governing this area is constantly developing, therefore the Company is unable to fully ascertain any future liability that may arise from the implementation of any new laws or regulations, although such laws and regulations are typically strict and may impose severe penalties (financial or otherwise). The proposed activities of the Company, as with any exploration, may have an environmental impact which may result in unbudgeted delays, damage, loss and other costs and obligations including, without limitation, rehabilitation and/or compensation. There is also a risk that the Company’s operations and financial position may be adversely affected by the actions of environmental groups or any other group or person opposed in general to the Company’s activities and, in particular, the proposed exploration and mining by the Company within the Province of Newfoundland and Labrador.
Social and Environmental Activism
There is an increasing level of public concern relating to the effects of mining on the nature landscape, in communities and on the environment. Certain non-governmental organizations, public interest groups and reporting organizations (“NGOs”) who oppose resource development can be vocal critics of the mining industry. In addition, there have been many instances in which local community groups have opposed resource extraction activities, which have resulted in disruption and delays to the relevant operation.
While the Company seeks to operate in a social responsible manner and believes it has good relationships with local communities in the regions in which it operates, NGOs or local community organizations could direct adverse publicity against and/or disrupt the operations of the Company in respect of one or more of its properties, regardless of its successful compliance with social and environmental best practices, due to political factors, activities of unrelated third parties on lands in which the Company has an interest or the Company’s operations specifically. Any such actions and the resulting media coverage could have an adverse effect on the reputation and financial condition of the Company or its relationships with the communities in which it operates, which could have a material adverse effect on the Company’s business, financial condition, results of operations, cash flows or prospects.
Dependence on Management and Key Personnel
The success of the Company is currently largely dependent on the performance of its directors and officers. The loss of the services of any of these persons could have a materially adverse effect on the Company’s business and prospects. There is no assurance the Company can maintain the services of its directors, officers or other qualified personnel required to operate its business. As the Company’s business activity grows, the Company will require additional key financial, administrative and mining personnel as well as additional operations staff. There can be no assurance that these efforts will be successful in attracting, training and retaining qualified personnel as competition for persons with these skill sets increase.
- 117 -
|
Management’s Discussion and Analysis For the years ended December 31, 2024 and 2023 |
If the Company is not successful in attracting, training and retaining qualified personnel, the efficiency of its operations could be impaired, which could have an adverse impact on the Company’s operations and financial condition.
First Nations Land Claims
Certain of the Company’s mineral properties may now or in the future be the subject of First Nations land claims. The legal nature of First Nations land claims is a matter of considerable complexity. The impact of any such claim on the Company’s material interest in the Company’s mineral properties and/or potential ownership interest in the Company’s mineral properties in the future, cannot be predicted with any degree of certainty and no assurance can be given that a broad recognition of First Nations rights in the areas in which the Company’s mineral properties are located, by way of negotiated settlements or judicial pronouncements, would not have an adverse effect on the Company’s activities.
Even in the absence of such recognition, the Company may at some point be required to negotiate with and seek the approval of holders of First Nations interests in order to facilitate exploration and development work on the Company’s mineral properties, there is no assurance that the Company will be able to establish practical working relationships with the First Nations in the area which would allow it to ultimately develop the Company’s mineral properties.
Claims and Legal Proceedings
The Company and/or its directors and officers may be subject to a variety of civil or other legal proceedings, with or without merit. From time to time in the ordinary course of its business, the Company may become involved in various legal proceedings, including commercial, employment and other litigation and claims, as well as governmental and other regulatory investigations and proceedings. Such matters can be time-consuming, divert management’s attention and resources and cause the Company to incur significant expenses.
Furthermore, because litigation is inherently unpredictable, the results of any such actions may have a material adverse effect on the Company’s business, operating results or financial condition.
On November 15, 2019, ThreeD Capital Inc. (“ThreeD”) and 1313366 Ontario Inc. (“131” and together with ThreeD, the “Plaintiffs”) each entered into share purchase agreements (the “Share Purchase Agreements”) with Palisades Goldcorp Ltd. (“Palisades”) under which Palisades agreed to purchase the 13,500,000 common shares owned by ThreeD and the 4,000,000 common shares owned by 131 for $0.08 per common share. The transactions closed on November 20, 2019. As a private company with restrictions on the transfer of its common shares, the Company had to approve the proposed transfer, which it did by a consent resolution of the Board.
On March 10, 2020, ThreeD Capital Inc. and 131 filed a statement of claim in the Ontario Superior Court of Justice against Collin Kettell, Palisades and the Company (the “Defendants” and the “ThreeD Claim”). Pursuant to the ThreeD Claim, the Plaintiffs are challenging the validity of the sale of 17,500,000 common shares by the Plaintiffs to Palisades on November 20, 2019. ThreeD and 131 claim that at the time of negotiation and execution of the Share Purchase Agreements, Palisades and Mr. Kettell were aware of positive drill results from the Company’s 2019 Drill Program and the results were not disclosed to ThreeD and 131 to their detriment. Palisades and Mr. Kettell strongly deny ThreeD and 131’s allegations. ThreeD and 131 have made specific claims for (a) recission of the Share Purchase Agreements on the basis of oppression or unfair prejudice; (b) or alternatively, damages in the amount of $21,000,000 for the alleged improper actions by ThreeD and 131, (c) a declaration that Palisades and Collin Kettell, as shareholder or director and/or officer of the Company, have had acted in a manner that is oppressive, unfairly prejudicial or unfairly disregarded their interests, (d) a declaration that Palisades and Collin Kettell engaged in insider trading contrary to section 138 of the Securities Act (Ontario), (e) unjust enrichment and (f) interests and costs. Palisades and Mr. Kettell refute each of the specific claims made by the Plaintiffs.
In early 2022, the Plaintiffs formally amended their statement of claim to increase the amount claimed to $229,000,000 and to advance a direct claim of oppressive conduct against the Company. While continuing to deny any and all liability to the Plaintiffs, the Company had amended its defence to include specific denials of the new allegations of oppressive conduct against it. The parties completed an additional round of examinations for discovery in January 2023, following which the plaintiffs set the action down for trial. The parties had a mediation meeting on October 3, 2023, but were unable to settle the case.
- 118 -
|
Management’s Discussion and Analysis For the years ended December 31, 2024 and 2023 |
On June 5, 2024, the Company entered into a Settlement Agreement, pursuant to which the Plaintiffs received a total of 3,750,000 common shares of the Company from the Defendants. Palisades transferred 2,607,434 common shares of the Company to ThreeD and 772,566 common shares of the Company to 131. The Company issued 285,429 common shares to ThreeD and 84,571 common shares to 131 with a total value of $1,750,100 recorded in the statement of loss and comprehensive loss for the year ended December 31, 2024. The Settlement Agreement resolves the lawsuit completely, does not include any admission of liability and provides for fulsome releases by the Plaintiffs to the Defendants.
Conflicts of Interest
Most of the Company’s directors and officers do not devote their full time to the affairs of the Company. All of the directors and some of the officers of the Company are also directors, officers and shareholders of other natural resource or public companies, and as a result they may find themselves in a position where their duty to another company conflicts with their duty to the Company. Although the Company has policies which address such potential conflicts and the OBCA has provisions governing directors in the event of such a conflict, none of the Company’s constating documents or any of its other agreements contain any provisions mandating a procedure for addressing such conflicts of interest. There is no assurance that any such conflicts will be resolved in favour of the Company. If any such conflicts are not resolved in favour of the Company, the Company may be adversely affected.
Gold and Metal Prices
If the Company’s mineral properties are developed from exploration properties to full production properties, the majority of our revenue will be derived from the sale of gold. Therefore, the Company’s future profitability will depend upon the world market prices of the gold for which it is exploring. The price of gold and other metals are affected by numerous factors beyond the Company’s control, including levels of supply and demand, global or regional consumptive patterns, sales by government holders, metal stock levels maintained by producers and others, increased production due to new mine developments and improved mining and production methods, speculative activities related to the sale of metals, availability and costs of metal substitutes. Moreover, gold prices are also affected by macroeconomic factors such as expectations regarding inflation, interest rates and global and regional demand for, and supply of, gold as well as general global economic conditions. These factors may have an adverse effect on the Company’s exploration, development and production activities, as well as on its ability to fund those activities.
- 119 -
|
Management’s Discussion and Analysis For the years ended December 31, 2024 and 2023 |
Negative Cash Flow from Operating Activities
The Company has no history of earnings and had negative cash flow from operating activities since inception. The Company’s mineral properties are in the exploration stage and there are no known mineral resources or reserves and the proposed exploration programs on the Company’s mineral properties are exploratory in nature. Significant capital investment will be required to achieve commercial production from the Company’s existing projects. There is no assurance that any of the Company’s mineral properties will generate earnings, operate profitably or provide a return on investment in the future. Accordingly, the Company will be required to obtain additional financing in order to meet its future cash commitments.
Going Concern Risk
The Company’s financial statements have been prepared assuming the Company will continue on a going-concern basis and do not include adjustments to amounts and classifications of assets and liabilities that might be necessary should the Company be unable to continue operations. The ability of the Company to continue as a going concern depends upon its ability to develop profitable operations and to continue to raise adequate financing. Management is actively targeting sources of additional financing including through the issuance of shares, which would assure continuation of the Company’s operations and exploration programs. In order for the Company to meet its liabilities as they come due and to continue its operations, the Company is solely dependent upon its ability to generate such financing. Although the Company has been successful in the past in generating financing, there is no assurance it will be able to do so in the future. These items give rise to material uncertainties that cast significant doubt as to the Company’s ability to continue as a going concern.
Risks Associated with Acquisitions
If appropriate opportunities present themselves, the Company may acquire mineral claims, material interests in other mineral claims, and companies that the Company believes are strategic. The Company currently has no understandings, commitments or agreements with respect to any material acquisition, other than as described in this MD&A, and no other material acquisition is currently being pursued. There can be no assurance that the Company will be able to identify, negotiate or finance future acquisitions successfully, or to integrate such acquisitions with its current business. The process of integrating an acquired Company or mineral claims into the Company may result in unforeseen operating difficulties and expenditures and may absorb significant management attention that would otherwise be available for ongoing development of the Company’s business. Future acquisitions could result in potentially dilutive issuances of equity securities, the incurrence of debt, contingent liabilities and/or amortization expenses related to goodwill and other intangible assets, which could materially adversely affect the Company’s business, results of operations and financial condition.
Force Majeure
The Company’s projects now or in the future may be adversely affected by risks outside the control of the Company, including the price of gold on world markets, labour unrest, civil disorder, war, subversive activities or sabotage, fires, floods, explosions or other catastrophes, pandemics, epidemics or quarantine restrictions.
Infrastructure
Exploration, development and processing activities depend, to one degree or another, on adequate infrastructure. Reliable roads, bridges, power sources and water supply are important elements of infrastructure, which affect access, capital and operating costs. The lack of availability on acceptable terms or the delay in the availability of any one or more of these items could prevent or delay exploration or development of the Company’s mineral properties. If adequate infrastructure is not available in a timely manner, there can be no assurance that the exploration or development of the Company’s mineral properties will be commenced or completed on a timely basis, if at all.
- 120 -
|
Management’s Discussion and Analysis For the years ended December 31, 2024 and 2023 |
Furthermore, unusual or infrequent weather phenomena, sabotage, government or other interference in the maintenance or provision of necessary infrastructure could adversely affect our operations.
Exploration operations depend on adequate infrastructure. In particular, reliable power sources, water supply, transportation and surface facilities are necessary to explore and develop mineral projects. Failure to adequately meet these infrastructure requirements or changes in the cost of such requirements could affect the Company’s ability to carry out exploration and future development operations and could have a material adverse effect on the Company’s business, financial condition, results of operations, cash flows or prospects.
Climate Change Risks
The Company acknowledges climate change as an international and community concern and it supports and endorses various initiatives for voluntary actions consistent with international initiatives on climate change. However, in addition to voluntary actions, governments are moving to introduce climate change legislation and treaties at the international, national, state/provincial and local levels. Where legislation already exists, regulation relating to emission levels and energy efficiency is becoming more stringent. Some of the costs associated with reducing emissions can be offset by increased energy efficiency and technological innovation. However, if the current regulatory trend continues, the Company expects that this could result in increased costs at some of its operations in the future.
The Company and the mining industry are facing continued geotechnical challenges, which could adversely impact the Company’s production and profitability. Unanticipated adverse geotechnical and hydrological conditions, such as landslides, floods, seismic activity, droughts and pit wall failures, may occur in the future and such events may not be detected in advance. Geotechnical instabilities and adverse climatic conditions can be difficult to predict and are often affected by risks and hazards outside of the Company’s control, such as severe weather and considerable rainfall. Geotechnical failures could result in limited or restricted access to mine sites, suspension of operations, government investigations, increased monitoring costs, remediation costs, loss of ore and other impacts, which could cause one or more of the Company’s projects to be less profitable than currently anticipated and could result in a material adverse effect on the Company’s business results of operations and financial position.
Information Systems and Cyber Security
The Company’s operations depend on information technology (“IT”) systems. These IT systems could be subject to network disruptions caused by a variety of sources, including computer viruses, security breaches and cyber-attacks, as well as disruptions resulting from incidents such as cable cuts, damage to physical plants, natural disasters, terrorism, fire, power loss, vandalism and theft.
The Company’s operations also depend on the timely maintenance, upgrade and replacement of networks, equipment, IT systems and software, as well as pre-emptive expenses to mitigate the risks of failures. Any of these and other events could result in information system failures, delays and/or increase in capital expenses. The failure of information systems or a component of information systems could, depending on the nature of any such failure, adversely impact the Company’s reputation and results of operations.
Although to date the Company has not experienced any material losses relating to cyber-attacks or other information security breaches, there can be no assurance that the Company will not incur such losses in the future. The Company’s risk and exposure to these matters cannot be fully mitigated because of, among other things, the evolving nature of these threats. As a result, cyber security and the continued development and enhancement of controls, processes and practices designed to protect systems, computers, software, data and networks from attack, damage or unauthorized access remain a priority. As cyber threats continue to evolve, the Company may be required to expend additional resources to continue to modify or enhance protective measures or to investigate and remediate any security vulnerabilities.
- 121 -
|
Management’s Discussion and Analysis For the years ended December 31, 2024 and 2023 |
Critical Accounting Policies and Estimates
The Company prepares its financial statements using accounting policies consistent with IFRS as issued by the International Accounting Standards Board (“IASB”).
The preparation of the financial statements requires management to make certain estimates, judgments and assumptions that affect the reported amounts of assets and liabilities at the date of the financial statements and reported amounts of expenses during the reporting period. Actual outcomes could differ from these estimates.
The financial statements include estimates which, by their nature, are uncertain. The impacts of such estimates are pervasive throughout the financial statements, and may require accounting adjustments based on future occurrences. Revisions to accounting estimates are recognized in the period in which the estimate is revised and future periods if the revision affects both current and future periods. These estimates are based on historical experience, current and future economic conditions and other factors, including expectations of future events that are believed to be reasonable under the circumstances.
Significant assumptions about the future and other sources of estimation uncertainty that management has made at period end that could result in a material adjustment to the carrying amounts of assets and liabilities, in the event that actual results differ from assumptions made, relate to the following:
(i)Critical accounting estimates
Valuation of Secured Notes
The fair value of secured notes at the issue date and the period end date is determined using the Hull-White model of interest rate uncertainty within a FINCAD Callable / Puttable Bond Model. The model involves various inputs to determine the fair value of the secured notes, including coupon rate, credit spread, mean reversion, rate volatility, riskless rates and redemption prices. Certain of the inputs are estimates that involve considerable judgment and are, or could be, affected by significant factors that are out of the Company’s control. These estimates impact the value of the secured notes recognized in the statement of financial position and revaluation adjustments recognized in the statement of loss and comprehensive loss during the period.
Valuation of Options Granted
The fair value of common share purchase options granted is determined at the issue date using the Black-Scholes option pricing model. The Black-Scholes model involves six key inputs to determine the fair value of an option, which are: risk-free interest rate, exercise price, market price at the grant date, expected dividend yield, expected life, and expected volatility. Certain of the inputs are estimates that involve considerable judgment and are or could be affected by significant factors that are out of the Company’s control. The Company is also required to estimate the future forfeiture rate of options based on historical information in its calculation of share-based payments expense. These estimates impact the values of stock-based compensation expense and reserves.
Computation of Income Taxes
The determination of tax expense for the period and deferred tax assets and liabilities involves significant estimation and judgment by management. In determining these amounts, management interprets tax legislation in a variety of jurisdictions and make estimates of the expected timing of the reversal of deferred tax assets and liabilities. Management also makes estimates of future earnings which affect the extent to which potential future tax benefits may be used.
The Company is subject to assessments by taxation authorities, which may interpret legislation differently. These differences may affect the final amount or the timing of the payment of taxes. We provide for such differences where known based on our best estimate of the probable outcome of these matters.
- 122 -
|
Management’s Discussion and Analysis For the years ended December 31, 2024 and 2023 |
Shares Issued to Acquire Exploration and Evaluation Assets
From time to time, the Company issues common shares in the course of acquiring exploration and evaluation assets. When shares are issued without cash consideration, the transaction is recognized at the fair value of the assets received. In the event that the fair value of the assets cannot be reliably determined, the Company will recognize the transaction at the fair value of the shares issued. These estimates impact the value of share capital and exploration and evaluation assets.
Valuation of flow-through premium
The determination of the valuation of flow-through premium is subject to significant judgment and estimates. The flow-through premium is valued as the estimated premium that investors pay for the flow-through feature, being the portion in excess of the market value of shares without the flow-through feature.
Reclamation provision
The valuation of any reclamation provision is subject to significant judgement and estimates. Assumptions, based on the current economic environment, are made to estimate the future liability. These estimates take into account any material changes to the assumptions that occur when reviewed regularly by management and are based on current regulatory requirements. Significant changes in estimates of discount rate, contamination, restoration standards and techniques will result in changes to the provision from period to period.
Actual reclamation and closure costs will ultimately depend on future market prices for the costs which will reflect the market condition at the time the expenditures are actually incurred. The final cost of the reclamation provision currently recognized may be higher or lower than currently provided for.
(ii)Critical accounting judgments
Asset acquisition versus business combination
Management applied judgment with respect to whether the acquisition of the Kingsway Project in 2024 was an asset acquisition or a business combination. The assessment required management to assess the inputs, processes and outputs acquired at the time of acquisition. Pursuant to the assessment, the Kingsway Project acquisition was determined to be an asset acquisition.
Impairment of Exploration and Evaluation Assets
Management is required to assess impairment in respect to the Company’s mineral property interests. The triggering events are defined in IFRS 6. In making the assessment, management is required to make judgments on the status of each project and the future plans towards finding commercial reserves. The carrying value of each exploration and evaluation asset is reviewed regularly for conditions that may suggest impairment. This review requires significant judgment.
- 123 -
|
Management’s Discussion and Analysis For the years ended December 31, 2024 and 2023 |
Factors considered in the assessment of asset impairment include, but are not limited to, whether there has been a significant adverse change in the legal, regulatory, accessibility, title, environmental or political factors that could affect the property’s value; whether there has been an accumulation of costs significantly in excess of the amounts originally expected for the property’s acquisition, development or cost of holding; and whether exploration activities produced results that are not promising such that no more work is being planned in the foreseeable future. If impairment is determined to exist, a formal estimate of the recoverable amount is performed and an impairment loss is recognized to the extent that the carrying amount exceeds the recoverable amount.
Management determined that there were no indicators of impairment as at December 31, 2024 in exploration and evaluation assets. Management had determined that there were indicators of impairment at June 30, 2023 and impaired $8,000 in exploration and evaluation assets during the year ended December 31, 2023.
Determination of whether the Company has significant influence over investees
Significant influence is presumed to exist where the Company has between 20% and 50% of the voting rights, but can also arise where the Company has less than 20%, if the Company has the power to participate in the financial and operating policy decisions affecting the entity. Determination of whether the Company has significant influence over investees requires an assessment of the activities of the investee that significantly affect the investee's returns, including strategic, operational and financing decision-making, appointment, remuneration and termination of the key management personnel and when decisions related to those activities can be influenced by the Company.
Based on assessments of the relevant facts and circumstances, primarily, the Company's ownership interests, board representation and ability to influence operating, strategic and financing decisions, the Company concluded that it has significant influence over Kirkland Lake Discoveries Corp.
Impairment assessment for investment in associates
At each balance sheet date, management considers whether there is objective evidence of impairment in associates, including one or more loss events that would evidence a significant or prolonged decline in the fair value of the investment in an associate below the carrying value. The net investment in an associate is impaired and impairment losses are incurred if there is objective evidence of impairment as a result of one or more events that occurred after the initial recognition of the net investment and that loss event or events have a negative impact on the estimated future cash flows from the net investment that can be reliably estimated. If there is such evidence, management determines the amount of impairment to record, if any, in relation to the associate.
The Company had significant influence over Kirkland Lake Discoveries Corp. during the period from May 25, 2023 to December 31, 2024 and as a result, has accounted for it as an investment in an associate during this period. Management determined that there were no indicators of impairment as at December 31, 2024. Management determined that there were indicators of impairment as at December 31, 2023 and had impaired $1,000,237 in its investment in Kirkland Lake Discoveries Corp. during the year ended December 31, 2023.
Presentation of financial statements as a going concern
Presentation of the financial statements as a going concern, which assumes that the Company will continue in operation for the foreseeable future, obtain additional financing as required, and will be able to realize its assets and discharge its liabilities in the normal course of operations as they come due, involves significant judgment by management.
- 124 -
|
Management’s Discussion and Analysis For the years ended December 31, 2024 and 2023 |
Financial Risk Management
The Company is exposed in varying degrees to a variety of financial instrument related risks. The Board approves and monitors the risk management processes.
Credit risk
Credit risk is the risk that one party to a financial instrument will fail to discharge an obligation and cause the other party to incur a financial loss. The Company is subject to the credit through its investment in Maritime Resources Corp. secured notes, in which case the maximum exposure to the credit risk is the full value of the secured notes of $2,817,554 at December 31, 2024 (December 31, 2023 - 2,454,300). Sales taxes recoverable are due from the Canada Revenue Agency and the Company places its cash with financial institutions with high credit ratings, therefore in management’s judgment, credit risk related to sales taxes recoverable and cash is low.
There have been no changes in management’s methods for managing credit risk since December 31, 2023.
Liquidity risk
Liquidity risk is the risk that the Company will not be able to meet its financial obligations as they fall due. The Company has in place a planning and budgeting process to help determine the funds required to ensure the Company has the appropriate liquidity to meet its operating and growth objectives. The Company has historically relied on the issuance of shares to fund exploration programs and may require doing so again in the future. As at December 31, 2024, the Company has total liabilities of $7,448,306 and cash of $22,317,548 which is available to discharge these liabilities (December 31, 2023 – total liabilities of $19,076,473 and cash of $53,884,809).
There have been no changes in management’s methods for managing liquidity risk since December 31, 2023.
Market risk
Market risk is the risk that changes in market prices, such as commodity prices, interest rates and foreign exchange rates will affect the Company’s net earnings or the value of financial instruments. The objective of the Company is to manage and mitigate market risk exposures within acceptable limits, while maximizing returns.
- 125 -
|
Management’s Discussion and Analysis For the years ended December 31, 2024 and 2023 |
(i) Currency risk
Financial instruments that impact the Company’s net earnings or other comprehensive income due to currency fluctuation include cash accounts, secured notes, interest receivable, investments and accounts payable and accrued liabilities denominated in US dollars. The sensitivity of the Company’s net loss to changes in the exchange rate between the US dollar and the Canadian dollar at December 31, 2024 would change the Company’s net loss by $322,434 as a result of a 10% change in the exchange rate.
(ii) |
Interest rate risk |
Interest rate risk is the risk that the fair value of future cash flows of a financial instrument will fluctuate due to changes in market interest rates. As the Company deposits its cash into demand accounts with minimal interest rates, the interest rate risk is not significant. Interest receivable on secured notes is subject to interest rate fluctuations, the interest rate risk is not material.
(iii) |
Commodity price risk |
Commodity price risk is defined as the potential adverse impact on earnings and economic value due to commodity price movements and volatilities. The Company’s property has exposure to predominantly gold. Commodity prices, especially gold, greatly affect the value of the Company and the potential value of its property and investments.
(iv) |
Equity price risk |
Equity price risk is the risk that the fair value of or future cash flows from the Company’s financial instruments will significantly fluctuate because of changes in market prices. The Company is exposed to market risk in trading its investments in unfavorable market conditions which could result in dispositions of investments at less than favorable prices. Additionally, the Company adjusts its investments to fair value at the end of each reporting period. This process could result in write-downs of the Company’s investments over one or more reporting periods, particularly during periods of overall market instability. The sensitivity of the Company’s net loss to changes in market prices at December 31, 2024 would change the Company’s net loss by $92,602 as a result of a 10% change in the market price of its investments.
There have been no changes in management’s methods for managing market risks since December 31, 2023.
Capital Management
The Company’s objectives when managing capital are:
| ● | To safeguard our ability to continue as a going concern in order to develop and operate our current projects; |
| ● | Pursue strategic growth initiatives; and |
| ● | To maintain a flexible capital structure which lowers the cost of capital. |
In assessing our capital structure, we include in our assessment the components of equity consisting of common shares, stock options and warrants, and deficit that as at December 31, 2024 totalled $66,570,705 (December 31, 2023 - $65,503,020). In order to facilitate the management of capital requirements, the Company prepares annual expenditure budgets and continuously monitors and reviews actual and forecasted cash flows. The annual and updated budgets are monitored and approved by the Board of Directors. To maintain or adjust the capital structure, the Company may, from time to time, issue new shares, issue new debt, repay debt or dispose of non-core assets. The Company’s current capital resources are sufficient to carry out our exploration plans and support operations through the current operating period.
The Company is not subject to any capital requirements imposed by a regulator.
There were no changes in the Company’s approach to capital management during the year ended December 31, 2023.
- 126 -
|
Management’s Discussion and Analysis For the years ended December 31, 2024 and 2023 |
Management’s Report on Internal Control Over Financial Reporting
Disclosure Controls and Procedures
The Company’s management, with the participation of its Chief Executive Officer (“CEO”) and Chief Financial Officer (“CFO”), has evaluated the effectiveness of the Company’s disclosure controls and procedures. Based upon the results of that evaluation, the Company’s CEO and CFO have concluded that, as of December 31, 2024, the Company’s disclosure controls and procedures were effective to provide reasonable assurance that the information required to be disclosed by the Company in reports it files is recorded, processed, summarized and reported, within the appropriate time periods and is accumulated and communicated to management, including the CEO and CFO, as appropriate to allow timely decisions regarding required disclosure.
Internal Control over Financial Reporting
The Company’s management, with the participation of its CEO and CFO, is responsible for establishing and maintaining adequate internal control over financial reporting as such term is defined in the rules of the United States Securities and Exchange Commission and the Canadian Securities Administrators. The Company’s internal control over financial reporting is a process designed to provide reasonable assurance regarding the reliability of financial reporting and the preparation of financial statements for external purposes in accordance with IFRS as issued by the IASB. The Company’s internal control over financial reporting includes policies and procedures that:
| ● | maintain records that accurately and fairly reflect, in reasonable detail, the transactions and dispositions of assets of the Company; |
| ● | provide reasonable assurance that transactions are recorded as necessary for preparation of financial statements in accordance with IFRS as issued by IASB; |
| ● | provide reasonable assurance that the Company’s receipts and expenditures are made only in accordance with authorizations of management and the Company’s Directors; and |
| ● | provide reasonable assurance regarding prevention or timely detection of unauthorized acquisition, use, or disposition of the Company’s assets that could have a material effect on the Company’s financial statements. |
The Company’s internal control over financial reporting may not prevent or detect all misstatements because of inherent limitations. Additionally, projections of any evaluation of effectiveness for future periods are subject to the risk that controls may become inadequate because of changes in conditions or deterioration in the degree of compliance with the Company’s policies and procedures.
The Company’s management has determined that there have been no significant changes in the Company’s internal control over financial reporting during the year ended December 31, 2024, that have materially affected, or are reasonably likely to materially affect, the Company’s internal control over financial reporting. The Company's management evaluated the effectiveness of internal controls over financial reporting based upon the criteria set forth in Internal Control - Integrated Framework (2013) issued by the Committee of Sponsoring Organizations of the Treadway Commission. Based on management's evaluation, the CEO and CFO concluded that the Company’s internal controls over financial reporting were effective as of December 31, 2024.
Limitations of Controls and Procedures
The Company’s management, including the CEO and CFO, believes that any disclosure controls and procedures or internal control over financial reporting, no matter how well conceived and operated, may not prevent or detect all misstatements because of inherent limitations. Further, the design of a control system must reflect the fact that there are resource constraints, and the benefits of controls must be considered relative to their costs. Because of the inherent limitations in all control systems, they cannot provide absolute assurance that all control issues and instances of fraud, if any, within the Company have been prevented or detected. These inherent limitations include the realities that judgments in decision-making can be faulty, and that breakdowns can occur because of simple error or mistake. Additionally, controls can be circumvented by the individual acts of some persons, by collusion of two or more people, or by unauthorized override of the control. The design of any control system also is based in part upon certain assumptions about the likelihood of future events, and there can be no assurance that any design will succeed in achieving its stated goals under all potential future conditions. Accordingly, because of the inherent limitations in a cost effective control system, misstatements due to error or fraud may occur and not be detected.
- 127 -
|
Management’s Discussion and Analysis For the years ended December 31, 2024 and 2023 |
Cautionary Notes Regarding Forward-Looking Statements
This MD&A contains forward looking statements which reflect management's expectations regarding the Company’s future growth, results from operations (including, without limitation, statements about the Company’s opportunities, strategies, competition, expected activities and expenditures as the Company pursues its business plan, the adequacy of the Company’s available cash resources and other statements about future events or results), performance (both operational and financial) and business prospects, future business plans and opportunities. Wherever possible, words such as “expects”, “plans”, “anticipates”, “believes”, “interpreted”, “intends”, “estimates”, “projects”, “aims”, “suggests”, “appears”, “indicate”, “often”, “target”, “future”, “likely”, “pending”, “potential”, “goal”, “objective”, “prospective”, “possibly”, “preliminary”, “initial”, and similar expressions or statements that certain actions, events or results “may”, “could”, “would”, “might” or “will” be taken, occur or be achieved, or the negative or grammatical variation thereof or other variations thereof, or comparable terminology have been used to identify forward-looking statements. These forward-looking statements include, among other things, statements relating to the Queensway Project and the Company’s planned and future exploration, drilling and mineralization on the Company’s Queensway gold project in Newfoundland and Labrador; the interpretation of the results and benefits of the drilling program; future drilling and the timing and expected benefits thereof; the maiden resource estimate and expected timing and benefits thereof; the Preliminary Economic Assessment (“PEA”) and the expected timing and benefits thereof; assay results; the interpretation of drilling and assay results, the extent of mineralization and the discovery of zones of high-grade gold mineralization; plans for future exploration and drilling and the focus and timing of same; the merits of the Queensway Project; future press releases by the Company; the Company’s future business plans; expectations regarding the ability to raise further capital; the market price of gold; expectations regarding any environmental issues that may affect planned or future exploration and development programs and the potential impact of complying with existing and proposed environmental laws and regulations; the ability to retain and/or maintain any required permits, licenses or other necessary approvals for the exploration or development of its mineral properties; government regulation of mineral exploration and development operations in the Province of Newfoundland and Labrador; the Company’s compensation policy and practices; the Company’s expected reliance on key management personnel, advisors and consultants; the potential impact of any tariffs, countervailing duties or other trade restrictions; economic and other consequences from Russia’s military action against Ukraine and the sanctions imposed in response to that action; economic and other consequences from the Israel-Hamas war.
Forward-looking statements are not a guarantee of future performance and is based upon a number of estimates and assumptions of management in light of management’s experience and perception of trends, current conditions and expected developments, as well as other factors that management believes to be relevant and reasonable in the circumstances.
- 128 -
|
Management’s Discussion and Analysis For the years ended December 31, 2024 and 2023 |
As of the date of this MD&A, without limitation, assumptions about: the ability to raise any necessary additional capital on reasonable terms to advance exploration and development of the Company’s mineral properties; future prices of gold and other metal prices; the timing and results of exploration and drilling programs; the demand for, and price of gold; that general business and economic conditions will not change in a material adverse manner; the Company’s ability to procure equipment and operating supplies in sufficient quantities and on a timely basis; the geology of the Queensway Project as described in the Queensway Technical Report; the accuracy of budgeted exploration and development costs and expenditures; future currency exchange rates and interest rates; operating conditions being favourable such that the Company is able to operate in a safe, efficient and effective manner; the Company’s ability to attract and retain skilled personnel; political and regulatory stability; the receipt of governmental, regulatory and third-party approvals, licenses and permits on favourable terms; obtaining required renewals for existing approvals, licenses and permits on favourable terms; requirements under applicable laws; sustained labour stability; stability in financial and capital goods markets; availability of equipment.
Furthermore, such forward-looking information involves a variety of known and unknown risks, uncertainties and other factors which may cause the actual plans, intentions, activities, results, performance or achievements of the Company to be materially different from any future plans, intentions, activities, results, performance or achievements expressed or implied by such forward-looking statements. Such risks include, without limitation: the Company may fail to find a commercially viable deposit at any of its mineral properties; there are no resources or mineral reserves on any of the properties in which the Company has an interest; the Company’s plans may be adversely affected by the Company’s reliance on historical data compiled by previous parties involved with its mineral properties; mineral exploration and development are inherently risky; the mineral exploration industry is intensely competitive; additional financing may not be available to the Company when required or, if available, the terms of such financing may not be favourable to the Company; fluctuations in the demand for gold; the Company may not be able to identify, negotiate or finance any future acquisitions successfully, or to integrate such acquisitions with its current business; the Company’s exploration activities are dependent upon the grant of appropriate licenses, concessions, leases, permits and regulatory consents, which may be withdrawn or not granted; the Company’s operations could be adversely affected by possible future government legislation, policies and controls or by changes in applicable laws and regulations; there is no guarantee that title to the properties in which the Company has a material interest will not be challenged or impugned; the Company faces various risks associated with mining exploration that are not insurable or may be the subject of insurance which is not commercially feasible for the Company; the volatility of global capital markets over the past several years has generally made the raising of capital more difficult; compliance with environmental regulations can be costly; social and environmental activism can negatively impact exploration, development and mining activities; the success of the Company is largely dependent on the performance of its directors and officers; the Company’s operations may be adversely affected by First Nations land claims; the Company and/or its directors and officers may be subject to a variety of legal proceedings, the results of which may have a material adverse effect on the Company’s business; the Company may be adversely affected if potential conflicts of interests involving its directors and officers are not resolved in favour of the Company; the Company’s future profitability may depend upon the world market prices of gold; dilution from future equity financing could negatively impact holders of the Company’s securities; failure to adequately meet infrastructure requirements could have a material adverse effect on the Company’s business; the Company’s projects now or in the future may be adversely affected by risks outside the control of the Company; the Company is subject to various risks associated with climate change; other factors discussed under “Risk and Uncertainties”.
Although the Company has attempted to identify important factors that could cause actual actions, events, conditions, results, performance or achievements to differ materially from those described in forward-looking statements, there may be other factors that cause actions, events, conditions, results, performance or achievements to differ from those anticipated, estimated or intended.
- 129 -
|
Management’s Discussion and Analysis For the years ended December 31, 2024 and 2023 |
The Company cautions that the foregoing lists of important assumptions and factors are not exhaustive. Other events or circumstances could cause actual results to differ materially from those estimated or projected and expressed in, or implied by, the forward-looking statements contained herein. There can be no assurance that forward-looking statements will prove to be accurate, as actual results and future events could differ materially from those anticipated in such information. Accordingly, readers should not place undue reliance on forward-looking statements.
Forward-looking statements contained herein are made as of the date of this MD&A and the Company disclaims any obligation to update or revise any forward-looking statements, whether as a result of new information, future events or results or otherwise, except as and to the extent required by applicable securities laws.
Off-Balance Sheet Arrangements
The Company does not utilize off-balance sheet arrangements.
Proposed Transactions
There are no proposed transactions at the date of this report.
Additional Information
Additional information relating to the Company is available on SEDAR+ at www.sedarplus.ca.
- 130 -
Exhibit 99.3

FINANCIAL STATEMENTS
FOR THE YEARS ENDED
DECEMBER 31, 2024 AND 2023
(Expressed in Canadian Dollars)
Report of Independent Registered Public Accounting Firm
To the Shareholders and Board of Directors
New Found Gold Corp.
Opinion on the Financial Statements
We have audited the accompanying statements of financial position of New Found Gold Corp. (the Company) as of December 31, 2024 and 2023, the related statements of loss and comprehensive loss, cash flows, and changes in equity for each of the years in the two-year period ended December 31, 2024, and the related notes (collectively, the financial statements). In our opinion, the financial statements present fairly, in all material respects, the financial position of the Company as of December 31, 2024 and 2023, and its financial performance and its cash flows for each of the years in the two-year period ended December 31, 2024, in conformity with International Financial Reporting Standards as issued by the International Accounting Standards Board.
Going Concern
The accompanying financial statements have been prepared assuming that the Company will continue as a going concern. As discussed in Note 1 to the financial statements, the Company has suffered recurring losses from operations and has an accumulated deficit that raise substantial doubt about its ability to continue as a going concern. Management’s plans in regard to these matters are also described in Note 1. The financial statements do not include any adjustments that might result from the outcome of this uncertainty.
Basis for Opinion
These financial statements are the responsibility of the Company’s management. Our responsibility is to express an opinion on these financial statements based on our audits. We are a public accounting firm registered with the Public Company Accounting Oversight Board (United States) (PCAOB) and are required to be independent with respect to the Company in accordance with the U.S. federal securities laws and the applicable rules and regulations of the Securities and Exchange Commission and the PCAOB.
We conducted our audits in accordance with the standards of the PCAOB. Those standards require that we plan and perform the audit to obtain reasonable assurance about whether the financial statements are free of material misstatement, whether due to error or fraud. The Company is not required to have, nor were we engaged to perform, an audit of its internal control over financial reporting. As part of our audits, we are required to obtain an understanding of internal control over financial reporting but not for the purpose of expressing an opinion on the effectiveness of the Company’s internal control over financial reporting. Accordingly, we express no such opinion.
Our audits included performing procedures to assess the risks of material misstatement of the financial statements, whether due to error or fraud, and performing procedures that respond to those risks. Such procedures included examining, on a test basis, evidence regarding the amounts and disclosures in the financial statements. Our audits also included evaluating the accounting principles used and significant estimates made by management, as well as evaluating the overall presentation of the financial statements. We believe that our audits provide a reasonable basis for our opinion.
/s/ KPMG LLP
Chartered Professional Accountants
We have served as the Company’s auditor since 2023.
Vancouver, Canada
March 20, 2025
-1-
New Found Gold Corp.
Statements of Financial Position
(Expressed in Canadian Dollars)
|
|
|
|
December 31, |
|
December 31, |
|
|
|
|
2024 |
|
2023 |
|
|
Note |
|
$ |
|
$ |
ASSETS |
|
|
|
|
|
|
Current assets |
|
|
|
|
|
|
Cash |
|
|
|
22,317,548 |
|
53,884,809 |
Investments |
|
5 |
|
926,019 |
|
3,596,592 |
Prepaid expenses and deposits |
|
|
|
1,480,341 |
|
1,519,157 |
Sales taxes recoverable |
|
|
|
2,209,948 |
|
3,299,646 |
Interest receivable |
|
7 |
|
— |
|
75,322 |
Secured notes |
|
7 |
|
2,817,554 |
|
— |
Total current assets |
|
|
|
29,751,410 |
|
62,375,526 |
|
|
|
|
|
|
|
Non-current assets |
|
|
|
|
|
|
Exploration and evaluation assets |
|
3 |
|
34,505,484 |
|
9,093,187 |
Investment in Kirkland Lake Discoveries Corp. |
|
6 |
|
1,525,756 |
|
2,861,250 |
Property and equipment |
|
4 |
|
7,938,149 |
|
7,638,608 |
Secured notes |
|
7 |
|
— |
|
2,454,300 |
Right-of-use assets |
|
|
|
118,509 |
|
156,622 |
Other assets |
|
|
|
179,703 |
|
— |
Total non-current assets |
|
|
|
44,267,601 |
|
22,203,967 |
|
|
|
|
|
|
|
Total Assets |
|
|
|
74,019,011 |
|
84,579,493 |
|
|
|
|
|
|
|
LIABILITIES |
|
|
|
|
|
|
Current liabilities |
|
|
|
|
|
|
Accounts payable and accrued liabilities |
|
9,11 |
|
7,325,203 |
|
6,492,354 |
Flow-through share premium |
|
8 |
|
— |
|
12,426,322 |
Lease liabilities |
|
|
|
53,783 |
|
88,958 |
Total current liabilities |
|
|
|
7,378,986 |
|
19,007,634 |
|
|
|
|
|
|
|
Lease liabilities |
|
|
|
69,320 |
|
68,839 |
Total non-current liabilities |
|
|
|
69,320 |
|
68,839 |
|
|
|
|
|
|
|
Total liabilities |
|
|
|
7,448,306 |
|
19,076,473 |
|
|
|
|
|
|
|
EQUITY |
|
|
|
|
|
|
Share capital |
|
10 |
|
341,346,716 |
|
290,244,029 |
Reserves |
|
10 |
|
34,988,421 |
|
34,755,069 |
Deficit |
|
|
|
(309,764,432) |
|
(259,496,078) |
Total equity |
|
|
|
66,570,705 |
|
65,503,020 |
|
|
|
|
|
|
|
Total Liabilities and Equity |
|
|
|
74,019,011 |
|
84,579,493 |
NATURE OF OPERATIONS AND GOING CONCERN (Note 1)
COMMITMENTS (Notes 3)
SUBSEQUENT EVENTS (Notes 4, 10 and 19)
These financial statements are authorized for issue by the Board of Directors on March 20, 2025. They are signed on the Company’s behalf by:
“Paul Huet” |
|
, Director |
|
“William Hayden” |
|
, Director |
|
The accompanying notes are an integral part of these financial statements.
-2-
New Found Gold Corp.
Statements of Loss and Comprehensive Loss
(Expressed in Canadian Dollars, except share amounts)
|
|
|
|
Year ended December 31, |
||
|
|
|
|
2024 |
|
2023 |
|
|
Note |
|
$ |
|
$ |
Expenses |
|
|
|
|
|
|
Corporate development and investor relations |
|
11 |
|
711,506 |
|
1,274,632 |
Depreciation |
|
4 |
|
813,654 |
|
940,208 |
Exploration and evaluation expenditures |
|
3,11 |
|
52,563,340 |
|
94,038,277 |
Office and sundry |
|
|
|
779,138 |
|
798,198 |
Professional fees |
|
|
|
1,332,556 |
|
1,652,312 |
Salaries and consulting |
|
11 |
|
2,612,010 |
|
2,499,578 |
Share-based compensation |
|
10,11 |
|
889,045 |
|
1,410,563 |
Transfer agent and regulatory fees |
|
|
|
446,384 |
|
635,848 |
Travel |
|
|
|
169,291 |
|
217,954 |
Loss from operating activities |
|
|
|
(60,316,924) |
|
(103,467,570) |
Other income (expenses) |
|
|
|
|
|
|
Settlement of flow-through share premium |
|
8 |
|
12,426,322 |
|
22,932,528 |
Foreign exchange gain |
|
|
|
224,286 |
|
101,959 |
Gain on sale of exploration and evaluation assets |
|
3(ii) |
|
— |
|
4,217,935 |
Loss from equity investment |
|
6 |
|
(1,306,722) |
|
(795,995) |
Loss on dilution of equity investment |
|
6 |
|
(28,772) |
|
— |
Impairment of equity investment |
|
6 |
|
— |
|
(1,000,237) |
Loss on disposal of property and equipment |
|
4 |
|
— |
|
(5,928) |
Part XII.6 tax |
|
8 |
|
(928,769) |
|
(584,120) |
Revaluation of secured notes |
|
7 |
|
140,786 |
|
33,599 |
Impairment of exploration and evaluation assets |
|
3 |
|
— |
|
(8,000) |
Interest expense |
|
|
|
(25,105) |
|
(27,119) |
Interest income |
|
7 |
|
2,869,403 |
|
2,791,248 |
Realized losses on disposal of investments |
|
5 |
|
(380,877) |
|
— |
Unrealized losses on investments |
|
5 |
|
(1,191,882) |
|
(4,079,063) |
Settlement of legal claim |
|
10,16 |
|
(1,750,100) |
|
— |
Total |
|
|
|
10,048,570 |
|
23,576,807 |
Loss and comprehensive loss for the year |
|
|
|
(50,268,354) |
|
(79,890,763) |
Loss per share – basic and diluted ($) |
|
12 |
|
(0.26) |
|
(0.45) |
Weighted average number of common shares outstanding – basic and diluted |
|
12 |
|
194,032,544 |
|
178,363,103 |
The accompanying notes are an integral part of these financial statements.
-3-
New Found Gold Corp.
Statements of Cash Flows
(Expressed in Canadian Dollars)
|
|
Year ended December 31, |
||
|
|
2024 |
|
2023 |
|
|
$ |
|
$ |
Cash flows used in operating activities |
|
|
|
|
Loss for the year |
|
(50,268,354) |
|
(79,890,763) |
Adjustments for: |
|
|
|
|
Depreciation |
|
813,654 |
|
940,208 |
Gain on sale of exploration and evaluation assets |
|
— |
|
(4,123,183) |
Loss from equity investment |
|
1,306,722 |
|
795,995 |
Loss on dilution of equity investment |
|
28,772 |
|
— |
Impairment of equity investment |
|
— |
|
1,000,237 |
Loss on disposal of property and equipment |
|
— |
|
5,928 |
Impairment of exploration and evaluation assets |
|
— |
|
8,000 |
Revaluation of secured notes |
|
(140,786) |
|
(33,599) |
Foreign exchange (gain) loss on secured notes |
|
(222,468) |
|
43,299 |
Unrealized foreign exchange gain |
|
(1,719) |
|
— |
Interest income on secured notes |
|
(302,718) |
|
— |
Interest expense |
|
25,105 |
|
27,119 |
Settlement of flow-through share premium |
|
(12,426,322) |
|
(22,932,528) |
Settlement of legal claim |
|
1,750,100 |
|
— |
Share-based compensation |
|
889,045 |
|
1,410,563 |
Realized losses on disposal of investments |
|
380,877 |
|
— |
Unrealized losses on investments |
|
1,191,882 |
|
4,079,063 |
|
|
(56,976,210) |
|
(98,669,661) |
Change in non-cash working capital items: |
|
|
|
|
Decrease (increase) in prepaid expenses and deposits |
|
38,816 |
|
(97,103) |
Increase in other assets |
|
— |
|
(106,179) |
Decrease (increase) in sales taxes recoverable |
|
1,089,698 |
|
(155,358) |
Increase in interest receivable |
|
— |
|
(75,322) |
Increase (decrease) in accounts payable and accrued liabilities |
|
164,636 |
|
(170,689) |
Net cash used in operating activities |
|
(55,683,060) |
|
(99,274,312) |
Cash flows used in investing activities |
|
|
|
|
Expenditures on claims staking and mineral license renewals |
|
(5,550) |
|
(16,565) |
Interest received on secured notes |
|
378,040 |
|
— |
Purchases of exploration and evaluation assets |
|
(3,853,119) |
|
(208,034) |
Transaction costs on sale of exploration and evaluation assets |
|
— |
|
(94,752) |
Proceeds on disposal of investments |
|
1,097,814 |
|
— |
Proceeds on disposal of property and equipment |
|
— |
|
9,084 |
Purchases of property and equipment |
|
(625,775) |
|
(1,487,150) |
Purchase of secured notes |
|
— |
|
(2,464,000) |
Purchase of investments |
|
— |
|
(174,500) |
Net cash used in investing activities |
|
(3,008,590) |
|
(4,435,917) |
|
|
|
|
|
Cash flows from financing activities |
|
|
|
|
Issuance of common shares in prospectus offering |
|
27,522,494 |
|
78,986,588 |
Share issue costs |
|
(924,657) |
|
(3,517,377) |
Stock options exercised |
|
862,500 |
|
131,630 |
Increase in other assets |
|
(179,703) |
|
— |
Lease principal payments |
|
(134,001) |
|
(143,957) |
Lease interest payments |
|
(25,105) |
|
(27,119) |
Net cash generated from financing activities |
|
27,121,528 |
|
75,429,765 |
|
|
|
|
|
Effect of exchange rate fluctuations on cash held |
|
2,861 |
|
— |
Net decrease in cash |
|
(31,567,261) |
|
(28,280,464) |
Cash at beginning of year |
|
53,884,809 |
|
82,165,273 |
Cash at end of year |
|
22,317,548 |
|
53,884,809 |
SUPPLEMENTAL DISCLOSURE WITH RESPECT TO CASH FLOWS (Note 13)
The accompanying notes are an integral part of these financial statements.
-4-
New Found Gold Corp.
Statements of Changes in Equity
(Expressed in Canadian Dollars)
|
|
Share capital |
|
Reserves |
|
|
|
|
||||
|
|
|
|
|
|
Equity settled |
|
|
|
|
|
|
|
|
|
|
|
|
share-based |
|
|
|
|
|
|
|
|
Number |
|
Amount |
|
payments |
|
Warrants |
|
Deficit |
|
Total equity |
|
|
of shares |
|
$ |
|
$ |
|
$ |
|
$ |
|
$ |
Balance at December 31, 2022 |
|
175,377,526 |
|
229,632,005 |
|
33,443,292 |
|
3,918 |
|
(179,605,315) |
|
83,473,900 |
Issued pursuant to acquisition of exploration and evaluation assets |
|
39,762 |
|
203,979 |
|
— |
|
— |
|
— |
|
203,979 |
Issued in prospectus offering Share issue costs |
|
11,277,224 |
|
78,986,588 |
|
— |
|
— |
|
— |
|
78,986,588 |
Flow-through share premium |
|
— |
|
(15,295,500) |
|
— |
|
— |
|
— |
|
(15,295,500) |
Share issue costs |
|
— |
|
(3,517,377) |
|
— |
|
— |
|
— |
|
(3,517,377) |
Share-based compensation |
|
— |
|
— |
|
1,410,563 |
|
— |
|
— |
|
1,410,563 |
Stock options exercised |
|
178,500 |
|
234,334 |
|
(102,704) |
|
— |
|
— |
|
131,630 |
Total loss and comprehensive loss for the year |
|
— |
|
— |
|
— |
|
— |
|
(79,890,763) |
|
(79,890,763) |
Balance at December 31, 2023 |
|
186,873,012 |
|
290,244,029 |
|
34,751,151 |
|
3,918 |
|
(259,496,078) |
|
65,503,020 |
Issued pursuant to acquisition of the Kingsway Project (Note 3(i)) |
|
5,263,157 |
|
20,000,000 |
|
— |
|
— |
|
— |
|
20,000,000 |
Issued pursuant to acquisition of exploration and evaluation assets |
|
369,583 |
|
1,226,707 |
|
— |
|
— |
|
— |
|
1,226,707 |
Issued in prospectus offering Share issue costs |
|
5,857,242 |
|
27,522,494 |
|
— |
|
— |
|
— |
|
27,522,494 |
Share issue costs |
|
— |
|
(914,807) |
|
— |
|
— |
|
— |
|
(914,807) |
Issued in settlement of legal claim (Note 16) |
|
370,000 |
|
1,750,100 |
|
— |
|
— |
|
— |
|
1,750,100 |
Share-based compensation |
|
— |
|
— |
|
889,045 |
|
— |
|
— |
|
889,045 |
Stock options exercised |
|
1,725,000 |
|
1,518,193 |
|
(655,693) |
|
— |
|
— |
|
862,500 |
Total loss and comprehensive loss for the year |
|
— |
|
— |
|
— |
|
— |
|
(50,268,354) |
|
(50,268,354) |
Balance at December 31, 2024 |
|
200,457,994 |
|
341,346,716 |
|
34,984,503 |
|
3,918 |
|
(309,764,432) |
|
66,570,705 |
The accompanying notes are an integral part of these financial statements.
-5-
New Found Gold Corp.
Notes to the Financial Statements
For the years ended December 31, 2024 and 2023
(Expressed in Canadian Dollars Unless Otherwise Noted)
1. |
NATURE OF OPERATIONS AND GOING CONCERN |
New Found Gold Corp. (the “Company”) was incorporated on January 6, 2016, under the Business Corporations Act in the Province of Ontario. On June 23, 2020, the Company continued as a British Columbia corporation under the Business Corporations Act in the Province of British Columbia. The Company’s registered office is located at Suite 3500, The Stack, 1133 Melville Street, Vancouver, British Columbia V6E 4E5.
The Company is a mineral exploration company engaged in the acquisition, exploration and evaluation of resource properties with a focus on gold properties located in Newfoundland and Labrador, Canada. The Company’s exploration and evaluation assets presently have no proven or probable reserves, and on the basis of information to date, it has not yet determined whether these properties contain economically recoverable resources. The recoverability of amounts shown for exploration and evaluation assets are dependent upon the existence of economically recoverable reserves or the Company’s ability to recover the value of exploration and evaluation assets through their sale, the ability of the Company to obtain necessary financing to complete the development of those reserves and upon future profitable production.
These financial statements have been prepared assuming the Company will continue on a going-concern basis and do not include adjustments to amounts and classifications of assets and liabilities that might be necessary should the Company be unable to continue operations. Such adjustments could be material. The ability of the Company to continue as a going concern depends upon its ability to develop profitable operations and to continue to raise adequate financing. As at December 31, 2024, the Company had an accumulated deficit of $309,764,432 and shareholders’ equity of $66,570,705. In addition, the Company has a working capital surplus, calculated as current assets less current liabilities, of $22,372,424, consisting primarily of cash, and negative cash flow from operating activities of $55,683,060 for the year ended December 31, 2024.
Management is actively targeting sources of additional financing including through the issuance of shares, which would assure continuation of the Company’s operations and exploration programs. In order for the Company to meet its liabilities as they come due and to continue its operations, the Company is solely dependent upon its ability to generate such financing. Although the Company has been successful in the past in generating financing, there is no assurance it will be able to do so in the future. These items give rise to material uncertainties that cast significant doubt as to the Company’s ability to continue as a going concern.
These financial statements were approved by the Board of Directors of the Company on March 20, 2025.
-6-
New Found Gold Corp.
Notes to the Financial Statements
For the years ended December 31, 2024 and 2023
(Expressed in Canadian Dollars Unless Otherwise Noted)
2. |
MATERIAL ACCOUNTING POLICY INFORMATION |
The principal accounting policies applied in the preparation of these financial statements are set out below.
a) |
Statement of compliance |
The Company’s financial statements, including comparatives, have been prepared in accordance with and using accounting policies in compliance with the International Financial Reporting Standards (“IFRS”) issued by the International Accounting Standards Board (“IASB”), effective for the Company’s reporting for the years ended December 31, 2024 and 2023.
b) |
Basis of presentation |
These financial statements have been prepared on a historical cost basis except for financial instruments classified as subsequently measured at fair value. In addition, these financial statements have been prepared using the accrual basis of accounting, except for cash flow information.
Certain comparative figures have been reclassified to conform to the current period presentation.
c) |
Exploration, evaluation and development expenditures |
Costs incurred before the Company has obtained the legal right to explore are expensed as incurred. Once the legal right to explore has been acquired, the Company capitalizes the costs of acquiring rights or licenses, including those purchased from other parties or staked directly by the Company, until such time as the lease expires, it is abandoned, sold or considered impaired in value. Indirect administrative costs and costs of surveying, exploratory drilling, sampling, materials, fuel, equipment rentals or payments to contractors are expensed as incurred. Once the technical feasibility and commercial viability of extracting a mineral resource are demonstrable and economically recoverable reserves are developed, any direct exploration costs of the related property are capitalized as development costs.
Exploration and evaluation properties are not amortized during the exploration and evaluation stage.
The Company does not have revenue from mining operations. The Company recognizes gains or losses on the sale of exploration and evaluation assets in accordance with the terms of the purchase and sale agreements. Gains or losses are recognized when a mining option is executed and the cost is derecognized in accordance with the percentage interest sold.
At each reporting date the carrying amounts of the Company’s exploration and evaluation assets are reviewed to determine whether there is any indication that those assets are impaired. If any such indication exists, the recoverable amount of the asset is estimated in order to determine the extent of the impairment, if any. The recoverable amount is the higher of fair value less costs to sell and value in use. If the recoverable amount of an asset is estimated to be less than its carrying amount, the carrying amount of the asset is reduced to its recoverable amount and the impairment loss is recognized in profit or loss for the period.
For the purposes of impairment testing, exploration and evaluation assets are allocated to cash generating units (“CGU”) to which the exploration activity relates. Each of the Company’s properties is considered to be a separate CGU. Where an impairment loss subsequently reverses, the carrying amount of the asset (or CGU) is increased to the revised estimate of its recoverable amount, but only to the extent that the increased carrying amount does not exceed the carrying amount that would have been determined had no impairment loss been recognized for the asset (or CGU) in prior years. A reversal of an impairment loss is recognized immediately in profit or loss.
-7-
New Found Gold Corp.
Notes to the Financial Statements
For the years ended December 31, 2024 and 2023
(Expressed in Canadian Dollars Unless Otherwise Noted)
2. |
MATERIAL ACCOUNTING POLICY INFORMATION (continued) |
d) |
Decommissioning liabilities |
The Company recognizes liabilities for statutory, contractual, constructive or legal obligations associated with the retirement of exploration and evaluation assets and equipment when those obligations result from the acquisition, construction, development or normal operation of assets. The net present value of future reclamation costs is expensed as part of exploration and evaluation expenditures up until the point it is concluded that the technical feasibility and commercial viability of extracting a mineral resource from a particular project are demonstrable and economically recoverable reserves are developed, after which any such costs are capitalized as development costs with a corresponding increase in the reclamation provision in the period incurred.
Pre-tax discount rates that reflect the time value of money are used to calculate the net present value. The Company’s estimates of reclamation costs could change as a result of changes in regulatory requirements, discount rates and assumptions regarding the amount and timing of the future expenditures. These changes are recorded directly to exploration and evaluation expenditures or exploration and evaluation assets and the reclamation provision. The Company’s estimates are reviewed annually for changes in regulatory requirements, discount rates, effects of inflation and changes in estimates. Changes in the net present value, excluding changes in the Company’s estimates of reclamation costs, are charged to profit or loss for the period.
e) |
Property, plant and equipment |
Property, plant and equipment is recorded at cost less accumulated depreciation calculated using the straight-line method over the estimated useful lives as follows:
Property and Buildings |
|
10-25 years |
Geological Equipment and Other Facilities |
|
2-20 years |
Computer Equipment |
|
2-5 years |
Office Furniture and Equipment |
|
5 years |
Vehicles |
|
3 years |
Depreciation of an asset begins once it is available for use.
Long-lived assets are comprised of property and equipment. At the end of each reporting period the carrying amounts of the Company’s long-lived assets are reviewed to determine whether there is any indication that those assets are impaired. If any such indication exists, the recoverable amount of the asset is estimated in order to determine the extent of the impairment, if any. The recoverable amount is the higher of fair value less costs to sell and value in use.
Fair value is determined as the amount that would be obtained by the sale of the asset in any arm’s length transaction between knowledgeable and willing parties. Fair value of mineral assets is generally determined as the present value of the estimated cash flows expected to arise from the continued use of the asset, including an expansion project. Value in use is determined as the present value of the estimated future cash flows expected to arise from the continued use of the asset in its present form and from its ultimate disposal.
Impairment is assessed at the CGU level, which is identified as the smallest identifiable group of assets that generates cash inflows that are largely independent of the cash inflows from other assets.
Non-financial assets that have been impaired are tested for possible reversal of the impairment whenever events or changes in circumstances indicate that the impairment may have reversed. When a reversal of a previous impairment is recorded, the reversal amount is adjusted for depreciation that would have been recorded had the impairment not taken place.
-8-
New Found Gold Corp.
Notes to the Financial Statements
For the years ended December 31, 2024 and 2023
(Expressed in Canadian Dollars Unless Otherwise Noted)
2. |
MATERIAL ACCOUNTING POLICY INFORMATION (continued) |
f) |
Share-based payment transactions |
Share-based payments to employees are measured at the fair value of the instruments issued and amortized over the vesting periods. Share-based payments to non-employees are measured at the fair value of the goods or services received or the fair value of the equity instruments issued if it is determined the fair value of the goods or services cannot be reliably measured, and are recorded at the date the goods or services are received. The amount recognized as an expense is adjusted to reflect the number of awards expected to vest. The offset to the recorded cost is to equity settled share-based payments reserve.
Consideration received on the exercise of stock options is recorded as share capital and the related equity settled share-based payments reserve is transferred to share capital. Charges for options that are forfeited/cancelled before vesting are transferred from equity settled share-based payment reserve to deficit. Charges for options that are expired remain in equity settled share-based payment reserve.
Where the terms and conditions of options are modified before they vest, the changes in fair value of the options, measured immediately before and after the modification, is also charged to profit or loss over the remaining vesting period.
g) |
Valuation of equity units issued in private placements |
The Company follows the pro-rata allocation method with respect to the measurement of shares and warrants issued as private placement units. This values each component at fair value and allocates total proceeds received between shares and warrants based on the pro rata relative values of the components. The fair value of the common shares is based on the closing quoted bid price on the issue date and the fair value of the common share purchase warrants is determined at the issue date using the Black- Scholes pricing model. In the event of a modification in warrants issued as private placement units, no re-measurement adjustment is recognized within equity.
h) |
Financial instruments |
Financial assets and liabilities are recognized when the entity becomes a party to the contractual provisions of the instrument. Financial assets are derecognized when the rights to receive cash flows have expired or substantially all risks and rewards of ownership have been transferred. Gains and losses on derecognition are generally recognized in profit and loss. Financial liabilities are derecognized when the Company’s obligation has been discharged, cancelled or expired.
Financial assets are classified and measured either at amortized cost, fair value through other comprehensive income (“FVOCI”) or fair value through profit or loss (“FVTPL”) based on the business model in which they are held and the characteristics of their contractual cash flows. Financial assets that are held within a business model whose objective is to collect the contractual cash flows, and that have contractual cash flows that are solely payments of principal and interest are measured at amortized cost at the end of the subsequent accounting periods. All other financial assets including equity investments and secured notes are measured at their fair values at the end of subsequent accounting periods, with any change taken through profit or loss or other comprehensive income. Financial liabilities include accounts payable and lease liabilities, which are measured at amortized cost.
-9-
New Found Gold Corp.
Notes to the Financial Statements
For the years ended December 31, 2024 and 2023
(Expressed in Canadian Dollars Unless Otherwise Noted)
2. |
MATERIAL ACCOUNTING POLICY INFORMATION (continued) |
h) |
Financial instruments (continued) |
All financial instruments are initially recognized at fair value on the statement of financial position. Subsequent measurement of financial instruments is based on their classification. Financial assets and liabilities classified at FVTPL are measured at fair value with changes in those fair values recognized in profit or loss or other comprehensive income for the period. Financial assets and liabilities classified at amortized cost are measured at amortized cost using the effective interest method.
The following table sets out the classifications of the Company’s financial assets and liabilities:
Financial assets/liabilities |
|
Classification under IFRS 9 |
Cash |
|
Amortized cost |
Investments |
|
FVTPL |
Deposits |
|
Amortized cost |
Secured notes |
|
FVTPL |
Interest receivable |
|
Amortized cost |
Accounts payables and accrued liabilities |
|
Amortized cost |
Lease liabilities |
|
Amortized cost |
IFRS requires an expected credit loss model for calculating the impairment of financial assets.
The expected credit loss model requires an entity to account for expected credit losses and changes in those expected credit losses at each reporting date to reflect changes in initial recognition. Impairment losses on financial assets carried at amortized cost are reversed in subsequent periods, if the amount of the loss decreases and the decrease can be objectively related to an event occurring after the impairment was recognized.
Impairment losses on financial assets carried at amortized cost are reversed in subsequent periods, if the amount of the loss decreases and the decrease can be objectively related to an event occurring after the impairment was recognized.
i) |
Investments |
Purchases and sales of investments are recognized on the settlement date. Realized gains and losses on disposal of investments and unrealized gains and losses in the fair value of investments are reflected in the statement of loss and comprehensive loss. Upon disposal of an investment, previously recognized unrealized gains or losses are reversed so as to recognize the full realized gain or loss in the period of disposition. All transaction costs associated with the acquisition and disposition of investments are expensed to the statement of loss and comprehensive loss as incurred. Interest income and other income are recorded on an accrual basis.
The fair value of investments is determined as follows:
| (a) | Securities that are traded in an active market and for which no sales restrictions apply, are presented at fair value based on quoted closing trade prices at the date of statement of financial position. If there were no trades on the date of the statement of financial position, these securities are presented at the closing price on the last date the security traded. These investments are included in Level 1 of the fair value hierarchy. |
| (b) | Securities that are traded in an active market, but which are escrowed or otherwise restricted as to their sale or transfer, are recorded at amounts discounted from market value to a maximum of 10%. In determining the discount for such investments, the Company considers the nature and length of the restriction. These investments are included in Level 2 of the fair value hierarchy. |
| (c) | Securities that are not traded in an active market or are valued based on unobservable market inputs are included in the Level 3 of the fair value hierarchy. |
See Note 5 for details of investments held by the Company as at December 31, 2024 and 2023.
-10-
New Found Gold Corp.
Notes to the Financial Statements
For the years ended December 31, 2024 and 2023
(Expressed in Canadian Dollars Unless Otherwise Noted)
2. |
MATERIAL ACCOUNTING POLICY INFORMATION (continued) |
j) |
Investment in an associate |
An associate is an entity over which the investor has significant influence but not control and that is neither a subsidiary nor an interest in a joint venture. The Company’s share of the net assets and net earnings or loss is accounted for in the financial statements using the equity method of accounting.
Under the equity method, the Company’s investment in an associate is initially recognized at cost and subsequently increased or decreased to recognize the Company’s share of net earnings and losses of the associate, after any adjustments necessary to give effect to uniform accounting policies, any other movement in the associate’s reserves, any dilution gains /losses as a result of changes in equity interest, and for impairment losses after the initial recognition date. The Company’s share of an associate’s losses that are in excess of its investment are recognized only to the extent that the Company has incurred legal or constructive obligations or made payments on behalf of the associate. The Company’s share of earnings and losses of associates are recognized in net earnings/(loss) during the period. Dividends and repayment of capital received from an associate are accounted for as a reduction in the carrying amount of the Company’s investment. Unrealized gains and losses between the Company and its associates are recognized only to the extent of unrelated investors’ interests in the joint ventures and associates. Intercompany balances and interest expense and income arising on loans and borrowings between the Company and associates are not eliminated.
k) |
Flow-through shares |
The Company will from time to time issue flow-through common shares to finance a significant portion of its exploration program. Pursuant to the terms of the flow-through share agreements, these shares transfer the tax deductibility of qualifying resource expenditures to investors. On issuance, the Company bifurcates the flow-through share into i) a flow-through share premium, equal to the estimated premium, if any, investors pay for the flow-through feature, which is recognized as a liability, and ii) share capital. Upon expenditures being incurred, the Company derecognizes the liability and recognizes a deferred tax liability for the amount of tax reduction renounced to the shareholders. The premium is recognized as recovery of flow-through premium liability and the related deferred tax is recognized as a tax provision.
The Company is subject to the flow-through share rules under the Income Tax Act of Canada. Proceeds received from the issuance of flow-through shares are required to be used only for Canadian resource property exploration expenditures within a specified time. The Company may also be subject to Part XII.6 tax on flow through proceeds renounced but not spent under the Look-Back Rules. When applicable, this tax is accrued as an expense.
l) |
Income taxes |
Income tax on the profit or loss for the years presented comprises current and deferred tax. Income tax is recognized in profit or loss except to the extent that it relates to items recognized directly in equity, in which case it is recognized in equity.
Current tax expense is the expected tax payable on the taxable income for the year, using tax rates enacted or substantively enacted at year end, adjusted for amendments to tax payable with regards to previous years.
Deferred tax is provided using the statement of financial position liability method, providing for temporary differences between the carrying amounts of assets and liabilities for financial reporting purposes and the amounts used for taxation purposes. However, deferred tax liabilities are not recognized if they arise from the initial recognition of goodwill; deferred income tax is not accounted for if it arises from initial recognition of an asset or liability in a transaction other than a business combination that at the time of the transaction affects neither accounting nor taxable profit or loss. The amount of deferred tax provided is based on the expected manner of realization or settlement of the carrying amount of assets and liabilities, using tax rates enacted or substantively enacted at year end applicable to the period of expected realization or settlement.
A deferred tax asset is recognized only to the extent that it is probable that future taxable profits will be available against which the asset can be utilized.
-11-
New Found Gold Corp.
Notes to the Financial Statements
For the years ended December 31, 2024 and 2023
(Expressed in Canadian Dollars Unless Otherwise Noted)
2. |
MATERIAL ACCOUNTING POLICY INFORMATION (continued) |
m) |
Significant accounting estimates and judgments |
The preparation of these financial statements requires management to make certain estimates, judgments and assumptions that affect the reported amounts of assets and liabilities at the date of the financial statements and reported amounts of expenses during the reporting period. Actual outcomes could differ from these estimates.
These financial statements include estimates which, by their nature, are uncertain. The impacts of such estimates may be pervasive throughout the financial statements, and may require accounting adjustments based on future occurrences. Revisions to accounting estimates are recognized in the period in which the estimate is revised and future periods if the revision affects both current and future periods. These estimates are based on historical experience, current and future economic conditions and other factors, including expectations of future events that are believed to be reasonable under the circumstances.
Significant assumptions about the future and other sources of estimation uncertainty that management has made at year end that could result in a material adjustment to the carrying amounts of assets and liabilities, in the event that actual results differ from assumptions made, relate to the following:
| (i) | Critical accounting estimates |
Valuation of Secured Notes
The fair value of secured notes at the issue date and the period end date is determined using the Hull-White model of interest rate uncertainty within a FINCAD Callable / Puttable Bond Model. The model involves various inputs to determine the fair value of the secured notes, including coupon rate, credit spread, mean reversion, rate volatility, riskless rates and redemption prices. Certain of the inputs are estimates that involve considerable judgment and are, or could be, affected by significant factors that are out of the Company’s control. These estimates impact the value of the secured notes recognized in the statement of financial position and revaluation adjustments recognized in the statement of loss and comprehensive loss during the period.
Valuation of Options Granted
The fair value of common share purchase options granted is determined at the issue date using the Black-Scholes option pricing model. The Black-Scholes model involves six key inputs to determine the fair value of an option, which are: risk-free interest rate, exercise price, market price at the grant date, expected dividend yield, expected life, and expected volatility. Certain of the inputs are estimates that involve considerable judgment and are, or could be, affected by significant factors that are out of the Company’s control. The Company is also required to estimate the future forfeiture rate of options based on historical information in its calculation of share-based payments expense. These estimates impact the values of stock-based compensation expense and reserves.
Computation of Income Taxes
The determination of tax expense for the period and deferred tax assets and liabilities involves significant estimation and judgment by management. In determining these amounts, management interprets tax legislation in a variety of jurisdictions and make estimates of the expected timing of the reversal of deferred tax assets and liabilities. Management also makes estimates of future earnings which affect the extent to which potential future tax benefits may be used.
The Company is subject to assessments by taxation authorities, which may interpret legislation differently. These differences may affect the final amount or the timing of the payment of taxes. We provide for such differences where known based on our best estimate of the probable outcome of these matters.
-12-
New Found Gold Corp.
Notes to the Financial Statements
For the years ended December 31, 2024 and 2023
(Expressed in Canadian Dollars Unless Otherwise Noted)
2. |
MATERIAL ACCOUNTING POLICY INFORMATION (continued) |
m) |
Significant accounting estimates and judgments (continued) |
(i)Critical accounting estimates (continued)
Shares Issued to Acquire Exploration and Evaluation Assets
From time to time, the Company issues common shares in the course of acquiring exploration and evaluation assets. When shares are issued without cash consideration, the transaction is recognized at the fair value of the assets received. In the event that the fair value of the assets cannot be reliably determined, the Company will recognize the transaction at the fair value of the shares issued. These estimates impact the value of share capital and exploration and evaluation assets.
Valuation of flow-through premium
The determination of the valuation of flow-through premium is subject to significant judgment and estimates. The flow-through premium is valued as the estimated premium that investors pay for the flow-through feature, being the portion in excess of the market value of shares without the flow-through feature.
Reclamation provision
The valuation of any reclamation provision is subject to significant judgement and estimates. Assumptions, based on the current economic environment, are made to estimate the future liability recognized in Note 9. These estimates take into account any material changes to the assumptions that occur when reviewed regularly by management and are based on current regulatory requirements. Significant changes in estimates of discount rate, contamination, restoration standards and techniques will result in changes to the provision from period to period. Actual reclamation and closure costs will ultimately depend on future market prices for the costs which will reflect the market condition at the time the expenditures are actually incurred. The final cost of the reclamation provision currently recognized may be higher or lower than currently provided for.
(ii)Critical accounting judgments
Asset acquisition versus business combination
Management applied judgment with respect to whether the acquisition of the Kingsway Project (as defined in Note 3 (i)), was an asset acquisition or a business combination. The assessment required management to assess the inputs, processes and outputs acquired at the time of acquisition. Pursuant to the assessment, the Kingsway Project acquisition was determined to be an asset acquisition.
-13-
New Found Gold Corp.
Notes to the Financial Statements
For the years ended December 31, 2024 and 2023
(Expressed in Canadian Dollars Unless Otherwise Noted)
2. |
MATERIAL ACCOUNTING POLICY INFORMATION (continued) |
m) |
Significant accounting estimates and judgments (continued) |
(ii)Critical accounting judgments (continued)
Impairment of Exploration and Evaluation Assets
Management is required to assess impairment in respect to the Company’s mineral property interests. The triggering events are defined in IFRS 6. In making the assessment, management is required to make judgments on the status of each project and the future plans towards finding commercial reserves. The carrying value of each exploration and evaluation asset is reviewed regularly for conditions that may suggest impairment.This review requires significant judgment. Factors considered in the assessment of asset impairment include, but are not limited to, whether there has been a significant adverse change in the legal, regulatory, accessibility, title, environmental or political factors that could affect the property’s value; whether there has been an accumulation of costs significantly in excess of the amounts originally expected for the property’s acquisition, development or cost of holding; and whether exploration activities produced results that are not promising such that no more work is being planned in the foreseeable future. If impairment is determined to exist, a formal estimate of the recoverable amount is performed and an impairment loss is recognized to the extent that the carrying amount exceeds the recoverable amount.
Management determined that there were no indicators of impairment at December 31, 2024 or 2023. Management determined that there were indicators of impairment as at June 30, 2023 and impaired $8,000 in exploration and evaluation assets during the year ended December 31, 2023. Refer to Note 3(ii) for further information.
Determination of whether the Company has significant influence over investees
Significant influence is presumed to exist where the Company has between 20% and 50% of the voting rights, but can also arise where the Company has less than 20%, if the Company has the power to participate in the financial and operating policy decisions affecting the entity. Determination of whether the Company has significant influence over investees requires an assessment of the activities of the investee that significantly affect the investee's returns, including strategic, operational and financing decision-making, appointment, remuneration and termination of the key management personnel and when decisions related to those activities can be influenced by the Company.
Based on assessments of the relevant facts and circumstances, primarily, the Company's ownership interests, board representation and ability to influence operating, strategic and financing decisions, the Company concluded that it has significant influence over Kirkland Lake Discoveries Corp. described in Note 6.
Impairment assessment for investment in associates
At each balance sheet date, management considers whether there is objective evidence of impairment in associates, including one or more loss events that would evidence a significant or prolonged decline in the fair value of the investment in associates below the carrying value. The net investment in an associate is impaired and impairment losses are incurred if there is objective evidence of impairment as a result of one or more events that occurred after the initial recognition of the net investment and that loss event or events have a negative impact on the estimated future cash flows from the net investment that can be reliably estimated. If there is such evidence, management determines the amount of impairment to record, if any, in relation to the associate.
The Company had significant influence over Kirkland Lake Discoveries Corp. during the period from May 25, 2023 to December 31, 2024 and as a result, has accounted for it as an investment in an associate during this period. Management determined that there were no indicators of impairment as at December 31, 2024. Management determined that there were indicators of impairment as at December 31, 2023 and had impaired $1,000,237 in its investment in Kirkland Lake Discoveries Corp. during the year ended December 31, 2023.
-14-
New Found Gold Corp.
Notes to the Financial Statements
For the years ended December 31, 2024 and 2023
(Expressed in Canadian Dollars Unless Otherwise Noted)
2. |
MATERIAL ACCOUNTING POLICY INFORMATION (continued) |
m) |
Significant accounting estimates and Judgments (continued) |
(ii) |
Critical accounting judgments (continued) |
Presentation of financial statements as a going concern
Presentation of the financial statements as a going concern, which assumes that the Company will continue in operation for the foreseeable future, obtain additional financing as required, and will be able to realize its assets and discharge its liabilities in the normal course of operations as they come due, involves significant judgment by management.
n) |
Initial application of standards, interpretations and amendments to standards and interpretations in the reporting period |
The IASB issued certain new accounting standards or amendments that are mandatory for accounting periods on or after January 1, 2024, including amendments to IAS 1 “Classification of Liabilities as Current or Non-Current”, amendments to IFRS 16 “Leases”, and amendments to IAS 7 “Statement of Cash Flow” and IFRS 7 “Financial Instruments Disclosures”. The effect of such new accounting standards or amendments did not have a material impact on the Company and therefore the Company did not record any adjustments to the financial statements.
o)New and amended IFRS standards not yet effective
Certain new accounting standards or interpretations have been published that are not mandatory for the current period and have not been early adopted. These standards and interpretations are not expected to have a material impact on the Company’s financial statements, except for IFRS 18 “Presentation and Disclosure in Financial Statements”.
IFRS 18 includes requirements for all entities applying IFRS for the presentation and disclosure of information in financial statements and has an effective date of January 1, 2027. The effects of the adoption of IFRS 18 on the Company’s financial statements have not yet been determined.
-15-
New Found Gold Corp.
Notes to the Financial Statements
For the years ended December 31, 2024 and 2023
(Expressed in Canadian Dollars Unless Otherwise Noted)
3. |
EXPLORATION AND EVALUATION ASSETS |
The schedules below summarize the carrying costs of acquisition costs and exploration expenditures incurred to date for each exploration and evaluation asset that the Company is continuing to explore as at December 31, 2024 and 2023:
|
|
Newfoundland |
||||
|
|
Queensway(i) |
|
Other |
|
Total |
Year ended December 31, 2024 |
|
$ |
|
$ |
|
$ |
Exploration and evaluation assets |
|
|
|
|
|
|
Balance as at December 31, 2023 |
|
9,014,478 |
|
78,709 |
|
9,093,187 |
Additions: |
|
|
|
|
|
|
Acquisition costs – Kingsway Project |
|
20,088,541 |
|
— |
|
20,088,541 |
Expenditure target payment – Kingsway Project |
|
750,000 |
|
— |
|
750,000 |
Acquisition costs – royalty purchases |
|
4,040,844 |
|
— |
|
4,040,844 |
Acquisition costs – other claims |
|
481,863 |
|
35,499 |
|
517,362 |
Claim staking and license renewal costs |
|
15,250 |
|
300 |
|
15,550 |
Balance as at December 31, 2024 |
|
34,390,976 |
|
114,508 |
|
34,505,484 |
|
|
|
|
|
|
|
Exploration and evaluation expenditures |
|
|
|
|
|
|
Cumulative exploration expense – December 31, 2023 |
|
215,285,192 |
|
574,857 |
|
215,860,049 |
Assays |
|
6,006,877 |
|
— |
|
6,006,877 |
Drilling |
|
23,828,589 |
|
— |
|
23,828,589 |
Environmental studies |
|
971,923 |
|
— |
|
971,923 |
Geochemistry |
|
134,971 |
|
— |
|
134,971 |
Geophysics |
|
723,154 |
|
— |
|
723,154 |
Imagery and mapping |
|
175,145 |
|
350 |
|
175,495 |
Metallurgy |
|
1,315,279 |
|
— |
|
1,315,279 |
Office and general |
|
706,448 |
|
— |
|
706,448 |
Other |
|
870,615 |
|
— |
|
870,615 |
Permitting |
|
636,745 |
|
— |
|
636,745 |
Preliminary economic assessment |
|
62,608 |
|
— |
|
62,608 |
Property taxes, mining leases and rent |
|
87,166 |
|
— |
|
87,166 |
Reclamation |
|
1,739,648 |
|
— |
|
1,739,648 |
Resource estimate |
|
354,155 |
|
— |
|
354,155 |
Salaries and consulting |
|
9,721,226 |
|
488 |
|
9,721,714 |
Seismic survey |
|
117,583 |
|
— |
|
117,583 |
Supplies and equipment |
|
1,517,546 |
|
— |
|
1,517,546 |
Travel and accommodations |
|
680,142 |
|
— |
|
680,142 |
Technical reports |
|
95,206 |
|
— |
|
95,206 |
Trenching |
|
2,932,976 |
|
— |
|
2,932,976 |
Exploration cost recovery |
|
(115,500) |
|
— |
|
(115,500) |
|
|
52,562,502 |
|
838 |
|
52,563,340 |
Cumulative exploration expense – December 31, 2024 |
|
267,847,694 |
|
575,695 |
|
268,423,389 |
-16-
New Found Gold Corp.
Notes to the Financial Statements
For the years ended December 31, 2024 and 2023
(Expressed in Canadian Dollars Unless Otherwise Noted)
3. |
EXPLORATION AND EVALUATION ASSETS (continued) |
|
|
Newfoundland |
|
|
|
|
||
|
|
Queensway (i) |
|
Other |
|
Ontario(ii) |
|
Total |
Year ended December 31, 2023 |
|
$ |
|
$ |
|
$ |
|
$ |
Exploration and evaluation assets |
|
|
|
|
|
|
|
|
Balance as at December 31, 2022 |
|
8,616,693 |
|
47,916 |
|
272,000 |
|
8,936,609 |
Additions |
|
|
|
|
|
|
|
|
Acquisition costs |
|
381,220 |
|
30,793 |
|
— |
|
412,013 |
Claim staking and license renewal costs |
|
16,565 |
|
— |
|
— |
|
16,565 |
Disposals |
|
|
|
|
|
|
|
|
Disposal of exploration and evaluation assets |
|
— |
|
— |
|
(264,000) |
|
(264,000) |
Impairment of exploration and evaluation assets |
|
— |
|
— |
|
(8,000) |
|
(8,000) |
Balance as at December 31, 2023 |
|
9,014,478 |
|
78,709 |
|
— |
|
9,093,187 |
|
|
|
|
|
|
|
|
|
Exploration and evaluation expenditures |
|
|
|
|
|
|
|
|
Cumulative exploration expense – December 31, 2022 |
|
121,302,318 |
|
539,998 |
|
3,428,034 |
|
125,270,350 |
Assays |
|
16,102,874 |
|
14,515 |
|
— |
|
16,117,389 |
Drilling |
|
41,121,168 |
|
— |
|
— |
|
41,121,168 |
Environmental studies |
|
1,280,147 |
|
— |
|
— |
|
1,280,147 |
Geochemistry |
|
857,555 |
|
— |
|
— |
|
857,555 |
Geophysics |
|
814,877 |
|
— |
|
— |
|
814,877 |
Imagery and mapping |
|
644,205 |
|
9,932 |
|
— |
|
654,137 |
Metallurgy |
|
950,855 |
|
— |
|
— |
|
950,855 |
Office and general |
|
855,902 |
|
— |
|
144 |
|
856,046 |
Other |
|
590,575 |
|
— |
|
— |
|
590,575 |
Permitting |
|
225,162 |
|
— |
|
— |
|
225,162 |
Property taxes, mining leases and rent |
|
143,010 |
|
— |
|
5,915 |
|
148,925 |
Reclamation |
|
2,122,598 |
|
— |
|
— |
|
2,122,598 |
Salaries and consulting |
|
13,243,577 |
|
10,103 |
|
13,850 |
|
13,267,530 |
Seismic survey |
|
8,118,668 |
|
— |
|
— |
|
8,118,668 |
Supplies and equipment |
|
4,438,579 |
|
— |
|
480 |
|
4,439,059 |
Technical reports |
|
55,025 |
|
— |
|
— |
|
55,025 |
Travel and accommodations |
|
1,481,399 |
|
309 |
|
155 |
|
1,481,863 |
Trenching |
|
982,148 |
|
— |
|
— |
|
982,148 |
Exploration cost recovery |
|
(45,450) |
|
— |
|
— |
|
(45,450) |
|
|
93,982,874 |
|
34,859 |
|
20,544 |
|
94,038,277 |
Cumulative exploration expense – December 31, 2023 |
|
215,285,192 |
|
574,857 |
|
3,448,578 |
|
219,308,627 |
As at December 31, 2024, the Company owned a 100% interest in 103 (December 31, 2023 – 96) mineral licenses including 7,024 claims (December 31, 2023 – 6,659 claims) comprising 175,600 hectares of land (December 31, 2023 – 166,475) located near Gander, Newfoundland and Labrador. The project rights were acquired by map staking mineral licenses and making staged payments in cash and common shares of the Company from 2016 through 2022 under ten separate option agreements, of which nine are completed. The Queensway Project carries various net smelter return (“NSR”) royalties ranging from 0.4% to 3.00%, many of which include buy-back provisions that allow the Company, at its option, to reduce the NSR by making lump-sum payments ranging from $250,000 to $1,000,000 to the holders of the royalties.The total cost of the NSR’s if the Company were to exercise all of its buy-back rights is $4,250,000 resulting in NSR’s ranging from 0.5% to 1.5% for the mineral licenses subject to an NSR royalty.
-17-
New Found Gold Corp.
Notes to the Financial Statements
For the years ended December 31, 2024 and 2023
(Expressed in Canadian Dollars Unless Otherwise Noted)
3. |
EXPLORATION AND EVALUATION ASSETS (continued) |
(i)Queensway Project – Gander, Newfoundland (continued)
On November 2, 2022, the Company entered into a definitive property option agreement to acquire a 100% interest in five mineral licenses located in Gander, Newfoundland. Under the terms of this agreement, the Company may exercise the option by issuing an aggregate of 487,078 common shares in the capital of the Company and making aggregate cash payments of $2,350,000 to the optionors as follows:
| ● | $200,000 (paid) and 39,762 common shares (issued) on the later of (i) staking confirmation date as defined in the Option Agreement and (ii) the receipt of the TSX Venture Exchange’s approval; |
| ● | $200,000 (paid) and 39,762 common shares on or before November 2, 2023 (issued); |
| ● | $250,000 (paid) and 69,583 common shares on or before November 2, 2024 (issued); |
| ● | $300,000 and 89,463 common shares on or before November 2, 2025; |
| ● | $600,000 and 129,224 common shares on or before November 2, 2026; and |
| ● | $800,000 and 119,284 common shares on or before November 2, 2027. |
Acquisition of Kingsway Project
On April 21, 2024, the Company entered into a property purchase agreement with Labrador Gold Corp. (“LabGold”) to acquire a 100% interest in LabGold’s Kingsway Project, located near Gander, Newfoundland and Labrador, as well as certain related assets of LabGold (the “Transaction”). The Transaction closed on July 9, 2024. Pursuant to the acquisition, the Company issued 5,263,157 common shares to LabGold with a value of $20,000,000 (Note 10). The Company paid $438,541 in professional and filing fees in connection with the Transaction.
The acquisition of the Kingsway Project was accounted for as an asset acquisition. The Company allocated the fair value of consideration paid to the acquired assets based on their relative fair values at the date of purchase as follows:
Value of equity instruments issued |
|
$ |
20,000,000 |
Transaction costs |
|
|
438,541 |
Total consideration |
|
|
20,438,541 |
|
|
|
|
Assets |
|
|
|
Exploration and evaluation assets |
|
|
20,088,541 |
Property and equipment |
|
|
350,000 |
Total assets acquired |
|
$ |
20,438,541 |
Under the terms of the original Kingsway Option Agreement, the optionors would receive an Expenditure Target Payment of $750,000 upon completion of an aggregate of $30,000,000 of exploration expenditures being incurred on the property. During the year ended December 31, 2024, the Company incurred certain exploration expenditures and having met the remaining expenditure target on the property paid $750,000 to the optionors.
The Kingsway Project carries a 1.0% NSR payable to the royalty holders upon commencement of commercial production. The Company will also pay to the royalty holders $1 per ounce of gold contained within the property in the indicated mineral resource and measured mineral resource categories (the “Resource Payment”) as defined by the Canadian Institute of Mining, Metallurgy and Petroleum, and established in a National Instrument 43-101 – Standards of Disclosure for Mineral Projects or like technical report for the development of the property. The Resource Payment is payable upon the commencement of commercial production. An advance royalty payment of $50,000 per year will be payable commencing on March 3, 2026 and continuing each year until the commencement of commercial production. Any advance royalties paid will be deducted from the royalty payable after commencement of commercial production.
-18-
New Found Gold Corp.
Notes to the Financial Statements
For the years ended December 31, 2024 and 2023
(Expressed in Canadian Dollars Unless Otherwise Noted)
3. |
EXPLORATION AND EVALUATION ASSETS (continued) |
(i)Queensway Project – Gander, Newfoundland (continued)
Royalty Purchases
On July 29, 2024, the Company entered into three royalty purchase agreements (the “Royalty Purchase Agreements”) with arm’s length royalty holders (together, the “Vendors” and each, a “Vendor”) to purchase part of each Vendor’s royalty interest in aggregate, 0.6% of the Vendors’ 1.6% net smelter returns royalty underlying several zones at the Company’s Queensway project (the “Royalty Interests”). The transaction closed on August 8, 2024. Pursuant to the transaction, the Company paid aggregate cash consideration of $1,950,000 and aggregate share consideration of 300,000 common shares with a combined value of $1,011,000 to the Vendors (Note 10). The Company paid $63,620 in professional fees in connection with the royalty purchases.
The Company also had the right to purchase the remaining 1.0% net smelter returns royalty from the Vendors for an aggregate price equal to $1,000,000 (the “Repurchase Price”) by November 12, 2024, payable by (i) an aggregate of $100,000 and (ii) an additional $4,950, in the aggregate, per year until the Repurchase Price has been satisfied. During the year ended December 31, 2024, the Company purchased the remaining 1.0% net smelter returns royalty from the Vendors for $1,000,000 in aggregate in cash, of which $666,667 was paid subsequent to December 31, 2024, which fully satisfied the Repurchase Price. The Company also paid $16,225 in professional fees in connection with the purchase.
Disposal of Lucky Strike
During the year ended December 31, 2023, the Company recognized a gain on disposal of its Lucky Strike project in Kirkland Lake, Ontario of $4,217,935. The Company received total non-cash consideration having a fair value of $4,657,482 consisting of 28,612,500 common shares of Kirkland Lake Discoveries Corp. and a 1.0% net smelter return royalty on future production from the mineral claims. The Company recognized $175,547 of professional fees in connection with the transaction and derecognized the Lucky Strike project at its carrying value of $264,000. Refer to Note 6 for further information.
Impairment of Ontario Properties
During the year ended December 31, 2023, the Company recorded an impairment of $8,000 in acquisition costs related to projects no longer being explored.
-19-
New Found Gold Corp.
Notes to the Financial Statements
For the years ended December 31, 2024 and 2023
(Expressed in Canadian Dollars Unless Otherwise Noted)
4. |
PROPERTY AND EQUIPMENT |
|
|
|
|
|
|
Geological |
|
|
|
Office |
|
|
|
|
Property |
|
|
|
Equipment |
|
|
|
Furniture |
|
|
|
|
and |
|
Computer |
|
and Other |
|
|
|
and |
|
|
|
|
Buildings |
|
Equipment |
|
Facilities |
|
Vehicles |
|
Equipment |
|
Total |
|
|
$ |
|
$ |
|
$ |
|
$ |
|
$ |
|
$ |
Cost |
|
|
|
|
|
|
|
|
|
|
|
|
Balance at January 1, 2023 |
|
6,192,912 |
|
93,498 |
|
1,547,454 |
|
779,888 |
|
30,148 |
|
8,643,900 |
Additions |
|
172,344 |
|
46,395 |
|
763,576 |
|
190,230 |
|
8,205 |
|
1,180,750 |
Disposals |
|
— |
|
(3,401) |
|
— |
|
(34,795) |
|
— |
|
(38,196) |
Balance at December 31, 2023 |
|
6,365,256 |
|
136,492 |
|
2,311,030 |
|
935,323 |
|
38,353 |
|
9,786,454 |
Additions - Kingsway Project |
|
100,000 |
|
— |
|
250,000 |
|
— |
|
— |
|
350,000 |
Additions - other |
|
3,615 |
|
— |
|
583,610 |
|
38,550 |
|
— |
|
625,775 |
Balance at December 31, 2024 |
|
6,468,871 |
|
136,492 |
|
3,144,640 |
|
973,873 |
|
38,353 |
|
10,762,229 |
Accumulated Depreciation |
|
|
|
|
|
|
|
|
|
|
|
|
Balance at January 1, 2023 |
|
141,526 |
|
43,789 |
|
787,598 |
|
403,561 |
|
412 |
|
1,376,886 |
Depreciation |
|
271,505 |
|
42,327 |
|
228,621 |
|
244,312 |
|
7,379 |
|
794,144 |
Disposals |
|
— |
|
(567) |
|
— |
|
(22,617) |
|
— |
|
(23,184) |
Balance at December 31, 2023 |
|
413,031 |
|
85,549 |
|
1,016,219 |
|
625,256 |
|
7,791 |
|
2,147,846 |
Depreciation |
|
277,685 |
|
33,153 |
|
184,532 |
|
173,193 |
|
7,671 |
|
676,234 |
Balance at December 31, 2024 |
|
690,716 |
|
118,702 |
|
1,200,751 |
|
798,449 |
|
15,462 |
|
2,824,080 |
Carrying Amount |
|
|
|
|
|
|
|
|
|
|
|
|
At December 31, 2023 |
|
5,952,225 |
|
50,943 |
|
1,294,811 |
|
310,067 |
|
30,562 |
|
7,638,608 |
At December 31, 2024 |
|
5,778,155 |
|
17,790 |
|
1,943,889 |
|
175,424 |
|
22,891 |
|
7,938,149 |
5. |
INVESTMENTS |
The Company classifies its investments at FVTPL. Realized gains and losses on disposal of investments and unrealized gains and losses in the fair value of investments are reflected in the statement of loss and comprehensive loss in the period in which they occur.
Investments consisted of the following as at December 31, 2024 and 2023:
|
|
December 31, 2024 |
|
December 31, 2023 |
|
|
$ |
|
$ |
Equities held (i) |
|
779,019 |
|
3,408,092 |
Warrants held (ii) |
|
147,000 |
|
188,500 |
Total Investments |
|
926,019 |
|
3,596,592 |
-20-
New Found Gold Corp.
Notes to the Financial Statements
For the years ended December 31, 2024 and 2023
(Expressed in Canadian Dollars Unless Otherwise Noted)
5. |
INVESTMENTS (continued) |
(i) Equities held
The Company held the following equities as at December 31, 2024 and 2023:
|
|
|
|
|
|
Fair Value |
|
|
|
|
|
|
December 31, |
|
|
|
|
Cost |
|
2024 |
|
|
Quantity |
|
$ |
|
$ |
Exploits Discovery Corp. |
|
4,157,466 |
|
2,659,473 |
|
187,086 |
Labrador Gold Corp. |
|
9,865,556 |
|
6,953,907 |
|
591,933 |
Total Equities |
|
|
|
9,613,380 |
|
779,019 |
|
|
|
|
|
|
Fair Value |
|
|
|
|
|
|
December 31, |
|
|
|
|
Cost |
|
2023 |
|
|
Quantity |
|
$ |
|
$ |
Exploits Discovery Corp. |
|
13,229,466 |
|
8,462,704 |
|
1,587,536 |
Labrador Gold Corp. |
|
12,555,556 |
|
8,850,000 |
|
1,820,556 |
Gold Hunter Resources Corp. (formerly Long Range Exploration Corporation) |
|
5,000,000 |
|
500,000 |
|
— |
Total Equities |
|
|
|
17,812,704 |
|
3,408,092 |
Investments in Exploits Discovery Corp. and Labrador Gold Corp. represent investments in public companies that are quoted on an active exchange and are measured using the quoted market price of these companies.
(ii) Warrants held
The Company held the following warrants as at December 31, 2024 and 2023:
|
|
|
|
|
|
Fair Value |
|
|
|
|
|
|
December 31, |
|
|
|
|
Cost |
|
2024 |
|
|
Quantity |
|
$ |
|
$ |
Maritime Resources Corp. (1) |
|
15,324,571 |
|
174,500 |
|
147,000 |
Total Warrants |
|
|
|
174,500 |
|
147,000 |
|
|
|
|
|
|
Fair Value |
|
|
|
|
|
|
December 31, |
|
|
|
|
Cost |
|
2023 |
|
|
Quantity |
|
$ |
|
$ |
Maritime Resources Corp. (1) |
|
15,324,571 |
|
174,500 |
|
188,500 |
Total Warrants |
|
|
|
174,500 |
|
188,500 |
| (1) | Each warrant is exercisable into one common share of Maritime Resources Corp. at a price of $0.07 per warrant until August 14, 2025, subject to extension to August 14, 2026 in the event that the Initial Maturity Date of the notes is extended to the Extended Maturity Date as defined in Note 7. |
-21-
New Found Gold Corp.
Notes to the Financial Statements
For the years ended December 31, 2024 and 2023
(Expressed in Canadian Dollars Unless Otherwise Noted)
5. |
INVESTMENTS (continued) |
Warrants that do not have a quoted market price are valued using a Black-Scholes option pricing model using assumptions including risk free interest rate, expected dividend yield, expected volatility, and expected remaining life of the warrant, which are supported by observable market conditions.
An analysis of investments including related gains and losses for the years ended December 31, 2024 and 2023 is as follows:
|
|
Year ended December 31, |
||
|
|
2024 |
|
2023 |
|
|
$ |
|
$ |
Investments, beginning of year |
|
3,596,592 |
|
7,501,155 |
Purchases of investments |
|
— |
|
174,500 |
Proceeds on disposal of investments |
|
(1,097,814) |
|
— |
Realized losses on investments |
|
(380,877) |
|
— |
Unrealized losses on investments |
|
(1,191,882) |
|
(4,079,063) |
Investments, end of year |
|
926,019 |
|
3,596,592 |
6. |
INVESTMENT IN KIRKLAND LAKE DISCOVERIES CORP. |
The investment in Kirkland Lake Discoveries Corp. (“KLDC”) represents 25.91% of the issued and outstanding common shares of KLDC at December 31, 2024 (December 31, 2023 – 32.29%). The companies had a director and officer in common up until December 16, 2024, being Denis Laviolette, former Director and President of the Company. At the time of the closing of the transaction, the Company also exercised its right to nominate two additional directors to the board of directors of KLDC. Based on assessments of the relevant facts and circumstances, primarily, the Company's ownership interests, board representation and ability to influence operating, strategic and financing decisions, the Company concluded that it continues to have significant influence over KLDC, and as a result has accounted for it as an investment in an associate since the acquisition of its ownership interest on May 25, 2023.
The following tables illustrate the summarised financial information of the Company’s investment in KLDC as at December 31, 2024 and 2023 on a 100% basis and reflecting adjustments made by the Company, including fair value adjustments made at the time of acquisition and adjustments for differences due to accounting policies:
|
|
December 31, 2024 |
|
December 31, 2023 |
|
|
|
$ |
|
$ |
|
Summarised Statement of Financial Position |
|
|
|
|
|
Current assets |
|
1,913,417 |
|
4,601,136 |
|
Non-current assets |
|
4,551,364 |
|
4,583,769 |
|
Current liabilities |
|
(576,261) |
|
(322,453) |
|
Non-current liabilities |
|
— |
|
— |
|
Net assets |
|
5,888,520 |
|
8,862,452 |
|
The Company’s ownership interest |
|
25.91 |
% |
32.29 |
% |
Share of Kirkland Lake Discoveries Corp.’s net assets |
|
1,525,756 |
|
2,861,250 |
|
|
|
|
|
|
|
Summarised Statement of Loss and Comprehensive Loss |
|
|
|
|
|
Net loss and comprehensive loss for the period |
|
(4,047,447) |
|
(2,465,518) |
|
Share of Kirkland Lake Discoveries Corp.’s loss for the period |
|
(1,306,722) |
|
(795,995) |
|
The Company assesses impairment of its investment in KLDC at each period end. The assessment is based on the review of recent share price history, industry statistics and current market conditions. As at December 31, 2024, the Company has determined that there are no indicators of impairment of the Company’s investment in KLDC. During the year ended December 31, 2023, the Company recognized an impairment of its equity investment of $1,000,237 which was included in the statement of loss and comprehensive loss for the year.
-22-
New Found Gold Corp.
Notes to the Financial Statements
For the years ended December 31, 2024 and 2023
(Expressed in Canadian Dollars Unless Otherwise Noted)
6. |
INVESTMENT IN KIRKLAND LAKE DISCOVERIES CORP. (continued) |
The following table illustrates the movement in investment in associate for the period from May 25, 2023 to December 31, 2024:
Net Carrying amount – May 25, 2023 |
|
$ |
4,657,482 |
Share of loss from operations of associate during the period |
|
|
(795,995) |
Impairment of equity investment |
|
|
(1,000,237) |
Net Carrying amount – December 31, 2023 |
|
$ |
2,861,250 |
Share of loss from operations of associate during the period |
|
|
(1,306,722) |
Loss on dilution of equity investment |
|
|
(28,772) |
Net Carrying amount – December 31, 2024 |
|
$ |
1,525,756 |
The estimated fair value of the Company’s investment in KLDC is $1,287,563 as at December 31, 2024 (December 31, 2023 - $2,861,250) based on the quoted market price of its common shares on the TSX Venture exchange.
7. |
SECURED NOTES |
On August 14, 2023, the Company participated in a brokered note offering completed by Maritime Resources Corp. (“Maritime”) consisting of the issuance of non‐convertible senior secured notes (the “Notes”) and common share purchase warrants. The Notes mature on August 14, 2025 (the “Initial Maturity Date”). The Company subscribed for 2,000 notes with a face value of US$1,000 each. The Notes were issued at a 2.0% original issue discount on the principal amount of the Notes for a gross investment of US$1,960,000 (CAD$2,638,500).
The Notes bear interest at a rate equal to the Secured Overnight Financing Rate (“SOFR”) plus 6% per annum, payable quarterly in arrears. The Initial Maturity Date of the Notes can be extended to August 14, 2026 (the “Extended Maturity Date”) at the election of Maritime subject to the approval of holders of at least 65% of the principal amount of the Notes then outstanding. In the event of such an extension, Maritime will pay an extension fee to note holders equal to 3% of the aggregate principal amount of the Notes then outstanding (the “Extension Fee”) and the interest rate on the Notes will increase to SOFR plus 9% until the Extended Maturity Date. Maritime may elect to pay the Extension Fee by issuing Maritime’s common shares at the market price on the trading day prior to the maturity date, subject to the approval of the TSX Venture exchange.
Pursuant to certain conditions set out in the Note indenture, including the approval of Noteholders holding at least 65% of the principal amount of the Notes then outstanding, Maritime has the option to satisfy interest payments under the Notes by issuing shares (“Interest Shares”) having a deemed value equal to 90% of the market price as of the date of a news release announcing Maritime’s intention to issue the Interest Shares, subject to the approval of the exchange.
The indebtedness under the Notes may be redeemed in whole or in part at the option of Maritime for cash consideration equal to 113% of the aggregate amount of indebtedness if the Notes are redeemed on or prior to August 14, 2024, or 100% of the aggregate amount of indebtedness if redeemed after the date that is 12 months after the issuance date.
The Notes are secured by a general security interest over Maritime and rank senior to all existing and future indebtedness of Maritime.
Based on the business model in which the secured notes are held and the characteristics of their contractual cash flows, the secured notes are classified as a financial instrument at fair value through profit and loss ("FVTPL") in accordance with IFRS 9 “Financial Instruments”.
The issuance of the Notes included a 40% warrant coverage resulting in the Company receiving 15,324,571 warrants (“Warrants”). These warrants were classified by the Company as investments at FVTPL (Note 5).
The Company has allocated the gross investment of US$1,960,000 (CAD$2,638,500) to the Notes and warrants based on their respective fair values at initial recognition. At the time of issuance, the fair value of the Notes was CAD$2,464,000 (US$1,830,300) and the fair value of the warrants was CAD$174,500 (US$129,700).
-23-
New Found Gold Corp.
Notes to the Financial Statements
For the years ended December 31, 2024 and 2023
(Expressed in Canadian Dollars Unless Otherwise Noted)
7. |
SECURED NOTES (continued) |
The following table illustrates the movement in the Company’s secured notes for the period from August 14, 2023 to December 31, 2024:
Secured notes at August 14, 2023 |
|
$ |
2,464,000 |
Revaluation of secured notes |
|
|
33,599 |
Foreign exchange loss |
|
|
(43,299) |
Secured notes at December 31, 2023 |
|
$ |
2,454,300 |
Revaluation of secured notes |
|
|
140,786 |
Foreign exchange gain |
|
|
222,468 |
Secured notes at December 31, 2024 |
|
$ |
2,817,554 |
During the year ended December 31, 2024, the Company recognized $302,718 of interest income on the secured notes (December 31, 2023 - $114,434), of which $Nil was included in interest receivable at December 31, 2024 (December 31, 2023 - $75,322).
8. |
FLOW-THROUGH SHARE PREMIUM |
|
|
Issued |
|
Issued |
|
Issued |
|
|
|
|
November 25, |
|
December 14, |
|
November 6, |
|
|
|
|
2021 |
|
2022 |
|
2023 |
|
Total |
|
|
$ |
|
$ |
|
$ |
|
$ |
Balance at December 31, 2022 |
|
5,563,350 |
|
14,500,000 |
|
— |
|
20,063,350 |
Liability incurred on flow-through shares issued |
|
— |
|
— |
|
15,295,500 |
|
15,295,500 |
Settlement of flow-through share premium on expenditures incurred |
|
(5,563,350) |
|
(14,500,000) |
|
(2,869,178) |
|
(22,932,528) |
Balance at December 31, 2023 |
|
— |
|
— |
|
12,426,322 |
|
12,426,322 |
Settlement of flow-through share premium on expenditures incurred |
|
— |
|
— |
|
(12,426,322) |
|
(12,426,322) |
Balance at December 31, 2024 |
|
— |
|
— |
|
— |
|
— |
Flow-through share arrangements entitle the holder of the flow-through share to a 100% tax deduction in respect of qualifying Canadian exploration expenses as defined in the Income Tax Act, Canada (“Qualifying CEE”).
During the year ended December 31, 2024, the Company incurred $45,500,423 (2023 – $81,699,542) in Qualifying CEE and amortized a total of $12,426,322 (2023 - $22,932,528) of its flow-through share premium liabilities.
The flow-through premium liability does not represent a cash liability to the Company and is to be fully amortized to the statement of loss and comprehensive loss pro-rata with the amount of qualifying expenditures that will be incurred.
During the year ended December 31, 2024, the Company incurred $928,769 (2023 - $584,120) in Part XII.6 tax in respect of unspent flow-through proceeds renounced in year 1 under the Look-Back Rule, in accordance with the Income Tax Act of Canada.
-24-
New Found Gold Corp.
Notes to the Financial Statements
For the years ended December 31, 2024 and 2023
(Expressed in Canadian Dollars Unless Otherwise Noted)
9. |
ACCOUNTS PAYABLE AND ACCRUED LIABILITIES |
|
|
December 31, 2024 |
|
December 31, 2023 |
|
|
$ |
|
$ |
Accounts payable and accrued liabilities |
|
4,898,825 |
|
5,207,323 |
Reclamation provision(1) |
|
2,426,378 |
|
1,285,031 |
Accounts payable and accrued liabilities, end of year |
|
7,325,203 |
|
6,492,354 |
(1) |
Provincial laws and regulations concerning environmental protection affect the Company’s exploration and operations. Under current regulations, the Company is required to meet performance standards to minimize the environmental impact from its activities and to perform site restoration and other reclamation activities. The Company’s reclamation provision is based on known requirements. |
The breakdown of the Company’s reclamation provision is as follows:
|
|
December 31, 2024 |
|
December 31, 2023 |
|
|
$ |
|
$ |
Balance, beginning of year |
|
1,285,031 |
|
1,411,293 |
Additions to reclamation provision |
|
1,515,593 |
|
1,327,278 |
Change in estimate |
|
26,784 |
|
2,687 |
Reclamation costs incurred |
|
(401,030) |
|
(1,456,227) |
Balance, end of year |
|
2,426,378 |
|
1,285,031 |
The Company has estimated that the reclamation obligations are current costs and as such considers the present value of the provision at December 31, 2024 to be equal to the total future undiscounted cash flows to settle the provision for reclamation, being $2,426,378 (December 31, 2023 - $1,285,031). Additions to the reclamation provision are included in the total amount of exploration and evaluation expenditures in the statement of loss and comprehensive loss.
10. |
SHARE CAPITAL AND RESERVES |
Authorized Share Capital
At December 31, 2023, the authorized share capital comprised an unlimited number of common shares. The common shares do not have a par value. All issued shares are fully paid.
Details of Common Shares Issued in 2024 and 2023
|
|
Year ended |
|
Year ended |
||||||
|
|
December 31, 2024 |
|
December 31, 2023 |
||||||
|
|
Number of shares |
|
Gross proceeds |
|
Number of shares |
|
Gross proceeds |
||
ATM program |
|
5,857,242 |
|
$ |
27,522,494 |
|
3,552,224 |
|
$ |
22,980,338 |
Total |
|
5,857,242 |
|
$ |
27,522,494 |
|
3,552,224 |
|
$ |
22,980,338 |
In August 2022, the Company filed a prospectus supplement to its short form base shelf prospectus, pursuant to which the Company may, at its discretion and from time-to-time, sell common shares of the Company for aggregate gross proceeds of up to US$100,000,000. The sale of common shares is to be made through “at-the-market distributions” (“ATM”), as defined in the Canadian Securities Administrators’ National Instrument 44-102 Shelf Distributions, directly on the TSX Venture Exchange and the NYSE American stock exchange.
During the year ended December 31, 2024, the Company sold 5,857,242 (2023 – 3,552,224) common shares of the Company under the ATM program at an average price of $4.70 (2023 – $6.47) for gross proceeds of $27,522,494 (2023 - $22,980,338) or net proceeds of $26,607,687 (2023 - $22,440,215), and paid an aggregate commission of $914,807 (2023 - $540,123). At December 31, 2024, the Company completed $51,798,893 of the ATM program. As at December 31, 2024, the ATM has expired.
-25-
New Found Gold Corp.
Notes to the Financial Statements
For the years ended December 31, 2024 and 2023
(Expressed in Canadian Dollars Unless Otherwise Noted)
10. |
SHARE CAPITAL AND RESERVES (continued) |
On November 1, 2024, the Company issued 69,583 common shares with a value of $215,707 pursuant to the acquisition of exploration and evaluation assets in accordance with the terms of certain property option agreements (Note 3 (i)).
On August 8, 2024, the Company issued 300,000 common shares with a value of $1,011,000 pursuant to the acquisition of certain royalty interests (Note 3(i)).
On July 9, 2024, the Company issued 5,263,157 common shares to LabGold with a value of $20,000,000 pursuant to the acquisition of the Kingsway Project (Note 3(i)).
On June 26, 2024, the Company issued 370,000 common shares with a value of $1,750,100 pursuant to a legal claim settlement agreement (Note 16).
During the year ended December 31, 2024, 1,725,000 stock options were exercised at a weighted average exercise price of $0.50 per share for gross proceeds of $862,500.
On November 6, 2023, the Company completed a bought-deal prospectus offering of 7,725,000 flow-through common shares at a price of $7.25 per common share for gross proceeds of $56,006,250. The Company paid share issuance costs of $2,977,254 in cash of which $2,357,908 was paid to the underwriters. The premium received on the flow-through shares issued was determined to be $15,295,500.
On November 2, 2023, the Company issued 39,762 common shares with a value of $203,979 pursuant to the acquisition of exploration and evaluation assets in accordance with the terms of certain property option agreements (Note 3(i)).
During the year ended December 31, 2023, 178,500 stock options were exercised at a weighted average exercise price of $0.74 per share for gross proceeds of $131,630.
Share Purchase Option Compensation Plan
As at December 31, 2024, the Company has a share purchase option plan (the “Option Plan”) approved by the Company’s shareholders that allows it to grant share purchase options, subject to regulatory and corporate approval, to its officers, directors, employees and service providers. The Option Plan is based on the maximum number of eligible shares not exceeding 10% in the aggregate and 5% with respect to any one optionee of the Company’s outstanding common shares in any twelve-month period. If outstanding share purchase options are exercised or expire, and/or the number of issued and outstanding common shares of the Company increases, then the share purchase options available to grant under the Option Plan increase proportionately. The exercise price and vesting terms of each share purchase option is set by the Board of Directors at the time of grant. Share purchase options granted may be subject to a four-month hold period and exercisable for a period determined by the Board of Directors which cannot exceed ten years.
-26-
New Found Gold Corp.
Notes to the Financial Statements
For the years ended December 31, 2024 and 2023
(Expressed in Canadian Dollars Unless Otherwise Noted)
10. |
SHARE CAPITAL AND RESERVES (continued) |
Share Unit Compensation Plan
Subsequent to December 31, 2024, the Company adopted a share unit plan (the “Share Unit Plan”). Under the Share Unit Plan, the Company may grant incentive awards (the “Awards”) consisting of restricted share units (“RSUs”), deferred share units (“DSUs”), and performance share units (“PSUs”), subject to regulatory and corporate approvals, to its officers, directors, employees and service providers (the “Participants”). The Share Unit Plan, in conjunction with the Option Plan, cannot exceed 10% of the issued and outstanding common shares of the Company. The terms of the Awards are set by the Board of Directors at the time of grant. The Share Unit Plan and any Awards granted thereunder are subject to shareholder approval at the Company’s next Annual General Meeting of Shareholders.
The continuity of share purchase options for the year ended December 31, 2024 is as follows:
|
|
|
|
|
Outstanding |
|
|
|
|
|
Cancelled/ |
|
Outstanding |
|
Exercisable |
|
|
Exercise |
|
December |
|
|
|
|
|
Forfeited/ |
|
December |
|
December |
|
Expiry date |
|
Price |
|
31, 2023 |
|
Granted |
|
Exercised |
|
Expired |
|
31, 2024 |
|
31, 2024 |
|
December 17, 2024 |
|
$ |
0.50 |
|
1,725,000 |
|
— |
|
(1,725,000) |
|
— |
|
— |
|
— |
April 18, 2025 |
|
$ |
1.00 |
|
100,000 |
|
— |
|
— |
|
— |
|
100,000 |
|
100,000 |
May 23, 2025 |
|
$ |
1.075 |
|
75,000 |
|
— |
|
— |
|
— |
|
75,000 |
|
75,000 |
August 11, 2025 |
|
$ |
1.40 |
|
1,125,000 |
|
— |
|
— |
|
— |
|
1,125,000 |
|
1,125,000 |
September 3, 2025 |
|
$ |
2.07 |
|
50,000 |
|
— |
|
— |
|
— |
|
50,000 |
|
50,000 |
October 1, 2025 |
|
$ |
2.15 |
|
25,000 |
|
— |
|
— |
|
— |
|
25,000 |
|
25,000 |
December 31, 2025 |
|
$ |
4.10 |
|
5,305,000 |
|
— |
|
— |
|
— |
|
5,305,000 |
|
5,305,000 |
April 29, 2026 |
|
$ |
6.79 |
|
962,875 |
|
— |
|
— |
|
(71,375) |
|
891,500 |
|
891,500 |
May 17, 2026 |
|
$ |
8.62 |
|
200,000 |
|
— |
|
— |
|
— |
|
200,000 |
|
200,000 |
September 27, 2026 |
|
$ |
8.70 |
|
125,000 |
|
— |
|
— |
|
— |
|
125,000 |
|
125,000 |
November 8, 2026 |
|
$ |
8.04 |
|
47,500 |
|
— |
|
— |
|
(40,000) |
|
7,500 |
|
7,500 |
January 4, 2027 |
|
$ |
8.98 |
|
22,500 |
|
— |
|
— |
|
(7,500) |
|
15,000 |
|
12,750 |
August 19, 2027 |
|
$ |
5.75 |
|
340,000 |
|
— |
|
— |
|
— |
|
340,000 |
|
283,000 |
September 8, 2027 |
|
$ |
5.00 |
|
20,000 |
|
— |
|
— |
|
— |
|
20,000 |
|
20,000 |
December 27, 2027 |
|
$ |
5.68 |
|
2,156,250 |
|
— |
|
— |
|
(118,500) |
|
2,037,750 |
|
1,963,500 |
February 20, 2029 |
|
$ |
4.59 |
|
— |
|
200,000 |
|
— |
|
— |
|
200,000 |
|
200,000 |
May 6, 2029 |
|
$ |
4.78 |
|
— |
|
40,000 |
|
— |
|
— |
|
40,000 |
|
10,000 |
|
|
|
|
|
12,279,125 |
|
240,000 |
|
(1,725,000) |
|
(237,375) |
|
10,556,750 |
|
10,393,250 |
Weighted average exercise price $ |
|
|
|
|
3.97 |
|
4.62 |
|
0.50 |
|
6.52 |
|
4.50 |
|
4.48 |
Weighted average contractual remaining life (years) |
|
|
|
|
2.25 |
|
— |
|
— |
|
— |
|
1.50 |
|
1.48 |
-27-
New Found Gold Corp.
Notes to the Financial Statements
For the years ended December 31, 2024 and 2023
(Expressed in Canadian Dollars Unless Otherwise Noted)
10. |
SHARE CAPITAL AND RESERVES (continued) |
The continuity of share purchase options for the year ended December 31, 2023 is as follows:
|
|
|
|
|
Outstanding |
|
|
|
|
|
Cancelled/ |
|
Outstanding |
|
Exercisable |
|
|
|
|
|
December |
|
|
|
|
|
Forfeited/ |
|
December |
|
December |
Expiry date |
|
Exercise Price |
|
31, 2022 |
|
Granted |
|
Exercised |
|
Expired |
|
31, 2023 |
|
31, 2023 |
|
September 30, 2023 |
|
$ |
0.40 |
|
150,000 |
|
— |
|
(150,000) |
|
— |
|
— |
|
— |
December 17, 2024 |
|
$ |
0.50 |
|
1,725,000 |
|
— |
|
— |
|
— |
|
1,725,000 |
|
1,725,000 |
April 18, 2025 |
|
$ |
1.00 |
|
100,000 |
|
— |
|
— |
|
— |
|
100,000 |
|
100,000 |
May 23, 2025 |
|
$ |
1.075 |
|
75,000 |
|
— |
|
— |
|
— |
|
75,000 |
|
75,000 |
August 11, 2025 |
|
$ |
1.40 |
|
1,125,000 |
|
— |
|
— |
|
— |
|
1,125,000 |
|
1,125,000 |
September 3, 2025 |
|
$ |
2.07 |
|
75,000 |
|
— |
|
(25,000) |
|
— |
|
50,000 |
|
50,000 |
October 1, 2025 |
|
$ |
2.15 |
|
25,000 |
|
— |
|
— |
|
— |
|
25,000 |
|
25,000 |
December 31, 2025 |
|
$ |
4.10 |
|
5,305,000 |
|
— |
|
— |
|
— |
|
5,305,000 |
|
5,305,000 |
April 29, 2026 |
|
$ |
6.79 |
|
1,258,625 |
|
— |
|
— |
|
(295,750) |
|
962,875 |
|
940,000 |
May 17, 2026 |
|
$ |
8.62 |
|
200,000 |
|
— |
|
— |
|
— |
|
200,000 |
|
200,000 |
September 27, 2026 |
|
$ |
8.70 |
|
125,000 |
|
— |
|
— |
|
— |
|
125,000 |
|
87,500 |
November 26, 2026 |
|
$ |
8.04 |
|
55,000 |
|
— |
|
— |
|
(7,500) |
|
47,500 |
|
33,250 |
January 4, 2027 |
|
$ |
8.98 |
|
24,375 |
|
— |
|
— |
|
(1,875) |
|
22,500 |
|
12,375 |
August 19, 2027 |
|
$ |
5.75 |
|
340,000 |
|
— |
|
— |
|
— |
|
340,000 |
|
226,000 |
September 8, 2027 |
|
$ |
5.00 |
|
20,000 |
|
— |
|
— |
|
— |
|
20,000 |
|
20,000 |
December 27, 2027 |
|
$ |
5.68 |
|
2,257,500 |
|
— |
|
(3,500) |
|
(97,750) |
|
2,156,250 |
|
1,938,750 |
|
|
|
|
|
12,860,500 |
|
— |
|
(178,500) |
|
(402,875) |
|
12,279,125 |
|
11,862,875 |
Weighted average exercise price $ |
|
|
|
|
4.01 |
|
— |
|
0.74 |
|
6.55 |
|
3.97 |
|
3.89 |
Weighted average contractual remaining life (years) |
|
|
|
|
3.24 |
|
— |
|
— |
|
— |
|
2.25 |
|
2.20 |
The table below summarizes the weighted average fair value of share purchase options granted and exercised:
|
|
Year ended December 31, |
||||
|
|
2024 |
|
2023 |
||
Weighted average: |
|
|
|
|
|
|
Fair value of share purchase options granted |
|
$ |
3.06 |
|
|
— |
Fair value of share purchase options exercised |
|
$ |
0.38 |
|
$ |
0.58 |
Closing share price at the date of exercise |
|
$ |
2.47 |
|
$ |
5.75 |
Options were priced based on the Black-Scholes option pricing model using the following weighted average assumptions to estimate the fair value of options granted:
|
|
Year ended December 31, |
|
||||
|
|
2024 |
|
|
2023 |
|
|
Risk-free interest rate |
|
|
3.59 |
% |
|
— |
|
Expected option life in years |
|
|
5 |
|
|
— |
|
Expected share price volatility(i) |
|
|
80.23 |
% |
|
— |
|
Grant date share price |
|
$ |
4.62 |
|
|
— |
|
Expected forfeiture rate |
|
|
Nil |
|
|
— |
|
Expected dividend yield |
|
|
Nil |
|
|
— |
|
| (i) | The expected share price volatility is based on the average historical share price of comparable companies over the life of the option. |
-28-
New Found Gold Corp.
Notes to the Financial Statements
For the years ended December 31, 2024 and 2023
(Expressed in Canadian Dollars Unless Otherwise Noted)
11. |
RELATED PARTY BALANCES AND TRANSACTIONS |
All transactions with related parties have occurred in the normal course of operations and are measured at the amount of consideration paid or received. A summary of the Company’s related party transactions with corporations having similar directors and officers is as follows:
|
|
Year ended December 31, |
||
|
|
2024 |
|
2023 |
|
|
$ |
|
$ |
Amounts paid to EarthLabs Inc. (i) for exploration and evaluation |
|
18,000 |
|
18,000 |
Amounts paid to Notz Capital Corp. (ii) for corporate development and investor relations |
|
177,310 |
|
104,637 |
| (i) | EarthLabs Inc. is a related entity having the following common former director and officer to the Company: Denis Laviolette, Director and President. |
| (ii) | Notz Capital Corp. is a related entity of a director. |
There are no ongoing contractual commitments resulting from these transactions with related parties.
Key management personnel compensation
Key management personnel include those persons having authority and responsibility for planning, directing and controlling the activities of the Company as a whole. The Company has determined that key management personnel consist of executive and non-executive members of the Company’s Board of Directors and corporate officers.
|
|
|
|
|
|
|
|
Year ended |
|
|
Salaries and |
|
Share-based |
|
|
|
December 31, |
|
|
Consulting |
|
compensation |
|
Bonus |
|
2024 |
|
|
$ |
|
$ |
|
$ |
|
$ |
Executive Chairman and Chief Executive Officer |
|
388,800 |
|
— |
|
129,600 |
|
518,400 |
President |
|
15,000 |
|
— |
|
— |
|
15,000 |
Former President |
|
261,917 |
|
— |
|
90,720 |
|
352,637 |
Chief Financial Officer |
|
116,640 |
|
— |
|
38,880 |
|
155,520 |
Chief Operating Officer |
|
270,220 |
|
— |
|
84,240 |
|
354,460 |
Chief Development Officer |
|
336,960 |
|
96,083 |
|
112,320 |
|
545,363 |
Non-executive directors |
|
83,440 |
|
— |
|
— |
|
83,440 |
Former non-executive directors |
|
138,580 |
|
— |
|
— |
|
138,580 |
Total |
|
1,611,557 |
|
96,083 |
|
455,760 |
|
2,163,400 |
|
|
|
|
|
|
|
|
Year ended |
|
|
Salaries and |
|
Share-based |
|
|
|
December 31, |
|
|
Consulting |
|
compensation |
|
Bonus |
|
2023 |
|
|
$ |
|
$ |
|
$ |
|
$ |
Executive Chairman and Chief Executive Officer |
|
388,800 |
|
— |
|
129,600 |
|
518,400 |
President |
|
272,160 |
|
— |
|
90,720 |
|
362,880 |
Chief Financial Officer |
|
116,640 |
|
— |
|
38,880 |
|
155,520 |
Chief Operating Officer |
|
252,720 |
|
— |
|
84,240 |
|
336,960 |
Chief Development Officer |
|
336,960 |
|
235,560 |
|
112,320 |
|
684,840 |
Non-executive directors |
|
216,000 |
|
— |
|
— |
|
216,000 |
Total |
|
1,583,280 |
|
235,560 |
|
455,760 |
|
2,274,600 |
-29-
New Found Gold Corp.
Notes to the Financial Statements
For the years ended December 31, 2024 and 2023
(Expressed in Canadian Dollars Unless Otherwise Noted)
11. |
RELATED PARTY BALANCES AND TRANSACTIONS (continued) |
As at December 31, 2024, there was $56,040 payable to key management personnel in respect of key management compensation and expense reimbursements included in accounts payable and accrued liabilities (December 31, 2023 - $18,888). The amounts are unsecured, non-interest bearing and without fixed terms of repayment.
Under the terms of their management agreements, certain officers of the Company are entitled to 18 months of base pay in the event of their agreements being terminated without cause.
12. |
BASIC AND DILUTED LOSS PER COMMON SHARE |
|
|
Year ended December 31, |
||
|
|
2024 |
|
2023 |
Loss and comprehensive loss for the year ($) |
|
(50,268,354) |
|
(79,890,763) |
Loss per share – basic and diluted ($) |
|
(0.26) |
|
(0.45) |
Basic weighted average number of common shares outstanding |
|
194,032,544 |
|
178,363,103 |
Effect of outstanding securities |
|
— |
|
— |
Diluted weighted average number of common shares outstanding |
|
194,032,544 |
|
178,363,103 |
For the years ended December 31, 2024 and 2023, the Company incurred net loss and comprehensive loss. As such, diluted loss per share excludes any potential conversion of 10,556,750 (2023 – 12,279,125) share purchase options as they are anti-dilutive.
13. |
SUPPLEMENTAL DISCLOSURE WITH RESPECT TO CASH FLOWS |
|
|
Year ended December 31, |
||||
|
|
2024 |
|
2023 |
||
|
|
$ |
|
$ |
||
Non-cash investing and financing activities: |
|
|
|
|
|
|
Right-of-use assets and liabilities |
|
|
99,307 |
|
|
151,527 |
Shares issued pursuant to acquisition of exploration and evaluation assets (Note 3(i)) |
|
|
20,876,707 |
|
|
203,979 |
Shares issued pursuant to acquisition of property and equipment (Note 3(i)) |
|
|
350,000 |
|
|
— |
Consideration received for disposal of Lucky Strike project (Note 3(ii)) |
|
|
— |
|
|
4,657,482 |
Exploration and evaluation assets included in accounts payable and accrued liabilities |
|
|
676,921 |
|
|
— |
Share issuance costs included in accounts payable and accrued liabilities |
|
|
— |
|
|
9,850 |
Cash paid for income taxes |
|
|
— |
|
|
— |
Cash paid for interest |
|
|
25,105 |
|
|
— |
Cash received for interest |
|
|
2,944,725 |
|
|
2,715,926 |
14. |
SEGMENTED INFORMATION |
The Company’s operations are limited to a single reportable segment, being mineral exploration and evaluation. All of the Company’s evaluation and exploration assets are located in Canada.
-30-
New Found Gold Corp.
Notes to the Financial Statements
For the years ended December 31, 2024 and 2023
(Expressed in Canadian Dollars Unless Otherwise Noted)
15. |
INCOME TAXES |
The recovery of income taxes shown in the statements of loss and comprehensive loss differs from the amounts obtained by applying statutory rates to the loss before provision for income taxes due to the following:
|
|
2024 |
|
2023 |
|
|
|
$ |
|
$ |
|
(Loss) before income taxes |
|
(50,268,354) |
|
(79,890,763) |
|
Statutory tax rate |
|
27.00 |
% |
27.00 |
% |
Income tax (recovery) at statutory rate |
|
(13,572,000) |
|
(21,571,000) |
|
Flow-through renunciations |
|
12,285,000 |
|
22,059,000 |
|
Other non-deductible differences |
|
(3,033,000) |
|
(5,952,000) |
|
Change in unrecognized deductible temporary differences |
|
4,320,000 |
|
5,464,000 |
|
Income tax expense (recovery) |
|
— |
|
— |
|
The significant components of the Company’s deductible temporary differences, unused tax credits and unused tax losses that have not been included on the statement of financial position are as follows:
|
|
2024 |
|
2023 |
|
|
$ |
|
$ |
Investments |
|
11,973,000 |
|
16,166,000 |
Exploration and evaluation assets |
|
25,619,000 |
|
20,296,000 |
Non-capital tax losses carryforward |
|
38,411,000 |
|
28,328,000 |
Net capital losses carryforward |
|
18,630,000 |
|
11,528,000 |
Capital assets |
|
2,950,000 |
|
2,276,000 |
Reclamation provision |
|
2,426,000 |
|
1,285,000 |
Other |
|
5,190,000 |
|
7,688,000 |
Total |
|
105,199,000 |
|
87,567,000 |
As at December 31, 2024, the Company has Canadian non-capital loss carry forwards of approximately $38,411,000 that may be available for tax purposes. The Company’s non-capital losses expire as follows:
Expiry Date |
|
$ |
2040 |
|
791,000 |
2041 |
|
7,661,000 |
2042 |
|
9,964,000 |
2043 |
|
9,979,000 |
2044 |
|
10,016,000 |
|
|
38,411,000 |
As at December 31, 2024, the Company also has capital loss carry forwards of approximately $18,630,000 that may be available for tax purposes. These losses can be carried forward indefinitely.
-31-
New Found Gold Corp.
Notes to the Financial Statements
For the years ended December 31, 2024 and 2023
(Expressed in Canadian Dollars Unless Otherwise Noted)
16. |
SETTLEMENT OF LEGAL CLAIM |
Claims and Legal Proceedings
On November 15, 2019, ThreeD Capital Inc. (“ThreeD”) and 1313366 Ontario Inc. (“131” and together with ThreeD, the “Plaintiffs”) each entered into share purchase agreements (the “Share Purchase Agreements”) with Palisades Goldcorp Ltd. (“Palisades”) under which Palisades agreed to purchase the 13,500,000 common shares of the Company owned by ThreeD and the 4,000,000 common shares of the Company owned by 131 for $0.08 per common share. The transactions closed on November 20, 2019. As a private company with restrictions on the transfer of its common shares, the Company had to approve the proposed transfer, which it did by a consent resolution of the Board.
On March 10, 2020, ThreeD Capital Inc. and 131 filed a statement of claim in the Ontario Superior Court of Justice against Collin Kettell, Palisades and the Company (the “Defendants” and the “ThreeD Claim”). Pursuant to the ThreeD Claim, the Plaintiffs are challenging the validity of the sale of 17,500,000 common shares by the Plaintiffs to Palisades on November 20, 2019. ThreeD and 131 claim that at the time of negotiation and execution of the Share Purchase Agreements, Palisades and Mr. Kettell were aware of positive drill results from the Company’s 2019 Drill Program and the results were not disclosed to ThreeD and 131 to their detriment. Palisades and Mr. Kettell strongly deny ThreeD and 131’s allegations. ThreeD and 131 have made specific claims for (a) recission of the Share Purchase Agreements on the basis of oppression or unfair prejudice; (b) or alternatively, damages in the amount of $21,000,000 for the alleged improper actions by ThreeD and 131, (c) a declaration that Palisades and Collin Kettell, as shareholder or director and/or officer of the Company, have had acted in a manner that is oppressive, unfairly prejudicial or unfairly disregarded their interests, (d) a declaration that Palisades and Collin Kettell engaged in insider trading contrary to section 138 of the Securities Act (Ontario), (e) unjust enrichment and (f) interests and costs. Palisades and Mr. Kettell refute each of the specific claims made by the Plaintiffs.
In early 2022, the Plaintiffs formally amended their statement of claim to increase the amount claimed to $229,000,000 and to advance a direct claim of oppressive conduct against the Company. While continuing to deny any and all liability to the Plaintiffs, the Company had amended its defence to include specific denials of the new allegations of oppressive conduct against it. The parties completed an additional round of examinations for discovery in January 2023, following which the plaintiffs set the action down for trial. The parties had a mediation meeting on October 3, 2023, but were unable to settle the case.
On June 5, 2024, the Company entered into a Settlement Agreement, pursuant to which the Plaintiffs received a total of 3,750,000 common shares of the Company from the Defendants. Palisades transferred 2,607,434 common shares of the Company to ThreeD and 772,566 common shares of the Company to 131. The Company issued 285,429 common shares to ThreeD and 84,571 common shares to 131 with a total value of $1,750,100 recorded in the statement of loss and comprehensive loss for the year ended December 31, 2024. The Settlement Agreement resolves the lawsuit completely, does not include any admission of liability and provides for fulsome releases by the Plaintiffs to the Defendants.
-32-
New Found Gold Corp.
Notes to the Financial Statements
For the years ended December 31, 2024 and 2023
(Expressed in Canadian Dollars Unless Otherwise Noted)
17. |
FINANCIAL INSTRUMENTS |
The Company thoroughly examines the various financial instrument risks to which it is exposed and assesses the impact and likelihood of those risks. These risks may include credit risk, liquidity risk, currency risk, and interest rate risk. Where material, these risks are reviewed and monitored by the Board of Directors.
(a) |
Fair Values |
Financial assets and liabilities measured at fair value are recognized according to a fair value hierarchy that prioritizes the inputs to valuation techniques used to measure fair value. The hierarchy gives the highest priority to unadjusted quoted prices in active markets for identical assets and liabilities and the lowest priority to unobservable inputs. The three levels of fair value hierarchy are as follows:
Level 1 – Unadjusted quoted prices in active markets that are accessible at the measurement date for identical, unrestricted assets or liabilities.
Level 2 – Quoted prices in markets that are not active, or inputs that are observable, either directly or indirectly, for substantially the full term of the asset or liability.
Level 3 – Prices or valuation techniques that require inputs that are both significant to the fair value measurement and unobservable (supported by little or no market activity).
The Company’s financial instruments measured at fair value are its investments, which includes equities, warrants and Notes held. The fair value of equities held is determined using closing prices at the statement of financial position date with any unrealized gain or loss recognized in profit or loss. The Company’s equities that are subject to non-standard restrictions, warrants and Notes are classified within level 2 of the fair value hierarchy. Warrants are not traded on an active exchange and are valued using the Black-Scholes option pricing model using assumptions including risk-free interest rate, expected dividend yield, expected volatility and expected remaining life of the warrant which are supported by observable market conditions. The Notes are not traded on an active exchange and are valued using the Hull-White valuation model using assumptions including coupon rate, credit spread, mean reversion, rate volatility, riskless rate curve and redemption prices.
The carrying values of other financial instruments, including cash, deposits, interest receivable, accounts payable and accrued liabilities, and lease liabilities approximate their fair values due to the short-term maturity of these financial instruments.
The Company’s financial instruments carried at fair value and categorized according to the fair value hierarchy are as follows as at December 31, 2024:
|
|
|
|
Level 1 |
|
Level 2 |
|
Level 3 |
|
Total |
|
|
|
|
$ |
|
$ |
|
$ |
|
$ |
Recurring measurements |
|
Carrying amount |
|
Fair value |
||||||
Investments |
|
926,019 |
|
779,019 |
|
147,000 |
|
— |
|
926,019 |
Secured notes |
|
2,817,554 |
|
— |
|
2,817,554 |
|
— |
|
2,817,554 |
The Company’s financial instruments carried at fair value and categorized according to the fair value hierarchy are as follows as at December 31, 2023:
|
|
|
|
Level 1 |
|
Level 2 |
|
Level 3 |
|
Total |
|
|
|
|
$ |
|
$ |
|
$ |
|
$ |
Recurring measurements |
|
Carrying amount |
|
Fair value |
||||||
Investments |
|
3,596,592 |
|
3,408,092 |
|
188,500 |
|
— |
|
3,596,592 |
Secured notes |
|
2,454,300 |
|
— |
|
2,454,300 |
|
— |
|
2,454,300 |
There were no movements between levels during the years ended December 31, 2024 and 2023.
-33-
New Found Gold Corp.
Notes to the Financial Statements
For the years ended December 31, 2024 and 2023
(Expressed in Canadian Dollars Unless Otherwise Noted)
17. |
FINANCIAL INSTRUMENTS (continued) |
(b) |
Financial Instrument Risk Exposure |
Credit risk
Credit risk is the risk that one party to a financial instrument will fail to discharge an obligation and cause the other party to incur a financial loss. The Company is subject to the credit through its investment in Maritime secured notes, in which case the maximum exposure to the credit risk is the full value of the secured notes of $2,817,554 at December 31, 2024 (December 31, 2023 - 2,454,300). Interest receivable on Maritime secured notes is collected quarterly. Sales taxes recoverable are due from the Canada Revenue Agency and the Company places its cash with financial institutions with high credit ratings, therefore in management’s judgment, credit risk related to sales taxes recoverable and cash is low.
There have been no changes in management’s methods for managing credit risk during the years ended December 31, 2024 and 2023.
Liquidity risk
Liquidity risk is the risk that the Company will not be able to meet its financial obligations as they fall due. The Company has in place a planning and budgeting process to help determine the funds required to ensure the Company has the appropriate liquidity to meet its operating and growth objectives. The Company has historically relied on the issuance of shares to fund exploration programs and may require doing so again in the future. As at December 31, 2024, the Company has total liabilities of $7,448,306 and cash of $22,317,548 which is available to discharge these liabilities (December 31, 2023 – total liabilities of $19,076,473 and cash of $53,884,809).
There have been no changes in management’s methods for managing credit risk during the years ended December 31, 2024 and 2023.
Market risk
Market risk is the risk that changes in market prices, such as commodity prices, interest rates and foreign exchange rates will affect the Company’s net earnings or the value of financial instruments. The objective of the Company is to manage and mitigate market risk exposures within acceptable limits, while maximizing returns.
(i) |
Currency risk |
Financial instruments that impact the Company’s net earnings or other comprehensive income due to currency fluctuation include cash accounts, secured notes, interest receivable, investments and accounts payable and accrued liabilities denominated in US dollars. The sensitivity of the Company’s net loss to changes in the exchange rate between the US dollar and the Canadian dollar at December 31, 2024 would change the Company’s net loss by $322,434 as a result of a 10% change in the exchange rate.
(ii) |
Interest rate risk |
Interest rate risk is the risk that the fair value of future cash flows of a financial instrument will fluctuate due to changes in market interest rates. As the Company deposits its cash into demand accounts with minimal interest rates, the interest rate risk is not significant. Interest receivable on secured notes is determined based on a floating interest rate and therefore subject to interest rate fluctuations, the interest rate risk is not material.
-34-
New Found Gold Corp.
Notes to the Financial Statements
For the years ended December 31, 2024 and 2023
(Expressed in Canadian Dollars Unless Otherwise Noted)
17. |
FINANCIAL INSTRUMENTS (continued) |
(b) |
Financial Instrument Risk Exposure (continued) |
(iii) |
Commodity price risk |
Commodity price risk is defined as the potential adverse impact on earnings and economic value due to commodity price movements and volatilities. The Company’s property has exposure to predominantly gold. Commodity prices, especially gold, greatly affect the value of the Company and the potential value of its property and investments.
(iv) |
Equity price risk |
Equity price risk is the risk that the fair value of or future cash flows from the Company’s financial instruments will significantly fluctuate because of changes in market prices. The Company is exposed to market risk in trading its investments in unfavorable market conditions which could result in dispositions of investments at less than favorable prices. Additionally, the Company adjusts its investments to fair value at the end of each reporting period. This process could result in write-downs of the Company’s investments over one or more reporting periods, particularly during periods of overall market instability. The sensitivity of the Company’s net loss to changes in market prices at December 31, 2024 would change the Company’s net loss by $92,602 as a result of a 10% change in the market price of its investments.
There have been no changes in management’s methods for managing market risks during the years ended December 31, 2024 and 2023.
18. |
CAPITAL MANAGEMENT |
The Company’s objectives when managing capital are:
| ● | To safeguard our ability to continue as a going concern in order to develop and operate our current projects; |
| ● | Pursue strategic growth initiatives; and |
| ● | To maintain a flexible capital structure which lowers the cost of capital. |
In assessing our capital structure, we include in our assessment the components of equity consisting of common shares, stock options and warrants, and deficit that as at December 31, 2024 totalled $66,570,705 (December 31, 2023 - $65,503,020). In order to facilitate the management of capital requirements, the Company prepares annual expenditure budgets and continuously monitors and reviews actual and forecasted cash flows. The annual and updated budgets are monitored and approved by the Board of Directors. To maintain or adjust the capital structure, the Company may, from time to time, issue new shares, issue new debt, repay debt or dispose of non-core assets.
There were no changes in the Company’s approach to capital management during the years ended December 31, 2024 and 2023.
19. |
SUBSEQUENT EVENTS |
Stock Options Exercised
Subsequent to December 31, 2024, 125,000 stock options with an exercise price of $1.40 per share were exercised for gross proceeds of $175,000, and 25,000 stock options with an exercise price of $1.075 were exercised for gross proceeds of $26,875.
Stock Options Forfeited/Expired
Subsequent to December 31, 2024, 75,000 stock options with a weighted-average exercise price of $5.36 per share were forfeited and 420,250 stock options with a weighted-average exercise price of $7.08 per share expired.
-35-
EXHIBIT 99.4
CERTIFICATION REQUIRED BY RULE 13a-14(a) OR RULE 15d-14(a), PURSUANT TO SECTION 302 OF THE SARBANES-OXLEY ACT OF 2002
I, Keith Boyle, certify that:
1. |
I have reviewed this annual report on Form 40-F of New Found Gold Corp. |
2. |
Based on my knowledge, this report does not contain any untrue statement of a material fact or omit to state a material fact necessary to make the statements made, in light of the circumstances under which such statements were made, not misleading with respect to the period covered by this report; |
3. |
Based on my knowledge, the financial statements, and other financial information included in this report, fairly present in all material respects the financial condition, results of operations and cash flows of the issuer as of, and for, the periods presented in this report; |
4. |
The issuer’s other certifying officer(s) and I are responsible for establishing and maintaining disclosure controls and procedures (as defined in Exchange Act Rules 13a-15(e) and 15d-15(e)) and internal control over financial reporting (as defined in Exchange Act Rules 13a-15(f) and 15d-15(f)) for the issuer and have: |
a. |
Designed such disclosure controls and procedures, or caused such disclosure controls and procedures to be designed under our supervision, to ensure that material information relating to the issuer, including its consolidated subsidiaries, is made known to us by others within those entities, particularly during the period in which this report is being prepared; |
b. |
Evaluated the effectiveness of the issuer’s disclosure controls and procedures and presented in this report our conclusions about the effectiveness of the disclosure controls and procedures, as of the end of the period covered by this report based on such evaluation; |
c. |
Disclosed in this report any change in the issuer’s internal control over financial reporting that occurred during the period covered by the annual report that has materially affected, or is reasonably likely to materially affect, the issuer’s internal control over financial reporting; |
d. |
Disclosed in this report any change in the issuer’s internal control over financial reporting that occurred during the period covered by the annual report that has materially affected, or is reasonably likely to materially affect, the issuer’s internal control over financial reporting; and |
5. |
The issuer’s other certifying officer(s) and I have disclosed, based on our most recent evaluation of internal control over financial reporting, to the issuer’s auditors and the audit committee of the issuer’s board of directors (or persons performing the equivalent functions): |
a. |
All significant deficiencies and material weaknesses in the design or operation of internal control over financial reporting which are reasonably likely to adversely affect the issuer’s ability to record, process, summarize and report financial information; and |
b. |
Any fraud, whether or not material, that involves management or other employees who have a significant role in the issuer’s internal control over financial reporting. |
Date: March 20, 2025 |
|
|
|
/s/ Keith Boyle |
|
Signature |
|
Chief Executive Officer |
|
Title |
|
EXHIBIT 99.5
CERTIFICATION REQUIRED BY RULE 13a-14(a) OR RULE 15d-14(a), PURSUANT TO SECTION 302 OF THE SARBANES-OXLEY ACT OF 2002
I, Michael Kanevsky, certify that:
1. |
I have reviewed this annual report on Form 40-F of New Found Gold Corp. |
2. |
Based on my knowledge, this report does not contain any untrue statement of a material fact or omit to state a material fact necessary to make the statements made, in light of the circumstances under which such statements were made, not misleading with respect to the period covered by this report; |
3. |
Based on my knowledge, the financial statements, and other financial information included in this report, fairly present in all material respects the financial condition, results of operations and cash flows of the issuer as of, and for, the periods presented in this report; |
4. |
The issuer’s other certifying officer(s) and I are responsible for establishing and maintaining disclosure controls and procedures (as defined in Exchange Act Rules 13a-15(e) and 15d-15(e)) and internal control over financial reporting (as defined in Exchange Act Rules 13a-15(f) and 15d-15(f)) for the issuer and have: |
a. |
Designed such disclosure controls and procedures, or caused such disclosure controls and procedures to be designed under our supervision, to ensure that material information relating to the issuer, including its consolidated subsidiaries, is made known to us by others within those entities, particularly during the period in which this report is being prepared; |
b. |
Evaluated the effectiveness of the issuer’s disclosure controls and procedures and presented in this report our conclusions about the effectiveness of the disclosure controls and procedures, as of the end of the period covered by this report based on such evaluation; |
c. |
Disclosed in this report any change in the issuer’s internal control over financial reporting that occurred during the period covered by the annual report that has materially affected, or is reasonably likely to materially affect, the issuer’s internal control over financial reporting; |
d. |
Disclosed in this report any change in the issuer’s internal control over financial reporting that occurred during the period covered by the annual report that has materially affected, or is reasonably likely to materially affect, the issuer’s internal control over financial reporting; and |
5. |
The issuer’s other certifying officer(s) and I have disclosed, based on our most recent evaluation of internal control over financial reporting, to the issuer’s auditors and the audit committee of the issuer’s board of directors (or persons performing the equivalent functions): |
a. |
All significant deficiencies and material weaknesses in the design or operation of internal control over financial reporting which are reasonably likely to adversely affect the issuer’s ability to record, process, summarize and report financial information; and |
b. |
Any fraud, whether or not material, that involves management or other employees who have a significant role in the issuer’s internal control over financial reporting. |
Date: March 20, 2025 |
|
|
|
/s/ Michael Kanevsky |
|
Signature |
|
Chief Financial Officer |
|
Title |
|
EXHIBIT 99.6
CERTIFICATION PURSUANT TO 18 U.S.C. SECTION 1350,
AS ENACTED PURSUANT TO
SECTION 906 OF THE U.S. SARBANES-OXLEY ACT OF 2002
New Found Gold Corp. (the “Company”) is filing with the U.S. Securities and Exchange Commission on the date hereof, its annual report on Form 40-F for the fiscal year ended December 31, 2024 (the “Report”).
I, Keith Boyle, Chief Executive Officer of the Company, certify, pursuant to 18 U.S.C. section 1350, as enacted pursuant to section 906 of the U.S. Sarbanes-Oxley Act of 2002, that:
(i) |
the Report fully complies with the requirements of section 13(a) or 15(d) of the U.S. Securities Exchange Act of 1934; and |
(ii) |
the information contained in the Report fairly presents, in all material respects, the financial condition and results of operations of the Company. |
/s/ Keith Boyle |
|
|
Name: |
Keith Boyle |
|
Title: |
Chief Executive Officer |
|
|
|
|
Date: March 20, 2025 |
|
|
EXHIBIT 99.7
CERTIFICATION PURSUANT TO 18 U.S.C. SECTION 1350,
AS ENACTED PURSUANT TO
SECTION 906 OF THE U.S. SARBANES-OXLEY ACT OF 2002
New Found Gold Corp. (the “Company”) is filing with the U.S. Securities and Exchange Commission on the date hereof, its annual report on Form 40-F for the fiscal year ended December 31, 2024 (the “Report”).
I, Michael Kanevsky, Chief Financial Officer of the Company, certify, pursuant to 18 U.S.C. section 1350, as enacted pursuant to section 906 of the U.S. Sarbanes-Oxley Act of 2002, that:
(i) |
the Report fully complies with the requirements of section 13(a) or 15(d) of the U.S. Securities Exchange Act of 1934; and |
(ii) |
the information contained in the Report fairly presents, in all material respects, the financial condition and results of operations of the Company. |
/s/ Michael Kanevsky |
|
|
Name: |
Michael Kanevsky |
|
Title: |
Chief Financial Officer |
|
|
|
|
Date: March 20, 2025 |
|
|
EXHIBIT 99.8
Consent of Independent Registered Public Accounting Firm
The Board of Directors
New Found Gold Corp.
We consent to the use of our report dated March 20, 2025 on the financial statements of New Found Gold Corp. (the “Company”), which comprise the statements of financial position as of December 31, 2024 and December 31, 2023, the related statements of loss and comprehensive loss, cash flows, and changes in equity for each of the years in the two-year period ended December 31, 2024, and the related notes, which is included in the Annual Report on Form 40-F of the Company for the fiscal year ended December 31, 2024.
/s/ KPMG LLP
Chartered Professional Accountants
March 20, 2025
Vancouver, Canada
EXHIBIT 99.9
Consent of Roy Eccles
The undersigned hereby consents to the use of the technical report titled “NI 43-101 Technical Report New Found Gold Corp.’s Queensway Gold Project in Newfoundland and Labrador, Canada: 2024 Property Expansion and Exploration Update” with an effective date November 1, 2024, and prepared for the Company in accordance with National Instrument 43-101, and the information derived therefrom, as well as the reference to their name, in each case where used or incorporated by reference in the Annual Report on Form 40-F for the year ended December 31, 2024 of New Found Gold Corp.
Dated this March 20, 2025
/s/ Roy Eccles |
|
|
|
Roy Eccles MSc. P. Geol. P. Geo.
Chief Operations Officer and Senior Consultant Consent of Mark K. Jorgensen
APEX Geoscience Ltd.
EXHIBIT 99.10
The undersigned hereby consents to the use of the technical report titled “NI 43-101 Technical Report New Found Gold Corp.’s Queensway Gold Project in Newfoundland and Labrador, Canada: 2024 Property Expansion and Exploration Update” with an effective date November 1, 2024, and prepared for the Company in accordance with National Instrument 43-101, and the information derived therefrom, as well as the reference to their name, in each case where used or incorporated by reference in the Annual Report on Form 40-F for the year ended December 31, 2024 of New Found Gold Corp.
Dated this March 20, 2025
/s/ Mark K. Jorgensen |
|
|
|
Mark K. Jorgensen, B.Sc., QP Metallurgy
Principal Engineer
Jorgensen Engineering and Technical Services, LLC Gary Simmons, B.Sc.
EXHIBIT 99.11
Consent of Gary Simmons
The undersigned hereby consents to the use of the technical report titled “NI 43-101 Technical Report New Found Gold Corp.’s Queensway Gold Project in Newfoundland and Labrador, Canada: 2024 Property Expansion and Exploration Update” with an effective date November 1, 2024, and prepared for the Company in accordance with National Instrument 43-101, and the information derived therefrom, as well as the reference to their name, in each case where used or incorporated by reference in the Annual Report on Form 40-F for the year ended December 31, 2024 of New Found Gold Corp.
Dated this March 20, 2025
/s/ Gary Simmons |
|
|
|
QP Metallurgy
Owner
GL Simmons Consulting, LLC
EXHIBIT 99.12
Consent of Melissa Render
The undersigned hereby consents to being named as having approved the disclosure of certain scientific and technical information contained or incorporated by reference in, as well as the reference to their name, in each case where used or incorporated by reference in the Annual Report on Form 40-F for the year ended December 31, 2024 of New Found Gold Corp.
/s/ Melissa Render |
|
|
|
By: Melissa Render, P.Geo. |
|
|
|
Date: March 20, 2025 |
|