UNITED STATES
SECURITIES AND EXCHANGE COMMISSION
Washington, DC 20549
FORM 10-K
☒ |
ANNUAL REPORT PURSUANT TO SECTION 13 or 15(d) OF THE SECURITIES EXCHANGE ACT OF 1934 |
For the fiscal year ended December 31, 2023
OR
☐ |
TRANSITION REPORT PURSUANT TO SECTION 13 or 15(d) OF THE SECURITIES EXCHANGE ACT OF 1934 |
For the transition period from N/A to N/A
Commission File Number 0-16540
|
UNITED BANCORP, INC. |
|
|
(Exact name of registrant as specified in its Charter.) |
|
Ohio |
|
34-1405357 |
(State or other jurisdiction of incorporation or organization) |
|
(IRS) Employer Identification No.) |
201 South Fourth Street, Martins Ferry, Ohio |
|
43935 |
(Address of principal executive offices) |
|
(ZIP Code) |
Registrant’s telephone number, including area code: (740) 633-0445
Securities registered pursuant to Section 12(b) of the Act:
|
|
|||
Title of each class |
|
Trading Symbol(s) |
|
Name of each exchange on which |
Common Stock, Par Value $1.00 |
|
UBCP |
|
NASDQ Capital Market |
Securities registered pursuant to Section 12(g) of the Act: None
Indicate by check mark if the registrant is a well-known seasoned issuer, as defined in Rule 405 of the Securities Act. Yes ☐ No ☒.
Indicated by check mark if the registrant is not required to file reports pursuant to Section 13 or Section 15(d) of the Exchange Act. Yes ☐ No ☒.
Indicate by check mark whether the registrant (1) has filed all reports required to be filed by Section 13 or 15(d) of the Securities Exchange Act of 1934 during the preceding 12 months (or for such shorter period that the registrant was required to file such reports), and (2) has been subject to such filing requirements for the past 90 days.
Yes ☒ No ☐s
Indicate by check mark whether the registrant has submitted electronically every Interactive Data File required to be submitted pursuant to Rule 405 of Regulation S-T (§232.405 of this chapter) during the preceding 12 months (or for such shorter period that the registrant was required to submit such files).
Yes ☒. No ☐.
Indicate by check mark whether the registrant is a large accelerated filer, an accelerated filer, a non-accelerated filer, or a smaller reporting company. See the definitions of “large accelerated filer,” “accelerated filer,” “smaller reporting company” and “emerging growth company” in Rule 12b-2 of the Exchange Act:
Large accelerated filer ☐ |
Accelerated filer ☐ |
|
|
Non-accelerated filer ☒ |
Smaller reporting company ☒ |
Emerging growth company ☐
If an emerging growth company, indicate by check mark if the registrant has elected not to use the extended transition period for complying with any new or revised financial accounting standards provided pursuant to Section 13(a) of the Exchange Act. ☐
Indicate by check mark whether the registrant has filed a report on and attestation to its management’s assessment of the effectiveness of its internal control over financial reporting under Section 404(b) of the Sarbanes-Oxley Act (15 U.S.C. 7262(b)) by the registered public accounting firm that prepared or issued its audit report. ☐
If securities are registered pursuant to Section 12(b) of the Act, indicate by check mark whether the financial statements of the registrant included in the filing reflect the correction of an error to previously issued financial statements. ☐
Indicate by check mark whether any of those error corrections are restatements that required a recovery analysis of incentive-based compensation received by any of the registrant’s executive officers during the relevant recovery period pursuant to §240.10D-1(b). ☐
Indicate by check mark whether the registrant is a shell company (as defined in Rule 12b-2 of the Exchange Act).
Yes ☐ No ☒
As of June 30, 2023 the aggregate market value of the registrant’s common stock held by non-affiliates of the registrant was $57,635,454 based on the closing sale price as reported on the National Association of Securities Dealers Automated Quotation System.
Indicate the number of shares outstanding of each of the issuer’s classes of common stock, as of the latest practicable date:
Registrant had 5,702,685 common shares outstanding as of March 11, 2024.
DOCUMENTS INCORPORATED BY REFERENCE
Portions of the proxy statement for the Annual Shareholders meeting to be held April 17, 2024 are incorporated by reference into Part III.
Portions of the Annual Report to Shareholders for the year ended December 31, 2023 are incorporated by reference into Parts I and II.
PART I
Item 1Business
Business
United Bancorp, Inc. (Company) is a bank holding company headquartered in Martins Ferry, Ohio. The Company is an Ohio corporation which filed its initial articles of incorporation on July 8, 1983. At December 31, 2023 the Company has one wholly-owned subsidiary bank, Unified Bank, Martins Ferry, Ohio (Unified, or the Bank).
The Company serves customers in northeastern, eastern, southeastern and south central Ohio and the Northern panhandle of West Virginia and is engaged in the business of commercial and retail banking in Belmont, Harrison, Jefferson, Tuscarawas, Carroll, Athens, Hocking, and Fairfield counties and the surrounding localities. The bank also operates in Marshall County West Virginia. The Bank provides a broad range of banking and financial services, which includes accepting demand, savings and time deposits and granting commercial, real estate and consumer loans. Unified conducts its business through its main office and stand alone operations center in Martins Ferry, Ohio and eighteen branches located in the counties mentioned above.
Unified has no single customer or related group of customers whose banking activities, whether through deposits or lending, would have a material impact on the continued earnings capabilities if those activities were removed.
For a discussion of the development of the Company’s business over the course of the prior fiscal year, refer to “Management’s Discussion and Analysis” from the 2023 Annual Report To Shareholders filed herewith as Exhibit 13.
Competition
The markets in which Unified operates continue to be highly competitive. Unified competes for loans and deposits with other retail commercial banks, savings and loan associations, finance companies, credit unions and other types of financial institutions within the Mid-Ohio valley geographic area along the eastern border of Ohio including Belmont, Harrison and Jefferson counties and extending into the northern panhandle of West Virginia and the Tuscarawas and Carroll County geographic areas of northeastern Ohio. Unified also encounters similar competition for loans and deposits throughout the Athens, and Fairfield County geographic areas of central and southeastern Ohio.
Pursuant to deposit market share information provided by the FDIC as of June 30, 2023, Unified competes with approximately 39 other commercial banking institutions in its Ohio and West Virginia markets. Based on this information, the Bank ranked fifth in total deposit market share. The top four institutions in Unified’s primary banking markets included: Huntington National Bank; JP Morgan Chase Bank; PNC Bank; and Wesbanco Bank.
Supervision and Regulation
Regulatory Environment
The banking industry is highly regulated. We are subject to supervision, regulation, and examination by various federal and state regulators, including the Federal Reserve, Federal Deposit Insurance Corporation (FDIC), and the Ohio Division of Financial Institutions (ODFI). The statutory and regulatory framework that governs us is generally intended to protect depositors and customers, the Deposit Insurance Fund (DIF) maintained by the FDIC, the U.S. banking and financial system, and financial markets as a whole.
Banking statutes, regulations, and policies are continually under review by Congress, state legislatures, and federal and state regulatory agencies. In addition to laws and regulations, state and federal bank regulatory agencies may issue policy statements, interpretive letters, and similar written guidance applicable to the Company and the Bank. Any change in the statutes, regulations, or regulatory policies applicable to us, including changes in their interpretation or implementation, could have a material effect on our business or organization.
Several of the more significant regulatory provisions applicable to banks and bank holding companies to which the Company and Unified are subject are discussed below. To the extent that the following information describes statutory or regulatory provisions, it is qualified in its entirety by reference to the particular statutory provisions. Any change in applicable law or regulation may have a material effect on the business and prospects of the Company and Unified.
Supervision, Examination and Enforcement
A principal objective of the U.S. bank regulatory regime is to protect depositors and customers, the DIF, the U.S. banking and financial system, and financial markets as a whole by ensuring the financial safety and soundness of BHCs and banks, including the Company and the Bank. Bank regulators regularly examine the operations of BHCs and banks. In addition, BHCs and banks are subject to periodic reporting and filing requirements.
The Federal Reserve, ODFI and FDIC have broad supervisory and enforcement authority with regard to BHCs and banks, including the power to conduct examinations and investigations, impose nonpublic supervisory agreements, issue cease and desist orders, impose fines and other civil and criminal penalties, terminate deposit insurance, and appoint a conservator or receiver. Supervision and examinations are confidential, and the outcomes of these actions may not be made public.
Bank regulators have various remedies available if they determine that the financial condition, capital resources, asset quality, earnings prospects, management, liquidity, or other aspects of a banking organization’s operations are unsatisfactory. The regulators may also take action if they determine that the banking organization or its management is violating or has violated any law or regulation. The regulators have the power to, among other things, prohibit unsafe or unsound practices, require affirmative actions to correct any violation or practice, issue administrative orders that can be judicially enforced, direct increases in capital, direct the sale of subsidiaries or other assets, limit dividends and distributions, restrict growth, assess civil monetary penalties, remove officers and directors, and terminate deposit insurance.
Engaging in unsafe or unsound practices or failing to comply with applicable laws, regulations, and supervisory agreements could subject the Company, the Bank, and their respective officers, directors, and institution-affiliated parties to the remedies described above, and other sanctions. In addition, the FDIC may terminate a bank’s deposit insurance upon a finding that the bank’s financial condition is unsafe or unsound or that the bank has engaged in unsafe or unsound practices or has violated an applicable rule, regulation, order, or condition enacted or imposed by the bank’s regulatory agency.
Regulatory Agencies
The Company is a registered bank holding company and is subject to inspection, examination and supervision by the Board of Governors of the Federal Reserve System (Federal Reserve) pursuant to the Bank Holding Company Act of 1956, as amended.
Unified is an Ohio chartered commercial bank. It is subject to regulation and examination by both the ODFI and the FDIC.
Regulatory Reform
Overview. Congress, the U.S. Department of the Treasury (“Treasury”), and the federal banking regulators, including the FDIC, have taken broad action since early September 2008 to address volatility in the U.S. banking system and financial markets. Beginning in late 2008, the U.S. and global financial markets experienced deterioration of the worldwide credit markets, which created significant challenges for financial institutions both in the United States and around the world. These actions included the adoption by Congress of both the Emergency Economic Stabilization Act of 2008 (“EESA”), and the American Recovery and Reinvestment Act of 2009 (“ARRA”). The most recent significant piece of legislation adopted in response to this crisis was the Dodd-Frank Wall Street Reform and Consumer Protection Act of 2010 (“Dodd-Frank Act”), which was signed into law on July 21, 2010, and which is discussed more thoroughly below.
Dodd-Frank Wall Street Reform and Consumer Protection Act. The Dodd-Frank Act created many new restrictions and an expanded framework of regulatory oversight for financial institutions, including insured depository institutions. Currently, federal regulators are still in the process of drafting the implementing regulations for many portions of the Dodd-Frank Act. Federal regulators continue to implement many provisions of the Dodd-Frank Act. The Dodd-Frank Act created an independent regulatory body, the Bureau of Consumer Financial Protection (“Bureau”), with authority and responsibility to set rules and regulations for most consumer protection laws applicable to all banks - both large and small. Oversight of Federal consumer financial protection functions have been transferred to the Bureau. The Bureau has responsibility for mortgage reform and enforcement, as well as broad new powers over consumer financial activities which could impact what consumer financial services would be available and how they are provided. The following consumer protection laws are the designated laws that fall under the Bureau’s rulemaking authority: the Alternative Mortgage Transactions Parity Act of 1928, the Consumer Leasing Act of 1976, the Electronic Fund Transfer Act, the Equal Credit Opportunity Act, the Fair Credit Billing Act, the Fair Credit Reporting Act subject to certain exclusions, the Fair Debt Collection Practices Act, the Home Owners Protection Act, certain privacy provisions of the Gramm-Leach-Bliley Act, the Home Mortgage Disclosure Act (HMDA), the Home Ownership and Equity Protection Act of 1994, the Real Estate Settlement Procedures Act (RESPA), the S.A.F.E. Mortgage Licensing Act of 2008 (SAFE Act), and the Truth in Lending Act. Review and revision of current financial regulations in conjunction with added new financial service regulations will heighten the regulatory compliance burden and increase litigation risk for the banking industry.
The Holding Company Regulation
As a holding company incorporated and doing business within the State of Ohio, the Company is subject to regulation and supervision under the Bank Holding Act of 1956, as amended (the “Act”). The Company is required to file with the Federal Reserve on quarterly basis information pursuant to the Act. The Federal Reserve may conduct examinations or inspections of the Company and Unified.
The Company is required to obtain prior approval from the Federal Reserve for the acquisition of more than five percent of the voting shares or substantially all of the assets of any bank or bank holding company. In addition, the Company is generally prohibited by the Act from acquiring direct or indirect ownership or control of more than five percent of the voting shares of any company which is not a bank or bank holding company and from engaging directly or indirectly in activities other than those of banking, managing or controlling banks or furnishing services to its subsidiaries. The Company may, however, subject to certain prior approval requirements of the Federal Reserve, engage in, or acquire shares of companies engaged in activities which are deemed by the Federal Reserve by order or by regulation to be financial in nature or closely related to banking.
On November 12, 1999, the Gramm-Leach-Bliley Act (the “GLB Act”) was enacted into law. The GLB Act made sweeping changes with respect to the permissible financial services which various types of financial institutions may now provide. The Glass-Steagall Act, which had generally prevented banks from affiliation with securities and insurance firms, was repealed. Pursuant to the GLB Act, bank holding companies may elect to become a “financial holding company,” provided that all of the depository institution subsidiaries of the bank holding company are “well capitalized” and “well managed” under applicable regulatory standards.
Under the GLB Act, a bank holding company that has elected to become a financial holding company may affiliate with securities firms and insurance companies and engage in other activities that are financial in nature. Activities that are “financial in nature” include securities underwriting, dealing and market-making, sponsoring mutual funds and investment companies, insurance underwriting and agency, merchant banking, and activities that the Federal Reserve has determined to be closely related to banking. No Federal Reserve approval is required for a financial holding company to acquire a company, other than a bank holding company, bank or savings association, engaged in activities that are financial in nature or incidental to activities that are financial in nature, as determined by the Federal Reserve. As with bank holding companies, prior Federal Reserve approval is required before a financial holding company may acquire the beneficial ownership or control of more than five percent of the voting shares, or substantially all of the assets, of a bank holding company, bank or savings association. If any subsidiary bank of a financial holding company ceases to be “well capitalized” or “well managed” under applicable regulatory standards, the Federal Reserve may, among other actions, order the Company to divest the subsidiary bank. Alternatively, the company may elect to conform its activities to those permissible for a bank holding company that is not also a financial holding company. If any subsidiary bank of a financial holding company receives a rating under the Community Reinvestment Act of 1977 of less than satisfactory, the company will be prohibited from engaging in new activities or acquiring companies other than bank holding companies, banks or savings associations. The Company is not a financial holding company and has no current intention of making such an election.
Dividends and Capital Reductions. The Board of Governors of the Federal Reserve has issued Supervisory Guidance and Regulations on the Payment of Dividends, Stock Redemptions, and Stock Repurchases by Bank Holding Companies (the “Policy Statement”). In the Policy Statement, the Federal Reserve stated that it is important for a banking organization’s board of directors to ensure that the dividend level is prudent relative to the organization’s financial position and is not based on overly optimistic earnings scenarios. As a general matter, the Policy Statement provides that the board of directors of a bank holding company should inform the Federal Reserve and should eliminate, defer, or significantly reduce its dividends if:
(1) net income available to shareholders for the past four quarters, net of dividends previously paid during that period, is not sufficient to fully fund the dividends;
(2) the prospective rate of earnings retention is not consistent with the company’s capital needs and overall current and prospective financial condition; or
(3) the company will not meet, or is in danger of not meeting, its minimum regulatory capital adequacy ratios.
Failure to do so could result in a supervisory finding that the organization is operating in an unsafe and unsound manner. Moreover, the Policy Statement requires a bank holding company to inform the Federal Reserve reasonably in advance of declaring or paying a dividend that exceeds earnings for the period (e.g., quarter) for which the dividend is being paid or that could result in a material adverse change to the organization’s capital structure. Declaring or paying a dividend in either circumstance could raise supervisory concerns. Unified exceeded its minimum capital requirements under applicable guidelines as of December 31, 2023.
Control Acquisitions. The Federal Change in Bank Control Act prohibits a person or group of persons from acquiring “control” of the Company unless the Federal Reserve has been notified and has not objected to the transaction. The acquisition of 10% or more of a class of voting stock of a bank holding company with a class of securities registered under Section 12 of the Exchange Act, such as the Company, is rebuttably presumed to constitute the acquisition of control of the bank holding company. In addition, a company is required to obtain the approval of the Federal Reserve under the Federal Bank Holding Company Act before acquiring 25% (5% in the case of an acquirer that is a bank holding company) or more of any class of outstanding voting stock of a bank holding company, or otherwise obtaining control or a “controlling influence” over that bank holding company.
Liability for Banking Subsidiaries. Under the current Federal Reserve policy, the Company is expected to act as a source of financial and managerial strength to its subsidiary bank and to maintain resources adequate to support the Bank. This support may be required at times when the Company may not have the resources to provide it. In the event of the Company’s bankruptcy, any commitment to a U.S. federal bank regulatory agency to maintain the capital of the Bank would be assumed by the bankruptcy trustee and entitled to priority of payment.
Regulation of the Bank
General. Unified is an Ohio-chartered bank that is not a member of the Federal Reserve System. Unified is therefore regulated by the ODFI as well as the FDIC. The regulatory agencies have the authority to regularly examine Unified, which is subject to all applicable rules and regulations promulgated by its supervisory agencies. In addition, the deposits of Unified are insured by the FDIC to the fullest extent permitted by law.
Deposit Insurance. As an FDIC-insured institution, Unified is required to pay deposit insurance premium assessments to the FDIC. The FDIC has adopted a risk-based assessment system under which all insured depository institutions are placed into one of nine categories and assessed insurance premiums based upon their respective levels of capital and results of supervisory evaluations. Institutions classified as well-capitalized (as defined by the FDIC) and considered healthy pay the lowest premium while institutions that are less than adequately capitalized (as defined by the FDIC) and considered of substantial supervisory concern pay the highest premium. Risk classification of all insured institutions is made by the FDIC for each semi-annual assessment period.
The FDIC may terminate the deposit insurance of any insured depository institution if the FDIC determines, after a hearing, that the institution has engaged or is engaging in unsafe or unsound practices, is in an unsafe or unsound condition to continue operations or has violated any applicable law, regulation, order, or any condition imposed in writing by, or written agreement with, the FDIC. The FDIC may also suspend deposit insurance temporarily during the hearing process for a permanent termination of insurance if the institution has no tangible capital. Management of the Company is not aware of any activity or condition that could result in termination of the deposit insurance of Unified.
The Dodd-Frank Act revised the statutory authorities governing the FDIC’s management of the DIF. Key requirements from the Dodd-Frank Act resulted in the FDIC’s adoption of new rules in February 2011 regarding Assessments, Dividends, Assessment Base, and Large Bank Pricing. The new rules implemented the following changes: (1) redefined the definition of an institution’s deposit insurance assessment base from one based on domestic deposits to one based on assets now defined as “average consolidated total assets minus average tangible equity”; (2) changed the assessment rate adjustments to better account for risk based on an institution’s funding sources; (3) revised the deposit insurance assessment rate schedule in light of the new assessment base and assessment rate adjustments; (4) implemented Dodd-Frank Act dividend provisions; (5) revised the large insured depository institution assessment system to better differentiate for risk and to take into account losses the FDIC may incur from large institution failures; and (6) provided technical and other changes to the FDIC’s assessment rules. Though deposit insurance assessments maintain a risk-based approach, the FDIC imposed a more extensive risk-based assessment system on large insured depository institutions with at least $10 billion in total assets since they are more complex in nature and could pose greater risk.
Regulatory Capital Requirements Unified is required to maintain minimum levels of capital in accordance with FDIC capital adequacy guidelines. If capital falls below minimum guideline levels, a bank, among other things, may be denied approval to acquire or establish additional branches or organize or acquire other non-bank businesses. The required capital levels and the Bank’s capital position at December 31, 2023 and 2022 are summarized in the table included in Note 11 to the consolidated financial statements.
Beginning in 2015, bank holding companies and banks were required to measure capital adequacy using Basel III accounting. Basel III is a comprehensive set of reform measures, developed by the Basel Committee on Banking Supervision, to strengthen the regulation, supervision and risk management of the banking sector. Implementation of the rules will be overseen by the Federal Reserve, the FDIC and the OCC. Reporting under the new rules began with the March 2015 quarterly regulatory filings.
FDICIA
The Federal Deposit Insurance Corporation Improvement Act of 1991 (“FDICIA”), and the regulations promulgated under FDICIA, among other things, established five capital categories for insured depository institutions-well capitalized, adequately capitalized, undercapitalized, significantly undercapitalized and critically undercapitalized-and requires U.S. federal bank regulatory agencies to implement systems for “prompt corrective action” for insured depository institutions that do not meet minimum capital requirements based on these categories. Unless a bank is well capitalized, it is subject to restrictions on its ability to offer brokered deposits and on certain other aspects of its operations. An undercapitalized bank must develop a capital restoration plan and its parent bank holding company must guarantee the bank’s compliance with the plan up to the lesser of 5% of the bank’s assets at the time it became undercapitalized and the amount needed to comply with the plan. As of December 31, 2023, the Bank was well capitalized pursuant to these prompt corrective action guidelines.
Dividends. Ohio law prohibits Unified, without the prior approval of the ODFI, from paying dividends in an amount greater than the lesser of its undivided profits or the total of its net income for that year, combined with its retained net income from the preceding two years. The payment of dividends by any financial institution is also affected by the requirement to maintain adequate capital pursuant to applicable capital adequacy guidelines and regulations.
Safety and Soundness Standards. The Federal banking agencies have adopted guidelines that establish operational and managerial standards to promote the safety and soundness of federally insured depository institutions. The guidelines set forth standards for internal controls, information systems, internal audit systems, loan documentation, credit underwriting, interest rate exposure, asset growth, compensation, fees and benefits, asset quality and earnings.
In general, the safety and soundness guidelines prescribe the goals to be achieved in each area, and each institution is responsible for establishing its own procedures to achieve those goals. If an institution fails to comply with any of the standards set forth in the guidelines, the institution’s primary federal regulator may require the institution to submit a plan for achieving and maintaining compliance. If an institution fails to submit an acceptable compliance plan, or fails in any material respect to implement a compliance plan that has been accepted by its primary federal regulator, the regulator is required to issue an order directing the institution to cure the deficiency. Until the deficiency cited in the regulator’s order is cured, the regulator may restrict the institution’s rate of growth, require the institution to increase its capital, restrict the rates the institution pays on deposits or require the institution to take any action the regulator deems appropriate under the circumstances. Noncompliance with the standards established by the safety and soundness guidelines may also constitute grounds for other enforcement action by the federal banking regulators, including cease and desist orders and civil money penalty assessments.
With respect to lending, the federal bank regulatory agencies have adopted uniform regulations prescribing standards for extensions of credit that are secured by liens or interests in real estate or made for the purpose of financing permanent improvements to real estate. Under these regulations, all insured depository institutions, such as the Bank, must adopt and maintain written policies establishing appropriate limits and standards for extensions of credit that are secured by liens or interests in real estate or are made for the purpose of financing permanent improvements to real estate. These policies must establish loan portfolio diversification standards, prudent underwriting standards (including loan-to-value limits) that are clear and measurable, loan administration procedures, and documentation, approval and reporting requirements. The real estate lending policies must reflect consideration of the federal bank regulatory agencies’ Interagency Guidelines for Real Estate Lending Policies.
With respect to compensation practices, ours are subject to oversight by the Federal regulatory agencies, which have issued joint guidance on executive compensation designed to ensure that the incentive compensation policies of banking organizations, such as the Company and the Bank, do not encourage imprudent risk taking and are consistent with the safety and soundness of the organization. In addition, in October 2022 the SEC adopted final Executive Compensation Clawback Rules directing national stock exchanges to require listed public companies to implement policies intended to recoup bonuses paid to executives if the company is found to have misstated its financial results. The SEC rules, mandated by Section 954 of the Dodd-Frank Wall Street Reform and Consumer Protection Act, are intended to discourage executives from taking questionable actions that temporarily boost share prices but ultimately result in a correction of financial statements. On June 9, 2023 the U.S. Securities and Exchange Commission (the “SEC”) approved the clawback listing standards proposed by the New York Stock Exchange and The Nasdaq Stock Market. As a result, all listed companies had until Friday, December 1, 2023 to adopt and implement a compliant clawback policy.
Branching Authority. Ohio chartered banks have the authority under Ohio law to establish branches anywhere in the State of Ohio, subject to receipt of all required regulatory approvals. Additionally, in May 1997 Ohio adopted legislation “opting in” to the provisions of Riegle-Neal Interstate Banking and Branching Efficiency Act of 1994 (the “Interstate Act”) which allows banks to establish interstate branch networks through acquisitions of other banks, subject to certain conditions, including certain limitations on the aggregate amount of deposits that may be held by the surviving bank and all of its insured depository institution affiliates. Effective with the enactment of The Dodd-Frank Act, the FDI Act and the National Bank Act have been amended to remove the expressly required “opt-in” concept applicable to de novo interstate branching and now permits national and insured state banks to engage in de novo in interstate branching if, under the laws of the state where the new branch is to be established, a state bank chartered in that state would be permitted to establish a branch.
Affiliate Transactions. Various governmental requirements, including Sections 23A and 23B of the Federal Reserve Act, limit borrowings by holding companies and non-bank subsidiaries from affiliated insured depository institutions, and also limit various other transactions between holding companies and their non-bank subsidiaries, on the one hand, and their affiliated insured depository institutions on the other. Section 23A of the Federal Reserve Act also generally requires that an insured depository institution’s loan to its non-bank affiliates be secured, and Section 23B of the Federal Reserve Act generally requires that an insured depository institution’s transactions with its non-bank affiliates be on arms-length terms.
Depositor Preference. The Federal Deposit Insurance Act provides that, in the event of the “liquidation or other resolution” of an insured depository institution, the claims of depositors of the institution, including the claims of the FDIC as subrogee of insured depositors, and certain claims for administrative expenses of the FDIC as a receiver, will have priority over other general unsecured claims against the institution. If an insured depository institution fails, insured and uninsured depositors, along with the FDIC, will have priority in payment ahead of unsecured, non deposit creditors and shareholders of the institution.
Privacy Provisions of Gramm-Leach-Bliley Act. Under GLB, federal banking regulators adopted rules that limit the ability of banks and other financial institutions to disclose non-public information about consumers to non-affiliated third parties. These limitations require disclosure of privacy policies to consumers and, in some circumstances, allow consumers to prevent disclosure of certain personal information to non-affiliated third parties. The privacy provisions of GLB affect how consumer information is transmitted through diversified financial companies and conveyed to outside vendors.
Cybersecurity. GLB also requires financial institutions to implement a comprehensive information security program that includes administrative, technical, and physical safeguards to ensure the security and confidentiality of customer records and information.
Anti-Money Laundering Provisions of the USA Patriot Act of 2001. On October 26, 2001, the USA Patriot Act of 2001 (the “Patriot Act”) was signed into law. The Patriot Act is intended to strengthen U.S. law enforcement’s and the intelligence community’s ability to work cohesively to combat terrorism on a variety of fronts. The potential impact of the Patriot Act on financial institutions of all kinds is significant and wide-ranging. The Patriot Act contains sweeping anti-money laundering and financial transparency laws and requires various regulations, including: (a) due diligence requirements for financial institutions that administer, maintain, or manage private bank accounts or correspondent accounts for non-U.S. persons; (b) standards for verifying customer identification at account opening; and (c) rules to promote cooperation among financial institutions, regulators and law enforcement entities in identifying parties that may be involved in terrorism or money laundering.
Fiscal and Monetary Policies. Unified’s business and earnings are affected significantly by the fiscal and monetary policies of the federal government and its agencies. Unified is particularly affected by the policies of the Federal Reserve, which regulates the supply of money and credit in the United States. Among the instruments of monetary policy available to the Federal Reserve are (a) conducting open market operations in United States government securities, (b) changing the discount rates of borrowings of depository institutions, (c) imposing or changing reserve requirements against depository institutions’ deposits, and (d) imposing or changing reserve requirements against certain borrowing by banks and their affiliates. These methods are used in varying degrees and combinations to affect directly the availability of bank loans and deposits, as well as the interest rates charged on loans and paid on deposits. For that reason alone, the policies of the Federal Reserve have a material effect on the earnings of Unified.
Environmental Laws. Banks that hold mortgages on property as secured lenders are exempt from liability under Federal environmental protection laws if certain criteria are met. The Comprehensive Environmental Response, Compensation, and Liability Act (CERCLA) contains a secured creditor exemption that eliminates owner or operator liability for lenders who take an ownership interest in a property primarily to protect their interest in the facility as security on a loan, provided that the bank does not participate in the management of the facility. Generally, participation in management applies if a bank exercises decision-making control over a property’s environmental compliance, or exercises control at a level similar to a manager of the facility or property.
Additional and Pending Regulation. Unified is also subject to federal regulation as to such matters as the maintenance of required reserves against deposits, limitations in connection with affiliate transactions, limitations as to the nature and amount of its loans and investments, regulatory approval of any merger or consolidation, issuance or retirement by Unified of its own securities and other aspects of banking operations. In addition, the activities and operations of Unified are subject to a number of additional detailed, complex and sometimes overlapping laws and regulations. These include state usury and consumer credit laws, state laws relating to fiduciaries, the Federal Truth-in-Lending Act and Regulation Z, the Federal Equal Credit Opportunity Act and Regulation B, the Fair Credit Reporting Act, the Truth in Savings Act, the Community Reinvestment Act, anti-redlining legislation and antitrust laws.
Congress regularly considers legislation that may have an impact upon the operation of the Company and Unified. At this time, the Company is unable to predict whether any proposed legislation will be enacted and, therefore, is unable to predict the impact such legislation may have on the operations of the Company.
Employees
The Company itself, as a holding company, has no compensated employees. Unified has 115 full time employees, with 31 of these serving in a management capacity, and 11 part time employees.
|
|
|
|
Executive Officers Positions held with Company; |
|
Name |
|
Age |
|
Business Experience |
|
Scott Everson |
|
56 |
|
President and Chief Executive Officer |
|
|
|
|
|
|
|
Matthew F. Branstetter |
|
56 |
|
Senior Vice President – Chief Operating Officer |
|
|
|
|
|
|
|
Randall M. Greenwood |
|
60 |
|
Senior Vice President, Chief Financial Officer, Treasurer & Corporate Secretary |
|
Each individual has held the position noted during the past five years.
Each of these Executive Officers is appointed annually by the Company’s board of directors and is serving at-will in their current positions.
Industry Segments
United Bancorp and its subsidiary are engaged in one line of business, banking. Item 8 of this 10-K provides financial information for United Bancorp’s business.
Statistical Disclosures by Bank Holding Companies
I Distribution of Assets, Liabilities and Stockholders’ Equity; Interest Rates and Interest Differential
Refer to Management’s Discussion and Analysis “Average Balances, Net Interest Income and Yields Earned and Rates Paid” and “Rate/Volume Analysis on pages 19 and 20 of our 2023 Annual Report filed herewith as Exhibit 13, which is incorporated by reference.
Average Balances, Net Interest Income and Yields Earned and Rates Paid
The following table provides average balance sheet information and reflects the taxable equivalent average yield on interest-earning assets and the average cost of interest-bearing liabilities for the years ended December 31, 2022 and 2021. The yields and costs are calculated by dividing income or expense by the average balance of interest-earning assets or interest-bearing liabilities.
The average balance of available-for-sale securities is computed using the carrying value of securities while the yield for available for sale securities has been computed using the average amortized cost. Average balances are derived from average month-end balances, which include nonaccruing loans in the loan portfolio, net of the allowance for loan losses. Interest income has been adjusted to tax-equivalent basis.
|
|
2021 |
|
|
2022 |
|
||||||||||||
|
|
|
|
|
Interest |
|
|
|
|
|
|
|
Interest |
|
|
|
||
|
|
Average |
|
Income/ |
|
Yield/ |
|
|
Average |
|
Income/ |
|
Yield/ |
|
||||
|
|
Balance |
|
Expense |
|
Rate |
|
|
Balance |
|
Expense |
|
Rate |
|
||||
Loans (1) |
|
$ |
451,762 |
|
$ |
20,220 |
|
4.48 |
% |
|
$ |
462,692 |
|
$ |
20,748 |
|
4.48 |
% |
Taxable Securitied AFS |
|
|
13,297 |
|
|
467 |
|
3.51 |
|
|
|
54,852 |
|
|
1,899 |
|
3.46 |
|
Tax Exempt securities available for sale (1) |
|
|
118,062 |
|
|
4,908 |
|
4.16 |
|
|
|
120,073 |
|
|
5,565 |
|
4.63 |
|
Federal funds sold |
|
|
79,698 |
|
|
101 |
|
0.13 |
|
|
|
44,668 |
|
|
493 |
|
1.10 |
|
FHLB stock and other |
|
|
3,925 |
|
|
81 |
|
2.06 |
|
|
|
3,191 |
|
|
139 |
|
4.35 |
|
|
|
|
|
|
|
|
|
|
|
|
|
|
|
|
|
|
|
|
Total interest-bearing assets |
|
|
666,744 |
|
|
25,777 |
|
3.87 |
|
|
|
685,476 |
|
|
28,844 |
|
4.21 |
|
|
|
|
|
|
|
|
|
|
|
|
|
|
|
|
|
|
|
|
Non interest-earning assets |
|
|
|
|
|
|
|
|
|
|
|
|
|
|
|
|
|
|
Cash and due from banks |
|
|
8,593 |
|
|
|
|
|
|
|
|
8,301 |
|
|
|
|
|
|
Premises and equipment (net) |
|
|
13,469 |
|
|
|
|
|
|
|
|
12,547 |
|
|
|
|
|
|
Other nonearning assets |
|
|
38,170 |
|
|
|
|
|
|
|
|
32,471 |
|
|
|
|
|
|
Less: allowance for loan losses |
|
|
(4,576) |
|
|
|
|
|
|
|
|
(3,020) |
|
|
|
|
|
|
Total noninterest-earning assets |
|
|
55,656 |
|
|
|
|
|
|
|
|
50,299 |
|
|
|
|
|
|
Total assets |
|
$ |
722,400 |
|
|
|
|
|
|
|
$ |
735,775 |
|
|
|
|
|
|
|
|
|
|
|
|
|
|
|
|
|
|
|
|
|
|
|
|
|
Demand deposits |
|
$ |
256,638 |
|
|
313 |
|
0.12 |
% |
|
$ |
262,763 |
|
|
845 |
|
0.32 |
% |
Savings deposits |
|
|
133,826 |
|
|
17 |
|
0.01 |
|
|
|
144,283 |
|
|
77 |
|
0.05 |
|
Time deposits |
|
|
69,591 |
|
|
920 |
|
1.32 |
|
|
|
67,848 |
|
|
722 |
|
1.06 |
|
Subordinated debentures |
|
|
23,665 |
|
|
1,323 |
|
5.59 |
|
|
|
23,726 |
|
|
1,387 |
|
5.85 |
|
Repurchase agreements |
|
|
19,452 |
|
|
23 |
|
0.12 |
|
|
|
22,581 |
|
|
242 |
|
1.07 |
|
|
|
|
|
|
|
|
|
|
|
|
|
|
|
|
|
|
|
|
Total interest-bearing liabilities |
|
$ |
503,172 |
|
|
2,596 |
|
0.52 |
|
|
$ |
521,201 |
|
|
3,273 |
|
0.63 |
|
|
|
|
|
|
|
|
|
|
|
|
|
|
|
|
|
|
|
|
Non interest-bearing liabilities |
|
|
|
|
|
|
|
|
|
|
|
|
|
|
|
|
|
|
Demand deposits |
|
|
140,555 |
|
|
|
|
|
|
|
|
151,342 |
|
|
|
|
|
|
Other liabilities |
|
|
7,512 |
|
|
|
|
|
|
|
|
4,016 |
|
|
|
|
|
|
Total noninterest-bearing liabilities |
|
|
148,067 |
|
|
|
|
|
|
|
|
155,858 |
|
|
|
|
|
|
|
|
|
|
|
|
|
|
|
|
|
|
|
|
|
|
|
|
|
Total liabilities |
|
|
651,239 |
|
|
|
|
|
|
|
|
677,059 |
|
|
|
|
|
|
|
|
|
|
|
|
|
|
|
|
|
|
|
|
|
|
|
|
|
Total stockholders’ equity |
|
|
71,161 |
|
|
|
|
|
|
|
|
58,716 |
|
|
|
|
|
|
|
|
|
|
|
|
|
|
|
|
|
|
|
|
|
|
|
|
|
Total liabilities & stockholders’ equity |
|
$ |
722,400 |
|
|
|
|
|
|
|
$ |
735,775 |
|
|
|
|
|
|
|
|
|
|
|
|
|
|
|
|
|
|
|
|
|
|
|
|
|
Net interest income |
|
|
|
|
$ |
23,181 |
|
|
|
|
|
|
|
$ |
25,571 |
|
|
|
Net interest spread |
|
|
|
|
|
|
|
3.35 |
% |
|
|
|
|
|
|
|
3.58 |
% |
|
|
|
|
|
|
|
|
|
|
|
|
|
|
|
|
|
|
|
Net yield on interest earning assets |
|
|
|
|
|
|
|
3.48 |
% |
|
|
|
|
|
|
|
3.73 |
% |
| ● | For purposes of this schedule, nonaccrual loans are included in loans. |
| ● | Fees collected on loans are included in interest on loans. However, such fees are not material for comparative purposes. |
| ● | Earnings on tax-exempt earnings is shown on a tax equivalent basis using a marginal tax rate of 21% |
Rate/Volume Analysis
The table below describes the extent to which changes in interest rates and changes in volume of interest-earning assets and interest-bearing liabilities have affected interest income and expense during 2022. For purposes of this table, changes in interest due to volume and rate were determined using the following methods:
| ● | Volume variance results when the change in volume is multiplied by the previous year’s rate. |
| ● | Rate variance results when the change in rate is multiplied by the previous year’s volume. |
| ● | Rate/volume variance results when the change in volume is multiplied by the change in rate. |
NOTE: The rate/volume variance was allocated to volume variance and rate variance in proportion to the relationship of the absolute dollar amount of the change in each. Non accrual loans are ignored for purposes of the calculations due to the nominal amount of the loans.
|
|
2022 Compared to 2021 |
|||||
|
|
Increase/(Decrease) |
|||||
(In thousands) |
|
|
|
|
Change |
|
Change |
|
|
Total |
|
Due To |
|
Due To |
|
|
|
Change |
|
Volume |
|
Rate |
|
Interest and dividend income |
|
|
|
|
|
|
|
Loans |
|
$ |
528 |
|
490 |
|
38 |
Taxable securities available for sale |
|
|
1,432 |
|
1,367 |
|
65 |
Tax-exempt securities available for sale |
|
|
657 |
|
550 |
|
107 |
Federal funds sold |
|
|
392 |
|
(63) |
|
455 |
FHLB stock and other |
|
|
58 |
|
(18) |
|
76 |
Total interest and dividend income |
|
|
3,067 |
|
2,326 |
|
741 |
|
|
|
|
|
|
|
|
Interest expense |
|
|
|
|
|
|
|
Demand deposits |
|
|
532 |
|
8 |
|
524 |
Savings deposits |
|
|
60 |
|
1 |
|
59 |
Time deposits |
|
|
(198) |
|
(23) |
|
(175) |
Trust Preferred debentures |
|
|
64 |
|
— |
|
64 |
Repurchase agreements |
|
|
219 |
|
4 |
|
215 |
Total interest expense |
|
|
677 |
|
(10) |
|
687 |
|
|
|
|
|
|
|
|
Net interest income |
|
$ |
2,390 |
|
2,336 |
|
54 |
II Investment Portfolio
A Contractual maturities of securities at year-end 2023 were as follows:
|
|
Amortized |
|
Estimated |
|
Average Tax |
|
||
|
|
Cost |
|
Fair Value |
|
Equivalent Yield |
|
||
|
|
(dollars in thousands) |
|
||||||
US Agency obligations |
|
|
|
|
|
|
|
|
|
Under 1 Year |
|
$ |
15,000 |
|
$ |
14,870 |
|
3.71 |
% |
1 – 5 Years |
|
|
27,500 |
|
|
27,043 |
|
3.82 |
% |
5-10 Years |
|
|
2,500 |
|
|
2,355 |
|
4.00 |
% |
Over 10 Years |
|
|
— |
|
|
— |
|
— |
|
|
|
|
|
|
|
|
|
|
|
State and municipal obligations |
|
|
|
|
|
|
|
|
|
Under 1 Year |
|
$ |
— |
|
$ |
— |
|
— |
|
1 – 5 Years |
|
|
— |
|
|
— |
|
— |
|
5-10 Years |
|
|
4,514 |
|
|
4,468 |
|
3.68 |
% |
Over 10 Years |
|
|
173,156 |
|
|
169,724 |
|
4.49 |
% |
|
|
|
|
|
|
|
|
|
|
Subordinated Debt |
|
|
|
|
|
|
|
|
|
Under 1 Year |
|
|
— |
|
|
— |
|
— |
|
1 – 5 Years |
|
$ |
3,097 |
|
$ |
2,890 |
|
2.96 |
% |
5-10 Years |
|
|
25,916 |
|
|
21,410 |
|
3.53 |
% |
Over 10 Years |
|
|
— |
|
|
— |
|
— |
|
|
|
|
|
|
|
|
|
|
|
Total securities available for sale |
|
$ |
251,683 |
|
$ |
242,760 |
|
4.24 |
% |
III Loan Portfolio
A Maturities and Sensitivities of Loans to Changes in Interest Rates
The following is a schedule of commercial and commercial real estate loans at December 31, 2023 maturing within the various time frames indicated:
|
|
|
|
|
|
|
|
Five |
|
|
|
|
|
|
|
|
|
One |
|
One |
|
Through |
|
|
|
|
|
|
|||
|
|
Year or |
|
Through |
|
Fifteen |
|
After |
|
|
|
||||
|
|
Less |
|
Five Years |
|
Years |
|
Fifteen Years |
|
Total |
|||||
|
|
(In thousands) |
|||||||||||||
Commercial and industrial loans |
|
$ |
5,599 |
|
$ |
62,043 |
|
$ |
20,562 |
|
$ |
3,090 |
|
$ |
91,294 |
Commercial real estate loans |
|
|
8,406 |
|
|
47,159 |
|
|
135,466 |
|
|
100,828 |
|
|
291,859 |
|
|
|
|
|
|
|
|
|
|
|
|
|
|
|
|
Total |
|
$ |
14,005 |
|
$ |
109,202 |
|
$ |
156,028 |
|
$ |
103,918 |
|
$ |
383,153 |
The following is a schedule of fixed-rate and variable-rate commercial and commercial real estate loans at December 31, 2023 due to mature after one year:
|
|
|
|
|
|
|
|
Total > |
|
|
|
Fixed |
|
Variable |
|
One |
|||
|
|
Rate |
|
Rate |
|
Year |
|||
|
|
(In thousands) |
|||||||
Commercial and industrial loans |
|
$ |
49,288 |
|
$ |
36,407 |
|
$ |
85,695 |
Commercial real estate loans |
|
|
54,517 |
|
|
228,936 |
|
|
283,453 |
|
|
|
|
|
|
|
|
|
|
Total |
|
$ |
103,805 |
|
$ |
265,343 |
|
$ |
369,148 |
Variable rate loans are those loans with floating or adjustable interest rates.
IV Summary of Credit Loss Experience
The allowance for credit losses (“ACL”) is a valuation reserve established and maintained by charges against income and is deducted from the amortized cost basis of loans to present the net amount expected to be collected on the loans. Loans, or portions thereof, are charged off against the ACL when they are deemed uncollectible. Expected recoveries do not exceed the aggregate of amounts previously charged-off and expected to be charged-off.
The ACL is an estimate of expected credit losses, measured over the contractual life of a loan, that considers our historical loss experience, current conditions and forecasts of future economic conditions. Determination of an appropriate ACL is inherently subjective and may have significant changes from period to period.
The methodology for determining the ACL has two main components: evaluation of expected credit losses for certain groups of homogeneous loans that share similar risk characteristics and evaluation of loans that do not share risk characteristics with other loans.
The allowance for credit losses is measured on a collective (pool) basis when similar risk characteristics exist. The Company uses the call report classification as its segment breakout and measures the allowance for credit losses using the Weighted Average Remaining Maturity method for all loan segments.
Historical credit loss experience is the basis for the estimation of expected credit losses. We apply historical loss rates to pools of loans with similar risk characteristics. After consideration of the historic loss calculation, management applies qualitative adjustments to reflect the current conditions and reasonable and supportable forecasts not already reflected in the historical loss information at the balance sheet date. Our reasonable and supportable forecast adjustment is based on a 2 year unemployment forecast provided by Bloomberg and management judgment. For periods beyond our reasonable and supportable forecast, we revert back to historical annual loss rates for the remainder of the life of each pool after the forecast period. The qualitative adjustments for current conditions are based upon current level of inflation and the rapid increase in interest rates, changes in lending policies and practices, experience and ability of lending staff, quality of the Company’s loan review system, value of underlying collateral, the existence of and changes in concentrations and other external factors. These modified historical loss rates are multiplied by the outstanding principal balance of each loan to calculate a required reserve.
The Company has elected to exclude accrued interest receivable from the measurement of its ACL. When a loan is placed on non-accrual status, any outstanding accrued interest is reversed against interest income.
The ACL for individual loans begins with the use of normal credit review procedures to identify whether a loan no longer shares similar risk characteristics with other pooled loans and therefore, should be individually assessed. We evaluate all commercial and industrial and commercial real estate loans, as well as residential and installment loans greater than $100,000 that meet the following criteria: 1) when it is determined that foreclosure is probable, 2) substandard, doubtful and nonperforming loans when repayment is expected to be provided substantially through the operation or sale of the collateral, 3) when it is determined by management that a loan does not share similar risk characteristics with other loans. Specific reserves are established based on the following three acceptable methods for measuring the ACL: 1) the present value of expected future cash flows discounted at the loan’s original effective interest rate; 2) the loan’s observable market price; or 3) the fair value of the collateral when the loan is collateral dependent. Our individual loan evaluations consist primarily of the fair value of collateral method because most of our loans are collateral dependent. Collateral values are discounted to consider disposition costs when appropriate. A specific reserve is established or a charge-off is taken if the fair value of the loan is less than the loan balance.
For additional explanation of factors which influence management’s judgment in determining amounts charged to expense, refer to pages 13-15 of the “Management’s Discussion and Analysis” and Notes to Consolidated Financial Statements set forth in our 2023 Annual Report, which is incorporated herein by reference.
A |
Analysis of the Allowance for Credit Losses |
The following table provides key credit ratios for each applicable period.
|
|
2023 |
|
2022 |
|
2021 |
|
|||
Ratio of net charge-offs to average loans outstanding for the year |
|
|
0.02 |
% |
|
0.14 |
% |
|
0.04 |
% |
Ratio of commercial loans and industrial net charge-offs to average commercial loans |
|
|
(0.03) |
% |
|
(0.01) |
% |
|
0.08 |
% |
Ratio of commercial real estate loans net charge-offs to average commercial real estate loans |
|
|
0.00 |
% |
|
0.21 |
% |
|
0.00 |
% |
Ratio of real estate loans net charge-offs to average real estate loans |
|
|
0.00 |
% |
|
0.00 |
% |
|
0.02 |
% |
Ratio of installment loans net charge-off to average consumer loans |
|
|
1.93 |
% |
|
1.90 |
% |
|
1.39 |
% |
Total allowance for credit losses to total loans |
|
|
0.81 |
% |
|
0.45 |
% |
|
0.81 |
% |
Nonaccrual loans to total loans |
|
|
0.10 |
% |
|
0.04 |
% |
|
0.64 |
% |
Total allowance for credit losses to nonperforming loans |
|
|
611.23 |
% |
|
1127.47 |
% |
|
87.27 |
% |
B |
Allocation of the Allowance for Credit Losses |
The following table allocates the allowance for credit losses at December 31, 2023, 2022, and 2021. Management adjusts the allowance periodically to account for changes in national trends and economic conditions in the Bank’s service areas. The allowance has been allocated according to the amount deemed to be reasonably necessary to provide for the probability of losses being incurred within the following categories of loans at the dates indicated:
|
|
2023 |
|
2022 |
|
2021 |
|
||||||||||
|
|
|
|
|
% of |
|
|
|
|
% of |
|
|
|
|
% of |
|
|
|
|
|
|
|
Loans |
|
|
|
|
Loans |
|
|
|
|
Loans |
|
|
|
|
Allowance |
|
to Total |
|
Allowance |
|
to Total |
|
Allowance |
|
to Total |
|
||||
|
|
Amount |
|
Loans |
|
Amount |
|
Loans |
|
Amount |
|
Loans |
|
||||
Loan type |
|
|
|
|
|
|
|
|
|
|
|
|
|
|
|
|
|
Commercial and Industrial |
|
$ |
573 |
|
|
18.89 |
% |
$ |
215 |
|
19.65 |
% |
$ |
1,046 |
|
20.00 |
% |
Commercial real estate |
|
|
1,408 |
|
|
60.40 |
% |
|
815 |
|
58.65 |
% |
|
1,235 |
|
58.71 |
% |
Residential real estate |
|
|
1,843 |
|
|
19.32 |
% |
|
816 |
|
20.40 |
% |
|
1,121 |
|
19.84 |
% |
Consumer |
|
|
94 |
|
|
1.39 |
% |
|
206 |
|
1.30 |
% |
|
271 |
|
1.45 |
% |
General |
|
|
N/A |
|
|
|
|
|
— |
|
N/A |
|
|
— |
|
N/A |
|
|
|
|
|
|
|
|
|
|
|
|
|
|
|
|
|
|
|
Total |
|
$ |
3,918 |
|
|
100.00 |
% |
$ |
2,052 |
|
100.00 |
% |
$ |
3,673 |
|
100.00 |
% |
V Deposits
A |
Schedule of Average Deposit Amounts and Rates |
Refer to Section I of this “Statistical Disclosures by Bank Holding Companies” section and to Management’s Discussion and Analysis “Average Balances, Net Interest Income and Yields Earned and Rates Paid” on page 19 of our 2023 Annual Report filed herewith as Exhibit 13, which is incorporated by reference. At December 31, 2023, 2022 and 2021 the aggregate amount of uninsured deposits was approximately $102.9 million, $89.8 million and $77.9 million.
B |
Maturity analysis of time deposits greater than $250,000. |
At December 31, 2023, the time to remaining maturity for time deposits in excess of $250,000 was:
|
|
2023 |
|
|
|
(In thousands) |
|
Three months or less |
|
$ |
4,234 |
Over three through six months |
|
|
12,069 |
Over six through twelve months |
|
|
5,878 |
Over twelve months |
|
|
15,426 |
|
|
|
|
Total |
|
$ |
37,607 |
Item 1A. Risk Factors
Smaller Reporting Companies are not required to provide this disclosure.
Item 1B. Unresolved Staff Comments
None.
Item 1C. Cybersecurity
General
All companies utilizing technology are subject to threats of breaches of their cybersecurity programs. To mitigate the threat to our business and address regulatory requirements, we take a comprehensive approach to cybersecurity risk management and have developed and implemented a cybersecurity risk management program intended to protect the confidentiality, integrity, and availability of our critical systems and information. As described in more detail below, we have established policies, standards, processes, and practices for assessing, identifying, and managing material risks from cybersecurity threats. We devote significant financial and personnel resources to implement and maintain security measures to meet regulatory requirements and customer expectations, and we intend to continue to make significant investments to maintain the security of our data and cybersecurity infrastructure.
Legal Overview
Pursuant to the requirements of section 39 of the Federal Deposit Insurance Act (12 U.S.C. 1831p–1) and sections 501 and 505(b) of the Gramm-Leach-Bliley Act (15 U.S.C. 6801, 6805(b)), the federal bank regulatory agencies adopted the Interagency Guidelines Establishing Information Security Standards (the “Guidelines”). The requirements of the Guidelines apply to all FDIC-insured depository institutions, most subsidiaries of such entities, and to state savings associations. Federal law also mandates that information security procedures and controls be routinely evaluated by the Bank’s state and federal regulators as part of the standard safety and soundness examination process.
Bank Security Policy
To comply with all applicable federal requirements, the Bank’s Board of Directors has adopted the Unified Bank Information Security Policy (the “ISP”), which establishes a program that the Bank’s management and board can use to:
| ● | Ensure the security and confidentiality of customer information; |
| ● | Protect against any anticipated threats or hazards to the security or integrity of such information; and |
| ● | Protect against unauthorized access to or use of customer information that could result in substantial harm or inconvenience to any customer. |
Under the ISP, the Board of Directors or an appropriate committee thereof is required to oversee all efforts with respect to the development, implementation and maintenance of an effective information security program. In addition, the ISP charges management with responsibility for identifying all reasonably foreseeable internal and external threats that could result in unauthorized disclosure, misuse, alteration or destruction of Bank information, and directs management to develop and implement procedures and other controls designed to reduce or eliminate identified risks.
The Bank has also implemented controls designed to identify and mitigate cybersecurity threats associated with our use of the Bank’s critical third-party service providers. Such providers are subject to security risk assessments at the time of onboarding, contract renewal, and based on risk profile. A variety of inputs are used in such assessments, including information supplied by providers and third parties. In addition, we require our providers to meet appropriate security requirements, controls and responsibilities and investigate security incidents that have impacted our third-party providers, as appropriate.
In addition to being subject to routine examination by the Bank’s state and federal regulators, the efficacy of the Bank’s information security program is also audited annually by an independent third-party auditing firm.
Managerial and Board Oversight
To facilitate oversight, the Bank has established a front line committee, the Compliance Risk Assessment Committee, which is comprised of all members of senior management, the head of information security and certain other operationally significant employees. This Committee, which meets quarterly, is responsible for monitoring all key operational risks applicable to the Bank. Cyber risk assessments are routinely conducted and reported to the Audit Committee of the Board of Directors In addition, key members of senior management also meet annually with a cyber risk consultant who apprises management on emerging cyber threats and evaluates the Company’s adequacy of cyber risk insurance coverage. The findings of this meeting are also reported to the Executive Committee. All significant matters are reported by the Executive Committee to the full Board of Directors.
Item 2Properties
The Company owns and operates its Main Office and stand alone operations center in Martins Ferry, Ohio and the following offices:
Branch Office Location |
|
Owned or Leased |
|
Location |
|
Owned or Leased |
Bridgeport, Ohio |
|
Owned |
|
Sherrodsville, Ohio |
|
Owned |
Colerain, Ohio |
|
Owned |
|
Glouster, Ohio |
|
Owned |
Jewett, Ohio |
|
Owned |
|
Nelsonville, Ohio |
|
Owned |
St. Clairsville, Ohio |
|
Owned |
|
Lancaster, Ohio |
|
Owned |
Dover, Ohio |
|
Owned |
|
Lancaster, Ohio |
|
Owned |
Dellroy, Ohio |
|
Owned |
|
Powhatan, Ohio |
|
Owned |
New Philadelphia, Ohio |
|
Owned |
|
Moundsville, WV |
|
Owned |
Strasburg, Ohio |
|
Owned |
|
St. Clairsville, Ohio |
|
Owned |
Tiltonsville, Ohio |
|
Owned |
|
Wheeling, WV |
|
Leased |
Management believes the properties described above to be in good operating condition for the purpose for which they are used. The properties are unencumbered by any mortgage or security interest and are, in management’s opinion, adequately insured.
Item 3Legal Proceedings
There are no material legal proceedings, other than ordinary routine litigation incidental to its business, to which the Company or its subsidiary is a party or to which any of its property is subject.
Item 4Mine Safety Disclosures
Not applicable.
PART II
Item 5Market for Registrant’s Common Equity, Related Shareholder Matters and Issuer Purchases of Equity Securities
Refer to Page 9, “Shareholder Information” of the 2023 Annual Report To Shareholders filed herewith as Exhibit 13 and refer to Page 31, Note 1 of the Notes to the Consolidated Financial Statements of the Company in the 2023 Annual Report To Shareholders for common stock trading ranges, cash dividends declared and information relating to dividend restrictions, which information is incorporated herein by reference. Additional disclosure regarding dividend restrictions is also included under Part I, Item 1 of this 10-K in the section captioned “Supervision and Regulation.”
ISSUER PURCHASES OF EQUITY SECURITIES
|
|
|
|
|
|
|
(c) |
|
(d) |
|
|
|
|
|
|
|
Total Number of |
|
Maximum Number |
|
|
|
|
|
|
|
Shares (or Units) |
|
(or Approximate Dollar Value) of |
|
|
(a) |
|
(b) |
|
Purchased as Part |
|
Shares (or Units) |
|
|
|
Total Number of |
|
Average Price |
|
of Publicly |
|
that May Yet Be |
|
|
|
Shares (or Units) |
|
Paid per Share |
|
Announced Plans |
|
Purchased Under the |
|
Period |
|
Purchased |
|
(or Unit) |
|
or Programs |
|
Plans or Programs |
|
Month #l 10/1/2023 to 10/31/2023 |
|
— |
|
$ |
— |
|
— |
|
— |
Month #2 11/1/2023 to 11/30/2023 |
|
— |
|
|
— |
|
— |
|
— |
Month #3 12/1/2023 to 12/31/2023 |
|
10,507 |
(1) |
|
11.57 |
|
— |
|
— |
Total |
|
10,507 |
(1) |
$ |
11.57 |
|
— |
|
— |
(1) |
All of these shares were purchased by the Company on the open market to fund acquisitions under the Company’s Directors and Officers Deferred Compensation Plan. |
Unregistered Sales of Equity Securities and Use of Proceeds
The Company adopted the United Bancorp, Inc. Affiliate Banks Directors and Officers Deferred Compensation Plan (the “Plan”), which is an unfunded deferred compensation plan. Amounts deferred pursuant to the Plan remain unrestricted assets of the Company, and the right to participate in the Plan is limited to members of the Board of Directors and Company officers. Under the Plan, directors or other eligible participants may defer fees and up to 50% of their annual cash incentive award payable to them by the Company, which are used to acquire common shares which are credited to a participant’s respective account. Except in the event of certain emergencies, no distributions are to be made from any account as long as the participant continues to be an employee or member of the Board of Directors. Upon termination of service, the aggregate number of shares credited to the participant’s account are distributed to him or her along with any cash proceeds credited to the account which have not yet been invested in the Company’s stock. During the quarter ended December 31, 2023, the Plan purchased 10,507 shares at an average cost of $11.57, which were allocated to participant accounts. All purchases under the Plan are funded with either earned director fees or officer incentive award payments. No underwriting fees, discounts, or commissions are paid in connection with the Plan. The shares allocated to participant accounts under the Plan have not been registered under the Securities Act of 1933 in reliance upon the exemption provided by Section 4(a)(2) thereof.
Item 6[Reserved]
Not Applicable
Item 7Management’s Discussion and Analysis of Financial Condition and Results of Operations
Refer to Pages 10-22, “Management’s Discussion and Analysis” of the 2023 Annual Report To Shareholders filed herewith as Exhibit 13, which section is incorporated herein by reference. For a comparison of results of operations between 2022 and 2021, see “Management’s Discussion and Analysis” in the 2022 Annual Report To Shareholders filed as Exhibit 13 to the Company’s annual report on 10-K for 2022.
Critical Accounting Policy
Allowance for Credit Losses:
Our allowances for credit losses represents management’s best estimate of probable losses inherent in our loan portfolios, excluding those loans accounted for under fair value.
The allowance for credit losses represents an estimate of expected credit losses, measured over the contractual life of a loan, that considers our historical loss experience, current conditions and forecasts of future economic conditions. Determination of an appropriate allowance for credit losses is inherently subjective and may have significant changes from period to period. The methodology for determining the allowance for credit losses has two main components: evaluation of expected credit losses for certain groups of homogeneous loans that share similar risk characteristics and evaluation of loans that do not share risk characteristics with other loans. The allowance for credit losses is measured on a collective (pool) basis when similar risk characteristics exist. The Company uses the call report classification as its segment breakout and measures the allowance for credit losses using the Weighted Average Remaining Maturity method for all loan segments.
Historical credit loss experience is the basis for the estimation of expected credit losses. We apply historical loss rates to pools of loans with similar risk characteristics. After consideration of the historic loss calculation, management applies qualitative adjustments to reflect the current conditions and reasonable and supportable forecasts not already reflected in the historical loss information at the balance sheet date. Our reasonable and supportable forecast adjustment is based on a 2 year unemployment forecast provided by Bloomberg and management judgment. For periods beyond our reasonable and supportable forecast, we revert back to historical annual loss rates for the remainder of the life of each pool after the forecast period. The qualitative adjustments for current conditions are based upon current level of inflation and the rapid increase in interest rates, changes in lending policies and practices, experience and ability of lending staff, quality of the Company’s loan review system, value of underlying collateral, the existence of and changes in concentrations and other external factors. These modified historical loss rates are multiplied by the outstanding principal balance of each loan to calculate a required reserve.
The process of determining the level of the allowance for credit losses requires a high degree of judgment. To the extent actual outcomes differ from our estimates, additional provision for loan and lease losses may be required that would reduce future earnings. Refer to Note 1 in the Notes to the Consolidated Financial Statements for further information.
Item 7AQuantitative and Qualitative Disclosures About Market Risk
Smaller Reporting Companies are not required to provide this disclosure.
Item 8Financial Statements and Supplementary Data
Refer to the Report of the Company’s Independent Registered Public Accounting Firm and the related audited financial statements and notes thereto contained in the 2023 Annual Report To Shareholders filed herewith as Exhibit 13, which items are incorporated herein by reference.
Item 9Changes In and Disagreements with Accountants
The Corporation filed a Current Report on Form 8-K with the SEC on September 30, 2022 to report the dismissal of FORVIS, which filing included as an Exhibit item the letter from FORVIS required by Item 304(a)(3).
On September 29, 2022 the Corporation’s Audit Committee also approved the appointment of S.R. Snodgrass, P.C. (“Snodgrass”) as the Corporation’s new independent registered public accounting firm to perform independent audit services for the fiscal year ending December 31, 2022. During the fiscal years ended December 31, 2021 and 2020 and through September 29, 2022, neither the Corporation, nor anyone acting on its behalf, consulted Snodgrass regarding either (i) the application of accounting principles to a specified transaction, either completed or proposed, or the type of audit opinion that might be rendered with respect to the consolidated financial statements of the Corporation, and no written report or oral advice was provided to the Corporation by Snodgrass that was an important factor considered by the Corporation in reaching a decision as to any accounting, auditing or financial reporting issue; or (ii) any matter that was the subject of a “disagreement” (within the meaning of Item 304(a)(1)(iv) of Regulation S-K and the related instructions) or a “reportable event” (as described in Item 304(a)(1)(v) of Regulation S-K).
Item 9AControls and Procedures
The Company, under the supervision, and with the participation, of its management and its outsourced internal audit firm Greenestock Consulting LLC, including the Company’s principal executive and principal financial officers, evaluated the effectiveness of the design and operation of the Company’s disclosure controls and procedures as of December 31, 2023, pursuant to the requirements of Exchange Act Rule 13a-15. Based upon that evaluation, the Chief Executive Officer and Chief Financial Officer concluded that the Company’s disclosure controls and procedures were effective as of December 31, 2023, in timely alerting them to material information relating to the Company (including its consolidated subsidiaries) required to be included in the Company’s periodic SEC filings.
Management is responsible for establishing and maintaining adequate internal control over financial reporting for the Company. Under the supervision and with the participation of management, including our principal executive and principal financial officers, we conducted an evaluation of the effectiveness of our internal control over financial reporting based on the framework in Internal Control – Integrated Framework issued by the Committee of Sponsoring Organizations of the Treadway Commission, as required by paragraph (c) of Exchange Act Rule13a-15. Based on the evaluation under Internal Control – Integrated Framework, management concluded that the Company’s internal control over financial reporting was effective as of December 31, 2023. This annual report does not include an attestation report of the Company’s registered public accounting firm regarding internal control over financial reporting. Management’s report was not subject to attestation by the Company’s independent registered public accounting firm.
There was no change in the Company’s internal control over financial reporting that occurred during the Company’s fiscal quarter ended December 31, 2023 that has materially affected, or is reasonably likely to materially affect, the Company’s internal control over financial reporting.
Item 9BOther Information
None.
PART III
Item 10Directors and Executive Officers of the Registrant
Information concerning executive officers of the Company is set forth in Part I, “Executive Officers of Registrant.” Other information responding to this Item 10 is included in the Registrant’s Proxy Statement for the 2024 Annual Meeting of Shareholders and is incorporated by reference under the captions “Proposal 1 – Election of Directors,” “Corporate Governance and Committees of the Board” and “Delinquent Section 16(a) Reports.”
The Company’s Board of Directors has adopted a Code of Ethics that applies to its Principal Executive, Principal Financial, and Principal Accounting Officers. A copy of the Company’s Code of Ethics is posted and can be viewed on the Company’s internet web site at http://www.unitedbancorp.com. In the event the Company amends or waives any provision of its Code of Ethics which applies to its Principal Executive, Principal Financial, or Principal Accounting Officers, and which relates to any element of the code of ethics definition set forth in Item 406(b) of Regulation S-K, the Company shall post a description of the nature of such amendment or waiver on its internet web site. With respect to a waiver of any relevant provision of the code of ethics, the Company shall also post the name of the person to whom the waiver was granted and the date of the waiver grant.
Item 11Executive Compensation
The information required by this item is incorporated by reference from the section of the Registrant’s Proxy Statement for the 2024 Annual Meeting of Shareholders captioned “Executive Compensation and Other Information”. During 2023, the Compensation Committee authorized the accelerated vesting of 12,500 shares of restricted stock for Mr. Everson and 10,000 shares of restricted stock for each of Messrs. Greenwood and Branstetter. These awards were originally scheduled to vest in 2030.
Item 12Security Ownership of Certain Beneficial Owners and Management and Related Stock Holder Matters
The information contained in the Registrant’s Proxy Statement for the 2024 Annual Meeting of Shareholders under the caption “Ownership of Voting Shares” is incorporated herein by reference.
The following table is a disclosure of securities authorized for issuance under equity compensation plans:
Equity Compensation Plan Information December 31, 2023 | |||||||
|
|
|
|
|
|
|
Number of securities remaining |
|
|
Number of securities to be |
|
|
|
|
available for future issuance |
|
|
issued upon exercise of |
|
Weighted-average exercise |
|
under equity compensation |
|
|
|
outstanding options, warrants |
|
price of outstanding options, |
|
plans (excluding securities |
|
|
|
and rights |
|
warrants and rights |
|
reflected in column (a)) |
|
Equity compensation plans approved by security holders |
|
217,500 |
(1) |
$ |
— |
|
337,500 |
Equity compensation plans not approved by security holders |
|
|
|
|
|
|
|
Total |
|
217,500 |
|
$ |
— |
|
337,500 |
(1) Represents shares of restricted stock awarded under the 2008 and 2018 Stock Incentive Plans.
Item 13Certain Relationships and Related Transactions
The information required by this item is incorporated herein by reference to the sections in the Registrant’s Proxy Statement for the 2024 Annual Meeting of Shareholders captioned “Director Independence and Related Party Transactions “ and ” Corporate Governance and Committees of the Board.”
Item 14Principal Accountant Fees and Services
The information required by this item is incorporated by reference from the section under the caption “Principal Accounting Firm Fees” of the Registrant’s Proxy Statement for the 2024 Annual Meeting of Shareholders.
PART IV
Item 15Exhibits and Financial Statement/Schedules
Financial Statements
The following Consolidated Financial Statements and related Notes to Consolidated Financial Statements, together with the report of the Independent Registered Public Accounting Firm (PCAOB ID 74), appear on pages 25 through 85 of the United Bancorp, Inc. 2023 Annual Report and are incorporated herein by reference.
Consolidated Balance Sheets
December 31, 2023 and 2022
Consolidated Statements of Income
Years Ended December 31, 2023 and 2022
Consolidated Statements of Comprehensive Income
Years Ended December 31, 2023 and 2022
Consolidated Statements of Stockholders’ Equity
Years Ended December 31, 2023 and 2022
Consolidated Statements of Cash Flows
Years Ended December 31, 2023 and 2022
Notes to Consolidated Financial Statements
December 31, 2023 and 2022
Report of Independent Registered Public Accounting Firm (PCAOB ID 74)
Exhibits
Exhibit Number |
|
Exhibit Description |
|
|
|
3.1 |
|
|
|
|
|
3.2 |
|
|
|
|
|
4.1 |
|
|
|
|
|
4.2 |
|
Forms of 6.00% Fixed to Floating Rate Subordinated Note due May 15, 2029 (11) |
|
|
|
10.1 |
|
|
|
|
|
10.2 |
|
|
|
|
|
10.3 |
|
|
|
|
|
10.4 |
|
|
|
|
|
10.5 |
|
|
|
|
|
10.6 |
|
|
|
|
|
10.7 |
|
|
|
|
|
10.8 |
|
|
|
|
|
10.9 |
|
|
|
|
|
10.10 |
|
|
|
|
|
10.11 |
|
|
|
|
|
10.12 |
|
|
|
|
|
13 |
|
|
|
|
|
21 |
|
|
|
|
|
23 |
|
|
|
|
|
31.1 |
|
|
|
|
|
31.2 |
|
|
|
|
|
32.1 |
|
|
|
|
|
32.2 |
|
|
|
|
97 |
|
|
|
|
|
101 |
|
The following materials from United Bancorp, Inc. on Form 10-K for the year ended December 31, 2023, formatted in XBRL (Extensible Business Reporting Language): (i) the Consolidated Balance Sheets; (ii) the Consolidated Statements of Income and Comprehensive Income; (iii) the Consolidated Statements of Cash Flows and (iv) Notes to Consolidated Financial Statements, tagged as blocks of text. |
|
|
|
104 |
|
Cover Page Interactive Data File (formatted as inline XBRL and contained in Exhibit 101) |
|
|
|
|
|
(1) Incorporated by reference to Appendix B to the registrant’s Definitive Proxy Statement filed with the Securities and Exchange Commission on March 14, 2001. |
|
|
|
|
|
(2) Incorporated by reference to Exhibit 3.2 to the registrant’s Current Report on Form 8-K filed with the Securities and Exchange Commission on November 18, 2016 |
|
|
|
|
|
(3) Incorporated by reference to the registrant’s 10-K filed with the Securities and Exchange Commission on March 27, 2003. |
|
|
|
|
|
(4) Incorporated by reference to Exhibit 4 to registrant’s 10-K filed with the Securities and Exchange Commission on March 20, 2020. |
|
|
|
|
|
(5) Incorporated by reference to the registrant’s 10-K filed with the Securities and Exchange Commission on March 29, 2004. |
|
|
|
|
|
(6) Incorporated by reference to the registrant’s 10-K filed with the Securities and Exchanges Commission on March 30, 2006. |
|
|
|
|
|
(7) Incorporated by reference to the registrant’s 8-K filed with the Securities and Exchange Commission on September 24, 2008. |
|
|
|
|
|
(8) Incorporated by reference to the registrant’s 8-K filed with the Securities and Exchange Commission on April 22, 2008. |
|
|
|
|
|
(9) Incorporated by reference to Exhibit 10.10 to the registant’s Annual Report on Form 10-K filed with the Securities and Exchange Commission on March 19, 2014 |
|
|
|
|
|
(10) Incorporated by reference to Exhibit 10.1 to the registant’s Quarterly Report on Form 10-Q filed with the Securities and Exchange Commission on August 14, 2018 |
|
|
|
|
|
(11) Incorporated by reference to Exhibit 4.1 to the registrant’s Current Report on Form 8-K filed with the Securities and Exchange Commission on May 14, 2019. |
|
|
|
|
|
(12) Incorporated by reference to Exhibit 10.1 to the registrant’s Current Report on Form 8-K filed with the Securities and Exchange Commission on May 14, 2019. |
United Bancorp Inc.
Signatures
Pursuant to the requirements of Section 13 or 15(d) of the Securities Exchange Act of 1934, the registrant has duly caused this report to be signed on its behalf by the undersigned, thereunto duly authorized.
(Registrant) United Bancorp, Inc.
By: |
/s/ Scott A. Everson |
|
March 20, 2024 |
|
Scott A. Everson, President & Chief Executive Officer |
|
|
Pursuant to the requirements of the Securities Exchange Act of 1934, this report has been signed below by the following persons on behalf of the registrant and in the capacities and on the dates indicated.
By: |
/s/ Scott A. Everson |
|
March 20, 2024 |
|
Scott A. Everson, Director, President & Chief Executive Officer |
|
|
|
|
|
|
By: |
/s/ Randall M. Greenwood |
|
March 20, 2024 |
|
Randall M. Greenwood, Senior Vice President & CFO |
|
|
|
|
|
|
By: |
/s/ Gary W. Glessner |
|
March 20, 2024 |
|
Gary W. Glessner, Director |
|
|
|
|
|
|
By: |
/s/ John M. Hoopingarner |
|
March 20, 2024 |
|
John M. Hoopingarner, Director |
|
|
|
|
|
|
By: |
/s/ Richard L. Riesbeck |
|
March 20, 2024 |
|
Richard L. Riesbeck, Director |
|
|
|
|
|
|
By: |
/s/ Bethany E. Schunn |
|
March 20, 2024 |
|
Bethany E. Schunn, Director |
|
|
|
|
|
|
By: |
/s/ Brian M. Hendershot |
|
March 20, 2024 |
|
Brian M. Hendershot, Director |
|
|
Exhibit 13
A Letter from the President and CEO

To the shareholders of United Bancorp, Inc….
As we reflect on another year, it is with a profound sense of gratitude and optimism that I share with you the achievements and progress of United Bancorp, Inc. (UBCP) throughout 2023. Amidst a dynamic economic landscape, characterized by continued adjustments in monetary policy and evolving market conditions, our Company not only navigated these challenges with resilience; but, it also evolved and capitalized on emerging opportunities to maintain its relevance and deliver commendable financial performance and strategic growth.
As I have communicated to you in previous reports, what truly strange times these last three years have been for everyone! Beginning in 2020, we experienced a world-wide pandemic for which we had been “theoretically” preparing for many years at the guidance of our regulatory authorities. Quite frankly, many within our industry thought that doing the “table top” testing in our business continuity planning for such an event was an act of frivolity. This global pandemic, no doubt, changed the world forever and was projected to have a cataclysmic impact on the financial services industry. But, overall, our industry and Company prevailed and performed at relatively high levels throughout its duration… all things considered.
In 2021, our country started to somewhat recover from the pandemic and our economy started to slowly open, once again--- albeit, not in a linear fashion throughout the entirety of our country. During this timeframe, we started to see inflation rear its ugly head at levels we had not seen since the early 1980’s… after thinking for many years that this “inflation beast” was a thing of the past! In reality, our monetary policy was too accommodating for far too long--- being at Zero Interest Rate Policy (ZIRP) or, at least extremely relaxed relative to historic levels for the better part of the previous fourteen plus years. This relaxed and overly accommodating monetary policy started in 2008 with the general concern about our country’s low economic growth that arose out of the Great Recession (and, the real risk of deflation that prevailed at that time) and, ended in 2022 after the shutdown of our economy in response to the pandemic and the supply chain disruption resulting therefrom. During the latter part of this period… and, for the first time in almost forty years… we experienced heightening levels of inflation. But, we were told by the “experts” at The Federal Reserve and other national economists that the phenomena of heightened inflation that we had not seen for many years was simply “transitory” (or, would be short-lived) and that it would moderate as our economy recovered from the pandemic-induced slow-down and more fully normalized. How wrong they were!
As the year 2021 progressed and we entered 2022, we started to experience levels of inflation that started to create stress for everyone--- culminating in a Consumer Price Index (CPI) reaching nearly double digits. In 2022 and in response to the heightened inflation that we were experiencing, the Federal Open Market Committee of the Federal Reserve (FOMC) finally realized that inflation was more than “transitory” and started to increase the target for the Federal Funds Rate (FFR) in March of that year. Over the course of the next sixteen months, the FOMC increased the target for the FFR eleven (11) times by raising the range for the target rate from a range of zero to twenty-five basis points (0% to 0.25%) to a level of five and a quarter percent to five and a half percent (5.25% to 5.50%) by July of 2023. The rapidity of and degree to which the target for the FFR rose during this relatively short-timeframe is historically unprecedented and started to create both a drag on the earnings that our industry produced due to declining net interest incomes and compressing margins, along with putting stress on the tangible capital levels of many banks due to the unrealized losses in their securities portfolios.
As we entered the year 2023, inflation was coming down--- albeit, rather slowly--- from the higher levels that peaked in June of 2022. At the beginning of this past year, it was projected that inflation would normalize as the tightened monetary policy and elevated interest rates would finally push our economy into a recession. With an inverted yield curve for the entirety of the year (and, for the better part of the previous year for that matter), the markets certainly thought that a recession would occur and that interest rates would also decline sometime during the year. One by-product of the dramatic increase in overall interest rate levels from 2022 and continuing into 2023 was the reality that some banks were not managed prudently and had overinvested in longer-term assets over the course of 2020 and 2021 when monetary policy was Zero Interest Rate Policy (ZIRP) and overnight interest rates were at zero or close thereto. During this timeframe, the free-flow of lower-cost deposits (which were highly liquid since they were typically uninsured and not term funds) into these banks enticed them to invest longer-term to generate a profitable spread.
|
1 |
||
A Letter from the President and CEO - Continued
Unfortunately for these few banks, when interest rates dramatically rose over the course of a short period of time, the cost of these formally low-cost deposits increased and caused financial hardship for them. Arguably, only a handful of banks were in this situation; but, the media sensationalized this as being an industry-wide phenomena, which created issues for our industry as a whole and caused concern with investors that many banks would fail or need to sell. This put extreme pressure on the market values of most banks in our country and induced unwarranted panic among many regarding the general health of the financial services industry.
With all of this turmoil that has occurred over the course of these past three years and the challenges with which our Company has been confronted, it is quite remarkable that United Bancorp, Inc. (UBCP) had the three best years of earnings performance in its entire one hundred twenty-one(121) year history during this period. Arguably, 2023 was the best year of performance that UBCP has ever seen on a “core” operating basis… when the negative provisioning realized by our Company in each of these three years is not considered. But, looking at the reported financial performance of UBCP (including the positive impact of negative provisioning), our Company had the second highest level of earnings performance in its history in 2023. For the year ended December 31, 2023, UBCP produced net income of $8,950,000 and diluted earnings per share of $1.57, respective increases over the results achieved for each the previous year of $293,000, or 3.4%, and $0.07 or 4.7% (and, only lower that that achieved in 2021). At the earnings level achieved in 2023, UBCP had a return on average assets (ROA) of 1.12% and a return on average equity of 17.12%, which compares very favorably with our peer group of banks and industry. In addition, Management was also extremely happy to report that UBCP, once again, was recognized by American Banker in their annual “Top 200 Publicly Traded Community Banks”, coming in at number 84, which matched the same rank achieved the previous year.
As previously mentioned, the year 2023 was marked by continued adjustment in monetary policy, with the Federal Reserve maintaining its stance on interest rates to navigate inflationary pressures and economic shifts. In addition, it was further marked by the “media-driven” banking crisis that develop late in the first quarter, which gave our entire industry a black eye. But, this event, in reality, was isolated to a few financial institutions within our industry and primarily caused by the poor management of these specific banks. Nonetheless, these events continued to create headwinds for our Company. Despite these challenges, United Bancorp, Inc. (UBCP) remained well-positioned to leverage the environment to our advantage by responding to each accordingly.
United Bancorp, Inc. (UBCP) has been able to capitalize on the historically extreme tightening of monetary policy undertaken by the Federal Open Market Committee of the Federal Reserve (FOMC) over the course of a short period of sixteen months. Although it has been somewhat challenging to produce improving results in such a fast-paced, increasing interest rate environment, UBCP was properly positioned to take advantage of this historic and dramatic increase in interest rates and our Company experienced an improvement in the level of net interest income that it realized this past year, while maintaining a very stable net interest margin… a feat not experienced by many financial institutions in 2023!
On the asset-side of our balance sheet, we achieved the positive result of increasing net interest income and a stabile net interest margin partly by seeing our overall loan portfolio yield increase in the current rising rate environment, even though from a volume perspective, our average loans were relatively flat, only increasing for the year ending December 31, 2023 by $920,000 or 0.20%. Of note is that our Company did see a more significant uptick in gross loans during the fourth quarter of this past year by $22.4 million, or 4.9%, to a level of $483.2 million at year-end.
More strongly contributing to the improvement in United Bancorp, Inc.’s (UBCP) net interest income level achieved and its stabile net interest margin in 2023 were its higher balance sheet totals for both average cash and due from the Federal Reserve Bank and average investment securities. Our Company’s overnight funds, that are parked in cash equivalents, have benefited from the inverted yield curve that continued over the course of the past year, which was driven by the aggressive tightening policy of the Federal Open Market Committee (FOMC). At year-end 2023, the average balance of these overnight, liquid funds totaled $53.8 million, an increase of $9.2 million, or 20.5%, over the previous year, and yielded approximately 5.1% for our Company after the final increase in the target for the federal funds rate by the FOMC in July of this past year. Each time the FOMC increased the target for the federal funds rate, UBCP benefited by seeing the yield on these liquid funds increase by a like amount.
2 |
|
|
|
A Letter from the President and CEO - Continued
But, the most impactful force upon our Company achieving a higher level of net interest income in 2023 was the higher average balance in our investment securities portfolio in a rising rate environment. As we have previously reported, we did not invest in securities for almost two years beginning in March of 2020, when rates dramatically decreased due to the Zero Interest Rate Policy (ZIRP) by the Federal Open Market Committee (FOMC) due to the onset of the pandemic. Quite simply, we patiently waited for policy tightening by the FOMC to begin and rates to increase to more historically normalized levels. Accordingly, our Company started to, once again, invest in securities when rates began to rise to more appealing levels toward the end of the first quarter of 2022 and continued to regularly invest in new security offerings until March of 2023… when challenges arose for our industry and liquidity became more of a focus for us due to the aforementioned “media-driven” banking crisis. Even though this fabricated crisis caused our Company to refrain from purchasing investment securities from early March and throughout the majority of this past year in order to maintain a strong liquidity position, we did benefit from the leveraged position that we developed in our investment portfolio over the previous twelve months and, for the year, our average securities for our Company increased by $54.7 million, or 31.3%, to a level of $229.6 million.
On the liability-side of the balance sheet, this past year United Bancorp, Inc. (UBCP) did experience an increase in the interest expense that it incurred. As could be expected with the dramatic increase in interest rates that continued during the course of this past year, total interest expense increased by $7.7 million, or 236.5%, year-over-year in 2023. But, even with this dramatic increase in interest expense for our Company, we were able to control the level of increase in this key area; thereby, maintaining the previously discussed increase in our Company’s net interest income and a stabile net interest margin. We achieved this result by becoming less liability-sensitive in the first quarter in reaction to the “media driven” banking crisis, when liquidity became “king” for our industry and Company. With the developments that occurred within our industry in the late first quarter of 2023, we transitioned into a more conservative operating position that greatly increased our overall liquidity and “locked in” a fair portion of our funding as a hedge against further interest rate increases by taking a $75.0 million advance from the Federal Home Loan Bank (FHLB). Initially, this significant advance had somewhat of a dilutive impact on our returns and margins (such as our return on assets and our net interest margin); but, it was immediately accretive to our bottom-line earnings. Since rates continued to rise after the origination of these now competitively priced advances (to which we locked-in on a blended basis at a rate of approximately 4.2% for an approximate term of four years), we were able to more selectively manage our depository portfolio by allowing a portion of the “rate sensitive” funding to either roll-off or reinvest in other higher cost depository products which still cost less than overnight federal funds; thus, helping us to control our interest expense, while maintaining very adequate liquidity levels and generating increasing returns on this strategic posture. For the first time in several years, UBCP did experience a decline in its total deposits, which decreased by $28.5 million, or 4.4%, in 2023. This decline in total deposits included a decrease in low-cost deposits (consisting of noninterest bearing deposits, interest bearing demand and savings balances) of $78.1 million, which was partially offset by an increase in time deposits of $49.6 million. With this change in the mix of our funding, our Company’s interest expense to total assets was 1.34% at year-end, an increase of 91 basis points year-over-year. As previously mentioned, even with this increase in interest expense, UBCP was able to maintain a relatively stable net interest margin this past year, which only dropped by 8 basis points to a level of 3.65% at year-end. Each of these metrics compare very favorably to peer and contributed to UBCP achieving its solid earnings performance in 2023.
Relating to the noninterest margin of United Bancorp, Inc. (UBCP) in 2023, our Company was able to maintain the level of noninterest income that it generated even though there was both extreme political and regulatory pressure on the purported “junk fees” that our industry is accused of charging… even though, most customers believe that the fees charged by the banking industry are fair and the services provided relating thereto are desired. With a focus on the future, in September our Company hired new staffing relating to our newest division, Unified Mortgage. With the need to develop or enhance revenue lines within our Company, we hired an individual who successfully ran a mortgage company for over twenty years. In addition, we have developed a model; whereby, we finally have dedicated mortgage originators that strictly focus on the production of purchase money consumer mortgage loans. As we ramp up the operations of Unified Mortgage by revamping our product offerings and leveraging our origination platform, we are confident that we will generate higher levels of noninterest or fee income in the coming years, even though both nonsufficient fund and interchange income will remain under attack. In 2023, UBCP generated noninterest income of $4.1 million, a marginal decline of $29,000, or 0.71%, over the previous year.
Relating to the other half of the noninterest margin, United Bancorp, Inc. (UBCP) was able to somewhat control the inevitable increase in its noninterest expense level. Considering that inflation continues to remain well-above historic norms, our Company saw its noninterest expense increase by a respectable $962,000 or 4.8%. Much of this increase is attributed to higher personnel related expenses incurred to keep adequate staffing during this very challenging time--- when wage inflation remained high (along with a high level of job openings) and unemployment remained relatively low. In addition, UBCP maintained its focus on remaining relevant by keeping a focus on digital transformation and investing in the digital delivery services and channels demanded by our customer base, which further added to noninterest expense levels. Lastly, and very excitedly, our Company successfully negotiated a lease on a prime parcel of real estate in the desirable Wheeling, West Virginia Market that added to our noninterest expense in the fourth quarter. We are in the process of designing and building a new regional banking center at this location which should be finished sometime in the late fourth quarter of 2024 or early 2025. Overall, our Company is committed to eliminating unnecessary expenses where warranted… but, prudently taking on expenses in areas that will help us to maintain our relevancy and ensure our future success.
|
3 |
||
A Letter from the President and CEO - Continued
In 2023, even with the continued heightened inflation levels and related increases in interest rates that impacted our borrowers with higher operating costs and potential rate resets to higher interest rate levels and payments on their loans, United Bancorp, Inc. (UBCP) maintained credit-related strength and stability in its loan portfolio. At year-end, our Company’s total nonaccrual loans and loans past due 30 plus days were $1.15 million, or 0.24%, which is a slight increase of $540,000 year-over-year. Nonaccrual loans and OREO to average assets wat 0.48%, a decrease of one(1) basis point over the previous year. Also, further highlighting the overall strength of our loan portfolio, our Company had net loans charged off of (-$19,000), or a net loan recovery (exclusive of overdraft charge-offs), this past year. Amazingly, all of the charge off activity that UBCP experienced in 2023 related to overdraft activity, which totaled $120,000 for the year. With the enhanced loan loss reserve build-up under CECL that occurred on January 1, 2023 (and, our Company’s stable and solid credit quality metrics), we were able to have a negative provision for credit losses, once again, this past year. Though UBCP’s provision for credit losses was a negative amount in 2023... it still increased by $501,000 over the previous year, which reduced net income and diluted earnings per share by respective amounts of $396,000 and $0.07, relative to the prior year. Even with this lower level of negative credit provisioning in 2023, we firmly believe that we are well reserved with very strong coverage… having a total allowance for credit losses to total loans of 0.81% and a total allowance for credit losses to nonperforming loans of 706% at year-end.
At United Bancorp, Inc. (UBCP), our primary focus is protecting the investment of our valued shareholders in our Company and rewarding you in a balanced fashion by growing our Company’s market value over time and paying an attractive cash dividend. This past year was a challenging one for the market values of all bank-related stocks and--- even though we had very solid earnings results--- we did see the market value of our Company’s stock decline from the previous year. At year-end, UBCP’s stock closed at $12.84. Once again in 2023, our Company rewarded its shareholders with a very solid dividend payout of $0.8150 per share, which was higher than the previous year’s cash dividend payout of $0.7750… an increase of $0.04 per share or 5.2%. At this dividend payout level and our year-end market value, our dividend yield is a very solid 6.3%. In looking at the Total Return Performance Chart in this annual report, the five-year total return performance--- which considers both market value appreciation and cash dividend payouts--- shows that your investment in UBCP compared very favorably to all of the other bank related indices, to which our Company compares, listed on this chart. As always, our goal is to provide the highest level of return to you, our valued shareholders, while growing our company in a safe and sound manner!
As you can see, United Bancorp, Inc. (UBCP) had one of its highest performing years in terms of earnings performance in 2023, while operating in a very dynamic economic and regulatory environment. But… your management team will never be satisfied resting on past performance and laurels. This past year, we grew our total assets by $62.1 million, or 8.2%, to a level of $819.4 million. Moving forward, we continue to remain strongly focusing on achieving our goal of becoming a $1.0 billion community banking organization in, hopefully, the not too distant future. While striving to reach this goal, we will maintain our commitment to and standard of producing stellar, above peer, performance-related results as we confidently move forward as one of the premier community banks in our industry. UBCP is truly blessed to have a “Unified and United” team, management, board of directors and shareholder group. As a successful financial services company, we truly appreciate everyone’s continued support… Together, We Will Accomplish More!
4 |
|
|
|

Scott A. Everson
President and Chief Executive Officer
ceo@unitedbancorp.com
February 19, 2024
Certain statements contained herein are not based on historical facts and are “forward-looking statements” within the meaning of Section 21A of the Securities Exchange Act of 1934. Forward-looking statements, which are based on various assumptions (some of which are beyond the Company’s control), may be identified by reference to a future period or periods, or by the use of forward-looking terminology, such as “may,” “will,” “believe,” “expect,” “estimate,” “anticipate,” “continue,” or similar terms or variations on those terms, or the negative of these terms. Actual results could differ materially from those set forth in forward-looking statements, due to a variety of factors, including, but not limited to, those related to the economic environment, particularly in the market areas in which the company operates, competitive products and pricing, fiscal and monetary policies of the U.S. Government, changes in government regulations affecting financial institutions, including regulatory fees and capital requirements, changes in prevailing interest rates, acquisitions and the integration of acquired businesses, credit risk management, asset/liability management, changes in the financial and securities markets, including changes with respect to the market value of our financial assets, and the availability of and costs associated with sources of liquidity. The Company undertakes no obligation to update or clarify forward-looking statements, whether as a result of new information, future events or otherwise. |
|
|
5 |
||
DIVIDEND AND STOCK HISTORY
|
|
|
|
|
|
|
Distribution Date of |
|
|
|
Cash Dividends |
|
Special Cash Dividends |
|
Dividends and |
|
|
|
|
Declared (1) |
|
and Stock Dividends |
|
Exchanges |
|
|
1983 |
|
$ |
0.05 |
|
— |
|
— |
|
1984 |
|
$ |
0.06 |
|
4 for 1 Exchange (2) |
|
January 2, 1984 |
|
1985 |
|
$ |
0.07 |
|
— |
|
— |
|
1986 |
|
$ |
0.09 |
|
— |
|
— |
|
1987 |
|
$ |
0.09 |
|
50% Stock Dividend |
|
October 2, 1987 |
|
1988 |
|
$ |
0.10 |
|
— |
|
— |
|
1989 |
|
$ |
0.10 |
|
— |
|
— |
|
1990 |
|
$ |
0.11 |
|
— |
|
— |
|
1991 |
|
$ |
0.12 |
|
— |
|
— |
|
1992 |
|
$ |
0.12 |
|
100% Stock Dividend |
|
September 10, 1992 |
|
1993 |
|
$ |
0.12 |
|
100% Stock Dividend |
|
November 30, 1993 |
|
1994 |
|
$ |
0.13 |
|
10% Stock Dividend |
|
September 9, 1994 |
|
1995 |
|
$ |
0.19 |
|
— |
|
— |
|
1996 |
|
$ |
0.20 |
|
10% Stock Dividend |
|
June 20, 1996 |
|
1997 |
|
$ |
0.23 |
|
10% Stock Dividend |
|
September 19, 1997 |
|
1998 |
|
$ |
0.26 |
|
5% Stock Dividend |
|
December 18, 1998 |
|
1999 |
|
$ |
0.30 |
|
5% Stock Dividend |
|
December 20, 1999 |
|
2000 |
|
$ |
0.31 |
|
5% Stock Dividend |
|
December 20, 2000 |
|
2001 |
|
$ |
0.32 |
|
5% Stock Dividend |
|
December 20, 2001 |
|
2002 |
|
$ |
0.33 |
|
5% Stock Dividend |
|
December 20, 2002 |
|
2003 |
|
$ |
0.35 |
|
10% Stock Dividend |
|
December 19, 2003 |
|
2004 |
|
$ |
0.39 |
|
10% Stock Dividend |
|
December 20, 2004 |
|
2005 |
|
$ |
0.43 |
|
10% Stock Dividend |
|
December 20, 2005 |
|
2006 |
|
$ |
0.48 |
|
10% Stock Dividend |
|
December 20, 2006 |
|
2007 |
|
$ |
0.52 |
|
— |
|
— |
|
2008 |
|
$ |
0.54 |
|
— |
|
— |
|
2009 |
|
$ |
0.56 |
|
— |
|
— |
|
2010 |
|
$ |
0.56 |
|
— |
|
— |
|
2011 |
|
$ |
0.56 |
|
— |
|
— |
|
2012 |
|
$ |
0.42 |
|
— |
|
— |
|
2013 |
|
$ |
0.29 |
|
— |
|
— |
|
2014 |
|
$ |
0.33 |
|
— |
|
— |
|
2015 |
|
$ |
0.37 |
|
5¢ Per Share Special Dividend |
|
December 29, 2016 |
|
2016 |
|
$ |
0.42 |
|
5¢ Per Share Special Dividend |
|
December 29, 2017 |
|
2017 |
|
$ |
0.46 |
|
5¢ Per Share Special Dividend |
|
December 29, 2018 |
|
2018 |
|
$ |
0.52 |
|
5¢ Per Share Special Dividend |
|
December 28, 2019 |
|
2019 |
|
$ |
0.545 |
|
— |
|
— |
|
2020 |
|
$ |
0.57 |
|
— |
|
— |
|
2021 |
|
$ |
0.685 |
|
10¢ Per Share Special Dividend |
|
March 19, 2022 |
|
2022 |
|
$ |
0.775 |
|
15¢ Per Share Special Dividend |
|
March 18, 2022 |
|
2023 |
|
$ |
0.815 |
|
15¢ Per Share Special Dividend |
|
March 20, 2023 |
|
6 |
|
|
|
2024 ANTICIPATED DIVIDEND PAYABLE DATES
♦ |
First Quarter |
March 20, 2024 |
|
|
|
|
|
♦ |
Second Quarter* |
June 20, 2024 |
|
|
|
|
|
♦ |
Third Quarter* |
September 20, 2024 |
|
|
|
|
|
♦ |
Fourth Quarter* |
December 20, 2024 |
|
|
|
* |
Subject to action by Board of Directors |
| (1) | Adjusted for stock dividends and exchanges. |
| (2) | Formation of United Bancorp, Inc. (UBCP). Unified Bank (formerly The Citizen’s Saving Bank) shareholders received 4 shares of UBCP stock in exchange for 1 share of bank stock. |
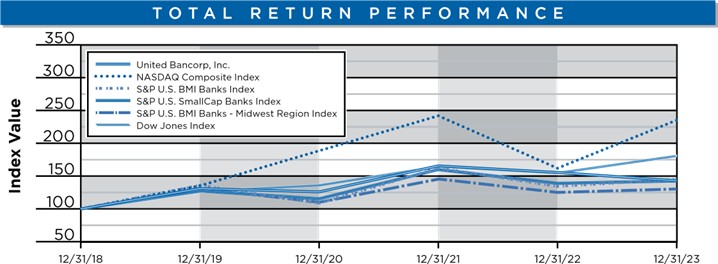
Index |
|
12/31/18 |
|
12/31/19 |
|
12/31/20 |
|
12/31/21 |
|
12/31/22 |
|
12/31/23 |
United Bancorp, Inc. |
|
100.00 |
|
131.06 |
|
126.17 |
|
166.62 |
|
154.34 |
|
143.61 |
NASDAQ Composite Index |
|
100.00 |
|
136.69 |
|
198.10 |
|
242.03 |
|
163.28 |
|
236.17 |
S&P U.S. BMI Banks Index |
|
100.00 |
|
137.36 |
|
119.83 |
|
162.92 |
|
135.13 |
|
147.41 |
S&P U.S. SmallCap Banks Index |
|
100.00 |
|
125.46 |
|
113.94 |
|
158.62 |
|
139.85 |
|
140.55 |
S&P U.S. BMI Banks - Midwest Region Index |
|
100.00 |
|
130.10 |
|
111.85 |
|
147.78 |
|
127.53 |
|
130.20 |
Dow Jones Index |
|
100.00 |
|
125.34 |
|
137.53 |
|
166.34 |
|
154.92 |
|
180.00 |
|
7 |
||
Directors

8 |
|
|
|
Directors and Officers
DIRECTORS OF UNITED BANCORP, INC. | |||
|
|
|
|
Scott A. Everson1 |
|
President & Chief Executive Officer, United Bancorp, Inc. |
|
|
|
Chairman, President & Chief Executive Officer, Unified Bank, Martins Ferry, Ohio |
|
|
|
|
|
Gary W. Glessner2 |
|
CPA & CGMA, Managing Member, Glessner & Associates, PLLC; |
|
|
|
Glessner Wharton Andrews Insurance, LLC; Tiffany’s, LLC; GWA Realty, LLC, |
|
|
|
GW Rentals, LLC; Trustee, Windmill Truckers Center, Inc. |
|
|
|
|
|
Brian M. Hendershot |
|
President, Ohio - West Virginia Excavating, Shadyside, Ohio |
|
|
|
|
|
|
|
|
|
John M. Hoopingarner, Esq.1,2,3,4 |
|
Of Counsel, McMahon, DeGulis LLP, Columbus, Cleveland & Cincinnati, Ohio |
|
|
|
|
|
Richard L. Riesbeck1,2,3,4 |
|
Chairman, United Bancorp, Inc.; President, Riesbeck Food Markets, Inc., St. Clairsville, Ohio |
|
|
|
|
|
Bethany E. Schunn |
|
Plant Manager, Cardinal Operating Company, Brilliant, Ohio |
|
|
|
|
|
James W. Everson |
|
Chairman Emeritus 1969 - 2017 |
|
OFFICERS OF UNITED BANCORP, INC. | ||
|
|
|
Scott A. Everson |
|
President & Chief Executive Officer |
Matthew F. Branstetter |
|
Senior Vice President, Chief Operating Officer |
Randall M. Greenwood |
|
Senior Vice President, Chief Financial Officer, Treasurer & Corporate Secretary |
|
9 |
||
DIRECTORS OF UNIFIED BANK |
|
|||
|
|
|
|
|
Erin S. Ball |
|
Vice President, Carenbauer Distributing Corporation, Wheeling, West Virginia |
|
|
|
|
|
|
|
Jonathan C. Clark, Esq |
|
Attorney at Law, Lancaster, Ohio |
|
|
|
|
|
|
|
Scott A. Everson1 |
|
President & Chief Executive Officer, United Bancorp, Inc. |
|
|
|
|
Chairman, President & Chief Executive Officer, Unified Bank, Martins Ferry, Ohio |
|
|
|
|
|
|
|
Gary W. Glessner2 |
|
CPA & CGMA, Managing Member, Glessner & Associates, PLLC; |
|
|
|
|
Glessner Wharton Andrews Insurance, LLC; Tiffany’s, LLC; GWA Realty, LLC, |
|
|
|
|
GW Rentals, LLC; Trustee, Windmill Truckers Center, Inc. |
|
|
|
|
|
|
|
Brian M. Hendershot |
|
President, Ohio-West Virginia Excavating, Shadyside, Ohio |
|
|
|
|
|
|
|
John R. Herzig |
|
President, Toland-Herzig Funeral Homes & Crematory, Strasburg and Dover, Ohio |
|
|
|
|
|
|
|
John M. Hoopingarner, Esq.1,2 |
|
Of Counsel, McMahon, DeGulis LLP, Columbus, Cleveland and Cincinnati, Ohio |
|
|
|
|
|
|
|
Richard L. Riesbeck1,2, F |
|
Chairman, United Bancorp, Inc.; President, Riesbeck Food Markets, Inc., St. Clairsville, Ohio |
|
|
|
|
|
|
|
Bethany E. Schunn |
|
Plant Manager, Cardinal Operating Company, Brilliant, Ohio |
|
|
|
|
|
|
|
James W. Everson |
|
Chairman Emeritus 1969 - 2017 |
|
|
|
|
|
|
|
|
1 = Executive Committee 2 = Audit Committee 3 = Compensation Committee 4 = Nominating and Governance Committee ö = Lead Director | ||||
| ||||
10 |
|
|
|
Bank Past Presidents & Directors
The journey to becoming the institution we are today began in Martins Ferry, Ohio in 1902. Originally founded as The German Savings Bank and renamed to The Citizens Savings Bank in 1918, the last 121 years have seen growth and change that would have been unimaginable at its' founding. The bank has grown through sound management, the addition of new offices and the acquisition of others. With the name change from The Citizens Savings Bank to Unified Bank in 2019, it has and will continue to move forward.
The growth and success of the bank has been attributed to the association of many dedicated individuals.
PAST PRESIDENTS
Edward E. McCombs, 1902-1936
John E. Reynolds, 1936 – 1940
Harold H. Riethmiller, 1940 – 1973
James W. Everson, 1973 – 2002
Past Board of Directors |
|
|
|
Edward E. McCombs, 1902-1936* |
Dr. Charles D. Messerly, 1957-1987 |
John E. Reynolds, 1902-1940 |
James M. Blackford, 1962-1968 |
Dr. Joseph W. Darrah, 1902-1937 |
John H. Morgan, 1967-1976 |
J.A. Crossley, 1902-1903 |
Emil F. Snyder, 1968-1975 |
William M. Lupton, 1902-1902 |
James H. Cook, 1976-1986 |
F.K. Dixon, 1902-1909 |
Paul Ochsenbein, 1978-1991 |
Dr. R.H. Wilson, 1902-1905 |
David W. Totterdale, 1981-1995 |
Chris A. Heil, 1903-1909 |
Albert W. Lash, 1975-1996 |
David Coss, 1904-1938 |
Premo R. Funari, 1976-1997 |
L.L. Scheele, 1905-1917 |
Donald A. Davison, 1963-1997* |
A.T. Selby, 1906-1954 |
Harold W. Price, 1999-1999 |
H.H. Rothermund, 1907-1912 |
John H. Clark, Jr., 1976-2001 |
Dr. J.G. Parr, 1912-1930 |
Dwain R. Hicks, 1999-2002 |
T.E. Pugh, 1920-1953 |
Michael A. Ley, 1999-2002 |
J.J. Weiskircher, 1925-1942 |
Michael J. Arciello 1992 - 2009 |
David H. James, 1925-1963 |
Leon F. Favede, O.D., 1981-2012 |
Dr. C.B. Messerly, 1931-1957 |
Herman E. Borkoski, 1987-2012 |
H.H. Riethmiller, 1936-1980* |
James W. Everson, 1969-2014* |
E.M. Nickles, 1938-1968 |
Robin L. Rhodes, 2007-2015 |
L.A. Darrah, 1939-1962 |
Andrew C. Phillips, 2007-2015 |
R.L. Heslop, 1941-1983 |
Errol C. Sambuco, 1996-2015 |
Joseph E. Weiskircher, 1943-1975 |
Samuel J. Jones, 2007-2015 |
Edward M. Selby, 1953-1976 |
Matthew C. Thomas, 1988-2016 |
David W. Thompson, 1954-1966 |
Terry A. McGhee, 2001-2017 |
Carl A Novak, D.D.S., 2018-2021 |
|
|
|
|
* Past Chairman |
|
11 |
||
Shareholder Information
United Bancorp, Inc.’s (the Company) common stock trades on The Nasdaq Capital Market tier of The Nasdaq Stock Market under the symbol UBCP, CUSIP #909911109. At year-end 2023, there were 6,063,851 shares issued, held among approximately 3,000 shareholders of record and in street name. The following table sets forth the quarterly high and low closing prices of the Company’s common stock from January 1, 2023 to December 31, 2023 compared to the same periods in 2022 as reported by the NASDAQ.
|
|
2023 |
|
|
2022 |
||||||||||||||
|
|
31-Mar |
|
30-Jun |
|
30-Sep |
|
31-Dec |
|
|
31-Mar |
|
30-Jun |
|
30-Sep |
|
31-Dec |
||
Market Price Range |
|
|
|
|
|
|
|
|
|
|
|
|
|
|
|
|
|
|
|
High ($) |
|
$ |
15.43 |
|
14.37 |
|
12.24 |
|
13.95 |
|
|
$ |
18.38 |
|
20.60 |
|
18.04 |
|
16.70 |
Low ($) |
|
$ |
12.26 |
|
11.14 |
|
11.23 |
|
9.90 |
|
|
$ |
16.51 |
|
15.40 |
|
14.99 |
|
14.35 |
|
|
|
|
|
|
|
|
|
|
|
|
|
|
|
|
|
|
|
|
Cash Dividends |
|
|
|
|
|
|
|
|
|
|
|
|
|
|
|
|
|
|
|
Quarter ($) |
|
$ |
0.3125 |
|
0.1650 |
|
0.1675 |
|
0.1700 |
|
|
$ |
0.3025 |
|
0.1550 |
|
0.1575 |
|
0.1600 |
Cumulative ($) |
|
$ |
0.3125 |
|
0.4775 |
|
0.6450 |
|
0.8150 |
|
|
$ |
0.3025 |
|
0.4575 |
|
0.6150 |
|
0.7750 |
Investor Relations:
A copy of the Company’s Annual Report on form 10-K as filed with the SEC, will be furnished free of charge upon written or E-mail request to:
Randall M. Greenwood, CFO United Bancorp, Inc.
201 South 4th Street PO Box 10
Martins Ferry, OH 43935
or
cfo@unitedbancorp.com
Dividend Reinvestment and Stock Purchase Plan:
Shareholders may elect to reinvest their dividends in additional shares of United Bancorp, Inc.’s common stock through the Company’s Dividend Reinvestment Plan. Shareholders may also invest optional cash payments of up to $5,000 per month in our common stock at market price. To arrange automatic purchase of shares with quarterly dividend proceeds, please contact:
Equiniti Trust Company, LLC 48 Wall Street, Floor 23 New York, NY 10005
Phone (US Shareholders):
+1 (800) 937-5449
Phone (Non-US Shareholders):
+1 (718) 921-8124
Annual Meeting:
The Annual Meeting of Shareholders will be held at 2:00 p.m., April 17, 2024 at the Corporate Offices in Martins Ferry, Ohio.
Internet:
Please look us up at http//:www.unitedbancorp.com
Independent Auditors:
S.R. Snodgrass, P.C.
2009 Mackenzie Way, Suite 340
Cranberry Township, PA 16066
(724) 934 0344
12 |
|
|
|
Corporate Offices:
Unified Bank Building
201 South 4th Street, Martins Ferry, Ohio 43935
Randall M. Greenwood
Corporate Secretary
(888) 275-5566 (EXT 6181)
(740) 633-0445 (EXT 6181)
(740) 633-1448 (FAX)
Transfer Agent and Registrar:
For transfers and general correspondence, please contact:
Equiniti Trust Company, LLC 48 Wall Street, Floor 23 New York, NY 10005
Phone (US Shareholders): +1 (800) 937-5449
Phone (Non-US Shareholders): +1 (718) 921-8124
Stock Trading:
Raymond James
222 South Riverside Plaza
7th Floor
Chicago, Illinois 60606
Anthony LanFranco
312-655-2961
Piper | Sandler
Johathan Rook
1 Greewich Plz
Greewich, CT 06830-6352
212-466-8036
|
13 |
||
Management’s Discussion and Analysis
In the following pages, management presents an analysis of United Bancorp, Inc.’s financial condition and results of operations as of and for the year ended December 31, 2023 as compared to prior years. This discussion is designed to provide shareholders with a more comprehensive review of the operating results and financial position than could be obtained from an examination of the financial statements alone. This analysis should be read in conjunction with the Consolidated Financial Statements and related footnotes and the selected financial data included elsewhere in this report.
When used in this discussion or future filings by the Company with the Securities and Exchange Commission, or other public or shareholder communications, or in oral statements made with approval of an authorized executive officer, the words or phrases “will likely result,” “are expected to,” “will continue,” “is anticipated,” “estimate,” “project,” “believe,” or similar expressions are intended to identify “forward-looking statements” within the meaning of the Private Securities Litigation Reform Act of 1995. The Company wishes to caution readers not to place undue reliance on any such forward-looking statements, which speak only as of the date made, and to advise readers that various factors, including regional and national economic conditions, changes in levels of market interest rates, credit risks of lending activities and competitive and regulatory factors, could affect the Company’s financial performance and could cause the Company’s actual results for future periods to differ materially from those anticipated or projected.
The Company is not aware of any trends, events or uncertainties that will have or are reasonably likely to have a material effect on its liquidity, capital resources or operations except as discussed herein. The Company is not aware of any current recommendations by regulatory authorities that would have such effect if implemented.
The Company does not undertake, and specifically disclaims, any obligation to publicly release any revisions that may be made to any forward-looking statements to reflect occurrence of anticipated or unanticipated events or circumstances after the date of such statements.
14 |
|
|
|
Financial Condition
Overview
United Bancorp, Inc. (NASDAQ: UBCP) reported diluted earnings per share of $0.42 for the three months ended December 31, 2023, an increase of $0.02, or 5.00%, over the quarterly earnings reported for the same period in 2022. For the year ending December 31, 2023, UBCP reported diluted earnings per share of $1.57, an increase of $0.07, or 4.7%, over the previous year.
We are exceedingly pleased to report on the earnings performance of United Bancorp, Inc. (UBCP) for the fourth quarter and year ended December 31, 2023. For the quarter, our Company achieved solid net income and diluted earnings per share results of $2,389,000 and $0.42, which were respective increases of $83,000, or 3.6%, and $0.02, or 5.0%, over the results achieved during the fourth quarter of last year. For the year ended December 31, 2023, our Company produced net income of $8,950,000 and diluted earnings per share of $1.57, increases over the results achieved for each the prior year of $293,000, or 3.4%, and $0.07, or 4.7%, respectively. As we have previously reported, UBCP was been able to capitalize on the historically extreme tightening of monetary policy undertaken by the Federal Open Market Committee of the Federal Reserve (FOMC) over the course of a short period of sixteen months, over which timeframe the target for the Federal Funds Rate rapidly rose from a range of 25 to 50 basis points in March 2022 to a range of 5.25% to 5.50% as of July 2023 (and, remaining at this level through year-end). Although it has been somewhat challenging to produce improving results in such a fast-paced, increasing interest rate environment, our Company was properly positioned to take advantage of this historic and dramatic increase in interest rates over the course of the past twenty-one months and, accordingly, we experienced an improvement in the level of net interest income that we generated, once again, this past year ending, December 31, 2023.
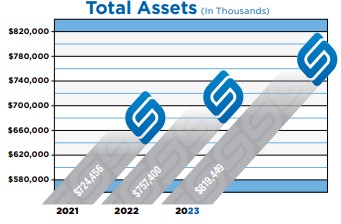
We are grateful to see that our net interest income and net interest margin levels have either increased or remained very stable with only minimal declines in the current, dynamic economic and monetary policy environment in which we are operating. We have achieved this positive result by seeing our overall loan portfolio yield increase in the current rising rate environment, even though from a volume perspective, our average loans were relatively flat, only increasing for the year-ended December 31, 2023 by $920,000 or 0.20%. Of note is that our Company did see a more significant uptick in gross loans toward the end of the fourth quarter by $22.4 million, or 4.9%, to a level of $483.2 million as of December 31, 2023. More strongly contributing to the improvement in our net interest income level achieved and our stabile net interest margin in 2023 were our higher balance sheet totals for both our average Cash and due from the Federal Reserve Bank and average investment securities. Our overnight funds, that are parked in cash-equivalents, have benefited from the inverted yield curve that we have experienced over the course of the past year, which has been driven by the aggressive tightening policy of the Federal Open Market Committee (FOMC). As of December 31, 2023, the average balance of these overnight, liquid funds totaled $64.8 million, an increase of $11.8 million, or 22.3%, over the previous year, and yielded approximately 5.4% for our Company after the final increase in the target for the federal funds rate by the FOMC in July of this past year. Each time the FOMC increased the target for the federal funds rate, our Company benefited by seeing the yield on these liquid funds increase by a like amount. The most impactful force upon our Company’s improving level of net interest income in 2023 was the increased balance in our investment securities portfolio in the rising rate environment that we continued to experience. As we have previously stated, we did not invest in securities for almost two years beginning in March of 2020, when rates dramatically decreased due to the Zero Interest Rate policy implemented by the FOMC due to the pandemic. Quite simply, we patiently waited for policy tightening by the FOMC to begin and rates to increase to more historically normalized levels. Accordingly, our Company started to, once again, invest in securities when rates began to rise to more appealing levels toward the end of the first quarter of 2022 and continued to regularly invest in new security offerings until March of 2023, when challenges arose for our industry and liquidity became more of a focus for us. On a year - over - year basis, average securities for our Company increased by $56.6 million to a level of $245.7 million. In addition, even with our Company’s higher investment level in securities in 2023, as of December 31, 2023, our accumulated other comprehensive loss, net of taxes (AOCI) actually declined on a year-over-year basis by $1.9 million, or 20.0%, to a level of $7.5 million. On a linked-quarter basis,
|
15 |
||
the decline in our AOCI was $9.5 million or 56.1%. With this year-over-year decline in AOCI, our tangible shareholders equity increased to a level of $62.7 million, an increase of $4.1 million, or 6.9%, and our tangible book value increased to $10.66, an increase of $0.74, or 7.5%, both on a year-over-year basis. Also, on a linked-quarter basis, our tangible shareholder equity increased by $11.1 million, or 21.5%, and our tangible book value increased by $1.89 or 21.6%. Overall, our Company continues to be considered well-capitalized from a regulatory perspective with equity to assets of 7.8%, which is up from 6.5% at the end of the third quarter of 2023. With the overall quality of our investment portfolio, our well capitalized position, our solid liquidity position and our low level of uninsured deposits (which were 16.8% of total deposits as of December 31, 2023), we firmly believe that any issues which could potentially create a risk to our capital and capital position are very minimal.
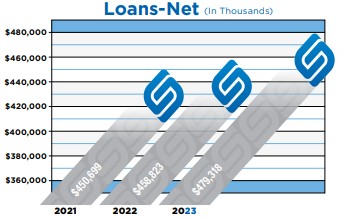
Even with the continued heightened inflation levels and related increases in interest rates that may be impacting some of our borrowers with higher operating costs and rate resets to higher interest rate levels on their loans, we have successfully maintained credit-related strength and stability within our loan portfolio as of year-end. As of December 31, 2023, our Company’s total nonaccrual loans and loans past due 30 plus days were $1.15 million, or 0.24%, which is a slight increase of $539,000 year-over-year. Nonaccrual loans and OREO to average assets was 0.47%, a decrease of two basis points over the previous year. Also, further highlighting the overall strength of our loan portfolio, our Company had net loans charged off of (-$19,000), or a net loan recovery, in 2023. All of the charge off activity that our Company experienced this past year related to overdraft activity, which totaled $120,000 for the year. With the enhanced credit loss reserve build-up under CECL that occurred on January 1, 2023 (and, our Company’s stable and solid credit quality metrics), we were able to have a negative provision for credit losses in the fourth quarter of $154,000, which relative to the fourth quarter of last year added approximately $133,000 to net income and $0.02 to diluted earnings per share. For the year ending December 31, 2023, though, our Company’s provision for credit losses increased (although it was still negative for the entire year) by $501,000 over the previous year, which reduced net income and diluted earnings per share by respective amounts of $396,000 and $0.07, relative to the prior year. We are very happy that we were able to overcome the lower level of negative credit provisioning in the current year while maintaining a total allowance for credit losses to total loans of 0.81% and having a total allowance for credit losses to nonperforming loans of 804%. Overall, we firmly believe that we are presently well reserved with very strong coverage.
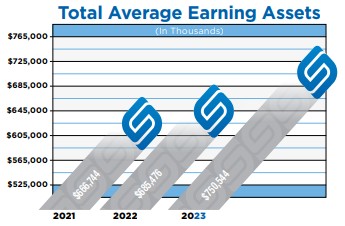
Considering the exceedingly dynamic economic and monetary policy environments in which we have operated for almost two years and the more recent issues which have impacted our industry since mid-March, we are very happy to report on the very strong earnings performance that United Bancorp, Inc. (UBCP) achieved for the year ended December 31, 2023. Relating to the excessive tightening of our country’s monetary policy during this aforementioned timeframe, we are extremely pleased that we have been able to grow the level
16 |
|
|
|
of interest income that our Company generated while controlling overall interest expense levels; thereby, expanding the level of net interest income that we realized and having a stable net interest margin. This is somewhat of a counter-trend to what occurred within our industry over this same period. With the aforementioned developments that occurred within our industry late in the first quarter of 2023, we transitioned into a more conservative operating position that greatly increased our overall liquidity and locked in a fair portion of our funding as a hedge against further interest rate increases by taking a $75.0 million advance from the Federal Home Loan Bank (FHLB). Initially, this significant advance had somewhat of a dilutive impact on our returns and margins (such as our return on assets and our net interest margin); but, it was immediately accretive to our bottom-line earnings. Since rates have continued to rise since the origination of this now competitively priced advance (to which we locked in on a blended basis at a rate of approximately 4.24% for an approximate term of four years), we have been able to more selectively manage our depository portfolio; thus, helping us to control our interest expense, while maintaining very adequate liquidity levels and generating increasing returns on this strategic posture. Overall, our capital levels remain very strong and our Company is classified as being well-capitalized based on industry standards. We firmly believe with our strong liquidity, our relatively stable core deposits base with minimal levels of uninsured deposits and our solid earnings our risk to capital is very low, and, fundamentally, our Company’s financial position and future prospects are very solid.
Our primary focus is protecting the investment of our shareholders in our Company and rewarding them in a balanced fashion by growing their value and paying an attractive cash dividend. In the fourth quarter, we paid a regular cash dividend of $0.17, which was an increase of $0.01, or 6.3%, over that paid in the fourth quarter of the previous year. At December 31, 2023, on a year-over-year basis, our total cash dividend payout was $0.8150, which included a special cash dividend of $0.15 paid in the first quarter. This is a 5.2% increase over the total cash dividend paid during the previous year and produces a near-industry leading total dividend yield of 6.4%, considering our Company’s year-ending market value of $12.84. Even though our fair market value decreased year-over-year (as did the fair market value of most financial institution stocks), our Company still had a market price to tangible book value of 121%, which compares favorably to industry standards as of year-end.
Considering that we continue to operate in a challenging economic and concerning industry-related environment, we are very pleased with our overall present performance and future prospects. Even with the present threats with which our overall industry is exposed, we are very optimistic about the future growth and earnings potential for United Bancorp, Inc. (UBCP). We firmly believe that with the challenges that our industry has experienced over the course of the past few years, our Company has evolved into a more fundamentally sound organization with a focus of growing to achieve greater efficiencies and scales, while controlling overall costs. We have invested in areas that will lead to our continued and future relevancy within our industry along with anticipated higher revenue generation while implementing cost control initiatives, where needed, by consolidating delivery channels in markets in which we had low banking center performance and considerable overlap. We still have a vision of growing UBCP to an asset threshold of $1.0 billion or greater in the near term in a prudent and profitable fashion. Excitingly, our Company announced in the third quarter that we have plans to open a new regional banking center in the very appealing market of Wheeling, West Virginia. We anticipate breaking ground on this exciting new regional banking center toward the end of the first quarter of the current year. Our Company already has a very solid customer base in the Wheeling, West Virginia- market, which we firmly believe we can more fully leverage to help us achieve our growth goals in a profitable fashion. We are truly excited about our Company’s direction and the potential that it brings. In addition, we will continue to build upon our solid foundation and maintain a longer-term vision. With a keen focus on continual process improvement, product development and delivery, we firmly believe the future for our Company is very bright.
Earning Assets - Loans
The Company’s gross loans totaled $483.2 million at December 31, 2023, representing a $22.4 million, or 4.86%, increase over the $460.9 million at December 31, 2022. Average loans totaled $463.6 million for 2023, representing a 0.20% increase compared to average loans of $462.7 million for 2022.
The increase in gross loans from December 31, 2022 to December 31, 2023 was primarily an increase in commercial real estate by $21.5 million.
The Company's commercial and commercial real estate loan portfolio represents 79.3% of the total portfolio at December 31, 2023 compared to 78.3% at December 31, 2022. The Company’s commercial and commercial real estate loans increased approximately $22.3 million from December 31, 2022 to December 31, 2023. We utilize all the SBA, Ohio Department of Development and State of Ohio loan programs as well as local revolving loan funds to best fit the needs of our customers.
The Company’s installment lending portfolio represented 1.4% of the total portfolio at December 31, 2023, compared to 1.3% at December 31, 2022. Competition for installment loans principally comes from the captive finance companies offering low to zero percent financing for extended terms.
|
17 |
||
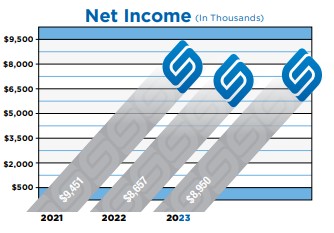
The Company’s residential real estate portfolio represents 19.3% of the total portfolio at December 31, 2023, compared to 20.4% at December 31, 2022. Residential real estate loans are comprised of 1-, 3-, and 5-year adjustable-rate mortgages and 15-year fixed rate loans used to finance 1-4 family units. The Company also offers fixed-rate real estate loans through our Secondary Market Real Estate Mortgage Program. Once these fixed-rate loans are originated and immediately sold without recourse in what is referred to as the secondary market, the Company does not assume credit risk or interest rate risk in this portfolio. This arrangement is quite common in banks and saves our customers from looking elsewhere for their home financing needs.
The Company did recognize a gain on the sale of secondary market loans of $29,000 in 2023 and a gain of $36,000 in 2022.
The Company adopted ASU No. 2016-13 effective January 1, 2023. The impact of the adoption was $2.4 million in the allowance for credit losses. The allowance for credit losses totaled $3.9 million at December 31, 2023, which represented 0.81% of total loans. The allowance for loan losses, prior to adopting ASU 2016-13 as of December 31, 2022, was $2.1 million or 0.45% of total loans. The allowance represents the amount which management and the Board of Directors estimates is adequate to provide for probable losses inherent in the loan portfolio. The allowance balance and the provision charged to expense are reviewed by management and the Board of Directors monthly using a risk evaluation model that considers borrowers’ past due experience, economic conditions and various other circumstances that are subject to change over time. Management believes the current balance of the allowance for credit losses is adequate to absorb future expected credit losses associated with the loan portfolio. Net loan (recoveries) charge-offs (exclusive of overdrafts net charge-offs of $120,000) for the year ended December 31, 2023 were approximately ($19,000) . Net loans charged off (exclusive of overdrafts net charge-offs $108,000) was $558,000) for the year ended December 31, 2022.
The Company generally recognizes interest income on the accrual basis, except for certain loans which are placed on non-accrual status, when in the opinion of management; doubt exists as to collection on the loan. The Company’s policy is to generally place loans greater than 90 days past due on non-accrual status unless the loan is both well secured and in the process of collection. When a loan is placed on non-accrual status, interest income may be recognized on a cash basis as payment is received if the loan is well secured. If the loan is not deemed well secured, payments are credited to principal.
Management and the Board of Directors believe the current balance of the allowance for loan losses is sufficient to cover probable incurred losses. Refer to the Provision for Loan Losses section for further discussion on the Company’s credit quality.
Earning Assets – Securities and Federal Funds Sold
The securities portfolio is comprised of U.S. Government agency-backed securities, tax-exempt obligations of state and political subdivisions and certain other investments. Securities available for sale at December 31, 2023 increased approximately $25.1 million from December 31, 2022 totals.
Sources of Funds – Deposits
The Company’s primary source of funds is retail core deposits from individuals and business customers. These demand,savings and time deposits. Total deposits decreased $28.5 million, or 4.4%, from $649.9 million at December 31, 2022 to $621.4 million at December 31, 2023. Overall the total deposit decrease was mainly focused on non-interest and interest bearing demand and deposit accounts and savings accounts.
18 |
|
|
|
On average, the Company has a strong deposit base from public agencies, including local school districts, city and township municipalities, public works facilities and others, which may tend to be more seasonal in nature resulting from the receipt and disbursement of state and federal grants. These entities have maintained relatively stable balances with the Company due to various funding and disbursement timeframes.
Sources of Funds – Securities Sold Under Agreements to Repurchase and Other Borrowed Funds Other interestbearing liabilities include securities sold under agreements to repurchase, and Federal Home Loan Bank (“FHLB”) advances Securities sold under agreements to repurchase increased approximately $8.7 million from December 31, 2022 to December 31, 2023. Securities sold under agreements to repurchase totaled $26.8 million and $18.1 million at December 31, 2023 and 2022, respectively. At December 31, 2023, advances from the Federal Home Loan Bank were $75 million. The Company did not have any advances from the Federal Home Loan Bank at December 31, 2022. At December 31, 2023, required annual payments on Federal Home Loan Bank advances were for years ending December 31, 2026 $20 million (4.39% fixed rate), December 31, 2027 $35 million (4.24% fixed rate) and December 31, 2028 $20 million (4.11% fixed rate).
On May 14, 2019 the Company issued $20,000,000 of junior subordinated debentures in denominations of not less than $250,000. The debentures bear interest at a fixed rate of 6.0% until May 2024, which then becomes a floating interest rate equal to the three-month SOFR plus 3.625%, resetting quarterly. Interest on the subordinated notes will be payable semiannually through May 2024 and quarterly thereafter through the maturity date of May 2029. Principal is due upon maturity. The debentures are unsecured and payable to various investors. For purposes of computing regulatory capital, the debentures are included in Tier 2 Capital. The subordinated notes may not be repaid in whole or in part prior to the fifth anniversary of the issue date (May 2019).
Performance Overview 2022 to 2021
Net Income
The Company reported basic and diluted earnings per share of $1.57 and net income of $8,950,000 for the year ended December 31, 2023, an increase of $293,000, or 3.4%, over net income of $8,657,000 for the year ended December 31, 2022.
Net Interest Income
Net interest income, by definition, is the difference between interest income generated on interest-earning assets and the interest expense incurred on interest-bearing liabilities. Various factors contribute to changes in net interest income, including volumes, interest rates and the composition or mix of interest-earning assets in relation to interest-bearing liabilities.
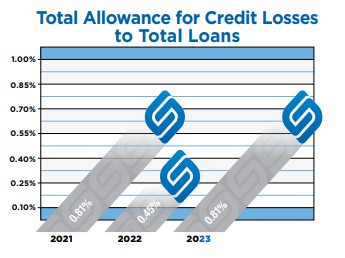
Average interest-earning assets increased $65.1 million in 2023, as compared to 2022 while the associated weighted average yield on these interest-earning assets increased from 4.21% in 2022 to 5.12% for 2023. Average interest bearing liabilities increased $76.5 million in 2023 as compared to 2022, while the associated weighted-average costs on these interest-bearing liabilities increased from 0.63% in 2022 to 1.84% in 2023. Refer to the sections on Asset and Liability Management and Sensitivity to Market Risks and Average Balances, Net Interest Income and Yields Earned and Rates Paid elsewhere herein for further information.
Provision for (Reversal of ) Credit Loss Expense - Loans The provision for (reversal of) credit losses is a charge or credit to expense recorded to maintain the related balance sheet allowance for credit losses at an amount considered adequate by Management and the
|
19 |
||
Board of Directors to cover expected future credit losses in the portfolio. In 2023 the Company released $454,000 in credit reserves as compared to a $955,000 credit release in 2022.
At December 31, 2023, our total non-accrual loans were $487,000 or 0.10% of total loans. This level of non-accrual loans was an increase of $305,000 over the previous year. In addition, other real estate and repossession (OREO) decreased by $142,000 year-over-year. At year-end, nonaccrual loans and OREO to total assets was a very solid 0.47%, along with loans past due 30+ days at $659,000 or 0.13% of total loans.
Noninterest Income
Total noninterest income is made up of bank-related fees and service charges, as well as other income-producing services, sales of loans in the secondary market, ATM income, early-redemption penalties for certificates of deposit, safe deposit rental income, deposit service fees, earnings on bank-owned life insurance and other miscellaneous items.
Noninterest income for the year ended December 31, 2023 was $4,054,000, a decrease of $29,000, compared to $4,083,000 for the year ended December 31, 2022.
Noninterest Expense
Our Company experienced an increase in total noninterest expense. In 2023, total noninterest expense increased by $962,000 or 4.8%. Most of this increase in non-interest expense is correlated to a higher IT-related expense due to our investment in our future and higher customer utilization of our suite of products and higher deposit insurance premiums due mainly to an increase in rate from the FDIC.
Income tax expense for 2023 was $541,000 compared to $879,000 in 2022, a decrease of $338,000. The Company’s effective income tax rate was 5.7% in 2023 and 9.2% in 2022. Refer to Note 9 Income Taxes for a reconciliation of the effective tax rate for the Company.
(In thousands) |
|
2023 |
|
2022 |
||
Noninterest income |
|
|
|
|
|
|
Customer service fees |
|
$ |
2,940 |
|
$ |
2,978 |
Gains on sales of loans |
|
|
29 |
|
|
36 |
Earnings on bank-owned life insurance |
|
|
725 |
|
|
708 |
Other income |
|
|
360 |
|
|
361 |
Total noninterest income |
|
$ |
4,054 |
|
$ |
4,083 |
|
|
|
|
|
|
|
Noninterest expense |
|
|
|
|
|
|
Salaries and employee benefits |
|
$ |
10,272 |
|
$ |
10,305 |
Occupancy and equipment |
|
|
2,064 |
|
|
2,217 |
Professional services |
|
|
1,465 |
|
|
1,451 |
Insurance |
|
|
623 |
|
|
568 |
FDIC Insurance |
|
|
375 |
|
|
198 |
Franchise and other taxes |
|
|
555 |
|
|
562 |
Advertising |
|
|
361 |
|
|
346 |
Printing and office supplies |
|
|
113 |
|
|
110 |
Amortization of intangibles |
|
|
150 |
|
|
150 |
Other expenses |
|
|
4,874 |
|
|
3,983 |
Total noninterest expense |
|
$ |
20,852 |
|
$ |
19,890 |
20 |
|
|
|
Asset/Liability Management and \Sensitivity to Market Risks
In the environment of changing business cycles, interest rate fluctuations and growing competition, it has become increasingly difficult for banks to produce adequate earnings on a consistent basis. Although management can anticipate changes in interest rates, it is not possible to reliably predict the magnitude of interest rate changes. As a result, the Company must establish a sound asset/liability management policy, which will minimize exposure to interest rate risk while maintaining an acceptable interest rate spread and insuring adequate liquidity.
The principal goal of asset/liability management – earnings management – can be accomplished by establishing decision processes and control procedures for all bank assets and liabilities. Thus, the full scope of asset/liability management encompasses the entire balance sheet of the Company. The broader principal components of asset/liability management include, but are not limited to liquidity planning, capital planning, gap management and spread management.
By definition, liquidity is measured by the Company’s ability to raise cash at a reasonable cost or with a minimum amount of loss. Liquidity planning is necessary so the Company will be capable of funding all obligations to its customers at all times, from meeting their immediate cash withdrawal requirements to fulfilling their short-term credit needs.
Capital planning is an essential portion of asset/liability management, as capital is a limited Bank resource, which, due to minimum capital requirements, can place possible restraints on Bank growth. Capital planning refers to maintaining capital standards through effective growth management, dividend policies and asset/liability strategies.
Gap is defined as the dollar difference between rate sensitive assets and rate sensitive liabilities with respect to a specified time frame. A gap has three components – the asset component, the liability component, and the time component. Gap management involves the management of all three components.
Gap management is defined as those actions taken to measure and match rate-sensitive assets to rate-sensitive liabilities. A rate-sensitive asset is any interest-earning asset, which can be repriced to a market rate in a given time frame. Similarly, a rate-sensitive liability is any interestbearing liability, which can have its interest rate changed to a market rate during the specified time period. Caps, collars and prepayment penalties may prevent certain loans and securities from adjusting to the market rate.
A negative gap is created when rate-sensitive liabilities exceed rate-sensitive assets and, conversely, a positive gap occurs when rate-sensitive assets exceed rate-sensitive liabilities. Generally, a negative gap position will cause profits to decline in a rising interest rate environment and cause profits to increase in a falling interest rate environment. Conversely, a positive gap will cause profits to decline in a falling interest rate environment and increase in a rising interest rate environment. The Company’s goal is to have acceptable profits under any interest rate environment. To avoid volatile profits as a result of interest rate fluctuations, the Company attempts to match interest rate sensitivities. The Company achieves this by pricing both the asset and liability components to yield a sufficient interest rate spread, so that profits will remain relatively consistent across interest rate cycles.
Management of the income statement is called spread management and is defined as managing investments, loans, and liabilities to achieve an acceptable spread between the Company’s return on its earning assets and its cost of funds. Gap management without consideration of interest spread can cause unacceptably low profit margins. Spread management without consideration of gap positions can cause acceptable profits in some interest rate environments and unacceptable profits in others. A sound asset/liability management program combines gap and spread management into a single cohesive system.
Management measures the Company’s interest rate risk by computing estimated changes in net interest income and the Net Portfolio Value (“NPV”) of its cash flows from assets, liabilities and off-balance-sheet items in the event of a range of assumed changes in market interest rates. The Bank’s senior management and the Executive Committee of the Board of Directors, comprising the Asset/Liability Committee (“ALCO”), review the exposure to interest rates monthly. Exposure to interest rate risk is measured with the use of an interest rate sensitivity analysis to determine the change in NPV in the event of hypothetical changes in interest rates, while interest rate sensitivity gap analysis is used to determine the repricing characteristics of the assets and liabilities.
NPV represents the market value of portfolio equity and is equal to the market value of assets minus the market value of liabilities, with adjustments made for off-balance-sheet items.
Computations of prospective effects of hypothetical interest rate changes are based on numerous assumptions, including relative levels of market interest rates, loan prepayments and deposit decay rates, and should not be relied upon as indicative of actual results. Further, the computations do not contemplate any actions the Company may undertake in response to changes in interest rates. The NPV calculation is based on the net present value of discounted cash flows utilizing market prepayment assumptions and market rates of interest provided by surveys performed during each quarterly period, with adjustments made to reflect the shift in the Treasury
|
21 |
||
yield curve between the survey date and quarter-end date. Certain shortcomings are inherent in this method of analysis presented in the computation of estimated NPV. Certain assets such as adjustable-rate loans have features that restrict changes in interest rates on a short-term basis and over the life of the asset. In addition, the portion of adjustable-rate loans in the Company’s portfolio could decrease in future periods if market interest rates remain at or decrease below current levels due to refinancing activity. Further, in the event of a change in interest rates, prepayment and early withdrawal levels would likely deviate from those assumed in the table. Finally, the ability of many borrowers to repay their adjustable-rate debt may decrease in the case of an increase in interest rates.
The following tables present an analysis of the potential sensitivity of the Company’s net present value of its financial instruments to sudden and sustained changes in the prevailing interest rates.
(Dollars in Thousands) |
|
||||||
Net Portfolio Value - December 31, 2023 |
|
||||||
Change in Rates |
|
$ Amount |
|
$ Change |
|
% Change |
|
+200 |
|
131,619 |
|
(3,624) |
|
(3) |
% |
+100 |
|
134,561 |
|
(682) |
|
(1) |
% |
Base |
|
135,243 |
|
— |
|
— |
|
-100 |
|
132,326 |
|
(2,917) |
|
(2) |
% |
-200 |
|
124,865 |
|
(10,378) |
|
(8) |
|
(Dollars in Thousands) |
|
||||||
Net Portfolio Value - December 31, 2022 |
|
||||||
Change in Rates |
|
$ Amount |
|
$ Change |
|
% Change |
|
+200 |
|
176,852 |
|
1,133 |
|
1 |
% |
+100 |
|
177,236 |
|
1,517 |
|
1 |
% |
Base |
|
175,719 |
|
— |
|
— |
|
-100 |
|
170,591 |
|
(5,128) |
|
(3) |
% |
-200 |
|
159,361 |
|
(16,358) |
|
(9) |
|
The projected volatility of the net present value at both December 31, 2023 and 2022 fall within the general guidelines established by the Board of Directors. The 2023 NPV table shows that in a falling interest rate environment, in the event of a 100 basis point change, the NPV would decrease 2%. In the event of a 200 basis point change, the NPV would decrease 6%.
In an upward change in interest rates, the Company’s NPV would decrease 1% with a 100 basis point interest rate increase. In a 200 basis point rate increase, the Company’s NPV would also decrease 2%.
22 |
|
|
|
The following table is a summary of selected quarterly results of operations for the years ended December 31, 2023 and 2022.
|
|
Three Months Ended |
||||||||||
|
|
March 31 |
|
June 30 |
|
September 30 |
|
December 31 |
||||
|
|
(In thousands, except per share data) |
||||||||||
|
|
2023 |
||||||||||
Total interest income |
|
$ |
8,208 |
|
$ |
9,286 |
|
$ |
9,651 |
|
$ |
9,704 |
Total interest expense |
|
|
1,785 |
|
|
2,941 |
|
|
3,085 |
|
|
3,203 |
|
|
|
|
|
|
|
|
|
|
|
|
|
Net interest income |
|
|
6,423 |
|
|
6,345 |
|
|
6,566 |
|
|
6,501 |
|
|
|
|
|
|
|
|
|
|
|
|
|
(Credit) Provision for losses on loans |
|
|
— |
|
|
(146) |
|
|
(154) |
|
|
(154) |
Other income |
|
|
1,016 |
|
|
1,046 |
|
|
963 |
|
|
1,029 |
General, administrative and other expense |
|
|
5,438 |
|
|
5,089 |
|
|
5,233 |
|
|
5,092 |
|
|
|
|
|
|
|
|
|
|
|
|
|
Income before income taxes |
|
|
2,001 |
|
|
2,448 |
|
|
2,450 |
|
|
2,592 |
Federal income taxes |
|
|
113 |
|
|
168 |
|
|
58 |
|
|
202 |
|
|
|
|
|
|
|
|
|
|
|
|
|
Net income |
|
$ |
1,888 |
|
$ |
2,280 |
|
$ |
2,392 |
|
$ |
2,390 |
|
|
|
|
|
|
|
|
|
|
|
|
|
Earnings per share |
|
|
|
|
|
|
|
|
|
|
|
|
Basic |
|
$ |
0.33 |
|
$ |
0.40 |
|
$ |
0.42 |
|
$ |
0.42 |
Diluted |
|
$ |
0.33 |
|
$ |
0.40 |
|
$ |
0.42 |
|
$ |
0.42 |
|
|
Three Months Ended |
||||||||||
|
|
March 31 |
|
June 30 |
|
September 30 |
|
December 31 |
||||
|
|
(In thousands, except per share data) |
||||||||||
|
|
2022 |
||||||||||
Total interest income |
|
$ |
5,997 |
|
$ |
6,445 |
|
$ |
7,297 |
|
$ |
7,922 |
Total interest expense |
|
|
487 |
|
|
477 |
|
|
928 |
|
|
1,381 |
|
|
|
|
|
|
|
|
|
|
|
|
|
Net interest income |
|
|
5,510 |
|
|
5,968 |
|
|
6,369 |
|
|
6,541 |
|
|
|
|
|
|
|
|
|
|
|
|
|
(Credit) Provision for losses on loans |
|
|
|
|
|
|
|
|
|
|
|
|
Other income |
|
|
(500) |
|
|
(485) |
|
|
15 |
|
|
15 |
General, administrative and other expense |
|
|
987 |
|
|
988 |
|
|
1,043 |
|
|
1,065 |
|
|
|
5,110 |
|
|
4,849 |
|
|
4,879 |
|
|
5,052 |
|
|
|
|
|
|
|
|
|
|
|
|
|
Income before income taxes |
|
|
1,887 |
|
|
2,592 |
|
|
2,518 |
|
|
2,539 |
Federal income taxes |
|
|
136 |
|
|
295 |
|
|
215 |
|
|
233 |
|
|
|
|
|
|
|
|
|
|
|
|
|
Net income |
|
$ |
1,751 |
|
$ |
2,297 |
|
$ |
2,303 |
|
$ |
2,306 |
|
|
|
|
|
|
|
|
|
|
|
|
|
Earnings per share |
|
|
|
|
|
|
|
|
|
|
|
|
Basic |
|
$ |
0.30 |
|
$ |
0.40 |
|
$ |
0.40 |
|
$ |
0.40 |
Diluted |
|
$ |
0.30 |
|
$ |
0.40 |
|
$ |
0.40 |
|
$ |
0.40 |
Average Balances, Net Interest Income and Yields Earned and Rates Paid
he following table provides average balance sheet information and reflects the taxable equivalent average yield on interest-earning assets and the average cost of interest-bearing liabilities for the years ended December 31, 2023 and 2022. The yields and costs are calculated by dividing income or expense by the average balance of interest-earning assets or interest-bearing liabilities.
The average balance of available-for-sale securities is computed using the carrying value of securities while the yield for available for sale securities has been computed using the average amortized cost. Average balances are derived from average month-end balances,
|
23 |
||
which include nonaccruing loans in the loan portfolio, net of the allowance for credit losses. Interest income has been adjusted to taxequivalent basis.
|
|
2023 |
|
|
2022 |
|
||||||||||||
(Dollars In thousands) |
|
|
|
|
Interest |
|
|
|
|
|
|
|
Interest |
|
|
|
||
|
|
Average |
|
Income/ |
|
Yield/ |
|
|
Average |
|
Income/ |
|
Yield/ |
|
||||
|
|
Balance |
|
Expense |
|
Rate |
|
|
Balance |
|
Expense |
|
Rate |
|
||||
Assets |
|
|
|
|
|
|
|
|
|
|
|
|
|
|
|
|
|
|
Interest-earning assets |
|
|
|
|
|
|
|
|
|
|
|
|
|
|
|
|
|
|
Loans (1) |
|
$ |
463,612 |
|
|
25,261 |
|
5.45 |
% |
|
$ |
462,692 |
|
|
20,748 |
|
4.48 |
% |
Taxable securities - AFS |
|
|
75,494 |
|
|
2,741 |
|
3.63 |
|
|
|
54,852 |
|
|
1,899 |
|
3.46 |
|
Tax-exempt securities - AFS (1) |
|
|
154,151 |
|
|
7,430 |
|
4.82 |
|
|
|
120,073 |
|
|
5,565 |
|
4.63 |
|
Federal funds sold |
|
|
53,826 |
|
|
2,752 |
|
5.11 |
|
|
|
44,668 |
|
|
493 |
|
1.10 |
|
FHLB stock and other |
|
|
3,461 |
|
|
254 |
|
7.34 |
|
|
|
3,191 |
|
|
139 |
|
4.35 |
|
Total interest-earning assets |
|
|
750,544 |
|
|
38,438 |
|
5.12 |
|
|
|
685,476 |
|
|
28,844 |
|
4.21 |
|
|
|
|
|
|
|
|
|
|
|
|
|
|
|
|
|
|
|
|
Noninterest-earning assets |
|
|
|
|
|
|
|
|
|
|
|
|
|
|
|
|
|
|
Cash and due from banks |
|
|
8,967 |
|
|
|
|
|
|
|
|
8,301 |
|
|
|
|
|
|
Premises and equipment (net) |
|
|
12,222 |
|
|
|
|
|
|
|
|
12,547 |
|
|
|
|
|
|
Other nonearning assets |
|
|
34,244 |
|
|
|
|
|
|
|
|
32,471 |
|
|
|
|
|
|
Less: allowance for loan losses |
|
|
(3,923) |
|
|
|
|
|
|
|
|
(3,020) |
|
|
|
|
|
|
Total noninterest-earning assets |
|
|
51,510 |
|
|
|
|
|
|
|
|
50,299 |
|
|
|
|
|
|
Total assets |
|
$ |
802,054 |
|
|
|
|
|
|
|
$ |
735,775 |
|
|
|
|
|
|
|
|
|
|
|
|
|
|
|
|
|
|
|
|
|
|
|
|
|
Liabilities & stockholders’ equity |
|
|
|
|
|
|
|
|
|
|
|
|
|
|
|
|
|
|
Interest-bearing liabilities |
|
|
|
|
|
|
|
|
|
|
|
|
|
|
|
|
|
|
Demand deposits |
|
$ |
216,947 |
|
|
1,923 |
|
0.89 |
|
|
$ |
262,763 |
|
|
845 |
|
0.32 |
% |
Savings deposits |
|
|
137,862 |
|
|
132 |
|
0.10 |
|
|
|
144,283 |
|
|
77 |
|
0.05 |
|
Time deposits |
|
|
134,011 |
|
|
3,818 |
|
2.85 |
|
|
|
67,848 |
|
|
722 |
|
1.06 |
|
Subordinated debentures |
|
|
23,787 |
|
|
1,532 |
|
6.44 |
|
|
|
23,726 |
|
|
1,387 |
|
5.85 |
|
Repurchase agreements |
|
|
25,049 |
|
|
1,053 |
|
4.20 |
|
|
|
22,581 |
|
|
242 |
|
1.07 |
|
Advances from Federal Home Loan |
|
|
60,081 |
|
|
2,556 |
|
4.25 |
|
|
|
— |
|
|
— |
|
— |
|
Total interest-bearing liabilities |
|
|
597,737 |
|
|
11,014 |
|
1.84 |
|
|
|
521,201 |
|
|
3,273 |
|
0.63 |
|
|
|
|
|
|
|
|
|
|
|
|
|
|
|
|
|
|
|
|
Noninterest-bearing liabilities |
|
|
|
|
|
|
|
|
|
|
|
|
|
|
|
|
|
|
Demand deposits |
|
|
146,987 |
|
|
|
|
|
|
|
|
151,842 |
|
|
|
|
|
|
Other liabilities |
|
|
5,042 |
|
|
|
|
|
|
|
|
4,016 |
|
|
|
|
|
|
Total noninterest-bearing liabilities |
|
|
152,029 |
|
|
|
|
|
|
|
|
155,858 |
|
|
|
|
|
|
Total liabilities |
|
|
749,766 |
|
|
|
|
|
|
|
|
677,059 |
|
|
|
|
|
|
Total stockholders’ equity |
|
|
52,288 |
|
|
|
|
|
|
|
|
58,716 |
|
|
|
|
|
|
Total liabilities & stockholders’ equity |
|
$ |
802,054 |
|
|
|
|
|
|
|
$ |
735,775 |
|
|
|
|
|
|
Net interest income |
|
|
|
|
$ |
27,424 |
|
|
|
|
|
|
|
$ |
25,571 |
|
|
|
Net interest spread |
|
|
|
|
|
|
|
3.28 |
% |
|
|
|
|
|
|
|
3.58 |
% |
|
|
|
|
|
|
|
|
|
|
|
|
|
|
|
|
|
|
|
Net yield on interest-earning assets |
|
|
|
|
|
|
|
3.65 |
% |
|
|
|
|
|
|
|
3.73 |
% |
| ● | For purposes of this schedule, nonaccrual loans are included in loans. |
| ● | Fees collected on loans are included in interest on loans. Not material for comparative purposes. |
| (1) | Shown on a tax equivalent basis. Federal taxes of 21%. |
24 |
|
|
|
For purposes of this schedule, nonaccrual loans are included in loans.
Fees collected on loans are included in interest on loans. Not material for comparative purposes.
Shown on a tax equivalent basis. Federal taxes of 21%.
Rate/Volume Analysis
The table below describes the extent to which changes in interest rates and changes in volume of interest-earning assets and interest-bearing liabilities have affected interest income and expense during 2023. For purposes of this table, changes in interest due to volume and rate were determined using the following methods:
| ● | Volume variance results when the change in volume is multiplied by the previous year’s rate. |
| ● | Rate variance results when the change in rate is multiplied by the previous year’s volume. |
| ● | Rate/volume variance results when the change in volume is multiplied by the change in rate. |
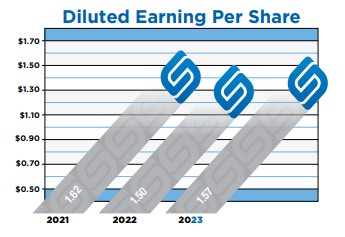
NOTE: The rate/volume variance was allocated to volume variance and rate variance in proportion to the relationship of the absolute dollar amount of the change in each. Nonaccrual loans are ignored for purposes of the calculations due to the nominal amount of the loans.
|
25 |
||
Capital Resources
Internal capital growth, through the retention of earnings, is the primary means of maintaining capital adequacy for the Bank. The Company’s stockholders’ equity was $63.6 million and $59.8 million at December 31, 2023 and 2022, respectively. Total stockholders’ equity in relation to total assets was 7.76% at December 31, 2023 and 7.89% at December 31, 2022. Please refer to the Consolidated Statements of Stockholders’ Equity for a detailed roll forward of stockholders’ equity from 2022 to 2023.
|
|
2023 Compared to 2022 |
|||||||
|
|
Increase/(Decrease) |
|||||||
|
|
(In thousands) |
|||||||
|
|
|
|
Change |
|
Change |
|||
|
|
Total |
|
Due To |
|
Due To |
|||
|
|
Change |
|
Volume |
|
Rate |
|||
Interest and dividend income |
|
|
|
|
|
|
|
|
|
Loans |
|
$ |
4,508 |
|
$ |
41 |
|
$ |
4,467 |
Taxable securities available for sale |
|
|
842 |
|
|
745 |
|
|
97 |
Tax-exempt securities available for sale |
|
|
1,866 |
|
|
1,057 |
|
|
809 |
Federal funds sold |
|
|
2,259 |
|
|
121 |
|
|
2,138 |
FHLB stock and other |
|
|
119 |
|
|
12 |
|
|
107 |
Total interest and dividend income |
|
|
9,594 |
|
|
1,976 |
|
|
7,618 |
|
|
|
|
|
|
|
|
|
|
Interest expense |
|
|
|
|
|
|
|
|
|
Demand deposits |
|
|
1,078 |
|
|
(171) |
|
|
1,249 |
Savings deposits |
|
|
55 |
|
|
(4) |
|
|
59 |
Time deposits |
|
|
3,096 |
|
|
1,136 |
|
|
1,960 |
Subordinated debentures |
|
|
145 |
|
|
— |
|
|
145 |
Repurchase agreements |
|
|
811 |
|
|
29 |
|
|
782 |
Advances from federal home loan bank |
|
|
2,556 |
|
|
2,556 |
|
|
— |
Total interest expense |
|
$ |
7,741 |
|
$ |
3,546 |
|
$ |
4,195 |
|
|
|
|
|
|
|
|
|
|
Net interest income |
|
$ |
1,853 |
|
$ |
(1,570) |
|
$ |
3,423 |
26 |
|
|
|
The Company has established a Dividend Reinvestment Plan (“The Plan”) for stockholders under which the Company’s common stock will be purchased by The Plan for participants with automatically reinvested dividends. The Plan does not represent a change in the dividend policy or a guarantee of future dividends. Stockholders who do not wish to participate in The Plan continue to receive cash dividends, as declared in the usual and customary manner.
The Company’s Articles of Incorporation permits the creation of a class of preferred shares with 2,000,000 authorized shares. If utilized, this will enable the Company, at the option of the Board of Directors, to issue series of preferred shares in a manner calculated to take advantage of financing techniques which may provide a lower effective cost of capital to the Company. The class of preferred shares provides greater flexibility to the Board of Directors in structuring the terms of equity securities that may be issued by the Company. As of December 31, 2023, the Company has not issued any preferred shares.
On May 14, 2019 the Company issued $20,000,000 of junior subordinated debentures in denominations of not less than $250,000. The debentures bear interest at a fixed rate of 6.0% until May 2024, which then becomes a floating interest rate equal to the three-month SOFR plus 3.625%, resetting quarterly. Interest on the subordinated notes will be payable semiannually through May 2024 and quarterly thereafter through the maturity date of May 2029. Principal is due upon maturity. The debentures are unsecured and payable to various investors. For purposes of computing regulatory capital, the debentures are included in Tier 2 Capital. The subordinated notes may not be repaid in whole or in part prior to the fifth anniversary of the issue date (May 2019).
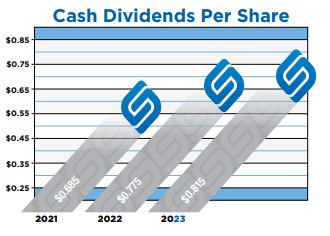
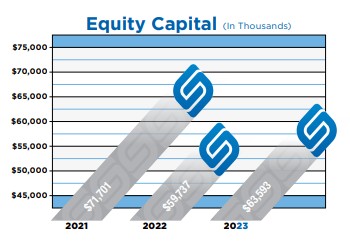
In 2005, a Delaware statutory business trust owned by the Company, United Bancorp Statutory Trust I (“Trust I” or the “Trust”), issued $4.1 million of mandatorily redeemable debt securities which mature in 2035. The sale proceeds were utilized to purchase $4.1 million of the Company’s subordinated debentures. The Company’s subordinated debentures are the sole asset of Trust I. The Company’s investment in Trust I is not consolidated herein as the Company is not deemed the primary beneficiary of the Trust. However, the $4.1 million of mandatorily redeemable debt securities issued by the Trust are includible for regulatory purposes as a component of the Company’s Tier 1 Capital. The interest rate is a variable rate per annum, reset quarterly, equal to three-month SOFR plus 1.35% and is payable quarterly.
|
27 |
||
Liquidity
Liquidity relates primarily to the Company’s ability to fund loan demand, meet deposit customers’ withdrawal requirements and provide for operating expenses. Assets used to satisfy these needs consist of cash and due from banks, federal funds sold and securities available-for-sale. These assets are commonly referred to as liquid assets. Liquid assets were $283.5 million at December 31, 2023, compared to $247.7 million at December 31, 2022. The Company’s residential real estate portfolio can and has been readily used to collateralize borrowings as an additional source of liquidity. Management believes its current liquidity level is sufficient to meet cash requirements.
The Cash Flow Statements for the periods presented provide an indication of the Company’s sources and uses of cash as well as an indication of the ability of the Company to maintain an adequate level of liquidity. A discussion of the cash flow statements for 2023 and 2022 follows.
Net cash provided by operating activities totaled $8.7 million and $8.5 million for the years ended December 31, 2023 and 2022, respectively. The adjustments to reconcile net income to net cash from operating activities consisted mainly of depreciation and amortization of premises and equipment and intangibles, gain on sales of loans, securities and other assets, the provision for credit losses, Federal Home Loan Bank stock dividends, net amortization of securities and net changes in other assets and liabilities.
For the year ended December 31, 2023, net cash used in investing activities totaled $47.7 million. For the year ended December 31, 2022 net cash used in investing activities totaled $103.3 million. The changes in net cash from investing activities include loan growth, security purchases, as well as normal maturities, security calls/sales and reinvestments of securities and premises and equipment expenditures.
Net cash provided by financing activities totaled $49.7 million for the year ended December 31, 2023. For the year ended December 31, 2022 net cash provided by financing activities totaled $41.9 million. The net cash provided by financing activities in 2023 was primarily attributable to a $75.0 million advance from the Federal Home Loan Bank.
Management feels that it has the capital adequacy, profitability, liquidity and reputation to meet the current and projected financial needs of its customers.
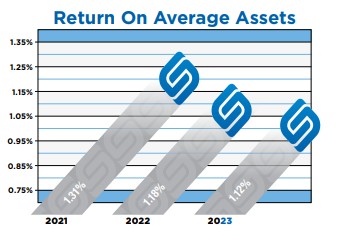
Inflation
The majority of assets and liabilities of the Company are monetary in nature and therefore the Company differs greatly from most commercial and industrial companies that have significant investments in fixed assets or inventories. However, inflation does have an important impact on the growth of total assets in the banking industry and the resulting need to increase equity capital at higher than normal rates in order to maintain an appropriate equity to assets ratio. Inflation significantly affects noninterest expense, which tends to rise during periods of general inflation. Management believes the most significant impact on financial results is the Company’s ability to react to changes in interest rates. Management seeks to maintain an essentially balanced position between interest sensitive assets and liabilities and actively manages the amount of securities available for sale in order to protect against the effects of wide interest rate fluctuations on net income and shareholders’ equity.
28 |
|
|
|

REPORT OF INDEPENDENT REGISTERED PUBLIC ACCOUNTING FIRM
To the Shareholders and the Board of Directors of United Bancorp, Inc.
Opinion on the Financial Statements
We have audited the accompanying consolidated balance sheets of United Bancorp, Inc. (the “Company”) as of December 31, 2023 and 2022; the related consolidated statements of income, comprehensive income, stockholders’ equity, and cash flows for the years then ended; and the related notes to the consolidated financial statements (collectively, the financial statements). In our opinion, the financial statements present fairly, in all material respects, the financial position of the Company as of December 31, 2023 and 2022, and the results of its operations and its cash flows for the years then ended, in conformity with accounting principles generally accepted in the United States of America.
Change in Accounting Principle
As discussed in Note 1 to the financial statements, the Company changed its method of accounting for credit losses effective January 1, 2023, due to the adoption of Accounting Standards Codification (ASC) Topic 326, Financial Instruments – Credit Losses.
Basis for Opinion
These financial statements are the responsibility of the Company’s management. Our responsibility is to express an opinion on the Company’s financial statements based on our audits. We are a public accounting firm registered with the Public Company Accounting Oversight Board (United States) (PCAOB) and are required to be independent, with respect to the Company, in accordance with U.S. federal securities laws and the applicable rules and regulations of the Securities and Exchange Commission and the PCAOB.
We conducted our audits in accordance with the standards of the PCAOB. Those standards require that we plan and perform the audit to obtain reasonable assurance about whether the financial statements are free of material misstatement, whether due to error or fraud. The Company is not required to have, nor were we engaged to perform, an audit of its internal control over financial reporting. As part of our audits, we are required to obtain an understanding of internal control over financial reporting but not for the purpose of expressing an opinion on the effectiveness of the Company’s internal control over financial reporting. Accordingly, we express no such opinion.
Our audits included performing procedures to assess the risks of material misstatement of the financial statements, whether due to error or fraud, and performing procedures that respond to those risks. Such procedures included examining, on a test basis, evidence regarding the amounts and disclosures in the financial statements. Our audits also included evaluating the accounting principles used and significant estimates made by management, as well as evaluating the overall presentation of the financial statements. We believe that our audits provide a reasonable basis for our opinion.
PITTSBURGH, PA |
|
PHILADELPHIA, PA |
|
WHEELING, WV |
|
STEUBENVILLE, OH |
|
2009 Mackenzie Way • Suite 340 |
|
2100 Renaissance Blvd. • Suite 110 |
|
980 National Road |
|
511 N. Fourth Street |
|
Cranberry Township, PA 16066 |
|
King of Prussia, PA 19406 |
|
Wheeling, WV 26003 |
|
Steubenville, OH 43952 |
|
(724) 934-0344 |
|
(610) 278-9800 |
|
(304) 233-5030 |
|
(304) 233-5030 |
|
|
|
S.R. Snodgrass, P.C. d/b/a S.R. Snodgrass, A.C. in West Virginia |
|
|
|
||
Critical Audit Matters
The critical audit matters communicated below are matters arising from the current period audit of the financial statements that were communicated or required to be communicated to the Audit Committee and that: (1) relate to accounts or disclosures that are material to the financial statements; and (2) involve our especially challenging, subjective, or complex judgments. The communication of critical audit matters does not alter, in any way, our opinion on the financial statements, taken as a whole, and we are not, by communicating the critical audit matters below, providing separate opinions on the critical audit matters or on the accounts or disclosures to which they relate.
Allowance for Credit Losses (ACL) – Qualitative Adjustments
The Company’s loan portfolio totaled $483 million as of December 31, 2023, and the associated ACL was $3.9 million. As discussed in Notes 1 and 4 to the consolidated financial statements, determining the amount of the ACL requires significant judgment about the expected future losses, which is based on a baseline lifetime loss rate, calculated using a weighted-average remaining maturities method, which is then adjusted for current qualitative conditions and reasonable and supportable forecasts. Management applies these qualitative adjustments to the baseline lifetime loss rate to reflect changes in the current and forecasted environment, both internal and external, that are different from the conditions that existed during the historical loss calculation period.
We identified these qualitative adjustments within the ACL as critical audit matters because they involve a high degree of subjectivity. While the determination of these qualitative adjustments includes analysis of observable data over the historical loss period, the judgments required to assess the directionality and magnitude of adjustments is highly subjective. Auditing these complex judgments and assumptions involved especially challenging auditor judgment due to the nature of audit evidence and the nature and extent of effort required to address these matters.
The primary procedures we performed to address this critical audit matter included:
| ● | Testing the design, implementation, and operating effectiveness of internal controls over the calculation of the allowance for credit losses, including the qualitative factor adjustments. |
| ● | Testing the completeness and accuracy of the significant data points that management uses in their evaluation of the qualitative adjustments. |
| ● | Evaluating the directional consistency and reasonableness of management's conclusions regarding basis points applied based on the trends identified in the underlying data. |
| ● | Testing the mathematical accuracy of the application of the qualitative adjustments to the loan segments within the ACL calculation |
We have served as the Company’s auditor since 2022.

Cranberry Township, Pennsylvania
March 20, 2024
United Bancorp, Inc.
Consolidated Balance Sheets
December 31, 2023 and 2022
(In thousands, except share data)
|
|
2023 |
|
2022 |
||
Assets |
|
|
|
|
|
|
Cash and due from banks |
|
$ |
7,352 |
|
$ |
8,279 |
Interest-bearing demand deposits |
|
|
33,418 |
|
|
21,801 |
Cash and cash equivalents |
|
|
40,770 |
|
|
30,080 |
|
|
|
|
|
|
|
Available-for-sale securities, amortized cost of $251,683 net of allowance for credit losses of $0 at December 31, 2023 |
|
|
242,760 |
|
|
217,624 |
Loans, net of allowance for credit losses of $3,918 and $2,052 at December 31, 2023 and 2022, respectively |
|
|
479,318 |
|
|
458,823 |
Premises and equipment |
|
|
14,984 |
|
|
12,144 |
Federal Home Loan Bank stock |
|
|
3,979 |
|
|
2,499 |
Foreclosed assets held for sale, net |
|
|
3,377 |
|
|
3,519 |
Core deposit intangible assets |
|
|
260 |
|
|
410 |
Goodwill |
|
|
682 |
|
|
682 |
Accrued interest receivable |
|
|
4,098 |
|
|
3,403 |
Deferred federal income tax |
|
|
2,409 |
|
|
2,423 |
Bank-owned life insurance |
|
|
19,423 |
|
|
19,000 |
Other assets |
|
|
7,389 |
|
|
6,793 |
Total Assets |
|
$ |
819,449 |
|
$ |
757,400 |
Liabilities and Stockholders’ Equity |
|
|
|
|
|
|
Liabilities |
|
|
|
|
|
|
Deposits |
|
|
|
|
|
|
Demand |
|
$ |
339,280 |
|
$ |
402,341 |
Savings |
|
|
130,821 |
|
|
145,836 |
Time |
|
|
151,358 |
|
|
101,736 |
Total deposits |
|
|
621,459 |
|
|
649,913 |
Securities sold under repurchase agreements |
|
|
26,781 |
|
|
18,106 |
Subordinated debentures |
|
|
23,787 |
|
|
23,726 |
Advances Federal Home Loan Bank |
|
|
75,000 |
|
|
— |
Lease liability – finance lease |
|
|
2,764 |
|
|
— |
Interest payable and other liabilities |
|
|
6,065 |
|
|
5,918 |
Total liabilities |
|
|
755,856 |
|
|
697,663 |
Stockholders’ Equity |
|
|
|
|
|
|
Preferred stock, no par value, authorized 2,000,000 shares; no shares issued |
|
|
–– |
|
|
–– |
Common stock, $1 par value; authorized 10,000,000 shares; issued 2023 – 6,063,851 shares, 2022 - 6,043,851 shares; outstanding 2023 – 5,702,685 shares, 2022 – 5,740,251 shares |
|
|
6,064 |
|
|
6,044 |
Additional paid-in capital |
|
|
25,913 |
|
|
24,814 |
Retained earnings |
|
|
44,018 |
|
|
41,945 |
Stock held by deferred compensation plan; 2023 – 181,803 shares, 2022 – 174,237 shares |
|
|
(2,363) |
|
|
(1,902) |
Unearned ESOP compensation |
|
|
— |
|
|
— |
Accumulated other comprehensive loss |
|
|
(7,478) |
|
|
(9,336) |
Treasury stock, at cost 2023 – 179,363 shares, 2022 – 129,363 shares |
|
|
(2,561) |
|
|
(1,828) |
Total stockholders’ equity |
|
|
63,593 |
|
|
59,737 |
Total liabilities and stockholders’ equity |
|
$ |
819,449 |
|
$ |
757,400 |
See Notes to Consolidated Financial Statements
32 |
|
United Bancorp, Inc.
Consolidated Statements of Income
Years Ended December 31, 2023 and 2022
(In thousands except per share data)
|
|
2023 |
|
2022 |
||
Interest and Dividend Income |
|
|
|
|
|
|
Loans |
|
$ |
25,232 |
|
$ |
20,734 |
Securities |
|
|
|
|
|
|
Taxable |
|
|
2,741 |
|
|
1,899 |
Tax-exempt |
|
|
5,870 |
|
|
4,396 |
Federal funds sold |
|
|
2,752 |
|
|
493 |
Dividends on Federal Home Loan Bank and other stock |
|
|
254 |
|
|
139 |
Total interest and dividend income |
|
|
36,849 |
|
|
27,661 |
Interest Expense |
|
|
|
|
|
|
Deposits |
|
|
5,873 |
|
|
1,643 |
Borrowings |
|
|
5,141 |
|
|
1,630 |
Total interest expense |
|
|
11,014 |
|
|
3,273 |
Net Interest Income |
|
|
25,835 |
|
|
24,388 |
Provision for (reversal of ) Credit Losses |
|
|
(454) |
|
|
(955) |
Net Interest Income After Provision for (reversal of) Credit Losses |
|
|
26,289 |
|
|
25,343 |
Noninterest Income |
|
|
|
|
|
|
Customer service fees |
|
|
2,940 |
|
|
2,978 |
Net gains on loan sales |
|
|
29 |
|
|
36 |
Earnings on bank-owned life insurance |
|
|
725 |
|
|
708 |
Other |
|
|
360 |
|
|
361 |
Total noninterest income |
|
|
4,054 |
|
|
4,083 |
Noninterest Expense |
|
|
|
|
|
|
Salaries and employee benefits |
|
|
10,272 |
|
|
10,305 |
Net occupancy and equipment expense |
|
|
2,064 |
|
|
2,217 |
Professional fees |
|
|
1,465 |
|
|
1,451 |
Insurance |
|
|
623 |
|
|
568 |
Deposit insurance premiums |
|
|
375 |
|
|
198 |
Franchise and other taxes |
|
|
555 |
|
|
562 |
Advertising expense |
|
|
361 |
|
|
346 |
Printing and office supplies |
|
|
113 |
|
|
110 |
Amortization of intangible assets |
|
|
150 |
|
|
150 |
Other |
|
|
4,874 |
|
|
3,983 |
Total noninterest expense |
|
|
20,852 |
|
|
19,890 |
Income Before Federal Income Taxes |
|
|
9,491 |
|
|
9,536 |
Provision for Federal Income Taxes |
|
|
541 |
|
|
879 |
Net Income |
|
$ |
8,950 |
|
$ |
8,657 |
Basic Earnings Per Share |
|
$ |
1.57 |
|
$ |
1.50 |
Diluted Earnings Per Share |
|
$ |
1.57 |
|
$ |
1.50 |
See Notes to Consolidated Financial Statements
33 |
United Bancorp, Inc.
Consolidated Statements of Comprehensive Income
Years Ended December 31, 2023 and 2022
(In thousands)
|
|
2023 |
|
2022 |
||
Net income |
|
$ |
8,950 |
|
$ |
8,657 |
Other comprehensive income (loss), net of tax |
|
|
|
|
|
|
Unrealized holding gain (losses) losses on available-for-sale securities during the period, net of taxes (benefits) of $432 and $4,605 for each respective period |
|
|
1,628 |
|
|
(17,322) |
Change in funded status of defined benefit plan, net of taxes of $69 and $252 for each respective period |
|
|
263 |
|
|
947 |
Amortization of prior service included in net periodic pension expense, net of tax benefits of $19 and $19 for each respective period |
|
|
(70) |
|
|
(70) |
Amortization of net loss included in net periodic pension cost, net of taxes of $10 and $38 for each respective period |
|
|
37 |
|
|
145 |
Comprehensive income (loss) |
|
$ |
10,808 |
|
$ |
(7,643) |
See Notes to Consolidated Financial Statements
34 |
|
United Bancorp, Inc.
Consolidated Statements of Stockholders’ Equity
Years Ended December 31, 2023 and 2022
(In thousands except per share data)
|
|
|
|
|
|
|
|
Treasury |
|
|
|
|
Accumulated |
|
|
|
||
|
|
|
|
|
Additional |
|
Stock and |
|
|
|
|
Other |
|
|
|
|||
|
|
Common |
|
Paid-in |
|
Deferred |
|
Retained |
|
Comprehensive |
|
|
|
|||||
|
|
Stock |
|
Capital |
|
Compensation |
|
Earnings |
|
Income (Loss) |
|
Total |
||||||
Balance, January 1, 2022 |
|
$ |
6,054 |
|
$ |
23,635 |
|
$ |
(2,799) |
|
$ |
37,847 |
|
$ |
6,964 |
|
$ |
71,701 |
Net income |
|
|
— |
|
|
— |
|
|
— |
|
|
8,657 |
|
|
— |
|
|
8,657 |
Other comprehensive loss |
|
|
— |
|
|
— |
|
|
— |
|
|
— |
|
|
(16,300) |
|
|
(16,300) |
Cash dividends - $0.775 per share |
|
|
— |
|
|
— |
|
|
— |
|
|
(4,559) |
|
|
— |
|
|
(4,559) |
Shares activity for deferred compensation plan |
|
|
— |
|
|
164 |
|
|
(164) |
|
|
— |
|
|
— |
|
|
— |
Shares purchased for treasury stock |
|
|
— |
|
|
— |
|
|
(767) |
|
|
— |
|
|
— |
|
|
(767) |
Expense related to share-based compensation plans |
|
|
— |
|
|
1,005 |
|
|
— |
|
|
— |
|
|
— |
|
|
1,005 |
Restricted stock activity |
|
|
(10) |
|
|
10 |
|
|
— |
|
|
— |
|
|
— |
|
|
— |
Balance, December 31, 2022 |
|
|
6,044 |
|
$ |
24,814 |
|
$ |
(3,730) |
|
$ |
41,945 |
|
$ |
(9,336) |
|
$ |
59,737 |
Net income |
|
|
— |
|
|
— |
|
|
— |
|
|
8,950 |
|
|
— |
|
|
8,950 |
Other comprehensive income |
|
|
— |
|
|
— |
|
|
— |
|
|
— |
|
|
1,858 |
|
|
1,858 |
Cash dividends - $0.815 per share |
|
|
— |
|
|
— |
|
|
— |
|
|
(4,789) |
|
|
— |
|
|
(4,789) |
Shares activity for deferred compensation plan |
|
|
— |
|
|
461 |
|
|
(461) |
|
|
— |
|
|
— |
|
|
— |
Shares purchased for treasury stock |
|
|
— |
|
|
— |
|
|
(733) |
|
|
— |
|
|
— |
|
|
(733) |
Cumulative effect of adoption of ASU 2016-13 |
|
|
— |
|
|
— |
|
|
— |
|
|
(2,088) |
|
|
— |
|
|
(2,088) |
Expense related to share-based compensation plans |
|
|
— |
|
|
658 |
|
|
— |
|
|
— |
|
|
— |
|
|
658 |
Restricted stock activity |
|
|
20 |
|
|
(20) |
|
|
— |
|
|
— |
|
|
— |
|
|
— |
|
|
|
|
|
|
|
|
|
|
|
|
|
|
|
|
|
|
|
Balance, December 31, 2023 |
|
$ |
6,064 |
|
$ |
25,913 |
|
$ |
(4,924) |
|
$ |
44,018 |
|
$ |
(7,478) |
|
$ |
63,593 |
See Notes to Consolidated Financial Statements
35 |
United Bancorp, Inc.
Consolidated Statements of Cash Flows
Years Ended December 31, 2023 and 2022
(In thousands)
|
|
2023 |
|
2022 |
||
Operating Activities |
|
|
|
|
|
|
Net income |
|
$ |
8,950 |
|
$ |
8,657 |
Items not requiring (providing) cash: |
|
|
|
|
|
|
Depreciation and amortization |
|
|
997 |
|
|
1,013 |
Provision for (reversal of) credit loss expense |
|
|
(454) |
|
|
(955) |
Amortization of premiums and discounts on securities-net |
|
|
512 |
|
|
533 |
Amortization of intangible assets |
|
|
150 |
|
|
150 |
Deferred income taxes |
|
|
13 |
|
|
342 |
Originations of loans held for sale |
|
|
(615) |
|
|
(1,891) |
Proceeds from sale of loans held for sale |
|
|
644 |
|
|
1,927 |
Net gains on sales of loans |
|
|
(29) |
|
|
(36) |
Expense related to share-based compensation plans |
|
|
658 |
|
|
1,005 |
Net loss (gain) or on sale or write-down of foreclosed assets and other repossessed assets |
|
|
12 |
|
|
23 |
Increase in cash surrender value of bank-owned life insurance |
|
|
(422) |
|
|
(191) |
Amortization of debt issuance costs |
|
|
61 |
|
|
61 |
Changes in: |
|
|
|
|
|
|
Accrued interest receivable |
|
|
(695) |
|
|
(1,058) |
Other assets |
|
|
(288) |
|
|
(824) |
Interest payable and other liabilities |
|
|
(31) |
|
|
(275) |
Net cash provided by operating activities |
|
|
9,463 |
|
|
8,481 |
Investing Activities |
|
|
|
|
|
|
Purchases of available-for-sale securities |
|
|
(25,918) |
|
|
(99,992) |
Maturities, prepayments and calls |
|
|
2,330 |
|
|
6,190 |
Net change in loans |
|
|
(22,465) |
|
|
(10,415) |
Purchase of Federal Home Loan Bank Stock |
|
|
(3,149) |
|
|
— |
Redemption of Federal Home Loan Bank Stock |
|
|
1,669 |
|
|
1,205 |
Purchases of premises and equipment, net |
|
|
(1,081) |
|
|
(511) |
Proceeds from sale of premises and equipment |
|
|
9 |
|
|
111 |
Proceeds from sales of foreclosed assets |
|
|
133 |
|
|
156 |
Net cash used in investing activities |
|
|
(48,472) |
|
|
(103,256) |
See Notes to Consolidated Financial Statements
36 |
|
United Bancorp, Inc.
Consolidated Statements of Cash Flows (continued)
December 31, 2023 and 2022
(In thousands)
|
|
2023 |
|
2022 |
||
Financing Activities |
|
|
|
|
|
|
Net (decrease) increase in deposits |
|
$ |
(28,454) |
|
$ |
44,777 |
Net change in securities sold under repurchase agreements |
|
|
8,675 |
|
|
2,405 |
Repurchase of common stock |
|
|
(733) |
|
|
(767) |
Proceeds from Federal Home Loan Bank Advances |
|
|
75,000 |
|
|
— |
Cash dividends paid |
|
|
(4,789) |
|
|
(4,559) |
Net cash provided by financing activities |
|
|
49,699 |
|
|
41,856 |
Increase (Decrease) in Cash and Cash Equivalents |
|
|
10,690 |
|
|
(52,919) |
Cash and Cash Equivalents, Beginning of Year |
|
|
30,080 |
|
|
82,999 |
Cash and Cash Equivalents, End of Year |
|
$ |
40,770 |
|
$ |
30,080 |
Supplemental Cash Flows Information |
|
|
|
|
|
|
Interest paid on deposits and borrowings |
|
$ |
10,585 |
|
$ |
3,150 |
Federal income taxes paid |
|
$ |
— |
|
$ |
230 |
Supplemental Disclosure of Non-Cash Investing Activities |
|
|
|
|
|
|
Transfers from loans to foreclosed assets held for sale |
|
$ |
33 |
|
$ |
3,283 |
Adoption of ASU 2016-13 |
|
$ |
2,089 |
|
$ |
— |
Finance lease asset and lease liability |
|
|
2,764 |
|
|
|
See Notes to Consolidated Financial Statements
37 |
Notes to Consolidated Financial Statements
December 31, 2023 and 2022
Note 1: Nature of Operations and Summary of Significant Accounting Policies
Principles of Consolidation
The consolidated financial statements include the accounts of United Bancorp, Inc. (“United” or “the Company”) and its wholly-owned subsidiary, Unified Bank of Martins Ferry, Ohio (“the Bank” or “Unified”). All intercompany transactions and balances have been eliminated in consolidation.
Nature of Operations
The Company’s revenues, operating income and assets are almost exclusively derived from banking. Accordingly, all of the Company’s banking operations are considered by management to be aggregated in one reportable operating segment. Customers are mainly located in Athens, Belmont, Carroll, Fairfield, Harrison, Jefferson and Tuscarawas Counties in Ohio and Marshall and Ohio Counties in West Virginia and the surrounding localities in northeastern, east-central and southeastern Ohio and include a wide range of individuals, businesses and other organizations. Unified Bank conducts its business through its main office in Martins Ferry, Ohio and branches in Bridgeport, Colerain, Dellroy, Dover, Glouster, Jewett, Lancaster Downtown, Lancaster East, Nelsonville, New Philadelphia, Powhatan Point, St. Clairsville East, St. Clairsville West, Sherrodsville, Strasburg, Tiltonsville, Ohio and Moundsville West Virginia.
The Company’s primary deposit products are checking, savings and term certificate accounts and its primary lending products are residential mortgage, commercial and installment loans. Substantially all loans are secured by specific items of collateral including business assets, consumer assets and real estate. Commercial loans are expected to be repaid from cash flow from operations of businesses. Real estate loans are secured by both residential and commercial real estate. Net interest income is affected by the relative amount of interest-earning assets and interest-bearing liabilities and the interest received or paid on these balances. The level of interest rates paid or received by the Company can be significantly influenced by a number of environmental factors, such as governmental monetary policy, that are outside of management’s control.
Revenue Recognition
Accounting Standards Codification (“ASC”) 606, Revenue from Contracts with Customers (“ASC 606”), establishes principles for reporting information about the nature, amount, timing and uncertainty of revenue and cash flows arising from the entity’s contracts to provide goods or services to customers. The core principle requires an entity to recognize revenue to depict the transfer of goods or services to customers in an amount that reflects the consideration that it expects to be entitled to receive in exchange for those goods or services recognized as performance obligations are satisfied.
The majority of our revenue-generating transactions are not subject to ASC 606, including revenue generated from financial instruments, such as our loans, investment securities, as well as revenue related to our mortgage banking activities, as these activities are subject to other GAAP discussed elsewhere within our disclosures.
Descriptions of our revenue-generating activities that are within the scope of ASC 606, which are presented in our statements of income as components of non-interest income are as follows:
Service charges on deposit accounts - these represent general service fees for monthly account maintenance and activity- or transaction-based fees and consist of transaction-based revenue, time-based revenue (service period), item-based revenue or some other individual attribute-based revenue. Revenue is recognized when our performance obligation is completed which is generally monthly for account maintenance services or when a transaction has been completed (such as a wire transfer). Payment for such performance obligations are generally received at the time the performance obligations are satisfied.
Use of Estimates
The preparation of financial statements in conformity with accounting principles generally accepted in the United States of America requires management to make estimates and assumptions that affect the reported amounts of assets and liabilities and disclosure of contingent assets and liabilities at the date of the financial statements and the reported amounts of revenues and expenses during the reporting period. Actual results could differ from those estimates.
Material estimates that are particularly susceptible to significant change relate to the determination of the allowance for credit losses and the valuation of real estate acquired in connection with foreclosures or in satisfaction of loans. In connection with
38 |
|
Notes to Consolidated Financial Statements
December 31, 2023 and 2022
the determination of the allowance for credit losses and the valuation of foreclosed assets held for sale, management obtains independent appraisals for significant properties.
Cash Equivalents
The Company considers all liquid investments with original maturities of three months or less to be cash equivalents. At December 31, 2023 and 2022, cash equivalents consisted primarily of due from accounts with the Federal Reserve and other correspondent banks.
Currently, the FDIC’s insurance limits are $250,000. At December 31, 2023 and 2022, the Company’s various cash accounts did not exceed the federally insured limit of $250,000. At December 31, 2023 and 2022, the Company held $33,418,000 and $21,541,000 at the Federal Home Loan Bank and the Federal Reserve Bank, respectively, which are not subject to FDIC limits.
Investment Securities
Management determines the appropriate classification of debt securities at the time of purchase and re-evaluates such designation as of each balance sheet date.
Investment securities classified as available for sale are those securities that the Company intends to hold for an indefinite period of time but not necessarily to maturity. Securities available for sale are carried at fair value. Any decision to sell a security classified as available for sale would be based on various factors, including significant movements in interest rates, changes in the maturity mix of the Company’s assets and liabilities, liquidity needs, regulatory capital considerations, and other similar factors. Unrealized gains or losses are reported as increases or decreases in other comprehensive income (loss), net of the deferred tax effect. Realized gains or losses, determined on the basis of the cost of the specific securities sold, are included in earnings. Premiums and discounts are recognized in interest income using the interest method over the terms of the securities.
Allowance for Credit Losses – Available for Sale Securities
The Company measures expected credit losses on available-for-sale debt securities when the Company does not intend to sell, or when it is not more likely than not that it will be required to sell, the security before recovery of its amortized cost basis. If either of the criteria regarding intent or requirement to sell is met, the security’s amortized cost basis is written down to fair value through income. For available-for-sale debt securities that do not meet the aforementioned criteria, the Company evaluates whether the decline in fair value has resulted from credit losses or other factors. In making this assessment, the Company considers the extent to which fair value is less than amortized cost, any changes to the rating of the security by a rating agency, and adverse conditions specifically related to the security, among other factors. If this evaluation indicates that a credit loss exists, the present value of cash flows expected to be collected from the security are compared to the amortized cost basis of the security. If the present value of cash flows expected to be collected is less than the amortized cost basis, a credit loss exists and an allowance for credit losses is recorded for the credit loss, equal to the amount that the fair value is less than the amortized cost basis. Economic forecast data is utilized to calculate the present value of expected cash flows. The Company utilizes independent firms to evaluate the Company’s State and Municipal Obligations and Subordinated Notes to measure any expected credit losses. Any impairment that has not been recorded through an allowance for credit losses is recognized in other comprehensive income (loss).
The allowance for credit losses on available-for-sale debt securities is included within investment securities available-for-sale on the consolidated balance sheets. Changes in the allowance for credit losses are recorded within provision for credit losses on the consolidated statements of income. Losses are charged against the allowance when the Company believes the collectability of an available-for-sale security is in jeopardy or when either of the criteria regarding intent or requirement to sell is met.
Accrued interest receivable on available-for-sale debt securities totaled $2.7 million at December 31, 2023 and is included within the line item accrued interest receivable on the consolidated balance sheets. This amount is excluded from the estimate of expected credit losses. Available-for-sale debt securities are typically classified as nonaccrual when the contractual payment of principal or interest has become 90 days past due or management has serious doubts about the further collectability of principal or interest. When available-for-sale debt securities are placed on nonaccrual status, unpaid interest credited to income is reversed.
Loans Held for Sale
39 |
Notes to Consolidated Financial Statements
December 31, 2023 and 2022
Mortgage loans originated and intended for sale in the secondary market are carried at the lower of cost or fair value in the aggregate. Net unrealized losses, if any, are recognized through a valuation allowance by charges to income. At December 31, 2023 and 2022, the Company did not have any loans held for sale.
Loans
Loans receivable that management has the intent and ability to hold for the foreseeable future or until maturity or payoff are stated at their outstanding unpaid principal balances, net of an allowance for credit losses and any deferred fees or costs. Accrued interest receivable totaled $1.4 million at December 31, 2023 and was reported in the line item accrued interest receivable on the consolidated balance sheets and is excluded from the estimate of credit losses. Interest income is accrued on the unpaid principal balance. Loan origination fees, net of certain direct origination costs, are deferred and recognized as an adjustment of the yield (interest income) of the related loans. The Company is amortizing these amounts over the contractual life of the loan. Premiums and discounts on purchased loans are amortized as adjustments to interest income using the effective yield method.
The loans receivable portfolio is segmented into commercial and industrial, which are typically utilized for general business purposes and commercial real estate, which are collaterized by real estate. Homogenouse loans consisting similar products that are smaller in amount and distributed over a large number of individual borrowers include residential real estate and consumer loans.
For all classes of loans receivable, the accrual of interest is discontinued when the contractual payment of principal or interest has become 90 days past due or management has serious doubts about further collectability of principal or interest, even though the loan is currently performing. A loan may remain on accrual status if it is in the process of collection and is either guaranteed or well secured. When a loan is placed on nonaccrual status, unpaid interest credited to income in the current year is reversed and unpaid interest accrued in prior years is charged against the allowance for credit losses. Interest generally is either applied against principal or reported as interest income on a cash basis, according to management’s judgment as to the collectability of principal. Generally, loans are restored to accrual status when the obligation is brought current, has performed in accordance with the contractual terms for a reasonable period of time (generally six months), and the ultimate collectability of the total contractual principal and interest is no longer in doubt. The past-due status of all classes of loans receivable is determined based on contractual due dates for loan payments.
Accounting Pronouncements Adopted in 2023
In June 2016, the FASB issued ASU No. 2016-13, “Financial Instruments – Credit Losses (Topic 326): Measurement of Credit Losses on Financial Instruments” and subsequent related updates. This ASU replaces the incurred loss methodology for recognizing credit losses and requires businesses and other organizations to measure the current expected credit losses (CECL) on financial assets measured at amortized cost, including loans and held-to-maturity securities, net investments in leases, off-balance sheet credit exposures such as unfunded commitments, and other financial instruments. In addition, ASC 326 requires credit losses on available-for-sale debt securities to be presented as an allowance rather than as a write-down when management does not intend to sell or believes that it is not more likely than not they will be required to sell. This guidance became effective on January 1, 2023 for the Company. The results reported for periods beginning after January 1, 2023 are presented under ASC 326 while prior period amounts continue to be reported in accordance with previously applicable accounting standards.
The Company adopted this guidance, and subsequent related updates, using the modified retrospective approach for all financial assets measured at amortized cost, including loans and available-for-sale debt securities and unfunded commitments. On January 1, 2023, the Company recorded a cumulative effect decrease to retained earnings of $2,088,000, net of tax, of which $1,911,000 related to loans, $177,000 related to unfunded commitments.
The Company adopted the provisions of ASC 326 related to presenting other-than-temporary impairment on available-for-sale debt securities prior to January 1, 2023 using the prospective transition approach, though no such charges had been recorded on the securities held by the Company as of the date of adoption. The Company did not change the segmentation from the incurred loss method upon adoption of ASC 326.
In January 2023, the Company adopted ASU 2022-02, “Financial Instruments - Credit Losses (Topic 326): Troubled Debt Restructurings and Vintage Disclosures” (“ASU 2022-02”), which eliminated the accounting guidance for troubled debt restructurings (“TDRs”) while enhancing disclosure requirements for certain loan refinancing and restructurings by creditors when a borrower is experiencing financial difficulty. This guidance was applied on a prospective basis. Upon adoption of this
40 |
|
Notes to Consolidated Financial Statements
December 31, 2023 and 2022
guidance, the Company no longer establishes a specific reserve for modifications to borrowers experiencing financial difficulty. Instead, these modifications are included in their historical loss rate which is applied to the current loan balance to arrive at the quantitative baseline portion of the Allowance for Credit Losses.
Allowance for Credit Losses – Loans
The allowance for credit losses (“ACL”) is a valuation reserve established and maintained by charges against income and is deducted from the amortized cost basis of loans to present the net amount expected to be collected on the loans. Loans, or portions thereof, are charged off against the ACL when they are deemed uncollectible. Expected recoveries do not exceed the aggregate of amounts previously charged-off and expected to be charged-off.
The ACL is an estimate of expected credit losses, measured over the contractual life of a loan, that considers our historical loss experience, current conditions and forecasts of future economic conditions. Determination of an appropriate ACL is inherently subjective and may have significant changes from period to period.
The methodology for determining the ACL has two main components: evaluation of expected credit losses for certain groups of homogeneous loans that share similar risk characteristics and evaluation of loans that do not share risk characteristics with other loans.
The allowance for credit losses is measured on a collective (pool) basis when similar risk characteristics exist. The Company uses the call report classification as its segment breakout and measures the allowance for credit losses using the Weighted Average Remaining Maturity method for all loan segments.
Historical credit loss experience is the basis for the estimation of expected credit losses. We apply historical loss rates to pools of loans with similar risk characteristics. After consideration of the historic loss calculation, management applies qualitative adjustments to reflect the current conditions and reasonable and supportable forecasts not already reflected in the historical loss information at the balance sheet date. Our reasonable and supportable forecast adjustment is based on a 2 year unemployment forecast provided by Bloomberg and management judgment. For periods beyond our reasonable and supportable forecast, we revert back to historical annual loss rates for the remainder of the life of each pool after the forecast period. The qualitative adjustments for current conditions are based upon current level of inflation and the rapid increase in interest rates, changes in lending policies and practices, experience and ability of lending staff, quality of the Company’s loan review system, value of underlying collateral, the existence of and changes in concentrations and other external factors. These modified historical loss rates are multiplied by the outstanding principal balance of each loan to calculate a required reserve.
The Company has elected to exclude accrued interest receivable from the measurement of its ACL. When a loan is placed on non-accrual status, any outstanding accrued interest is reversed against interest income.
The ACL for individual loans begins with the use of normal credit review procedures to identify whether a loan no longer shares similar risk characteristics with other pooled loans and therefore, should be individually assessed. We evaluate all commercial and industrial and commercial real estate loans, as well as residential and installment loans greater than $100,000 that meet the following criteria: 1) when it is determined that foreclosure is probable, 2) substandard, doubtful and nonperforming loans when repayment is expected to be provided substantially through the operation or sale of the collateral, 3) when it is determined by management that a loan does not share similar risk characteristics with other loans. Specific reserves are established based on the following three acceptable methods for measuring the ACL: 1) the present value of expected future cash flows discounted at the loan’s original effective interest rate; 2) the loan’s observable market price; or 3) the fair value of the collateral when the loan is collateral dependent. Our individual loan evaluations consist primarily of the fair value of collateral method because most of our loans are collateral dependent. Collateral values are discounted to consider disposition costs when appropriate. A specific reserve is established or a charge-off is taken if the fair value of the loan is less than the loan balance. The impact of the change from incurred loss model to the current expected credit loss model is detailed below (in thousands)
|
|
January 1, 2023 |
|||||||
Loan Categories (in thousands) |
|
Pre-adoption |
|
Adoption Impact |
|
As Reported |
|||
Commercial and Industrial |
|
$ |
215 |
|
$ |
755 |
|
$ |
970 |
Commercial Real Estate |
|
|
815 |
|
|
388 |
|
|
1,203 |
Residential Real Estate |
|
|
816 |
|
|
1,379 |
|
|
2,195 |
Consumer |
|
|
206 |
|
|
(103) |
|
|
103 |
41 |
Notes to Consolidated Financial Statements
December 31, 2023 and 2022
|
|
|
|
|
|
|
|
|
|
|
|
$ |
2,052 |
|
$ |
2,419 |
|
$ |
4,471 |
Allowance for Credit Losses on Off-Balance Sheet Credit Exposures
The Company estimates expected credit losses over the contractual period in which the Company is exposed to credit risk via a contractual obligation to extend credit, unless that obligation is unconditionally cancellable by the Company. The allowance for credit losses on off-balance sheet credit exposures is adjusted through credit loss expense. The estimate includes consideration of the likelihood that funding will occur and an estimate of expected credit losses on commitments expected to be funded over its estimated life.
Premises and Equipment
Land is carried at cost. Depreciable assets are stated at cost less accumulated depreciation which range from 10-39 years for Company buildings, 3-7 years for furniture and equipment, and 1-3 years for computer software. Depreciation is charged to expense using the straight-line method over the estimated useful lives of the assets. An accelerated method is used for tax purposes. Expenditures for maintenance and repairs are charged against income as incurred. Costs of major additions and improvements are capitalized.
Federal Home Loan Bank Stock
Federal Home Loan Bank stock is a required investment for institutions that are members of the Federal Home Loan Bank system. The required investment in the common stock is based on a predetermined formula, carried at cost and evaluated for impairment.
Foreclosed Assets Held for Sale
Assets acquired through, or in lieu of, loan foreclosure are held for sale and are initially recorded at fair value, less costs to sell, at the date of foreclosure, establishing a new cost basis. Subsequent to foreclosure, valuations are periodically performed by management and the assets are carried at the lower of carrying amount or fair value less cost to sell. Revenue and expenses from operations and changes in the valuation allowance are included in net income or expense from foreclosed assets.
Bank-Owned Life Insurance
The Company and the Bank have purchased life insurance policies on certain key executives. Company and bank-owned life insurance is recorded at its cash surrender value, or the amount that can be realized.
Treasury Stock
Common shares repurchased are recorded at cost. Cost of shares retired or reissued is determined using the weighted average cost.
Restricted Stock Awards
The Company has a share-based employee compensation plan, which is described more fully in Note 14.
Income Taxes
The Company accounts for income taxes in accordance with income tax accounting guidance (ASC 740, Income Taxes). The income tax accounting guidance results in two components of income tax expense: current and deferred. Current income tax expense reflects taxes to be paid or refunded for the current period by applying the provisions of the enacted tax law to the taxable income or excess of deductions over revenues. The Company determines deferred income taxes using the liability (or balance sheet) method. Under this method, the net deferred tax asset or liability is based on the tax effects of the differences between the book and tax bases of assets and liabilities, and enacted changes in tax rates and laws are recognized in the period in which they occur.
42 |
|
Notes to Consolidated Financial Statements
December 31, 2023 and 2022
Deferred income tax expense results from changes in deferred tax assets and liabilities between periods. Deferred tax assets are reduced by a valuation allowance if based on the weight of evidence available it is more likely than not that some portion or all of a deferred tax asset will not be realized.
Uncertain tax positions are recognized if it is more likely than not, based on the technical merits, that the tax position will be realized or sustained upon examination. The term more likely than not means a likelihood of more than 50 percent; the terms examined and upon examination also include resolution of the related appeals or litigation processes, if any. A tax position that meets the more-likely-than-not recognition threshold is initially and subsequently measured as the largest amount of tax benefit that has a greater than 50 percent likelihood of being realized upon settlement with a taxing authority that has full knowledge of all relevant information. The determination of whether or not a tax position has met the more-likely-than-not recognition threshold considers the facts, circumstances and information available at the reporting date and is subject to management’s judgment. At December 31, 2023, the Company had no uncertain tax positions.
The Company recognizes interest and penalties on income taxes as a component of income tax expense.
The Company files consolidated income tax returns with its subsidiary. With a few exceptions, the Company is no longer subject to the examination by tax authorities for years before 2020.
Deferred Compensation Plan
Directors have the option to defer all or a portion of fees for their services into a deferred stock compensation plan that invests in common shares of the Company. Officers of the Company have the option to defer up to 50% of their annual incentive award into this plan. The plan does not permit diversification and must be settled by the delivery of a fixed number of shares of the Company stock. The stock held in the plan is included in equity as deferred shares and is accounted for in a manner similar to treasury stock. Subsequent changes in the fair value of the Company’s stock are not recognized. The deferred compensation obligation is also classified as an equity instrument and changes in the fair value of the amount owed to the participant are not recognized.
The Company has entered into supplemental income agreements for certain individuals. These agreements call for a fixed payment over 180 months after the individual reaches normal retirement age.
Stockholders’ Equity and Dividend Restrictions
The Bank is subject to certain restrictions on the amount of dividends that it may declare without prior regulatory approval. Generally, the Bank’s payment of dividends is limited to net income for the current year plus the two preceding calendar years, less capital distributions paid over the comparable time period. Dividend payments to the stockholders may be legally paid from additional paid-in capital or retained earnings.
Earnings Per Share
Basic earnings per share allocated to common stockholders is calculated using the two-class method and is computed by dividing net income allocated to common stockholders by the weighted average number of commons shares outstanding during the period. Diluted earnings per share is adjusted for the dilutive effects of stock based compensation and is calculated using the two-class method or the treasury method. There were no dilutive effects for the years ended December 31, 2023 and 2022.
Comprehensive Income (Loss)
Comprehensive income consists of net income (loss) and other comprehensive (loss) income, net of applicable income taxes. Other comprehensive (loss) income includes unrealized appreciation (depreciation) on available-for-sale securities and changes in the funded status of the defined benefit pension plan.
Advertising
Advertising expenses are expensed as incurred.
43 |
Notes to Consolidated Financial Statements
December 31, 2023 and 2022
Note 2: Restriction on Cash and Due From Banks
The Company did not have a reserve requirement at December 31, 2023 and 2022.
Note 3: Securities
The amortized cost and approximate fair values, together with gross unrealized gains and losses of securities are as follows:
|
|
|
|
|
Gross |
|
Gross |
|
|
|
||
|
|
Amortized |
|
Unrealized |
|
Unrealized |
|
|
||||
|
|
Cost |
|
Gains |
|
Losses |
|
Fair Value |
||||
|
|
(In thousands) |
||||||||||
Available-for-sale Securities: |
|
|
|
|
|
|
|
|
|
|
|
|
December 31, 2023: |
|
|
|
|
|
|
|
|
|
|
|
|
U.S. government agencies |
|
$ |
45,000 |
|
$ |
— |
|
$ |
(732) |
|
$ |
44,268 |
Subordinated notes |
|
|
29,013 |
|
|
— |
|
|
(4,713) |
|
|
24,300 |
State and municipal obligations |
|
|
177,670 |
|
|
2,264 |
|
|
(5,742) |
|
|
174,192 |
Total debt securities |
|
$ |
251,683 |
|
$ |
2,264 |
|
$ |
(11,187) |
|
$ |
242,760 |
Available-for-sale Securities: |
|
|
|
|
|
|
|
|
|
|
|
|
December 31, 2022: |
|
|
|
|
|
|
|
|
|
|
|
|
U.S. government agencies |
|
$ |
45,000 |
|
$ |
— |
|
$ |
(968) |
|
$ |
44,032 |
Subordinated notes |
|
|
31,160 |
|
|
— |
|
|
(3,066) |
|
|
28,094 |
State and municipal obligations |
|
|
152,447 |
|
|
459 |
|
|
(7,408) |
|
|
145,498 |
Total debt securities |
|
$ |
228,607 |
|
$ |
459 |
|
$ |
(11,442) |
|
$ |
217,624 |
There were no allowance for credit losses as of December 31, 2023.
There were no sales of investment securities during 2023 and 2022.
The amortized cost and fair value of available-for-sale securities at December 31, 2023, by contractual maturity, are shown below. Expected maturities will differ from contractual maturities because issuers may have the right to call or prepay obligations with or without call or prepayment penalties.
|
|
Amortized |
|
Fair |
||
|
|
Cost |
|
Value |
||
|
|
(In thousands) |
||||
Less than one year |
|
$ |
15,000 |
|
$ |
14,869 |
One to five years |
|
|
30,597 |
|
|
29,937 |
Five to ten years |
|
|
32,930 |
|
|
28,234 |
Over ten years |
|
|
173,156 |
|
|
169,720 |
Totals |
|
$ |
251,683 |
|
$ |
242,760 |
The carrying value of securities pledged as collateral, to secure public deposits and for other purposes, was $72.8 million and $68.7 million at December 31, 2023 and 2022, respectively.
Certain investments in debt securities are reported in the financial statements at an amount less than their historical cost. The total fair value of these investments at December 31, 2023 and 2022, was $123.1 million and $166.1 million, which represented approximately 51% and approximately 76%, respectively, of the Company’s available-for-sale investment portfolio.
Based on evaluation of available evidence, including recent changes in market interest rates, credit rating information and information obtained from regulatory filings, management believes the declines in fair value for these securities are not credit related.
44 |
|
Notes to Consolidated Financial Statements
December 31, 2023 and 2022
The following tables show the Company’s investments’ gross unrealized losses and fair value for which an allowance for credit losses has not been recorded,, aggregated by investment category and length of time that individual securities have been in a continuous unrealized loss position at December 31, 2023 and 2022:
|
|
December 31, 2023 |
||||||||||||||||
|
|
Less than 12 Months |
|
12 Months or More |
|
Total |
||||||||||||
Description of |
|
Fair |
|
Unrealized |
|
Fair |
|
Unrealized |
|
Fair |
|
Unrealized |
||||||
Securities |
|
Value |
|
Losses |
|
Value |
|
Losses |
|
Value |
|
Losses |
||||||
|
|
(In thousands) |
||||||||||||||||
US government agencies |
|
$ |
— |
|
$ |
— |
|
$ |
44,268 |
|
$ |
(732) |
|
$ |
44,268 |
|
$ |
(732) |
Subordinated notes |
|
|
3,717 |
|
|
(799) |
|
|
20,583 |
|
|
(3,914) |
|
|
24,300 |
|
|
(4,713) |
State and municipal obligations |
|
|
3,365 |
|
|
(12) |
|
|
51,163 |
|
|
(5,730) |
|
|
54,528 |
|
|
(5,742) |
Total temporarily impaired securities |
|
$ |
7,082 |
|
$ |
(811) |
|
$ |
116,014 |
|
$ |
(10,376) |
|
$ |
123,096 |
|
$ |
(11,187) |
|
|
December 31, 2022 |
||||||||||||||||
|
|
Less than 12 Months |
|
12 Months or More |
|
Total |
||||||||||||
Description of |
|
Fair |
|
Unrealized |
|
Fair |
|
Unrealized |
|
Fair |
|
Unrealized |
||||||
Securities |
|
Value |
|
Losses |
|
Value |
|
Losses |
|
Value |
|
Losses |
||||||
|
|
(In thousands) |
||||||||||||||||
US government agencies |
|
$ |
44,032 |
|
$ |
(968) |
|
$ |
— |
|
$ |
— |
|
$ |
44,032 |
|
$ |
(968) |
Subordinated notes |
|
|
11,185 |
|
|
(1,565) |
|
|
10,300 |
|
|
(1,501) |
|
|
21,485 |
|
|
(3,066) |
State and municipal obligations |
|
|
100,599 |
|
|
(7,408) |
|
|
— |
|
|
— |
|
|
100,599 |
|
|
(7,408) |
Total temporarily impaired securities |
|
$ |
155,816 |
|
$ |
(9,941) |
|
$ |
10,300 |
|
$ |
(1,501) |
|
$ |
166,116 |
|
$ |
(11,442) |
The unrealized losses on the Company’s investments in US government agencies, state and municipal obligations, and subordinated notes were caused by interest rate increases. Because the Company does not intend to sell the investments and it is not more likely than not the Company will be required to sell the investments before recovery of their amortized cost bases, which may be maturity, the Company does not consider those investments to require an allowance for credit losses to be recognized.
Note 4: Loans and Allowance for Credit Losses
Categories of loans at December 31, include:
|
|
2023 |
|
2022 |
||
|
|
(In thousands) |
||||
Commercial and industrial loans |
|
$ |
91,294 |
|
$ |
90,548 |
Commercial real estate |
|
|
291,859 |
|
|
270,312 |
Residential real estate |
|
|
93,364 |
|
|
94,012 |
Consumer loans |
|
|
6,719 |
|
|
6,003 |
Total gross loans |
|
|
483,236 |
|
|
460,875 |
Less allowance for credit losses |
|
|
(3,918) |
|
|
(2,052) |
Total loans |
|
$ |
479,318 |
|
$ |
458,823 |
The risk characteristics of each loan portfolio segment are as follows:
Commercial and Industrial
Commercial and industrial loans are primarily based on the identified cash flows of the borrower and secondarily on the underlying collateral provided by the borrower. The cash flows of borrowers, however, may not be as expected and the collateral securing these loans may fluctuate in value. Most commercial and industrial loans are secured by the assets being financed or other business assets, such as accounts receivable or inventory, and may include a personal guarantee. Short-term loans may be made on an unsecured basis. In the case of loans secured by accounts receivable, the availability of funds for the repayment of these loans may be substantially dependent on the ability of the borrower to collect amounts due from its customers.
45 |
Notes to Consolidated Financial Statements
December 31, 2023 and 2022
Commercial Real Estate
Commercial real estate loans are viewed primarily as cash flow loans and secondarily as loans secured by real estate. Commercial real estate lending typically involves higher loan principal amounts and the repayment of these loans is generally dependent on the successful operation of the property securing the loan or the business conducted on the property securing the loan. Commercial real estate loans may be more adversely affected by conditions in the real estate markets or in the general economy. The characteristics of properties securing the Company’s commercial real estate portfolio are diverse, but with geographic location almost entirely in the Company’s market area. Management monitors and evaluates commercial real estate loans based on collateral, geography and risk grade criteria. In general, the Company avoids financing single purpose projects unless other underwriting factors are present to help mitigate risk. In addition, management tracks the level of owner-occupied commercial real estate versus nonowner-occupied loans.
Residential and Consumer
Residential and consumer loans consist of two segments - residential mortgage loans and personal loans. For residential mortgage loans that are secured by 1-4 family residences and are generally owner-occupied, the Company generally establishes a maximum loan-to-value ratio and requires private mortgage insurance if that ratio is exceeded. Home equity loans are typically secured by a subordinate interest in 1-4 family residences, and consumer personal loans are secured by consumer personal assets, such as automobiles or recreational vehicles. Some consumer personal loans are unsecured, such as small installment loans and certain lines of credit. Repayment of these loans is primarily dependent on the personal income of the borrowers, which can be impacted by economic conditions in their market areas, such as unemployment levels. Repayment can also be impacted by changes in property values on residential properties. Risk is mitigated by the fact that the loans are of smaller individual amounts and spread over a large number of borrowers.
46 |
|
Notes to Consolidated Financial Statements
December 31, 2023 and 2022
The following tables present the balance in the allowance for credit losses and the recorded investment in loans based on portfolio segment and impairment method as of December 31, 2023 and 2022:
|
|
2023 |
|||||||||||||
|
|
Commercial |
|
Commercial |
|
|
|
|
|
|
|
|
|
||
|
|
And Industrial |
|
Real Estate |
|
Residential |
|
Consumer |
|
Total |
|||||
|
|
(In thousands) |
|||||||||||||
Allowance for credit losses: |
|
|
|
|
|
|
|
|
|
|
|
|
|
|
|
Balance, beginning of year |
|
$ |
215 |
|
$ |
815 |
|
$ |
816 |
|
$ |
206 |
|
$ |
2,052 |
Provision for (reversal of) credit losses |
|
|
(421) |
|
|
205 |
|
|
(352) |
|
|
114 |
|
|
(454) |
Impact of adopting ASC 326 |
|
|
755 |
|
|
388 |
|
|
1,379 |
|
|
(103) |
|
|
2,419 |
Losses charged off |
|
|
— |
|
|
— |
|
|
— |
|
|
(138) |
|
|
(138) |
Recoveries |
|
|
24 |
|
|
— |
|
|
— |
|
|
15 |
|
|
39 |
Balance, end of year |
|
$ |
573 |
|
$ |
1,408 |
|
$ |
1,843 |
|
$ |
94 |
|
$ |
3,918 |
Ending balance: individually evaluated for credit loss |
|
$ |
— |
|
$ |
— |
|
$ |
— |
|
$ |
— |
|
$ |
— |
Ending balance: collectively evaluated for credit loss |
|
$ |
573 |
|
$ |
1,408 |
|
$ |
1,843 |
|
$ |
94 |
|
$ |
3,918 |
Loans: |
|
|
|
|
|
|
|
|
|
|
|
|
|
|
|
Ending balance: individually evaluated for credit loss |
|
$ |
— |
|
$ |
8 |
|
$ |
318 |
|
$ |
— |
|
$ |
326 |
Ending balance: collectively evaluated for credit loss |
|
$ |
91,294 |
|
$ |
291,851 |
|
$ |
93,046 |
|
$ |
6,719 |
|
$ |
482,910 |
|
|
2022 |
|||||||||||||
|
|
|
|
|
Commercial |
|
|
|
|
|
|
|
|
|
|
|
|
Commercial |
|
Real Estate |
|
Residential |
|
Installment |
|
Total |
|||||
|
|
(In thousands) |
|||||||||||||
Allowance for loan losses: |
|
|
|
|
|
|
|
|
|
|
|
|
|
|
|
Balance, beginning of year |
|
$ |
1,046 |
|
$ |
1,235 |
|
$ |
1,121 |
|
$ |
271 |
|
$ |
3,673 |
Provision charged to expense |
|
|
(842) |
|
|
141 |
|
|
(303) |
|
|
49 |
|
|
(955) |
Losses charged off |
|
|
(16) |
|
|
(561) |
|
|
(2) |
|
|
(143) |
|
|
(722) |
Recoveries |
|
|
27 |
|
|
— |
|
|
— |
|
|
29 |
|
|
56 |
Balance, end of year |
|
$ |
215 |
|
$ |
815 |
|
$ |
816 |
|
$ |
206 |
|
$ |
2,052 |
Ending balance: individually evaluated for impairment |
|
$ |
— |
|
$ |
— |
|
$ |
— |
|
$ |
— |
|
$ |
— |
Ending balance: collectively evaluated for impairment |
|
$ |
215 |
|
$ |
815 |
|
$ |
816 |
|
$ |
206 |
|
$ |
2,052 |
Loans: |
|
|
|
|
|
|
|
|
|
|
|
|
|
|
|
Ending balance: individually evaluated for impairment |
|
$ |
— |
|
$ |
123 |
|
$ |
— |
|
$ |
— |
|
$ |
123 |
Ending balance: collectively evaluated for impairment |
|
$ |
90,548 |
|
$ |
270,189 |
|
$ |
94,012 |
|
$ |
6,003 |
|
$ |
460,752 |
The following tables show the portfolio quality indicators.
47 |
Notes to Consolidated Financial Statements
December 31, 2023 and 2022
Based on the most recent analysis performed, the following table presents the recorded investment in non-homogeneous loans by internal risk rating system as of December 31, 2023 (in thousands):
|
|
|
|
|
|
|
|
|
|
|
|
|
|
|
|
|
|
|
|
|
|
|
|
|
|
|
|
|
|
|
|
|
|
|
|
|
|
|
|
|
|
|
|
|
|
|
|
Revolving |
|
Revolving |
|
|
|
||
|
|
|
|
|
|
|
|
|
|
|
|
|
|
|
|
|
|
|
|
Loans |
|
Loans |
|
|
|
||
|
|
|
|
|
|
|
|
|
|
|
|
|
|
|
|
|
|
|
|
Amortized |
|
Converted |
|
|
|
||
December 31, 2023 |
|
2023 |
|
2022 |
|
2021 |
|
2020 |
|
2019 |
|
Prior |
|
Cost Basis |
|
to Term |
|
Total |
|||||||||
Commercial and industrial |
|
|
|
|
|
|
|
|
|
|
|
|
|
|
|
|
|
|
|
|
|
|
|
|
|
|
|
Risk Rating |
|
|
|
|
|
|
|
|
|
|
|
|
|
|
|
|
|
|
|
|
|
|
|
|
|
|
|
Pass |
|
$ |
21,847 |
|
$ |
14,723 |
|
$ |
13,067 |
|
$ |
14,042 |
|
$ |
6,017 |
|
$ |
5,292 |
|
$ |
15,019 |
|
$ |
— |
|
$ |
90,007 |
Special Mention |
|
|
— |
|
|
26 |
|
|
— |
|
|
— |
|
|
— |
|
|
128 |
|
|
1,133 |
|
|
— |
|
|
1,287 |
Substandard |
|
|
— |
|
|
— |
|
|
— |
|
|
— |
|
|
— |
|
|
— |
|
|
— |
|
|
— |
|
|
— |
Doubtful |
|
|
— |
|
|
— |
|
|
— |
|
|
— |
|
|
— |
|
|
— |
|
|
— |
|
|
— |
|
|
— |
Total |
|
$ |
21,847 |
|
$ |
14,752 |
|
$ |
13,067 |
|
$ |
14,042 |
|
$ |
6,017 |
|
$ |
5,459 |
|
$ |
16,152 |
|
$ |
— |
|
$ |
91,294 |
|
|
|
|
|
|
|
|
|
|
|
|
|
|
|
|
|
|
|
|
|
|
|
|
|
|
|
|
Commercial and industrial |
|
|
|
|
|
|
|
|
|
|
|
|
|
|
|
|
|
|
|
|
|
|
|
|
|
|
|
Current period gross charge-offs |
|
$ |
— |
|
$ |
— |
|
$ |
— |
|
$ |
— |
|
$ |
— |
|
$ |
— |
|
$ |
— |
|
$ |
— |
|
$ |
— |
|
|
|
|
|
|
|
|
|
|
|
|
|
|
|
|
|
|
|
|
|
|
|
|
|
|
|
|
Commercial real estate |
|
|
|
|
|
|
|
|
|
|
|
|
|
|
|
|
|
|
|
|
|
|
|
|
|
|
|
Risk Rating |
|
|
|
|
|
|
|
|
|
|
|
|
|
|
|
|
|
|
|
|
|
|
|
|
|
|
|
Pass |
|
$ |
29,246 |
|
$ |
35,721 |
|
$ |
48,569 |
|
$ |
34,671 |
|
$ |
26,562 |
|
$ |
57,441 |
|
$ |
55,141 |
|
$ |
— |
|
$ |
287,351 |
Special Mention |
|
|
— |
|
|
— |
|
|
242 |
|
|
2,050 |
|
|
— |
|
|
2,121 |
|
|
— |
|
|
— |
|
|
4,413 |
Substandard |
|
|
— |
|
|
— |
|
|
— |
|
|
— |
|
|
— |
|
|
95 |
|
|
— |
|
|
— |
|
|
95 |
Doubtful |
|
|
— |
|
|
— |
|
|
— |
|
|
— |
|
|
— |
|
|
— |
|
|
— |
|
|
— |
|
|
— |
Total |
|
$ |
29,246 |
|
$ |
35,721 |
|
$ |
48,811 |
|
$ |
36,721 |
|
$ |
26,562 |
|
$ |
59,657 |
|
$ |
55,141 |
|
$ |
— |
|
$ |
291,859 |
|
|
|
|
|
|
|
|
|
|
|
|
|
|
|
|
|
|
|
|
|
|
|
|
|
|
|
|
Commercial real estate |
|
|
|
|
|
|
|
|
|
|
|
|
|
|
|
|
|
|
|
|
|
|
|
|
|
|
|
Current period gross charge-offs |
|
$ |
— |
|
$ |
— |
|
$ |
— |
|
$ |
— |
|
$ |
— |
|
$ |
— |
|
$ |
— |
|
$ |
— |
|
$ |
— |
|
|
|
|
|
|
|
|
|
|
|
|
|
|
|
|
|
|
|
|
|
|
|
|
|
|
|
|
Total |
|
|
|
|
|
|
|
|
|
|
|
|
|
|
|
|
|
|
|
|
|
|
|
|
|
|
|
Pass |
|
$ |
51,093 |
|
$ |
50,444 |
|
$ |
61,636 |
|
$ |
48,713 |
|
$ |
32,579 |
|
$ |
62,733 |
|
$ |
70,160 |
|
$ |
— |
|
$ |
377,358 |
Special Mention |
|
|
— |
|
|
26 |
|
|
242 |
|
|
2,050 |
|
|
— |
|
|
2,249 |
|
|
1,133 |
|
|
— |
|
|
5,700 |
Substandard |
|
|
— |
|
|
— |
|
|
— |
|
|
— |
|
|
— |
|
|
95 |
|
|
— |
|
|
— |
|
|
95 |
Doubtful |
|
|
— |
|
|
— |
|
|
— |
|
|
— |
|
|
— |
|
|
— |
|
|
— |
|
|
— |
|
|
— |
Total |
|
$ |
51,093 |
|
$ |
50,473 |
|
$ |
62,853 |
|
$ |
50,763 |
|
$ |
32,579 |
|
$ |
65,047 |
|
$ |
71,293 |
|
$ |
— |
|
$ |
383,153 |
Current period gross charge-offs |
|
$ |
— |
|
$ |
— |
|
$ |
— |
|
$ |
— |
|
$ |
— |
|
$ |
— |
|
$ |
— |
|
$ |
— |
|
$ |
— |
48 |
|
Notes to Consolidated Financial Statements
December 31, 2023 and 2022
The Company monitors the credit risk profile by payment activity for residential and consumer loan classes. Loans past due 90 days or more and loans on nonaccrual status are considered nonperforming. Nonperforming loans are reviewed quarterly. The following table presents the amortized cost in residential and consumer loans based on payment activity (in thousands):
|
|
|
|
|
|
|
|
|
|
|
|
|
|
|
|
|
|
|
|
Revolving |
|
Revolving |
|
|
|
||
|
|
|
|
|
|
|
|
|
|
|
|
|
|
|
|
|
|
|
|
Loans |
|
Loans |
|
|
|
||
|
|
|
|
|
|
|
|
|
|
|
|
|
|
|
|
|
|
|
|
Amortized |
|
Converted |
|
|
|
||
December 31, 2023 |
|
2023 |
|
2022 |
|
2021 |
|
2020 |
|
2019 |
|
Prior |
|
Cost Basis |
|
to Term |
|
Total |
|||||||||
Residential Real Estate |
|
|
|
|
|
|
|
|
|
|
|
|
|
|
|
|
|
|
|
|
|
|
|
|
|
|
|
Payment Performance |
|
|
|
|
|
|
|
|
|
|
|
|
|
|
|
|
|
|
|
|
|
|
|
|
|
|
|
Performing |
|
$ |
12,036 |
|
$ |
18,297 |
|
$ |
16,343 |
|
$ |
19,476 |
|
$ |
5,687 |
|
$ |
21,046 |
|
$ |
— |
|
$ |
— |
|
$ |
92,885 |
Nonperforming |
|
|
— |
|
|
— |
|
|
— |
|
|
38 |
|
|
— |
|
|
441 |
|
|
— |
|
|
— |
|
|
479 |
Total |
|
$ |
12,036 |
|
$ |
18,297 |
|
$ |
16,343 |
|
$ |
19,514 |
|
$ |
5,687 |
|
$ |
21,487 |
|
$ |
— |
|
$ |
— |
|
$ |
93,364 |
|
|
|
|
|
|
|
|
|
|
|
|
|
|
|
|
|
|
|
|
|
|
|
|
|
|
|
|
Residential real estate |
|
|
|
|
|
|
|
|
|
|
|
|
|
|
|
|
|
|
|
|
|
|
|
|
|
|
|
Current period gross charge-offs |
|
$ |
— |
|
$ |
— |
|
$ |
— |
|
$ |
— |
|
$ |
— |
|
$ |
— |
|
$ |
— |
|
$ |
— |
|
$ |
— |
|
|
|
|
|
|
|
|
|
|
|
|
|
|
|
|
|
|
|
|
|
|
|
|
|
|
|
|
Consumer |
|
|
|
|
|
|
|
|
|
|
|
|
|
|
|
|
|
|
|
|
|
|
|
|
|
|
|
Payment Performance |
|
|
|
|
|
|
|
|
|
|
|
|
|
|
|
|
|
|
|
|
|
|
|
|
|
|
|
Performing |
|
$ |
2,484 |
|
$ |
1,396 |
|
$ |
674 |
|
$ |
456 |
|
$ |
385 |
|
$ |
953 |
|
$ |
371 |
|
$ |
— |
|
$ |
6,719 |
Nonperforming |
|
|
— |
|
|
— |
|
|
— |
|
|
— |
|
|
— |
|
|
— |
|
|
— |
|
|
— |
|
|
— |
Total |
|
$ |
2,484 |
|
$ |
1,396 |
|
$ |
674 |
|
$ |
456 |
|
$ |
385 |
|
$ |
953 |
|
$ |
371 |
|
$ |
— |
|
$ |
6,719 |
|
|
|
|
|
|
|
|
|
|
|
|
|
|
|
|
|
|
|
|
|
|
|
|
|
|
|
|
Consumer |
|
|
|
|
|
|
|
|
|
|
|
|
|
|
|
|
|
|
|
|
|
|
|
|
|
|
|
Current period gross charge-offs |
|
$ |
138 |
|
$ |
— |
|
$ |
— |
|
$ |
— |
|
$ |
— |
|
$ |
— |
|
$ |
— |
|
$ |
— |
|
$ |
138 |
|
|
|
|
|
|
|
|
|
|
|
|
|
|
|
|
|
|
|
|
|
|
|
|
|
|
|
|
Total |
|
|
|
|
|
|
|
|
|
|
|
|
|
|
|
|
|
|
|
|
|
|
|
|
|
|
|
Payment Performance |
|
|
|
|
|
|
|
|
|
|
|
|
|
|
|
|
|
|
|
|
|
|
|
|
|
|
|
Performing |
|
$ |
14,520 |
|
$ |
19,693 |
|
$ |
17,017 |
|
$ |
19,932 |
|
$ |
6,072 |
|
$ |
21,999 |
|
$ |
371 |
|
$ |
— |
|
$ |
99,604 |
Nonperforming |
|
|
— |
|
|
— |
|
|
— |
|
|
38 |
|
|
—- |
|
|
441 |
|
|
— |
|
|
— |
|
|
479 |
Total |
|
$ |
14,520 |
|
$ |
19,693 |
|
$ |
17,017 |
|
$ |
19,970 |
|
$ |
6,072 |
|
$ |
24,440 |
|
$ |
371 |
|
$ |
— |
|
$ |
100,083 |
Current period gross charge-offs |
|
$ |
138 |
|
$ |
— |
|
$ |
— |
|
$ |
— |
|
$ |
— |
|
$ |
— |
|
$ |
— |
|
$ |
— |
|
$ |
138 |
To facilitate the monitoring of credit quality within the loan portfolio, and for purposes of analyzing historical loss rates used in the determination of the allowance for credit loss estimate, the Company utilizes the following categories of credit grades: pass, special mention, substandard, and doubtful. The four categories, which are derived from standard regulatory rating definitions, are assigned upon initial approval of credit to borrowers and updated periodically thereafter. Pass ratings, which are assigned to those borrowers that do not have identified potential or well defined weaknesses and for which there is a high likelihood of orderly repayment, are updated periodically based on the size and credit characteristics of the borrower. All other categories are updated on at least a quarterly basis.
For the years ended December 31, 2023 and 2022, the Company recorded a credit to the loan credit provision of $454,000 and $955,000, respectively.
The Company assigns a special mention rating to loans that have potential weaknesses that deserve management’s close attention. If left uncorrected, these potential weaknesses may, at some future date, result in the deterioration of the repayment prospects for the loan or the Company’s credit position.
The Company assigns a substandard rating to loans that are inadequately protected by the current sound worth and paying capacity of the borrower or of the collateral pledged. Substandard loans have well defined weaknesses or weaknesses that could jeopardize the orderly repayment of the debt. Loans and leases in this grade also are characterized by the distinct possibility that the Company will sustain some loss if the deficiencies noted are not addressed and corrected.
The Company assigns a doubtful rating to loans that have all the attributes of a substandard rating with the added characteristic that the weaknesses make collection or liquidation in full, on the basis of currently existing facts, conditions, and values, highly questionable and improbable. The possibility of loss is extremely high, but because of certain important and reasonable specific pending factors that may work to the advantage of and strengthen the credit quality of the loan or lease, its classification as an
49 |
Notes to Consolidated Financial Statements
December 31, 2023 and 2022
estimated loss is deferred until its more exact status may be determined. Pending factors may include a proposed merger or acquisition, liquidation proceeding, capital injection, perfecting liens on additional collateral or refinancing plans.
The following table shows the portfolio quality indicators as of December 31, 2022:
|
|
|
|
|
Commercial |
|
|
|
|
|
|
|
|
|
|
Loan Class |
|
Commercial |
|
Real Estate |
|
Residential |
|
Installment |
|
Total |
|||||
|
|
(In thousands) |
|||||||||||||
Pass Grade |
|
$ |
90,548 |
|
$ |
262,472 |
|
$ |
94,012 |
|
$ |
6,003 |
|
$ |
453,035 |
Special Mention |
|
|
— |
|
|
4,066 |
|
|
— |
|
|
— |
|
|
4,066 |
Substandard |
|
|
— |
|
|
3,774 |
|
|
— |
|
|
— |
|
|
3,774 |
Doubtful |
|
|
— |
|
|
— |
|
|
— |
|
|
— |
|
|
— |
|
|
$ |
90,548 |
|
$ |
270,312 |
|
$ |
94,012 |
|
$ |
6,003 |
|
$ |
460,875 |
The Company evaluates the loan risk grading system definitions and allowance for loan losses methodology on an ongoing basis. No significant methodology changes were made during 2022.
The following table shows the loan portfolio aging analysis of the recorded investment in loans as of December 31, 2023:
|
|
30‑59 Days |
|
60‑89 Days |
|
Greater |
|
|
|
|
|
|
|
|
|
||||||
|
|
Past |
|
Past |
|
Than 90 |
|
|
|
Total Past |
|
|
|
|
|
||||||
|
|
Due and |
|
Due and |
|
Days and |
|
Non |
|
Due and |
|
|
|
|
Total Loans |
||||||
|
|
Accruing |
|
Accruing |
|
Accruing |
|
Accrual |
|
Non Accrual |
|
Current |
|
Receivable |
|||||||
|
|
(In thousands) |
|||||||||||||||||||
Commercial and industrial |
|
$ |
10 |
|
$ |
48 |
|
$ |
154 |
|
$ |
— |
|
$ |
212 |
|
$ |
91,082 |
|
$ |
91,294 |
Commercial real estate |
|
|
— |
|
|
242 |
|
|
— |
|
|
8 |
|
|
250 |
|
|
291,609 |
|
|
291,859 |
Residential |
|
|
201 |
|
|
— |
|
|
— |
|
|
479 |
|
|
680 |
|
|
92,684 |
|
|
93,364 |
Consumer |
|
|
5 |
|
|
— |
|
|
— |
|
|
— |
|
|
5 |
|
|
6,714 |
|
|
6,719 |
Total |
|
$ |
216 |
|
$ |
290 |
|
$ |
154 |
|
$ |
487 |
|
$ |
1,147 |
|
$ |
482,089 |
|
$ |
483,236 |
The following table shows the loan portfolio aging analysis of the recorded investment in loans as of December 31, 2022:
|
|
|
|
|
|
|
|
|
|
|
|
|
|
|
|
|
|
|
|
|
|
|
|
30‑59 Days |
|
60‑89 Days |
|
Greater |
|
|
|
|
|
|
|
|
|
||||||
|
|
Past |
|
Past |
|
Than 90 |
|
|
|
Total Past |
|
|
|
|
|
||||||
|
|
Due and |
|
Due and |
|
Days and |
|
Non |
|
Due and |
|
|
|
|
Total Loans |
||||||
|
|
Accruing |
|
Accruing |
|
Accruing |
|
Accrual |
|
Non Accrual |
|
Current |
|
Receivable |
|||||||
|
|
(In thousands) |
|||||||||||||||||||
Commercial and industrial |
|
$ |
126 |
|
$ |
— |
|
$ |
— |
|
$ |
— |
|
$ |
126 |
|
$ |
90,422 |
|
$ |
90,548 |
Commercial real estate |
|
|
158 |
|
|
— |
|
|
— |
|
|
9 |
|
|
167 |
|
|
270,145 |
|
|
270,312 |
Residential |
|
|
102 |
|
|
24 |
|
|
— |
|
|
173 |
|
|
299 |
|
|
93,713 |
|
|
94,012 |
Installment |
|
|
15 |
|
|
— |
|
|
— |
|
|
— |
|
|
15 |
|
|
5,988 |
|
|
6,003 |
Total |
|
$ |
401 |
|
$ |
24 |
|
$ |
— |
|
$ |
182 |
|
$ |
607 |
|
$ |
460,268 |
|
$ |
460,875 |
50 |
|
Notes to Consolidated Financial Statements
December 31, 2023 and 2022
Nonperforming Loans
The following table present the amortized cost basis of loans on nonaccrual status and loans past due over 90 days still accruing interest as of December 31, 2023:
|
|
|
|
|
|
|
|
|
|
|
Loans Past |
|
|
|
|
|
|
|
|
|
|
|
|
|
|
Due Over 90 Days |
|
Total |
|||
|
|
Nonaccrual with no ACL |
|
Nonaccrual with ACL |
|
Total Nonaccrual |
|
Still Accruing |
|
Nonperforming |
|||||
|
|
|
(In thousands) |
||||||||||||
Commercial and industrial |
|
$ |
— |
|
$ |
— |
|
$ |
— |
|
$ |
154 |
|
$ |
154 |
Commercial real estate |
|
|
8 |
|
|
— |
|
|
8 |
|
|
— |
|
|
8 |
Residential |
|
|
479 |
|
|
— |
|
|
479 |
|
|
— |
|
|
479 |
Consumer |
|
|
— |
|
|
— |
|
|
— |
|
|
— |
|
|
— |
Total |
|
$ |
487 |
|
$ |
— |
|
$ |
487 |
|
$ |
154 |
|
$ |
641 |
The Company did recognized approximately $13,000 interest income on nonaccrual loans during the the period ended December 31, 2023.
Impaired Loans
For 2022, a loan is considered impaired, in accordance with the impairment accounting guidance (ASC 310-10-35-16), when based on current information and events, it is probable the Company will be unable to collect all amounts due from the borrower in accordance with the contractual terms of the loan. Impaired loans include nonperforming commercial and industrial loans but also include loans modified in troubled debt restructurings where concessions have been granted to borrowers experiencing financial difficulties. These concessions could include a reduction in the interest rate on the loan, payment extensions, forgiveness of principal, forbearance or other actions intended to maximize collection.
The following table presents impaired loans for the year ended December 31,2022:
|
|
|
|
|
|
|
|
Average |
|
|
|||||
|
|
|
|
Unpaid |
|
|
|
Investment in |
|
Interest |
|||||
|
|
Recorded |
|
Principal |
|
Specific |
|
Impaired |
|
Income |
|||||
|
|
Balance |
|
Balance |
|
Allowance |
|
Loans |
|
Recognized |
|||||
|
|
(In thousands) |
|||||||||||||
Loans without a specific valuation allowance: |
|
|
|
|
|
|
|
|
|
|
|
|
|
|
|
Commercial and industrial |
|
$ |
— |
|
$ |
— |
|
$ |
— |
|
$ |
27 |
|
$ |
1 |
Commercial real estate |
|
|
123 |
|
|
123 |
|
|
— |
|
|
130 |
|
|
11 |
Real Estate |
|
|
— |
|
|
— |
|
|
— |
|
|
— |
|
|
— |
Installment |
|
|
— |
|
|
— |
|
|
— |
|
|
— |
|
|
— |
|
|
$ |
123 |
|
$ |
123 |
|
$ |
— |
|
$ |
157 |
|
$ |
12 |
Loans with a specific valuation allowance: |
|
|
|
|
|
|
|
|
|
|
|
|
|
|
|
Commercial and industrial |
|
$ |
— |
|
$ |
— |
|
$ |
— |
|
$ |
— |
|
$ |
— |
Commercial real estate |
|
|
— |
|
|
— |
|
|
— |
|
|
3,653 |
|
|
40 |
Real Estate |
|
|
— |
|
|
— |
|
|
— |
|
|
— |
|
|
— |
|
|
$ |
— |
|
$ |
— |
|
$ |
— |
|
$ |
3,653 |
|
$ |
40 |
|
|
|
|
|
|
|
|
|
|
|
|
|
|
|
|
Total: |
|
|
|
|
|
|
|
|
|
|
|
|
|
|
|
Commercial and industrial |
|
$ |
— |
|
$ |
— |
|
$ |
— |
|
$ |
27 |
|
$ |
1 |
Commercial Real Estate |
|
$ |
123 |
|
$ |
123 |
|
$ |
— |
|
$ |
3,783 |
|
$ |
51 |
Real Estate |
|
$ |
— |
|
$ |
— |
|
$ |
— |
|
$ |
— |
|
$ |
— |
Installment |
|
$ |
— |
|
$ |
— |
|
$ |
— |
|
$ |
— |
|
$ |
— |
At December 31, 2022, the Company had certain loans that were modified in troubled debt restructurings and impaired. The modification of terms of such loans included one or a combination of the following: an extension of maturity, a reduction of the stated interest rate.
51 |
Notes to Consolidated Financial Statements
December 31, 2023 and 2022
The following tables present information regarding troubled debt restructurings by class and by type of modification for the year ended December 31, 2022:
|
|
Year Ended December 31, 2022 |
||||||
|
|
|
|
Pre-Modification |
|
Post-Modification |
||
|
|
|
|
Outstanding |
|
Outstanding |
||
|
|
Number of |
|
Recorded |
|
Recorded |
||
|
|
Contracts |
|
Investment |
|
Investment |
||
|
|
(In thousands) |
||||||
Commercial and industrial |
|
— |
|
$ |
— |
|
$ |
— |
Commercial Real Estate |
|
1 |
|
$ |
48 |
|
$ |
48 |
|
|
Year Ended December 31, 2022 |
||||||||||
|
|
Interest |
|
|
|
|
|
|
|
Total |
||
|
|
Only |
|
Term |
|
Combination |
|
Modification |
||||
|
|
(In thousands) |
||||||||||
Commercial and industrial |
|
$ |
— |
|
$ |
— |
|
$ |
— |
|
$ |
— |
Commercial Real Estate |
|
$ |
1 |
|
$ |
1 |
|
$ |
— |
|
$ |
1 |
During the year ended December 31, 2022, troubled debt restructurings did not have an impact on the allowance for loan losses. At December 31, 2022, there were no material defaults of any troubled debt restructurings that were modified in the last 12 months. The Company generally considers TDR’s that become 90 days or more past due under the modified terms as subsequently defaulted.
Note 5: Premises and Equipment
Major classifications of premises and equipment, stated at cost, are as follows:
|
|
2023 |
|
2022 |
||
|
|
(In thousands) |
||||
Land, buildings and improvements |
|
$ |
22,927 |
|
$ |
20,493 |
Furniture and equipment |
|
|
15,398 |
|
|
15,567 |
Computer software |
|
|
2,546 |
|
|
2,460 |
|
|
|
40,871 |
|
|
38,520 |
Less accumulated depreciation |
|
|
(25,887) |
|
|
(26,376) |
Net premises and equipment |
|
$ |
14,984 |
|
$ |
12,144 |
Depreciation and amortization charged to operations was $997,000 in 2023 and $1,013,000 in 2022.
Note 6: Time Deposits
Time deposits in denominations of $250,000 or more were $37.6 million at December 31, 2023 and $11.3 million at December 31, 2022. At December 31, 2023, the scheduled maturities of time deposits are as follows:
|
|
(In thousands) |
|
Due during the year ending December 31, |
|
|
|
2024 |
|
$ |
79,670 |
2025 |
|
|
63,073 |
2026 |
|
|
7,961 |
2027 |
|
|
163 |
2028 |
|
|
230 |
Thereafter |
|
|
261 |
|
|
$ |
151,358 |
52 |
|
Notes to Consolidated Financial Statements
December 31, 2023 and 2022
Note 7: Borrowings
At December 31, 2023 and 2022, as a member of the Federal Home Loan Bank system the Bank had the ability to obtain up to $87.5 million and $177.2 million, respectively, in additional borrowings based on securities and certain loans pledged to the FHLB. At December 31, 2023, Advances from the Federal Home Loan Bank were $75 million. The Company did not have any advances from the Federal Home Loan Bank at December 31, 2022. At December 31, 2023, required annual payments on Federal Home Loan Bank advances were for year ending December 31, 2026 $20 million (4.39% fixed rate), December 31, 2027 $35 million (4.24% fixed rate) and December 31, 2028 $20 million (4.11% fixed rate).
At December 31, 2023 and 2022, the Bank had approximately $251.0 million and $248.0 million, respectively of one- to four-family residential real estate and commercial real estate loans pledged as collateral for borrowings. Also at December 31, 2023 and 2022, the Company and the Bank have cash management lines of credit with various correspondent banks (excluding FHLB cash management lines of credit) enabling additional borrowings of up to $18.0 million. At December 31, 2022 the Company had no outstanding borrowings with the FHLB.
Securities sold under repurchase agreements were approximately $26.8 million and $18.1 million at December 31, 2023 and 2022, respectively.
Securities sold under agreements to repurchase are financing arrangements whereby the Company sells securities and agrees to repurchase the identical securities at the maturities of the agreements at specified prices. Physical control is maintained for all securities sold under repurchase agreements. Information concerning securities sold under agreements to repurchase is summarized as follows:
|
|
2023 |
|
2022 |
|
||
|
|
(Dollars in thousands) |
|
||||
Balance outstanding at year end |
|
$ |
26,781 |
|
$ |
18,106 |
|
Average daily balance during the year |
|
$ |
25,049 |
|
$ |
22,581 |
|
Average interest rate during the year |
|
|
4.17 |
% |
|
1.02 |
% |
Maximum month-end balance during the year |
|
$ |
30,509 |
|
$ |
28,114 |
|
Weighted-average interest rate at year end |
|
|
4.589 |
% |
|
3.04 |
% |
All repurchase agreements are subject to term and conditions of repurchase/security agreements between the Company and the customer and are accounted for as secured borrowings. The Company’s repurchase agreements reflected in short-term borrowings consist of customer accounts and securities which are pledged on an individual security basis.
The following table presents the Company’s repurchase agreements accounted for as secured borrowings:
Remaining Contractual Maturity of the Agreement
(In thousands)
|
|
Overnight and |
|
|
|
|
|
Greater than 90 |
|
|
|||||
December 31, 2023 |
|
Continuous |
|
Up to 30 Days |
|
30‑90 Days |
|
Days |
|
Total |
|||||
Repurchase Agreements |
|
|
|
|
|
|
|
|
|
|
|
|
|
|
|
State and municipal obligations |
|
$ |
26,781 |
|
$ |
— |
|
$ |
— |
|
$ |
— |
|
$ |
26,781 |
Total |
|
$ |
26,781 |
|
$ |
— |
|
$ |
— |
|
$ |
— |
|
$ |
26,781 |
|
|
Overnight and |
|
|
|
|
|
Greater than 90 |
|
|
|||||
December 31, 2022 |
|
Continuous |
|
Up to 30 Days |
|
30‑90 Days |
|
Days |
|
Total |
|||||
Repurchase Agreements |
|
|
|
|
|
|
|
|
|
|
|
|
|
|
|
U.S government agencies |
|
$ |
18,106 |
|
$ |
— |
|
$ |
— |
|
$ |
— |
|
$ |
18,106 |
Total |
|
$ |
18,106 |
|
$ |
— |
|
$ |
— |
|
$ |
— |
|
$ |
18,106 |
Securities with an approximate carrying value of $41.1 million and $38.8 million at December 31, 2023 and 2022, respectively, were pledged as collateral for repurchase borrowings.
53 |
Notes to Consolidated Financial Statements
December 31, 2023 and 2022
Note 8: Subordinated Debentures
On May 14, 2019 the Company issued $20,000,000 of junior subordinated debentures. The debentures bear interest at a fixed rate of 6.0% until May 2024, which then becomes a floating interest rate equal to the three-month SOFR plus 3.625%, resetting quarterly. Interest on the subordinated notes is payable semiannually through May 2024 and quarterly thereafter through the maturity date of May 2029. Principal is due upon maturity. The debentures are unsecured and payable to various investors. For purposes of computing regulatory capital, the debentures are included in Tier 2 Capital. The subordinated notes may not be repaid in whole or in part prior to the fifth anniversary of the issue date (May 2019). Unamortized debt costs were $337,000 and $398,000 as of December 31, 2023 and 2022, respectively.
In 2005, a Delaware statutory business trust owned by the Company, United Bancorp Statutory Trust I (“Trust I” or the “Trust”), issued $4.1 million of mandatorily redeemable debt securities. The sale proceeds were utilized to purchase $4.1 million of the Company’s subordinated debentures which mature in 2035. The Company’s subordinated debentures are the sole asset of Trust I. The Company’s investment in Trust I is not consolidated herein as the Company is not deemed the primary beneficiary of the Trust. However, the $4.1 million of mandatorily redeemable debt securities issued by the Trust are includible for regulatory purposes as a component of the Company’s Tier I Capital. Interest on the Company’s subordinated debentures is equal to three month SOFR plus 1.35% and is payable quarterly. Subordinated debentures, net of unamortized debt costs, totaled $23.8 million and $23.7 million at December 31, 2023 and 2022, respectively.
Note 9: Income Taxes
The provision for income taxes includes these components:
|
|
2023 |
|
2022 |
||
|
|
(In thousands) |
||||
Taxes currently payable |
|
$ |
528 |
|
$ |
537 |
Deferred income taxes |
|
|
13 |
|
|
342 |
Income tax expense |
|
$ |
541 |
|
$ |
879 |
|
|
|
|
|
|
|
A reconciliation of income tax expense at the statutory rate to the Company’s actual income tax expense is shown below:
|
|
2023 |
|
2022 |
||
|
|
(In thousands) |
||||
Computed at the statutory rate (21%) |
|
$ |
1,993 |
|
$ |
2,003 |
(Decrease) increase resulting from |
|
|
|
|
|
|
Tax exempt interest |
|
|
(1,256) |
|
|
(935) |
Earnings on bank-owned life insurance - net |
|
|
(152) |
|
|
(149) |
Low income housing credit |
|
|
(49) |
|
|
(49) |
Other |
|
|
5 |
|
|
9 |
Actual tax expense |
|
$ |
541 |
|
$ |
879 |
54 |
|
Notes to Consolidated Financial Statements
December 31, 2023 and 2022
The tax effects of temporary differences related to deferred taxes shown on the balance sheets were:
|
|
2023 |
|
2022 |
||
|
|
(In thousands) |
||||
Deferred tax assets |
|
|
|
|
|
|
Allowance for credit losses |
|
$ |
870 |
|
$ |
431 |
Stock based compensation |
|
|
238 |
|
|
310 |
Deferred compensation, and other accruals |
|
|
80 |
|
|
507 |
Employee benefit expense |
|
|
525 |
|
|
— |
Non-accrual loan interest |
|
|
6 |
|
|
1 |
Unrealized loss on securities available for sale |
|
|
1,874 |
|
|
2,307 |
Other |
|
|
— |
|
|
10 |
Total deferred tax assets |
|
|
3,593 |
|
|
3,566 |
|
|
|
|
|
|
|
Deferred tax liabilities |
|
|
|
|
|
|
Depreciation |
|
|
(410) |
|
|
(414) |
Deferred loan costs, net |
|
|
(2) |
|
|
(11) |
FHLB stock dividends |
|
|
(60) |
|
|
(182) |
Prepaid expenses |
|
|
(55) |
|
|
(68) |
Intangibles |
|
|
(58) |
|
|
(78) |
Employee benefit expense |
|
|
(599) |
|
|
(390) |
|
|
|
|
|
|
|
Total deferred tax liabilities |
|
|
(1,184) |
|
|
(1,143) |
Net deferred tax asset |
|
$ |
2,409 |
|
$ |
2,423 |
Note 10: Accumulated Other Comprehensive Income (Loss)
The components of accumulated other comprehensive income (loss), included in stockholders’ equity, are as follows:
|
|
2023 |
|
2022 |
||
|
|
(In thousands) |
||||
Net unrealized loss on securities available-for-sale |
|
$ |
(8,922) |
|
$ |
(10,984) |
Net unrealized loss for funded status of defined benefit plan liability |
|
|
(543) |
|
|
(835) |
|
|
|
(9,465) |
|
|
(11,819) |
Tax effect |
|
|
1,987 |
|
|
2,483 |
Net-of-tax amount |
|
$ |
(7,478) |
|
$ |
(9,336) |
Note 11: Regulatory Matters
Unified is subject to various regulatory capital requirements administered by the federal banking agencies. Failure to meet minimum capital requirements can initiate certain mandatory–and possibly additional discretionary–actions by regulators that, if undertaken, could have a direct material effect on the Company’s and the Bank’s financial statements. Under capital adequacy guidelines and the regulatory framework for prompt corrective action, the Company and the Bank must meet specific capital guidelines that involve quantitative measures of assets, liabilities and certain off-balance-sheet items as calculated under regulatory accounting practices. The capital amounts and classification are also subject to qualitative judgments by the regulators about components, risk weightings and other factors. Furthermore, the Company and the Bank’s regulators could require adjustments to regulatory capital not reflected in these financial statements.
In July 2013, the Federal Reserve approved final rules, referred to herein as the Basel III Rules, establishing a new comprehensive capital framework for U.S. banking organizations. The Basel III Rules generally implement the Basel Committee on Banking Supervision’s December 2010 final capital framework referred to as “Basel III” for strengthening international capital standards. The Basel III Rules substantially revise the risk-based capital requirements applicable to bank holding companies and their depository institution subsidiaries, including the Company and Unified, as compared to the current U.S. general risk-based capital rules. The Basel III Rules revise the definitions and the components of regulatory capital, as well as address other issues affecting the computation of regulatory capital ratios. The Basel III rules added another capital ratio component “Tier 1 Common Capital Ratio” which is a measurement of a bank’s core equity capital compared with its total risk-weighted assets The Basel III Rules also prescribe a new standardized approach for risk weightings that expand the
55 |
Notes to Consolidated Financial Statements
December 31, 2023 and 2022
risk-weighting categories from the current categories to a larger more risk-sensitive number of categories, depending on the nature of the assets, generally ranging from 0% for U.S. government and agency securities, to 600% for certain equity exposures, and resulting in higher risk weights for a variety of asset classes.
The Basel III capital rules became effective for Unified on January 1, 2015, subject to phase-in periods for certain components. The net unrealized gain or loss on available-for-sale securities is not included in computing regulatory capital.
As of December 31, 2023, the most recent notification from Federal Deposit Insurance Corporation categorized the Bank as well capitalized under the regulatory framework for prompt corrective action. To be categorized as well-capitalized, the Bank must maintain capital ratios as set forth in the table. There are no conditions or events since that notification that management believes have changed the Bank’s category.
The Bank’s actual capital amounts and ratios are presented in the following table.
|
|
|
|
|
|
|
|
|
|
|
|
To Be Well Capitalized |
|
|||
|
|
|
|
|
|
|
For Capital Adequacy |
|
Under Prompt Corrective |
|
||||||
|
|
Actual |
|
Purposes |
|
Action Provisions |
|
|||||||||
|
|
Amount |
|
Ratio |
|
Amount |
|
Ratio |
|
Amount |
|
Ratio |
|
|||
|
|
(Dollars in thousands) |
|
|||||||||||||
As of December 31, 2023 |
|
|
|
|
|
|
|
|
|
|
|
|
|
|
|
|
Total Capital (to Risk-Weighted Assets) |
|
|
|
|
|
|
|
|
|
|
|
|
|
|
|
|
Unified |
|
|
81,811 |
|
13.9 |
|
|
46,975 |
|
8.0 |
|
$ |
58,719 |
|
10.0 |
% |
|
|
|
|
|
|
|
|
|
|
|
|
|
|
|
|
|
Common Equity Tier 1 Capital (to Risk-Weighted Assets) |
|
|
|
|
|
|
|
|
|
|
|
|
|
|
|
|
Unified |
|
|
77,893 |
|
13.3 |
|
|
26,424 |
|
4.5 |
|
$ |
38,167 |
|
6.5 |
% |
|
|
|
|
|
|
|
|
|
|
|
|
|
|
|
|
|
Tier I Capital (to Risk-Weighted Assets) |
|
|
|
|
|
|
|
|
|
|
|
|
|
|
|
|
Unified |
|
|
77,893 |
|
13.3 |
|
|
35,231 |
|
6.0 |
|
$ |
46,975 |
|
8.0 |
% |
|
|
|
|
|
|
|
|
|
|
|
|
|
|
|
|
|
Tier I Capital (to Average Assets) |
|
|
|
|
|
|
|
|
|
|
|
|
|
|
|
|
Unified |
|
|
77,893 |
|
9.7 |
|
|
32,302 |
|
4.0 |
|
$ |
40,378 |
|
5.0 |
% |
|
|
|
|
|
|
|
|
|
|
|
|
|
|
|
|
|
As of December 31, 2022 |
|
|
|
|
|
|
|
|
|
|
|
|
|
|
|
|
Total Capital (to Risk-Weighted Assets) |
|
|
|
|
|
|
|
|
|
|
|
|
|
|
|
|
Unified |
|
|
79,551 |
|
14.2 |
|
|
44,778 |
|
8.0 |
|
$ |
55,973 |
|
10.0 |
% |
|
|
|
|
|
|
|
|
|
|
|
|
|
|
|
|
|
Common Equity Tier 1 Capital (to Risk-Weighted Assets) |
|
|
|
|
|
|
|
|
|
|
|
|
|
|
|
|
Unified |
|
|
77,499 |
|
13.9 |
|
|
25,188 |
|
4.5 |
|
$ |
36,383 |
|
6.5 |
% |
|
|
|
|
|
|
|
|
|
|
|
|
|
|
|
|
|
Tier I Capital (to Risk-Weighted Assets) |
|
|
|
|
|
|
|
|
|
|
|
|
|
|
|
|
Unified |
|
|
77,499 |
|
13.9 |
|
|
33,584 |
|
6.0 |
|
$ |
44,778 |
|
8.0 |
% |
|
|
|
|
|
|
|
|
|
|
|
|
|
|
|
|
|
Tier I Capital (to Average Assets) |
|
|
|
|
|
|
|
|
|
|
|
|
|
|
|
|
Unified |
|
|
77,499 |
|
10.1 |
|
|
30,617 |
|
4.0 |
|
$ |
38,272 |
|
5.0 |
% |
56 |
|
Notes to Consolidated Financial Statements
December 31, 2023 and 2022
Note 12: Related Party Transactions
At December 31, 2023 and 2022, the Bank had loan commitments outstanding to executive officers, directors, significant stockholders and their affiliates (related parties). In management’s opinion, such loans and other extensions of credit and deposits were made in the ordinary course of business and were made on substantially the same terms (including interest rates and collateral) as those prevailing at the time for comparable transactions with other persons. Further, in management’s opinion, these loans did not involve more than normal risk of collectability or present other unfavorable features. Such loans are summarized below.
|
|
2023 |
|
2022 |
||
|
|
(In thousands) |
||||
Aggregate balance – January 1 |
|
$ |
20,041 |
|
$ |
20,347 |
New loans |
|
|
4,394 |
|
|
1,726 |
Repayments |
|
|
(2,212) |
|
|
(2,032) |
Aggregate balance – December 31 |
|
$ |
22,223 |
|
$ |
20,041 |
Deposits from related parties held by the Bank at December 31, 2023 and 2022, totaled approximately $5.9 million and $3.3 million, respectively.The Company is under a purchase contract to acquire real estate from a related party. The amount of the purchase is approximately $2.8 million and it will be used for future expansion.
Note 13: Benefit Plans
Pension and Other Postretirement Benefit Plans
The Company has a noncontributory defined benefit pension plan covering all employees who meet the eligibility requirements. The Company’s funding policy is to make the minimum annual contribution that is required by applicable regulations, plus such amounts as the Company may determine to be appropriate from time to time. The Company expects to contribute $672,000 to the plan in 2024.
57 |
Notes to Consolidated Financial Statements
December 31, 2023 and 2022
The Company has certain agreements which provide for a fixed number of payments once the individual reaches normal retirement age. At December 31, 2023, the present value of these future payments was approximately $383,000.
The Company uses a December 31st measurement date for the plan. Information about the plan’s funded status and pension cost follows:
|
|
Pension Benefits |
||||
|
|
2023 |
|
2022 |
||
|
|
(In thousands) |
||||
Change in benefit obligation |
|
|
|
|
|
|
Beginning of year |
|
$ |
(5,078) |
|
$ |
(7,558) |
Service cost |
|
|
(302) |
|
|
(519) |
Interest cost |
|
|
(311) |
|
|
(274) |
Actuarial gain (loss) |
|
|
(229) |
|
|
2,991 |
Benefits paid |
|
|
441 |
|
|
282 |
|
|
|
|
|
|
|
End of year |
|
|
(5,479) |
|
|
(5,078) |
|
|
|
|
|
|
|
Change in fair value of plan assets |
|
|
|
|
|
|
Beginning of year |
|
|
6,988 |
|
|
7,744 |
Actual return on plan assets |
|
|
1,092 |
|
|
(1,217) |
Employer contribution |
|
|
742 |
|
|
744 |
Benefits paid |
|
|
(441) |
|
|
(283) |
|
|
|
|
|
|
|
End of year |
|
|
8,381 |
|
|
6,988 |
|
|
|
|
|
|
|
Funded status at end of year |
|
$ |
2,902 |
|
$ |
1,910 |
Amounts recognized in accumulated other comprehensive loss not yet recognized as components of net periodic benefit cost consist of:
|
|
Pension Benefits |
||||
|
|
2023 |
|
2022 |
||
|
|
(In thousands) |
||||
Unamortized net loss |
|
$ |
770 |
|
$ |
1,150 |
Unamortized prior service |
|
|
(227) |
|
|
(315) |
|
|
|
|
|
|
|
|
|
$ |
543 |
|
$ |
835 |
The estimated net loss and prior service credit for the defined benefit pension plan that will be amortized from accumulated other comprehensive loss as a credit into net periodic benefit cost over the next fiscal year is approximately $89,000. The accumulated benefit obligation for the defined benefit pension plan was $4.7 million and $4.4 million at December 31, 2023 and 2022, respectively.
Information for the pension plan with respect to accumulated benefit obligation and plan assets is as follows:
|
|
December 31, |
||||
|
|
2023 |
|
2022 |
||
|
|
(In thousands) |
||||
Projected benefit obligation |
|
$ |
5,479 |
|
$ |
5,078 |
Accumulated benefit obligation |
|
$ |
4,695 |
|
$ |
4,421 |
Fair value of plan assets |
|
$ |
8,381 |
|
$ |
6,988 |
58 |
|
Notes to Consolidated Financial Statements
December 31, 2023 and 2022
|
|
December 31, |
||||
|
|
2023 |
|
2022 |
||
|
|
(In thousands) |
||||
Components of net periodic benefit cost |
|
|
|
|
|
|
Service cost |
|
$ |
302 |
|
$ |
519 |
Interest cost |
|
|
311 |
|
|
274 |
Expected return on plan assets |
|
|
(530) |
|
|
(575) |
Amortization of prior service credit |
|
|
(89) |
|
|
(89) |
Amortization of net loss |
|
|
48 |
|
|
183 |
|
|
|
|
|
|
|
Net periodic benefit cost |
|
$ |
42 |
|
$ |
312 |
Significant assumptions include:
|
|
Pension Benefits |
|
||
|
|
2023 |
|
2022 |
|
Weighted-average assumptions used to determine benefit obligation: |
|
|
|
|
|
Discount rate |
|
3.75 |
% |
3.75 |
% |
Rate of compensation increase |
|
3.50 |
% |
3.50 |
% |
|
|
|
|
|
|
Weighted-average assumptions used to determine benefit cost: |
|
|
|
|
|
Discount rate |
|
3.75 |
% |
3.75 |
% |
Expected return on plan assets |
|
7.00 |
% |
7.00 |
% |
Rate of compensation increase |
|
3.50 |
% |
3.50 |
% |
The Company has estimated the long-term rate of return on plan assets based primarily on historical returns on plan assets, adjusted for changes in target portfolio allocations and recent changes in long-term interest rates based on publicly available information.
The following benefit payments, which reflect expected future service, as appropriate, are expected to be paid as of December 31, 2023:
|
|
Pension |
|
|
|
Benefits |
|
|
|
(In thousands) |
|
2024 |
|
$ |
316 |
2025 |
|
|
339 |
2026 |
|
|
312 |
2027 |
|
|
635 |
2028 |
|
|
529 |
2029-2033 |
|
|
5,104 |
Total |
|
$ |
7,235 |
Plan assets are held by an outside trustee which invests the plan assets in accordance with the provisions of the plan agreement. All equity and fixed income investments are held in various mutual funds with quoted market prices. Mutual fund equity securities primarily include investment funds that are comprised of large-cap, mid-cap and international companies. Fixed income mutual funds primarily include investments in corporate bonds, mortgage-backed securities and U.S. Treasuries. Other types of investments include a prime money market fund.
59 |
Notes to Consolidated Financial Statements
December 31, 2023 and 2022
The asset allocation strategy of the plan is designed to allow flexibility in the determination of the appropriate investment allocations between equity and fixed income investments. This strategy is designed to help achieve the actuarial long term rate on plan assets of 7.0%. The target asset allocation percentages for both 2023 and 2022 are as follows:
Large-Cap stocks |
|
Not to exceed 68% |
Small-Cap stocks |
|
Not to exceed 23% |
Mid-Cap stocks |
|
Not to exceed 23% |
International equity securities |
|
Not to exceed 30% |
Fixed income investments |
|
Not to exceed 35% |
Alternative investments |
|
Not to exceed 19% |
At December 31, 2023 and 2022, the fair value of plan assets as a percentage of the total was invested in the following:
|
|
December 31, |
|
||
|
|
2023 |
|
2022 |
|
Equity securities |
|
69.2 |
% |
70.0 |
% |
Debt securities |
|
27.5 |
|
27.8 |
|
Cash and cash equivalents |
|
3.3 |
|
2.2 |
|
|
|
|
|
|
|
|
|
100.0 |
% |
100.0 |
% |
Pension Plan Assets
Following is a description of the valuation methodologies used for pension plan assets measured at fair value on a recurring basis, as well as the general classification of pension plan assets pursuant to the valuation hierarchy.
Where quoted market prices are available in an active market, plan assets are classified within Level 1 of the valuation hierarchy. Level 1 plan assets include investments in mutual funds that involve equity, bond and money market investments. All of the Plan’s assets are classified as Level 1. If quoted market prices are not available, then fair values are estimated by using pricing models, quoted prices of plan assets with similar characteristics or discounted cash flows. In certain cases where Level 1 or Level 2 inputs are not available, plan assets are classified within Level 3 of the hierarchy. At December 31, 2023 and 2022, the Plan did not contain Level 2 or Level 3 investments.
The fair values of Company’s pension plan assets at December 31st, by asset category are as follows:
December 31, 2023 | ||||||||||||
|
|
|
|
|
Fair Value Measurements Using |
|||||||
|
|
|
|
|
Quoted Prices |
|
Significant |
|
|
|||
|
|
|
|
|
in Active |
|
Other |
|
Significant |
|||
|
|
|
|
|
Markets for |
|
Observable |
|
Unobservable |
|||
|
|
Total Fair |
|
Identical Assets |
|
Inputs |
|
Inputs |
||||
Asset Category |
|
Value |
|
(Level 1) |
|
(Level 2) |
|
(Level 3) |
||||
|
|
(In thousands) |
||||||||||
Mutual money market |
|
$ |
279 |
|
$ |
279 |
|
$ |
— |
|
$ |
— |
Mutual funds – equities |
|
|
|
|
|
|
|
|
|
|
|
|
ETF mutual funds |
|
|
5,283 |
|
|
5,283 |
|
|
— |
|
|
— |
Large and small Cap |
|
|
159 |
|
|
159 |
|
|
— |
|
|
— |
International |
|
|
356 |
|
|
356 |
|
|
|
|
|
|
Mutual funds – fixed income |
|
|
|
|
|
|
|
|
|
|
|
|
Fixed income |
|
|
1,559 |
|
|
1,559 |
|
|
— |
|
|
— |
ETF fixed income |
|
|
745 |
|
|
745 |
|
|
— |
|
|
— |
|
|
|
|
|
|
|
|
|
|
|
|
|
Total |
|
$ |
8,381 |
|
$ |
8,381 |
|
$ |
— |
|
$ |
— |
60 |
|
Notes to Consolidated Financial Statements
December 31, 2023 and 2022
December 31, 2022 | ||||||||||||
|
|
|
|
|
Fair Value Measurements Using |
|||||||
|
|
|
|
|
Quoted Prices |
|
Significant |
|
|
|
||
|
|
|
|
|
in Active |
|
Other |
|
Significant |
|||
|
|
|
|
|
Markets for |
|
Observable |
|
Unobservable |
|||
|
|
Total Fair |
|
Identical Assets |
|
Inputs |
|
Inputs |
||||
Asset Category |
|
Value |
|
(Level 1) |
|
(Level 2) |
|
(Level 3) |
||||
|
|
(In thousands) |
||||||||||
Mutual money market |
|
$ |
154 |
|
$ |
154 |
|
$ |
— |
|
$ |
— |
Mutual funds – equities |
|
|
|
|
|
|
|
|
|
|
|
|
ETF mutual funds |
|
|
4,445 |
|
|
4,445 |
|
|
— |
|
|
— |
Large and small Cap |
|
|
142 |
|
|
142 |
|
|
— |
|
|
— |
International |
|
|
301 |
|
|
301 |
|
|
|
|
|
|
Mutual funds – fixed income |
|
|
|
|
|
|
|
|
|
|
|
|
Fixed income |
|
|
1,348 |
|
|
1,348 |
|
|
— |
|
|
— |
ETF fixed income |
|
|
598 |
|
|
598 |
|
|
— |
|
|
— |
|
|
|
|
|
|
|
|
|
|
|
|
|
Total |
|
$ |
6,988 |
|
$ |
6,988 |
|
$ |
— |
|
$ |
— |
Employee Stock Ownership and 401(k) Plans
The Company has an Employee Stock Ownership Plan (“ESOP”) with an integrated 401(k) plan covering substantially all employees of the Company. The Company’s 401(k) matching percentage was 50% of the employees’ first 6% of contributions for 2023 and 2022.
The Company’s 401(k) expense for the years ended December 31, 2023 and 2022 was approximately $142,000 and $141,000, respectively.
Share information for the ESOP is as follows at December 31, 2023 and 2022:
|
|
2023 |
|
2022 |
||
Allocated shares at beginning of the year |
|
|
384,404 |
|
|
398,104 |
Net shares distributed due to retirement/diversification |
|
|
(6,534) |
|
|
(13,700) |
|
|
|
|
|
|
|
Total ESOP shares |
|
|
377,870 |
|
|
384,404 |
|
|
|
|
|
|
|
Fair value of unearned shares at December 31st |
|
$ |
— |
|
$ |
— |
At December 31, 2023, the fair value of the 377,870 the shares held by the ESOP was approximately $4,852,000. There were no unearned ESOP shares as of December 31, 2023 and 2022.
Split Dollar Life Insurance Arrangements
The Company has split-dollar life insurance arrangements with its executive officers and certain directors that provide certain death benefits to the executive’s beneficiaries upon his or her death. The agreements provide a pre- and post-retirement death benefit payable to the beneficiaries of the executive in the event of the executive’s death. The Company has purchased life insurance policies on the lives of all participants covered by these agreements in amounts sufficient to provide the sums necessary to pay the beneficiaries, and the Company pays all premiums due on the policies. In the case of an early separation from the Company, the nonvested executive portion of the death benefit is retained by the Company. The accumulated post retirement benefit obligation was $2.0 million and $1.9 million at December 31, 2023 and 2022, respectively.
Note 14: Restricted Stock Plan
During 2018, the Company’s stockholders authorized the adoption of the United Bancorp, Inc. 2018 Stock Incentive Plan (the “2018 Plan”). No more than 500,000 shares of the Company’s common stock may be issued under the 2018 Plan. As of December 31, 2023, 162,500 shares have been issued under this plan. The shares that may be issued can be authorized but unissued shares or treasury shares. The 2018 Plan permits the grant of incentive awards in the form of options, stock appreciation rights, restricted share and share unit awards, and performance share awards. The 2018 Plan contains annual limits
61 |
Notes to Consolidated Financial Statements
December 31, 2023 and 2022
on certain types of awards to individual participants. In any calendar year, no participant may be granted awards covering more than 25,000 shares.
During 2008, the Company’s stockholders authorized the adoption of the United Bancorp, Inc. 2008 Stock Incentive Plan (the “2008 Plan”). No more than 500,000 shares of the Company’s common stock may be issued under the 2008 Plan. The shares that may be issued can be authorized but unissued shares or treasury shares. The 2008 Plan permits the grant of incentive awards in the form of options, stock appreciation rights, restricted share and share unit awards, and performance share awards. The 2008 Plan contains annual limits on certain types of awards to individual participants. In any calendar year, no participant may be granted awards covering more than 25,000 shares. As of December 31, 2018, no additional shares can be awarded under the 2008 Plan.
The Company believes that such awards better align the interests of its employees with those of its stockholders. Stock options are generally granted with an exercise price, and restricted stock awards are valued, equal to the market price of the Company’s stock at the date of grant; stock option awards generally vest within 9.5 years of continuous service and have a 9.5 year contractual term. Restricted stock awards generally vest over a 9.5 year contractual term, or over the period to retirement, whichever is shorter. Restricted stock awards have no post-vesting restrictions. Restricted stock awards provide for accelerated vesting if there is a change in control (as defined in the Plans).
A summary of the status of the Company’s nonvested restricted shares as of December 31, 2023, and changes during the year then ended, is presented below:
|
|
|
|
Weighted- |
|
|
|
|
|
Average |
|
|
|
|
|
Grant-Date |
|
|
|
Shares |
|
Fair Value |
|
Nonvested, beginning of year |
|
257,500 |
|
$ |
11.86 |
Granted |
|
20,000 |
|
|
12.03 |
Vested |
|
(50,000) |
|
|
12.19 |
Forfeited |
|
— |
|
|
— |
Nonvested, end of year |
|
227,500 |
|
$ |
11.79 |
Total compensation cost recognized in the income statement for share-based payment arrangements during the years ended December 31, 2023 and 2022 was $658,000 and $1,006,000, respectively.
The recognized tax benefits related thereto were $138,000 and $211,000, for the years ended December 31, 2023 and 2022, respectively.
As of December 31, 2023 and 2022, there was $1,253,000 and $1,549,000, respectively, of total unrecognized compensation cost related to nonvested share-based compensation arrangements granted under the Plan. That cost is expected to be recognized over a weighted-average period of 3.8 years.
Note 15: Earnings Per Share
Earnings per share (EPS) were computed as follows:
|
|
Year Ended December 31, 2023 |
||||||
|
|
|
|
|
Weighted- |
|
|
|
|
|
|
|
|
Average |
|
|
|
|
|
Net |
|
Shares |
|
Per Share |
||
|
|
Income |
|
Outstanding |
|
Amount |
||
|
|
(In thousands) |
|
|
|
|
|
|
Net income |
|
$ |
8,950 |
|
|
|
|
|
Less allocated earnings on non-vested restricted stock |
|
|
(167) |
|
|
|
|
|
Less allocated dividends on non-vested restricted stock |
|
|
(190) |
|
|
|
|
|
Net income allocated to common stockholders |
|
|
8,593 |
|
|
|
|
|
|
|
|
|
|
5,490,488 |
|
|
|
Basic and diluted earnings per share |
|
|
|
|
|
|
$ |
1.57 |
62 |
|
Notes to Consolidated Financial Statements
December 31, 2023 and 2022
|
|
Year Ended December 31, 2022 |
||||||
|
|
|
|
|
Weighted- |
|
|
|
|
|
|
|
|
Average |
|
Per Share |
|
|
|
Net |
|
Shares |
|
|
|
|
|
|
Income |
|
Outstanding |
|
Amount |
||
|
|
(In thousands) |
|
|
|
|
|
|
Net income |
|
$ |
8,657 |
|
|
|
|
|
Less allocated earnings on non-vested restricted stock |
|
|
(185) |
|
|
|
|
|
Less allocated dividends on non-vested restricted stock |
|
|
(203) |
|
|
|
|
|
Net income allocated to common stockholders |
|
|
8,269 |
|
|
|
|
|
|
|
|
|
|
5,483,305 |
|
|
|
Basic and diluted earnings per share |
|
|
|
|
|
|
$ |
1.50 |
Note 16: Disclosures about Fair Value of Financial Instruments and Other Assets and Liabilities
The Company defines fair value as the price that would be received to sell an asset or paid to transfer a liability in an orderly transaction between market participants at the measurement date. The Company also utilizes a fair value hierarchy which requires an entity to maximize the use of observable inputs and minimize the use of unobservable inputs when measuring fair value. The standard describes three levels of inputs that may be used to measure fair value:
Level 1 |
Quoted prices in active markets for identical assets or liabilities |
Level 2 |
Observable inputs other than Level 1 prices, such as quoted prices for similar assets or liabilities; quoted prices in markets that are not active; or other inputs that are observable or can be corroborated by observable market data for substantially the full term of the assets or liabilities |
Level 3 |
Unobservable inputs that are supported by little or no market activity and that are significant to the fair value of the assets or liabilities |
Following is a description of the valuation methodologies used for assets measured at fair value on a recurring basis and recognized in the accompanying balance sheets, as well as the general classification of such assets pursuant to the valuation hierarchy.
63 |
Notes to Consolidated Financial Statements
December 31, 2023 and 2022
Available-for-sale Securities
Where quoted market prices are available in an active market, securities are classified within Level 1 of the valuation hierarchy. If quoted market prices are not available, then fair values are estimated by using quoted prices of securities with similar characteristics or independent asset pricing services and pricing models, the inputs of which are market-based or independently sourced market parameters, including, but not limited to, yield curves, interest rates, volatilities, prepayments, defaults, cumulative loss projections and cash flows. Such securities are classified in Level 2 of the valuation hierarchy.
The following tables present the fair value measurements of assets recognized in the accompanying balance sheets measured at fair value on a recurring basis and the level within the fair value hierarchy in which the fair value measurements fall at December 31, 2023 and 2022:
|
|
|
|
|
December 31, 2023 |
|||||||
|
|
|
|
|
Fair Value Measurements Using |
|||||||
|
|
|
|
|
Quoted Prices in |
|
Significant |
|
|
|
||
|
|
|
|
|
Active Markets |
|
Other |
|
Significant |
|||
|
|
|
|
|
for Identical |
|
Observable |
|
Unobservable |
|||
|
|
Fair |
|
Assets |
|
Inputs |
|
Inputs |
||||
|
|
Value |
|
(Level 1) |
|
(Level 2) |
|
(Level 3) |
||||
|
|
(In thousands) |
||||||||||
U.S government agencies |
|
$ |
44,268 |
|
$ |
— |
|
$ |
44,268 |
|
$ |
— |
Subordinated notes |
|
|
24,300 |
|
|
— |
|
|
24,300 |
|
|
— |
State and municipal obligation |
|
|
174,192 |
|
|
— |
|
|
174,192 |
|
|
— |
|
|
|
|
|
December 31, 2022 |
|||||||
|
|
|
|
|
Fair Value Measurements Using |
|||||||
|
|
|
|
|
Quoted Prices in |
|
Significant |
|
|
|
||
|
|
|
|
|
Active Markets |
|
Other |
|
Significant |
|||
|
|
|
|
|
for Identical |
|
Observable |
|
Unobservable |
|||
|
|
Fair |
|
Assets |
|
Inputs |
|
Inputs |
||||
|
|
Value |
|
(Level 1) |
|
(Level 2) |
|
(Level 3) |
||||
|
|
(In thousands) |
||||||||||
U.S government agencies |
|
$ |
44,032 |
|
$ |
— |
|
$ |
44,032 |
|
$ |
— |
Subordinated notes |
|
|
28,094 |
|
|
— |
|
|
28,094 |
|
|
— |
State and municipal obligation |
|
|
145,498 |
|
|
— |
|
|
145,498 |
|
|
— |
Following is a description of the valuation methodologies used for instruments measured at fair value on a non-recurring basis and recognized in the accompanying balance sheets, as well as the general classification of such instruments pursuant to the valuation hierarchy.
Collateral Dependent
Collateral dependent loans consisted primarily of loans secured by nonresidential real estate. Management has determined fair value measurements on collateral dependent loans primarily through evaluations of appraisals performed. Due to the nature of the valuation inputs, collateral dependent loans are classified within Level 3 of the hierarchy.
The Company considers the appraisal or evaluation as the starting point for determining fair value and then considers other factors and events in the environment that may affect the fair value. Appraisals of the collateral underlying collateral-dependent loans are obtained when the loan is determined to be collateral-dependent and subsequently as deemed necessary by the Company’s Chief Lender. Appraisals are reviewed for accuracy and consistency by the Company’s Chief Lender. Appraisers are selected from the list of approved appraisers maintained by management. The appraised values are reduced by discounts to consider lack of marketability and estimated cost to sell if repayment or satisfaction of the loan is dependent on the sale of the collateral. These discounts and estimates are developed by the Company’s Chief Lender by comparison to historical results.
Foreclosed Assets Held for Sale
Assets acquired through, or in lieu of, loan foreclosure are held for sale and are initially recorded at fair value (based on current appraised value) at the date of foreclosure, establishing a new cost basis. Subsequent to foreclosure, valuations are periodically performed by management and the assets are carried at the lower of carrying amount or fair value less cost to sell. Management has determined fair value measurements on other real estate owned primarily through evaluations of appraisals performed, and
64 |
|
Notes to Consolidated Financial Statements
December 31, 2023 and 2022
current and past offers for the other real estate under evaluation. Due to the nature of the valuation inputs, foreclosed assets held for sale are classified within Level 3 of the hierarchy.
Appraisals of other real estate owned (OREO) are obtained when the real estate is acquired and subsequently as deemed necessary by the Company’s Chief Lender. Appraisals are reviewed for accuracy and consistency by the Company’s Chief Lender and are selected from the list of approved appraisers maintained by management.
The following tables present the fair value measurements of assets recognized in the accompanying balance sheets measured at fair value on a non-recurring basis and the level within the fair value hierarchy in which the fair value measurements fall at December 31, 2023 and 2022:
|
|
|
|
|
December 31, 2023 |
|||||||
|
|
|
|
|
Fair Value Measurements Using |
|||||||
|
|
|
|
|
Quoted Prices in |
|
Significant |
|
|
|
||
|
|
|
|
|
Active Markets |
|
Other |
|
Significant |
|||
|
|
|
|
|
for Identical |
|
Observable |
|
Unobservable |
|||
|
|
Fair |
|
Assets |
|
Inputs |
|
Inputs |
||||
|
|
Value |
|
(Level 1) |
|
(Level 2) |
|
(Level 3) |
||||
|
|
(In thousands) |
||||||||||
Collateral dependent impaired loans |
|
$ |
— |
|
$ |
— |
|
$ |
— |
|
$ |
— |
Foreclosed assets held for sale |
|
|
3,273 |
|
|
— |
|
|
— |
|
|
3,273 |
|
|
|
|
|
December 31, 2022 |
|||||||
|
|
|
|
|
Fair Value Measurements Using |
|||||||
|
|
|
|
Quoted Prices in |
|
Significant |
|
|
||||
|
|
|
|
Active Markets |
|
Other |
|
Significant |
||||
|
|
|
|
for Identical |
|
Observable |
|
Unobservable |
||||
|
|
Fair |
|
Assets |
|
Inputs |
|
Inputs |
||||
|
|
Value |
|
(Level 1) |
|
(Level 2) |
|
(Level 3) |
||||
|
|
(In thousands) |
||||||||||
Collateral dependent impaired loans |
|
$ |
9 |
|
$ |
— |
|
$ |
— |
|
$ |
9 |
Foreclosed assets held for sale |
|
|
3,519 |
|
|
— |
|
|
— |
|
|
3,519 |
Unobservable (Level 3) Inputs
The following tables present quantitative information about unobservable inputs used in nonrecurring Level 3 fair value measurements.
|
|
Fair Value at |
|
Valuation |
|
|
|
|
|
|
|
12/31/23 |
|
Technique |
|
Unobservable Inputs |
|
Range |
|
|
|
(In thousands) |
|
|
|
|
|
|
|
Collateral-dependent loans |
|
$ |
— |
|
Market comparable properties |
|
Comparability adjustments |
|
5% – 10% |
Foreclosed assets held for sale |
|
|
3,273 |
|
Market comparable properties |
|
Marketability discount |
|
10% – 35% |
|
|
Fair Value at |
|
Valuation |
|
|
|
|
|
|
|
12/31/22 |
|
Technique |
|
Unobservable Inputs |
|
Range |
|
|
|
(In thousands) |
|
|
|
|
|
|
|
Collateral-dependent loans |
|
$ |
9 |
|
Market comparable properties |
|
Comparability adjustments |
|
5% – 10% |
Foreclosed assets held for sale |
|
|
3,519 |
|
Market comparable properties |
|
Marketability discount |
|
10% – 35% |
There were no significant changes in the valuation techniques used during 2023.
The following tables presents estimated fair values of the Company’s financial instruments not required to be reported at fair value. The fair values of certain of these instruments were calculated by discounting expected cash flows, which involves significant judgments by management and uncertainties. Fair value is the estimated amount at which financial assets or liabilities could be exchanged in a current transaction between willing parties, other than in a forced or liquidation sale. Because no market exists for certain of these financial instruments and because management does not intend to sell these financial
65 |
Notes to Consolidated Financial Statements
December 31, 2023 and 2022
instruments, the Company does not know whether the fair values shown below represent values at which the respective financial instruments could be sold individually or in the aggregate.
|
|
|
|
|
Fair Value Measurements Using |
|||||||
|
|
|
|
|
Quoted Prices |
|
|
|
|
|
|
|
|
|
|
|
|
in Active |
|
|
|
|
|
|
|
|
|
|
|
|
Markets for |
|
Significant |
|
Significant |
|||
|
|
|
|
|
Identical |
|
Other |
|
Unobservable |
|||
|
|
Carrying |
|
Assets |
|
Observable Inputs |
|
Inputs |
||||
|
|
Amount |
|
(Level 1) |
|
(Level 2) |
|
(Level 3) |
||||
|
|
(In thousands) |
||||||||||
December 31, 2023 |
|
|
|
|
|
|
|
|
|
|
|
|
Financial assets |
|
|
|
|
|
|
|
|
|
|
|
|
Cash and cash equivalents |
|
$ |
40,770 |
|
$ |
40,770 |
|
$ |
— |
|
$ |
— |
Loans, net of allowance |
|
|
479,318 |
|
|
— |
|
|
— |
|
|
459,759 |
Federal Home Loan Bank stock |
|
|
3,979 |
|
|
— |
|
|
3,979 |
|
|
— |
Accrued interest receivable |
|
|
4,098 |
|
|
— |
|
|
4,098 |
|
|
— |
|
|
|
|
|
|
|
|
|
|
|
|
|
Financial liabilities |
|
|
|
|
|
|
|
|
|
|
|
|
Deposits |
|
$ |
621,459 |
|
$ |
— |
|
$ |
623,813 |
|
$ |
— |
Securities sold under repurchase agreements |
|
|
26,781 |
|
|
— |
|
|
26,781 |
|
|
— |
Federal Home Loan Bank Advances |
|
|
75,000 |
|
|
— |
|
|
74,911 |
|
|
— |
Subordinated debentures |
|
|
23,787 |
|
|
— |
|
|
22,146 |
|
|
— |
Interest payable |
|
|
579 |
|
|
— |
|
|
579 |
|
|
— |
|
|
|
|
|
Fair Value Measurements Using |
|||||||
|
|
|
|
|
Quoted Prices |
|
|
|
|
|
|
|
|
|
|
|
|
in Active |
|
Significant |
|
|
|
||
|
|
|
|
|
Markets for |
|
Other |
|
Significant |
|||
|
|
|
|
|
Identical |
|
Observable |
|
Unobservable |
|||
|
|
Carrying |
|
Assets |
|
Inputs |
|
Inputs |
||||
|
|
Amount |
|
(Level 1) |
|
(Level 2) |
|
(Level 3) |
||||
|
|
(In thousands) |
||||||||||
December 31, 2022 |
|
|
|
|
|
|
|
|
|
|
|
|
Financial assets |
|
|
|
|
|
|
|
|
|
|
|
|
Cash and cash equivalents |
|
$ |
30,080 |
|
$ |
30,080 |
|
$ |
— |
|
$ |
— |
Loans, net of allowance |
|
|
458,823 |
|
|
— |
|
|
— |
|
|
444,704 |
Federal Home Loan Bank stock |
|
|
2,499 |
|
|
— |
|
|
2,499 |
|
|
— |
Accrued interest receivable |
|
|
3,403 |
|
|
— |
|
|
3,403 |
|
|
— |
|
|
|
|
|
|
|
|
|
|
|
|
|
Financial liabilities |
|
|
|
|
|
|
|
|
|
|
|
|
Deposits |
|
$ |
649,913 |
|
$ |
— |
|
$ |
646,455 |
|
$ |
— |
Securities sold under repurchase agreements |
|
|
18,106 |
|
|
— |
|
|
18,106 |
|
|
— |
Subordinated debentures |
|
|
23,726 |
|
|
— |
|
|
24,454 |
|
|
— |
Interest payable |
|
|
304 |
|
|
— |
|
|
304 |
|
|
— |
The following methods and assumptions were used to estimate the fair value of each class of financial instruments.
Cash and Cash Equivalents, Accrued Interest Receivable and Federal Home Loan Bank Stock
The carrying amounts approximate fair value.
Loans
Fair values of loans and leases are estimated on an exit price basis incorporating discounts for credit, liquidity and marketability factors.
66 |
|
Notes to Consolidated Financial Statements
December 31, 2023 and 2022
Deposits
Deposits include demand deposits, savings accounts, NOW accounts and certain money market deposits. The carrying amount approximates fair value. The fair value of fixed-maturity time deposits is estimated using a discounted cash flow calculation that applies the rates currently offered for deposits of similar remaining maturities.
Interest Payable
The carrying amount approximates fair value.
Securities Sold Under Repurchase Agreements and Subordinated Debentures
Rates currently available to the Company for debt with similar terms and remaining maturities are used to estimate the fair value of existing debt.
Advances from the Federal Home Loan Bank
The fair values of advances from the Federal Home Loan Bank, are based on the discounted value of estimated cash flows. The discounted rate is estimated using market rates currently offered for debts with similar credit rating, terms and remaining maturities.
Commitments to Originate Loans, Letters of Credit and Lines of Credit
The fair value of commitments to originate loans is estimated using the fees currently charged to enter into similar agreements, taking into account the remaining terms of the agreements and the present creditworthiness of the counterparties. For fixed-rate loan commitments, fair value also considers the difference between current levels of interest rates and the committed rates. The fair values of letters of credit and lines of credit are based on fees currently charged for similar agreements or on the estimated cost to terminate or otherwise settle the obligations with the counterparties at the reporting date. Fair values of commitments were not material at December 31, 2023 and 2022.
Note 17: Significant Estimates and Concentrations
Accounting principles generally accepted in the United States of America require disclosure of certain significant estimates and current vulnerabilities due to certain concentrations. Estimates related to the allowance for credit losses are reflected in the footnote regarding loans. Current vulnerabilities due to certain concentrations of credit risk are discussed in the footnote on commitments and credit risk.
The Company invests in various investment securities. Investment securities are exposed to various risks such as interest rate, market and credit risks. Due to the level of risk associated with certain investment securities, it is possible that changes in the values of investment securities may occur and that such changes could affect the amounts reported in the accompanying consolidated balance sheets.
Note 18: Commitments and Credit Risk
At December 31, 2023 and 2022, total commercial and commercial real estate loans made up 79.3% and 78.3%, respectively, of the loan portfolio. Installment loans account for 1.4% and 1.3%, respectively, of the loan portfolio. Real estate loans comprise 19.3% and 20.4% of the loan portfolio as of December 31, 2023 and 2022, respectively, and primarily include first mortgage loans on residential properties and home equity lines of credit.
Included in cash and cash and cash equivalents as of December 31, 2023 and 2022 is $33.4 million and $21.5 million, respectively, of deposits with the Federal Reserve Bank of Cleveland and the Federal Home Loan Bank.
Commitments to Originate Loans
Commitments to originate loans are agreements to lend to a customer as long as there is no violation of any condition established in the contract. Commitments generally have fixed expiration dates or other termination clauses and may require payment of a fee. Since a portion of the commitments may expire without being drawn upon, the total commitment amounts do not
67 |
Notes to Consolidated Financial Statements
December 31, 2023 and 2022
necessarily represent future cash requirements. Each customer’s creditworthiness is evaluated on a case-by-case basis. The amount of collateral obtained, if deemed necessary, is based on management’s credit evaluation of the counterparty. Collateral held varies, but may include accounts receivable, inventory, property, plant and equipment, commercial real estate and residential real estate.
At December 31, 2023 and 2022, the Company had outstanding commitments to originate variable rate loans aggregating approximately $91.7 million and $77.9 million, respectively. The commitments extended over varying periods of time with the majority being disbursed within a one-year period.
Mortgage loans in the process of origination represent amounts that the Company plans to fund within a normal period of 60 to 90 days, some of which are intended for sale to investors in the secondary market. The Company did not have any mortgage loans in the process of origination which are intended for sale at December 31, 2023 or 2022.
Standby Letters of Credit
Standby letters of credit are irrevocable conditional commitments issued by the Company to guarantee the performance of a customer to a third party. Financial standby letters of credit are primarily issued to support public and private borrowing arrangements, including commercial paper, bond financing and similar transactions. Performance standby letters of credit are issued to guarantee performance of certain customers under non-financial contractual obligations. The credit risk involved in issuing standby letters of credit is essentially the same as that involved in extending loans to customers. Fees for letters of credit are initially recorded by the Company as deferred revenue and are included in earnings at the termination of the respective agreements. Should the Company be obligated to perform under the standby letters of credit, the Company may seek recourse from the customer for reimbursement of amounts paid.
The Company had $136,000 and $136,000 at December 31, 2023 and 2022, respectively in outstanding standby letters of credit. At both December 31, 2023 and 2022, the Company had no deferred revenue under standby letter of credit agreements.
Lines of Credit and Other
Lines of credit are agreements to lend to a customer as long as there is no violation of any condition established in the contract. Lines of credit generally have fixed expiration dates. Since a portion of the line may expire without being drawn upon, the total unused lines do not necessarily represent future cash requirements. Each customer’s creditworthiness is evaluated on a case-by-case basis. The amount of collateral obtained, if deemed necessary, is based on management’s credit evaluation of the counterparty. Collateral held varies but may include accounts receivable, inventory, property, plant and equipment, commercial real estate and residential real estate. Management uses the same credit policies in granting lines of credit as it does for on-balance-sheet instruments.
At December 31, 2023, the Company had granted unused lines of credit to borrowers aggregating approximately $93.7 million and $37.0 million for commercial lines and open-end consumer lines, respectively. At December 31, 2022, the Company had granted unused lines of credit to borrowers aggregating approximately $79.7 million and $37.6 million for commercial lines and open-end consumer lines, respectively.
68 |
|
Notes to Consolidated Financial Statements
December 31, 2023 and 2022
Note 19: Recent Accounting Pronouncements
Recent Accounting Pronouncements
In December 2023, the FASB issued ASU 2023-09, Income Taxes (Topic 740): Improvements to Income Tax Disclosures, which provides for improvements to income tax disclosures primarily related to the rate reconciliation and income taxes paid information. This guidance is effective for public business entities for annual period beginning after December 15, 2024. This Update is not expected to have a significant impact on the Company’s financial statements.
In January 2020, the FASB issued ASU 2020-04, Reference Rate Reform (Topic 848): Facilitation of the Effects of Reference Rate Reform on Financial Reporting, March 2020, to provide temporary optional expedients and exceptions to the U.S. GAAP guidance on contract modifications and hedge accounting to ease the financial reporting burdens of the expected market transition from LIBOR and other interbank offered rates to alternative reference rates, such as the Secured Overnight Financing Rate. Entities can elect not to apply certain modification accounting requirements to contracts affected by what the guidance calls “reference rate reform” if certain criteria are met. An entity that makes this election would not have to remeasure the contracts at the modification date or reassess a previous accounting determination. Also, entities can elect various optional expedients that would allow them to continue applying hedge accounting for hedging relationships affected by reference rate reform if certain criteria are met, and can make a one-time election to sell and/or reclassify held-to-maturity debt securities that reference an interest rate affected by reference rate reform. The amendments in this ASU are effective for all entities upon issuance through December 31, 2022. In December 2022, the FASB issued ASU 2022-06, Reference Rate Reform (Topic 848): Deferral of the Sunset Date of Topic 848, which extends the sunset (or expiration) date of Accounting Standards Codification (ASC) Topic 848 to December 31, 2024. This gives reporting entities two additional years to apply the accounting relief provided under ASC Topic 848 for matters related to reference rate reform. ASU 2022-06 is effective for all reporting entities immediately upon issuance and must be applied on a prospective basis. This Update is not expected to have a significant impact on the Company’s financial statements.
69 |
Notes to Consolidated Financial Statements
December 31, 2023 and 2022
Note 20: Condensed Financial Information (Parent Company Only)
Presented below is condensed financial information as to financial position, results of operations and cash flows of the Company:
Condensed Balance Sheets
|
|
December 31, |
||||
|
|
2023 |
|
2022 |
||
|
|
(In thousands) |
||||
Assets |
|
|
|
|
|
|
Cash and cash equivalents |
|
$ |
12,094 |
|
$ |
11,273 |
Investment in the Bank |
|
|
71,787 |
|
|
69,914 |
Other assets |
|
|
4,078 |
|
|
3,110 |
|
|
|
|
|
|
|
Total assets |
|
$ |
87,959 |
|
$ |
84,297 |
|
|
|
|
|
|
|
Liabilities and Stockholders’ Equity |
|
|
|
|
|
|
Subordinated debentures |
|
$ |
23,787 |
|
$ |
23,726 |
Other liabilities |
|
|
579 |
|
|
834 |
Stockholders’ equity |
|
|
63,593 |
|
|
59,737 |
|
|
|
|
|
|
|
Total liabilities and stockholders’ equity |
|
$ |
87,959 |
|
$ |
84,297 |
Condensed Statements of Income and Comprehensive Income
|
|
Years Ended December 31, |
||||
|
|
2023 |
|
2022 |
||
|
|
(In thousands) |
||||
Operating Income |
|
|
|
|
|
|
Dividends from subsidiary |
|
$ |
12,103 |
|
$ |
10,779 |
Interest and dividend income from securities and federal funds |
|
|
9 |
|
|
— |
|
|
|
|
|
|
|
Total operating income |
|
|
12,112 |
|
|
10,779 |
|
|
|
|
|
|
|
General, Administrative and Other Expenses |
|
|
4,390 |
|
|
4,498 |
|
|
|
|
|
|
|
Income (Loss) Before Income Taxes and Equity in Undistributed Income of Subsidiary |
|
|
7,722 |
|
|
6,281 |
|
|
|
|
|
|
|
Income Tax Benefits |
|
|
983 |
|
|
1,095 |
|
|
|
|
|
|
|
Income (Loss) Before Equity in Undistributed Income of Subsidiary |
|
|
8,705 |
|
|
7,376 |
|
|
|
|
|
|
|
Equity in Undistributed Income of Subsidiary |
|
|
245 |
|
|
1,281 |
|
|
|
|
|
|
|
Net Income |
|
$ |
8,950 |
|
$ |
8,657 |
|
|
|
|
|
|
|
Comprehensive Income (Loss) |
|
$ |
10,808 |
|
$ |
(7,643) |
70 |
|
Notes to Consolidated Financial Statements
December 31, 2023 and 2022
Condensed Statements of Cash Flows
|
|
Years Ended December 31, |
||||
|
|
2023 |
|
2022 |
||
|
|
(In thousands) |
||||
Operating Activities |
|
|
|
|
|
|
Net income |
|
$ |
8,950 |
|
$ |
8,657 |
Items not requiring (providing) cash |
|
|
|
|
|
|
Equity in undistributed income of subsidiary |
|
|
(245) |
|
|
(1,281) |
Amortization of share-based compensation plans |
|
|
658 |
|
|
1,005 |
Net change in other assets and other liabilities |
|
|
(3,021) |
|
|
(874) |
|
|
|
|
|
|
|
Net cash provided by operating activities |
|
|
6,342 |
|
|
7,507 |
|
|
|
|
|
|
|
Investing Activities |
|
|
|
|
|
|
|
|
|
|
|
|
|
Net cash used in investing activities |
|
|
— |
|
|
— |
|
|
|
|
|
|
|
Financing Activities |
|
|
|
|
|
|
Repurchase of common stock |
|
|
(733) |
|
|
(767) |
Cash dividends paid |
|
|
(4,788) |
|
|
(4,559) |
|
|
|
|
|
|
|
Net cash used in financing activities |
|
|
(5,521) |
|
|
(5,326) |
|
|
|
|
|
|
|
Net Change in Cash and Cash Equivalents |
|
|
821 |
|
|
2,181 |
|
|
|
|
|
|
|
Cash and Cash Equivalents at Beginning of Year |
|
|
11,273 |
|
|
9,092 |
|
|
|
|
|
|
|
Cash and Cash Equivalents at End of Year |
|
$ |
12,094 |
|
$ |
11,273 |
Note 21: Quarterly Financial Data (Unaudited)
The following tables summarize the Company’s quarterly results of operations for the years ended December 31, 2023 and 2022.
|
|
Three Months Ended |
||||||||||
2023: |
|
March 31, |
|
June 30, |
|
September 30, |
|
December 31, |
||||
|
|
(In thousands, except per share data) |
||||||||||
Total interest income |
|
$ |
8,208 |
|
$ |
9,286 |
|
$ |
9,651 |
|
$ |
9,704 |
Total interest expense |
|
|
1,785 |
|
|
2,941 |
|
|
3,085 |
|
|
3,203 |
|
|
|
|
|
|
|
|
|
|
|
|
|
Net interest income |
|
|
6,423 |
|
|
6,345 |
|
|
6,566 |
|
|
6,501 |
|
|
|
|
|
|
|
|
|
|
|
|
|
Provision (Credit) for loan losses |
|
|
— |
|
|
(146) |
|
|
(154) |
|
|
(154) |
Noninterest income |
|
|
1,016 |
|
|
1,046 |
|
|
963 |
|
|
1,029 |
Noninterest expense |
|
|
5,438 |
|
|
5,089 |
|
|
5,233 |
|
|
5,092 |
|
|
|
|
|
|
|
|
|
|
|
|
|
Income before income taxes |
|
|
2,001 |
|
|
2,448 |
|
|
2,450 |
|
|
2,592 |
Federal income taxes |
|
|
113 |
|
|
168 |
|
|
58 |
|
|
202 |
|
|
|
|
|
|
|
|
|
|
|
|
|
Net income |
|
$ |
1,888 |
|
$ |
2,280 |
|
$ |
2,392 |
|
$ |
2,390 |
|
|
|
|
|
|
|
|
|
|
|
|
|
Earnings per share |
|
|
|
|
|
|
|
|
|
|
|
|
Basic |
|
$ |
0.33 |
|
$ |
0.40 |
|
$ |
0.42 |
|
$ |
0.42 |
Diluted |
|
$ |
0.33 |
|
$ |
0.40 |
|
$ |
0.42 |
|
$ |
0.42 |
71 |
Notes to Consolidated Financial Statements
December 31, 2023 and 2022
|
|
Three Months Ended |
||||||||||
2022: |
|
March 31, |
|
June 30, |
|
September 30, |
|
December 31, |
||||
|
|
(In thousands, except per share data) |
||||||||||
Total interest income |
|
$ |
5,997 |
|
$ |
6,445 |
|
$ |
7,297 |
|
$ |
7,922 |
Total interest expense |
|
|
487 |
|
|
477 |
|
|
928 |
|
|
1,381 |
|
|
|
|
|
|
|
|
|
|
|
|
|
Net interest income |
|
|
5,510 |
|
|
5,968 |
|
|
6,369 |
|
|
6,541 |
|
|
|
|
|
|
|
|
|
|
|
|
|
Provision for loan losses |
|
|
(500) |
|
|
(485) |
|
|
15 |
|
|
15 |
Noninterest income |
|
|
987 |
|
|
988 |
|
|
1,043 |
|
|
1,065 |
Noninterest expense |
|
|
5,110 |
|
|
4,849 |
|
|
4,879 |
|
|
5,052 |
|
|
|
|
|
|
|
|
|
|
|
|
|
Income before income taxes |
|
|
1,887 |
|
|
2,592 |
|
|
2,518 |
|
|
2,539 |
Federal income taxes |
|
|
136 |
|
|
295 |
|
|
215 |
|
|
233 |
|
|
|
|
|
|
|
|
|
|
|
|
|
Net income |
|
$ |
1,751 |
|
$ |
2,297 |
|
$ |
2,303 |
|
$ |
2,306 |
|
|
|
|
|
|
|
|
|
|
|
|
|
Earnings per share |
|
|
|
|
|
|
|
|
|
|
|
|
Basic |
|
$ |
0.30 |
|
$ |
0.40 |
|
$ |
0.40 |
|
$ |
0.40 |
Diluted |
|
$ |
0.30 |
|
$ |
0.40 |
|
$ |
0.40 |
|
$ |
0.40 |
Note 22: Goodwill and Core Deposits
The following table shows the changes in the carrying amount of goodwill for the years ended December 31, 2023 and 2022 (in thousands):
|
|
2023 |
|
2022 |
||
Balance beginning of year |
|
$ |
682 |
|
$ |
682 |
Additions from acquisition |
|
|
— |
|
|
— |
Balance, end of year |
|
$ |
682 |
|
$ |
682 |
Intangible assets in the consolidated balance sheets at December 31, 2023 and 2022 were as follows (in thousands):
|
|
2023 |
|
|
2022 |
|||||||||||||
|
|
Gross |
|
|
|
|
|
|
|
|
Gross |
|
|
|
|
|
|
|
|
|
Intangible |
|
|
Accumulated |
|
|
Net Intangible |
|
|
Intangible |
|
|
Accumulated |
|
|
Net Intangible |
|
|
|
Assets |
|
|
Amortization |
|
|
Assets |
|
|
Assets |
|
|
Amortization |
|
|
Assets |
|
Core deposit intangibles |
|
$ |
1,041 |
|
$ |
781 |
|
$ |
260 |
|
$ |
1,041 |
|
$ |
631 |
|
$ |
410 |
The estimated aggregate future amortization expense for each of the next two years for intangible assets remaining as of December 31, 2023 is as follows (in thousands):
2024 |
|
$ |
150 |
2025 |
|
|
110 |
Note 23: Finance Lease
The Company has a finance lease in connection with the expansion into Wheeling, West Virginia to build a banking center during 2024. The finance lease term is 40 years with two additional 10 year terms available. The payment structure for this lease is fixed and will either increase or decrease on pre-dertemined dates at a pre-determined amount.
In accordance with ASC 842, the Company recognized a financing lease asset and corresponding lease liability related to the ground lease. The financing lease asset represents the Company’s right to use an underlying asset for the lease terms, and the lease liability represents the Company’s obligation to make lease payments over the lease term.
The lease is a net lease and, therefore does not contain non-lease components. The Company either pays directly or reimburses the lessor for property and casualty insurance cost and the the propery taxes asserted on the property, as well as a portion of the
72 |
|
Notes to Consolidated Financial Statements
December 31, 2023 and 2022
common area maintenance associated with the property which as categorized as non-components as outline in the applicable guidance.
This financing lease asset and lease liability was determined at the commencement date of the lease based on the present value of the lease payments. This lease does not provide an implicit interest rate. The Company used its incremental collateralized borrowing rate at the Federal Home Loan Bank with similar terms of repayment. The Company used a discount rate of 6.86% and recorded a right of use asset (ROU) and lease liability of $2,764,000. The effective date of the lease was November 21, 2023 and therefore the remaining term is 439 months and the amount of amortization of the ROU assest was not material to the Company’s is 2023. At December 31, 2023 the ROU asset is included in Premise and Equipment on the Consilidated Balance Sheet.
Maturities of the finance lease liability as December 31, 2023 are as follows:
|
|
(In thousands) |
|
Due during the year ending December 31, |
|
|
|
2024 |
|
$ |
93 |
2025 |
|
|
130 |
2026 |
|
|
210 |
2027 |
|
|
210 |
2028 |
|
|
207 |
Thereafter |
|
|
8,760 |
Total lease payments |
|
$ |
9,610 |
Interest |
|
|
(6,846) |
Lease Liability |
|
$ |
2,764 |
73 |
Exhibit 21
Subsidiaries of Registrant
· |
Unified Bank (Ohio commercial bank) |
o |
Unified Securities, Inc. (Ohio corporation) |
· |
United Bancorp Statutory Trust (Delaware statutory trust) |
Exhibit 23
Consent of Independent Registered Public Accounting Firm
We consent to the incorporation by reference in the registration statements of United Bancorp, Inc. on Forms S-8 (file No. 33-123036 effective February 28, 2005) and S-3 (file Nos. 333-136708 effective August 17, 2006 and 333-225002 effective May 17, 2018) of our report dated March 20, 2024, on our audit of the consolidated financial statements of United Bancorp, Inc. as of December 31, 2023 and 2022 and for the years then ended, which report is included in this Annual Report on Form 10-K.
/s/ S. R. Snodgrass, P.C. |
|
|
|
Cranberry, PA |
|
March 20, 2024 |
|
Exhibit 31.1
CERTIFICATIONS
I, Scott A. Everson, President and Chief Executive Officer of United Bancorp, Inc., certify that:
| 1. | I have reviewed this annual report on Form 10-K of United Bancorp, Inc.; |
| 2. | Based on my knowledge, this report does not contain any untrue statement of a material fact or omit to state a material fact necessary to make the statements made, in light of the circumstances under which such statements were made, not misleading with respect to the period covered by this report; |
| 3. | Based on my knowledge, the financial statements, and other financial information included in this report, fairly present in all material respects the financial condition, results of operations and cash flows of the registrant as of, and for, the periods presented in this report; |
| 4. | The registrant’s other certifying officer and I are responsible for establishing and maintaining disclosure controls and procedures (as defined in Exchange Act Rules 13a-15(e) and 15d-15(e)) and internal control over financial reporting (as defined in Exchange Act Rules 13a-15(f) and 15d-15(f)) for the registrant and have: |
| 5. | The registrant’s other certifying officer and I have disclosed, based on our most recent evaluation of internal control over financial reporting, to the registrant’s auditors and the audit committee of the registrant’s board of directors (or persons performing the equivalent functions): |
Date: March 20, 2024 |
/s/Scott A. Everson |
Scott A. Everson, President and CEO |
Exhibit 31.2
CERTIFICATIONS
I, Randall M. Greenwood, Chief Financial Officer of United Bancorp, Inc., certify that:
| 1. | I have reviewed this annual report on Form 10-K of United Bancorp, Inc.; |
| 2. | Based on my knowledge, this report does not contain any untrue statement of a material fact or omit to state a material fact necessary to make the statements made, in light of the circumstances under which such statements were made, not misleading with respect to the period covered by this report; |
| 3. | Based on my knowledge, the financial statements, and other financial information included in this report, fairly present in all material respects the financial condition, results of operations and cash flows of the registrant as of, and for, the periods presented in this report; |
| 4. | The registrant’s other certifying officer and I are responsible for establishing and maintaining disclosure controls and procedures (as defined in Exchange Act Rules 13a-15(e) and 15d-15(e)) and internal control over financial reporting (as defined in Exchange Act Rules 13a-15(f) and 15d-15(f)) for the registrant and have: |
| 5. | The registrant’s other certifying officer and I have disclosed, based on our most recent evaluation of internal control over financial reporting, to the registrant’s auditors and the audit committee of the registrant’s board of directors (or persons performing the equivalent functions): |
Date: March 20, 2024 |
/s/Randall M. Greenwood |
Randall M. Greenwood, CFO |
Exhibit 32.1
CERTIFICATION PURSUANT TO
18 U.S.C. SECTION 1350,
AS ENACTED PURSUANT TO
SECTION 906 OF THE SARBANES-OXLEY ACT OF 2002
In connection with the Annual Report of United Bancorp, Inc. (the “Company”) on Form 10-K for the period ending December 31, 2023 as filed with the Securities and Exchange Commission on the date hereof (the “Report”), I, Scott A. Everson, President and Chief Executive Officer of the Company, certify, pursuant to 18 U.S.C. § 1350, as enacted pursuant to Section 906 of the Sarbanes-Oxley Act of 2002, that:
/s/Scott A. Everson |
|
Scott A. Everson, |
|
President and Chief Executive Officer |
|
|
|
March 20, 2024 |
|
Exhibit 32.2
CERTIFICATION PURSUANT TO
18 U.S.C. SECTION 1350,
AS ENACTED PURSUANT TO
SECTION 906 OF THE SARBANES-OXLEY ACT OF 2002
In connection with the Annual Report of United Bancorp, Inc. (the “Company”) on Form 10-K for the period ending December 31, 2023 as filed with the Securities and Exchange Commission on the date hereof (the “Report”), I, Randall M. Greenwood, Chief Financial Officer of the Company, certify, pursuant to 18 U.S.C. § 1350, as enacted pursuant to Section 906 of the Sarbanes-Oxley Act of 2002, that:
/s/Randall M. Greenwood |
|
Randall M. Greenwood, |
|
Chief Financial Officer |
|
|
|
March 20, 2024 |
|
Exhibit 97
United Bancorp, Inc. Clawback Policy
The following statement of Company policy (the “Clawback Statement”) is designed to comply with Section 10D of the Securities Exchange Act of 1934 and any applicable listing standards of Nasdaq, and it shall be interpreted in accordance therewith.
· |
Policy of Recoupment Upon Accounting Restatement |
In the event the Company is required to prepare an accounting restatement of its financial statements due to the Company's material noncompliance with any financial reporting requirement under the securities laws, the Board will, to the extent not impracticable, require reimbursement or forfeiture of any excess Incentive Compensation received by any Covered Executive during the three completed fiscal years immediately preceding the date on which the Company is required to prepare an accounting restatement.
The Board intends to enforce its recoupment rights under this statement of policy to the fullest extent of the law and will determine, in its sole discretion, the method for recouping Incentive Compensation hereunder. The Board shall recover any excess Incentive Compensation unless such recovery would be impracticable, as determined by the Board in accordance with Rule 10D-1 of the Exchange Act and the listing standards of the national securities exchange on which the Company's securities are listed.
The Board may require that any employment agreement, equity award agreement, or similar agreement shall, as a condition to the grant of any benefit thereunder, require a Covered Executive to agree to abide by the terms of this Clawback Statement. Any right of recoupment under this statement of policy is in addition to, and not in lieu of, any other remedies or rights of recoupment that may be available to the Company pursuant to the terms of any similar policy in any employment agreement, equity award agreement, or similar agreement and any other legal remedies available to the Company.
· |
Administration |
Unlike the remainder of the Code of Ethics, the Clawback Statement shall be administered exclusively by the full Board of Directors of United Bancorp (the “Board”). The Board is authorized to interpret and construe this Clawback Statement and to make all determinations necessary, appropriate, or advisable for its administration. Any determinations made by the Board shall be final and binding on all affected individuals.
· |
Covered Executives |
The Company’s Clawback Statement applies to the current and former executive officers, as determined by the Board in accordance with Section 10D of the Exchange Act and the listing standards of Nasdaq, and such other senior executives/employees who may from time to time be deemed subject to the Policy by the Board (the Covered Executives).
· |
Incentive Compensation |
For purposes of the Company’s Clawback Statement, “Incentive Compensation” means any compensation received by a Covered Executive that is granted, earned, or vested based wholly or in part on the attainment of a financial reporting measure.
· |
Excess Incentive Compensation: Amount Subject to Recovery |
The amount to be recovered will be the excess of the Incentive Compensation paid to the Covered Executive based on the erroneous data over the Incentive Compensation that would have been paid had it been based on the restated results, as determined by the Board.
If the Board cannot determine the amount of excess Incentive Compensation received by the Covered Executive directly from the information in the accounting restatement, then it will make its determination based on a reasonable estimate of the effect of the accounting restatement.
· |
No Indemnification |
The Company shall not indemnify any Covered Executives against the loss of any incorrectly awarded Incentive Compensation.