Document
Kennedy-Wilson Holdings, Inc.
Supplemental Financial Information
For the Quarter Ended September 30, 2023
TABLE OF CONTENTS
|
|
|
|
|
|
|
|
|
Earnings Release |
|
|
News Release |
|
|
Consolidated Balance Sheets (unaudited) |
|
|
Consolidated Statements of Operations (unaudited) |
|
|
Non-GAAP Metrics (unaudited) |
|
|
|
|
|
| Supplemental Financial Information (unaudited) |
|
|
Capitalization Summary |
|
|
| Components of Value |
|
|
Components of Value Summary |
|
|
|
|
|
|
|
|
Multifamily Portfolio |
|
|
| Office Portfolio |
|
|
| Industrial Portfolio |
|
|
| Retail Portfolio |
|
|
Hotel, Loans, Residential and Other Investment Portfolio |
|
|
| Lease-up Portfolio |
|
|
| Development Projects |
|
|
Debt Schedule |
|
|
Investment Management |
|
|
| Other Portfolio and Financial Information |
|
|
Same Property - Multifamily |
|
|
|
|
|
Investment Transactions |
|
|
EBITDA by Segment (Non-GAAP) |
|
|
Pro-rata Financial Information |
|
|
Appendix |
|
|
Certain terms used in this release are defined below under the caption "Common Definitions". Certain information included in
this release constitutes non-GAAP financial measures. For a definition of the non-GAAP financial measures used in this release, see "Common Definitions" below, and for a reconciliation of those measures to their most comparable GAAP measure, see the tables set forth in the Company's supplemental financial information available at www.kennedywilson.com.
|
|
|
|
|
|
|
|
|
|
| Contact: Daven Bhavsar, CFA |
|
| Vice President of Investor Relations |
|
| (310) 887-3431 |
|
| dbhavsar@kennedywilson.com |
151 S. El Camino Drive |
| www.kennedywilson.com |
Beverly Hills, CA 90212 |
|
NEWS RELEASE
KENNEDY WILSON REPORTS THIRD QUARTER 2023 RESULTS
BEVERLY HILLS, Calif. (November 1, 2023) - Kennedy-Wilson Holdings, Inc. (NYSE: KW), a leading global real estate investment company with $25 billion in AUM across its real estate equity and debt investment portfolio, today reported results for Q3-2023:
“With high levels of inflation, interest rates at multi-decade highs and rising geopolitical issues, the global investment environment continues to face headwinds. These factors have impacted our results due to non-cash mark-to-market adjustments in our fair value portfolio for assets which are generally being held as long term investments in well capitalized joint ventures with institutional partners and are currently producing excellent net operating income," said William McMorrow, Chairman and CEO of Kennedy Wilson. “ We saw continued strong demand for rental housing and further growth in our debt investment platform and our Fee-Bearing Capital. We also remain on track to complete and lease-up several development projects in the near term, including approximately 1,000 multifamily units delivered in Q3 and over 1,300 units expected to complete by the end of Q2-24, which will continue to convert non-income producing investments into cash flowing assets."
Financial Results
|
|
|
|
|
|
|
|
|
|
|
|
|
|
|
|
|
|
|
|
|
|
|
|
|
Q3 |
|
YTD |
| (Amounts in millions, except per share data) |
2023 |
|
2022 |
|
2023 |
|
2022 |
| GAAP Results |
|
|
|
|
|
|
|
| GAAP Net (Loss) Income to Common Shareholders |
($92.2) |
|
|
$16.4 |
|
|
($94.0) |
|
|
$42.2 |
|
| Per Diluted Share |
(0.66) |
|
|
0.12 |
|
|
(0.67) |
|
|
0.31 |
|
|
|
|
|
|
|
|
|
| Non-GAAP Results |
|
|
|
|
|
|
|
| Adjusted EBITDA |
$33.2 |
|
|
$165.9 |
|
|
$319.2 |
|
|
$444.4 |
|
| Adjusted Net (Loss) Income |
(46.7) |
|
|
68.7 |
|
|
44.6 |
|
|
195.5 |
|
•Adjusted EBITDA Totals $33 million (vs. $166 million in Q3-22) Driven by Unrealized Fair Value Declines in its Co-Investment Portfolio:
◦KW's share of recurring property NOI, loan income and fees totaled $131 million in Q3-23 (vs. $130 million in Q3-22).
◦Realized gains on sale from real estate, net of non-controlling interest, totaled $14 million in Q3-23 (vs $49 million of realized gains from the sale of real and realized performance allocation from Q3-22).
◦Changes in the fair-value of the Company's co-investment portfolio and resulting adjustment to its net accrued performance allocation resulted in a non-cash $74 million net unrealized loss in Q3-23 (vs. a non-cash net unrealized loss of $7 million in Q3-22).
◦Other income totaled $3 million in Q3-23 (vs $37 million in Q3-22). Other income in Q3-22 primarily related to the increase in value of the Company's interest rate hedging derivative contracts.
•Estimated Annual NOI Increased by 3% and Fee-Bearing Capital by 46% from Q3-22:
|
|
|
|
|
|
|
|
|
|
|
|
|
|
|
|
|
Est. Annual NOI To KW
($ in millions) |
|
Fee-Bearing Capital
($ in billions) |
| As of Q3-22 |
|
|
$473 |
|
|
$5.6 |
|
| As of Q4-22 |
|
|
$491 |
|
|
$5.9 |
|
| As of Q2-23 |
|
|
$499 |
|
|
$7.9 |
|
| Gross acquisitions and loan investments |
|
|
3 |
|
|
0.3 |
|
| Gross dispositions and loan repayments |
|
|
(11) |
|
|
(0.2) |
|
| Assets stabilized/unstabilized |
|
|
2 |
|
|
— |
|
| Operations |
|
|
(1) |
|
|
— |
|
FX and other(1) |
|
|
(7) |
|
|
0.2 |
|
| Total as of Q3-23 |
|
|
$485 |
|
$8.2 |
(1) See further discussion of foreign currency hedging strategy below.
•Multifamily Same Property Performance(1) :
|
|
|
|
|
|
|
|
|
|
|
|
|
|
|
|
|
|
|
|
|
|
|
|
|
|
|
|
|
|
|
|
|
|
|
|
|
|
|
|
|
|
|
|
|
|
Q3 - 2023 vs. Q3- 2022 |
YTD - 2023 vs. YTD - 2022 |
|
Occupancy |
|
Revenue |
|
Expenses |
|
NOI |
Occupancy |
|
Revenue |
|
Expenses |
|
NOI |
| Multifamily - Market Rate |
0.1% |
|
3.6% |
|
5.3% |
|
2.8% |
(0.6)% |
|
4.1% |
|
5.7% |
|
3.3% |
| Multifamily - Affordable |
(0.5)% |
|
7.0% |
|
14.5% |
|
3.5% |
(0.9)% |
|
8.2% |
|
15.4% |
|
4.9% |
| Total |
—% |
|
4.1% |
|
6.6% |
|
2.9% |
(0.6)% |
|
4.7% |
|
7.4% |
|
3.5% |
(1) Excludes minority-held investments and assets under going development or lease-up.
•U.S. Multifamily - Market Rate:
◦Mountain West and Pacific Northwest : The Company's Mountain West and Pacific Northwest portfolio, which represents 73% of its U.S. market-rate same-property portfolio, generated same-property revenue growth of 5% and NOI growth of 4% in Q3-23 (vs. Q3-22).
◦California: Same Property results in California continue to be impacted by higher delinquencies related to the expiration of governmental rental assistance programs and elevated one-time eviction related costs. The Company received $2.8 million in YTD-22 in rental assistance payments vs. $0.2 million in YTD-23.
•Office Same Property Performance(1):
|
|
|
|
|
|
|
|
|
|
|
|
|
|
|
|
|
|
|
|
|
|
|
|
|
|
|
|
|
|
|
|
|
|
|
|
|
|
|
|
|
|
|
|
|
|
Q3-2023 vs. Q3-2022 |
YTD - 2023 vs. YTD - 2022 |
|
Occupancy |
|
Revenue |
|
Expenses |
|
NOI |
Occupancy |
|
Revenue |
|
Expenses |
|
NOI |
| Office |
0.3% |
|
0.5% |
|
6.3% |
|
(0.4)% |
1.0% |
|
1.3% |
|
2.9% |
|
1.0% |
(1) Excludes minority-held investments and assets under going development or lease-up.
•Development and Lease-Up Portfolio Update:
◦Dublin Multifamily Completions: Completed construction of 471-unit Coopers Cross and 287-unit Grange multifamily projects in Dublin, which are leasing up ahead of business plan.
◦U.S. Multifamily Lease-Up:
▪Stabilized the 227-unit Quinn by Vintage and 197-unit Station by Vintage communities in the Pacific Northwest. The Company's Vintage affordable multifamily portfolio totals over 10,000 stabilized units with another 1,765 under development or lease-up.
▪The Company has begun delivering units at its two Mountain West market-rate development projects, Dovetail and Oxbow, which will total 508 units at completion. Construction is expected to complete during the first half of 2024.
◦Approximately 70% of the Company's development and lease-up up portfolio is expected to stabilize by YE-24. The Company has completed 82% of total expected development costs of $592 million, with its share of remaining expected cash investment to complete construction totaling approximately $32 million.
Investment Activity
•$343 million in Gross New Investments ($28 million at share):
◦Co-Investment Acquisitions: Acquired the final tranche of loans totaling $212 million from the previously announced $4.1 billion loan acquisition from Pacific Western Bank (KW share 5%). The Company also acquired two UK industrial assets totaling $36 million (KW share 20%) and a 315-unit multifamily property in the Pacific Northwest for $94 million (KW share 10%).
• $499 million in Gross Dispositions and Loan Repayments ($131 million at share):
◦Consolidated Portfolio:
▪Multifamily Dispositions: Sold a 200-unit multifamily property located in Montana for $62 million, in which the Company had a 80% ownership interest. The disposition generated a gain on sale of $20 million (net of non-controlling interest).
▪Further Progress On Non-Core Asset Sales: Sold six UK retail assets, one retail asset in Dublin, Ireland, and one Mountain West retail asset for $52 million.
◦Co-Investment Portfolio: The Company had loan repayments totaling $376 million (KW share 7%).
Investment Management
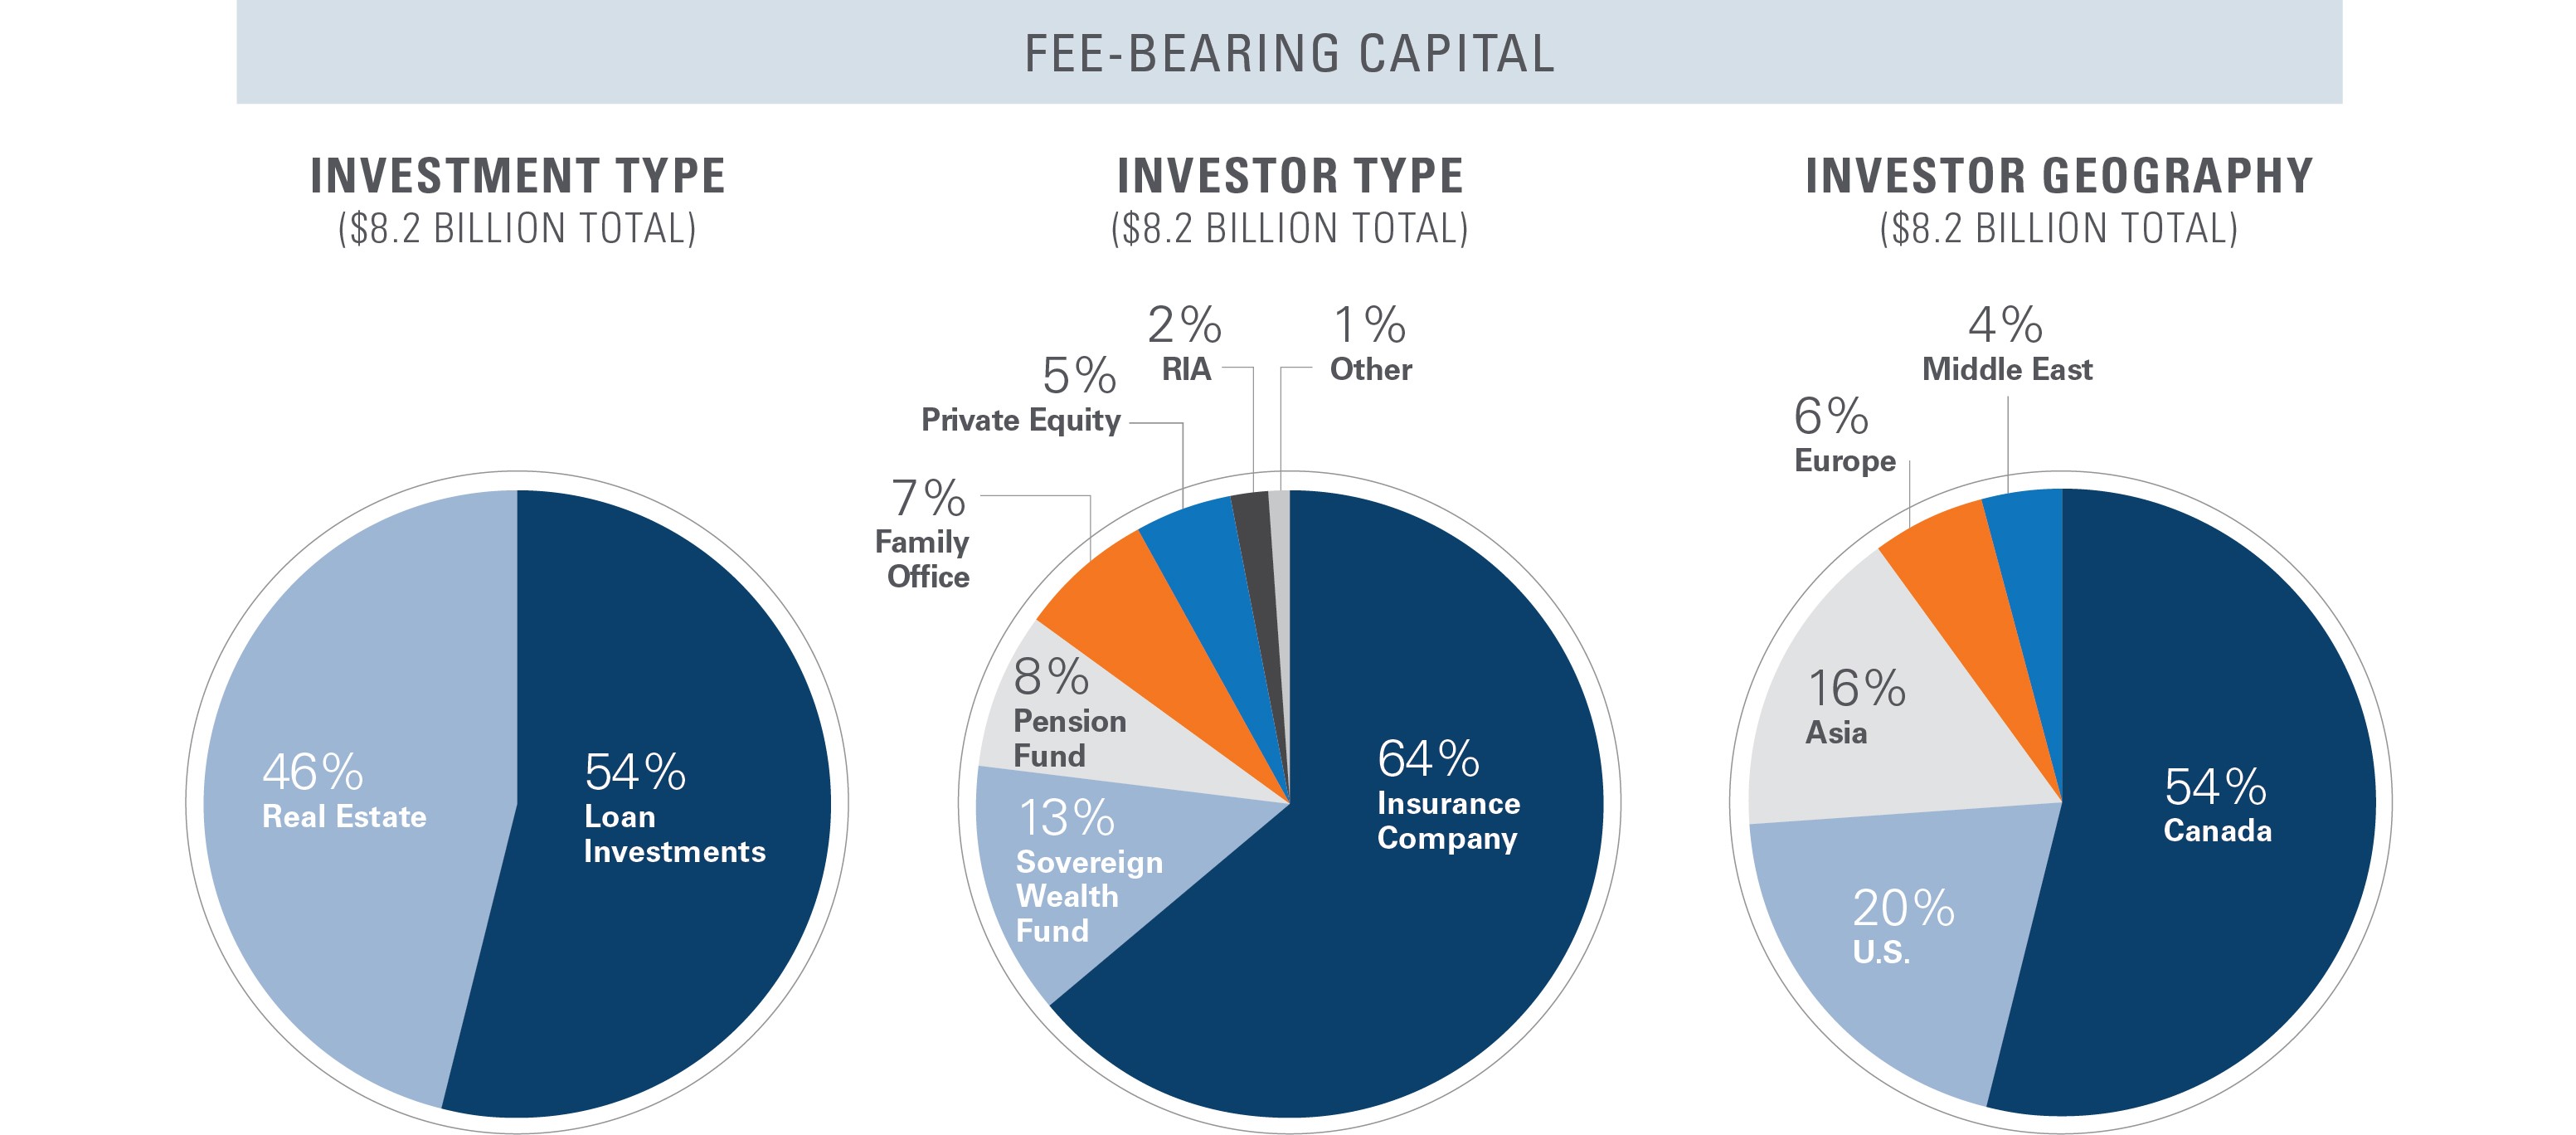
•Fee-Bearing Capital Grows to a Record $8.2 billion; +39% YTD: 4% quarterly growth in Fee-Bearing Capital with approximately $3.2 billion in additional non-discretionary capital with certain strategic partners that is currently available for investment:
◦Debt Investment Platform Doubles in Size in 2023:
◦In Q3, the Company acquired the final tranche of loans as part of the previously announced Pacific Western Bank transaction, totaling $212 million, while also completing $252 million in additional fundings and realizing $376 million in repayments (acquired for $364 million), increasing the debt platform by 2% in Q3-23.
◦The Debt Investment Platform totals $6.5 billion of outstanding loans (including $1.8 billion of future funding commitments) and $4.4 billion of Fee-Bearing Capital at quarter-end, in which the Company has a 5% ownership interest in.
Balance Sheet and Liquidity
•Cash and Line of Credit Availability: As of September 30, 2023, Kennedy Wilson had a total of $331 million(1) in cash and cash equivalents and $146 million drawn on its $500 million revolving credit facility.
•Debt Profile: Kennedy Wilson's share of debt had a weighted average effective interest rate of 4.3% per annum and a weighted average maturity of 5.4 years as of September 30, 2023. Approximately 100% of the Company's debt is either fixed or hedged with interest rate hedges.
•Interest Rate Hedging Strategy: The Company hedges its floating rate exposure through the usage of interest rate caps and swaps. The Company's interest rate hedges have a weighted average maturity of 1.7 years.
•Foreign Currency Hedging Strategy: Kennedy Wilson hedges its exposure to foreign currency fluctuations by borrowing in the currency in which it invests and using foreign currency hedging instruments. As of September 30, 2023, the Company has hedged approximately 92% of the carrying value of its foreign currency investments, using local currency debt and hedging instruments with a weighted average term of 2.2 years.
Subsequent Events
In October, the Company sold a wholly-owned office property located in the United Kingdom for a sale price of $46 million, resulting in a gain on sale of approximately $13 million.
________________________________________________________________________________________
Footnotes
(1) Represents consolidated cash and includes $65 million of restricted cash, which is included in cash and cash equivalents and primarily relates to lender reserves associated with consolidated mortgages that we hold on properties. These reserves typically relate to interest, tax, insurance and future capital expenditures at the properties. Additionally, we are subject to withholding taxes to the extent we repatriate cash from certain of our foreign subsidiaries. Under the KWE Notes covenants we have to maintain certain interest coverage and leverage ratios to remain in compliance (see "Indebtedness and Related Covenants" for more detail on KWE Notes in the Company's quarterly report). Due to these covenants, we evaluate the tax and covenant implications before we distribute cash, which could impact the availability of funds at the corporate level. The Company's share of cash, including unconsolidated joint-ventures, totals $425 million.
Conference Call and Webcast Details
Kennedy Wilson will hold a live conference call and webcast to discuss results at 9:00 a.m. PT/ 12:00 p.m. ET on Thursday, November 2. The direct dial-in number for the conference call is (844) 340-4761 for U.S. callers and (412) 717-9616 for international callers. A replay of the call will be available for one week beginning one hour after the live call and can be accessed by (877) 344-7529 for U.S. callers and (412) 317-0088 for international callers. The passcode for the replay is 1180933.
The webcast will be available at: https://event.choruscall.com/mediaframe/webcast.html?webcastid=7Cb4wg0G. A replay of the webcast will be available one hour after the original webcast on the Company’s investor relations web site for three months.
About Kennedy Wilson
Kennedy Wilson (NYSE:KW) is a leading global real estate investment company. We own, operate, and invest in real estate through our balance sheet and through our investment management platform in the United States, United Kingdom, and Ireland. We primarily focus on multifamily and office properties as well as industrial and debt investments in our investment management business. For further information on Kennedy Wilson, please visit www.kennedywilson.com.
Kennedy-Wilson Holdings, Inc.
Consolidated Balance Sheets
(Unaudited)
(Dollars in millions)
|
|
|
|
|
|
|
|
|
|
|
|
|
|
|
| |
|
September 30,
2023 |
|
December 31,
2022 |
| Assets |
|
|
|
|
| Cash and cash equivalents |
|
$ |
330.9 |
|
|
$ |
439.3 |
|
| Accounts receivable |
|
47.4 |
|
|
40.8 |
|
Real estate and acquired in place lease values (net of accumulated depreciation and amortization of $922.1 and $882.2) |
|
4,849.6 |
|
|
5,188.1 |
|
Unconsolidated investments (including $2,089.2 and $2,093.7 at fair value) |
|
2,232.7 |
|
|
2,238.1 |
|
| Other assets |
|
211.7 |
|
|
216.1 |
|
| Loan purchases and originations |
|
238.0 |
|
|
149.4 |
|
| Total assets |
|
$ |
7,910.3 |
|
|
$ |
8,271.8 |
|
|
|
|
|
|
| Liabilities |
|
|
|
|
| Accounts payable |
|
$ |
14.0 |
|
|
$ |
16.2 |
|
| Accrued expenses and other liabilities (including $284.0 and $303.7 of deferred tax liabilities) |
|
593.1 |
|
|
658.2 |
|
| Mortgage debt |
|
2,821.2 |
|
|
3,018.0 |
|
| KW unsecured debt |
|
1,928.9 |
|
|
2,062.6 |
|
| KWE unsecured bonds |
|
500.8 |
|
|
506.4 |
|
| Total liabilities |
|
5,858.0 |
|
|
6,261.4 |
|
| Equity |
|
|
|
|
| Cumulative perpetual preferred stock |
|
790.5 |
|
|
592.5 |
|
| Common stock |
|
— |
|
|
— |
|
| Additional paid-in capital |
|
1,717.7 |
|
|
1,679.5 |
|
| Retained (deficit) earnings |
|
(72.3) |
|
|
122.1 |
|
| Accumulated other comprehensive loss |
|
(427.3) |
|
|
(430.1) |
|
| Total Kennedy-Wilson Holdings, Inc. shareholders’ equity |
|
2,008.6 |
|
|
1,964.0 |
|
| Noncontrolling interests |
|
43.7 |
|
|
46.4 |
|
| Total equity |
|
2,052.3 |
|
|
2,010.4 |
|
| Total liabilities and equity |
|
$ |
7,910.3 |
|
|
$ |
8,271.8 |
|
Kennedy-Wilson Holdings, Inc.
Consolidated Statements of Operations
(Unaudited)
(Dollars in millions, except share amounts and per share data)
|
|
|
|
|
|
|
|
|
|
|
|
|
|
|
|
|
|
|
|
|
|
|
|
|
|
|
|
|
Three Months Ended September 30, |
|
Nine Months Ended September 30, |
|
|
2023 |
|
2022 |
|
2023 |
|
2022 |
| Revenue |
|
|
|
|
|
|
|
|
| Rental |
|
$ |
102.4 |
|
|
$ |
110.9 |
|
|
$ |
315.6 |
|
|
$ |
324.4 |
|
| Hotel |
|
16.6 |
|
|
14.0 |
|
|
42.7 |
|
|
33.2 |
|
| Investment management fees |
|
15.5 |
|
|
11.2 |
|
|
45.6 |
|
|
33.5 |
|
| Property services fees |
|
0.7 |
|
|
0.5 |
|
|
1.6 |
|
|
1.3 |
|
| Loans and other |
|
6.1 |
|
|
3.0 |
|
|
14.5 |
|
|
8.0 |
|
| Total revenue |
|
141.3 |
|
|
139.6 |
|
|
420.0 |
|
|
400.4 |
|
|
|
|
|
|
|
|
|
|
| (Loss) income from unconsolidated investments |
|
|
|
|
|
|
|
|
| Principal co-investments |
|
(56.1) |
|
|
30.3 |
|
|
(33.4) |
|
|
147.9 |
|
| Performance allocations |
|
(17.9) |
|
|
(18.0) |
|
|
(36.3) |
|
|
0.5 |
|
| Total (loss) income from unconsolidated investments |
|
(74.0) |
|
|
12.3 |
|
|
(69.7) |
|
|
148.4 |
|
|
|
|
|
|
|
|
|
|
| Gain on sale of real estate, net |
|
30.4 |
|
|
37.0 |
|
|
138.6 |
|
|
50.8 |
|
|
|
|
|
|
|
|
|
|
| Expenses |
|
|
|
|
|
|
|
|
| Rental |
|
38.4 |
|
|
38.6 |
|
|
113.7 |
|
|
110.7 |
|
| Hotel |
|
9.8 |
|
|
8.6 |
|
|
27.4 |
|
|
20.5 |
|
Compensation and related (including $7.3, $7.3, $21.7, $21.7 of share-based compensation) |
|
31.1 |
|
|
33.8 |
|
|
98.7 |
|
|
103.7 |
|
| Performance allocation compensation |
|
(6.0) |
|
|
(6.6) |
|
|
(5.5) |
|
|
3.2 |
|
| General and administrative |
|
8.4 |
|
|
9.2 |
|
|
25.5 |
|
|
26.5 |
|
| Depreciation and amortization |
|
38.8 |
|
|
46.1 |
|
|
118.3 |
|
|
132.7 |
|
| Total expenses |
|
120.5 |
|
|
129.7 |
|
|
378.1 |
|
|
397.3 |
|
| Interest expense |
|
(64.2) |
|
|
(57.1) |
|
|
(192.5) |
|
|
(160.8) |
|
| Loss on early extinguishment of debt |
|
— |
|
|
(1.3) |
|
|
(1.6) |
|
|
(2.4) |
|
| Other income |
|
3.2 |
|
|
36.7 |
|
|
24.5 |
|
|
46.1 |
|
| (Loss) income before provision for income taxes |
|
(83.8) |
|
|
37.5 |
|
|
(58.8) |
|
|
85.2 |
|
| Benefit from (provision for) income taxes |
|
19.7 |
|
|
(13.9) |
|
|
13.3 |
|
|
(22.5) |
|
| Net (loss) income |
|
(64.1) |
|
|
23.6 |
|
|
(45.5) |
|
|
62.7 |
|
| Net (income) loss attributable to noncontrolling interests |
|
(17.3) |
|
|
0.7 |
|
|
(21.4) |
|
|
0.5 |
|
Preferred dividends |
|
(10.8) |
|
|
(7.9) |
|
|
(27.1) |
|
|
(21.0) |
|
| Net (loss) income attributable to Kennedy-Wilson Holdings, Inc. common shareholders |
|
$ |
(92.2) |
|
|
$ |
16.4 |
|
|
$ |
(94.0) |
|
|
$ |
42.2 |
|
| Basic earnings (loss) per share |
|
|
|
|
|
|
|
|
| (Loss) earnings per share |
|
$ |
(0.66) |
|
|
$ |
0.12 |
|
|
$ |
(0.67) |
|
|
$ |
0.31 |
|
| Weighted average shares outstanding |
|
139,391,316 |
|
|
136,840,874 |
|
|
138,914,964 |
|
|
136,832,102 |
|
| Diluted (loss) earnings share |
|
|
|
|
|
|
|
|
| (Loss) earnings per share |
|
$ |
(0.66) |
|
|
$ |
0.12 |
|
|
$ |
(0.67) |
|
|
$ |
0.31 |
|
| Weighted average shares outstanding |
|
139,391,316 |
|
|
137,078,495 |
|
|
138,914,964 |
|
|
137,136,352 |
|
| Dividends declared per common share |
|
$ |
0.24 |
|
|
$ |
0.24 |
|
|
$ |
0.72 |
|
|
$ |
0.72 |
|
Kennedy-Wilson Holdings, Inc.
Adjusted EBITDA
(Unaudited)
(Dollars in millions)
The table below reconciles net income attributable to Kennedy-Wilson Holdings, Inc. common shareholders to Adjusted EBITDA, using Kennedy Wilson’s pro-rata share amounts for each adjustment item.
|
|
|
|
|
|
|
|
|
|
|
|
|
|
|
|
|
|
|
|
|
|
|
|
|
|
|
|
|
Three Months Ended |
|
Nine Months Ended |
|
|
September 30, |
|
September 30, |
|
|
2023 |
|
2022 |
|
2023 |
|
2022 |
| Net (loss) income attributable to Kennedy-Wilson Holdings, Inc. common shareholders |
|
$ |
(92.2) |
|
|
$ |
16.4 |
|
|
$ |
(94.0) |
|
|
$ |
42.2 |
|
| Non-GAAP adjustments: |
|
|
|
|
|
|
|
|
Add back (Kennedy Wilson's Share)(1): |
|
|
|
|
|
|
|
|
| Interest expense |
|
89.4 |
|
|
72.9 |
|
|
259.6 |
|
|
201.8 |
|
| Loss on early extinguishment of debt |
|
— |
|
|
1.3 |
|
|
1.6 |
|
|
2.4 |
|
Depreciation and amortization |
|
38.2 |
|
|
45.0 |
|
|
116.9 |
|
|
131.6 |
|
| (Benefit from) provision for income taxes |
|
(20.3) |
|
|
15.1 |
|
|
(13.7) |
|
|
23.7 |
|
| Preferred dividends |
|
10.8 |
|
|
7.9 |
|
|
27.1 |
|
|
21.0 |
|
| Share-based compensation |
|
7.3 |
|
|
7.3 |
|
|
21.7 |
|
|
21.7 |
|
| Adjusted EBITDA |
|
$ |
33.2 |
|
|
$ |
165.9 |
|
|
$ |
319.2 |
|
|
$ |
444.4 |
|
(1) See Appendix for reconciliation of Kennedy Wilson's Share amounts.
Adjusted Net Income
(Unaudited)
(Dollars in millions, except share data)
The table below reconciles net income attributable to Kennedy-Wilson Holdings, Inc. common shareholders to Adjusted Net Income, using Kennedy Wilson’s pro-rata share amounts for each adjustment item.
|
|
|
|
|
|
|
|
|
|
|
|
|
|
|
|
|
|
|
|
|
|
|
|
|
|
|
|
|
Three Months Ended |
|
Nine Months Ended |
|
|
September 30, |
|
September 30, |
|
|
2023 |
|
2022 |
|
2023 |
|
2022 |
| Net (loss) income attributable to Kennedy-Wilson Holdings, Inc. common shareholders |
|
$ |
(92.2) |
|
|
$ |
16.4 |
|
|
$ |
(94.0) |
|
|
$ |
42.2 |
|
| Non-GAAP adjustments: |
|
|
|
|
|
|
|
|
Add back (Kennedy Wilson's Share)(1): |
|
|
|
|
|
|
|
|
| Depreciation and amortization |
|
38.2 |
|
|
45.0 |
|
|
116.9 |
|
|
131.6 |
|
| Share-based compensation |
|
7.3 |
|
|
7.3 |
|
|
21.7 |
|
|
21.7 |
|
| Adjusted Net (Loss) Income |
|
$ |
(46.7) |
|
|
$ |
68.7 |
|
|
$ |
44.6 |
|
|
$ |
195.5 |
|
|
|
|
|
|
|
|
|
|
| Weighted average shares outstanding for diluted |
|
139,391,316 |
|
|
137,078,495 |
|
|
138,914,964 |
|
|
137,136,352 |
|
(1) See Appendix for reconciliation of Kennedy Wilson's Share amounts.
Forward-Looking Statements
Statements made by us in this report and in other reports and statements released by us that are not historical facts constitute "forward-looking statements" within the meaning of Section 27A of the Securities Act of 1933, as amended, and Section 21E of the Securities Exchange Act of 1934, as amended. These forward-looking statements are necessarily estimates reflecting the judgment of our senior management based on our current estimates, expectations, forecasts and projections and include comments that express our current opinions about trends and factors that may impact future operating results. Disclosures that use words such as "believe," "anticipate," "estimate," "intend," "may," "could," "plan," "expect," "project" or the negative of these, as well as similar expressions, are intended to identify forward-looking statements. These statements are not guarantees of future performance, rely on a number of assumptions concerning future events, many of which are outside of our control, and involve known and unknown risks and uncertainties that could cause our actual results, performance or achievement, or industry results, to differ materially from any future results, performance or achievements expressed or implied by such forward-looking statements. These risks and uncertainties may include the factors and the risks and uncertainties described elsewhere in this report and other filings with the Securities and Exchange Commission (the "SEC"), including the Item 1A. "Risk Factors" section of our Annual Report on Form 10-K for the year ended December 31, 2021, as amended by our subsequent filings with the SEC. Any such forward-looking statements, whether made in this report or elsewhere, should be considered in the context of the various disclosures made by us about our businesses including, without limitation, the risk factors discussed in our filings with the SEC. Except as required under the federal securities laws and the rules and regulations of the SEC, we do not have any intention or obligation to update publicly any forward-looking statements, whether as a result of new information, future events, changes in assumptions, or otherwise.
Common Definitions
· “KWH,” "KW," “Kennedy Wilson,” the "Company," "we," "our," or "us" refers to Kennedy-Wilson Holdings, Inc. and its wholly-owned subsidiaries.
· “Adjusted EBITDA” represents net income before interest expense, loss (gain) on early extinguishment of debt, our share of interest expense included in unconsolidated investments, depreciation and amortization, our share of depreciation and amortization included in unconsolidated investments, provision for (benefit from) income taxes, our share of taxes included in unconsolidated investments, share-based compensation for the Company, and EBITDA attributable to noncontrolling interests.
Please also see the reconciliation to GAAP in the Company’s supplemental financial information included in this release and also available at www.kennedywilson.com. Our management uses Adjusted EBITDA to analyze our business because it adjusts net income for items we believe do not accurately reflect the nature of our business going forward or that relate to non-cash compensation expense or noncontrolling interests. Such items may vary for different companies for reasons unrelated to overall operating performance. Additionally, we believe Adjusted EBITDA is useful to investors to assist them in getting a more accurate picture of our results from operations. However, Adjusted EBITDA is not a recognized measurement under GAAP and when analyzing our operating performance, readers should use Adjusted EBITDA in addition to, and not as an alternative for, net income as determined in accordance with GAAP. Because not all companies use identical calculations, our presentation of Adjusted EBITDA may not be comparable to similarly titled measures of other companies. Furthermore, Adjusted EBITDA is not intended to be a measure of free cash flow for management’s discretionary use, as it does not remove all non-cash items or consider certain cash requirements such as tax and debt service payments. The amount shown for Adjusted EBITDA also differs from the amount calculated under similarly titled definitions in our debt instruments, which are further adjusted to reflect certain other cash and non-cash charges and are used to determine compliance with financial covenants and our ability to engage in certain activities, such as incurring additional debt and making certain restricted payments.
· "Adjusted Fees" refers to Kennedy Wilson’s gross investment management and property services fees adjusted to include Kennedy Wilson's share of fees eliminated in consolidation, Kennedy Wilson’s share of fees in unconsolidated service businesses and performance fees included in unconsolidated investments. Our management uses Adjusted fees to analyze our investment management and real estate services business because the measure removes required eliminations under GAAP for properties in which the Company provides services but also has an ownership interest. These eliminations understate the economic value of the investment management and property services fees and makes the Company comparable to other real estate companies that provide investment management and real estate services but do not have an ownership interest in the properties they manage. Our management believes that adjusting GAAP fees to reflect these amounts eliminated in consolidation presents a more holistic measure of the scope of our investment management and real estate services business.
· “Adjusted Net Income” represents net income (loss) before depreciation and amortization, Kennedy Wilson's share of depreciation and amortization included in unconsolidated investments, share-based compensation, and excluding net income attributable to noncontrolling interests, before depreciation and amortization and preferred dividends. Please also see the reconciliation to GAAP in the Company’s supplemental financial information included in this release and also available at www.kennedywilson.com.
· “Annual Return on Loans” is a metric that applies to our real estate debt business that represents the sum of annual interest income, transaction fees and the payback of principal for discounted loan purchases, amortized over the life of the loans and divided by the principal balances of the loans.
· "Cap rate" represents the net operating income of an investment for the year preceding its acquisition or disposition, as applicable, divided by the purchase or sale price, as applicable. Capitalization ("Cap") rates set forth in this presentation only include data from income-producing properties. We calculate cap rates based on information that is supplied to us during the acquisition diligence process. This information is not audited or reviewed by independent accountants and may be presented in a manner that is different from similar information included in our financial statements prepared in accordance with GAAP. In addition, cap rates represent historical performance and are not a guarantee of future NOI. Properties for which a cap rate is provided may not continue to perform at that cap rate.
· "Equity partners" refers to non-wholly-owned subsidiaries that we consolidate in our financial statements under U.S. GAAP and third-party equity providers.
· "Estimated Annual NOI" is a property-level non-GAAP measure representing the estimated annual net operating income from each property as of the date shown, inclusive of rent abatements (if applicable). The calculation excludes depreciation and amortization expense, and does not capture the changes in the value of our properties that result from use or market conditions, nor the level of capital expenditures, tenant improvements, and leasing commissions necessary to maintain the operating performance of our properties. For assets wholly-owned and fully occupied by KW, the Company provides an estimated NOI for valuation purposes of $4.2 million, which includes an assumption for applicable market rents. Any of the enumerated items above could have a material effect on the performance of our properties. Also, where specifically noted, for properties purchased in 2023, the NOI represents estimated Year 1 NOI from our original underwriting. Estimated year 1 NOI for properties purchased in 2023 may not be indicative of the actual results for those properties. Estimated annual NOI is not an indicator of the actual annual net operating income that the Company will or expects to realize in any period. Please also see the definition of "Net operating income" below.
· "Fee-Bearing Capital" represents total third-party committed or invested capital that we manage in our joint-ventures and commingled funds that entitle us to earn fees, including without limitation, asset management fees, construction management fees, acquisition and disposition fees and/or promoted interest, if applicable.
· "Gross Asset Value” refers to the gross carrying value of assets, before debt, depreciation and amortization, and net of noncontrolling interests.
· "Net operating income" or "NOI” is a non-GAAP measure representing the income produced by a property calculated by deducting certain property expenses from property revenues. Our management uses net operating income to assess and compare the performance of our properties and to estimate their fair value.
Net operating income does not include the effects of depreciation or amortization or gains or losses from the sale of properties because the effects of those items do not necessarily represent the actual change in the value of our properties resulting from our value-add initiatives or changing market conditions. Our management believes that net operating income reflects the core revenues and costs of operating our properties and is better suited to evaluate trends in occupancy and lease rates. Please also see the reconciliation to GAAP in the Company’s supplemental financial information included in this release and also available at www.kennedywilson.com.
· "Noncontrolling interests" represents the portion of equity ownership in a consolidated subsidiary not attributable to Kennedy Wilson.
· "Performance allocations” relates to allocations to the Company of Kennedy Wilson's co-investments it invests in and manages based on the cumulative performance of the fund or investment vehicle, as applicable, and are subject to preferred return thresholds of the limited partners.
· "Performance allocation compensation” - the compensation committee of the Company’s board of directors approved and reserved between twenty percent (20%) and thirty-five percent (35%) of any performance allocation earned by certain commingled funds and separate account investments to be allocated to certain non-NEO employees of the Company.
· "Principal co-investments” consists of the Company’s share of income or loss earned on investments in which the Company can exercise significant influence but does not have control. Income from unconsolidated investments includes income from ordinary course operations of the underlying investment, gains on sale, fair value gains and losses.
· "Pro-Rata" represents Kennedy Wilson's share calculated by using our proportionate economic ownership of each asset in our portfolio. Please also refer to the pro-rata financial data in our supplemental financial information.
· "Property NOI" or "Property-level NOI" is a non-GAAP measure calculated by deducting the Company's Pro-Rata share of rental and hotel property expenses from the Company's Pro-Rata rental, hotel and loans and other revenues. Please also see the reconciliation to GAAP in the Company’s supplemental financial information included in this release and also available at www.kennedywilson.com.
· "Real Estate Assets under Management" ("AUM") generally refers to the properties and other assets with respect to which we provide (or participate in) oversight, investment management services and other advice, and which generally consist of real estate properties or loans, and investments in joint ventures. Our AUM is principally intended to reflect the extent of our presence in the real estate market, not the basis for determining our management fees. Our AUM consists of the total estimated fair value of the real estate properties and other real estate related assets either owned by third parties, wholly-owned by us or held by joint ventures and other entities in which our sponsored funds or investment vehicles and client accounts have invested. Committed (but unfunded) capital from investors in our sponsored funds is not included in our AUM. The estimated value of development properties is included at estimated completion cost. The accuracy of estimating fair value for investments cannot be determined with precision and cannot be substantiated by comparison to quoted prices in active markets and may not be realized in a current sale or immediate settlement of the asset or liability (particularly given the ongoing macroeconomic conditions such as, but not limited to, recent adverse developments affecting regional banks and other financial institutions, high inflation and central banks raising interest rates to curtail high inflation continue to fuel recessionary fears). Additionally, there are inherent uncertainties in any fair value measurement technique, and changes in the underlying assumptions used, including capitalization rates, discount rates, liquidity risks, and estimates of future cash flows could significantly affect the fair value measurement amounts. All valuations of real estate involve subjective judgments, and the actual market price of real estate can only be determined by negotiation between independent parties in a sales transaction.
· "Return on Equity" is a ratio calculated by dividing the net cash distributions of an investment to Kennedy Wilson, after the cost of leverage, if applicable, by the total cash contributions by Kennedy Wilson over the lifetime of the investment.
· “Same property” refers to stabilized consolidated and unconsolidated properties in which Kennedy Wilson has an ownership interest during the entire span of both periods being compared. This analysis excludes properties that during the comparable periods (i) were acquired, (ii) were sold, (iii) are either under development or undergoing lease up or major repositioning as part of the Company’s asset management strategy, (iv) were investments in which the Company holds a minority ownership position, and (v) certain non-recurring income and expenses. The analysis only includes Office, Multifamily and Hotel properties, where applicable. To derive an appropriate measure of operating performance across the comparable periods, the Company removes the effects of foreign currency exchange rate movements by using the reported period-end exchange rate to translate from local currency into the U.S. dollar, for both periods. Amounts are calculated using Kennedy Wilson’s ownership share in the Company’s consolidated and unconsolidated properties. Management evaluates the performance of the operating properties the Company owns and manages using a “same property” analysis because the population of properties in this analysis is consistent from period to period, which allows management and investors to analyze (i) the Company’s ongoing business operations and (ii) the revenues and expenses directly associated with owning and operating the Company’s properties and the impact to operations from trends in occupancy rates, rental rates and operating costs. Same property metrics are widely recognized measures in the real estate industry, however, other publicly-traded real estate companies may not calculate and report same property results in the same manner as the Company.
Note about Non-GAAP and certain other financial information included in this presentation
In addition to the results reported in accordance with U.S. generally accepted accounting principles ("GAAP") included within this presentation, Kennedy Wilson has provided certain information, which includes non-GAAP financial measures (including Adjusted EBITDA, Adjusted Net Income, Net Operating Income, and Adjusted Fees, as defined above). Such information is reconciled to its closest GAAP measure in accordance with the rules of the SEC, and such reconciliations are included within this presentation. These measures may contain cash and non-cash acquisition-related gains and expenses and gains and losses from the sale of real-estate related investments. Consolidated non-GAAP measures discussed throughout this report contain income or losses attributable to non-controlling interests. Management believes that these non-GAAP financial measures are useful to both management and Kennedy Wilson's shareholders in their analysis of the business and operating performance of the Company. Management also uses this information for operational planning and decision-making purposes. Non-GAAP financial measures are not and should not be considered a substitute for any GAAP measures. Additionally, non-GAAP financial measures as presented by Kennedy Wilson may not be comparable to similarly titled measures reported by other companies. Annualized figures used throughout this release and supplemental financial information, and our estimated annual net operating income metrics, are not an indicator of the actual net operating income that the Company will or expects to realize in any period.
KW-IR
|
|
|
|
|
|
|
|
|
|
|
|
|
|
|
| Supplemental Financial Information |
|
|
|
|
|
|
Kennedy-Wilson Holdings, Inc.
Capitalization Summary
(Unaudited)
(Dollars in millions, except per share data)
|
|
|
|
|
|
|
|
|
|
|
|
|
|
|
|
|
September 30, 2023 |
|
December 31, 2022 |
| Market Data |
|
|
|
|
Common stock price per share |
|
$ |
14.74 |
|
|
$ |
15.73 |
|
| Common stock and convertible preferred stock |
|
|
|
|
| Common stock shares outstanding |
|
139,390,837 |
|
|
137,790,768 |
|
Shares of common stock underlying convertible perpetual preferred stock and warrants(1)(2)(3) |
|
37,458,836 |
|
|
25,091,671 |
|
| Total Common stock outstanding and underlying convertible preferred stock and warrants |
|
176,849,673 |
|
|
162,882,439 |
|
|
|
|
|
|
| Equity Market Capitalization |
|
$ |
2,606.8 |
|
|
$ |
2,562.1 |
|
|
|
|
|
|
| Kennedy Wilson's Share of Debt |
|
|
|
|
| Kennedy Wilson's share of property debt |
|
5,355.0 |
|
|
5,351.5 |
|
| Senior notes payable |
|
1,800.0 |
|
|
1,800.0 |
|
| Kennedy Wilson Europe bonds |
|
502.3 |
|
|
508.4 |
|
| Credit Facility |
|
145.7 |
|
|
282.0 |
|
| Total Kennedy Wilson's share of debt |
|
7,803.0 |
|
|
7,941.9 |
|
| Total Capitalization |
|
$ |
10,409.8 |
|
|
$ |
10,504.0 |
|
| Less: Kennedy Wilson's share of cash |
|
(424.6) |
|
|
(519.5) |
|
| Total Enterprise Value |
|
$ |
9,985.2 |
|
|
$ |
9,984.5 |
|
(1) Assumes conversion of $300 million of our Series A convertible perpetual preferred stock based on current conversion price of $25.00 per share. The Series A preferred stock is callable by Kennedy Wilson on and after October 15, 2025.
(2) Assumes exercise of warrants based on current conversion price of $23.00 per share, which were issued along with $300 million Series B perpetual preferred stock. The Series B preferred stock is callable by Kennedy Wilson at any time.
(3) Assumes exercise of warrants based on current conversion price of $16.21 per share, which were issued along with $200 million Series C perpetual preferred stock. The Series C preferred stock is callable by Kennedy Wilson at any time.
Kennedy-Wilson Holdings, Inc.
Components of Value Summary
As of September 30, 2023
(Unaudited, Dollars in millions)
Below are key valuation metrics provided to assist in the calculation of a sum-of-the-parts valuation of the Company as of September 30, 2023.
|
|
|
|
|
|
|
|
|
|
|
|
|
|
|
|
|
|
|
|
|
|
|
|
|
|
|
|
|
|
|
|
|
|
|
|
|
Kennedy Wilson's Share |
|
|
| Investments |
|
Description |
|
Occupancy |
|
Est. Annual NOI(1) |
|
Page # |
| Income Producing Assets |
|
|
|
|
|
|
|
|
| 1 |
Multifamily(2) |
|
33,514 units |
|
94.0% |
|
$ |
260.2 |
|
|
|
| 2 |
Office |
|
9.6 million square feet |
|
93.6% |
|
140.4 |
|
|
|
| 3 |
Industrial |
|
10.4 million square feet |
|
98.2% |
|
14.3 |
|
|
|
| 4 |
Retail |
|
3.2 million square feet |
|
91.4% |
|
24.3 |
|
|
|
| 5 |
Hotels |
|
1 Hotel / 265 Hotel Rooms |
|
N/A |
|
20.6 |
|
|
|
| 6 |
Loan Investments |
|
98 loan investments
KW Loan balance of $255.9 million
|
|
N/A |
|
25.6 |
|
|
|
|
Total Estimated Annual NOI |
|
|
|
|
|
$ |
485.4 |
|
|
|
|
|
|
|
|
|
|
|
|
|
| Lease-up, Development, and Non-income Producing Assets |
|
|
|
KW Gross Asset Value |
|
|
| 7 |
Lease-up Portfolio(3)(4) |
|
919 multifamily units
1.4 million office sq. ft.
0.4 million industrial sq. ft.
0.1 million retail sq. ft.
One five-star resort
|
|
38.6% |
|
$ |
1,074.6 |
|
|
|
| 8 |
Development Projects(3)(4) |
|
3,066 multifamily units
0.5 million office sq. ft.
|
|
N/A |
|
679.1 |
|
|
| 9 |
Residential and other(3) |
|
11 investments |
|
N/A |
|
204.5 |
|
|
|
Total KW Gross Asset Value |
|
|
|
|
|
$ |
1,958.2 |
|
|
|
|
|
|
|
|
|
|
|
|
|
| Investment Management |
|
Fee-Bearing Capital |
|
Total |
|
|
| 10 |
Investment management |
|
Asset management fees (TTM)(5) |
|
$8,200 |
|
$ |
49.3 |
|
|
|
| 11 |
Investment management |
|
Accrued performance allocations, net |
|
|
|
$ |
73.4 |
|
|
|
|
|
|
|
|
|
|
|
|
|
| Net Debt, Hedging and KW Share Count |
|
|
|
|
|
Total |
|
|
| 12 |
KW Share of Debt |
|
Secured and Unsecured Debt |
|
|
|
$ |
7,803.0 |
|
|
|
| 13 |
KW Share of Cash |
|
Cash |
|
|
|
(424.6) |
|
|
|
|
Total Net Debt |
|
|
|
|
|
$ |
7,378.4 |
|
|
|
|
|
|
|
|
|
|
|
|
|
| 14 |
KW Share of Interest Rate and Currency Hedging Contracts(6) |
|
Corporate and Property Level |
|
|
|
$ |
86.6 |
|
|
|
|
|
|
|
|
|
|
|
|
|
|
Total Common stock outstanding and underlying convertible preferred stock |
|
176,849,673 |
|
|
|
(1) Based on weighted average ownership figures held by KW.
(2) Includes 10,054 affordable units the Company owns through its Vintage Housing Holdings platform. Kennedy Wilson's equity investment in Vintage Housing Holdings has a fair value of $299.2 million as of September 30, 2023.
(3) See additional detail related to Lease-up, Development, and Non-income Producing Assets, as of September 30, 2023. KW Share of Debt below is included in the Net Debt amounts within the Components of Value Summary above.
|
|
|
|
|
|
|
|
|
|
|
|
|
|
|
|
|
|
|
|
|
|
|
KW Gross Asset Value |
|
KW Share of Debt |
|
Investment Account
(GAV - share of debt)
|
| Lease-up - Multifamily and Commercial |
|
$ |
1,074.6 |
|
|
$ |
302.0 |
|
|
$ |
772.6 |
|
Development - Multifamily, Commercial, and Hotel |
|
679.1 |
|
|
262.9 |
|
|
416.2 |
|
Residential and other |
|
204.5 |
|
|
24.8 |
|
|
179.7 |
|
| Lease-up, Development, and Non-income Producing Assets |
|
$ |
1,958.2 |
|
|
$ |
589.7 |
|
|
$ |
1,368.5 |
|
(4) Includes $75.6 million of gross asset value related to development that the Company owns through its investment Vintage Housing Holdings as of September 30, 2023.
(5) TTM figures are representative of the trailing 12 months and are not indicators of the actual results that the Company will or expects to realize in any period.
(6) Includes $58.3 million included within net Other Assets and $28.3 million within Unconsolidated investments on the Company's Consolidated Balance Sheet .
Kennedy-Wilson Holdings, Inc.
Stabilized Portfolio
As of September 30, 2023
(Unaudited, Dollars in millions)
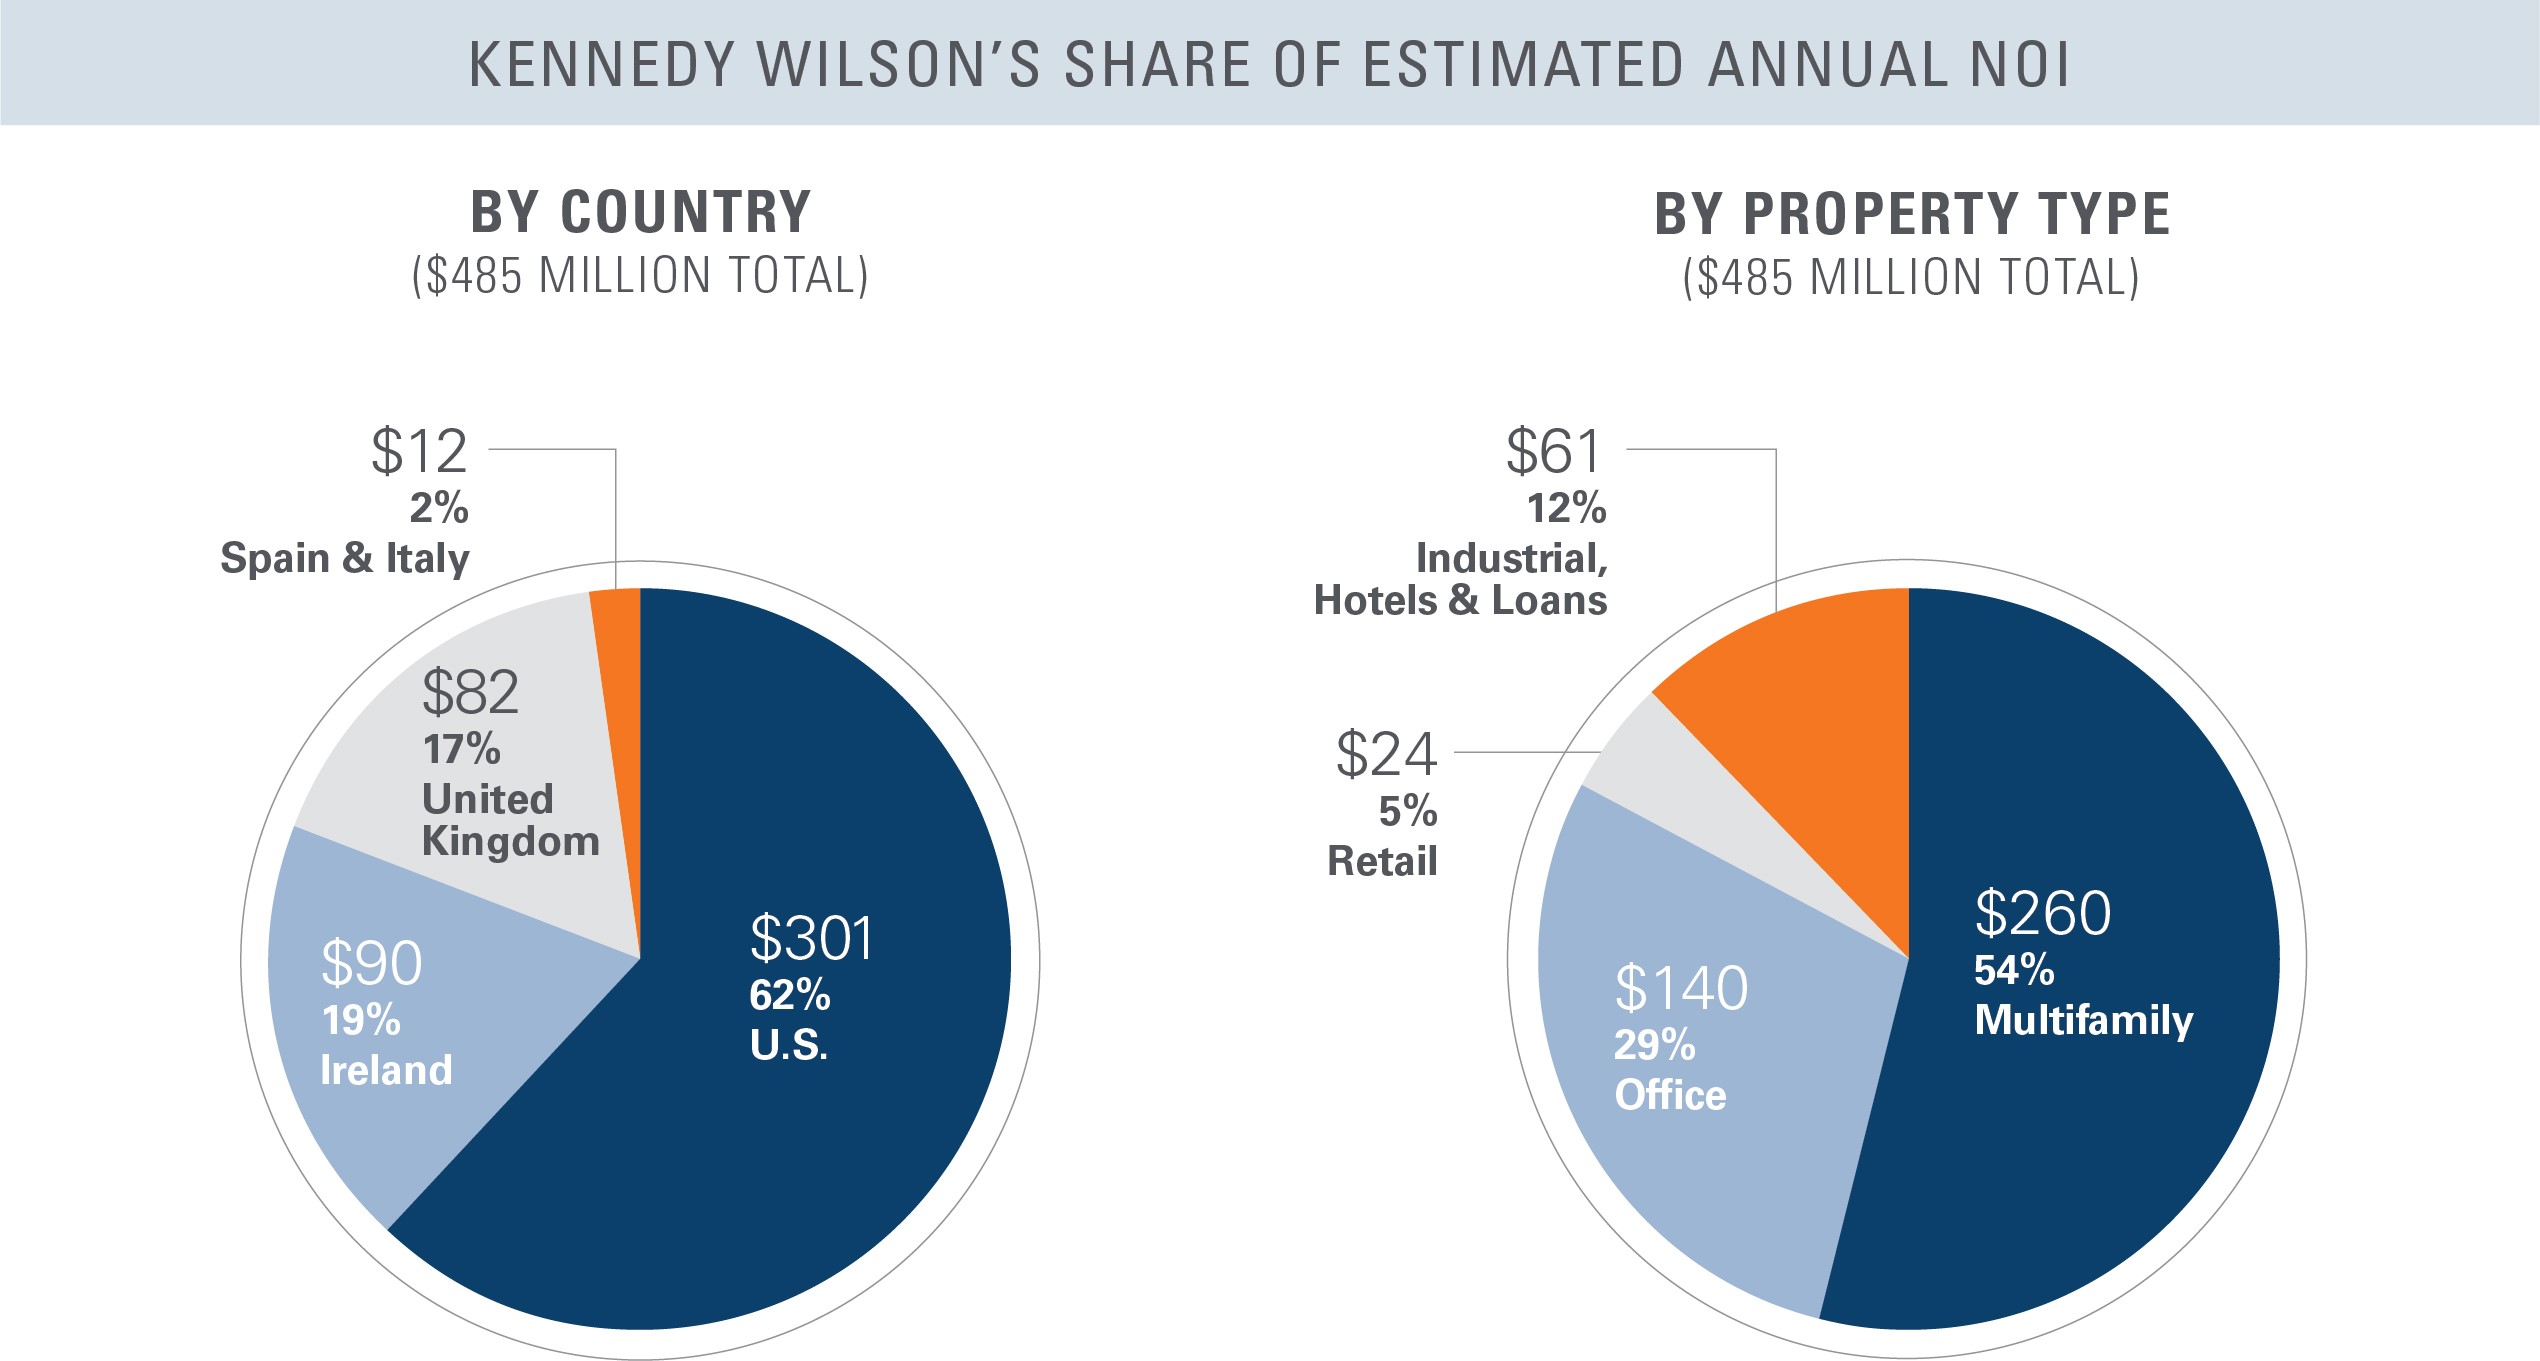
The following information reflects Kennedy Wilson's Pro-rata share of Estimated Annual NOI (from income-producing assets) by geography and property type, as of September 30, 2023, of which 58% is derived from consolidated assets.
The following summarizes Kennedy Wilson's Pro-rata share of Estimated Annual NOI from its stabilized income-producing portfolio by property type and geography.
|
|
|
|
|
|
|
|
|
|
|
|
|
|
|
|
|
|
|
|
|
|
|
|
|
|
|
|
|
|
|
|
|
|
Pacific Northwest |
Southern California |
Northern California |
Mountain West |
Other U.S. |
U.K. |
Ireland |
Italy |
Spain |
Total |
| Multifamily - Market Rate |
$ |
51.8 |
|
$ |
26.2 |
|
$ |
20.6 |
|
$ |
89.8 |
|
$ |
— |
|
$ |
— |
|
$ |
29.8 |
|
$ |
— |
|
$ |
— |
|
$ |
218.2 |
|
| Multifamily - Affordable |
27.3 |
|
4.0 |
|
3.0 |
|
7.7 |
|
— |
|
— |
|
— |
|
— |
|
— |
|
42.0 |
|
| Office |
19.2 |
|
11.8 |
|
8.7 |
|
2.4 |
|
— |
|
59.1 |
|
33.0 |
|
6.2 |
|
— |
|
140.4 |
|
| Industrial |
— |
|
— |
|
0.9 |
|
0.4 |
|
— |
|
11.6 |
|
1.2 |
|
— |
|
0.2 |
|
14.3 |
|
| Retail |
— |
|
1.0 |
|
— |
|
1.9 |
|
— |
|
9.7 |
|
5.9 |
|
— |
|
5.8 |
|
24.3 |
|
| Hotel |
— |
|
— |
|
— |
|
— |
|
— |
|
— |
|
20.6 |
|
— |
|
— |
|
20.6 |
|
| Loans |
1.9 |
|
7.7 |
|
4.4 |
|
2.7 |
|
7.7 |
|
1.2 |
|
— |
|
— |
|
— |
|
25.6 |
|
| Total Estimated Annual NOI |
$ |
100.2 |
|
$ |
50.7 |
|
$ |
37.6 |
|
$ |
104.9 |
|
$ |
7.7 |
|
$ |
81.6 |
|
$ |
90.5 |
|
$ |
6.2 |
|
$ |
6.0 |
|
$ |
485.4 |
|
Kennedy-Wilson Holdings, Inc.
Segment Investment Summary
As of September 30, 2023
(Unaudited)
(Dollars in millions, except Fee-Bearing Capital)
The following summarizes Kennedy Wilson's income-producing portfolio by segment. Excluded below are lease-up, development, and residential and other investments.
|
|
|
|
|
|
|
|
|
|
|
|
|
|
|
|
|
|
|
|
|
|
|
|
|
|
|
|
|
|
|
|
|
| Stabilized Portfolio |
| KW Segment |
Description |
Balance Sheet Classification |
Multifamily Units |
Commercial Rentable Sq. Ft. |
Hotels |
Loan Investments |
KW Share of Est. Annual NOI |
Fee-Bearing Capital(1) ($bn) |
KW Gross Asset Value |
Ownership(2) |
| 1) Consolidated |
Consists primarily of wholly-owned real estate investments |
Consolidated |
9,230 |
5.4 |
1 |
— |
$282.7 |
$— |
$4,905.2 |
97% |
|
|
|
|
|
|
|
|
|
|
|
| 2) Co-investment Portfolio: |
|
|
|
|
|
|
|
|
|
| ~50% owned |
Consists primarily of 50/50 investments with partners and our Vintage Housing joint-venture |
Unconsolidated |
19,514 |
1.0 |
— |
— |
142.3 |
1.3 |
2,830.4 |
47% |
| Minority-held |
Includes fund investments, loans, and other minority-held investments |
Unconsolidated |
4,770 |
16.8 |
— |
98 |
60.4 |
6.9 |
916.2 |
9% |
| Co-investment Portfolio |
|
24,284 |
17.8 |
— |
98 |
$202.7 |
$8.2 |
$3,746.6 |
21% |
|
|
|
|
|
|
|
|
|
|
|
| Total Stabilized Portfolio |
|
|
33,514 |
23.2 |
1 |
98 |
$485.4 |
$8.2 |
$8,651.8 |
39% |
(1) Includes Fee-Bearing Capital related to lease-up, development, and non-income producing assets.
(2) Weighted average ownership figures based on the Company’s share of NOI and are presented on a pre-promote basis.
Kennedy-Wilson Holdings, Inc.
Multifamily Portfolio
As of September 30, 2023
(Unaudited)
(Dollars in millions, except average rents per unit)
|
|
|
|
|
|
|
|
|
|
|
|
|
|
|
|
|
|
|
|
|
|
|
|
|
|
|
|
|
|
|
|
|
|
|
|
|
|
|
|
|
|
|
|
|
|
|
|
|
|
|
|
|
|
Consolidated |
|
Co-Investment (Unconsolidated) |
|
|
|
|
|
|
|
|
|
|
| Multifamily |
# of Assets |
|
Market-Rate
Units |
|
Market-Rate
Units |
VHH Affordable Units (5) |
Total
# of Units |
|
Market-Rate Occupancy (Asset Level) |
|
Market-Rate
Occupancy (KW Share) |
VHH Affordable
Occupancy |
Total Occupancy (KW Share) |
Average Rent(1)(2)(3) |
|
KW Share
of Estimated Annual NOI(4)
|
| Mountain West |
44 |
|
|
5,712 |
|
|
4,210 |
|
2,273 |
|
12,195 |
|
|
93.6 |
% |
|
93.4 |
% |
94.5 |
% |
93.6 |
% |
$ |
1,606 |
|
|
$ |
97.5 |
|
| Pacific Northwest |
52 |
|
|
1,544 |
|
|
3,999 |
|
6,401 |
|
11,944 |
|
|
95.1 |
|
|
94.0 |
|
96.0 |
|
94.9 |
|
2,051 |
|
|
79.1 |
|
| Southern California |
13 |
|
|
846 |
|
|
2,131 |
|
704 |
|
3,681 |
|
|
94.8 |
|
|
95.3 |
|
96.6 |
|
95.5 |
|
2,273 |
|
|
30.2 |
|
| Northern California |
9 |
|
|
1,128 |
|
|
1,357 |
|
676 |
|
3,161 |
|
|
93.2 |
|
|
92.0 |
|
98.1 |
|
92.9 |
|
2,157 |
|
|
23.6 |
|
| Total Western U.S. |
118 |
|
|
9,230 |
|
|
11,697 |
|
10,054 |
|
30,981 |
|
|
94.3 |
% |
|
93.6 |
% |
95.8 |
% |
94.2 |
% |
$ |
1,850 |
|
|
$ |
230.4 |
|
Ireland(4) |
10 |
|
|
— |
|
|
2,533 |
|
— |
|
2,533 |
|
|
97.6 |
|
|
97.6 |
|
— |
|
97.6 |
|
2,545 |
|
|
29.8 |
|
| Total Stabilized |
128 |
|
|
9,230 |
|
|
14,230 |
|
10,054 |
|
33,514 |
|
|
94.5 |
% |
|
94.0 |
% |
95.8 |
% |
94.4 |
% |
$ |
1,912 |
|
|
$ |
260.2 |
|
|
|
|
|
|
|
|
|
|
|
|
|
|
|
|
|
|
| Lease-up Assets |
3 |
|
|
— |
|
|
758 |
|
161 |
|
919 |
|
|
See Page 26 for more information |
|
|
| Development Projects |
17 |
|
|
962 |
|
|
500 |
|
1,604 |
|
3,066 |
|
|
See Page 27 for more information |
|
|
| Total |
20 |
|
|
962 |
|
|
1,258 |
|
1,765 |
|
3,985 |
|
|
|
|
|
|
|
|
|
|
|
|
|
|
|
|
|
|
|
|
|
|
|
|
|
|
|
| Total Multifamily |
148 |
|
|
10,192 |
|
|
15,488 |
|
11,819 |
|
37,499 |
|
|
|
|
|
|
|
|
|
|
(1) Average Monthly Rents Per Unit is defined as the total potential monthly rental revenue (actual rent for occupied units plus market rent for vacant units) divided by the number of units, and are weighted averages based on the Company's ownership percentage in the underlying properties.
(2) Average Monthly Rents Per Market Rate Unit for the market rate portfolio based on Kennedy Wilson's share of units. Average Monthly Rents Per Unit for the affordable portfolio are $1,358 per month, including $1,227, $1,376, $1,627, and $1,356 for Mountain West, Pacific Northwest, Southern California and Northern California, respectively.
(3) Excludes 642 units related to investment in Langdon Park Capital.
(4) Estimated foreign exchange rates are €1.00 = $1.06 USD, and £1.00 = $1.22 USD related to NOI.
(5) The Company has a 41% economic ownership interest in its Vintage Housing affordable portfolio.
Kennedy-Wilson Holdings, Inc.
Office Portfolio
As of September 30, 2023
(Unaudited)
(Dollars and Square Feet in millions, except average rent per sq. ft.)
|
|
|
|
|
|
|
|
|
|
|
|
|
|
|
|
|
|
|
|
|
|
|
|
|
|
|
|
|
|
|
|
|
|
|
|
|
|
|
|
|
|
|
|
|
|
|
|
Consolidated |
|
Co-Investment (Unconsolidated) |
|
|
|
|
|
|
|
|
|
| Office |
# of Assets |
|
Rentable Sq. Ft. |
|
Rentable Sq. Ft. |
Total
Rentable Sq. Ft. |
|
Occupancy (Asset Level) |
|
Occupancy (KW Share) |
|
Average Annual Rent per Sq. Ft.(1) |
|
Kennedy Wilson's Share of
Estimated Annual NOI |
Pacific Northwest(2) |
3 |
|
|
0.6 |
|
|
0.6 |
|
1.2 |
|
|
99.0 |
% |
|
99.8 |
% |
|
$ |
27.1 |
|
|
$ |
19.2 |
|
Southern California(3) |
6 |
|
|
0.2 |
|
|
1.3 |
|
1.5 |
|
|
74.7 |
|
|
85.8 |
|
|
67.7 |
|
|
11.8 |
|
| Northern California |
5 |
|
|
0.3 |
|
|
1.2 |
|
1.5 |
|
|
87.8 |
|
|
85.6 |
|
|
34.9 |
|
|
8.7 |
|
| Mountain West |
5 |
|
|
— |
|
|
1.7 |
|
1.7 |
|
|
85.4 |
|
|
85.6 |
|
|
20.3 |
|
|
2.4 |
|
| Total Western U.S. |
19 |
|
|
1.1 |
|
|
4.8 |
|
5.9 |
|
|
85.9 |
% |
|
91.8 |
% |
|
$ |
35.8 |
|
|
$ |
42.1 |
|
United Kingdom(4) |
10 |
|
|
1.5 |
|
|
0.5 |
|
2.0 |
|
|
91.1 |
|
|
92.8 |
|
|
37.9 |
|
|
59.1 |
|
Ireland(4)(5) |
9 |
|
|
0.6 |
|
|
0.5 |
|
1.1 |
|
|
95.1 |
|
|
94.3 |
|
|
46.0 |
|
|
33.0 |
|
Italy(4) |
6 |
|
|
0.6 |
|
|
— |
|
0.6 |
|
|
100.0 |
|
|
100.0 |
|
|
12.1 |
|
|
6.2 |
|
Total Europe(4) |
25 |
|
|
2.7 |
|
|
1.0 |
|
3.7 |
|
|
93.6 |
% |
|
94.5 |
% |
|
$ |
34.8 |
|
|
$ |
98.3 |
|
|
|
|
|
|
|
|
|
|
|
|
|
|
|
|
| Total Stabilized |
44 |
|
|
3.8 |
|
|
5.8 |
|
9.6 |
|
|
88.9 |
% |
|
93.6 |
% |
|
$ |
35.2 |
|
|
$ |
140.4 |
|
|
|
|
|
|
|
|
|
|
|
|
|
|
|
|
|
|
|
|
|
|
|
|
|
|
|
|
|
|
|
| Lease-up Assets |
8 |
|
|
0.8 |
|
|
0.6 |
|
1.4 |
|
|
See page 26 for more information |
|
|
| Development Projects |
4 |
|
|
0.1 |
|
|
0.4 |
|
0.5 |
|
|
See page 27 for more information |
|
|
| Total |
12 |
|
|
0.9 |
|
|
1.0 |
|
1.9 |
|
|
|
|
|
|
|
|
|
|
|
|
|
|
|
|
|
|
|
|
|
|
|
|
| Total Office |
56 |
|
|
4.7 |
|
|
6.8 |
|
11.5 |
|
|
|
|
|
|
|
|
|
(1) Average Annual Rent per Sq. Ft. represents contractual rents as in-place as of September 30, 2023 and are weighted averages based on the Company's ownership percentage in the underlying properties.
(2) Includes 396,000 sq. ft. and $12 million of Estimated Annual NOI related to a tenant that vacated during Q4-23.
(3) Includes our corporate headquarters wholly-owned by KW comprising 58,000 sq. ft., 100% occupancy, and $3.0 million in Estimated Annual NOI.
(4) Estimated foreign exchange rates are €1.00 = $1.06 USD, and £1.00 = $1.22 USD related to NOI.
(5) Includes our Irish headquarters wholly owned by KW comprising 19,000 sq. ft., 100% occupancy, and $1.2 million in Estimated Annual NOI.
Kennedy-Wilson Holdings, Inc.
Industrial Portfolio
As of September 30, 2023
(Unaudited)
(Dollars and Square Feet in millions, except average rent per sq. ft.)
|
|
|
|
|
|
|
|
|
|
|
|
|
|
|
|
|
|
|
|
|
|
|
|
|
|
|
|
|
|
|
|
|
|
|
|
|
|
|
|
|
|
Co-Investment (Unconsolidated) |
|
|
|
|
|
|
|
|
|
| Industrial |
# of Assets |
|
|
Rentable Sq. Ft. |
|
|
Occupancy
(Asset Level) |
|
Occupancy
(KW Share) |
|
Average Annual Rent per Sq. Ft.(1) |
|
Kennedy Wilson's Share of
Estimated Annual NOI |
| Mountain West |
4 |
|
|
|
0.4 |
|
|
|
100.0 |
|
|
100.0 |
|
|
$ |
8.6 |
|
|
$ |
0.4 |
|
| Northern California |
2 |
|
|
|
1.0 |
|
|
|
100.0 |
|
|
100.0 |
|
|
4.8 |
|
|
0.9 |
|
| Total Western U.S. |
6 |
|
|
|
1.4 |
|
|
|
100.0 |
% |
|
100.0 |
% |
|
$ |
5.5 |
|
|
$ |
1.3 |
|
United Kingdom(2) |
77 |
|
|
|
8.1 |
|
|
|
96.4 |
|
|
97.7 |
|
|
8.4 |
|
|
11.6 |
|
Ireland(2) |
20 |
|
|
|
0.7 |
|
|
|
100.0 |
|
|
100.0 |
|
|
9.2 |
|
|
1.2 |
|
Spain(2) |
3 |
|
|
|
0.2 |
|
|
|
100.0 |
|
|
100.0 |
|
|
5.2 |
|
|
0.2 |
|
Total Europe(2) |
100 |
|
|
|
9.0 |
|
|
|
96.7 |
% |
|
98.0 |
% |
|
$ |
8.4 |
|
|
$ |
13.0 |
|
|
|
|
|
|
|
|
|
|
|
|
|
|
|
| Total Stabilized |
106 |
|
|
|
10.4 |
|
|
|
97.2 |
% |
|
98.2 |
% |
|
$ |
8.0 |
|
|
$ |
14.3 |
|
|
|
|
|
|
|
|
|
|
|
|
|
|
|
|
|
|
|
|
|
|
|
|
|
|
|
|
|
| Lease-up Assets |
3 |
|
|
|
0.4 |
|
|
|
See page 26 for more information |
|
|
| Development Projects |
4 |
|
|
|
TBD |
|
|
See page 27 for more information |
|
|
| Total |
7 |
|
|
|
0.4 |
|
|
|
|
|
|
|
|
|
|
|
|
|
|
|
|
|
|
|
|
|
|
|
|
| Total Industrial |
113 |
|
|
|
10.8 |
|
|
|
|
|
|
|
|
|
|
(1) Average Annual Rent per Sq. Ft. represents contractual rents as in-place as of September 30, 2023 and are weighted averages based on the Company's ownership percentage in the underlying properties.
(2) Estimated foreign exchange rates are €1.00 = $1.06 USD, and £1.00 = $1.22 USD related to NOI.
Kennedy-Wilson Holdings, Inc.
Retail Portfolio
As of September 30, 2023
(Unaudited)
(Dollars and Square Feet in millions, except average rent per sq. ft.)
|
|
|
|
|
|
|
|
|
|
|
|
|
|
|
|
|
|
|
|
|
|
|
|
|
|
|
|
|
|
|
|
|
|
|
|
|
|
|
|
|
|
|
|
|
Consolidated |
Co-Investment (Unconsolidated) |
|
|
|
|
|
|
|
|
|
| Retail |
# of Assets |
|
Rentable Sq. Ft. |
Rentable Sq. Ft. |
Total
Rentable Sq. Ft. |
|
Occupancy (Asset Level) |
|
Occupancy (KW Share) |
|
Average Annual Rent per Sq. Ft.(1) |
|
Kennedy Wilson's Share of
Estimated Annual NOI |
| Southern California |
4 |
|
|
— |
|
0.9 |
|
0.9 |
|
|
99.1 |
|
|
99.3 |
|
|
$ |
18.1 |
|
|
$ |
1.0 |
|
| Mountain West |
3 |
|
|
0.1 |
|
0.5 |
|
0.6 |
|
|
87.2 |
|
|
82.6 |
|
|
13.7 |
|
|
1.9 |
|
| Total Western U.S. |
7 |
|
|
0.1 |
|
1.4 |
|
1.5 |
|
|
88.3 |
% |
|
85.6 |
% |
|
$ |
14.6 |
|
|
$ |
2.9 |
|
United Kingdom(2) |
10 |
|
|
1.1 |
|
0.1 |
|
1.2 |
|
|
93.7 |
|
|
92.8 |
|
|
15.7 |
|
|
9.7 |
|
Ireland(2) |
1 |
|
|
0.2 |
|
— |
|
0.2 |
|
|
90.1 |
|
|
90.1 |
|
|
43.5 |
|
|
5.9 |
|
Spain(2) |
1 |
|
|
0.3 |
|
— |
|
0.3 |
|
|
92.6 |
|
|
92.6 |
|
|
21.9 |
|
|
5.8 |
|
Total Europe(2) |
12 |
|
|
1.6 |
|
0.1 |
|
1.7 |
|
|
93.2 |
% |
|
92.4 |
% |
|
$ |
20.6 |
|
|
$ |
21.4 |
|
|
|
|
|
|
|
|
|
|
|
|
|
|
|
| Total Stabilized |
19 |
|
|
1.7 |
|
1.5 |
|
3.2 |
|
|
91.7 |
% |
|
91.4 |
% |
|
$ |
19.8 |
|
|
$ |
24.3 |
|
|
|
|
|
|
|
|
|
|
|
|
|
|
|
|
|
|
|
|
|
|
|
|
|
|
|
|
|
| Lease-up Assets |
1 |
|
|
0.1 |
|
— |
|
0.1 |
|
|
See page 26 for more information |
|
|
| Total |
1 |
|
|
0.1 |
|
— |
|
0.1 |
|
|
|
|
|
|
|
|
|
|
|
|
|
|
|
|
|
|
|
|
|
|
|
| Total Retail |
20 |
|
|
1.8 |
|
1.5 |
|
3.3 |
|
|
|
|
|
|
|
|
|
(1) Average Annual Rent per Sq. Ft. represents contractual rents as in-place as of September 30, 2023 and are weighted averages based on the Company's ownership percentage in the underlying properties.
(2) Estimated foreign exchange rates are €1.00 = $1.06 USD, and £1.00 = $1.22 USD related to NOI.
Kennedy-Wilson Holdings, Inc.
Hotel, Loans, Residential and Other Investment Portfolio
As of September 30, 2023
(Unaudited)
(Dollars in millions, except ADR)
|
|
|
|
|
|
|
|
|
|
|
|
|
|
|
|
|
|
|
|
|
|
|
|
| Hotel |
# of Assets |
|
Hotel Rooms |
|
Average Daily Rate(1) |
|
Kennedy Wilson's Share
of Estimated Annual NOI |
Ireland(2) |
1 |
|
|
265 |
|
|
$ |
453.9 |
|
|
$ |
20.6 |
|
| Total Hotel |
1 |
|
|
265 |
|
|
$ |
453.9 |
|
|
$ |
20.6 |
|
|
|
|
|
|
|
|
|
| Lease-up |
1 |
|
|
150 |
|
|
See page 27 for more information |
|
| Total Hotel |
2 |
|
|
415 |
|
|
|
|
|
(1) Average Daily Rate data is based on the most recent 12 months and is weighted based on the Company's ownership percentage in the underlying properties
(2) Estimated foreign exchange rates are €1.00 = $1.06 USD, and £1.00 = $1.22 USD related to NOI.
|
|
|
|
|
|
|
|
|
|
|
|
|
|
|
|
|
|
|
|
|
| Loan Investments |
# of Loans |
|
Average Interest Rate (KW Share) |
|
Loan Balance (KW Share) |
Kennedy Wilson's Share
of Annual Interest Income |
| Southern California |
22 |
|
|
10.9 |
% |
|
$ |
71.0 |
|
$ |
7.7 |
|
| Northern California |
17 |
|
|
9.0 |
% |
|
49.1 |
|
4.4 |
|
| Mountain West |
16 |
|
|
8.8 |
% |
|
30.3 |
|
2.7 |
|
| Pacific Northwest |
7 |
|
|
8.1 |
% |
|
23.3 |
|
1.9 |
|
| Other U.S. |
32 |
|
|
10.8 |
% |
|
71.4 |
|
7.7 |
|
| Total U.S. |
94 |
|
|
10.1 |
% |
|
$ |
245.1 |
|
$ |
24.4 |
|
United Kingdom(1) |
4 |
|
|
10.9 |
% |
|
10.8 |
|
1.2 |
|
| Total Loan Investments |
98 |
|
|
10.1 |
% |
|
$ |
255.9 |
|
$ |
25.6 |
|
(1) Estimated foreign exchange rates are €1.00 = $1.06 USD, and £1.00 = $1.22 USD related to Loan Balance and Annual Interest Income.
|
|
|
|
|
|
|
|
|
|
|
|
|
|
|
|
|
|
| Residential and Other |
# of Investments |
|
Total Acres |
|
KW Gross Asset Value |
| Southern California |
1 |
|
|
527 |
|
|
$ |
13.8 |
|
| Hawaii |
1 |
|
|
542 |
|
|
151.3 |
|
| Total Western U.S. |
2 |
|
|
1,069 |
|
|
$ |
165.1 |
|
United Kingdom(1) |
1 |
|
|
1 |
|
|
4.1 |
|
| Total Residential |
3 |
|
|
1,070 |
|
|
$ |
169.2 |
|
|
|
|
|
|
|
| Other Investments |
8 |
|
|
— |
|
|
$ |
35.3 |
|
| Total Residential and Other |
11 |
|
|
1,070 |
|
|
$ |
204.5 |
|
(1) Estimated foreign exchange rates are €1.00 = $1.06 USD, and £1.00 = $1.22 USD related to Gross Asset Value.
Kennedy-Wilson Holdings, Inc.
Lease-up Portfolio
As of September 30, 2023
(Unaudited)
(Dollars in millions)
Lease-up Portfolio
This section includes the Company's assets that are undergoing lease-up. There is no certainty that these assets will reach stabilization in the time periods shown. In addition, the cost to complete lease-up assets is subject to many uncertainties that are beyond our control, and the actual costs may be significantly higher than the estimates shown below. All dollar amounts are Kennedy Wilson's share.
|
|
|
|
|
|
|
|
|
|
|
|
|
|
|
|
|
|
|
|
|
|
|
|
|
|
|
|
|
|
|
|
|
|
|
|
| Property |
Location |
Type |
KW Ownership % |
# of Assets |
Commercial Sq. Ft. |
MF Units |
Hotel Rooms |
Leased % |
KW Share Est. Stabilized NOI |
KW Est. Costs to Complete(1) |
KW Gross Asset Value |
| 2023 |
|
|
|
|
|
|
|
|
|
|
|
| The Oaks |
Southern California |
Office |
100% |
1 |
|
357,000 |
|
— |
|
— |
|
83 |
% |
$ |
5.6 |
|
$ |
4.2 |
|
$ |
134.7 |
|
|
2023 Subtotal |
|
|
1 |
|
357,000 |
|
— |
|
— |
|
83 |
% |
$ |
5.6 |
|
$ |
4.2 |
|
$ |
134.7 |
|
| 2024 |
|
|
|
|
|
|
|
|
|
|
|
| Kona Village |
Hawaii |
Hotel |
50% |
1 |
|
— |
|
— |
|
150 |
|
— |
% |
$ |
22.0 |
|
$ |
3.6 |
|
$ |
367.2 |
|
| Coopers Cross |
Ireland(2) |
Multifamily |
50% |
1 |
|
— |
|
471 |
|
— |
|
11 |
|
6.0 |
|
1.3 |
|
134.0 |
|
| Grange |
Ireland(2) |
Multifamily |
50% |
1 |
|
— |
|
287 |
|
— |
|
27 |
|
3.4 |
|
1.3 |
|
78.2 |
|
| The Heights Building 4 |
United Kingdom(2) |
Office |
51% |
1 |
|
80,000 |
|
— |
|
— |
|
43 |
|
1.8 |
|
— |
|
23.7 |
|
| Stockley Park |
United Kingdom(2) |
Office |
100% |
1 |
|
54,000 |
|
— |
|
— |
|
— |
|
2.2 |
|
— |
|
35.4 |
|
| Hamilton Landing H4 & H7 |
Northern California |
Office |
100% |
1 |
|
118,000 |
|
— |
|
— |
|
34 |
|
3.1 |
|
7.2 |
|
33.9 |
|
| Various |
United Kingdom(2) |
Office |
100% |
2 |
|
281,000 |
|
— |
|
— |
|
34 |
|
7.6 |
|
17.1 |
|
128.4 |
|
|
2024 Subtotal |
|
|
8 |
|
533,000 |
|
758 |
|
150 |
|
32 |
% |
$ |
46.1 |
|
$ |
30.5 |
|
$ |
800.8 |
|
|
|
|
|
|
|
|
|
|
|
|
|
|
Total Lease-Up |
|
9 |
|
890,000 |
|
758 |
|
150 |
|
52 |
% |
$ |
51.7 |
|
$ |
34.7 |
|
$ |
935.5 |
|
Note: The table above excludes minority-held investments, and two wholly-owned assets expected to sell totaling 1.0 million commercial sq. ft. and KW Gross Asset Value of $116.1 million.
(1) Figures shown in this column are an estimate of KW's remaining costs to develop to completion or to complete the entitlement process, as applicable, as of September 30, 2023. Total remaining costs may be financed with third-party cash contributions, proceeds from projected sales, and/or debt financing. These figures are budgeted costs and are subject to change. There is no guarantee that the Company will be able to secure the project-level debt financing that is assumed in the figures above. If the Company is unable to secure such financing, the amount of capital that the Company will have to invest to complete the projects above may significantly increase.
(2) Estimated foreign exchange rates are €1.00 = $1.06 USD, and £1.00 = $1.22 USD related to NOI.
Kennedy-Wilson Holdings, Inc.
Development Projects - Income Producing
As of September 30, 2023
(Unaudited)
(Dollars in millions)
Development Projects - Income Producing
This section includes the market rate development or redevelopment projects that the Company is undergoing or considering, and excludes Vintage Housing Holdings and residential investments. The scope of these projects may change. There is no certainty that the Company will develop or redevelop any or all of these potential projects. In addition, the cost to complete development projects is subject to many uncertainties that are beyond our control, and the actual costs may be significantly higher than the estimates shown below. All dollar amounts are at Kennedy Wilson's share.
|
|
|
|
|
|
|
|
|
|
|
|
|
|
|
|
|
|
|
|
|
|
|
|
|
|
|
|
|
|
|
|
|
|
|
|
|
|
|
|
|
|
|
|
|
|
|
|
If Completed |
|
Current |
| Property |
Location |
Type |
Status |
KW Ownership % |
Est. Completion Date(1) |
Est. Stabilization Date |
Commercial Sq. Ft. |
MF Units |
KW Share
Est. Stabilized NOI |
KW Est.
Total Cost(1)
|
Est. Yield on Cost |
|
KW Costs Incurred(2) |
KW Est. Costs to Complete(1) |
| 38° North Phase II |
Nor. California |
Multifamily |
Under Construction |
100% |
2023 |
2024 |
— |
|
172 |
|
4 |
|
73 |
|
6% |
|
55 |
|
18 |
|
| Coopers Cross |
Ireland(3) |
Office |
Under Construction |
50% |
2023 |
2025 |
395,000 |
|
— |
|
11 |
|
162 |
|
7% |
|
145 |
|
17 |
|
| Dovetail |
Mountain West |
Multifamily |
Under Construction |
90% |
2024 |
2024 |
— |
|
240 |
|
3 |
|
56 |
|
5% |
|
50 |
|
6 |
|
| Oxbow |
Mountain West |
Multifamily |
Under Construction |
51% |
2024 |
2024 |
— |
|
268 |
|
2 |
|
41 |
|
6% |
|
35 |
|
6 |
|
| Two10 |
Pacific Northwest |
Multifamily |
Under Construction |
90% |
2024 |
2024 |
— |
|
210 |
|
3 |
|
60 |
|
5% |
|
40 |
|
20 |
|
| 38° North Phase III |
Nor. California |
Multifamily |
Under Construction |
100% |
2024 |
2024 |
— |
|
30 |
|
1 |
|
13 |
|
6% |
|
4 |
|
9 |
|
| The Cornerstone |
Ireland(3) |
Mixed-Use |
Under Construction |
50% |
2024 |
2025 |
20,000 |
|
232 |
|
3 |
|
67 |
|
5% |
|
56 |
|
11 |
|
| University Glen Phase II |
So. California |
Multifamily |
Under Construction |
100% |
2024 |
2025 |
— |
|
310 |
|
7 |
|
120 |
|
6% |
|
71 |
|
49 |
|
| Gateway @ The Oaks |
So. California |
Multifamily |
In Planning |
100% |
TBD |
TBD |
— |
|
TBD |
TBD |
TBD |
TBD |
|
11 |
|
TBD |
| Bend |
Pacific Northwest |
Multifamily |
In Planning |
43% |
TBD |
TBD |
— |
|
TBD |
TBD |
TBD |
TBD |
|
18 |
|
TBD |
|
|
|
|
415,000 |
|
1,462 |
|
$ |
34 |
|
$ |
592 |
|
6% |
|
$ |
485 |
|
$ |
136 |
|
Note: The table above excludes minority-held development projects and three development projects where the scope is still being explored, totaling KW Gross Asset Value of $125 million.
(1) Figures shown in this column are an estimate of KW's remaining costs to develop to completion or to complete the entitlement process, as applicable, as of September 30, 2023. Total remaining costs may be financed with third-party cash contributions, proceeds from projected sales, and/or debt financing. Kennedy Wilson expects to fund approximately $32 million of its share of remaining costs to complete with cash. These figures are budgeted costs and are subject to change. There is no guarantee that the Company will be able to secure the project-level debt financing that is assumed in the figures above. If the Company is unable to secure such financing, the amount of capital that the Company will have to invest to complete the projects above may significantly increase. KW cost to complete differs from KW share total capitalization as the latter includes costs that have already been incurred to date while the former relates to future estimated costs.
(2) Includes land costs.
(3) Estimated foreign exchange rates are €1.00 = $1.06 USD, and £1.00 = $1.22 USD related to NOI.
Kennedy-Wilson Holdings, Inc.
Vintage Housing Holdings - Lease-up Assets and Development Projects
As of September 30, 2023
(Unaudited)
(Dollars in millions)
Vintage Housing Holdings - Lease-up Assets and Development Projects
This section includes the Company's lease-up assets and development projects or redevelopment projects that the Company is undergoing or considering through its Vintage platform, which the Company has a 41% ownership interest in. The Company expects to have no cash equity basis in these projects at completion due to the use of property level debt and proceed from the sale of tax credits. The scope of these projects may change. There is no certainty the lease-up assets will reach stabilization or the Company will develop or redevelop any or all of these potential projects. All dollar amounts are Kennedy Wilson's share.
|
|
|
|
|
|
|
|
|
|
|
|
|
|
|
|
|
|
|
|
|
|
|
|
|
|
|
|
|
|
|
|
|
If Completed |
Current |
| Property |
Location |
Status |
Est. Completion Date(1) |
Est. Stabilization Date |
MF Units |
Est. Cash to KW(2) |
KW Share
Est. Stabilized NOI |
KW Cash Basis |
Leased % |
| The Point |
Pacific Northwest |
Lease-up |
n/a |
2023 |
161 |
|
$ |
1.6 |
|
$ |
1.0 |
|
— |
|
92 |
| Spanish Springs |
Mountain West |
Under Construction |
2024 |
2025 |
257 |
|
0.3 |
|
0.8 |
|
— |
|
— |
| University Glen |
Southern California |
Under Construction |
2024 |
2025 |
170 |
|
1.2 |
|
0.8 |
|
— |
|
— |
| Washington Station |
Mountain West |
Under Construction |
2025 |
2025 |
205 |
|
0.6 |
|
0.6 |
|
— |
|
— |
| Beacon Hill |
Pacific Northwest |
Under Construction |
2025 |
2025 |
272 |
|
3.0 |
|
1.5 |
|
2.3 |
|
— |
| Lockwood |
Southern California |
Under Construction |
2025 |
2025 |
341 |
|
0.5 |
|
2.1 |
|
0.5 |
|
— |
| Redfield |
Mountain West |
Under Construction |
2025 |
2025 |
223 |
|
1.7 |
|
0.8 |
|
— |
|
— |
| Folsom |
Northern California |
In Planning |
2025 |
2025 |
136 |
|
3.5 |
|
0.6 |
|
3.5 |
|
— |
|
|
|
|
1,765 |
|
$ |
12.4 |
|
$ |
8.2 |
|
$ |
6.3 |
|
|
(1) The actual completion date for projects is subject to several factors, many of which are not within our control. Accordingly, the projects identified may not be completed when expected, or at all. Kennedy Wilson expects to have no cash equity basis in these projects at completion.
(2) Represents the total cash Kennedy Wilson currently expects to receive from paid developer fees and proceeds from the sale of tax credits. Payment of the developer fee is contingent on the Company’s ability to meet certain criteria as outlined in each project’s Limited Partnership Agreement and may vary based on a number of factors.
Kennedy-Wilson Holdings, Inc.
Debt and Liquidity Schedule
As of September 30, 2023
(Unaudited)
(Dollars in millions)
|
|
|
|
|
|
|
|
|
|
|
|
|
|
|
|
|
|
|
|
|
|
|
|
|
|
|
|
|
|
|
|
|
|
|
|
|
Consolidated @ KW Share |
|
Unconsolidated @ KW Share |
|
|
| Maturity |
Secured(1) |
|
Kennedy Wilson Europe Unsecured Bonds(2) |
|
KW Unsecured Debt(3) |
|
Unconsolidated Secured |
|
Vintage Housing |
|
KW Share |
| 2023 |
$ |
73.4 |
|
|
$ |
— |
|
|
$ |
— |
|
|
$ |
19.4 |
|
|
$ |
1.0 |
|
|
$ |
93.8 |
|
| 2024 |
203.0 |
|
|
— |
|
|
— |
|
|
159.1 |
|
|
41.9 |
|
(6) |
404.0 |
|
| 2025 |
222.6 |
|
|
502.3 |
|
|
145.7 |
|
|
323.0 |
|
|
21.5 |
|
|
1,215.1 |
|
| 2026 |
517.2 |
|
|
— |
|
|
— |
|
|
440.7 |
|
|
46.9 |
|
|
1,004.8 |
|
| 2027 |
359.7 |
|
|
— |
|
|
— |
|
|
293.6 |
|
|
4.7 |
|
|
658.0 |
|
| 2028 |
337.0 |
|
|
— |
|
|
— |
|
|
234.5 |
|
|
15.6 |
|
|
587.1 |
|
| 2029 |
180.0 |
|
|
— |
|
|
600.0 |
|
|
349.9 |
|
|
16.4 |
|
|
1,146.3 |
|
| 2030 |
197.4 |
|
|
— |
|
|
600.0 |
|
|
18.7 |
|
|
12.7 |
|
|
828.8 |
|
| 2031 |
525.5 |
|
|
— |
|
|
600.0 |
|
|
94.1 |
|
|
5.2 |
|
|
1,224.8 |
|
| 2032 |
40.1 |
|
|
— |
|
|
— |
|
|
66.6 |
|
|
5.5 |
|
|
112.2 |
|
| Thereafter |
102.5 |
|
|
— |
|
|
— |
|
|
52.0 |
|
|
373.6 |
|
|
528.1 |
|
| Total |
$ |
2,758.4 |
|
|
$ |
502.3 |
|
|
$ |
1,945.7 |
|
|
$ |
2,051.6 |
|
|
$ |
545.0 |
|
|
$ |
7,803.0 |
|
|
|
|
|
|
|
|
|
|
|
|
|
| Cash |
(142.0) |
|
|
(15.5) |
|
|
(166.9) |
|
|
(85.0) |
|
|
(15.2) |
|
|
(424.6) |
|
| Net Debt |
$ |
2,616.4 |
|
|
$ |
486.8 |
|
|
$ |
1,778.8 |
|
|
$ |
1,966.6 |
|
|
$ |
529.8 |
|
|
$ |
7,378.4 |
|
|
|
|
|
|
|
|
|
|
|
|
|
Effective Interest Rate(4) |
4.1% |
|
3.3% |
|
4.8% |
|
4.4% |
|
5.0% |
|
4.3% |
Years to Maturity(5) |
4.7 |
|
2.1 |
|
6.1 |
|
4.0 |
|
13.9 |
|
5.4 |
|
|
|
|
|
|
|
|
|
|
|
|
(1) Excludes $77.6 million of secured consolidated debt related to noncontrolling interests, $13.9 million of unamortized loan fees and unamortized net premium of $0.9 million, as of September 30, 2023.
(2) Excludes $0.5 million of unamortized loan fees and unamortized net discount of $1.1 million, as of September 30, 2023.
(3) Excludes $20.1 million of unamortized loan fees and unamortized net discount of $3.3 million, as of September 30, 2023.
(4) Includes the effect of interest rate hedges and excludes prepaid loan costs.
(5) Years to maturity reflects contractual maturity dates, including the effects of extension options.
(6) $15.3 million of Vintage Housing maturities in 2024 are expected to be paid off using tax credit equity.
Kennedy-Wilson Holdings, Inc.
Debt and Liquidity Schedule (continued)
As of September 30, 2023
(Unaudited)
(Dollars in millions)
Kennedy Wilson has exposure to fixed and floating rate debt through its corporate debt along with debt encumbering its consolidated properties and its joint venture investments. The table below details Kennedy Wilson's total consolidated and unconsolidated debt by interest rate type.
|
|
|
|
|
|
|
|
|
|
|
|
|
|
|
|
|
|
|
|
|
|
|
|
|
KW Share of Debt |
|
Fixed Rate Debt |
|
Floating with Interest Hedges |
|
Floating without Interest Hedges |
|
Total KW Share of Debt |
| Secured Investment Level Debt |
$ |
3,274.5 |
|
|
$ |
2,080.5 |
|
|
$ |
— |
|
|
$ |
5,355.0 |
|
| Kennedy Wilson Europe Unsecured Bonds |
502.3 |
|
|
— |
|
|
— |
|
|
502.3 |
|
| KW Unsecured Debt |
1,800.0 |
|
|
145.7 |
|
|
— |
|
|
1,945.7 |
|
| Total |
$ |
5,576.8 |
|
|
$ |
2,226.2 |
|
|
$ |
— |
|
|
$ |
7,803.0 |
|
| % of Total Debt |
71 |
% |
|
29 |
% |
|
— |
% |
|
100 |
% |
|
|
|
|
|
|
|
|
|
|
|
|
|
|
|
|
|
|
|
|
|
|
|
|
|
|
|
|
|
|
|
|
|
|
|
|
|
|
|
|
|
|
|
|
|
|
|
|
|
KW Share of Secured Investment Debt |
|
|
|
Multifamily |
|
Office |
|
Industrial |
|
Retail |
|
Hotels |
|
Residential and Other |
|
Total |
|
% of KW Share |
| Pacific Northwest |
$ |
989.9 |
|
|
$ |
107.0 |
|
|
$ |
— |
|
|
$ |
3.3 |
|
|
$ |
— |
|
|
$ |
— |
|
|
$ |
1,100.2 |
|
|
21 |
% |
| Southern California |
324.4 |
|
|
144.8 |
|
|
— |
|
|
4.3 |
|
|
— |
|
|
— |
|
|
473.5 |
|
|
9 |
% |
| Northern California |
347.4 |
|
|
85.9 |
|
|
9.6 |
|
|
— |
|
|
— |
|
|
— |
|
|
442.9 |
|
|
8 |
% |
| Mountain West |
1,249.0 |
|
|
20.9 |
|
|
4.0 |
|
|
12.0 |
|
|
— |
|
|
— |
|
|
1,285.9 |
|
|
23 |
% |
| Hawaii |
— |
|
|
— |
|
|
— |
|
|
— |
|
|
125.0 |
|
|
24.8 |
|
|
149.8 |
|
|
3 |
% |
| Total Western US |
$ |
2,910.7 |
|
|
$ |
358.6 |
|
|
$ |
13.6 |
|
|
$ |
19.6 |
|
|
$ |
125.0 |
|
|
$ |
24.8 |
|
|
$ |
3,452.3 |
|
|
64 |
% |
|
|
|
|
|
|
|
|
|
|
|
|
|
|
|
|
| United Kingdom |
$ |
— |
|
|
$ |
567.6 |
|
|
$ |
167.1 |
|
|
$ |
29.3 |
|
|
$ |
— |
|
|
$ |
— |
|
|
$ |
764.0 |
|
|
14 |
% |
| Ireland |
565.2 |
|
|
474.5 |
|
|
9.5 |
|
|
49.1 |
|
|
— |
|
|
— |
|
|
1,098.3 |
|
|
21 |
% |
| Spain |
— |
|
|
— |
|
|
4.2 |
|
|
36.2 |
|
|
— |
|
|
— |
|
|
40.4 |
|
|
1 |
% |
| Total Europe |
$ |
565.2 |
|
|
$ |
1,042.1 |
|
|
$ |
180.8 |
|
|
$ |
114.6 |
|
|
$ |
— |
|
|
$ |
— |
|
|
$ |
1,902.7 |
|
|
36 |
% |
|
|
|
|
|
|
|
|
|
|
|
|
|
|
|
|
| Total |
$ |
3,475.9 |
|
|
$ |
1,400.7 |
|
|
$ |
194.4 |
|
|
$ |
134.2 |
|
|
$ |
125.0 |
|
|
$ |
24.8 |
|
|
$ |
5,355.0 |
|
|
100 |
% |
| % of Total Debt |
65 |
% |
|
26 |
% |
|
4 |
% |
|
3 |
% |
|
2 |
% |
|
— |
% |
|
100 |
% |
|
|
Kennedy-Wilson Holdings, Inc.
Investment Management Platform
(Unaudited, Dollars in millions)
Kennedy Wilson's investment management and real estate services platform offers a comprehensive line of real estate services for the full lifecycle of real estate ownership. Kennedy Wilson has approximately $25 billion in Real Estate AUM(1) as of September 30, 2023.
|
|
|
|
|
|
|
|
|
|
|
|
|
|
|
|
|
|
|
|
|
|
|
|
|
|
|
| Adjusted Fees |
|
|
Q3 |
|
YTD |
| Fee Description |
|
2023 |
|
2022 |
|
2023 |
|
2022 |
| Investment Management — Base |
|
$ |
15.0 |
|
|
$ |
11.1 |
|
|
$ |
38.0 |
|
|
$ |
33.0 |
|
| Investment Management — Acquisition/Disposition |
|
0.5 |
|
|
0.2 |
|
|
7.8 |
|
|
0.9 |
|
| Investment Management — Performance Allocations: |
|
|
|
|
|
|
|
|
| Unrealized |
|
(17.9) |
|
|
(21.2) |
|
|
(36.3) |
|
|
(5.4) |
|
| Realized |
|
— |
|
|
6.8 |
|
|
— |
|
|
6.8 |
|
| Amounts reclassified from Unrealized to Realized |
|
— |
|
|
(3.6) |
|
|
— |
|
|
(0.9) |
|
| Total - Investment Management — Performance Allocations |
|
(17.9) |
|
|
(18.0) |
|
|
(36.3) |
|
|
0.5 |
|
| Property Services |
|
0.7 |
|
|
0.5 |
|
|
1.6 |
|
|
1.3 |
|
Total Adjusted Fees(2) |
|
$ |
(1.7) |
|
|
$ |
(6.2) |
|
|
$ |
11.1 |
|
|
$ |
35.7 |
|
(1) As defined in "Common Definitions" section of the earnings release.
(2) Please see the appendix for a reconciliation of Adjusted Fees to its closest GAAP measure.
Kennedy-Wilson Holdings, Inc.
Multifamily Same Property Analysis
(Unaudited)
(Dollars in millions)
Same Property Analysis By Region - Kennedy Wilson's Pro-Rata Share
The Same Property analysis below reflects Kennedy Wilson's ownership in each underlying property and is shown to provide greater clarity of the impact of the Same Property changes to Kennedy Wilson. The analysis below excludes minority-owned investments.
|
|
|
|
|
|
|
|
|
|
|
|
|
|
|
|
|
|
|
|
|
|
|
|
|
|
|
|
|
|
|
|
|
|
|
|
|
|
|
|
|
|
|
|
|
|
|
|
|
|
|
|
|
|
|
|
|
|
|
|
|
|
|
|
|
|
|
|
|
|
|
|
|
|
|
|
|
|
|
|
|
| Three Months Ended September 30, |
|
Units |
|
Average Occupancy % |
|
Total Revenues |
|
Total Operating Expenses |
|
Net Operating Income |
| 2023 vs. 2022 |
|
2023 |
|
2023 |
|
2022 |
|
% Change |
|
2023 |
|
2022 |
|
% Change |
|
2023 |
|
2022 |
|
% Change |
|
2023 |
|
2022 |
|
% Change |
|
|
|
|
|
|
|
|
|
|
|
|
|
|
|
|
|
|
|
|
|
|
|
|
|
|
|
| Market Rate Portfolio |
|
|
|
|
|
|
|
|
|
|
|
|
|
|
|
|
|
|
|
|
|
|
|
|
| Region: |
|
|
|
|
|
|
|
|
|
|
|
|
|
|
|
|
|
|
|
|
|
|
|
|
|
|
| Mountain West |
|
7,403 |
|
|
93.2 |
% |
|
92.7 |
% |
|
0.4 |
% |
|
$ |
30.4 |
|
|
$ |
29.0 |
|
|
4.8 |
% |
|
$ |
10.1 |
|
|
$ |
9.6 |
|
|
4.4 |
% |
|
$ |
20.3 |
|
|
$ |
19.4 |
|
|
5.0 |
% |
| Pacific Northwest |
|
4,195 |
|
|
93.3 |
|
|
93.0 |
|
|
0.4 |
% |
|
18.6 |
|
|
17.8 |
|
|
4.4 |
|
|
6.6 |
|
|
6.2 |
|
|
6.1 |
|
|
12.0 |
|
|
11.6 |
|
|
3.5 |
|
| Southern California |
|
1,898 |
|
|
94.3 |
|
|
94.2 |
|
|
0.1 |
% |
|
9.5 |
|
|
9.2 |
|
|
2.5 |
|
|
3.5 |
|
|
3.3 |
|
|
6.3 |
|
|
5.9 |
|
|
5.9 |
|
|
0.4 |
|
| Northern California |
|
1,670 |
|
|
90.4 |
|
|
92.4 |
|
|
(2.2) |
|
|
8.5 |
|
|
8.6 |
|
|
(0.8) |
|
|
3.7 |
|
|
3.4 |
|
|
8.3 |
|
|
4.9 |
|
|
5.2 |
|
|
(6.7) |
|
| Western U.S. |
|
15,166 |
|
|
93.0 |
% |
|
92.9 |
% |
|
0.1 |
% |
|
$ |
67.0 |
|
|
$ |
64.6 |
|
|
3.6 |
% |
|
$ |
23.9 |
|
|
$ |
22.5 |
|
|
5.8 |
% |
|
$ |
43.1 |
|
|
$ |
42.1 |
|
|
2.5 |
% |
| Ireland |
|
2,497 |
|
|
98.6 |
|
|
98.3 |
|
|
0.4 |
|
|
8.9 |
|
|
8.6 |
|
|
3.4 |
|
|
2.0 |
|
|
2.0 |
|
|
(0.2) |
|
|
6.9 |
|
|
6.6 |
|
|
4.5 |
|
| Market Rate Total |
|
17,663 |
|
|
93.6 |
% |
|
93.5 |
% |
|
0.1 |
% |
|
$ |
75.9 |
|
|
$ |
73.2 |
|
|
3.6 |
% |
|
$ |
25.9 |
|
|
$ |
24.5 |
|
|
5.3 |
% |
|
$ |
50.0 |
|
|
$ |
48.7 |
|
|
2.8 |
% |
|
|
|
|
|
|
|
|
|
|
|
|
|
|
|
|
|
|
|
|
|
|
|
|
|
|
|
| Affordable Portfolio |
|
|
|
|
|
|
|
|
|
|
|
|
|
|
|
|
|
|
|
|
|
|
|
|
| Region: |
|
|
|
|
|
|
|
|
|
|
|
|
|
|
|
|
|
|
|
|
|
|
|
|
|
|
| Pacific Northwest |
|
5,977 |
|
|
96.4 |
% |
|
96.6 |
% |
|
(0.2) |
% |
|
$ |
9.5 |
|
|
$ |
8.9 |
|
|
7.1 |
% |
|
$ |
3.4 |
|
|
$ |
2.9 |
|
|
16.8 |
% |
|
$ |
6.2 |
|
|
$ |
6.0 |
|
|
2.4 |
% |
| Mountain West |
|
1,592 |
|
|
96.1 |
|
|
97.7 |
|
|
(1.6) |
|
|
2.1 |
|
|
2.0 |
|
|
6.4 |
|
|
0.7 |
|
|
0.7 |
|
|
8.3 |
|
|
1.4 |
|
|
1.3 |
|
|
5.5 |
|
| Southern California |
|
704 |
|
|
97.4 |
|
|
98.2 |
|
|
(0.8) |
|
|
1.3 |
|
|
1.3 |
|
|
6.3 |
|
|
0.4 |
|
|
0.3 |
|
|
9.4 |
|
|
1.0 |
|
|
0.9 |
|
|
5.2 |
|
| Northern California |
|
676 |
|
|
97.8 |
|
|
98.6 |
|
|
(0.8) |
|
|
1.1 |
|
|
1.0 |
|
|
8.6 |
|
|
0.4 |
|
|
0.3 |
|
|
12.1 |
|
|
0.8 |
|
|
0.7 |
|
|
7.0 |
|
| Affordable Total |
|
8,949 |
|
|
96.5 |
% |
|
97.1 |
% |
|
(0.5) |
% |
|
$ |
14.0 |
|
|
$ |
13.2 |
|
|
7.0 |
% |
|
$ |
4.9 |
|
|
$ |
4.2 |
|
|
14.5 |
% |
|
$ |
9.4 |
|
|
$ |
8.9 |
|
|
3.5 |
% |
|
|
|
|
|
|
|
|
|
|
|
|
|
|
|
|
|
|
|
|
|
|
|
|
|
|
|
| Total |
|
26,612 |
|
|
94.2 |
% |
|
94.2 |
% |
|
— |
% |
|
$ |
89.9 |
|
|
$ |
86.4 |
|
|
4.1 |
% |
|
$ |
30.8 |
|
|
$ |
28.7 |
|
|
6.6 |
% |
|
$ |
59.4 |
|
|
$ |
57.6 |
|
|
2.9 |
% |
|
|
|
|
|
|
|
|
|
|
|
|
|
|
|
|
|
|
|
|
|
|
|
|
|
|
|
| Total Same Property Units |
|
26,612 |
|
|
|
|
|
|
|
|
|
|
|
|
|
|
|
|
|
|
|
|
|
|
|
|
|
| Excluded from Same-Property analysis: |
|
|
|
|
|
|
|
|
|
|
|
|
|
|
|
|
|
|
|
|
|
|
| Units acquired or stabilized after 7/1/22 |
|
2,132 |
|
|
|
|
|
|
|
|
|
|
|
|
|
|
|
|
|
|
|
|
|
|
|
|
|
| Minority-held units |
|
4,770 |
|
|
|
|
|
|
|
|
|
|
|
|
|
|
|
|
|
|
|
|
|
|
|
|
|
| Total Stabilized Units |
|
33,514 |
|
|
|
|
|
|
|
|
|
|
|
|
|
|
|
|
|
|
|
|
|
|
|
|
|
Note: Percentage changes are based on whole numbers while revenues and net operating income are shown in millions.
Kennedy-Wilson Holdings, Inc.
Multifamily Same Property Analysis (continued)
(Unaudited)
(Dollars in millions)
Same Property Analysis By Region - Kennedy Wilson's Pro-Rata Share
The Same Property analysis below reflects Kennedy Wilson's ownership in each underlying property and is shown to provide greater clarity of the impact of the Same Property changes to Kennedy Wilson. The analysis below excludes minority-owned investments.
|
|
|
|
|
|
|
|
|
|
|
|
|
|
|
|
|
|
|
|
|
|
|
|
|
|
|
|
|
|
|
|
|
|
|
|
|
|
|
|
|
|
|
|
|
|
|
|
|
|
|
|
|
|
|
|
|
|
|
|
|
|
|
|
|
|
|
|
|
|
|
|
|
|
|
|
|
|
|
|
|
| Nine Months Ended September 30, |
|
Units |
|
Average Occupancy % |
|
Total Revenues |
|
Total Operating Expenses |
|
Net Operating Income |
| 2023 vs. 2022 |
|
2023 |
|
2023 |
|
2022 |
|
% Change |
|
2023 |
|
2022 |
|
% Change |
|
2023 |
|
2022 |
|
% Change |
|
2023 |
|
2022 |
|
% Change |
|
|
|
|
|
|
|
|
|
|
|
|
|
|
|
|
|
|
|
|
|
|
|
|
|
|
|
| Market Rate Portfolio |
|
|
|
|
|
|
|
|
|
|
|
|
|
|
|
|
|
|
|
|
|
|
|
|
| Region: |
|
|
|
|
|
|
|
|
|
|
|
|
|
|
|
|
|
|
|
|
|
|
|
|
|
|
| Mountain West |
|
5,609 |
|
|
93.1 |
% |
|
93.5 |
% |
|
(0.5) |
% |
|
$ |
69.0 |
|
|
$ |
65.1 |
|
|
6.0 |
% |
|
$ |
21.6 |
|
|
$ |
20.8 |
|
|
3.7 |
% |
|
$ |
47.5 |
|
|
$ |
44.3 |
|
|
7.1 |
% |
| Pacific Northwest |
|
3,974 |
|
|
93.4 |
|
|
93.7 |
|
|
(0.3) |
% |
|
53.0 |
|
|
49.9 |
|
|
6.1 |
|
|
18.7 |
|
|
17.8 |
|
|
5.0 |
|
|
34.3 |
|
|
32.2 |
|
|
6.7 |
|
| Southern California |
|
1,898 |
|
|
94.0 |
|
|
95.0 |
|
|
(1.0) |
% |
|
28.1 |
|
|
27.6 |
|
|
1.9 |
|
|
10.3 |
|
|
9.6 |
|
|
7.4 |
|
|
17.8 |
|
|
18.0 |
|
|
(1.0) |
|
| Northern California |
|
1,670 |
|
|
90.8 |
|
|
93.4 |
|
|
(2.8) |
|
|
25.4 |
|
|
26.1 |
|
|
(2.7) |
|
|
10.5 |
|
|
9.6 |
|
|
8.9 |
|
|
15.0 |
|
|
16.5 |
|
|
(9.5) |
|
| Western U.S. |
|
13,151 |
|
|
93.0 |
% |
|
93.8 |
% |
|
(0.8) |
% |
|
$ |
175.5 |
|
|
$ |
168.7 |
|
|
4.0 |
% |
|
$ |
61.1 |
|
|
$ |
57.8 |
|
|
5.6 |
% |
|
$ |
114.6 |
|
|
$ |
111.0 |
|
|
3.2 |
% |
| Ireland |
|
2,497 |
|
|
98.5 |
|
|
97.4 |
|
|
1.5 |
|
|
26.6 |
|
|
25.4 |
|
|
4.5 |
|
|
6.1 |
|
|
5.7 |
|
|
7.1 |
|
|
20.5 |
|
|
19.8 |
|
|
3.8 |
|
| Market Rate Total |
|
15,648 |
|
|
93.6 |
% |
|
94.2 |
% |
|
(0.6) |
% |
|
$ |
202.1 |
|
|
$ |
194.1 |
|
|
4.1 |
% |
|
$ |
67.2 |
|
|
$ |
63.5 |
|
|
5.7 |
% |
|
$ |
135.1 |
|
|
$ |
130.8 |
|
|
3.3 |
% |
|
|
|
|
|
|
|
|
|
|
|
|
|
|
|
|
|
|
|
|
|
|
|
|
|
|
|
| Affordable Portfolio |
|
|
|
|
|
|
|
|
|
|
|
|
|
|
|
|
|
|
|
|
|
|
|
|
| Region: |
|
|
|
|
|
|
|
|
|
|
|
|
|
|
|
|
|
|
|
|
|
|
|
|
|
|
| Pacific Northwest |
|
5,623 |
|
|
96.5 |
% |
|
97.3 |
% |
|
(0.7) |
% |
|
$ |
26.1 |
|
|
$ |
24.0 |
|
|
9.0 |
% |
|
$ |
9.1 |
|
|
$ |
7.9 |
|
|
16.1 |
% |
|
$ |
17.0 |
|
|
$ |
16.1 |
|
|
5.6 |
% |
| Mountain West |
|
1,592 |
|
|
96.1 |
|
|
97.7 |
|
|
(1.6) |
|
|
6.3 |
|
|
5.9 |
|
|
6.9 |
|
|
2.1 |
|
|
1.8 |
|
|
15.0 |
|
|
4.2 |
|
|
4.1 |
|
|
3.4 |
|
| Southern California |
|
704 |
|
|
97.4 |
|
|
98.2 |
|
|
(0.8) |
|
|
4.0 |
|
|
3.8 |
|
|
6.1 |
|
|
1.0 |
|
|
0.9 |
|
|
11.5 |
|
|
3.0 |
|
|
2.8 |
|
|
4.4 |
|
| Northern California |
|
676 |
|
|
97.8 |
|
|
98.6 |
|
|
(0.8) |
|
|
3.2 |
|
|
3.0 |
|
|
6.6 |
|
|
1.1 |
|
|
0.9 |
|
|
14.2 |
|
|
2.1 |
|
|
2.1 |
|
|
3.1 |
|
| Affordable Total |
|
8,595 |
|
|
96.6 |
% |
|
97.5 |
% |
|
(0.9) |
% |
|
$ |
39.6 |
|
|
$ |
36.7 |
|
|
8.2 |
% |
|
$ |
13.3 |
|
|
$ |
11.5 |
|
|
15.4 |
% |
|
$ |
26.3 |
|
|
$ |
25.1 |
|
|
4.9 |
% |
|
|
|
|
|
|
|
|
|
|
|
|
|
|
|
|
|
|
|
|
|
|
|
|
|
|
|
| Total |
|
24,243 |
|
|
94.3 |
% |
|
94.9 |
% |
|
(0.6) |
% |
|
$ |
241.7 |
|
|
$ |
230.8 |
|
|
4.7 |
% |
|
$ |
80.5 |
|
|
$ |
75.0 |
|
|
7.4 |
% |
|
$ |
161.4 |
|
|
$ |
155.9 |
|
|
3.5 |
% |
|
|
|
|
|
|
|
|
|
|
|
|
|
|
|
|
|
|
|
|
|
|
|
|
|
|
|
| Total Same Property Units |
|
24,243 |
|
|
|
|
|
|
|
|
|
|
|
|
|
|
|
|
|
|
|
|
|
|
|
|
|
| Excluded from Same-Property analysis: |
|
|
|
|
|
|
|
|
|
|
|
|
|
|
|
|
|
|
|
|
|
|
| Units acquired or stabilized after 1/1/22 |
|
4,501 |
|
|
|
|
|
|
|
|
|
|
|
|
|
|
|
|
|
|
|
|
|
|
|
|
|
| Minority-held units |
|
4,770 |
|
|
|
|
|
|
|
|
|
|
|
|
|
|
|
|
|
|
|
|
|
|
|
|
|
| Total Stabilized Units |
|
33,514 |
|
|
|
|
|
|
|
|
|
|
|
|
|
|
|
|
|
|
|
|
|
|
|
|
|
Note: Percentage changes are based on whole numbers while revenues and net operating income are shown in millions.
Kennedy-Wilson Holdings, Inc.
Office Same Property Analysis
(Unaudited)
(Dollars and Square Feet in millions)
Same Property Analysis By Region - Kennedy Wilson's Pro-Rata Share (including straight-line rents)
The Same Property analysis below reflects Kennedy Wilson's ownership in each underlying property and is shown to provide greater clarity of the impact of the Same Property changes to Kennedy Wilson. The analysis below excludes minority-owned investments.
|
|
|
|
|
|
|
|
|
|
|
|
|
|
|
|
|
|
|
|
|
|
|
|
|
|
|
|
|
|
|
|
|
|
|
|
|
|
|
|
|
|
|
|
|
|
|
|
|
|
|
|
|
|
|
|
|
|
|
|
|
|
|
|
|
|
|
|
|
|
|
|
|
|
|
|
|
|
|
|
|
| Three Months Ended September 30, |
|
Square Feet |
|
Average Occupancy % |
|
Total Revenues |
|
Total Operating Expenses |
|
Net Operating Income |
| 2023 vs. 2022 |
|
2023 |
|
2023 |
|
2022 |
|
% Change |
|
2023 |
|
2022 |
|
% Change |
|
2023 |
|
2022 |
|
% Change |
|
2023 |
|
2022 |
|
% Change |
|
|
|
|
|
|
|
|
|
|
|
|
|
|
|
|
|
|
|
|
|
|
|
|
|
|
|
| Region: |
|
|
|
|
|
|
|
|
|
|
|
|
|
|
|
|
|
|
|
|
|
|
|
|
|
|
| Pacific Northwest |
|
0.6 |
|
|
100.0 |
% |
|
100.0 |
% |
|
— |
% |
|
$ |
4.3 |
|
|
$ |
4.3 |
|
|
0.9 |
% |
|
$ |
0.8 |
|
|
$ |
0.8 |
|
|
1.3 |
% |
|
$ |
3.6 |
|
|
$ |
3.5 |
|
|
0.8 |
% |
| Southern California |
|
0.2 |
|
|
90.5 |
|
|
92.1 |
|
|
(1.8) |
|
|
2.8 |
|
|
2.7 |
|
|
3.3 |
|
|
1.0 |
|
|
1.0 |
|
|
(2.6) |
|
|
1.8 |
|
|
1.7 |
|
|
6.9 |
|
| Northern California |
|
0.3 |
|
|
84.5 |
|
|
83.0 |
|
|
1.8 |
|
|
2.7 |
|
|
2.7 |
|
|
1.5 |
|
|
1.2 |
|
|
1.1 |
|
|
5.7 |
|
|
1.5 |
|
|
1.6 |
|
|
(1.6) |
|
| Western U.S. |
|
1.1 |
|
|
94.2 |
% |
|
94.1 |
% |
|
0.2 |
% |
|
9.8 |
|
|
9.7 |
|
|
1.7 |
% |
|
3.0 |
|
|
2.9 |
|
|
1.6 |
% |
|
6.9 |
|
|
6.8 |
|
|
1.8 |
% |
| United Kingdom |
|
2.0 |
|
|
93.1 |
|
|
92.5 |
|
|
0.7 |
|
|
13.2 |
|
|
13.1 |
|
|
0.4 |
|
|
1.1 |
|
|
0.9 |
|
|
17.6 |
|
|
12.1 |
|
|
12.2 |
|
|
(0.9) |
|
| Ireland |
|
0.9 |
|
|
96.0 |
|
|
96.0 |
|
|
— |
|
|
7.0 |
|
|
6.6 |
|
|
5.7 |
|
|
0.2 |
|
|
0.2 |
|
|
(1.5) |
|
|
6.8 |
|
|
6.4 |
|
|
5.9 |
|
| Italy |
|
0.6 |
|
|
100.0 |
|
|
100.0 |
|
|
— |
|
|
1.8 |
|
|
2.2 |
|
|
(19.9) |
|
|
0.2 |
|
|
0.2 |
|
|
33.7 |
|
|
1.5 |
|
|
2.0 |
|
|
(24.6) |
|
| Europe |
|
3.5 |
|
|
95.1 |
% |
|
94.7 |
% |
|
0.4 |
% |
|
22.0 |
|
|
21.9 |
|
|
(0.1) |
% |
|
1.5 |
|
|
1.3 |
|
|
16.9 |
% |
|
20.4 |
|
|
20.6 |
|
|
(1.1) |
% |
|
|
|
|
|
|
|
|
|
|
|
|
|
|
|
|
|
|
|
|
|
|
|
|
|
|
|
| Total |
|
4.6 |
|
|
94.9 |
% |
|
94.5 |
% |
|
0.3 |
% |
|
$ |
31.8 |
|
|
$ |
31.6 |
|
|
0.5 |
% |
|
$ |
4.5 |
|
|
$ |
4.2 |
|
|
6.3 |
% |
|
$ |
27.3 |
|
|
$ |
27.4 |
|
|
(0.4) |
% |
|
|
|
|
|
|
|
|
|
|
|
|
|
|
|
|
|
|
|
|
|
|
|
|
|
|
|
| Total Same Property Square Feet |
|
4.6 |
|
|
|
|
|
|
|
|
|
|
|
|
|
|
|
|
|
|
|
|
|
| Excluded from Same-Property analysis: |
|
|
|
|
|
|
|
|
|
|
|
|
|
|
|
|
|
|
|
|
|
|
| Assets acquired or stabilized after 1/1/22 or occupied by KW |
|
0.1 |
|
|
|
|
|
|
|
|
|
|
|
|
|
|
|
|
|
|
|
|
|
| Minority-held office properties |
|
4.9 |
|
|
|
|
|
|
|
|
|
|
|
|
|
|
|
|
|
|
|
|
|
| Total Stabilized Square Feet |
|
9.6 |
|
|
|
|
|
|
|
|
|
|
|
|
|
|
|
|
|
|
|
|
|
Note: Percentage changes are based on whole numbers while revenues and net operating income are shown in millions.
Kennedy-Wilson Holdings, Inc.
Office Same Property Analysis (continued)
(Unaudited)
(Dollars and Square Feet in millions)
Same Property Analysis By Region - Kennedy Wilson's Pro-Rata Share (including straight-line rents)
The Same Property analysis below reflects Kennedy Wilson's ownership in each underlying property and is shown to provide greater clarity of the impact of the Same Property changes to Kennedy Wilson. The analysis below excludes minority-owned investments.
|
|
|
|
|
|
|
|
|
|
|
|
|
|
|
|
|
|
|
|
|
|
|
|
|
|
|
|
|
|
|
|
|
|
|
|
|
|
|
|
|
|
|
|
|
|
|
|
|
|
|
|
|
|
|
|
|
|
|
|
|
|
|
|
|
|
|
|
|
|
|
|
|
|
|
|
|
|
|
|
|
| Nine Months Ended September 30, |
|
Square Feet |
|
Average Occupancy % |
|
Total Revenues |
|
Total Operating Expenses |
|
Net Operating Income |
| 2023 vs. 2022 |
|
2023 |
|
2023 |
|
2022 |
|
% Change |
|
2023 |
|
2022 |
|
% Change |
|
2023 |
|
2022 |
|
% Change |
|
2023 |
|
2022 |
|
% Change |
|
|
|
|
|
|
|
|
|
|
|
|
|
|
|
|
|
|
|
|
|
|
|
|
|
|
|
| Region: |
|
|
|
|
|
|
|
|
|
|
|
|
|
|
|
|
|
|
|
|
|
|
|
|
|
|
| Pacific Northwest |
|
0.6 |
|
|
100.0 |
% |
|
100.0 |
% |
|
— |
% |
|
$ |
13.0 |
|
|
$ |
12.9 |
|
|
0.8 |
% |
|
$ |
2.3 |
|
|
$ |
2.4 |
|
|
(4.2) |
% |
|
$ |
10.6 |
|
|
$ |
10.4 |
|
|
1.9 |
% |
| Southern California |
|
0.2 |
|
|
90.1 |
|
|
92.1 |
|
|
(2.2) |
|
|
8.4 |
|
|
8.3 |
|
|
1.2 |
|
|
3.1 |
|
|
3.0 |
|
|
4.3 |
|
|
5.3 |
|
|
5.3 |
|
|
(0.5) |
|
| Northern California |
|
0.3 |
|
|
83.1 |
|
|
79.5 |
|
|
4.5 |
|
|
7.1 |
|
|
7.4 |
|
|
(3.5) |
|
|
3.5 |
|
|
3.0 |
|
|
15.6 |
|
|
3.6 |
|
|
4.4 |
|
|
(16.8) |
|
| Western U.S. |
|
1.1 |
|
|
93.8 |
% |
|
93.1 |
% |
|
0.7 |
% |
|
28.5 |
|
|
28.6 |
|
|
(0.2) |
% |
|
8.9 |
|
|
8.4 |
|
|
5.9 |
% |
|
19.5 |
|
|
20.1 |
|
|
(2.8) |
% |
| United Kingdom |
|
1.8 |
|
|
92.8 |
|
|
90.6 |
|
|
2.4 |
|
|
36.7 |
|
|
35.1 |
|
|
4.4 |
|
|
2.5 |
|
|
2.8 |
|
|
(9.8) |
|
|
34.2 |
|
|
32.4 |
|
|
5.6 |
|
| Ireland |
|
0.8 |
|
|
95.8 |
|
|
96.7 |
|
|
(1.0) |
|
|
19.0 |
|
|
18.1 |
|
|
5.4 |
|
|
0.5 |
|
|
0.4 |
|
|
2.0 |
|
|
18.6 |
|
|
17.6 |
|
|
5.5 |
|
| Italy |
|
0.6 |
|
|
100.0 |
|
|
100.0 |
|
|
— |
|
|
5.2 |
|
|
6.6 |
|
|
(20.8) |
|
|
0.8 |
|
|
0.7 |
|
|
17.0 |
|
|
4.4 |
|
|
5.8 |
|
|
(25.5) |
|
| Europe |
|
3.2 |
|
|
95.0 |
% |
|
94.0 |
% |
|
1.1 |
% |
|
60.9 |
|
|
59.8 |
|
|
2.0 |
% |
|
3.8 |
|
|
3.9 |
|
|
(3.5) |
% |
|
57.2 |
|
|
55.8 |
|
|
2.3 |
% |
|
|
|
|
|
|
|
|
|
|
|
|
|
|
|
|
|
|
|
|
|
|
|
|
|
|
|
| Total |
|
4.3 |
|
|
94.7 |
% |
|
93.7 |
% |
|
1.0 |
% |
|
$ |
89.4 |
|
|
$ |
88.4 |
|
|
1.3 |
% |
|
$ |
12.7 |
|
|
$ |
12.3 |
|
|
2.9 |
% |
|
$ |
76.7 |
|
|
$ |
75.9 |
|
|
1.0 |
% |
|
|
|
|
|
|
|
|
|
|
|
|
|
|
|
|
|
|
|
|
|
|
|
|
|
|
|
| Total Same Property Square Feet |
|
4.3 |
|
|
|
|
|
|
|
|
|
|
|
|
|
|
|
|
|
|
|
|
|
| Excluded from Same-Property analysis: |
|
|
|
|
|
|
|
|
|
|
|
|
|
|
|
|
|
|
|
|
|
|
| Assets acquired or stabilized after 1/1/22 or occupied by KW |
|
0.3 |
|
|
|
|
|
|
|
|
|
|
|
|
|
|
|
|
|
|
|
|
|
| Minority-held office properties |
|
5.0 |
|
|
|
|
|
|
|
|
|
|
|
|
|
|
|
|
|
|
|
|
|
| Total Stabilized Square Feet |
|
9.6 |
|
|
|
|
|
|
|
|
|
|
|
|
|
|
|
|
|
|
|
|
|
Note: Percentage changes are based on whole numbers while revenues and net operating income are shown in millions.
Kennedy-Wilson Holdings, Inc.
Office Same Property Analysis (continued)
(Unaudited)
(Dollars and Square Feet in millions)
Same Property Analysis By Region - Kennedy Wilson's Pro-Rata Share (excluding straight-line rents)
The Same Property analysis below reflects Kennedy Wilson's ownership in each underlying property and is shown to provide greater clarity of the impact of the Same Property changes to Kennedy Wilson. The analysis below excludes the effect of straight-line rents, and minority-owned investments.
|
|
|
|
|
|
|
|
|
|
|
|
|
|
|
|
|
|
|
|
|
|
|
|
|
|
|
|
|
|
|
|
|
|
|
|
|
|
|
|
|
|
|
|
|
|
|
|
|
|
|
|
|
|
|
|
|
|
|
|
|
|
|
|
|
|
|
|
|
|
|
|
|
|
|
|
|
|
|
|
|
| Three Months Ended September 30, |
|
Square Feet |
|
Average Occupancy % |
|
Total Revenues |
|
Total Operating Expenses |
|
Net Operating Income |
| 2023 vs. 2022 |
|
2023 |
|
2023 |
|
2022 |
|
% Change |
|
2023 |
|
2022 |
|
% Change |
|
2023 |
|
2022 |
|
% Change |
|
2023 |
|
2022 |
|
% Change |
|
|
|
|
|
|
|
|
|
|
|
|
|
|
|
|
|
|
|
|
|
|
|
|
|
|
|
| Region: |
|
|
|
|
|
|
|
|
|
|
|
|
|
|
|
|
|
|
|
|
|
|
|
|
|
|
| Pacific Northwest |
|
0.6 |
|
|
100.0 |
% |
|
100.0 |
% |
|
— |
% |
|
$ |
4.7 |
|
|
$ |
4.6 |
|
|
3.1 |
% |
|
$ |
0.8 |
|
|
$ |
0.8 |
|
|
1.3 |
% |
|
$ |
4.0 |
|
|
$ |
3.8 |
|
|
3.5 |
% |
| Southern California |
|
0.2 |
|
|
90.5 |
|
|
92.1 |
|
|
(1.8) |
|
|
2.5 |
|
|
2.7 |
|
|
(7.8) |
|
|
1.0 |
|
|
1.0 |
|
|
(2.6) |
|
|
1.5 |
|
|
1.7 |
|
|
(10.9) |
|
| Northern California |
|
0.3 |
|
|
84.5 |
|
|
83.0 |
|
|
1.8 |
|
|
2.0 |
|
|
2.4 |
|
|
(14.5) |
|
|
1.2 |
|
|
1.1 |
|
|
5.7 |
|
|
0.9 |
|
|
1.3 |
|
|
(32.2) |
|
| Western U.S. |
|
1.1 |
|
|
94.2 |
% |
|
94.1 |
% |
|
0.2 |
% |
|
9.2 |
|
|
9.7 |
|
|
(4.3) |
% |
|
3.0 |
|
|
2.9 |
|
|
1.6 |
% |
|
6.4 |
|
|
6.8 |
|
|
(6.8) |
% |
| United Kingdom |
|
2.0 |
|
|
93.1 |
|
|
92.5 |
|
|
0.7 |
|
|
13.1 |
|
|
11.9 |
|
|
10.0 |
|
|
1.1 |
|
|
0.9 |
|
|
17.6 |
|
|
12.1 |
|
|
11.0 |
|
|
9.4 |
|
| Ireland |
|
0.9 |
|
|
96.0 |
|
|
96.0 |
|
|
— |
|
|
6.8 |
|
|
6.3 |
|
|
7.9 |
|
|
0.2 |
|
|
0.2 |
|
|
(1.5) |
|
|
6.6 |
|
|
6.1 |
|
|
8.2 |
|
| Italy |
|
0.6 |
|
|
100.0 |
|
|
100.0 |
|
|
— |
|
|
1.8 |
|
|
2.2 |
|
|
(19.9) |
|
|
0.2 |
|
|
0.2 |
|
|
33.7 |
|
|
1.5 |
|
|
2.0 |
|
|
(24.6) |
|
| Europe |
|
3.5 |
|
|
95.1 |
% |
|
94.7 |
% |
|
0.4 |
% |
|
21.7 |
|
|
20.4 |
|
|
6.1 |
% |
|
1.5 |
|
|
1.3 |
|
|
16.9 |
% |
|
20.2 |
|
|
19.1 |
|
|
5.4 |
% |
|
|
|
|
|
|
|
|
|
|
|
|
|
|
|
|
|
|
|
|
|
|
|
|
|
|
|
| Total |
|
4.6 |
|
|
94.9 |
% |
|
94.5 |
% |
|
0.3 |
% |
|
$ |
30.9 |
|
|
$ |
30.1 |
|
|
2.8 |
% |
|
$ |
4.5 |
|
|
$ |
4.2 |
|
|
6.3 |
% |
|
$ |
26.6 |
|
|
$ |
25.9 |
|
|
2.2 |
% |
|
|
|
|
|
|
|
|
|
|
|
|
|
|
|
|
|
|
|
|
|
|
|
|
|
|
|
| Total Same Property Square Feet |
|
4.6 |
|
|
|
|
|
|
|
|
|
|
|
|
|
|
|
|
|
|
|
|
|
| Excluded from Same-Property analysis: |
|
|
|
|
|
|
|
|
|
|
|
|
|
|
|
|
|
|
|
|
|
|
| Assets acquired or stabilized after 1/1/22 or occupied by KW |
|
0.1 |
|
|
|
|
|
|
|
|
|
|
|
|
|
|
|
|
|
|
|
|
|
| Minority-held office properties |
|
4.9 |
|
|
|
|
|
|
|
|
|
|
|
|
|
|
|
|
|
|
|
|
|
| Total Stabilized Square Feet |
|
9.6 |
|
|
|
|
|
|
|
|
|
|
|
|
|
|
|
|
|
|
|
|
|
Note: Percentage changes are based on whole numbers while revenues and net operating income are shown in millions.
Kennedy-Wilson Holdings, Inc.
Office Same Property Analysis (continued)
(Unaudited)
(Dollars and Square Feet in millions)
Same Property Analysis By Region - Kennedy Wilson's Pro-Rata Share (excluding straight-line rents)
The Same Property analysis below reflects Kennedy Wilson's ownership in each underlying property and is shown to provide greater clarity of the impact of the Same Property changes to Kennedy Wilson. The analysis below excludes the effect of straight-line rents, and minority-owned investments.
|
|
|
|
|
|
|
|
|
|
|
|
|
|
|
|
|
|
|
|
|
|
|
|
|
|
|
|
|
|
|
|
|
|
|
|
|
|
|
|
|
|
|
|
|
|
|
|
|
|
|
|
|
|
|
|
|
|
|
|
|
|
|
|
|
|
|
|
|
|
|
|
|
|
|
|
|
|
|
|
|
| Nine Months Ended September 30, |
|
Square Feet |
|
Average Occupancy % |
|
Total Revenues |
|
Total Operating Expenses |
|
Net Operating Income |
| 2023 vs. 2022 |
|
2023 |
|
2023 |
|
2022 |
|
% Change |
|
2023 |
|
2022 |
|
% Change |
|
2023 |
|
2022 |
|
% Change |
|
2023 |
|
2022 |
|
% Change |
|
|
|
|
|
|
|
|
|
|
|
|
|
|
|
|
|
|
|
|
|
|
|
|
|
|
|
| Region: |
|
|
|
|
|
|
|
|
|
|
|
|
|
|
|
|
|
|
|
|
|
|
|
|
|
|
| Pacific Northwest |
|
0.6 |
|
|
100.0 |
% |
|
100.0 |
% |
|
— |
% |
|
$ |
14.2 |
|
|
$ |
13.7 |
|
|
3.9 |
% |
|
$ |
2.3 |
|
|
$ |
2.4 |
|
|
(4.2) |
% |
|
$ |
11.9 |
|
|
$ |
11.2 |
|
|
5.6 |
% |
| Southern California |
|
0.2 |
|
|
90.1 |
|
|
92.1 |
|
|
(2.2) |
|
|
7.6 |
|
|
8.3 |
|
|
(8.1) |
|
|
3.1 |
|
|
3.0 |
|
|
4.3 |
|
|
4.4 |
|
|
5.2 |
|
|
(15.3) |
|
| Northern California |
|
0.3 |
|
|
83.1 |
|
|
79.5 |
|
|
4.5 |
|
|
6.7 |
|
|
7.0 |
|
|
(5.0) |
|
|
3.5 |
|
|
3.0 |
|
|
15.6 |
|
|
3.1 |
|
|
4.0 |
|
|
(20.8) |
|
| Western U.S. |
|
1.1 |
|
|
93.8 |
% |
|
93.1 |
% |
|
0.7 |
% |
|
28.5 |
|
|
29.0 |
|
|
(1.7) |
% |
|
8.9 |
|
|
8.4 |
|
|
5.9 |
% |
|
19.4 |
|
|
20.4 |
|
|
(4.9) |
% |
| United Kingdom |
|
1.8 |
|
|
92.8 |
|
|
90.6 |
|
|
2.4 |
|
|
35.8 |
|
|
32.4 |
|
|
10.4 |
|
|
2.5 |
|
|
2.8 |
|
|
(9.8) |
|
|
33.3 |
|
|
29.6 |
|
|
12.2 |
|
| Ireland |
|
0.8 |
|
|
95.8 |
|
|
96.7 |
|
|
(1.0) |
|
|
19.5 |
|
|
18.9 |
|
|
3.4 |
|
|
0.5 |
|
|
0.4 |
|
|
2.0 |
|
|
19.1 |
|
|
18.4 |
|
|
3.5 |
|
| Italy |
|
0.6 |
|
|
100.0 |
|
|
100.0 |
|
|
— |
|
|
5.2 |
|
|
6.6 |
|
|
(20.8) |
|
|
0.8 |
|
|
0.7 |
|
|
17.0 |
|
|
4.4 |
|
|
5.8 |
|
|
(25.5) |
|
| Europe |
|
3.2 |
|
|
95.0 |
% |
|
94.0 |
% |
|
1.1 |
% |
|
60.5 |
|
|
57.9 |
|
|
4.6 |
% |
|
3.8 |
|
|
3.9 |
|
|
(3.5) |
% |
|
56.8 |
|
|
53.8 |
|
|
5.2 |
% |
|
|
|
|
|
|
|
|
|
|
|
|
|
|
|
|
|
|
|
|
|
|
|
|
|
|
|
| Total |
|
4.3 |
|
|
94.7 |
% |
|
93.7 |
% |
|
1.0 |
% |
|
$ |
89.0 |
|
|
$ |
86.9 |
|
|
25.5 |
% |
|
$ |
12.7 |
|
|
$ |
12.3 |
|
|
2.9 |
% |
|
$ |
76.2 |
|
|
$ |
74.2 |
|
|
2.4 |
% |
|
|
|
|
|
|
|
|
|
|
|
|
|
|
|
|
|
|
|
|
|
|
|
|
|
|
|
| Total Same Property Square Feet |
|
4.3 |
|
|
|
|
|
|
|
|
|
|
|
|
|
|
|
|
|
|
|
|
|
| Excluded from Same-Property analysis: |
|
|
|
|
|
|
|
|
|
|
|
|
|
|
|
|
|
|
|
|
|
|
| Assets acquired or stabilized after 1/1/22 or occupied by KW |
|
0.3 |
|
|
|
|
|
|
|
|
|
|
|
|
|
|
|
|
|
|
|
|
|
| Minority-held office properties |
|
5.0 |
|
|
|
|
|
|
|
|
|
|
|
|
|
|
|
|
|
|
|
|
|
| Total Stabilized Square Feet |
|
9.6 |
|
|
|
|
|
|
|
|
|
|
|
|
|
|
|
|
|
|
|
|
|
Note: Percentage changes are based on whole numbers while revenues and net operating income are shown in millions.
Kennedy-Wilson Holdings, Inc.
Investment Transactions
(Unaudited)
(Dollars in millions)
Listed below is additional detailed information about the acquisitions and dispositions completed during the three and nine months ended September 30, 2023:
|
|
|
|
|
|
|
|
|
|
|
|
|
|
|
|
|
|
|
|
|
|
|
|
|
|
|
|
|
|
|
100% |
Kennedy Wilson's Share |
| Acquisitions |
Real Estate Aggregate Purchase Price |
Cap Rate(1)
|
Loan Purchases/Originations |
Annual Return on Loans(4) |
Real Estate Pro-Rata Purchase Price |
Cap Rate(2)(4) |
Loan Purchases/Originations |
Annual Return on Loans(4) |
KW Ownership(3) |
| Q3-23 |
|
|
|
|
|
|
|
|
| Western U.S. |
$94.0 |
|
6.0% |
$212.3 |
|
12.8% |
$9.4 |
|
6.0% |
$10.6 |
|
14.1% |
6.5% |
| Europe |
37.1 |
|
5.3% |
— |
|
—% |
8.1 |
|
5.3% |
— |
|
—% |
21.7% |
| Total |
$131.1 |
|
5.8% |
$212.3 |
|
12.8% |
$17.5 |
|
5.7% |
$10.6 |
|
14.1% |
8.2% |
|
|
|
|
|
|
|
|
|
|
| YTD |
|
|
|
|
|
|
|
|
| Western U.S. |
$94.0 |
|
6.0% |
$2,329.3 |
|
11.3% |
$9.4 |
|
6.0% |
$111.7 |
|
12.6% |
5.0% |
| Europe |
54.3 |
|
5.2% |
— |
|
—% |
11.5 |
|
5.2% |
— |
|
|
21.2% |
| Total |
$148.3 |
|
5.7% |
$2,329.3 |
|
11.3% |
$20.9 |
|
5.6% |
$111.7 |
|
12.6% |
5.4% |
|
|
|
|
|
|
|
|
|
|
|
|
|
|
|
|
|
|
|
|
|
|
|
|
|
|
|
100% |
Kennedy Wilson's Share |
| Dispositions |
Real Estate
Aggregate Sale Price |
Cap Rate(1)
|
Loan Repayments |
|
Real Estate Pro-Rata Sale Price |
Cap Rate(2)(4) |
Loan Repayments |
|
KW Ownership(3) |
| Q3-23 |
|
|
|
|
|
|
|
|
| Western U.S. |
$72.2 |
|
5.6% |
$375.5 |
|
|
$58.3 |
|
5.7% |
$24.6 |
|
|
18.5% |
| Europe |
43.7 |
|
10.7% |
— |
|
|
43.7 |
|
10.7% |
— |
|
|
100.0% |
| Total |
$115.9 |
|
7.5% |
$ |
375.5 |
|
|
$102.0 |
|
7.8% |
$24.6 |
|
|
25.8% |
|
|
|
|
|
|
|
|
|
|
| YTD |
|
|
|
|
|
|
|
|
| Western U.S. |
$455.7 |
|
5.2% |
$531.1 |
|
|
$333.3 |
|
5.2% |
$34.4 |
|
|
37.3% |
| Europe |
163.4 |
|
8.2% |
— |
|
|
95.4 |
|
9.4% |
— |
|
|
58.4% |
| Total |
$619.1 |
|
5.9% |
$531.1 |
|
|
$428.7 |
|
6.2% |
$34.4 |
|
|
40.3% |
Note: The table above excludes partial sales in Ireland for $8 million, of which Kennedy Wilson's share was $4 million.
(1) For acquisitions and dispositions, the Cap Rate includes only income-producing properties. For Q3-23, there were $0.8 million of acquisitions and $2.2 million of dispositions of non-income producing real estate assets. For YTD-23, there were $0.8 million of acquisitions and $107.3 million of dispositions of non-income producing real estate assets. Please see "common definitions" for a definition of Cap Rate and a description of its limitations.
(2) For acquisitions and dispositions, the Cap Rate includes only income-producing properties at Kennedy Wilson's share. For Q3-23, there were $0.8 million of acquisitions and $1.2 million of dispositions of non-income producing real estate assets. For YTD-23, there were $0.8 million of acquisitions and $58.5 million of dispositions of non-income producing real estate assets. Please see "common definitions" for a definition of Cap Rate and a description of its limitations
(3) Kennedy Wilson's ownership is shown on a weighted average basis based upon the aggregate purchase/sale price of each investment and Kennedy Wilson's ownership in each investment at the time of acquisition/disposition.
(4) As defined in "Common Definitions" section of the earnings release.
Kennedy-Wilson Holdings, Inc.
Segment Detail
(Unaudited, Dollars in millions)
|
|
|
|
|
|
|
|
|
|
|
|
|
|
|
|
|
|
|
|
|
|
|
|
|
|
|
|
|
|
|
|
|
Three Months Ended September 30, 2023 |
|
|
Consolidated |
|
|
|
|
|
Co-Investment |
|
Corporate |
|
Total |
|
|
|
|
|
|
|
|
|
| Revenue |
|
|
|
|
|
|
|
|
|
|
|
|
| Rental |
|
$ |
102.4 |
|
|
|
|
|
|
$ |
— |
|
|
$ |
— |
|
|
$ |
102.4 |
|
| Hotel |
|
16.6 |
|
|
|
|
|
|
— |
|
|
— |
|
|
16.6 |
|
| Investment management fees |
|
— |
|
|
|
|
|
|
15.5 |
|
|
— |
|
|
15.5 |
|
| Property services fees |
|
— |
|
|
|
|
|
|
— |
|
|
0.7 |
|
|
0.7 |
|
| Loans and other |
|
— |
|
|
|
|
|
|
6.1 |
|
|
— |
|
|
6.1 |
|
| Total revenue |
|
119.0 |
|
|
|
|
|
|
21.6 |
|
|
0.7 |
|
|
141.3 |
|
|
|
|
|
|
|
|
|
|
|
|
|
|
| Loss from unconsolidated investments |
|
|
|
|
|
|
|
|
|
|
|
|
| Principal co-investments |
|
— |
|
|
|
|
|
|
(56.1) |
|
|
— |
|
|
(56.1) |
|
| Performance allocations |
|
— |
|
|
|
|
|
|
(17.9) |
|
|
— |
|
|
(17.9) |
|
| Loss from unconsolidated investments |
|
— |
|
|
|
|
|
|
(74.0) |
|
|
— |
|
|
(74.0) |
|
|
|
|
|
|
|
|
|
|
|
|
|
|
| Gain on sale of real estate, net |
|
30.4 |
|
|
|
|
|
|
— |
|
|
— |
|
|
30.4 |
|
| Expenses |
|
|
|
|
|
|
|
|
|
|
|
|
| Rental |
|
38.4 |
|
|
|
|
|
|
— |
|
|
— |
|
|
38.4 |
|
| Hotel |
|
9.8 |
|
|
|
|
|
|
— |
|
|
— |
|
|
9.8 |
|
Compensation and related (including $7.3 of share-based compensation) |
|
13.2 |
|
|
|
|
|
|
5.5 |
|
|
12.4 |
|
|
31.1 |
|
| Performance allocation compensation |
|
— |
|
|
|
|
|
|
(6.0) |
|
|
— |
|
|
(6.0) |
|
| General and administrative |
|
4.8 |
|
|
|
|
|
|
1.9 |
|
|
1.7 |
|
|
8.4 |
|
| Depreciation and amortization |
|
38.8 |
|
|
|
|
|
|
— |
|
|
— |
|
|
38.8 |
|
| Total expenses |
|
105.0 |
|
|
|
|
|
|
1.4 |
|
|
14.1 |
|
|
120.5 |
|
| Interest expense |
|
(40.8) |
|
|
|
|
|
|
— |
|
|
(23.4) |
|
|
(64.2) |
|
| Loss on early extinguishment of debt |
|
— |
|
|
|
|
|
|
— |
|
|
— |
|
|
— |
|
| Other (loss) income |
|
(4.9) |
|
|
|
|
|
|
— |
|
|
8.1 |
|
|
3.2 |
|
| Loss before benefit from income taxes |
|
(1.3) |
|
|
|
|
|
|
(53.8) |
|
|
(28.7) |
|
|
(83.8) |
|
| Benefit from income taxes |
|
0.7 |
|
|
|
|
|
|
— |
|
|
19.0 |
|
|
19.7 |
|
| Net loss |
|
(0.6) |
|
|
|
|
|
|
(53.8) |
|
|
(9.7) |
|
|
(64.1) |
|
| Net income attributable to noncontrolling interests |
|
(17.3) |
|
|
|
|
|
|
— |
|
|
— |
|
|
(17.3) |
|
| Preferred dividends |
|
— |
|
|
|
|
|
|
— |
|
|
(10.8) |
|
|
(10.8) |
|
| Net loss attributable to Kennedy-Wilson Holdings, Inc. common shareholders |
|
$ |
(17.9) |
|
|
|
|
|
|
$ |
(53.8) |
|
|
$ |
(20.5) |
|
|
$ |
(92.2) |
|
|
|
|
|
|
|
|
|
|
|
|
|
|
| Add back (less) (Kennedy Wilson's Share): |
|
|
|
|
|
|
|
|
|
|
|
|
| Interest expense |
|
$ |
40.2 |
|
|
|
|
|
|
$ |
25.8 |
|
|
$ |
23.4 |
|
|
$ |
89.4 |
|
| Loss on early extinguishment of debt |
|
— |
|
|
|
|
|
|
— |
|
|
— |
|
|
— |
|
| Depreciation and amortization |
|
37.4 |
|
|
|
|
|
|
0.8 |
|
|
— |
|
|
38.2 |
|
| Benefit from income taxes |
|
(0.7) |
|
|
|
|
|
|
(0.6) |
|
|
(19.0) |
|
|
(20.3) |
|
| Share-based compensation |
|
— |
|
|
|
|
|
|
— |
|
|
7.3 |
|
|
7.3 |
|
| Preferred Dividends |
|
— |
|
|
|
|
|
|
— |
|
|
10.8 |
|
|
10.8 |
|
| Fees eliminated in consolidation |
|
— |
|
|
|
|
|
|
— |
|
|
— |
|
|
— |
|
| Adjusted EBITDA |
|
$ |
59.0 |
|
|
|
|
|
|
$ |
(27.8) |
|
|
$ |
2.0 |
|
|
$ |
33.2 |
|
Kennedy-Wilson Holdings, Inc.
Segment Detail (continued)
(Unaudited, Dollars in millions)
|
|
|
|
|
|
|
|
|
|
|
|
|
|
|
|
|
|
|
|
|
|
|
|
|
|
|
|
|
|
|
|
|
Nine Months Ended September 30, 2023 |
|
|
Consolidated |
|
|
|
|
|
Co-Investment |
|
Corporate |
|
Total |
|
|
|
|
|
|
|
|
|
| Revenue |
|
|
|
|
|
|
|
|
|
|
|
|
| Rental |
|
$ |
315.6 |
|
|
|
|
|
|
$ |
— |
|
|
$ |
— |
|
|
$ |
315.6 |
|
| Hotel |
|
42.7 |
|
|
|
|
|
|
— |
|
|
— |
|
|
42.7 |
|
| Investment management fees |
|
— |
|
|
|
|
|
|
45.6 |
|
|
— |
|
|
45.6 |
|
| Property services fees |
|
— |
|
|
|
|
|
|
— |
|
|
1.6 |
|
|
1.6 |
|
| Loans and other |
|
— |
|
|
|
|
|
|
14.5 |
|
|
— |
|
|
14.5 |
|
| Total revenue |
|
358.3 |
|
|
|
|
|
|
60.1 |
|
|
1.6 |
|
|
420.0 |
|
|
|
|
|
|
|
|
|
|
|
|
|
|
| Loss from unconsolidated investments |
|
|
|
|
|
|
|
|
|
|
|
|
| Principal co-investments |
|
— |
|
|
|
|
|
|
(33.4) |
|
|
— |
|
|
(33.4) |
|
| Performance allocations |
|
— |
|
|
|
|
|
|
(36.3) |
|
|
— |
|
|
(36.3) |
|
| Loss from unconsolidated investments |
|
— |
|
|
|
|
|
|
(69.7) |
|
|
— |
|
|
(69.7) |
|
|
|
|
|
|
|
|
|
|
|
|
|
|
| Gain on sale of real estate, net |
|
138.6 |
|
|
|
|
|
|
— |
|
|
— |
|
|
138.6 |
|
| Expenses |
|
|
|
|
|
|
|
|
|
|
|
|
| Rental |
|
113.7 |
|
|
|
|
|
|
— |
|
|
— |
|
|
113.7 |
|
| Hotel |
|
27.4 |
|
|
|
|
|
|
— |
|
|
— |
|
|
27.4 |
|
Compensation and related (including $21.7 of share-based compensation) |
|
36.4 |
|
|
|
|
|
|
24.0 |
|
|
38.3 |
|
|
98.7 |
|
| Performance allocation compensation |
|
— |
|
|
|
|
|
|
(5.5) |
|
|
— |
|
|
(5.5) |
|
| General and administrative |
|
12.7 |
|
|
|
|
|
|
7.6 |
|
|
5.2 |
|
|
25.5 |
|
| Depreciation and amortization |
|
118.3 |
|
|
|
|
|
|
— |
|
|
— |
|
|
118.3 |
|
| Total expenses |
|
308.5 |
|
|
|
|
|
|
26.1 |
|
|
43.5 |
|
|
378.1 |
|
| Interest expense |
|
(119.0) |
|
|
|
|
|
|
— |
|
|
(73.5) |
|
|
(192.5) |
|
| Loss on early extinguishment of debt |
|
(1.6) |
|
|
|
|
|
|
— |
|
|
— |
|
|
(1.6) |
|
| Other income |
|
7.1 |
|
|
|
|
|
|
— |
|
|
17.4 |
|
|
24.5 |
|
| Income (loss) before (provision for) benefit from income taxes |
|
74.9 |
|
|
|
|
|
|
(35.7) |
|
|
(98.0) |
|
|
(58.8) |
|
| (Provision for) benefit from income taxes |
|
(7.3) |
|
|
|
|
|
|
— |
|
|
20.6 |
|
|
13.3 |
|
| Net income (loss) |
|
67.6 |
|
|
|
|
|
|
(35.7) |
|
|
(77.4) |
|
|
(45.5) |
|
| Net income attributable to noncontrolling interests |
|
(21.4) |
|
|
|
|
|
|
— |
|
|
— |
|
|
(21.4) |
|
| Preferred dividends |
|
— |
|
|
|
|
|
|
— |
|
|
(27.1) |
|
|
(27.1) |
|
| Net income (loss) attributable to Kennedy-Wilson Holdings, Inc. common shareholders |
|
$ |
46.2 |
|
|
|
|
|
|
$ |
(35.7) |
|
|
$ |
(104.5) |
|
|
$ |
(94.0) |
|
|
|
|
|
|
|
|
|
|
|
|
|
|
| Add back (less) (Kennedy Wilson's Share): |
|
|
|
|
|
|
|
|
|
|
|
|
| Interest expense |
|
$ |
117.2 |
|
|
|
|
|
|
$ |
68.9 |
|
|
$ |
73.5 |
|
|
$ |
259.6 |
|
| Loss on early extinguishment of debt |
|
1.6 |
|
|
|
|
|
|
— |
|
|
— |
|
|
1.6 |
|
| Depreciation and amortization |
|
114.5 |
|
|
|
|
|
|
2.4 |
|
|
— |
|
|
116.9 |
|
| Provision for (benefit from) income taxes |
|
7.3 |
|
|
|
|
|
|
(0.4) |
|
|
(20.6) |
|
|
(13.7) |
|
| Share-based compensation |
|
— |
|
|
|
|
|
|
— |
|
|
21.7 |
|
|
21.7 |
|
| Preferred dividends |
|
— |
|
|
|
|
|
|
— |
|
|
27.1 |
|
|
27.1 |
|
| Fees eliminated in consolidation |
|
(0.2) |
|
|
|
|
|
|
0.2 |
|
|
— |
|
|
— |
|
| Adjusted EBITDA |
|
$ |
286.6 |
|
|
|
|
|
|
$ |
35.4 |
|
|
$ |
(2.8) |
|
|
$ |
319.2 |
|
Kennedy-Wilson Holdings, Inc.
Segment Detail (continued)
(Unaudited, Dollars in millions)
|
|
|
|
|
|
|
|
|
|
|
|
|
|
|
|
|
|
|
|
|
|
|
|
|
|
|
|
|
|
|
|
|
Three Months Ended September 30, 2022 |
|
|
Consolidated |
|
|
|
|
|
Co-Investment |
|
Corporate |
|
Total |
|
|
|
|
|
|
|
|
|
| Revenue |
|
|
|
|
|
|
|
|
|
|
|
|
| Rental |
|
$ |
110.9 |
|
|
|
|
|
|
$ |
— |
|
|
$ |
— |
|
|
$ |
110.9 |
|
| Hotel |
|
14.0 |
|
|
|
|
|
|
— |
|
|
— |
|
|
14.0 |
|
| Investment management fees |
|
— |
|
|
|
|
|
|
11.2 |
|
|
— |
|
|
11.2 |
|
| Property services fees |
|
— |
|
|
|
|
|
|
— |
|
|
0.5 |
|
|
0.5 |
|
| Loans and other |
|
— |
|
|
|
|
|
|
3.0 |
|
|
— |
|
|
3.0 |
|
| Total revenue |
|
124.9 |
|
|
|
|
|
|
14.2 |
|
|
0.5 |
|
|
139.6 |
|
|
|
|
|
|
|
|
|
|
|
|
|
|
| Income (loss) from unconsolidated investments |
|
|
|
|
|
|
|
|
|
|
|
|
| Principal co-investments |
|
— |
|
|
|
|
|
|
30.3 |
|
|
— |
|
|
30.3 |
|
| Performance allocations |
|
— |
|
|
|
|
|
|
(18.0) |
|
|
— |
|
|
(18.0) |
|
| Income from unconsolidated investments |
|
— |
|
|
|
|
|
|
12.3 |
|
|
— |
|
|
12.3 |
|
|
|
|
|
|
|
|
|
|
|
|
|
|
| Gain on sale of real estate, net |
|
37.0 |
|
|
|
|
|
|
— |
|
|
— |
|
|
37.0 |
|
| Expenses |
|
|
|
|
|
|
|
|
|
|
|
|
| Rental |
|
38.6 |
|
|
|
|
|
|
— |
|
|
— |
|
|
38.6 |
|
| Hotel |
|
8.6 |
|
|
|
|
|
|
— |
|
|
— |
|
|
8.6 |
|
Compensation and related (includes $7.3 of share-based compensation) |
|
11.8 |
|
|
|
|
|
|
8.8 |
|
|
13.2 |
|
|
33.8 |
|
| Performance allocation compensation |
|
— |
|
|
|
|
|
|
(6.6) |
|
|
— |
|
|
(6.6) |
|
| General and administrative |
|
4.2 |
|
|
|
|
|
|
3.1 |
|
|
1.9 |
|
|
9.2 |
|
| Depreciation and amortization |
|
46.1 |
|
|
|
|
|
|
— |
|
|
— |
|
|
46.1 |
|
| Total expenses |
|
109.3 |
|
|
|
|
|
|
5.3 |
|
|
15.1 |
|
|
129.7 |
|
| Interest expense |
|
(33.1) |
|
|
|
|
|
|
— |
|
|
(24.0) |
|
|
(57.1) |
|
| Loss on early extinguishment of debt |
|
(1.3) |
|
|
|
|
|
|
— |
|
|
— |
|
|
(1.3) |
|
| Other income |
|
23.8 |
|
|
|
|
|
|
— |
|
|
12.9 |
|
|
36.7 |
|
| Income (loss) before provision for income taxes |
|
42.0 |
|
|
|
|
|
|
21.2 |
|
|
(25.7) |
|
|
37.5 |
|
| Provision for income taxes |
|
(12.2) |
|
|
|
|
|
|
— |
|
|
(1.7) |
|
|
(13.9) |
|
| Net income (loss) |
|
29.8 |
|
|
|
|
|
|
21.2 |
|
|
(27.4) |
|
|
23.6 |
|
| Net loss attributable to noncontrolling interests |
|
0.7 |
|
|
|
|
|
|
— |
|
|
— |
|
|
0.7 |
|
| Preferred dividends |
|
— |
|
|
|
|
|
|
— |
|
|
(7.9) |
|
|
(7.9) |
|
| Net (loss) income attributable to Kennedy-Wilson Holdings, Inc. common shareholders |
|
$ |
30.5 |
|
|
|
|
|
|
$ |
21.2 |
|
|
$ |
(35.3) |
|
|
$ |
16.4 |
|
|
|
|
|
|
|
|
|
|
|
|
|
|
| Add back (less) (Kennedy Wilson's Share): |
|
|
|
|
|
|
|
|
|
|
|
|
| Interest expense |
|
$ |
32.3 |
|
|
|
|
|
|
$ |
16.6 |
|
|
$ |
24.0 |
|
|
$ |
72.9 |
|
| Loss on early extinguishment of debt |
|
1.3 |
|
|
|
|
|
|
— |
|
|
— |
|
|
1.3 |
|
| Depreciation and amortization |
|
44.2 |
|
|
|
|
|
|
0.8 |
|
|
— |
|
|
45.0 |
|
| Provision for income taxes |
|
11.5 |
|
|
|
|
|
|
1.9 |
|
|
1.7 |
|
|
15.1 |
|
| Share-based compensation |
|
— |
|
|
|
|
|
|
— |
|
|
7.3 |
|
|
7.3 |
|
| Preferred dividends |
|
— |
|
|
|
|
|
|
— |
|
|
7.9 |
|
|
7.9 |
|
| Fees eliminated in consolidation |
|
(0.2) |
|
|
|
|
|
|
0.2 |
|
|
— |
|
|
— |
|
| Adjusted EBITDA |
|
$ |
119.6 |
|
|
|
|
|
|
$ |
40.7 |
|
|
$ |
5.6 |
|
|
$ |
165.9 |
|
Kennedy-Wilson Holdings, Inc.
Segment Detail (continued)
(Unaudited, Dollars in millions)
|
|
|
|
|
|
|
|
|
|
|
|
|
|
|
|
|
|
|
|
|
|
|
|
|
|
|
|
|
|
|
|
|
Nine Months Ended September 30, 2022 |
|
|
Consolidated |
|
|
|
|
|
Co-Investment |
|
Corporate |
|
Total |
|
|
|
|
|
|
|
|
|
| Revenue |
|
|
|
|
|
|
|
|
|
|
|
|
| Rental |
|
$ |
324.4 |
|
|
|
|
|
|
$ |
— |
|
|
$ |
— |
|
|
$ |
324.4 |
|
| Hotel |
|
33.2 |
|
|
|
|
|
|
— |
|
|
— |
|
|
33.2 |
|
| Investment management fees |
|
— |
|
|
|
|
|
|
33.5 |
|
|
— |
|
|
33.5 |
|
| Property services fees |
|
— |
|
|
|
|
|
|
— |
|
|
1.3 |
|
|
1.3 |
|
| Loans and other |
|
— |
|
|
|
|
|
|
8.0 |
|
|
— |
|
|
8.0 |
|
| Total revenue |
|
357.6 |
|
|
|
|
|
|
41.5 |
|
|
1.3 |
|
|
400.4 |
|
|
|
|
|
|
|
|
|
|
|
|
|
|
| Income from unconsolidated investments |
|
|
|
|
|
|
|
|
|
|
|
|
| Principal co-investments |
|
— |
|
|
|
|
|
|
147.9 |
|
|
— |
|
|
147.9 |
|
| Performance allocations |
|
— |
|
|
|
|
|
|
0.5 |
|
|
— |
|
|
0.5 |
|
| Income from unconsolidated investments |
|
— |
|
|
|
|
|
|
148.4 |
|
|
— |
|
|
148.4 |
|
|
|
|
|
|
|
|
|
|
|
|
|
|
| Gain on sale of real estate, net |
|
50.8 |
|
|
|
|
|
|
— |
|
|
— |
|
|
50.8 |
|
| Expenses |
|
|
|
|
|
|
|
|
|
|
|
|
| Rental |
|
110.7 |
|
|
|
|
|
|
— |
|
|
— |
|
|
110.7 |
|
| Hotel |
|
20.5 |
|
|
|
|
|
|
— |
|
|
— |
|
|
20.5 |
|
Compensation and related (including $21.7 of share-based compensation) |
|
29.8 |
|
|
|
|
|
|
34.1 |
|
|
39.8 |
|
|
103.7 |
|
| Performance allocation compensation |
|
— |
|
|
|
|
|
|
3.2 |
|
|
— |
|
|
3.2 |
|
| General and administrative |
|
10.3 |
|
|
|
|
|
|
10.7 |
|
|
5.5 |
|
|
26.5 |
|
| Depreciation and amortization |
|
132.7 |
|
|
|
|
|
|
— |
|
|
— |
|
|
132.7 |
|
| Total expenses |
|
304.0 |
|
|
|
|
|
|
48.0 |
|
|
45.3 |
|
|
397.3 |
|
| Interest expense |
|
(92.8) |
|
|
|
|
|
|
— |
|
|
(68.0) |
|
|
(160.8) |
|
| Loss on early extinguishment of debt |
|
(2.4) |
|
|
|
|
|
|
— |
|
|
— |
|
|
(2.4) |
|
| Other income |
|
29.7 |
|
|
|
|
|
|
— |
|
|
16.4 |
|
|
46.1 |
|
| Income (loss) before (provision for) benefit from income taxes |
|
38.9 |
|
|
|
|
|
|
141.9 |
|
|
(95.6) |
|
|
85.2 |
|
| (Provision for) benefit from income taxes |
|
(22.6) |
|
|
|
|
|
|
— |
|
|
0.1 |
|
|
(22.5) |
|
| Net income (loss) |
|
16.3 |
|
|
|
|
|
|
141.9 |
|
|
(95.5) |
|
|
62.7 |
|
| Net loss attributable to noncontrolling interests |
|
0.5 |
|
|
|
|
|
|
— |
|
|
— |
|
|
0.5 |
|
| Preferred dividends |
|
— |
|
|
|
|
|
|
— |
|
|
(21.0) |
|
|
(21.0) |
|
| Net income (loss) attributable to Kennedy-Wilson Holdings, Inc. common shareholders |
|
$ |
16.8 |
|
|
|
|
|
|
$ |
141.9 |
|
|
$ |
(116.5) |
|
|
$ |
42.2 |
|
|
|
|
|
|
|
|
|
|
|
|
|
|
| Add back (less) (Kennedy Wilson's Share): |
|
|
|
|
|
|
|
|
|
|
|
|
| Interest expense |
|
$ |
90.8 |
|
|
|
|
|
|
$ |
43.0 |
|
|
$ |
68.0 |
|
|
$ |
201.8 |
|
| Loss on early extinguishment of debt |
|
2.4 |
|
|
|
|
|
|
— |
|
|
— |
|
|
2.4 |
|
| Depreciation and amortization |
|
128.8 |
|
|
|
|
|
|
2.8 |
|
|
— |
|
|
131.6 |
|
| Provision for (benefit from) income taxes |
|
21.9 |
|
|
|
|
|
|
1.9 |
|
|
(0.1) |
|
|
23.7 |
|
| Share-based compensation |
|
— |
|
|
|
|
|
|
— |
|
|
21.7 |
|
|
21.7 |
|
| Preferred dividends |
|
— |
|
|
|
|
|
|
— |
|
|
21.0 |
|
|
21.0 |
|
| Fees eliminated in consolidation |
|
(0.4) |
|
|
|
|
|
|
0.4 |
|
|
— |
|
|
— |
|
| Adjusted EBITDA |
|
$ |
260.3 |
|
|
|
|
|
|
$ |
190.0 |
|
|
$ |
(5.9) |
|
|
$ |
444.4 |
|
NON-GAAP PRO RATA FINANCIAL INFORMATION
The following non-GAAP Pro-rata information is not intended to be a presentation in accordance with GAAP. The Pro-rata financial information reflects our proportionate economic ownership of each asset in our portfolio that we do not wholly own. The amounts in the column labeled “KW Share of Unconsolidated Investments” were derived on a property-by-property basis by applying to each financial statement line item the ownership percentage interest used to arrive at our share of net income or loss during the period when applying the equity method of accounting to each of our unconsolidated joint ventures. A similar calculation was performed for the amounts in the column labeled “Noncontrolling Interests,” which represents the share of consolidated assets attributable to noncontrolling interests.
We do not control the unconsolidated investments and the presentations of the assets and liabilities and revenues and expenses do not represent our legal claim to such items. The operating agreements of the unconsolidated investments generally provide that partners may receive cash distributions (1) to the extent there is available cash from operations, (2) upon a capital event, such as a refinancing or sale or (3) upon liquidation of the venture. The amount of cash each partner receives is based upon specific provisions of each operating agreement and varies depending on factors including the amount of capital contributed by each partner and whether any contributions are entitled to priority distributions. Upon liquidation of the unconsolidated investments and after all liabilities, priority distributions and initial equity contributions have been repaid, the partners generally would be entitled to any residual cash remaining based on their respective legal ownership percentages. We provide this information because we believe it assists investors and analysts in estimating our economic interest in our unconsolidated investments when read in conjunction with the Company’s reported results under GAAP.
The presentation of Pro-rata financial information has limitations as an analytical tool. Some of these limitations include:
• The amounts shown on the individual line items were derived by applying our overall economic ownership interest percentage determined when applying the equity method of accounting and do not necessarily represent our legal claim to the assets and liabilities, or the revenues and expenses; and
• Other companies in our industry may calculate their pro rata interest differently than we do, which limits the usefulness of the amount in our pro rata financial statements as a comparative measure.
Because of these limitations, the pro rata financial information should not be considered in isolation or as a substitute for our financial statements as reported under U.S. GAAP. We compensate for these limitations by relying primarily on our U.S. GAAP results and using the Pro-rata financial information only supplementally.
Kennedy-Wilson Holdings, Inc.
Non-GAAP Pro-rata Financial Information
(Unaudited)
(Dollars in millions)
|
|
|
|
|
|
|
|
|
|
|
|
|
|
|
|
|
|
|
|
|
|
|
|
|
|
|
|
|
September 30, 2023 |
|
December 31, 2022 |
|
|
Non-GAAP |
|
Non-GAAP |
|
Non-GAAP |
|
Non-GAAP |
| |
|
Noncontrolling Interests (2) |
|
KW Share of Unconsolidated Investments (3) |
|
Noncontrolling Interests (2) |
|
KW Share of Unconsolidated Investments (3) |
| Assets |
|
|
|
|
|
|
|
|
| Cash and cash equivalents |
|
$ |
(6.5) |
|
|
$ |
100.2 |
|
|
$ |
(6.7) |
|
|
$ |
86.9 |
|
| Accounts receivable |
|
(0.5) |
|
|
110.9 |
|
|
(0.5) |
|
|
147.2 |
|
Real estate and acquired in place lease values, net of accumulated depreciation and amortization (1) |
|
(122.4) |
|
|
4,565.7 |
|
|
(122.0) |
|
|
4,319.1 |
|
| Unconsolidated investments |
|
— |
|
|
(2,232.7) |
|
|
— |
|
|
(2,238.1) |
|
| Other assets |
|
(5.7) |
|
|
147.4 |
|
|
(4.6) |
|
|
150.8 |
|
| Loan purchases and originations |
|
— |
|
|
10.9 |
|
|
— |
|
|
9.3 |
|
| Total assets |
|
$ |
(135.1) |
|
|
$ |
2,702.4 |
|
|
$ |
(133.8) |
|
|
$ |
2,475.2 |
|
|
|
|
|
|
|
|
|
|
| Liabilities |
|
|
|
|
|
|
|
|
| Accounts payable |
|
$ |
(0.4) |
|
|
$ |
— |
|
|
$ |
(0.3) |
|
|
$ |
— |
|
| Accrued expenses and other liabilities (including $284.0 and $303.7 of deferred tax liabilities) |
|
(13.5) |
|
|
105.7 |
|
|
(16.2) |
|
|
88.0 |
|
| Mortgage debt |
|
(77.5) |
|
|
2,596.7 |
|
|
(70.9) |
|
|
2,387.2 |
|
| KW unsecured debt |
|
— |
|
|
— |
|
|
— |
|
|
— |
|
| KWE unsecured bonds |
|
— |
|
|
— |
|
|
— |
|
|
— |
|
| Total liabilities |
|
(91.4) |
|
|
2,702.4 |
|
|
(87.4) |
|
|
2,475.2 |
|
| Equity |
|
|
|
|
|
|
|
|
| Total Kennedy-Wilson Holdings, Inc. shareholders’ equity |
|
— |
|
|
— |
|
|
— |
|
|
— |
|
| Noncontrolling interests |
|
(43.7) |
|
|
— |
|
|
(46.4) |
|
|
— |
|
| Total equity |
|
(43.7) |
|
|
— |
|
|
(46.4) |
|
|
— |
|
| Total liabilities and equity |
|
$ |
(135.1) |
|
|
$ |
2,702.4 |
|
|
$ |
(133.8) |
|
|
$ |
2,475.2 |
|
(1) Includes Kennedy Wilson's total share of accumulated depreciation and amortization of $26.9 million and $41.6 million relating to noncontrolling interests and unconsolidated investments, and $26.5 million and $41.6 million relating to noncontrolling interests and unconsolidated investments, as of September 30, 2023 and December 31, 2022, respectively.
(2) Represents the portion of equity ownership in a consolidated subsidiary not attributable to Kennedy Wilson.
(3) Represents Kennedy Wilson's pro-rata share of unconsolidated joint-ventures.
Kennedy-Wilson Holdings, Inc.
Non-GAAP Pro-rata Financial Information
(Unaudited)
(Dollars in millions)
|
|
|
|
|
|
|
|
|
|
|
|
|
|
|
|
|
|
|
|
|
|
|
|
|
|
|
|
|
Q3 - 2023 |
|
Q3 - 2022 |
|
|
Non-GAAP |
|
Non-GAAP |
|
Non-GAAP |
|
Non-GAAP |
|
|
Noncontrolling Interests(1) |
|
KW Share of Unconsolidated Investments(2) |
|
Noncontrolling Interests(1) |
|
KW Share of Unconsolidated Investments(2) |
| Revenue |
|
|
|
|
|
|
|
|
| Rental |
|
$ |
(3.2) |
|
|
$ |
65.0 |
|
|
$ |
(3.1) |
|
|
$ |
57.7 |
|
| Hotel |
|
— |
|
|
4.6 |
|
|
— |
|
|
— |
|
| Sale of real estate |
|
— |
|
|
1.2 |
|
|
— |
|
|
15.3 |
|
| Investment management and property services fees |
|
— |
|
|
(17.9) |
|
|
— |
|
|
(18.0) |
|
| Total revenue |
|
(3.2) |
|
|
52.9 |
|
|
(3.1) |
|
|
55.0 |
|
|
|
|
|
|
|
|
|
|
| Total income from unconsolidated investments |
|
— |
|
|
74.0 |
|
|
— |
|
|
(12.3) |
|
|
|
|
|
|
|
|
|
|
Fair value (3) |
|
— |
|
|
(61.8) |
|
|
— |
|
|
4.7 |
|
| Gain on sale of real estate, net |
|
(17.3) |
|
|
— |
|
|
(0.9) |
|
|
4.9 |
|
|
|
|
|
|
|
|
|
|
| Expenses |
|
|
|
|
|
|
|
|
| Rental |
|
(1.2) |
|
|
21.2 |
|
|
(1.2) |
|
|
18.0 |
|
| Hotel |
|
— |
|
|
7.8 |
|
|
— |
|
|
— |
|
| Cost of real estate sold |
|
— |
|
|
0.7 |
|
|
— |
|
|
11.0 |
|
| Compensation and related |
|
— |
|
|
— |
|
|
— |
|
|
— |
|
| General and administrative |
|
— |
|
|
— |
|
|
— |
|
|
— |
|
| Depreciation and amortization |
|
(1.3) |
|
|
0.8 |
|
|
(1.9) |
|
|
0.9 |
|
| Total expenses |
|
(2.5) |
|
|
30.5 |
|
|
(3.1) |
|
|
29.9 |
|
| Interest expense |
|
0.6 |
|
|
(25.9) |
|
|
0.8 |
|
|
(16.4) |
|
| Other loss |
|
0.1 |
|
|
(9.2) |
|
|
— |
|
|
(4.1) |
|
| Income before benefit from income taxes |
|
(17.3) |
|
|
(0.5) |
|
|
(0.1) |
|
|
1.9 |
|
| Benefit from income taxes |
|
— |
|
|
0.5 |
|
|
0.8 |
|
|
— |
|
| Net income |
|
(17.3) |
|
|
— |
|
|
0.7 |
|
|
1.9 |
|
| Net loss attributable to noncontrolling interests |
|
17.3 |
|
|
— |
|
|
(0.7) |
|
|
(1.9) |
|
| Net income attributable to Kennedy-Wilson Holdings, Inc. common shareholders |
|
$ |
— |
|
|
$ |
— |
|
|
$ |
— |
|
|
$ |
— |
|
(1) Represents the portion of equity ownership in a consolidated subsidiary not attributable to Kennedy Wilson.
(2) Represents Kennedy Wilson's pro-rata share of unconsolidated joint-ventures.
(3) Includes the reclassification of cumulative unrealized fair value gains/losses on unconsolidated investments, as realized.
Kennedy-Wilson Holdings, Inc.
Non-GAAP Pro-rata Financial Information
(Unaudited)
(Dollars in millions)
|
|
|
|
|
|
|
|
|
|
|
|
|
|
|
|
|
|
|
|
|
|
|
|
|
|
|
|
|
Nine Months Ended September 30, 2023 |
|
Nine Months Ended September 30, 2022 |
|
|
Non-GAAP |
|
Non-GAAP |
|
Non-GAAP |
|
Non-GAAP |
|
|
Noncontrolling Interests(1) |
|
KW Share of Unconsolidated Investments(2) |
|
Noncontrolling Interests(1) |
|
KW Share of Unconsolidated Investments(2) |
| Revenue |
|
|
|
|
|
|
|
|
| Rental |
|
$ |
(9.3) |
|
|
$ |
186.7 |
|
|
$ |
(8.3) |
|
|
$ |
167.8 |
|
| Hotel |
|
— |
|
|
4.6 |
|
|
— |
|
|
— |
|
| Sale of real estate |
|
— |
|
|
11.7 |
|
|
— |
|
|
50.4 |
|
| Investment management and property services fees |
|
0.2 |
|
|
(36.2) |
|
|
— |
|
|
0.5 |
|
| Total revenue |
|
(9.1) |
|
|
166.8 |
|
|
(8.3) |
|
|
218.7 |
|
|
|
|
|
|
|
|
|
|
| Total income from unconsolidated investments |
|
— |
|
|
69.7 |
|
|
— |
|
|
(148.4) |
|
|
|
|
|
|
|
|
|
|
Fair value (3) |
|
— |
|
|
(76.6) |
|
|
— |
|
|
74.9 |
|
| Gain on sale of real estate, net |
|
(21.5) |
|
|
— |
|
|
(1.0) |
|
|
4.9 |
|
|
|
|
|
|
|
|
|
|
| Expenses |
|
|
|
|
|
|
|
|
| Rental |
|
(3.4) |
|
|
59.7 |
|
|
(3.4) |
|
|
49.6 |
|
| Hotel |
|
— |
|
|
7.8 |
|
|
— |
|
|
— |
|
| Cost of real estate sold |
|
— |
|
|
6.5 |
|
|
— |
|
|
39.4 |
|
| General and administrative |
|
— |
|
|
— |
|
|
— |
|
|
— |
|
| Depreciation and amortization |
|
(3.9) |
|
|
2.4 |
|
|
(4.0) |
|
|
2.9 |
|
| Total expenses |
|
(7.3) |
|
|
76.4 |
|
|
(7.4) |
|
|
91.9 |
|
| Interest expense |
|
1.8 |
|
|
(68.9) |
|
|
1.9 |
|
|
(42.9) |
|
| Other income (loss) |
|
0.1 |
|
|
(14.9) |
|
|
(0.3) |
|
|
(13.4) |
|
| Loss before benefit from income taxes |
|
(21.4) |
|
|
(0.3) |
|
|
(0.3) |
|
|
1.9 |
|
| Provision for income taxes |
|
— |
|
|
0.3 |
|
|
0.8 |
|
|
(1.9) |
|
| Net income |
|
(21.4) |
|
|
— |
|
|
0.5 |
|
|
— |
|
| Net (loss) income attributable to noncontrolling interests |
|
21.4 |
|
|
— |
|
|
(0.5) |
|
|
— |
|
| Net income attributable to Kennedy-Wilson Holdings, Inc. common shareholders |
|
$ |
— |
|
|
$ |
— |
|
|
$ |
— |
|
|
$ |
— |
|
(1) Represents the portion of equity ownership in a consolidated subsidiary not attributable to Kennedy Wilson.
(2) Represents Kennedy Wilson's pro-rata share of unconsolidated joint-ventures.
(3) Includes the reclassification of cumulative unrealized fair value gains/losses on unconsolidated investments, as realized.
APPENDIX
Kennedy-Wilson Holdings, Inc.
Estimated Annual NOI Reconciliation
(Unaudited)
(Dollars in millions)
|
|
|
|
|
|
|
|
|
| Rental Revenues |
|
$ |
102.4 |
|
| Hotel Revenues |
|
16.6 |
|
| Rental (Expenses) |
|
(38.4) |
|
| Hotel (Expenses) |
|
(9.8) |
|
| Loans and other |
|
6.1 |
|
| Consolidated NOI |
|
$ |
76.9 |
|
| Adjustments: |
|
|
Non-controlling interest |
|
(2.0) |
|
NOI from Unconsolidated investments (KW Share) |
|
40.6 |
|
| Property-Level NOI - Q3-23 (KW Share) |
|
$ |
115.5 |
|
|
|
|
| Adjustments |
|
|
| Assets acquired and disposed (net) |
|
(1.4) |
|
| Lease-up and development portfolio |
|
4.8 |
|
| Hotel operations |
|
(1.6) |
|
| Assets owned and occupied by Kennedy Wilson |
|
1.2 |
|
| Amortization of above/below market leases (net) |
|
(0.3) |
|
| Straight-line and free rent (net) |
|
2.1 |
|
| Non-recurring income/expense, FX, and other |
|
1.0 |
|
| Q3-23 Estimated NOI |
|
$ |
121.3 |
|
| Estimated Annual NOI - September 30, 2023 |
|
$ |
485.4 |
|
Kennedy-Wilson Holdings, Inc.
Reconciliation of Kennedy Wilson's Share Amounts
(Unaudited)
(Dollars in millions)
|
|
|
|
|
|
|
|
|
|
|
|
|
|
|
|
|
|
|
|
|
|
|
|
|
|
|
|
|
Three Months Ended |
|
Nine Months Ended, |
|
|
September 30, |
|
September 30, |
|
|
2023 |
|
2022 |
|
2023 |
|
2022 |
| Interest expense (Kennedy Wilson's Share) |
|
|
|
|
|
|
|
|
| Interest expense |
|
$ |
64.2 |
|
|
$ |
57.1 |
|
|
$ |
192.5 |
|
|
$ |
160.8 |
|
| Interest expense (attributable to noncontrolling interests) |
|
(0.6) |
|
|
(0.8) |
|
|
(1.8) |
|
|
(2.0) |
|
Kennedy Wilson's share of interest expense included in unconsolidated investments |
|
25.8 |
|
|
16.6 |
|
|
68.9 |
|
|
43.0 |
|
| Interest expense - (Kennedy Wilson's Share) |
|
$ |
89.4 |
|
|
$ |
72.9 |
|
|
$ |
259.6 |
|
|
$ |
201.8 |
|
|
|
|
|
|
|
|
|
|
| Loss on early extinguishment of debt (Kennedy Wilson's Share) |
|
|
|
|
|
|
|
|
| Loss on early extinguishment of debt |
|
$ |
— |
|
|
$ |
1.3 |
|
|
$ |
1.6 |
|
|
$ |
2.4 |
|
| Loss on early extinguishment of debt (Kennedy Wilson's Share) |
|
$ |
— |
|
|
$ |
1.3 |
|
|
$ |
1.6 |
|
|
$ |
2.4 |
|
|
|
|
|
|
|
|
|
|
| Depreciation and amortization (Kennedy Wilson's Share) |
|
|
|
|
|
|
|
|
| Depreciation and amortization |
|
$ |
38.8 |
|
|
$ |
46.1 |
|
|
$ |
118.3 |
|
|
$ |
132.7 |
|
Depreciation and amortization (attributable to noncontrolling interests) |
|
(1.4) |
|
|
(1.9) |
|
|
(3.8) |
|
|
(3.9) |
|
Kennedy Wilson's share of depreciation and amortization included in unconsolidated investments |
|
0.8 |
|
|
0.8 |
|
|
2.4 |
|
|
2.8 |
|
| Depreciation and amortization (Kennedy Wilson's Share) |
|
$ |
38.2 |
|
|
$ |
45.0 |
|
|
$ |
116.9 |
|
|
$ |
131.6 |
|
|
|
|
|
|
|
|
|
|
| Provision for (benefit from) income taxes (Kennedy Wilson's Share) |
|
|
|
|
|
|
|
|
| Provision for income taxes |
|
$ |
(19.7) |
|
|
$ |
13.9 |
|
|
$ |
(13.3) |
|
|
$ |
22.5 |
|
| Provision for income taxes (attributable to noncontrolling interests) |
|
— |
|
|
(0.7) |
|
|
— |
|
|
(0.7) |
|
Provision for income taxes included in unconsolidated investments |
|
(0.6) |
|
|
1.9 |
|
|
(0.4) |
|
|
1.9 |
|
| Provision for income taxes (Kennedy Wilson's Share) |
|
$ |
(20.3) |
|
|
$ |
15.1 |
|
|
$ |
(13.7) |
|
|
$ |
23.7 |
|
Kennedy-Wilson Holdings, Inc.
Same Property Reconciliation
(Unaudited)
(Dollars in millions)
|
|
|
|
|
|
|
|
|
|
|
|
|
|
|
|
|
|
|
|
|
|
|
|
|
|
|
|
|
Q3 - 2023 |
|
Q3 - 2022 |
|
|
Same Property |
|
Same Property |
|
|
Revenue |
|
NOI(6) |
|
Revenue |
|
NOI(6) |
| Rental Revenues |
|
$ |
102.4 |
|
|
$ |
102.4 |
|
|
$ |
110.9 |
|
|
$ |
110.9 |
|
| Hotel Revenues |
|
16.6 |
|
|
16.6 |
|
|
14.0 |
|
|
14.0 |
|
| Rental (Expenses) |
|
— |
|
|
(38.4) |
|
|
— |
|
|
(38.6) |
|
| Hotel (Expenses) |
|
— |
|
|
(9.8) |
|
|
— |
|
|
(8.6) |
|
| Consolidated Total |
|
119.0 |
|
|
70.8 |
|
|
124.9 |
|
|
77.7 |
|
Less: NCI adjustments (1) |
|
(3.6) |
|
|
(2.2) |
|
|
(3.2) |
|
|
(2.0) |
|
Add: Unconsolidated investment adjustments (2) |
|
46.6 |
|
|
32.8 |
|
|
44.6 |
|
|
31.8 |
|
Add: Above/below market rents |
|
(0.4) |
|
|
(0.4) |
|
|
(1.0) |
|
|
(1.0) |
|
Less: Reimbursement of recoverable operating expenses |
|
(9.3) |
|
|
— |
|
|
(7.3) |
|
|
— |
|
Less: Properties bought and sold (3) |
|
(5.3) |
|
|
(2.7) |
|
|
(12.7) |
|
|
(7.7) |
|
Less: Other properties excluded (4) |
|
(25.7) |
|
|
(12.0) |
|
|
(28.5) |
|
|
(15.2) |
|
Other Reconciling Items (5) |
|
0.4 |
|
|
0.4 |
|
|
1.2 |
|
|
1.4 |
|
| Same Property |
|
$ |
121.7 |
|
|
$ |
86.7 |
|
|
$ |
118.0 |
|
|
$ |
85.0 |
|
|
|
|
|
|
|
|
|
|
|
|
|
|
|
|
|
|
|
|
|
|
|
|
|
|
|
|
|
|
Q3 - 2023 |
|
Q3 - 2022 |
|
|
Same Property |
|
Same Property |
| Same Property (Reported) |
|
Revenue |
|
NOI |
|
Revenue |
|
NOI |
| Office - Same Property |
|
$ |
31.8 |
|
|
$ |
27.3 |
|
|
$ |
31.6 |
|
|
$ |
27.4 |
|
| Multifamily Market Rate Portfolio - Same Property |
|
75.9 |
|
|
50.0 |
|
|
73.2 |
|
|
48.7 |
|
| Multifamily Affordable Portfolio - Same Property |
|
14.0 |
|
|
9.4 |
|
|
13.2 |
|
|
8.9 |
|
| Same Property |
|
$ |
121.7 |
|
|
$ |
86.7 |
|
|
$ |
118.0 |
|
|
$ |
85.0 |
|
| Straight-line rent adjustments (net) |
|
(0.9) |
|
|
(0.9) |
|
|
(1.5) |
|
|
(1.5) |
|
| Same Property (Excluding Straight-Line Rents) |
|
$ |
120.8 |
|
|
$ |
85.8 |
|
|
$ |
116.5 |
|
|
$ |
83.5 |
|
(1) Represents rental revenue and operating expenses and hotel revenue and operating expenses attributable to non-controlling interests.
(2) Represents the Company’s share of unconsolidated investment rental revenues and net operating income, as applicable, which are within the applicable same property population.
(3) Represents properties excluded from the same property population that were purchased or sold during the applicable period.
(4) Represents properties excluded from the same property population that were not stabilized during the applicable period, or retail or industrial properties.
(5) Represents other properties excluded from the same property population that were not classified as a commercial or multifamily property within the Company’s portfolio. Also includes immaterial adjustments for foreign exchange rates, changes in ownership percentages, and certain non-recurring income and expenses.
(6) Excludes above/below market rents from the same property population, as they are representative of non-cash purchase price accounting income.
Kennedy-Wilson Holdings, Inc.
Same Property Reconciliation
(Unaudited)
(Dollars in millions)
|
|
|
|
|
|
|
|
|
|
|
|
|
|
|
|
|
|
|
|
|
|
|
|
|
|
|
|
|
Nine Months Ended September 30, 2023 |
|
Nine Months Ended September 30, 2022 |
|
|
Same Property |
|
Same Property |
|
|
Revenue |
|
NOI(6) |
|
Revenue |
|
NOI(6) |
| Rental Revenues |
|
$ |
315.6 |
|
|
$ |
315.6 |
|
|
$ |
324.4 |
|
|
$ |
324.4 |
|
| Hotel Revenues |
|
42.7 |
|
|
42.7 |
|
|
33.2 |
|
|
33.2 |
|
| Rental (Expenses) |
|
— |
|
|
(113.7) |
|
|
— |
|
|
(110.7) |
|
| Hotel (Expenses) |
|
— |
|
|
(27.4) |
|
|
— |
|
|
(20.5) |
|
| Consolidated Total |
|
358.3 |
|
|
217.2 |
|
|
357.6 |
|
|
226.4 |
|
Less: NCI adjustments (1) |
|
(9.3) |
|
|
(5.7) |
|
|
(8.8) |
|
|
(5.2) |
|
Add: Unconsolidated investment adjustments (2) |
|
130.4 |
|
|
92.5 |
|
|
123.7 |
|
|
89.3 |
|
Add: Above/below market rents |
|
(1.3) |
|
|
(1.3) |
|
|
(2.9) |
|
|
(2.9) |
|
Less: Reimbursement of recoverable operating expenses |
|
(25.4) |
|
|
— |
|
|
(20.9) |
|
|
— |
|
Less: Properties bought and sold (3) |
|
(42.7) |
|
|
(28.8) |
|
|
(55.0) |
|
|
(39.4) |
|
Less: Other properties excluded (4) |
|
(76.3) |
|
|
(36.2) |
|
|
(72.6) |
|
|
(37.3) |
|
Other Reconciling Items (5) |
|
(2.6) |
|
|
0.4 |
|
|
(1.9) |
|
|
0.9 |
|
| Same Property |
|
$ |
331.1 |
|
|
$ |
238.1 |
|
|
$ |
319.2 |
|
|
$ |
231.8 |
|
|
|
|
|
|
|
|
|
|
|
|
|
|
|
|
|
|
|
|
|
|
|
|
|
|
|
|
|
|
Nine Months Ended September 30, 2023 |
|
Nine Months Ended September 30, 2022 |
|
|
Same Property |
|
Same Property |
| Same Property (Reported) |
|
Revenue |
|
NOI |
|
Revenue |
|
NOI |
| Office - Same Property |
|
$ |
89.4 |
|
|
$ |
76.7 |
|
|
$ |
88.4 |
|
|
$ |
75.9 |
|
| Multifamily Market Rate Portfolio - Same Property |
|
202.1 |
|
|
135.1 |
|
|
194.1 |
|
|
130.8 |
|
| Multifamily Affordable Portfolio - Same Property |
|
39.6 |
|
|
26.3 |
|
|
36.7 |
|
|
25.1 |
|
| Same Property |
|
$ |
331.1 |
|
|
$ |
238.1 |
|
|
$ |
319.2 |
|
|
$ |
231.8 |
|
| Straight-line rent adjustments (net) |
|
(0.4) |
|
|
(0.4) |
|
|
(1.5) |
|
|
(1.5) |
|
| Same Property (Excluding Straight-Line Rents) |
|
$ |
330.7 |
|
|
$ |
237.7 |
|
|
$ |
317.7 |
|
|
$ |
230.3 |
|
(1) Represents rental revenue and operating expenses and hotel revenue and operating expenses attributable to non-controlling interests.
(2) Represents the Company’s share of unconsolidated investment rental revenues and net operating income, as applicable, which are within the applicable same property population.
(3) Represents properties excluded from the same property population that were purchased or sold during the applicable period.
(4) Represents properties excluded from the same property population that were not stabilized during the applicable period, or retail or industrial properties.
(5) Represents other properties excluded from the same property population that were not classified as a commercial or multifamily property within the Company’s portfolio. Also includes immaterial adjustments for foreign exchange rates, changes in ownership percentages, and certain non-recurring income and expenses.
(6) Excludes above/below market rents from the same property population, as they are representative of non-cash purchase price accounting income.
Kennedy-Wilson Holdings, Inc.
Reconciliation of Adjusted Fees
(Unaudited)
(Dollars in millions)
|
|
|
|
|
|
|
|
|
|
|
|
|
|
|
|
|
|
|
|
|
|
|
|
|
|
|
| Adjusted Fees |
|
|
Q3 |
|
YTD |
|
|
2023 |
|
2022 |
|
2023 |
|
2022 |
| Investment management fees |
|
$ |
15.5 |
|
|
$ |
11.2 |
|
|
$ |
45.6 |
|
|
$ |
33.5 |
|
| Property services fees |
|
0.7 |
|
|
0.5 |
|
|
1.6 |
|
|
1.3 |
|
|
|
|
|
|
|
|
|
|
| Non-GAAP adjustments: |
|
|
|
|
|
|
|
|
| Add back: |
|
|
|
|
|
|
|
|
KW share of fees eliminated in consolidation(1) |
|
— |
|
|
0.1 |
|
|
0.2 |
|
|
0.4 |
|
Performance fees included in unconsolidated investments |
|
(17.9) |
|
|
(18.0) |
|
|
(36.3) |
|
|
0.5 |
|
| Adjusted Fees |
|
$ |
(1.7) |
|
|
$ |
(6.2) |
|
|
$ |
11.1 |
|
|
$ |
35.7 |
|
(1) Represents fees recognized in net (income) loss attributable to noncontrolling interests relating to portion of fees paid by noncontrolling interest holders.