エドガーで原本を確認する
UNITED STATES
SECURITIES AND EXCHANGE COMMISSION
Washington, D.C. 20549
FORM
CURRENT REPORT
Pursuant to Section 13 or 15(d) of the
Securities Exchange Act of 1934
Date of Report (Date of earliest event reported):
(Exact name of Registrant as specified in its charter)
(State or other jurisdiction of incorporation) |
(Commission File Number) |
(IRS Employer Identification Number) |
(Address of principal executive offices)
(
(Registrant's telephone number, including area code)
Check the appropriate box below if the Form 8-K filing is intended to simultaneously satisfy the filing obligation of the registrant under any of the following provisions:
Title of Each Class |
|
Trading Symbol(s) |
|
Name of Each Exchange |
NYSE Texas |
Indicate by check mark whether the registrant is an emerging growth company as defined in as defined in Rule 405 of the Securities Act of 1933 (§230.405 of this chapter) or Rule 12b-2 of the Securities Exchange Act of 1934 (§240.12b-2 of this chapter).
Emerging growth company
If an emerging growth company, indicate by check mark if the registrant has elected not to use the extended transition period for complying with any new or revised financial accounting standards provided pursuant to Section 13(a) of the Exchange Act. ☐
Item 2.02 Results of Operations and Financial Condition.
On July 28, 2026, Orion Group Holdings, Inc. (the “Company”) issued a press release announcing its financial results for the second quarter ended June 30, 2026. A copy of the press release is attached to this Current Report on Form 8-K as Exhibit 99.1 and is incorporated herein by reference.
The information contained in this Item 2.02 to the Company’s Current Report on Form 8-K, including Exhibit 99.1 attached hereto, is being furnished and shall not be deemed “filed” for any purpose, and shall not be deemed incorporated by reference in any filing under the Securities Act of 1933, as amended (the “Securities Act”), or the Securities Exchange Act of 1934, as amended (the “Exchange Act”), except as expressly set forth by specific reference in such filing.
Use of Non-GAAP Financial Information
To help understand the Company’s financial performance, the Company has supplemented its financial results that it provides in accordance with generally accepted accounting principles (“GAAP”) with non-GAAP financial measures. Such financial measures include Adjusted Net Income (Loss), Adjusted Earnings (Loss) Per Common Share, earnings before interest, taxes, depreciation and amortization (“EBITDA”), Adjusted EBITDA, and Adjusted EBITDA Margin.
We believe these non-GAAP financial measures are frequently used by investors, securities analysts and other parties in the evaluation of our performance and liquidity with that of other companies in our industry. Management uses these measures to evaluate our operating performance, liquidity and capital structure. In addition, our incentive compensation plan measures performance based on our consolidated EBITDA, along with other factors. The methods we use to produce these non-GAAP financial measures may differ from methods used by other companies. These measures should be considered in addition to, not as a substitute for, financial measures prepared in accordance with GAAP. Applicable reconciliations to the nearest GAAP financial measure of each non-GAAP financial measure are included in the attached Exhibit 99.1.
Item 7.01 Regulation FD Disclosure.
On July 29, 2026, the Company posted the second quarter 2026 investor presentation to its website. The presentation is attached as Exhibit 99.2 to this Current Report on Form 8-K and is incorporated herein by reference. All information included in the presentation is presented as of the dates indicated, and the Company does not assume any obligation to correct or update such information in the future. In addition, the Company disclaims any inferences regarding the materiality of such information that may arise as a result of it furnishing such information under Item 7.01 of this Current Report on Form 8-K.
The information contained in this Item 7.01, including Exhibit 99.2 attached hereto, is being furnished and shall not be deemed “filed” for any purpose, and shall not be deemed incorporated by reference in any filing under the Securities Act or the Exchange Act, except as expressly set forth by specific reference in such filing.
Item 9.01 Financial Statements and Exhibits.
(d) Exhibits
Exhibit No. |
Description |
Press Release of Orion Group Holdings, Inc. dated July 28, 2026. |
|
Investor Presentation, dated July 2026. |
|
104 |
Cover Page Interactive Data File (embedded within the Inline XBRL document). |
EXHIBIT INDEX
SIGNATURE
Pursuant to the requirements of the Securities Exchange Act of 1934, the registrant has duly caused this report to be signed on its behalf by the undersigned hereunto duly authorized.
Orion Group Holdings, Inc. |
||
Dated: July 29, 2026 |
By: |
/s/ Travis J. Boone |
President and Chief Executive Officer |
||

Exhibit 99.1
ORION GROUP HOLDINGS REPORTS
SECOND QUARTER 2026 RESULTS
HOUSTON – July 28, 2026 – Orion Group Holdings, Inc. (NYSE: ORN) (the “Company” or “Orion”), a leading specialty construction company, today reported its financial results for the second quarter ended
June 30, 2026, and updated its full-year 2026 outlook.
Highlights for the quarter ended June 30, 2026
“In the quarter, Orion delivered solid year-over-year revenue growth and project bookings, reflecting favorable demand in our end markets. Our confidence in the long-term opportunities across our Marine and Concrete businesses remains robust, and our pipeline of opportunities has grown to approximately $27 billion. Recent awards across both of our businesses reinforce our competitive position in attractive end markets, spanning defense infrastructure, port and transportation infrastructure, data centers, healthcare and advanced manufacturing. With a growing opportunity pipeline, expanded capabilities, and an outstanding team delivering projects that matter, our conviction in Orion's long-term growth trajectory is strong,” said Travis Boone, Chief Executive Officer of Orion.
“Our Concrete business posted excellent results reporting over 30% revenue growth and over 45% adjusted EBITDA growth in the quarter benefitting from expansion of site civil services, favorable utilization and solid execution. Marine contract revenue and adjusted EBITDA were down primarily due to the timing of project start-ups and lower equipment utilization, and we have reset our full year 2026 guidance accordingly. Today, we have strong visibility into the remainder of the year with nearly 90% of Marine work under contract and strong Concrete momentum to achieve our updated guidance,” concluded Boone.
Second Quarter 2026 Results
Amounts in the table are in millions, except per share information
|
Quarter Ended |
||||
|
June 30, |
|
June 30, |
||
|
2026 |
|
2025 |
||
Revenue |
$ |
221.9 |
|
$ |
205.3 |
GAAP Net (Loss) Income |
$ |
(4.1) |
|
$ |
0.8 |
GAAP Earnings Per Share (“EPS”) |
$ |
(0.10) |
|
$ |
0.02 |
Adjusted EBITDA |
$ |
7.9 |
|
$ |
11.0 |
Adjusted EPS |
$ |
0.02 |
|
$ |
0.07 |
See definitions and reconciliation of non-GAAP measures elsewhere in this release.
1
Contract revenues of $221.9 million in the second quarter of 2026 increased $16.6 million, or 8%, from $205.3 million in the second quarter of last year. The increase was driven by the Concrete segment, reflecting strong demand, new project awards and higher volumes. This increase was partially offset by a reduction in Marine revenue, primarily attributable to the timing of project start-ups due to client-related issues such as site readiness and timing of delivery of client-provided materials.
Gross profit was $22.9 million in the second quarter of 2026, a decrease of $2.9 million, or 11%, from $25.8 million in the second quarter of 2025. The decrease was primarily driven by lower Marine volume and equipment utilization. The decrease was partially offset by favorable project execution within the Concrete segment.
Selling, general and administrative expenses were $24.4 million for the second quarter of 2026, up from $22.8 million in the second quarter of last year, primarily attributable to costs to support business growth.
GAAP net loss for the quarter ended June 30, 2026 was $4.1 million, or $0.10 per diluted share, compared to net income of $0.8 million, or $0.02 per diluted share, in the second quarter of last year.
Adjusted EBITDA for the second quarter of 2026 was $7.9 million, compared to $11.0 million in the second quarter of 2025.
Backlog
Amounts in the table are in millions
|
June 30, |
|
December 31, |
||
|
2026 |
|
2025 |
||
Marine |
$ |
554 |
|
$ |
480 |
Concrete |
|
168 |
|
|
160 |
Total |
$ |
722 |
|
$ |
640 |
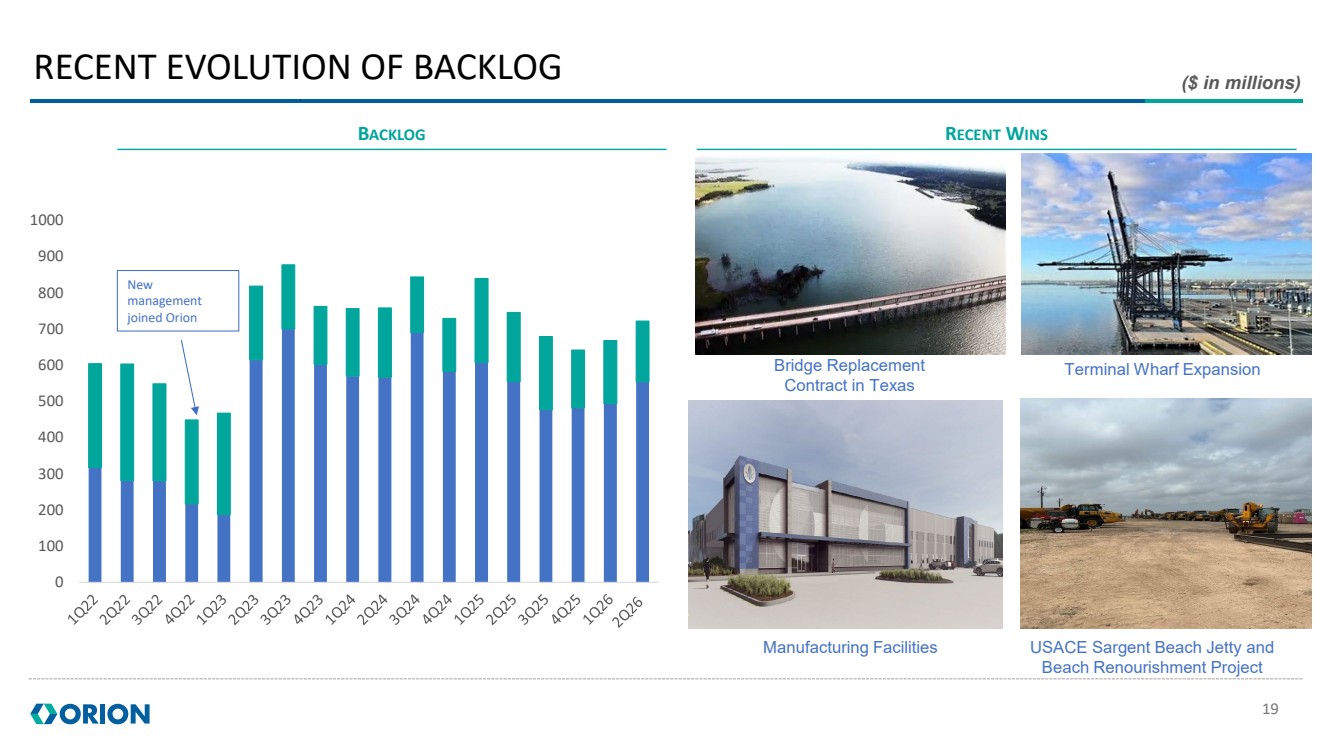
Second quarter 2026 backlog included approximately $277 million in new awards. Second quarter Marine awards included a major port terminal expansion project, a large dredging project and a jetty rehabilitation project. Recent Concrete awards included several data centers and expanded site work as well as healthcare and advanced manufacturing.
Balance Sheet Update
As of June 30, 2026, working capital was $92 million, including unrestricted cash and cash equivalents of $2.5 million. Total debt outstanding was $99 million, with $76 million of outstanding borrowings under the UMB Credit Facility.
2
Guidance
The following forward-looking guidance reflects the Company’s current expectations and beliefs as of July 28, 2026, and is subject to change. The following statements apply only as of the date of this press release and are expressly qualified in their entirety by the cautionary statements included elsewhere in this press release.
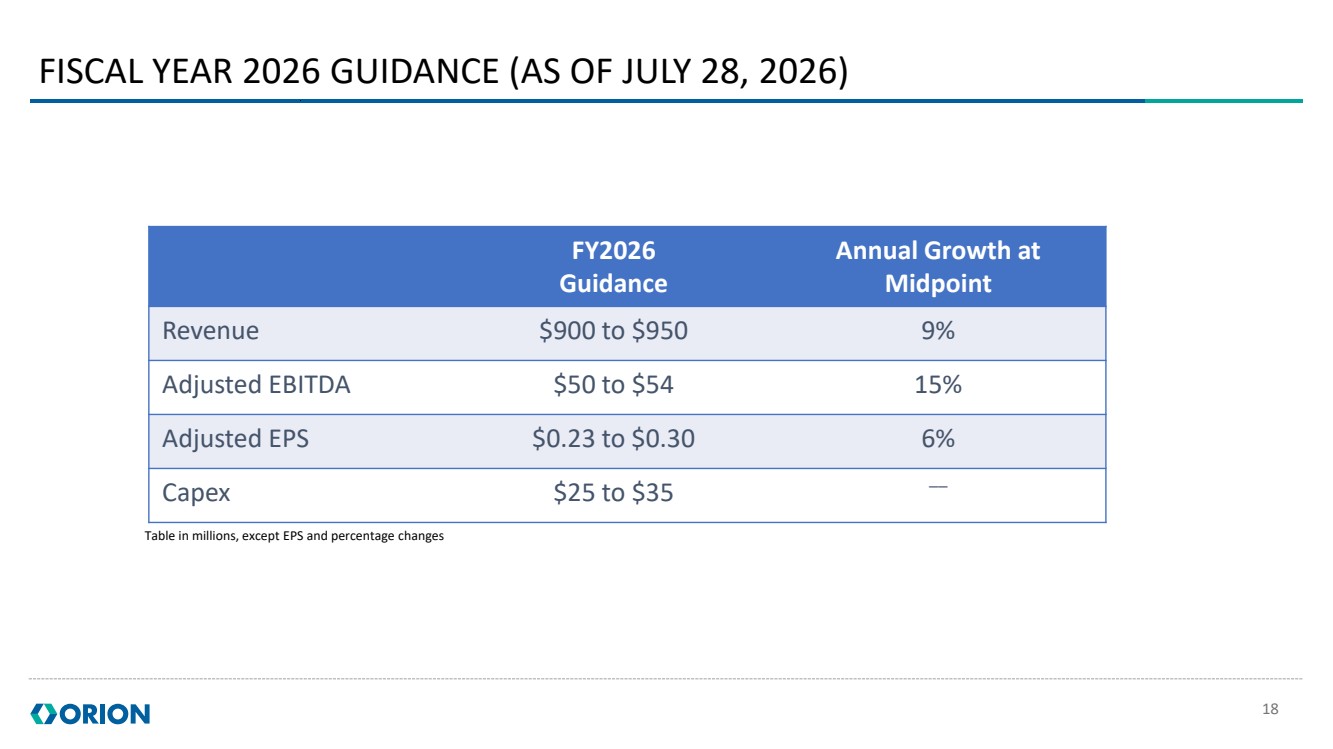
The Company provided the following revised guidance for the full year 2026:
In millions, except per share amounts and percentages
|
Revised Estimated Range for Full-Year Ended |
|||||||||
|
December 31, 2026 |
|||||||||
|
Low |
|
High |
|
Annual Growth |
|
Previous |
|||
|
Estimate |
|
Estimate |
|
at Midpoint |
|
Guidance |
|||
Revenue |
$ |
900 |
|
$ |
950 |
|
9 |
% |
|
No Change |
Adjusted EBITDA |
$ |
50 |
|
$ |
54 |
|
15 |
% |
|
$54-$58 |
Adjusted EPS |
$ |
0.23 |
|
$ |
0.30 |
|
6 |
% |
|
$0.36-$0.42 |
Capital Expenditures |
$ |
25 |
|
$ |
35 |
|
— |
|
|
No Change |
Conference Call Details
Orion Group Holdings will host a conference call to discuss the second quarter 2026 financial results at 9:00 a.m. Eastern Time/8:00 a.m. Central Time on Wednesday, July 29, 2026. To participate, please call (844) 481-2994 and ask for the Orion Group Holdings conference call. A live audio webcast of the call will also be available on the Investor Relations section of Orion’s website at https://www.oriongroupholdingsinc.com/investor/ and will be archived for replay.
About Orion Group Holdings
Orion Group Holdings, Inc., a leading specialty construction company serving the infrastructure, industrial and building sectors, provides services both on and off the water in the continental United States, Alaska, Hawaii, Canada and the Caribbean Basin through its marine segment and its concrete segment. The Company’s Marine segment provides construction and dredging services relating to marine transportation facility construction, marine pipeline construction, marine environmental structures, dredging of waterways, channels and ports, environmental dredging, design and specialty services. Its Concrete segment provides turnkey concrete construction services including place and finish, site prep, layout, forming, and rebar placement for large commercial, structural and other associated business areas. The Company is headquartered in Houston, Texas. The Company’s website is located at: https://www.oriongroupholdingsinc.com.
Backlog Definition
Backlog consists of projects under contract that have either (a) not been started, or (b) are in progress but are not yet complete. The Company cannot guarantee that the revenue implied by its backlog will be realized, or, if realized, will result in earnings or profitability. Backlog can fluctuate from period to period due to the timing and execution of contracts. The typical duration of the Company’s Concrete projects ranges from six to twelve months and Marine projects range from 18 to 24 months. The Company's backlog at any point in time includes both revenue it expects to realize during the next twelve-month period as well as revenue it expects to realize in future years.
3
Non-GAAP Financial Measures
This press release includes the financial measures “adjusted net income/loss,” “adjusted earnings/loss per share,” “EBITDA,” “Adjusted EBITDA,” and “Adjusted EBITDA margin.” These measurements are determined by methods other than in accordance with U.S. generally accepted accounting principles (“GAAP”) and are “non-GAAP financial measures” under rules of the U.S. Securities and Exchange Commission, including Regulation G. The non-GAAP financial information may be determined or calculated differently by other companies that use similarly titled measures. By reporting such non-GAAP financial information, the Company does not intend to give such information greater prominence than comparable GAAP financial information. Investors are urged to consider these non-GAAP measures in addition to and not in substitute for measures prepared in accordance with GAAP.
Adjusted net income/loss and adjusted earnings/loss per share should not be viewed as an equivalent financial measure to net income/loss or earnings/loss per share. Adjusted net income/loss and adjusted earnings/loss per share exclude certain items that management believes are one-time items or items whose timing or amount cannot be reasonably estimated. The Company believes these adjusted financial measures are a useful supplement to earnings/loss calculated in accordance with GAAP.
Orion defines EBITDA as net income/loss before net interest expense, income taxes, depreciation and amortization. Adjusted EBITDA is calculated by adjusting EBITDA for certain items that management believes are one-time items or items whose timing or amount cannot be reasonably estimated, such as non-cash share-based compensation, enterprise resource planning implementation, severance, process improvement initiatives and acquisition and integration costs. Adjusted EBITDA margin is calculated by dividing Adjusted EBITDA for the period by contract revenues for the period. The GAAP financial measure that is most directly comparable to EBITDA and Adjusted EBITDA is net income, while the GAAP financial measure that is most directly comparable to Adjusted EBITDA margin is operating margin, which represents operating income divided by contract revenues. EBITDA, Adjusted EBITDA and Adjusted EBITDA margin are used internally to evaluate current operating expense, operating efficiency, and operating profitability on a variable cost basis, by excluding the depreciation and amortization expenses, primarily related to capital expenditures and acquisitions, and net interest and tax expenses. Additionally, EBITDA, Adjusted EBITDA and Adjusted EBITDA margin provide useful information regarding the Company's ability to meet future debt service and working capital requirements while providing an overall evaluation of the Company’s financial condition. In addition, EBITDA is used internally for incentive compensation purposes. The Company includes EBITDA, Adjusted EBITDA and Adjusted EBITDA margin to provide transparency to investors as they are commonly used by investors and others in assessing performance. EBITDA, Adjusted EBITDA and Adjusted EBITDA margin have certain limitations as analytical tools and should not be used as a substitute for operating margin, net income, cash flows, or other data prepared in accordance with GAAP, or as a measure of the Company’s profitability or liquidity.
Forward-Looking Statements
The matters discussed in this press release may constitute or include projections or other forward-looking statements within the meaning of the “safe harbor” provisions of Section 27A of the Securities Act of 1933, as amended, and Section 21E of the Securities Exchange Act of 1934, as amended, of which provisions the Company is availing itself. Certain forward-looking statements can be identified by the use of forward-looking terminology, such as “believes,” ”expects,” “may,” ”will,” ”could,” ”should,” ”seeks,” ”approximately,” ”intends,” “plans,” ”estimates,” or “anticipates,” or the negative thereof or other comparable terminology, or by discussions of strategy, plans, objectives, intentions, estimates, forecasts, guidance, outlook, assumptions, or goals. In particular, statements regarding our pipeline of opportunities, achievement of strategic priorities, position for growth, financial guidance and future operations or results, including those set forth in this press release, and any other statement, express or implied, concerning financial guidance or future operating
4
results or the future generation of or ability to generate revenues, income, net income, gross profit, EBITDA, Adjusted EBITDA, Adjusted EBITDA margin, or cash flow, including to service debt or maintain compliance with debt covenants, and including any estimates, guidance, forecasts or assumptions regarding future revenues or revenue growth, are forward-looking statements. Forward-looking statements also include project award announcements, estimated project start dates, ramp-up of contract activity and contract options, which may or may not be awarded in the future. Forward-looking statements involve risks, including those associated with the Company's fixed price contracts that impacts profits, unforeseen productivity delays that may alter the final profitability of the contract, cancellation of the contract by the customer for unforeseen reasons, delays or decreases in funding by the customer, levels and predictability of government funding or other governmental budgetary constraints, and any potential contract options that may or may not be awarded in the future, and are at the sole discretion of award by the customer. Past performance is not necessarily an indicator of future results. Considering these and other uncertainties, the inclusion of forward-looking statements in this press release should not be regarded as a representation by the Company that the Company's plans, estimates, forecasts, goals, intentions, or objectives will be achieved or realized. Readers are cautioned not to place undue reliance on these forward-looking statements, which speak only as of the date hereof. The Company assumes no obligation to update information contained in this press release whether as a result of new developments or otherwise, except as required by law.
Please refer to the Company's 2025 Annual Report on Form 10-K, filed on March 4, 2026 which is available on its website at www.oriongroupholdingsinc.com or at the SEC's website at www.sec.gov, and filings and press releases subsequent to such Annual Report on Form 10-K for additional and more detailed discussion of risk factors that could cause actual results to differ materially from our current expectations, estimates or forecasts.
Contact:
Margaret Boyce
346-278-3762
mboyce@orn.net
Source: Orion Group Holdings, Inc.
5
Orion Group Holdings, Inc. and Subsidiaries
Condensed Consolidated Statements of Operations
(In Thousands, Except Share and Per Share Information)
(Unaudited)
|
|
Three Months Ended |
|
Six Months Ended |
||||||||
|
|
June 30, |
|
June 30, |
||||||||
|
|
2026 |
|
2025 |
|
2026 |
|
2025 |
||||
Contract revenues |
|
$ |
221,878 |
|
$ |
205,286 |
|
$ |
438,179 |
|
$ |
393,939 |
Costs of contract revenues |
|
|
198,951 |
|
|
179,489 |
|
|
389,373 |
|
|
345,127 |
Gross profit |
|
|
22,927 |
|
|
25,797 |
|
|
48,806 |
|
|
48,812 |
Selling, general and administrative expenses |
|
|
24,395 |
|
|
22,774 |
|
|
51,104 |
|
|
45,319 |
Gain on disposal of assets, net |
|
|
(153) |
|
|
(409) |
|
|
(188) |
|
|
(772) |
Operating (loss) income |
|
|
(1,315) |
|
|
3,432 |
|
|
(2,110) |
|
|
4,265 |
Other (expense) income: |
|
|
|
|
|
|
|
|
|
|
|
|
Interest expense |
|
|
(2,505) |
|
|
(2,920) |
|
|
(4,036) |
|
|
(5,254) |
Other income |
|
|
149 |
|
|
117 |
|
|
310 |
|
|
344 |
Other expense, net |
|
|
(2,356) |
|
|
(2,803) |
|
|
(3,726) |
|
|
(4,910) |
(Loss) income before income taxes |
|
|
(3,671) |
|
|
629 |
|
|
(5,836) |
|
|
(645) |
Income tax expense (benefit) |
|
|
474 |
|
|
(212) |
|
|
(6,378) |
|
|
(72) |
Net (loss) income |
|
$ |
(4,145) |
|
$ |
841 |
|
$ |
542 |
|
$ |
(573) |
|
|
|
|
|
|
|
|
|
|
|
|
|
Basic (loss) income per share |
|
$ |
(0.10) |
|
$ |
0.02 |
|
$ |
0.01 |
|
$ |
(0.01) |
Diluted (loss) income per share |
|
$ |
(0.10) |
|
$ |
0.02 |
|
$ |
0.01 |
|
$ |
(0.01) |
Shares used to compute (loss) income per share |
|
|
|
|
|
|
|
|
|
|
|
|
Basic |
|
|
40,479,053 |
|
|
39,765,051 |
|
|
40,295,569 |
|
|
39,412,681 |
Diluted |
|
|
40,479,053 |
|
|
39,791,164 |
|
|
40,325,118 |
|
|
39,412,681 |
6
Orion Group Holdings, Inc. and Subsidiaries
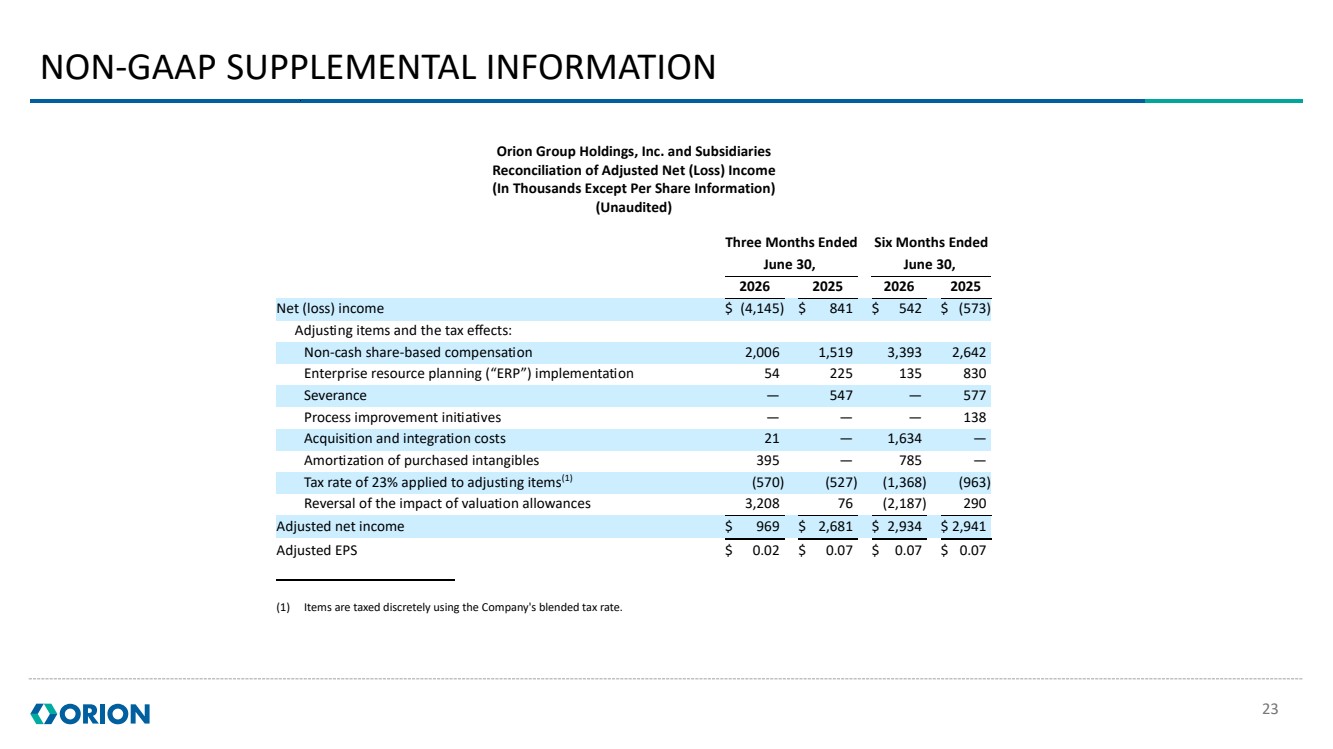
Reconciliation of Adjusted Net (Loss) Income
(In Thousands, Except Per Share Information)
(Unaudited)
|
|
Three Months Ended |
|
Six Months Ended |
||||||||
|
|
June 30, |
|
June 30, |
||||||||
|
|
2026 |
|
2025 |
|
2026 |
|
2025 |
||||
Net (loss) income |
|
$ |
(4,145) |
|
$ |
841 |
|
$ |
542 |
|
$ |
(573) |
Adjusting items and the tax effects: |
|
|
|
|
|
|
|
|
|
|
|
|
Non-cash share-based compensation |
|
|
2,006 |
|
|
1,519 |
|
|
3,393 |
|
|
2,642 |
Enterprise resource planning (“ERP”) implementation |
|
|
54 |
|
|
225 |
|
|
135 |
|
|
830 |
Severance |
|
|
— |
|
|
547 |
|
|
— |
|
|
577 |
Process improvement initiatives |
|
|
— |
|
|
— |
|
|
— |
|
|
138 |
Acquisition and integration costs |
|
|
21 |
|
|
— |
|
|
1,634 |
|
|
— |
Amortization of purchased intangibles |
|
|
395 |
|
|
— |
|
|
785 |
|
|
— |
Tax rate of 23% applied to adjusting items(1) |
|
|
(570) |
|
|
(527) |
|
|
(1,368) |
|
|
(963) |
Reversal of the impact of valuation allowances |
|
|
3,208 |
|
|
76 |
|
|
(2,187) |
|
|
290 |
Adjusted net income |
|
$ |
969 |
|
$ |
2,681 |
|
$ |
2,934 |
|
$ |
2,941 |
Adjusted EPS |
|
$ |
0.02 |
|
$ |
0.07 |
|
$ |
0.07 |
|
$ |
0.07 |
| (1) | Items are taxed discretely using the Company's blended tax rate. |
7
Orion Group Holdings, Inc. and Subsidiaries
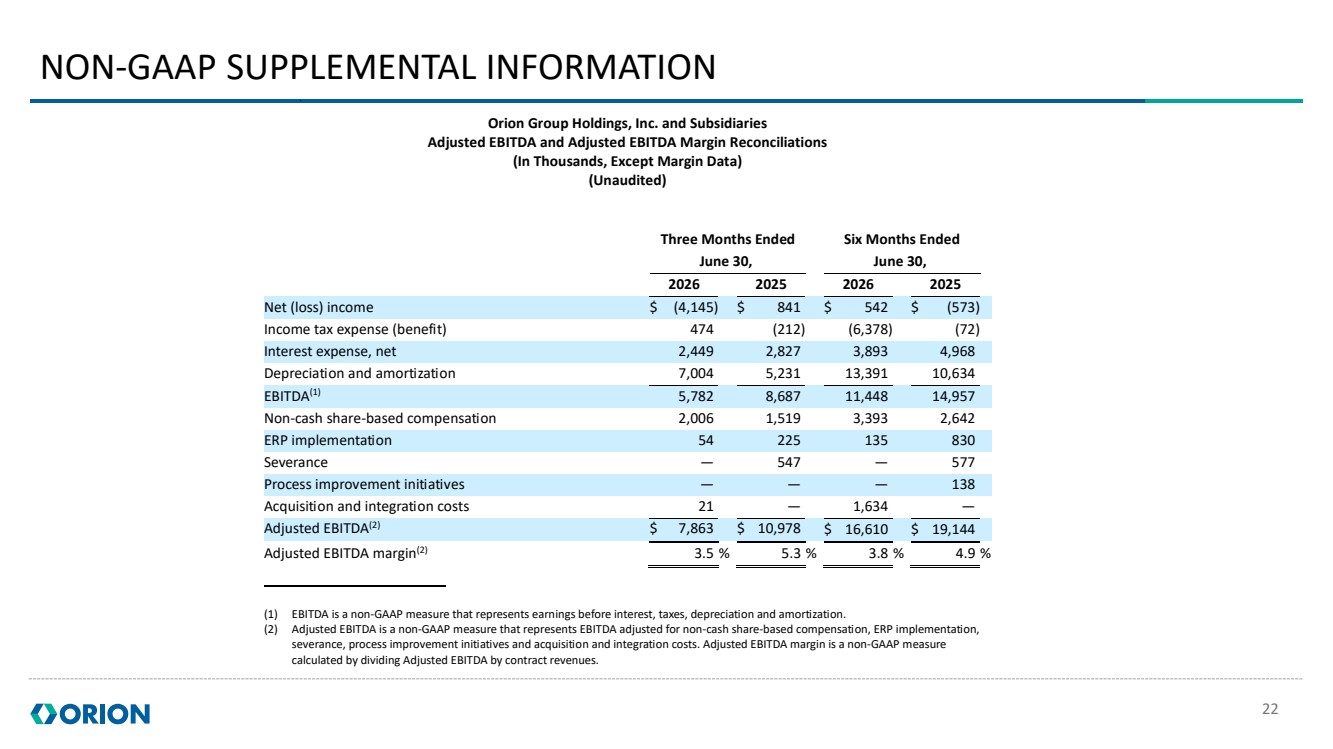
Adjusted EBITDA and Adjusted EBITDA Margin Reconciliations
(In Thousands, Except Margin Data)
(Unaudited)
|
|
Three Months Ended |
|
Six Months Ended |
|
||||||||
|
|
June 30, |
|
June 30, |
|
||||||||
|
|
2026 |
|
2025 |
|
2026 |
|
2025 |
|
||||
Net (loss) income |
|
$ |
(4,145) |
|
$ |
841 |
|
$ |
542 |
|
$ |
(573) |
|
Income tax expense (benefit) |
|
|
474 |
|
|
(212) |
|
|
(6,378) |
|
|
(72) |
|
Interest expense, net |
|
|
2,449 |
|
|
2,827 |
|
|
3,893 |
|
|
4,968 |
|
Depreciation and amortization |
|
|
7,004 |
|
|
5,231 |
|
|
13,391 |
|
|
10,634 |
|
EBITDA(1) |
|
|
5,782 |
|
|
8,687 |
|
|
11,448 |
|
|
14,957 |
|
Non-cash share-based compensation |
|
|
2,006 |
|
|
1,519 |
|
|
3,393 |
|
|
2,642 |
|
ERP implementation |
|
|
54 |
|
|
225 |
|
|
135 |
|
|
830 |
|
Severance |
|
|
— |
|
|
547 |
|
|
— |
|
|
577 |
|
Process improvement initiatives |
|
|
— |
|
|
— |
|
|
— |
|
|
138 |
|
Acquisition and integration costs |
|
|
21 |
|
|
— |
|
|
1,634 |
|
|
— |
|
Adjusted EBITDA(2) |
|
$ |
7,863 |
|
$ |
10,978 |
|
$ |
16,610 |
|
$ |
19,144 |
|
Adjusted EBITDA margin(2) |
|
|
3.5 |
% |
|
5.3 |
% |
|
3.8 |
% |
|
4.9 |
% |
| (1) | EBITDA is a non-GAAP measure that represents earnings before interest, taxes, depreciation and amortization. |
| (2) | Adjusted EBITDA is a non-GAAP measure that represents EBITDA adjusted for non-cash share-based compensation, ERP implementation, severance, process improvement initiatives and acquisition and integration costs. Adjusted EBITDA margin is a non-GAAP measure calculated by dividing Adjusted EBITDA by contract revenues. |
8
Orion Group Holdings, Inc. and Subsidiaries
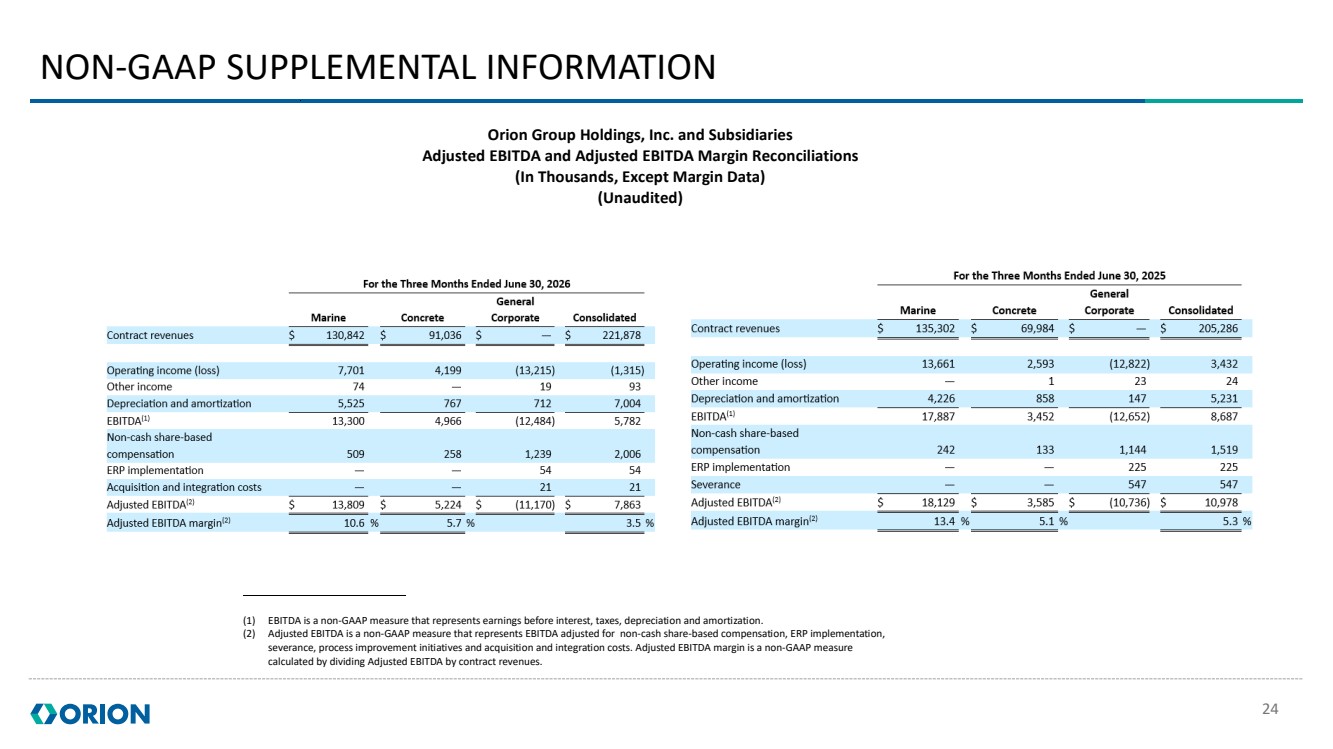
Adjusted EBITDA and Adjusted EBITDA Margin Reconciliations by Segment
(In Thousands, Except Margin Data)
(Unaudited)
|
|
For the Three Months Ended June 30, 2026 |
|
||||||||||
|
|
Marine |
|
Concrete |
|
General Corporate |
|
Consolidated |
|
||||
Contract revenues |
|
$ |
130,842 |
|
$ |
91,036 |
|
$ |
— |
|
$ |
221,878 |
|
|
|
|
|
|
|
|
|
|
|
|
|
|
|
Operating income (loss) |
|
|
7,701 |
|
|
4,199 |
|
|
(13,215) |
|
|
(1,315) |
|
Other income |
|
|
74 |
|
|
— |
|
|
19 |
|
|
93 |
|
Depreciation and amortization |
|
|
5,525 |
|
|
767 |
|
|
712 |
|
|
7,004 |
|
EBITDA(1) |
|
|
13,300 |
|
|
4,966 |
|
|
(12,484) |
|
|
5,782 |
|
Non-cash share-based compensation |
|
|
509 |
|
|
258 |
|
|
1,239 |
|
|
2,006 |
|
ERP implementation |
|
|
— |
|
|
— |
|
|
54 |
|
|
54 |
|
Acquisition and integration costs |
|
|
— |
|
|
— |
|
|
21 |
|
|
21 |
|
Adjusted EBITDA(2) |
|
$ |
13,809 |
|
$ |
5,224 |
|
$ |
(11,170) |
|
$ |
7,863 |
|
Adjusted EBITDA margin(2) |
|
|
10.6 |
% |
|
5.7 |
% |
|
|
|
|
3.5 |
% |
|
|
|
|
|
|
|
|
|
|
|
|
|
|
|
|
|
|
|
|
|
|
|
|
|
|
|
|
|
|
For the Three Months Ended June 30, 2025 |
|
||||||||||
|
|
Marine |
|
Concrete |
|
General Corporate |
|
Consolidated |
|
||||
Contract revenues |
|
$ |
135,302 |
|
$ |
69,984 |
|
$ |
— |
|
$ |
205,286 |
|
|
|
|
|
|
|
|
|
|
|
|
|
|
|
Operating income (loss) |
|
|
13,661 |
|
|
2,593 |
|
|
(12,822) |
|
|
3,432 |
|
Other income |
|
|
— |
|
|
1 |
|
|
23 |
|
|
24 |
|
Depreciation and amortization |
|
|
4,226 |
|
|
858 |
|
|
147 |
|
|
5,231 |
|
EBITDA(1) |
|
|
17,887 |
|
|
3,452 |
|
|
(12,652) |
|
|
8,687 |
|
Non-cash share-based compensation |
|
|
242 |
|
|
133 |
|
|
1,144 |
|
|
1,519 |
|
ERP implementation |
|
|
— |
|
|
— |
|
|
225 |
|
|
225 |
|
Severance |
|
|
— |
|
|
— |
|
|
547 |
|
|
547 |
|
Adjusted EBITDA(2) |
|
$ |
18,129 |
|
$ |
3,585 |
|
$ |
(10,736) |
|
$ |
10,978 |
|
Adjusted EBITDA margin(2) |
|
|
13.4 |
% |
|
5.1 |
% |
|
|
|
|
5.3 |
% |
| (1) | EBITDA is a non-GAAP measure that represents earnings before interest, taxes, depreciation and amortization. |
| (2) | Adjusted EBITDA is a non-GAAP measure that represents EBITDA adjusted for non-cash share-based compensation, ERP implementation, severance, process improvement initiatives and acquisition and integration costs. Adjusted EBITDA margin is a non-GAAP measure calculated by dividing Adjusted EBITDA by contract revenues. |
9
Orion Group Holdings, Inc. and Subsidiaries
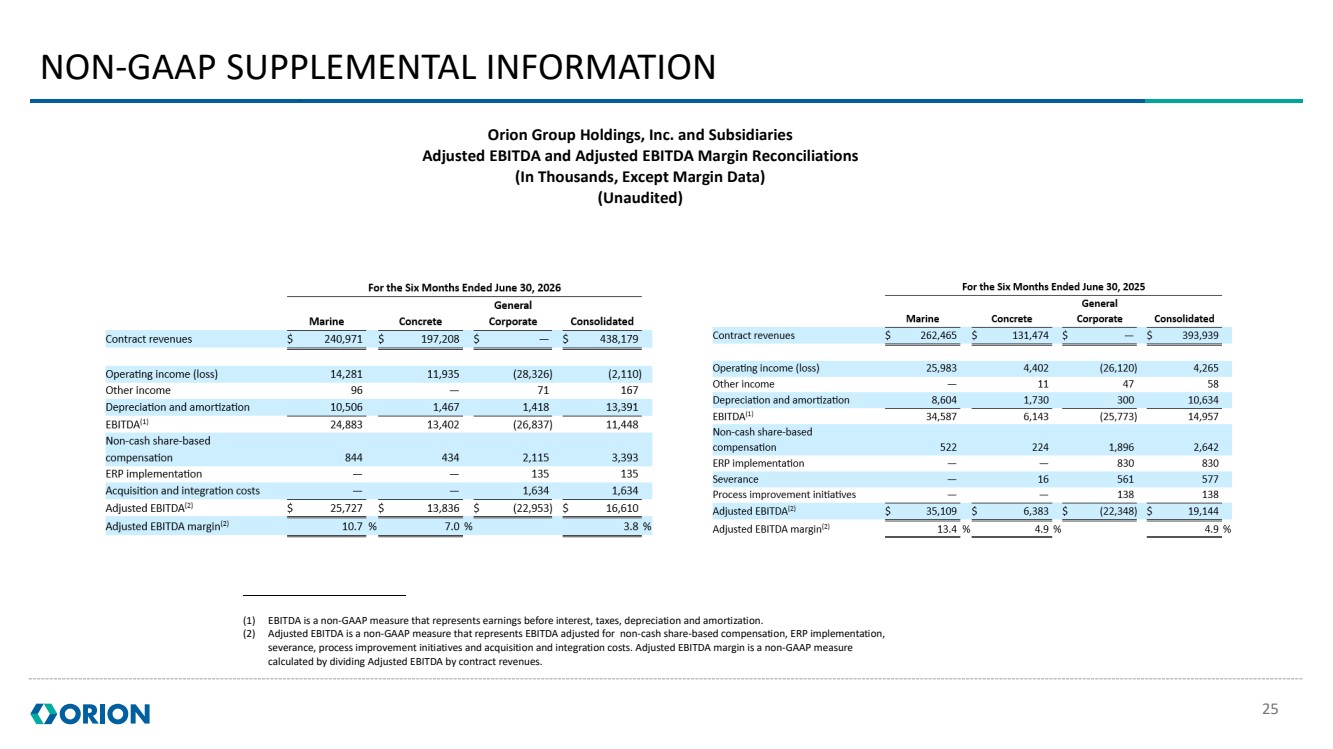
Adjusted EBITDA and Adjusted EBITDA Margin Reconciliations by Segment
(In Thousands, Except Margin Data)
(Unaudited)
|
|
For the Six Months Ended June 30, 2026 |
|
||||||||||
|
|
Marine |
|
Concrete |
|
General Corporate |
|
Consolidated |
|
||||
Contract revenues |
|
$ |
240,971 |
|
$ |
197,208 |
|
$ |
— |
|
$ |
438,179 |
|
|
|
|
|
|
|
|
|
|
|
|
|
|
|
Operating income (loss) |
|
|
14,281 |
|
|
11,935 |
|
|
(28,326) |
|
|
(2,110) |
|
Other income |
|
|
96 |
|
|
— |
|
|
71 |
|
|
167 |
|
Depreciation and amortization |
|
|
10,506 |
|
|
1,467 |
|
|
1,418 |
|
|
13,391 |
|
EBITDA(1) |
|
|
24,883 |
|
|
13,402 |
|
|
(26,837) |
|
|
11,448 |
|
Non-cash share-based compensation |
|
|
844 |
|
|
434 |
|
|
2,115 |
|
|
3,393 |
|
ERP implementation |
|
|
— |
|
|
— |
|
|
135 |
|
|
135 |
|
Acquisition and integration costs |
|
|
— |
|
|
— |
|
|
1,634 |
|
|
1,634 |
|
Adjusted EBITDA(2) |
|
$ |
25,727 |
|
$ |
13,836 |
|
$ |
(22,953) |
|
$ |
16,610 |
|
Adjusted EBITDA margin(2) |
|
|
10.7 |
% |
|
7.0 |
% |
|
|
|
|
3.8 |
% |
|
|
|
|
|
|
|
|
|
|
|
|
|
|
|
|
|
|
|
|
|
|
|
|
|
|
|
|
|
|
For the Six Months Ended June 30, 2025 |
|
||||||||||
|
|
Marine |
|
Concrete |
|
General Corporate |
|
Consolidated |
|
||||
Contract revenues |
|
$ |
262,465 |
|
$ |
131,474 |
|
$ |
— |
|
$ |
393,939 |
|
|
|
|
|
|
|
|
|
|
|
|
|
|
|
Operating income (loss) |
|
|
25,983 |
|
|
4,402 |
|
|
(26,120) |
|
|
4,265 |
|
Other income |
|
|
— |
|
|
11 |
|
|
47 |
|
|
58 |
|
Depreciation and amortization |
|
|
8,604 |
|
|
1,730 |
|
|
300 |
|
|
10,634 |
|
EBITDA(1) |
|
|
34,587 |
|
|
6,143 |
|
|
(25,773) |
|
|
14,957 |
|
Non-cash share-based compensation |
|
|
522 |
|
|
224 |
|
|
1,896 |
|
|
2,642 |
|
ERP implementation |
|
|
— |
|
|
— |
|
|
830 |
|
|
830 |
|
Severance |
|
|
— |
|
|
16 |
|
|
561 |
|
|
577 |
|
Process improvement initiatives |
|
|
— |
|
|
— |
|
|
138 |
|
|
138 |
|
Adjusted EBITDA(2) |
|
$ |
35,109 |
|
$ |
6,383 |
|
$ |
(22,348) |
|
$ |
19,144 |
|
Adjusted EBITDA margin(2) |
|
|
13.4 |
% |
|
4.9 |
% |
|
|
|
|
4.9 |
% |
| (1) | EBITDA is a non-GAAP measure that represents earnings before interest, taxes, depreciation and amortization. |
| (2) | Adjusted EBITDA is a non-GAAP measure that represents EBITDA adjusted for non-cash share-based compensation, ERP implementation, severance, process improvement initiatives and acquisition and integration costs. Adjusted EBITDA margin is a non-GAAP measure calculated by dividing Adjusted EBITDA by contract revenues. |
10
Orion Group Holdings, Inc. and Subsidiaries
Condensed Consolidated Statements of Cash Flows
(In Thousands)
(Unaudited)
|
|
Six Months Ended June 30, |
||||
|
|
2026 |
|
2025 |
||
Cash flows from operating activities |
|
|
|
|
|
|
Net income (loss) |
|
$ |
542 |
|
$ |
(573) |
Adjustments to reconcile net income (loss) to net cash used in operating activities: |
|
|
|
|
|
|
Depreciation and amortization |
|
|
9,834 |
|
|
6,886 |
Amortization of right-of-use (“ROU”) operating leases |
|
|
2,860 |
|
|
4,848 |
Amortization of ROU finance leases |
|
|
3,723 |
|
|
4,360 |
Non-cash interest expense on seller note |
|
|
630 |
|
|
— |
Deferred income taxes |
|
|
(6,117) |
|
|
2 |
Share-based compensation |
|
|
3,393 |
|
|
2,642 |
Gain on disposal of assets, net |
|
|
(189) |
|
|
(772) |
Allowance for credit losses |
|
|
(77) |
|
|
544 |
Change in operating assets and liabilities: |
|
|
|
|
|
|
Accounts receivable |
|
|
55,302 |
|
|
(71,339) |
Income tax receivable |
|
|
(362) |
|
|
(392) |
Inventory |
|
|
(440) |
|
|
819 |
Prepaid expenses and other |
|
|
2,546 |
|
|
312 |
Contract assets |
|
|
(43,692) |
|
|
33,456 |
Accounts payable |
|
|
(18,743) |
|
|
13,636 |
Accrued liabilities |
|
|
(5,829) |
|
|
(1,141) |
Operating lease liabilities |
|
|
(3,101) |
|
|
(3,179) |
Income tax payable |
|
|
(43) |
|
|
(505) |
Contract liabilities |
|
|
(12,936) |
|
|
1,391 |
Net cash used in operating activities |
|
|
(12,699) |
|
|
(9,005) |
Cash flows from investing activities: |
|
|
|
|
|
|
Proceeds from sale of property and equipment |
|
|
683 |
|
|
1,189 |
Purchase of property and equipment |
|
|
(20,108) |
|
|
(16,165) |
Business acquisition, net cash acquired |
|
|
(42,871) |
|
|
— |
Net cash used in investing activities |
|
|
(62,296) |
|
|
(14,976) |
Cash flows from financing activities: |
|
|
|
|
|
|
Borrowings on credit facilities |
|
|
121,000 |
|
|
77,007 |
Payments on credit facilities |
|
|
(85,000) |
|
|
(67,212) |
Proceeds from term loan |
|
|
41,991 |
|
|
— |
Proceeds from deemed financing obligation |
|
|
6,073 |
|
|
— |
Principal payments on deemed financing obligation |
|
|
(1,816) |
|
|
(7,204) |
Loan costs related to credit facilities |
|
|
(419) |
|
|
(323) |
Payments of finance lease liabilities |
|
|
(4,858) |
|
|
(5,316) |
Employee stock plans, net activity |
|
|
(1,037) |
|
|
445 |
Net cash provided by (used in) financing activities |
|
|
75,934 |
|
|
(2,603) |
Net change in cash, cash equivalents and restricted cash |
|
|
939 |
|
|
(26,584) |
Cash, cash equivalents and restricted cash at beginning of period |
|
|
3,285 |
|
|
28,316 |
Cash, cash equivalents and restricted cash at end of period |
|
$ |
4,224 |
|
$ |
1,732 |
11
Orion Group Holdings, Inc. and Subsidiaries
Condensed Consolidated Balance Sheets
(In Thousands, Except Share and Per Share Information)
|
|
June 30, |
|
December 31, |
||
|
|
2026 |
|
2025 |
||
|
|
(Unaudited) |
|
|
|
|
ASSETS |
|
|
|
|
|
|
Current assets: |
|
|
|
|
|
|
Cash and cash equivalents |
|
$ |
2,527 |
|
$ |
1,588 |
Restricted cash |
|
|
1,697 |
|
|
1,697 |
Accounts receivable: |
|
|
|
|
|
|
Trade, net of allowance for credit losses of $3,146 and $3,461, respectively |
|
|
113,317 |
|
|
175,695 |
Retainage |
|
|
58,370 |
|
|
49,194 |
Income taxes receivable |
|
|
619 |
|
|
256 |
Other current |
|
|
5,049 |
|
|
3,531 |
Inventory |
|
|
2,546 |
|
|
2,432 |
Contract assets |
|
|
75,868 |
|
|
31,083 |
Prepaid expenses and other |
|
|
8,817 |
|
|
12,686 |
Total current assets |
|
|
268,810 |
|
|
278,162 |
Property and equipment, net of accumulated depreciation |
|
|
129,629 |
|
|
88,210 |
Operating lease right-of-use assets, net of accumulated amortization |
|
|
23,270 |
|
|
20,397 |
Financing lease right-of-use assets, net of accumulated amortization |
|
|
22,430 |
|
|
18,360 |
Inventory, non-current |
|
|
6,720 |
|
|
6,395 |
Other non-current |
|
|
3,287 |
|
|
3,128 |
Goodwill |
|
|
35,139 |
|
|
— |
Intangible assets, net of accumulated amortization |
|
|
6,955 |
|
|
— |
Total assets |
|
$ |
496,240 |
|
$ |
414,652 |
LIABILITIES AND STOCKHOLDERS’ EQUITY |
|
|
|
|
|
|
Current liabilities: |
|
|
|
|
|
|
Current debt, net of debt issuance costs |
|
$ |
6,203 |
|
$ |
1,789 |
Accounts payable: |
|
|
|
|
|
|
Trade |
|
|
92,379 |
|
|
107,433 |
Retainage |
|
|
1,496 |
|
|
1,699 |
Accrued liabilities |
|
|
21,084 |
|
|
31,750 |
Income taxes payable |
|
|
154 |
|
|
197 |
Contract liabilities |
|
|
41,859 |
|
|
49,104 |
Current portion of operating lease liabilities |
|
|
4,293 |
|
|
4,418 |
Current portion of financing lease liabilities |
|
|
9,352 |
|
|
7,517 |
Total current liabilities |
|
|
176,820 |
|
|
203,907 |
Long-term debt, net of debt issuance costs |
|
|
92,959 |
|
|
6,085 |
Operating lease liabilities |
|
|
27,592 |
|
|
24,695 |
Financing lease liabilities |
|
|
8,379 |
|
|
5,878 |
Other long-term liabilities |
|
|
26,033 |
|
|
15,055 |
Total liabilities |
|
|
331,783 |
|
|
255,620 |
Stockholders’ equity: |
|
|
|
|
|
|
Accumulated other comprehensive income |
|
|
129 |
|
|
— |
Preferred stock -- $0.01 par value, 10,000,000 authorized, none issued |
|
|
— |
|
|
— |
Common stock -- $0.01 par value, 50,000,000 authorized, 41,206,521 and 40,612,139 issued; 40,495,290 and 39,900,908 outstanding at June 30, 2026 and December 31, 2025, respectively |
|
|
412 |
|
|
406 |
Treasury stock, 711,231 shares, at cost, as of June 30, 2026 and December 31, 2025, respectively |
|
|
(6,540) |
|
|
(6,540) |
Additional paid-in capital |
|
|
231,117 |
|
|
226,369 |
Retained loss |
|
|
(60,661) |
|
|
(61,203) |
Total stockholders’ equity |
|
|
164,457 |
|
|
159,032 |
Total liabilities and stockholders’ equity |
|
$ |
496,240 |
|
$ |
414,652 |
12
Orion Group Holdings, Inc. and Subsidiaries
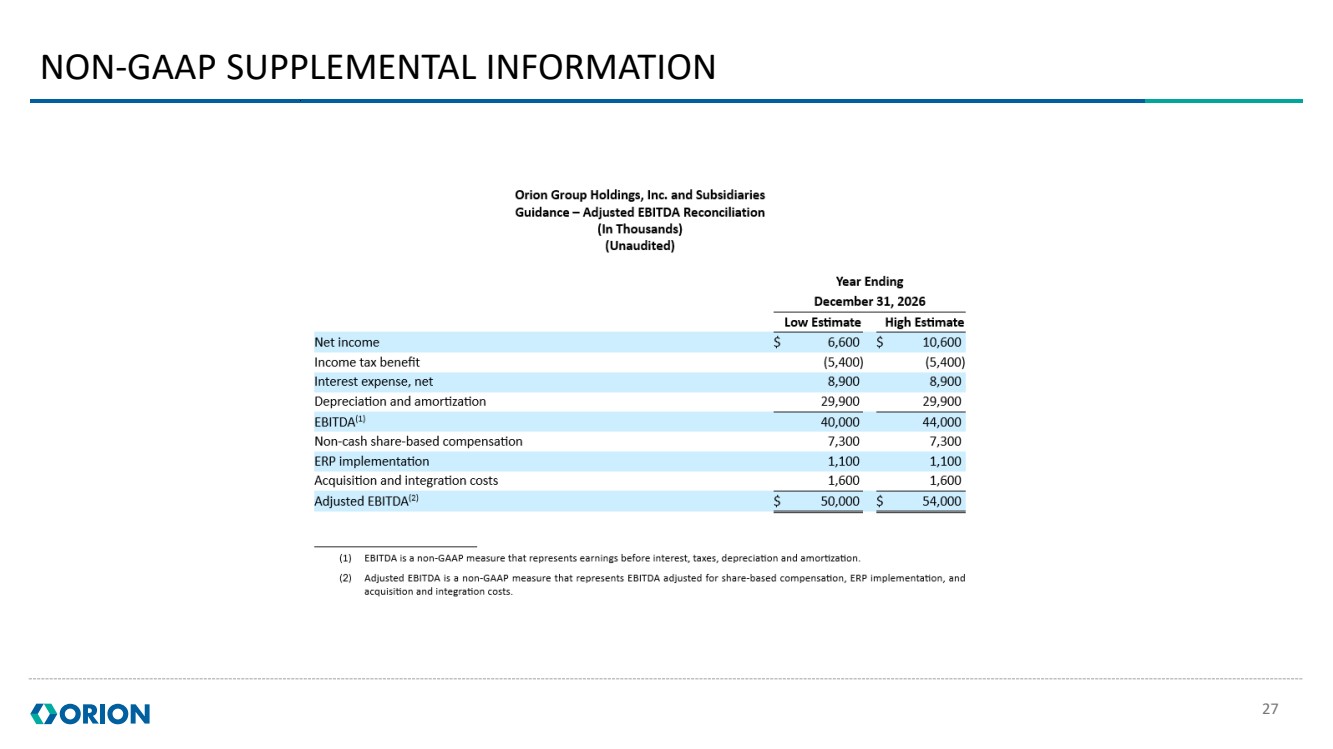
Guidance – Adjusted EBITDA Reconciliation
(In Thousands)
(Unaudited)
|
|
Year Ending |
||||
|
|
December 31, 2026 |
||||
|
|
|
Low Estimate |
|
|
High Estimate |
Net income |
|
$ |
6,600 |
|
$ |
10,600 |
Income tax benefit |
|
|
(5,400) |
|
|
(5,400) |
Interest expense, net |
|
|
8,900 |
|
|
8,900 |
Depreciation and amortization |
|
|
29,900 |
|
|
29,900 |
EBITDA(1) |
|
|
40,000 |
|
|
44,000 |
Non-cash share-based compensation |
|
|
7,300 |
|
|
7,300 |
ERP implementation |
|
|
1,100 |
|
|
1,100 |
Acquisition and integration costs |
|
|
1,600 |
|
|
1,600 |
Adjusted EBITDA(2) |
|
$ |
50,000 |
|
$ |
54,000 |
| (1) | EBITDA is a non-GAAP measure that represents earnings before interest, taxes, depreciation and amortization. |
| (2) | Adjusted EBITDA is a non-GAAP measure that represents EBITDA adjusted for non-cash share-based compensation, ERP implementation, and acquisition and integration costs. |
Orion Group Holdings, Inc. and Subsidiaries
Guidance – Adjusted EPS Reconciliation
(In Thousands except per share information)
(Unaudited)
|
|
Year Ending |
||||
|
|
December 31, 2026 |
||||
|
|
|
Low Estimate |
|
|
High Estimate |
Net income |
|
$ |
6,600 |
|
$ |
10,600 |
Adjusting items and the tax effects: |
|
|
|
|
|
|
Non-cash share-based compensation |
|
|
7,300 |
|
|
7,300 |
ERP implementation |
|
|
1,100 |
|
|
1,100 |
Acquisition and integration costs |
|
|
1,600 |
|
|
1,600 |
Amortization of purchased intangibles |
|
|
2,000 |
|
|
2,000 |
Tax rate of 23% applied to adjusting items(1) |
|
|
(2,800) |
|
|
(2,800) |
Reversal of the impact of valuation allowances |
|
|
(6,700) |
|
|
(7,600) |
Adjusted net income(2) |
|
$ |
9,100 |
|
$ |
12,200 |
Adjusted EPS(2) |
|
$ |
0.23 |
|
$ |
0.30 |
| (1) | Items are taxed discretely using the Company's blended tax rate. |
| (2) | Adjusted net income and Adjusted EPS are non-GAAP measures that represent net income adjusted for non-cash share-based compensation, ERP implementation, acquisition and integration costs and amortization of purchased intangibles. |
13
Exhibit 99.2
|
MARINE | CONCRETE | ENGINEERING & CONSULTING Investor Presentation July 2026 |
|
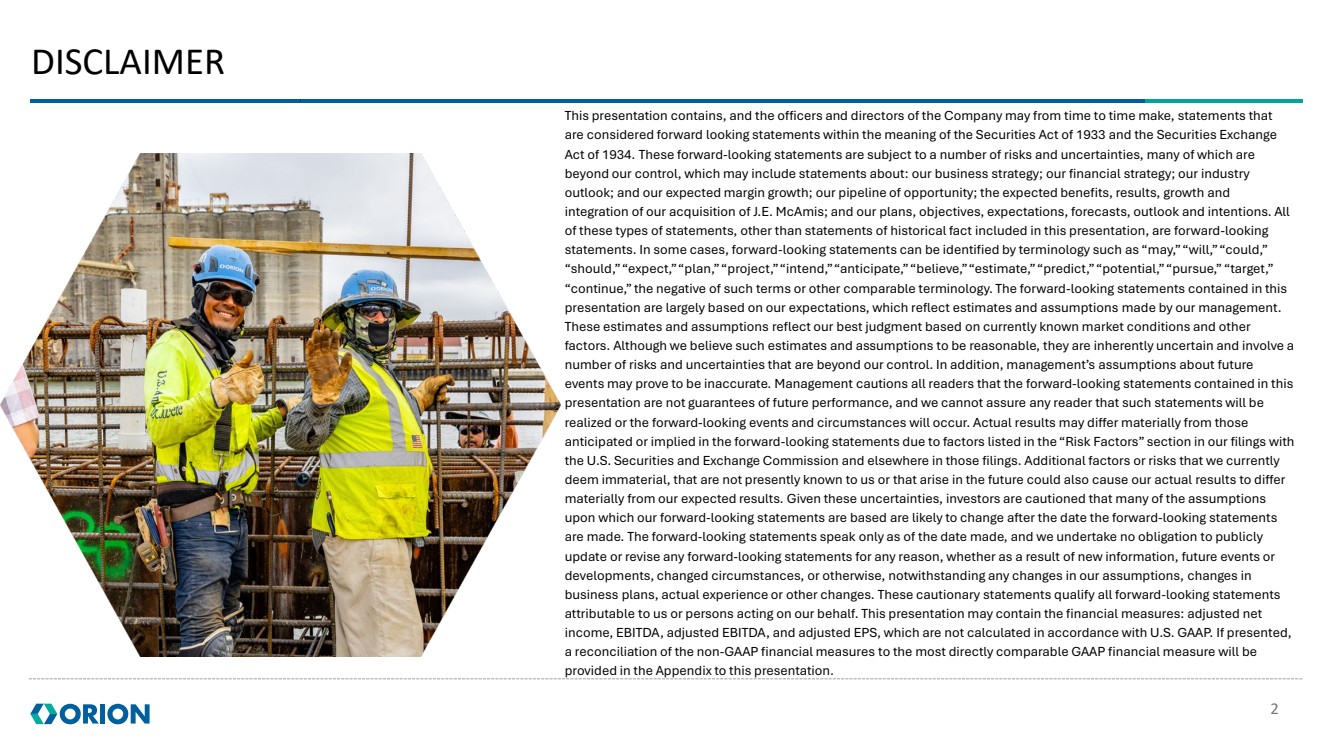
2 DISCLAIMER This presentation contains, and the officers and directors of the Company may from time to time make, statements that are considered forward looking statements within the meaning of the Securities Act of 1933 and the Securities Exchange Act of 1934. These forward-looking statements are subject to a number of risks and uncertainties, many of which are beyond our control, which may include statements about: our business strategy; our financial strategy; our industry outlook; and our expected margin growth; our pipeline of opportunity; the expected benefits, results, growth and integration of our acquisition of J.E. McAmis; and our plans, objectives, expectations, forecasts, outlook and intentions. All of these types of statements, other than statements of historical fact included in this presentation, are forward-looking statements. In some cases, forward-looking statements can be identified by terminology such as “may,” “will,” “could,” “should,” “expect,” “plan,” “project,” “intend,” “anticipate,” “believe,” “estimate,” “predict,” “potential,” “pursue,” “target,” “continue,” the negative of such terms or other comparable terminology. The forward-looking statements contained in this presentation are largely based on our expectations, which reflect estimates and assumptions made by our management. These estimates and assumptions reflect our best judgment based on currently known market conditions and other factors. Although we believe such estimates and assumptions to be reasonable, they are inherently uncertain and involve a number of risks and uncertainties that are beyond our control. In addition, management’s assumptions about future events may prove to be inaccurate. Management cautions all readers that the forward-looking statements contained in this presentation are not guarantees of future performance, and we cannot assure any reader that such statements will be realized or the forward-looking events and circumstances will occur. Actual results may differ materially from those anticipated or implied in the forward-looking statements due to factors listed in the “Risk Factors” section in our filings with the U.S. Securities and Exchange Commission and elsewhere in those filings. Additional factors or risks that we currently deem immaterial, that are not presently known to us or that arise in the future could also cause our actual results to differ materially from our expected results. Given these uncertainties, investors are cautioned that many of the assumptions upon which our forward-looking statements are based are likely to change after the date the forward-looking statements are made. The forward-looking statements speak only as of the date made, and we undertake no obligation to publicly update or revise any forward-looking statements for any reason, whether as a result of new information, future events or developments, changed circumstances, or otherwise, notwithstanding any changes in our assumptions, changes in business plans, actual experience or other changes. These cautionary statements qualify all forward-looking statements attributable to us or persons acting on our behalf. This presentation may contain the financial measures: adjusted net income, EBITDA, adjusted EBITDA, and adjusted EPS, which are not calculated in accordance with U.S. GAAP. If presented, a reconciliation of the non-GAAP financial measures to the most directly comparable GAAP financial measure will be provided in the Appendix to this presentation. |
|
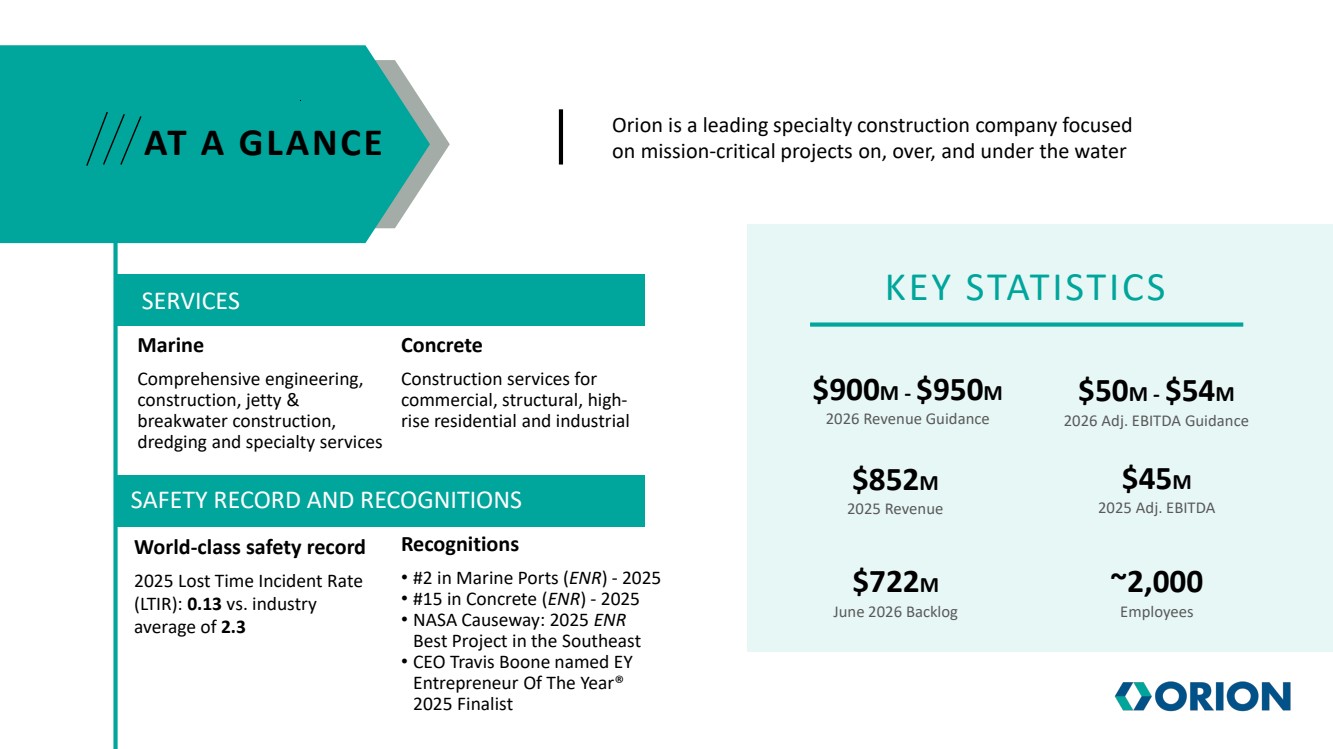
AT A GLANCE Orion is a leading specialty construction company focused on mission-critical projects on, over, and under the water KEY STATISTICS $852M 2025 Revenue $45M 2025 Adj. EBITDA $722M June 2026 Backlog ~2,000 Employees Marine Comprehensive engineering, construction, jetty & breakwater construction, dredging and specialty services SERVICES Concrete Construction services for commercial, structural, high-rise residential and industrial SAFETY RECORD AND RECOGNITIONS $900M - $950M 2026 Revenue Guidance $50M - $54M 2026 Adj. EBITDA Guidance World-class safety record 2025 Lost Time Incident Rate (LTIR): 0.13 vs. industry average of 2.3 Recognitions • #2 in Marine Ports (ENR) - 2025 • #15 in Concrete (ENR) - 2025 • NASA Causeway: 2025 ENR Best Project in the Southeast • CEO Travis Boone named EY Entrepreneur Of The Year® 2025 Finalist |
|
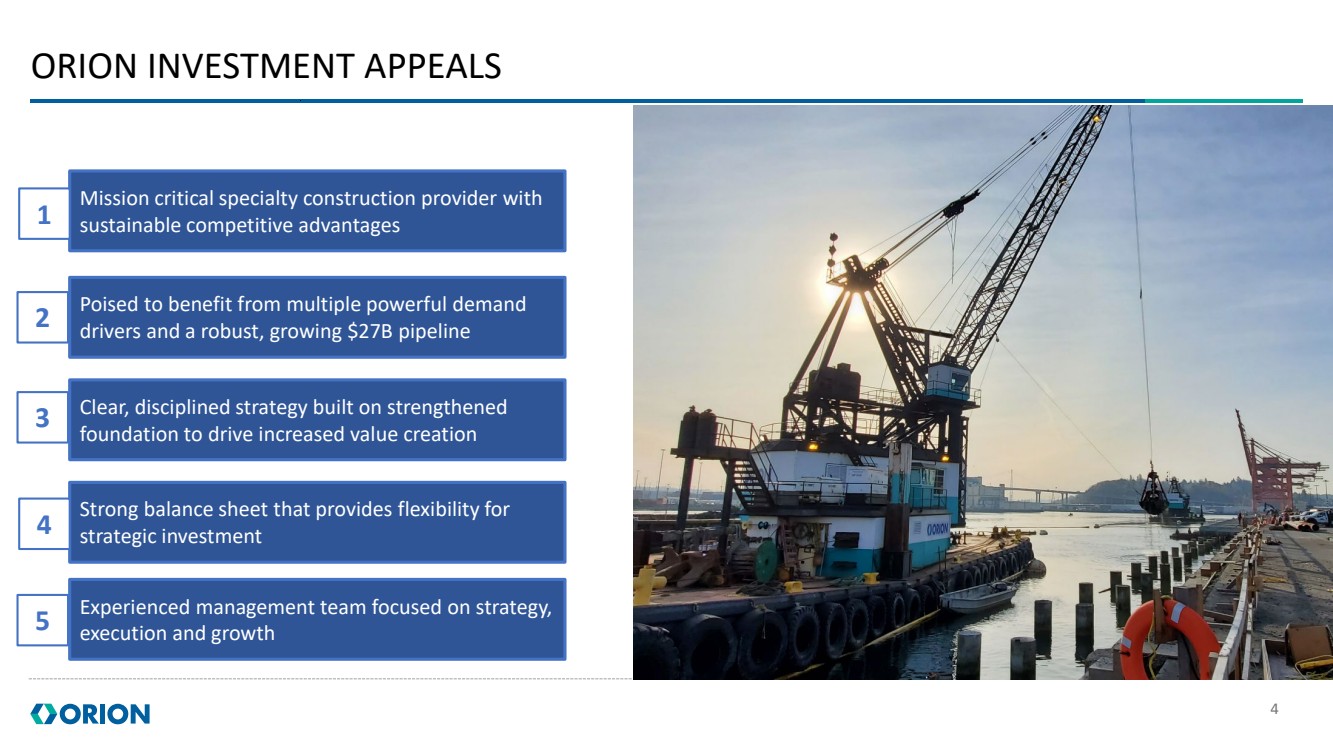
4 ORION INVESTMENT APPEALS Mission critical specialty construction provider with sustainable competitive advantages 1 Poised to benefit from multiple powerful demand drivers and a robust, growing $27B pipeline 2 Clear, disciplined strategy built on strengthened foundation to drive increased value creation 3 Strong balance sheet that provides flexibility for strategic investment Experienced management team focused on strategy, execution and growth 4 5 |
|
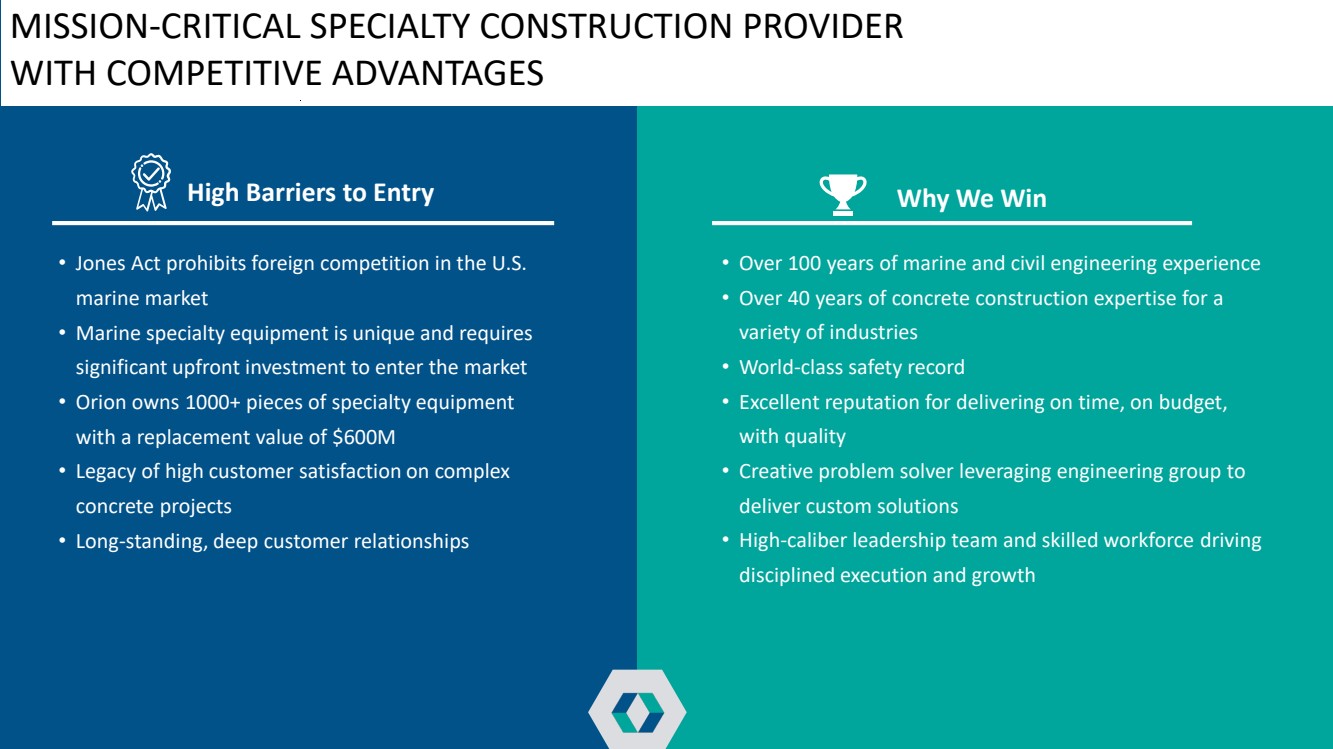
High Barriers to Entry • Jones Act prohibits foreign competition in the U.S. marine market • Marine specialty equipment is unique and requires significant upfront investment to enter the market • Orion owns 1000+ pieces of specialty equipment with a replacement value of $600M • Legacy of high customer satisfaction on complex concrete projects • Long-standing, deep customer relationships Why We Win MISSION-CRITICAL SPECIALTY CONSTRUCTION PROVIDER WITH COMPETITIVE ADVANTAGES • Over 100 years of marine and civil engineering experience • Over 40 years of concrete construction expertise for a variety of industries • World-class safety record • Excellent reputation for delivering on time, on budget, with quality • Creative problem solver leveraging engineering group to deliver custom solutions • High-caliber leadership team and skilled workforce driving disciplined execution and growth |
|
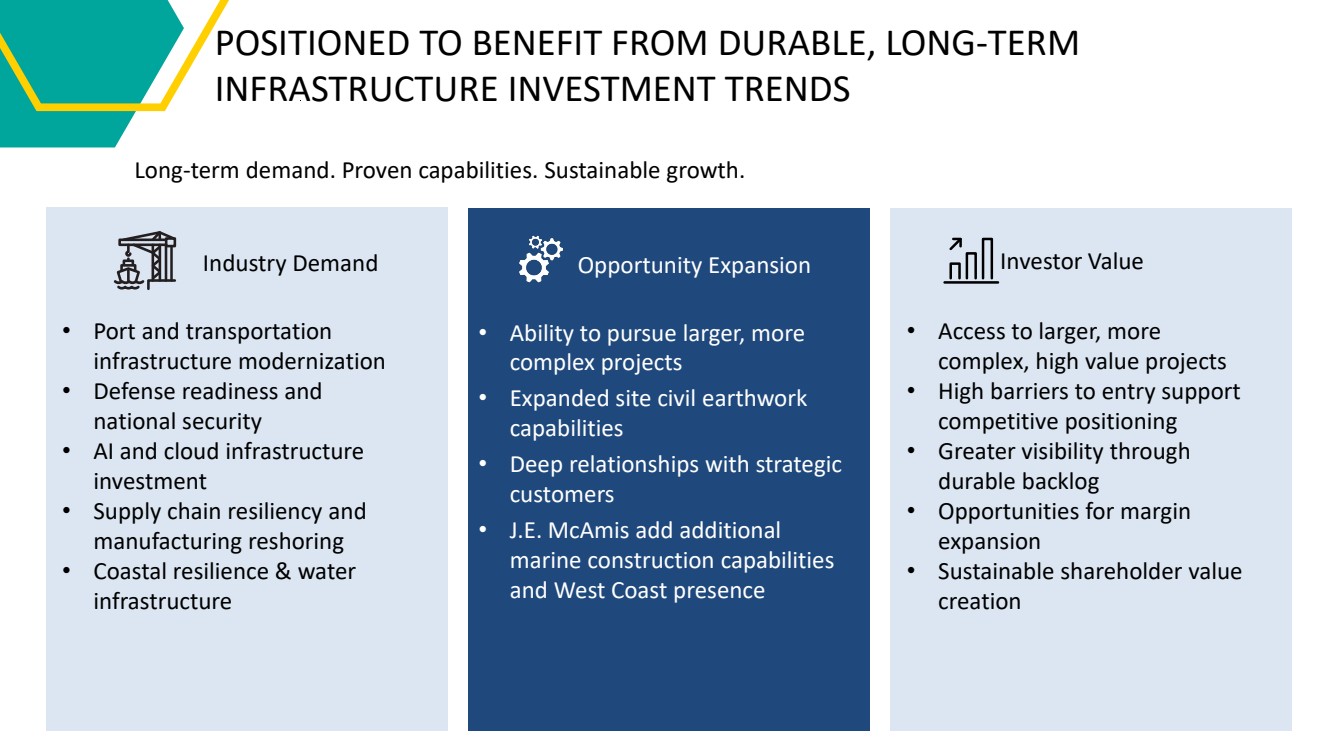
Opportunity Expansion • Ability to pursue larger, more complex projects • Expanded site civil earthwork capabilities • Deep relationships with strategic customers • J.E. McAmis add additional marine construction capabilities and West Coast presence Investor Value POSITIONED TO BENEFIT FROM DURABLE, LONG-TERM INFRASTRUCTURE INVESTMENT TRENDS Long-term demand. Proven capabilities. Sustainable growth. Industry Demand • Port and transportation infrastructure modernization • Defense readiness and national security • AI and cloud infrastructure investment • Supply chain resiliency and manufacturing reshoring • Coastal resilience & water infrastructure • Access to larger, more complex, high value projects • High barriers to entry support competitive positioning • Greater visibility through durable backlog • Opportunities for margin expansion • Sustainable shareholder value creation |
|
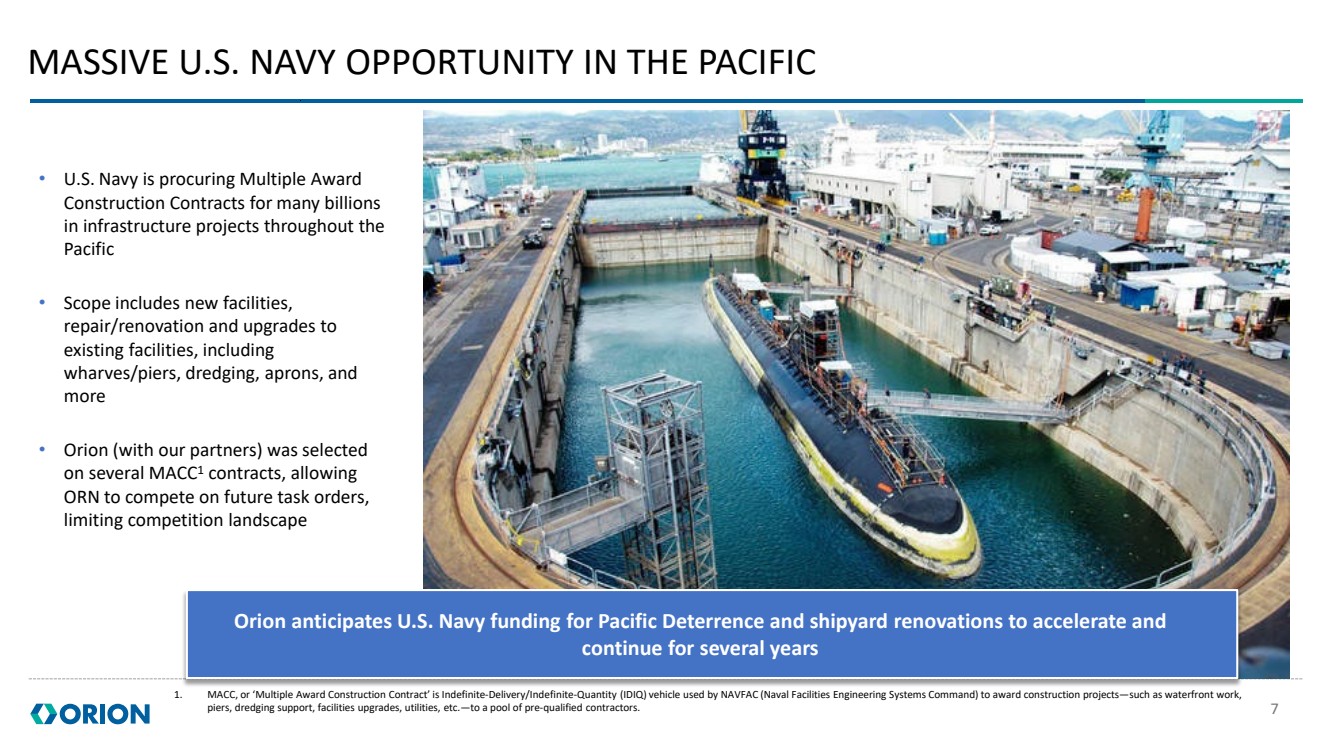
7 MASSIVE U.S. NAVY OPPORTUNITY IN THE PACIFIC • U.S. Navy is procuring Multiple Award Construction Contracts for many billions in infrastructure projects throughout the Pacific • Scope includes new facilities, repair/renovation and upgrades to existing facilities, including wharves/piers, dredging, aprons, and more • Orion (with our partners) was selected on several MACC1 contracts, allowing ORN to compete on future task orders, limiting competition landscape Orion anticipates U.S. Navy funding for Pacific Deterrence and shipyard renovations to accelerate and continue for several years 1. MACC, or ‘Multiple Award Construction Contract’ is Indefinite-Delivery/Indefinite-Quantity (IDIQ) vehicle used by NAVFAC (Naval Facilities Engineering Systems Command) to award construction projects—such as waterfront work, piers, dredging support, facilities upgrades, utilities, etc.—to a pool of pre-qualified contractors. |
|
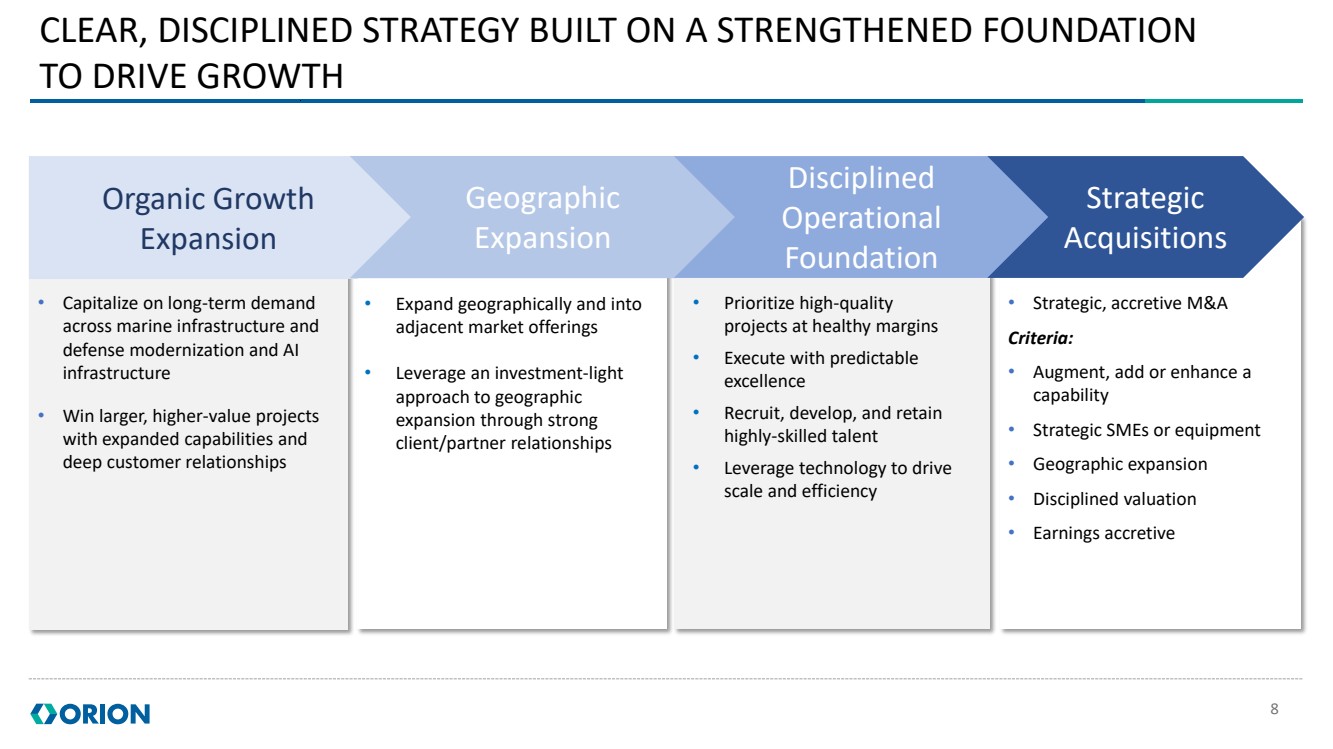
• Strategic, accretive M&A Criteria: • Augment, add or enhance a capability • Strategic SMEs or equipment • Geographic expansion • Disciplined valuation • Earnings accretive • Capitalize on long-term demand across marine infrastructure and defense modernization and AI infrastructure • Win larger, higher-value projects with expanded capabilities and deep customer relationships 8 CLEAR, DISCIPLINED STRATEGY BUILT ON A STRENGTHENED FOUNDATION TO DRIVE GROWTH • Expand geographically and into adjacent market offerings • Leverage an investment-light approach to geographic expansion through strong client/partner relationships Organic Growth Expansion Geographic Expansion Disciplined Operational Foundation Strategic Acquisitions • Prioritize high-quality projects at healthy margins • Execute with predictable excellence • Recruit, develop, and retain highly-skilled talent • Leverage technology to drive scale and efficiency |
|
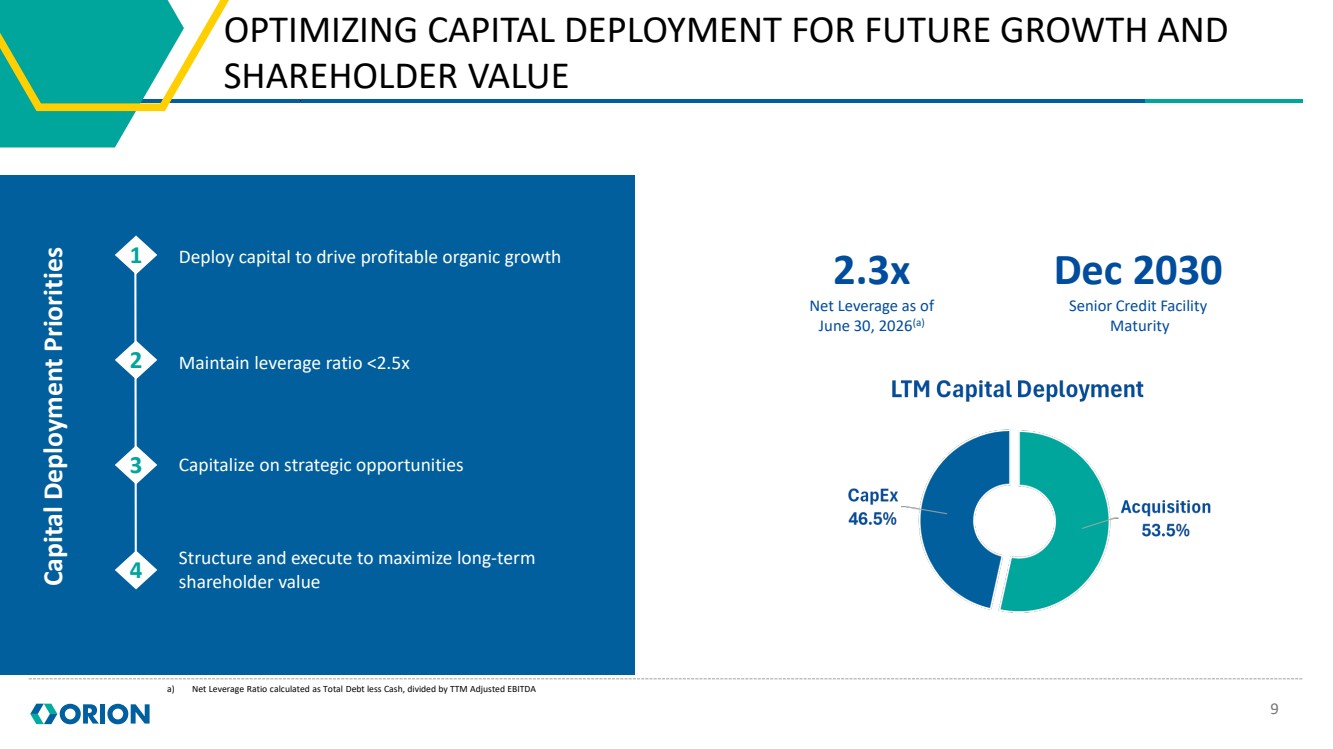
Deploy capital to drive profitable organic growth Maintain leverage ratio <2.5x Capitalize on strategic opportunities Structure and execute to maximize long-term shareholder value 9 Dec 2030 Senior Credit Facility Maturity a) Net Leverage Ratio calculated as Total Debt less Cash, divided by TTM Adjusted EBITDA OPTIMIZING CAPITAL DEPLOYMENT FOR FUTURE GROWTH AND SHAREHOLDER VALUE Capital Deployment Priorities 1 2 3 4 2.3x Net Leverage as of June 30, 2026(a) |
|
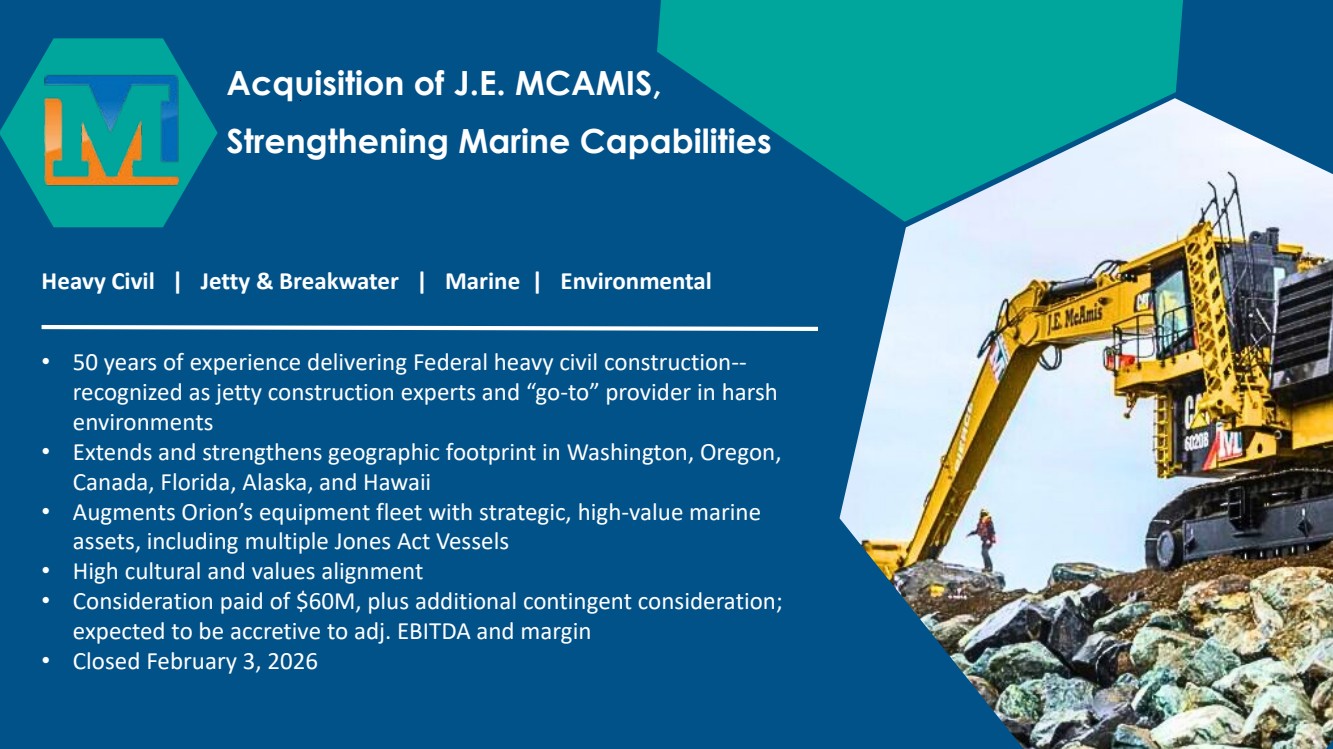
Heavy Civil | Jetty & Breakwater | Marine | Environmental • 50 years of experience delivering Federal heavy civil construction-- recognized as jetty construction experts and “go-to” provider in harsh environments • Extends and strengthens geographic footprint in Washington, Oregon, Canada, Florida, Alaska, and Hawaii • Augments Orion’s equipment fleet with strategic, high-value marine assets, including multiple Jones Act Vessels • High cultural and values alignment • Consideration paid of $60M, plus additional contingent consideration; expected to be accretive to adj. EBITDA and margin • Closed February 3, 2026 Acquisition of J.E. MCAMIS, Strengthening Marine Capabilities |
|
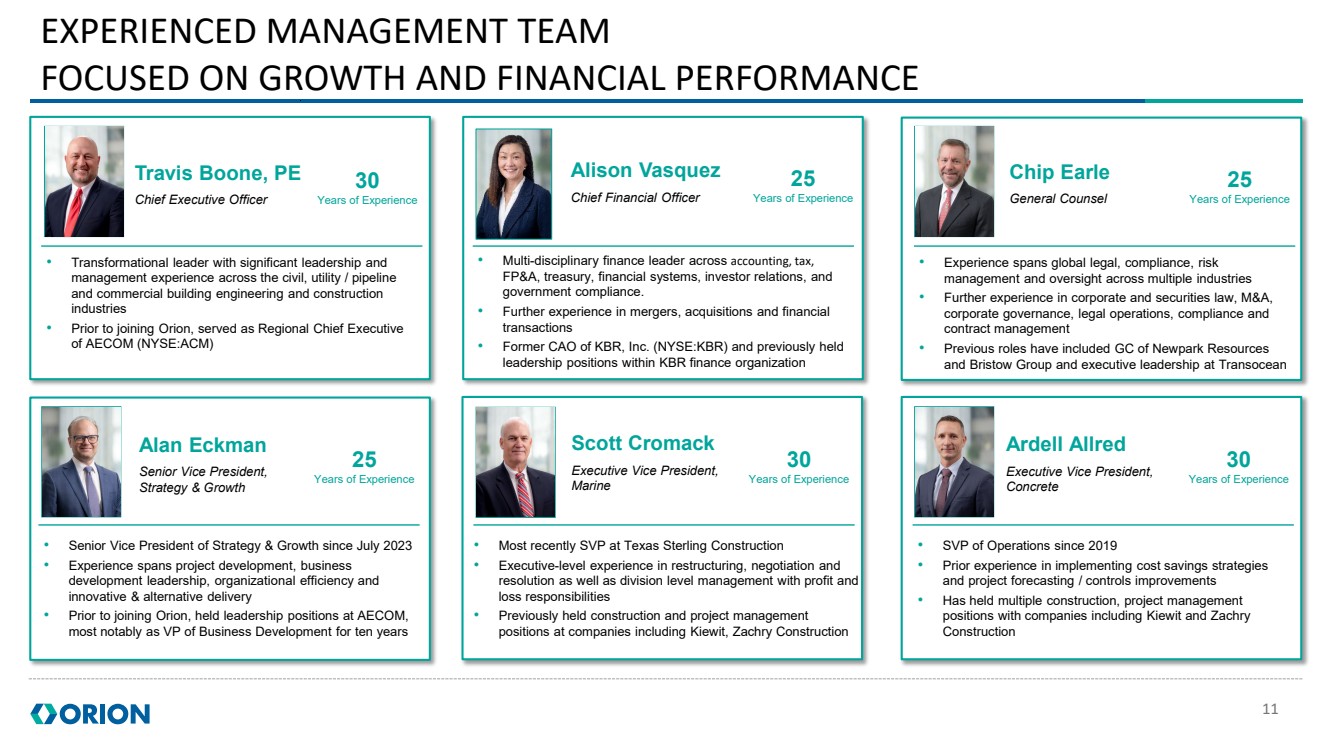
11 EXPERIENCED MANAGEMENT TEAM FOCUSED ON GROWTH AND FINANCIAL PERFORMANCE Travis Boone, PE Chief Executive Officer • Transformational leader with significant leadership and management experience across the civil, utility / pipeline and commercial building engineering and construction industries • Prior to joining Orion, served as Regional Chief Executive of AECOM (NYSE:ACM) Travis Boone, PE Chief Executive Officer 30 Years of Experience • Multi-disciplinary finance leader across accounting, tax, FP&A, treasury, financial systems, investor relations, and government compliance. • Further experience in mergers, acquisitions and financial transactions • Former CAO of KBR, Inc. (NYSE:KBR) and previously held leadership positions within KBR finance organization Alison Vasquez Chief Financial Officer 25 Years of Experience • Experience spans global legal, compliance, risk management and oversight across multiple industries • Further experience in corporate and securities law, M&A, corporate governance, legal operations, compliance and contract management • Previous roles have included GC of Newpark Resources and Bristow Group and executive leadership at Transocean Chip Earle General Counsel 25 Years of Experience • Senior Vice President of Strategy & Growth since July 2023 • Experience spans project development, business development leadership, organizational efficiency and innovative & alternative delivery • Prior to joining Orion, held leadership positions at AECOM, most notably as VP of Business Development for ten years Alan Eckman Senior Vice President, Strategy & Growth 25 Years of Experience • SVP of Operations since 2019 • Prior experience in implementing cost savings strategies and project forecasting / controls improvements • Has held multiple construction, project management positions with companies including Kiewit and Zachry Construction Ardell Allred Executive Vice President, Concrete 30 Years of Experience • Most recently SVP at Texas Sterling Construction • Executive-level experience in restructuring, negotiation and resolution as well as division level management with profit and loss responsibilities • Previously held construction and project management positions at companies including Kiewit, Zachry Construction Scott Cromack Executive Vice President, Marine 30 Years of Experience |
|
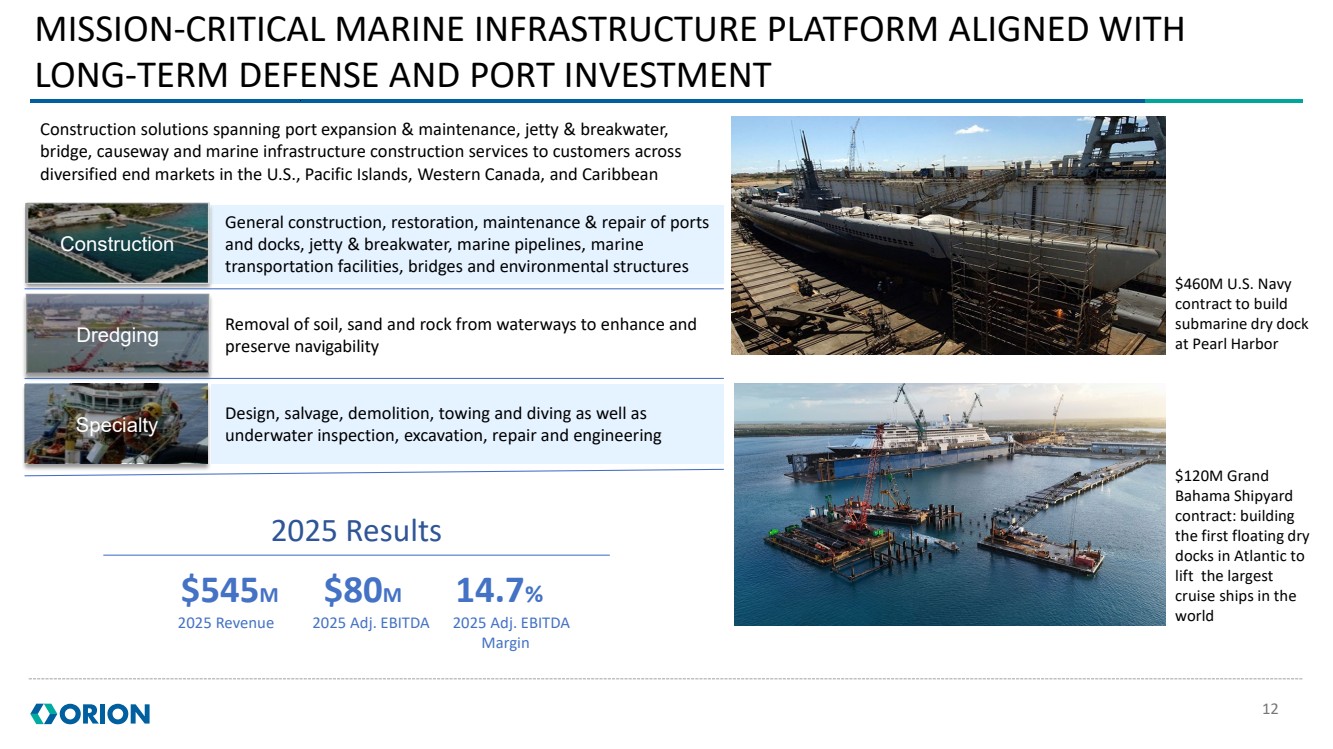
12 MISSION-CRITICAL MARINE INFRASTRUCTURE PLATFORM ALIGNED WITH LONG-TERM DEFENSE AND PORT INVESTMENT Construction Dredging Specialty General construction, restoration, maintenance & repair of ports and docks, jetty & breakwater, marine pipelines, marine transportation facilities, bridges and environmental structures Removal of soil, sand and rock from waterways to enhance and preserve navigability Design, salvage, demolition, towing and diving as well as underwater inspection, excavation, repair and engineering $545M $80M 14.7% 2025 Revenue 2025 Adj. EBITDA 2025 Adj. EBITDA Margin Construction solutions spanning port expansion & maintenance, jetty & breakwater, bridge, causeway and marine infrastructure construction services to customers across diversified end markets in the U.S., Pacific Islands, Western Canada, and Caribbean $120M Grand Bahama Shipyard contract: building the first floating dry docks in Atlantic to lift the largest cruise ships in the world $460M U.S. Navy contract to build submarine dry dock at Pearl Harbor 2025 Results |
|
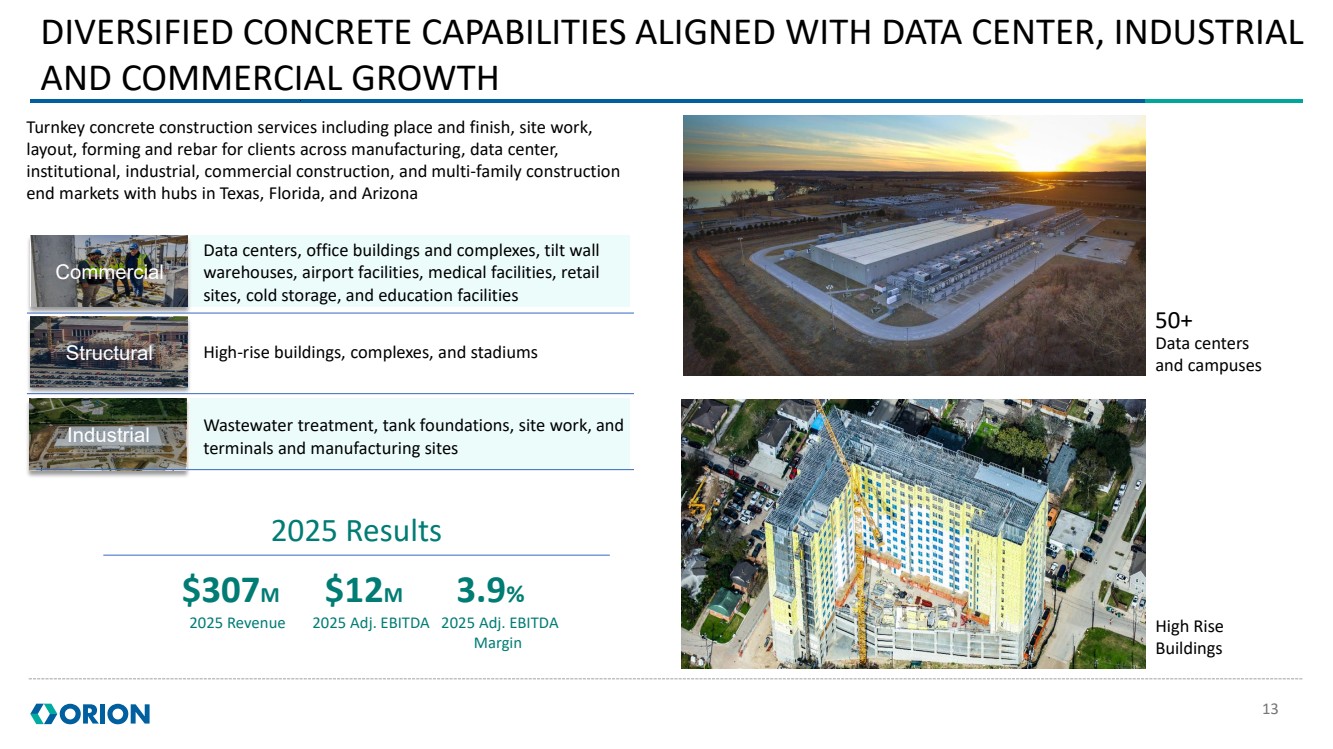
Data centers, office buildings and complexes, tilt wall warehouses, airport facilities, medical facilities, retail sites, cold storage, and education facilities High-rise buildings, complexes, and stadiums Commercial Structural Wastewater treatment, tank foundations, site work, and terminals and manufacturing sites Industrial Turnkey concrete construction services including place and finish, site work, layout, forming and rebar for clients across manufacturing, data center, institutional, industrial, commercial construction, and multi-family construction end markets with hubs in Texas, Florida, and Arizona 13 DIVERSIFIED CONCRETE CAPABILITIES ALIGNED WITH DATA CENTER, INDUSTRIAL AND COMMERCIAL GROWTH Data centers and campuses High Rise Buildings 50+ 2025 Results $307M $12M 3.9% 2025 Revenue 2025 Adj. EBITDA 2025 Adj. EBITDA Margin |
|
FINANCIAL PERFORMANCE 14 |
|
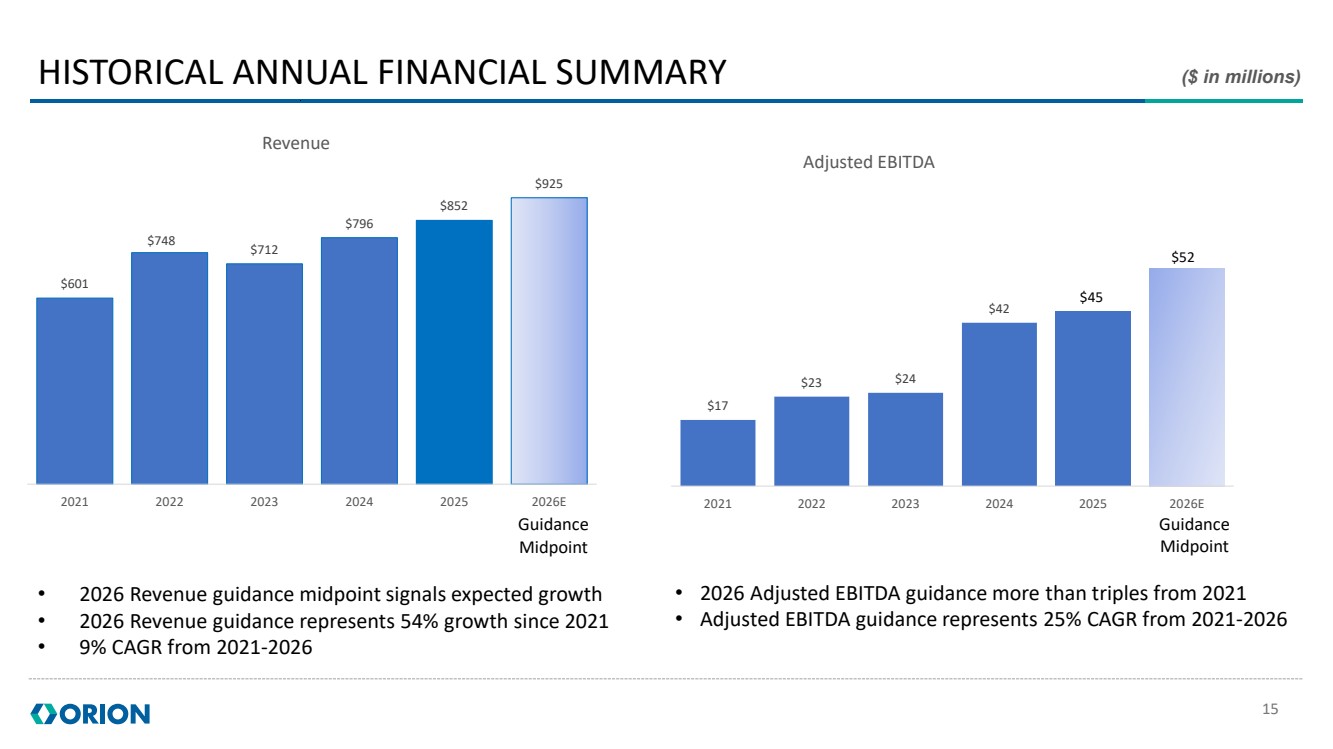
$17 $23 $24 $42 2021 2022 2023 2024 2025 2026E Adjusted EBITDA $45 $52 15 HISTORICAL ANNUAL FINANCIAL SUMMARY ($ in millions) $601 $748 $712 $796 $852 $925 2021 2022 2023 2024 2025 2026E Revenue 2021 Guidance Midpoint Guidance Midpoint • 2026 Revenue guidance midpoint signals expected growth • 2026 Revenue guidance represents 54% growth since 2021 • 9% CAGR from 2021-2026 • 2026 Adjusted EBITDA guidance more than triples from 2021 • Adjusted EBITDA guidance represents 25% CAGR from 2021-2026 |
|
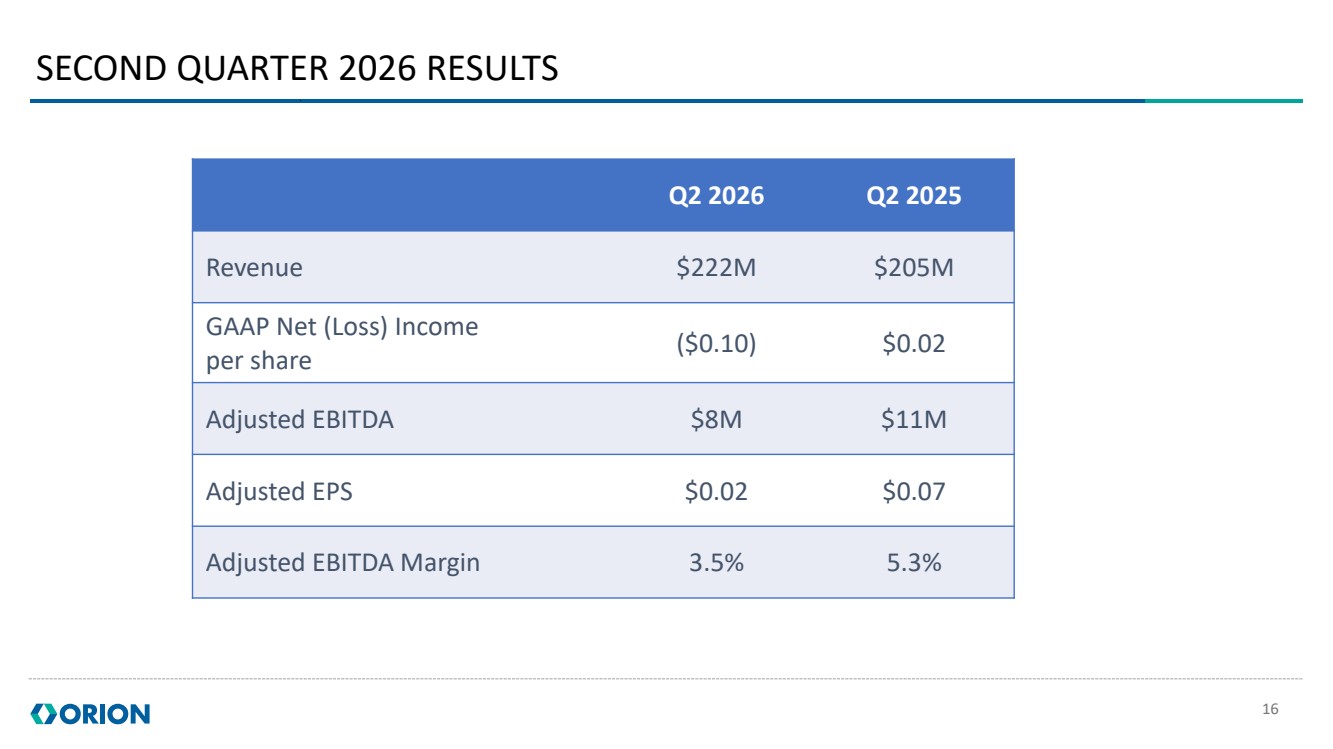
16 SECOND QUARTER 2026 RESULTS Q2 2026 Q2 2025 Revenue $222M $205M GAAP Net (Loss) Income per share ($0.10) $0.02 Adjusted EBITDA $8M $11M Adjusted EPS $0.02 $0.07 Adjusted EBITDA Margin 3.5% 5.3% |
|
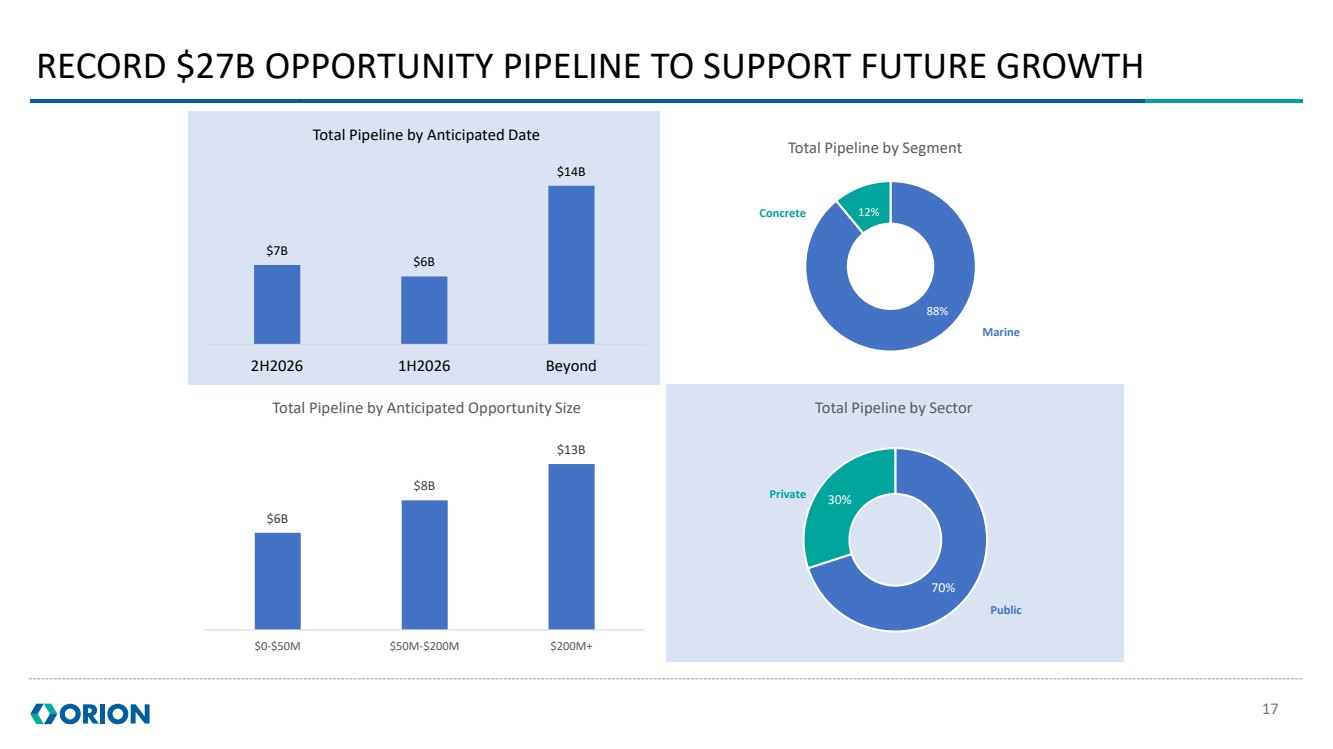
17 RECORD $27B OPPORTUNITY PIPELINE TO SUPPORT FUTURE GROWTH $6B $8B $13B $0-$50M $50M-$200M $200M+ Total Pipeline by Anticipated Opportunity Size 70% 30% Total Pipeline by Sector Public Private Total Pipeline by Segment Marine Concrete 12% 88% $7B $6B $14B 2H2026 1H2026 Beyond Total Pipeline by Anticipated Date |
|
18 FISCAL YEAR 2026 GUIDANCE (AS OF JULY 28, 2026) FY2026 Guidance Annual Growth at Midpoint Revenue $900 to $950 9% Adjusted EBITDA $50 to $54 15% Adjusted EPS $0.23 to $0.30 6% Capex $25 to $35 __ Table in millions, except EPS and percentage changes |
|
0 100 200 300 400 500 600 700 800 900 1000 New management joined Orion 19 RECENT EVOLUTION OF BACKLOG BACKLOG ($ in millions) RECENT WINS Manufacturing Facilities USACE Sargent Beach Jetty and Beach Renourishment Project Bridge Replacement Terminal Wharf Expansion Contract in Texas |
|
APPENDIX 20 |
|
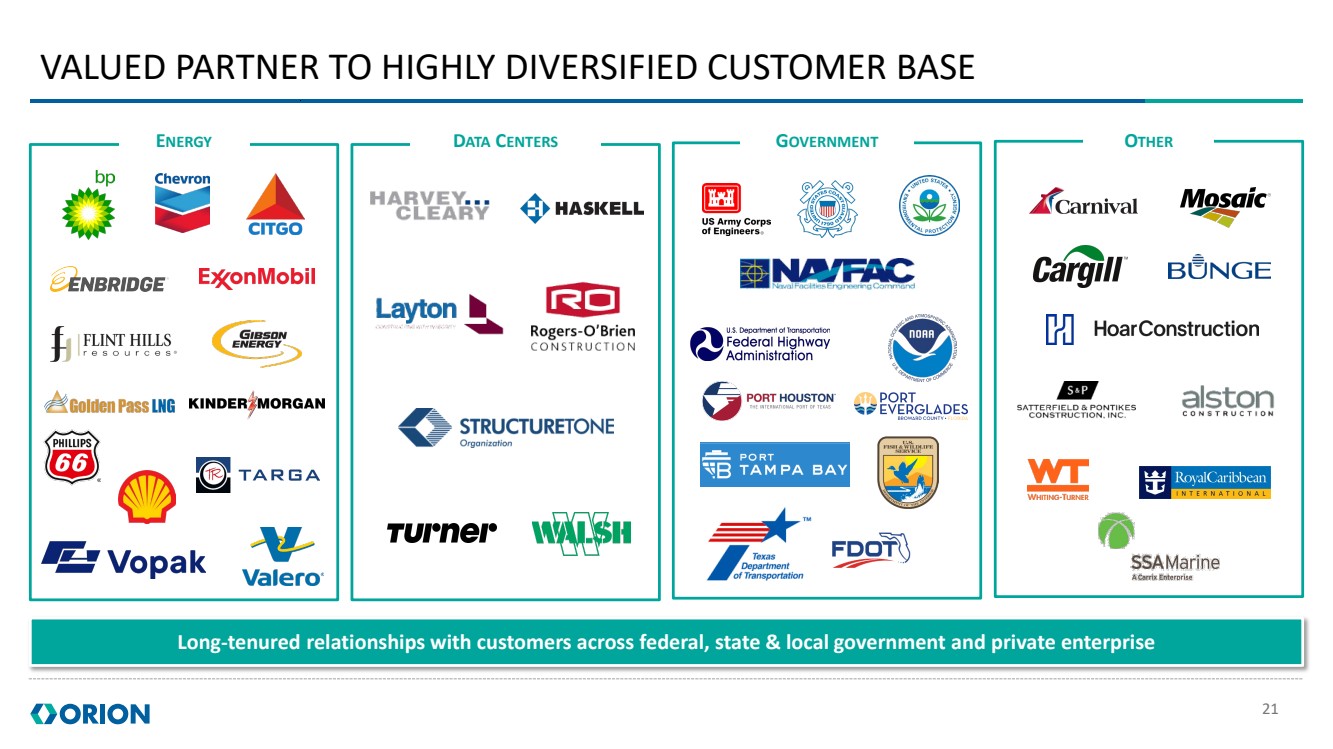
21 VALUED PARTNER TO HIGHLY DIVERSIFIED CUSTOMER BASE ENERGY DATA CENTERS GOVERNMENT OTHER Long-tenured relationships with customers across federal, state & local government and private enterprise |
|
NON-GAAP SUPPLEMENTAL INFORMATION 22 Orion Group Holdings, Inc. and Subsidiaries Adjusted EBITDA and Adjusted EBITDA Margin Reconciliations (In Thousands, Except Margin Data) (Unaudited) Three Months Ended Six Months Ended June 30, June 30, 2026 2025 2026 2025 Net (loss) income $ (4,145) $ 841 $ 542 $ (573) Income tax expense (benefit) 474 (212) (6,378) (72) Interest expense, net 2,449 2,827 3,893 4,968 Depreciation and amortization 7,004 5,231 13,391 10,634 EBITDA(1) 5,782 8,687 11,448 14,957 Non-cash share-based compensation 2,006 1,519 3,393 2,642 ERP implementation 54 225 135 830 Severance — 547 — 577 Process improvement initiatives — — — 138 Acquisition and integration costs 21 — 1,634 — Adjusted EBITDA(2) $ 7,863 $ 10,978 $ 16,610 $ 19,144 Adjusted EBITDA margin(2) 3.5 % 5.3 % 3.8 % 4.9 % (1) EBITDA is a non-GAAP measure that represents earnings before interest, taxes, depreciation and amortization. (2) Adjusted EBITDA is a non-GAAP measure that represents EBITDA adjusted for non-cash share-based compensation, ERP implementation, severance, process improvement initiatives and acquisition and integration costs. Adjusted EBITDA margin is a non-GAAP measure calculated by dividing Adjusted EBITDA by contract revenues. |
|
23 Orion Group Holdings, Inc. and Subsidiaries Reconciliation of Adjusted Net (Loss) Income (In Thousands Except Per Share Information) (Unaudited) Three Months Ended Six Months Ended June 30, June 30, 2026 2025 2026 2025 Net (loss) income $ (4,145) $ 841 $ 542 $ (573) Adjusting items and the tax effects: Non-cash share-based compensation 2,006 1,519 3,393 2,642 Enterprise resource planning (“ERP”) implementation 54 225 135 830 Severance — 547 — 577 Process improvement initiatives — — — 138 Acquisition and integration costs 21 — 1,634 — Amortization of purchased intangibles 395 — 785 — Tax rate of 23% applied to adjusting items(1) (570) (527) (1,368) (963) Reversal of the impact of valuation allowances 3,208 76 (2,187) 290 Adjusted net income $ 969 $ 2,681 $ 2,934 $ 2,941 Adjusted EPS $ 0.02 $ 0.07 $ 0.07 $ 0.07 (1) Items are taxed discretely using the Company's blended tax rate. NON-GAAP SUPPLEMENTAL INFORMATION |
|
24 (1) EBITDA is a non-GAAP measure that represents earnings before interest, taxes, depreciation and amortization. (2) Adjusted EBITDA is a non-GAAP measure that represents EBITDA adjusted for non-cash share-based compensation, ERP implementation, severance, process improvement initiatives and acquisition and integration costs. Adjusted EBITDA margin is a non-GAAP measure calculated by dividing Adjusted EBITDA by contract revenues. Orion Group Holdings, Inc. and Subsidiaries Adjusted EBITDA and Adjusted EBITDA Margin Reconciliations (In Thousands, Except Margin Data) (Unaudited) NON-GAAP SUPPLEMENTAL INFORMATION |
|
25 (1) EBITDA is a non-GAAP measure that represents earnings before interest, taxes, depreciation and amortization. (2) Adjusted EBITDA is a non-GAAP measure that represents EBITDA adjusted for non-cash share-based compensation, ERP implementation, severance, process improvement initiatives and acquisition and integration costs. Adjusted EBITDA margin is a non-GAAP measure calculated by dividing Adjusted EBITDA by contract revenues. Orion Group Holdings, Inc. and Subsidiaries Adjusted EBITDA and Adjusted EBITDA Margin Reconciliations (In Thousands, Except Margin Data) (Unaudited) NON-GAAP SUPPLEMENTAL INFORMATION |
|
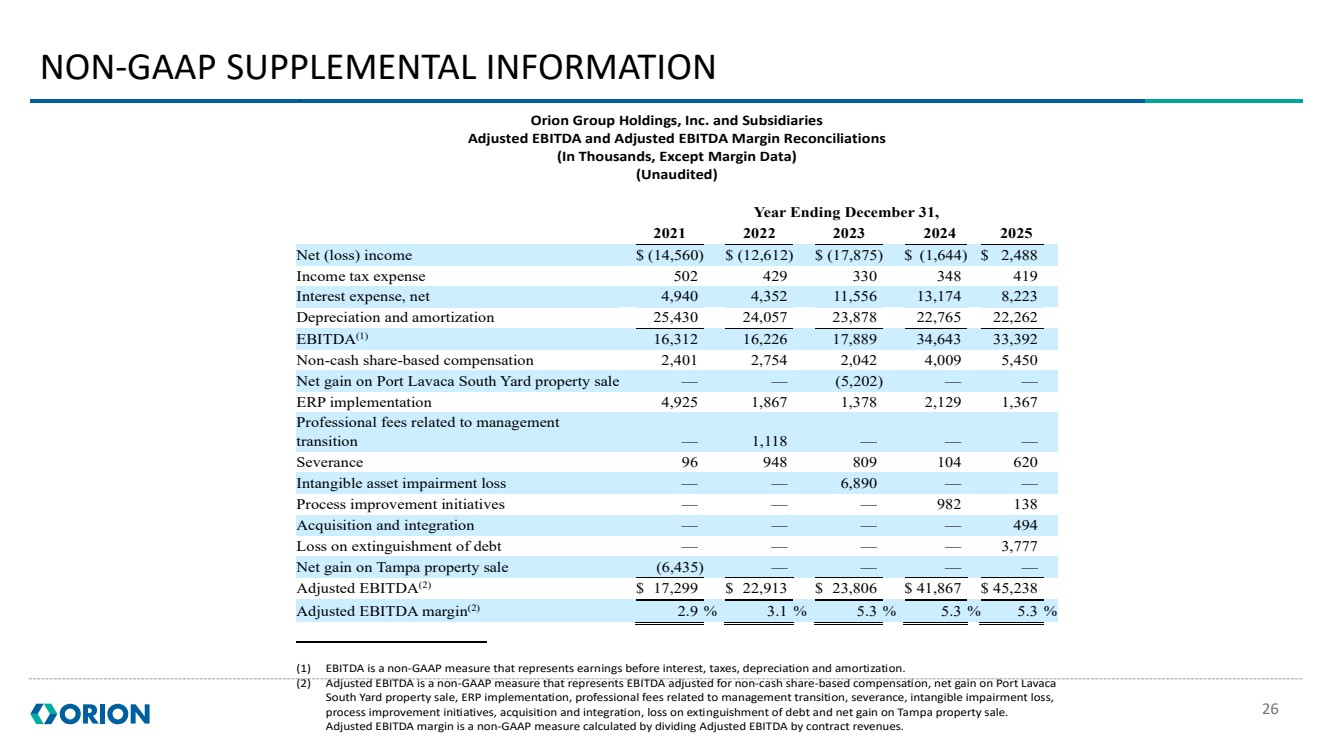
26 Orion Group Holdings, Inc. and Subsidiaries Adjusted EBITDA and Adjusted EBITDA Margin Reconciliations (In Thousands, Except Margin Data) (Unaudited) Year Ending December 31, 2021 2022 2023 2024 2025 Net (loss) income $ (14,560) $ (12,612) $ (17,875) $ (1,644) $ 2,488 Income tax expense 502 429 330 348 419 Interest expense, net 4,940 4,352 11,556 13,174 8,223 Depreciation and amortization 25,430 24,057 23,878 22,765 22,262 EBITDA(1) 16,312 16,226 17,889 34,643 33,392 Non-cash share-based compensation 2,401 2,754 2,042 4,009 5,450 Net gain on Port Lavaca South Yard property sale — — (5,202) — — ERP implementation 4,925 1,867 1,378 2,129 1,367 Professional fees related to management transition — 1,118 — — — Severance 96 948 809 104 620 Intangible asset impairment loss — — 6,890 — — Process improvement initiatives — — — 982 138 Acquisition and integration — — — — 494 Loss on extinguishment of debt — — — — 3,777 Net gain on Tampa property sale (6,435) — — — — Adjusted EBITDA(2) $ 17,299 $ 22,913 $ 23,806 $ 41,867 $ 45,238 Adjusted EBITDA margin(2) 2.9 % 3.1 % 5.3 % 5.3 % 5.3 % (1) EBITDA is a non-GAAP measure that represents earnings before interest, taxes, depreciation and amortization. (2) Adjusted EBITDA is a non-GAAP measure that represents EBITDA adjusted for non-cash share-based compensation, net gain on Port Lavaca South Yard property sale, ERP implementation, professional fees related to management transition, severance, intangible impairment loss, process improvement initiatives, acquisition and integration, loss on extinguishment of debt and net gain on Tampa property sale. Adjusted EBITDA margin is a non-GAAP measure calculated by dividing Adjusted EBITDA by contract revenues. NON-GAAP SUPPLEMENTAL INFORMATION |
|
27 NON-GAAP SUPPLEMENTAL INFORMATION |
|
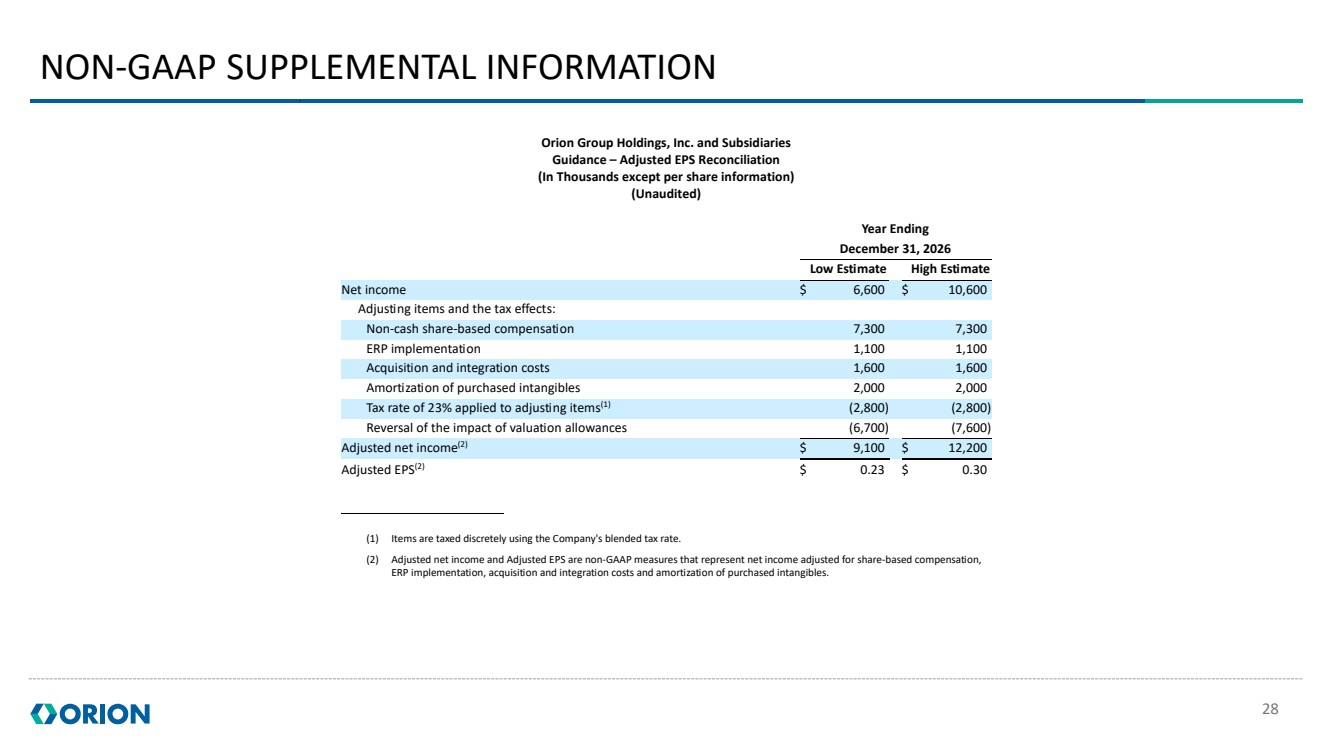
28 Orion Group Holdings, Inc. and Subsidiaries Guidance – Adjusted EPS Reconciliation (In Thousands except per share information) (Unaudited) Year Ending December 31, 2026 Low Estimate High Estimate Net income $ 6,600 $ 10,600 Adjusting items and the tax effects: Non-cash share-based compensation 7,300 7,300 ERP implementation 1,100 1,100 Acquisition and integration costs 1,600 1,600 Amortization of purchased intangibles 2,000 2,000 Tax rate of 23% applied to adjusting items(1) (2,800) (2,800) Reversal of the impact of valuation allowances (6,700) (7,600) Adjusted net income(2) $ 9,100 $ 12,200 Adjusted EPS(2) $ 0.23 $ 0.30 (1) Items are taxed discretely using the Company's blended tax rate. (2) Adjusted net income and Adjusted EPS are non-GAAP measures that represent net income adjusted for share-based compensation, ERP implementation, acquisition and integration costs and amortization of purchased intangibles. NON-GAAP SUPPLEMENTAL INFORMATION |