UNITED STATES
SECURITIES AND EXCHANGE COMMISSION
Washington, D.C. 20549
FORM 8-K
CURRENT REPORT
Pursuant to Section 13 or 15(d) of the
Securities Exchange Act of 1934
Date of Report (Date of earliest event reported): October 28, 2025
ORION GROUP HOLDINGS, INC.
(Exact name of Registrant as specified in its charter)
Delaware |
1-33891 |
26-0097459 |
(State or other jurisdiction of incorporation) |
(Commission File Number) |
(IRS Employer Identification Number) |
2940 Riverby Road, Suite 400
Houston, Texas 77020
(Address of principal executive offices)
(713) 852-6500
(Registrant's telephone number, including area code)
Check the appropriate box below if the Form 8-K filing is intended to simultaneously satisfy the filing obligation of the registrant under any of the following provisions:
☐ Written communications pursuant to Rule 425 under the Securities Act (17 CFR 230.425)
☐ Soliciting material pursuant to Rule 14a-12 under the Exchange Act (17 CFR 240.14a-12)
☐ Pre-commencement communications pursuant to Rule 14d-2(b) under the Exchange Act (17 CFR 240.14d-2(b))
☐ Pre-commencement communications pursuant to Rule 13e-4(c) under the Exchange Act (17 CFR 240.13e-4(c)
Title of Each Class |
|
Trading Symbol(s) |
|
Name of Each Exchange |
Common stock, $0.01 par value per share |
|
ORN |
|
The New York Stock Exchange |
Common stock, $0.01 par value per share |
|
ORN |
|
NYSE Texas |
Indicate by check mark whether the registrant is an emerging growth company as defined in as defined in Rule 405 of the Securities Act of 1933 (§230.405 of this chapter) or Rule 12b-2 of the Securities Exchange Act of 1934 (§240.12b-2 of this chapter).
Emerging growth company ☐
If an emerging growth company, indicate by check mark if the registrant has elected not to use the extended transition period for complying with any new or revised financial accounting standards provided pursuant to Section 13(a) of the Exchange Act. ☐
Item 2.02 Results of Operations and Financial Condition.
On October 28, 2025, Orion Group Holdings, Inc. (the “Company”) issued a press release announcing its financial results for the third quarter ended September 30, 2025. A copy of the press release is attached to this Current Report on Form 8-K as Exhibit 99.1 and is incorporated herein by reference.
The information contained in this Item 2.02 to the Company’s Current Report on Form 8-K, including Exhibit 99.1 attached hereto, is being furnished and shall not be deemed “filed” for any purpose, and shall not be deemed incorporated by reference in any filing under the Securities Act of 1933, as amended (the “Securities Act”), or the Securities Exchange Act of 1934, as amended (the “Exchange Act”), except as expressly set forth by specific reference in such filing.
Use of Non-GAAP Financial Information
To help understand the Company’s financial performance, the Company has supplemented its financial results that it provides in accordance with generally accepted accounting principles (“GAAP”) with non-GAAP financial measures. Such financial measures include Adjusted Net Income (Loss), Adjusted Earnings (Loss) Per Common Share, earnings before interest, taxes, depreciation and amortization (“EBITDA”), Adjusted EBITDA, and Adjusted EBITDA Margin.
We believe these non-GAAP financial measures are frequently used by investors, securities analysts and other parties in the evaluation of our performance and liquidity with that of other companies in our industry. Management uses these measures to evaluate our operating performance, liquidity and capital structure. In addition, our incentive compensation plan measures performance based on our consolidated EBITDA, along with other factors. The methods we use to produce these non-GAAP financial measures may differ from methods used by other companies. These measures should be considered in addition to, not as a substitute for, financial measures prepared in accordance with GAAP. Applicable reconciliations to the nearest GAAP financial measure of each non-GAAP financial measure are included in the attached Exhibit 99.1.
Item 7.01 Regulation FD Disclosure.
On October 29, 2025, the Company posted the third quarter 2025 investor presentation to its website. The presentation is attached as Exhibit 99.2 to this Current Report on Form 8-K and is incorporated herein by reference. All information included in the presentation is presented as of the dates indicated, and the Company does not assume any obligation to correct or update such information in the future. In addition, the Company disclaims any inferences regarding the materiality of such information that may arise as a result of it furnishing such information under Item 7.01 of this Current Report on Form 8-K.
The information contained in this Item 7.01, including Exhibit 99.2 attached hereto, is being furnished and shall not be deemed “filed” for any purpose, and shall not be deemed incorporated by reference in any filing under the Securities Act or the Exchange Act, except as expressly set forth by specific reference in such filing.
Item 9.01 Financial Statements and Exhibits.
(d) Exhibits
Exhibit No. |
Description |
|
|
Press Release of Orion Group Holdings, Inc. dated October 28, 2025. |
|
Orion Group Holdings, Inc. Investor Presentation for Third Quarter 2025. |
|
104 |
Cover Page Interactive Data File (embedded within the Inline XBRL document). |
EXHIBIT INDEX
SIGNATURE
Pursuant to the requirements of the Securities Exchange Act of 1934, the registrant has duly caused this report to be signed on its behalf by the undersigned hereunto duly authorized.
|
Orion Group Holdings, Inc. |
|
Dated: October 29, 2025 |
By: |
/s/ Travis J. Boone |
|
|
President and Chief Executive Officer |

Exhibit 99.1
ORION GROUP HOLDINGS REPORTS
THIRD QUARTER 2025 RESULTS AND INCREASES FISCAL YEAR 2025 GUIDANCE
HOUSTON – October 28, 2025 – Orion Group Holdings, Inc. (NYSE: ORN) (the “Company”, “Orion”), a leading specialty construction company, today reported its financial results for the third quarter ended September 30, 2025.
Highlights for the quarter ended September 30, 2025:
($ in millions, except EPS)
Management Commentary
“We delivered another strong third quarter marked by top- and bottom-line results, robust cash generation, good bookings, and market-leading safety. We have also continued to advance strategic priorities, including expanding our bonding capacity by $400 million, continuing to strengthen our board with the appointment of Robert Ledford, and closing the sale of the East and West Jones property in October. With a strong balance sheet, disciplined capital deployment strategy, and focus on long-term strategic execution, our team is laying the foundation for Orion’s next phase of growth,” said Travis Boone, President and Chief Executive Officer of Orion Group Holdings.
“As we enter the fourth quarter, Orion is well positioned opposite multiple growing tailwinds that span robust AI investment, strong domestic focus on reshoring manufacturing, commercial investment in marine infrastructure, and defense expansion across the Pacific. Our talented team is poised to build on our momentum and capture the exciting opportunities on our doorstep.”
“Following another strong quarter of performance and with a favorable outlook, we are pleased to raise our annual guidance for revenue, adjusted EBITDA, and adjusted EPS for fiscal year 2025.”
Fiscal Year 2025 Guidance
For the full year 2025, Orion is pleased to update its annual financial guidance as follows:
1
Third Quarter 2025 Results
|
Three months ended |
||||
|
September 30, |
|
September 30, |
||
|
2025 |
|
2024 |
||
Revenue |
$ |
225.1 |
|
$ |
226.7 |
GAAP Net Income |
$ |
3.3 |
|
$ |
4.3 |
GAAP EPS |
$ |
0.08 |
|
$ |
0.12 |
Adjusted EBITDA |
$ |
13.1 |
|
$ |
15.2 |
Adjusted EPS |
$ |
0.09 |
|
$ |
0.16 |
See definitions and reconciliation of non-GAAP measures elsewhere in this release.
Contract revenues were $225.1 million in the third quarter of 2025 compared with $226.7 million in the third quarter last year and up 10% sequentially from $205.3 million in the second quarter of 2025, driven by increased volume in our Marine and Concrete segments.
Gross profit was $29.8 million, up 10% from $27.1 million in the third quarter of 2024 and up 16% from $25.8 million in the second quarter of 2025. The increases in gross profit were driven by strong project execution primarily in our Marine business.
Selling, general and administrative (“SG&A”) expenses were $25.1 million for the quarter, up from $20.8 million in the third quarter of 2024 primarily due to increased investment to support business growth.
GAAP net income for the third quarter was $3.3 million, or $0.08 per diluted share, compared to net income of $4.3 million, or $0.12 per diluted share, in the third quarter of 2024.
Adjusted EBITDA for the third quarter was $13.1 million, compared to $15.2 million in the third quarter of 2024 and up 19% from $11.0 million in the second quarter of 2025. The year-over-year decrease is primarily attributable to favorable project close outs in 2024 that did not reoccur in 2025. The sequential increase was driven by revenue growth and strong execution.
Backlog
|
September 30, |
|
September 30 |
||
|
2025 |
|
2024 |
||
Marine |
$ |
477 |
|
$ |
537 |
Concrete |
|
202 |
|
|
154 |
Total |
$ |
679 |
|
$ |
691 |
Third quarter 2025 backlog included over $160 million in new awards and were evenly balanced between Orion’s Marine and Concrete segments. Recent Marine awards included maintenance dredging for the U.S. Army Corp of Engineers, repair work on a marine transportation facility, and installation of a crane trestle for a major transportation project. Recent Concrete awards included multiple data centers, a cold storage facility and several manufacturing and healthcare projects.
Balance Sheet Update
As of September 30, 2025, current assets were $269.7 million, including unrestricted cash and cash equivalents of $4.9 million. Total debt outstanding as of September 30, 2025 was $23.6 million and the Company had no borrowings under its revolving credit facility.
2
Recent Developments
In September 2025, the Company announced the appointment of Robert Ledford to its Board of Directors, effective November 19, 2025. Mr. Ledford’s decades of experience leading complex global businesses in the construction industry and driving strategic growth through mergers and acquisitions will provide valuable insight for our Board and executive team as Orion executes its growth strategy.
In October 2025, the Company increased its aggregate bonding capacity by $400 million, which enables the Company to bid on and capture larger projects to accelerate Orion’s long-term growth.
In October 2025, the Company closed on the sale of its East and West Jones property for an aggregate purchase price of $23.5 million. Proceeds are expected to be used to reduce debt and for general corporate purposes. In connection with the sale of the property, the Company entered into an Exclusive Dredge Spoils Agreement with the purchaser. Under the Agreement, the Company has the right to deliver dredge spoils to the property for ten years, which is expected to decrease the Company’s disposal costs.
Conference Call Details
Orion Group Holdings will host a conference call to discuss the third quarter 2025 financial results at 9:00 a.m. Eastern Time/8:00 a.m. Central Time on Wednesday, October 29, 2025. To participate, please call (844) 481-2994 and ask for the Orion Group Holdings Conference Call. A live audio webcast of the call will also be available on the Investor Relations section of Orion’s website at https://www.oriongroupholdingsinc.com/investor/ and will be archived for replay.
About Orion Group Holdings
Orion Group Holdings, Inc., a leading specialty construction company serving the infrastructure, industrial and building sectors, provides services both on and off the water in the continental United States, Alaska, Hawaii, Canada and the Caribbean Basin through its marine segment and its concrete segment. The Company’s marine segment provides construction and dredging services relating to marine transportation facility construction, marine pipeline construction, marine environmental structures, dredging of waterways, channels and ports, environmental dredging, design and specialty services. Its concrete segment provides turnkey concrete construction services including place and finish, site prep, layout, forming, and rebar placement for large commercial, structural and other associated business areas. The Company is headquartered in Houston, Texas. The Company’s website is located at: https://www.oriongroupholdingsinc.com.
Backlog Definition
Backlog consists of projects under contract that have either (a) not been started, or (b) are in progress but are not yet complete. The Company cannot guarantee that the revenue implied by its backlog will be realized, or, if realized, will result in earnings or profitability. Backlog can fluctuate from period to period due to the timing and execution of contracts. The typical duration of the Company’s projects ranges from three to nine months on shorter projects to multiple years on larger projects. The Company's backlog at any point in time includes both revenue it expects to realize during the next twelve-month period as well as revenue it expects to realize in future years.
Non-GAAP Financial Measures
This press release includes the financial measures “adjusted net income/loss,” “adjusted earnings/loss per share,” “EBITDA,” "Adjusted EBITDA" and “Adjusted EBITDA margin." These measurements are “non-GAAP financial measures” under rules of the Securities and Exchange Commission, including Regulation G. The non-GAAP financial information may be determined or calculated differently by other companies that use similarly titled measures. By reporting such non-GAAP financial information, the Company does not intend to give such information greater prominence than comparable GAAP financial information. Investors are urged to consider these non-GAAP measures in addition to and not in substitute for measures prepared in accordance with GAAP.
3
Adjusted net income/loss and adjusted earnings/loss per share should not be viewed as an equivalent financial measure to net income/loss or earnings/loss per share. Adjusted net income/loss and adjusted earnings/loss per share exclude certain items that management believes are one-time items or items whose timing or amount cannot be reasonably estimated. The Company believes these adjusted financial measures are a useful supplement to earnings/loss calculated in accordance with GAAP.
Orion Group Holdings defines EBITDA as net income/loss before net interest expense, income taxes, depreciation and amortization. Adjusted EBITDA is calculated by adjusting EBITDA for certain items that management believes are one-time items or items whose timing or amount cannot be reasonably estimated. Adjusted EBITDA margin is calculated by dividing Adjusted EBITDA for the period by contract revenues for the period. The GAAP financial measure that is most directly comparable to EBITDA and Adjusted EBITDA is net income, while the GAAP financial measure that is most directly comparable to Adjusted EBITDA margin is operating margin, which represents operating income divided by contract revenues. EBITDA, Adjusted EBITDA and Adjusted EBITDA margin are used internally to evaluate current operating expense, operating efficiency, and operating profitability on a variable cost basis, by excluding the depreciation and amortization expenses, primarily related to capital expenditures and acquisitions, and net interest and tax expenses. Additionally, EBITDA, Adjusted EBITDA and Adjusted EBITDA margin provide useful information regarding the Company's ability to meet future debt service and working capital requirements while providing an overall evaluation of the Company's financial condition. In addition, EBITDA is used internally for incentive compensation purposes. The Company includes EBITDA, Adjusted EBITDA and Adjusted EBITDA margin to provide transparency to investors as they are commonly used by investors and others in assessing performance. EBITDA, Adjusted EBITDA and Adjusted EBITDA margin have certain limitations as analytical tools and should not be used as a substitute for operating margin, net income, cash flows, or other data prepared in accordance with GAAP, or as a measure of the Company's profitability or liquidity.
Forward-Looking Statements
The matters discussed in this press release may constitute or include projections or other forward-looking statements within the meaning of the “safe harbor” provisions of Section 27A of the Securities Act of 1933, as amended, and Section 21E of the Securities Exchange Act of 1934, as amended, of which provisions the Company is availing itself. Certain forward-looking statements can be identified by the use of forward-looking terminology, such as 'believes', 'expects', 'may', 'will', 'could', 'should', 'seeks', 'approximately', 'intends', 'plans', 'estimates', or 'anticipates', or the negative thereof or other comparable terminology, or by discussions of strategy, plans, objectives, intentions, estimates, forecasts, guidance, outlook, assumptions, or goals. In particular, statements regarding our pipeline of opportunities, financial guidance and future operations or results, including those set forth in this press release, and any other statement, express or implied, concerning financial guidance or future operating results or the future generation of or ability to generate revenues, income, net income, gross profit, EBITDA, Adjusted EBITDA, Adjusted EBITDA margin, or cash flow, including to service debt or maintain compliance with debt covenants, and including any estimates, guidance, forecasts or assumptions regarding future revenues or revenue growth, are forward-looking statements. Forward-looking statements also include project award announcements, estimated project start dates, ramp-up of contract activity and contract options, which may or may not be awarded in the future. Forward-looking statements involve risks, including those associated with the Company's fixed price contracts that impacts profits, unforeseen productivity delays that may alter the final profitability of the contract, cancellation of the contract by the customer for unforeseen reasons, delays or decreases in funding by the customer, levels and predictability of government funding or other governmental budgetary constraints, and any potential contract options which may or may not be awarded in the future, and are at the sole discretion of award by the customer. Past performance is not necessarily an indicator of future results. Considering these and other uncertainties, the inclusion of forward-looking statements in this press release should not be regarded as a representation by the Company that the Company's plans, estimates, forecasts, goals, intentions, or objectives will be achieved or realized. Readers are cautioned not to place undue reliance on these forward-looking statements, which speak only as of the date hereof. The Company assumes no obligation to update information contained in this press release whether as a result of new developments or otherwise, except as required by law.
4
Please refer to the Company's 2024 Annual Report on Form 10-K, filed on March 5, 2025 which is available on its website at www.oriongroupholdingsinc.com or at the SEC's website at www.sec.gov, and filings and press releases subsequent to such Annual Report on Form 10-K for additional and more detailed discussion of risk factors that could cause actual results to differ materially from our current expectations, estimates or forecasts.
Contact:
Margaret Boyce
713-852-6500
mboyce@orn.net
Source: Orion Group Holdings, Inc.
Orion Group Holdings, Inc. and Subsidiaries
Condensed Consolidated Statements of Operations
(In Thousands, Except Share and Per Share Information)
(Unaudited)
|
|
Three months ended |
|
Nine months ended |
||||||||
|
|
September 30, |
|
September 30, |
||||||||
|
|
2025 |
|
2024 |
|
2025 |
|
2024 |
||||
Contract revenues |
|
$ |
225,097 |
|
$ |
226,675 |
|
$ |
619,037 |
|
$ |
579,514 |
Costs of contract revenues |
|
|
195,345 |
|
|
199,611 |
|
|
540,473 |
|
|
518,631 |
Gross profit |
|
|
29,752 |
|
|
27,064 |
|
|
78,564 |
|
|
60,883 |
Selling, general and administrative expenses |
|
|
25,059 |
|
|
20,846 |
|
|
70,378 |
|
|
60,980 |
Amortization of intangible assets |
|
|
— |
|
|
— |
|
|
— |
|
|
— |
Gain on disposal of assets, net |
|
|
(628) |
|
|
(1,563) |
|
|
(1,400) |
|
|
(1,986) |
Operating income |
|
|
5,321 |
|
|
7,781 |
|
|
9,586 |
|
|
1,889 |
Other (expense) income: |
|
|
|
|
|
|
|
|
|
|
|
|
Interest expense |
|
|
(2,120) |
|
|
(3,617) |
|
|
(7,373) |
|
|
(10,336) |
Other income |
|
|
417 |
|
|
180 |
|
|
761 |
|
|
396 |
Other expense, net |
|
|
(1,703) |
|
|
(3,437) |
|
|
(6,612) |
|
|
(9,940) |
Income (loss) before income taxes |
|
|
3,618 |
|
|
4,344 |
|
|
2,974 |
|
|
(8,051) |
Income tax expense |
|
|
317 |
|
|
82 |
|
|
246 |
|
|
347 |
Net income (loss) |
|
$ |
3,301 |
|
$ |
4,262 |
|
$ |
2,728 |
|
$ |
(8,398) |
|
|
|
|
|
|
|
|
|
|
|
|
|
Basic income (loss) per share |
|
$ |
0.08 |
|
$ |
0.12 |
|
$ |
0.07 |
|
$ |
(0.25) |
Diluted income (loss) per share |
|
$ |
0.08 |
|
$ |
0.12 |
|
$ |
0.07 |
|
$ |
(0.25) |
Shares used to compute income (loss) per share: |
|
|
|
|
|
|
|
|
|
|
|
|
Basic |
|
|
39,776,096 |
|
|
34,494,302 |
|
|
39,535,151 |
|
|
33,390,722 |
Diluted |
|
|
39,787,227 |
|
|
34,518,680 |
|
|
39,544,405 |
|
|
33,390,722 |
5
Orion Group Holdings, Inc. and Subsidiaries
Reconciliation of Adjusted Net Income (Loss)
(In thousands except per share information)
(Unaudited)
|
|
Three months ended |
|
Nine Months Ended |
||||||||
|
|
September 30, |
|
September 30, |
||||||||
|
|
2025 |
|
2024 |
|
2025 |
|
2024 |
||||
Net income (loss) |
|
$ |
3,301 |
|
$ |
4,262 |
|
$ |
2,728 |
|
$ |
(8,398) |
Adjusting items and the tax effects: |
|
|
|
|
|
|
|
|
|
|
|
|
Share-based compensation |
|
|
1,376 |
|
|
1,016 |
|
|
4,018 |
|
|
2,930 |
ERP implementation |
|
|
301 |
|
|
342 |
|
|
1,131 |
|
|
1,641 |
Severance |
|
|
31 |
|
|
4 |
|
|
608 |
|
|
85 |
Process improvement initiatives |
|
|
— |
|
|
393 |
|
|
138 |
|
|
393 |
Tax rate of 23% applied to adjusting items (1) |
|
|
(393) |
|
|
(1,309) |
|
|
(1,356) |
|
|
(1,879) |
Total adjusting items and the tax effects |
|
|
1,315 |
|
|
446 |
|
|
4,539 |
|
|
3,170 |
Federal and state tax valuation allowances |
|
|
(1,157) |
|
|
934 |
|
|
(867) |
|
|
3,344 |
Adjusted net income (loss) |
|
$ |
3,459 |
|
$ |
5,642 |
|
$ |
6,400 |
|
$ |
(1,884) |
Adjusted EPS |
|
$ |
0.09 |
|
$ |
0.16 |
|
$ |
0.16 |
|
$ |
(0.06) |
| (1) | Items are taxed discretely using the Company's blended tax rate. |
6
Orion Group Holdings, Inc. and Subsidiaries
Adjusted EBITDA and Adjusted EBITDA Margin Reconciliations
(In Thousands, Except Margin Data)
(Unaudited)
|
|
Three months ended |
|
Nine Months Ended |
|
||||||||
|
|
September 30, |
|
September 30, |
|
||||||||
|
|
2025 |
|
2024 |
|
2025 |
|
2024 |
|
||||
Net income (loss) |
|
$ |
3,301 |
|
$ |
4,262 |
|
$ |
2,728 |
|
$ |
(8,398) |
|
Income tax expense |
|
|
317 |
|
|
82 |
|
|
246 |
|
|
347 |
|
Interest expense, net |
|
|
1,914 |
|
|
3,544 |
|
|
6,881 |
|
|
10,239 |
|
Depreciation and amortization |
|
|
5,892 |
|
|
5,568 |
|
|
16,526 |
|
|
17,558 |
|
EBITDA (1) |
|
|
11,424 |
|
|
13,456 |
|
|
26,381 |
|
|
19,746 |
|
Share-based compensation |
|
|
1,376 |
|
|
1,016 |
|
|
4,018 |
|
|
2,930 |
|
ERP implementation |
|
|
301 |
|
|
342 |
|
|
1,131 |
|
|
1,641 |
|
Severance |
|
|
31 |
|
|
4 |
|
|
608 |
|
|
85 |
|
Process improvement initiatives |
|
|
— |
|
|
393 |
|
|
138 |
|
|
393 |
|
Adjusted EBITDA(2) |
|
$ |
13,132 |
|
$ |
15,211 |
|
$ |
32,276 |
|
$ |
24,795 |
|
Adjusted EBITDA margin(2) |
|
|
5.8 |
% |
|
6.7 |
% |
|
5.2 |
% |
|
4.3 |
% |
|
|
|
|
|
|
|
|
|
|
|
|
|
|
| (1) | EBITDA is a non-GAAP measure that represents earnings before interest, taxes, depreciation and amortization. |
| (2) | Adjusted EBITDA is a non-GAAP measure that represents EBITDA adjusted for share-based compensation, ERP implementation, severance and process improvement initiatives. Adjusted EBITDA margin is a non-GAAP measure calculated by dividing Adjusted EBITDA by contract revenues. |
7
Orion Group Holdings, Inc. and Subsidiaries
Adjusted EBITDA and Adjusted EBITDA Margin Reconciliations by Segment
(In Thousands, Except Margin Data)
(Unaudited)
|
|
Marine |
|
Concrete |
|
||||||||
|
|
Three months ended |
|
Three months ended |
|
||||||||
|
|
September 30, |
|
September 30, |
|
||||||||
|
|
2025 |
|
2024 |
|
2025 |
|
2024 |
|
||||
Contract revenues |
|
$ |
142,942 |
|
$ |
140,013 |
|
$ |
82,155 |
|
$ |
86,662 |
|
|
|
|
|
|
|
|
|
|
|
|
|
|
|
Operating income (loss) |
|
$ |
10,985 |
|
$ |
5,485 |
|
$ |
(5,664) |
|
$ |
2,296 |
|
Other income |
|
|
209 |
|
|
86 |
|
|
2 |
|
|
21 |
|
Depreciation and amortization |
|
|
5,081 |
|
|
4,552 |
|
|
811 |
|
|
1,016 |
|
EBITDA (1) |
|
|
16,275 |
|
|
10,123 |
|
|
(4,851) |
|
|
3,333 |
|
Share-based compensation |
|
|
1,064 |
|
|
915 |
|
|
312 |
|
|
101 |
|
ERP implementation |
|
|
188 |
|
|
194 |
|
|
113 |
|
|
148 |
|
Severance |
|
|
31 |
|
|
4 |
|
|
— |
|
|
— |
|
Process improvement initiatives |
|
|
— |
|
|
256 |
|
|
— |
|
|
137 |
|
Adjusted EBITDA(2) |
|
$ |
17,558 |
|
$ |
11,492 |
|
$ |
(4,426) |
|
$ |
3,719 |
|
Adjusted EBITDA margin (2) |
|
|
12.3 |
% |
|
8.2 |
% |
|
(5.4) |
% |
|
4.3 |
% |
|
|
|
|
|
|
|
|
|
|
|
|
|
|
|
|
Marine |
|
Concrete |
|
||||||||
|
|
Nine months ended |
|
Nine months ended |
|
||||||||
|
|
September 30, |
|
September 30, |
|
||||||||
|
|
2025 |
|
2024 |
|
2025 |
|
2024 |
|
||||
Contract revenues |
|
$ |
405,409 |
|
$ |
377,291 |
|
$ |
213,628 |
|
$ |
202,223 |
|
|
|
|
|
|
|
|
|
|
|
|
|
|
|
Operating income (loss) |
|
|
21,993 |
|
|
(4,847) |
|
|
(12,407) |
|
|
6,736 |
|
Other income |
|
|
256 |
|
|
217 |
|
|
13 |
|
|
82 |
|
Depreciation and amortization |
|
|
13,985 |
|
|
14,405 |
|
|
2,541 |
|
|
3,153 |
|
EBITDA (1) |
|
|
36,234 |
|
|
9,775 |
|
|
(9,853) |
|
|
9,971 |
|
Share-based compensation |
|
|
3,615 |
|
|
2,735 |
|
|
403 |
|
|
195 |
|
ERP implementation |
|
|
741 |
|
|
1,068 |
|
|
390 |
|
|
573 |
|
Severance |
|
|
591 |
|
|
85 |
|
|
17 |
|
|
— |
|
Process improvement initiatives |
|
|
93 |
|
|
256 |
|
|
45 |
|
|
137 |
|
Adjusted EBITDA(2) |
|
$ |
41,274 |
|
$ |
13,919 |
|
$ |
(8,998) |
|
$ |
10,876 |
|
Adjusted EBITDA margin (2) |
|
|
10.2 |
% |
|
3.7 |
% |
|
(4.2) |
% |
|
5.4 |
% |
|
|
|
|
|
|
|
|
|
|
|
|
|
|
| (1) | EBITDA is a non-GAAP measure that represents earnings before interest, taxes, depreciation and amortization. |
| (2) | Adjusted EBITDA is a non-GAAP measure that represents EBITDA adjusted for share-based compensation, ERP implementation, severance and process improvement initiatives. Adjusted EBITDA margin is a non-GAAP measure calculated by dividing Adjusted EBITDA by contract revenues. |
8
Orion Group Holdings, Inc. and Subsidiaries
Condensed Consolidated Statements of Cash Flows
(In Thousands)
(Unaudited)
|
|
Nine months ended September 30, |
||||
|
|
2025 |
|
2024 |
||
Cash flows from operating activities |
|
|
|
|
|
|
Net income (loss) |
|
$ |
2,728 |
|
$ |
(8,398) |
Adjustments to reconcile net income (loss) to net cash used in operating activities: |
|
|
|
|
|
|
Depreciation and amortization |
|
|
10,036 |
|
|
11,961 |
Amortization of ROU operating leases |
|
|
6,727 |
|
|
7,491 |
Amortization of ROU finance leases |
|
|
6,490 |
|
|
5,597 |
Amortization of deferred debt issuance costs |
|
|
900 |
|
|
1,562 |
Deferred income taxes |
|
|
29 |
|
|
(36) |
Share-based compensation |
|
|
4,018 |
|
|
2,930 |
Gain on disposal of assets, net |
|
|
(1,400) |
|
|
(1,986) |
Allowance for credit losses |
|
|
2,449 |
|
|
355 |
Change in operating assets and liabilities: |
|
|
|
|
|
|
Accounts receivable |
|
|
(73,808) |
|
|
(40,276) |
Income tax receivable |
|
|
(255) |
|
|
(69) |
Inventory |
|
|
637 |
|
|
(567) |
Prepaid expenses and other |
|
|
3,958 |
|
|
4,940 |
Contract assets |
|
|
43,889 |
|
|
23,027 |
Accounts payable |
|
|
11,550 |
|
|
33,481 |
Accrued liabilities |
|
|
4,765 |
|
|
(14,333) |
Operating lease liabilities |
|
|
(4,591) |
|
|
(6,625) |
Income tax payable |
|
|
(353) |
|
|
(54) |
Contract liabilities |
|
|
(3,509) |
|
|
(19,687) |
Net cash provided by (used in) operating activities |
|
|
14,260 |
|
|
(687) |
Cash flows from investing activities: |
|
|
|
|
|
|
Proceeds from sale of property and equipment |
|
|
1,732 |
|
|
1,922 |
Purchase of property and equipment |
|
|
(25,510) |
|
|
(10,644) |
Net cash used in investing activities |
|
|
(23,778) |
|
|
(8,722) |
Cash flows from financing activities: |
|
|
|
|
|
|
Borrowings on Credit Facility |
|
|
138,138 |
|
|
39,279 |
Payments on Credit Facility |
|
|
(138,451) |
|
|
(39,671) |
Proceeds from failed sales-leasebacks |
|
|
1,600 |
|
|
— |
Payments on failed sale-leasebacks |
|
|
(7,463) |
|
|
(3,172) |
Loan costs from Credit Facility |
|
|
(323) |
|
|
(393) |
Payments of finance lease liabilities |
|
|
(7,847) |
|
|
(6,456) |
Proceeds from issuance of common stock under ESPP |
|
|
730 |
|
|
— |
Payments related to tax withholding for share-based compensation |
|
|
(373) |
|
|
(436) |
Exercise of stock options |
|
|
108 |
|
|
368 |
Net cash used in financing activities |
|
|
(13,881) |
|
|
(10,481) |
Net change in cash, cash equivalents and restricted cash |
|
|
(23,399) |
|
|
(19,890) |
Cash, cash equivalents and restricted cash at beginning of period |
|
|
28,316 |
|
|
30,938 |
Cash, cash equivalents and restricted cash at end of period |
|
$ |
4,917 |
|
$ |
11,048 |
9
Orion Group Holdings, Inc. and Subsidiaries
Condensed Consolidated Balance Sheets
(In Thousands, Except Share and Per Share Information)
|
|
September 30, |
|
December 31, |
||
|
|
2025 |
|
2024 |
||
|
|
(Unaudited) |
|
|
|
|
|
|
|
|
|
|
|
Current assets: |
|
|
|
|
|
|
Cash and cash equivalents |
|
$ |
4,917 |
|
|
28,316 |
Accounts receivable: |
|
|
|
|
|
|
Trade, net of allowance for credit losses of $3,004 and $555, respectively |
|
|
164,911 |
|
|
106,304 |
Retainage |
|
|
48,345 |
|
|
35,633 |
Income taxes receivable |
|
|
738 |
|
|
483 |
Other current |
|
|
3,116 |
|
|
3,127 |
Inventory |
|
|
2,115 |
|
|
1,974 |
Contract assets |
|
|
40,518 |
|
|
84,407 |
Prepaid expenses and other |
|
|
5,080 |
|
|
9,084 |
Total current assets |
|
|
269,740 |
|
|
269,328 |
Property and equipment, net of accumulated depreciation |
|
|
101,114 |
|
|
86,098 |
Operating lease right-of-use assets, net of accumulated amortization |
|
|
22,240 |
|
|
27,101 |
Financing lease right-of-use assets, net of accumulated amortization |
|
|
21,028 |
|
|
25,806 |
Inventory, non-current |
|
|
6,862 |
|
|
7,640 |
Deferred income tax asset |
|
|
17 |
|
|
17 |
Other non-current |
|
|
1,374 |
|
|
1,327 |
Total assets |
|
$ |
422,375 |
|
$ |
417,317 |
LIABILITIES AND STOCKHOLDERS’ EQUITY |
|
|
|
|
|
|
Current liabilities: |
|
|
|
|
|
|
Current debt, net of issuance costs |
|
$ |
1,044 |
|
$ |
426 |
Accounts payable: |
|
|
|
|
|
|
Trade |
|
|
107,671 |
|
|
97,139 |
Retainage |
|
|
1,984 |
|
|
1,310 |
Accrued liabilities |
|
|
28,522 |
|
|
26,294 |
Income taxes payable |
|
|
154 |
|
|
507 |
Contract liabilities |
|
|
43,862 |
|
|
47,371 |
Current portion of operating lease liabilities |
|
|
4,650 |
|
|
7,546 |
Current portion of financing lease liabilities |
|
|
9,953 |
|
|
10,580 |
Total current liabilities |
|
|
197,840 |
|
|
191,173 |
Long-term debt, net of debt issuance costs |
|
|
22,564 |
|
|
22,751 |
Operating lease liabilities |
|
|
20,929 |
|
|
20,837 |
Financing lease liabilities |
|
|
6,346 |
|
|
11,346 |
Other long-term liabilities |
|
|
16,748 |
|
|
20,503 |
Deferred income tax liability |
|
|
57 |
|
|
28 |
Total liabilities |
|
|
264,485 |
|
|
266,638 |
Stockholders’ equity: |
|
|
|
|
|
|
Preferred stock -- $0.01 par value, 10,000,000 authorized, none issued |
|
|
— |
|
|
— |
Common stock -- $0.01 par value, 50,000,000 authorized, 40,601,098 and 39,681,597 issued; 39,889,867 and 38,970,366 outstanding at September 30, 2025 and December 31, 2024, respectively |
|
|
406 |
|
|
397 |
Treasury stock, 711,231 shares, at cost, as of September 30, 2025 and December 31, 2024, respectively |
|
|
(6,540) |
|
|
(6,540) |
Additional paid-in capital |
|
|
224,987 |
|
|
220,513 |
Retained loss |
|
|
(60,963) |
|
|
(63,691) |
Total stockholders’ equity |
|
|
157,890 |
|
|
150,679 |
Total liabilities and stockholders’ equity |
|
$ |
422,375 |
|
$ |
417,317 |
10
Orion Group Holdings, Inc. and Subsidiaries
Guidance – Adjusted EBITDA Reconciliation
(In Thousands)
(Unaudited)
|
|
Year Ending |
||||
|
|
December 31, 2025 |
||||
|
|
|
Low Estimate |
|
|
High Estimate |
Net income |
|
$ |
1,765 |
|
$ |
4,603 |
Income tax expense |
|
|
1,500 |
|
|
2,000 |
Interest expense, net |
|
|
9,385 |
|
|
9,385 |
Depreciation and amortization |
|
|
23,646 |
|
|
22,308 |
EBITDA (1) |
|
|
36,296 |
|
|
38,296 |
Share-based compensation |
|
|
5,551 |
|
|
5,551 |
ERP implementation |
|
|
1,407 |
|
|
1,407 |
Severance |
|
|
608 |
|
|
608 |
Process improvement initiatives |
|
|
138 |
|
|
138 |
Adjusted EBITDA (2) |
|
$ |
44,000 |
|
$ |
46,000 |
| (1) | EBITDA is a non-GAAP measure that represents earnings before interest, taxes, depreciation and amortization. |
| (2) | Adjusted EBITDA is a non-GAAP measure that represents EBITDA adjusted for share-based compensation, ERP implementation, severance and process improvement initiatives. |
Orion Group Holdings, Inc. and Subsidiaries
Guidance – Adjusted EPS Reconciliation
(In thousands except per share information)
(Unaudited)
|
|
Year Ending |
||||
|
|
December 31, 2025 |
||||
|
|
|
Low Estimate |
|
|
High Estimate |
Net income |
|
$ |
1,765 |
|
$ |
4,603 |
Adjusting items and the tax effects: |
|
|
|
|
|
|
Share-based compensation |
|
|
5,551 |
|
|
5,551 |
ERP implementation |
|
|
1,407 |
|
|
1,407 |
Severance |
|
|
608 |
|
|
608 |
Process improvement initiatives |
|
|
138 |
|
|
138 |
Tax rate of 23% applied to adjusting items (1) |
|
|
(1,772) |
|
|
(1,772) |
Total adjusting items and the tax effects |
|
|
5,932 |
|
|
5,932 |
Federal and state tax valuation allowances |
|
|
(471) |
|
|
(1,631) |
Adjusted net income (2) |
|
$ |
7,226 |
|
$ |
8,904 |
Adjusted EPS (2) |
|
$ |
0.18 |
|
$ |
0.22 |
| (1) | Items are taxed discretely using the Company's blended tax rate. |
| (2) | Adjusted net income and Adjusted EPS are non-GAAP measures that represent net income adjusted for share-based compensation, ERP implementation, severance and process improvement initiatives. |
11
|
Investor Presentation October 2025 |
|
Disclaimer This presentation contains, and the officers and directors of the Company may from time to time make, statements that are considered forward looking statements within the meaning of the Securities Act of 1933 and the Securities Exchange Act of 1934. These forward-looking statements are subject to a number of risks and uncertainties, many of which are beyond our control, which may include statements about: our business strategy; our financial strategy; our industry outlook; and our expected margin growth; our pipeline of opportunity, and our plans, objectives, expectations, forecasts, outlook and intentions. All of these types of statements, other than statements of historical fact included in this presentation, are forward-looking statements. In some cases, forward-looking statements can be identified by terminology such as “may,” “will,” “could,” “should,” “expect,” “plan,” “project,” “intend,” “anticipate,” “believe,” “estimate,” “predict,” “potential,” “pursue,” “target,” “continue,” the negative of such terms or other comparable terminology. The forward-looking statements contained in this presentation are largely based on our expectations, which reflect estimates and assumptions made by our management. These estimates and assumptions reflect our best judgment based on currently known market conditions and other factors. Although we believe such estimates and assumptions to be reasonable, they are inherently uncertain and involve a number of risks and uncertainties that are beyond our control. In addition, management’s assumptions about future events may prove to be inaccurate. Management cautions all readers that the forward-looking statements contained in this presentation are not guarantees of future performance, and we cannot assure any reader that such statements will be realized or the forward-looking events and circumstances will occur. Actual results may differ materially from those anticipated or implied in the forward-looking statements due to factors listed in the “Risk Factors” section in our filings with the U.S. Securities and Exchange Commission and elsewhere in those filings. Additional factors or risks that we currently deem immaterial, that are not presently known to us or that arise in the future could also cause our actual results to differ materially from our expected results. Given these uncertainties, investors are cautioned that many of the assumptions upon which our forward-looking statements are based are likely to change after the date the forward-looking statements are made. The forward-looking statements speak only as of the date made, and we undertake no obligation to publicly update or revise any forward-looking statements for any reason, whether as a result of new information, future events or developments, changed circumstances, or otherwise, notwithstanding any changes in our assumptions, changes in business plans, actual experience or other changes. These cautionary statements qualify all forward-looking statements attributable to us or persons acting on our behalf. This presentation may contain the financial measures: adjusted net income, EBITDA, adjusted EBITDA, and adjusted EPS, which are not calculated in accordance with U.S. GAAP. If presented, a reconciliation of the non-GAAP financial measures to the most directly comparable GAAP financial measure will be provided in the Appendix to this presentation. 2 |
|
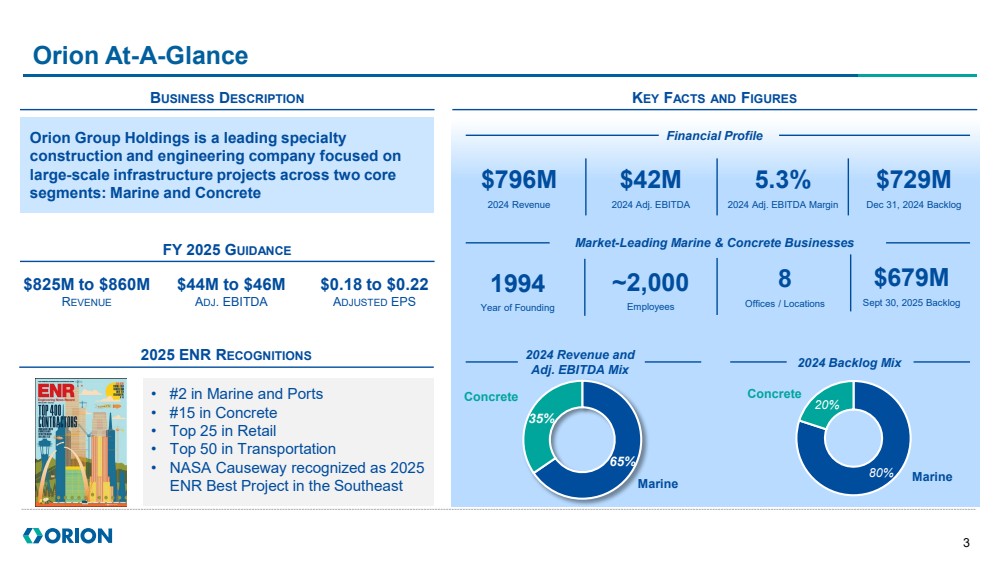
Orion At-A-Glance FY 2025 GUIDANCE KEY FACTS AND FIGURES 1994 Year of Founding ~2,000 Employees 8 Offices / Locations Market-Leading Marine & Concrete Businesses 65% 35% Orion Group Holdings is a leading specialty construction and engineering company focused on large-scale infrastructure projects across two core segments: Marine and Concrete Marine Concrete 2024 Backlog Mix 2024 Revenue and Adj. EBITDA Mix $796M 2024 Revenue 5.3% 2024 Adj. EBITDA Margin $729M Dec 31, 2024 Backlog Financial Profile $42M 2024 Adj. EBITDA $0.18 to $0.22 ADJUSTED EPS $679M Sept 30, 2025 Backlog 80% 20% Concrete Marine 3 • #2 in Marine and Ports • #15 in Concrete • Top 25 in Retail • Top 50 in Transportation • NASA Causeway recognized as 2025 ENR Best Project in the Southeast Recent Honors BUSINESS DESCRIPTION 2025 ENR RECOGNITIONS $44M to $46M ADJ. EBITDA $825M to $860M REVENUE |
|
Large Market Opportunity with Strong, Diverse Tailwinds… $1.2T Infrastructure Act Multi-year catalyst for public sector projects: transportation funding, ports, waterways, water infrastructure and bridges Port Expansion and Maintenance Larger ships via expanded Panama Canal require upgraded shipping channels and expanded infrastructure U.S. Navy Pacific Expansion U.S. Navy investments in infrastructure across Pacific to support DOD strategy Coastal Rehabilitation Increased disaster recovery from regional weather events, environmental remediation and sea level rise Energy and Petrochem Security Investment in domestic energy, LNG, chemical and petrochemical facilities Data Center Demand AI driving need for more data centers and power generation across US U.S. Manufacturing Re-Shoring Tariff and tax incentives driving reshoring initiatives across the U.S. and demand for new structures OBBBA & Trump Administration Directives Prioritizing restoration of maritime dominance with investment in shipyards, vessel upgrades, drydocks 4 |
|
Marine Segment At-A-Glance SEGMENT OVERVIEW Marine benefits from higher-margin projects with high barriers to entry and consistent maintenance demand SUB-SEGMENT OVERVIEW Construction Dredging Specialty General construction, restoration, maintenance & repair of ports and docks, marine pipelines, marine transportation facilities, bridges and environmental structures Removal of soil, sand and rock from waterways to enhance / preserve navigability Design, salvage, demolition, towing and diving as well as underwater inspection, excavation, repair and engineering KEY FACTS AND FIGURES $521M 2024 Revenue 5.2% 2024 Adj. EBITDA Margin $477M 9/30/2025 Backlog • Construction solutions spanning port expansion & maintenance, bridge, causeway and marine infrastructure construction services to customers across diversified end markets in the Continental U.S., Pacific Islands, Western Canada and Caribbean ♦ Top-tier recognized marine construction contractor ♦ Maintenance dredging provides a strong source of recurring revenue due to natural sedimentation in shipping channels and ports ♦ Much of Orion’s equipment is qualified vessels under the Jones Act and Foreign Dredging Act • Customer base spans both private and public sector clients 86% 11% 3% Construction Dredging 2024 Revenue Mix by Type Specialty 2024 Revenue Mix by Customer Public Private 77% 23% $27M 2024 Adj. EBITDA1 1. Adj. EBITDA includes allocated corporate costs 5 |
|
• Turnkey concrete construction services including place and finish, site work, layout, forming and rebar for clients across manufacturing, data center, institutional, industrial, commercial construction and multi-family construction end markets ♦ Core bidding strategy prioritizes value over volume – focusing on a combination of project quality, schedule and safety for stronger margins ♦ Hubs in Texas, Florida and Arizona • Customer base is concentrated in the private sector across a targeted set of end markets Concrete Segment At-A-Glance Improving project margins are laying the groundwork for future success SEGMENT OVERVIEW SUB-SEGMENT OVERVIEW KEY FACTS AND FIGURES $275M 2024 Revenue 5.4% 2024 Adj. EBITDA Margin $15M 2024 Adj. EBITDA1 $202M 9/30/2025 Backlog 78% 22% Light Commercial Structural 2024 Revenue Mix by Type 2024 Revenue Mix by Customer 10% 90% Private Public 1. Adj. EBITDA includes allocated corporate costs Data centers, office buildings & complexes, airport facilities, medical facilities, retail sites, education facilities and religious buildings High-rise buildings & complexes, stadiums and tower parking garages Commercial Structural Wastewater treatment, tank foundations & site work, tilt wall warehouses & terminals and manufacturing sites Industrial 6 |
|
Orion Key Highlights 1 2 3 4 5 Mission Critical Specialty Construction Provider with Sustainable Competitive Advantages Highly Diversified Customer Base and Multiple Funding Sources Strategic Plan Underway to Drive Long-Term Growth Experienced Management Team Focused on Strategy, Execution and Growth Multiple, Growing Market Opportunities with Strong Tailwinds and Diverse Demand Drivers 7 |
|
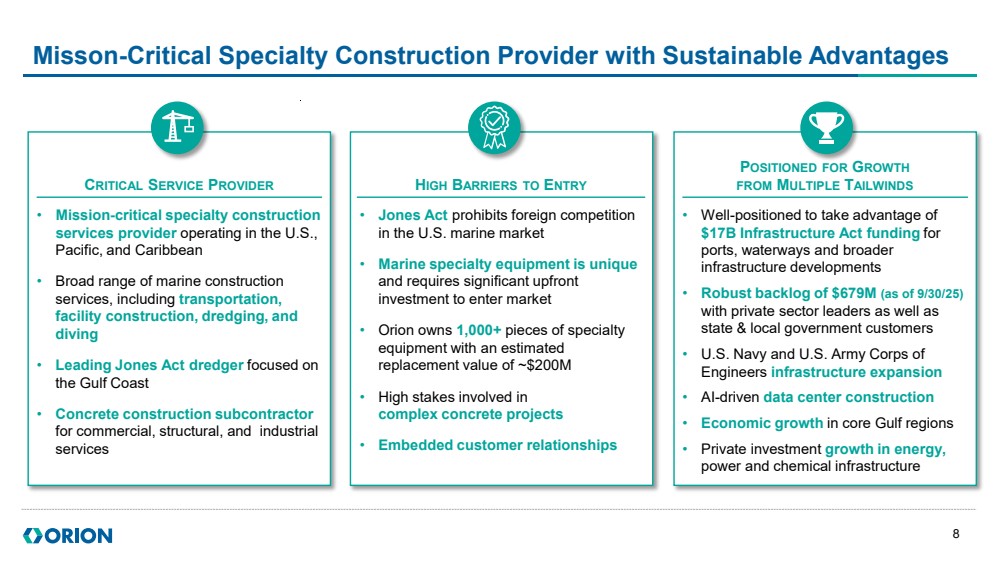
• Well-positioned to take advantage of $17B Infrastructure Act funding for ports, waterways and broader infrastructure developments • Robust backlog of $679M (as of 9/30/25) with private sector leaders as well as state & local government customers • U.S. Navy and U.S. Army Corps of Engineers infrastructure expansion • AI-driven data center construction • Economic growth in core Gulf regions • Private investment growth in energy, power and chemical infrastructure • Mission-critical specialty construction services provider operating in the U.S., Pacific, and Caribbean • Broad range of marine construction services, including transportation, facility construction, dredging, and diving • Leading Jones Act dredger focused on the Gulf Coast • Concrete construction subcontractor for commercial, structural, and industrial services • Jones Act prohibits foreign competition in the U.S. marine market • Marine specialty equipment is unique and requires significant upfront investment to enter market • Orion owns 1,000+ pieces of specialty equipment with an estimated replacement value of ~$200M • High stakes involved in complex concrete projects • Embedded customer relationships Misson-Critical Specialty Construction Provider with Sustainable Advantages POSITIONED FOR GROWTH CRITICAL SERVICE PROVIDER HIGH BARRIERS TO ENTRY FROM MULTIPLE TAILWINDS 8 |
|
Highly Diversified Customer Base ENERGY DATA CENTERS GOVERNMENT OTHER Long-tenured relationships with blue-chip customers across federal, state & local government and private enterprise 9 |
|
Capital investment in fleet improvement and information systems Improve project management and execution to drive margin expansion Enter new geographies (including Western U.S. and Pacific Islands) that have high demand, limited competition and strong growth profiles Leverage Concrete & Marine integration / best practices to drive synergies Recruit, develop and retain talent through training and professional development Experienced Management Leading Strategic Plan to Drive Long-Term Growth FLEET & SYSTEMS UPGRADE PROJECT EXECUTION GEOGRAPHIC EXPANSION SEGMENT INTEGRATION TALENT DEVELOPMENT Focus on high-quality projects at healthier margins PURSUIT AND BID DISCIPLINE Orion leadership’s strategic priorities are aligned with stakeholder creation Execution on Actionable, Multi-Phase Strategic Plan is Underway 10 |
|
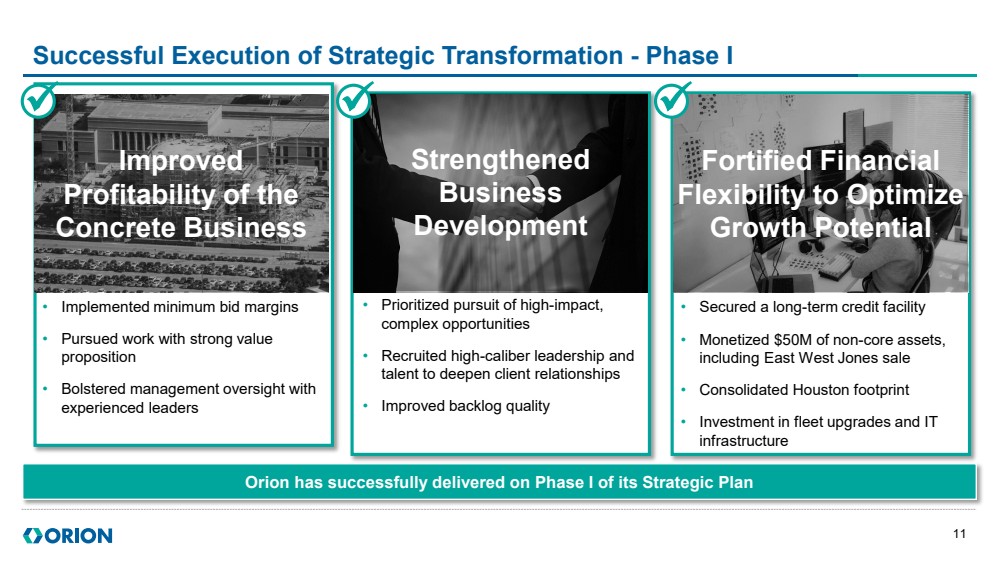
Successful Execution of Strategic Transformation - Phase I • Implemented minimum bid margins • Pursued work with strong value proposition • Bolstered management oversight with experienced leaders • Prioritized pursuit of high-impact, complex opportunities • Recruited high-caliber leadership and talent to deepen client relationships • Improved backlog quality • Secured a long-term credit facility • Monetized $50M of non-core assets, including East West Jones sale • Consolidated Houston footprint • Investment in fleet upgrades and IT infrastructure Improved Profitability of the Concrete Business Strengthened Business Development Fortified Financial Flexibility to Optimize Growth Potential Orion has successfully delivered on Phase I of its Strategic Plan 11 |
|
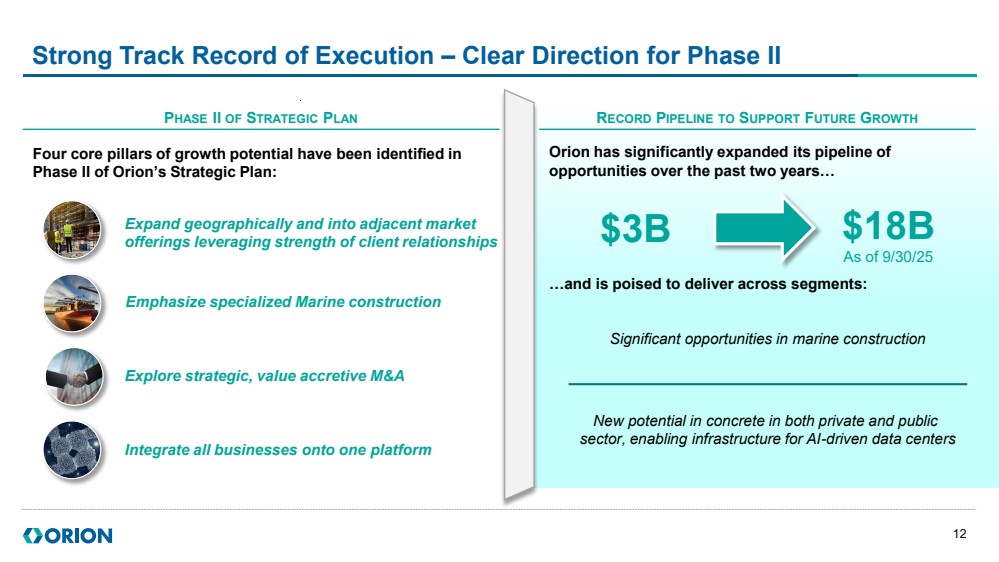
Strong Track Record of Execution – Clear Direction for Phase II Orion has significantly expanded its pipeline of opportunities over the past two years… $3B $18B As of 9/30/25 Expand geographically and into adjacent market offerings leveraging strength of client relationships Emphasize specialized Marine construction Explore strategic, value accretive M&A Integrate all businesses onto one platform Four core pillars of growth potential have been identified in Phase II of Orion’s Strategic Plan: …and is poised to deliver across segments: New potential in concrete in both private and public sector, enabling infrastructure for AI-driven data centers Significant opportunities in marine construction PHASE II OF STRATEGIC PLAN RECORD PIPELINE TO SUPPORT FUTURE GROWTH 12 |
|
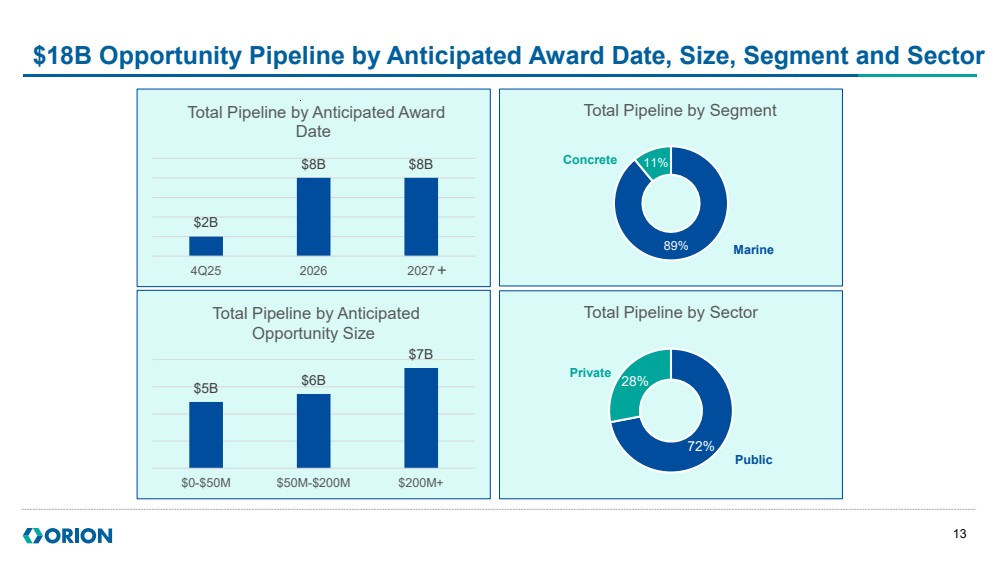
$18B Opportunity Pipeline by Anticipated Award Date, Size, Segment and Sector $5B $6B $7B $0-$50M $50M-$200M $200M+ Total Pipeline by Anticipated Opportunity Size 72% 28% Total Pipeline by Sector Public Private Total Pipeline by Segment Marine Concrete 11% 89% 13 $2B $8B $8B 4Q25 2026 2027 Total Pipeline by Anticipated Award Date + |
|
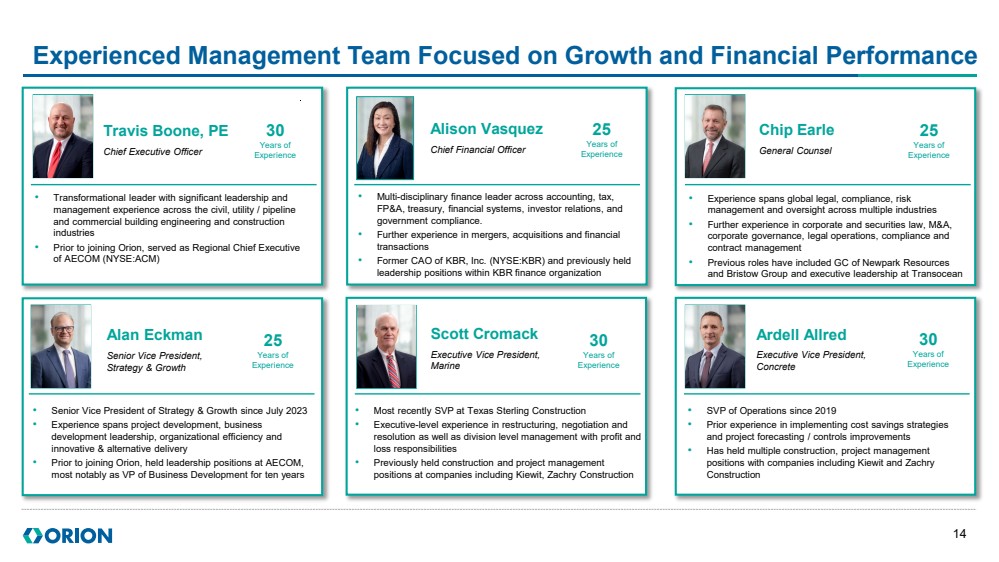
Experienced Management Team Focused on Growth and Financial Performance Travis Boone, PE Chief Executive Officer • Transformational leader with significant leadership and management experience across the civil, utility / pipeline and commercial building engineering and construction industries • Prior to joining Orion, served as Regional Chief Executive of AECOM (NYSE:ACM) Travis Boone, PE Chief Executive Officer 30 Years of Experience • Multi-disciplinary finance leader across accounting, tax, FP&A, treasury, financial systems, investor relations, and government compliance. • Further experience in mergers, acquisitions and financial transactions • Former CAO of KBR, Inc. (NYSE:KBR) and previously held leadership positions within KBR finance organization Alison Vasquez Chief Financial Officer 25 Years of Experience • Experience spans global legal, compliance, risk management and oversight across multiple industries • Further experience in corporate and securities law, M&A, corporate governance, legal operations, compliance and contract management • Previous roles have included GC of Newpark Resources and Bristow Group and executive leadership at Transocean Chip Earle General Counsel 25 Years of Experience • Senior Vice President of Strategy & Growth since July 2023 • Experience spans project development, business development leadership, organizational efficiency and innovative & alternative delivery • Prior to joining Orion, held leadership positions at AECOM, most notably as VP of Business Development for ten years Alan Eckman Senior Vice President, Strategy & Growth 25 Years of Experience • SVP of Operations since 2019 • Prior experience in implementing cost savings strategies and project forecasting / controls improvements • Has held multiple construction, project management positions with companies including Kiewit and Zachry Construction Ardell Allred Executive Vice President, Concrete 30 Years of Experience • Most recently SVP at Texas Sterling Construction • Executive-level experience in restructuring, negotiation and resolution as well as division level management with profit and loss responsibilities • Previously held construction and project management positions at companies including Kiewit, Zachry Construction Scott Cromack Executive Vice President, Marine 30 Years of Experience 14 |
|
Case Study: Aging U.S. Navy Infrastructure Orion anticipates U.S. Navy funding for shipyard renovations and Pacific Deterrence to accelerate and continue for several years • Aging US Navy port infrastructure – average dry dock is now 107 years old1 • The U.S. Navy has 9 dry docks in HI & WA; replacement of dry dock 3 in Pearl Harbor is underway at estimated cost of $3.6B • U.S. Navy Pacific Deterrence Initiative (PDI) is actively procuring $80B+ in Multiple Award Construction Contracts to include major waterfront facilities on multiple Pacific Islands 1. U.S. Navy FY 2025 budget Highlights Book, February 2024 U.S. NAVY INFRASTRUCTURE IN NEED OF REPAIR Airfield Improvements Seaport Improvements Fuel Storage Warehousing 15 |
|
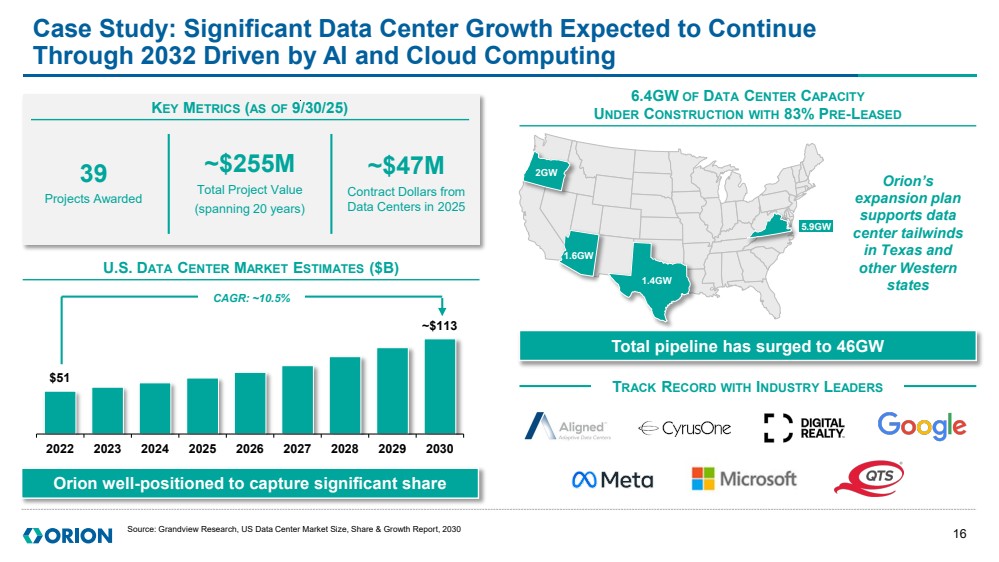
$51 ~$113 2022 2023 2024 2025 2026 2027 2028 2029 2030 Case Study: Significant Data Center Growth Expected to Continue Through 2032 Driven by AI and Cloud Computing KEY METRICS (AS OF 9/30/25) 39 Projects Awarded ~$255M Total Project Value (spanning 20 years) ~$47M Contract Dollars from Data Centers in 2025 U.S. DATA CENTER MARKET ESTIMATES ($B) 6.4GW OF DATA CENTER CAPACITY UNDER CONSTRUCTION WITH 83% PRE-LEASED Total pipeline has surged to 46GW TRACK RECORD WITH INDUSTRY LEADERS Orion well-positioned to capture significant share CAGR: ~10.5% 2GW 1.6GW 1.4GW 5.9GW Orion’s expansion plan supports data center tailwinds in Texas and other Western states Source: Grandview Research, US Data Center Market Size, Share & Growth Report, 2030 16 |
|
Financial Overview |
|
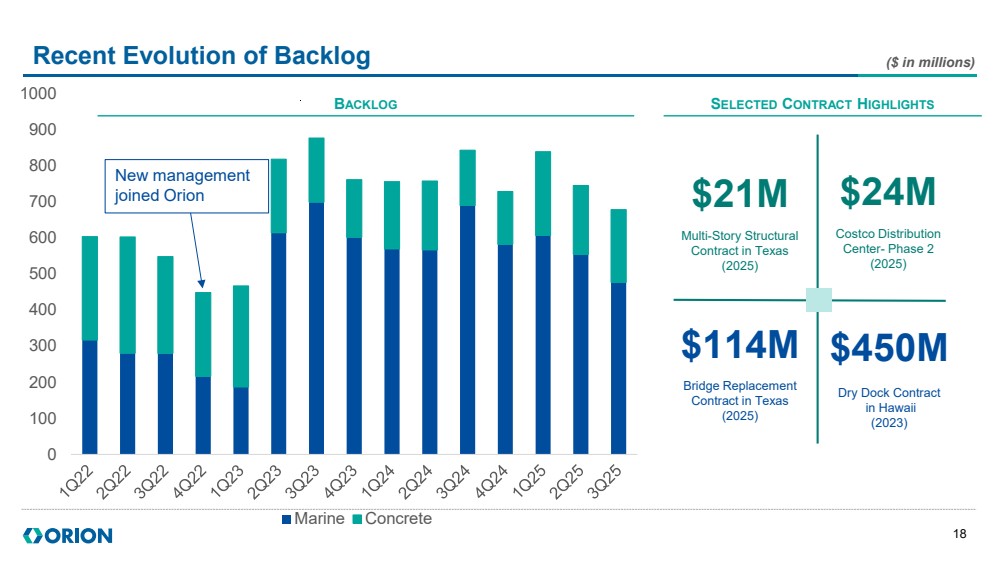
0 100 200 300 400 500 600 700 800 900 1000 Marine Concrete New management joined Orion Recent Evolution of Backlog BACKLOG ($ in millions) SELECTED CONTRACT HIGHLIGHTS $21M Multi-Story Structural Contract in Texas (2025) $24M Costco Distribution Center- Phase 2 (2025) $450M Dry Dock Contract in Hawaii (2023) $114M Bridge Replacement Contract in Texas (2025) 18 |
|
$17 $23 $24 $42 2021 2022 2023 2024 2025E Adjusted EBITDA $45 Historical Annual Financial Summary ($ in millions) $601 $748 $712 $796 $843 2021 2022 2023 2024 2025E Revenue 2021 Guidance Midpoint 19 Guidance Midpoint • 2025 Revenue guidance midpoint signals continued growth • 2025 Revenue guidance represents 40% growth since 2021 • 9% CAGR from 2021-2025 • 2025 Adjusted EBITDA guidance almost triples from 2021 • Adjusted EBITDA guidance represents 27% CAGR from 2021-2025 |
|
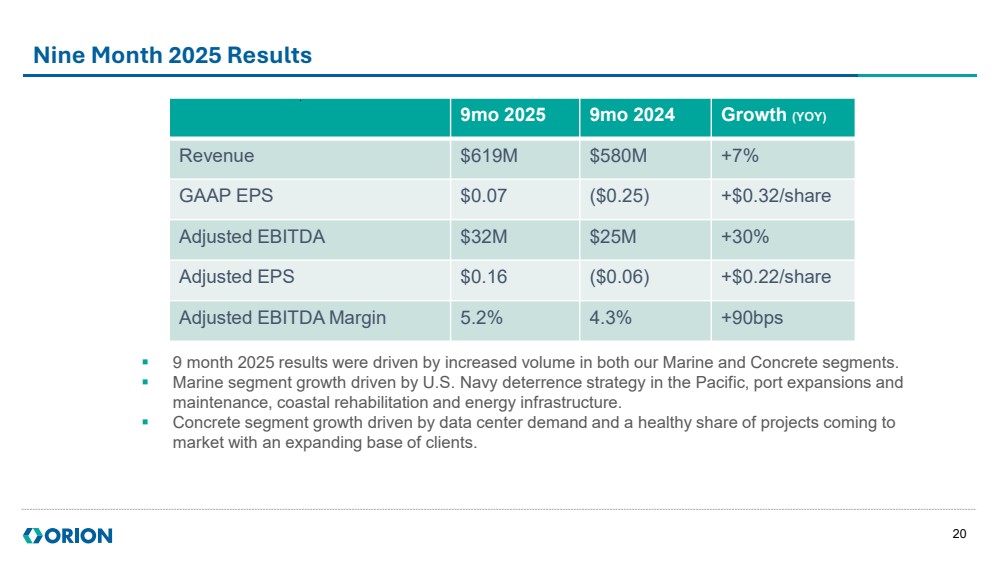
Nine Month 2025 Results 9mo 2025 9mo 2024 Growth (YOY) Revenue $619M $580M +7% GAAP EPS $0.07 ($0.25) +$0.32/share Adjusted EBITDA $32M $25M +30% Adjusted EPS $0.16 ($0.06) +$0.22/share Adjusted EBITDA Margin 5.2% 4.3% +90bps 9 month 2025 results were driven by increased volume in both our Marine and Concrete segments. Marine segment growth driven by U.S. Navy deterrence strategy in the Pacific, port expansions and maintenance, coastal rehabilitation and energy infrastructure. Concrete segment growth driven by data center demand and a healthy share of projects coming to market with an expanding base of clients. 20 |
|
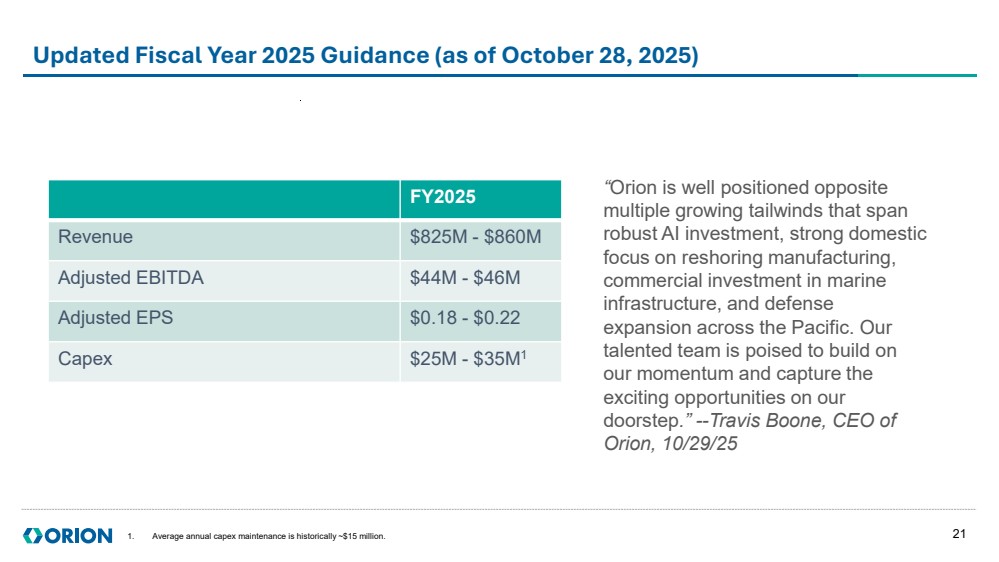
Updated Fiscal Year 2025 Guidance (as of October 28, 2025) 1. Average annual capex maintenance is historically ~$15 million. FY2025 Revenue $825M - $860M Adjusted EBITDA $44M - $46M Adjusted EPS $0.18 - $0.22 Capex $25M - $35M1 “Orion is well positioned opposite multiple growing tailwinds that span robust AI investment, strong domestic focus on reshoring manufacturing, commercial investment in marine infrastructure, and defense expansion across the Pacific. Our talented team is poised to build on our momentum and capture the exciting opportunities on our doorstep.” --Travis Boone, CEO of Orion, 10/29/25 21 |
|
Appendix |
|
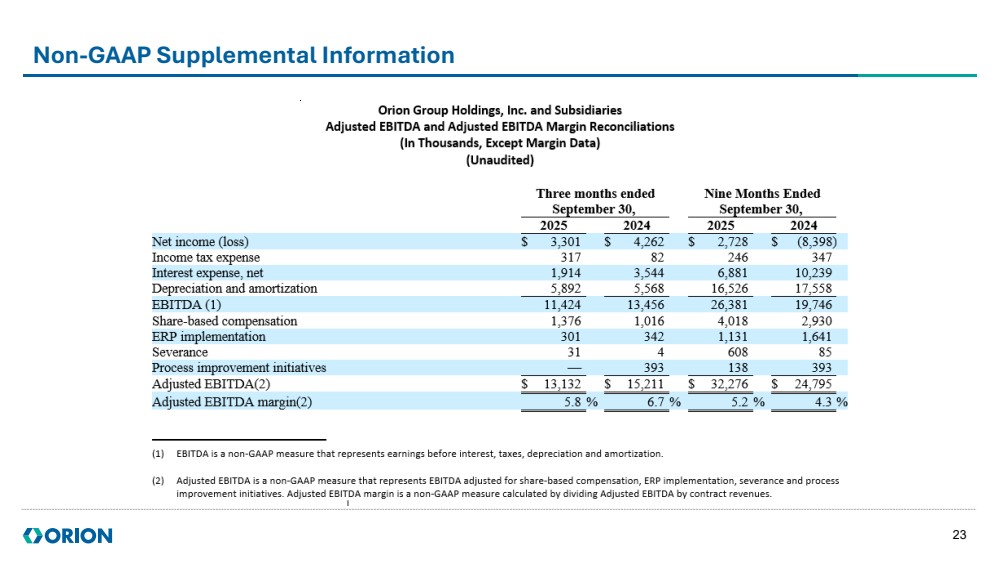
Non-GAAP Supplemental Information 23 |
|
Non-GAAP Supplemental Information 24 |
|
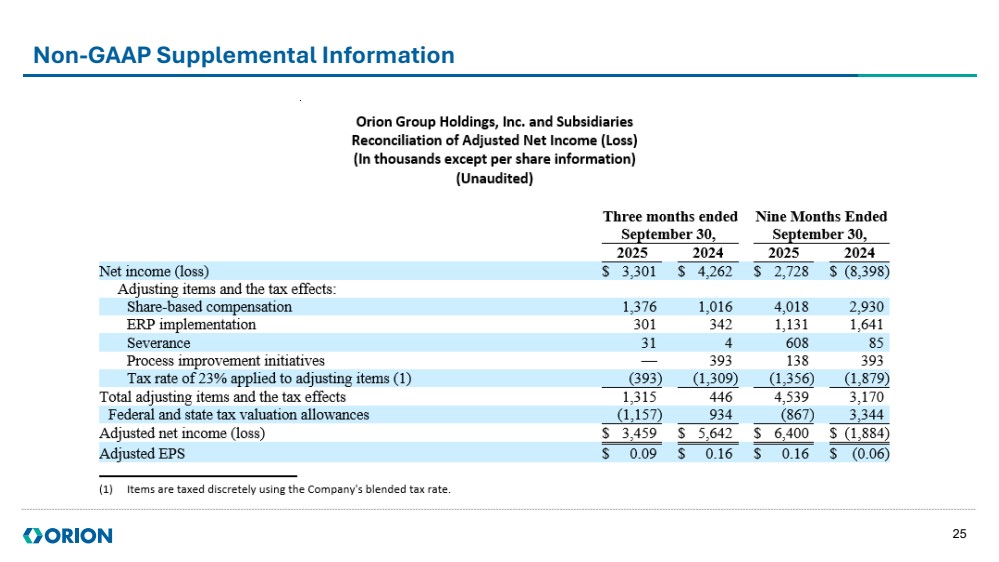
Non-GAAP Supplemental Information 25 |
|
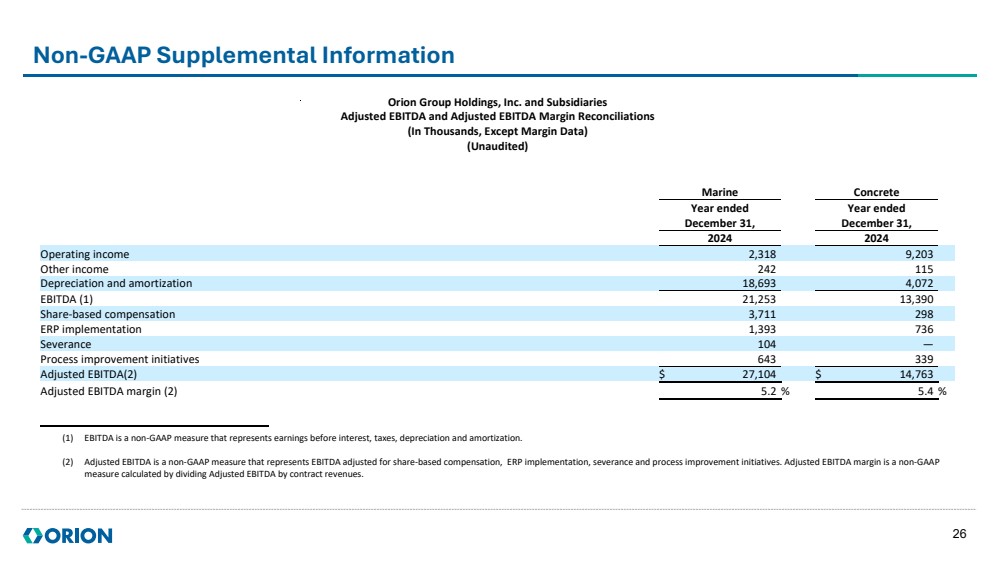
Non-GAAP Supplemental Information Orion Group Holdings, Inc. and Subsidiaries Adjusted EBITDA and Adjusted EBITDA Margin Reconciliations (In Thousands, Except Margin Data) (Unaudited) Marine Concrete Year ended Year ended December 31, December 31, 2024 2024 Operating income 2,318 9,203 Other income 242 115 Depreciation and amortization 18,693 4,072 EBITDA (1) 21,253 13,390 Share-based compensation 3,711 298 ERP implementation 1,393 736 Severance 104 — Process improvement initiatives 643 339 Adjusted EBITDA(2) $ 27,104 $ 14,763 Adjusted EBITDA margin (2) 5.2 % 5.4 % (1) EBITDA is a non-GAAP measure that represents earnings before interest, taxes, depreciation and amortization. (2) Adjusted EBITDA is a non-GAAP measure that represents EBITDA adjusted for share-based compensation, ERP implementation, severance and process improvement initiatives. Adjusted EBITDA margin is a non-GAAP measure calculated by dividing Adjusted EBITDA by contract revenues. 26 |
|
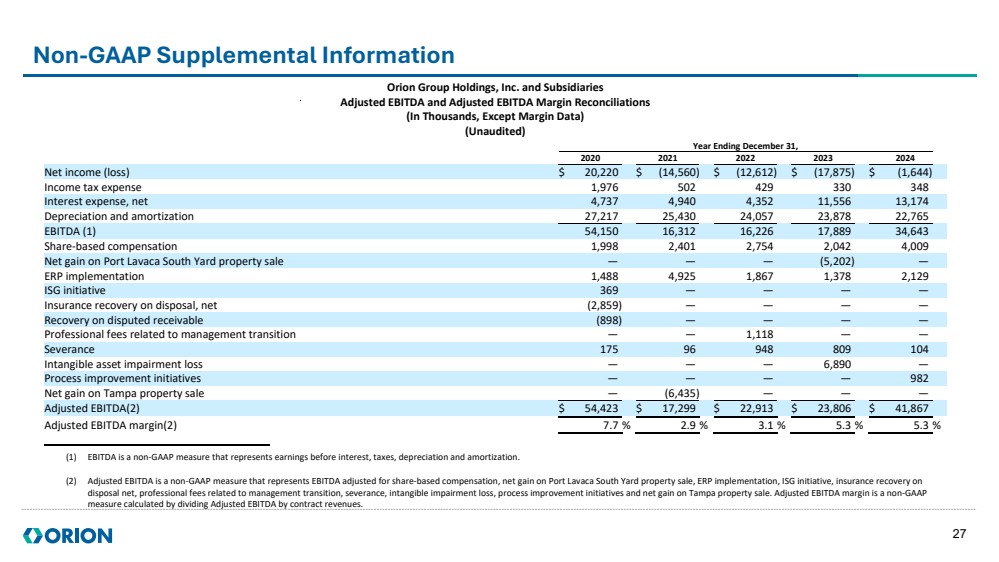
Non-GAAP Supplemental Information Orion Group Holdings, Inc. and Subsidiaries Adjusted EBITDA and Adjusted EBITDA Margin Reconciliations (In Thousands, Except Margin Data) (Unaudited) Year Ending December 31, 2020 2021 2022 2023 2024 Net income (loss) $ 20,220 $ (14,560) $ (12,612) $ (17,875) $ (1,644) Income tax expense 1,976 502 429 330 348 Interest expense, net 4,737 4,940 4,352 11,556 13,174 Depreciation and amortization 27,217 25,430 24,057 23,878 22,765 EBITDA (1) 54,150 16,312 16,226 17,889 34,643 Share-based compensation 1,998 2,401 2,754 2,042 4,009 Net gain on Port Lavaca South Yard property sale — — — (5,202) — ERP implementation 1,488 4,925 1,867 1,378 2,129 ISG initiative 369 — — — — Insurance recovery on disposal, net (2,859) — — — — Recovery on disputed receivable (898) — — — — Professional fees related to management transition — — 1,118 — — Severance 175 96 948 809 104 Intangible asset impairment loss — — — 6,890 — Process improvement initiatives — — — — 982 Net gain on Tampa property sale — (6,435) — — — Adjusted EBITDA(2) $ 54,423 $ 17,299 $ 22,913 $ 23,806 $ 41,867 Adjusted EBITDA margin(2) 7.7 % 2.9 % 3.1 % 5.3 % 5.3 % (1) EBITDA is a non-GAAP measure that represents earnings before interest, taxes, depreciation and amortization. (2) Adjusted EBITDA is a non-GAAP measure that represents EBITDA adjusted for share-based compensation, net gain on Port Lavaca South Yard property sale, ERP implementation, ISG initiative, insurance recovery on disposal net, professional fees related to management transition, severance, intangible impairment loss, process improvement initiatives and net gain on Tampa property sale. Adjusted EBITDA margin is a non-GAAP measure calculated by dividing Adjusted EBITDA by contract revenues. 27 |
|
Non-GAAP Supplemental Information 28 Orion Group Holdings, Inc. and Subsidiaries Adjusted EBITDA, Unburdened Adjusted EBITDA and Unburdened Adjusted EBITDA Margin Reconciliations (In Thousands, Except Margin Data) (Unaudited) Three Months Ended September 30, 2025 Marine Concrete Operating income (loss) $ 10,985 $ (5,664) Other income 209 2 Depreciation and amortization 5,081 811 EBITDA (1) 16,275 (4,851) Share-based compensation 1,064 312 ERP implementation 188 113 Severance 31 — Adjusted EBITDA(2) 17,558 (4,426) Shared service allocation 6,693 5,899 Unburdened Adjusted EBITDA (3) 24,251 1,473 Unburdened Adjusted EBITDA margin (4) $ 17.0 % $ 1.8 % (1) EBITDA is a non-GAAP measure that represents earnings before interest, taxes, depreciation and amortization. (2) Adjusted EBITDA is a non-GAAP measure that represents EBITDA adjusted for share-based compensation, ERP implementation and severance. (3) Unburdened Adjusted EBITDA is a non-GAAP measure calculated as Adjusted EBITDA for the relevant segment (shown above) less the segment’s share of shared service allocation. (4) Unburdened Adjusted EBITDA margin is a non-GAAP measure calculated by dividing Unburdened Adjusted EBITDA by contract revenues. |
|
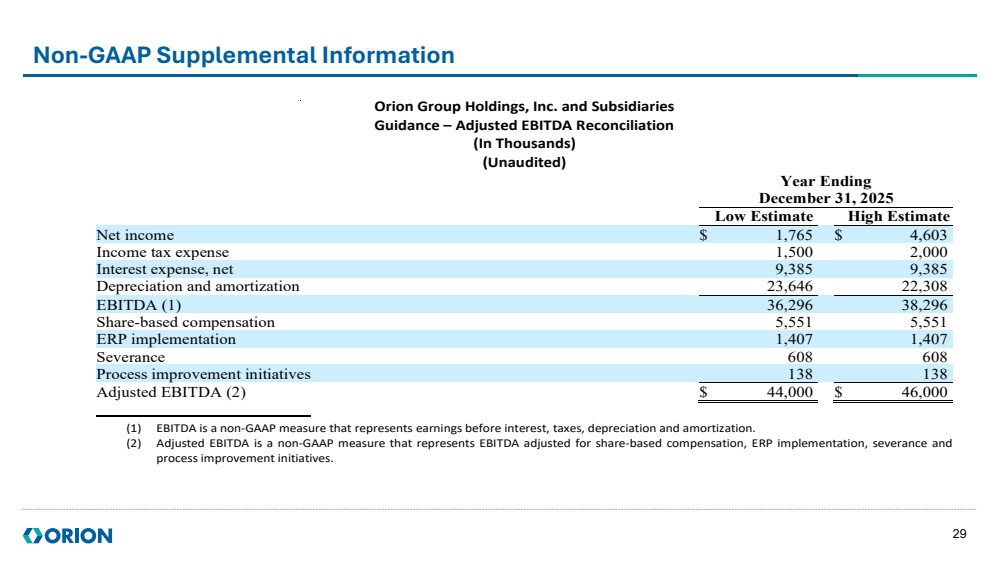
Non-GAAP Supplemental Information 29 Orion Group Holdings, Inc. and Subsidiaries Guidance – Adjusted EBITDA Reconciliation (In Thousands) (Unaudited) Year Ending December 31, 2025 Low Estimate High Estimate Net income $ 1,765 $ 4,603 Income tax expense 1,500 2,000 Interest expense, net 9,385 9,385 Depreciation and amortization 23,646 22,308 EBITDA (1) 36,296 38,296 Share-based compensation 5,551 5,551 ERP implementation 1,407 1,407 Severance 608 608 Process improvement initiatives 138 138 Adjusted EBITDA (2) $ 44,000 $ 46,000 (1) EBITDA is a non-GAAP measure that represents earnings before interest, taxes, depreciation and amortization. (2) Adjusted EBITDA is a non-GAAP measure that represents EBITDA adjusted for share-based compensation, ERP implementation, severance and process improvement initiatives. |
|
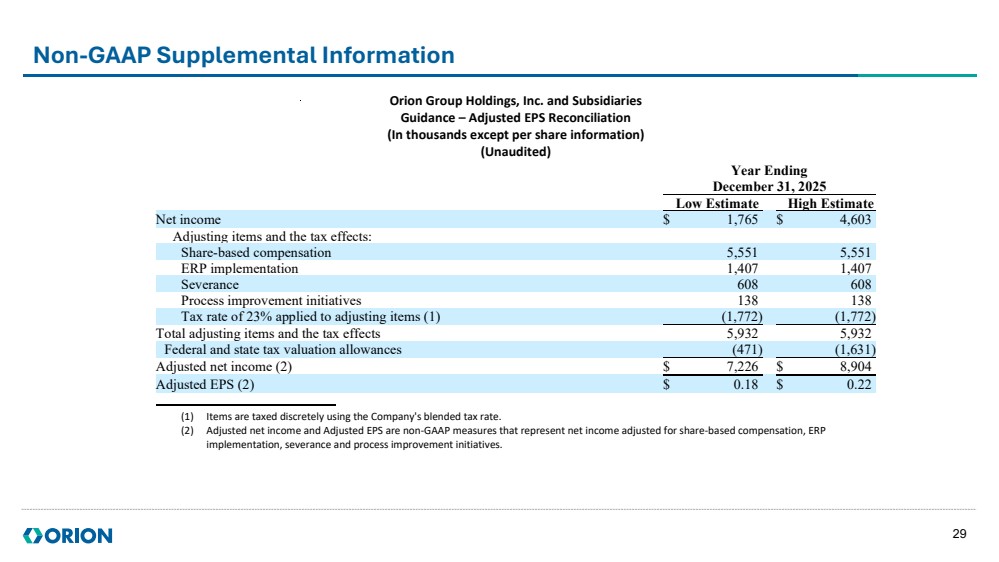
Non-GAAP Supplemental Information 29 Orion Group Holdings, Inc. and Subsidiaries Guidance – Adjusted EPS Reconciliation (In thousands except per share information) (Unaudited) Year Ending December 31, 2025 Low Estimate High Estimate Net income $ 1,765 $ 4,603 Adjusting items and the tax effects: Share-based compensation 5,551 5,551 ERP implementation 1,407 1,407 Severance 608 608 Process improvement initiatives 138 138 Tax rate of 23% applied to adjusting items (1) (1,772) (1,772) Total adjusting items and the tax effects 5,932 5,932 Federal and state tax valuation allowances (471) (1,631) Adjusted net income (2) $ 7,226 $ 8,904 Adjusted EPS (2) $ 0.18 $ 0.22 (1) Items are taxed discretely using the Company's blended tax rate. (2) Adjusted net income and Adjusted EPS are non-GAAP measures that represent net income adjusted for share-based compensation, ERP implementation, severance and process improvement initiatives. |