UNITED STATES
SECURITIES AND EXCHANGE COMMISSION
Washington, D.C. 20549
FORM 8-K
CURRENT REPORT
Pursuant to Section 13 or 15(d) of the
Securities Exchange Act of 1934
Date of Report (Date of earliest event reported): September 20, 2023
ORION GROUP HOLDINGS, INC.
(Exact name of Registrant as specified in its charter)
Delaware |
1-33891 |
26-0097459 |
(State or other jurisdiction of incorporation) |
(Commission File Number) |
(IRS Employer Identification Number) |
12000 Aerospace Suite 300
Houston, Texas 77034
(Address of principal executive offices)
(713) 852-6500
(Registrant's telephone number, including area code)
Check the appropriate box below if the Form 8-K filing is intended to simultaneously satisfy the filing obligation of the registrant under any of the following provisions:
☐ Written communications pursuant to Rule 425 under the Securities Act (17 CFR 230.425)
☐ Soliciting material pursuant to Rule 14a-12 under the Exchange Act (17 CFR 240.14a-12)
☐ Pre-commencement communications pursuant to Rule 14d-2(b) under the Exchange Act (17 CFR 240.14d-2(b))
☐ Pre-commencement communications pursuant to Rule 13e-4(c) under the Exchange Act (17 CFR 240.13e-4(c)
Title of Each Class |
|
Trading Symbol(s) |
|
Name of Each Exchange |
Common stock, $0.01 par value per share |
|
ORN |
|
The New York Stock Exchange |
Indicate by check mark whether the registrant is an emerging growth company as defined in as defined in Rule 405 of the Securities Act of 1933 (§230.405 of this chapter) or Rule 12b-2 of the Securities Exchange Act of 1934 (§240.12b-2 of this chapter).
Emerging growth company ☐
If an emerging growth company, indicate by check mark if the registrant has elected not to use the extended transition period for complying with any new or revised financial accounting standards provided pursuant to Section 13(a) of the Exchange Act. ☐
Item 7.01 |
Regulation FD Disclosure. |
Orion Group Holdings, Inc. (the "Company") intends to participate in the Sidoti September Virtual Investor Conference on September 20 and September 21, 2023. During this conference, members of the Company's executive management team will meet with investors and analysts. Attached as Exhibit 99.1 to this Current Report on Form 8-K is the presentation the Company's executive management team will present. The presentation is also available on the Investor Relations page of the Company's website at https://www.oriongroupholdingsinc.com.
All information included in the presentation is presented as of the dates indicated, and the Company does not assume any obligation to correct or update such information in the future. In addition, the Company disclaims any inferences regarding the materiality of such information that may arise as a result of it furnishing such information under Item 7.01 of this Current Report on Form 8-K.
As provided in General Instruction B.2 to Form 8-K, the information furnished in Item 7.01 and Exhibit 99.1 of this Current Report on Form 8-K shall not be deemed “filed” for purposes of Section 18 of the Securities Exchange Act of 1934, as amended (the “Exchange Act”), or otherwise subject to the liabilities of that section, and such information shall not be deemed incorporated by reference in any filing under the Securities Act of 1933, as amended, or the Exchange Act, except as shall be expressly set forth by specific reference in such filing.
Item 9.01 Financial Statements and Exhibits.
The Exhibits to this Current Report are furnished in the Exhibit Index, which appears at the end of, and is incorporated by reference into, this Current Report.
Exhibit Index
Exhibit No. |
|
Description |
|
Orion Group Holdings, Inc. Investor Presentation for September Conference |
|
104.1 |
Cover Page Interactive Data File (embedded within the Inline XBRL document). |
SIGNATURES
Pursuant to the requirements of the Securities Exchange Act of 1934, the registrant has duly caused this report to be signed on its behalf by the undersigned hereunto duly authorized.
ORION GROUP HOLDINGS, INC.
By: /s/ Travis J. Boone
Travis J. Boone
President & CEO
Date: September 20, 2023
|
Investor Presentation September 2023 |
|
2 Disclaimer This presentation contains, and the officers and directors of the Company may from time to time make, statements that are considered forward looking statements within the meaning of the Securities Act of 1933 and the Securities Exchange Act of 1934. These forward-looking statements are subject to a number of risks and uncertainties, many of which are beyond our control, which may include statements about: our business strategy; our financial strategy; our industry outlook; and our expected margin growth; and our plans, objectives, expectations, forecasts, outlook and intentions. All of these types of statements, other than statements of historical fact included in this presentation, are forward-looking statements. In some cases, forward-looking statements can be identified by terminology such as “may,” “will,” “could,” “should,” “expect,” “plan,” “project,” “intend,” “anticipate,” “believe,” “estimate,” “predict,” “potential,” “pursue,” “target,” “continue,” the negative of such terms or other comparable terminology. The forward-looking statements contained in this presentation are largely based on our expectations, which reflect estimates and assumptions made by our management. These estimates and assumptions reflect our best judgment based on currently known market conditions and other factors. Although we believe such estimates and assumptions to be reasonable, they are inherently uncertain and involve a number of risks and uncertainties that are beyond our control. In addition, management’s assumptions about future events may prove to be inaccurate. Management cautions all readers that the forward-looking statements contained in this presentation are not guarantees of future performance, and we cannot assure any reader that such statements will be realized or the forward-looking events and circumstances will occur. Actual results may differ materially from those anticipated or implied in the forward-looking statements due to factors listed in the “Risk Factors” section in our filings with the U.S. Securities and Exchange Commission and elsewhere in those filings. Additional factors or risks that we currently deem immaterial, that are not presently known to us or that arise in the future could also cause our actual results to differ materially from our expected results. Given these uncertainties, investors are cautioned that many of the assumptions upon which our forward-looking statements are based are likely to change after the date the forward-looking statements are made. The forward-looking statements speak only as of the date made, and we undertake no obligation to publicly update or revise any forward-looking statements for any reason, whether as a result of new information, future events or developments, changed circumstances, or otherwise, notwithstanding any changes in our assumptions, changes in business plans, actual experience or other changes. These cautionary statements qualify all forward-looking statements attributable to us or persons acting on our behalf. This presentation may contain the financial measures: adjusted net income, EBITDA, adjusted EBITDA, and adjusted EPS, which are not calculated in accordance with U.S. GAAP. If presented, a reconciliation of the non-GAAP financial measures to the most directly comparable GAAP financial measure will be provided in the Appendix to this presentation. |
|
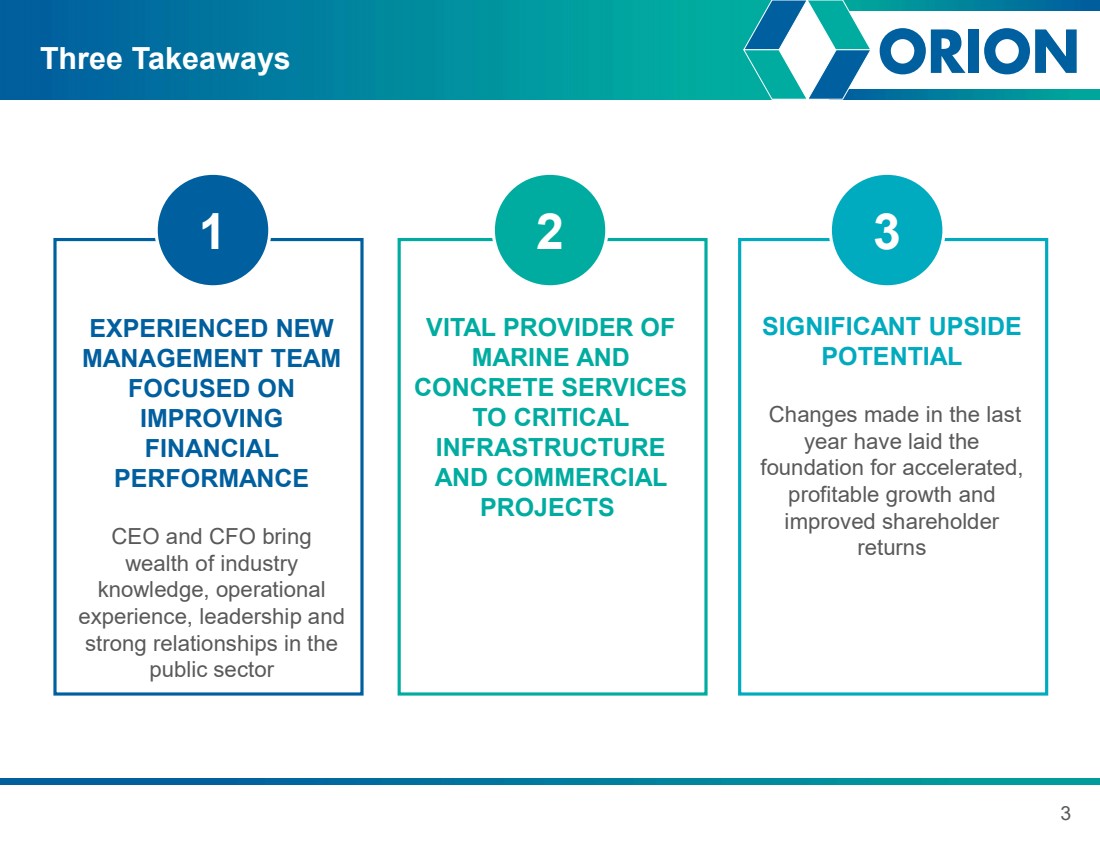
3 Three Takeaways 1 EXPERIENCED NEW MANAGEMENT TEAM FOCUSED ON IMPROVING FINANCIAL PERFORMANCE CEO and CFO bring wealth of industry knowledge, operational experience, leadership and strong relationships in the public sector VITAL PROVIDER OF MARINE AND CONCRETE SERVICES TO CRITICAL INFRASTRUCTURE AND COMMERCIAL PROJECTS 2 3 SIGNIFICANT UPSIDE POTENTIAL Changes made in the last year have laid the foundation for accelerated, profitable growth and improved shareholder returns |
|
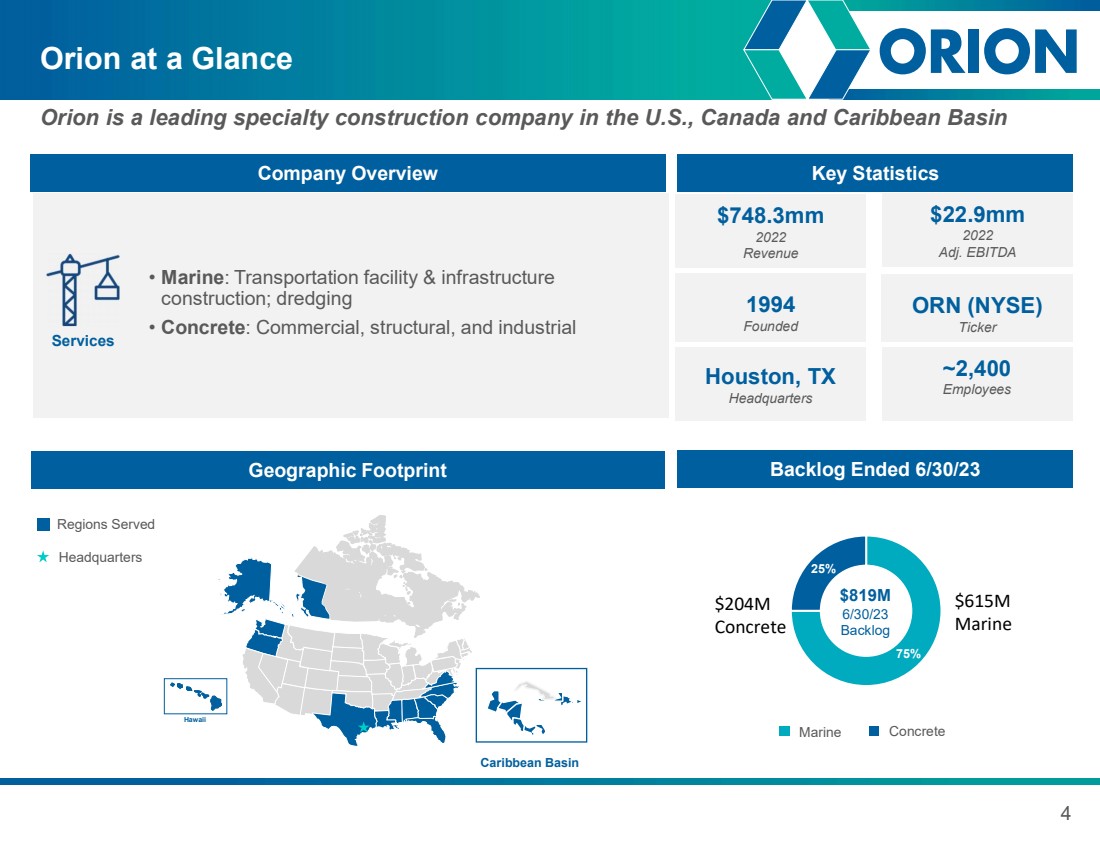
75% 25% $204M Concrete 4 Orion at a Glance Orion is a leading specialty construction company in the U.S., Canada and Caribbean Basin Company Overview • Marine: Transportation facility & infrastructure construction; dredging • Concrete: Commercial, structural, and industrial Key Statistics $748.3mm 2022 Revenue $22.9mm 2022 Adj. EBITDA Services Backlog Ended 6/30/23 Marine Concrete $819M 6/30/23 Backlog Geographic Footprint Headquarters Caribbean Basin Regions Served Hawaii 1994 Founded Houston, TX Headquarters ORN (NYSE) Ticker ~2,400 Employees $615M Marine |
|
5 Compelling Investment Opportunity 5 4 3 Experienced New Management Team Focused on Improved Financial Performance 2 Mission Critical Specialty Construction Provider with Sustainable Competitive Advantages 1 Significant Upside Potential: Strong demand in both concrete and marine segments 6 3-Point Strategic Plan To Deliver Enhanced Growth and Returns Large Market Opportunity with Strong Tailwinds and Demand Drivers Diversified Revenue with Industry Leaders and Government Clients |
|
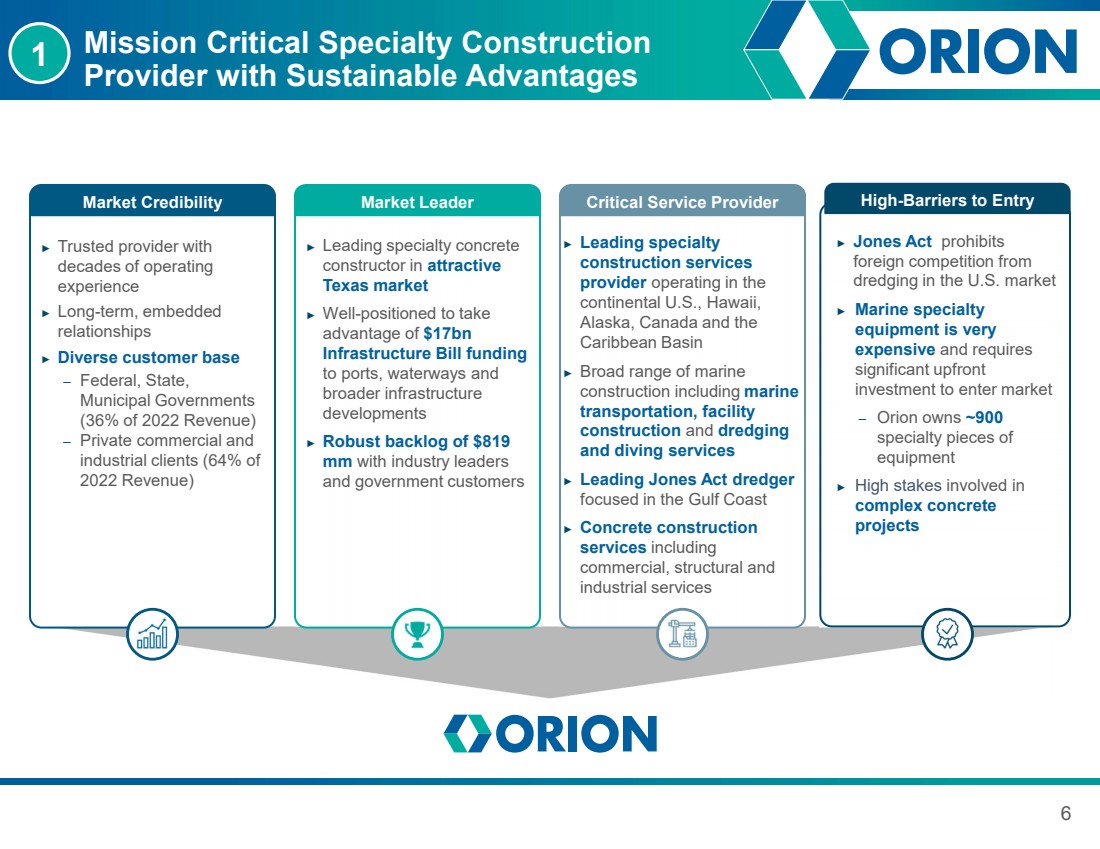
6 Mission Critical Specialty Construction Provider with Sustainable Advantages Market Credibility ► Trusted provider with decades of operating experience ► Long-term, embedded relationships ► Diverse customer base – Federal, State, Municipal Governments (36% of 2022 Revenue) – Private commercial and industrial clients (64% of 2022 Revenue) 1 Market Leader ► Leading specialty concrete constructor in attractive Texas market ► Well-positioned to take advantage of $17bn Infrastructure Bill funding to ports, waterways and broader infrastructure developments ► Robust backlog of $819 mm with industry leaders and government customers Critical Service Provider ► Leading specialty construction services provider operating in the continental U.S., Hawaii, Alaska, Canada and the Caribbean Basin ► Broad range of marine construction including marine transportation, facility construction and dredging and diving services ► Leading Jones Act dredger focused in the Gulf Coast ► Concrete construction services including commercial, structural and industrial services High-Barriers to Entry ► Jones Act prohibits foreign competition from dredging in the U.S. market ► Marine specialty equipment is very expensive and requires significant upfront investment to enter market – Orion owns ~900 specialty pieces of equipment ► High stakes involved in complex concrete projects |
|
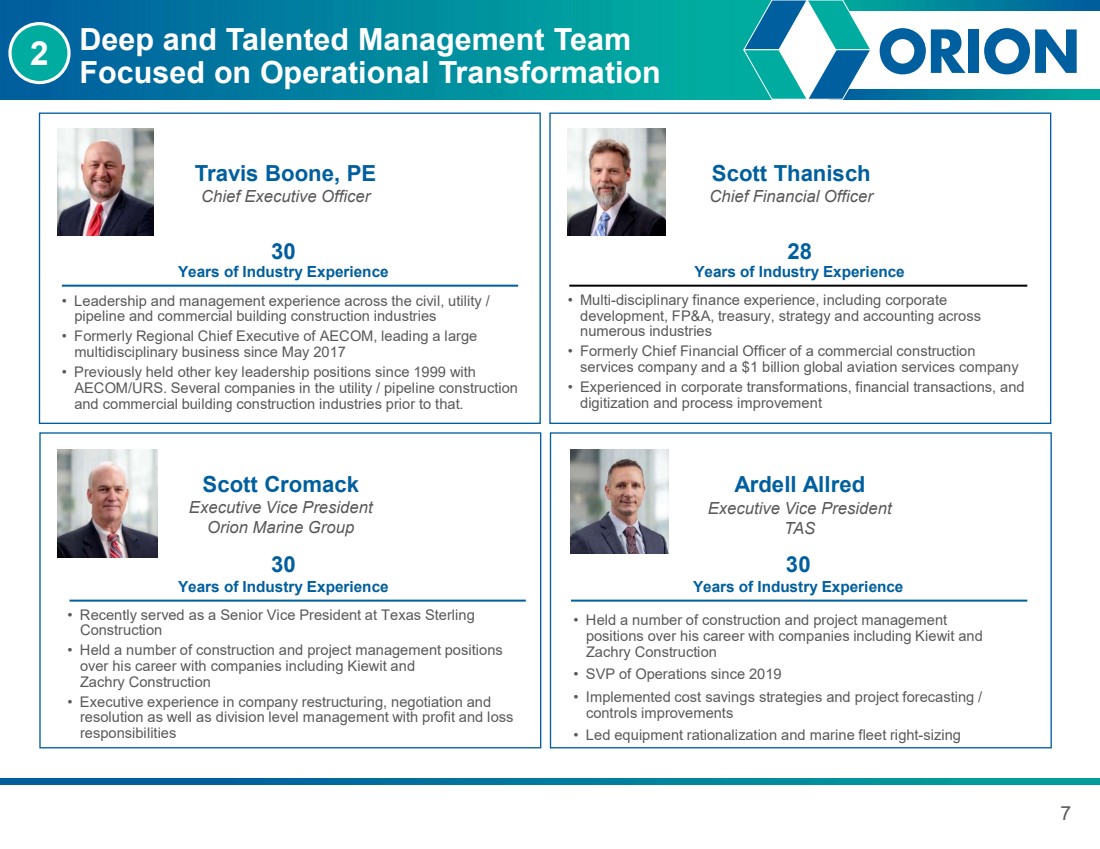
7 Deep and Talented Management Team Focused on Operational Transformation Travis Boone, PE Chief Executive Officer • Leadership and management experience across the civil, utility / pipeline and commercial building construction industries • Formerly Regional Chief Executive of AECOM, leading a large multidisciplinary business since May 2017 • Previously held other key leadership positions since 1999 with AECOM/URS. Several companies in the utility / pipeline construction and commercial building construction industries prior to that. 30 Years of Industry Experience • Multi-disciplinary finance experience, including corporate development, FP&A, treasury, strategy and accounting across numerous industries • Formerly Chief Financial Officer of a commercial construction services company and a $1 billion global aviation services company • Experienced in corporate transformations, financial transactions, and digitization and process improvement 28 Years of Industry Experience Scott Thanisch Chief Financial Officer • Recently served as a Senior Vice President at Texas Sterling Construction • Held a number of construction and project management positions over his career with companies including Kiewit and Zachry Construction • Executive experience in company restructuring, negotiation and resolution as well as division level management with profit and loss responsibilities 30 Years of Industry Experience Scott Cromack Executive Vice President Orion Marine Group Ardell Allred Executive Vice President TAS • Held a number of construction and project management positions over his career with companies including Kiewit and Zachry Construction • SVP of Operations since 2019 • Implemented cost savings strategies and project forecasting / controls improvements • Led equipment rationalization and marine fleet right-sizing 30 Years of Industry Experience 2 |
|
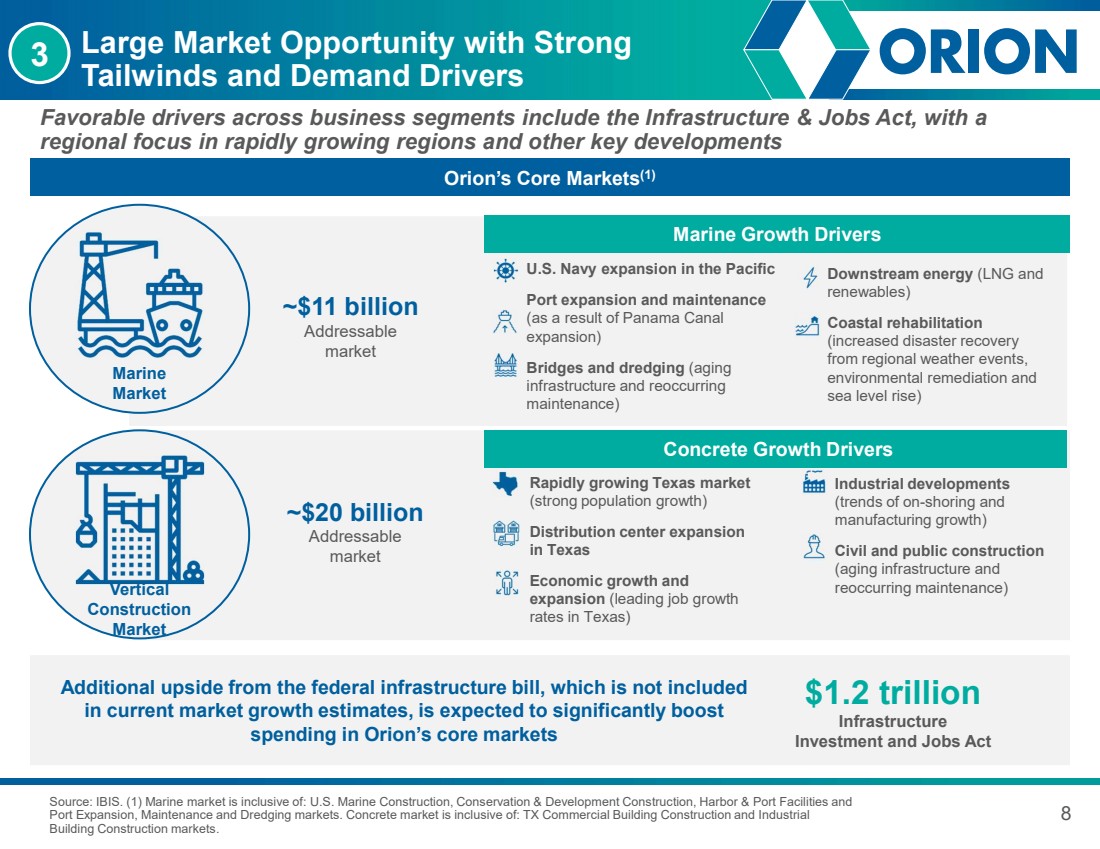
8 Large Market Opportunity with Strong Tailwinds and Demand Drivers Source: IBIS. (1) Marine market is inclusive of: U.S. Marine Construction, Conservation & Development Construction, Harbor & Port Facilities and Port Expansion, Maintenance and Dredging markets. Concrete market is inclusive of: TX Commercial Building Construction and Industrial Building Construction markets. Favorable drivers across business segments include the Infrastructure & Jobs Act, with a regional focus in rapidly growing regions and other key developments Orion’s Core Markets(1) Concrete Growth Drivers Rapidly growing Texas market (strong population growth) Distribution center expansion in Texas Economic growth and expansion (leading job growth rates in Texas) Marine Growth Drivers U.S. Navy expansion in the Pacific Port expansion and maintenance (as a result of Panama Canal expansion) Bridges and dredging (aging infrastructure and reoccurring maintenance) $1.2 trillion Infrastructure Investment and Jobs Act Additional upside from the federal infrastructure bill, which is not included in current market growth estimates, is expected to significantly boost spending in Orion’s core markets Marine Market Vertical Construction Market ~$11 billion Addressable market ~$20 billion Addressable market Downstream energy (LNG and renewables) Coastal rehabilitation (increased disaster recovery from regional weather events, environmental remediation and sea level rise) Industrial developments (trends of on-shoring and manufacturing growth) Civil and public construction (aging infrastructure and reoccurring maintenance) 3 |
|
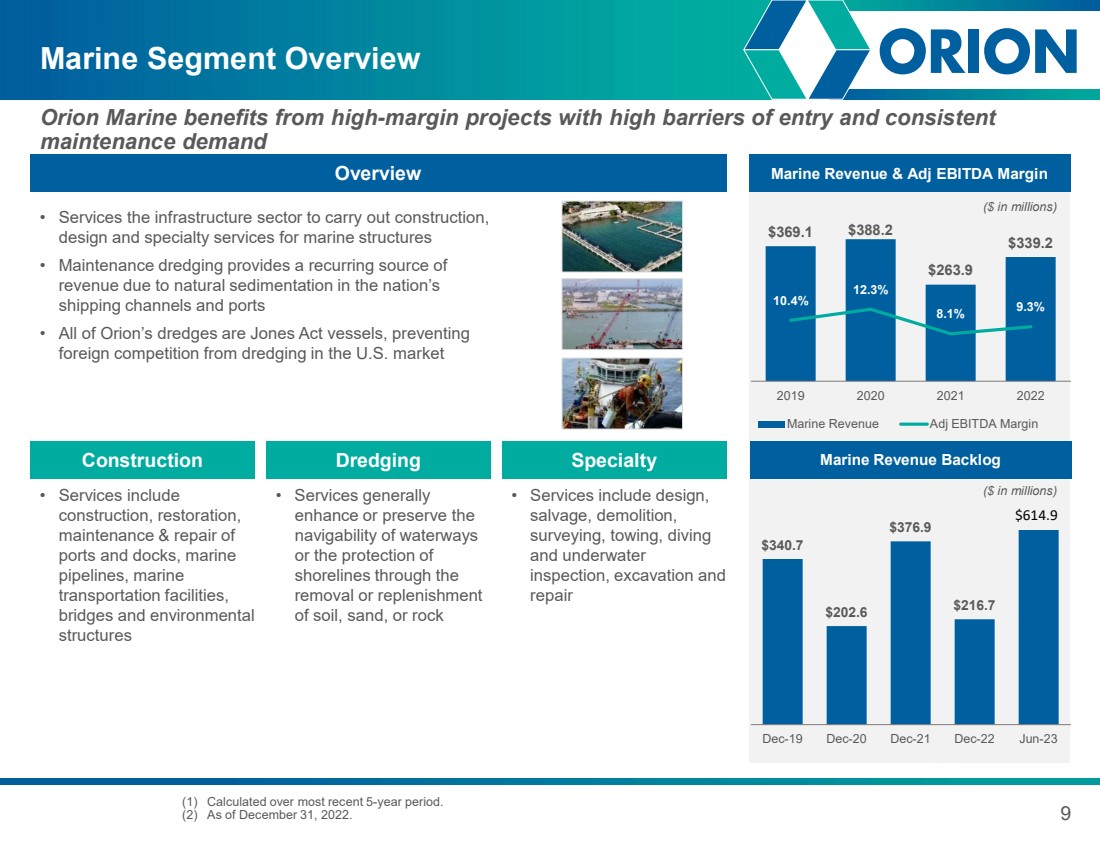
$340.7 $202.6 $376.9 $216.7 Dec-19 Dec-20 Dec-21 Dec-22 Jun-23 9 Marine Segment Overview Orion Marine benefits from high-margin projects with high barriers of entry and consistent maintenance demand (1) Calculated over most recent 5-year period. (2) As of December 31, 2022. Overview Marine Revenue & Adj EBITDA Margin • Services the infrastructure sector to carry out construction, design and specialty services for marine structures • Maintenance dredging provides a recurring source of revenue due to natural sedimentation in the nation’s shipping channels and ports • All of Orion’s dredges are Jones Act vessels, preventing foreign competition from dredging in the U.S. market Construction Dredging Marine Revenue Backlog ($ in millions) Specialty • Services include construction, restoration, maintenance & repair of ports and docks, marine pipelines, marine transportation facilities, bridges and environmental structures • Services generally enhance or preserve the navigability of waterways or the protection of shorelines through the removal or replenishment of soil, sand, or rock • Services include design, salvage, demolition, surveying, towing, diving and underwater inspection, excavation and repair ($ in millions) $369.1 $388.2 $263.9 $339.2 10.4% 12.3% 8.1% 9.3% 2019 2020 2021 2022 Marine Revenue Adj EBITDA Margin $614.9 |
|
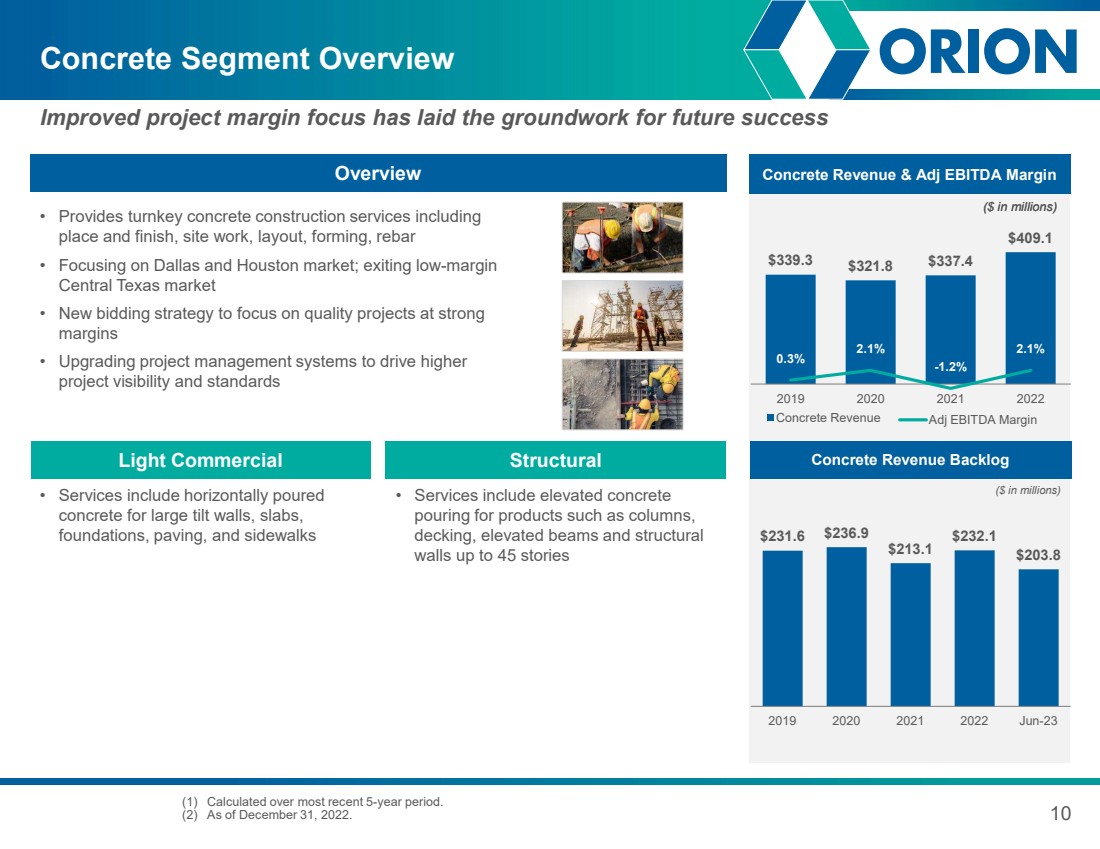
$339.3 $321.8 $337.4 $409.1 2019 2020 2021 2022 Concrete Revenue 0.3% 2.1% -1.2% 2.1% Adj EBITDA Margin Concrete Revenue & Adj EBITDA Margin 10 Concrete Segment Overview Improved project margin focus has laid the groundwork for future success (1) Calculated over most recent 5-year period. (2) As of December 31, 2022. Overview • Provides turnkey concrete construction services including place and finish, site work, layout, forming, rebar • Focusing on Dallas and Houston market; exiting low-margin Central Texas market • New bidding strategy to focus on quality projects at strong margins • Upgrading project management systems to drive higher project visibility and standards ($ in millions) Concrete Revenue Backlog ($ in millions) Structural • Services include elevated concrete pouring for products such as columns, decking, elevated beams and structural walls up to 45 stories Light Commercial • Services include horizontally poured concrete for large tilt walls, slabs, foundations, paving, and sidewalks Concrete Revenue & Adj EBITDA Margin ($ in millions) $231.6 $236.9 $213.1 $232.1 $203.8 2019 2020 2021 2022 Jun-23 |
|
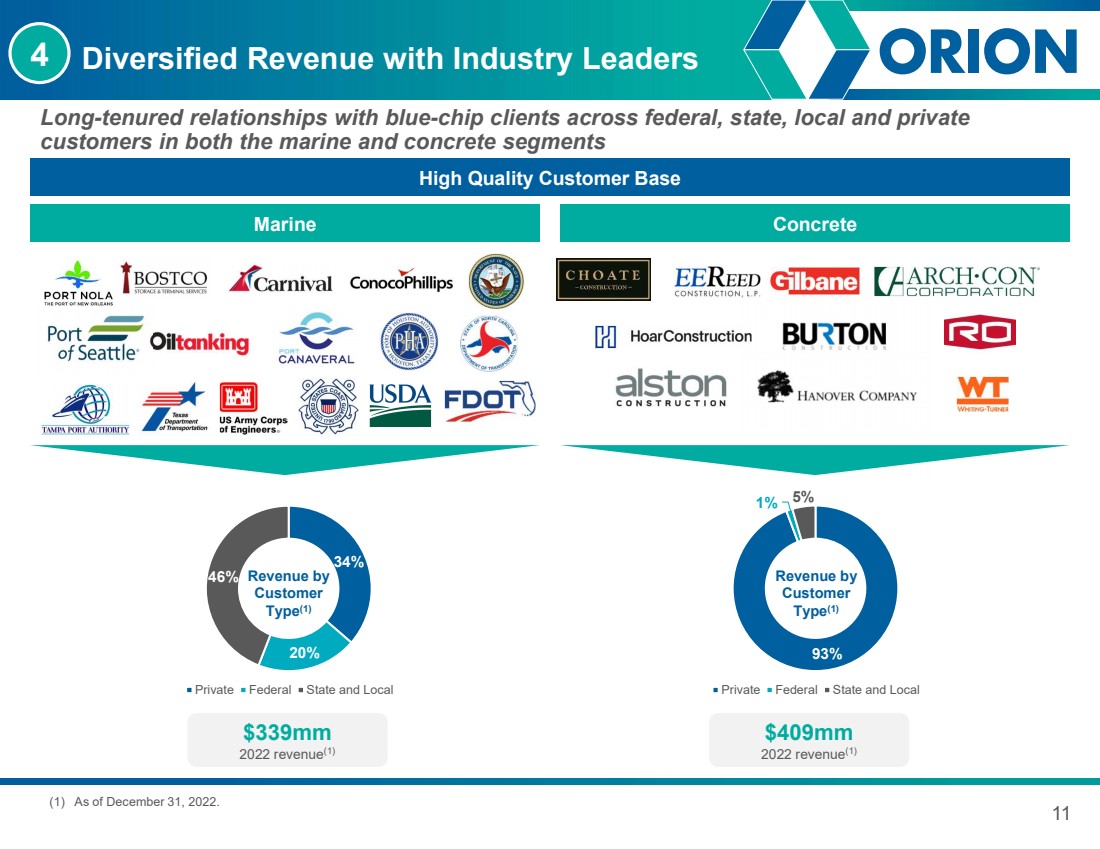
34% 20% 46% Private Federal State and Local 93% 1% 5% Private Federal State and Local 11 (1) As of December 31, 2022. $409mm 2022 revenue(1) Diversified Revenue with Industry Leaders Long-tenured relationships with blue-chip clients across federal, state, local and private customers in both the marine and concrete segments High Quality Customer Base $339mm 2022 revenue(1) Marine Concrete Revenue by Customer Type(1) Revenue by Customer Type(1) 4 |
|
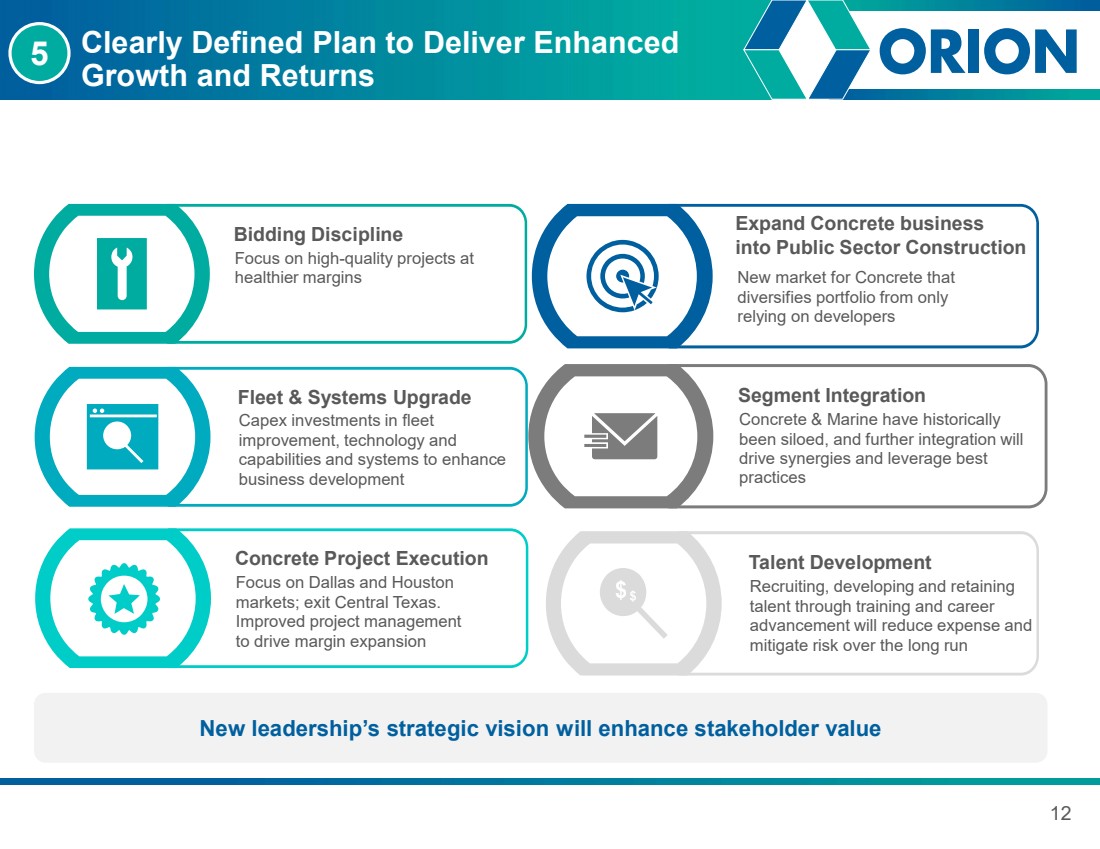
Focus on Dallas and Houston markets; exit Central Texas. Improved project management to drive margin expansion Concrete Project Execution Capex investments in fleet improvement, technology and capabilities and systems to enhance business development Fleet & Systems Upgrade Focus on high-quality projects at healthier margins Bidding Discipline 12 Clearly Defined Plan to Deliver Enhanced Growth and Returns Concrete & Marine have historically been siloed, and further integration will drive synergies and leverage best practices Segment Integration Recruiting, developing and retaining talent through training and career advancement will reduce expense and mitigate risk over the long run Talent Development New market for Concrete that diversifies portfolio from only relying on developers Expand Concrete business into Public Sector Construction New leadership’s strategic vision will enhance stakeholder value 5 |
|
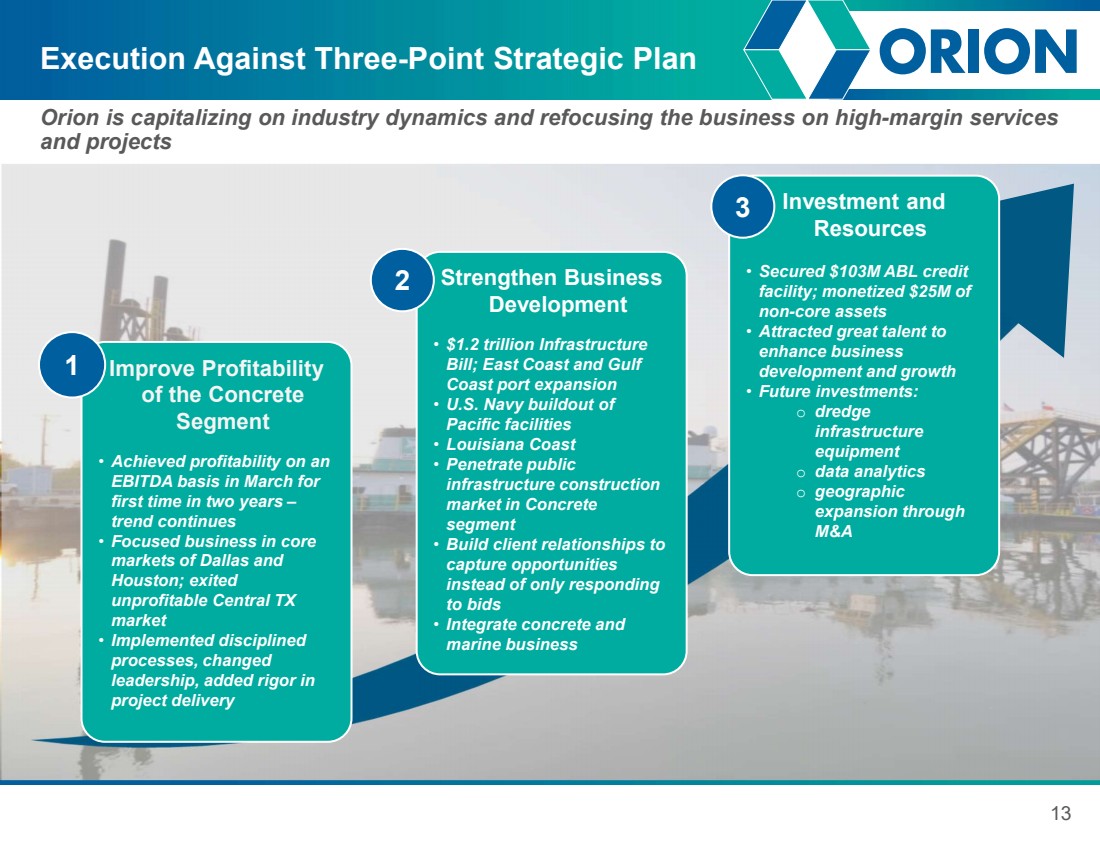
13 Execution Against Three-Point Strategic Plan Orion is capitalizing on industry dynamics and refocusing the business on high-margin services and projects Improve Profitability of the Concrete Segment • Achieved profitability on an EBITDA basis in March for first time in two years – trend continues • Focused business in core markets of Dallas and Houston; exited unprofitable Central TX market • Implemented disciplined processes, changed leadership, added rigor in project delivery 1 Strengthen Business Development • $1.2 trillion Infrastructure Bill; East Coast and Gulf Coast port expansion • U.S. Navy buildout of Pacific facilities • Louisiana Coast • Penetrate public infrastructure construction market in Concrete segment • Build client relationships to capture opportunities instead of only responding to bids • Integrate concrete and marine business 2 Investment and Resources • Secured $103M ABL credit facility; monetized $25M of non-core assets • Attracted great talent to enhance business development and growth • Future investments: o dredge infrastructure equipment o data analytics o geographic expansion through M&A 3 |
|
Financial Overview |
|
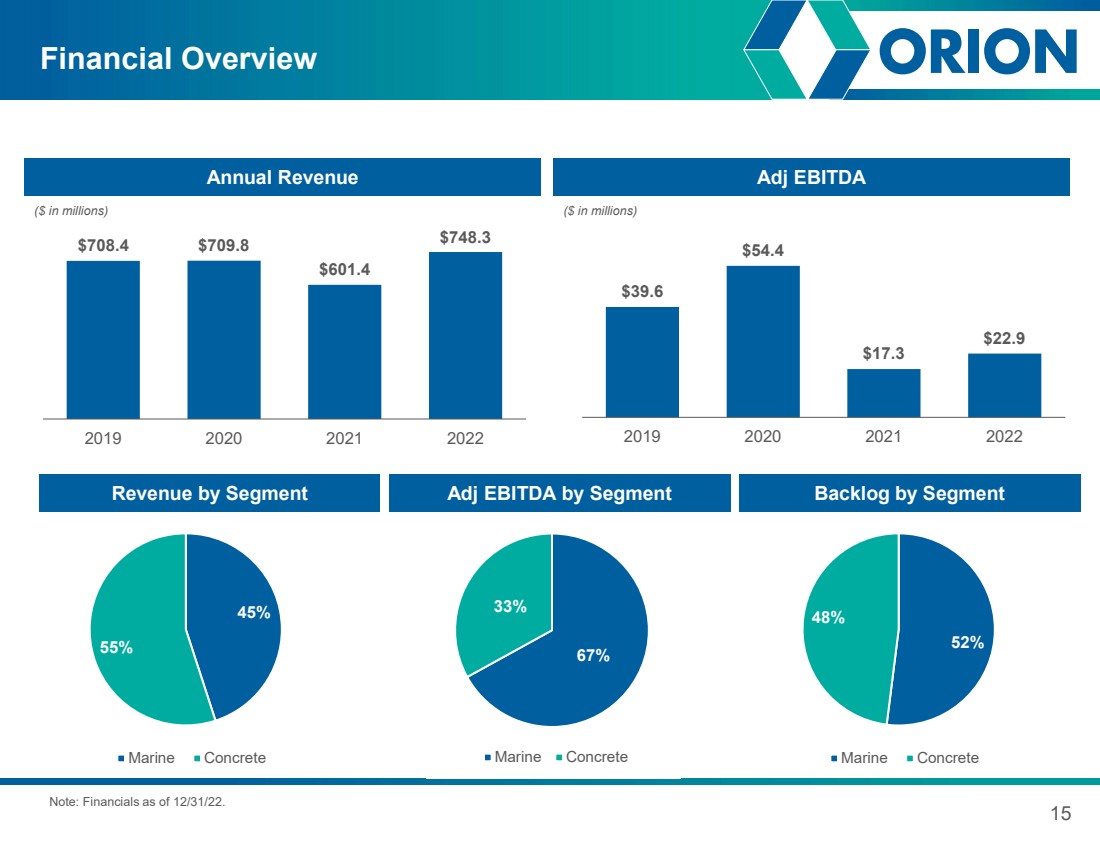
67% 33% Marine Concrete 15 Financial Overview Note: Financials as of 12/31/22. Revenue by Segment Adj EBITDA by Segment Backlog by Segment ($ in millions) Adj EBITDA ($ in millions) Annual Revenue $708.4 $709.8 $601.4 $748.3 2019 2020 2021 2022 $39.6 $54.4 $17.3 $22.9 2019 2020 2021 2022 45% 55% Marine Concrete 52% 48% Marine Concrete |
|
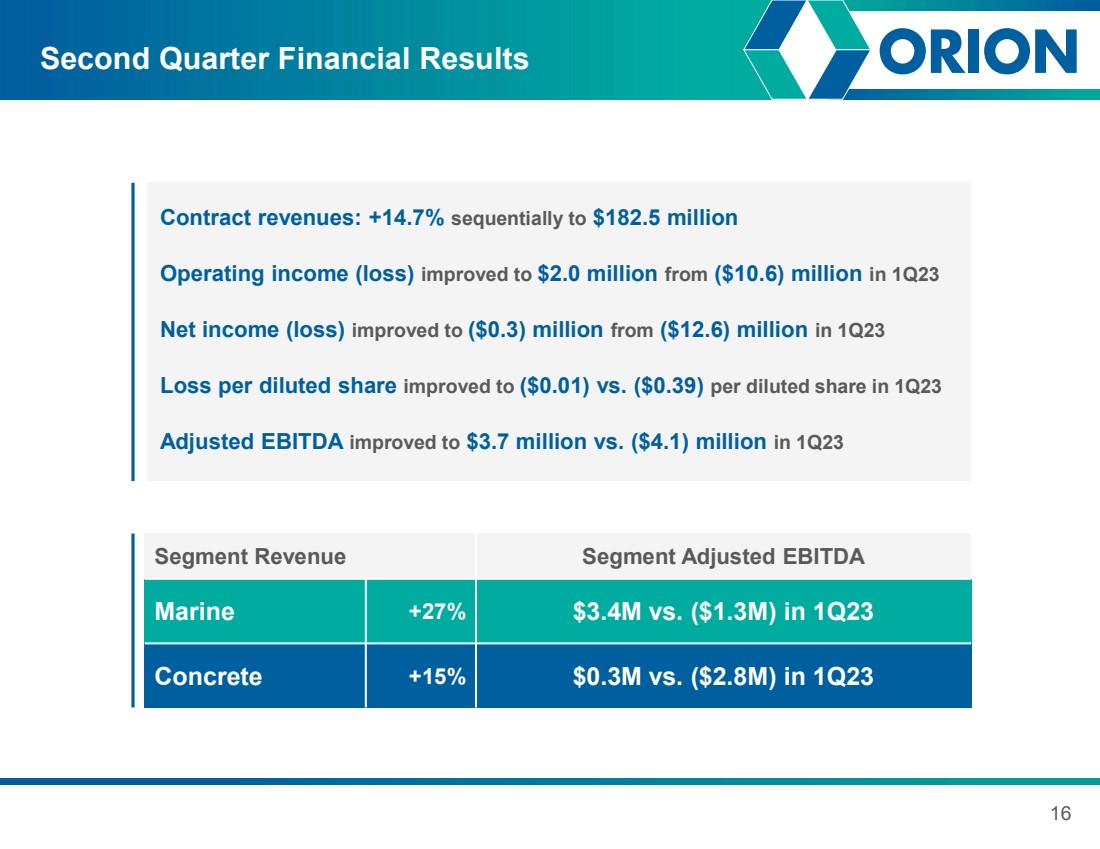
16 Second Quarter Financial Results Operating income (loss) improved to $2.0 million from ($10.6) million in 1Q23 Segment Revenue Segment Adjusted EBITDA Marine +27% $3.4M vs. ($1.3M) in 1Q23 Concrete +15% $0.3M vs. ($2.8M) in 1Q23 Contract revenues: +14.7% sequentially to $182.5 million Net income (loss) improved to ($0.3) million from ($12.6) million in 1Q23 Loss per diluted share improved to ($0.01) vs. ($0.39) per diluted share in 1Q23 Adjusted EBITDA improved to $3.7 million vs. ($4.1) million in 1Q23 |
|
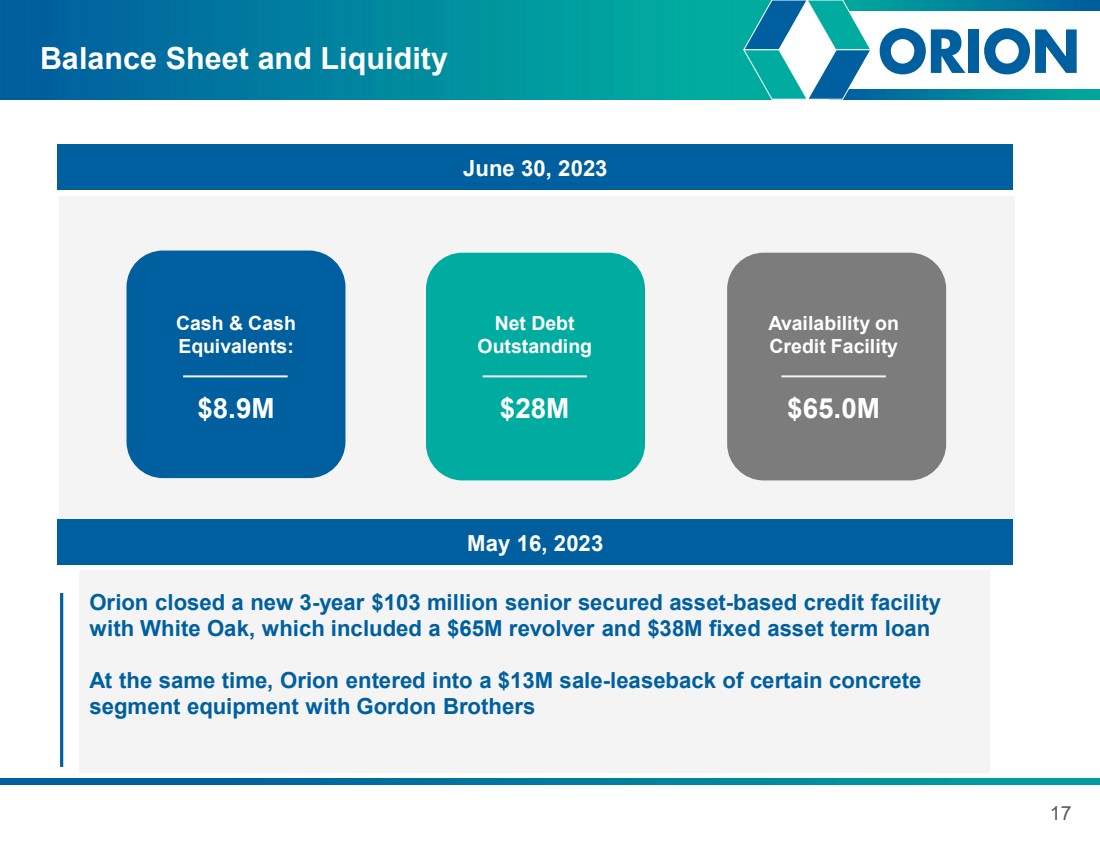
June 30, 2023 17 Balance Sheet and Liquidity Cash & Cash Equivalents: $8.9M Net Debt Outstanding $28M Availability on Credit Facility $65.0M Orion closed a new 3-year $103 million senior secured asset-based credit facility with White Oak, which included a $65M revolver and $38M fixed asset term loan At the same time, Orion entered into a $13M sale-leaseback of certain concrete segment equipment with Gordon Brothers May 16, 2023 |
|
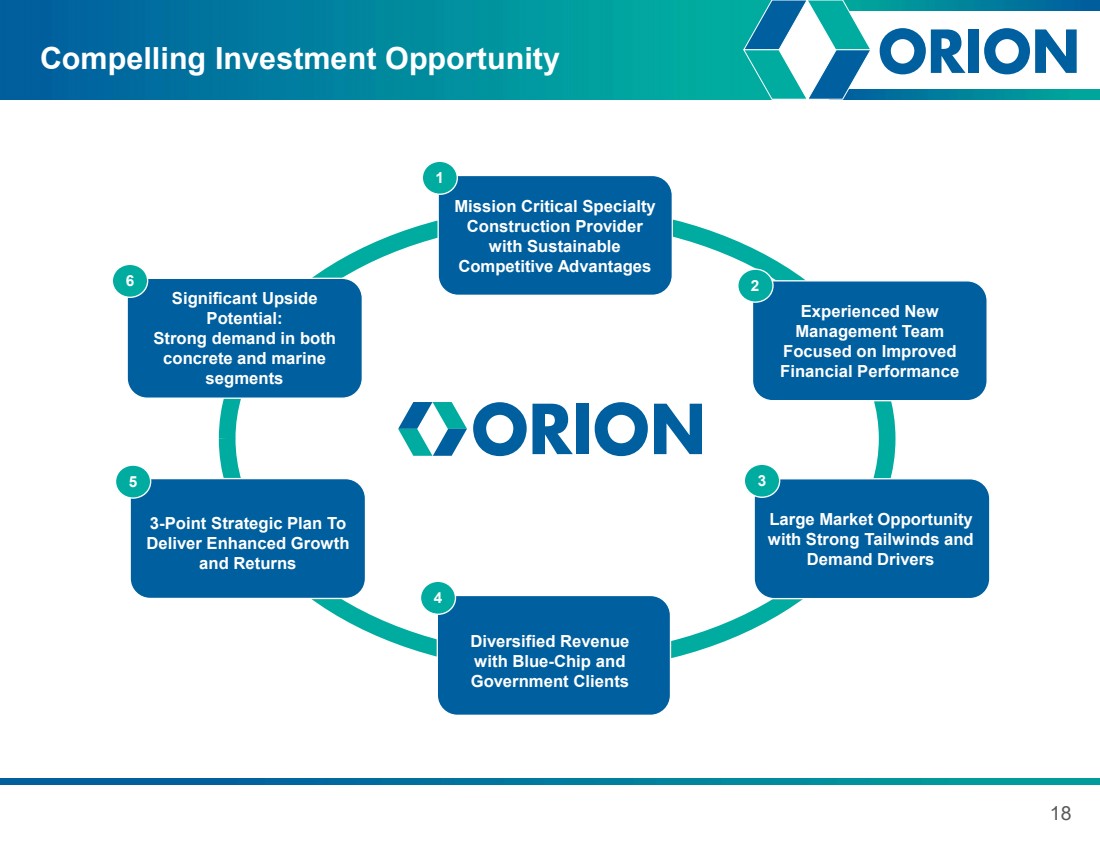
18 Compelling Investment Opportunity 5 4 3 Experienced New Management Team Focused on Improved Financial Performance 2 Mission Critical Specialty Construction Provider with Sustainable Competitive Advantages 1 Significant Upside Potential: Strong demand in both concrete and marine segments 6 3-Point Strategic Plan To Deliver Enhanced Growth and Returns Large Market Opportunity with Strong Tailwinds and Demand Drivers Diversified Revenue with Blue-Chip and Government Clients |
|
APPENDIX |
|
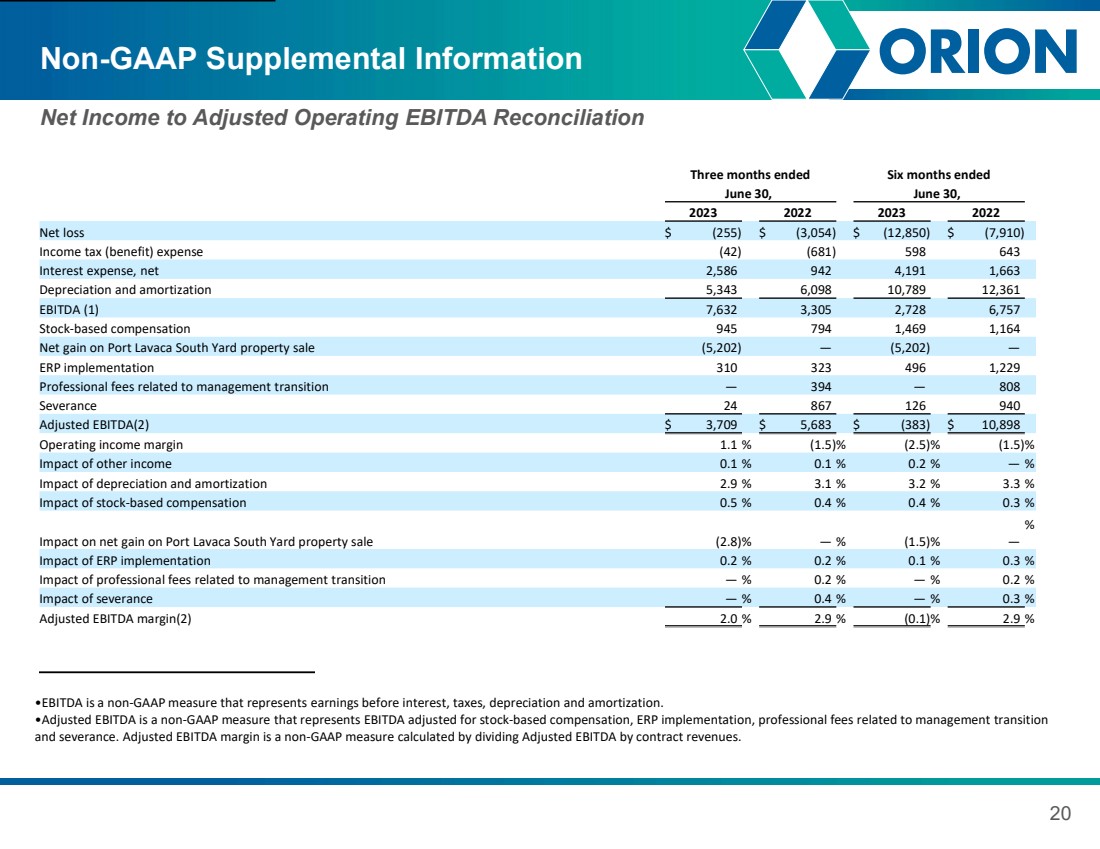
20 Non-GAAP Supplemental Information Net Income to Adjusted Operating EBITDA Reconciliation Three months ended Six months ended June 30, June 30, 2023 2022 2023 2022 Net loss $ (255) $ (3,054) $ (12,850) $ (7,910) Income tax (benefit) expense (42) (681) 598 643 Interest expense, net 2,586 942 4,191 1,663 Depreciation and amortization 5,343 6,098 10,789 12,361 EBITDA (1) 7,632 3,305 2,728 6,757 Stock-based compensation 945 794 1,469 1,164 Net gain on Port Lavaca South Yard property sale (5,202) — (5,202) — ERP implementation 310 323 496 1,229 Professional fees related to management transition — 394 — 808 Severance 24 867 126 940 Adjusted EBITDA(2) $ 3,709 $ 5,683 $ (383) $ 10,898 Operating income margin 1.1 % (1.5)% (2.5)% (1.5)% Impact of other income 0.1 % 0.1 % 0.2 % — % Impact of depreciation and amortization 2.9 % 3.1 % 3.2 % 3.3 % Impact of stock-based compensation 0.5 % 0.4 % 0.4 % 0.3 % Impact on net gain on Port Lavaca South Yard property sale (2.8)% — % (1.5)% — % Impact of ERP implementation 0.2 % 0.2 % 0.1 % 0.3 % Impact of professional fees related to management transition — % 0.2 % — % 0.2 % Impact of severance — % 0.4 % — % 0.3 % Adjusted EBITDA margin(2) 2.0 % 2.9 % (0.1)% 2.9 % •EBITDA is a non-GAAP measure that represents earnings before interest, taxes, depreciation and amortization. •Adjusted EBITDA is a non-GAAP measure that represents EBITDA adjusted for stock-based compensation, ERP implementation, professional fees related to management transition and severance. Adjusted EBITDA margin is a non-GAAP measure calculated by dividing Adjusted EBITDA by contract revenues. |