Q2 2026 Letter to Shareholders August 6, 2026 yelp-ir.com Q4 and Full Year 2024 Letter to Shareholder s EXHIBIT 99.2
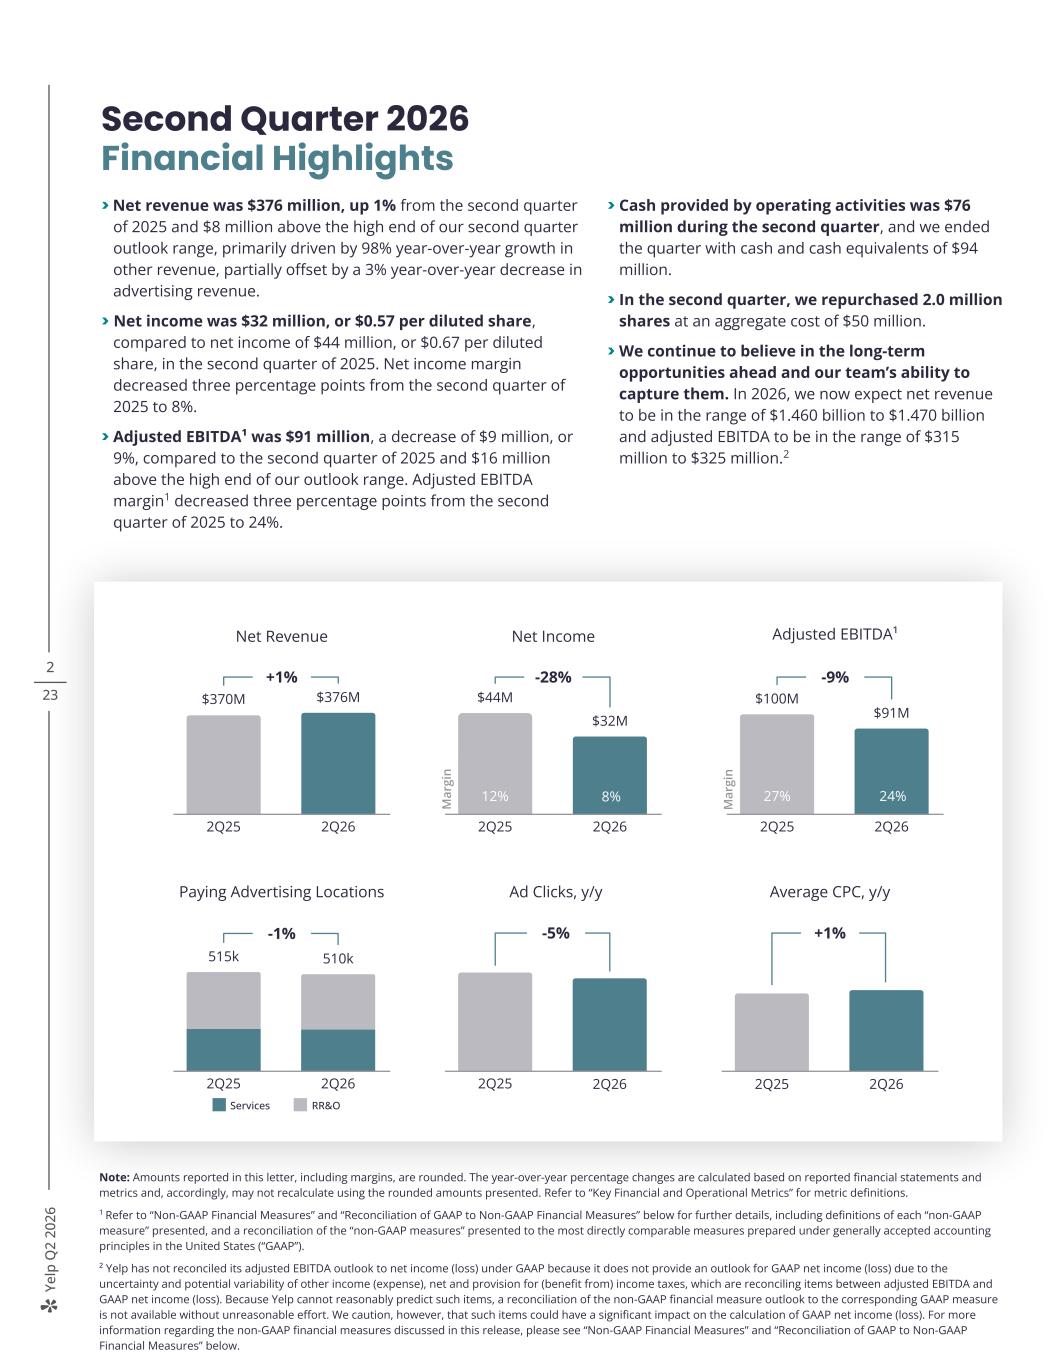
Ye lp Q 2 20 26 2 23 Note: Amounts reported in this letter, including margins, are rounded. The year-over-year percentage changes are calculated based on reported financial statements and metrics and, accordingly, may not recalculate using the rounded amounts presented. Refer to “Key Financial and Operational Metrics” for metric definitions. 1 Refer to “Non-GAAP Financial Measures” and “Reconciliation of GAAP to Non-GAAP Financial Measures” below for further details, including definitions of each “non-GAAP measure” presented, and a reconciliation of the “non-GAAP measures” presented to the most directly comparable measures prepared under generally accepted accounting principles in the United States (“GAAP”). ² Yelp has not reconciled its adjusted EBITDA outlook to net income (loss) under GAAP because it does not provide an outlook for GAAP net income (loss) due to the uncertainty and potential variability of other income (expense), net and provision for (benefit from) income taxes, which are reconciling items between adjusted EBITDA and GAAP net income (loss). Because Yelp cannot reasonably predict such items, a reconciliation of the non-GAAP financial measure outlook to the corresponding GAAP measure is not available without unreasonable effort. We caution, however, that such items could have a significant impact on the calculation of GAAP net income (loss). For more information regarding the non-GAAP financial measures discussed in this release, please see “Non-GAAP Financial Measures” and “Reconciliation of GAAP to Non-GAAP Financial Measures” below. Second Quarter 2026 Financial Highlights > Net revenue was $376 million, up 1% from the second quarter of 2025 and $8 million above the high end of our second quarter outlook range, primarily driven by 98% year-over-year growth in other revenue, partially offset by a 3% year-over-year decrease in advertising revenue. > Net income was $32 million, or $0.57 per diluted share, compared to net income of $44 million, or $0.67 per diluted share, in the second quarter of 2025. Net income margin decreased three percentage points from the second quarter of 2025 to 8%. > Adjusted EBITDA¹ was $91 million, a decrease of $9 million, or 9%, compared to the second quarter of 2025 and $16 million above the high end of our outlook range. Adjusted EBITDA margin1 decreased three percentage points from the second quarter of 2025 to 24%. > Cash provided by operating activities was $76 million during the second quarter, and we ended the quarter with cash and cash equivalents of $94 million. > In the second quarter, we repurchased 2.0 million shares at an aggregate cost of $50 million. > We continue to believe in the long-term opportunities ahead and our team’s ability to capture them. In 2026, we now expect net revenue to be in the range of $1.460 billion to $1.470 billion and adjusted EBITDA to be in the range of $315 million to $325 million.2 19% 17% Net Revenue +1% $370M $376M 2Q25 2Q26 Average CPC, y/y +1% 2Q25 2Q26 Paying Advertising Locations -1% 515k 510k 2Q25 2Q26 Services RR&O Adjusted EBITDA¹ -9% $100M $91M 2Q25 2Q26 M ar gi n 27% 24%8% 7% M ar gi n Net Income -28% $44M $32M 2Q25 2Q26 812% Ad Clicks, y/y -5% 2Q25 2Q26
Ye lp Q 2 20 26 3 23 Dear fellow shareholders, Yelp continued to advance its AI transformation in the second quarter, as our team made local discovery more conversational, delivered tools to help businesses succeed, and expanded the reach of our trusted content through new partnerships. We are pleased by the progress of our initiatives and the meaningful signs of improvement that emerged across several key metrics. At the same time, consumers and local businesses continued to face a challenging economic environment. Yelp delivered modest revenue growth in the second quarter, with broad strength in other revenue offsetting softness in advertising revenue. While we anticipate these economic headwinds will persist into the second half of the year, we are encouraged by recent operational trends on Yelp and remain confident that our strategic initiatives will continue to transform Yelp and position us to drive long-term profitable growth. +2 ppt 3% 4% 2Q22 2Q23 Net Income Margin
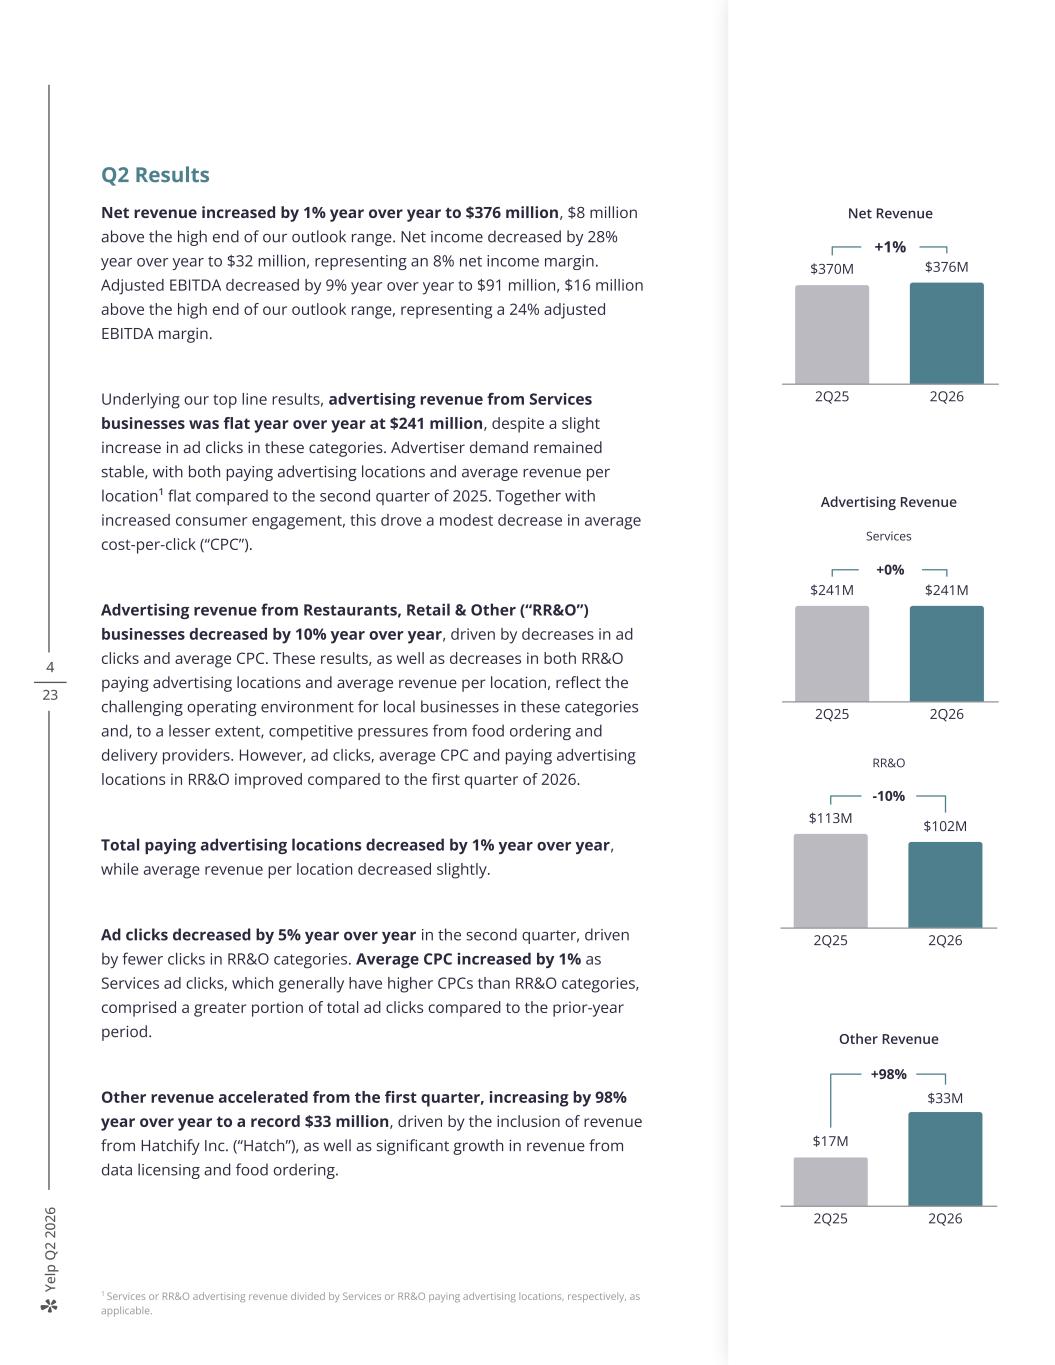
Ye lp Q 2 20 26 4 23 Q2 Results Net revenue increased by 1% year over year to $376 million, $8 million above the high end of our outlook range. Net income decreased by 28% year over year to $32 million, representing an 8% net income margin. Adjusted EBITDA decreased by 9% year over year to $91 million, $16 million above the high end of our outlook range, representing a 24% adjusted EBITDA margin. Underlying our top line results, advertising revenue from Services businesses was flat year over year at $241 million, despite a slight increase in ad clicks in these categories. Advertiser demand remained stable, with both paying advertising locations and average revenue per location¹ flat compared to the second quarter of 2025. Together with increased consumer engagement, this drove a modest decrease in average cost-per-click (“CPC”). Advertising revenue from Restaurants, Retail & Other (“RR&O”) businesses decreased by 10% year over year, driven by decreases in ad clicks and average CPC. These results, as well as decreases in both RR&O paying advertising locations and average revenue per location, reflect the challenging operating environment for local businesses in these categories and, to a lesser extent, competitive pressures from food ordering and delivery providers. However, ad clicks, average CPC and paying advertising locations in RR&O improved compared to the first quarter of 2026. Total paying advertising locations decreased by 1% year over year, while average revenue per location decreased slightly. Ad clicks decreased by 5% year over year in the second quarter, driven by fewer clicks in RR&O categories. Average CPC increased by 1% as Services ad clicks, which generally have higher CPCs than RR&O categories, comprised a greater portion of total ad clicks compared to the prior-year period. Other revenue accelerated from the first quarter, increasing by 98% year over year to a record $33 million, driven by the inclusion of revenue from Hatchify Inc. (“Hatch”), as well as significant growth in revenue from data licensing and food ordering. 1 Services or RR&O advertising revenue divided by Services or RR&O paying advertising locations, respectively, as applicable. +0% $241M $241M 2Q25 2Q26 Advertising Revenue Services -10% $113M $102M 2Q25 2Q26 RR&O +98% $17M $33M 2Q25 2Q26 Other Revenue Net Revenue +1% $370M $376M 2Q25 2Q26
Ye lp Q 2 20 26 5 23 Initiatives to drive long-term, profitable growth In 2026, we are continuing to invest in Yelp’s AI transformation, guided by three areas of strategic focus designed to deliver growth through product innovation: > Reconceive Yelp around answers and actions > Deliver AI tools that help service pros and other local businesses grow, operate and succeed > Extend our reach to power local discovery across the AI ecosystem Through these strategic initiatives, we are transforming key parts of Yelp: the experience, the technology, and the value we provide to consumers and businesses. Our updated review submission flow enables users to post high-resolution videos AI-powered review topics suggest helpful items for contributors to cover when writing a review Depictions of Yelp's features are provided for illustrative purposes only, and may differ from the actual product. I was just blown away by people having these conversations with the AI. It's the voice, the inflection, the way Yelp Host can build on the information and extrapolate and can speak words you never typed into the backend. We've had guests walk up to us in the restaurant and compliment us on it. - John Garbiel, Owner, Metropolitan Diner
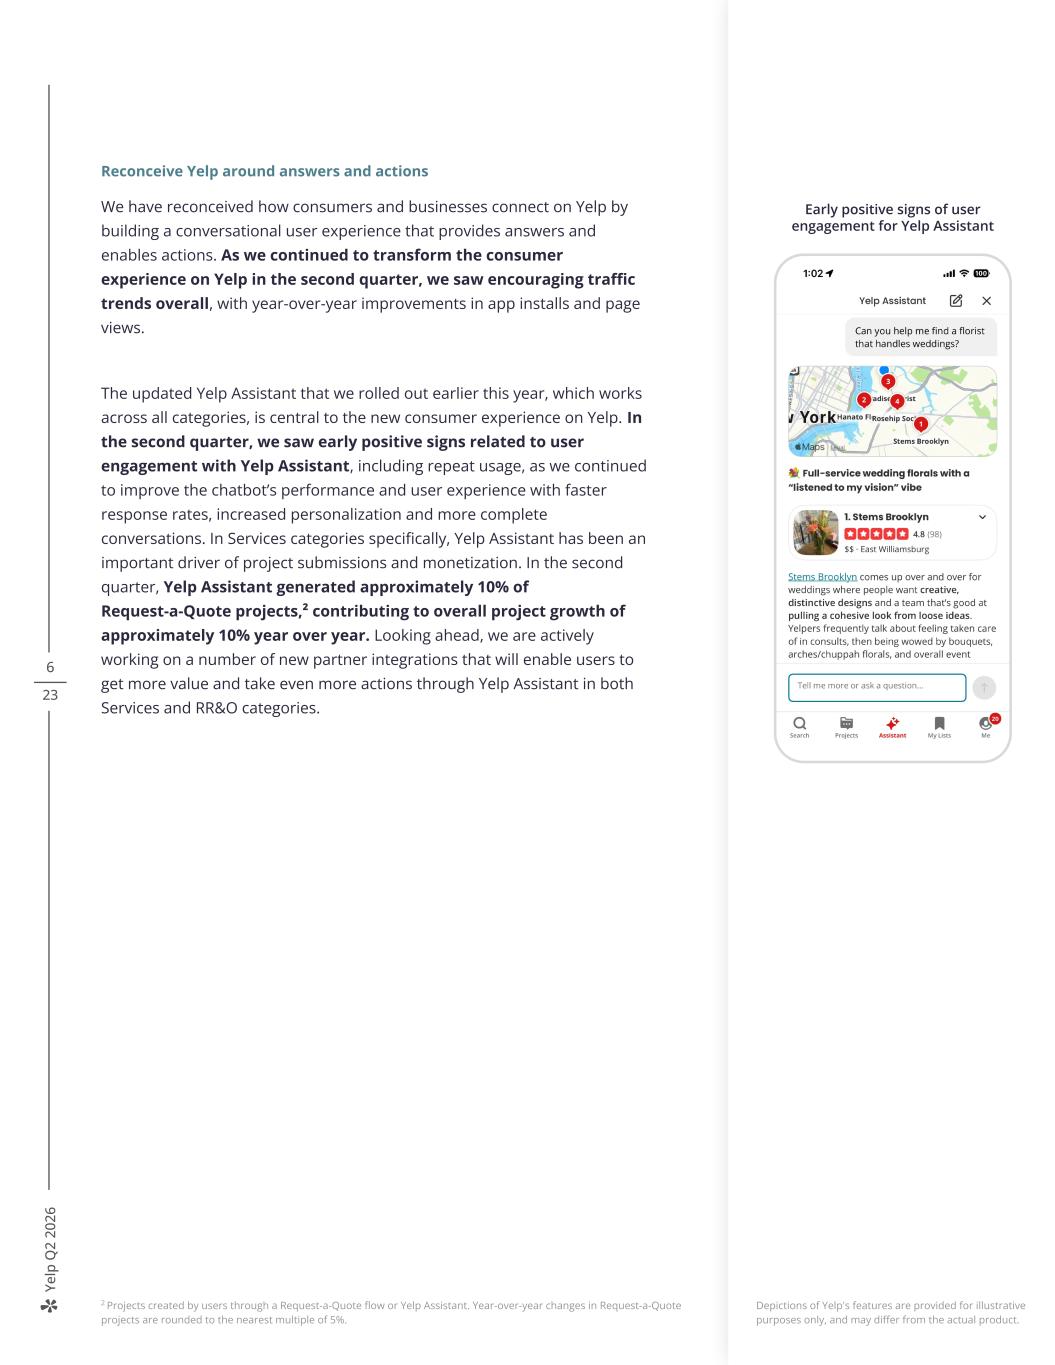
Ye lp Q 2 20 26 6 23 Reconceive Yelp around answers and actions We have reconceived how consumers and businesses connect on Yelp by building a conversational user experience that provides answers and enables actions. As we continued to transform the consumer experience on Yelp in the second quarter, we saw encouraging traffic trends overall, with year-over-year improvements in app installs and page views. The updated Yelp Assistant that we rolled out earlier this year, which works across all categories, is central to the new consumer experience on Yelp. In the second quarter, we saw early positive signs related to user engagement with Yelp Assistant, including repeat usage, as we continued to improve the chatbot’s performance and user experience with faster response rates, increased personalization and more complete conversations. In Services categories specifically, Yelp Assistant has been an important driver of project submissions and monetization. In the second quarter, Yelp Assistant generated approximately 10% of Request-a-Quote projects,² contributing to overall project growth of approximately 10% year over year. Looking ahead, we are actively working on a number of new partner integrations that will enable users to get more value and take even more actions through Yelp Assistant in both Services and RR&O categories. Depictions of Yelp's features are provided for illustrative purposes only, and may differ from the actual product. The new Yelp Assistant supports local discovery across every category on Yelp 2 Projects created by users through a Request-a-Quote flow or Yelp Assistant. Year-over-year changes in Request-a-Quote projects are rounded to the nearest multiple of 5%. Early positive signs of user engagement for Yelp Assistant
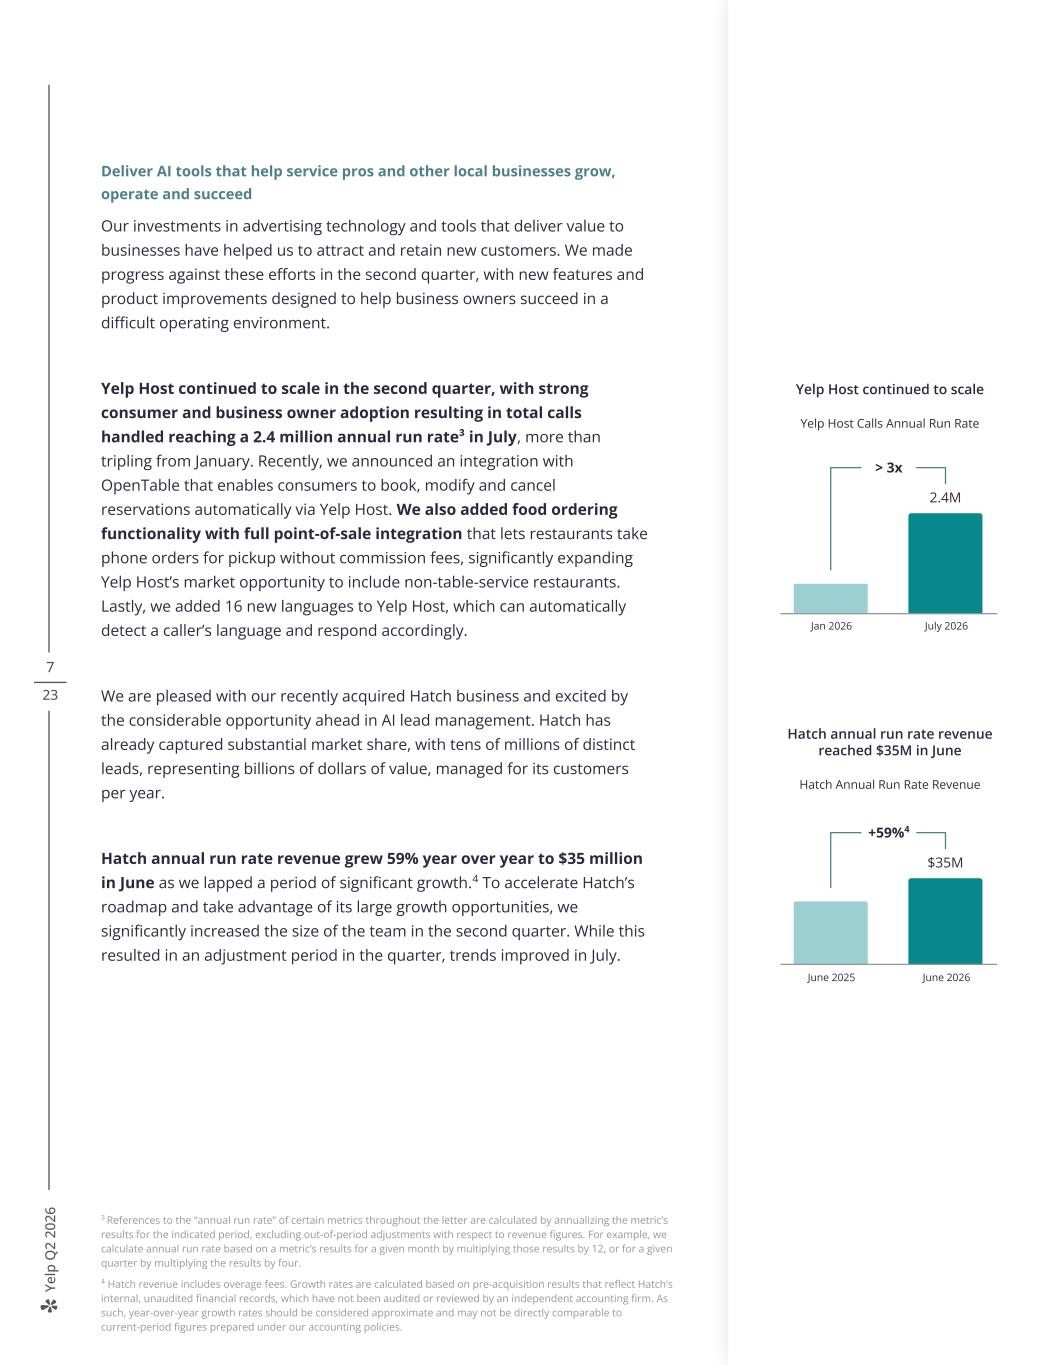
Ye lp Q 2 20 26 7 23 Deliver AI tools that help service pros and other local businesses grow, operate and succeed Our investments in advertising technology and tools that deliver value to businesses have helped us to attract and retain new customers. We made progress against these efforts in the second quarter, with new features and product improvements designed to help business owners succeed in a difficult operating environment. Yelp Host continued to scale in the second quarter, with strong consumer and business owner adoption resulting in total calls handled reaching a 2.4 million annual run rate³ in July, more than tripling from January. Recently, we announced an integration with OpenTable that enables consumers to book, modify and cancel reservations automatically via Yelp Host. We also added food ordering functionality with full point-of-sale integration that lets restaurants take phone orders for pickup without commission fees, significantly expanding Yelp Host’s market opportunity to include non-table-service restaurants. Lastly, we added 16 new languages to Yelp Host, which can automatically detect a caller’s language and respond accordingly. We are pleased with our recently acquired Hatch business and excited by the considerable opportunity ahead in AI lead management. Hatch has already captured substantial market share, with tens of millions of distinct leads, representing billions of dollars of value, managed for its customers per year. Hatch annual run rate revenue grew 59% year over year to $35 million in June as we lapped a period of significant growth.4 To accelerate Hatch’s roadmap and take advantage of its large growth opportunities, we significantly increased the size of the team in the second quarter. While this resulted in an adjustment period in the quarter, trends improved in July. Hatch annual run rate revenue reached $35M in June Hatch Annual Run Rate Revenue 3 References to the “annual run rate” of certain metrics throughout the letter are calculated by annualizing the metric’s results for the indicated period, excluding out-of-period adjustments with respect to revenue figures. For example, we calculate annual run rate based on a metric’s results for a given month by multiplying those results by 12, or for a given quarter by multiplying the results by four. 4 Hatch revenue includes overage fees. Growth rates are calculated based on pre-acquisition results that reflect Hatch’s internal, unaudited financial records, which have not been audited or reviewed by an independent accounting firm. As such, year-over-year growth rates should be considered approximate and may not be directly comparable to current-period figures prepared under our accounting policies. +59%4 $35M June 2025 June 2026 Yelp Host continued to scale Yelp Host Calls Annual Run Rate > 3x 2.4M Jan 2026 July 2026
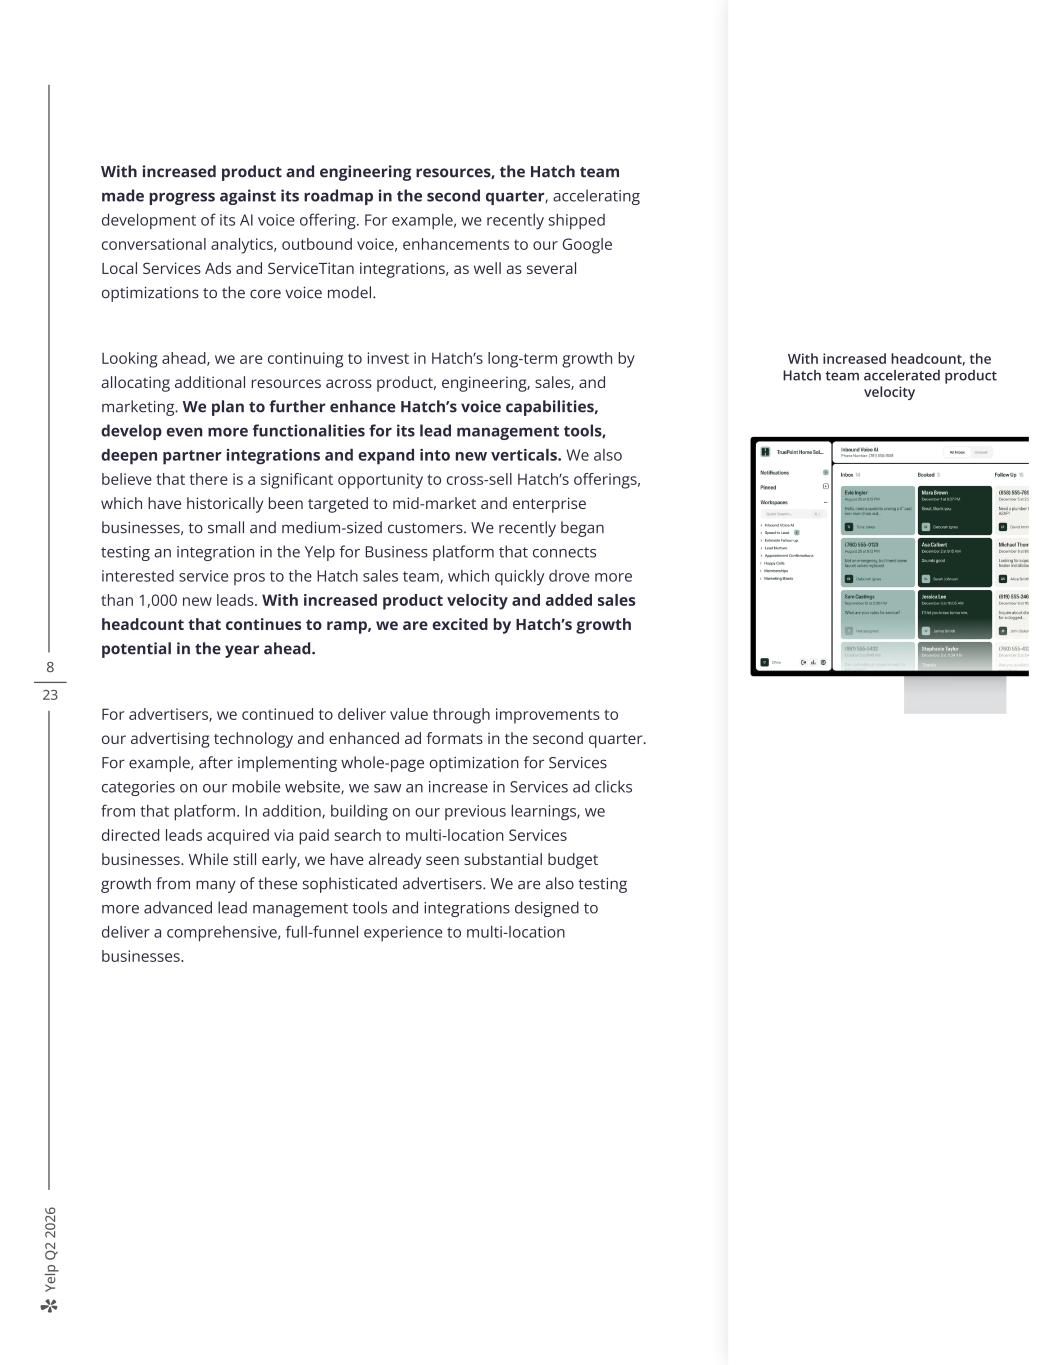
Ye lp Q 2 20 26 8 23 With increased product and engineering resources, the Hatch team made progress against its roadmap in the second quarter, accelerating development of its AI voice offering. For example, we recently shipped conversational analytics, outbound voice, enhancements to our Google Local Services Ads and ServiceTitan integrations, as well as several optimizations to the core voice model. Looking ahead, we are continuing to invest in Hatch’s long-term growth by allocating additional resources across product, engineering, sales, and marketing. We plan to further enhance Hatch’s voice capabilities, develop even more functionalities for its lead management tools, deepen partner integrations and expand into new verticals. We also believe that there is a significant opportunity to cross-sell Hatch’s offerings, which have historically been targeted to mid-market and enterprise businesses, to small and medium-sized customers. We recently began testing an integration in the Yelp for Business platform that connects interested service pros to the Hatch sales team, which quickly drove more than 1,000 new leads. With increased product velocity and added sales headcount that continues to ramp, we are excited by Hatch’s growth potential in the year ahead. For advertisers, we continued to deliver value through improvements to our advertising technology and enhanced ad formats in the second quarter. For example, after implementing whole-page optimization for Services categories on our mobile website, we saw an increase in Services ad clicks from that platform. In addition, building on our previous learnings, we directed leads acquired via paid search to multi-location Services businesses. While still early, we have already seen substantial budget growth from many of these sophisticated advertisers. We are also testing more advanced lead management tools and integrations designed to deliver a comprehensive, full-funnel experience to multi-location businesses. We began testing an integration with Yelp for Business to drive interested Service pros to the Hatch sales team With increased headcount, the Hatch team accelerated product velocity
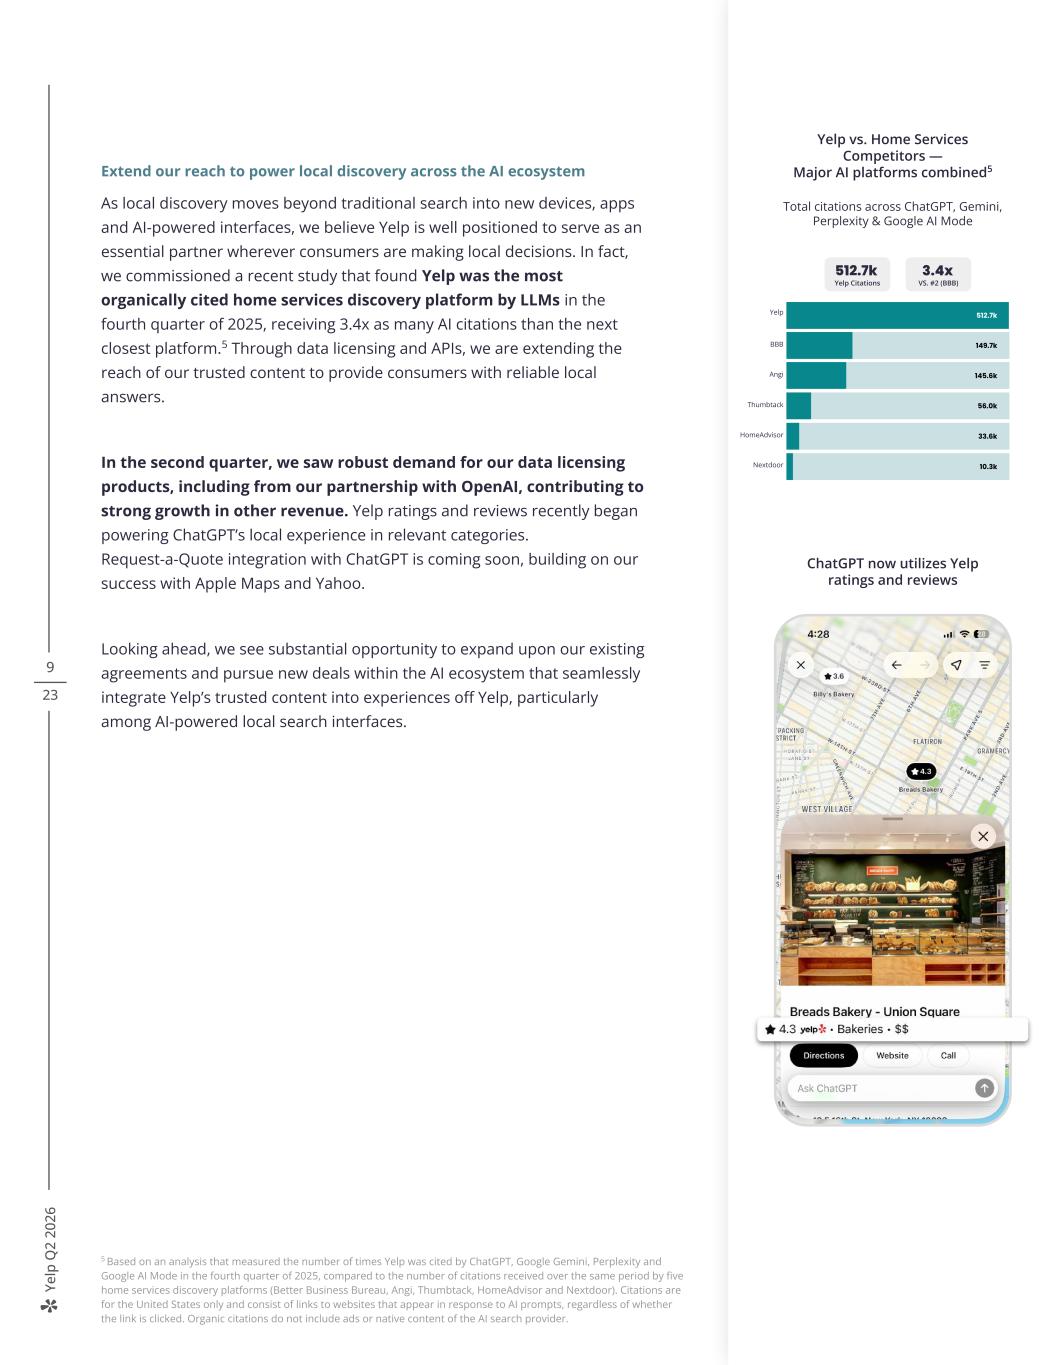
Ye lp Q 2 20 26 9 23 Extend our reach to power local discovery across the AI ecosystem As local discovery moves beyond traditional search into new devices, apps and AI-powered interfaces, we believe Yelp is well positioned to serve as an essential partner wherever consumers are making local decisions. In fact, we commissioned a recent study that found Yelp was the most organically cited home services discovery platform by LLMs in the fourth quarter of 2025, receiving 3.4x as many AI citations than the next closest platform.5 Through data licensing and APIs, we are extending the reach of our trusted content to provide consumers with reliable local answers. In the second quarter, we saw robust demand for our data licensing products, including from our partnership with OpenAI, contributing to strong growth in other revenue. Yelp ratings and reviews recently began powering ChatGPT’s local experience in relevant categories. Request-a-Quote integration with ChatGPT is coming soon, building on our success with Apple Maps and Yahoo. Looking ahead, we see substantial opportunity to expand upon our existing agreements and pursue new deals within the AI ecosystem that seamlessly integrate Yelp’s trusted content into experiences off Yelp, particularly among AI-powered local search interfaces. Yelp BBB Angi Thumbtack HomeAdvisor Nextdoor 512.7k 149.7k 145.6k 56.0k 33.6k 10.3k 512.7k Yelp Citations 3.4x VS. #2 (BBB) ChatGPT now utilizes Yelp ratings and reviews 5 Based on an analysis that measured the number of times Yelp was cited by ChatGPT, Google Gemini, Perplexity and Google AI Mode in the fourth quarter of 2025, compared to the number of citations received over the same period by five home services discovery platforms (Better Business Bureau, Angi, Thumbtack, HomeAdvisor and Nextdoor). Citations are for the United States only and consist of links to websites that appear in response to AI prompts, regardless of whether the link is clicked. Organic citations do not include ads or native content of the AI search provider. Yelp vs. Home Services Competitors — Major AI platforms combined5 Total citations across ChatGPT, Gemini, Perplexity & Google AI Mode
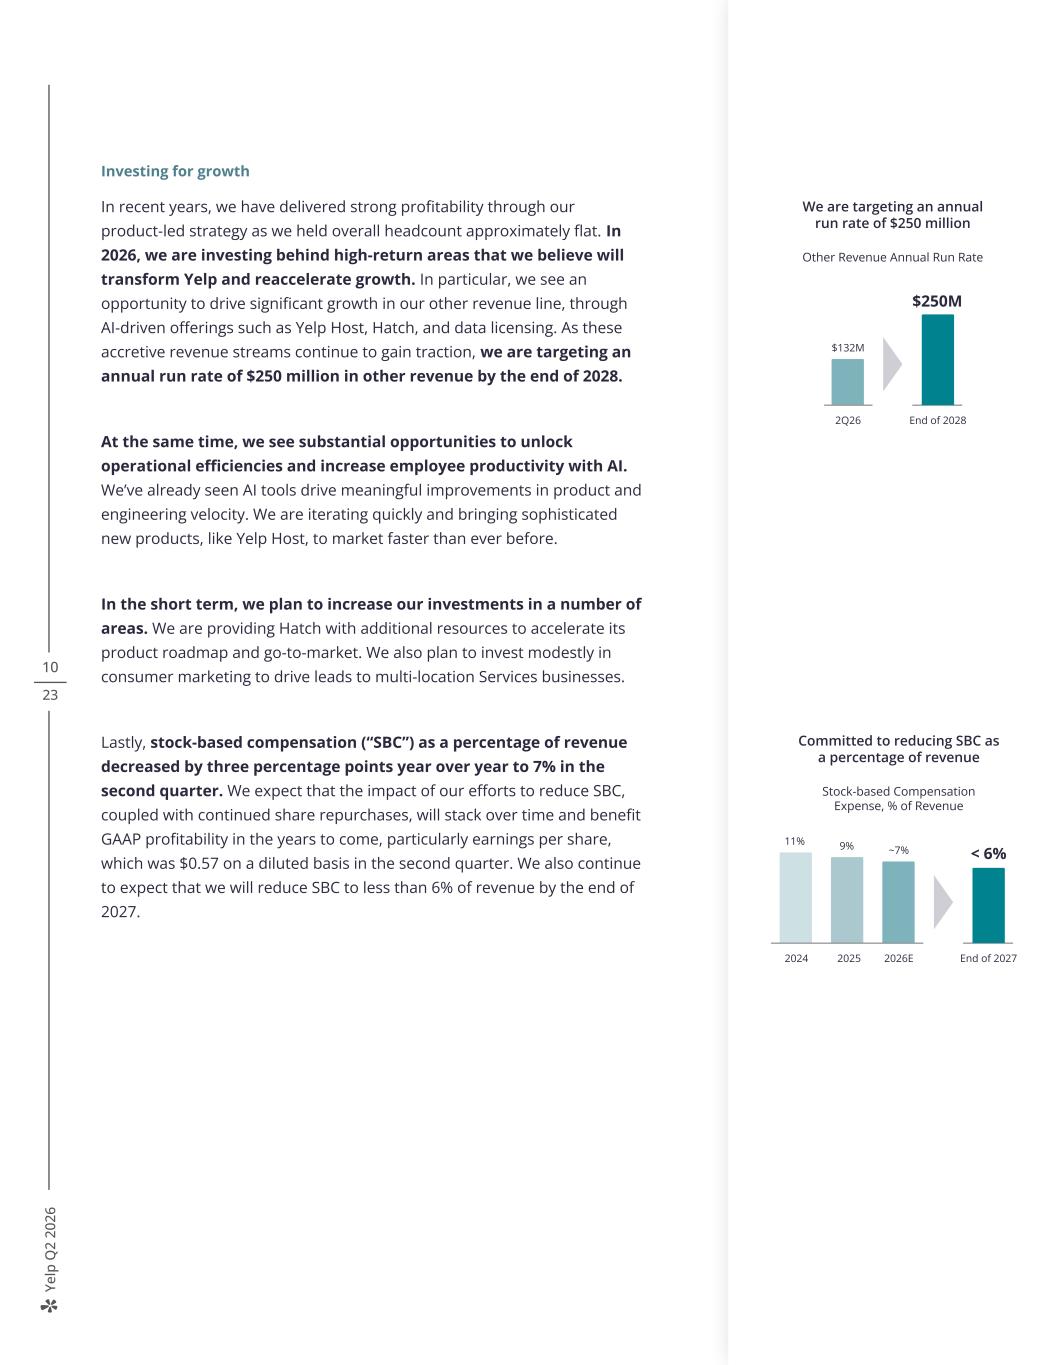
Ye lp Q 2 20 26 10 23 Investing for growth In recent years, we have delivered strong profitability through our product-led strategy as we held overall headcount approximately flat. In 2026, we are investing behind high-return areas that we believe will transform Yelp and reaccelerate growth. In particular, we see an opportunity to drive significant growth in our other revenue line, through AI-driven offerings such as Yelp Host, Hatch, and data licensing. As these accretive revenue streams continue to gain traction, we are targeting an annual run rate of $250 million in other revenue by the end of 2028. At the same time, we see substantial opportunities to unlock operational efficiencies and increase employee productivity with AI. We’ve already seen AI tools drive meaningful improvements in product and engineering velocity. We are iterating quickly and bringing sophisticated new products, like Yelp Host, to market faster than ever before. In the short term, we plan to increase our investments in a number of areas. We are providing Hatch with additional resources to accelerate its product roadmap and go-to-market. We also plan to invest modestly in consumer marketing to drive leads to multi-location Services businesses. Lastly, stock-based compensation (“SBC”) as a percentage of revenue decreased by three percentage points year over year to 7% in the second quarter. We expect that the impact of our efforts to reduce SBC, coupled with continued share repurchases, will stack over time and benefit GAAP profitability in the years to come, particularly earnings per share, which was $0.57 on a diluted basis in the second quarter. We also continue to expect that we will reduce SBC to less than 6% of revenue by the end of 2027. 2026E End of 2027 Committed to reducing SBC as a percentage of revenue Stock-based Compensation Expense, % of Revenue 11% 9% 2024 2025 < 6%~7% $132M 2Q26 End of 2028 We are targeting an annual run rate of $250 million Other Revenue Annual Run Rate $250M
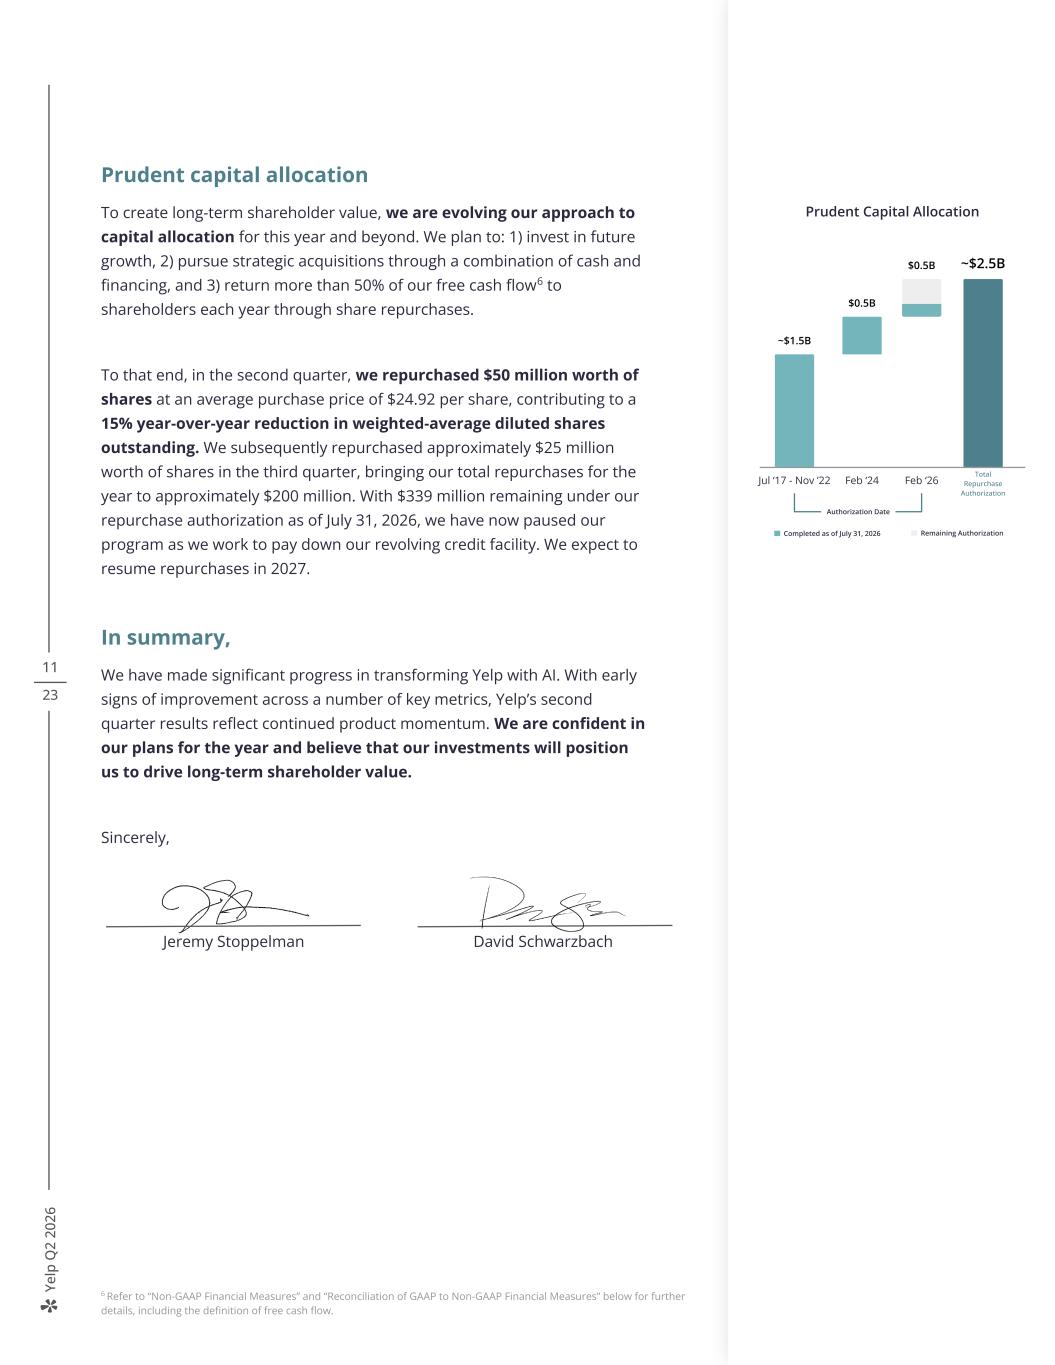
Ye lp Q 2 20 26 11 23 Prudent capital allocation To create long-term shareholder value, we are evolving our approach to capital allocation for this year and beyond. We plan to: 1) invest in future growth, 2) pursue strategic acquisitions through a combination of cash and financing, and 3) return more than 50% of our free cash flow6 to shareholders each year through share repurchases. To that end, in the second quarter, we repurchased $50 million worth of shares at an average purchase price of $24.92 per share, contributing to a 15% year-over-year reduction in weighted-average diluted shares outstanding. We subsequently repurchased approximately $25 million worth of shares in the third quarter, bringing our total repurchases for the year to approximately $200 million. With $339 million remaining under our repurchase authorization as of July 31, 2026, we have now paused our program as we work to pay down our revolving credit facility. We expect to resume repurchases in 2027. In summary, We have made significant progress in transforming Yelp with AI. With early signs of improvement across a number of key metrics, Yelp’s second quarter results reflect continued product momentum. We are confident in our plans for the year and believe that our investments will position us to drive long-term shareholder value. Sincerely, Total Repurchase Authorization Authorization Date Prudent Capital Allocation $2.0B Completed as of June 30, 2024 Remaining Authorization $200M $250M $250M $250M $250M $250M Nov ‘22Jul ‘17 Nov ‘18 Feb ‘19 Jan ‘20 Aug ‘21 Feb ‘24 $500M Jeremy Stoppelman David Schwarzbach Total Repurchase Authorization Jul ‘17 - Nov ’22 Feb ‘24 Feb ‘26 ~$2.5B$0.5B $0.5B ~$1.5B Prudent Capital Allocation Authorization Date Completed as of July 31, 2026 Remaining Authorization 6 Refer to “Non-GAAP Financial Measures” and “Reconciliation of GAAP to Non-GAAP Financial Measures” below for further details, including the definition of free cash flow.
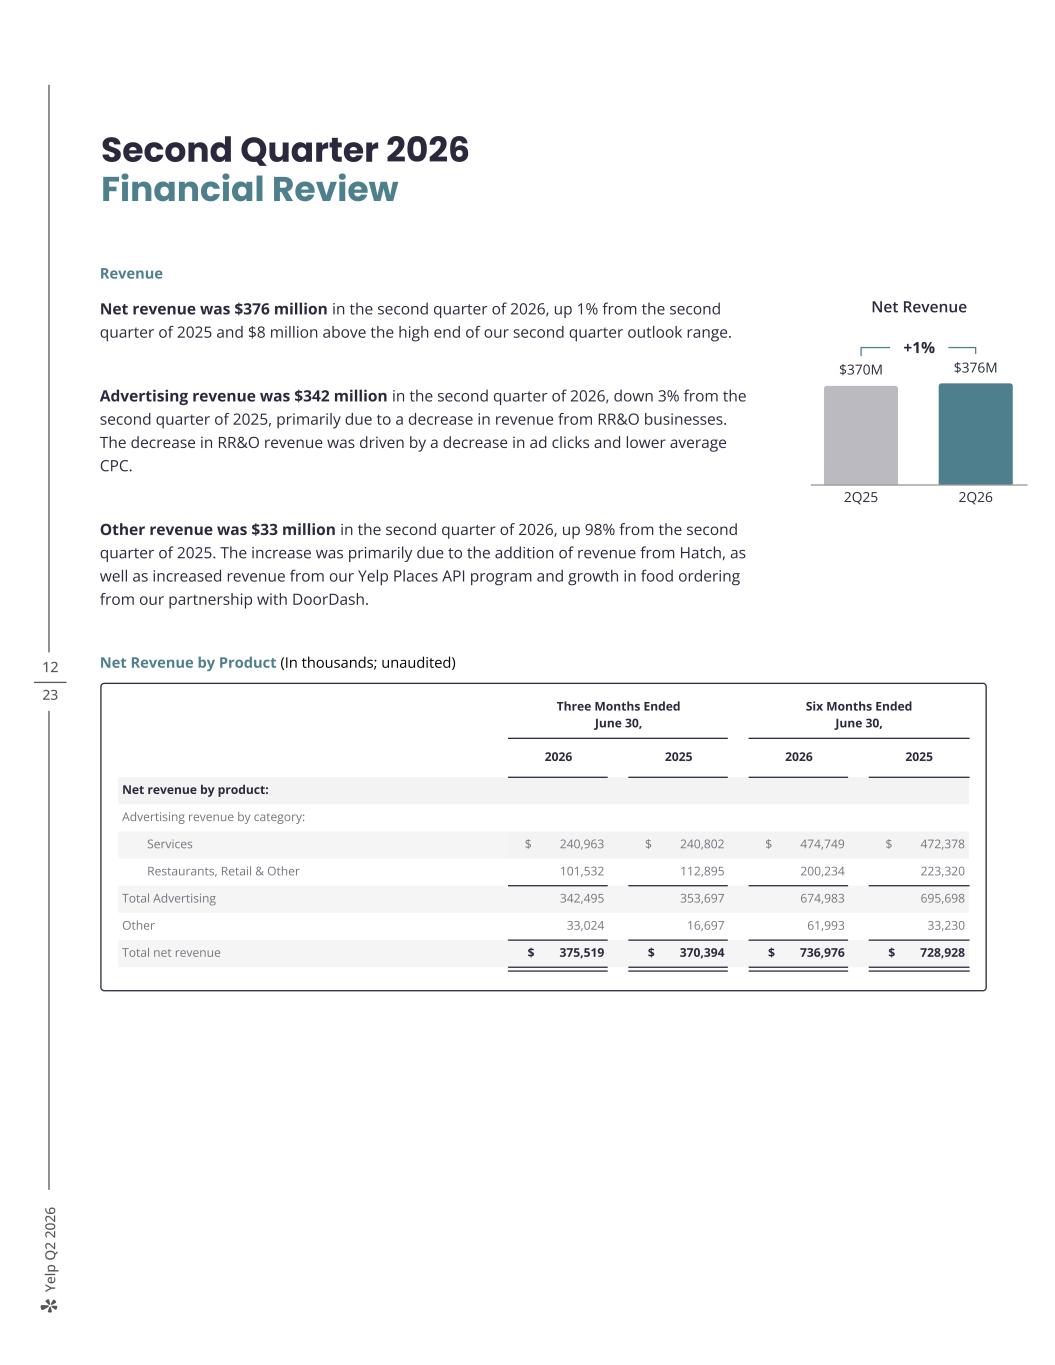
Ye lp Q 2 20 26 12 23 Revenue Net revenue was $376 million in the second quarter of 2026, up 1% from the second quarter of 2025 and $8 million above the high end of our second quarter outlook range. Advertising revenue was $342 million in the second quarter of 2026, down 3% from the second quarter of 2025, primarily due to a decrease in revenue from RR&O businesses. The decrease in RR&O revenue was driven by a decrease in ad clicks and lower average CPC. Other revenue was $33 million in the second quarter of 2026, up 98% from the second quarter of 2025. The increase was primarily due to the addition of revenue from Hatch, as well as increased revenue from our Yelp Places API program and growth in food ordering from our partnership with DoorDash. Net Revenue by Product (In thousands; unaudited) Second Quarter 2026 Financial Review Three Months Ended June 30, Six Months Ended June 30, 2026 2025 2026 2025 Net revenue by product: Advertising revenue by category: Services $ 240,963 $ 240,802 $ 474,749 $ 472,378 Restaurants, Retail & Other 101,532 112,895 200,234 223,320 Total Advertising 342,495 353,697 674,983 695,698 Other 33,024 16,697 61,993 33,230 Total net revenue $ 375,519 $ 370,394 $ 736,976 $ 728,928 Net Revenue +1% $370M $376M 2Q25 2Q26
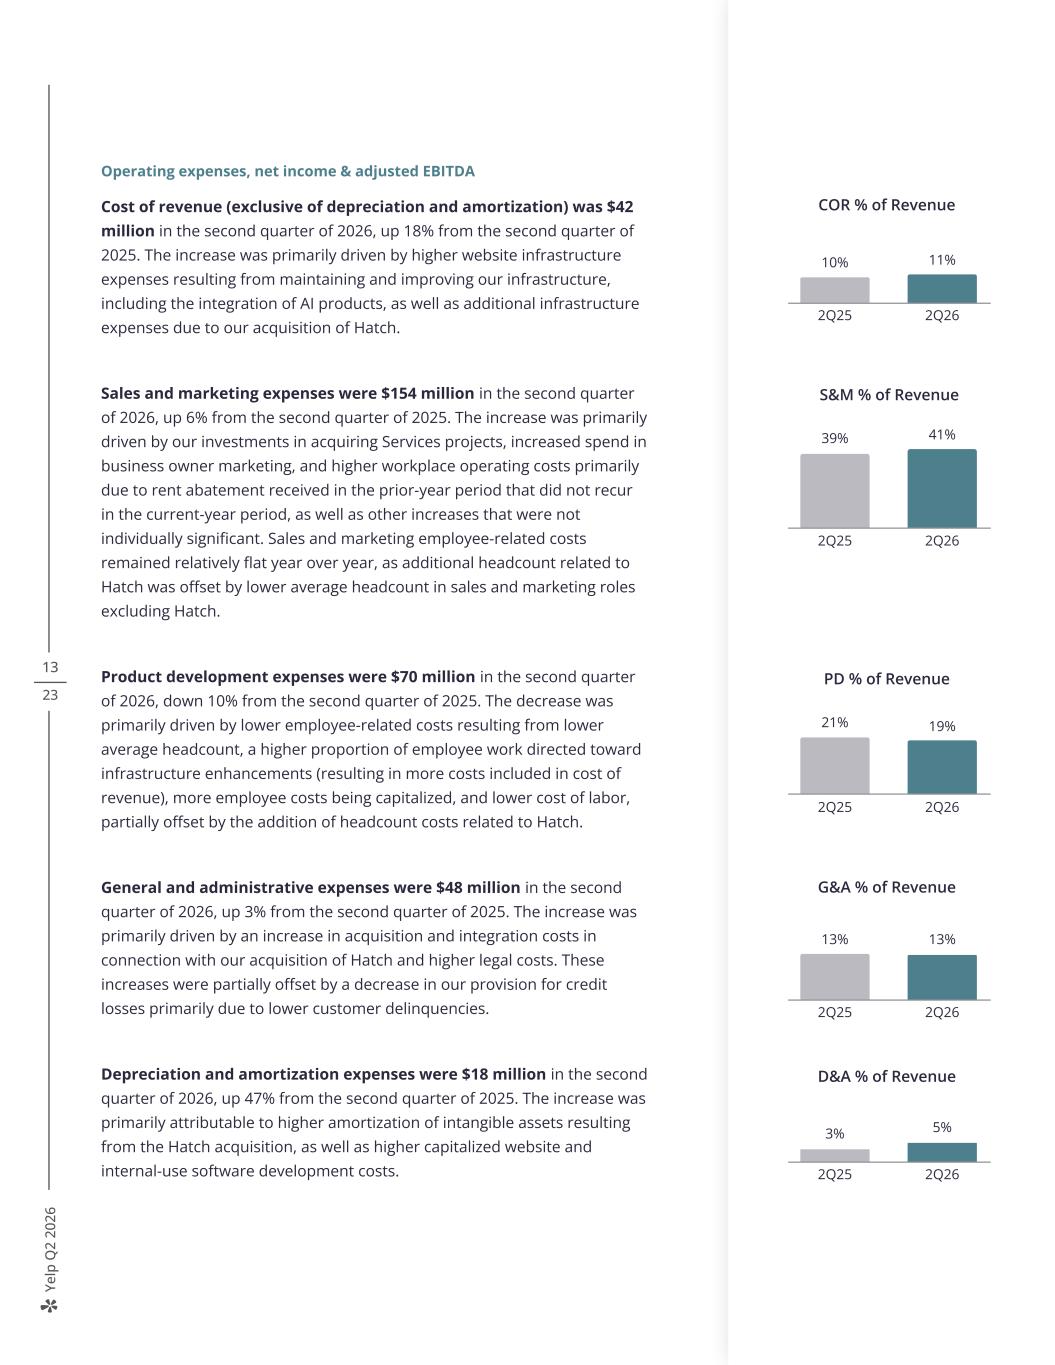
Ye lp Q 2 20 26 13 23 Operating expenses, net income & adjusted EBITDA Cost of revenue (exclusive of depreciation and amortization) was $42 million in the second quarter of 2026, up 18% from the second quarter of 2025. The increase was primarily driven by higher website infrastructure expenses resulting from maintaining and improving our infrastructure, including the integration of AI products, as well as additional infrastructure expenses due to our acquisition of Hatch. Sales and marketing expenses were $154 million in the second quarter of 2026, up 6% from the second quarter of 2025. The increase was primarily driven by our investments in acquiring Services projects, increased spend in business owner marketing, and higher workplace operating costs primarily due to rent abatement received in the prior-year period that did not recur in the current-year period, as well as other increases that were not individually significant. Sales and marketing employee-related costs remained relatively flat year over year, as additional headcount related to Hatch was offset by lower average headcount in sales and marketing roles excluding Hatch. Product development expenses were $70 million in the second quarter of 2026, down 10% from the second quarter of 2025. The decrease was primarily driven by lower employee-related costs resulting from lower average headcount, a higher proportion of employee work directed toward infrastructure enhancements (resulting in more costs included in cost of revenue), more employee costs being capitalized, and lower cost of labor, partially offset by the addition of headcount costs related to Hatch. General and administrative expenses were $48 million in the second quarter of 2026, up 3% from the second quarter of 2025. The increase was primarily driven by an increase in acquisition and integration costs in connection with our acquisition of Hatch and higher legal costs. These increases were partially offset by a decrease in our provision for credit losses primarily due to lower customer delinquencies. Depreciation and amortization expenses were $18 million in the second quarter of 2026, up 47% from the second quarter of 2025. The increase was primarily attributable to higher amortization of intangible assets resulting from the Hatch acquisition, as well as higher capitalized website and internal-use software development costs. COR % of Revenue 10% 11% 2Q25 2Q26 S&M % of Revenue 39% 41% 2Q25 2Q26 PD % of Revenue 21% 19% 2Q25 2Q26 G&A % of Revenue 13% 13% 2Q25 2Q26 D&A % of Revenue 3% 5% 2Q25 2Q26
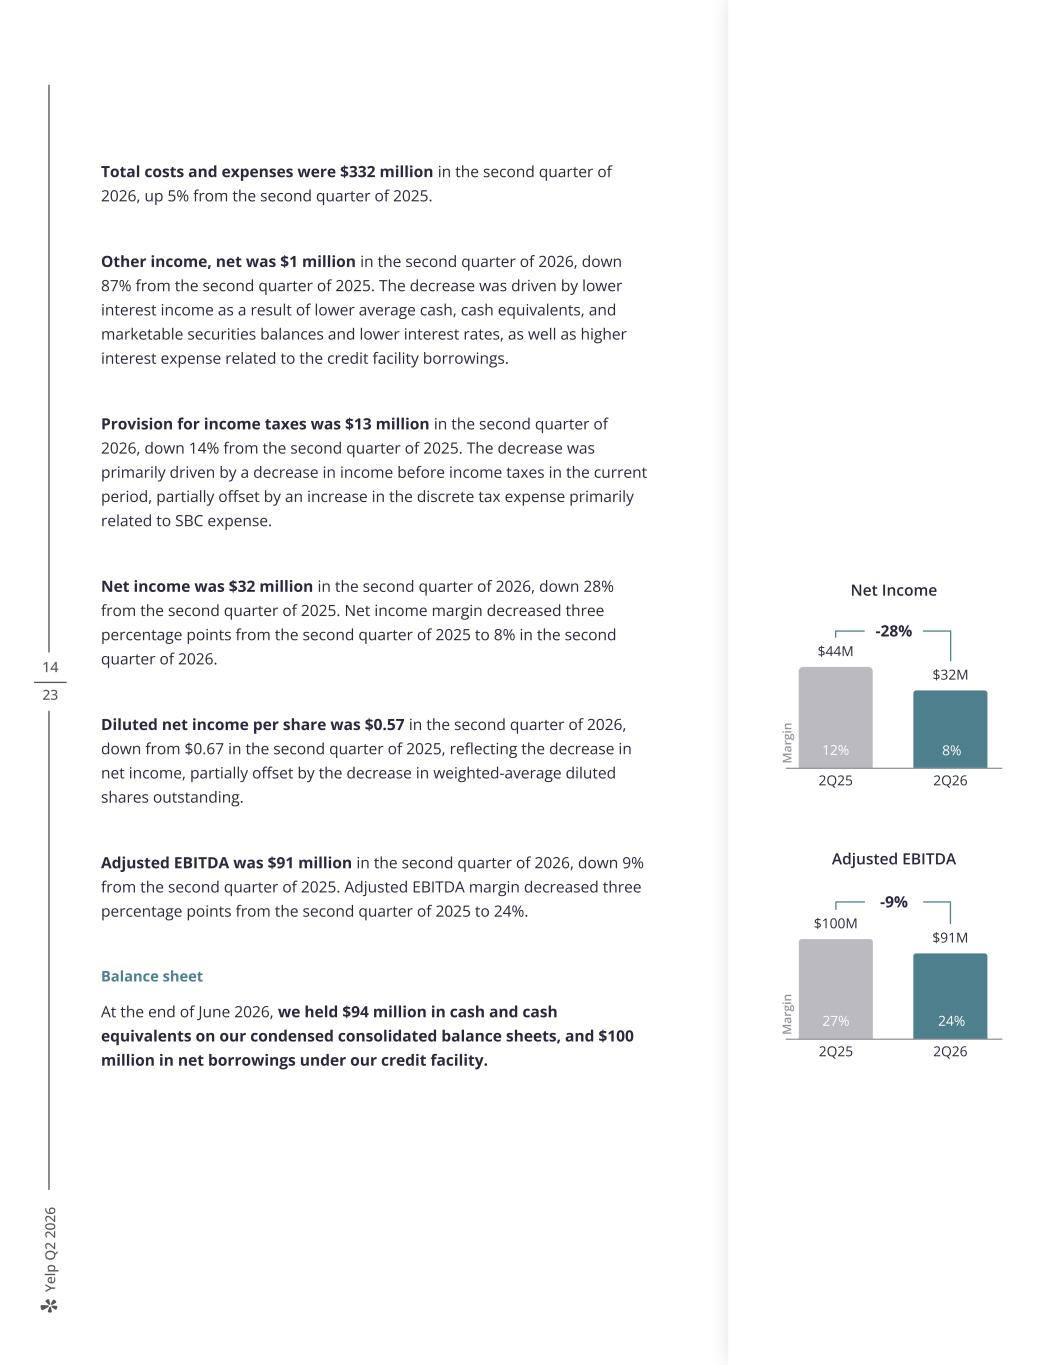
Ye lp Q 2 20 26 14 23 Total costs and expenses were $332 million in the second quarter of 2026, up 5% from the second quarter of 2025. Other income, net was $1 million in the second quarter of 2026, down 87% from the second quarter of 2025. The decrease was driven by lower interest income as a result of lower average cash, cash equivalents, and marketable securities balances and lower interest rates, as well as higher interest expense related to the credit facility borrowings. Provision for income taxes was $13 million in the second quarter of 2026, down 14% from the second quarter of 2025. The decrease was primarily driven by a decrease in income before income taxes in the current period, partially offset by an increase in the discrete tax expense primarily related to SBC expense. Net income was $32 million in the second quarter of 2026, down 28% from the second quarter of 2025. Net income margin decreased three percentage points from the second quarter of 2025 to 8% in the second quarter of 2026. Diluted net income per share was $0.57 in the second quarter of 2026, down from $0.67 in the second quarter of 2025, reflecting the decrease in net income, partially offset by the decrease in weighted-average diluted shares outstanding. Adjusted EBITDA was $91 million in the second quarter of 2026, down 9% from the second quarter of 2025. Adjusted EBITDA margin decreased three percentage points from the second quarter of 2025 to 24%. Balance sheet At the end of June 2026, we held $94 million in cash and cash equivalents on our condensed consolidated balance sheets, and $100 million in net borrowings under our credit facility. 19% 17% 19% 17% Adjusted EBITDA -9% $100M $91M 2Q25 2Q26 M ar gi n 27% 24% 8% 7% M ar gi n Net Income -28% $44M $32M 2Q25 2Q26 812%
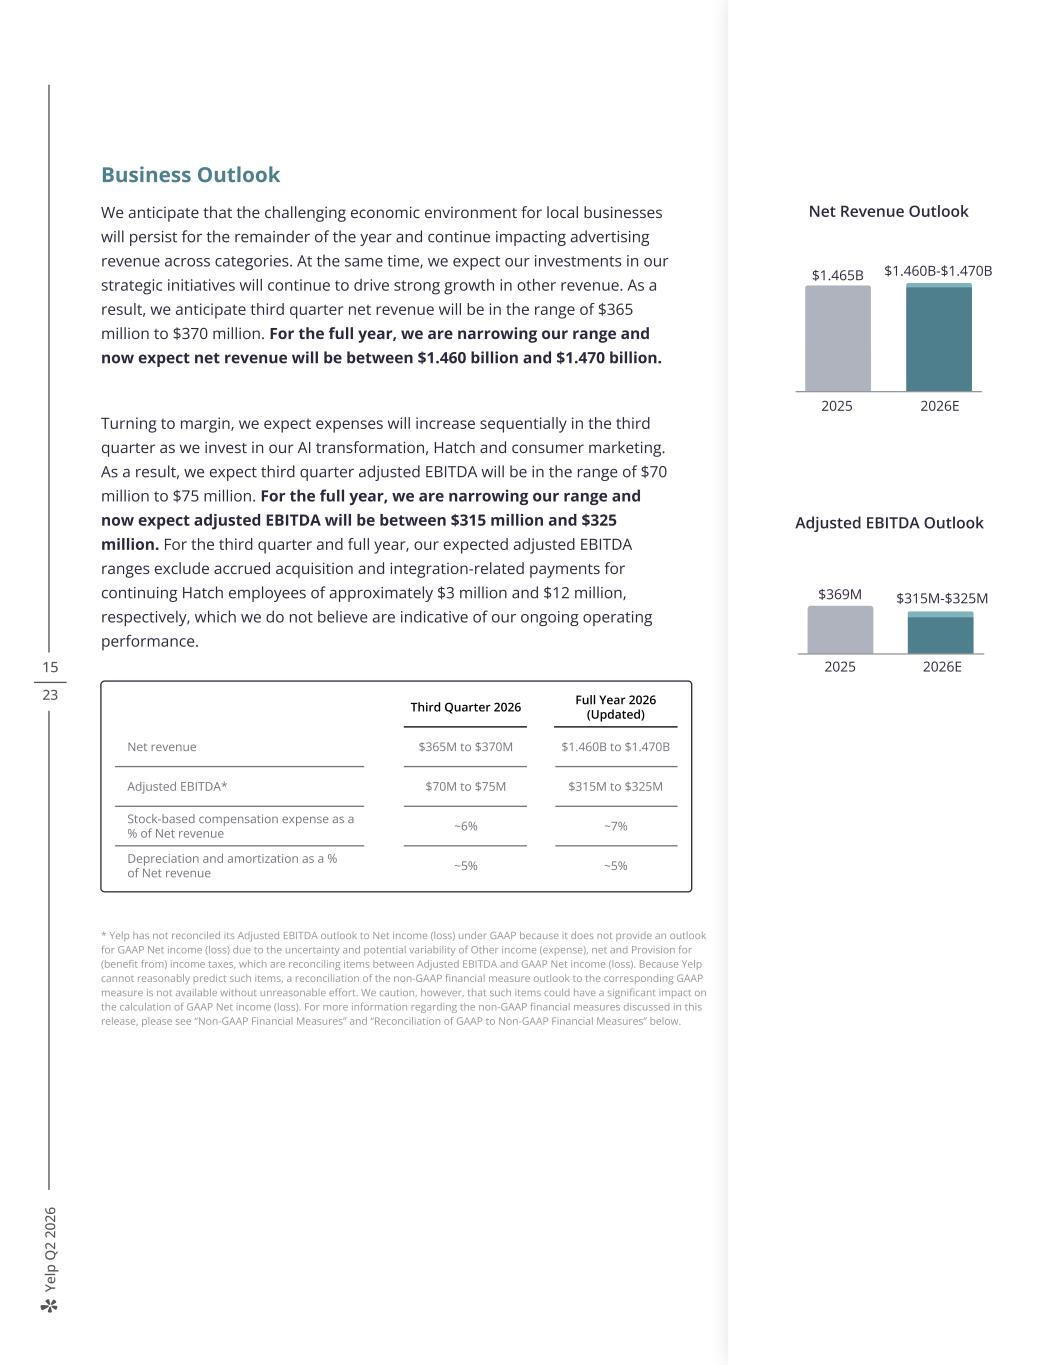
Ye lp Q 2 20 26 15 23 Business Outlook We anticipate that the challenging economic environment for local businesses will persist for the remainder of the year and continue impacting advertising revenue across categories. At the same time, we expect our investments in our strategic initiatives will continue to drive strong growth in other revenue. As a result, we anticipate third quarter net revenue will be in the range of $365 million to $370 million. For the full year, we are narrowing our range and now expect net revenue will be between $1.460 billion and $1.470 billion. Turning to margin, we expect expenses will increase sequentially in the third quarter as we invest in our AI transformation, Hatch and consumer marketing. As a result, we expect third quarter adjusted EBITDA will be in the range of $70 million to $75 million. For the full year, we are narrowing our range and now expect adjusted EBITDA will be between $315 million and $325 million. For the third quarter and full year, our expected adjusted EBITDA ranges exclude accrued acquisition and integration-related payments for continuing Hatch employees of approximately $3 million and $12 million, respectively, which we do not believe are indicative of our ongoing operating performance. $369M Adjusted EBITDA Outlook 2025 2026E $315M-$325M * Yelp has not reconciled its Adjusted EBITDA outlook to Net income (loss) under GAAP because it does not provide an outlook for GAAP Net income (loss) due to the uncertainty and potential variability of Other income (expense), net and Provision for (benefit from) income taxes, which are reconciling items between Adjusted EBITDA and GAAP Net income (loss). Because Yelp cannot reasonably predict such items, a reconciliation of the non-GAAP financial measure outlook to the corresponding GAAP measure is not available without unreasonable effort. We caution, however, that such items could have a significant impact on the calculation of GAAP Net income (loss). For more information regarding the non-GAAP financial measures discussed in this release, please see “Non-GAAP Financial Measures” and “Reconciliation of GAAP to Non-GAAP Financial Measures” below. 2025 2026E $1.465B $1.460B-$1.470B Net Revenue Outlook Third Quarter 2026 Full Year 2026 (Updated) Net revenue $365M to $370M $1.460B to $1.470B Adjusted EBITDA* $70M to $75M $315M to $325M Stock-based compensation expense as a % of Net revenue ~6% ~7% Depreciation and amortization as a % of Net revenue ~5% ~5%
Ye lp Q 2 20 26 16 23 Quarterly Earnings Webcast Yelp will host a live webcast today at 2:00 p.m. PT to discuss the second quarter 2026 financial results and outlook for the third quarter and full year 2026. The webcast can be accessed on the Yelp Investor Relations website at yelp-ir.com. A replay of the webcast will be available at the same website. About Yelp Yelp Inc. (yelp.com) is a community-driven platform that connects people with great local businesses. Millions rely on Yelp to inform their spending decisions and get things done. By combining authentic human content and AI technologies, including the new Yelp Assistant, Yelp helps people move seamlessly from discovery to taking action, whether it’s requesting quotes, making reservations, ordering food, scheduling appointments, or connecting with the right businesses for their needs. Yelp was founded in San Francisco in 2004.
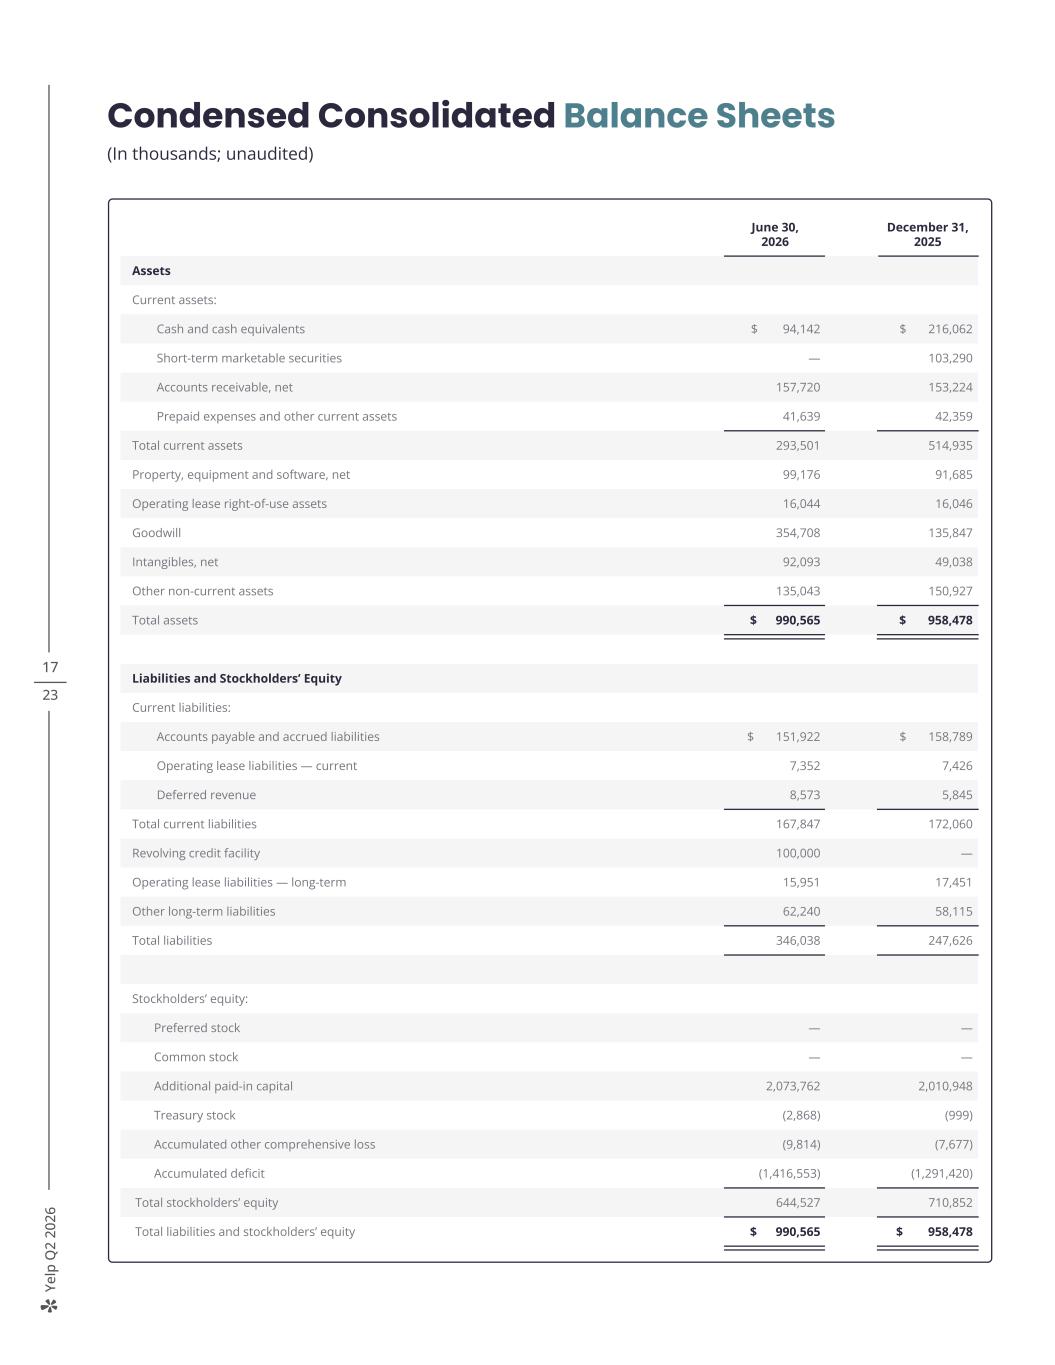
Ye lp Q 2 20 26 17 23 Condensed Consolidated Balance Sheets (In thousands; unaudited) June 30, 2026 December 31, 2025 Assets Current assets: Cash and cash equivalents $ 94,142 $ 216,062 Short-term marketable securities — 103,290 Accounts receivable, net 157,720 153,224 Prepaid expenses and other current assets 41,639 42,359 Total current assets 293,501 514,935 Property, equipment and software, net 99,176 91,685 Operating lease right-of-use assets 16,044 16,046 Goodwill 354,708 135,847 Intangibles, net 92,093 49,038 Other non-current assets 135,043 150,927 Total assets $ 990,565 $ 958,478 Liabilities and Stockholders’ Equity Current liabilities: Accounts payable and accrued liabilities $ 151,922 $ 158,789 Operating lease liabilities — current 7,352 7,426 Deferred revenue 8,573 5,845 Total current liabilities 167,847 172,060 Revolving credit facility 100,000 — Operating lease liabilities — long-term 15,951 17,451 Other long-term liabilities 62,240 58,115 Total liabilities 346,038 247,626 Stockholders’ equity: Preferred stock — — Common stock — — Additional paid-in capital 2,073,762 2,010,948 Treasury stock (2,868) (999) Accumulated other comprehensive loss (9,814) (7,677) Accumulated deficit (1,416,553) (1,291,420) Total stockholders’ equity 644,527 710,852 Total liabilities and stockholders’ equity $ 990,565 $ 958,478
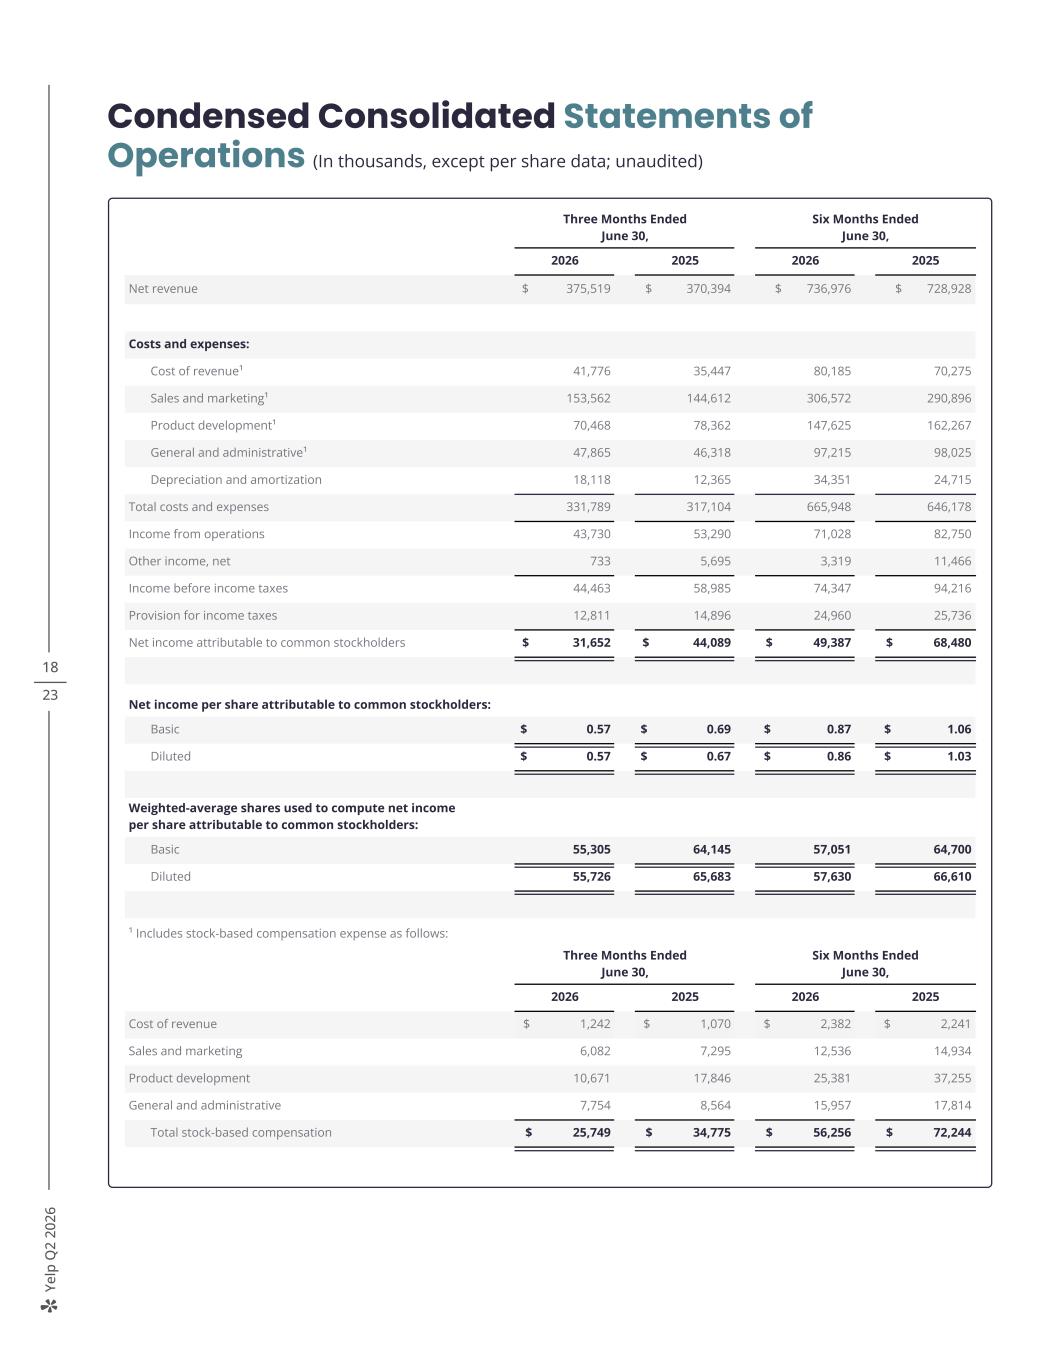
Ye lp Q 2 20 26 18 23 Condensed Consolidated Statements of Operations (In thousands, except per share data; unaudited) Three Months Ended June 30, Six Months Ended June 30, 2026 2025 2026 2025 Net revenue $ 375,519 $ 370,394 $ 736,976 $ 728,928 Costs and expenses: Cost of revenue¹ 41,776 35,447 80,185 70,275 Sales and marketing¹ 153,562 144,612 306,572 290,896 Product development¹ 70,468 78,362 147,625 162,267 General and administrative¹ 47,865 46,318 97,215 98,025 Depreciation and amortization 18,118 12,365 34,351 24,715 Total costs and expenses 331,789 317,104 665,948 646,178 Income from operations 43,730 53,290 71,028 82,750 Other income, net 733 5,695 3,319 11,466 Income before income taxes 44,463 58,985 74,347 94,216 Provision for income taxes 12,811 14,896 24,960 25,736 Net income attributable to common stockholders $ 31,652 $ 44,089 $ 49,387 $ 68,480 Net income per share attributable to common stockholders: Basic $ 0.57 $ 0.69 $ 0.87 $ 1.06 Diluted $ 0.57 $ 0.67 $ 0.86 $ 1.03 Weighted-average shares used to compute net income per share attributable to common stockholders: Basic 55,305 64,145 57,051 64,700 Diluted 55,726 65,683 57,630 66,610 ¹ Includes stock-based compensation expense as follows: Three Months Ended June 30, Six Months Ended June 30, 2026 2025 2026 2025 Cost of revenue $ 1,242 $ 1,070 $ 2,382 $ 2,241 Sales and marketing 6,082 7,295 12,536 14,934 Product development 10,671 17,846 25,381 37,255 General and administrative 7,754 8,564 15,957 17,814 Total stock-based compensation $ 25,749 $ 34,775 $ 56,256 $ 72,244
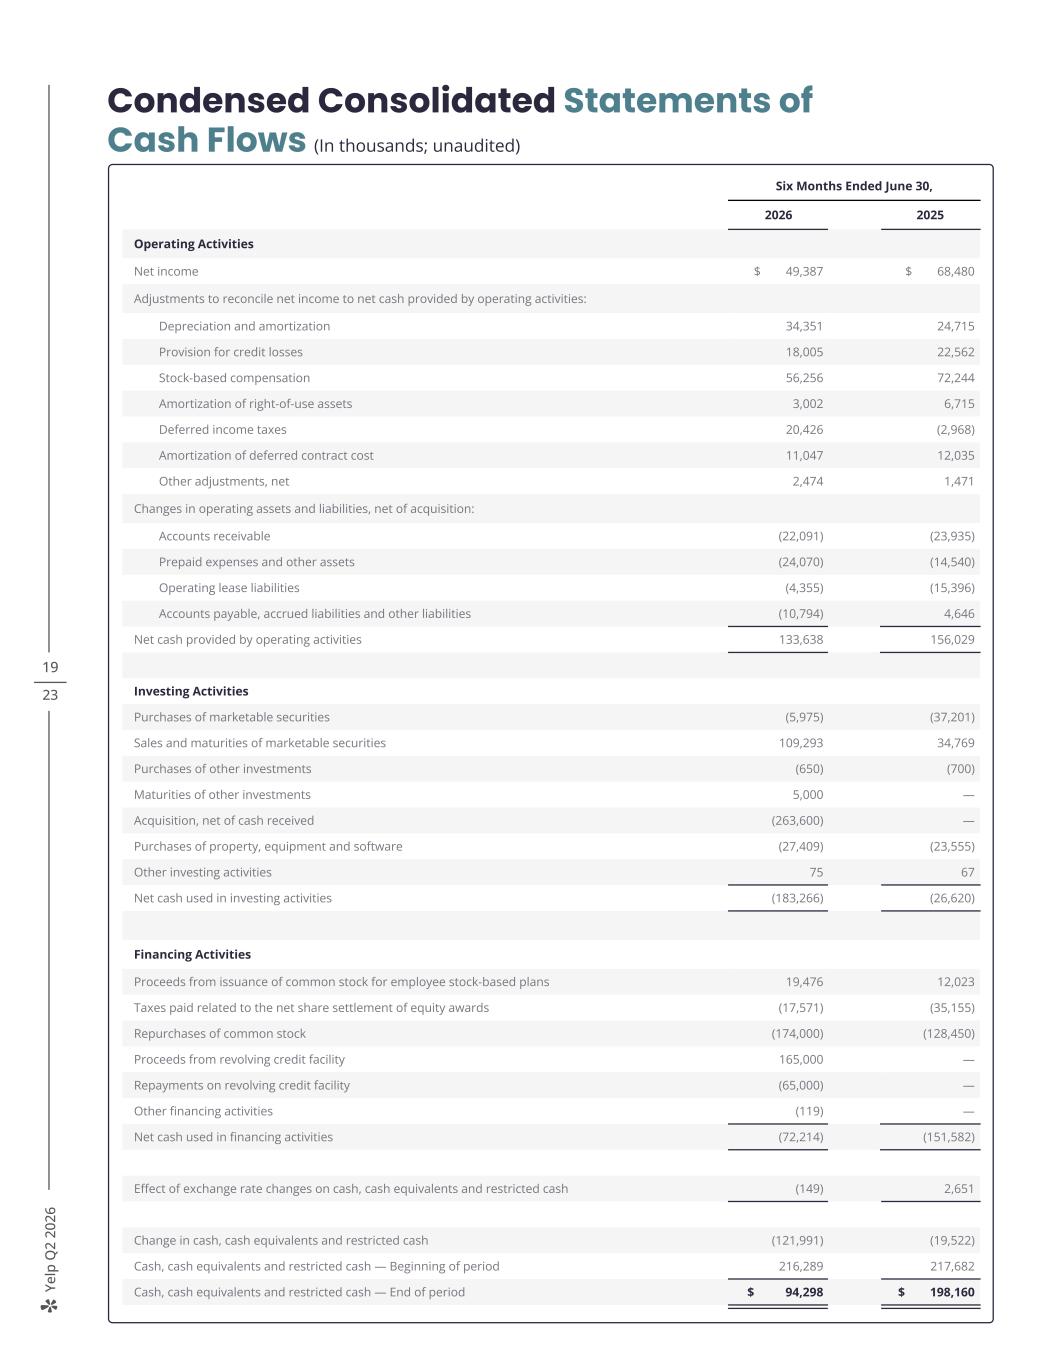
Ye lp Q 2 20 26 19 23 Condensed Consolidated Statements of Cash Flows (In thousands; unaudited) Six Months Ended June 30, 2026 2025 Operating Activities Net income $ 49,387 $ 68,480 Adjustments to reconcile net income to net cash provided by operating activities: Depreciation and amortization 34,351 24,715 Provision for credit losses 18,005 22,562 Stock-based compensation 56,256 72,244 Amortization of right-of-use assets 3,002 6,715 Deferred income taxes 20,426 (2,968) Amortization of deferred contract cost 11,047 12,035 Other adjustments, net 2,474 1,471 Changes in operating assets and liabilities, net of acquisition: Accounts receivable (22,091) (23,935) Prepaid expenses and other assets (24,070) (14,540) Operating lease liabilities (4,355) (15,396) Accounts payable, accrued liabilities and other liabilities (10,794) 4,646 Net cash provided by operating activities 133,638 156,029 Investing Activities Purchases of marketable securities (5,975) (37,201) Sales and maturities of marketable securities 109,293 34,769 Purchases of other investments (650) (700) Maturities of other investments 5,000 — Acquisition, net of cash received (263,600) — Purchases of property, equipment and software (27,409) (23,555) Other investing activities 75 67 Net cash used in investing activities (183,266) (26,620) Financing Activities Proceeds from issuance of common stock for employee stock-based plans 19,476 12,023 Taxes paid related to the net share settlement of equity awards (17,571) (35,155) Repurchases of common stock (174,000) (128,450) Proceeds from revolving credit facility 165,000 — Repayments on revolving credit facility (65,000) — Other financing activities (119) — Net cash used in financing activities (72,214) (151,582) Effect of exchange rate changes on cash, cash equivalents and restricted cash (149) 2,651 Change in cash, cash equivalents and restricted cash (121,991) (19,522) Cash, cash equivalents and restricted cash — Beginning of period 216,289 217,682 Cash, cash equivalents and restricted cash — End of period $ 94,298 $ 198,160
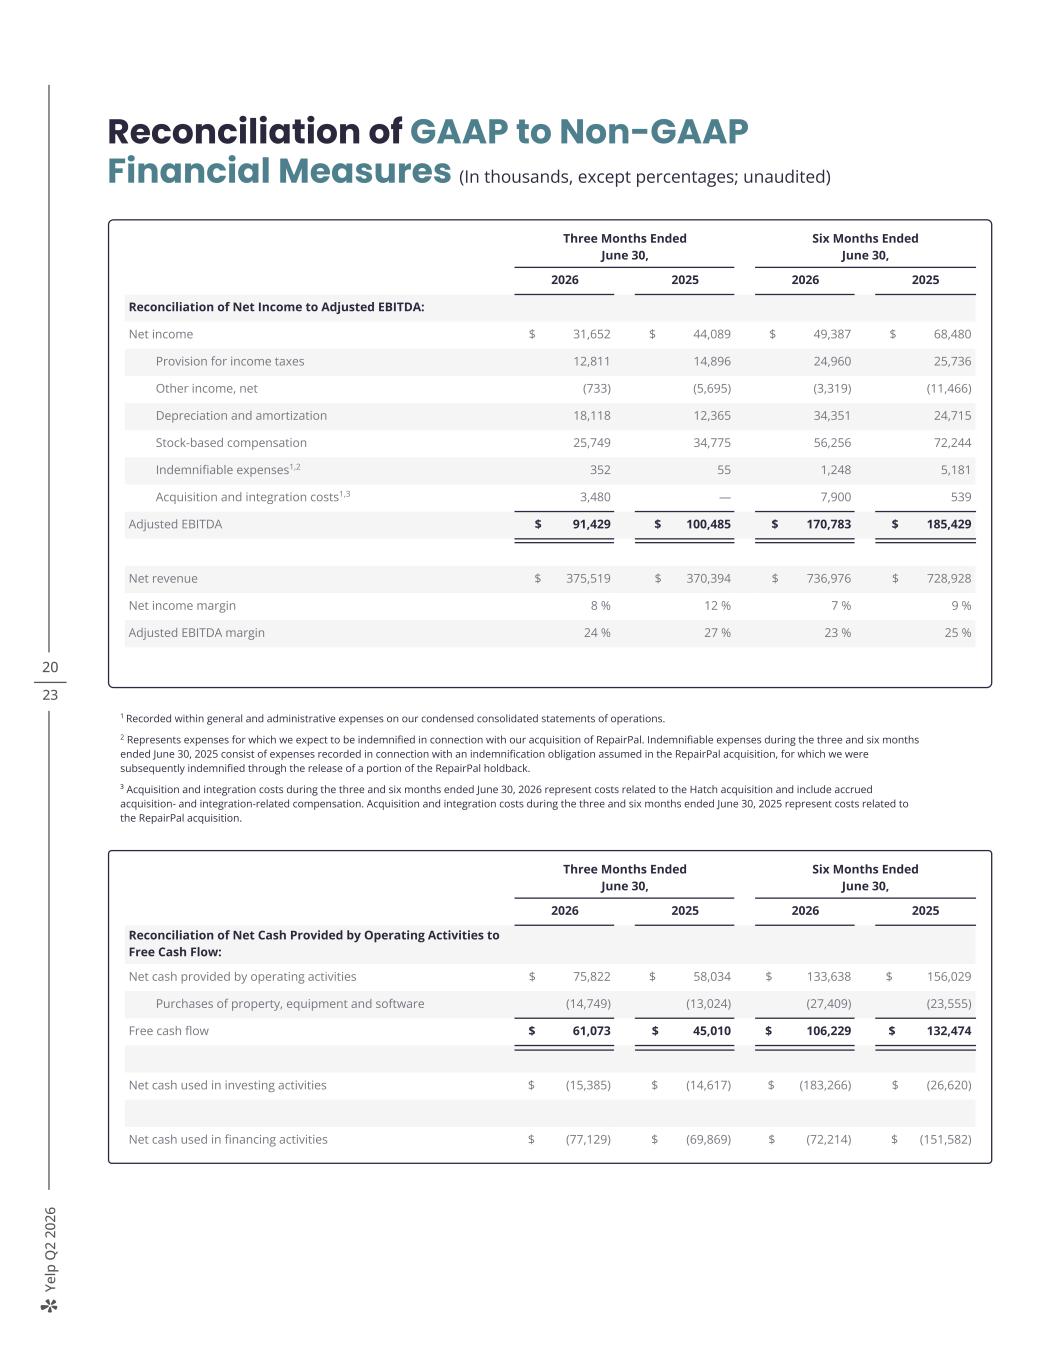
Ye lp Q 2 20 26 20 23 Reconciliation of GAAP to Non-GAAP Financial Measures (In thousands, except percentages; unaudited) 1 Recorded within general and administrative expenses on our condensed consolidated statements of operations. 2 Represents expenses for which we expect to be indemnified in connection with our acquisition of RepairPal. Indemnifiable expenses during the three and six months ended June 30, 2025 consist of expenses recorded in connection with an indemnification obligation assumed in the RepairPal acquisition, for which we were subsequently indemnified through the release of a portion of the RepairPal holdback. ³ Acquisition and integration costs during the three and six months ended June 30, 2026 represent costs related to the Hatch acquisition and include accrued acquisition- and integration-related compensation. Acquisition and integration costs during the three and six months ended June 30, 2025 represent costs related to the RepairPal acquisition. Three Months Ended June 30, Six Months Ended June 30, 2026 2025 2026 2025 Reconciliation of Net Income to Adjusted EBITDA: Net income $ 31,652 $ 44,089 $ 49,387 $ 68,480 Provision for income taxes 12,811 14,896 24,960 25,736 Other income, net (733) (5,695) (3,319) (11,466) Depreciation and amortization 18,118 12,365 34,351 24,715 Stock-based compensation 25,749 34,775 56,256 72,244 Indemnifiable expenses1,2 352 55 1,248 5,181 Acquisition and integration costs1,3 3,480 — 7,900 539 Adjusted EBITDA $ 91,429 $ 100,485 $ 170,783 $ 185,429 Net revenue $ 375,519 $ 370,394 $ 736,976 $ 728,928 Net income margin 8 % 12 % 7 % 9 % Adjusted EBITDA margin 24 % 27 % 23 % 25 % Three Months Ended June 30, Six Months Ended June 30, 2026 2025 2026 2025 Reconciliation of Net Cash Provided by Operating Activities to Free Cash Flow: Net cash provided by operating activities $ 75,822 $ 58,034 $ 133,638 $ 156,029 Purchases of property, equipment and software (14,749) (13,024) (27,409) (23,555) Free cash flow $ 61,073 $ 45,010 $ 106,229 $ 132,474 Net cash used in investing activities $ (15,385) $ (14,617) $ (183,266) $ (26,620) Net cash used in financing activities $ (77,129) $ (69,869) $ (72,214) $ (151,582)
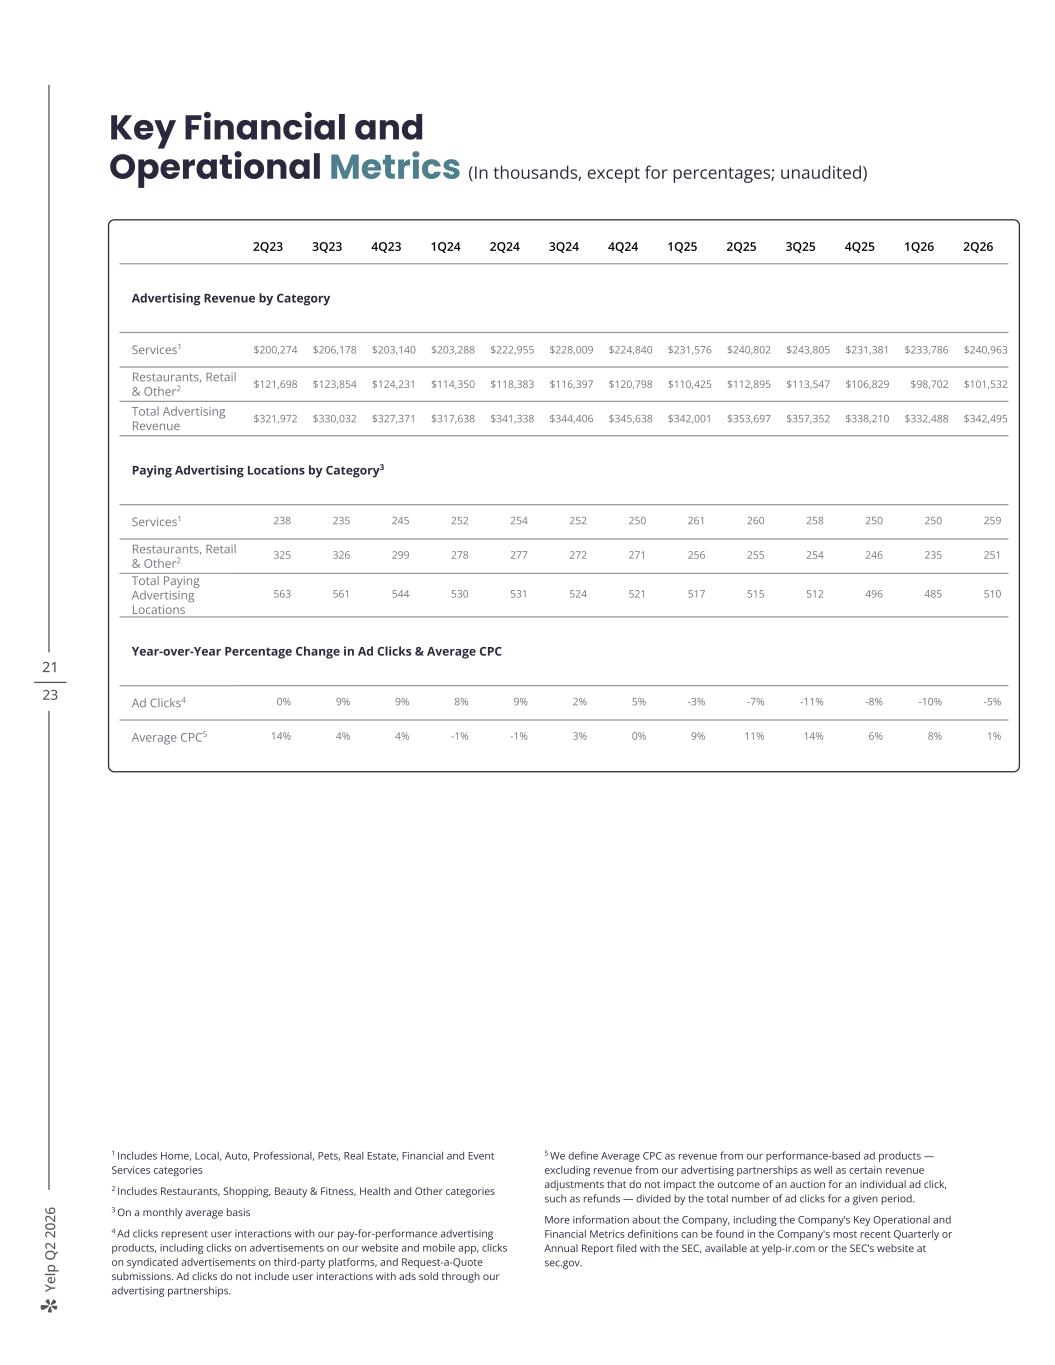
Ye lp Q 2 20 26 21 23 Key Financial and Operational Metrics (In thousands, except for percentages; unaudited) 2Q23 3Q23 4Q23 1Q24 2Q24 3Q24 4Q24 1Q25 2Q25 3Q25 4Q25 1Q26 2Q26 Advertising Revenue by Category Services1 $200,274 $206,178 $203,140 $203,288 $222,955 $228,009 $224,840 $231,576 $240,802 $243,805 $231,381 $233,786 $240,963 Restaurants, Retail & Other2 $121,698 $123,854 $124,231 $114,350 $118,383 $116,397 $120,798 $110,425 $112,895 $113,547 $106,829 $98,702 $101,532 Total Advertising Revenue $321,972 $330,032 $327,371 $317,638 $341,338 $344,406 $345,638 $342,001 $353,697 $357,352 $338,210 $332,488 $342,495 Paying Advertising Locations by Category3 Services1 238 235 245 252 254 252 250 261 260 258 250 250 259 Restaurants, Retail & Other2 325 326 299 278 277 272 271 256 255 254 246 235 251 Total Paying Advertising Locations 563 561 544 530 531 524 521 517 515 512 496 485 510 Year-over-Year Percentage Change in Ad Clicks & Average CPC Ad Clicks4 0% 9% 9% 8% 9% 2% 5% -3% -7% -11% -8% -10% -5% Average CPC5 14% 4% 4% -1% -1% 3% 0% 9% 11% 14% 6% 8% 1% 1 Includes Home, Local, Auto, Professional, Pets, Real Estate, Financial and Event Services categories 2 Includes Restaurants, Shopping, Beauty & Fitness, Health and Other categories 3 On a monthly average basis 4 Ad clicks represent user interactions with our pay-for-performance advertising products, including clicks on advertisements on our website and mobile app, clicks on syndicated advertisements on third-party platforms, and Request-a-Quote submissions. Ad clicks do not include user interactions with ads sold through our advertising partnerships. 5 We define Average CPC as revenue from our performance-based ad products — excluding revenue from our advertising partnerships as well as certain revenue adjustments that do not impact the outcome of an auction for an individual ad click, such as refunds — divided by the total number of ad clicks for a given period. More information about the Company, including the Company’s Key Operational and Financial Metrics definitions can be found in the Company's most recent Quarterly or Annual Report filed with the SEC, available at yelp-ir.com or the SEC’s website at sec.gov.
Ye lp Q 2 20 26 Non-GAAP Financial Measures This letter and statements made during the above referenced webcast may include information relating to Adjusted EBITDA, Adjusted EBITDA margin and Free cash flow, each of which is a “non-GAAP financial measure.” We define Adjusted EBITDA as net income (loss), adjusted to exclude: provision for (benefit from) income taxes; other income (expense), net; depreciation and amortization; stock-based compensation expense; and, in certain periods, certain other operating income and expense items, such as expenses for which we expect to be indemnified, acquisition and integration costs, and other items that we deem not to be indicative of our ongoing operating performance. We define Adjusted EBITDA margin as Adjusted EBITDA divided by net revenue. We define Free cash flow as net cash provided by (used in) operating activities, less cash used for purchases of property, equipment and software. Adjusted EBITDA and Free cash flow, which are not prepared under any comprehensive set of accounting rules or principles, have limitations as analytical tools and you should not consider them in isolation or as substitutes for analysis of Yelp’s financial results as reported in accordance with GAAP. In particular, Adjusted EBITDA and Free cash flow should not be viewed as substitutes for, or superior to, net income (loss) or net cash provided by (used in) operating activities prepared in accordance with GAAP as measures of profitability or liquidity. Some of these limitations are: > although depreciation and amortization are non-cash charges, the assets being depreciated and amortized may have to be replaced in the future, and Adjusted EBITDA does not reflect all cash capital expenditure requirements for such replacements or for new capital expenditure requirements; > Adjusted EBITDA does not reflect changes in, or cash requirements for, Yelp’s working capital needs; > Adjusted EBITDA does not reflect the impact of the recording or release of valuation allowances or tax payments that may represent a reduction in cash available to Yelp; > Adjusted EBITDA does not consider the potentially dilutive impact of equity-based compensation; > Adjusted EBITDA does not take into account certain other operating income and expense items, such as indemnifiable expenses, acquisition and integration costs, or other costs that management determines are not indicative of our ongoing operating performance; > Free cash flow does not represent the total residual cash flow available for discretionary purposes because it does not reflect our contractual commitments or obligations; and > other companies, including those in Yelp’s industry, may calculate Adjusted EBITDA and Free cash flow differently, which reduces their usefulness as comparative measures. Because of these limitations, you should consider Adjusted EBITDA, Adjusted EBITDA margin and Free cash flow alongside other financial performance measures, including net income (loss), net cash provided by (used in) operating activities and Yelp’s other GAAP results. Forward-Looking Statements This letter contains, and statements made during the above-referenced webcast will contain, forward-looking statements relating to, among other things, the future performance of Yelp and its consolidated subsidiaries, that are based on Yelp’s current expectations, forecasts and assumptions and involve risks and uncertainties. These statements include, but are not limited to, statements regarding: Yelp’s expected financial and operational results, including its expectations regarding other revenue growth; Yelp’s plans and ability to drive profitable growth in 2026 and the long term; Yelp’s expectations regarding market opportunities, including within the AI ecosystem, and its ability to meaningfully capture them, the drivers of its business performance and the timing of expenses; Yelp’s plans for and ability to execute on its strategic initiatives, particularly its AI transformation, as well as the expected results thereof; Yelp’s product roadmap, planned investments therein, and expected benefits therefrom; Yelp’s integration of Hatch, plans to invest in Hatch and expected results of that investment; Yelp’s plans for strategic acquisitions, partner integrations and licensing agreements; Yelp’s expectations regarding its ability to achieve operational efficiencies and increases in employee productivity with AI, as well as the benefits thereof; Yelp’s plans to reduce SBC expense as a percentage of revenue and the expected timing and benefits therefrom; Yelp’s expectations regarding its capital allocation strategy and share repurchase program; and Yelp’s expectations with respect to trends that will continue to impact its results of operations. 22 23
Ye lp Q 2 20 26 Yelp’s actual results could differ materially from those predicted or implied by such forward-looking statements and reported results should not be considered as an indication of future performance. Factors that could cause or contribute to such differences include, but are not limited to: > Adverse macroeconomic conditions — particularly those affecting local economies — and their impact on consumer behavior and advertiser spending; > Yelp’s ability to maintain and expand its advertiser base; > Yelp’s ability to execute on its strategic initiatives, including its AI transformation, and the effectiveness thereof; > Yelp's ability to maintain and increase traffic to and user engagement on its platform, including its ability to generate, maintain and recommend sufficient content that consumers find relevant, helpful and reliable; > Yelp’s reliance on internet search engines and application marketplaces, certain providers of which offer products and services that compete directly with its products; > Yelp’s ability to successfully manage acquisitions of new businesses, solutions or technologies to successfully integrate those businesses, solutions or technologies, including Hatch, and to monetize such acquired products, solutions or technologies; > Yelp’s ability to continue to effectively operate with a remote work force and attract and retain key talent; > Yelp’s reliance on third-party service providers and strategic partners; > Competition in, and the rapid evolution of, Yelp’s industry; > Yelp’s ability to maintain, protect and enhance its brand; and > Yelp’s ability to maintain the uninterrupted and proper operation of its technology and network infrastructure. Factors that could cause or contribute to such differences also include, but are not limited to, those factors that could affect Yelp’s business, operating results and stock price included under the captions “Risk Factors” and “Management’s Discussion and Analysis of Financial Condition and Results of Operations” in Yelp's most recent Annual Report on Form 10-K and Quarterly Report on Form 10-Q at yelp-ir.com or the SEC's website at sec.gov. Undue reliance should not be placed on the forward-looking statements in this letter or the above-referenced webcast, which are based on information available to Yelp on the date hereof. Such forward-looking statements do not include the potential impact of any acquisitions or divestitures that may be announced and/or completed after the date hereof. Yelp assumes no obligation to update such statements. 23 23
 エドガーで原本を確認する