Q3 2023 Letter to Shareholders November 2, 2023 | yelp-ir.com
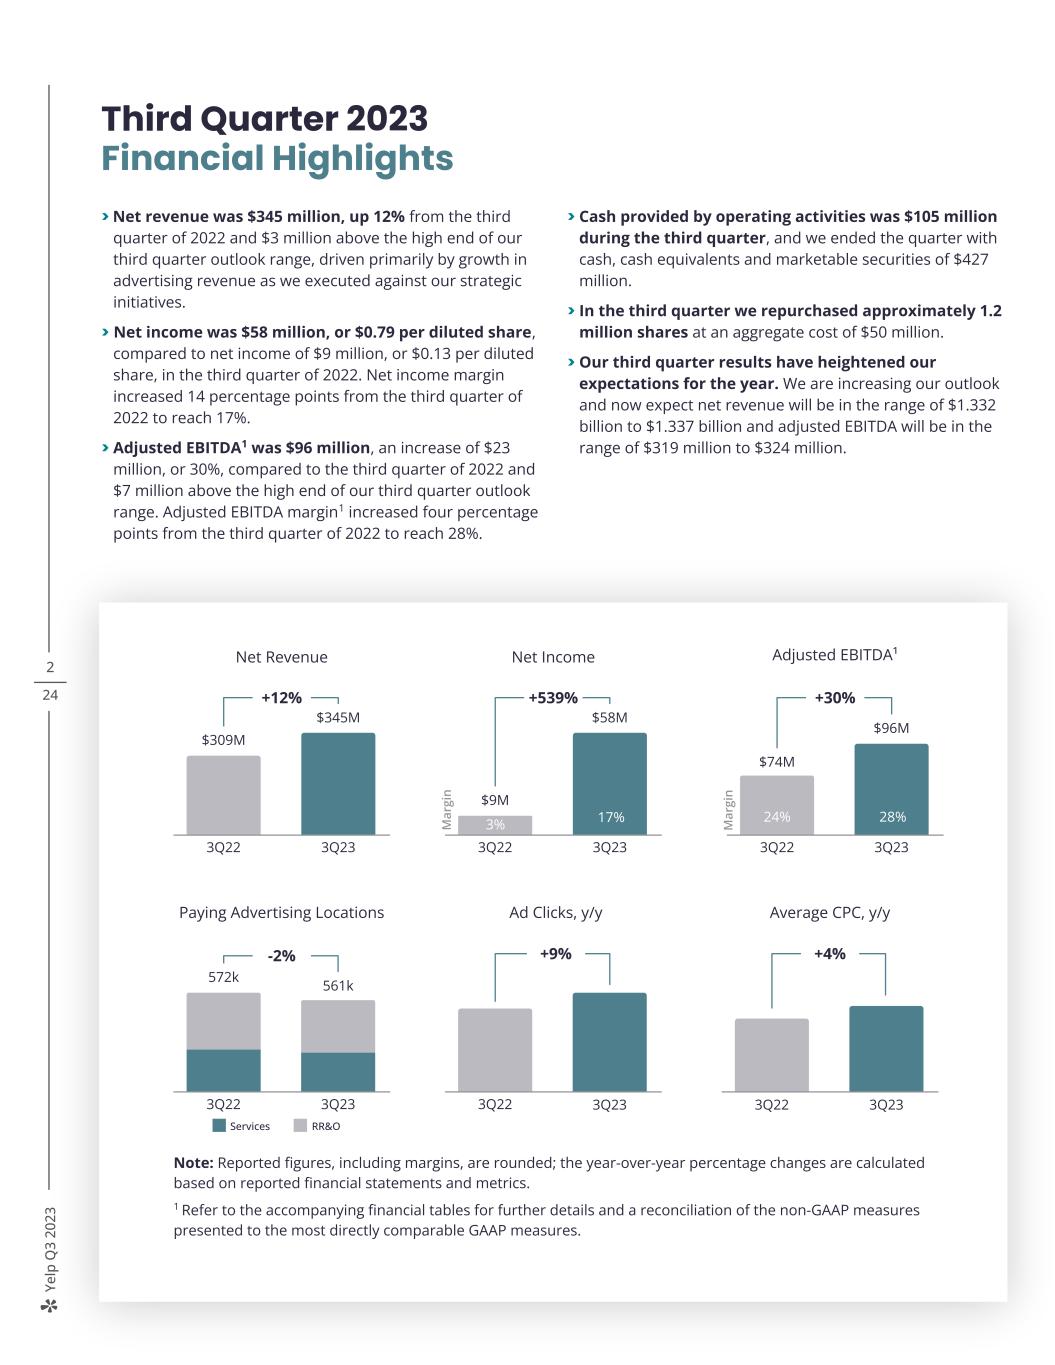
Ye lp Q 3 20 23 2 24 Note: Reported figures, including margins, are rounded; the year-over-year percentage changes are calculated based on reported financial statements and metrics. 1 Refer to the accompanying financial tables for further details and a reconciliation of the non-GAAP measures presented to the most directly comparable GAAP measures. Third Quarter 2023 Financial Highlights > Net revenue was $345 million, up 12% from the third quarter of 2022 and $3 million above the high end of our third quarter outlook range, driven primarily by growth in advertising revenue as we executed against our strategic initiatives. > Net income was $58 million, or $0.79 per diluted share, compared to net income of $9 million, or $0.13 per diluted share, in the third quarter of 2022. Net income margin increased 14 percentage points from the third quarter of 2022 to reach 17%. > Adjusted EBITDA1 was $96 million, an increase of $23 million, or 30%, compared to the third quarter of 2022 and $7 million above the high end of our third quarter outlook range. Adjusted EBITDA margin1 increased four percentage points from the third quarter of 2022 to reach 28%. > Cash provided by operating activities was $105 million during the third quarter, and we ended the quarter with cash, cash equivalents and marketable securities of $427 million. > In the third quarter we repurchased approximately 1.2 million shares at an aggregate cost of $50 million. > Our third quarter results have heightened our expectations for the year. We are increasing our outlook and now expect net revenue will be in the range of $1.332 billion to $1.337 billion and adjusted EBITDA will be in the range of $319 million to $324 million. 19% 17% Net Revenue +12% $309M $345M 3Q22 3Q23 Ad Clicks, y/y +9% 3Q22 3Q23 Average CPC, y/y +4% 3Q22 3Q23 Paying Advertising Locations -2% 572k 561k 3Q22 3Q23 Services RR&O Adjusted EBITDA¹ +30% $74M $96M 3Q22 3Q23 M ar gi n 24% 28%8% 7% M ar gi n Net Income +539% $9M $58M 3Q22 3Q23 17%3%
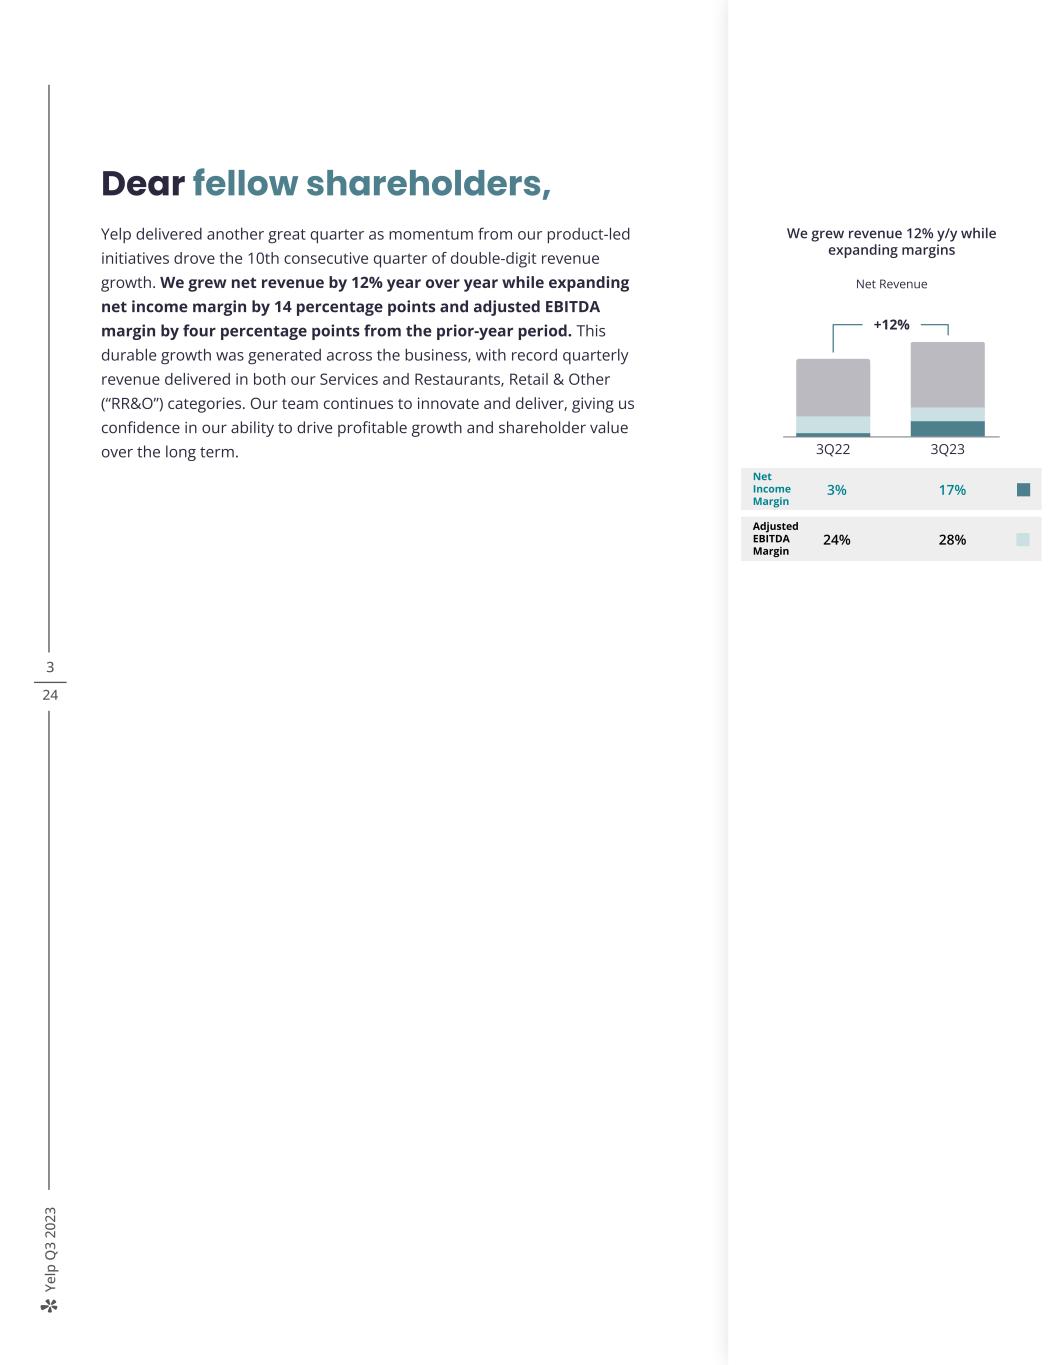
Ye lp Q 3 20 23 3 24 Dear fellow shareholders, Yelp delivered another great quarter as momentum from our product-led initiatives drove the 10th consecutive quarter of double-digit revenue growth. We grew net revenue by 12% year over year while expanding net income margin by 14 percentage points and adjusted EBITDA margin by four percentage points from the prior-year period. This durable growth was generated across the business, with record quarterly revenue delivered in both our Services and Restaurants, Retail & Other (“RR&O”) categories. Our team continues to innovate and deliver, giving us confidence in our ability to drive profitable growth and shareholder value over the long term. Advertiser demand drove strong results in the first quarter Net Revenue +2 ppt 3% 4% 2Q22 2Q23 Net Income Margin +2 ppt 23% 25% 2Q22 2Q23 Adjusted EBITDA Margin +13% 2Q22 2Q23 +13% 2Q22 2Q23 +2 ppt y/y 23% 25% +2 ppt y/y 3% 4% +13% 2Q22 2Q23 We grew revenue 13% y/y while expanding margins Adjusted EBITDA Net Income 2Q22 2Q23 We grew revenue 13% y/y while expanding margins Net Income Margin 4%3% Adjusted EBITDA Margin 25%23% Net Income +13% Adjusted EBITDA 3Q22 3Q23 Net Income Margin 17%3% Adjusted EBITDA Margin 28%24% +12% We grew revenue 12% y/y while expanding margins Net Revenue
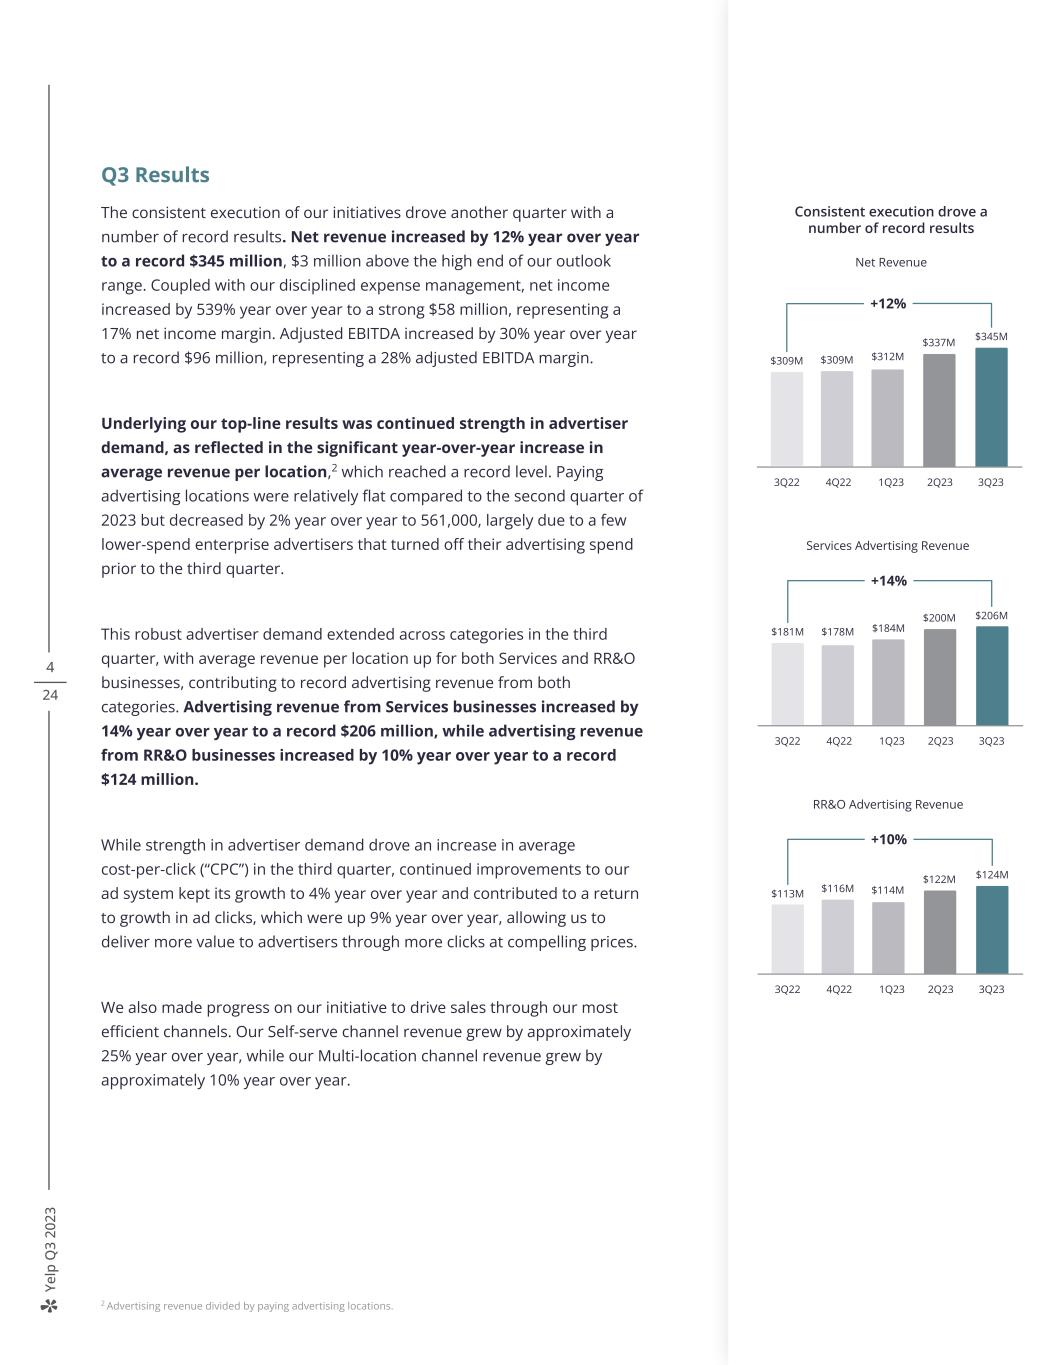
Ye lp Q 3 20 23 4 24 Q3 Results The consistent execution of our initiatives drove another quarter with a number of record results. Net revenue increased by 12% year over year to a record $345 million, $3 million above the high end of our outlook range. Coupled with our disciplined expense management, net income increased by 539% year over year to a strong $58 million, representing a 17% net income margin. Adjusted EBITDA increased by 30% year over year to a record $96 million, representing a 28% adjusted EBITDA margin. Underlying our top-line results was continued strength in advertiser demand, as reflected in the significant year-over-year increase in average revenue per location,2 which reached a record level. Paying advertising locations were relatively flat compared to the second quarter of 2023 but decreased by 2% year over year to 561,000, largely due to a few lower-spend enterprise advertisers that turned off their advertising spend prior to the third quarter. This robust advertiser demand extended across categories in the third quarter, with average revenue per location up for both Services and RR&O businesses, contributing to record advertising revenue from both categories. Advertising revenue from Services businesses increased by 14% year over year to a record $206 million, while advertising revenue from RR&O businesses increased by 10% year over year to a record $124 million. While strength in advertiser demand drove an increase in average cost-per-click (“CPC”) in the third quarter, continued improvements to our ad system kept its growth to 4% year over year and contributed to a return to growth in ad clicks, which were up 9% year over year, allowing us to deliver more value to advertisers through more clicks at compelling prices. We also made progress on our initiative to drive sales through our most efficient channels. Our Self-serve channel revenue grew by approximately 25% year over year, while our Multi-location channel revenue grew by approximately 10% year over year. Services Advertising Revenue +14% $181M 3Q22 4Q22 1Q23 2Q23 3Q23 $206M $178M $184M $200M RR&O Advertising Revenue +10% $113M 3Q22 4Q22 1Q23 2Q23 3Q23 $124M $116M $114M $122M Consistent execution drove a number of record results Net Revenue +12% $309M 3Q22 4Q22 1Q23 2Q23 3Q23 $345M $309M $312M $337M 2 Advertising revenue divided by paying advertising locations.
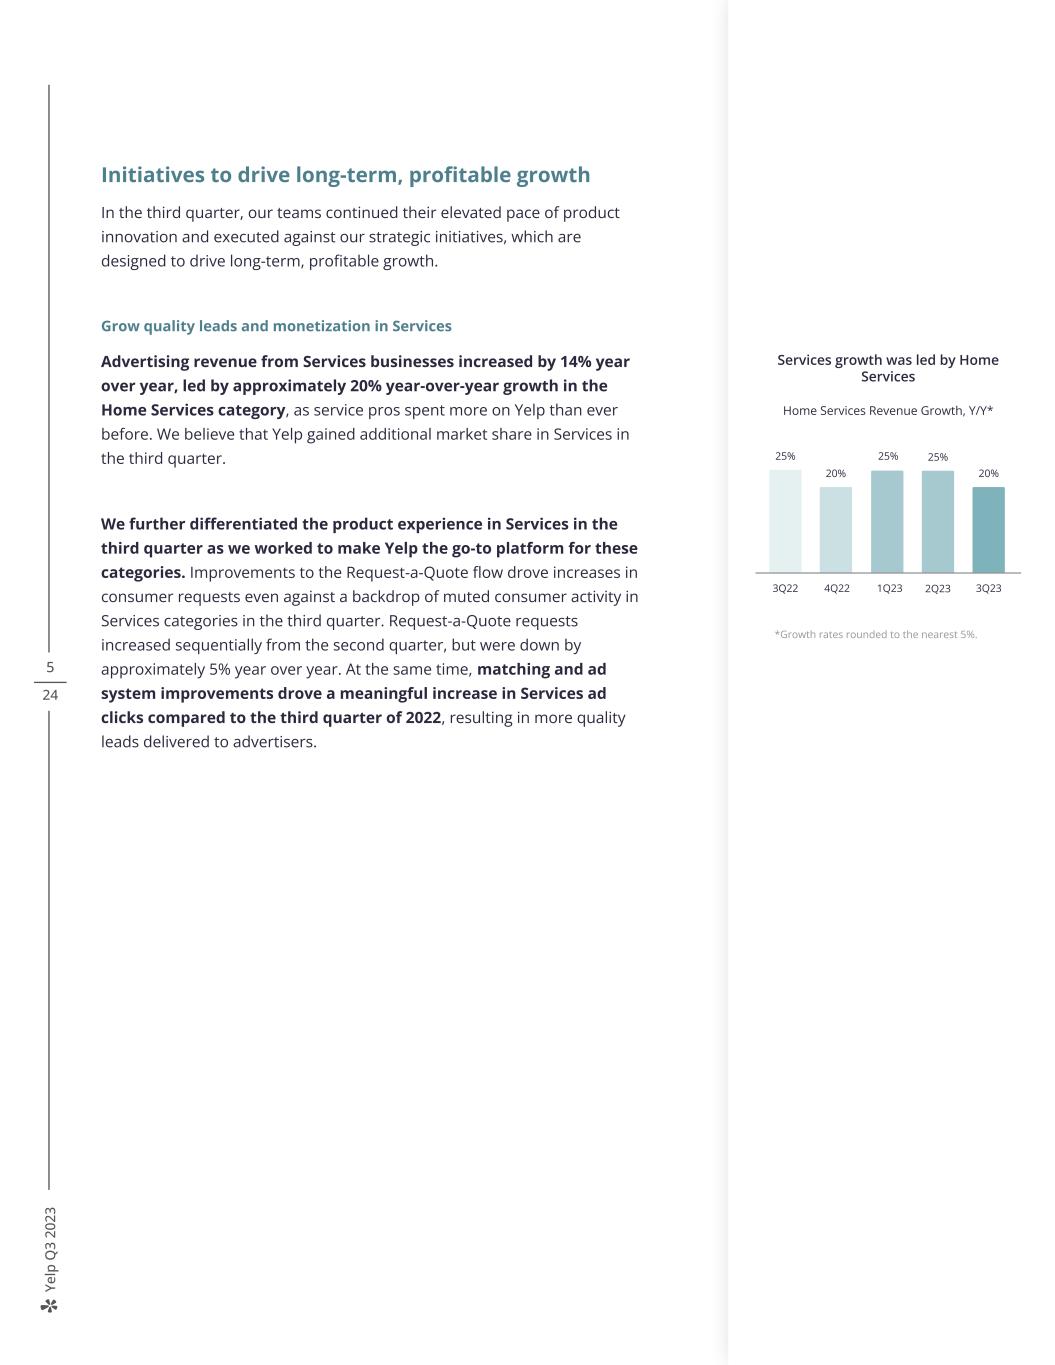
Ye lp Q 3 20 23 5 24 Initiatives to drive long-term, profitable growth In the third quarter, our teams continued their elevated pace of product innovation and executed against our strategic initiatives, which are designed to drive long-term, profitable growth. Grow quality leads and monetization in Services Advertising revenue from Services businesses increased by 14% year over year, led by approximately 20% year-over-year growth in the Home Services category, as service pros spent more on Yelp than ever before. We believe that Yelp gained additional market share in Services in the third quarter. We further differentiated the product experience in Services in the third quarter as we worked to make Yelp the go-to platform for these categories. Improvements to the Request-a-Quote flow drove increases in consumer requests even against a backdrop of muted consumer activity in Services categories in the third quarter. Request-a-Quote requests increased sequentially from the second quarter, but were down by approximately 5% year over year. At the same time, matching and ad system improvements drove a meaningful increase in Services ad clicks compared to the third quarter of 2022, resulting in more quality leads delivered to advertisers. Services growth was led by Home Services Home Services Revenue Growth, Y/Y* 3Q22 4Q22 1Q23 3Q232Q23 25% 20% 25% 25% 20% *Growth rates rounded to the nearest 5%. ~20% 3Q22 3Q23 +14% Local, Auto, Professional, Pets, Real Estate, Financial and Event Services Home Services Services growth led by Home Services Services Revenue
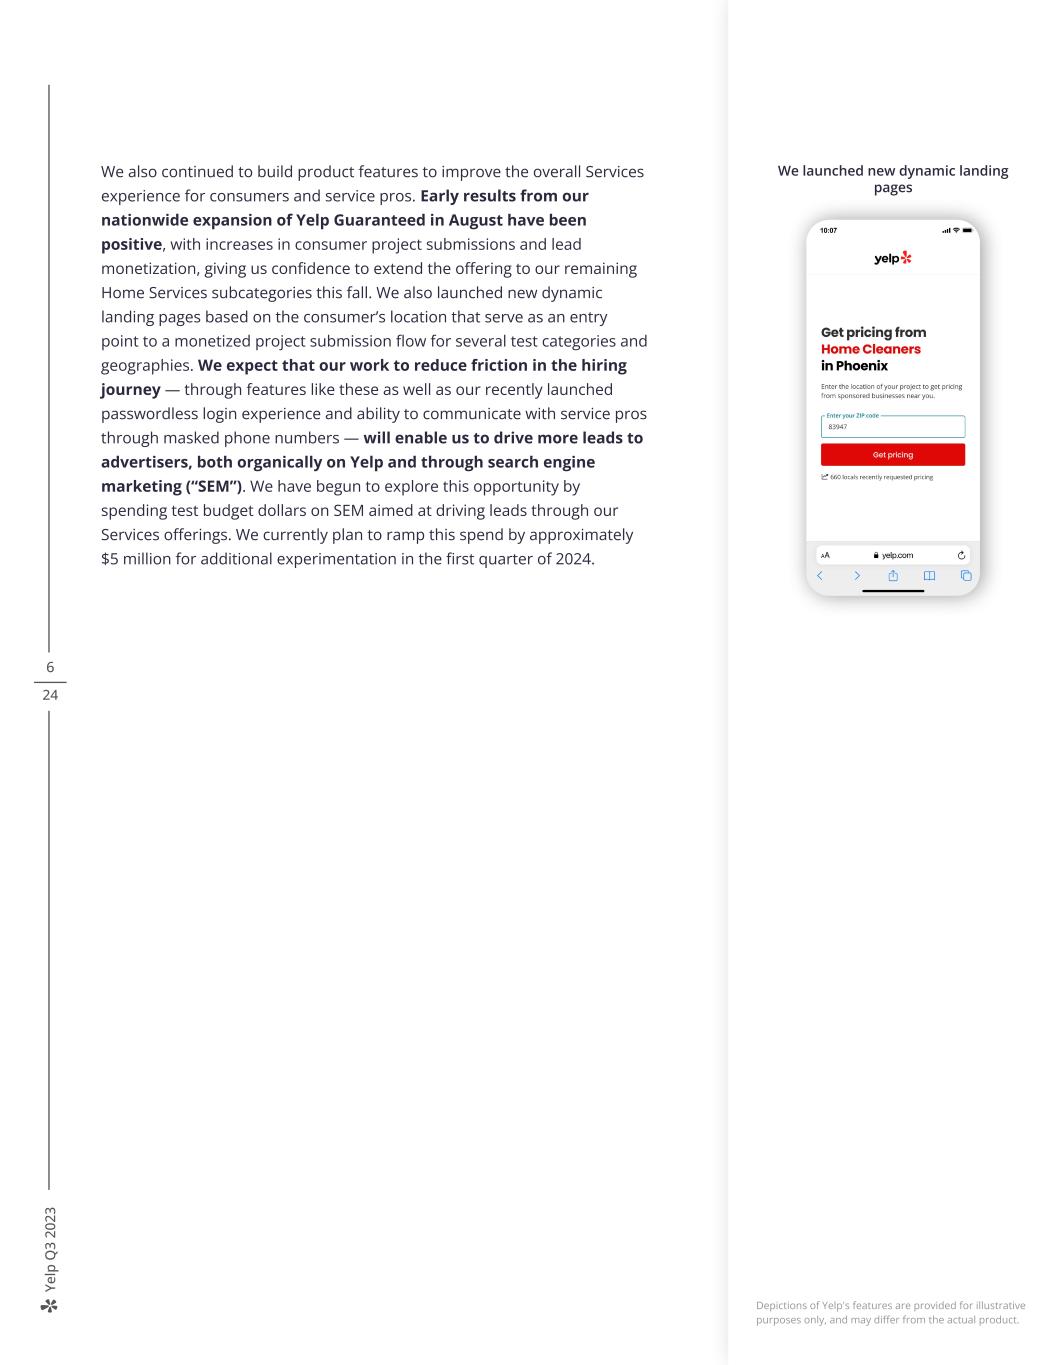
Ye lp Q 3 20 23 6 24 We also continued to build product features to improve the overall Services experience for consumers and service pros. Early results from our nationwide expansion of Yelp Guaranteed in August have been positive, with increases in consumer project submissions and lead monetization, giving us confidence to extend the offering to our remaining Home Services subcategories this fall. We also launched new dynamic landing pages based on the consumer’s location that serve as an entry point to a monetized project submission flow for several test categories and geographies. We expect that our work to reduce friction in the hiring journey — through features like these as well as our recently launched passwordless login experience and ability to communicate with service pros through masked phone numbers — will enable us to drive more leads to advertisers, both organically on Yelp and through search engine marketing (“SEM”). We have begun to explore this opportunity by spending test budget dollars on SEM aimed at driving leads through our Services offerings. We currently plan to ramp this spend by approximately $5 million for additional experimentation in the first quarter of 2024. ~20% 3Q22 3Q23 +14% Local, Auto, Professional, Pets, Real Estate, Financial and Event Services Home Services Services growth led by Home Services Services Revenue We launched new dynamic landing pages Depictions of Yelp's features are provided for illustrative purposes only, and may differ from the actual product.
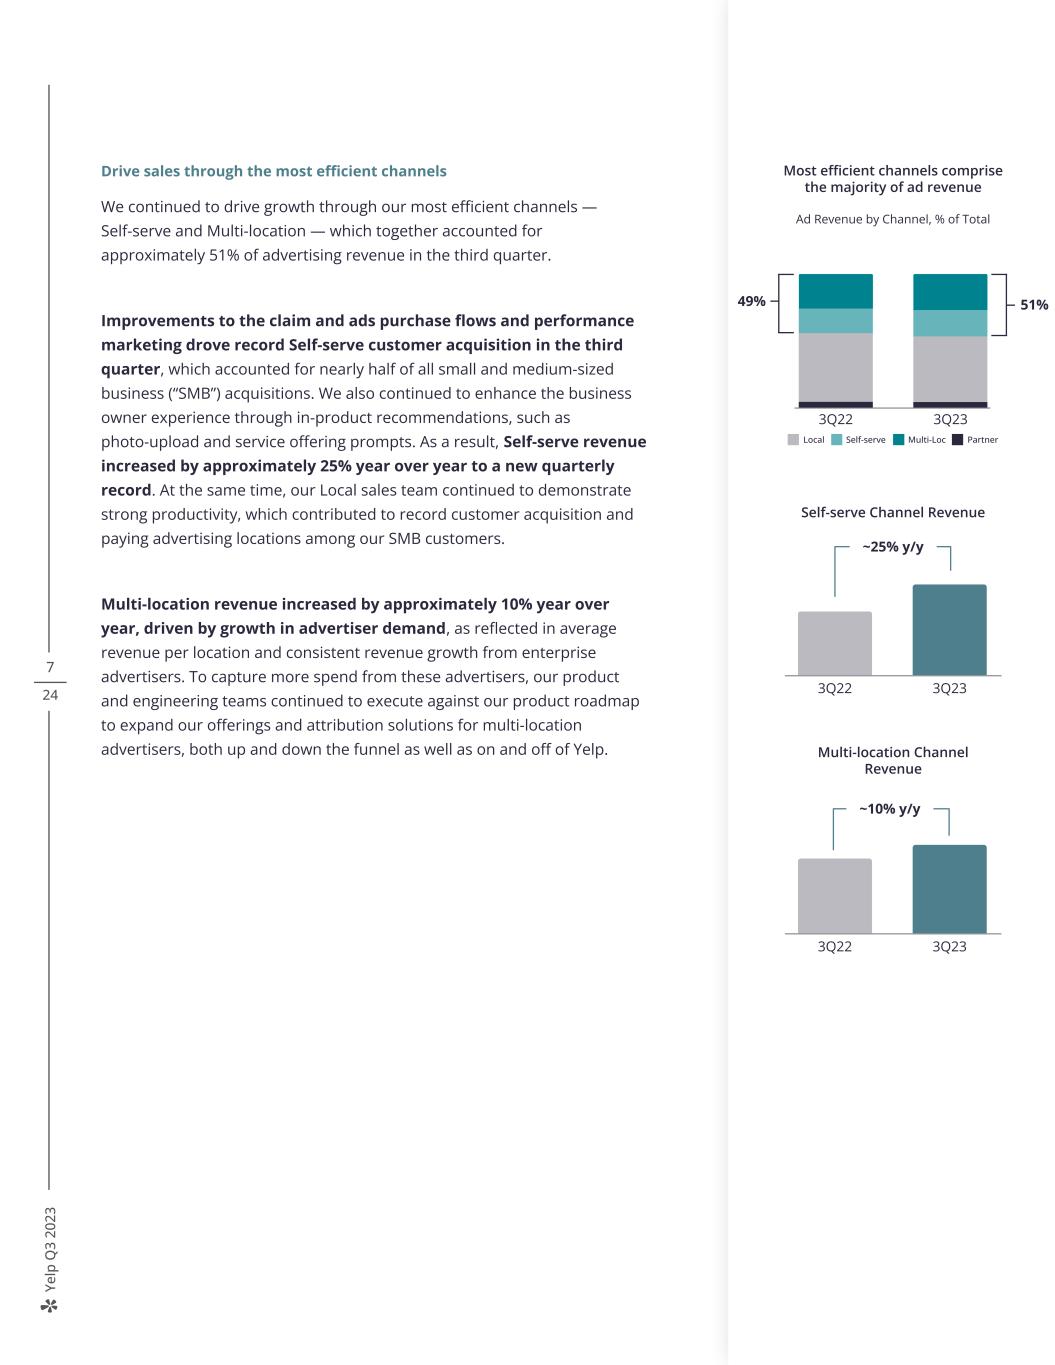
Ye lp Q 3 20 23 7 24 Drive sales through the most efficient channels We continued to drive growth through our most efficient channels — Self-serve and Multi-location — which together accounted for approximately 51% of advertising revenue in the third quarter. Improvements to the claim and ads purchase flows and performance marketing drove record Self-serve customer acquisition in the third quarter, which accounted for nearly half of all small and medium-sized business (“SMB”) acquisitions. We also continued to enhance the business owner experience through in-product recommendations, such as photo-upload and service offering prompts. As a result, Self-serve revenue increased by approximately 25% year over year to a new quarterly record. At the same time, our Local sales team continued to demonstrate strong productivity, which contributed to record customer acquisition and paying advertising locations among our SMB customers. Multi-location revenue increased by approximately 10% year over year, driven by growth in advertiser demand, as reflected in average revenue per location and consistent revenue growth from enterprise advertisers. To capture more spend from these advertisers, our product and engineering teams continued to execute against our product roadmap to expand our offerings and attribution solutions for multi-location advertisers, both up and down the funnel as well as on and off of Yelp. 3Q22 3Q23 Self-serveLocal Multi-Loc Partner 28%49% 51% Most efficient channels comprise the majority of ad revenue Ad Revenue by Channel, % of Total 3Q20 3Q21 3Q22 3Q23 Self-serveLocal Multi-Loc Partner 30% 19% 49% 30% 21% 47% Most efficient channels accounted for 51% of ad revenue Ad Revenue by Channel, % of Total 51%28% 17% 52% 26% 14% 56% Service offering prompts Multi-location Channel Revenue ~10% y/y 3Q22 3Q23 Self-serve Channel Revenue ~25% y/y 3Q22 3Q23
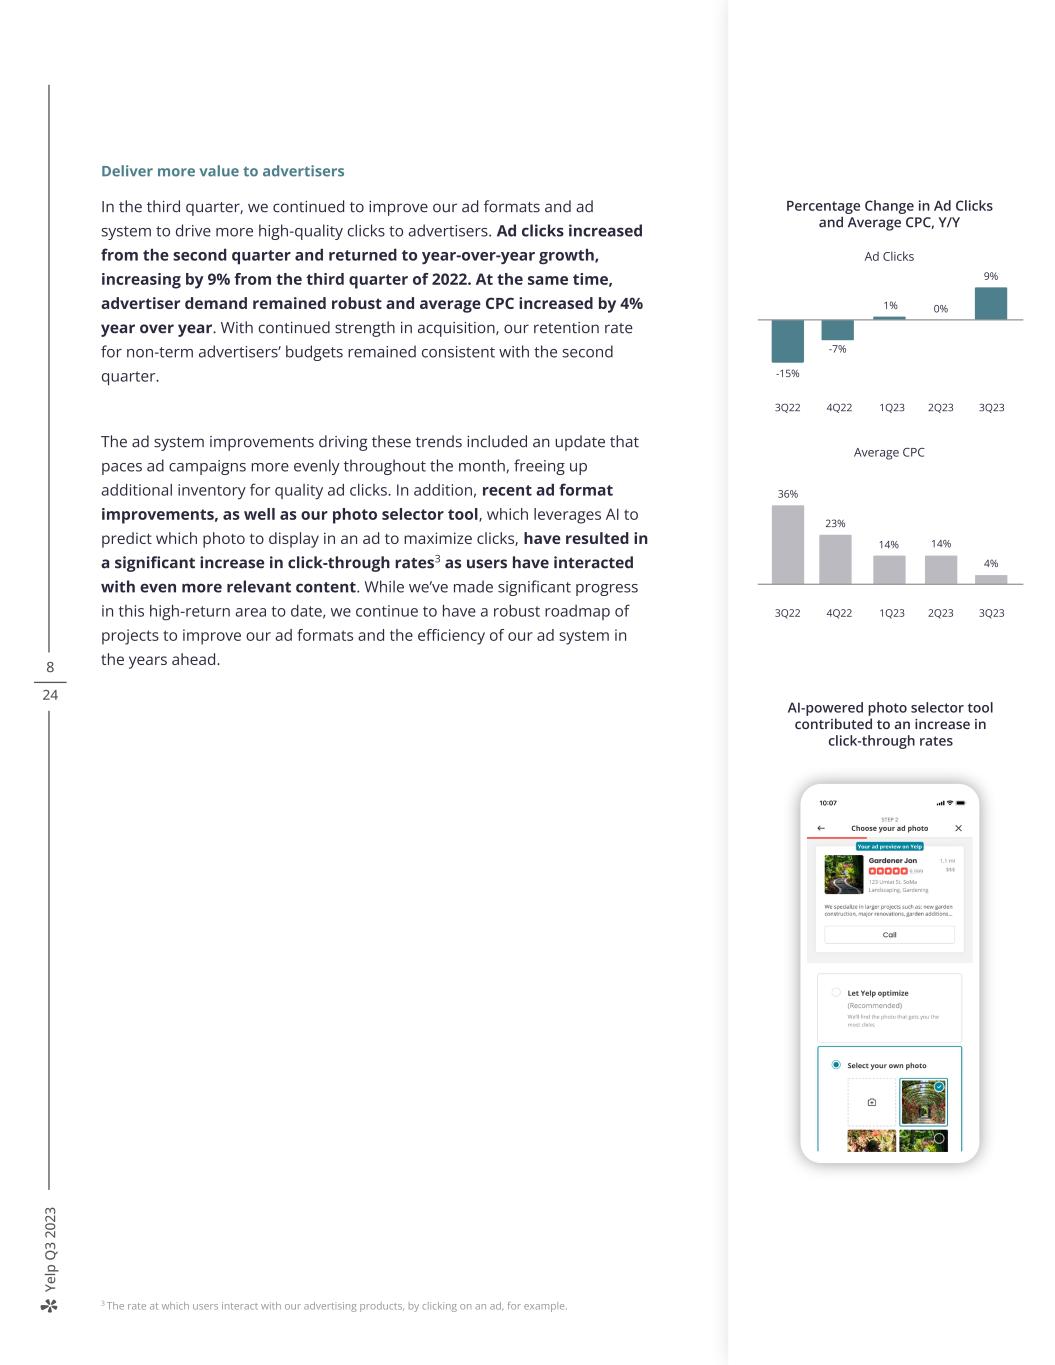
Ye lp Q 3 20 23 8 24 Deliver more value to advertisers In the third quarter, we continued to improve our ad formats and ad system to drive more high-quality clicks to advertisers. Ad clicks increased from the second quarter and returned to year-over-year growth, increasing by 9% from the third quarter of 2022. At the same time, advertiser demand remained robust and average CPC increased by 4% year over year. With continued strength in acquisition, our retention rate for non-term advertisers’ budgets remained consistent with the second quarter. The ad system improvements driving these trends included an update that paces ad campaigns more evenly throughout the month, freeing up additional inventory for quality ad clicks. In addition, recent ad format improvements, as well as our photo selector tool, which leverages AI to predict which photo to display in an ad to maximize clicks, have resulted in a significant increase in click-through rates3 as users have interacted with even more relevant content. While we’ve made significant progress in this high-return area to date, we continue to have a robust roadmap of projects to improve our ad formats and the efficiency of our ad system in the years ahead. Percentage Change in Ad Clicks and Average CPC, Y/Y Ad Clicks -15% 3Q22 4Q22 1Q23 2Q23 3Q23 9% -7% 1% 0% Average CPC 36% 3Q22 4Q22 1Q23 2Q23 3Q23 14% 23% 4% 14% Improved mobile web experience Neural nets - predicting which photo shown in an ad will generate the most clicks 3 The rate at which users interact with our advertising products, by clicking on an ad, for example. AI-powered photo selector tool contributed to an increase in click-through rates
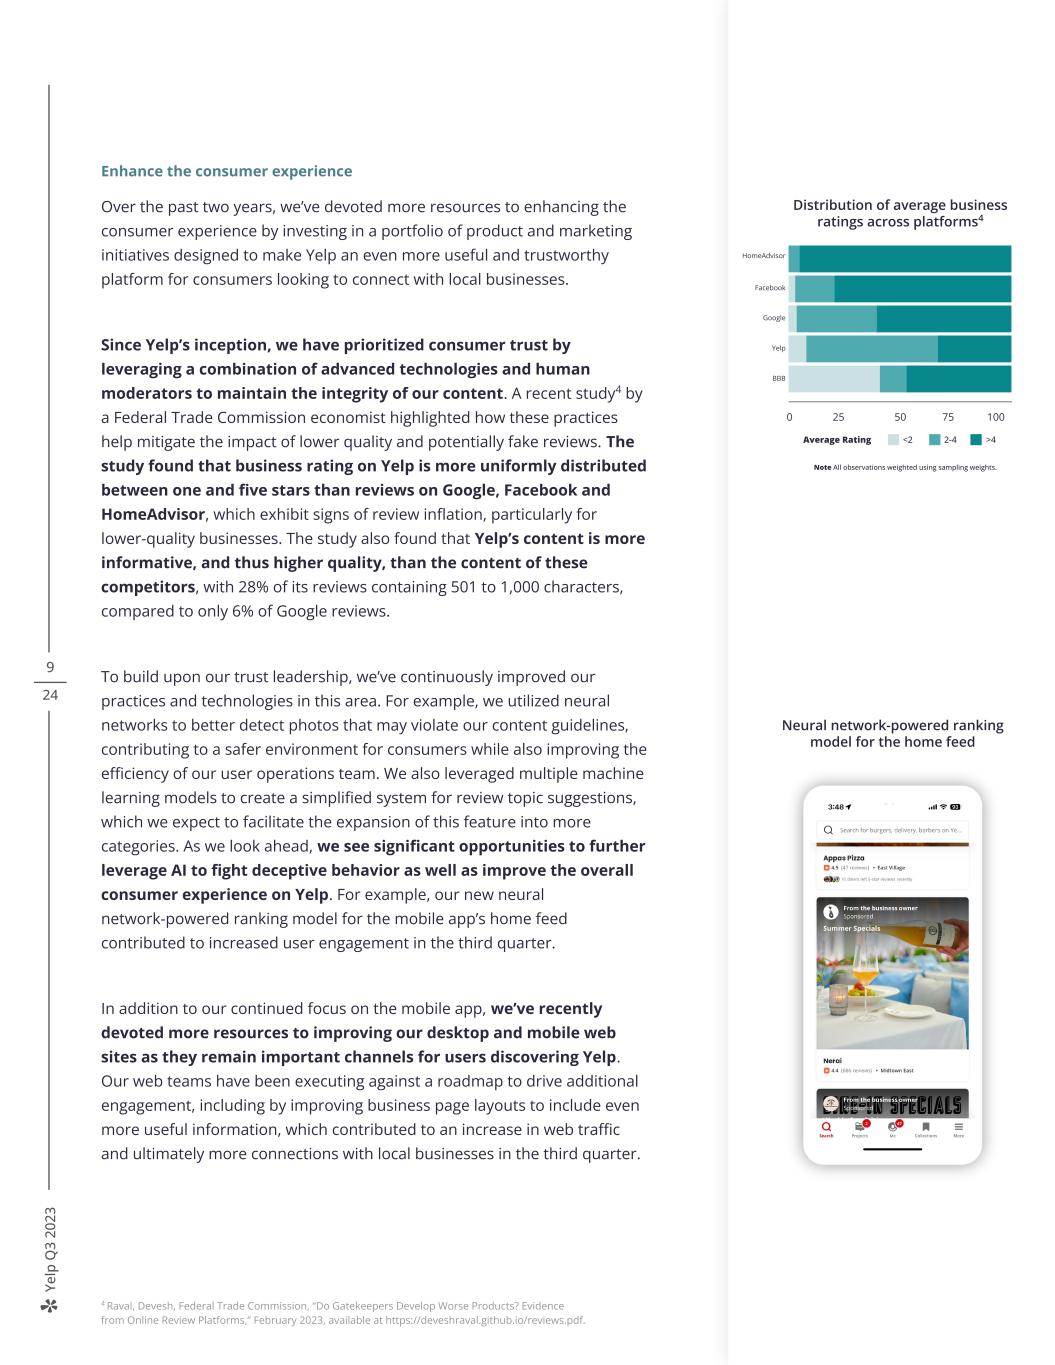
Ye lp Q 3 20 23 9 24 Enhance the consumer experience Over the past two years, we’ve devoted more resources to enhancing the consumer experience by investing in a portfolio of product and marketing initiatives designed to make Yelp an even more useful and trustworthy platform for consumers looking to connect with local businesses. Since Yelp’s inception, we have prioritized consumer trust by leveraging a combination of advanced technologies and human moderators to maintain the integrity of our content. A recent study4 by a Federal Trade Commission economist highlighted how these practices help mitigate the impact of lower quality and potentially fake reviews. The study found that business rating on Yelp is more uniformly distributed between one and five stars than reviews on Google, Facebook and HomeAdvisor, which exhibit signs of review inflation, particularly for lower-quality businesses. The study also found that Yelp’s content is more informative, and thus higher quality, than the content of these competitors, with 28% of its reviews containing 501 to 1,000 characters, compared to only 6% of Google reviews. To build upon our trust leadership, we’ve continuously improved our practices and technologies in this area. For example, we utilized neural networks to better detect photos that may violate our content guidelines, contributing to a safer environment for consumers while also improving the efficiency of our user operations team. We also leveraged multiple machine learning models to create a simplified system for review topic suggestions, which we expect to facilitate the expansion of this feature into more categories. As we look ahead, we see significant opportunities to further leverage AI to fight deceptive behavior as well as improve the overall consumer experience on Yelp. For example, our new neural network-powered ranking model for the mobile app’s home feed contributed to increased user engagement in the third quarter. In addition to our continued focus on the mobile app, we’ve recently devoted more resources to improving our desktop and mobile web sites as they remain important channels for users discovering Yelp. Our web teams have been executing against a roadmap to drive additional engagement, including by improving business page layouts to include even more useful information, which contributed to an increase in web traffic and ultimately more connections with local businesses in the third quarter. We experimented with a new ranking model for the home feed using neural networks AI-powered review topic suggestions drove incremental review submissions We improved business page layouts for mobile web 4 Raval, Devesh, Federal Trade Commission, “Do Gatekeepers Develop Worse Products? Evidence from Online Review Platforms,” February 2023, available at https://deveshraval.github.io/reviews.pdf. Neural network-powered ranking model for the home feed 0 10050 7525 HomeAdvisor Facebook Google Yelp BBB <2 2-4 >4Average Rating Distribution of average business ratings across platforms4 Note All observations weighted using sampling weights.
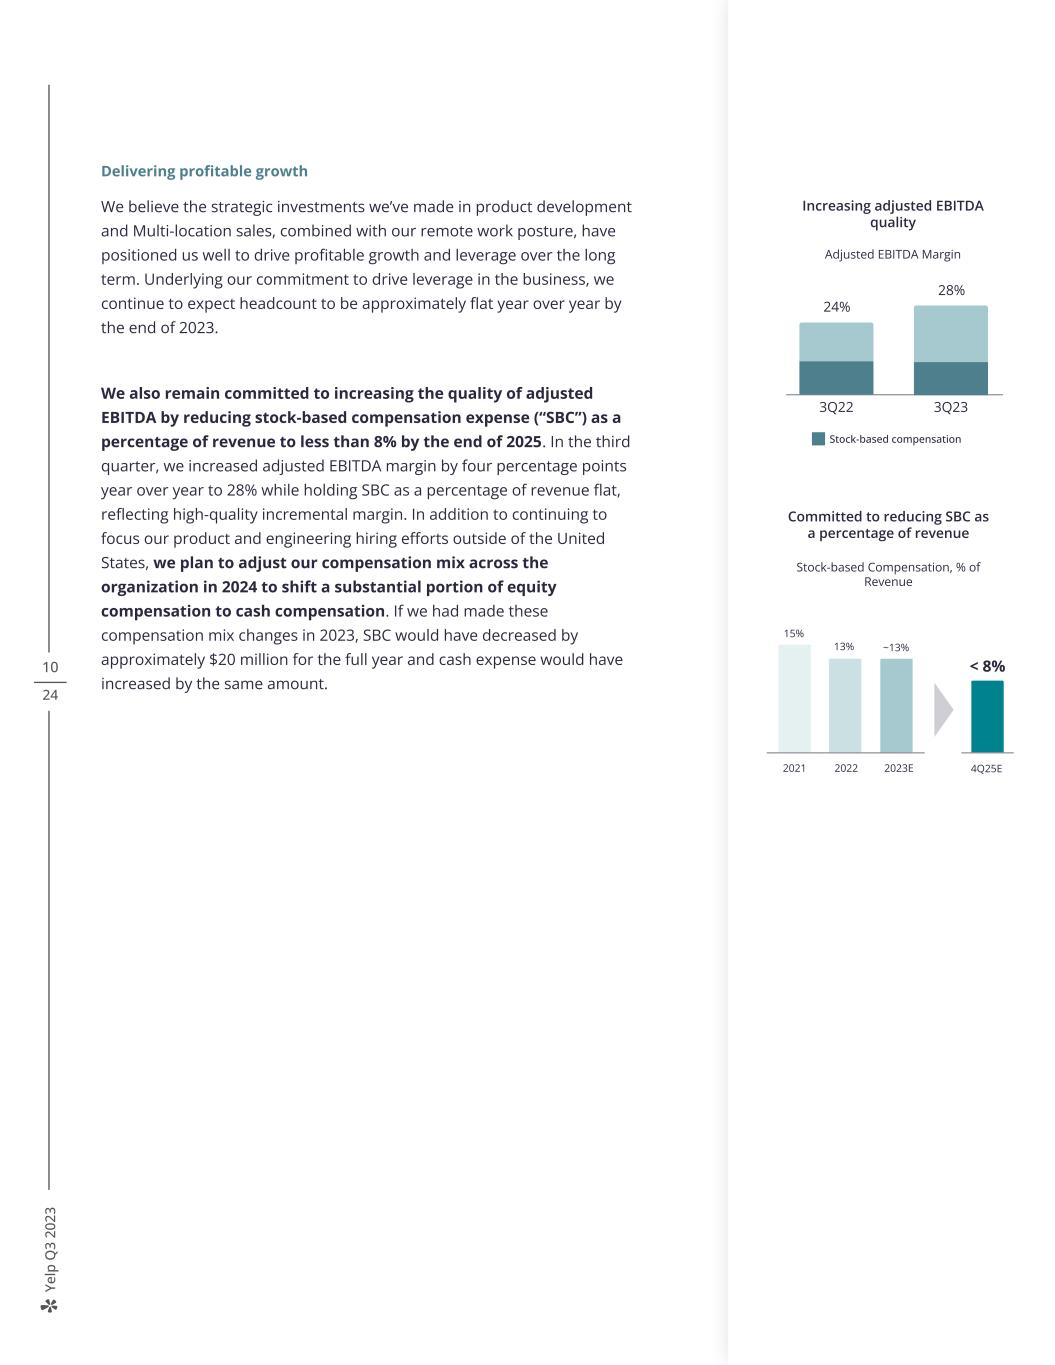
Ye lp Q 3 20 23 10 24 Delivering profitable growth We believe the strategic investments we’ve made in product development and Multi-location sales, combined with our remote work posture, have positioned us well to drive profitable growth and leverage over the long term. Underlying our commitment to drive leverage in the business, we continue to expect headcount to be approximately flat year over year by the end of 2023. We also remain committed to increasing the quality of adjusted EBITDA by reducing stock-based compensation expense (“SBC”) as a percentage of revenue to less than 8% by the end of 2025. In the third quarter, we increased adjusted EBITDA margin by four percentage points year over year to 28% while holding SBC as a percentage of revenue flat, reflecting high-quality incremental margin. In addition to continuing to focus our product and engineering hiring efforts outside of the United States, we plan to adjust our compensation mix across the organization in 2024 to shift a substantial portion of equity compensation to cash compensation. If we had made these compensation mix changes in 2023, SBC would have decreased by approximately $20 million for the full year and cash expense would have increased by the same amount. Home feed captions Numerical ratings to one decimal point 3Q22 3Q23 Stock-based compensation 24% 28% Increasing adjusted EBITDA quality Adjusted EBITDA Margin Exhibit 92021 2022 2023E 4Q25E 15% 13% ~13% < 8% Committed to reducing SBC as a percentage of revenue Stock-based Compensation, % of Revenue
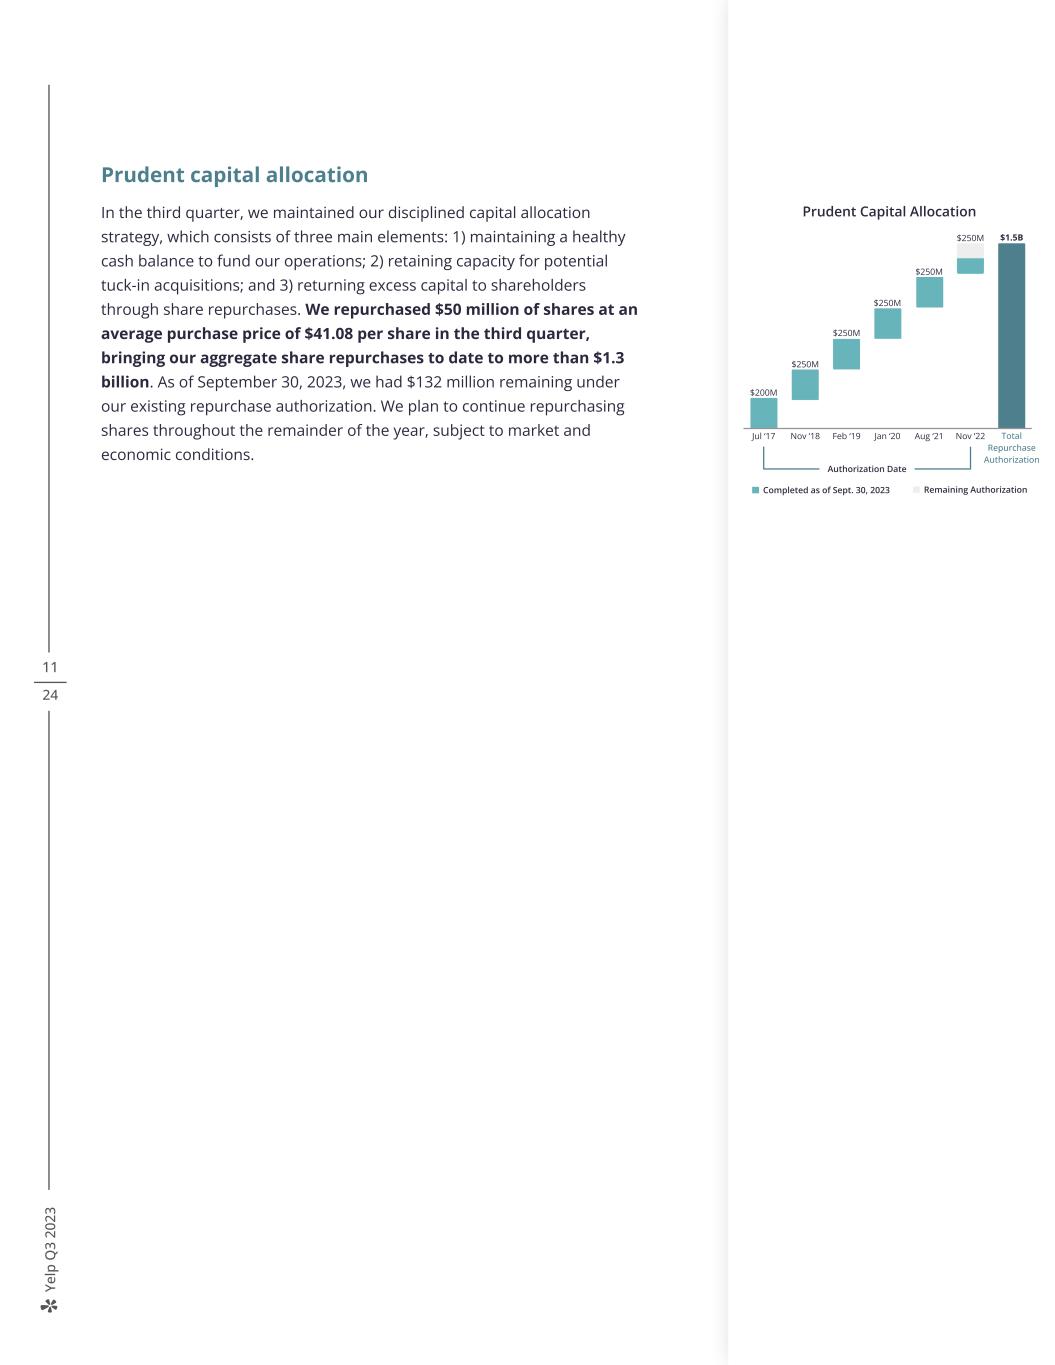
Ye lp Q 3 20 23 11 24 Prudent capital allocation In the third quarter, we maintained our disciplined capital allocation strategy, which consists of three main elements: 1) maintaining a healthy cash balance to fund our operations; 2) retaining capacity for potential tuck-in acquisitions; and 3) returning excess capital to shareholders through share repurchases. We repurchased $50 million of shares at an average purchase price of $41.08 per share in the third quarter, bringing our aggregate share repurchases to date to more than $1.3 billion. As of September 30, 2023, we had $132 million remaining under our existing repurchase authorization. We plan to continue repurchasing shares throughout the remainder of the year, subject to market and economic conditions. Total Repurchase Authorization Nov ‘22 Authorization Date Prudent Capital Allocation $1.5B Completed as of Sept. 30, 2023 Remaining Authorization $200M Jul ‘17 Nov ‘18 Feb ‘19 Jan ‘20 $250M $250M $250M $250M Aug ‘21 $250M
Ye lp Q 3 20 23 In summary, Yelp’s third quarter results demonstrate our ability to drive consistent double-digit growth while expanding margins. As our product-led strategy continues to strengthen Yelp’s business and our team executes against our plan, we have even more conviction in the durability of Yelp’s broad-based local advertising platform. We remain excited by the significant opportunities ahead to drive profitable growth and shareholder value over the long term. Sincerely, Jeremy Stoppelman David Schwarzbach Co-founder, CEO CFO 12 24
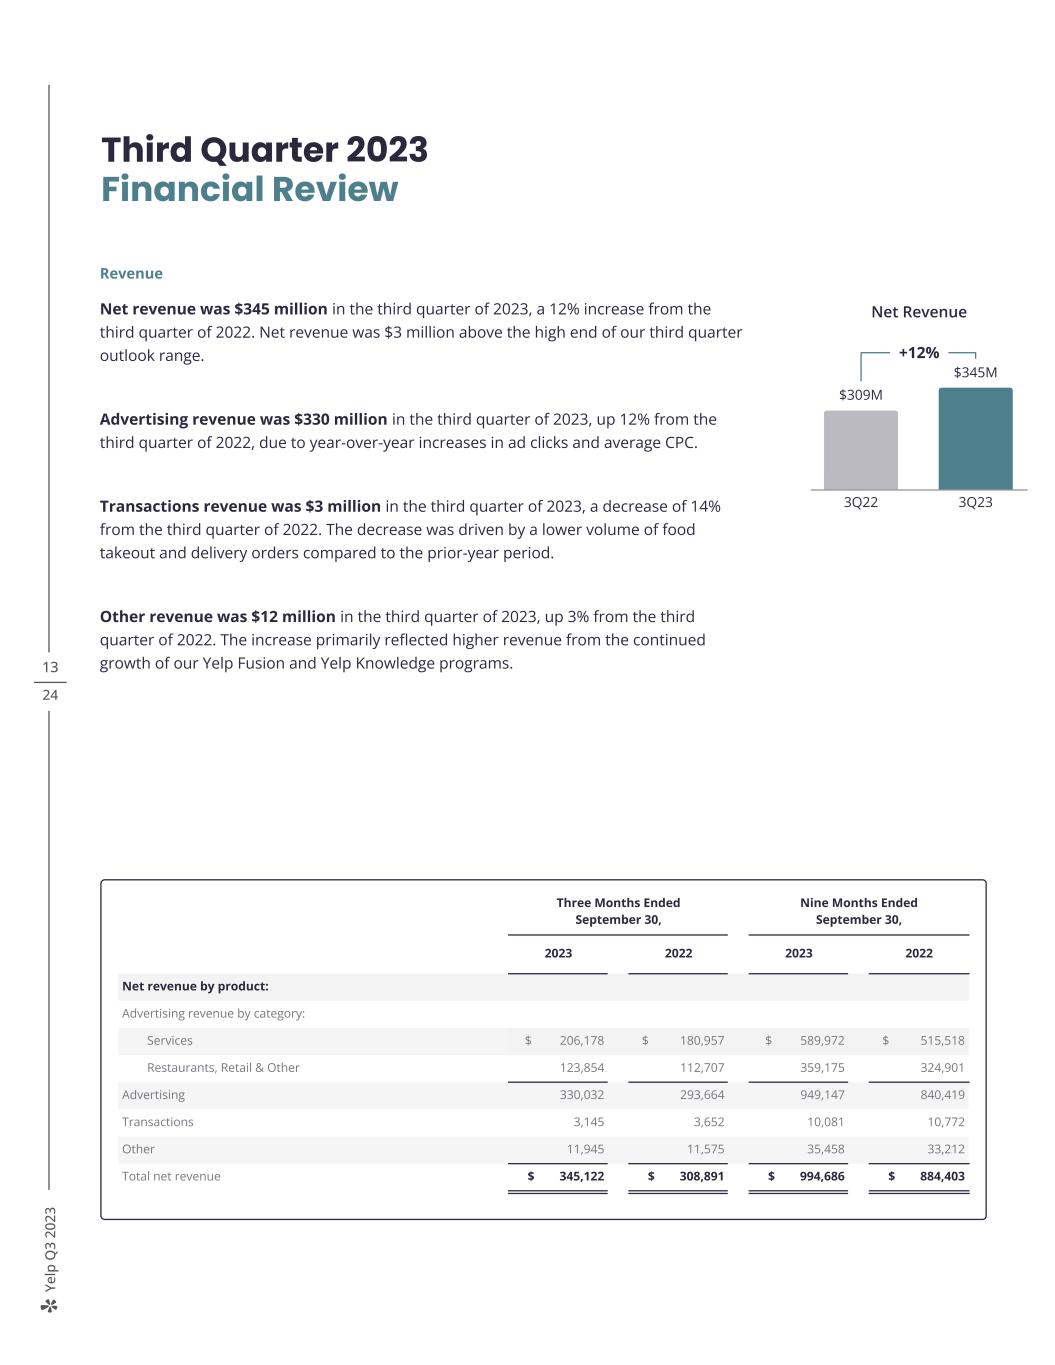
Ye lp Q 3 20 23 13 24 Revenue Net revenue was $345 million in the third quarter of 2023, a 12% increase from the third quarter of 2022. Net revenue was $3 million above the high end of our third quarter outlook range. Advertising revenue was $330 million in the third quarter of 2023, up 12% from the third quarter of 2022, due to year-over-year increases in ad clicks and average CPC. Transactions revenue was $3 million in the third quarter of 2023, a decrease of 14% from the third quarter of 2022. The decrease was driven by a lower volume of food takeout and delivery orders compared to the prior-year period. Other revenue was $12 million in the third quarter of 2023, up 3% from the third quarter of 2022. The increase primarily reflected higher revenue from the continued growth of our Yelp Fusion and Yelp Knowledge programs. Third Quarter 2023 Financial Review Three Months Ended September 30, Nine Months Ended September 30, 2023 2022 2023 2022 Net revenue by product: Advertising revenue by category: Services $ 206,178 $ 180,957 $ 589,972 $ 515,518 Restaurants, Retail & Other 123,854 112,707 359,175 324,901 Advertising 330,032 293,664 949,147 840,419 Transactions 3,145 3,652 10,081 10,772 Other 11,945 11,575 35,458 33,212 Total net revenue $ 345,122 $ 308,891 $ 994,686 $ 884,403 Net Revenue +12% $309M $345M 3Q22 3Q23
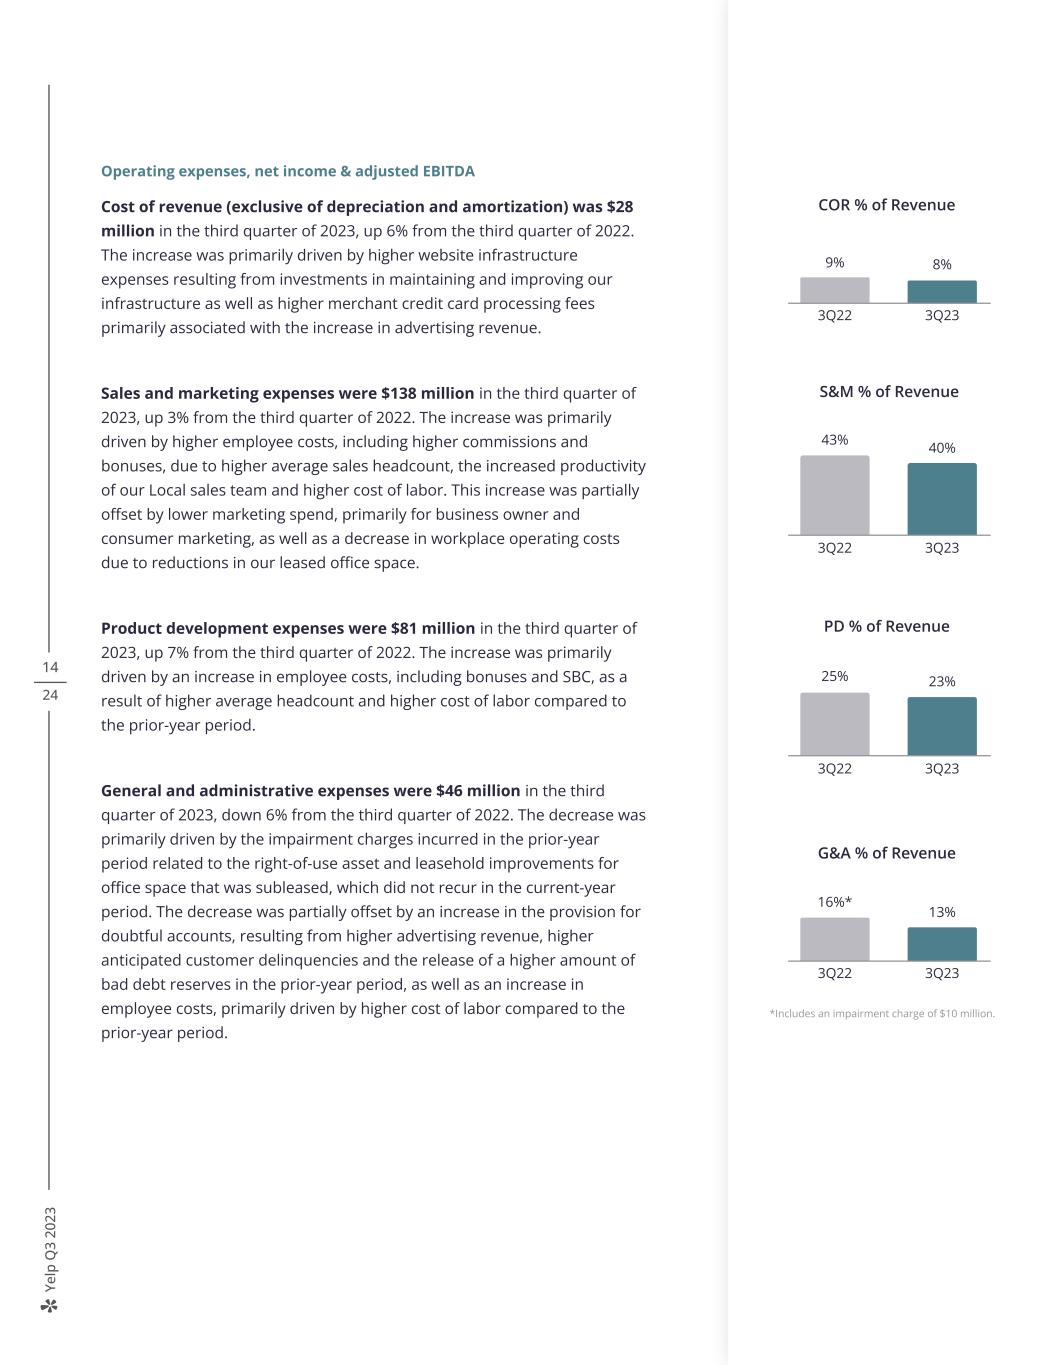
Ye lp Q 3 20 23 14 24 Operating expenses, net income & adjusted EBITDA Cost of revenue (exclusive of depreciation and amortization) was $28 million in the third quarter of 2023, up 6% from the third quarter of 2022. The increase was primarily driven by higher website infrastructure expenses resulting from investments in maintaining and improving our infrastructure as well as higher merchant credit card processing fees primarily associated with the increase in advertising revenue. Sales and marketing expenses were $138 million in the third quarter of 2023, up 3% from the third quarter of 2022. The increase was primarily driven by higher employee costs, including higher commissions and bonuses, due to higher average sales headcount, the increased productivity of our Local sales team and higher cost of labor. This increase was partially offset by lower marketing spend, primarily for business owner and consumer marketing, as well as a decrease in workplace operating costs due to reductions in our leased office space. Product development expenses were $81 million in the third quarter of 2023, up 7% from the third quarter of 2022. The increase was primarily driven by an increase in employee costs, including bonuses and SBC, as a result of higher average headcount and higher cost of labor compared to the prior-year period. General and administrative expenses were $46 million in the third quarter of 2023, down 6% from the third quarter of 2022. The decrease was primarily driven by the impairment charges incurred in the prior-year period related to the right-of-use asset and leasehold improvements for office space that was subleased, which did not recur in the current-year period. The decrease was partially offset by an increase in the provision for doubtful accounts, resulting from higher advertising revenue, higher anticipated customer delinquencies and the release of a higher amount of bad debt reserves in the prior-year period, as well as an increase in employee costs, primarily driven by higher cost of labor compared to the prior-year period. COR % of Revenue 9% 8% 3Q22 3Q23 S&M % of Revenue 43% 40% 3Q22 3Q23 PD % of Revenue 25% 23% 3Q22 3Q23 G&A % of Revenue 16%* 13% 3Q22 3Q23 *Includes an impairment charge of $10 million.
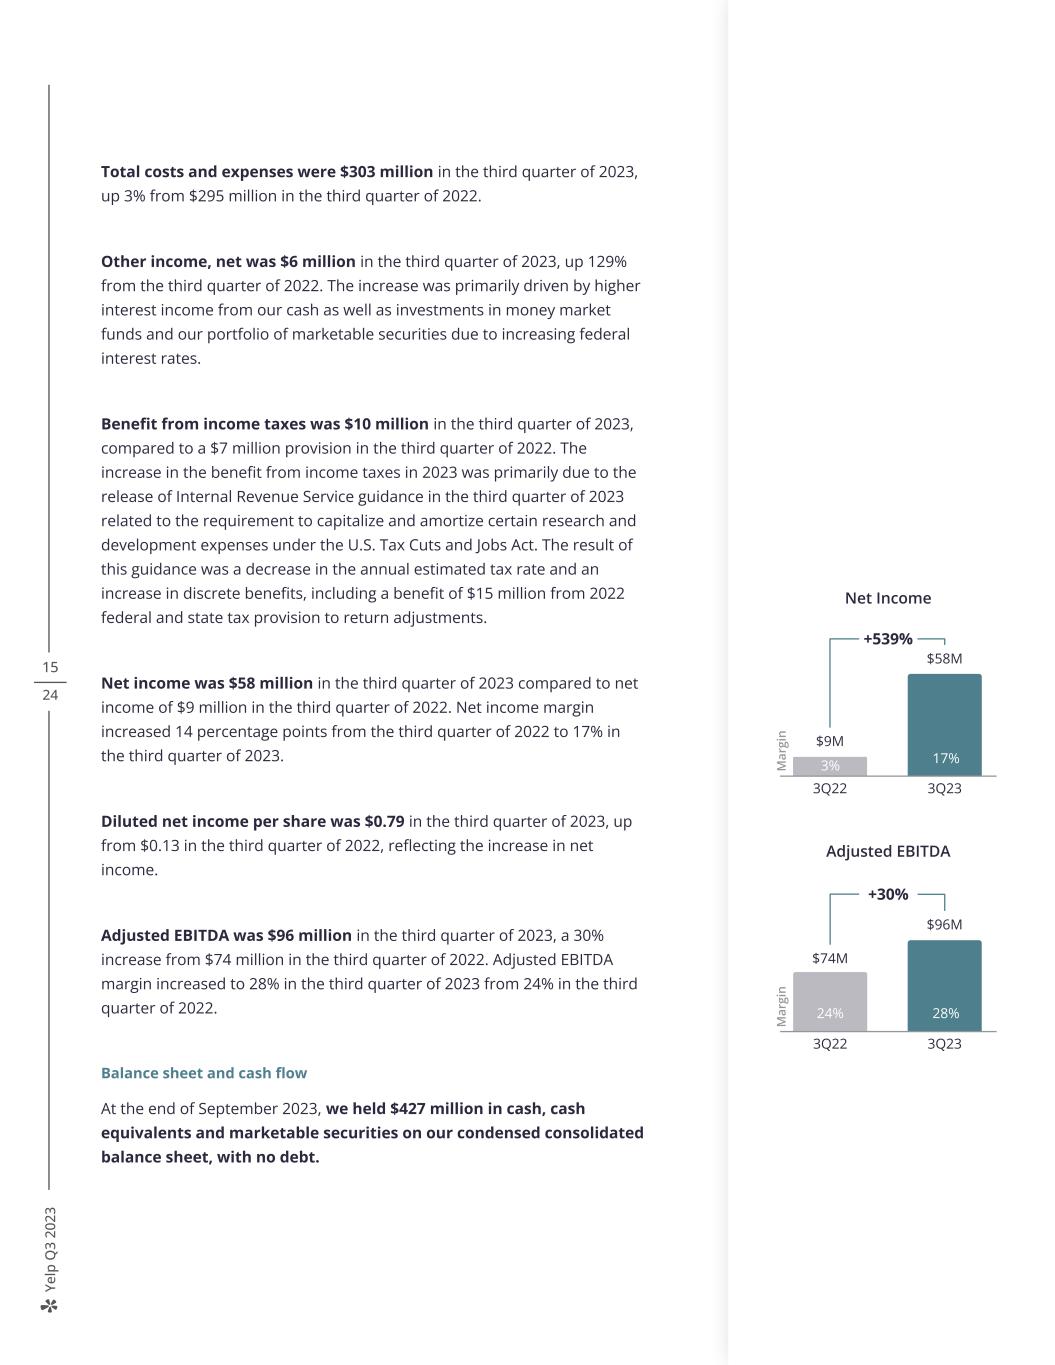
Ye lp Q 3 20 23 15 24 Total costs and expenses were $303 million in the third quarter of 2023, up 3% from $295 million in the third quarter of 2022. Other income, net was $6 million in the third quarter of 2023, up 129% from the third quarter of 2022. The increase was primarily driven by higher interest income from our cash as well as investments in money market funds and our portfolio of marketable securities due to increasing federal interest rates. Benefit from income taxes was $10 million in the third quarter of 2023, compared to a $7 million provision in the third quarter of 2022. The increase in the benefit from income taxes in 2023 was primarily due to the release of Internal Revenue Service guidance in the third quarter of 2023 related to the requirement to capitalize and amortize certain research and development expenses under the U.S. Tax Cuts and Jobs Act. The result of this guidance was a decrease in the annual estimated tax rate and an increase in discrete benefits, including a benefit of $15 million from 2022 federal and state tax provision to return adjustments. Net income was $58 million in the third quarter of 2023 compared to net income of $9 million in the third quarter of 2022. Net income margin increased 14 percentage points from the third quarter of 2022 to 17% in the third quarter of 2023. Diluted net income per share was $0.79 in the third quarter of 2023, up from $0.13 in the third quarter of 2022, reflecting the increase in net income. Adjusted EBITDA was $96 million in the third quarter of 2023, a 30% increase from $74 million in the third quarter of 2022. Adjusted EBITDA margin increased to 28% in the third quarter of 2023 from 24% in the third quarter of 2022. Balance sheet and cash flow At the end of September 2023, we held $427 million in cash, cash equivalents and marketable securities on our condensed consolidated balance sheet, with no debt. 19% 17% 8% 7% M ar gi n Net Income +539% $9M $58M 3Q22 3Q23 17%3% Adjusted EBITDA +30% $74M $96M 3Q22 3Q23 M ar gi n 24% 28%
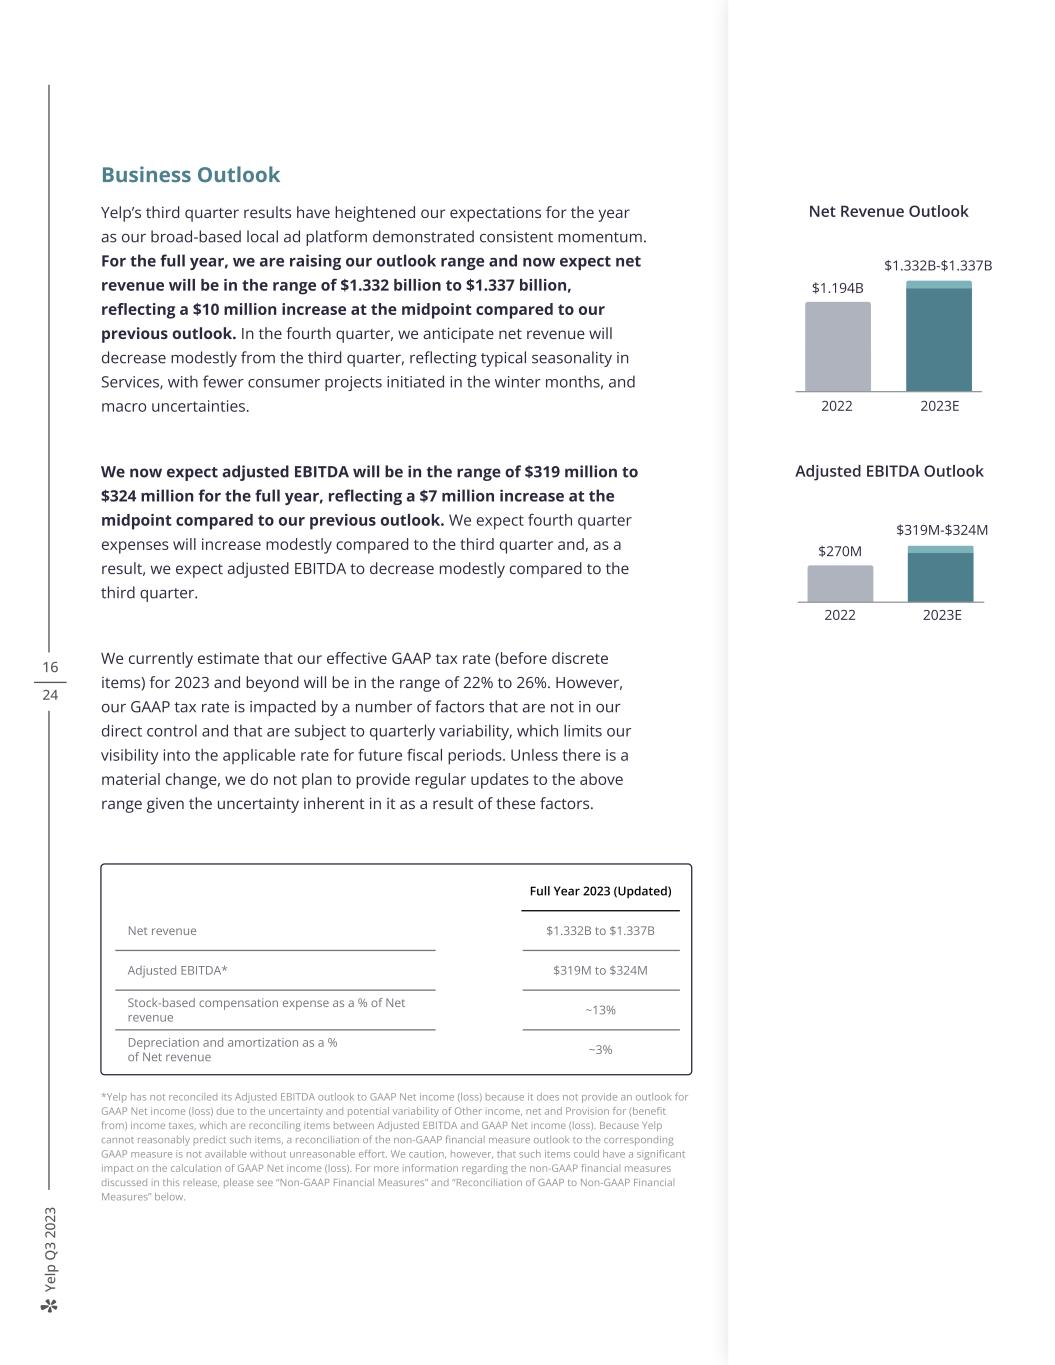
Ye lp Q 3 20 23 16 24 Business Outlook Yelp’s third quarter results have heightened our expectations for the year as our broad-based local ad platform demonstrated consistent momentum. For the full year, we are raising our outlook range and now expect net revenue will be in the range of $1.332 billion to $1.337 billion, reflecting a $10 million increase at the midpoint compared to our previous outlook. In the fourth quarter, we anticipate net revenue will decrease modestly from the third quarter, reflecting typical seasonality in Services, with fewer consumer projects initiated in the winter months, and macro uncertainties. We now expect adjusted EBITDA will be in the range of $319 million to $324 million for the full year, reflecting a $7 million increase at the midpoint compared to our previous outlook. We expect fourth quarter expenses will increase modestly compared to the third quarter and, as a result, we expect adjusted EBITDA to decrease modestly compared to the third quarter. We currently estimate that our effective GAAP tax rate (before discrete items) for 2023 and beyond will be in the range of 22% to 26%. However, our GAAP tax rate is impacted by a number of factors that are not in our direct control and that are subject to quarterly variability, which limits our visibility into the applicable rate for future fiscal periods. Unless there is a material change, we do not plan to provide regular updates to the above range given the uncertainty inherent in it as a result of these factors. $270M Adjusted EBITDA Outlook 2022 2023E $319M-$324M Full Year 2023 (Updated) Net revenue $1.332B to $1.337B Adjusted EBITDA* $319M to $324M Stock-based compensation expense as a % of Net revenue ~13% Depreciation and amortization as a % of Net revenue ~3% *Yelp has not reconciled its Adjusted EBITDA outlook to GAAP Net income (loss) because it does not provide an outlook for GAAP Net income (loss) due to the uncertainty and potential variability of Other income, net and Provision for (benefit from) income taxes, which are reconciling items between Adjusted EBITDA and GAAP Net income (loss). Because Yelp cannot reasonably predict such items, a reconciliation of the non-GAAP financial measure outlook to the corresponding GAAP measure is not available without unreasonable effort. We caution, however, that such items could have a significant impact on the calculation of GAAP Net income (loss). For more information regarding the non-GAAP financial measures discussed in this release, please see “Non-GAAP Financial Measures” and “Reconciliation of GAAP to Non-GAAP Financial Measures” below. 2022 2023E $1.194B $1.332B-$1.337B Net Revenue Outlook
Ye lp Q 3 20 23 17 24 Quarterly Earnings Webcast Yelp will host a live webcast today at 2:00 p.m. PDT to discuss the third quarter 2023 financial results and outlook for the full year 2023. The webcast can be accessed on the Yelp Investor Relations website at yelp-ir.com. A replay of the webcast will be available at the same website. About Yelp Yelp Inc. (yelp.com) is a community-driven platform that connects people with great local businesses. Millions of people rely on Yelp for useful and trusted local business information, reviews and photos to help inform their spending decisions. As a one-stop local platform, Yelp helps consumers easily discover, connect and transact with businesses across a broad range of categories by making it easy to request a quote for a service, book a table at a restaurant, and more. Yelp was founded in San Francisco in 2004.
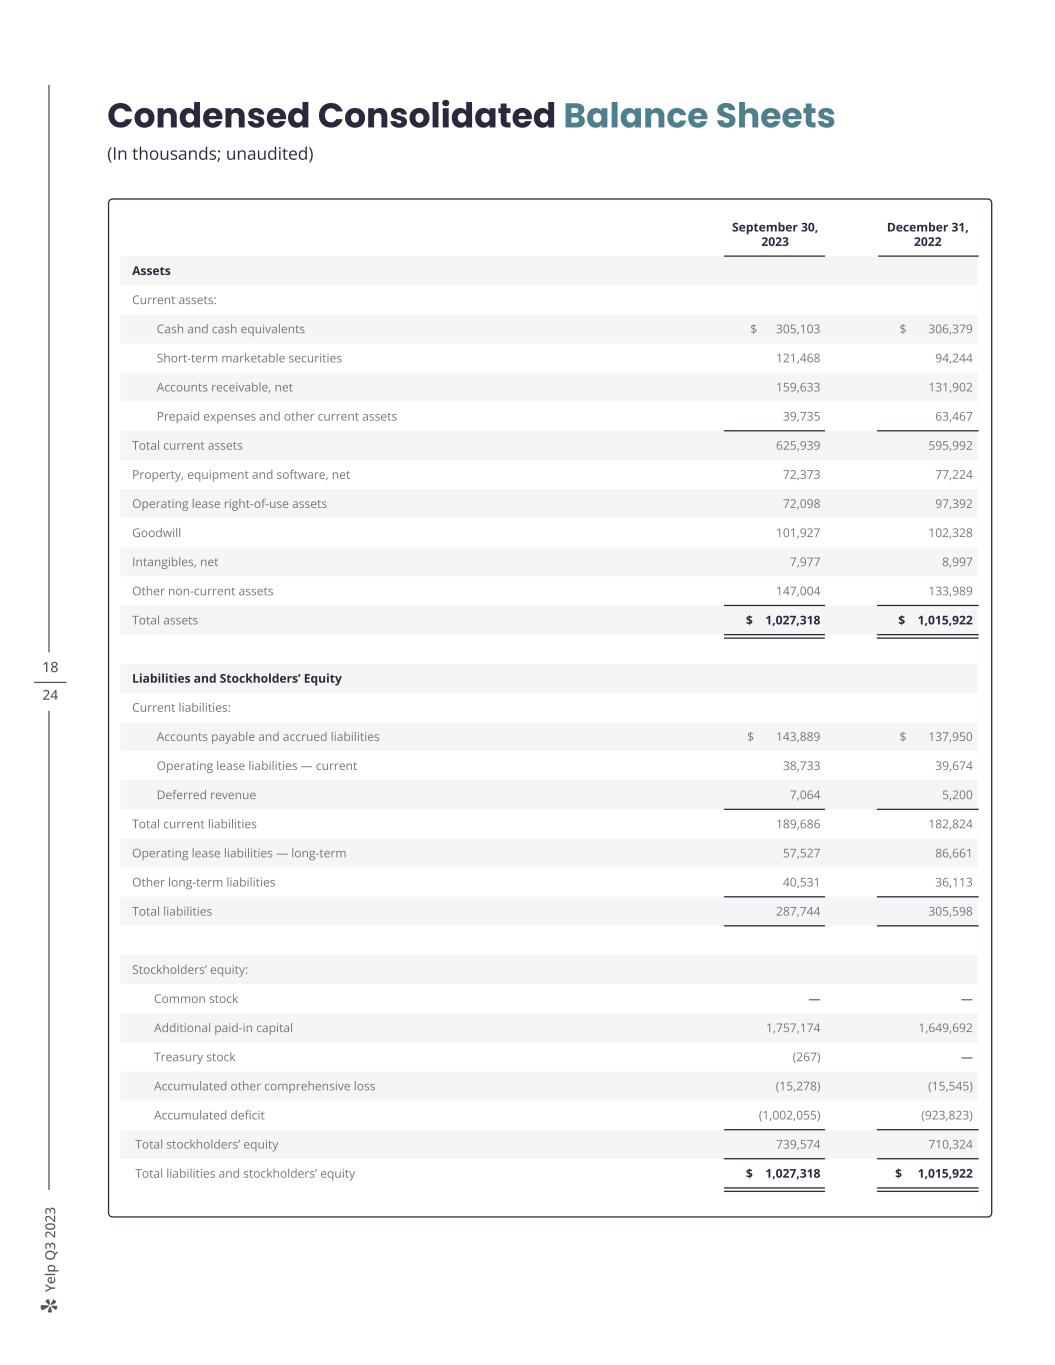
Ye lp Q 3 20 23 18 24 Condensed Consolidated Balance Sheets (In thousands; unaudited) September 30, 2023 December 31, 2022 Assets Current assets: Cash and cash equivalents $ 305,103 $ 306,379 Short-term marketable securities 121,468 94,244 Accounts receivable, net 159,633 131,902 Prepaid expenses and other current assets 39,735 63,467 Total current assets 625,939 595,992 Property, equipment and software, net 72,373 77,224 Operating lease right-of-use assets 72,098 97,392 Goodwill 101,927 102,328 Intangibles, net 7,977 8,997 Other non-current assets 147,004 133,989 Total assets $ 1,027,318 $ 1,015,922 Liabilities and Stockholders’ Equity Current liabilities: Accounts payable and accrued liabilities $ 143,889 $ 137,950 Operating lease liabilities — current 38,733 39,674 Deferred revenue 7,064 5,200 Total current liabilities 189,686 182,824 Operating lease liabilities — long-term 57,527 86,661 Other long-term liabilities 40,531 36,113 Total liabilities 287,744 305,598 Stockholders’ equity: Common stock — — Additional paid-in capital 1,757,174 1,649,692 Treasury stock (267) — Accumulated other comprehensive loss (15,278) (15,545) Accumulated deficit (1,002,055) (923,823) Total stockholders’ equity 739,574 710,324 Total liabilities and stockholders’ equity $ 1,027,318 $ 1,015,922
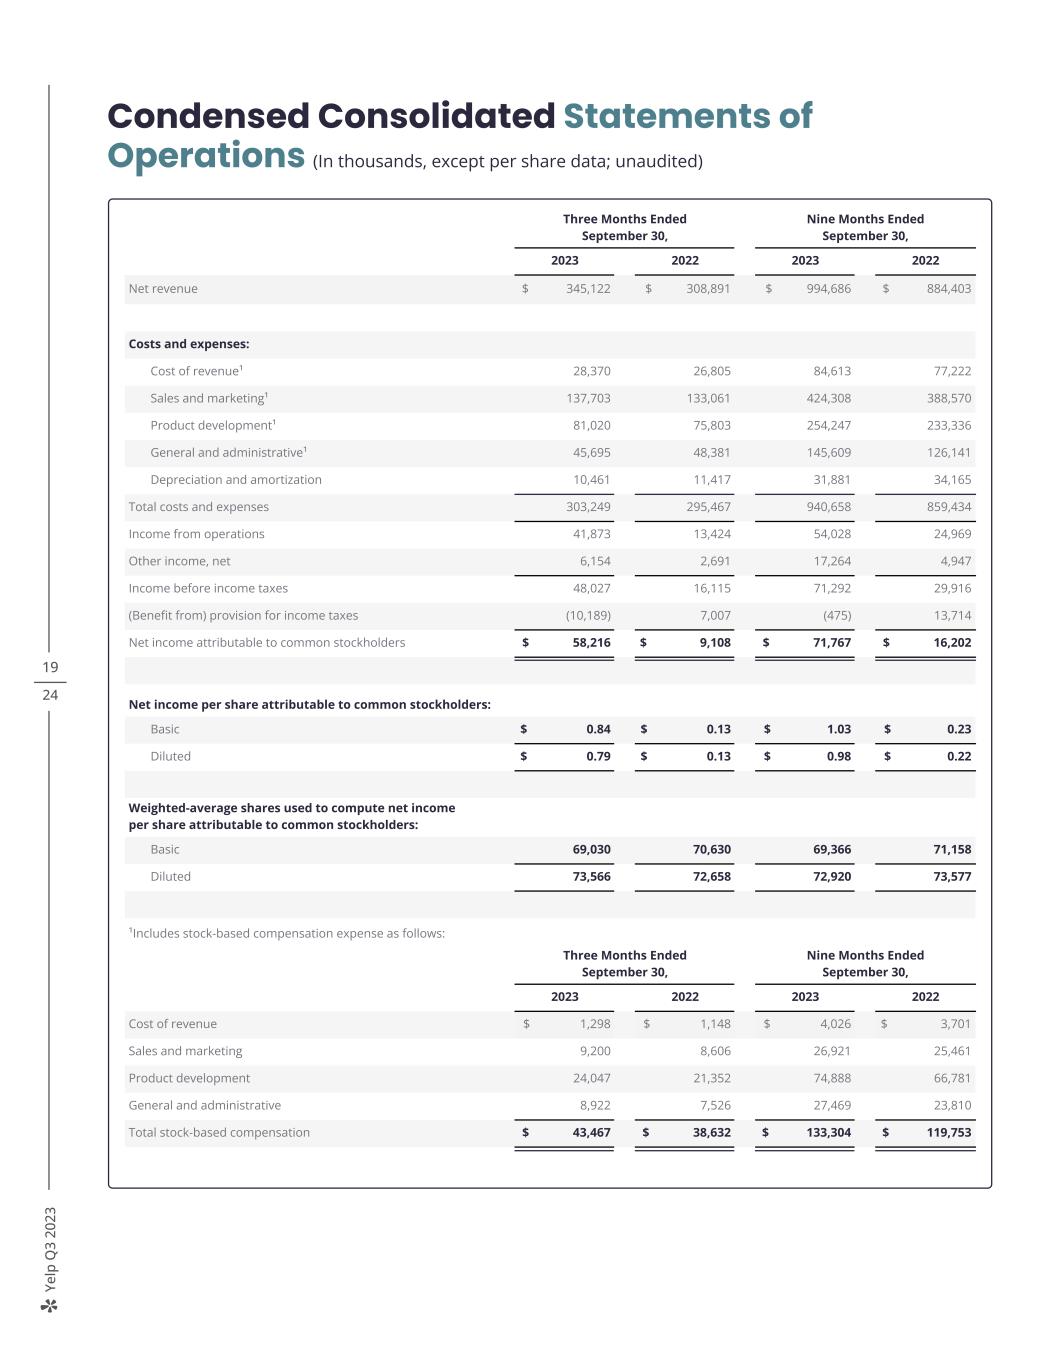
Ye lp Q 3 20 23 19 24 Condensed Consolidated Statements of Operations (In thousands, except per share data; unaudited) Three Months Ended September 30, Nine Months Ended September 30, 2023 2022 2023 2022 Net revenue $ 345,122 $ 308,891 $ 994,686 $ 884,403 Costs and expenses: Cost of revenue¹ 28,370 26,805 84,613 77,222 Sales and marketing¹ 137,703 133,061 424,308 388,570 Product development¹ 81,020 75,803 254,247 233,336 General and administrative¹ 45,695 48,381 145,609 126,141 Depreciation and amortization 10,461 11,417 31,881 34,165 Total costs and expenses 303,249 295,467 940,658 859,434 Income from operations 41,873 13,424 54,028 24,969 Other income, net 6,154 2,691 17,264 4,947 Income before income taxes 48,027 16,115 71,292 29,916 (Benefit from) provision for income taxes (10,189) 7,007 (475) 13,714 Net income attributable to common stockholders $ 58,216 $ 9,108 $ 71,767 $ 16,202 Net income per share attributable to common stockholders: Basic $ 0.84 $ 0.13 $ 1.03 $ 0.23 Diluted $ 0.79 $ 0.13 $ 0.98 $ 0.22 Weighted-average shares used to compute net income per share attributable to common stockholders: Basic 69,030 70,630 69,366 71,158 Diluted 73,566 72,658 72,920 73,577 ¹Includes stock-based compensation expense as follows: Three Months Ended September 30, Nine Months Ended September 30, 2023 2022 2023 2022 Cost of revenue $ 1,298 $ 1,148 $ 4,026 $ 3,701 Sales and marketing 9,200 8,606 26,921 25,461 Product development 24,047 21,352 74,888 66,781 General and administrative 8,922 7,526 27,469 23,810 Total stock-based compensation $ 43,467 $ 38,632 $ 133,304 $ 119,753
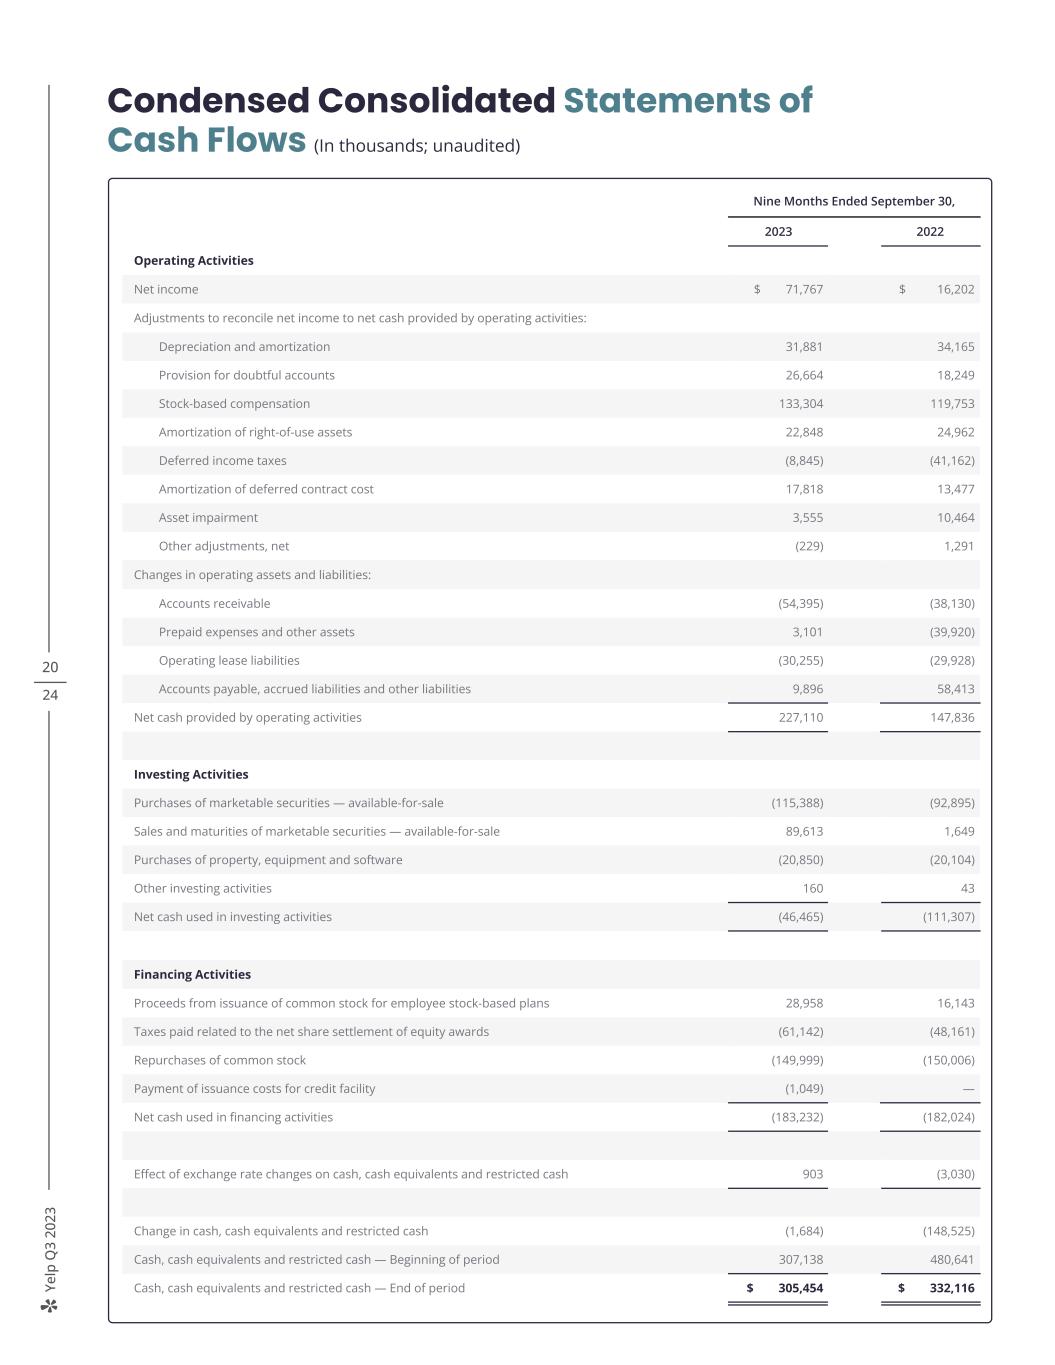
Ye lp Q 3 20 23 20 24 Condensed Consolidated Statements of Cash Flows (In thousands; unaudited) Nine Months Ended September 30, 2023 2022 Operating Activities Net income $ 71,767 $ 16,202 Adjustments to reconcile net income to net cash provided by operating activities: Depreciation and amortization 31,881 34,165 Provision for doubtful accounts 26,664 18,249 Stock-based compensation 133,304 119,753 Amortization of right-of-use assets 22,848 24,962 Deferred income taxes (8,845) (41,162) Amortization of deferred contract cost 17,818 13,477 Asset impairment 3,555 10,464 Other adjustments, net (229) 1,291 Changes in operating assets and liabilities: Accounts receivable (54,395) (38,130) Prepaid expenses and other assets 3,101 (39,920) Operating lease liabilities (30,255) (29,928) Accounts payable, accrued liabilities and other liabilities 9,896 58,413 Net cash provided by operating activities 227,110 147,836 Investing Activities Purchases of marketable securities — available-for-sale (115,388) (92,895) Sales and maturities of marketable securities — available-for-sale 89,613 1,649 Purchases of property, equipment and software (20,850) (20,104) Other investing activities 160 43 Net cash used in investing activities (46,465) (111,307) Financing Activities Proceeds from issuance of common stock for employee stock-based plans 28,958 16,143 Taxes paid related to the net share settlement of equity awards (61,142) (48,161) Repurchases of common stock (149,999) (150,006) Payment of issuance costs for credit facility (1,049) — Net cash used in financing activities (183,232) (182,024) Effect of exchange rate changes on cash, cash equivalents and restricted cash 903 (3,030) Change in cash, cash equivalents and restricted cash (1,684) (148,525) Cash, cash equivalents and restricted cash — Beginning of period 307,138 480,641 Cash, cash equivalents and restricted cash — End of period $ 305,454 $ 332,116
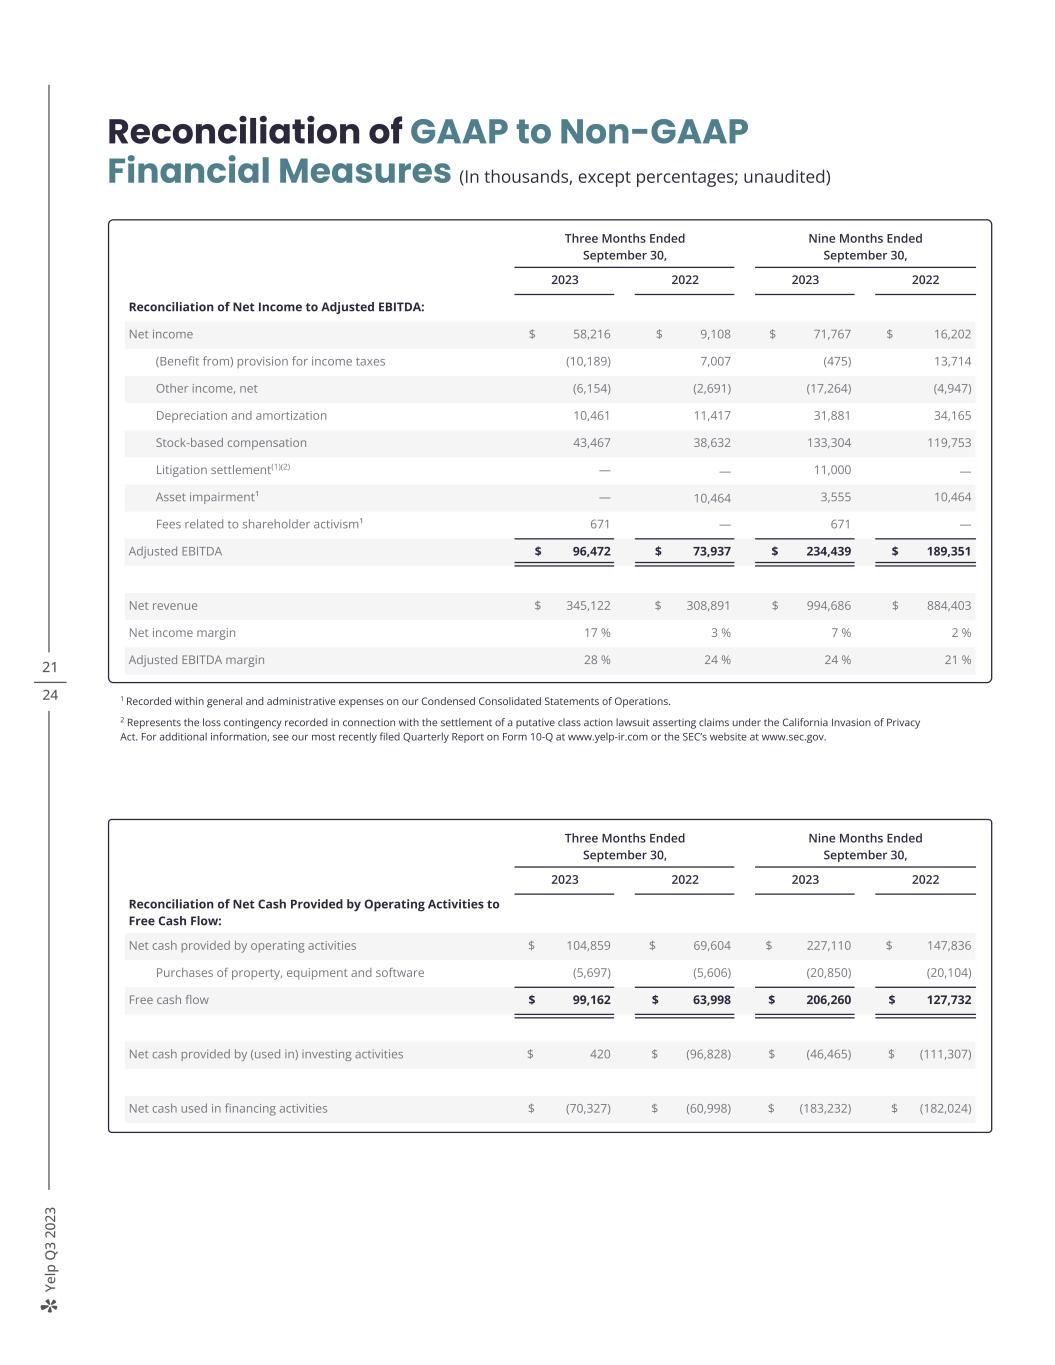
Ye lp Q 3 20 23 21 24 Reconciliation of GAAP to Non-GAAP Financial Measures (In thousands, except percentages; unaudited) 1 Recorded within general and administrative expenses on our Condensed Consolidated Statements of Operations. 2 Represents the loss contingency recorded in connection with the settlement of a putative class action lawsuit asserting claims under the California Invasion of Privacy Act. For additional information, see our most recently filed Quarterly Report on Form 10-Q at www.yelp-ir.com or the SEC’s website at www.sec.gov. Three Months Ended September 30, Nine Months Ended September 30, 2023 2022 2023 2022 Reconciliation of Net Income to Adjusted EBITDA: Net income $ 58,216 $ 9,108 $ 71,767 $ 16,202 (Benefit from) provision for income taxes (10,189) 7,007 (475) 13,714 Other income, net (6,154) (2,691) (17,264) (4,947) Depreciation and amortization 10,461 11,417 31,881 34,165 Stock-based compensation 43,467 38,632 133,304 119,753 Litigation settlement(1)(2) — — 11,000 — Asset impairment¹ — 10,464 3,555 10,464 Fees related to shareholder activism¹ 671 — 671 — Adjusted EBITDA $ 96,472 $ 73,937 $ 234,439 $ 189,351 Net revenue $ 345,122 $ 308,891 $ 994,686 $ 884,403 Net income margin 17 % 3 % 7 % 2 % Adjusted EBITDA margin 28 % 24 % 24 % 21 % Three Months Ended September 30, Nine Months Ended September 30, 2023 2022 2023 2022 Reconciliation of Net Cash Provided by Operating Activities to Free Cash Flow: Net cash provided by operating activities $ 104,859 $ 69,604 $ 227,110 $ 147,836 Purchases of property, equipment and software (5,697) (5,606) (20,850) (20,104) Free cash flow $ 99,162 $ 63,998 $ 206,260 $ 127,732 Net cash provided by (used in) investing activities $ 420 $ (96,828) $ (46,465) $ (111,307) Net cash used in financing activities $ (70,327) $ (60,998) $ (183,232) $ (182,024)
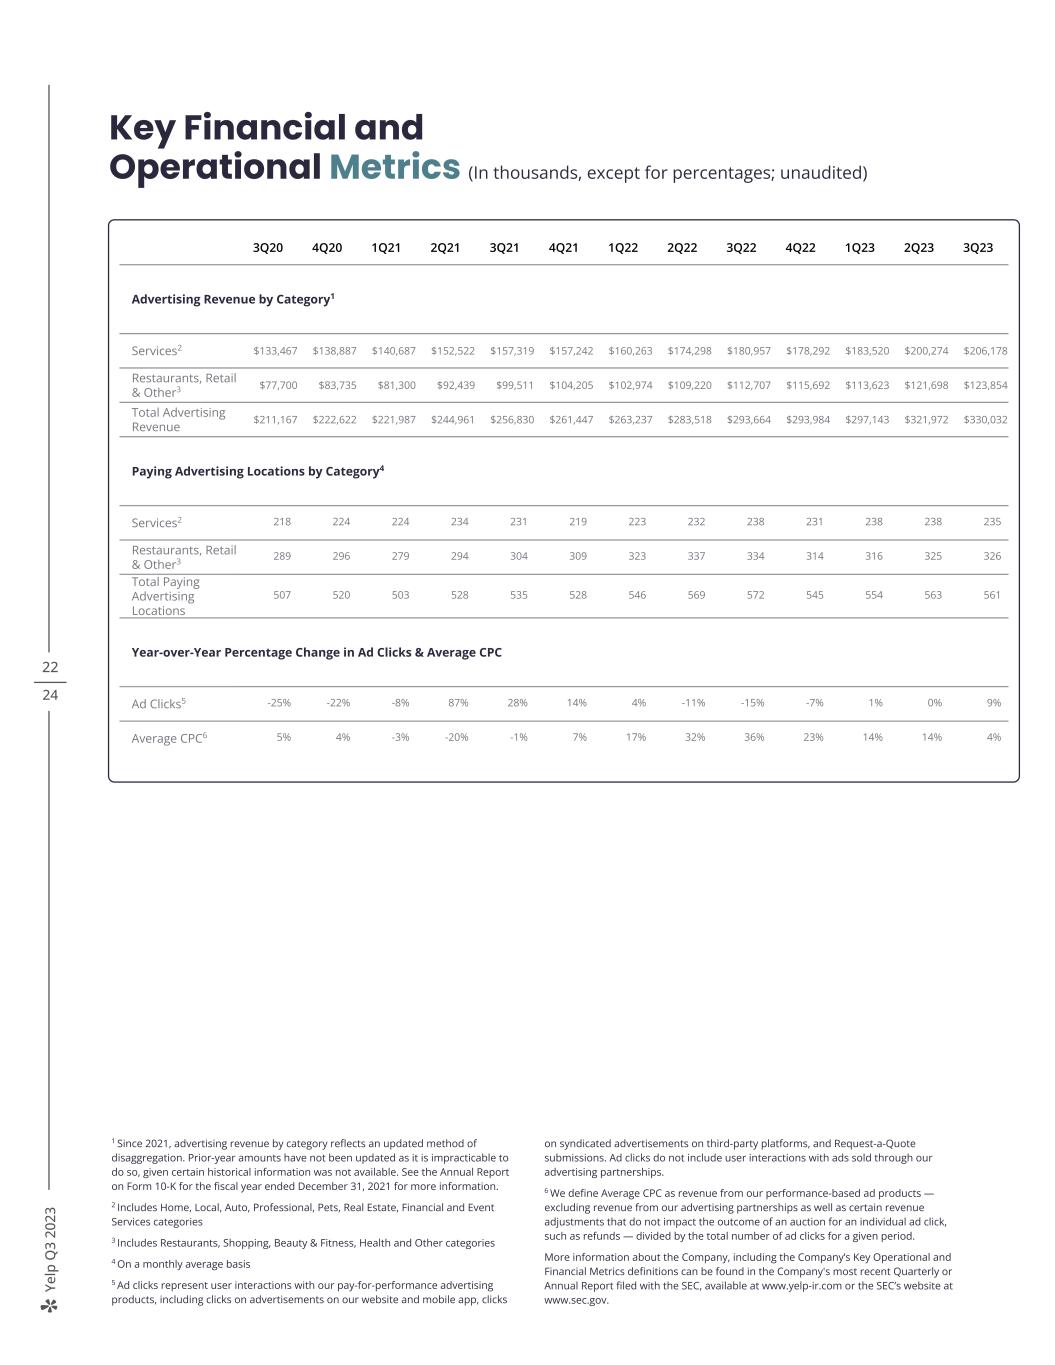
Ye lp Q 3 20 23 22 24 Key Financial and Operational Metrics (In thousands, except for percentages; unaudited) 3Q20 4Q20 1Q21 2Q21 3Q21 4Q21 1Q22 2Q22 3Q22 4Q22 1Q23 2Q23 3Q23 Advertising Revenue by Category1 Services2 $133,467 $138,887 $140,687 $152,522 $157,319 $157,242 $160,263 $174,298 $180,957 $178,292 $183,520 $200,274 $206,178 Restaurants, Retail & Other3 $77,700 $83,735 $81,300 $92,439 $99,511 $104,205 $102,974 $109,220 $112,707 $115,692 $113,623 $121,698 $123,854 Total Advertising Revenue $211,167 $222,622 $221,987 $244,961 $256,830 $261,447 $263,237 $283,518 $293,664 $293,984 $297,143 $321,972 $330,032 Paying Advertising Locations by Category4 Services2 218 224 224 234 231 219 223 232 238 231 238 238 235 Restaurants, Retail & Other3 289 296 279 294 304 309 323 337 334 314 316 325 326 Total Paying Advertising Locations 507 520 503 528 535 528 546 569 572 545 554 563 561 Year-over-Year Percentage Change in Ad Clicks & Average CPC Ad Clicks5 -25% -22% -8% 87% 28% 14% 4% -11% -15% -7% 1% 0% 9% Average CPC6 5% 4% -3% -20% -1% 7% 17% 32% 36% 23% 14% 14% 4% 1 Since 2021, advertising revenue by category reflects an updated method of disaggregation. Prior-year amounts have not been updated as it is impracticable to do so, given certain historical information was not available. See the Annual Report on Form 10-K for the fiscal year ended December 31, 2021 for more information. 2 Includes Home, Local, Auto, Professional, Pets, Real Estate, Financial and Event Services categories 3 Includes Restaurants, Shopping, Beauty & Fitness, Health and Other categories 4 On a monthly average basis 5 Ad clicks represent user interactions with our pay-for-performance advertising products, including clicks on advertisements on our website and mobile app, clicks on syndicated advertisements on third-party platforms, and Request-a-Quote submissions. Ad clicks do not include user interactions with ads sold through our advertising partnerships. 6 We define Average CPC as revenue from our performance-based ad products — excluding revenue from our advertising partnerships as well as certain revenue adjustments that do not impact the outcome of an auction for an individual ad click, such as refunds — divided by the total number of ad clicks for a given period. More information about the Company, including the Company’s Key Operational and Financial Metrics definitions can be found in the Company's most recent Quarterly or Annual Report filed with the SEC, available at www.yelp-ir.com or the SEC’s website at www.sec.gov.
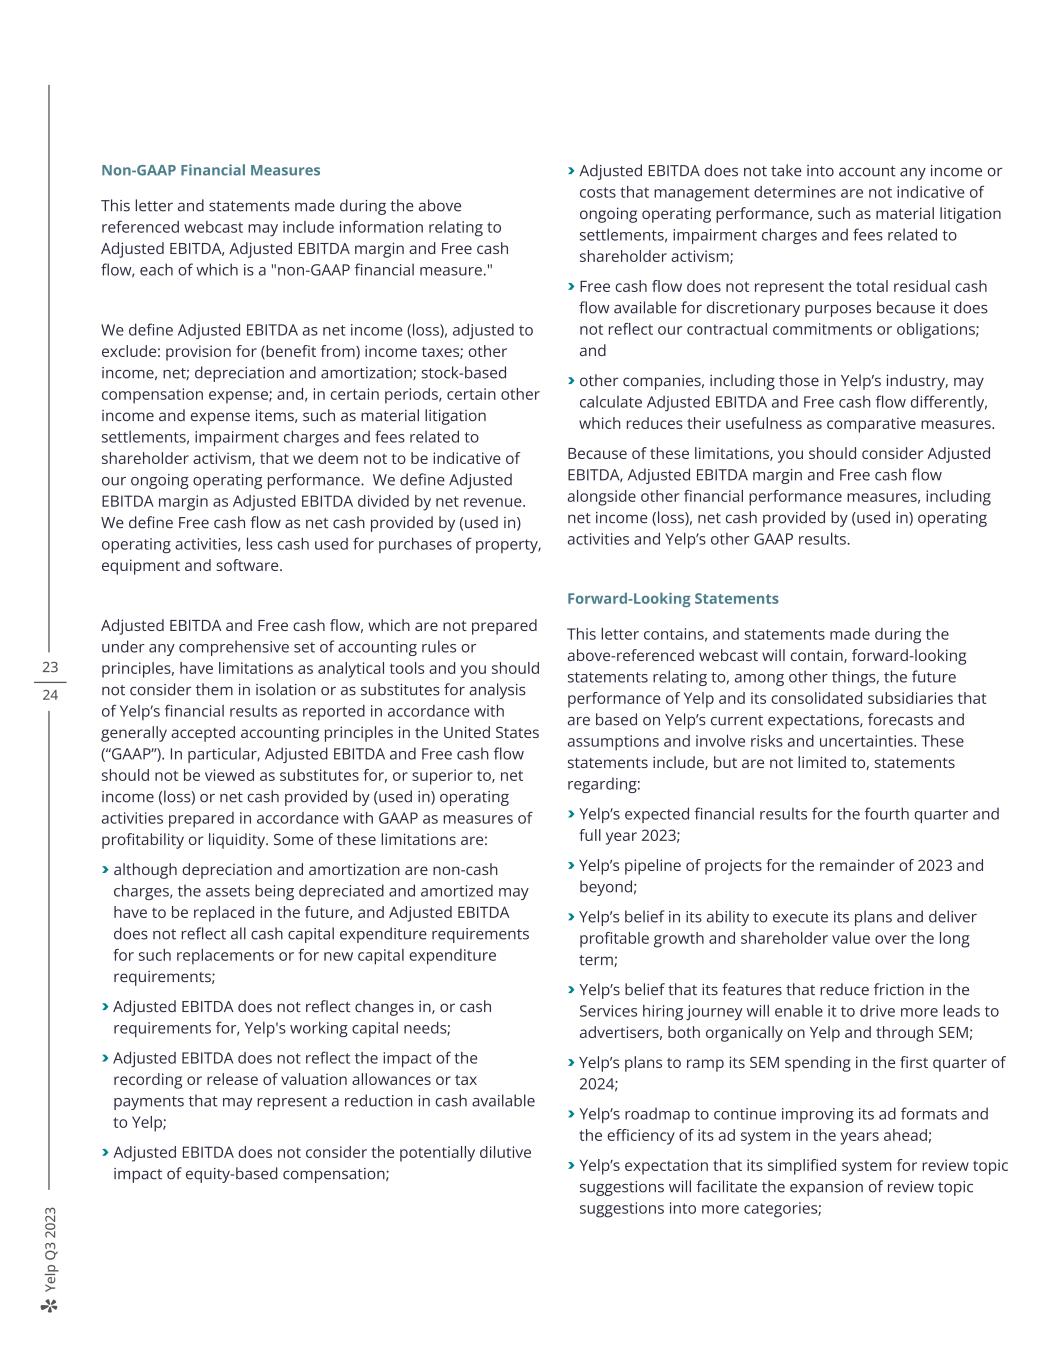
Ye lp Q 3 20 23 Non-GAAP Financial Measures This letter and statements made during the above referenced webcast may include information relating to Adjusted EBITDA, Adjusted EBITDA margin and Free cash flow, each of which is a "non-GAAP financial measure." We define Adjusted EBITDA as net income (loss), adjusted to exclude: provision for (benefit from) income taxes; other income, net; depreciation and amortization; stock-based compensation expense; and, in certain periods, certain other income and expense items, such as material litigation settlements, impairment charges and fees related to shareholder activism, that we deem not to be indicative of our ongoing operating performance. We define Adjusted EBITDA margin as Adjusted EBITDA divided by net revenue. We define Free cash flow as net cash provided by (used in) operating activities, less cash used for purchases of property, equipment and software. Adjusted EBITDA and Free cash flow, which are not prepared under any comprehensive set of accounting rules or principles, have limitations as analytical tools and you should not consider them in isolation or as substitutes for analysis of Yelp’s financial results as reported in accordance with generally accepted accounting principles in the United States (“GAAP”). In particular, Adjusted EBITDA and Free cash flow should not be viewed as substitutes for, or superior to, net income (loss) or net cash provided by (used in) operating activities prepared in accordance with GAAP as measures of profitability or liquidity. Some of these limitations are: > although depreciation and amortization are non-cash charges, the assets being depreciated and amortized may have to be replaced in the future, and Adjusted EBITDA does not reflect all cash capital expenditure requirements for such replacements or for new capital expenditure requirements; > Adjusted EBITDA does not reflect changes in, or cash requirements for, Yelp's working capital needs; > Adjusted EBITDA does not reflect the impact of the recording or release of valuation allowances or tax payments that may represent a reduction in cash available to Yelp; > Adjusted EBITDA does not consider the potentially dilutive impact of equity-based compensation; > Adjusted EBITDA does not take into account any income or costs that management determines are not indicative of ongoing operating performance, such as material litigation settlements, impairment charges and fees related to shareholder activism; > Free cash flow does not represent the total residual cash flow available for discretionary purposes because it does not reflect our contractual commitments or obligations; and > other companies, including those in Yelp’s industry, may calculate Adjusted EBITDA and Free cash flow differently, which reduces their usefulness as comparative measures. Because of these limitations, you should consider Adjusted EBITDA, Adjusted EBITDA margin and Free cash flow alongside other financial performance measures, including net income (loss), net cash provided by (used in) operating activities and Yelp’s other GAAP results. Forward-Looking Statements This letter contains, and statements made during the above-referenced webcast will contain, forward-looking statements relating to, among other things, the future performance of Yelp and its consolidated subsidiaries that are based on Yelp’s current expectations, forecasts and assumptions and involve risks and uncertainties. These statements include, but are not limited to, statements regarding: > Yelp’s expected financial results for the fourth quarter and full year 2023; > Yelp’s pipeline of projects for the remainder of 2023 and beyond; > Yelp’s belief in its ability to execute its plans and deliver profitable growth and shareholder value over the long term; > Yelp’s belief that its features that reduce friction in the Services hiring journey will enable it to drive more leads to advertisers, both organically on Yelp and through SEM; > Yelp’s plans to ramp its SEM spending in the first quarter of 2024; > Yelp’s roadmap to continue improving its ad formats and the efficiency of its ad system in the years ahead; > Yelp’s expectation that its simplified system for review topic suggestions will facilitate the expansion of review topic suggestions into more categories; 23 24
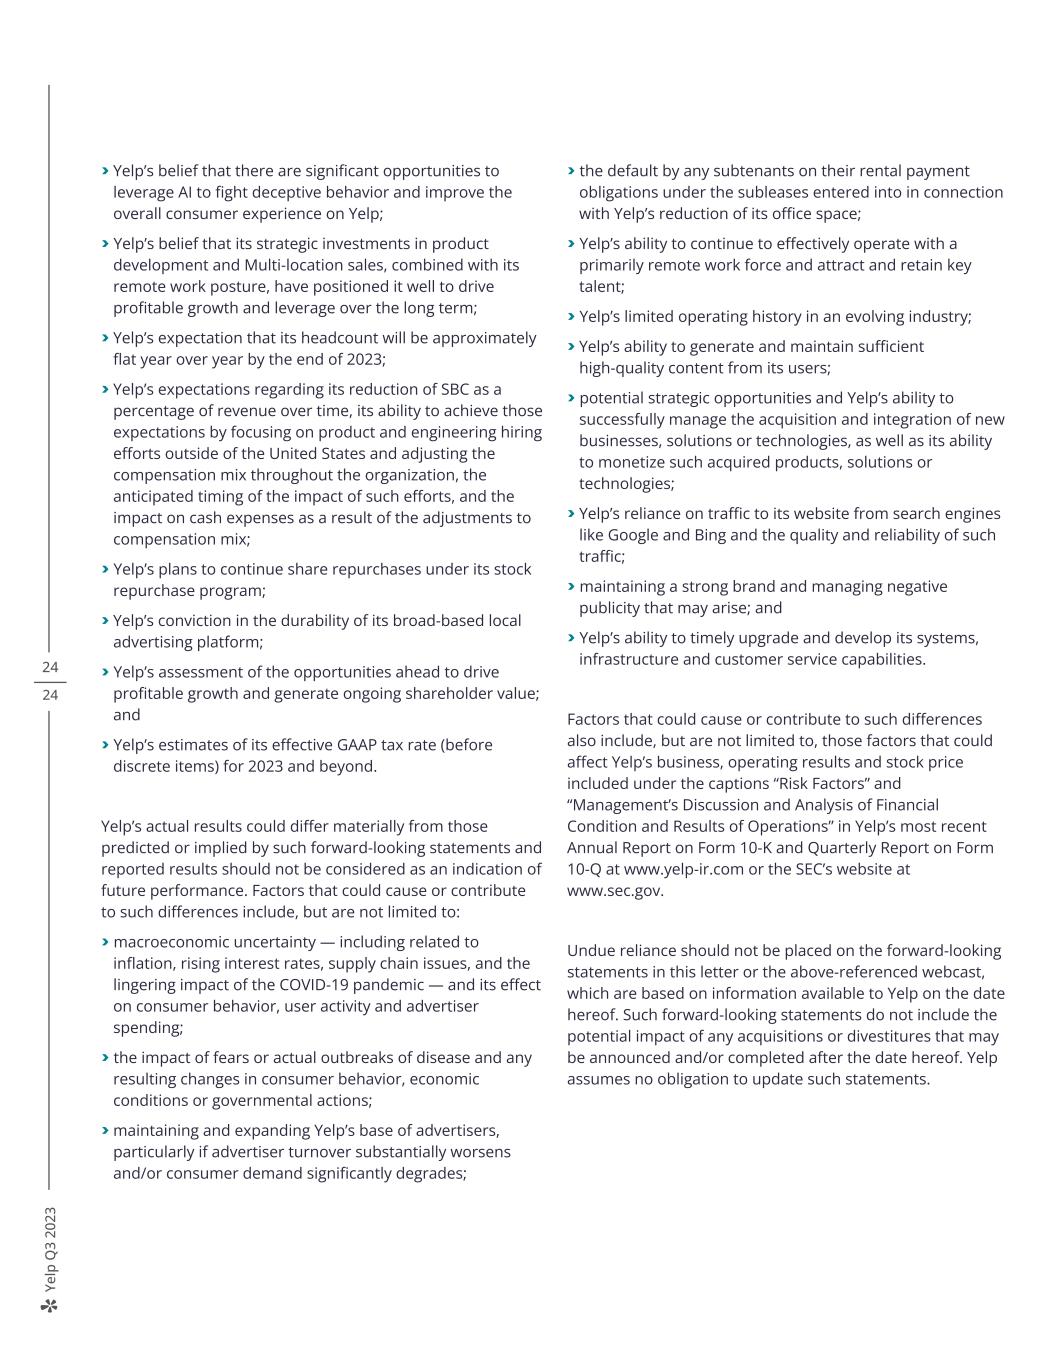
Ye lp Q 3 20 23 > Yelp’s belief that there are significant opportunities to leverage AI to fight deceptive behavior and improve the overall consumer experience on Yelp; > Yelp’s belief that its strategic investments in product development and Multi-location sales, combined with its remote work posture, have positioned it well to drive profitable growth and leverage over the long term; > Yelp’s expectation that its headcount will be approximately flat year over year by the end of 2023; > Yelp’s expectations regarding its reduction of SBC as a percentage of revenue over time, its ability to achieve those expectations by focusing on product and engineering hiring efforts outside of the United States and adjusting the compensation mix throughout the organization, the anticipated timing of the impact of such efforts, and the impact on cash expenses as a result of the adjustments to compensation mix; > Yelp’s plans to continue share repurchases under its stock repurchase program; > Yelp’s conviction in the durability of its broad-based local advertising platform; > Yelp’s assessment of the opportunities ahead to drive profitable growth and generate ongoing shareholder value; and > Yelp’s estimates of its effective GAAP tax rate (before discrete items) for 2023 and beyond. Yelp’s actual results could differ materially from those predicted or implied by such forward-looking statements and reported results should not be considered as an indication of future performance. Factors that could cause or contribute to such differences include, but are not limited to: > macroeconomic uncertainty — including related to inflation, rising interest rates, supply chain issues, and the lingering impact of the COVID-19 pandemic — and its effect on consumer behavior, user activity and advertiser spending; > the impact of fears or actual outbreaks of disease and any resulting changes in consumer behavior, economic conditions or governmental actions; > maintaining and expanding Yelp’s base of advertisers, particularly if advertiser turnover substantially worsens and/or consumer demand significantly degrades; > the default by any subtenants on their rental payment obligations under the subleases entered into in connection with Yelp’s reduction of its office space; > Yelp’s ability to continue to effectively operate with a primarily remote work force and attract and retain key talent; > Yelp’s limited operating history in an evolving industry; > Yelp’s ability to generate and maintain sufficient high-quality content from its users; > potential strategic opportunities and Yelp’s ability to successfully manage the acquisition and integration of new businesses, solutions or technologies, as well as its ability to monetize such acquired products, solutions or technologies; > Yelp’s reliance on traffic to its website from search engines like Google and Bing and the quality and reliability of such traffic; > maintaining a strong brand and managing negative publicity that may arise; and > Yelp’s ability to timely upgrade and develop its systems, infrastructure and customer service capabilities. Factors that could cause or contribute to such differences also include, but are not limited to, those factors that could affect Yelp’s business, operating results and stock price included under the captions “Risk Factors” and “Management’s Discussion and Analysis of Financial Condition and Results of Operations” in Yelp’s most recent Annual Report on Form 10-K and Quarterly Report on Form 10-Q at www.yelp-ir.com or the SEC’s website at www.sec.gov. Undue reliance should not be placed on the forward-looking statements in this letter or the above-referenced webcast, which are based on information available to Yelp on the date hereof. Such forward-looking statements do not include the potential impact of any acquisitions or divestitures that may be announced and/or completed after the date hereof. Yelp assumes no obligation to update such statements. 24 24


