false2022FY0001345016http://fasb.org/us-gaap/2022#AccountingStandardsUpdate201613MemberP3Y
00013450162022-01-012022-12-3100013450162022-06-30iso4217:USD00013450162023-02-17xbrli:shares00013450162022-12-3100013450162021-12-31iso4217:USDxbrli:shares00013450162021-01-012021-12-3100013450162020-01-012020-12-310001345016us-gaap:CommonStockMember2019-12-310001345016us-gaap:AdditionalPaidInCapitalMember2019-12-310001345016us-gaap:TreasuryStockMember2019-12-310001345016us-gaap:AccumulatedOtherComprehensiveIncomeMember2019-12-310001345016us-gaap:RetainedEarningsMember2019-12-3100013450162019-12-3100013450162019-01-012019-12-310001345016us-gaap:RetainedEarningsMembersrt:CumulativeEffectPeriodOfAdoptionAdjustmentMember2019-12-310001345016srt:CumulativeEffectPeriodOfAdoptionAdjustmentMember2019-12-310001345016us-gaap:CommonStockMember2020-01-012020-12-310001345016us-gaap:AdditionalPaidInCapitalMember2020-01-012020-12-310001345016us-gaap:TreasuryStockMember2020-01-012020-12-310001345016us-gaap:RetainedEarningsMember2020-01-012020-12-310001345016us-gaap:AccumulatedOtherComprehensiveIncomeMember2020-01-012020-12-310001345016us-gaap:CommonStockMember2020-12-310001345016us-gaap:AdditionalPaidInCapitalMember2020-12-310001345016us-gaap:TreasuryStockMember2020-12-310001345016us-gaap:AccumulatedOtherComprehensiveIncomeMember2020-12-310001345016us-gaap:RetainedEarningsMember2020-12-3100013450162020-12-310001345016us-gaap:CommonStockMember2021-01-012021-12-310001345016us-gaap:AdditionalPaidInCapitalMember2021-01-012021-12-310001345016us-gaap:TreasuryStockMember2021-01-012021-12-310001345016us-gaap:RetainedEarningsMember2021-01-012021-12-310001345016us-gaap:AccumulatedOtherComprehensiveIncomeMember2021-01-012021-12-310001345016us-gaap:CommonStockMember2021-12-310001345016us-gaap:AdditionalPaidInCapitalMember2021-12-310001345016us-gaap:TreasuryStockMember2021-12-310001345016us-gaap:AccumulatedOtherComprehensiveIncomeMember2021-12-310001345016us-gaap:RetainedEarningsMember2021-12-310001345016us-gaap:CommonStockMember2022-01-012022-12-310001345016us-gaap:AdditionalPaidInCapitalMember2022-01-012022-12-310001345016us-gaap:TreasuryStockMember2022-01-012022-12-310001345016us-gaap:RetainedEarningsMember2022-01-012022-12-310001345016us-gaap:AccumulatedOtherComprehensiveIncomeMember2022-01-012022-12-310001345016us-gaap:CommonStockMember2022-12-310001345016us-gaap:AdditionalPaidInCapitalMember2022-12-310001345016us-gaap:TreasuryStockMember2022-12-310001345016us-gaap:AccumulatedOtherComprehensiveIncomeMember2022-12-310001345016us-gaap:RetainedEarningsMember2022-12-310001345016us-gaap:AdvertisingMember2022-01-012022-12-310001345016yelp:TransactionsMember2022-01-012022-12-310001345016srt:MaximumMember2022-12-310001345016srt:MinimumMember2022-01-012022-12-310001345016srt:MaximumMember2022-01-012022-12-310001345016us-gaap:LeaseholdImprovementsMember2022-01-012022-12-310001345016us-gaap:SoftwareAndSoftwareDevelopmentCostsMember2022-01-012022-12-31yelp:award_type0001345016us-gaap:CommercialPaperMemberus-gaap:CashEquivalentsMember2022-12-310001345016us-gaap:CashEquivalentsMember2022-12-310001345016us-gaap:CertificatesOfDepositMemberyelp:MarketableSecuritiesCurrentMember2022-12-310001345016us-gaap:CommercialPaperMemberyelp:MarketableSecuritiesCurrentMember2022-12-310001345016us-gaap:CorporateDebtSecuritiesMemberyelp:MarketableSecuritiesCurrentMember2022-12-310001345016us-gaap:USGovernmentAgenciesDebtSecuritiesMemberyelp:MarketableSecuritiesCurrentMember2022-12-310001345016us-gaap:USGovernmentSponsoredEnterprisesDebtSecuritiesMemberyelp:MarketableSecuritiesCurrentMember2022-12-310001345016yelp:MarketableSecuritiesCurrentMember2022-12-310001345016us-gaap:CorporateDebtSecuritiesMember2022-12-310001345016us-gaap:USGovernmentAgenciesDebtSecuritiesMember2022-12-310001345016us-gaap:USGovernmentSponsoredEnterprisesDebtSecuritiesMember2022-12-3100013450162020-03-3100013450162020-04-012020-06-300001345016us-gaap:FairValueMeasurementsRecurringMemberus-gaap:MoneyMarketFundsMemberus-gaap:FairValueInputsLevel1Member2022-12-310001345016us-gaap:FairValueMeasurementsRecurringMemberus-gaap:MoneyMarketFundsMemberus-gaap:FairValueInputsLevel2Member2022-12-310001345016us-gaap:FairValueMeasurementsRecurringMemberus-gaap:MoneyMarketFundsMemberus-gaap:FairValueInputsLevel3Member2022-12-310001345016us-gaap:FairValueMeasurementsRecurringMemberus-gaap:MoneyMarketFundsMember2022-12-310001345016us-gaap:FairValueMeasurementsRecurringMemberus-gaap:MoneyMarketFundsMemberus-gaap:FairValueInputsLevel1Member2021-12-310001345016us-gaap:FairValueMeasurementsRecurringMemberus-gaap:MoneyMarketFundsMemberus-gaap:FairValueInputsLevel2Member2021-12-310001345016us-gaap:FairValueMeasurementsRecurringMemberus-gaap:MoneyMarketFundsMemberus-gaap:FairValueInputsLevel3Member2021-12-310001345016us-gaap:FairValueMeasurementsRecurringMemberus-gaap:MoneyMarketFundsMember2021-12-310001345016us-gaap:FairValueMeasurementsRecurringMemberus-gaap:CommercialPaperMemberus-gaap:FairValueInputsLevel1Member2022-12-310001345016us-gaap:FairValueMeasurementsRecurringMemberus-gaap:CommercialPaperMemberus-gaap:FairValueInputsLevel2Member2022-12-310001345016us-gaap:FairValueMeasurementsRecurringMemberus-gaap:FairValueInputsLevel3Memberus-gaap:CommercialPaperMember2022-12-310001345016us-gaap:FairValueMeasurementsRecurringMemberus-gaap:CommercialPaperMember2022-12-310001345016us-gaap:FairValueMeasurementsRecurringMemberus-gaap:CommercialPaperMemberus-gaap:FairValueInputsLevel1Member2021-12-310001345016us-gaap:FairValueMeasurementsRecurringMemberus-gaap:CommercialPaperMemberus-gaap:FairValueInputsLevel2Member2021-12-310001345016us-gaap:FairValueMeasurementsRecurringMemberus-gaap:FairValueInputsLevel3Memberus-gaap:CommercialPaperMember2021-12-310001345016us-gaap:FairValueMeasurementsRecurringMemberus-gaap:CommercialPaperMember2021-12-310001345016us-gaap:FairValueMeasurementsRecurringMemberus-gaap:CertificatesOfDepositMemberus-gaap:FairValueInputsLevel1Member2022-12-310001345016us-gaap:FairValueMeasurementsRecurringMemberus-gaap:CertificatesOfDepositMemberus-gaap:FairValueInputsLevel2Member2022-12-310001345016us-gaap:FairValueMeasurementsRecurringMemberus-gaap:FairValueInputsLevel3Memberus-gaap:CertificatesOfDepositMember2022-12-310001345016us-gaap:FairValueMeasurementsRecurringMemberus-gaap:CertificatesOfDepositMember2022-12-310001345016us-gaap:FairValueMeasurementsRecurringMemberus-gaap:CertificatesOfDepositMemberus-gaap:FairValueInputsLevel1Member2021-12-310001345016us-gaap:FairValueMeasurementsRecurringMemberus-gaap:CertificatesOfDepositMemberus-gaap:FairValueInputsLevel2Member2021-12-310001345016us-gaap:FairValueMeasurementsRecurringMemberus-gaap:FairValueInputsLevel3Memberus-gaap:CertificatesOfDepositMember2021-12-310001345016us-gaap:FairValueMeasurementsRecurringMemberus-gaap:CertificatesOfDepositMember2021-12-310001345016us-gaap:FairValueMeasurementsRecurringMemberus-gaap:FairValueInputsLevel1Memberus-gaap:CommercialPaperNotIncludedWithCashAndCashEquivalentsMember2022-12-310001345016us-gaap:FairValueMeasurementsRecurringMemberus-gaap:FairValueInputsLevel2Memberus-gaap:CommercialPaperNotIncludedWithCashAndCashEquivalentsMember2022-12-310001345016us-gaap:FairValueMeasurementsRecurringMemberus-gaap:FairValueInputsLevel3Memberus-gaap:CommercialPaperNotIncludedWithCashAndCashEquivalentsMember2022-12-310001345016us-gaap:FairValueMeasurementsRecurringMemberus-gaap:CommercialPaperNotIncludedWithCashAndCashEquivalentsMember2022-12-310001345016us-gaap:FairValueMeasurementsRecurringMemberus-gaap:FairValueInputsLevel1Memberus-gaap:CommercialPaperNotIncludedWithCashAndCashEquivalentsMember2021-12-310001345016us-gaap:FairValueMeasurementsRecurringMemberus-gaap:FairValueInputsLevel2Memberus-gaap:CommercialPaperNotIncludedWithCashAndCashEquivalentsMember2021-12-310001345016us-gaap:FairValueMeasurementsRecurringMemberus-gaap:FairValueInputsLevel3Memberus-gaap:CommercialPaperNotIncludedWithCashAndCashEquivalentsMember2021-12-310001345016us-gaap:FairValueMeasurementsRecurringMemberus-gaap:CommercialPaperNotIncludedWithCashAndCashEquivalentsMember2021-12-310001345016us-gaap:FairValueMeasurementsRecurringMemberus-gaap:CorporateDebtSecuritiesMemberus-gaap:FairValueInputsLevel1Member2022-12-310001345016us-gaap:FairValueMeasurementsRecurringMemberus-gaap:CorporateDebtSecuritiesMemberus-gaap:FairValueInputsLevel2Member2022-12-310001345016us-gaap:FairValueMeasurementsRecurringMemberus-gaap:CorporateDebtSecuritiesMemberus-gaap:FairValueInputsLevel3Member2022-12-310001345016us-gaap:FairValueMeasurementsRecurringMemberus-gaap:CorporateDebtSecuritiesMember2022-12-310001345016us-gaap:FairValueMeasurementsRecurringMemberus-gaap:CorporateDebtSecuritiesMemberus-gaap:FairValueInputsLevel1Member2021-12-310001345016us-gaap:FairValueMeasurementsRecurringMemberus-gaap:CorporateDebtSecuritiesMemberus-gaap:FairValueInputsLevel2Member2021-12-310001345016us-gaap:FairValueMeasurementsRecurringMemberus-gaap:CorporateDebtSecuritiesMemberus-gaap:FairValueInputsLevel3Member2021-12-310001345016us-gaap:FairValueMeasurementsRecurringMemberus-gaap:CorporateDebtSecuritiesMember2021-12-310001345016us-gaap:FairValueMeasurementsRecurringMemberus-gaap:USGovernmentAgenciesDebtSecuritiesMemberus-gaap:FairValueInputsLevel1Member2022-12-310001345016us-gaap:FairValueMeasurementsRecurringMemberus-gaap:USGovernmentAgenciesDebtSecuritiesMemberus-gaap:FairValueInputsLevel2Member2022-12-310001345016us-gaap:FairValueMeasurementsRecurringMemberus-gaap:USGovernmentAgenciesDebtSecuritiesMemberus-gaap:FairValueInputsLevel3Member2022-12-310001345016us-gaap:FairValueMeasurementsRecurringMemberus-gaap:USGovernmentAgenciesDebtSecuritiesMember2022-12-310001345016us-gaap:FairValueMeasurementsRecurringMemberus-gaap:USGovernmentAgenciesDebtSecuritiesMemberus-gaap:FairValueInputsLevel1Member2021-12-310001345016us-gaap:FairValueMeasurementsRecurringMemberus-gaap:USGovernmentAgenciesDebtSecuritiesMemberus-gaap:FairValueInputsLevel2Member2021-12-310001345016us-gaap:FairValueMeasurementsRecurringMemberus-gaap:USGovernmentAgenciesDebtSecuritiesMemberus-gaap:FairValueInputsLevel3Member2021-12-310001345016us-gaap:FairValueMeasurementsRecurringMemberus-gaap:USGovernmentAgenciesDebtSecuritiesMember2021-12-310001345016us-gaap:FairValueMeasurementsRecurringMemberus-gaap:USGovernmentSponsoredEnterprisesDebtSecuritiesMemberus-gaap:FairValueInputsLevel1Member2022-12-310001345016us-gaap:FairValueMeasurementsRecurringMemberus-gaap:USGovernmentSponsoredEnterprisesDebtSecuritiesMemberus-gaap:FairValueInputsLevel2Member2022-12-310001345016us-gaap:FairValueMeasurementsRecurringMemberus-gaap:FairValueInputsLevel3Memberus-gaap:USGovernmentSponsoredEnterprisesDebtSecuritiesMember2022-12-310001345016us-gaap:FairValueMeasurementsRecurringMemberus-gaap:USGovernmentSponsoredEnterprisesDebtSecuritiesMember2022-12-310001345016us-gaap:FairValueMeasurementsRecurringMemberus-gaap:USGovernmentSponsoredEnterprisesDebtSecuritiesMemberus-gaap:FairValueInputsLevel1Member2021-12-310001345016us-gaap:FairValueMeasurementsRecurringMemberus-gaap:USGovernmentSponsoredEnterprisesDebtSecuritiesMemberus-gaap:FairValueInputsLevel2Member2021-12-310001345016us-gaap:FairValueMeasurementsRecurringMemberus-gaap:FairValueInputsLevel3Memberus-gaap:USGovernmentSponsoredEnterprisesDebtSecuritiesMember2021-12-310001345016us-gaap:FairValueMeasurementsRecurringMemberus-gaap:USGovernmentSponsoredEnterprisesDebtSecuritiesMember2021-12-310001345016us-gaap:FairValueMeasurementsRecurringMemberus-gaap:FairValueInputsLevel1Member2022-12-310001345016us-gaap:FairValueMeasurementsRecurringMemberus-gaap:FairValueInputsLevel2Member2022-12-310001345016us-gaap:FairValueMeasurementsRecurringMemberus-gaap:FairValueInputsLevel3Member2022-12-310001345016us-gaap:FairValueMeasurementsRecurringMember2022-12-310001345016us-gaap:FairValueMeasurementsRecurringMemberus-gaap:FairValueInputsLevel1Member2021-12-310001345016us-gaap:FairValueMeasurementsRecurringMemberus-gaap:FairValueInputsLevel2Member2021-12-310001345016us-gaap:FairValueMeasurementsRecurringMemberus-gaap:FairValueInputsLevel3Member2021-12-310001345016us-gaap:FairValueMeasurementsRecurringMember2021-12-310001345016yelp:CloudComputingImplementationCostMember2022-12-310001345016us-gaap:OtherNoncurrentAssetsMemberyelp:CloudComputingImplementationCostMember2022-12-310001345016us-gaap:SoftwareDevelopmentMember2022-12-310001345016us-gaap:SoftwareDevelopmentMember2021-12-310001345016us-gaap:LeaseholdImprovementsMember2022-12-310001345016us-gaap:LeaseholdImprovementsMember2021-12-310001345016us-gaap:ComputerEquipmentMember2022-12-310001345016us-gaap:ComputerEquipmentMember2021-12-310001345016us-gaap:FurnitureAndFixturesMember2022-12-310001345016us-gaap:FurnitureAndFixturesMember2021-12-310001345016us-gaap:TechnologyEquipmentMember2022-12-310001345016us-gaap:TechnologyEquipmentMember2021-12-310001345016us-gaap:SoftwareAndSoftwareDevelopmentCostsMember2022-12-310001345016us-gaap:SoftwareAndSoftwareDevelopmentCostsMember2021-12-310001345016yelp:PropertyEquipmentAndSoftwareMember2022-01-012022-12-310001345016yelp:PropertyEquipmentAndSoftwareMember2021-01-012021-12-310001345016yelp:PropertyEquipmentAndSoftwareMember2020-01-012020-12-310001345016us-gaap:LeaseholdImprovementsMember2021-01-012021-12-31yelp:lease0001345016yelp:BusinessRelationshipsMember2022-12-310001345016yelp:BusinessRelationshipsMember2022-01-012022-12-310001345016us-gaap:DevelopedTechnologyRightsMember2022-12-310001345016us-gaap:DevelopedTechnologyRightsMember2022-01-012022-12-310001345016us-gaap:LicensingAgreementsMember2022-12-310001345016us-gaap:LicensingAgreementsMember2022-01-012022-12-310001345016us-gaap:InternetDomainNamesMember2022-12-310001345016us-gaap:InternetDomainNamesMember2022-01-012022-12-310001345016yelp:BusinessRelationshipsMember2021-12-310001345016yelp:BusinessRelationshipsMember2021-01-012021-12-310001345016us-gaap:DevelopedTechnologyRightsMember2021-12-310001345016us-gaap:DevelopedTechnologyRightsMember2021-01-012021-12-310001345016us-gaap:LicensingAgreementsMember2021-12-310001345016us-gaap:LicensingAgreementsMember2021-01-012021-12-310001345016us-gaap:InternetDomainNamesMember2021-12-310001345016us-gaap:InternetDomainNamesMember2021-01-012021-12-31xbrli:pure00013450162021-12-012021-12-310001345016yelp:SecuritiesClassActionMember2021-12-030001345016yelp:SecuritiesClassActionMember2022-08-262022-08-260001345016yelp:SecuritiesClassActionMember2021-12-310001345016yelp:SecuritiesClassActionMemberus-gaap:ScenarioPlanMember2021-12-310001345016yelp:SecuritiesClassActionMember2022-07-012022-09-300001345016yelp:SecuritiesClassActionMember2022-12-310001345016us-gaap:RevolvingCreditFacilityMember2020-05-012020-05-310001345016us-gaap:RevolvingCreditFacilityMember2020-05-310001345016us-gaap:LetterOfCreditMember2020-05-310001345016us-gaap:RevolvingCreditFacilityMemberus-gaap:LondonInterbankOfferedRateLIBORMember2020-05-012020-05-310001345016us-gaap:BaseRateMemberus-gaap:RevolvingCreditFacilityMember2020-05-012020-05-310001345016us-gaap:RevolvingCreditFacilityMember2022-12-310001345016us-gaap:LetterOfCreditMember2020-05-012020-05-310001345016yelp:CreditAgreementSublimitMember2022-12-310001345016yelp:July2017ShareRepurchaseProgramMember2022-12-310001345016yelp:July2017ShareRepurchaseProgramMember2022-01-012022-12-310001345016yelp:July2017ShareRepurchaseProgramMember2021-01-012021-12-310001345016yelp:EmployeeStockOptionsOutstandingMember2022-12-310001345016yelp:RestrictedStockUnitsAndPerformanceAwardsOutstandingMember2022-12-310001345016yelp:EmployeeStockOptionsRestrictedStockUnitsAndRestrictedStockAvailableForGrantMember2022-12-310001345016yelp:EmployeeStockPurchasePlanAvailableForGrantMember2022-12-310001345016us-gaap:SubsequentEventMember2023-02-060001345016srt:MaximumMemberus-gaap:EmployeeStockOptionMember2022-01-012022-12-310001345016us-gaap:EmployeeStockOptionMember2022-01-012022-12-31yelp:numberOfSchedule0001345016yelp:FirstAnniversaryMemberus-gaap:EmployeeStockOptionMember2022-01-012022-12-310001345016us-gaap:EmployeeStockOptionMember2021-01-012021-12-310001345016us-gaap:EmployeeStockOptionMember2020-01-012020-12-310001345016us-gaap:EmployeeStockOptionMember2022-12-310001345016us-gaap:RestrictedStockUnitsRSUMember2022-01-012022-12-310001345016yelp:FirstAnniversaryMemberus-gaap:RestrictedStockUnitsRSUMember2022-01-012022-12-310001345016us-gaap:PerformanceSharesMember2022-01-012022-12-310001345016us-gaap:PerformanceSharesMember2022-12-310001345016yelp:GrantedIn2019Memberus-gaap:PerformanceSharesMember2022-01-012022-12-310001345016yelp:GrantedIn2022Memberus-gaap:PerformanceSharesMember2022-01-012022-12-310001345016us-gaap:PerformanceSharesMembersrt:MinimumMember2022-12-310001345016srt:MaximumMemberus-gaap:PerformanceSharesMember2022-12-310001345016us-gaap:RestrictedStockUnitsRSUMember2021-12-310001345016us-gaap:RestrictedStockUnitsRSUMember2022-12-310001345016us-gaap:RestrictedStockUnitsRSUMember2021-01-012021-12-310001345016us-gaap:RestrictedStockUnitsRSUMember2020-01-012020-12-310001345016us-gaap:EmployeeStockMember2022-12-310001345016us-gaap:EmployeeStockMember2022-01-012022-12-310001345016us-gaap:EmployeeStockMember2021-01-012021-12-310001345016us-gaap:EmployeeStockMember2020-01-012020-12-310001345016us-gaap:EmployeeStockMember2021-12-310001345016us-gaap:EmployeeStockMember2020-12-310001345016us-gaap:CostOfSalesMember2022-01-012022-12-310001345016us-gaap:CostOfSalesMember2021-01-012021-12-310001345016us-gaap:CostOfSalesMember2020-01-012020-12-310001345016us-gaap:SellingAndMarketingExpenseMember2022-01-012022-12-310001345016us-gaap:SellingAndMarketingExpenseMember2021-01-012021-12-310001345016us-gaap:SellingAndMarketingExpenseMember2020-01-012020-12-310001345016us-gaap:ResearchAndDevelopmentExpenseMember2022-01-012022-12-310001345016us-gaap:ResearchAndDevelopmentExpenseMember2021-01-012021-12-310001345016us-gaap:ResearchAndDevelopmentExpenseMember2020-01-012020-12-310001345016us-gaap:GeneralAndAdministrativeExpenseMember2022-01-012022-12-310001345016us-gaap:GeneralAndAdministrativeExpenseMember2021-01-012021-12-310001345016us-gaap:GeneralAndAdministrativeExpenseMember2020-01-012020-12-310001345016us-gaap:DomesticCountryMember2022-12-310001345016us-gaap:StateAndLocalJurisdictionMember2022-12-310001345016country:DE2022-12-310001345016us-gaap:ResearchMemberus-gaap:DomesticCountryMember2022-12-310001345016us-gaap:ResearchMemberus-gaap:StateAndLocalJurisdictionMember2022-12-310001345016us-gaap:ResearchMemberus-gaap:ForeignCountryMember2022-12-310001345016us-gaap:EmployeeStockOptionMember2022-01-012022-12-310001345016us-gaap:EmployeeStockOptionMember2021-01-012021-12-310001345016us-gaap:EmployeeStockOptionMember2020-01-012020-12-310001345016us-gaap:RestrictedStockUnitsRSUMember2022-01-012022-12-310001345016us-gaap:RestrictedStockUnitsRSUMember2021-01-012021-12-310001345016us-gaap:RestrictedStockUnitsRSUMember2020-01-012020-12-310001345016us-gaap:EmployeeStockMember2022-01-012022-12-310001345016us-gaap:EmployeeStockMember2021-01-012021-12-310001345016us-gaap:EmployeeStockMember2020-01-012020-12-310001345016yelp:AdvertisingServicesMember2022-01-012022-12-310001345016yelp:AdvertisingServicesMember2021-01-012021-12-310001345016yelp:AdvertisingServicesMember2020-01-012020-12-310001345016yelp:AdvertisingRestaurantsAndOtherMember2022-01-012022-12-310001345016yelp:AdvertisingRestaurantsAndOtherMember2021-01-012021-12-310001345016yelp:AdvertisingRestaurantsAndOtherMember2020-01-012020-12-310001345016us-gaap:AdvertisingMember2021-01-012021-12-310001345016us-gaap:AdvertisingMember2020-01-012020-12-310001345016yelp:TransactionsMember2021-01-012021-12-310001345016yelp:TransactionsMember2020-01-012020-12-310001345016yelp:OtherRevenueMember2022-01-012022-12-310001345016yelp:OtherRevenueMember2021-01-012021-12-310001345016yelp:OtherRevenueMember2020-01-012020-12-3100013450162020-04-012020-05-310001345016country:US2022-01-012022-12-310001345016country:US2021-01-012021-12-310001345016country:US2020-01-012020-12-310001345016us-gaap:NonUsMember2022-01-012022-12-310001345016us-gaap:NonUsMember2021-01-012021-12-310001345016us-gaap:NonUsMember2020-01-012020-12-310001345016country:US2022-12-310001345016country:US2021-12-310001345016us-gaap:NonUsMember2022-12-310001345016us-gaap:NonUsMember2021-12-31
UNITED STATES
SECURITIES AND EXCHANGE COMMISSION
☑ ANNUAL REPORT PURSUANT TO SECTION 13 OR 15(d) OF THE SECURITIES EXCHANGE ACT OF 1934
For the fiscal year ended December 31, 2022
OR
☐ TRANSITION REPORT PURSUANT TO SECTION 13 OR 15(d) OF THE SECURITIES EXCHANGE ACT OF 1934
For the transition period from to
Commission file number: 001-35444
YELP INC.
(Exact name of Registrant as specified in its charter)
|
|
|
|
|
|
| Delaware |
20-1854266 |
| (State or other jurisdiction of incorporation or organization) |
(I.R.S. Employer Identification No.) |
350 Mission Street, 10th Floor
San Francisco, California 94105
(Address of principal executive offices) (Zip Code)
Registrant’s telephone number, including area code: (415) 908-3801
_________________________________________
|
|
|
|
|
|
|
|
|
|
|
|
|
|
|
| Securities registered pursuant to Section 12(b) of the Act: |
| Title of Each Class |
|
Trading Symbol(s) |
|
Name of Each Exchange on Which Registered |
| Common Stock, par value $0.000001 per share |
|
YELP |
|
New York Stock Exchange LLC |
Securities registered pursuant to Section 12(g) of the Act:
None
Indicate by check mark if the registrant is a well-known seasoned issuer, as defined in Rule 405 of the Securities Act.
Yes ☑ No ¨
Indicate by check mark if the registrant is not required to file reports pursuant to Section 13 or Section 15(d) of the Act.
Yes ¨ No ☑
Indicate by check mark whether the registrant (1) has filed all reports required to be filed by Section 13 or 15(d) of the Securities Exchange Act of 1934 during the preceding 12 months (or for such shorter period that the registrant was required to file such reports), and (2) has been subject to such filing requirements for the past 90 days. Yes ☑ No ¨
Indicate by check mark whether the registrant has submitted electronically every Interactive Data File required to be submitted pursuant to Rule 405 of Regulation S-T during the preceding 12 months (or for such shorter period that the registrant was required to submit such files). Yes ☑ No ¨
Indicate by check mark whether the registrant is a large accelerated filer, an accelerated filer, a non-accelerated filer, a smaller reporting company or an emerging growth company. See the definitions of “large accelerated filer,” “accelerated filer,” “smaller reporting company” and “emerging growth company” in Rule 12b-2 of the Exchange Act.
|
|
|
|
|
|
|
|
|
|
|
|
| Large accelerated filer |
☑ |
Accelerated filer |
☐ |
| Non-accelerated filer |
☐ |
Smaller reporting company |
☐ |
|
|
Emerging growth company |
☐ |
If an emerging growth company, indicate by check mark if the registrant has elected not to use the extended transition period for complying with any new or revised financial accounting standards provided pursuant to Section 13(a) of the Exchange Act ¨
Indicate by check mark whether the registrant has filed a report on and attestation to its management's assessment of the effectiveness of its internal control over financial reporting under Section 404(b) of the Sarbanes-Oxley Act (15 U.S.C. 7262(b)) by the registered public accounting firm that prepared or issued its audit report. ☑
If securities are registered pursuant to Section 12(b) of the Act, indicate by check mark whether the financial statements of the registrant included in the filing reflect the correction of an error to previously issued financial statements. ☐
Indicate by check mark whether any of those error corrections are restatements that required a recovery analysis of incentive-based compensation received by any of the registrant’s executive officers during the relevant recovery period pursuant to §240.10D-1(b). ☐
Indicate by check mark whether the registrant is a shell company (as defined in Rule 12b-2 of the Act). Yes ☐ No ☑
The aggregate market value of the voting and non-voting common equity held by non-affiliates of the registrant was approximately $1,459,848,656 as of June 30, 2022, the last day of the registrant’s most recently completed second fiscal quarter, based upon the closing sale price of the registrant’s common stock on the New York Stock Exchange LLC reported for June 30, 2022. An aggregate of 18,656,367 shares of the registrant’s common stock held by officers, directors, affiliated stockholders and The Yelp Foundation as of June 30, 2022 were excluded. For purposes of determining whether a stockholder was an affiliate of the registrant at June 30, 2022, the registrant assumed that a stockholder was an affiliate of the registrant if such stockholder (i) beneficially owned 10% or more of the registrant’s capital stock, as determined based on public filings, and/or (ii) was an executive officer or director, or was affiliated with an executive officer or director, of the registrant at June 30, 2022. Exclusion of such shares should not be construed to indicate that any such person possesses the power, direct or indirect, to direct or cause the direction of the management or policies of the registrant or that such person is controlled by or under common control with the registrant.
As of February 17, 2023, there were 69,543,177 shares of the registrant’s common stock, par value $0.000001 per share, issued and outstanding.
DOCUMENTS INCORPORATED BY REFERENCE
Portions of the registrant’s definitive Proxy Statement for the 2023 Annual Meeting of Stockholders to be filed with the U.S. Securities and Exchange Commission pursuant to Regulation 14A not later than 120 days after the end of the fiscal year covered by this Annual Report on Form 10-K are incorporated by reference in Part III, Items 10-14 of this Annual Report on Form 10-K.
YELP INC.
2022 ANNUAL REPORT ON FORM 10-K
TABLE OF CONTENTS
|
|
|
|
|
|
|
|
|
|
|
|
|
|
|
|
|
|
|
Page |
PART I |
|
|
|
|
|
|
|
|
|
|
|
|
|
|
|
|
|
|
|
|
|
|
|
|
|
|
|
|
|
|
|
PART II |
|
|
|
|
|
|
|
|
|
|
|
|
|
|
|
|
|
|
|
|
|
|
|
|
|
|
|
|
|
|
|
|
|
|
|
|
|
|
|
|
|
|
|
|
|
|
PART III |
|
|
|
|
|
|
|
|
|
|
|
|
|
|
|
|
|
|
|
|
|
|
|
|
|
|
PART IV |
|
|
|
|
|
|
|
|
|
|
|
|
|
FINANCIAL STATEMENTS |
|
|
|
|
|
|
|
|
|
|
|
|
|
|
|
|
|
|
|
|
|
|
___________________________________
Unless the context suggests otherwise, references in this Annual Report on Form 10-K (the “Annual Report”) to “Yelp,” the “Company,” “we,” “us” and “our” refer to Yelp Inc. and, where appropriate, its subsidiaries.
Unless the context otherwise indicates, where we refer in this Annual Report to our “mobile application” or “mobile app,” we refer to all of our consumer applications for mobile-enabled devices; references to our “mobile platform” refer to both our mobile app and the versions of our consumer-facing website that are optimized for mobile-based browsers. Similarly, references to our “website” refer to versions of our consumer-facing website dedicated to both desktop- and mobile-based browsers, as well as the U.S. and international versions of our consumer-facing website. These terms do not refer to the Yelp for Business mobile application, web-based versions of our business owner account or other business owner products unless stated.
SPECIAL NOTE REGARDING FORWARD-LOOKING STATEMENTS
This Annual Report contains forward-looking statements that involve risks, uncertainties and assumptions that, if they never materialize or prove incorrect, could cause our results to differ materially from those expressed or implied by such forward-looking statements. The statements contained in this Annual Report that are not purely historical are forward-looking statements within the meaning of Section 27A of the Securities Act of 1933, as amended (the “Securities Act”), and Section 21E of the Securities Exchange Act of 1934, as amended (the “Exchange Act”). Forward-looking statements are often identified by the use of words such as, but not limited to, “anticipate,” “believe,” “can,” “continue,” “could,” “estimate,” “expect,” “intend,” “may,” “might,” “plan,” “project,” “seek,” “should,” “target,” “will,” “would” and similar expressions or variations intended to identify forward-looking statements. These statements are based on the beliefs and assumptions of our management, which are in turn based on information currently available to management. Such forward-looking statements are subject to risks, uncertainties and other important factors that could cause actual results and the timing of certain events to differ materially from future results expressed or implied by such forward-looking statements. Factors that could cause or contribute to such differences include, but are not limited to, those discussed in the section entitled “
Risk Factors” included under Part I, Item 1A below. Furthermore, such forward-looking statements speak only as of the date of this report. Except as required by law, we undertake no obligation to update any forward-looking statements to reflect events or circumstances after the date of such statements.
NOTE REGARDING METRICS
We review a number of performance metrics to evaluate our business, measure our performance, identify trends in our business, prepare financial projections and make strategic decisions. Please see the section titled “
Management’s Discussion and Analysis of Financial Condition and Results of Operations—Key Metrics” for information on how we define our key metrics. Unless otherwise stated, these metrics do not include metrics from subscription products or our business owner products.
While our metrics are based on what we believe to be reasonable calculations, there are inherent challenges in measuring usage across our large user base. Certain of our performance metrics, including the number of unique devices accessing our mobile app, ad clicks, average cost-per-click (“CPC”) and active claimed local business locations, are tracked with internal company tools, which are not independently verified by any third party and have a number of limitations. For example, our metrics may be affected by mobile applications that automatically contact our servers for regular updates with no discernible user action involved; this activity can cause our system to count the device associated with the app as an app unique device in a given period. Although we take steps to exclude such activity and, as a result, do not believe it has had a material impact on our reported metrics, our efforts may not successfully account for all such activity.
Our metrics that are calculated based on data from third parties — the number of desktop and mobile website unique visitors — are subject to similar limitations. Our third-party providers periodically encounter difficulties in providing accurate data for such metrics as a result of a variety of factors, including human and software errors. In addition, because these traffic metrics are tracked based on unique identifiers, an individual who accesses our website from multiple devices with different identifiers may be counted as multiple unique visitors, and multiple individuals who access our website from a shared device with a single identifier may be counted as a single unique visitor. As a result, the calculations of our unique visitors may not accurately reflect the number of people actually visiting our website.
Our measures of traffic and other key metrics may also differ from estimates published by third parties (other than those whose data we use to calculate such metrics) or from similar metrics of our competitors. We are continually seeking to improve our ability to measure these key metrics, and regularly review our processes to assess potential improvements to their accuracy. From time to time, we may discover inaccuracies in our metrics or make adjustments to improve their accuracy, including adjustments that may result in the recalculation of our historical metrics. We believe that any such inaccuracies or adjustments are immaterial unless otherwise stated.
RISK FACTOR SUMMARY
Our business operations are subject to numerous risks and uncertainties, including the risks described in the section titled “
Risk Factors” included under Part I, Item 1A of this Annual Report, that could cause our business, financial condition or operating results to be harmed, including risks regarding the following:
Business and Industry
•adverse macroeconomic conditions and their impact on consumer behavior and advertiser spending;
•our ability to maintain and expand our advertiser base;
•our ability to execute on our strategic initiatives and the effectiveness thereof;
•our ability to hire, retain, motivate and effectively manage well-qualified employees in a remote work environment;
•our ability to maintain and increase user engagement on our platform, including our ability to generate, maintain and recommend sufficient content that consumers find relevant, helpful and reliable;
•competition in our industry;
•our reliance on third-party service providers and strategic partners;
•our reliance on Internet search engines and application marketplaces;
•our ability to maintain, protect and enhance our brand;
Technology and Intellectual Property
•our ability to maintain the uninterrupted and proper operation of our technology and network infrastructure;
•actual or perceived security breaches as well as errors, vulnerabilities or defects in our software or in products of third-party providers;
•our ability to protect our intellectual property rights;
•our use of open source software;
Financial and Tax Matters
•fluctuations in our operating results;
•our significant operating losses and potential inability to maintain profitability;
•real or perceived inaccuracies in our key metrics;
•our credit obligations;
•our tax liabilities;
Regulatory Compliance and Legal Matters
•current and future disputes and assertions by others that we violate their rights;
•complex and evolving U.S. and foreign laws and regulations;
Factors Related to Ownership of Our Common Stock
•the volatility of the trading price of our common stock; and
•provisions of Delaware law and our charter documents that could impair a takeover attempt if deemed undesirable by our board of directors.
PART I
Item 1. Business.
Company Overview
Since Yelp's founding 18 years ago, our mission has remained the same — to connect consumers with great local businesses. Over that time, we have built one of the best-known Internet brands in the United States. Consumers trust us for our more than 240 million ratings and reviews of businesses across a broad range of categories. This consumer trust is the foundation of our business, from which we are able to empower other businesses to succeed. Our advertising products help businesses of all sizes reach a large audience, advertise their products and drive conversion of their services.
Our performance in 2022 — which included record annual revenue and profitable growth — demonstrates our ability to execute on our strategic initiatives as well as the durability of our broad-based local advertising platform. For a discussion of our results for the year ended December 31, 2022, see the section titled “
Management’s Discussion and Analysis of Financial Condition and Results of Operations” included under Part II, Item 7 of this Annual Report.
Our Long-term Growth Opportunity is Large
We believe our ability to provide value to both consumers and businesses positions us well in the large and growing local, digital advertising market in the United States. The competitive advantages we have established over the past 18 years, together with the product-led business model and improved cost structure we have implemented in recent years, provide us with the opportunity for consistent, long-term growth in this market. We have:
•A proven engine to generate and recommend trusted content. Our platform provides the type of reliable and useful review content that consumers value, which is the basis for a positive feedback loop in which more content attracts more users, content and businesses in turn. The breadth and depth of our high-quality content is the result of our significant investments over the past 18 years in both developing communities of users as well as providing a great consumer experience that enables and encourages consumers to share their everyday business experiences through reviews, photos and other content. We have also developed industry-leading content moderation practices to maintain the quality and integrity of our content. For example, our recommendation software and other machine learning algorithms are designed to surface the most useful and trustworthy information on our platform for consumers. This technology, together with content moderation by our User Operations team and other consumer protection efforts, helps us detect and mitigate attempts to manipulate ratings and reviews. As of December 31, 2022, approximately 74% of the reviews submitted to our platform were recommended.
•A strong brand and a large consumer audience. Our trusted content has attracted a large, high-intent consumer audience. This large audience of engaged consumers reflects the strength of our brand as the go-to source for reliable local business information as well as our availability across a wide range of platforms and devices. It also provides a compelling value proposition to advertisers. In addition to its size, our audience has high purchase intent and is generally affluent — we estimate that over 55% of our audience has annual household income of more than $100,000.
•A broad-based local advertising platform and sophisticated advertising technology. Our large consumer audience supports a broad-based advertising model with products designed to meet the needs of businesses of all sizes. Our portfolio of products and attribution capabilities leverage first-party data to provide advertising solutions across categories and each stage of the consumer funnel, both on and off platform. These products are backed by a scaled and extensible advertising technology platform. To establish the price of an individual ad click on our platform, we run an auction for each advertising unit displayed to a consumer on our website or mobile app, which resulted in an average of 19 million auctions per day in 2022. The bidding algorithms used in our auction system are designed to prioritize spending advertiser budgets efficiently and maximize ad clicks to optimize the value we deliver to advertisers, while our proprietary ad delivery technology is designed to determine the most relevant ads to display to consumers to drive fulfillment.
Our Growth and Margin Strategy
We believe that the strategic initiatives that have led our business to new highs in recent years continue to provide significant opportunities for growth. In 2023, we plan to expand upon these initiatives by continuing to invest in the areas set forth below, each of which we believe represents its own long-term opportunity and which together we believe will drive long-term sustainable and profitable growth.
Revenue Growth
•Grow quality leads and monetization of our Services categories. Although we have made significant progress on increasing the percentage of monetized leads in our Services categories in recent years, the substantial majority of leads in these categories remain unmonetized. As a result, we believe that our large and high-intent consumer audience positions us well to capture more of the significant opportunity that the advertising market for Services businesses represents. Because the needs of both consumers and businesses in our Services categories are generally distinct from those in our Restaurants, Retail & Other (“RR&O”) categories — restaurants, shopping, beauty & fitness, health and other — we continue to believe that differentiating the Services experience on Yelp will allow us to both monetize more of our consumer traffic and convert more Services businesses into advertisers. In 2023, we also plan to improve the experience for consumers and Services businesses by making it easier for them to manage their Services projects. We are also exploring new ways for Services businesses to build trust with consumers through complementary products like Verified License.
•Drive sales through our most efficient channels. Our go-to-market mix has shifted significantly in recent years towards our most efficient sales channels — Self-serve and national, mid-market and franchise (“Multi-location”). We plan to continue to explore ways to drive small to medium-sized businesses (“SMBs”) through our fully digital Self-serve channel in 2023, including through marketing and a more streamlined ads purchase flow, further improvements to the business owner platform and additional tools to help educate business owners on how to get the most out of their ad campaigns, such as targeted budget recommendations. We also plan to further expand our suite of full-funnel ad products tailored to multi-location advertisers as well as enhance our attributing and reporting capabilities, allowing these large advertisers to optimize for even more campaign objectives. In addition, we are exploring opportunities to expand Yelp Audiences to traditional location-based clients looking to drive performance both on and off Yelp.
•Deliver more value to advertisers. Our sophisticated ad system optimizes for value by matching consumers with the right advertisers at the right time, allowing us to deliver more value to our advertisers in the form of higher performing ad clicks. We believe that we can drive more value to advertisers and increase platform monetization through additional ad system improvements. In 2023, we plan to increase the quality of our ad clicks through improved relevancy and matching, improve the user experience of our ads and introduce more ad formats. In the longer term, we also plan to explore opportunities to expand our off-platform capabilities through Yelp Audiences to drive more ad clicks across publishing partners.
•Enhance the consumer experience. Our trusted content forms the basis for our business, attracting the large audience of consumers that is our value proposition to advertisers to Yelp. In 2023, we plan to continue investing in consumer product and marketing initiatives to support long-term audience and engagement growth. We plan to continue working to reduce review contribution friction and to convert more users into contributors. We are also leveraging our rich photo content in projects focused on creating a more visual user experience to drive increased engagement.
Delivering Profitable Growth
•Our revenue growth strategies also drive improved profitability. Retention improvements also benefit our margins and, accordingly, we believe our investments designed to improve lead quality and deliver more value to advertisers will also drive margin expansion over the long term. We expect that our plans to drive sales through our Self-serve and Multi-location sales channels will also help improve our margins; in addition to being more margin-accretive than Local sales, these channels have historically exhibited better revenue retention characteristics than Local sales. As a result, we expect our Self-serve and Multi-location sales initiatives will continue to help improve our overall revenue retention over the long term as revenue from these channels makes up an increasing percentage of our total advertising revenue.
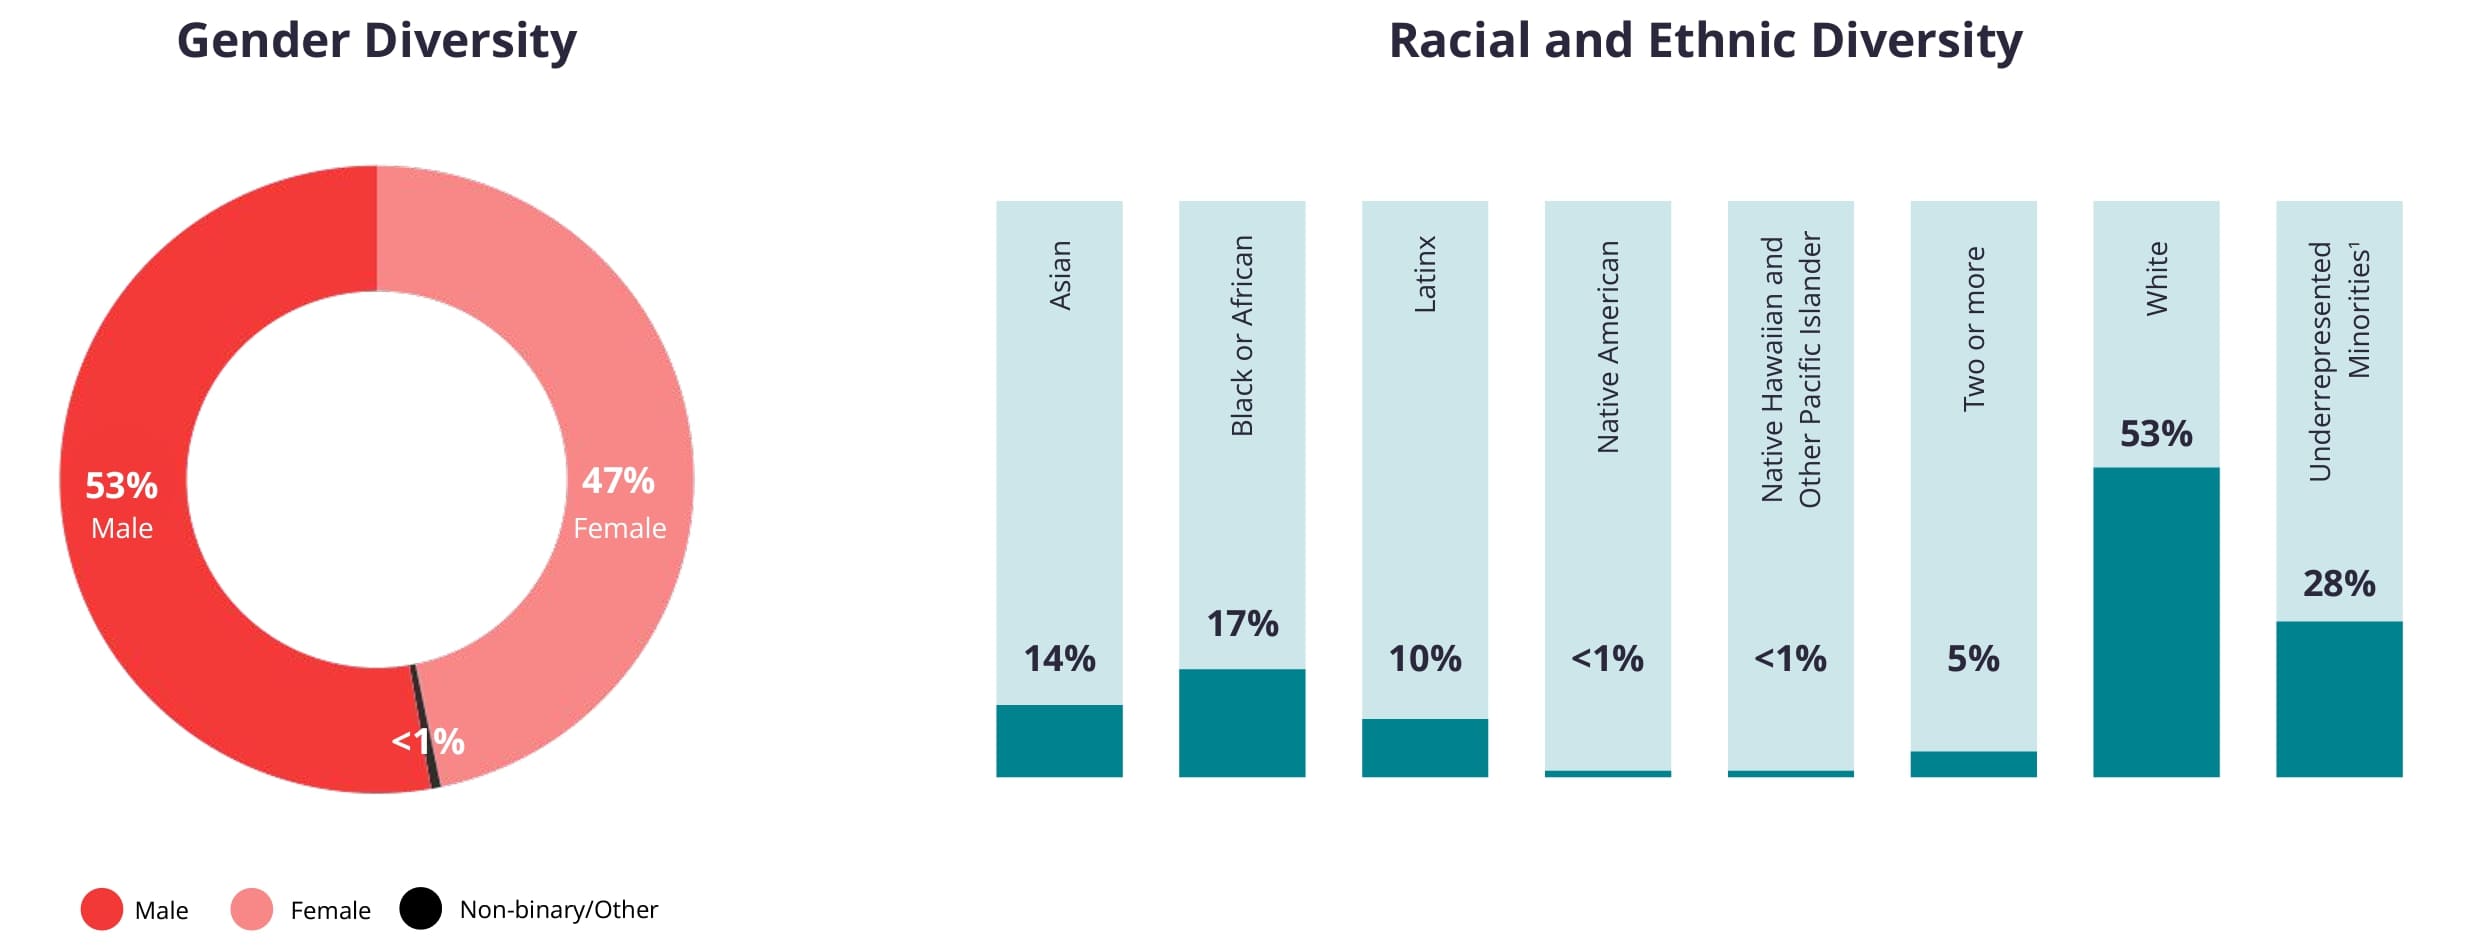
•Reduce expenses through distributed work. We believe that operating on a distributed basis is in the best interests of both Yelp and our employees; it reduces our reliance on the San Francisco Bay Area and provides employees with more flexibility. As we continue hiring into geographies outside of the Bay Area, we believe that we can improve employee retention and build a more diverse workforce. We also expect that this will result in our stock-based compensation expense as a percentage of revenue to trend toward a less dilutive mix over time. We decreased our stock-based compensation expense as a percentage of revenue by approximately two percentage points in 2022 and expect to drive an additional percentage point decrease in 2023. We believe we can lower stock-based compensation expense to less than 8% of revenue by the end of 2025. In addition, we continue to explore additional opportunities to reduce our real estate footprint.
Our Products and Services
Advertising
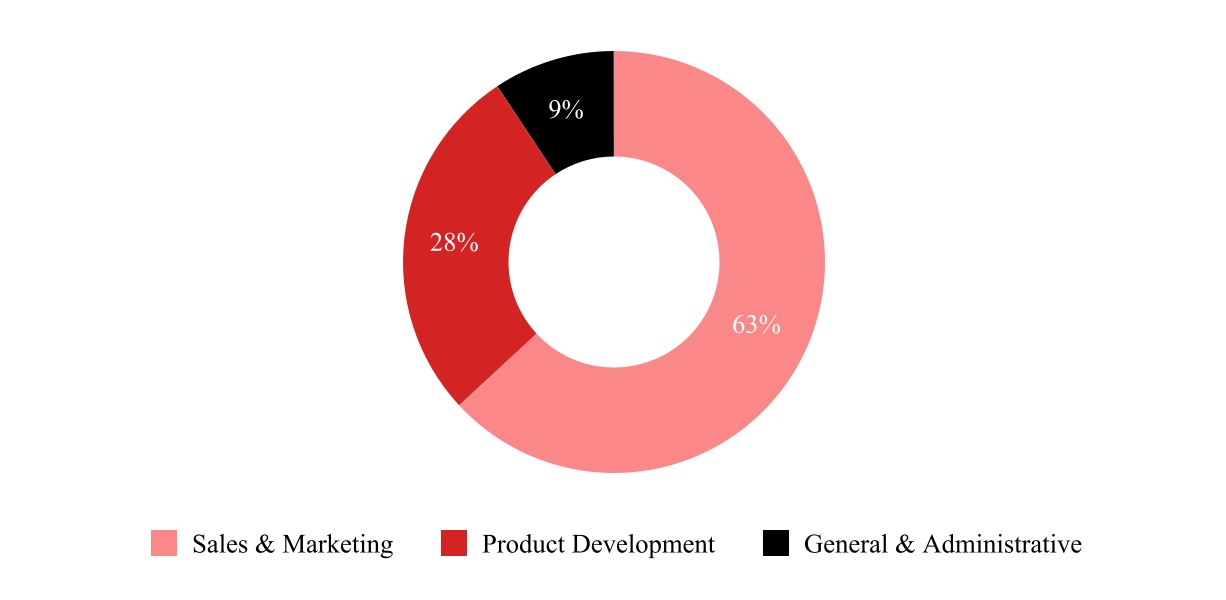
We offer a range of free and paid advertising products to businesses of all sizes, including the products listed below, which provide the ability to deliver targeted advertising to our large and high-intent audience. As in past years, advertising accounted for the vast majority of our revenue during the year ended December 31, 2022, contributing 95% of our revenue, which was fairly consistent with the years ended December 31, 2020 and 2021. We recognize revenue from our business listing and advertising products, including advertising sold by partners, as advertising revenue.
|
|
|
|
|
|
|
|
|
| Advertising Products |
|
|
|
| CPC Advertising (“Yelp Ads”) |
|
We allow businesses to promote themselves in sponsored search results on our platform, on the Yelp pages of businesses in the same or related categories, and other places on our platform. We also provide Services businesses with the ability to provide competing quotes for consumers using our Request-a-Quote feature and with a way for consumers to easily request a phone call from them through our Request-a-Call feature. We primarily sell performance-based ads, which our advertising platform matches to individual consumers through our automated auction system priced on a CPC basis. We generate a majority of our advertising revenue from the sale of CPC advertising. |
|
|
|
Multi-location Ad Products |
|
We offer a range of ad products designed for multi-location advertisers, including: Showcase Ads, which showcase and feature limited-time offers, new products or promotions in relevant search results; Spotlight Ads, which highlight special offers and promotions related to seasonal or other special events in a carousel directly on the Yelp app home screen; and Yelp Audiences, which extends campaign reach to our high-intent audience off platform. We also offer a first-party attribution solution, Yelp Store Visits, which provides insights on how Yelp Ads drive physical store foot traffic. |
|
|
|
| Business Page Products |
|
|
|
Free Business Account |
|
Businesses have the ability to create a free business account and claim a Yelp page for each of their business locations. Once a business has claimed its listing page, it can update its listing information and has the option to purchase certain page upgrade features. |
|
|
|
| Upgrade Package |
|
Our most popular product after Yelp Ads is our Upgrade Package, which includes access to features such as the removal of competitor ads from the business’s Yelp page, Business Highlights, Portfolio, Yelp Connect and Logo, each as described below, among other features. |
|
|
|
| Branded Profile |
|
Our Branded Profile product provides businesses with access to premium features in connection with their Yelp business pages, such as the ability to update listing information and select photos to highlight on the page through a slideshow feature. |
|
|
|
| Enhanced Profile |
|
In addition to providing businesses with the same premium features and support options as our Branded Profile product, our Enhanced Profile product prevents ads from other businesses from appearing on the Yelp business pages of our Enhanced Profile customers. |
|
|
|
| Verified License |
|
Verified License is a badge that appears on Yelp business pages as a paid upgrade for certain eligible licensed advertisers, primarily in our home & local services category. The badge indicates that we have verified the business's trade license and confirmed it was in good standing as of a certain date, allowing businesses to distinguish themselves as licensed and helping consumers make confident decisions when selecting businesses for their projects. |
|
|
|
| Business Highlights |
|
Businesses in eligible categories can pay to highlight up to six attributes that make their business unique, such as “Family Owned” or “Pet Friendly.” |
|
|
|
| Portfolio |
|
Portfolio allows businesses to showcase their work or services to prospective customers through a photo collection of projects. |
|
|
|
|
|
|
|
|
|
|
|
|
| Yelp Connect |
|
Yelp Connect provides advertisers with a channel to market new offerings, such as new menu items, or communicate business updates to customers. Yelp automatically promotes Yelp Connect posts to a business's followers. |
|
|
|
| Logo |
|
Logo provides businesses with the ability to display their logos in high-visibility locations, including prominently at the top of Yelp business pages and in search results. |
|
|
|
| Nearby Jobs |
|
Nearby Jobs provides businesses with the ability to see a dynamic feed of job quote requests in their area of business. |
Transactions
In addition to our advertising products, we also offer features and consumer-interactive tools to facilitate transactions between consumers and the local businesses they find on Yelp. These features are primarily available through partner integrations, the largest of which — by both transaction volume and revenue — is our partnership with Grubhub, which allows consumers to place food orders for pickup and delivery through Yelp. We recognize revenue from these sources on a net basis as transactions revenue.
Other
We generate other revenue through subscription services, licensing payments for access to Yelp data and other non-advertising, non-transaction arrangements.
|
|
|
|
|
|
|
|
|
| Yelp Guest Manager |
|
Yelp Guest Manager is a subscription-based suite of front-of-house management tools for restaurants, nightlife and certain other venues. These tools include online reservations, a waitlist management solution that allows consumers to check wait times and join waitlists remotely as well as through hostless kiosks, and seating and server rotation management tools. |
|
|
|
| Yelp Knowledge |
|
Through partnerships with companies such as Sprinklr and Chatmeter, our Yelp Knowledge program offers business owners local analytics and insights through access to our historical data and other proprietary content. Our Yelp Knowledge partners pay us license fees for access to Yelp Knowledge content. |
|
|
|
| Yelp Fusion |
|
Our Yelp Fusion program enables developers to build products that include our high-quality content and data. We partner with industry leaders like Apple, which makes our content available through Apple Maps and its virtual assistant Siri, as well as several auto manufacturers, including Audi AG and BMW, to make our content available in their in-dash experiences. We offer free access to certain basic information through our publicly available APIs as well as paid access to broader sets of content and data for consumer-facing enterprise use. We typically enter into multi-year license agreements with paying Yelp Fusion customers, with rates determined based on the type and volume of usage. |
|
|
|
| Other Partnerships |
|
Other non-advertising partner arrangements include content licensing and allowing third-party data providers to update and manage business listing information on behalf of businesses. |
Sales
We sell our advertising products directly through our sales force, indirectly through partners, and online through our website and our Yelp for Business app.
Self-serve Ads. Our Self-serve platform allows businesses to purchase and manage their Yelp Ads campaigns directly from our website or Yelp for Business app. Businesses can purchase sponsored CPC search advertising and business page upgrades such as Business Highlights and Yelp Portfolio directly through our Self-serve platform. The convenience of our Self-serve platform has helped us improve revenue retention and reduce our reliance on sales and customer support headcount, and continues to be a strategic priority for us. In 2022, our performance marketing and continued improvements to the claim and ads purchase flows as well as the business owner platform drove record Self-serve customer acquisition. In 2023, we plan to invest further in driving business owner engagement and capitalizing on post-sales opportunities with existing customers.
Direct Local Sales. Our Local sales team primarily sells Yelp Ads to SMBs. Local sales representatives are primarily responsible for generating qualified sales leads by identifying and contacting businesses through direct engagement, direct marketing campaigns and e-mails to claimed local businesses. Although our Local sales team is primarily focused on increasing revenue by adding new customers, sales representatives on our customer success team engage with existing customers with the goal of increasing their overall spend.
Revenue from direct Local sales has historically comprised the largest share of advertising revenue and was driven by growth in Local sales headcount. As we have increased our focus on our more margin-accretive Self-serve and Multi-location channels in recent years, however, we have become less reliant on Local sales headcount to drive growth. We have been able to substantially reduce the size of the Local sales team accordingly, while also retaining our most tenured and successful sales representatives and optimizing their compensation structure. Although Local sales revenue was still the largest share of advertising revenue in 2022, its share has decreased in recent years as Self-serve and Multi-location sales revenue has increased.
Multi-location Sales. Our Multi-location sales team is responsible for selling our advertising products to national, mid-market and franchise businesses. We believe that Multi-location advertising budgets represent a significant growth opportunity and this channel has been a focus of our strategic investments in recent years as we expanded our products and attribution capabilities to meet the needs of these advertisers. We believe that our enhanced suite of Multi-location products, together with strengthened customer relationships, provide a significant opportunity to expand revenue from this sales channel. We plan to continue investing in initiatives to grow revenue from our Multi-location sales channel in 2023.
Sales Partnerships. We also generate revenue through the resale of our advertising products by certain agencies and partners, such as Thryv, as well as monetization of remnant advertising inventory through third-party ad networks. Our Yelp Ads Certified Partners Program allows partner agencies to independently sell and manage ad campaigns on behalf of their SMB clients, providing increased centralization and flexibility. The products covered by these arrangements include all of our profile products as well as search advertising.
Customer Success. Our customer success team supports existing business advertisers through account management, cross-selling and retention initiatives.
Technology
We rely on a set of core technologies that enable us to be a trusted local resource for consumers and a partner in success to businesses of all sizes. We provide scalable services across platforms and devices using a combination of proprietary, open source and third-party technology solutions and products:
•Anticipating Consumer Needs. We analyze the large volumes of data collected from our platform and apply our proprietary indexing and ranking techniques to provide our users with contextual, relevant and up-to-date information. Our sophisticated search platform delivers search results 30% to 50% faster than the industry-standard solution while costing as much as 40% less to run for some use cases, allowing better search matching and ad targeting. We also apply machine learning algorithms to predict user needs and preferences based on factors such as the user's recent activity, location, time of day and season, then tailor the user's experience on Yelp accordingly. In our Services categories, for example, if a user recently searched for movers, we might suggest searches for businesses offering self-storage or junk removal. Similarly, if our data suggests that a user is a homeowner, we might promote collections of businesses that offer spring cleaning or other seasonally appropriate services.
•Recommendation Software. Our recommendation software refers to the proprietary automated trust and safety software systems that we have developed to analyze the relevance, reliability and utility of each review submitted to our platform. “Recommended” reviews — those that the software deems to be the most useful and reliable — appear directly on Yelp business pages, while less trustworthy and unreliable content appear on secondary pages and do not factor into a business’s overall star rating. Our recommendation software applies the same objective standards to each review, regardless of whether the business being reviewed advertises on Yelp, based on hundreds of signals associated with the business, review and reviewer. These signals include the reviewer’s type and level of activity with Yelp (which might correspond to the reviewer’s reliability or suggest reviewer biases) and whether certain reviews originate from related Internet Protocol (“IP”) addresses (which might mean the reviews were submitted by the same person). The software evaluates each review based on hundreds of signals every day and, as a result, its analysis can change over time as new data becomes available; reviews that were previously recommended may become not recommended, and reviews that were previously not recommended may be restored to recommended status.
•Machine Learning, Artificial Intelligence and Large Language Models. We use advanced machine learning and artificial intelligence to power and enhance features across our platform. Deep learning neural networks model user behavior to select the most relevant ads to display as well as categorize user-generated photos to improve their usefulness. We are beginning to use large language models to better understand user intent in search queries and enhance our search capabilities. Large language models also play an important role in analyzing user-generated content to protect consumers and business owners from malicious or harmful content.
•Mobile Solutions. With our most engaged users on our mobile app, we have invested significant resources into developing a comprehensive mobile platform for consumers. Although our platform supports both major smartphone operating systems available today, iOS and Android, our Android app has historically lagged our iOS app in feature parity. In 2022, we invested in improving the Android app experience through a more visual, vertical home feed and an updated map view search experience, among other things, which contributed to increased engagement and monetization on Android.
Similarly, we designed our Yelp for Business app to make it easier for businesses to engage with their customers and manage their presence on Yelp. Currently available for iOS and Android, this app provides businesses with daily metrics reports, page view analytics and leads data, as well as the ability to manage quote requests and opportunities in Nearby Jobs. Businesses can also purchase, customize and manage Yelp Ads through the Yelp for Business app.
•Ad Delivery. We use proprietary ad targeting and delivery technologies that are designed to quickly target and display hyper-relevant advertisements to users of our platform. When a consumer enters a search on our app, these technologies determine the most relevant ads to show and serve those ads alongside the organic search results, typically in less than half a second. Our targeting software leverages machine learning models that evaluate more than 350 signals about the user, business and search context to make sure consumers see the right ad at the right time and drive ad clicks.
•Auction System. We use an auction system to determine the price we charge advertisers for ad clicks. Our auction system uses advanced algorithms to bid on ad placements on behalf of advertisers, taking into account their budgets, current and predicted levels of relevant consumer traffic, changes in user behavior and competition from other advertisers, among other things. These bidding algorithms are also designed to prioritize spending advertiser budgets efficiently and maximize ad clicks, with the goal of delivering as much value to advertisers as possible. For example, if our models predict that relevant consumer traffic will meaningfully decrease for a period of time during an ad campaign, our bidding algorithms will dynamically allocate advertiser budget around that period to avoid spending a disproportionate amount of the budget while supply is constrained. To conduct an average of 19 million auctions per day, we predict demand for 16 million ad categories and distinct time intervals to set bid pricing and pacing, then optimize bids 96 times per day per advertiser.
•Infrastructure. The vast majority of our platform is currently hosted by Amazon Web Services from multiple locations, which allows us to scale our infrastructure dynamically according to demand as well as optimize the cost and performance of our infrastructure. Our platform is designed to have high availability, from the Internet connectivity providers we choose, to the servers, databases and networking hardware that we deploy. We design our systems such that the failure of any individual component is not expected to affect the overall availability of our platform. We also leverage other third-party cloud-based services such as content delivery networks, rich-content storage, map-related services, ad serving and bulk processing.
•Network Security. Computer viruses, malware, phishing attacks, denial-of-service and other attacks and similar disruptions from unauthorized use of computer systems have become more prevalent in our industry, have occurred on our systems in the past and we expect them to occur periodically on our systems in the future. For this reason, our platform includes a host of encryption, antivirus, multi-factor authentication, firewall and patch-management technologies designed to help protect and maintain the systems and computers across our business. We regularly conduct security audits and penetration tests of our applications and network infrastructure, as well as run a bug reporting program that offers financial incentives to encourage security researchers to identify and report vulnerabilities.
Maintaining the Integrity of Our Content
Providing access to useful and reliable information to help inform consumers’ spending decisions is critical to our mission of connecting people with great local businesses. With misinformation and deceptive behavior common across the Internet, we have prioritized combating this sort of conduct since our earliest days to maintain user trust and level the playing field for hard-working businesses that earn their great reputations honestly. Our industry-leading trust and safety measures include investments in both technology and human moderation:
Recommendation Software. Our automated recommendation software is our first line of defense against unreliable content and misinformation submitted to our platform. As described in more detail under "—Technology" above, our recommendation software analyzes billions of data points and hundreds of signals from all reviews, businesses and reviewers in an effort to recommend the most useful and reliable reviews. Our recommendation software helps us mitigate misinformation at scale by detecting and de-emphasizing less trustworthy reviews, including content that may be:
•Biased: including reviews written by those with ties to a business, such as competitors, disgruntled employees, friends or family.
•Solicited: when someone associated with a business requested the review, which can create a positive bias that is unfair to other businesses. When asked to write a review by a business, customers may feel pressured to give the business a higher star rating than someone who was inspired to write a review on their own. Businesses also tend to ask for reviews from customers they know will give them a great rating.
•Less reliable: including reviews written by less active users, whom we don't know enough about to recommend their opinion to our community, and reviews connected to suspicious behavior, such as when a disproportionate number of reviews for a business are submitted from the same IP address.
•Less useful: including unhelpful rants and raves as well as irrelevant information.
As of December 31, 2022, approximately 74% of the reviews submitted to our platform were recommended by our automated software and approximately 18% were not recommended but still accessible on secondary pages. Although they do not factor into a business’s overall star rating, we provide access to reviews that are not recommended because they provide additional perspectives and information on reviewed businesses and reviewers, as well as transparency as to the efficacy of our recommendation software.
Community. Yelp has always been a community-driven review platform, and we encourage authentic content from the start of the user experience. We encourage users to complete a public profile, which not only helps build a community but also helps signal the reliability of their content. We also established the Yelp Elite Squad to provide recognition to users who are active in the Yelp community and consistently contribute high-quality content.
In addition to encouraging reliable content and fair play from the outset, our communities serve as additional layers of oversight. For example, we provide easy ways for our communities of users and business owners to report content that they believe violates our guidelines and suggest updates to business information. We also provide multiple ways for business owners to respond to reviews.
Human Content Moderation. In addition to investigating individual reports of content that violates our policies, our User Operations team conducts and facilitates larger investigations into attempts to deceive consumers. For example, we proactively work to identify businesses and individuals who offer or receive cash, discounts or other benefits in exchange for reviews, such as review solicitation and reputation management companies that offer to artificially inflate search rankings and online reputations. Our human-powered moderation is also able to identify and thwart more nuanced attempts to mislead consumers that platforms with less sophisticated and fully automated content moderation may miss. For example, since 2018, our moderators have manually evaluated business pages and recategorized businesses that offer reproductive health services, but not abortion services or referrals to such services, as crisis pregnancy centers. And in 2022, as the ability to access safe abortion care became more limited for millions of women across the United States with the reversals of Roe v. Wade and Planned Parenthood v. Casey, we introduced a new consumer notice on Yelp business pages categorized as crisis pregnancy centers to protect consumers from the potential of being misled when seeking reproductive health services.
In addition to taking direct corrective action — such as recategorizing businesses to appropriately reflect their services, as in the example above — if we identify or confirm any such issues through our investigations, we typically pursue one or more of the courses of action described below (each of which we may also employ on a stand-alone basis).
Consumer Alerts Program. Our consumer alerts program warns consumers when we find evidence of extreme attempts to manipulate a business’s ratings and reviews or other egregious conduct that may harm consumers and unfairly put other businesses at a disadvantage. When we issue a consumer alert, a warning message appears above the review section of the business’s Yelp page with information about the reason for the alert and, where available, a link to the evidence we collected in support of the alert. We issue consumer alerts for the following types of activity:
•Unusual activity: in order for Yelp to remain a useful resource, reviews must be based on genuine, first-hand experiences. When people take to a business’s Yelp page to express their views after the business receives increased public attention, our User Operations team may temporarily disable the posting of content to the page and publish a public attention alert as they investigate and remove content that violates our policies. In 2020, we expanded this category of alert to add new notifications informing consumers when a business gains public attention for either being accused of, or the target of, racist behavior. Additionally, in July 2022, due to a coordinated effort to spam crisis pregnancy centers and a large influx of reviews that did not reflect first-hand consumer experiences, we temporarily placed unusual activity alerts across more than 1,080 Yelp pages categorized as crisis pregnancy centers to briefly disable the ability to spam them with reviews while our moderators confirmed that only first-hand consumer experiences were reflected.
•Suspicious review activity: this alert informs consumers if we have uncovered a disproportionate number of positive reviews submitted from the same IP address, which can indicate a concerted effort to inflate the business’s overall star rating on Yelp. We also issue this type of alert when we discover a business has a possible connection to a deceptive review ring.
•Compensated activity: we issue this type of consumer alert if we encounter a business attempting to purchase favorable reviews, incentivizing new or updated reviews, or offering compensation to remove reviews.
•Questionable legal threats: when we receive evidence that a business is making dubious legal threats against a reviewer or using a contractual gag clause in an attempt to prevent critical reviews, we issue this type of alert to warn others that the business may be attempting to abuse the legal system to maintain an inflated star rating.
Removal of Reviews. We regularly remove reviews from our platform that we believe violate our terms of service, including, without limitation: reviews that do not reflect a first-hand consumer experience; content that has been bought, sold or traded; and reviews that are posted by someone we believe to be affiliated with the reviewed business. We also take steps to ensure that Yelp is a safe and welcoming place for everyone by removing threatening, harassing or lewd content, as well as hate speech and other displays of bigotry. Consumers can access information about reviews that we have removed for a particular business by clicking on a link on the business’s Yelp page. As of December 31, 2022, approximately 8% of the reviews submitted to our platform had been removed.
Coordination with Law Enforcement. We regularly cooperate with law enforcement and consumer protection agencies to investigate and identify businesses and individuals who may be engaged in false advertising or other deceptive practices relating to reviews.
Legal Action. Our terms of service prohibit the buying and selling of reviews, as well as writing fake reviews. We regularly issue demands to third parties engaging in these and other deceptive activities that they cease such activities in relation to our platform. In egregious cases, we take legal action against businesses we believe to be engaged in deceptive practices based on these prohibitions.
Consumer Engagement
At the heart of our business are the vibrant communities of users that contribute the content on our platform. We help businesses succeed by empowering them to reach a large audience of purchase-oriented consumers, which depends on our ability to attract consumer traffic with valuable content. The rich, first-hand information about local businesses that our users share — in the form of reviews, ratings, photos and more — is the reason consumers come to Yelp when making their spending decisions and is therefore the foundation of our value proposition to businesses. Although measures of our content (including our cumulative review metric) and traffic (including our desktop and mobile unique visitors and app unique device metrics) do not factor directly into the advertising arrangements we have with our advertising customers, this dynamic underpins our ability to deliver ad clicks and drive conversion of advertisers' products and services. Consumer engagement metrics validate our value proposition to businesses as they seek easy-to-use and effective advertising solutions.
Community Management
For the above reasons, we foster and support communities of users and make the consumer experience a top priority. We have a team of Community Managers and Community Ambassadors based across the United States and Canada whose primary goals are to support and grow communities of users in the local markets that they serve, raise brand awareness and engage with their surrounding communities through:
•planning and executing fun and engaging events for the community, such as parties, outings and activities at restaurants, museums, hotels and other local places of interest;
•getting to know community members and helping them get to know one another to foster an offline community experience that can be transferred online;
•promoting Yelp, including guest appearances on local television and radio, and at local events such as concerts and street fairs; and
•recurring weekly e-mail newsletters to share information with the community about local businesses, events and activities.
Through these activities, we believe our Community Management team helps us increase awareness of our platform and grow avid communities who are willing to contribute content to our platform. Even in the face of the COVID-19 pandemic, our Community Management team have continued these efforts by hosting virtual events and helping consumers and local businesses stay connected during these extraordinary times. We plan to continue these community development efforts in 2023.
Yelp Elite Squad
Our Community Managers' responsibilities include engaging with our most passionate users — Yelp Elite Squad members. From the earliest days of Yelp, it was clear that some of our users went above and beyond with their prolific reviews, thoughtful photos and commitment to supporting local businesses by sharing their experiences. These users were not only active in their Yelp communities, but were also role models on and offline. Their voices helped make Yelp what it is today, and we started the Yelp Elite Squad to recognize these passionate individuals, signal our trust in them and their contributions, and encourage similar beneficial activities in our communities.
Beyond having well-written reviews, high-quality photos and a detailed personal profile, Yelp Elite Squad members are active evangelists for their Yelp communities. Yelp Elites receive a badge on their Yelp profile pages and Community Managers organize sponsored social events for them, which facilitates face-to-face interactions, builds the Yelp brand and fosters the sense of true community in which we believe so strongly. These behind-the-scenes looks at top-rated businesses often include interacting with business owners, hearing their unique stories and engaging with other locals in their community; however, as users of our service, Yelp Elites do not receive compensation for their contributions.
Intellectual Property
We rely on federal, state, and international statutory, common law and other legal rights, as well as contractual restrictions, to protect our intellectual property. We control access to and distribution of our proprietary technology and algorithms, including our trade secrets, by entering into confidentiality and inventions assignment agreements with our employees and contractors, as well as confidentiality agreements with third parties and other reasonable precautions intended to prevent unauthorized disclosure.
In addition to these contractual arrangements, we pursue the registration of our copyrights, trademarks, service marks and domain names in the United States and in certain locations internationally. Our registration efforts have focused on gaining trademark protection for the word mark “Yelp” and the Yelp burst logo, among others. These marks are material to our business and essential to our brand identity as they enable others to easily identify us as the source of the services offered in connection with these marks. We currently have limited patent protection for our core business, which may make it more difficult to assert certain of our intellectual property rights. For example, the contractual restrictions, policies and processes that protect our trade secrets, including our proprietary technology and algorithms, provide only limited safeguards against misappropriation.
Circumstances outside our control could pose a threat to our intellectual property rights. For example, effective intellectual property protection may not be available in the United States or other countries in which we operate. Also, the efforts we have taken to protect our proprietary rights may not be sufficient or effective. Any significant impairment of our intellectual property rights could harm our business or our ability to compete.
Protecting our intellectual property rights is also costly and time consuming. Any unauthorized disclosure or use of our intellectual property could make it more expensive to do business and harm our operating results.
Companies in the Internet, technology and media industries own large numbers of patents and other intellectual property rights, and may request license agreements or threaten to enter into litigation based on allegations of infringement or other violations of such rights. From time to time, we receive notice letters from patent holders alleging that certain of our products and services infringe their patent rights. We have also been subject to, and expect to face in the future, allegations that we have infringed the trademarks, copyrights, patents and other intellectual property rights of third parties, including our competitors and non-practicing entities. As we face increasing competition and as our business grows, we may face more such claims of infringement.
Competition
We compete in rapidly evolving and intensely competitive markets, and we expect competition to intensify further in the future with the emergence of new technologies and market entrants. Our competitors consist of companies that help businesses — particularly businesses in our strategically important Services categories and, to a lesser extent, restaurants category — connect and engage with consumers, including:
•online search engines and directories, such as Google, as well as traditional, offline business guides and directories;
•online and offline providers of consumer ratings, reviews and referrals, such as TripAdvisor;
•providers of online marketing and tools for managing and optimizing advertising campaigns, such as Google, Instagram and TikTok, as well as various forms of traditional offline advertising, including radio, direct marketing campaigns, yellow pages and newspapers;
•restaurant reservation and seating tools, such as OpenTable and Resy, as well as food ordering and delivery services; and
•home and/or local services-related platforms and offerings, such as Angi.
Our competitors may enjoy competitive advantages, such as greater name recognition, longer operating histories, substantially greater market share, established marketing relationships with, and access to, large existing user bases and substantially greater financial, technical and other resources. These companies may use these advantages to offer products similar to ours at a lower price, develop different products to compete with our current solutions and respond more quickly and effectively than we do to new or changing opportunities, technologies, standards or client requirements. Certain competitors could also use strong or dominant positions in one or more markets to gain competitive advantage against us in markets in which we operate.
We believe our ability to compete successfully for users, content, and advertising and other customers depends upon many factors both within and beyond our control, including:
•the popularity, usefulness, ease of use, performance and reliability of our products and services compared to those of our competitors;
•our ability, in and of itself as well as in comparison to the ability of our competitors, to develop new products and services and enhancements to existing products and services;
•the quantity, quality and reliability of our content, including its breadth, depth and timeliness;
•our ad targeting and measurement capabilities, and those of our competitors;
•the size, composition and level of engagement of our consumer audience relative to those of our competitors;
•our marketing and selling efforts, and those of our competitors;
•the pricing of our products and services relative to those of our competitors;
•the actual or perceived return our customers receive from our products and services relative to returns from our competitors;
•the frequency and relative prominence of the ads displayed by us or our competitors;
•acquisitions or consolidation within our industry, which may result in more formidable competitors; and
•our reputation and brand strength relative to our competitors.
Government Regulation
As a company conducting business on the Internet, we are subject to a variety of laws and regulations in the United States and abroad that involve matters central to our business, including laws regarding privacy, data protection, data security, user-generated content and consumer protection, among others. For example:
•Privacy, Data Protection and Data Security. Because we receive, store and process personal information and other user data, including credit card information in certain cases, we are subject to numerous data privacy and security obligations, including federal, state, local and foreign laws, regulations, guidance and industry standards, that restrict the collection, storing, use, retention, processing and disclosure of personal information and other user data. The laws in many jurisdictions require companies to implement specific security controls and contractual arrangements to protect certain types of information. Likewise, many jurisdictions have laws in place requiring companies to notify users and government agencies if there is a security breach that compromises certain categories of their information. We may also be subject to laws that require us to publish statements that accurately and fairly describe how we handle personal information and choices individuals have about the way we handle their personal information.
•Liability for Third-Party Action. We rely on laws limiting the liability of providers of online services for activities of their users and other third parties, such as Section 230 of the Communications Decency Act (“CDA 230”) in the United States.
•Advertising. We are subject to a variety of laws, regulations and guidelines that regulate the way we distinguish paid search results and other types of advertising from unpaid search results.
We operate in a rapidly evolving industry, and many laws and regulations that impact our business are being proposed, still evolving or being tested in courts. The application and interpretation of these laws and regulations are often uncertain, and they could be interpreted and applied in ways that harm our business. They may also conflict with other rules, be interpreted and applied inconsistently (including from country to country) and in ways that are at odds with our current policies and practices. As our business grows and evolves, we will also become subject to additional laws and regulations, including in jurisdictions outside of the United States.
For example, laws providing immunity to websites that publish user-generated content are regularly tested in courts by a number of claims, including actions based on invasion of privacy and other torts, unfair competition, copyright and trademark infringement and other theories based on the nature and content of the materials searched, the ads posted or the content provided by users. There are also regular Congressional efforts to restrict the scope of the protections available to online platforms under CDA 230, and our current protections from liability for third-party content in the United States could decrease or change as a result. Claims and legislation applicable to user-generated content also regularly arise in other jurisdictions.
Regulatory frameworks related to the processing of personal information are also evolving and generally becoming increasingly stringent. In the United States, states have begun to introduce comprehensive privacy, data protection and data security legislation, such as the California Consumer Privacy Act (“CCPA”), which took effect in 2020. The CCPA and its implementing regulations give California residents expanded rights to access and require deletion of their personal information, opt out of certain personal information sharing and receive detailed information about how their personal information is used, as well as provide for civil penalties and a private right of action for data breaches, which may include an award of statutory damages. The CCPA was expanded substantially on January 1, 2023, when the California Privacy Rights Act of 2020 (“CPRA”) came into effect. The CPRA, among other things, gives California residents the ability to limit use of certain sensitive personal information, further restricts the use of cross-contextual advertising, establishes restrictions on the retention of personal information, expands the types of data breaches subject to the CCPA’s private right of action, provides for increased penalties for CPRA violations concerning California residents under the age of 16, and establishes a new California Privacy Protection Agency to implement and enforce the new law. If California or other individual states pass additional privacy, data protection and data security laws that place different obligations or limitations on the processing of personal information of individuals in those states, it will become more complex to comply with these laws and our compliance costs and potential liability may increase. There is also discussion in Congress of new comprehensive federal data protection and privacy law to which we likely would be subject if it is enacted.
Foreign laws and regulations concerning privacy, data protection and data security are also evolving and are often more restrictive and burdensome than those in the United States; any failure on our part to comply with them may subject us to significant liabilities. For example, the European Union’s General Data Protection Regulation (“GDPR”) imposes comprehensive privacy, data protection and data security obligations on businesses and imposes significant penalties for non-compliance.
Among other obligations under the GDPR, businesses are required to make contractual privacy, data protection and data security commitments; give detailed disclosures about how they collect, use and share personal information; maintain adequate security measures; notify regulators and affected individuals of certain personal information breaches; meet extensive governance and documentation requirements; and honor individuals’ rights to their personal information.
European data protection laws including the GDPR also restrict the transfer of personal information from Europe to the United States and most other countries unless the parties to the transfer have implemented specific safeguards to protect the transferred personal information. However, recent judicial decisions invalidated the primary framework allowing such transfers, and the new framework negotiated by the European Union and United States may impose additional obligations and requirements with respect to such transfers. If we are unable to implement a valid solution for personal information transfers from Europe, we will face increased exposure to regulatory actions, substantial fines, and injunctions against processing or transferring personal information from Europe and may be required to increase our data processing capabilities in Europe at significant expense. Other countries outside of Europe have enacted or are considering enacting similar cross-border data transfer restrictions and laws requiring local data residency as well, which could increase the cost and complexity of operating our business.
Human Capital Management
At Yelp, we deeply value our community of employees who sustain our culture through their dedication to our mission of connecting people with great local businesses and to living our values of authenticity, tenacity, creativity, collegiality, and prioritizing consumer trust. We are committed to providing them with a great work experience by creating an equitable and inclusive environment. We have long focused on building a diverse team of innovators and problem solvers who can bring their most authentic selves to work, which we believe positions our employees to relate to and solve the diverse needs of consumers and businesses.
As of December 31, 2022, we had approximately 4,900 employees globally across the following teams:
Distributed Work
Following our move to distributed operations in March 2020 in connection with the COVID-19 pandemic, it became evident that we were able to operate successfully as a remote workforce and that distributed operations were beneficial to both Yelp and our employees. For example, in addition to allowing us to reduce our office space and our reliance on the San Francisco Bay Area, distributed work provides employees with greater opportunities for flexible work schedules and reduces time spent commuting. As a result, in 2021 we announced that we would continue our distributed operations on a permanent basis and in 2022, based on strong employee support for our distributed operations, we announced our adoption of a fully remote working model. The vast majority of our team now works remotely on a full-time basis, which has allowed us to significantly reduce our office footprint and workplace operating costs. We believe this model provides even greater flexibility to our employees, who now have the opportunity to relocate within the countries where we operate so they can live where they want to live and work where they will feel most effective. It also allows us to access and attract great talent from a more diverse pool of candidates across the United States, Canada and in Europe.
Culture
We consider our company culture to be one of our competitive strengths; it is at the foundation of our success and continues to help drive our business forward as a pivotal part of our everyday operations. It allows us to attract and retain a talented group of employees, create an energetic work experience and continue to innovate in a highly competitive market.
Distributed Workforce. While we have always taken great pride in our company culture, it has never been static, and our decision to become a fully remote workforce is driving its latest evolution. We are working to build on our existing strong and collaborative culture with the goal of supporting and fostering a thriving distributed workforce. These efforts include focusing on equity in opportunities for career advancement, regardless of where an employee is located, as well as in opportunities to contribute by continuing to hold meetings in digital space. At the same time, we are committed to establishing and maintaining the collaborative and creative working relationships that our pre-pandemic office environments fostered through, among other things, regular in-person gatherings.
Employee Engagement. To maintain our vibrant culture and address any areas of employee concern, we conduct annual employee engagement surveys covering a wide range of topics including: employee programs and benefits; manager effectiveness; feedback and recognition; company confidence; inclusion; learning and development; and remote work issues such as managing remotely, manager and team support, employee well-being in a remote environment, and remote growth and connection opportunities. We implemented a number of initiatives in response to the results of our 2022 surveys, including increasing the monthly stipend that employees can dedicate to their wellness, eliminating the annual limit on bereavement leave and providing additional paid time off for employees to participate in elections, among other things. We also improved the benefit programs for our employees in Canada and Europe.
Fostering Local Communities. Our culture extends beyond our offices and into the local communities in which people use Yelp. Our Community Management team’s responsibilities include fostering and supporting communities of users in the local markets that they serve, as well as encouraging consumers to share their experiences with local businesses. Community Managers organize events throughout the year to engage our most passionate users, which facilitates face-to-face interactions, builds the Yelp brand and fosters the sense of true community in which we believe so strongly. We also engage with small businesses, including through conferences and events hosted by industry groups to interact with and get feedback from our core community of local business owners.
Content Moderation. Consumer trust is a top priority at Yelp, and we take significant measures to maintain the integrity and quality of the content on our platform while leveling the playing field for hard-working business owners who rightfully earn their great reputations. We place a high value on personal expression and provide a platform that encourages people to share their experiences. At the same time, we take active steps to enhance the trust and safety of our users, as well as to provide them with reliable content to inform their spending decisions. Our User Operations team is on the front lines of our consumer protection efforts; it works to maintain the high quality of content on our platform, including by evaluating reviews, photos and other information about businesses, investigating potential fraud and moderating content. User Operations also manages our Consumer Alert program, which warns users of manipulation of a business’s ratings and reviews as well as egregious tactics that may harm consumers and unfairly put other businesses at a disadvantage, and our Public Attention Alerts, which warn consumers about businesses that have been accused of, or are the target of, racist incidents to help inform users' spending decisions and whether they will feel welcome. In addition to these content moderation efforts, our User Operations team communicates with the users and businesses impacted by our moderation decisions to promote constructive participation on Yelp.
Making a Difference. We endeavor to have a positive impact on the diverse communities in which people use Yelp by using our platform to raise awareness, promote economic opportunity for those in need and support organizations that serve local communities. Our initiatives in 2022 included: launching new attributes that veteran-owned and eco-friendly businesses can add to their Yelp pages to make it easier for consumers to find and support businesses that align with their values, and hosting our annual Women in Business and Black in Business Summits to celebrate diverse business owners and provide a forum for them to share their stories and offer tactical advice for entrepreneurs. In addition, we launched virtual volunteer events in partnership with nonprofit organizations in the United States, Canada and the United Kingdom. During these events, our employees gave their time and talent to deserving causes, including by working with entrepreneurs building socially innovative projects on their pitches and attending a workshop led by refugee artists.
The Yelp Foundation. The Yelp Foundation (the “Foundation”), a non-profit organization established by our board of directors in 2011, directly supports consumers and local businesses in the communities in which we operate. In 2011, our board of directors approved the contribution and issuance to the Foundation of 520,000 shares of our common stock to fund grants to local non-profit organizations that are actively engaged in supporting community and small business growth. The Foundation held 187,500 shares as of December 31, 2022, which represented less than 1% of our outstanding common stock.
One of the Foundation’s missions is to promote a culture of philanthropy among Yelp employees and, to that end, the Foundation offers up to $1,000 per person in matching donations each year to charitable organizations made by our regular full-time employees. Continuing a practice we began in 2021, the Foundation double-matched Yelp employee donations made to certain charitable organizations focused on issues that matter most to our employees in 2022: women’s reproductive rights; prevention of gun violence; fight against climate change; advocacy for the LGBTQ+ community; and response to the war in Ukraine.
Diversity, Inclusion and Belonging
Every local business has a unique story; having a diverse workforce means our employees are better equipped to relate to and solve for the diverse needs of consumers and businesses. As a result, we are committed to increasing diversity at all levels of our organization to better reflect the diversity of the communities in which we live and work. Our Executive Diversity Task Force, which includes our Chief Executive Officer, Chief Operating Officer and Chief Financial Officer, oversees the implementation of our diversity initiatives, including by holding individual department heads accountable for growing the diversity of their organizations.
Our distributed operations provide us with an opportunity to proactively grow and cultivate an employee community based on a variety of backgrounds, talents and perspectives, including by evaluating new opportunities to improve access and equity. While our ability to attract talent was previously limited by our requirement that employees work in our physical office space, we are now able to access talent in areas where we do not have offices. This has allowed us to reach a wider pool of individuals from a broader variety of backgrounds and recruit an even more diverse workforce, with representation in all 50 states.
While our 2022 diversity data* shows that our efforts have had a positive impact, we plan to continue our work in this area.
* Our 2022 diversity data presented above are based on self-reported information from our employees during the 2022 calendar year, reflect judgments about our organizational structure and, with respect to the ethnic diversity data presented above, do not include employees who declined to provide the relevant information. The underrepresented minority (“URM”) grouping includes Black, Latinx, Native American, and Native Hawaiian and other Pacific Islander employees.
We also firmly believe that inclusion is just as important as diversity. We aim to cultivate a sense of belonging through company-supported employee resource and affinity groups, hosting events that provide our employees with the opportunity to celebrate and learn about the diverse cultures of their colleagues, and instituting a mandatory company-wide diversity training program that covers systemic racism and institutional bias. For example, our Yelp Employee Resource Groups (“YERGs”) serve as a resource for employees with shared social identities, characteristics or life experiences and help foster employee engagement, professional development and a sense of belonging. We now have 21 YERGs that count nearly half of our employee population as members and provide key insights and support for employees.
Talent Attraction and Retention
Our future depends on our continuing ability to attract, develop, motivate, and retain highly qualified and skilled employees. Qualified individuals are in high demand and we expect to continue to face significant competition from other companies in hiring and retaining such personnel. While our plans to continue operating on a distributed basis may mitigate this challenge by expanding the pool of candidates from which we draw, we may continue to face significant competition for talent.
We focus on attracting top talent through our employment marketing and outreach initiatives. We advertise our career opportunities on premier job boards and aggregators in addition to running targeted brand campaigns that enable us to connect with diverse talent pools. We maintain an active voice on social media through our Life at Yelp channel, which highlights employee testimonials regarding their Yelp experiences. Our distributed workforce model has expanded our hiring reach, allowing us to access and attract great talent pools regardless of geography. We also focus on attracting early-in-career talent through university outreach and on-campus recruiting efforts, including at historically Black colleges and universities.
We believe that happy employees are successful employees and that providing an environment in which our employees can thrive both personally and professionally will help us attract and retain great talent. In addition to offering our employees the flexibility to work remotely, we offer competitive compensation and comprehensive benefits, including standard health, dental, vision, life and disability insurance benefits as well as a 401(k) plan with company matching. To foster a sense of ownership and align the interests of our employees and stockholders, we also grant equity awards, primarily in the form of restricted stock units, to eligible employees under our equity incentive plans. We are committed to compensating all of our employees fairly for their contributions, regardless of gender, race or ethnicity.
We also provide comprehensive talent development programs, as described below, as well as health and financial wellness programs. In addition to our insurance benefits, our wellness program includes a monthly wellness subsidy, access to mental health support and services through Modern Health and our Employee Assistance Program, as well as financial wellness programs such as financial counseling and tools to help manage student loans.
Talent Development
To help our employees succeed in their current roles and to aid their career development, we emphasize continuous learning and development opportunities. Our talent development programs begin with a global onboarding program to acclimate new employees to our culture and collaborative ways of working in a distributed work environment. We believe this investment in creating early connections and establishing a solid foundation for further career growth is a critical factor in employee success and ultimately employee retention. Similarly, effective leadership is an important driver of an employee’s growth and feelings of belonging and connection to our purpose. To that end, we provide leadership development programs for new and continuing managers that focus on developing the self, developing others and driving business results.
We also provide ongoing learning opportunities for individual contributors that focus on managing the self, emotional intelligence, and career and professional development. Through our professional development program, employees can partner with their managers to create career development plans and receive an annual development reimbursement to invest in their growth. We also offer customized coaching resources to provide individual support and develop critical skills, as well as regular, ongoing training in compliance and workplace conduct matters to all employees.
Seasonality and Cyclicality
Our business is affected by seasonal fluctuations in Internet usage and advertising spending, as well as cyclicality in economic activity:
Seasonality. Based on historical trends, our revenue is typically lowest in the first quarter and increases through the year to its highest level in the fourth quarter. This is also the typical spending pattern for our multi-location customers, whose ad budgets are generally lowest at the beginning of the year and peak in the fourth quarter, though SMBs tend to decrease their advertising spending at that time. Our traffic is also typically weakest in the fourth quarter of the year in connection with year-end holidays.
Cyclicality. Many businesses reduce their advertising spending during challenging macroeconomic environments. SMBs in particular — which have historically experienced high failure rates and which make up a significant portion of our advertiser base — may be disproportionately affected by negative fluctuations in the business cycle. As a result, adverse macroeconomic conditions or a worsening economic outlook typically have a negative impact on the ability and willingness of advertisers to spend on our products and services.
Although public health restrictions related to the COVID-19 pandemic have eased, many businesses, particularly in our RR&O categories, continued operating at a limited capacity as a safety precaution or in response to reduced consumer demand, which continued to negatively impact their advertising spending with us. In addition, the economic environment in the United States remains uncertain and inflationary; many businesses continue to face supply chain issues, rising commodity prices, and inventory and labor shortages. These conditions have had, and may continue to have, a significant adverse impact on our business and revenue; we expect that our business will continue to be significantly negatively affected for the duration of the current adverse macroeconomic conditions as well as any future recessionary period or protracted economic downturn.
Corporate and Available Information
We were incorporated in Delaware on September 3, 2004. Our principal executive offices are located at 350 Mission Street, 10th Floor, San Francisco, California 94105, and our telephone number is (415) 908-3801. Our website is located at www.yelp.com, and our investor relations website is located at www.yelp-ir.com.
We file or furnish electronically with the U.S. Securities and Exchange Commission (“SEC”) annual reports on Form 10-K, quarterly reports on Form 10-Q, current reports on Form 8-K and amendments to those reports filed or furnished pursuant to Section 13(a) or 15(d) of the Exchange Act. We make copies of these reports available free of charge through our investor relations website as soon as reasonably practicable after we file or furnish them with the SEC. These reports are also accessible through the SEC website at www.sec.gov.
We webcast our earnings calls and certain events we participate in or host with members of the investment community on our investor relations website. Additionally, we provide notifications of news or announcements regarding our financial performance, including filings with the SEC, investor events, press and earnings releases, and blogs as part of our investor relations website. Investors and others can receive notifications of new information posted on our investor relations website in real time by signing up for e-mail alerts and RSS feeds.
Information contained on or accessible through our websites is not incorporated into, and does not form a part of, this Annual Report or any other report or document we file with the SEC, and any references to our websites are intended to be inactive textual references only.
Item 1A. Risk Factors
Risks Related to Our Business and Industry
Adverse macroeconomic conditions — such as the COVID-19 pandemic and current uncertain economic environment — have had, and may continue to have, a significant adverse impact on our business and results of operations, and also exposes our business to other risks.
There is currently an uncertain and inflationary economic environment in the United States, partially as a result of the COVID-19 pandemic and efforts to contain it and manage its impacts, which have created significant macroeconomic disruption and volatility. These challenging macroeconomic conditions have had, and may continue to have, a significant adverse impact on our business and results of operations. For example, adverse macroeconomic conditions have had, and may continue to have, a negative impact on the ability and willingness of advertisers to spend on our products and services. In 2020, businesses reduced their spending with us as a result of pandemic-related closures and restrictions, resulting in a 14% decrease in net revenue compared to 2019. Although public health restrictions eased in 2021, many businesses, particularly in our RR&O categories, continued operating at a limited capacity as a safety precaution or in response to reduced consumer demand, which continued to negatively impact their advertising spending with us. While our business has now surpassed its pre-pandemic performance in many areas and advertiser demand was strong in 2022, many businesses continue to face supply chain issues, rising commodity prices, and inventory and labor shortages. We observed increased caution among RR&O businesses in the second half of 2022 in response to the macroeconomic environment, which led to, and may continue to lead to, less incremental spend from such advertisers, which may have an adverse impact on our results of operations in 2023.
Changes in consumer behavior due to adverse economic conditions may also negatively impact our business. For example, in 2022 economic uncertainty and inflationary pressures, ongoing concerns related to COVID-19 and its variants, and the non-renewal of government stimulus programs contributed to consumer traffic to our platform remaining below pre-pandemic 2019 levels. This impact was particularly pronounced in certain geographies within the United States and in our RR&O categories.
Because traffic to and user engagement on our platform together impact the number of ads we are able to show as well as the value of those ads to businesses, such negative impacts on consumer activity may also make it more difficult to convince existing and prospective advertisers that our products offer them a material benefit and generate a competitive return relative to other alternatives. Strong advertiser demand combined with less robust consumer activity significantly increased our average CPC in 2022 compared to 2021; if the value our products provide to advertisers does not keep pace with any further price increases, our revenue and results of operations could be harmed.
As adverse macroeconomic conditions continue, our business is exposed to a variety of risks, including:
•continued reduced demand for our products, lower retention rates, and increased challenges in or cost of acquiring new customers;
•reductions in cash flows from operations and liquidity, which impacts our capital allocation strategy in turn;
•setbacks on the progress of our strategic initiatives as we reallocate resources to responding to such adverse conditions;
•reductions in traffic, engagement, and the quantity and quality of the content provided by our users, which may further harm traffic to our platform;
•increased fluctuation in our operating results and volatility and uncertainty in our financial projections;
•inefficiencies, delays and disruptions in our business due to the illness of key employees or a significant portion of our workforce;
•additional restructuring and impairment charges; and
•operational difficulties due to adverse effects of such conditions on our third-party service providers and strategic partners.
It is not possible for us to predict the remaining duration of the current adverse macroeconomic conditions or of the pandemic, the severity of future COVID-19 variants and resulting restrictions, or the duration or magnitude of the adverse impact on our business.
We generate substantially all of our revenue from advertising. If we fail to maintain and expand our base of advertisers, our revenue and our business will be harmed.
In order to maintain and expand our advertiser base, we must convince existing and prospective advertisers alike that our advertising products offer them a material benefit and generate a competitive return relative to other alternatives. Adverse macroeconomic conditions may make this more difficult, particularly when such macroeconomic conditions disproportionately affect the SMBs on which we rely, as has been the case with the economic impact of the COVID-19 pandemic. Although public health restrictions related to the COVID-19 pandemic have eased, many businesses, particularly in our RR&O categories, are still operating at limited capacity as a safety precaution or in response to reduced consumer demand and have been forced to reduce their advertising spending with us as a result. Many businesses also continue to face supply chain issues, rising commodity prices, and inventory and labor shortages. These conditions have had, and may continue to have, a significant adverse impact on our business and revenue; we expect that our business would continue to be significantly adversely affected for the duration of any recessionary period or protracted economic downturn.
Advertisers will not advertise with us, or they will reduce the prices they are willing to pay to advertise with us, if we do not deliver compelling ad products in an effective manner, or if we do not provide accurate, easy-to-use analytics and measurement solutions that demonstrate the effectiveness and value of our products. As is typical in our industry, our advertisers generally have the ability to cancel their ad campaigns at any time without penalty. If we are unable to quickly and effectively respond to any decrease in customer satisfaction, economic downturn (including as a result of the COVID-19 pandemic and any related labor and supply chain issues) or other change negatively affecting our ability to retain advertisers, our ability to maintain and expand our advertiser base will be harmed.
In addition, a significant portion of our advertiser base consists of SMBs, which are subject to increased challenges and risks. SMBs often have limited advertising budgets and view online advertising products like ours as experimental and unproven; as a result, we may need to devote additional time and resources to educate them about our products and services. Such businesses have also historically experienced high failure rates, and we must continually add new advertisers to replace those who do not renew their advertising due to factors outside of our control, such as declining advertising budgets, closures and bankruptcies.
Our advertising revenue could be impacted by a number of other factors, including, but not limited to:
•the perceived effectiveness and acceptance of online advertising generally, particularly among SMBs that may have less experience with it;
•our ability to drive traffic to our platform, which remains below pre-pandemic levels, and increase user engagement, including engagement with the ads displayed on our platform;
•challenging macroeconomic conditions or trends that negatively impact consumer demand, such as the current inflationary environment and consumers visiting many types of businesses less frequently than prior to the pandemic;
•the effectiveness of our ad targeting technology and tools for advertisers to optimize their campaigns;
•our ability to innovate and introduce enhanced products meeting advertiser expectations;
•product changes or inventory management decisions we may make that change the size, format, frequency or relative prominence of ads displayed on our platform;
•the widespread adoption of any technologies that make it more difficult for us to deliver ads, such as ad-blocking programs;
•loss of advertising business to our competitors, including if competitors offer lower priced or more integrated products;
•the prevalence of low-quality or invalid traffic on our platform, such as robots and spiders, which we have discovered in the past and expect to discover in the future, and our ability to detect and prevent click fraud or other invalid clicks on ads;
•our reputation and perceptions regarding our platform, including of the ratings and reviews that businesses receive from our users — favorable ratings and reviews could be perceived as obviating the need to advertise, while unfavorable ratings and reviews could discourage businesses from advertising to an audience that they perceive as hostile;
•the size and effectiveness of our sales force, which may be affected by a range of factors, not all of which are within our control, including our sales force's ability to connect with potential customers’ key decision makers as well as catastrophic occurrences, such as earthquakes or fires, and major public health crises like the COVID-19 pandemic that negatively impact the productivity of our sales force;
•the degree to which businesses choose to reach users through our free products in lieu of our paid products and services; and
•the pricing of our products, including the CPC ad prices determined by our auction system, which have increased in recent quarters even as we have delivered fewer ad clicks.
Any of these or other factors could result in a reduction in demand for our products, which may reduce the prices we are able to charge, either of which would negatively affect our revenue and operating results.
Our strategy to grow our business may not be successful and may expose us to additional risks.
Our growth strategy includes priorities such as improving monetization of our Services categories, driving sales through our Self-serve and Multi-location channels, delivering more value to advertisers and enhancing the consumer experience. These initiatives involve risks and executing on them may prove more difficult than we currently anticipate. We may not succeed in realizing the benefits of these efforts, including growing our revenue and improving our margins, within the time frame we expect or at all.
Our ability to execute each of our strategic priorities depends on our ability to develop innovative, relevant and useful products in a timely manner. Developing successful products requires substantial investments, and such investments may not prioritize short-term financial results and may involve significant risks and uncertainties. For example, new products may fail to generate sufficient revenue, operating margin or other value to justify the investments we made in them, which is a particular risk for new products that are unproven or that are outside of our historical core business.
We will also face industry challenges in our efforts to monetize more of the leads we deliver to Services businesses. In addition to being a highly competitive, fragmented market, it has not yet fully embraced online solutions of the type we offer. Many of our consumers continue to search for, select and hire service professionals offline through word-of-mouth and referrals. Changing traditional habits is difficult, and the speed and ultimate outcome of the shift of these markets online for consumers and businesses alike is uncertain and may not occur as quickly as we expect, or at all.
Our efforts to provide advertisers more value for their money may include lowering prices while making significant investments in product development. We cannot guarantee that any resulting increase in demand for our products or improvement in retention will offset lower prices or otherwise generate sufficient revenue to justify our investments.
Certain of our past strategic decisions may also continue to impact our opportunities and long-term prospects. For example, we wound down our international sales and marketing operations in 2016 and reallocated the associated resources primarily to our U.S. and Canadian markets. While our decision to focus our sales and marketing resources primarily on the United States and Canada has resulted in some cost savings, it also limited the markets from which we generate revenue and affects our ability to expand internationally in the future. Our continued growth depends on our ability to further expand our U.S. and Canadian business for the foreseeable future; however, our business in these markets is in a relatively late stage of development, and further expansion may not yield similar results. If we are not able to develop these markets as we expect, or if we fail to address the needs of those markets, our business will be harmed.
We rely on the performance of highly skilled personnel, and if we are unable to attract, retain and motivate well-qualified employees, our business could be harmed.
We believe our success has depended, and continues to depend, on the efforts and talents of our employees, including our senior management team, our product and engineering teams, marketing professionals and advertising sales staff. All but one of our officers and all of our other U.S. employees are at-will employees, which means they may terminate their employment relationship with us at any time, and their knowledge of our business and industry would be extremely difficult to replace. Any changes in our senior management team in particular, even in the ordinary course of business, may be disruptive to our business. While we seek to manage these transitions carefully, including by establishing strong processes and procedures and succession planning, such changes may result in a loss of institutional knowledge and cause disruptions to our business. If our senior management team fails to work together effectively or execute our plans and strategies on a timely basis as a result of management turnover or otherwise, our business could be harmed.
Our ability to execute on our key strategic initiatives depends on our continuing ability to attract, develop, motivate and retain highly qualified and skilled employees, which may be more difficult with a distributed workforce. Qualified individuals are in high demand and we expect to continue to face significant competition from other companies in hiring such personnel. Although we expect our decision to continue operating on a distributed basis to reduce our reliance on the San Francisco Bay Area, where the cost of living is high and competition for qualified candidates is particularly high, we may not succeed in realizing the benefits of these efforts within the time frame we expect or at all.
Identifying, recruiting, training and integrating new hires will require significant time, expense and attention; as a result, we may incur significant costs to attract them before we can validate their productivity. As we continue to mature, the incentives to attract, retain and motivate employees provided by our equity awards may not be as effective as in the past, and if we issue significant equity to attract additional employees or to retain our existing employees, we would incur substantial additional stock-based compensation expense and the ownership of our existing stockholders would be further diluted. Volatility in the price of our common stock may also make it more difficult or costly in the future to use equity compensation to motivate, incentivize and retain our employees. If we fail to manage our hiring needs effectively, our efficiency and ability to meet our forecasts, as well as employee morale, productivity and retention, could suffer, and our business and operating results could be adversely affected.
If user engagement on our platform declines, our revenue, business and operating results may be harmed.
We derive a substantial majority of our revenue based on our users' engagement with the ads that we display. Because traffic to our platform and user engagement on our platform together determine the number of ads we are able to show, affect the value of those ads to businesses and support the content creation that drives further traffic, our ability to attract, retain and engage visitors on our platform is critical to our business and financial success. A number of factors could adversely affect our traffic and user engagement, including, but not limited to:
•if users engage with other products, services or activities as an alternative to our platform;
•if we fail to introduce new and improved products or features that users find engaging, or we introduce new products or features that do not effectively address consumer needs or otherwise alienate consumers;
•our ability to manage and prioritize information to ensure users are presented with content that is relevant and helpful to them, including through the effective operation of our automated recommendation software;
•if users have difficulty installing, updating or otherwise accessing our platform as a result of actions by us or third parties that we rely on to distribute our products, such as
application marketplaces and
device manufacturers;
•if users believe that their experience is diminished as a result of the decisions we make with respect to the frequency, relevance and prominence of the advertising we display;
•adverse macroeconomic conditions and their negative impact on consumer spending at local businesses;
•the adoption of any laws or regulations that adversely affect the growth, popularity or use of our platform or the Internet in general, such as the repeal of Internet neutrality regulations in the United States;
•any actions taken by companies with significant market power in the broadband and Internet marketplace that degrade, disrupt or increase the cost of user access to our products and services; and
We cannot predict the remaining duration of the current adverse macroeconomic conditions or of the pandemic, or the duration or magnitude of their impact on our traffic, and we expect that our traffic levels will continue to fluctuate with consumers’ level of confidence, particularly in our RR&O categories. We further anticipate that our traffic growth rate will continue to slow over the medium and long term, and potentially decrease in certain periods due to the maturation of our business and our high penetration rates in most major geographic markets within the United States and Canada. As our traffic growth rate slows, our business and financial performance will become increasingly dependent on our ability to drive user engagement with our platform and the ads that we display.
If we fail to manage our employee operations and organization effectively, our brand, results of operations and business could be harmed.
Our employee operations are complex and place substantial demands on management and our operational infrastructure. These operations may be negatively affected by a range of external factors that are not within our control, including catastrophic events, such as earthquakes or fires, and public health crises, such as the COVID-19 pandemic. Such factors may have a substantial impact on employee attendance or productivity, and the extent and duration of their impact are typically uncertain; if we are not able to respond to and manage the impact of such events effectively, our business will be harmed. For example, our rapid and broad-based shift to a remote working environment in connection with the COVID-19 pandemic added to the complexity of our employee operations by creating productivity, connectivity, security and oversight challenges. While we believe these challenges have been addressed, we expect similar challenges to arise in the future as we continue to operate with a distributed workforce going forward. Addressing these challenges could adversely affect our company culture and will require the attention of our executive team and other key employees, which could adversely affect our business.
To execute on our growth strategy, we will need to continue to increase the productivity of our current employees as well as hire, train and manage new employees, which may be particularly difficult in a fully remote environment. As a result, we will have to effectively integrate, develop and motivate a large number of employees in a remote environment while maintaining the beneficial aspects of our company culture.
As our business matures, we make periodic changes and adjustments to our organization in response to various internal and external considerations, including market opportunities, the competitive landscape, new and enhanced products, acquisitions, sales performance, availability of employee talent and costs. In some instances, these changes have resulted in a temporary lack of focus and reduced productivity, which may occur again in connection with any future changes to our organization and may negatively affect our results of operations. If we are unable to adapt quickly and effectively to changes or adjustments to our organization, our business will be harmed.
We may also need to improve our operational, financial and management systems and processes to support our large and distributed workforce, which may require significant capital expenditures and allocation of valuable management and employee resources, as well as subject us to the risk of over-expanding our operating infrastructure. For example, it can be difficult to train thousands of sales employees across multiple offices according to the same business standards, practices and laws, and we have been the subject of lawsuits alleging that we have failed to do so. If we fail to scale our operations successfully and increase productivity, the quality of our platform and efficiency of our operations could suffer, which could harm our brand, results of operations and business.
We face intense competition in rapidly evolving markets, and expect competition to increase in the future.
We compete in rapidly evolving and intensely competitive markets, and we expect competition to intensify further in the future with the emergence of new technologies and market entrants. We face competition for users, content, and advertising and other customers, including from: online search engines and directories; traditional, offline business guides and directories; online and offline providers of consumer ratings, reviews and referrals; providers of online marketing and tools for managing and optimizing advertising campaigns; various forms of traditional offline advertising; restaurant reservation and seating tools; food ordering and delivery services; and home and/or local services-related platforms and offerings.
Our competitors may enjoy competitive advantages, such as greater name recognition, longer operating histories, substantially greater market share, large existing user bases and substantially greater financial, technical and other resources. These companies may use these advantages to offer products similar to ours at a lower price, develop different products to compete with our current solutions and respond more quickly and effectively than we do to new or changing opportunities, technologies, standards or client requirements. In particular, major Internet companies, such as Google and Meta, may be more successful than us in developing and marketing online advertising and other services directly to local businesses, and may leverage their relationships based on other products or services to gain additional share of advertising budgets. Certain competitors could also use strong or dominant positions in one or more markets to gain competitive advantage against us in areas in which we operate, including by:
•integrating review platforms or features into products they control, such as search engines, web browsers or mobile device operating systems;
•making acquisitions;
•changing their unpaid search result rankings to promote their own products;
•refusing to enter into or renew licenses on which we depend;
•limiting or denying our access to advertising measurement or delivery systems;
•limiting our ability to target or measure the effectiveness of ads; or
•making access to our platform more difficult.
These risks may be exacerbated by the trend in recent years toward consolidation among online media companies, potentially allowing our larger competitors to offer bundled or integrated products that feature alternatives to our platform.
To compete effectively, we must continue to invest significant resources in product development to enhance user experience and engagement, as well as sales and marketing to expand our base of advertisers. However, there can be no assurance that we will be able to compete successfully for users and customers against existing or new competitors, and failure to do so could result in loss of existing users, reduced revenue, increased marketing expenses or diminished brand strength, any of which could harm our business.
We rely on third-party service providers and strategic partners for many aspects of our business, and any failure to maintain these relationships could harm our business.
We rely on relationships with various third parties to grow our business, including strategic partners and technology and content providers. For example, we rely on third parties for data about local businesses, mapping functionality, payment processing, information technology and systems, network infrastructure and administrative software solutions. We also rely on partnership integrations for various transactions available through Yelp, including Grubhub for food-ordering services. Identifying, negotiating and maintaining relationships with third parties require significant time and resources, as does integrating their data, services and technologies onto our platform. This may divert the attention of our management and employees from other aspects of our business operations, and there can be no assurance that we will be able to continue to realize the intended benefits of any given partnership.
It is possible that third-party providers and strategic partners may not be able to devote the resources we expect to the relationships. We may also have competing interests and obligations with respect to certain of our partners, which may make it difficult to maintain, grow or maximize the benefit for each partnership. For example, we rely on the integration of our content into Apple Maps to drive a significant amount of traffic to our website and downloads of our application. If Apple were to offer products competitive with ours, such as local business reviews, our relationship with Apple would be negatively impacted and our longstanding partnership may be difficult to maintain as a result; if our partnership with Apple ended, we would be required to increase our marketing spend to drive traffic and downloads from alternate sources, which would adversely affect our financial results. Similarly, our entry into the online reservations space with our acquisition of SeatMe, Inc. in 2013 put us in competition with OpenTable, which led to the end of our partnership with OpenTable in 2015. If our relationships with our partners and providers deteriorate, we could suffer increased costs and delays in our ability to provide consumers and advertisers with content or similar services. As in the case of the expiration or termination of any of our agreements with third-party providers, transitioning from one partner or provider to another could subject us to operational delays and inefficiencies and we may not be able to replace the services provided to us in a timely manner or on terms that are favorable to us, if at all.
In addition, we exercise limited control over our third-party partners and vendors, which makes us vulnerable to any errors, interruptions or delays in their operations. If these third parties experience any service disruptions, financial distress or other business disruption, or difficulties meeting our requirements or standards, it could make it difficult for us to operate some aspects of our business. For example, we rely on Amazon Web Services’ (“AWS”) cloud computing infrastructure to host our website, mobile app and many of the internal tools we use to operate our business. Any significant disruption of, limitation of our access to or other interference with our use of AWS would negatively impact our operations and business, including potentially causing harm to our reputation, results of operations and financial results. Any transition of the cloud services currently provided by AWS to another provider could cause us to incur significant time and expense, and any unplanned transition could also disrupt or degrade our ability to deliver our products and services.
Similarly, the actions of our partners may affect our brand if users or customers do not have a positive experience interacting with or through them. For example, if advertisers do not have a positive experience purchasing our advertising products through our resale partners, such as Thryv, or the agency participants in our Yelp Ads Certified Partners Program, they may not continue advertising with us, which would negatively affect our revenue and operating results. Although such partners are contractually obligated to observe certain standards and best practices while selling our advertising products, our ability to ensure their compliance is limited.
Any disagreements or disputes with these or other partners about our respective contractual obligations — which we have had in the past and may have again from time to time in the future — could result in legal proceedings or negatively affect our brand and reputation.
We rely on Internet search engines and application marketplaces to drive traffic to our platform, certain providers of which offer products and services that compete directly with our products. If links to our applications and website are not displayed prominently, traffic to our platform could decline and our business would be adversely affected.
We rely heavily on Internet search engines, such as Google, to drive traffic to our platform through their unpaid search results and on application marketplaces, such as Apple’s App Store and Google’s Play, to drive downloads of our applications. If they fail to drive sufficient traffic to our platform, we may need to increase our marketing spend to acquire additional traffic. We cannot assure you that the value we ultimately derive from any such additional traffic would exceed the cost of acquisition, and any increase in marketing expense may in turn harm our operating results.
The amount of traffic we attract from search engines is due in large part to how and where information from and links to our website are displayed on search engine result pages. The display, including rankings, of unpaid search results can be affected by a number of factors, many of which are not in our direct control, and may change frequently. Search engines have made changes in the past to their ranking algorithms, methodologies and design layouts that have reduced the prominence of links to our platform and negatively impacted our traffic, and we expect they will continue to make such changes from time to time in the future.
Similarly, Apple, Google or other marketplace operators may make changes to their marketplaces, technical requirements or policies that make access to our products more difficult, reduce the prominence or rank of our applications within marketplaces, require us to change our current practices or make it more difficult for us to provide effective advertising tools to businesses on our platform. For example, Google has implemented product changes to its Chrome browser and announced future plans to limit the ability of websites to collect and use data signals from user activity to target and measure advertising. While these changes currently impact only a small portion of our advertising business, they could limit our ability to expand the relevant advertising products in the future. Similarly, if application marketplaces change their policies in a manner that adversely impacts the way in which we offer our services, or how we or our partners collect, use and share data from users, our ability to maintain and expand our base of advertisers will be harmed. However, if we do not comply with these requirements, we could lose access to the app store and users, and our business would be harmed. For example, in 2022 Apple provided notice claiming that our process to request account deletion through the Yelp for Business app was not sufficient to meet its recently announced account deletion requirements. Although our app remained available in the app store, the resolution of this issue was time consuming and required additional expenditures. We cannot guarantee that similar issues will not arise again in the future or that, if they do, we would be able to resolve them at a reasonable cost or in a timely manner.
We may not know how or otherwise be in a position to influence search results or our treatment in application marketplaces. With respect to search results in particular, even when search engines announce the details of their methodologies, their parameters may change from time to time, be poorly defined or be inconsistently interpreted. For example, Google previously announced that the rankings of sites showing certain types of app install interstitials could be penalized on its mobile search results pages. While we believe the type of interstitial we currently use is not being penalized, we cannot guarantee that Google will not unexpectedly penalize our app install interstitials, causing links to our mobile website to be featured less prominently in Google’s mobile search results and harming traffic to our platform as a result.
In some instances, search engine companies and application marketplaces may change their displays or rankings in order to promote their own competing products or services or the products or services of one or more of our competitors. For example, Google has integrated its local product offering with certain of its products, including search and maps. The resulting promotion of Google’s own competing products in its web search results has negatively impacted the search ranking of our website. Because Google in particular is the most significant source of traffic to our website, accounting for a substantial portion of the visits to our website, our success depends on our ability to maintain a prominent presence in search results for queries regarding local businesses on Google. As a result, Google’s promotion of its own competing products, or similar actions by Google in the future that have the effect of reducing our prominence or ranking on its search results, could have a substantial negative effect on our business and results of operations.
Consumers frequently access online services through a variety of platforms other than desktop computers, including mobile devices. If we are unable to operate effectively on such devices or our products for such devices are not compelling, our business could be adversely affected.
Consumers frequently access the Internet through devices other than desktop computers, including mobile phones, tablets, handheld computers, voice-assisted speakers, automobiles and television set-top devices. We generate a substantial majority of our revenue from advertising delivered on mobile devices, and anticipate that this will continue to be the case for the foreseeable future. As a result, we must continue to drive adoption of and user engagement on our mobile platform, and on our mobile app in particular, which is less reliant on search results for traffic than our website. If we are unable to drive continued adoption of and engagement on our mobile app, our business may be harmed and we may be unable to decrease our reliance on traffic from Google and other search engines.
In order to attract and retain engaged users of our platform on mobile and other alternative devices, the products and services we introduce on such devices must be compelling. However, the functionality and user experience associated with some alternative devices may make the use of our platform and products more difficult than through a desktop computer. For example, devices with small screen sizes or that lack a screen may exacerbate the risks associated with how and where our website is displayed in search results because they display or otherwise present fewer search results than desktop computers. We also expect that the ways in which users engage with our platform will continue to change over time as users increasingly engage via alternative devices. This may make it more difficult to develop products that consumers find useful, may make it more difficult for us to monetize our products and may also negatively affect our content if users do not continue to contribute high-quality content through such devices.
Similarly, as new devices and platforms develop, advertiser demand may increase for products that we do not offer or that may alienate our user base, which we must balance against our commitment to prioritizing the quality of user experience over short-term monetization. If we are not able to balance these competing considerations successfully to develop compelling advertising products, advertisers may stop or reduce their advertising with us and we may not be able to generate meaningful revenue from alternative devices despite the expected growth in their usage.
As new devices and platforms are continually being released, it is also difficult to predict the problems we may encounter in adapting our products and services — and developing competitive new products and services — to them, and we may need to devote significant resources to the creation, support and maintenance of such products. Our success will be dependent on the interoperability and compliance of our products with a range of technologies, systems, networks and standards that we do not control, such as mobile operating systems like Android and iOS. For example, in 2021, Apple made certain changes to its products and data use policies in connection with changes to its iOS operating system that reduce our ability to target and measure advertising. While these changes currently impact only a small portion of our advertising business, they could limit our ability to expand the relevant advertising products in the future. We may not be successful in developing products that operate effectively with these technologies, systems, networks and standards or in creating, maintaining and developing relationships with key participants in related industries, some of which may be our competitors.
If we experience difficulties or increased costs in integrating our products into alternative devices, or if manufacturers elect not to include our products on their devices, make changes that degrade the functionality of our products, give preferential treatment to competitive products or prevent us from delivering advertising, our user growth and operating results may be harmed. This risk may be exacerbated by the frequency with which users change or upgrade their devices; in the event users choose devices that do not already include or support our platform or do not install our products when they change or upgrade their devices, our traffic and user engagement may be harmed.
If we fail to generate, maintain and recommend sufficient content from our users that consumers find relevant, helpful and reliable, our traffic and revenue will be negatively affected.
Our success depends on our ability to attract consumer traffic with valuable content, which in turn depends on the quantity and quality of the content provided by our users, as well as consumer perceptions of the relevance, helpfulness and reliability of that content. We may be unable to provide consumers with valuable information if our users do not contribute sufficient content or if our users remove content they previously submitted. For example, users may be unwilling to contribute content as a result of concerns that they may be harassed or sued by the businesses they review, instances of which have occurred in the past and may occur again in the future.
Consumers also may not find the content on our platform to be valuable if they do not perceive it as relevant, helpful or reliable. For example, information about the operations of many local businesses — such as hours of operation and services offered — has been subject to frequent change since the COVID-19 pandemic began, making it difficult to ensure the information on business pages is accurate and up-to-date.
Similarly, we do not phase out or remove dated reviews, and consumers may view older reviews as less relevant or reliable than more recent reviews. If the high concentration of reviews in our restaurants and shopping categories creates a perception that our platform is primarily limited to these categories, consumers may not believe that we can provide them with helpful information about businesses in other categories and seek that information elsewhere.
Our automated recommendation software is a critical part of our efforts to provide consumers with relevant, helpful and reliable content. However, although we have designed our technology to avoid recommending content that we believe to be biased, unreliable or otherwise unhelpful, we cannot guarantee that our efforts will be successful, or that each of the recommended reviews available on our platform at any given time is useful or reliable. If our automated software does not recommend helpful content or recommends unhelpful content, consumers may reduce or stop their use of our platform.
We may acquire or invest in other companies or technologies, which could divert our management’s attention, result in additional dilution to our stockholders and otherwise disrupt our operations and harm our operating results. We may also be unable to realize the expected benefits and synergies of any acquisitions or investments.
Our success will depend, in part, on our ability to expand our product offerings and grow our business in response to changing technologies, user and advertiser demands and competitive pressures. In some circumstances, we may determine to do so through the acquisition of complementary businesses or technologies rather than through internal development. Similarly, we may pursue investments in privately held companies in furtherance of our strategic objectives. We have limited experience as a company in the complex processes of acquiring and investing in businesses and technologies. The pursuit of potential future acquisitions or investments may divert the attention of management and cause us to incur expenses in identifying, investigating and pursuing transactions, whether or not they are consummated.
Acquisitions that are consummated could result in dilutive issuances of equity securities or the incurrence of debt, which could adversely affect our results of operations. The incurrence of debt in particular could result in increased fixed obligations or include covenants or other restrictions that would impede our ability to manage our operations. In addition, any transactions we announce could be viewed negatively by users, businesses or investors. We may also fail to accurately forecast the financial impact of a transaction, including tax and accounting charges.
We may also discover liabilities or deficiencies associated with the companies or assets we acquire or invest in that we did not identify in advance, which may result in significant unanticipated costs or losses. For example, in 2015, two lawsuits were filed against us by former Eat24 employees alleging that Eat24 failed to comply with certain labor laws prior to the acquisition. The effectiveness of our due diligence review and our ability to evaluate the results of such due diligence are dependent upon the accuracy and completeness of statements and disclosures made by the companies we acquire or their representatives, as well as the limited amount of time in which acquisitions are executed.
In order to realize the expected benefits and synergies of any acquisition that is consummated, we must meet a number of significant challenges that may create unforeseen operating difficulties and expenditures, including:
•integrating operations, strategies, services, sites and technologies of an acquired company;
•managing the post-transaction business effectively;
•retaining and assimilating the employees of an acquired company;
•retaining existing customers and strategic partners, and minimizing disruption to existing relationships, as a result of any integration of new personnel or departure of existing personnel;
•difficulties in the assimilation of corporate cultures;
•implementing and retaining uniform standards, controls, procedures, policies and information systems; and
•addressing risks related to the business of an acquired company that may continue to impact the business following the acquisition.
Any inability to integrate services, sites and technologies, operations or personnel in an efficient and timely manner could harm our results of operations. Transition activities are complex and require significant time and resources, and we may not manage the process successfully, particularly if we are managing multiple transactions concurrently. Our ability to integrate complex acquisitions is unproven, particularly with respect to companies that have significant operations or that develop products with which we do not have prior experience. We expect to invest resources to support any future acquisitions, which will result in ongoing operating expenses and may divert resources and management attention from other areas of our business.
We cannot assure you that these investments will be successful. Even if we are able to integrate the operations of any acquired company successfully, we may not realize the full benefits of synergies, cost savings, innovation and operational efficiencies that may be possible from the transaction, or we may not achieve these benefits within a reasonable period of time.
Similarly, investments in private companies are inherently risky in that such companies are typically at an early stage of development, may have no or limited revenues, may not be or may never become profitable, may not be able to secure additional funding or their technologies, services or products may not be successfully developed or introduced into the market. The success of any such investment is typically dependent on a liquidity event, such as a public offering or acquisition. If any company in which we invest decreases in value, we could lose all or part of our investment. These risks would be heightened to the extent any such investment is a minority investment in which we have limited management or operational control over the business.
Our business depends on a strong brand. Maintaining, protecting and enhancing our brand requires significant resources and our efforts to do so may not be successful.
We have developed a strong brand that we believe has contributed significantly to the success of our business. Maintaining, protecting and enhancing the “Yelp” brand are critical to expanding our base of users and advertisers and increasing the frequency with which they use our solutions. If we fail to maintain and enhance our brand successfully, or if we incur excessive expenses in this effort, our business and financial results may be adversely affected.
Our ability to do so will depend largely on our ability to maintain business owner and consumer trust in the integrity of our products and in the quality of the user content and other information found on our platform, which we may not do successfully. Although we dedicate significant resources to these goals, we may fail to respond to user or business owner concerns expeditiously or in a manner they perceive to be appropriate, which could erode confidence in our brand. For example, some consumers and businesses have alternately expressed concern that our technology either recommends too many reviews, thereby recommending some reviews that may not be legitimate, or too few reviews, thereby not recommending some reviews that may be legitimate. The actions of our partners, over whom we have limited, if any, control, may also affect the perceived integrity of our brand if users or advertisers do not have a positive experience interacting with or through them. In addition, our website and mobile app serve as a platform for expression by our users, and third parties or the public at large may attribute the political or other sentiments expressed by users on our platform to us, which could harm our reputation.
Negative publicity about our company, including our technology, sales practices, personnel, customer service, litigation, strategic plans or political activities, could also diminish confidence in our brand and the use of our products. Certain media outlets have previously reported allegations, although untrue, that we manipulate our reviews, rankings and ratings in favor of our advertisers and against non-advertisers. Although we have taken action to combat this perception, our reputation and brand, and our traffic and business in turn, may suffer if negative publicity about our company persists or if users otherwise perceive that our content is manipulated or biased. Allegations and complaints regarding our business practices, and any resulting negative publicity, may also result in increased regulatory scrutiny of our company. In addition to requiring management time and attention, any regulatory inquiry or investigation could itself result in further negative publicity regardless of its merit or outcome.
Trademarks are also an important element of our brand and require substantial investments to maintain, which may not be successful. We have faced in the past, and may face in the future, oppositions from third parties to our applications to register key trademarks. If we are unsuccessful in defending against these oppositions, our trademark applications may be denied. Whether or not our trademark applications are denied, third parties may claim that our trademarks infringe their rights. As a result, we could be forced to pay significant settlement costs or cease the use of these trademarks and associated elements of our brand. Doing so could harm our brand recognition and adversely affect our business. Conversely, if we are unable to prevent others from misusing our brand or passing themselves off as being endorsed or affiliated with us, it could harm our reputation and our business could suffer. For example, we have encountered instances of reputation management companies falsely representing themselves as being affiliated with us when soliciting customers; this practice could be contributing to the perception that business owners can pay to manipulate reviews, rankings and ratings.
We are committed to providing a great consumer experience, which may cause us to forgo short-term gains and advertising revenue.
We base many of our decisions on our commitment to providing the consumers who use our platform with a great experience. In the past, we have forgone, and we may in the future forgo, certain expansion or revenue opportunities that we believe excessively degrade the consumer experience, even if such decisions negatively impact our results of operations in the short term. For example, we phased out our brand advertising products in part because demand in the brand advertising market shifted toward products disruptive to the consumer experience.
Any decisions we make that prioritize consumers may negatively impact our relationship with existing or prospective advertisers. For example, unless we believe that a review violates our terms of service, such as reviews that contain hate speech or bigotry, we will allow the review to remain on our platform, even if the business disputes its accuracy. Certain advertisers may therefore perceive us as an impediment to their success as a result of reviews and ratings that are critical of them. This practice could result in a loss of advertisers, which in turn could harm our results of operations. However, we believe that this approach has been essential to our success in attracting users and increasing the frequency with which they use our platform. As a result, we believe this approach has served the long-term interests of our company and our stockholders and will continue to do so in the future.
Risks Related to Our Technology and Intellectual Property
Our business is dependent on the uninterrupted and proper operation of our technology and network infrastructure. Any significant disruption in our service could damage our reputation, result in a potential loss of users and engagement and adversely affect our results of operations.
It is important to our success that users in all geographies be able to access our platform at all times. If our platform is unavailable when users attempt to access it or it does not load as quickly as they expect, users may seek other services to obtain the information for which they are looking, and may not return to our platform as often in the future, or at all. This would negatively impact our ability to attract users and advertisers and increase the frequency with which they use our platform.
We have previously experienced, and may experience in the future, service disruptions, outages and other performance problems. Such performance problems may be due to a variety of factors, including those set forth below; however, in some instances, we may not be able to identify the cause or causes of these performance problems within an acceptable period of time.
•Infrastructure Changes and Capacity Constraints. We may experience capacity constraints due to an overwhelming number of users accessing our platform simultaneously. It may become increasingly difficult to maintain and improve the availability of our platform, especially during peak usage times, as our products become more complex and our traffic increases.
•Human or Software Errors. Our products and services are highly technical and complex, and may contain errors or vulnerabilities that could result in unanticipated downtime for our platform. Users may also use our products in unanticipated ways that may cause a disruption in service for other users attempting to access our platform. We may encounter such difficulties more frequently as we acquire companies and incorporate their technologies into our service.
•Service Providers. We rely on a number of providers of infrastructure and software services, including AWS. Although we use these systems and services in a manner designed to achieve high reliability and minimize risk, large-scale outages affecting our service providers could negatively impact our ability to maintain the full functionality of our systems.
•Catastrophic Occurrences. Our systems are vulnerable to damage or interruption from earthquakes, fires, floods, power losses, telecommunications failures, terrorist attacks and similar events. Our U.S. corporate offices are located in the San Francisco Bay Area, a region known for seismic activity. Acts of terrorism, which may be targeted at metropolitan areas that have higher population densities than rural areas, could cause disruptions in our or our advertisers’ businesses or the economy as a whole. While our distributed operations may help to reduce this risk in the context of local catastrophic events, coordinating a response to a larger-scale event could be complex and we may not manage it successfully.
We may not have sufficient protection or recovery plans in certain circumstances, such as natural disasters affecting the San Francisco Bay Area, and our business interruption insurance may be insufficient to compensate us for losses that may occur. Our disaster recovery program contemplates transitioning our platform and data to a backup center in the event of a catastrophe. Although this program is functional, if our primary data center shuts down, there will be a period of time that our services will remain shut down while the transition to the back-up data center takes place. During this time, our platform may be unavailable in whole or in part to our users.
We expect to continue to make significant investments to maintain and improve the availability of our platform and to enable rapid releases of new features and products. To the extent that we do not address capacity constraints, upgrade our systems as needed and continually develop our technology and network architecture to accommodate actual and anticipated changes in technology in a cost-effective manner, while at the same time maintaining the reliability and integrity of our systems and infrastructure, our business and operating results may be harmed.
If our security measures are compromised, or if our platform is subject to attacks that degrade or deny the ability of users to access our content, users may curtail or stop use of our platform.
Our industry is prone to cyber-attacks by third parties seeking unauthorized access to our data or users’ data, or to disrupt our ability to provide our services. Any failure to prevent or mitigate security breaches could expose us to the risk of loss or misuse of private user and business information, which could result in potential liability and litigation. We may be a particularly compelling target for such attacks as a result of our brand recognition.
Computer viruses, break-ins, malware, social engineering (particularly spear phishing attacks), attempts to overload servers with denial-of-service or other attacks and similar disruptions from unauthorized use of computer systems have become more prevalent in our industry, have occurred on our systems in the past and are expected to occur periodically on our systems in the future. The changes in our work environment as a result of the COVID-19 pandemic and our decision to continue operating with a distributed workforce could impact the security of our systems, as well as our ability to protect against attacks and detect and respond to them quickly. We may also be subject to increased cyber-attacks, such as phishing attacks by threat actors using the attention placed on the pandemic as a method for targeting our personnel. In addition, we face risks associated with security breaches affecting our third-party partners and service providers. A security breach at any such third party could be perceived by consumers as a security breach of our systems and result in negative publicity, damage to our reputation and expose us to other losses.
Cyber-attacks continue to evolve in sophistication and volume, and may be inherently difficult to detect for long periods of time. Although we have developed systems and processes that are designed to protect our data and prevent data loss and other security breaches, the techniques used to obtain unauthorized access, disable or degrade service or sabotage systems change frequently, often are not recognized until launched against a target or long after, and may originate from less regulated and more remote areas around the world. As a result, these preventative measures may not be adequate and we cannot assure you that they will provide absolute security. Although none of the disruptions we have experienced to date have had a material effect on our business, any future disruptions could lead to interruptions, delays or website shutdowns, causing loss of critical data or the unauthorized disclosure or use of personally identifiable or other confidential information. Even if we experience no significant shutdown or no critical data is lost, obtained or misused in connection with an attack, the occurrence of such attack or the perception that we are vulnerable to such attacks may harm our reputation, degrade the user experience, cause loss of confidence in our products or result in financial harm to us.
Any or all of these issues could negatively impact our ability to attract new users, deter current users from returning to our platform, cause existing or potential advertisers to cancel their contracts or subject us to third-party lawsuits or other liabilities. For example, we work with third-party vendors to process credit card payments by users and businesses, and are subject to payment card association operating rules. Compliance with applicable operating rules, however, will not necessarily prevent illegal or improper use of our payment systems, or the theft, loss or misuse of payment information. If our security measures fail to prevent fraudulent credit card transactions and protect payment information adequately as a result of employee error, malfeasance or otherwise, or we fail to comply with the applicable operating rules, we could be liable to the users and businesses for their losses, as well as the vendor under our agreement with it, and be subject to fines and higher transaction fees. In addition, government authorities could also initiate legal or regulatory actions against us in connection with such incidents, which could cause us to incur significant expense and liability or result in orders or consent decrees forcing us to modify our business practices.
Failure to protect or enforce our intellectual property rights could harm our business and results of operations.
We regard the protection of our trade secrets, copyrights, trademarks, patent rights and domain names as critical to our success. In particular, we must maintain, protect and enhance the "Yelp" brand. We strive to protect our intellectual property rights by relying on federal, state and common law rights, as well as contractual restrictions. We pursue the registration of our domain names, copyrights, trademarks and service marks in the United States and in certain jurisdictions abroad. While we have pursued a number of patent applications, we currently have only limited patent protection for our core business, which may make it more difficult to assert certain of our intellectual property rights. We typically enter into confidentiality and invention assignment agreements with our employees and contractors, as well as confidentiality agreements with parties with whom we conduct business in order to limit access to, and disclosure and use of, our proprietary information. However, these contractual arrangements and the other steps we have taken to protect our intellectual property may not prevent the misappropriation or disclosure of our proprietary information or deter independent development of similar technologies by others, which may diminish the value of our brand and other intangible assets and allow competitors to more effectively mimic our products and services.
Effective trade secret, copyright, trademark, patent and domain name protection is expensive to develop and maintain, both in terms of initial and ongoing registration requirements and expenses and the costs of defending our rights. Seeking protection for our intellectual property is expensive, time consuming and may not be successful; accordingly, we may determine not to seek such protections for all of our intellectual property or in every location in which we operate. Litigation may become necessary to enforce our intellectual property rights, protect our trade secrets or determine the validity and scope of proprietary rights claimed by others. For example, we may incur significant costs in enforcing our trademarks against those who attempt to imitate our “Yelp” brand. Any litigation of this nature, regardless of outcome or merit, could result in substantial costs and diversion of management and technical resources, any of which could adversely affect our business and operating results.
Some of our products contain open source software, which may pose particular risks to our proprietary software and solutions.
We have used open source software in our products and will use open source software in the future. From time to time, we may face claims from third parties claiming ownership of, or demanding release of, the open source software or derivative works that we developed using such software (which could include our proprietary source code), or otherwise seeking to enforce the terms of the applicable open source license. These claims could result in litigation and could require us to purchase a costly license or cease offering the implicated solutions unless and until we can re-engineer them to avoid infringement. This re-engineering process could require significant additional research and development resources. In addition to risks related to license requirements, use of certain open source software can lead to greater risks than use of third-party commercial software because open source licensors generally do not provide warranties or controls on the origin of the software. Any of these risks could be difficult to eliminate or manage, and, if not addressed, could have a negative effect on our business and operating results.
We may be unable to continue to use the domain names that we use in our business, or prevent third parties from acquiring and using domain names that infringe on, are similar to, or otherwise decrease the value of our brand or our trademarks or service marks.
We have registered domain names for the websites that we use in our business, such as Yelp.com. If we lose the ability to use a domain name, whether due to trademark claims, failure to renew the applicable registration or any other cause, we may be forced to market our products under a new domain name, which could cause us substantial harm or cause us to incur significant expense in order to purchase rights to the domain name in question. In addition, our competitors and others could attempt to capitalize on our brand recognition by using domain names similar to ours. Domain names similar to ours have been registered by others in the United States and elsewhere. We may be unable to prevent third parties from acquiring and using domain names that infringe on, are similar to or otherwise decrease the value of our brand or our trademarks or service marks. Protecting and enforcing our rights in our domain names may require litigation, which could result in substantial costs and diversion of management’s attention.
Risks Related to Our Financial Statements and Tax Matters
We expect a number of factors to cause our operating results to fluctuate on a quarterly and annual basis, which may make it difficult to predict our future performance.
Our operating results could vary significantly from period to period as a result of a variety of factors, many of which may be outside of our control. This volatility increases the difficulty in predicting our future performance and means comparing our operating results on a period-to-period basis may not be meaningful.
In addition to the other risk factors discussed in this section, factors that may contribute to the volatility of our operating results include:
•the impact of macroeconomic conditions, including the economic downturn caused by the COVID-19 pandemic, as well as the resulting effect on consumer spending at local businesses and the level of advertising spending by local businesses;
•changes in advertiser budgets or their ability to pay for our products, including due to the impact of adverse macroeconomic conditions;
•changes in consumer behavior with respect to local businesses, including as a result of adverse macroeconomic conditions;
•changes in the products we offer and the market acceptance of those products and online advertising solutions generally;
•changes or updates to our business strategies;
•changes in our pricing policies and terms of contracts, whether initiated by us or as a result of competition;
•changes in the markets in which we operate, such as the wind down of our international sales and marketing operations to focus on our core markets of the United States and Canada;
•cyclicality and seasonality, which has become more pronounced since we transitioned to non-term contracts and may become further pronounced as our growth rate slows;
•the effects of changes in search engine placement and prominence;
•the adoption of any laws or regulations that adversely affect the growth, popularity or use of the Internet, such as the repeal of Internet neutrality regulations in the United States;
•the success of our sales and marketing efforts;
•adverse litigation judgments, settlements or other litigation-related costs, including the costs associated with investigating and defending claims;
•interruptions in service and any related impact on our reputation;
•changes in our tax rates or exposure to additional tax liabilities;
•new accounting pronouncements or changes in existing accounting standards and practices; and
•the effects of natural or man-made catastrophic events.
The impact of these and other factors on our local advertising results may occur earlier and be more concentrated going forward than prior to our transition to non-term contracts, due to the substantial proportion of advertisers with the ability to terminate their ad campaigns at any time without penalty.
We have incurred significant operating losses in the past, and we may not be able to generate sufficient revenue to maintain profitability. Our failure to achieve an adequate growth rate will adversely affect our business and results of operations.
Our revenue was also significantly negatively impacted as businesses reduced their advertising spending as a result of COVID-19 closures or restrictions, resulting in a 14% year-over-year decrease in revenue in 2020. While our business has now surpassed its pre-pandemic performance in many areas and advertiser demand was strong in 2022, consumer traffic remained below pre-pandemic 2019 levels during due to economic uncertainty and inflationary pressures as well as ongoing concerns related to COVID-19 and its variants, among other adverse macroeconomic conditions. Our RR&O categories have been particularly sensitive to changes in consumer confidence. We cannot predict the remaining duration of the current adverse economic conditions or the pandemic, the severity of future COVID-19 variants and resulting restrictions, or the duration or magnitude of the adverse impact on our revenue.
Historically, our costs have increased each year and we expect our costs to increase in future periods as we continue to expend substantial financial resources on:
•product and feature development;
•sales and marketing;
•our technology infrastructure;
•market development efforts;
•strategic opportunities, including commercial relationships and acquisitions;
•our stock repurchase program; and
•general administration, including legal and accounting expenses related to being a public company.
These investments may not result in increased revenue or growth in our business. Our expenses may grow faster than our revenue and may be greater than we anticipate in a particular period or over time. If we are unable to maintain adequate revenue growth and to manage our expenses, we may continue to incur significant losses in the future and may not be able to maintain profitability.
We have a limited operating history in an evolving industry, which makes it difficult to evaluate our future prospects and may increase the risk that we will not be successful.
We have a limited operating history at the current scale of our business in an evolving industry that may not develop as expected, if at all. If the demand for connecting consumers and local businesses does not develop as we expect, or if we fail to address the needs of this demand, our business will be harmed. As a result, our historical operating results may not be indicative of our future operating results, making it difficult to assess our future prospects. You should consider our business and prospects in light of the risks and difficulties we may encounter in this rapidly evolving industry, which we may not be able to address successfully. These risks and difficulties include numerous factors, many of which we are unable to predict or are outside of our control, including those discussed elsewhere in these Risk Factors. Failure to address these risks and difficulties adequately could harm our business and cause our operating results to suffer.
We rely on data from both internal tools and third parties to calculate certain of our performance metrics. Real or perceived inaccuracies in such metrics may harm our reputation and negatively affect our business.
We track certain performance metrics — including the number of unique devices accessing our mobile app in a given period, paying advertising locations, active claimed local business locations, ad clicks and CPCs — with internal tools, which are not independently verified by any third party. Our internal tools have a number of limitations and our methodologies for tracking these metrics may change over time, which could result in unexpected changes to our metrics, including key metrics that we report. If the internal tools we use to track these metrics over- or under-count performance or contain algorithm or other technical errors, the data we report may not be accurate and our understanding of certain details of our business may be distorted, which could affect our longer-term strategies. For example, in 2018, we discovered a software error that caused our previously reported claimed local business locations metric to be overstated for the third quarter of 2017 through the first quarter of 2018, and revised them accordingly. Our metrics may also be affected by mobile applications that automatically contact our servers for regular updates with no discernible user action involved; this activity can cause our system to count the device associated with the app as an app unique device in a given period. Although we take steps to exclude such activity and, as a result, do not believe it has had a material impact on our reported metrics, our efforts may not successfully account for all such activity.
In addition, certain of our other key metrics — the number of our desktop unique visitors and mobile website unique visitors — are calculated based on data from third parties. While these numbers are based on what we believe to be reasonable calculations for the applicable periods of measurement, our third-party providers periodically encounter difficulties in providing accurate data for such metrics as a result of a variety of factors, including human and software errors. We expect these challenges to continue to occur, and potentially to increase as our traffic grows. For example, we have discovered in the past, and expect to discover in the future, that portions of our desktop traffic, as measured by Google Analytics, have been attributable to robots. Because the traffic from robots does not represent valid consumer traffic, our reported desktop unique visitor metric for impacted periods reflects an adjustment to the Google Analytics measurement of our traffic to remove traffic identified as originating from robots to provide greater accuracy and transparency. We expect to continue to make similar adjustments in the future if we determine that our traffic metrics are materially impacted by robot or other invalid traffic.
There are also inherent challenges in measuring usage across our large user base. For example, because these metrics are based on users with unique identifiers, an individual who accesses our website from multiple devices with different identifiers may be counted as multiple unique visitors, and multiple individuals who access our website from a shared device with a single identifier may be counted as a single unique visitor. In addition, although we use technology designed to block low-quality traffic, such as robots, spiders and other software, we may not be able to prevent all such traffic, and such technology may have the effect of blocking some valid traffic. For these and other reasons, the calculations of our desktop unique visitors and mobile website unique visitors may not accurately reflect the number of people actually using our platform.
Our measures of traffic and other key metrics may differ from estimates published by third parties (other than those whose data we use to calculate our key metrics) or from similar metrics of our competitors. We are continually seeking to improve our ability to measure these key metrics, and regularly review our processes to assess potential improvements to their accuracy. Similarly, the third parties on which we rely for certain of our key metrics may also make changes or improvements to their tools and methodologies; for example, in July 2023, Google Analytics will be replaced by Google Analytics 4, Google’s next generation digital marketing intelligence product. However, changes to these tools and methodologies could cause inconsistency between current data and previously reported data, which could confuse investors or raise questions about the integrity of our data. In addition, as both the industry in which we operate and our business continue to evolve, so too might the metrics by which we evaluate our business. We may revise or cease reporting metrics if we determine such metrics are no longer accurate or appropriate measures of our performance. For example, we stopped reporting our claimed local business locations metric and instead disclose the number of active claimed local business locations, which we believe provides a better measure of the number of businesses that represent the highest quality leads available to our local sales force than our claimed local business locations metric. We also phased out our paid advertising accounts metric and replaced it with paid advertising locations, which we believe provides a better measurement of our market penetration. If our users, advertisers, partners and stockholders do not perceive our metrics to be accurate representations, or if we discover material inaccuracies in our metrics, our reputation may be harmed.
If we default on our credit obligations, our business, revenue and financial results could be harmed.
Our revolving credit facility contains financial covenants and other restrictions on our actions that may limit our operational flexibility or otherwise adversely affect our results of operations. It contains a number of covenants that limit our ability and our subsidiaries’ ability to, among other things, incur additional indebtedness, pay dividends, make redemptions and repurchases of stock, make investments, loans and acquisitions, incur liens, engage in transactions with affiliates, merge or consolidate with other companies, sell material businesses or assets, or license or transfer certain of our intellectual property. We are also required to maintain certain financial covenants. Complying with these covenants may make it more difficult for us to successfully execute our business strategy and compete against companies who are not subject to such restrictions.
If we fail to comply with the covenants under the revolving credit facility, Wells Fargo would have a right to, among other things, terminate the commitments to provide additional loans under the facility, declare all outstanding loans and accrued interest and fees to be due and payable and require us to post cash collateral to be held as security for any reimbursement obligations in respect of any outstanding letters of credit issued under the facility. If any remedies under the facility were exercised, we may not have sufficient cash or be able to borrow sufficient funds to refinance the debt or sell sufficient assets to repay the debt, which could immediately materially and adversely affect our business, cash flows, operations and financial condition. Even if we were able to obtain new financing, it may not be on commercially reasonable terms or on terms that are acceptable to us.
If our goodwill or intangible assets become impaired, we may be required to record a significant charge to our statements of operations.
We have recorded a significant amount of goodwill related to our acquisitions to date, and a significant portion of the purchase price of any companies we acquire in the future may be allocated to acquired goodwill and other intangible assets. Under accounting principles generally accepted in the United States (“GAAP”), we review our intangible assets for impairment when events or changes in circumstances indicate the carrying value of our goodwill and other intangible assets may not be recoverable. Goodwill is required to be tested for impairment at least annually. Factors that may be considered include declines in our stock price, market capitalization and future cash flow projections. If our acquisitions do not yield expected returns, our stock price declines or any other adverse change in market conditions occurs, a change to the estimation of fair value could result.
For example, we performed an impairment test after identifying indicators of impairment during the first quarter of 2020 as a result of COVID-19. While we ultimately recorded only an immaterial impairment charge related to intangible assets as a result of this test, any further adverse changes in our business environment, stock price, market capitalization and future cash flow projections could result in additional impairment charges to our intangible assets or goodwill, particularly if such change impacts any of our critical assumptions or estimates, and may have a negative impact on our financial position and operating results.
We may require additional capital to support business growth, and such capital might not be available on acceptable terms, if at all.
We intend to continue to invest in our business and may require or otherwise seek additional funds to respond to business challenges, including the need to develop new features and products, enhance our existing services, improve our operating infrastructure and acquire complementary businesses and technologies. As a result, we may need to engage in equity or debt financings to secure additional funds. If our access to capital is restricted or our borrowing costs increase as a result of developments in financial markets relating to the current macroeconomic uncertainty or otherwise, our operations and financial condition could be adversely impacted.
If we raise additional funds through future issuances of equity or convertible debt securities, our existing stockholders could suffer significant dilution, and any new equity securities we issue could have rights, preferences and privileges superior to those of our common stock. Any future debt financing we secure could involve restrictive covenants relating to our capital raising activities and other financial and operational matters, which may make it more difficult for us to obtain additional capital and to pursue business opportunities, including potential acquisitions. We may not be able to obtain additional financing on terms favorable to us, if at all. If we are unable to obtain adequate financing or financing on terms satisfactory to us when we require it, our ability to continue to support our business growth and respond to business challenges could be significantly impaired, and our business may be harmed.
We may have exposure to greater than anticipated tax liabilities.
Our income tax obligations are based in part on our corporate operating structure and intercompany arrangements, including the manner in which we develop, value and use our intellectual property and the valuations of our intercompany transactions. For example, our corporate structure includes legal entities located in jurisdictions with income tax rates lower than the U.S. statutory tax rate. Our intercompany arrangements allocate income to such entities in accordance with arm’s length principles and commensurate with functions performed, risks assumed and ownership of valuable corporate assets. We believe that income taxed in certain foreign jurisdictions at a lower rate relative to the U.S. statutory rate will have a beneficial impact on our worldwide effective tax rate.
However, significant judgment is required in evaluating our tax positions and determining our provision for income taxes. During the ordinary course of business, there are many transactions and calculations for which the ultimate tax determination is uncertain. For example, our effective tax rates could be adversely affected by changes in the valuation of our deferred tax assets and liabilities, or by changes in relevant tax, accounting and other laws, regulations, principles and interpretations.
In addition, the application of the tax laws of various jurisdictions, including the United States, to our international business activities is subject to interpretation and depends on our ability to operate our business in a manner consistent with our corporate structure and intercompany arrangements. The taxing authorities of jurisdictions in which we operate may challenge our methodologies for valuing developed technology or intercompany arrangements, including our transfer pricing, or determine that the manner in which we operate our business does not achieve the intended tax consequences, which could increase our worldwide effective tax rate and harm our financial position and results of operations. As we operate in numerous taxing jurisdictions, the application of tax laws can also be subject to diverging and sometimes conflicting interpretations by tax authorities of these jurisdictions. It is not uncommon for taxing authorities in different countries to have conflicting views, for instance, with respect to, among other things, the manner in which the arm’s-length standard is applied for transfer pricing purposes, or with respect to the valuation of intellectual property.
Changes in tax laws or tax rulings, or the examination of our tax positions, could materially affect our financial position and results of operations.
Tax laws are dynamic and subject to change as new laws are passed and new interpretations of the law are issued or applied. Our current practices, existing corporate structure and intercompany arrangements have been implemented in a manner we believe is in compliance with current prevailing tax laws. However, the tax benefits that we intend to eventually derive could be undermined due to changing tax laws or new interpretations of existing laws that are inconsistent with previous interpretations or positions taken by taxing authorities on which we have relied.
For example, the U.S. Tax Cuts and Jobs Act (the “Tax Act”), which was enacted on December 22, 2017, made broad and complex changes to the U.S. tax code, including, among other things, reducing the federal corporate tax rate. Beginning in 2022, the Tax Act required the capitalization of research and development expenses with amortization periods over five and fifteen years pursuant to Internal Revenue Code Section 174 (“Section 174”), which has a material and adverse impact on our effective tax rate and cash flow. If the requirement to capitalize Section 174 expenditures is not modified, it may also impact our effective tax rate and our cash tax liability in future years. We expect further guidance regarding Section 174 may be forthcoming from the Financial Accounting Standards Board and the SEC, as well as regulations, interpretations and rulings from federal and state agencies, which could impact our consolidated financial statements.
Furthermore, taxing authorities in various jurisdictions worldwide have enacted or proposed new tax laws, rules and regulations directed at taxing the digital economy and multinational entities. As part of its Base Erosion and Profit Sharing Project, the Organization for Economic Co-operation and Development has published proposals and blueprints covering issues including country-by-country reporting, transfer pricing rules and taxation of digital services. Various jurisdictions have also unilaterally enacted or are considering a digital services tax on companies that generate revenues from the provision of digital services. These ongoing efforts to modernize the international tax framework and address the digitalization of the global economy could increase our future tax obligations. The Company will continue to monitor the developments and assess any impacts on our long-term tax planning and consolidated financial statements.
In addition, the taxing authorities in the United States and other jurisdictions where we do business regularly examine our income and other tax returns. The ultimate outcome of these examinations cannot be predicted with certainty. Should the Internal Revenue Service or other taxing authorities assess additional taxes as a result of examinations or changes to applicable law or interpretations of the law, we may be required to record charges to our operations, which could harm our business, operating results and financial condition.
Risks Related to Regulatory Compliance and Legal Matters
We are, and may be in the future, subject to disputes and assertions that we violate the rights of other parties. These disputes may be costly to defend and could harm our business and operating results.
We currently face, and we expect to face from time to time in the future, allegations that we have violated the rights of other parties, including patent, trademark, copyright and other intellectual property rights, privacy or data protection rights of our users, and the rights of current and former employees, users and business owners. For example, various businesses have sued us alleging that we manipulate Yelp reviews in order to coerce them and other businesses to pay for Yelp advertising.
The nature of our business also exposes us to claims relating to the information posted on our platform, including claims for defamation, libel, negligence and patent, copyright or trademark infringement, among others. For example, businesses have in the past claimed, and may in the future claim, that we are responsible for the content of reviews posted by our users. We expect claims like these to continue, and potentially increase in proportion to the amount of content on our platform. In some instances, we may elect or be compelled to remove the content that is the subject of such claims, or may be forced to pay substantial damages if we are unsuccessful in our efforts to defend against these claims. For example, laws in Germany may impose significant fines for failure to comply with certain content removal and disclosure obligations. If we elect or are compelled to remove content from our platform, our products and services may become less useful to consumers and our traffic may decline, which would have a negative impact on our business. This risk may increase if the protections afforded us by CDA 230 are limited by legislative or judicial actions. This risk may also be greater in certain jurisdictions outside of the United States where our protection from such liability may be unclear.
We are also regularly exposed to claims based on allegations of infringement or other violations of intellectual property rights. Companies in the Internet, technology and media industries own large numbers of patent and other intellectual property rights, and frequently enter into litigation. Various “non-practicing entities” that own patents and other intellectual property rights also often aggressively attempt to assert claims in order to extract value from technology companies.
From time to time, we receive complaints that certain of our products and services may violate the intellectual property rights of others, and have previously been involved in patent lawsuits, including lawsuits involving plaintiffs targeting multiple defendants in the same or similar suits. While we have pursued a number of patent applications, we currently have only limited patent protection for our core business, and the contractual restrictions and trade secrets that protect our proprietary technology provide only limited safeguards against appropriation. This may make it more difficult to defend certain of our intellectual property rights, particularly related to our core business.
We expect other claims to be made against us in the future, and the results of litigation and claims to which we may be subject cannot be predicted with any certainty. Even if the claims are without merit, the costs associated with defending against them may be substantial in terms of time, money and management distraction. In particular, patent and other intellectual property litigation may be protracted and expensive, and the results may require us to stop offering certain features, purchase licenses or modify our products and features while we develop non-infringing substitutes, or otherwise involve significant settlement costs. The development of alternative non-infringing technology or practices could require significant effort and expense or may not be feasible. Even if claims do not result in litigation or are resolved in our favor without significant cash settlements, such matters, and the time and resources necessary to resolve them, could harm our business, results of operations and reputation.
Our business is subject to complex and evolving domestic and foreign laws, regulations and other obligations related to privacy, data protection, data security and other matters. Our actual or perceived failure to comply with such laws, regulations and obligations could harm our business.
We are subject to numerous domestic and foreign laws and regulations that involve matters central to our business, including laws regarding privacy, data protection, data security, user-generated content and consumer protection, among others, as described in more detail under “Business—Government Regulation” under Item 1 of this Annual Report. For example, we are subject to numerous laws around the world that restrict the collection, use, storing, processing and disclosure of personal information and other user data. We are also subject to a variety of laws, regulations and guidelines that regulate the way we distinguish paid search results and other types of advertising from unpaid search results. We operate in a rapidly evolving industry, and many laws and regulations that impact our business are being proposed, are still evolving or are being tested in courts, which adds to the complexity of operating our business.
In addition to various laws and regulations, we are or may become bound by industry standards and other contractual obligations, particularly related to data privacy and security, and our efforts to comply with such obligations may not be successful. We must also comply with the technical requirements and policies of the
search engines, application marketplace operators,
mobile operating systems and other third-party products and services on which we rely. For example, Apple recently made certain changes to its products and data use policies in connection with changes to its iOS operating system that reduce our ability to target and measure advertising across third-party platforms. If we do not comply with these requirements, we could lose access to such products and services, which would harm our business. We also publish privacy policies, marketing materials and other statements, such as compliance with certain third-party certifications, regarding data privacy and security. If these policies, materials or statements are found to be deficient, lacking in transparency, deceptive, unfair or not representative of our practices, we may be subject to investigation, enforcement actions by regulators or other adverse consequences.
Our business could be adversely affected if we are required to change our current policies, practices or the design of our platform, products or features based on new laws, regulations or judicial interpretations. For example, there have been ongoing legislative efforts to restrict the scope of the critical liability protections afforded to online platforms like ours under CDA 230, which could increase our content moderation costs and our exposure to liability in connection with the publication of third-party content, including user-generated reviews. Changes to CDA 230, whether the result of legislative or judicial action, could also cause us to remove more third-party content from our platform, particularly critical consumer commentary, in response to takedown demands that may or may not be legitimate, which would negatively affect the quality and quantity of information available through our service.
Similarly, regulatory frameworks for privacy issues and behavioral advertising are currently in flux worldwide and are trending toward more restrictive obligations, reflecting increased public scrutiny of the practices of companies offering online services with respect to the personal information and behavior of their users. Changes to privacy and data security laws could make it more difficult for consumers to use our platform, resulting in lower traffic and revenue, or make it more difficult for us to provide effective advertising tools to businesses on our platform, resulting in fewer advertisers and lower revenue. Delivering targeted advertising off Yelp in particular is becoming more difficult due to changes in our ability to gather information about user behavior through third-party platforms, new laws and regulations, and consumer resistance. Current and proposed laws and regulations regulate the use of cookies and other tracking technologies, electronic communications and marketing. For example, in addition to giving residents expansive rights related to their personal information, California law restricts the “sale” of personal information and the use of cookies and similar technologies for certain advertising purposes.
If these and other future restrictions negatively impact our ability to offer ad products that are highly targeted to audience interests, or to measure the effectiveness of our ad products, such as our ability to offer store-level attribution through integrations with third-party data partners, our ability to maintain and expand our base of advertisers will be harmed. In addition, if we encounter widespread consumer withholding of consent, adoption of “do not track” mechanisms or adoptions of “ad-blocking” software to prevent the collection of personal information for targeted advertising purposes, we may be required to change the way we market our products, our ability to reach new or existing customers may be materially impaired or our operations may be otherwise harmed.
These challenges may be compounded to the extent that different jurisdictions adopt inconsistent or conflicting laws and regulations applicable to our business, which would add complexity to our operations and increase our compliance costs. For example, laws in all states and U.S. territories require businesses to notify affected individuals and governmental entities of the occurrence of certain security breaches affecting personal information. However, these laws are not consistent, and compliance with them in the event of a widespread data breach would be complex and costly. It is also possible that the interpretation and application of various laws and regulations may conflict with other rules or our practices, such as industry standards to which we adhere, our privacy policies and our privacy-related obligations to third parties (including, in certain instances, voluntary third-party certification bodies).
Uncertainty regarding the application and interpretation of existing laws and regulations due to court challenges or evolving legislation may also result in a significantly greater compliance burden for us. For example, a decision by the European Court of Justice of the European Union invalidated the primary framework allowing transfers of personal information from Europe to the United States and most other countries under the U.S.-E.U. Privacy Shield Framework. The European Union and the United States have negotiated a new framework that may impose additional obligations and requirements with respect to the transfer of E.U. personal data to other jurisdictions, which in turn may increase the legal risks and liabilities under the GDPR and local E.U. laws associated with cross-border data transfers, as well as result in material increases in our compliance and operational costs. If we are unable to implement a valid solution for personal information transfers from Europe, we will face increased exposure to regulatory actions, substantial fines, and injunctions against processing or transferring personal information from Europe and may be required to increase our data processing capabilities in Europe at significant expense. Similarly, the CPRA, which came into effect in 2023, significantly modifies the privacy obligations under the CCPA, creating uncertainty and requiring us to incur additional costs and expenses. Other states and countries, such as Virginia and Canada, have passed their own privacy legislation or have such legislation pending. Aspects of the CCPA, CPRA and other laws remain unclear and we may be required to modify our practices further in an effort to comply with them.
Our actual or perceived failure to comply with laws, regulations and other obligations has led to, and could lead to further, costly legal actions, which in turn could result in adverse publicity, significant liability and decreased demand for our services, which could adversely affect our business, results of operations and financial condition. For example, our failure or perceived failure to comply with applicable laws and regulations may result, and in some cases has resulted, in inquiries and other proceedings and actions against us by governments, regulations or others. Responding to and resolving any future litigation, investigations, settlements or other regulatory actions may require significant time and resources, and could diminish confidence in, and the use of, our products. We may also be forced to implement new measures to reduce our legal exposure, which may require us to expend substantial resources, delay development of new products or discontinue certain products or features, which would negatively impact our business. For example, if we fail to comply with our privacy-related obligations to users or third parties, or any compromise of security that results in the unauthorized release or transfer of personal information or other user data, we may be compelled to provide additional disclosures to our users, obtain additional consents from our users before collecting or using their information or implement new safeguards to help our users manage our use of their information, among other changes. Any resulting negative publicity could adversely affect our reputation and brand, regardless of whether the internal resources expended and expenses incurred in connection with such inquiries and their resolutions are material.
The requirements of being a public company may strain our resources, divert management’s attention and affect our ability to attract and retain qualified board members.
As a public company, we are subject to the reporting requirements of the Exchange Act, the Sarbanes-Oxley Act, the Dodd-Frank Act, the listing requirements of the New York Stock Exchange and other applicable securities rules and regulations. Compliance with these rules and regulations has increased, and will likely continue to increase, our legal and financial compliance costs, make some activities more difficult, time-consuming or costly, and place significant strain on our personnel, systems and resources. In addition, changing laws, regulations and standards relating to corporate governance and public disclosure are creating uncertainty for public companies, increasing legal and financial compliance costs and making some activities more time consuming. These laws, regulations and standards are subject to varying interpretations, in many cases due to their lack of specificity, and, as a result, their application in practice may evolve over time.
This could result in continuing uncertainty regarding compliance matters, higher administrative expenses and a diversion of management’s time and attention. Further, if our compliance efforts differ from the activities intended by regulatory or governing bodies due to ambiguities related to practice, regulatory authorities may initiate legal proceedings against us and our business may be harmed. Being a public company that is subject to these rules and regulations also makes it more expensive for us to obtain and retain director and officer liability insurance, and we may in the future be required to accept reduced coverage or incur substantially higher costs to obtain or retain adequate coverage. These factors could also make it more difficult for us to attract and retain qualified members of our board of directors and qualified executive officers.
Risks Related to Ownership of Our Common Stock
Our share price has been and will likely continue to be volatile.
The trading price of our common stock has been, and is likely to continue to be, highly volatile and could be subject to wide fluctuations in response to various factors, some of which are beyond our control. In addition to the factors discussed in these Risk Factors and elsewhere in this Annual Report, factors that may cause volatility in our share price include:
•the short- and long-term impacts of the COVID-19 pandemic and related macroeconomic uncertainty, as well as the timing and pace of the recovery;
•actual or anticipated fluctuations in our financial condition and operating results;
•changes in projected operating and financial results;
•actual or anticipated changes in our growth rate relative to our competitors;
•repurchases of our common stock pursuant to our stock repurchase program, which could also cause our stock price to be higher that it would be in the absence of such a program and could potentially reduce the market liquidity for our stock;
•announcements of changes in strategy;
•announcements of technological innovations or new offerings by us or our competitors;
•announcements by us or our competitors of significant acquisitions, strategic partnerships, joint ventures or capital-raising activities or commitments;
•additions or departures of key personnel;
•actions of securities analysts who cover our company, such as publishing research or forecasts about our business (and our performance against such forecasts), changing the rating of our common stock or ceasing coverage of our company;
•investor sentiment, including that of derivatives traders, with respect to us or our competitors, business partners and industry in general;
•any disruption to the proper operation of our network infrastructure or compromise of our security measures;
•any failure to maintain effective controls or difficulties encountered in their implementation or improvement;
•reporting on our business by the financial media, including television, radio and press reports and blogs;
•fluctuations in the value of companies perceived by investors to be comparable to us;
•changes in the way we measure our key metrics;
•sales of our common stock;
•changes in laws or regulations applicable to our solutions;
•share price and volume fluctuations attributable to inconsistent trading volume levels of our shares; and
•general economic and market conditions such as recessions or interest rate changes.
Furthermore, the stock markets have recently experienced extreme price and volume fluctuations that have affected and continue to affect the market prices of equity securities of many companies. In some cases, these fluctuations often have been unrelated or disproportionate to the operating performance of those companies. In the past, companies that have experienced volatility in the market price of their stock have been subject to securities class action litigation. For example, in January 2018, we and certain of our officers were sued in a putative class action lawsuit alleging violations of the federal securities laws for allegedly making materially false and misleading statements. We may be the target of additional litigation of this type in the future as well.
Securities litigation against us could result in substantial costs and divert our management’s time and attention from other business concerns, which could harm our business.
We cannot guarantee that our stock repurchase program will be fully consummated or that it will enhance long-term stockholder value. Share repurchases could also increase the volatility of the trading price of our stock and could diminish our cash reserves.
Since we implemented our stock repurchase program in July 2017, our board of directors has authorized the repurchase of up to an aggregate of $1.45 billion of our common stock, of which $254.7 million remained available as of February 17, 2023 and which does not have an expiration date. Although our board of directors has authorized this repurchase program, the program does not obligate us to repurchase any specific dollar amount or to acquire any specific number of shares. The actual timing and amount of repurchases remain subject to a variety of factors, including liquidity, cash flow and market conditions, all of which may be negatively impacted by the ongoing pandemic. In addition, the terms of our Credit Agreement with Wells Fargo Bank, National Association impose limitations on our ability to repurchase shares during the term of our revolving credit facility. We cannot guarantee that the program will be fully consummated or that it will enhance long-term stockholder value. The program could affect the trading price of our stock and increase volatility, and any announcement of a termination of this program may result in a decrease in the trading price of our stock. In addition, this program could diminish our cash and cash equivalents, and marketable securities.
We do not intend to pay dividends for the foreseeable future, and as a result, our stockholders’ ability to achieve a return on their investment will depend on appreciation in the price of our common stock.
We have never declared or paid any cash dividends on our common stock and do not intend to pay any cash dividends in the foreseeable future. Any determination to pay dividends in the future will be at the discretion of our board of directors. Accordingly, investors must rely on sales of their common stock after price appreciation, which may never occur, as the only way to realize future gains on their investments.
Anti-takeover provisions in our charter documents and under Delaware law could make an acquisition of our Company more difficult, limit attempts by our stockholders to replace or remove our current management and limit the market price of our common stock.
Provisions in our amended and restated certificate of incorporation and bylaws may have the effect of delaying or preventing a change in control or changes in our board and management. Our amended and restated certificate of incorporation and amended and restated bylaws include provisions that:
•authorize our board of directors to issue, without further action by the stockholders, up to 10,000,000 shares of undesignated preferred stock;
•require that any action to be taken by our stockholders be effected at a duly called annual or special meeting and not by written consent;
•specify that special meetings of our stockholders can be called only by our board of directors, the Chair of our board of directors or our Chief Executive Officer;
•establish an advance notice procedure for stockholder proposals to be brought before an annual meeting, including proposed nominations of persons for election to our board of directors;
•establish that our board of directors is divided into classes, with directors serving staggered terms, until our 2023 annual meeting of stockholders when the classes will be fully phased out;
•prohibit cumulative voting in the election of directors;
•provide that vacancies on our board of directors may be filled only by a majority of directors then in office, even though less than a quorum; and
•require the approval of our board of directors or the holders of a supermajority of our outstanding shares of capital stock to amend our bylaws and certain provisions of our amended and restated certificate of incorporation.
These provisions may frustrate or prevent any attempts by our stockholders to replace or remove our current management by making it more difficult for stockholders to replace members of our board of directors, which is responsible for appointing the members of our management. In addition, because we are incorporated in Delaware, we are governed by the provisions of Section 203 of the Delaware General Corporation Law, which generally prohibits a Delaware corporation from engaging in any of a broad range of business combinations with any “interested” stockholder for a period of three years following the date on which the stockholder became an “interested” stockholder.
Our amended and restated certificate of incorporation and bylaws provide that the Court of Chancery of the State of Delaware and the U.S. federal district courts will be the exclusive forums for the adjudication of certain disputes, which could limit our stockholders’ ability to obtain a favorable judicial forum for disputes with us or our directors, officers, or employees.
Our amended and restated certificate of incorporation provides that the Court of Chancery of the State of Delaware is the sole and exclusive forum for the following types of actions or proceedings under Delaware statutory or common law:
•any derivative action or proceeding brought on our behalf;
•any action asserting a claim of breach of a fiduciary duty owed by any director, officer or other employee of Yelp to us or our stockholders;
•any action asserting a claim against us arising pursuant to any provision of the General Corporation Law of the State of Delaware, our amended and restated certificate of incorporation or our amended and restated bylaws; and
•any action asserting a claim against us that is governed by the internal affairs doctrine.
This exclusive-forum provision would not apply to suits brought to enforce a duty or liability created by the Exchange Act.
Furthermore, section 22 of the Securities Act creates concurrent jurisdiction for federal and state courts over all Securities Act actions. Accordingly, both state and federal courts have jurisdiction to entertain such claims. To prevent having to litigate claims in multiple jurisdictions and the threat of inconsistent or contrary rulings by different courts, among other considerations, our amended and restated bylaws provide that the U.S. federal district courts will be the exclusive forum for resolving any compliant asserting a cause of action arising under the Securities Act.
While the Delaware courts have determined that such choice of forum provisions are facially valid, a stockholder may nevertheless seek to bring a claim in a venue other than those designated in the exclusive forum provisions. In such instance, we would expect to vigorously assert the validity and enforceability of the exclusive forum provisions of our amended and restated certificate of incorporation and bylaws. This may require significant additional costs associated with resolving such action in other jurisdictions and there can be no assurance that the provisions will be enforced by a court in such other jurisdictions.
These exclusive-forum provisions further provide that any person or entity that acquires any interest in shares of our capital stock will be deemed to have notice of and consented to such provisions and may limit a stockholder's ability to bring a claim in a judicial forum that it finds favorable for disputes with us or our directors, officers, or other employees, which may discourage lawsuits against us and our directors, officers, and other employees. If a court were to find either exclusive-forum provision to be inapplicable or unenforceable in an action, we may incur further significant additional costs associated with resolving the dispute in other jurisdictions, all of which could harm our business.
Future sales of our common stock in the public market could cause our share price to decline.
Sales of a substantial number of shares of our common stock in the public market, particularly sales by our directors, officers, employees and significant stockholders, or the perception that these sales might occur, could depress the market price of our common stock and could impair our ability to raise capital through the sale of additional equity securities. As of December 31, 2022, we had 69,796,932 shares of common stock outstanding.
Item 1B. Unresolved Staff Comments.
None.
Item 2. Properties.
Our principal executive offices in North America are currently located at 350 Mission Street, San Francisco, California, where we lease office space pursuant to a lease agreement that expires in 2030. We also lease office space in multiple cities across North America and Europe. We believe that our properties are generally suitable to meet our needs for the foreseeable future and, to the extent we require additional space in the future, we believe that it would be available on commercially reasonable terms.
Item 3. Legal Proceedings.
For information regarding material legal proceedings in which we are involved, see “Legal Proceedings” in
Note 13, “Commitments and Contingencies,” of the Notes to Consolidated Financial Statements included in this Annual Report, which is incorporated herein by reference. We are also subject to legal proceedings arising in the ordinary course of business. Although the results of litigation and claims cannot be predicted with certainty, we currently do not believe that the final outcome of any of these matters will have a material effect on our business, financial position, results of operations or cash flows.
Item 4. Mine Safety Disclosures.
Not applicable.
PART II
Item 5. Market for Registrant’s Common Equity, Related Stockholder Matters and Issuer Purchases of Equity Securities.
Market Information
Our common stock, par value $0.000001 per share, is listed on the New York Stock Exchange LLC ("NYSE") under the symbol “YELP.”
Stockholders
As of the close of business on February 17, 2023, there were 34 stockholders of record of our common stock. The actual number of holders of our common stock is greater than this number of record holders, and includes stockholders who are beneficial owners, but whose shares are held in street name by brokers or other nominees. This number of holders of record also does not include stockholders whose shares may be held in trust by other entities.
Dividend Policy
We have never declared or paid, and do not anticipate declaring or paying, any cash dividends on our capital stock. Any future determination as to the declaration and payment of dividends, if any, will be at the discretion of our board of directors and will depend on then-existing conditions, including our financial condition, operating results, contractual restrictions, capital requirements, business prospects and other factors that our board of directors may deem relevant.
Performance Graph
We have presented below the cumulative total return to our stockholders during the period from December 31, 2017 through December 31, 2022 in comparison to the NYSE Composite Index and NYSE Arca Tech 100 Index. All values assume a $100 initial investment and data for the NYSE Composite Index and NYSE Arca Tech 100 Index assume reinvestment of dividends. The comparisons are based on historical data and are not indicative of, nor intended to forecast, the future performance of our common stock.
The information under “Performance Graph” is not deemed to be “soliciting material” or “filed” with the SEC or subject to Regulation 14A or 14C, or to the liabilities of Section 18 of the Exchange Act, and is not to be incorporated by reference in any
filing of Yelp under the Securities Act or the Exchange Act, whether made before or after the date of this Annual Report and irrespective of any general incorporation language in those filings.
Issuer Purchases of Equity Securities
The following table summarizes our stock repurchase activity for the three months ended December 31, 2022 (in thousands except for price per share):
|
|
|
|
|
|
|
|
|
|
|
|
|
|
|
|
|
|
|
|
|
|
|
|
|
|
|
| Period |
|
Total Number
of Shares Purchased(1)
|
|
Average Price Paid per Share(2) |
|
Total Number of Shares Purchased as Part of Publicly Announced Plans or Programs |
|
Approximate Dollar Value of Shares that May Yet Be Purchased Under the Plans or Program |
| October 1 - October 31, 2022 |
|
685 |
|
|
$ |
35.99 |
|
|
685 |
|
|
$ |
57,007 |
|
| November 1 - November 30, 2022 |
|
298 |
|
|
$ |
31.52 |
|
|
298 |
|
|
$ |
297,626 |
|
| December 1 - December 31, 2022 |
|
573 |
|
|
$ |
27.86 |
|
|
573 |
|
|
$ |
281,658 |
|
(2) Average price paid per share includes costs associated with the repurchases.
Item 6. [Reserved].
Item 7. Management’s Discussion and Analysis of Financial Condition and Results of Operations.
The following discussion and analysis of our financial condition and results of operations should be read in conjunction with our consolidated financial statements and related notes appearing elsewhere in this Annual Report. This discussion contains forward-looking statements that reflect our plans, estimates and beliefs, and involve risks and uncertainties. Our actual results and the timing of certain events could differ materially from those anticipated in these forward-looking statements as a result of several factors, including those discussed in the section titled “
Risk Factors” included under Part I, Item 1A and elsewhere in this Annual Report. See “
Special Note Regarding Forward-Looking Statements” in this Annual Report.
The following section also includes information regarding 2022 and 2021, year-over-year comparisons between these periods and certain information regarding 2020. A full discussion of 2020 items and year-over-year comparisons between 2021 and 2020 can be found in the section titled “Management’s Discussion and Analysis of Financial Condition and Results of Operations” in our Annual Report on Form 10-K for the year ended December 31, 2021.
Overview
As one of the best known Internet brands in the United States, Yelp is a trusted local resource for consumers and a partner in success for businesses of all sizes. Consumers trust us for our more than 240 million ratings and reviews of businesses across a broad range of categories, while businesses advertise with us to reach our large audience of purchase-oriented and generally affluent consumers. We believe our ability to provide value to both consumers and businesses not only fulfills our mission to connect consumers with great local businesses, but also positions us well in the local, digital advertising market in the United States.
We generate substantially all of our revenue through the sale of performance-based advertising products, which our advertising platform matches to individual consumers through auctions priced on a CPC basis. In the year ended December 31, 2022, our net revenue was $1.19 billion, up 16% from the year ended December 31, 2021 and 37% from the year ended December 31, 2020, and we recorded net income of $36.3 million and adjusted EBITDA of $269.8 million. For information on how we define and calculate adjusted EBITDA and a reconciliation of this non-GAAP financial measure to net income (loss), see “
—Non-GAAP Financial Measures” below.
In 2022, we delivered another year of record annual revenue and profitable growth through the consistent execution of our product-led strategic initiatives:
Grow Quality Leads and Monetization in Our Services Categories
•After significantly increasing the percentage of monetized leads in our Services categories — home, local, auto, professional, pets, events, real estate and financial services — in recent years to approximately 25%, in 2022 we shifted our primary focus to improving lead quality and the projects experience while preserving our lead monetization gains. We continued to improve the Request-a-Quote flow and underlying matching technology to create an even more seamless experience. We launched Request-a-Call, which helps reduce initial friction in the hiring process by allowing users to easily request a phone call directly from Services businesses. We also expanded our project-specific search filters, redesigned the Yelp for Business inbox, and introduced a new projects experience in the Yelp app to help consumers more easily view and manage all of their services projects. These efforts contributed to our record advertising revenue from Services businesses in 2022.
Drive Sales through Our Self-Serve and Multi-location Channels
•By prioritizing investments in our Self-serve and Multi-location channels, we have significantly shifted our go-to-market mix toward our most efficient channels in recent years. Our product and marketing efforts drove record Self-serve customer acquisition in 2022, which contributed to annual revenue growth of approximately 25% year over year in this channel. As a result, revenue from our Self-serve channel increased as a percentage of advertising revenue to 19% in 2022 from 17% in 2021.
•Multi-location channel revenue also increased by approximately 25% year over year in 2022 as our sales team leveraged our portfolio of ad products and attribution solutions, both on and off Yelp, to make inroads with these larger advertisers. We continued to expand our offerings, including new iterations of themed and spotlight ad formats. We also enhanced our measurement capabilities through improvements to our first-party attribution solution, Yelp Store Visits. As a result of these efforts, Multi-location channel revenue increased as a percentage of total advertising revenue to 30% in 2022 from 27% in 2021.
Deliver More Value to Advertisers
•Since transitioning to flexible non-term contracts, we have been able to increase our pace of product innovation and better align our business with our advertisers. In 2022, we continued to deliver value to our advertisers in the form of higher performing clicks by optimizing our ad system to better match consumers with the right advertisers at the right time. For example, we improved the lead-through rate, an important quality indicator, converting a greater percentage of ad clicks to leads on average in 2022 compared to 2021. Despite the macroeconomic challenges of 2022, average CPC increased by 27% from 2021 as advertiser demand remained robust.
Enhance the Consumer Experience
•After several years of substantial monetization progress, we were able to allocate more resources towards enhancing the consumer experience in 2022 and made early progress over the course of the year. We reduced friction in the review-writing process and leveraged smart notifications to prompt more review contributions. We also introduced a more visual, vertical home feed and updated the map view search experience for our Android app to bring it more in-line with the high quality of our iOS app. Together, these efforts contributed to improved new user retention and an 18% increase in the click-through rate of Android ads.
Looking ahead, we believe these strategic initiatives continue to provide opportunities for growth and plan to expand on our progress in 2022 by continuing to invest in each of them. We expect that our expenses will increase modestly year over year in 2023 as we invest in these initiatives and maintain approximately the same headcount we ended 2022 with, following an increase in expenses from the fourth quarter of 2022 to the first quarter of 2023. We also expect that our revenue will grow year over year in 2023 as the benefits of our initiatives build; however, we expect revenue in the first quarter of 2023 to be flat to slightly down sequentially, reflecting seasonal trends.
Factors Affecting Our Performance
Macroeconomic Conditions. There is currently an uncertain and inflationary economic environment in the United States, partially as a result of the COVID-19 pandemic and efforts to contain it and manage its impacts, which have created significant macroeconomic disruption and volatility. These challenging macroeconomic conditions have had, and may continue to have, a significant adverse impact on our business and results of operations. For example, adverse macroeconomic conditions have had, and may continue to have, a negative impact on the ability and willingness of advertisers to spend on our products and services. While our business has now surpassed its pre-pandemic performance in many areas and advertiser demand was strong in 2022, many businesses continue to face supply chain issues, rising commodity prices, and inventory and labor shortages, which has negatively impacted their advertising spending with us.
Changes in consumer behavior due to adverse economic conditions have also had, and may continue to have, a negative impact our business. For example, in 2022 economic uncertainty and inflationary pressures, ongoing concerns related to COVID-19 and its variants, and the non-renewal of government stimulus programs contributed to consumer traffic to our platform remaining below pre-pandemic 2019 levels. Because traffic to and user engagement on our platform together impact the number of ads we are able to show as well as the value of those ads to businesses, such negative impacts on consumer activity may also make it more difficult to convince existing and prospective advertisers that our products offer them a material benefit and generate a competitive return relative to other alternatives. Strong advertiser demand combined with less robust consumer activity has significantly increased our average CPC in 2022 compared to 2021; if the value our products provide to advertisers does not keep pace with any further price increases, our revenue and results of operations could be harmed.
It is not possible for us to predict the remaining duration of the ongoing adverse macroeconomic conditions or of the pandemic, the severity of future COVID-19 variants and resulting restrictions, or the duration or magnitude of any resulting adverse impact on our business. Adverse macroeconomic conditions have historically been particularly challenging for the SMBs on which we rely and any protracted economic downturn would have significant negative effects on our business.
Investment in Growth. In 2023, we plan to invest heavily in our strategic initiatives to grow quality leads and monetization of our Services categories, expand our Self-serve and Multi-location channels, deliver more value to advertisers and enhance the consumer experience. These initiatives will require substantial investments that may not prioritize short-term financial results, depend on our ability to develop innovative, relevant and useful products in a timely manner, and involve significant risks and uncertainties. For example, new products may fail to generate sufficient revenue, operating margin or other value to justify the investments we made in them, which is a particular risk for new products that are unproven or that are outside of our historical core business. While we believe these initiatives will ultimately drive revenue growth, our investments in them will increase our operating expenses, and any increase in revenue resulting from these product innovations will likely trail the increase in expenses.
Our Ability to Attract, Retain and Engage Consumers. We generate substantially all of our revenue based on our users’ engagement with the ads that we display. Because traffic to our platform and user engagement on our platform together determine the number of ads we are able to show, affect the value of those ads to businesses and support the content creation that drives further traffic, our ability to attract, retain and engage visitors on our platform is critical to our business and financial success. While we believe our largest growth opportunity will be to monetize a greater portion of our existing traffic, rather than to grow traffic generally, we are also investing in a broad set of consumer initiatives to support the long-term growth of our traffic and business.
Our Ability to Attract and Retain Advertisers. Our revenue growth is driven by our ability to attract and retain advertising customers. To do so, we must deliver tailored advertising products at a competitive price in a highly competitive market. A substantial portion of our advertisers have the ability to cancel their advertising campaigns at any time. Their decisions to renew depend on the degree of satisfaction with our products as well as a number of factors that are outside of our control, including their ability to continue their operations and spending levels. Although the opportunity presented by our Multi-location channel is a strategic priority, we continue to rely heavily on SMBs that often have limited advertising budgets, may view online advertising products like ours as experimental and unproven, and are disproportionately impacted by macroeconomic conditions.
Our Ability to Attract and Retain Talent. Our ability to execute on our strategic initiatives depends on our continuing ability to attract, develop, motivate and retain highly qualified and skilled employees. Qualified individuals are in high demand and we expect to continue to face significant competition from other companies in hiring such personnel, particularly for technical roles. In 2022, we made substantial investments in our engineering, sales and marketing organizations, which has required us to effectively integrate, develop and motivate a large number of new employees in a remote environment while maintaining the beneficial aspects of our company culture. Our employee operations are complex and place substantial demands on management and our operational infrastructure, particularly in our fully remote work environment. We believe our decision to maintain distributed operations will provide even greater flexibility to our employees, who now have the opportunity to relocate within the countries where we operate so they can live where they want to live and work where they will feel most effective, will allow us to access and attract great talent from a more diverse pool of candidates across the United States, Canada and in Europe.
Stock Repurchases. Since July 2017, our board of directors has authorized us to repurchase up to an aggregate of $1.45 billion of our outstanding common stock, $254.7 million of which remained available as of February 17, 2023 and which does not have an expiration date. During the year ended December 31, 2022, we repurchased on the open market 6,195,093 shares for an aggregate purchase price of $200.0 million. The actual timing and amount of repurchases remain subject to a variety of factors, including liquidity, cash flow and market conditions. In addition, the terms of our Credit Agreement with Wells Fargo Bank, National Association, which we entered into in May 2020 (the “Credit Agreement”), impose limitations on our ability to repurchase shares during the term of our revolving credit facility. We have funded the repurchases, and expect to fund future repurchases under the stock repurchase program, with cash available on our balance sheet. As a result, this program could diminish our cash reserves and reduce our ability to invest in our business, in addition to affecting the trading price and volatility of our stock.
Corporate Development Activities. As part of our business strategy, we may decide to expand our product offerings and grow our business through the acquisition of complementary businesses or technologies, as well as through partnerships. In addition to diverting our management’s attention and otherwise disrupting our operations, our corporate development activities will affect our future financial results due to factors such as expenses incurred in identifying, investigating and pursuing transactions, whether or not they are consummated, possible dilutive issuances of equity securities or the incurrence of debt, unidentified liabilities and the amortization of acquired intangible assets. Maintaining relationships with partners also requires significant time and resources, as does integrating their data, services and technologies onto our platform. We may not realize the full benefits of synergies, innovation and operational efficiencies that may be possible from a corporate transaction; similarly, if our relationships with partners deteriorate, we could suffer increased costs and delays in our ability to provide consumers and advertisers with our content or services.
Seasonality and Cyclicality. Our business is affected by seasonal fluctuations in Internet usage and advertising spending. Based on historical trends, our revenue is typically lowest in the first quarter and increases through the year to its highest level in the fourth quarter. Multi-location ad budgets are generally lowest at the beginning of the year and peak in the fourth quarter, though our SMB customers tend to decrease their spending at that time. Our traffic is also typically weakest in the fourth quarter of the year in connection with year-end holidays.
Key Metrics
We regularly review a number of metrics, including the key metrics set forth below, to evaluate our business, measure our performance, identify trends in our business, prepare financial projections and make strategic decisions.
Ad Clicks
Ad clicks represent user interactions with our pay-for-performance advertising products, including clicks on advertisements on our website and mobile app, clicks on syndicated advertisements on third-party platforms and Request-a-Quote submissions, among others. Ad clicks include only user interactions that we are able to track directly, and therefore do not include user interactions with ads sold through our advertising partnerships. We do not expect the exclusion of such user interactions to materially affect this metric.
Because we generate revenue primarily from the sale of performance-based ads, our revenue depends in large part on our ability to deliver ad clicks, which in turn depends on the level of consumer activity on our platform. We report the year-over-year percentage change in ad clicks on a quarterly and annual basis as a measure of our success in monetizing more of our consumer traffic and delivering more value to advertisers. Although ad clicks decreased in the three months and year ended December 31, 2022 compared to the prior-year periods — which benefited from reopening tailwinds following the widespread availability of the COVID-19 vaccine as well as elevated consumer spending — revenue increased year over year in both periods as a result of increases in average CPC, as discussed below.
The following table presents year-over-year changes in our ad clicks for the periods indicated (expressed as a percentage):
|
|
|
|
|
|
|
|
|
|
|
|
|
|
|
|
|
|
|
|
|
|
|
|
|
Three Months Ended December 31, |
|
Year Ended December 31, |
| |
2022 |
|
2021 |
|
2022 |
|
2021 |
| Ad Clicks |
(7)% |
|
14% |
|
(8)% |
|
24% |
Average CPC
We define average CPC as revenue from our performance-based ad products — excluding certain revenue adjustments that do not impact the outcome of an auction for an individual ad click, such as refunds, as well as revenue from our advertising partnerships — divided by the total number of ad clicks for a given quarterly or annual period.
Average CPC, when viewed together with ad clicks, provides important insight into the value we deliver to advertisers, which we believe is a significant factor in our ability to retain both revenue and customers. For example, a positive change in ad clicks for a given period combined with lower growth or a negative change in average CPC over the same period would indicate that we delivered more ad clicks at lower prices, thereby delivering more value to our advertisers; we would expect this to have a positive impact on retention.
We believe that average CPC and ad clicks together reflect one of the largest dynamics affecting our advertising revenue performance. These metrics reflect, among other things, the interplay of advertiser demand and consumer behavior on our platform, each of which is currently subject to
complex macroeconomic pressures that we expect to continue to cause volatility in these metrics in the near term. For example, despite ad clicks decreasing year over year in the three months and year ended December 31, 2022, advertiser demand remained strong and average CPC increased year over year in both periods. We believe this was because we delivered more value to advertisers in 2022 in the form of higher performing clicks — rather than simply a greater number of clicks as in certain previous periods — contributing to a record retention rate of non-term advertisers’ budgets in 2022 despite a modest increase in churn in the second half of the year.
The following table presents year-over-year changes in our average CPC for the periods indicated (expressed as a percentage):
|
|
|
|
|
|
|
|
|
|
|
|
|
|
|
|
|
|
|
|
|
|
|
|
|
Three Months Ended December 31, |
|
Year Ended December 31, |
| |
2022 |
|
2021 |
|
2022 |
|
2021 |
| Average CPC |
23% |
|
7% |
|
27% |
|
(5)% |
Advertising Revenue by Category
Our advertising revenue comprises revenue from the sale of our advertising products, including the resale of our advertising products by partners and syndicated ads appearing on third-party platforms.
To reflect our strategic focus on creating two differentiated experiences on Yelp, we provide a breakdown of our advertising revenue attributable to businesses in two high-level category groupings: Services and RR&O. Our Services categories consist of home, local, auto, professional, pets, events, real estate and financial services. Our RR&O categories consist of restaurants, shopping, beauty & fitness, health and other.
The following table presents our advertising revenue by category for the periods presented (in thousands):
|
|
|
|
|
|
|
|
|
|
|
|
|
|
|
|
|
|
|
|
|
|
|
|
|
Three Months Ended December 31, |
|
Year Ended December 31, |
|
2022 |
|
2021 |
|
2022 |
|
2021 |
| Services |
$ |
178,292 |
|
|
$ |
157,242 |
|
|
$ |
693,810 |
|
|
$ |
607,770 |
|
| Restaurants, Retail & Other |
115,692 |
|
|
104,205 |
|
|
440,593 |
|
|
377,455 |
|
| Total Advertising Revenue |
$ |
293,984 |
|
|
$ |
261,447 |
|
|
$ |
1,134,403 |
|
|
$ |
985,225 |
|
Paying Advertising Locations
Paying advertising locations comprise all business locations associated with a business account from which we recognized advertising revenue in a given month, excluding business accounts that purchased advertising through partner programs other than Yelp Ads Certified Partners, averaged over a given three- or twelve-month period. We also provide a breakdown of paying advertising locations between our Services categories and RR&O categories.
We provide our paying advertising locations on a quarterly basis as a measure of the reach and scale of our business; however, this metric may exhibit short-term volatility as a result of factors such as seasonality and macroeconomic conditions. For example, macroeconomic factors, such as ongoing concerns about COVID-19 and its variants as well as inflationary pressures and labor and supply chain challenges, have had a predominant negative impact on RR&O paying advertising locations in recent quarters. Short-term fluctuations in paying advertising locations may also reflect the acquisition or loss of single advertising accounts associated with large numbers of locations, or the pausing/restarting of advertising campaigns by such multi-location advertisers.
The following table presents the number of paying advertising locations for the periods presented (in thousands):
|
|
|
|
|
|
|
|
|
|
|
|
|
|
|
|
|
|
|
|
|
|
|
|
|
Three Months Ended December 31, |
|
Year Ended December 31, |
|
2022 |
|
2021 |
|
2022 |
|
2021 |
| Services |
231 |
|
219 |
|
231 |
|
227 |
| Restaurants, Retail & Other |
314 |
|
309 |
|
327 |
|
296 |
| Total Paying Advertising Locations |
545 |
|
528 |
|
558 |
|
523 |
Reviews, Traffic and Active Claimed Local Business Locations
We report our reviews, traffic and active claimed local business locations metrics on an annual basis as measures of the volume of our content, the size of our audience and the scope of our business, respectively.
Reviews
Number of reviews represents the cumulative number of reviews submitted to Yelp since inception, as of the period end, including reviews that were not recommended or had been removed from our platform. In addition to the text of the review, each review includes a rating of one to five stars. We include reviews that are not recommended and that have been removed because all of them are either currently accessible on our platform or were accessible at some point in time, providing information that may be useful to users to evaluate businesses and individual reviewers. Because our automated recommendation software continually reassesses which reviews to recommend based on new information that becomes available, the “recommended” or “not recommended” status of reviews may change over time. Reviews that are not recommended or that have been removed do not factor into a business’s overall star rating. Users can access the reviews that are not currently recommended, as well as the star rating and other information about reviews that were removed for violation of our terms of service, through a link on the business’s page.
As of December 31, 2022, 265.3 million reviews had been submitted to our platform, of which 243.0 million reviews were available on business pages, including 48.0 million reviews that were not recommended, and 22.3 million reviews had been removed from our platform, either by us for violation of our terms of service or by the users who contributed them. The following table presents the number of cumulative reviews as of the dates indicated (in thousands):
|
|
|
|
|
|
|
|
|
|
|
|
|
As of December 31, |
| |
2022 |
|
2021 |
| Reviews |
265,288 |
|
244,435 |
Traffic
Traffic to our website and mobile app has three components: mobile devices accessing our mobile app, visitors to our non-mobile optimized website, which we refer to as our desktop website, and visitors to our mobile-optimized website, which we refer to as our mobile website. App users generate a substantial majority of activity on Yelp, including the page views and ad clicks that we monetize, and we expect that traffic to our website will fluctuate and generally decline over time. While we believe our largest growth opportunity will be to monetize a greater portion of our existing traffic, rather than to grow traffic generally, we are also investing in a broad set of consumer initiatives to support the long-term growth of our traffic and business.
Since the early stages of the COVID-19 pandemic in 2020, traffic levels, particularly in our RR&O categories, have fluctuated as consumer confidence levels changed in response to the pandemic and COVID-19 variants, as well as other macroeconomic conditions. As a result, although our traffic recovered in 2021 compared to the prior year, it remained below our pre-pandemic 2019 traffic. Similarly, subsequent increases in economic uncertainty and inflationary pressures, ongoing concerns related to COVID-19 and its variants, and the non-renewal of government stimulus programs continued to negatively impact consumer traffic in 2022 compared to 2019. We cannot predict the remaining duration of these conditions, or the duration or magnitude of any resulting adverse impacts on our traffic, and we expect that our traffic levels will continue to fluctuate with consumers’ level of confidence.
We use the metrics set forth below to measure each of our traffic streams. An individual user who accesses our platform through multiple traffic streams will be counted in each applicable traffic metric; as a result, the sum of our traffic metrics will not accurately represent the number of people who visit our platform on an average monthly basis.
App Unique Devices. We calculate app unique devices as the number of unique mobile devices using our mobile app in a given month, averaged over a given twelve-month period. Under this method of calculation, an individual who accesses our mobile app from multiple mobile devices will be counted as multiple app unique devices. Multiple individuals who access our mobile app from a shared device will be counted as a single app unique device.
The following table presents app unique devices for the periods indicated (in thousands):
|
|
|
|
|
|
|
|
|
|
|
|
|
|
|
|
|
|
|
|
|
Year Ended December 31, |
|
|
|
|
|
|
|
2022 |
|
2021 |
| App Unique Devices |
|
|
|
|
|
|
33,026 |
|
33,085 |
Desktop and Mobile Website Unique Visitors. We calculate desktop unique visitors as the number of “users,” as measured by Google Analytics, who have visited our desktop website at least once in a given month, averaged over a given twelve-month period. Similarly, we calculate mobile website unique visitors as the number of “users” who have visited our mobile website at least once in a given month, averaged over a given twelve-month period.
Google Analytics, a product from Google Inc. that provides digital marketing intelligence, measures “users” based on unique identifiers. Because the numbers of desktop unique visitors and mobile website unique visitors are therefore based on unique identifiers, an individual who accesses our desktop website or mobile website from multiple devices with different identifiers may be counted as multiple desktop unique visitors or mobile website unique visitors, as applicable, and multiple individuals who access our desktop website or mobile website from a shared device with a single identifier may be counted as a single desktop unique visitor or mobile website unique visitor.
The following table presents our web traffic for the periods indicated (in thousands):
|
|
|
|
|
|
|
|
|
|
|
|
|
|
|
|
|
|
|
|
|
Year Ended December 31, |
|
|
|
|
|
|
|
2022 |
|
2021 |
| Desktop Unique Visitors |
|
|
|
|
|
|
38,046 |
|
45,990 |
| Mobile Web Unique Visitors |
|
|
|
|
|
|
59,172 |
|
56,668 |
Active Claimed Local Business Locations
The number of active claimed local business locations represents the number of claimed local business locations — business addresses for which a business representative has visited our platform and claimed the free business page for the business located at that address — that are both (a) active on Yelp and (b) associated with an active business owner account as of a given date. We consider a claimed local business location to be active if it has not closed, been removed from our platform or merged with another claimed local business.
The table set forth below presents the number of active claimed local business locations as of the dates presented (in thousands).
|
|
|
|
|
|
|
|
|
|
|
|
|
As of December 31, |
|
2022 |
|
2021 |
| Active Claimed Local Business Locations |
6,321 |
|
5,794 |
Critical Accounting Estimates
Our consolidated financial statements are prepared in accordance with GAAP. The preparation of these consolidated financial statements requires us to make estimates and assumptions that affect the reported amounts of assets, liabilities, revenue, expenses and related disclosures. We evaluate our estimates and assumptions on an ongoing basis. Our estimates and assumptions are based on historical experience and various other assumptions that we believe to be reasonable under the circumstances. Our actual results could differ from those estimates.
We consider the estimates discussed below to be critical as we believe that the assumptions and estimates associated with these policies have the greatest potential impact on our consolidated financial statements. For further information on these and our other significant accounting estimates, see
Note 2, “Summary of Significant Accounting Policies,” of the Notes to Consolidated Financial Statements included elsewhere in this Annual Report.
Revenue Recognition—We generate revenue from the sale of advertising products, transactions with consumers and other revenue sources, which correspond to our major product lines. We recognize revenue by applying the following steps: the contract with the customer is identified; the performance obligations in the contract are identified; the transaction price is determined; the transaction price is allocated to the performance obligations in the contract; and revenue is recognized when (or as) we satisfy these performance obligations in an amount that reflects the consideration we expect to be entitled to in exchange for those services. We apply the portfolio practical expedient to account for contracts with customers in each category of revenue. We do not disclose the value of unsatisfied performance obligations for (i) contracts with an original expected length of one year or less and (ii) contracts for which the amount of revenue we recognize is equal to the amount we have a right to invoice.
We perform estimates and apply judgment when determining the amount of revenue to be recognized and may accept lower consideration than what is agreed to in the relevant contract. We refer to the difference between the agreed upon consideration amount and the actual consideration estimated to be received as variable consideration; types of variable consideration include cash based incentives, credits and refunds that are estimated based on historical information as well as considering economic conditions, which constrain the revenue. For all contracts with customers, estimates and assumptions include determining variable consideration and identifying the nature and timing of satisfaction of performance obligations. We believe that there will not be significant changes to our estimates of variable consideration. To date, actual amounts of consideration received have been materially consistent with the provisions we have made based on our historical estimates. For contracts satisfied over time, we apply the invoice practical expedient to depict the value transferred to the customer and measure of progress towards completion of its obligations. We consider the right to receive consideration from a customer to correspond directly with the value to the customer of our performance completed to date. We do not consider the effects of the time value of money as substantially all of our contracts are invoiced on a monthly basis, one month in arrears.
For revenue generated from arrangements that involve third parties, considerable judgment may be required in evaluating whether we are the principal, and report revenue on a gross basis, or the agent, and report revenue on a net basis. In this assessment, we consider whether we obtain control of the specified goods or services before they are transferred to the customer as well as other indicators, such as whether we are the party primarily responsible for the fulfillment, inventory risk and discretion in establishing price. The assessment of whether we are considered the principal or agent in a transaction could impact our revenue and cost of revenue recognized on our consolidated statements of operations. Changes in judgments with respect to assumptions and estimates could impact the amount of revenue recognized.
Website and Internal-Use Software Development Costs—Costs related to website and internal-use software are primarily related to our website and mobile app, including support systems. We capitalize our costs to develop software when: preliminary development efforts are successfully completed; management has authorized and committed project funding; and it is probable that the project will be completed and the software will be used as intended. We use judgment to determine which projects will be capitalized and the estimated useful life over which the related asset will be amortized. Costs incurred for enhancements that are expected to result in additional material functionality are capitalized and amortized over the estimated useful life of the upgrades. Such costs are amortized on a straight-line basis over the estimated useful life of the related asset, which is generally three years. This estimated useful life of three years has not historically changed and actual useful lives have been materially consistent with our estimates. While we do not believe that there is a reasonable likelihood of material change in our estimates, factors including obsolescence, the pace of changes in technology, changes in the expected use of the software, competition and other economic factors could require us to change the estimated useful life, which would result in a change to the amount of amortization that we record on our consolidated statements of operations.
Income Taxes—Significant judgment is required to determine our provision (benefit) for income taxes and income tax assets and liabilities, including evaluating uncertainties in the application of accounting principles, complex tax laws, or variances between our actual and anticipated operating results. Therefore, actual income taxes could materially vary from these estimates.
We record income taxes using the asset and liability method, which requires the recognition of deferred tax assets and liabilities for the expected future tax consequences of events that have been recognized in our financial statements or tax returns. In estimating future tax consequences, we generally consider all expected future events other than enactments or changes in the tax law or rates. In assessing the realization of deferred tax assets, we consider whether it is more likely than not that all or some portion of deferred tax assets will not be realized. The ultimate realization of the deferred tax assets is dependent upon the generation of future taxable income during the periods in which those temporary differences become deductible. Valuation allowances are provided to reduce deferred tax assets to the amount that is more likely than not to be realized.
In determining the need for a valuation allowance, the weight given to positive and negative evidence is commensurate with the extent to which the evidence may be objectively verified. The determination of future taxable income requires significant judgment and relies on various estimates and assumptions using forecasted amounts. Changes in various factors, including economic and political conditions, could drive actual results in future years to differ from our current assumptions, judgments and estimates. We evaluate the ability to realize net deferred tax assets and the related valuation allowance on a quarterly basis.
We operate in various tax jurisdictions and are subject to audit by various tax authorities. We provide for tax contingencies whenever it is deemed probable that a tax asset has been impaired or a tax liability has been incurred for events such as tax claims or changes in tax laws. Tax contingencies are based upon their technical merits, relative tax law and the specific facts and circumstances as of each reporting period. Changes in facts and circumstances could result in material changes to the amounts recorded for such tax contingencies.
We recognize a tax benefit from an uncertain tax position only if it is more likely than not that the tax position will be sustained on examination by the taxing authorities based on the technical merits of the position. The tax benefits recognized in the financial statements from such a position are then measured based on the largest benefit that has a greater than 50% likelihood of being realized upon ultimate settlement. However, the outcome of tax audits cannot be predicted with certainty. If any issues addressed in our tax audits are resolved in a manner not consistent with our expectations, we could be required to adjust our provision for income taxes in the period such resolution occurs.
Results of Operations
The following tables set forth our results of operations for 2022 and 2021 (in thousands, except percentages). The period-to-period comparison of financial results is not necessarily indicative of future results.
|
|
|
|
|
|
|
|
|
|
|
|
|
|
|
|
|
|
|
|
|
|
|
|
|
|
|
|
|
|
|
Year Ended December 31, |
|
$ Change |
|
% Change(1) |
|
2022 |
|
2021 |
|
|
|
2022
vs.
2021 |
|
|
|
2022
vs.
2021 |
|
|
|
|
|
|
|
|
|
| Consolidated Statements of Operations Data: |
|
|
|
|
|
|
|
|
|
|
|
|
|
| Net revenue by product: |
|
|
|
|
|
|
|
|
|
|
|
|
|
| Advertising revenue by category: |
|
|
|
|
|
|
|
|
|
|
|
|
|
| Services |
$ |
693,810 |
|
|
$ |
607,770 |
|
|
|
|
$ |
86,040 |
|
|
|
|
14 |
% |
|
|
| Restaurants, Retail & Other |
440,593 |
|
|
377,455 |
|
|
|
|
63,138 |
|
|
|
|
17 |
% |
|
|
| Advertising |
1,134,403 |
|
|
985,225 |
|
|
|
|
149,178 |
|
|
|
|
15 |
% |
|
|
| Transactions |
14,063 |
|
|
13,196 |
|
|
|
|
867 |
|
|
|
|
7 |
% |
|
|
| Other |
45,040 |
|
|
33,418 |
|
|
|
|
11,622 |
|
|
|
|
35 |
% |
|
|
| Total net revenue |
$ |
1,193,506 |
|
|
$ |
1,031,839 |
|
|
|
|
$ |
161,667 |
|
|
|
|
16 |
% |
|
|
| Costs and expenses: |
|
|
|
|
|
|
|
|
|
|
|
|
|
| Cost of revenue (exclusive of depreciation and amortization shown separately below) |
$ |
105,705 |
|
|
$ |
78,097 |
|
|
|
|
$ |
27,608 |
|
|
|
|
35 |
% |
|
|
| Sales and marketing |
514,927 |
|
|
454,224 |
|
|
|
|
60,703 |
|
|
|
|
13 |
% |
|
|
| Product development |
305,561 |
|
|
276,473 |
|
|
|
|
29,088 |
|
|
|
|
11 |
% |
|
|
| General and administrative |
164,108 |
|
|
135,816 |
|
|
|
|
28,292 |
|
|
|
|
21 |
% |
|
|
| Depreciation and amortization |
44,852 |
|
|
55,683 |
|
|
|
|
(10,831) |
|
|
|
|
(19) |
% |
|
|
| Restructuring |
— |
|
|
32 |
|
|
|
|
(32) |
|
|
|
|
NM(2) |
|
|
|
|
|
|
|
|
|
|
|
|
|
|
|
|
| Total costs and expenses |
1,135,153 |
|
|
1,000,325 |
|
|
|
|
134,828 |
|
|
|
|
13 |
% |
|
|
| Income from operations |
58,353 |
|
|
31,514 |
|
|
|
|
26,839 |
|
|
|
|
85 |
% |
|
|
| Other income, net |
8,425 |
|
|
2,204 |
|
|
|
|
6,221 |
|
|
|
|
282 |
% |
|
|
| Income before income taxes |
66,778 |
|
|
33,718 |
|
|
|
|
33,060 |
|
|
|
|
98 |
% |
|
|
| Provision for (benefit from) income taxes |
30,431 |
|
|
(5,953) |
|
|
|
|
36,384 |
|
|
|
|
(611) |
% |
|
|
| Net income attributable to common stockholders |
$ |
36,347 |
|
|
$ |
39,671 |
|
|
|
|
$ |
(3,324) |
|
|
|
|
(8) |
% |
|
|
(1) Percentage changes are calculated based on rounded numbers and may not recalculate exactly due to rounding.
(2) Percentage change is not meaningful.
Years Ended December 31, 2022 and 2021
Net Revenue
Advertising. We generate advertising revenue from the sale of our advertising products — including enhanced business pages and performance-based advertising in search results and elsewhere on our platform — to businesses of all sizes, from single-location local businesses to multi-location national businesses. Advertising revenue also includes revenue generated from the resale of our advertising products by certain partners and monetization of advertising inventory through third-party ad networks. We present advertising revenue on a disaggregated basis for our high-level category groupings, Services and RR&O.
Advertising revenue increased in 2022 compared to 2021 driven by higher aggregate customer spend and an increase in paying advertising locations.
Transactions. We generate revenue from various transactions with consumers, primarily through our partnership integrations, which are mainly revenue-sharing arrangements that provide consumers with the ability to place food orders for pickup and delivery through third parties directly on Yelp. We earn a fee for acting as an agent for transactions placed through these integrations, which we record on a net basis and include in revenue upon completion of a transaction.
Transactions revenue increased in 2022 compared to 2021, primarily due to an increase in the per-order transaction fee that we receive from Grubhub following the renewal of our partnership in March 2022. This increase was partially offset by a lower volume of food takeout and delivery orders compared to the prior year; food order volume decreased year over year in both 2021 and 2022 as public health restrictions and concerns related to COVID-19 and its variants eased, resulting in more dine-in options.
Other Revenue. We generate revenue through our subscription services, which include our Yelp Guest Manager product. We also generate revenue through our Yelp Fusion and Yelp Knowledge programs, which provide access to Yelp data for a fee, as well as other non-advertising partnerships.
Other revenue increased in 2022 compared to 2021, primarily reflecting higher revenue from the continued growth of our Yelp Fusion program. The increase also reflects lower COVID-19 relief incentives, mainly in the form of waived subscription fees, for our subscription product customers in the current year.
Trends and Uncertainties of Net Revenue. Net revenue in the year ended December 31, 2022 increased by 16% year over year, driven by strong advertiser demand in both our Services and RR&O categories despite a challenging macroeconomic environment. Although we anticipate that net revenue in the first quarter of 2023 will decrease from or remain relatively consistent with the fourth quarter of 2022, reflecting historical seasonal trends, we also expect that net revenue will grow in the first quarter and full year of 2023 compared to the prior-year periods as our initiatives continue to drive growth.
Costs and Expenses
Cost of Revenue (exclusive of depreciation and amortization). Our cost of revenue consists primarily of credit card processing fees and website infrastructure expense, which includes website hosting costs and employee costs (including stock-based compensation expense) for the infrastructure teams responsible for operating our website and mobile app, and excludes depreciation and amortization expense. Cost of revenue also includes third-party advertising fulfillment costs.
Cost of revenue increased in 2022 compared to 2021, primarily as a result of:
•an increase in website infrastructure expense of $12.1 million as a result of investments in maintaining and improving our infrastructure;
•an increase in advertising fulfillment costs of $11.1 million largely attributable to the expansion of Yelp Audiences; and
•an increase in merchant credit card processing fees of $3.4 million primarily due to a higher volume of transactions associated with the increase in advertising revenue.
We expect cost of revenue to increase on an absolute dollar basis in 2023 compared to 2022.
Sales and Marketing. Our sales and marketing expenses primarily consist of employee costs (including sales commission and stock-based compensation expenses) for our sales and marketing employees. Sales and marketing expenses also include business and consumer acquisition marketing, community management, as well as allocated workplace and other supporting overhead costs.
Sales and marketing expenses increased in 2022 compared to 2021, primarily due to:
•an increase of $54.0 million in employee costs due to higher average sales headcount; and
•an increase in marketing and advertising costs of $16.4 million primarily reflecting our investment in business owner and consumer marketing.
These increases were partially offset by a decrease of $9.7 million in workplace operating costs from reductions in our leased office space. See
Note 9, “Leases,” of the Notes to Consolidated Financial Statements for further detail.
We expect sales and marketing expenses to increase in 2023 compared to 2022 as we continue to invest in our marketing initiatives. However, we expect sales and marketing expenses to decrease as a percentage of net revenue in 2023 compared to 2022.
Product Development. Our product development expenses primarily consist of employee costs (including bonuses and stock-based compensation expense, net of capitalized employee costs associated with capitalized website and internal-use software development) for our engineers, product management and corporate infrastructure employees. In addition, product development expenses include allocated workplace and other supporting overhead costs.
Product development expenses increased in 2022 compared to 2021, primarily due to an increase in employee costs of $31.1 million as a result of higher average headcount.
We expect product development expenses to increase in 2023 compared to 2022 as we invest to support our product initiatives. We expect product development expenses as a percentage of net revenue to remain relatively consistent in 2023 compared to 2022.
General and Administrative. Our general and administrative expenses primarily consist of employee costs (including bonuses and stock-based compensation expense) for our executive, finance, user operations, legal, people operations and other administrative employees. Our general and administrative expenses also include our provision for doubtful accounts, consulting costs, as well as workplace and other supporting overhead costs.
General and administrative expenses increased in 2022 compared to 2021, primarily due to:
•an increase in employee costs of $15.1 million resulting from higher average headcount;
•an increase in our provision for doubtful accounts of $10.4 million due to the higher advertising revenue in 2022 and the release of COVID-19-related bad debt reserves in 2021; and
•a net gain of $3.7 million recognized in 2021 as a result of the termination of an office lease, which did not recur in 2022. See
Note 9, “Leases,” of the Notes to Consolidated Financial Statements for further detail.
We expect general and administrative expenses to increase in 2023 compared to 2022 to support the continued growth of our business. We expect general and administrative expenses as a percentage of net revenue to remain relatively consistent in 2023 compared to 2022.
Depreciation and Amortization. Depreciation and amortization expense primarily consists of depreciation on computer equipment, software, leasehold improvements, capitalized website and software development costs, and amortization of purchased intangible assets.
Depreciation and amortization expense decreased in 2022 compared to 2021, primarily due to a decrease in depreciation expense of leasehold improvements from asset retirements related to lease terminations and expirations and, to a lesser extent, lower amortization expense resulting from intangible assets that had become fully amortized since prior year.
Restructuring. In April 2020, we announced the Restructuring Plan to help manage the near-term financial impacts of the COVID-19 pandemic, followed by an additional workforce reduction announced in July 2020. We incurred $3.9 million in restructuring costs during the year ended December 31, 2020, which consisted of severance, payroll taxes and related benefits costs for terminated employees.
We incurred an immaterial amount of restructuring costs in 2021 and no restructuring costs during the year ended December 31, 2022. We do not expect to incur any additional restructuring costs related to the Restructuring Plan and subsequent workforce reduction in July 2020.
Other Income, Net
Other income, net consists primarily of the interest income earned on our cash, cash equivalents and marketable securities, research and development tax credits, the portion of our sublease income in excess of our lease cost, amortization of debt issuance costs, credit facility fees and foreign exchange gains and losses.
Other income, net increased in 2022 compared to 2021, primarily driven by higher interest income from our investments in money market funds due to increasing federal interest rates and net accretion on our investments in marketable securities, which we began purchasing in July 2022.
Provision for (Benefit from) Income Taxes
Provision for (benefit from) income taxes consists of: federal and state income taxes in the United States and income taxes in certain foreign jurisdictions; deferred income taxes reflecting the net tax effects of temporary differences between the carrying amounts of assets and liabilities for financial reporting purposes and the amounts used for income tax purposes.
The change from a (benefit from) income taxes in 2021 to a provision for income taxes in 2022 was primarily due to an increase in profit before tax and the capitalization of research and development expenses, which became mandatory under section 174 of the Tax Act in 2022. The mandatory capitalization of Section 174 expenses under the Tax Act requires us to capitalize research and experimental expenditures and amortize them on the U.S. tax return over five or fifteen years based on where research is conducted. This required capitalization resulted in an overall increase in provision for income taxes and in deferred tax assets (“DTAs”).
As of December 31, 2022, we had approximately $97.4 million in net DTAs. At this time, we consider it more likely than not that we will have sufficient taxable income in the future to allow us to realize these DTAs. However, it is possible that some or all of these DTAs will not be realized. Therefore, unless we are able to generate sufficient taxable income from our operations, a substantial valuation allowance to reduce our U.S. DTAs may be required, which materially increase our expenses in the period in which we recognize the allowance and have a materially adverse impact on our consolidated financial statements. The exact timing and amount of the valuation allowance recognition are subject to change on the basis of the net income that we are able to actually achieve. We will continue to evaluate the possible recognition of a valuation allowance on a quarterly basis.
Non-GAAP Financial Measures
Our consolidated financial statements are prepared in accordance with GAAP. However, we have also disclosed below adjusted EBITDA and adjusted EBITDA margin, each of which is a non-GAAP financial measure. We have included adjusted EBITDA and adjusted EBITDA margin because they are key measures used by our management and board of directors to understand and evaluate our operating performance and trends, to prepare and approve our annual budget and to develop short- and long-term operational plans. In particular, the exclusion of certain expenses in calculating adjusted EBITDA can provide a useful measure for period-to-period comparisons of our primary business operations. Accordingly, we believe that adjusted EBITDA and adjusted EBITDA margin provide useful information to investors and others in understanding and evaluating our operating results in the same manner as our management and board of directors.
Adjusted EBITDA has limitations as an analytical tool, and you should not consider it in isolation or as a substitute for analysis of our results as reported under GAAP. In particular, adjusted EBITDA should not be viewed as a substitute for, or superior to, net income (loss) prepared in accordance with GAAP as a measure of profitability or liquidity. Some of these limitations are:
•although depreciation and amortization are non-cash charges, the assets being depreciated and amortized may have to be replaced in the future, and adjusted EBITDA does not reflect all cash capital expenditure requirements for such replacements or for new capital expenditure requirements;
•adjusted EBITDA does not reflect changes in, or cash requirements for, our working capital needs;
•adjusted EBITDA does not reflect the impact of the recording or release of valuation allowances or tax payments that may represent a reduction in cash available to us;
•adjusted EBITDA does not consider the potentially dilutive impact of equity-based compensation;
•adjusted EBITDA does not take into account any income or costs that management determines are not indicative of ongoing operating performance, such as restructuring costs, impairment charges and net gain on lease termination; and
•other companies, including those in our industry, may calculate adjusted EBITDA differently, which reduces its usefulness as a comparative measure.
Because of these limitations, you should consider adjusted EBITDA and adjusted EBITDA margin alongside other financial performance measures, net income (loss), and our other GAAP results.
Adjusted EBITDA. Adjusted EBITDA is a non-GAAP financial measure that we calculate as net income (loss), adjusted to exclude: provision for (benefit from) income taxes; other income (expense), net; depreciation and amortization; stock-based compensation expense; and, in certain periods, certain other income and expense items, such as restructuring costs, impairment charges and net gain on lease termination.
Adjusted EBITDA margin. Adjusted EBITDA margin is a non-GAAP financial measure that we calculate as Adjusted EBITDA divided by net revenue.
The following is a reconciliation of net income to adjusted EBITDA, as well as the calculation of net income margin and adjusted EBITDA margin, for each of the periods indicated (in thousands, except percentages):
|
|
|
|
|
|
|
|
|
|
|
|
|
|
|
|
|
|
|
Year Ended December 31, |
|
2022 |
|
2021 |
|
|
|
|
|
|
| Reconciliation of Net Income to Adjusted EBITDA: |
|
|
|
|
|
|
|
|
|
| Net income |
$ |
36,347 |
|
|
$ |
39,671 |
|
|
|
|
|
|
|
| Provision for (benefit from) income taxes |
30,431 |
|
|
(5,953) |
|
|
|
|
|
|
|
| Other income, net |
(8,425) |
|
|
(2,204) |
|
|
|
|
|
|
|
| Depreciation and amortization |
44,852 |
|
|
55,683 |
|
|
|
|
|
|
|
| Stock-based compensation |
156,090 |
|
|
151,679 |
|
|
|
|
|
|
|
| Restructuring |
— |
|
|
32 |
|
|
|
|
|
|
|
Asset impairment(1) |
10,464 |
|
|
11,164 |
|
|
|
|
|
|
|
Gain on lease termination, net(1) |
— |
|
|
(3,748) |
|
|
|
|
|
|
|
|
|
|
|
|
|
|
|
|
|
|
|
|
|
|
|
|
|
|
|
| Adjusted EBITDA |
$ |
269,759 |
|
|
$ |
246,324 |
|
|
|
|
|
|
|
|
|
|
|
|
|
|
|
|
|
| Net revenue |
$ |
1,193,506 |
|
|
$ |
1,031,839 |
|
|
|
|
|
|
|
| Net income margin |
3 |
% |
|
4 |
% |
|
|
|
|
|
|
| Adjusted EBITDA margin |
23 |
% |
|
24 |
% |
|
|
|
|
|
|
(1)Recorded within general and administrative expenses on our consolidated statements of operations.
Liquidity and Capital Resources
Sources of Liquidity
Our principal sources of liquidity are our cash and cash equivalents, marketable securities and cash generated from operations. As of December 31, 2022, we had cash and cash equivalents of $306.4 million and marketable securities of $94.2 million. Cash and cash equivalents consist of cash, money market funds and investments with original maturities of three month or less. Our cash held internationally as of December 31, 2022 was $31.7 million. As of December 31, 2022, we also had $10.0 million of investments in certificates of deposit with minority-owned financial institutions.
In July 2022, we began purchasing highly rated debt securities which are classified as available-for-sale on our consolidated balance sheets. Our investment portfolio comprises highly rated marketable securities, and our investment policy limits the amount of credit exposure to any one issuer. The policy generally requires securities to be investment grade (i.e., rated ‘A’ or higher by bond rating firms) with the objective of minimizing the potential risk of principal loss.
We have the ability to access backup liquidity to fund working capital and other capital requirements, as needed, through a three-year, $75.0 million senior unsecured revolving credit facility (including a $25.0 million letter of credit sub-limit) as part of our Credit Agreement with Wells Fargo. As of December 31, 2022, we had $20.5 million of letters of credit under the sub-limit related to lease agreements for certain office locations, which are required to be maintained and issued to the landlords of each facility, and $54.5 million remained available under the revolving credit facility as of that date. The commitments under the Credit Agreement expire on May 5, 2023; however, we expect to refinance the credit facility prior to maturity, subject to market conditions.
The Credit Agreement requires us to comply with a maximum consolidated total leverage ratio and minimum consolidated interest coverage ratio. The Credit Agreement also contains customary limitations on our ability to: create, incur, assume or be liable for indebtedness; dispose of assets outside the ordinary course; acquire, merge or consolidate with or into another person or entity; create, incur or allow any lien on any of our property; make investments; or pay dividends, make distributions or repurchase shares. Such limitations are subject to certain exceptions. In addition, the Credit Agreement provides for certain events of default such as nonpayment of principal and interest when due, breaches of representations and warranties, noncompliance with covenants, acts of insolvency and default on indebtedness held by third parties (subject to certain limitations and cure periods). As of December 31, 2022, we were in compliance with all covenants and there were no loans outstanding under the Credit Agreement.
Material Cash Requirements
Our future capital requirements and the adequacy of available funds will depend on many factors, including those set forth under the heading “
Risk Factors” in this Annual Report. We believe that our existing cash and cash equivalents, together with any cash generated from operations, will be sufficient to meet our material cash requirements in the next 12 months and beyond, including: working capital requirements; our anticipated repurchases of common stock pursuant to our stock repurchase program; payment of taxes related to the net share settlement of equity awards; payment of lease costs related to our operating leases; the potential payment of a higher amount of income taxes in 2023 and beyond, primarily due to the requirement to amortize certain research and development expenses under the Tax Act; and purchases of property, equipment and software and website hosting services. However, this estimate is based on a number of assumptions that may prove to be materially different and we could exhaust our available cash and cash equivalents earlier than presently anticipated. We are not able to reasonably estimate the timing of future cash flows related to $31.0 million of uncertain tax positions. We may be required to draw down funds from our revolving credit facility or seek additional funds through equity or debt financings to respond to business challenges associated with the uncertain macroeconomic environment or other challenges, including the need to develop new features and products or enhance existing services, improve our operating infrastructure or acquire complementary businesses and technologies.
We lease office facilities under operating lease agreements that expire from 2023 to 2031. Our cash requirements related to these lease agreements are $139.6 million, of which $45.3 million is expected to be paid within the next 12 months. The total lease obligations are partially offset by our future minimum rental receipts to be received under non-cancelable subleases of $42.9 million. See
Note 9, “Leases,” of the Notes to Consolidated Financial Statements for further detail on our operating lease obligations.
Our cash requirements related to purchase obligations consisting of non-cancelable agreements to purchase goods and services required in the ordinary course of business — primarily website hosting services — are approximately $33.0 million, of which approximately $31.4 million is expected to be paid within the next 12 months.
The cost of capital associated with any additional funds sought in the future might be adversely impacted by the effects of macroeconomic conditions on our business. Additionally, amounts deposited with third-party financial institutions exceed the Federal Deposit Insurance Corporation and Securities Investor Protection Corporation insurance limits, as applicable. These cash and cash equivalents could be impacted if the underlying financial institutions fail or are subjected to other adverse conditions in the financial markets. To date, we have experienced no loss or lack of access to our cash and cash equivalents; however, we can provide no assurances that access to our invested cash and cash equivalents will not be impacted by adverse conditions in the financial markets.
Cash Flows
The following table summarizes our cash flows for the periods indicated (in thousands):
|
|
|
|
|
|
|
|
|
|
|
|
|
|
|
|
|
|
|
Year Ended December 31, |
|
2022 |
|
2021 |
|
2020 |
| Consolidated Statements of Cash Flows Data: |
|
|
|
|
|
| Net cash provided by operating activities |
$ |
192,309 |
|
|
$ |
212,655 |
|
|
$ |
176,701 |
|
| Net cash (used in) provided by investing activities |
$ |
(126,144) |
|
|
$ |
(27,650) |
|
|
$ |
248,359 |
|
| Net cash used in financing activities |
$ |
(237,532) |
|
|
$ |
(300,489) |
|
|
$ |
(21,052) |
|
Operating Activities. Net cash provided by operating activities during the year ended December 31, 2022 decreased compared to 2021 primarily due to higher income taxes and employee costs paid as well as the timing of payments to vendors. These movements were partially offset by an increase in cash provided by customers due to higher revenue.
Investing Activities. Net cash used in investing activities during the year ended December 31, 2022 increased compared to 2021 primarily due to the purchase of marketable securities. In July 2022, we began investing in highly rated debt securities as we changed our investment strategy in order to earn a higher overall rate of return for our cash position. This increase in cash used was partially offset by cash provided by the sales and maturities of marketable securities.
Financing Activities. Net cash used in financing activities during the year ended December 31, 2022 decreased compared to 2021 primarily due to a decrease in repurchases of common stock pursuant to our stock repurchase program.
Stock Repurchase Program
Since its initial authorization in July 2017, our board of directors has authorized us to repurchase up to an aggregate of $1.45 billion of our outstanding common stock, $254.7 million of which remained available as of February 17, 2023.
We may purchase shares at our discretion in the open market, privately negotiated transactions, in transactions structured through investment banking institutions, or a combination of the foregoing. The program is not subject to any time limit and may be modified, suspended or discontinued at any time. The amount and timing of repurchases are subject to a variety of factors, including liquidity, cash flow and market conditions.
During the year ended December 31, 2022, we repurchased 6,195,093 shares on the open market for an aggregate purchase price of $200.0 million.
We have funded all repurchases to date and expect to fund future repurchases with cash available on our balance sheet.
Item 7A. Quantitative and Qualitative Disclosures About Market Risk.
We have operations both within the United States and internationally, and we are exposed to market risks in the ordinary course of business. These risks include primarily interest rate, foreign exchange risks and inflation, and have not changed materially from the market risks we were exposed to in the year ended December 31, 2021.
Interest Rate Fluctuation
The primary objective of our investment activities is to preserve principal while maximizing income without significantly increasing risk.
Our cash and cash equivalents consist of cash and money market funds. We do not have any long-term borrowings. Because our cash and cash equivalents have relatively short maturities, their fair values are relatively insensitive to interest rate changes.
Our marketable securities comprise fixed-rate debt securities issued by U.S. corporations, U.S. government agencies and the U.S. Treasury; as such, their fair value may be affected by fluctuations in interest rates in the broader economy. We believe a hypothetical 100 basis point increase in interest rates as of December 31, 2022 would not have a material impact on our marketable securities portfolio.
Foreign Currency Exchange Risk
We have foreign currency risks related to our revenue and operating expenses denominated in currencies other than the U.S. dollar, principally in the British pound sterling, Canadian dollar and the Euro. The volatility of exchange rates depends on many factors that we cannot forecast with reliable accuracy. Although we have experienced and will continue to experience fluctuations in net income (loss) as a result of transaction gains (losses), net, related to revaluing certain cash balances, trade accounts receivable balances and intercompany balances that are denominated in currencies other than the U.S. dollar, we believe a hypothetical 10% strengthening (weakening) of the U.S. dollar against the British pound sterling, Canadian dollar or Euro, either alone or in combination with each other, would not have a material impact on our results of operations. In the event our foreign sales and expenses increase as a proportion of our overall sales and expenses, our operating results may be more greatly affected by fluctuations in the exchange rates of the currencies in which we do business. At this time, we do not enter into derivatives or other financial instruments in an attempt to hedge our foreign currency exchange risk, though we may in the future. It is difficult to predict the impact hedging activities would have on our results of operations.
Inflation Risk
We do not believe that inflation has had a direct material effect on our business, financial condition or results of operations. If our costs were to become subject to significant inflationary pressures, we may not be able to fully offset such higher costs through price increases. However, adverse macroeconomic conditions, including the current inflationary environment, have had, and may continue to have, a negative impact on consumer demand as well as the ability and willingness of advertisers to spend on our products and services. These factors could harm our business, financial condition or results of operations.
Item 8. Financial Statements and Supplementary Data.
Our financial statements and the report of our independent registered public accounting firm are included in this Annual Report beginning on page
F-1. The index to our financial statements is included in Part IV,
Item 15 below.
Item 9. Changes in and Disagreements with Accountants on Accounting and Financial Disclosure.
None.
Item 9A. Controls and Procedures.
Evaluation of Disclosure Controls and Procedures
We maintain “disclosure controls and procedures,” as defined in Rules 13a-15(e) and 15d-15(e) under the Exchange Act, that are designed to provide reasonable assurance that information required to be disclosed by a company in the reports that it files or submits under the Exchange Act is recorded, processed, summarized and reported within the time periods specified in the SEC’s rules and forms and is accumulated and communicated to our management, including our Chief Executive Officer and Chief Financial Officer, as appropriate to allow timely decisions regarding required disclosure. Disclosure controls and procedures include, without limitation, controls and procedures designed to ensure that information required to be disclosed by a company in the reports that it files or submits under the Exchange Act is accumulated and communicated to the company’s management, including its principal executive and principal financial officers, as appropriate to allow timely decisions regarding required disclosure.
Our management, with the participation of our Chief Executive Officer and Chief Financial Officer, evaluated the effectiveness of our disclosure controls and procedures as of December 31, 2022. Based on this evaluation, our Chief Executive Officer and Chief Financial Officer concluded that, as of December 31, 2022, our disclosure controls and procedures were effective at the reasonable assurance level.
Management’s Annual Report on Internal Control Over Financial Reporting
Our management is responsible for establishing and maintaining adequate internal control over financial reporting, as such term is defined in Exchange Act Rules 13a-15(f) and 15d-15(f). Under the supervision and with the participation of our Chief Executive Officer and Chief Financial Officer, our management evaluated the effectiveness of our internal control over financial reporting based on the framework set forth in “Internal Control—Integrated Framework (2013)” issued by the Committee of Sponsoring Organizations of the Treadway Commission. Based on this evaluation, our management concluded that our internal control over financial reporting was effective as of December 31, 2022. Our management reviewed the results of this evaluation with the audit committee of our board of directors.
Deloitte & Touche LLP, an independent registered public accounting firm, has audited the consolidated financial statements included in this Annual Report and, as part of the audit, has issued an attestation report on the effectiveness of our internal control over financial reporting as of December 31, 2022, which is included below.
Changes in Internal Control Over Financial Reporting
There was no change in our internal control over financial reporting identified in connection with the evaluation required by Rule 13a-15(d) and 15d-15(d) of the Exchange Act that occurred during the three months ended December 31, 2022 that has materially affected, or is reasonably likely to materially affect, our internal control over financial reporting.
Inherent Limitations on Effectiveness of Controls
Our management, including our Chief Executive Officer and our Chief Financial Officer, believes that our disclosure controls and procedures and internal control over financial reporting are designed to provide reasonable assurance of achieving their objectives and are effective at the reasonable assurance level. However, our management does not expect that our disclosure controls and procedures or our internal control over financial reporting will prevent all errors and all fraud. A control system, no matter how well conceived and operated, can provide only reasonable, not absolute, assurance that the objectives of the control system are met. Further, the design of a control system must reflect the fact that there are resource constraints, and the benefits of controls must be considered relative to their costs. Because of the inherent limitations in all control systems, no evaluation of controls can provide absolute assurance that all control issues and instances of fraud, if any, have been detected. These inherent limitations include the realities that judgments in decision making can be faulty, and that breakdowns can occur because of a simple error or mistake. Additionally, controls can be circumvented by the individual acts of some persons, by the collusion of two or more people or by management override of controls. The design of any system of controls is also based in part upon certain assumptions about the likelihood of future events, and there can be no assurance that any design will succeed in achieving its stated goals under all potential future conditions; over time, controls may become inadequate because of changes in conditions, or the degree of compliance with policies or procedures may deteriorate. Because of the inherent limitations in a cost-effective control system, misstatements due to error or fraud may occur and not be detected.
REPORT OF INDEPENDENT REGISTERED PUBLIC ACCOUNTING FIRM
To the Stockholders and the Board of Directors of Yelp Inc.
Opinion on Internal Control over Financial Reporting
We have audited the internal control over financial reporting of Yelp Inc. and subsidiaries (the “Company”) as of December 31, 2022, based on criteria established in Internal Control — Integrated Framework (2013) issued by the Committee of Sponsoring Organizations of the Treadway Commission (COSO). In our opinion, the Company maintained, in all material respects, effective internal control over financial reporting as of December 31, 2022, based on criteria established in Internal Control — Integrated Framework (2013) issued by COSO.
We have also audited, in accordance with the standards of the Public Company Accounting Oversight Board (United States) (PCAOB), the consolidated financial statements as of and for the year ended December 31, 2022 of the Company, and our report dated February 24, 2023 expressed an unqualified opinion on those financial statements.
Basis for Opinion
The Company’s management is responsible for maintaining effective internal control over financial reporting and for its assessment of the effectiveness of internal control over financial reporting, included in the accompanying Management’s Annual Report on Internal Control Over Financial Reporting. Our responsibility is to express an opinion on the Company’s internal control over financial reporting based on our audit. We are a public accounting firm registered with the PCAOB and are required to be independent with respect to the Company in accordance with the U.S. federal securities laws and the applicable rules and regulations of the Securities and Exchange Commission and the PCAOB.
We conducted our audit in accordance with the standards of the PCAOB. Those standards require that we plan and perform the audit to obtain reasonable assurance about whether effective internal control over financial reporting was maintained in all material respects. Our audit included obtaining an understanding of internal control over financial reporting, assessing the risk that a material weakness exists, testing and evaluating the design and operating effectiveness of internal control based on the assessed risk, and performing such other procedures as we considered necessary in the circumstances. We believe that our audit provides a reasonable basis for our opinion.
Definition and Limitations of Internal Control over Financial Reporting
A company’s internal control over financial reporting is a process designed to provide reasonable assurance regarding the reliability of financial reporting and the preparation of financial statements for external purposes in accordance with generally accepted accounting principles. A company’s internal control over financial reporting includes those policies and procedures that (1) pertain to the maintenance of records that, in reasonable detail, accurately and fairly reflect the transactions and dispositions of the assets of the company; (2) provide reasonable assurance that transactions are recorded as necessary to permit preparation of financial statements in accordance with generally accepted accounting principles, and that receipts and expenditures of the company are being made only in accordance with authorizations of management and directors of the company; and (3) provide reasonable assurance regarding prevention or timely detection of unauthorized acquisition, use, or disposition of the company’s assets that could have a material effect on the financial statements.
Because of its inherent limitations, internal control over financial reporting may not prevent or detect misstatements. Also, projections of any evaluation of effectiveness to future periods are subject to the risk that controls may become inadequate because of changes in conditions, or that the degree of compliance with the policies or procedures may deteriorate.
/s/ DELOITTE & TOUCHE LLP
San Francisco, California
February 24, 2023
Item 9B. Other Information.
None.
Item 9C. Disclosure Regarding Foreign Jurisdictions that Prevent Inspections.
Not applicable.
PART III
Item 10. Directors, Executive Officers and Corporate Governance.
Information required by this item regarding directors and director nominees, executive officers, the board of directors and its committees, and certain corporate governance matters is incorporated by reference to the information set forth under the captions “Proposal No. 1—Election of Directors,” “Information Regarding the Board of Directors and Corporate Governance” and “Executive Officers” in the definitive proxy statement for our 2023 Annual Meeting of Stockholders (the “2023 Proxy Statement”). Information required by this item regarding compliance with Section 16(a) of the Exchange Act is incorporated by reference to the information set forth under the caption “Delinquent Section 16(a) Reports” in our 2023 Proxy Statement.
We have adopted a written code of business conduct and ethics that applies to all of our employees, officers and directors, including our principal executive officer, principal financial officer and principal accounting officer. The code of business conduct and ethics is available on our corporate website at www.yelp-ir.com under the section entitled “Governance Documents” in the “Governance” menu. If we make any substantive amendments to our code of business conduct and ethics or grant any of our directors or executive officers any waiver, including any implicit waiver, from a provision of our code of business conduct and ethics, we will disclose the nature of the amendment or waiver on our website or in a Current Report on Form 8-K.
Item 11. Executive Compensation.
Information required by this item regarding executive compensation is incorporated by reference to the information set forth under the captions “Executive Compensation,” “Director Compensation” and “Information Regarding the Board of Directors and Corporate Governance” in our 2023 Proxy Statement.
Item 12. Security Ownership of Certain Beneficial Owners and Management and Related Stockholder Matters.
Information required by this item regarding security ownership of certain beneficial owners and management is incorporated by reference to the information set forth under the caption “Security Ownership of Certain Beneficial Owners and Management” in our 2023 Proxy Statement. Information required by this item regarding securities authorized for issuance under our equity compensation plans is incorporated by reference to the information set forth under the caption “Equity Compensation Plan Information” in our 2023 Proxy Statement.
Item 13. Certain Relationships and Related Transactions, and Director Independence.
Information required by this item regarding certain relationships and related transactions is incorporated by reference to the information set forth under the caption “Transactions with Related Persons” in our 2023 Proxy Statement. Information required by this item regarding director independence is incorporated by reference to the information set forth under the caption “Information Regarding the Board of Directors and Corporate Governance” in our 2023 Proxy Statement.
Item 14. Principal Accountant Fees and Services.
Information required by this item regarding principal accounting fees and services is incorporated by reference to the information set forth under the caption “Proposal No. 2—Ratification of Selection of Independent Registered Public Accounting Firm” in our 2023 Proxy Statement.
PART IV
Item 15. Exhibits and Financial Statement Schedules.
|
|
|
|
|
|
|
|
|
|
|
|
|
|
|
|
|
|
| (a) |
|
The following documents are filed as part of this Annual Report: |
|
|
|
1. |
|
Financial Statements. Our consolidated financial statements and the Report of Independent Registered Public Accounting Firm are included herein on the pages indicated: |
|
|
|
|
|
|
|
|
|
|
|
|
|
|
|
|
|
|
|
|
|
|
|
|
|
|
|
|
|
|
|
|
|
|
|
|
|
|
|
|
|
|
|
|
|
2. |
|
Financial Statement Schedules. None. All financial statement schedules are omitted because they are not applicable, not required under the instructions, or the requested information is included in the consolidated financial statements or notes thereto. |
|
|
|
3. |
|
Exhibits. The following is a list of exhibits filed with this report or incorporated herein by reference: |
|
|
|
|
|
|
|
|
|
|
|
|
|
|
|
|
|
|
|
|
|
|
|
|
|
|
|
|
|
|
|
|
|
|
|
|
|
|
|
|
|
|
|
|
Incorporated by Reference |
|
|
| Exhibit |
|
|
|
|
|
|
|
|
|
Filing |
|
Filed |
| Number |
|
Exhibit Description |
|
Form |
|
File No. |
|
Exhibit |
|
Date |
|
Herewith |
|
|
|
|
|
|
|
|
|
|
|
|
|
|
|
|
|
8-K |
|
001-35444 |
|
3.1 |
|
7/8/2020 |
|
|
|
|
|
|
8-K |
|
001-35444 |
|
3.1 |
|
1/31/2022 |
|
|
| 4.1 |
|
Reference is made to Exhibits 3.1 and 3.2. |
|
|
|
|
|
|
|
|
|
|
|
|
|
|
8-A/A |
|
001-35444 |
|
4.1 |
|
9/23/2016 |
|
|
|
|
|
|
10-K |
|
001-35444 |
|
4.3 |
|
2/28/2022 |
|
|
|
|
|
|
8-K |
|
001-35444 |
|
10.2 |
|
2/13/2019 |
|
|
|
|
|
|
S-1/A |
|
333-178030 |
|
10.17 |
|
2/3/2012 |
|
|
|
|
|
|
8-K |
|
001-35444 |
|
10.2 |
|
2/16/2022 |
|
|
|
|
|
|
8-K |
|
001-35444 |
|
10.2 |
|
9/23/2016 |
|
|
|
|
|
|
8-K |
|
001-35444 |
|
10.1 |
|
2/9/2023 |
|
|
|
|
|
|
8-K |
|
001-35444 |
|
10.2 |
|
2/9/2023 |
|
|
|
|
|
|
10-K |
|
001-35444 |
|
10.9 |
|
2/28/2020 |
|
|
|
|
|
|
10-K |
|
001-35444 |
|
10.8 |
|
2/28/2022 |
|
|
|
|
|
|
8-K |
|
001-35444 |
|
10.1 |
|
2/16/2022 |
|
|
|
|
|
|
S-1 |
|
333-178030 |
|
10.6 |
|
2/3/2012 |
|
|
|
|
|
|
S-1/A |
|
333-178030 |
|
10.15 |
|
2/3/2012 |
|
|
|
|
|
|
10-Q |
|
001-35444 |
|
10.1 |
|
8/7/2020 |
|
|
|
|
|
|
|
|
|
|
|
|
|
|
|
|
|
|
|
|
|
|
|
|
|
|
|
|
|
|
|
|
|
|
|
|
|
|
|
|
|
|
|
|
|
Incorporated by Reference |
|
|
| Exhibit |
|
|
|
|
|
|
|
|
|
Filing |
|
Filed |
| Number |
|
Exhibit Description |
|
Form |
|
File No. |
|
Exhibit |
|
Date |
|
Herewith |
|
|
|
|
|
|
|
|
|
|
|
|
|
|
|
|
|
10-K |
|
001-35444 |
|
10.12 |
|
2/28/2020 |
|
|
|
|
|
|
S-1/A |
|
333-178030 |
|
10.9 |
|
2/3/2012 |
|
|
|
|
|
|
8-K |
|
001-35444 |
|
99.1 |
|
5/28/2014 |
|
|
|
|
|
|
10-K |
|
001-35444 |
|
10.20 |
|
2/28/2022 |
|
|
|
|
|
|
10-Q |
|
001-35444 |
|
10.3 |
|
5/6/2022 |
|
|
|
|
|
|
10-Q |
|
001-35444 |
|
10.1 |
|
5/6/2022 |
|
|
|
|
|
|
10-Q |
|
001-35444 |
|
10.2 |
|
5/6/2022 |
|
|
|
|
|
|
10-K/A |
|
001-35444 |
|
10.19 |
|
4/29/2020 |
|
|
|
|
|
|
10-Q |
|
001-35444 |
|
10.2 |
|
8/7/2020 |
|
|
|
|
|
|
10-Q |
|
001-35444 |
|
10.1 |
|
11/4/2022 |
|
|
|
|
|
|
10-K |
|
001-35444 |
|
21.1 |
|
2/28/2022 |
|
|
|
|
|
|
|
|
|
|
|
|
|
|
X |
|
|
|
|
|
|
|
|
|
|
|
|
X |
|
|
|
|
|
|
|
|
|
|
|
|
X |
|
|
|
|
|
|
|
|
|
|
|
|
X |
|
|
|
|
|
|
|
|
|
|
|
|
X
|
| 101.INS |
|
XBRL Instance Document. |
|
|
|
|
|
|
|
|
|
X |
| 101.SCH |
|
XBRL Taxonomy Extension Schema Document. |
|
|
|
|
|
|
|
|
|
X |
| 101.CAL |
|
XBRL Taxonomy Extension Calculation Linkbase Document. |
|
|
|
|
|
|
|
|
|
X |
| 101.DEF |
|
XBRL Taxonomy Extension Definition Linkbase Document. |
|
|
|
|
|
|
|
|
|
X |
| 101.LAB |
|
XBRL Taxonomy Extension Labels Linkbase Document. |
|
|
|
|
|
|
|
|
|
X |
| 101.PRE |
|
XBRL Taxonomy Extension Presentation Linkbase Document. |
|
|
|
|
|
|
|
|
|
X |
| 104 |
|
Cover Page Interactive Data File (formatted as inline XBRL and contained in Exhibit 101). |
|
|
|
|
|
|
|
|
|
X |
* Indicates management contract or compensatory plan or arrangement.
† The certifications attached as Exhibit 32.1 accompany this Annual Report on Form 10-K are not deemed filed with the Securities and Exchange Commission and are not to be incorporated by reference into any filing of Yelp Inc. under the Securities Act of 1933, as amended, or the Securities Exchange Act of 1934, as amended, whether made before or after the date of this Annual Report on Form 10-K, irrespective of any general incorporation language contained in such filing.
Item 16. Form 10-K Summary.
None.
SIGNATURES
Pursuant to the requirements of Section 13 or 15(d) of the Securities Exchange Act of 1934, the registrant has duly caused this report to be signed on its behalf by the undersigned, thereunto duly authorized.
Date: February 24, 2023
|
|
|
|
|
|
|
Yelp Inc. |
|
|
|
/s/ David Schwarzbach |
|
David Schwarzbach |
|
Chief Financial Officer |
|
(Principal Financial and Accounting Officer) |
POWER OF ATTORNEY
KNOW ALL PERSONS BY THESE PRESENTS, that each person whose signature appears below constitutes and appoints David Schwarzbach and Aaron Schur, and each of them, as his or her true and lawful attorneys-in-fact and agents, with full power of substitution for him or her, and in his or her name in any and all capacities, to sign any and all amendments to this Annual Report on Form 10-K, and to file the same, with exhibits thereto and other documents in connection therewith, with the U.S. Securities and Exchange Commission, granting unto said attorneys-in-fact and agents, and each of them, full power and authority to do and perform each and every act and thing requisite and necessary to be done therewith, as fully to all intents and purposes as he or she might or could do in person, hereby ratifying and confirming all that said attorneys-in-fact and agents, and either of them, his or her substitute or substitutes, may lawfully do or cause to be done by virtue hereof.
Pursuant to the requirements of the Securities Exchange Act of 1934, as amended, this report has been signed below by the following persons on behalf of the registrant and in the capacities and on the dates indicated.
|
|
|
|
|
|
|
|
|
|
|
|
|
|
|
| Signature |
|
Title |
|
Date |
|
|
|
|
|
| /s/ Jeremy Stoppelman |
|
Chief Executive Officer and Director |
|
February 24, 2023 |
| Jeremy Stoppelman |
|
(Principal Executive Officer) |
|
|
|
|
|
|
|
| /s/ David Schwarzbach |
|
Chief Financial Officer |
|
February 24, 2023 |
| David Schwarzbach |
|
(Principal Financial Officer and Principal Accounting Officer) |
|
|
|
|
|
|
|
| /s/ Diane Irvine |
|
Chairperson |
|
February 24, 2023 |
| Diane Irvine |
|
|
|
|
|
|
|
|
|
| /s/ Fred D. Anderson, Jr. |
|
Director |
|
February 24, 2023 |
| Fred D. Anderson, Jr. |
|
|
|
|
|
|
|
|
|
| /s/ Christine Barone |
|
Director |
|
February 24, 2023 |
| Christine Barone |
|
|
|
|
|
|
|
|
|
| /s/ Robert Gibbs |
|
Director |
|
February 24, 2023 |
| Robert Gibbs |
|
|
|
|
|
|
|
|
|
| /s/ George Hu |
|
Director |
|
February 24, 2023 |
| George Hu |
|
|
|
|
|
|
|
|
|
| /s/ Sharon Rothstein |
|
Director |
|
February 24, 2023 |
| Sharon Rothstein |
|
|
|
|
|
|
|
|
|
| /s/ Chris Terrill |
|
Director |
|
February 24, 2023 |
| Chris Terrill |
|
|
|
|
|
|
|
|
|
| /s/ Tony Wells |
|
Director |
|
February 24, 2023 |
| Tony Wells |
|
|
|
|
REPORT OF INDEPENDENT REGISTERED PUBLIC ACCOUNTING FIRM
To the Stockholders and the Board of Directors of Yelp Inc.
Opinion on the Financial Statements
We have audited the accompanying consolidated balance sheets of Yelp Inc. and subsidiaries (the "Company") as of December 31, 2022 and 2021, the related consolidated statements of operations, comprehensive income, stockholders’ equity, and cash flows, for each of the three years in the period ended December 31, 2022, and the related notes (collectively referred to as the "financial statements"). In our opinion, the financial statements present fairly, in all material respects, the financial position of the Company as of December 31, 2022 and 2021, and the results of its operations and its cash flows for each of the three years in the period ended December 31, 2022 in conformity with accounting principles generally accepted in the United States of America.
We have also audited, in accordance with the standards of the Public Company Accounting Oversight Board (United States) (PCAOB), the Company's internal control over financial reporting as of December 31, 2022, based on criteria established in Internal Control — Integrated Framework (2013) issued by the Committee of Sponsoring Organizations of the Treadway Commission and our report dated February 24, 2023, expressed an unqualified opinion on the Company's internal control over financial reporting.
Basis for Opinion
These financial statements are the responsibility of the Company's management. Our responsibility is to express an opinion on the Company's financial statements based on our audits. We are a public accounting firm registered with the PCAOB and are required to be independent with respect to the Company in accordance with the U.S. federal securities laws and the applicable rules and regulations of the Securities and Exchange Commission and the PCAOB.
We conducted our audits in accordance with the standards of the PCAOB. Those standards require that we plan and perform the audit to obtain reasonable assurance about whether the financial statements are free of material misstatement, whether due to error or fraud. Our audits included performing procedures to assess the risks of material misstatement of the financial statements, whether due to error or fraud, and performing procedures that respond to those risks. Such procedures included examining, on a test basis, evidence regarding the amounts and disclosures in the financial statements. Our audits also included evaluating the accounting principles used and significant estimates made by management, as well as evaluating the overall presentation of the financial statements. We believe that our audits provide a reasonable basis for our opinion.
Critical Audit Matter
The critical audit matter communicated below is a matter arising from the current-period audit of the financial statements that was communicated or required to be communicated to the audit committee and that (1) relates to accounts or disclosures that are material to the financial statements and (2) involved our especially challenging, subjective, or complex judgments. The communication of critical audit matters does not alter in any way our opinion on the financial statements, taken as a whole, and we are not, by communicating the critical audit matter below, providing a separate opinion on the critical audit matter or on the accounts or disclosures to which it relates.
Advertising Revenue – Refer to Note 2 to the financial statements
Critical Audit Matter Description
The Company’s revenue consists of advertising placements, primarily performance-based cost-per-click advertising (CPC), which is comprised of a significant volume of low-dollar transactions, initiated and maintained within internally developed systems. The processing and recording of those transactions are highly automated and are based on contractual terms with customers. The Company relies on information from these internally developed systems and automations to record its CPC revenue.
We identified CPC revenue as a critical audit matter because the Company’s processes to record CPC revenue are highly dependent on internally developed systems and automations. This required an increased extent of effort, including the need for us to involve professionals with expertise in information technology (IT), to identify, test, and evaluate the Company’s systems, databases, tools, software applications, and automated controls.
How the Critical Audit Matter Was Addressed in the Audit
Our audit procedures related to the Company’s processes and systems used to record CPC revenue included the following, among others:
•We tested internal controls within the relevant CPC revenue business processes, including those in place to reconcile the various systems to the Company’s general ledger and address the accuracy and completeness of transaction data from those systems.
•With the assistance of our IT specialists, we:
◦Identified the significant systems, automated controls, and tools used to maintain databases and process CPC revenue transactions and tested the general IT controls over each of these systems, including testing of user access controls, change management controls, and IT operations controls.
◦Performed testing of system interface controls and automated controls within CPC revenue transactions, as well as the controls designed to address the accuracy and completeness of CPC revenue.
•With the assistance of our data specialists, we created data visualizations to evaluate recorded CPC revenue, evaluate trends in the transactional CPC revenue data, and recalculate the rate of fulfillment for CPC budget-based advertising customers.
•We generated synthetic click transactions on the Company’s website and traced the recording of these transactions into the Company’s systems to understand how CPC revenue transactions are initiated, processed, and aggregated.
•For a sample of CPC revenue transactions, we performed detail transaction testing by agreeing the amounts recognized to source documentation and system reports.
/s/ DELOITTE & TOUCHE LLP
San Francisco, California
February 24, 2023
We have served as the Company's auditor since 2008.
YELP INC.
CONSOLIDATED BALANCE SHEETS
(In thousands, except par value)
|
|
|
|
|
|
|
|
|
|
|
|
|
December 31,
2022 |
|
December 31,
2021 |
| Assets |
|
|
|
| Current assets: |
|
|
|
| Cash and cash equivalents |
$ |
306,379 |
|
|
$ |
479,783 |
|
| Short-term marketable securities |
94,244 |
|
|
— |
|
|
Accounts receivable (net of allowance for doubtful accounts of $9,277 and $7,153
at December 31, 2022 and 2021, respectively)
|
131,902 |
|
|
107,358 |
|
| Prepaid expenses and other current assets |
63,467 |
|
|
57,536 |
|
| Total current assets |
595,992 |
|
|
644,677 |
|
|
|
|
|
| Property, equipment and software, net |
77,224 |
|
|
83,857 |
|
| Operating lease right-of-use assets |
97,392 |
|
|
140,785 |
|
| Goodwill |
102,328 |
|
|
105,128 |
|
| Intangibles, net |
8,997 |
|
|
10,673 |
|
|
|
|
|
| Other non-current assets |
133,989 |
|
|
65,408 |
|
| Total assets |
$ |
1,015,922 |
|
|
$ |
1,050,528 |
|
| Liabilities and Stockholders’ Equity |
|
|
|
| Current liabilities: |
|
|
|
| Accounts payable and accrued liabilities |
$ |
137,950 |
|
|
$ |
119,620 |
|
| Operating lease liabilities — current |
39,674 |
|
|
40,237 |
|
| Deferred revenue |
5,200 |
|
|
4,156 |
|
| Total current liabilities |
182,824 |
|
|
164,013 |
|
| Operating lease liabilities — long-term |
86,661 |
|
|
127,979 |
|
| Other long-term liabilities |
36,113 |
|
|
7,218 |
|
| Total liabilities |
305,598 |
|
|
299,210 |
|
Commitments and contingencies ( Note 13) |
|
|
|
| Stockholders’ equity: |
|
|
|
Common stock, $0.000001 par value — 200,000 shares authorized, 69,797 shares issued and outstanding at December 31, 2022 and 72,171 shares issued and outstanding at December 31, 2021 |
— |
|
|
— |
|
| Additional paid-in capital |
1,649,692 |
|
|
1,522,572 |
|
|
|
|
|
| Accumulated other comprehensive loss |
(15,545) |
|
|
(11,090) |
|
| Accumulated deficit |
(923,823) |
|
|
(760,164) |
|
| Total stockholders’ equity |
710,324 |
|
|
751,318 |
|
| Total liabilities and stockholders’ equity |
$ |
1,015,922 |
|
|
$ |
1,050,528 |
|
See notes to consolidated financial statements.
YELP INC.
CONSOLIDATED STATEMENTS OF OPERATIONS
(In thousands, except per share data)
|
|
|
|
|
|
|
|
|
|
|
|
|
|
|
|
|
|
|
Year Ended December 31, |
|
2022 |
|
2021 |
|
2020 |
| Net revenue |
$ |
1,193,506 |
|
|
$ |
1,031,839 |
|
|
$ |
872,933 |
|
| Costs and expenses: |
|
|
|
|
|
| Cost of revenue (exclusive of depreciation and amortization shown separately below) |
105,705 |
|
|
78,097 |
|
|
57,186 |
|
| Sales and marketing |
514,927 |
|
|
454,224 |
|
|
437,060 |
|
| Product development |
305,561 |
|
|
276,473 |
|
|
232,561 |
|
| General and administrative |
164,108 |
|
|
135,816 |
|
|
130,450 |
|
| Depreciation and amortization |
44,852 |
|
|
55,683 |
|
|
50,609 |
|
| Restructuring |
— |
|
|
32 |
|
|
3,862 |
|
|
|
|
|
|
|
| Total costs and expenses |
1,135,153 |
|
|
1,000,325 |
|
|
911,728 |
|
| Income (loss) from operations |
58,353 |
|
|
31,514 |
|
|
(38,795) |
|
| Other income, net |
8,425 |
|
|
2,204 |
|
|
3,670 |
|
| Income (loss) before income taxes |
66,778 |
|
|
33,718 |
|
|
(35,125) |
|
| Provision for (benefit from) income taxes |
30,431 |
|
|
(5,953) |
|
|
(15,701) |
|
| Net income (loss) attributable to common stockholders |
$ |
36,347 |
|
|
$ |
39,671 |
|
|
$ |
(19,424) |
|
| Net income (loss) per share attributable to common stockholders |
|
|
|
|
|
| Basic |
$ |
0.51 |
|
|
$ |
0.53 |
|
|
$ |
(0.27) |
|
| Diluted |
$ |
0.50 |
|
|
$ |
0.50 |
|
|
$ |
(0.27) |
|
| Weighted-average shares used to compute net income (loss) per share attributable to common stockholders |
|
|
|
|
|
| Basic |
70,867 |
|
|
74,221 |
|
|
73,005 |
|
| Diluted |
73,402 |
|
|
78,616 |
|
|
73,005 |
|
See notes to consolidated financial statements.
YELP INC.
CONSOLIDATED STATEMENTS OF COMPREHENSIVE INCOME (LOSS)
(In thousands)
|
|
|
|
|
|
|
|
|
|
|
|
|
|
|
|
|
|
|
Year Ended December 31, |
|
2022 |
|
2021 |
|
2020 |
| Net income (loss) attributable to common stockholders |
$ |
36,347 |
|
|
$ |
39,671 |
|
|
$ |
(19,424) |
|
| Other comprehensive (loss) income: |
|
|
|
|
|
| Foreign currency translation adjustments, net of tax |
(3,975) |
|
|
(4,283) |
|
|
4,952 |
|
| Unrealized loss on available-for-sale debt securities, net of tax |
(480) |
|
|
— |
|
|
— |
|
|
|
|
|
|
|
| Other comprehensive (loss) income |
(4,455) |
|
|
(4,283) |
|
|
4,952 |
|
| Comprehensive income (loss) |
$ |
31,892 |
|
|
$ |
35,388 |
|
|
$ |
(14,472) |
|
See notes to consolidated financial statements.
YELP INC.
CONSOLIDATED STATEMENTS OF STOCKHOLDERS’ EQUITY
(In thousands)
|
|
|
|
|
|
|
|
|
|
|
|
|
|
|
|
|
|
|
|
|
|
|
|
|
|
|
|
|
|
|
|
|
|
|
|
|
|
|
|
|
|
|
|
|
|
|
|
|
|
|
|
|
|
|
|
|
Common Stock |
|
Additional Paid-In Capital |
|
Treasury Stock |
|
Accumulated Other Comprehensive Loss |
|
Accumulated Deficit |
|
Total Stockholders' Equity |
|
Shares |
|
Amount |
|
|
|
|
|
| Balance as of December 31, 2019 |
71,185 |
|
|
$ |
— |
|
|
$ |
1,259,803 |
|
|
$ |
— |
|
|
$ |
(11,759) |
|
|
$ |
(493,053) |
|
|
$ |
754,991 |
|
| Cumulative effect adjustment upon adoption of ASU 2016-13 |
— |
|
|
— |
|
|
— |
|
|
— |
|
|
— |
|
|
(34) |
|
|
(34) |
|
| Issuance of common stock upon exercises of employee stock options |
1,545 |
|
|
— |
|
|
13,168 |
|
|
— |
|
|
— |
|
|
— |
|
|
13,168 |
|
| Issuance of common stock upon vesting of restricted stock units ("RSUs"), net |
2,684 |
|
|
— |
|
|
— |
|
|
— |
|
|
— |
|
|
— |
|
|
— |
|
| Issuance of common stock for employee stock purchase plan |
662 |
|
|
— |
|
|
14,214 |
|
|
— |
|
|
— |
|
|
— |
|
|
14,214 |
|
| Stock-based compensation (inclusive of capitalized stock-based compensation) |
— |
|
|
— |
|
|
134,003 |
|
|
— |
|
|
— |
|
|
— |
|
|
134,003 |
|
| Taxes withheld related to net share settlement of equity awards |
— |
|
|
— |
|
|
(22,940) |
|
|
— |
|
|
— |
|
|
— |
|
|
(22,940) |
|
| Repurchases of common stock |
— |
|
|
— |
|
|
— |
|
|
(24,396) |
|
|
— |
|
|
— |
|
|
(24,396) |
|
| Retirement of common stock |
(705) |
|
|
— |
|
|
— |
|
|
21,432 |
|
|
— |
|
|
(21,432) |
|
|
— |
|
| Other comprehensive income |
— |
|
|
— |
|
|
— |
|
|
— |
|
|
4,952 |
|
|
— |
|
|
4,952 |
|
| Net loss |
— |
|
|
— |
|
|
— |
|
|
— |
|
|
— |
|
|
(19,424) |
|
|
(19,424) |
|
| Balance as of December 31, 2020 |
75,371 |
|
|
— |
|
|
1,398,248 |
|
|
(2,964) |
|
|
(6,807) |
|
|
(533,943) |
|
|
854,534 |
|
|
|
|
|
|
|
|
|
|
|
|
|
|
|
| Issuance of common stock upon exercises of employee stock options |
663 |
|
|
— |
|
|
8,650 |
|
|
— |
|
|
— |
|
|
— |
|
|
8,650 |
|
| Issuance of common stock upon vesting of RSUs, net |
2,714 |
|
|
— |
|
|
— |
|
|
— |
|
|
— |
|
|
— |
|
|
— |
|
| Issuance of common stock for employee stock purchase plan |
517 |
|
|
— |
|
|
16,334 |
|
|
— |
|
|
— |
|
|
— |
|
|
16,334 |
|
| Stock-based compensation (inclusive of capitalized stock-based compensation) |
— |
|
|
— |
|
|
162,295 |
|
|
— |
|
|
— |
|
|
— |
|
|
162,295 |
|
| Taxes withheld related to net share settlement of equity awards |
— |
|
|
— |
|
|
(62,955) |
|
|
— |
|
|
— |
|
|
— |
|
|
(62,955) |
|
| Repurchases of common stock |
— |
|
|
— |
|
|
— |
|
|
(262,928) |
|
|
— |
|
|
— |
|
|
(262,928) |
|
| Retirement of common stock |
(7,094) |
|
|
— |
|
|
— |
|
|
265,892 |
|
|
— |
|
|
(265,892) |
|
|
— |
|
| Other comprehensive loss |
— |
|
|
— |
|
|
— |
|
|
— |
|
|
(4,283) |
|
|
— |
|
|
(4,283) |
|
| Net income |
— |
|
|
— |
|
|
— |
|
|
— |
|
|
— |
|
|
39,671 |
|
|
39,671 |
|
| Balance as of December 31, 2021 |
72,171 |
|
|
— |
|
|
1,522,572 |
|
|
— |
|
|
(11,090) |
|
|
(760,164) |
|
|
751,318 |
|
| Issuance of common stock upon exercises of employee stock options |
304 |
|
|
— |
|
|
7,500 |
|
|
— |
|
|
— |
|
|
— |
|
|
7,500 |
|
| Issuance of common stock upon vesting of RSUs, net |
2,890 |
|
|
— |
|
|
— |
|
|
— |
|
|
— |
|
|
— |
|
|
— |
|
| Issuance of common stock for employee stock purchase plan |
627 |
|
|
— |
|
|
16,030 |
|
|
— |
|
|
— |
|
|
— |
|
|
16,030 |
|
| Stock-based compensation (inclusive of capitalized stock-based compensation) |
— |
|
|
— |
|
|
164,985 |
|
|
— |
|
|
— |
|
|
— |
|
|
164,985 |
|
| Taxes withheld related to net share settlement of equity awards |
— |
|
|
— |
|
|
(61,395) |
|
|
— |
|
|
— |
|
|
— |
|
|
(61,395) |
|
| Repurchases of common stock |
— |
|
|
— |
|
|
— |
|
|
(200,006) |
|
|
— |
|
|
— |
|
|
(200,006) |
|
| Retirement of common stock |
(6,195) |
|
|
— |
|
|
— |
|
|
200,006 |
|
|
— |
|
|
(200,006) |
|
|
— |
|
| Other comprehensive loss |
— |
|
|
— |
|
|
— |
|
|
— |
|
|
(4,455) |
|
|
— |
|
|
(4,455) |
|
| Net income |
— |
|
|
— |
|
|
— |
|
|
— |
|
|
— |
|
|
36,347 |
|
|
36,347 |
|
| Balance as of December 31, 2022 |
69,797 |
|
|
$ |
— |
|
|
$ |
1,649,692 |
|
|
$ |
— |
|
|
$ |
(15,545) |
|
|
$ |
(923,823) |
|
|
$ |
710,324 |
|
See notes to consolidated financial statements.
YELP INC.
CONSOLIDATED STATEMENTS OF CASH FLOWS
(In thousands)
|
|
|
|
|
|
|
|
|
|
|
|
|
|
|
|
|
|
|
Year Ended December 31, |
|
2022 |
|
2021 |
|
2020 |
| Operating Activities |
|
|
|
|
|
| Net income (loss) |
$ |
36,347 |
|
|
$ |
39,671 |
|
|
$ |
(19,424) |
|
| Adjustments to reconcile net income (loss) to net cash provided by operating activities: |
|
|
|
|
|
| Depreciation and amortization |
44,852 |
|
|
55,683 |
|
|
50,609 |
|
| Provision for doubtful accounts |
25,006 |
|
|
14,574 |
|
|
32,265 |
|
| Stock-based compensation |
156,090 |
|
|
151,679 |
|
|
124,574 |
|
| Noncash lease cost |
32,810 |
|
|
39,339 |
|
|
42,235 |
|
| Deferred income taxes |
(56,621) |
|
|
(9,190) |
|
|
(11,181) |
|
| Amortization of deferred contract cost |
18,827 |
|
|
14,613 |
|
|
15,960 |
|
| Asset impairment |
10,464 |
|
|
11,164 |
|
|
— |
|
| Noncash gain on lease termination |
— |
|
|
(11,485) |
|
|
— |
|
| Other adjustments, net |
1,036 |
|
|
392 |
|
|
2,193 |
|
| Changes in operating assets and liabilities: |
|
|
|
|
|
| Accounts receivable |
(49,555) |
|
|
(33,535) |
|
|
(13,833) |
|
| Prepaid expenses and other assets |
(36,032) |
|
|
(49,246) |
|
|
(15,796) |
|
| Operating lease liabilities |
(40,057) |
|
|
(41,008) |
|
|
(46,283) |
|
| Accounts payable, accrued liabilities and other liabilities |
49,142 |
|
|
30,004 |
|
|
15,382 |
|
| Net cash provided by operating activities |
192,309 |
|
|
212,655 |
|
|
176,701 |
|
| Investing Activities |
|
|
|
|
|
| Purchases of marketable securities — available-for-sale |
(127,080) |
|
|
— |
|
|
— |
|
| Sales and maturities of marketable securities — available-for-sale |
32,821 |
|
|
— |
|
|
290,395 |
|
| Purchases of marketable securities — held-to-maturity |
— |
|
|
— |
|
|
(87,438) |
|
| Maturities of marketable securities — held-to-maturity |
— |
|
|
— |
|
|
93,200 |
|
| Purchases of other investments |
— |
|
|
— |
|
|
(10,000) |
|
|
|
|
|
|
|
|
|
|
|
|
|
|
|
|
|
|
|
|
|
|
|
|
|
| Purchases of property, equipment and software |
(31,979) |
|
|
(28,282) |
|
|
(32,002) |
|
| Purchase of intangible asset |
— |
|
|
— |
|
|
(6,129) |
|
| Other investing activities |
94 |
|
|
632 |
|
|
333 |
|
| Net cash (used in) provided by investing activities |
(126,144) |
|
|
(27,650) |
|
|
248,359 |
|
| Financing Activities |
|
|
|
|
|
| Proceeds from issuance of common stock for employee stock-based plans |
23,497 |
|
|
24,984 |
|
|
27,382 |
|
| Taxes paid related to the net share settlement of equity awards |
(61,023) |
|
|
(62,545) |
|
|
(23,605) |
|
| Repurchases of common stock |
(200,006) |
|
|
(262,928) |
|
|
(24,396) |
|
| Other financing activities |
— |
|
|
— |
|
|
(433) |
|
| Net cash used in financing activities |
(237,532) |
|
|
(300,489) |
|
|
(21,052) |
|
| Effect of exchange rate changes on cash, cash equivalents and restricted cash |
(2,136) |
|
|
(415) |
|
|
214 |
|
| Change in cash, cash equivalents and restricted cash |
(173,503) |
|
|
(115,899) |
|
|
404,222 |
|
| Cash, cash equivalents and restricted cash — Beginning of period |
480,641 |
|
|
596,540 |
|
|
192,318 |
|
| Cash, cash equivalents and restricted cash — End of period |
$ |
307,138 |
|
|
$ |
480,641 |
|
|
$ |
596,540 |
|
| Supplemental Disclosures of Other Cash Flow Information |
|
|
|
|
|
| Cash paid for income taxes, net |
$ |
50,416 |
|
|
$ |
2,523 |
|
|
$ |
214 |
|
| Supplemental Disclosures of Noncash Investing and Financing Activities |
|
|
|
|
|
| Purchases of property, equipment and software recorded in accounts payable and accrued liabilities |
$ |
956 |
|
|
$ |
1,595 |
|
|
$ |
1,155 |
|
|
|
|
|
|
|
| Tax liabilities related to equity awards included in accounts payable and accrued liabilities |
$ |
(4) |
|
|
$ |
17 |
|
|
$ |
45 |
|
| Operating lease right-of-use assets obtained in exchange for new operating lease liabilities |
$ |
50 |
|
|
$ |
36,049 |
|
|
$ |
13,549 |
|
| Repurchases of common stock recorded in accounts payable and accrued liabilities |
$ |
2,427 |
|
|
$ |
1,948 |
|
|
$ |
1,689 |
|
See notes to consolidated financial statements.
YELP INC.
NOTES TO CONSOLIDATED FINANCIAL STATEMENTS
YEARS ENDED DECEMBER 31, 2022, 2021 AND 2020
1. ORGANIZATION AND DESCRIPTION OF BUSINESS
Yelp Inc. was incorporated in Delaware on September 3, 2004. Except where specifically noted or the context otherwise requires, the use of terms such as the “Company” and “Yelp” in these Notes to Consolidated Financial Statements refers to Yelp Inc. and its subsidiaries.
Yelp is a trusted local resource for consumers and a partner in success for businesses of all sizes. Consumers trust Yelp for its extensive ratings and reviews of businesses across a broad range of categories, while businesses advertise on Yelp to reach its large audience of purchase-oriented and generally affluent consumers. Yelp has operations in the United States, United Kingdom, Canada, Ireland and Germany.
Basis of Presentation—The consolidated financial statements have been prepared in accordance with accounting principles generally accepted in the United States of America (“GAAP”). All intercompany balances and transactions have been eliminated upon consolidation. Certain reclassifications have been made to the consolidated financial statements of prior periods and the accompanying notes to conform to the current period presentation.
Certain Significant Risks and Uncertainties—The Company operates in a dynamic industry and, accordingly, may be affected by a variety of factors. For example, the Company’s management believes that changes in any of the following areas could have a significant negative impact on the Company in terms of its future financial position, results of operations or cash flows: adverse macroeconomic conditions, such as the ongoing impact of the COVID-19 pandemic; the Company’s ability to maintain and expand its advertiser base; the success of the Company's strategy; qualified employees and key personnel; levels of user engagement on the Company's platform; industry competition; reliance on search engines and application marketplaces; the quality and reliability of reviews; real or perceived security breaches and the Company's ability to maintain uninterrupted operation of its network infrastructure; protection of the Company’s brand, reputation and intellectual property; intellectual property infringement and other disputes; and changes in government regulation affecting the Company’s business, among other things.
2. SUMMARY OF SIGNIFICANT ACCOUNTING POLICIES
Use of Estimates—The preparation of the Company’s consolidated financial statements in conformity with GAAP requires management to make estimates, judgments and assumptions that affect the reported amounts of assets and liabilities, disclosure of contingent assets and liabilities at the date of the consolidated financial statements and the reported amounts of income and expenses during the reporting period. Items that require estimates, judgments or assumptions include, but are not limited to, determining variable consideration and identifying the nature and timing of satisfaction of performance obligations, allowance for doubtful accounts and credit losses, fair value and estimated useful lives of long- and indefinite-lived assets, litigation loss contingencies, liabilities related to incurred but not reported insurance claims, fair value and achievement of targets for performance-based restricted stock units (“PRSUs”) and income taxes. These estimates, judgments and assumptions are based on information available as of the date of the consolidated financial statements; therefore, actual results could differ from management’s estimates due to macroeconomic uncertainty and other factors.
Foreign Currency Translation—The consolidated financial statements of the Company’s foreign subsidiaries are measured using the local currency as the functional currency. Assets and liabilities of foreign subsidiaries are translated at exchange rates in effect as of the balance sheet date. Revenues and expenses are translated at average exchange rates in effect during the year. Translation adjustments are recorded within accumulated other comprehensive loss, a separate component of stockholders’ equity.
Cash and Cash Equivalents—The Company considers all highly liquid investments, such as treasury bills, commercial paper, certificates of deposit and money market instruments with maturities of three months or less at the time of acquisition to be cash equivalents. Cash and cash equivalents primarily consist of amounts held in interest-bearing money market funds that were readily convertible to cash. The fair value of cash and cash equivalents approximates their carrying value.
Marketable Securities—The Company considers highly liquid treasury notes, U.S. agency securities, corporate debt securities, money market funds and other funds with maturities of more than three months to be marketable securities. These securities are classified as short-term marketable securities on the consolidated balance sheets as they represent the investment of cash available for current operations. The Company has a policy that generally requires its securities to be investment grade (i.e., rated ‘A’ or higher by bond rating firms) with the objective of minimizing the potential risk of principal loss. The Company classifies its marketable securities as available-for-sale and determines the classification at the time of purchase based on its investment strategy; it reevaluates such designation at each balance sheet date.
Available-for-sale securities are stated at fair value as of each balance sheet date and are periodically assessed for impairment. An investment is impaired if the fair value of the investment is less than its amortized cost basis. The Company reviews the securities in an unrealized loss position and evaluates whether credit loss exists by considering factors such as historical experience, market data, issuer-specific factors including their credit rating, and current economic conditions. If a credit loss exists, the Company measures the loss by comparing the present value of cash flows expected to be collected from the security with the amortized cost basis of the security. An allowance for credit loss is recorded as a component of other income (expense), net, limited by the amount of unrealized loss. Any remaining unrealized losses are recorded to other comprehensive income (loss).
The Company determines any realized gains or losses on the sale of marketable securities on a specific identification method and records such gains and losses as a component of other income (expense), net. Amortization of premiums and accretion of discounts are included in interest income. If the Company has the intent to sell an available-for-sale security in an unrealized loss position or it is more likely than not that it will be required to sell the security prior to recovery of its amortized cost basis, any previously recorded allowance is reversed and the entire difference between the amortized cost basis of the security and its fair value is recognized in the consolidated statements of operations.
Concentrations of Credit Risk—Financial instruments that potentially subject the Company to concentration of credit risk consist primarily of cash and cash equivalents, marketable securities and other investments, and accounts receivable. The Company places its cash and cash equivalents, marketable securities and other investments with major financial institutions, which management assesses to be of high credit quality, in order to limit the exposure of each investment.
Credit risk with respect to accounts receivable is dispersed due to the Company’s large number of customers. In addition, the Company’s credit risk is mitigated by the relatively short collection period. Collateral is not required for accounts receivable.
Accounts Receivable, Net, and Payment Terms—The timing of revenue recognition may differ from the timing of invoicing to customers. The Company records an accounts receivable balance when revenue is recognized prior to or at the time of invoicing the customer. Payment terms and conditions vary by contract type and the service being provided. For advertising services, the Company typically invoices customers on a monthly basis, one month in arrears, with payment due either at the end of each billing period or up to 30 days after the end of the billing period. For transaction services, the Company collects its commission fee on each transaction either at the time of the transaction or up to 30 days after the end of the billing period. For subscription services, the Company typically invoices customers one month in advance, with payment due at the beginning of each billing period.
Allowance for Doubtful Accounts—The Company maintains an allowance for doubtful accounts receivable. The allowance reflects the Company's best estimate of probable losses associated with the accounts receivable balance. It is based upon historical experience and loss patterns, the number of days that billings are past due, an evaluation of the potential risk of loss associated with delinquent accounts based on the credit risk of those accounts, known delinquent accounts, as well as current conditions and reasonable and supportable economic forecasts. When new information becomes available that allows the Company to more accurately estimate the allowance, it makes an adjustment, which is considered a change in accounting estimate. The carrying value of accounts receivable approximates their fair value.
Deferred Contract Costs—The Company has determined that certain sales incentive compensation costs are incremental costs to obtain the related contract. These costs are capitalized in the period in which they are incurred and amortized on a straight-line basis over the expected customer life of the associated contract. The Company uses a straight-line basis as it expects the benefit of these costs to be realized uniformly over the amortization period. The amortization periods for contract costs, which extend up to 32 months, were determined based on both qualitative and quantitative factors, including product life cycle attributes and customer retention historical data. For contract costs with amortization periods of less than 12 months, the Company applies a practical expedient to expense such costs as incurred. The Company assesses deferred contract costs for impairment on a quarterly basis. No impairment charges were recorded in the periods presented. Amortized contract costs are recorded within sales and marketing expense in the consolidated statements of operations.
Deferred contract costs are included within other non-current assets on the Company’s consolidated balance sheets (see Note 10, “Other Non-Current Assets”).
Deferred Revenue—The Company records deferred revenue when it has received consideration, or has the right to receive consideration, in advance of the transfer of the performance obligations of the contract to the customer.
Property, Equipment and Software—Property, equipment and software are stated at cost less accumulated depreciation and amortization. Depreciation is computed using the straight-line method over the estimated useful lives of the assets, which are approximately three to five years. Leasehold improvements are amortized over the shorter of the lease term or ten years. Following the disposition of an asset, the associated net cost is no longer recognized as an asset, and any gain or loss on the disposition is reflected in operating expenses.
Website and Internal-Use Software Development Costs—Costs related to website and internal-use software are primarily related to the Company’s website and mobile app, including support systems. The Company capitalizes its costs to develop software when: preliminary development efforts are successfully completed; management has authorized and committed project funding; and it is probable that the project will be completed and the software will be used as intended. Costs incurred for enhancements that are expected to result in additional material functionality are capitalized and amortized over the estimated useful life of the upgrades. Such costs are amortized on a straight-line basis over the estimated useful life of the related asset, which is generally three years.
The Company capitalizes certain implementation costs incurred related to cloud computing arrangements that are service contracts. Such costs are amortized on a straight-line basis over the term of the associated hosting arrangement plus any reasonably certain renewal period. Any capitalized amounts related to such arrangements are recorded within prepaid expense and other current assets and within non-current assets on the consolidated balance sheets.
Leases—The Company leases its office facilities under operating lease agreements that expire from 2023 to 2031, some of which include options to renew at the Company’s sole discretion. If exercised, such options would extend the lease terms by up to ten years. Additionally, certain lease agreements contain options to terminate the leases, which require 6 to 12 months prior written notice to the landlord. The Company does not have any finance lease agreements.
The Company determines if an arrangement contains a lease at inception. The Company recognizes on its consolidated balance sheets operating lease liabilities representing the present value of future lease payments, and an associated operating lease right-of-use asset for any operating lease with a term greater than one year. The Company recognizes the amortization of the right-of-use asset each month within lease expense. The Company elected to use the practical expedient for short-term leases, and therefore does not record operating lease right-of-use assets or lease liabilities associated with leases with durations of 12 months or less.
When recording the present value of lease liabilities, a discount rate is required. The Company has concluded that the rates implicit in the various operating lease agreements are not readily determinable. As a result, the Company instead uses its incremental borrowing rate, which is calculated based on hypothetical borrowings to fund each respective lease over the lease term, as of the lease commencement date, assuming that borrowings are secured by the various leased properties. The incremental borrowing rates are determined based on an assessment of the Company’s implied credit rating, using ratings scales from reputable rating agencies that consider a number of qualitative and quantitative factors. Market rates are derived as of the lease commencement dates with reference to companies with the same debt rating that operate in a similar industry to the Company.
The Company does not recognize its renewal options as part of its right-of-use assets and lease liabilities until it is reasonably certain that it will exercise such renewal options.
The Company does not combine lease and non-lease components; its lease agreements provide specific allocations of the Company’s obligations between lease and non-lease components. As a result, the Company is not required to exercise any judgment in determining such allocations.
The Company has subleased certain office facilities under operating lease agreements that expire in 2025. The sublease agreements do not contain any options to renew. The Company recognizes a majority of the sublease rental income as a reduction in rent expense on a straight-line basis over the lease period, with any sublease income in excess of the original lease cost recorded to other income, net.
Goodwill—Goodwill represents the excess of the purchase price in a business combination over the fair value of net tangible and intangible assets acquired. The carrying amount of goodwill is reviewed at least annually, or more frequently if events or changes in circumstances indicate that the carrying value of goodwill may not be recoverable. The Company has the option to first assess qualitative factors to determine whether it is more likely than not that the fair value of a reporting unit is less than its carrying amount. If the Company determines that it is more likely than not that its fair value is less than the carrying amount, or opts not to perform a qualitative assessment, then the Company will compare the fair value of a reporting unit with its carrying amount and recognize an impairment charge for the amount by which the carrying amount exceeds the reporting unit’s fair value. No impairment charges associated with goodwill have been recorded by the Company to date.
Intangible Assets—Intangible assets include acquired intangible assets identified through business combinations, which are carried at fair value less accumulated amortization, and purchased intangible assets, which are carried at cost less accumulated amortization. Amortization is recorded over the estimated useful lives of the assets, generally two years to 12 years. The Company reviews amortizable intangible assets to be held and used for impairment whenever events or changes in circumstances indicate that the carrying value of the assets may not be recoverable. Determination of recoverability is based on the lowest level of identifiable estimated undiscounted cash flows resulting from the use of the asset and its eventual disposition. Measurement of any impairment loss is based on the excess of the carrying value of the asset over its fair value. No material impairment charges have been recorded to date.
Impairment of Long-Lived Assets and Long-Lived Assets to Be Disposed of—The Company evaluates its long-lived assets for impairment whenever events or changes in circumstances indicate that the carrying amount of such assets may not be recoverable. Recoverability of assets to be held and used is measured by a comparison of the carrying amount of an asset to future undiscounted net cash flows expected to be generated by the asset. If such assets are considered to be impaired, the impairment to be recognized is measured as the amount by which the carrying amount of the assets exceeds the fair value of the assets. Assets to be disposed of are reported at the lower of the carrying amount or fair value less costs to sell.
Stock Repurchases—The Company accounts for repurchases of its common stock by recording the cost to repurchase those shares to treasury stock, a separate component of stockholders’ equity. Upon retirement, the carrying amount of treasury stock is reduced with a corresponding reduction to par value of common stock, with any excess of the cost incurred to repurchase shares over their par value recorded as an adjustment to retained earnings (accumulated deficit) on the date of retirement.
Revenue Recognition—The Company generates revenue from the sale of advertising products, transactions with consumers and other revenue sources, which correspond to the Company’s major product lines. The Company recognizes revenue by applying the following steps: the contract with the customer is identified; the performance obligations in the contract are identified; the transaction price is determined; the transaction price is allocated to the performance obligations in the contract; and revenue is recognized when (or as) the Company satisfies these performance obligations in an amount that reflects the consideration it expects to be entitled to in exchange for those services. The Company applies the portfolio practical expedient to account for the vast majority of contracts with customers in each category of revenue. The Company does not disclose the value of unsatisfied performance obligations for (i) contracts with an original expected length of one year or less and (ii) contracts for which the amount of revenue it recognizes is equal to the amount which the Company has a right to invoice.
Contracts with customers can include multiple performance obligations, where the transaction price is allocated to each performance obligation based on its relative standalone selling price (“SSP”). The Company determines SSP based on the prices of the promised goods or services charged when sold separately to customers, which are determined using contractually stated prices. The Company allocates revenue to each of the performance obligations included in a contract with multiple performance obligations at the inception of the contract. The various products and services comprising contracts with multiple performance obligations are typically capable of being both distinct and distinct within the context of the arrangement and are accounted for as separate performance obligations.
For all contracts with customers, estimates and assumptions include determining variable consideration and identifying the nature and timing of satisfaction of performance obligations. The Company may accept lower consideration than the amount promised per the contract for certain revenue transactions and certain customers may receive cash based incentives, credits or refunds, which are accounted for as variable consideration when estimating the amount of revenue to recognize. The Company estimates these amounts based on the expected amount to be provided to customers and constrains the revenue. The Company believes that there will not be a significant reversal in the amount of cumulative revenue recognized when the uncertainty associated with the estimates of variable consideration is subsequently resolved. For contracts satisfied over time, the Company applies the invoice practical expedient to depict the value transferred to the customer and measure of progress towards completion of its obligations. The Company considers the right to receive consideration from a customer to correspond directly with the value to the customer of its performance completed to date. The Company does not consider the effects of the time value of money as substantially all of the Company’s contracts are invoiced on a monthly basis, one month in arrears.
Revenue is recognized net of any taxes collected from customers, which are remitted to governmental authorities. The Company does not typically refund customers for services once it determines the performance obligations of the contract have been satisfied, but will assess any refund requests from customers and partners on a case by case basis. The Company records an allowance for potential future refunds, which is estimated based on historical trends and recorded as a reduction of net revenue.
Advertising. The Company generates advertising revenue primarily through the display of advertising products on its website and mobile app. These arrangements are evidenced by either written or electronic acceptance of a contract that stipulates the types of advertising to be delivered, the timing and pricing. Performance-based advertising placements are priced on a cost-per-click basis, while impression-based advertising placements are priced on a cost per thousand impressions basis. The Company recognizes revenue from the delivery of performance-based ads and impression-based ads in the period of delivery, in each case net of customer discounts. The Company also offers businesses premium features in connection with their business pages pursuant to fixed monthly fees, and recognizes revenue from such offerings over the service period.
The Company also generates advertising revenue through indirect sales of advertising products, such as through reseller contracts that allow partners to sell Yelp Branded Profiles to their clients and the monetization of remnant advertising inventory through third-party ad networks, and recognizes revenue in the period of delivery.
Transactions. The Company generates transactions revenue primarily from revenue-sharing partner contracts. The Company’s transactions platform provides consumers with the ability to place food orders for pickup and delivery through third parties, primarily Grubhub, or complete other transactions directly on Yelp. The Company earns a per-transaction commission fee pursuant to partnership contracts for acting as an agent for these transactions, which it recognizes on a net basis and includes in revenue upon completion of a transaction.
Other Revenue. The Company generates other revenue through subscription services contracts, such as sales of monthly subscriptions to Yelp Guest Manager, licensing contracts for access to Yelp data, and other non-advertising, non-transaction partnerships. Subscription revenues are recognized ratably over the contract terms beginning on the commencement date of each contract, which is the date the service is made available to customers.
Cost of Revenue—The Company’s cost of revenue primarily consists of credit card processing fees, website infrastructure expense, which includes website hosting costs, and salaries, benefits and stock-based compensation expense for the infrastructure teams responsible for operating the Company’s website and mobile app, and excludes depreciation and amortization expense. Cost of revenue also includes third-party advertising fulfillment costs.
Research and Development—The Company incurs research and development expenses for costs it incurs in research aimed at developing, and in translating the results of such research into, new products and services or significant improvements to existing products or services intended for internal use. Such costs are considered research and development and are expensed as incurred. These expenses primarily consist of employee-related costs (including stock-based compensation) for the Company’s engineers and other employees engaged in the research and development of its products and services, as well as allocated indirect overhead costs. Research and development costs were $294.5 million, $265.2 million and $230.1 million for the years ended December 31, 2022, 2021 and 2020, respectively, and are recorded to costs and expenses in the consolidated statements of operations for those periods, primarily within product development costs.
Stock-Based Compensation—The Company accounts for stock-based employee compensation plans under the fair value recognition and measurement provisions, which require all stock-based payments to employees, including grants of stock options, restricted stock awards, restricted stock units (“RSUs”), PRSUs and issuances under its 2012 Employee Stock Purchase Plan, as amended (“ESPP”), to be measured based on the grant-date fair value of the awards. The Company accounts for forfeitures as they occur.
The Company estimates the fair value of options granted to employees on the grant date using the Black-Scholes-Merton option valuation model. This valuation model for stock-based compensation expense requires the Company to make assumptions and judgments about the variables used in the calculation, including the expected term (weighted-average period of time that the options granted are expected to be outstanding), the expected volatility in the fair market value of the Company’s common stock, a risk-free interest rate and expected dividends. No compensation cost is recorded for options that do not vest. The Company uses the simplified calculation of expected life as it does not have sufficient appropriate historical exercise data on which to base its own estimate. Expected volatility is based on an average of the historical volatilities of the common stock of several entities with characteristics similar to those of the Company. The risk-free rate is based on the U.S. Treasury yield curve in effect at the time of grant for periods corresponding with the expected life of the option. The Company recognizes compensation cost related to options using the straight-line method.
The fair value of RSUs is measured using the closing price of the Company’s common stock on the New York Stock Exchange on the grant date. The Company recognizes compensation cost related to RSUs using the straight-line method. No compensation cost is recorded for RSUs that do not vest. In May 2020, the Company changed its method of settling the employee tax liabilities associated with the vesting of RSUs from withholding a portion of the vested shares and covering such taxes with cash from its balance sheet (“Net Share Withholding”), to selling a portion of the vested shares to cover taxes. In November 2020, the Company reverted its method of settling these employee tax liabilities to Net Share Withholding.
The Company has two types of PRSUs outstanding — awards for which the vesting is subject to both a time-based vesting schedule and either (a) a market condition or (b) the achievement of performance goals.
For the awards subject to a market condition, the Company uses a Monte Carlo model to determine the fair value of the PRSUs. The Company recognizes compensation cost related to PRSUs using the accelerated method. Compensation costs are recorded if the service condition is met regardless of whether the market performance condition is satisfied. No compensation cost is recorded if the service condition is not met.
For the awards subject to performance goals, compensation costs are recorded when the Company concludes that it is probable that the performance conditions will be achieved. The Company performs an analysis in each reporting period to determine the probability that the performance goals will be met, and recognizes a cumulative catch-up adjustment to compensation cost for changes in its probability assessment in subsequent reporting periods, if required, until the performance period has expired. The fair value of the PRSUs is measured using the closing price of the Company's common stock on the New York Stock Exchange on the grant date. The Company recognizes compensation cost related to PRSUs using the accelerated method. No compensation cost is recorded if the service condition is not met.
Advertising Expenses—Advertising costs are expensed in the period in which the advertising takes place. Costs of producing advertising are expensed in the period in which production takes place. Total advertising expenses incurred were $71.1 million, $56.3 million and $22.2 million for the years ended December 31, 2022, 2021 and 2020, respectively.
Comprehensive Income (Loss)—Comprehensive income (loss) consists of net income (loss) and other comprehensive income (loss), which consists of foreign currency adjustments and unrealized loss on available-for-sale debt securities, net of tax.
Income Taxes—The Company records income taxes using the asset and liability method, which requires the recognition of deferred tax assets (“DTAs”) and liabilities for the expected future tax consequences of events that have been recognized in the Company’s financial statements or tax returns. In estimating future tax consequences, the Company generally considers all expected future events other than enactments or changes in the tax law or rates. In assessing the realization of deferred tax assets, the Company considers whether it is more likely than not that all or some portion of deferred tax assets will not be realized. The ultimate realization of the deferred tax assets is dependent upon the generation of future taxable income during the periods in which those temporary differences become deductible. Valuation allowances are provided to reduce deferred tax assets to the amount that is more likely than not to be realized. In determining the need for a valuation allowance, the weight given to positive and negative evidence is commensurate with the extent to which the evidence may be objectively verified. The Company evaluates the ability to realize net deferred tax assets and the related valuation allowance on a quarterly basis.
The Company operates in various tax jurisdictions and is subject to audit by various tax authorities. The Company provides for tax contingencies whenever it is deemed probable that a tax asset has been impaired or a tax liability has been incurred for events such as tax claims or changes in tax laws. Tax contingencies are based upon their technical merits, relative tax law and the specific facts and circumstances as of each reporting period. Changes in facts and circumstances could result in material changes to the amounts recorded for such tax contingencies.
The Company recognizes a tax benefit from an uncertain tax position only if it is more likely than not that the tax position will be sustained on examination by the taxing authorities based on the technical merits of the position. The tax benefits recognized in the financial statements from such a position are then measured based on the largest benefit that has a greater than 50% likelihood of being realized upon ultimate settlement.
Employee Benefit Plan—The Company sponsors a qualified 401(k) defined contribution plan covering eligible employees. Participants may contribute a portion of their annual compensation up to a maximum annual amount set by the Internal Revenue Service (“IRS”). Employer contributions under this plan were $8.7 million, $8.0 million and $6.1 million for the years ended December 31, 2022, 2021 and 2020, respectively.
Insurance—The Company is self-insured for certain employee benefits including medical, dental and vision; however, the Company obtains third-party excess insurance coverage to limit its exposure to certain claims. Liabilities associated with these benefits include estimates of both claims filed and losses incurred but not yet reported. The Company utilizes valuations provided by reputable, independent third-party actuaries. The Company’s self-insured liabilities are included in the consolidated balance sheets within accounts payable and accrued liabilities.
3. CASH, CASH EQUIVALENTS AND RESTRICTED CASH
Cash, cash equivalents and restricted cash as of December 31, 2022 and 2021 consisted of the following (in thousands):
|
|
|
|
|
|
|
|
|
|
|
|
|
December 31,
2022 |
|
December 31,
2021 |
Cash |
$ |
56,304 |
|
|
$ |
89,407 |
|
Cash equivalents |
250,075 |
|
|
390,376 |
|
Total cash and cash equivalents |
$ |
306,379 |
|
|
$ |
479,783 |
|
Restricted cash |
759 |
|
|
858 |
|
Total cash, cash equivalents and restricted cash |
$ |
307,138 |
|
|
$ |
480,641 |
|
Restricted cash is included in other non-current assets on the Company’s consolidated balance sheets.
4. MARKETABLE SECURITIES
Short-term investments and certain cash equivalents consist of investments in debt securities that are classified as available-for-sale. The amortized cost, gross unrealized gains and losses and fair value of investments as of December 31, 2022 were as follows (in thousands):
|
|
|
|
|
|
|
|
|
|
|
|
|
|
|
|
|
|
|
|
|
|
|
|
|
December 31, 2022 |
| Amortized Cost |
|
Gross
Unrealized
Gains |
|
Gross
Unrealized
Losses |
|
Fair Value |
|
| Cash equivalents: |
|
|
|
|
|
|
|
| Commercial paper |
$ |
2,524 |
|
|
$ |
— |
|
|
$ |
— |
|
|
$ |
2,524 |
|
| Total cash equivalents |
2,524 |
|
|
— |
|
|
— |
|
|
2,524 |
|
| Short-term marketable securities: |
|
|
|
|
|
|
|
| Certificates of deposit |
10,651 |
|
|
— |
|
|
— |
|
|
10,651 |
|
| Commercial paper |
13,054 |
|
|
— |
|
|
— |
|
|
13,054 |
|
| Corporate bonds |
32,701 |
|
|
3 |
|
|
(353) |
|
|
32,351 |
|
| Agency bonds |
3,010 |
|
|
— |
|
|
(11) |
|
|
2,999 |
|
| U.S. government bonds |
35,479 |
|
|
8 |
|
|
(298) |
|
|
35,189 |
|
| Total short-term marketable securities |
94,895 |
|
|
11 |
|
|
(662) |
|
|
94,244 |
|
|
|
|
|
|
|
|
|
|
|
|
|
|
|
|
|
|
|
|
|
|
|
|
|
|
|
|
|
|
|
|
|
|
|
|
|
|
|
|
|
| Total |
$ |
97,419 |
|
|
$ |
11 |
|
|
$ |
(662) |
|
|
$ |
96,768 |
|
The following table presents gross unrealized losses and fair values for those securities that were in an unrealized loss position as of December 31, 2022, aggregated by investment category and the length of time that the individual securities have been in a continuous loss position (in thousands):
|
|
|
|
|
|
|
|
|
|
|
|
|
|
|
|
|
|
|
|
|
|
|
|
|
|
|
|
|
|
|
|
|
|
|
|
|
December 31, 2022 |
| Less than 12 months |
|
12 Months or Greater |
|
Total |
| Fair Value |
|
Unrealized Loss |
Fair Value |
|
Unrealized Loss |
Fair Value |
|
Unrealized Loss |
|
|
|
|
|
|
|
|
|
|
|
|
|
|
|
|
|
|
|
|
|
|
|
|
| Corporate bonds |
$ |
29,428 |
|
|
$ |
(353) |
|
|
$ |
— |
|
|
$ |
— |
|
|
$ |
29,428 |
|
|
$ |
(353) |
|
| Agency bonds |
2,999 |
|
|
(11) |
|
|
— |
|
|
— |
|
|
2,999 |
|
|
(11) |
|
| U.S. government bonds |
27,368 |
|
|
(298) |
|
|
— |
|
|
— |
|
|
27,368 |
|
|
(298) |
|
| Total |
$ |
59,795 |
|
|
$ |
(662) |
|
|
$ |
— |
|
|
$ |
— |
|
|
$ |
59,795 |
|
|
$ |
(662) |
|
|
|
|
|
|
|
|
|
|
|
|
|
|
|
|
|
|
|
|
|
|
|
|
|
|
|
|
|
|
|
|
|
|
|
|
|
|
|
|
|
|
|
|
|
|
|
|
|
|
|
|
|
|
|
|
|
|
|
|
|
|
|
|
|
|
|
|
|
|
|
|
|
|
|
|
|
|
As of December 31, 2022, the Company did not recognize any credit loss related to available-for-sale marketable securities. As of December 31, 2021, the Company did not have any marketable securities and a majority of the Company's investments were in highly liquid money market funds.
The contractual maturities for marketable securities classified as available-for-sale as of December 31, 2022 were as follows (in thousands):
|
|
|
|
|
|
|
|
|
|
|
|
|
Amortized Cost |
|
Fair Value |
| Due in one year or less |
$ |
50,057 |
|
|
$ |
49,969 |
|
| Due in one to five years |
47,362 |
|
|
46,799 |
|
| Total |
$ |
97,419 |
|
|
$ |
96,768 |
|
In March 2020, the Company changed its investment strategy in response to uncertainties resulting from the COVID-19 pandemic to allow for more flexibility in preserving liquidity, which led to the transfer of $300.2 million of amortized cost of its investment portfolio from a held-to-maturity classification to available-for-sale. As a result of this transfer, in March 2020, the Company reversed the allowance for credit loss that had been previously recorded and measured the securities at fair value as of the transfer date by recording an immaterial allowance for credit loss to other income, net and the remaining adjustment as an immaterial unrealized loss recorded to other comprehensive income.
Following this transfer, during the three months ended June 30, 2020, the Company liquidated its investment portfolio, which consisted of available-for-sale short- and long-term marketable securities, for proceeds of $253.4 million. The Company recorded an immaterial net realized gain to other income, net.
5. FAIR VALUE MEASUREMENTS
The Company’s cash equivalents are recorded at fair value in the consolidated balance sheets. Additionally, the Company carries its available-for-sale debt securities at fair value. See
Note 4, “Marketable Securities,” for further details.
The accounting guidance for fair value measurements prioritizes the inputs used in measuring fair value in the following hierarchy:
Level 1—Observable inputs, such as quoted prices in active markets,
Level 2—Inputs other than quoted prices in active markets that are observable either directly or indirectly, or
Level 3—Unobservable inputs in which there are little or no market data, which require the Company to develop its own assumptions.
This hierarchy requires the Company to use observable market data, when available, to minimize the use of unobservable inputs when determining fair value. The Company’s money market funds are classified within Level 1 of the fair value hierarchy because they are valued using quoted prices in active markets. The Company’s certificates of deposit, commercial paper, corporate bonds, agency bonds and U.S. government bonds are classified within Level 2 of the fair value hierarchy because they have been valued using inputs other than quoted prices in active markets that are observable directly or indirectly.
The following table represents the fair value of the Company’s financial instruments, including those measured at fair value on a recurring basis, as of December 31, 2022 and 2021 (in thousands):
|
|
|
|
|
|
|
|
|
|
|
|
|
|
|
|
|
|
|
|
|
|
|
|
|
|
|
|
|
|
|
|
|
|
|
|
|
|
|
|
|
|
|
|
|
|
|
|
|
December 31, 2022 |
|
December 31, 2021 |
|
Level 1 |
|
Level 2 |
|
Level 3 |
|
Total |
|
Level 1 |
|
Level 2 |
|
Level 3 |
|
Total |
| Cash equivalents: |
|
|
|
|
|
|
|
|
|
|
|
|
|
|
|
| Money market funds |
$ |
247,551 |
|
|
$ |
— |
|
|
$ |
— |
|
|
$ |
247,551 |
|
|
$ |
390,376 |
|
|
$ |
— |
|
|
$ |
— |
|
|
$ |
390,376 |
|
| Commercial paper |
— |
|
|
2,524 |
|
|
— |
|
|
2,524 |
|
|
— |
|
|
— |
|
|
— |
|
|
— |
|
| Marketable securities: |
|
|
|
|
|
|
|
|
|
|
|
|
|
|
|
| Certificates of deposit |
— |
|
|
10,651 |
|
|
— |
|
|
10,651 |
|
|
— |
|
|
— |
|
|
— |
|
|
— |
|
| Commercial paper |
— |
|
|
13,054 |
|
|
— |
|
|
13,054 |
|
|
— |
|
|
— |
|
|
— |
|
|
— |
|
| Corporate bonds |
— |
|
|
32,351 |
|
|
— |
|
|
32,351 |
|
|
— |
|
|
— |
|
|
— |
|
|
— |
|
| Agency bonds |
— |
|
|
2,999 |
|
|
— |
|
|
2,999 |
|
|
— |
|
|
— |
|
|
— |
|
|
— |
|
| U.S. government bonds |
— |
|
|
35,189 |
|
|
— |
|
|
35,189 |
|
|
— |
|
|
— |
|
|
— |
|
|
— |
|
| Other investments: |
|
|
|
|
|
|
|
|
|
|
|
|
|
|
|
| Certificates of deposit |
— |
|
|
10,000 |
|
|
— |
|
|
10,000 |
|
|
— |
|
|
10,000 |
|
|
— |
|
|
10,000 |
|
| Total cash equivalents, marketable securities and other investments |
$ |
247,551 |
|
|
$ |
106,768 |
|
|
$ |
— |
|
|
$ |
354,319 |
|
|
$ |
390,376 |
|
|
$ |
10,000 |
|
|
$ |
— |
|
|
$ |
400,376 |
|
The certificates of deposit that are categorized as other investments are reflected in prepaid expenses and other current assets on the consolidated balance sheets as of December 31, 2022 and 2021.
Certain long- and indefinite-lived assets are recognized at fair value on a nonrecurring basis, including assets that are written down as a result of an impairment. The Company recognized an impairment charge related to right-of-use (“ROU”) assets and leasehold improvements associated with certain of its operating leases that it subleased during the years ended December 31, 2022 and 2021. See
Note 9, “Leases,” for further details. The Company estimated the fair value of these assets as of the effective dates of the agreements using an income approach based on expected future cash flows from the subleased properties, which relied on certain assumptions made by management based on both internal and external data, such as the incremental borrowing rates used to discount these cash flows to its present values. As a result, these assets are classified within Level 3 of the fair value hierarchy.
6. PREPAID EXPENSES AND OTHER CURRENT ASSETS
Prepaid expenses and other current assets as of December 31, 2022 and 2021 consisted of the following (in thousands):
|
|
|
|
|
|
|
|
|
|
|
|
|
December 31,
2022 |
|
December 31,
2021 |
| Prepaid expenses |
$ |
14,632 |
|
|
$ |
13,480 |
|
| Certificates of deposit |
10,000 |
|
|
10,000 |
|
| Non-trade receivables |
31,338 |
|
|
28,875 |
|
| Other current assets |
7,497 |
|
|
5,181 |
|
| Total prepaid expenses and other current assets |
$ |
63,467 |
|
|
$ |
57,536 |
|
Prepaid expenses included $0.7 million of short-term capitalized implementation costs related to cloud computing arrangements that are service contracts. The long-term portion of capitalized cloud computing implementation costs of $1.6 million is included in other non-current assets. The Company recorded an immaterial amount of amortization expense during the years ended December 31, 2022 and 2021 related to capitalized implementation costs.
As of December 31, 2022, other current assets primarily consisted of deferred costs related to unsettled share repurchases, short-term deposits and income taxes receivable.
7. PROPERTY, EQUIPMENT AND SOFTWARE, NET
The Company capitalized $28.4 million, $31.0 million and $32.4 million in website and internal-use software costs during the years ended December 31, 2022, 2021 and 2020, respectively, which are included in property, equipment and software, net on the consolidated balance sheets. Amortization expense related to capitalized website and internal-use software was $29.6 million, $30.6 million and $27.1 million for the years ended December 31, 2022, 2021 and 2020, respectively.
The Company wrote off $1.0 million, $0.6 million, and $1.5 million of capitalized website and internal-use software costs in the years ended December 31, 2022, 2021 and 2020, respectively.
Property, equipment and software, net as of December 31, 2022 and 2021 consisted of the following (in thousands):
|
|
|
|
|
|
|
|
|
|
|
|
|
December 31,
2022 |
|
December 31,
2021 |
| Capitalized website and internal-use software development costs |
$ |
229,638 |
|
|
$ |
202,169 |
|
Leasehold improvements(1) |
60,407 |
|
|
59,190 |
|
| Computer equipment |
50,920 |
|
|
48,264 |
|
| Furniture and fixtures |
11,627 |
|
|
12,573 |
|
| Telecommunication |
4,930 |
|
|
4,953 |
|
| Software |
1,702 |
|
|
1,703 |
|
| Total |
359,224 |
|
|
328,852 |
|
| Less accumulated depreciation and amortization |
(282,000) |
|
|
(244,995) |
|
| Property, equipment and software, net |
$ |
77,224 |
|
|
$ |
83,857 |
|
(1) The cost basis was reduced to reflect an impairment of $1.5 million and $2.7 million recorded during the years ended December 31, 2022 and 2021, respectively, as a result of sublease agreements the Company entered into for portions of its office space.
Depreciation and amortization expense related to property, equipment and software (including capitalized website and internal-use software) for the years ended December 31, 2022, 2021 and 2020 was approximately $43.2 million, $52.8 million and $48.0 million, respectively. Depreciation and amortization expense for the year ended December 31, 2021 included $5.2 million of accelerated depreciation for leasehold improvements related to the termination of one of the Company’s office leases.
For more information on the impairment charges and lease termination, see
Note 9, “Leases.”
8. GOODWILL AND INTANGIBLE ASSETS
The Company’s goodwill is the result of its acquisitions of other businesses and represents the excess of purchase consideration over the fair value of assets acquired and liabilities assumed. The Company performed its annual goodwill impairment analysis on August 31, 2022 and concluded that goodwill was not impaired, as the fair value of the reporting unit exceeded its carrying value. Additionally, no triggering events were identified as of December 31, 2022 that would more likely than not reduce the fair value of goodwill below its carrying value.
The changes in the carrying amounts of goodwill during the years ended December 31, 2022 and 2021, were as follows (in thousands):
|
|
|
|
|
|
|
|
|
|
|
|
|
Year Ended December 31, |
|
2022 |
|
2021 |
| Balance, beginning of period |
$ |
105,128 |
|
|
$ |
109,261 |
|
|
|
|
|
|
|
|
|
|
|
|
|
| Effect of currency translation |
(2,800) |
|
|
(4,133) |
|
| Balance, end of period |
$ |
102,328 |
|
|
$ |
105,128 |
|
Intangible assets as of December 31, 2022 and 2021 consisted of the following (dollars in thousands):
|
|
|
|
|
|
|
|
|
|
|
|
|
|
|
|
|
|
|
|
|
|
|
|
|
December 31, 2022 |
|
Gross
Carrying
Amount |
|
Accumulated
Amortization |
|
Net
Carrying
Amount |
|
Weighted
Average
Remaining
Life |
| Business relationships |
$ |
9,918 |
|
|
$ |
(5,550) |
|
|
$ |
4,368 |
|
|
6.2 years |
| Developed technology |
7,709 |
|
|
(7,709) |
|
|
— |
|
|
0.0 years |
| Licensing agreements |
6,129 |
|
|
(1,505) |
|
|
4,624 |
|
|
7.2 years |
|
|
|
|
|
|
|
|
| Domain and data licenses |
2,869 |
|
|
(2,864) |
|
|
5 |
|
|
0.5 years |
|
|
|
|
|
|
|
|
|
|
|
|
|
|
|
|
| Total |
$ |
26,625 |
|
|
$ |
(17,628) |
|
|
$ |
8,997 |
|
|
|
|
|
|
|
|
|
|
|
|
|
|
|
|
|
|
|
|
|
|
|
|
|
|
|
|
December 31, 2021 |
|
Gross
Carrying
Amount |
|
Accumulated
Amortization |
|
Net
Carrying
Amount |
|
Weighted
Average
Remaining
Life |
| Business relationships |
$ |
9,918 |
|
|
$ |
(4,786) |
|
|
$ |
5,132 |
|
|
7.1 years |
| Developed technology |
7,709 |
|
|
(7,453) |
|
|
256 |
|
|
0.2 years |
| Licensing agreements |
6,129 |
|
|
(860) |
|
|
5,269 |
|
|
8.2 years |
|
|
|
|
|
|
|
|
| Domain and data licenses |
2,869 |
|
|
(2,853) |
|
|
16 |
|
|
1.5 years |
|
|
|
|
|
|
|
|
|
|
|
|
|
|
|
|
| Total |
$ |
26,625 |
|
|
$ |
(15,952) |
|
|
$ |
10,673 |
|
|
|
Amortization expense for the years ended December 31, 2022, 2021 and 2020 was $1.7 million, $2.8 million and $2.6 million, respectively.
As of December 31, 2022, estimated future amortization expense were as follows (in thousands):
|
|
|
|
|
|
|
|
|
| 2023 |
|
$ |
1,359 |
|
| 2024 |
|
1,353 |
|
| 2025 |
|
1,353 |
|
| 2026 |
|
1,353 |
|
| 2027 |
|
1,353 |
|
| Thereafter |
|
2,226 |
|
| Total amortization |
|
$ |
8,997 |
|
9. LEASES
The components of lease cost, net for the years ended December 31, 2022, 2021 and 2020 were as follows (in thousands):
|
|
|
|
|
|
|
|
|
|
|
|
|
|
|
|
|
|
|
Year Ended December 31, |
|
2022 |
|
2021 |
|
2020 |
| Operating lease cost |
$ |
40,819 |
|
|
$ |
49,989 |
|
|
$ |
55,214 |
|
| Short-term lease cost (12 months or less) |
1,065 |
|
|
532 |
|
|
1,288 |
|
| Sublease income |
(12,152) |
|
|
(8,490) |
|
|
(7,826) |
|
| Total lease cost, net |
$ |
29,732 |
|
|
$ |
42,031 |
|
|
$ |
48,676 |
|
The Company’s leases and subleases do not include any variable lease payments, residual value guarantees, related-party leases, or restrictions or covenants that would limit or prevent the Company from exercising its right to obtain substantially all of the economic benefits from use of the respective assets during the lease term.
Supplemental cash flow information related to leases for the years ended December 31, 2022, 2021 and 2020 was as follows (in thousands):
|
|
|
|
|
|
|
|
|
|
|
|
|
|
|
|
|
|
|
Year Ended December 31, |
|
2022 |
|
2021 |
|
2020 |
| Cash paid for amounts included in the measurement of lease liabilities: |
|
|
|
|
|
| Operating cash flows from operating leases |
$ |
49,900 |
|
|
$ |
52,091 |
|
|
$ |
58,515 |
|
As of December 31, 2022, maturities of lease liabilities were as follows (in thousands):
|
|
|
|
|
|
| 2023 |
$ |
45,341 |
|
| 2024 |
42,614 |
|
| 2025 |
22,077 |
|
| 2026 |
7,139 |
|
| 2027 |
6,327 |
|
| Thereafter |
16,053 |
|
| Total minimum lease payments |
139,551 |
|
| Less imputed interest |
(13,216) |
|
| Present value of lease liabilities |
$ |
126,335 |
|
As of December 31, 2022 and 2021, the weighted-average remaining lease term and weighted-average discount rate were as follows:
|
|
|
|
|
|
|
|
|
|
December 31, 2022 |
December 31, 2021 |
| Weighted-average remaining lease term (years) — operating leases |
4.1 |
4.8 |
| Weighted-average discount rate — operating leases |
5.3 |
% |
5.4 |
% |
During the years ended December 31, 2022 and 2021, the Company entered into sublease agreements for portions of its office space in San Francisco and New York. The Company evaluated the associated ROU assets and leasehold improvements for impairment as a result of the subleases in accordance with Accounting Standards Codification Topic 360, “Property, Plant, and Equipment,” because the change in circumstances indicated that the carrying amount of such assets may not be recoverable. The Company compared the future undiscounted cash flows under the sublease agreement to the carrying amounts of the respective ROU assets and leasehold improvements and determined that an impairment existed.
The Company compared the carrying values of the impacted assets to the fair values to determine the impairment amount related to the subleases. The Company recognized impairment charges of $10.5 million and $11.2 million during the years ended December 31, 2022 and 2021, respectively, which are included in general and administrative expenses on its consolidated statement of operations. The impairment charge during the year ended December 31, 2022 reduced the carrying amount of the ROU assets and leasehold improvements by $9.0 million and $1.5 million, respectively. The impairment charge during the year ended December 31, 2021 reduced the carrying amount of the ROU assets and leasehold improvements by $8.5 million and $2.7 million, respectively. For more information on the fair values of the ROU asset and leasehold improvements used in the impairment analysis, see
Note 5, “Fair Value Measurements.”
In December 2021, the Company terminated the lease for its office space in Washington, D.C. As a result, the Company recognized a net gain of $3.7 million, which includes certain termination-related fees and is included in general and administrative expenses on its consolidated statement of operations. The Company accelerated the depreciation of related leasehold improvements assets and recorded $5.2 million of depreciation expense for these assets during the year ended December 31, 2021.
10. OTHER NON-CURRENT ASSETS
Other non-current assets as of December 31, 2022 and 2021 consisted of the following (in thousands):
|
|
|
|
|
|
|
|
|
|
|
|
|
December 31,
2022 |
|
December 31,
2021 |
| Deferred tax assets |
$ |
97,426 |
|
|
$ |
40,606 |
|
| Deferred contract costs |
25,946 |
|
|
16,931 |
|
|
|
|
|
| Other non-current assets |
10,617 |
|
|
7,871 |
|
| Total other non-current assets |
$ |
133,989 |
|
|
$ |
65,408 |
|
Deferred contract costs as of December 31, 2022 and 2021, and changes in deferred contract costs during the years ended December 31, 2022 and 2021, were as follows (in thousands):
|
|
|
|
|
|
|
|
|
|
|
|
|
Year Ended December 31, |
|
2022 |
|
2021 |
| Balance, beginning of period |
$ |
16,931 |
|
|
$ |
14,522 |
|
| Add: costs deferred on new contracts |
27,842 |
|
|
17,015 |
|
| Less: amortization recorded in sales and marketing expenses |
(18,827) |
|
|
(14,606) |
|
|
|
|
|
| Balance, end of period |
$ |
25,946 |
|
|
$ |
16,931 |
|
11. CONTRACT BALANCES
The changes in the allowance for doubtful accounts during the years ended December 31, 2022, 2021 and 2020, were as follows (in thousands):
|
|
|
|
|
|
|
|
|
|
|
|
|
|
|
|
|
|
|
Year Ended December 31, |
|
2022 |
|
2021 |
|
2020 |
| Balance, beginning of period |
$ |
7,153 |
|
|
$ |
11,559 |
|
|
$ |
7,686 |
|
| Add: provision for doubtful accounts |
25,006 |
|
|
14,574 |
|
|
32,265 |
|
| Less: write-offs, net of recoveries |
(22,882) |
|
|
(18,980) |
|
|
(28,392) |
|
| Balance, end of period |
$ |
9,277 |
|
|
$ |
7,153 |
|
|
$ |
11,559 |
|
The net increase in the allowance for doubtful accounts in the year ended December 31, 2022 was primarily related to an anticipated increase in customer delinquencies due to an increase in both the number of advertiser accounts and customer spend.
The net decrease in the allowance for doubtful accounts in the year ended December 31, 2021 was primarily a result of a reduction in expected customer delinquencies compared to December 31, 2020, as collection rates improved.
In calculating the allowance for doubtful accounts as of December 31, 2022 and 2021, the Company considered expectations of probable credit losses, including probable credit losses associated with the COVID-19 pandemic, based on observed trends in cancellations, observed changes in the credit risk of specific customers, the impact of anticipated closures and bankruptcies using forecasted economic indicators in addition to historical experience and loss patterns during periods of macroeconomic uncertainty.
Contract liabilities consist of deferred revenue, which is recorded on the consolidated balance sheets when the Company has received consideration, or has the right to receive consideration, in advance of transferring the performance obligations under the contract to the customer.
The changes in short-term deferred revenue during the years ended December 31, 2022 and 2021 were as follows (in thousands):
|
|
|
|
|
|
|
|
|
|
|
|
|
Year Ended December 31, |
|
2022 |
|
2021 |
| Balance, beginning of period |
$ |
4,156 |
|
|
$ |
4,109 |
|
| Less: recognition of deferred revenue from beginning balance |
(3,922) |
|
|
(3,279) |
|
| Add: net increase in current period contract liabilities |
4,966 |
|
|
3,326 |
|
| Balance, end of period |
$ |
5,200 |
|
|
$ |
4,156 |
|
The majority of the Company’s deferred revenue as of December 31, 2022 is considered short-term and is expected to be recognized as revenue in the subsequent three-month period ending March 31, 2023. An immaterial amount of long-term deferred revenue is included in other long-term liabilities as of December 31, 2022. No other contract assets or liabilities are recorded on the Company’s consolidated balance sheets as of December 31, 2022 and 2021.
12. ACCOUNTS PAYABLE AND ACCRUED LIABILITIES
Accounts payable and accrued liabilities as of December 31, 2022 and 2021 consisted of the following (in thousands):
|
|
|
|
|
|
|
|
|
|
|
|
|
December 31,
2022 |
|
December 31,
2021 |
| Accounts payable |
$ |
14,525 |
|
|
$ |
16,127 |
|
| Employee-related liabilities |
66,929 |
|
|
50,132 |
|
| Accrued sales and marketing expenses |
4,365 |
|
|
5,455 |
|
|
|
|
|
| Accrued cost of revenue |
6,609 |
|
|
9,537 |
|
| Accrued legal settlements |
26,250 |
|
|
26,037 |
|
| Other accrued liabilities |
19,272 |
|
|
12,332 |
|
| Total accounts payable and accrued liabilities |
$ |
137,950 |
|
|
$ |
119,620 |
|
As of December 31, 2022, other accrued liabilities primarily consisted of income taxes payable, unsettled share repurchases, and accrued costs related to workplace and general and administrative expenses.
13. COMMITMENTS AND CONTINGENCIES
Legal Proceedings—In January 2018, a putative class action lawsuit alleging violations of the federal securities laws was filed in the U.S. District Court for the Northern District of California, naming as defendants the Company and certain of its officers (the “Securities Class Action”). The complaint, which the plaintiff amended on June 25, 2018, alleged violations of the Securities Exchange Act of 1934, as amended, by the Company and its officers for allegedly making materially false and misleading statements regarding its business and operations on February 9, 2017. The plaintiff sought unspecified monetary damages and other relief. On November 27, 2018, the Court granted in part and denied in part the defendants’ motion to dismiss. On October 22, 2019, the Court approved a stipulation to certify a class in this action and, on September 9, 2021, it denied the defendants’ motion for summary judgment. The case was scheduled for trial to begin on February 7, 2022. However, on December 3, 2021, the defendants reached a preliminary agreement with the plaintiff to settle this matter for $22.25 million. The proposed settlement was subsequently filed with the Court, which preliminarily approved it on July 25, 2022. The settlement was then funded by defendants’ insurers during the three months ended September 30, 2022. The Court entered an order granting final approval to the settlement on January 27, 2023, and on the same day entered judgment in the Securities Class Action. The settlement resolves all claims asserted against all defendants in the Securities Class Action without any liability or wrongdoing attributed to them.
On August 26, 2022, the Court granted final approval of the settlement of a stockholder derivative action (the “Derivative Action”) asserting claims against certain current and former officers, and naming the Company as a nominal defendant, which arose out of the same facts as the Securities Class Action and was pending before the Court. The settlement resolved all claims asserted against all defendants in the Derivative Action without any liability or wrongdoing attributed to them personally or to the Company. Under the terms of the settlement, the Company’s board of directors adopted certain corporate governance modifications and the Company received $18.0 million of insurance proceeds. The Company has paid $3.75 million of such insurance proceeds to the plaintiff’s attorneys as fees. The remaining insurance proceeds funded the Securities Class Action settlement.
The Company assesses, in conjunction with its legal counsel, the need to record a liability for litigation and contingencies, which it will accrue when it believes a loss is probable and the amount can be reasonably estimated. The Company believed the losses for both the settlements of the Securities Class Action and the Derivative Action were probable and the payment amounts described above, which totaled $26.0 million, represented reasonable estimates of loss contingencies. The Company also believed that the anticipated insurance proceeds related to the settlement of each action described above, which also totaled $26.0 million, were probable and represented reasonable estimates for loss recovery. Accordingly, the Company recorded a $26.0 million accrual for loss contingency within accounts payable and accrued liabilities as well as a $26.0 million receivable for loss recovery within prepaid expenses and other current assets during 2021, of which $3.75 million was released from each of the receivable for loss recovery and the accrual for loss contingency during the three months ended September 30, 2022 upon payment to the plaintiff's attorneys in the Derivative Action. As of December 31, 2022, the Company had a $22.25 million remaining accrual for the settlement of the Securities Class Action on its consolidated balance sheets within each of accounts payable and accrued liabilities as well as prepaid expenses and current assets. In January 2023, the Company released the remaining receivable and accrual upon the Court granting final approval of these settlements.
On October 12, 2016, a putative class action lawsuit asserting claims against the Company was filed in the Superior Court of California for the County of San Francisco relating to alleged unlawful call recording and/or monitoring under the California Invasion of Privacy Act. Plaintiff seeks statutory damages and other relief. In response, the Company filed a motion for summary judgment, which the Court granted. Plaintiff appealed and, in October 2020, the California Court of Appeal for the First District reversed the decision of the trial court, and the California Supreme Court denied review. The case was then remanded to the Superior Court, where the Company subsequently amended its answer to add affirmative defenses, and Plaintiff amended his complaint to add additional named plaintiffs. On January 12, 2023, the Company filed another motion for summary judgment, and a hearing on that motion is scheduled for May 19, 2023. On January 18, 2023 the Court granted plaintiffs’ motion for class certification. On February 17, 2023, the Company filed a petition for a writ with the California Court of Appeal, seeking reversal of the lower court’s class certification decision. No date has been set for trial.
The Company is subject to other legal proceedings arising in the ordinary course of business. Although the results of litigation and claims cannot be predicted with certainty, the Company currently does not believe that the final outcome of any of these other matters will have a material effect on the Company’s business, financial position, results of operations or cash flows.
Indemnification Agreements—In the ordinary course of business, the Company may provide indemnifications of varying scope and terms to customers, vendors, lessors, business partners and other parties with respect to certain matters, including, but not limited to, losses arising out of the breach of such agreements, services to be provided by the Company or from intellectual property infringement claims made by third parties.
In addition, the Company has entered into indemnification agreements with directors and certain officers and employees that require the Company to, among other things, indemnify them against certain liabilities that may arise by reason of their status or service as directors, officers or employees.
While the outcome of claims cannot be predicted with certainty, the Company does not believe that the outcome of any claims under the indemnification arrangements will have a material effect on the Company’s financial position, results of operations or cash flows.
Revolving Credit Facility—The Company is a party to a Credit Agreement with Wells Fargo Bank, National Association (the “Credit Agreement”), which provides for a three-year, $75.0 million senior unsecured revolving credit facility including a letter of credit sub-limit of $25.0 million. The commitments under the Credit Agreement expire on May 5, 2023. Interest on any borrowings under the revolving credit facility will accrue at either LIBOR plus 1.25% or at an alternative base rate plus 0.25%, at the Company’s election. Interest is payable monthly in arrears for base rate loans and at the end of the applicable interest period (or, if the interest period extends over three months, at the end of each three-month interval during the interest period) for LIBOR loans. The Company is also required to pay an annual commitment fee that accrues at 0.25% per annum on the unused portion of the aggregate commitments under the revolving credit facility, payable quarterly in arrears.
Debt issuance-related costs were $0.4 million and are being amortized to interest expense on a straight-line basis over the life of the Credit Agreement.
The Company is required to pay a fee that accrues at 0.70% per annum on the undrawn portion of any letter of credit, payable quarterly in arrears. As of December 31, 2022, the Company had $20.5 million of letters of credit under the sub-limit related to lease agreements for certain office locations, which are required to be maintained and issued to the landlords of each facility, and $54.5 million remained available under the revolving credit facility as of this date.
The Company was in compliance with all covenants associated with the credit facility and there were no loans outstanding under the Credit Agreement as of December 31, 2022. See “
Liquidity and Capital Resources,” included under Part II, Item 7 in this Annual Report for additional information on the covenants included in the Credit Agreement.
14. STOCKHOLDERS’ EQUITY
The following table presents the number of shares authorized and issued as of the dates indicated (in thousands):
|
|
|
|
|
|
|
|
|
|
|
|
|
|
|
|
|
|
|
|
|
|
|
|
|
December 31, 2022 |
|
December 31, 2021 |
|
Shares
Authorized |
|
Shares
Issued |
|
Shares
Authorized |
|
Shares
Issued |
| Stockholders’ equity: |
|
|
|
|
|
|
|
Common stock, $0.000001 par value |
200,000 |
|
|
69,797 |
|
|
200,000 |
|
|
72,171 |
|
| Undesignated preferred stock |
10,000 |
|
|
— |
|
|
10,000 |
|
|
— |
|
Stock Repurchase Program
As of December 31, 2022, the Company’s board of directors had authorized it to repurchase up to an aggregate of $1.45 billion of its outstanding common stock, $281.7 million of which remained available as of December 31, 2022. The Company may purchase shares at management’s discretion in the open market, in privately negotiated transactions, in transactions structured through investment banking institutions or a combination of the foregoing.
During the year ended December 31, 2022, the Company repurchased on the open market and subsequently retired 6,195,093 shares for an aggregate purchase price of $200.0 million. The Company had no treasury stock balance as of December 31, 2022.
During the year ended December 31, 2021, the Company repurchased 6,995,170 shares on the open market for an aggregate purchase price of $262.9 million. The Company retired 7,094,000 shares during the year ended December 31, 2021 and had no treasury stock balance as of December 31, 2021.
Common Stock Reserved for Future Issuance
As of December 31, 2022, the Company had reserved shares of common stock for future issuances in connection with the following (in thousands):
|
|
|
|
|
|
|
Number of Shares |
| Stock options outstanding |
3,543 |
|
| RSUs and PRSUs outstanding |
9,962 |
|
| Available for future equity award grants |
13,258 |
|
| Available for future ESPP offerings |
2,686 |
|
| Total reserved for future issuance |
29,449 |
|
Equity Incentive Plans
The Company has outstanding awards under its 2012 Equity Incentive Plan, as amended (the “2012 Plan”). Under the 2012 Plan, the Company has the ability to issue incentive stock options, non-statutory stock options, stock appreciation rights, RSUs, restricted stock awards, performance units and performance shares. Additionally, the 2012 Plan provides for the grant of performance cash awards to employees, directors and consultants.
On February 6, 2023, the Company adopted the Yelp Inc. 2023 Inducement Award Plan (the “Inducement Plan”), pursuant to which it reserved 1,400,000 shares of its common stock for issuance to individuals who were not previously employees of the Company, or who are returning to employment following a bona fide period of non-employment with the Company, as an inducement material to such persons entering into employment with the Company, in accordance with New York Stock Exchange Listed Company Manual Rule 303A.08. Under the Inducement Plan, the Company has the ability to issue non-statutory stock options, stock appreciation rights, RSUs, restricted stock awards, performance units and performance shares. The Inducement Plan also provides for the grant of performance cash awards to individuals eligible to receive awards under the Inducement Plan.
Stock Options
Stock options granted under the 2012 Plan are granted at a price per share not less than the fair value of a share of the Company’s common stock on the grant date. Options generally vest over a four-year period, on one of two schedules: (a) 25% vesting at the end of one year and the remaining shares vesting monthly thereafter or (b) ratably on a monthly basis. Options granted are generally exercisable for contractual terms of up to 10 years. The Company issues new shares when stock options are exercised.
For the years ended December 31, 2022, 2021 and 2020, the weighted-average assumptions used for the Black-Scholes-Merton option valuation model were as follows:
|
|
|
|
|
|
|
|
|
|
|
|
|
|
|
|
|
|
|
Year Ended December 31, |
|
2022 |
|
2021 |
|
2020 |
| Dividend yield |
— |
|
|
— |
|
|
— |
|
| Annual risk-free rate |
3.0 |
% |
|
1.1 |
% |
|
0.5 |
% |
| Expected volatility |
50.4 |
% |
|
49.4 |
% |
|
45.9 |
% |
| Expected term (years) |
6.0 |
|
6.0 |
|
5.7 |
A summary of stock option activity for the year ended December 31, 2022 is as follows:
|
|
|
|
|
|
|
|
|
|
|
|
|
|
|
|
|
|
|
|
|
|
|
|
|
|
|
|
|
|
|
Number of
Shares (in thousands) |
|
Weighted-
Average
Exercise
Price |
|
Weighted-
Average
Remaining
Contractual
Term (in
years) |
|
Aggregate
Intrinsic
Value (in
thousands) |
| Outstanding at December 31, 2021 |
3,979 |
|
|
$ |
32.59 |
|
|
4.4 |
|
$ |
24,580 |
|
| Granted |
10 |
|
|
31.42 |
|
|
|
|
|
| Exercised |
(306) |
|
|
24.66 |
|
|
|
|
|
| Canceled |
(140) |
|
|
44.49 |
|
|
|
|
|
| Outstanding at December 31, 2022 |
3,543 |
|
|
$ |
32.81 |
|
|
3.6 |
|
$ |
7,507 |
|
| Options vested and exercisable at December 31, 2022 |
3,424 |
|
|
$ |
32.73 |
|
|
3.4 |
|
$ |
7,507 |
|
Aggregate intrinsic value represents the difference between the closing price of the Company’s common stock as quoted on the New York Stock Exchange on a given date and the exercise price of outstanding, in-the-money options. The total intrinsic value of options exercised was approximately $3.2 million, $13.8 million and $33.8 million for the years ended December 31, 2022, 2021 and 2020, respectively.
The weighted-average grant date fair value of options granted was $16.07, $18.55 and $10.01 per share for the years ended December 31, 2022, 2021 and 2020, respectively.
As of December 31, 2022, total unrecognized compensation costs related to unvested stock options was approximately $1.7 million, which the Company expects to recognize over a weighted-average time period of 1.7 years.
RSUs
RSUs generally vest over a four-year period, on one of two schedules: (a) 25% vesting at the end of one year and the remaining vesting quarterly thereafter or (b) ratably on a quarterly basis.
RSUs also include PRSUs, which are subject to either (a) a market condition or (b) the achievement of performance goals. PRSUs may also be subject to a time-based vesting schedule of quarterly over four years (the “Time-Based Vesting Schedule”). For PRSUs subject to a market condition, the Company recognizes expense from the date of grant. For PRSUs subject to performance goals, the Company recognizes expense when it is probable that the performance condition will be achieved.
The Company granted PRSUs subject to market conditions in 2019 and 2022. The shares underlying each PRSU award granted in 2019 will be eligible to vest only if the average closing price of the Company’s common stock equaled or exceeded $45.3125 over any 60-day trading period during the four years following the grant date of February 7, 2019. If this market condition is met, the shares underlying each PRSU award will vest according to the Time-Based Vesting Schedule. Any shares subject to the PRSUs that have met the Time-Based Vesting Schedule at the time the market condition is achieved will fully vest as of such date; thereafter, any remaining nonvested shares subject to the PRSUs will continue vesting solely according to the Time-Based Vesting Schedule, subject to the applicable employee's continued service as of each such vesting date. Based on the performance of the Company’s stock over the four years following the grant date, the market condition for the 2019 PRSUs was not achieved and the Company expects the shares underlying these awards to return to the pool of shares reserved for future issuance under the 2012 Plan following certification of this result in the first quarter of 2023.
The shares underlying each PRSUs granted in 2022 that is subject to market conditions vest based on the relative performance of the Company’s total stockholder return (“TSR”) over a three-year period. A percentage of the target number of shares underlying each award, ranging from zero to 200%, will vest based on the percentile rank of the Company’s TSR relative to that of the other companies in the Russell 2000 index over the period beginning January 1, 2022 and ending December 31, 2024. The Company’s TSR, as well as the TSR of the other companies in the Russell 2000 Index, will be calculated based on the average closing price of each company’s stock over the last 20 trading days of the performance period compared to the average closing price over the first 20 trading days of the performance period. Any shares that become eligible to vest based on the Company’s level of achievement of the market goal will fully vest on or following certification of the Company’s performance on February 20, 2025 or, if the certification occurs following such date, March 15, 2025, subject to the applicable employee’s continued service as of such vesting date.
For PRSUs subject to performance goals, a percentage of the target number of shares, ranging from zero to 200%, will become eligible to vest based on the Company’s level of achievement of certain financial targets, subject to the Time-Based Vesting Schedule. The shares subject to performance goals become eligible to vest once the achievement against the financial targets is known, which will be no later than March of the following year. On the quarterly vest date immediately following such determination (or a vest date otherwise specified in the agreement), the eligible shares, if any, will vest to the extent that the employee has met the Time-Based Vesting Schedule as of such date. Thereafter, the eligible shares will continue to vest in accordance with the Time-Based Vesting Schedule, subject to the applicable employee’s continued service as of each such vesting date. The Company performed an analysis as of December 31, 2022 to assess the probability of achievement of the PRSU financial targets and, as a result, recorded compensation costs in the year ended December 31, 2022 for the PRSUs that it expected to vest.
As the PRSU activity during the year ended December 31, 2022 was not material, it is presented together with the RSU activity in the table below. A summary of RSU and PRSU activity for the year ended December 31, 2022 is as follows (in thousands, except per share amounts):
|
|
|
|
|
|
|
|
|
|
|
|
|
|
|
Number of
Shares
|
|
Weighted-
Average Grant
Date Fair Value
|
| Nonvested at December 31, 2021 |
10,016 |
|
|
$ |
32.39 |
|
| Granted |
6,807 |
|
|
34.89 |
|
Vested(1) |
(4,786) |
|
|
33.40 |
|
| Canceled |
(2,075) |
|
|
33.05 |
|
Nonvested at December 31, 2022(2) |
9,962 |
|
|
$ |
33.48 |
|
(1) Includes 1,894,504 shares that vested but were not issued due to the Company’s use of Net Share Withholding for payment of employee taxes.
(2) Includes 656,659 PRSUs.
The aggregate fair value as of the vest date of RSUs and PRSUs that vested during the years ended December 31, 2022, 2021 and 2020 was $155.0 million, $164.5 million and $95.0 million, respectively. As of December 31, 2022, the Company had approximately $305.5 million of unrecognized stock-based compensation expense related to RSUs and PRSUs, which it expects to recognize over the remaining weighted-average vesting period of approximately 2.5 years.
Employee Stock Purchase Plan
The ESPP allows eligible employees to purchase shares of the Company’s common stock at a discount through payroll deductions of up to 15% of their eligible compensation, subject to any plan limitations, during designated six-month offering periods. At the end of each offering period, employees are able to purchase shares at 85% of the fair market value of the Company’s common stock on the last day of the offering period, based on the closing sales price of the Company’s common stock as quoted on the New York Stock Exchange on such date.
During the years ended December 31, 2022, 2021 and 2020, employees purchased 627,485, 517,309 and 662,063 shares, respectively, at a weighted-average purchase price per share of $25.55, $31.58 and $21.47, respectively. The Company recognized stock-based compensation expense related to the ESPP of $2.8 million, $3.0 million and $2.5 million in the years ended December 31, 2022, 2021 and 2020, respectively.
Stock-Based Compensation
The following table summarizes the effects of stock-based compensation expense related to stock-based awards in the consolidated statements of operations during the periods presented (in thousands):
|
|
|
|
|
|
|
|
|
|
|
|
|
|
|
|
|
|
|
Year Ended December 31, |
|
2022 |
|
2021 |
|
2020 |
| Cost of revenue |
$ |
4,761 |
|
|
$ |
4,302 |
|
|
$ |
3,784 |
|
| Sales and marketing |
33,621 |
|
|
32,335 |
|
|
29,670 |
|
| Product development |
86,871 |
|
|
81,624 |
|
|
67,622 |
|
| General and administrative |
30,837 |
|
|
33,418 |
|
|
23,498 |
|
| Total stock-based compensation recorded to income before incomes taxes |
156,090 |
|
|
151,679 |
|
|
124,574 |
|
| Benefit from income taxes |
(33,792) |
|
|
(35,778) |
|
|
(31,920) |
|
| Total stock-based compensation recorded to net income |
$ |
122,298 |
|
|
$ |
115,901 |
|
|
$ |
92,654 |
|
During the years ended December 31, 2022, 2021 and 2020, the Company capitalized $8.9 million, $10.7 million and $9.4 million, respectively, of stock-based compensation expense as website and internal-use software costs and, to a lesser extent, implementation costs incurred related to cloud computing arrangements that are service contracts.
15. OTHER INCOME, NET
Other income, net for the years ended December 31, 2022, 2021 and 2020 consisted of the following (in thousands):
|
|
|
|
|
|
|
|
|
|
|
|
|
|
|
|
|
|
|
Year Ended December 31, |
|
2022 |
|
2021 |
|
2020 |
| Interest income (expense), net |
$ |
5,762 |
|
|
$ |
(116) |
|
|
$ |
2,273 |
|
| Transaction (loss) gain on foreign exchange, net |
(130) |
|
|
231 |
|
|
20 |
|
| Other non-operating income, net |
2,793 |
|
|
2,089 |
|
|
1,377 |
|
| Other income, net |
$ |
8,425 |
|
|
$ |
2,204 |
|
|
$ |
3,670 |
|
16. INCOME TAXES
The following table presents domestic and foreign components of income (loss) before income taxes for the periods presented (in thousands):
|
|
|
|
|
|
|
|
|
|
|
|
|
|
|
|
|
|
|
Year Ended December 31, |
|
2022 |
|
2021 |
|
2020 |
| United States |
$ |
89,215 |
|
|
$ |
44,009 |
|
|
$ |
(28,878) |
|
| Foreign |
(22,437) |
|
|
(10,291) |
|
|
(6,247) |
|
| Total income (loss) before income taxes |
$ |
66,778 |
|
|
$ |
33,718 |
|
|
$ |
(35,125) |
|
The income tax provision (benefit) is composed of the following (in thousands):
|
|
|
|
|
|
|
|
|
|
|
|
|
|
|
|
|
|
|
Year Ended December 31, |
|
2022 |
|
2021 |
|
2020 |
| Current: |
|
|
|
|
|
| Federal |
$ |
74,464 |
|
|
$ |
1,133 |
|
|
$ |
(4,823) |
|
| State |
11,070 |
|
|
1,859 |
|
|
(434) |
|
| Foreign |
1,518 |
|
|
245 |
|
|
737 |
|
| Total current tax |
87,052 |
|
|
3,237 |
|
|
(4,520) |
|
| Deferred: |
|
|
|
|
|
| Federal |
(51,217) |
|
|
(9,338) |
|
|
(10,456) |
|
| State |
(5,281) |
|
|
(443) |
|
|
(731) |
|
| Foreign |
(123) |
|
|
591 |
|
|
6 |
|
| Total deferred tax |
(56,621) |
|
|
(9,190) |
|
|
(11,181) |
|
| Total provision for (benefit from) income taxes |
$ |
30,431 |
|
|
$ |
(5,953) |
|
|
$ |
(15,701) |
|
The following table presents a reconciliation of the statutory federal rate and the Company’s effective tax rate for the periods presented:
|
|
|
|
|
|
|
|
|
|
|
|
|
|
|
|
|
|
|
Year Ended December 31, |
|
2022 |
|
2021 |
|
2020 |
| Income tax at federal statutory rate |
21.00 |
% |
|
21.00 |
% |
|
21.00 |
% |
| State tax, net of federal tax effect |
5.16 |
|
|
5.09 |
|
|
2.75 |
|
| Foreign income tax rate differential |
(1.27) |
|
|
(1.83) |
|
|
1.04 |
|
| Stock-based compensation |
8.55 |
|
|
(11.58) |
|
|
(6.47) |
|
| Provision to return true-ups |
0.46 |
|
|
2.46 |
|
|
(1.30) |
|
| Income tax credits |
(12.73) |
|
|
(39.39) |
|
|
39.52 |
|
| Change in valuation allowance |
2.24 |
|
|
11.50 |
|
|
(15.64) |
|
| Change in uncertain tax positions |
(0.36) |
|
|
(18.68) |
|
|
(0.34) |
|
| Global intangible low-taxed income ("GILTI") |
16.09 |
|
|
— |
|
|
— |
|
| Employee fringe benefits |
0.43 |
|
|
0.35 |
|
|
(1.83) |
|
| Other non-deductible expenses |
5.19 |
|
|
9.95 |
|
|
(1.49) |
|
|
|
|
|
|
|
| Deferred adjustments |
1.46 |
|
|
0.98 |
|
|
1.36 |
|
|
|
|
|
|
|
| Net operating loss carryback and true-up |
— |
|
|
2.71 |
|
|
5.03 |
|
| Other |
(0.65) |
|
|
(0.22) |
|
|
1.07 |
|
| Effective tax rate |
45.57 |
% |
|
(17.66) |
% |
|
44.70 |
% |
Certain reclassifications have been made to prior period amounts in the table above to conform to the current period presentation. The change reclassifies all state tax impacts, except for income tax credits and change in valuation allowance, to the state tax, net of federal tax effect line item.
Beginning in 2022, additional changes under the U.S. Tax Cuts and Jobs Act came into effect, including the mandatory capitalization and amortization of research and development expenses. These provisions require the Company to capitalize research and experimental expenditures and amortize them on the U.S. tax return over five or fifteen years, depending on where research is conducted. This required capitalization results in an overall increase in provision for income taxes (including an increase in GILTI as well as the overall effective tax rate in 2022) and in DTAs.
Deferred Tax Balances
Deferred income taxes reflect the net tax effects of temporary differences between carrying amounts of assets and liabilities for financial reporting purposes and the amounts used for income tax purposes. The following table presents the significant components of the Company’s deferred tax assets and liabilities for the periods presented (in thousands):
|
|
|
|
|
|
|
|
|
|
|
|
|
As of December 31, |
|
2022 |
|
2021 |
| Deferred tax assets: |
|
|
|
| Reserves and others |
$ |
4,803 |
|
|
$ |
4,963 |
|
| Stock-based compensation |
20,214 |
|
|
21,749 |
|
| Net operating loss carryforward |
1,754 |
|
|
3,064 |
|
| Tax credit carryforward |
34,462 |
|
|
47,340 |
|
| Capitalized research and development |
84,390 |
|
|
9,408 |
|
| Operating lease liabilities |
30,394 |
|
|
40,616 |
|
| Gross deferred tax assets |
176,017 |
|
|
127,140 |
|
| Valuation allowance |
(34,303) |
|
|
(32,815) |
|
| Total deferred tax assets |
141,714 |
|
|
94,325 |
|
| Deferred tax liabilities: |
|
|
|
| Depreciation and amortization |
(13,955) |
|
|
(14,914) |
|
|
|
|
|
| Deferred contract costs |
(6,750) |
|
|
(4,372) |
|
| Operating lease right-of-use assets |
(23,631) |
|
|
(34,515) |
|
| Total deferred tax liabilities |
(44,336) |
|
|
(53,801) |
|
| Net deferred tax assets |
$ |
97,378 |
|
|
$ |
40,524 |
|
As of December 31, 2022, the Company had federal and state net operating loss carryforwards of approximately $4 million and $22.6 million, respectively, expiring beginning in 2037 and 2025, respectively. As of December 31, 2022, the Company's wholly owned subsidiary, Yelp GmbH (Germany), had net operating loss carryforwards of $0.5 million, which have an indefinite carryforward period. The Company had federal research credit carryforwards of approximately $0.4 million (gross) that begin to expire in 2031, if unused; California research credit carryforwards of approximately $70.7 million (gross) that do not expire; and Canada research credit carryforwards of approximately $1.6 million (gross) that begin to expire in 2041.
Utilization of net operating loss carryforwards and credits may be subject to a substantial annual limitation due to the ownership change limitations provided by the Internal Revenue Code of 1986, as amended, and similar state provisions. The annual limitation may result in the expiration of net operating losses and credits before utilization. The Company does not expect any previous ownership changes, as defined under Section 382 and 383 of the Internal Revenue Code, to result in a limitation that will materially reduce the total amount of net operating loss carryforwards and credits that can be utilized. Further, foreign loss carryforwards may be subject to limitations under the applicable laws of the taxing jurisdictions due to ownership change limitations.
As of December 31, 2022, the Company had accumulated undistributed earnings generated by its foreign subsidiaries of approximately $16.9 million. The Company continues to assert that all its foreign earnings are to be permanently reinvested and expects future U.S. cash generation to be sufficient to meet future U.S. cash needs. As such, the Company has not recognized a deferred tax liability related to unremitted foreign earnings.
Deferred Tax Valuation Allowance
As more fully described in “Income Taxes” in
Note 2, “Summary of Significant Accounting Policies,” the Company maintains valuation allowances against deferred tax balances where appropriate and considers all positive and negative evidence that the Company would have future taxable income sufficient to realize the benefit of its deferred tax assets.
Valuation allowances of $34.3 million and $32.8 million primarily related to California state tax credits were recorded against the Company’s net deferred tax asset balances as of December 31, 2022 and 2021, respectively. Since the Company mainly conducts research and development activities in California but earns a substantial portion of its U.S. income in other states, the Company could not assert, at the required more-likely-than-not level of certainty, that it would generate future taxable California income sufficient to realize the benefit of these deferred tax assets.
Accordingly, the Company maintained a valuation allowance against specific state credits.
Unrecognized Tax Benefits
A reconciliation of the beginning and ending amount of unrecognized tax benefits is as follows (in thousands):
|
|
|
|
|
|
|
|
|
|
|
|
|
|
|
|
|
|
|
Year Ended December 31, |
|
2022 |
|
2021 |
|
2020 |
| Balance at the beginning of the year |
$ |
52,605 |
|
|
$ |
48,207 |
|
|
$ |
40,718 |
|
| Increase (decrease) based on tax positions related to the prior year |
61 |
|
|
(291) |
|
|
(453) |
|
| Increase based on tax positions related to the current year |
7,455 |
|
|
10,750 |
|
|
7,942 |
|
|
|
|
|
|
|
| Lapse of statute of limitations |
(357) |
|
|
(6,061) |
|
|
— |
|
| Balance at the end of the year |
$ |
59,764 |
|
|
$ |
52,605 |
|
|
$ |
48,207 |
|
As of December 31, 2022, the Company had $30.9 million of unrecognized tax benefits that, if recognized, would affect the effective tax rate. The Company’s policy is to record interest and penalties related to unrecognized tax benefits as income tax expense. During each of the years ended December 31, 2022, 2021 and 2020, the Company recorded an immaterial amount of interest and penalties.
In addition, the Company is subject to the continuous examination of its income tax returns by the IRS and other tax authorities. The Company’s federal and state income tax returns for fiscal years subsequent to 2003 remain open to examination. In the Company’s foreign jurisdictions — Canada, Ireland, United Kingdom and Germany — the tax years subsequent to 2017 remain open to examination. The Company regularly assesses the likelihood of adverse outcomes resulting from examinations to determine the adequacy of its provision for income taxes, and monitors the progress of ongoing discussions with tax authorities and the impact, if any, of the expected expiration of the statute of limitations in various taxing jurisdictions. The Company believes that an adequate provision has been made for any adjustments that may result from tax examinations. However, the outcome of tax audits cannot be predicted with certainty. If any issues addressed in the Company’s tax audits are resolved in a manner not consistent with management’s expectations, the Company could be required to adjust its provision for income taxes in the period such resolution occurs. Although the timing of the resolution or closure of audits is not certain, the Company believes that it is reasonably possible that unrecognized tax benefits will not be reduced within the next 12 months.
17. NET INCOME (LOSS) PER SHARE ATTRIBUTABLE TO COMMON STOCKHOLDERS
Basic net income (loss) per share attributable to common stockholders is computed using the weighted-average number of outstanding shares of common stock during the period. Diluted net income (loss) per share attributable to common stockholders is computed using the weighted-average number of outstanding shares of common stock and the effect of potentially dilutive securities outstanding during the period. Potentially dilutive securities include stock options, RSUs (including PRSUs) and, to a lesser extent, ESPP shares. If dilutive, such potentially dilutive securities are reflected in net income (loss) per share attributable to common stockholders using the treasury stock method.
The following tables present the calculation of basic and diluted net income (loss) per share attributable to common stockholders for the periods presented (in thousands, except per share data):
|
|
|
|
|
|
|
|
|
|
|
|
|
|
|
|
|
|
|
Year Ended December 31, |
|
2022 |
|
2021 |
2020 |
| Basic net income (loss) per share: |
|
|
|
|
|
| Net income (loss) attributable to common stockholders |
$ |
36,347 |
|
|
$ |
39,671 |
|
|
$ |
(19,424) |
|
| Shares used in computation: |
|
|
|
|
|
| Weighted-average common shares outstanding |
70,867 |
|
|
74,221 |
|
|
73,005 |
|
| Basic net income (loss) per share attributable to common stockholders: |
$ |
0.51 |
|
|
$ |
0.53 |
|
|
$ |
(0.27) |
|
|
|
|
|
|
|
|
|
|
|
|
|
|
|
|
|
|
|
|
Year Ended December 31, |
|
2022 |
|
2021 |
2020 |
| Diluted net income (loss) per share: |
|
|
|
|
|
| Net income (loss) attributable to common stockholders |
$ |
36,347 |
|
|
$ |
39,671 |
|
|
$ |
(19,424) |
|
| Shares used in computation: |
|
|
|
|
|
| Weighted-average common shares outstanding |
70,867 |
|
|
74,221 |
|
|
73,005 |
|
| Stock options |
474 |
|
|
786 |
|
|
— |
|
| RSUs |
2,058 |
|
|
3,607 |
|
|
— |
|
| ESPP |
3 |
|
|
2 |
|
|
— |
|
| Number of shares used in diluted calculation |
73,402 |
|
|
78,616 |
|
|
73,005 |
|
| Diluted net income (loss) per share attributable to common stockholders: |
$ |
0.50 |
|
|
$ |
0.50 |
|
|
$ |
(0.27) |
|
The following stock-based instruments were excluded from the calculation of diluted net income (loss) per share attributable to common stockholders because their effect would have been anti-dilutive for the periods presented (in thousands):
|
|
|
|
|
|
|
|
|
|
|
|
|
|
|
|
|
|
|
Year Ended December 31, |
|
2022 |
|
2021 |
|
2020 |
| Stock options |
2,030 |
|
|
1,541 |
|
|
4,623 |
|
| RSUs |
853 |
|
|
59 |
|
|
9,758 |
|
| ESPP |
— |
|
|
— |
|
|
62 |
|
|
|
|
|
|
|
18. INFORMATION ABOUT REVENUE AND GEOGRAPHIC AREAS
The Company considers operating segments to be components of the Company for which separate financial information is available and evaluated regularly by the Company’s chief operating decision maker in deciding how to allocate resources and in assessing performance. The chief operating decision maker for the Company is the chief executive officer. The chief executive officer reviews financial information presented on a consolidated basis, accompanied by information about revenue by product line and geographic region for purposes of allocating resources and evaluating financial performance.
The Company has determined that it has a single operating and reporting segment. When the Company communicates results externally, it disaggregates net revenue into major product lines and primary geographical markets, which is based on the billing address of the customer. The disaggregation of net revenue by major product lines is based on the type of service provided and also aligns with the timing of revenue recognition for each. To reflect the Company’s strategic focus on creating differentiated experiences for its Services categories and Restaurants, Retail & Other categories, the Company further disaggregates advertising revenue to reflect these two high-level category groupings. The Services categories consist of the following businesses: home, local, auto, professional, pets, events, real estate and financial services. The Restaurants, Retail & Other categories consist of the following businesses: restaurants, shopping, beauty & fitness, health and other.
Net Revenue
The following table presents the Company’s net revenue by major product line (and by category for advertising revenue) for the periods presented (in thousands):
|
|
|
|
|
|
|
|
|
|
|
|
|
|
|
|
|
|
|
Year Ended December 31, |
|
2022 |
|
2021 |
|
2020 |
| Net revenue by product: |
|
|
|
|
|
Advertising revenue by category(1): |
|
|
|
|
|
| Services |
$ |
693,810 |
|
|
$ |
607,770 |
|
|
$ |
515,019 |
|
| Restaurants, Retail & Other |
440,593 |
|
|
377,455 |
|
|
321,096 |
|
| Advertising |
1,134,403 |
|
|
985,225 |
|
|
836,115 |
|
| Transactions |
14,063 |
|
|
13,196 |
|
|
15,017 |
|
| Other |
45,040 |
|
|
33,418 |
|
|
21,801 |
|
| Total net revenue |
$ |
1,193,506 |
|
|
$ |
1,031,839 |
|
|
$ |
872,933 |
|
(1) Beginning in 2021, advertising revenue by category reflects an updated method of disaggregation. Prior-year amounts have not been updated as it is impracticable to do so, given certain historical information is not available.
During the years ended December 31, 2022, 2021 and 2020, no individual customer accounted for 10% or more of consolidated net revenue.
As a result of the COVID-19 pandemic, the Company considered whether there was any impact to the manner in which it recognizes revenue, in particular with respect to the collectability criteria for recognizing revenue from contracts with customers. The Company did not change the manner in which it recognizes revenue as a result of that assessment.
The Company offered a number of relief incentives to advertising and other revenue customers most impacted by the COVID-19 pandemic totaling $0.4 million, $3.5 million and $22.6 million during the years ended December 31, 2022, 2021 and 2020, respectively. These incentives were primarily in the form of waived advertising and subscription fees. The Company accounted for these incentives as price concessions and reduced net revenue recognized in the years ended December 31, 2022, 2021 and 2020 accordingly. During the year ended December 31, 2020, the Company also paused certain advertising campaigns that were scheduled to run from April to May 2020 and offered certain free advertising products during those months with a total value of $14.5 million. All paused advertising campaigns that were not cancelled by customers resumed by the end of May 2020.
The following table presents the Company’s net revenue by major geographic region for the periods presented (in thousands):
|
|
|
|
|
|
|
|
|
|
|
|
|
|
|
|
|
|
|
Year Ended December 31, |
|
2022 |
|
2021 |
|
2020 |
| United States |
$ |
1,185,202 |
|
|
$ |
1,023,143 |
|
|
$ |
863,300 |
|
| All other countries |
8,304 |
|
|
8,696 |
|
|
9,633 |
|
| Total net revenue |
$ |
1,193,506 |
|
|
$ |
1,031,839 |
|
|
$ |
872,933 |
|
Long-Lived Assets
The following table presents the Company’s long-lived assets by major geographic region for the periods presented (in thousands):
|
|
|
|
|
|
|
|
|
|
|
|
|
As of December 31, |
|
2022 |
|
2021 |
| United States |
$ |
72,325 |
|
|
$ |
79,027 |
|
| All other countries |
4,899 |
|
|
4,830 |
|
| Total long-lived assets |
$ |
77,224 |
|
|
$ |
83,857 |
|
EX-23.1
2
yelp10k12312022ex231.htm
EX-23.1
Document
CONSENT OF INDEPENDENT REGISTERED PUBLIC ACCOUNTING FIRM
We consent to the incorporation by reference in Registration Statement Nos. 333-180221, 333-187545, 333-192016, 333-194260, 333-202332, 333-209683, 333-211198, 333-216389, 333-223321, 333-229986, 333-236795, 333-253610 and 333-263104 on Form S-8 and Registration Statement No. 333-253627 on Form S-3 of our reports dated February 24, 2023, relating to the financial statements of Yelp Inc. and the effectiveness of Yelp Inc.’s internal control over financial reporting appearing in this Annual Report on Form 10-K of Yelp Inc. for the year ended December 31, 2022.
/s/ DELOITTE & TOUCHE LLP
San Francisco, California
February 24, 2023
EX-31.1
3
yelp10k12312022ex311.htm
EX-31.1
Document
Exhibit 31.1
CERTIFICATION
I, Jeremy Stoppelman, certify that:
1. I have reviewed this Annual Report on Form 10-K of Yelp Inc.;
2. Based on my knowledge, this report does not contain any untrue statement of a material fact or omit to state a material fact necessary to make the statements made, in light of the circumstances under which such statements were made, not misleading with respect to the period covered by this report;
3. Based on my knowledge, the financial statements, and other financial information included in this report, fairly present in all material respects the financial condition, results of operations and cash flows of the registrant as of, and for, the periods presented in this report;
4. The registrant’s other certifying officer(s) and I are responsible for establishing and maintaining disclosure controls and procedures (as defined in Exchange Act Rules 13a-15(e) and 15d-15(e)) and internal control over financial reporting (as defined in Exchange Act Rules 13a-15(f) and 15d-15(f)) for the registrant and have:
a) Designed such disclosure controls and procedures, or caused such disclosure controls and procedures to be designed under our supervision, to ensure that material information relating to the registrant, including its consolidated subsidiaries, is made known to us by others within those entities, particularly during the period in which this report is being prepared;
b) Designed such internal control over financial reporting, or caused such internal control over financial reporting to be designed under our supervision, to provide reasonable assurance regarding the reliability of financial reporting and the preparation of financial statements for external purposes in accordance with generally accepted accounting principles;
c) Evaluated the effectiveness of the registrant’s disclosure controls and procedures and presented in this report our conclusions about the effectiveness of the disclosure controls and procedures, as of the end of the period covered by this report based on such evaluation; and
d) Disclosed in this report any change in the registrant’s internal control over financial reporting that occurred during the registrant’s most recent fiscal quarter (the registrant’s fourth fiscal quarter in the case of an Annual Report) that has materially affected, or is reasonably likely to materially affect, the registrant’s internal control over financial reporting; and
5. The registrant’s other certifying officer(s) and I have disclosed, based on our most recent evaluation of internal control over financial reporting, to the registrant’s auditors and the audit committee of the registrant’s board of directors (or persons performing the equivalent functions):
a) All significant deficiencies and material weaknesses in the design or operation of internal control over financial reporting which are reasonably likely to adversely affect the registrant’s ability to record, process, summarize and report financial information; and
b) Any fraud, whether or not material, that involves management or other employees who have a significant role in the registrant’s internal control over financial reporting.
Date: February 24, 2023
|
|
|
| /s/ Jeremy Stoppelman |
| Jeremy Stoppelman |
| Chief Executive Officer |
EX-31.2
4
yelp10k12312022ex312.htm
EX-31.2
Document
Exhibit 31.2
CERTIFICATION
I, David Schwarzbach, certify that:
1. I have reviewed this Annual Report on Form 10-K of Yelp Inc.;
2. Based on my knowledge, this report does not contain any untrue statement of a material fact or omit to state a material fact necessary to make the statements made, in light of the circumstances under which such statements were made, not misleading with respect to the period covered by this report;
3. Based on my knowledge, the financial statements, and other financial information included in this report, fairly present in all material respects the financial condition, results of operations and cash flows of the registrant as of, and for, the periods presented in this report;
4. The registrant’s other certifying officer(s) and I are responsible for establishing and maintaining disclosure controls and procedures (as defined in Exchange Act Rules 13a-15(e) and 15d-15(e)) and internal control over financial reporting (as defined in Exchange Act Rules 13a-15(f) and 15d-15(f)) for the registrant and have:
a) Designed such disclosure controls and procedures, or caused such disclosure controls and procedures to be designed under our supervision, to ensure that material information relating to the registrant, including its consolidated subsidiaries, is made known to us by others within those entities, particularly during the period in which this report is being prepared;
b) Designed such internal control over financial reporting, or caused such internal control over financial reporting to be designed under our supervision, to provide reasonable assurance regarding the reliability of financial reporting and the preparation of financial statements for external purposes in accordance with generally accepted accounting principles;
c) Evaluated the effectiveness of the registrant’s disclosure controls and procedures and presented in this report our conclusions about the effectiveness of the disclosure controls and procedures, as of the end of the period covered by this report based on such evaluation; and
d) Disclosed in this report any change in the registrant’s internal control over financial reporting that occurred during the registrant’s most recent fiscal quarter (the registrant’s fourth fiscal quarter in the case of an Annual Report) that has materially affected, or is reasonably likely to materially affect, the registrant’s internal control over financial reporting; and
5. The registrant’s other certifying officer(s) and I have disclosed, based on our most recent evaluation of internal control over financial reporting, to the registrant’s auditors and the audit committee of the registrant’s board of directors (or persons performing the equivalent functions):
a) All significant deficiencies and material weaknesses in the design or operation of internal control over financial reporting which are reasonably likely to adversely affect the registrant’s ability to record, process, summarize and report financial information; and
b) Any fraud, whether or not material, that involves management or other employees who have a significant role in the registrant’s internal control over financial reporting.
Date: February 24, 2023
|
|
|
| /s/ David Schwarzbach |
| David Schwarzbach |
| Chief Financial Officer |
EX-32.1
5
yelp10k12312022ex321.htm
EX-32.1
Document
Exhibit 32.1
CERTIFICATION
Pursuant to the requirement set forth in Rule 13a-14(b) of the Securities Exchange Act of 1934, as amended (the “Exchange Act”), and Section 1350 of Chapter 63 of Title 18 of the United States Code (18 U.S.C. § 1350), Jeremy Stoppelman, Chief Executive Officer of Yelp Inc. (the “Company”), and David Schwarzbach, Chief Financial Officer of the Company, each hereby certifies that, to the best of his knowledge:
1. The Company’s Annual Report on Form 10-K for the period ended December 31, 2022, to which this Certification is attached as Exhibit 32.1 (the “Annual Report”), fully complies with the requirements of Section 13(a) or Section 15(d) of the Exchange Act; and
2. The information contained in the Annual Report fairly presents, in all material respects, the financial condition and results of operations of the Company.
In Witness Whereof, the undersigned have set their hands hereto as of the 24th day of February, 2023.
|
|
|
|
|
|
|
|
|
| /s/ Jeremy Stoppelman |
|
/s/ David Schwarzbach |
| Jeremy Stoppelman |
|
David Schwarzbach |
| Chief Executive Officer |
|
Chief Financial Officer |
This certification accompanies the Annual Report on Form 10-K to which it relates, is not deemed filed with the Securities and Exchange Commission and is not to be incorporated by reference into any filing of Yelp Inc. under the Securities Act of 1933, as amended, or the Securities Exchange Act of 1934, as amended (whether made before or after the date of the Form 10-K), irrespective of any general incorporation language contained in such filing.