Document
FORM 6 - K
SECURITIES AND EXCHANGE COMMISSION
Washington, D.C. 20549
Report of Foreign Private Issuer
Pursuant to Rule 13a - 16 or 15d - 16 of
the Securities Exchange Act of 1934
As of 11/05/2024
Ternium S.A.
(Translation of Registrant’s name into English)
Ternium S.A.
26, Boulevard Royal - 4th floor
L-2449 Luxembourg
(352) 2668-3152
(Address of principal executive offices)
Indicate by check mark whether the registrant files or will file annual reports under cover Form 20-F or 40-F.
Form 20-F a Form 40-F __
Indicate by check mark whether the registrant by furnishing the information contained in this Form is also thereby furnishing the information to the Commission pursuant to Rule 12G3-2(b) under the Securities Exchange Act of 1934.
Yes __ No a
If “Yes” is marked, indicate below the file number assigned to the registrant in connection with Rule 12g3-2(b):
Not applicable
The attached material is being furnished to the Securities and Exchange Commission pursuant to Rule 13a-16 and Form 6-K under the Securities Exchange Act of 1934, as amended.
This report contains Ternium S.A.’s press release announcing third quarter 2024 results.
SIGNATURE
Pursuant to the requirements of the Securities Exchange Act of 1934, the Registrant has duly caused this report to be signed on its behalf by the undersigned, thereunto duly authorized.
TERNIUM S.A.
By: /s/ Guillermo Etchepareborda By: /s/ Sebastián Martí
Name: Guillermo Etchepareborda Name: Sebastián Martí
Title: Attorney in Fact Title: Attorney in Fact Luxembourg, November 5, 2024 – Ternium S.A. (NYSE: TX) today announced its results for the third quarter and first nine months ended September 30, 2024.
Dated: November 5, 2024
Sebastián Martí
Ternium - Investor Relations
+1 (866) 890 0443
+54 (11) 4018 8389
www.ternium.com
Ternium Announces Third Quarter and First Nine Months of 2024 Results
The financial and operational information contained in this press release is based on Ternium S.A.’s operational data and consolidated condensed interim financial statements prepared in accordance with IAS 34 “Interim financial reporting” (IFRS) and presented in US dollars ($) and metric tons. Interim financial figures are unaudited. This press release includes certain non-IFRS alternative performance measures such as Adjusted EBITDA, Cash Operating Income, Net Cash, Free Cash Flow, Adjusted Net Income, Adjusted Equity Holders’ Net Income and Adjusted Earnings per ADS. The reconciliation of these figures to the most directly comparable IFRS measures is included in Exhibit I.
Third Quarter of 2024 Highlights
|
|
|
|
|
|
|
|
|
|
|
|
|
|
|
|
|
|
|
|
|
|
|
|
|
|
|
|
|
|
|
|
|
|
|
|
|
|
|
|
|
|
|
|
|
|
|
|
|
|
|
SHIPMENTS - STEEL PRODUCTS |
|
|
ADJUSTED EBITDA |
|
|
|
NET INCOME |
|
|
4.1 MILLION TONS |
|
|
|
$368 MILLION |
|
|
|
$93 MILLION |
|
|
|
|
|
|
|
|
|
|
|
|
|
|
|
|
|
|
|
SHIPMENTS - MINING PRODUCTS |
|
|
ADJUSTED EBITDA MARGIN |
|
|
|
EARNINGS PER ADS |
|
|
1.8 MILLION TONS |
|
|
|
8% |
|
|
|
$0.16 |
|
|
|
|
|
|
|
|
|
|
|
|
|
|
|
|
|
|
|
|
|
|
|
|
|
|
|
|
|
|
|
|
|
|
|
|
| CASH PROVIDED BY OPERATING ACTIVITIES |
|
|
INTERIM DIVIDEND ANNOUNCEMENT |
|
|
NET CASH POSITION |
|
|
$303 MILLION |
|
|
|
$0.90 PER ADS |
|
|
|
|
$1.7 BILLION |
|
|
|
|
|
|
|
|
|
|
|
|
|
|
|
|
|
|
|
|
|
|
|
|
|
|
|
|
|
|
|
|
|
|
|
|
Summary of Third Quarter of 2024 Results
|
|
|
|
|
|
|
|
|
|
|
|
|
|
|
|
|
|
|
|
|
|
|
|
|
|
|
|
|
|
|
|
|
| CONSOLIDATED |
|
3Q24 |
2Q24 |
DIF |
3Q23 |
DIF |
|
9M24 |
9M23 |
DIF |
|
|
|
|
|
|
|
|
|
|
|
| Steel Products Shipments (thousand tons) |
|
4,123 |
|
3,841 |
|
7 |
% |
4,131 |
|
0 |
% |
|
11,858 |
|
10,179 |
|
16 |
% |
| Mining Products Shipments (thousand tons) |
|
1,781 |
|
1,496 |
|
19 |
% |
2,176 |
|
-18 |
% |
|
4,701 |
|
2,176 |
|
116 |
% |
| Net Sales ($ million) |
|
4,480 |
|
4,514 |
|
-1 |
% |
5,185 |
|
-14 |
% |
|
13,773 |
|
12,679 |
|
9 |
% |
| Operating Income ($ million) |
|
175 |
|
371 |
|
-53 |
% |
527 |
|
-67 |
% |
|
1,221 |
|
1,616 |
|
-24 |
% |
| Adjusted EBITDA ($ million) |
|
368 |
|
545 |
|
-32 |
% |
698 |
|
-47 |
% |
|
1,768 |
|
2,089 |
|
-15 |
% |
| Adjusted EBITDA Margin (% of net sales) |
|
8 |
% |
12 |
% |
|
13 |
% |
|
|
13 |
% |
16 |
% |
|
|
|
|
|
|
|
|
|
|
|
|
| Net Income (Loss) ($ million) |
|
93 |
|
(743) |
|
|
(783) |
|
|
|
(159) |
|
433 |
|
|
| Equity Holders’ Net Income (Loss) ($ million) |
|
32 |
|
(728) |
|
|
(739) |
|
|
|
(335) |
|
262 |
|
|
Earnings (Losses) per ADS1 ($) |
|
0.16 |
|
(3.71) |
|
|
(3.77) |
|
|
|
(1.70) |
|
1.34 |
|
|
| Adjusted Net Income ($ million) |
|
93 |
|
40 |
|
|
323 |
|
|
|
624 |
|
1,539 |
|
|
| Adjusted Equity Holders’ Net Income (Loss) ($ million) |
|
32 |
|
(21) |
|
|
271 |
|
|
|
372 |
|
1,272 |
|
|
Adjusted Earnings (Losses) per ADS1 ($) |
|
0.16 |
|
(0.11) |
|
|
1.38 |
|
|
|
1.89 |
|
6.48 |
|
|
1 American Depositary Share. Each ADS represents 10 shares of Ternium’s common stock. Results are based on a weighted average number of shares of common stock outstanding (net of treasury shares) of 1,963,076,776.
Third Quarter of 2024 Highlights
Ternium achieved a strong level of shipments in the third quarter of 2024, on record-high sales volumes in Mexico, higher shipments in Brazil and a continued recovery in the Southern Region.
However, Adjusted EBITDA was $368 million in the third quarter of 2024, reflecting a relatively low margin. Steel revenue per ton decreased sequentially in the third quarter due to lower steel prices in Ternium’s main steel markets and a decrease in industrial contract prices in Mexico. This was partially offset by a modest decrease in steel cost per ton, as the company consumed previously purchased high-priced inventory during the third quarter.
Capital expenditures in the third quarter of 2024 amounted to $446 million, as Ternium progressed with its expansion programs in Mexico and with its new wind farm in Argentina. Cash provided by operating activities was $303 million after a working capital increase of $155 million. Consequently, Ternium’s net cash position decreased to $1.7 billion as of the end of September 2024 from net cash position of $1.9 billion as of the end of June.
Interim Dividend Payment
Ternium’s board of directors approved the payment of an interim dividend of $0.90 per ADS ($0.09 per share), or $177 million based on total shares of common stock outstanding net of treasury shares.
The payment date of the interim dividend will be November 21, 2024, with an ex-dividend date on November 15, 2024 and record date on November 18, 2024.
|
|
|
|
ANNUAL DIVIDEND
$ PER ADS
|
Outlook
Ternium expects a slight sequential increase in adjusted EBITDA for the fourth quarter of 2024 due to improved margins partially offset by a reduction in shipments. Apparent demand in Mexico and Brazil is anticipated to decline due to year-end seasonality in the fourth quarter. Conversely, apparent demand in Argentina is expected to remain relatively stable, albeit at levels below historical volumes.
The company anticipates a continued decrease in cost per ton, as a result of the gradual consumption of lower-priced slabs and raw material inventories. However, realized steel prices are projected to decline in the fourth quarter of 2024 compared to the third quarter of 2024, mainly due to the reset of quarterly price contracts with industrial customers in Mexico at reduced levels.
During the third quarter, the company's new push-pull pickling line in the Pesquería industrial center, as well as three of the five finishing lines in Ternium's downstream expansion project, have started operations and are currently ramping up. In addition, our new wind farm in Argentina is expected to begin operations by year-end, boosting our use of self-generated renewable energy and reducing reliance on external sources. This will represent a significant milestone in our commitment to renewable energy and decarbonization.
Analysis of Third Quarter of 2024 Results
Consolidated Net Sales
|
|
|
|
|
|
|
|
|
|
|
|
|
|
|
|
|
|
|
|
|
|
|
|
|
|
|
|
|
|
|
|
|
| $ MILLION |
|
3Q24 |
2Q24 |
DIF |
3Q23 |
DIF |
|
9M24 |
9M23 |
DIF |
|
|
|
|
|
|
|
|
|
|
|
| Steel segment |
|
4,368 |
|
4,395 |
|
-1 |
% |
5,036 |
|
-13 |
% |
|
13,453 |
|
12,531 |
|
7 |
% |
| Mining segment |
|
112 |
|
119 |
|
-6 |
% |
149 |
|
-25 |
% |
|
320 |
|
149 |
|
115 |
% |
| Total net sales |
|
4,480 |
|
4,514 |
|
-1 |
% |
5,185 |
|
-14 |
% |
|
13,773 |
|
12,679 |
|
9 |
% |
Adjusted EBITDA
Adjusted EBITDA in the third quarter of 2024 equals Net Income adjusted to exclude:
◦Depreciation and Amortization;
◦Income Tax Results;
◦Net Financial Result;
◦Equity in Results of Non-consolidated Companies; and
◦Provision for ongoing litigation related to the acquisition of a participation in Usiminas.
And adjusted to include the proportional EBITDA in Unigal (70% participation).
Adjusted EBITDA Margin equals Adjusted EBITDA divided by net sales. For more information see Exhibit I - Alternative performance measures - “Adjusted EBITDA”.
|
|
|
|
ADJUSTED EBITDA
$ MILLION
|
The Steel Segment shipments increased 7% sequentially in the third quarter of 2024. However, net sales in period remained stable compared to the second quarter of 2024 due to lower realized steel prices. The sequential decrease in revenue per ton was due to lower steel prices in Ternium’s main steel markets and lower contract prices in Mexico.
On a year-over-year basis, the Steel Segment shipments remained stable. Nevertheless, net sales decreased year-over-year as a result of lower steel prices in Ternium’s main steel markets.
|
|
|
|
SHIPMENTS - STEEL PRODUCTS
MILLION TONS
|

|
|
|
|
NET SALES - STEEL SEGMENT
$ BILLION
|

In Mexico, shipments achieved a new record-high in the third quarter of 2024. Sales volumes to the industrial sector increased sequentially, including higher shipments to automotive manufacturers and a recovery in the sales to the HVAC sector. Shipments to the commercial market improved sequentially, albeit from a relatively low base.
In Brazil, shipments to industrial customers and distributors increased sequentially in the third quarter of 2024. On the other hand, sales volumes to automotive manufacturers remained unchanged. Demand for steel products in the country was strong. However, imports of steel products continued increasing in the third quarter, mainly from China.
In the Southern Region, steel shipments continued to recover in the quarter, mainly reflecting better demand
in Argentina from the construction sector, the automotive industry, and agribusiness and transportation equipment manufacturers.
|
|
|
|
SHIPMENTS BY REGION - STEEL PRODUCTS
MILLION TONS
|

|
|
|
|
|
|
|
|
|
|
|
|
|
|
|
|
|
|
|
|
|
|
|
|
|
|
|
|
|
|
|
|
|
|
|
|
|
|
|
|
|
|
|
|
|
|
|
|
|
|
|
|
|
|
|
|
|
| STEEL SEGMENT |
|
NET SALES ($ MILLION) |
|
SHIPMENTS (THOUSAND TONS) |
|
REVENUE/TON ($/TON) |
|
|
|
|
|
|
|
|
|
|
|
|
|
|
|
|
|
|
|
|
|
3Q24 |
2Q24 |
DIF |
3Q23 |
DIF |
|
3Q24 |
2Q24 |
DIF |
3Q23 |
DIF |
|
3Q24 |
2Q24 |
DIF |
3Q23 |
DIF |
|
|
|
|
|
|
|
|
|
|
|
|
|
|
|
|
|
|
|
| Mexico |
|
2,142 |
|
2,145 |
|
0 |
% |
2,383 |
|
-10 |
% |
|
2,167 |
|
1,985 |
|
9 |
% |
2,135 |
|
1 |
% |
|
988 |
|
1,081 |
|
-9 |
% |
1,116 |
|
-11 |
% |
| Brazil |
|
1,048 |
|
1,007 |
|
4 |
% |
1,136 |
|
-8 |
% |
|
1,076 |
|
977 |
|
10 |
% |
957 |
|
12 |
% |
|
974 |
|
1,031 |
|
-6 |
% |
1,187 |
|
-18 |
% |
| Southern Region |
|
677 |
|
569 |
|
19 |
% |
941 |
|
-28 |
% |
|
515 |
|
426 |
|
21 |
% |
603 |
|
-15 |
% |
|
1,314 |
|
1,337 |
|
-2 |
% |
1,561 |
|
-16 |
% |
| Other Markets |
|
431 |
|
561 |
|
-23 |
% |
504 |
|
-14 |
% |
|
365 |
|
453 |
|
-20 |
% |
436 |
|
-16 |
% |
|
1,183 |
|
1,239 |
|
-4 |
% |
1,157 |
|
2 |
% |
| Total Steel Products |
|
4,298 |
|
4,283 |
|
0 |
% |
4,964 |
|
-13 |
% |
|
4,123 |
|
3,841 |
|
7 |
% |
4,131 |
|
0 |
% |
|
1,042 |
|
1,115 |
|
-7 |
% |
1,202 |
|
-13 |
% |
| Other Products |
|
70 |
|
112 |
|
-37 |
% |
72 |
|
-3 |
% |
|
|
|
|
|
|
|
|
|
|
|
|
| Total Steel Segment |
|
4,368 |
|
4,395 |
|
-1 |
% |
5,036 |
|
-13 |
% |
|
|
|
|
|
|
|
|
|
|
|
|
|
|
|
|
|
|
|
|
|
|
|
|
|
|
|
|
|
|
|
|
|
|
|
|
|
|
|
|
|
|
|
|
|
|
|
|
|
|
|
|
|
|
|
|
|
|
|
|
|
|
|
|
|
|
|
|
|
|
| STEEL SEGMENT |
|
NET SALES ($ MILLION) |
|
SHIPMENTS (THOUSAND TONS) |
|
REVENUE/TON ($/TON) |
|
|
|
|
|
|
|
|
|
|
|
|
|
|
|
9M24 |
9M23 |
DIF |
|
9M24 |
9M23 |
DIF |
|
9M24 |
9M23 |
DIF |
|
|
|
|
|
|
|
|
|
|
|
|
|
| Mexico |
|
6,677 |
|
7,046 |
|
-5 |
% |
|
6,230 |
|
6,233 |
|
0 |
% |
|
1,072 |
|
1,130 |
|
-5 |
% |
| Brazil |
|
3,101 |
|
1,216 |
|
155 |
% |
|
2,976 |
|
1,063 |
|
180 |
% |
|
1,042 |
|
1,144 |
|
-9 |
% |
| Southern Region |
|
1,809 |
|
2,664 |
|
-32 |
% |
|
1,311 |
|
1,709 |
|
-23 |
% |
|
1,380 |
|
1,559 |
|
-11 |
% |
| Other Markets |
|
1,596 |
|
1,398 |
|
14 |
% |
|
1,341 |
|
1,174 |
|
14 |
% |
|
1,190 |
|
1,191 |
|
0 |
% |
| Total Steel Products |
|
13,182 |
|
12,324 |
|
7 |
% |
|
11,858 |
|
10,179 |
|
16 |
% |
|
1,112 |
|
1,211 |
|
-8 |
% |
| Other Products |
|
271 |
|
207 |
|
31 |
% |
|
|
|
|
|
|
|
|
| Total Steel Segment |
|
13,453 |
|
12,531 |
|
7 |
% |
|
|
|
|
|
|
|
|
|
|
|
|
|
|
|
|
|
|
|
|
|
Note: other products include mainly electricity sales in Mexico and Brazil.
|
|
|
|
CASH OPERATING INCOME MARGIN - STEEL SEGMENT
%
|

|
|
|
|
CASH OPERATING INCOME PER TON - STEEL SEGMENT
$/TON
|
Note: For information on the Steel Segment’s Cash Operating Income per Ton and Margin, see Exhibit I - Alternative performance measures - “Cash Operating Income - Steel Segment”.
The Steel Segment’s Cash Operating Income per Ton and Margin decreased sequentially in the third quarter of 2024 due to lower revenue per ton partially offset by slightly lower cost per ton.
Ternium’s and Usiminas’ blast furnace operations recorded efficiency gains in the period, particularly in fuel consumption. In addition, labor and maintenance costs decreased sequentially in the third quarter.
On the other hand, the company consumed high-cost inventory in the period. The decrease in raw material and slab market prices during 2024 was not totally reflected on Ternium’s cost of sales in the third quarter, as the company consumed inventories produced in prior periods.
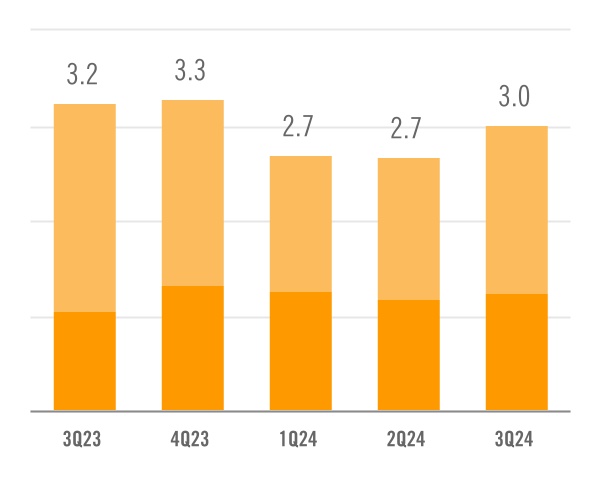
Mining Segment
The Mining Segment shipments increased 13% sequentially in the third quarter of 2024, supported by higher production levels in our Mexican and Brazilian mining operations. However, net sales decreased slightly in the period reflecting lower iron ore market prices.
On a year-over-year basis, iron ore shipments decreased in the third quarter of 2024 reflecting lower production levels in our Mexican and Brazilian
operations. Net sales decreased slightly year-over-year in the third quarter, as lower sales volumes were partially offset by higher realized iron ore prices. The increase in revenue per ton was the result of an improved sales mix of iron ore products, partially offset by lower iron ore market prices.
|
|
|
|
SHIPMENTS - MINING PRODUCTS
MILLION TONS
|
|
|
|
n Intercompany n Third parties |
|
|
|
|
|
NET SALES - MINING SEGMENT
$ MILLION
|
|
|
|
n Intercompany n Third parties |
|
|
|
|
|
|
|
|
|
|
|
|
|
|
|
|
|
|
|
|
|
|
|
|
|
|
|
|
|
|
|
|
|
|
|
|
|
|
|
|
|
|
|
|
|
|
|
|
|
|
|
|
|
|
|
|
|
|
| MINING SEGMENT |
|
NET SALES ($ MILLION) |
|
SHIPMENTS (THOUSAND TONS) |
|
REVENUE/TON ($/TON) |
|
|
|
|
|
|
|
|
|
|
|
|
|
|
|
|
|
|
|
|
|
3Q24 |
2Q24 |
DIF |
3Q23 |
DIF |
|
3Q24 |
2Q24 |
DIF |
3Q23 |
DIF |
|
3Q24 |
2Q24 |
DIF |
3Q23 |
DIF |
| Third parties |
|
112 |
|
119 |
|
-6 |
% |
149 |
|
-25 |
% |
|
1,781 |
|
1,496 |
|
19 |
% |
2,176 |
-18 |
% |
|
63 |
|
80 |
|
-21 |
% |
68 |
|
-8 |
% |
| Intercompany |
|
152 |
|
152 |
|
0 |
% |
127 |
|
20 |
% |
|
1,239 |
|
1,178 |
|
5 |
% |
1,057 |
|
17 |
% |
|
123 |
|
129 |
|
-5 |
% |
120 |
|
2 |
% |
| Total |
|
264 |
|
271 |
|
-3 |
% |
276 |
|
-4 |
% |
|
3,020 |
|
2,674 |
|
13 |
% |
3,232 |
|
-7 |
% |
|
87 |
|
102 |
|
-15 |
% |
85 |
|
2 |
% |
|
|
|
|
|
|
|
|
|
|
|
|
|
|
|
|
|
|
|
|
|
|
|
|
|
|
|
|
|
|
|
|
|
|
|
|
|
|
|
| MINING SEGMENT |
|
NET SALES ($ MILLION) |
|
SHIPMENTS (THOUSAND TONS) |
|
REVENUE/TON ($/TON) |
|
|
|
|
|
|
|
|
|
|
|
|
|
|
|
9M24 |
9M23 |
DIF |
|
9M24 |
9M23 |
DIF |
|
9M24 |
9M23 |
DIF |
| Third parties |
|
320 |
|
149 |
|
115 |
% |
|
4,701 |
|
2,176 |
|
116 |
% |
|
68 |
|
68 |
|
-1 |
% |
| Intercompany |
|
490 |
|
322 |
|
52 |
% |
|
3,689 |
|
2,723 |
|
35 |
% |
|
133 |
|
118 |
|
12 |
% |
| Total |
|
810 |
|
471 |
|
72 |
% |
|
8,389 |
|
4,899 |
|
71 |
% |
|
97 |
|
96 |
|
0 |
% |
|
|
|
|
CASH OPERATING INCOME MARGIN - MINING SEGMENT
%
|

|
|
|
|
CASH OPERATING INCOME PER TON - MINING PRODUCTS
$/TON
|
Note: For information on the Mining Segment’s Cash Operating Income per Ton and Margin, see Exhibit I - Alternative performance measures - “Cash Operating Income - Mining Segment”.
The Mining Segment’s Cash Operating Income per Ton and Margin decreased in the third quarter of 2024 due to lower iron ore realized prices, partially offset by a slight decrease in cost per ton.
On a year-over-year basis, the Mining Segment’s Cash Operating Income per Ton and Margin increased in the third quarter reflecting a slight increase in realized iron ore prices and a slight decrease in cost per ton.
Net Financial Results
Net financial results were a gain of $74 million in the third quarter of 2024. Of note in the period was a $57 million net foreign exchange gain, mainly reflecting the positive impact of the depreciation of the Mexican Peso and the appreciation of the Brazilian Real vis-a-
vis the US dollar on Ternium Mexico’s net short local currency position and Usiminas’ US dollar denominated debt, respectively. Usiminas uses the Brazilian Real as functional currency.
|
|
|
|
|
|
|
|
|
|
|
|
|
|
|
|
|
|
|
|
|
|
|
|
| $ MILLION |
|
3Q24 |
2Q24 |
3Q23 |
|
9M24 |
9M23 |
|
|
|
|
|
|
|
|
| Net interest results |
|
17 |
|
28 |
|
30 |
|
|
83 |
|
80 |
|
| Net foreign exchange result |
|
57 |
|
(49) |
|
(33) |
|
|
(32) |
|
(73) |
|
| Change in fair value of financial assets |
|
11 |
|
(5) |
|
36 |
|
|
(131) |
|
26 |
|
| Other financial expense, net |
|
(11) |
|
(13) |
|
(4) |
|
|
(47) |
|
(13) |
|
| Net financial results |
|
74 |
|
(39) |
|
30 |
|
|
(127) |
|
20 |
|
Income Tax Results
Ternium Mexico, Ternium Argentina and Ternium Brasil use the US dollar as their functional currency and are, therefore, affected by deferred tax results. These results account for the impact of local currency fluctuations against the US dollar, as well as for the
effect of local inflation. Effective tax rates in the
second quarter and first nine months of 2024 included, in addition, the effect of a provision for ongoing litigation related to the acquisition of a participation in Usiminas and, in the third quarter and first nine months of 2023, certain non-cash effects related to the increase in the participation in Usiminas.
|
|
|
|
|
|
|
|
|
|
|
|
|
|
|
|
|
|
|
|
|
|
|
|
| $ MILLION |
|
3Q24 |
2Q24 |
3Q23 |
|
9M24 |
9M23 |
|
|
|
|
|
|
|
|
| Current income tax expense |
|
(63) |
|
(124) |
|
(164) |
|
|
(312) |
|
(450) |
|
| Deferred tax (loss) gain |
|
(80) |
|
(183) |
|
(89) |
|
|
(178) |
|
271 |
|
| Income tax expense |
|
(143) |
|
(307) |
|
(253) |
|
|
(490) |
|
(179) |
|
| Result before income tax |
|
236 |
|
(436) |
|
(530) |
|
|
331 |
|
611 |
|
| Effective tax rate |
|
61 |
% |
-70 |
% |
-48 |
% |
|
148 |
% |
29 |
% |
|
|
|
|
|
|
|
|
| Excluding provision in the 2Q24 for ongoing litigation related to the acquisition of a participation in Usiminas in 2012 |
|
— |
|
(783) |
|
— |
|
|
(783) |
|
— |
|
| Excluding non-cash effects in the 3Q23 related to the increase in the participation in Usiminas |
|
— |
|
— |
|
(1,106) |
|
|
— |
|
(1,106) |
|
| Result before income tax excluding provision and non-cash effects |
|
236 |
|
347 |
|
576 |
|
|
1,114 |
|
1,717 |
|
| Effective tax rate excluding provision and non-cash effects |
|
61 |
% |
88 |
% |
44 |
% |
|
44 |
% |
10 |
% |
Net Income
Net Income was $93 million in the third quarter of 2024, on operating income of $175 million. Of note in the period were financial result gains of $74 million and deferred tax losses of $80 million.
Equity Holder’s Net Income was $32 million in the third quarter, or $0.16 per ADS, mainly after accounting for the participation of a 76.7% non-controlling interest in Usiminas and a 37.4% non-controlling interest in Ternium Argentina.
|
|
|
|
NET INCOME (LOSS), EARNINGS (LOSSES) PER ADS
$ MILLION, $
|
|
|
|
|
|
|
|
|
|
|
|
|
|
|
|
|
|
|
|
|
|
|
|
|
| $ MILLION |
|
3Q24 |
2Q24 |
3Q23 |
|
9M24 |
9M23 |
|
|
|
|
|
|
|
|
| Owners of the parent |
|
32 |
|
(728) |
|
(739) |
|
|
(335) |
|
262 |
|
| Non-controlling interest |
|
61 |
|
(16) |
|
(44) |
|
|
176 |
|
170 |
|
Net Income (Loss) |
|
93 |
|
(743) |
|
(783) |
|
|
(159) |
|
433 |
|
|
|
|
|
|
|
|
|
| Excluding provision in the 2Q24 for ongoing litigation related to the acquisition of a participation in Usiminas in 2012 |
|
— |
|
(783) |
|
— |
|
|
(783) |
|
— |
|
| Excluding non-cash effects in the 3Q23 related to the increase in the participation in Usiminas |
|
— |
|
— |
|
(1,106) |
|
|
— |
|
(1,106) |
|
| Adjusted Net Income |
|
93 |
|
40 |
|
323 |
|
|
624 |
|
1,539 |
|
|
|
|
|
|
|
|
|
|
|
|
|
|
|
|
|
Cash Flow and Liquidity
Cash from operations reached $303 million in the third quarter of 2024, including a $155 million increase in working capital. The change in working capital was due to a $258 million decrease in trade payables and other liabilities, partially offset by a $54 million decrease in inventories and a $49 million net decrease in trade and other receivables.
Capital expenditures amounted to $446 million in the third quarter of 2024. Among other initiatives, Ternium made progress in the construction of new facilities in its Pesquería industrial center and in the construction of a new wind farm in Argentina.
|
|
|
|
CASH FROM OPERATIONS, CHANGES IN WORKING CAPITAL
$ BILLION
|
|
|
|
n Cash from operations n (Incr.) decr. in working capital |
|
|
|
|
|
CAPITAL EXPENDITURES
$ MILLION
|
Ternium’s net cash position in the third quarter decreased to $1.7 billion as of September 30, 2024, and included Ternium Argentina’s total position of cash and cash equivalents and other investments of $1.1 billion.
On November 21, 2024, the company will pay an
interim dividend to shareholders of $0.90 per ADS ($0.09 per share), or $177 million based on total shares of common stock outstanding net of treasury shares.
|
|
|
|
NET CASH POSITION
$ BILLION
|
Conference Call and Webcast
Ternium will host a conference call on November 6, 2024, at 8:30 a.m. ET in which management will discuss third quarter of 2024 results. A webcast link will be available in the Investor Center section of the company’s website at www.ternium.com.
Forward Looking Statements
Some of the statements contained in this press release are “forward-looking statements”. Forward-looking statements are based on management’s current views and assumptions and involve known and unknown risks that could cause actual results, performance or events to differ materially from those expressed or implied by those statements. These risks include but are not limited to risks arising from uncertainties as to gross domestic product, related market demand, global production capacity, tariffs, cyclicality in the industries that purchase steel products, and other factors beyond Ternium’s control.
About Ternium
Ternium is a leading steel producer in the Americas, providing advanced steel products to a wide range of manufacturing industries and the construction sector. We invest in low carbon emissions steelmaking technologies to support the energy transition and the mobility of the future. We also support the development of our communities, especially through educational programs in Latin America. More information about Ternium is available at www.ternium.com.
Income Statement
|
|
|
|
|
|
|
|
|
|
|
|
|
|
|
|
|
|
|
|
|
|
|
|
| $ MILLION |
|
3Q24 |
2Q24 |
3Q23 |
|
9M24 |
9M23 |
|
|
|
|
|
|
|
|
| Net sales |
|
4,480 |
|
4,514 |
|
5,185 |
|
|
13,773 |
|
12,679 |
|
| Cost of sales |
|
(3,902) |
|
(3,758) |
|
(4,192) |
|
|
(11,334) |
|
(10,012) |
|
| Gross profit |
|
578 |
|
757 |
|
993 |
|
|
2,439 |
|
2,667 |
|
| Selling, general and administrative expenses |
|
(412) |
|
(435) |
|
(443) |
|
|
(1,278) |
|
(1,040) |
|
| Other operating income |
|
9 |
|
49 |
|
(22) |
|
|
60 |
|
(11) |
|
| Operating income |
|
175 |
|
371 |
|
527 |
|
|
1,221 |
|
1,616 |
|
|
|
|
|
|
|
|
|
| Financial expense |
|
(54) |
|
(45) |
|
(47) |
|
|
(144) |
|
(81) |
|
| Financial income |
|
71 |
|
73 |
|
78 |
|
|
227 |
|
161 |
|
| Other financial (expense) income, net |
|
57 |
|
(67) |
|
0 |
|
|
(210) |
|
(60) |
|
Equity in earnings of non-consolidated companies |
|
17 |
|
15 |
|
19 |
|
|
51 |
|
81 |
|
| Effect related to the increase of the participation in Usiminas |
|
— |
|
— |
|
(171) |
|
|
— |
|
(171) |
|
| Recycling of other comprehensive income related to Usiminas |
|
— |
|
— |
|
(935) |
|
|
— |
|
(935) |
|
| Provision for ongoing litigation related to the acquisition of a participation in Usiminas |
|
(31) |
|
(783) |
|
— |
|
|
(814) |
|
— |
|
| Profit (Loss) before income tax results |
|
236 |
|
(436) |
|
(530) |
|
|
331 |
|
611 |
|
| Income tax (expense) credit |
|
(143) |
|
(307) |
|
(253) |
|
|
(490) |
|
(179) |
|
| Profit (Loss) for the period |
|
93 |
|
(743) |
|
(783) |
|
|
(159) |
|
433 |
|
|
|
|
|
|
|
|
|
| Attributable to: |
|
|
|
|
|
|
|
| Owners of the parent |
|
32 |
|
(728) |
|
(739) |
|
|
(335) |
|
262 |
|
| Non-controlling interest |
|
61 |
|
(16) |
|
(44) |
|
|
176 |
|
170 |
|
Net Profit (Loss) for the period |
|
93 |
|
(743) |
|
(783) |
|
|
(159) |
|
433 |
|
Statement of Financial Position
|
|
|
|
|
|
|
|
|
|
|
|
|
|
|
| $ MILLION |
|
SEPTEMBER 30, 2024 |
|
DECEMBER 31, 2023 |
|
|
|
|
|
| Property, plant and equipment, net |
|
8,142 |
|
|
7,638 |
|
| Intangible assets, net |
|
1,062 |
|
|
996 |
|
| Investments in non-consolidated companies |
|
517 |
|
|
517 |
|
| Other investments |
|
27 |
|
|
211 |
|
| Deferred tax assets |
|
1,432 |
|
|
1,713 |
|
| Receivables, net |
|
1,013 |
|
|
1,073 |
|
|
|
|
|
|
| Total non-current assets |
|
12,194 |
|
|
12,149 |
|
|
|
|
|
|
| Receivables, net |
|
940 |
|
|
1,173 |
|
| Derivative financial instruments |
|
24 |
|
|
15 |
|
| Inventories, net |
|
5,019 |
|
|
4,948 |
|
| Trade receivables, net |
|
1,896 |
|
|
2,065 |
|
| Other investments |
|
2,243 |
|
|
1,976 |
|
| Cash and cash equivalents |
|
1,614 |
|
|
1,846 |
|
| Total current assets |
|
11,737 |
|
|
12,024 |
|
|
|
|
|
|
| Non-current assets classified as held for sale |
|
8 |
|
|
7 |
|
|
|
|
|
|
| Total assets |
|
23,938 |
|
|
24,179 |
|
Statement of Financial Position (cont.)
|
|
|
|
|
|
|
|
|
|
|
|
|
|
|
| $ MILLION |
|
SEPTEMBER 30, 2024 |
|
DECEMBER 31, 2023 |
|
|
|
|
|
| Capital and reserves attributable to the owners of the parent |
|
11,941 |
|
|
12,419 |
|
| Non-controlling interest |
|
4,385 |
|
|
4,393 |
|
| Total equity |
|
16,326 |
|
|
16,812 |
|
|
|
|
|
|
| Provisions |
|
627 |
|
|
840 |
|
| Deferred tax liabilities |
|
106 |
|
|
171 |
|
| Other liabilities |
|
1,087 |
|
|
1,149 |
|
| Trade payables |
|
6 |
|
|
12 |
|
| Lease liabilities |
|
167 |
|
|
189 |
|
| Borrowings |
|
1,597 |
|
|
1,206 |
|
| Total non-current liabilities |
|
3,590 |
|
|
3,567 |
|
|
|
|
|
|
| Provision for ongoing litigation related to the acquisition of a participation in Usiminas |
|
814 |
|
|
— |
|
| Current income tax liabilities |
|
124 |
|
|
137 |
|
| Other liabilities |
|
445 |
|
|
430 |
|
| Trade payables |
|
1,992 |
|
|
2,233 |
|
| Derivative financial instruments |
|
7 |
|
|
8 |
|
| Lease liabilities |
|
50 |
|
|
52 |
|
| Borrowings |
|
590 |
|
|
940 |
|
| Total current liabilities |
|
4,022 |
|
|
3,801 |
|
|
|
|
|
|
| Total liabilities |
|
7,612 |
|
|
7,367 |
|
|
|
|
|
|
Total equity and liabilities |
|
23,938 |
|
|
24,179 |
|
Statement of Cash Flows
|
|
|
|
|
|
|
|
|
|
|
|
|
|
|
|
|
|
|
|
|
|
|
|
| $ MILLION |
|
3Q24 |
2Q24 |
3Q23 |
|
9M24 |
9M23 |
|
|
|
|
|
|
|
|
| Result for the period |
|
93 |
|
(743) |
|
(783) |
|
|
(159) |
|
433 |
|
|
|
|
|
|
|
|
|
| Adjustments for: |
|
|
|
|
|
|
|
| Depreciation and amortization |
|
184 |
|
199 |
|
165 |
|
|
554 |
|
467 |
|
| Income tax accruals less payments |
|
204 |
|
283 |
|
158 |
|
|
474 |
|
(116) |
|
| Equity in earnings of non-consolidated companies |
|
(17) |
|
(15) |
|
(19) |
|
|
(51) |
|
(81) |
|
| Provision for ongoing litigation related to the acquisition of a participation in Usiminas |
|
31 |
|
783 |
|
— |
|
|
814 |
|
— |
|
| Interest accruals less payments/receipts, net |
|
3 |
|
(11) |
|
1 |
|
|
(10) |
|
(11) |
|
| Changes in provisions |
|
(1) |
|
(62) |
|
(4) |
|
|
(70) |
|
(4) |
|
| Changes in working capital |
|
(155) |
|
169 |
|
388 |
|
|
(252) |
|
1 |
|
| Net foreign exchange results and others |
|
(38) |
|
52 |
|
8 |
|
|
134 |
|
(12) |
|
| Non-cash effects related to the increase of the participation in Usiminas |
|
— |
|
— |
|
1,106 |
|
|
— |
|
1,106 |
|
| Net cash provided by operating activities |
|
303 |
|
656 |
|
1,020 |
|
|
1,435 |
|
1,783 |
|
|
|
|
|
|
|
|
|
| Capital expenditures and advances to suppliers for PP&E |
|
(446) |
|
(409) |
|
(430) |
|
|
(1,304) |
|
(864) |
|
| (Increase) Decrease in other investments |
|
(164) |
|
329 |
|
(333) |
|
|
166 |
|
(847) |
|
| Proceeds from the sale of property, plant & equipment |
|
0 |
|
1 |
|
1 |
|
|
2 |
|
2 |
|
| Dividends received from non-consolidated companies |
|
3 |
|
1 |
|
— |
|
|
5 |
|
15 |
|
|
|
|
|
|
|
|
|
| Acquisition of business: |
|
|
|
|
|
|
|
| Purchase consideration |
|
— |
|
— |
|
(119) |
|
|
— |
|
(119) |
|
| Cash acquired |
|
— |
|
— |
|
781 |
|
|
— |
|
781 |
|
| Net cash used in investing activities |
|
(606) |
|
(79) |
|
(100) |
|
|
(1,132) |
|
(1,031) |
|
|
|
|
|
|
|
|
|
| Dividends paid in cash to company’s shareholders |
|
— |
|
(432) |
|
— |
|
|
(432) |
|
(353) |
|
| Dividends paid in cash to non-controlling interest |
|
(3) |
|
(46) |
|
— |
|
|
(49) |
|
— |
|
| Finance lease payments |
|
(13) |
|
(15) |
|
(16) |
|
|
(46) |
|
(43) |
|
| Proceeds from borrowings |
|
852 |
|
303 |
|
163 |
|
|
1,286 |
|
236 |
|
| Repayments of borrowings |
|
(652) |
|
(365) |
|
(145) |
|
|
(1,183) |
|
(372) |
|
| Net cash provided by (used in) financing activities |
|
183 |
|
(556) |
|
3 |
|
|
(425) |
|
(532) |
|
|
|
|
|
|
|
|
|
| (Decrease) Increase in cash and cash equivalents |
|
(121) |
|
22 |
|
923 |
|
|
(123) |
|
220 |
|
Exhibit I - Alternative Performance Measures
These non-IFRS measures should not be considered in isolation of, or as a substitute for, measures of performance prepared in accordance with IFRS. These non-IFRS measures do not have a standardized meaning under IFRS and, therefore, may not correspond to similar non-IFRS financial measures reported by other companies.
Adjusted EBITDA
|
|
|
|
|
|
|
|
|
|
|
|
|
|
|
|
|
|
|
|
|
|
|
|
| $ MILLION |
|
3Q24 |
2Q24 |
3Q23 |
|
9M24 |
9M23 |
|
|
|
|
|
|
|
|
| Net result |
|
93 |
|
(743) |
|
(783) |
|
|
(159) |
|
433 |
|
| Adjusted to exclude: |
|
|
|
|
|
|
|
| Depreciation and amortization |
|
184 |
|
199 |
|
165 |
|
|
554 |
|
467 |
|
| Income tax results |
|
143 |
|
307 |
|
253 |
|
|
490 |
|
179 |
|
| Net financial result |
|
(74) |
|
39 |
|
(30) |
|
|
127 |
|
(20) |
|
| Equity in earnings of non-consolidated companies |
|
(17) |
|
(15) |
|
(19) |
|
|
(51) |
|
(81) |
|
| Non-cash effects related to the increase in the participation in Usiminas |
|
— |
|
— |
|
1,106 |
|
|
— |
|
1,106 |
|
| Provision for ongoing litigation in the 2Q24 related to the acquisition of a participation in Usiminas |
|
31 |
|
783 |
|
|
|
814 |
|
— |
|
Reversal of other Usiminas contingencies recognized as part of the PPA |
|
— |
|
(34) |
|
|
|
(34) |
|
— |
|
| Adjusted to include: |
|
|
|
|
|
|
|
| Proportional EBITDA in Unigal (70% participation) |
|
8 |
|
9 |
|
6 |
|
|
27 |
|
6 |
|
| Adjusted EBITDA |
|
368 |
|
545 |
|
698 |
|
|
1,768 |
|
2,089 |
|
| Divided by: net sales |
|
4,480 |
|
4,514 |
|
5,185 |
|
|
13,773 |
|
12,679 |
|
| Adjusted EBITDA Margin (%) |
|
8 |
% |
12 |
% |
13 |
% |
|
13 |
% |
16 |
% |
Exhibit I - Alternative Performance Measures (cont.)
Cash Operating Income - Steel Segment
|
|
|
|
|
|
|
|
|
|
|
|
|
|
|
|
|
|
|
|
|
|
|
|
| $ MILLION |
|
3Q24 |
2Q24 |
3Q23 |
|
9M24 |
9M23 |
|
|
|
|
|
|
|
|
Operating Income - Management View (Note “Segment Information” to Ternium’s Financial Statements as of the corresponding dates) |
|
381 |
|
278 |
|
667 |
|
|
1,252 |
|
1,784 |
|
| Plus/Minus differences in cost of sales (IFRS) |
|
(219) |
|
88 |
|
(162) |
|
|
(71) |
|
(157) |
|
| Excluding depreciation and amortization |
|
138 |
|
134 |
|
136 |
|
|
410 |
|
389 |
|
| Excluding reversal of other Usiminas contingencies |
|
— |
|
(34) |
|
— |
|
|
(34) |
|
— |
|
|
|
|
|
|
|
|
|
|
|
|
|
|
|
|
|
|
|
|
|
|
|
|
|
|
|
|
|
|
|
|
|
| Including proportional EBITDA in Unigal (70% participation) |
|
8 |
|
9 |
|
6 |
|
|
27 |
|
6 |
|
| Cash Operating Income |
|
309 |
|
476 |
|
647 |
|
|
1,583 |
|
2,021 |
|
| Divided by steel shipments (thousand tons) |
|
4,123 |
|
3,841 |
|
4,131 |
|
|
11,858 |
|
10,179 |
|
| Cash Operating Income per Ton - Steel |
|
75 |
|
124 |
|
157 |
|
|
134 |
|
199 |
|
| Divided by steel net sales |
|
4,368 |
|
4,395 |
|
5,036 |
|
|
13,453 |
|
12,531 |
|
| Cash Operating Income Margin - Steel (%) |
|
7 |
% |
11 |
% |
13 |
% |
|
12 |
% |
16 |
% |
Cash Operating Income - Mining Segment
|
|
|
|
|
|
|
|
|
|
|
|
|
|
|
|
|
|
|
|
|
|
|
|
|
| $ MILLION |
|
3Q24 |
2Q24 |
3Q23 |
|
9M24 |
9M23 |
|
|
|
|
|
|
|
|
|
|
Operating Income - Management View (Note “Segment Information” to Ternium’s Financial Statements as of the corresponding dates) |
|
(58) |
|
(52) |
|
(4) |
|
|
(131) |
|
(35) |
|
|
| Plus/minus differences in cost of sales (IFRS) |
|
64 |
|
61 |
|
17 |
|
|
179 |
|
11 |
|
|
| Excluding depreciation and amortization |
|
46 |
|
65 |
|
29 |
|
|
145 |
|
78 |
|
|
|
|
|
|
|
|
|
|
|
| Cash Operating Income |
|
52 |
|
74 |
|
42 |
|
|
192 |
|
54 |
|
|
| Divided by mining shipments (thousand tons) |
|
3,020 |
|
2,674 |
|
3,232 |
|
|
8,389 |
|
4,899 |
|
|
| Cash Operating Income per Ton - Mining |
|
17 |
|
28 |
|
13 |
|
|
23 |
|
11 |
|
|
| Divided by mining net sales |
|
264 |
|
271 |
|
276 |
|
|
810 |
|
471 |
|
|
| Cash Operating Income Margin - Mining (%) |
|
20 |
% |
27 |
% |
15 |
% |
|
24 |
% |
12 |
% |
|
|
|
|
|
|
|
|
|
|
Exhibit I - Alternative Performance Measures (cont.)
Adjusted Net Result
|
|
|
|
|
|
|
|
|
|
|
|
|
|
|
|
|
|
|
|
|
| $ MILLION |
|
2Q24 |
3Q23 |
|
9M24 |
9M23 |
|
|
|
|
|
|
|
Net (Loss) income |
|
(743) |
|
(783) |
|
|
(159) |
|
433 |
|
| Excluding non-cash effects related to the increase in the participation in Usiminas |
|
— |
|
(1,106) |
|
|
— |
|
(1,106) |
|
| Excluding provision for ongoing litigation related to the acquisition of a participation in Usiminas |
|
(783) |
|
— |
|
|
(783) |
|
— |
|
| Adjusted Net Income |
|
|
40 |
|
|
323 |
|
|
|
624 |
|
|
1,539 |
|
Adjusted Equity Holders’ Net Result and Adjusted Earnings (Losses) per ADS
|
|
|
|
|
|
|
|
|
|
|
|
|
|
|
|
|
|
|
|
|
| $ MILLION |
|
2Q24 |
3Q23 |
|
9M24 |
9M23 |
|
|
|
|
|
|
|
Equity holders’ net income |
|
(728) |
|
(739) |
|
|
(335) |
|
262 |
|
| Excluding non-cash effects related to the increase in the participation in Usiminas |
|
— |
|
(1,010) |
|
|
— |
|
(1,010) |
|
| Excluding provision for ongoing litigation related to the acquisition of a participation in Usiminas |
|
(706) |
|
— |
|
|
(706) |
|
— |
|
| Adjusted Equity Holders’ Net Income |
|
(21) |
|
271 |
|
|
372 |
|
1,272 |
|
| Divided by: outstanding shares of common stock, net of treasury shares (expressed in million of ADS equivalent) |
|
196 |
|
196 |
|
|
196 |
|
196 |
|
Adjusted (Losses) Earnings per ADS ($) |
|
|
(0.11) |
|
|
1.38 |
|
|
|
1.89 |
|
|
6.48 |
|
Free Cash Flow
|
|
|
|
|
|
|
|
|
|
|
|
|
|
|
|
|
|
|
|
|
|
|
|
| $ MILLION |
|
3Q24 |
2Q24 |
3Q23 |
|
9M24 |
9M23 |
|
|
|
|
|
|
|
|
| Net cash provided by operating activities |
|
303 |
|
656 |
|
1,020 |
|
|
1,435 |
|
1,783 |
|
| Excluding capital expenditures and advances to suppliers for PP&E |
|
(446) |
|
(409) |
|
(430) |
|
|
(1,304) |
|
(864) |
|
| Free cash flow |
|
(143) |
|
247 |
|
590 |
|
|
130 |
|
919 |
|
Exhibit I - Alternative Performance Measures (cont.)
Net Cash Position
|
|
|
|
|
|
|
|
|
|
|
|
|
|
|
| $ BILLION |
|
SEPTEMBER 30, 2024 |
JUNE 30, 2024 |
SEPTEMBER 30, 2023 |
|
|
|
|
|
Cash and cash equivalents2 |
|
1.6 |
|
1.7 |
|
1.8 |
|
Plus: other investments (current and non-current)2 |
|
2.3 |
|
2.1 |
|
2.7 |
|
| Less: borrowings (current and non-current) |
|
(2.2) |
|
(2.0) |
|
(2.2) |
|
| Net cash position |
|
1.7 |
|
1.9 |
|
2.4 |
|
2 Ternium Argentina’s consolidated position of cash and cash equivalents and other investments amounted to $1.1 billion and $1.3 billion as of September 30 and June 30, 2024, respectively, and $1.2 billion as of September 30, 2023.


