Document
FORM 6 - K
SECURITIES AND EXCHANGE COMMISSION
Washington, D.C. 20549
Report of Foreign Private Issuer
Pursuant to Rule 13a - 16 or 15d - 16 of
the Securities Exchange Act of 1934
As of 4/24/2024
Ternium S.A.
(Translation of Registrant’s name into English)
Ternium S.A.
26, Boulevard Royal - 4th floor
L-2449 Luxembourg
(352) 2668-3152
(Address of principal executive offices)
Indicate by check mark whether the registrant files or will file annual reports under cover Form 20-F or 40-F.
Form 20-F a Form 40-F __
Indicate by check mark whether the registrant by furnishing the information contained in this Form is also thereby furnishing the information to the Commission pursuant to Rule 12G3-2(b) under the Securities Exchange Act of 1934.
Yes __ No a
If “Yes” is marked, indicate below the file number assigned to the registrant in connection with Rule 12g3-2(b):
Not applicable
The attached material is being furnished to the Securities and Exchange Commission pursuant to Rule 13a-16 and Form 6-K under the Securities Exchange Act of 1934, as amended.
This report contains Ternium S.A.’s press release announcing first quarter 2024 results.
SIGNATURE
Pursuant to the requirements of the Securities Exchange Act of 1934, the Registrant has duly caused this report to be signed on its behalf by the undersigned, thereunto duly authorized.
TERNIUM S.A.
By: /s/ Guillermo Etchepareborda By: /s/ Sebastián Martí
Name: Guillermo Etchepareborda Name: Sebastián Martí
Title: Attorney in Fact Title: Attorney in Fact Luxembourg, April 24, 2024 – Ternium S.A. (NYSE: TX) today announced its results for the first quarter ended March 31, 2024.
Dated: April 24, 2024
Sebastián Martí
Ternium - Investor Relations
+1 (866) 890 0443
+54 (11) 4018 8389
www.ternium.com
Ternium Announces First Quarter of 2024 Results
The financial and operational information contained in this press release is based on Ternium S.A.’s operational data and consolidated condensed interim financial statements prepared in accordance with IAS 34 “Interim financial reporting” (IFRS) and presented in US dollars ($) and metric tons. Interim financial figures are unaudited. This press release includes certain non-IFRS alternative performance measures such as Adjusted EBITDA, Cash Operating Income, Net Cash, Free Cash Flow, Adjusted Net Income, Adjusted Equity Holders’ Net Income and Adjusted Earnings per ADS. The reconciliation of these figures to the most directly comparable IFRS measures is included in Exhibit I.
First Quarter of 2024 Highlights
|
|
|
|
|
|
|
|
|
|
|
|
|
|
|
|
|
|
|
|
|
|
|
|
|
|
|
|
|
|
|
|
|
|
|
|
|
|
|
|
|
|
|
|
|
|
|
|
SHIPMENTS - STEEL PRODUCTS |
|
|
ADJUSTED EBITDA |
|
|
|
NET INCOME |
|
3.9 MILLION TONS |
|
|
|
$855 MILLION |
|
|
|
$491 MILLION |
|
|
|
|
|
|
|
|
|
|
|
|
|
|
|
|
|
SHIPMENTS - MINING PRODUCTS |
|
|
ADJUSTED EBITDA MARGIN |
|
|
|
EQUITY HOLDERS’S NET INCOME |
|
1.4 MILLION TONS |
|
|
|
18% |
|
|
|
$361 MILLION |
|
|
|
|
|
|
|
|
|
|
|
|
|
|
|
|
|
|
|
|
|
|
|
|
|
|
|
|
|
|
|
|
|
| CASH PROVIDED BY OPERATING ACTIVITIES |
|
|
NET CASH POSITION |
|
|
|
EARNINGS PER ADS |
|
475 MILLION |
|
|
|
|
$2.0 BILLION |
|
|
|
|
$1.84 |
|
|
|
|
|
|
|
|
|
|
|
|
|
|
|
|
|
Summary of First Quarter of 2024 Results
|
|
|
|
|
|
|
|
|
|
|
|
|
|
|
|
|
|
|
|
|
| CONSOLIDATED |
|
1Q24 |
4Q23 |
DIF |
1Q23 |
DIF |
|
|
|
|
|
|
|
| Steel Products Shipments (thousand tons) |
|
3,894 |
|
4,035 |
|
-3 |
% |
3,065 |
|
27 |
% |
| Mining Products Shipments (thousand tons) |
|
1,424 |
|
1,952 |
|
-27 |
% |
— |
|
|
| Net Sales ($ million) |
|
4,778 |
|
4,931 |
|
-3 |
% |
3,623 |
|
32 |
% |
| Operating Income ($ million) |
|
675 |
|
582 |
|
16 |
% |
357 |
|
89 |
% |
| Adjusted EBITDA ($ million) |
|
855 |
|
651 |
|
31 |
% |
508 |
|
68 |
% |
| Adjusted EBITDA Margin (% of net sales) |
|
18 |
% |
13 |
% |
|
14 |
% |
|
|
|
|
|
|
|
|
| Net Income ($ million) |
|
491 |
|
554 |
|
|
480 |
|
|
| Equity Holders’ Net Income ($ million) |
|
361 |
|
414 |
|
|
374 |
|
|
Earnings per ADS1 ($) |
|
1.84 |
|
2.11 |
|
|
1.91 |
|
|
1 American Depositary Share. Each ADS represents 10 shares of Ternium’s common stock. Results are based on a weighted average number of shares of common stock outstanding (net of treasury shares) of 1,963,076,776.
First quarter of 2024 highlights
Ternium achieved a strong operating performance in the first quarter, reflecting a rebound in its margins and sustained high steel sales volumes.
The company’s net sales of steel products in Mexico increased sequentially in the first quarter, mainly driven by the lagged adjustment of industrial contract prices to higher levels. The sales volumes of steel products in Mexico experienced a slight decline in the period, due to the adverse effect of a destocking trend in Mexico’s commercial market, which was associated with a downturn in spot steel prices. This effect was largely offset by robust demand from industrial customers.
In the Southern Region, the company’s net sales of steel products decreased significantly in the first quarter compared to the fourth quarter of 2023, reflecting weaker demand for steel products in the Argentine market and a decrease in revenue per ton. The Argentine market was affected by lower activity levels and a destocking process in the company’s value chain.
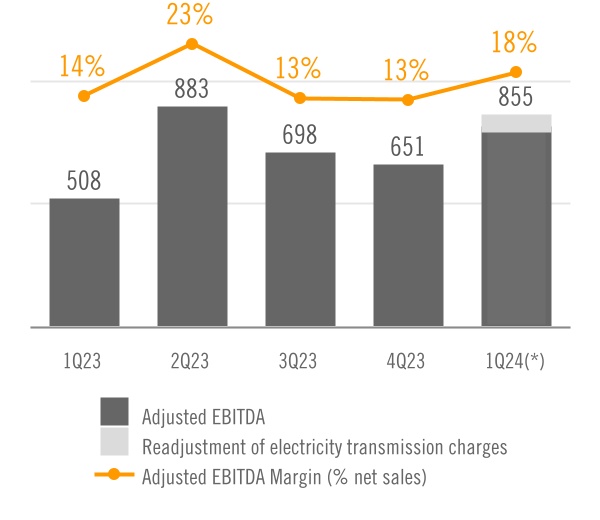
The first quarter’s Adjusted EBITDA of $855 million rose sequentially in the period mainly due to lower costs of purchased slabs and raw materials, a higher operational efficiency associated with the ramp-up of the main blast furnace at Usiminas’ Ipatinga facility and a higher revenue per ton in Mexico. In addition, the first quarter's Adjusted EBITDA was benefited by a $56 million gain related to a readjustment of electricity transmission charges in Mexico.
Change in Ternium’s Operating Segments from the First Quarter of 2024
Starting from the first quarter of 2024, Ternium has redefined its operating segments to reflect the integration of Usiminas’ operations, which it consolidated since July 2023. The new segments are Steel and Mining, based on the criteria of resource allocation and performance assessment.
The Steel segment encompasses the sales of steel products as well as other products, mainly electricity sales in Mexico and Brazil. The Mining segment comprises the sales of iron ore products originating from the mining activities of Las Encinas, a wholly owned subsidiary of Ternium Mexico, Peña Colorada, a joint venture in which Ternium Mexico holds a 50% stake, and Mineração Usiminas, a subsidiary of Usiminas.
Outlook
Mexico’s steel market is anticipated to remain robust, with a sustained expansion in the northern region fueled by the relocation of production capacity from Asia to North America. Most industrial sectors, such as automotive, show solid performance, except for home appliances and electric motors, which face headwinds from U.S. inflation. Moreover, the commercial market is resuming activity after a destocking phase in the first quarter triggered by a downturn in steel benchmark prices in North America.
In Brazil, the steel market is slightly improving, with moderate growth in many sectors. The auto industry’s latest forecast points to a 6% production increase for 2024. The capital goods and construction sectors are slowly picking up, driven by lower interest rates, improved consumer confidence and infrastructure projects. Meanwhile, the country still faces a high influx of steel imports at unfair prices. Ternium Brasil’s slab production experienced a temporary disruption due to an unexpected outage in one of its blast furnaces at the close of the first quarter. The blast furnace is undergoing repairs.
In Argentina, the first quarter of 2024 saw a sharp decline in local steel demand, as the economic stabilization measures implemented by the new government adversely impacted both the construction and industrial sectors. The outlook for Argentina remains uncertain, but Ternium expects to see a recovery in the second quarter of 2024, as the economy adapts to the new policy environment and inflation slows down.
Compared to the first quarter of 2024, Ternium expects a lower recurring Adjusted EBITDA in the second quarter of 2024, mainly due to a margin reduction that would be partly offset by higher steel shipments. The steel segment’s revenue per ton is anticipated to decline in most of Ternium’s markets while cost per ton will remain relatively stable. Steel shipments are expected to grow, reflecting increased volumes in Mexico and Argentina and steady shipments in Brazil. In addition, the mining segment will show sequentially stable iron ore volumes in the second quarter of 2024.
Analysis of First Quarter of 2024 Results
Consolidated Net Sales
|
|
|
|
|
|
|
|
|
|
|
|
|
|
|
|
|
|
|
|
|
| $ MILLION |
|
1Q24 |
4Q23 |
DIF |
1Q23 |
DIF |
|
|
|
|
|
|
|
| Mexico |
|
2,389 |
|
2,265 |
|
5 |
% |
2,206 |
|
8 |
% |
| Brazil |
|
1,045 |
|
1,064 |
|
-2 |
% |
42 |
|
|
| Southern Region |
|
563 |
|
905 |
|
-38 |
% |
854 |
|
-34 |
% |
| Other Markets |
|
603 |
|
455 |
|
32 |
% |
452 |
|
33 |
% |
| Total steel products |
|
4,601 |
|
4,689 |
|
-2 |
% |
3,554 |
|
29 |
% |
| Other products |
|
89 |
|
62 |
|
45 |
% |
69 |
|
28 |
% |
| Steel segment |
|
4,690 |
|
4,750 |
|
-1 |
% |
3,623 |
|
29 |
% |
| Mining segment |
|
88 |
|
180 |
|
-51 |
% |
0 |
|
|
| Total net sales |
|
4,778 |
|
4,931 |
|
-3 |
% |
3,623 |
|
32 |
% |
Note: other products include mainly electricity sales in Mexico and Brazil.
Adjusted EBITDA
Adjusted EBITDA in the first quarter was benefited by a $56 million gain related to a readjustment of electricity transmission charges in Mexico.
Adjusted EBITDA in the first quarter of 2024 equals Net Income adjusted to exclude:
◦Income Tax Results;
◦Equity in Results of Non-consolidated Companies;
◦Net Financial Results; and
◦Depreciation and Amortization.
And adjusted to include the proportional EBITDA in Unigal (70% participation).
Adjusted EBITDA Margin equals Adjusted EBITDA divided by net sales. For more information see Exhibit I - Alternative performance measures - “Adjusted EBITDA”.
|
|
|
|
ADJUSTED EBITDA
$ MILLION
|
Steel Segment
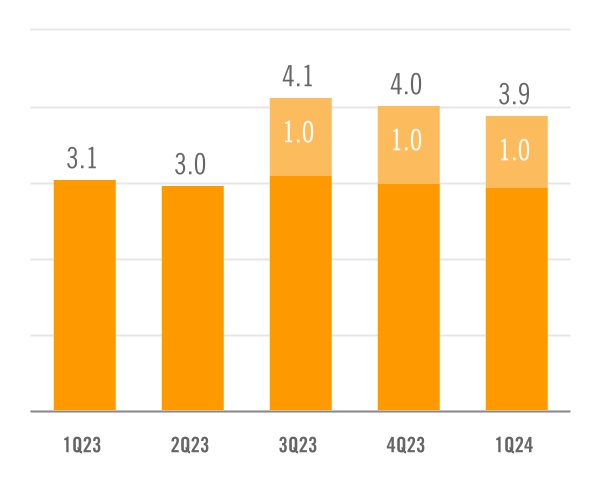
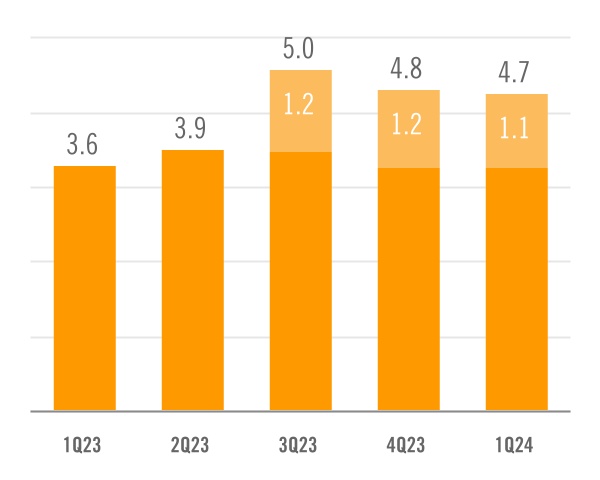
The steel segment net sales remained strong in the first quarter of 2024, slightly below the levels achieved in the prior quarter. On a year-over-year basis, the
consolidation of Usiminas added $1.1 billion to steel segment net sales and 1.0 million tons to steel product shipments.
|
|
|
|
SHIPMENTS - STEEL PRODUCTS
MILLION TONS
|
|
|
|
|
NET SALES - STEEL SEGMENT
$ BILLION
|
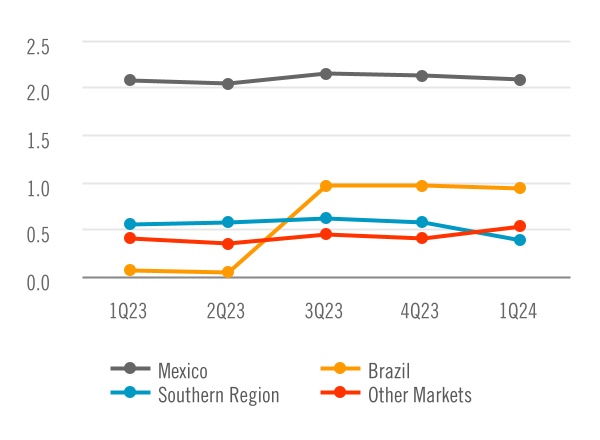
Steel products shipments in Mexico remained high in the period. Volumes decreased slightly sequentially, reflecting the negative impact of a transitory destocking in Mexico’s commercial steel market, which was mostly offset by the positive impact of a strong industrial customer demand.
In Brazil, steel shipments remained relatively stable sequentially and increased 0.9 million tons year-over-year due to the consolidation of Usiminas.
In the Southern Region, sales volumes decreased significantly in the first quarter of 2024, reflecting lower activity levels in Argentina and a destocking process in the steel value chain associated with the negative short-term impact of the government’s economic stabilization measures on the construction and industrial sectors.
|
|
|
|
SHIPMENTS BY REGION - STEEL PRODUCTS
MILLION TONS
|
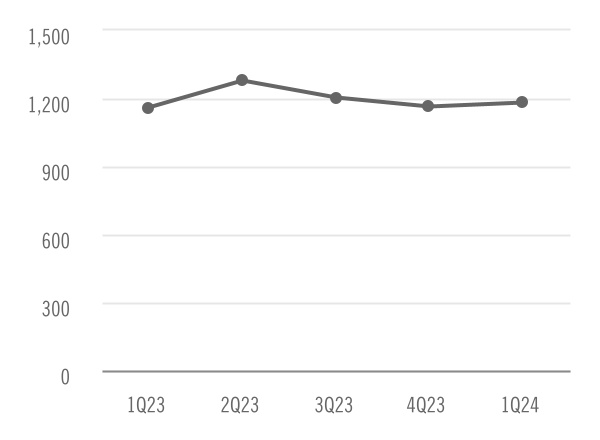
Steel revenue per ton increased slightly sequentially and on a year-over-year basis.
In Mexico, realized steel prices increased in the first quarter of 2024 reflecting the lagged reset of industrial contract prices at higher levels. On the other hand, weak market conditions in Argentina contributed to a decrease in realized steel prices in the Southern Region on a sequential and on a year-over-year basis.
|
|
|
|
REVENUE PER TON - STEEL PRODUCTS
$/TON
|
|
|
|
|
|
|
|
|
|
|
|
|
|
|
|
|
|
|
|
|
|
|
|
|
|
|
|
|
|
|
|
|
|
|
|
|
|
|
|
|
|
|
|
|
|
|
|
|
|
|
|
|
|
|
|
|
|
| STEEL SEGMENT |
|
NET SALES ($ MILLION) |
|
SHIPMENTS (THOUSAND TONS) |
|
REVENUE/TON ($/TON) |
|
|
|
|
|
|
|
|
|
|
|
|
|
|
|
|
|
|
|
|
|
1Q24 |
4Q23 |
DIF |
1Q23 |
DIF |
|
1Q24 |
4Q23 |
DIF |
1Q23 |
DIF |
|
1Q24 |
4Q23 |
DIF |
1Q23 |
DIF |
|
|
|
|
|
|
|
|
|
|
|
|
|
|
|
|
|
|
|
| Mexico |
|
2,389 |
|
2,265 |
|
5 |
% |
2,206 |
|
8 |
% |
|
2,078 |
|
2,122 |
|
-2 |
% |
2,066 |
|
1 |
% |
|
1,150 |
|
1,067 |
|
8 |
% |
1,068 |
|
8 |
% |
| Brazil |
|
1,045 |
|
1,064 |
|
-2 |
% |
42 |
|
|
|
923 |
|
952 |
|
-3 |
% |
63 |
|
|
|
1,132 |
|
1,118 |
|
1 |
% |
664 |
|
|
| Southern Region |
|
563 |
|
905 |
|
-38 |
% |
854 |
|
-34 |
% |
|
370 |
|
561 |
|
-34 |
% |
544 |
|
-32 |
% |
|
1,522 |
|
1,611 |
|
-6 |
% |
1,570 |
|
-3 |
% |
| Other Markets |
|
603 |
|
455 |
|
32 |
% |
452 |
|
33 |
% |
|
523 |
|
399 |
|
31 |
% |
392 |
|
34 |
% |
|
1,153 |
|
1,140 |
|
1 |
% |
1,153 |
|
0 |
% |
| Total Steel Products |
|
4,601 |
|
4,689 |
|
-2 |
% |
3,554 |
|
29 |
% |
|
3,894 |
|
4,035 |
|
-3 |
% |
3,065 |
|
27 |
% |
|
1,181 |
|
1,162 |
|
2 |
% |
1,159 |
|
2 |
% |
| Other Products |
|
89 |
|
62 |
|
45 |
% |
69 |
|
28 |
% |
|
|
|
|
|
|
|
|
|
|
|
|
| Total Steel Segment |
|
4,690 |
|
4,750 |
|
-1 |
% |
3,623 |
|
29 |
% |
|
|
|
|
|
|
|
|
|
|
|
|
|
|
|
|
|
|
|
|
|
|
|
|
|
|
|
|
|
|
|
|
|
|
|
CASH OPERATING INCOME PER TON - STEEL SEGMENT
$/TON
|
|
|
|
|
CASH OPERATING INCOME MARGIN - STEEL SEGMENT
%
|
Cash Operating Income equals Operating Income adjusted to exclude depreciation and amortization as well as certain other non-cash items. The steel segment’s Cash Operating Income per Ton and Margin equal the steel segment’s Cash Operating Income divided by Steel Segment’s Shipments and Net Sales, respectively. For more information see Exhibit I - Alternative performance measures - “Cash Operating Income - Steel Segment”.
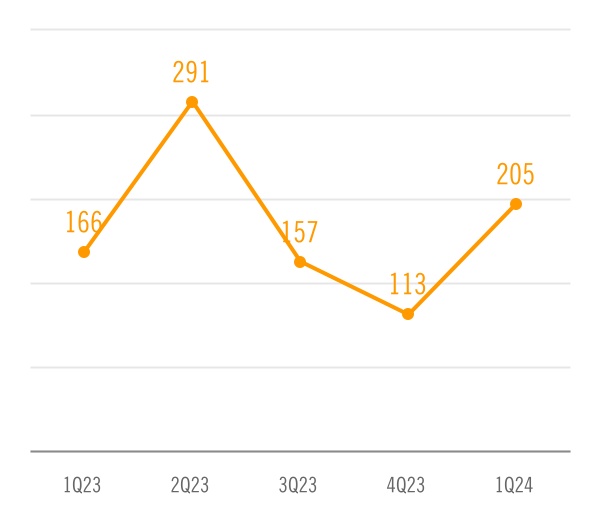
Ternium recorded strong steel segment Cash Operating Income per Ton and Margin in the first quarter of 2024. Reported ratios were positively impacted by lower costs of purchased slabs and raw materials as well as better operating efficiencies in Usiminas’ steel facility in Ipatinga. In addition, Ternium recorded a $56 million gain in its steel segment’s cost of sales related to a readjustment of electricity transmission charges in Mexico.
Mining Segment
Ternium reports intercompany and third-party sales of mining products under the Mining segment.
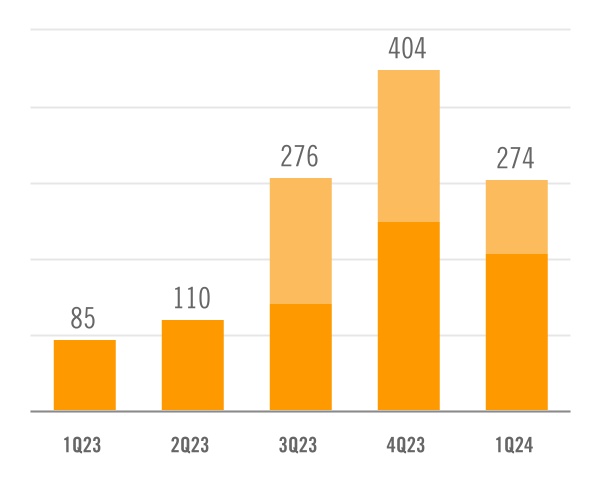
The Mining segment net sales in the first quarter of 2024 decreased sequentially, mainly reflecting lower iron ore prices and a decrease in iron ore shipments to third parties. Mining product shipments decreased in the period mainly due to lower iron ore production levels.
On a year-over-year basis, the consolidation of Usiminas added 2.0 million tons to mining products shipments and $131 million to net sales of mining products.
|
|
|
|
SHIPMENTS - MINING PRODUCTS
MILLION TONS
|
|
|
|
n Intercompany n Third parties |
|
|
|
|
|
NET SALES - MINING SEGMENT
$ MILLION
|
|
|
|
n Intercompany n Third parties |
|
Iron ore price volatility remained high in the first quarter, with reference prices reaching a 12-month peak early in January 2024 and then falling to a bottom near the lowest level recorded in the last 12-months. However, starting in April, iron ore reference prices have been on an upward trend.
|
|
|
|
REVENUE PER TON - MINING PRODUCTS
$/TON
|
|
|
|
|
|
|
|
|
|
|
|
|
|
|
|
|
|
|
|
|
|
|
|
|
|
|
|
|
|
|
|
|
|
|
|
|
|
|
|
|
|
|
|
|
|
|
|
|
|
|
|
|
|
|
|
|
|
| MINING SEGMENT |
|
NET SALES ($ MILLION) |
|
SHIPMENTS (THOUSAND TONS) |
|
REVENUE/TON ($/TON) |
|
|
|
|
|
|
|
|
|
|
|
|
|
|
|
|
|
|
|
|
|
1Q24 |
4Q23 |
DIF |
1Q23 |
DIF |
|
1Q24 |
4Q23 |
DIF |
1Q23 |
DIF |
|
1Q24 |
4Q23 |
DIF |
1Q23 |
DIF |
| Third parties |
|
88 |
|
180 |
|
-51 |
% |
— |
|
— |
|
|
1,424 |
|
1,952 |
|
-27 |
% |
— |
|
— |
|
|
62 |
|
92 |
|
-33 |
% |
— |
|
— |
|
| Intercompany |
|
186 |
|
224 |
|
-17 |
% |
85 |
|
119 |
% |
|
1,271 |
|
1,325 |
|
-4 |
% |
799 |
|
59 |
% |
|
146 |
|
169 |
|
-13 |
% |
106 |
|
38 |
% |
| Total |
|
274 |
|
404 |
|
-32 |
% |
85 |
|
223 |
% |
|
2,695 |
|
3,277 |
|
-18 |
% |
799 |
|
237 |
% |
|
102 |
|
123 |
|
-17 |
% |
106 |
|
-4 |
% |
|
|
|
|
CASH OPERATING INCOME PER TON - MINING PRODUCTS
$/TON
|
|
|
|
|
CASH OPERATING INCOME MARGIN - MINING SEGMENT
%
|
Cash Operating Income equals Operating Income adjusted to exclude depreciation and amortization as well as certain other non-cash items. The mining segment Cash Operating Income per Ton and Cash Operating Income Margin equal the mining
segment’s Cash Operating Income divided by its
Shipments and Net Sales, respectively. For more information see Exhibit I - Alternative performance measures - “Cash Operating Income - Mining Segment”.
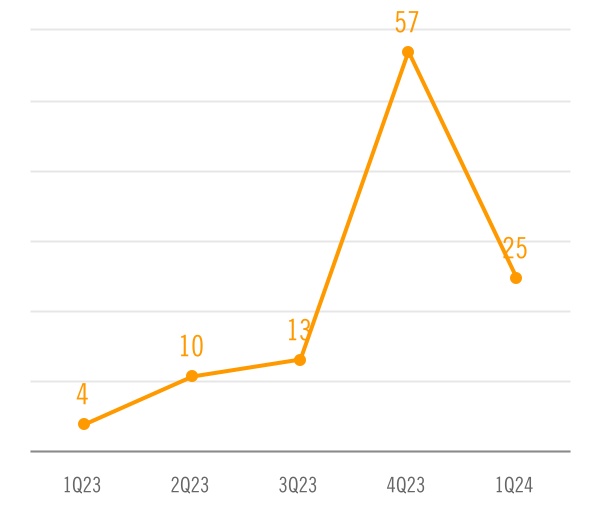
The mining segment’s Cash Operating Income per Ton and Margin in the first quarter of 2024 were negatively affected by the decrease in mining products revenue per ton.
Net Financial Results
In the first quarter of 2024, Ternium’s divestment of Argentine government bond holdings resulted in a loss of $106 million due to the recycling of changes in the fair value of financial instruments from Other Comprehensive Income to Financial Results.
As of March 31, 2024, the balance of Ternium’s Other Comprehensive Income in connection with its
Argentine government bond holdings amounted to a
negative $238 million.
Ternium recorded a $41 million net foreign exchange loss in the period, mainly due to the impact on Usiminas’ net short foreign currency position of the depreciation of the Brazilian Real vis-a-vis the US
dollar (as Usiminas uses the Brazilian Real as its functional currency), and the impact of the appreciation of the Mexican Peso vis-a-vis the US dollar on Ternium Mexico’s net short local currency position.
|
|
|
|
|
|
|
|
|
|
|
|
|
|
|
| $ MILLION |
|
1Q24 |
4Q23 |
1Q23 |
|
|
|
|
|
| Net interest results |
|
38 |
|
49 |
|
25 |
|
| Net foreign exchange result |
|
(41) |
|
171 |
|
(16) |
|
| Change in fair value of financial assets |
|
(137) |
|
(85) |
|
4 |
|
| Other financial expense, net |
|
(22) |
|
(32) |
|
(6) |
|
| Net financial results |
|
(163) |
|
103 |
|
8 |
|
Income Tax Results
Using the US dollar as their functional currency, Ternium Mexico, Ternium Argentina and Ternium Brasil are affected by deferred tax results. These
results account for the impact of local currency fluctuations against the US dollar, as well as the effect of local inflation.
|
|
|
|
|
|
|
|
|
|
|
|
|
|
|
| $ MILLION |
|
1Q24 |
4Q23 |
1Q23 |
|
|
|
|
|
| Current income tax expense |
|
(126) |
|
(141) |
|
(139) |
|
| Deferred tax gain (loss) |
|
86 |
|
(15) |
|
218 |
|
| Income tax expense |
|
(40) |
|
(156) |
|
79 |
|
| Result before income tax |
|
532 |
|
709 |
|
400 |
|
| Effective tax rate |
|
8 |
% |
22 |
% |
-20 |
% |
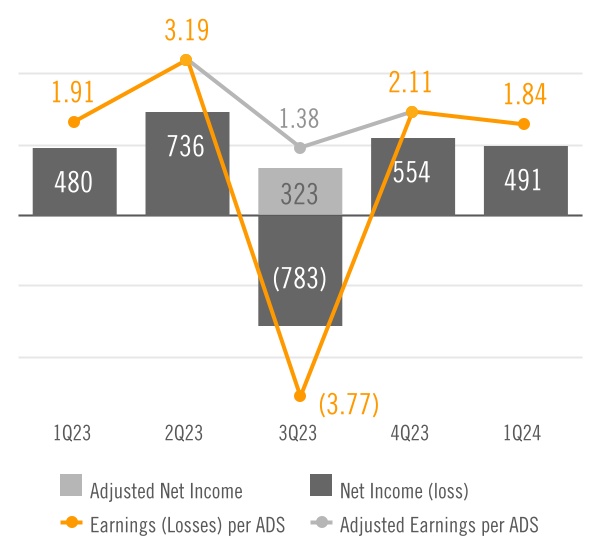
Net Income
A robust operating performance coupled with a $56 million gain related to a readjustment of electricity transmission charges in Mexico contributed to Ternium’s Net Income in the first quarter of 2024. In addition, Net Income in the period reflected higher financial expenses and an unusually low effective tax rate caused by deferred tax gains.
In the third quarter of 2023, Adjusted Net Income equaled the period’s Net Loss adjusted to exclude a loss of $1.1 billion in connection with an increase in the participation in Usiminas. Adjusted Earnings per ADS equaled the period’s Adjusted Equity Holders’ Net Income divided by 1,963 million outstanding shares of Ternium’s common stock, net of treasury shares, expressed in ADS equivalent (each ADS represents 10 shares).
|
|
|
|
NET INCOME (LOSS), EARNINGS (LOSSES) PER ADS
$ MILLION, $
|
|
|
|
|
|
|
|
|
|
|
|
|
|
|
|
| $ MILLION |
|
1Q24 |
4Q23 |
1Q23 |
|
|
|
|
|
| Owners of the parent |
|
361 |
|
414 |
|
374 |
|
| Non-controlling interest |
|
130 |
|
140 |
|
105 |
|
Net Income |
|
491 |
|
554 |
|
480 |
|
|
|
|
|
|
|
|
|
|
|
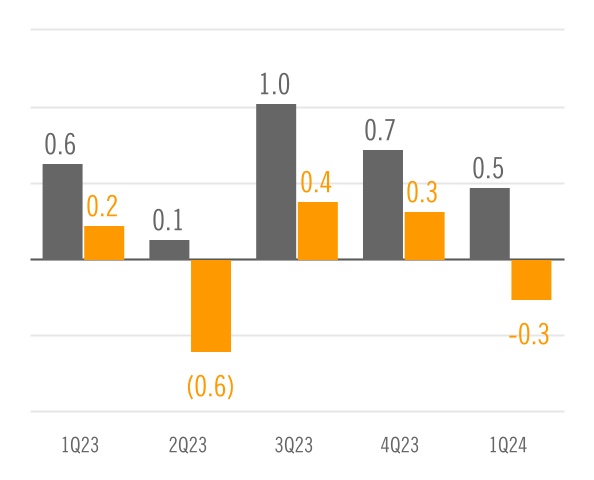
Cash Flow and Liquidity
In the first quarter of 2024, cash from operations was $475 million, a relatively healthy level considering a $266 million increase in working capital, mainly related to higher inventories of $153 million and a net increase in trade and other receivables of $146 million.
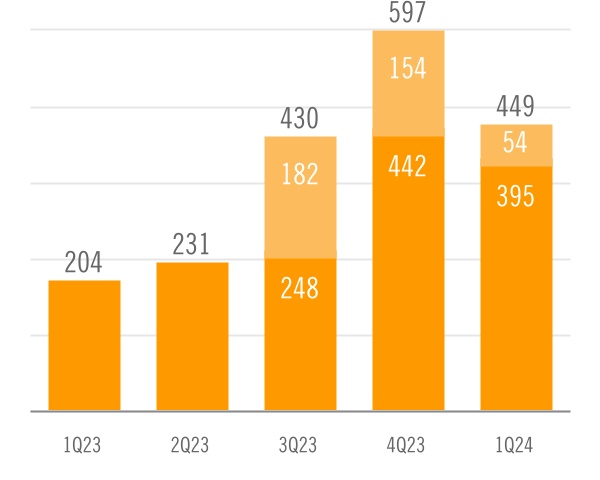
Capital expenditures decreased sequentially in the first quarter mainly reflecting the completion of the relining of the main blast furnace in Ipatinga and a decrease in advanced payments to equipment manufacturers in connection with the construction of the new facilities at the industrial center in Pesquería.
|
|
|
|
CASH FROM OPERATIONS, CHANGES IN WORKING CAPITAL
$ BILLION
|
|
|
|
n Cash from operations n (Incr.) decr. in working capital |
|
|
|
|
|
CAPITAL EXPENDITURES
$ MILLION
|
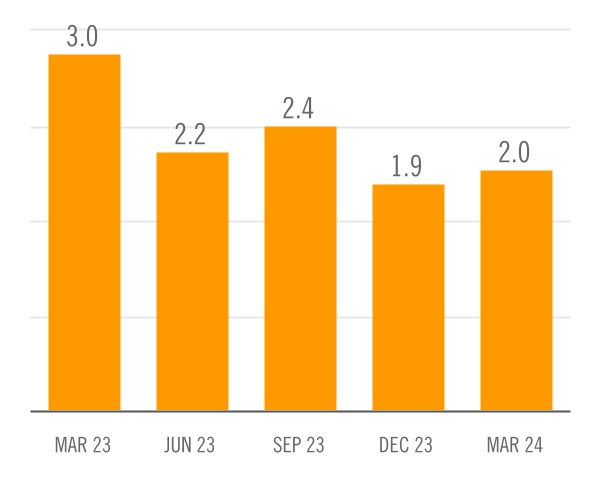
Ternium’s net cash position increased slightly in the first quarter, reaching $2.0 billion as of March 31, 2024.
The sequential change in net cash position was mainly related to an improved valuation of Ternium Argentina’s holdings of Argentine sovereign bonds. Net cash as of the end of the period included Ternium Argentina’s total position of cash and cash equivalents and other investments of $1.2 billion.
|
|
|
|
NET CASH POSITION
$ BILLION
|
Conference Call and Webcast
Ternium will host a conference call on April 25, 2024, at 8:30 a.m. ET in which management will discuss first quarter of 2024 results. A webcast link will be available in the Investor Center section of the company’s website at www.ternium.com.
Forward Looking Statements
Some of the statements contained in this press release are “forward-looking statements”. Forward-looking statements are based on management’s current views and assumptions and involve known and unknown risks that could cause actual results, performance or events to differ materially from those expressed or implied by those statements. These risks include but are not limited to risks arising from uncertainties as to gross domestic product, related market demand, global production capacity, tariffs, cyclicality in the industries that purchase steel products and other factors beyond Ternium’s control.
About Ternium
Ternium is a leading steel producer in the Americas, providing advanced steel products to a wide range of manufacturing industries and the construction sector. We invest in low carbon emissions steelmaking technologies to support the energy transition and the mobility of the future. We also support the development of our communities, especially through educational programs in Latin America. More information about Ternium is available at www.ternium.com.
Income Statement
|
|
|
|
|
|
|
|
|
|
|
|
|
|
|
| $ MILLION |
|
1Q24 |
4Q23 |
1Q23 |
|
|
|
|
|
| Net sales |
|
4,778 |
|
4,931 |
|
3,623 |
|
| Cost of sales |
|
(3,675) |
|
(4,039) |
|
(2,981) |
|
| Gross profit |
|
1,104 |
|
892 |
|
643 |
|
| Selling, general and administrative expenses |
|
(431) |
|
(432) |
|
(293) |
|
| Other operating income |
|
2 |
|
121 |
|
8 |
|
| Operating income |
|
675 |
|
582 |
|
357 |
|
|
|
|
|
|
| Financial expense |
|
(45) |
|
(44) |
|
(16) |
|
| Financial income |
|
83 |
|
94 |
|
41 |
|
| Other financial (expense) income, net |
|
(200) |
|
54 |
|
(17) |
|
Equity in earnings of non-consolidated companies |
|
20 |
|
24 |
|
35 |
|
|
|
|
|
|
|
|
|
|
|
| Profit before income tax results |
|
532 |
|
709 |
|
400 |
|
| Income tax (expense) credit |
|
(40) |
|
(156) |
|
79 |
|
| Profit for the period |
|
491 |
|
554 |
|
480 |
|
|
|
|
|
|
| Attributable to: |
|
|
|
|
| Owners of the parent |
|
361 |
|
414 |
|
374 |
|
| Non-controlling interest |
|
130 |
|
140 |
|
105 |
|
Net income |
|
491 |
|
554 |
|
480 |
|
Statement of Financial Position
|
|
|
|
|
|
|
|
|
|
|
|
|
|
|
| $ MILLION |
|
MARCH 31,
2024 |
|
DECEMBER 31,
2023 |
|
|
|
|
|
| Property, plant and equipment, net |
|
7,856 |
|
|
7,638 |
|
| Intangible assets, net |
|
1,025 |
|
|
996 |
|
| Investments in non-consolidated companies |
|
524 |
|
|
517 |
|
| Other investments |
|
35 |
|
|
211 |
|
| Deferred tax assets |
|
1,694 |
|
|
1,713 |
|
| Receivables, net |
|
994 |
|
|
1,073 |
|
|
|
|
|
|
| Total non-current assets |
|
12,128 |
|
|
12,149 |
|
|
|
|
|
|
| Receivables, net |
|
1,221 |
|
|
1,173 |
|
| Derivative financial instruments |
|
7 |
|
|
15 |
|
| Inventories, net |
|
5,059 |
|
|
4,948 |
|
| Trade receivables, net |
|
2,181 |
|
|
2,065 |
|
| Other investments |
|
2,283 |
|
|
1,976 |
|
| Cash and cash equivalents |
|
1,780 |
|
|
1,846 |
|
| Total current assets |
|
12,532 |
|
|
12,024 |
|
|
|
|
|
|
| Non-current assets classified as held for sale |
|
9 |
|
|
7 |
|
|
|
|
|
|
| Total assets |
|
24,669 |
|
|
24,179 |
|
Statement of Financial Position (cont.)
|
|
|
|
|
|
|
|
|
|
|
|
|
|
|
| $ MILLION |
|
MARCH 31,
2024 |
|
DECEMBER 31,
2023 |
|
|
|
|
|
| Capital and reserves attributable to the owners of the parent |
|
13,029 |
|
|
12,419 |
|
| Non-controlling interest |
|
4,527 |
|
|
4,393 |
|
| Total equity |
|
17,556 |
|
|
16,812 |
|
|
|
|
|
|
| Provisions |
|
806 |
|
|
840 |
|
| Deferred tax liabilities |
|
23 |
|
|
171 |
|
| Other liabilities |
|
1,139 |
|
|
1,149 |
|
| Trade payables |
|
6 |
|
|
12 |
|
| Lease liabilities |
|
186 |
|
|
189 |
|
| Borrowings |
|
1,176 |
|
|
1,206 |
|
| Total non-current liabilities |
|
3,337 |
|
|
3,567 |
|
|
|
|
|
|
| Current income tax liabilities |
|
120 |
|
|
137 |
|
| Other liabilities |
|
490 |
|
|
430 |
|
| Trade payables |
|
2,195 |
|
|
2,233 |
|
| Derivative financial instruments |
|
2 |
|
|
8 |
|
| Lease liabilities |
|
50 |
|
|
52 |
|
| Borrowings |
|
919 |
|
|
940 |
|
| Total current liabilities |
|
3,776 |
|
|
3,801 |
|
|
|
|
|
|
| Total liabilities |
|
7,113 |
|
|
7,367 |
|
|
|
|
|
|
Total equity and liabilities |
|
24,669 |
|
|
24,179 |
|
Statement of Cash Flows
|
|
|
|
|
|
|
|
|
|
|
|
|
|
|
| $ MILLION |
|
1Q24 |
4Q23 |
1Q23 |
|
|
|
|
|
| Result for the period |
|
491 |
|
554 |
|
480 |
|
|
|
|
|
|
| Adjustments for: |
|
|
|
|
| Depreciation and amortization |
|
171 |
|
191 |
|
151 |
|
| Income tax accruals less payments |
|
(13) |
|
(45) |
|
(157) |
|
| Equity in earnings of non-consolidated companies |
|
(20) |
|
(24) |
|
(35) |
|
| Impairment charge |
|
— |
|
42 |
|
— |
|
| Interest accruals less payments/receipts, net |
|
(2) |
|
(34) |
|
(18) |
|
| Changes in provisions |
|
(7) |
|
(61) |
|
(1) |
|
| Changes in working capital |
|
(266) |
|
320 |
|
218 |
|
| Net foreign exchange results and others |
|
120 |
|
(225) |
|
(1) |
|
|
|
|
|
|
| Net cash provided by operating activities |
|
475 |
|
718 |
|
636 |
|
|
|
|
|
|
| Capital expenditures and advances to suppliers for PP&E |
|
(449) |
|
(597) |
|
(204) |
|
| Decrease (increase) in other investments |
|
0 |
|
129 |
|
(686) |
|
| Proceeds from the sale of property, plant & equipment |
|
1 |
|
1 |
|
1 |
|
| Dividends received from non-consolidated companies |
|
1 |
|
28 |
|
— |
|
|
|
|
|
|
|
|
|
|
|
|
|
|
|
|
|
|
|
|
|
| Net cash used in investing activities |
|
(447) |
|
(439) |
|
(889) |
|
|
|
|
|
|
| Dividends paid in cash to company’s shareholders |
|
— |
|
(216) |
|
— |
|
| Finance lease payments |
|
(18) |
|
(16) |
|
(14) |
|
| Proceeds from borrowings |
|
131 |
|
119 |
|
46 |
|
| Repayments of borrowings |
|
(166) |
|
(121) |
|
(196) |
|
| Net cash used in financing activities |
|
(53) |
|
(234) |
|
(164) |
|
|
|
|
|
|
| (Decrease) increase in cash and cash equivalents |
|
(24) |
|
45 |
|
(417) |
|
Exhibit I - Alternative performance measures
These non-IFRS measures should not be considered in isolation of, or as a substitute for, measures of performance prepared in accordance with IFRS. These non-IFRS measures do not have a standardized meaning under IFRS and, therefore, may not correspond to similar non-IFRS financial measures reported by other companies.
Adjusted EBITDA
|
|
|
|
|
|
|
|
|
|
|
|
|
|
|
|
|
|
|
|
|
| $ MILLION |
|
1Q24 |
4Q23 |
3Q23 |
2Q23 |
1Q23 |
|
|
|
|
|
|
|
| Net income (loss) |
|
491 |
|
554 |
|
(783) |
|
736 |
|
480 |
|
| Adjusted to exclude: |
|
|
|
|
|
|
| Income tax results |
|
40 |
|
156 |
|
253 |
|
5 |
|
(79) |
|
| Equity in earnings of non-consolidated companies |
|
(20) |
|
(24) |
|
(19) |
|
(27) |
|
(35) |
|
| Net financial results |
|
163 |
|
(103) |
|
(30) |
|
18 |
|
(8) |
|
| Reversal of Usiminas’ post-retirement liabilities |
|
— |
|
(109) |
|
— |
|
— |
|
— |
|
| Contingency reversal - dismissal of public civil action against Usiminas |
|
— |
|
(63) |
|
— |
|
— |
|
— |
|
| Non-cash effects related to the increase in the participation in Usiminas |
|
— |
|
— |
|
1,106 |
|
— |
|
— |
|
Impairment on Las Encinas’ mining assets |
|
— |
|
42 |
|
— |
|
— |
|
— |
|
| Depreciation and amortization |
|
171 |
|
191 |
|
165 |
|
151 |
|
151 |
|
| Adjusted to include: |
|
|
|
|
|
|
| Proportional EBITDA in Unigal (70% participation) |
|
9 |
|
8 |
|
6 |
|
— |
|
— |
|
| Adjusted EBITDA |
|
855 |
|
651 |
|
698 |
|
883 |
|
508 |
|
| Divided by: net sales |
|
4,778 |
|
4,931 |
|
5,185 |
|
3,871 |
|
3,623 |
|
| Adjusted EBITDA Margin (%) |
|
18 |
% |
13 |
% |
13 |
% |
23 |
% |
14 |
% |
Exhibit I - Alternative performance measures (cont.)
Cash Operating Income - Steel Segment
|
|
|
|
|
|
|
|
|
|
|
|
|
|
|
|
|
|
|
|
|
| $ MILLION |
|
1Q24 |
4Q23 |
3Q23 |
2Q23 |
1Q23 |
|
|
|
|
|
|
|
Operating Income - Management View (Note “Segment Information” to Ternium’s Financial Statements as of the corresponding dates) |
|
593 |
|
543 |
|
667 |
|
597 |
|
521 |
|
| Plus/Minus differences in Cost of Sales (IFRS) |
|
59 |
|
(75) |
|
(162) |
|
144 |
|
(139) |
|
| Excluding Reversal of Usiminas’ post-retirement liabilities |
|
— |
|
(109) |
|
— |
|
— |
|
— |
|
| Excluding Contingency reversal - dismissal of public civil action against Usiminas |
|
— |
|
(63) |
|
— |
|
— |
|
— |
|
|
|
|
|
|
|
|
|
|
|
|
|
|
|
| Excluding Depreciation and Amortization |
|
137 |
|
154 |
|
136 |
|
126 |
|
126 |
|
| Including Proportional EBITDA in Unigal (70% participation) |
|
9 |
|
8 |
|
6 |
|
— |
|
— |
|
| Cash Operating Income |
|
798 |
|
458 |
|
647 |
|
867 |
|
507 |
|
| Divided by Steel Shipments (thousand tons) |
|
3,894 |
|
4,035 |
|
4,131 |
|
2,982 |
|
3,065 |
|
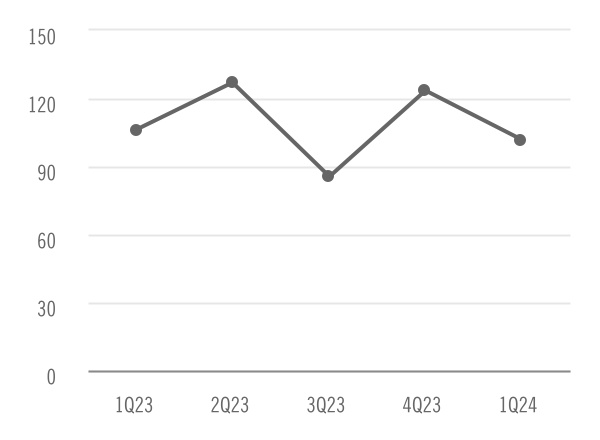
| Cash Operating Income per Ton - Steel |
|
205 |
|
114 |
|
157 |
|
291 |
|
166 |
|
| Divided by Steel Net Sales |
|
4,690 |
|
4,750 |
|
5,036 |
|
3,871 |
|
3,623 |
|
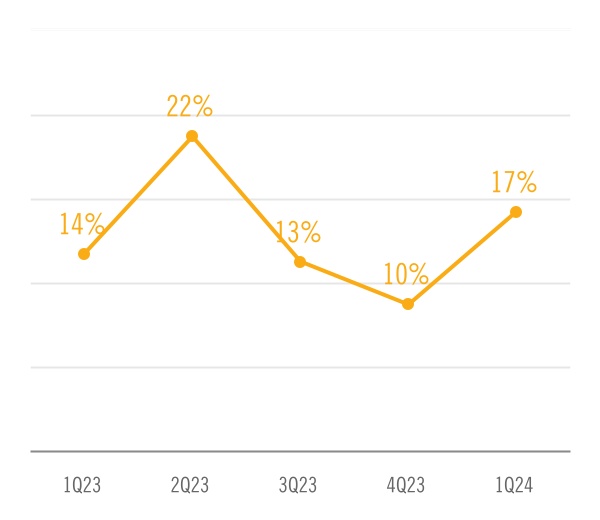
| Cash Operating Income Margin - Steel (%) |
|
17 |
% |
10 |
% |
13 |
% |
22 |
% |
14 |
% |
Cash Operating Income - Mining Segment
|
|
|
|
|
|
|
|
|
|
|
|
|
|
|
|
|
|
|
|
|
|
| $ MILLION |
|
1Q24 |
4Q23 |
3Q23 |
2Q23 |
1Q23 |
|
|
|
|
|
|
|
|
|
Operating Income - Management View (Note “Segment Information” to Ternium’s Financial Statements as of the corresponding dates) |
|
(22) |
|
97 |
|
(4) |
|
(25) |
|
(6) |
|
|
| Plus/Minus differences in Cost of Sales (IFRS) |
|
54 |
|
9 |
|
17 |
|
10 |
|
(16) |
|
|
| Excluding Impairment on Las Encinas’ mining assets |
|
— |
|
42 |
|
— |
|
— |
|
— |
|
|
| Excluding Depreciation and Amortization |
|
34 |
|
37 |
|
29 |
|
25 |
|
24 |
|
|
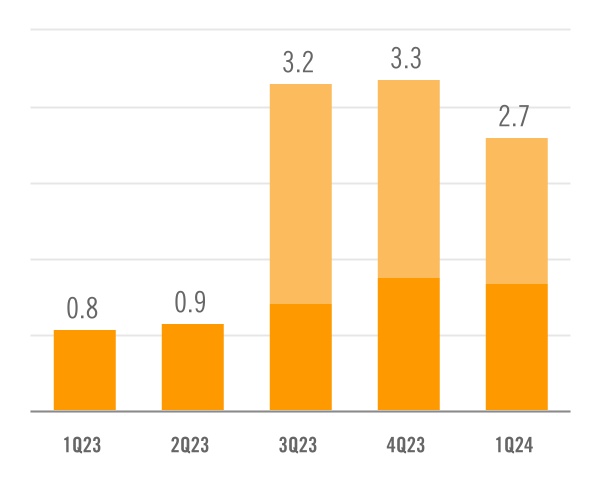
| Cash Operating Income |
|
66 |
|
185 |
|
42 |
|
9 |
|
3 |
|
|
| Divided by Mining Shipments (thousand tons) |
|
2,695 |
|
3,277 |
|
3,232 |
|
867 |
|
799 |
|
|
| Cash Operating Income per Ton - Mining |
|
25 |
|
57 |
|
13 |
|
10 |
|
4 |
|
|
| Divided by Mining Net Sales |
|
274 |
|
404 |
|
276 |
|
110 |
|
85 |
|
|
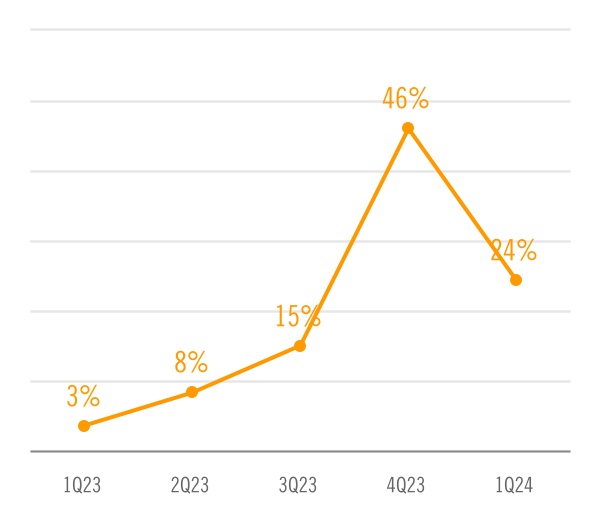
| Cash Operating Income Margin - Mining (%) |
|
24 |
% |
46 |
% |
15 |
% |
8 |
% |
3 |
% |
|
Exhibit I - Alternative performance measures (cont.)
Adjusted Net Income
|
|
|
|
|
|
|
|
|
| $ MILLION |
|
3Q23 |
|
|
|
Net loss |
|
(783) |
|
| Less: non-cash effects related to the increase in the participation in Usiminas |
|
(1,106) |
|
| Adjusted Net Income |
|
|
323 |
|
Adjusted Equity Holders’ Net Income and Adjusted Earnings per ADS
|
|
|
|
|
|
|
|
|
| $ MILLION |
|
3Q23 |
|
|
|
Equity holders’ net loss |
|
(739) |
|
| Less: non-cash effects related to the increase in the participation in Usiminas |
|
(1,010) |
|
| Adjusted Equity Holders’ Net Income |
|
271 |
|
| Divided by: outstanding shares of common stock, net of treasury shares (expressed in million of ADS equivalent) |
|
196 |
|
Adjusted Earnings per ADS ($) |
|
|
1.38 |
|
Free Cash Flow
|
|
|
|
|
|
|
|
|
|
|
|
|
|
|
|
|
|
|
|
|
| $ MILLION |
|
1Q24 |
4Q23 |
3Q23 |
2Q23 |
1Q23 |
|
|
|
|
|
|
|
| Net cash provided by operating activities |
|
475 |
|
718 |
|
1,020 |
|
127 |
|
636 |
|
| Less: capital expenditures and advances to suppliers for PP&E |
|
(449) |
|
(597) |
|
(430) |
|
(231) |
|
(204) |
|
| Free cash flow |
|
26 |
|
121 |
|
590 |
|
(104) |
|
433 |
|
Note: Free Cash Flow in the comparative quarters in 2023 has been modified due to a reclassification, moving the following amounts from Interest accruals less payments to Other investments: $27 million in the third quarter of 2023, $46 million in the second quarter of 2023 and $18 million in the first quarter of 2023.
Exhibit I - Alternative performance measures (cont.)
Net Cash Position
|
|
|
|
|
|
|
|
|
|
|
|
|
|
|
|
|
|
|
|
|
| $ BILLION |
|
MAR 31, 2024 |
DEC 31, 2023 |
SEP 30, 2023 |
JUN 30, 2023 |
MAR 31, 2023 |
|
|
|
|
|
|
|
Cash and cash equivalents2 |
|
1.8 |
|
1.8 |
|
1.8 |
|
0.9 |
|
1.2 |
|
Plus: other investments (current and non-current)2 |
|
2.3 |
|
2.2 |
|
2.7 |
|
2.1 |
|
2.6 |
|
| Less: borrowings (current and non-current) |
|
(2.1) |
|
(2.1) |
|
(2.2) |
|
(0.9) |
|
(0.9) |
|
| Net cash position |
|
2.0 |
|
1.9 |
|
2.4 |
|
2.2 |
|
3.0 |
|
2 Ternium Argentina’s consolidated position of cash and cash equivalents and other investments amounted to $1.2 billion as of March 31, 2024, and $1.1 billion, $1.2 billion, $1.0 billion and $1.5 billion as of December 31, September 30, June 30 and March 31, 2023, respectively.