Document
FORM 6 - K
SECURITIES AND EXCHANGE COMMISSION
Washington, D.C. 20549
Report of Foreign Private Issuer
Pursuant to Rule 13a - 16 or 15d - 16 of
the Securities Exchange Act of 1934
As of 10/31/2023
Ternium S.A.
(Translation of Registrant’s name into English)
Ternium S.A.
26, Boulevard Royal - 4th floor
L-2449 Luxembourg
(352) 2668-3152
(Address of principal executive offices)
Indicate by check mark whether the registrant files or will file annual reports under cover Form 20-F or 40-F.
Form 20-F a Form 40-F __
Indicate by check mark whether the registrant by furnishing the information contained in this Form is also thereby furnishing the information to the Commission pursuant to Rule 12G3-2(b) under the Securities Exchange Act of 1934.
Yes __ No a
If “Yes” is marked, indicate below the file number assigned to the registrant in connection with Rule 12g3-2(b):
Not applicable
The attached material is being furnished to the Securities and Exchange Commission pursuant to Rule 13a-16 and Form 6-K under the Securities Exchange Act of 1934, as amended.
This report contains Ternium S.A.’s press release announcing third quarter and first nine months of 2023 results.
SIGNATURE
Pursuant to the requirements of the Securities Exchange Act of 1934, the Registrant has duly caused this report to be signed on its behalf by the undersigned, thereunto duly authorized.
TERNIUM S.A.
By: /s/ Guillermo Etchepareborda By: /s/ Sebastián Martí
Name: Guillermo Etchepareborda Name: Sebastián Martí
Title: Attorney in Fact Title: Attorney in Fact Luxembourg, October 31, 2023 – Ternium S.A. (NYSE: TX) today announced its results for the third quarter and first nine months ended September 30, 2023.
Dated: October 31, 2023
Sebastián Martí
Ternium - Investor Relations
+1 (866) 890 0443
+54 (11) 4018 8389
www.ternium.com
Ternium Announces Third Quarter and First Nine Months of 2023 Results
The financial and operational information contained in this press release is based on Ternium S.A.’s operational data and consolidated condensed interim financial statements prepared in accordance with IAS 34 “Interim financial reporting” (IFRS) and presented in US dollars ($) and metric tons. Interim financial figures are unaudited. This press release includes certain non-IFRS alternative performance measures such as Adjusted Net Result, Adjusted Equity Holders’ Net Result, Adjusted Earnings per ADS, Adjusted EBITDA, Net Cash and Free Cash Flow. The reconciliation of these figures to the most directly comparable IFRS measures is included in Exhibit I.
Third Quarter of 2023 Highlights
|
|
|
|
|
|
|
|
|
|
|
|
|
|
|
|
|
|
|
|
|
|
|
|
|
|
|
|
|
|
|
|
|
|
|
|
|
|
|
|
|
|
|
|
|
|
|
|
|
CONSOLIDATED SHIPMENTS
STEEL PRODUCTS
|
|
|
|
ADJUSTED EBITDA |
|
|
|
ADJUSTED NET INCOME |
|
4.1 MILLION TONS |
|
|
|
$698 MILLION |
|
|
|
$323 MILLION |
|
|
|
|
|
|
|
|
|
|
|
|
|
|
|
|
|
| MINING PRODUCTS |
|
|
ADJUSTED EBITDA MARGIN |
|
|
|
NET LOSS |
|
2.2 MILLION TONS |
|
|
|
13% |
|
|
|
$783 MILLION |
|
|
|
|
|
|
|
|
|
|
|
|
|
|
|
|
|
|
|
|
|
|
|
|
|
|
|
|
|
|
|
|
|
| CASH PROVIDED BY OPERATING ACTIVITIES |
|
|
INTERIM DIVIDEND ANNOUNCEMENT |
|
|
|
ADJUSTED EARNINGS PER ADS |
|
945 MILLION |
|
|
|
$1.10 PER ADS |
|
|
|
$1.38 |
|
|
|
|
|
|
|
|
|
|
|
|
|
|
|
|
|
| NET CASH POSITION |
|
|
|
Up 20 cents per ADS compared to last year´s interim dividend.
Record date: November 13, 2023.
Pay date: November 16, 2023.
|
|
|
LOSS PER ADS |
|
$2.4 BILLION |
|
|
|
|
|
$3.77 |
|
|
|
|
|
|
|
|
|
|
|
|
|
|
|
|
|
Summary of Third Quarter of 2023 Results
|
|
|
|
|
|
|
|
|
|
|
|
|
|
|
|
|
|
|
|
|
|
|
|
|
|
|
|
|
|
|
|
|
| CONSOLIDATED |
|
3Q23 |
2Q23 |
DIF |
3Q22 |
DIF |
|
9M23 |
9M22 |
DIF |
|
|
|
|
|
|
|
|
|
|
|
| Steel Shipments (thousand tons) |
|
4,131 |
|
2,982 |
|
39 |
% |
2,967 |
|
39 |
% |
|
10,179 |
|
8,876 |
|
15 |
% |
| Mining Shipments (thousand tons) |
|
2,176 |
|
— |
|
|
— |
|
|
|
2,176 |
|
— |
|
|
| Net Sales ($ million) |
|
5,185 |
|
3,871 |
|
34 |
% |
4,125 |
|
26 |
% |
|
12,679 |
|
12,868 |
|
-1 |
% |
| Operating Income ($ million) |
|
527 |
|
732 |
|
-28 |
% |
526 |
|
0 |
% |
|
1,616 |
|
2,656 |
|
-39 |
% |
| Adjusted EBITDA ($ million) |
|
698 |
|
883 |
|
-22 |
% |
679 |
|
2 |
% |
|
2,089 |
|
3,112 |
|
-33 |
% |
| Adjusted EBITDA Margin (% of net sales) |
|
13 |
% |
23 |
% |
|
16 |
% |
|
|
16 |
% |
24 |
% |
|
| Net (Loss) Income ($ million) |
|
(783) |
|
736 |
|
|
220 |
|
|
|
433 |
|
2,034 |
|
|
| Equity Holders’ Net (Loss) Income ($ million) |
|
(739) |
|
627 |
|
|
153 |
|
|
|
262 |
|
1,728 |
|
|
(Losses) Earnings per ADS1 ($) |
|
(3.77) |
|
3.19 |
|
|
0.78 |
|
|
|
1.34 |
|
8.80 |
|
|
| Adjusted Net Income ($ million) |
|
323 |
|
736 |
|
|
220 |
|
|
|
1,539 |
|
2,034 |
|
|
| Adjusted Equity Holders’ Net Income ($ million) |
|
271 |
|
627 |
|
|
153 |
|
|
|
1,272 |
|
1,728 |
|
|
Adjusted Earnings per ADS1 ($) |
|
1.38 |
|
3.19 |
|
|
0.78 |
|
|
|
6.48 |
|
8.80 |
|
|
1 American Depositary Share. Each ADS represents 10 shares of Ternium’s common stock. Results are based on a weighted average number of shares of common stock outstanding (net of treasury shares) of 1,963,076,776.
Net sales and shipments
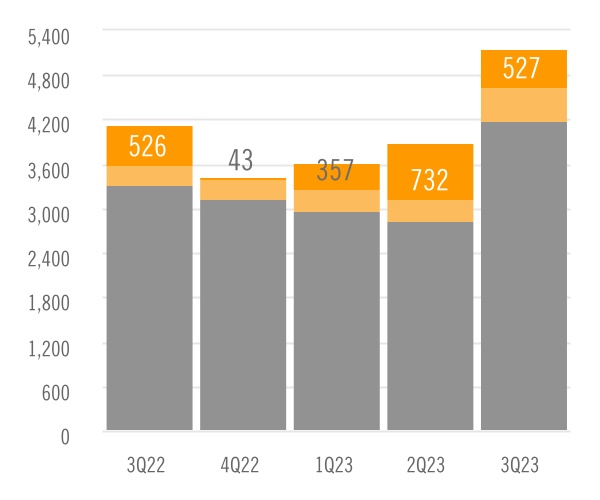
Net sales were $1.3 billion higher sequentially in the third quarter of 2023, mainly as a result of an increase of $1.2 billion from the consolidation of Usiminas’ sales.
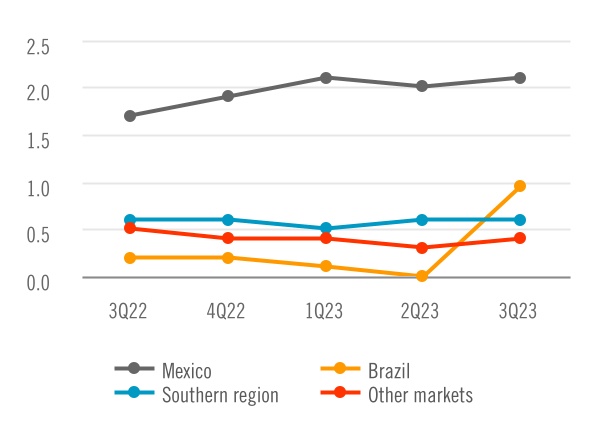
In Mexico, volumes increased sequentially in the third quarter, driven mainly by higher shipments to commercial customers and increased demand from the country’s automotive industry. On the other hand, revenue per ton decreased in this region reflecting lower market steel prices, partially offset by higher industrial contract prices.
As a result of the consolidation of Usiminas, steel shipments in Brazil increased 1.0 million tons sequentially in the third quarter. Shipments to industrial customers account for approximately 70% of total steel shipments in the country, with a significant participation of the Brazilian automotive sector.
In the Southern Region, Ternium’s shipments increased 7% sequentially in the third quarter of 2023 mainly as a result of the consolidation of Usiminas shipments to this region. Revenue per ton in the period remained relatively unchanged compared to the prior quarter. In Argentina, steel demand from industrial and commercial customers in the third quarter was similar to that in the second quarter.
In Other Markets, the company’s shipments increased 26% in the third quarter of 2023 compared with the second quarter, reflecting the consolidation of Usiminas shipments in this region and higher shipments in the US market.
Results and capital allocation
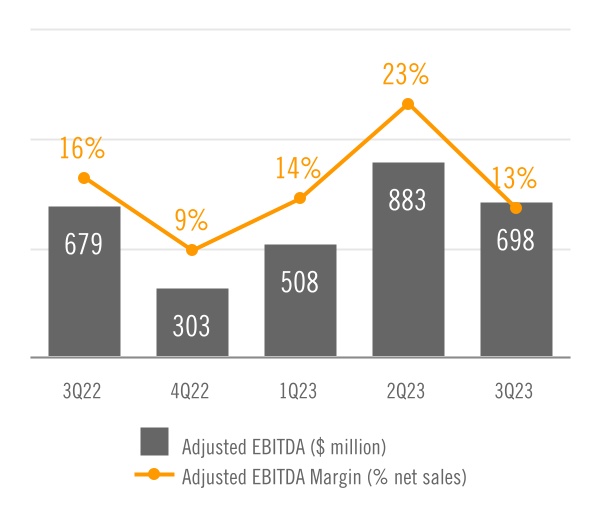
Ternium’s adjusted EBITDA decreased 22% sequentially in the third quarter of 2023 mainly due to the negative impact of lower steel prices in the USMCA region and higher cost of purchased slabs, partially offset by higher shipments in Mexico and Other Markets. Adjusted EBITDA margin in the period was affected by these variables, as well as by the consolidation of Usiminas’ operating results, which recorded a very low level of profitability in the quarter.
Capital expenditures increased in the third quarter mainly due to the consolidation of Usiminas. The main projects carried out during the period were those for the relining of blast furnace #3 in the Ipatinga facilities and the construction of new downstream facilities in the Pesquería facilities.
During the period, Ternium acquired additional shares of Usiminas and announced an interim dividend payable to the company’s shareholders on November 16, 2023.
Effects of the increase in the participation in Usiminas
On July 3, 2023, Ternium acquired an additional stake in Usiminas of 57.7 million ordinary shares, increasing its participation in the Usiminas control group to 51.5% and its economic participation to 23.3%. In addition, the Usiminas shareholders agreement was updated to reflect a new governance structure. Pursuant to the updated agreement, Ternium started to fully consolidate Usiminas balance sheet and results of operations. The increase in the participation in Usiminas resulted in a $1.1 billion non-cash net loss and a net $171 reduction in the value of Ternium’s Equity.
Non-cash $935 million loss mainly due to the recycling of Currency Translation Adjustment (CTA) from Other Comprehensive Income to Net Results
As of June 30, 2023, items recognized in Other Comprehensive Income related to Ternium’s previous stake in Usiminas amounted to a loss of $935 million. This negative reserve was mainly related to CTA losses due to the impact on Usiminas valuation of the depreciation, over the years, of the Brazilian Real versus the U.S. dollar, as Usiminas uses the Brazilian Real as its functional currency.
As a result of the increase in the participation in Usiminas, items recognized in Other Comprehensive Income related to Ternium’s previous stake in Usiminas were recycled to the results of the period. The resulting loss is non-cash, it has no income tax effects and did not change the value of Ternium’s equity.
Remeasurement of Ternium’s stake in Usiminas
As a result of the purchase price allocation related to the business combination performed in the third quarter of 2023 and the remeasurement of Ternium's previous stake in Usiminas, the company registered a net loss of $171 million.
Recognition of contingencies as part of the business combination
As part of the business combination Ternium recognized Usiminas' contingencies of $656 million related to tax, civil, labor and other issues that were defined as "of no probable occurrence". These contingencies are not recognized in Usiminas' standalone balance sheet.
Interim Dividend Payment
Ternium’s board of directors approved the payment of an interim dividend for 2023 of $1.10 per ADS ($0.11 per share), or $216 million in the aggregate. The interim dividend will be paid on November 16, 2023 to shareholders on record as of November 13, 2023. This represents an increase of 20 cents per ADS, or 22%, compared to last year’s interim dividend.
Outlook
Ternium expects fourth quarter adjusted EBITDA to decrease compared to the third quarter, with lower adjusted EBITDA margin partially offset by slightly higher steel shipments. The company anticipates a sequential decrease in steel revenue per ton in the fourth quarter, reflecting lower realized prices in Mexico and Brazil.
In Mexico, the company expects apparent steel consumption to remain strong in the fourth quarter. Industrial sectors are showing healthy steel demand. Similarly, the commercial market continues to be very active due to low inventory levels and a recent improvement in steel benchmark prices. However, Ternium anticipates realized prices in Mexico to sequentially decrease in the fourth quarter, due primarily to the delayed impact of quarterly contract prices resetting at lower levels than in the third quarter.
In Brazil, Ternium expects shipments to remain relatively stable in most market sectors. In addition, the company anticipates realized steel prices to decrease in the fourth quarter compared to the third quarter due to a recent decrease in prices of local steel finished products.
In Argentina, the company anticipates a sequential decrease in fourth quarter shipments due to seasonality and government-imposed restrictions on the importation of inputs required for production by the company and its value chain. The steel market also continues to be highly unpredictable, as it is unclear what government measures may be taken to address the country’s ongoing macroeconomic challenges when a new administration takes office in December of 2023.
Analysis of Third Quarter of 2023 Results
Consolidated Steel Products Sales
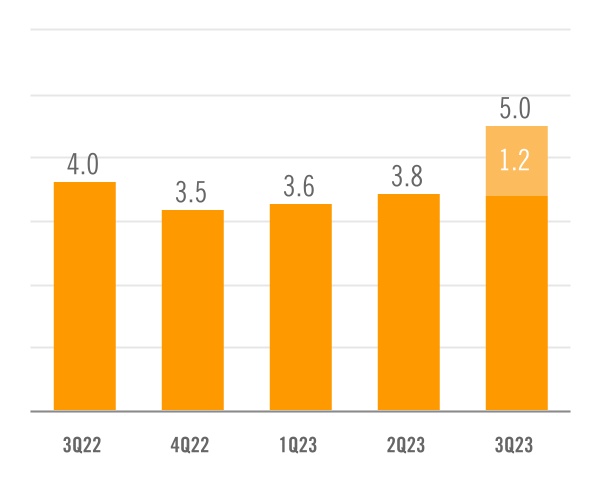
Ternium reports its sales of steel products under the Steel and Usiminas segments. The consolidation of Usiminas resulted in a $1.2 billion sequential increase in net sales to third parties in the third quarter of 2023 (1.0 million tons). The Steel segment net sales remained relatively stable sequentially in
the third quarter, as higher shipments of steel products were offset by a lower revenue per ton.
Particularly in Mexico, revenue per ton decreased sequentially in the third quarter reflecting lower market steel prices in the USMCA region, partially offset by higher industrial contract prices.
|
|
|
|
NET SALES - STEEL PRODUCTS
$ BILLION
|
|
|
|
|
SHIPMENTS - STEEL PRODUCTS
MILLION TONS
|
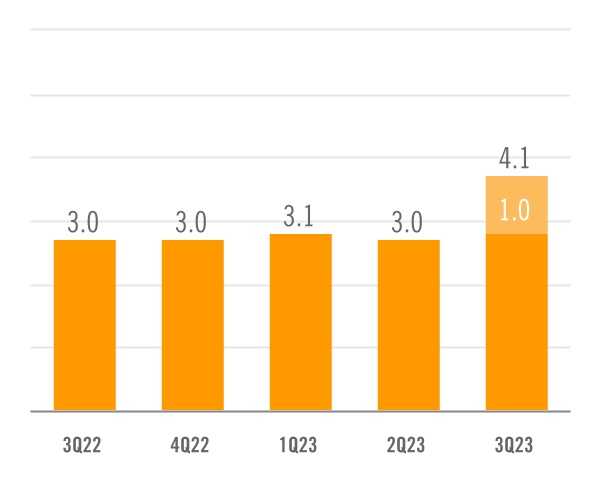
Ternium’s steel shipments in Mexico achieved a new all-time high in the third quarter. Volumes to industrial customers continued growing supported by the company’s new state-of-the-art facilities in Pesquería. In addition, shipments to commercial customers improved sequentially in the third quarter.
The consolidation of Usiminas’ shipments led to a significant increase in reported steel volumes in Brazil and to a moderate increase in steel volumes in the Southern Region and Other Markets.
|
|
|
|
SHIPMENTS BY REGION - STEEL PRODUCTS
MILLION TONS
|
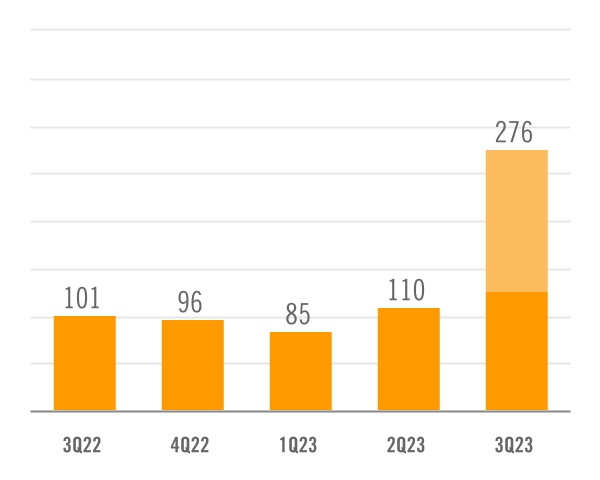
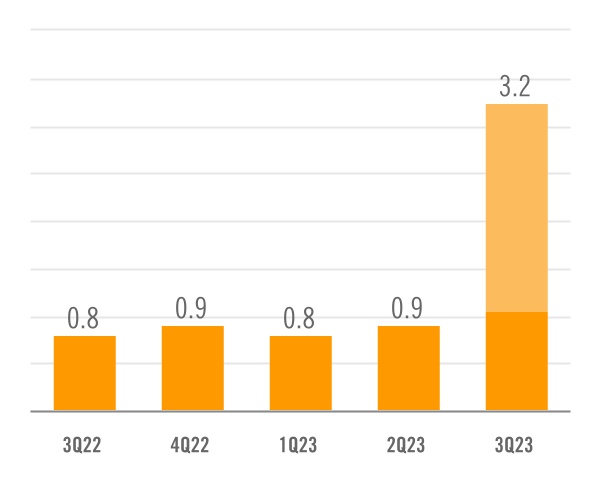
Mining Products Sales
Ternium reports intercompany and third-party sales of mining products under the Mining and
Usiminas segments. The consolidation of Usiminas resulted in a $149 million sequential increase in net sales to third parties in the third quarter of 2023 (2.2 million tons).
|
|
|
|
NET SALES - MINING PRODUCTS
$ MILLION
|
|
|
|
n Intercompany n Third parties |
|
|
|
|
|
SHIPMENTS - MINING PRODUCTS
MILLION TONS
|
|
|
|
n Intercompany n Third parties |
|
|
|
|
|
|
|
|
|
|
|
|
|
|
|
|
|
|
|
|
|
|
|
|
|
|
|
|
|
|
|
|
|
|
|
|
|
|
|
|
| CONSOLIDATED |
|
NET SALES ($ MILLION) |
|
SHIPMENTS (THOUSAND TONS) |
|
REVENUE/TON ($/TON) |
|
|
|
|
|
|
|
|
|
|
|
|
|
|
|
3Q23 |
2Q23 |
DIF |
|
3Q23 |
2Q23 |
DIF |
|
3Q23 |
2Q23 |
DIF |
|
|
|
|
|
|
|
|
|
|
|
|
|
| Mexico |
|
2,383 |
|
2,457 |
|
-3 |
% |
|
2,135 |
|
2,031 |
|
5 |
% |
|
1,116 |
|
1,209 |
|
-8 |
% |
| Brazil |
|
1,136 |
|
38 |
|
|
|
957 |
|
42 |
|
|
|
1,187 |
|
906 |
|
|
| Southern Region |
|
941 |
|
870 |
|
8 |
% |
|
603 |
|
563 |
|
7 |
% |
|
1,561 |
|
1,545 |
|
1 |
% |
| Other Markets |
|
504 |
|
442 |
|
14 |
% |
|
436 |
|
346 |
|
26 |
% |
|
1,157 |
|
1,277 |
|
-9 |
% |
| Total steel products |
|
4,964 |
|
3,806 |
|
30 |
% |
|
4,131 |
|
2,982 |
|
39 |
% |
|
1,202 |
|
1,276 |
|
-6 |
% |
| Mining products |
|
149 |
|
— |
|
|
|
2,176 |
|
— |
|
|
|
68 |
|
|
|
| Other products |
|
72 |
65 |
11 |
% |
|
|
|
|
|
|
|
|
| Net sales |
|
5,185 |
3,871 |
34 |
% |
|
|
|
|
|
|
|
|
|
|
|
|
|
|
|
|
|
|
|
|
|
|
|
|
|
|
|
|
|
|
|
|
|
|
|
|
|
|
|
|
|
|
|
|
|
|
|
| CONSOLIDATED |
|
NET SALES ($ MILLION) |
|
SHIPMENTS (THOUSAND TONS) |
|
REVENUE/TON ($/TON) |
|
|
|
|
|
|
|
|
|
|
|
|
|
|
|
9M23 |
9M22 |
DIF |
|
9M23 |
9M22 |
DIF |
|
9M23 |
9M22 |
DIF |
|
|
|
|
|
|
|
|
|
|
|
|
|
| Mexico |
|
7,046 |
|
6,874 |
|
3 |
% |
|
6,233 |
|
4,970 |
|
25 |
% |
|
1,130 |
|
1,383 |
|
-18 |
% |
| Brazil |
|
1,216 |
|
467 |
|
161 |
% |
|
1,063 |
|
541 |
|
96 |
% |
|
1,144 |
|
862 |
|
33 |
% |
| Southern Region |
|
2,664 |
|
2,883 |
|
-8 |
% |
|
1,709 |
|
1,773 |
|
-4 |
% |
|
1,559 |
|
1,626 |
|
-4 |
% |
| Other Markets |
|
1,398 |
|
2,386 |
|
-41 |
% |
|
1,174 |
|
1,592 |
|
-26 |
% |
|
1,191 |
|
1,499 |
|
-21 |
% |
| Total steel products |
|
12,324 |
|
12,610 |
|
-2 |
% |
|
10,179 |
|
8,876 |
|
15 |
% |
|
1,211 |
|
1,421 |
|
-15 |
% |
| Mining products |
|
149 |
|
— |
|
|
|
2,176 |
|
— |
|
|
|
68 |
|
|
|
| Other products |
|
207 |
258 |
-20 |
% |
|
|
|
|
|
|
|
|
| Net sales |
|
12,679 |
12,868 |
-1 |
% |
|
|
|
|
|
|
|
|
Note: other products include mainly electricity sales in Mexico and Brazil.
Operating Income
The consolidation of Usiminas’ financial statements did not add significant results at the operating income level in the third quarter of 2023.
The sequential decrease in Ternium’s operating income in the third quarter was primarily due to lower steel prices in the USMCA region and higher purchased slab costs, partially offset by higher shipments in Mexico and Other Markets.
|
|
|
|
OPERATING INCOME
$ MILLION
|
|
|
|
n Operating income n SG&A expenses & other n Cost of sales |
|
|
|
|
|
|
|
|
|
|
|
|
|
|
|
|
|
|
|
|
|
|
|
|
|
|
|
|
|
|
|
|
|
|
| $ MILLION |
|
3Q23 |
2Q23 |
DIF |
3Q22 |
DIF |
|
9M23 |
9M22 |
DIF |
|
|
|
|
|
|
|
|
|
|
|
| Operating income |
|
527 |
|
732 |
|
-28 |
% |
526 |
|
0 |
% |
|
1,616 |
|
2,656 |
|
-39 |
% |
| Net sales |
|
5,185 |
|
3,871 |
|
34 |
% |
4,126 |
|
26 |
% |
|
12,679 |
|
12,868 |
|
-1 |
% |
| Cost of sales |
|
(4,192) |
|
(2,839) |
|
48 |
% |
(3,325) |
|
26 |
% |
|
(10,012) |
|
(9,368) |
|
7 |
% |
| SG&A expenses |
|
(443) |
|
(304) |
|
46 |
% |
(277) |
|
60 |
% |
|
(1,040) |
|
(869) |
|
20 |
% |
| Other operating (loss) income |
|
(22) |
|
4 |
|
|
3 |
|
|
|
(11) |
|
26 |
|
|
Net foreign exchange results in the third quarter of 2023 were a loss of $33 million, mainly due to the impact of the depreciation of the Brazilian Real against the US dollar on Usiminas’ net short foreign currency position. Fair value of Ternium
Argentina’s financial investments increased during the period. The US dollar value of these investments is based on their Argentine Peso local market price, converted at the ARS/$ official exchange rate.
|
|
|
|
|
|
|
|
|
|
|
|
|
|
|
|
|
|
|
|
|
|
|
|
| $ MILLION |
|
3Q23 |
2Q23 |
3Q22 |
|
9M23 |
9M22 |
|
|
|
|
|
|
|
|
| Net interest results |
|
30 |
|
25 |
|
(8) |
|
|
80 |
|
18 |
|
| Net foreign exchange result |
|
(33) |
|
(25) |
|
(19) |
|
|
(73) |
|
(137) |
|
| Change in fair value of financial assets |
|
36 |
|
(14) |
|
(23) |
|
|
26 |
|
56 |
|
| Other financial income (expense), net |
|
(3) |
|
(4) |
|
(5) |
|
|
(13) |
|
(16) |
|
| Net financial results |
|
30 |
|
(18) |
|
(55) |
|
|
20 |
|
(79) |
|
Ternium's effective tax rate in the third quarter of 2023 was affected by a $1.1 billion non-cash and non-taxable loss in connection with the increase in the participation in Usiminas. In addition, Ternium’s subsidiaries in Mexico and Argentina
recorded deferred tax losses as a result of the depreciation of the Mexican Peso and the Argentine Peso against the US dollar (net of the positive impact of inflation).
|
|
|
|
|
|
|
|
|
|
|
|
|
|
|
|
|
|
|
|
|
|
|
|
| $ MILLION |
|
3Q23 |
2Q23 |
3Q22 |
|
9M23 |
9M22 |
|
|
|
|
|
|
|
|
| Current income tax expense |
|
(164) |
|
(148) |
|
(73) |
|
|
(450) |
|
(577) |
|
| Deferred tax gain (loss) |
|
(89) |
|
143 |
|
(89) |
|
|
271 |
|
15 |
|
| Income tax (expense) gain |
|
(253) |
|
(5) |
|
(162) |
|
|
(179) |
|
(562) |
|
| Result before income tax |
|
(530) |
|
741 |
|
382 |
|
|
611 |
|
2,596 |
|
| Effective tax rate |
|
48 |
% |
-1 |
% |
-42 |
% |
|
-29 |
% |
-22 |
% |
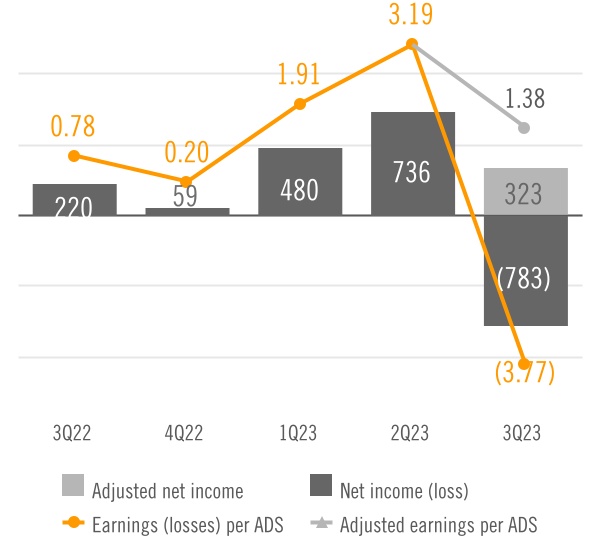
Adjusted net income in the third quarter equals a net loss of $783 million, adjusted to exclude a loss of $1.1 billion in connection with the increase in the participation in Usiminas.
Adjusted equity holders’ net income in the period equals an equity holders’ net loss of $739 million adjusted to exclude a loss of $1.1 billion in connection with the increase in the participation in Usiminas.
Adjusted earnings per ADS equals adjusted equity holders’ net income of $271 million divided by 1,963 million outstanding shares of Ternium’s common stock, net of treasury shares, expressed in ADS equivalent (each ADS represents 10 shares).
|
|
|
|
NET INCOME (LOSS), EARNINGS (LOSSES) PER ADS
$ MILLION, $
|
|
|
|
|
|
|
|
|
|
|
|
|
|
|
|
|
|
|
|
|
|
|
|
|
| $ MILLION |
|
3Q23 |
2Q23 |
3Q22 |
|
9M23 |
9M22 |
|
|
|
|
|
|
|
|
| Owners of the parent |
|
(739) |
|
627 |
|
153 |
|
|
262 |
|
1,728 |
|
| Non-controlling interest |
|
(44) |
|
109 |
|
67 |
|
|
171 |
|
306 |
|
Net (Loss) Income |
|
(783) |
|
736 |
|
220 |
|
|
433 |
|
2,034 |
|
| Less: non-cash effects related to the increase in the participation in Usiminas |
|
(1,106) |
|
— |
|
— |
|
|
(1,106) |
|
— |
|
| Adjusted Net Income |
|
323 |
|
736 |
|
220 |
|
|
1,539 |
|
2,034 |
|
Adjusted EBITDA
Adjusted EBITDA equals net results adjusted to exclude net financial results, income tax results, depreciation and amortization, the equity in results of non-consolidated companies, and non-cash effects related to the increase in the participation in Usiminas, and, in the third quarter of 2023, adjusted to include the proportional EBITDA in Unigal (70% participation).
Adjusted EBITDA Margin equals Adjusted EBITDA divided by net sales.
|
|
|
|
ADJUSTED EBITDA
$ MILLION
|
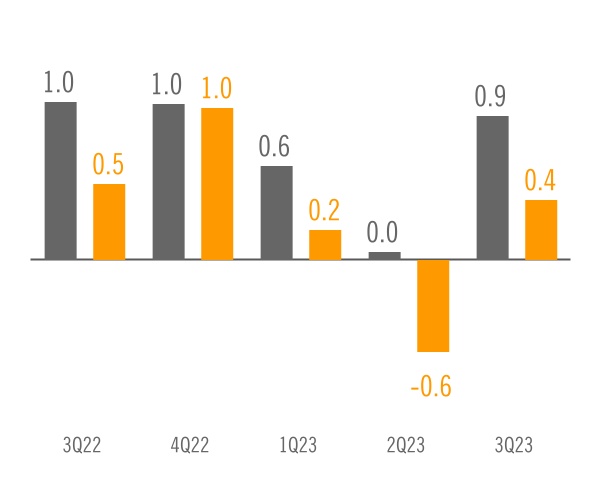
Cash Flow and Liquidity
Cash provided by operating activities in the third quarter of 2023 was $945 million, including a working capital reduction of $388 million.
The decrease in working capital was due to a $272 million decrease in inventories and an aggregate $270 million net increase in accounts payable and other liabilities, partially offset by an aggregate $153 million increase in trade and other receivables. Inventories decreased along Ternium’s main
operating subsidiaries, particularly Usiminas. The increase in accounts payable was also broad based.
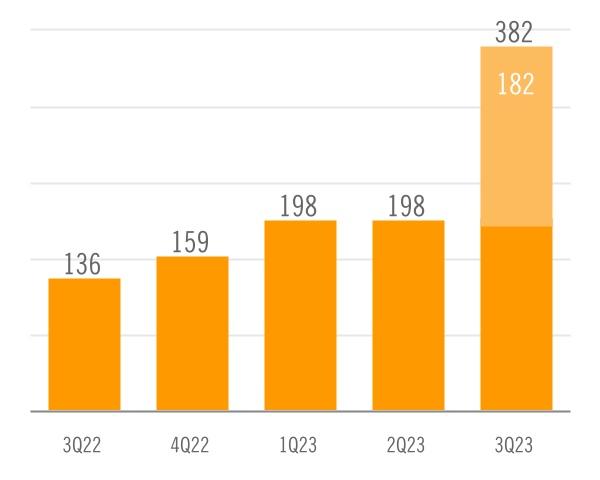
The main capital expenditure projects carried out during the period were those for the relining of blast furnace #3 in Ipatinga, Brazil, those for the development of the new expansion projects in the industrial center in Pesquería, Mexico, and those for further improving environmental and safety conditions.
|
|
|
|
CASH FROM OPERATIONS, CHANGES IN WORKING CAPITAL
$ BILLION
|
|
|
|
n Cash from operations n (Incr.) decr. in working capital |
|
|
|
|
|
CAPITAL EXPENDITURES
$ MILLION
|
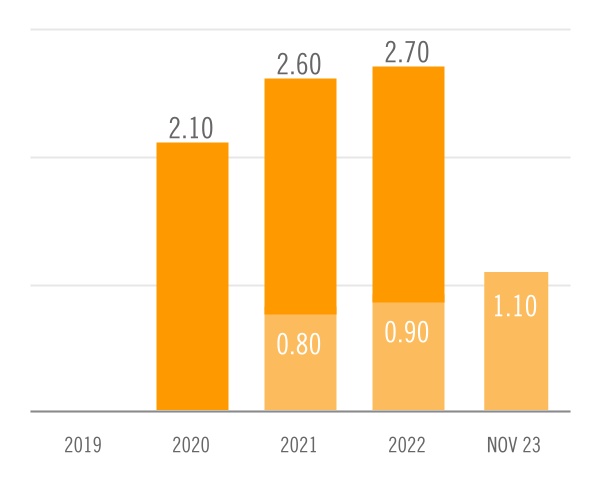
Ternium’s free cash flow was $563 million in the third quarter of 2023. During the period, the company invested $119 million in the acquisition of additional shares of Usiminas. Ternium’s net cash position as of September 30, 2023, included Ternium
Argentina’s total position of cash and cash equivalents and other investments of $1.3 billion. On November 16, 2023, the company will pay an interim dividend to shareholders of $1.10 per ADS.
|
|
|
|
ANNUAL DIVIDEND
$ PER ADS
|
|
|
|
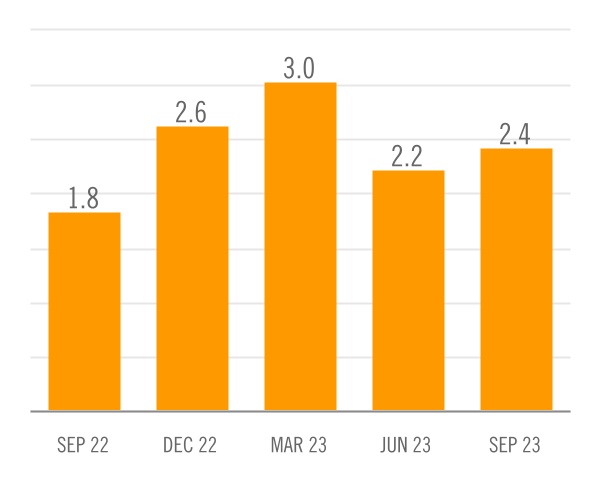
|
NET CASH POSITION
$ BILLION
|
Conference Call and Webcast
Ternium will host a conference call on November 1, 2023, at 8:30 a.m. ET in which management will discuss third quarter of 2023 results. A webcast link will be available in the Investor Center section of the company’s website at www.ternium.com.
Forward Looking Statements
Some of the statements contained in this press release are “forward-looking statements”. Forward-looking statements are based on management’s current views and assumptions and involve known and unknown risks that could cause actual results, performance or events to differ materially from those expressed or implied by those statements. These risks include but are not limited to risks arising from uncertainties as to gross domestic product, related market demand, global production capacity, tariffs, cyclicality in the industries that purchase steel products and other factors beyond Ternium’s control.
About Ternium
Ternium is Latin America’s leading flat steel producer, with operating facilities in Mexico, Brazil,
Argentina, Colombia, the southern United States and Central America. The company offers a broad
range of high value-added steel products for customers active in the automotive, home appliances,
HVAC, construction, capital goods, container, food and energy industries through its manufacturing
facilities, service center and distribution networks, and advanced customer integration systems. More
information about Ternium is available at www.ternium.com.
Income Statement
|
|
|
|
|
|
|
|
|
|
|
|
|
|
|
|
|
|
|
|
|
|
|
|
| $ MILLION |
|
3Q23 |
2Q23 |
3Q22 |
|
9M23 |
9M22 |
|
|
|
|
|
|
|
|
| Net sales |
|
5,185 |
|
3,871 |
|
4,125 |
|
|
12,679 |
|
12,868 |
|
| Cost of sales |
|
(4,192) |
|
(2,839) |
|
(3,325) |
|
|
(10,012) |
|
(9,368) |
|
| Gross profit |
|
993 |
|
1,032 |
|
800 |
|
|
2,667 |
|
3,500 |
|
| Selling, general and administrative expenses |
|
(443) |
|
(304) |
|
(277) |
|
|
(1,040) |
|
(869) |
|
| Other operating (expense) income, net |
|
(22) |
|
4 |
|
3 |
|
|
(11) |
|
26 |
|
| Operating income |
|
527 |
|
732 |
|
526 |
|
|
1,616 |
|
2,656 |
|
|
|
|
|
|
|
|
|
| Financial expense |
|
(47) |
|
(18) |
|
(15) |
|
|
(81) |
|
(29) |
|
| Financial income |
|
78 |
|
42 |
|
7 |
|
|
161 |
|
47 |
|
| Other financial (expense) income, net |
|
0 |
|
(42) |
|
(47) |
|
|
(60) |
|
(97) |
|
Equity in earnings of non-consolidated companies |
|
19 |
|
27 |
|
(90) |
|
|
81 |
|
18 |
|
| Effect related to the increase of the participation in Usiminas |
|
(171) |
|
— |
|
— |
|
|
(171) |
|
— |
|
| Recycling of other comprehensive income related to Usiminas |
|
(935) |
|
— |
|
— |
|
|
(935) |
|
— |
|
| (Loss) profit before income tax results |
|
(530) |
|
741 |
|
382 |
|
|
611 |
|
2,596 |
|
| Income tax expense |
|
(253) |
|
(5) |
|
(162) |
|
|
(179) |
|
(562) |
|
| (Loss) profit for the period |
|
(783) |
|
736 |
|
220 |
|
|
433 |
|
2,034 |
|
|
|
|
|
|
|
|
|
| Attributable to: |
|
|
|
|
|
|
|
| Owners of the parent |
|
(739) |
|
627 |
|
153 |
|
|
262 |
|
1,728 |
|
| Non-controlling interest |
|
(44) |
|
109 |
|
67 |
|
|
170 |
|
306 |
|
Net (loss) income |
|
(783) |
|
736 |
|
220 |
|
|
433 |
|
2,034 |
|
Statement of Financial Position
|
|
|
|
|
|
|
|
|
|
|
|
|
|
|
| $ MILLION |
|
SEPTEMBER 30, 2023 |
|
DECEMBER 31, 2022 |
|
|
|
|
|
| Property, plant and equipment, net |
|
7,384 |
|
|
6,262 |
|
| Intangible assets, net |
|
1,029 |
|
|
944 |
|
| Investments in non-consolidated companies |
|
513 |
|
|
822 |
|
| Other investments |
|
263 |
|
|
101 |
|
| Deferred tax assets |
|
1,527 |
|
|
200 |
|
| Receivables, net |
|
809 |
|
|
319 |
|
| Trade receivables, net |
|
0 |
|
|
— |
|
| Total non-current assets |
|
11,524 |
|
|
8,648 |
|
|
|
|
|
|
| Receivables, net |
|
1,162 |
|
|
663 |
|
| Derivative financial instruments |
|
— |
|
|
0 |
|
| Inventories, net |
|
5,136 |
|
|
3,470 |
|
| Trade receivables, net |
|
2,173 |
|
|
1,181 |
|
| Other investments |
|
2,469 |
|
|
1,875 |
|
| Cash and cash equivalents |
|
1,816 |
|
|
1,653 |
|
| Total current assets |
|
12,755 |
|
|
8,842 |
|
|
|
|
|
|
| Non-current assets classified as held for sale |
|
7 |
|
|
2 |
|
|
|
|
|
|
| Total assets |
|
24,285 |
|
|
17,492 |
|
Statement of Financial Position (cont.)
|
|
|
|
|
|
|
|
|
|
|
|
|
|
|
| $ MILLION |
|
SEPTEMBER 30, 2023 |
|
DECEMBER 31, 2022 |
|
|
|
|
|
| Capital and reserves attributable to the owners of the parent |
|
12,437 |
|
|
11,846 |
|
| Non-controlling interest |
|
4,430 |
|
|
1,922 |
|
| Total equity |
|
16,866 |
|
|
13,768 |
|
|
|
|
|
|
| Provisions |
|
909 |
|
|
81 |
|
| Deferred tax liabilities |
|
26 |
|
|
163 |
|
| Other liabilities |
|
1,153 |
|
|
538 |
|
| Trade payables |
|
11 |
|
|
1 |
|
| Lease liabilities |
|
199 |
|
|
190 |
|
| Borrowings |
|
1,194 |
|
|
533 |
|
| Total non-current liabilities |
|
3,491 |
|
|
1,506 |
|
|
|
|
|
|
| Current income tax liabilities |
|
173 |
|
|
136 |
|
| Other liabilities |
|
512 |
|
|
345 |
|
| Trade payables |
|
2,199 |
|
|
1,188 |
|
| Derivative financial instruments |
|
20 |
|
|
1 |
|
| Lease liabilities |
|
52 |
|
|
49 |
|
| Borrowings |
|
971 |
|
|
499 |
|
| Total current liabilities |
|
3,928 |
|
|
2,217 |
|
|
|
|
|
|
| Total liabilities |
|
7,419 |
|
|
3,723 |
|
|
|
|
|
|
Total equity and liabilities |
|
24,285 |
|
|
17,492 |
|
Statement of Cash Flows
|
|
|
|
|
|
|
|
|
|
|
|
|
|
|
|
|
|
|
|
|
|
|
|
| $ MILLION |
|
3Q23 |
2Q23 |
3Q22 |
|
9M23 |
9M22 |
|
|
|
|
|
|
|
|
| Result for the period |
|
(783) |
|
736 |
|
220 |
|
|
433 |
|
2,034 |
|
|
|
|
|
|
|
|
|
| Adjustments for: |
|
|
|
|
|
|
|
| Depreciation and amortization |
|
165 |
|
151 |
|
153 |
|
|
467 |
|
456 |
|
| Income tax accruals less payments |
|
158 |
|
(117) |
|
(22) |
|
|
(116) |
|
(1,106) |
|
| Equity in earnings of non-consolidated companies |
|
(19) |
|
(27) |
|
90 |
|
|
(81) |
|
(18) |
|
|
|
|
|
|
|
|
|
| Interest accruals less payments/receipts, net |
|
(26) |
|
(40) |
|
5 |
|
|
(102) |
|
9 |
|
| Changes in provisions |
|
(4) |
|
1 |
|
— |
|
|
(4) |
|
(2) |
|
| Changes in working capital |
|
388 |
|
(605) |
|
548 |
|
|
1 |
|
198 |
|
| Net foreign exchange results and others |
|
(40) |
|
(51) |
|
40 |
|
|
(98) |
|
150 |
|
| Non-cash effects related to the increase of the participation in Usiminas |
|
1,106 |
|
— |
|
— |
|
|
1,106 |
|
— |
|
| Net cash provided by operating activities |
|
945 |
|
48 |
|
1,034 |
|
|
1,606 |
|
1,721 |
|
|
|
|
|
|
|
|
|
| Capital expenditures |
|
(382) |
|
(198) |
|
(136) |
|
|
(778) |
|
(422) |
|
| (Increase) decrease in other investments |
|
(306) |
|
219 |
|
(131) |
|
|
(755) |
|
(327) |
|
| Proceeds from the sale of property, plant & equipment |
|
1 |
|
— |
|
— |
|
|
2 |
|
1 |
|
| Dividends received from non-consolidated companies |
|
— |
|
15 |
|
— |
|
|
15 |
|
29 |
|
| Acquisition of non-controlling interest |
|
— |
|
— |
|
— |
|
|
— |
|
(4) |
|
| Acquisition of business: |
|
|
|
|
|
|
|
| Purchase consideration |
|
(119) |
|
— |
|
— |
|
|
(119) |
|
— |
|
| Cash acquired |
|
781 |
|
— |
|
— |
|
|
781 |
|
— |
|
| Net cash (used in) provided by investing activities |
|
(25) |
|
37 |
|
(267) |
|
|
(854) |
|
(723) |
|
|
|
|
|
|
|
|
|
| Dividends paid in cash to company’s shareholders |
|
— |
|
(353) |
|
— |
|
|
(353) |
|
(353) |
|
| Finance lease payments |
|
(16) |
|
(13) |
|
(12) |
|
|
(43) |
|
(37) |
|
| Proceeds from borrowings |
|
163 |
|
27 |
|
71 |
|
|
236 |
|
225 |
|
| Repayments of borrowings |
|
(145) |
|
(31) |
|
(73) |
|
|
(372) |
|
(614) |
|
| Net cash provided by (used in) financing activities |
|
3 |
|
(371) |
|
(14) |
|
|
(532) |
|
(780) |
|
|
|
|
|
|
|
|
|
| Increase (decrease) in cash and cash equivalents |
|
923 |
|
(286) |
|
753 |
|
|
220 |
|
218 |
|
Shipments
Steel and Mining Segments
|
|
|
|
|
|
|
|
|
|
|
|
|
|
|
|
|
|
|
|
|
|
|
|
|
|
|
|
|
|
|
|
|
| THOUSAND TONS |
|
3Q23 |
2Q23 |
DIF |
3Q22 |
DIF |
|
9M23 |
9M22 |
DIF |
|
|
|
|
|
|
|
|
|
|
|
| Mexico |
|
2,135 |
|
2,031 |
|
5 |
% |
1,717 |
|
24 |
% |
|
6,233 |
|
4,970 |
|
25 |
% |
| Brazil |
|
194 |
|
42 |
|
360 |
% |
201 |
|
-4 |
% |
|
299 |
|
541 |
|
-45 |
% |
| Southern Region |
|
558 |
|
563 |
|
-1 |
% |
584 |
|
-4 |
% |
|
1,665 |
|
1,773 |
|
-6 |
% |
| Other Markets |
|
408 |
|
346 |
|
18 |
% |
464 |
|
-12 |
% |
|
1,146 |
|
1,592 |
|
-28 |
% |
| Total steel products |
|
3,296 |
|
2,982 |
|
11 |
% |
2,967 |
|
11 |
% |
|
9,344 |
|
8,876 |
|
5 |
% |
| Mining products |
|
842 |
|
867 |
|
-3 |
% |
831 |
|
1 |
% |
|
2,508 |
|
2,565 |
|
-2 |
% |
Usiminas Segment
|
|
|
|
|
|
|
|
|
|
|
|
|
|
|
|
|
|
|
|
|
|
|
|
|
|
|
|
|
|
|
|
|
| THOUSAND TONS |
|
3Q23 |
2Q23 |
DIF |
3Q22 |
DIF |
|
9M23 |
9M22 |
DIF |
|
|
|
|
|
|
|
|
|
|
|
| Mexico |
|
— |
|
|
|
|
|
|
— |
|
|
|
| Brazil |
|
955 |
|
|
|
|
|
|
955 |
|
|
|
| Southern Region |
|
45 |
|
|
|
|
|
|
45 |
|
|
|
| Other Markets |
|
39 |
|
|
|
|
|
|
39 |
|
|
|
| Total Usiminas steel products |
|
1,038 |
|
|
|
|
|
|
1,038 |
|
|
|
| Intercompany shipments |
|
215 |
|
|
|
|
|
|
215 |
|
|
|
| Third-party shipments |
|
2,176 |
|
|
|
|
|
|
2,176 |
|
|
|
| Total Usiminas mining products |
|
2,391 |
|
|
|
|
|
|
2,391 |
|
|
|
Consolidated
|
|
|
|
|
|
|
|
|
|
|
|
|
|
|
|
|
|
|
|
|
|
|
|
|
|
|
|
|
|
|
|
|
| THOUSAND TONS |
|
3Q23 |
2Q23 |
DIF |
3Q22 |
DIF |
|
9M23 |
9M22 |
DIF |
|
|
|
|
|
|
|
|
|
|
|
| Mexico |
|
2,135 |
|
2,031 |
|
5 |
% |
1,717 |
|
24 |
% |
|
6,233 |
|
4,970 |
|
25 |
% |
| Brazil |
|
957 |
|
42 |
|
|
201 |
|
|
|
1,063 |
|
541 |
|
|
| Southern Region |
|
603 |
|
563 |
|
7 |
% |
584 |
|
3 |
% |
|
1,709 |
|
1,773 |
|
-4 |
% |
| Other Markets |
|
436 |
|
346 |
|
26 |
% |
464 |
|
-6 |
% |
|
1,174 |
|
1,592 |
|
-26 |
% |
| Total steel products |
|
4,131 |
|
2,982 |
|
39 |
% |
2,967 |
|
39 |
% |
|
10,179 |
|
8,876 |
|
15 |
% |
| Mining products |
|
2,176 |
|
— |
|
|
— |
|
|
|
2,176 |
|
— |
|
|
Net Sales
Steel and Mining Segments
|
|
|
|
|
|
|
|
|
|
|
|
|
|
|
|
|
|
|
|
|
|
|
|
|
|
|
|
|
|
|
|
|
| $ MILLION |
|
3Q23 |
2Q23 |
DIF |
3Q22 |
DIF |
|
9M23 |
9M22 |
DIF |
|
|
|
|
|
|
|
|
|
|
|
| Mexico |
|
2,383 |
|
2,457 |
|
-3 |
% |
2,155 |
|
11 |
% |
|
7,046 |
|
6,874 |
|
3 |
% |
| Brazil |
|
148 |
|
38 |
|
288 |
% |
192 |
|
-23 |
% |
|
228 |
|
467 |
|
-51 |
% |
| Southern Region |
|
874 |
|
870 |
|
0 |
% |
998 |
|
-12 |
% |
|
2,597 |
|
2,883 |
|
-10 |
% |
| Other Markets |
|
495 |
|
442 |
|
12 |
% |
701 |
|
-29 |
% |
|
1,389 |
|
2,386 |
|
-42 |
% |
| Total steel products |
|
3,900 |
|
3,806 |
|
2 |
% |
4,046 |
|
-4 |
% |
|
11,261 |
|
12,610 |
|
-11 |
% |
| Other products |
|
81 |
|
65 |
|
26 |
% |
79 |
|
3 |
% |
|
216 |
|
258 |
|
-16 |
% |
| Total steel segment |
|
3,982 |
|
3,871 |
|
3 |
% |
4,126 |
|
-3 |
% |
|
11,476 |
|
12,868 |
|
-11 |
% |
| Mining products |
|
114 |
|
110 |
|
3 |
% |
101 |
|
13 |
% |
|
309 |
|
314 |
|
-2 |
% |
Note: other products include mainly electricity sales in Mexico and Brazil.
Usiminas Segment
|
|
|
|
|
|
|
|
|
|
|
|
|
|
|
|
|
|
|
|
|
|
|
|
|
|
|
|
|
|
|
|
|
| $ MILLION |
|
3Q23 |
2Q23 |
DIF |
3Q22 |
DIF |
|
9M23 |
9M22 |
DIF |
|
|
|
|
|
|
|
|
|
|
|
| Mexico |
|
— |
|
|
|
|
|
|
— |
|
|
|
| Brazil |
|
1,134 |
|
|
|
|
|
|
1,134 |
|
|
|
| Southern Region |
|
68 |
|
|
|
|
|
|
68 |
|
|
|
| Other Markets |
|
20 |
|
|
|
|
|
|
20 |
|
|
|
| Total Usiminas steel products |
|
1,221 |
|
|
|
|
|
|
1,221 |
|
|
|
| Intercompany |
|
14 |
|
|
|
|
|
|
14 |
|
|
|
| Third parties |
|
149 |
|
|
|
|
|
|
149 |
|
|
|
| Total Usiminas mining products |
|
162 |
|
|
|
|
|
|
162 |
|
|
|
| Usiminas segment consolidated net sales |
|
1,370 |
|
|
|
|
|
|
1,370 |
|
|
|
Net Sales (cont.)
Consolidated
|
|
|
|
|
|
|
|
|
|
|
|
|
|
|
|
|
|
|
|
|
|
|
|
|
|
|
|
|
|
|
|
|
| $ MILLION |
|
3Q23 |
2Q23 |
DIF |
3Q22 |
DIF |
|
9M23 |
9M22 |
DIF |
|
|
|
|
|
|
|
|
|
|
|
| Mexico |
|
2,383 |
|
2,457 |
|
-3 |
% |
2,155 |
|
11 |
% |
|
7,046 |
|
6,874 |
|
3 |
% |
| Brazil |
|
1,136 |
|
38 |
|
|
192 |
|
|
|
1,216 |
|
467 |
|
|
| Southern Region |
|
941 |
|
870 |
|
8 |
% |
998 |
|
-6 |
% |
|
2,664 |
|
2,883 |
|
-8 |
% |
| Other Markets |
|
504 |
|
442 |
|
14 |
% |
701 |
|
-28 |
% |
|
1,398 |
|
2,386 |
|
-41 |
% |
| Total steel products |
|
4,964 |
|
3,806 |
|
30 |
% |
4,046 |
|
23 |
% |
|
12,324 |
|
12,610 |
|
-2 |
% |
| Mining products |
|
149 |
|
— |
|
|
— |
|
|
|
149 |
|
— |
|
|
| Other products |
|
72 |
|
65 |
|
11 |
% |
79 |
|
-9 |
% |
|
207 |
|
258 |
|
-20 |
% |
| Total net sales |
|
5,185 |
|
3,871 |
|
34 |
% |
4,125 |
|
26 |
% |
|
12,679 |
|
12,868 |
|
-1 |
% |
Note: other products includes mainly electricity sales in Mexico and Brazil.
Exhibit I - Alternative performance measures
These non-IFRS measures should not be considered in isolation of, or as a substitute for, measures of performance prepared in accordance with IFRS. These non-IFRS measures do not have a standardized meaning under IFRS and, therefore, may not correspond to similar non-IFRS financial measures reported by other companies.
Adjusted EBITDA
|
|
|
|
|
|
|
|
|
|
|
|
|
|
|
|
|
|
|
|
|
|
|
|
| $ MILLION |
|
3Q23 |
2Q23 |
3Q22 |
|
9M23 |
9M22 |
|
|
|
|
|
|
|
|
| Consolidated net (loss) income |
|
(783) |
|
736 |
|
220 |
|
|
433 |
|
2,034 |
|
| Adjusted to exclude: |
|
|
|
|
|
|
|
| Net financial results |
|
(30) |
|
18 |
|
55 |
|
|
(20) |
|
79 |
|
| Income tax results |
|
253 |
|
5 |
|
162 |
|
|
179 |
|
562 |
|
| Depreciation and amortization |
|
165 |
|
151 |
|
153 |
|
|
467 |
|
456 |
|
| Equity in earnings of non-consolidated companies |
|
(19) |
|
(27) |
|
90 |
|
|
(81) |
|
(18) |
|
| Non-cash effects related to the increase in the participation in Usiminas |
|
1,106 |
|
— |
|
— |
|
|
1,106 |
|
— |
|
| Adjusted to include: |
|
|
|
|
|
|
|
| Proportional EBITDA in Unigal (70% participation) |
|
6 |
|
|
|
|
6 |
|
|
| Adjusted EBITDA |
|
698 |
|
883 |
|
679 |
|
|
2,089 |
|
3,112 |
|
| Divided by: net sales |
|
5,185 |
|
3,871 |
|
4,125 |
|
|
12,679 |
|
12,868 |
|
| Adjusted EBITDA Margin (%) |
|
13 |
% |
23 |
% |
16 |
% |
|
16 |
% |
24 |
% |
Adjusted Net Income
|
|
|
|
|
|
|
|
|
|
|
|
|
|
|
|
|
|
|
|
|
|
|
|
| $ MILLION |
|
3Q23 |
2Q23 |
3Q22 |
|
9M23 |
9M22 |
|
|
|
|
|
|
|
|
Net (loss) income |
|
(783) |
|
736 |
|
220 |
|
|
433 |
|
2,034 |
|
| Less: non-cash effects related to the increase in the participation in Usiminas |
|
(1,106) |
|
— |
|
— |
|
|
(1,106) |
|
— |
|
| Adjusted Net Income |
|
|
323 |
|
|
736 |
|
|
220 |
|
|
|
1,539 |
|
|
2,034 |
|
Exhibit I - Alternative performance measures (cont.)
Adjusted Equity Holders' Net Income and Adjusted Earnings per ADS
|
|
|
|
|
|
|
|
|
|
|
|
|
|
|
|
|
|
|
|
|
|
|
|
| $ MILLION |
|
3Q23 |
2Q23 |
3Q22 |
|
9M23 |
9M22 |
|
|
|
|
|
|
|
|
Equity holders’ net (loss) income |
|
(739) |
|
627 |
|
153 |
|
|
262 |
|
1,728 |
|
| Less: non-cash effects related to the increase in the participation in Usiminas |
|
(1,010) |
|
— |
|
— |
|
|
(1,010) |
|
— |
|
Adjusted Equity Holders’ Net Income |
|
271 |
|
627 |
|
153 |
|
|
1,272 |
|
1,728 |
|
Divided by: the outstanding shares of common stock, net of treasury shares (expressed in ADS equivalent) |
|
196 |
|
196 |
|
196 |
|
|
196 |
|
196 |
|
Adjusted Earnings per ADS ($) |
|
|
1.38 |
|
|
3.19 |
|
|
0.78 |
|
|
|
6.48 |
|
|
8.80 |
|
Free Cash Flow
|
|
|
|
|
|
|
|
|
|
|
|
|
|
|
|
|
|
|
|
|
|
|
|
| $ MILLION |
|
3Q23 |
2Q23 |
3Q22 |
|
9M23 |
9M22 |
|
|
|
|
|
|
|
|
| Net cash provided by operating activities |
|
945 |
|
48 |
|
1,034 |
|
|
1,606 |
|
1,721 |
|
| Less: capital expenditures |
|
(382) |
|
(198) |
|
(136) |
|
|
(778) |
|
(422) |
|
| Free cash flow |
|
563 |
|
(150) |
|
898 |
|
|
828 |
|
1,299 |
|
Net Cash Position
|
|
|
|
|
|
|
|
|
|
|
|
|
|
|
| $ BILLION |
|
SEPTEMBER 30, 2023 |
JUNE 30, 2023 |
SEPTEMBER 30, 2022 |
|
|
|
|
|
Cash and cash equivalents2 |
|
1.8 |
|
0.9 |
|
1.5 |
|
Plus: other investments (current and non-current)2 |
|
2.7 |
|
2.1 |
|
1.4 |
|
| Less: borrowings (current and non-current) |
|
(2.2) |
|
(0.9) |
|
(1.1) |
|
| Net cash position |
|
2.4 |
|
2.2 |
|
1.8 |
|
(2) Ternium Argentina’s consolidated position of cash and cash equivalents and other investments amounted to $1.3 billion as of September 30, 2023, and $1.0 billion as of June 30, 2023, and September 30, 2022.