| Arkansas | 001-41093 | 71-0682831 | ||||||
| (State or Other Jurisdiction of Incorporation) | (Commission File Number) | (IRS Employer Identification No.) | ||||||
| ☐ | Written communications pursuant to Rule 425 under the Securities Act (17 CFR 230.425) | ||||
| ☐ | Soliciting material pursuant to Rule 14a-12 under the Exchange Act (17 CFR 240.14a-12) | ||||
| ☐ | Pre-commencement communications pursuant to Rule 14d-2(b) under the Exchange Act (17 CFR 240.14d-2(b)) | ||||
| ☐ | Pre-commencement communications pursuant to Rule 13e-4(c) under the Exchange Act (17 CFR 240.13e-4(c)) | ||||
| Title of each class | Trading Symbol(s) | Name of each exchange on which registered | ||||||||||||
| Common Stock, par value $0.01 per share | HOMB | New York Stock Exchange | ||||||||||||
| 99.1 | |||||
| 99.2 | |||||
| 104 | Cover Page Interactive Data File (embedded within the Inline XBRL document) | ||||
| Home BancShares, Inc. | |||||||||||
| Date: | April 15, 2026 | By: | /s/ Jennifer C. Floyd | ||||||||
| Jennifer C. Floyd | |||||||||||
| Chief Accounting Officer | |||||||||||

| For Immediate Release: | April 15, 2026 | ||||
| Metric | Q1 2026 | Q4 2025 | Q3 2025 | Q2 2025 | Q1 2025 | ||||||||||||
| Net income | $118.2 million |
$118.2 million |
$123.6 million |
$118.4 million |
$115.2 million |
||||||||||||
Net income, as adjusted (non-GAAP)(1) |
$118.2 million |
$117.9 million |
$119.7 million |
$114.6 million |
$111.9 million |
||||||||||||
| Total revenue (net) | $266.7 million |
$282.1 million |
$277.7 million |
$271.0 million |
$260.1 million |
||||||||||||
| Income before income taxes | $152.2 million |
$153.3 million |
$159.3 million |
$152.0 million |
$147.2 million |
||||||||||||
Pre-tax, pre-provision, net income (PPNR) (non-GAAP)(1) |
$152.7 million |
$167.7 million |
$162.8 million |
$155.0 million |
$147.2 million |
||||||||||||
PPNR, as adjusted (non-GAAP)(1) |
$152.7 million |
$167.1 million |
$157.7 million |
$150.4 million |
$142.8 million |
||||||||||||
| Pre-tax net income to total revenue (net) | 57.08% |
54.35% |
57.38% | 56.08% |
56.58% | ||||||||||||
Pre-tax net income, as adjusted, to total revenue (net) (non-GAAP)(1) |
57.06% | 54.14% | 55.53% | 54.39% |
54.91% | ||||||||||||
P5NR (Pre-tax, pre-provision, profit percentage) (PPNR to total revenue (net)) (non-GAAP)(1) |
57.27% |
59.46% |
58.64% | 57.19% |
56.58% | ||||||||||||
P5NR, as adjusted (non-GAAP)(1) |
57.25% | 59.25% | 56.80% | 55.49% |
54.91% | ||||||||||||
| ROA | 2.09% |
2.06% |
2.17% | 2.08% | 2.07% | ||||||||||||
ROA, as adjusted (non-GAAP)(1) |
2.09% | 2.05% | 2.10% | 2.02% | 2.01% | ||||||||||||
| NIM | 4.51% |
4.61% |
4.56% | 4.44% | 4.44% | ||||||||||||
| Purchase accounting accretion | $1.1 million |
$1.3 million |
$1.3 million |
$1.2 million |
$1.4 million |
||||||||||||
| ROE | 11.09% |
11.04% |
11.91% | 11.77% | 11.75% | ||||||||||||
ROE, as adjusted (non-GAAP)(1) |
11.08% | 11.01% | 11.54% | 11.39% | 11.41% | ||||||||||||
ROTCE (non-GAAP)(1) |
16.56% |
16.65% |
18.28% | 18.26% | 18.39% | ||||||||||||
ROTCE, as adjusted (non-GAAP)(1) |
16.55% | 16.60% | 17.70% | 17.68% | 17.87% | ||||||||||||
| Diluted earnings per share | $0.60 |
$0.60 |
$0.63 | $0.60 | $0.58 | ||||||||||||
Diluted earnings per share, as adjusted (non-GAAP)(1) |
$0.60 | $0.60 | $0.61 | $0.58 | $0.56 | ||||||||||||
| Non-performing assets to total assets | 0.97% |
0.55% |
0.56% | 0.60% | 0.56% | ||||||||||||
| Common equity tier 1 capital | 16.7% | 16.3% | 16.1% | 15.6% | 15.4% | ||||||||||||
| Leverage | 14.3% | 14.1% | 13.8% | 13.4% | 13.3% | ||||||||||||
| Tier 1 capital | 16.7% | 16.3% | 16.1% | 15.6% | 15.4% | ||||||||||||
| Total risk-based capital | 19.5% | 19.1% | 18.9% | 19.3% | 19.1% | ||||||||||||
| Allowance for credit losses to total loans | 1.90% |
1.90% |
1.87% | 1.86% | 1.87% | ||||||||||||
| Book value per share | $22.15 | $21.88 | $21.41 | $20.71 | $20.40 | ||||||||||||
Tangible book value per share (non-GAAP)(1) |
$14.87 | $14.60 | $14.13 | $13.44 | $13.15 | ||||||||||||
Dividends per share |
$0.21 | $0.21 | $0.20 | $0.20 | $0.195 | ||||||||||||
Shareholder buyback yield(2) |
0.25% | 0.27% | 0.18% | 0.49% | 0.53% | ||||||||||||
Quarterly Financial Performance Trends | ||||||||
|
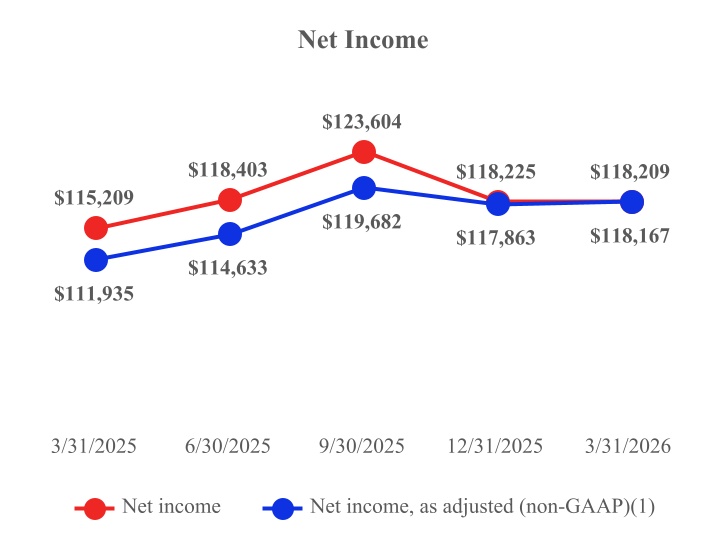
During the first quarter of 2026, the Company delivered stable and resilient earnings performance, with net income of approximately $118.2 million, consistent with the prior quarter and up year over year. Net income, as adjusted (non‑GAAP)(1), of approximately $118.2 million further reflects the strength and sustainability of underlying operations.
|
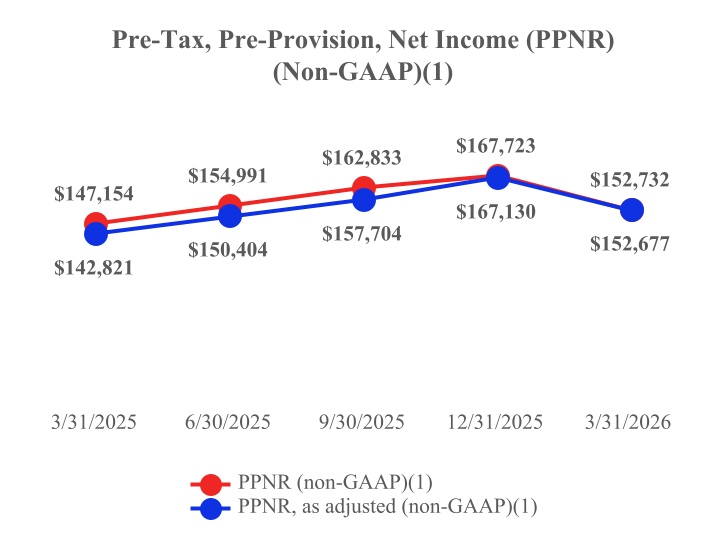
The chart below reflects solid year‑over‑year growth in pre‑tax, pre‑provision net revenue (PPNR) during the first quarter of 2026, reflecting continued strength in operating performance. PPNR totaled approximately $152.7 million, representing an increase of $5.6 million, or 3.8%, compared to the first quarter of 2025. PPNR, as adjusted (non-GAAP)(1), increased $9.9 million, or 6.9%, year over year to approximately $152.7 million, underscoring improved underlying profitability and disciplined expense management. |
|||||||
| Dollar amounts presented below in thousands. | ||||||||
 |
 |
|||||||
| Net interest income after credit loss expense increased by $6.2 million from Q4 2025 to Q1 2026 and $8.7 million on a year over year basis. These results reflect a generally upward trend throughout the periods presented, supported by effective balance sheet management and stable credit performance. Despite normal quarterly variability, the Company delivered consistent, high‑quality earnings, underscoring the strength and resilience of its net interest income. | Non-interest income was $42.8 million for the first quarter of 2026, reflecting a normalization from the levels experienced in prior quarters, primarily due to certain non-continuing other income items. Results remained supported by a diversified mix of revenue streams, with performance over the prior several quarters demonstrating the Company’s ability to generate stable non‑interest income despite typical quarterly variability. Management continues to emphasize disciplined execution and strategic growth initiatives to support long‑term, sustainable income generation. | |||||||
 |
 |
|||||||
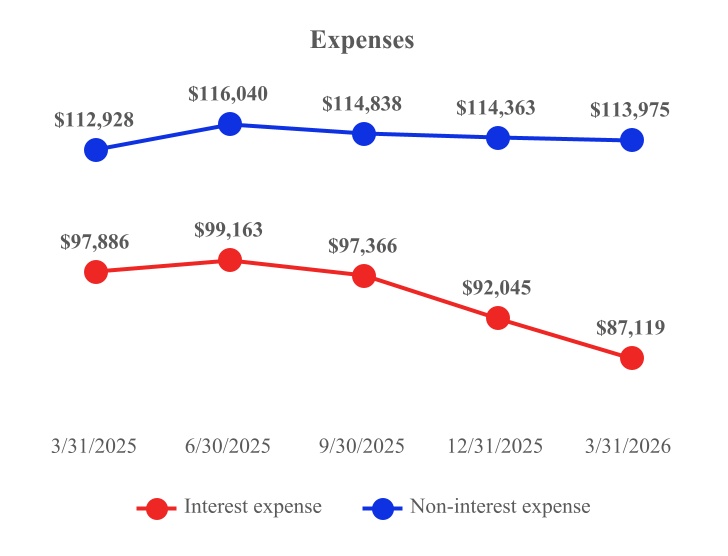
| Total revenue (net) during the first quarter of 2026 was approximately $266.7 million, representing an increase of $6.6 million, or 2.5%, year over year. While revenue moderated from the fourth quarter, results demonstrate the durability of the Company’s revenue base and provide a strong foundation for further growth as 2026 progresses. | During the first quarter of 2026, the Company demonstrated continued expense discipline and effective balance sheet management. Interest expense declined to $87.1 million primarily due to the declining interest rate environment. Non‑interest expense remained well controlled at approximately $114.0 million, consistent with prior quarter levels. Together, these trends highlight the Company’s focus on cost efficiency and operating discipline, supporting strong operating leverage and overall earnings performance. | |||||||
 |
 |
|||||||
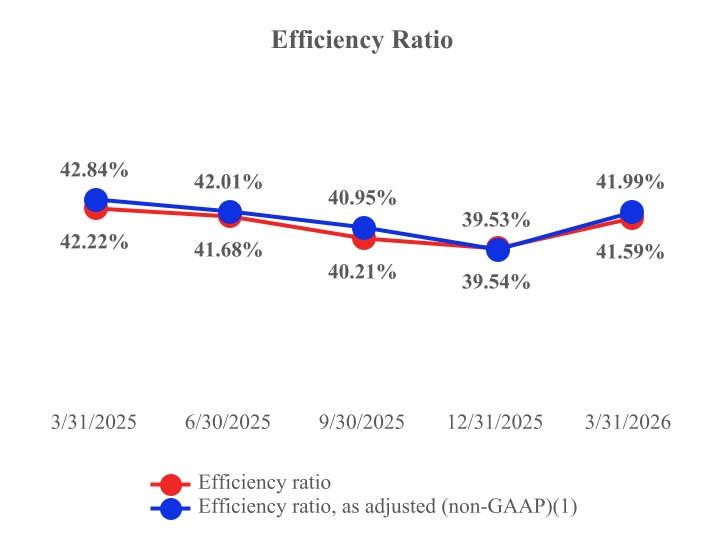
The Company continued to demonstrate strong operating discipline throughout Q1 2026, posting an efficiency ratio of 41.6%. While modestly higher than the fourth quarter level, the efficiency ratio reflects continued, effective expense management and remains well controlled. The efficiency ratio, as adjusted (non-GAAP)(1), of approximately 42.0% underscores the consistency of underlying operating efficiency, highlighting the Company’s ability to balance investment in growth with disciplined cost management. |
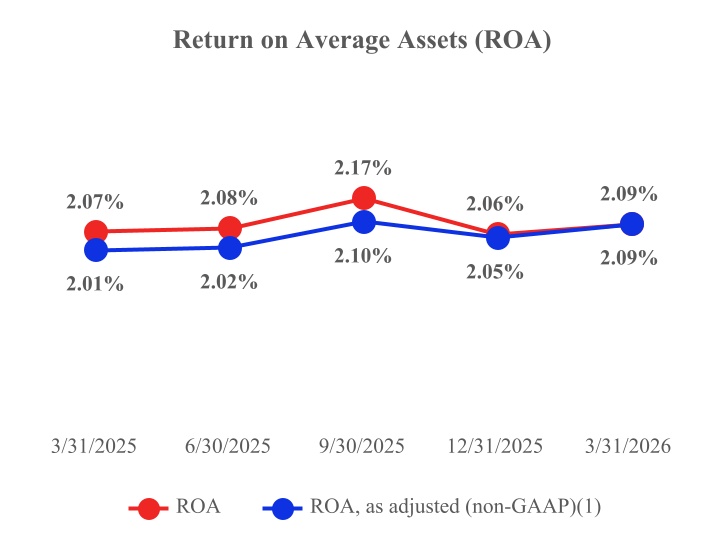
The Company delivered strong and improving return on average assets (ROA) during the first quarter of 2026, with an ROA of approximately 2.09%. This performance reflects both a year over year and sequential quarterly increase, underscoring continued balance sheet efficiency and disciplined execution. ROA, as adjusted (non-GAAP)(1), also increased to approximately 2.09%, demonstrating consistent earnings quality and effective asset utilization. Overall, Q1 2026 ROA highlights the Company’s ability to generate attractive returns while maintaining operational and financial stability. |
|||||||
 |
 |
|||||||
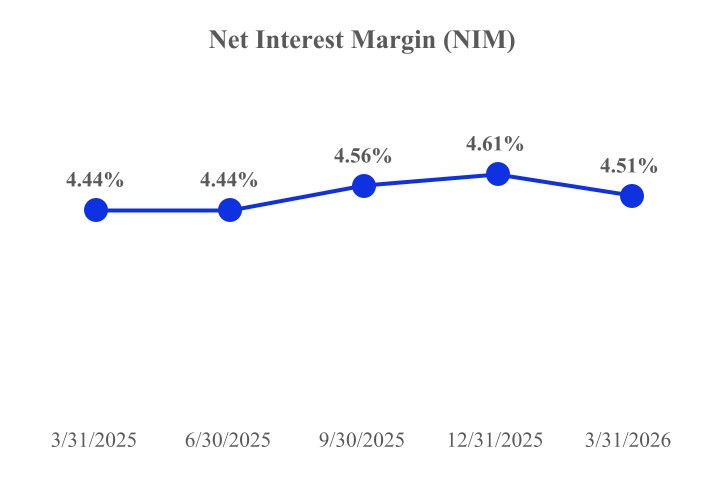
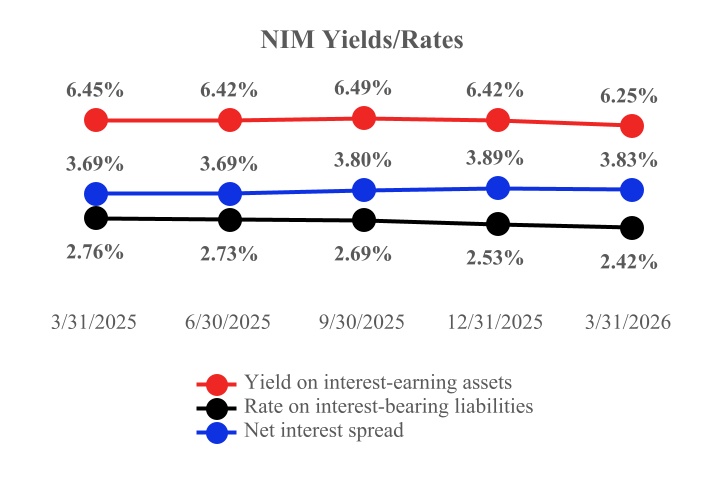
| The tables below present additional key financial metrics over the past five quarters, including net interest margin (NIM), yield on interest-earning assets, rate on interest-bearing liabilities, and net interest spread. These metrics are fundamental indicators of the Company’s profitability and operational efficiency. | ||||||||
 |
 |
|||||||
Book value per share increased to $22.15 at March 31, 2026, representing steady growth from $20.40 at March 31, 2025. Tangible book value per share (non‑GAAP)(1) also rose consistently to $14.87 over the same period. The continued sequential improvement reflects retained earnings growth and disciplined capital management, underscoring the Company’s ability to build shareholder value through a range of operating conditions. Book value per share and tangible book value per share (non-GAAP)(1) as of March 31, 2026 are both records for the Company. |
||||||||
 |
||||||||
| For the Three Months Ended March 31, 2026 | ||||||||||||||||||||||||||||||||||||||||||||
| (in thousands) | Texas | Arkansas | Centennial CFG | Shore Premier Finance | Florida | Alabama | Total | |||||||||||||||||||||||||||||||||||||
| Charge-offs | $ | 1,720 | $ | 982 | $ | — | $ | — | $ | 137 | $ | 10 | $ | 2,849 | ||||||||||||||||||||||||||||||
| Recoveries | (788) | (278) | — | (277) | (54) | (3) | (1,400) | |||||||||||||||||||||||||||||||||||||
| Net charge-offs (recoveries) | $ | 932 | $ | 704 | $ | — | $ | (277) | $ | 83 | $ | 7 | $ | 1,449 | ||||||||||||||||||||||||||||||
| For the Three Months Ended December 31, 2025 | ||||||||||||||||||||||||||||||||||||||||||||
| (in thousands) | Texas | Arkansas | Centennial CFG | Shore Premier Finance | Florida | Alabama | Total | |||||||||||||||||||||||||||||||||||||
| Charge-offs | $ | 600 | $ | 1,420 | $ | — | $ | 400 | $ | 542 | $ | 101 | $ | 3,063 | ||||||||||||||||||||||||||||||
| Recoveries | (345) | (195) | — | (4) | (49) | (4) | (597) | |||||||||||||||||||||||||||||||||||||
| Net charge-offs (recoveries) | $ | 255 | $ | 1,225 | $ | — | $ | 396 | $ | 493 | $ | 97 | $ | 2,466 | ||||||||||||||||||||||||||||||
| (in thousands) | Texas | Arkansas | Centennial CFG | Shore Premier Finance | Florida | Alabama | Total | |||||||||||||||||||||||||||||||||||||
| Non-accrual loans | $ | 119,333 | $ | 21,833 | $ | 787 | $ | 12,131 | $ | 25,532 | $ | 23 | $ | 179,639 | ||||||||||||||||||||||||||||||
| Loans 90+ days past due | 1,077 | 36 | — | — | 1,368 | — | 2,481 | |||||||||||||||||||||||||||||||||||||
| Total non-performing loans | 120,410 | 21,869 | 787 | 12,131 | 26,900 | 23 | 182,120 | |||||||||||||||||||||||||||||||||||||
| Foreclosed assets held for sale | 16,164 | 1,638 | 22,812 | — | 260 | — | 40,874 | |||||||||||||||||||||||||||||||||||||
| Other non-performing assets | — | — | — | 1,140 | — | — | 1,140 | |||||||||||||||||||||||||||||||||||||
| Total other non-performing assets | 16,164 | 1,638 | 22,812 | 1,140 | 260 | — | 42,014 | |||||||||||||||||||||||||||||||||||||
| Total non-performing assets | $ | 136,574 | $ | 23,507 | $ | 23,599 | $ | 13,271 | $ | 27,160 | $ | 23 | $ | 224,134 | ||||||||||||||||||||||||||||||
| (in thousands) | Texas | Arkansas | Centennial CFG | Shore Premier Finance | Florida | Alabama | Total | |||||||||||||||||||||||||||||||||||||
| Non-accrual loans | $ | 24,234 | $ | 18,234 | $ | 787 | $ | 10,048 | $ | 24,645 | $ | 54 | $ | 78,002 | ||||||||||||||||||||||||||||||
| Loans 90+ days past due | 2,383 | 291 | — | 3,286 | 1,020 | — | 6,980 | |||||||||||||||||||||||||||||||||||||
| Total non-performing loans | 26,617 | 18,525 | 787 | 13,334 | 25,665 | 54 | 84,982 | |||||||||||||||||||||||||||||||||||||
| Foreclosed assets held for sale | 15,988 | 771 | 22,812 | — | 260 | — | 39,831 | |||||||||||||||||||||||||||||||||||||
| Total other non-performing assets | 15,988 | 771 | 22,812 | — | 260 | — | 39,831 | |||||||||||||||||||||||||||||||||||||
| Total non-performing assets | $ | 42,605 | $ | 19,296 | $ | 23,599 | $ | 13,334 | $ | 25,925 | $ | 54 | $ | 124,813 | ||||||||||||||||||||||||||||||
| (In thousands) | Mar 31, 2026 |
Dec 31, 2025 |
Sep 30, 2025 |
Jun 30, 2025 |
Mar 31, 2025 |
|||||||||||||||||||||||||||
| ASSETS | ||||||||||||||||||||||||||||||||
| Cash and due from banks | $ | 296,209 | $ | 237,224 | $ | 284,750 | $ | 291,344 | $ | 319,747 | ||||||||||||||||||||||
| Interest-bearing deposits with other banks | 815,714 | 430,113 | 516,170 | 809,729 | 975,983 | |||||||||||||||||||||||||||
| Cash and cash equivalents | 1,111,923 | 667,337 | 800,920 | 1,101,073 | 1,295,730 | |||||||||||||||||||||||||||
| Federal funds sold | 6,025 | 3,000 | 3,625 | 2,600 | 6,275 | |||||||||||||||||||||||||||
| Investment securities - available-for-sale, net of allowance for credit losses |
2,803,847 | 2,871,931 | 2,924,496 | 2,899,968 | 3,003,320 | |||||||||||||||||||||||||||
| Investment securities - held-to-maturity, net of allowance for credit losses |
1,256,635 | 1,259,262 | 1,264,200 | 1,265,292 | 1,269,896 | |||||||||||||||||||||||||||
| Total investment securities | 4,060,482 | 4,131,193 | 4,188,696 | 4,165,260 | 4,273,216 | |||||||||||||||||||||||||||
| Loans receivable | 15,633,628 | 15,686,209 | 15,285,972 | 15,180,624 | 14,952,116 | |||||||||||||||||||||||||||
| Allowance for credit losses | (297,634) | (297,583) | (285,649) | (281,869) | (279,944) | |||||||||||||||||||||||||||
| Loans receivable, net | 15,335,994 | 15,388,626 | 15,000,323 | 14,898,755 | 14,672,172 | |||||||||||||||||||||||||||
| Bank premises and equipment, net | 374,010 | 369,324 | 374,515 | 379,729 | 384,843 | |||||||||||||||||||||||||||
| Foreclosed assets held for sale | 40,874 | 39,831 | 41,263 | 41,529 | 39,680 | |||||||||||||||||||||||||||
| Cash value of life insurance | 221,830 | 220,469 | 219,075 | 218,113 | 221,621 | |||||||||||||||||||||||||||
| Accrued interest receivable | 106,628 | 108,939 | 110,702 | 107,732 | 115,983 | |||||||||||||||||||||||||||
| Deferred tax asset, net | 143,987 | 148,022 | 155,963 | 174,323 | 170,120 | |||||||||||||||||||||||||||
| Goodwill | 1,398,253 | 1,398,253 | 1,398,253 | 1,398,253 | 1,398,253 | |||||||||||||||||||||||||||
| Core deposit intangible | 30,355 | 32,293 | 34,231 | 36,255 | 38,280 | |||||||||||||||||||||||||||
| Other assets | 371,318 | 374,592 | 380,236 | 383,400 | 376,030 | |||||||||||||||||||||||||||
| Total assets | $ | 23,201,679 | $ | 22,881,879 | $ | 22,707,802 | $ | 22,907,022 | $ | 22,992,203 | ||||||||||||||||||||||
LIABILITIES AND SHAREHOLDERS' EQUITY |
||||||||||||||||||||||||||||||||
| Deposits: | ||||||||||||||||||||||||||||||||
| Demand and non-interest-bearing | $ | 3,994,217 | $ | 3,868,405 | $ | 3,880,101 | $ | 4,024,574 | $ | 4,079,289 | ||||||||||||||||||||||
| Savings and interest-bearing transaction accounts
|
11,971,866 | 11,792,828 | 11,500,921 | 11,571,949 | 11,586,106 | |||||||||||||||||||||||||||
| Time deposits | 1,772,192 | 1,818,724 | 1,946,674 | 1,891,909 | 1,876,096 | |||||||||||||||||||||||||||
| Total deposits | 17,738,275 | 17,479,957 | 17,327,696 | 17,488,432 | 17,541,491 | |||||||||||||||||||||||||||
| Securities sold under agreements to repurchase | 157,409 | 155,803 | 145,998 | 140,813 | 161,401 | |||||||||||||||||||||||||||
| FHLB and other borrowed funds | 500,250 | 500,250 | 550,500 | 550,500 | 600,500 | |||||||||||||||||||||||||||
| Accrued interest payable and other liabilities | 176,727 | 169,733 | 189,551 | 203,004 | 207,154 | |||||||||||||||||||||||||||
| Subordinated debentures | 279,433 | 279,265 | 279,093 | 438,957 | 439,102 | |||||||||||||||||||||||||||
| Total liabilities | 18,852,094 | 18,585,008 | 18,492,838 | 18,821,706 | 18,949,648 | |||||||||||||||||||||||||||
| Shareholders' equity | ||||||||||||||||||||||||||||||||
| Common stock | 1,964 | 1,964 | 1,969 | 1,972 | 1,982 | |||||||||||||||||||||||||||
| Capital surplus | 2,191,243 | 2,201,923 | 2,214,211 | 2,221,576 | 2,246,312 | |||||||||||||||||||||||||||
| Retained earnings | 2,335,787 | 2,258,871 | 2,181,911 | 2,097,712 | 2,018,801 | |||||||||||||||||||||||||||
| Accumulated other comprehensive loss | (179,409) | (165,887) | (183,127) | (235,944) | (224,540) | |||||||||||||||||||||||||||
| Total shareholders' equity | 4,349,585 | 4,296,871 | 4,214,964 | 4,085,316 | 4,042,555 | |||||||||||||||||||||||||||
| Total liabilities and shareholders' equity | $ | 23,201,679 | $ | 22,881,879 | $ | 22,707,802 | $ | 22,907,022 | $ | 22,992,203 | ||||||||||||||||||||||
| Quarter Ended | Three Months Ended | |||||||||||||||||||||||||||||||||||||||||||
| (In thousands) | Mar 31, 2026 |
Dec 31, 2025 |
Sep 30, 2025 |
Jun 30, 2025 |
Mar 31, 2025 |
Mar 31, 2026 |
Mar 31, 2025 |
|||||||||||||||||||||||||||||||||||||
| Interest income: | ||||||||||||||||||||||||||||||||||||||||||||
| Loans | $ | 273,473 | $ | 285,491 | $ | 283,165 | $ | 276,041 | $ | 270,784 | $ | 273,473 | $ | 270,784 | ||||||||||||||||||||||||||||||
| Investment securities | ||||||||||||||||||||||||||||||||||||||||||||
| Taxable | 24,728 | 25,860 | 26,326 | 26,444 | 27,433 | 24,728 | 27,433 | |||||||||||||||||||||||||||||||||||||
| Tax-exempt | 7,829 | 7,834 | 7,743 | 7,626 | 7,650 | 7,829 | 7,650 | |||||||||||||||||||||||||||||||||||||
| Deposits - other banks | 4,945 | 4,405 | 6,242 | 8,951 | 6,620 | 4,945 | 6,620 | |||||||||||||||||||||||||||||||||||||
| Federal funds sold | 48 | 41 | 56 | 53 | 55 | 48 | 55 | |||||||||||||||||||||||||||||||||||||
| Total interest income | 311,023 | 323,631 | 323,532 | 319,115 | 312,542 | 311,023 | 312,542 | |||||||||||||||||||||||||||||||||||||
| Interest expense: | ||||||||||||||||||||||||||||||||||||||||||||
| Interest on deposits | 79,145 | 83,739 | 87,962 | 88,489 | 86,786 | 79,145 | 86,786 | |||||||||||||||||||||||||||||||||||||
| FHLB and other borrowed funds | 4,692 | 4,985 | 5,378 | 5,539 | 5,902 | 4,692 | 5,902 | |||||||||||||||||||||||||||||||||||||
| Securities sold under agreements to repurchase
|
927 | 962 | 1,019 | 1,012 | 1,074 | 927 | 1,074 | |||||||||||||||||||||||||||||||||||||
| Subordinated debentures | 2,355 | 2,359 | 3,007 | 4,123 | 4,124 | 2,355 | 4,124 | |||||||||||||||||||||||||||||||||||||
| Total interest expense | 87,119 | 92,045 | 97,366 | 99,163 | 97,886 | 87,119 | 97,886 | |||||||||||||||||||||||||||||||||||||
| Net interest income | 223,904 | 231,586 | 226,166 | 219,952 | 214,656 | 223,904 | 214,656 | |||||||||||||||||||||||||||||||||||||
| Provision for credit losses on loans | 1,500 | 14,400 | 6,700 | 3,000 | — | 1,500 | — | |||||||||||||||||||||||||||||||||||||
| Recovery of credit losses on unfunded commitments
|
(1,000) | — | (1,000) | — | — | (1,000) | — | |||||||||||||||||||||||||||||||||||||
| Recovery of credit losses on investment securities
|
— | — | (2,194) | — | — | — | — | |||||||||||||||||||||||||||||||||||||
| Total credit loss expense | 500 | 14,400 | 3,506 | 3,000 | — | 500 | — | |||||||||||||||||||||||||||||||||||||
| Net interest income after credit loss expense | 223,404 | 217,186 | 222,660 | 216,952 | 214,656 | 223,404 | 214,656 | |||||||||||||||||||||||||||||||||||||
| Non-interest income: | ||||||||||||||||||||||||||||||||||||||||||||
| Service charges on deposit accounts | 10,007 | 10,480 | 10,486 | 9,552 | 9,650 | 10,007 | 9,650 | |||||||||||||||||||||||||||||||||||||
| Other service charges and fees | 9,810 | 11,148 | 12,130 | 12,643 | 10,689 | 9,810 | 10,689 | |||||||||||||||||||||||||||||||||||||
| Trust fees | 5,482 | 5,121 | 4,600 | 5,234 | 4,760 | 5,482 | 4,760 | |||||||||||||||||||||||||||||||||||||
| Mortgage lending income | 4,430 | 4,680 | 4,691 | 4,780 | 3,599 | 4,430 | 3,599 | |||||||||||||||||||||||||||||||||||||
| Insurance commissions | 536 | 460 | 574 | 589 | 535 | 536 | 535 | |||||||||||||||||||||||||||||||||||||
| Increase in cash value of life insurance | 1,368 | 1,400 | 1,404 | 1,415 | 1,842 | 1,368 | 1,842 | |||||||||||||||||||||||||||||||||||||
| Dividends from FHLB, FRB, FNBB & other | 2,536 | 2,678 | 2,658 | 2,657 | 2,718 | 2,536 | 2,718 | |||||||||||||||||||||||||||||||||||||
| Gain on SBA loans | 80 | 308 | 46 | — | 288 | 80 | 288 | |||||||||||||||||||||||||||||||||||||
| (Loss) gain on branches, equipment and other assets, net |
(7) | 11 | (66) | 972 | (163) | (7) | (163) | |||||||||||||||||||||||||||||||||||||
| Gain (loss) on OREO, net | 707 | 203 | (1) | 13 | (376) | 707 | (376) | |||||||||||||||||||||||||||||||||||||
| Fair value adjustment for marketable securities
|
(1,248) | 1,173 | 1,020 | (238) | 442 | (1,248) | 442 | |||||||||||||||||||||||||||||||||||||
| Other income | 9,102 | 12,838 | 13,963 | 13,462 | 11,442 | 9,102 | 11,442 | |||||||||||||||||||||||||||||||||||||
| Total non-interest income | 42,803 | 50,500 | 51,505 | 51,079 | 45,426 | 42,803 | 45,426 | |||||||||||||||||||||||||||||||||||||
| Non-interest expense: | ||||||||||||||||||||||||||||||||||||||||||||
| Salaries and employee benefits | 63,236 | 62,891 | 63,804 | 64,318 | 61,855 | 63,236 | 61,855 | |||||||||||||||||||||||||||||||||||||
| Occupancy and equipment | 14,867 | 14,434 | 14,828 | 14,023 | 14,425 | 14,867 | 14,425 | |||||||||||||||||||||||||||||||||||||
| Data processing expense | 8,884 | 8,653 | 8,871 | 8,364 | 8,558 | 8,884 | 8,558 | |||||||||||||||||||||||||||||||||||||
| Merger and acquisition expenses | 394 | 580 | — | — | — | 394 | — | |||||||||||||||||||||||||||||||||||||
| Other operating expenses | 26,594 | 27,805 | 27,335 | 29,335 | 28,090 | 26,594 | 28,090 | |||||||||||||||||||||||||||||||||||||
| Total non-interest expense | 113,975 | 114,363 | 114,838 | 116,040 | 112,928 | 113,975 | 112,928 | |||||||||||||||||||||||||||||||||||||
| Income before income taxes | 152,232 | 153,323 | 159,327 | 151,991 | 147,154 | 152,232 | 147,154 | |||||||||||||||||||||||||||||||||||||
| Income tax expense | 34,023 | 35,098 | 35,723 | 33,588 | 31,945 | 34,023 | 31,945 | |||||||||||||||||||||||||||||||||||||
| Net income | $ | 118,209 | $ | 118,225 | $ | 123,604 | $ | 118,403 | $ | 115,209 | $ | 118,209 | $ | 115,209 | ||||||||||||||||||||||||||||||
| Quarter Ended | Three Months Ended | |||||||||||||||||||||||||||||||||||||||||||
| (Dollars and shares in thousands, except per share data) | Mar 31, 2026 | Dec 31, 2025 | Sep 30, 2025 | Jun 30, 2025 | Mar 31, 2025 | Mar 31, 2026 | Mar 31, 2025 | |||||||||||||||||||||||||||||||||||||
| PER SHARE DATA | ||||||||||||||||||||||||||||||||||||||||||||
| Diluted earnings per common share | $ | 0.60 | $ | 0.60 | $ | 0.63 | $ | 0.60 | $ | 0.58 | $ | 0.60 | $ | 0.58 | ||||||||||||||||||||||||||||||
|
Diluted earnings per common share, as adjusted
(non-GAAP)(1)
|
0.60 | 0.60 | 0.61 | 0.58 | 0.56 | 0.60 | 0.56 | |||||||||||||||||||||||||||||||||||||
| Basic earnings per common share | 0.60 | 0.60 | 0.63 | 0.60 | 0.58 | 0.60 | 0.58 | |||||||||||||||||||||||||||||||||||||
| Dividends per share - common | 0.21 | 0.21 | 0.200 | 0.200 | 0.195 | 0.210 | 0.195 | |||||||||||||||||||||||||||||||||||||
Shareholder buyback yield(2) |
0.25% | 0.27% | 0.18% | 0.49% | 0.53% | 0.25% | 0.53% | |||||||||||||||||||||||||||||||||||||
| Book value per common share | $ | 22.15 | $ | 21.88 | $ | 21.41 | $ | 20.71 | $ | 20.40 | $ | 22.15 | $ | 20.40 | ||||||||||||||||||||||||||||||
|
Tangible book value per common share
(non-GAAP)(1)
|
14.87 | 14.60 | 14.13 | 13.44 | 13.15 | 14.87 | 13.15 | |||||||||||||||||||||||||||||||||||||
| STOCK INFORMATION | ||||||||||||||||||||||||||||||||||||||||||||
| Average common shares outstanding | 196,528 | 196,553 | 197,078 | 197,532 | 198,657 | 196,528 | 198,657 | |||||||||||||||||||||||||||||||||||||
| Average diluted shares outstanding | 196,733 | 196,764 | 197,288 | 197,765 | 198,852 | 196,733 | 198,852 | |||||||||||||||||||||||||||||||||||||
| End of period common shares outstanding | 196,394 | 196,357 | 196,889 | 197,239 | 198,206 | 196,394 | 198,206 | |||||||||||||||||||||||||||||||||||||
| ANNUALIZED PERFORMANCE METRICS | ||||||||||||||||||||||||||||||||||||||||||||
| Return on average assets (ROA) | 2.09 | % | 2.06 | % | 2.17 | % | 2.08 | % | 2.07 | % | 2.09 | % | 2.07 | % | ||||||||||||||||||||||||||||||
|
Return on average assets, as adjusted:
(ROA, as adjusted) (non-GAAP)(1)
|
2.09 | 2.05 | 2.10 | 2.02 | 2.01 | 2.09 | 2.01 | |||||||||||||||||||||||||||||||||||||
|
Return on average assets excluding intangible
amortization (non-GAAP)(1)
|
2.25 | 2.22 | 2.34 | 2.25 | 2.24 | 2.25 | 2.24 | |||||||||||||||||||||||||||||||||||||
|
Return on average assets, as adjusted, excluding
intangible amortization (non-GAAP)(1)
|
2.25 | 2.22 | 2.27 | 2.18 | 2.18 | 2.25 | 2.18 | |||||||||||||||||||||||||||||||||||||
| Return on average common equity (ROE) | 11.09 | 11.04 | 11.91 | 11.77 | 11.75 | 11.09 | 11.75 | |||||||||||||||||||||||||||||||||||||
|
Return on average common equity, as adjusted:
(ROE, as adjusted) (non-GAAP)(1)
|
11.08 | 11.01 | 11.54 | 11.39 | 11.41 | 11.08 | 11.41 | |||||||||||||||||||||||||||||||||||||
|
Return on average tangible common equity
(ROTCE) (non-GAAP)(1)
|
16.56 | 16.65 | 18.28 | 18.26 | 18.39 | 16.56 | 18.39 | |||||||||||||||||||||||||||||||||||||
|
Return on average tangible common equity, as adjusted:
(ROTCE, as adjusted) (non-GAAP)(1)
|
16.55 | 16.60 | 17.70 | 17.68 | 17.87 | 16.55 | 17.87 | |||||||||||||||||||||||||||||||||||||
|
Return on average tangible common equity excluding
intangible amortization (non-GAAP)(1)
|
16.76 | 16.85 | 18.51 | 18.50 | 18.64 | 16.76 | 18.64 | |||||||||||||||||||||||||||||||||||||
|
Return on average tangible common equity, as adjusted,
excluding intangible amortization (non-GAAP)(1)
|
16.76 | 16.80 | 17.93 | 17.92 | 18.12 | 16.76 | 18.12 | |||||||||||||||||||||||||||||||||||||
| Quarter Ended | Three Months Ended | |||||||||||||||||||||||||||||||||||||||||||
| (Dollars in thousands) | Mar 31, 2026 | Dec 31, 2025 | Sep 30, 2025 | Jun 30, 2025 | Mar 31, 2025 | Mar 31, 2026 | Mar 31, 2025 | |||||||||||||||||||||||||||||||||||||
| Efficiency ratio | 41.59 | % | 39.54 | % | 40.21 | % | 41.68 | % | 42.22 | % | 41.59 | % | 42.22 | % | ||||||||||||||||||||||||||||||
Efficiency ratio, as adjusted (non-GAAP)(1) |
41.99 | 39.53 | 40.95 | 42.01 | 42.84 | 41.99 | 42.84 | |||||||||||||||||||||||||||||||||||||
| Net interest margin - FTE (NIM) | 4.51 | 4.61 | 4.56 | 4.44 | 4.44 | 4.51 | 4.44 | |||||||||||||||||||||||||||||||||||||
| Fully taxable equivalent adjustment | $ | 2,661 | $ | 2,252 | $ | 2,916 | $ | 2,526 | $ | 2,534 | $ | 2,661 | $ | 2,534 | ||||||||||||||||||||||||||||||
| Total revenue (net) | 266,707 | 282,086 | 277,671 | 271,031 | 260,082 | 266,707 | 260,082 | |||||||||||||||||||||||||||||||||||||
|
Pre-tax, pre-provision, net income (PPNR)
(non-GAAP)(1)
|
152,732 | 167,723 | 162,833 | 154,991 | 147,154 | 152,732 | 147,154 | |||||||||||||||||||||||||||||||||||||
PPNR, as adjusted (non-GAAP)(1) |
152,677 | 167,130 | 157,704 | 150,404 | 142,821 | 152,677 | 142,821 | |||||||||||||||||||||||||||||||||||||
| Pre-tax net income to total revenue (net) | 57.08 | % | 54.35 | % | 57.38 | % | 56.08 | % | 56.58 | % | 57.08 | % | 56.58 | % | ||||||||||||||||||||||||||||||
Pre-tax net income, as adjusted, to total revenue (net) (non-GAAP)(1) |
57.06 | 54.14 | 55.53 | 54.39 | 54.91 | 57.06 | 54.91 | |||||||||||||||||||||||||||||||||||||
P5NR ((Pre-tax, pre-provision, profit percentage) (PPNR to total revenue (net)) (non-GAAP)(1) |
57.27 | 59.46 | 58.64 | 57.19 | 56.58 | 57.27 | 56.58 | |||||||||||||||||||||||||||||||||||||
P5NR, as adjusted (non-GAAP)(1) |
57.25 | 59.25 | 56.80 | 55.49 | 54.91 | 57.25 | 54.91 | |||||||||||||||||||||||||||||||||||||
| Total purchase accounting accretion | $ | 1,061 | $ | 1,265 | $ | 1,272 | $ | 1,233 | $ | 1,378 | $ | 1,061 | $ | 1,378 | ||||||||||||||||||||||||||||||
| Average purchase accounting loan discounts | 12,507 | 13,753 | 15,009 | 16,219 | 17,493 | 12,507 | 17,493 | |||||||||||||||||||||||||||||||||||||
| OTHER OPERATING EXPENSES | ||||||||||||||||||||||||||||||||||||||||||||
| Advertising | $ | 2,227 | $ | 2,114 | $ | 2,149 | $ | 2,054 | $ | 1,928 | $ | 2,227 | $ | 1,928 | ||||||||||||||||||||||||||||||
| Amortization of intangibles | 1,938 | 1,938 | 2,024 | 2,025 | 2,047 | 1,938 | 2,047 | |||||||||||||||||||||||||||||||||||||
| Electronic banking expense | 3,326 | 3,288 | 3,357 | 3,172 | 3,055 | 3,326 | 3,055 | |||||||||||||||||||||||||||||||||||||
| Directors' fees | 518 | 388 | 405 | 431 | 452 | 518 | 452 | |||||||||||||||||||||||||||||||||||||
| Due from bank service charges | 333 | 324 | 404 | 283 | 281 | 333 | 281 | |||||||||||||||||||||||||||||||||||||
| FDIC and state assessment | 1,599 | 2,970 | 3,245 | 1,636 | 3,387 | 1,599 | 3,387 | |||||||||||||||||||||||||||||||||||||
| Insurance | 1,074 | 1,044 | 1,110 | 1,049 | 999 | 1,074 | 999 | |||||||||||||||||||||||||||||||||||||
| Legal and accounting | 914 | 1,362 | 1,061 | 2,360 | 3,641 | 914 | 3,641 | |||||||||||||||||||||||||||||||||||||
| Other professional fees | 1,946 | 2,168 | 2,083 | 2,211 | 1,947 | 1,946 | 1,947 | |||||||||||||||||||||||||||||||||||||
| Operating supplies | 748 | 759 | 773 | 711 | 711 | 748 | 711 | |||||||||||||||||||||||||||||||||||||
| Postage | 543 | 564 | 538 | 488 | 503 | 543 | 503 | |||||||||||||||||||||||||||||||||||||
| Telephone | 363 | 382 | 367 | 419 | 436 | 363 | 436 | |||||||||||||||||||||||||||||||||||||
| Other expense | 11,065 | 10,504 | 9,819 | 12,496 | 8,703 | 11,065 | 8,703 | |||||||||||||||||||||||||||||||||||||
| Total other operating expenses | $ | 26,594 | $ | 27,805 | $ | 27,335 | $ | 29,335 | $ | 28,090 | $ | 26,594 | $ | 28,090 | ||||||||||||||||||||||||||||||
| (Dollars in thousands) | Mar 31, 2026 |
Dec 31, 2025 |
Sep 30, 2025 |
Jun 30, 2025 |
Mar 31, 2025 |
|||||||||||||||||||||||||||
| BALANCE SHEET RATIOS | ||||||||||||||||||||||||||||||||
| Total loans to total deposits | 88.13 | % | 89.74 | % | 88.22 | % | 86.80 | % | 85.24 | % | ||||||||||||||||||||||
| Common equity to assets | 18.75 | 18.78 | 18.56 | 17.83 | 17.58 | |||||||||||||||||||||||||||
|
Tangible common equity to tangible assets
(non-GAAP)(1)
|
13.42 | 13.36 | 13.08 | 12.35 | 12.09 | |||||||||||||||||||||||||||
| LOANS RECEIVABLE | ||||||||||||||||||||||||||||||||
| Real estate | ||||||||||||||||||||||||||||||||
| Commercial real estate loans | ||||||||||||||||||||||||||||||||
| Non-farm/non-residential | $ | 5,395,529 | $ | 5,290,112 | $ | 5,494,492 | $ | 5,553,182 | $ | 5,588,681 | ||||||||||||||||||||||
| Construction/land development | 2,613,604 | 2,726,993 | 2,709,197 | 2,695,561 | 2,735,760 | |||||||||||||||||||||||||||
| Agricultural | 321,046 | 332,412 | 331,301 | 315,926 | 335,437 | |||||||||||||||||||||||||||
| Residential real estate loans | ||||||||||||||||||||||||||||||||
| Residential 1-4 family | 2,100,374 | 2,134,334 | 2,142,375 | 2,138,990 | 1,947,872 | |||||||||||||||||||||||||||
| Multifamily residential | 1,232,639 | 1,140,911 | 716,595 | 620,439 | 576,089 | |||||||||||||||||||||||||||
| Total real estate | 11,663,192 | 11,624,762 | 11,393,960 | 11,324,098 | 11,183,839 | |||||||||||||||||||||||||||
| Consumer | 1,254,936 | 1,253,746 | 1,233,523 | 1,218,834 | 1,227,745 | |||||||||||||||||||||||||||
| Commercial and industrial | 2,172,267 | 2,222,401 | 2,100,268 | 2,107,326 | 2,045,036 | |||||||||||||||||||||||||||
| Agricultural | 329,563 | 359,879 | 346,167 | 323,457 | 314,323 | |||||||||||||||||||||||||||
| Other | 213,670 | 225,421 | 212,054 | 206,909 | 181,173 | |||||||||||||||||||||||||||
| Loans receivable | $ | 15,633,628 | $ | 15,686,209 | $ | 15,285,972 | $ | 15,180,624 | $ | 14,952,116 | ||||||||||||||||||||||
| ALLOWANCE FOR CREDIT LOSSES | ||||||||||||||||||||||||||||||||
| Balance, beginning of period | $ | 297,583 | $ | 285,649 | $ | 281,869 | $ | 279,944 | $ | 275,880 | ||||||||||||||||||||||
| Loans charged off | 2,849 | 3,063 | 4,651 | 4,071 | 3,458 | |||||||||||||||||||||||||||
| Recoveries of loans previously charged off | 1,400 | 597 | 1,731 | 2,996 | 7,522 | |||||||||||||||||||||||||||
| Net loans charged off (recovered) | 1,449 | 2,466 | 2,920 | 1,075 | (4,064) | |||||||||||||||||||||||||||
| Provision for credit losses - loans | 1,500 | 14,400 | 6,700 | 3,000 | — | |||||||||||||||||||||||||||
| Balance, end of period | $ | 297,634 | $ | 297,583 | $ | 285,649 | $ | 281,869 | $ | 279,944 | ||||||||||||||||||||||
| Net charge-offs (recoveries) to average total loans | 0.04 | % | 0.06 | % | 0.08 | % | 0.03 | % | (0.11) | % | ||||||||||||||||||||||
| Allowance for credit losses to total loans | 1.90 | 1.90 | 1.87 | 1.86 | 1.87 | |||||||||||||||||||||||||||
| NON-PERFORMING ASSETS | ||||||||||||||||||||||||||||||||
| Non-performing loans | ||||||||||||||||||||||||||||||||
| Non-accrual loans | $ | 179,639 | $ | 78,002 | $ | 81,087 | $ | 89,261 | $ | 86,383 | ||||||||||||||||||||||
| Loans past due 90 days or more | 2,481 | 6,980 | 4,125 | 7,031 | 3,264 | |||||||||||||||||||||||||||
| Total non-performing loans | 182,120 | 84,982 | 85,212 | 96,292 | 89,647 | |||||||||||||||||||||||||||
| Other non-performing assets | ||||||||||||||||||||||||||||||||
| Foreclosed assets held for sale, net | 40,874 | 39,831 | 41,263 | 41,529 | 39,680 | |||||||||||||||||||||||||||
| Other non-performing assets | 1,140 | — | — | — | 63 | |||||||||||||||||||||||||||
| Total other non-performing assets | 42,014 | 39,831 | 41,263 | 41,529 | 39,743 | |||||||||||||||||||||||||||
| Total non-performing assets | $ | 224,134 | $ | 124,813 | $ | 126,475 | $ | 137,821 | $ | 129,390 | ||||||||||||||||||||||
| Allowance for credit losses for loans to non-performing loans | 163.43 | % | 350.17 | % | 335.22 | % | 292.72 | % | 312.27 | % | ||||||||||||||||||||||
| Non-performing loans to total loans | 1.16 | 0.54 | 0.56 | 0.63 | 0.60 | |||||||||||||||||||||||||||
| Non-performing assets to total assets | 0.97 | 0.55 | 0.56 | 0.60 | 0.56 | |||||||||||||||||||||||||||
| Three Months Ended | ||||||||||||||||||||||||||||||||||||||
| March 31, 2026 | December 31, 2025 | |||||||||||||||||||||||||||||||||||||
| (Dollars in thousands) | Average Balance |
Income/ Expense |
Yield/ Rate |
Average Balance |
Income/ Expense |
Yield/ Rate |
||||||||||||||||||||||||||||||||
| ASSETS | ||||||||||||||||||||||||||||||||||||||
| Earning assets | ||||||||||||||||||||||||||||||||||||||
| Interest-bearing balances due from banks | $ | 557,451 | $ | 4,945 | 3.60 | % | $ | 450,187 | $ | 4,405 | 3.88 | % | ||||||||||||||||||||||||||
| Federal funds sold | 5,282 | 48 | 3.69 | 4,177 | 41 | 3.89 | ||||||||||||||||||||||||||||||||
| Investment securities - taxable | 2,935,901 | 24,728 | 3.42 | 3,001,146 | 25,860 | 3.42 | ||||||||||||||||||||||||||||||||
| Investment securities - non-taxable - FTE | 1,175,663 | 10,285 | 3.55 | 1,166,233 | 10,240 | 3.48 | ||||||||||||||||||||||||||||||||
| Loans receivable - FTE | 15,680,598 | 273,678 | 7.08 | 15,506,534 | 285,337 | 7.30 | ||||||||||||||||||||||||||||||||
| Total interest-earning assets | 20,354,895 | 313,684 | 6.25 | 20,128,277 | 325,883 | 6.42 | ||||||||||||||||||||||||||||||||
| Non-earning assets | 2,599,546 | 2,658,575 | ||||||||||||||||||||||||||||||||||||
| Total assets | $ | 22,954,441 | $ | 22,786,852 | ||||||||||||||||||||||||||||||||||
| LIABILITIES AND SHAREHOLDERS' EQUITY | ||||||||||||||||||||||||||||||||||||||
| Liabilities | ||||||||||||||||||||||||||||||||||||||
| Interest-bearing liabilities | ||||||||||||||||||||||||||||||||||||||
| Savings and interest-bearing transaction accounts | $ | 11,868,976 | $ | 64,408 | 2.20 | % | $ | 11,613,721 | $ | 67,534 | 2.31 | % | ||||||||||||||||||||||||||
| Time deposits | 1,795,501 | 14,737 | 3.33 | 1,858,205 | 16,205 | 3.46 | ||||||||||||||||||||||||||||||||
| Total interest-bearing deposits | 13,664,477 | 79,145 | 2.35 | 13,471,926 | 83,739 | 2.47 | ||||||||||||||||||||||||||||||||
| Securities sold under agreement to repurchase
|
151,877 | 927 | 2.48 | 148,791 | 962 | 2.57 | ||||||||||||||||||||||||||||||||
| FHLB and other borrowed funds | 500,250 | 4,692 | 3.80 | 518,188 | 4,985 | 3.82 | ||||||||||||||||||||||||||||||||
| Subordinated debentures | 279,350 | 2,355 | 3.42 | 279,180 | 2,359 | 3.35 | ||||||||||||||||||||||||||||||||
| Total interest-bearing liabilities | 14,595,954 | 87,119 | 2.42 | 14,418,085 | 92,045 | 2.53 | ||||||||||||||||||||||||||||||||
| Non-interest bearing liabilities | ||||||||||||||||||||||||||||||||||||||
| Non-interest bearing deposits | 3,856,492 | 3,926,307 | ||||||||||||||||||||||||||||||||||||
| Other liabilities | 177,275 | 193,604 | ||||||||||||||||||||||||||||||||||||
| Total liabilities | 18,629,721 | 18,537,996 | ||||||||||||||||||||||||||||||||||||
| Shareholders' equity | 4,324,720 | 4,248,856 | ||||||||||||||||||||||||||||||||||||
| Total liabilities and shareholders' equity | $ | 22,954,441 | $ | 22,786,852 | ||||||||||||||||||||||||||||||||||
| Net interest spread | 3.83 | % | 3.89 | % | ||||||||||||||||||||||||||||||||||
| Net interest income and margin - FTE | $ | 226,565 | 4.51 | $ | 233,838 | 4.61 | ||||||||||||||||||||||||||||||||
| Three Months Ended | ||||||||||||||||||||||||||||||||||||||
| March 31, 2026 | March 31, 2025 | |||||||||||||||||||||||||||||||||||||
| (Dollars in thousands) | Average Balance |
Income/ Expense |
Yield/ Rate |
Average Balance |
Income/ Expense |
Yield/ Rate |
||||||||||||||||||||||||||||||||
| ASSETS | ||||||||||||||||||||||||||||||||||||||
| Earning assets | ||||||||||||||||||||||||||||||||||||||
| Interest-bearing balances due from banks | $ | 557,451 | $ | 4,945 | 3.60 | % | $ | 611,962 | $ | 6,620 | 4.39 | % | ||||||||||||||||||||||||||
| Federal funds sold | 5,282 | 48 | 3.69 | 5,091 | 55 | 4.38 | ||||||||||||||||||||||||||||||||
| Investment securities - taxable | 2,935,901 | 24,728 | 3.42 | 3,179,290 | 27,433 | 3.50 | ||||||||||||||||||||||||||||||||
| Investment securities - non-taxable - FTE | 1,175,663 | 10,285 | 3.55 | 1,135,783 | 10,061 | 3.59 | ||||||||||||||||||||||||||||||||
| Loans receivable - FTE | 15,680,598 | 273,678 | 7.08 | 14,893,912 | 270,907 | 7.38 | ||||||||||||||||||||||||||||||||
| Total interest-earning assets | 20,354,895 | 313,684 | 6.25 | 19,826,038 | 315,076 | 6.45 | ||||||||||||||||||||||||||||||||
| Non-earning assets | 2,599,546 | 2,722,797 | ||||||||||||||||||||||||||||||||||||
| Total assets | $ | 22,954,441 | $ | 22,548,835 | ||||||||||||||||||||||||||||||||||
| LIABILITIES AND SHAREHOLDERS' EQUITY | ||||||||||||||||||||||||||||||||||||||
| Liabilities | ||||||||||||||||||||||||||||||||||||||
| Interest-bearing liabilities | ||||||||||||||||||||||||||||||||||||||
| Savings and interest-bearing transaction accounts | $ | 11,868,976 | $ | 64,408 | 2.20 | % | $ | 11,402,688 | $ | 69,672 | 2.48 | % | ||||||||||||||||||||||||||
| Time deposits | 1,795,501 | 14,737 | 3.33 | 1,801,503 | 17,114 | 3.85 | ||||||||||||||||||||||||||||||||
| Total interest-bearing deposits | 13,664,477 | 79,145 | 2.35 | 13,204,191 | 86,786 | 2.67 | ||||||||||||||||||||||||||||||||
| Securities sold under agreement to repurchase
|
151,877 | 927 | 2.48 | 155,861 | 1,074 | 2.79 | ||||||||||||||||||||||||||||||||
| FHLB and other borrowed funds | 500,250 | 4,692 | 3.80 | 600,681 | 5,902 | 3.98 | ||||||||||||||||||||||||||||||||
| Subordinated debentures | 279,350 | 2,355 | 3.42 | 439,173 | 4,124 | 3.81 | ||||||||||||||||||||||||||||||||
| Total interest-bearing liabilities | 14,595,954 | 87,119 | 2.42 | 14,399,906 | 97,886 | 2.76 | ||||||||||||||||||||||||||||||||
| Non-interest bearing liabilities | ||||||||||||||||||||||||||||||||||||||
| Non-interest bearing deposits | 3,856,492 | 3,980,944 | ||||||||||||||||||||||||||||||||||||
| Other liabilities | 177,275 | 190,314 | ||||||||||||||||||||||||||||||||||||
| Total liabilities | 18,629,721 | 18,571,164 | ||||||||||||||||||||||||||||||||||||
| Shareholders' equity | 4,324,720 | 3,977,671 | ||||||||||||||||||||||||||||||||||||
| Total liabilities and shareholders' equity | $ | 22,954,441 | $ | 22,548,835 | ||||||||||||||||||||||||||||||||||
| Net interest spread | 3.83 | % | 3.69 | % | ||||||||||||||||||||||||||||||||||
| Net interest income and margin - FTE | $ | 226,565 | 4.51 | $ | 217,190 | 4.44 | ||||||||||||||||||||||||||||||||
| Quarter Ended | Three Months Ended | |||||||||||||||||||||||||||||||||||||||||||
| (Dollars and shares in thousands, except per share data) |
Mar 31, 2026 |
Dec 31, 2025 |
Sep 30, 2025 |
Jun 30, 2025 |
Mar 31, 2025 |
Mar 31, 2026 |
Mar 31, 2025 |
|||||||||||||||||||||||||||||||||||||
| NET INCOME (EARNINGS), AS ADJUSTED | ||||||||||||||||||||||||||||||||||||||||||||
| GAAP net income available to common shareholders (A) | $ | 118,209 | $ | 118,225 | $ | 123,604 | $ | 118,403 | $ | 115,209 | $ | 118,209 | $ | 115,209 | ||||||||||||||||||||||||||||||
| Pre-tax adjustments | ||||||||||||||||||||||||||||||||||||||||||||
| Merger and acquisition expense | 394 | 580 | — | — | — | 394 | — | |||||||||||||||||||||||||||||||||||||
| Gain on retirement of subordinated debt | — | — | (1,882) | — | — | — | — | |||||||||||||||||||||||||||||||||||||
| FDIC special assessment credit | (1,697) | — | — | (1,516) | — | (1,697) | — | |||||||||||||||||||||||||||||||||||||
| BOLI death benefits | — | — | (187) | (1,243) | — | — | — | |||||||||||||||||||||||||||||||||||||
| Gain on sale of premises and equipment | — | — | — | (983) | — | — | — | |||||||||||||||||||||||||||||||||||||
| Fair value adjustment for marketable securities | 1,248 | (1,173) | (1,020) | 238 | (442) | 1,248 | (442) | |||||||||||||||||||||||||||||||||||||
| Special income from equity investment | — | — | — | (3,498) | (3,891) | — | (3,891) | |||||||||||||||||||||||||||||||||||||
| Legal fee reimbursement | — | — | — | (885) | — | — | — | |||||||||||||||||||||||||||||||||||||
| Legal claims expense | — | — | — | 3,300 | — | — | — | |||||||||||||||||||||||||||||||||||||
| Recoveries on historic losses | — | — | (2,040) | — | — | — | — | |||||||||||||||||||||||||||||||||||||
| Total pre-tax adjustments | (55) | (593) | (5,129) | (4,587) | (4,333) | (55) | (4,333) | |||||||||||||||||||||||||||||||||||||
| Tax-effect of adjustments | (13) | (231) | (1,207) | (817) | (1,059) | (13) | (1,059) | |||||||||||||||||||||||||||||||||||||
| Total adjustments after-tax (B) | (42) | (362) | (3,922) | (3,770) | (3,274) | (42) | (3,274) | |||||||||||||||||||||||||||||||||||||
| Net income, as adjusted (C) | $ | 118,167 | $ | 117,863 | $ | 119,682 | $ | 114,633 | $ | 111,935 | $ | 118,167 | $ | 111,935 | ||||||||||||||||||||||||||||||
| Average diluted shares outstanding (D) | 196,733 | 196,764 | 197,288 | 197,765 | 198,852 | 196,733 | 198,852 | |||||||||||||||||||||||||||||||||||||
| GAAP diluted earnings per share: (A/D) | $ | 0.60 | $ | 0.60 | $ | 0.63 | $ | 0.60 | $ | 0.58 | $ | 0.60 | $ | 0.58 | ||||||||||||||||||||||||||||||
| Adjustments after-tax: (B/D) | — | — | (0.02) | (0.02) | (0.02) | — | (0.02) | |||||||||||||||||||||||||||||||||||||
| Diluted earnings per common share, as adjusted: (C/D) | $ | 0.60 | $ | 0.60 | $ | 0.61 | $ | 0.58 | $ | 0.56 | $ | 0.60 | $ | 0.56 | ||||||||||||||||||||||||||||||
| ANNUALIZED RETURN ON AVERAGE ASSETS | ||||||||||||||||||||||||||||||||||||||||||||
| Return on average assets: (A/E) | 2.09 | % | 2.06 | % | 2.17 | % | 2.08 | % | 2.07 | % | 2.09 | % | 2.07 | % | ||||||||||||||||||||||||||||||
| Return on average assets, as adjusted: (ROA, as adjusted) ((A+D)/E) | 2.09 | 2.05 | 2.10 | 2.02 | 2.01 | 2.09 | 2.01 | |||||||||||||||||||||||||||||||||||||
| Return on average assets excluding intangible amortization: ((A+C)/(E-F)) | 2.25 | 2.22 | 2.34 | 2.25 | 2.24 | 2.25 | 2.24 | |||||||||||||||||||||||||||||||||||||
| Return on average assets, as adjusted, excluding intangible amortization: ((A+C+D)/(E-F)) | 2.25 | 2.22 | 2.27 | 2.18 | 2.18 | 2.25 | 2.18 | |||||||||||||||||||||||||||||||||||||
| GAAP net income available to common shareholders (A) | $ | 118,209 | $ | 118,225 | $ | 123,604 | $ | 118,403 | $ | 115,209 | $ | 118,209 | $ | 115,209 | ||||||||||||||||||||||||||||||
| Amortization of intangibles (B) | 1,938 | 1,938 | 2,024 | 2,025 | 2,047 | 1,938 | 2,047 | |||||||||||||||||||||||||||||||||||||
| Amortization of intangibles after-tax (C) | 1,466 | 1,466 | 1,529 | 1,530 | 1,547 | 1,466 | 1,547 | |||||||||||||||||||||||||||||||||||||
| Adjustments after-tax (D) | (42) | (362) | (3,922) | (3,770) | (3,274) | (42) | (3,274) | |||||||||||||||||||||||||||||||||||||
| Average assets (E) | 22,954,441 | 22,786,852 | 22,638,938 | 22,797,738 | 22,548,835 | 22,954,441 | 22,548,835 | |||||||||||||||||||||||||||||||||||||
| Average goodwill & core deposit intangible (F) | 1,429,527 | 1,431,479 | 1,433,474 | 1,435,480 | 1,437,515 | 1,429,527 | 1,437,515 | |||||||||||||||||||||||||||||||||||||
| Quarter Ended | Three Months Ended | |||||||||||||||||||||||||||||||||||||||||||
| (Dollars in thousands) | Mar 31, 2026 |
Dec 31, 2025 |
Sep 30, 2025 |
Jun 30, 2025 |
Mar 31, 2025 |
Mar 31, 2026 |
Mar 31, 2025 |
|||||||||||||||||||||||||||||||||||||
| ANNUALIZED RETURN ON AVERAGE COMMON EQUITY | ||||||||||||||||||||||||||||||||||||||||||||
| Return on average common equity: (A/D) | 11.09 | % | 11.04 | % | 11.91 | % | 11.77 | % | 11.75 | % | 11.09 | % | 11.75 | % | ||||||||||||||||||||||||||||||
| Return on average common equity, as adjusted: (ROE, as adjusted) ((A+C)/D) | 11.08 | 11.01 | 11.54 | 11.39 | 11.41 | 11.08 | 11.41 | |||||||||||||||||||||||||||||||||||||
| Return on average tangible common equity: (ROTCE) (A/(D-E)) |
16.56 | 16.65 | 18.28 | 18.26 | 18.39 | 16.56 | 18.39 | |||||||||||||||||||||||||||||||||||||
| Return on average tangible common equity, as adjusted: (ROTCE, as adjusted) ((A+C)/(D-E)) | 16.55 | 16.60 | 17.70 | 17.68 | 17.87 | 16.55 | 17.87 | |||||||||||||||||||||||||||||||||||||
| Return on average tangible common equity excluding intangible amortization: (B/(D-E)) | 16.76 | 16.85 | 18.51 | 18.50 | 18.64 | 16.76 | 18.64 | |||||||||||||||||||||||||||||||||||||
| Return on average tangible common equity, as adjusted, excluding intangible amortization: ((B+C)/(D-E)) | 16.76 | 16.80 | 17.93 | 17.92 | 18.12 | 16.76 | 18.12 | |||||||||||||||||||||||||||||||||||||
| GAAP net income available to common shareholders (A) | $ | 118,209 | $ | 118,225 | $ | 123,604 | $ | 118,403 | $ | 115,209 | $ | 118,209 | $ | 115,209 | ||||||||||||||||||||||||||||||
| Earnings excluding intangible amortization (B) | 119,675 | 119,691 | 125,133 | 119,933 | 116,756 | 119,675 | 116,756 | |||||||||||||||||||||||||||||||||||||
| Adjustments after-tax (C) | (42) | (362) | (3,922) | (3,770) | (3,274) | (42) | (3,274) | |||||||||||||||||||||||||||||||||||||
| Average common equity (D) | 4,324,720 | 4,248,856 | 4,115,884 | 4,036,155 | 3,977,671 | 4,324,720 | 3,977,671 | |||||||||||||||||||||||||||||||||||||
| Average goodwill & core deposits intangible (E) | 1,429,527 | 1,431,479 | 1,433,474 | 1,435,480 | 1,437,515 | 1,429,527 | 1,437,515 | |||||||||||||||||||||||||||||||||||||
EFFICIENCY RATIO & P5NR |
||||||||||||||||||||||||||||||||||||||||||||
| Efficiency ratio: ((D-G)/(B+C+E)) | 41.59 | % | 39.54 | % | 40.21 | % | 41.68 | % | 42.22 | % | 41.59 | % | 42.22 | % | ||||||||||||||||||||||||||||||
| Efficiency ratio, as adjusted: ((D-G-I)/(B+C+E-H)) | 41.99 | 39.53 | 40.95 | 42.01 | 42.84 | 41.99 | 42.84 | |||||||||||||||||||||||||||||||||||||
| Pre-tax net income to total revenue (net) (A/(B+C)) | 57.08 | 54.35 | 57.38 | 56.08 | 56.58 | 57.08 | 56.58 | |||||||||||||||||||||||||||||||||||||
| Pre-tax net income, as adjusted, to total revenue (net) ((A+F)/(B+C)) | 57.06 | 54.14 | 55.53 | 54.39 | 54.91 | 57.06 | 54.91 | |||||||||||||||||||||||||||||||||||||
| Pre-tax, pre-provision, net income (PPNR) (B+C-D) | $ | 152,732 | $ | 167,723 | $ | 162,833 | $ | 154,991 | $ | 147,154 | $ | 152,732 | $ | 147,154 | ||||||||||||||||||||||||||||||
| Pre-tax, pre-provision, net income, as adjusted (B+C-D+F) | 152,677 | 167,130 | 157,704 | 150,404 | 142,821 | 152,677 | 142,821 | |||||||||||||||||||||||||||||||||||||
P5NR ((Pre-tax, pre-provision, profit percentage) PPNR to total revenue (net)) (B+C-D)/(B+C) |
57.27 | % | 59.46 | % | 58.64 | % | 57.19 | % | 56.58 | % | 57.27 | % | 56.58 | % | ||||||||||||||||||||||||||||||
P5NR, as adjusted (B+C-D+F)/(B+C) |
57.25 | 59.25 | 56.80 | 55.49 | 54.91 | 57.25 | 54.91 | |||||||||||||||||||||||||||||||||||||
| Pre-tax net income (A) | $ | 152,232 | $ | 153,323 | $ | 159,327 | $ | 151,991 | $ | 147,154 | $ | 152,232 | $ | 147,154 | ||||||||||||||||||||||||||||||
| Net interest income (B) | 223,904 | 231,586 | 226,166 | 219,952 | 214,656 | 223,904 | 214,656 | |||||||||||||||||||||||||||||||||||||
| Non-interest income (C) | 42,803 | 50,500 | 51,505 | 51,079 | 45,426 | 42,803 | 45,426 | |||||||||||||||||||||||||||||||||||||
| Non-interest expense (D) | 113,975 | 114,363 | 114,838 | 116,040 | 112,928 | 113,975 | 112,928 | |||||||||||||||||||||||||||||||||||||
| Fully taxable equivalent adjustment (E) | 2,661 | 2,252 | 2,916 | 2,526 | 2,534 | 2,661 | 2,534 | |||||||||||||||||||||||||||||||||||||
| Total pre-tax adjustments (F) | (55) | (593) | (5,129) | (4,587) | (4,333) | (55) | (4,333) | |||||||||||||||||||||||||||||||||||||
| Amortization of intangibles (G) | 1,938 | 1,938 | 2,024 | 2,025 | 2,047 | 1,938 | 2,047 | |||||||||||||||||||||||||||||||||||||
| Adjustments: | ||||||||||||||||||||||||||||||||||||||||||||
| Non-interest income: | ||||||||||||||||||||||||||||||||||||||||||||
| Gain on retirement of subordinated debt | $ | — | $ | — | $ | 1,882 | $ | — | $ | — | $ | — | $ | — | ||||||||||||||||||||||||||||||
| Fair value adjustment for marketable securities | (1,248) | 1,173 | 1,020 | (238) | 442 | (1,248) | 442 | |||||||||||||||||||||||||||||||||||||
| Gain (loss) on OREO | 707 | 203 | (1) | 13 | (376) | 707 | (376) | |||||||||||||||||||||||||||||||||||||
| Gain (loss) on branches, equipment and other assets, net | (7) | 11 | (66) | 972 | (163) | (7) | (163) | |||||||||||||||||||||||||||||||||||||
| Special income from equity investment | — | — | — | 3,498 | 3,891 | — | 3,891 | |||||||||||||||||||||||||||||||||||||
| Legal expense reimbursement | — | — | — | 885 | — | — | — | |||||||||||||||||||||||||||||||||||||
| BOLI death benefits | — | — | 187 | 1,243 | — | — | — | |||||||||||||||||||||||||||||||||||||
| Recoveries on historic losses | — | — | 2,040 | — | — | — | — | |||||||||||||||||||||||||||||||||||||
| Total non-interest income adjustments (H) | $ | (548) | $ | 1,387 | $ | 5,062 | $ | 6,373 | $ | 3,794 | $ | (548) | $ | 3,794 | ||||||||||||||||||||||||||||||
| Non-interest expense: | ||||||||||||||||||||||||||||||||||||||||||||
| FDIC special assessment credit | (1,697) | — | — | (1,516) | — | (1,697) | — | |||||||||||||||||||||||||||||||||||||
| Merger and acquisition expenses | 394 | 580 | — | — | — | 394 | — | |||||||||||||||||||||||||||||||||||||
| Legal claims expense | — | — | — | 3,300 | — | — | — | |||||||||||||||||||||||||||||||||||||
| Total non-interest expense adjustments (I) | $ | (1,303) | $ | 580 | $ | — | $ | 1,784 | $ | — | $ | (1,303) | $ | — | ||||||||||||||||||||||||||||||
| Quarter Ended | ||||||||||||||||||||||||||||||||
| Mar 31, 2026 |
Dec 31, 2025 |
Sep 30, 2025 |
Jun 30, 2025 |
Mar 31, 2025 |
||||||||||||||||||||||||||||
| TANGIBLE BOOK VALUE PER COMMON SHARE | ||||||||||||||||||||||||||||||||
| Book value per common share: (A/B) | $ | 22.15 | $ | 21.88 | $ | 21.41 | $ | 20.71 | $ | 20.40 | ||||||||||||||||||||||
| Tangible book value per common share: ((A-C-D)/B) | 14.87 | 14.60 | 14.13 | 13.44 | 13.15 | |||||||||||||||||||||||||||
| Total shareholders' equity (A) | $ | 4,349,585 | $ | 4,296,871 | $ | 4,214,964 | $ | 4,085,316 | $ | 4,042,555 | ||||||||||||||||||||||
| End of period common shares outstanding (B) | 196,394 | 196,357 | 196,889 | 197,239 | 198,206 | |||||||||||||||||||||||||||
| Goodwill (C) | 1,398,253 | 1,398,253 | 1,398,253 | 1,398,253 | 1,398,253 | |||||||||||||||||||||||||||
| Core deposit and other intangibles (D) | 30,355 | 32,293 | 34,231 | 36,255 | 38,280 | |||||||||||||||||||||||||||
| TANGIBLE COMMON EQUITY TO TANGIBLE ASSETS | ||||||||||||||||||||||||||||||||
| Equity to assets: (B/A) | 18.75 | % | 18.78 | % | 18.56 | % | 17.83 | % | 17.58 | % | ||||||||||||||||||||||
| Tangible common equity to tangible assets: ((B-C-D)/(A-C-D)) | 13.42 | 13.36 | 13.08 | 12.35 | 12.09 | |||||||||||||||||||||||||||
| Total assets (A) | $ | 23,201,679 | $ | 22,881,879 | $ | 22,707,802 | $ | 22,907,022 | $ | 22,992,203 | ||||||||||||||||||||||
| Total shareholders' equity (B) | 4,349,585 | 4,296,871 | 4,214,964 | 4,085,316 | 4,042,555 | |||||||||||||||||||||||||||
| Goodwill (C) | 1,398,253 | 1,398,253 | 1,398,253 | 1,398,253 | 1,398,253 | |||||||||||||||||||||||||||
| Core deposit and other intangibles (D) | 30,355 | 32,293 | 34,231 | 36,255 | 38,280 | |||||||||||||||||||||||||||
| Quarter Ended | Three Months Ended | |||||||||||||||||||||||||||||||||||||||||||
| (Dollars and shares in thousands) | Mar 31, 2026 |
Dec 31, 2025 |
Sep 30, 2025 |
Jun 30, 2025 |
Mar 31, 2025 |
Mar 31, 2026 |
Mar 31, 2025 |
|||||||||||||||||||||||||||||||||||||
| SHAREHOLDER BUYBACK YIELD | ||||||||||||||||||||||||||||||||||||||||||||
| Shareholder buyback yield: (A/B) | 0.25 | % | 0.27 | % | 0.18 | % | 0.49 | % | 0.53 | % | 0.25 | % | 0.53 | % | ||||||||||||||||||||||||||||||
| Shares repurchased | 508 | 541 | 350 | 1,000 | 1,000 | 508 | 1,000 | |||||||||||||||||||||||||||||||||||||
Average price per share |
$ | 27.32 | $ | 27.26 | $ | 28.34 | $ | 26.99 | $ | 29.67 | $ | 27.32 | $ | 29.67 | ||||||||||||||||||||||||||||||
Principal cost |
13,877 | 14,747 | 9,918 | 26,989 | 29,668 | 13,877 | 29,668 | |||||||||||||||||||||||||||||||||||||
| Excise tax | 1 | 141 | 93 | 459 | 117 | 1 | 117 | |||||||||||||||||||||||||||||||||||||
| Total share repurchase cost (A) | $ | 13,878 | $ | 14,888 | $ | 10,011 | $ | 27,448 | $ | 29,785 | $ | 13,878 | $ | 29,785 | ||||||||||||||||||||||||||||||
| Shares outstanding beginning of period | 196,357 | 196,889 | 197,239 | 198,206 | 198,882 | 196,357 | 198,882 | |||||||||||||||||||||||||||||||||||||
| Price per share beginning of period | $ | 27.78 | $ | 28.30 | $ | 28.46 | $ | 28.27 | $ | 28.30 | $ | 27.78 | $ | 28.30 | ||||||||||||||||||||||||||||||
Market capitalization beginning of period (B) |
$ | 5,454,797 | $ | 5,571,959 | $ | 5,613,422 | $ | 5,603,284 | $ | 5,628,361 | $ | 5,454,797 | $ | 5,628,361 | ||||||||||||||||||||||||||||||


