UNITED STATES
SECURITIES AND EXCHANGE COMMISSION
WASHINGTON, DC 20549
FORM 8-K
CURRENT REPORT PURSUANT TO
SECTION 13 OR 15(d) OF THE
SECURITIES EXCHANGE ACT OF 1934
Date of report (Date of earliest event reported): December 2, 2025
CUBESMART
CUBESMART, L.P.
(Exact Name of Registrant as Specified in Its Charter)
Maryland (CubeSmart) |
001-32324 |
20-1024732 |
Delaware (CubeSmart, L.P.) |
000-54462 |
34-1837021 |
|
(State or Other Jurisdiction of Incorporation) |
(Commission File Number) |
(IRS Employer Identification No.) |
5 Old Lancaster Road |
Malvern, |
Pennsylvania |
19355 |
(Address of Principal |
Executive Offices) |
(610) 535-5000
(Registrant’s telephone number, including area code)
Not applicable
(Former Name or Former Address, if Changed Since Last Report)
Securities registered pursuant to Section 12(b) of the Act:
Title of Each Class |
|
Trading Symbol(s) |
|
Name of Each Exchange on Which Registered |
Common Shares, $0.01 par value per share, of CubeSmart |
|
CUBE |
|
New York Stock Exchange |
Check the appropriate box below if the Form 8-K filing is intended to simultaneously satisfy the filing obligation of the registrant under any of the following provisions (see General Instruction A.2. below):
☐ |
Written communications pursuant to Rule 425 under the Securities Act (17 CFR 230.425) |
☐ |
Soliciting material pursuant to Rule 14a-12 under the Exchange Act (17 CFR 240.14a-12) |
☐ |
Pre-commencement communications pursuant to Rule 14d-2(b) under the Exchange Act (17 CFR 240.14d-2(b)) |
☐ |
Pre-commencement communications pursuant to Rule 13e-4(c) under the Exchange Act (17 CFR 240.13e-4(c)) |
Indicate by check mark whether the registrant is an emerging growth company as defined in Rule 405 of the Securities Act of 1933 (17 CFR 230.405) or Rule 12b-2 of the Securities Exchange Act of 1934 (17 CFR 240.12b-2).
Emerging Growth Company (CubeSmart) ☐
Emerging Growth Company (CubeSmart, L.P.) ☐
If an emerging growth company, indicate by check mark if the registrant has elected not to use the extended transition period for complying with any new or revised financial accounting standards provided pursuant to Section 13(a) of the Exchange Act.
CubeSmart ☐
CubeSmart, L.P. ☐
Item 2.02 Results of Operations and Financial Condition.
We are furnishing with this report a slide presentation (attached as Exhibit 99.1) that may be used in presentations to investors from time to time.
Item 7.01 Regulation FD Disclosure.
The information disclosed in Item 2.02 above is incorporated into this Item 7.01.
The information included in this Current Report on Form 8-K (including the exhibit hereto) is being furnished under Item 2.02, “Results of Operations and Financial Condition,” Item 7.01, “Regulation FD Disclosure” and Item 9.01 “Financial Statements and Exhibits” of Form 8-K. As such, the information (including the exhibit) herein shall not be deemed to be “filed” for the purposes of Section 18 of the Securities Exchange Act of 1934, as amended (the “Exchange Act”), or otherwise subject to the liabilities of that Section, nor shall it be incorporated by reference into a filing under the Securities Act of 1933, as amended, or the Exchange Act, regardless of any general incorporation language in such filing, except as shall be expressly set forth by specific reference in such a filing. This Current Report (including the exhibit hereto) will not be deemed an admission as to the materiality of any information required to be disclosed solely to satisfy the requirements of Regulation FD.
Item 9.01 Financial Statements and Exhibits.
(a) Not applicable.
(b) Not applicable.
(c) Not applicable.
(d) Exhibits.
Exhibit No. |
|
Description |
|
||
104 |
|
Cover Page Interactive Data File – the cover page interactive data file does not appear in the Interactive Data File because its XBRL tags are embedded within the Inline XBRL document. |
2
SIGNATURES
Pursuant to the requirements of the Securities Exchange Act of 1934, the Registrant has duly caused this report to be signed on its behalf by the undersigned hereunto duly authorized.
|
CUBESMART |
|
|
|
|
|
By: |
/s/ Jeffrey P. Foster |
|
Name: |
Jeffrey P. Foster |
Date: December 2, 2025 |
Title: |
Chief Legal Officer and Secretary |
|
|
|
|
|
|
|
CUBESMART, L.P. |
|
|
|
|
|
By: CUBESMART, its general partner |
|
|
|
|
|
By: |
/s/ Jeffrey P. Foster |
|
Name: |
Jeffrey P. Foster |
Date: December 2, 2025 |
Title: |
Chief Legal Officer and Secretary |
|
|
|
|
|
|
3
4
|
December 2025 Investor Presentation |
|
2 The forward-looking statements contained in this presentation are subject to various risks and known and unknown uncertainties . Although the Company believes the expectations reflected in such forward-looking statements are based on reasonable assumptions, there can be no assurance that the Company’s expectations will be achieved . Factors which could cause the Company’s actual results, performance, or achievements to differ significantly from the results, performance, or achievements expressed or implied by such statements are set forth under the captions “Item 1A. Risk Factors” and “Forward - Looking Statements” in our annual report on Form 10-K and in our quarterly reports on Form 10-Q and described from time to time in the Company’s filings with the SEC . Forward -looking statements are not guarantees of performance . For forward-looking statements herein, the Company claims the protection of the safe harbor for forward-looking statements contained in the Private Securities Litigation Reform Act of 1995. The Company assumes no obligation to update or supplement forward-looking statements that become untrue because of subsequent events. This presentation contains certain non-GAAP financial measures, including Net Operating Income (NOI), Funds From Operations (FFO), and Funds From Operations, as adjusted (FFO, as adjusted) . The definitions of these terms, the reasons for their use, and reconciliations to the most directly comparable GAAP measures are included in our Earnings Release as well as the Non-GAAP Financial Measures section under the caption “Management’s Discussion and Analysis of Financial Condition and Results of Operations” (or similar captions) in our annual report on Form 10-K and quarterly reports on Form 10-Q, and described from time to time in the Company’s filings with the SEC . Safe Harbor Statement Use of Non -GAAP Financial Measures |
|
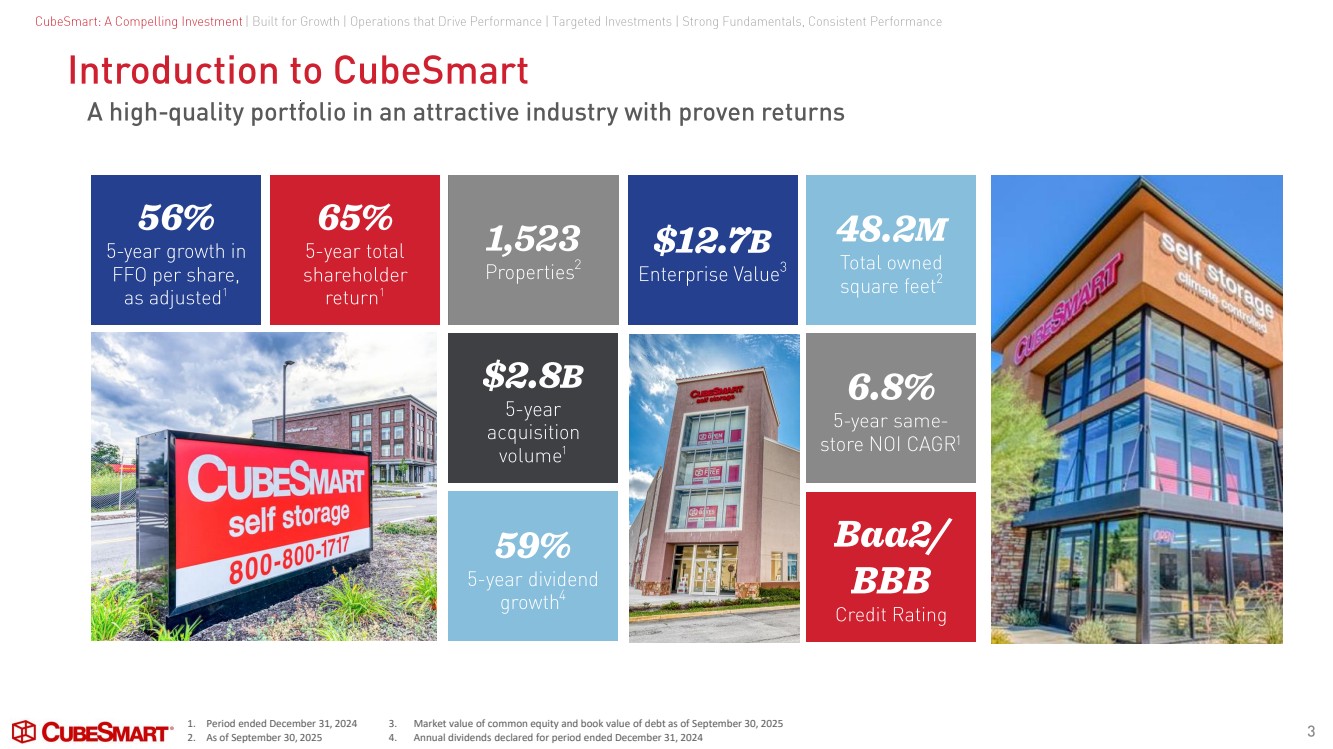
Introduction to CubeSmart 3 A high -quality portfolio in an attractive industry with proven returns 1. Period ended December 31, 2024 2. As of September 30, 2025 3. Market value of common equity and book value of debt as of September 30, 2025 4. Annual dividends declared for period ended December 31, 2024 1,287 Properties 1 $12.7 B Enterprise Value 3 65% 5- year total shareholder return 1 56% 5- year growth in FFO per share, as adjusted 1 $2.8 B 5- year acquisition volume 1 59% 5- year dividend growth4 1,523 Properties 2 48.2 M Total owned square feet 2 6.8% 5- year same - store NOI CAGR 1 Baa2/ BBB Credit Rating CubeSmart: A Compelling Investment | Built for Growth | Operations that Drive Performance | Targeted Investments | Strong Fundamentals, Consistent Performance |
|
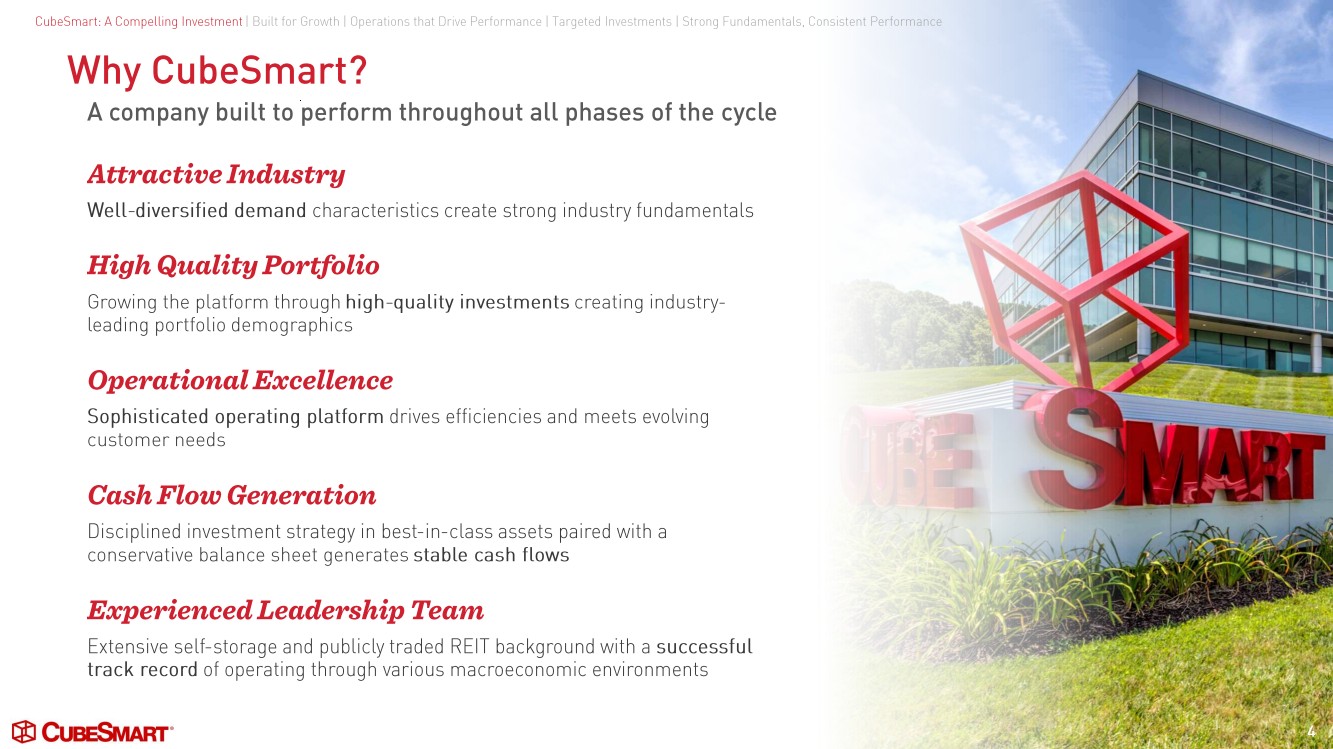
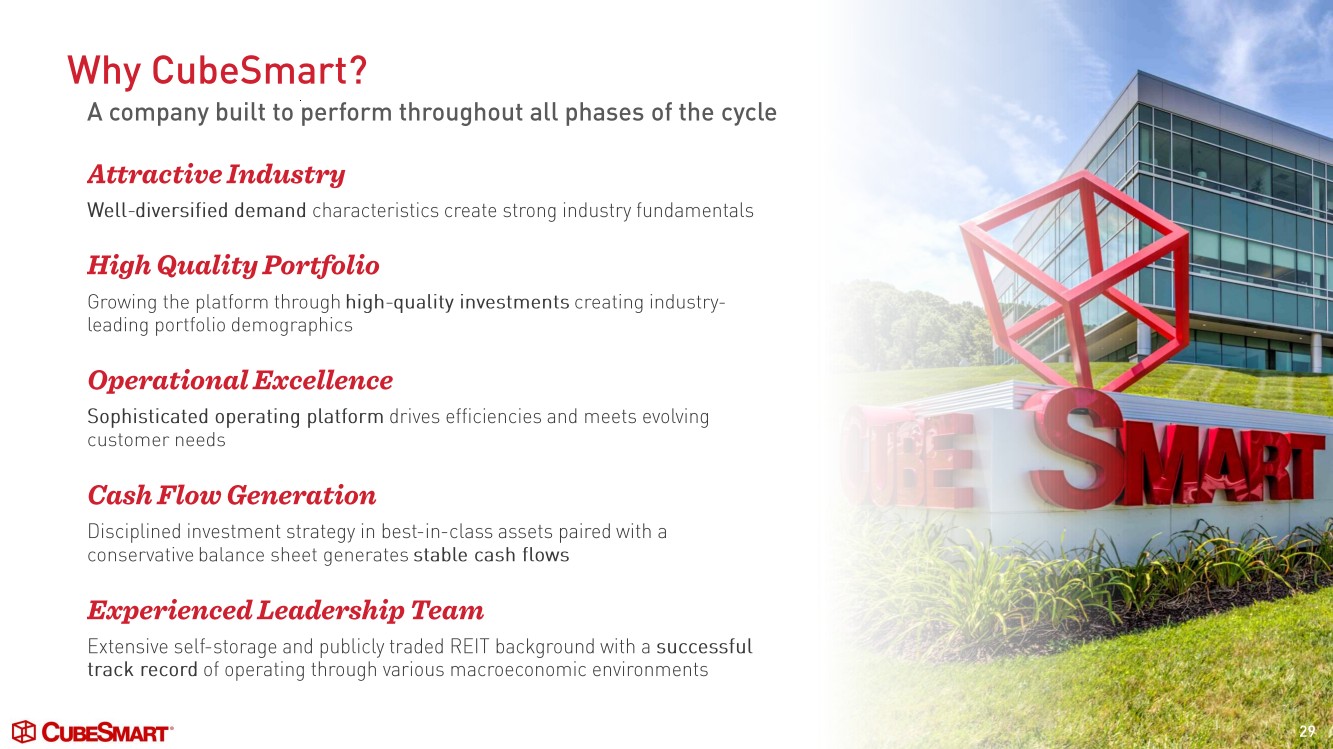
Why CubeSmart? 4 A company built to perform throughout all phases of the cycle Attractive Industry Well- diversified demand characteristics create strong industry fundamentals High Quality Portfolio Growing the platform through high - quality investments creating industry - leading portfolio demographics Operational Excellence Sophisticated operating platform drives efficiencies and meets evolving customer needs Cash Flow Generation Disciplined investment strategy in best -in- class assets paired with a conservative balance sheet generates stable cash flows Experienced Leadership Team Extensive self -storage and publicly traded REIT background with a successful track record of operating through various macroeconomic environments CubeSmart: A Compelling Investment | Built for Growth | Operations that Drive Performance | Targeted Investments | Strong Fundamentals, Consistent Performance |
|
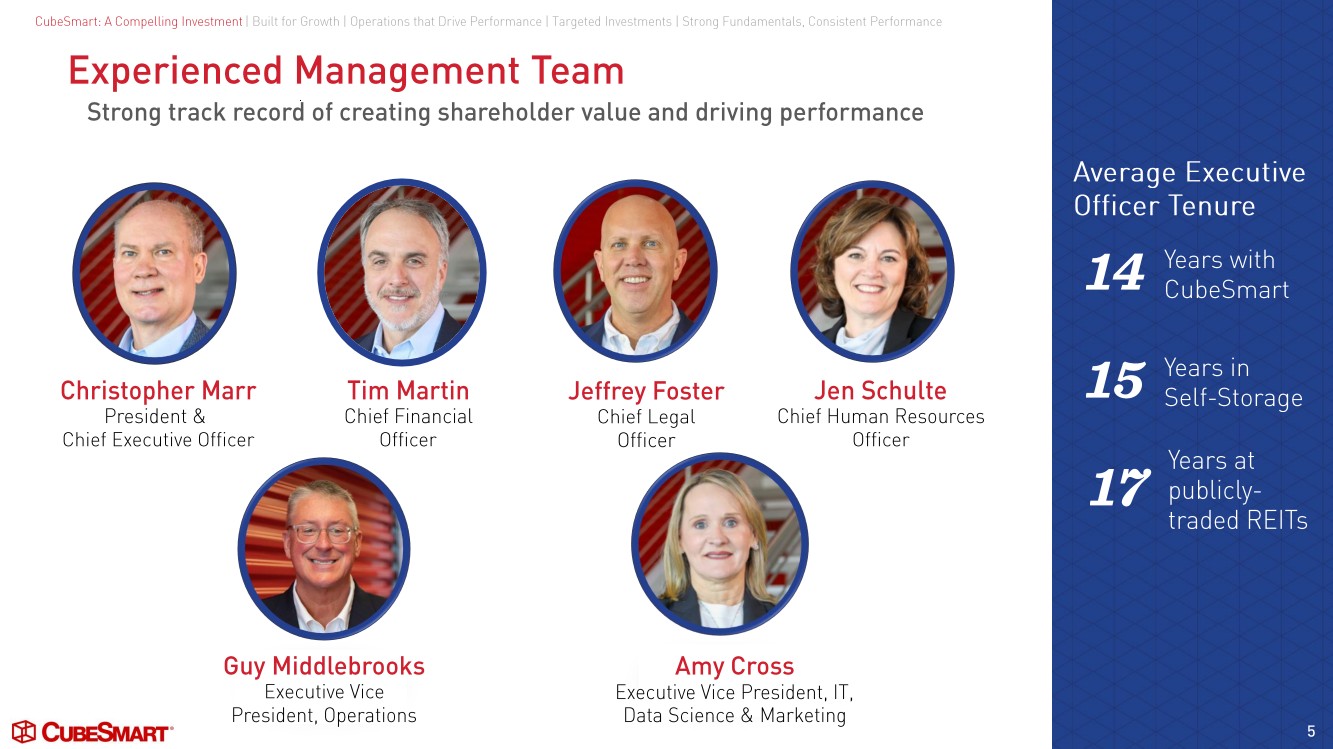
5 Experienced Management Team Strong track record of creating shareholder value and driving performance Years with 14 CubeSmart Years in 15 Self - Storage Years at publicly - traded REITs 17 Christopher Marr President & Chief Executive Officer Tim Martin Chief Financial Officer Jeffrey Foster Chief Legal Officer Jen Schulte Chief Human Resources Officer Average Executive Officer Tenure CubeSmart: A Compelling Investment | Built for Growth | Operations that Drive Performance | Targeted Investments | Strong Fundamentals, Consistent Performance Guy Middlebrooks Executive Vice President, Operations Amy Cross Executive Vice President, IT, Data Science & Marketing |
|
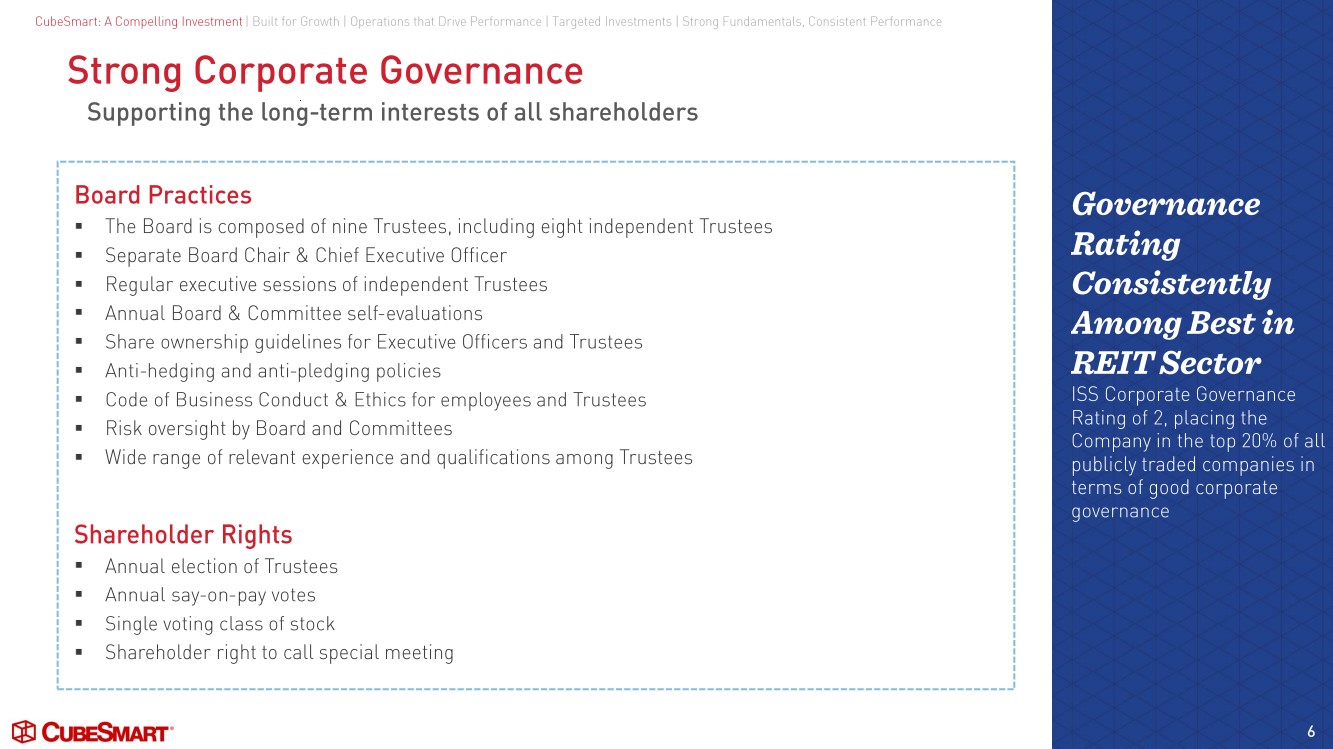
6 Strong Corporate Governance Supporting the long -term interests of all shareholders Board Practices ▪ The Board is composed of nine Trustees, including eight independent Trustees ▪ Separate Board Chair & Chief Executive Officer ▪ Regular executive sessions of independent Trustees ▪ Annual Board & Committee self -evaluations ▪ Share ownership guidelines for Executive Officers and Trustees ▪ Anti-hedging and anti -pledging policies ▪ Code of Business Conduct & Ethics for employees and Trustees ▪ Risk oversight by Board and Committees ▪ Wide range of relevant experience and qualifications among Trustees CubeSmart: A Compelling Investment | Built for Growth | Operations that Drive Performance | Targeted Investments | Strong Fundamentals, Consistent Performance Governance Rating Consistently Among Best in REIT Sector ISS Corporate Governance Rating of 2, placing the Company in the top 20% of all publicly traded companies in terms of good corporate governance Shareholder Rights ▪ Annual election of Trustees ▪ Annual say -on-pay votes ▪ Single voting class of stock ▪ Shareholder right to call special meeting |
|
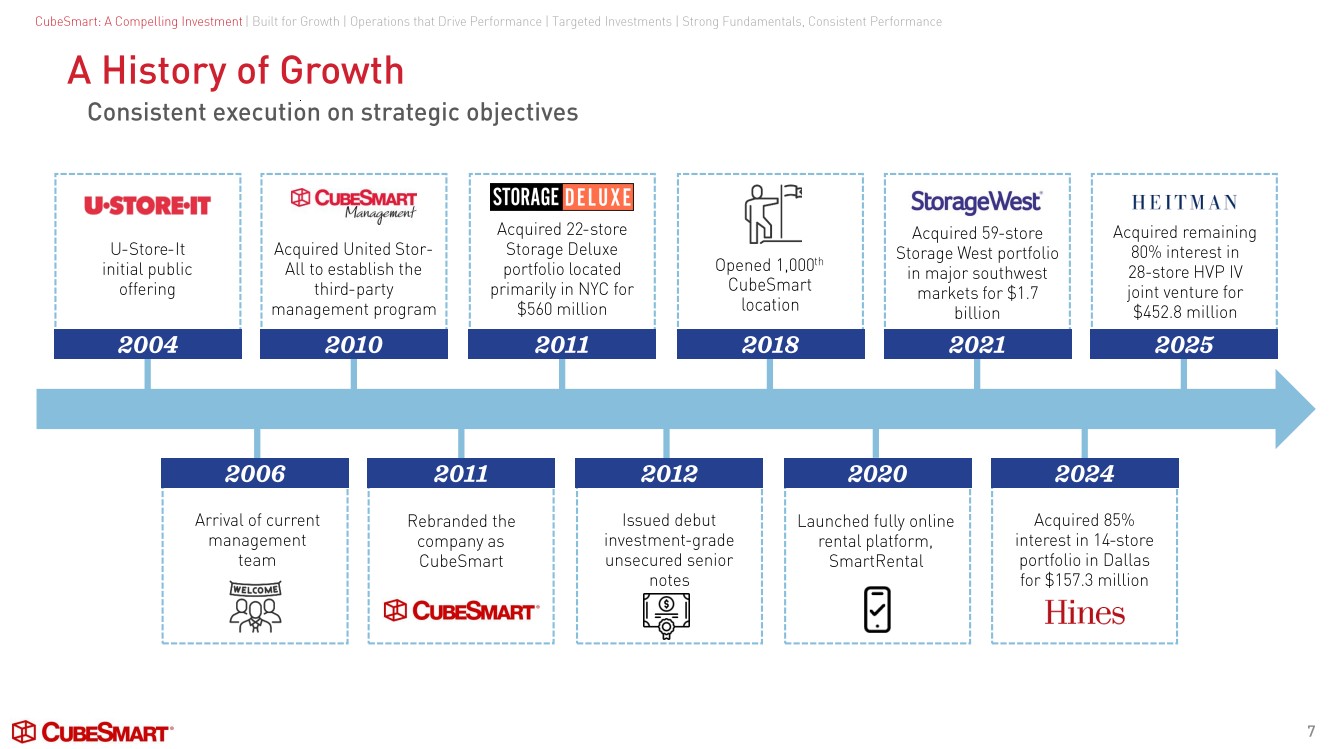
A History of Growth Consistent execution on strategic objectives U- Store -It initial public offering 2004 2010 2011 2018 2021 2025 Acquired United Stor - All to establish the third-party management program Acquired 22 -store Storage Deluxe portfolio located primarily in NYC for $560 million Opened 1,000 th CubeSmart location Acquired 59 -store Storage West portfolio in major southwest markets for $1.7 billion Acquired remaining 80% interest in 28-store HVP IV joint venture for $452.8 million 2006 2011 2012 2020 2024 Arrival of current management team Rebranded the company as CubeSmart Issued debut investment - grade unsecured senior notes Launched fully online rental platform, SmartRental Acquired 85% interest in 14 -store portfolio in Dallas for $157.3 million 7 CubeSmart: A Compelling Investment | Built for Growth | Operations that Drive Performance | Targeted Investments | Strong Fundamentals, Consistent Performance |
|
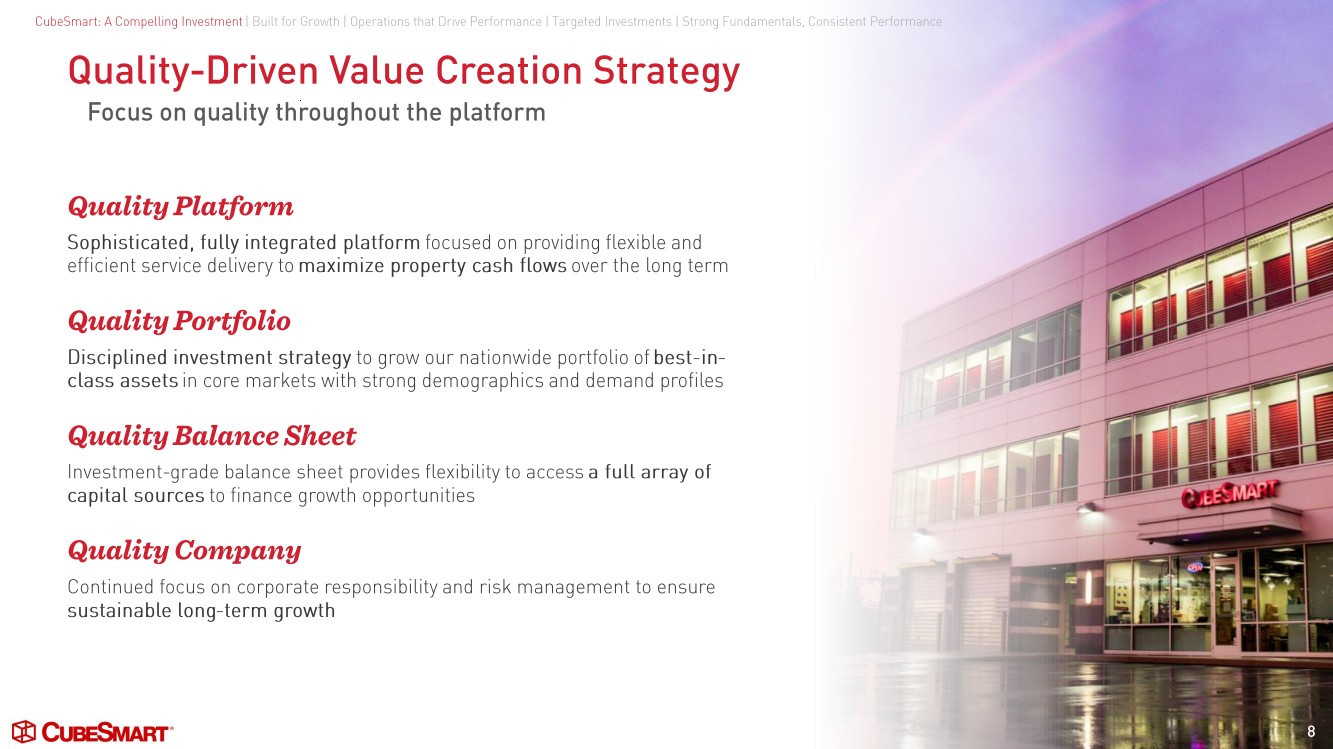
Quality -Driven Value Creation Strategy 8 Focus on quality throughout the platform Quality Platform Sophisticated, fully integrated platform focused on providing flexible and efficient service delivery to maximize property cash flows over the long term Quality Portfolio Disciplined investment strategy to grow our nationwide portfolio of best -in-class assets in core markets with strong demographics and demand profiles Quality Balance Sheet Investment - grade balance sheet provides flexibility to access a full array of capital sources to finance growth opportunities Quality Company Continued focus on corporate responsibility and risk management to ensure sustainable long -term growth CubeSmart: A Compelling Investment | Built for Growth | Operations that Drive Performance | Targeted Investments | Strong Fundamentals, Consistent Performance |
|
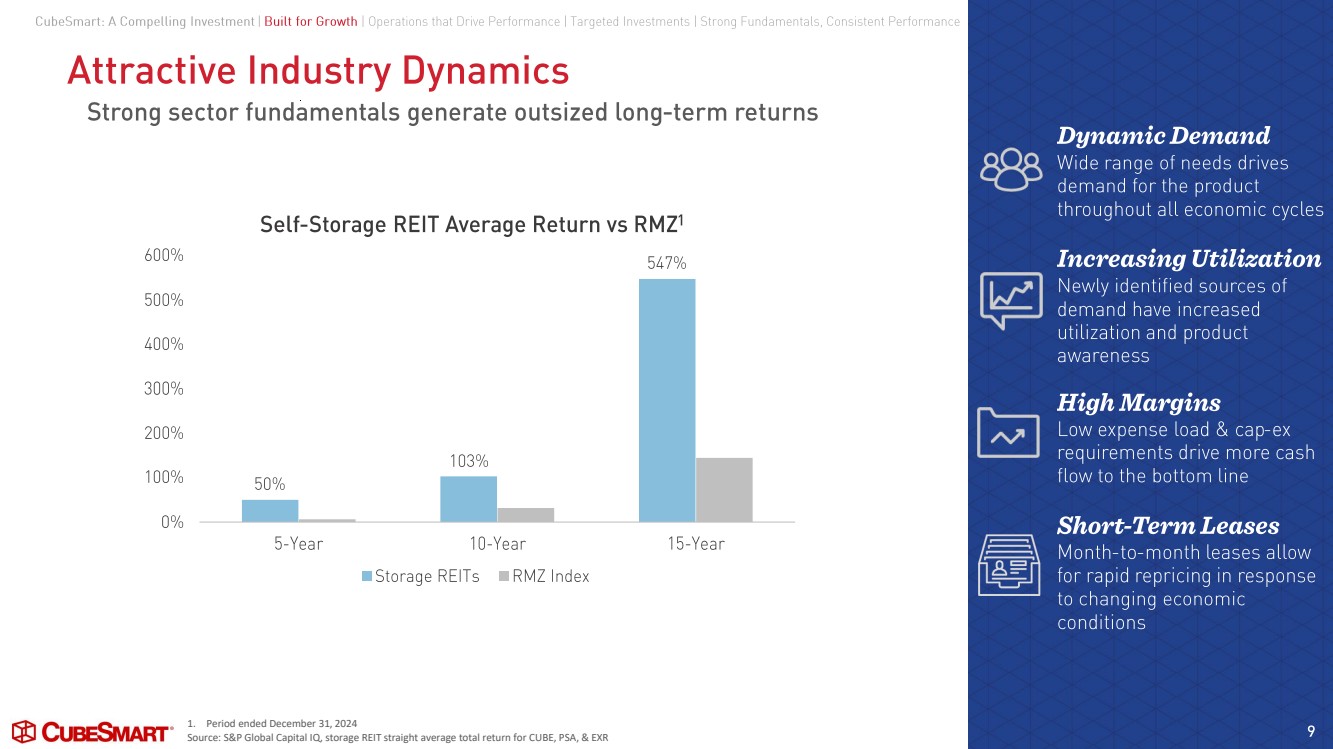
Attractive Industry Dynamics 9 Strong sector fundamentals generate outsized long -term returns Dynamic Demand Wide range of needs drives demand for the product throughout all economic cycles Increasing Utilization Newly identified sources of demand have increased utilization and product awareness High Margins Low expense load & cap -ex requirements drive more cash flow to the bottom line Short -Term Leases Month-to-month leases allow for rapid repricing in response to changing economic conditions 50% 103% 547% 0% 100% 200% 300% 400% 500% 600% 5-Year 10-Year 15-Year Self - Storage REIT Average Return vs RMZ 1 Storage REITs RMZ Index 1. Period ended December 31, 2024 Source: S&P Global Capital IQ, storage REIT straight average total return for CUBE, PSA, & EXR CubeSmart: A Compelling Investment | Built for Growth | Operations that Drive Performance | Targeted Investments | Strong Fundamentals, Consistent Performance |
|
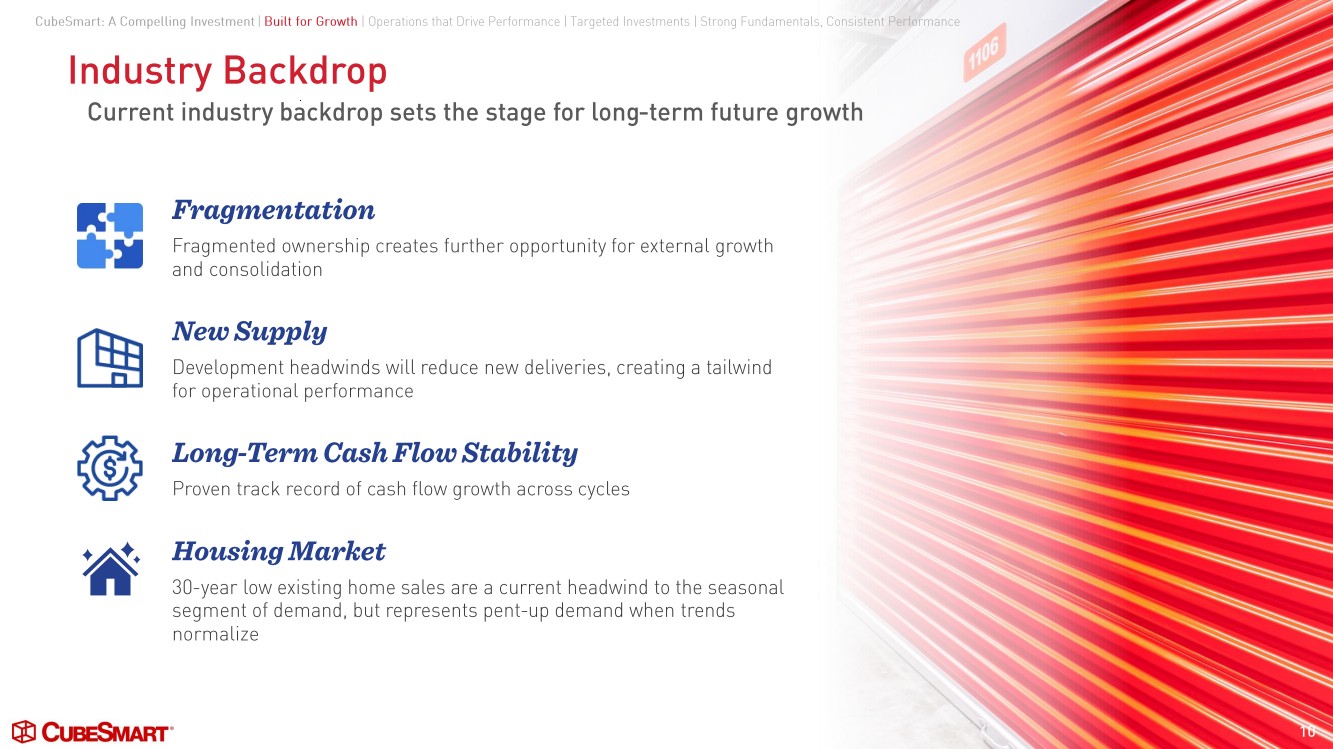
Industry Backdrop 10 Current industry backdrop sets the stage for long -term future growth Fragmentation Fragmented ownership creates further opportunity for external growth and consolidation New Supply Development headwinds will reduce new deliveries, creating a tailwind for operational performance Long -Term Cash Flow Stability Proven track record of cash flow growth across cycles Housing Market 30- year low existing home sales are a current headwind to the seasonal segment of demand, but represents pent -up demand when trends normalize CubeSmart: A Compelling Investment | Built for Growth | Operations that Drive Performance | Targeted Investments | Strong Fundamentals, Consistent Performance |
|
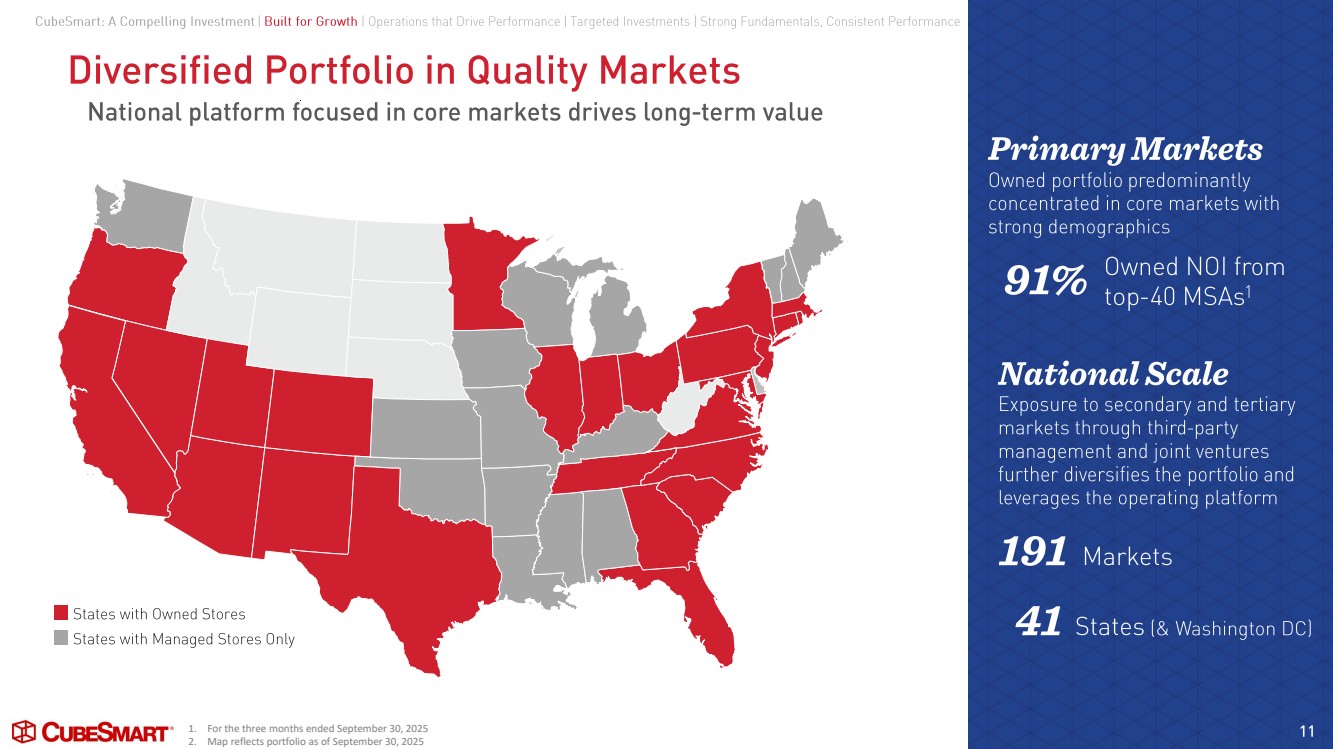
Diversified Portfolio in Quality Markets 11 National platform focused in core markets drives long -term value Owned NOI from top-40 MSAs 1 States with Managed Stores Only States with Owned Stores 91% 191 Markets 41 States (& Washington DC) National Scale Exposure to secondary and tertiary markets through third -party management and joint ventures further diversifies the portfolio and leverages the operating platform Primary Markets Owned portfolio predominantly concentrated in core markets with strong demographics CubeSmart: A Compelling Investment | Built for Growth | Operations that Drive Performance | Targeted Investments | Strong Fundamentals, Consistent Performance 1. For the three months ended September 30, 2025 2. Map reflects portfolio as of September 30, 2025 |
|
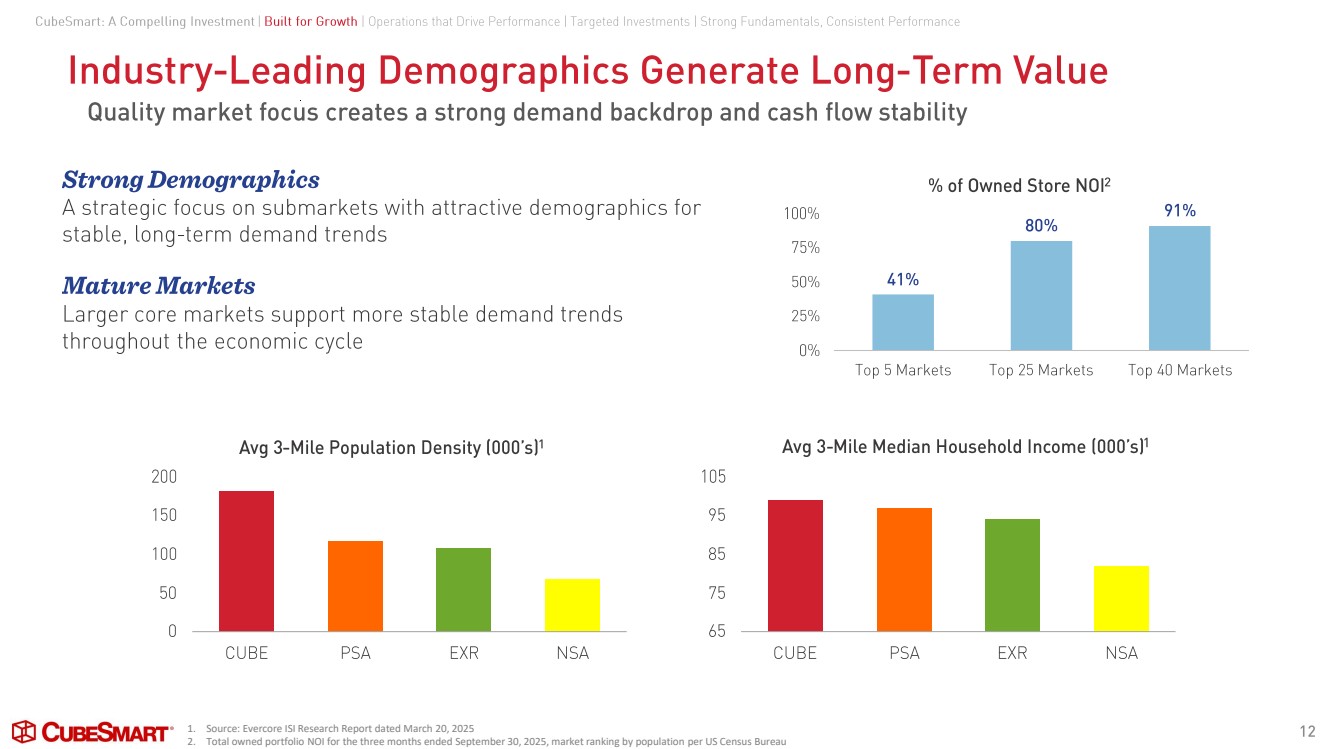
Industry - Leading Demographics Generate Long -Term Value 12 Quality market focus creates a strong demand backdrop and cash flow stability 1. Source: Evercore ISI Research Report dated March 20, 2025 2. Total owned portfolio NOI for the three months ended September 30, 2025, market ranking by population per US Census Bureau 0 50 100 150 200 CUBE PSA EXR NSA Avg 3 -Mile Population Density (000’s) 1 65 75 85 95 105 CUBE PSA EXR NSA Avg 3 -Mile Median Household Income (000’s) 1 41% 80% 91% 0% 25% 50% 75% 100% Top 5 Markets Top 25 Markets Top 40 Markets % of Owned Store NOI Strong Demographics 2 A strategic focus on submarkets with attractive demographics for stable, long -term demand trends Mature Markets Larger core markets support more stable demand trends throughout the economic cycle CubeSmart: A Compelling Investment | Built for Growth | Operations that Drive Performance | Targeted Investments | Strong Fundamentals, Consistent Performance |
|
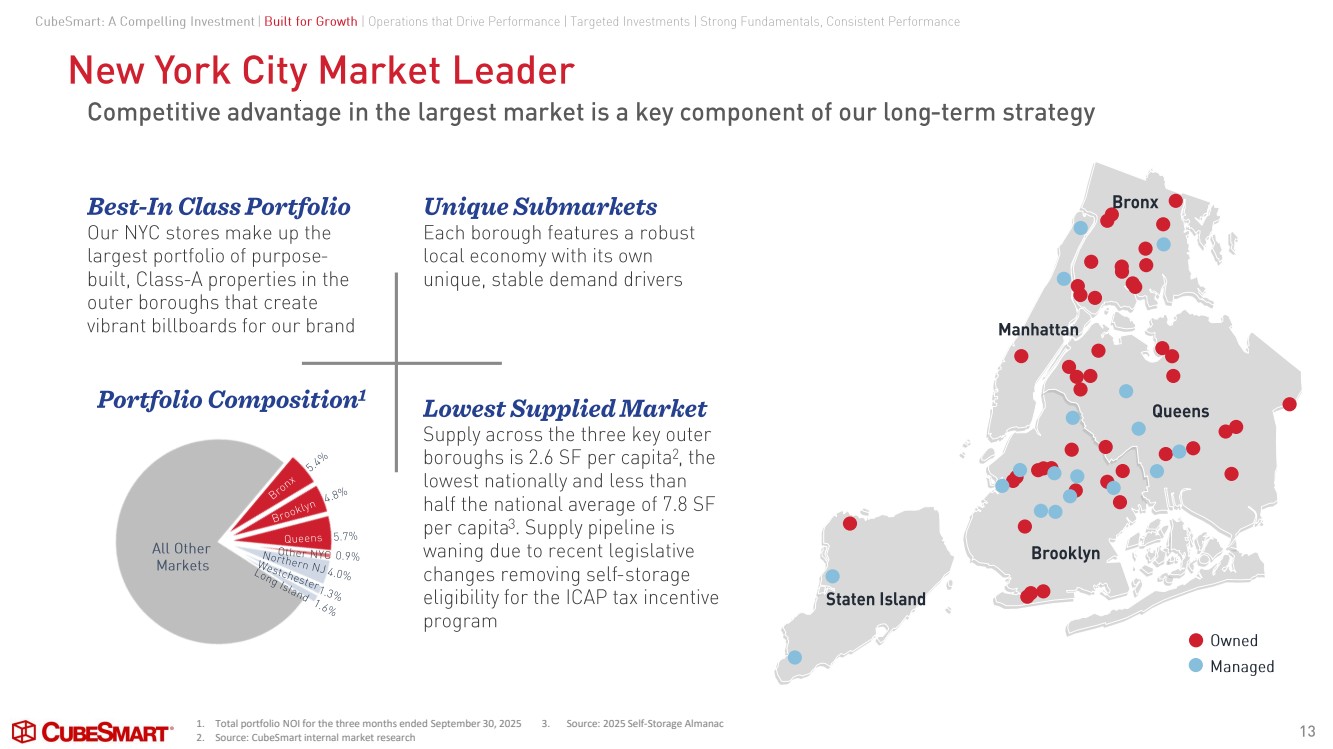
New York City Market Leader 13 Competitive advantage in the largest market is a key component of our long -term strategy Lowest Supplied Market Supply across the three key outer boroughs is 2.6 SF per capita 2 , the lowest nationally and less than half the national average of 7.8 SF per capita 3 . Supply pipeline is waning due to recent legislative changes removing self -storage eligibility for the ICAP tax incentive program Best -In Class Portfolio Our NYC stores make up the largest portfolio of purpose - built, Class -A properties in the outer boroughs that create vibrant billboards for our brand Unique Submarkets Each borough features a robust local economy with its own unique, stable demand drivers Portfolio Composition 1 1. Total portfolio NOI for the three months ended September 30, 2025 2. Source: CubeSmart internal market research All Other Markets 3. Source: 2025 Self-Storage Almanac Brooklyn Queens Bronx Manhattan Staten Island Owned Managed CubeSmart: A Compelling Investment | Built for Growth | Operations that Drive Performance | Targeted Investments | Strong Fundamentals, Consistent Performance |
|
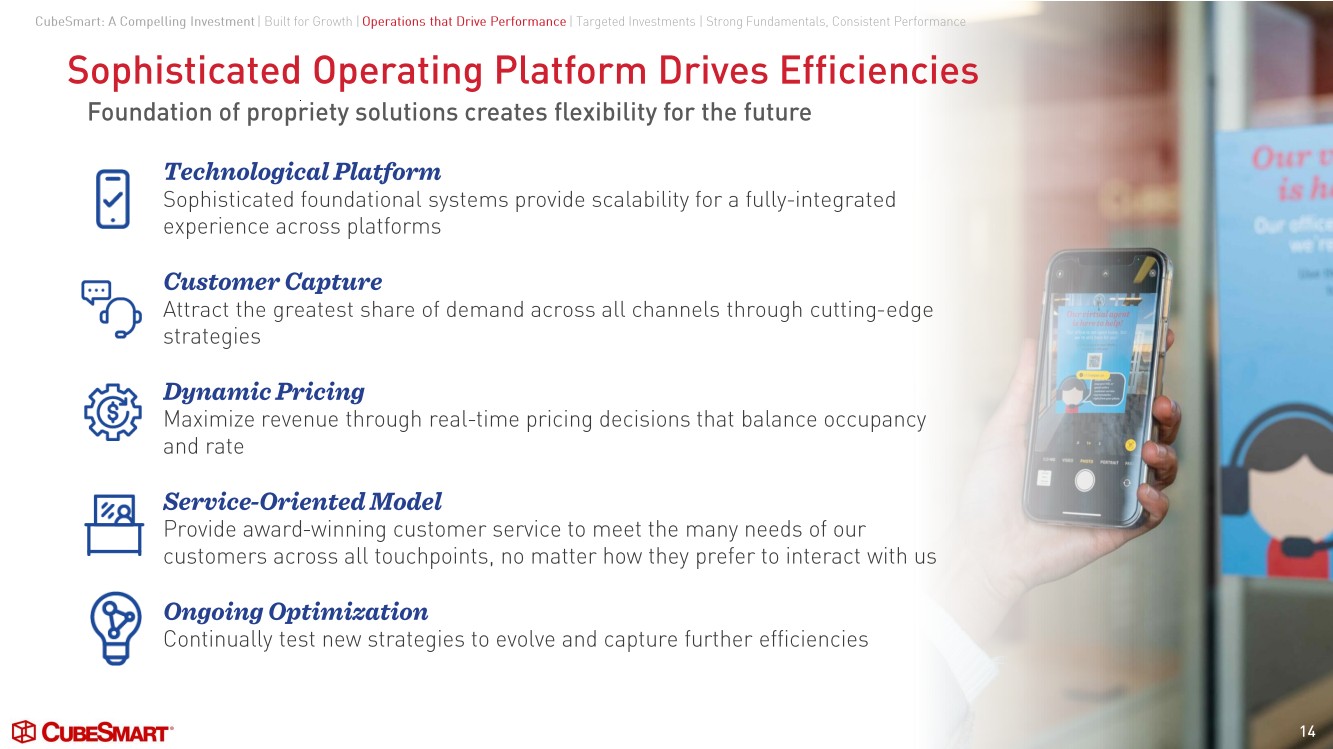
Sophisticated Operating Platform Drives Efficiencies 14 Foundation of propriety solutions creates flexibility for the future Technological Platform Sophisticated foundational systems provide scalability for a fully -integrated experience across platforms Customer Capture Attract the greatest share of demand across all channels through cutting -edge strategies Dynamic Pricing Maximize revenue through real -time pricing decisions that balance occupancy and rate Service -Oriented Model Provide award -winning customer service to meet the many needs of our customers across all touchpoints, no matter how they prefer to interact with us Ongoing Optimization Continually test new strategies to evolve and capture further efficiencies CubeSmart: A Compelling Investment | Built for Growth | Operations that Drive Performance | Targeted Investments | Strong Fundamentals, Consistent Performance |
|
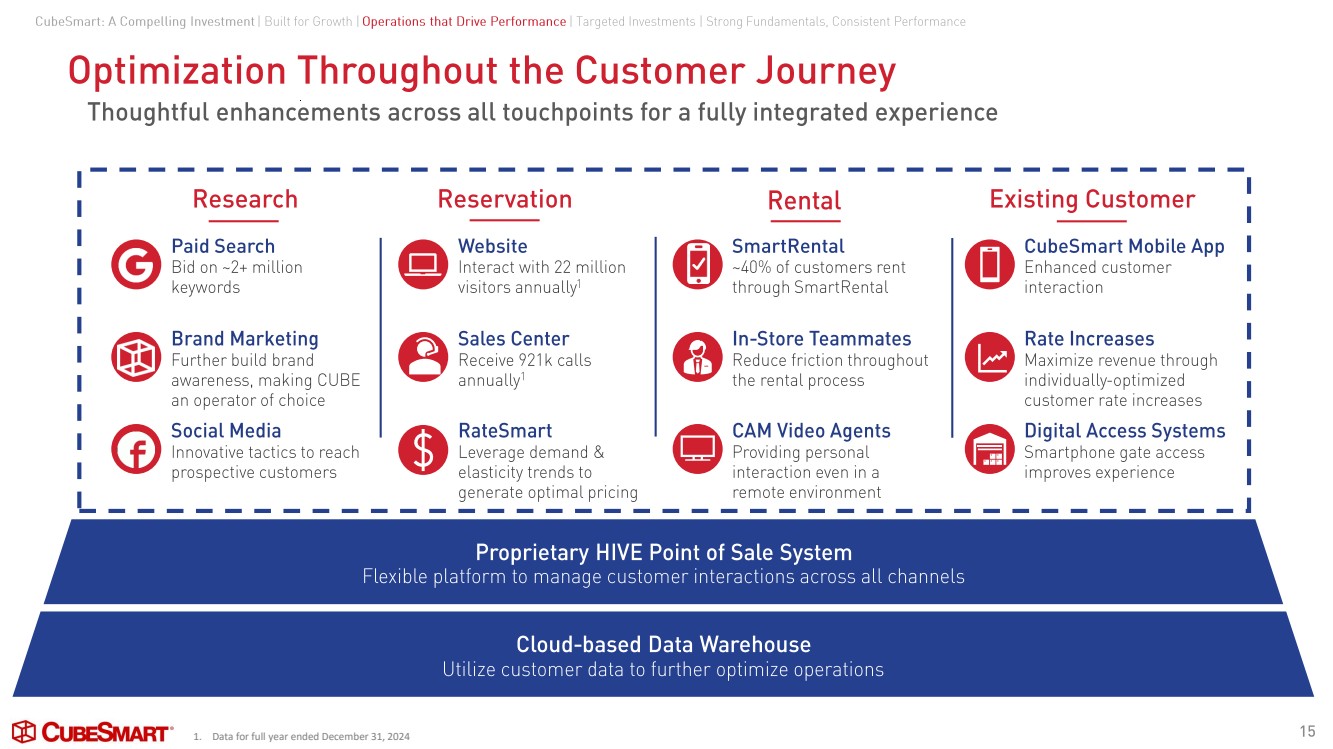
Cloud -based Data Warehouse Utilize customer data to further optimize operations Proprietary HIVE Point of Sale System Flexible platform to manage customer interactions across all channels Optimization Throughout the Customer Journey 15 Thoughtful enhancements across all touchpoints for a fully integrated experience Reservation Rental Existing Customer Paid Search Bid on ~2+ million keywords Brand Marketing Further build brand awareness, making CUBE an operator of choice Social Media Innovative tactics to reach prospective customers Website Interact with 22 million visitors annually 1 Sales Center Receive 921k calls annually 1 RateSmart Leverage demand & elasticity trends to generate optimal pricing SmartRental ~40% of customers rent through SmartRental In- Store Teammates Reduce friction throughout the rental process CAM Video Agents Providing personal interaction even in a remote environment CubeSmart Mobile App Enhanced customer interaction Rate Increases Maximize revenue through individually -optimized customer rate increases Digital Access Systems Smartphone gate access improves experience Research 1. Data for full year ended December 31, 2024 CubeSmart: A Compelling Investment | Built for Growth | Operations that Drive Performance | Targeted Investments | Strong Fundamentals, Consistent Performance |
|
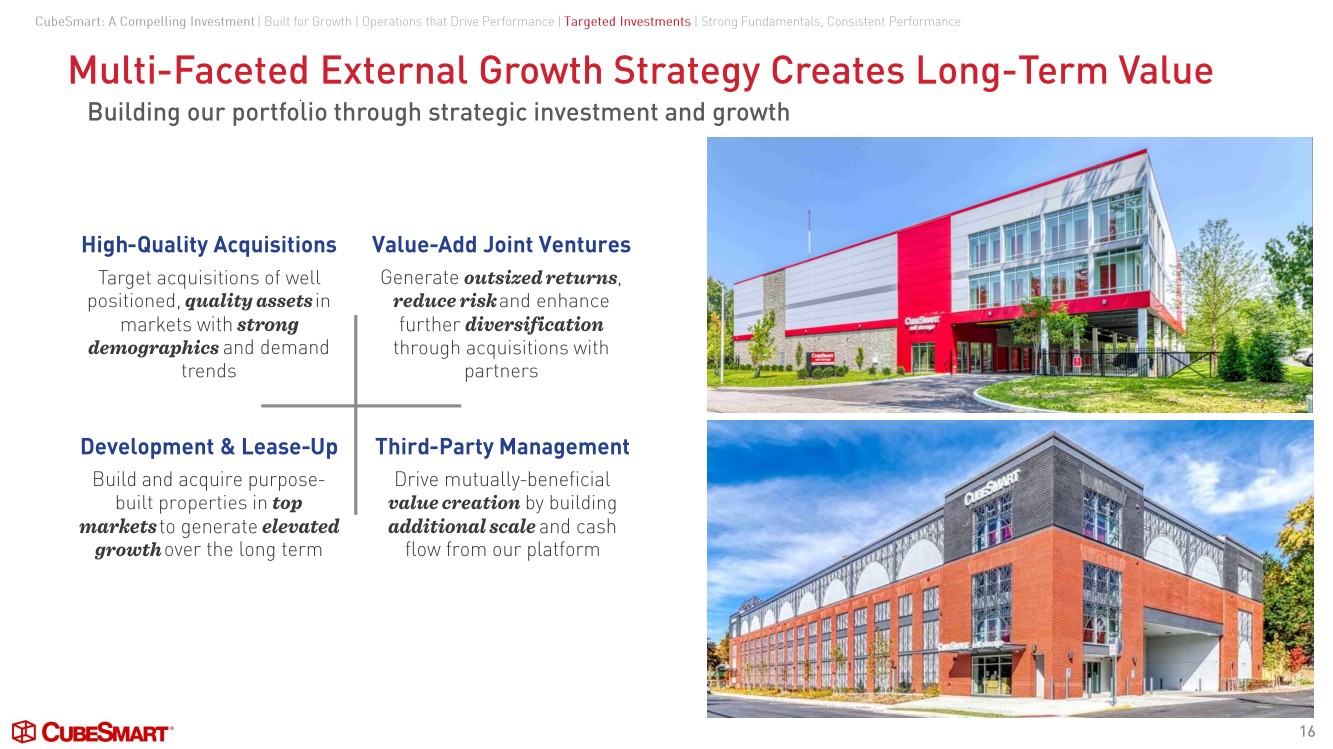
Multi- Faceted External Growth Strategy Creates Long -Term Value 16 Building our portfolio through strategic investment and growth Development & Lease -Up Build and acquire purpose - built properties in top markets to generate elevated growth over the long term Third -Party Management Drive mutually -beneficial value creation by building additional scale and cash flow from our platform High -Quality Acquisitions Target acquisitions of well positioned, quality assets in markets with strong demographics and demand trends CubeSmart: A Compelling Investment | Built for Growth | Operations that Drive Performance | Targeted Investments | Strong Fundamentals, Consistent Performance Value -Add Joint Ventures Generate outsized returns , reduce risk and enhance further diversification through acquisitions with partners |
|
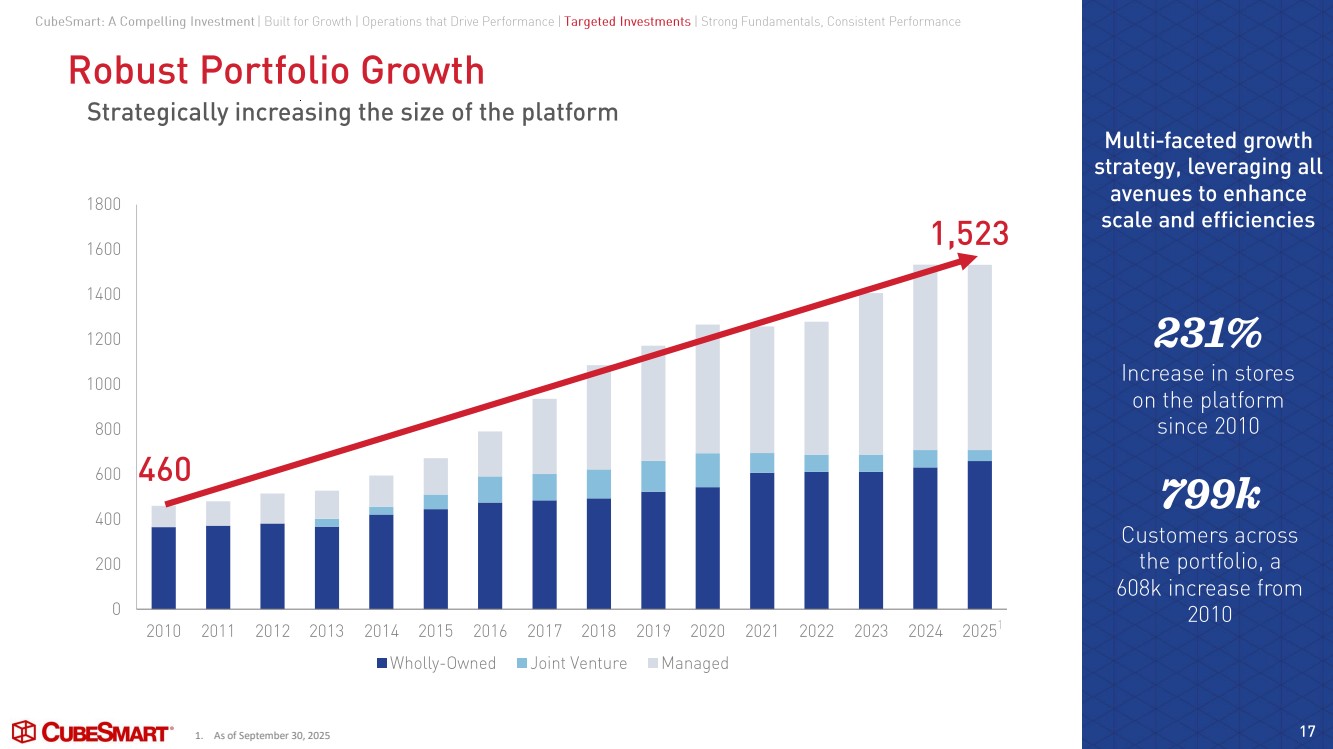
Robust Portfolio Growth 17 Strategically increasing the size of the platform Increase in stores on the platform since 2010 231% Customers across the portfolio, a 608k increase from 2010 799k 0 200 400 600 800 1000 1200 1400 1600 1800 2010 2011 2012 2013 2014 2015 2016 2017 2018 2019 2020 2021 2022 2023 2024 2025 Wholly-Owned Joint Venture Managed 1,523 460 Multi-faceted growth strategy, leveraging all avenues to enhance scale and efficiencies 1. As of September 30, 2025 CubeSmart: A Compelling Investment | Built for Growth | Operations that Drive Performance | Targeted Investments | Strong Fundamentals, Consistent Performance 1 |
|
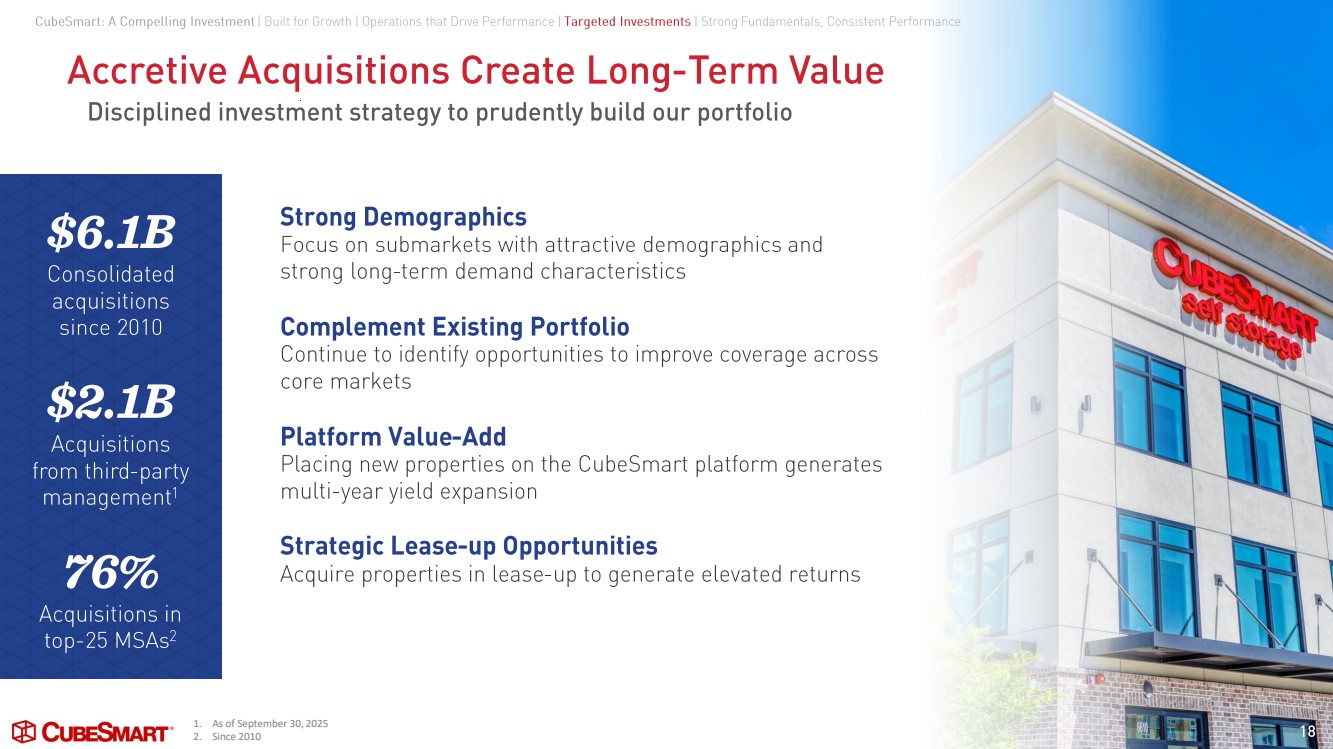
$6.1B Consolidated acquisitions since 2010 $2.1B Acquisitions from third -party management 1 76% Acquisitions in top-25 MSAs 2 Accretive Acquisitions Create Long -Term Value 18 Disciplined investment strategy to prudently build our portfolio Strong Demographics Focus on submarkets with attractive demographics and strong long -term demand characteristics Complement Existing Portfolio Continue to identify opportunities to improve coverage across core markets Platform Value -Add Placing new properties on the CubeSmart platform generates multi - year yield expansion Strategic Lease -up Opportunities Acquire properties in lease -up to generate elevated returns 1. As of September 30, 2025 2. Since 2010 CubeSmart: A Compelling Investment | Built for Growth | Operations that Drive Performance | Targeted Investments | Strong Fundamentals, Consistent Performance |
|
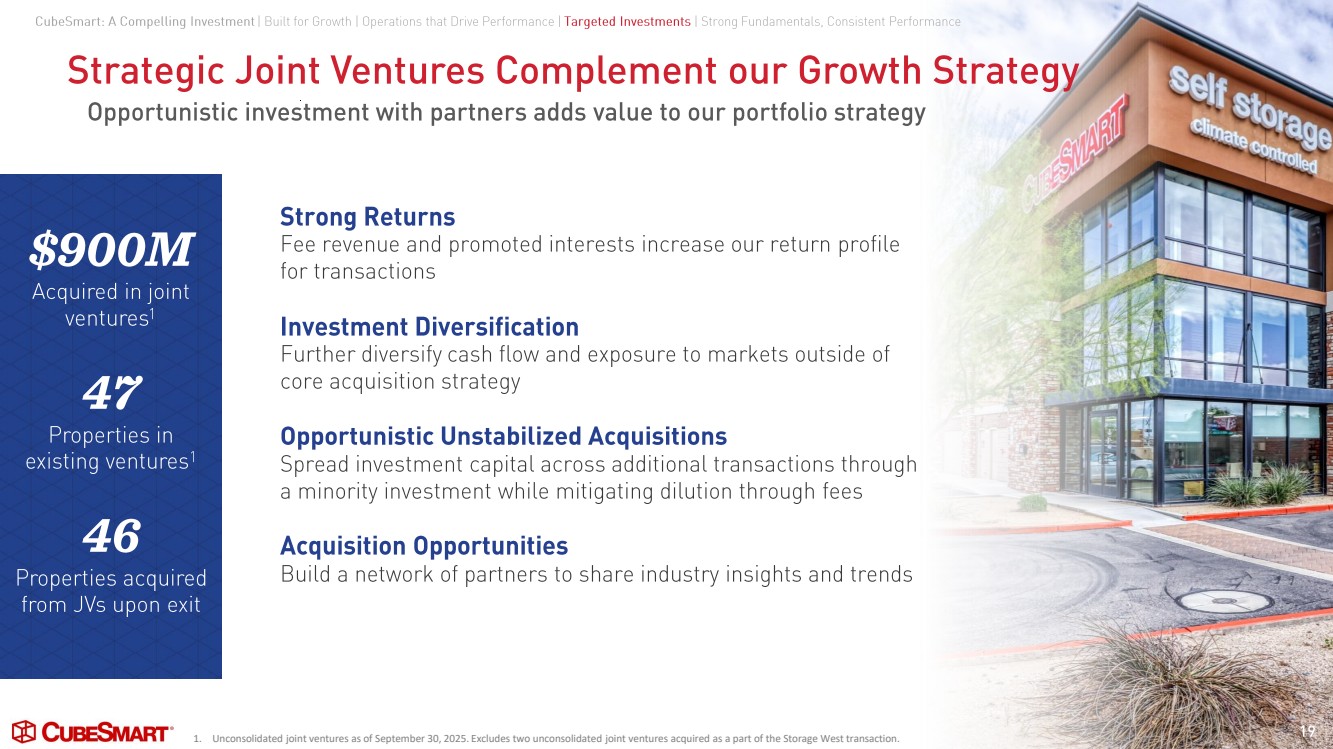
Strategic Joint Ventures Complement our Growth Strategy 19 Opportunistic investment with partners adds value to our portfolio strategy $900M Acquired in joint ventures 1 47 Properties in existing ventures 1 46 Properties acquired from JVs upon exit Strong Returns Fee revenue and promoted interests increase our return profile for transactions Investment Diversification Further diversify cash flow and exposure to markets outside of core acquisition strategy Opportunistic Unstabilized Acquisitions Spread investment capital across additional transactions through a minority investment while mitigating dilution through fees Acquisition Opportunities Build a network of partners to share industry insights and trends 1. Unconsolidated joint ventures as of September 30, 2025. Excludes two unconsolidated joint ventures acquired as a part of the Storage West transaction. CubeSmart: A Compelling Investment | Built for Growth | Operations that Drive Performance | Targeted Investments | Strong Fundamentals, Consistent Performance |
|
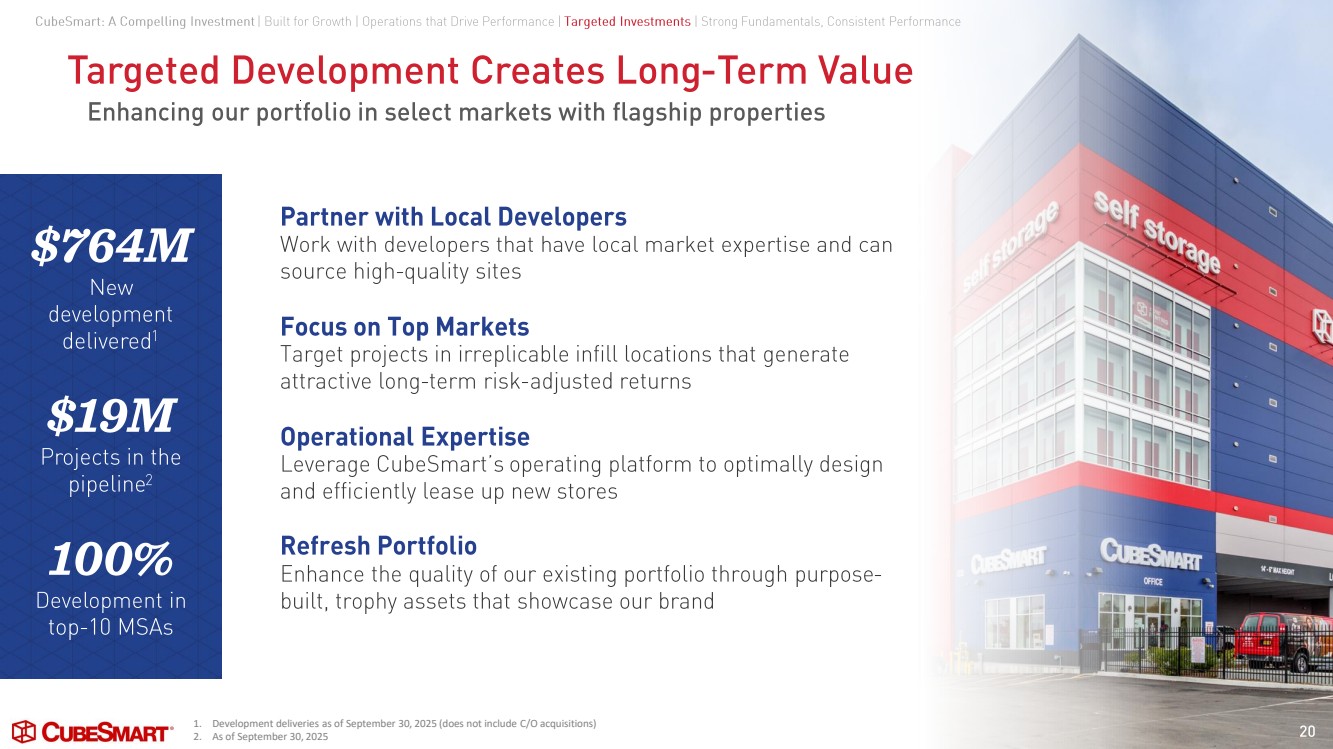
Targeted Development Creates Long -Term Value 20 Enhancing our portfolio in select markets with flagship properties Partner with Local Developers Work with developers that have local market expertise and can source high -quality sites Focus on Top Markets Target projects in irreplicable infill locations that generate attractive long -term risk - adjusted returns Operational Expertise Leverage CubeSmart’s operating platform to optimally design and efficiently lease up new stores Refresh Portfolio Enhance the quality of our existing portfolio through purpose - built, trophy assets that showcase our brand $764M New development delivered 1 $19M Projects in the pipeline 2 100% Development in top-10 MSAs 1. Development deliveries as of September 30, 2025 (does not include C/O acquisitions) 2. As of September 30, 2025 CubeSmart: A Compelling Investment | Built for Growth | Operations that Drive Performance | Targeted Investments | Strong Fundamentals, Consistent Performance |
|
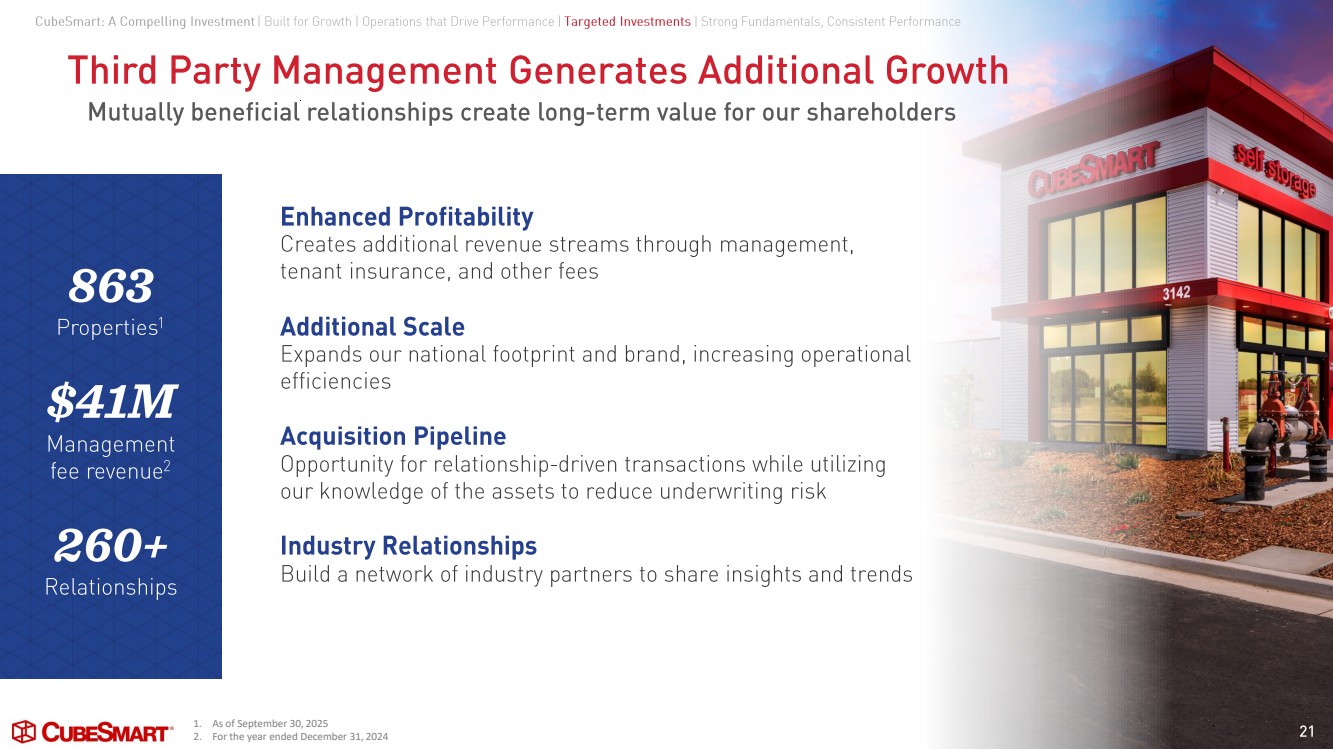
Third Party Management Generates Additional Growth 21 Mutually beneficial relationships create long -term value for our shareholders 863 Properties 1 $41M Management fee revenue 2 260+ Relationships Enhanced Profitability Creates additional revenue streams through management, tenant insurance, and other fees Additional Scale Expands our national footprint and brand, increasing operational efficiencies Acquisition Pipeline Opportunity for relationship -driven transactions while utilizing our knowledge of the assets to reduce underwriting risk Industry Relationships Build a network of industry partners to share insights and trends 1. As of September 30, 2025 2. For the year ended December 31, 2024 CubeSmart: A Compelling Investment | Built for Growth | Operations that Drive Performance | Targeted Investments | Strong Fundamentals, Consistent Performance |
|
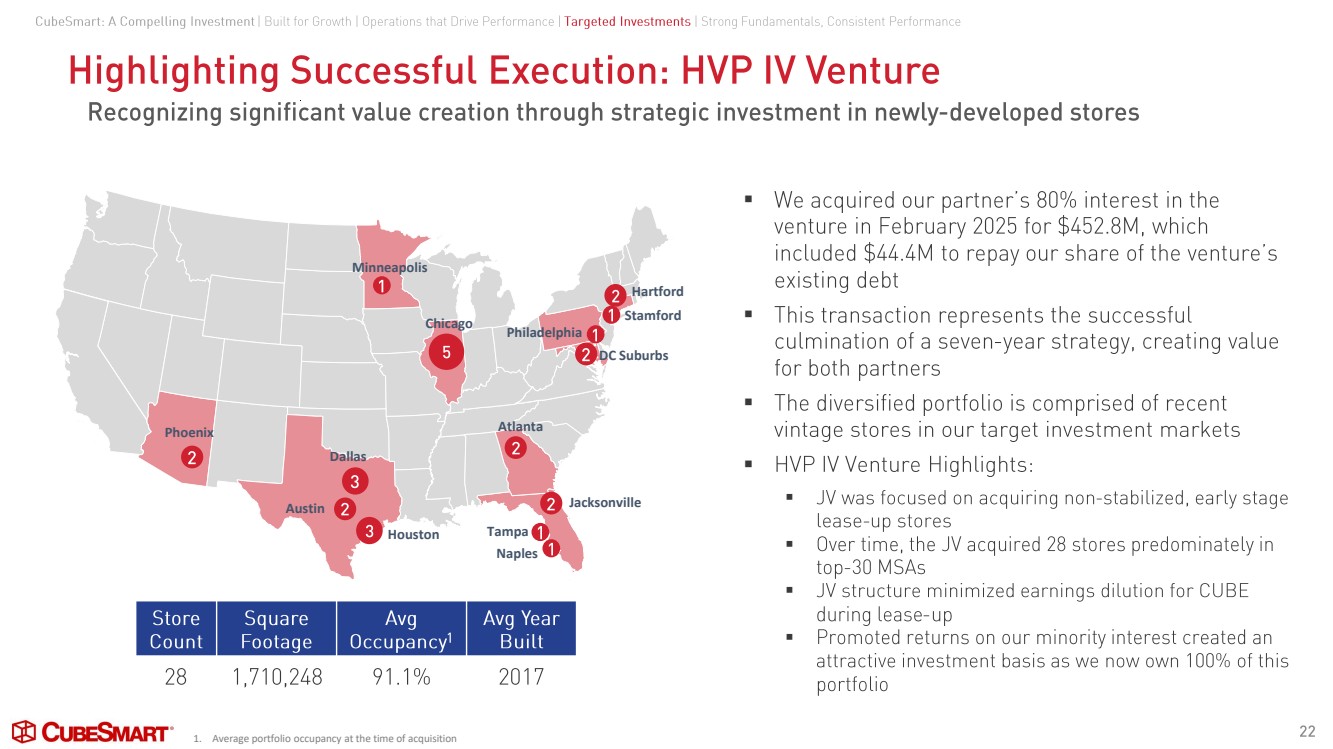
Highlighting Successful Execution: HVP IV Venture 22 Recognizing significant value creation through strategic investment in newly -developed stores Store Count Square Footage Avg Occupancy 1 Avg Year Built 28 1,710,248 91.1% 2017 ▪ We acquired our partner’s 80% interest in the venture in February 2025 for $452.8M, which included $44.4M to repay our share of the venture’s existing debt ▪ This transaction represents the successful culmination of a seven - year strategy, creating value for both partners ▪ The diversified portfolio is comprised of recent vintage stores in our target investment markets ▪ HVP IV Venture Highlights: ▪ JV was focused on acquiring non -stabilized, early stage lease -up stores ▪ Over time, the JV acquired 28 stores predominately in top-30 MSAs ▪ JV structure minimized earnings dilution for CUBE during lease -up ▪ Promoted returns on our minority interest created an attractive investment basis as we now own 100% of this portfolio 1 1 1 2 2 2 2 1 2 3 3 5 2 1 Minneapolis Phoenix Dallas Austin Houston Jacksonville Tampa Philadelphia Atlanta DC Suburbs Stamford Hartford Chicago Naples CubeSmart: A Compelling Investment | Built for Growth | Operations that Drive Performance | Targeted Investments | Strong Fundamentals, Consistent Performance 1. Average portfolio occupancy at the time of acquisition |
|
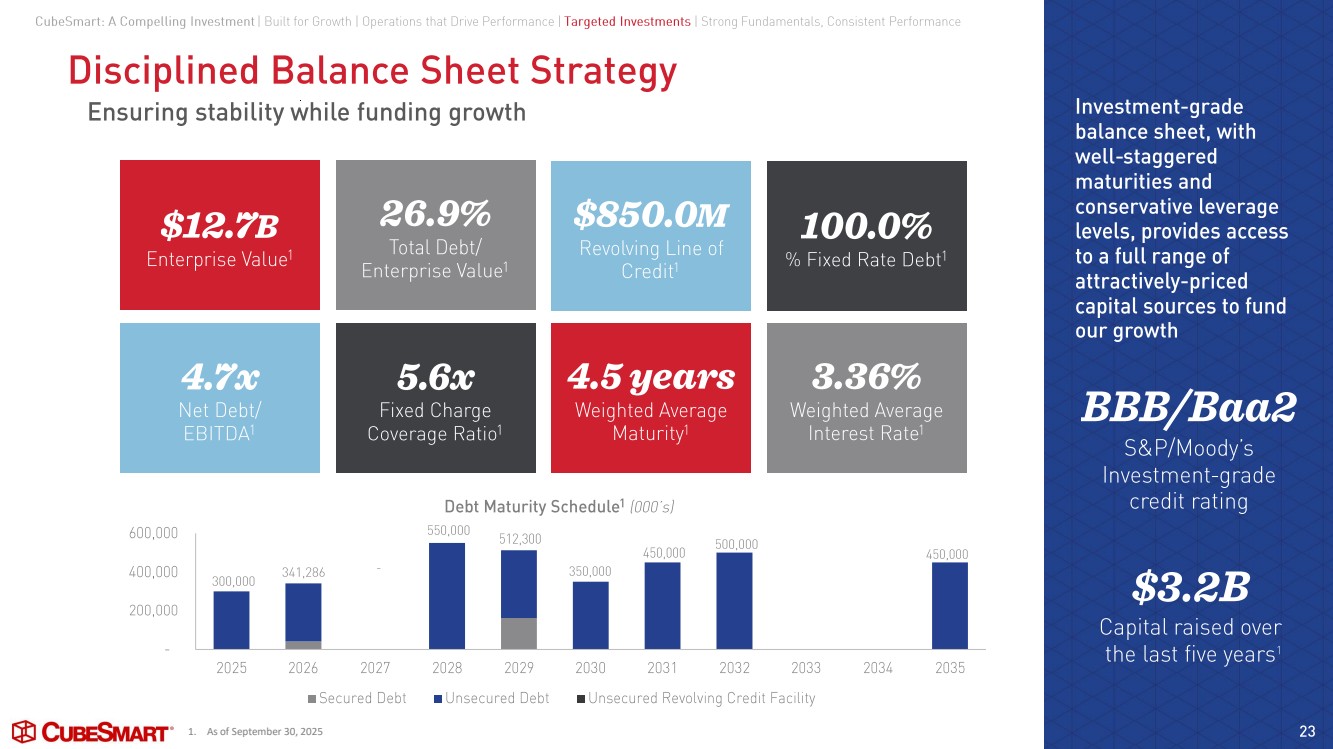
Disciplined Balance Sheet Strategy 23 Ensuring stability while funding growth 300,000 341,286 - 550,000 512,300 350,000 450,000 500,000 450,000 - 200,000 400,000 600,000 2025 2026 2027 2028 2029 2030 2031 2032 2033 2034 2035 Debt Maturity Schedule 1 (000’s) Secured Debt Unsecured Debt Unsecured Revolving Credit Facility 4.7x Net Debt/ EBITDA 1 5.6x Fixed Charge Coverage Ratio 1 $850.0 M Revolving Line of Credit 1 4.5 years Weighted Average Maturity1 100.0% % Fixed Rate Debt 1 3.36% Weighted Average Interest Rate 1 Capital raised over the last five years $3.2B Investment - grade balance sheet, with well -staggered maturities and conservative leverage levels, provides access to a full range of attractively -priced capital sources to fund our growth BBB/Baa2 $12.7 B Enterprise Value 1 26.9% Total Debt/ Enterprise Value 1 S&P/Moody’s Investment - grade credit rating CubeSmart: A Compelling Investment | Built for Growth | Operations that Drive Performance | Targeted Investments | Strong Fundamentals, Consistent Performance 1. As of September 30, 2025 1 |
|
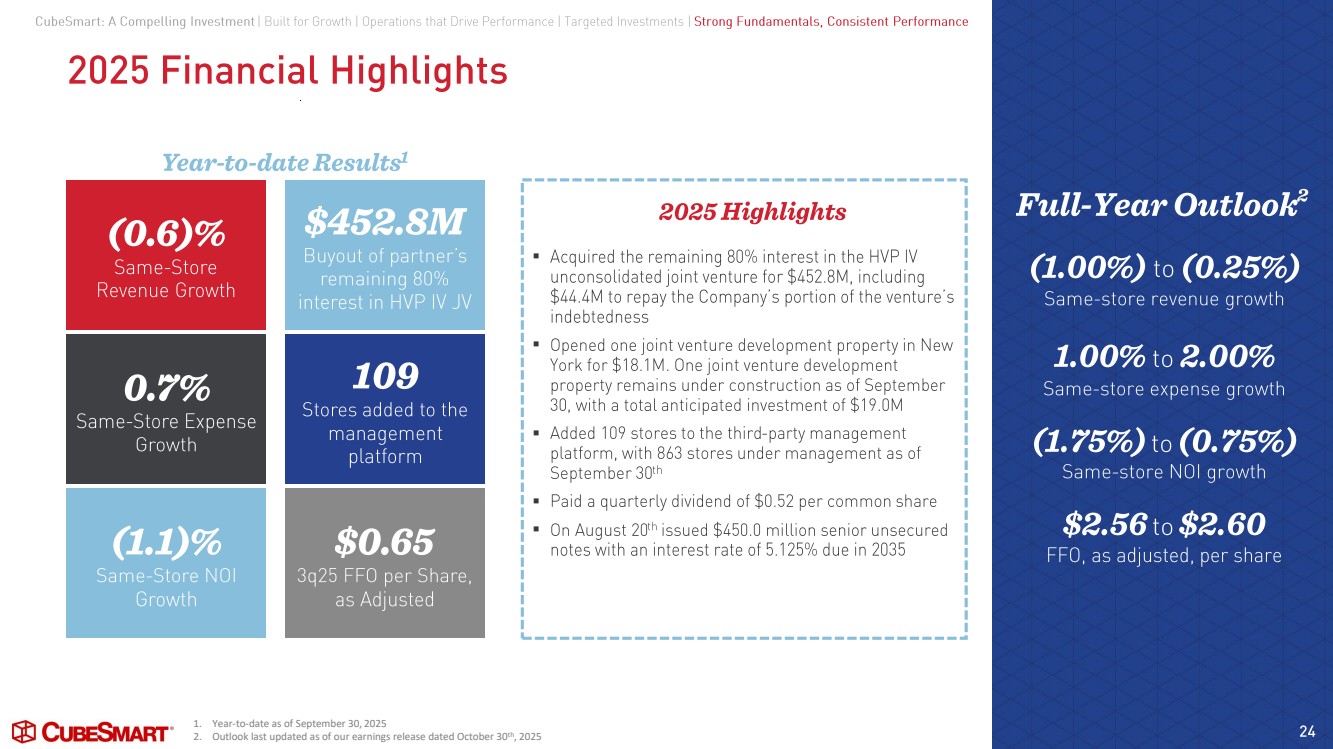
2025 Financial Highlights 24 (0.6)% Same - Store Revenue Growth 0.7% Same - Store Expense Growth (1.1)% Same - Store NOI Growth Full -Year Outlook 2 (1.00%) to (0.25%) Same -store revenue growth 1.00% to 2.00% Same -store expense growth (1.75%) to (0.75%) Same -store NOI growth $2.56 to $2.60 FFO, as adjusted, per share ▪ Acquired the remaining 80% interest in the HVP IV unconsolidated joint venture for $452.8M, including $44.4M to repay the Company’s portion of the venture’s indebtedness ▪ Opened one joint venture development property in New York for $18.1M. One joint venture development property remains under construction as of September 30, with a total anticipated investment of $19.0M ▪ Added 109 stores to the third -party management platform, with 863 stores under management as of September 30 th ▪ Paid a quarterly dividend of $0.52 per common share ▪ On August 20 th issued $450.0 million senior unsecured notes with an interest rate of 5.125% due in 2035 2025 Highlights $452.8M Buyout of partner’s remaining 80% interest in HVP IV JV 109 Stores added to the management platform $0.65 3q25 FFO per Share, as Adjusted 1. Year-to-date as of September 30, 2025 2. Outlook last updated as of our earnings release dated October 30th, 2025 CubeSmart: A Compelling Investment | Built for Growth | Operations that Drive Performance | Targeted Investments | Strong Fundamentals, Consistent Performance Year -to-date Results 1 |
|
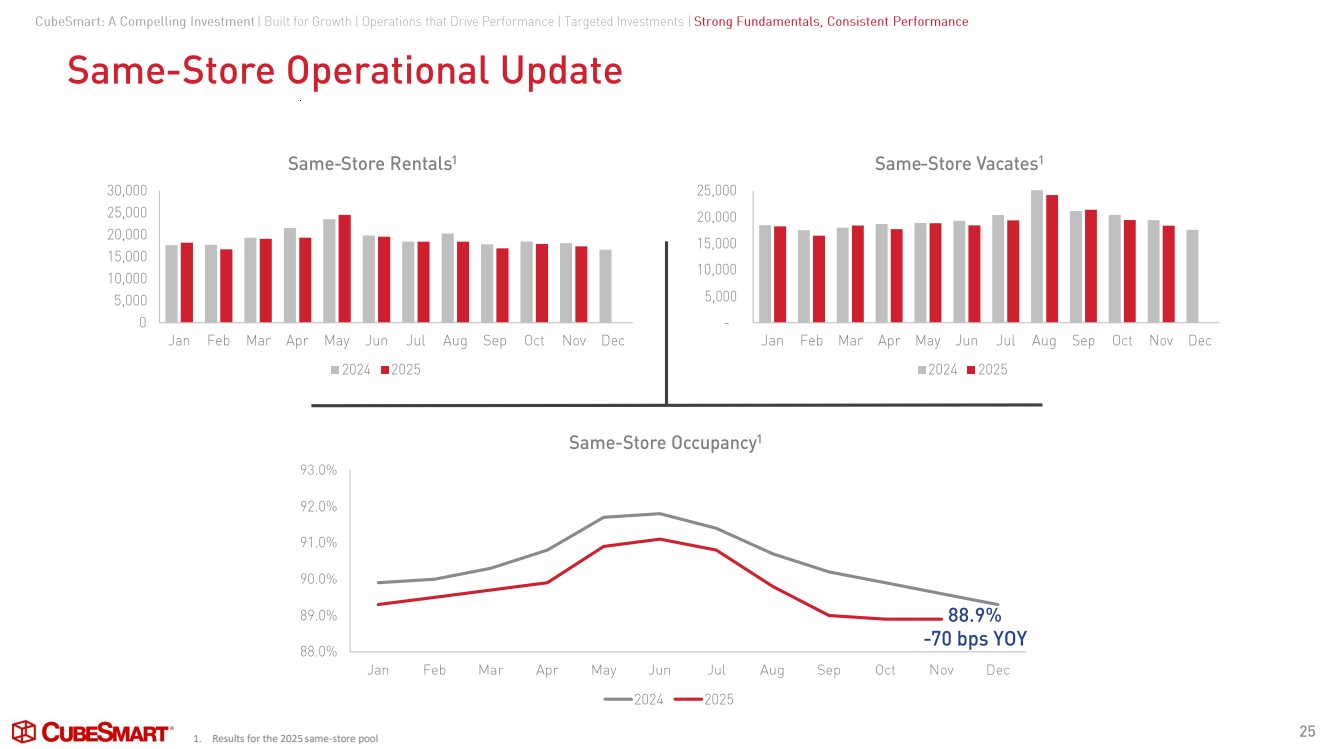
Same - Store Operational Update 25 88.0% 89.0% 90.0% 91.0% 92.0% 93.0% Jan Feb Mar Apr May Jun Jul Aug Sep Oct Nov Dec Same - Store Occupancy 1 2024 2025 0 5,000 10,000 15,000 20,000 25,000 30,000 Jan Feb Mar Apr May Jun Jul Aug Sep Oct Nov Dec Same - Store Rentals 1 2024 2025 - 5,000 10,000 15,000 20,000 25,000 Jan Feb Mar Apr May Jun Jul Aug Sep Oct Nov Dec Same - Store Vacates 1 2024 2025 88.9% -70 bps YOY 1. Results for the 2025 same-store pool CubeSmart: A Compelling Investment | Built for Growth | Operations that Drive Performance | Targeted Investments | Strong Fundamentals, Consistent Performance |
|
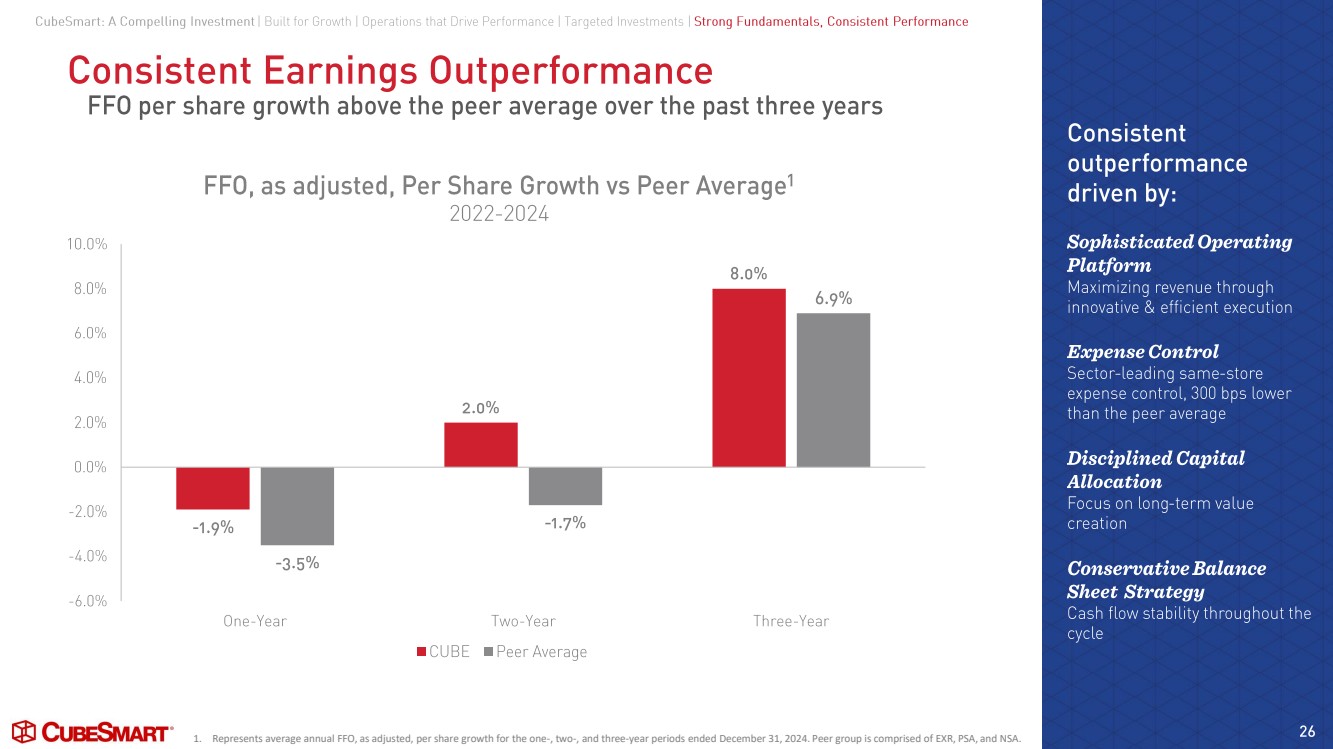
Consistent Earnings Outperformance 26 FFO per share growth above the peer average over the past three years Consistent outperformance driven by: Sophisticated Operating Platform Maximizing revenue through innovative & efficient execution Expense Control Sector -leading same -store expense control, 300 bps lower than the peer average Disciplined Capital Allocation Focus on long -term value creation Conservative Balance Sheet Strategy Cash flow stability throughout the cycle -1.9% 2.0% 8.0% -3.5% -1.7% 6.9% -6.0% -4.0% -2.0% 0.0% 2.0% 4.0% 6.0% 8.0% 10.0% One-Year Two-Year Three-Year FFO, as adjusted, Per Share Growth vs Peer Average 1 2022-2024 CUBE Peer Average 1. Represents average annual FFO, as adjusted, per share growth for the one-, two-, and three-year periods ended December 31, 2024. Peer group is comprised of EXR, PSA, and NSA. CubeSmart: A Compelling Investment | Built for Growth | Operations that Drive Performance | Targeted Investments | Strong Fundamentals, Consistent Performance |
|
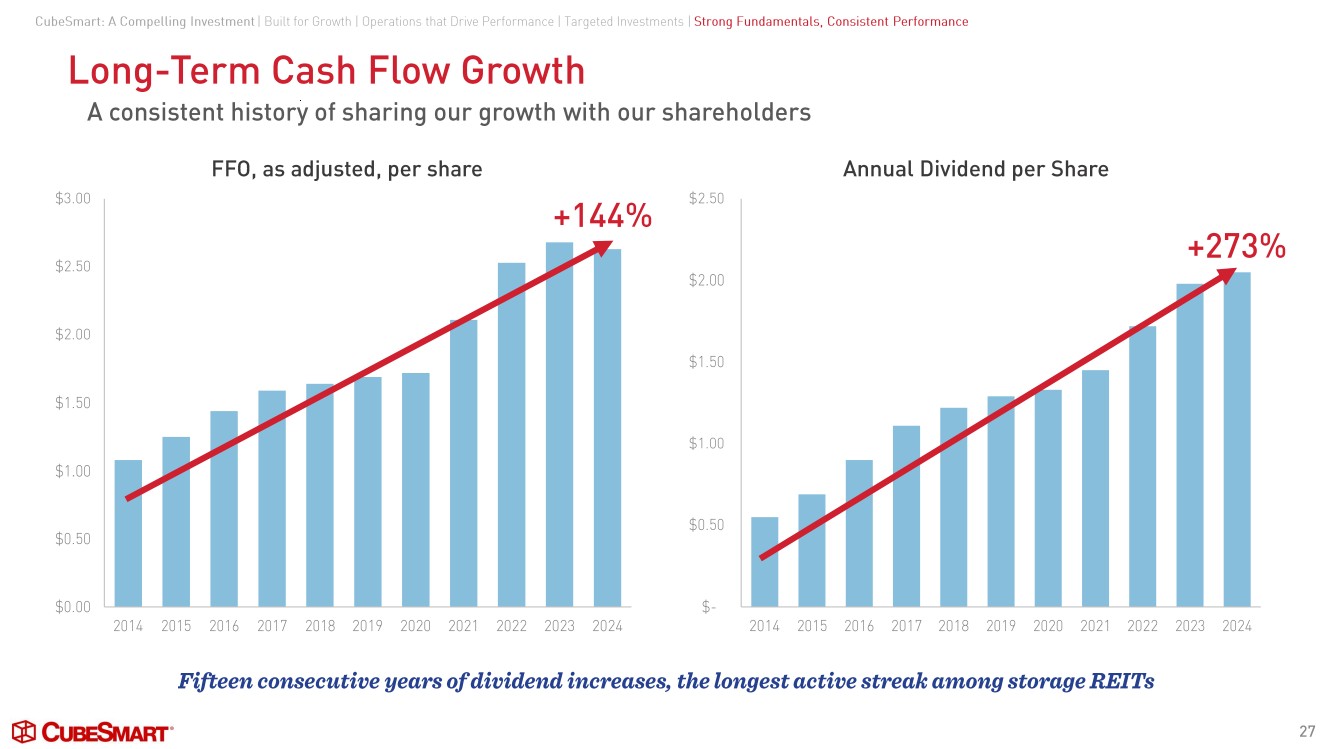
Long -Term Cash Flow Growth 27 A consistent history of sharing our growth with our shareholders $- $0.50 $1.00 $1.50 $2.00 $2.50 2014 2015 2016 2017 2018 2019 2020 2021 2022 2023 2024 Annual Dividend per Share +273% $0.00 $0.50 $1.00 $1.50 $2.00 $2.50 $3.00 2014 2015 2016 2017 2018 2019 2020 2021 2022 2023 2024 FFO, as adjusted, per share +144% CubeSmart: A Compelling Investment | Built for Growth | Operations that Drive Performance | Targeted Investments | Strong Fundamentals, Consistent Performance Fifteen consecutive years of dividend increases, the longest active streak among storage REITs |
|
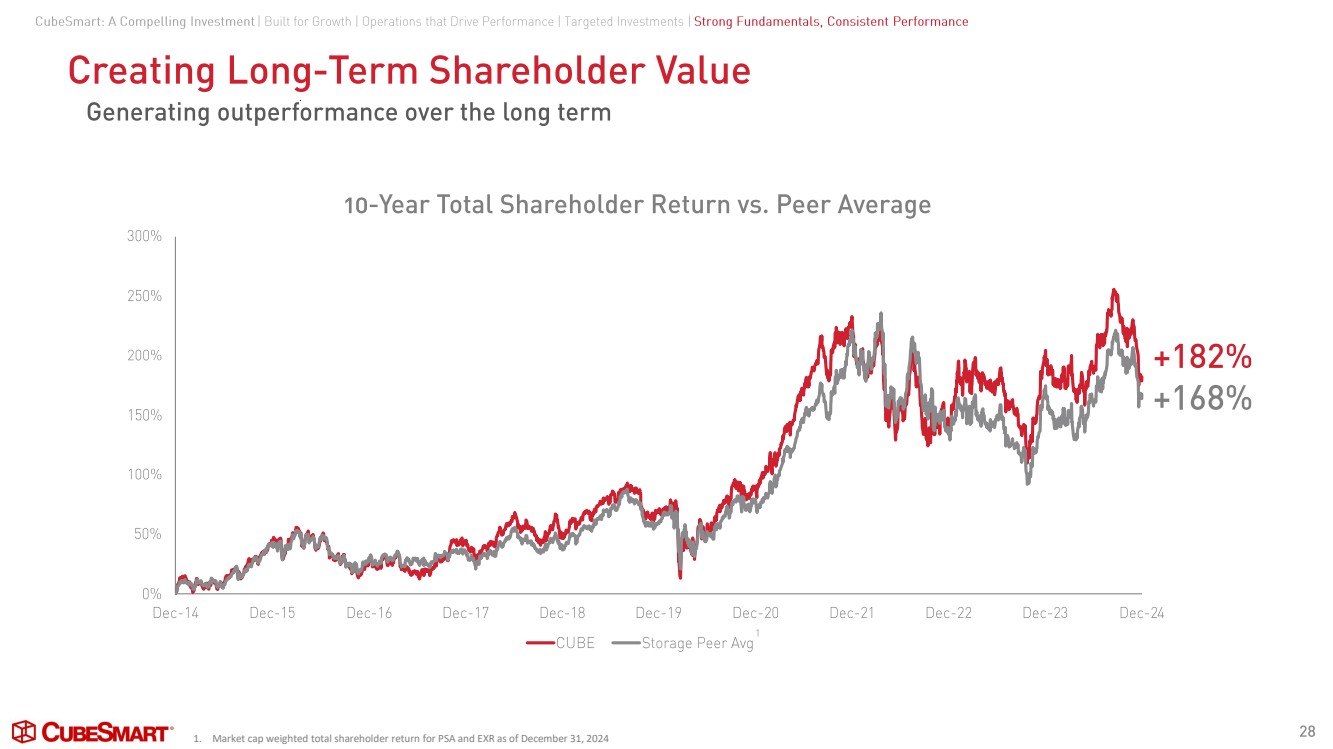
Creating Long -Term Shareholder Value 28 Generating outperformance over the long term 0% 50% 100% 150% 200% 250% 300% Dec-14 Dec-15 Dec-16 Dec-17 Dec-18 Dec-19 Dec-20 Dec-21 Dec-22 Dec-23 Dec-24 10-Year Total Shareholder Return vs. Peer Average CUBE Storage Peer Avg +182% +168% 1 1. Market cap weighted total shareholder return for PSA and EXR as of December 31, 2024 CubeSmart: A Compelling Investment | Built for Growth | Operations that Drive Performance | Targeted Investments | Strong Fundamentals, Consistent Performance 4 |
|
Why CubeSmart? 29 A company built to perform throughout all phases of the cycle Attractive Industry Well- diversified demand characteristics create strong industry fundamentals High Quality Portfolio Growing the platform through high - quality investments creating industry - leading portfolio demographics Operational Excellence Sophisticated operating platform drives efficiencies and meets evolving customer needs Cash Flow Generation Disciplined investment strategy in best -in- class assets paired with a conservative balance sheet generates stable cash flows Experienced Leadership Team Extensive self -storage and publicly traded REIT background with a successful track record of operating through various macroeconomic environments |