 エドガーで原本を確認する
UNITED STATES SECURITIES AND EXCHANGE COMMISSION
Washington, D.C. 20549
FORM 6-K
REPORT OF FOREIGN PRIVATE ISSUER
PURSUANT TO RULE 13a-16 OR 15d-16 UNDER
THE SECURITIES EXCHANGE ACT OF 1934
For the month of August, 2026
Commission File Number: 001-38049
Azul S.A.
(Name of Registrant)
Edifício Jatobá, 8th floor, Castelo Branco Office Park
Avenida Marcos Penteado de Ulhôa Rodrigues, 939
Tamboré, Barueri, São Paulo, SP 06460-040, Brazil.
+55 (11) 4831 2880
(Address of Principal Executive Office)
Indicate by check mark whether the registrant files or will file annual reports under cover of Form 20-F or Form 40-F.
Form 20-F x Form 40-F ¨
Indicate by check mark if the registrant is submitting the Form 6-K in paper as permitted by Regulation S-T Rule 101(b)(1):
Yes ¨ No x
Indicate by check mark if the registrant is submitting the Form 6-K in paper as permitted by Regulation S-T Rule 101(b)(7):
Yes ¨ No x
 |
Second Quarter Results 2026
|
Azul Reports 2Q26 Results, Maintaining Capacity Discipline and Positioning for Long-Term Value Creation
São Paulo, August 13, 2026 – Azul S.A., “Azul” (B3:AZUL3, NYSE:AZUL), the largest airline in Brazil by number of cities served, announces today its results for the second quarter of 2026 (“2Q26”). The following financial information, unless stated otherwise, is presented in Brazilian reais and in accordance with International Financial Reporting Standards (IFRS).
Financial and Operating Highlights
| 2Q26 Highlights¹ | 2Q26 | 2Q25 | % Δ | 1H26 | 1H25 | % Δ |
| Total operating revenue (R$ million) | 4,978.7 | 4,942.3 | 0.7% | 10,450.0 | 10,336.8 | 1.1% |
| EBITDA (R$ million) | 510.1 | 1,142.7 | -55.4% | 2,209.5 | 2,528.5 | -12.6% |
| EBITDA margin (%) | 10.2% | 23.1% | -12.9 p.p. | 21.1% | 24.5% | -3.3 p.p. |
| ASK (million) | 11,468 | 12,827 | -10.6% | 23,921 | 25,630 | -6.7% |
| RASK (R$ cents) | 43.41 | 38.53 | 12.7% | 43.69 | 40.33 | 8.3% |
| PRASK (R$ cents) | 39.77 | 35.70 | 11.4% | 40.17 | 37.44 | 7.3% |
| Yield (R$ cents) | 49.43 | 43.78 | 12.9% | 48.88 | 45.93 | 6.4% |
| CASK (R$ cents) | 44.80 | 35.57 | 26.0% | 39.98 | 36.62 | 9.2% |
| CASK ex-fuel (R$ cents) | 27.70 | 24.74 | 12.0% | 26.18 | 25.07 | 4.4% |
| Average exchange rate (R$) | 5.05 | 5.67 | -10.9% | 5.15 | 5.76 | -10.4% |
| Fuel cost per liter (R$) | 6.25 | 3.86 | 61.8% | 5.03 | 4.12 | 22.1% |
¹ Operating results were adjusted for non-recurring items totaling R$359.4 million in 2Q26. For more information see page 7.
| § | Record operating revenue for a second quarter at R$5.0 billion, even with a 10.6% capacity reduction year-over-year. Such result was driven by higher fares implemented to offset the significant increase in fuel prices and resulted in stronger yields and unit revenues. |
| § | During 2Q26, Azul strategically reduced domestic and international capacity by 6.5% and 24.9%, respectively, versus 2Q25, consistent with its restructuring plan. In response to higher fuel prices, the Company proactively implemented further capacity reductions to protect liquidity and maintain focus on long-term value creation. |
| § | Azul remained focused on capturing premium demand through a strategic focus on high-yield customers. In 2Q26, premium revenue increased 12.4% versus 2Q25. |
| § | RASK reached a record for a second quarter at R$43.41 cents in 2Q26, up 12.7% year-over-year. Our business units continued to make meaningful contributions, accounting for 21% of RASK in the quarter. |
| § | CASK in 2Q26 was R$44.80 cents, 26.0% higher compared to 2Q25, primarily driven by a 61.8% increase in fuel cost, and a 10.6% capacity reduction, which temporarily reduced fixed-cost absorption. Strategic and temporary retention initiatives, higher sales incentives, and inflation also contributed to the increase. |
| § | 2Q26 EBITDA reached R$510.1 million, in a significantly higher jet fuel price environment, representing a 10.2%, with the Company operating in a significantly higher fuel-price environment and 10.6% lower capacity. |
| § | Azul ended 2Q26 with R$3.7 billion in immediate liquidity. In the quarter, the company paid R$794.5 million in non-recurring restructuring-related items per the restructuring plan. The government recently approved up to R$4.6 billion in long-term financing in Brazilian reais at attractive rates, exceeding the amounts contemplated in our business plan. This provides Azul additional financial flexibility to navigate this transition year and to focus on executing our long-term plan. |
| § | Compared to 2Q25, total debt reduced R$13.0 billion to R$21.4 billion due to the successful completion of our financial restructuring. Azul’s leverage ratio measured as net debt to EBITDA and using available liquidity was 3.0x, down 2.3 turns year-over-year. Using immediate liquidity, net leverage was 2.8x as of quarter-end. |
| § | Azul made significant improvement in the overall travel experience, which translated into a Net Promoter Score (NPS) increase of more than 26 points in 2026. Azul was ranked the most on-time airline in Brazil in April and June, and the most on-time airline in Latin America in July. |
| 1 |
|
|
Second Quarter Results 2026
|
Management Comments
I would like to begin by thanking our more than 14,000 crewmembers for their dedication, passion, and commitment to our customers. Our team remains focused on safety, operational excellence, and delivering the best travel experience in Brazil as we continue building a stronger Azul following the successful completion of our restructuring.
The second quarter is historically the most challenging period of the year for profitability in Brazil, and 2Q26 was impacted by significant increase in fuel prices and the World Cup. Despite these headwinds, demand remained healthy, supporting our record second-quarter revenue of R$5.0 billion and record RASK of R$43.41 cents, up 12.7% year-over-year.
During 2Q26, Azul continued to implement disciplined capacity adjustments consistent with its restructuring plan, which included significant fleet transition, while proactively reducing capacity further in response to the increase in fuel prices. These actions enabled Azul to align capacity with profitable demand, supported stronger yields, and delivered record RASK. At the same time, the lower capacity environment temporarily pressured unit costs as fixed costs were spread over a smaller base.
As fleet availability stabilizes and modest capacity growth resumes from 4Q26, these temporary pressures are expected to diminish, allowing Azul to capture greater operating leverage and translate the efficiency gains from its transformation into stronger cash generation and value creation in the future.
2026 is a transition year for Azul. While the successful completion of our restructuring significantly strengthened our balance sheet, the quarter was still impacted by non-recurring payments, such as advisory fees, restructuring-related payments, aircraft redeliveries, fleet transitions, and other initiatives required to position the Company for long-term success. At the same time, we are already seeing the benefits of this transformation. Compared to the prior year, Azul reduced total debt by approximately R$13.0 billion and significantly lowered leverage, allowing our focus to shift from restructuring to execution, operational improvement, free cash flow generation, and deleveraging.
Azul’s current liquidity position, combined with availability of up to R$4.6 billion in government-backed, long-term financing in Brazilian reais at attractive rates, provides the financial flexibility to navigate this transition year and gives management confidence to execute the Company’s strategic plan and deliver long-term value creation.
Operationally, Azul continues to make meaningful progress. We were recognized as the most on-time airline in Latin America in July, while our NPS continues to improve quarter-over-quarter, reflecting our commitment to offering the best product and service in Brazil. We are also gradually eliminating ACMI operations, with the objective of operating exclusively with Azul aircraft and Azul crewmembers in 2027, further improving operational reliability and customer experience.
As we continue to enhance our product, we remain focused on growing premium and recurring revenue streams. Even with a reduction in total capacity by 10.6% versus 2Q25, premium revenues increased 12.4% during the quarter, demonstrating the success of our strategy to prioritize revenue quality over volume growth. In parallel, we are deploying Artificial Intelligence solutions across the organization to improve productivity, automate processes, enhance decision-making, and identify efficiency opportunities, supporting long-term margin expansion and scalability.
Looking ahead, we believe the challenges that impacted the second quarter are largely temporary. Azul enters the second half with a stronger balance sheet, improving operational metrics, growing customer satisfaction, a modern and fuel-efficient fleet, and a disciplined commercial strategy centered on profitability and cash generation. Our focus remains clear: delivering the best travel experience in Brazil while creating sustainable long-term value for our customers, crewmembers, and shareholders.
John Rodgerson, CEO of Azul S.A.
| 2 |
|
|
Second Quarter Results 2026
|
Consolidated Financial Results
The following income statement and operating data should be read in conjunction with the quarterly results comments presented below:
| Income statement (R$ million)¹ | 2Q26 | 2Q25 | % Δ | 1H26 | 1H25 | % ∆ |
| Operating Revenue | ||||||
| Passenger revenue | 4,560.5 | 4,578.9 | -0.4% | 9,609.3 | 9,596.3 | 0.1% |
| Cargo revenue and other | 418.1 | 363.4 | 15.1% | 840.7 | 740.5 | 13.5% |
| Total operating revenue | 4,978.7 | 4,942.3 | 0.7% | 10,450.0 | 10,336.8 | 1.1% |
| Operating Expenses | ||||||
| Aircraft fuel | (1,960.8) | (1,388.7) | 41.2% | (3,301.8) | (2,960.7) | 11.5% |
| Salaries and benefits | (745.0) | (614.4) | 21.3% | (1,452.2) | (1,322.3) | 9.8% |
| Depreciation and amortization | (669.2) | (762.8) | -12.3% | (1,323.6) | (1,578.0) | -16.1% |
| Other rent & ACMI | (139.4) | (152.4) | -8.5% | (276.9) | (278.5) | -0.6% |
| Airport fees | (288.4) | (316.6) | -8.9% | (590.3) | (634.4) | -7.0% |
| Traffic and customer servicing | (228.2) | (251.0) | -9.1% | (456.0) | (484.8) | -5.9% |
| Sales and marketing | (270.6) | (164.9) | 64.1% | (525.2) | (410.7) | 27.9% |
| Maintenance and repairs | (222.7) | (202.8) | 9.9% | (447.4) | (405.3) | 10.4% |
| Share based incentive | (0.4) | (57.7) | -99.2% | (0.7) | (70.5) | -99.0% |
| Other | (612.9) | (651.1) | -5.9% | (1,190.0) | (1,241.0) | -4.1% |
| Total Operating Expenses | (5,137.7) | (4,562.4) | 12.6% | (9,564.1) | (9,386.2) | 1.9% |
| Operating Result | (159.1) | 380.0 | n.a. | 885.9 | 950.5 | -6.8% |
| Operating margin | -3.2% | 7.7% | -10.9 p.p. | 8.5% | 9.2% | -0.7 p.p. |
| EBITDA | 510.1 | 1,142.7 | -55.4% | 2,209.5 | 2,528.5 | -12.6% |
| EBITDA margin | 10.2% | 23.1% | -12.9 p.p. | 21.1% | 24.5% | -3.3 p.p. |
| Financial Result | (882.2) | 913.5 | n.a. | (503.6) | 1,126.0 | n.a. |
| Financial income | 14.3 | 783.6 | -98.2% | 44.3 | 815.2 | -94.6% |
| Financial expenses² | (938.0) | (1,617.8) | -42.0% | (2,055.5) | (4,011.4) | -48.8% |
| Derivative financial instruments, net² | 14.4 | (27.4) | n.a. | 14.4 | (20.0) | n.a. |
| Foreign currency exchange, net | 27.1 | 1,775.1 | -98.5% | 1,493.1 | 4,342.1 | -65.6% |
| Result Before Income Taxes | (1,041.2) | 1,293.4 | n.a. | 382.3 | 2,076.5 | -81.6% |
| Income tax and social contribution | - | (0.0) | n.a. | (1.9) | (0.0) | 6851.7% |
| Net Result² | (1,041.2) | 1,293.4 | n.a. | 380.4 | 2,076.5 | -81.7% |
| Net margin | -20.9% | 26.2% | -47.1 p.p. | 3.6% | 20.1% | -16.4 p.p. |
| Adjusted Net Result² ³ | (1,070.9) | (475.8) | 125.1% | (1,115.3) | (2,292.5) | -51.4% |
| Adjusted net margin² ³ | -21.5% | -9.6% | -11.9 p.p. | -10.7% | -22.2% | +11.5 p.p. |
¹ Operating results were adjusted for non-recurring items totaling R$359.4 million in 2Q26. For more information see page 7.
² Excludes conversion rights related to convertible debentures recognized in 2Q25.
³ Adjusted for unrealized derivative results and foreign currency.
| 3 |
|
|
Second Quarter Results 2026
|
| Operating Data¹ | 2Q26 | 2Q25 | % Δ | 1H26 | 1H25 | % ∆ |
| ASK (million) | 11,468 | 12,827 | -10.6% | 23,921 | 25,630 | -6.7% |
| Domestic | 9,314 | 9,958 | -6.5% | 19,155 | 19,894 | -3.7% |
| International | 2,154 | 2,869 | -24.9% | 4,766 | 5,735 | -16.9% |
| RPK (million) | 9,227 | 10,459 | -11.8% | 19,659 | 20,893 | -5.9% |
| Domestic | 7,329 | 8,020 | -8.6% | 15,516 | 16,085 | -3.5% |
| International | 1,898 | 2,439 | -22.2% | 4,143 | 4,808 | -13.8% |
| Load factor (%) | 80.5% | 81.5% | -1.1 p.p. | 82.2% | 81.5% | +0.7 p.p. |
| Domestic | 78.7% | 80.5% | -1.8 p.p. | 81.0% | 80.9% | +0.1 p.p. |
| International | 88.1% | 85.0% | +3.1 p.p. | 86.9% | 83.8% | +3.1 p.p. |
| Average fare (R$) | 628.9 | 574.1 | 9.5% | 640.8 | 603.8 | 6.1% |
| Passengers (thousands) | 7,252 | 7,976 | -9.1% | 14,995 | 15,892 | -5.6% |
| Block hours | 127,847 | 146,283 | -12.6% | 263,375 | 293,677 | -10.3% |
| Aircraft utilization (hours per day)² | 11.3 | 11.5 | -2.3% | 11.4 | 11.8 | -3.2% |
| Departures | 69,198 | 79,312 | -12.8% | 141,104 | 159,108 | -11.3% |
| Average stage length (km) | 1,227 | 1,282 | -4.2% | 1,264 | 1,282 | -1.5% |
| End of period operating passenger aircraft | 155 | 176 | -11.9% | 155 | 176 | -11.9% |
| Fuel consumption (thousands of liters) | 313,741 | 359,534 | -12.7% | 656,329 | 718,351 | -8.6% |
| Fuel consumption per ASK | 27.4 | 28.0 | -2.4% | 27.4 | 28.0 | -2.1% |
| ASK per FTE (thousand) | 778.3 | 834.9 | -6.8% | 1,623.4 | 1,668.3 | -2.7% |
| Full-time-equivalent employees | 14,735 | 15,363 | -4.1% | 14,735 | 15,363 | -4.1% |
| End of period FTE per aircraft | 95 | 87 | 8.9% | 95 | 87 | 8.9% |
| Yield (R$ cents) | 49.43 | 43.78 | 12.9% | 48.88 | 45.93 | 6.4% |
| RASK (R$ cents) | 43.41 | 38.53 | 12.7% | 43.69 | 40.33 | 8.3% |
| PRASK (R$ cents) | 39.77 | 35.70 | 11.4% | 40.17 | 37.44 | 7.3% |
| CASK (R$ cents) | 44.80 | 35.57 | 26.0% | 39.98 | 36.62 | 9.2% |
| CASK ex-fuel (R$ cents) | 27.70 | 24.74 | 12.0% | 26.18 | 25.07 | 4.4% |
| Fuel cost per liter (R$) | 6.25 | 3.86 | 61.8% | 5.03 | 4.12 | 22.1% |
| Break-even load factor (%) | 83.0% | 75.3% | +7.8 p.p. | 75.2% | 74.0% | +1.2 p.p. |
| Average exchange rate (R$ per US$) | 5.05 | 5.67 | -10.9% | 5.15 | 5.76 | -10.4% |
| End of period exchange rate | 5.18 | 5.46 | -5.1% | 5.18 | 5.46 | -5.1% |
| Inflation (IPCA/LTM) | 4.64% | 5.35% | -0.7 p.p. | 4.64% | 5.35% | -0.7 p.p. |
| WTI (average per barrel, US$) | 87.31 | 61.37 | 42.3% | 82.59 | 66.31 | 24.5% |
| Heating oil (US$ per gallon) | 3.85 | 2.18 | 76.9% | 3.08 | 2.27 | 35.9% |
¹ Operating results were adjusted for non-recurring items totaling R$359.4 million in 2Q26. For more information see page 7.
² Excludes Cessna aircraft and freighters.
Operating Revenue
In 2Q26, Azul’s total operating revenues increased R$36.3 million, to a second-quarter record of R$5.0 billion, up 0.7% year-over-year. This performance was driven by higher fares implemented to partially offset the significant increase in fuel prices, resulting in stronger yields and unit revenues.
Our RASK and PRASK were at record levels for a second quarter at R$43.41 cents and R$39.77 cents respectively. In 2Q26, our beyond-the-metal business units accounted for 21% of RASK, while unit contribution increased from R$8.70 cents to R$9.15 cents year-over-year.
| 4 |
|
|
Second Quarter Results 2026
|
Azul Logistics revenue and other totaled R$418.1 million, 15.1% higher than 2Q25, mainly due to better performance in our domestic logistics operation. In 2Q26, logistic revenues increased 16.1% year-over-year, driven by stronger freighter operations and supported by healthy margins in addition to the improvement in our charter business.
| R$ cents¹ | 2Q26 | 2Q25 | % Δ | 1H26 | 1H25 | % Δ |
| Operating revenue per ASK | ||||||
| Passenger revenue | 39.77 | 35.70 | 11.4% | 40.17 | 37.44 | 7.3% |
| Cargo revenue and other | 3.65 | 2.83 | 28.7% | 3.51 | 2.89 | 21.6% |
| Operating revenue (RASK) | 43.41 | 38.53 | 12.7% | 43.69 | 40.33 | 8.3% |
| Operating expenses per ASK | ||||||
| Aircraft fuel | (17.10) | (10.83) | 57.9% | (13.80) | (11.55) | 19.5% |
| Salaries and benefits | (6.50) | (4.79) | 35.6% | (6.07) | (5.16) | 17.7% |
| Depreciation and amortization | (5.83) | (5.95) | -1.9% | (5.53) | (6.16) | -10.1% |
| Other rent & ACMI | (1.22) | (1.19) | 2.3% | (1.16) | (1.09) | 6.5% |
| Airport fees | (2.51) | (2.47) | 1.9% | (2.47) | (2.48) | -0.3% |
| Traffic and customer servicing | (1.99) | (1.96) | 1.7% | (1.91) | (1.89) | 0.8% |
| Sales and marketing | (2.36) | (1.29) | 83.5% | (2.20) | (1.60) | 37.0% |
| Maintenance and repairs | (1.94) | (1.58) | 22.9% | (1.87) | (1.58) | 18.3% |
| Share based incentive | (0.00) | (0.45) | -99.2% | (0.00) | (0.28) | -99.0% |
| Other operating expenses | (5.34) | (5.08) | 5.3% | (4.97) | (4.84) | 2.7% |
| Total operating expenses (CASK) | (44.80) | (35.57) | 26.0% | (39.98) | (36.62) | 9.2% |
| Operating income per ASK (RASK-CASK) | (1.39) | 2.96 | n.a. | 3.70 | 3.71 | -0.1% |
¹ Operating results were adjusted for non-recurring items totaling R$ 359.4 million in 2Q26. For more information see page 7.
Operating Expenses
In 2Q26, operating expenses totaled R$5.1 billion, an increase of 12.6% compared with 2Q25. Costs per ASK increased 26.0% to R$44.80 cents, primarily driven by the increase of 61.8% in fuel cost and 10.6% reduction in capacity.
The breakdown of our main operating expenses compared to 2Q25 is as follows:
| § | Aircraft fuel increased 41.2% to R$1,960.8 million, mainly driven by the 61.8% increase in fuel price per liter, partially offset by lower capacity, and a 2.4% improvement in fuel burn per ASK from the higher utilization of our next-generation fleet. |
| § | Salaries and benefits increased 21.3% compared to 2Q25, driven by strategic and temporary investments in crew retention, hiring and training to support future operations and 5% union increase in salaries as a result of collective bargaining agreements with unions applicable to all airline employees in Brazil. |
| § | Depreciation and amortization reduced 12.3% or R$93.6 million, primarily due to the 8.0% reduction in right-of-use assets following the lease modifications negotiated during the restructuring, partially offset by the larger E2 fleet compared to 2Q25 as part of our ongoing fleet transformation. |
| § | Other rent & ACMI reduced R$13.0 million compared to 2Q25, mainly due to lower spare engine rent following the restructuring process. |
| § | Airport fees reduced 8.9% or R$28.2 million driven by the shift to a lower capacity growth strategy, with the 12.8% reduction in departures in 2Q26. |
| 5 |
|
|
Second Quarter Results 2026
|
| § | Traffic and customer servicing reduced 9.1% or R$22.8 million, primarily due to the 9.1% reduction on passengers. |
| § | Sales and marketing increased R$105.7 million, mainly reflecting higher incentive costs associated with increased fares and stronger logistics revenue performance, which grew 16.1% and contributed to higher commissions. |
| § | Maintenance and repairs increased 9.9% compared to 2Q25, mainly due to the higher maintenance events in the period, partially offset by the 10.9% appreciation of the Brazilian real against the US dollar. |
| § | Other reduced R$38.2 million, mainly due to reduction in legal claims related to irregular operations, due to an improved operating performance in 2026, partially offset by a 4.6% annual inflation. |
Non-Operating Results
| Net financial results (R$ million)¹ | 2Q26 | 2Q25 | % Δ | 1H26 | 1H25 | % ∆ |
| Net financial expenses | (923.7) | (834.2) | 10.7% | (2,011.1) | (3,196.1) | -37.1% |
| Derivative financial instruments, net | 14.4 | (27.4) | n.a. | 14.4 | (20.0) | n.a. |
| Foreign currency exchange, net | 27.1 | 1,775.1 | -98.5% | 1,493.1 | 4,342.1 | -65.6% |
| Net financial results | (882.2) | 913.5 | n.a. | (503.6) | 1,126.0 | n.a. |
¹ Excludes the conversion right related to the convertible debentures recognized in 2Q25.
Net financial expenses were R$923.7 million in the quarter, mainly due to a R$226.2 million in interest on loans and financing accrued in 2Q26, R$432.0 million in accrued interest related to leases recognized as determined by IFRS16 rules and R$66.8 million related to paid interest on credit card receivable advanced.
Derivative financial instruments, net registered a gain of R$14.4 million in 2Q26 reflecting the implementation of NDF (Non-Deliverable Forward) contracts to mitigate foreign exchange exposure related to certain foreign currency-denominated financial liabilities.
Foreign currency exchange, net registered a gain of R$27.1 million in 2Q26 due to the 0.8% end of period appreciation of the Brazilian real against the US dollar versus 1Q26, resulting in a reduction in lease liabilities and loans denominated in foreign currency.
| 6 |
|
|
Second Quarter Results 2026
|
Non-Recurring Items Reconciliation
The operating results presented in this release include items that we deem non-recurring and that should not be considered when making comparisons to prior or future periods.
In 2Q26, our operating results were adjusted for non-recurring items totaling R$359.4 million mainly related to:
| § | Salaries and benefits: R$21.8 million due to payroll expenses related to the restructuring process. |
| § | Depreciation and amortization: R$77.9 million due to the write-off of 6 E-1´s being prepared for redelivery. |
| § | Other rent and ACMI: R$10.1 million in spare engine costs due to OEM contract suspension as part of our restructuring process. |
| § | Airport fees: R$0.3 million due to parking fees for rejected aircraft. |
| § | Traffic and customer servicing: R$7.5 million primarily driven by handling supplier replacement during the restructuring process. |
| § | Maintenance and repairs: R$12.3 million related to OEM contract write-off during the restructuring and aircraft preservation. |
| § | Share-based incentive: R$19.6 million due to non-cash share-based incentive plan related to the restructuring process. |
| § | Other: R$209.8 million associated with the R$101.4 million expenses related to rejected aircraft and R$108.5 million restructuring advisor fees. |
The table below provides a reconciliation of our reported amounts to the adjusted amounts excluding non-recurrent items:
| 2Q26 Non-recurring Adjustments | As recorded | Adjustments | Adjusted |
| Operating Revenue | |||
| Passenger revenue | 4,560.5 | - | 4,560.5 |
| Cargo revenue and other | 418.1 | - | 418.1 |
| Total operating revenue | 4,978.7 | - | 4,978.7 |
| Operating Expenses | |||
| Aircraft fuel | 1,960.8 | - | 1,960.8 |
| Salaries and benefits | 766.8 | (21.8) | 745.0 |
| Depreciation and amortization | 747.1 | (77.9) | 669.2 |
| Other rent & ACMI | 149.6 | (10.1) | 139.4 |
| Airport fees | 288.7 | (0.3) | 288.4 |
| Traffic and customer servicing | 235.8 | (7.5) | 228.2 |
| Sales and marketing | 270.6 | - | 270.6 |
| Maintenance and repairs | 235.1 | (12.3) | 222.7 |
| Share based incentive | 20.0 | (19.6) | 0.4 |
| Other | 822.8 | (209.8) | 612.9 |
| Total Operating Expenses | 5,497.2 | (359.4) | 5,137.7 |
| Operating Result | (518.5) | 359.4 | (159.1) |
| Operating margin | -10.4% | +7.2 p.p. | -3.2% |
| EBITDA | 228.6 | 281.5 | 510.1 |
| EBITDA margin | 4.6% | +5.7 p.p. | 10.2% |
| 7 |
|
|
Second Quarter Results 2026
|
EBITDA and Cash Flow Managerial View Reconciliation
The reconciliation below provides a bridge between our IFRS-reported figures and the Company’s Managerial View, which Azul believes provides improved investor visibility into the economics of the business.
| IFRS | Reclassifications | Non-Recurring | Managerial View | ||||
| 2Q26 EBITDA and cash reconciliations (R$ million)¹ | Advances | Leases | Capex | EBITDA | Non-EBITDA | ||
| EBITDA | 228.6 | - | - | - | 281.5 | - | 510.1 |
| Non-Cash EBITDA items² | 361.0 | - | - | - | (22.8) | - | 338.2 |
| Non-EBITDA Cash items³ | (114.9) | - | - | - | - | - | (114.9) |
| Change in working capital | (501.8) | 85.6 | 43.2 | 301.1 | (37.7) | 338.6 | 229.0 |
| Capex | (130.6) | - | - | (332.3) | - | 155.0 | (307.9) |
| Recurring FCF (ex. Rent) | (157.7) | 85.6 | 43.2 | (31.1) | 221.0 | 493.6 | 654.6 |
| Rent | (658.3) | - | (96.9) | - | - | 79.9 | (675.3) |
| Recurring FCF | (816.1) | 85.6 | (53.6) | (31.1) | 221.0 | 573.5 | (20.7) |
| Interest Paid, Net | (180.9) | 66.8 | 53.6 | 3.0 | - | - | (57.5) |
| Recurring Levered FCF | (996.9) | 152.4 | - | (28.2) | 221.0 | 573.5 | (78.2) |
| Non-recurring items | - | - | - | - | (221.0) | (573.5) | (794.5) |
| Advances in Credit Card Receivables | - | (152.4) | - | - | - | - | (152.4) |
| Levered FCF | (996.9) | - | - | (28.2) | - | - | (1,025.1) |
| Growth capex | - | - | - | (3.9) | - | - | (3.9) |
| Debt repayment | (88.0) | - | - | 32.0 | - | - | (56.0) |
| New Cash | 330.0 | - | - | - | - | - | 330.0 |
| FX impact on Cash | (159.9) | - | - | - | - | - | (159.9) |
| Change in Cash | (914.9) | - | - | - | - | - | (914.9) |
| Cash at Beginning of the Period | 2,183.8 | - | - | - | - | - | 2,183.8 |
| Ending Cash Balance | 1,268.9 | - | - | - | - | - | 1,268.9 |
| Credit card receivable | 1,456.7 | - | - | - | - | - | 1,456.7 |
| Other accounts receivable | 933.5 | - | - | - | - | - | 933.5 |
| Available Liquidity | 3,659.1 | - | - | - | - | - | 3,659.1 |
¹ Managerial View reclassifications set forth above represent presentation-only changes within income statement and cash flow statement line items and do not affect Azul’s financial statements prepared in accordance with IFRS. The Managerial View is presented with the objective of facilitating the understanding of the underlying operations in relation to the reclassifications presented above. Azul’s IFRS consolidated financial statements remain the sole basis for statutory reporting. The Managerial View line items are derived exclusively from Azul’s IFRS consolidated financial statements and are constructed through a defined set of operational reclassifications.
² Non-cash EBITDA items include: R$19.6 million in share-based incentive and R$3.2 million in write-off related to aircraft rejects in the restructuring.
Reclassifications
| § | Advances: managerial view separates out advances in credit card receivables from normal-course changes in accounts receivable for improved investor visibility. |
| § | Leases: managerial view incorporates the interest component of both operating and finance lease payments as well as the principal component of finance lease payments, in addition to any security deposits paid in the quarter. |
| § | Capex: managerial view moves capex items recognized in financing activities (financed capex) and in working capital (such as maintenance reserves and pre-payments to suppliers) into the capex line. |
| 8 |
|
|
Second Quarter Results 2026
|
Non-recurring items impacting EBITDA in the period totaled R$281.5 million. Of this amount, R$22.8 million was non-cash EBITDA related items and were related to share-based incentive and write-off related to aircraft rejected as a result of the comprehensive restructuring while R$221.0 million was paid in the period and is related to advisors’ fees and other deferrals in connection to our restructuring and R$37.7 million was adjusted against working capital. Please see page 7 for detailed information on each non-recurring item adjusting EBITDA in the period.
Non-recurring items that do not impact EBITDA in the period totaled R$573.5 million:
| § | Change in Working Capital in Managerial View was adjusted by R$338.6 million in 2Q26, mainly due to out-of-period amounts that were negotiated to be rolled over and paid in this quarter, including government tax settlement and amounts paid in the quarter for other suppliers from previous periods that were negotiated to be paid this quarter. |
| § | Capex: Azul paid R$155.0 million of deferred capitalized maintenance in 2Q26 for services that were completed in prior periods and were negotiated to be postponed. |
| § | Leases: Azul made R$79.9 million in deferred rent payments during 2Q26, related to prior forbearance agreements with lessors, finalized once both parties completed the restructuring of the Company’s lease terms. |
Liquidity and Financing
Azul ended the second quarter with Immediate Liquidity of R$3.7 billion, representing 16.6% of our LTM revenues. In the quarter, we paid R$794.5 million in non-recurring items related to our restructuring process. In June, Azul raised R$330 million through Brazil's a short-term government-backed credit program for the airline industry, approved by the CMN in May 2026, reinforcing the Company's liquidity and financial flexibility.
Accounts receivable grew 41.5%, or R$700.9 million, compared to June 30, 2025, driven mainly by a deliberate strategic decision to not advance the totality of available credit card receivables. In Brazil, these receivables are predominantly tied to tickets already flown, eliminating cardholder credit risk and allowing for immediate access to funds without holdbacks. This structure provides Azul with significant liquidity flexibility, as receivables can be advanced at minimal cost when needed.
As of June 30, 2026, the Company holds a credit card receivables balance of R$1,456.7 million (R$683.1 million as of June 30, 2025).
| Liquidity (R$ million) | 2Q26 | 1Q26 | % Δ | 2Q25 | % Δ |
| Cash and cash equivalents | 1,268.9 | 2,088.0 | -39.2% | 1,458.8 | -13.0% |
| Short-term investments | - | - | n.a. | 142.4 | n.a. |
| Accounts receivable | 2,390.3 | 2,570.2 | -7.0% | 1,689.3 | 41.5% |
| Immediate liquidity | 3,659.2 | 4,658.3 | -21.4% | 3,290.5 | 11.2% |
| Cash as % of LTM revenue | 16.6% | 21.2% | -4.6 p.p. | 15.7% | +1.0 p.p. |
Azul’s debt amortization schedule as of June 30, 2026 is presented below. The chart converts our dollar denominated debt to reais using the quarter-end foreign exchange rate of R$5.18. Azul has no material debt maturities until 2031, providing enhanced liquidity visibility and financial flexibility.
| 9 |
|
|
Second Quarter Results 2026
|
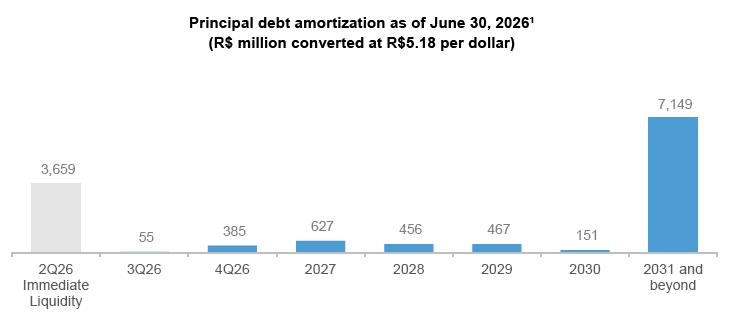
¹ Excludes approximately R$303 million in pre delivery payment obligations due in 3Q26, which will be extinguished once the aircraft are acquired by the lessor.
Compared to 1Q26, gross debt increased 3.7% or R$773.4 million to R$21,415.9 million, primarily driven by the R$330 million drawn under the short-term government-backed credit program for the airline industry in June and higher lease liabilities resulting from the addition of two A330 and one E2 aircraft to the fleet.
| Lease, Loans and financing (R$ million)¹ | 2Q26 | 1Q26 | % Δ | 2Q25 | % Δ |
| Lease liabilities | 11,109.9 | 10,587.9 | 4.9% | 16,304.3 | -31.9% |
| Lease notes | - | - | n.a. | 722.3 | n.a. |
| Finance lease liabilities | 421.9 | 341.2 | 23.7% | 594.8 | -29.1% |
| Other aircraft loans and financing | 529.4 | 796.4 | -33.5% | 1,068.7 | -50.5% |
| Loans and financing | 9,354.7 | 8,917.0 | 4.9% | 15,720.4 | -40.5% |
| % of non-aircraft debt in local currency | 15% | 12% | +2.9 p.p. | 5% | +9.8 p.p. |
| % of total debt in local currency | 7% | 5% | +1.3 p.p. | 2% | +4.1 p.p. |
| Gross debt | 21,415.9 | 20,642.5 | 3.7% | 34,410.4 | -37.8% |
¹ Considers the effect of hedges on debt. Excludes convertible debentures, and OEM notes.
The table below presents additional information related to our loans and financing payments in 2Q26:
| Loans and financing payments (R$ million) | 2Q26 | 1Q26 | % Δ | 2Q25 | % Δ |
| Loans and financing repayments | 88.0 | 7,588.2 | -98.8% | 194.2 | -54.7% |
| Interest on loans and financing | 40.2 | 56.6 | -29.0% | 77.0 | -47.9% |
| Total loans and financing payments | 128.2 | 7,644.8 | -98.3% | 271.2 | -52.7% |
| 10 |
|
|
Second Quarter Results 2026
|
The table below presents additional information related to our interest payments in 2Q26 according to IFRS:
| Interest payments (R$ million) | 2Q26 | 1Q26 | % Δ | 2Q25 | % Δ |
| Interest on loans and financing | 40.2 | 56.6 | -29.0% | 77.0 | -47.9% |
| Interest on leases | 53.6 | 38.8 | 38.1% | 39.9 | 34.5% |
| Interest on leases - notes and equity | - | - | n.a. | 52.5 | n.a. |
| Interest on convertible instruments | - | - | n.a. | 42.1 | n.a. |
| Interest on factoring credit card receivables | 66.8 | 96.2 | -30.6% | 111.5 | -40.1% |
| Other interest | 20.3 | 4.3 | 368.3% | 2.5 | 720.1% |
| Total interest payments | 180.9 | 196.0 | -7.7% | 325.5 | -44.4% |
Managerial View reclassifies interest expenses associated with advancing credit card receivables, operating leases and aircraft financing, as well as interest on engine facilities to “Advances in Credit Card Receivables”. “Rent” and “Capex”, respectively. Managerial interest totaled R$57.5 million in the quarter, as demonstrated below:
| Interest payments (R$ million) | IFRS | Reclassifications | Managerial View | ||
| Advances | Leases | Capex | |||
| Interest on loans and financing | 40.2 | - | (3.0) | 37.2 | |
| Interest on leases | 53.6 | - | (53.6) | - | - |
| Interest on factoring credit card receivables | 66.8 | (66.8) | - | - | - |
| Other interest | 20.3 | - | - | - | 20.3 |
| Total interest payments | 180.9 | (66.8) | (53.6) | (3.0) | 57.5 |
As of June 30, 2026, Azul’s average debt maturity excluding lease liabilities was 4.1 years, with an average interest rate on debt in U.S. dollars of 9.7%. Average interest rate debt in on local currency was 16.1% or CDI +2% while the average interest rate on dollar-denominated obligations was 9.8%.
Azul’s leverage ratio measured as net debt to LTM EBITDA and using available liquidity was 3.0x. Down 2.3 turns year-over-year, positioning Azul for continued deleveraging process. When using immediate liquidity, the Company’s leverage is 2.8x.
| Key financial ratios (R$ million) | 2Q26 | 1Q26 | % Δ | 2Q25 | % Δ |
| Cash¹ | 1,268.9 | 2,088.0 | -39.2% | 1,601.2 | -20.8% |
| Credit Card Receivables | 1,456.7 | 1,727.6 | -15.7% | 683.1 | 113.2% |
| Other receivables | 933.6 | 842.6 | 10.8% | 1,006.2 | -7.2% |
| Gross debt² | 21,415.9 | 20,642.5 | 3.7% | 34,410.4 | -37.8% |
| Net debt w/ Credit Card Receivables | 18,690.3 | 16,826.8 | 11.1% | 32,126.1 | -41.8% |
| Net debt / EBITDA (LTM) w/ Credit Card Receivables3 | 3.0x | 2.4x | 0.5x | 5.2x | -2.3x |
| Net debt w/ Other Receivables | 17,756.7 | 15,984.2 | 11.1% | 31,119.9 | -42.9% |
| Net debt / EBITDA (LTM) w/ Other Receivables4 | 2.8x | 2.3x | 0.5x | 5.1x | -2.3x |
¹ Includes cash, cash equivalents and short-term investments.
² Excludes convertible debentures and OEM notes.
3 Net debt / EBITDA (LTM) using available liquidity.
4 Net
debt / EBITDA (LTM) using immediate liquidity.
| 11 |
|
|
Second Quarter Results 2026
|
Fleet
As of June 30, 2026, Azul had an available to schedule fleet of 155 aircraft with an average aircraft age of 7.3 years excluding Cessna aircraft. Over the year, five widebody aircraft, two narrowbody aircraft, seventeen Embraer E1, six ATR and two Cessna exited the operation as part of ongoing fleet optimization plan. Azul ended 2Q26 with approximately 94.1% of its domestic capacity operated by next-generation aircraft, significantly above any other airline in the region.
| Available to Schedule Fleet | 2Q26 | 2Q25 | % Δ |
| Airbus widebody | 5 | 10 | -50.0% |
| Airbus narrowbody | 53 | 55 | -3.6% |
| Embraer E2 | 42 | 31 | 35.5% |
| Embraer E1 | 8 | 25 | -68.0% |
| ATR | 23 | 29 | -20.7% |
| Cessna | 24 | 26 | -7.7% |
| Total available to schedule fleet | 155 | 176 | -11.9% |
The table below presents additional information related to our Managerial View of rent payments in 2Q26:
| Rent (R$ million) | IFRS | Reclassifications | Non-Recurring | Managerial View |
| Leases | Out of Period | |||
| Rent | 658.3 | - | (79.9) | 578.4 |
| Interest on leases | - | 53.6 | - | 53.6 |
| Security deposits | - | 43.2 | - | 43.2 |
| Total rent payments | 658.3 | 96.9 | (79.9) | 675.3 |
Reclassifications: Under IFRS 16, only principal payments for operating leases are classified as “Leases” under cash flow from financing activities. Managerial View incorporates the interest component of operating and financing leases of R$53.6 million, as well as security deposits of R$43.2 million captured under change in working capital under IFRS.
Non-Recurring: Managerial View removes the impact of out-of-period cash rent and penalties due to late aircraft redelivery payments, which totaled R$79.9 million in the quarter.
Capex
Capital expenditure as presented in our cash flows from investing activities excluding short-term investment and sale and leaseback totaled R$212.9 million in 2Q26, mostly due to the capitalization of engine overhauls and the acquisition of spare parts in the quarter. This does not include prepayments and maintenance reserves.
| Capex (R$ million) | 2Q26 | 2Q25 | % Δ | 1H26 | 1H25 | % Δ |
| Aircraft and maintenance and checks | 166.1 | 23.2 | 617.4% | 251.0 | 136.1 | 84.4% |
| Intangible assets | 36.5 | 31.4 | 16.1% | 79.2 | 47.4 | 67.2% |
| Pre-delivery payments | - | - | n.a. | - | - | n.a. |
| Other | 10.3 | 2.8 | 263.3% | 21.3 | 18.2 | 16.6% |
| Capex | 212.9 | 57.4 | 270.9% | 351.5 | 201.7 | 74.3% |
| Sale and leaseback | (82.3) | (28.3) | 190.7% | (151.6) | (30.7) | 393.9% |
| Net capex | 130.6 | 29.1 | 349.0% | 199.9 | 171.0 | 16.9% |
| 12 |
|
|
Second Quarter Results 2026
|
Certain items Azul views as capex are recognized in working capital, interest and financing activities under IFRS. In 2Q26 Managerial capex totaled R$307.9 million, driven by these reclassifications as demonstrated below:
| · | R$105.7 million prepaid maintenance payments reclassified from change in other assets and change in accounts payable to capex. |
| · | R$3.0 million related to interest on engine maintenance financing reclassified from interest paid to capex. |
| · | R$32.0 million related to engine maintenance financing line repayments reclassified from debt repayments to capex. |
| · | R$195.5 million maintenance reserves payments reclassified from change in other assets and change in accounts payable to capex. |
| · | R$3.9 million related to pre-delivery payments and redelivery payments reclassified from capex to growth capex. |
Non-Recurring: In 2Q26, Azul paid R$155.0 million in previously deferred capex which was reclassified under Managerial View.
| Capex (R$ million) | IFRS | Reclassifications | Non-Recurring | Managerial View |
| Capex | Out of Period | |||
| Capex | 130.6 | - | (155.0) | (24.4) |
| Pre-payments | - | 105.7 | - | 105.7 |
| Interest on loans and financing | - | 3.0 | - | 3.0 |
| Debt repayment | - | 32.0 | - | 32.0 |
| Maintenance reserve | - | 195.5 | - | 195.5 |
| Growth capex transfer | - | (3.9) | - | (3.9) |
| Total capex payments | 130.6 | 332.3 | (155.0) | 307.9 |
| Total growth capex | - | 3.9 | - | 3.9 |
| 13 |
|
|
Second Quarter Results 2026
|
Conference Call:
Friday, August 14, 2026
9:00 a.m. (EDT) | 10:00 a.m. (Brasília time)
USA: +1 360 209 5623 or +1 386 347 5053
Brazil: +55 11 4632 2236 or +55 11 4632 2237
Code: 837 6186 9705
Webcast: 2Q26 Earnings Call
About Azul
Azul S.A. (B3: AZUL3; NYSE: AZUL), Brazil’s largest airline in number of cities served, offers more than 800 daily flights to more than 135 destinations. With an operating fleet of more than 150 aircraft and more than 14,000 crew members, the Company operates a network of 250 nonstop routes. In 2020, it was named the world’s best airline by TripAdvisor, the first time a Brazilian airline achieved the top position in the Traveler’s Choice Awards.For more information visit ri.voeazul.com.br/en/.
Contact:
Investor Relations |
Press Relations |
Tel: +55 11 4831 2880 |
Tel: +55 11 98196-1035 |
invest@voeazul.com.br |
imprensa@voeazul.com.br |
| 14 |
|
|
Second Quarter Results 2026
|
Balance Sheet – IFRS
| (R$ million) | June 30, 2026 | March 31, 2026 | June 30, 2025 |
| Assets | 30,784.9 | 31,166.5 | 26,897.0 |
| Current assets | 6,292.5 | 7,228.0 | 7,180.1 |
| Cash and cash equivalents | 1,268.9 | 2,088.0 | 1,458.8 |
| Short-term investments | - | - | 1,134.3 |
| Accounts receivable | 2,390.3 | 2,570.2 | 1,689.3 |
| Inventories | 1,095.9 | 975.0 | 988.1 |
| Security deposits and maintenance reserves | 300.9 | 387.2 | 329.7 |
| Taxes recoverable | 207.6 | 209.8 | 210.8 |
| Derivative financial instruments | 5.0 | - | - |
| Prepaid expenses | 494.8 | 439.8 | 257.2 |
| Other current assets | 529.1 | 557.9 | 1,111.9 |
| Non-current assets | 24,492.4 | 23,938.5 | 19,716.9 |
| Long-term investments | - | - | - |
| Security deposits and maintenance reserves | 2,500.7 | 2,372.4 | 3,205.7 |
| Other non-current assets | 8,160.3 | 7,989.5 | 516.7 |
| Right of use – leased aircraft and other assets | 2,448.1 | 7,626.6 | 9,824.3 |
| Right of use – maintenance of leased aircraft | 8,137.3 | 1,658.6 | 1,684.3 |
| Property and equipment | 1,708.7 | 2,759.4 | 2,919.4 |
| Intangible assets | 1,537.2 | 1,532.0 | 1,566.5 |
| Liabilities and equity | 30,784.9 | 31,166.5 | 26,897.0 |
| Current liabilities | 14,891.9 | 14,479.4 | 21,363.7 |
| Loans and financing | 1,347.7 | 1,068.8 | 4,962.0 |
| Convertible instruments | - | - | 30.7 |
| Leases | 2,591.2 | 2,496.8 | 4,100.6 |
| Lease notes | - | - | 53.1 |
| Accounts payable | 2,635.7 | 2,919.7 | 3,576.9 |
| Air traffic liability | 6,262.7 | 5,675.4 | 6,530.7 |
| Salaries and benefits | 564.4 | 527.3 | 563.2 |
| Insurance payable | 10.8 | 15.9 | 6.9 |
| Taxes payable | 184.7 | 168.4 | 97.1 |
| Derivative financial instruments | 2.5 | - | - |
| Provisions | 376.9 | 474.1 | 500.4 |
| Airport fees | 804.3 | 917.8 | 756.2 |
| Other | 111.1 | 215.0 | 185.8 |
| Non-current liabilities | 21,047.8 | 20,461.5 | 31,573.8 |
| Loans and financing | 8,536.3 | 8,644.6 | 11,827.1 |
| Convertible instruments | - | - | 641.6 |
| Leases | 8,940.7 | 8,432.3 | 12,798.4 |
| Lease notes | - | - | 669.2 |
| Accounts payable | 131.5 | 161.5 | 1,370.5 |
| Provision | 1,425.4 | 1,340.2 | 2,509.3 |
| Airport fees | 820.3 | 688.3 | 756.8 |
| Other non-current liabilities | 1,193.7 | 1,194.7 | 1,000.9 |
| Equity | (5,154.9) | (3,774.3) | (26,040.5) |
| Issued capital | 21,685.8 | 21,685.8 | 7,060.8 |
| Advance for future capital increase | 1.1 | 1.1 | - |
| Capital reserve | 3,227.2 | 3,208.5 | (1,406.0) |
| Treasury shares | - | (1.4) | (4.3) |
| Accumulated other comprehensive result | 4.9 | 4.9 | 5.9 |
| Accumulated losses | (30,073.9) | (28,673.2) | (31,696.9) |
| 15 |
|
|
Second Quarter Results 2026
|
Cash Flow Statement – IFRS
| (R$ million) | 2Q26 | 2Q25 | % Δ | 1H26 | 1H25 | % Δ |
| Cash flows from operating activities | ||||||
| Net profit (loss) for the period | (1,400.7) | 1,468.0 | n.a. | 4,619.7 | 3,121.6 | 48.0% |
| Total non-cash adjustments | ||||||
| Depreciation and amortization | 747.1 | 762.8 | -2.1% | 1,401.5 | 1,578.0 | -11.2% |
| Unrealized derivatives | (14.4) | (655.8) | -97.8% | (14.4) | (860.7) | -98.3% |
| Exchange gain and (losses) in foreign currency | 17.0 | (1,788.3) | n.a. | (1,434.6) | (4,552.5) | -68.5% |
| Financial income and expenses, net | 764.6 | 929.0 | -17.7% | 6,612.3 | 3,484.2 | 89.8% |
| Provisions | 42.5 | 143.4 | -70.4% | 196.1 | 84.6 | 131.7% |
| Result from modification of lease and provision | (22.7) | (61.9) | -63.3% | (103.9) | (1,293.0) | -92.0% |
| Other | 341.2 | (51.9) | n.a. | (9,630.9) | 78.6 | n.a. |
| Changes in operating assets and liabilities | ||||||
| Trade and other receivables | 254.5 | 71.9 | 254.0% | 512.0 | 21.3 | 2308.8% |
| Security deposits and maintenance reserves | (106.3) | (244.6) | -56.5% | (73.7) | (274.4) | -73.1% |
| Other assets | (240.9) | (116.1) | 107.5% | (211.9) | (263.2) | -19.5% |
| Derivatives | 11.8 | (21.6) | n.a. | 11.8 | (46.8) | n.a. |
| Accounts payable | (634.5) | (173.6) | 265.5% | (1,486.4) | (489.7) | 203.5% |
| Salaries and benefits | 13.2 | 77.4 | -82.9% | 25.5 | 106.9 | -76.2% |
| Air traffic liability | 395.0 | 231.5 | 70.6% | (192.3) | 371.6 | n.a. |
| Provisions | (238.2) | (170.2) | 39.9% | (313.0) | (307.9) | 1.7% |
| Other liabilities | 43.3 | (142.8) | n.a. | 122.1 | (47.5) | n.a. |
| Interest paid | (180.9) | (325.5) | -44.4% | (376.9) | (1,092.4) | -65.5% |
| Interest on loans and financing | (40.2) | (77.0) | -47.9% | (96.8) | (437.1) | -77.9% |
| Interest on leases | (53.6) | (39.9) | 34.5% | (92.5) | (195.0) | -52.6% |
| Interest on leases - notes and equity | - | (52.5) | n.a. | - | (61.3) | n.a. |
| Interest on convertible instruments | - | (42.1) | n.a. | - | (175.2) | n.a. |
| Interest on factoring credit card receivables | (66.8) | (111.5) | -40.1% | (163.0) | (220.6) | -26.1% |
| Other interest | (20.3) | (2.5) | 720.1% | (24.6) | (3.1) | 687.2% |
| Net cash generated (used) by operating activities | (208.1) | (68.2) | 205.1% | (336.9) | (381.4) | -11.7% |
| Cash flows from investing activities | ||||||
| Short-term investment | - | 81.1 | n.a. | 26.7 | (22.4) | n.a. |
| Cash received on sale of property and equipment | - | - | n.a. | - | 7.3 | n.a. |
| Sales and leaseback | 82.3 | 28.3 | 190.7% | 151.6 | 30.7 | 393.9% |
| Acquisition of intangible | (36.5) | (31.4) | 16.1% | (79.2) | (47.4) | 67.2% |
| Acquisition of property and equipment | (176.4) | (26.0) | 578.6% | (272.3) | (154.3) | 76.4% |
| Net cash generated (used) in investing activities | (130.6) | 52.0 | n.a. | (173.3) | (186.1) | -6.9% |
| Cash flows from financing activities | ||||||
| Loans and financing | ||||||
| Proceeds | 330.0 | 2,024.2 | -83.7% | 7,387.4 | 5,118.0 | 44.3% |
| Repayment | (88.0) | (269.2) | -67.3% | (7,756.3) | (2,508.5) | 209.2% |
| Lease repayment | (658.3) | (696.3) | -5.4% | (1,439.6) | (1,729.4) | -16.8% |
| Factoring | - | - | n.a. | - | - | n.a. |
| Cost of issuing shares | - | (43.0) | n.a. | - | (43.0) | n.a. |
| Capital increase | (0.0) | 49.4 | n.a. | 2,755.7 | 51.2 | n.a. |
| Net cash generated (used) in financing activities | (416.2) | 1,065.1 | n.a. | 947.3 | 888.3 | 6.6% |
| Exchange gain (loss) on cash and cash equivalents | (64.2) | (50.8) | 26.3% | (159.9) | (72.0) | 122.3% |
| Net decrease in cash and cash equivalents | (819.1) | 998.1 | n.a. | 277.2 | 248.8 | 11.4% |
| Cash and cash equivalents at the beginning of the period | 2,088.0 | 460.7 | 353.2% | 991.6 | 1,210.0 | -18.0% |
| Cash and cash equivalents at the end of the period | 1,268.9 | 1,458.8 | -13.0% | 1,268.9 | 1,458.8 | -13.0% |
| 16 |
|
|
Second Quarter Results 2026
|
Glossary
Aircraft Utilization
Average number of block hours per day per aircraft operated.
Available Seat Kilometers (ASK)
Number of aircraft seats multiplied by the number of kilometers flown.
Completion Factor
Percentage of scheduled flights that were executed.
Cost per ASK (CASK)
Operating expenses divided by available seat kilometers.
Cost per ASK ex-fuel (CASK ex-fuel)
Operating expenses divided by available seat kilometers excluding fuel expenses.
EBITDA
Earnings before interest, taxes, depreciation, and amortization. Adjusted EBITDA excludes non-recurring items.
FTE (Full-Time Equivalent)
Equivalent number of employees assuming all work full-time.
Immediate Liquidity
Cash, cash equivalents, short-term investments, and receivables.
Load Factor
Number of passengers as a percentage of number of seats flown (calculated by dividing RPK by ASK).
LTM
Last twelve months ended on the last day of the quarter presented.
Revenue Passenger Kilometers (RPK)
One-fare paying passenger transported one kilometer. RPK is calculated by multiplying the number of revenue passengers by the number of kilometers flown.
Passenger Revenue per Available Seat Kilometer (PRASK)
Passenger revenue divided by available seat kilometers (also equal to load factor multiplied by yield).
Revenue per ASK (RASK)
Operating revenue divided by available seat kilometers.
Stage Length
The average number of kilometers flown per flight.
Trip Cost
Average cost of each flight calculated by dividing total operating expenses by total number of departures.
Yield
Average amount paid per passenger to fly one kilometer. Usually, yield is calculated as average revenue per revenue passenger kilometer.
| 17 |
|
|
Second Quarter Results 2026
|
This earnings release includes estimates and forward-looking statements within the meaning of the U.S. federal securities laws. These estimates and forward-looking statements are based mainly on our current expectations and estimates of future events and trends that affect or may affect our business, financial condition, results of operations, cash flow, liquidity, prospects, and the trading price of our preferred shares, including in the form of ADSs. Although we believe that these estimates and forward-looking statements are based upon reasonable assumptions, they are subject to many significant risks, uncertainties and assumptions and are made in light of information currently available to us. In addition, in this release, the words “may,” “will,” “estimate,” “anticipate,” “intend,” “expect,” “should” and similar words are intended to identify forward-looking statements. You should not place undue reliance on such statements, which speak only as of the date they were made. Azul is not under the obligation to update publicly or to revise any forward-looking statements after we distribute this earnings release because of new information, future events, or other factors. Our independent public auditors have neither examined nor compiled the forward-looking statements and, accordingly, do not provide any assurance with respect to such statements. In light of the risks and uncertainties described above, the future events and circumstances discussed in this release might not occur and are not guarantees of future performance. Because of these uncertainties, you should not make any investment decision based upon these estimates and forward-looking statements.
In this earnings release, we present EBITDA and EBITDA margin, which are non-IFRS performance measures and are not financial performance measures determined in accordance with IFRS and should not be considered in isolation or as alternatives to operating income or net income or loss, or as indications of operating performance, or as alternatives to operating cash flows, or as indicators of liquidity, or as the basis for the distribution of dividends. Accordingly, you are cautioned not to place undue reliance on this information.
| 18 |
SIGNATURES
Pursuant to the requirements of the Securities Exchange Act of 1934, the registrant has duly caused this report to be signed on its behalf by the undersigned, thereunto duly authorized.
Date: August 13, 2026
Azul S.A.
By: /s/ Antônio Carlos Garcia
Name: Antônio Carlos Garcia
Title: Chief Financial Officer