 エドガーで原本を確認する
UNITED STATES
SECURITIES AND EXCHANGE COMMISSION
Washington, D.C. 20549
FORM 6-K
Report of Foreign Private
Issuer
Pursuant to Rule 13a-16 or 15d-16 of the
Securities Exchange Act of 1934
For the month of August, 2026
Commission File Number 1-15106
PETRÓLEO BRASILEIRO S.A. – PETROBRAS
(Exact name of registrant as specified in its charter)
Brazilian Petroleum Corporation – PETROBRAS
(Translation of Registrant's name into English)
Avenida Henrique Valadares, 28 – 9th floor
20231-030 – Rio de Janeiro, RJ
Federative Republic of Brazil
(Address of principal executive office)
Indicate by check mark whether the registrant files or will file annual reports under cover Form 20-F or Form 40-F.
Form 20-F ___X___ Form 40-F _______
Indicate by check mark whether the registrant by furnishing the information contained in this Form is also thereby furnishing the information to the Commission pursuant to Rule 12g3-2(b) under the Securities Exchange Act of 1934.
Yes _______ No___X____
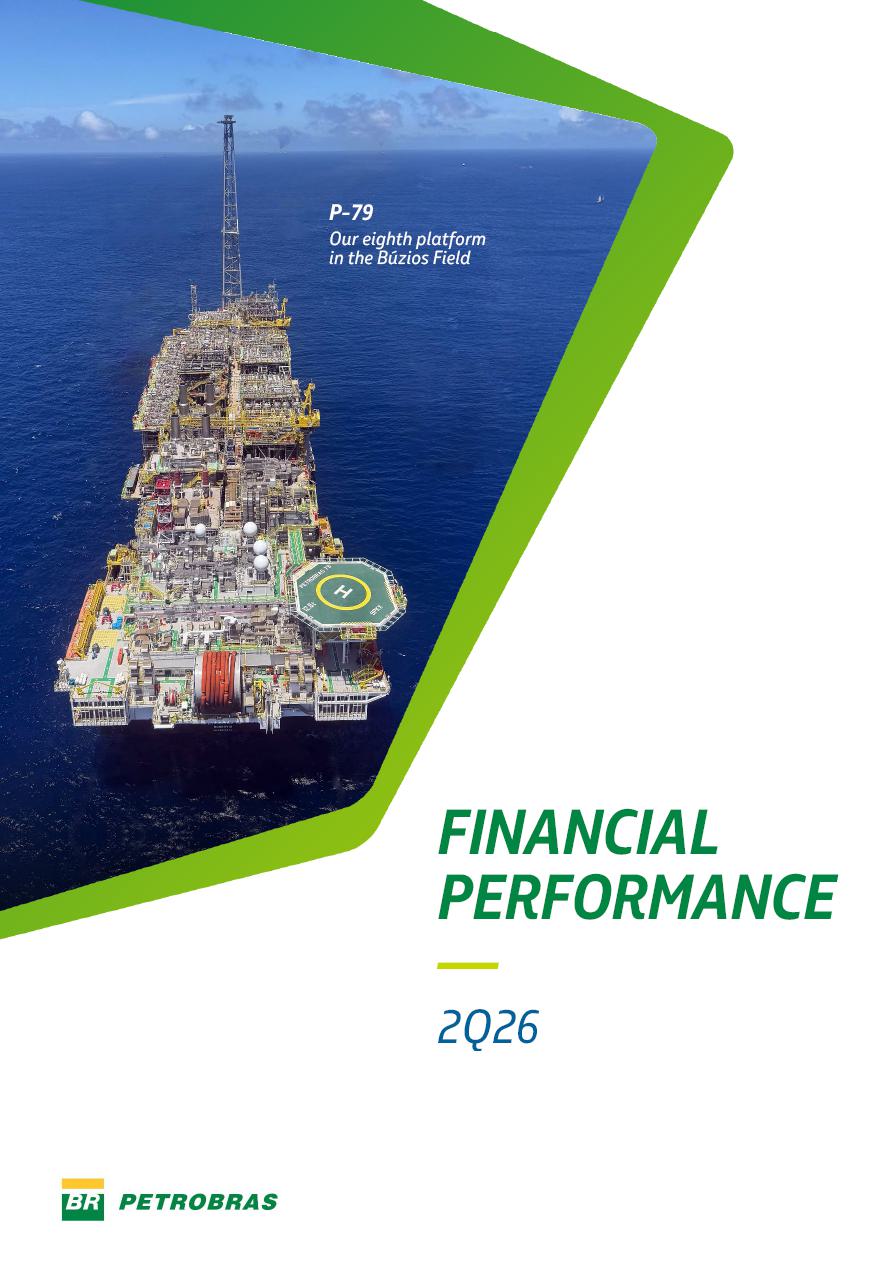
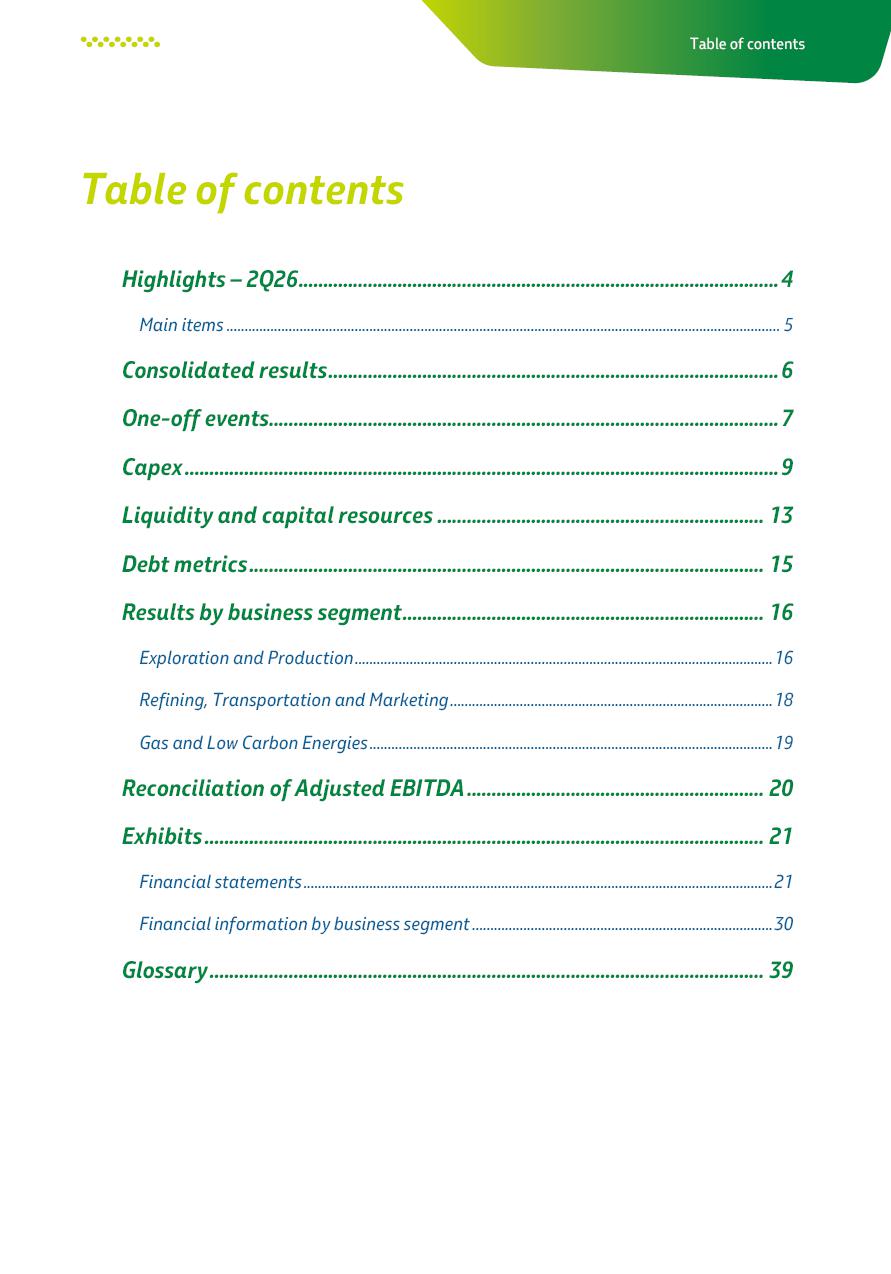
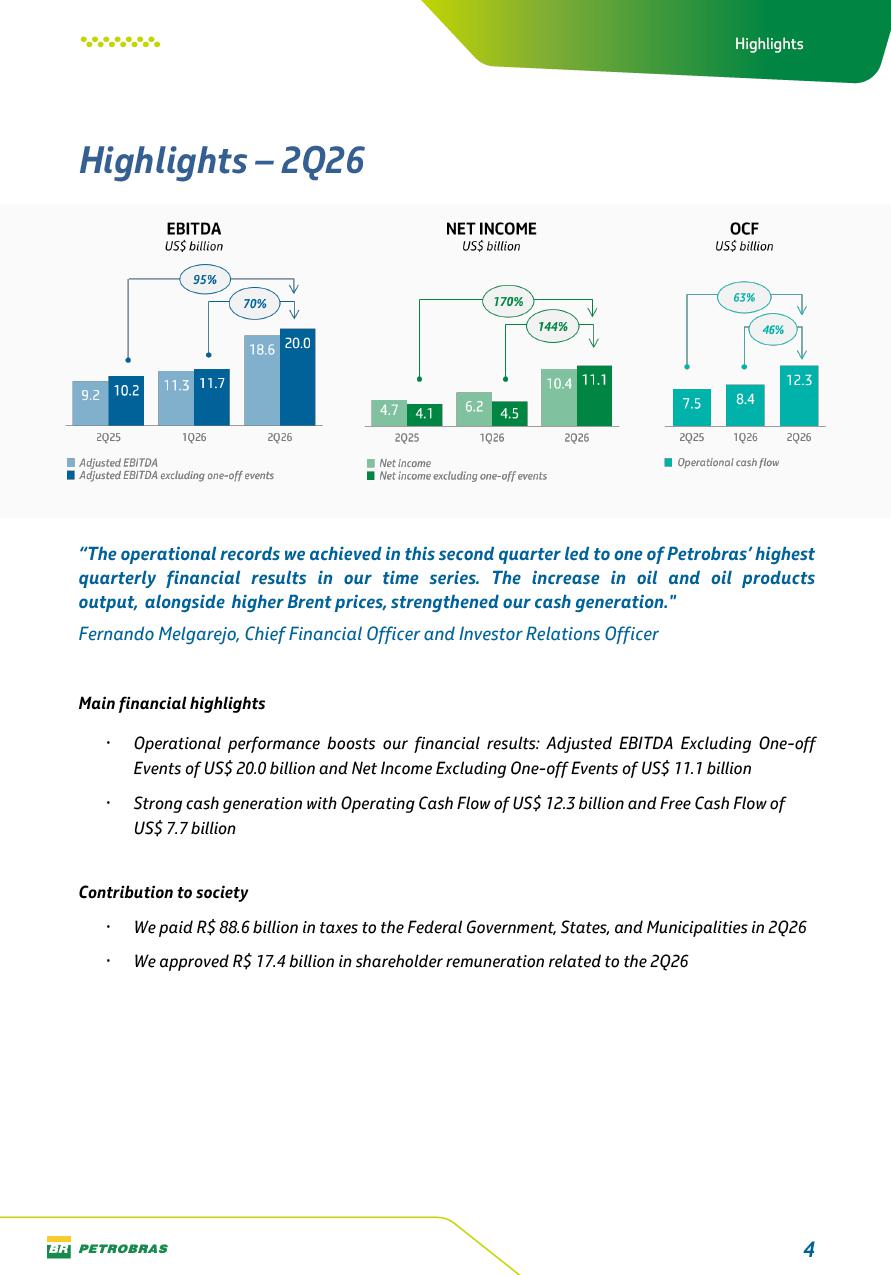
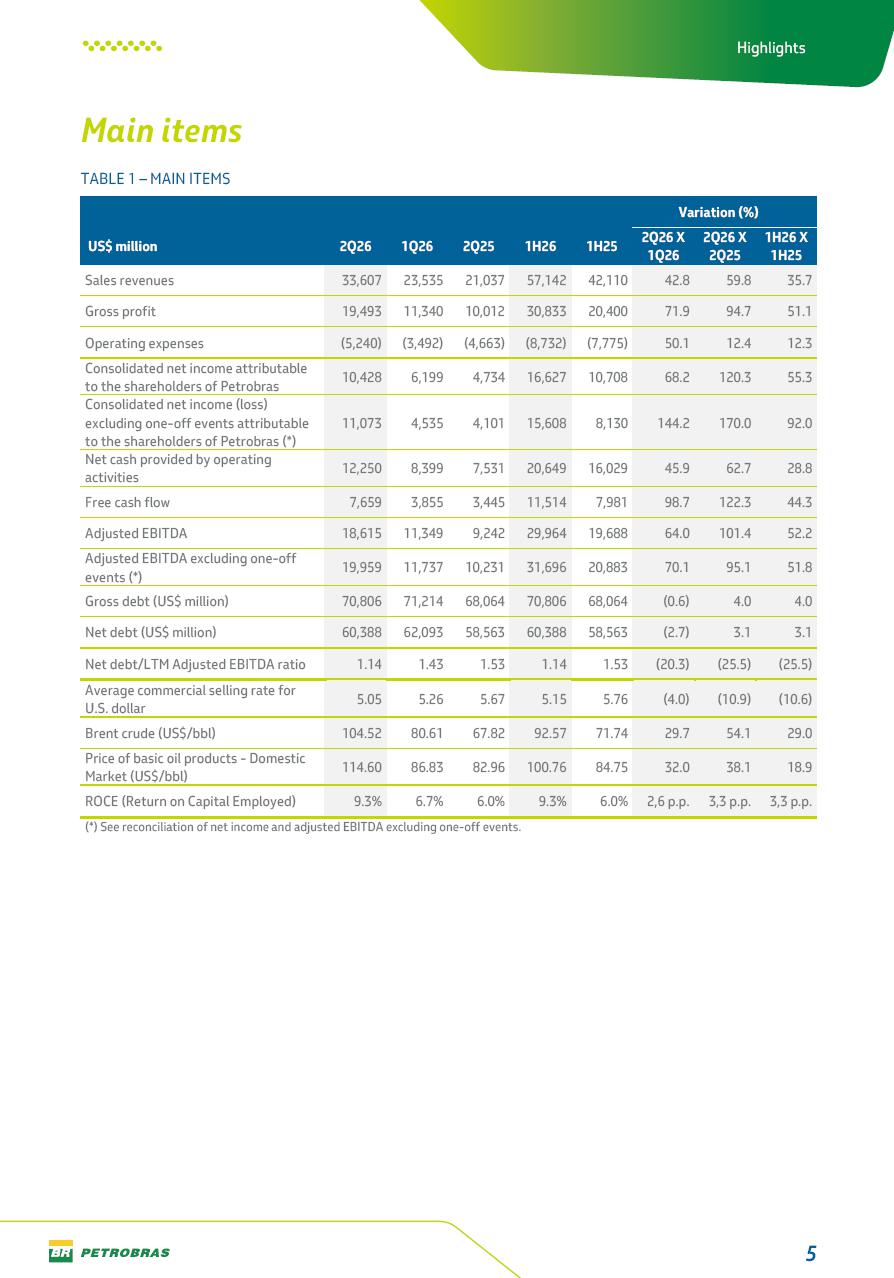
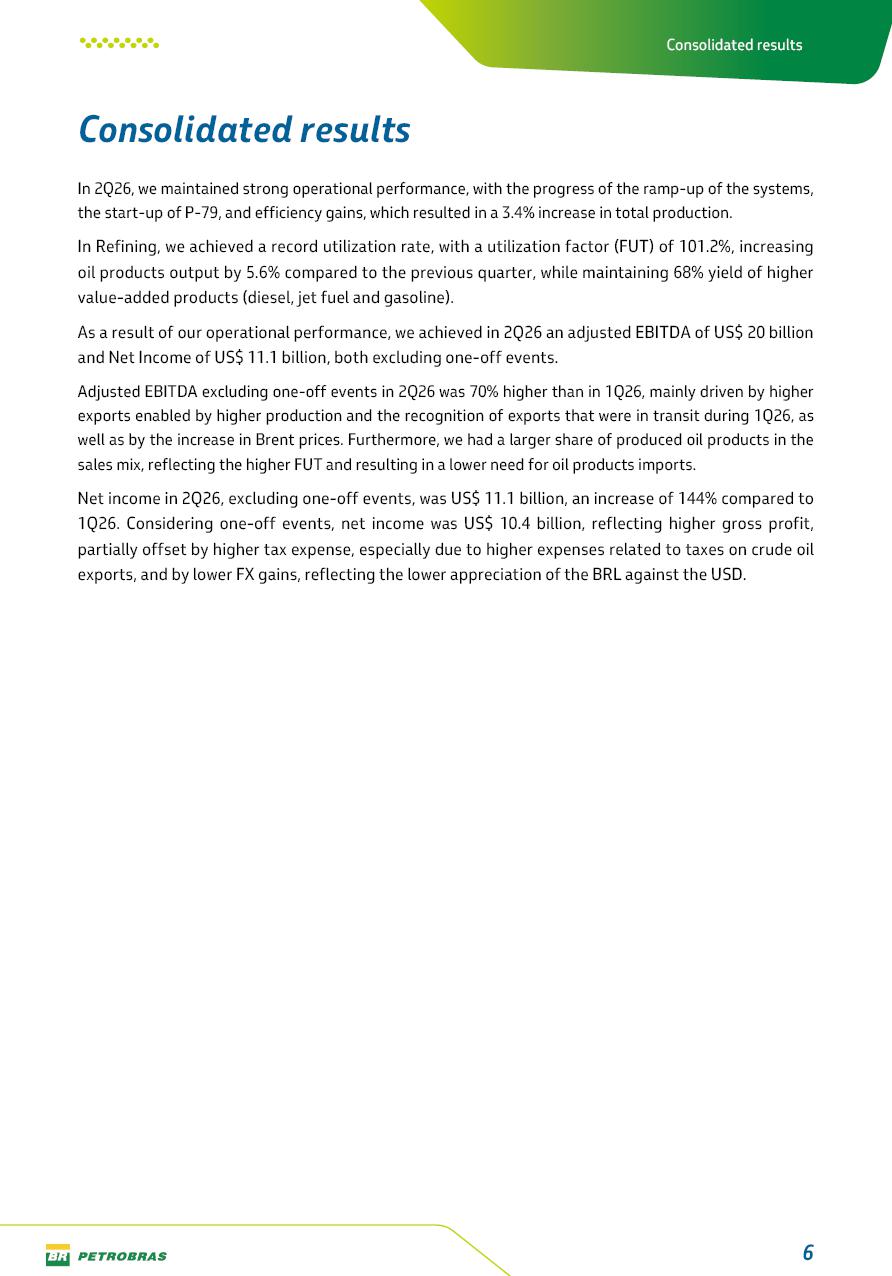
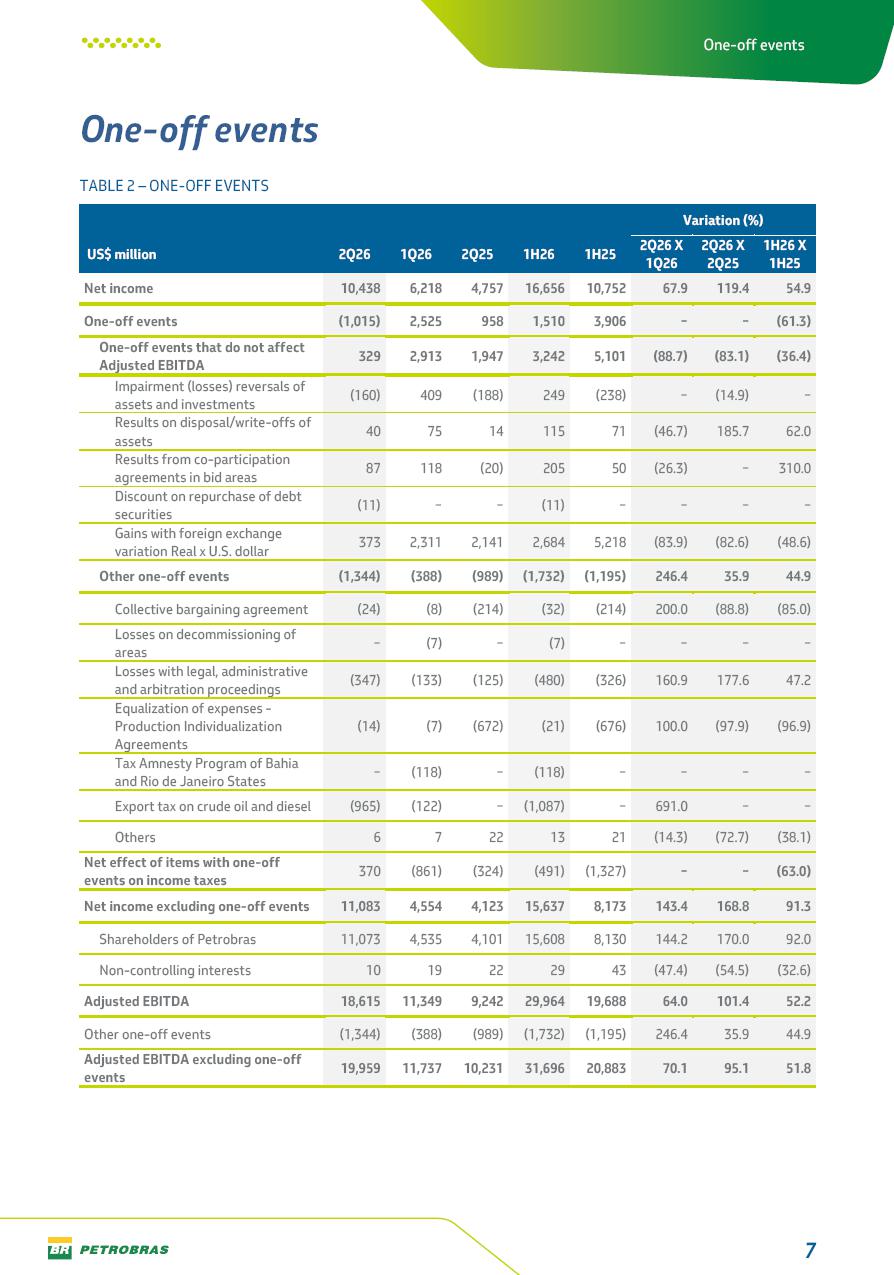
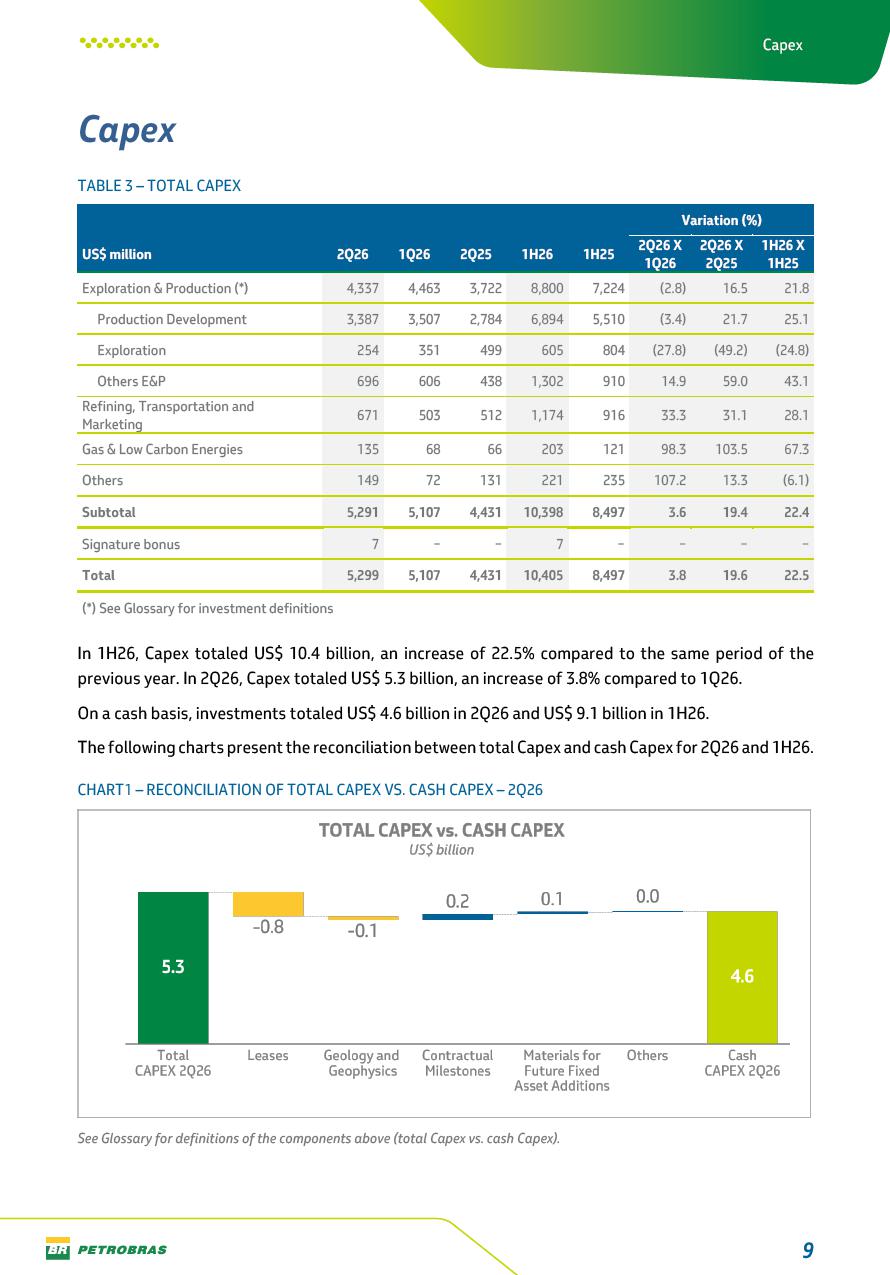
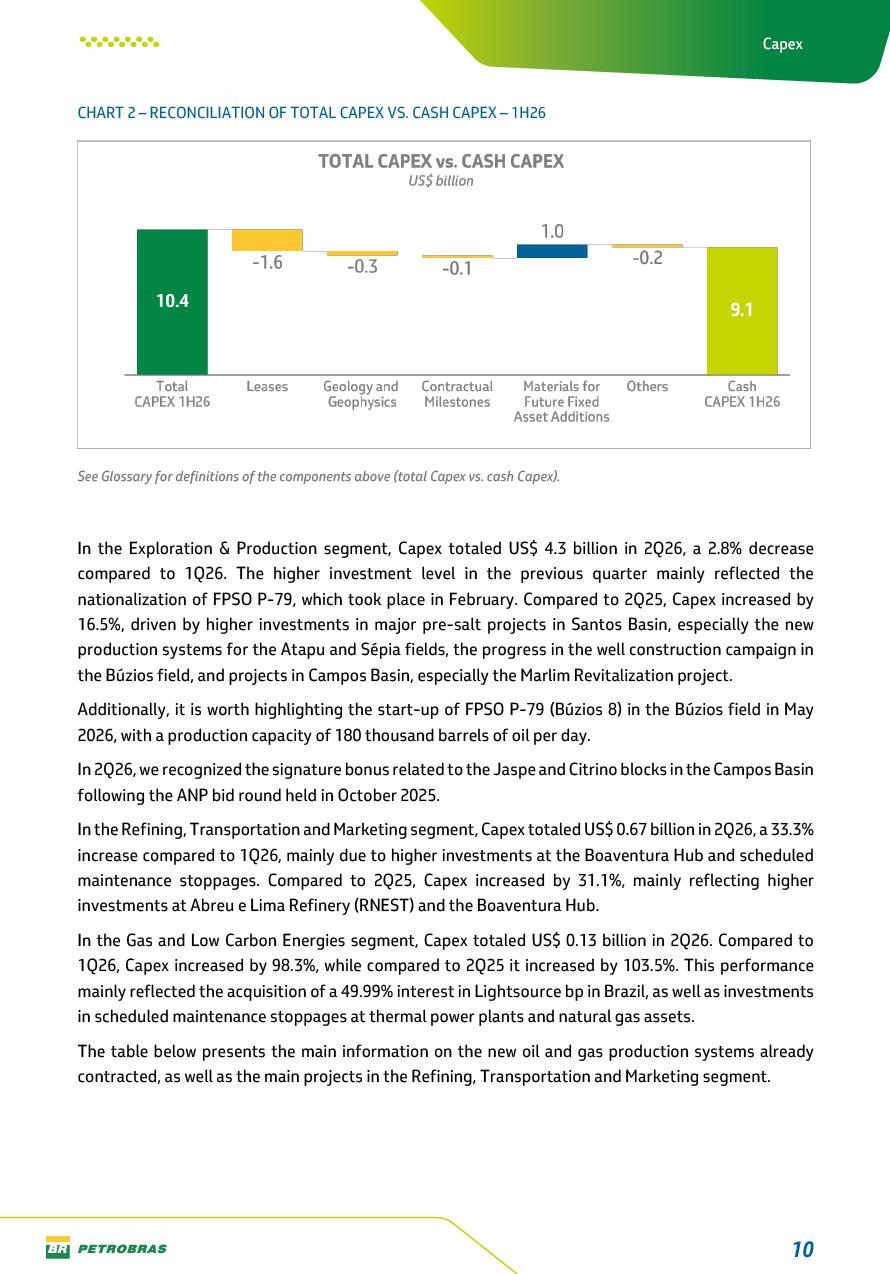
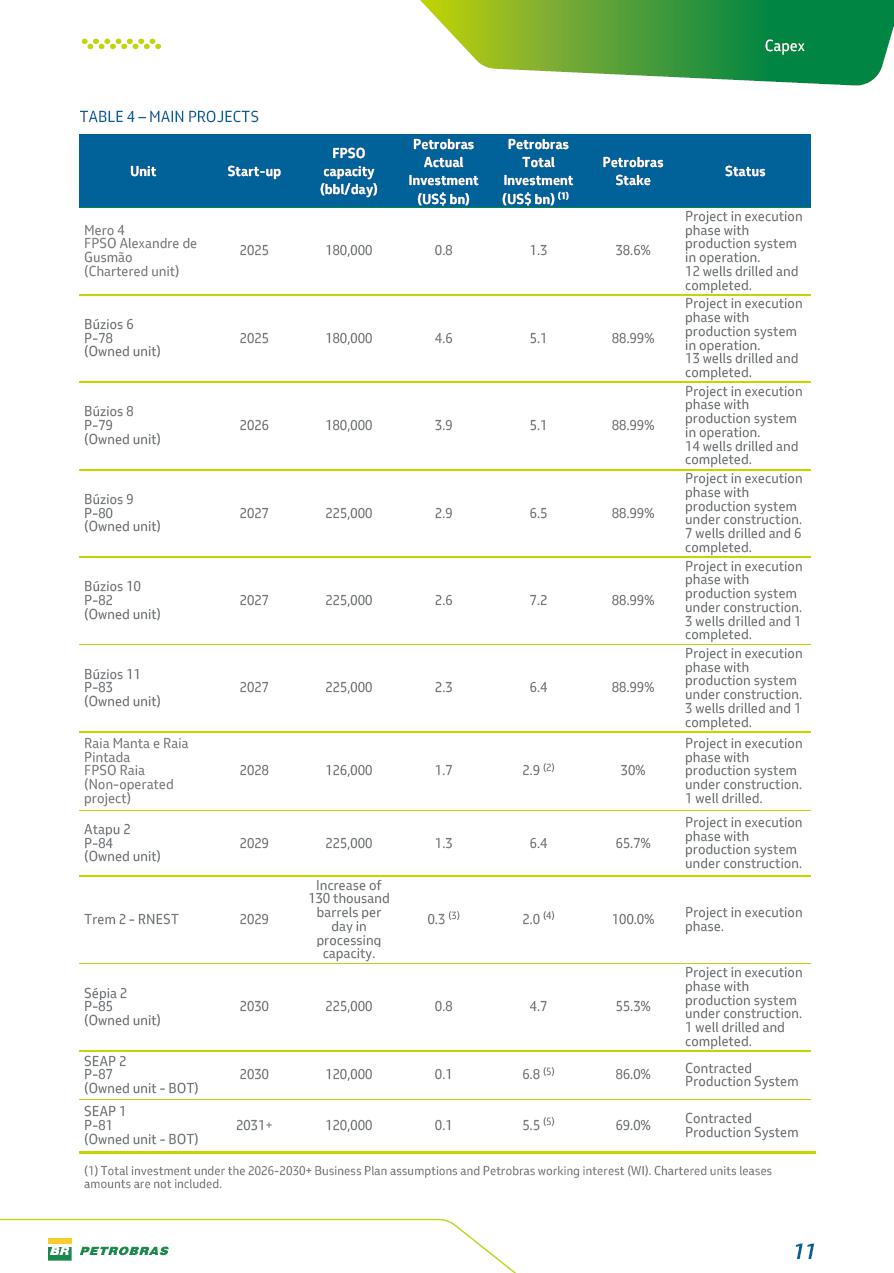
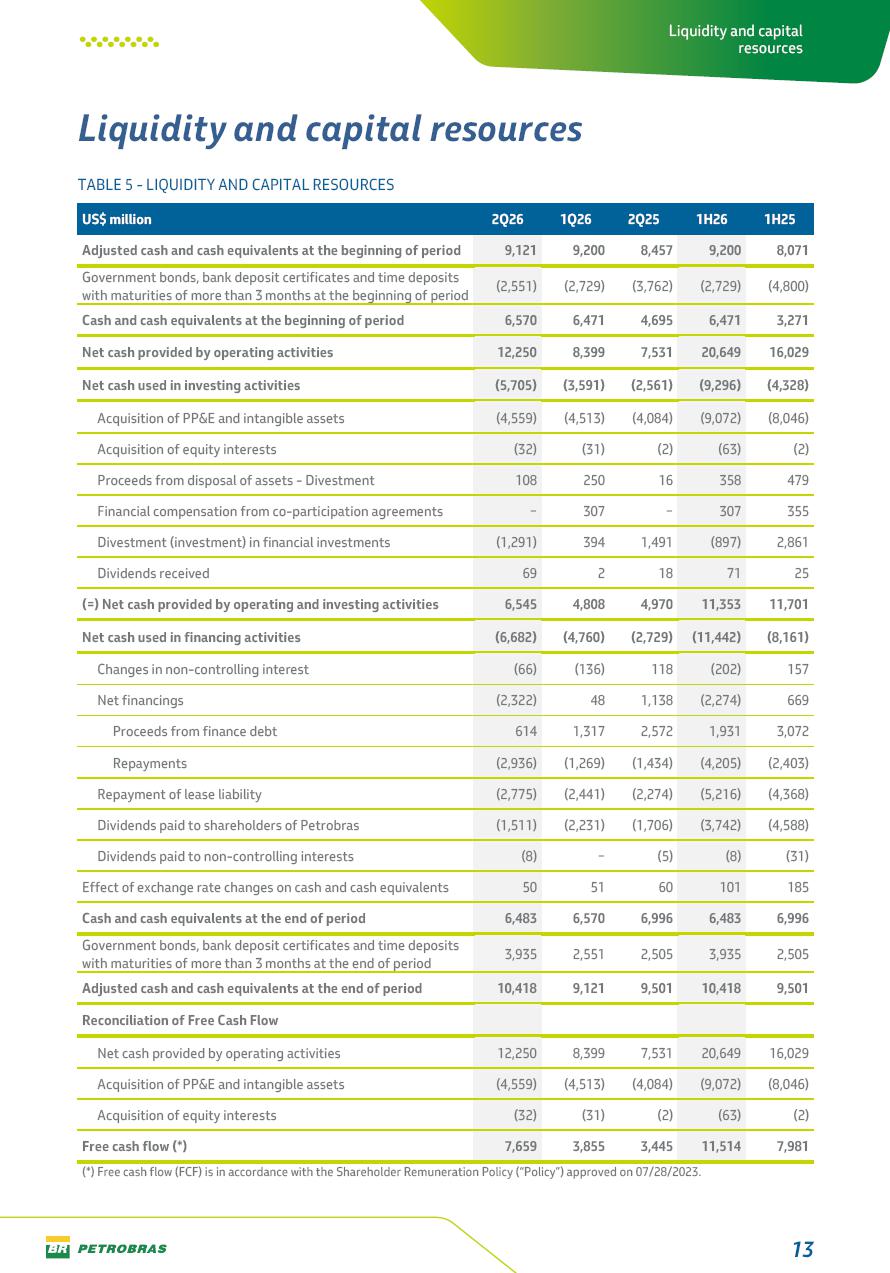
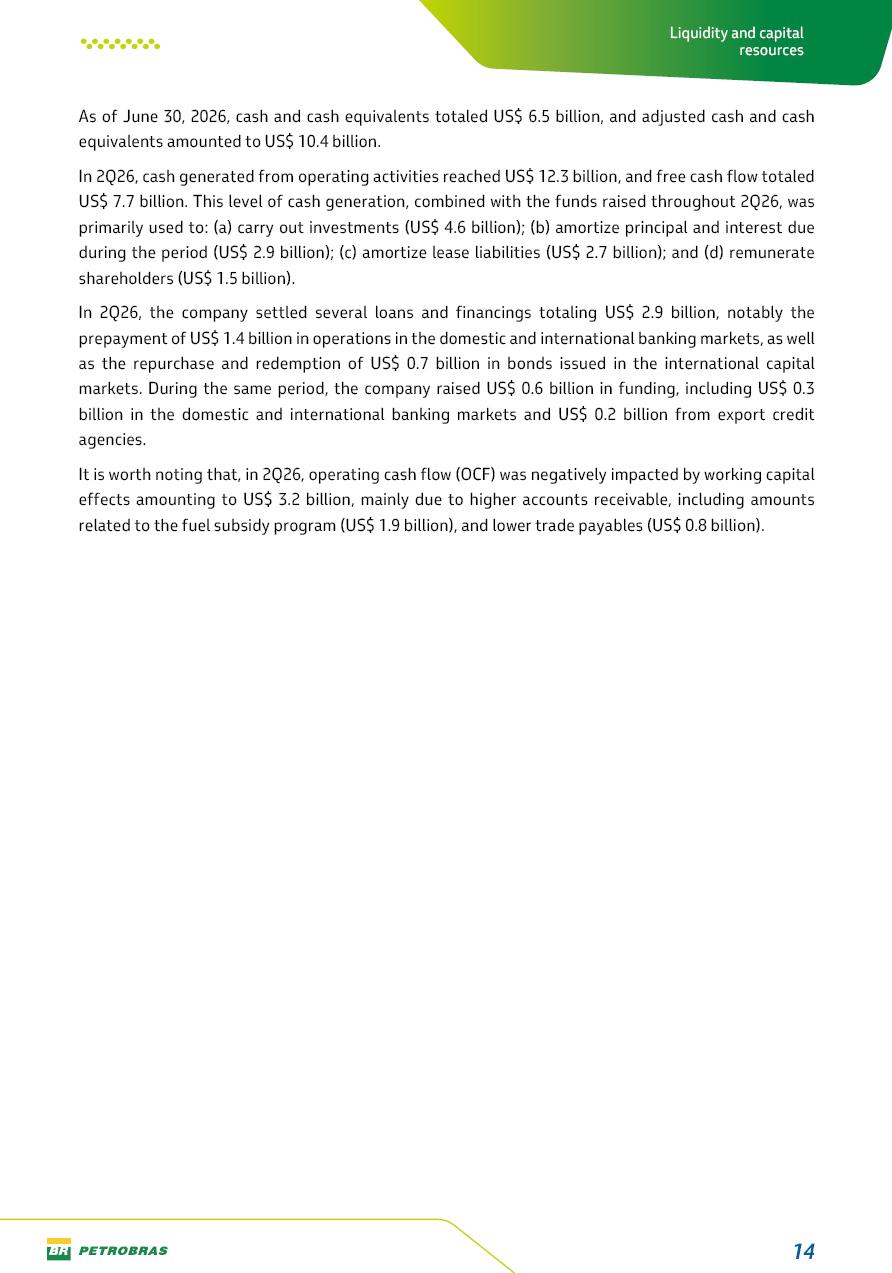
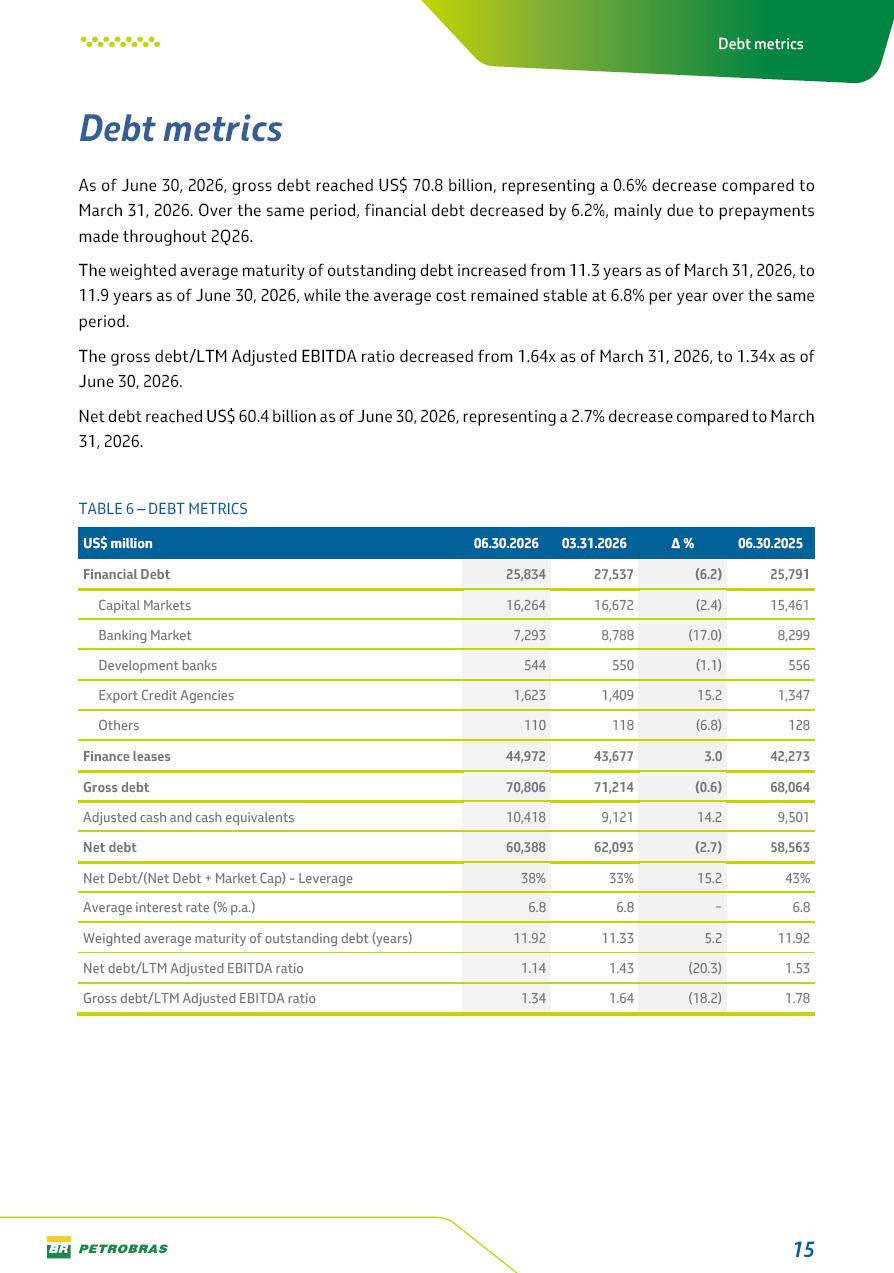
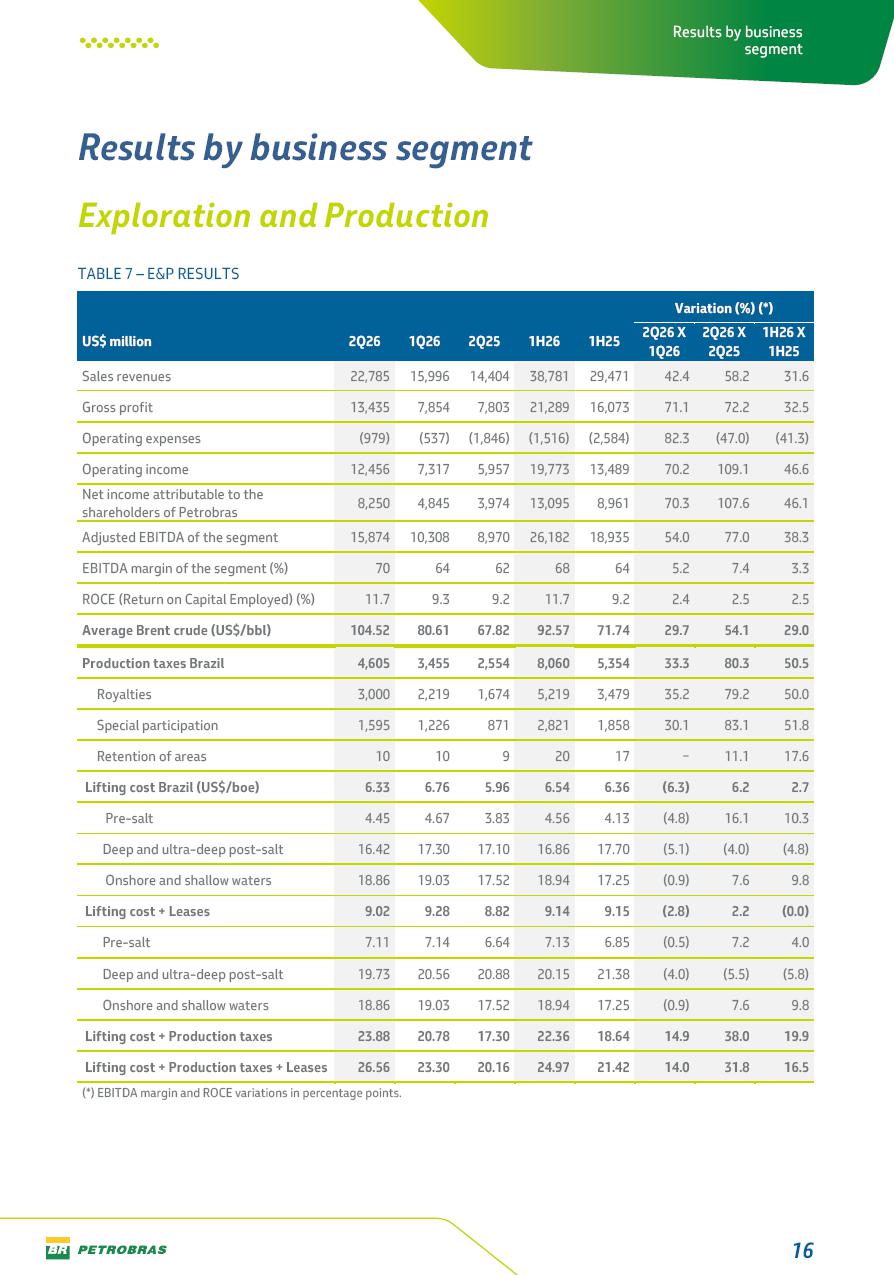
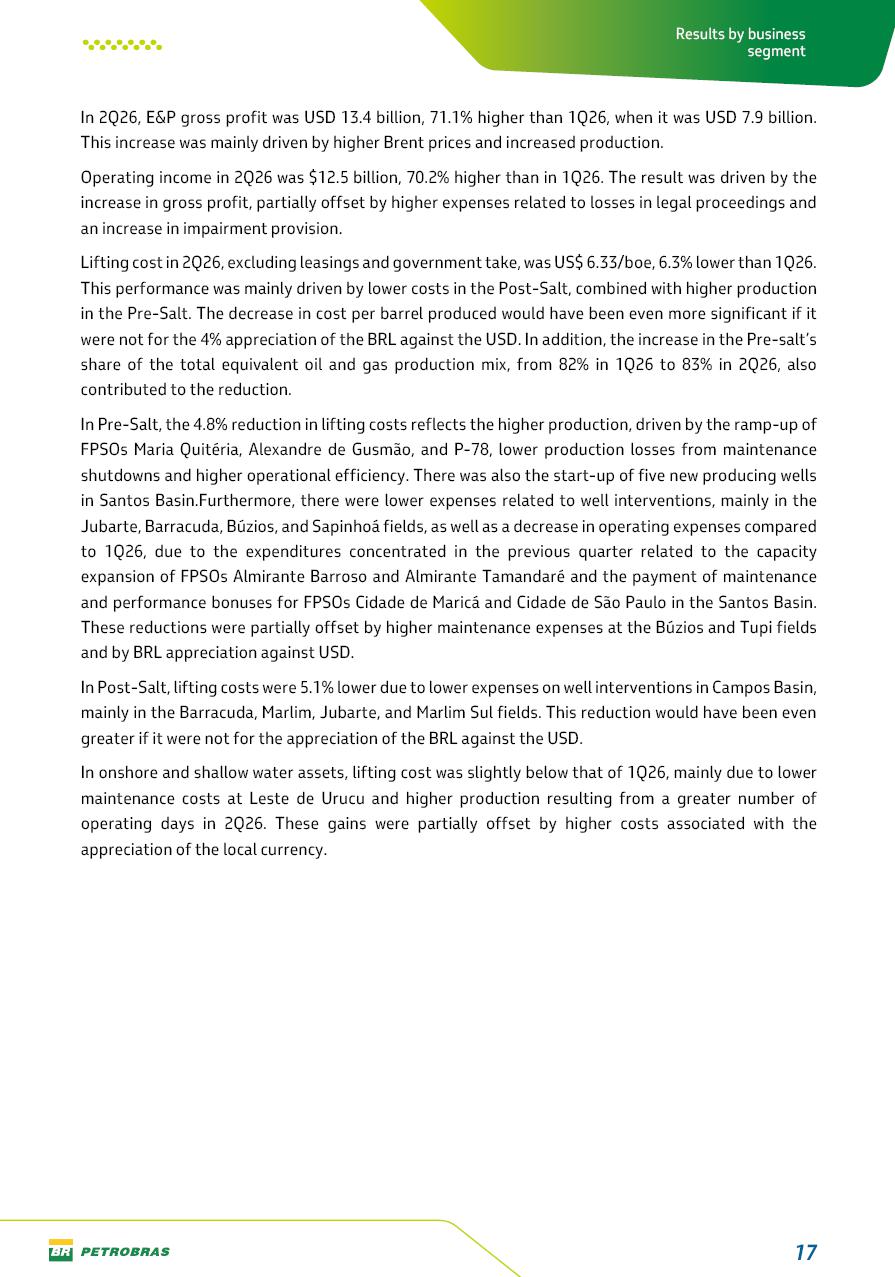
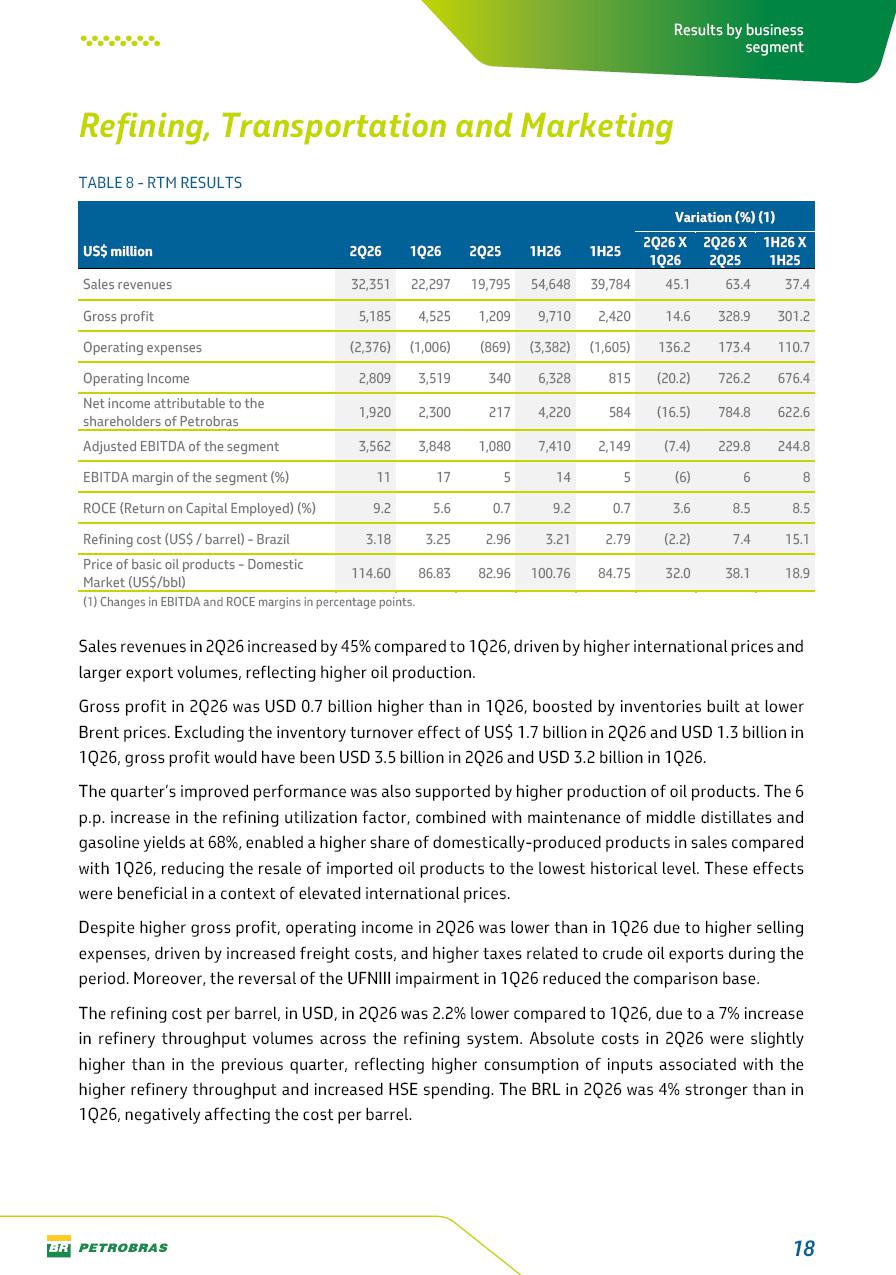
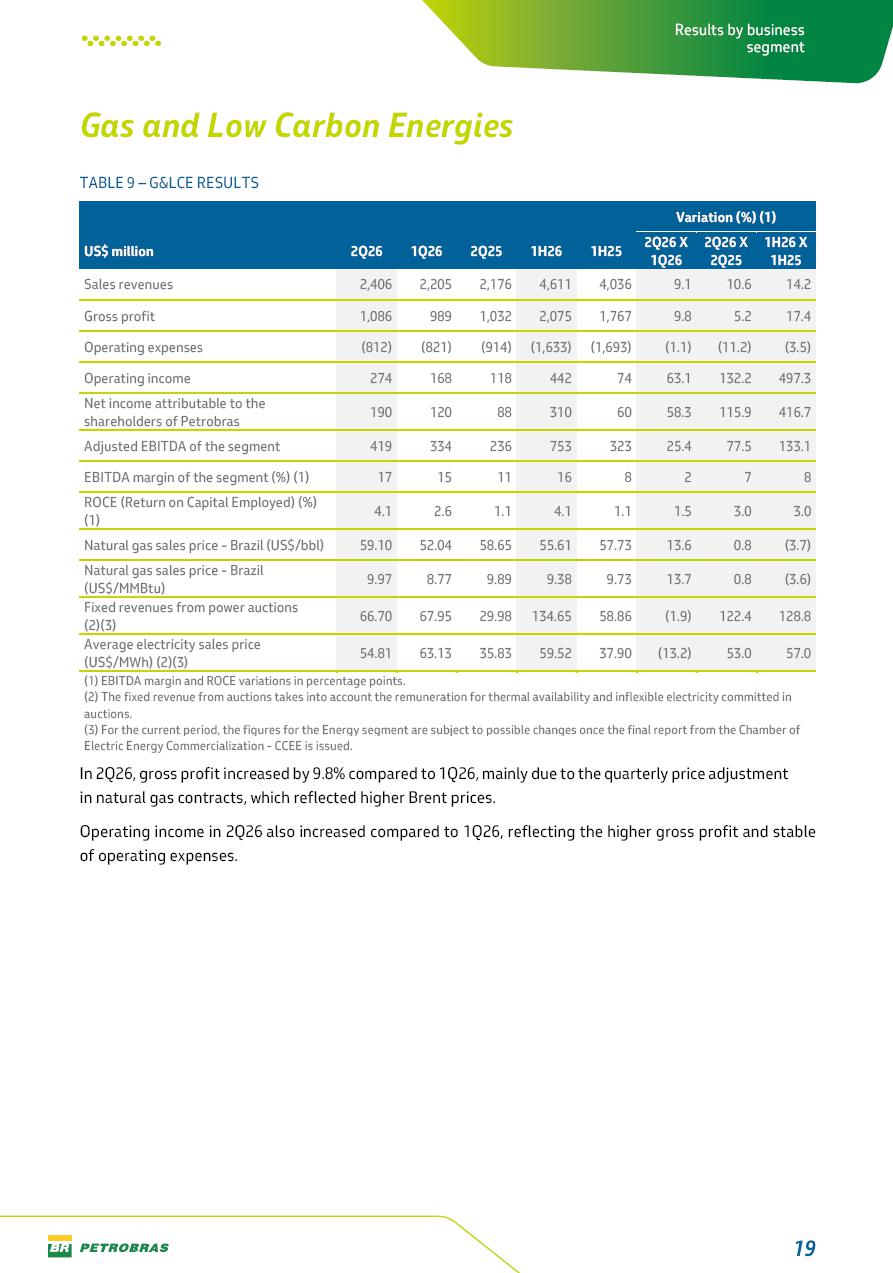
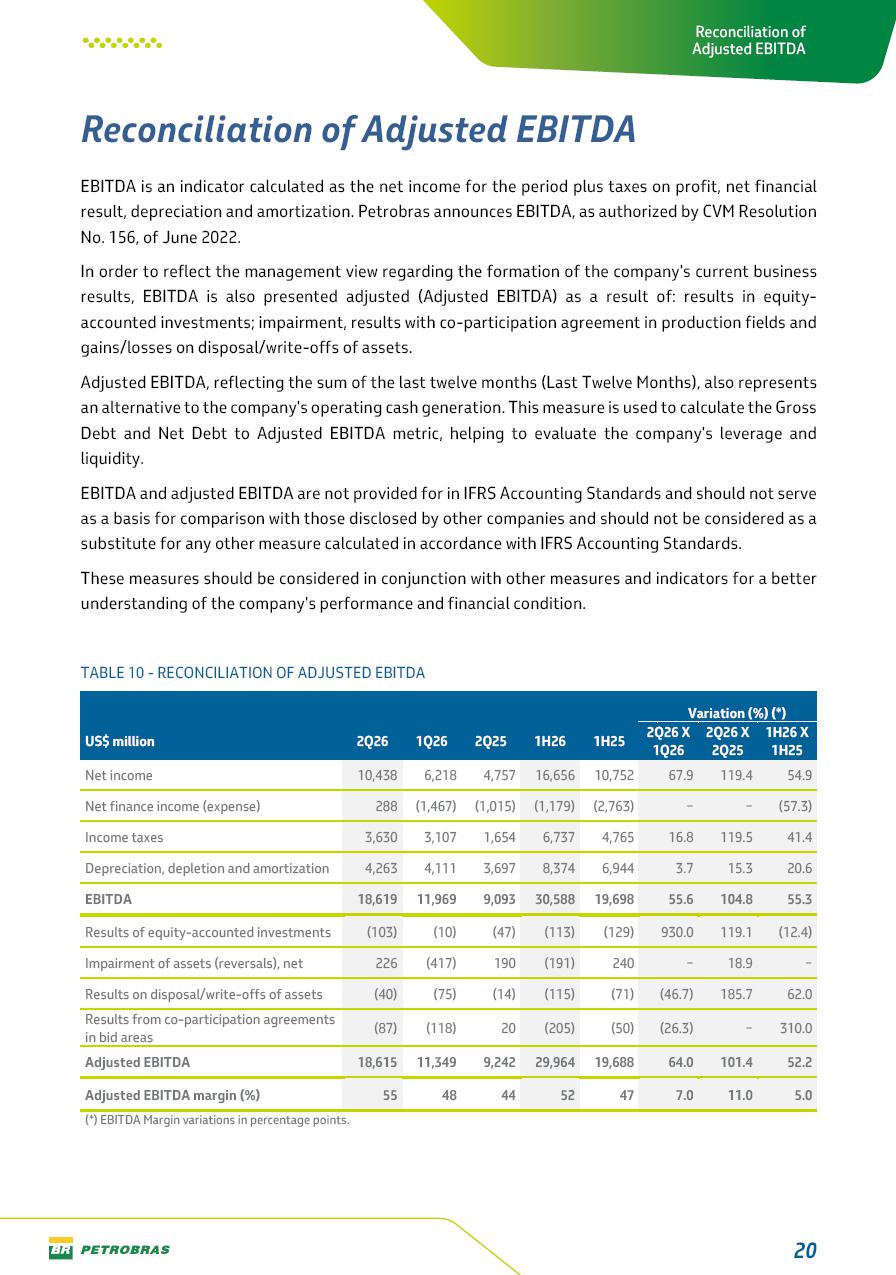
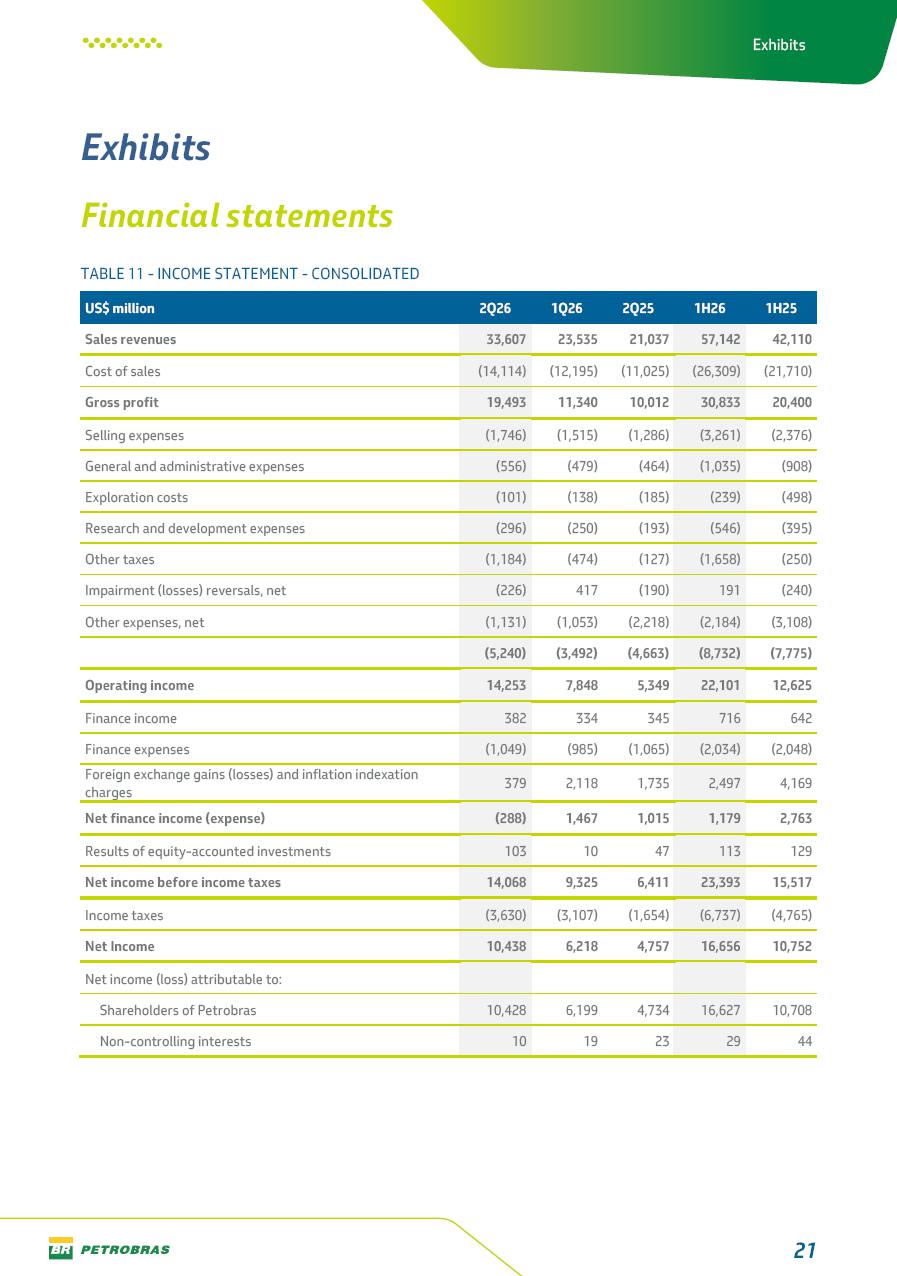
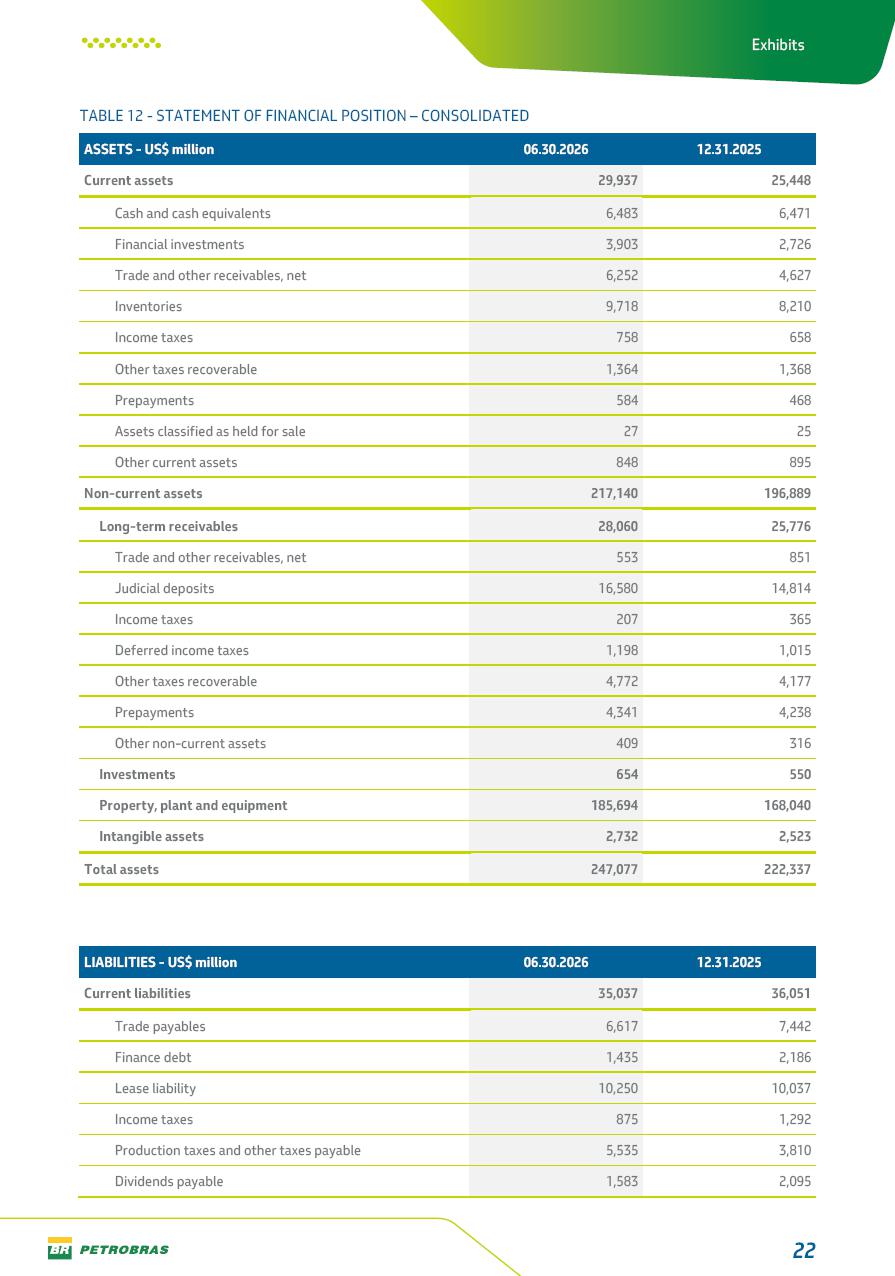
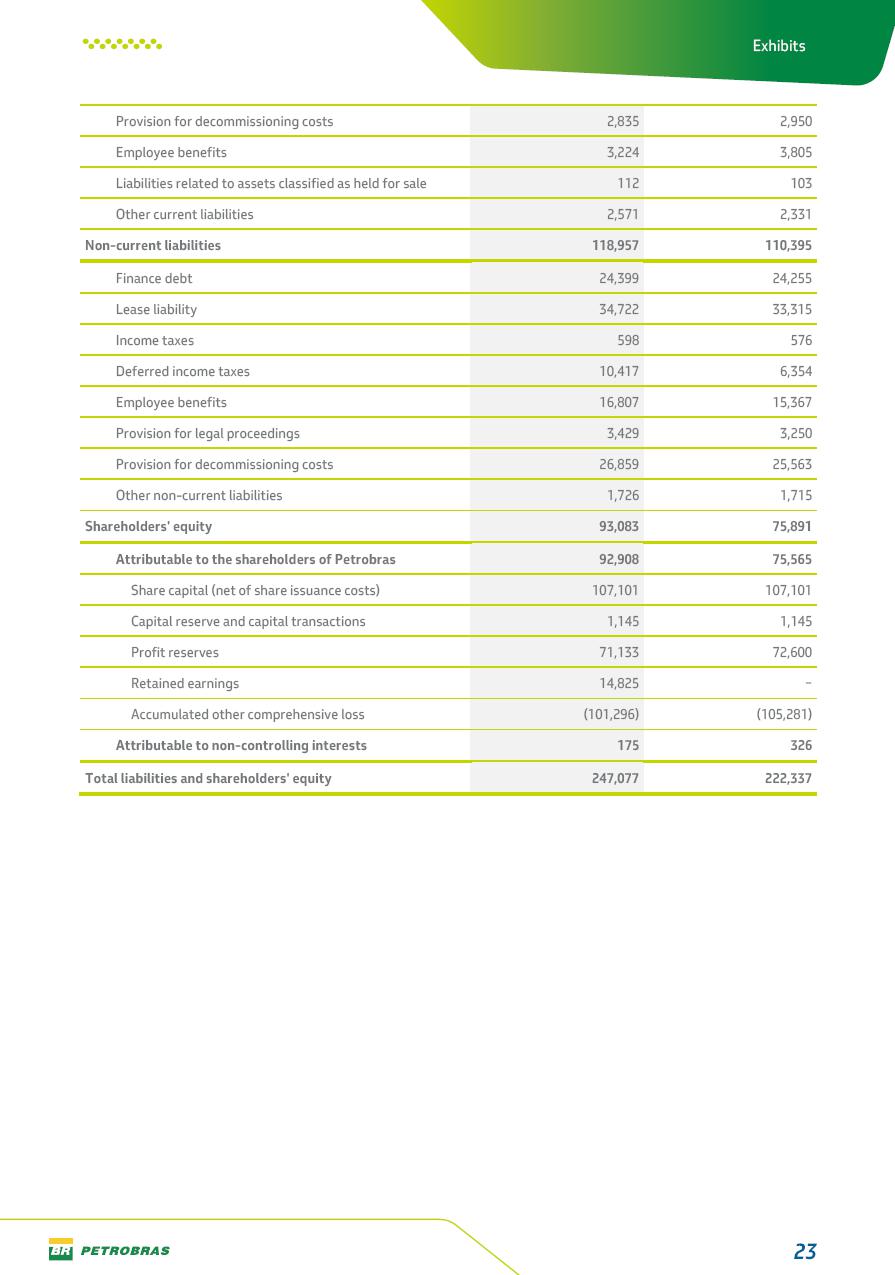
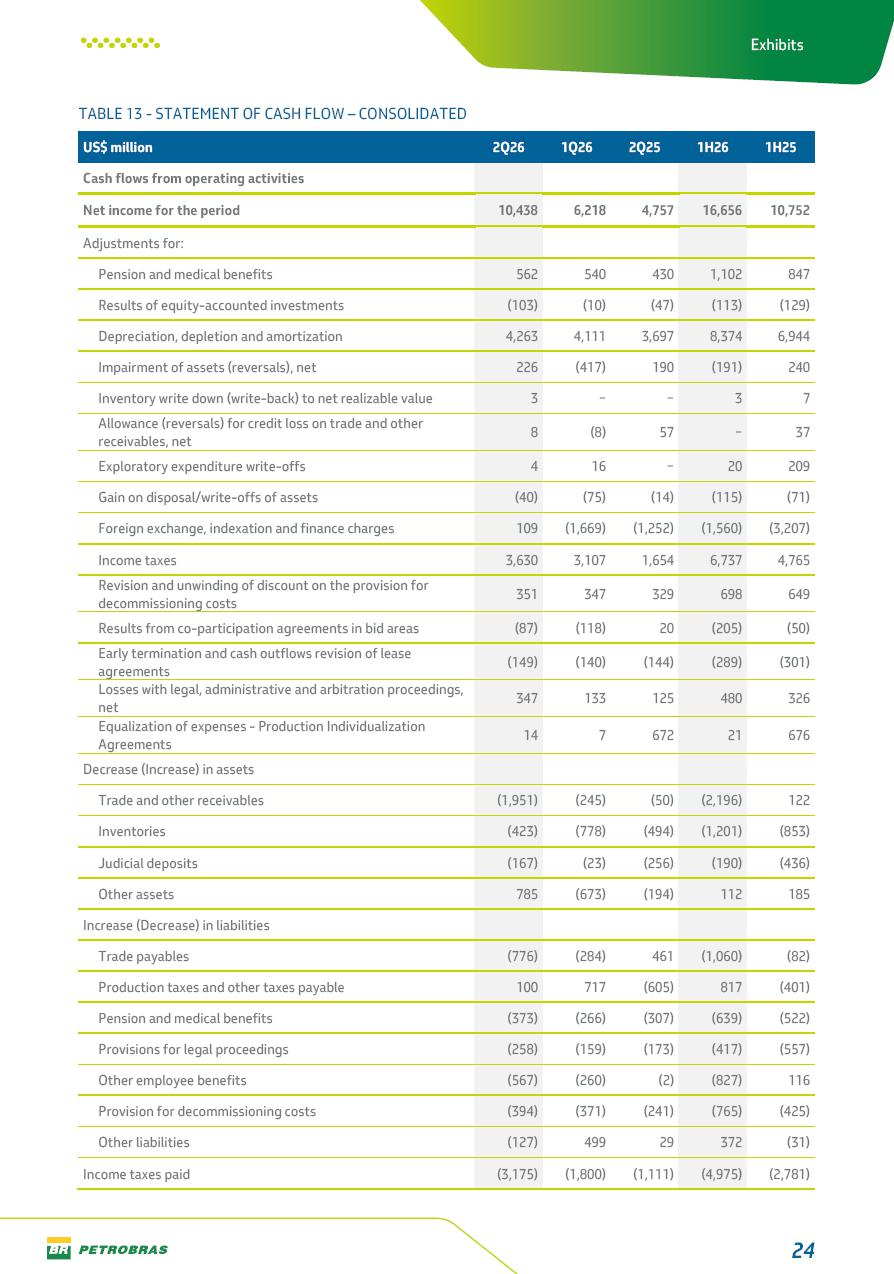
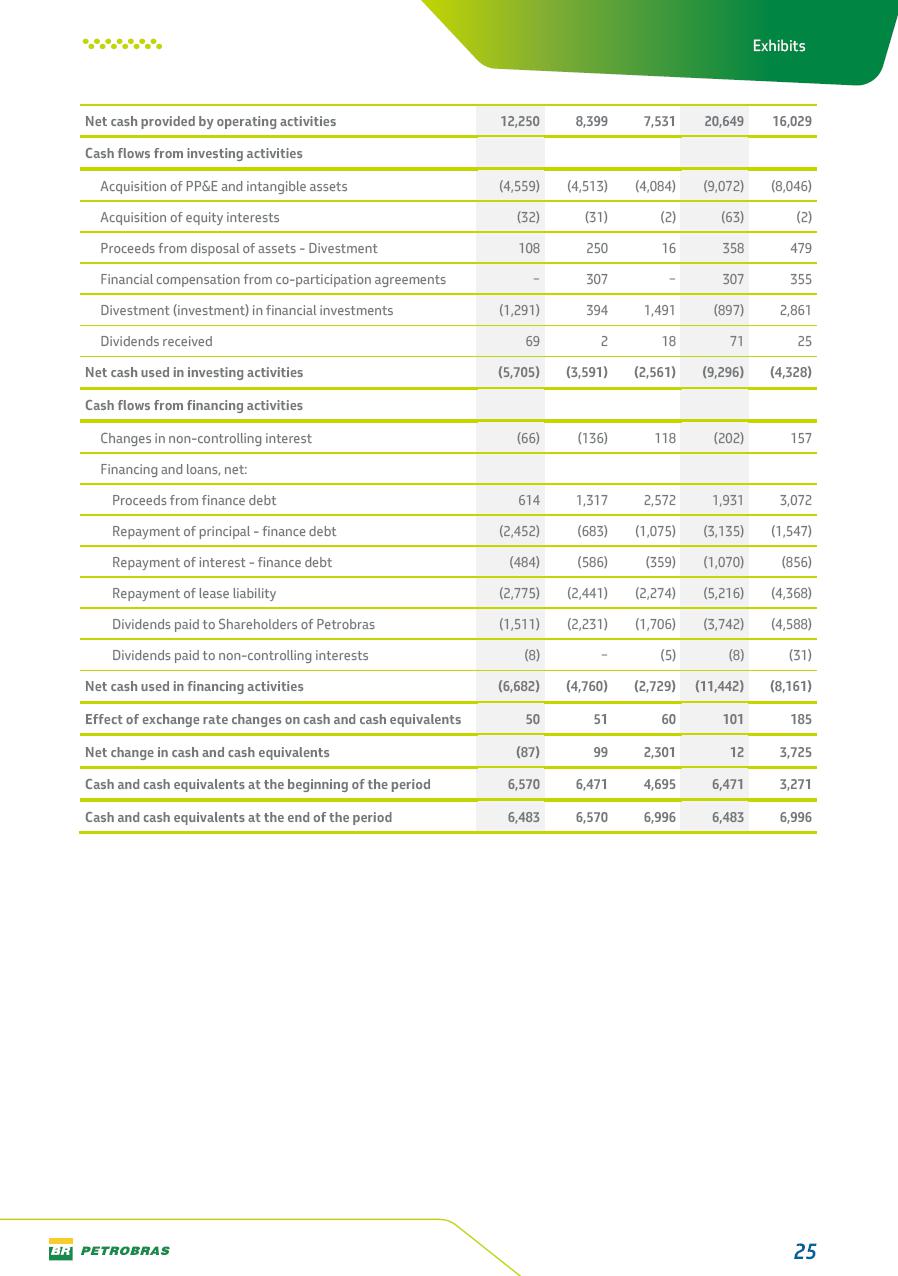
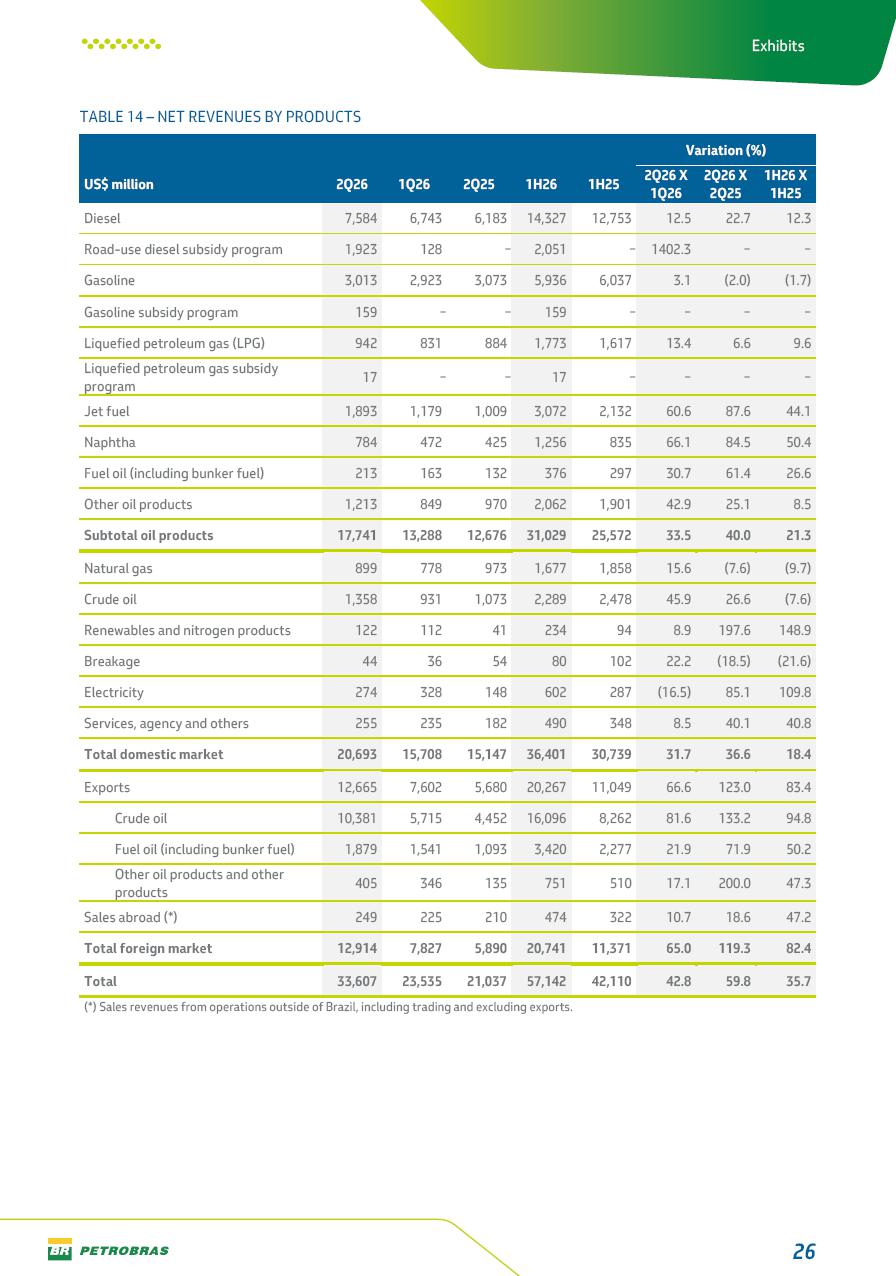
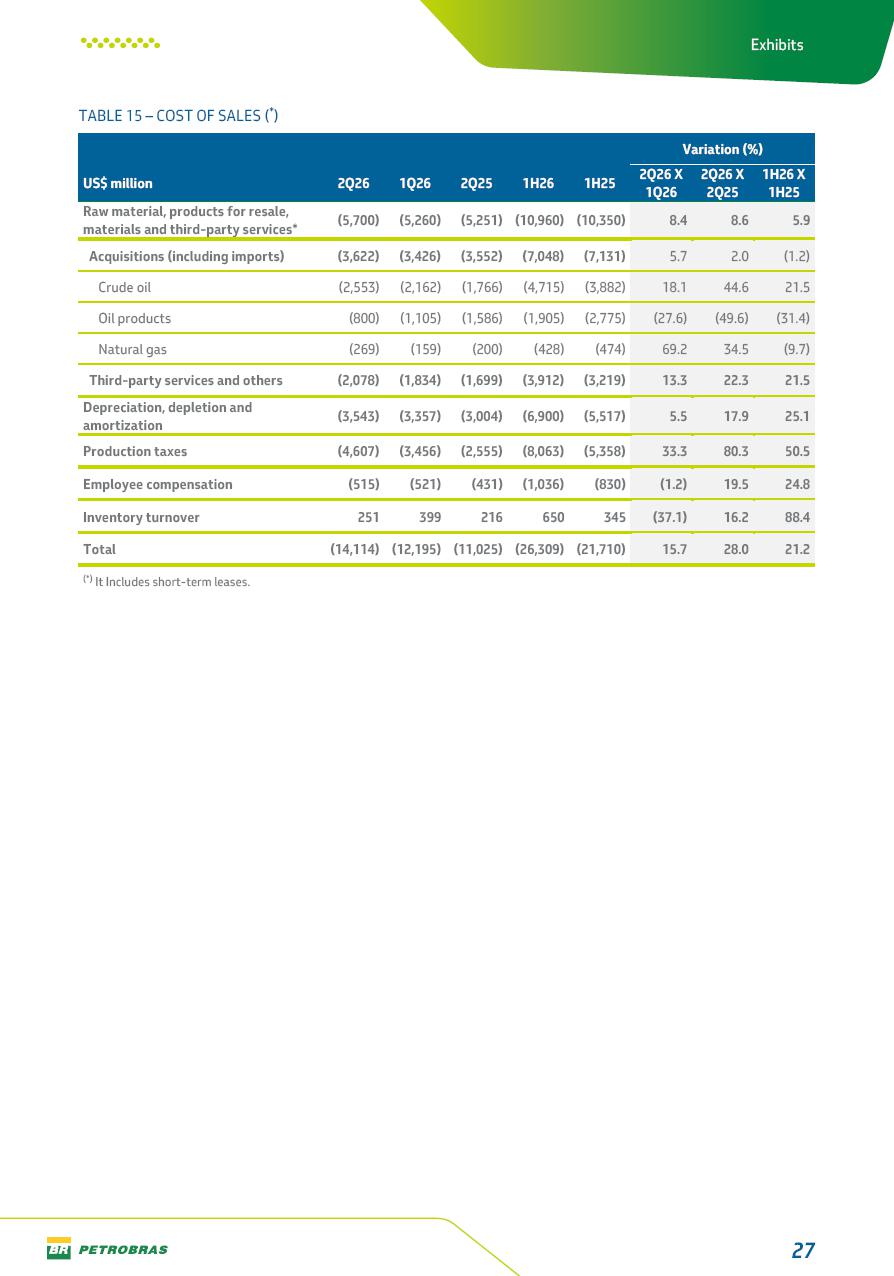
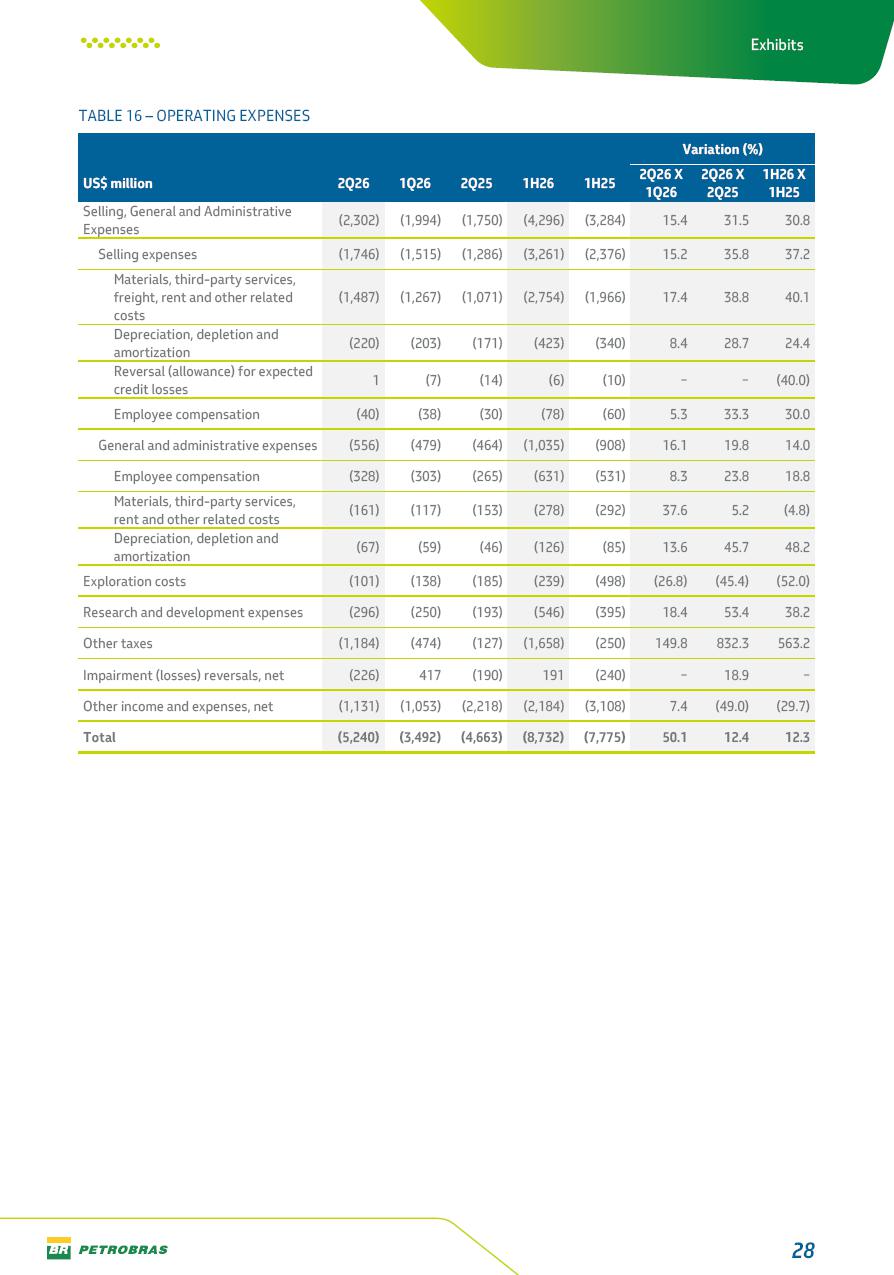
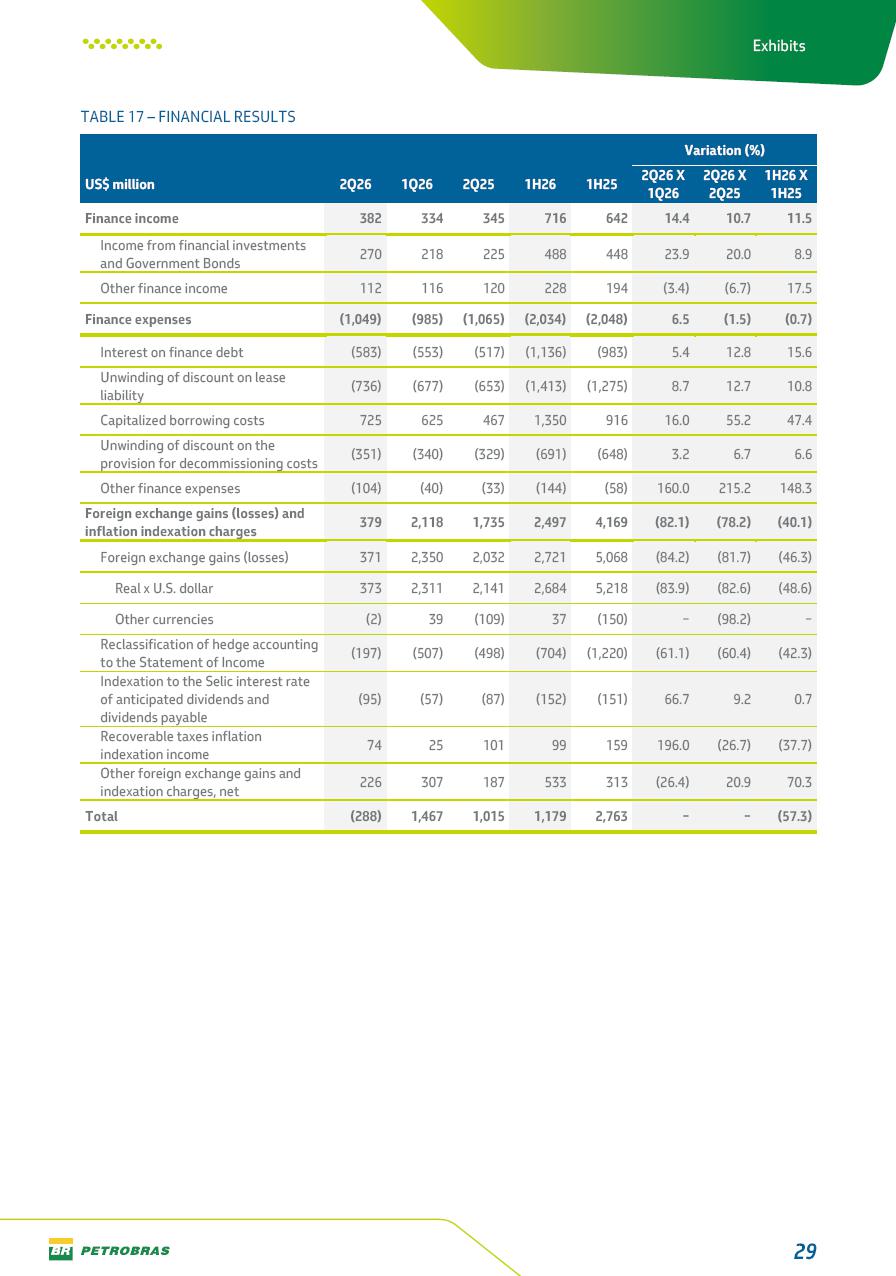
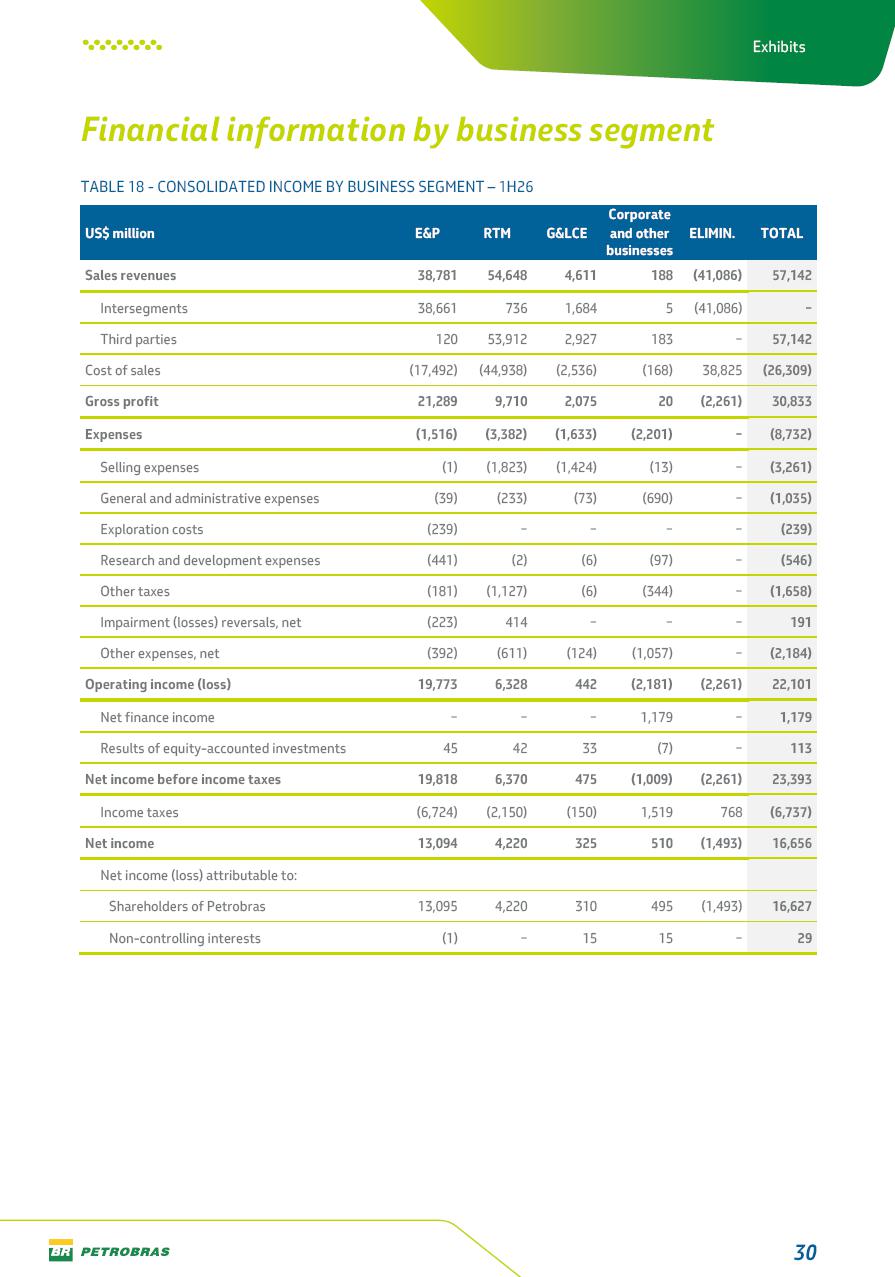
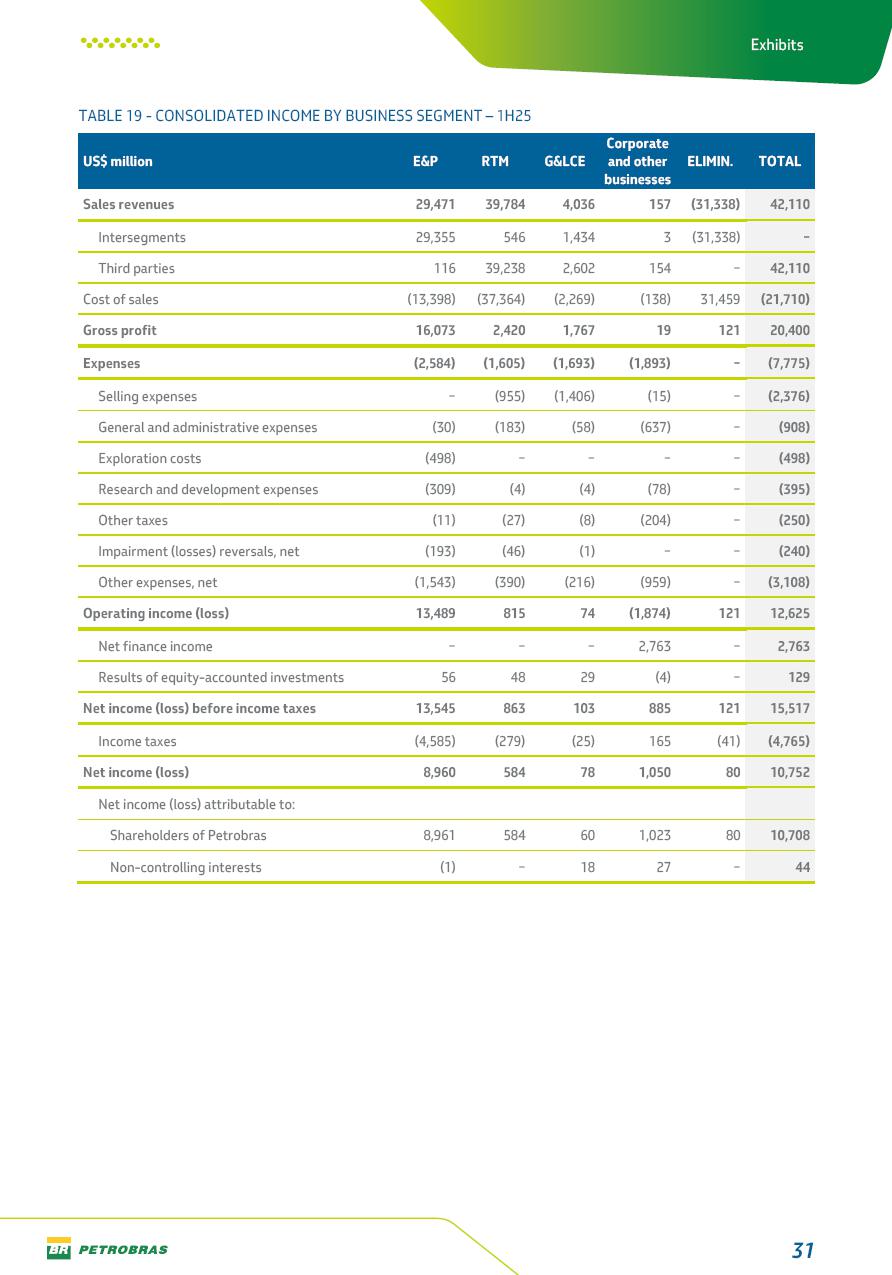
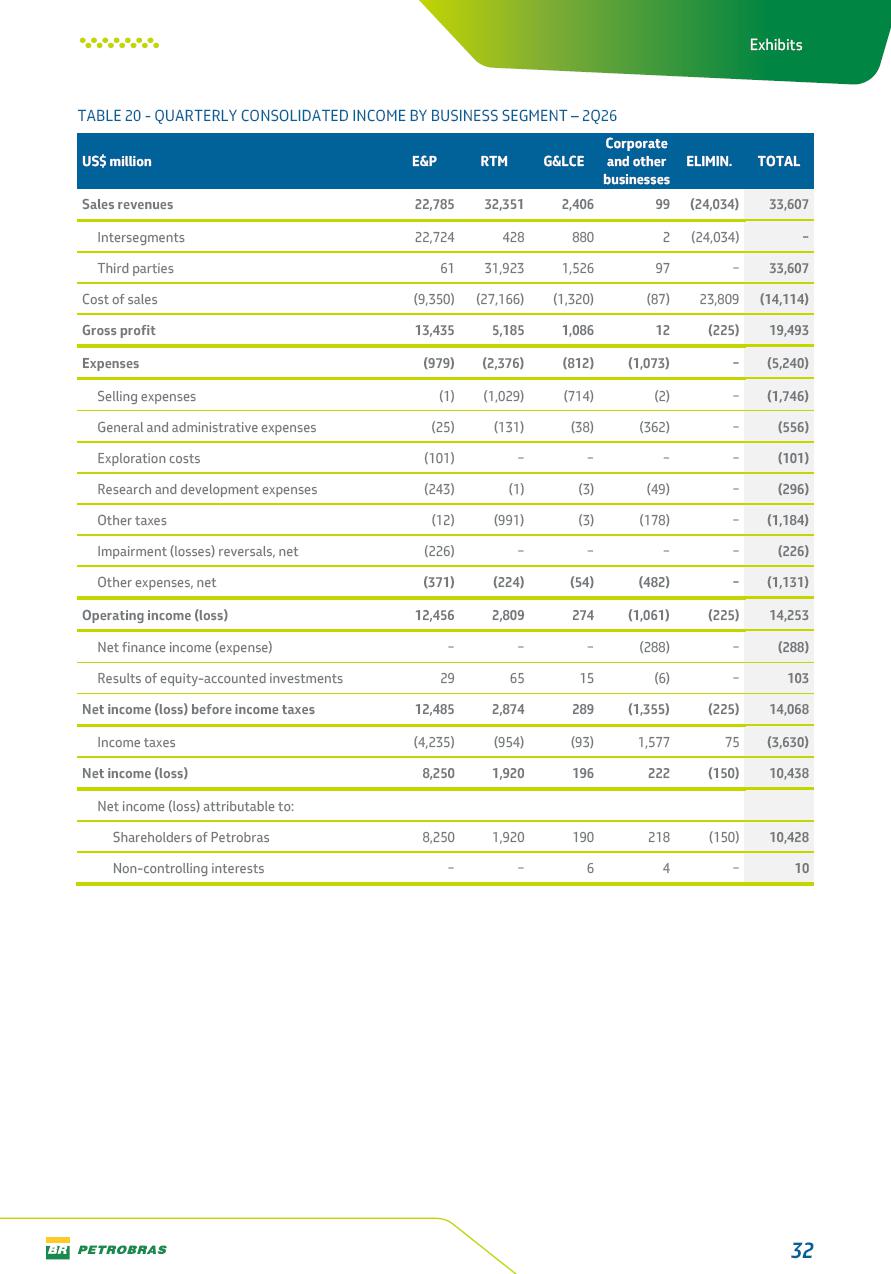
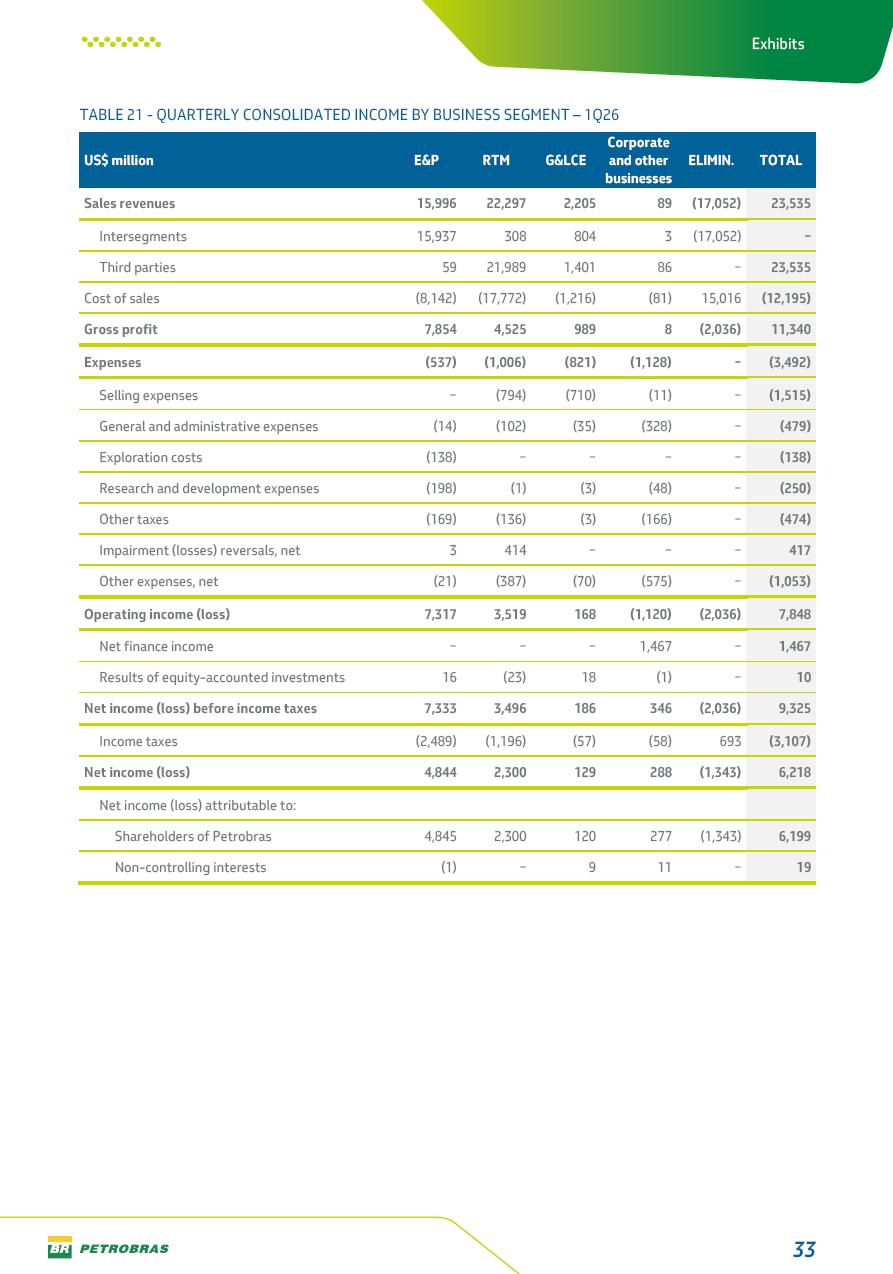
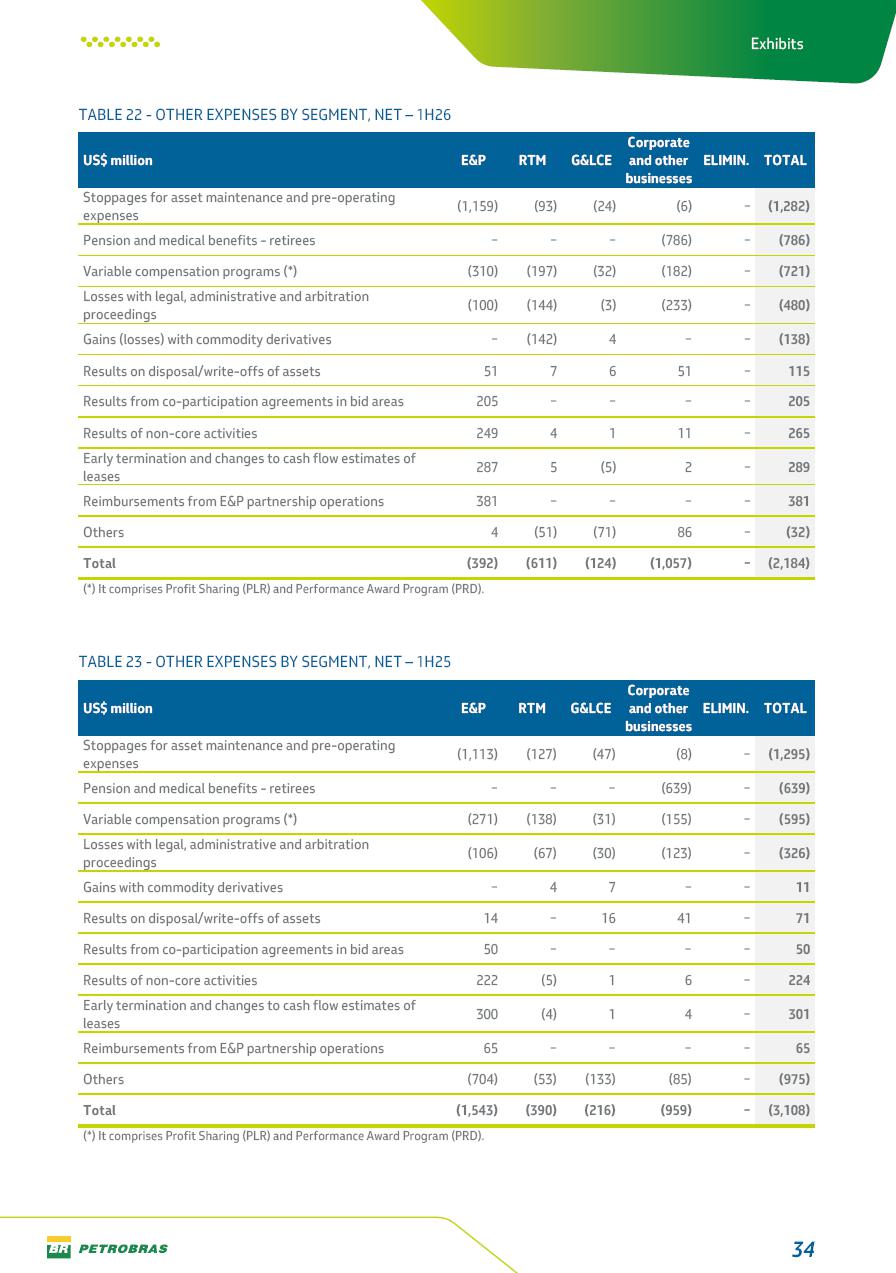
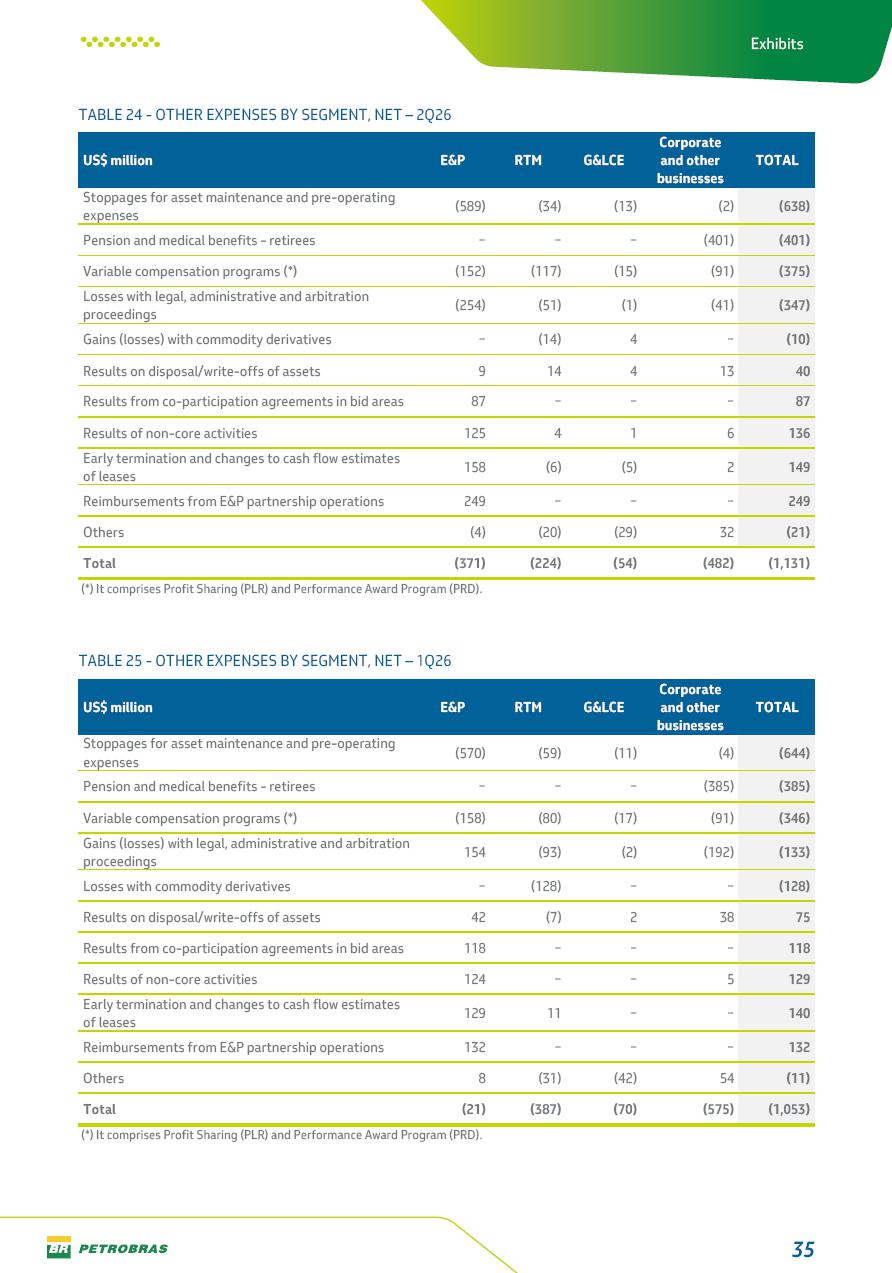
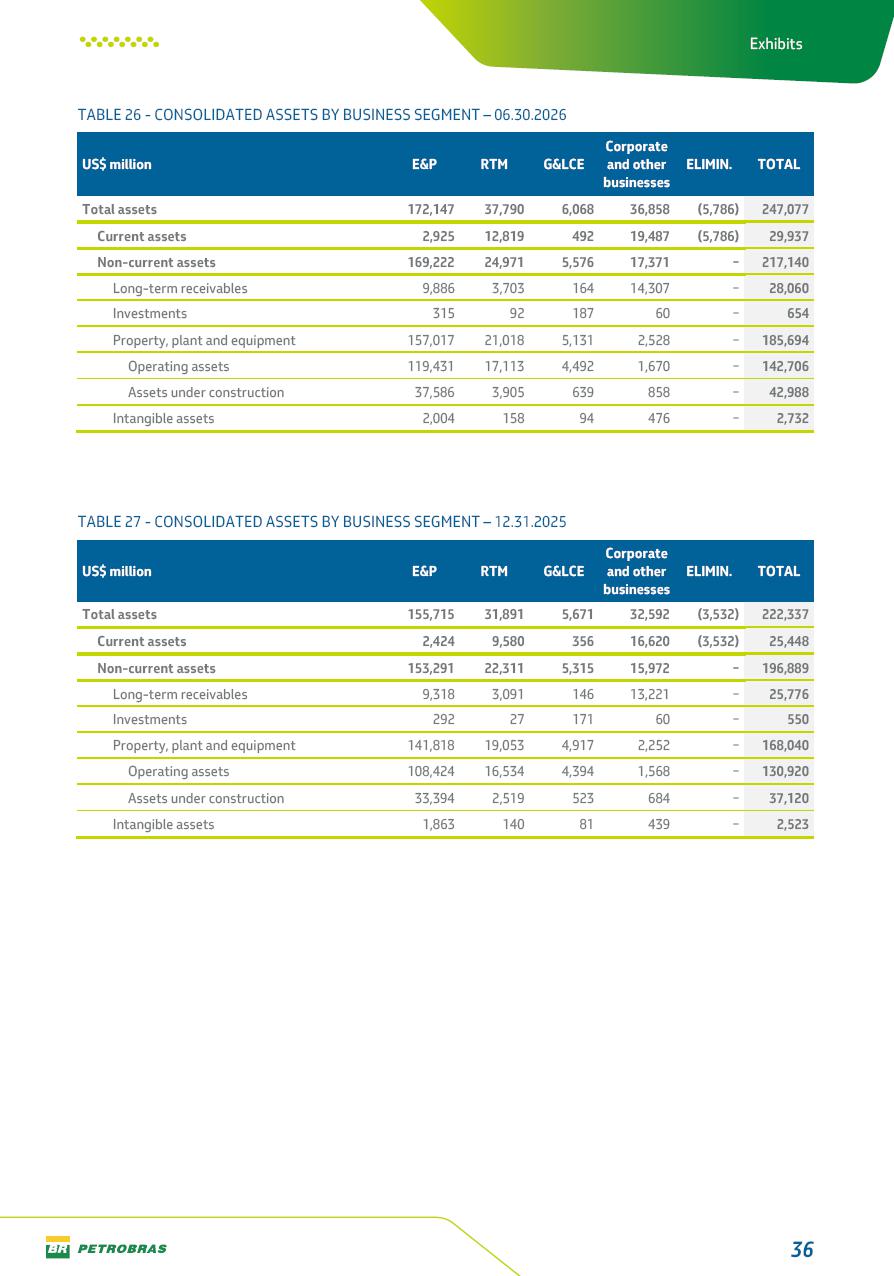
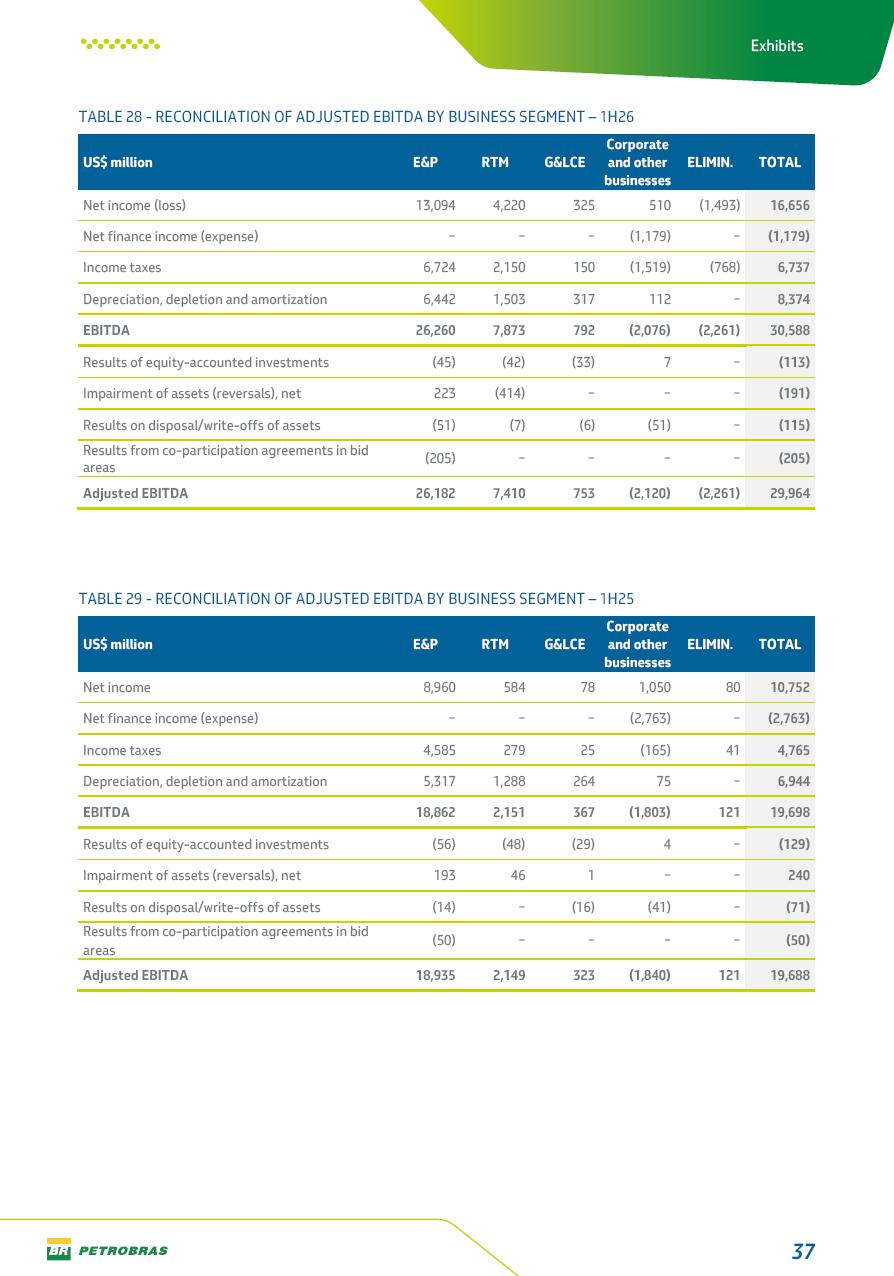
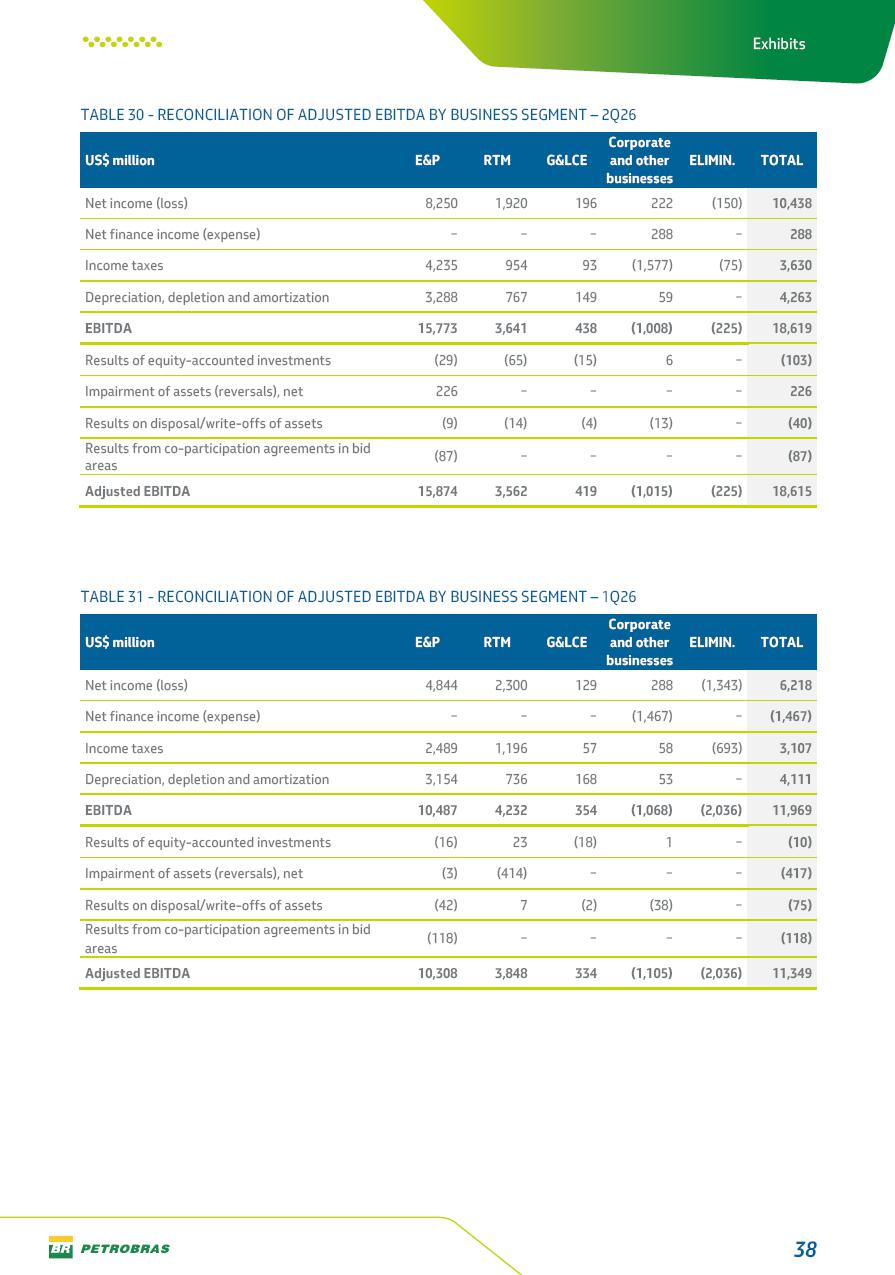
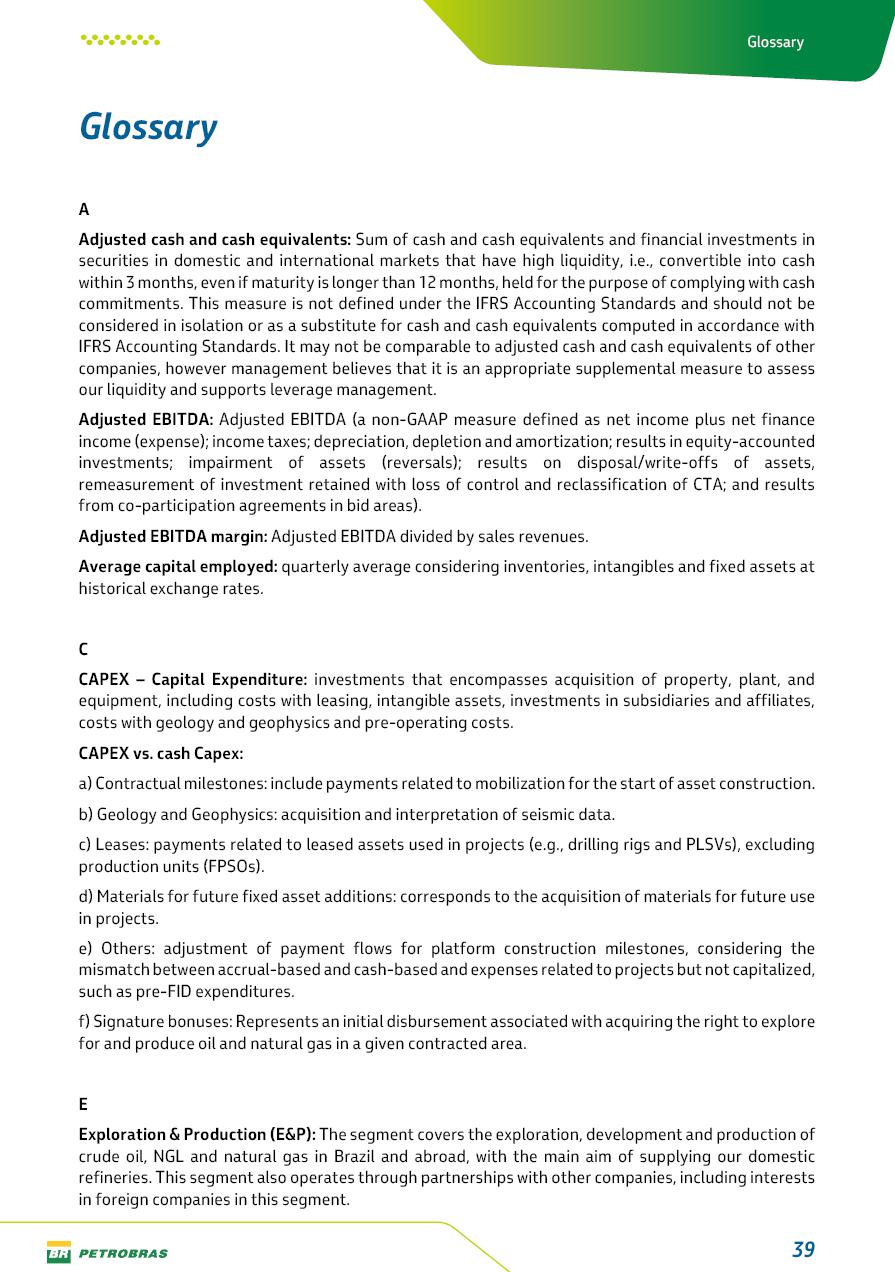
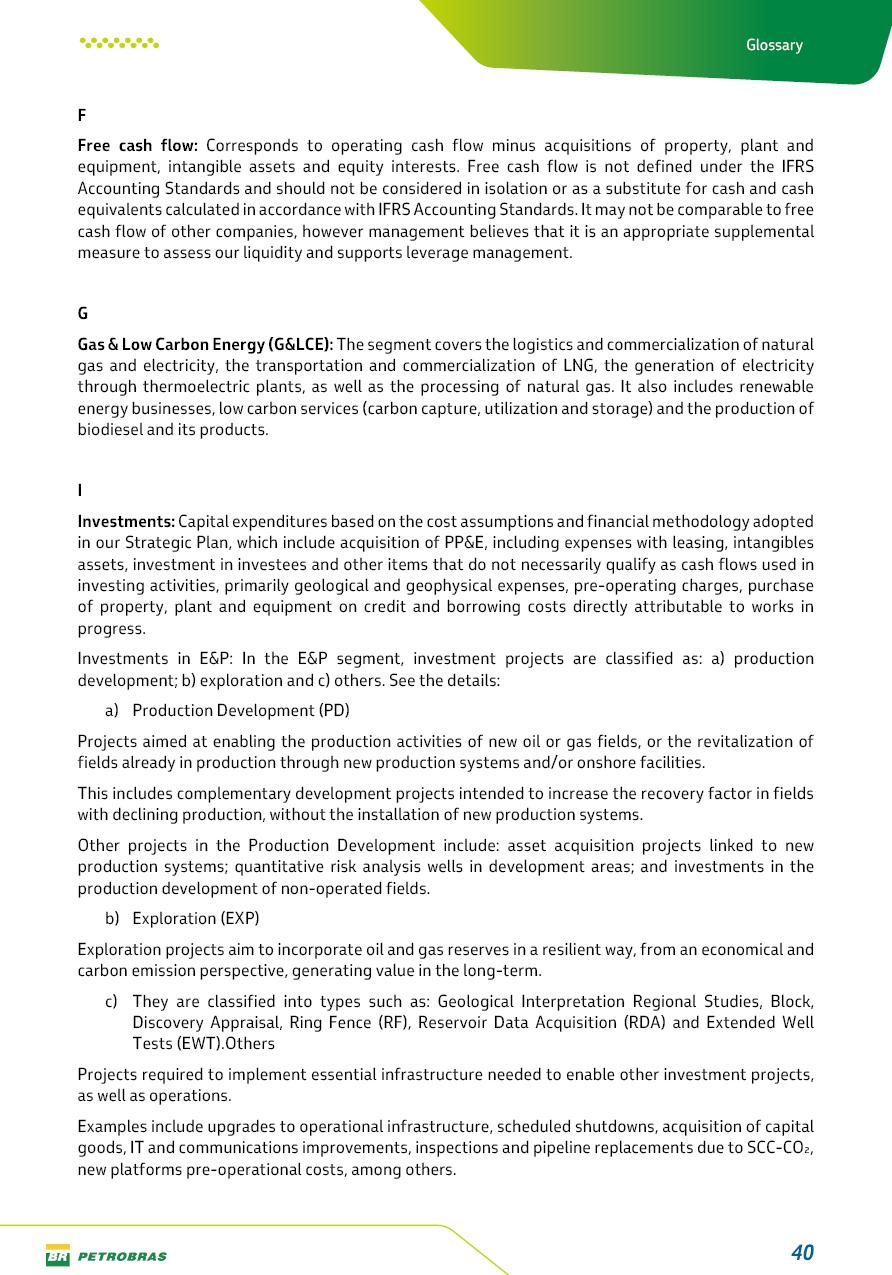
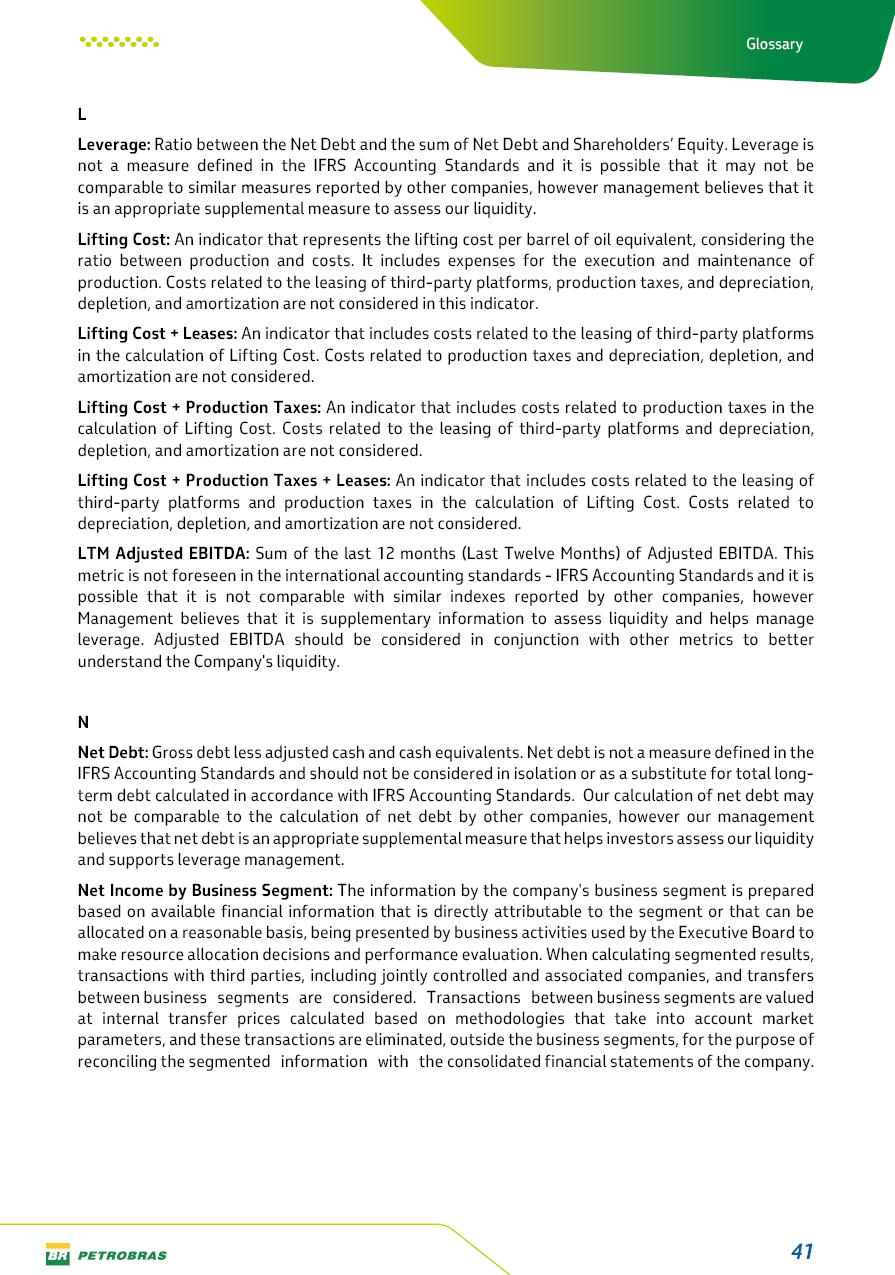
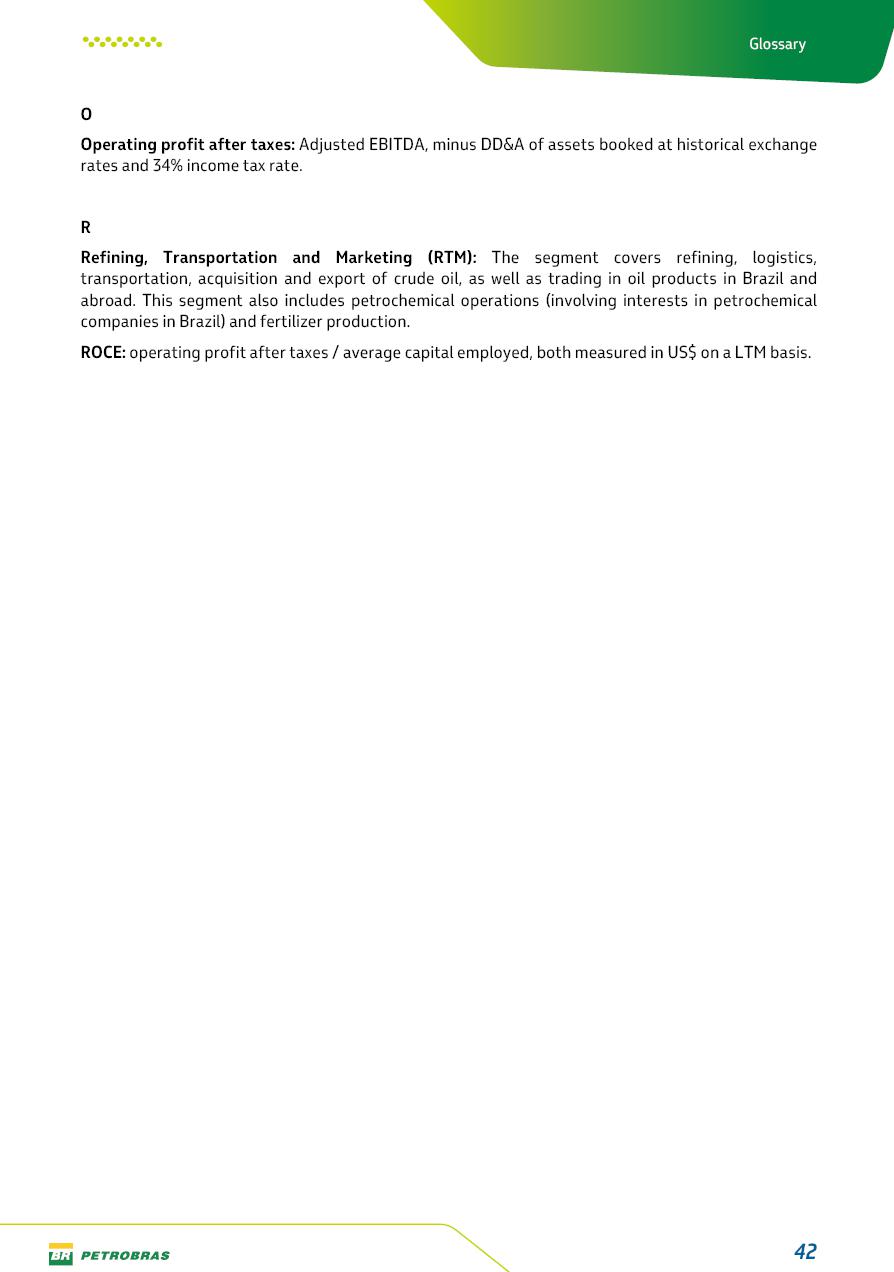
P-79 Our eighth platform in the Búzios Field FINANCIAL PERFORMANCE — 2Q26 Table of contents Table of contents Highlights – 2Q26 ................................................................................................. 4 Main items ...................................................................................................................................................... 5 Consolidated results ........................................................................................... 6 One-off events ....................................................................................................... 7 Capex ........................................................................................................................ 9 Liquidity and capital resources .................................................................. 13 Debt metrics ........................................................................................................ 15 Results by business segment ......................................................................... 16 Exploration and Production .................................................................................................................. 16 Refining, Transportation and Marketing ........................................................................................ 18 Gas and Low Carbon Energies .............................................................................................................. 19 Reconciliation of Adjusted EBITDA ............................................................ 20 Exhibits ................................................................................................................. 21 Financial statements ............................................................................................................................... 21 Financial information by business segment .................................................................................. 30 Glossary ................................................................................................................ 39 Disclaimer Disclaimer This report may contain forward-looking statements about future events. Such forecasts reflect only the expectations of the company's management about future economic conditions, as well as the company's industry, performance and financial results, among others. The terms "anticipates", "believes", "expects", "predicts", "intends", "plans", "projects", "aims", "should", as well as other similar terms, are intended to identify such forecasts, which, of course, involve risks and uncertainties foreseen or not foreseen by the company and, consequently, are not guarantees of the company's future results. Therefore, future results of the company's operations may differ from current expectations, and the reader should not rely solely on the information contained herein. The Company undertakes no obligation to update the presentations and forecasts in the light of new information or future developments. The figures reported for 3Q26 onwards are estimates or targets. Additionally, this presentation contains some financial indicators that are not recognized under IFRS Accounting Standards. These indicators do not have standardized meanings and may not be comparable to indicators with a similar description used by other companies. We provide these indicators because we use them as measures of the company's performance; they should not be considered in isolation or as a substitute for other financial metrics that have been disclosed in accordance with IFRS Accounting Standards. See definitions of Free Cash Flow, Adjusted EBITDA and Net Debt in the Glossary and respective reconciliations in the Liquidity and Capital Resources, Reconciliation of Adjusted EBITDA and Net Debt sections. Condensed Consolidated Interim Financial Statementshas been prepared in accordance with IFRS Accounting Standards and reviewed by independent auditors. 4 Highlights Highlights – 2Q26 “The operational records we achieved in this second quarter led to one of Petrobras’ highest quarterly financial results in our time series. The increase in oil and oil products output, alongside higher Brent prices, strengthened our cash generation." Fernando Melgarejo, Chief Financial Officer and Investor Relations Officer Main financial highlights •Operational performance boosts our financial results: Adjusted EBITDA Excluding One-off Events of US$ 20.0 billion and Net Income Excluding One-off Events of US$ 11.1 billion•Strong cash generation with Operating Cash Flow of US$ 12.3 billion and Free Cash Flow of US$ 7.7 billion Contribution to society •We paid R$ 88.6 billion in taxes to the Federal Government, States, and Municipalities in 2Q26 •We approved R$ 17.4 billion in shareholder remuneration related to the 2Q26 5 Highlights Main items TABLE 1 – MAIN ITEMS Variation (%) US$ million 2Q26 1Q26 2Q25 1H26 1H25 2Q26 X 1Q26 2Q26 X 2Q25 1H26 X 1H25 Sales revenues 33,607 23,535 21,037 57,142 42,110 42.8 59.8 35.7 Gross profit 19,493 11,340 10,012 30,833 20,400 71.9 94.7 51.1 Operating expenses (5,240) (3,492) (4,663) (8,732) (7,775) 50.1 12.4 12.3 Consolidated net income attributable to the shareholders of Petrobras 10,428 6,199 4,734 16,627 10,708 68.2 120.3 55.3 Consolidated net income (loss) excluding one-off events attributable to the shareholders of Petrobras (*) 11,073 4,535 4,101 15,608 8,130 144.2 170.0 92.0 Net cash provided by operating activities 12,250 8,399 7,531 20,649 16,029 45.9 62.7 28.8 Free cash flow 7,659 3,855 3,445 11,514 7,981 98.7 122.3 44.3 Adjusted EBITDA 18,615 11,349 9,242 29,964 19,688 64.0 101.4 52.2 Adjusted EBITDA excluding one-off events (*) 19,959 11,737 10,231 31,696 20,883 70.1 95.1 51.8 Gross debt (US$ million) 70,806 71,214 68,064 70,806 68,064 (0.6) 4.0 4.0 Net debt (US$ million) 60,388 62,093 58,563 60,388 58,563 (2.7) 3.1 3.1 Net debt/LTM Adjusted EBITDA ratio 1.14 1.43 1.53 1.14 1.53 (20.3) (25.5) (25.5) Average commercial selling rate for U.S. dollar 5.05 5.26 5.67 5.15 5.76 (4.0) (10.9) (10.6) Brent crude (US$/bbl) 104.52 80.61 67.82 92.57 71.74 29.7 54.1 29.0 Price of basic oil products - Domestic Market (US$/bbl) 114.60 86.83 82.96 100.76 84.75 32.0 38.1 18.9 ROCE (Return on Capital Employed) 9.3% 6.7% 6.0% 9.3% 6.0% 2,6 p.p. 3,3 p.p. 3,3 p.p. (*) See reconciliation of net income and adjusted EBITDA excluding one-off events. 6 Consolidated results Consolidated results In 2Q26, we maintained strong operational performance, with the progress of the ramp-up of the systems, the start-up of P-79, and efficiency gains, which resulted in a 3.4% increase in total production. In Refining, we achieved a record utilization rate, with a utilization factor (FUT) of 101.2%, increasing oil products output by 5.6% compared to the previous quarter, while maintaining 68% yield of higher value-added products (diesel, jet fuel and gasoline). As a result of our operational performance, we achieved in 2Q26 an adjusted EBITDA of US$ 20 billion and Net Income of US$ 11.1 billion, both excluding one-off events. Adjusted EBITDA excluding one-off events in 2Q26 was 70% higher than in 1Q26, mainly driven by higher exports enabled by higher production and the recognition of exports that were in transit during 1Q26, as well as by the increase in Brent prices. Furthermore, we had a larger share of produced oil products in the sales mix, reflecting the higher FUT and resulting in a lower need for oil products imports. Net income in 2Q26, excluding one-off events, was US$ 11.1 billion, an increase of 144% compared to 1Q26. Considering one-off events, net income was US$ 10.4 billion, reflecting higher gross profit, partially offset by higher tax expense, especially due to higher expenses related to taxes on crude oil exports, and by lower FX gains, reflecting the lower appreciation of the BRL against the USD. 7 One-off events One-off events TABLE 2 – ONE-OFF EVENTS Variation (%) US$ million 2Q26 1Q26 2Q25 1H26 1H25 2Q26 X 1Q26 2Q26 X 2Q25 1H26 X 1H25 Net income 10,438 6,218 4,757 16,656 10,752 67.9 119.4 54.9 One-off events (1,015) 2,525 958 1,510 3,906 − − (61.3) One-off events that do not affect Adjusted EBITDA 329 2,913 1,947 3,242 5,101 (88.7) (83.1) (36.4) Impairment (losses) reversals of assets and investments (160) 409 (188) 249 (238) − (14.9) − Results on disposal/write-offs of assets 40 75 14 115 71 (46.7) 185.7 62.0 Results from co-participation agreements in bid areas 87 118 (20) 205 50 (26.3) − 310.0 Discount on repurchase of debt securities (11) − − (11) − − − − Gains with foreign exchange variation Real x U.S. dollar 373 2,311 2,141 2,684 5,218 (83.9) (82.6) (48.6) Other one-off events (1,344) (388) (989) (1,732) (1,195) 246.4 35.9 44.9 Collective bargaining agreement (24) (8) (214) (32) (214) 200.0 (88.8) (85.0) Losses on decommissioning of areas − (7) − (7) − − − − Losses with legal, administrative and arbitration proceedings (347) (133) (125) (480) (326) 160.9 177.6 47.2 Equalization of expenses - Production Individualization Agreements (14) (7) (672) (21) (676) 100.0 (97.9) (96.9) Tax Amnesty Program of Bahia and Rio de Janeiro States − (118) − (118) − − − − Export tax on crude oil and diesel (965) (122) − (1,087) − 691.0 − − Others 6 7 22 13 21 (14.3) (72.7) (38.1) Net effect of items with one-off events on income taxes 370 (861) (324) (491) (1,327) − − (63.0) Net income excluding one-off events 11,083 4,554 4,123 15,637 8,173 143.4 168.8 91.3 Shareholders of Petrobras 11,073 4,535 4,101 15,608 8,130 144.2 170.0 92.0 Non-controlling interests 10 19 22 29 43 (47.4) (54.5) (32.6) Adjusted EBITDA 18,615 11,349 9,242 29,964 19,688 64.0 101.4 52.2 Other one-off events (1,344) (388) (989) (1,732) (1,195) 246.4 35.9 44.9 Adjusted EBITDA excluding one-off events 19,959 11,737 10,231 31,696 20,883 70.1 95.1 51.8 8 One-off events In management's view, the one-off events presented above, although related to the Company's business, were highlighted as complementary information for a better understanding and evaluation of our performance. Such items do not necessarily occur in all periods and shall be disclosed when relevant. 9 Capex Capex TABLE 3 – TOTAL CAPEX Variation (%) US$ million 2Q26 1Q26 2Q25 1H26 1H25 2Q26 X 1Q26 2Q26 X 2Q25 1H26 X 1H25 Exploration & Production (*) 4,337 4,463 3,722 8,800 7,224 (2.8) 16.5 21.8 Production Development 3,387 3,507 2,784 6,894 5,510 (3.4) 21.7 25.1 Exploration 254 351 499 605 804 (27.8) (49.2) (24.8) Others E&P 696 606 438 1,302 910 14.9 59.0 43.1 Refining, Transportation and Marketing 671 503 512 1,174 916 33.3 31.1 28.1 Gas & Low Carbon Energies 135 68 66 203 121 98.3 103.5 67.3 Others 149 72 131 221 235 107.2 13.3 (6.1) Subtotal 5,291 5,107 4,431 10,398 8,497 3.6 19.4 22.4 Signature bonus 7 − − 7 − − − − Total 5,299 5,107 4,431 10,405 8,497 3.8 19.6 22.5 (*) See Glossary for investment definitions In 1H26, Capex totaled US$ 10.4 billion, an increase of 22.5% compared to the same period of the previous year. In 2Q26, Capex totaled US$ 5.3 billion, an increase of 3.8% compared to 1Q26. On a cash basis, investments totaled US$ 4.6 billion in 2Q26 and US$ 9.1 billion in 1H26. The following charts present the reconciliation between total Capex and cash Capex for 2Q26 and 1H26. CHART1 – RECONCILIATION OF TOTAL CAPEX VS. CASH CAPEX – 2Q26 See Glossary for definitions of the components above (total Capex vs. cash Capex). 10 Capex CHART 2 – RECONCILIATION OF TOTAL CAPEX VS. CASH CAPEX – 1H26 See Glossary for definitions of the components above (total Capex vs. cash Capex). In the Exploration & Production segment, Capex totaled US$ 4.3 billion in 2Q26, a 2.8% decrease compared to 1Q26. The higher investment level in the previous quarter mainly reflected the nationalization of FPSO P-79, which took place in February. Compared to 2Q25, Capex increased by 16.5%, driven by higher investments in major pre-salt projects in Santos Basin, especially the new production systems for the Atapu and Sépia fields, the progress in the well construction campaign in the Búzios field, and projects in Campos Basin, especially the Marlim Revitalization project. Additionally, it is worth highlighting the start-up of FPSO P-79 (Búzios 8) in the Búzios field in May 2026, with a production capacity of 180 thousand barrels of oil per day. In 2Q26, we recognized the signature bonus related to the Jaspe and Citrino blocks in the Campos Basin following the ANP bid round held in October 2025. In the Refining, Transportation and Marketing segment, Capex totaled US$ 0.67 billion in 2Q26, a 33.3% increase compared to 1Q26, mainly due to higher investments at the Boaventura Hub and scheduled maintenance stoppages. Compared to 2Q25, Capex increased by 31.1%, mainly reflecting higher investments at Abreu e Lima Refinery (RNEST) and the Boaventura Hub. In the Gas and Low Carbon Energies segment, Capex totaled US$ 0.13 billion in 2Q26. Compared to 1Q26, Capex increased by 98.3%, while compared to 2Q25 it increased by 103.5%. This performance mainly reflected the acquisition of a 49.99% interest in Lightsource bp in Brazil, as well as investments in scheduled maintenance stoppages at thermal power plants and natural gas assets. The table below presents the main information on the new oil and gas production systems already contracted, as well as the main projects in the Refining, Transportation and Marketing segment. 11 Capex TABLE 4 – MAIN PROJECTS Unit Start-up FPSO capacity (bbl/day) Petrobras Actual Investment (US$ bn) Petrobras Total Investment (US$ bn) (1) Petrobras Stake Status Mero 4 FPSO Alexandre de Gusmão (Chartered unit) 2025 180,000 0.8 1.3 38.6% Project in execution phase with production system in operation. 12 wells drilled and completed. Búzios 6 P-78 (Owned unit) 2025 180,000 4.6 5.1 88.99% Project in execution phase with production system in operation. 13 wells drilled and completed. Búzios 8 P-79 (Owned unit) 2026 180,000 3.9 5.1 88.99% Project in execution phase with production system in operation. 14 wells drilled and completed. Búzios 9 P-80 (Owned unit) 2027 225,000 2.9 6.5 88.99% Project in execution phase with production system under construction. 7 wells drilled and 6 completed. Búzios 10 P-82 (Owned unit) 2027 225,000 2.6 7.2 88.99% Project in execution phase with production system under construction. 3 wells drilled and 1 completed. Búzios 11 P-83 (Owned unit) 2027 225,000 2.3 6.4 88.99% Project in execution phase with production system under construction. 3 wells drilled and 1 completed. Raia Manta e Raia Pintada FPSO Raia (Non-operated project) 2028 126,000 1.7 2.9 (2) 30% Project in execution phase with production system under construction. 1 well drilled. Atapu 2 P-84 (Owned unit) 2029 225,000 1.3 6.4 65.7% Project in execution phase with production system under construction. Trem 2 - RNEST 2029 Increase of 130 thousand barrels per day in processing capacity. 0.3 (3) 2.0 (4) 100.0% Project in execution phase. Sépia 2 P-85 (Owned unit) 2030 225,000 0.8 4.7 55.3% Project in execution phase with production system under construction. 1 well drilled and completed. SEAP 2 P-87 (Owned unit - BOT) 2030 120,000 0.1 6.8 (5) 86.0% Contracted Production System SEAP 1 P-81 (Owned unit - BOT) 2031+ 120,000 0.1 5.5 (5) 69.0% Contracted Production System (1) Total investment under the 2026-2030+ Business Plan assumptions and Petrobras working interest (WI). Chartered units leases amounts are not included. 12 Capex (2) Total investment considering Petrobras working interest (WI). It is included the FPSO, contracted on a lump sum turnkey modality,which includes engineering, procurement, construction and installation for the unit. The contractor will also provide FPSO operation andmaintenance services during the first year from the start of production. (3) Actual Investment starting in 2023 (project reassessment). (4) Total investment under the BP 2026-2030+, in the prospective view starting in 2023 (project reassessment) through project execution. (5) Total investment under the FID (Final Investment Decision) assumptions, reflecting the changes compared with the 2026–2030+ Business Plan. Additional Information: Criteria for inclusion of projects in the table: E&P Projects – investment project with the production system already contracted until the end of its first year of operation Refining, Transportation and Gas Projects – investment project above USD 1 billion, with the main EPC (Engineering, Procurement, andConstruction) scopes already contracted. 13 Liquidity and capital resources Liquidity and capital resources TABLE 5 - LIQUIDITY AND CAPITAL RESOURCES US$ million 2Q26 1Q26 2Q25 1H26 1H25 Adjusted cash and cash equivalents at the beginning of period 9,121 9,200 8,457 9,200 8,071 Government bonds, bank deposit certificates and time deposits with maturities of more than 3 months at the beginning of period (2,551) (2,729) (3,762) (2,729) (4,800) Cash and cash equivalents at the beginning of period 6,570 6,471 4,695 6,471 3,271 Net cash provided by operating activities 12,250 8,399 7,531 20,649 16,029 Net cash used in investing activities (5,705) (3,591) (2,561) (9,296) (4,328) Acquisition of PP&E and intangible assets (4,559) (4,513) (4,084) (9,072) (8,046) Acquisition of equity interests (32) (31) (2) (63) (2) Proceeds from disposal of assets - Divestment 108 250 16 358 479 Financial compensation from co-participation agreements − 307 − 307 355 Divestment (investment) in financial investments (1,291) 394 1,491 (897) 2,861 Dividends received 69 2 18 71 25 (=) Net cash provided by operating and investing activities 6,545 4,808 4,970 11,353 11,701 Net cash used in financing activities (6,682) (4,760) (2,729) (11,442) (8,161) Changes in non-controlling interest (66) (136) 118 (202) 157 Net financings (2,322) 48 1,138 (2,274) 669 Proceeds from finance debt 614 1,317 2,572 1,931 3,072 Repayments (2,936) (1,269) (1,434) (4,205) (2,403) Repayment of lease liability (2,775) (2,441) (2,274) (5,216) (4,368) Dividends paid to shareholders of Petrobras (1,511) (2,231) (1,706) (3,742) (4,588) Dividends paid to non-controlling interests (8) − (5) (8) (31) Effect of exchange rate changes on cash and cash equivalents 50 51 60 101 185 Cash and cash equivalents at the end of period 6,483 6,570 6,996 6,483 6,996 Government bonds, bank deposit certificates and time deposits with maturities of more than 3 months at the end of period 3,935 2,551 2,505 3,935 2,505 Adjusted cash and cash equivalents at the end of period 10,418 9,121 9,501 10,418 9,501 Reconciliation of Free Cash Flow Net cash provided by operating activities 12,250 8,399 7,531 20,649 16,029 Acquisition of PP&E and intangible assets (4,559) (4,513) (4,084) (9,072) (8,046) Acquisition of equity interests (32) (31) (2) (63) (2) Free cash flow (*) 7,659 3,855 3,445 11,514 7,981 (*) Free cash flow (FCF) is in accordance with the Shareholder Remuneration Policy (“Policy”) approved on 07/28/2023. 14 Liquidity and capital resources As of June 30, 2026, cash and cash equivalents totaled US$ 6.5 billion, and adjusted cash and cash equivalents amounted to US$ 10.4 billion. In 2Q26, cash generated from operating activities reached US$ 12.3 billion, and free cash flow totaled US$ 7.7 billion. This level of cash generation, combined with the funds raised throughout 2Q26, was primarily used to: (a) carry out investments (US$ 4.6 billion); (b) amortize principal and interest due during the period (US$ 2.9 billion); (c) amortize lease liabilities (US$ 2.7 billion); and (d) remunerate shareholders (US$ 1.5 billion). In 2Q26, the company settled several loans and financings totaling US$ 2.9 billion, notably the prepayment of US$ 1.4 billion in operations in the domestic and international banking markets, as well as the repurchase and redemption of US$ 0.7 billion in bonds issued in the international capital markets. During the same period, the company raised US$ 0.6 billion in funding, including US$ 0.3 billion in the domestic and international banking markets and US$ 0.2 billion from export credit agencies. It is worth noting that, in 2Q26, operating cash flow (OCF) was negatively impacted by working capital effects amounting to US$ 3.2 billion, mainly due to higher accounts receivable, including amounts related to the fuel subsidy program (US$ 1.9 billion), and lower trade payables (US$ 0.8 billion). 15 Debt metrics Debt metrics As of June 30, 2026, gross debt reached US$ 70.8 billion, representing a 0.6% decrease compared to March 31, 2026. Over the same period, financial debt decreased by 6.2%, mainly due to prepayments made throughout 2Q26. The weighted average maturity of outstanding debt increased from 11.3 years as of March 31, 2026, to 11.9 years as of June 30, 2026, while the average cost remained stable at 6.8% per year over the same period. The gross debt/LTM Adjusted EBITDA ratio decreased from 1.64x as of March 31, 2026, to 1.34x as of June 30, 2026. Net debt reached US$ 60.4 billion as of June 30, 2026, representing a 2.7% decrease compared to March 31, 2026. TABLE 6 – DEBT METRICS US$ million 06.30.2026 03.31.2026 Δ % 06.30.2025 Financial Debt 25,834 27,537 (6.2) 25,791 Capital Markets 16,264 16,672 (2.4) 15,461 Banking Market 7,293 8,788 (17.0) 8,299 Development banks 544 550 (1.1) 556 Export Credit Agencies 1,623 1,409 15.2 1,347 Others 110 118 (6.8) 128 Finance leases 44,972 43,677 3.0 42,273 Gross debt 70,806 71,214 (0.6) 68,064 Adjusted cash and cash equivalents 10,418 9,121 14.2 9,501 Net debt 60,388 62,093 (2.7) 58,563 Net Debt/(Net Debt + Market Cap) - Leverage 38% 33% 15.2 43% Average interest rate (% p.a.) 6.8 6.8 − 6.8 Weighted average maturity of outstanding debt (years) 11.92 11.33 5.2 11.92 Net debt/LTM Adjusted EBITDA ratio 1.14 1.43 (20.3) 1.53 Gross debt/LTM Adjusted EBITDA ratio 1.34 1.64 (18.2) 1.78 16 Results by business segment Results by business segment Exploration and Production TABLE 7 – E&P RESULTS Variation (%) (*) US$ million 2Q26 1Q26 2Q25 1H26 1H25 2Q26 X 1Q26 2Q26 X 2Q25 1H26 X 1H25 Sales revenues 22,785 15,996 14,404 38,781 29,471 42.4 58.2 31.6 Gross profit 13,435 7,854 7,803 21,289 16,073 71.1 72.2 32.5 Operating expenses (979) (537) (1,846) (1,516) (2,584) 82.3 (47.0) (41.3) Operating income 12,456 7,317 5,957 19,773 13,489 70.2 109.1 46.6 Net income attributable to the shareholders of Petrobras 8,250 4,845 3,974 13,095 8,961 70.3 107.6 46.1 Adjusted EBITDA of the segment 15,874 10,308 8,970 26,182 18,935 54.0 77.0 38.3 EBITDA margin of the segment (%) 70 64 62 68 64 5.2 7.4 3.3 ROCE (Return on Capital Employed) (%) 11.7 9.3 9.2 11.7 9.2 2.4 2.5 2.5 Average Brent crude (US$/bbl) 104.52 80.61 67.82 92.57 71.74 29.7 54.1 29.0 Production taxes Brazil 4,605 3,455 2,554 8,060 5,354 33.3 80.3 50.5 Royalties 3,000 2,219 1,674 5,219 3,479 35.2 79.2 50.0 Special participation 1,595 1,226 871 2,821 1,858 30.1 83.1 51.8 Retention of areas 10 10 9 20 17 − 11.1 17.6 Lifting cost Brazil (US$/boe) 6.33 6.76 5.96 6.54 6.36 (6.3) 6.2 2.7 Pre-salt 4.45 4.67 3.83 4.56 4.13 (4.8) 16.1 10.3 Deep and ultra-deep post-salt 16.42 17.30 17.10 16.86 17.70 (5.1) (4.0) (4.8) Onshore and shallow waters 18.86 19.03 17.52 18.94 17.25 (0.9) 7.6 9.8 Lifting cost + Leases 9.02 9.28 8.82 9.14 9.15 (2.8) 2.2 (0.0) Pre-salt 7.11 7.14 6.64 7.13 6.85 (0.5) 7.2 4.0 Deep and ultra-deep post-salt 19.73 20.56 20.88 20.15 21.38 (4.0) (5.5) (5.8) Onshore and shallow waters 18.86 19.03 17.52 18.94 17.25 (0.9) 7.6 9.8 Lifting cost + Production taxes 23.88 20.78 17.30 22.36 18.64 14.9 38.0 19.9 Lifting cost + Production taxes + Leases 26.56 23.30 20.16 24.97 21.42 14.0 31.8 16.5 (*) EBITDA margin and ROCE variations in percentage points. 17 Results by business segment In 2Q26, E&P gross profit was USD 13.4 billion, 71.1% higher than 1Q26, when it was USD 7.9 billion. This increase was mainly driven by higher Brent prices and increased production. Operating income in 2Q26 was $12.5 billion, 70.2% higher than in 1Q26. The result was driven by the increase in gross profit, partially offset by higher expenses related to losses in legal proceedings and an increase in impairment provision. Lifting cost in 2Q26, excluding leasings and government take, was US$ 6.33/boe, 6.3% lower than 1Q26. This performance was mainly driven by lower costs in the Post-Salt, combined with higher production in the Pre-Salt. The decrease in cost per barrel produced would have been even more significant if it were not for the 4% appreciation of the BRL against the USD. In addition, the increase in the Pre-salt’s share of the total equivalent oil and gas production mix, from 82% in 1Q26 to 83% in 2Q26, also contributed to the reduction. In Pre-Salt, the 4.8% reduction in lifting costs reflects the higher production, driven by the ramp-up of FPSOs Maria Quitéria, Alexandre de Gusmão, and P-78, lower production losses from maintenance shutdowns and higher operational efficiency. There was also the start-up of five new producing wells in Santos Basin.Furthermore, there were lower expenses related to well interventions, mainly in the Jubarte, Barracuda, Búzios, and Sapinhoá fields, as well as a decrease in operating expenses compared to 1Q26, due to the expenditures concentrated in the previous quarter related to the capacity expansion of FPSOs Almirante Barroso and Almirante Tamandaré and the payment of maintenance and performance bonuses for FPSOs Cidade de Maricá and Cidade de São Paulo in the Santos Basin. These reductions were partially offset by higher maintenance expenses at the Búzios and Tupi fields and by BRL appreciation against USD. In Post-Salt, lifting costs were 5.1% lower due to lower expenses on well interventions in Campos Basin, mainly in the Barracuda, Marlim, Jubarte, and Marlim Sul fields. This reduction would have been even greater if it were not for the appreciation of the BRL against the USD. In onshore and shallow water assets, lifting cost was slightly below that of 1Q26, mainly due to lower maintenance costs at Leste de Urucu and higher production resulting from a greater number of operating days in 2Q26. These gains were partially offset by higher costs associated with the appreciation of the local currency. 18 Results by business segment Refining, Transportation and Marketing TABLE 8 - RTM RESULTS Variation (%) (1) US$ million 2Q26 1Q26 2Q25 1H26 1H25 2Q26 X 1Q26 2Q26 X 2Q25 1H26 X 1H25 Sales revenues 32,351 22,297 19,795 54,648 39,784 45.1 63.4 37.4 Gross profit 5,185 4,525 1,209 9,710 2,420 14.6 328.9 301.2 Operating expenses (2,376) (1,006) (869) (3,382) (1,605) 136.2 173.4 110.7 Operating Income 2,809 3,519 340 6,328 815 (20.2) 726.2 676.4 Net income attributable to the shareholders of Petrobras 1,920 2,300 217 4,220 584 (16.5) 784.8 622.6 Adjusted EBITDA of the segment 3,562 3,848 1,080 7,410 2,149 (7.4) 229.8 244.8 EBITDA margin of the segment (%) 11 17 5 14 5 (6) 6 8 ROCE (Return on Capital Employed) (%) 9.2 5.6 0.7 9.2 0.7 3.6 8.5 8.5 Refining cost (US$ / barrel) - Brazil 3.18 3.25 2.96 3.21 2.79 (2.2) 7.4 15.1 Price of basic oil products - Domestic Market (US$/bbl) 114.60 86.83 82.96 100.76 84.75 32.0 38.1 18.9 (1) Changes in EBITDA and ROCE margins in percentage points. Sales revenues in 2Q26 increased by 45% compared to 1Q26, driven by higher international prices and larger export volumes, reflecting higher oil production. Gross profit in 2Q26 was USD 0.7 billion higher than in 1Q26, boosted by inventories built at lower Brent prices. Excluding the inventory turnover effect of US$ 1.7 billion in 2Q26 and USD 1.3 billion in 1Q26, gross profit would have been USD 3.5 billion in 2Q26 and USD 3.2 billion in 1Q26. The quarter’s improved performance was also supported by higher production of oil products. The 6 p.p. increase in the refining utilization factor, combined with maintenance of middle distillates and gasoline yields at 68%, enabled a higher share of domestically-produced products in sales compared with 1Q26, reducing the resale of imported oil products to the lowest historical level. These effects were beneficial in a context of elevated international prices. Despite higher gross profit, operating income in 2Q26 was lower than in 1Q26 due to higher selling expenses, driven by increased freight costs, and higher taxes related to crude oil exports during the period. Moreover, the reversal of the UFNIII impairment in 1Q26 reduced the comparison base. The refining cost per barrel, in USD, in 2Q26 was 2.2% lower compared to 1Q26, due to a 7% increase in refinery throughput volumes across the refining system. Absolute costs in 2Q26 were slightly higher than in the previous quarter, reflecting higher consumption of inputs associated with the higher refinery throughput and increased HSE spending. The BRL in 2Q26 was 4% stronger than in 1Q26, negatively affecting the cost per barrel. 19 Results by business segment Gas and Low Carbon Energies TABLE 9 – G&LCE RESULTS Variation (%) (1) US$ million 2Q26 1Q26 2Q25 1H26 1H25 2Q26 X 1Q26 2Q26 X 2Q25 1H26 X 1H25 Sales revenues 2,406 2,205 2,176 4,611 4,036 9.1 10.6 14.2 Gross profit 1,086 989 1,032 2,075 1,767 9.8 5.2 17.4 Operating expenses (812) (821) (914) (1,633) (1,693) (1.1) (11.2) (3.5) Operating income 274 168 118 442 74 63.1 132.2 497.3 Net income attributable to the shareholders of Petrobras 190 120 88 310 60 58.3 115.9 416.7 Adjusted EBITDA of the segment 419 334 236 753 323 25.4 77.5 133.1 EBITDA margin of the segment (%) (1) 17 15 11 16 8 2 7 8 ROCE (Return on Capital Employed) (%) (1) 4.1 2.6 1.1 4.1 1.1 1.5 3.0 3.0 Natural gas sales price - Brazil (US$/bbl) 59.10 52.04 58.65 55.61 57.73 13.6 0.8 (3.7) Natural gas sales price - Brazil (US$/MMBtu) 9.97 8.77 9.89 9.38 9.73 13.7 0.8 (3.6) Fixed revenues from power auctions (2)(3) 66.70 67.95 29.98 134.65 58.86 (1.9) 122.4 128.8 Average electricity sales price (US$/MWh) (2)(3) 54.81 63.13 35.83 59.52 37.90 (13.2) 53.0 57.0 (1) EBITDA margin and ROCE variations in percentage points. (2) The fixed revenue from auctions takes into account the remuneration for thermal availability and inflexible electricity committed in auctions. (3) For the current period, the figures for the Energy segment are subject to possible changes once the final report from the Chamber of Electric Energy Commercialization - CCEE is issued. In 2Q26, gross profit increased by 9.8% compared to 1Q26, mainly due to the quarterly price adjustment in natural gas contracts, which reflected higher Brent prices. Operating income in 2Q26 also increased compared to 1Q26, reflecting the higher gross profit and stable of operating expenses. 20 Reconciliation of Adjusted EBITDA Reconciliation of Adjusted EBITDA EBITDA is an indicator calculated as the net income for the period plus taxes on profit, net financial result, depreciation and amortization. Petrobras announces EBITDA, as authorized by CVM Resolution No. 156, of June 2022. In order to reflect the management view regarding the formation of the company's current business results, EBITDA is also presented adjusted (Adjusted EBITDA) as a result of: results in equity-accounted investments; impairment, results with co-participation agreement in production fields and gains/losses on disposal/write-offs of assets. Adjusted EBITDA, reflecting the sum of the last twelve months (Last Twelve Months), also represents an alternative to the company's operating cash generation. This measure is used to calculate the Gross Debt and Net Debt to Adjusted EBITDA metric, helping to evaluate the company's leverage and liquidity. EBITDA and adjusted EBITDA are not provided for in IFRS Accounting Standards and should not serve as a basis for comparison with those disclosed by other companies and should not be considered as a substitute for any other measure calculated in accordance with IFRS Accounting Standards. These measures should be considered in conjunction with other measures and indicators for a better understanding of the company's performance and financial condition. TABLE 10 - RECONCILIATION OF ADJUSTED EBITDA Variation (%) (*) US$ million 2Q26 1Q26 2Q25 1H26 1H25 2Q26 X 1Q26 2Q26 X 2Q25 1H26 X 1H25 Net income 10,438 6,218 4,757 16,656 10,752 67.9 119.4 54.9 Net finance income (expense) 288 (1,467) (1,015) (1,179) (2,763) − − (57.3) Income taxes 3,630 3,107 1,654 6,737 4,765 16.8 119.5 41.4 Depreciation, depletion and amortization 4,263 4,111 3,697 8,374 6,944 3.7 15.3 20.6 EBITDA 18,619 11,969 9,093 30,588 19,698 55.6 104.8 55.3 Results of equity-accounted investments (103) (10) (47) (113) (129) 930.0 119.1 (12.4) Impairment of assets (reversals), net 226 (417) 190 (191) 240 − 18.9 − Results on disposal/write-offs of assets (40) (75) (14) (115) (71) (46.7) 185.7 62.0 Results from co-participation agreements in bid areas (87) (118) 20 (205) (50) (26.3) − 310.0 Adjusted EBITDA 18,615 11,349 9,242 29,964 19,688 64.0 101.4 52.2 Adjusted EBITDA margin (%) 55 48 44 52 47 7.0 11.0 5.0 (*) EBITDA Margin variations in percentage points. 21 Exhibits Exhibits Financial statements TABLE 11 - INCOME STATEMENT - CONSOLIDATED US$ million 2Q26 1Q26 2Q25 1H26 1H25 Sales revenues 33,607 23,535 21,037 57,142 42,110 Cost of sales (14,114) (12,195) (11,025) (26,309) (21,710) Gross profit 19,493 11,340 10,012 30,833 20,400 Selling expenses (1,746) (1,515) (1,286) (3,261) (2,376) General and administrative expenses (556) (479) (464) (1,035) (908) Exploration costs (101) (138) (185) (239) (498) Research and development expenses (296) (250) (193) (546) (395) Other taxes (1,184) (474) (127) (1,658) (250) Impairment (losses) reversals, net (226) 417 (190) 191 (240) Other expenses, net (1,131) (1,053) (2,218) (2,184) (3,108) (5,240) (3,492) (4,663) (8,732) (7,775) Operating income 14,253 7,848 5,349 22,101 12,625 Finance income 382 334 345 716 642 Finance expenses (1,049) (985) (1,065) (2,034) (2,048) Foreign exchange gains (losses) and inflation indexation charges 379 2,118 1,735 2,497 4,169 Net finance income (expense) (288) 1,467 1,015 1,179 2,763 Results of equity-accounted investments 103 10 47 113 129 Net income before income taxes 14,068 9,325 6,411 23,393 15,517 Income taxes (3,630) (3,107) (1,654) (6,737) (4,765) Net Income 10,438 6,218 4,757 16,656 10,752 Net income (loss) attributable to: Shareholders of Petrobras 10,428 6,199 4,734 16,627 10,708 Non-controlling interests 10 19 23 29 44 22 Exhibits TABLE 12 - STATEMENT OF FINANCIAL POSITION – CONSOLIDATED ASSETS - US$ million 06.30.2026 12.31.2025 Current assets 29,937 25,448 Cash and cash equivalents 6,483 6,471 Financial investments 3,903 2,726 Trade and other receivables, net 6,252 4,627 Inventories 9,718 8,210 Income taxes 758 658 Other taxes recoverable 1,364 1,368 Prepayments 584 468 Assets classified as held for sale 27 25 Other current assets 848 895 Non-current assets 217,140 196,889 Long-term receivables 28,060 25,776 Trade and other receivables, net 553 851 Judicial deposits 16,580 14,814 Income taxes 207 365 Deferred income taxes 1,198 1,015 Other taxes recoverable 4,772 4,177 Prepayments 4,341 4,238 Other non-current assets 409 316 Investments 654 550 Property, plant and equipment 185,694 168,040 Intangible assets 2,732 2,523 Total assets 247,077 222,337 LIABILITIES - US$ million 06.30.2026 12.31.2025 Current liabilities 35,037 36,051 Trade payables 6,617 7,442 Finance debt 1,435 2,186 Lease liability 10,250 10,037 Income taxes 875 1,292 Production taxes and other taxes payable 5,535 3,810 Dividends payable 1,583 2,095 23 Exhibits Provision for decommissioning costs 2,835 2,950 Employee benefits 3,224 3,805 Liabilities related to assets classified as held for sale 112 103 Other current liabilities 2,571 2,331 Non-current liabilities 118,957 110,395 Finance debt 24,399 24,255 Lease liability 34,722 33,315 Income taxes 598 576 Deferred income taxes 10,417 6,354 Employee benefits 16,807 15,367 Provision for legal proceedings 3,429 3,250 Provision for decommissioning costs 26,859 25,563 Other non-current liabilities 1,726 1,715 Shareholders' equity 93,083 75,891 Attributable to the shareholders of Petrobras 92,908 75,565 Share capital (net of share issuance costs) 107,101 107,101 Capital reserve and capital transactions 1,145 1,145 Profit reserves 71,133 72,600 Retained earnings 14,825 − Accumulated other comprehensive loss (101,296) (105,281) Attributable to non-controlling interests 175 326 Total liabilities and shareholders' equity 247,077 222,337 24 Exhibits TABLE 13 - STATEMENT OF CASH FLOW – CONSOLIDATED US$ million 2Q26 1Q26 2Q25 1H26 1H25 Cash flows from operating activities Net income for the period 10,438 6,218 4,757 16,656 10,752 Adjustments for: Pension and medical benefits 562 540 430 1,102 847 Results of equity-accounted investments (103) (10) (47) (113) (129) Depreciation, depletion and amortization 4,263 4,111 3,697 8,374 6,944 Impairment of assets (reversals), net 226 (417) 190 (191) 240 Inventory write down (write-back) to net realizable value 3 − − 3 7 Allowance (reversals) for credit loss on trade and other receivables, net 8 (8) 57 − 37 Exploratory expenditure write-offs 4 16 − 20 209 Gain on disposal/write-offs of assets (40) (75) (14) (115) (71) Foreign exchange, indexation and finance charges 109 (1,669) (1,252) (1,560) (3,207) Income taxes 3,630 3,107 1,654 6,737 4,765 Revision and unwinding of discount on the provision for decommissioning costs 351 347 329 698 649 Results from co-participation agreements in bid areas (87) (118) 20 (205) (50) Early termination and cash outflows revision of lease agreements (149) (140) (144) (289) (301) Losses with legal, administrative and arbitration proceedings, net 347 133 125 480 326 Equalization of expenses - Production Individualization Agreements 14 7 672 21 676 Decrease (Increase) in assets Trade and other receivables (1,951) (245) (50) (2,196) 122 Inventories (423) (778) (494) (1,201) (853) Judicial deposits (167) (23) (256) (190) (436) Other assets 785 (673) (194) 112 185 Increase (Decrease) in liabilities Trade payables (776) (284) 461 (1,060) (82) Production taxes and other taxes payable 100 717 (605) 817 (401) Pension and medical benefits (373) (266) (307) (639) (522) Provisions for legal proceedings (258) (159) (173) (417) (557) Other employee benefits (567) (260) (2) (827) 116 Provision for decommissioning costs (394) (371) (241) (765) (425) Other liabilities (127) 499 29 372 (31) Income taxes paid (3,175) (1,800) (1,111) (4,975) (2,781) 25 Exhibits Net cash provided by operating activities 12,250 8,399 7,531 20,649 16,029 Cash flows from investing activities Acquisition of PP&E and intangible assets (4,559) (4,513) (4,084) (9,072) (8,046) Acquisition of equity interests (32) (31) (2) (63) (2) Proceeds from disposal of assets - Divestment 108 250 16 358 479 Financial compensation from co-participation agreements − 307 − 307 355 Divestment (investment) in financial investments (1,291) 394 1,491 (897) 2,861 Dividends received 69 2 18 71 25 Net cash used in investing activities (5,705) (3,591) (2,561) (9,296) (4,328) Cash flows from financing activities Changes in non-controlling interest (66) (136) 118 (202) 157 Financing and loans, net: Proceeds from finance debt 614 1,317 2,572 1,931 3,072 Repayment of principal - finance debt (2,452) (683) (1,075) (3,135) (1,547) Repayment of interest - finance debt (484) (586) (359) (1,070) (856) Repayment of lease liability (2,775) (2,441) (2,274) (5,216) (4,368) Dividends paid to Shareholders of Petrobras (1,511) (2,231) (1,706) (3,742) (4,588) Dividends paid to non-controlling interests (8) − (5) (8) (31) Net cash used in financing activities (6,682) (4,760) (2,729) (11,442) (8,161) Effect of exchange rate changes on cash and cash equivalents 50 51 60 101 185 Net change in cash and cash equivalents (87) 99 2,301 12 3,725 Cash and cash equivalents at the beginning of the period 6,570 6,471 4,695 6,471 3,271 Cash and cash equivalents at the end of the period 6,483 6,570 6,996 6,483 6,996 26 Exhibits TABLE 14 – NET REVENUES BY PRODUCTS Variation (%) US$ million 2Q26 1Q26 2Q25 1H26 1H25 2Q26 X 1Q26 2Q26 X 2Q25 1H26 X 1H25 Diesel 7,584 6,743 6,183 14,327 12,753 12.5 22.7 12.3 Road-use diesel subsidy program 1,923 128 − 2,051 − 1402.3 − − Gasoline 3,013 2,923 3,073 5,936 6,037 3.1 (2.0) (1.7) Gasoline subsidy program 159 − − 159 − − − − Liquefied petroleum gas (LPG) 942 831 884 1,773 1,617 13.4 6.6 9.6 Liquefied petroleum gas subsidy program 17 − − 17 − − − − Jet fuel 1,893 1,179 1,009 3,072 2,132 60.6 87.6 44.1 Naphtha 784 472 425 1,256 835 66.1 84.5 50.4 Fuel oil (including bunker fuel) 213 163 132 376 297 30.7 61.4 26.6 Other oil products 1,213 849 970 2,062 1,901 42.9 25.1 8.5 Subtotal oil products 17,741 13,288 12,676 31,029 25,572 33.5 40.0 21.3 Natural gas 899 778 973 1,677 1,858 15.6 (7.6) (9.7) Crude oil 1,358 931 1,073 2,289 2,478 45.9 26.6 (7.6) Renewables and nitrogen products 122 112 41 234 94 8.9 197.6 148.9 Breakage 44 36 54 80 102 22.2 (18.5) (21.6) Electricity 274 328 148 602 287 (16.5) 85.1 109.8 Services, agency and others 255 235 182 490 348 8.5 40.1 40.8 Total domestic market 20,693 15,708 15,147 36,401 30,739 31.7 36.6 18.4 Exports 12,665 7,602 5,680 20,267 11,049 66.6 123.0 83.4 Crude oil 10,381 5,715 4,452 16,096 8,262 81.6 133.2 94.8 Fuel oil (including bunker fuel) 1,879 1,541 1,093 3,420 2,277 21.9 71.9 50.2 Other oil products and other products 405 346 135 751 510 17.1 200.0 47.3 Sales abroad (*) 249 225 210 474 322 10.7 18.6 47.2 Total foreign market 12,914 7,827 5,890 20,741 11,371 65.0 119.3 82.4 Total 33,607 23,535 21,037 57,142 42,110 42.8 59.8 35.7 (*) Sales revenues from operations outside of Brazil, including trading and excluding exports. 27 Exhibits TABLE 15 – COST OF SALES (*) Variation (%) US$ million 2Q26 1Q26 2Q25 1H26 1H25 2Q26 X 1Q26 2Q26 X 2Q25 1H26 X 1H25 Raw material, products for resale, materials and third-party services* (5,700) (5,260) (5,251) (10,960) (10,350) 8.4 8.6 5.9 Acquisitions (including imports) (3,622) (3,426) (3,552) (7,048) (7,131) 5.7 2.0 (1.2) Crude oil (2,553) (2,162) (1,766) (4,715) (3,882) 18.1 44.6 21.5 Oil products (800) (1,105) (1,586) (1,905) (2,775) (27.6) (49.6) (31.4) Natural gas (269) (159) (200) (428) (474) 69.2 34.5 (9.7) Third-party services and others (2,078) (1,834) (1,699) (3,912) (3,219) 13.3 22.3 21.5 Depreciation, depletion and amortization (3,543) (3,357) (3,004) (6,900) (5,517) 5.5 17.9 25.1 Production taxes (4,607) (3,456) (2,555) (8,063) (5,358) 33.3 80.3 50.5 Employee compensation (515) (521) (431) (1,036) (830) (1.2) 19.5 24.8 Inventory turnover 251 399 216 650 345 (37.1) 16.2 88.4 Total (14,114) (12,195) (11,025) (26,309) (21,710) 15.7 28.0 21.2 (*) It Includes short-term leases. 28 Exhibits TABLE 16 – OPERATING EXPENSES Variation (%) US$ million 2Q26 1Q26 2Q25 1H26 1H25 2Q26 X 1Q26 2Q26 X 2Q25 1H26 X 1H25 Selling, General and Administrative Expenses (2,302) (1,994) (1,750) (4,296) (3,284) 15.4 31.5 30.8 Selling expenses (1,746) (1,515) (1,286) (3,261) (2,376) 15.2 35.8 37.2 Materials, third-party services, freight, rent and other related costs (1,487) (1,267) (1,071) (2,754) (1,966) 17.4 38.8 40.1 Depreciation, depletion and amortization (220) (203) (171) (423) (340) 8.4 28.7 24.4 Reversal (allowance) for expected credit losses 1 (7) (14) (6) (10) − − (40.0) Employee compensation (40) (38) (30) (78) (60) 5.3 33.3 30.0 General and administrative expenses (556) (479) (464) (1,035) (908) 16.1 19.8 14.0 Employee compensation (328) (303) (265) (631) (531) 8.3 23.8 18.8 Materials, third-party services, rent and other related costs (161) (117) (153) (278) (292) 37.6 5.2 (4.8) Depreciation, depletion and amortization (67) (59) (46) (126) (85) 13.6 45.7 48.2 Exploration costs (101) (138) (185) (239) (498) (26.8) (45.4) (52.0) Research and development expenses (296) (250) (193) (546) (395) 18.4 53.4 38.2 Other taxes (1,184) (474) (127) (1,658) (250) 149.8 832.3 563.2 Impairment (losses) reversals, net (226) 417 (190) 191 (240) − 18.9 − Other income and expenses, net (1,131) (1,053) (2,218) (2,184) (3,108) 7.4 (49.0) (29.7) Total (5,240) (3,492) (4,663) (8,732) (7,775) 50.1 12.4 12.3 29 Exhibits TABLE 17 – FINANCIAL RESULTS Variation (%) US$ million 2Q26 1Q26 2Q25 1H26 1H25 2Q26 X 1Q26 2Q26 X 2Q25 1H26 X 1H25 Finance income 382 334 345 716 642 14.4 10.7 11.5 Income from financial investments and Government Bonds 270 218 225 488 448 23.9 20.0 8.9 Other finance income 112 116 120 228 194 (3.4) (6.7) 17.5 Finance expenses (1,049) (985) (1,065) (2,034) (2,048) 6.5 (1.5) (0.7) Interest on finance debt (583) (553) (517) (1,136) (983) 5.4 12.8 15.6 Unwinding of discount on lease liability (736) (677) (653) (1,413) (1,275) 8.7 12.7 10.8 Capitalized borrowing costs 725 625 467 1,350 916 16.0 55.2 47.4 Unwinding of discount on the provision for decommissioning costs (351) (340) (329) (691) (648) 3.2 6.7 6.6 Other finance expenses (104) (40) (33) (144) (58) 160.0 215.2 148.3 Foreign exchange gains (losses) and inflation indexation charges 379 2,118 1,735 2,497 4,169 (82.1) (78.2) (40.1) Foreign exchange gains (losses) 371 2,350 2,032 2,721 5,068 (84.2) (81.7) (46.3) Real x U.S. dollar 373 2,311 2,141 2,684 5,218 (83.9) (82.6) (48.6) Other currencies (2) 39 (109) 37 (150) − (98.2) − Reclassification of hedge accounting to the Statement of Income (197) (507) (498) (704) (1,220) (61.1) (60.4) (42.3) Indexation to the Selic interest rate of anticipated dividends and dividends payable (95) (57) (87) (152) (151) 66.7 9.2 0.7 Recoverable taxes inflation indexation income 74 25 101 99 159 196.0 (26.7) (37.7) Other foreign exchange gains and indexation charges, net 226 307 187 533 313 (26.4) 20.9 70.3 Total (288) 1,467 1,015 1,179 2,763 − − (57.3) 30 Exhibits Financial information by business segment TABLE 18 - CONSOLIDATED INCOME BY BUSINESS SEGMENT – 1H26 US$ million E&P RTM G&LCE Corporate and other businesses ELIMIN. TOTAL Sales revenues 38,781 54,648 4,611 188 (41,086) 57,142 Intersegments 38,661 736 1,684 5 (41,086) − Third parties 120 53,912 2,927 183 − 57,142 Cost of sales (17,492) (44,938) (2,536) (168) 38,825 (26,309) Gross profit 21,289 9,710 2,075 20 (2,261) 30,833 Expenses (1,516) (3,382) (1,633) (2,201) − (8,732) Selling expenses (1) (1,823) (1,424) (13) − (3,261) General and administrative expenses (39) (233) (73) (690) − (1,035) Exploration costs (239) − − − − (239) Research and development expenses (441) (2) (6) (97) − (546) Other taxes (181) (1,127) (6) (344) − (1,658) Impairment (losses) reversals, net (223) 414 − − − 191 Other expenses, net (392) (611) (124) (1,057) − (2,184) Operating income (loss) 19,773 6,328 442 (2,181) (2,261) 22,101 Net finance income − − − 1,179 − 1,179 Results of equity-accounted investments 45 42 33 (7) − 113 Net income before income taxes 19,818 6,370 475 (1,009) (2,261) 23,393 Income taxes (6,724) (2,150) (150) 1,519 768 (6,737) Net income 13,094 4,220 325 510 (1,493) 16,656 Net income (loss) attributable to: Shareholders of Petrobras 13,095 4,220 310 495 (1,493) 16,627 Non-controlling interests (1) − 15 15 − 29 31 Exhibits TABLE 19 - CONSOLIDATED INCOME BY BUSINESS SEGMENT – 1H25 US$ million E&P RTM G&LCE Corporate and other businesses ELIMIN. TOTAL Sales revenues 29,471 39,784 4,036 157 (31,338) 42,110 Intersegments 29,355 546 1,434 3 (31,338) − Third parties 116 39,238 2,602 154 − 42,110 Cost of sales (13,398) (37,364) (2,269) (138) 31,459 (21,710) Gross profit 16,073 2,420 1,767 19 121 20,400 Expenses (2,584) (1,605) (1,693) (1,893) − (7,775) Selling expenses − (955) (1,406) (15) − (2,376) General and administrative expenses (30) (183) (58) (637) − (908) Exploration costs (498) − − − − (498) Research and development expenses (309) (4) (4) (78) − (395) Other taxes (11) (27) (8) (204) − (250) Impairment (losses) reversals, net (193) (46) (1) − − (240) Other expenses, net (1,543) (390) (216) (959) − (3,108) Operating income (loss) 13,489 815 74 (1,874) 121 12,625 Net finance income − − − 2,763 − 2,763 Results of equity-accounted investments 56 48 29 (4) − 129 Net income (loss) before income taxes 13,545 863 103 885 121 15,517 Income taxes (4,585) (279) (25) 165 (41) (4,765) Net income (loss) 8,960 584 78 1,050 80 10,752 Net income (loss) attributable to: Shareholders of Petrobras 8,961 584 60 1,023 80 10,708 Non-controlling interests (1) − 18 27 − 44 32 Exhibits TABLE 20 - QUARTERLY CONSOLIDATED INCOME BY BUSINESS SEGMENT – 2Q26 US$ million E&P RTM G&LCE Corporate and other businesses ELIMIN. TOTAL Sales revenues 22,785 32,351 2,406 99 (24,034) 33,607 Intersegments 22,724 428 880 2 (24,034) − Third parties 61 31,923 1,526 97 − 33,607 Cost of sales (9,350) (27,166) (1,320) (87) 23,809 (14,114) Gross profit 13,435 5,185 1,086 12 (225) 19,493 Expenses (979) (2,376) (812) (1,073) − (5,240) Selling expenses (1) (1,029) (714) (2) − (1,746) General and administrative expenses (25) (131) (38) (362) − (556) Exploration costs (101) − − − − (101) Research and development expenses (243) (1) (3) (49) − (296) Other taxes (12) (991) (3) (178) − (1,184) Impairment (losses) reversals, net (226) − − − − (226) Other expenses, net (371) (224) (54) (482) − (1,131) Operating income (loss) 12,456 2,809 274 (1,061) (225) 14,253 Net finance income (expense) − − − (288) − (288) Results of equity-accounted investments 29 65 15 (6) − 103 Net income (loss) before income taxes 12,485 2,874 289 (1,355) (225) 14,068 Income taxes (4,235) (954) (93) 1,577 75 (3,630) Net income (loss) 8,250 1,920 196 222 (150) 10,438 Net income (loss) attributable to: Shareholders of Petrobras 8,250 1,920 190 218 (150) 10,428 Non-controlling interests − − 6 4 − 10 33 Exhibits TABLE 21 - QUARTERLY CONSOLIDATED INCOME BY BUSINESS SEGMENT – 1Q26 US$ million E&P RTM G&LCE Corporate and other businesses ELIMIN. TOTAL Sales revenues 15,996 22,297 2,205 89 (17,052) 23,535 Intersegments 15,937 308 804 3 (17,052) − Third parties 59 21,989 1,401 86 − 23,535 Cost of sales (8,142) (17,772) (1,216) (81) 15,016 (12,195) Gross profit 7,854 4,525 989 8 (2,036) 11,340 Expenses (537) (1,006) (821) (1,128) − (3,492) Selling expenses − (794) (710) (11) − (1,515) General and administrative expenses (14) (102) (35) (328) − (479) Exploration costs (138) − − − − (138) Research and development expenses (198) (1) (3) (48) − (250) Other taxes (169) (136) (3) (166) − (474) Impairment (losses) reversals, net 3 414 − − − 417 Other expenses, net (21) (387) (70) (575) − (1,053) Operating income (loss) 7,317 3,519 168 (1,120) (2,036) 7,848 Net finance income − − − 1,467 − 1,467 Results of equity-accounted investments 16 (23) 18 (1) − 10 Net income (loss) before income taxes 7,333 3,496 186 346 (2,036) 9,325 Income taxes (2,489) (1,196) (57) (58) 693 (3,107) Net income (loss) 4,844 2,300 129 288 (1,343) 6,218 Net income (loss) attributable to: Shareholders of Petrobras 4,845 2,300 120 277 (1,343) 6,199 Non-controlling interests (1) − 9 11 − 19 34 Exhibits TABLE 22 - OTHER EXPENSES BY SEGMENT, NET – 1H26 US$ million E&P RTM G&LCE Corporate and other businesses ELIMIN. TOTAL Stoppages for asset maintenance and pre-operating expenses (1,159) (93) (24) (6) − (1,282) Pension and medical benefits - retirees − − − (786) − (786) Variable compensation programs (*) (310) (197) (32) (182) − (721) Losses with legal, administrative and arbitration proceedings (100) (144) (3) (233) − (480) Gains (losses) with commodity derivatives − (142) 4 − − (138) Results on disposal/write-offs of assets 51 7 6 51 − 115 Results from co-participation agreements in bid areas 205 − − − − 205 Results of non-core activities 249 4 1 11 − 265 Early termination and changes to cash flow estimates of leases 287 5 (5) 2 − 289 Reimbursements from E&P partnership operations 381 − − − − 381 Others 4 (51) (71) 86 − (32) Total (392) (611) (124) (1,057) − (2,184) (*) It comprises Profit Sharing (PLR) and Performance Award Program (PRD). TABLE 23 - OTHER EXPENSES BY SEGMENT, NET – 1H25 US$ million E&P RTM G&LCE Corporate and other businesses ELIMIN. TOTAL Stoppages for asset maintenance and pre-operating expenses (1,113) (127) (47) (8) − (1,295) Pension and medical benefits - retirees − − − (639) − (639) Variable compensation programs (*) (271) (138) (31) (155) − (595) Losses with legal, administrative and arbitration proceedings (106) (67) (30) (123) − (326) Gains with commodity derivatives − 4 7 − − 11 Results on disposal/write-offs of assets 14 − 16 41 − 71 Results from co-participation agreements in bid areas 50 − − − − 50 Results of non-core activities 222 (5) 1 6 − 224 Early termination and changes to cash flow estimates of leases 300 (4) 1 4 − 301 Reimbursements from E&P partnership operations 65 − − − − 65 Others (704) (53) (133) (85) − (975) Total (1,543) (390) (216) (959) − (3,108) (*) It comprises Profit Sharing (PLR) and Performance Award Program (PRD). 35 Exhibits TABLE 24 - OTHER EXPENSES BY SEGMENT, NET – 2Q26 US$ million E&P RTM G&LCE Corporate and other businesses TOTAL Stoppages for asset maintenance and pre-operating expenses (589) (34) (13) (2) (638) Pension and medical benefits - retirees − − − (401) (401) Variable compensation programs (*) (152) (117) (15) (91) (375) Losses with legal, administrative and arbitration proceedings (254) (51) (1) (41) (347) Gains (losses) with commodity derivatives − (14) 4 − (10) Results on disposal/write-offs of assets 9 14 4 13 40 Results from co-participation agreements in bid areas 87 − − − 87 Results of non-core activities 125 4 1 6 136 Early termination and changes to cash flow estimates of leases 158 (6) (5) 2 149 Reimbursements from E&P partnership operations 249 − − − 249 Others (4) (20) (29) 32 (21) Total (371) (224) (54) (482) (1,131) (*) It comprises Profit Sharing (PLR) and Performance Award Program (PRD). TABLE 25 - OTHER EXPENSES BY SEGMENT, NET – 1Q26 US$ million E&P RTM G&LCE Corporate and other businesses TOTAL Stoppages for asset maintenance and pre-operating expenses (570) (59) (11) (4) (644) Pension and medical benefits - retirees − − − (385) (385) Variable compensation programs (*) (158) (80) (17) (91) (346) Gains (losses) with legal, administrative and arbitration proceedings 154 (93) (2) (192) (133) Losses with commodity derivatives − (128) − − (128) Results on disposal/write-offs of assets 42 (7) 2 38 75 Results from co-participation agreements in bid areas 118 − − − 118 Results of non-core activities 124 − − 5 129 Early termination and changes to cash flow estimates of leases 129 11 − − 140 Reimbursements from E&P partnership operations 132 − − − 132 Others 8 (31) (42) 54 (11) Total (21) (387) (70) (575) (1,053) (*) It comprises Profit Sharing (PLR) and Performance Award Program (PRD). 36 Exhibits TABLE 26 - CONSOLIDATED ASSETS BY BUSINESS SEGMENT – 06.30.2026 US$ million E&P RTM G&LCE Corporate and other businesses ELIMIN. TOTAL Total assets 172,147 37,790 6,068 36,858 (5,786) 247,077 Current assets 2,925 12,819 492 19,487 (5,786) 29,937 Non-current assets 169,222 24,971 5,576 17,371 − 217,140 Long-term receivables 9,886 3,703 164 14,307 − 28,060 Investments 315 92 187 60 − 654 Property, plant and equipment 157,017 21,018 5,131 2,528 − 185,694 Operating assets 119,431 17,113 4,492 1,670 − 142,706 Assets under construction 37,586 3,905 639 858 − 42,988 Intangible assets 2,004 158 94 476 − 2,732 TABLE 27 - CONSOLIDATED ASSETS BY BUSINESS SEGMENT – 12.31.2025 US$ million E&P RTM G&LCE Corporate and other businesses ELIMIN. TOTAL Total assets 155,715 31,891 5,671 32,592 (3,532) 222,337 Current assets 2,424 9,580 356 16,620 (3,532) 25,448 Non-current assets 153,291 22,311 5,315 15,972 − 196,889 Long-term receivables 9,318 3,091 146 13,221 − 25,776 Investments 292 27 171 60 − 550 Property, plant and equipment 141,818 19,053 4,917 2,252 − 168,040 Operating assets 108,424 16,534 4,394 1,568 − 130,920 Assets under construction 33,394 2,519 523 684 − 37,120 Intangible assets 1,863 140 81 439 − 2,523 37 Exhibits TABLE 28 - RECONCILIATION OF ADJUSTED EBITDA BY BUSINESS SEGMENT – 1H26 US$ million E&P RTM G&LCE Corporate and other businesses ELIMIN. TOTAL Net income (loss) 13,094 4,220 325 510 (1,493) 16,656 Net finance income (expense) − − − (1,179) − (1,179) Income taxes 6,724 2,150 150 (1,519) (768) 6,737 Depreciation, depletion and amortization 6,442 1,503 317 112 − 8,374 EBITDA 26,260 7,873 792 (2,076) (2,261) 30,588 Results of equity-accounted investments (45) (42) (33) 7 − (113) Impairment of assets (reversals), net 223 (414) − − − (191) Results on disposal/write-offs of assets (51) (7) (6) (51) − (115) Results from co-participation agreements in bid areas (205) − − − − (205) Adjusted EBITDA 26,182 7,410 753 (2,120) (2,261) 29,964 TABLE 29 - RECONCILIATION OF ADJUSTED EBITDA BY BUSINESS SEGMENT – 1H25 US$ million E&P RTM G&LCE Corporate and other businesses ELIMIN. TOTAL Net income 8,960 584 78 1,050 80 10,752 Net finance income (expense) − − − (2,763) − (2,763) Income taxes 4,585 279 25 (165) 41 4,765 Depreciation, depletion and amortization 5,317 1,288 264 75 − 6,944 EBITDA 18,862 2,151 367 (1,803) 121 19,698 Results of equity-accounted investments (56) (48) (29) 4 − (129) Impairment of assets (reversals), net 193 46 1 − − 240 Results on disposal/write-offs of assets (14) − (16) (41) − (71) Results from co-participation agreements in bid areas (50) − − − − (50) Adjusted EBITDA 18,935 2,149 323 (1,840) 121 19,688 38 Exhibits TABLE 30 - RECONCILIATION OF ADJUSTED EBITDA BY BUSINESS SEGMENT – 2Q26 US$ million E&P RTM G&LCE Corporate and other businesses ELIMIN. TOTAL Net income (loss) 8,250 1,920 196 222 (150) 10,438 Net finance income (expense) − − − 288 − 288 Income taxes 4,235 954 93 (1,577) (75) 3,630 Depreciation, depletion and amortization 3,288 767 149 59 − 4,263 EBITDA 15,773 3,641 438 (1,008) (225) 18,619 Results of equity-accounted investments (29) (65) (15) 6 − (103) Impairment of assets (reversals), net 226 − − − − 226 Results on disposal/write-offs of assets (9) (14) (4) (13) − (40) Results from co-participation agreements in bid areas (87) − − − − (87) Adjusted EBITDA 15,874 3,562 419 (1,015) (225) 18,615 TABLE 31 - RECONCILIATION OF ADJUSTED EBITDA BY BUSINESS SEGMENT – 1Q26 US$ million E&P RTM G&LCE Corporate and other businesses ELIMIN. TOTAL Net income (loss) 4,844 2,300 129 288 (1,343) 6,218 Net finance income (expense) − − − (1,467) − (1,467) Income taxes 2,489 1,196 57 58 (693) 3,107 Depreciation, depletion and amortization 3,154 736 168 53 − 4,111 EBITDA 10,487 4,232 354 (1,068) (2,036) 11,969 Results of equity-accounted investments (16) 23 (18) 1 − (10) Impairment of assets (reversals), net (3) (414) − − − (417) Results on disposal/write-offs of assets (42) 7 (2) (38) − (75) Results from co-participation agreements in bid areas (118) − − − − (118) Adjusted EBITDA 10,308 3,848 334 (1,105) (2,036) 11,349 39 Glossary Glossary A Adjusted cash and cash equivalents: Sum of cash and cash equivalents and financial investments in securities in domestic and international markets that have high liquidity, i.e., convertible into cash within 3 months, even if maturity is longer than 12 months, held for the purpose of complying with cash commitments. This measure is not defined under the IFRS Accounting Standards and should not be considered in isolation or as a substitute for cash and cash equivalents computed in accordance with IFRS Accounting Standards. It may not be comparable to adjusted cash and cash equivalents of other companies, however management believes that it is an appropriate supplemental measure to assess our liquidity and supports leverage management. Adjusted EBITDA: Adjusted EBITDA (a non-GAAP measure defined as net income plus net finance income (expense); income taxes; depreciation, depletion and amortization; results in equity-accounted investments; impairment of assets (reversals); results on disposal/write-offs of assets, remeasurement of investment retained with loss of control and reclassification of CTA; and results from co-participation agreements in bid areas). Adjusted EBITDA margin: Adjusted EBITDA divided by sales revenues. Average capital employed: quarterly average considering inventories, intangibles and fixed assets at historical exchange rates. C CAPEX – Capital Expenditure: investments that encompasses acquisition of property, plant, and equipment, including costs with leasing, intangible assets, investments in subsidiaries and affiliates, costs with geology and geophysics and pre-operating costs. CAPEX vs. cash Capex: a) Contractual milestones: include payments related to mobilization for the start of asset construction. b) Geology and Geophysics: acquisition and interpretation of seismic data. c) Leases: payments related to leased assets used in projects (e.g., drilling rigs and PLSVs), excluding production units (FPSOs). d) Materials for future fixed asset additions: corresponds to the acquisition of materials for future use in projects. e) Others: adjustment of payment flows for platform construction milestones, considering the mismatch between accrual-based and cash-based and expenses related to projects but not capitalized, such as pre-FID expenditures. f) Signature bonuses: Represents an initial disbursement associated with acquiring the right to explore for and produce oil and natural gas in a given contracted area. E Exploration & Production (E&P): The segment covers the exploration, development and production of crude oil, NGL and natural gas in Brazil and abroad, with the main aim of supplying our domestic refineries. This segment also operates through partnerships with other companies, including interests in foreign companies in this segment. 40 Glossary F Free cash flow: Corresponds to operating cash flow minus acquisitions of property, plant and equipment, intangible assets and equity interests. Free cash flow is not defined under the IFRS Accounting Standards and should not be considered in isolation or as a substitute for cash and cash equivalents calculated in accordance with IFRS Accounting Standards. It may not be comparable to free cash flow of other companies, however management believes that it is an appropriate supplemental measure to assess our liquidity and supports leverage management. G Gas & Low Carbon Energy (G&LCE): The segment covers the logistics and commercialization of natural gas and electricity, the transportation and commercialization of LNG, the generation of electricity through thermoelectric plants, as well as the processing of natural gas. It also includes renewable energy businesses, low carbon services (carbon capture, utilization and storage) and the production of biodiesel and its products. I Investments: Capital expenditures based on the cost assumptions and financial methodology adopted in our Strategic Plan, which include acquisition of PP&E, including expenses with leasing, intangibles assets, investment in investees and other items that do not necessarily qualify as cash flows used in investing activities, primarily geological and geophysical expenses, pre-operating charges, purchase of property, plant and equipment on credit and borrowing costs directly attributable to works in progress. Investments in E&P: In the E&P segment, investment projects are classified as: a) production development; b) exploration and c) others. See the details: a) Production Development (PD) Projects aimed at enabling the production activities of new oil or gas fields, or the revitalization of fields already in production through new production systems and/or onshore facilities. This includes complementary development projects intended to increase the recovery factor in fields with declining production, without the installation of new production systems. Other projects in the Production Development include: asset acquisition projects linked to new production systems; quantitative risk analysis wells in development areas; and investments in the production development of non-operated fields. b) Exploration (EXP) Exploration projects aim to incorporate oil and gas reserves in a resilient way, from an economical and carbon emission perspective, generating value in the long-term. c) They are classified into types such as: Geological Interpretation Regional Studies, Block, Discovery Appraisal, Ring Fence (RF), Reservoir Data Acquisition (RDA) and Extended Well Tests (EWT).Others Projects required to implement essential infrastructure needed to enable other investment projects, as well as operations. Examples include upgrades to operational infrastructure, scheduled shutdowns, acquisition of capital goods, IT and communications improvements, inspections and pipeline replacements due to SCC-CO₂, new platforms pre-operational costs, among others. 41 Glossary L Leverage: Ratio between the Net Debt and the sum of Net Debt and Shareholders’ Equity. Leverage is not a measure defined in the IFRS Accounting Standards and it is possible that it may not be comparable to similar measures reported by other companies, however management believes that it is an appropriate supplemental measure to assess our liquidity. Lifting Cost: An indicator that represents the lifting cost per barrel of oil equivalent, considering the ratio between production and costs. It includes expenses for the execution and maintenance of production. Costs related to the leasing of third-party platforms, production taxes, and depreciation, depletion, and amortization are not considered in this indicator. Lifting Cost + Leases: An indicator that includes costs related to the leasing of third-party platforms in the calculation of Lifting Cost. Costs related to production taxes and depreciation, depletion, and amortization are not considered. Lifting Cost + Production Taxes: An indicator that includes costs related to production taxes in the calculation of Lifting Cost. Costs related to the leasing of third-party platforms and depreciation, depletion, and amortization are not considered. Lifting Cost + Production Taxes + Leases: An indicator that includes costs related to the leasing of third-party platforms and production taxes in the calculation of Lifting Cost. Costs related to depreciation, depletion, and amortization are not considered. LTM Adjusted EBITDA: Sum of the last 12 months (Last Twelve Months) of Adjusted EBITDA. This metric is not foreseen in the international accounting standards - IFRS Accounting Standards and it is possible that it is not comparable with similar indexes reported by other companies, however Management believes that it is supplementary information to assess liquidity and helps manage leverage. Adjusted EBITDA should be considered in conjunction with other metrics to better understand the Company's liquidity. N Net Debt: Gross debt less adjusted cash and cash equivalents. Net debt is not a measure defined in the IFRS Accounting Standards and should not be considered in isolation or as a substitute for total long-term debt calculated in accordance with IFRS Accounting Standards. Our calculation of net debt may not be comparable to the calculation of net debt by other companies, however our management believes that net debt is an appropriate supplemental measure that helps investors assess our liquidity and supports leverage management. Net Income by Business Segment: The information by the company's business segment is prepared based on available financial information that is directly attributable to the segment or that can be allocated on a reasonable basis, being presented by business activities used by the Executive Board to make resource allocation decisions and performance evaluation. When calculating segmented results, transactions with third parties, including jointly controlled and associated companies, and transfers between business segments are considered. Transactions between business segments are valued at internal transfer prices calculated based on methodologies that take into account market parameters, and these transactions are eliminated, outside the business segments, for the purpose of reconciling the segmented information with the consolidated financial statements of the company. 42 Glossary O Operating profit after taxes: Adjusted EBITDA, minus DD&A of assets booked at historical exchange rates and 34% income tax rate. R Refining, Transportation and Marketing (RTM): The segment covers refining, logistics, transportation, acquisition and export of crude oil, as well as trading in oil products in Brazil and abroad. This segment also includes petrochemical operations (involving interests in petrochemical companies in Brazil) and fertilizer production. ROCE: operating profit after taxes / average capital employed, both measured in US$ on a LTM basis. Petrobras | Investor Relations www.petrobras.com.br/ir


SIGNATURES
Pursuant to the requirements of the Securities Exchange Act of 1934, the registrant has duly caused this report to be signed on its behalf by the undersigned, thereunto duly authorized.
Date: August 6, 2026
PETRÓLEO BRASILEIRO S.A–PETROBRAS
By: /s/ Fernando Sabbi Melgarejo
______________________________
Fernando Sabbi Melgarejo
Chief Financial Officer and Investor Relations Officer