 エドガーで原本を確認する
SECURITIES AND EXCHANGE COMMISSION
Washington, D.C. 20549
FORM 6-K
Report of Foreign Private Issuer
Pursuant to Rule 13a-16 or 15d-16 of the
Securities Exchange Act of 1934
For the month of August, 2026
Commission File Number 1-14668
COMPANHIA PARANAENSE DE ENERGIA
(Exact name of registrant as specified in its charter)
Energy Company of Paraná
(Translation of Registrant's name into English)
José Izidoro Biazetto, 158
81200-240 Curitiba, Paraná
Federative Republic of Brazil
+55 (41) 3331-4011
(Address of principal executive offices)
Indicate by check mark whether the registrant files or will file annual reports under cover Form 20-F or Form 40-F. Form 20-F ___X___ Form 40-F _______
Indicate by check mark whether the registrant by furnishing the information contained in this Form is also thereby furnishing the information to the Commission pursuant to Rule 12g3-2(b) under the Securities Exchange Act of 1934.
Yes _______ No ___X____
RESULTS 2Q26 │ Highlights 2Q26 Operational and Commercial Performance Financial results Shareholder returns Tariff Review 2026 Success in the 6thcycle rate review RAB reaches R$ 19.9 billion Efficient commercial strategy Revenue from modulation and pricing across submarkets (hydro): R$ 74.6 million Billed Grid Market (DisCo) 7.2% growth Recurring Ebitda R$ 1,612.6 million +20.8% compared to 2Q25 Recurring Net Income R$ 645.1 million +42.6% compared to 2Q25 Capex R$ 957.2 million in 2Q26 Financial Leverage 2.9x (net debt to Ebitda) as of June 30, 2026, in line with the new parameters of the optimal capital structure Interest on Equity R$ 706 million (R$ 0.2377 per share), to be paid on September 30, 2026 Dividend payment R$ 1.35 billion, paid on June 30, 2026, relating to dividends announced in December 2025 │Financial Indicators R$ million Key Financial Highlights 2Q26 2Q25 Δ% 1H26 1H25 Δ% Ebitda (R$ million) 1,993.8 1,582.8 26.0 3,901.6 3,319.3 17.5 Recurring Ebitda (R$ million) 1,612.6 1,335.0 20.8 3,367.2 2,838.2 18.6 Net Income (R$ million) 1,047.5 573.6 82.6 1,741.5 1,238.2 40.6 Recurring Net Income (R$ million) 645.1 452.4 42.6 1,284.0 1,029.3 24.7 EPS - Earnings per share (R$)1 0.33 0.22 50.0 0.57 0.42 35.7 Return on Equity (ROE)2 4.3% 2.5% 1.8 p.p. 7.2% 5.4% 1.8 p.p. Ebitda margin 28.8% 25.4% 3.4 p.p. 27.9% 27.4% 0.5 p.p. Recurring Ebitda Margin 27.1% 24.7% 2.4 p.p. 27.3% 26.7% 0.6 p.p. Recurring Operating Margin 9.3% 10.6% -1.3 p.p. 11.5% 12.0% '-0.5 p.p. Book value per share (R$)3 8.13 7.78 4.5 8.13 7.78 4.5 Net Debt-to-Equity Ratio4 81.4% 77.1% 4.3 p.p. 81.4% 77.1% 4.3 p.p. Current Ratio 1.3 1.0 30.0 1.3 1.0 30.0 Leverage 2.9x 2.9x5 0 2.9x 2.9x5 — ¹ Net income attributable to shareholders of the parent company / shares outstanding. ² Based on shareholders’ equity at the end of the period. ³ Shareholders’ equity at the end of the period / shares outstanding. 4 Net debt / shareholders’ equity at the end of the period. 5 Excludes the effect of the acquisition of 70% of the Baixo Iguaçu Hydroelectric Plant. COPEL | 2Q26 | Access link COPEL | 2Q26 | │Summary 1 Consolidated Results 3 1.1 Ebitda 3 1.2 Operating Revenue 4 1.3 Operating costs and expenses 5 1.4 Equity Income Result 8 1.5 Financial Results 8 1.6 Consolidated Net Income 9 1.7 Debt and Leverage 10 2 Investments 12 3 Copel Geração e Transmissão 13 3.1 Economic and Financial Performance 13 3.1.1 Ebitda 13 3.1.2 Recurring Manageable Costs (PMSO) 14 3.1.3 Recurring Net Income 15 3.1.4 IFRS effect on the Transmission segment 16 3.2 Operational Performance 16 3.2.1 Generation 17 3.2.2 Transmission 18 4 Commercial Strategy 20 4.1 Business Context 20 4.2 Commercial Performance 20 5 Copel Distribuição (DisCo) 23 5.1 Economic and Financial Performance 23 5.1.1 Ebitda 23 5.1.2 Recurring Manageable Costs (PMSO) 24 5.1.3 Recurring Net Income 25 5.2 Operational Performance 26 5.2.1 Grid Market (TUSD) 26 5.2.2 Captive Market 26 5.2.3 Operational data 26 5.2.4 Periodic Rate Review (Highlights) 27 6 ESG performance 29 6.1 ESG in Copel's Strategy 29 6.2 Recent highlights 30 6.3 Indicators 30 6.4 Ratings, Rankings and Indexes 31 7 Other highlights from the period 32 8. Exhibits 35 COPEL | 2Q26 | 1 Consolidated Results The consolidated results consist of the combined operations of Copel (Holding), Copel Geração e Transmissão (GenCo), Copel Distribuição (DisCo), Copel Comercialização (TradeCo) and other equity investments1. The following analyses refer to the second quarter of 2026 (2Q26) compared to the same period in 2025 (2Q25). The amounts presented in this document are expressed in thousands of Brazilian reais (R$), unless otherwise indicated. Any discrepancies in the sum of amounts or in percentage changes result from rounding criteria. 1.1 Ebitda Copel reported Recurring Ebitda2 of R$ 1,612.6 million in 2Q26, representing a 20.8% increase compared to the R$ 1,335.0 million reported in 2Q25. This solid performance reflects the continued progress in operational synergies, rigorous discipline in capital allocation, and the strategic commercial positioning adopted by the Company. Consolidated Recurring Ebitda for the period was driven primarily by growth in recurring Ebitda from the distribution segment (DisCo), which rose 34.5% (+R$ 196.3 million), and the generation and transmission segment (GenCo), which increased 10.1% (+R$ 76.8 million). Performance highlights by segment in 2Q26: DisCo (Distribution) DisCo’s Recurring Ebitda increased by 34.5% (+R$ 196.3 million) compared to 2Q25. This result was driven primarily by: • Billed grid-market: A 7.2% increase between the periods analyzed, due to stronger economic activity in the concession area, higher temperatures at the beginning of the quarter, and continued expansion of the customer base • Annual Tariff Adjustment (ATA): Implementation of the rate adjustment in June 2025, which generated an average positive impact of 1.3% on Part B. (Further details are available in section 5.1.1); GenCo (Generation and Transmission) GenCo’s Recurring Ebitda reached R$ 838.2 million in 2Q26, a 10.1% increase (+R$ 76.8 million) compared to 2Q25. This performance primarily reflects the combination of the following factors: • Transmission Company Revenue: An increase of R$ 70.2 million in Grid Availability Revenue (adjusted for the effect of IFRS), resulting from the full consolidation of Transmissora Mata de Santa Genebra S.A. (MSG) and the 2.2% average increase in Annual Permitted Revenue (RAP) for transmission companies for the 2025–2026 cycle (ex-MSG). • Bilateral Contracts: An increase of R$ 83.7 million in Revenue from Bilateral Contract Supplies, driven by a 6.4% rise in the average selling price of energy from the generator’s portfolio, which offset the 7.8% decrease in the physical volume sold. • Energy Purchased for Resale: A decrease of R$ 6.4 million in costs related to Energy Purchased for Resale, driven by favorable hydrological conditions during the quarter. This positive performance in the GenCo segment was partially offset by: COPEL | 2Q26 | 3 Summary Results Investments GenCo TradeCo DisCo ESG Others Exhibits 1 Copel Serviços, Elejor, and other holdings in generation assets. 2 Excluding non-recurring items, fair value of energy purchases and sales (Mark-to-Market - MTM) at Copel Comercialização, new replacement value resulting from the present value adjustment of Copel Distribuição’s indemnifiable assets (VNR), equity income accounting, and the effects of IFRS on transmission contract assets. • CCEE Supply Revenue (MCP): A decrease of R$ 35.2 million in CCEE, affected by the results of transactions carried out in the MCP and by the lower impact of hydroelectric portfolio modulation compared to 2Q25. • Generation Curtailment: A negative impact of R$ 34.8 million (+155.9%) due to operational restrictions imposed by the National Electric System Operator (ONS), which raised the generation curtailment rate from 15.7% in 2Q25 to 23.7% in 2Q26. (Further details are available in section 3.1.1). Centrais Elétricas do Rio Jordão S.A. (Elejor) Elejor’s Recurring Ebitda increased by R$ 12.1 million compared to 2Q25, totaling R$ 29.1 million, driven by the expansion in the volume of energy sold under bilateral contracts during the period and by the higher average selling price of energy in the quarter. The non-recurring items considered in the calculation of Recurring Ebitda are shown in the table below: R$ million Recurring Ebitda 2Q26 2Q25 Δ% 1H26 1H25 Δ% Ebitda 1,993.8 1,582.8 26.0 3,901.6 3,319.3 17.5 (-/+) Fair value on purchase and sale of energy (MTM) (11.4) (61.2) (81.4) (59.3) (67.9) (12.7) (-/+) Provision/Reversal for Voluntary Separation Program (VSP) indemnity — — — 18.9 21.0 (10.0) (-/+) Disposal of assets / asset swap — (200.6) — — (310.4) — (-/+) Equity income (55.9) (64.3) (13.1) (125.7) (164.7) (23.7) (-/+) New Replacement Value (VNR) (288.7) (11.7) 2367.5 (308.8) (35.7) 765.0 (-/+) IFRS effect (Corporate/Regulatory Transmission Revenue) (25.2) 90.0 — (59.5) 76.6 — Recurring Ebitda 1,612.6 1,335.0 20.8 3,367.2 2,838.2 18.6 | Consolidated Recurring Ebitda (R$ million) '+R$277.6 million +20.8% W +1,335.0 +196.3 +76.8 +12.1 -7.6 1,612.6 Recurring Ebitda 2Q25 Δ DisCo Δ GenCo Δ Elejor Δ Others* Recurring Ebitda 2Q26 *Includes Ebitda from the Holding, TradeCo, Copel Serviços, and eliminations and reclassifications between group companies. 1.2 Operating Revenue Recurring Net Operating Revenue totaled R$ 5,960.7 million in 2Q26, representing a 10.4% increase compared to the R$ 5,401.2 million recorded in 2Q25. This metric excludes the effects of COPEL | 2Q26 | 4 Summary Results Investments GenCo TradeCo DisCo ESG Others Exhibits IFRS on the power transmission segment, the Fair Value of Indemnifiable Assets/New Replacement Value (VNR), the fair value adjustment to power purchase and sale contracts (MTM), DisCo’s construction revenue, and any non-recurring effects. This positive performance was driven primarily by the increases detailed below: I. Grid Availability Revenue: R$ 262.7 million (+16.2%), driven by growth in DisCo’s grid market (+7.3%) and higher transmission revenue from GenCo, adjusted for the impact of IFRS, due primarily to the consolidation of MSG, contributing an additional R$ 73.1 million, and an average 2.2% increase in the RAP of transmission companies wholly owned by GenCo for the 2025–2026 cycle, excluding MSG; II. Electric Power Supply Revenue: R$ 147.0 million (+12.9%), driven by a 13.5% increase in energy sales under bilateral contracts at TradeCo. This result was partially offset by a 155.9% increase (+R$ 34.8 million) in generation variances at wind farms due to higher curtailment in 2Q26 and by a 61.9% decrease in DisCo’s energy settlements at the CCEE; III. Sector Financial Assets and Liabilities Result (CVA): R$ 77.7 million (+13.5%), resulting from the implementation of rate-based cost coverage for Part A costs, particularly for energy purchased for resale and the refund of PIS/COFINS taxes to DisCo consumers during the period; and IV. Revenue from Energy Supply: R$ 68.4 million (+3.6%), reflecting a 2.3% increase in billed captive market revenue at DisCo, partially offset by a 19.5% decrease in energy sales to eligible consumers at TradeCo. The following table presents the reconciliation of Operating Revenue: R$ mm Operating Revenue 2Q26 2Q25 Δ% 1H26 1H25 Δ% Net Operating Revenue 6,918.1 6,225.2 11.1 13,985.8 12,117.2 15.4 (-) New Replacement Value (VNR) 288.7 11.7 2,367.5 308.8 35.7 765.0 (-) DisCo's Construction Revenue 567.1 786.7 (27.9) 1,089.8 1,371.3 (20.5) (-) Fair value in energy trading 11.4 61.2 (81.4) 59.3 67.9 (12.7) (-/+) Transmission segment's revenue (IFRS Effect) (90.2) 35.6 — (180.8) (28.3) 538.9 Recurring Net Operating Revenue 5,960.7 5,401.2 10.4 % 12,347.1 10,614.0 16.3 | Net operating revenue Energy sales to final consumers 33.2% Energy sales to distributors 21.6% Grid availability (TUSD/TUST) 31.6% Result of the sectorial financial assets and liabilities 11.0% Other operating revenues 2.5% R$5,960.70 1.3 Operating costs and expenses In 2Q26, Recurring Operating Costs and Expenses, excluding construction costs, totaled R$ 4,754.3 million, an increase of 7.4% compared to the R$ 4,427.5 million recorded in 2Q25. The main cost COPEL | 2Q26 | 5 Summary Results Investments GenCo TradeCo DisCo ESG Others Exhibits driver for the quarter was energy purchased for resale (59.4% of the total), followed by sector charges (15.1%), PMSO expenses (14.8%), and other operating expenses (10.7%). | Breakdown of Costs and Expenses Energy purchased for resale 59.4% Grid usage charges 15.1% PMSO 14.8% Depreciation and amortization 8.5% Provisions and reversals 2.2% R$4,754.3 mi The main changes in operating costs and expenses for the period are: I. Electricity purchased for resale: An increase of R$ 259.8 million (+10.1%), resulting primarily from: i. an increase of R$ 136.4 million in electricity purchases by DisCo, notably due to higher volumes from the distributed generation system (+R$ 150.5 million); and ii. a rise of R$ 184.1 million (+17.7%) at TradeCo, primarily due to the purchase of electricity under bilateral contracts. This result was partially offset by eliminations and reclassifications among group companies, with an increase of R$ 49.5 million, mainly related to TradeCo’s purchases of electricity from GenCo’s portfolio; II. Depreciation and Amortization: An increase of R$ 45.0 million (+12.5%), a direct reflection of the growth in the base of fixed assets in service, resulting from the progress of the group’s investment program, with a greater concentration at DisCo; III. Provisions and Reversals: An increase of R$ 22.6 million (+26.9%), due primarily to: i. higher Expected Credit and Bad Debt Losses (PECLD) in the amount of R$ 17.0 million, concentrated at DisCo (+R$ 15.3 million); and ii. a R$ 2.8 million increase in provisions for litigation; and IV. Electric Grid Usage Charges: An increase of R$ 5.8 million (+0.8%), primarily due to higher Basic Grid charges at DisCo. These increases in costs and expenses were partially offset by a reduction of R$ 6.5 million (-0.9%) in Manageable Costs (PMSO). This positive performance stems from a R$ 35.1 million (-32.7%) reduction in Other operating costs and expenses, primarily in DisCo’s asset retirement losses and lower expenses related to invoice collection fees — an effect that offset the following upward pressures on PMSO: I. Third-Party Services: an increase of R$ 10.3 million (+3.7%), concentrated at DisCo and directed toward maintenance activities for the power distribution system, with a focus on meeting the targets for regulatory quality indicators (DEC/FEC); II. Pension and Welfare Plans: an increase of R$ 6.6 million (+11.5%) due to the adjustment of the indices used to calculate social security benefits and contributions, which took place in December 2025; COPEL | 2Q26 | 6 Summary Results Investments GenCo TradeCo DisCo ESG Others Exhibits III. Personnel: an increase of R$ 6.2 million (+2.6%), driven primarily by the 5.1% salary adjustment based on the National Consumer Price Index (INPC) in accordance with the 2025 Collective Bargaining Agreement (CBA), partially offset by a reduction in the provision for profit-sharing (PLR) due to a methodological update of the eligibility criteria; and IV. Materials: an increase of R$ 5.4 million (+24.7%), driven primarily by the purchase of electrical components at GenCo, mainly for wind power assets. The table below presents manageable costs, comparing quarter-over-quarter and year-to-date figures: R$ million Recurring Manageable Costs* 2Q26 2Q25 Δ% 1H26 1H25 Δ% Staff and management 248.6 242.4 2.6 512.4 491.6 4.2 Pension and Welfare Plans 64.7 58.0 11.6 130.8 119.0 9.9 Material 27.3 21.9 24.7 53.2 44.9 18.5 Third-party services 289.0 278.7 3.7 545.0 561.0 (2.9) Other operating costs and expense 72.3 107.4 (32.7) 192.3 217.0 (11.4) TOTAL 701.9 708.4 (0.9) 1,433.7 1,433.5 — * Excludes the effects of the following non-recurring items: Personnel - Reversal/provision for Voluntary Separation Indemnity; and Other - disposal of assets/asset swap. After neutralizing the effects of provisions related to the Performance Bonus (PPD), Profit Sharing (PLR), and Long-Term Incentives (ILP), there was an increase of R$ 2.1 million (+1.1%) in staff and management costs compared to the previous quarter. This variation stems primarily from the 5.1% salary adjustment resulting from the Collective Bargaining Agreement (CBA) 2025 (effective as of October 2025), which was partially offset by personnel synergies and position optimization during the period. Adjusted for the cumulative inflation of 4.3% as measured by the INPC between July 2025 and June 2026, the Company recorded a real decrease of approximately 3.1% in this cost category. R$ million Recurring Personnel Costs 2Q26 2Q25 Δ% 1H26 1H25 Δ% Staff and management 248.6 242.4 2.6 512.4 491.6 4.2 (-/+) Profit sharing, PPD, and ILP (52.9) (48.8) 8.4 (126.1) (94.2) 33.9 TOTAL 195.7 193.6 1.1 386.3 397.4 (2.8) COPEL | 2Q26 | 7 Summary Results Investments GenCo TradeCo DisCo ESG Others Exhibits | Changes in the workforce Note: For calculation purposes, the analysis included permanent employees and participants in the Juvenile Apprentice Program. 1.4 Equity Income Result Equity in earnings from affiliates and jointly controlled ventures totaled R$ 55.9 million in 2Q26, representing a 13.1% decrease compared to the R$ 64.3 million recorded in the same period of the previous year. This change is primarily due to the change in the consolidation method for Transmissora Mata de Santa Genebra S.A. (MSG). With the acquisition of controlling interest, MSG’s results — which contributed R$ 7.5 million to this line item in 2Q25 — began to be consolidated line-by-line in the Company’s financial statements as of June 2025, generating a direct positive impact on operating Ebitda and no longer being included in equity in earnings. Excluding the effect of MSG’s consolidation for comparability purposes (pro forma view), equity income from other holdings decreased by 1.6%, from R$ 56.8 million in 2Q25 to R$ 55.9 million in 2Q26. 1.5 Financial Results Recurring Net Financial Loss was R$ 653.3 million in 2Q26, compared to the negative result of R$ 401.9 million reported in 2Q25. This amount excludes the non-recurring effect of R$ 284.4 million on financial income, resulting from the renegotiation of Elejor’s Use of Public Assets (UBP) agreement. The change in recurring financial results is primarily explained by: I. An increase of R$ 195.0 million (+32.0%) in debt charges, resulting from the higher average debt balance during the period, reflecting recent funding raised to finance the Company’s investment plan; and II. An increase of R$ 63.2 million in financial expenses related to PIS/COFINS taxes on Interest on Equity (IoE), due to the transfer of earnings from subsidiaries to the holding company during the quarter. COPEL | 2Q26 | 8 Summary Results Investments GenCo TradeCo DisCo ESG Others Exhibits R$ million Financial Results 2Q26 2Q25 Δ% 1H26 1H25 Δ% Financial Revenues1 505.5 375.3 34.7 838.4 673.0 24.6 Financial Expenses (1,158.8) (777.2) 49.1 (1,981.3) (1,521.4) 30.2 Total Financial Result (653.3) (401.9) 62.5 (1,142.9) (848.4) 34.6 1 Excludes the effects of the renegotiation of Elejor’s UBP in the amount of R$ 284.4 million. 1.6 Consolidated Net Income Copel reported a net income of R$ 1,047.5 million in 2Q26, compared to R$ 573.6 million in 2Q25, an increase of 82.6%. This result is primarily explained by the following factors: I. improved operating performance with Reported Ebitda of R$ 1,993.8 million (+26.0%), compared to Ebitda of R$ 1,582.8 million in 2Q25; II. a reduction of R$ 74.9 million in tax payments, resulting primarily from the tax benefit arising from the Interest on Equity (IoE) declaration made in 2Q26 — an event that did not occur in the same quarter of the previous year; and III. an increase of R$ 33.0 million in Reported Financial Result, due to the positive effect of R$ 284.4 million on Financial Revenue resulting from the renegotiation of Elejor’s Use of Public Assets (UBP). This result was partially offset by higher depreciation and amortization expenses (-R$ 45.0 million) due to the larger asset base, given the growth in invested capital between the periods, particularly at DisCo. The main adjustments to net income in 2Q26 were: | Reconciliation of net income in 2Q26 (R$ million) 645.1 1,047.5 -7.5 -16.6 -190.5 -187.7 Reported Net Income MTM IFRS Effect New Replacement Value UBP Renegotiation (Financial Results) Recurring Net Income Excluding non-recurring effects and non-cash items — such as VNR, MTM, and IFRS adjustments for transmission utilities — Recurring Net Income grew 42.6% compared to 2Q25, reaching R$ 645.1 million. This performance was driven by an increase in Recurring Ebitda of R$ 277.6 million and lower tax payments, which had a positive effect of R$ 219.8 million, primarily due to the declaration of Interest on Equity (IoE) on April 15, 2026, with a payment date of September 30, 2026. These effects were partially offset by lower net financial income of R$ 251.4 million (as detailed in item 1.5), higher depreciation and amortization expenses of R$ 45.0 million, due to the larger asset base, and a decrease in equity in earnings of R$ 8.4 million (as detailed in item 1.4). COPEL | 2Q26 | 9 Summary Results Investments GenCo TradeCo DisCo ESG Others Exhibits | Change in Recurring Net Income (R$ million) 645.1 452.4 +277.6 +219.9 -45.0 -251.4 -8.4 Recurring 2Q25 Δ Recurring Ebitda Δ Taxes Δ Depreciation Δ Financial Results Δ Equity Recurring 2Q26 1.7 Debt and Leverage Copel’s total consolidated debt as of June 30, 2026, was R$ 23,484.2 million, an increase of +17.2% compared to the amount recorded on December 31, 2025, of R$ 20,038.9 million. The following table and charts show the debt of Copel and its equity interests as of June 30, 2026. | Debt by subsidiary R$ million Capital Management GenCo2 DisCo Others3 Total Total Debt1 7,967.2 10,743.8 4,773.2 23,484.2 Availability 819.1 808.9 2,205.0 3,833.0 Adjusted Net Debt 7,148.1 9,934.9 2,568.2 19,651.2 Leverage 2,9x Duration (years) 3.4 3.7 5.4 3.7 1 Includes the effect of swaps on debentures. 2 Includes Copel Geração e Transmissão S.A. (parent company). 3 Includes Copel Serviços, wind farms (Brisa Potiguar, São Bento, Cutia, Jandaíra, Vilas, Aventura, and SRMN), and transmission companies (Costa Oeste, Marumbi, and Mata de Santa Genebra). As of June 30, 2026, the Company’s consolidated leverage ratio stood at 2.9x, reflecting a net debt of R$ 19,651.2 million. The ratio increased by 0.2x compared to the 2.7x recorded at the end of 2025. Compared to the end of 2Q25, when leverage was also 2.9x (excluding the effects of the acquisition of 70% of the Baixo Iguaçu Hydroelectric Plant), the leverage ratio remained stable. The indicator remains at a comfortable level and within the parameters defined by the Company’s optimal capital structure, which sets the target midpoint at 2.9x and a fluctuation range (band) between 2.6x and 3.2x, with convergence to 2.9x within 48 months, in accordance with the update to the parameters guiding the optimal capital structure and the Dividend Policy published in a Material Fact on July 15, 2026. COPEL | 2Q26 | 10 Summary Results Investments GenCo TradeCo DisCo ESG Others Exhibits | Adjusted Net Debt/Recurring Ebitda 13,157 16,300 17,457 19,651 2.6 2.7 2.8 2.9 Net Debt Net Debt/Recurring Ebitda* LTM 2024 2025 Mar-26 Jun-26 *Excluding equity-method investments, includes discontinued operations, and excludes the effects of impairment, Voluntary Separation Program indemnity, mark-to-market (MTM), GSF renegotiation, losses on asset decommissioning, and gains on asset disposals and swaps. The average cost of debt at the nominal rate as of June 30, 2026, reached 12.92% (13.07% as of December 31, 2025), which is equivalent to 91.33% of the CDI (87.74% of the CDI as of December 31, 2025). Compared to the nominal rate of 13.54% as of June 30, 2025 (90.88% of the CDI), the average cost of debt decreased by 62 basis points (bps). | Debt Composition and Indexers | Amortization (R$ million) Average term: 5.2 years (vs. 4.9 years in 2025) COPEL | 2Q26 | 11 Summary Results Investments GenCo TradeCo DisCo ESG Others Exhibits 2 Investments In 2Q26, the amount spent on the investment program totaled R$ 957.2 million, with 50.1% coming from DisCo and 49.9% from GenCo, TradeCo, and Copel Holding. We highlight the initial investments of R$ 317.9 million to expand the installed capacity of the Governador Bento Munhoz (Foz do Areia - FDA) and Governador Ney Braga (Segredo) hydroelectric plants, as part of the Capacity Reserve Auction (LRCAP) held on March 18, 2026. R$ million Subsidiary / SPE 2Q26 2Q25 Δ% 1H26 1H25 Δ% DisCo 479.1 881.1 (45.6) 917.7 1,477.7 (37.9) GenCo 476.4 92.5 415.0 617.7 173.2 256.6 Generation 371.5 25.7 1,345.5 430.2 46.2 831.2 Hydroelectric 34.4 12.0 186.7 77.9 20.7 276.3 Wind 19.2 13.6 41.2 34.4 25.5 34.9 LRCAP 317.9 0.0 — 317.9 0.0 — Transmission 90.8 64.7 40.3 164.2 113.6 44.5 Improvements/Reinforcement¹ 87.8 62.5 40.5 160.2 108.3 47.9 Other Investments 3.0 2.2 36.4 4.0 5.3 (24.5) Other GenCo Projects² 14.1 2.1 571.4 23.3 13.4 73.9 Copel (Holding) 1.2 1.0 20.0 2.6 1.2 116.7 TradeCo 0.2 0.2 — 0.5 0.5 — Copel Serviços and other equities3 0.3 0.6 (50.0) 0.3 0.9 (66.7) Total 957.2 975.3 (1.9) 1,538.8 1,653.5 (6.9) 1 Includes Facility Modernization Plan - PMI. 2 Includes modernization of COGT (Generation and Transmission Operations Center), digital transformation, and investment in the operational network of Copel GenCo 3 Includes an innovation plan in the energy sector aligned with the investment thesis, Copel's innovation programs, and ESG practices. Investments made in the Distribution Company are primarily allocated to the modernization and renewal of the distribution network, using standardized technologies to support automation equipment. Among the benefits are enhanced grid resilience to reduce outages and ensure service quality, lower O&M and commercial costs, and improved control of the Equivalent Duration of Interruption per Consumer Unit (DEC) and Equivalent Frequency of Interruption per Consumer Unit (FEC) indicators. The entire amount invested in DisCo during the quarter was allocated to investments in electrical assets. During the quarter, in addition to expanding the installed capacity of the Foz do Areia and Segredo hydroelectric plants, investments made in GenCo were directed primarily toward reinforcing and upgrading transmission lines, maintaining and modernizing the generating units at hydroelectric plants, and improving the performance of wind power assets. COPEL | 2Q26 | 12 Summary Results Investments GenCo TradeCo DisCo ESG Others Exhibits 3 Copel Geração e Transmissão (GenCo)(Consolidated Results) 3.1 Economic and Financial Performance 3.1.1 Ebitda GenCo reported recurring Ebitda3 of R$ 838.2 million, an amount 10.1% or R$ 76.8 million higher than the R$ 761.5 million recorded in 2Q25. This result primarily reflects the combination of the following factors: I. Grid Availability Revenue: An increase of R$ 70.2 million (adjusted for the impact of IFRS), resulting from the full consolidation of Transmissora Mata de Santa Genebra S.A. (MSG) and the 2.2% average increase in the Annual Permitted Revenue (RAP) of the transmission companies for the 2025–2026 cycle (ex-MSG). II. Revenue from Supply Under Bilateral Contracts and Quotas: An increase of R$ 85.2 million, primarily due to a 6.4% rise in the average energy sales price of GenCo’s portfolio (R$ 198.99/MWh in 2Q26 compared to R$ 187.10/MWh in 2Q25), despite the lower volume of energy sold (-7.8%) between the periods; III. Recurring Manageable Costs (PMSO): Decrease of R$ 13.7 million, as detailed in item 3.1.2; IV. Cost of Electricity Purchased for Resale: Decrease of R$ 6.4 million, resulting from a more favorable hydrological scenario during the quarter (average GSF of 99.6% in 2Q26 compared to 95.55% in 2Q25); and V. Electric Grid Usage Charges: A reduction of R$ 4.9 million, resulting from the increased weight of the locational signal in the TUST calculation and the optimization of generation assets. The positive effects mentioned above were partially offset by the following negative factors: I. CCEE Supply Revenue: a R$ 35.2 million decrease in earnings from MCP transactions. This performance is primarily attributable to the group’s portfolio optimization strategy, which redirected a portion of the time-of-use transactions to Copel Comercialização, thereby impacting the allocation of this revenue from GenCo; II. Generation Variance: An increase of R$ 34.8 million, resulting from a 17.4% decline in physical generation from wind farms (660 GWh in 2Q26 vs. 799 GWh in 2Q25). This performance was driven primarily by a higher curtailment rate, which rose from 15.7% in 2Q25 to 23.7% in 2Q26; III. Provisions and Reversals: An increase of R$ 15.4 million, resulting primarily from higher provisions for civil and labor litigation, driven by the final judgment in long-standing lawsuits; IV. Revenue from Auction Supplies: A decrease of R$ 6.6 million, resulting from a review of the Company’s portfolio, including the disposal of small-scale assets and an asset swap of synergistic assets; and COPEL | 2Q26 | 13 Summary Results Investments GenCo TradeCo DisCo ESG Others Exhibits 3 Excluding non-recurring items and the effects of IFRS on transmission contract assets. V. Other Operating Revenues: A decrease of R$ 9.0 million, resulting from lower volumes of operation and maintenance services provided, as well as a reduction in revenue from fines. The non-recurring items considered in the calculation of Recurring Ebitda are shown in the following table: R$ million Recurring Ebitda 2Q26 2Q25 Δ% 1H26 1H25 Δ% Ebitda 912.7 936.9 (2.6) 2,036.8 1,935.0 5.3 (-/+) Disposal and swap of assets — (200.6) — — (310.4) — (-/+) Reversal/provision for Voluntary Separation Program (VSP) indemnity — — — 5.5 8.6 (36.0) (-/+) Equity income (49.3) (64.9) (24.0) (120.9) (165.3) (26.9) (-/+) IFRS effect (Corporate/Regulatory Transmission Revenue) - see item 3.1.4 (25.2) 90.0 — (59.5) 76.6 — Recurring Ebitda 838.2 761.5 10.1 1,861.9 1,544.5 20.6 3.1.2 Recurring Manageable Costs (PMSO) Recurring PMSO (excluding the effects of non-recurring items, provisions, and reversals) decreased by R$ 13.7 million (-6.3%) in 2Q26. This decline is primarily attributable to the following favorable factors: I. Other Costs and Expenses: a decrease of R$ 12.6 million, due to gains from the decommissioning and disposal of assets; and II. Third-Party Services: a decrease of R$ 7.0 million, reflecting lower costs for facility maintenance and services. This decrease was partially offset by an increase in: III. Staff and Management: An increase of R$ 2.6 million, resulting from a higher provision for variable compensation, comprising Profit Sharing (PLR), Performance Bonus (PPD), and Long-Term Incentive (ILP), driven by the Company’s improved operating performance during the period; and IV. Materials: an increase of R$ 1.2 million, due to higher expenses related primarily to the maintenance and operation of wind power generation assets. R$ million Recurring Manageable Costs* 2Q26 2Q25 Δ% 1H26 1H25 Δ% Staff and management 75.2 72.6 3.6 155.6 148.3 4.9 Pension and welfare plans 19.5 17.3 12.7 39.6 35.5 11.5 Material 12.6 11.4 10.5 23.5 16.1 46.0 Third-party services 58.4 65.4 (10.7) 106.3 133.3 (20.3) Other operating costs and expenses 36.7 49.3 (25.6) 99.4 116.4 (14.6) TOTAL 202.4 216.0 (6.3) 424.4 449.6 (5.6) *Excludes the effects of the following non-recurring items: Personnel - Reversal/provision for Voluntary Separation Program; and Others - disposal/swap of assets. Excluding the effects of PLR (Profit Sharing), PPD (Performance based bonus), and ILP (Long-term incentives), personnel costs remained virtually stable, with a 0.2% change, reflecting efficiency in workforce management, partially offset by the effect of a 5.1% salary adjustment (cumulative INPC for the 12 months through September 2025). Excluding the effects of cumulative inflation as measured by the INPC, which stood at 4.3% between July 2025 and June 2026, there was a 3.9% reduction in personnel costs. COPEL | 2Q26 | 14 Summary Results Investments GenCo TradeCo DisCo ESG Others Exhibits R$ million Recurring Personnel costs 2Q26 2Q25 Δ% 1H26 1H25 Δ% Staff and management ¹ 75.2 72.6 3.6 155.6 148.3 4.9 (-/+) Profit sharing, PPD and ILP (12.9) (10.4) 24.0 (32.2) (23.3) 38.2 TOTAL 62.3 62.2 0.2% 123.4 125.0 (1.3)% ¹ Excludes the effects of the following non-recurring items: Personnel - Reversal/provision for Voluntary Separation Program. 3.1.3 Recurring Net Income Recurring Net Income reached R$ 392.0 million in 2Q26, an increase of 34.0% (+R$ 99.5 million) compared to 2Q25. This performance is primarily explained by a combination of the following operational, financial, and tax factors: I. Recurring Ebitda: an increase of R$ 76.8 million, driven by solid operating performance and the consolidation of Transmissora Mata de Santa Genebra S.A. into the Company’s portfolio; and II. Income Tax and Social Contribution: a positive tax effect of R$ 143.1 million, shifting from an expense of R$ 119.4 million in 2Q25 to a tax credit of R$ 23.7 million in 2Q26, primarily due to the utilization of tax benefits related to the payment of Interest on Equity (IoE) to the holding company, an event that did not occur in 2Q25. Conversely, these positive effects were partially offset by: I. Depreciation and amortization: an increase of R$ 12.7 million, in line with the higher volume of investments made during the period; II. Financial results: net financial results showed a negative change of R$ 92.1 million, rising from a net expense of R$ 236.5 million in 2Q25 to R$ 328.6 million in 2Q26. This performance is mainly explained by the increase in debt charges, reflecting the higher average debt level during the period, which was partially offset by growth in income from financial investments; and III. Equity Income: a decrease of R$ 15.6 million, a direct result of the consolidation of Mata de Santa Genebra (which reduced the equity income line by R$ 19.5 million and was subsequently included in operating Ebitda results), the impact of which was mitigated by the expansion of the Annual Permitted Revenue (RAP) from the other equity investments. | Change in recurring Net Income (R$ million) 392.0 292.5 76.8 143.1 -12.7 -92.1 -15.6 Recurring 2Q25 Δ Ebitda Δ Taxes Δ D&A Δ Financial Results Δ Equity Recurring 2Q26 The following table presents the key indicators, based on Copel Geração e Transmissão’s recurring results: COPEL | 2Q26 | 15 Summary Results Investments GenCo TradeCo DisCo ESG Others Exhibits R$ million Recurring Key Indicators 2Q26 2Q25 Δ% 1H26 1H25 Δ% Net Operating Revenue (R$ million) 1,264.4 1,197.1 5.6 2,753.0 2,372.6 16.0 Operating Costs and Expenses (R$ million) (616.7) (613.6) 0.5 (1,271.8) (1,182.9) 7.5 Operating Result (R$ million) 647.6 583.5 11.0 1,481.2 1,189.7 24.5 Net Income (R$ million) 392.0 292.5 34.0 847.4 632.9 33.9 Ebitda (R$ million) 838.2 761.5 10.1 1,861.9 1,544.4 20.6 Operating Margin 51.2% 48.7% 2.5 p.p. 53.8% 50.1% 3.7 p.p. Net Margin 31.0% 24.4% 6.6 p.p. 30.8% 26.7% 4.1 p.p. Ebitda Margin 66.3% 63.6% 2.7 p.p. 67.6% 65.1% 2.5 p.p. Investment Program (R$ million) 476.4 92.5 415.0 617.7 173.2 256.6 3.1.4 IFRS effect on the Transmission segment For the calculation, an adjustment was made to account for the effects of applying ICPC 01/IFRIC 12 to the company’s financial statements in the Transmission segment. R$ million IFRS effect in the Transmission segment 2Q26 2Q25 Δ% 1H26 1H25 Δ% (A) Corporate revenue1 381.7 196.2 94.5 776.3 476.5 62.9 O&M revenue and effective interest 369.1 194.5 89.8 765.9 470.3 62.9 Construction revenue and margin 77.6 56.0 38.6 131.6 111.1 18.5 Cost of construction (65.0) (54.3) 19.7 (121.2) (104.9) 15.5 (B) Regulatory revenue1 356.5 286.2 24.6 716.8 553.1 29.6 (B-A) IFRS effect - Difference between regulatory and corporate revenue (25.2) 90.0 — (59.5) 76.6 (177.7) (+/-) Effects on Equity of transmission companies2 (10.5) (30.9) (66.0) (31.5) (90.1) (65.0) IFRS effect in Transmission business (35.7) 59.1 — (91.0) (13.5) — ¹ Net of taxes and charges. ² Difference between corporate and regulatory profit of jointly owned subsidiaries in the transmission segment, proportional to GenCo's stake in the ventures. 3.2 Operational Performance Operating in 10 Brazilian states, Copel Geração e Transmissão manages a diversified portfolio of hydroelectric and wind power plants, totaling 6,226.1 MW of installed capacity and an average of 2,696.4 MW of Physical Guarantee. In the Transmission segment, Copel operates a grid totaling 9,700 km of transmission lines and 53 basic grid substations, considering its equity interests. COPEL | 2Q26 | 16 Summary Results Investments GenCo TradeCo DisCo ESG Others Exhibits 3.2.1 Generation Copel’s generation portfolio consists entirely of renewable sources in operation. | Installed Capacity by Source Hydro 81.0% 6.226,1 MW Wind 19.0% Hydropower generation by Copel Geração e Transmissão S.A. was 10.9% lower in 2Q26 (2,430 GWh, compared to 2,726 GWh in 2Q25), due to the divestment of Small Hydroelectric Power Plants (SHPPs) and the Colíder Hydropower Plant. At wind farms, generation was 17.4% lower in 2Q26 (660 GWh, compared to 799 GWh in 2Q25), primarily due to increased curtailment in 2Q26 (23.7%, compared to 15.7% in 2Q25). COPEL | 2Q26 | 17 Summary Results Investments GenCo TradeCo DisCo ESG Others Exhibits | GSF - Generation Scaling Factor (Seasonalized) 113.2% 111.0% 98.8% 101.7% 97.1% 87.7% 69.3% 62.6% 63.0% 62.8% 65.7% 73.6% 81.2% 100.3% 94.6% 101.3% 101.2% 96.3% 2025 2026 Jan Feb Mar Apr May Jun Jul Aug Sep Oct Nov Dec source: CCEE | Average Monthly PLD - Southern Submarket (R$/MWh) 59.21 93.83 332.56 202.98 233.39 236.10 211.67 287.17 260.34 250.18 278.02 265.89 249.95 402.69 425.57 254.03 244.33 193.64 2025 2026 Jan Feb Mar Apr May Jun Jul Aug Sep Oct Nov Dec source: CCEE 3.2.2 Transmission Copel operates 9,700 km of transmission lines across eight Brazilian states, including both its own assets and those operated in partnership with other companies. In addition to building, maintaining, and operating its own extensive power transmission network, it provides services to projects operated by other utilities. The transmission projects comprise 12 line contracts from our GenCo, the SPEs Costa Oeste, Marumbi, Uirapuru Transmissora, and MSG (100% GenCo), as well as the six SPEs in which Copel Geração e Transmissão holds an equity interest. COPEL | 2Q26 | 18 Summary Results Investments GenCo TradeCo DisCo ESG Others Exhibits RBSE Below we describe the revenue stream from the portion of revenue related to the Basic Grid of the Existing System (RBSE)4 for the upcoming cycles. It is important to note that the data may change in the future as a result of tariff review processes and/or revisions to the parameters used to calculate these revenues by the regulatory agency. The amounts below reflect the revision to the calculation methodology for the financial component, established by Approval Resolution No. 3,467/2025, with a negative impact of R$ 115.1 million, and have been adjusted annually based on the IPCA, in accordance with Order No. 2,268/2026. 717.3 792.5 601.8 607.9 185.0 185.0 185.0 185.0 127.9 127.9 127.9 127.9 184.6 184.6 219.8 295.0 288.9 295.0 RBSE - O&M RBSE - Economic component PRT 120/2016 RBSE - Financial component PRT 120/2016 RBNI - new projects 2026-2027 cycle 2027-2028 cycle 2028-2029 cycle 2029-2030 cycle — 250.0 500.0 750.0 1,000.0 Economic component: future amounts based on the 2026-2027 cycle (pursuant to Order No. 2,268/2026) Financial component: amounts published in Order No. 2,268/2026 RAP amounts through the 2027–2028 cycle projected based on the amounts in Order No. 2,268/2026, excluding PIS/Cofins and the Adjustment Installment. COPEL | 2Q26 | 19 Summary Results Investments GenCo TradeCo DisCo ESG Others Exhibits 4 Refers to concession contract 060/2001, which represents 37.1% of the annual permitted revenue (RAP) for transmission by Copel Geração e Transmissão and is proportional to the equity interests. 4 Commercial Strategy 4.1 Business Context The commercial strategy of Copel's TradeCo focuses on consistent and sustainable growth, with disciplined capital allocation and active risk management, within an environment of transition and modernization in the Brazilian electricity sector. Through our TradeCo, Copel consolidates its operations in the Free Contracting Environment (ACL) as a smart platform for value creation and revenue diversification, acting as a strategic partner focused on ensuring financial predictability for customers in the face of the growing volatility of the Difference Settlement Price (PLD). This approach is supported by the offering of customized products, positioning the Company to capitalize on the growth of new structural energy demands. As of June 30, 2026, TradeCo reported: • 1,519 active customers across 23 states. • 6,727 GWh of energy sold, an increase of 0.6% compared to the same period the previous year. This result reflects the portfolio’s commercial selectivity, prioritizing margin optimization and the balance between scale, risk, and profitability. 4.2 Commercial Performance In the second quarter of 2026 (2Q26), the volume of energy sold from the GenCo portfolio (hydro and wind) was 4,686 GWh, representing a 4.1% decline compared to 2Q25. This change stems from a combination of two main factors: • A structural reduction in the Physical Guarantee due to the strategic divestment of small power plants carried out throughout 2025; and • An uncontracted position to take advantage of opportunities during upward cycles, while maintaining the necessary liquidity to act in the event of adverse scenarios. Conversely, the long-term contracting strategy continues to prioritize favorable price windows for the coming years. The primary focus was on 2027, given the El Niño scenario this year, which should not impact prices from 2028 onward. Despite the lower physical volume sold, profitability was significant due to active portfolio management and favorable seasonal conditions: • Hourly Curves: The modulation of hydroelectric generation generated gains of approximately R$ 51.8 million in the quarter; • Submarkets: The appreciation of the Southern submarket contributed R$ 22.8 million in earnings, while hedging operations successfully offset price volatility in the Northeastern submarket; • Even amid increased industry-wide focus on credit risk, Copel maintained its delinquency rate at just 0.01% for energy sales and expanded its reach among customers. This outstanding performance is supported by a robust risk mitigation framework and a strong commercial presence; • A robust credit policy that takes into account the specific characteristics of each counterparty’s or customer’s sector or economic activity; • Market Risk Monitoring: Use of advanced tools such as Value at Risk (VaR 95%), Drawdown and specific indicators to protect the portfolio against exposures due to lack of liquidity; COPEL | 2Q26 | 20 Summary Results Investments GenCo TradeCo DisCo ESG Others Exhibits • Portfolio Management: Systematic assessment of counterparties based on maturity, level of market concentration, equity volume, and energy leverage indicators; • The sales force, combined with the group’s financial strength and its ability to offer a variety of energy buying and selling solutions, has enabled the energy retailer to increase its market share among customers in the open energy market. | Consolidated Sales (GWh) 4,885 4,686 3,708 3,547 1,177 1,139 -4.1% Wind Farms GenCo + FDA + Bela Vista 2T25 2T26 | Energy balance The energy balance sheet presented reflects the Company’s strategy of maintaining a robust and diversified portfolio, combining its own resources with purchase and sale contracts in effect as of June 30, 2026. The breakdown of the contracted portfolio and average sales prices highlights how Copel manages hydrological, regulatory, and market risks, balancing cash flow predictability with commercial flexibility to operate efficiently throughout the electricity sector’s cycles. (MWavg) Energy balance - GenCo - Jun/26 2026 2027 2028 2029/2030(5) Own Resources - Hydro 1,890 1,901 1,920 1,928 GenCo (1) 1,291 1,291 1,291 1,291 GPS (CCGF) (2) 73 73 73 73 Bela Vista + FDA 526 537 556 564 Own Resources - Wind Farms (3) 544 544 544 544 Purchases 120 177 35 8 Total Own Resources + Purchases 2,554 2,622 2,499 2,480 Total Sold 2,166 2,095 1,743 1,155 Sales (Regulated) 706 706 706 706 Sales (Regulated) % 28% 27% 28% 28% Sales (Free Market) 1,460 1,389 1,037 449 Sales (Free Market) % 57% 53% 41% 19% Total Available 388 527 757 1,324 Total Available (%) 15% 20% 31% 53% Average price of energy sold (R$/MWh)(4) 198.99 204.88 207.96 224.70 Reference: June/26 (1) Includes GPS 30% (formerly CCGF). Does not include Elejor and Foz do Chopim. (2) GPS 70% (quota regime). (3) Does not include Voltália Wind Complex. (4) Average gross energy price (with PIS/COFINS and without ICMS). The GPS CCGF RAG is not considered in the calculation of average prices. (5) Weighted average based on the resources of both periods. COPEL | 2Q26 | 21 Summary Results Investments GenCo TradeCo DisCo ESG Others Exhibits | Energy balance (Hydro + Wind) P-MIX (R$/MWh) 198.99 204.88 207.96 224.70 85% 80% 69% 47% 15% 20% 31% 53% Disponibilidade Vendas 2026 2027 2028 2029-2030 Availability 2026 2027 2028 2029-2030 Hydro (%)1 20% 28% 44% 78% (1) Does not include: (i) GPS CCGF (Quotas) (73 MWavg); and (ii) 96% for the Mauá Hydroelectric Plant (or 184 MWavg) and its contracts, insured against GSF fluctuations. Notes on the Energy Balance Sheet: (i) net of losses and internal consumption; (ii) assuming that the Physical Guarantees of wind power SPEs remain constant for all periods; (iii) energy purchases in each period are taken into account; (iv) prices were adjusted according to contractual adjustment indices from the respective reference dates through June 2026; (v) the CCGF’s RAG (quota) for GPS was excluded from the calculation of average prices; (vi) average energy prices are gross, including PIS/COFINS and excluding ICMS; (vii) the Physical Guarantee of the power plants in effect as of June 30, 2026, was considered; (viii) the Mauá Hydroelectric Plant has GSF insurance covering 96%; and (ix) short-term capacity backing sales transactions were not considered; (x) for 2029–2030, this refers to the weighted average of total internal resources plus purchases for the respective years. COPEL | 2Q26 | 22 Summary Results Investments GenCo TradeCo DisCo ESG Others Exhibits 5 Copel Distribuição (DisCo) 5.1 Economic and Financial Performance 5.1.1 Ebitda DisCo reported recurring Ebitda of R$ 765.6 million in 2Q26, a 34.5% increase (R$ 196.3 million) compared to 2Q25. This performance was driven primarily by: i. a 7.2% increase in the billed grid market — which already accounts for the deduction of the portion of energy offset by Mini and Micro Distributed Generation (MMGD) — reflecting increased economic activity within the concession area, a 1.9% growth in the customer base over the period, and higher temperatures at the beginning of the quarter; and ii. the Annual Tariff Adjustment (ATA) of June 2025, with an average effect of +1.3% on Part B. The following table shows the change in recurring Ebitda and non-recurring adjustments:: R$ million Recurring Ebitda 2Q26 2Q25 Δ% 1H26 1H25 Δ% Ebitda 1,054.3 581.0 81.5 1,823.4 1,285.7 41.8 (-/+) Provision/Reversal for Voluntary Separation Program (VSP) indemnity — — — 13.2 12.2 8.2 (-/+) New Replacement Value (VNR) (288.7) (11.7) 2367.5 (308.8) (35.7) 765.0 Recurring Ebitda 765.6 569.3 34.5 1,527.8 1,262.2 21.0 The following factors combined to contribute to the recurring Ebitda result: I. an increase of R$ 15.0 million in other revenue, resulting primarily from increased infrastructure sharing; and II. an increase of R$ 184.3 million (+19.2%) in the distribution gross margin (table below), an indicator that reflects the amount retained by the distributor to remunerate its activities, after deducting costs directly associated with the purchase of electricity and sector-specific charges. R$ million Gross Distribution Margin 2Q26 2Q25 Δ% 1H26 1H25 Δ% Recurring Net Operating Revenue (excluding Construction Revenue) 4,113.8 3,757.7 9.5 8,495.7 7,453.9 14.0 (-) Other Operating Income 146.3 131.2 11.5 291.4 258.1 12.9 (=) Recurring Net Operating Revenue (NOR) (excluding construction, other revenues, and VNR) 3,967.5 3,626.5 9.4 8,204.3 7,195.8 14.0 (-) Electricity Purchased for Resale 2,114.8 1,978.4 6.9 4,501.4 3,825.6 17.7 (-) Electricity Grid Usage Charges 709.7 689.4 2.9 1,418.1 1,346.2 5.3 Gross Distribution Margin 1,143.0 958.7 19.2 2,284.8 2,024.0 12.9 The main margin results were: a. an increase of R$ 198.8 million in Grid Availability Revenue, resulting primarily from the 6.4% adjustment to the Distribution System Usage Tariff (TUSD - ATA/2025) and the 7.3% growth in consumption in the grid market (excluding Distributed Generation), partially offset by a R$ 207.7 million increase in CDE Usage (CDE quota); b. an increase of R$ 130.8 million in Supply Revenue, reflecting a 2.3% growth in energy consumption in the billed captive market, which already accounts for the deduction of the portion of energy offset by Mini and Micro Distributed Generation (MMGD); COPEL | 2Q26 | 23 Summary Results Investments GenCo TradeCo DisCo ESG Others Exhibits c. an increase of R$ 136.4 million in Energy Purchased for Resale, driven primarily by the greater impact of MMGD; d. an increase of R$ 77.6 million in CVA (sector financial assets and liabilities) resulting from the adherence of tariff coverage to costs related to Part A, particularly with energy purchased for resale and the refund of PIS/COFINS to DisCo consumers during the period; e. a decrease of R$ 66.2 million in Supply Revenue, reflecting the decline in earnings resulting from settlements at the CCEE and in bilateral contracts; f. an increase of R$ 20.3 million in Electricity Grid Usage Charges, due to higher costs related to the use of the National Interconnected System (SIN) transmission infrastructure; III. a decrease of R$ 1.8 million in recurring PMSO (-0.4%) compared to 2Q25, due primarily to: a. a decrease of R$ 20.3 million in Other Costs and Expenses, mainly due to lower losses on the disposal of assets and rights, reflecting the lower amount of write-offs of fixed assets in the distribution network; b. a decrease of R$ 5.8 million in the Personnel line (ex-VSP), explained by the methodological and eligibility updates to the profit sharing (PLR) provision — in accordance with the new ACT. The accounting treatment is no longer a percentage of net income but is now linked to operational targets (Overall Ebitda and PMSO). Additionally, the new guideline excluded management positions from the pool of PLR-eligible employees, which reduced the provisioned amount, accounting for the lower figure reported. This effect was partially offset by the 5.1% salary adjustment under the latest CBA, the increase in the number of employees, and the rise in Long-Term Incentives (ILP), in line with the new policy for attracting and retaining managers; c. an increase of R$ 24.4 million in costs for Third-Party Services, Pension Plans, and Supplies, which limited the effect of the reductions achieved in the preceding line items (Personnel and Other Costs), consisting of: i. an increase of R$ 15.8 million in Third-Party Services due to electrical system maintenance activities aimed at maintaining service quality indicators; ii. an increase of R$ 4.6 million in Pension and Welfare Plans; and iii. an increase of R$ 4.0 million in Materials, particularly electrical materials for maintenance, partially offset by lower costs for fuel, parts, and equipment for the Company’s fleet. 5.1.2 Recurring Manageable Costs (PMSO) R$ million Recurring Manageable Costs (PMSO) ¹ 2Q26 2Q25 Δ% 1H26 1H25 Δ% Staff and management 136.0 141.8 (4.1) 281.5 272.0 3.5 Pension and welfare plans 42.3 37.7 12.2 85.3 77.5 10.1 Material 14.2 10.2 39.2 28.5 28.0 1.8 Third-party services 216.5 200.8 7.8 412.2 401.5 2.7 Other operating costs and expenses 31.5 51.8 (39.2) 77.1 92.9 (17.0) TOTAL 440.5 442.3 (0.4) 884.6 871.9 1.5 ¹ Excludes the effects of the following non-recurring items: Personnel - Reversal/provision for Voluntary Separation Program Personnel costs, excluding the effects of PLR (Profit sharing), PPD (Performance based bonus), and ILP (Long-term incentives), decreased by 0.2%, primarily reflecting the 5.1% salary adjustment (cumulative INPC for the 12 months through September 2025). Excluding the effects of cumulative inflation as measured by the INPC, which stood at 4.3% between July 2025 and June 2026, personnel costs fell by 4.3% in real terms. COPEL | 2Q26 | 24 Summary Results Investments GenCo TradeCo DisCo ESG Others Exhibits R$ million Recurring Personnel Costs ¹ 2Q26 2Q25 Δ% 1H26 1H25 Δ% Staff and management 136.0 141.8 (4.1) 281.5 272.0 3.5 (-/+) Profit sharing, PPD and ILP* (24.8) (30.4) (18.4) (63.7) (57.3) 11.2 TOTAL 111.2 111.4 (0.2) 217.8 214.7 1.4 ¹ Excludes the effects of the following non-recurring items: Personnel - Reversal/provision for Voluntary Separation Program The positive effects I and II, mentioned above, were slightly reduced by increases of R$ 4.8 million in expenses related to provisions and reversals, primarily due to a R$ 15.3 million increase in Expected Credit Losses and Bad Debt (PECLD). 5.1.3 Recurring Net Income DisCo’s Recurring Net Income reached R$ 288.5 million in 2Q26, a 98.7% increase compared to 2Q25. This increase was driven by solid operating performance, which resulted in a R$ 196.3 million increase in Recurring Ebitda compared to the same period last year. On the non-operating side, the result was bolstered by a R$ 40.0 million reduction in the Income Tax and Social Contribution line item, resulting from the recognition of Interest on Equity (IoE) during the quarter. These positive effects were partially offset by a R$ 60.0 million (-30.5%) decrease in net financial income, driven by an increase in monetary variation and debt charges resulting from new funding, and by a 19.1% increase (+R$ 32.9 million) in depreciation expenses, resulting from the expansion of the asset base in service. | Change in Recurring Net Income (R$ million) 288.5 145.2 196.3 39.9 -32.9 -60.0 Recurring 2Q25 Δ Recurring Ebitda Δ Taxes Δ D&A Δ Financial Results Recurring 2Q26 The following table presents the key indicators, based on DisCo’s recurring results: Recurring Key Indicators 2Q26 2Q25 Δ% 1H26 1H25 Δ% Net Operating Revenue (R$ million) 4,113.8 3,757.7 9.5 8,495.7 7,453.9 14.0 Operating Costs and Expenses (R$ million) (3,554.0) (3,361.2) 5.7 (7,376.6) (6,532.1) 12.9 Operating Income (R$ million) 303.2 199.8 51.8 621.4 532.6 16.7 Net income (R$ million) 288.5 145.2 98.7 503.2 369.8 36.1 Ebitda (R$ million) 765.6 569.3 34.5 1,527.9 1,262.2 21.1 Operating Margin 7.4% 5.3% 2.1 p.p. 7.3% 7.1% 0.2 p.p. Net Margin 7.0% 3.9% 3.1 p.p. 5.9% 5.0% 0.9 p.p. Ebitda Margin 18.6% 15.2% 3.4 p.p. 18.0% 16.9% 1.1 p.p. Investment Program (R$ million) 479.1 881.1 (45.6) 917.7 1,477.7 (37.9) 1 Excludes Construction Revenue, As Well As Non-recurring Items COPEL | 2Q26 | 25 Summary Results Investments GenCo TradeCo DisCo ESG Others Exhibits 5.2 Operational Performance 5.2.1 Grid Market (TUSD) In 2Q26, electricity consumption in DisCo’s grid market grew 7.3% compared to the same period last year. Billed grid market, which excludes a portion of the energy offset by MMGD, grew 7.2% in 2Q26 compared to 2Q25. This performance was driven primarily by consumption in the residential and commercial segments, reflecting, essentially, the increase in average income in the state with the highest economic activity within the concession area, the growth of the customer base over the period, and temperatures at the beginning of 2Q26 that were higher than those observed in 2Q25. 5.2.2 Captive Market The captive market saw an 8.0% increase in electricity consumption in 2Q26 compared to the same period last year. Billed captive market sales, which include energy offset by MMGD, grew 7.7%, rose 7.7% in 2Q26, in line with the factors that drove the expansion of the grid market. 5.2.3 Operational data Our DisCo holds a concession valid through July 7, 2045, whose service quality criteria (Equivalent Duration of Interruption per Consumer Unit — DEC and Equivalent Frequency of Interruption per Consumer Unit — FEC) are defined by Aneel. The Company has acted promptly to restore power supply and prevent vegetation encroachment on the grid, which has helped maintain service quality indices within regulatory limits. For the DEC, the result for the last 12 months, calculated in June 2026, was 6.52 hours, while for the FEC, the result for the same period was 4.18 interruptions, both within the established regulatory limit. DEC (Measured in hours and hundredths of an hour) 7.47 7.96 7.97 7.92 7.17 6.52 7.47 7.96 7.97 7.92 7.17 6.52 9.29 9.19 8.69 8.35 8.14 7.88 Performed Regulatory threshold 2021 2022 2023 2024 2025 LTM 2Q26 FEC (Measured in terms of outage frequency and fraction) 5.09 5.1 5.41 5.36 4.65 4.18 5.09 5.1 5.41 5.36 4.65 4.18 6.84 6.8 6.39 5.93 5.8 5.36 Performed Regulatory threshold 2021 2022 2023 2024 2025 LTM 2Q26 Losses - Distribution losses can be defined as the difference between the electricity purchased by distributors and that billed to their customers, and are categorized as Technical and Non-Technical. Technical losses are inherent to the electricity distribution activity, while non-technical losses stem primarily from theft (illegal connections, direct diversion from the grid), fraud (meter tampering or diversion), and errors in meter reading, measurement, and billing. At the end of June 2026, Technical Losses for the past 12 months totaled 2,521 GWh, compared to 2,291 GWh for the same period the previous year, and Non-Technical Losses totaled 586 GWh, compared to 716 GWh for the same period the previous year. Total losses for the past 12 months amounted to 3,106 GWh. COPEL | 2Q26 | 26 Summary Results Investments GenCo TradeCo DisCo ESG Others Exhibits GWh - 12 Months Jun-22 Jun-23 Jun-24 Jun-25 Jun-26 Injected Energy 35,063 35,459 38,545 39,591 40,591 Distribution Losses 2,694 2,697 3,107 3,007 3,106 Technical Losses 2,029 2,052 2,230 2,291 2,521 Non-Technical Losses 665 645 876 716 586 *As established by the result of Public Consultation - CP 09/2024 (Order nº 1,220/2025) Non-Technical Losses, calculated as the difference between total losses and technical losses, are largely associated with the utility’s management and the socioeconomic characteristics of the service areas. In this regard, Copel maintains a Program to Combat Non-Technical Losses through, among other measures, the following actions: • using smart meter alarms to improve performance at selected targets; • enhancing efforts to combat irregular practices, thereby improving the effectiveness of targeted inspections; • investments aimed at providing and/or acquiring inspection equipment; • developing and conducting specific training and refresher courses related to commercial losses; • conducting inspections in both medium- and low-voltage systems; • educational notices in the press and messages on electricity bills; • joint operations with the Civil Police and the Public Prosecutor’s Office; and • the initiation of police investigations in regions where significant numbers of irregularities have been identified. The pass-through of tariff costs associated with efficient loss levels is provided for in the concession contracts, and these losses are included in energy purchase costs up to the regulatory limit set by ANEEL. DisCo remained within regulatory limits in recent tariff proceedings, and in June 2026, total losses were 0.91 percentage points below the regulatory limit, influenced by the revision of targets resulting from the effects of CP No. 09/24 and ATA 2026, as established in Technical Note No. 24/2026-STD/ANEEL. Losses 7.7 7.6 8.1 7.6 7.7 7.7 7.6 7.6 8.1 8.6 Total losses/Injected energy (%) Regulatory Framework (%) Jun-22 Jun-23 Jun-24 Jun-25 Jun-26 5.2.4 Periodic Rate Review (Highlights) On June 23, 2026, ANEEL approved the results of DisCo's 6th Periodic Tariff Review (RTP) Cycle, effective as of June 24, 2026. The rate-setting process established the new Net Regulatory Asset Base (Net RAB) at R$ 19.9 billion, a milestone that reflects recognition of the Company’s prudent investments and efficiency in modernizing and expanding its distribution assets over the past five years. The new rate structure essentially reflects the adjustment of Part B (the distributor’s manageable costs) and Part A (unmanageable costs, such as energy, transmission, and sector charges). To COPEL | 2Q26 | 27 Summary Results Investments GenCo TradeCo DisCo ESG Others Exhibits optimize the transition to this new cycle, a Tariff Deferral of R$ 1.3 billion was applied, which mitigated the immediate financial impact of the regulatory process. The adjustment to Operating Costs (+52.9%) reflects the Company’s new cost structure, aligned with its efficiency trajectory. The X Factor, which measures productivity gains to be shared with consumers, was set at 0.95%. The outcome of this rate review reinforces Copel’s capital allocation discipline and its ability to generate value sustainably for its shareholders. For more information, see Material Fact 04/26. COPEL | 2Q26 | 28 Summary Results Investments GenCo TradeCo DisCo ESG Others Exhibits 6 ESG performance 6.1 ESG in Copel's Strategy Copel incorporates ESG (Environmental, Social, and Governance) principles into its corporate strategy, basing its actions on the material issues identified through stakeholder consultation, in accordance with the guidelines established by the Sustainability Policy. Integrity is a cross-cutting value that guides all of the company’s practices, reinforcing its commitment to ethics, transparency, and compliance. This approach is complemented by voluntary commitments aligned with the Global Compact Principles and the UN Sustainable Development Goals (2030 Agenda). Priority SDGs by Copel ESG in Copel's strategy aims to promote a systemic and broad culture of sustainability, originating from stakeholders, and material issues guide programs and initiatives that generate shared value, minimize risks, and maximize opportunities. On the environmental front, decarbonization, climate adaptation and resilience, biodiversity, and eco-efficiency are drivers for projects and initiatives such as the Carbon Neutrality Plan, through which the Company is taking measures to neutralize its direct carbon emissions by 2030. Copel invests in 100% renewable energy, researches alternative sources, and reduces greenhouse gas emissions, reinforcing its commitment to combating climate change. In the social field, the People pillar is central, focusing on employee health and safety, human rights, and diversity. Copel values the promotion of a healthy work environment, with a goal of zero fatal accidents, acting fairly and inclusively with employees and stakeholders, in addition to strengthening engagement with communities. In governance, Copel adopts a structured and transparent approach, with emphasis on the Integrity Program, which is based on the Code of Conduct and aligned with the principles of the Global Compact. The program develops actions aimed at risk prevention, the promotion of an ethical culture, and the continuous engagement of employees. The Company also maintains robust risk management and internal controls, ensuring compliance with rules and regulations and strengthening governance at all organizational levels. ESG performance is continuously monitored by indicators and external assessments, such as ISE, from [B]³, CSA, from S&P Global, and CDP. In this way, Copel integrates its strategy across the board, committed to sustainable development, generating value for society, and strengthening corporate governance. Additional details on sustainability management and the integration of ESG factors into corporate strategy can be found in Copel’s Integrated Report, available on the Sustainability Portal of the Investor Relations website. COPEL | 2Q26 | 29 Summary Results Investments GenCo TradeCo DisCo ESG Others Exhibits 6.2 Recent highlights - Copel Among the World’s Most Sustainable Companies: Copel has been included in the Dow Jones Best-in-Class Index (DJ BIC) and the Sustainability Yearbook 2026, both of which are based on S&P Global’s corporate sustainability assessment. These distinctions position the Company among the top performers in environmental, social, and governance (ESG) practices within its sector, reflecting the consistency of its sustainable management, the adoption of international best practices, and its commitment to generating long-term value. - Copel Remains Listed on B3’s Major ESG Indices: Copel has maintained its simultaneous listing on B3’s major ESG indices, including the Corporate Sustainability Index (ISE B3), the Carbon Efficiency Index (ICO2 B3), and the Diversity Index (IDIVERSA B3). This recognition reinforces the Company’s commitment to creating long-term sustainable value and demonstrates the integration of environmental, social, and governance aspects into its corporate strategy. - Copel ranks among Brazil’s most ethical companies: The company was recognized in the 2025–2026 Pro-Ethics Program, an initiative promoted by the Office of the Comptroller General (CGU) and the Ethos Institute. This recognition highlights the maturity of Copel’s Integrity Program and reinforces its commitment to ethics, transparency, compliance, and corporate governance. - Publication of the 2025 Integrated Report: Copel has published its 2025 Integrated Report, presenting the Company’s key results, operational progress, ESG indicators, and strategic drivers that underpin its sustainable value creation. The document reinforces the integration of sustainability into the corporate strategy and the business’s long-term vision. - Environmental Progress and Decarbonization: In 2025, Copel reduced its greenhouse gas (GHG) emissions by 23% compared to 2024, a result that demonstrates the progress of its climate agenda and the effectiveness of its initiatives aimed at decarbonizing its business operations. This performance reinforces the Company’s commitment to creating sustainable value and to a responsible energy transition. 6.3 Indicators Regarding the scope 1 GHG indicator (tCO2), the data refer to direct greenhouse gas emissions from Copel's operations (fleet, land use change, and fugitive emissions), calculated every six months. The 2026 data will be audited later by a third party. Environmental Indicator 2Q26 2Q25 Δp.p 1H26 1H25 Δp.p Renewable sources (% Installed Capacity) 100.0 100.0 — 100.0 100.0 — Renewable sources (% Energy Generated) 100.0 100.0 — 100.0 100.0 — Scope 1 GHG emissions (tCO2)¹ (3) 4,937.7 — (3) 4,937.7 — Scope 2 GHG emissions (tCO2)² (3) 169,117.0 — (3) 169,117.0 — ¹Scope 1 refers to direct greenhouse gas emissions from Copel's operations (fleet, land use change, and fugitive emissions), calculated every six months. The 2026 data will be verified later by a third party. ²Scope 2 refers to indirect greenhouse gas emissions from Copel's operations (electricity consumption and loss) - GHG emissions are calculated every six months. 3Data is still being compiled COPEL | 2Q26 | 30 Summary Results Investments GenCo TradeCo DisCo ESG Others Exhibits Social Indicator 2Q26 2Q25 Δp.p 1H26 1H25 Δp.p Women at Copel (% of Own Employees) 21.4 22.1 (0.7) 21.4 22.1 (0.7) Women at Copel (% Third-Party Employees) 11.1 16.6 (5.5) 11.1 16.6 (5.5) Accident frequency rate - TFIFR (% Own Employees) 1.0 1.3 (0.3) 1.0 1.3 (0.3) Accident frequency rate - TFIFR (% Third-Party Employees) 1.4 3.0 (1.6) 1.4 3.0 (1.6) TFIFR: Lost time injury frequency rate. This rate represents, in relation to one million man-hours of exposure to risk, the number of contractors involved in lost time accidents or fatal cases during the period considered. ABNT – NBR 14280: 2001 Governance Indicator 2Q26 2Q25 Δp.p 1H26 1H25 Δp.p Women in leadership positions (%) 21.0 20.3 0.7 21.0 20.3 0.7 Women on the Board of Directors (%) 11.1 11.1 — 11.1 11.1 — Independent directors (%) 88.8 88.8 — 88.8 88.8 — Complaints resolved through the Complaints Channel (%)* 62.0 66.0 (4.0) 89.0 79.0 10.0 *The indicator considers the completion of investigations in the period analyzed/year. The Company analyzes 100% of the complaints received. 6.4 Ratings, Rankings and Indexes Index Ranking 88.21% Ranked 10th CSA Score 84 A Yes Yes Medium Risk AA Reference Year 2025 2026 2025 2025 2025 2025 2025 COPEL | 2Q26 | 31 Summary Results Investments GenCo TradeCo DisCo ESG Others Exhibits 7 Other highlights from the period 7.1 Shareholder returns On April 15, 2026, the Board of Directors approved the distribution of R$ 706.0 million as Interest on Equity (IoE), to be paid on September 30, 2026. 7.2 Fitch Reaffirms ‘AAA(bra)’ Rating for Copel and its subsidiaries On May 15, the credit rating agency Fitch Ratings reaffirmed the “AAA (bra)” Long-Term rating for Copel and its wholly-owned subsidiaries Copel Geração e Transmissão, Copel Distribuição, and Copel Serviços - the highest possible rating on Fitch’s scale. At the same time, the outlook for the corporate ratings was maintained at stable. The Company’s solid business profile, featuring significant and profitable power generation, transmission, and distribution assets that help mitigate operational and regulatory risks, stands out as a key factor in the rating. 7.3 Amendment and Renewal of the Share Buyback Program On May 21, the Board of Directors approved the amendment and renewal of the Company’s share repurchase program, with the objective of acquiring Copel shares for treasury holdings, cancellation, or sale, and to fulfill stock-based incentive plans, without reducing the amount of the Company’s capital stock. The program has a term of 18 months, with a limit on acquisitions of up to 10% of the total shares outstanding on the market. For more information, see Material Fact 02/26. 7.4 Elejor Renegotiates the Use of Public Assets (UBP) Centrais Elétricas do Rio Jordão S.A. – ELEJOR, a Special Purpose Entity (SPE) in which COPEL holds a majority stake, formalized on May 25 the renegotiation of the installments due under the UBP, pursuant to Law No. 15,235 of October 8, 2025, and ANEEL Order No. 668/2026 of February 24, 2026, regarding the Santa Clara and Fundão hydroelectric plants, in accordance with the amount officially calculated and published by ANEEL, totaling R$ 420.6 million. The renegotiation demonstrates the creation of value for the concessions of the assets operated by ELEJOR and is fully aligned with the Company’s value creation strategy. 7.5 Sale of Stake in the Dona Francisca Hydroelectric Plant On June 15, the Company entered into a Share Purchase Agreement with Gerdau S.A. for the sale of its 23.03% stake in the share capital of Dona Francisca Energética S.A., a shareholder in the consortium responsible for operating the Dona Francisca Hydroelectric Plant. The transaction has a total value of R$ 150 million, with full payment due at closing, subject to the necessary approvals. The transaction reinforces Copel’s strategy of focusing its portfolio on strategic assets and generating value for shareholders. 7.6 Adjustment of Annual Permitted Revenue (RAP) for the 2026–2027 Cycle Through Approval Resolution No. 2,268/2026, ANEEL established the Annual Permitted Revenues (RAPs) for electric power transmission assets for the 2026–2027 cycle, effective as of July 1, 2026. According to Aneel Order No. 2,268, Technical Note No. 102/2026, the RAPs for Copel Geração e Transmissão S.A. and its equity interests are now set at R$ 1,912.5 million, a 5.6% increase compared to the previous cycle. 7.7 Copel Receives Award from ANEEL for Excellence in Its Ombudsman Program On June 17, the Company won the ANEEL Ombudsman Award for the sixth time in the category of distributors with more than one million customers. The award ceremony, held during the 23rd COPEL | 2Q26 | 32 Summary Results Investments GenCo TradeCo DisCo ESG Others Exhibits National Meeting of Ombudsmen in the Electricity Sector, recognizes companies with the best complaint resolution rates, promptness in responses, and customer service infrastructure. Since the award’s inception in 2017, Copel has been on the podium in every edition in the Large-Scale category. This recognition reinforces Copel’s commitment to customer experience and satisfaction. 7.8 New General Director of DisCo Copel Distribuição has begun a new leadership cycle with the appointment of Denis Mollica as General Director, succeeding Marco Antônio Villela. With more than 20 years of experience in the electric power sector and having held executive positions at Cemig and EDP, Mollica assumes the role with a commitment to continuing the distributor’s operational efficiency agenda and executing its investment plan. The Company expresses its gratitude to Marco Antônio Villela for the significant strategic repositioning carried out during his tenure, marked by the strengthening of operational safety, process optimization, and the development of high-performance teams. 7.9 Copel Innovation Week Copel Innovation Week took place from June 30 to July 3; the event promotes a culture of innovation as a driver of transformation for the Company. The initiative featured panels and lectures by industry experts in innovation and digital transformation and focuses on collaborative innovation, connecting employees, startups, companies, and universities to co-create solutions addressing strategic themes such as digitization, artificial intelligence, and process automation. During the event, the Copel Innovation Challenge was launched, seeking solutions focused on efficiency and cost reduction, such as the use of artificial intelligence and new technologies. The challenge is part of Copel Beyond, our largest digital transformation program, which focuses on efficiency, digitization, and productivity. 7.10 Copel President Honored for Excellence in Management On July 1, Daniel Slaviero, the Company’s President, received the EVEx (Energy Virtual Experience) award in the “Excellence in Management and Sector Modernization” category, in recognition of his leadership at Copel. EVEx is one of the largest gatherings and business platforms focused on the future of energy, bringing together government officials, CEOs, regulators, and experts. Its goal is to accelerate the energy transition and cooperation between Latin America and the Iberian Peninsula. 7.11 Update to the Parameters Governing the Optimal Capital Structure and Dividend Policy On July 15, the Company approved an update to the parameters that guide its optimal capital structure and its Dividend Policy, reinforcing balanced and sustainable capital allocation, the preservation of financial strength, returns to shareholders, investment opportunities, and continuous improvement in customer service. The Optimal Capital Structure now sets financial leverage at 2.9x, measured by net debt/EBITDA, with a tolerance of 0.3x above (3.2x) or below (2.6x), provided that the ratio converges to the midpoint of the range (2.9x) within 48 months. The annual distribution of earnings continues to be guided by the following financial parameters defined at the end of each fiscal year, in line with the capital structure guidelines, with a minimum of 75% of net income and a minimum payment frequency of twice a year. For more information, please refer to Material Fact No. 05/2026. COPEL | 2Q26 | 33 Summary Results Investments GenCo TradeCo DisCo ESG Others Exhibits 8. Disclaimer Information contained in this document may include forward-looking statements and reflects management’s current perceptions and outlook regarding the evolution of the macroeconomic environment, industry conditions, the Company’s performance, and financial results. Any statements, expectations, capabilities, plans, and projections contained in this document that do not describe historical facts — such as information regarding the declaration of dividend payments, the future direction of operations, the implementation of relevant operational and financial strategies, the investment program, and the factors or trends affecting the financial condition, liquidity, or results of operations—are forward-looking statements as defined in the U.S. Private Securities Litigation Reform Act of 1995 and involve various risks and uncertainties. There is no guarantee that such results will occur. The statements are based on various factors and expectations, including economic and market conditions, industry competitiveness, and operational factors. Any changes in such expectations and factors may cause actual results to differ materially from current expectations. Investor Relations ri@copel.com Phone: +55 (41) 3331-4011 COPEL | 2Q26 | 34 Summary Results Investments GenCo TradeCo DisCo ESG Others Exhibits 8. Exhibits Consolidated Results Result by Subsidiary INCOME STATEMENTS COPEL GET INCOME STATEMENT BALANCE SHEET COPEL DIS INCOME STATEMENT CASH FLOW COPEL COM INCOME STATEMENT EBITDA AND FINANCIAL RESULT The remaining tables are available on the Investor Relations website. To access them, click here. 35 Summary Results Investments GenCo TradeCo DisCo ESG Others Exhibits │CONSOLIDATED RESULTS - Income Statement R$ '000 Income Statement 2Q26 2Q25 Δ% 1H26 1H25 Δ% OPERATING REVENUES 6,918,061 6,225,154 11.1 13,985,762 12,117,240 15.4 Electricity sales to final customers 1,980,394 1,912,016 3.6 3,976,535 4,104,115 (3.1) Electricity sales to distributors 1,287,703 1,140,733 12.9 2,801,175 2,115,673 32.4 Use of the main distribution and transmission grid 1,898,610 1,531,656 24.0 3,957,308 3,459,679 14.4 Construction revenue 644,723 842,770 (23.5) 1,221,491 1,482,460 (17.6) Fair value of assets from the indemnity for the concession 288,695 11,726 2362.0 308,770 35,742 763.9 Result of Sectorial financial assets and liabilities 654,834 577,183 13.5 1,354,434 562,727 140.7 Other operating revenues 163,102 209,070 (22.0) 366,049 356,844 2.6 (-/+) Recurring Adjustments (957,341) (823,944) 16.2 (1,638,660) (1,503,242) 9.0 RECURRING NET OPERATING REVENUE 5,960,720 5,401,210 10.4 12,347,102 10,613,998 16.3 OPERATING COSTS AND EXPENSES (5,386,398) (5,067,863) 6.3 (11,019,082) (9,678,833) 13.8 Electricity purchased for resale (2,823,231) (2,563,409) 10.1 (5,925,420) (4,815,762) 23.0 Charge of the main distribution and transmission grid (716,377) (710,578) 0.8 (1,428,682) (1,393,101) 2.6 Personnel and management (248,628) (242,352) 2.6 (531,259) (491,574) 8.1 Pension and healthcare plans (64,663) (58,015) 11.5 (130,783) (118,952) 9.9 Materials and supplies (27,335) (21,913) 24.7 (53,226) (44,914) 18.5 Third-party services (289,037) (278,689) 3.7 (545,025) (561,010) (2.8) Depreciation and amortization (406,223) (361,211) 12.5 (809,272) (716,231) 13.0 Provisions and reversals (106,494) (83,934) 26.9 (192,095) (154,445) 24.4 Construction cost (632,096) (840,991) (24.8) (1,211,027) (1,476,182) (18.0) Other cost and expenses (72,314) 93,229 (177.6) (192,293) 93,338 (306.0) (-/+) Recurring Adjustments 632,102 640,406 (1.3) 1,229,921 1,186,769 3.6 RECURRING OPERATING COSTS AND EXPENSES (4,754,296) (4,427,457) 7.4 (9,789,161) (8,492,064) 15.3 EQUITY IN EARNINGS OF SUBSIDIARIES 55,883 64,256 (13.0) 125,668 164,672 (23.7) PROFIT BEFORE FINANCIAL RESULTS AND TAXES 1,587,546 1,221,547 30.0 3,092,348 2,603,079 18.8 PROFIT BEFORE FINANCIAL RESULTS AND RECURRING TAXES 1,262,307 1,038,009 21.6 2,683,609 2,286,606 17.4 FINANCIAL RESULTS (368,883) (401,861) (8.2) (858,446) (848,386) 1.2 Financial income 789,896 375,312 110.5 1,122,842 672,952 66.9 Financial expenses (1,158,779) (777,173) 49.1 (1,981,288) (1,521,338) 30.2 (-/+) Recurring Adjustments (284,424) — — (284,424) — — RECURRING FINANCIAL RESULT (653,307) (401,861) 62.6 (1,142,870) (848,386) 34.7 OPERATIONAL EXPENSES/ INCOME 1,218,663 819,686 48.7 2,233,902 1,754,693 27.3 RECURRING OPERATING INCOME 609,000 636,148 (4.3) 1,540,739 1,438,220 7.1 INCOME TAX AND SOCIAL CONTRIBUTION ON PROFIT (171,204) (246,122) (30.4) (492,399) (516,462) (4.7) Income tax and social contribution on profit (92,747) 76,677 (221.0) (255,603) (152,305) 67.8 Deferred income tax and social contribution on profit (78,457) (322,799) (75.7) (236,796) (364,157) (35.0) (-/+) Recurring Adjustments 207,283 62,404 232.2 235,676 107,601 119.0 RECURRING INCOME TAX AND SOCIAL SECURITY CONTRIBUTIONS 36,079 (183,718) (119.6) (256,723) (408,861) (37.2) NET INCOME continuing operations 1,047,459 573,564 82.6 1,741,503 1,238,231 40.6 REPORTED NET INCOME continuing operations 645,079 452,430 42.6 1,284,016 1,029,359 24.7 NET INCOME discontinued operations — — — — — — NET INCOME 1,047,459 573,564 82.6 1,741,503 1,238,231 40.6 RECURRING NET INCOME 645,079 452,430 42.6 1,284,016 1,029,359 24.7 Ebitda continued operations 1,993,769 1,582,758 26.0 % 3,901,620 3,319,310 17.5 % RECURRING EBITDA 1,612,647 1,334,964 20.8 % 3,367,213 2,838,165 18.6 % COPEL | 2Q26 | 36 Summary Results Investments GenCo TradeCo DisCo ESG Others Exhibits │CONSOLIDATED RESULTS - Balance Sheet R$ '000 Assets Jun-26 Dec-25 Δ% CURRENT 10,943,746 10,881,654 0.6 Cash and cash equivalents 3,272,606 3,130,363 4.5 Bonds and securities 161 895 (82.0) Collaterals and escrow accounts 9 9 — Customers — 4,300,957 (100.0) Dividends receivable 3,999,644 141,297 2,730.7 Sectorial financial assets 142,021.0 400,463 (64.5) Account receivable related to concession 717,522 12,867 5,476.5 Contract Assets 14,672 392,594 (96.3) Fair value in energy purchase and sale operations 424,364 263,645 61.0 Other current receivables 286,038 1,050,086 (72.8) Inventories 1,064,699 173,398 514.0 Income tax and social contribution 150,066 502,825 (70.2) Other current recoverable taxes 351,890 426,106 (17.4) Prepaid expenses 425,632 60,972 598.1 Related parties 56,542 — — Assets held for sale 37,880 25,177 50.5 NON-CURRENT 50,702,481 49,532,802 2.4 Long Term Assets 20,159,711 19,065,339 5.7 Bonds and securities 652,304 690,886 (5.6) Other temporary investments 45,134 30,627 47.4 Customers 161,633 162,189 (0.3) Judicial deposits 378,911 373,949 1.3 Sectoral financial assets 642,995 400,463 60.6 Account receivable related to concession 5,023,245 4,590,579 9.4 Contract Assets 9,740,393 9,202,412 5.8 Fair value in energy purchase and sale operations 721,180 597,856 20.6 Other non-current receivables 838,553 794,296 5.6 Income tax and social contribution 106,849 102,589 4.2 Deferred income tax and social contribution 851,402 991,404 (14.1) Other non-current recoverable taxes 997,112 1,127,582 (11.6) Prepaid expenses — 507 (100.0) Investments 2,884,909 2,849,002 1.3 Property, plant and equipment, net 8,348,827 8,145,552 2.5 Intangible assets 19,053,574 19,206,609 (0.8) Right to use an asset 255,460 266,300 (4.1) TOTAL 61,646,227 60,414,456 2.0 COPEL | 2Q26 | 37 Summary Results Investments GenCo TradeCo DisCo ESG Others Exhibits R$ '000 CURRENT Jun-26 Dec-25 Δ% CURRENT LIABILITIES 8,406,486 11,062,317 (24.0) Payroll, social charges and accruals 236,531 310,773 (23.9) Accounts payable to related parties — — — Accounts payable to suppliers 3,061,787 3,059,667 0.1 Accounts payable to suppliers - Reverse factoring 20,029 — — Income tax and social contribution payable 151,562 81,875 85.1 Other taxes due 378,911 677,273 (44.1) Loans and financing 224,040 217,827 2.9 Debentures 1,976,945 1,850,538 6.8 Derivative financial instruments 4,278 3,657 17.0 Dividend payable 631,686 2,325,889 (72.8) Post-employment benefits 120,729 118,854 1.6 Sectorial charges payable 26,879 60,108 (55.3) Research and development and Energy efficiency 92,623 99,244 (6.7) Accounts payable related to concession 42,013 147,205 (71.5) Sectorial financial liabilities — 883,990 (100.0) Lease liability 60,043 58,741 2.2 Fair value in the purchase and sale of power 259,994 262,821 (1.1) Other accounts payable 882,059 784,575 12.4 Provision for allocation of PIS and Cofins credits 236,377 119,280 98.2 NONCURRENT LIABILITIES 29,091,391 26,260,161 10.8 Payroll, social charges and accruals 6,233 4,764 30.8 Accounts payable to related parties — — — Accounts payable to suppliers 135,979 133,544 — Deferred income tax and social contribution 2,079,176 1,982,596 4.9 Other taxes due 205,728 239,448 (14.1) Loans and financing 3,065,775 3,150,592 (2.7) Debentures 18,017,940 14,796,386 21.8 Derivative financial instruments 195,180 19,878 881.9 Post-employment benefits 1,369,957 1,359,303 0.8 Research and development and Energy efficiency 376,747 311,856 20.8 Accounts payable related to concession 339,813 959,122 (64.6) Lease liability 224,927 234,221 (4.0) Fair value in the purchase and sale of power 357,846 268,621 33.2 Other accounts payable 191,156 204,537 (6.5) Provision for allocation of PIS and Cofins credits 563,995 661,273 (14.7) Provisions for legal claims and other provisions 1,960,939 1,934,020 1.4 EQUITY 24,148,350 23,091,978 4.6 Attributable to controlling shareholders 24,128,112 23,130,019 4.3 Share capital 12,821,758 12,821,758 — Capital reserves 39,068 18,638 109.6 Equity valuation adjustments 272,856 287,992 (5.3) Treasury shares (113,067) (113,389) (0.3) Legal reserves 1,900,541 1,900,541 — Profit retention reserve 7,508,855 8,214,479 (8.6) Accumulated 1,698,101 — — Attributable to non-controlling interests 20,238 (38,041) (153.2) TOTAL LIABILITIES & EQUITY 61,646,227 60,414,456 2.0 COPEL | 2Q26 | 38 Summary Results Investments GenCo TradeCo DisCo ESG Others Exhibits │CONSOLIDATED RESULTS - Cash Flow R$ '000 06.30.2026 06.30.2025 CASH FLOWS FROM OPERATIONAL ACTIVITIES Net income from continuing operations 1,741,503 1,238,231 Adjustments to reconcile net income for the period with cash generation from operating activities: 2,226,851 2,635,914 Unrealized charges and monetary variations - net 1,696,672 1,343,542 Interest – bonus from the grant of concession agreements under the quota system (71,265) (66,137) Result of transmission concession contracts (627,244) (329,669) Income tax and social contribution 255,603 152,305 Deferred income tax and social contribution 236,796 364,157 Equity in earnings of investees (125,668) (164,672) Appropriation of post-employment benefits obligations 126,872 116,829 Appropriation of research and development and energy efficiency programs 111,499 95,448 Recognition of fair value of assets from the indemnity for the concession (308,770) (35,742) Sectorial financial assets and liabilities result (1,492,489) (620,085) Depreciation and amortization 809,272 716,231 Provision arising from the dismissal program 18,894 20,979 Long-Term Incentive Plan - ILP 21,393 3,864 Net operating estimated losses, provisions and reversals 192,095 154,445 Realization of added value in business combinations (1,571) (361) Fair value in energy purchase and sale operations (59,319) (67,899) Fair value adjustment of debt instruments and Hedge (Swap) (30,634) — Result of write-offs of accounts receivable related to concession 923 1,854 Result of write-offs or disposal of contract assets 4,725 4,516 Result of write-offs or disposal of property, plant and equipment 425 1,074 Result of write-offs or disposal of intangible assets 33,721 42,894 Result of write-offs of use rights of assets and liabilities of leases – net 234 — Result from asset sales and business combinations (298,295) — Results from asset sales (1,221) (320,927) Others (7,300) (14,963) Decrease (increase) in assets 534,126 564,551 Trade accounts receivable 791,071 601,922 Dividends and interest on own capital received 50,847 143,243 Judicial deposits 10,971 25,037 Sectorial financial assets 97,513 141,256 Other receivables (154,436) (80,361) Inventories 23,332 (28,213) Income tax and social contribution recoverable (332,140) (203,841) Other taxes recoverable 42,031 (40,222) Prepaid expenses 4,937 5,109 Related parties — 621 Increase (decrease) in liabilities (740,418) (332,046) Payroll, social charges and accruals (87,399) (88,006) Related parties — — Suppliers (158,561) 149,882 Other taxes 225,439 475,590 Post-employment benefits (114,343) (100,616) Sectorial charges due (33,229) 53,130 Research and development and energy efficiency (64,406) (136,662) Payable related to the concession (485,671) (56,796) Other accounts payable 105,066 (511,043) Provisions for legal claims (127,314) (117,525) COPEL | 2Q26 | 39 Summary Results Investments GenCo TradeCo DisCo ESG Others Exhibits CASH GENERATED BY OPERATING ACTIVITIES 2,020,559 2,868,419 Income tax and social contribution paid (185,916) (179,761) Loans and financing - interest due and paid (160,985) (244,568) Debentures - interest due and paid (989,339) (688,758) Lease liabilities - interest paid (15,234) (16,786) NET CASH GENERATED FROM OPERATING ACTIVITIES 669,085 1,738,546 CASH FLOWS FROM INVESTMENT ACTIVITIES Financial investments 24,744 (5,867) Additions to contract assets -899,991 -1,374,321 Additions to property, plant and equipment -396,493 -190,433 Additions to intangible assets (22,165) (1,060,804) Acquisitions of subsidiaries, net of cash acquired 0 434,502 Acquisition of investments — (53,820) Investment disposal 174,892 (17,508) NET CASH USED FROM INVESTING ACTIVITIES (1,119,013) (2,268,251) CASH FLOWS FROM FINANCING ACTIVITIES Loans and financing obtained from third parties 550,000 — Transaction costs of loans and financing obtained from third parties (213) — Issue of debentures 3,700,000 2,000,000 Transaction costs in the issuing of debentures (104,635) (22,632) Payments of principal - loans and financing (653,970) (630,854) Payments of principal - debentures (525,166) (781,958) Payments of principal of lease liabilities (35,925) (32,558) Share buyback — (70,040) Dividends and interest on own capital paid (2,337,920) -1,249,032 NET CASH GENERATED (USED) FROM FINANCING ACTIVITIES 592,171 (787,074) TOTAL EFFECTS ON CASH AND CASH EQUIVALENTS 142,243 (1,316,779) Cash and cash equivalents at the beginning of the period 3,130,363 4,161,939 Cash and cash equivalents at the end of the period 3,272,606 2,835,585 Cash and cash equivalents from assets classified as held for sale — 9,575 CHANGE IN CASH AND CASH EQUIVALENTS 142,243 (1,316,779) COPEL | 2Q26 | 40 Summary Results Investments GenCo TradeCo DisCo ESG Others Exhibits │CONSOLIDATED RESULTS - Adjusted Ebitda and Financial Result R$ '000 RECURRING EBITDA 2Q26 2Q25 Δ% 1H26 1H25 Δ% EBITDA 1,993.8 1,582.8 2597 % 3,901.6 3,319.3 1754 % (-/+) Fair value in the purchase and sale of energy (11.4) (61.2) (81.4) (59.3) (67.9) (12.7) (-/+) Provision (reversal) Incentive Dismissal Program — — — 18.9 21.0 (10.0) (-/+) Assets disposal /swap — (200.6) (100.0) — (310.4) (100.0) (-/+) Equity Income (55.9) (64.3) (13.1) (125.7) (164.7) (23.7) (-/+)NRV (288.7) (11.7) 2,367.5 (308.8) (35.7) 765.0 (+/-)Difference in Revenue from Corporate/Regulatory Transfer (25.2) 90.0 (128.0) (59.5) 76.6 (177.7) RECURRING EBITDA 1,613 1,335 20.8 3,367 2,838 18.6 2Q26 2Q25 Δ% 1H26 1H25 Δ% Financial Revenues 789,896 375,312 110.5 1,122,842 672,952 66.9 Income from investments held for trading 177,487 189,453 (6.3) 337,580 344,066 (1.9) Renegotiation of use of public property (Note 23) 298,295 — — 298,295 — — Late fees on electricity bills 98,062 84,809 15.6 174,786 163,559 6.9 Interest on taxes to be compensated 27,186 39,894 (31.9) 61,325 83,307 (26.4) Monetary restatement and adjustment to present value of accounts payable related to concession (9,593) 26,588 (136.1) 228 34,352 (99.3) Income and monetary restatement of judicial deposits 11,657 10,393 12.2 19,755 21,827 (9.5) Income from sectorial assets and liabilities (Note 8) 28,759 13,578 111.8 50,788 15,942 218.6 Fair value adjustment of debentures (Note 20) 190,014 — — 192,116 — — Effect of a swap on debentures (Note 20) (12,990) — — — — — (-) Pis/Pasep and Cofins on revenues (27,038) (14,989) 80.4 (39,720) (28,793) 38.0 Other financial revenues 8,057 25,586 (68.5) 27,689 38,692 (28.4) Financial Expenses (1,158,779) (777,173) 49.1 (1,981,288) (1,521,338) 30.2 Monetary variation, foreign exchange and debt service charges (804,222) (609,220) 32.0 (1,537,917) (1,213,710) 26.7 Monetary variation and adjustment to present value of accounts payable related to concession (17,196) (39,346) (56.3) (59,693) (87,745) (32.0) Income from sectorial assets and liabilities (Note 8) — (63,416) (100.0) — (77,774) (100.0) Monetary variation of litigation (Note 26.1) (79,604) (16,313) — (74,229) (32,296) — Uptade of provision for allocation of Pis and Cofins credits (Note 12.3) (10,373) (20,996) (50.6) (22,002) (45,865) (52.0) Adjust the fair value of debentures (Note 20) 10,640 — — 15,978 — — Swap effect on debentures (Note 20) (160,968) — — (177,460) — — Interest on lease liabilities (Note 24.2) (7,174) (8,474) (15.3) (15,406) (16,954) (9.1) Interest on tax installments (12,223) (4,493) — (12,223) (13,172) — Interest on R&D and PEE (note 22) (6,775) (6,037) 12.2 (12,225) (11,609) 5.3 Pis/ Pasep and Cofins taxes over interest on equity (63,290) (56) — (63,290) (56) — Exchange rate fluctuation on the purchase of electricity from Itaipu — — — — — — Other financial expenses (7,594) (8,822) (13.9) (22,821) (22,157) 3.0 Financial income (expenses) 1,948,675 1,152,485 69.1 3,104,130 2,194,290 41.5 COPEL | 2Q26 | 41 Summary Results Investments GenCo TradeCo DisCo ESG Others Exhibits │RESULT BY SUBSIDIARY - COPEL GET R$ '000 Income Statement 2Q26 2Q25 Δ% 1H26 1H25 Δ% OPERATING REVENUES 1,354,558 1,161,383 16.6 2,933,746 2,400,930 22.2 Electricity sales to distributors 905,712 899,666 0.7 2,027,545 1,800,118 12.6 Use of the main transmission grid 366,590 192,102 90.8 761,191 465,773 63.4 Construction revenue 77,641 56,034 38.6 131,648 111,141 18.5 Other operating revenues 4,615 13,581 (66.0) 13,362 23,898 (44.1) OPERATING COSTS AND EXPENSES (681,736) (467,248) 45.9 (1,398,565) (985,937) 41.9 Electricity purchased for resale (80,157) (86,583) (7.4) (200,371) (110,670) 81.1 Charges of main distribution and transmission grid (123,464) (128,349) (3.8) (244,464) (261,115) (6.4) Personnel and management (75,203) (72,593) 3.6 (161,102) (156,899) 2.7 Pension and healthcare plans (19,492) (17,302) 12.7 (39,581) (35,482) 11.6 Materials and supplies (12,569) (11,419) 10.1 (23,454) (16,078) 45.9 Third-party services (58,359) (65,410) (10.8) (106,276) (133,337) (20.3) Depreciation and amortization (190,540) (177,828) 7.1 (380,695) (354,701) 7.3 Provisions and reversals (20,255) (4,807) 321.4 (22,033) (6,769) 225.5 Construction cost (65,014) (54,256) 19.8 (121,184) (104,863) 15.6 Other cost and expenses (36,683) 151,299 (124.2) (99,405) 193,977 (151.2) EQUITY IN EARNINGS OF SUBSIDIARIES 49,288 64,900 (24.1) 120,927 165,337 (26.9) PROFIT BEFORE FINANCIAL RESULTS AND TAXES 722,110 759,035 (4.9) 1,656,108 1,580,330 4.8 FINANCIAL RESULTS (328,576) (236,488) 38.9 (574,793) (493,591) 16.5 Financial income 209,304 133,626 56.6 334,410 225,520 48.3 Financial expenses (537,880) (370,114) 45.3 (909,203) (719,111) 26.4 OPERATIONAL EXPENSES/ INCOME 393,534 522,547 (24.7) 1,081,315 1,086,739 (0.5) INCOME TAX AND SOCIAL CONTRIBUTION ON PROFIT 15,134 (157,033) (109.6) (198,277) (305,181) (35.0) Income tax and social contribution on profit (8,316) (8,514) (2.3) (120,489) (130,690) (7.8) Deferred income tax and social contribution on profit 23,450 (148,519) (115.8) (77,788) (174,491) (55.4) NET INCOME continuing operations 408,668 365,514 11.8 883,038 781,558 13.0 NET INCOME discontinued operations — — - — — - NET INCOME 408,668 365,514 11.8 883,038 781,558 13.0 Attributed to shareholders of the parent company - continuing operations 408,668 365,514 11.8 883,038 781,558 13.0 Attributed to non-controlling shareholders — — - - EBITDA continuing operations 912,650 936,863 (2.6) 2,036,803 1,935,031 5.3 COPEL | 2Q26 | 42 Summary Results Investments GenCo TradeCo DisCo ESG Others Exhibits #CIRCUL AR! #DIV/0! - #CIRCUL AR! #DIV/0! - 905,712 899,666 #DIV/0! 2,027,545 1,800,118 #DIV/0! 366,590 192,102 #CIRCULA R! 761,191 465,773 #CIRCULA R! 77,641 56,034 #CIRCULA R! 131,648 111,141 #CIRCULA R! 4,615 13,581 #DIV/0! 13,362 23,898 #DIV/0! #CIRCUL AR! #CIRCUL AR! #CIRCUL AR! #CIRCUL AR! #CIRCUL AR! #CIRCUL AR! (80,157) (86,583) #CIRCULA R! (200,371) (110,670) #CIRCULA R! (123,464) (128,349) #DIV/0! (244,464) (261,115) #DIV/0! (75,203) (72,593) #CIRCULA R! (161,102) (156,899) #CIRCULA R! (19,492) (17,302) #CIRCULA R! (39,581) (35,482) #CIRCULA R! (12,569) (11,419) #DIV/0! (23,454) (16,078) #DIV/0! (58,359) (65,410) #CIRCULA R! (106,276) (133,337) #CIRCULA R! (190,540) (177,828) #CIRCULA R! (380,695) (354,701) #CIRCULA R! (20,255) (4,807) #DIV/0! (22,033) (6,769) #DIV/0! (65,014) (54,256) #CIRCULA R! (121,184) (104,863) #CIRCULA R! (36,683) 151,299 #CIRCULA R! (99,405) 193,977 #CIRCULA R! 49,288 64,900 #DIV/0! 120,927 165,337 #DIV/0! 117,067 #CIRCUL AR! #DIV/0! 179,762 #CIRCUL AR! #DIV/0! #DIV/0! #CIRCUL AR! #DIV/0! #DIV/0! #CIRCUL AR! #DIV/0! 209,304 133,626 #DIV/0! 334,410 225,520 #DIV/0! (537,880) (370,114) #DIV/0! (909,203) (719,111) #DIV/0! #DIV/0! #DIV/0! #CIRCUL AR! #DIV/0! #DIV/0! #CIRCUL AR! #CIRCUL AR! #DIV/0! #CIRCUL AR! #CIRCUL AR! #DIV/0! #CIRCUL AR! (8,316) (8,514) #DIV/0! (120,489) (130,690) #DIV/0! 23,450 (148,519) #CIRCULA R! (77,788) (174,491) #CIRCULA R! #CIRCUL AR! #CIRCUL AR! #CIRCUL AR! #CIRCUL AR! #CIRCUL AR! #CIRCUL AR! — — - — — - 365,514 #CIRCUL AR! #DIV/0! 781,558 #CIRCUL AR! #DIV/0! 408,668 365,514 #CIRCULA R! 883,038 781,558 #CIRCULA R! — — — — — — — — - - (34,232) #CIRCUL AR! #DIV/0! (14,215) #CIRCUL AR! #DIV/0! COPEL | 2Q26 | 43 Summary Results Investments GenCo TradeCo DisCo ESG Others Exhibits │RESULT BY SUBSIDIARY - COPEL DIS R$ '000 Income Statement 2Q26 2Q25 Δ% 1H26 1H25 Δ% OPERATING REVENUES 4,969,593 4,556,168 9.1 9,894,357 8,860,934 11.7 Electricity sales to final customers 1,653,419 1,522,602 8.6 3,378,525 3,306,270 2.2 Electricity sales to distributors 4,185 70,344 (94.1) 28,185 101,347 (72.2) Use of the main distribution grid 1,655,120 1,456,332 13.6 3,443,189 3,225,479 6.7 Construction revenue 567,082 786,735 (27.9) 1,089,843 1,371,319 (20.5) Fair value of assets from the indemnity for the concession 288,695 11,726 2362.0 308,770 35,742 763.9 Sectorial assets and liabilities result 654,834 577,183 13.5 1,354,434 562,727 140.7 Other operating revenues 146,258 131,246 11.4 291,411 258,050 12.9 OPERATING COSTS AND EXPENSES (4,121,038) (4,147,934) (0.6) (8,479,601) (7,915,621) 7.1 Electricity purchased for resale (2,114,778) (1,978,386) 6.9 (4,501,417) (3,825,567) 17.7 Charges of main transmission grid (709,714) (689,408) 2.9 (1,418,139) (1,346,210) 5.3 Personnel and management (136,000) (141,781) (4.1) (294,656) (284,160) 3.7 Pension and healthcare plans (42,273) (37,692) 12.2 (85,332) (77,465) 10.2 Materials and supplies (14,225) (10,214) 39.3 (28,468) (28,021) 1.6 Third-party services (216,523) (200,750) 7.9 (412,197) (401,456) 2.7 Depreciation and amortization (205,700) (172,760) 19.1 (408,672) (340,418) 20.1 Provisions and reversals (83,216) (78,403) 6.1 (163,752) (148,108) 10.6 Construction cost (567,082) (786,735) (27.9) (1,089,843) (1,371,319) (20.5) Other cost and expenses (31,527) (51,805) (39.1) (77,125) (92,897) (17.0) PROFIT BEFORE FINANCIAL RESULTS AND TAXES 848,555 408,234 107.9 1,414,756 945,313 49.7 FINANCIAL RESULTS (256,701) (196,714) 30.5 (497,746) (389,094) 27.9 Financial income 281,257 172,005 63.5 450,203 324,933 38.6 Financial expenses (537,958) (368,719) 45.9 (947,949) (714,027) 32.8 OPERATIONAL EXPENSES/ INCOME 591,854 211,520 179.8 917,010 556,219 64.9 INCOME TAX AND SOCIAL CONTRIBUTION ON PROFIT (112,794) (58,555) 92.6 (218,733) (170,832) 28.0 Income tax and social contribution on profit (10,790) 95,565 (111.3) (59,470) — — Deferred income tax and social contribution on profit (102,004) (154,120) (33.8) (159,263) (170,832) (6.8) NET INCOME (LOSS) 479,060 152,965 213.2 698,277 385,387 81.2 EBITDA 1,054,255 580,994 81.5 1,823,428 1,285,731 41.8 COPEL | 2Q26 | 44 Summary Results Investments GenCo TradeCo DisCo ESG Others Exhibits │RESULT BY SUBSIDIARY - COPEL COM R$ '000 Income Statement 2Q26 2Q25 Δ% 1H26 1H25 Δ% OPERATING REVENUES 1,270,076 1,131,213 12.3 2,539,110 2,087,455 21.6 Electricity sales to final customers 327,100 389,635 (16.0) 598,230 798,251 (25.1) Electricity sales to distributors 931,187 679,905 37.0 1,880,009 1,219,750 54.1 Other operating revenues 11,789 61,673 (80.9) 60,871 69,454 (12.4) OPERATING COSTS AND EXPENSES (1,237,779) (1,052,153) 17.6 (2,480,149) (1,980,962) 25.2 Electricity purchased for resale (1,226,668) (1,042,565) 17.7 (2,458,215) (1,963,222) 25.2 Personnel and management (6,856) (5,183) 32.3 (13,980) (8,836) 58.2 Pension and healthcare plans (471) (435) 8.3 (935) (873) 7.1 Materials and supplies (23) 51 (145.1) (35) (109) (67.9) Third-party services (1,157) (959) 20.6 (2,093) (2,007) 4.3 Depreciation and amortization (500) (458) 9.2 (1,006) (887) 13.4 Provisions and reversals (264) (140) 88.6 (193) (1,237) (84.4) Other cost and expenses (1,840) (2,464) (25.3) (3,692) (3,791) (2.6) PROFIT BEFORE FINANCIAL RESULTS AND TAXES 32,297 79,060 (59.1) 58,961 106,493 (44.6) FINANCIAL RESULTS 3,142 194,192 (98.4) 8,564 19,610 (56.3) Financial income 3,353 185,174 (98.2) 8,889 19,892 (55.3) Financial expenses (211) 9,018 (102.3) (325) (282) 15.2 OPERATIONAL EXPENSES/ INCOME 35,439 273,252 (87.0) 67,525 126,103 (46.5) INCOME TAX AND SOCIAL CONTRIBUTION ON PROFIT (13,601) (39,055) (65.2) (24,644) (43,091) (42.8) Income tax and social contribution on profit — (30,082) (100.0) — (20,106) (100.0) Deferred income tax and social contribution on profit (13,601) (8,973) 51.6 (24,644) (22,985) 7.2 NET INCOME (LOSS) 21,838 234,197 (90.7) 42,881 83,012 (48.3) EBITDA 32,797 79,518 (58.8) % 59,967 107,380 (44.2) % COPEL | 2Q26 | 45 Summary Results Investments GenCo TradeCo DisCo ESG Others Exhibits
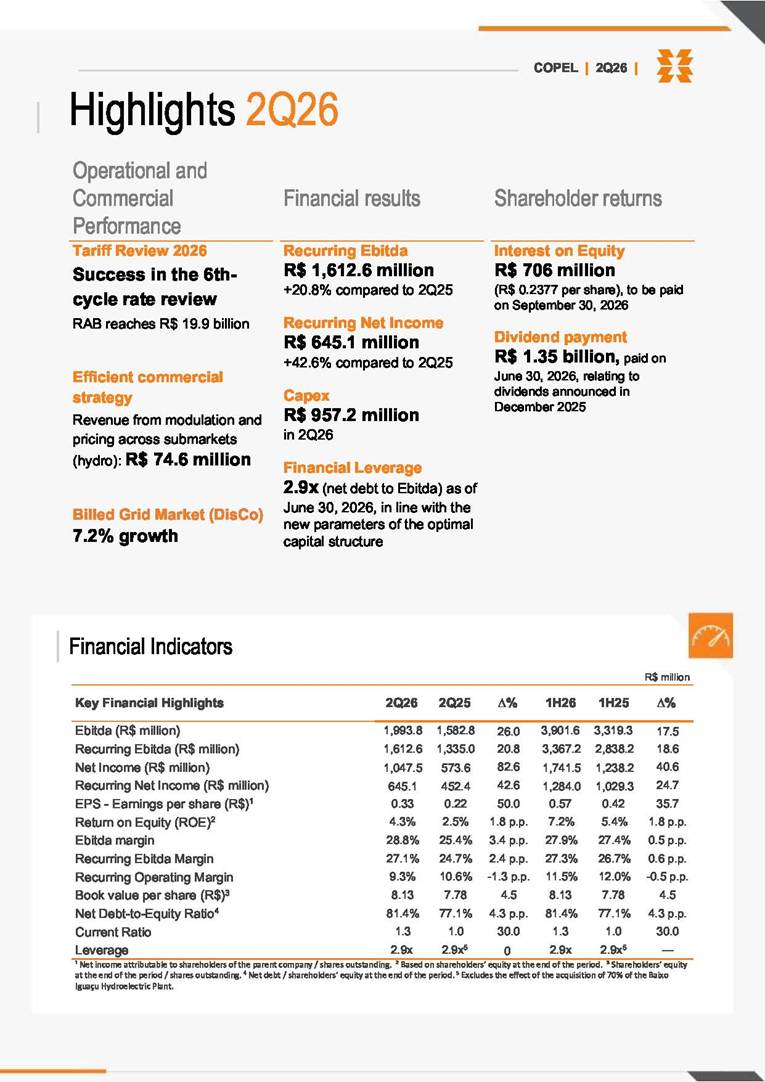
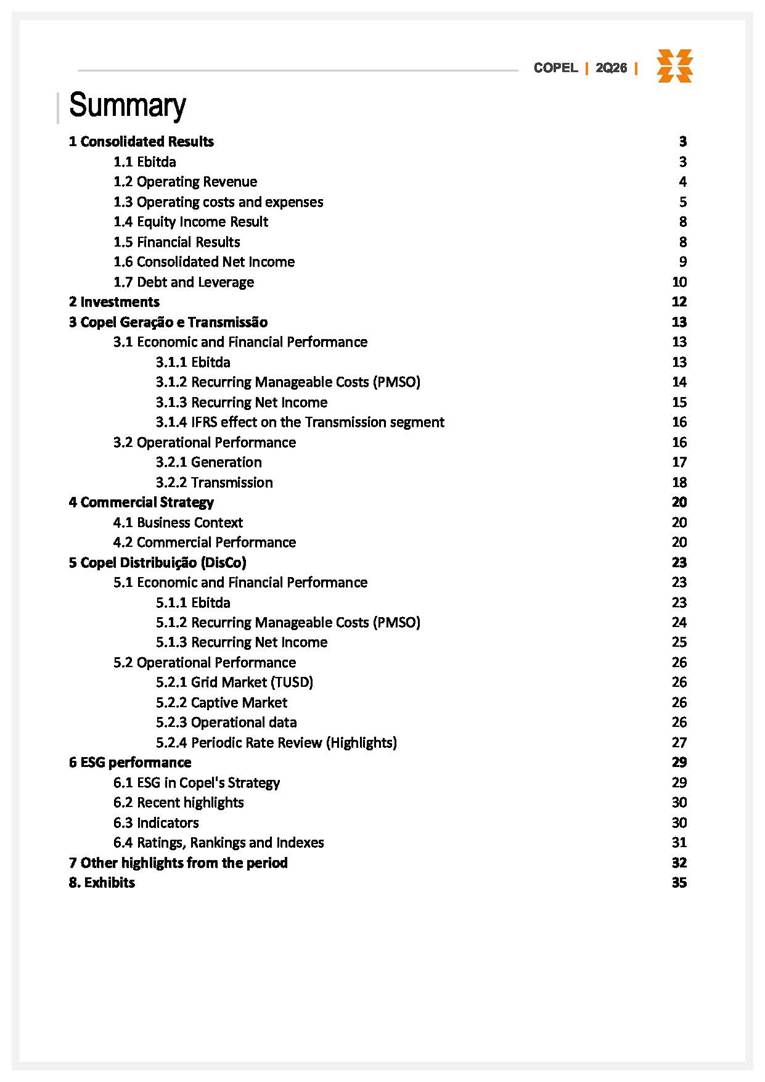
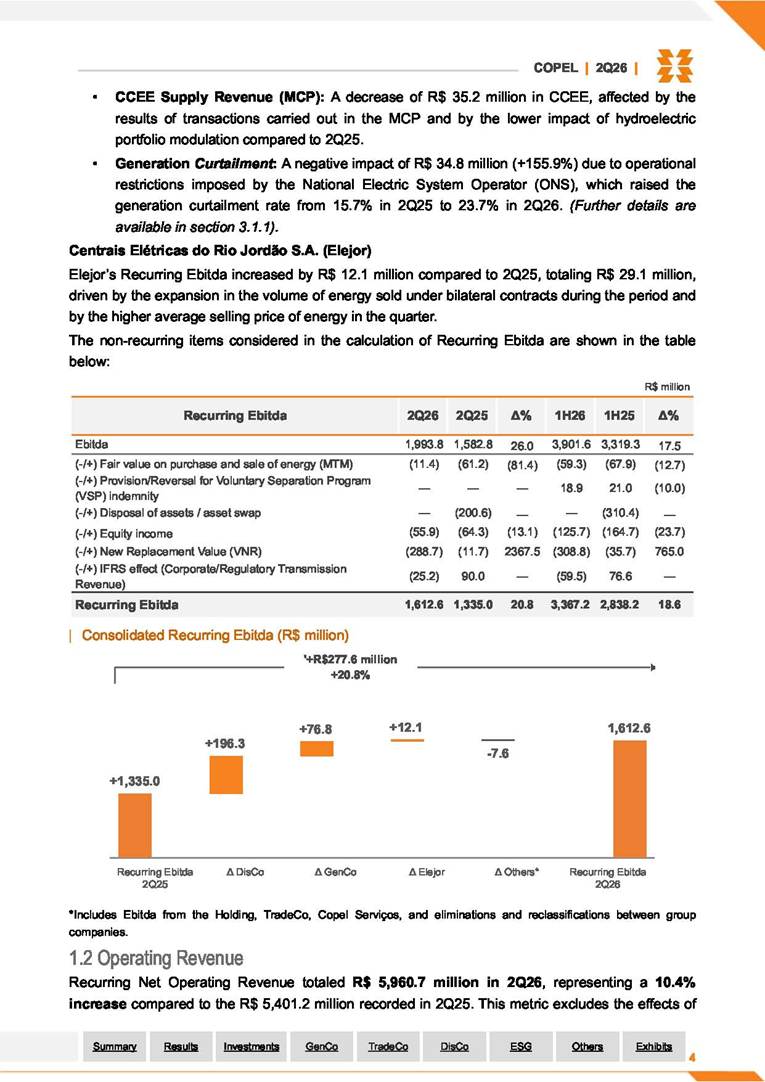
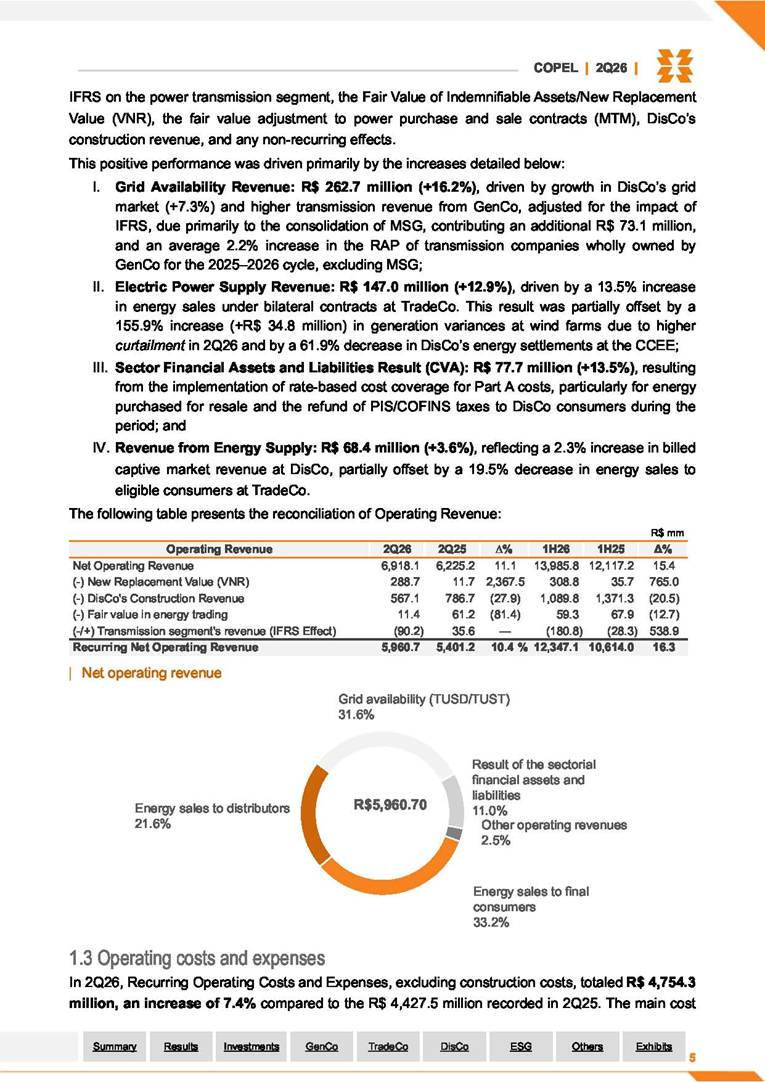
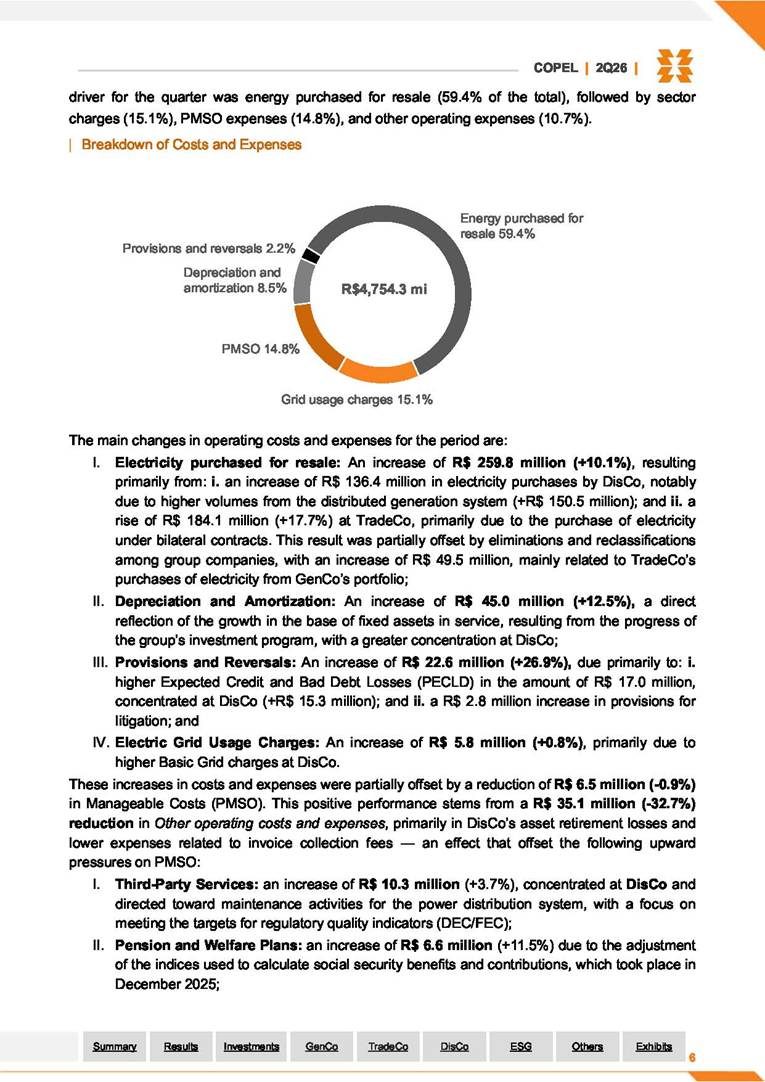
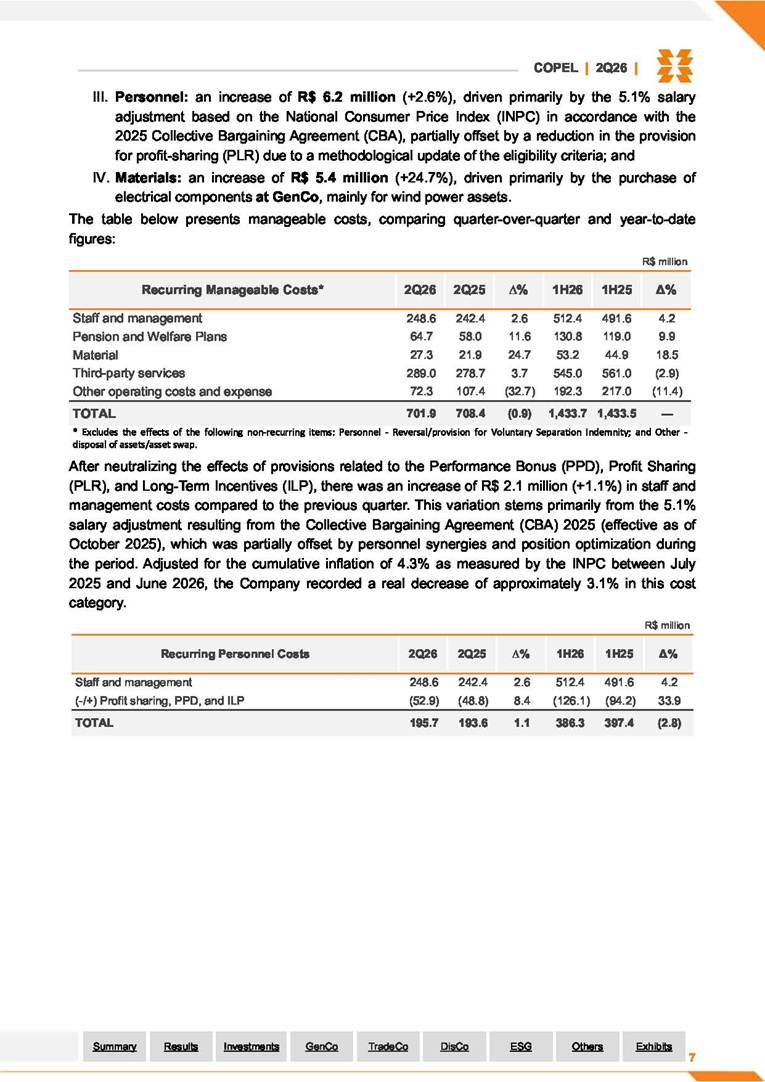
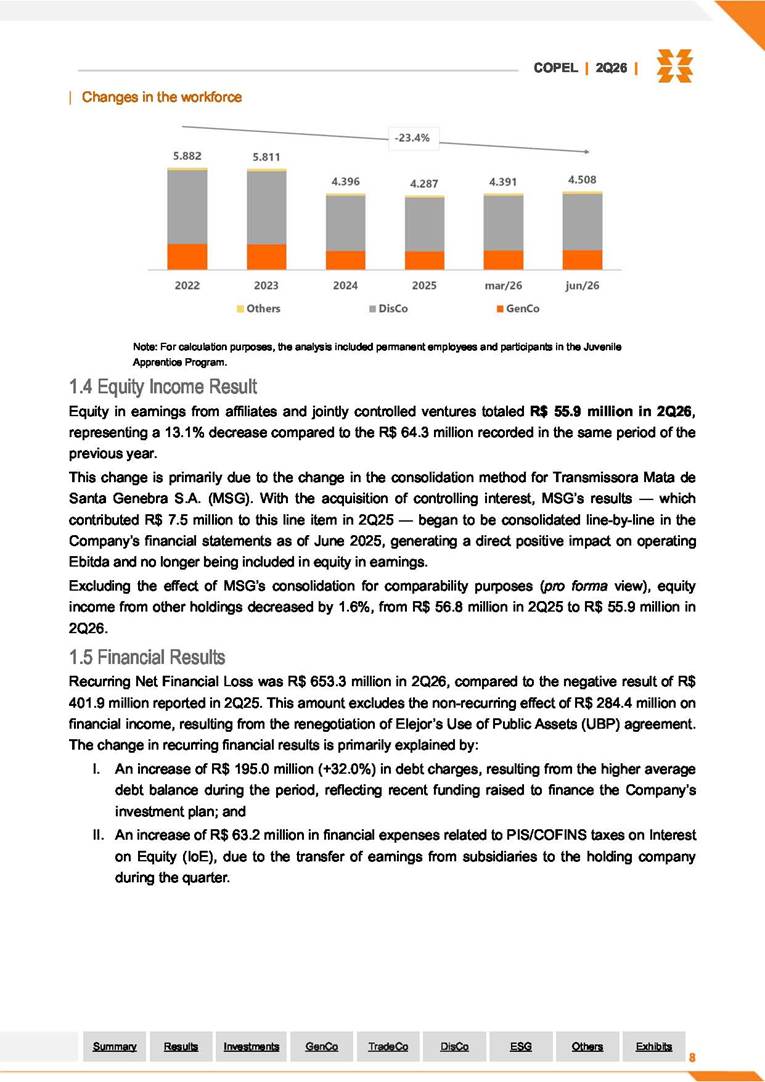
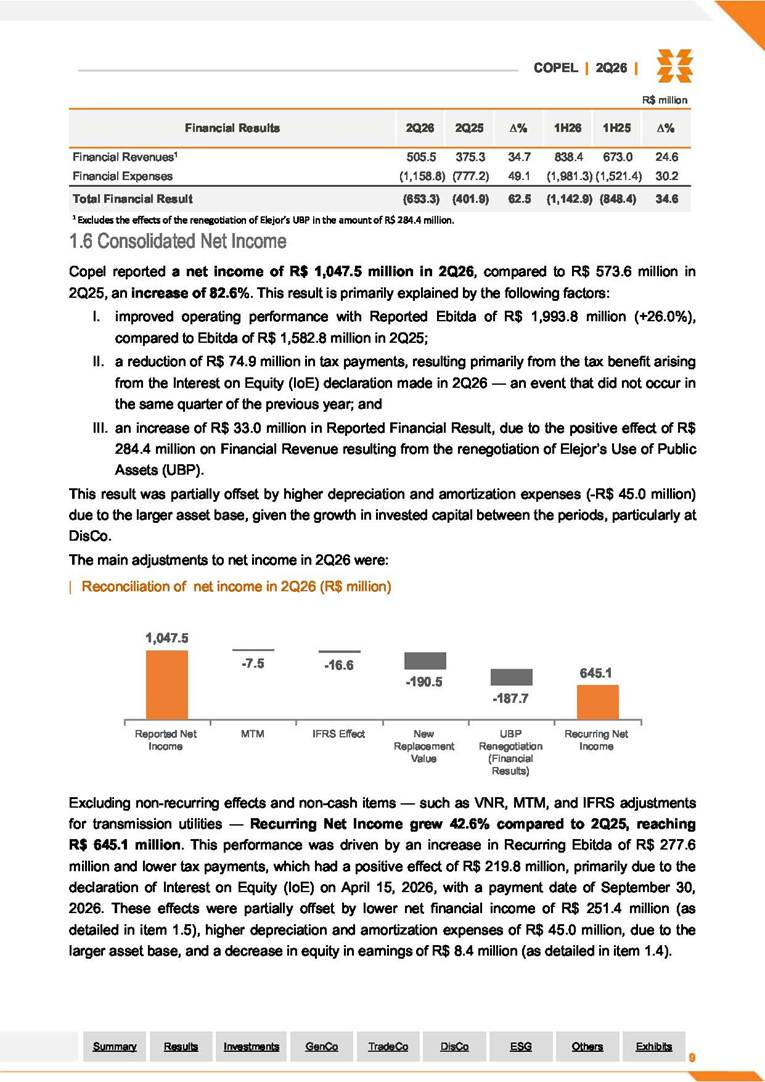
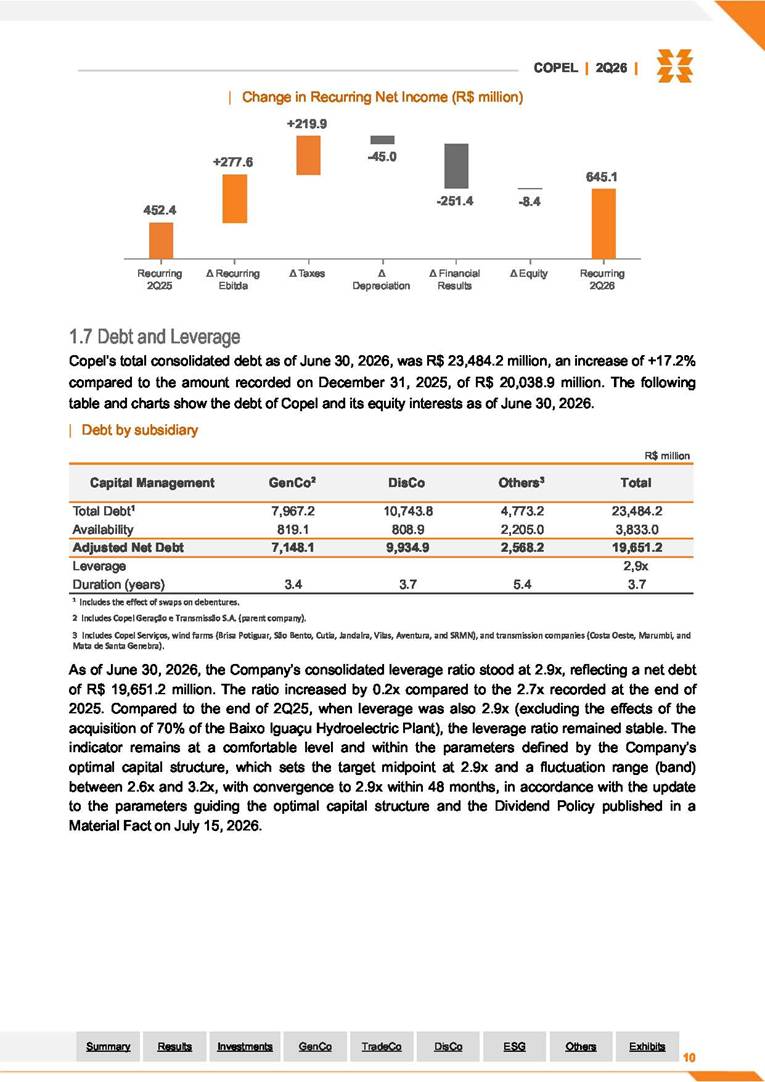
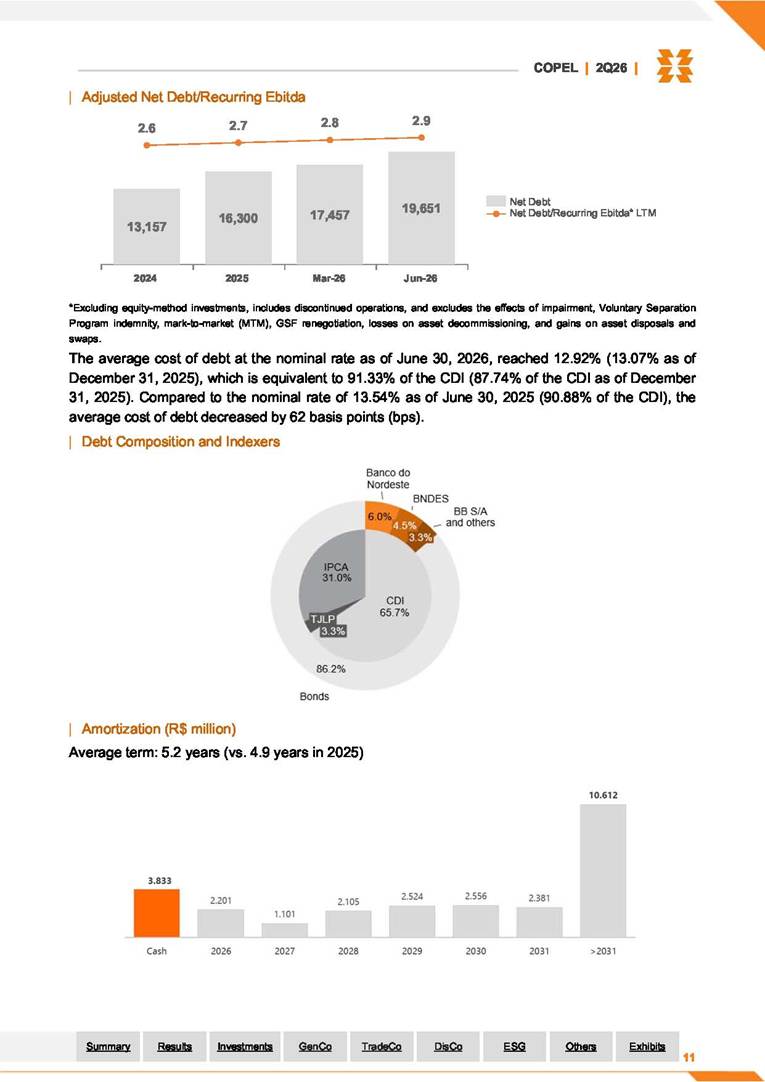
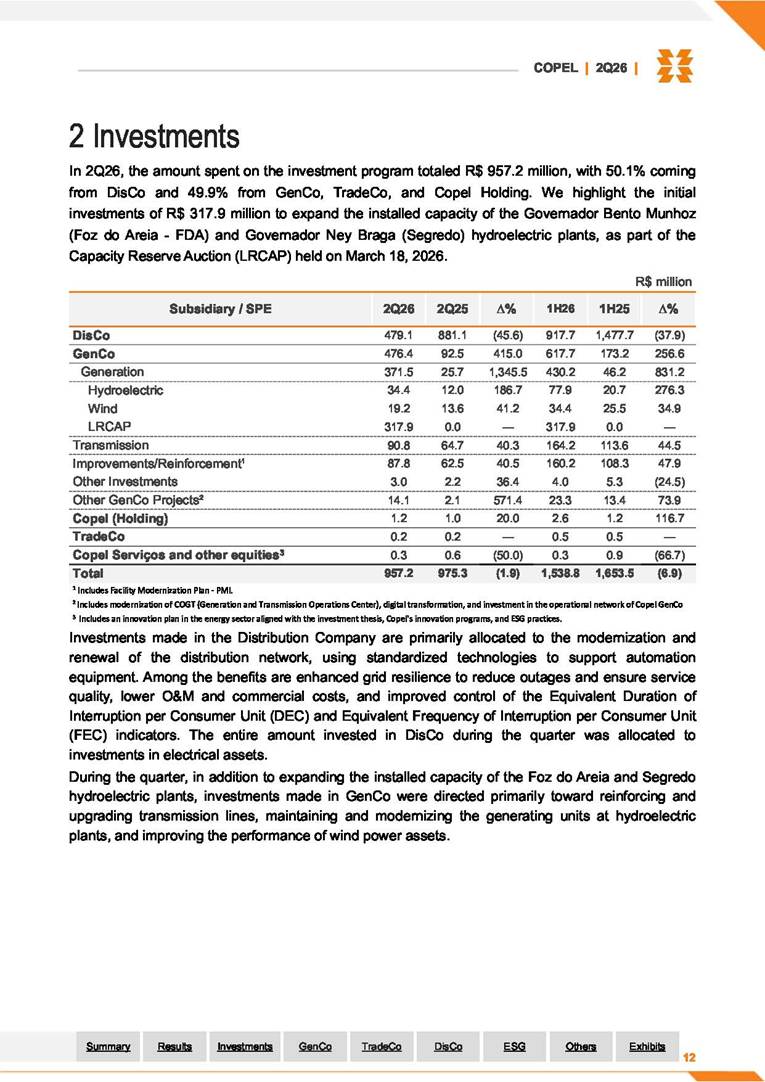
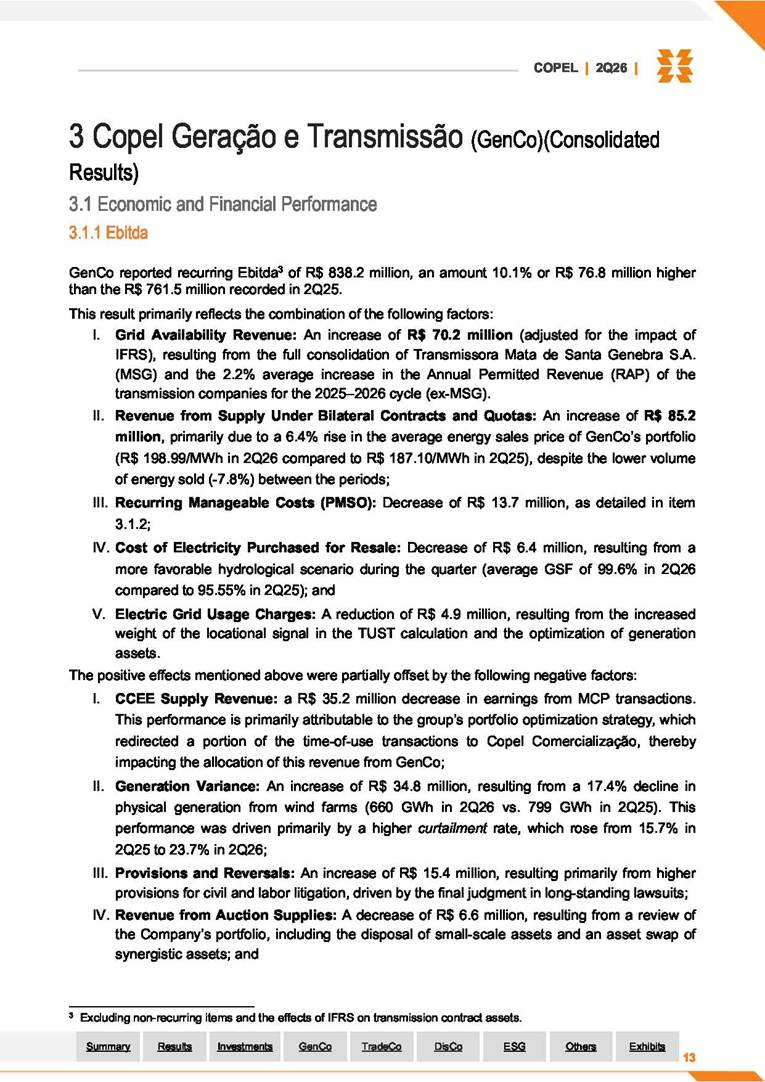
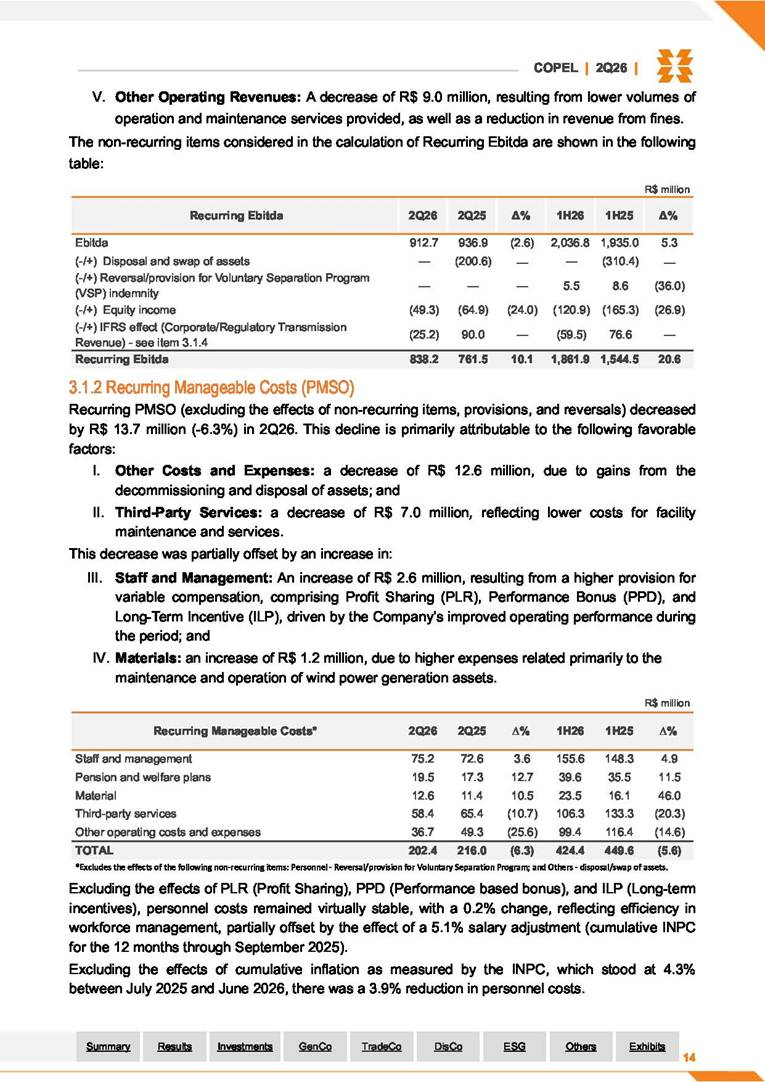
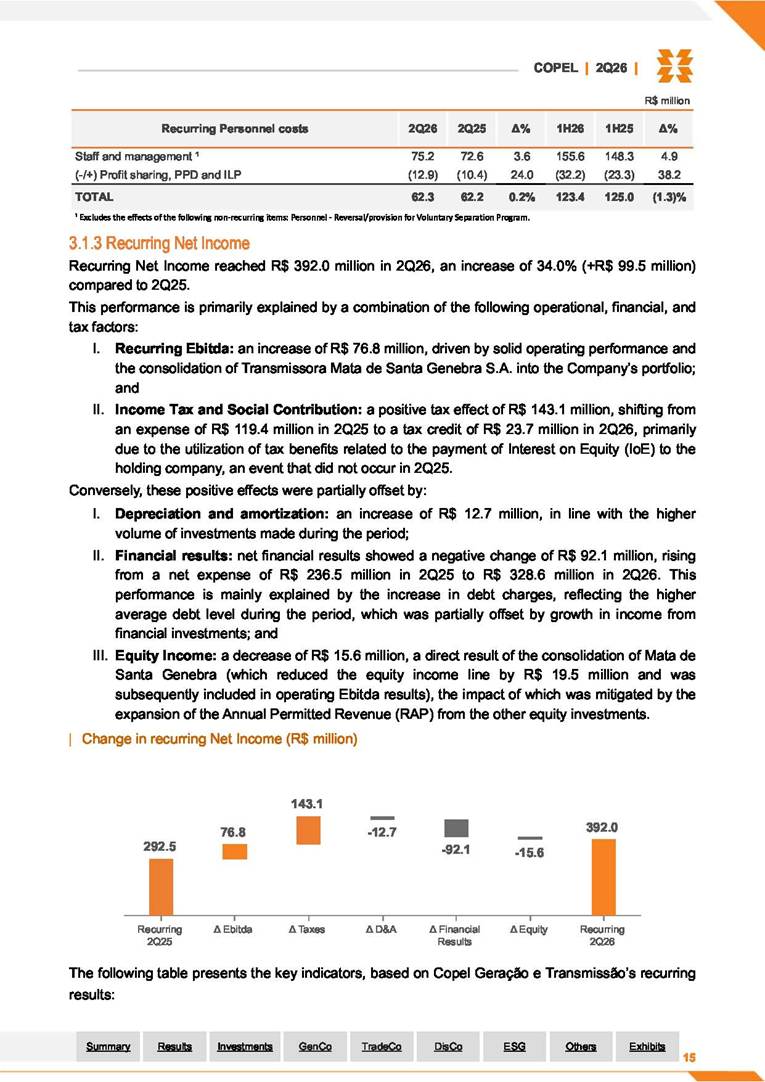
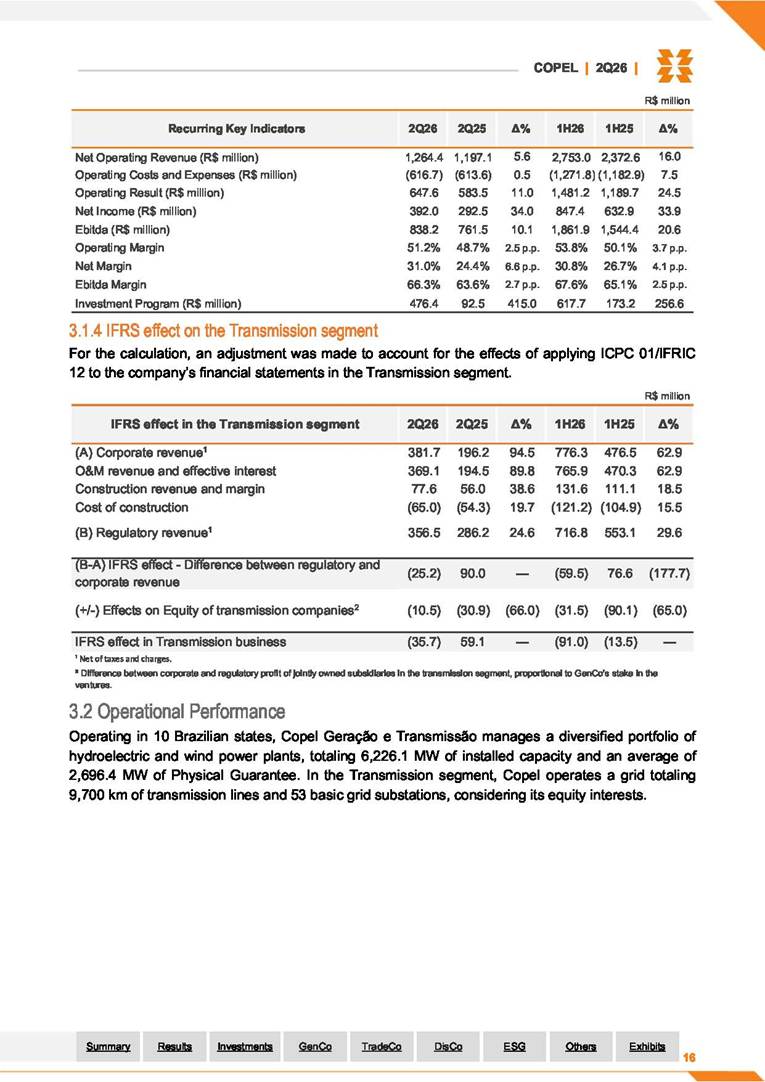
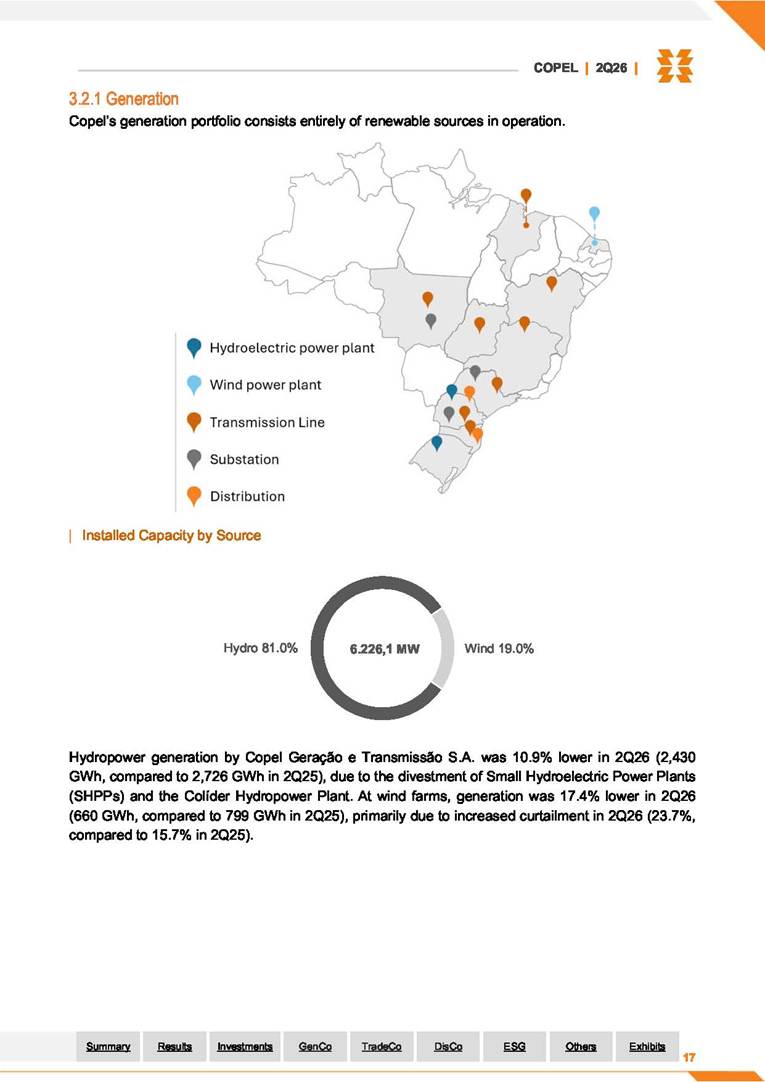
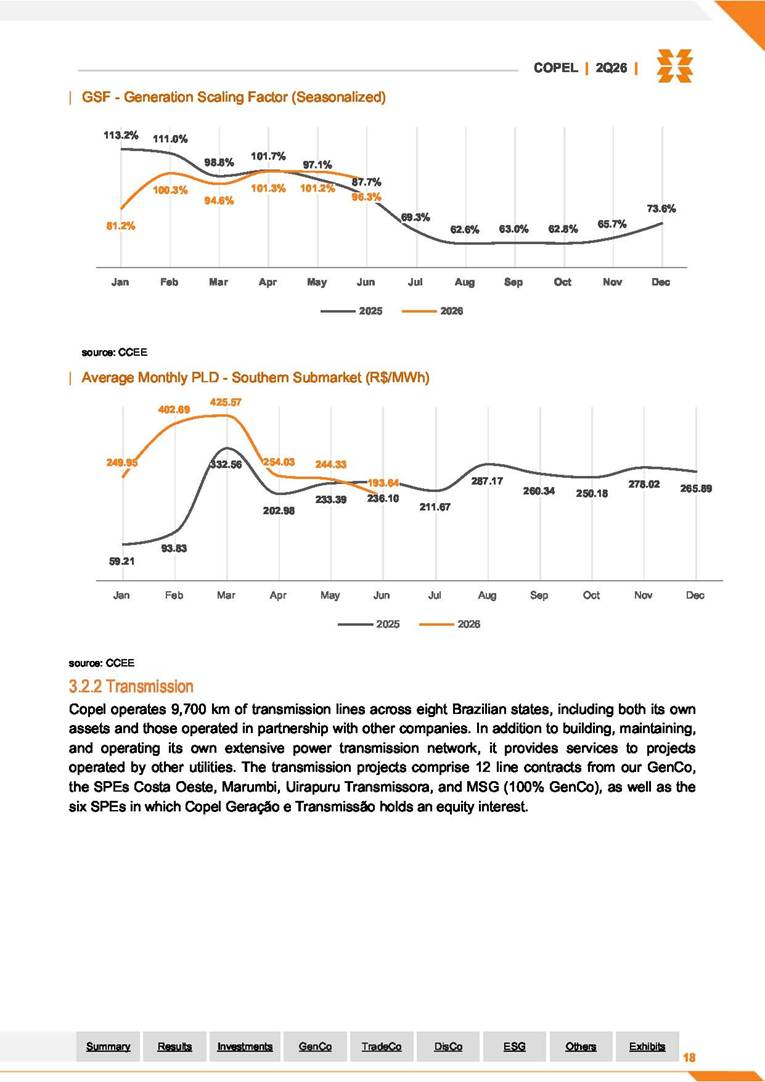
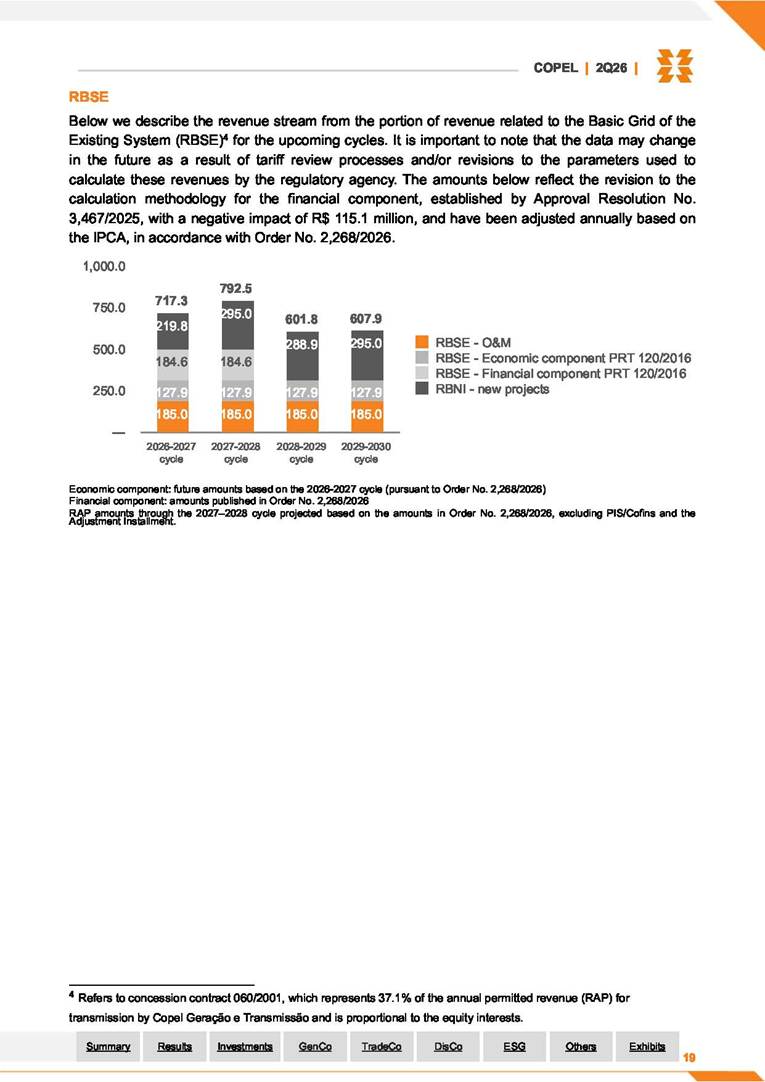
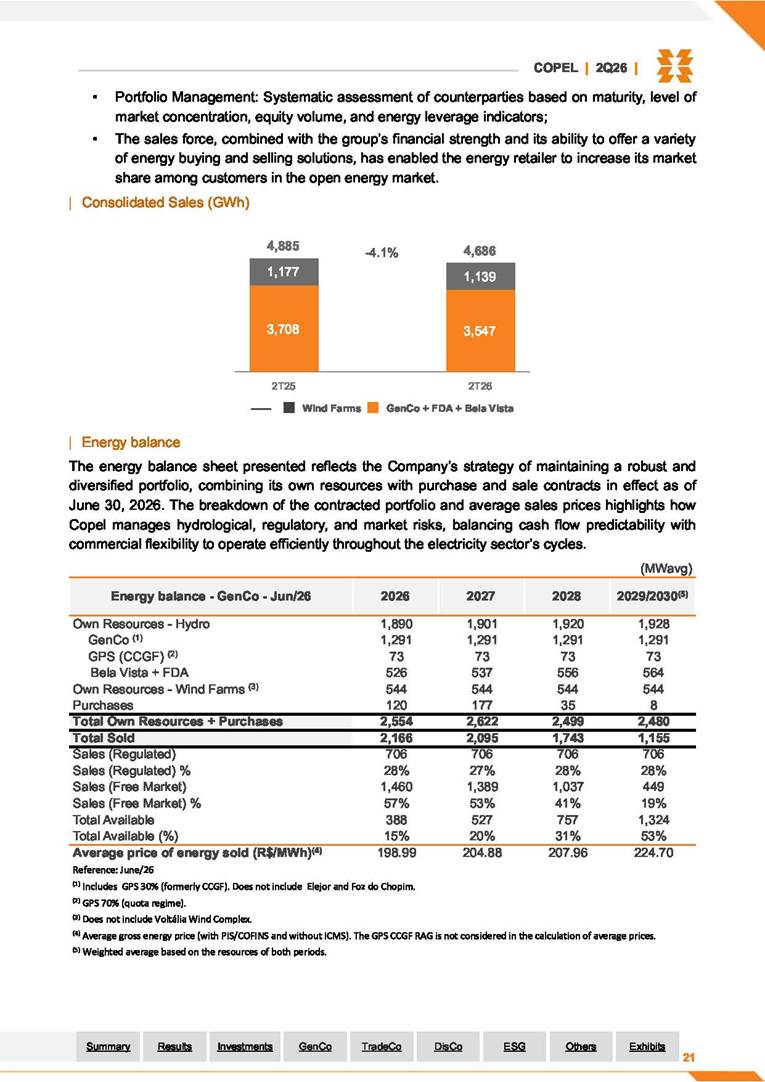
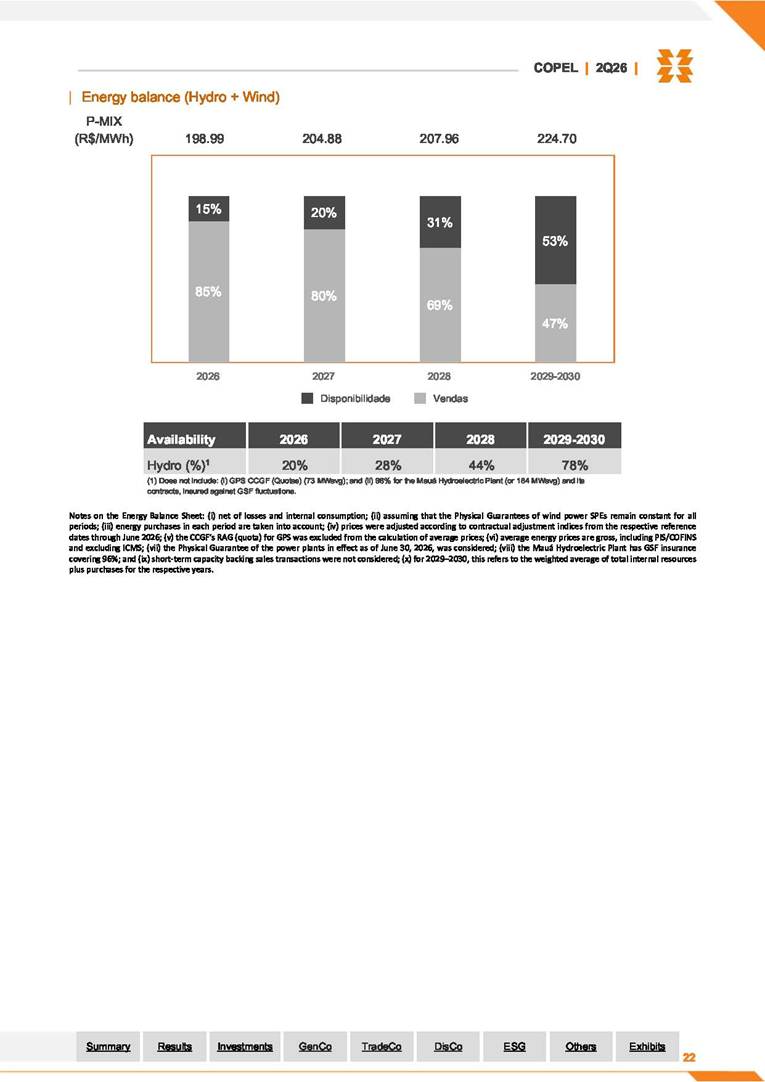
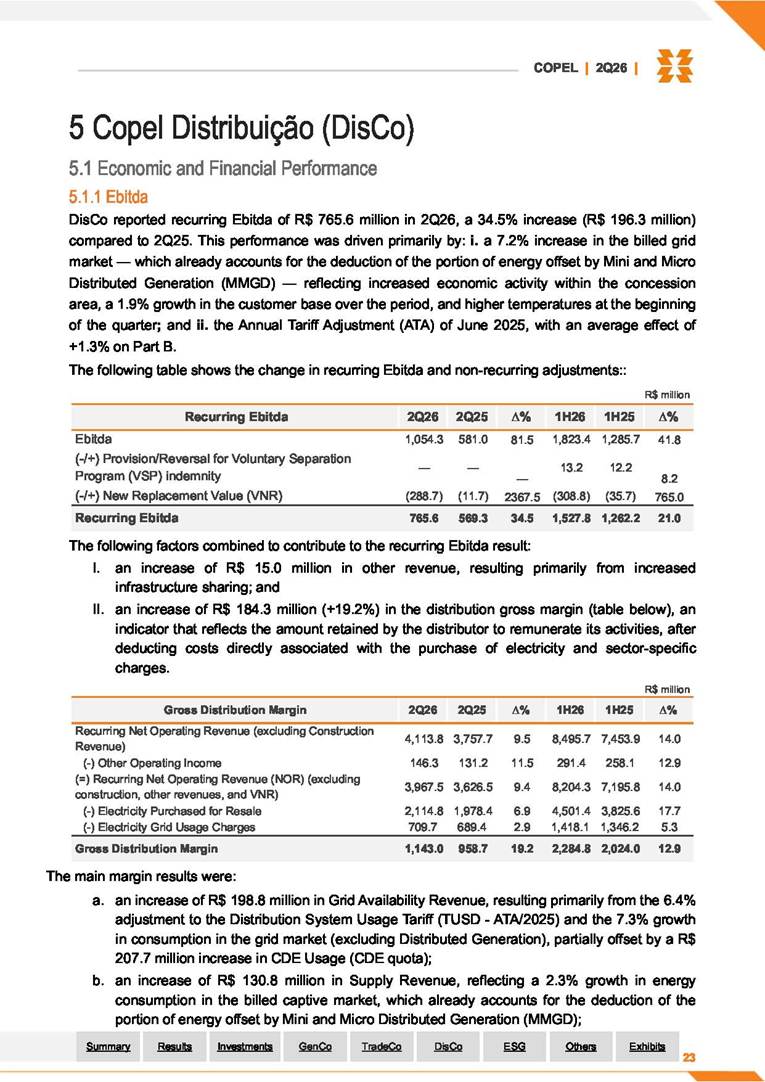
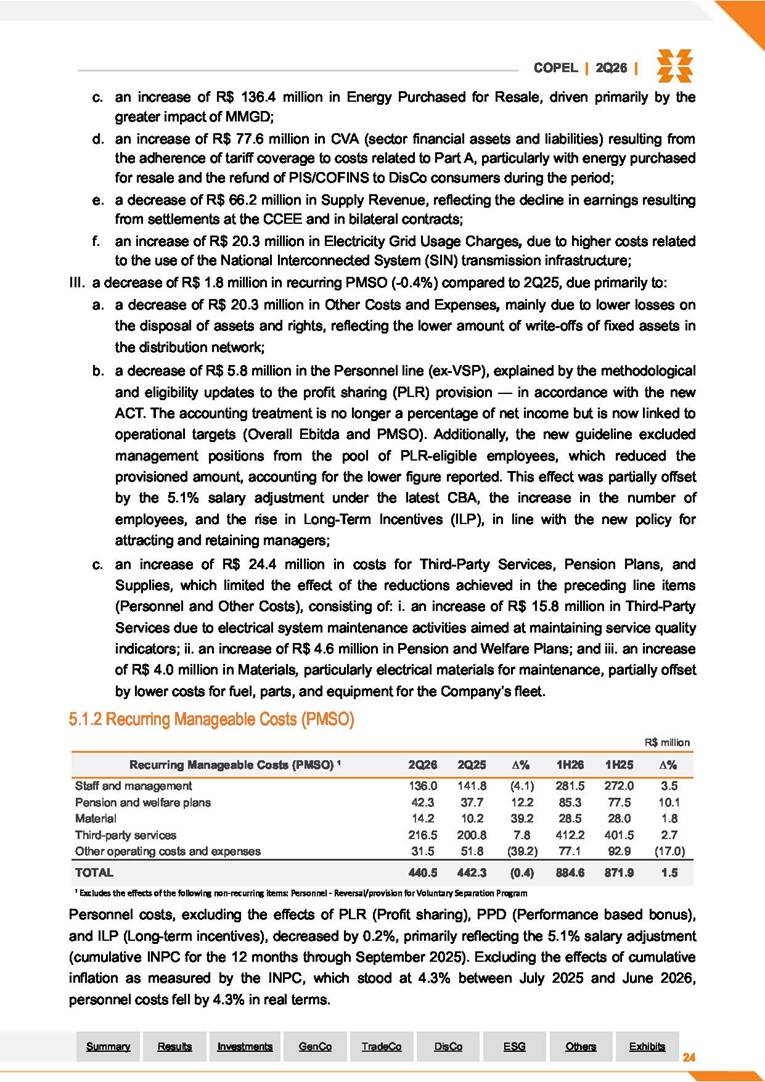
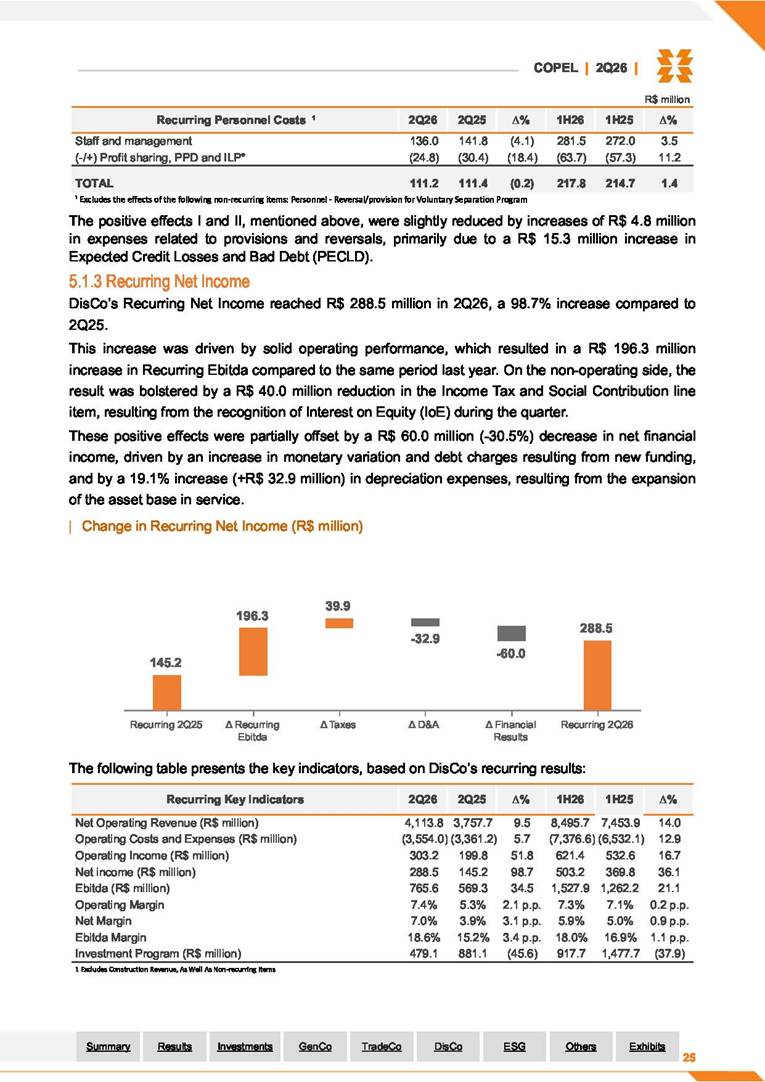
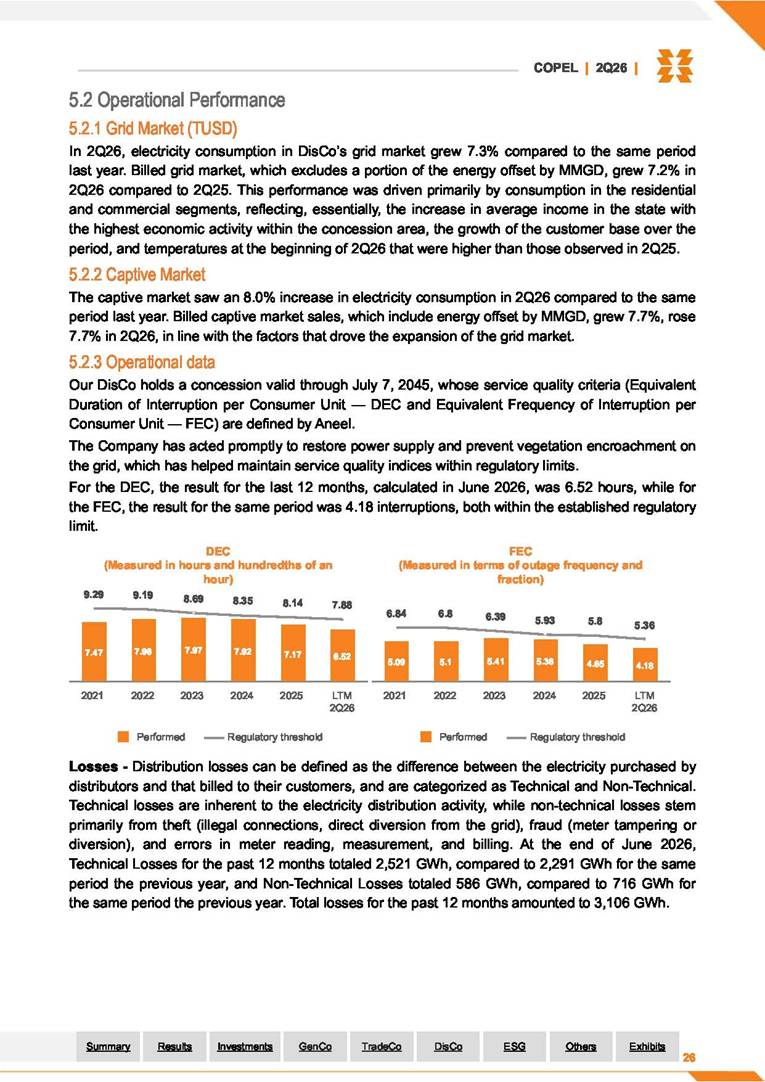
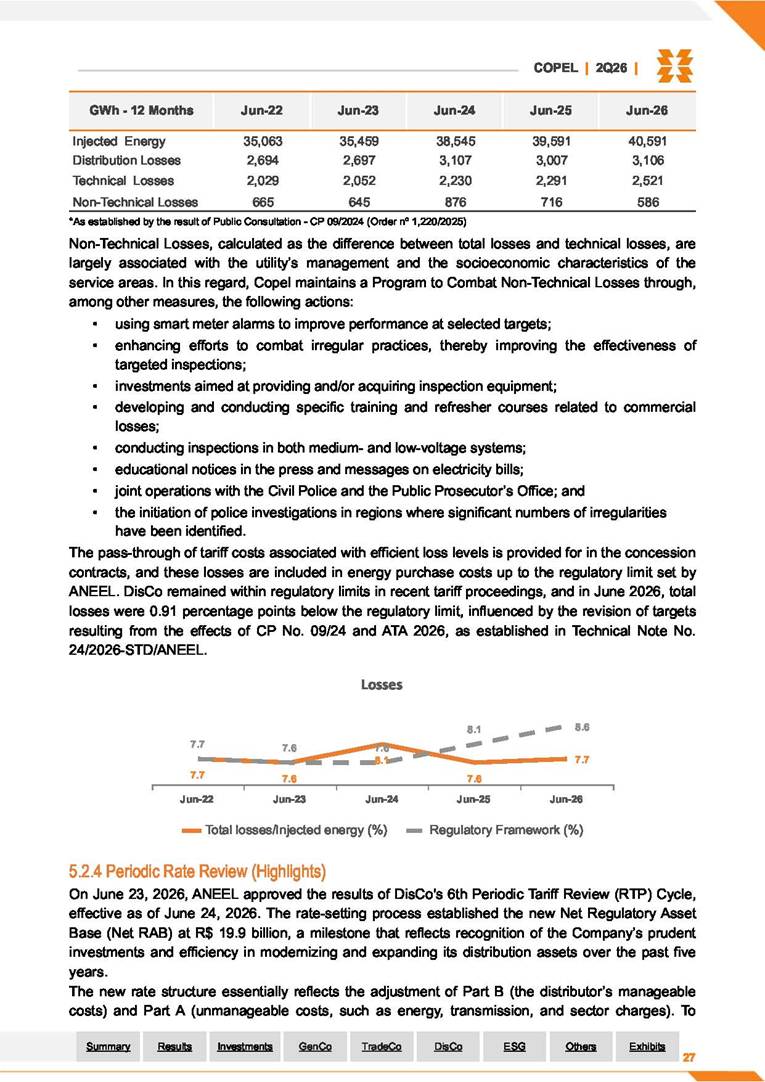
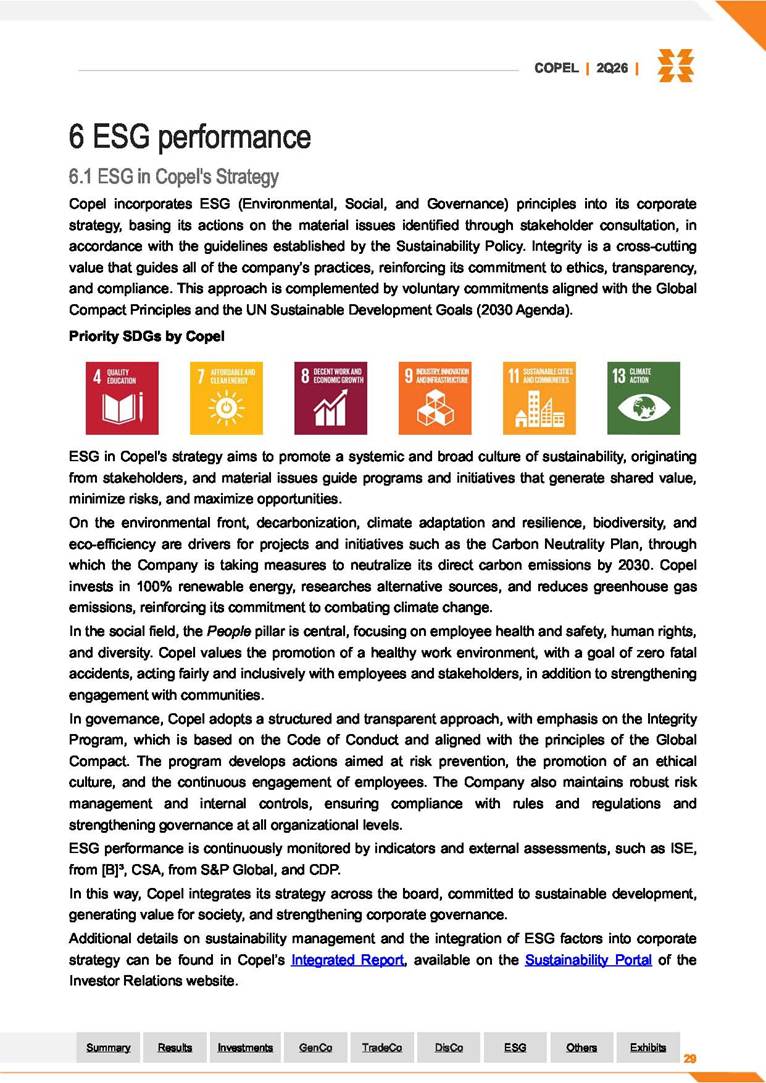
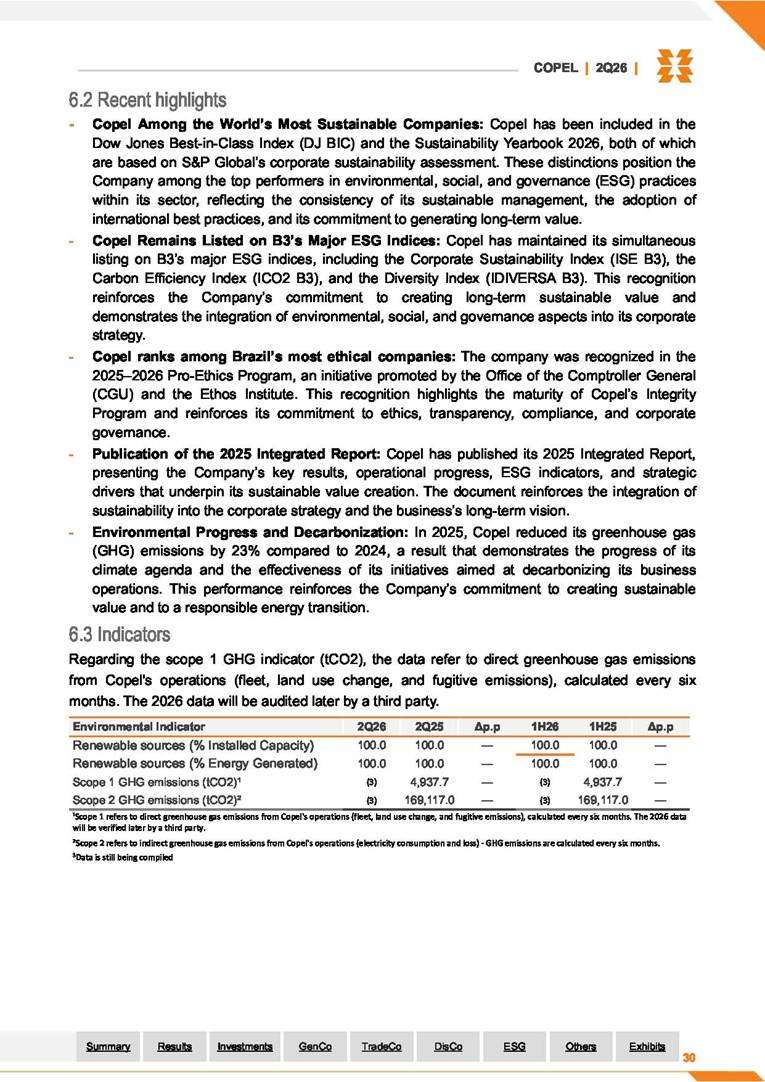
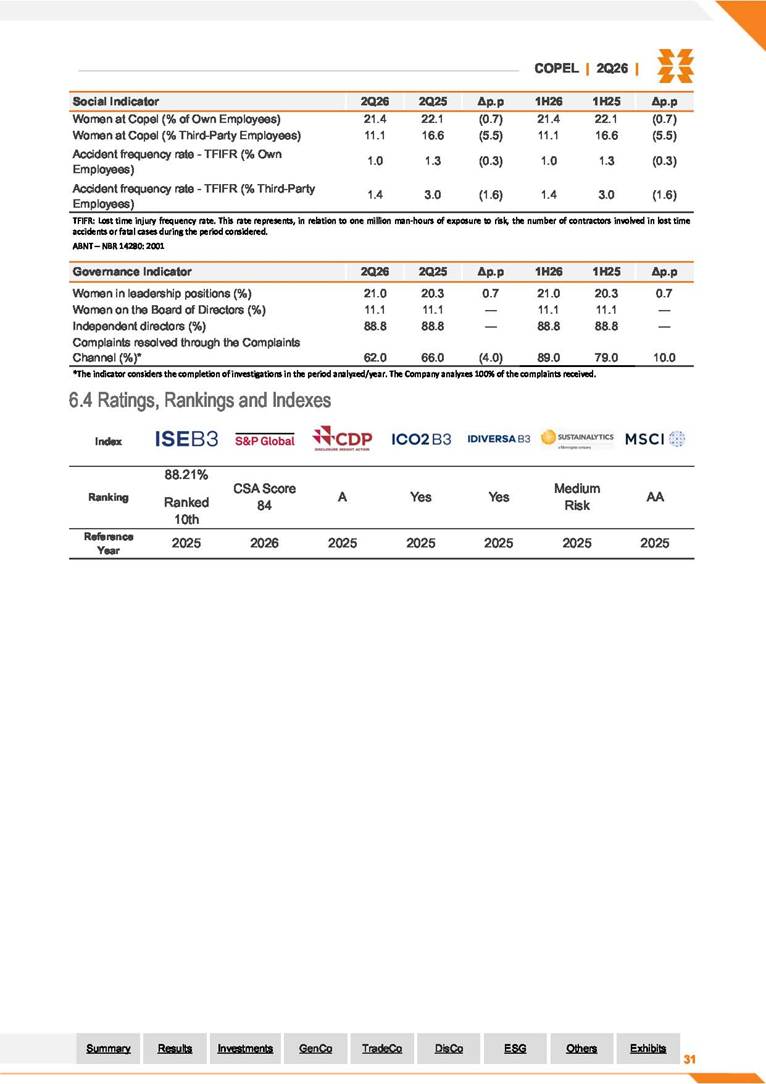
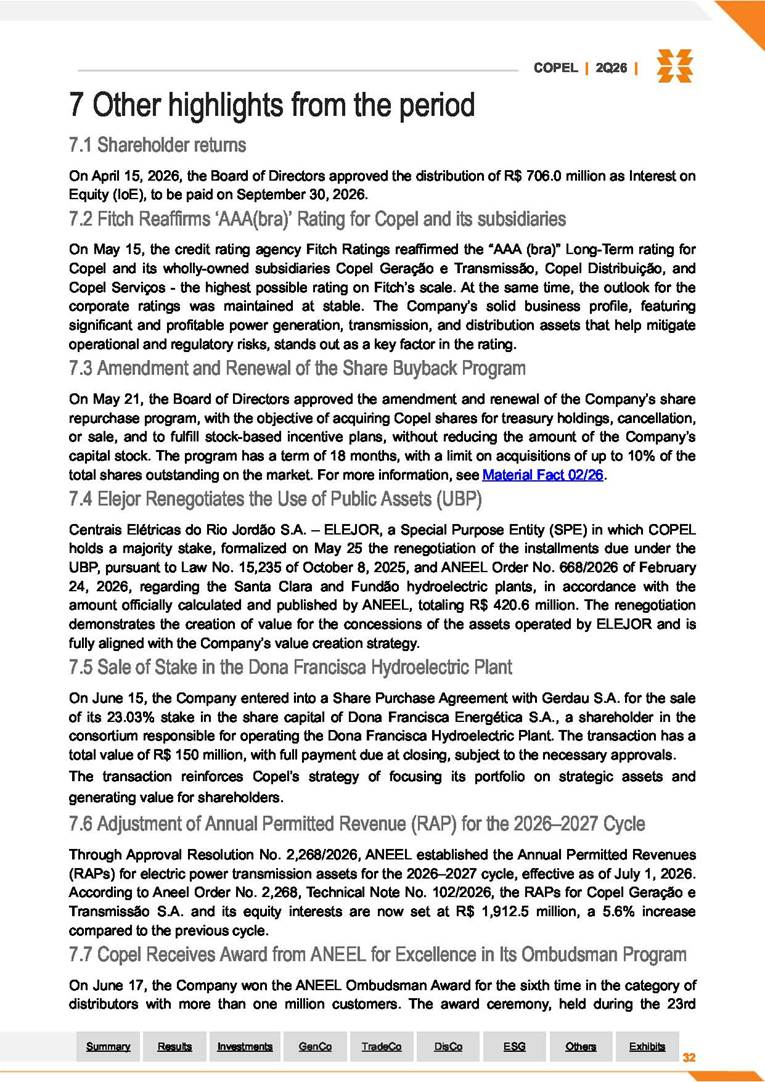
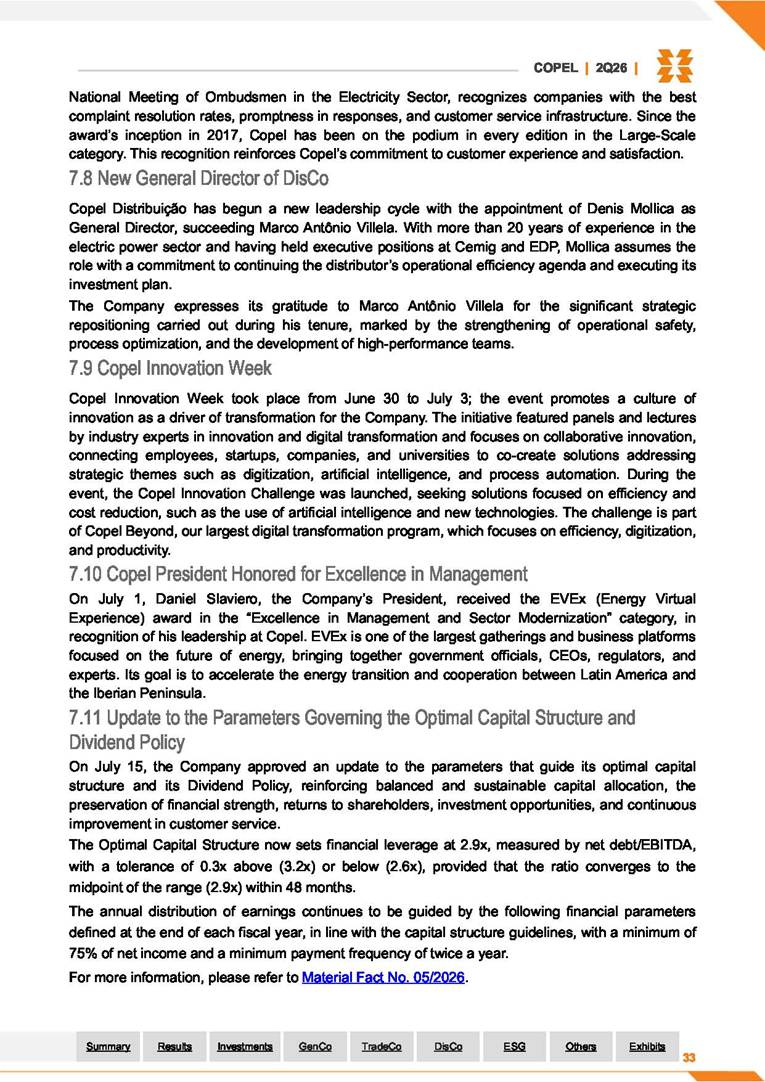
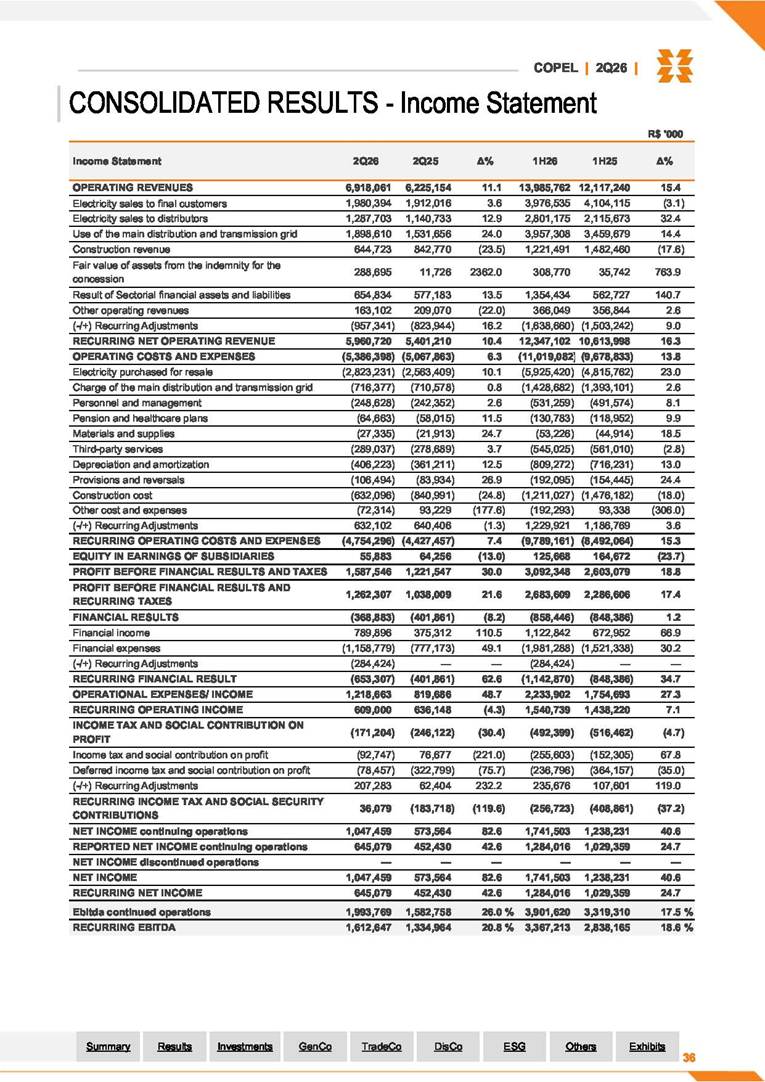
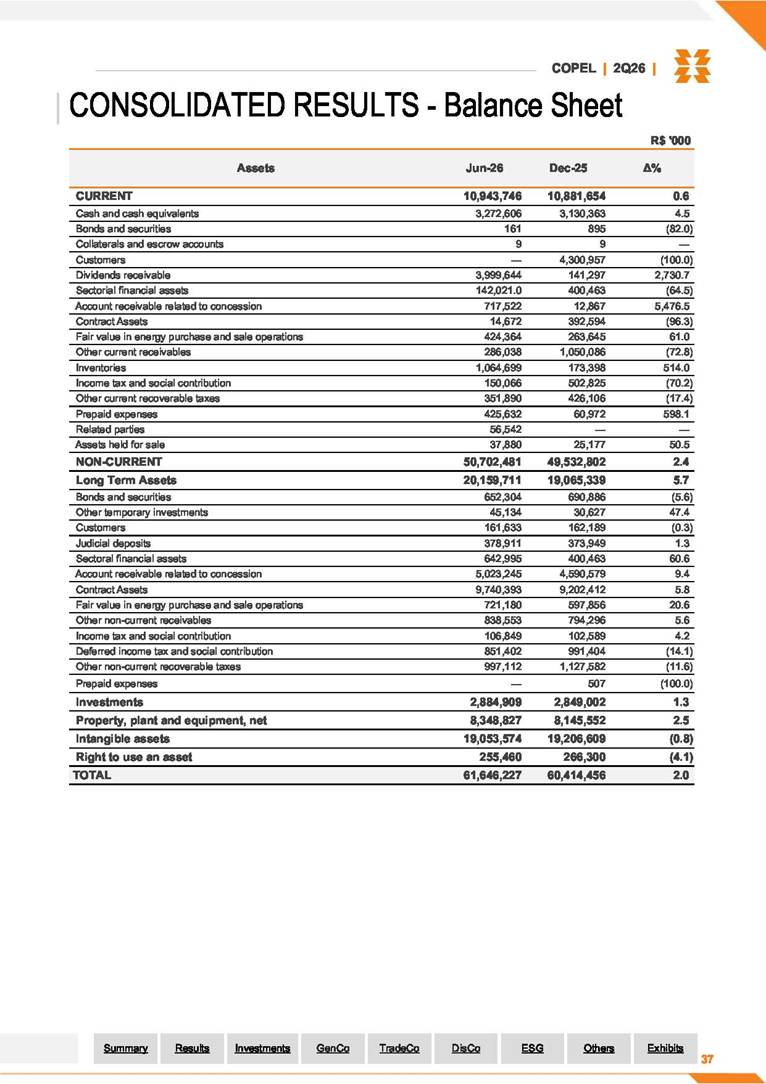
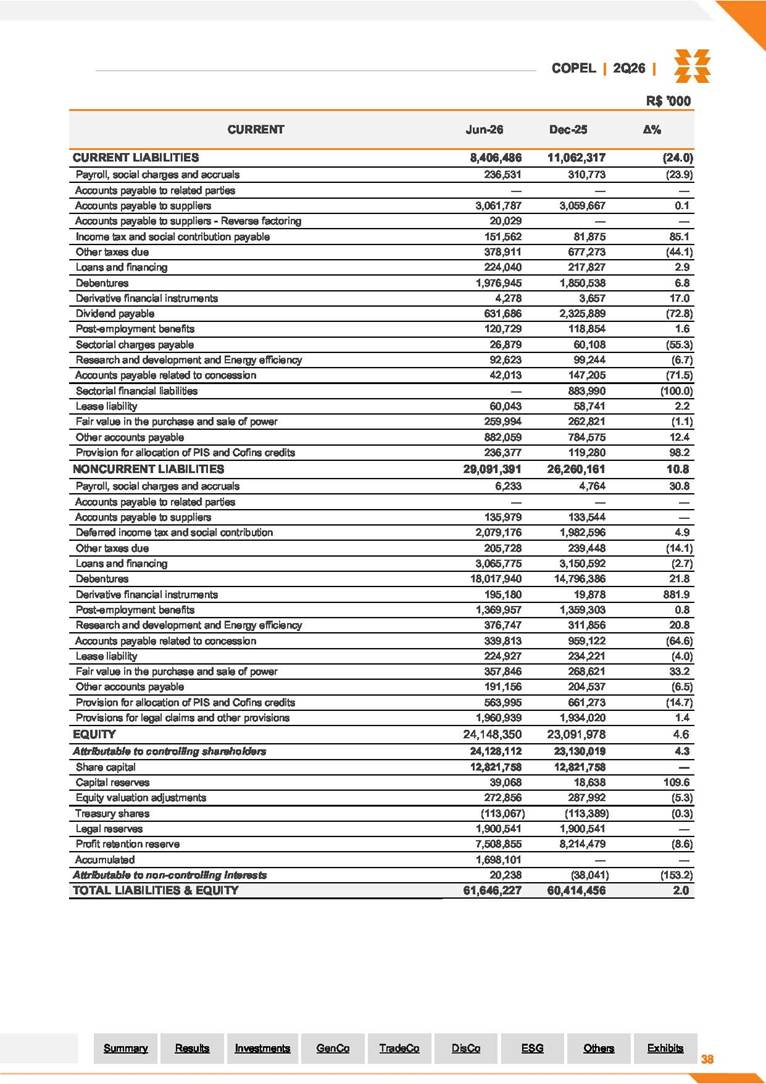
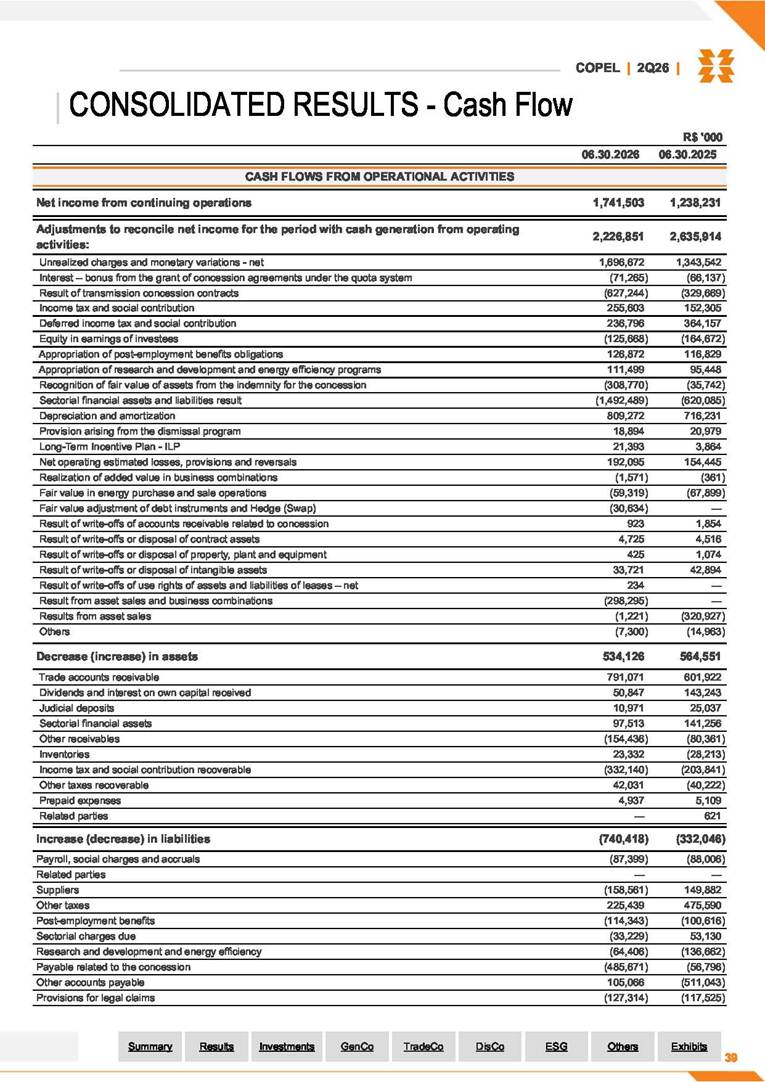
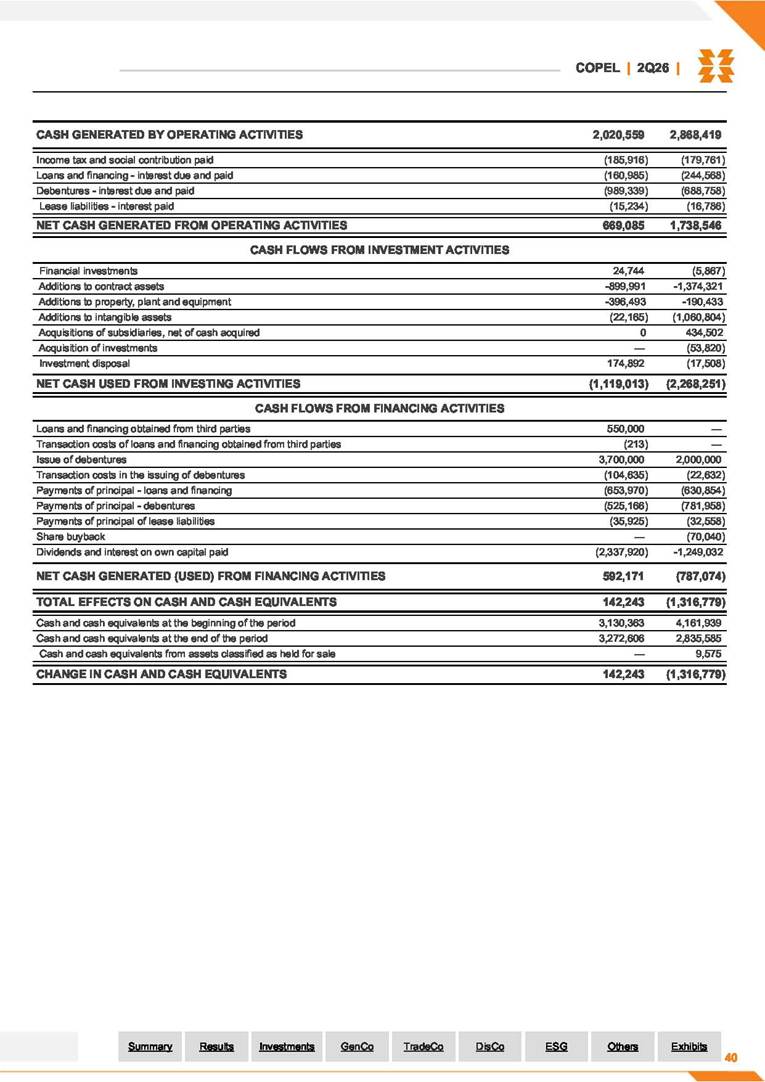
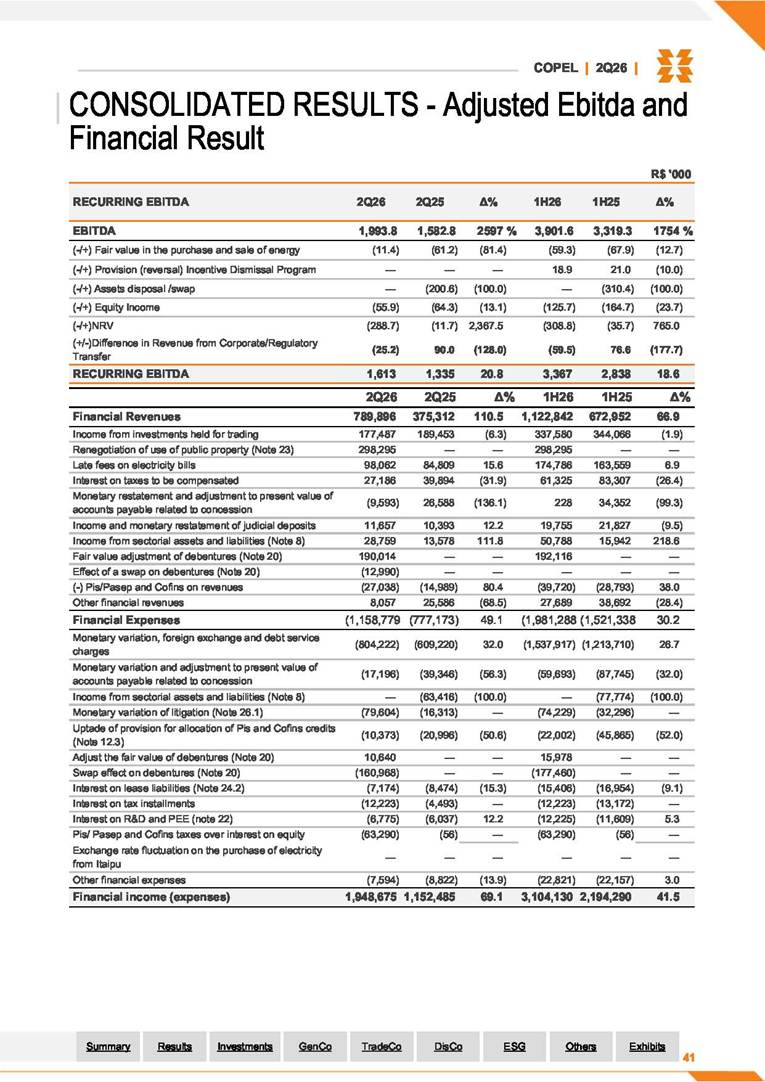
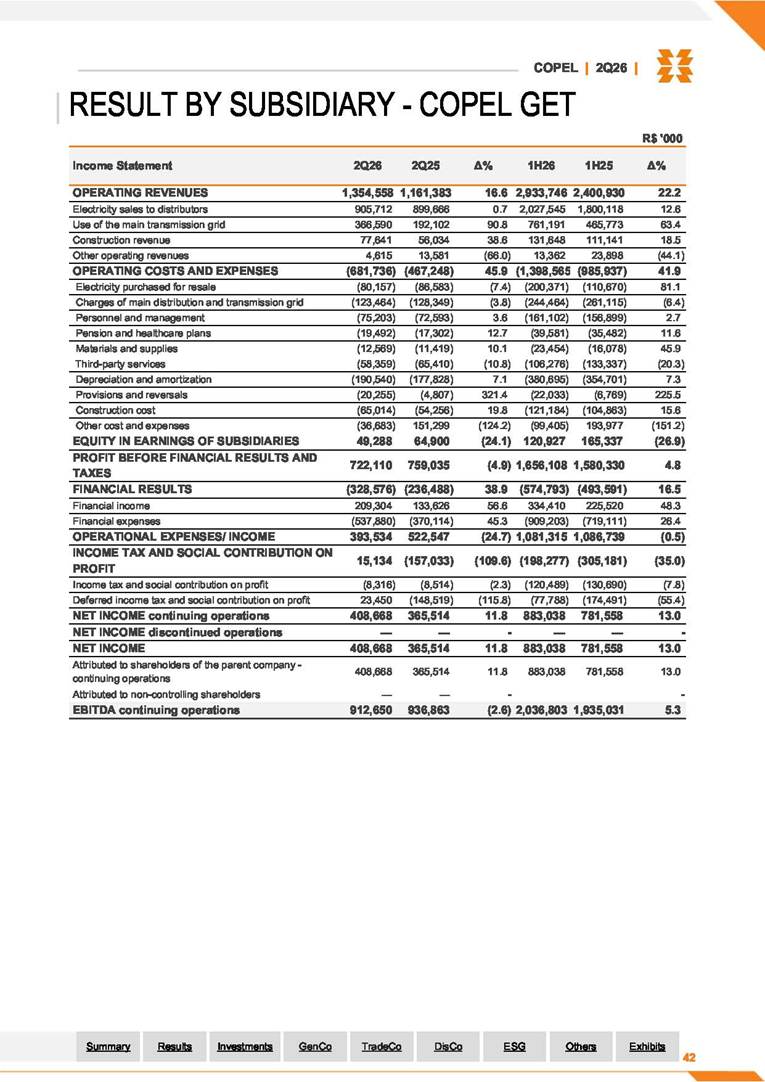
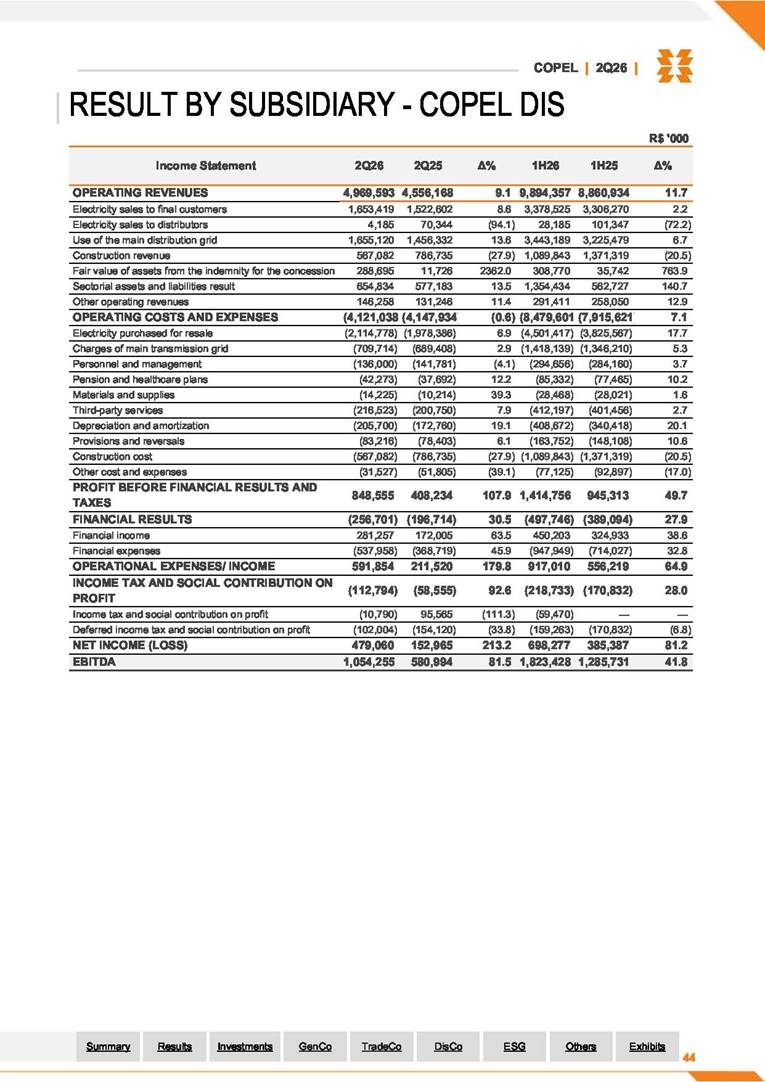
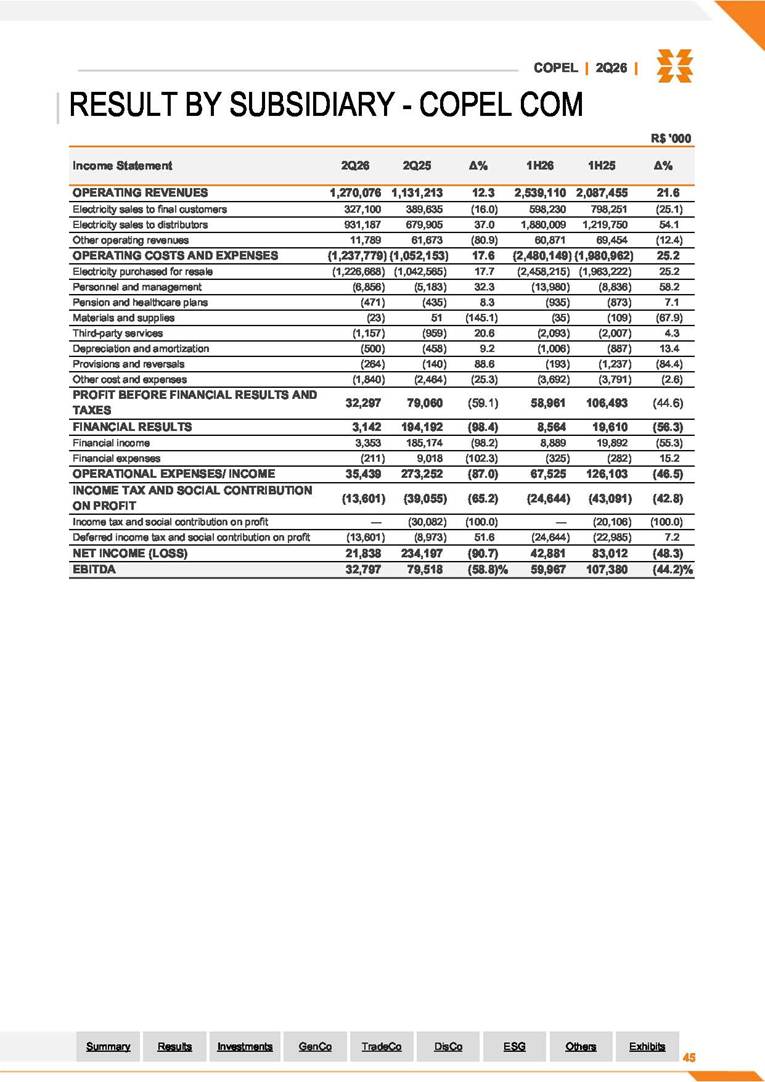
SIGNATURE
Pursuant to the requirements of the Securities Exchange Act of 1934, the registrant has duly caused this report to be signed on its behalf by the undersigned, thereunto duly authorized.
Date August 5, 2026
| COMPANHIA PARANAENSE DE ENERGIA – COPEL | ||
| By: |
/S/ Daniel Pimentel Slaviero |
|
| Daniel Pimentel Slaviero Chief Executive Officer |
||
FORWARD-LOOKING STATEMENTS
This press release may contain forward-looking statements. These statements are statements that are not historical facts, and are based on management's current view and estimates of future economic circumstances, industry conditions, company performance and financial results. The words "anticipates", "believes", "estimates", "expects", "plans" and similar expressions, as they relate to the company, are intended to identify forward-looking statements. Statements regarding the declaration or payment of dividends, the implementation of principal operating and financing strategies and capital expenditure plans, the direction of future operations and the factors or trends affecting financial condition, liquidity or results of operations are examples of forward-looking statements. Such statements reflect the current views of management and are subject to a number of risks and uncertainties. There is no guarantee that the expected events, trends or results will actually occur. The statements are based on many assumptions and factors, including general economic and market conditions, industry conditions, and operating factors. Any changes in such assumptions or factors could cause actual results to differ materially from current expectations.