United States
Securities and Exchange Commission
Washington, D.C. 20549
FORM 6-K
Report of Foreign Private Issuer
Pursuant to Rule 13a-16 or 15d-16
of the
Securities Exchange Act of 1934
For the month of
January 2026
Vale S.A.
Praia de Botafogo nº 186, 18º andar,
Botafogo
22250-145 Rio de Janeiro, RJ, Brazil
(Address of principal executive office)
(Indicate by check mark whether the registrant files or will file annual reports under cover of Form 20-F or Form 40-F.)
(Check One) Form 20-F x Form 40-F ¨
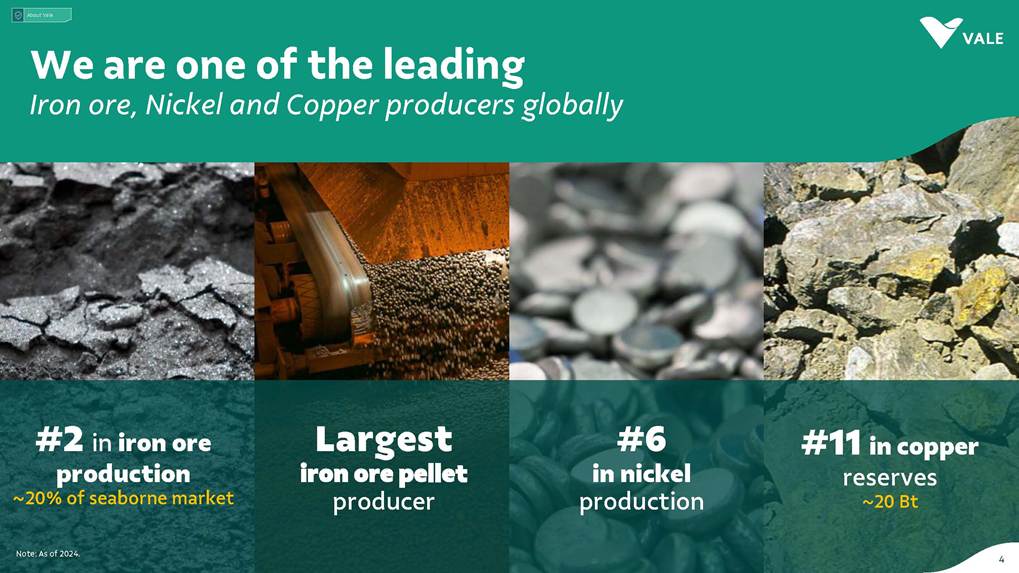
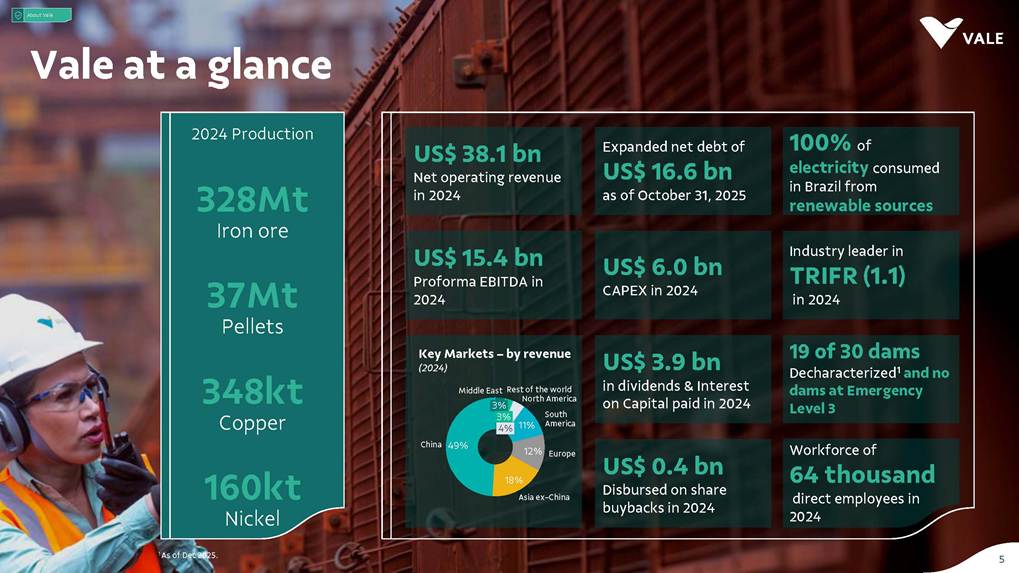
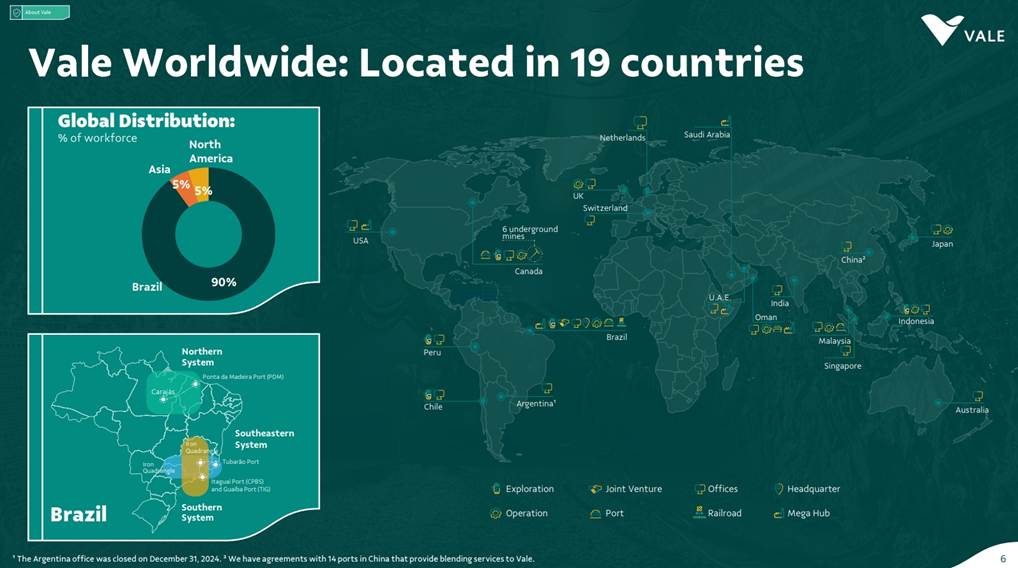
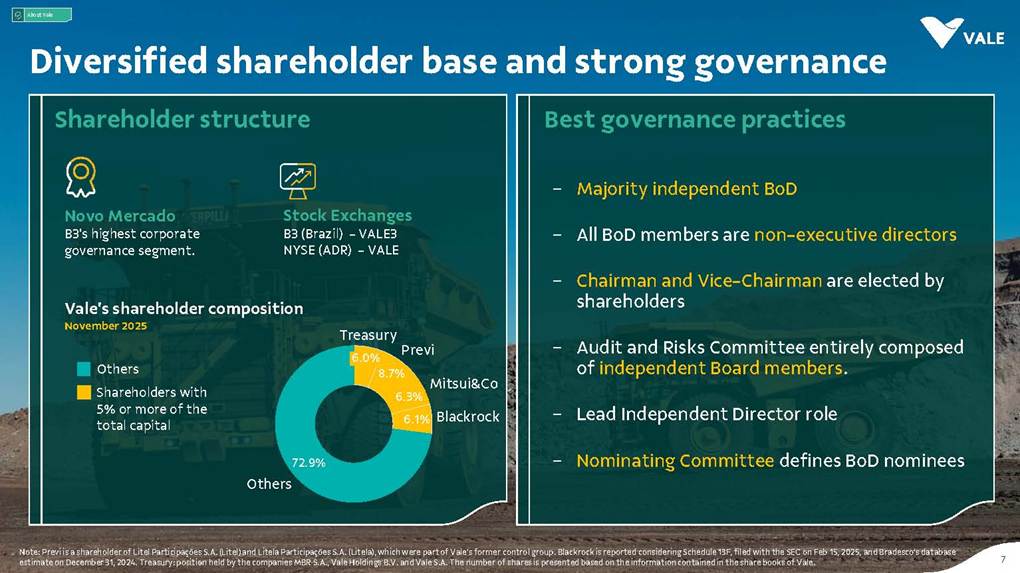
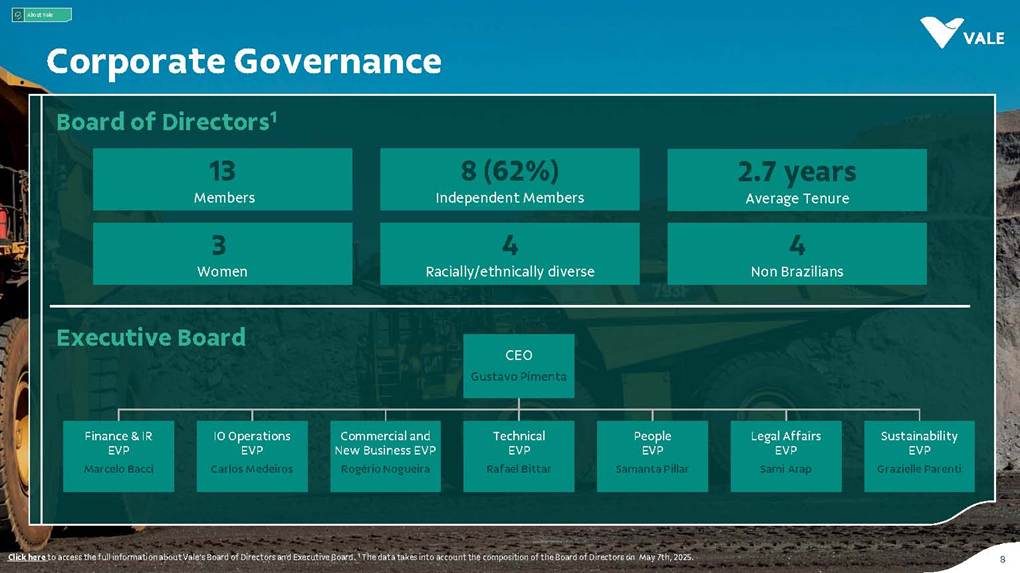
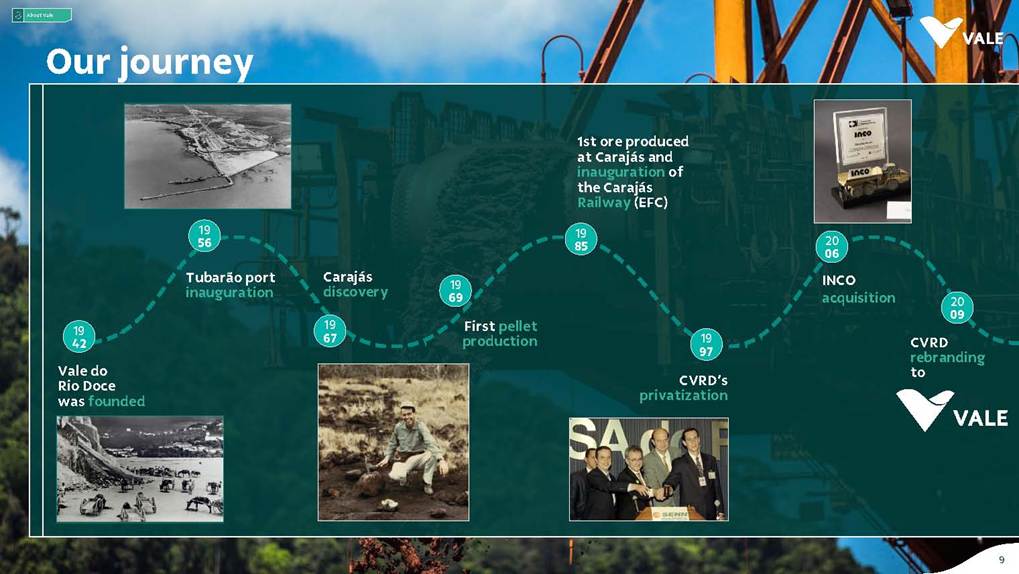
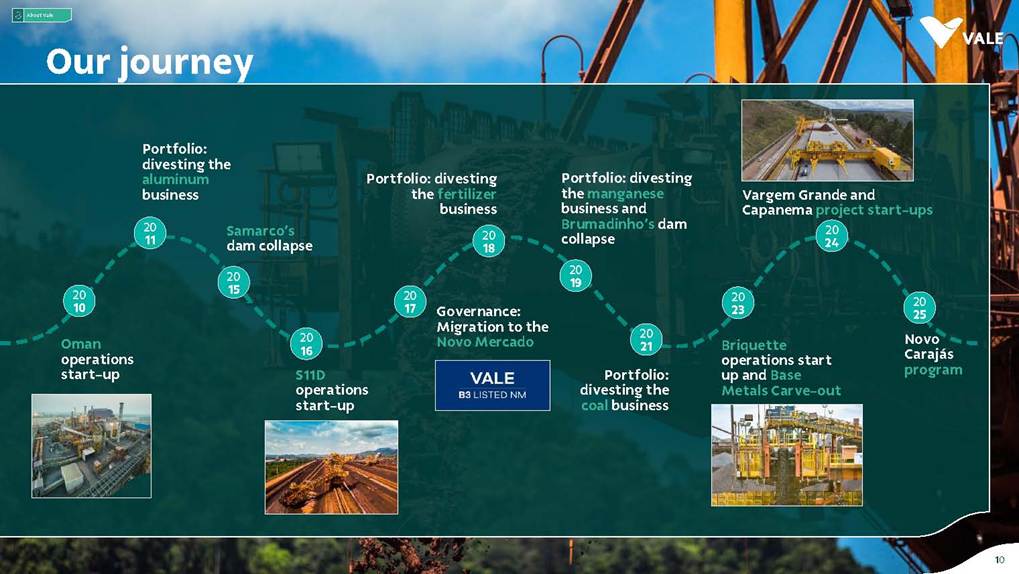
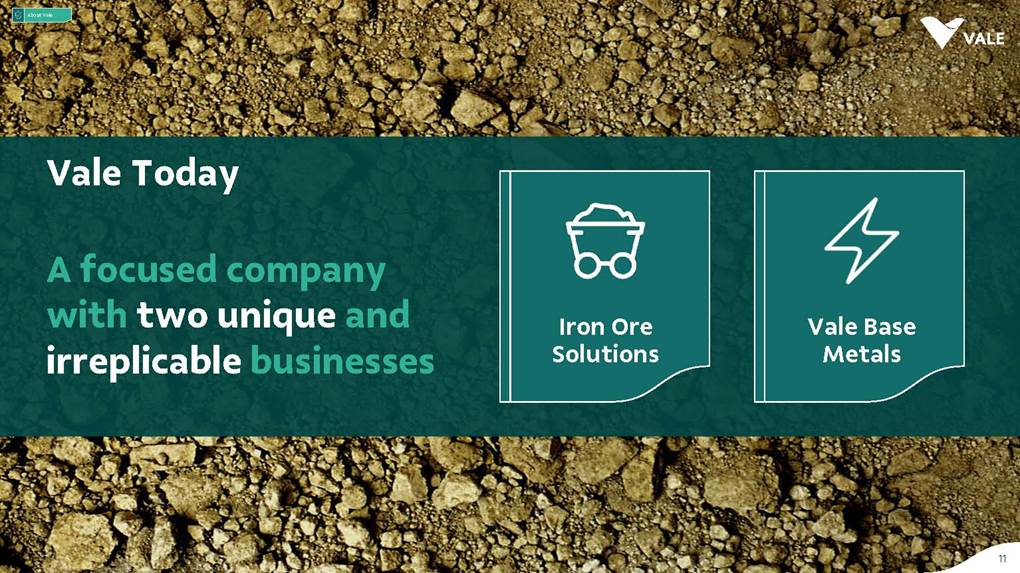
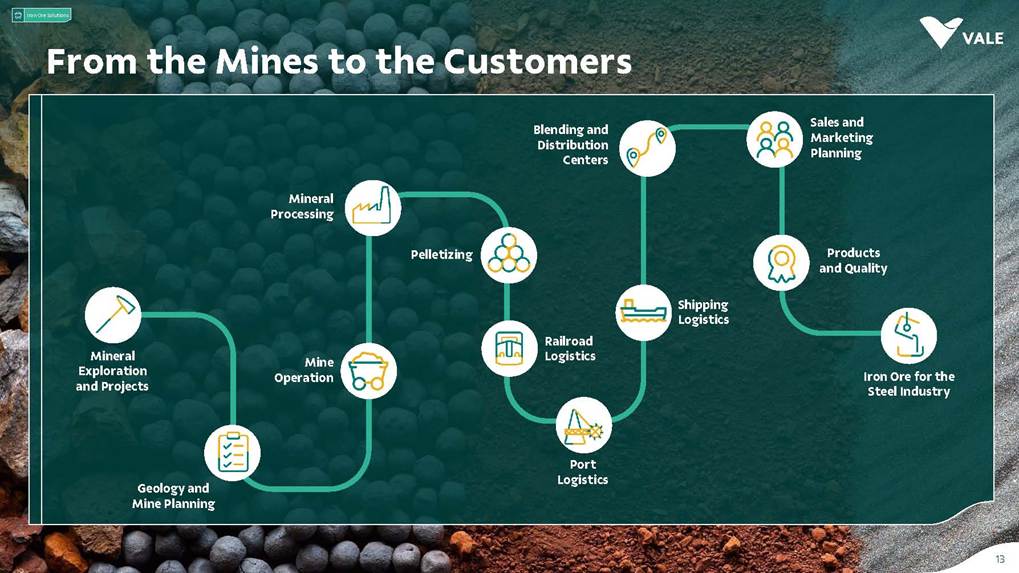
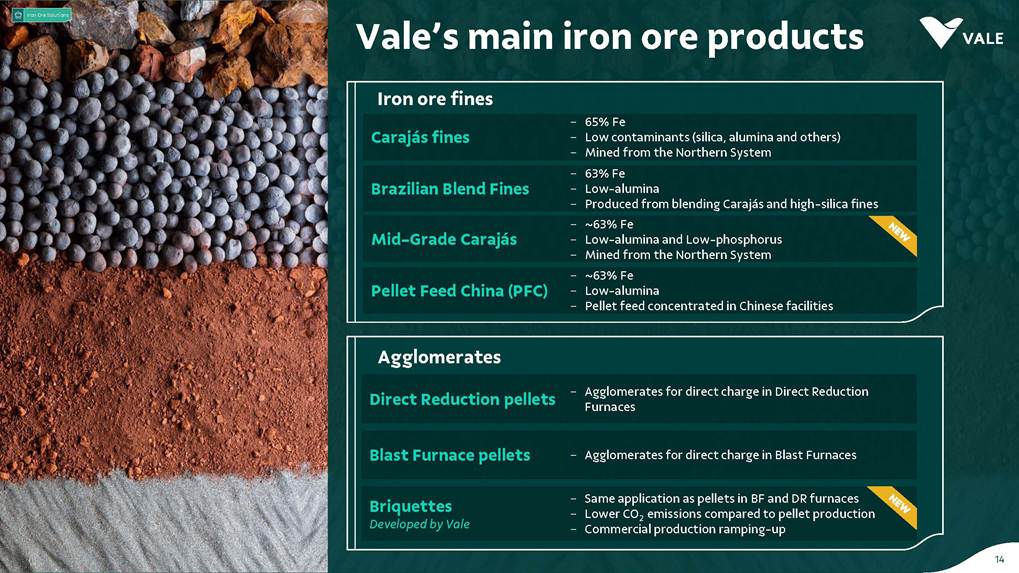
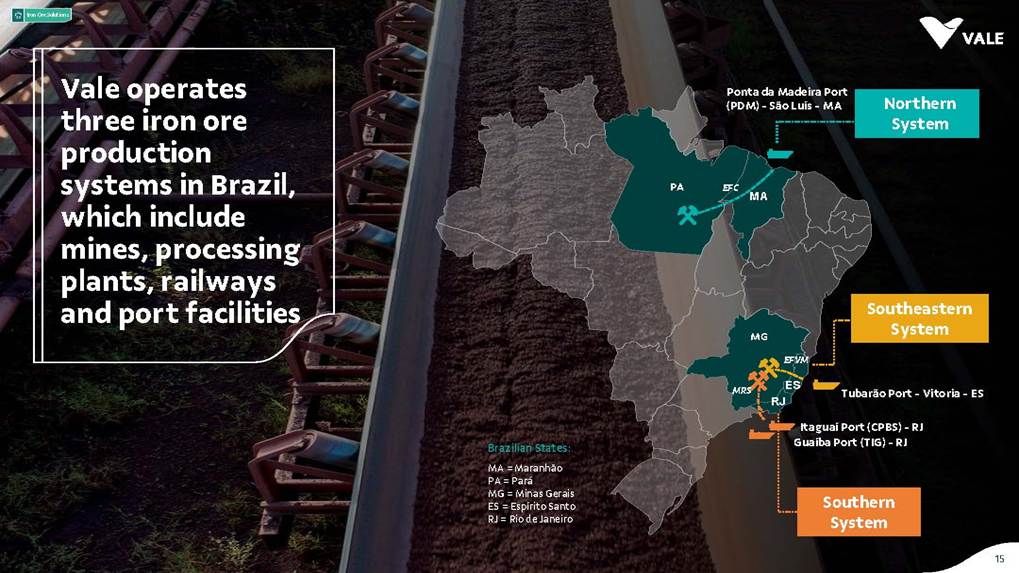
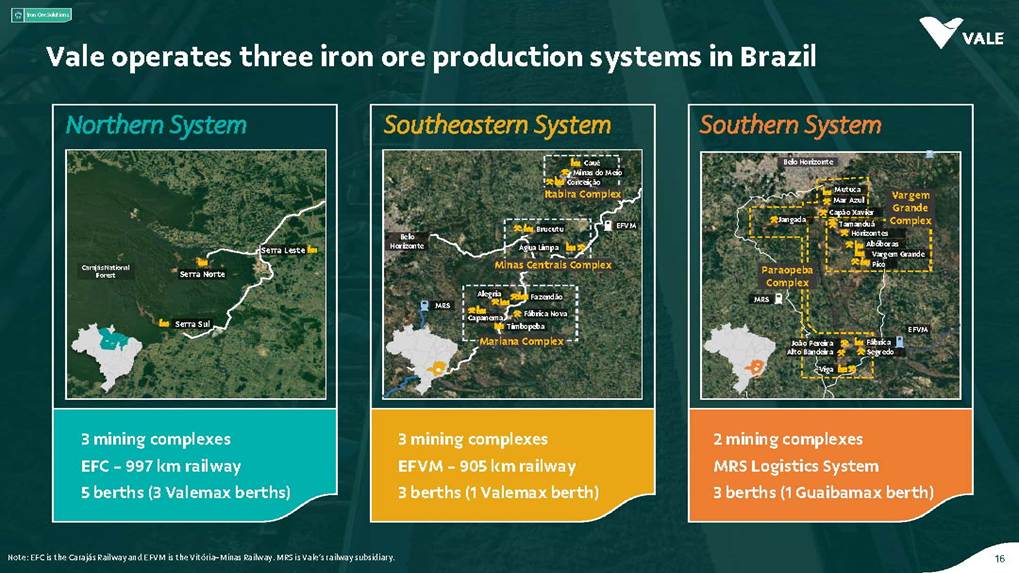
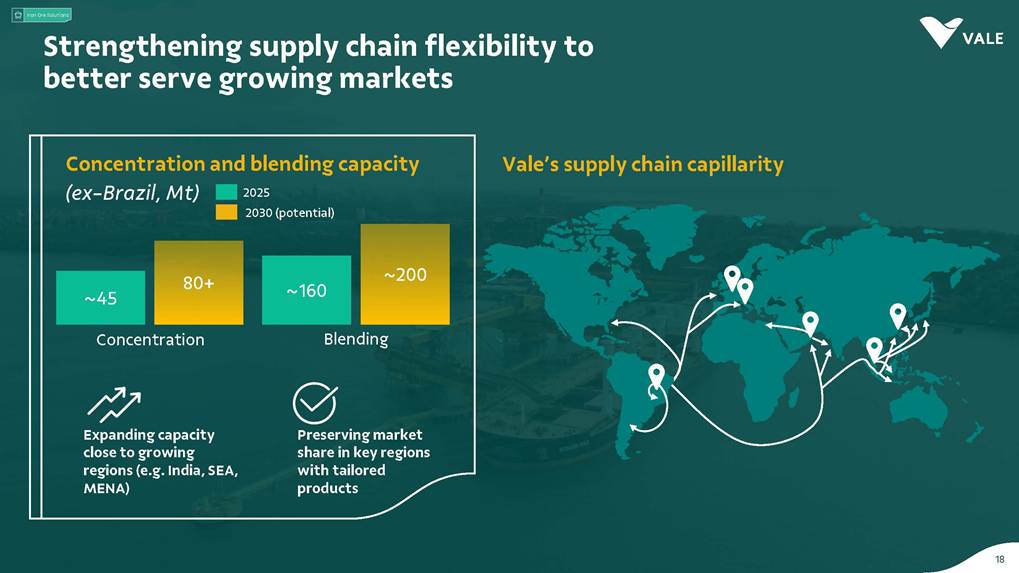
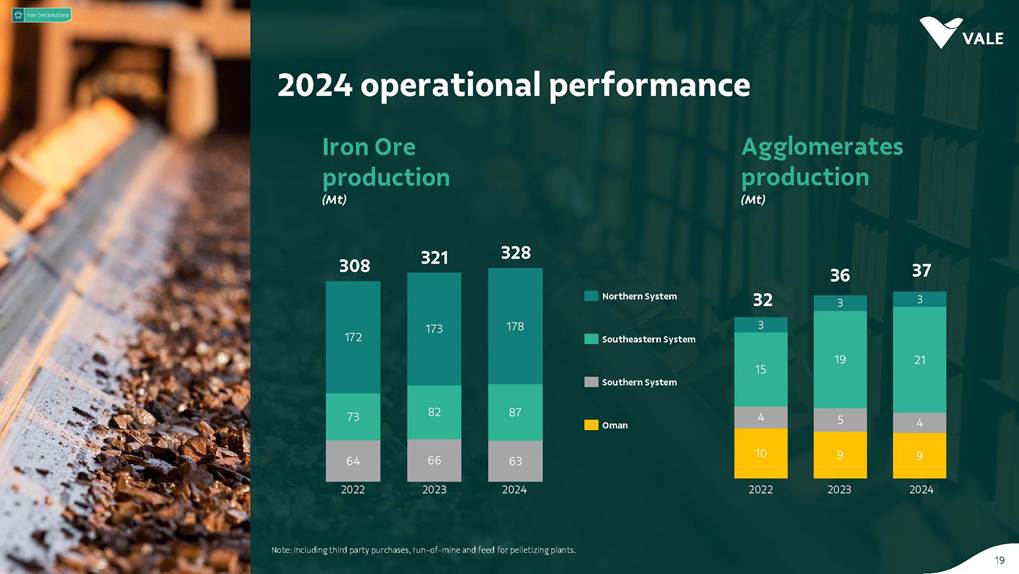
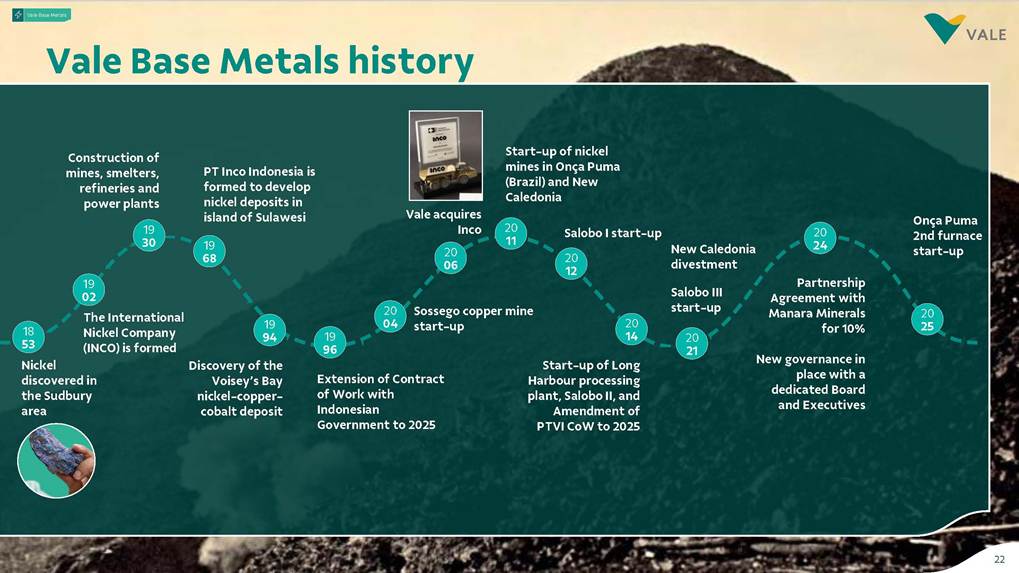
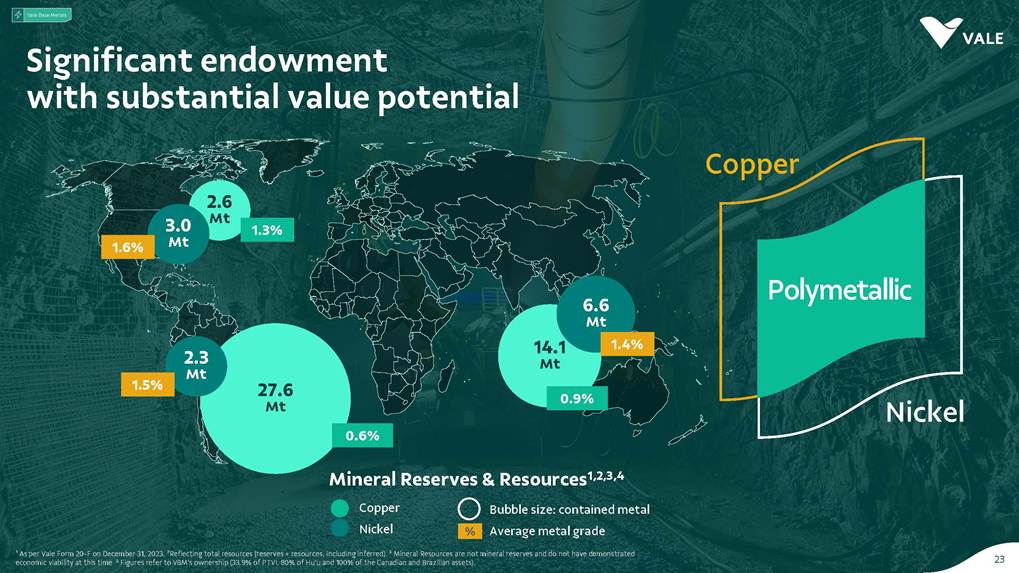
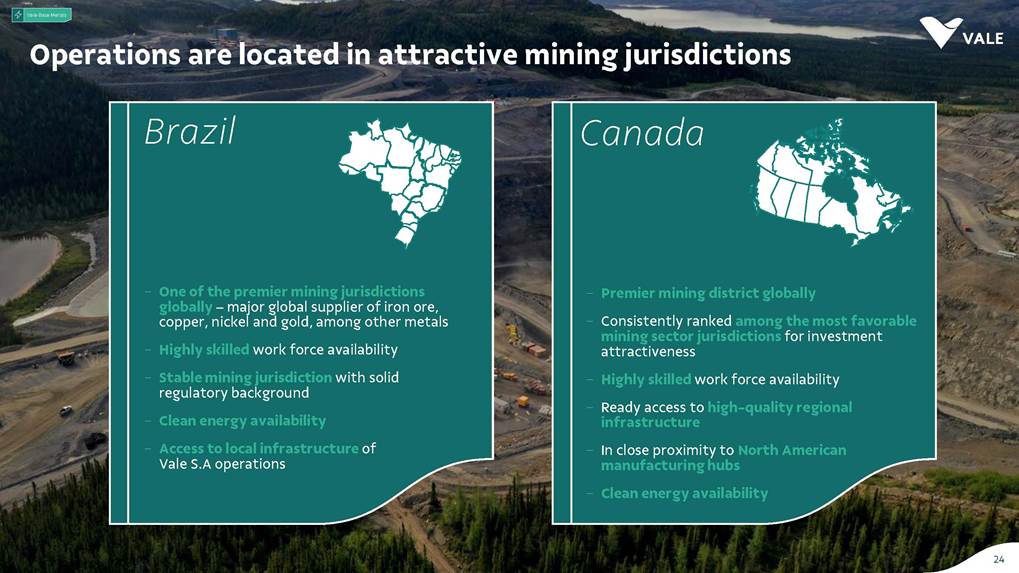
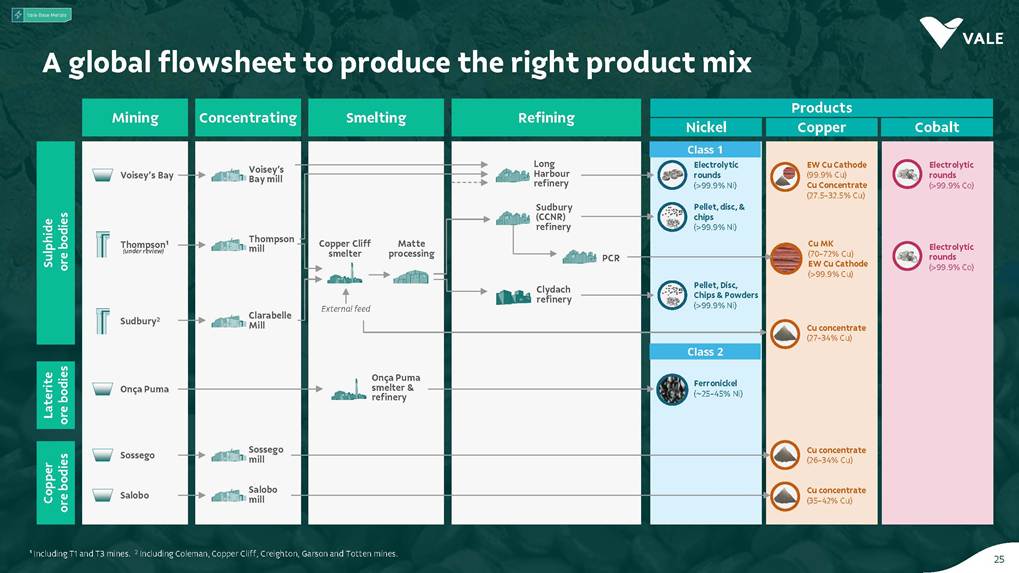
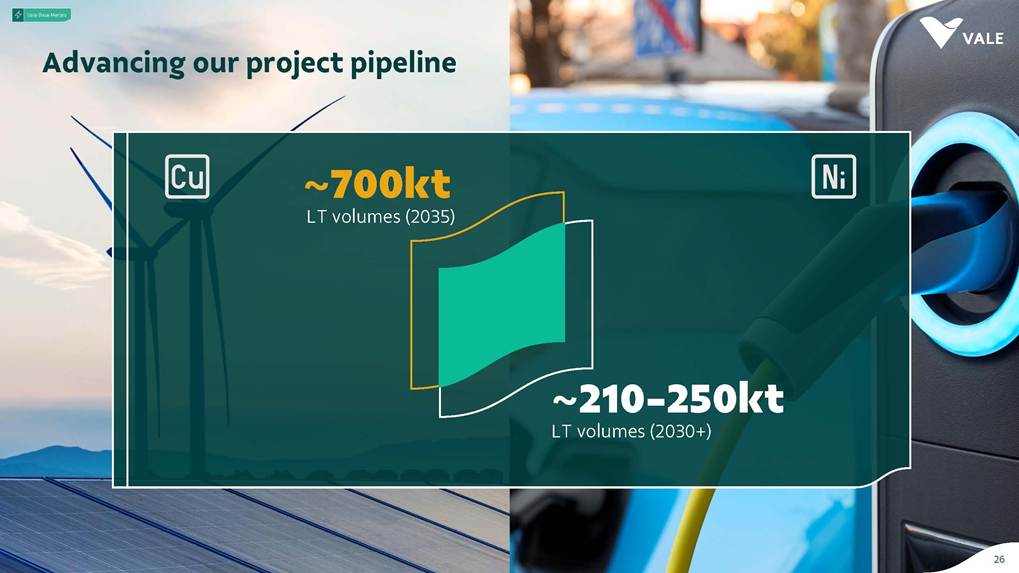
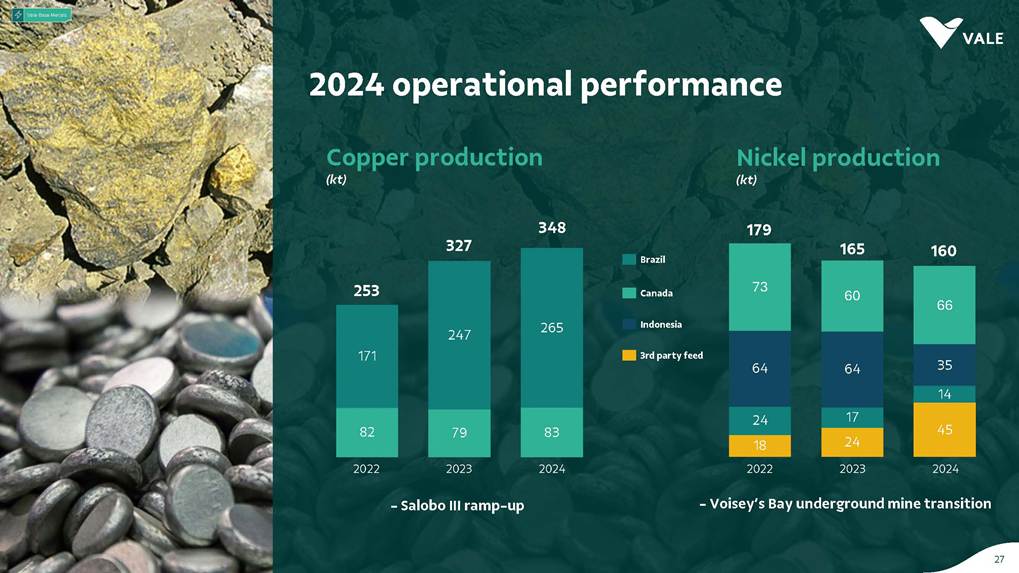
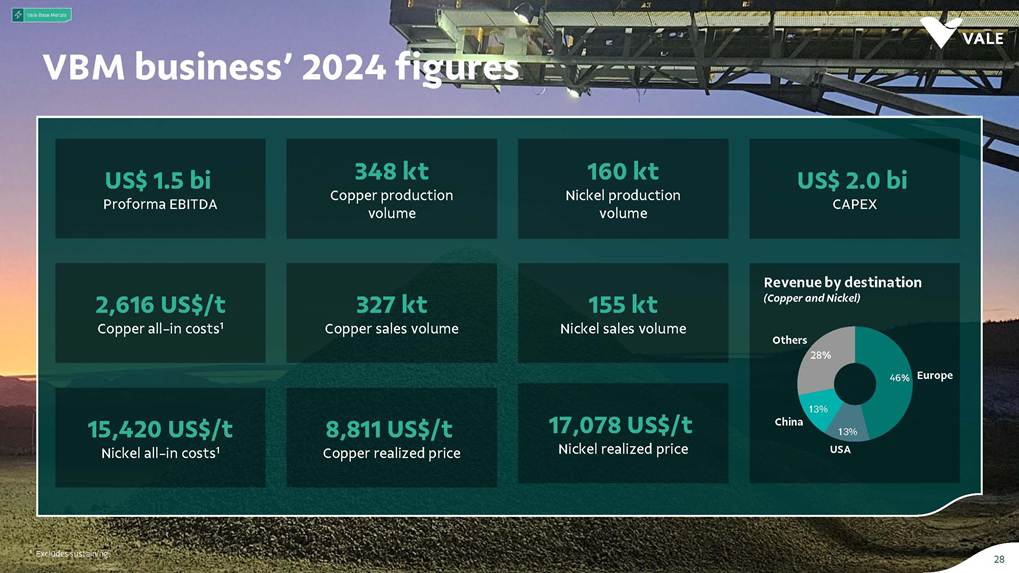
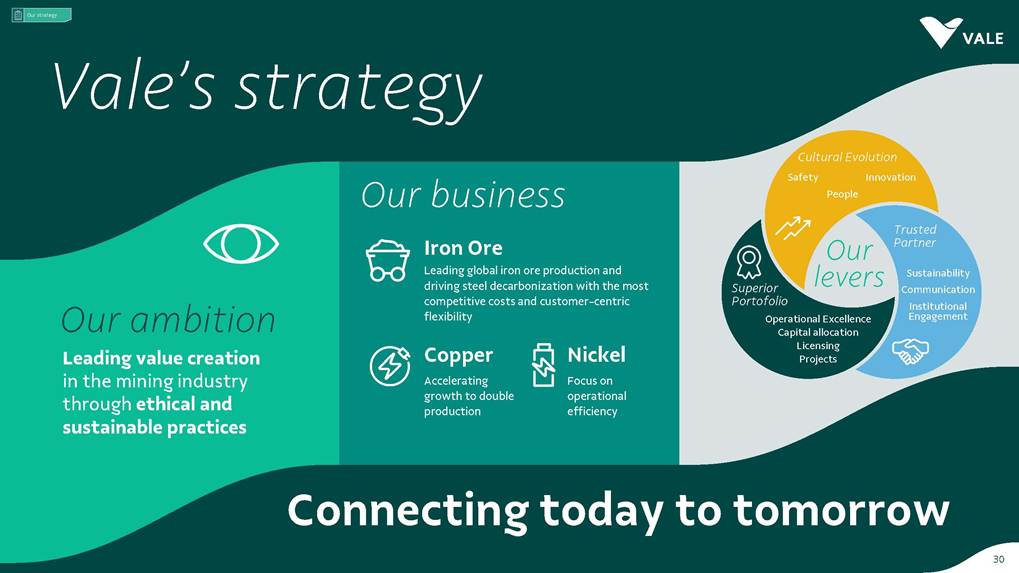
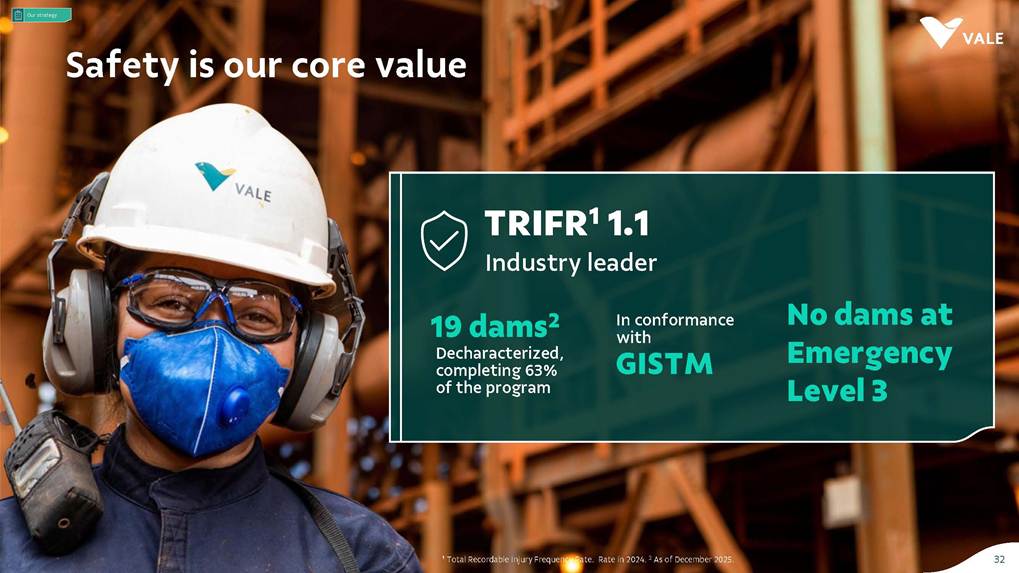
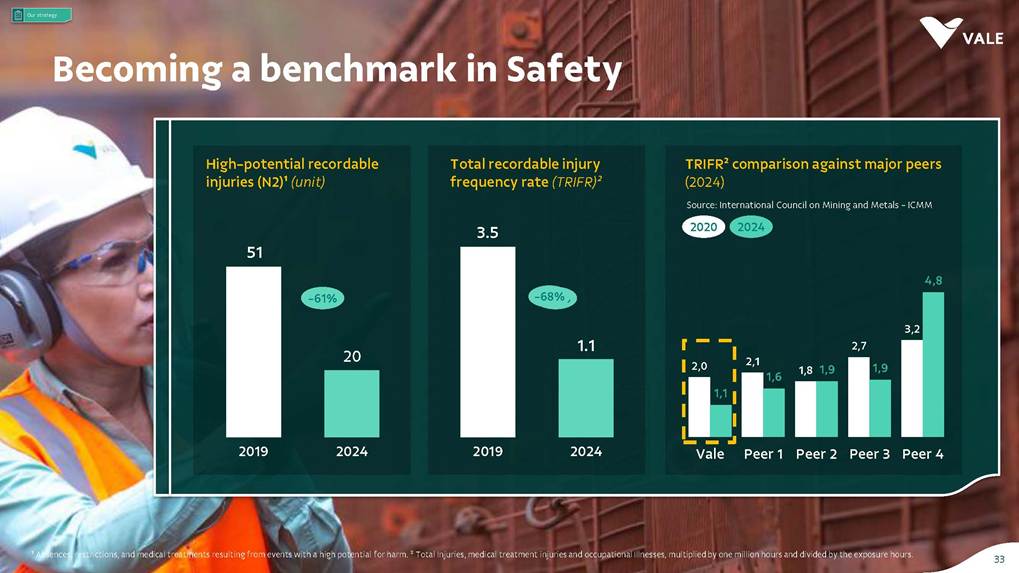
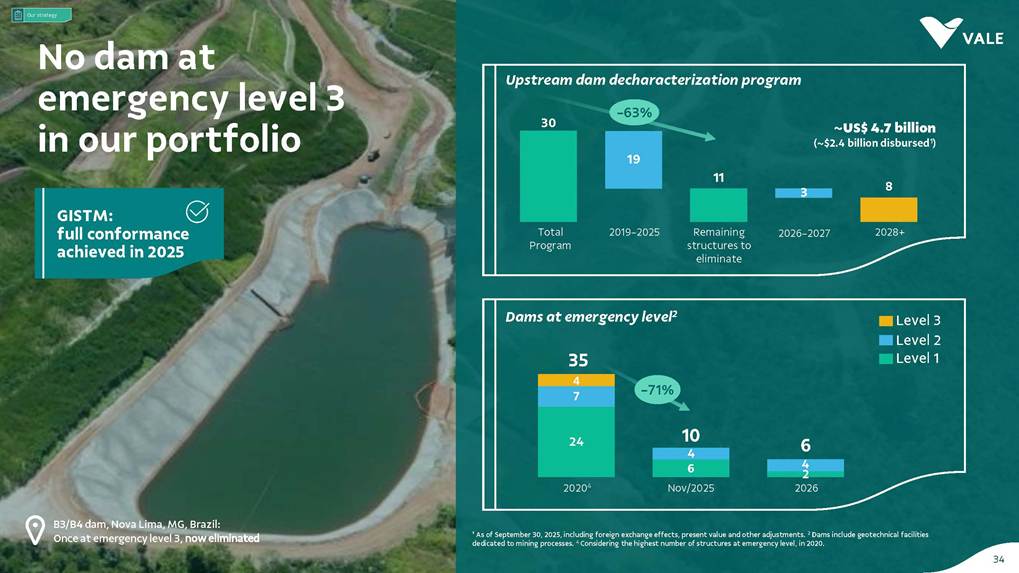
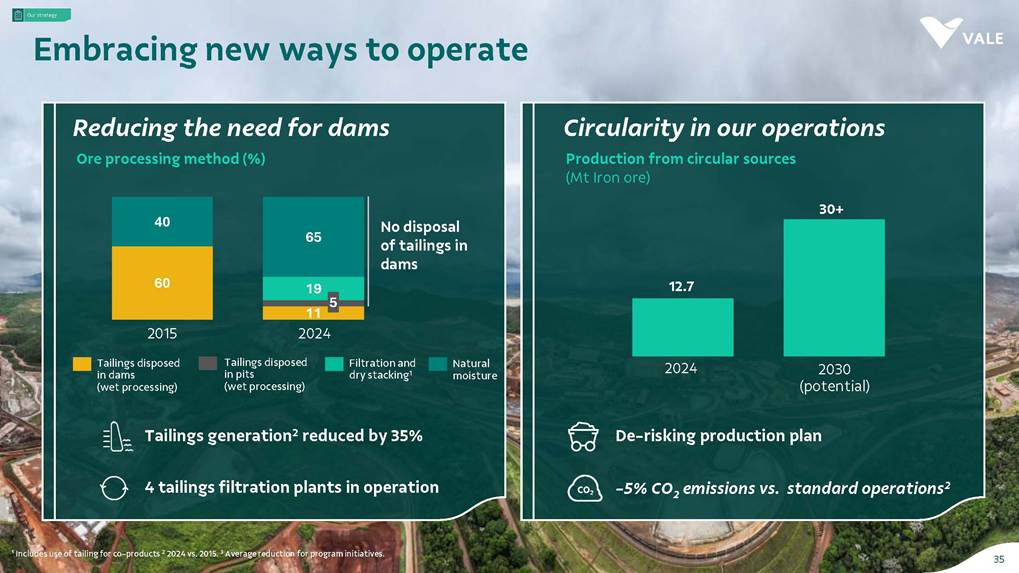
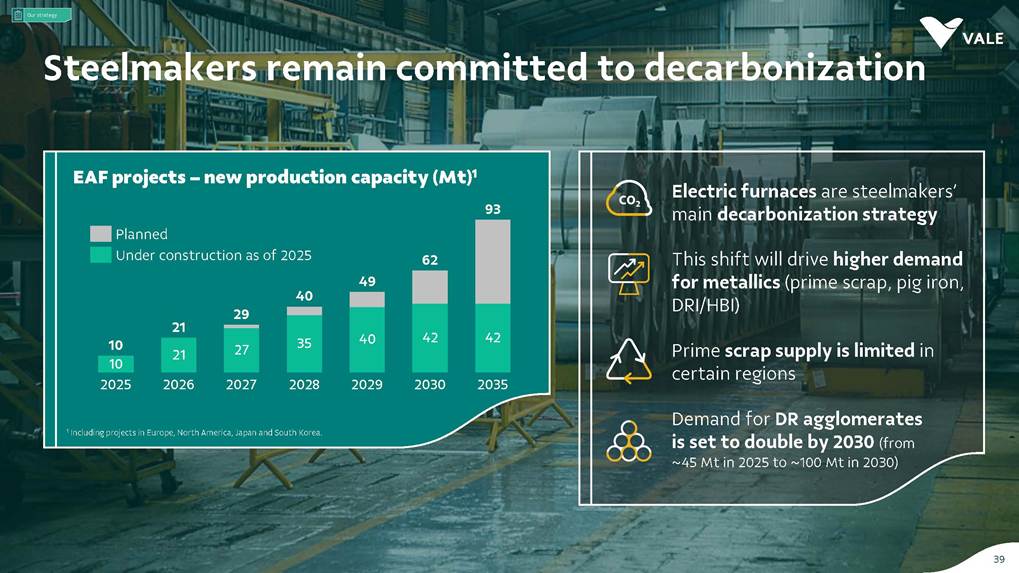
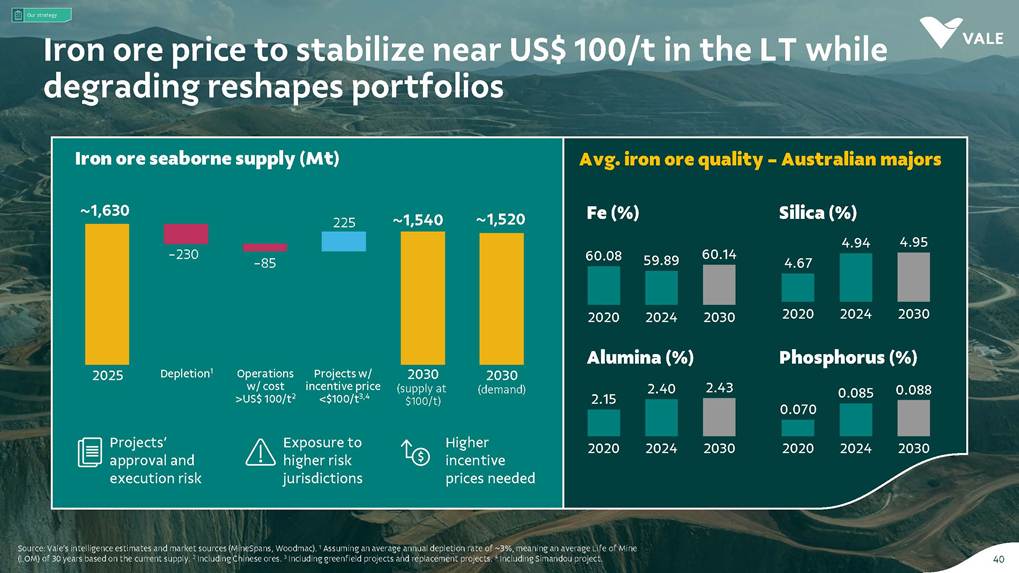
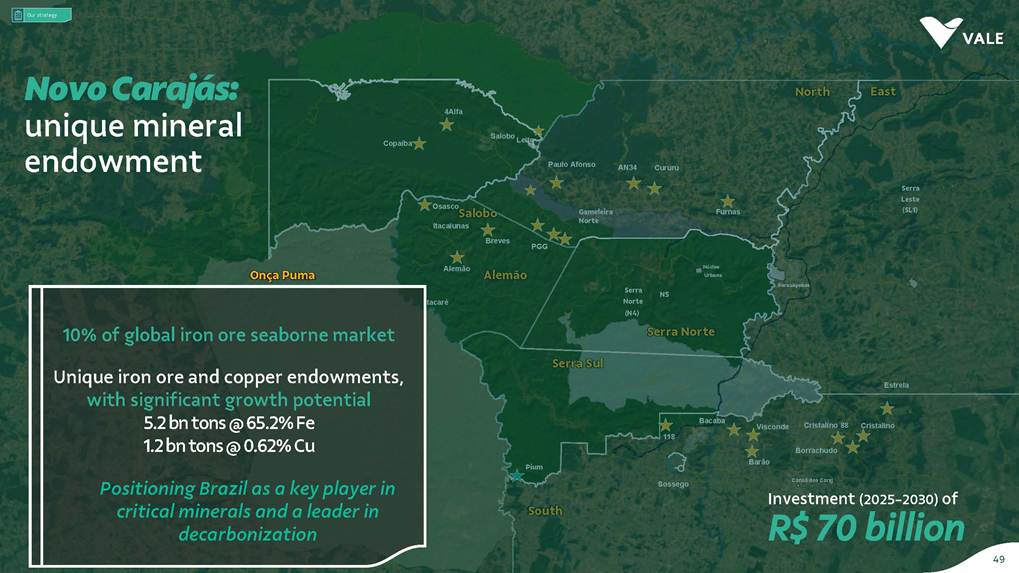
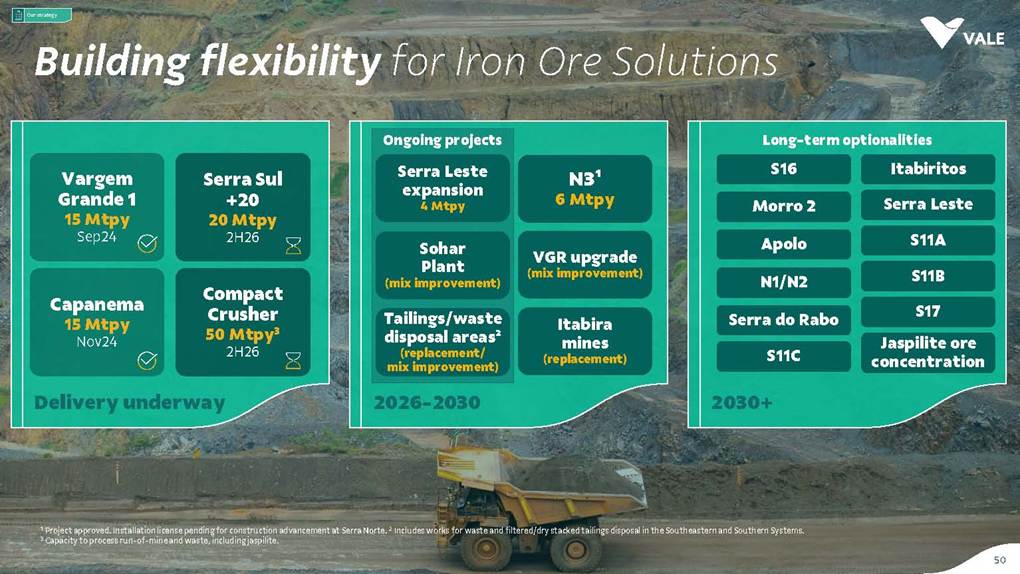
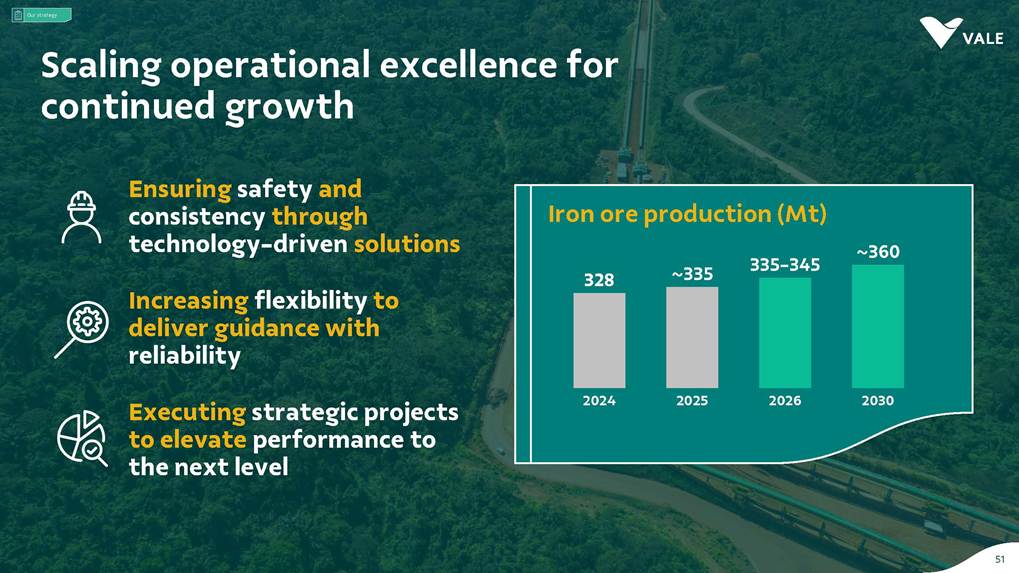
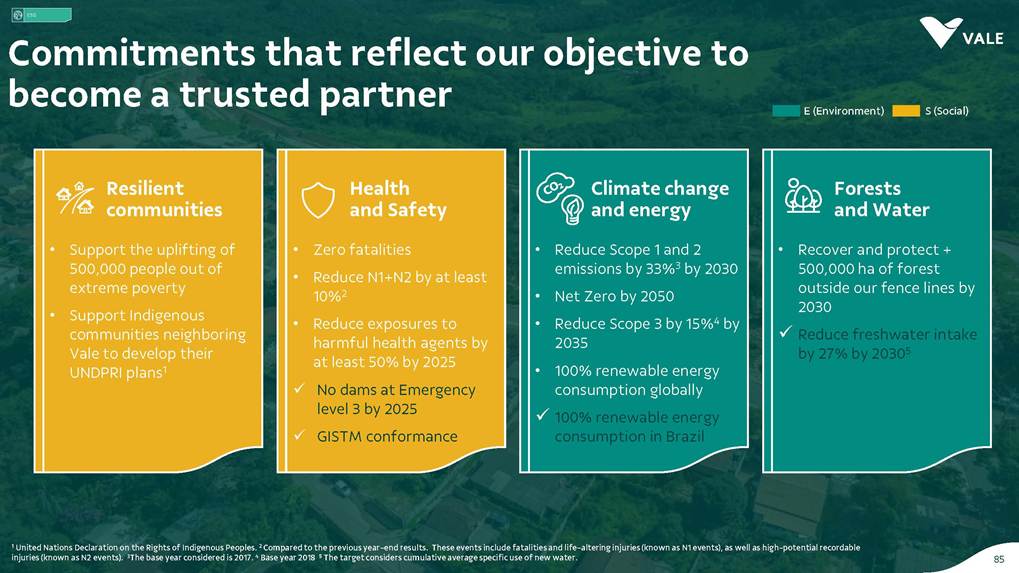
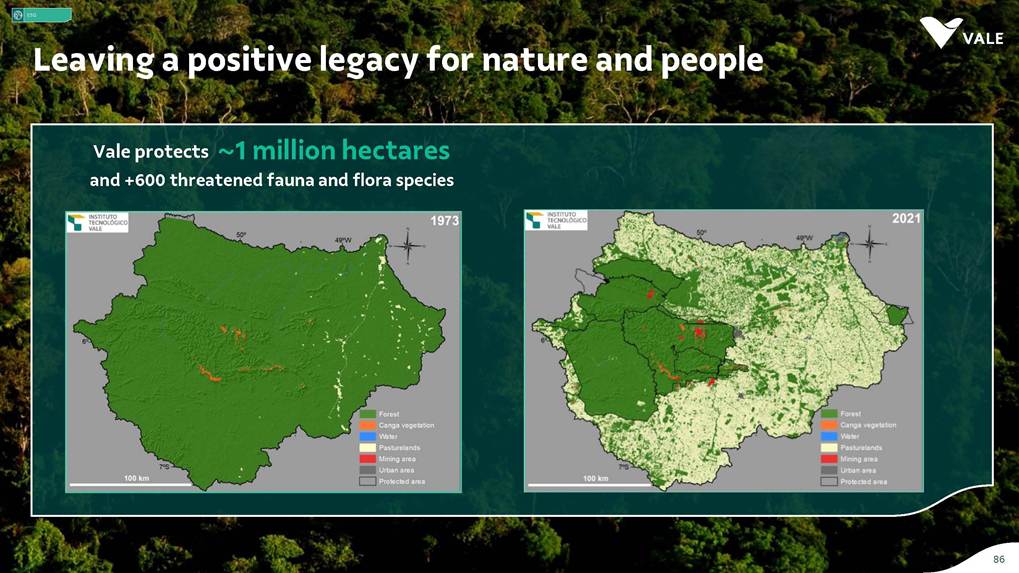
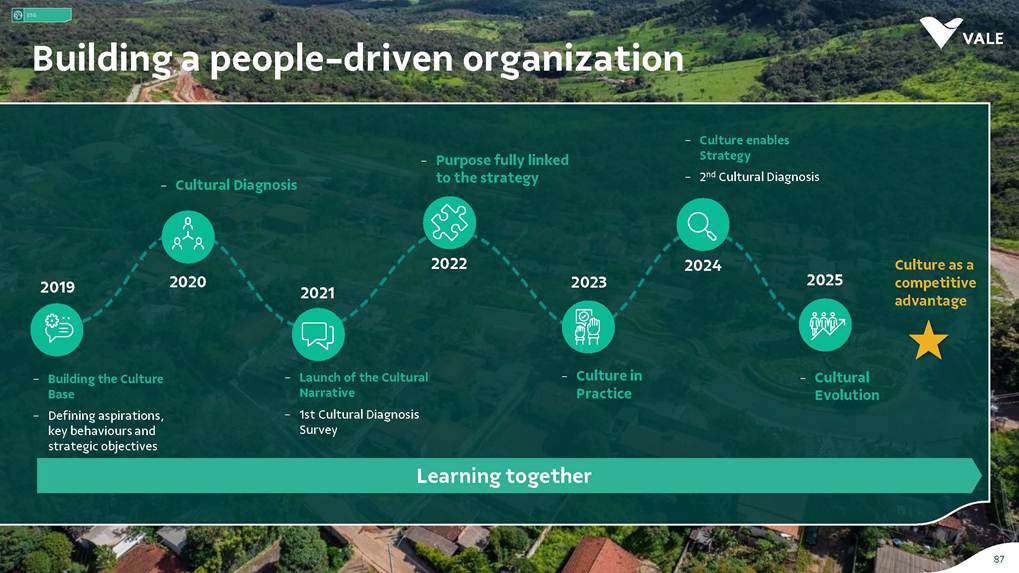
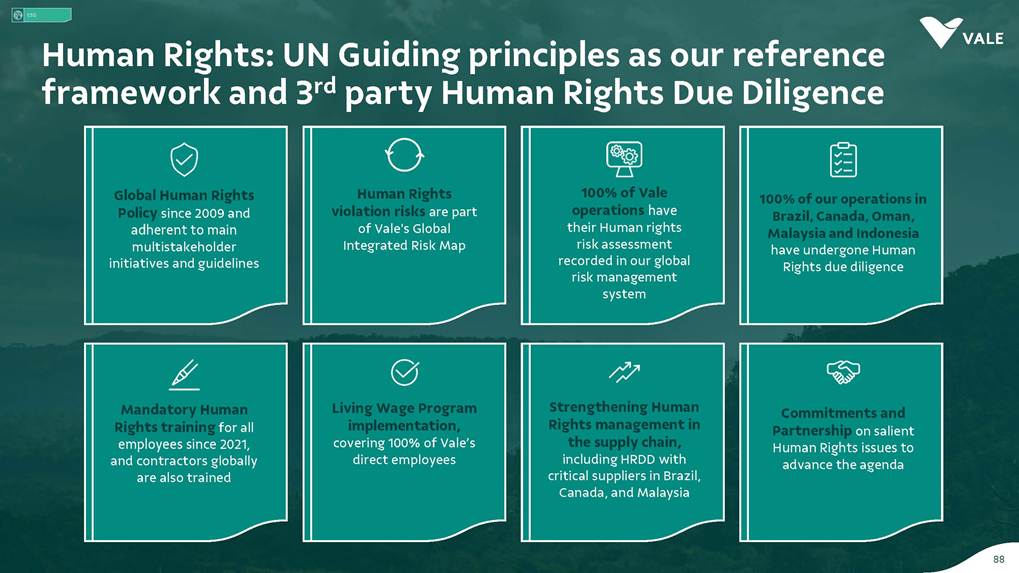
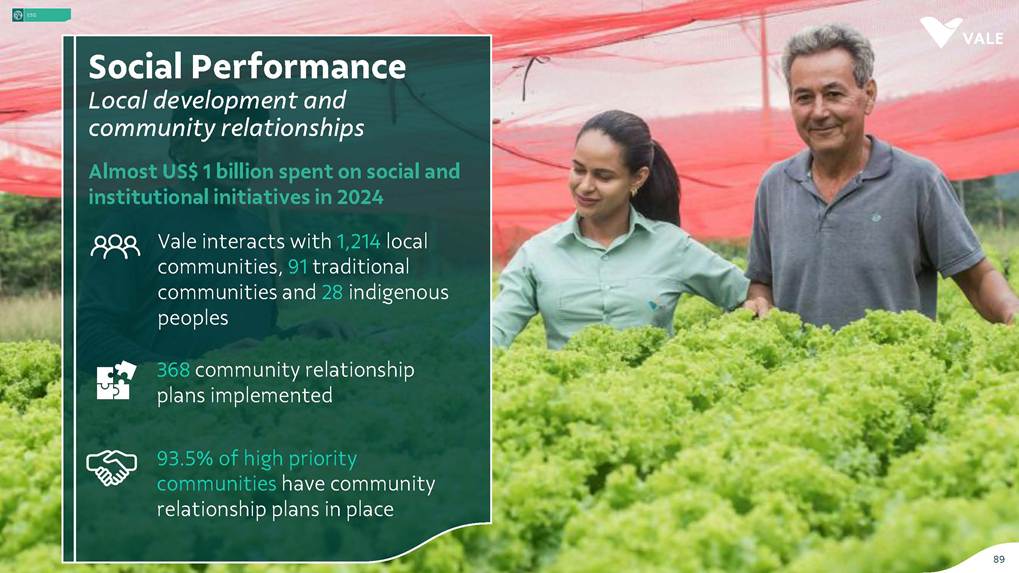
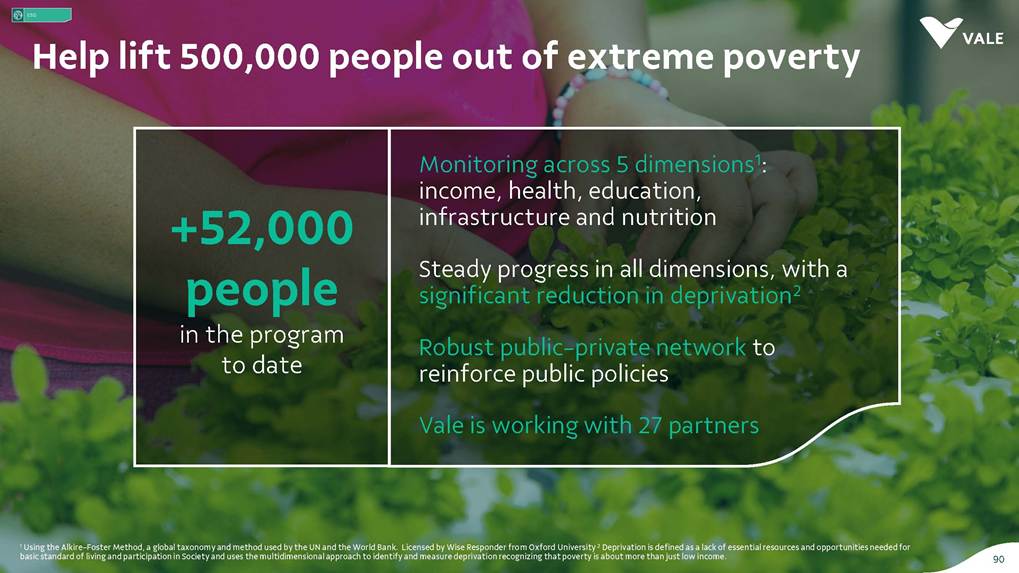
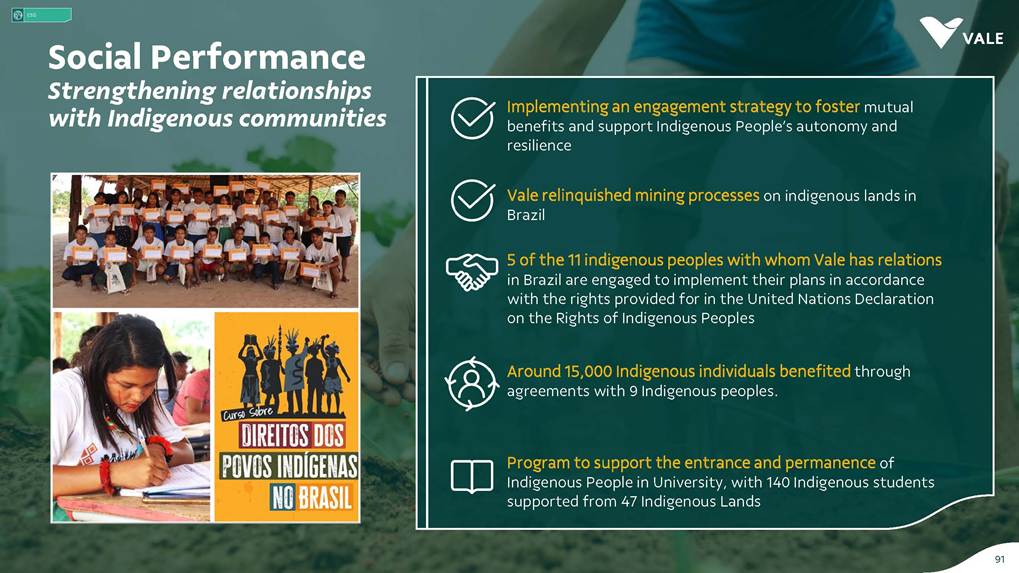
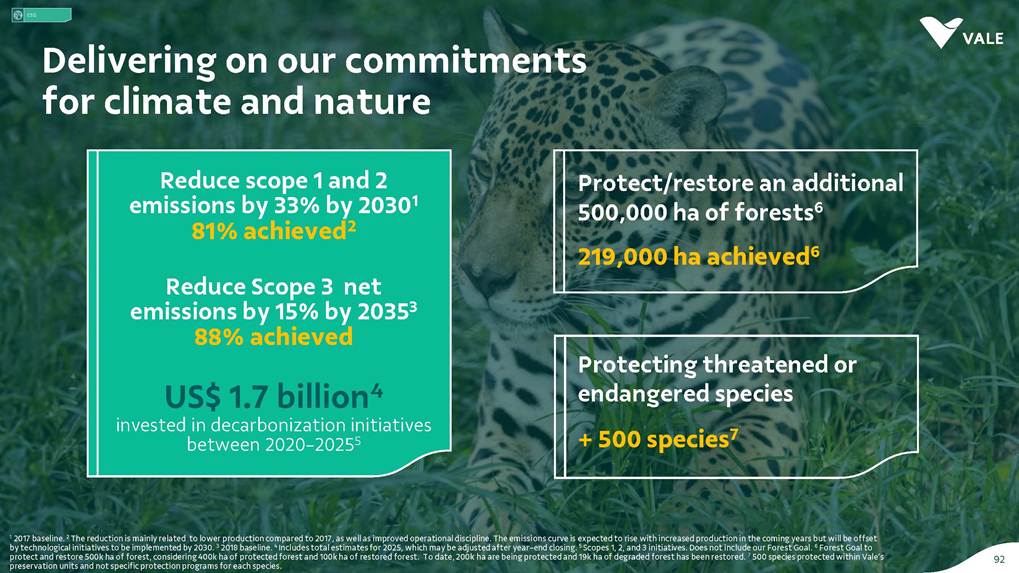
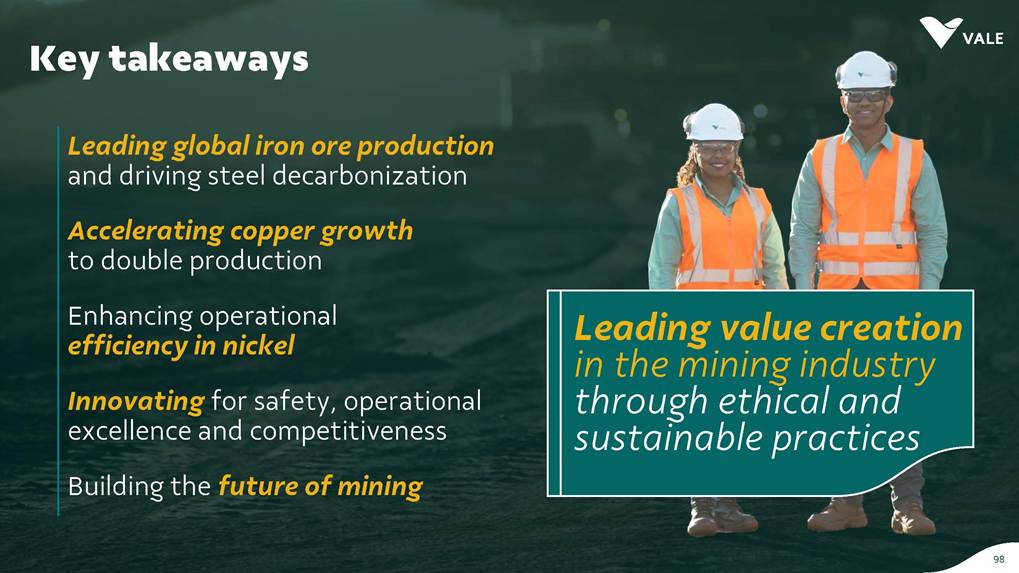
1 Institutional Presentation Investor Relations December 2025 2 AboutVale ESG Iron OreSolutions Vale Base Metals OurStrategy Capital Allocation AboutVale 3 #2 in iron ore production ~20% of seaborne market #6in nickel production Largestiron ore pellet producer #11 in copper reserves ~20 Bt We are one of the leadingIron ore, Nickel and Copper producers globally Note: As of 2024. About Vale 4 Vale at a glance About Vale 328MtIron ore 37MtPellets 348ktCopper 160ktNickel 2024 Production US$ 38.1 bn Net operating revenue in 2024 Expanded net debt of US$ 16.6 bn as of October 31, 2025 100% of electricity consumed in Brazil from renewable sources US$ 15.4 bn Proforma EBITDA in 2024 US$ 6.0 bn CAPEX in 2024 Industry leader in TRIFR (1.1) in 2024 US$ 3.9 bn in dividends & Interest on Capital paid in 2024 19 of 30 dams Decharacterized1 and no dams at Emergency Level 3 US$ 0.4 bn Disbursed on share buybacks in 2024 Key Markets – by revenue (2024) 11% 12% 18% 49% 3% Middle East 3% Rest of the world 4% North America SouthAmerica Europe Asia ex-China China Workforce of 64 thousand direct employees in 2024 5 1 As of Dec 2025. Australia Oman U.A.E. Malaysia India Singapore Japan USA Chile Brazil Argentina¹ Peru Diversified shareholder base and strong governance Note: Previ is a shareholder of Litel Participações S.A. (Litel) and Litela Participações S.A. (Litela), which w r p rt of V ’s form r contro group. B ckrock is r port consi ring Sch u 1 F, fi with th SEC on F b 15, 5, n Br sco’s t b s estimate on December 31, 2024. Treasury: position held by the companies MBR S.A., Vale Holdings B.V. and Vale S.A. The number of shares is presented based on the information contained in the share books of Vale. 6.0% Treasury 8.7% Previ 6.3% Mitsui&Co 6.1% Blackrock 72.9% Others Shareholder structure Novo Mercado B3's highest corporate governance segment. Vale's shareholder composition November 2025 Stock Exchanges B3 (Brazil) - VALE3 NYSE (ADR) - VALE Shareholders with 5% or more of the total capital Others − Majority independent BoD − All BoD members are non-executive directors − Chairman and Vice-Chairman are elected by shareholders − Audit and Risks Committee entirely composed of independent Board members. − Lead Independent Director role − Nominating Committee defines BoD nominees Best governance practices 7 About Vale Corporate Governance About Vale Executive Board Board of Directors1 CEO Gustavo Pimenta Finance & IR EVP Marcelo Bacci IO OperationsEVP Carlos Medeiros Commercial and New Business EVP Rogério Nogueira Technical EVP Rafael Bittar People EVP Samanta Pillar Legal AffairsEVP Sami Arap SustainabilityEVP Grazielle Parenti Click here to cc ss th fu inform tion bout V ’s Bo r of Dir ctors n Ex cuti Bo r . 1 The data takes into account the composition of the Board of Directors on May 7th, 2025. 2.7 years Average Tenure 13 Members 8 (62%) Independent Members 3 Women 4 Racially/ethnically diverse 4 Non Brazilians 8 Our journey Vale doRio Doce was founded Tubarão port inauguration CVRD rebranding to About Vale 9 1942 1956 1967 1969 1985 1997 2006 2009 Carajás discovery First pellet production 1st ore producedat Carajás and inauguration of the Carajás Railway (EFC) CVRD’s privatization INCOacquisition Our journey S11D operations start-up Samarco’s dam collapse 2010 2011 2015 2016 2017 2018 2019 2021 2023 2024 2025 Oman operations start-up Portfolio: divesting the aluminum business Governance: Migration to the Novo Mercado Portfolio: divesting the fertilizer business Portfolio: divesting the manganese business and Brumadinho’s dam collapse Portfolio: divesting the coal business Briquette operations start up and Base Metals Carve-out Vargem Grande and Capanema project start-ups Novo Carajás program About Vale 10 A focused companywith two unique and irreplicable businesses Vale Today About Vale 11 Iron Ore Solutions Vale Base Metals Iron OreSolutions 12 From the Mines to the Customers 13 Iron Ore Solutions Mineral Explorationand Projects Geology and Mine Planning Mine Operation Mineral Processing Pelletizing Railroad Logistics Port Logistics Shipping Logistics Blending and Distribution Centers Sales and Marketing Planning Products and Quality Iron Ore for the Steel Industry Vale’s mai ir re pr ucts Iron Ore Solutions Iron ore fines Carajás fines Brazilian Blend Fines Pellet Feed China (PFC) − 65% Fe − Low contaminants (silica, alumina and others) − Mined from the Northern System − 63% Fe − Low-alumina − Produced from blending Carajás and high-silica fines − ~63% Fe − Low-alumina − Pellet feed concentrated in Chinese facilities Mid-Grade Carajás − ~63% Fe − Low-alumina and Low-phosphorus − Mined from the Northern System Direct Reduction pellets Blast Furnace pellets BriquettesDeveloped by Vale − Agglomerates for direct charge in Direct Reduction Furnaces − Agglomerates for direct charge in Blast Furnaces − Same application as pellets in BF and DR furnaces − Lower CO2 emissions compared to pellet production − Commercial production ramping-up Agglomerates 14 Brazilian States: MA = Maranhão PA = Pará MG = Minas Gerais ES = Espírito Santo RJ = Rio de Janeiro Iron Ore Solutions 15 Vale operates three iron ore production systems in Brazil, which include mines, processing plants, railways and port facilities Southern System PA MG EFC EFVM MRS Ponta da Madeira Port (PDM) - São Luís - MA Tubarão Port - Vitoria - ES Itaguaí Port (CPBS) - RJ Guaíba Port (TIG) - RJ MA RJ ES Northern System Southeastern System Vale operates three iron ore production systems in Brazil Note: EFC is the Carajás Railway and EFVM is the Vitória-Min s R i w . MRS is V ’s r i w subsi i r . Northern System Southeastern System Southern System − 3 mining complexes − EFC - 997 km railway − 5 berths (3 Valemax berths) Serra Norte Serra Sul Serra Leste Carajás National Forest Cauê Belo Horizonte Conceição Alegria Timbopeba Brucutu Água Limpa Fazendão Itabira Complex Minas Centrais Complex Mariana Complex EFVM MRS Minas do Meio Fábrica Nova Capanema MRS EFVM Belo Horizonte Paraopeba Complex Abóboras Pico Mutuca Jangada Fábrica Viga Vargem Grande Vargem Grande Complex Tamanduá Capão Xavier Horizontes Mar Azul Segredo João Pereira Alto Bandeira − 3 mining complexes − EFVM - 905 km railway − 3 berths (1 Valemax berth) − 2 mining complexes − MRS Logistics System − 3 berths (1 Guaibamax berth) MG MG Iron Ore Solutions 16 Vale has a total of 11 pelletizing plants Oman Tubarão Vargem Grande São Luis 1 Installed capacity. Operations at Fábrica Plant (4.5 Mtpy) and São Luís Plant (7.5 Mtpy) have remained suspended since 2019 and 3Q25, respectively. 2 Start-up of the plant at Ferteco. Incorporated by Vale in 2003 Sohar - Oman Plants Start-up Cap. (Mtpy) 1 & 2 2011 9.0 Total 9.0 Tubarão Plants Start-up Cap. (Mtpy) 3-8 1977-2014 31.3 Total 31.3 Fábrica & Vargem Grande Plants Start-up Cap. (Mtpy) Fábrica 19772 4.5 VGR 2009 7.0 Total 11.5 São Luís Plant Start-up Cap. (Mtpy) São Luís 2002 7.5 Total 7.5 Iron Ore Solutions 17 Total pellet production capacity ~ 59.3Mtpy1 Strengthening supply chain flexibility to better serve growing markets Concentration and blending capacity (ex-Brazil, Mt) Vale’s supply chain capillarity ~45 80+ ~160 ~200 Concentration Blending Preserving market share in key regions with tailored products Expanding capacity close to growing regions (e.g. India, SEA, MENA) 2025 2030 (potential) Iron Ore Solutions 18 2024 operational performance Agglomerates production (Mt) Iron Ore production (Mt) 64 66 63 73 82 87 172 173 178 2022 2023 2024 308 321 328 10 9 9 4 5 4 15 19 21 3 3 3 2022 2023 2024 32 36 37 Northern System Southeastern System Southern System Oman Note: Including third party purchases, run-of-mine and feed for pelletizing plants. Iron Ore Solutions 19 Iron Ore business’ 2024 figures 154.6 US$/t Iron ore pellets realized price US$ 4.0 bi CAPEX US$ 15.0 bn Proforma EBITDA 38 Mt Pellets sales volume 37 Mt Pellets production volume 95.3 US$/t Iron ore fines realized price 260 Mt Iron ore fines sales volume 328 Mt Iron ore production volume 21.8 US$/t C1 cash cost ex-3rd party purchases 55.9 US$/tall-in costs Sales by destination (iron ore fines and pellets) 13% 61% 17% 2% Middle East 2% Rest of the world 5% Europe Americas Asia ex-China China Iron Ore Solutions 20 Vale Base Metals 21 Vale Base Metals history 22 Vale Base Metals 1853 1902 1930 1968 1994 1996 2004 2006 2011 2012 2014 2021 2024 2025 Nickel discovered in the Sudbury area The International Nickel Company (INCO) is formed Construction of mines, smelters, refineries and power plants PT Inco Indonesia is formed to develop nickel deposits in island of Sulawesi Discovery of the Voisey’s Bay nickel-copper-cobalt deposit Extension of Contract of Work with Indonesian Government to 2025 Sossego copper mine start-up Vale acquires Inco Start-up of nickel mines in Onça Puma (Brazil) and New Caledonia Salobo I start-up Start-up of Long Harbour processing plant, Salobo II, and Amendment of PTVI CoW to 2025 New Caledonia divestment Salobo III start-up Partnership Agreement with Manara Minerals for 10% New governance in place with a dedicated Board and Executives Onça Puma 2nd furnace start-up Significant endowment with substantial value potential 27.6 Mt 2.6 Mt 1.3% 3.0 Mt 1.6% 2.3Mt 1.5% 0.6% Mineral Reserves & Resources1,2,3,4 % Average metal grade Bubble size: contained metal Copper Nickel 14.1 Mt 0.9% 6.6Mt 1.4% ¹ As per Vale Form 20-F on December 31, 2023. ²Reflecting total resources (reserves + resources, including inferred). ³ Mineral Resources are not mineral reserves and do not have demonstrated economic viability at this time 4 Figures refer to VBM’s ownership (33.9% of PTVI, 80% of Hu’u and 100% of the Canadian and Brazilian assets). 23 Vale Base Metals Polymetallic Nickel Copper Operations are located in attractive mi i g juris icti s Canada − Premier mining district globally − Consistently ranked among the most favorable mining sector jurisdictions for investment attractiveness − Highly skilled work force availability − Ready access to high-quality regional infrastructure − In close proximity to North American manufacturing hubs − Clean energy availability Brazil − One of the premier mining jurisdictions globally – major global supplier of iron ore, copper, nickel and gold, among other metals − Highly skilled work force availability − Stable mining jurisdiction with solid regulatory background − Clean energy availability − Access to local infrastructure of Vale S.A operations 24 Vale Base Metals A gl bal fl wsheet t pr uce the right pr uct mix Copper ore bodies Mining Concentrating Smelting Refining Products Sudbury2 Salobo Salobo mill Sossego Sossego mill Laterite ore bodies Onça Puma Onça Puma smelter & refinery Ferronickel (~25-45% Ni) Voisey’s Bay Voisey’s Bay mill Long Harbour refinery Electrolytic rounds (>99.9% Co) Electrolytic rounds (>99.9% Ni) EW Cu Cathode (99.9% Cu) Cu Concentrate (27.5-32.5% Cu) Thompson mill Clarabelle Mill Cu concentrate (27-34% Cu) Matte processing Copper Cliff smelter Sudbury (CCNR) refinery Clydach refinery Pellet, Disc, Chips & Powders (>99.9% Ni) Thompson1 (under review) External feed Cu MK (70-72% Cu) EW Cu Cathode (>99.9% Cu) Sulphide ore bodies Electrolytic rounds (>99.9% Co) PCR Cu concentrate (35-42% Cu) Cu concentrate (26-34% Cu) Pellet, disc, & chips (>99.9% Ni) Nickel Cobalt Copper Class 1 Class 2 ¹ Including T1 and T3 mines. 2 Including Coleman, Copper Cliff, Creighton, Garson and Totten mines. 25 Vale Base Metals Advancing our project pipeline Vale Base Metals LT volumes (2030+) ~700kt ~210-250kt LT volumes (2035) 26 2024 operational performance Nickel production (kt) Copper production (kt) 82 79 83 171 247 265 2022 2023 2024 253 327 348 Brazil Canada 18 24 45 24 17 14 64 64 35 73 60 66 2022 2023 2024 179 165 160 Indonesia 3rd party feed - Salobo III ramp-up - Voisey’s Bay underground mine transition 27 Vale Base Metals VBM busi ess’ 2024 figures 2,616 US$/t Copper all-in costs1 15,420 US$/t Nickel all-in costs1 US$ 1.5 bi Proforma EBITDA 17,078 US$/t Nickel realized price US$ 2.0 bi CAPEX 155 kt Nickel sales volume 160 kt Nickel productionvolume 8,811 US$/t Copper realized price 327 kt Copper sales volume 348 kt Copper productionvolume Revenue by destination (Copper and Nickel) 46% 13% 13% 28% Europe USA China Others ¹ Excludes sustaining. Vale Base Metals 28 OurStrategy 29 Our ambition Our business Ourlevers Leading value creationin the mining industry through ethical and sustainable practices Iron Ore Leading global iron ore production and driving steel decarbonization with the most competitive costs and customer-centric flexibility Nickel Copper Focus on operational efficiency Accelerating growth to double production Cultural Evolution Safety People Innovation Trusted Partner Superior Portofolio Operational Excellence Capital allocation Licensing Projects Sustainability Communication Institutional Engagement Vale’s strategy Connecting today to tomorrow 30 Our strategy Safety first 31 Our strategy Safety is our core value ¹ Total Recordable Injury Frequency Rate. Rate in 2024. 2 As of December 2025. 32 Our strategy TRIFR1 1.1 Industry leader Decharacterized, completing 63% of the program 19 dams2 No dams at Emergency Level 3 GISTM In conformance with Becoming a benchmark in Safety ¹ Absences, restrictions, and medical treatments resulting from events with a high potential for harm. ² Total Injuries, medical treatment injuries and occupational Illnesses, multiplied by one million hours and divided by the exposure hours. 2,0 2,1 1,8 2,7 3,2 1,1 1,6 1,9 1,9 4,8 Vale Peer 1 Peer 2 Peer 3 Peer 4 High-potential recordable injuries (N2)¹ (unit) Total recordable injury frequency rate (TRIFR)² TRIFR² comparison against major peers (2024) -58% Source: International Council on Mining and Metals - ICMM 51 2019 2024 -61% 2019 2024 3.5 1.1 20 2024 2020 -68% 33 Our strategy No dam at emergency level 3in ourportfolio B3/B4 dam, Nova Lima, MG, Brazil:Once at emergency level 3, now eliminated ~US$ 4.7 billion(~$2.4 billion disbursed1) 30 11 8 19 3 Total Program 2019-2025 2026-2027 2028+ Remaining structures to eliminate -63% Upstream dam decharacterization program Dams at emergency level2 20204 Nov/2025 24 6 2 7 4 4 4 35 10 6 Level 3 Level 2 Level 1 ¹ As of September 30, 2025, including foreign exchange effects, present value and other adjustments. 2 Dams include geotechnical facilities dedicated to mining processes. 4 Considering the highest number of structures at emergency level, in 2020. GISTM:full conformance achieved in 2025 2026 -71% 34 Our strategy Embracing new ways to operate 4 tailings filtration plants in operation Tailings generation2 reduced by 35% 60 11 5 19 40 65 Filtration anddry stacking1 Naturalmoisture Tailings disposed in dams (wet processing) Ore processing method (%) 2015 2024 No disposal of tailings in dams Production from circular sources (Mt Iron ore) 12.7 30+ 2024 2030 (potential) -5% CO2 emissions vs. standard operations2 De-risking production plan Reducing the need for dams Circularity in our operations Tailings disposed in pits (wet processing) ¹ Includes use of tailing for co-products 2 2024 vs. 2015. 3 Average reduction for program initiatives. 35 Our strategy 36 Our strategy Iron Ore Market Steel fundamentals are supported by long-term structural drivers ~300 ~1,000 2025 ~320 ~1,000 2026 ~410 ~950 2030 ~620 ~915 2040 ~1,905 ~1,940 ~2,020 ~2,270 Steel production (Mt) China India, SEA, MENA1 Others CAGR 1.2% 1 India, Southeast Asia and Middle East/North Africa. Steel regional trends China Flat steel production growth, driven by manufacturing and export demand India, SEA, MENA¹ Rising steel output fueled by strong economic development and urbanization Developed markets Reindustrialization and renewable energy infrastructure 37 Our strategy Iron ore demand to remain stable while gradually shifting to low-carbon needs China Seaborne demand moderating, yet at robust levels India, SEA, MENA¹ Growing demand for iron ore that is complementary to domestic supply Consumption profile Need for supply security to new steelmaking processes Iron ore seaborne demand (Mt) Iron ore fines, lump and others Iron ore agglomerates 1 India, Southeast Asia and Middle East/North Africa. 80 20 ~100 ~1,480 2025 China India, SEA, MENA¹ Others ~175 ~1,345 2030 ~1,580 -160 ~1,520 38 Our strategy Steelmakers remain committed to decarbonization EAF projects – new production capacity (Mt)1 1 Including projects in Europe, North America, Japan and South Korea. 10 21 27 35 40 42 42 2025 2026 2027 2028 2029 2030 2035 10 21 29 40 49 62 93 Planned Under construction as of 2025 Demand for DR agglomerates is set to double by 2030 (from ~45 Mt in 2025 to ~100 Mt in 2030) Prime scrap supply is limited in certain regions This shift will drive higher demand for metallics (prime scrap, pig iron, DRI/HBI) Electric furnaces are steelmakers’ main decarbonization strategy 39 Our strategy Note: Medium-term refers to 2030. 2020 2024 2030 60.08 59.89 60.14 Fe (%) 2020 2024 2030 2.15 2.40 2.43 Alumina (%) 2020 2024 2030 0.070 0.085 0.088 Phosphorus (%) 2020 2024 2030 4.67 4.94 4.95 Silica (%) Iron ore price to stabilize near US$ 100/t in the LT while degrading reshapes portfolios Avg. iron ore quality - Australian majors Iron ore seaborne supply (Mt) -85 2025 -230 Depletion1 Operations w/ cost >US$ 100/t2 225 Projects w/ incentive price <$100/t3,4 2030 (supply at $100/t) ~1,630 ~1,540 ~1,520 2030(demand) Exposure to higher risk jurisdictions Higher incentive prices needed Proj cts’ approval and execution risk Source: Vale’s intelligence estimates and market sources (MineSpans, Woodmac). 1 Assuming an average annual depletion rate of ~3%, meaning an average Life of Mine (LOM) of 30 years based on the current supply. 2 Including Chinese ores. 3 Including greenfield projects and replacement projects. 4 Including Simandou project. 40 Our strategy Maximizing product portfolio value in any scenario Decarbonization journey Adjusting portfolio for value optimization Developing solutions for greener steelmaking processes Coal-based steelmaking routes1 Low-carbonsteelmaking routes Long-term Short-term Portfoliore-design Portfolio optimization 1 Coal-based routes currently account for around 70% of global steel production. 41 Our strategy Proactive strategy to maximize value Repositioning portfolio towards premium mid-grade ores Strategically allocating high-grade products Enhancing flexibility through our supply chain Vale’s product portfolio evolution (%) 29% 18% 49% 61% 8% 5% 13% 16% 2023 2025 High-grade2 Premium mid-grade1 High-silica Others Vale’s portfolio flexibility secures unique competitive advantage 1 Including BRBF, Mid-grade Carajás and PFC. 2 Including IOCJ and agglomerates. 42 42 Our strategy Expanding our premium mid-grade offering with a strong focus on customer needs Al2O3/SiO2 relation1 0,5 1,0 1,5 2,0 2,5 3,0 3,5 4,0 1,5 2,0 2,5 3,0 3,5 4,0 4,5 5,0 5,5 6,0 6,5 7,0 7,5 8,0 % SiO2 % Al2O3 High silica & alumina High alumina & Low silica High silica High alumina Australian iron ore fines Vale’s iron ore fines PFC BRBF Mid-grade Carajás Ideal blast furnace zone Mid-grade Carajás: ~50 Mt sales in 2026 ▪ Introduced in 2025 ▪ Similar to BRBF ▪ No blending required ▪ Simplified logistics process to serve different markets BRBF: 100+ Mtpy sales2 ▪ Launched in 2015 ▪ Low-alumina product reference ▪ Premium over 62%Fe index ▪ Produced from blending Carajás ore and high-silica products 1 Limit proportion between Al2O3 and SiO2 percentages for an efficient sintering and blast furnace operation. 2 Vale’s current blending capacity totals ~160 Mtpy. IOCJ 43 Our strategy Improving Carajás mine plan flexibilitywith the new product portfolio Production optimization ▪ No blending required ▪ Competitive C1 cash cost Strip ratio improvement ▪ Maximizing ore recovery ▪ Reduction of 4% vs. the prior portfolio review Flexibility to mining plan ▪ Alternative ore sources for licensing delays Strip ratio – Serra Norte Basis 100% 2025 2026 Future -3% -4% Improvement vs. prior portfolio review 44 Our strategy Concentration as an enabler for portfolio repositioning PFC product sales (Mt) 9 13 2022 2024 2025 2026 ~26 ~40 Mass recovery improving processes to reduce mass loss Pellet Feed China (PFC): 63% Fe, low Al/Si (<0.2 ratio) Unlocking concentration capacity through partnerships ~3x 45 Our strategy Developing competitive solutions for greener steelmaking Iron ore concentration plant under construction in Oman with Jinnan Steel Mega Hubs Discussions with over 10 clients, with potential to lock-in 30+ Mt of DR feed in the next decade Partnerships Building asset-light solutions with clients and investors in multiple technologies Agglomerates BF and DR briquette testing progressing as the Tubarão plant ramps up 46 Our strategy Generating value through the cycle Value maximization through our flexible portfolio and extended supply chain Solutions provider for different decarbonization pathways 47 Our strategy 48 Our strategy Growth projects Novo Carajás: largest mining province in the world Salobo PGG Breves 4Alfa Osasco Itacaiunas Copaíba Núcleo Urbano Parauapebas N5 Serra Leste (SL1) Serra Norte (N4) Pium Gameleira Norte South East North Serra Norte Serra Sul Canaã dos Caraj Sossego Cristalino 118 Bacaba Visconde Barão Borrachudo Cristalino 88 Estrela Alemão Itacaré Alemão Furnas Paulo Afonso Cururu AN34 Salobo Leite Novo Carajás: unique mineral endowment Investment (2025-2030) of R$ 70 billion 49 Our strategy Onça Puma 10% of global iron ore seaborne market Unique iron ore and copper endowments, with significant growth potential 5.2 bn tons @ 65.2% Fe 1.2 bn tons @ 0.62% Cu Positioning Brazil as a key player in critical minerals and a leader in decarbonization Building flexibility for Iron Ore Solutions 1 Project approved. Installation license pending for construction advancement at Serra Norte. 2 Includes works for waste and filtered/dry stacked tailings disposal in the Southeastern and Southern Systems.3 Capacity to process run-of-mine and waste, including jaspilite. Vargem Grande 115 Mtpy Sep24 Capanema 15 Mtpy Nov24 Serra Sul +20 20 Mtpy2H26 Compact Crusher 50 Mtpy3 2H26 2026-2030 2030+ S16 Morro 2 Apolo N1/N2 Serra do Rabo S11C S11A Itabiritos S11B S17 Jaspilite ore concentration Serra Leste Delivery underway Ongoing projects Serra Leste expansion 4 Mtpy Sohar Plant(mix improvement) N3¹6 Mtpy Itabiramines(replacement) Tailings/waste disposal areas²(replacement/ mix improvement) VGR upgrade (mix improvement) Long-term optionalities 50 Our strategy Scaling operational excellence for continued growth 328 2024 2025 2026 2030 ~335 335-345 ~360 Iron ore production (Mt) Ensuring safety and consistency through technology-driven solutions Executing strategic projects to elevate performance to the next level Increasing flexibility to deliver guidance with reliability 51 Our strategy 52 Our strategy Vale Base Metals Transformation The new Vale Base MetalsCreating a leading critical minerals company High-Growth Copper ▪ 1st Quartile Producer ▪ Long life assets ▪ District level growth ▪ Low capex intensity Leading Western Nickel Producer ▪ Polymetallic Business ▪ Long life assets ▪ Vertically integrated ▪ Western supplier of high purity Ni A people-driven business with a high-performanceculture 53 Our strategy Building a foundation for value 2025: a year of transformation & delivery Do it safely, life matters most All-in costs downlower-end of guidance range for Cu & Ni Ramp-up ahead of schedule at VBME, record output at Long Harbour Self funded-growthsupported by a Net Debt/EBITDA <1x Advancing Licensing for Bacaba and Alemão Portfolio optimizationunder execution Lower overhead~30% reduction of overhead in 2025 Strong team in placewinner of multiple awards in 2025 Simplify Drive excellence Deliver growth Higher productivityhigher throughput at Salobo and Sudbury 54 Our strategy Project pipeline Onça Puma 2nd furnace 15 ktpy VBME 45 ktpy (Sustaining) 2023-2028(approved projects) 55 Our strategy Vale Base Metals Nickel Copper i2 2029 onwards Salobo CPF 30 ktpy JV with Glencore1 25 ktpa2 Alemão 80 ktpy CCM 3&4 12-22 ktpy CCM Pit 12-15 ktpy Bacaba 50 ktpy 118 60 ktpy Cristalino 80 ktpy Paulo Afonso 70-100 ktpy ¹ Formerly Victor project. ² Figure reflects 50% ownership High-Growth Copper 56 Our strategy A new approach for growthRevamped Bacaba development approach Bacaba project (in execution) ▪ Cu production: ~50 ktpy (LOM average) ▪ LOM: 8 years ▪ CAPEX: ~US$ 290 M (US$ 5.0k/t CuEq) ▪ Unit costs, net of by-product: US$ ~4,600/t ▪ IRR: >50% Start-up 1H28 ▪ Revisited construction model ▪ Revised CAPEX from US$ 500 M to US$ 290 M ▪ Early works started in 2025 >40% decrease in project CAPEX Bacaba site early works 57 Our strategy A new approach for growthUnlocking additional value at Salobo ▪ Cu production: +30 ktpy ▪ CAPEX: US$ 225-275 M (US$ 8.5-11k/t CuEq) ▪ No impact on S obo’s unit costs ▪ IRR: >50% ▪ ~6 Mtpy processing capacity addition ▪ ~10% reduction in energy consumption ▪ Increase in total mine movement by 15 Mtpy to 145 Mtpy, supporting mine plan optimization ▪ Maintain S obo’s production at 230-250 kt Coarse Particle Flotation Start-up 2029 Revised mining strategy CPF (Feasibility study) 58 Our strategy A new approach for growthRe-design of Alemão for value and risk Alemão (Feasibility Study) ▪ ~5.45 Mtpy plant throughput capacity ▪ Production: ~80 ktpy Cu; ~140 kozpy Au ▪ LOM: 20 years ▪ CAPEX: ~US$ 1.6 – 1.8 B (US$ 13-15k/t CuEq) ▪ Unit costs, net of by-product: US$ ~ -1,450/t ▪ IRR: >25% Start-up 2030 ▪ From sublevel caving to sublevel stoping ▪ Lower environmental impact, supporting licensing ▪ Around US$ 500 M in CAPEX savings Revised mining method 1st quartile asset ▪ Significant gold production (140 kozpy Au) ▪ 1.7:1 Au to Cu production ratio1 1 1.7 troy ounce of gold to 1 metric ton of copper ratio, based on average production. 59 Our strategy A new approach for growthA synergistic partnership with Glencore JV Project1 (Feasibility Study, 50% Equity) ▪ Production: ~21 ktpy Cu; ~42 ktpy CuEq ▪ LOM: 20+ years ▪ CAPEX2: ~US$ 0.8 -1.0 billion ▪ Unit costs, net of by-product: ~US$ -1,000/t ▪ IRR: >15% Start-up 2030+ 1 Figures reflect Vale Base Metals equity in the project, as per framework agreement with LT prices of Ni: 18,000/t, Cu: 9,500/t Au: 2,400/oz 2CAPEX of ~CAD$ 1.0 – 1.25 B converted at a CAD:USD FX of 0.75, only reflective of VBM’s 50% equity in the project Accessing VBM ore bodies through new access drifts from NRS ▪ Exploring significant synergies of mining Victor (VBM) and Nickel Rim South (Glencore) properties ▪ Expected FID by mid-2027 ▪ Transition to a Joint Venture as equal partners Framework agreement with Glencore Significant synergies ▪ Deepening of existing shaft ▪ Ties to current ventilation system 60 Our strategy Efficiently expanding exploration Drilling Program in Carajás Km per year 29 31 2023 2024 2025 2026 60-70 100-110 Improving endowment knowledgethrough MIRA¹, drilling, a new core shed and data recovery program ~20% production upside potentialpost-2035 through brownfield drilling ~30% drilling unit cost reduction 1 Mineral Inventory Range Analysis. 61 Our strategy Brownfield upside as we advance drillingSossego case study Mineralization at Sossego Mined Out Pit 2024 OP Mineral Reserve 2024 OP Mineral Resource Mineralized Trend 2024 Indicated Resource 2024 Inferred Resource 2025 Significant Drill Hole Results 2024 Mineral model (>1% Cu) Selected 2025 intercepts1: 1. ~141.0m @~1.8%Cu, inc. 63.8m @ 3.1% Cu 2. ~85.3m @~2.2%Cu, inc. 11.0m @ 5.0% Cu 3. ~29.7m @~5.0%Cu, inc. 10.6m @ 11.1%Cu 1 2 3 1 2 3 2026 Plans Potential to double mill capacity with a multi-mine approach >60km drilling for further UG exploration of South Hub deposits Our vision ~20km of drilling – improved geological understanding 2025 Results 1 The disclosure of exploration results contained herein has been prepared in compliance with the Securities and Exchange Commission (“SEC”) rules set forth in Subpart 1300 of Regulation S-K. Such disclosure is based upon information and supporting documentation prepared by a Qualified Person who has reviewed and approved the technical information contained in this report. Exploration results (drill hole intercepts) are preliminary in nature, are not indicative of Mineral Resources or Mineral Reserve, and do not demonstrate economic viability. Investors are cautioned not to assume that any part or all of the mineralization described will result in an economically mineable deposit. The geological, lithological and structural models are preliminary in nature and are subject to further refinement as data is collected through further drilling and exploration activities. Intercepts are calculated as down-hole length (not true width) and assays are uncapped Looking North Surface 62 Our strategy The roadmap to 700 ktpy Copper production ktpy Bacaba/Sossego Salobo Polymetal- lics Ramp-up Alemão 2030 Ramp-upAlemão Victor/Polymetallic 2035 w/ upside 2035 South Hub Exp. NorthHub 350-380 15-25 30-50 20-30 5-15 420-500 ~65 25-35 70-100 60-80 ~700 2026 Exploration & Hu’u Brownfield drilling 63 Our strategy 64 Our strategy Copper ambition enablers − Advance on drilling and scoping studies − Define deposits suitable for partnership strategy − Accelerate the engineering development Exploration Drilling and R&D − Develop additional processing capacity Processing capacity − Obtain license & permits on time for all projects Licensing Leading WesternNickel Producer 65 Our strategy Disciplined delivery towards cash flow-neutral business AISC (all-in sustaining costs) S$ ‘ /t VBME ramp-up ▪ Current operation AISC ~65% lower vs. early 2024 ▪ Further reduction expected with ramp-up completion Efficiency program ▪ ~$240 M in savings in the Nickel Business in 2025, comprising lower G&A, costs and capital ▪ Improvements on controllable cash flow items to persist in the next years 2024 2025 2027 24 18 Cash breakeven¹ ¹ Based on gold prices of $3,500/oz and copper prices of $9,500/t in 2027 66 Our strategy Sudbury “fill the mill” − Debottleneck to process more mine production 2024 2025 2027 Ore milled Mtpy From 2024 to 2027 40% decrease in unit costs after by-products ~30% increase in copper production ~7 ~5.5 4.3 67 Our strategy − Low CAPEX projects that add lower grade ore tons Short-term payback projects − Change in cut-off grades and extraction strategies − Increase in mine development to support an increase in production and lower costs Mining strategy Clarabelle mill expansion Value and optionality over volume Nickel production kt ~175 2025 2026 2030 175-200 210-250 Business operating at optimal capacity Increased mill throughput in Sudbury Long Harbour refinery at nameplate capacity Onça Puma operating with 2 furnaces Our goals 68 Our strategy De-risking Copper growth through a new approachtranslating into more efficient project development Impr vi g C pper pr jects’ retur s below average capital intensity and strong IRRs Delivering cost and capital efficiency on Nickel with target cash flow neutral by early 2027 Healthy balance sheet, self-funding growthsupported by a Net Debt/EBITDA <1x Do it safely, life matters most The newVale Base MetalsCreating a leading critical minerals company 69 Our strategy Capital Allocation 70 Efficiency program securing structural cost improvement 1 Assuming BRL FX of 5.60 in 2026. Fixed spending – Iron Ore Solutions (US$ bn)1 2023 2024 2025 0.2 FX and inflation 0.1 New assets and new operating model -0.4 Efficiency program 2026 6.3 6.0 5.8 5.7 10% fixed spending improvement in nominal terms (2026 vs. 2023) Cost efficiency culture increasing accountability Leaner organization Capital Allocation 71 Costs have gone up across the iron ore industry in the past years 1 Iron ore fines C1 cash cost – ex. 3rd-party purchases (US$/t). 2 Considers the net effect of FX (US$ -3.7t) and inflation (US$ 5.7/t) between 2018 and 2024. Capital Allocation Peers’ C1 cash c st (US$/t)1 2018 FX and inflation Geological inflation New way to operate 1.0 Lower volumes and mix -1.7 Efficiency initiatives 0.5 Others 2024 13.1 2.0 1.6 5.3 21.8 Vale’s C1 cash c st (US$/t)1 12.9 17.7 19.2 14.1 19.3 18.2 13.3 21.5 23.0 2018 2023 Peer 1 Peer 2 Peer 3 2024 2018 2023 2024 2018 2023 2024 72 Advancing towards US$ ~20/t C1 cash costs 1 Assuming BRL FX of 5.60 for 2026. 2 Iron ore fines C1 cash cost – ex. 3rd-party purchase. 3 Includes US$ 0.2/t increase from the Aliança Energia transaction, impacting energy costs. Vale’s C1 cash c st – nominal terms (US$/t)1, 2 2025 0.5 FX and inflation 0.3 Geological inflation 0.3 New assets and new operating model -1.6 Efficiency program3 2026 ~21.3 20.0-21.5 2023 2024 2025 2026 ~21.3 20.0-21.5 22.3 21.8 -10% Capital Allocation 73 Costs guidance (US$/t)1 Main assumptions for 2026 2025 2026 1 Assuming BRL FX of 5.60 for 2026. 2 Assuming gold prices of US$ 3,500/tr. oz. for 2026. ▪ Product portfolio strategy optimization ▪ Efficiency program ▪ Long-term affreightment strategy ~21.3 All-in C1 20.0 – 21.5 All-in All-in ~55 52 - 56 ~1,000 1,000 - 1,500 ~13,000 12,000 – 13,500 ▪ Solid operational performance ▪ Planned maintenance at Sossego ▪ Conservative gold price assumptions2 ▪ VBME and Onça Puma 2nd furnace ramp-up ▪ Planned maintenance at Sudbury Cost discipline driving competitiveness in all businesses Capital Allocation 74 Scaling CAPEX below US$ 6 billion, while growing in core commodities 1 Assuming BRL FX of 5.60 for 2026 and 5.65 for 2027+. 2 Copper equivalent basis. 3 New operating model includes different initiatives to sustain production level as tailings/waste stockpile. Growth Vale Base Metals Iron Ore Solutions Growth CAPEX shifting from iron ore to copper Sustaining CAPEX increase driven by new operating model3 Accretive growth opportunities Sustaining Copper projects with capital intensity2 of US$ 14k/t vs. US$ 20k/t industry avg. CAPEX (US$ bn)1 ~1.2 ~4.3 2025 ~1.1 ~4.5 2026 ~5.5 5.4-5.7 ~1.4 ~4.5 2027+ ~2.0 ~3.9 Business breakdown <6 <6 Capital Allocation 75 Performing on our commitments Expected cash disbursement schedule (US$ bn) 1, 2 1 Estimated cash outflow for 2025-2035 period, given BRL-USD exchange rates of 5.3186 and amounts stated in real terms. 2 Amounts stated without discount to present value, net of judicial deposits and inflation adjustments. 3 Disbursements related to the Integral Reparation Agreement ending in 2031. 4 Estimated annual average cash flow for Decharacterization in the 2031-2035 period is US$ 186 million per year. ▪ Disbursements concentrated in 2025-2027 ▪ BRL hedge program offsetting FX risks Included in expanded net debt Not included in expanded net debt ▪ Including UK claim provision ▪ Samarco fully funding reparation 2031+ ▪ ~80% of Reparation Agreement completed ▪ ~63% of dam decharacterization completed ▪ Stable cash outlays ▪ Declining to zero by 2030 ’25 ‘26 ‘27 ‘2 ‘29 ‘30 ‘31-35 Avg. Total Samarco 2.5 1.0 0.6 0.4 0.8 0.3 - Brumadinho agreements3 1.0 0.8 0.5 0.3 0.2 0.2 <0.1 Decharacterization4 0.4 0.5 0.5 0.4 0.3 0.3 0.2 Incurred expenses - 0.3 0.3 0.3 0.2 0.2 - 4.2 2.6 1.9 1.3 1.5 0.8 0.2 Capital Allocation 76 Comfortable with our current expanded net debt target Note: as of 3Q25. Disciplined capital allocation Remaining committed to our dividend policy Extraordinary dividends subject to cash generation and expanded net debt Current target will continue to guide the company in the next cycle Expanded net debt (US$ bn) Expanded net debt target range US$ 10 bn US$ 20 bn 18,5 Gross debt and leases -6,1 Cash, cash equivalents and short-term investments 12,5 Net debt -0,2 Currency swaps 2,0 Brumadinho provisions 2,4 Samarco & Renova Foundation provisions 16,6 Expanded net debt Capital Allocation 77 Closing the value gap Source: Bloomberg. 1 Peers include BHP, Rio Tinto, Fortescue, Glencore and Anglo American. Closing the gap Cost and CAPEX efficiency Right ESG credentials Operational stability Growth story in core commodities Superior shareholder returns P/NAV (X, 12mma) -10% 0% 10% 20% Vale discount vs peers (P/NAV, %) 2015-2018 average: 3% 2019-2026 average: 13% 9% Capital Allocation 78 0.6 0.7 0.8 0.9 1.0 1.1 2015 2016 2017 2018 2019 2020 2021 2022 2023 2024 2025 2026 Vale P rs’ r g 1 Disciplined approach on capital allocation Investments Balance sheet Shareholder returns ▪ New Carajás Program ▪ Accelerating copper growth ▪ Optimal CAPEX level below US$ 6 billion ▪ Asset-light approach ▪ Value accretive liability management ▪ Expanded net debt range of US$ 10-20 bn ▪ Healthy shareholder remuneration ▪ US$ 1 bn extra dividends to be paid in Jan-26 ▪ FCF yield above peers Capital Allocation 79 ESG 80 Our sustainability strategy is built on three pillars Social licenseto operate Improve people’s lives Create business value Sustainability strategy Responsible operator Society Climate & Nature ESG 81 Rebuilding trust with society We are still learning Active listening Taking responsibility Empathy On-the-ground presence Humility 1 Based on the UN Basic Principles and Guidelines on the Right to a Remedy and Reparation. Reparations ESG Public apology Restitution Rehabilitation Compensation (economic & noneconomic) Sanctions (legal & administrative) Measures fornon-repetition Based on Six Principles1 − Emergency Works − Indemnification Payments − Projects (infrastructure, socioeconomic, environmental) − Resettlement & Evacuated Regions Main Actions Regain the social license to operate 82 MarianaStrong progress with the definitive agreement signed in Oct-2024 ESG Note: Information provided by the Renova Foundation, Learn more at www.fundacaorenova.org, 1 PID = Definitive Indemnification Program. 2 Data as of Dec.16th, 2025. Includes Renova administrative expenses. 3 Based on records dated November 2025, including emergency aid and adhesions to the compensation program of the definitive Settelment (PÌD). 4 Water quality data undergoes quality control and is validated by environmental agencies responsible for overseeing the monitoring program. Remediation and compensation already disbursed ~R$ 73 billion2 +610k Individuals compensated3 98.6%of housing solutions delivered 964k m³of tailings removed Rio Doce water quality similar to pre-breach4 DefinitiveAgreement(R$ billion) 100 32 38 +R$170 bn “To pay” obligations “To do” obligations Pre-agreement actions 100% Compensation (PID1) status (as of Dec. 16th, 2025) +330kindividuals adhered +302kagreements signed +300k compensations already paid (R$ 11 billion) 83 BrumadinhoReparation in advanced stages 1 & 2 Financial progress considering disbursements by mid Dec. 2025. 3 As per Integral Reparation Agreement settled in February 2021. Nominal amount. Total value considering IPCA (Brazilian consumer price index) adjustment is ~R$ 40 billion. 4 ~ 79% executed 5 The data is corroborated by monitoring by the Water Management Institute of Minas Gerais (Igam), a public body of the Government of MG 2019 2021 15 Dec. 2025 2026 Feb-2031 B1 damcollapse BrumadinhoIntegral Reparation Agreement 81% Complete1 Complete 100% of the To Pay Obligations Complete 100% of the To Do Obligations Integral Reparation Agreement (R$ billion)2 19.9 11.4 6.4 R$37.7 bn3 “To do” obligations 50% Pre-agreement actions 100% “To pay” obligations 95% ESG 84 Additional Agreements: R$ 25.3 bn4 Emergency compensation, Community Centers, Parks, Water supply works and monitoring, tourism initiative, and individual compensation R$ 19.9 billionpayments made, including individual compensation to over 17,300 individuals R$ 5.4 billionin payments programmed for 2025-2029 Paraopeba River Water quality is similar or better than prior to the dam breach5 Commitments that reflect our objective to become a trusted partner ESG 1 United Nations Declaration on the Rights of Indigenous Peoples. 2 Compared to the previous year-end results. These events include fatalities and life-altering injuries (known as N1 events), as well as high-potential recordable injuries (known as N2 events). 3The base year considered is 2017. 4 Base year 2018 5 The target considers cumulative average specific use of new water. E (Environment) S (Social) Climate change and energy Forestsand Water Healthand Safety Resilient communities • Support the uplifting of 500,000 people out of extreme poverty • Support Indigenous communities neighboring Vale to develop their UNDPRI plans1 • Zero fatalities • Reduce N1+N2 by at least 10%2 • Reduce exposures to harmful health agents by at least 50% by 2025 ✓ No dams at Emergency level 3 by 2025 ✓ GISTM conformance • Reduce Scope 1 and 2 emissions by 33%3 by 2030 • Net Zero by 2050 • Reduce Scope 3 by 15%4 by 2035 • 100% renewable energy consumption globally ✓ 100% renewable energy consumption in Brazil • Recover and protect + 500,000 ha of forest outside our fence lines by 2030 ✓ Reduce freshwater intake by 27% by 20305 85 Leaving a positive legacy for nature and people ESG 86 Vale protects ~1 million hectares and +600 threatened fauna and flora species Building a people-driven organization Learning together ESG 87 2019 2020 2021 2022 2023 − Purpose fully linked to the strategy − Culture in Practice Culture as a competitive advantage 2024 2025 − Cultural Evolution − Building the Culture Base − Defining aspirations, key behaviours and strategic objectives − Cultural Diagnosis − Launch of the Cultural Narrative − 1st Cultural Diagnosis Survey − Culture enables Strategy − 2nd Cultural Diagnosis Human Rights: UN Guiding principles as our reference framework and 3rd party Human Rights Due Diligence Global Human Rights Policy since 2009 and adherent to main multistakeholder initiatives and guidelines Human Rights violation risks are part of Vale's Global Integrated Risk Map 100% of our operations in Brazil, Canada, Oman, Malaysia and Indonesia have undergone Human Rights due diligence 100% of Vale operations have their Human rights risk assessment recorded in our global risk management system Mandatory Human Rights training for all employees since 2021, and contractors globally are also trained Living Wage Program implementation, co ring 1 % of V ’s direct employees Commitments and Partnership on salient Human Rights issues to advance the agenda Strengthening Human Rights management in the supply chain, including HRDD with critical suppliers in Brazil, Canada, and Malaysia ESG 88 ESG 89 Vale interacts with 1,214 local communities, 91 traditional communities and 28 indigenous peoples 368 community relationship plans implemented 93.5% of high priority communities have community relationship plans in place Almost US$ 1 billion spent on social and institutional initiatives in 2024 Social Performance Local development and community relationships Help lift 500,000 people out of extreme poverty +52,000 people in the program to date Monitoring across 5 dimensions1: income, health, education, infrastructure and nutrition Steady progress in all dimensions, with a significant reduction in deprivation2 Robust public-private network to reinforce public policies Vale is working with 27 partners 1 Using the Alkire-Foster Method, a global taxonomy and method used by the UN and the World Bank. Licensed by Wise Responder from Oxford University 2 Deprivation is defined as a lack of essential resources and opportunities needed for basic standard of living and participation in Society and uses the multidimensional approach to identify and measure deprivation recognizing that poverty is about more than just low income. ESG 90 Social Performance Strengthening relationships with Indigenous communities ESG 91 Vale relinquished mining processes on indigenous lands in Brazil 5 of the 11 indigenous peoples with whom Vale has relations in Brazil are engaged to implement their plans in accordance with the rights provided for in the United Nations Declaration on the Rights of Indigenous Peoples Around 15,000 Indigenous individuals benefited through agreements with 9 Indigenous peoples. Program to support the entrance and permanence of Indigenous People in University, with 140 Indigenous students supported from 47 Indigenous Lands Implementing an engagement strategy to foster mutual benefits and support Indigenous People’s autonomy and resilience Delivering on our commitments for climate and nature 1 2017 baseline. 2 The reduction is mainly related to lower production compared to 2017, as well as improved operational discipline. The emissions curve is expected to rise with increased production in the coming years but will be offset by technological initiatives to be implemented by 2030. 3 2018 baseline. 4 Includes total estimates for 2025, which may be adjusted after year-endclosing. 5 Scopes 1, 2, and 3 initiatives. Does not include our Forest Goal. 6 Forest Goal to protect and restore 500k ha of forest, considering 400k ha of protected forest and 100k ha of restored forest. To date, 200k ha are being protected and 19k ha of degraded forest has been restored. 7 5 sp ci s prot ct within V ’s preservation units and not specific protection programs for each species. Protecting threatened or endangered species + 500 species7 Protect/restore an additional 500,000 ha of forests6 219,000 ha achieved6 US$ 1.7 billion4invested in decarbonization initiatives between 2020-20255 Reduce scope 1 and 2 emissions by 33% by 20301 81% achieved2 Reduce Scope 3 net emissions by 15% by 20353 88% achieved ESG 92 Pioneering transparencyin climate-related risks & opportunitiesVale is an early adopter of IFRS’ ISSB¹ standards 1st Brazilian Company to publish the Sustainability-Related Financial Information Report 1st Major Mining Company & US$ 1.4 billioninvested in decarbonization since 2020 1 The ISSB (International Sustainability Standards Board) is part of the IFRS Foundation that issues the IFRS accounting standards, already widely used by companies and investors worldwide. The objective of the standards issued by the ISSB is to bring the same level of clarity, comparability and rigor of financial statements to sustainability information. ESG 93 Why does it matter? Strategic clarity Climate targets, transition plans, and financial impacts disclosed Transparency & leadership Voluntary adoption reinforces our role in responsible mining and long-term value creation Investor focus Clear view of how Vale manages climate-related risks and opportunities and their financial impacts Embedding Nature in our Strategy ESG 94 1st Major Mining Company & One of the first Brazilian Companies to publish the Taskforce on Nature-related Financial Disclosures (TNFD) report Nature Positive Impact Metrics Pilot Projectto monitor our performance on nature Achievements Partnerships to make it happen +500 threatened or endangered species protected 50% of our Forest Protection Goal = +200 k ha of forest beyond our borders protected IUCN to improve our nature strategy and management Life Institute to help us measure biodiversity A Governance structure to oversee Sustainability related Risks and Opportunities Low Carbon Forum Meets every 4 months to discuss challenges and progress in low-carbon. The results are periodically presented to the Sustainability Committee and Board of Directors, as part of the Company’s governance system. Evaluation of the previous year’s performance and future expectations in relation emissions Review of the roadmap and targetsfor GHG emissions Alignment with the Company’s strategic planning, considering financial impacts on Vale’s valuation Identification of risks and opportunities Analysis of investments and prioritization 1 2 3 4 5 SustainabilityAdvisory Committee SustainabilityRisk Committee Committees supporting the Board of Directors ESG 95 Consistently improving ESG risk perception MSCI B CCC B BB 2018 2019 2023 Today Laggard Average Laggard Laggard Scale: CCC to AAA the higher, the better Sustainalytics 36,5 54,5 34 27 2018 2019 2023 Today High risk High risk High risk Scale: 0 - 100 the lower, the better Medium risk ISS (Governance) 8 10 1 1 2018 2019 2023 Today Scale: 1 - 10 the lower, the better ESG 96 97 AboutVale ESG Iron OreSolutions Vale Base Metals OurStrategy Capital Allocation Leading global iron ore production and driving steel decarbonization Accelerating copper growthto double production Enhancing operationalefficiency in nickel Innovating for safety, operational excellence and competitiveness Building the future of mining Leading value creationin the mining industry through ethical and sustainable practices Key takeaways 98 We are building an even better Vale 99


Signatures
Pursuant to the requirements of the Securities Exchange Act of 1934, the registrant has duly caused this report to be signed on its behalf by the undersigned, thereunto duly authorized.
| Vale S.A. (Registrant) |
||
| By: | /s/ Thiago Lofiego | |
| Date: January 12, 2026 | Director of Investor Relations | |