UNITED STATES
SECURITIES AND EXCHANGE COMMISSION
Washington, D.C. 20549
FORM 6-K
REPORT OF FOREIGN
ISSUER
PURSUANT TO RULE 13a-16 OR 15d-16 UNDER
SECURITIES EXCHANGE ACT OF 1934
For the month of August, 2025
(Commission File No. 001-34429),
PAMPA ENERGIA S.A.
(PAMPA ENERGY INC.)
Argentina
(Jurisdiction of incorporation or organization)
Maipú 1
C1084ABA
City of Buenos Aires
Argentina
(Address of principal executive offices)
(Indicate by check
mark whether the registrant files or will file annual reports under cover of Form 20-F or Form 40-F.)
Form 20-F ___X___ Form 40-F ______
(Indicate
by check mark whether the registrant by furnishing the
information contained in this form is also thereby furnishing the
information to the Commission pursuant to Rule 12g3-2(b) under
the Securities Exchange Act of 1934.)
Yes ______ No ___X___
(If "Yes"
is marked, indicate below the file number assigned to the
registrant in connection with Rule 12g3-2(b): 82- .)
This Form 6-K for Pampa Energía S.A. (“Pampa” or the “Company”) contains:
Exhibit 1: Earnings Release Q2 25
SIGNATURE
Pursuant to the requirements of the Securities Exchange Act of 1934, the registrant has duly caused this report to be signed on its behalf by the undersigned, thereunto duly authorized.
Date: August 6, 2025
| Pampa Energía S.A. | ||
| By: |
/s/ Gustavo Mariani |
|
|
Name: Gustavo Mariani Title: Chief Executive Officer |
||
FORWARD-LOOKING STATEMENTS
This press release may contain forward-looking statements. These statements are statements that are not historical facts, and are based on management's current view and estimates offuture economic circumstances, industry conditions, company performance and financial results. The words "anticipates", "believes", "estimates", "expects", "plans" and similar expressions, as they relate to the company, are intended to identify forward-looking statements. Statements regarding the declaration or payment of dividends, the implementation of principal operating and financing strategies and capital expenditure plans, the direction of future operations and the factors or trends affecting financial condition, liquidity or results of operations are examples of forward-looking statements. Such statements reflect the current views of management and are subject to a number of risks and uncertainties. There is no guarantee that the expected events, trends or results will a ctually occur. The statements are based on many assumptions and factors, including general economic and market conditions, industry conditions, and operating factors. Any changes in such assumptions or factors could cause actual results to differ materially from current expectations.

|
Pampa Energía, an independent company with active participation in the Argentine oil, gas and electricity, announces the results for the six-month period and quarter ended on June 30, 2025.
|
Stock information |
Buenos Aires, August 6, 2025 Basis of presentation Pampa reports its financial information in US$, its functional currency. For local currency equivalents, transactional FX is applied. However, Transener and TGS’s figures are adjusted for inflation as of June 30, 2025, and converted into US$ using the period-end FX. Previously reported figures remained unchanged. Q2 25 main results1 Sales recorded US$486 million in Q2 252, a 3% year-on-year slight decline, driven by lower deliveries under the Plan Gas GSA and a drop in petrochemical and crude oil prices, partially offset by contributions from PEPE 6, higher spot energy prices and increased export volumes of gas, crude and reformer products. During Q2 25, oil production rose at Rincón de Aranda, and wind power generation achieved a high load factor. Adjusted EBITDA3 reached US$239 million in Q2 25, 17% less than Q2 24, explained by lower gas deliveries under Plan Gas and weaker domestic demand, a decline in petrochemical prices and higher operating expenses, partially offset by higher spot prices, PEPE 6 and increased oil output and gas exports. Net income attributable to shareholders was US$40 million, a 60% year-on-year decrease, mainly explained by higher non-cash deferred tax charges and a lower operating margin, offset by gains from holding financial instruments and the absence of impairments recorded on Q2 24. Net debt totaled US$712
million, representing a net-debt to EBITDA ratio of 1.1x, mainly due to higher working capital
needs and continued investments in the development of Rincón de Aranda. |
|
 |
Buenos Aires Stock Exchange Ticker: PAMP |
|
 |
New York Stock Exchange Ticker: PAM 1 ADS = 25 common shares |
|
|
Share capital Market capitalization: Information about the videoconference Date and time: Access link: bit.ly/Pampa2Q2025VC For further information about Pampa Email Website
for investors Argentina’s Securities and Exchange
Commission US Securities and |
||
1 The information is based on FS prepared according to IFRS in force in Argentina.
2 Sales from the affiliates CTBSA, Transener and TGS are excluded, shown as ‘Results for participation in joint businesses and associates.’
3 Consolidated adjusted EBITDA represents the flows before financial items, income tax, depreciations and amortizations, extraordinary and non-cash income and expense, equity income, and includes affiliates’ EBITDA at our ownership. Further information on section 3.1.
| Earnings release Q2 25 ● |
| 1. | Relevant events |
| 1.1 | Reopening of the 2034 Notes |
On May 28, 2025, Pampa reopened its international bond maturing in December 2034, which accrues a 7.875% annual interest rate. The new issuance of US$340 million was placed at an 8% yield, increasing the total amount outstanding to US$700 million.
Proceeds were used for the early redemption of the 2029 Notes (Series 3), covering US$300 million in principal, plus the redemption premium and accrued interest. 2029 Notes bore a 9.125% fixed annual interest rate and were due on April 15, 2029.
This transaction extended the Company’s debt maturity profile, reduced interest expenses and positioned the 2034 Notes as Pampa’s benchmark bond. Notably, the 2034 Notes were priced at the lowest spread over US Treasuries in Pampa’s debt issuance history.
| 1.2 | Oil and gas |
New record of peak gas production
On July 24, 2025, Pampa set a new all-time high for gas production, reaching 17.4 mcmpd. This outstanding growth was driven by shale gas development in Vaca Muerta, launched in 2022-2023. El Mangrullo accounted for 58% of the output and Sierra Chata 29%, both ranking among the top-performing gas blocks in the Neuquina Basin.
Financing of VMOS
In July 2025, VMOS S.A. —a consortium integrated by YPF, Pampa, Vista, PAE, Pluspetrol, Chevron, Shell and Tecpetrol— secured US$2 billion in financing for the construction of the Vaca Muerta Oil Sur pipeline. The project demands a total estimated investment of US$3 billion, and includes a loading and unloading terminal with single-buoy moorings, tank storage and infrastructure to export crude oil and liquids using Very Large Crude Carriers (VLCCs). The project has already been incorporated under the RIGI scheme (Res. No. 302/25).
Pampa holds a 10.2% stake in VMOS and has signed a contract to transport 50 kbpd, including storage and loading services.
Rincón de Aranda’s infrastructure application for the RIGI
On July 1, 2025, Pampa applied for the RIGI for the development of the Central Processing Facility (CPF) and other infrastructure facilities at Rincón de Aranda, with an overall estimated investment of US$426 million. The CPF will be capable of processing and storing up to 45 kbpd of crude oil, with commissioning targeted for year-end 2026.
| 1.3 | Regulatory updates and emergency extension in the energy sector |
On July 7, 2025, National Laws No. 15,336 and 24,065, which govern the national electricity sector, were amended. The reforms include the merger of ENARGAS and ENRE (DNU No. 450 and 452/25) and establish a 24-month transition period, during which the SE must advance towards a liberalization of the oil and gas market through enabling free fuel procurement by generators, ensure payment compliance under PPAs signed with power distribution companies and define remuneration schemes for thermal generation, in order to allow for greater efficiency in fuel procurement, among others regulations. Additionally, the SE must develop mechanisms to transfer CAMMESA PPAs to distributors and large users.
| Earnings release Q2 25 ● |
The amendments of Laws No. 15,336 and 24,065 also set terms for hydroelectric concessions of up to 60 years, require re-bidding at expiration, and ensure the principle of free contracting among power producers, large users and free users in the WEM.
The amendments also introduce two new frameworks to expand the power transmission system. The first allows the SE to authorize expansion projects within existing concessions, financed through the National Power Energy Fund (‘Fondo Nacional de Energía Eléctrica’) and pass-through to end-user tariffs, prior consultation with CAMMESA. The second scheme enables privately led expansions at their own risk, granting priority access to the transportation capacity and the option to transfer to third parties. The investment repayment term caps the reserved capacity period.
Additionally, on May 30, 2025, the National Government extended the energy emergency for power generation, transmission, and distribution, and natural gas transportation and distribution until July 9, 2026 (DNU No. 370/25).
| 1.4 | Power generation |
Price updates for the legacy or spot scheme
| Effective as of: | Legacy energy/spot | |
| Increase | Resolution | |
| January 2025 | 4% | SE No. 603/24 |
| February 2025 | 4% | SE No. 27/25 |
| March 2025 | 1.5% | SE No. 113/25 |
| April 2025* | 1.5% | SE No. 143/25 |
| May 2025* | 2% | SE No. 177/25 |
| June 2025* | 1.5% | SE No. 227/25 |
| July 2025 | 1% | SE No. 280/25 |
| August 2025 | 0.4% | SE No. 331/25 |
Note: *These updates exclude hydro power plants undergoing a tender process (Alicurá, El Chocón-Arroyito, Cerros Colorados, and Piedra del Águila).
Extension of HIDISA and HINISA’s hydroelectric concessions
On June 5, 2025, the SE extended HIDISA’s transition period. Therefore, the national and provincial concessions will expire on October 19, 2025 (Res. SE No. 240/25).
As for HINISA, on May 26, 2025, the Province of Mendoza declared the system emergency and extended the transition period by 14 months, with prior authorization from the National Government (Law No. 9,630). The Company noted that such extension must be agreed upon with HINISA. However, since the national concession expired on June 1, 2025, and no final decision has been issued by the authorities, HINISA decided to continue operating in order to safeguard concession assets, electricity supply, and the safety of people and facilities. This does not imply acceptance by HINISA of the extension, new obligations, responsibilities, or waiver of rights under the existing Concession Agreements.
BESS Tender (Battery Energy Storage Systems)
In February 2025, the SE launched a national and international tender for battery energy storage projects totaling up to 500 MW in the Buenos Aires metro area, aimed at improving grid reliability (Res No. 67/25). The 15-year PPAs offered up to US$15,000/MW-month for capacity and US$10/MWh for energy delivered. CAMMESA will act as the guarantor of last resort. A total of 27 projects for 1,347 MW were submitted. Pampa participated in a 50 MW project at CTPP. The awards are scheduled for August 29, 2025.
| Earnings release Q2 25 ● |
| 1.5 | Transener and TGS |
Tariff updates
| Effective as of: | Transener/Transba | TGS | |||
| Increase | Resolution | Increase | Resolution | ||
| January 2025 | 4% | ENRE No. 1,065 y 1,066/24 | 2.5% | ENARGAS No. 915/24 | |
| February 2025 | 4% | ENRE No. 85 y 87/25 | 1.5% | ENARGAS No. 51/25 | |
| March 2025 | 2% | ENRE No. 158 y 154/25 | 1.7% | ENARGAS No. 124/25 | |
| April 2025 | 4% | ENRE No. 227 y 231/25 | 0% | NO-2025-32668903-APN-MEC | |
| May 2025 | 8.6%/2.1% | ENRE No. 305 y 312/25 | 0.1% | ENARGAS No. 256/25 | |
| June 2025 | 7.3%/4.1% | ENRE No. 388 y 383/25 | 3.0% | ENARGAS No. 350/25 | |
| July 2025 | 4.6%/1.5% | ENRE No. 451 y 454/25 | 0.8% | ENARGAS No. 421/25 | |
| August 2025 | 6.0%/2.9% | ENRE No. 549 and 555/25 | 1.8% | ENARGAS No. 539/25 | |
On June 4, 2025, the SE approved the new tariff adjustment mechanism for gas transportation, which combines 50% CPI and 50% PPI (Res. SE No. 241/25).
License extension for natural gas transportation
On July 24, 2025, the National Government extended TGS’s natural gas transportation license for 20 years, starting from its December 2027 expiration (DNU No. 495/25).
Normalization of TGS’s Cerri Complex
In early May 2025, TGS announced the full recovery of its Cerri Complex, which had been out of operation since the floods in Bahía Blanca on March 7, 2025, disrupting NGL production and gas transportation.
Tender to expand GPM
On May 22, 2025, ENARSA launched a tender to expand the GPM, following TGS’s private initiative proposal from June 2023. The goal is to increase the natural gas transportation capacity from Vaca Muerta by 14 mcmpd. Bids were submitted on July 28, 2025, with TGS as the sole bidder, and the award is scheduled on October 13, 2025. The expansion works is expected to be completed over approximately 18 months.
TGS dividend distribution
On April 30, 2025,
the TGS Shareholders’ Meeting approved a cash dividend distribution of US$202.7 million, equivalent to AR$266 per share or US$0.95
per ADR.
| Earnings release Q2 25 ● |
| 2. | Analysis of the Q2 25 results |
| Breakdown by segment Figures in US$ million |
Q2 25 | Q2 24 | Variation | ||||||
| Sales | Adjusted EBITDA | Net Income | Sales | Adjusted EBITDA | Net Income | Sales | Adjusted EBITDA | Net Income | |
| Oil and Gas | 204 | 87 | 20 | 218 | 121 | 27 | -6% | -28% | -26% |
| Power generation | 185 | 112 | (5) | 168 | 106 | 36 | +10% | +5% | NA |
| Petrochemicals | 122 | 3 | (13) | 134 | 15 | 15 | -9% | -80% | NA |
| Holding and Others | 5 | 38 | 38 | 7 | 46 | 22 | -29% | -17% | +73% |
| Eliminations | (30) | - | - | (27) | - | - | +10% | NA | NA |
| Total | 486 | 239 | 40 | 500 | 288 | 100 | -3% | -17% | -60% |
Note: Net income attributable to the Company’s shareholders.
| 2.1 | Reconciliation of consolidated adjusted EBITDA |
| Reconciliation of adjusted EBITDA, in US$ million |
First half | Second quarter | ||||
| 2025 | 2024 | 2025 | 2024 | |||
| Consolidated operating income | 234 | 238 | 113 | 119 | ||
| Consolidated depreciations and amortizations | 181 | 152 | 97 | 84 | ||
| Reporting EBITDA | 415 | 390 | 210 | 203 | ||
| Adjustments from oil and gas segment | (3) | (9) | (1) | (0) | ||
| Adjustments from generation segment | 15 | 73 | 14 | 71 | ||
| Adjustments from petrochemicals segment | (17) | (0) | (0) | (0) | ||
| Adjustments from holding & others segment | 50 | 20 | 17 | 14 | ||
| Consolidated adjusted EBITDA | 459 | 475 | 239 | 288 | ||
| At our ownership | 458 | 474 | 239 | 288 | ||
| Earnings release Q2 25 ● |
| 2.2 | Analysis of the oil and gas segment |
| Oil & gas segment, consolidated Figures in US$ million |
First half | Second quarter | ||||||
| 2025 | 2024 | ∆% | 2025 | 2024 | ∆% | |||
| Sales revenue | 350 | 368 | -5% | 204 | 218 | -6% | ||
| Domestic sales | 284 | 311 | -9% | 164 | 192 | -14% | ||
| Foreign market sales | 66 | 57 | +16% | 40 | 26 | +53% | ||
| Cost of sales | (270) | (234) | +15% | (152) | (135) | +13% | ||
| Gross profit | 80 | 134 | -40% | 52 | 83 | -37% | ||
| Selling expenses | (34) | (29) | +17% | (17) | (16) | +6% | ||
| Administrative expenses | (40) | (36) | +11% | (19) | (18) | +6% | ||
| Other operating income | 16 | 42 | -62% | 12 | 28 | -57% | ||
| Other operating expenses | (8) | (14) | -43% | (5) | (9) | -44% | ||
| Impairment of financial assets | (2) | (10) | -80% | (2) | (10) | -80% | ||
| Impairment on int. assets & inventories | (1) | - | NA | (1) | - | NA | ||
| Results for participation in joint businesses | 2 | - | NA | 2 | - | NA | ||
| Operating income | 13 | 87 | -85% | 22 | 58 | -62% | ||
| Finance costs | (55) | (49) | +12% | (30) | (23) | +30% | ||
| Other financial results | - | (14) | -100% | 4 | (10) | NA | ||
| Financial results, net | (55) | (63) | -13% | (26) | (33) | -21% | ||
| Loss before tax | (42) | 24 | NA | (4) | 25 | NA | ||
| Income tax | 13 | 51 | -75% | 24 | 2 | NA | ||
| Net (loss)/income for the period | (29) | 75 | NA | 20 | 27 | -26% | ||
| Adjusted EBITDA | 128 | 188 | -32% | 87 | 121 | -28% | ||
| Increases in PPE and right-of-use assets | 453 | 197 | +130% | 306 | 109 | +181% | ||
| Depreciation and amortization | 118 | 110 | +7% | 66 | 63 | +5% | ||
| Lifting cost | (103) | (83) | +25% | (58) | (44) | +31% | ||
| Lifting cost per boe | (7) | (6) | +31% | (8) | (5) | +42% | ||
The decline of 6% in Q2 25 sales from the oil and gas segment was mainly explained by reduced gas demand from milder weather, the expiration of Plan Gas winter peak commitments and lower export prices to Chile. These effects were partially offset by increased crude oil production in Rincón de Aranda and higher export volumes. Since May, in addition to supplying central Chile, Pampa began exporting on a take-or-pay basis to Chile’s BioBío region.
Regarding the operational performance, total production averaged 84.1 kboepd in Q2 25 (-7% vs. Q2 24, +16% vs. Q1 25), mainly explained by lower gas deliveries to retail and for thermal generation. Those effects were partially offset by higher gas exports to Chile and sustained oil production growth in Rincón de Aranda, where two new pads were tied in, alongside newly commissioned evacuation and processing infrastructure. The increase vs. Q1 25 reflected seasonal gas demand and increased contribution from Rincón de Aranda.
Gas production reached 12.9 mcmpd in Q2 25 (-11% vs. Q2 24 but +10% vs. Q1 25). Analyzing the gas output by block, El Mangrullo accounted for 58% of the total gas output, averaging 7.5 mcmpd (-19% vs. Q2 24, +16% vs. Q1 25), followed by Sierra Chata with 3.8 mcmpd, contributing 29% of the production (+14% vs. Q2 24, +6% vs. Q1 25). At non-operated blocks, Río Neuquén produced 1.3 mcmpd (-19% vs. Q2 24, -7% vs. Q1 25), while Rincón del Mangrullo continued its natural decline, producing 0.2 mcmpd (-17% vs. Q2 24, -4% vs. Q1 25). It is worth highlighting that in June, El Mangrullo and Sierra Chata delivered 8.7 and 4.7 mcmpd, respectively, boosted by winter demand. Sierra Chata hit an all-time high production record.
| Earnings release Q2 25 ● |
| Oil and gas' key performance indicators |
2025 | 2024 | Variation | |||||||||
| Oil | Gas | Total | Oil | Gas | Total | Oil | Gas | Total | ||||
| First half | ||||||||||||
| Volume | ||||||||||||
| Production | ||||||||||||
| In thousand m3/day | 0.9 | 12,375 | 0.8 | 13,098 | +15% | -6% | -4% | |||||
| In million cubic feet/day | 437 | 463 | ||||||||||
| In thousand boe/day | 5.6 | 72.8 | 78.5 | 4.9 | 77.1 | 82.0 | ||||||
| Sales | ||||||||||||
| In thousand m3/day | 0.8 | 12,434 | 0.7 | 13,179 | +14% | -6% | -5% | |||||
| In million cubic feet/day | 439 | 465 | ||||||||||
| In thousand boe/day | 5.1 | 73.2 | 78.3 | 4.5 | 77.6 | 82.0 | ||||||
| Average Price | ||||||||||||
| In US$/bbl | 63.7 | 70.4 | -9% | -4% | ||||||||
| In US$/MBTU | 3.5 | 3.7 | ||||||||||
| Second quarter | ||||||||||||
| Volume | ||||||||||||
| Production | ||||||||||||
| In thousand m3/day | 1.3 | 12,933 | 0.9 | 14,512 | +47% | -11% | -7% | |||||
| In million cubic feet/day | 457 | 513 | ||||||||||
| In thousand boe/day | 8.0 | 76.1 | 84.1 | 5.4 | 85.4 | 90.8 | ||||||
| Sales | ||||||||||||
| In thousand m3/day | 1.0 | 12,975 | 0.8 | 14,550 | +30% | -11% | -9% | |||||
| In million cubic feet/day | 458 | 514 | ||||||||||
| In thousand boe/day | 6.6 | 76.4 | 82.9 | 5.0 | 85.6 | 90.7 | ||||||
| Average Price | ||||||||||||
| In US$/bbl | 61.6 | 71.8 | -14% | -1% | ||||||||
| In US$/MBTU | 4.0 | 4.0 | ||||||||||
Note: The net production in Argentina. The gas volume is standardized at 9,300 kilocalories (kCal).
Our gas price in Q2 25 averaged US$4.0 per MBTU (flat vs. Q2 24, +31% vs. Q1 25, due to seasonality). Although export prices to Chile decreased due to a lower reference price, this was partially offset by tariff increases to the retail segment and a marginal improvement in industrial prices.
Regarding our gas deliveries breakdown by customer, during Q2 25, 52% was destined for thermal power generation and 29% to distribution companies, both under the Plan Gas GSA. 9% supplied the industrial/spot market, 8% was exported, and the remaining 3% was sold to our petchem plants. Compared to Q2 24, 58% was allocated for thermal power units, 26% supplied the retail segment, 9% was sold to the industrial/spot market, 4% was exported, and the remaining 3% was sold to our petchem plants.
Oil production reached 8.0 kbpd in Q2 25 (+47% vs. Q2 24, 2.5x vs. Q1 25), explained by the ramp-up of shale oil production in Rincón de Aranda, which averaged 5.3 kbpd in Q2 25 (+4.1 kbpd vs. Q2 24, +4.4 kbpd vs Q1 25) thanks to the tie-in of 8 new wells, together with the commissioning of the temporary processing facility (TPF), internal pipelines and the Duplicar oil trunk pipeline in April. This growth was partially offset by the sale of our non-operated stake at Gobernador Ayala in October 2024 (-1.1 kbpd vs. Q2 24), and lower volumes at non-operated conventional crude oil blocks El Tordillo (-0.8 kbpd vs. Q2 24) and Los Blancos (-0.2 kbpd vs. Q2 24). Notably, 2 new wells targeting Vaca Muerta were tied-in in Río Neuquén in Q2 25, marking the block’s first shale development.
The oil price averaged US$61.6 per barrel, mainly reflecting the drop in Brent prices, which had a greater impact on exports. Without Rincón de Aranda’s partial price hedging in place since April 2025, the average oil price would have been US$58.5 per barrel. Moreover, exports grew significantly, accounting for 55% of sales in Q2 25, compared to 32% in Q2 24.
| Earnings release Q2 25 ● |
The lifting cost4 recorded US$58 million in Q2 25 (+31% vs. Q2 24, +28% vs. Q1 25), explained by higher gas treatment expenses and the lease of the temporary processing facility at Rincón de Aranda. The lifting cost per boe rose 42% to US$7.6 per boe produced in Q2 25 vs. US$5.3 per boe in Q2 24, mainly explained by Rincón de Aranda. The moderate increase in lifting cost per boe vs. Q1 25 was due to the commissioning of proprietary facilities, replacing truck-based evacuation.
Excluding depreciation and amortization, other operating costs remained flat vs. Q2 24, with higher inventory-related expenses, offset by lower freight costs. Compared to Q1 25, royalties and levies increased due to higher seasonal output.
Other operating income and expenses dropped 63% vs Q2 24, mainly due to the Plan Gas income, a compensation paid by the Government to the price agreed in said contract for the retail segment that, due to the consecutive tariff increases, fell 41% vs. Q2 24 to US$11 million. Improved collections from CAMMESA and ENARSA substantially reduced commercial interest income (-98% vs. Q2 24). Compared to Q1 25, Plan Gas compensation increased, explained by seasonality.
Financial results in Q2 25 recorded net losses of US$26 million, a 21% improvement vs. Q2 24, mainly explained by higher gains on financial instruments, partially offset by higher expenses from redeeming 2029 Notes and FX losses from higher devaluation, which impacted the segment’s net monetary asset position in AR$.
| Reconciliation of adjusted EBITDA from oil & gas, in US$ million |
First half | Second quarter | ||||
| 2025 | 2024 | 2025 | 2024 | |||
| Consolidated operating income | 13 | 87 | 22 | 58 | ||
| Consolidated depreciations and amortizations | 118 | 110 | 66 | 63 | ||
| Reporting EBITDA | 131 | 197 | 88 | 121 | ||
| Deletion of int. assets & inventories' impairment | 1 | - | 1 | - | ||
| Deletion of gain from commercial interests | (2) | (13) | (0) | (7) | ||
| Deletion of CAMMESA's receivable impairment | - | 4 | - | 7 | ||
| Deletion of SESA's equity income | (2) | - | (2) | - | ||
| Adjusted EBITDA from oil & gas | 128 | 188 | 87 | 121 | ||
Our oil and gas adjusted EBITDA amounted to US$87 million in Q2 25 (-28% vs. Q2 24, +113% vs. Q1 25), mainly explained by weaker gas demand, the expiration of winter peak Plan Gas GSA, and higher lifting costs from Rincón de Aranda’s development. These impacts were partially offset by higher export volumes and the production ramp-up in Rincón de Aranda. Seasonal gas deliveries and higher crude oil sales explain the quarter-on-quarter improvement in EBITDA. The adjusted EBITDA excludes non-recurring and non-cash income and expenses, as well as overdue commercial interests and equity income from affiliates.
Finally, capital expenditures amounted to US$306 million (+181% vs. Q2 24, +109% vs Q1 25), of which 81% was destined for the development of Rincón de Aranda.
4 It only considers maintenance, treatment, internal transportation and wellhead staff costs. It does not include amortizations and depreciations.
| Earnings release Q2 25 ● |
| 2.3 | Analysis of the power generation segment |
| Power generation segment, consolidated Figures in US$ million |
First half | Second quarter | ||||||
| 2025 | 2024 | ∆% | 2025 | 2024 | ∆% | |||
| Sales revenue | 380 | 322 | +18% | 185 | 168 | +10% | ||
| Cost of sales | (205) | (158) | +30% | (102) | (81) | +26% | ||
| Gross profit | 175 | 164 | +7% | 83 | 87 | -5% | ||
| Selling expenses | (2) | (1) | +100% | (1) | - | NA | ||
| Administrative expenses | (21) | (25) | -16% | (10) | (12) | -17% | ||
| Other operating income | 13 | 32 | -59% | 7 | 15 | -53% | ||
| Other operating expenses | (5) | (7) | -29% | (4) | (4) | - | ||
| Impairment of financial assets | - | (46) | -100% | - | (12) | -100% | ||
| Results for participation in joint businesses | 7 | (38) | NA | (6) | (59) | -90% | ||
| Operating income | 167 | 79 | +111% | 69 | 15 | NA | ||
| Finance income | 8 | 2 | +300% | 2 | 1 | +100% | ||
| Finance costs | (25) | (28) | -11% | (13) | (11) | +18% | ||
| Other financial results | 80 | 80 | - | 49 | 27 | +81% | ||
| Financial results, net | 63 | 54 | +17% | 38 | 17 | +124% | ||
| Profit before tax | 230 | 133 | +73% | 107 | 32 | +234% | ||
| Income tax | (111) | 100 | NA | (113) | 3 | NA | ||
| Net income for the period | 119 | 233 | -49% | (6) | 35 | NA | ||
| Attributable to owners of the Company | 119 | 233 | -49% | (5) | 36 | NA | ||
| Attributable to non-controlling interests | - | - | NA | (1) | (1) | - | ||
| Adjusted EBITDA | 242 | 192 | +26% | 112 | 106 | +5% | ||
| Adjusted EBITDA at our share ownership | 240 | 192 | +25% | 111 | 106 | +5% | ||
| Increases in PPE and right-of-use assets | 28 | 43 | -35% | 20 | 19 | +4% | ||
| Depreciation and amortization | 60 | 40 | +50% | 29 | 20 | +45% | ||
In Q2 25, power generation sales rose 10% year-on-year, mainly driven by the contribution of PEPE 6, which has been fully online since November 2024 with 140 MW of installed capacity, in addition to increased spot energy prices measured in US$, and higher fuel, transport and electricity tariffs recognition. However, this income was offset by associated costs.
Improved spot prices mainly benefited capacity payments: open cycles (GT and ST) averaged US$4.8 thousand per MW-month (+22% vs. Q2 24, -12% vs. Q1 25); hydros earned US$2.3 thousand per MW-month (+16% vs. Q2 24, -6% vs. Q1 25); and CCGTs invoiced US$5.3 thousand per MW-month (+11% vs. Q2 24, -10% vs. Q1 25). Compared to Q1 25, the capacity payments decline because the 5% remuneration increase in AR$ was not enough to offset the 12% currency devaluation during the quarter. CCGTs remain the only technology under the legacy pricing scheme with partial US$ income (Res. SE No. 59/23).
These variations were offset by lower dispatch levels due to scheduled maintenance at CTLL’s GT01 and the ongoing outage of two out of three HINISA dams since January 2025. Compared to Q1 25, the slight drop in sales is explained by lower load factor and spot prices in US$.
The operational performance of Pampa’s operated power generation dropped 7% year-on-year, while the national power grid remained stable, mainly explained by scheduled overhaul in CTLL (-477 GWh) and the upgrade works in CTEB’s CCGT (-326 GWh), in addition to lower hydro output mainly from HINISA (-125 GWh). These effects were partially offset by higher gas supply through GPM in CTGEBA (+278 GWh) and CPB (+144 GWh), in addition to PEPE 6’s contribution (+142 GWh).
The total availability of Pampa’s operated units was 91.6% in Q2 25 vs 98.1% in Q2 24 (-649 basis points), affected by CTLL’s GT01 overhaul in April and May, and forced outages in HINISA since January and CPB in June. These variations were partially offset by PEPE 6. Thermal availability dropped 325 basis points, reaching 94.3% in Q2 25.
| Earnings release Q2 25 ● |
| Power generation's key performance indicators |
2025 | 2024 | Variation | ||||||||||||
| Wind | Hydro | Thermal | Total | Wind | Hydro | Thermal | Total | Wind | Hydro | Thermal | Total | ||||
| Installed capacity (MW) | 427 | 938 | 4,107 | 5,472 | 332 | 938 | 4,107 | 5,377 | +28% | - | - | +2% | |||
| New capacity (%) | 100% | - | 33% | 32% | 100% | - | 33% | 31% | - | - | - | +1% | |||
| Market share (%) | 1.0% | 2.1% | 9.4% | 12.5% | 0.8% | 2.2% | 9.4% | 12.3% | +0% | -0% | -0% | +0% | |||
| First half | |||||||||||||||
| Net generation (GWh) | 824 | 777 | 9,054 | 10,655 | 502 | 1,100 | 9,392 | 10,995 | +64% | -29% | -4% | -3% | |||
| Volume sold (GWh) | 826 | 777 | 9,469 | 11,072 | 504 | 1,100 | 9,774 | 11,378 | +64% | -29% | -3% | -3% | |||
| Average price (US$/MWh) | 69 | 21 | 39 | 40 | 72 | 14 | 34 | 34 | -3% | +49% | +13% | +17% | |||
| Average gross margin (US$/MWh) | 54 | 10 | 24 | 25 | 68 | 5 | 22 | 22 | -21% | +89% | +9% | +13% | |||
| Second quarter | |||||||||||||||
| Net generation (GWh) | 406 | 293 | 4,006 | 4,704 | 259 | 418 | 4,391 | 5,067 | +57% | -30% | -9% | -7% | |||
| Volume sold (GWh) | 406 | 293 | 4,210 | 4,909 | 258 | 418 | 4,559 | 5,234 | +57% | -30% | -8% | -6% | |||
| Average price (US$/MWh) | 69 | 24 | 42 | 43 | 72 | 19 | 38 | 38 | -5% | +27% | +11% | +14% | |||
| Average gross margin (US$/MWh) | 57 | 9 | 24 | 26 | 72 | 9 | 24 | 25 | -20% | +8% | +2% | +5% | |||
Note: Gross margin before amortization and depreciation. It includes CTEB (co-operated by Pampa, 50% equity stake).
Excluding depreciation and amortizations, net operating costs increased by 15% to US$84 million in Q2 25, mainly explained by higher energy purchases and maintenance expenses due to lower capital activation. Reduced labor and insurance costs offset these effects. Compared to Q1 25, operating expenses remained stable, with increased power purchases offset by lower maintenance and material costs.
Other operating income and expenses fell 73% vs Q2 24, mainly due to lower overdue interest from CAMMESA, offset by higher insurance recoveries.
Financial results in Q2 25 reached a net profit of US$38 million, up 124% vs. Q2 24, due to higher gains on financial instruments, partially offset by increased expenses related to the redemption of 2029 Notes.
| Reconciliation of adjusted EBITDA from power generation, in US$ million | First half | Second quarter | ||||
| 2025 | 2024 | 2025 | 2024 | |||
| Consolidated operating income | 167 | 79 | 69 | 15 | ||
| Consolidated depreciations and amortizations | 60 | 40 | 29 | 20 | ||
| Reporting EBITDA | 227 | 119 | 98 | 35 | ||
| Deletion of CTEB's equity income | (7) | 38 | 6 | 59 | ||
| Deletion of commercial interests to CAMMESA | (2) | (26) | (1) | (13) | ||
| Deletion of CAMMESA's receivable impairment | - | 32 | - | 12 | ||
| Deletion of PPE activation in operating expenses | - | 2 | - | 1 | ||
| Deletion of provision in hydros | 0 | 3 | - | 2 | ||
| CTEB's EBITDA, at our 50% ownership | 23 | 25 | 9 | 11 | ||
| Adjusted EBITDA from power generation | 242 | 192 | 112 | 106 | ||
Adjusted EBITDA for the power generation segment was US$112 million, a 5% increase year-on-year, supported by PEPE 6’s commissioning, resilient spot prices measured in US$ and increased insurance recoveries. These effects were partially offset by higher power purchases and operating costs, in addition to reduced thermal availability due to programmed maintenance. Adjusted EBITDA excludes non-operating, non-recurrent and non-cash items and considers CTEB’s 50% ownership, which posted US$9 million in Q2 25 (-21% vs. Q2 24), explained by the CCGT enhancement. Quarter-on-quarter, the 14% decline in EBITDA is explained by lower spot prices in US$ and operating availability.
Finally, excluding CTEB, capital expenditures totaled US$20 million in Q2 25 vs. US$19 million in Q2 24, mainly allocated to maintenance.
| Earnings release Q2 25 ● |
| 2.4 | Analysis of the petrochemicals segment |
| Petrochemicals segment, consolidated Figures in US$ million |
First half | Second quarter | ||||||
| 2025 | 2024 | ∆% | 2025 | 2024 | ∆% | |||
| Sales revenue | 214 | 254 | -16% | 122 | 134 | -9% | ||
| Domestic sales | 131 | 155 | -15% | 74 | 79 | -7% | ||
| Foreign market sales | 83 | 99 | -16% | 48 | 54 | -12% | ||
| Cost of sales | (206) | (226) | -9% | (116) | (118) | -2% | ||
| Gross profit | 8 | 28 | -71% | 6 | 16 | -63% | ||
| Selling expenses | (6) | (6) | - | (3) | (4) | -25% | ||
| Administrative expenses | (3) | (3) | - | (1) | (1) | - | ||
| Other operating income | 19 | 8 | +138% | - | 5 | -100% | ||
| Other operating expenses | (5) | (3) | +67% | (1) | (2) | -50% | ||
| Operating income | 13 | 24 | -46% | 1 | 14 | -93% | ||
| Finance income | 27 | - | NA | - | - | NA | ||
| Finance costs | - | (2) | -100% | - | (1) | -100% | ||
| Other financial results | 3 | 1 | +200% | 4 | 1 | +300% | ||
| Financial results, net | 30 | (1) | NA | 4 | - | NA | ||
| Profit before tax | 43 | 23 | +87% | 5 | 14 | -64% | ||
| Income tax | (14) | 3 | NA | (18) | 1 | NA | ||
| Net income for the period | 29 | 26 | +12% | (13) | 15 | NA | ||
| Adjusted EBITDA | (1) | 26 | NA | 3 | 15 | -80% | ||
| Increases in PPE | 6 | 3 | +100% | 3 | 2 | +50% | ||
| Depreciation and amortization | 3 | 2 | +50% | 2 | 1 | +100% | ||
| Reconciliation of adjusted EBITDA from petrochemicals, in US$ million | First half | Second quarter | ||||
| 2025 | 2024 | 2025 | 2024 | |||
| Consolidated operating income | 13 | 24 | 1 | 14 | ||
| Consolidated depreciations and amortizations | 3 | 2 | 2 | 1 | ||
| Reporting EBITDA | 16 | 26 | 3 | 15 | ||
| Deletion of gain from commercial interests | (0) | (0) | (0) | (0) | ||
| Deletion of contingencies adjustment | (17) | - | - | - | ||
| Adjusted EBITDA from petrochemicals | (1) | 26 | 3 | 15 | ||
The adjusted EBITDA for the petrochemicals segment was US$3 million in Q2 25, down from US$15 million in Q2 24, mainly due to lower prices across all products, reflecting the trend on international reference prices and, to a lesser extent, reduced SBR demand and a non-recurrent US$4 million profit from the settlement of exports at a differential FX in Q2 24. These effects were partially offset by higher sales volumes of reformer products and styrene. Higher EBITDA compared to Q1 25 is explained by the reformer plant’s scheduled overhaul during that quarter.
The total volume sold reached 125 thousand tons (+12% vs. Q2 24, +49% vs. Q1 25), boosted by increased exports of isomerized naphtha and domestic sales of solvents, octane bases and styrene. These effects were partially offset by lower SBR volumes and, to a lesser extent, polystyrene due to a plant overhaul in April and May 2025.
In Q2 25, financial results from the petrochemicals segment showed a profit of US$4 million, compared to a break-even in Q2 24, mainly due to FX gains from a steeper AR$ devaluation over net liability position in that currency, and higher gains on financial instruments.
| Earnings release Q2 25 ● |
| Petrochemicals' key performance indicators |
Products | Total | ||||
| Styrene & polystyrene1 | SBR | Reforming & others | ||||
| First half | ||||||
| Volume sold 2025 (thousand ton) | 42 | 20 | 147 | 209 | ||
| Volume sold 2024 (thousand ton) | 42 | 22 | 157 | 221 | ||
| Variation 2025 vs. 2024 | -0% | -11% | -6% | -6% | ||
| Average price 2025 (US$/ton) | 1,523 | 1,742 | 787 | 1,025 | ||
| Average price 2024 (US$/ton) | 1,794 | 1,798 | 885 | 1,149 | ||
| Variation 2025 vs. 2024 | -15% | -3% | -11% | -11% | ||
| Second quarter | ||||||
| Volume sold Q2 25 (thousand ton) | 22 | 9 | 93 | 125 | ||
| Volume sold Q2 24 (thousand ton) | 19 | 12 | 80 | 111 | ||
| Variation Q2 25 vs. Q2 24 | +17% | -26% | +17% | +12% | ||
| Average price Q2 25 (US$/ton) | 1,510 | 1,715 | 781 | 978 | ||
| Average price Q2 24 (US$/ton) | 1,891 | 1,933 | 924 | 1,199 | ||
| Variation Q2 25 vs. Q2 24 | -20% | -11% | -15% | -18% | ||
Note: 1 Includes Propylene.
| 2.5 | Analysis of the holding and others segment |
| Holding and others segment, consolidated Figures in US$ million |
First half | Second quarter | ||||||
| 2025 | 2024 | ∆% | 2025 | 2024 | ∆% | |||
| Sales revenue | 12 | 10 | +20% | 5 | 7 | -29% | ||
| Cost of sales | - | - | NA | - | - | NA | ||
| Gross profit | 12 | 10 | +20% | 5 | 7 | -29% | ||
| Selling expenses | (1) | - | NA | (1) | - | NA | ||
| Administrative expenses | (20) | (19) | +5% | (11) | (11) | - | ||
| Other operating income | 5 | 1 | NA | 2 | - | NA | ||
| Other operating expenses | (22) | (28) | -21% | (8) | (6) | +33% | ||
| Income from the sale of associates | - | 7 | -100% | - | 5 | -100% | ||
| Results for participation in joint businesses | 67 | 77 | -13% | 34 | 37 | -8% | ||
| Operating income | 41 | 48 | -15% | 21 | 32 | -34% | ||
| Finance income | - | - | NA | - | (2) | -100% | ||
| Finance costs | (19) | (15) | +27% | (15) | (5) | +200% | ||
| Other financial results | 39 | 7 | NA | 28 | 4 | NA | ||
| Financial results, net | 20 | (8) | NA | 13 | (3) | NA | ||
| Profit before tax | 61 | 40 | +53% | 34 | 29 | +17% | ||
| Income tax | 13 | (7) | NA | 4 | (7) | NA | ||
| Net income for the period | 74 | 33 | +124% | 38 | 22 | +73% | ||
| Adjusted EBITDA | 91 | 69 | +33% | 38 | 46 | -17% | ||
| Increases in PPE | 4 | 2 | +117% | 2 | 1 | +134% | ||
| Depreciation and amortization | - | - | NA | - | - | NA | ||
The holding and others segment, excluding equity income from affiliates TGS and Transener, posted a higher loss on operating margin of US$13 million in Q2 25 compared to US$10 million in Q2 24, mainly explained by lower fee income, partially offset by reduced labor costs.
In Q2 25, financial results showed a net profit of US$13 million vs. a US$3 million loss in Q2 24, driven by FX gains from the sharper AR$ devaluation over the net liability position in that currency, partially offset by higher tax interest expenses.
| Earnings release Q2 25 ● |
| Reconciliation of adjusted EBITDA from holding and others, in US$ million | First half | Second quarter | ||||
| 2025 | 2024 | 2025 | 2024 | |||
| Consolidated operating income | 41 | 48 | 21 | 32 | ||
| Consolidated depreciations and amortizations | - | - | - | - | ||
| Reporting EBITDA | 41 | 48 | 21 | 32 | ||
| Deletion of equity income | (67) | (77) | (34) | (37) | ||
| Deletion of gain from commercial interests | - | (0) | - | - | ||
| Deletion of contigencies provision | - | 16 | - | - | ||
| Deletion of the sale of associates | - | (7) | - | (5) | ||
| Deletion of arbitration costs in OCP | 8 | - | - | - | ||
| TGS's EBITDA adjusted by ownership | 82 | 73 | 37 | 46 | ||
| Transener's EBITDA adjusted by ownership | 27 | 15 | 14 | 10 | ||
| Adjusted EBITDA from holding and others | 91 | 68 | 38 | 46 | ||
The adjusted EBITDA from our holding and others segment excludes non-operating, non-recurring and non-cash items and includes the EBITDA adjusted by equity ownership in TGS and Transener. In Q2 25, adjusted EBITDA was US$38 million, down 17% from US$46 million in Q2 24, mainly due to lower contribution from TGS.
In TGS, the EBITDA adjusted by our stake was US$37 million in Q2 25, down from US$46 million in Q2 24, impacted by reduced NGL volumes produced due to the Cerri flood. Operations fully resumed in May 2025. Asset impairments/recoveries from said event were excluded from EBITDA. In addition, tariff increases in the regulated segment did not keep pace with inflation and AR$ devaluation. Midstream growth in Vaca Muerta partially offset these effects.
In
Transener, the EBITDA adjusted by our stake was US$14 million
in Q2 25, up from US$10 million recorded in Q2 24, mainly due to tariff hikes exceeding
inflation and devaluation.
| Earnings release Q2 25 ● |
| 3. | Cash and financial borrowings |
| As of June 30, 2025, in US$ million |
Cash1 | Financial debt | Net debt | |||||||
| Consolidated in FS |
Ownership adjusted | Consolidated in FS |
Ownership adjusted | Consolidated in FS |
Ownership adjusted | |||||
| Power generation | 879 | 871 | 405 | 405 | (474) | (466) | ||||
| Petrochemicals | - | - | - | - | - | - | ||||
| Holding and others | - | - | - | - | - | - | ||||
| Oil and gas | - | - | 1,186 | 1,186 | 1,186 | 1,186 | ||||
| Total under IFRS/Restricted Group | 879 | 871 | 1,591 | 1,591 | 712 | 720 | ||||
| Affiliates at O/S2 | 201 | 201 | 253 | 253 | 52 | 52 | ||||
| Total with affiliates | 1,080 | 1,072 | 1,845 | 1,845 | 765 | 773 | ||||
Note: Financial debt includes accrued interest. 1 It includes cash and cash equivalents, financial assets at fair value with changing results, and investments at amortized cost. 2 Under IFRS, the affiliates CTBSA, Transener and TGS are excluded from Pampa’s consolidated figures.
| 3.1 | Debt transactions |
As of June 30, 2025, Pampa’s financial debt under IFRS amounted to US$1,591 million, 23% less compared to year-end 2024. This decrease is mainly explained by the early redemption of the 2027 Notes for US$353 million and 2029 Notes for US$300 million, funded with proceeds from the issuance of new 2034 Notes. The gross debt principal breakdown is shown below:
| Currency | Type of issuance |
Amount in million US$ |
Legislation | % over total gross debt |
Average coupon |
| US$ | US$1 | 1,230 | Foreign | 77% | 8.1% |
| US$ | 136 | Argentine | 9% | 5.2% | |
| US$ MEP | 140 | Argentine | 9% | 5.4% | |
| AR$ | US$-link | 88 | Argentine | 6% | 0% |
However, the net debt increased to US$712 million, reflecting higher seasonal working capital and increased capital expenditures, mostly destined for Rincón de Aranda.
Through proactive liability management, Pampa continues to strengthen its debt profile, extending the average life to 6.2 years. The chart below shows the principal maturity profile, net of repurchases, in US$ million by the end of Q2 25:
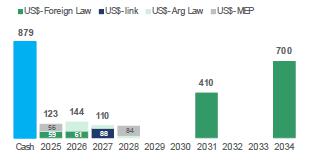 |
Note : The chart only considers Pampa’s consolidated figures under IFRS, and excludes affiliates TGS, Transener, and CTBSA. The cash position includes cash and cash equivalents, financial assets at fair value with changing results, and investments at amortized cost. |
During Q2 25, in addition to the retap of 2034 Notes and the early redemption of the 2029 Notes, Pampa redeemed CB Series 18 for US$72 million, canceled bank debt for US$40 million and repurchased CB Series 13 at a discount for a US$8 million face value.
After quarter-end, Pampa issued CB Series 25 for US$105 million, maturing in three years and at an annual fixed rate of 7.25%, with semiannual payments.
| Earnings release Q2 25 ● |
Regarding our affiliates, in Q2 25, CTEB obtained net bank borrowings of US$9 million and early redeemed CB Series 6 for US$84 million. Post-quarter, CTEB canceled US$15 million in bank borrowings.
As of today, Pampa remains in full compliance with all debt covenants.
| 3.2 | Summary of debt securities |
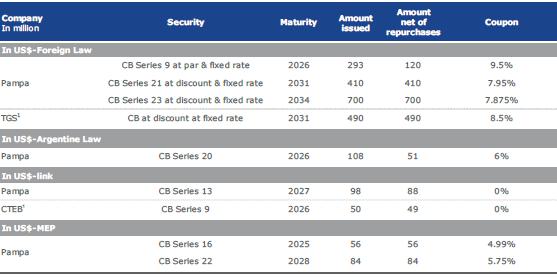
Note: 1 Under IFRS, affiliates are not consolidated in Pampa’s FS.
| 3.3 | Credit ratings |
In July 2025, Moody’s upgraded Pampa’s rating from ‘Caa1’ to ‘B2’, in line with the Argentine Government’s rating upgrade from ‘Caa3’ positive to ‘Caa1’ stable, and the country ceiling in foreign exchange from ‘Caa1’ to ‘B2’. The report highlights Pampa’s strong market position, robust liquidity, and solid debt structure. In addition, S&P raised Pampa’s stand-alone credit rating from ‘b+’ to ‘bb-’.
| Company | Agency | Rating | |
| Global | Local | ||
| Pampa | S&P | B-, bb- (stand-alone) | na |
| Moody's | B2 | na | |
| FitchRatings | B- | AAA (long-term)1 A1+ (short-term)1 |
|
| TGS | S&P | B-, b+ (stand-alone) | na |
| FitchRatings | B- | na | |
| Transener | FitchRatings | na | A+ (long-term)1 |
| CTEB | FitchRatings | na | AA+1 |
Note: 1 Issued
by FIX SCR.
| Earnings release Q2 25 ● |
| 4. | Appendix |
| 4.1 | Analysis of the first half, by subsidiary and segment |
| Subsidiary In US$ million |
First half 2025 | First half 2024 | |||||||
| % Pampa | Adjusted EBITDA | Net debt2 |
Net income3 |
% Pampa | Adjusted EBITDA | Net debt2 |
Net income3 |
||
| Oil & gas segment | |||||||||
| Pampa Energía | 100.0% | 128 | 1,186 | (29) | 100.0% | 188 | 1,046 | 75 | |
| Subtotal oil & gas | 128 | 1,186 | (29) | 188 | 1,046 | 75 | |||
| Power generation segment | |||||||||
| Diamante | 61.0% | 4 | (0) | 2 | 61.0% | 2 | (0) | 0 | |
| Los Nihuiles | 52.0% | (0) | (0) | (2) | 52.0% | (0) | (0) | (1) | |
| VAR | 100.0% | 8 | - | 3 | 100.0% | 10 | (0) | 7 | |
| CTBSA | 46 | 173 | 14 | 50 | 216 | (82) | |||
| Non-controlling stake adjustment | (23) | (86) | (7) | (25) | (108) | 41 | |||
| Subtotal CTBSA adjusted by ownership | 50.0% | 23 | 86 | 7 | 50.0% | 25 | 108 | (41) | |
| Pampa stand-alone, other companies, & adj.1 | 100.0% | 207 | (474) | 109 | 100% | 156 | (365) | 268 | |
| Subtotal power generation | 242 | (388) | 119 | 192 | (257) | 233 | |||
| Petrochemicals segment | |||||||||
| Pampa Energía | 100.0% | (1) | - | 29 | 100.0% | 26 | - | 26 | |
| Subtotal petrochemicals | (1) | - | 29 | 26 | - | 26 | |||
| Holding & others segment | |||||||||
| Transener | 102 | (127) | 61 | 57 | (44) | 27 | |||
| Non-controlling stake adjustment | (75) | 93 | (45) | (42) | 33 | (20) | |||
| Subtotal Transener adjusted by ownership | 26.3% | 27 | (33) | 16 | 26.3% | 15 | (12) | 7 | |
| TGS | 315 | (2) | 133 | 282 | (35) | 167 | |||
| Non-controlling stake adjustment | (233) | 1 | (97) | (209) | 26 | (124) | |||
| Subtotal TGS adjusted by ownership | 26.9% | 82 | (1) | 36 | 25.9% | 73 | (9) | 43 | |
| Pampa stand-alone, other companies, & adj.1 | 100.0% | (18) | - | 22 | 100% | (20) | 9 | (17) | |
| Subtotal holding & others | 91 | (34) | 74 | 68 | (12) | 33 | |||
| Deletions | 100% | - | (52) | - | 100% | - | (87) | - | |
| Total consolidated | 459 | 712 | 193 | 475 | 691 | 367 | |||
| At our share ownership | 458 | 765 | 193 | 474 | 778 | 367 | |||
Note: 1 The
deletion corresponds to other companies or inter-companies. 2 Net debt includes holding companies. 3 Attributable to the
Company’s shareholders.
| Earnings release Q2 25 ● |
| 4.2 | Analysis of the quarter, by subsidiary and segment |
| Subsidiary In US$ million |
Q2 25 | Q2 24 | |||||||
| % Pampa | Adjusted EBITDA |
Net debt3 |
Net income4 |
% Pampa | Adjusted EBITDA |
Net debt3 |
Net income4 |
||
| Oil & gas segment | |||||||||
| Pampa Energía | 100.0% | 87 | 1,186 | 20 | 100.0% | 121 | 1,046 | 27 | |
| Subtotal oil & gas | 87 | 1,186 | 20 | 121 | 1,046 | 27 | |||
| Power generation segment | |||||||||
| Diamante | 61.0% | 1 | (0) | 51 | 61.0% | 1 | (0) | (1) | |
| Los Nihuiles | 52.0% | 0 | (0) | (2) | 52.0% | (1) | (0) | (3) | |
| VAR | 100.0% | 4 | - | 52 | 100.0% | 6 | (0) | 3 | |
| CTBSA | 18 | 173 | (11) | 22 | 216 | (131) | |||
| Non-controlling stake adjustment | (9) | (86) | 5 | (11) | (108) | 66 | |||
| Subtotal CTBSA adjusted by ownership | 50.0% | 9 | 86 | (5) | 50.0% | 11 | 108 | (66) | |
| Pampa stand-alone, other companies, & adj.2 | 100.0% | 98 | (474) | (101) | 100% | 89 | (365) | 102 | |
| Subtotal power generation | 112 | (388) | (5) | 106 | (257) | 36 | |||
| Petrochemicals segment | |||||||||
| Pampa Energía | 100.0% | 3 | - | (13) | 100.0% | 15 | - | 15 | |
| Subtotal petrochemicals | 3 | - | (13) | 15 | - | 15 | |||
| Holding & others segment | |||||||||
| Transener | 54 | (127) | 32 | 36 | (44) | 15 | |||
| Non-controlling stake adjustment | (40) | 93 | (24) | (27) | 33 | (11) | |||
| Subtotal Transener adjusted by ownership | 26.3% | 14 | (33) | 9 | 26.3% | 10 | (12) | 4 | |
| TGS | 136 | (2) | 33 | 179 | (35) | 102 | |||
| Non-controlling stake adjustment | (99) | 1 | (24) | (133) | 26 | (75) | |||
| Subtotal TGS adjusted by ownership | 26.9% | 37 | (1) | 9 | 25.9% | 46 | (9) | 26 | |
| Pampa stand-alone, other companies, & adj.2 | 100.0% | (13) | - | 20 | 100% | (10) | 9 | (8) | |
| Subtotal holding & others | 38 | (34) | 38 | 46 | (12) | 22 | |||
| Deletions | 100% | - | (52) | - | 100% | - | (87) | - | |
| Total consolidated | 239 | 712 | 40 | 288 | 691 | 100 | |||
| At our share ownership | 239 | 765 | 40 | 288 | 778 | 100 | |||
Note:
1 The deletion corresponds to other companies or inter-companies. 2 Net debt
includes holding companies. 3 Attributable to the Company’s shareholders.
| Earnings release Q2 25 ● |
| 4.3 | Consolidated balance sheet |
| Figures in million | As of 06.30.2025 | As of 12.31.2024 | ||||
| AR$ | US$ | AR$ | US$ | |||
| ASSETS | ||||||
| Property, plant and equipment | 3,519,259 | 2,921 | 2,690,533 | 2,607 | ||
| Intangible assets | 111,806 | 92 | 99,170 | 95 | ||
| Right-of-use assets | 11,481 | 10 | 11,330 | 11 | ||
| Deferred tax asset | 139,295 | 116 | 161,694 | 157 | ||
| Investments in associates and joint ventures | 1,274,813 | 1,058 | 1,024,769 | 993 | ||
| Financial assets at amortized cost | - | - | - | - | ||
| Financial assets at fair value through profit and loss | 32,842 | 27 | 28,127 | 27 | ||
| Other assets | 436 | - | 366 | - | ||
| Trade and other receivables | 166,569 | 139 | 76,798 | 75 | ||
| Total non-current assets | 5,256,501 | 4,363 | 4,092,787 | 3,965 | ||
| Inventories | 294,050 | 244 | 230,095 | 223 | ||
| Financial assets at amortized cost | 51,012 | 42 | 82,628 | 80 | ||
| Financial assets at fair value through profit and loss | 814,863 | 676 | 877,623 | 850 | ||
| Derivative financial instruments | 45,748 | 38 | 979 | 1 | ||
| Trade and other receivables | 720,687 | 598 | 503,529 | 488 | ||
| Cash and cash equivalents | 193,570 | 161 | 761,231 | 738 | ||
| Total current assets | 2,119,930 | 1,759 | 2,456,085 | 2,380 | ||
| Total assets | 7,376,431 | 6,122 | 6,548,872 | 6,345 | ||
| EQUITY | ||||||
| Equity attributable to owners of the company | 4,199,021 | 3,485 | 3,391,127 | 3,286 | ||
| Non-controlling interest | 10,344 | 9 | 9,167 | 9 | ||
| Total equity | 4,209,365 | 3,494 | 3,400,294 | 3,295 | ||
| LIABILITIES | ||||||
| Provisions | 125,411 | 104 | 141,436 | 137 | ||
| Income tax and minimum notional income tax provision | 411,483 | 341 | 77,284 | 75 | ||
| Deferred tax liability | 58,729 | 49 | 50,223 | 49 | ||
| Defined benefit plans | 36,817 | 31 | 31,293 | 30 | ||
| Borrowings | 1,650,036 | 1,369 | 1,416,917 | 1,373 | ||
| Trade and other payables | 99,868 | 83 | 87,992 | 84 | ||
| Total non-current liabilities | 2,382,344 | 1,977 | 1,805,145 | 1,748 | ||
| Provisions | 10,215 | 8 | 10,725 | 10 | ||
| Income tax liability | 19,732 | 16 | 265,008 | 257 | ||
| Tax liabilities | 43,865 | 36 | 30,989 | 30 | ||
| Defined benefit plans | 6,942 | 6 | 7,077 | 7 | ||
| Salaries and social security payable | 28,461 | 24 | 40,035 | 39 | ||
| Derivative financial instruments | 2 | - | 2 | - | ||
| Borrowings | 267,715 | 222 | 728,096 | 706 | ||
| Trade and other payables | 407,790 | 339 | 261,501 | 253 | ||
| Total current liabilities | 784,722 | 651 | 1,343,433 | 1,302 | ||
| Total liabilities | 3,167,066 | 2,628 | 3,148,578 | 3,050 | ||
| Total liabilities and equity | 7,376,431 | 6,122 | 6,548,872 | 6,345 | ||
| Earnings release Q2 25 ● |
| 4.4 | Consolidated income statement |
| First half | Second quarter | |||||||||||
| Figures in million | 2025 | 2024 | 2025 | 2024 | ||||||||
| AR$ | US$ | AR$ | US$ | AR$ | US$ | AR$ | US$ | |||||
| Sales revenue | 1,008,884 | 900 | 783,788 | 901 | 570,169 | 486 | 446,412 | 500 | ||||
| Domestic sales | 839,685 | 750 | 649,186 | 742 | 466,791 | 398 | 374,607 | 416 | ||||
| Foreign market sales | 169,199 | 150 | 134,602 | 159 | 103,378 | 88 | 71,805 | 84 | ||||
| Cost of sales | (700,707) | (625) | (487,428) | (565) | (399,697) | (340) | (272,245) | (307) | ||||
| Gross profit | 308,177 | 275 | 296,360 | 336 | 170,472 | 146 | 174,167 | 193 | ||||
| Selling expenses | (47,845) | (43) | (31,582) | (36) | (25,355) | (22) | (18,002) | (20) | ||||
| Administrative expenses | (93,701) | (84) | (71,674) | (83) | (48,646) | (41) | (37,436) | (42) | ||||
| Exploration expenses | (225) | - | (167) | - | (167) | - | (85) | - | ||||
| Other operating income | 60,181 | 53 | 70,781 | 83 | 24,708 | 21 | 41,789 | 48 | ||||
| Other operating expenses | (44,759) | (40) | (43,054) | (52) | (21,048) | (18) | (16,669) | (21) | ||||
| Impairment on PPE, int. assets & inventories | (776) | (1) | (142) | - | 31 | (1) | (110) | - | ||||
| Impairment of financial assets | (2,508) | (2) | (49,592) | (56) | (2,296) | (2) | (19,762) | (22) | ||||
| Results for part. in joint businesses & associates | 91,347 | 76 | 31,894 | 39 | 43,203 | 30 | (19,522) | (22) | ||||
| Income from the sale of associates | - | - | 5,765 | 7 | - | - | 4,307 | 5 | ||||
| Operating income | 269,891 | 234 | 208,589 | 238 | 140,902 | 113 | 108,677 | 119 | ||||
| Financial income | 38,744 | 35 | 2,009 | 2 | 3,250 | 2 | 662 | - | ||||
| Financial costs | (111,459) | (99) | (81,688) | (94) | (68,615) | (58) | (37,733) | (41) | ||||
| Other financial results | 138,110 | 122 | 62,861 | 74 | 100,060 | 85 | 19,056 | 22 | ||||
| Financial results, net | 65,395 | 58 | (16,818) | (18) | 34,695 | 29 | (18,015) | (19) | ||||
| Profit before tax | 335,286 | 292 | 191,771 | 220 | 175,597 | 142 | 90,662 | 100 | ||||
| Income tax | (115,125) | (99) | 121,166 | 147 | (118,154) | (103) | (1,521) | (1) | ||||
| Net income for the period | 220,161 | 193 | 312,937 | 367 | 57,443 | 39 | 89,141 | 99 | ||||
| Attributable to the owners of the Company | 220,570 | 193 | 313,160 | 367 | 58,684 | 40 | 90,061 | 100 | ||||
| Attributable to the non-controlling interest | (409) | - | (223) | - | (1,241) | (1.0) | (920) | (1) | ||||
| Net income per share to shareholders | 162.2 | 0.1 | 230.3 | 0.3 | 43.2 | 0.0 | 66.2 | 0.1 | ||||
| Net income per ADR to shareholders | 4,054.6 | 3.5 | 5,756.6 | 6.7 | 1,078.8 | 0.7 | 1,655.5 | 1.8 | ||||
| Average outstanding common shares1 | 1,360 | 1,360 | 1,360 | 1,360 | 1,360 | 1,360 | 1,360 | 1,360.0 | ||||
| Outstanding shares by the end of period1 | 1,360 | 1,360 | 1,360 | 1,360 | 1,360 | 1,360 | 1,360 | 1,360.0 | ||||
Note: 1 It considers the Employee stock-based compensation plan shares, which amounted to 3.9 million common shares as of June 30, 2024 and 2025.
| Earnings release Q2 25 ● |
| 4.5 | Consolidated cash flow statement |
| Figures in millions | First half 2025 | First half 2024 | ||||
| AR$ | US$ | AR$ | US$ | |||
| OPERATING ACTIVITIES | ||||||
| Profit of the period | 220,161 | 193 | 312,937 | 367 | ||
| Adjustments to reconcile net profit to cash flows from operating activities | 170,306 | 163 | 52,945 | 47 | ||
| Changes in operating assets and liabilities | (267,928) | (209) | (294,654) | (350) | ||
| Increase in trade receivables and other receivables | (310,052) | (254) | (369,488) | (432) | ||
| Increase in inventories | (23,792) | (20) | (24,392) | (30) | ||
| Increase in trade and other payables | 66,873 | 65 | 71,280 | 81 | ||
| (Decrease) Increase in salaries and social security payables | (11,709) | (10) | 3,122 | 3 | ||
| Defined benefit plans payments | (1,314) | (1) | (1,074) | (1) | ||
| Increase in tax liabilities | 13,739 | 13 | 26,664 | 30 | ||
| Decrease in provisions | (4,245) | (4) | (916) | (1) | ||
| Collection for derivative financial instruments, net | 2,572 | 2 | 150 | - | ||
| Net cash generated by (used in) operating activities | 122,539 | 147 | 71,228 | 64 | ||
| INVESTING ACTIVITIES | ||||||
| Payment for property, plant and equipment acquisitions | (473,948) | (444) | (216,377) | (260) | ||
| Payment for intangible assets acquisitions | - | - | (2,457) | (3) | ||
| Collection for sales of public securities and shares, net | 350,106 | 316 | 32,883 | 86 | ||
| Suscription of mutual funds, net | (4,906) | (4) | (755) | (1) | ||
| Capital integration in companies | (44,726) | (41) | (19,750) | (23) | ||
| Payment for right-of-use | - | - | (11,192) | (13) | ||
| Collection for equity interests in companies sales | - | - | 15,802 | 18 | ||
| Collection for joint ventures´ share repurchase | - | - | 30,138 | 37 | ||
| Collections for intangible assets sales | 4,608 | 3 | - | - | ||
| Dividends collection | 4 | - | 6,955 | 8 | ||
| Collection for equity interests in areas sales | 2,410 | 2 | - | - | ||
| Collection (Payment) of loans | - | - | (115) | - | ||
| Net cash generated by (used in) investing activities | (166,452) | (168) | (164,868) | (151) | ||
| FINANCING ACTIVITIES | ||||||
| Proceeds from borrowings | 434,160 | 380 | 265,785 | 306 | ||
| Payment of borrowings | (115,152) | (108) | (60,169) | (69) | ||
| Payment of borrowings interests | (113,675) | (101) | (71,365) | (83) | ||
| Repurchase and redemption of corporate bonds | (804,524) | (725) | (66,329) | (75) | ||
| Payments of dividends | - | - | (37) | - | ||
| Payments of leases | (2,035) | (2) | (1,564) | (2) | ||
| Net cash (used in) generated by financing activities | (601,226) | (556) | 66,321 | 77 | ||
| (Decrease) Increase in cash and cash equivalents | (645,139) | (577) | (27,319) | (10) | ||
| Cash and cash equivalents at the beginning of the year | 761,231 | 738 | 137,973 | 171 | ||
| Exchange difference generated by cash and cash equivalents | 77,478 | n.a. | 27,860 | n.a. | ||
| Decrease in cash and cash equivalents | (645,139) | (577) | (27,319) | (10) | ||
| Cash and cash equivalents at the end of the period | 193,570 | 161 | 138,514 | 161 | ||
| Earnings release Q2 25 ● |
| 4.6 | Power generation’s main operational KPIs by plant |
| Power generation's key performance indicators |
Wind | Hydroelectric | Subtotal hydro +wind |
Thermal | Total | ||||||||||||||||||
| PEPE2 | PEPE3 | PEPE4 | PEA | PEPE6 | HINISA | HIDISA | HPPL | CTLL | CTG | CTP | CPB | CTPP | CTIW | CTGEBA | Eco- Energía |
CTEB1 | Subtotal thermal |
||||||
| Installed capacity (MW) | 53 | 53 | 81 | 100 | 140 | 265 | 388 | 285 | 1,366 | 780 | 361 | 30 | 620 | 100 | 100 | 1,253 | 14 | 848 | 4,107 | 5,472 | |||
| New capacity (MW) | 53 | 53 | 81 | 100 | 140 | - | - | - | 428 | 184 | 100 | - | - | 100 | 100 | 565 | 14 | 279 | 1,343 | 1,770 | |||
| Market share | 0.1% | 0.1% | 0.2% | 0.2% | 0.3% | 0.6% | 0.9% | 0.7% | 3.1% | 1.8% | 0.8% | 0.1% | 1.4% | 0.2% | 0.2% | 2.9% | 0.03% | 1.9% | 9.4% | 13% | |||
| First half | |||||||||||||||||||||||
| Net generation 2025 (GWh) | 97 | 115 | 177 | 155 | 280 | 164 | 272 | 341 | 1,601 | 1,960 | 189 | 25 | 398 | 88 | 81 | 4,476 | 20 | 1,818 | 9,054 | 10,655 | |||
| Market share | 0.3% | 0.3% | 0.5% | 0.46% | 0.83% | 0.5% | 0.8% | 1.0% | 4.8% | 5.8% | 0.6% | 0.1% | 1.2% | 0.3% | 0.2% | 13.3% | 0.1% | 5.4% | 26.9% | 31.7% | |||
| Sales 2025 (GWh) | 100 | 115 | 177 | 155 | 280 | 164 | 272 | 341 | 1,603 | 1,960 | 306 | 25 | 398 | 88 | 81 | 4,733 | 55 | 1,824 | 9,469 | 11,072 | |||
| Net generation 2024 (GWh) | 86 | 92 | 164 | 158 | 2 | 416 | 315 | 369 | 1,603 | 2,409 | 178 | 37 | 171 | 87 | 67 | 4,169 | 35 | 2,239 | 9,392 | 10,995 | |||
| Variation 2025 vs. 2024 | +13% | +25% | +8% | -2% | na | -61% | -14% | -7% | -0% | -19% | +6% | -33% | +132% | +2% | +20% | +7% | -41% | -19% | -4% | -3% | |||
| Sales 2024 (GWh) | 88 | 92 | 164 | 158 | 2 | 416 | 315 | 369 | 1,604 | 2,362 | 350 | 37 | 171 | 87 | 67 | 4,384 | 76 | 2,239 | 9,774 | 11,378 | |||
| Avg. price 2025 (US$/MWh) | 92 | 63 | 63 | 79 | 63 | 16 | 28 | 18 | 46 | 27 | 67 | 56 | 58 | na | na | 36 | 40 | 36 | 39 | 40 | |||
| Avg. price 2024 (US$/MWh) | 78 | 64 | 64 | 81 | 64 | 12 | 19 | 12 | 32 | 21 | 44 | 20 | 83 | na | na | 35 | 38 | 31 | 34 | 34 | |||
| Avg. gross margin 2025 (US$/MWh) | 49 | 55 | 55 | 52 | 56 | (0) | 18 | 8 | 32 | 18 | 32 | 26 | 32 | na | 128 | 20 | 11 | 26 | 24 | 25 | |||
| Avg. gross margin 2024 (US$/MWh) | 61 | 73 | 73 | 64 | 64 | 4 | 9 | 3 | 25 | 18 | 16 | (2) | 6 | na | na | 19 | 16 | 25 | 22 | 22 | |||
| Second quarter | |||||||||||||||||||||||
| Net generation Q2 25 (GWh) | 46 | 59 | 91 | 65 | 144 | 42 | 71 | 180 | 699 | 812 | 48 | 11 | 213 | 34 | 40 | 2,180 | 7 | 662 | 4,006 | 4,704 | |||
| Market share | 0.1% | 0.2% | 0.2% | 0.17% | 0.37% | 0.1% | 0.2% | 0.5% | 1.8% | 2.1% | 0.1% | 0.0% | 0.5% | 0.1% | 0.1% | 5.6% | 0.0% | 1.7% | 10.2% | 12.0% | |||
| Sales Q2 25 (GWh) | 47 | 59 | 91 | 65 | 144 | 42 | 71 | 180 | 699 | 812 | 103 | 11 | 213 | 34 | 40 | 2,312 | 23 | 662 | 4,210 | 4,909 | |||
| Net generation Q2 24 (GWh) | 47 | 47 | 85 | 76 | 2 | 106 | 107 | 205 | 676 | 1,289 | 43 | 9 | 70 | 43 | 30 | 1,901 | 18 | 989 | 4,391 | 5,067 | |||
| Variation Q2 25 vs. Q2 24 | -3% | +25% | +6% | -14% | na | -60% | -34% | -12% | +3% | -37% | +10% | +24% | na | -21% | +32% | +15% | -60% | -33% | -9% | -7% | |||
| Sales Q2 24 (GWh) | 47 | 47 | 85 | 76 | 2 | 106 | 107 | 205 | 676 | 1,271 | 121 | 9 | 70 | 43 | 30 | 1,990 | 38 | 988 | 4,559 | 5,234 | |||
| Avg. price Q2 25 (US$/MWh) | 95 | 62 | 62 | 81 | 62 | 24 | 45 | 17 | 50 | 32 | 86 | 55 | 45 | na | na | 37 | 49 | 44 | 42 | 43 | |||
| Avg. price Q2 24 (US$/MWh) | 79 | 64 | 64 | 82 | 64 | 22 | 30 | 12 | 39 | 21 | 63 | 42 | 108 | na | na | 39 | 37 | 35 | 38 | 38 | |||
| Avg. gross margin Q2 25 (US$/MWh) | 53 | 57 | 57 | 61 | 56 | (4) | 25 | 6 | 37 | 18 | 29 | 22 | 21 | na | 127 | 21 | 7 | 28 | 24 | 26 | |||
| Avg. gross margin Q2 24 (US$/MWh) | 64 | 73 | 73 | 73 | 64 | 6 | 22 | 3 | 33 | 19 | 20 | 3 | 2 | na | na | 20 | 13 | 27 | 24 | 25 | |||
Note: Gross margin before amortization and depreciation. 1 Co-operated by Pampa (50% equity stake).
| Earnings release Q2 25 ● |
| 4.7 | Production in the main oil and gas blocks |
| In kboe/day at ownership | Second quarter | ||||
| 2025 | 2024 | Variation | |||
| Gas | |||||
| El Mangrullo | 44.1 | 54.2 | -19% | ||
| Sierra Chata | 22.2 | 19.6 | +14% | ||
| Río Neuquén | 7.9 | 9.7 | -19% | ||
| Rincón del Mangrullo1 | 1.0 | 1.2 | -17% | ||
| Others | 0.9 | 0.7 | +30% | ||
| Total gas at working interest | 76.1 | 85.4 |
-11%
|
||
| Oil | |||||
| Rincón de Aranda | 5.3 | 1.2 | na | ||
| El Tordillo2 | 1.6 | 1.6 | -5% | ||
| Associated oil3 | 1.1 | 1.3 | -17% | ||
| Los Blancos | 0.1 | 0.2 | -72% | ||
| Gobernador Ayala4 | - | 1.1 | -100% | ||
| Total oil at working interest | 8.0 | 5.4 | +47% | ||
| Total | 84.1 | 90.8 | -7% | ||
Note:
Production in Argentina. 1 It does not include shale formation. 2 It includes the La Tapera – Puesto Quiroga block.
3 From gas fields. 4 In October 2024, Pampa transferred its 22.51% stake in the concession to Pluspetrol.
| Earnings release Q2 25 ● |
| 5. | Glossary of terms |
| ADR/ADS: American Depositary Receipt | Kbpd/kboepd: Thousands of barrels per day/thousands of barrels of oil equivalent per day | |
| AR$: Argentine pesos | LNG: Liquefied Natural Gas | |
| Bbl: Barrel | M3: Cubic meter | |
| Boe: Barrels of oil equivalent | Mboe: Million barrels of oil equivalent | |
| ByMA: Bolsas y Mercados Argentinos or Buenos Aires Stock Exchange | MBTU: Million British Thermal Units | |
| CAMMESA: Compañía Administradora del Mercado Mayorista Eléctrico S.A. or Argentine Wholesale Electricity Market Clearing Company | Mcmpd: Million cubic meters per day | |
| CB: Corporate Bonds | MW/MWh: Megawatt/Megawatt-hour | |
| 2027 CB: Corporate Bonds maturing in 2027 | N.a.: Not applicable | |
| 2029 CB: Corporate Bonds maturing in 2029 | NGL: Natural gas liquids | |
| 2034 CB: Corporate Bonds maturing in 2034 | O/S: Share ownership | |
| CCGT: Combined cycle | Pampa / The Company: Pampa Energía S.A. | |
| CPB: Piedra Buena Thermal Power Plant | PEA: Arauco II Wind Farm, stages 1 and 2 | |
| CPI: Consumer price index | PEPE: Pampa Energía Wind Farm | |
| CTBSA: CT Barragán S.A. | Plan Gas: Argentine Natural Gas Production Promotion Plan, 2020–2024 Supply and Demand Scheme (DNU No. 892/20, 730/22 and supplementary provisions) | |
| CTEB: Ensenada Barragán Thermal Power Plant | PPA: Power purchase agreement | |
| CTG: Güemes Thermal Power Plant | PPE: Property, plant and equipment | |
| CTGEBA: Genelba Thermal Power Plant | PPI: Producer’s Price Index | |
| CTIW: Ingeniero White Thermal Power Plant | Q1 25: First quarter of 2025 | |
| CTLL: Loma De La Lata Thermal Power Plant | Q2 25/Q2 24: Second quarter of 2025/Second quarter of 2024 | |
| CTP: Piquirenda Thermal Power Plant | Res.: Resolution/Resolutions | |
| CTPP: Parque Pilar Thermal Power Plant | RIGI: Régimen de Incentivo para Grandes Inversiones or Incentive Regime for Large Investments | |
| DNU: Emergency Executive Order | SE: Secretariat of Energy | |
| E&P: Exploration and Production | ST: Steam turbine | |
| EBITDA: Earnings before interest, tax, depreciation and amortization | TGS: Transportadora de Gas del Sur S.A. | |
| EcoEnergía: EcoEnergía Co-Generation Power Plant | Ton: Metric ton | |
| ENARGAS: Ente Nacional Regulador del Gas or National Gas Regulatory Entity | Transba: Empresa de Transporte de Energía Eléctrica por Distribución Troncal de la Provincia de Buenos Aires Transba S.A. | |
| ENARSA: Energía Argentina S.A. | Transener: Compañía de Transporte de Energía Eléctrica en Alta Tensión Transener S.A. | |
| ENRE: Ente Nacional Regulador de la Electricidad or National Electricity Regulatory Entity | US$: US Dollars | |
| FS: Financial Statements | US$-link: A security in which the underlying is linked to a US$ wholesale exchange rate | |
| FX: Nominal exchange rate | US$-MEP: A security in which the settlement uses US$ in the domestic market | |
| GPM, former GPNK: Francisco Pascasio Moreno Gas Pipeline, formerly President Nestor Kirchner | VMOS: Vaca Muerta Oil Sur | |
| GSA: Long-term gas sale agreement | WEM: Wholesale electricity market | |
| GT: Gas turbine | ||
| GWh: Gigawatt-hour | ||
| HIDISA: Diamante Hydro Power Plant | ||
| HINISA: Los Nihuiles Hydro Power Plant | ||
| HPPL: Pichi Picun Leufu Hydro Power Plant | ||
| IFRS: International Financial Reporting Standards | ||
| Kb/kboe: Thousands of barrels/thousands of barrels of oil equivalent | ||
| Earnings release Q2 25 ● |
