UNITED STATES
SECURITIES AND EXCHANGE COMMISSION
Washington, D.C. 20549
FORM 6-K
REPORT OF FOREIGN
ISSUER
PURSUANT TO RULE 13a-16 OR 15d-16 UNDER
SECURITIES EXCHANGE ACT OF 1934
For the month of May, 2025
(Commission File No. 001-34429),
PAMPA ENERGIA S.A.
(PAMPA ENERGY INC.)
Argentina
(Jurisdiction of incorporation or organization)
Maipú 1
C1084ABA
City of Buenos Aires
Argentina
(Address of principal executive offices)
(Indicate by check
mark whether the registrant files or will file annual reports under cover of Form 20-F or Form 40-F.)
Form 20-F ___X___ Form 40-F ______
(Indicate
by check mark whether the registrant by furnishing the
information contained in this form is also thereby furnishing the
information to the Commission pursuant to Rule 12g3-2(b) under
the Securities Exchange Act of 1934.)
Yes ______ No ___X___
(If "Yes"
is marked, indicate below the file number assigned to the
registrant in connection with Rule 12g3-2(b): 82- .)
This Form 6-K for Pampa Energía S.A. (“Pampa” or the “Company”) contains:
Exhibit 1: Earnings Release Q1 25
SIGNATURE
Pursuant to the requirements of the Securities Exchange Act of 1934, the registrant has duly caused this report to be signed on its behalf by the undersigned, thereunto duly authorized.
Date: May 12, 2025
| Pampa Energía S.A. | ||
| By: |
/s/ Gustavo Mariani |
|
|
Name: Gustavo Mariani Title: Chief Executive Officer |
||
FORWARD-LOOKING STATEMENTS
This press release may contain forward-looking statements. These statements are statements that are not historical facts, and are based on management's current view and estimates offuture economic circumstances, industry conditions, company performance and financial results. The words "anticipates", "believes", "estimates", "expects", "plans" and similar expressions, as they relate to the company, are intended to identify forward-looking statements. Statements regarding the declaration or payment of dividends, the implementation of principal operating and financing strategies and capital expenditure plans, the direction of future operations and the factors or trends affecting financial condition, liquidity or results of operations are examples of forward-looking statements. Such statements reflect the current views of management and are subject to a number of risks and uncertainties. There is no guarantee that the expected events, trends or results will a ctually occur. The statements are based on many assumptions and factors, including general economic and market conditions, industry conditions, and operating factors. Any changes in such assumptions or factors could cause actual results to differ materially from current expectations.


|
Pampa Energía, an independent company with active participation in the Argentine oil, gas and electricity, announces the results for the quarter ended on March 31, 2025. |
Buenos Aires, May 12, 2025
|
Stock information
Share capital Market capitalization Information about the videoconference Date and time Access link For further information about Pampa Email Website for investors Argentina’s Securities
and Exchange Commission Securities and |
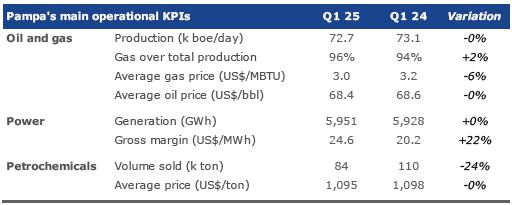
Basis of presentation Pampa’s financial information is reported in US$, its functional currency. For local currency equivalents, transactional FX are applied. However, Transener and TGS’s figures are inflation-adjusted as of March 31, 2025, and are converted to US$ at the period-end FX. Previously reported figures remained unchanged. Q1 25 main results1 Sales rose 3% year-on-year to US$414 million in Q1 252, driven by higher spot energy prices, the contribution from the newly commissioned PEPE 6, and greater deliveries under Plan Gas, partially offset by lower petrochemical reformer volumes and softer gas sales to industries and Chile. Strong thermal availability and solid wind generation in Q1 25:
Adjusted
EBITDA3 reached US$220 million in Q1 25, up 17% from US$153 million net profit to the Company’s shareholders, 43% lower than in Q1 24 due to a smaller recovery from non-cash deferred income tax and increasing operating costs, offset by higher sales and positive net financial results. Net debt stood at US$577 million, mainly reflecting increased working capital requirements and continued investment in the Rincón de Aranda development.
|
1 The information is based on FS prepared according to IFRS in force in Argentina.
2 Sales from the affiliates CTBSA, Transener and TGS are excluded, shown as ‘Results for participation in joint businesses and associates.’
3 Consolidated adjusted EBITDA represents the flows before financial items, income tax, depreciations and amortizations, extraordinary and non-cash income and expense, equity income, and includes affiliates’ EBITDA at our ownership. Further information on section 3.1.
| Pampa Energía ● Earnings release Q1 25 ● |
| 1. | Relevant Events |
| 1.1 | Participation in the FLNG Project for LNG Exports |
On May 2, 2025, the shareholders of SESA agreed to move forward with the FLNG Project by executing the final investment decision (FID) for a 20-year charter of the Hilli floating liquefaction vessel, with a nameplate capacity of 2.45 MTPA, as announced on November 29, 2024.
In addition, a second vessel provided by Golar LNG, the MKII, was incorporated, with a nameplate capacity of 3.5 MTPA and under a 20-year charter. Both vessels will be located in the San Matías Gulf, province of Río Negro, and will export up to 6 MTPA of LNG. The Hilli is expected to begin operations in late 2027 or early 2028, with the MKII following by the end of 2028.
SESA, the company established to develop this project, is owned by Pampa (20%), PAE (30%), YPF S.A. through its subsidiary SUR (25%), Wintershall (15%), and Golar Sub-Holding (10%).
To supply the vessels, SESA signed 20-year GSAs with Pampa, PAE, SUR, and Wintershall. Said vessels will require to process 27 mcmpd of natural gas, with Pampa contributing up to 6 mcmpd, representing an increase of almost 50% from the current average production. A dedicated gas pipeline is also planned to be built between the province of Neuquén and the San Matías Gulf to ensure the year-round operation of both vessels.
The MECON approved the FLNG Project under the RIGI (Res. MEC N° 559/25), and the SE recently granted a 30-year unrestricted LNG export permit.
The estimated investment amounts to US$7 billion over 20 years, making this initiative a strategic step to monetize Pampa’s Vaca Muerta reserves, position Argentina in the global LNG market, foster foreign currency inflows, create jobs, and develop local suppliers.
| 1.2 | Power generation |
Spot remuneration updates
| Effective as of: | Spot remuneration | |
| Increase | Resolution | |
| January 2025 | 4% | SE No. 603/24 |
| February 2025 | 4% | SE No. 27/25 |
| March 2025 | 1.5% | SE No. 113/25 |
| April 2025* | 1.5% | SE No. 143/25 |
| May 2025* | 2% | SE No. 177/25 |
Note: * These updates exclude hydro power plants under tender process (Alicurá, El Chocón-Arroyito, Cerros Colorados, and Piedra del Águila), which remain the remuneration established in Res. SE No. 113/25 (Executive Order No. 718/24).
Joint tender of HIDISA and HINISA’s concessions
On March 8, 2025, the National Government and the province of Mendoza agreed to jointly tender the HIDISA and HINISA concessions as a single business unit, transferring 51% of the concessionaire’s shares. The Public Enterprise Transformation Agency was appointed to coordinate and carry out the tender process within 60 working days. The current transition period for HINISA’s concession expires on May 31 for both national and provincial contracts. In the case of HIDISA, the national contract expires on May 31 and the provincial contract on October 19.
| Pampa Energía ● Earnings release Q1 25 ● |
| 1.3 | Transener and TGS |
TGS’s Cerri Complex flood impact
On March 7, 2025, severe flooding halted NGL production and natural gas transportation at TGS’s Cerri Complex, located in the city of Bahía Blanca. Given its strategic nature, the gas transportation service was safely restored on March 24. Works to fully resume NGL production are still underway, and as of today, operations have been partially normalized.
In Q1 25, TGS’s FS recorded a US$13 million loss related to the climate event expenses and impairment of materials and PPE. The final cost has not yet been determined. TGS has filed all relevant documentation with the insurance companies.
Tariff adjustments due to cost variations
| Effective as of: | Transener | TGS | |||
| Increase | Resolution | Increase | Resolution | ||
| January 2025 | 4% | ENRE No. 1,065 and 1,066/24 | 2.5% | ENARGAS No. 915/24 | |
| February 2025 | 4% | ENRE No. 85 and 87/25 | 1.5% | ENARGAS No. 51/25 | |
| March 2025 | 2% | ENRE No. 158 and 154/25 | 1.7% | ENARGAS No. 124/25 | |
| April 2025 | 4% | ENRE No. 227 and 231/25 | 0% | NO-2025-32668903-APN-MEC | |
TGS five-year tariff review
On April 30, 2025, the ENARGAS published the conditions concluding the RQT process, effective May 2025 until 2030 (Res. No. 256/25). The Res. sets the capital base as of December 31, 2024, the mandatory investments, and a real rate of return on capital post-tax of 7.18%, among other matters. The initial tariff schedule includes a 3.67% increase to April 2025 schedules, applicable from May and spread over 31 monthly and consecutive installments.
This Res. establishes monthly adjustments for cost variations using a 50% PPI and 50% CPI formula, replacing the semi-annual PPI-only adjustment set in the 2017 scheme. This methodology is pending SE’s approval.
Transener and Transba five-year tariff review
On May 5, 2025, the ENRE published the conditions concluding the RQT process, effective from May 2025 until 2030 (Res. No. 305 and 312/2025). Said Res. establishes the capital base as of December 31, 2024, the mandatory investments, and a real rate of return on capital post-tax of 6.48%, among other matters. The initial tariff schedule includes a 42.89% increase for Transener and 10.30% for Transba, applicable to April 2025 schedules. 20% of the increase will be applied in May 2025, and the remaining 80% will be phased in monthly from June to December 2025.
Additionally, the Res. set a monthly tariff adjustment mechanism for cost variations, combining 33% CPI and 67% PPI.
| Pampa Energía ● Earnings release Q1 25 ● |
| 1.4 | Approval of VMOS’s under RIGI |
On March 21, 2025, the MECON approved VMOS’s application to the RIGI (Res. No. 302/25). VMOS aims to build and operate a 437 km oil pipeline between Allen to Punta Colorada, province of Río Negro, with a capacity of up to 700 kbpd. Pampa holds an 11% stake in VMOS and has a contract to transport 50 kbpd, including storage and loading services.
| 1.5 | End of the Export Growth Program (‘PIE’) |
On April 14, 2025, Executive Order No. 269/25 mandates that 100% of export proceeds must be settled through the official exchange market MULC, effectively ending the PIE.
| 1.6 | Changes in the Board of Directors |
On April 7, 2025, Pampa’s Shareholders Meeting approved the appointments of Gabriel Szpiegel, Daniela Rivarola Meilan, and Nicolás Mindlin* as new Board members, with the latter replacing María Carolina Sigwald*, who resigned on March 5, 2025.
Additionally, the Shareholders’ Meeting approved the tenure renewals of Carolina Zang and Julia Pomares as members, Clarisa Lifsic, Lorena Rappaport, and Diego Martín Salaverri* as alternate members, and the appointments of Flavia Bevilacqua and María Carolina Sigwald* as alternate members of the Board.
Finally, Gabriel Szpiegel and Carolina Zang were designated members of the Audit Committee, and Clarisa Lifsic as an alternate member.
* = non-independent member.
| Pampa Energía ● Earnings release Q1 25 ● |
| 2. | Financial highlights |
| 2.1 | Consolidated balance sheet |
| Figures in million | As of 03.31.2025 | As of 12.31.2024 | ||||
| AR$ | US$ | AR$ | US$ | |||
| ASSETS | ||||||
| Property, plant and equipment | 2,883,249 | 2,685 | 2,690,533 | 2,607 | ||
| Intangible assets | 102,367 | 95 | 99,170 | 95 | ||
| Right-of-use assets | 10,720 | 10 | 11,330 | 11 | ||
| Deferred tax asset | 226,917 | 211 | 161,694 | 157 | ||
| Investments in associates and joint ventures | 1,184,425 | 1,103 | 1,024,769 | 993 | ||
| Financial assets at fair value through profit and loss | 29,272 | 27 | 28,127 | 27 | ||
| Other assets | 431 | - | 366 | - | ||
| Trade and other receivables | 186,248 | 173 | 76,798 | 75 | ||
| Total non-current assets | 4,623,629 | 4,304 | 4,092,787 | 3,965 | ||
| Inventories | 267,766 | 250 | 230,095 | 223 | ||
| Financial assets at amortized cost | 86,930 | 81 | 82,628 | 80 | ||
| Financial assets at fair value through profit and loss | 722,388 | 673 | 877,623 | 850 | ||
| Derivative financial instruments | 10 | - | 979 | 1 | ||
| Trade and other receivables | 569,480 | 530 | 503,529 | 488 | ||
| Cash and cash equivalents | 387,416 | 361 | 761,231 | 738 | ||
| Total current assets | 2,033,990 | 1,895 | 2,456,085 | 2,380 | ||
| Total assets | 6,657,619 | 6,199 | 6,548,872 | 6,345 | ||
| EQUITY | ||||||
| Equity attributable to owners of the company | 3,728,731 | 3,472 | 3,391,127 | 3,286 | ||
| Non-controlling interest | 10,384 | 10 | 9,167 | 9 | ||
| Total equity | 3,739,115 | 3,482 | 3,400,294 | 3,295 | ||
| LIABILITIES | ||||||
| Provisions | 109,698 | 102 | 141,436 | 137 | ||
| Income tax and minimum notional income tax provision | 81,851 | 76 | 77,284 | 75 | ||
| Deferred tax liability | 50,743 | 47 | 50,223 | 49 | ||
| Defined benefit plans | 34,110 | 32 | 31,293 | 30 | ||
| Borrowings | 1,437,072 | 1,338 | 1,416,917 | 1,373 | ||
| Trade and other payables | 90,035 | 83 | 87,992 | 84 | ||
| Total non-current liabilities | 1,803,509 | 1,678 | 1,805,145 | 1,748 | ||
| Provisions | 10,487 | 10 | 10,725 | 10 | ||
| Income tax liability | 321,343 | 299 | 265,008 | 257 | ||
| Tax liabilities | 34,599 | 32 | 30,989 | 30 | ||
| Defined benefit plans | 7,077 | 7 | 7,077 | 7 | ||
| Salaries and social security payable | 25,665 | 24 | 40,035 | 39 | ||
| Derivative financial instruments | 705 | 1 | 2 | - | ||
| Borrowings | 379,018 | 353 | 728,096 | 706 | ||
| Trade and other payables | 336,101 | 313 | 261,501 | 253 | ||
| Total current liabilities | 1,114,995 | 1,039 | 1,343,433 | 1,302 | ||
| Total liabilities | 2,918,504 | 2,717 | 3,148,578 | 3,050 | ||
| Total liabilities and equity | 6,657,619 | 6,199 | 6,548,872 | 6,345 | ||
| Pampa Energía ● Earnings release Q1 25 ● |
| 2.2 | Consolidated income statement |
| First quarter | ||||||
| Figures in million | 2025 | 2024 | ||||
| AR$ | US$ | AR$ | US$ | |||
| Sales revenue | 438,715 | 414 | 337,376 | 401 | ||
| Domestic sales | 372,894 | 352 | 274,579 | 326 | ||
| Foreign market sales | 65,821 | 62 | 62,797 | 75 | ||
| Cost of sales | (301,010) | (285) | (215,183) | (258) | ||
| Gross profit | 137,705 | 129 | 122,193 | 143 | ||
| Selling expenses | (22,490) | (21) | (13,580) | (16) | ||
| Administrative expenses | (45,055) | (43) | (34,238) | (41) | ||
| Exploration expenses | (58) | - | (82) | - | ||
| Other operating income | 35,473 | 32 | 28,992 | 35 | ||
| Other operating expenses | (23,711) | (22) | (26,385) | (31) | ||
| Impairment of financial assets | (212) | - | (29,830) | (34) | ||
| Impairment on PPE, int. assets & inventories | (807) | - | (32) | - | ||
| Results for part. in joint businesses & associates | 48,144 | 46 | 51,416 | 61 | ||
| Income from the sale of associates | - | - | 1,458 | 2 | ||
| Operating income | 128,989 | 121 | 99,912 | 119 | ||
| Financial income | 35,494 | 33 | 1,347 | 2 | ||
| Financial costs | (42,844) | (41) | (43,955) | (53) | ||
| Other financial results | 38,050 | 37 | 43,805 | 52 | ||
| Financial results, net | 30,700 | 29 | 1,197 | 1 | ||
| Profit before tax | 159,689 | 150 | 101,109 | 120 | ||
| Income tax | 3,029 | 4 | 122,687 | 148 | ||
| Net income for the period | 162,718 | 154 | 223,796 | 268 | ||
| Attributable to the owners of the Company | 161,886 | 153 | 223,796 | 267 | ||
| Attributable to the non-controlling interest | 832 | 1 | - | 1 | ||
| Net income per share to shareholders | 119.0 | 0.1 | 164.6 | 0.2 | ||
| Net income per ADR to shareholders | 2,975.8 | 2.8 | 4,113.9 | 4.9 | ||
| Average outstanding common shares1 | 1,360 | 1,360 | ||||
| Outstanding shares by the end of period1 | 1,360 | 1,360 | ||||
Note: 1 It considers the Employee stock-based compensation plan shares, which amounted to 3.9 million common shares as of March 31, 2024 and 2025.
| Pampa Energía ● Earnings release Q1 25 ● |
| 2.3 | Consolidated cash flow statement |
| Figures in millions | As of 03.31.2025 | As of 03.31.2024 | ||||
| AR$ | US$ | AR$ | US$ | |||
| OPERATING ACTIVITIES | ||||||
| Profit of the period | 162,718 | 154 | 223,796 | 268 | ||
| Adjustments to reconcile net profit to cash flows from operating activities | 8,017 | 3 | (74,640) | (94) | ||
| Changes in operating assets and liabilities | (76,850) | (67) | (163,370) | (194) | ||
| Net cash generated by (used in) operating activities | 93,885 | 90 | (14,214) | (20) | ||
| INVESTING ACTIVITIES | ||||||
| Payment for property, plant and equipment acquisitions | (164,292) | (162) | (109,435) | (139) | ||
| Collection for sales of public securities and shares acquisitions, net | 147,374 | 151 | 56,151 | 87 | ||
| Recovery of mutual funds, net | 237 | - | 1,117 | 1 | ||
| Payment for companies´acquisitions | (33,327) | (31) | (19,750) | (24) | ||
| Payment for right-of-use | (553) | (1) | (4,346) | (5) | ||
| Collection for equity interests in companies sales | - | - | 6,206 | 7 | ||
| Collection for joint ventures´ share repurchase | - | - | 30,135 | 37 | ||
| Dividends collection | - | - | 6,955 | 8 | ||
| Net cash generated by (used in) investing activities | (50,561) | (43) | (32,967) | (28) | ||
| FINANCING ACTIVITIES | ||||||
| Proceeds from borrowings | 47,700 | 45 | 112,857 | 133 | ||
| Payment of borrowings | (74,142) | (70) | (10,959) | (13) | ||
| Payment of borrowings interests | (39,094) | (38) | (34,128) | (42) | ||
| Repurchase and redemption of corporate bonds | (377,408) | (360) | - | - | ||
| Payments of leases | (968) | (1) | (782) | (1) | ||
| Net cash (used in) generated by financing activities | (443,912) | (424) | 66,988 | 77 | ||
| (Decrease) Increase in cash and cash equivalents | (400,588) | (377) | 19,807 | 29 | ||
| Cash and cash equivalents at the beginning of the year | 761,231 | 738 | 137,973 | 171 | ||
| Effect of exchange rate changes on cash and cash equivalents | 26,773 | n.a. | 13,797 | n.a. | ||
| (Decrease) Increase in cash and cash equivalents | (400,588) | (377) | 19,807 | 29 | ||
| Cash and cash equivalents at the end of the period | 387,416 | 361 | 171,577 | 200 | ||
Note: The amounts of cash and cash equivalents do not consider financial assets at fair value through profit or loss and investments at amortized cost.
| Pampa Energía ● Earnings release Q1 25 ● |
| 2.4 | Cash and financial borrowings |
| As of March 31, 2025, in US$ million |
Cash1 | Financial debt | Net debt | ||||||
| Consolidated in FS |
Ownership adjusted | Consolidated in FS |
Ownership adjusted | Consolidated in FS |
Ownership adjusted | ||||
| Power generation | 1,103 | 1,096 | 513 | 514 | (590) | (582) | |||
| Petrochemicals | - | - | - | - | - | - | |||
| Holding and others | - | - | (0) | (0) | (0) | (0) | |||
| Oil and gas | 11 | 11 | 1,178 | 1,178 | 1,167 | 1,167 | |||
| Total under IFRS/Restricted Group | 1,114 | 1,107 | 1,691 | 1,691 | 577 | 584 | |||
| Affiliates at O/S2 | 296 | 296 | 265 | 265 | (31) | (31) | |||
| Total with affiliates | 1,410 | 1,403 | 1,956 | 1,956 | 546 | 554 |
Note: Financial debt includes accrued interest. 1 It includes cash and cash equivalents, financial assets at fair value with changing results, and investments at amortized cost. 2 Under IFRS, the affiliates CTBSA, Transener and TGS are not consolidated in Pampa.
Debt transactions
As of March 31, 2025, Pampa’s financial debt under IFRS amounted to US$1,691 million, 19% less than the end of 2024. This decrease is mainly explained by the full redemption of the 2027 Notes, funded with proceeds from the international issuance of the 2034 Notes, which amounted to US$353 million of principal plus accrued interests. The gross debt principal breakdown is shown below:
| Currency | Type of issuance |
Amount in million US$ |
Legislation | % over total gross debt |
Avg coupon |
| US$ | US$1 | 1,183 | Foreign | 71% | 8.4% |
| US$ | 176 | Argentine | 11% | 5.0% | |
| US$ MEP | 203 | Argentine | 12% | 5.3% | |
| AR$ | AR$ | - | Argentine | - | na |
| US$-link | 96 | Argentine | 6% | 0% |
However, the net debt increased to US$577 million, due to the higher seasonal working capital needs and higher capital expenditures destined for Rincón de Aranda’s development and infrastructure.
The issuances of the 2031 and 2034 Notes significantly improved Pampa’s debt maturity profile, extending the average life to 5.0 years. The chart below shows the principal maturity profile, net of repurchases, in US$ million by the end of Q1 25:
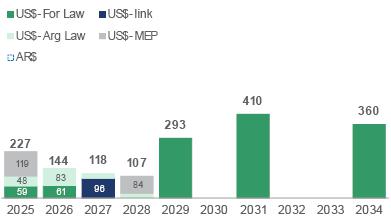 |
Note: The chart only considers Pampa consolidated under IFRS. It does not include affiliates TGS, Transener, and CTBSA. |
| Pampa Energía ● Earnings release Q1 25 ● |
In addition to the 2027 Notes, Pampa also redeemed CB Series 19 for AR$17,131 million. After quarter-end, Pampa paid bank borrowings for US$40 million and redeemed the outstanding CB Series 18 for US$72 million.
Regarding our affiliates, in Q1 25, CTEB obtained net bank borrowings for US$78 million, paid AR$6 billion in short-term bank calls, and repurchased CB Series 6 for US$30 million. After the quarter-end, CTEB borrowed US$20 million from banks and early redeemed the outstanding CB Series 6 for an amount of US$84 million.
As of today, Pampa continues to comply with all debt covenants.
Summary of debt securities
| Company In million |
Security | Maturity | Amount issued | Amount net of repurchases |
Coupon |
| In US$-Foreign Law | |||||
| Pampa | CB Series 9 at par & fixed rate | 2026 | 293 | 120 | 9.5% |
| CB Series 3 at discount & fixed rate | 2029 | 300 | 293 | 9.125% | |
| CB Series 21 at discount & fixed rate | 2031 | 410 | 410 | 7.95% | |
| CB Series 23 at discount & fixed rate | 2034 | 360 | 360 | 7.875% | |
| TGS1 | CB at discount at fixed rate | 2031 | 490 | 490 | 8.5% |
| In US$-Argentine Law | |||||
| Pampa | CB Series 20 | 2026 | 108 | 51 | 6% |
| In US$-link | |||||
| Pampa | CB Series 13 | 2027 | 98 | 96 | 0% |
| CTEB1 | CB Series 62 | 2025 | 84 | 54 | 0% |
| CB Series 9 | 2026 | 50 | 50 | 0% | |
| In US$-MEP | |||||
| Pampa | CB Series 16 | 2025 | 56 | 56 | 4.99% |
| CB Series 183 | 2025 | 72 | 63 | 5.0% | |
| CB Series 22 | 2028 | 84 | 84 | 5.75% |
Notes: 1 Under IFRS, affiliates are not consolidated in Pampa’s FS. 2 CTEB’s Series 6 CB was redeemed on April 30, 2025. 3 Pampa’s CB Series 18 was redeemed on May 8, 2025.
Credit ratings
| Company | Agency | Rating | |
| Global | Local | ||
| Pampa | S&P | B- | na |
| Moody's | Caa1 | na | |
| FitchRatings1 | B- | AAA (long-term) A1+ (short-term) |
|
| TGS | S&P | B- | na |
| FitchRatings | B- | na | |
| Transener | FitchRatings1 | na | A+ (long-term) |
| CTEB | FitchRatings1 | na | AA+ |
Note:
1 Local rating issued by FIX SCR.
| Pampa Energía ● Earnings release Q1 25 ● |
| 3. | Analysis of the Q1 25 results |
| Breakdown by segment Figures in US$ million |
Q1 25 | Q1 24 | Variation | ||||||
| Sales | Adjusted EBITDA | Net Income | Sales | Adjusted EBITDA | Net Income | Sales | Adjusted EBITDA | Net Income | |
| Oil and Gas | 146 | 41 | (49) | 150 | 67 | 48 | -3% | -39% | NA |
| Power generation | 195 | 130 | 124 | 154 | 86 | 197 | +27% | +51% | -37% |
| Petrochemicals | 92 | (4) | 42 | 120 | 11 | 11 | -23% | NA | +282% |
| Holding and Others | 7 | 53 | 36 | 3 | 23 | 11 | +133% | +133% | +227% |
| Eliminations | (26) | - | - | (26) | - | - | - | NA | NA |
| Total | 414 | 220 | 153 | 401 | 187 | 267 | +3% | +17% | -43% |
Note: Net income attributable to the Company’s shareholders.
| 3.1 | Reconciliation of consolidated adjusted EBITDA |
| Reconciliation of adjusted EBITDA, in US$ million |
First quarter | ||
| 2025 | 2024 | ||
| Consolidated operating income | 121 | 119 | |
| Consolidated depreciations and amortizations | 84 | 68 | |
| Reporting EBITDA | 205 | 187 | |
| Adjustments from oil and gas segment | (2) | (9) | |
| Adjustments from generation segment | 1 | 2 | |
| Adjustments from petrochemicals segment | (17) | (0) | |
| Adjustments from holding & others segment | 33 | 7 | |
| Consolidated adjusted EBITDA | 220 | 187 | |
| At our ownership | 219 | 187 | |
| Pampa Energía ● Earnings release Q1 25 ● |
| 3.2 | Analysis of the oil and gas segment |
| Oil & gas segment, consolidated Figures in US$ million |
First quarter | |||
| 2025 | 2024 | ∆% | ||
| Sales revenue | 146 | 150 | -3% | |
| Domestic sales | 120 | 119 | +1% | |
| Foreign market sales | 26 | 31 | -16% | |
| Cost of sales | (118) | (99) | +19% | |
| Gross profit | 28 | 51 | -45% | |
| Selling expenses | (17) | (13) | +31% | |
| Administrative expenses | (21) | (18) | +17% | |
| Exploration expenses | - | - | NA | |
| Other operating income | 4 | 14 | -71% | |
| Other operating expenses | (3) | (5) | -40% | |
| Operating income | (9) | 29 | NA | |
| Finance costs | (25) | (26) | -4% | |
| Other financial results | (4) | (4) | - | |
| Financial results, net | (29) | (30) | -3% | |
| Loss before tax | (38) | (1) | NA | |
| Income tax | (11) | 49 | NA | |
| Net loss for the period | (49) | 48 | NA | |
| Adjusted EBITDA | 41 | 67 | -39% | |
| Increases in PPE and right-of-use assets | 147 | 87 | +69% | |
| Depreciation and amortization | 52 | 47 | +11% | |
| Lifting cost | (45) | (38) | +18% | |
| Lifting cost per boe | (7) | (6) | +20% | |
The slight decline in Q1 25 sales from the oil and gas segment was mainly explained by lower gas sales to Chile and industries and, to a lesser extent, a drop in crude oil volumes, partially offset by higher deliveries under Plan Gas.
Regarding
operating performance, total production averaged 72.7 kboepd
in Q1 25
(flat vs. Q1 24, +18% vs. Q4 24), mainly explained by lower industrial gas demand due to floods in
Cerri, which briefly disrupted gas transportation in March, in addition to the divestment of the Gobernador
Ayala block in October 2024 and a slight decline in conventional crude oil production. These effects were partially offset by increased
Plan Gas deliveries to CAMMESA, driven by thermal power demand and, to a lesser extent, by higher shale oil production from Rincón
de Aranda, where the RDA-2001 well came online in March 2024. The quarter-on-quarter recovery was driven by seasonal demand and higher
gas deliveries to CAMMESA.
Gas production in Q1 25 reached 11.8 mcmpd, slightly above Q1 24 and +21% vs. Q4 24 due to seasonality. Analyzing the gas output by block, El Mangrullo block represented 55% of total gas production in Q1 25, with 6.5 mcmpd (-13% vs. Q1 24, +23% vs. Q4 24), followed by Sierra Chata with 30% of the production, reaching 3.5 mcmpd (+51% vs. Q1 24, +22% vs. Q4 24). At non-operated blocks, Río Neuquén remained flat at 1.4 mcmpd (-5% vs. Q1 24, +12% Q4 24), while Rincón del Mangrullo continued declining, producing 0.2 mcmpd (-29% vs. Q1 24, -8% vs. Q4 24).
| Pampa Energía ● Earnings release Q1 25 ● |
| Oil and gas' key performance indicators |
2025 | 2024 | Variation | |||||||||
| Oil | Gas | Total | Oil | Gas | Total | Oil | Gas | Total | ||||
| First quarter | ||||||||||||
| Volume | ||||||||||||
| Production | ||||||||||||
| In thousand m3/day | 0.5 | 11,811 | 0.7 | 11,684 | -25% | +1% | -0% | |||||
| In million cubic feet/day | 417 | 413 | ||||||||||
| In thousand boe/day | 3.2 | 69.5 | 72.7 | 4.3 | 68.8 | 73.1 | ||||||
| Sales | ||||||||||||
| In thousand m3/day | 0.6 | 11,886 | 0.6 | 11,807 | -7% | +1% | +0% | |||||
| In million cubic feet/day | 420 | 417 | ||||||||||
| In thousand boe/day | 3.6 | 70.0 | 73.6 | 3.9 | 69.5 | 73.4 | ||||||
| Average Price | ||||||||||||
| In US$/bbl | 68.4 | 68.6 | -0% | -6% | ||||||||
| In US$/MBTU | 3.0 | 3.2 | ||||||||||
Note: The net production in Argentina. The gas volume is standardized at 9,300 kilocalories (kCal).
Our gas price in Q1 25 averaged US$3.0 per MBTU (-6% vs. Q1 24, +6% vs. Q4 24), primarily explained by the lower export prices to Chile, in line with lower international reference prices, and seasonal oversupply in the industrial segment. These effects were partially offset by higher retail prices, driven by tariff increases.
Regarding our gas deliveries, during Q1 25, 74% was destined for thermal power generation and 8% to distribution companies, both under Plan Gas. 8% supplied the industrial/spot market, 8% was exported, and the remaining 2% was sold to our petchem plants as raw material. Compared to Q1 24, 66% was destined for thermal power units, 9% was supplied to the retail segment, 14% was sold to the industrial/spot market, 8% was exported, and the remaining 3% was sold to our petchem plants.
Oil production reached 3.2 kbpd in Q1 25 (-25% vs. Q1 24, -18% vs. Q4 24), explained by the sale of our non-operated stake at Gobernador Ayala in October 2024 (-1.1 kbpd), and lower volumes at non-operated conventional crude oil blocks El Tordillo (-0.2 kbpd) and Los Blancos (-0.1 kbpd). The rising shale oil production at Rincón de Aranda partially offset these effects (+0.7 kbpd).
Our oil price in Q1 25 slightly decreased to US$68.4 per barrel, mainly explained by lower Brent-linked export prices. The domestic market absorbed 71% of volume, compared to 69% in Q1 24.
The lifting cost4 recorded US$45 million in Q1 25 (+18% vs. Q1 24, -8% vs. Q4 24), explained by higher gas treatment expenses and well testing at Rincón de Aranda, in preparation for the production ramp-up. The lifting cost per boe rose 20% to US$6.9 per boe produced in Q1 25 vs. US$5.8 per boe in Q1 24, explained by Rincón de Aranda. However, the lifting cost was 20% lower vs. Q4 24 due to higher seasonal output and lower maintenance costs in treatment plants.
Other operating costs, excluding depreciation and amortizations, increased in Q1 25, mainly due to higher trading purchases and transportation and labor costs. Compared to Q4 24, higher royalties and hydrocarbon transportation costs were recorded due to higher seasonal production.
Other operating income and expenses dropped 85% year-on-year, explained by a 75% reduction to US$2 million in Plan Gas income, a compensation to the price agreed in said contract and paid by the Government, due to rising tariffs for distribution companies and, therefore, increased retail sales. Improved collections from CAMMESA and ENARSA, both in days and rate, also led to a 63% decline in commercial interest to US$2 million. There were no significant variations compared to Q4 24.
4 It only considers maintenance, treatment, internal transportation and wellhead staff costs. It does not include amortizations and depreciations.
| Pampa Energía ● Earnings release Q1 25 ● |
Financial results in Q1 25 recorded net losses of US$29 million, a 3% improvement vs. Q1 24, mainly explained by contingencies recorded in Q1 24, partially offset by higher FX losses, as lower devaluation impacted the net financial liability position in AR$.
| Reconciliation of adjusted EBITDA from oil & gas, in US$ million |
First quarter | ||
| 2025 | 2024 | ||
| Consolidated operating income | (9) | 29 | |
| Consolidated depreciations and amortizations | 52 | 47 | |
| Reporting EBITDA | 43 | 76 | |
| Deletion of gain from commercial interests | (2) | (6) | |
| Deletion of CAMMESA's receivable impairment | - | (3) | |
| Adjusted EBITDA from oil & gas | 41 | 67 | |
Our oil and gas adjusted EBITDA amounted to US$41 million in Q1 25 (-39% vs. Q1 24, +12% vs. Q4 24), mainly explained by lower gas sales to industries and exports, along with higher operating costs, mostly related to the development of Rincón de Aranda. Higher Plan Gas deliveries, in line with the increased thermal power demand, partially offset these effects. Compared to Q4 24, the improved EBITDA is explained by seasonal demand and lower lifting costs, offset by increased trading purchases and transportation costs. The adjusted EBITDA excludes non-recurring and non-cash income and expenses, as well as overdue commercial interests.
Finally, capital expenditures amounted to US$147 million in Q1 25 (+67% vs. Q1 24), with 78% allocated to the development of Rincón de Aranda.
| Pampa Energía ● Earnings release Q1 25 ● |
| 3.3 | Analysis of the power generation segment |
| Power generation segment, consolidated Figures in US$ million |
First quarter | |||
| 2025 | 2024 | ∆% | ||
| Sales revenue | 195 | 154 | +27% | |
| Cost of sales | (103) | (77) | +34% | |
| Gross profit | 92 | 77 | +19% | |
| Selling expenses | (1) | (1) | - | |
| Administrative expenses | (11) | (13) | -15% | |
| Other operating income | 6 | 17 | -65% | |
| Other operating expenses | (1) | (3) | -67% | |
| Impairment of financial assets | - | (34) | -100% | |
| Results for participation in joint businesses | 13 | 21 | -38% | |
| Operating income | 98 | 64 | +53% | |
| Finance income | 6 | 1 | NA | |
| Finance costs | (12) | (17) | -29% | |
| Other financial results | 31 | 53 | -42% | |
| Financial results, net | 25 | 37 | -32% | |
| Profit before tax | 123 | 101 | +22% | |
| Income tax | 2 | 97 | -98% | |
| Net income for the period | 125 | 198 | -37% | |
| Attributable to owners of the Company | 124 | 197 | -37% | |
| Attributable to non-controlling interests | 1 | 1 | - | |
| Adjusted EBITDA | 130 | 86 | +51% | |
| Adjusted EBITDA at our share ownership | 129 | 86 | +49% | |
| Increases in PPE | 9 | 24 | -63% | |
| Depreciation and amortization | 31 | 20 | +55% | |
During Q1 25, power generation sales grew 27% year-on-year, mainly driven by higher spot prices in US$ terms. From February 2024, prices in AR$ rose 136%, outpacing inflation (96%) and AR$ depreciation (28%). Additional drivers include the full commissioning of PEPE 6, which added 140 MW of installed capacity between June and November 2024, with energy sold under the MATER market. Increased recognition of fuel, gas and power transportation tariffs was also recorded, in line with higher thermal demand. However, these gains were offset by associated costs.
Improvement in spot prices mainly benefited capacity payments: open cycles/’peakers’ (GT and ST) averaged US$5.4 thousand per MW-month (+54% vs. Q1 24, +7% vs. Q4 24); hydros earned US$2.4 thousand per MW-month (+47% vs Q1 24, similar to Q4 24); and CCGTs invoiced US$5.9 thousand per MW-month (+30% vs. Q1 24, +67% vs. Q4 24), following the programmed overhauls in Q4 24. CCGTs are the only units under the legacy pricing scheme with a partial income in US$ (Res. SE No. 59/23).
The forced outage of HINISA’s units 2 and 3 due to intense floods in January 2025 reduced sales. Compared to Q4 24, the 17% growth in sales corresponds to a higher dispatch in CTGEBA, as the old CCGT had a major life extension overhaul during Q4 24.
The operating performance of Pampa’s operated power generation was similar to Q1 24, outperforming the national grid, which fell 1.3% year-on-year. This is mainly attributed to the commissioning of PEPE 6 (+135 GWh), higher dispatch in CPB due to improved gas supply at GPM (+83 GWh), stronger wind resource in other wind farms (+39 GWh) and improved availability in CTLL (+27 GWh). These effects were partially offset by the forced outage at HINISA mentioned before (-189 GWh) and programmed overhauls in CTEB’s GT02 in March 2025 (-95 GWh).
| Pampa Energía ● Earnings release Q1 25 ● |
The total availability of Pampa’s operated units dropped 307 basis points to 93.4% in Q1 25, compared to Q1 24’s 96.5%, mainly explained by HINISA’s outage, offset by the commissioning of PEPE 6. However, the thermal availability rate improved 21 basis points, reaching 95.8% during Q1 25, which was mainly related to CTLL and CTEB’s improvements.
| Power generation's key performance indicators |
2025 | 2024 | Variation | ||||||||||||
| Wind | Hydro | Thermal | Total | Wind | Hydro | Thermal | Total | Wind | Hydro | Thermal | Total | ||||
| Installed capacity (MW) | 427 | 938 | 4,107 | 5,472 | 287 | 938 | 4,107 | 5,332 | +49% | - | - | +3% | |||
| New capacity (%) | 100% | - | 33% | 32% | 100% | - | 33% | 31% | - | - | - | +2% | |||
| Market share (%) | 1.0% | 2.2% | 9.4% | 12.6% | 0.7% | 2.1% | 9.4% | 12.2% | +0% | +0% | +0% | +0% | |||
| First quarter | |||||||||||||||
| Net generation (GWh) | 418 | 485 | 5,048 | 5,951 | 244 | 683 | 5,002 | 5,928 | +72% | -29% | +1% | +0% | |||
| Volume sold (GWh) | 420 | 485 | 5,246 | 6,150 | 246 | 683 | 5,215 | 6,144 | +71% | -29% | +1% | +0% | |||
| Average price (US$/MWh) | 70 | 19 | 36 | 37 | 72 | 11 | 31 | 31 | -2% | +72% | +16% | +22% | |||
| Average gross margin (US$/MWh) | 51 | 10 | 24 | 25 | 64 | 3 | 20 | 20 | -20% | na | +17% | +22% | |||
Note: Gross margin before amortization and depreciation. It includes CTEB (co-operated by Pampa, 50% equity stake).
Excluding depreciation and amortizations, net operating costs increased by 39% to US$79 million in Q1 25, mainly explained by lower overdue interest from CAMMESA, higher gas and power transport costs and lower capitalization of maintenance works, in addition to increased power purchases to cover contracts. These effects were partially offset by lower insurance and contractor costs, and higher insurance recovery. Compared to Q4 24, operating expenses fell 16%, reflecting increased insurance recovery and lower maintenance and labor costs, partially offset by higher power purchases.
Financial results in Q1 25 reached a net profit of US$25 million, 32% lower vs. Q1 24, due to lesser gains from financial instruments, partially offset by recovery of penalties at PEA and lower financial expenses from reduced AR$-debt.
| Reconciliation of adjusted EBITDA from power generation, in US$ million | First quarter | ||
| 2025 | 2024 | ||
| Consolidated operating income | 98 | 64 | |
| Consolidated depreciations and amortizations | 31 | 20 | |
| Reporting EBITDA | 129 | 84 | |
| Deletion of CTEB's equity income | (13) | (21) | |
| Deletion of commercial interests to CAMMESA | (1) | (13) | |
| Deletion of CAMMESA's receivable impairment | - | 20 | |
| Deletion of PPE activation in operating expenses | - | 1 | |
| Deletion of provision in hydros | 0 | 1 | |
| CTEB's EBITDA, at our 50% ownership | 14 | 14 | |
| Adjusted EBITDA from power generation | 130 | 86 | |
Adjusted EBITDA from the power generation segment was US$130 million, a 51% increase year-on-year, mainly boosted by higher spot prices in US$ terms, the addition of PEPE 6 and operational improvements, especially in PPAs units (CAMMESA and private). In Q1 24, results had been affected by a US$20 million impairment on CAMMESA’s trade receivables. These gains were partially offset by higher operating expenses. Adjusted EBITDA excludes non-operating, non-recurrent and non-cash items and considers CTEB’s 50% ownership, which posted US$14 million in Q1 25, similar to Q1 24. Quarter-on-quarter, the higher EBITDA is explained by seasonality, PEPE 6 and lower operating expenses.
Finally, excluding CTEB, capital expenditures totaled US$9 million in Q1 25 vs. US$24 million in Q1 24, explained by the completion of PEPE 6 in Q4 24.
| Pampa Energía ● Earnings release Q1 25 ● |
| 3.4 | Analysis of the petrochemicals segment |
| Petrochemicals segment, consolidated Figures in US$ million |
First quarter | |||
| 2025 | 2024 | ∆% | ||
| Sales revenue | 92 | 120 | -23% | |
| Domestic sales | 57 | 76 | -25% | |
| Foreign market sales | 35 | 44 | -20% | |
| Cost of sales | (90) | (108) | -17% | |
| Gross profit | 2 | 12 | -83% | |
| Selling expenses | (3) | (2) | +50% | |
| Administrative expenses | (2) | (2) | - | |
| Other operating income | 19 | 3 | NA | |
| Other operating expenses | (4) | (1) | +300% | |
| Operating income | 12 | 10 | +20% | |
| Finance income | 27 | - | NA | |
| Finance costs | - | (1) | -100% | |
| Other financial results | (1) | - | NA | |
| Financial results, net | 26 | (1) | NA | |
| Profit before tax | 38 | 9 | NA | |
| Income tax | 4 | 2 | +100% | |
| Net income for the period | 42 | 11 | +282% | |
| Adjusted EBITDA | (4) | 11 | NA | |
| Increases in PPE | 3 | 1 | +200% | |
| Depreciation and amortization | 1 | 1 | - | |
| Reconciliation of adjusted EBITDA from petrochemicals, in US$ million | First quarter | ||
| 2025 | 2024 | ||
| Consolidated operating income | 12 | 10 | |
| Consolidated depreciations and amortizations | 1 | 1 | |
| Reporting EBITDA | 13 | 11 | |
| Deletion of gain from commercial interests | - | (0) | |
| Deletion of contingencies adjustment | (17) | - | |
| Adjusted EBITDA from petrochemicals | (4) | 11 | |
The adjusted EBITDA for the petrochemicals segment reported a US$4 million loss in Q1 25, compared to US$11 million gain in Q1 24, mainly due to an overhaul at the Reformer plant in February 2025, which reduced production by 30%, and to a lesser extent, lower of styrene and polystyrene prices and volumes and higher operating expenses. Increased SBR exports partially offset these effects. Adjusted EBITDA excludes a US$17 million gain from the reversal of a customs contingency.
The total volume sold was 84 thousand tons (-24% vs. Q1 24), impacted by the plant maintenance shutdown mentioned before and lower sales across most products, except SBR exports and domestic polystyrene sales.
In Q1 25, financial results from the petrochemicals segment recorded a profit of US$26 million, compared to a US$1 million loss in Q1 24, mainly explained by contingency recoveries.
| Pampa Energía ● Earnings release Q1 25 ● |
| Petrochemicals' key performance indicators |
Products | Total | ||||
| Styrene & polystyrene1 | SBR | Reforming & others | ||||
| First quarter | ||||||
| Volume sold Q1 25 (thousand ton) | 19 | 11 | 54 | 84 | ||
| Volume sold Q1 24 (thousand ton) | 23 | 10 | 77 | 110 | ||
| Variation Q1 25 vs. Q1 24 | -15% | +8% | -30% | -24% | ||
| Average price Q1 25 (US$/ton) | 1,539 | 1,764 | 799 | 1,095 | ||
| Average price Q1 24 (US$/ton) | 1,711 | 1,639 | 845 | 1,098 | ||
| Variation Q1 25 vs. Q1 24 | -10% | +8% | -6% | -0% | ||
Note: 1 Includes Propylene.
| 3.5 | Analysis of the holding and others segment |
| Holding and others segment, consolidated Figures in US$ million |
First quarter | |||
| 2025 | 2024 | ∆% | ||
| Sales revenue | 7 | 3 | +133% | |
| Cost of sales | - | - | NA | |
| Gross profit | 7 | 3 | +133% | |
| Administrative expenses | (9) | (8) | +13% | |
| Other operating income | 3 | 1 | +200% | |
| Other operating expenses | (14) | (22) | -36% | |
| Income from the sale of associates | - | 2 | -100% | |
| Results for participation in joint businesses | 33 | 40 | -18% | |
| Operating income | 20 | 16 | +25% | |
| Finance income | - | 2 | -100% | |
| Finance costs | (4) | (10) | -60% | |
| Other financial results | 11 | 3 | +267% | |
| Financial results, net | 7 | (5) | NA | |
| Profit before tax | 27 | 11 | +145% | |
| Income tax | 9 | - | NA | |
| Net income for the period | 36 | 11 | +227% | |
| Adjusted EBITDA | 53 | 23 | +133% | |
| Increases in PPE | 2 | 1 | +100% | |
| Depreciation and amortization | - | - | NA | |
The holding and others segment, excluding equity income from affiliates TGS and Transener, posted a loss on operating margin of US$13 million in Q1 25 vs. an improvement compared to the US$24 million loss in Q1 24, mainly explained by lower provisions for contingencies and higher fee income, partially offset by increased contractor costs.
In Q1 25, financial results showed a net profit of US$7 million vs. a US$5 million loss in Q1 24, mainly explained by gains from the slower AR$ devaluation on tax credits and lesser financial expenses from reduced AR$ debt, partially offset by lower interest income.
| Pampa Energía ● Earnings release Q1 25 ● |
| Reconciliation of adjusted EBITDA from holding and others, in US$ million | First quarter | ||
| 2025 | 2024 | ||
| Consolidated operating income | 20 | 16 | |
| Consolidated depreciations and amortizations | - | - | |
| Reporting EBITDA | 20 | 16 | |
| Deletion of equity income | (33) | (40) | |
| Deletion of gain from commercial interests | - | (0) | |
| Deletion of contigencies provision | - | 16 | |
| Deletion of the sale of associates | - | (2) | |
| Deletion of arbitration costs in OCP | 8 | - | |
| TGS's EBITDA adjusted by ownership | 46 | 27 | |
| Transener's EBITDA adjusted by ownership | 13 | 6 | |
| Adjusted EBITDA from holding and others | 53 | 23 | |
The adjusted EBITDA from our holding and others segment excludes non-operating, non-recurring and non-cash items and includes the EBITDA adjusted by equity ownership in TGS and Transener. The US$53 million profit in Q1 25, significantly above the US$23 million in Q1 24, was due to higher contributions from TGS and Transener and, to a lesser extent, improved losses from the corporate segment (US$5 million in Q1 25 vs. US$10 million in Q1 24).
In TGS, the EBITDA adjusted by our stake was US$46 million in Q1 25, compared to US$27 million in Q1 24, mainly driven by tariff increases in the regulated gas transportation business, partially offset by higher operating costs and lower NGL sales due to the weather-related disruptions at Cerri Complex. Operating losses from said event for US$10 million were excluded from EBITDA.
In Transener, the EBITDA adjusted by our stake was US$13 million in Q1 25 vs. US$6 million recorded in Q1 24, mainly due to tariff hikes.
| Pampa Energía ● Earnings release Q1 25 ● |
| 3.6 | Analysis of the quarter, by subsidiary and segment |
| Subsidiary In US$ million |
First quarter 2025 | First quarter 2024 | |||||||
| % Pampa | Adjusted EBITDA | Net debt2 |
Net income3 |
% Pampa | Adjusted EBITDA | Net debt2 |
Net income3 |
||
| Oil & gas segment | |||||||||
| Pampa Energía | 100.0% | 41 | 1,167 | (49) | 100.0% | 67 | 956 | 48 | |
| Subtotal oil & gas | 41 | 1,167 | (49) | 67 | 956 | 48 | |||
| Power generation segment | |||||||||
| Diamante | 61.0% | 3 | (0) | 3 | 61.0% | (0) | (0) | 1 | |
| Los Nihuiles | 52.0% | (0) | (0) | (0) | 52.0% | (0) | (0) | 2 | |
| VAR | 100.0% | 4 | (0) | 3 | 100.0% | 4 | 0 | 4 | |
| CTBSA | 28 | 176 | 21 | 28 | 219 | 49 | |||
| Non-controlling stake adjustment | (14) | (88) | (10) | (14) | (109) | (25) | |||
| Subtotal CTBSA adjusted by ownership | 50.0% | 14 | 88 | 10 | 50.0% | 14 | 109 | 25 | |
| Pampa stand-alone, other companies, & adj.1 | 109 | (590) | 108 | 68 | (238) | 166 | |||
| Subtotal power generation | 130 | (502) | 124 | 86 | (129) | 197 | |||
| Petrochemicals segment | |||||||||
| Pampa Energía | 100.0% | (4) | - | 42 | 100.0% | 11 | - | 11 | |
| Subtotal petrochemicals | (4) | - | 42 | 11 | - | 11 | |||
| Holding & others segment | |||||||||
| Transener | 48 | (120) | 28 | 21 | (28) | 12 | |||
| Non-controlling stake adjustment | (36) | 89 | (21) | (16) | 20 | (9) | |||
| Subtotal Transener adjusted by ownership | 26.3% | 13 | (32) | 8 | 26.3% | 6 | (7) | 3 | |
| TGS | 179 | (340) | 100 | 103 | 39 | 65 | |||
| Non-controlling stake adjustment | (133) | 253 | (74) | (76) | (29) | (48) | |||
| Subtotal TGS adjusted by ownership | 25.5% | 46 | (87) | 25 | 26.2% | 27 | 10 | 17 | |
| Pampa stand-alone, other companies, & adj.1 | (5) | (0) | 3 | (10) | (0) | (9) | |||
| Subtotal holding & others | 53 | (118) | 36 | 23 | 3 | 11 | |||
| Deletions | - | 31 | - | - | (112) | - | |||
| Total consolidated | 220 | 577 | 153 | 187 | 718 | 267 | |||
| At our share ownership | 219 | 546 | 153 | 187 | 830 | 267 | |||
Note:
1 The deletion corresponds to other companies or inter-companies. 2 Net debt
includes holding companies. 3 Attributable to the Company’s shareholders.
| Pampa Energía ● Earnings release Q1 25 ● |
| 4. | Appendix |
| 4.1 | Power generation’s main operational KPIs by plant |
| Power generation's key performance indicators |
Wind | Hydroelectric | Subtotal hydro +wind |
Thermal | Total | |||||||||||||||||||
| PEPE2 | PEPE3 | PEPE4 | PEA | PEPE61 | HINISA | HIDISA | HPPL | CTLL | CTG | CTP | CPB | CTPP | CTIW | CTGEBA | Eco- Energía |
CTEB2 | Subtotal thermal |
|||||||
| Installed capacity (MW) | 53 | 53 | 81 | 100 | 140 | 265 | 388 | 285 | 1,366 | 780 | 361 | 30 | 620 | 100 | 100 | 1,253 | 14 | 848 | 4,107 | 5,472 | ||||
| New capacity (MW) | 53 | 53 | 81 | 100 | 140 | - | - | - | 428 | 184 | 100 | - | - | 100 | 100 | 565 | 14 | 279 | 1,343 | 1,770 | ||||
| Market share | 0.1% | 0.1% | 0.2% | 0.2% | 0.3% | 0.6% | 0.9% | 0.7% | 3.1% | 1.8% | 0.8% | 0.1% | 1.4% | 0.2% | 0.2% | 2.9% | 0.03% | 1.9% | 9.4% | 13% | ||||
| First quarter | ||||||||||||||||||||||||
| Net generation Q1 25 (GWh) | 51 | 56 | 86 | 90 | 135 | 122 | 202 | 161 | 903 | 1,148 | 142 | 14 | 185 | 54 | 41 | 2,296 | 13 | 1,156 | 5,048 | 5,951 | ||||
| Market share | 0.1% | 0.1% | 0.2% | 0.23% | 0.35% | 0.3% | 0.5% | 0.4% | 2.3% | 2.9% | 0.4% | 0.0% | 0.5% | 0.1% | 0.1% | 5.9% | 0.0% | 3.0% | 12.9% | 15.2% | ||||
| Sales Q1 25 (GWh) | 53 | 56 | 86 | 90 | 135 | 122 | 202 | 161 | 905 | 1,134 | 203 | 14 | 186 | 54 | 41 | 2,421 | 32 | 1,161 | 5,246 | 6,150 | ||||
| Net generation Q1 24 (GWh) | 38 | 45 | 79 | 82 | - | 311 | 208 | 164 | 926 | 1,121 | 135 | 28 | 102 | 44 | 37 | 2,267 | 17 | 1,251 | 5,002 | 5,928 | ||||
| Variation Q1 25 vs. Q1 24 | +33% | +25% | +9% | +10% | na | -61% | -3% | -2% | -3% | +2% | +5% | -51% | +81% | +24% | +10% | +1% | -22% | -8% | +1% | +0% | ||||
| Sales Q1 24 (GWh) | 41 | 45 | 79 | 82 | - | 311 | 208 | 164 | 929 | 1,091 | 229 | 28 | 102 | 44 | 37 | 2,394 | 38 | 1,251 | 5,215 | 6,144 | ||||
| Avg. price Q1 25 (US$/MWh) | 90 | 63 | 63 | 78 | 63 | 14 | 22 | 19 | 43 | 24 | 57 | 56 | 72 | na | na | 35 | 33 | 31 | 36 | 37 | ||||
| Avg. price Q1 24 (US$/MWh) | 76 | 64 | 64 | 80 | na | 9 | 14 | 12 | 27 | 20 | 34 | 13 | 66 | na | na | 31 | 39 | 28 | 31 | 31 | ||||
| Avg. gross margin Q1 25 (US$/MWh) | (2) | 63 | 63 | 45 | 63 | 1 | 15 | 10 | 29 | 18 | 34 | 29 | 43 | 142 | 128 | 19 | 14 | 25 | 24 | 25 | ||||
| Avg. gross margin Q1 24 (US$/MWh) | 58 | 72 | 72 | 55 | na | 3 | 3 | 2 | 19 | 16 | 13 | (3) | 9 | na | 145 | 18 | 18 | 23 | 20 | 20 | ||||
Note: Gross margin before amortization and depreciation. 1 Co-operated by Pampa (50% equity stake).
| Pampa Energía ● Earnings release Q1 25 ● |
| 4.2 | Production in the main oil and gas blocks |
| In kboe/day at ownership | First quarter | |||
| 2025 | 2024 | Variation | ||
| Gas | ||||
| El Mangrullo | 38.1 | 43.7 | -13% | |
| Río Neuquén | 8.4 | 8.9 | -5% | |
| Sierra Chata | 20.9 | 13.8 | +51% | |
| Rincón del Mangrullo1 | 1.0 | 1.5 | -29% | |
| Others | 1.0 | 0.9 | +13% | |
| Total gas at working interest | 69.5 | 68.8 | +1% | |
| Oil | ||||
| El Tordillo2 | 1.3 | 1.6 | -15% | |
| Gobernador Ayala3 | - | 1.1 | -100% | |
| Rincón de Aranda | 0.9 | 0.2 | na | |
| Associated oil4 | 1.0 | 1.3 | -26% | |
| Others | 0.1 | 0.2 | -56% | |
| Total oil at working interest | 3.2 | 4.3 | -25% | |
| Total | 72.7 | 73.1 | -0% | |
Note:
Production in Argentina. 1 It does not include shale formation. 2 It includes the La Tapera – Puesto Quiroga block.
3 On October 21, 2024, Pampa transferred its 22.51% stake in the concession at the Gobernador Ayala to Pluspetrol. 4 From
gas fields.
| Pampa Energía ● Earnings release Q1 25 ● |
| 5. | Glossary of terms |
| Term | Definition |
| ADR/ADS | American Depositary Receipt |
| AR$ | Argentine pesos |
| Bbl | Barrel |
| Boe | Barrels of oil equivalent |
| ByMA | Bolsas y Mercados Argentinos or Buenos Aires Stock Exchange |
| CAMMESA | Compañía Administradora del Mercado Mayorista Eléctrico S.A. or Argentine Wholesale Electricity Market Clearing Company |
| CB | Corporate Bonds |
| 2027 CB | Corporate Bonds maturing in 2027 |
| 2031 CB | Corporate Bonds maturing in 2031 |
| 2034 CB | Corporate Bonds maturing in 2034 |
| CCGT | Combined cycle |
| CPB | Piedra Buena Thermal Power Plant |
| CPI | Consumer price index |
| CTBSA | CT Barragán S.A. |
| CTEB | Ensenada Barragán Thermal Power Plant |
| CTG | Güemes Thermal Power Plant |
| CTGEBA | Genelba Thermal Power Plant |
| CTIW | Ingeniero White Thermal Power Plant |
| CTLL | Loma De La Lata Thermal Power Plant |
| CTP | Piquirenda Thermal Power Plant |
| CTPP | Parque Pilar Thermal Power Plant |
| E&P | Exploration and Production |
| EBITDA | Earnings before interest, tax, depreciation and amortization |
| EcoEnergía | EcoEnergía Co-Generation Power Plant |
| ENARGAS | Ente Nacional Regulador del Gas or National Gas Regulatory Entity |
| ENARSA | Energía Argentina S.A. |
| ENRE | Ente Nacional Regulador de la Electricidad or National Electricity Regulatory Entity |
| FLNG | Floating liquefaction of natural gas |
| FS | Financial Statements |
| FX | Nominal exchange rate |
| Golar Subholding | Golar FLNG Sub-Holding Company Limited |
| GPM, former GPNK | Francisco Pascasio Moreno Gas Pipeline, formerly President Nestor Kirchner |
| GSA | Long-term gas sale agreement |
| GT | Gas turbine |
| GWh | Gigawatt-hour |
| HIDISA | Diamante Hydro Power Plant |
| Hilli | Hilli Episeyo liquefaction floating vessel |
| HINISA | Los Nihuiles Hydro Power Plant |
| HPPL | Pichi Picun Leufu Hydro Power Plant |
| IFRS | International Financial Reporting Standards |
| Kb/kboe | Thousands of barrels/thousands of barrels of oil equivalent |
| Kbpd/kboepd | Thousands of barrels per day/thousands of barrels of oil equivalent per day |
| Pampa Energía ● Earnings release Q1 25 ● |
| LNG | Liquefied Natural Gas |
| M3 | Cubic meter |
| MAT | Business-to-business market |
| Mboe | Million barrels of oil equivalent |
| MBTU | Million British Thermal Units |
| Mcmpd | Million cubic meters per day |
| MECON | Ministry of Economy |
| MEM | Wholesale electricity market |
| MTPA | Million tons per year |
| MULC | Mercado Único Libre de Cambios or Free and Single Foreign Exchange Market |
| MW/MWh | Megawatt/Megawatt-hour |
| N.a. | Not applicable |
| NGL | Natural gas liquids |
| O/S | Share ownership |
| PAE | Pan American Energy S.A. |
| Pampa / The Company | Pampa Energía S.A. |
| PEA | Arauco II Wind Farm, stage 1 and 2 |
| PEPE | Pampa Energía Wind Farm |
| Plan Gas | Argentine Natural Gas Production Promotion Plan, 2020–2024 Supply and Demand Scheme (Executive Order No. 892/20, 730/22 and supplementary provisions) |
| PPA | Power purchase agreement |
| PPE | Property, plant and equipment |
| PPI | Producer’s Price Index |
| Q4 24 | Fourth quarter of 2024 |
| Q1 25/Q1 24 | First quarter of 2025/First quarter of 2024 |
| Res. | Resolution/Resolutions |
| RIGI | Régimen de Incentivo para Grandes Inversiones or Incentive Regime for Large Investments |
| RQT | Five-year tariff review |
| SACDE | Sociedad Argentina de Construcción y Desarrollo Estratégico |
| SCEyM | Secretariat of Energy and Mining Coordination |
| SE | Secretariat of Energy |
| SESA | Southern Energy S.A. |
| SSEE | Undersecretariat of Electric Power |
| ST | Steam turbine |
| SUR | Sur Inversiones Energéticas S.A.U. |
| TGS | Transportadora de Gas del Sur S.A. |
| Ton | Metric ton |
| Transba | Empresa de Transporte de Energía Eléctrica por Distribución Troncal de la Provincia de Buenos Aires Transba S.A. |
| Transener | Compañía de Transporte de Energía Eléctrica en Alta Tensión Transener S.A. |
| US$ | U.S. Dollars |
| US$-link | A security in which the underlying is linked to a US$ wholesale exchange rate |
| US$-MEP | A security in which the settlement uses US$ in the domestic market |
| VMOS | Vaca Muerta Oil Sur |
| Wintershall | Wintershall DEA Argentina S.A. |
| Pampa Energía ● Earnings release Q1 25 ● |