U.S. SECURITIES AND EXCHANGE COMMISSION
Washington, D.C. 20549
FORM 6-K
REPORT OF FOREIGN PRIVATE ISSUER
PURSUANT TO RULE 13a-16 OR 15d-16 UNDER THE
SECURITIES EXCHANGE ACT OF 1934
For the Month of April 2025
Nexa Resources S.A.
(Exact Name as Specified in its Charter)
N/A
(Translation of Registrant’s Name)
37A, Avenue J.F. Kennedy
L-1855, Luxembourg
Grand Duchy of Luxembourg
(Address of principal executive offices)
Indicate by check mark whether the registrant files or will file annual reports under cover Form 20-F or Form 40-F.
| Form 20-F X | Form 40-F |
Indicate by check mark if the registrant is submitting the Form 6-K in paper as permitted by Regulation S-T Rule 101(b)(1): ____
Indicate by check mark if the registrant is submitting the Form 6-K in paper as permitted by Regulation S-T Rule 101(b)(7): ____
Indicate by check mark whether by furnishing the information contained in this Form, the registrant is also thereby furnishing the information to the Commission pursuant to Rule 12g3-2(b) under the Securities Exchange Act of 1934.
| Yes | No X |
If “Yes” is marked, indicate below the file number assigned to the registrant in connection with Rule 12g3-2(b): Not applicable.
SIGNATURES
Pursuant to the requirements of the Securities Exchange Act of 1934, the registrant has duly caused this report to be signed on its behalf by the undersigned, thereunto duly authorized.
Date: April 29, 2025
| NEXA RESOURCES S.A. |
| By:/s/ José Carlos del Valle |
| Name: José Carlos del Valle |
|
Title: Senior Vice President of Finance and Group Chief Financial Officer
|
EXHIBIT INDEX
| Exhibit | Description of Exhibit |
|
|
|
Nexa Reports First Quarter 2025
Financial Results including
Net Income of US$29 million and Adjusted EBITDA of US$125 million
Luxembourg, April 29, 2025 – Nexa Resources S.A. (“Nexa Resources”, “Nexa”, or the “Company”) announces today its results for the three-month period ended on March 31, 2025.
CEO Message – Ignacio Rosado
In the first quarter of 2025, we delivered resilient Adjusted EBITDA, demonstrating the strength of our integrated business model, ongoing cost discipline, and steady progress on our strategic priorities, despite operational challenges at certain of our sites that resulted in production volumes slightly below our initial estimates. These challenges were primarily driven by atypical heavy rainfall in both the Pasco region and Aripuanã, as well as production instabilities at our smelters in Brazil. We remain focused on enhancing operational stability, advancing key initiatives, such as the acquisition and installation of a fourth filter at Aripuanã in 2H25, which remains on track and is expected to ease current production constraints. We also continued to move forward with the Cerro Pasco Integration project, a central pillar of our strategy which plays a critical role in extending the operational life and value of our operating assets.
On the financial front, as part of our liability management strategy, in early April and during a volatile market we successfully executed a US$500 million bond issuance, alongside tender offers for a substantial portion of our 2027 and 2028 notes. This transaction allowed us to proactively and efficiently manage upcoming maturities, extending our debt profile, and further optimizing our capital structure. This outcome reinforces our financial flexibility, highlights our solid credit metrics and investor confidence, and aligns with our long-term commitment to capital discipline.
We are closely monitoring the evolving geopolitical landscape and ongoing discussions around tariffs. While uncertainties persist, we are encouraged by zinc’s designation as a critical mineral in several jurisdictions, given its essential role in strategic applications – a recognition that also underscores its importance to the global economy and the energy transition. With a tightening supply-demand balance and lower treatment charges, zinc market fundamentals continue to support a constructive outlook in 2025, despite potential volatility throughout the year.
We remain firmly committed to delivering the results we have planned for the year, while upholding the highest standards of safety and ESG performance across all operations. Enhancing engagement with our stakeholders – including collaborators, communities, and investors – remains a top priority as we navigate near-term challenges and pursue long-term value creation.
Summary of Financial Performance
| US$ million (except per share amounts) | 1Q25 | 4Q24 | 1Q24 |
| Net revenues | 627 | 741 | 580 |
| Gross profit | 127 | 143 | 88 |
| Net income (loss) | 29 | (111) | (12) |
| EBITDA (1) | 120 | 218 | 127 |
| Basic and diluted earnings (loss) per share ("EPS") | 0.09 | (0.74) | (0.18) |
| Adjusted net income (loss) (1) | 34 | (133) | (10) |
| Adjusted EBITDA (1) | 125 | 197 | 128 |
| Adjusted basic and diluted earnings (loss) per share (1) | 0.16 | (1.00) | (0.16) |
| Cash provided by operating activities before working capital (1) (2) | 158 | 91 | 87 |

|
| US$ million (except per share amounts) | 1Q25 | 4Q24 | 1Q24 |
| CapEx | 50 | 86 | 74 |
| Free cash flow (1) | (226) | 107 | (144) |
| Total cash (3) | 401 | 640 | 324 |
| Net debt (1) | 1,488 | 1,217 | 1,496 |
| Net Debt/LTM Adj. EBITDA | 2.1x | 1.7x | 3.7x |
(1) Refer to “Use of Non-IFRS Financial Measures” for further information. Adjusted EBITDA, adjusted net income (loss) and adjusted EPS, exclude the items presented in the “Net Income (Loss) reconciliation to Adjusted EBITDA” section of this earnings release. For details on segment definition and accounting policy, please refer to explanatory note 2 – “Information by business segment” in the “Condensed consolidated interim financial statements at and for the three-month period ended on March 31, 2025.”
(2) Working capital variations had a negative impact of US$265 million in 1Q25 and US$125 million in 1Q24, while a positive impact of US$203 million in 4Q24.
(3) Cash, cash equivalents and financial investments.
Executive Summary
Operational Performance
| § | Zinc production in 1Q25 totaled 67kt, down 23% from 1Q24, primarily due to lower output across all units except for Atacocha. Compared to 4Q24, zinc production decreased by 8%, also driven by lower output across operating units except for Cerro Lindo. |
| § | Run-of-mine mining cost in 1Q25 was US$48/t, up 7% compared to 1Q24, mainly driven by increased maintenance and personnel expenses, alongside lower treated ore volumes. Compared to 4Q24, run-of-mine mining cost rose by 8%, primarily due to higher maintenance, third-party and personnel expenses. Excluding Aripuanã, consolidated run-of-mine mining cost remained consistent across both comparative periods. |
| § | Mining cash cost net of by-products in 1Q25 improved to US$0.11/lb compared to US$0.26/lb in 1Q24. This reduction was primarily driven by higher by-products contribution, lower TCs, and favorable foreign exchange variations, partially offset by lower zinc volumes. Compared to 4Q24, cash cost increased by US$0.12/lb, impacted by lower zinc and by-products sales volume, which were partially offset by higher by-products prices (driven by increased LME prices) and lower TCs. |
| § | The smelting segment produced a total of 133kt of zinc metal and oxide in 1Q25, down 4% year-over-year and 12% quarter-over-quarter. This decrease was primarily driven by lower volumes at our Brazilian smelters, in line with our 2025 guidance, which anticipates an annual reduction of approximately 15kt compared to 2024 to accommodate a more volatile market environment and overall lower TCs. |
| § | Zinc metal and oxide sales in 1Q25 reached 130kt, down 6% and 14% from 1Q24 and 4Q24, respectively, resulting from lower production volumes at Três Marias and Juiz de Fora, as well as diminished demand for zinc oxide in the period. |
| § | Smelting conversion cost in 1Q25 was US$0.33/lb, up from US$0.30/lb in 1Q24, mainly due to higher variable costs and maintenance expenses, partially offset by favorable foreign exchange variations and reduced third-party services expenses. Compared to 4Q24, conversion cost increased by 11%, primarily driven by lower sales volume and higher variable costs and energy expenses, partially offset by lower third-party services expenses. |
| § | Smelting cash cost in 1Q25 was US$1.17/lb compared to US$0.98/lb in 1Q24. This increase was mainly attributed to higher raw material costs due to increased zinc prices, lower TCs, and higher operational costs, which were partially offset by increased by-products contribution and favorable foreign exchange variations. Compared to 4Q24, cash cost decreased by 7%, primarily driven by lower raw material costs stemming from zinc prices and operational cost reductions, which were partially offset by lower TCs and lower sales volume. |

|
|
Financial Performance
| § | Net revenues in 1Q25 were US$627 million, up 8% from US$580 million in 1Q24. This increase was primarily driven by higher LME metal prices (except for lead), partially offset by lower smelting sales volume. The LME average prices for zinc and copper rose by 16% and 11%, respectively, while lead prices declined by 5% compared to the same period in 2024. Compared to 4Q24, net revenues decreased by 15%, mainly reflecting lower smelting sales volume, along with declines in zinc and lead prices. |
| § | In 1Q25, net income amounted to US$29 million, resulting in basic and diluted earnings per share attributable to Nexa's shareholders of US$0.09. Compared to 1Q24, the increase in net income was primarily driven by foreign exchange gains from the appreciation of the Brazilian real against the U.S. dollar, as well as a slight increase in operating income. |
| § | Adjusted net income in 1Q25 was US$34 million, with an adjusted net income attributable to Nexa’s shareholders of US$21 million, resulting in an adjusted basic and diluted earnings per share of US$0.16. Refer to our “Net Income (Loss)” section for further details. |
| § | Adjusted EBITDA1 in 1Q25 was US$125 million compared to US$128 million in 1Q24 and US$197 million in 4Q24. The year-over-year decrease was primarily driven by higher costs (mainly attributed to increased calcine inventory consumption at Cajamarquilla) and lower smelting sales volume, which were partially offset by higher zinc prices, increased by-products contribution, and favorable foreign exchange variations. The quarter-over-quarter decrease was mainly due to lower smelting sales volume, an increase in other variations (primarily attributed to the reversal of environmental liabilities related to the Três Marias decommissioning plan in 4Q24), higher costs resulting from increased calcine inventory consumption at Cajamarquilla and lower TCs from third-party concentrates. |
| § | Consolidated Adjusted EBITDA margin in 1Q25 was 19.9%, 6.6pp lower than in 4Q24 and 2.2pp lower than in 1Q24. |
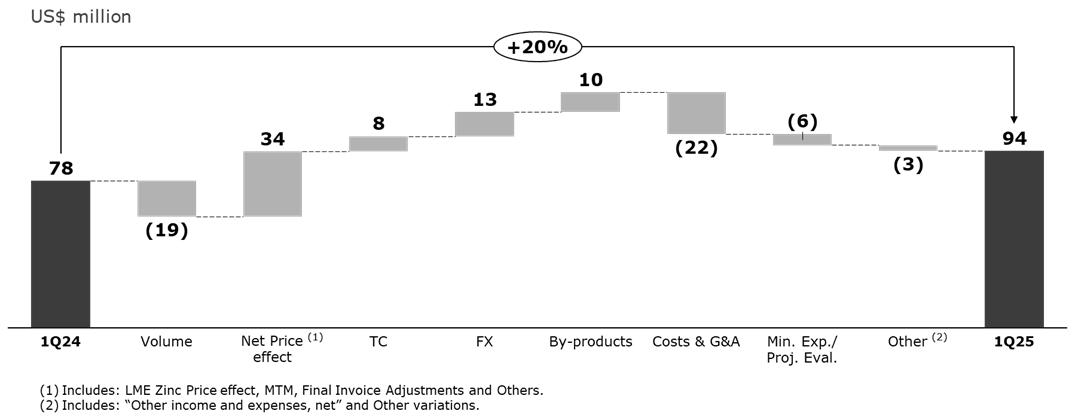
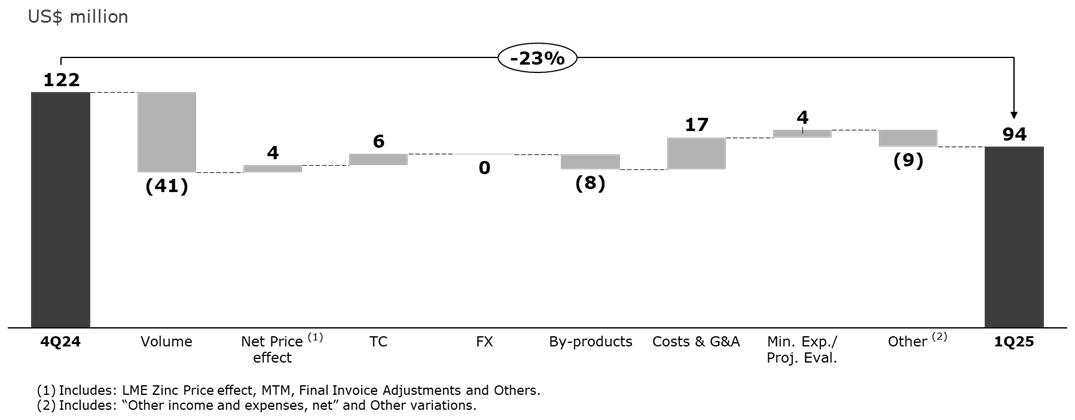
| § | Adjusted EBITDA for the mining segment in 1Q25 was US$94 million compared to US$122 million in 4Q24. This decrease was mainly driven by lower zinc sales across all units (except for Cerro Lindo), a negative impact from other variations (mainly due to lower turnover provisions, increased contingency provisions, and a reduction in cash dividend received from Enercan), and reduced by-products contribution. These effects were partially offset by cost efficiencies and lower TCs. Compared to 1Q24, Adjusted EBITDA increased by 20%, mainly due to higher zinc and copper prices, foreign exchange positive variation, increased by-products contribution and lower TCs. |
| § | Adjusted EBITDA for the smelting segment in 1Q25 was US$31 million, down from US$76 million in 4Q24. This decrease was mainly driven by lower sales volume across all units, a negative net impact in other variations (primarily attributed to the reversal of environmental liabilities related to the Três Marias decommissioning plan that benefitted 4Q24 and a reduction in cash dividend received from Enercan) and higher costs (primarily due to increased calcine inventory consumption at Cajamarquilla). These effects were partially offset by a positive zinc price effect in raw material cost and a positive impact from mark-to-market (“MTM”) variations. Compared to 1Q24, Adjusted EBITDA decreased by 38%, primarily due to higher costs (driven by increased calcine inventory consumption at Cajamarquilla), lower TCs, and reduced sales volume of both zinc metallic and oxide. These effects were partially offset by a positive MTM impact, higher zinc prices, increased by-products contribution and foreign exchange positive variation. |
Financial Position, Investments and Financing
| § | Total cash2 at March 31, 2025, was US$401 million compared to US$640 million at December 31, 2024. Our total available liquidity in 1Q25 stood at US$721 million, including US$320 million from our undrawn sustainability-linked revolving credit facility. This liquidity is sufficient to cover all financial commitments for approximately 3 years. |
1 Adjusted EBITDA excludes the items presented in the “Net Income (Loss) reconciliation to Adjusted EBITDA” section of this earnings release – US$5 million in 1Q25, US$2 million in 1Q24 and US$(22) million in 4Q24.
2 Cash and cash equivalents, and financial investments.
|
|
|
| § | In 1Q25, free cash flow was negative at US$226 million, primarily due to a seasonal variation in working capital of US$265 million. This variation was mainly driven by a decrease in trade payables resulting from increased payments to suppliers. Additionally, an increase in other assets – mainly related to tax claim payments – and a decrease in other liabilities, largely due to the write-off of the commercial advance agreement in 4Q24, along with VAT payments, increased salaries and payroll charges due to bonus payments, along with higher inventory levels, also contributed to the negative cash flow. As in previous years, we remain focused on implementing initiatives to reverse this position in the following quarters. These negative effects were partially offset by strong cash flows from operations, lower CapEX investments of US$50 million and net sales of financial investments in the quarter compared to 4Q24. For further details, please refer to the “Net cash flows from operating activities excluding working capital variations and free cash flow – Reconciliation” section. |
| § | Net debt to Adjusted EBITDA ratio for the last twelve months (“LTM”) increased to 2.1x at the end of 1Q25, compared to 1.7x at the end of 4Q24 and 3.7x at the end of 1Q24. The quarter-over-quarter increase was primarily driven by an increase in net debt and, to a lesser extent, a decline in LTM Adjusted EBITDA. Despite this temporary uptick, we remain committed to our deleveraging strategy and gross debt reduction. Total debt increased by US$19 million, mainly reflecting the negative effect of foreign exchange variations. |
Environmental, Social and Governance (“ESG”) and Corporate Highlights
| § | In January 2025, we introduced our first fleet of hybrid (diesel-electric) loaders for underground mining in Peru, in partnership with Ferreyros, a leading heavy machinery company. This initiative is part of our strategy to reduce fuel consumption and carbon emissions, reinforcing our commitment to sustainability and decarbonization. |
| § | In February 2025, we launched the 5th edition of the Mining Lab Beginnings, a program, which focuses on circular economy initiatives aligned with global sustainability trends. The program seeks researchers, entrepreneurs, startups, and companies with innovative solutions to address challenges in the mining and metals sector. This year’s challenge involves developing commercial and industrial applications for "Waelz Aggregate”, a slag by-product from recycling materials such as batteries and electric arc furnace (“EAF”) dust. Participants may receive R&D funding, technology scaling support, co-development opportunities and access to Nexa's supplier network. |
| § | Also in February 2025, we hosted the Safety Leadership Meeting in São Paulo, bringing together leaders from across our organization to define safety priorities for the year. The event reinforces our "Zero Harm" safety culture, with a focus on employee safety and well-being. |
| § | Additionally in February, we continued the Summer Sports Practice Program in Cajamarquilla, benefiting 80 children from the La Florida Association. Nexa assisted with soccer, volleyball, and dance classes. We also installed a new roof over the community sports court, promoting healthier habits, teamwork and discipline. |
| § | In March 2025, we inaugurated the Geotechnical Monitoring Center (“GMC”) at our Três Marias unit. The GCM enables continuous real-time monitoring of tailings dams and structural stability, strengthening our commitment to safe and responsible operations. |
| § | Also in March, we published our Responsible Mineral Sourcing Policy, which outlines clear guidelines for identifying and managing social and environmental risks in our supply chain. The policy reflects our commitment to human rights, transparency, and conflict-free sourcing, particularly in high-risk areas. The policy can be viewed here. (Note: Our Responsible Mineral Sourcing Policy and other information on our website is not incorporated by reference into this earnings release). |
| § | Throughout 1Q25, as part of Nexa’s circular economy efforts, we began commercializing bricks made from jarosite residue at our Juiz de Fora smelting unit. We also launched community training sessions to support the use of these bricks in construction and expect to extend the initiative to our Vazante unit in the upcoming months. |
|
|
|
| § | On April 28, 2025, we published our 2024 Annual Sustainability Report, detailing key environmental, social, and financial achievements throughout 2024. The document can be viewed here. (Note: Our Annual Sustainability Report and other information on our website is not incorporated by reference into this earnings release). |
| § | In 1Q25, Moody’s affirmed Nexa’s 'Ba2' rating and revised the Company’s outlook from 'negative' to 'stable', while S&P reaffirmed Nexa’s 'BBB-' investment grade rating, also with a 'stable' outlook. |
| § | On March 27, 2025, we published our 2024 Year-End Mineral Reserves and Mineral Resources report. As of December 31, 2024, Proven and Probable Mineral Reserves were estimated at 110.3 million tonnes, containing 4,075kt of zinc – an increase in contained metal compared to 4,031kt at the end of 2023, mainly driven by infill drilling at El Porvenir, Aripuanã, and Vazante. Additional increases resulted from Mineral Reserves conversion at Cerro Lindo, El Porvenir, Aripuanã, and Vazante. Our 2025 exploration program will continue to prioritize near-mine resource expansion and advanced-stage projects. |
| § | In April 2025, we successfully raised US$500 million through a 12-year bond issuance at a competitive 6.600% coupon. The transaction supported our proactive liability management strategy, enabling the repurchase of approximately 49% of the 2027 notes and 72% of the 2028 notes through two any-and-all tender offers. This refinancing initiative extends the Company’s debt maturity profile, enhances financial flexibility, highlights our solid credit metrics and investor confidence, and reduces near-term refinancing risk. The remaining 2027 notes are expected to be fully redeemed via a make-whole call, set to be executed on May 23, 2025, as announced on April 23, 2025. |
| § | Also in April, Mr. Gustavo Cicilini, Vice President of Human Resources and Corporate Affairs, stepped down after serving in the role since 2019. Mr. Carlos Alberto Hilario Andrade was appointed as his successor, bringing over 25 years of leadership experience as a leader in the mining industry’s Human Resources field. |
Growth, Portfolio Optimization and Strategic Investments
| § | In 1Q25, Nexa advanced on Phase I of the Cerro Pasco Integration Project – the tailings pumping and piping system – aimed at enhancing operational efficiency and extending the life of the mining complex. Engineering activities for the tailings infrastructure at El Porvenir and Atacocha proceeded on schedule. Major equipment manufacturing is underway, with electrical systems undergoing final testing, and the production of transformers and other critical components progressing as planned. Procurement of additional equipment is advancing, and the relevant construction permit is currently under review. Proposals for civil and electromechanical works have been received, with contracts expected to be awarded in May 2025. Construction is scheduled to commence in 2Q25. Preparatory work for Phase II, including technical assessments of the Picasso Shaft and the underground integration, is also progressing as planned. |
| § | We remain committed to enhancing free cash flow generation
and continuously assessing our capital allocation framework, which prioritizes sustaining capital, brownfield mineral exploration, and
ESG and Health, Safety, and Environment (“HS&E”) initiatives. Our strategy concentrates
on our most attractive assets and projects to ensure operational resilience and long-term value creation. |
|
|
|
2025 Outlook
Production, Sales and Cash Cost Guidance
Guidance is based on several assumptions and estimates, including but not limited to metal prices, operational performance, maintenance and input costs, and exchange rates.
| § | Nexa reaffirms its 2025 consolidated mining production guidance for all metals. Guidance and 2Q25 outlook for mining production, zinc sales, consolidated cash costs for its mining and smelting segments, capital expenditures, exploration, project evaluation and other expenses is outlined below. |
| o | Cerro Lindo: zinc production in 2Q25 is expected to be in line with or slightly higher than 1Q25 levels, while copper production is expected to increase as per the current mining plan, which includes the extraction of higher-grade stopes. |
| o | El Porvenir: zinc production in 2Q25 is expected to increase compared to 1Q25, driven by access to higher-grade zones and higher treated ore. Lead and silver production are also expected to follow a similar upward trend, supported by anticipated increases in average head grades for both metals. |
| o | Atacocha: we anticipate higher production of all metals in 2Q25 compared to 1Q25, driven by an increase in treated ore volumes and mining activities in higher-grade areas, which are currently being prepared for access in the upcoming quarters. This improvement is also supported by the end of the rainy season. |
| o | Vazante: ore throughput and zinc head grade are expected to be slightly higher in 2Q25 versus 1Q25, resulting in a modest increase in zinc production, in line with the mine sequencing plan for the period. Additionally, preparations are underway to access higher-grade zones in the subsequent quarters. |
| o | Aripuanã: We anticipate higher production of all metals in 2Q25 compared to 1Q25, supported by expected increases in average head grades, enhanced performance at the plant and tailings filters, and the seasonal benefit from the end of the rainy period. |
Mining segment – production
| Mining production | 1Q25 | Guidance 2025 | |||||
| (Metal in concentrate) | |||||||
| Zinc | kt | 67 | 311 | - | 351 | ||
| Cerro Lindo | 17 | 80 | - | 88 | |||
| El Porvenir | 12 | 56 | - | 62 | |||
| Atacocha | 2 | 10 | - | 12 | |||
| Vazante | 30 | 132 | - | 145 | |||
| Aripuanã | 6 | 35 | - | 45 | |||
| Copper | kt | 8 | 29 | - | 35 | ||
| Cerro Lindo | 6 | 24 | - | 27 | |||
| El Porvenir | 0.1 | 0.3 | - | 0.5 | |||
| Aripuanã | 1.2 | 5.1 | - | 8.2 | |||
| Lead | kt | 13 | 59 | - | 70 | ||
| Cerro Lindo | 2 | 11 | - | 12 | |||
| El Porvenir | 6 | 21 | - | 26 | |||
| Atacocha | 2 | 13 | - | 13 | |||
| Vazante | 0.2 | 1 | - | 1 | |||
| Aripuanã | 2 | 14 | - | 17 | |||
|
|
|
| Mining production | 1Q25 | Guidance 2025 | |||||
| (Metal in concentrate) | |||||||
| Silver | MMoz | 2 | 11 | - | 12 | ||
| Cerro Lindo | 0.9 | 3.9 | - | 4.2 | |||
| El Porvenir | 1.0 | 4.2 | - | 4.8 | |||
| Atacocha | 0.2 | 1.3 | - | 1.4 | |||
| Vazante | 0.1 | 0.4 | - | 0.6 | |||
| Aripuanã | 0.2 | 1.1 | - | 1.5 | |||
Smelting segment – sales
| § | Total sales (zinc metal and oxide) guidance also remains unchanged at 560-590kt. |
| o | Peru: we anticipate slightly higher production at Cajamarquilla in 2Q25 compared to 1Q25, driven by stable performance and consistent production levels. |
| o | Brazil: at Três Marias and Juiz de Fora, production in 2Q25 is expected to remain at similar levels to 1Q25, reflecting hydrometallurgical instability at Três Marias and the gradual recovery from the fire incident at Juiz de Fora in late December 2024. |
| Smelting sales | 1Q25 | Guidance 2025 | |||||
| Zinc metal | kt | 122 | 530 | - | 555 | ||
| Cajamarquilla | 81 | 320 | - | 330 | |||
| Três Marias | 29 | 145 | - | 155 | |||
| Juiz de Fora | 12 | 65 | - | 70 | |||
| Zinc oxide | kt | 8 | 30 | - | 35 | ||
| Três Marias | 8 | 30 | - | 35 | |||
| Total Sales | kt | 130 | 560 | - | 590 | ||
Nexa will continue to monitor risks associated with global supply chain disruptions, which could be exacerbated, among other factors, by the ongoing Russia-Ukraine war, the instability in the Middle-East, unusual weather conditions, a possible global recession and its potential impact on the demand for our products, inflationary cost pressure, metal price volatility, local community or union protests, and changes to the political situations or regulatory frameworks in the countries in which we operate that could affect our production levels and our costs. Additionally, the evolving trade policies and tariff changes globally, including recent tariff increases on imports to the U.S., could impact our cost structure, supply chain, and overall market dynamics. Nexa will continue to assess the implications of these trade policies on our operations and financial outlook. Refer to “Risks and Uncertainties” and “Cautionary Statement on Forward-Looking Statements” for further information.
Cash Costs
| § | Nexa also reaffirms its 2025 consolidated cash cost guidance for its mining and smelting segments. |
| o | Mining and smelting volumes: we anticipate a slight increase in 2Q25 compared to 1Q25, remaining within the outlined guidance ranges noted above. |
| o | We anticipate that ongoing improvements in operational efficiency and cost management will positively impact our overall performance. Several initiatives are currently being implemented across our mines and smelters to support this objective. |
| o | Commodity prices assumptions are as follows: Zinc (Zn) at US$1.29/lb, Copper (Cu) at US$4.22/lb, Lead (Pb) at US$0.94/lb, Silver (Ag) at US$31.0/oz, and Gold (Au) at US$2,600/oz. Nexa’s C1 cash cost is sensitive to by-product prices and volumes, which may affect our final cost outcomes. |
|
|
|
| o | Foreign Exchange Rates Assumptions: we maintain our assumptions at BRL/USD: 5.85 and PEN/USD: 3.85. |
| o | 2025 zinc treatment charges (“TCs”): while our current assumption for 2025 TCs remains at US$125/t of concentrate, recent market developments indicate a potential downward adjustment. Benchmark TCs have been agreed at US$80/t, the lowest in over 50 years. We are closely monitoring these market trends and will adjust our assumptions as necessary to align with the evolving industry landscape. |
| Mining Operating costs | Cost ROM (US$/t) |
Cash Cost (US$/lb) |
Cost ROM (US$/t) |
Cash Cost (US$/lb) |
||||||||
| 1Q25 | 1Q25 | Guidance 2025 | Guidance 2025 | |||||||||
| Mining (1) | 47.9 | 0.11 | 49.1 | - | 55.2 | 0.01 | - | 0.23 | ||||
| Cerro Lindo | 40.7 | (0.40) | 41.5 | - | 45.4 | (0.49) | - | (0.30) | ||||
| El Porvenir | 61.4 | (0.10) | 63.0 | - | 69.5 | (0.03) | - | 0.18 | ||||
| Atacocha | 39.9 | (0.41) | 34.5 | - | 38.3 | (1.16) | - | (1.07) | ||||
| Vazante | 41.1 | 0.53 | 50.4 | - | 56.1 | 0.46 | - | 0.52 | ||||
| Aripuanã | 79.3 | 0.56 | 69.0 | - | 86.6 | (0.10) | - | 0.69 | ||||
(1) C1 Weighted Cash cost net of by-products credits is measured with respect to zinc sold per mine.
| Smelting Operating costs | Conversion cost (US$/lb) |
Cash Cost (US$/lb) |
Conversion cost (US$/lb) |
Cash Cost (US$/lb) |
||||||||
| 1Q25 | 1Q25 | Guidance 2025 | Guidance 2025 | |||||||||
| Smelting (2) | 0.33 | 1.17 | 0.29 | - | 0.33 | 1.16 | - | 1.33 | ||||
| Cajamarquilla | 0.29 | 1.04 | 0.28 | - | 0.31 | 1.08 | - | 1.24 | ||||
| Três Marias | 0.33 | 1.39 | 0.24 | - | 0.29 | 1.27 | - | 1.47 | ||||
| Juiz de Fora | 0.55 | 1.39 | 0.42 | - | 0.50 | 1.22 | - | 1.40 | ||||
(2) C1 Weighted Cash cost net of by-products credits is measured with respect to zinc sold per smelter.
| § | In 1Q25, run-of-mine mining costs of US$47.9/t was slightly below our 2025 guidance, while the C1 cash cost stood at US$0.11/lb, in line with expectations. These results were achieved despite operational challenges in both Peru and Brazil, including disruptions in both the Pasco region and Aripuanã due to heavy rainfall. Our focus on cost control measures and operational improvements remains a priority to ensure the consistent execution of our mining plans. Additionally, higher by-products prices partially offset the negative impact of these challenges during the period. For further information, please see the section “Business performance – Mining segment.” |
| § | In 1Q25, smelting conversion cost was US$0.33/lb and the C1 cash cost stood at US$1.17/lb, both within our 2025 guidance ranges. These figures reflect the impact of operational instabilities at our Brazilian smelters during the quarter, while lower zinc volumes were offset by reduced operational expenses. Despite the challenges, our cost control measures remain effective, maintaining costs within the forecasted range. For further information, please see the section “Business performance – Smelting segment.” |
Capital Expenditures (“CAPEX”)
| § | In 1Q25, Nexa invested US$50 million, predominately allocated to sustaining expenditures, including mine development and maintenance of ongoing operations. Investments related to Phase I of the Cerro Pasco Integration Project – focused on the tailings pumping system – totaled approximately US$1 million during the quarter. |
|
|
|
| § | The appreciation of the Brazilian real against the U.S. dollar resulted in a negative impact of approximately US$0.5 million in the period. |
| § | CapEx disbursements are expected to accelerate in the upcoming quarters, and our 2025 CapEx guidance remains unchanged at US$347 million. |
| CAPEX | 1Q25 | Guidance 2025 | ||
| (US$ million) | ||||
| Non-Expansion | 52 | 344 | ||
| Sustaining (1) | 48 | 316 | ||
| HS&E | 3 | 18 | ||
| Others (2) | 0 | 11 | ||
| Expansion projects (3) | 0 | 3 | ||
| Reconciliation to Financial Statements (4) | (2) | - | ||
| TOTAL | 50 | 347 |
(1) Investments in TSF (“Tailings Storage Facility”) are included in sustaining expenses.
(2) Modernization, IT and others.
(3) Includes several projects in Vazante to improve operational performance.
(4) The amounts are mainly related to capitalization of interest net of advanced payments for imported materials and tax credits.
Exploration & Project Evaluation and Other Expenses
| § | In 1Q25, we invested US$16 million in exploration and project evaluation, reinforcing our focus on strengthening the mineral potential of our assets. Additionally, we allocated US$2 million to technology and community initiatives, supporting the continuous improvement of our operations and sustainable development of our host communities. |
| § | Our 2025 guidance for exploration and project evaluation remains unchanged at US$88 million, and US$20 million for other operating expenses. We anticipate a pickup in disbursements in the upcoming quarters, aligned with projects execution schedules. |
| § | As part of our long-term strategy, we remain committed to replacing and expanding our mineral reserves and resources. In this context, we will expect to continue advancing on our exploration programs, identifying new ore bodies and upgrading resource classifications, particularly through infill drilling campaigns. |
| Other Operating Expenses | 1Q25 | Guidance 2025 | ||
| (US$ million) | ||||
| Exploration | 14 | 70 | ||
| Mineral Exploration | 10 | 50 | ||
| Mineral rights | 2 | 10 | ||
| Exploration (mine development) | 2 | 9 | ||
| Project Evaluation | 2 | 18 | ||
| Exploration & Project Evaluation | 16 | 88 | ||
| Other | 2 | 20 | ||
| Technology | 0 | 6 | ||
| Communities | 2 | 14 |
Note: Exploration and project evaluation expenses consider several stages of development, from mineral potential definition, R&D, and subsequent scoping and pre-feasibility studies (FEL1 and FEL2).
|
|
|
Earnings Release 1Q25
This Earnings Release should be read in conjunction with the “Condensed consolidated interim financial statements at and for the three-month period ended on March 31, 2025.” This document contains forward-looking statements.
Table of contents
| Consolidated performance | 11 |
| Business performance – Mining | 17 |
| Business performance – Smelting | 28 |
| Liquidity and Indebtedness | 35 |
| Cash flows | 37 |
| Others | 38 |
| Market scenario | 39 |
| Risks and Uncertainties | 42 |
| Use of Non-IFRS Financial Measures | 44 |
| Cautionary Statement on Forward-Looking Statements | 45 |
| Appendix | 47 |
UPCOMING EVENT
Earnings Conference Call
Date: Wednesday, April 30, 2025 – 9:00am (EST)
Dial In
US: +1 646 931 3860
Canada: +1 780 666 0144
Brazil: +55 21 3958 7888
UK: +44 330 088 5830
Luxembourg: +352 342 080 9265
(Webinar ID: 820 0595 7999 | Passcode: 030519)
Zoom Webinar registration and slide presentation will
be available at:
https://ir.nexaresources.com
|
|
|
Consolidated performance
Selected financial information
| US$ million (except where otherwise indicated) |
1Q25 | 4Q24 | 1Q24 |
| Net Revenues | 627 | 741 | 580 |
| Mining | 313 | 354 | 294 |
| Smelting | 454 | 547 | 418 |
| Intersegment results | Adjustments | (140) | (160) | (133) |
| Cost of Sales | (501) | (598) | (492) |
| Mining | (215) | (256) | (251) |
| Smelting | (424) | (503) | (373) |
| Intersegment results | Adjustments | 139 | 162 | 132 |
| Selling, general and administrative | (35) | (34) | (34) |
| Mining | (18) | (19) | (17) |
| Smelting | (17) | (14) | (15) |
| Intersegment results | Adjustments | 1 | (1) | (1) |
| Depreciation and amortization | 66 | 97 | 77 |
| Mining | 42 | 69 | 56 |
| Smelting | 23 | 28 | 20 |
| Intersegment results | Adjustments | 1 | (1) | 0 |
| Adjusted EBITDA (1) | 125 | 197 | 128 |
| Mining | 94 | 122 | 78 |
| Smelting | 31 | 76 | 51 |
| Intersegment results | Adjustments | (0) | (1) | (0) |
| Adj. EBITDA margin (%) | 19.9% | 26.5% | 22.2% |
| Net income (loss) | 29 | (111) | (12) |
| Attributable to Nexa's shareholders | 12 | (99) | (24) |
| Attributable to non-controlling interests | 17 | (13) | 12 |
| Basic and diluted earnings (loss) per share | 0.09 | (0.74) | (0.18) |
| Adjusted net income (loss) (1) | 34 | (133) | (10) |
| Attributable to Nexa's shareholders | 21 | (133) | (21) |
| Attributable to non-controlling interests | 13 | (0) | 11 |
| Adjusted basic and diluted earnings (loss) per share (1) | 0.16 | (1.00) | (0.16) |
(1) Refer to “Use of Non-IFRS Financial Measures” for further information. Adjusted EBITDA, adjusted net income (loss) and adjusted EPS, exclude the items presented in the “Net Income (Loss) reconciliation to Adjusted EBITDA” section of this earnings release. For details on segment definition and accounting policy, please refer to explanatory note 2 – “Information by business segment” in the “Condensed consolidated interim financial statements at and for the three-month period ended on March 31, 2025.” This is a note about segments, and one of the explanations for the new adjustment for cash dividend at the consolidated level was to keep consistency with segment information.
|
|
|
Net Revenues
In 1Q25, net revenues totaled US$627 million, up 8% year-over-year, primarily driven by higher LME metal prices (except for lead). This positive impact was partially offset by lower smelting sales volume. The LME average prices for zinc and copper rose by 16% and 11%, respectively, while lead prices declined by 5% compared to the same period in 2024. For further details on metal prices, please refer to the “Market Scenario” section.
Compared to 4Q24, net revenues decreased by 15%, mainly reflecting lower smelting sales volume, along with declines in zinc and lead prices.
Cost of Sales
In 1Q25, cost of sales amounted to US$501 million, up 2% year-over-year. This was primarily driven by the negative impact of higher zinc prices on concentrate purchases by our smelters, as well as lower TCs from third-party concentrates. These factors were partially offset by favorable foreign exchange variations. Compared to 4Q24, cost of sales decreased by 16%, mainly due to lower sales volumes and the positive effect of lower zinc prices on concentrate purchases in our smelting segment.
Mineral exploration and Project evaluation
In 1Q25, investments in mineral exploration and project evaluation totaled US$16 million compared to US$12 million in 1Q24.
During 1Q25, we executed 10,419 meters of exploration drilling – achieving 78% of our planned activities for the period. This shortfall was primarily due to several challenges, including adverse climate conditions, operational challenges and a drilling program review as we reassessed priorities and adjusted plans. In addition, we executed 46,938 meters of mine infill drilling. Our brownfield exploration programs focus on expanding our exploration portfolio and extending the life of our mines. At Cerro Lindo, drilling has confirmed the depth and continuity of mineralization in Orebodies 8B, although economic viability was not demonstrated. At Aripuanã, drill hole BRAPD000207 intercepted 4.0 meters at 3.05% Zn, 0.90% Pb, and 4.7 meters at 2.45% Zn and 0.75% Pb. At the Cerro Pasco complex, our focus on mine development continues, and we expect to resume drilling activities in June 2025 at the Integración target.
SG&A
In 1Q25, SG&A expenses totaled US$35 million, 5% higher compared to 1Q24, primarily due to an impairment provision for trade accounts receivable, partially offset by a reduction in third-party services expenses in support areas and favorable foreign exchange variations. Compared to 4Q24, SG&A expenses increased by 3%, mainly due to increased workers’ participation expenses, partially offset by lower third-party services expenses.
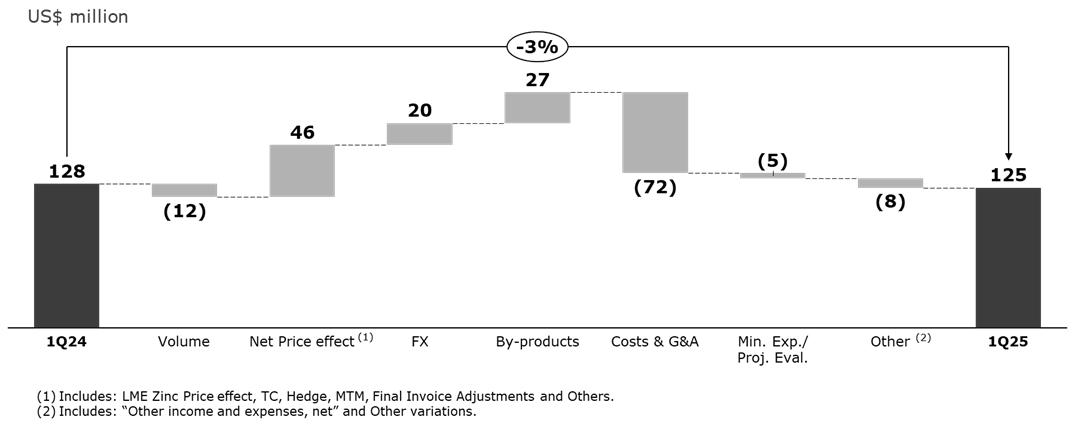
Adjusted EBITDA
In 1Q25, Adjusted EBITDA was US$125 million, down 3% compared to US$128 million in 1Q24. This slight decrease was primarily driven by (i) US$72 million negative impact from higher costs – stemming from increased calcine inventory consumption (associated with higher unitary costs at Cajamarquilla), the elimination of idleness adjustments at Aripuanã (applied in 1Q24), and lower TCs from third-party concentrates; (ii) lower smelting sales volume at our Brazilian units, resulting in a US$12 million decrease (partially offset by an increase of sales volume at Cajamarquilla); (iii) an increase in other variations of US$8 million, reflecting lower turnover provisions combined with higher tax contingency provisions at Cajamarquilla; and (iv) increased mineral exploration and project evaluation expenses of US$5 million. These negative impacts were partially offset by (v) a positive net price effect of US$46 million, primarily attributed to higher zinc prices, and a favorable impact in MTM variation; (vi) higher by-products contribution of US$27 million, mainly due to increased prices across all metals (partially offset by lower mining sales volumes); and (vii) a positive impact of US$20 million from foreign exchange variations.
|
|
|
Compared to 4Q24, Adjusted EBITDA decreased by 36%. This decrease was mainly attributed to (i) lower smelting sales volume of US$33 million across all smelters; (ii) an increase of US$30 million in other variations, primarily attributed to the reversal of environmental liabilities related to the Três Marias decommissioning plan that benefitted 4Q24, a reduction in cash dividend received from Enercan, and increased contingency provisions at Cajamarquilla, Vazante, and Aripuanã; and (iii) higher costs amounting to US$13 million, primarily due to increased calcine inventory consumption (associated with higher unitary costs at Cajamarquilla) and lower TCs from third-party concentrates, which were partially offset by reduced severance payments and maintenance expenses at Cerro Pasco, as well as decreased maintenance and third-party service expenses in Vazante. These negative impacts were partially offset by (iv) a positive net price effect of US$6 million, mainly resulting from favorable MTM variations, partially offset by lower zinc prices.

Net Income (Loss) reconciliation to Adjusted EBITDA
| US$ million | 1Q25 | 4Q24 | 1Q24 |
| Net Income (loss) | 28.7 | (111.4) | (12.0) |
| Depreciation and amortization | 65.8 | 96.6 | 77.0 |
| Share in the results of associates | (4.9) | (4.7) | (5.7) |
| Net financial results | 0.6 | 141.6 | 67.9 |
|
|
|
| US$ million | 1Q25 | 4Q24 | 1Q24 |
| Income tax benefit (expense) | 29.5 | 96.2 | (0.4) |
| EBITDA | 119.8 | 218.3 | 126.8 |
| Changes in fair value of offtake agreement (2) | 10.5 | (21.4) | 1.8 |
| Impairment loss (reversal) of long-lived assets (3) | 0.3 | 7.5 | (17.2) |
| Ramp-up expenses of greenfield projects (Aripuanã) (4) | 0.0 | 0.0 | 13.8 |
| Impairment (reversal) of other assets (5) | 0.0 | 0.0 | 0.3 |
| Gain (Loss) on sale and write-off of property, plant and equipment (6) | (0.1) | 9.3 | 0.2 |
| Remeasurement in estimates of asset retirement obligations (7) | 0.8 | (27.8) | 2.6 |
| Remeasurement adjustment of streaming agreement (8) | 0.0 | 0.0 | 0.0 |
| Changes in fair value of energy forward contracts (9) | (6.2) | 11.7 | (4.4) |
| Tax voluntary disclosure – Value added tax ("VAT") matters (10) | 0.0 | 0.0 | 0.0 |
| Other restoration obligations (11) | (0.1) | (0.1) | 1.4 |
| Divestment and restructuring (12) | 0.0 | (9.9) | 3.2 |
| Dividends received in cash (13) | 0.0 | 9.0 | 0.0 |
| Adjusted EBITDA (1) | 125.0 | 196.7 | 128.4 |
(1) Adjusted EBITDA excludes the items presented above in the “Net Income (Loss) reconciliation to Adjusted EBITDA.” For details on segment definition and accounting policy, please refer to explanatory note 2 – “Information by business segment” in the “Condensed consolidated interim financial statements at and for the three-month period ended on March 31, 2025.”
(2) Non-cash adjustment: Derivative financial instrument related to the “Offtake agreement” described in the section “Others—Offtake agreement” of this earnings release.
(3) Non-cash adjustment: Cash generating unit and individual PP&E assets impairment loss (reversal). Please refer to “Others – Impairment” section in this Earnings Release for further details.
(4) Expenses related to pre-operating and ramp-up expenses incurred during the commissioning and ramp-up phases of greenfield projects which have not achieved their expected production capacity. Commencing in July 2024, these effects were no longer included since, at the end of June 2024 it reached the final stage of its ramp-up phase, transitioning to an ongoing operation.
(5) Non-cash adjustment: Value-added-taxes impairment loss.
(6) Non-cash adjustment: Results from sale and disposal of certain non-current assets.
(7) Non-cash adjustment: Asset retirement obligation remeasurement of discount rate and updated studies that are not subject to capitalization.
(8) Non-cash adjustment: Remeasurement of contractual obligation related to the forward sale contract of Cerro Lindo's Silver contained in the ore.
(9) Non-cash adjustment: The fair value adjustment of the energy surplus resulting from electric energy purchase contracts of our subsidiary, Pollarix.
(10) Expenses related to the impact of accruals related to VAT matters.
(11) Non-cash adjustment: Expenses related to the remeasurement of provision related to estimated costs of anticipated additional obligations in relation to certain inactive industrial waste containment structures in Brazil that have been closed for more than 20 years and that do not contain mining tailings, water or liquid waste.
(12) Expenses related to the effects of obligations of restructuring and divestment related to assets held for sale.
(13) Amount in cash dividend received from associates (currently, Enercan is our only associate), as our management considers this dividend part of the analysis of our energy costs.
Net financial results
Net financial results for 1Q25 were a loss of US$0.6 million, a significant improvement from the US$142 million loss in 4Q24. This was primarily driven by foreign exchange gains stemming from the 7% appreciation of the Brazilian real against the U.S. dollar3, along with higher financial income resulting from the positive variation impact from interest update in the commercial advance agreement (related to lead concentrate) in 4Q24, and lower in financial expenses, particularly due to reduced interest on lease liabilities.
Foreign exchange variations had a positive impact of US$44 million in 1Q25 compared to a negative impact of US$76 million in 4Q24.
3 In 1Q25, the Brazilian real / U.S. dollar (end of period) exchange rate was R$5.742/US$1.00 compared to R$6.192/US$1.00 in 4Q24.
|
|
|
Excluding foreign exchange variations, net financial expenses totaled US$45 million in 1Q25, down from US$66 million in the previous quarter.
| US$ thousand | 1Q25 | 4Q24 | 1Q24 |
| Financial income | 8,856 | 6,034 | 5,013 |
| Financial expenses | (54,711) | (70,909) | (50,904) |
| Other financial items, net | 45,255 | (76,727) | (22,042) |
| Foreign exchange gain (loss) | 44,372 | (75,900) | (21,902) |
| Net financial result | (600) | (141,602) | (67,933) |
| Net financial result excluding FX | (44,972) | (65,702) | (46,031) |
Net Income (Loss)
In 1Q25, net income amounted to US$29 million compared to a net loss of US$12 million in 1Q24 and US$111 million in 4Q24. The improvement versus 4Q24 was primarily driven by foreign exchange gains, supported by the 7% appreciation of the Brazilian real against the U.S. dollar, as well as lower financial expenses, mainly related to reduced interest on lease liabilities. Additionally, higher financial income, primarily due to the positive variation impact from interest update in the commercial advance agreement in 4Q24, and lower income tax expenses contributed to the positive result. These effects were partially offset by lower operating income, which reflected changes in the fair value of our offtake agreement and an increase in provisions for legal claims.
Net Income attributable to Nexa’s shareholders totaled US$12 million in 1Q25, resulting in basic and diluted earnings per share of US$0.09.
Excluding miscellaneous adjustments, as detailed in the Net Income (Loss) reconciliation to Adjusted EBITDA section, adjusted net income in the quarter was US$34 million.
Adjusted Net Income attributable to Nexa’s shareholders totaled US$21 million in 1Q25, with adjusted basic and diluted earnings per share of US$0.16.
| US$ million (except where otherwise indicated) |
1Q25 | 4Q24 | 1Q24 |
| Net Income (loss) | 28.7 | (111.4) | (12.0) |
| Attributable to Nexa's shareholders | 11.8 | (98.5) | (24.4) |
| Attributable to non-controlling interests | 16.9 | (12.9) | 12.4 |
| Basic and diluted earnings (loss) per share | 0.09 | (0.74) | (0.18) |
| Miscellaneous adjustments (1) | 5.2 | (21.7) | 1.7 |
| Attributable to Nexa's shareholders | 9.4 | (34.1) | 3.5 |
| Attributable to non-controlling interests | (4.1) | 12.4 | (1.8) |
| Basic and diluted miscellaneous adjustments per share | 0.07 | (0.26) | 0.03 |
| Adjusted net income (loss) | 34.0 | (133.1) | (10.4) |
| Attributable to Nexa's shareholders | 21.2 | (132.6) | (20.9) |
|
|
|
| US$ million (except where otherwise indicated) |
1Q25 | 4Q24 | 1Q24 |
| Attributable to non-controlling interests | 12.8 | (0.5) | 10.5 |
| Weighted average number of outstanding shares - in thousand | 132,439 | 132,439 | 132,439 |
| Adjusted basic and diluted earnings (loss) per share | 0.16 | (1.00) | (0.16) |
(1) Miscellaneous adjustments include: (i) Changes in
fair value of the offtake agreement; (ii) Impairment loss (reversal) of long-lived assets; (iii) Ramp-up expenses of greenfield projects
(Aripuanã); (iv) Impairment (reversal) of other assets; (v) Gain (loss) on sale and write-off of property, plant and equipment;
(vi) Remeasurement in estimates of asset retirement obligations; (vii) Remeasurement adjustment of streaming agreement; (viii) Changes
in fair value of energy forward contracts; (ix) Tax voluntary disclosure – VAT matters; (x) Other restoration obligations; (xi)
Divestment and restructuring; and (xii) Dividends received in cash.
|
|
|
Business Performance
Mining segment
| Consolidated | 1Q25 | 4Q24 | 1Q24 | 1Q25 vs. 1Q24 | 1Q25 vs. 4Q24 | |
| Ore Mined | kt | 2,983 | 3,180 | 3,263 | (8.6%) | (6.2%) |
| Treated Ore | kt | 3,048 | 3,366 | 3,393 | (10.2%) | (9.4%) |
| Grade | ||||||
| Zinc | % | 2.62 | 2.68 | 3.02 | (40 bps) | (6 bps) |
| Copper | % | 0.34 | 0.35 | 0.31 | 2 bps | (1 bps) |
| Lead | % | 0.54 | 0.67 | 0.69 | (16 bps) | (13 bps) |
| Silver | oz/t | 1.05 | 1.23 | 1.14 | (8.5%) | (14.8%) |
| Gold | oz/t | 0.005 | 0.006 | 0.006 | (16.6%) | (11.2%) |
| Production | metal contained | ||||||
| Zinc | kt | 67.3 | 73.5 | 87.5 | (23.0%) | (8.4%) |
| Copper | kt | 7.6 | 9.1 | 7.5 | 1.6% | (16.8%) |
| Lead | kt | 12.7 | 17.3 | 18.2 | (30.5%) | (27.0%) |
| Silver | MMoz | 2.4 | 3.0 | 3.0 | (19.4%) | (18.9%) |
| Gold | koz | 8.3 | 9.5 | 8.7 | (3.9%) | (11.9%) |
| Zinc Equivalent (1) | kt | 133.4 | 154.7 | 163.8 | (18.6%) | (13.8%) |
(1) Consolidated mining production in kt of zinc equivalent is calculated by converting copper, lead, silver, and gold contents to a zinc equivalent grade, assuming 2024 LME average prices: Zn: US$1.26/lb; Cu: US$4.15/lb; Pb: US$0.94/lb; Ag: US$28.3/oz; Au: US$2,386/oz.
In 1Q25, treated ore volume reached 3,048kt, down 10% year-over-year and 9% quarter-over-quarter. This decline was primarily due to operational challenges across some of our mines. In the Pasco region (El Porvenir and Atacocha), we faced atypical heavy rainfall, while Aripuanã recorded water volumes over 30% higher than the average of the past two years. Additionally, Vazante experienced restricted access areas to higher-grade areas in the period.
Ore throughput increased year-over-year at Cerro Lindo (+2%) and Vazante (+1%). Conversely, throughput decreased at Atacocha (-10%), Aripuanã (-7%), and El Porvenir (-4%).
Zinc equivalent production reached 133kt in 1Q25, down 19% compared to 1Q24 and 14% compared to 4Q24.
The average zinc head grade declined to 2.62%, down 40bps from 1Q24 and 6bps from 4Q24. Copper head grade was 0.34%, up 2bps year-over-year and down 1bps quarter-over-quarter. Lead head grade decreased by 16bps and 13bps from 1Q24 and 4Q24 to 0.54%, respectively, while silver head grade dropped by 9% year-over-year and 15% quarter-over-quarter to 1.05oz/t.
Zinc production totaled 67kt in the quarter, down 23% from 1Q24, mainly due to lower output across all units except for Atacocha, as well as the cessation of mining activities at Morro Agudo. Compared to 4Q24, production decreased by 8%, with only Cerro Lindo contributing positively.
Copper production in 1Q25 was 8kt, up 2% compared to 1Q24 due to improved plant recovery at Cerro Lindo, and down 17% compared to 4Q24, primarily driven by lower output from the same unit.
Lead production decreased by 31% year-over-year and 27% quarter-over-quarter, mainly driven by lower contributions from El Porvenir and Aripuanã.
|
|
|
Cerro Lindo, Peru
| Cerro Lindo (100% basis) |
1Q25 | 4Q24 | 3Q24 | 2Q24 | 1Q24 | 2024 | |
| Ore Mined | kt | 1,487 | 1,537 | 1,593 | 1,484 | 1,457 | 6,070 |
| Treated Ore | kt | 1,498 | 1,577 | 1,560 | 1,472 | 1,471 | 6,080 |
| Grade | |||||||
| Zinc | % | 1.31 | 1.11 | 1.67 | 1.86 | 1.87 | 1.62 |
| Copper | % | 0.51 | 0.60 | 0.56 | 0.66 | 0.51 | 0.58 |
| Lead | % | 0.20 | 0.19 | 0.30 | 0.31 | 0.44 | 0.31 |
| Silver | oz/t | 0.78 | 0.80 | 0.89 | 0.92 | 1.14 | 0.93 |
| Gold | oz/t | 0.002 | 0.002 | 0.003 | 0.002 | 0.003 | 0.003 |
| Production | metal contained | |||||||
| Zinc | kt | 17.0 | 14.7 | 23.1 | 24.1 | 24.3 | 86.2 |
| Copper | kt | 6.4 | 8.1 | 7.5 | 8.4 | 5.9 | 29.9 |
| Lead | kt | 2.0 | 2.0 | 3.7 | 3.3 | 4.9 | 13.9 |
| Silver | MMoz | 0.9 | 0.9 | 1.1 | 1.0 | 1.3 | 4.3 |
| Gold | koz | 1.1 | 1.4 | 1.3 | 1.0 | 1.2 | 4.9 |
| Zinc sales | kt | 16.9 | 14.6 | 24.1 | 24.4 | 22.8 | 85.9 |
| Costs | |||||||
| Cost of sales | US$ mm | 81.2 | 82.6 | 88.5 | 92.9 | 84.9 | 348.9 |
| Cost ROM (2) | US$/t | 40.7 | 35.8 | 40.6 | 45.8 | 41.6 | 40.8 |
| Cash cost (1) | US$/lb | (0.40) | (0.77) | (0.36) | (0.58) | (0.23) | (0.46) |
| Sustaining cash cost (1) | US$/lb | (0.09) | (0.22) | (0.15) | (0.36) | (0.06) | (0.20) |
| CAPEX | US$ mm | ||||||
| Sustaining | 11.5 | 16.1 | 11.0 | 11.5 | 8.5 | 47.1 | |
| Other | 0.0 | 1.7 | 0.2 | 0.1 | 0.0 | 1.9 | |
(1) Our cash cost and sustaining cash cost are net of by-products credits, measured with respect to zinc sold per mine. For a cash cost reconciliation to COGS, please refer to Appendix – All in Sustaining Cash Cost | Mining.
(2) Our cost per ROM is measured with respect to treated ore volume. Refer to “Use of Non-IFRS Financial Measures” for further information.
In 1Q25, treated ore volume totaled 1,498kt, up 2% year-over-year and down 5% quarter-over-quarter.
Zinc production of 17kt decreased by 30% year-over-year, primarily due to the current mine sequencing plan in lower grade areas. On a quarter-over-quarter basis, zinc production increased by 15%, mainly driven by mining activities in higher-grade zones during the period.
The average zinc head grade was 1.31%, down 56bps compared to 1Q24 and up 20bps compared to 4Q24.
|
|
|
Copper production reached 6.4kt, up 7% from 1Q24, supported by higher ROM. Compared to 4Q24, production declined by 22%, reflecting the mine reserve plan. The average copper grade was 0.51% in 1Q25, compared to 0.60% in 4Q24 and 0.51% in 1Q24.
Lead production was 2kt, flat versus 4Q24 and down from 4.9kt in 1Q24, mainly due to a decline in the average lead grade, which decreased by 23bps year-over-year.
Cost
Cost of sales totaled US$81 million in 1Q25, a decrease from US$85 million in the same period of last year. This reduction was primarily driven by lower sales volume, reduced maintenance costs and lower depreciation and amortization expenses. Compared to 4Q24, cost of sales decreased by 2%, mainly due to lower workers’ participation and depreciation and amortization, partially offset by increased drilling costs.
Run-of-mine mining cost was US$41/t in the quarter, decreased by 2% year-over-year. This improvement was primarily attributed to higher treated ore volumes, along with lower maintenance and personnel expenses. Compared to 4Q24, run-of-mine mining cost increased by 13%, primarily due to lower treated ore volumes, higher maintenance expenses, and increased fixed and variables costs.
Cash cost net of by-products in 1Q25 decreased to US$(0.40)/lb compared with US$(0.23)/lb in 1Q24. This improvement was mainly due to higher by-products contribution, supported by higher LME metal prices, partially offset by lower zinc volumes. Compared to 4Q24 cash cost increased by US$0.37/lb, mainly attributed to lower by-products contribution, higher operational costs related to maintenance and variable expenses, partially offset by higher zinc volumes.
CAPEX
In 1Q25, sustaining capital expenditures amounted to US$12 million, primarily allocated to mine development activities.
El Porvenir, Peru
| El Porvenir (100% basis) |
1Q25 | 4Q24 | 3Q24 | 2Q24 | 1Q24 | 2024 | |
| Ore Mined | kt | 512 | 548 | 571 | 538 | 530 | 2,187 |
| Treated Ore | kt | 508 | 574 | 564 | 538 | 530 | 2,205 |
| Grade | |||||||
| Zinc | % | 2.64 | 2.54 | 2.58 | 2.56 | 2.76 | 2.61 |
| Copper | % | 0.16 | 0.13 | 0.14 | 0.14 | 0.16 | 0.14 |
| Lead | % | 1.33 | 1.53 | 1.35 | 1.41 | 1.48 | 1.44 |
| Silver | oz/t | 2.36 | 2.73 | 2.34 | 2.42 | 2.47 | 2.50 |
| Gold | oz/t | 0.009 | 0.011 | 0.009 | 0.009 | 0.011 | 0.010 |
| Production | metal contained | |||||||
| Zinc | kt | 11.9 | 12.9 | 12.8 | 12.1 | 12.9 | 50.6 |
| Copper | kt | 0.1 | 0.1 | 0.1 | 0.1 | 0.1 | 0.3 |
| Lead | kt | 5.8 | 7.5 | 6.4 | 6.4 | 6.6 | 26.8 |
| Silver | MMoz | 1.0 | 1.3 | 1.1 | 1.1 | 1.1 | 4.6 |
| Gold | koz | 1.8 | 2.3 | 1.8 | 1.7 | 2.2 | 8.0 |
| Zinc sales | kt | 12.0 | 12.9 | 12.6 | 12.0 | 12.7 | 50.3 |
|
|
|
| El Porvenir (100% basis) |
1Q25 | 4Q24 | 3Q24 | 2Q24 | 1Q24 | 2024 | |
| Costs | |||||||
| Cost of sales | US$ mm | 39.1 | 60.5 | 51.2 | 50.2 | 49.0 | 210.9 |
| Cost ROM (2) | US$/t | 61.4 | 66.6 | 63.1 | 65.7 | 62.0 | 64.4 |
| Cash cost (1) | US$/lb | (0.10) | (0.04) | 0.18 | (0.05) | 0.24 | 0.08 |
| Sustaining cash cost (1) | US$/lb | 0.30 | 1.04 | 0.52 | 0.40 | 1.14 | 0.78 |
| CAPEX | US$ mm | ||||||
| Sustaining | 10.5 | 30.1 | 9.1 | 12.0 | 25.2 | 76.4 | |
| Other | 0.0 | 0.6 | 0.3 | 0.0 | 0.0 | 0.9 | |
(1) Our cash cost and sustaining cash cost are net of by-products credits, measured with respect to zinc sold per mine. For a cash cost reconciliation to COGS, please refer to Appendix – All in Sustaining Cash Cost | Mining.
(2) Our cost per ROM is measured with respect to treated ore volume. Refer to “Use of Non-IFRS Financial Measures” for further information.
In 1Q25, treated ore volume reached 508kt, down 4% from 1Q24 and 11% from 4Q24, primarily due to atypical heavy rainfall in the Pasco region in the period. The intense weather conditions led to restricted road access in certain areas of the mine and safety-related stoppages. As a result, production was temporarily reduced to stabilize operations, following scheduled maintenance on the conveyor belt, which took place over 2 days in both January and March.
Zinc production totaled 12kt in the quarter, down 8% year-over-year and quarter-over-quarter due to lower throughput and grade variations.
Lead production decreased by 12% compared to 1Q24 and 23% compared to 4Q24, while silver production was down 7% year-over-year and 23% quarter-over-quarter. These decreases were mainly driven by the temporary reduction in mining and milling activities, as well as lower grades in the period.
Cost
Cost of sales amounted to US$39 million in 1Q25 down from US$49 million in 1Q24. This decrease was mainly due to lower depreciation and amortization related to asset life reviews, and reduced drilling costs, partially offset by higher maintenance expenses. Compared to 4Q24, cost of sales decreased by 35%, primarily driven by lower depreciation and amortization, personnel and maintenance expenses, and third-party services related to drilling, blasting, and shotcrete/steel support.
Run-of-mine mining cost was US$61/t in the quarter, consistent with 1Q24. Lower treated ore volumes and higher maintenance costs were offset by reduced drilling expenses. Compared to 4Q24, run-of-mine mining cost decreased by 8%, mainly driven by lower personnel and third-party service costs, partially offset by lower treated ore volumes.
Cash cost net of by-products in 1Q25 decreased to US$(0.10)/lb compared to US$0.24/lb in 1Q24. This improvement was driven by higher by-products contribution and lower TCs, partially offset by lower zinc volumes. Compared to 4Q24, cash cost decreased by US$0.06/lb, primarily due to increased by-products contribution due to higher prices, lower TCs and reduced operational costs, partially offset by lower zinc and by-products volume.
CAPEX
In 1Q25, sustaining capital expenditures amounted to US$11 million, primarily related to mine development activities and ongoing work on tailings dam as part of Phase I of the Cerro Pasco Integration Project (enhancing underground mine infrastructure and expanding tailings storage capacity, ensuring long-term operational sustainability).
|
|
|
Atacocha, Peru
| Atacocha (100% basis) |
1Q25 | 4Q24 | 3Q24 | 2Q24 | 1Q24 | 2024 | |
| Ore Mined | kt | 312 | 422 | 365 | 379 | 347 | 1,512 |
| Treated Ore | kt | 312 | 389 | 398 | 379 | 347 | 1,512 |
| Grade | |||||||
| Zinc | % | 0.98 | 0.88 | 0.98 | 0.86 | 0.89 | 0.90 |
| Lead | % | 0.88 | 0.93 | 1.14 | 0.90 | 0.81 | 0.95 |
| Silver | oz/t | 0.84 | 0.92 | 1.18 | 0.98 | 1.02 | 1.03 |
| Gold | oz/t | 0.011 | 0.011 | 0.012 | 0.010 | 0.008 | 0.011 |
| Production | metal contained | |||||||
| Zinc | kt | 2.5 | 2.7 | 2.9 | 2.4 | 2.4 | 10.4 |
| Lead | kt | 2.3 | 3.1 | 3.9 | 2.9 | 2.3 | 12.3 |
| Silver | MMoz | 0.2 | 0.3 | 0.4 | 0.3 | 0.3 | 1.2 |
| Gold | koz | 2.0 | 2.7 | 2.9 | 2.1 | 1.4 | 9.1 |
| Zinc sales | kt | 2.5 | 2.7 | 3.0 | 2.4 | 2.1 | 10.2 |
| Costs | |||||||
| Cost of sales | US$ mm | 20.2 | 24.5 | 28.3 | 16.5 | 16.3 | 85.7 |
| Cost ROM (2) | US$/t | 39.9 | 41.3 | 35.2 | 32.5 | 33.7 | 35.8 |
| Cash cost (1) | US$/lb | (0.41) | (0.53) | (0.93) | (1.05) | 0.05 | (0.65) |
| Sustaining cash cost (1) | US$/lb | 0.00 | (0.10) | (0.50) | (0.40) | 0.95 | (0.07) |
| CAPEX | US$ mm | ||||||
| Sustaining | 2.2 | 2.2 | 2.9 | 3.4 | 4.2 | 12.7 | |
| Other | 0.0 | 0.4 | 0.0 | - | 0.0 | 0.4 | |
(1) Our cash cost and sustaining cash cost are net of by-products credits, measured with respect to zinc sold per mine. For a cash cost reconciliation to COGS, please refer to Appendix – All in Sustaining Cash Cost | Mining.
(2) Our cost per ROM is measured with respect to treated ore volume. Refer to “Use of Non-IFRS Financial Measures” for further information.
In 1Q25, treated ore volume totaled 312kt, down 10% year-over-year and 20% quarter-over-quarter. As part of the Pasco region, Atacocha was also impacted by the atypical heavy rainfall in the period, which slowed down the extraction rate from the pit.
Zinc production reached 2.5kt, slightly up from 2.4kt in 1Q24 and down from 2.7kt in 4Q24, reflecting the lower treated ore volumes in the quarter.
Zinc average grade was 0.98%, up by 9bps year-over-year and 10bps quarter-over-quarter.
Lead production remained flat at 2.3kt compared to 1Q24 and decreased from 3.1kt in 4Q24. Silver production totaled 206koz, down 24% from 1Q24 and 26% from 4Q24, primarily due to lower silver grades in the ore mined during the period.
|
|
|
Cost
Cost of sales in 1Q25 was US$20 million, up 23% year-over-year, primarily driven by higher depreciation and amortization expenses related to revaluation of assets and increased mineral transportation costs. Compared to 4Q24, cost of sales was down 18%, mainly due to reductions in personnel, maintenance, and third-party services expenses, as well as lower depreciation and amortization.
Run-of-mine mining cost was US$40/t in the quarter, up 18% from 1Q24, primarily driven by higher variable costs related to mineral transportation and lower treated ore volumes. Compared to 4Q24, run-of-mine mining cost decreased by 3% due to lower personnel and third-party services, partially offset by lower treated ore volumes.
Cash cost net of by-products was US$(0.41)/lb in 1Q25, decreased by US$0.45/lb from 1Q24. This improvement was mainly driven by increased contribution from by-products, supported by higher silver and gold prices, partially offset by higher operational costs. Compared to 4Q24, cash cost increased by US$0.12/lb, primarily driven by lower by-products and zinc sales volumes, partially offset by lower TCs.
CAPEX
In 1Q25, sustaining capital expenditures amounted to US$2 million, mainly allocated to road infrastructure investments.
Vazante, Brazil
| Vazante (100% basis) |
1Q25 | 4Q24 | 3Q24 | 2Q24 | 1Q24 | 2024 | |
| Ore Mined | kt | 361 | 398 | 384 | 381 | 374 | 1,537 |
| Treated Ore | kt | 430 | 450 | 449 | 444 | 427 | 1,770 |
| Grade | |||||||
| Zinc | % | 8.29 | 8.78 | 9.39 | 9.18 | 9.55 | 9.22 |
| Lead | % | 0.29 | 0.30 | 0.29 | 0.28 | 0.26 | 0.28 |
| Silver | oz/t | 0.66 | 0.69 | 0.62 | 0.62 | 0.58 | 0.63 |
| Production | metal contained | |||||||
| Zinc | kt | 29.8 | 34.0 | 36.4 | 35.2 | 35.2 | 140.7 |
| Lead | kt | 0.2 | 0.2 | 0.3 | 0.3 | 0.1 | 0.9 |
| Silver | MMoz | 0.1 | 0.1 | 0.1 | 0.1 | 0.1 | 0.5 |
| Zinc sales | kt | 29.8 | 34.0 | 36.4 | 35.2 | 35.2 | 140.7 |
| Costs | |||||||
| Cost of sales | US$ mm | 30.7 | 29.1 | 31.0 | 31.6 | 33.2 | 124.9 |
| Cost ROM (2) | US$/t | 41.1 | 46.8 | 51.7 | 48.6 | 46.1 | 48.3 |
| Cash cost (1) | US$/lb | 0.53 | 0.46 | 0.48 | 0.49 | 0.53 | 0.49 |
| Sustaining cash cost (1) | US$/lb | 0.61 | 0.55 | 0.54 | 0.58 | 0.61 | 0.57 |
| CAPEX | US$ mm | ||||||
| Sustaining | 5.2 | 6.6 | 4.8 | 7.3 | 5.9 | 24.7 | |
|
|
|
| Vazante (100% basis) |
1Q25 | 4Q24 | 3Q24 | 2Q24 | 1Q24 | 2024 | |
| Other | 0.3 | 0.9 | 0.4 | 0.9 | 0.7 | 2.9 |
(1) Our cash cost and sustaining cash cost are net of by-products credits, measured with respect to zinc sold per mine. For a cash cost reconciliation to COGS, please refer to Appendix – All in Sustaining Cash Cost | Mining.
(2) Our cost per ROM is measured with respect to treated ore volume. Refer to “Use of Non-IFRS Financial Measures” for further information.
In 1Q25, treated ore volume was 430kt, up 1% year-over-year and down 4% quarter-over-quarter.
This result came despite geotechnical constraints at the mine, which reduced ore extraction in the period. The impact was partially offset by increased tailings reprocessing and stockpile utilization, albeit with a lower overall grade.
Zinc production totaled 30kt, down 15% from 1Q24 and 12% from 4Q24, primarily due to mining activities in lower-grade areas, following geotechnical constraints that restricted access to higher-grade zones. These high-grade areas are expected to be prioritized in 2Q25.
The average zinc grade for the quarter was 8.29%, down 126bps from 1Q24 and 49bps from 4Q24.
Lead production totaled 0.2kt, up from 0.1kt in 1Q24 and relatively flat compared to 4Q24. Silver production reached 0.1MMoz, down 4% both year-over-year and quarter-over-quarter, mainly due to lower ore grades during the quarter.
Cost
Cost of sales in 1Q25 was US$31 million, down 7% year-over-year, primarily driven by lower sales volume and favorable foreign exchange variations. Compared to 4Q24, cost of sales increased by 5%, mainly due to higher freights expenses, partially offset by lower third-party and maintenance costs.
Run-of-mine mining cost was US$41/t in 1Q25, decreased by 11% compared to US$46/t in 1Q24. This improvement was mainly attributed to favorable foreign exchange variations on operational costs. Compared to 4Q24, run-of-mine mining cost was down by 12%, mainly due to lower maintenance and third-party services expenses.
Cash cost net of by-products of US$0.53/lb was consistent with 1Q24. Lower operational costs, lower TCs, and favorable foreign exchange variations offset the impact of lower zinc sales volume. Compared to 4Q24, cash cost increased by US$0.07/lb, mainly due to lower zinc sales, partially offset by lower TCs and reduced operational costs.
CAPEX
In 1Q25, sustaining capital expenditures amounted to US$5 million, primarily allocated to mine development activities aimed at supporting life of mine extension.
Aripuanã, Brazil
| Aripuanã (100% basis) |
1Q25 | 4Q24 | 3Q24 | 2Q24 | 1Q24 | 2024 | |
| Ore Mined | kt | 311 | 276 | 513 | 359 | 299 | 1,446 |
| Treated Ore | kt | 300 | 377 | 410 | 367 | 322 | 1,476 |
| Grade | |||||||
| Zinc | % | 2.70 | 4.05 | 2.77 | 2.99 | 3.11 | 3.23 |
| Copper | % | 0.58 | 0.42 | 0.59 | 0.54 | 0.70 | 0.56 |
| Lead | % | 0.86 | 1.53 | 0.92 | 1.05 | 0.97 | 1.12 |
| Silver | oz/t | 0.93 | 1.68 | 0.98 | 1.07 | 0.91 | 1.17 |
|
|
|
| Aripuanã (100% basis) |
1Q25 | 4Q24 | 3Q24 | 2Q24 | 1Q24 | 2024 | |
| Gold | oz/t | 0.017 | 0.016 | 0.012 | 0.018 | 0.026 | 0.017 |
| Production | metal contained | |||||||
| Zinc | kt | 6.2 | 9.3 | 7.5 | 7.7 | 7.2 | 31.6 |
| Copper | kt | 1.2 | 1.0 | 1.7 | 1.3 | 1.5 | 5.5 |
| Lead | kt | 2.3 | 4.6 | 2.7 | 3.2 | 2.6 | 13.1 |
| Silver | MMoz | 0.2 | 0.3 | 0.3 | 0.3 | 0.2 | 1.1 |
| Gold | koz | 3.4 | 3.0 | 3.4 | 3.7 | 4.0 | 14.0 |
| Zinc sales | kt | 6.2 | - | - | - | - | - |
| Costs | |||||||
| Cost of sales | US$ mm | 44.2 | - | - | - | - | - |
| Cost ROM (2) | US$/t | 79.3 | - | - | - | - | - |
| Cash cost (1) | US$/lb | 0.56 | - | - | - | - | - |
| Sustaining cash cost (1) | US$/lb | 0.95 | - | - | - | - | - |
| CAPEX | US$ mm | ||||||
| Sustaining | 5.1 | 8.6 | 5.9 | 9.6 | 14.4 | 38.6 | |
| Other (1) | 0.2 | 1.5 | 2.0 | 0.4 | 0.2 | 4.1 | |
(1) The negative amounts are mainly related to reclassifications between Aripuanã and Corporate, and capitalization of interest net of advanced payments for imported materials and tax credits.
In 1Q25, treated ore volume totaled 300kt, down 7% from 322kt in 1Q24 and 20% from 377kt in 4Q24.
Utilization capacity averaged 53% during the quarter, with peak daily rates occasionally exceeding 70-75%, reflecting the impact of current tailings filter constraints, which were aggravated by heavier-than-usual rainfall.
Zinc production reached 6.2kt, down 14% from 7.2kt in 1Q24 and 33% from 9.3kt in 4Q24. These decreases were primarily driven by intense rainfall in the region – with precipitation volumes averaging 30% higher than in previous years, which lead to a temporary reduction in production to stabilize operations and prevent overloading the dry stacking process.
Copper production totaled 1.2kt in 1Q25, down 21% year-over-year due to lower grades areas and up 18% quarter-over-quarter, supported by higher copper grades.
We remain focused on continuous operational improvement, particularly in addressing the current limitations of the tailings filter circuit. While capacity has significantly improved since the start of operations, some challenges and constraints persist. As previously announced, a fourth tailings filter has been acquired and is currently in the manufacturing phase. Delivery and installation are expected in 2H25, with commissioning scheduled for 1H26. This upgrade is expected to further enhance utilization capacity, particularly during the rainy season.
Cost
Cost of sales in 1Q25 was US$44 million and run-of-mine mining cost was US$79/t, positioning both metrics within the mid to upper range of our 2025 guidance. Cash cost net of by-products was US$0.56/lb in 1Q25, also in the mid to upper range of our guidance. We anticipate a reduction in unitary costs in the upcoming quarters as we enhance plant capacity and increase sales volume, thereby improving operational efficiency and cost-effectiveness.
|
|
|
CAPEX
In 1Q25, sustaining capital expenditures amounted to US$5 million, mainly related to mine development activities.
Financial performance
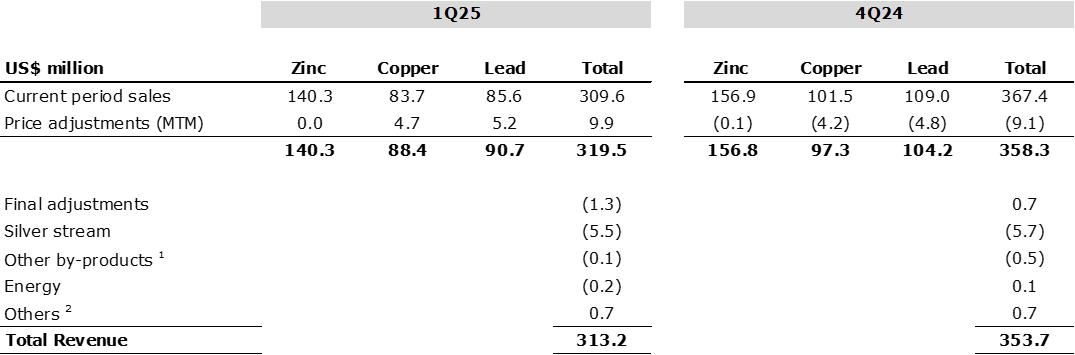
| US$ million | 1Q25 | 4Q24 | 1Q24 | 1Q25 vs. 1Q24 | 1Q25 vs. 4Q24 | |
| Net Revenues | 313.2 | 353.7 | 293.9 | 6.6% | (11.4%) | |
| Cost of Sales (1) | (215.0) | (256.5) | (251.4) | (14.5%) | (16.2%) | |
| Gross Profit | 98.3 | 97.2 | 42.5 | 131.0% | 1.1% | |
| Adjusted EBITDA | 93.7 | 121.8 | 78.0 | 20.1% | (23.1%) | |
| Adjusted EBITDA Mrg. | 29.9% | 34.4% | 26.5% | 3.4pp | (4.5pp) | |
Note: Financial performance pre intersegment eliminations.
Net revenues for the mining segment totaled US$313 million in 1Q25, up 7% compared to 1Q24. This increase was mainly driven by higher LME metal prices (except for lead) and lower TCs, despite a decline in zinc sales volumes. Compared to 4Q24, net revenues decreased by 11%, mainly due to lower sales volumes across all metals and decreased zinc prices, which were partially offset by lower TCs.
Cost of sales in 1Q25 was US$215 million, down 14% compared to 1Q24. This decrease was mainly attributed to reduced mining sales volume, favorable foreign exchange variations in Brazilian mines, and lower depreciation and amortization expenses. Compared to 4Q24, cost of sales declined by 16%, primarily due to reductions in personnel, maintenance, and third-party services expenses, as well as lower drilling costs and lower depreciation and amortization.
Reconciliation of realized prices
Revenues are recorded at provisional prices and, typically, an adjustment is then made after delivery, based on the pricing terms under the relevant contract. In addition, the difference between the provisional and the final price received is recognized by adjusting the price in the period in which the sale is concluded.
Adjusted EBITDA for the mining segment in 1Q25 totaled US$94 million, up 20% compared to US$78 million in 1Q24. This increase was primarily attributed to (i) a positive net price effect of US$34 million, resulting from higher zinc and copper prices; (ii) favorable foreign exchange variations of US$13 million; (iii) higher by-products contribution of US$10 million, mainly due to higher silver and gold prices, partially offset by lower sales volumes; and (iv) lower TCs amounting to US$8 million. These gains were partially offset by (v) a negative impact of US$22 million in costs, mainly related to idleness adjustments at Aripuanã in 1Q24 (which are no longer adjusted since 3Q24); and (vi) a negative impact of US$19 million, primarily due to lower zinc sales volume at Vazante, Cerro Lindo, and El Porvenir.
|
|
|
Compared to 4Q24, Adjusted EBITDA decreased by 23%. This performance was primarily driven by (i) a negative impact of US$41 million due to lower zinc sales across all units (except for Cerro Lindo), along with decreased lead and copper sales at Aripuanã, reduced copper sales at Cerro Lindo, and lower lead sales at Cerro Pasco; (ii) an increase of US$9 million in other variations, mainly attributed to low turnover provisions at Vazante, Cerro Lindo and Aripuanã, and a reduction in cash dividend received from Enercan; and (iii) lower by-products contribution of US$8 million, resulting from lower sales volumes, partially offset by higher silver and gold prices. These losses were partially offset by (iv) a positive impact of US$17 million in costs, driven by lower severance payments and maintenance expenses at Cerro Pasco, as well as reduced maintenance and third-party services expenses in Vazante; (v) lower TCs amounting to US$6 million; (vi) a positive net price effect of US$4 million, mainly due to favorable MTM variations, partially offset by lower zinc prices; and (vii) a reduction of US$4 million in mineral exploration and project evaluation expenses.
Run-of-mine cost, Cash cost and AISC 4
| Consolidated cash cost | 1Q25 | 4Q24 | 1Q24 | 1Q25 vs. 1Q24 | 1Q25 vs. 4Q24 | |
| Run-of-mine mining cost | US$/t | 47.9 | 44.3 | 44.7 | 7.2% | 8.1% |
| Cash cost net of by-products | US$/t | 253 | (2) | 578 | (56.1%) | - |
4 Our cash cost and AISC are net of by-products credits, measured with respect to zinc sold.
|
|
|
| Consolidated cash cost | 1Q25 | 4Q24 | 1Q24 | 1Q25 vs. 1Q24 | 1Q25 vs. 4Q24 | |
| AISC net of by-products | US$/t | 1,332 | 1,382 | 1,573 | (15.3%) | (3.6%) |
| Cash cost net of by-products | US$/lb | 0.11 | (0.001) | 0.26 | (56.1%) | - |
| AISC net of by-products | US$/lb | 0.60 | 0.63 | 0.71 | (15.3%) | (3.6%) |
Note: Cash cost and AISC per ton sold does not include the impact of the cost of idleness capacity of US$1.2 million in El Porvenir in 1Q24.
Cash cost net of by-products for the mining segment in 1Q25 decreased to US$0.11/lb compared to US$0.26/lb in 1Q24. This improvement was primarily driven by higher by-products contribution, lower TCs, and favorable foreign exchange variations, partially offset by lower zinc volumes.
Compared to 4Q24, cash cost increased by US$0.12/lb, mainly due to lower zinc and by-products sales volume, which were partially offset by higher by-products prices and lower TCs.
Run-of-mine mining cost was US$48/t in the quarter, up 7% from 1Q24. This increase was mainly due to higher maintenance and personnel expenses, partially offset by favorable foreign exchange variations in operational costs. Compared to 4Q24, run-of-mine mining cost increased by 8%, primarily due to higher maintenance, personnel, and variable costs. Excluding Aripuanã, run-of-mine mining cost remained consistent in both year-over-year and quarter-over-quarter comparisons.
AISC net of by-products in 1Q25 was US$0.60/lb, down 15% from US$0.71/lb in 1Q24 and 4% from US$0.63/lb in 4Q24.
For a reconciliation of cash cost and AISC net of
by-products, please refer to the appendix section “All in Sustaining Cash Cost | Mining.”
|
|
|
Smelting segment
| Consolidated | 1Q25 | 4Q24 | 1Q24 | 1Q25 vs. 1Q24 | 1Q25 vs. 4Q24 | |
| Production | ||||||
| Zinc metal | kt | 124.5 | 142.5 | 130.6 | (4.6%) | (12.6%) |
| Zinc oxide | kt | 8.2 | 8.4 | 7.7 | 7.3% | (1.9%) |
| Total | kt | 132.8 | 150.9 | 138.2 | (4.0%) | (12.0%) |
| Sales | ||||||
| Zinc metal | kt | 122.3 | 143.7 | 131.0 | (6.6%) | (14.9%) |
| Zinc oxide | kt | 7.8 | 8.1 | 7.6 | 3.0% | (3.8%) |
| Total | kt | 130.1 | 151.8 | 138.6 | (6.1%) | (14.3%) |
In 1Q25, total production reached 133kt, down 4% year-over-year and 12% quarter-over-quarter. This decrease was primarily driven by lower volumes at our Brazilian smelters, in line with our 2025 guidance, which anticipates an annual reduction of approximately 15kt compared to 2024 to accommodate a more volatile market environment and overall lower TCs.
Zinc metal and oxide sales totaled 130kt in 1Q25, down by 6% compared to 1Q24 and 14% compared to 4Q24, mainly due to lower production volumes at Três Marias and Juiz de Fora, as well as diminished demand for zinc oxide in the period.
Cajamarquilla, Peru
| Cajamarquilla (100% basis) |
1Q25 | 4Q24 | 3Q24 | 2Q24 | 1Q24 | 2024 | |
| Zinc metal production | kt | 82.3 | 87.2 | 87.6 | 85.4 | 73.9 | 334.1 |
| Global Recovery | % | 94.4 | 93.5 | 94.4 | 93.8 | 95.8 | 94.4 |
| Zinc metal sales | kt | 81.1 | 83.7 | 86.9 | 83.7 | 72.7 | 327.0 |
| Zinc content in products | kt | 80.9 | 83.5 | 86.8 | 83.5 | 72.6 | 326.5 |
| Cost of sales (2) | US$ mm | 259 | 284 | 274 | 262 | 201 | 1,021 |
| (-) Raw material | (208) | (212) | (206) | (181) | (142) | (740) | |
| (+) By-product | (5.2) | (5.4) | (5.9) | (6.7) | (7.3) | (25.2) | |
| (+/-) Consolidation effects | (3.1) | (22.9) | (0.2) | (14.7) | (11.7) | (49.4) | |
| (+) Others | 9.5 | 0.6 | (5.9) | (9.6) | 3.1 | (11.8) | |
| (=) Conversion cost | US$ mm | 52.6 | 44.3 | 55.7 | 50.6 | 43.8 | 194.4 |
| Conversion cost | US$/lb | 0.29 | 0.24 | 0.29 | 0.27 | 0.27 | 0.27 |
| Cash cost (1) | US$/lb | 1.04 | 1.21 | 1.14 | 1.18 | 0.92 | 1.12 |
| Sustaining cash cost (1) | US$/lb | 1.08 | 1.28 | 1.19 | 1.24 | 0.99 | 1.18 |
| CAPEX | US$ mm | ||||||
| Sustaining | 7.5 | 11.0 | 8.7 | 11.4 | 11.7 | 42.8 | |
| Other | 0.3 | 0.5 | 1.2 | 0.8 | 0.4 | 2.8 | |
(1) Our cash cost and sustaining cash cost are net of by-products credits, measured with respect to zinc sold per smelter. For a cash cost reconciliation to COGS, please refer to Appendix - Conversion and All in Sustaining Cash Cost | Smelting.
(2) Cost of sales does not include resale operations from third parties.
|
|
|
In 1Q25, production at the Cajamarquilla smelter reached 82kt, up 11% year-over-year. This increase was primarily driven by optimal roaster performance, improved calcine inventory consumption, and higher production volumes compared to the 1H24, when the unit underwent extensive maintenance. Compared to 4Q24, production was down by 6%, reflecting a strategic decision to build up calcine inventory. The measure aims to ensure operational continuity during the scheduled maintenance of the roaster, which is expected to begin at the end of April 2025.
Recovery rates averaged 94.4% in the quarter, down from 95.8% in 1Q24 and up from 93.5% in 4Q24, mainly due to the reintroduction of diverted solution into the process in the period.
Metal sales totaled 81kt in 1Q25, rose 11% year-over-year due to higher production volumes, and down 3% quarter-over-quarter, in line with our 2025 guidance.
Costs
Cost of sales was US$259 million in 1Q25 compared to US$201 million in 1Q24. This increase was primarily driven by higher sales volume, higher zinc prices, and lower TCs, as well as increased consumption of third-party raw materials. These factors were partially offset by lower third-party services and supplies expenses. Compared to 4Q24, cost of sales decreased by 9%, mainly due to lower sales volume and lower zinc prices, which positively impacted raw material costs. This was partially offset by lower TCs, higher freights expenses, and maintenance costs.
In 1Q25, conversion cost was US$0.29/lb, up by US$0.02/lb compared to 1Q24, primarily due to higher variable costs in the period, as well as increased maintenance and personnel expenses, partially offset by lower third-party services costs. Compared to 4Q24, conversion cost was up US$0.05/lb, driven by higher maintenance and variable costs, partially offset by lower energy and third-party services expenses.
Cash cost net of by-products in 1Q25 was US$1.04/lb, up 13% compared to US$0.92/lb in 1Q24. This increase was mainly due to higher zinc prices and lower TCs, partially offset by reduced operational costs related to third-party services. Compared to 4Q24, cash cost decreased by US$0.17/lb, driven by lower zinc prices and reduced operational costs, partially offset by lower TCs.
CAPEX
In 1Q25, sustaining capital expenditures amounted to US$8 million, primarily related equipment acquisitions, repairs and maintenance activities in the roaster and other facilities.
Três Marias, Brazil
| Três Marias (100% basis) |
1Q25 | 4Q24 | 3Q24 | 2Q24 | 1Q24 | 2024 | |
| Zinc metal production | kt | 31.0 | 34.4 | 35.8 | 36.3 | 37.5 | 144.1 |
| Zinc oxide production | kt | 8.2 | 8.4 | 9.7 | 8.8 | 7.7 | 34.6 |
| Global Recovery | % | 87.8 | 85.4 | 90.6 | 91.1 | 90.5 | 89.2 |
| Zinc metal sales | kt | 29.4 | 36.8 | 37.2 | 34.4 | 38.4 | 146.8 |
| Zinc oxide sales | kt | 7.8 | 8.1 | 10.1 | 8.7 | 7.6 | 34.5 |
| Zinc content in products | kt | 35.5 | 44.8 | 47.2 | 43.0 | 45.3 | 180.3 |
| Cost of sales (2) | US$ mm | 120 | 146 | 135 | 127 | 115 | 523 |
| (-) Raw material | (64) | (88) | (73) | (67) | (55) | (283) | |
| (+) By-product | (10.8) | (11.2) | (12.9) | (13.9) | (15.0) | (53.0) | |
| (+/-) Consolidation effects | (0.1) | 1.6 | (1.2) | (0.3) | 1.8 | 2.0 | |
|
|
|
| Três Marias (100% basis) |
1Q25 | 4Q24 | 3Q24 | 2Q24 | 1Q24 | 2024 | |
| (+) Others | (19.0) | (18.2) | (15.1) | (17.8) | (18.4) | (69.5) | |
| (=) Conversion cost | US$ mm | 25.9 | 30.5 | 32.4 | 28.0 | 28.1 | 119.0 |
| Conversion cost | US$/lb | 0.33 | 0.31 | 0.31 | 0.30 | 0.28 | 0.30 |
| Cash cost (1) | US$/lb | 1.39 | 1.33 | 1.14 | 1.21 | 1.02 | 1.17 |
| Sustaining cash cost (1) | US$/lb | 1.47 | 1.39 | 1.18 | 1.26 | 1.05 | 1.22 |
| CAPEX | US$ mm | ||||||
| Sustaining | 3.9 | 3.7 | 2.9 | 4.4 | 2.4 | 13.5 | |
| Other | 2.5 | 1.7 | 0.7 | 0.8 | 0.8 | 4.1 |
(1) Our cash cost and sustaining cash cost are net of by-products credits, measured with respect to zinc sold per smelter. For a cash cost reconciliation to COGS, please refer to Appendix – Conversion and All in Sustaining Cash Cost | Smelting.
(2) Cost of sales does not include resale operations from third parties.
In Três Marias, total production (zinc metal + oxide) reached 39kt in 1Q25, down 13% from 1Q24 and 8% from 4Q24. This performance was mainly impacted by hydrometallurgical instability – specifically, challenges with filters and soluble metal losses, which reduced zinc recoveries – as well as slightly lower concentrate availability due to inventory consumption, driven by reduced production at Vazante. Soft demand for zinc oxide during the period also contributed to the lower output. Nonetheless, these results are consistent with the production trend anticipated in our 2025 guidance.
Recovery rates averaged 87.8% during the quarter, down from 90.5% in 1Q24, reflecting process efficiency challenges and up from 85.4% in 4Q24.
In 1Q25, metallic zinc sales amounted to 29kt, down 23% year-over-year and 20% quarter-over-quarter, following lower production levels.
Zinc oxide sales totaled 8kt and increased by 3% compared to 1Q24, supported by improved demand. Conversely, compared to 4Q24, zinc oxide sales fell 4%, reflecting a decline in domestic demand during the quarter.
Costs
Cost of sales of US$120 million in 1Q25 increased by 4% compared to 1Q24, primarily due to higher raw material costs, attributed by higher zinc prices, lower TCs, and increased inputs prices, which were partially offset by favorable foreign exchange variations and lower sales volume. Compared to 4Q24, cost of sales decreased by 18%, mainly due to lower sales volume and lower zinc prices, which resulted in reduced raw material costs. This was partially offset by lower TCs and higher inputs prices.
In 1Q25, conversion cost was US$0.33/lb, up 17% compared to 1Q24, mainly driven by lower volumes, increased energy expenses and variable costs, partially offset by favorable foreign exchange variations. Compared to 4Q24, conversion cost rose by 7%, due to lower production volumes and higher energy expenses.
Cash cost net of by-products in 1Q25 increased to US$1.39/lb compared to US$1.02/lb in 1Q24 and US$1.33/lb in 4Q24. The year-over-year increase was driven by higher zinc prices, increased operational costs associated with maintenance and energy expenses, and lower TCs, partially offset by favorable foreign exchange variations and higher by-products prices. The quarter-over-quarter performance was attributed to higher operational costs related to energy expenses and lower TCs, partially offset by lower zinc prices.
|
|
|
CAPEX
In 1Q25, sustaining capital expenditures amounted to US$4 million, mainly driven by the tailings dry stacking project and investments in the automation of Healthy, Safety, and Environmental (HS&E) systems.
Juiz de Fora, Brazil
| Juiz de Fora (100% basis) |
1Q25 | 4Q24 | 3Q24 | 2Q24 | 1Q24 | 2024 | |
| Zinc metal production | kt | 11.2 | 20.8 | 20.0 | 21.9 | 19.2 | 82.0 |
| Global Recovery | % | 94.5 | 94.9 | 94.7 | 94.4 | 91.6 | 93.9 |
| Zinc metal sales | kt | 11.9 | 23.2 | 18.7 | 21.2 | 19.8 | 83.0 |
| Zinc content in products | kt | 11.5 | 23.1 | 18.6 | 21.1 | 19.7 | 82.6 |
| Cost of sales | US$ mm | 46 | 76 | 66 | 66 | 59 | 266 |
| (-) Raw material | (18) | (44) | (38) | (37) | (32) | (150) | |
| (+) By-product | (0.5) | (0.4) | (0.6) | (0.4) | (1.1) | (2.5) | |
| (+/-) Consolidation effects | (0.4) | 1.6 | (2.4) | (0.3) | (0.8) | (1.8) | |
| (+) Others | (13.0) | (9.0) | (7.4) | (9.9) | (6.0) | (32.2) | |
| (=) Conversion cost | US$ mm | 13.9 | 23.9 | 18.1 | 18.5 | 19.5 | 80.0 |
| Conversion cost | US$/lb | 0.55 | 0.47 | 0.44 | 0.40 | 0.45 | 0.44 |
| Cash cost (1) | US$/lb | 1.39 | 1.27 | 1.31 | 1.21 | 1.12 | 1.23 |
| Sustaining cash cost (1) | US$/lb | 1.49 | 1.37 | 1.42 | 1.25 | 1.14 | 1.29 |
| CAPEX | US$ mm | ||||||
| Sustaining | 2.4 | 4.3 | 4.4 | 1.8 | 0.7 | 11.2 | |
| Other | 0.1 | 0.8 | 0.2 | 0.1 | 0.1 | 1.2 | |
(1) Our cash cost and sustaining cash cost are net of by-products credits, measured with respect to zinc sold per smelter. For a cash cost reconciliation to COGS, please refer to Appendix - Conversion and All in Sustaining Cash Cost | Smelting.
In 1Q25, production at Juiz de Fora reached 11kt, down 42% year-over-year and 46% quarter-over-quarter, primarily due to a fire incident that affected wet electro-filters A and B in late December.
Repair efforts are ongoing, and the replacement of the electro-filters is expected to take place between the end of 2Q25 and the beginning of 3Q25, the unit is expected to resume full-capacity production in 2H25.
Recovery rates averaged 94.5% during the quarter, up from 91.6% in 1Q24 and slightly down from 94.9% in 4Q24.
Zinc metal sales totaled 12kt in 1Q25, decreasing by 40% compared to 1Q24 and 49% compared to 4Q24, mainly reflecting lower production volumes in the period.
Costs
Cost of sales was US$46 million in 1Q25, down 23% from US$59 million in 1Q24. This reduction was primarily driven by lower sales volume (-8kt) and favorable foreign exchange variations, partially offset by higher raw material costs associated with higher zinc prices and lower TCs. Compared to 4Q24, cost of sales decreased by 40%, mainly driven by lower sales volumes (-12kt) and lower zinc prices, which positively impacted raw material costs.
|
|
|
In 1Q25, conversion cost increased to US$0.55/lb from US$0.45/lb in 1Q24, primarily due to lower production volumes, higher variable costs (energy, inputs, among others), partially offset by favorable foreign exchange variations. Compared to 4Q24, conversion cost increased by US$0.08/lb, mainly due to lower volumes and higher energy and third-party costs.
Cash cost net of by-products in 1Q25 was US$1.39/lb, up from US$1.12/lb in 1Q24, mainly due to lower zinc volumes and higher raw material costs driven by higher zinc prices and lower TCs, which were partially offset by favorable foreign exchange variations. Compared to 4Q24, cash cost net of by-products increased by 10%, driven by lower zinc volumes and TCs in the period.
CAPEX
In 1Q25, sustaining capital expenditures amounted to US$2.4 million, primarily driven by the acquisition, replacement, and repair of equipment.
Financial performance
| US$ million | 1Q25 | 4Q24 | 1Q24 | 1Q25 vs. 1Q24 | 1Q25 vs. 4Q24 | |
| Net Revenues | 453.6 | 547.0 | 418.4 | 8.4% | (17.1%) | |
| Cost of Sales | (424.4) | (502.8) | (372.6) | 13.9% | (15.6%) | |
| Gross Profit | 29.1 | 44.1 | 45.8 | (36.4%) | (33.9%) | |
| Adjusted EBITDA | 31.3 | 75.6 | 50.7 | (38.2%) | (58.5%) | |
| Adjusted EBITDA Mrg. | 6.9% | 13.8% | 12.1% | (5.2pp) | (6.9pp) | |
Note: Financial performance pre intersegment eliminations.
Net revenues totaled US$454 million in 1Q25, up 8% compared to US$418 million in 1Q24, primarily driven by higher zinc prices, partially offset by decreased sales volumes. Compared to 4Q24, net revenues decreased by 17%, mainly due to lower sales volume and decreased zinc prices, which were partially offset by slightly higher net premiums.
Cost of sales increased by 14% in 1Q25, totaling US$424 million compared to US$373 million in 1Q24. This increase was mainly due to higher raw material costs associated with higher zinc prices and lower TCs, partially offset by lower sales volume and favorable foreign exchange variations. Compared to 4Q24, cost of sales declined by 16%, primarily due to lower sales volume and lower zinc prices, which positively impacted our raw material costs.
Reconciliation of realized prices
Purchases of zinc in concentrate are recorded at provisional prices and, typically, an adjustment is made after delivery, which is based on the pricing terms provided for under the respective contract. In addition, the difference between the provisional and the final price received is recognized by adjusting the price in the period in which the purchase is concluded.
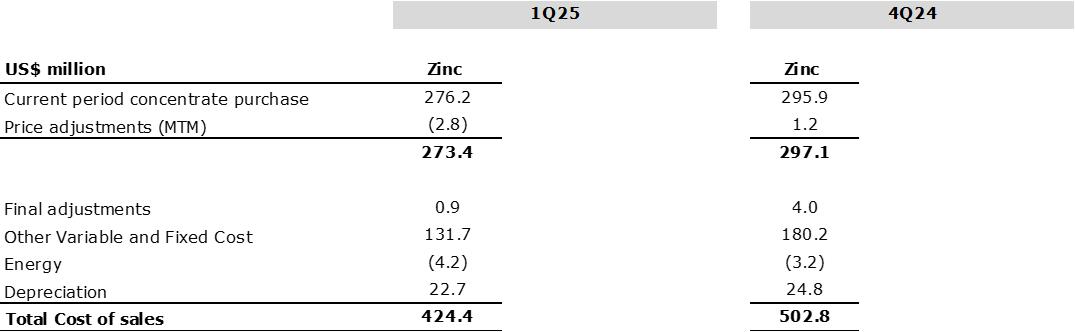
|
|
|
|
Sources of Zinc Concentrate to Nexa Smelters (kt) – 1Q25 In 1Q25, Nexa acquired 50% of zinc from its own mines, with the remainder supplied by third parties and secondary feed. The smelters use zinc concentrate as feedstock, which is supplied from our mines, and we apply a benchmark TC for our operations. From third-party suppliers, the treatment charge is based on the benchmark TC, spot TCs, or TCs negotiated annually, which remained relatively flat throughout the year. The 2025 benchmark TC, reportedly agreed between Korea Zinc and Teck in April 2025, was set at US$80/t of concentrate, down 52% from 2024 (US$165/t). To reduce volatility, Nexa considers a three-year rolling average for most third-party contracts, which are renewed at different periods throughout the year. The reference benchmark TCs for 2025, 2024 and 2023 are US$80/t, US$165/t, and US$274/t of concentrate, respectively. |
|
Adjusted EBITDA for the smelting segment totaled US$31 million in 1Q25, down 38% compared to US$51 million in 1Q24. This decline was primarily attributed to (i) a negative net impact of US$33 million from higher costs, mainly resulting from increased calcine inventory consumption associated with higher unitary costs in Cajamarquilla and higher inputs prices in Três Marias and Juiz de Fora; (ii) lower TCs of US$16 million impacting smelting margins; (iii) lower sales volume of US$5 million related to lower production at our Brazilian smelters due to operational instability, maintenances activities, partially offset by increased output at Cajamarquilla; and (iv) a negative net impact of US$4 million in other variations, reflecting lower turnover provisions and higher tax contingency provisions at Cajamarquilla. These factors were partially offset by (v) a positive net price effect of US$25 million, mainly due to favorable MTM variations in raw material costs; (vi) higher by-products contribution of US$7 million, primarily driven by increased sulphuric acid and silver prices; and (vii) a positive impact of US$7 million from foreign exchange variations.

Compared to 4Q24, Adjusted EBITDA decreased by 59%, mainly driven by (i) a negative net impact of US$22 million in other variations, primarily attributed to the reversal of environmental liabilities related to the Três Marias decommissioning plan that benefitted 4Q24, a reduction in cash dividend received from Enercan, and increased contingency provisions at Cajamarquilla; and (ii) a negative net impact of US$22 million from higher costs, mainly due to increased calcine inventory consumption associated with higher unitary costs in Cajamarquilla, higher energy costs in Juiz de Fora and Três Marias, along with higher sales and freight expenses in Cajamarquilla; and (iii) lower sales volume of US$10 million across all our smelters. All these effects were partially offset by (iv) a positive net price effect of US$15 million, resulting from favorable impacts from MTM variations.
|
|
|

Conversion cost, Cash cost and AISC 5
| Consolidated | 1Q25 | 4Q24 | 1Q24 | 1Q25 vs. 1Q24 | 1Q25 vs. 4Q24 | |
| Smelting conversion cost | US$/t | 722 | 651 | 665 | 8.6% | 10.9% |
| Cash cost net of by-products | US$/t | 2,576 | 2,771 | 2,158 | 19.4% | (7.0%) |
| AISC net of by-products | US$/t | 2,780 | 3,016 | 2,299 | 20.9% | (7.8%) |
| Smelting conversion cost | US$/lb | 0.33 | 0.30 | 0.30 | 8.6% | 10.9% |
| Cash cost net of by-products | US$/lb | 1.17 | 1.26 | 0.98 | 19.4% | (7.0%) |
| AISC net of by-products | US$/lb | 1.26 | 1.37 | 1.04 | 20.9% | (7.8%) |
Note: Cash cost and AISC per ton sold does not include the impact of the cost of metal purchased for resale and the impact of the cost of idleness capacity of US$2.1 million in Juiz de Fora in 1Q25.
Cash cost net of by-products for the smelting segment was US$1.17/lb in 1Q25, up 19% from US$0.98/lb in 1Q24. This increase was primarily attributed to higher raw material costs due to increased zinc prices impacting concentrate purchases, lower TCs, and higher operational costs, which were partially offset by increased by-products contribution and favorable foreign exchange variations. Compared to 4Q24, cash costs decreased by 7%, mainly driven by lower raw material costs due to decreased zinc prices and operational cost reductions, which were partially offset by lower applied TCs.
AISC net of by-products in 1Q25 was US$1.26/lb, up 21% from US$1.04/lb in 1Q24, while down 8% from US$1.37/lb in 4Q24.
Conversion cost was US$0.33/lb in 1Q25, up 9% compared to US$0.30/lb in 1Q24, primarily due to higher variable costs and increased maintenance and energy expenses, which were partially offset by foreign exchange benefits and lower third-party services expenses. Compared to 4Q24, conversion cost was up 11%, mainly driven by higher variable costs and energy expenses, partially offset by lower maintenance and third-party services expenses, as well as reduced personnel costs.
For a reconciliation of conversion cost, cash cost
and AISC, please refer to the appendix section “Conversion and All in Sustaining Cash Cost | Smelting.”
5 Our conversion cost, cash cost and AISC net of by-products credits are measured with respect to zinc sold.
|
|
|
Liquidity and Indebtedness
On March 31, 2025, Nexa’s consolidated gross debt6 amounted to US$1,782 million, 1% higher compared to the balance on December 31, 2024, mainly due to the 7% appreciation of the Brazilian real (end of period) against the U.S. dollar.
At the end of the period, 83% (or US$1,470 million) of the gross debt was denominated in U.S. dollars and 17% (or US$312 million) in Brazilian reais. The following charts show Nexa’s gross debt by category and currency.
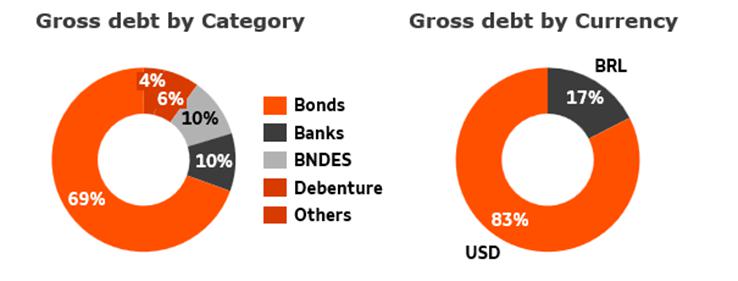
Cash and cash equivalents and financial investments (“total cash”) amounted to US$401 million on March 31, 2025, 37% lower compared to December 31, 2024, mainly driven by working capital investment of US$265 million, partially offset by positive cash flows from operations during the quarter.
Total cash, including the RCF, at the end of 1Q25 is sufficient to cover the payment of all obligations maturing over the next 3 years. At the end of 1Q25, the average maturity of the total debt was 5.3 years at an average interest rate of 6.28% per year with only 3% (US$51 million) of the total debt maturing in 2025, 46% (US$818 million) maturing between 2026 and 2028, 13% (US$234 million) maturing between 2029 and 2030, and 38% (US$679 million) of the total debt maturing in and after 2031.
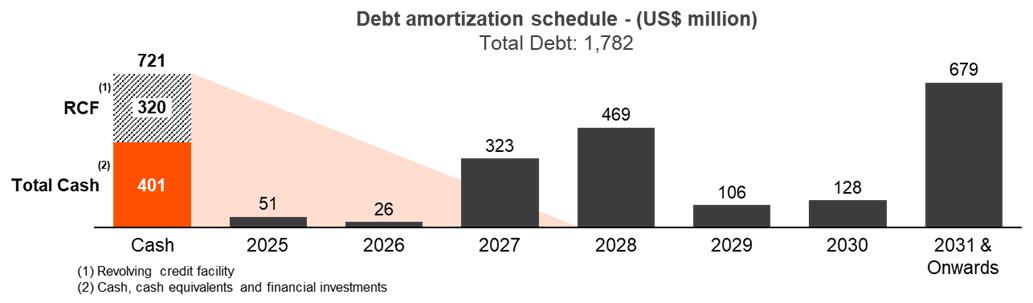
On March 31, 2025, Nexa’s net debt7 was US$1,488 million compared with US$1,217 million at the end of 4Q24.
| US$ million | Mar 31, 2025 | Dec 31, 2024 |
| Gross Debt | 1,781.9 | 1,762.6 |
| Net debt | 1,488.2 | 1,216.8 |
| LTM Adj. EBITDA | 710.7 | 714.1 |
| Net debt/LTM Adj. EBITDA | 2.09x | 1.70x |
6 Loans and financing (“gross debt”)
7 Gross debt (US$1,782 million) minus cash and cash equivalents (US$395 million), minus financial investments (US$6 million), plus negative derivatives (US$0.2 million), plus Lease Liabilities (US$108 million). It does not include the financial instrument related to the offtake agreement.
|
|
|
In addition to continuing to assess short-term and mid-term commodities prices, management continuously reviews Nexa’s capital structure, financial position, and the cost and maturity profile of our debt. Actions to improve the quantum and profile of outstanding debt, focusing on extending maturity, reducing average cost of debt and assessing financing alternatives, continue to be constantly evaluated.
Liability Management Strategy
In April 2025, Nexa successfully executed a US$500 million bond issuance of 6.600% senior unsecured notes due April 2037. The transaction reflects our proactive and effective approach to liability management, utilizing the net proceeds to repurchase approximately 49% of our 2027 notes and 72% of our 2028 notes.
This strategic refinancing initiative extends the Company’s debt maturity profile, enhances financial flexibility, highlights our solid credit metrics and investors’ confidence, and reduces near-term refinancing risk.
The outstanding 2027 notes of approximately US$110.5 million, are expected to be fully redeemed through a make-whole call on May 23, 2025, further strengthening our capital structure and reinforcing Nexa’s long-term financial resilience.
Credit Ratings – Reflecting Resilient Performance and Strategic Execution
In March 2025, Moody’s affirmed Nexa’s 'Ba2' rating and revised the outlook to 'stable' from 'negative'. The outlook revision reflects the Company’s improved operating performance in 2024, supported by a reduction in gross leverage to levels below 3x at the year-end and the generation of positive free cash flow for the first time since the Aripuanã investment. Moody’s also highlights the expected benefits of Aripuanã’s full contribution and the Cerro Pasco Integration Project, which are set to enhance production, extend life-of-mine, and strengthen cash flow generation through lower-cost operations. The stable outlook underscores Nexa’s ongoing financial strength, bolstered by strategic operational improvements and market fundamentals.
Additionally, in February 2025, S&P reaffirmed Nexa’s
‘BBB-’ rating with a stable outlook. The agency emphasized Nexa’s reduced leverage, solid mining and smelting volumes,
and better-than-expected zinc prices, while highlighting the Company’s strategic alignment with its parent, Votorantim S.A., as
a key strength.
|
|
|
Cash flows
| US$ million | 1Q25 | 1Q24 |
| Cash provided by operating activities before working capital | 157.6 | 86.5 |
| Variations in operating assets and liabilities ("Working Capital") | (265.2) | (124.6) |
| Net cash flows provided by (used in): | ||
| Operating activities | (183.3) | (85.6) |
| Investing activities | (33.2) | (73.7) |
| Financing activities | (13.6) | 18.0 |
| Decrease in cash and cash eq. | (225.7) | (144.0) |
| Cash and cash eq. at the beginning of the period | 620.5 | 457.3 |
| Cash and cash eq. at the end of the period (1) | 394.8 | 313.3 |
(1) Does not include financial investments totaling US$6 million at March 31, 2025.
Note: For details on Cash flows, please refer to the “Condensed consolidated interim financial statements at and for the three-month period ended on March 31, 2025.”
In 1Q25, cash provided by operating activities, before working capital variations was US$158 million. Working capital variations had a negative impact of US$265 million, primarily due to (i) a US$113 million decrease in trade payables, driven by increased payments to suppliers; (ii) a US$61 million increase in other assets, mainly related to tax claim payments; (iii) a US$58 million decrease in other liabilities, primarily related to the write-off of the commercial advance agreement in 4Q24, along with VAT payments, and the increase in salaries and payroll charges due to bonus payments; (iv) a US$22 million increase in inventories, reflecting higher finished products levels as part of our 2025 sales strategy and inventory recovery in Brazil, partially offset by higher smelting consumption in Peru, and increased semi-finished products in both segments; and (v) a US$12 million increase in trade accounts receivable. In 1Q25, we paid US$32 million in interest and US$44 million in taxes. As a result, net cash used in operating activities amounted to US$183 million.
We used US$33 million of net cash flows for investing activities in 1Q25, primarily including US$51 million in CapEx investments (nearly all of which was sustaining CapEx), partially offset by US$16 million in net sales of financial investments.
Net cash flows used in financing activities in the quarter totaled US$14 million, primarily due to payments of loans and financings repayments, as well as lease liabilities.
Foreign exchange effects on cash and cash equivalents had a positive impact of US$4 million in the quarter.
As a result, cash and cash equivalents (excluding
financial investments) decreased by US$226 million in the quarter, amounting to US$395 million at the end of 1Q25.
|
|
|
Others
Offtake agreement
As previously disclosed, in January 2022 Nexa signed an offtake agreement with a third-party international player (the “Offtaker”), in which Nexa agreed to sell 100% of the copper concentrate produced by Aripuanã for a 5-year period starting in February 2023 and limited to 30,810 tonnes, at the lower of current market prices or a price cap.
In September 2023, the parties agreed to amend the offtake agreement, which states that no penalty will be applied in case of delays in the agreed shipment schedule per year. However, if lower volumes are delivered in any given year within the contract period, the remaining balance will be shipped at the end of the contract period, totaling 30,018 tonnes. The offtake agreement was structured to completely extinguish a previously existing future royalty obligation that Nexa had with the Offtaker.
The offtake agreement resulted from negotiations with the Offtaker to sell the copper concentrate in lieu of paying future royalties related to the previous acquisition of the Aripuanã project mining rights from the Offtaker. Additionally, the Company opted to voluntarily and irrevocably designate the entire offtake agreement at fair value through profit and loss within the scope of IFRS 9, rather than separate the value of the embedded derivative associated with the price cap. This resulted in a non-cash loss of US$11 million recognized in the income statement for the period ended on March 31, 2025.
For further information, please refer to explanatory note 10 (e) – “Financial instruments in the offtake agreement: fair value” in the “Condensed consolidated interim financial statements at and for the three-month period ended on March 31, 2025.”
Cross-currency Swap
On March 28, 2025, Nexa entered into a cross-currency swap transaction with a notional amount of US$112.7 million (R$650 million at the transaction date) to hedge its Brazilian Real (“BRL”) exposure related to Nexa Brazil’s debentures issued on April 2, 2024. The swap mirrors the interest and principal payment schedules of the debentures, with a maturity date of March 28, 2030, with semiannual payments. Under the terms of the swap, Nexa pays a semi-annual rate of 6.209% on the USD notional amount and receives a floating rate of CDI + 1.50% per annum on the BRL notional amount.
Other tax claim payments
In January 2025, the Company paid a total amount of
US$42 million related to uncertain income tax positions of Nexa Peru 2018 of US$18.3 million and US$24.0 million related to Nexa CJM 2017,
respectively, to obtain penalty and interest reductions. For each of these proceedings the likelihood of loss is considered possible.
These payments do not represent a recognition of the tax liability, as the Company will proceed with its legal defense under the applicable
instances. Such payments were recognized as “judicial deposits and other tax claim payments” under “other assets in
the long-term”. A provision may be recorded against these amounts if the likelihood of loss for these proceedings turns out to be
probable. Additionally, the amounts paid could be recoverable in cash if the Company’s defense prevails or may be offset against
other tax liabilities in the event of unfavorable rulings.
|
|
|
Market Scenario
1Q25
| LME Prices | 1Q25 | 4Q24 | 1Q24 | 1Q25 vs. 1Q24 | 1Q25 vs. 4Q24 | |
| Zinc | US$/t | 2,838 | 3,050 | 2,450 | 15.8% | (7.0%) |
| Copper | US$/t | 9,340 | 9,193 | 8,438 | 10.7% | 1.6% |
| Lead | US$/t | 1,970 | 2,007 | 2,077 | (5.2%) | (1.9%) |
| Silver | US$/oz | 31.9 | 31.4 | 23.3 | 36.6% | 1.6% |
| Gold | US$/oz | 2,860 | 2,663 | 2,070 | 38.2% | 7.4% |
| Source: Bloomberg |
In 1Q25, the LME zinc price averaged US$2,838/t (or US$1.29/lb), up 16% year-over-year and down 7% quarter-over-quarter, trading within a range of US$2,699/t to US$2,966/t in the period.
The quarter was marked by heightened volatility amid rising geopolitical tensions and macroeconomic uncertainty. Zinc prices were supported by a weaker U.S. dollar compared to the end of 2024, driven by growing concerns over a potential U.S. economic slowdown and speculation around the impact of new U.S. import tariffs. Although no specific tariffs on zinc products had been announced as of the date of this report, broader trade tensions and the risk of retaliatory measures from China and the European Union have kept the market on edge.
Adding to this uncertainty, on April 15, President Trump ordered a Section 232 investigation into critical minerals, with Commerce Secretary expected to submit a final report withing 180 days. This investigation has the potential to result in new tariffs on zinc and related products, further contributing to market unease.
In response, major economies have announced stimulus plans. In March, China unveiled a new package of economic support measures aimed at safeguarding growth and reinforcing its 5% GDP target for 2025. Meanwhile, Germany announced a historical increase in defense and infrastructure spending, expected to stimulate demand across the broader European region – both key positive signals for base metals demand.
On the supply side, LME refined zinc inventories continued to decline, albeit at a slower pace, closing March at 140kt. SHFE inventories dropped to 72kt - the lowest March level since 2009 – highlighting the ongoing tightness in refined metal availability. This reinforces expectations of significantly lower metal production in 2025, driven by tight concentrate markets and persistently low TCs. Although some inventory restocking was anticipated following the Chinese New Year, market fundamentals remained relatively tight.
Zinc spots treatment charges (TCs), which had been in negative territory since August 2024, turned slightly positive in January 2025 and reached +US$79/t in March. This shift was driven by a post-holiday demand recovery, a modest increase in concentrate availability from new mine ramp-ups such as Kipushi (DRC) and Ozernoye (Russia), and the impact of reduced metal production – a consequence of the prolonged low TCs environment. Together, these factors point to a market that is improving, but still relatively tight.
Benchmarking discussions also point to a sharply lower TC environment. Korea Zinc reportedly agreed with Teck on a 2025 TC of US$80/t, down 52% from US$165 in 2024. This level is now considered official and has been adopted by the market, including industry consultants such as Fastmarkets and Wood Mackenzie. Another agreement with China´s Nandan Nanfang was settled at an even lower TC of US$60/t. These significant lowers TCs may pressure smelter margins, leading to metal supply constraints. For instance, Nyrstar announced a 25% production cut at its Hobart smelter in Australia, while Glencore is reportedly reviewing its global smelting operations – moves that could support zinc prices going forward.
The demand for zinc metal in our Home Market (Latin America, excluding Mexico) declined by 2.0% in 1Q25 compared to the previous quarter. This was primarily driven by weaker consumption in the Mercosur region – where industrial activity slowed and competition from imported materials intensified in Argentina. In contrast, increased zinc demand in Peru, supported by strong performance in the export sector, partially offset the overall contraction in the region.
|
|
|
Following a period of solid demand in 2024, zinc consumption in Latin America is expected to moderate in 2025, gradually returning to historical levels observed between 2020 and 2023, especially in Brazil. This adjustment reflects a less favorable macroeconomic environment, marked by high interest rates and persistent inflation, which continues to pressure key zinc-consuming sectors such as construction and automotive. In Brazil, the ongoing monetary tightening cycle has tempered industrial activity and consumer confidence. Nonetheless, both civil construction and light vehicle production are still forecasted to post year-over-year growth in 2025, of 1.7% and 5.1%, respectively.
In addition to regional dynamics, global trade developments may also influence demand trends. Recent tariff measures have raised concerns about how zinc-derived products will behave in international markets, particularly regarding U.S. import patterns. Although no critical impact on local demand has been observed so far, there is uncertainty around how these measures may affect trade flows. For instance, in Europe, the outlook remains cautious amid fragile economic conditions, which pose a downside risk to demand. We continue to closely monitor these evolving factors.
Copper
In 1Q25, the LME copper price averaged US$9,340/t (or US$4.24/lb), up 11% and 2% year-over-year and quarter-over-quarter, respectively, with prices peaking at US$9,982/t in late March. Market sentiment was buoyed by the U.S. Section 232 investigation into copper imports, which triggered accelerated buying and boosted premiums. While no tariffs have yet been implemented, uncertainty fueled the CME premium over LME copper to spike to US$1,650/t on March 26th.
Copper market fundamentals continue to tighten. LME copper inventories ended the 1Q25 at 213kt, roughly flat from 4Q24. Spot TC/RCs dropped to -US$25/t by quarter-end, reflecting growing pressure on concentrate availability. The ongoing decline in spot TC/RCs highlights a tightening copper concentrate market, with standalone smelters particularly exposed to rising input costs.
Looking ahead, metal prices are expected to remain volatile amid ongoing trade tensions – particularly between the U.S. and China – and macroeconomic uncertainty. However, zinc and copper fundamentals remain constructive. Strategic stimulus programs, low inventories, constrained smelter capacity, and the critical role of metals in the global energy transitions continue to provide a supportive backdrop for base metals price in 2025.
Foreign Exchange
| FX | 1Q25 | 4Q24 | 1Q24 | 1Q25 vs. 1Q24 | 1Q25 vs. 4Q24 | ||
| BRL/USD (Average) | 5.852 | 5.837 | 4.951 | 18.2% | 0.3% | ||
| BRL/USD (End of period) | 5.742 | 6.192 | 4.996 | 14.9% | (7.3%) | ||
| PEN/USD (Average) | 3.700 | 3.756 | 3.760 | (1.6%) | (1.5%) | ||
| PEN/USD (End of period) | 3.677 | 3.740 | 3.718 | (1.1%) | (1.7%) | ||
| Source: Bloomberg | |||||||
In 1Q25, the average exchange rate for the Brazilian real was 5.852 BRL/US$, a depreciation of 18% year-over-year. This weakening reflects continued uncertainty surrounding the country’s fiscal and monetary policies, which has raised concerns about the government’s ability to meet its fiscal targets. Additionally, the recent repricing of global assets has contributed to a deterioration in Brazil’s risk indicators. Compared to the previous quarter, the average exchange rate was relatively flat. The average exchange rate for the Peruvian sol in 1Q25 was 3.700 PEN/US$, an appreciation of 2% year-over-year. Despite ongoing shifts in global trade policy, the currency remained relatively stable during the period, supported by macroeconomic fundamentals and local market resilience.
|
|
|
Looking ahead, global financial markets are reacting
to the United States’ announcement of broad-based tariff increases. While the move was largely anticipated, the scope, scale, and
pace of the measures surprised investors, triggering renewed volatility. In the upcoming months, high uncertainty is expected across global
equity and currency markets, as economies adapt to the evolving trade landscape and explore new frameworks for international commerce.
|
|
|
Risks and Uncertainties
Risk management is considered one of the key points in our business strategy and contributes to value creation and increasing the level of confidence in the Company held by its main stakeholders, including shareholders, employees, customers, suppliers and the local communities.
As a result, we have adopted an Enterprise Risk Management (“ERM”) Policy that describes Nexa’s Risk Management Model, and its activities are an integral part of the processes in our operational units, corporate departments and projects, and provides support for decision-making by our Executive Officers and Board of Directors.
The risk assessment cycle is performed annually focusing on our strategy, operations and key projects. We seek to identify material risks, which are then assessed with consideration of the potential health, safety, environmental, social, reputational, legal and financial impacts. By embedding risk management into our work processes and critical business systems, we work to ensure we make decisions based on our risk appetite, updated annually, on relevant inputs and valid data. The material risks identified during the risk management process are monitored and reported to the Executive Team and the Board of Directors. The oversight of risk, responses and mitigation actions are delegated to the various committees of the Board according to the nature of the risk and the respective board committee’s area of responsibility. The Audit Committee is responsible for financial reporting, fraud and compliance risk as well as oversight of the risk management process, policies and procedures. The Audit Committee is also responsible for oversight of cybersecurity risk management, as described below. The Finance Committee is responsible for the financial risks as well as the oversight of the financial risk management policy as described below. The Compensation, Nominating and Governance Committee is responsible for the mitigation of risks associated with the Company’s compensation policies, among others. The Sustainability and Capital Projects Committee monitors compliance with applicable laws and policies and oversight the suitability and effectiveness of the Company’s risk management processes with respect to sustainability matters and capital projects matters, including but not limited to, tailings facility management and emergency response plans.
Our operations are exposed to a number of inherent risks and uncertainties, and our results may be influenced by the following factors, including, among others:
| · | the cyclical and volatile prices of commodities; |
| · | the changes in the expected level of supply and demand for commodities; |
| · | foreign exchange rates, fluctuations, inflation, and interest rate volatility; |
| · | the risks and uncertainties related to economic and political conditions in the countries in which we operate; |
| · | changes in global market conditions that may affect demand and price stability, including uncertainties related to international trade policies, such as tariffs imposed by the United States and other countries or jurisdictions, and potential retaliatory measures. Ongoing trade tensions may also increase the risk of a global economic recession, potentially driving greater commodity price volatility and potentially reducing demand; |
| · | the impact of expanded regional or global conflict, including the war between Russia and Ukraine, the Israel-Hamas conflict, tensions between China and Taiwan and the resulting potential impacts on supply and demand for commodities, global security concerns, and market volatility; |
| · | outbreaks of contagious diseases or health crises impacting overall economic activity regionally or globally, and the potential impact thereof on commodity prices and exchange rate variations in the currencies to which we are exposed to, our business and operating sites, and the global economy; |
| · | increasing demand and evolving expectations from stakeholders with respect to our environmental, social and governance (“ESG”) practices, performance and disclosures, including the ability to meet energy requirements while complying with greenhouse gas emissions regulations and other energy transition policy changes and laws in the countries in which we operate; |
|
|
|
| · | the impact of increasing severity of weather events on our operations, workforce and value chain; |
| · | environmental, safety and engineering challenges and risks inherent to mining; |
| · | severe natural disasters, such as storms, prolonged heavy rainfalls and floods, or earthquakes, disrupting our operations; |
| · | operational risks, such as operator errors, mechanical failures and other accidents; |
| · | the availability of materials, supplies, insurance coverage, equipment, required permits or approvals and financing; |
| · | supply-chain and logistic related interruptions, including impacts to international freight and transportation networks; |
| · | the implementation of our growth strategy, the availability of capital and the risks associated with related capital expenditures; |
| · | failure to obtain financial assurance to meet closure and remediation obligations; |
| · | the possible material differences between our estimates of Mineral Reserves and Mineral Resources and the mineral quantities we actually recover; |
| · | the possibility that permits, concessions, environmental studies, modificatory environmental studies and other governmental authorities requests may be terminated, not renewed or not granted by governmental authorities in the countries in which we operate which may result in impairment charges, fines and/or penalties. |
| · | the impact of political and government changes in the countries in which we operate, and the effects of potential new legislation, including changes in taxation laws and any related agreements that Nexa has entered or may enter into with local governments; |
| · | legal and regulatory risks, related to ongoing or future investigations by local authorities with respect to our business and operations, as well as the conduct of our customers, along with the impact to our financial statements regarding the resolution of any such matters; |
| · | labor disputes or disagreements with local communities or unions in the countries in which we operate; |
| · | loss of reputation due to unanticipated operational failures or significant occupational incidents; |
| · | failure or outage of our digital infrastructure or information and operating technology systems; |
| · | cyber events or attacks (including ransomware, state-sponsored, data breaches and other cyberattacks) due to negligence, IT security failures or the increased use of artificial intelligence; |
| · | the future impact of competition and changes in domestic and international governmental and regulatory policies that apply to our operations; |
| · | interest rates increases, making the cost of capital and financial expenses higher than expected or even unattainable; |
| · | regulatory changes in the countries where we operate, including new trade restrictions, tariff escalations, and policy shifts affecting cross-border commerce and supply chains, such as recent tariff increases on imports from Canada, Mexico, and China; and |
| · | other factors. |
For a broader discussion of risks please refer to our annual report on form 20-F filed with the SEC (www.sec.gov), on SEDAR+ (www.sedarplus.ca) and available on the Company’s website (ir.nexaresources.com).
|
|
|
Use of Non-IFRS Financial Measures
Nexa’s management uses Consolidated Adjusted EBITDA as an additional performance measure on a consolidated basis, in addition to, and not as a substitute for, net income. We define Adjusted EBITDA as net income (loss) for the year/period, adjusted by (i) share in the results of associates, depreciation and amortization, net financial results and income tax; (ii) addition of cash dividend received from associates; (iii) non-cash events and non-cash gains or losses that do not specifically reflect our operational performance for the specific period, including: gain (loss) on sale of investments; impairment and impairment reversals; gain (loss) on sale of long-lived assets; write-offs of long-lived assets; remeasurement in estimates of asset retirement obligations; and other restoration obligations; and (iv) pre-operating and ramp-up expenses incurred during the commissioning and ramp-up phases of greenfield projects. For future periods, when applicable, management may exclude the impact of certain types of transactions that in its judgments are (i) events that are non-recurring, unusual or infrequent, and (ii) other specific events that, by their nature and scope, do not reflect our operational performance for the specific period.
We believe this measure provides useful information about the performance of our operations as it facilitates consistent comparisons between periods, planning and forecasting of future operating results. This reflects the operational performance of our existing business without the impact of interest, taxes, amortization, depreciation, non-cash items that do not reflect our operational performance for the specific reporting period and the impact of pre-operating and ramp-up expenses during the commissioning and ramp-up phases of Aripuanã. Pre-operating and ramp-up expenses incurred during the commissioning and ramp-up of phases of Aripuanã are not considered infrequent, unusual or non-recurring expenses, as they have recurred in prior years with respect to Aripuanã and may recur in the future with respect to any other projects that may reach the commissioning or ramp-up phases. Commencing in July 2024, these effects have no longer been included since, at the end of June 2024, Aripuanã reached the final stage of its ramp-up phase, transitioning to an ongoing operation. Also, since 2024, our management includes the cash dividend received from associates (currently, Enercan is our only associate) as part of our Adjusted EBITDA calculation. Enercan is an equity method investee with which we have a long-term energy supply agreement. Energy is one of the key components of our costs; as the purpose of our equity investment in Enercan is to secure a reliable long-term energy supply, our management considers this cash dividend received from Enercan each year as part of its analysis of our energy costs for such year.
Our calculation of Adjusted EBITDA may be different from the calculation used by other companies, including our competitors in the mining industry, so our measures may not be comparable to those of other companies.
Mining segment | Cash cost net of by-products credits: for our mining operations, cash cost after by-products credits includes all direct costs associated with mining, concentrating, leaching, solvent extraction, on-site administration and general expenses, any off-site services essential to the operation, concentrate freight costs, marketing costs and property and severance taxes paid to state or federal agencies that are not profit-related. Treatment and refining charges on metal sales, which are typically recognized as a deduction component of sales revenues, are added to cash cost. Cash cost net of by-products credits is measured with respect to zinc sold per mine.
Mining segment | Cost ROM: includes all direct production costs for mining, concentrating, leaching, on-site mineral transportation, and other on-site administration expenses, excluding royalties and workers’ participation costs. Cost ROM is measured with respect to total treated ore volume and non-metallic products revenue (such as limestone and stones) are considered as cost-reduction for our mining operations.
Smelting segment | Cash cost net of by-products credits: for our smelting operations, cash cost, after by-products credits includes all the costs of smelting, including costs associated with labor, net energy, maintenance, materials, consumables and other on-site costs, as well as raw material costs. Cash cost net of by-products credits is measured with respect to zinc sold per smelter.
|
|
|
Smelting segment | Conversion cost: costs incurred to convert zinc concentrate (feed) into final products measured with respect to contained zinc sold per smelter, including energy, consumables, and other fixed and on-site expenses. Conversion cost does not include raw material, alloys, and by-products related cost.
Sustaining cost net of by-products credits is defined as the cash cost, net of by-product credits plus non-expansion capital expenditure, including sustaining, health, safety and environment, modernization and other non-expansion-related capital expenditures. Sustaining cash cost net of by-products credits is measured with respect to zinc sold.
All in sustaining cost (“AISC”) net of by-products credits is defined as sustaining cash cost, net of by-products credits plus corporate general and administrative expenses, royalties and workers’ participation. AISC net of by-products credits is measured with respect to zinc sold.
Net debt: defined as (i) loans and financing (the most comparable IFRS measure), less (ii) cash and cash equivalents, less (iii) financial investments, plus or less (iv) the fair value of derivative financial instruments, plus (v) leases liabilities. Our management believes that net debt is an important figure because it indicates our ability to repay outstanding debts that become due simultaneously using available cash and highly liquid assets.
All forward-looking non-IFRS financial measures in this release, including cash cost guidance, are provided only on a non-IFRS basis. This is due to the inherent difficulty of forecasting the timing or amount of items that would be included in the most directly comparable forward-looking IFRS financial measures. As a result, reconciliation of the forward-looking non-IFRS financial measures to IFRS financial measures is not available without unreasonable effort and the Company is unable to assess the probable significance of the unavailable information.
See “Cautionary Statement on Forward-Looking Statements” below.
Technical information
Jose Antonio Lopes, B.Geo., FAusIMM(Geo): 224829, a Mineral Resources manager, a qualified person for purposes of National Instrument 43-101 and a Nexa employee, has approved the scientific and technical information contained in this Earnings Release. Please note that the mineral reserves included in this Earnings Release were estimated in accordance with the Canadian Institute of Mining, Metallurgy and Petroleum (“CIM”) 2014 Definition Standards for Mineral Reserves and Mineral Resources, whose definitions are incorporated by reference in National Instrument 43-101. Accordingly, such information may not be comparable to similar information prepared in accordance with Subpart 1300 of Regulation S-K (“S-K 1300”). Our estimates of mineral reserves may be materially different from mineral quantities we actually recover, and market price fluctuations and changes in operating capital costs may render certain mineral reserves uneconomical to mine.
CAUTIONARY STATEMENT ON FORWARD-LOOKING STATEMENTS
This Earnings Release contains certain forward-looking information and forward-looking statements as defined in applicable securities laws (collectively referred to in this Earnings Release as “forward-looking statements”). All statements other than statements of historical fact are forward-looking statements. The words “believe,” “will,” “may,” “may have,” “would,” “estimate,” “continues,” “anticipates,” “intends,” “plans,” “expects,” “budget,” “scheduled,” “forecasts” and similar words are intended to identify estimates and forward-looking statements. Forward-looking statements are not guarantees and involve known and unknown risks, uncertainties and other factors which may cause the actual results, performance or achievements of Nexa to be materially different from any future results, performance or achievements expressed or implied by the forward-looking statements. Actual results and developments may be substantially different from the expectations described in the forward-looking statements for a number of reasons, many of which are not under our control, among them, the activities of our competition, the future global economic situation, weather conditions, market prices and conditions, exchange rates, and operational and financial risks. The unexpected occurrence of one or more of the abovementioned events may significantly change the results of our operations on which we have based our estimates and forward-looking statements.
|
|
|
Our estimates and forward-looking statements may also be influenced by, among others, legal, political, environmental or other risks that could materially affect the potential development of our projects, including risks related to outbreaks of contagious diseases or health crises impacting overall economic activity regionally or globally, as well as risks relating to ongoing or future investigations by local authorities with respect to our business and operations and the conduct of our customers, including the impact to our financial statements regarding the resolution of any such matters.
Our estimates and forward-looking statements may also be influenced by regulatory changes in the countries where we operate, including new trade restrictions, tariff escalations, and policy shifts affecting cross-border commerce and supply chains. Certain forward-looking statements are based on third-party data, market forecasts, and assumptions that may be subject to change. Nexa does not guarantee the accuracy of such external data and disclaims any obligation to update these statements unless required by law.
These forward-looking statements related to future events or future performance and include current estimates, predictions, forecasts, beliefs and statements as to management’s expectations with respect to, but not limited to, the business and operations of the Company and mining production our growth strategy, the impact of applicable laws and regulations, future zinc and other metal prices, smelting sales, CapEx expenses related to exploration and project evaluation, estimation of mineral reserves and mineral resources, mine life and our financial liquidity.
Forward-looking statements are necessarily based upon a number of factors and assumptions that, while considered reasonable and appropriate by management, are inherently subject to significant business, economic and competitive uncertainties and contingencies and may prove to be incorrect. Statements concerning future production costs or volumes are based on numerous assumptions of management regarding operating matters and on assumptions that demand for products develops as anticipated, that customers and other counterparties perform their contractual obligations, full integration of mining and smelting operations, that operating and capital plans will not be disrupted by issues such as mechanical failure, unavailability of parts and supplies, labor disturbances, interruption in transportation or utilities, and adverse weather conditions, and that there are no material unanticipated variations in metal prices, exchange rates, or the cost of energy, supplies or transportation, among other assumptions.
We assume no obligation to update forward-looking
statements except as required under securities laws. Estimates and forward-looking statements refer only to the date when they were made,
and we do not undertake any obligation to update or revise any estimate or forward-looking statement due to new information, future events
or otherwise, except as required by law. Estimates and forward-looking statements involve risks and uncertainties and do not guarantee
future performance, as actual results or developments may be substantially different from the expectations described in the forward-looking
statements. Further information concerning risks and uncertainties associated with these forward-looking statements and our business can
be found in our annual report on Form 20-F and in our other public disclosures available on our website and filed under our profile on
SEDAR+ (www.sedarplus.ca) and on EDGAR (www.sec.gov).
|
|
|
Appendix
| Income Statement | 48 |
| Net cash flows from operating activities excluding working capital variations and free cash flow – Reconciliation |
49 |
| CAPEX | 50 |
| All in Sustaining Cash Cost | Mining | 51 |
| Conversion and All in Sustaining Cash Cost | Smelting | 53 |
|
|
|
Income Statement
| US$ million | 1Q24 | 2Q24 | 3Q24 | 4Q24 | 1Q25 |
| Net Revenues | 579.8 | 736.3 | 709.5 | 740.9 | 627.1 |
| Cost of sales | (491.9) | (556.0) | (582.9) | (597.6) | (500.6) |
| Gross Profit | 87.8 | 180.3 | 126.6 | 143.3 | 126.6 |
| SG&A | (33.5) | (30.2) | (29.5) | (34.1) | (35.1) |
| Mineral Exploration and Project Evaluation | (12.7) | (18.0) | (16.1) | (21.2) | (16.0) |
| Impairment reversal (loss) of long-lived assets | 17.2 | (60.2) | 17.6 | (7.5) | (0.3) |
| Other income and expenses, net | (9.0) | (51.9) | (13.9) | 41.2 | (21.2) |
| Operating income (loss) | 49.8 | 20.1 | 84.8 | 121.7 | 54.0 |
| Share in the results of associates | 5.7 | 5.3 | 5.4 | 4.7 | 4.9 |
| Net Financial Results | (67.9) | (118.5) | (41.5) | (141.6) | (0.6) |
| Financial income | 5.0 | 6.8 | 6.2 | 6.0 | 8.9 |
| Financial expenses | (50.9) | (62.5) | (59.4) | (70.9) | (54.7) |
| Other financial items, net | (22.0) | (62.7) | 11.7 | (76.7) | 45.3 |
| Depreciation and amortization | (77.0) | (74.3) | (82.3) | (96.6) | (65.8) |
| Adjusted EBITDA | 128.4 | 206.1 | 182.9 | 196.7 | 125.0 |
| Adj. EBITDA margin | 22.2% | 28.0% | 25.8% | 26.5% | 19.9% |
| Income tax benefit (expense) | 0.4 | 23.0 | (42.8) | (96.2) | (29.5) |
| Net Income (loss) | (12.0) | (70.0) | 6.0 | (111.4) | 28.7 |
| Attributable to Nexa's shareholders | (24.4) | (77.0) | (5.2) | (98.5) | 11.8 |
| Attributable to non-controlling interests | 12.4 | 7.0 | 11.1 | (12.9) | 16.9 |
| Weighted average number of outstanding shares - in thousand | 132,439 | 132,439 | 132,439 | 132,439 | 132,439 |
| Basic and diluted earnings (loss) per share - (in US$) | (0.18) | (0.58) | (0.04) | (0.74) | 0.09 |
| Adjusted Net Income (loss) | (10.4) | 41.7 | 21.9 | (133.1) | 34.0 |
| Adjusted basic and diluted earnings (loss) per share - (in US$) | (0.16) | 0.14 | 0.03 | (1.00) | 0.16 |
|
|
|
Net cash flows from operating activities excluding working capital variations and free cash flow – Reconciliation
Nexa manages and reports cash flows from operating activities excluding variations in working capital. Working capital can be volatile due to several factors, including prices and a build-up or reduction of inventories.
Furthermore, we also exclude from the analysis interest and income tax payments. Management believes excluding these measures provides investors with better visibility of the operating cash flow performance and our capital allocation strategy.
The following table provides a reconciliation of the cash from operating activities before variations in working capital to free cash flow.
| US$ million | 1Q25 |
| Cash provided by operating activities | (108) |
| (-) Working capital variations | (265) |
| Trade accounts receivable | (12) |
| Inventory | (22) |
| Other assets | (58) |
| Payables | (115) |
| Other liabilities | (58) |
| Cash flows from operations excluding working capital variations | 158 |
| Interest paid | (32) |
| Income tax | (44) |
| Sustaining CAPEX (1) | (51) |
| Net cash flows from operations excluding working capital variations | 31 |
| Other CAPEX investments (2) | 1 |
| Loans and investments (3) | 4 |
| Dividends and share premium paid | (0) |
| Foreign exchange effects | 4 |
| Working capital variations | (265) |
| Free cash flow | (226) |
(1) Non expansion investments related to sustaining and HS&E.
(2) Other non-expansion investments. Refer to the “Capital Expenditures (“CAPEX”)” section of this earnings release for CAPEX breakdown.
(3) New loans and financings, Debt issue costs, Payments of loans and financings, Payments of lease liabilities, Payments of fair value debt, Bonds repurchase, Premium paid on bonds repurchase, Net sales (purchases) of financial investments, Purchase of non-controlling interest shares, Subsidiary acquisition cash effects, net, Proceeds from the sale of property, plant and equipment, Dividends received, Investments in equity instruments, Acquisition of additional shares in associates, and other high liquid short term investments.
For details on cash flows, please refer to the “Condensed consolidated interim financial statements at and for the three-month period ended on March 31, 2025.”
|
|
|
CAPEX
| US$ million | 1Q25 | 4Q24 | 3Q24 | 2Q24 | 1Q24 | 2024 |
| Mining | 35.1 | 68.8 | 36.6 | 45.1 | 59.2 | 209.7 |
| Cerro Lindo | 11.5 | 17.8 | 11.1 | 11.5 | 8.5 | 49.0 |
| El Porvenir | 10.5 | 30.7 | 9.3 | 12.0 | 25.2 | 77.3 |
| Atacocha | 2.3 | 2.6 | 2.9 | 3.4 | 4.2 | 13.1 |
| Vazante | 5.5 | 7.5 | 5.3 | 8.2 | 6.6 | 27.6 |
| Morro Agudo | 0.0 | 0.0 | 0.0 | 0.1 | 0.0 | 0.1 |
| Aripuanã | 5.2 | 10.1 | 8.0 | 10.0 | 14.6 | 42.7 |
| Smelting | 16.7 | 21.9 | 18.2 | 19.4 | 16.1 | 75.7 |
| Cajamarquilla | 7.9 | 11.5 | 9.9 | 12.2 | 12.1 | 45.7 |
| Três Marias | 6.4 | 5.4 | 3.7 | 5.3 | 3.3 | 17.6 |
| Juiz de Fora | 2.5 | 5.0 | 4.6 | 2.0 | 0.8 | 12.4 |
| Other | (1.4) | (5.1) | (1.5) | (0.8) | (1.2) | (8.5) |
| Total | 50.5 | 85.6 | 53.3 | 63.8 | 74.1 | 276.8 |
| Sustaining (US$ million) | 1Q25 | 4Q24 | 3Q24 | 2Q24 | 1Q24 | 2024 |
| Mining | 34.5 | 63.7 | 33.7 | 43.9 | 58.3 | 199.5 |
| Cerro Lindo | 11.5 | 16.1 | 11.0 | 11.5 | 8.5 | 47.1 |
| El Porvenir | 10.5 | 30.1 | 9.1 | 12.0 | 25.2 | 76.4 |
| Atacocha | 2.2 | 2.2 | 2.9 | 3.4 | 4.2 | 12.7 |
| Vazante | 5.2 | 6.6 | 4.8 | 7.3 | 5.9 | 24.7 |
| Morro Agudo | 0.0 | 0.0 | 0.0 | 0.1 | 0.0 | 0.1 |
| Aripuanã | 5.1 | 8.6 | 5.9 | 9.6 | 14.4 | 38.6 |
| Smelting | 13.8 | 18.9 | 16.0 | 17.7 | 14.9 | 67.5 |
| Cajamarquilla | 7.5 | 11.0 | 8.7 | 11.4 | 11.7 | 42.8 |
| Três Marias | 3.9 | 3.7 | 2.9 | 4.4 | 2.4 | 13.5 |
| Juiz de Fora | 2.4 | 4.3 | 4.4 | 1.8 | 0.7 | 11.2 |
| Total Operations Sustaining | 48.4 | 82.6 | 49.7 | 61.5 | 73.1 | 267.0 |
| Corporate Sustaining | 0.1 | 0.3 | 0.2 | 0.4 | 0.1 | 1.0 |
| Total Sustaining | 48.5 | 82.9 | 49.9 | 62.0 | 73.2 | 268.0 |
|
|
|
All in Sustaining Cash Cost | Mining (1)
1Q25
| US$ million (excepted indicated otherwise) |
Vazante | Aripuanã | Cerro Lindo | El Porvenir | Atacocha | Consolidation of Operations | Corporate & Others | Mining | |
| Sales Volume (Zinc content in Products) | |||||||||
| Tonnes | 29,803 | 6,188 | 16,885 | 12,002 | 2,492 | 67,370 | 67,370 | ||
| (+) | COGS | 30.7 | 44.2 | 81.2 | 39.1 | 20.2 | 215.4 | (0.8) | 214.5 |
| (+) | On-site G&A | 0.5 | 0.3 | 3.2 | 1.1 | 0.9 | 5.9 | 5.9 | |
| (-) | By-products revenue | (4.4) | (24.8) | (89.1) | (43.5) | (16.0) | (177.7) | (4.9) | (182.6) |
| (+) | Treatment Charges | 15.7 | 1.2 | 5.0 | 4.4 | 0.8 | 27.1 | 27.1 | |
| (+) | Selling Expenses | 0.0 | 0.4 | 0.5 | 0.7 | 0.0 | 1.7 | 1.7 | |
| (-) | Depreciation, amortization and depletion | (6.4) | (11.1) | (13.8) | (3.1) | (7.4) | (41.6) | 0.0 | (41.6) |
| (-) | Royalties | (0.6) | (2.4) | (1.2) | (0.6) | (0.2) | (5.0) | (5.0) | |
| (-) | Workers participation & Bonus | (0.7) | (0.5) | (2.3) | (2.0) | (0.2) | (5.6) | (5.6) | |
| (+) | Others | 0.2 | 0.4 | 1.5 | 1.1 | (0.4) | 2.8 | 2.8 | |
| (=) | Cash Cost (Sold) | 35.0 | 7.7 | (15.0) | (2.6) | (2.2) | 22.8 | (5.8) | 17.1 |
| Cash Cost (Sold) (per ton) | 1,175.5 | 1,242.4 | (888.7) | (220.4) | (899.2) | 338.9 | 0.0 | 253.3 | |
| (+) | Sustaining Capital Expenditure | 5.4 | 5.2 | 11.5 | 10.5 | 2.3 | 35.0 | 5.2 | 40.2 |
| (=) | Sustaining Cash Cost (Sold) | 40.4 | 12.9 | (3.5) | 7.9 | 0.0 | 57.8 | (0.5) | 57.2 |
| Sustaining Cash Cost (Sold) (per ton) | 1,355.7 | 2,087.2 | (204.9) | 658.4 | 8.1 | 857.7 | 0.0 | 849.7 | |
| (+) | Workers participation & Bonus | 0.7 | 0.5 | 2.3 | 2.0 | 0.2 | 5.6 | 5.6 | |
| (+) | Royalties | 0.6 | 2.4 | 1.2 | 0.6 | 0.2 | 5.0 | 5.0 | |
| (+) | Corporate G&A | 21.9 | 21.9 | ||||||
| (=) | AISC (Sold) | 89.8 | |||||||
| (=) | AISC (Sold) (per ton) | 1,332.5 | |||||||
| (=) | AISC (Sold) in US$/lb | 0.60 |
(1) Our cash cost, sustaining cash cost and AISC are net of by-products credits, measured with respect to zinc sold.
|
|
|
1Q24
| US$ million (excepted indicated otherwise) |
Vazante | Morro Agudo | Cerro Lindo | El Porvenir | Atacocha | Consolidation of Operations | Corporate & Others | Mining | |
| Sales Volume (Zinc content in Products) | |||||||||
| Tonnes | 35,188 | 5,665 | 22,847 | 12,742 | 2,121 | 78,563 | 78,563 | ||
| (+) | COGS | 33.2 | 13.2 | 84.9 | 49.0 | 16.3 | 196.6 | (0.7) | 195.9 |
| (+) | On-site G&A | 0.4 | 0.2 | 0.3 | 0.8 | 0.6 | 2.2 | 2.2 | |
| (-) | By-products revenue | (3.2) | (4.2) | (81.6) | (34.4) | (13.1) | (136.4) | (1.4) | (137.8) |
| (+) | Treatment Charges | 18.7 | 2.6 | 8.0 | 5.1 | 0.9 | 35.3 | 35.3 | |
| (+) | Selling Expenses | 0.1 | 0.1 | 0.4 | 0.5 | 0.0 | 1.1 | 1.1 | |
| (-) | Depreciation, amortization and depletion | (6.8) | (0.4) | (18.9) | (12.6) | (4.0) | (42.7) | 0.0 | (42.7) |
| (-) | Royalties | (0.6) | (0.3) | (1.2) | (0.6) | (0.2) | (2.8) | (2.8) | |
| (-) | Workers participation & Bonus | (0.9) | (0.4) | (2.7) | (0.9) | (0.4) | (5.3) | (5.3) | |
| (+) | Others | 0.4 | 0.1 | (0.9) | (0.0) | (0.1) | (0.5) | (0.5) | |
| (=) | Cash Cost (Sold) | 41.2 | 11.0 | (11.7) | 6.8 | 0.2 | 47.5 | (2.1) | 45.4 |
| Cash Cost (Sold) (per ton) | 1,171.0 | 1,933.6 | (511.9) | 534.0 | 103.9 | 604.5 | 0.0 | 577.6 | |
| (+) | Sustaining Capital Expenditure | 5.9 | 0.0 | 8.5 | 25.2 | 4.2 | 43.9 | 14.6 | 58.5 |
| (=) | Sustaining Cash Cost (Sold) | 47.1 | 11.0 | (3.2) | 32.0 | 4.4 | 91.4 | 12.5 | 103.9 |
| Sustaining Cash Cost (Sold) (per ton) | 1,339.7 | 1,936.8 | (140.4) | 2,515.3 | 2,090.8 | 1,163.3 | 0.0 | 1,322.3 | |
| (+) | Workers participation & Bonus | 0.9 | 0.4 | 2.7 | 0.9 | 0.4 | 5.3 | 5.3 | |
| (+) | Royalties | 0.6 | 0.3 | 1.2 | 0.6 | 0.2 | 2.8 | 2.8 | |
| (+) | Corporate G&A | 11.6 | 11.6 | ||||||
| (=) | AISC (Sold) | 123.6 | |||||||
| (=) | AISC (Sold) (per ton) | 1,573.1 | |||||||
| (=) | AISC (Sold) in US$/lb | 0.71 |
(1) Our cash cost, sustaining cash cost and AISC are net of by-products credits, measured with respect to zinc sold.
Note: Cash cost and AISC per ton sold does not include the impact of the cost of idleness capacity of US$1.2 million in El Porvenir in 1Q24.
|
|
|
Conversion and All in Sustaining Cash Cost | Smelting (2)
1Q25
| US$ million (excepted indicated otherwise) |
Três Marias | Juiz de Fora | Cajamarquilla | Consolidation of Operations | Corporate | Smelting | |
| Sales Volume (Zinc content in Products) | |||||||
| Tonnes | 35,518 | 11,463 | 80,916 | 127,897 | 127,897 | ||
| (+) | COGS | 119.8 | 45.6 | 258.9 | 424.3 | (0.8) | 423.6 |
| (-) | Cost of freight | (2.4) | (0.5) | (13.2) | (16.2) | (16.2) | |
| (+) | On-site G&A | 1.1 | 0.5 | 2.3 | 3.8 | 0.0 | 3.8 |
| (-) | Depreciation, amortization and depletion | (7.2) | (3.8) | (11.7) | (22.8) | (22.8) | |
| (-) | By-products revenue | (3.8) | (4.9) | (40.2) | (48.9) | 0.8 | (48.1) |
| (-) | Workers participation & Bonus | (0.5) | (0.3) | (1.3) | (2.0) | (2.0) | |
| (+) | Others | 1.6 | (1.4) | (9.1) | (8.9) | (8.9) | |
| (=) | Cash Cost (Sold) | 108.6 | 35.2 | 185.7 | 329.5 | 0.0 | 329.5 |
| Cash Cost (Sold) (per ton) | 3,057.8 | 3,067.8 | 2,295.5 | 2,576.5 | 2,576.5 | ||
| (+) | Sustaining Capital Expenditure | 6.4 | 2.5 | 7.8 | 16.6 | 0.2 | 16.9 |
| (=) | Sustaining Cash Cost (Sold) | 115.0 | 37.7 | 193.5 | 346.2 | 0.2 | 346.4 |
| Sustaining Cash Cost (Sold) (per ton) | 3,236.9 | 3,286.7 | 2,391.5 | 2,706.5 | 2,708.3 | ||
| (+) | Workers participation & Bonus | 0.5 | 0.3 | 1.3 | 2.0 | 2.0 | |
| (+) | Corporate G&A | 7.2 | 7.2 | ||||
| (=) | AISC (Sold) | 355.6 | |||||
| (=) | AISC (Sold) (per ton) | 2,780.2 | |||||
| (=) | AISC (Sold) in US$/lb | 1.26 |
Note: Cash cost and AISC per ton sold does not include the impact of the cost of metal purchased for resale and the impact of the cost of idleness capacity of US$2.1 million in Juiz de Fora in 1Q25.
| US$ million (excepted indicated otherwise) |
Três Marias | Juiz de Fora | Cajamarquilla | Smelting | |
| Contained Zinc Sales | |||||
| Tonnes | 35,518 | 11,463 | 80,916 | 127,897 | |
| COGS | 119.8 | 45.6 | 258.9 | 424.3 | |
| (-) | Raw Material | (64.0) | (17.8) | (207.7) | (289.5) |
| (+) | By product cost | (10.8) | (0.5) | (5.2) | (16.5) |
| (+/-) | Consolidation effects | (0.1) | (0.4) | (3.1) | (3.6) |
| (+) | Others | (19.0) | (13.0) | 9.5 | (22.4) |
| (=) | Conversion Cost | 25.9 | 13.9 | 52.6 | 92.3 |
| (=) | Conversion Cost in US$/t | 728.3 | 1,209.4 | 649.7 | 721.7 |
| (=) | Conversion Cost in US$/lb | 0.33 | 0.55 | 0.29 | 0.33 |
(2) Our conversion cost, cash cost, sustaining cash cost
and AISC net of by-products credits are measured with respect to zinc sold.
|
|
|
1Q24
| US$ million (excepted indicated otherwise) |
Três Marias | Juiz de Fora | Cajamarquilla | Consolidation of Operations | Corporate | Smelting | |
| Sales Volume (Zinc content in Products) | |||||||
| Tonnes | 45,284 | 19,686 | 72,609 | 137,579 | 137,579 | ||
| (+) | COGS | 115.1 | 59.1 | 201.5 | 375.8 | 0.0 | 375.8 |
| (-) | Cost of freight | (3.2) | (1.2) | (11.2) | (15.5) | (15.5) | |
| (+) | On-site G&A | 0.5 | 0.2 | 1.3 | 2.1 | 0.0 | 2.1 |
| (-) | Depreciation, amortization and depletion | (6.0) | (3.4) | (10.5) | (20.0) | (20.0) | |
| (-) | By-products revenue | (3.5) | (5.6) | (31.2) | (40.3) | 0.0 | (40.3) |
| (-) | Workers participation & Bonus | (2.2) | (0.8) | (1.1) | (4.2) | (4.2) | |
| (+) | Others | 0.7 | 0.2 | (1.9) | (0.9) | (0.9) | |
| (=) | Cash Cost (Sold) | 101.4 | 48.6 | 147.0 | 297.0 | 0.0 | 297.0 |
| Cash Cost (Sold) (per ton) | 2,238.9 | 2,468.3 | 2,024.3 | 2,158.5 | 2,158.5 | ||
| (+) | Sustaining Capital Expenditure | 3.3 | 0.8 | 12.0 | 16.1 | (8.3) | 7.7 |
| (=) | Sustaining Cash Cost (Sold) | 104.6 | 49.4 | 159.0 | 313.0 | (8.3) | 304.7 |
| Sustaining Cash Cost (Sold) (per ton) | 2,310.7 | 2,508.3 | 2,190.0 | 2,275.3 | 2,214.7 | ||
| (+) | Workers participation & Bonus | 2.2 | 0.8 | 1.1 | 4.2 | 4.2 | |
| (+) | Corporate G&A | 7.4 | 7.4 | ||||
| (=) | AISC (Sold) | 316.3 | |||||
| (=) | AISC (Sold) (per ton) | 2,298.8 | |||||
| (=) | AISC (Sold) in US$/lb | 1.04 |
Note: Cash cost and AISC per ton sold does not include the impact of the cost of metal purchased for resale.
| US$ million (excepted indicated otherwise) |
Três Marias | Juiz de Fora | Cajamarquilla | Smelting | |
| Contained Zinc Sales | |||||
| Tonnes | 45,284 | 19,686 | 72,609 | 137,579 | |
| COGS | 115.1 | 59.1 | 201.5 | 375.8 | |
| (-) | Raw Material | (55.4) | (31.8) | (141.8) | (229.0) |
| (+) | By product cost | (15.0) | (1.1) | (7.3) | (23.4) |
| (+/-) | Consolidation effects | 1.8 | (0.8) | (11.7) | (10.6) |
| (+) | Others | (18.4) | (6.0) | 3.1 | (21.3) |
| (=) | Conversion Cost | 28.1 | 19.5 | 43.8 | 91.5 |
| (=) | Conversion Cost in US$/t | 621.2 | 992.0 | 603.4 | 664.8 |
| (=) | Conversion Cost in US$/lb | 0.28 | 0.45 | 0.27 | 0.30 |
(2) Our conversion cost, cash cost, sustaining cash cost and AISC net of by-products credits are measured with respect to zinc sold.
|
|
|