FORM 6-K
SECURITIES AND EXCHANGE COMMISSION
Washington, D.C. 20549
Report of Foreign Issuer
Pursuant to Rule 13a-16 or 15d-16
of the Securities Exchange Act of 1934
For the month of March 2025
Commission File Number: 001-12568
BBVA Argentina Bank S.A.
(Translation of registrant’s name into English)
111 Córdoba Av, C1054AAA
Buenos Aires, Argentina
(Address of principal executive offices)
Indicate by check mark whether the registrant files or will file annual reports under cover of Form 20-F or Form 40-F:
| Form 20-F |
X |
Form 40-F |
|
Indicate by check mark if the registrant is submitting the Form 6-K in paper as permitted by Regulation S-T Rule 101(b)(1):
| Yes |
|
No |
X |
Indicate by check mark if the registrant is submitting the Form 6-K in paper as permitted by Regulation S-T Rule 101(b)(7):
| Yes |
|
No |
X |
Indicate by check mark whether by furnishing the information contained in this Form, the Registrant is also thereby furnishing the information to the Commission pursuant to Rule 12g3-2(b) under the Securities Exchange Act of 1934:
| Yes |
|
No |
X |
If “Yes” is marked, indicate below the file number assigned to the registrant in connection with Rule 12g3-2(b): N/A
Banco BBVA Argentina S.A.
TABLE OF CONTENTS
|
Item |
|
| 1. | Banco BBVA Argentina S.A. reports consolidated fourth quarter earnings for fiscal year 2024. |


Banco BBVA Argentina S.A. announces Fourth Quarter & Fiscal Year 2024 results
Buenos Aires, March 5, 2025 – Banco BBVA Argentina S.A (NYSE; BYMA; MAE: BBAR; LATIBEX: XBBAR) (“BBVA Argentina” or “BBVA” or “the Bank”) announced today its consolidated results for the fourth quarter (4Q24), ended on December 31, 2024.
As of January 1, 2020, the Bank started to inform its inflation adjusted results pursuant to IAS 29 reporting. To facilitate comparison, figures of comparable quarters of 2023 and 2024 have been updated according to IAS 29 reporting to reflect the accumulated effect of inflation adjustment for each period up to December 31, 2024.
4Q24 & 2024 Highlights
| · | BBVA Argentina’s inflation adjusted net income in 4Q24 was $64.7 billion, 39.6% below the $107.2 billion reported on the third quarter of 2024 (3Q24), and 38.9% lower than the $105.9 billion reported on the fourth quarter of 2023 (4Q23). Inflation adjusted accumulated net income for 2024 was $357.7 billion, 0.4% lower than the accumulated net result of $359.2 billion of 2023. |
| · | In 4Q24, BBVA Argentina posted an inflation adjusted average return on assets (ROAA) of 1.7% and an inflation adjusted average return on equity (ROAE) of 9.5%. In 2024, BBVA Argentina posted an inflation adjusted ROAA of 2.5% and an inflation adjusted ROAE of 12.5%. |
| · | Operating income in 4Q24 was $164.8 billion, 48.1% lower than the $317.6 billion recorded in 3Q24 and 84.2% lower than the $1.0 trillion recorded in 4Q23. In 2024, the accumulated operating income was $1.9 trillion, 25.8% below the $2.6 trillion recorded in 2023. |
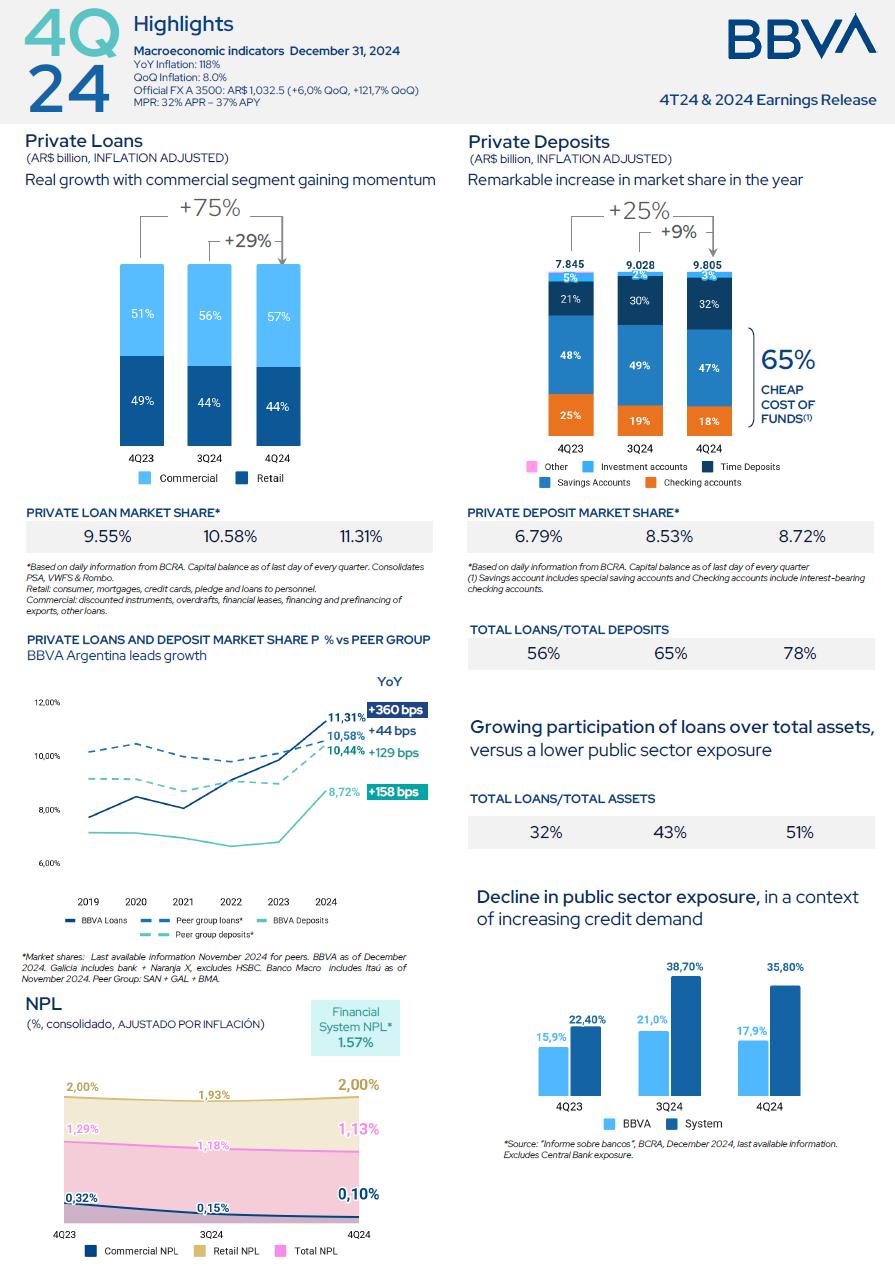
| · | In terms of activity, total consolidated financing to the private sector in 4Q24 totaled $7.6 trillion, increasing 28.7% in real terms compared to 3Q24, and 75.0% compared to 4Q23. In the quarter, the variation was driven by an overall growth in all lines, especially in prefinancing and financing of exports by 81.0%, in credit cards by 25.4% and in discounted instruments by 26.0%. BBVA’s consolidated market share of private sector loans reached 11.31% as of 4Q24, versus 9.85% in 4T23, gaining 146 bps in the year. |
| · | Total consolidated deposits in 4Q24 totaled $9.9 trillion, increasing 7.8% in real terms during the quarter, and 25.3% YoY. Quarterly increase was mainly explained by an increment in time deposits followed by savings accounts, by 14.3% and 3.6% respectively. The Bank’s consolidated market share of private deposits reached 8.72% as of 4Q24 versus 6.79% as of 4Q23, gaining 193 bps in the year. |
| · | As of 4Q24, the non-performing loan ratio (NPL) reached 1.13%, with a 177.0% coverage ratio. |
| · | The accumulated efficiency ratio in 4Q24 was 61.8%, deteriorating compared to 3Q24’s 59.7%, and 4Q23’s 58.6%. |
| · | As of 4Q24, BBVA Argentina reached a regulatory capital ratio of 19.5%, entailing a $1.36 trillion or 138.5% excess over minimum regulatory requirement. Tier I ratio was 19.5%. |
| · | Total
liquid assets represented 54.1% of the Bank’s total deposits as of 4Q24. |
|
|
Message from the CFO
“The significant fiscal and monetary consolidation, together with relative exchange rate stability, have contributed to a process of inflation moderation throughout 2024 in the country. Likewise, after a sharp contraction in the first half of the year, there are clear signs of economic activity recovery, which, after an expected average drop of 1.8% by the EMAE indicator in 2024, would expand around 5.5% in 2025, according to BBVA Research. The prospects for reducing inflation have been improving every month and the forecast is that it will converge to around 30% or even less in 2025. The collapse of country risk is also remarkable, which went from 1,900 bps to less than 700 bps at the end of 2024. On the other hand, one of the main factors of uncertainty is associated with the evolution of the exchange rate and the pace of removal of exchange regulations, since recently the peso has remained more appreciated than expected. The banking system continues to grow at a high rate, driven by inflation control and the reforms introduced by the new government.
As of December 2024, private credit in pesos of the system grew 234% year-on-year, while BBVA Argentina increased its portfolio of private loans in pesos by 263%1. Both the system and BBVA managed to exceed the inflation level in year-on-year growth (which reached 118% YoY in December 2024). With this information, a real monthly growth that began in April 2024 for BBVA Argentina and in May for the system, continues to be observed. The bank's market share of total private loans in consolidated currency, rose 146 bps from 9.85% in December 2023 to 11.31% in December 2024, maintaining a double-digit share. BBVA Argentina, according to the latest data available from the BCRA as of November 2024, rose to 2nd position in the Ranking of local banks of private capital in terms of private loans at a consolidated level. In the last five years, BBVA Argentina has grown its market share by 360 bps, above the growth of the peer group2. This has been done organically, maintaining the bank's commitment to focus on the financial intermediation business.
Regarding total private deposits in currency, the system grew 116% while the Bank grew 177%, exceeding the inflation level in the case of BBVA Argentina. The consolidated market share of total private deposits of BBVA Argentina was 8.72%, 193 bps higher than the 6.79% of the previous year. BBVA Argentina, according to the latest data available from the BCRA as of November 2024, remained in 3rd position in the Ranking of local banks of private capital in terms of private deposits at a consolidated level, compared to December 2023. It is worth mentioning that the growth in deposits was directly impacted by the tax amnesty law announced in June. In the last five years, BBVA Argentina has grown its market share by 158 bps, above the growth of the peer group3.
In an environment of falling interest rates, which has negatively impacted banks’ margins, BBVA Argentina's result in 2024 manages to remain in real terms at levels very similar to that of 2023, which represents an ROE of 12.5%, vs. 13.0% in 2023.
On the other hand, as of December 2024, BBVA Argentina reached an NPL ratio in private loans of 1.13%, below the latest available data from the system (December 2024) of 1.56%, reaffirming that the portfolio quality of the system and the bank are remarkably healthy.
Regarding liquidity and solvency indicators, the Bank closes the year with ratios of 54.1% and 19.5% respectively. The great dynamism of the system's credit activity in recent months, BBVA's market share gains, in addition to the dividend distribution made in the second quarter of the year, lead the entity to end December 2024 with a capital ratio lower than that of December 2023, still far from regulatory minimums.
On an annual level, I would also like to mention the strategic agreement in which BBVA Argentina and Stellantis participated in December 2024, and where BBVA Argentina intends to acquire 50% of FCA Compañía Financiera, an Argentine company 100% owned by Stellantis, which offers financing for retail customers and the dealer network of the Fiat, Jeep and RAM brands in the country. This acquisition is still pending approval by the relevant authorities. This operation reinforces our long-term commitment to Argentina, and allows us to reinforce customer service in financing new cars in a market with great potential and hand in hand with Stellantis, a sector leader.
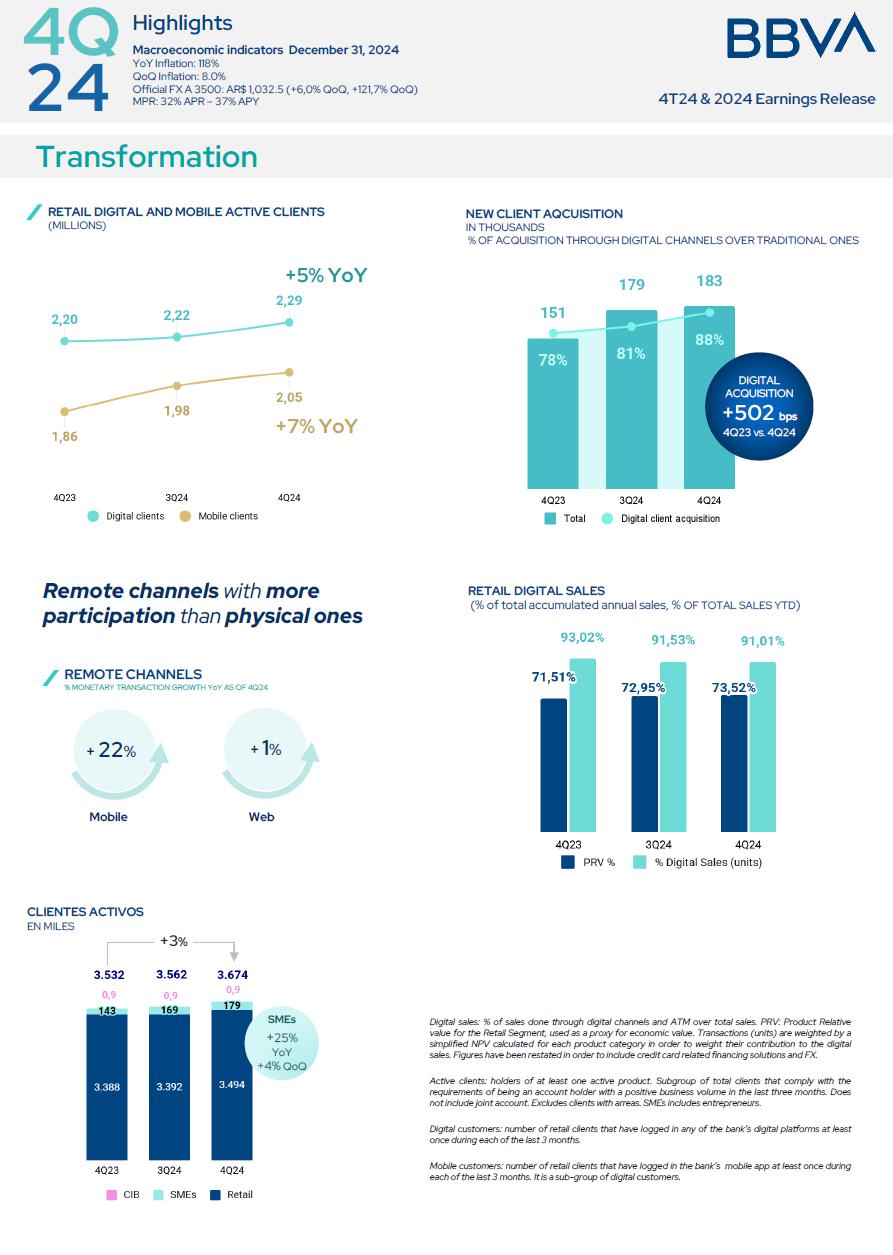
In the year, BBVA Argentina's active clients grew 3%, with a notable growth of SMEs, which grew 25% since 2023. The growth of this type of client supports the Bank's objective of servicing this segment.
Regarding digitization, our service offer has evolved in such a way that at the end of December 2024, mobile monetary transactions grew 22% compared to the same period of the previous year. In the quarter, the acquisition of new clients through digital means over traditional ones was 88%, while in December 2023 it was approximately 78%.
Regarding ESG, BBVA Argentina has a corporate responsibility with society, inherent to the Bank's business model, which promotes inclusion and financial education and supports scientific research and culture. Within the 2024 initiatives, BBVA Argentina certified as sustainable ten pre-financing and financing of exports loan operations to the wine company Grupo Peñaflor for a total of 64.8 million dollars.
1 Source: BCRA capital balances as of the last day of each period. Siscen information as of December 31, 2024.
2 Source: Informe de entidades financieras, BCRA. Last information available November 2024 for peers. BBVA as of December 2024. Galicia bank only Banco Macro includes Itau as of November 2024. Peer Group:SAN + GAL + BMA.
3 Last information available November 2024 for peers. BBVA as of December 2024. Galicia bank only Banco Macro includes Itau as of November 2024. Peer Group:SAN + GAL + BMA.
|
|
Finally, I would like to highlight the evolution of the BBAR stock in the market, both on the New York Stock Exchange and on the Buenos Aires Stock Exchange, in a year where the country took on relevance in the international investment community. Market capitalization grew 147% in 2024, with a 24% increase in earnings per share.
BBVA Argentina continues to actively monitor businesses, financial conditions and operating results, with the aim of maintaining a competitive position to face the challenges of a decisive year for Argentina”
Carmen Morillo Arroyo, CFO at BBVA Argentina
|
|
Safe Harbor Statement
This press release contains certain forward-looking statements that reflect the current views and/or expectations of Banco BBVA Argentina and its management with respect to its performance, business and future events. We use words such as “believe,” “anticipate,” “plan,” “expect,” “intend,” “target,” “estimate,” “project,” “predict,” “forecast,” “guideline,” “seek,” “future,” “should” and other similar expressions to identify forward-looking statements, but they are not the only way we identify such statements. Such statements are subject to a number of risks, uncertainties and assumptions. We caution you that a number of important factors could cause actual results to differ materially from the plans, objectives, expectations, estimates and intentions expressed in this release. Actual results, performance or events may differ materially from those in such statements due to, without limitation, (i) changes in general economic, financial, business, political, legal, social or other conditions in Argentina or elsewhere in Latin America or changes in either developed or emerging markets, (ii) changes in regional, national and international business and economic conditions, including inflation, (iii) changes in interest rates and the cost of deposits, which may, among other things, affect margins, (iv) unanticipated increases in financing or other costs or the inability to obtain additional debt or equity financing on attractive terms, which may limit our ability to fund existing operations and to finance new activities, (v) changes in government regulation, including tax and banking regulations, (vi) changes in the policies of Argentine authorities, (vii) adverse legal or regulatory disputes or proceedings, (viii) competition in banking and financial services, (ix) changes in the financial condition, creditworthiness or solvency of the customers, debtors or counterparties of Banco BBVA Argentina, (x) increase in the allowances for loan losses, (xi) technological changes or an inability to implement new technologies, (xii) changes in consumer spending and saving habits, (xiii) the ability to implement our business strategy and (xiv) fluctuations in the exchange rate of the Peso. The matters discussed herein may also be affected by risks and uncertainties described from time to time in Banco BBVA Argentina’s filings with the U.S. Securities and Exchange Commission (SEC) and Comisión Nacional de Valores (CNV). Readers are cautioned not to place undue reliance on forward-looking statements, which speak only as the date of this document. Banco BBVA Argentina is under no obligation and expressly disclaims any intention or obligation to update or revise any forward-looking statements, whether as a result of new information, future events or otherwise.
Information
This earnings release has been prepared in accordance with the accounting framework established by the Central Bank of Argentina (“BCRA”), based on International Financial Reporting Standards (“I.F.R.S.”) and the resolutions adopted by the International Accounting Standards Board (“I.A.S.B”) and by the Federación Argentina de Consejos Profesionales de Ciencias Económicas (“F.A.C.P.E.”), and with the the exclusion of the application of the IFRS 9 impairment model for non-financial public sector debt instruments.
The information in this press release contains unaudited financial information that consolidates, line item by line item, all of the banking activities of BBVA Argentina, including: BBVA Asset Management Argentina S.A., Consolidar AFJP-undergoing liquidation proceeding, PSA Finance Argentina Compañía Financiera S.A. (“PSA”) and Volkswagen Financial Services Compañía Financiera S.A (“VWFS”).
BBVA Seguros Argentina S.A. is disclosed on a consolidated basis recorded as Investments in associates (reported under the proportional consolidation method), and the corresponding results are reported as “Income from associates”), same as Rombo Compañía Financiera S.A. (“Rombo”), Play Digital S.A. (“MODO”), Openpay Argentina S.A. and Interbanking S.A.
Financial statements of subsidiaries have been elaborated as of the same dates and periods as Banco BBVA Argentina S.A.’s. In the case of consolidated companies PSA and VWFS, financial statements were prepared considering the B.C.R.A. accounting framework for institutions belonging to “Group C”, considering the model established by the IFRS 9 5.5. “Impairment” section for periods starting as of January 1, 2022, excluding debt instruments from the non-financial public sector.
The information
published by the BBVA Group for Argentina is prepared according to IFRS, without considering the temporary exceptions established by
BCRA.
|
|
Quarterly Results
| INCOME STATEMENT | BBVA ARGENTINA CONSOLIDATED | ||||
| In millions of AR$ - Inflation adjusted | ∆ % | ||||
| 4Q24 | 3Q24 | 4Q23 | QoQ | YoY | |
| Net Interest Income | 482,486 | 497,206 | 1,079,488 | (3.0%) | (55.3%) |
| Net Fee Income | 61,973 | 76,849 | 77,518 | (19.4%) | (20.1%) |
| Net income from measurement of financial instruments at fair value through P&L | 38,396 | 31,692 | (151,753) | 21.2% | 125.3% |
| Net income from write-down of assets at amortized cost and at fair value through OCI | 74,954 | 59,787 | 64,291 | 25.4% | 16.6% |
| Foreign exchange and gold gains | 8,114 | 7,196 | 429,980 | 12.8% | (98.1%) |
| Other operating income | 35,784 | 31,522 | 47,250 | 13.5% | (24.3%) |
| Loan loss allowances | (84,150) | (44,567) | (45,070) | (88.8%) | (86.7%) |
| Net operating income | 617,557 | 659,685 | 1,501,704 | (6.4%) | (58.9%) |
| Personnel benefits | (144,953) | (108,830) | (145,288) | (33.2%) | 0.2% |
| Adminsitrative expenses | (140,848) | (133,237) | (111,404) | (5.7%) | (26.4%) |
| Depreciation and amortization | (25,246) | (17,871) | (16,430) | (41.3%) | (53.7%) |
| Other operating expenses | (141,746) | (82,108) | (187,801) | (72.6%) | 24.5% |
| Operarting expenses | (452,793) | (342,046) | (460,923) | (32.4%) | 1.8% |
| Operating income | 164,764 | 317,639 | 1,040,781 | (48.1%) | (84.2%) |
| Income from associates | 808 | 371 | 125 | 117.8% | n.m |
| Income from net monetary position | (154,361) | (184,186) | (774,147) | 16.2% | 80.1% |
| Net income before income tax | 11,211 | 133,824 | 266,759 | (91.6%) | (95.8%) |
| Income tax | 53,472 | (26,648) | (160,888) | 300.7% | 133.2% |
| Net income for the period | 64,683 | 107,176 | 105,871 | (39.6%) | (38.9%) |
| Owners of the parent | 61,152 | 107,674 | 107,170 | (43.2%) | (42.9%) |
| Non-controlling interests | 3,531 | (498) | (1,299) | n.m | 371.8% |
| Other comprehensive Income (OCI) (1) | (26,042) | (78,972) | 442,936 | 67.0% | (105.9%) |
| Total comprehensive income | 38,641 | 28,204 | 548,807 | 37.0% | (93.0%) |
| (1) Net of Income Tax. | |||||
BBVA Argentina 4Q24 net income was $64.7 billion, decreasing 39.6% or $42.5 billion quarter-over-quarter (QoQ) and 38.9% or $41.2 billion year-over-year (YoY). This implied a quarterly ROAE of 9.5% and a quarterly ROAA of 1.7%.
The 48.1% fall in quarterly operating results was explained by a lower operating income and higher operating expenses. The decline in income was mainly due to (i) higher loan loss allowances, (ii) lower net fee income, (iii) lower net interest income as a result of a lower average monetary policy rate4 and (iv) lower interests generated by CPI linked bonds. On the side of expenses, personnel expenses and other operating expenses are higher, the latter due to the devaluation of investment properties.
Net Income for the period was highly impacted by income from net monetary position, although with lower impact than the prior quarter. Inflation on 4Q24 was 8.03%5, lower than 3Q24’s 12.1%. Consequently, the income from net monetary position line recorded a 16.2% lower loss than the previous quarter, having a positive impact in the QoQ net income comparison.
4 Monetary policy rate declined from 40% to 32% QoQ (BCRA)
5 Source: Instituto Nacional de Estadística y Censos (INDEC)
|
|
It should be noted that the income tax line reflects a positive result, derived from a change in accounting exposure that implied a reclassification of the income tax calculation from Other Comprehensive Income (OCI) to the Income Statement.
| OTHER COMPREHENSIVE INCOME | BBVA ARGENTINA CONSOLIDATED | ||||
| In millions of AR$ - Inflation adjusted | ∆ % | ||||
| 4Q24 | 3Q24 | 4Q23 | QoQ | YoY | |
| Net income for the period | 64,683 | 107,176 | 105,871 | (39.6%) | (38.9%) |
| Other comprehensive income components to be reclassified to income/(loss) for the period | |||||
| Profit or losses from financial isntruments at fair value through OCI | (26,038) | (79,301) | 442,979 | 67.2% | (105.9%) |
| Profit or losses from financial instruments at fair value through OCI | 22,508 | (83,152) | 734,383 | 127.1% | (96.9%) |
| Reclassification adjustment for the period | (11,032) | (6,493) | (66,231) | (69.9%) | 83.3% |
| Income tax | (37,514) | 10,344 | (225,173) | (462.7%) | 83.3% |
| Other comprehensive income coponents not to be reclassified to income/(loss) for the period | |||||
| Income or loss on equity instruments at fair value through OCI | (4) | 329 | (43) | (101.2%) | 90.7% |
| Resultado por instrumentos de patrimonio a VR con cambios en ORI | (4) | 329 | (43) | (101.2%) | 90.7% |
| Total Other Comprehensive Income/(loss) for the period | (26,042) | (78,972) | 442,936 | 67.0% | (105.9%) |
| Total Comprehensive Income | 38,641 | 28,204 | 548,807 | 37.0% | (93.0%) |
| Attributable to owners of the Parent | 35,899 | 28,749 | 548,542 | 24.9% | (93.5%) |
| Attributable to non-controlling interests | 2,742 | (545) | 265 | n.m | n.m |
Lastly, Total
OCI in 4Q24 reported a $26.0 billion loss, 67.0% lower than the loss recorded on 3Q24, explained by the results from financial instruments
at FV through OCI, especially due to the maturity and sale of CPI linked bonds. Thus, total comprehensive income for the period in 4Q24
was $38.6 billion.
|
|
Income Statement – 12 month accumulated
| INCOME STATEMENT - 12 MONTH ACCUMULATED | BBVA ARGENTINA CONSOLIDATED | ||
| In millions of AR$ - Inflation adjusted | |||
| 2024 | 2023 | ∆ % | |
| Interest income | 4,696,242 | 6,933,450 | (32.3%) |
| Interest expense | (1,763,175) | (3,386,244) | 47.9% |
| Net interest income | 2,933,067 | 3,547,206 | (17.3%) |
| Fee income | 555,263 | 554,853 | 0.1% |
| Fee expenses | (272,680) | (252,260) | (8.1%) |
| Net fee income | 282,583 | 302,593 | (6.6%) |
| Net income from financial instruments at fair value through P&L | 147,666 | (52,238) | 382.7% |
| Net loss from write-down of assets at amortized cost and fair value through OCI | 241,672 | 88,391 | 173.4% |
| Foreign exchange and gold gains | 54,636 | 457,541 | (88.1%) |
| Other operating income | 142,791 | 146,442 | (2.5%) |
| Loan loss allowances | (217,656) | (166,331) | (30.9%) |
| Net operating income | 3,584,759 | 4,323,604 | (17.1%) |
| Personnel benefits | (515,595) | (540,272) | 4.6% |
| Administrative expenses | (564,278) | (543,242) | (3.9%) |
| Depreciation and amortization | (79,612) | (62,449) | (27.5%) |
| Other operating expenses | (495,273) | (575,556) | 13.9% |
| Operating expenses | (1,654,758) | (1,721,519) | 3.9% |
| Operating income | 1,930,001 | 2,602,085 | (25.8%) |
| Income from associates and joint ventures | 51 | 2,519 | (98.0%) |
| Income from net monetary position | (1,485,576) | (1,946,903) | 23.7% |
| Income before income tax | 444,476 | 657,701 | (32.4%) |
| Income tax | (86,823) | (298,525) | 70.9% |
| Income for the period | 357,653 | 359,176 | (0.4%) |
| Owners of the parent | 353,242 | 358,311 | (1.4%) |
| Non-controlling interests | 4,411 | 865 | 409.9% |
| Other comprehensive Income (OCI) (1) | (330,461) | 430,348 | (176.8%) |
| Total comprehensive income | 27,192 | 789,524 | (96.6%) |
| (1) Net of Income Tax. | |||
In 2024, BBVA Argentina net income was $357.7 billion, 0.4% lower than the $359.2 billion reported in 2023. This implied an accumulated annualized ROAE of 12.5% and a ROAA of 2.5% in 2024, compared to an accumulated annualized ROAE of 13.0% and a ROAA of 2.7% in 2023.
The 25.8% fall in real terms of the Bank’s operating income is mainly explained by (i) a fall in net interest income due to lower accrued average rates in loans, and due to lower inflation which has an impact in CPI-linked bonds, and (ii) lower income from foreign exchange and gold gains, in particular due to the position in Dual bonds by the end of 2023, which increased the position in USD denominated assets by year end. Nonetheless, improvements in operating expenses are observed, especially in personnel expenses and lower expenses due to turnover tax.
|
|
These effects were compensated by better income from financial instruments at FV through P&L, and an improvement in income from write-down of assets at amortized cost and FV through OCI, as a result of the sale, exchange and maturity of bonds, mainly CPI-linked bonds.
In the year, net fee income decreased 6.6%, explained by a 0.1% increase in income and 8.1% increase in expenses. Fees performance is mainly due to (i) a lower income from collecting services and transfers, within an overall decline of the lines that are part of fees linked to liabilities, and (ii) higher expenses in foreign currency. Net fee income is also justified by the active strategy focused on client acquisition. As of December 2024, BBVA Argentina gained more than 142 thousand clients, reaching 3.7 million total active clients, which means a 3.0% growth YoY.
Additional to these factors, the net result is impacted by the income from net monetary position line, in a context of lower inflation (2024 YoY inflation was 117.8% while 2023 YoY inflation was 211,4%), as a consequence of a lower average net monetary position in 2024.
It should be noted that the income tax line reflects a lower loss due to lower operating income results, and is also affected by a change in accounting exposure that implied a reclassification of the income tax calculation from Other Comprehensive Income (OCI) to the Income Statement.
| OTHER COMPREHENSIVE INCOME | BBVA ARGENTINA CONSOLIDATED | ||
| In millions of AR$ - Inflation adjusted | |||
| 2024 | 2023 | ∆ % | |
| Net income for the period | 357,653 | 359,176 | (0.4%) |
| Other comprehensive income components to be reclassified to income/(loss) for the period | |||
| Profit or losses from financial isntruments at fair value through OCI | (330,605) | 427,335 | (177.4%) |
| Profit or losses from financial instruments at fair value through OCI | (381,708) | 724,029 | (152.7%) |
| Reclassification adjustment for the period | (122,608) | (75,818) | (61.7%) |
| Income tax | 173,711 | (220,876) | 178.6% |
| Other comprehensive income coponents not to be reclassified to income/(loss) for the period | - | - | |
| Income or loss on equity instruments at fair value through OCI | 144 | 3,013 | (95.2%) |
| Resultado por instrumentos de patrimonio a VR con cambios en ORI | 144 | 3,013 | (95.2%) |
| Total Other Comprehensive Income/(loss) for the period | (330,461) | 430,348 | (176.8%) |
| Total Comprehensive Income | 27,192 | 789,524 | (96.6%) |
| Attributable to owners of the Parent | 24,252 | 787,188 | (96.9%) |
| Attributable to non-controlling interests | 2,940 | 2,336 | 25.9% |
Total OCI in 2024 totaled a $330.5 billion loss, mainly impacted by the loss of financial instruments at FV through OCI, especially due to the position of CPI-linked bonds by December 2023 which either reach maturity or are sold during the year. Thus, the total comprehensive income for 2024 totaled $27.2 billion.
|
|
| EARNINGS PER SHARE | BBVA ARGENTINA CONSOLIDATED | ||||
| ∆ % | |||||
| 4Q24 | 3Q24 | 4Q23 | QoQ | YoY | |
| Financial Statement information | |||||
| Net income for the period attributable to owners of the parent (in AR$ millions, inflation adjusted) | 61,152 | 99,673 | 49,214 | (38.6%) | 24.3% |
| Total shares outstanding (1) | 613 | 613 | 613 | - | - |
| Market information | |||||
| Closing price of ordinary share at BYMA (in AR$) | 7,560.0 | 4,270.0 | 1,775.3 | 77.0% | 325.8% |
| Closing price of ADS at NYSE (in USD) | 19.1 | 10.4 | 5.4 | 83.8% | 250.4% |
| Book value per share (in AR$) | 4,277.61 | 3,901.35 | 2,324.33 | 9.6% | 84.0% |
| Price-to-book ratio (BYMA price) (%) | 176.73 | 109.45 | 76.38 | 61.5% | 131.4% |
| Earnings per share (in AR$) | 99,806 | 162,676 | 80,322 | (38.6%) | 24.3% |
| Earnings per ADS(2) (in AR$) | 299,417 | 488,027 | 240,966 | (38.6%) | 24.3% |
| Market Cap (USD millions) | 3,893 | 2,118 | 1,111 | 12.1% | 146.9% |
| (1) In thousands of shares. | |||||
| (2) Each ADS accounts for 3 ordinary shares | |||||
| Book value, Equity and Results not adjusted by inflation | |||||
|
|
Net Interest Income
| NET INTEREST INCOME | BBVA ARGENTINA CONSOLIDATED | ||||
| In millions of AR$ - Inflation adjusted | ∆ % | ||||
| 4Q24 | 3Q24 | 4Q23 | QoQ | YoY | |
| Net Interest Income | 482,486 | 497,206 | 1,079,488 | (3.0%) | (55.3%) |
| Interest Income | 862,656 | 821,194 | 1,915,523 | 5.0% | (55.0%) |
| From government securities | 178,385 | 207,108 | 461,668 | (13.9%) | (61.4%) |
| From private securities | 688 | 542 | 2,027 | 26.9% | (66.1%) |
| Interest from loans and other financing | 528,508 | 420,050 | 730,783 | 25.8% | (27.7%) |
| Financial Sector | 4,961 | 3,890 | 5,817 | 27.5% | (14.7%) |
| Overdrafts | 67,656 | 57,983 | 92,808 | 16.7% | (27.1%) |
| Discounted Instruments | 142,269 | 114,419 | 264,126 | 24.3% | (46.1%) |
| Mortgage loans | 4,179 | 3,823 | 2,368 | 9.3% | 76.5% |
| Pledge loans | 20,203 | 16,407 | 20,087 | 23.1% | 0.6% |
| Consumer Loans | 104,147 | 80,497 | 73,792 | 29.4% | 41.1% |
| Credit Cards | 100,923 | 86,878 | 164,013 | 16.2% | (38.5%) |
| Financial leases | 3,041 | 2,761 | 5,414 | 10.1% | (43.8%) |
| Loans for the prefinancing and financing of exports | 7,340 | 4,501 | 2,355 | 63.1% | 211.7% |
| Other loans | 73,789 | 48,891 | 100,003 | 50.9% | (26.2%) |
| Premiums on reverse REPO transactions | 735 | 9,444 | 349,647 | (92.2%) | (99.8%) |
| CER/UVA clause adjustment | 152,061 | 181,708 | 369,898 | (16.3%) | (58.9%) |
| Other interest income | 2,279 | 2,342 | 1,500 | (2.7%) | 51.9% |
| Interest expenses | 380,170 | 323,988 | 836,035 | 17.3% | (54.5%) |
| Deposits | 342,296 | 291,471 | 796,698 | 17.4% | (57.0%) |
| Checking accounts* | 71,124 | 58,584 | 196,391 | 21.4% | (63.8%) |
| Savings accounts | 2,284 | 2,716 | 5,405 | (15.9%) | (57.7%) |
| Time deposits | 252,539 | 199,405 | 483,462 | 26.6% | (47.8%) |
| Investment accounts | 16,349 | 30,766 | 111,440 | (46.9%) | (85.3%) |
| Other liabilities from financial transactions | 885 | 2,429 | 7,865 | (63.6%) | (88.7%) |
| Interfinancial loans received | 16,384 | 10,473 | 13,878 | 56.4% | 18.1% |
| Premiums on REPO transactions | 381 | 393 | 4 | (3.1%) | n.m |
| Guaranteed securities loans | 9,575 | 2,325 | - | 311.8% | N/A |
| CER/UVA clause adjustment | 10,648 | 16,896 | 17,588 | (37.0%) | (39.5%) |
| Other interest expense | 1 | 1 | 2 | - | (50.0%) |
| *Includes interest-bearing checking accounts | |||||
Net interest income in 4Q24 was $482.5 billion, falling 3.0% or $14.7 billion QoQ, and 55.3% or $597.0 billion YoY. In 4Q24, interest income increased less than interest expenses in monetary terms. The former increased due to a higher income from loans. Expenses increased due to higher time deposit expenses and interest-bearing checking account expenses.
In 4Q24, interest income totaled $862.6 billion, growing 5.0% compared to 3Q24 and falling 55.0% compared to 4Q23. Quarterly increase is mainly driven by higher interests from loans, offset by (i) lower income from CPI-linked bonds, in a context of lower quarterly inflation, and (ii) lower income from public securities, mainly LECAP.
Income from government securities fell 13.9% compared to 3Q24, and 61.4% compared to 4Q23. This is partially due to the rollover of the LECAP portfolio, with lower interest accrual due to lower market interest rates. 91% of these results correspond to government securities at fair value through OCI and 9% correspond to securities at amortized cost (2027 National Treasury Bonds at fixed rate, National Treasury Bonds Private 0.70 Badlar Rate maturing on November 2027, and National Treasury Bonds CER 2025, used for reserve requirement integration).
|
|
Interest income from loans and other financing totaled $528.5 billion, increasing 25.8% QoQ and falling 27.7% YoY. Quarterly increase is mainly due to growth in the credit portfolio, in line with an increase in market share. Interest from loans with the greatest increase were discounted instruments, other loans, consumer loans and credit cards.
Income from CER/UVA adjustments decreased 16.3% QoQ and 58.9% YoY. Quarterly decrease is explained by the delay with which the inflation adjustment effects are recorded, and impact on the subsequent financial statements, with a quarterly inflation below the previous quarter. 82% of income from interests from CER/UVA clause adjustments is explained by interests generated by CPI linked bonds.
Interest expenses totaled $380.2 billion, denoting an increase of 17.3% QoQ and falling 54.5% YoY. Quarterly increase is described by higher time deposit expenses, followed by higher expenses in interest-bearing accounts.
Interests from time deposits (including investment accounts, excluding CER/UVA adjustments from time deposits) explain 66.4% of interest expenses, versus 71.0% the previous quarter. Time deposit expenses increased 26.6% QoQ and fall 47.8% YoY.
NIM
As of 4Q24, net interest margin (NIM) was 20.0%, below the 24.5% reported in 3Q24. In 4Q24, NIM in pesos was 22.1% and 4.1% in U.S. dollars.
In 2024, total NIM was 35.0% versus 37.3% in 2023, recording a 234 bps fall. This happened in a context of an aggressive fall in interest rates (starting 2024 with a monetary policy rate of 100% and ending in 32%). However, given that the average maturity of interest-earning assets is longer than deposits, price adjustments for expenses is faster than for income, mitigating the fall in the NIM. Additionally, USD denominated deposits had a high relative growth, diluting the expenses generated by total deposits.
Sustained credit growth in real terms since April 2024, allowed the Bank to take a more defensive stance to protect the margin from successive decreases in interest rates during the year, with longer term fixed-rate credits.
Securities portfolio management is to be noted, as the Bank has converted part of its floating-rate securities into securities of longer maturities at fixed rate, in a context of declining rates, mitigating effects on NIM.
|
|
| ASSETS & LIABILITIES PERFORMANCE - TOTAL | BBVA ARGENTINA CONSOLIDATED | ||||||||
| In millions of AR$. Rates and spreads in annualized % | |||||||||
| 4Q24 | 3Q24 | 4Q23 | |||||||
| Average Balance | Interest Earned/Paid | Average Real Rate | Average Balance | Interest Earned/Paid | Average Real Rate | Average Balance | Interest Earned/Paid | Average Real Rate | |
| Total interest-earning assets | 9,577,667 | 862,656 | 35.7% | 8,066,128 | 821,183 | 40.4% | 8,563,881 | 1,915,523 | 88.7% |
| Debt securities | 2,946,450 | 305,046 | 41.1% | 3,086,609 | 369,191 | 47.5% | 4,045,054 | 1,107,836 | 108.7% |
| Loans to customers/financial institutions | 6,565,706 | 557,597 | 33.7% | 4,954,127 | 451,984 | 36.2% | 4,228,351 | 807,674 | 75.8% |
| Loans to the BCRA | 625 | 3 | 1.9% | 309 | 8 | 10.3% | 448 | 9 | 8.0% |
| Other assets | 64,886 | 10 | 0.1% | 25,083 | - | 0.0% | 290,028 | 4 | 0.0% |
| Total non interest-earning assets | 4,871,596 | - | 0.0% | 3,572,310 | 11 | 0.0% | 2,913,322 | - | 0.0% |
| Total Assets | 14,449,263 | 862,656 | 23.7% | 11,638,438 | 821,194 | 28.0% | 11,477,203 | 1,915,523 | 66.2% |
| Total interest-bearing liabilities | 8,117,701 | 380,170 | 18.6% | 5,931,651 | 323,988 | 21.7% | 5,202,112 | 836,035 | 63.8% |
| Savings accounts | 3,771,625 | 2,284 | 0.2% | 2,477,748 | 2,716 | 0.4% | 2,046,022 | 5,405 | 1.0% |
| Time deposits and investment accounts | 3,050,465 | 279,536 | 36.4% | 2,545,914 | 247,065 | 38.5% | 2,203,361 | 612,489 | 110.3% |
| Debt securities issued | 52,506 | 4,673 | 35.3% | 13,528 | 1,570 | 46.0% | 22,994 | 7,404 | 127.7% |
| Other liabilities | 1,243,105 | 93,677 | 29.9% | 894,461 | 72,637 | 32.2% | 929,735 | 210,737 | 89.9% |
| Total non-interest-bearing liabilities | 6,331,562 | - | 0.0% | 5,706,787 | - | 0.0% | 6,275,091 | - | 0.0% |
| Total liabilities and equity | 14,449,263 | 380,170 | 10.4% | 11,638,438 | 323,988 | 11.0% | 11,477,203 | 836,035 | 28.9% |
| NIM - Total | 20.0% | 24.5% | 50.0% | ||||||
| Spread - Total | 17.2% | 18.7% | 25.0% | ||||||
| Nominal rates are calculated over a 365-day year | |||||||||
| Does not include Net income from measurement of financial instruments at fair value through P&L nor Net income from write-down of assets at amortized cost and at fair value through OCI | |||||||||
| Interest-bearing checking accounts included in other interest-bearing liabilities. Non interest-bearing accounts are included in non-interest-bearing liabilities. | |||||||||
| ASSETS & LIABILITIES PERFORMANCE - AR$ | BBVA ARGENTINA CONSOLIDATED | ||||||||
| In millions of AR$. Rates and spreads in annualized % | |||||||||
| 4Q24 | 3Q24 | 4Q23 | |||||||
| Average Balance | Interest Earned/Paid | Average Real Rate | Average Balance | Interest Earned/Paid | Average Real Rate | Average Balance | Interest Earned/Paid | Average Real Rate | |
| Total interest-earning assets | 8,463,802 | 849,597 | 39.8% | 7,359,637 | 814,244 | 43.9% | 7,750,027 | 1,912,052 | 97.9% |
| Debt securities | 2,867,771 | 304,572 | 42.1% | 3,003,415 | 368,843 | 48.7% | 3,534,880 | 1,107,679 | 124.3% |
| Loans to customers/financial institutions | 5,530,552 | 545,022 | 39.1% | 4,330,863 | 445,404 | 40.8% | 3,934,923 | 804,364 | 81.1% |
| Loans to the BCRA | 623 | 3 | 1.9% | 307 | 8 | 10.3% | 446 | 9 | 8.0% |
| Other assets | 64,856 | - | 0.0% | 25,052 | (11) | -0.2% | 279,778 | - | 0.0% |
| Total non interest-earning assets | 2,215,124 | - | 0.0% | 1,800,491 | 11 | 0.0% | 1,489,764 | - | 0.0% |
| Total Assets | 10,678,926 | 849,597 | 31.6% | 9,160,128 | 814,255 | 35.3% | 9,239,791 | 1,912,052 | 82.1% |
| Total interest-bearing liabilities | 5,061,629 | 378,629 | 29.7% | 4,208,902 | 323,003 | 30.4% | 4,041,580 | 835,631 | 82.0% |
| Savings accounts | 992,467 | 2,245 | 0.9% | 963,519 | 2,686 | 1.1% | 1,050,786 | 5,385 | 2.0% |
| Time deposits and Investment accounts | 2,821,932 | 278,990 | 39.2% | 2,362,879 | 246,704 | 41.4% | 2,044,330 | 612,419 | 118.9% |
| Debt securities issued | 52,506 | 4,673 | 35.3% | 13,528 | 1,570 | 46.0% | 22,994 | 7,404 | 127.7% |
| Other liabilities | 1,194,724 | 92,721 | 30.8% | 868,976 | 72,043 | 32.9% | 923,470 | 210,423 | 90.4% |
| Total non-interest-bearing liabilities | 5,596,308 | - | 0.0% | 4,928,938 | - | 0.0% | 5,563,921 | - | 0.0% |
| Total liabilities and equity | 10,657,937 | 378,629 | 14.1% | 9,137,840 | 323,003 | 14.0% | 9,605,501 | 835,631 | 34.5% |
| NIM - AR$ | 22.1% | 26.5% | 55.1% | ||||||
| Spread - AR$ | 10.1% | 13.4% | 15.9% | ||||||
| Nominal rates are calculated over a 365-day year | |||||||||
| Does not include Net income from measurement of financial instruments at fair value through P&L nor Net income from write-down of assets at amortized cost and at fair value through OCI | |||||||||
| Interest-bearing checking accounts included in other interest-bearing liabilities. Non interest-bearing accounts are included in non-interest-bearing liabilities. | |||||||||
|
|
| ASSETS & LIABILITIES PERFORMANCE - FOREIGN CURRENCY | BBVA ARGENTINA CONSOLIDATED | ||||||||
| In millions of AR$. Rates and spreads in annualized % | |||||||||
| 4Q24 | 3Q24 | 4Q23 | |||||||
| Average Balance | Interest Earned/Paid | Average Real Rate | Average Balance | Interest Earned/Paid | Average Real Rate | Average Balance | Interest Earned/Paid | Average Real Rate | |
| Total interest-earning assets | 1,113,865 | 13,059 | 4.7% | 706,491 | 6,939 | 3.9% | 813,854 | 3,471 | 1.7% |
| Debt securities | 78,679 | 474 | 2.4% | 83,194 | 348 | 1.7% | 510,174 | 157 | 0.1% |
| Loans to customers/financial institutions | 1,035,154 | 12,575 | 4.8% | 623,264 | 6,580 | 4.2% | 293,428 | 3,310 | 4.5% |
| Loans to the BCRA | 2 | - | 0.0% | 2 | - | 0.0% | 2 | - | 0.0% |
| Other assets | 30 | 10 | 132.2% | 31 | 11 | 140.8% | 10,250 | 4 | 0.2% |
| Total non interest-earning assets | 2,656,472 | - | 0.0% | 1,771,819 | - | 0.0% | 1,423,558 | - | 0.0% |
| Total Assets | 3,770,337 | 13,059 | 1.4% | 2,478,310 | 6,939 | 1.1% | 2,237,412 | 3,471 | 0.6% |
| Total interest-bearing liabilities | 3,056,072 | 1,541 | 0.2% | 1,722,749 | 985 | 0.2% | 1,160,532 | 404 | 0.1% |
| Savings accounts | 2,779,158 | 39 | 0.0% | 1,514,229 | 30 | 0.0% | 995,236 | 20 | 0.0% |
| Time deposits and Investment accounts | 228,533 | 546 | 0.9% | 183,035 | 361 | 0.8% | 159,031 | 70 | 0.2% |
| Other liabilities | 48,381 | 956 | 7.8% | 25,485 | 594 | 9.2% | 6,265 | 314 | 19.9% |
| Total non-interest-bearing liabilities | 735,254 | - | 0.0% | 777,849 | - | 0.0% | 711,170 | - | 0.0% |
| Total liabilities and equity | 3,791,326 | 1,541 | 0.2% | 2,500,598 | 985 | 0.2% | 1,871,702 | 404 | 0.1% |
| NIM - Foreign currency | 4.1% | 3.3% | 1.5% | ||||||
| Spread - Foreign currency | 4.5% | 3.7% | 1.6% | ||||||
| Nominal rates are calculated over a 365-day year | |||||||||
| Does not include Net income from measurement of financial instruments at fair value through P&L nor Net income from write-down of assets at amortized cost and at fair value through OCI | |||||||||
| Interest-bearing checking accounts included in other interest-bearing liabilities. Non interest-bearing accounts are included in non-interest-bearing liabilities. | |||||||||
| ASSETS & LIABILITIES PERFORMANCE - TOTAL | BBVA ARGENTINA CONSOLIDATED | |||||
| In millions of AR$. Rates and spreads in annualized % | ||||||
| 2024 | 2023 | |||||
| Average Balance | Interest Earned/Paid | Average Real Rate | Average Balance | Interest Earned/Paid | Average Real Rate | |
| Total interest-earning assets | 8,366,219 | 4,696,231 | 56.0% | 9,509,155 | 6,933,450 | 72.9% |
| Debt securities | 3,604,334 | 2,474,951 | 68.5% | 4,818,917 | 4,179,189 | 86.7% |
| Loans to customers/financial institutions | 4,729,161 | 2,221,212 | 46.8% | 4,486,525 | 2,754,141 | 61.4% |
| Loans to the BCRA | 339 | 23 | 6.8% | 207 | 96 | 46.3% |
| Other assets | 32,385 | 45 | 0.1% | 203,507 | 24 | 0.0% |
| Total non interest-earning assets | 3,738,868 | 11 | 0.0% | 3,063,818 | - | 0.0% |
| Total Assets | 12,105,087 | 4,696,242 | 38.7% | 12,572,973 | 6,933,450 | 55.1% |
| Total interest-bearing liabilities | 6,123,426 | 1,763,175 | 28.7% | 6,293,629 | 3,386,244 | 53.8% |
| Savings accounts | 2,618,662 | 18,335 | 0.7% | 2,229,394 | 15,585 | 0.7% |
| Time deposits and investment accounts | 2,305,214 | 1,192,707 | 51.6% | 3,094,268 | 2,626,993 | 84.9% |
| Debt securities issued | 23,703 | 12,875 | 54.2% | 5,810 | 7,813 | 134.5% |
| Other liabilities | 1,175,847 | 539,258 | 45.7% | 964,157 | 735,852 | 76.3% |
| Total non-interest-bearing liabilities | 5,981,661 | - | 0.0% | 6,279,344 | - | 0.0% |
| Total liabilities and equity | 12,105,087 | 1,763,175 | 14.5% | 12,572,973 | 3,386,244 | 26.9% |
| NIM - Total | 35.0% | 37.3% | ||||
| Spread - Total | 27.3% | 19.1% | ||||
| Nominal rates are calculated over a 365-day year | ||||||
| Does not include Net income from measurement of financial instruments at fair value through P&L nor Net income from write-down of assets at amortized cost and at fair value through OCI | ||||||
| Interest-bearing checking accounts included in other interest-bearing liabilities. Non interest-bearing accounts are included in non-interest-bearing liabilities. | ||||||
|
|
Net Fee Income
| NET FEE INCOME | BBVA ARGENTINA CONSOLIDATED | ||||
| In millions of AR$ - Inflation adjusted | ∆ % | ||||
| 4Q24 | 3Q24 | 4Q23 | QoQ | YoY | |
| Net Fee Income | 61,973 | 76,849 | 77,518 | (19.4%) | (20.1%) |
| Fee Income | 137,857 | 143,971 | 154,064 | (4.2%) | (10.5%) |
| Linked to liabilities | 45,213 | 39,231 | 38,790 | 15.2% | 16.6% |
| From credit cards (1) | 59,785 | 73,233 | 80,768 | (18.4%) | (26.0%) |
| Linked to loans | 16,017 | 14,479 | 16,999 | 10.6% | (5.8%) |
| From insurance | 4,961 | 5,168 | 4,854 | (4.0%) | 2.2% |
| From foreign trade and foreign currency transactions | 6,183 | 6,130 | 6,014 | 0.9% | 2.8% |
| Other fee income | 264 | 307 | 284 | (14.0%) | (7.0%) |
| Linked to loan commitments | 67 | 179 | 71 | (62.6%) | (5.6%) |
| From guarantees granted | 5,367 | 5,244 | 6,284 | 2.3% | (14.6%) |
| Linked to securities | 5,434 | 5,423 | 6,355 | 0.2% | (14.5%) |
| Fee expenses | 75,884 | 67,122 | 76,546 | 13.1% | (0.9%) |
| (1) Includes results from Puntos BBVA royalty program pursuant to IFRS 15 regulation. | |||||
Net fee income as of 4Q24 totaled $62.0 billion, decreasing 19.4% or $14.9 billion QoQ and 20.1% or $15.5 billion YoY. The decrease is explained by a decrease in income and an increase in expenses in monetary and percentage terms.
In 4Q24, fee income totaled $137.9 billion, falling 4.2% QoQ and 10.5% YoY. Lower income is mainly explained by lower credit card fees, considering a higher use of the Millas BBVA loyalty program on the side of clients, slightly offset by a better income of fees linked to liabilities, mainly due to maintenance of accounts and bundles.
On the side of fee expenses, these totaled $75.9 billion, increasing 13.1% QoQ and falling 0.9% YoY. This is explained by higher expenses on processing fees and promotions on debit and credit cards.
Net Income from Measurement of Financial Instruments at Fair Value and Foreign Exchange and Gold Gains/Losses
| NET INCOME FROM FINANCIAL INSTRUMENTS AT FAIR VALUE (FV) THROUGH P&L | BBVA ARGENTINA CONSOLIDATED | ||||
| In millions of AR$ - Inflation adjusted | ∆ % | ||||
| 4Q24 | 3Q24 | 4Q23 | QoQ | YoY | |
| Net Income from financial instruments at FV through P&L | 38,396 | 31,692 | (151,753) | 21.2% | 125.3% |
| Income from government securities | 33,835 | 32,157 | (196,413) | 5.2% | 117.2% |
| Income from private securities | 4,322 | 81 | 1,846 | n.m | 134.1% |
| Interest rate swaps | 388 | 175 | (5) | 121.7% | n.m |
| Income from foreign currency forward transactions | (227) | (1,861) | 42,624 | 87.8% | (100.5%) |
| Income from put option long position | - | 726 | (604) | (100.0%) | 100.0% |
| Income from corporate bonds | 78 | 414 | 800 | (81.2%) | (90.3%) |
| Other | - | - | (1) | N/A | 100.0% |
In 4Q24, net income from financial instruments at fair value (FV) through P&L was $38.4 billion, increasing 21.2% or $6.7 billion QoQ and increasing 125.3% or $190.1 billion YoY.
|
|
Quarterly results are mainly explained by an increase in the income from private securities line item, followed by income from government securities, and a lower loss from foreign currency forward transactions.
| DIFFERENCES IN QUOTED PRICES OF GOLD AND FOREIGN FOREIGN CURRENCY | BBVA ARGENTINA CONSOLIDATED | ||||
| In millions of AR$ - Inflation adjusted | ∆ % | ||||
| 4Q24 | 3Q24 | 4Q23 | QoQ | YoY | |
| Foreign exchange and gold gains/(losses) (1) | 8,114 | 7,196 | 429,980 | 12.8% | (98.1%) |
| From foreign exchange position | (9,718) | (10,357) | 406,461 | 6.2% | (102.4%) |
| Income from purchase-sale of foreign currency | 17,832 | 17,553 | 23,519 | 1.6% | (24.2%) |
| Net income from financial instruments at FV through P&L (2) | (227) | (1,861) | 42,624 | 87.8% | (100.5%) |
| Income from foreign currency forward transactions | (227) | (1,861) | 42,624 | 87.8% | (100.5%) |
| Total differences in quoted prices of gold & foreign currency (1) + (2) | 7,887 | 5,335 | 472,604 | 47.8% | (98.3%) |
In 4Q24, the total differences in quoted prices of gold and foreign currency showed profit for $7.9 billion, increasing 47.8% or $2.6 billion compared to 3Q24.
The quarterly increase in foreign exchange and gold gains is explained by a lower loss in the income from foreign currency forward transactions line.
Other Operating Income
| OTHER OPERATING INCOME | BBVA ARGENTINA CONSOLIDATED | ||||
| In millions of AR$ - Inflation adjusted | ∆ % | ||||
| 4Q24 | 3Q24 | 4Q23 | QoQ | YoY | |
| Operating Income | 35,784 | 31,522 | 47,250 | 13.5% | (24.3%) |
| Rental of safe deposit boxes (1) | 6,380 | 6,505 | 4,446 | (1.9%) | 43.5% |
| Adjustments and interest on miscellaneous receivables (1) | 8,360 | 7,136 | 20,095 | 17.2% | (58.4%) |
| Punitive interest (1) | 2,173 | 1,923 | 1,492 | 13.0% | 45.6% |
| Loans recovered | 2,853 | 3,151 | 4,999 | (9.5%) | (42.9%) |
| Results from the sale of non-current assets held for sale | (205) | 205 | - | (200.0%) | N/A |
| Fee income from credit and debit cards (1) | 4,204 | 2,998 | 2,579 | 40.2% | 63.0% |
| Fee expenses recovery | 1,331 | 1,126 | 1,348 | 18.2% | (1.3%) |
| Rents | 1,494 | 1,198 | 1,179 | 24.7% | 26.7% |
| Sindicated transaction fees | 392 | 385 | 484 | 1.8% | (19.0%) |
| Disaffected provisions | 755 | 1,471 | 1,159 | (48.7%) | (34.9%) |
| Other Operating Income(2) | 8,047 | 5,424 | 9,469 | 48.4% | (15.0%) |
| (1) Included in the efficiency ratio calculation | |||||
| (2) Includes some of the concepts used in the efficiency ratio calculation | |||||
In 4Q24 other operating income
totaled $35.8 billion, increasing 13.5% or $4.3 billion QoQ, and falling 24.3% or $11.5 billion YoY. Quarterly increase is mostly explained
by a 48.4% increase in other operating income, and a 17.2% increase in the Adjustments and interest on miscellaneous receivables
line item, especially due to the credit card business guarantee fund, which is valuated in foreign currency. Growth is also observed in
the fee income from credit and debit cards line. The last two mentioned are linked to higher consumption abroad, and responds to a seasonal
factor, and macroeconomic and FX rate context.
|
|
Operating Expenses
Personnel Benefits and Administrative Expenses
| PERSONNEL BENEFITS & ADMINISTRATIVE EXPENSES | BBVA ARGENTINA CONSOLIDATED | ||||
| In millions of AR$ - Inflation adjusted | ∆ % | ||||
| 4Q24 | 3Q24 | 4Q23 | QoQ | YoY | |
| Total Personnel Benefits and Adminsitrative Expenses | 285,801 | 242,067 | 256,692 | 18.1% | 11.3% |
| Personnel Benefits (1) | 144,953 | 108,830 | 145,288 | 33.2% | (0.2%) |
| Administrative expenses (1) | 140,848 | 133,237 | 111,404 | 5.7% | 26.4% |
| Travel expenses | 1,141 | 974 | 821 | 17.1% | 39.0% |
| Outsourced administrative expenses | 22,284 | 26,603 | 14,605 | (16.2%) | 52.6% |
| Security services | 4,907 | 3,693 | 2,984 | 32.9% | 64.4% |
| Fees to Bank Directors and Supervisory Committee | 242 | 151 | 286 | 60.3% | (15.4%) |
| Other fees | 5,114 | 3,693 | 3,006 | 38.5% | 70.1% |
| Insurance | 972 | 1,411 | 1,125 | (31.1%) | (13.6%) |
| Rent | 16,517 | 11,387 | 10,346 | 45.1% | 59.6% |
| Stationery and supplies | 72 | 213 | 231 | (66.2%) | (68.8%) |
| Electricity and communications | 4,938 | 5,190 | 4,902 | (4.9%) | 0.7% |
| Advertising | 7,083 | 7,944 | 6,532 | (10.8%) | 8.4% |
| Taxes | 27,813 | 27,716 | 31,551 | 0.3% | (11.8%) |
| Maintenance costs | 13,534 | 11,619 | 12,223 | 16.5% | 10.7% |
| Armored transportation services | 13,378 | 12,441 | 11,604 | 7.5% | 15.3% |
| Software | 7,452 | 5,833 | (2,214) | 27.8% | 436.6% |
| Document distribution | 5,776 | 5,380 | 3,644 | 7.4% | 58.5% |
| Commercial reports | 3,366 | 3,005 | 2,057 | 12.0% | 63.6% |
| Other administrative expenses | 6,259 | 5,984 | 7,701 | 4.6% | (18.7%) |
| Headcount* | |||||
| BBVA (Bank) | 6,200 | 6,188 | 5,918 | 12 | 282 |
| Subsidiaries (2) | 89 | 90 | 91 | (1) | (2) |
| Total employees* | 6,289 | 6,278 | 6,009 | 11 | 280 |
| In branches** | 2,236 | 2,265 | 2,214 | (29) | 22 |
| At Main office | 4,053 | 4,013 | 3,795 | 40 | 258 |
| Total branches*** | 235 | 239 | 243 | (4) | (8) |
| Own | 118 | 111 | 112 | 7 | 6 |
| Rented | 117 | 128 | 131 | (11) | (14) |
| - | |||||
| Efficiency Ratio | |||||
| Efficiency ratio | 68.6% | 59.2% | 46.4% | 394 pbs | (2.318)pbs |
| Accumulated Efficiency Ratio | 61.8% | 59.7% | 58.6% | 216 pbs | 326 pbs |
| (1) Concept included in the efficiency ratio calculation | |||||
| (2) Includes BBVA Asset Management, PSA & VWFS. Employees included in Main Office. | |||||
| *Total effective employees, net of temporary contract employees. Expatriates excluded. | |||||
| **Branch employees + Business Center managers | |||||
| ***Excludes administrative branches | |||||
|
|
During 4Q24, personnel benefits and administrative expenses totaled $285.8 billion, increasing 18.1% or $43.7 billion compared to 3Q24, and 11.3% or $29.1 billion compared to 4Q23 in real terms.
Personnel benefits increased 33.2% QoQ, and fell 0.2% YoY. In spite of wages increasing in line with inflation, provisions recorded for the “Bankers’ day” benefit, stock of vacation days and variable remuneration, were adjusted.
As of 4Q24, administrative expenses increased 5.7% QoQ, and 26.4% YoY. This is mainly explained by (i) rent, (ii) maintenance costs, and (iii) software. Rent and software are related to expenses of software licenses and services contracted with the Parent company. These expenses were offset by a fall in the line of outsourced administrative expenses, considering a lower utilization of these services.
The quarterly efficiency ratio as of 4Q24 was 68.6 %, above the 59.2% reported in 3Q24, and the 46.4% reported in 4Q23. Increase in the ratio is explained by the numerator (expenses) increasing, while the denominator (income considering monetary position results) fell, especially due to a decrease in net fee income.
The accumulated efficiency ratio as of 4Q24 was 61.8%, above the 59.7% reported in 3Q24, and the 58.6% reported in 4Q23. The increase in this ratio is due to a decrease in income, both fee and interest income.
Other Operating Expenses
| OTHER OPERATING EXPENSES | BBVA ARGENTINA CONSOLIDATED | ||||
| In millions of AR$ - Inflation adjusted | ∆ % | ||||
| 4Q24 | 3Q24 | 4Q23 | QoQ | YoY | |
| Other Operating Expenses | 141,746 | 82,108 | 187,801 | 72.6% | (24.5%) |
| Turnover tax (1) | 64,548 | 55,526 | 131,579 | 16.2% | (50.9%) |
| Initial loss of loans below market rate (1) | 12,629 | 6,166 | 11,207 | 104.8% | 12.7% |
| Contribution to the Deposit Guarantee Fund (SEDESA) (1) | 3,366 | 2,712 | 2,785 | 24.1% | 20.9% |
| Interest on liabilities from financial lease | 965 | 1,078 | 1,043 | (10.5%) | (7.5%) |
| Other allowances | 12,068 | 6,007 | 25,486 | 100.9% | (52.6%) |
| Loss for sale or devaluation of investment properties and other non-financial assets | 37,588 | - | 519 | N/A | n.m |
| Claims | 1,084 | 1,497 | 1,316 | (27.6%) | (17.6%) |
| Other operating expenses (2) | 9,498 | 9,122 | 13,866 | 4.1% | (31.5%) |
| (1) Concept included for the calculation of the efficiency ratio | |||||
| (2) Considers some concepts included for the acalculation of the efficiency ratio | |||||
In 4Q24, other operating expenses totaled $141.7 billion, increasing 72.6% or $59.6 billion QoQ, and falling 24.5% or $46.0 billion YoY.
A loss was recorded in the loss for sale or devaluation of investment properties and other non-financial assets. This is followed by an increase in turnover tax, mainly due to financial income related to credit growth.
Other allowances increased 100.9%,
due to the increase in credit card limits, in particular from campaigns oriented to the premium client segments.
|
|
Income from Associates
This line reflects the results from non-consolidated associate companies. During 4Q24, a profit of $808 million has been reported, mainly due to the Bank’s participation in BBVA Seguros Argentina S.A., Rombo Compañía Financiera S.A., Interbanking S.A. and Play Digital S.A. and Openpay Argentina S.A.
Income Tax
Accumulated income tax during 2024 recorded a loss of $86.8 billion, while taxes for the quarter recorded a positive result for $57.5 billion. As mentioned previously, this result was affected by a change in accounting exposure that implied a reclassification of the income tax calculation from OCI to the Income Statement.
Accumulated income tax for 2023 recorded a loss of $298.5 billion.
The twelve month accumulated effective tax rate in 2024 was 20%6. , while that of 2023 was 45%.
6 Income tax, according to IAS 34, is recorded on interim financial periods over the best estimate of the weighted average tax rate expected for the fiscal year.
|
|
Balance sheet and activity
Loans and Other Financing
| LOANS AND OTHER FINANCING | BBVA ARGENTINA CONSOLIDATED | ||||
| In millions of AR$ - Inflation adjusted | ∆ % | ||||
| 4Q24 | 3Q24 | 4Q23 | QoQ | YoY | |
| To the public sector | 965 | 2,187 | 316 | (55.9%) | 205.4% |
| To the financial sector | 60,235 | 46,778 | 35,783 | 28.8% | 68.3% |
| Non-financial private sector and residents abroad | 7,636,215 | 5,931,221 | 4,364,709 | 28.7% | 75.0% |
| Non-financial private sector and residents abroad - AR$ | 6,338,575 | 5,023,226 | 3,924,185 | 26.2% | 61.5% |
| Overdrafts | 642,988 | 519,614 | 384,358 | 23.7% | 67.3% |
| Discounted instruments | 1,779,017 | 1,406,095 | 1,009,337 | 26.5% | 76.3% |
| Mortgage loans | 234,142 | 194,327 | 172,914 | 20.5% | 35.4% |
| Pledge loans | 178,349 | 135,391 | 96,546 | 31.7% | 84.7% |
| Consumer loans | 814,049 | 629,904 | 330,607 | 29.2% | 146.2% |
| Credit cards | 1,990,998 | 1,585,952 | 1,484,385 | 25.5% | 34.1% |
| Receivables from financial leases | 24,283 | 20,733 | 27,457 | 17.1% | (11.6%) |
| Loans to personnel | 44,164 | 31,282 | 22,361 | 41.2% | 97.5% |
| Other loans | 630,585 | 499,928 | 396,220 | 26.1% | 59.2% |
| Non-financial private sector and residents abroad - Foreign Currency | 1,297,640 | 907,995 | 440,524 | 42.9% | 194.6% |
| Overdrafts | 18 | 12 | 28 | 50.0% | (35.7%) |
| Discounted instruments | 50,377 | 45,950 | 6,084 | 9.6% | n.m |
| Credit cards | 61,692 | 51,129 | 45,742 | 20.7% | 34.9% |
| Receivables from financial leases | 1,389 | 572 | 242 | 142.8% | 474.0% |
| Loans for the prefinancing and financing of exports | 1,003,823 | 554,678 | 333,614 | 81.0% | 200.9% |
| Other loans | 180,341 | 255,654 | 54,814 | (29.5%) | 229.0% |
| % of total loans to Private sector in AR$ | 83.0% | 84.7% | 89.9% | (168)pbs | (690)pbs |
| % of total loans to Private sector in Foreign Currency | 17.0% | 15.3% | 10.1% | 168 pbs | 690 pbs |
| % of mortgage loans with UVA adjustments / Total mortgage loans (1) | 93.2% | 66.8% | 53.5% | 2.635 pbs | 3.972 pbs |
| % of pledge loans with UVA adjustments / Total pledge loans (1) | 5.9% | 4.0% | 1.3% | 193 pbs | 461 pbs |
| % of consumer loans with UVA adjustments / Total consumer loans (1) | 0.0% | 0.0% | 0.1% | (0)pbs | (5)pbs |
| % of loans with UVA adjustments / Total loans and other financing(1) | 0.9% | 0.2% | 0.0% | 68 pbs | 83 pbs |
| Total loans and other financing | 7,697,415 | 5,980,186 | 4,400,808 | 28.7% | 74.9% |
| Allowances | (158,843) | (111,706) | (98,911) | (42.2%) | (60.6%) |
| Total net loans and other financing | 7,538,572 | 5,868,480 | 4,301,897 | 28.5% | 75.2% |
| (1) Excludes effect of accrued interests adjustments. | |||||
| LOANS AND OTHER FINANCING TO NON-FINANCIAL PRIVATE SECTOR AND RESIDENTS ABROAD IN FOREIGN CURRENCY | BBVA ARGENTINA CONSOLIDATED | ||||
| In millions of USD | ∆ % | ||||
| 4Q24 | 3Q24 | 4Q23 | QoQ | YoY | |
| FX rate* | 1,032.50 | 970.92 | 808.48 | 6.3% | 27.7% |
| Non-financial private sector and residents abroad - Foreign Currency (USD) | 1,257 | 866 | 250 | 45.2% | 402.8% |
| *Wholesale U.S. dollar foreign exchange rates on BCRA’s Communication “A” 3500, as of the end of period. | |||||
|
|
Private sector loans as of 4Q24 totaled $7.6 trillion, increasing 28.7% or $1.7 trillion QoQ, and 75.0% or $3.3 trillion YoY.
Loans to the private sector in pesos increased 26.2% in 4Q24, and 61.5% YoY. During the quarter, growth was especially driven by (i) a 25.5% increase in credit cards, followed by (ii) a 26.5% increase in discounted instruments, and (iii) a 29.2% increase in consumer loans. This is followed by a 26.1% growth in loans to personnel and 23.7% growth in overdrafts. In all cases, the increment is boosted by genuine growth in real terms of the portfolio, levered on the lower market interest rates and a greater commercial efforts.
Loans to the private sector denominated in foreign currency increased 42.9% QoQ and 194.6% YoY. Quarterly increase is mainly explained by a 81.0% growth in financing and prefinancing of exports. Loans to the private sector in foreign currency measured in U.S. dollars increased 45.2% QoQ and 402.7% YoY. The depreciation of the argentine peso versus the U.S. dollar was 6.0% QoQ and 21.7% YoY7.
In 4Q24, total loans and other financing totaled $7.5 trillion, increasing 28.5% QoQ and 75.2% compared to 4Q23.
| LOANS AND OTHER FINANCING | BBVA ARGENTINA CONSOLIDATED | ||||
| In millions of AR$ - Inflation adjusted | ∆ % | ||||
| 4Q24 | 3Q24 | 4Q23 | QoQ | YoY | |
| Non-financial private sector and residents abroad - Retail | 3,323,394 | 2,627,985 | 2,152,555 | 26.5% | 54.4% |
| Mortgage loans | 234,142 | 194,327 | 172,914 | 20.5% | 35.4% |
| Pledge loans | 178,349 | 135,391 | 96,546 | 31.7% | 84.7% |
| Consumer loans | 814,049 | 629,904 | 330,607 | 29.2% | 146.2% |
| Credit cards | 2,052,690 | 1,637,081 | 1,530,127 | 25.4% | 34.2% |
| Loans to personnel | 44,164 | 31,282 | 22,361 | 41.2% | 97.5% |
| Non-financial private sector and residents abroad - Commercial | 4,312,821 | 3,303,236 | 2,212,154 | 30.6% | 95.0% |
| Overdrafts | 643,006 | 519,626 | 384,386 | 23.7% | 67.3% |
| Discounted instruments | 1,829,394 | 1,452,045 | 1,015,421 | 26.0% | 80.2% |
| Receivables from financial leases | 25,672 | 21,305 | 27,699 | 20.5% | (7.3%) |
| Loans for the prefinancing and financing of exports | 1,003,823 | 554,678 | 333,614 | 81.0% | 200.9% |
| Other loans | 810,926 | 755,582 | 451,034 | 7.3% | 79.8% |
| % of total loans to Retail sector | 43.5% | 44.3% | 49.3% | (79)pbs | (580)pbs |
| % of total loans to Commercial sector | 56.5% | 55.7% | 50.7% | 79 pbs | 580 pbs |
In real terms, retail loans (mortgage, pledge, consumer and credit cards, including loans to personnel) increased 26.5% QoQ and 54.4% YoY in real terms. During the quarter, growth is most evident in credit cards increasing 25.4% and consumer loans by 12.9%.
Commercial loans (overdrafts, discounted instruments, receivables from financial leases, loans for the prefinancing and financing of exports, and other loans) increased 30.6% QoQ and 95.0% YoY, both in real terms. In the quarter, it is noted that prefinancing and financing of exports increased 81.0% and discounted instruments increased 26.0%.
As observed in previous quarters, loan portfolios were impacted by the effect of inflation during the fourth quarter of 2024, which reached 8.0%. In nominal terms, BBVA Argentina managed to increase the retail, commercial and total loan portfolio by 36.6%, 41.0% and 39.0% respectively during the quarter, surpassing quarterly inflation levels in all cases.
7 Taking into consideration wholesale U.S. dollar foreign exchange rates on BCRA’s Communication “A” 3500.
|
|
| LOANS AND OTHER FINANCING - NON RESTATED FIGURES | BBVA ARGENTINA CONSOLIDATED | ||||
| In millions of AR$ | ∆ % | ||||
| 4Q24 | 3Q24 | 4Q23 | QoQ | YoY | |
| Non-financial private sector and residents abroad - Retail | 3,323,394 | 2,432,691 | 978,218 | 36.6% | 239.7% |
| Non-financial private sector and residents abroad - Commercial | 4,312,821 | 3,057,767 | 1,026,124 | 41.0% | 320.3% |
| Total loans and other financing (1) | 7,697,415 | 5,535,784 | 2,020,919 | 39.0% | 280.9% |
| (1) Does not include allowances | |||||
As of 4Q24, the total gross loans and other financing over deposits ratio was 77.5%, above the 64.9% recorded in 3Q24 and above the 55.5% in 4Q23.
Participation of total loans over assets is 51%, versus 43% in 3Q24 and 32% in 4Q23, evidencing a lower exposure to the public sector, in line with the real growth of credit demand.
| MARKET SHARE - PRIVATE SECTOR LOANS | BBVA ARGENTINA CONSOLIDATED | ||||
| In % | ∆ bps | ||||
| 4Q24 | 3Q24 | 4Q23 | QoQ | YoY | |
| Private sector loans - Bank | 10.26% | 9.74% | 9.12% | 52 pbs | 114 pbs |
| Private sector loans - Consolidated* | 11.31% | 10.58% | 9.85% | 73 pbs | 146 pbs |
| Based on daily BCRA information. Capital balance as of the last day of each quarter. | |||||
| * Consolidates PSA, VWFS & Rombo | |||||
| LOANS BY ECONOMIC ACTIVITY | BBVA ARGENTINA CONSOLIDATED | ||||
| % over total gross loans and other financing | ∆ bps | ||||
| 4Q24 | 3Q24 | 4Q23 | QoQ | YoY | |
| Government services | 0.00% | 0.00% | 0.00% | n.m | n.m. |
| Non-financial public sector | 0.01% | 0.00% | 0.01% | 1 pbs | n.m. |
| Financial Sector | 0.78% | 7.39% | 0.64% | (661)pbs | 14 pbs |
| Agricultural and Livestock | 5.48% | 3.48% | 5.52% | 199 pbs | (4)pbs |
| Mining products | 2.13% | 0.49% | 2.16% | 163 pbs | (3)pbs |
| Other manufacturing | 14.60% | 5.30% | 14.80% | 930 pbs | (20)pbs |
| Electricity, oil,water and sanitary services | 1.77% | 0.56% | 1.80% | 122 pbs | (3)pbs |
| Wholesale and retail trade | 8.04% | 3.21% | 8.14% | 483 pbs | (10)pbs |
| Transport | 1.45% | 0.78% | 1.47% | 67 pbs | (1)pbs |
| Services | 1.36% | 0.62% | 1.38% | 74 pbs | (2)pbs |
| Others | 17.27% | 5.29% | 17.52% | 1.198 pbs | (25)pbs |
| Construction | 0.57% | 0.46% | 0.58% | 11 pbs | (0)pbs |
| Consumer | 46.53% | 72.42% | 45.99% | (2.589)pbs | 55 pbs |
| Total gross loans and other financing | 100% | 100% | 100% | ||
|
|
Asset Quality
| ASSET QUALITY | BBVA ARGENTINA CONSOLIDATED | |||||
| In millions of AR$ - Inflation adjusted | ∆ % | |||||
| 4Q24 | 3Q24 | 4Q23 | QoQ | YoY | ||
| Commercial non-performing portfolio (1) | 3,706 | 3,917 | 6,229 | (5.4%) | (40.5%) | |
| Total commercial portfolio | 3,669,407 | 2,603,778 | 1,970,935 | 40.9% | 86.2% | |
| Commercial non-performing portfolio / Total commercial portfolio | 0.10% | 0.15% | 0.32% | (5)pbs | (22)pbs | |
| Retail non-performing portfolio (1) | 86,037 | 69,101 | 53,606 | 24.5% | 60.5% | |
| Total retail portfolio | 4,298,474 | 3,586,006 | 2,681,450 | 19.9% | 60.3% | |
| Retail non-performing portfolio / Total retail portfolio | 2.00% | 1.93% | 2.00% | 7 pbs | 0 pbs | |
| Total non-performing portfolio (1) | 89,743 | 73,018 | 59,835 | 22.9% | 50.0% | |
| Total portfolio | 7,967,881 | 6,189,784 | 4,652,385 | 28.7% | 71.3% | |
| Total non-performing portfolio / Total portfolio | 1.13% | 1.18% | 1.29% | (5)pbs | (16)pbs | |
| Allowances | 158,843 | 111,706 | 98,911 | 42.2% | 60.6% | |
| Allowances /Total non-performing portfolio | 177.00% | 152.98% | 165.31% | 2.401 pbs | 1.169 pbs | |
| Quarterly change in Write-offs | 23,069 | 14,648 | 17,841 | 57.5% | 29.3% | |
| Write offs / Total portfolio | 0.29% | 0.24% | 0.38% | 5 pbs | (9)pbs | |
| Cost of Risk (CoR) | 4.88% | 3.31% | 3.95% | 158 pbs | 93 pbs | |
| (1) Non-performing loans include: all loans to borrowers classified as "Deficient Servicing (Stage 3)", "High Insolvency Risk (Stage 4)", "Irrecoverable" and/or "Irrecoverable for Technical Decision" (Stage 5) according to BCRA debtor classification system | ||||||
As of 4Q24, asset quality ratio or NPL (total non-performing portfolio / total portfolio) keeps a very good performance at 1.13%, with non-performing loans growing below the total portfolio.
Coverage ratio (allowances / total non-performing portfolio) reached 177.0% in 4Q24, from 152.98% in 3Q24. The increase is due to higher requirements in provisions as a consequence of the remarkable growth observed in the credit portfolio in the last quarter of the year, keeping a good performance within the NPL.
Cost of risk (loan loss allowances / average total loans) reached 4.88% in 4Q24 compared to 3.31% in 3Q24. In line with the coverage ratio, the increase in the loan portfolio generated higher loan loss allowances compared to the prior quarter, incrementing the cost of risk ratio.
| ANALYSIS FOR THE ALLOWANCE OF LOAN LOSSES | BBVA ARGENTINA CONSOLIDATED | |||||
| In millions of AR$ | ||||||
| Balance at 12/31/2023 | Stage 1 | Stage 2 | Stage 3 | Monetary result generated by allowances | Balance at 12/31/2024 | |
| Other financial assets | 3,090 | (45) | - | 518 | (1,757) | 1,806 |
| Loans and other financing | 98,911 | 44,817 | 18,051 | 66,537 | (69,473) | 158,843 |
| Other debt securities | 213 | 93 | - | - | (149) | 157 |
| Eventual commitments | 13,006 | 14,966 | 3,949 | 575 | (9,716) | 22,780 |
| Total allowances | 115,220 | 59,831 | 22,000 | 67,630 | (81,095) | 183,586 |
| Note: to be consistent with Financial Statements, it must be recorded from the beginning of the year instead of the quarter | ||||||
Allowances for the Bank in 4Q24
reflect expected losses driven by the adoption of the IFRS 9 standards as of January 1, 2020, except for debt instruments issued by the
nonfinancial government sector which were excluded from the scope of such standard.
|
|
Public Sector Exposure
| NET PUBLIC DEBT EXPOSURE* | BBVA ARGENTINA CONSOLIDATED | ||||
| In millions of AR$ - Inflation adjusted | ∆ % | ||||
| 4Q24 | 3Q24 | 4Q23 | QoQ | YoY | |
| Treasury and National Government | 91,797 | 89,558 | 487,644 | 2.5% | (81.2%) |
| National Treasury Public Debt in AR$ | 71,456 | 88,111 | - | (18.9%) | N/A |
| National Treasury Public Debt CPI-linked | 20,275 | 1,286 | 837 | n.m | n.m |
| National Treasury Public Debt in USD | 66 | 161 | 121 | (59.0%) | (45.5%) |
| National Treasury Public Debt USD-linked | - | - | 486,686 | N/A | (100.0%) |
| BCRA | - | - | - | N/A | N/A |
| Public securities at FV through P&L | 91,797 | 89,558 | 487,644 | 2.5% | (81.2%) |
| Treasury and National Government | 159,904 | 207,695 | 220,915 | (23.0%) | (27.6%) |
| National Treasury Public Debt in AR$ | 10,372 | 15,012 | 32,168 | (30.9%) | (67.8%) |
| National Treasury Public Debt CPI-linked | 149,532 | 192,683 | 188,747 | (22.4%) | (20.8%) |
| BCRA | - | 12,534 | 151,938 | (100.0%) | (100.0%) |
| LEDIV** | - | 12,534 | 151,938 | (100.0%) | (100.0%) |
| Public securities at Amortized Cost | 159,904 | 220,229 | 372,853 | (27.4%) | (57.1%) |
| Treasury and National Government | 2,387,027 | 2,547,192 | 1,410,403 | (6.3%) | 69.2% |
| National Treasury Public Debt in AR$ | 1,161,136 | 1,333,761 | - | (12.9%) | N/A |
| National Treasury Public Debt CPI-linked | 1,225,891 | 1,213,431 | 1,410,403 | 1.0% | (13.1%) |
| National Treasury Public Debt in USD | - | - | - | N/A | N/A |
| BCRA | 37,099 | 38,405 | 138,116 | (3.4%) | (73.1%) |
| LEFIS | - | - | - | N/A | N/A |
| LELIQS | - | - | 131,714 | N/A | (100.0%) |
| BOPREAL | 37,099 | 38,405 | 6,402 | (3.4%) | 479.5% |
| Public securities at FV through OCI | 2,424,126 | 2,585,597 | 1,548,519 | (6.2%) | 56.5% |
| Total Public securities | 2,675,827 | 2,895,384 | 2,409,016 | (7.6%) | 11.1% |
| Treasury and National Government | - | - | - | N/A | N/A |
| BCRA | - | - | 2,618,437 | N/A | (100.0%) |
| BCRA AR$ | - | - | 2,618,437 | N/A | (100.0%) |
| BCRA USD | - | - | - | N/A | N/A |
| Total Repo | - | - | 2,618,437 | N/A | (100.0%) |
| Loans to the non-financial public sector | 965 | 2,187 | 316 | (55.9%) | 205.4% |
| Loans to the Central Bank | - | - | - | N/A | N/A |
| Total loans to the public sector | 965 | 2,187 | 316 | (55.9%) | 205.4% |
| Total public sector exposure | 2,676,792 | 2,897,571 | 5,027,769 | (7.6%) | (46.8%) |
| Public sector exposure (Excl. BCRA) | 2,639,693 | 2,846,632 | 2,119,278 | (7.3%) | 24.6% |
| % Public sector exposure (Excl. BCRA) / Assets | 17.9% | 21.0% | 15.9% | (307)pbs | 204 pbs |
| *Deposits at the Central Bank used to comply with reserve requirements not included. Includes assets used as collateral. | |||||
| **Securities denominated in foreign currency | |||||
4Q24 total public sector exposure (excluding BCRA) totaled $2.6 trillion, decreasing 7.3% or $220.8 trillion QoQ, and increasing 24.6% or $520.4 billion YoY. The annual increase is mainly explained by a greater increment of assets than that of the securities portfolio (in line with private credit portfolio growth).
The quarterly decrease is explained by the decline of securities in pesos, especially LECAPs. As of July 2024, the market reference rate will be that of the new instrument created by the Treasury, the LeFis (Letra Fiscal de Liquidez), which ended the quarter with no position.
As a result of the monetary policy adopted by the Treasury and the BCRA, BCRA exposure fell substantially, mainly explained by the maturity of LEDIVs and a lower position in BOPREAL.
|
|
Exposure to the public sector, excluding BCRA exposure, represents 17.9% of total assets, below the 21.0% of 3Q24 and 15.9% in 4Q23, and as mentioned before, in line with real loan growth demand.
Deposits
| TOTAL DEPOSITS | BBVA ARGENTINA CONSOLIDATED | ||||
| In millions of AR$ - Inflation adjusted | ∆ % | ||||
| 4Q24 | 3Q24 | 4Q23 | QoQ | YoY | |
| Total deposits | 9,929,679 | 9,214,476 | 7,925,054 | 7.8% | 25.3% |
| Non-financial Public Sector | 120,614 | 183,545 | 74,112 | (34.3%) | 62.7% |
| Financial Sector | 4,327 | 2,839 | 5,603 | 52.4% | (22.8%) |
| Non-financial private sector and residents abroad | 9,804,738 | 9,028,092 | 7,845,339 | 8.6% | 25.0% |
| Non-financial private sector and residents abroad - AR$ | 6,301,080 | 5,551,529 | 5,103,524 | 13.5% | 23.5% |
| Checking accounts* | 1,780,623 | 1,687,486 | 1,988,203 | 5.5% | (10.4%) |
| Savings accounts** | 1,311,574 | 1,140,472 | 1,290,647 | 15.0% | 1.6% |
| Time deposits | 2,860,585 | 2,506,124 | 1,392,665 | 14.1% | 105.4% |
| Investment accounts | 303,754 | 181,914 | 396,605 | 67.0% | (23.4%) |
| Other | 44,544 | 35,533 | 35,404 | 25.4% | 25.8% |
| Non-financial private sector and res. abroad - Foreign Currency | 3,503,658 | 3,476,563 | 2,741,815 | 0.8% | 27.8% |
| Checking accounts* | 674 | 734 | 1,412 | (8.2%) | (52.3%) |
| Savings accounts** | 3,257,047 | 3,270,346 | 2,455,211 | (0.4%) | 32.7% |
| Time deposits | 235,702 | 194,885 | 262,164 | 20.9% | (10.1%) |
| Other | 10,235 | 10,598 | 23,028 | (3.4%) | (55.6%) |
| % of total portfolio in the private sector in AR$ | 64.3% | 61.5% | 65.1% | 277 pbs | (79)pbs |
| % of total portfolio in the private sector in Foregin Currency | 35.7% | 38.5% | 34.9% | (277)pbs | 79 pbs |
| % of UVA Time deposits & Investment accounts / Total AR$ Time deposits & Investment accounts | 1.2% | 2.3% | 1.3% | (110)pbs | (16)pbs |
| *Includes interest-bearing checking accounts | |||||
| **Includes special checking accounts | |||||
| DEPOSITS TO THE NON-FINANCIAL PRIVATE SECTOR AND RES. ABROAD IN FOREIGN CURRENCY | BBVA ARGENTINA CONSOLIDATED | ||||
| In millions of USD | ∆ % | ||||
| 4Q24 | 3Q24 | 4Q23 | QoQ | YoY | |
| FX rate* | 1,032.5 | 970.9 | 808.5 | 6.3% | 27.7% |
| Non-financial private sector and residents abroad - Foreign Currency (USD) | 3,393 | 3,315 | 1,557 | 2.4% | 117.9% |
| *Wholesale U.S. dollar foreign exchange rates on BCRA’s Communication “A” 3500, as of the end of period. | |||||
As of 4Q24, total deposits reached $9.9 trillion, increasing 7.8% or $715.2 million QoQ, and 25.3% or $2.0 trillion YoY.
Private non-financial sector deposits in 4Q24 totaled $9.8 trillion, increasing 8.6% QoQ, and 25.0% YoY.
Private non-financial sector deposits in pesos totaled $6.3 trillion, increasing 13.5% compared to 3Q24, and 23.5% compared to 4Q23. The quarterly change is mainly affected by a 14.1% increase in time deposits, and 15.0% increase in savings accounts.
Private non-financial sector deposits in foreign currency expressed in pesos increased 0.8% QoQ and 27.8% YoY. This is mainly explained by a 20.9% increase in time deposits, partially offset by a 0.4% fall in savings accounts.
|
|
| PRIVATE DEPOSITS | BBVA ARGENTINA CONSOLIDATED | ||||
| In millions of AR$ - Inflation adjusted | ∆ % | ||||
| 4Q24 | 3Q24 | 4Q23 | QoQ | YoY | |
| Non-financial private sector and residents abroad | 9,804,738 | 9,028,092 | 7,845,339 | 8.6% | 25.0% |
| Sight deposits | 6,404,697 | 6,145,169 | 5,793,905 | 4.2% | 10.5% |
| Checking accounts* | 1,781,297 | 1,688,220 | 1,989,615 | 5.5% | (10.5%) |
| Savings accounts** | 4,568,621 | 4,410,818 | 3,745,858 | 3.6% | 22.0% |
| Other | 54,779 | 46,131 | 58,432 | 18.7% | (6.3%) |
| Time deposits | 3,400,041 | 2,882,923 | 2,051,434 | 17.9% | 65.7% |
| Time deposits | 3,096,287 | 2,701,009 | 1,654,829 | 14.6% | 87.1% |
| Investment accounts | 303,754 | 181,914 | 396,605 | 67.0% | (23.4%) |
| % of sight deposits over total private deposits | 65.8% | 68.7% | 74.1% | (295)pbs | (836)pbs |
| % of time deposits over total private deposits | 34.2% | 31.3% | 25.9% | 295 pbs | 836 pbs |
| *Includes interest-bearing checking accounts | |||||
| **Includes special checking accounts | |||||
As observed in previous quarters, deposits were impacted by the effect of inflation. This being said, in nominal terms, BBVA Argentina managed to increase the sight deposits, time deposits and total deposits by 12.6%, 27.4% and 17.3% respectively, surpassing the quarterly level of inflation in all cases.
| PRIVATE DEPOSITS - NON RESTATED FIGURES | BBVA ARGENTINA CONSOLIDATED | ||||
| In millions of AR$ | ∆ % | ||||
| 4Q24 | 3Q24 | 4Q23 | QoQ | YoY | |
| Sight deposits | 6,404,697 | 5,688,509 | 2,660,650 | 12.6% | 140.7% |
| Time deposits | 3,400,041 | 2,668,686 | 942,050 | 27.4% | 260.9% |
| Total deposits | 9,804,738 | 8,357,195 | 3,602,700 | 17.3% | 172.1% |
As of 4Q24, the Bank’s transactional deposits (checking accounts and savings accounts) represented 63.9% of total non-financial private deposits, totaling $6.3 trillion, versus 66.2% in 3Q24.
| MARKET SHARE - PRIVATE SECTOR DEPOSITS | BBVA ARGENTINA CONSOLIDATED | ||||
| In % | ∆ bps | ||||
| 4Q24 | 3Q24 | 4Q23 | QoQ | YoY | |
| Private sector Deposits - Consolidated* | 8.72% | 8.53% | 6.79% | 19 pbs | 193 pbs |
| Based on daily BCRA information. Capital balance as of the last day of each quarter. | |||||
|
|
Other Sources of Funds
| OTHER SOURCES OF FUNDS | BBVA ARGENTINA CONSOLIDATED | ||||
| In millions of AR$ - Inflation adjusted | ∆ % | ||||
| 4Q24 | 3Q24 | 4Q23 | QoQ | YoY | |
| Other sources of funds | 2,937,762 | 2,820,701 | 3,190,538 | 4.2% | (7.9%) |
| Central Bank | 233 | 147 | 238 | 58.5% | (2.1%) |
| Banks and international organizations | 43,777 | 45,818 | 5,819 | (4.5%) | n.m |
| Financing received from local financial institutions | 156,921 | 153,892 | 55,330 | 2.0% | 183.6% |
| Corporate bonds | 115,899 | 38,553 | 27,910 | 200.6% | 315.3% |
| Equity | 2,620,932 | 2,582,291 | 3,101,241 | 1.5% | (15.5%) |
In 4Q24, other sources of funds totaled $2.9 trillion, increasing 4.2% or $117.1 billion QoQ, and increasing 7.9% or $252.8 billion YoY.
The variation in the quarter is mostly explained by a 200.6% increase in funding form corporate bonds. In 4Q24, BBVA Argentina has returned to the corporate bond market for the first time since 2019, with corporate bonds Class 29, 30 and 31, all of them in pesos and with a maturity of less than a year.
Additionally, a 1.5% increment in Equity is observed.
Liquid Assets
| TOTAL LIQUID ASSETS | BBVA ARGENTINA CONSOLIDATED | ||||
| In millions of AR$ - Inflation adjusted | ∆ % | ||||
| 4Q24 | 3Q24 | 4Q23 | QoQ | YoY | |
| Total liquid assets | 5,376,784 | 6,201,813 | 7,231,703 | (13.3%) | (25.6%) |
| Cash and deposits in banks | 2,823,884 | 3,267,228 | 2,488,919 | (13.6%) | 13.5% |
| Debt securities at fair value through P&L | 91,797 | 89,558 | 487,641 | 2.5% | (81.2%) |
| Government securities | 91,797 | 89,558 | 487,641 | 2.5% | (81.2%) |
| Liquidity bills of B. C. R. A. | - | - | - | N/A | N/A |
| Net REPO transactions | - | - | 2,618,427 | N/A | (100.0%) |
| Other debt securities | 2,459,030 | 2,737,896 | 1,630,636 | (10.2%) | 50.8% |
| Government securities | 2,421,931 | 2,686,957 | 1,346,984 | (9.9%) | 79.8% |
| Liquidity bills of B. C. R. A. | 37,099 | 38,405 | 131,714 | (3.4%) | (71.8%) |
| Internal bills of B.C.R.A. | - | 12,534 | 151,938 | (100.0%) | (100.0%) |
| Overnight transactios in foreign banks | 2,073 | 107,131 | 6,080 | (98.1%) | (65.9%) |
| Liquid assets / Total Deposits | 54.1% | 67.3% | 91.3% | (1.316)pbs | (3.710)pbs |
| Liquid assets / Total Deposits | 47.2% | 58.6% | 82.6% | (1.141)pbs | (3.540)pbs |
| Liquid assets / Total Deposits | 66.3% | 81.0% | 107.1% | (1.468)pbs | (4.077)pbs |
In 4Q24, liquid assets were $5.4 trillion, decreasing 13.3% or $825.0 billion versus 3Q24, and 25.6% or $1.9 trillion compared to 4Q23. This was mainly driven by a 13.6% decline in cash and deposits in banks, a 9.9% fall in public securities and a 98.1% fall in overnight transactions in foreign banks.
In the quarter, the liquidity ratio (liquid assets / total deposits) reached 54.1%. Liquidity ratio in local and foreign currency reached 47.2% and 66.3% respectively. The decline is explained by the greater growth in total deposits than the fall in liquid assets.
|
|
Solvency
| MINIMUM CAPITAL REQUIREMENT | BBVA ARGENTINA CONSOLIDATED | ||||
| In millions of AR$ - Inflation adjusted | ∆ % | ||||
| 4Q24 | 3Q24 | 4Q23 | QoQ | YoY | |
| Minimum capital requirement | 981,148 | 826,468 | 733,085 | 18.7% | 33.8% |
| Credit risk | 724,706 | 585,129 | 483,634 | 23.9% | 49.8% |
| Market risk | 2,506 | 2,508 | 14,237 | (0.1%) | (82.4%) |
| Operational risk | 253,936 | 238,830 | 197,093 | 6.3% | 28.8% |
| Integrated Capital - RPC (1)* | 2,340,357 | 2,251,116 | 2,789,543 | 4.0% | (16.1%) |
| Ordinary Capital Level 1 ( COn1) | 2,586,631 | 2,518,540 | 2,997,761 | 2.7% | (13.7%) |
| Deductible items COn1 | (246,274) | (267,424) | (208,218) | 7.9% | (18.3%) |
| Excess Capital | - | - | - | ||
| Integration excess | 1,359,209 | 1,424,649 | 2,056,458 | (4.6%) | (33.9%) |
| Excess as % of minimum capital requirement | 138.5% | 172.4% | 280.5% | (3.385)pbs | (14.199)pbs |
| Risk-weighted assets (RWA, according to B.C.R.A. regulation) (2) | 12,000,496 | 10,117,815 | 8,510,974 | 18.6% | 41.0% |
| Regulatory Capital Ratio (1)/(2) | 19.5% | 22.2% | 32.8% | (275)pbs | (1.327)pbs |
| TIER I Capital Ratio (Ordinary Capital Level 1/ RWA) | 19.5% | 22.2% | 32.8% | (275)pbs | (1.327)pbs |
| * RPC includes 100% of quarterly results | |||||
BBVA Argentina continues to show strong solvency indicators on 4Q24. Capital ratio reached 19.5%, below 3Q24’s 22.2%. Capital excess over regulatory requirement was $1.4 trillion or 138.5%.
It is important to note that the capital ratio was greatly affected by the dividend distribution in the second quarter of 2024, which was paid in three consecutive instalments, in cash or in kind, for $264.2 billion expressed in current currency as of December 31, 2023, and that pursuant to BCRA regulation, was updated to current currency as of the day of payment of each installment in particular.
The fall in the capital ratio in this quarter
is partially explained by the 18.6% increase in Risk Weighted Assets (RWA), above the 2.7% increase of Ordinary Capital Level 1 (Con1).
The increase in RWA is linked to the real growth in the loan portfolio, in line with the increase in market risk requirements.
|
|
BBVA Argentina Asset Management S.A.
| MUTUAL FUNDS ASSETS | BBVA ARGENTINA CONSOLIDATED | ||||
| In millions of AR$ - Inflation adjusted | ∆ % | ||||
| 4Q24 | 3Q24 | 4Q23 | QoQ | YoY | |
| FBA Renta Pesos | 2,583,114 | 2,364,905 | 2,688,765 | 9.2% | (3.9%) |
| FBA Acciones Argentinas | 124,686 | 86,660 | 44,339 | 43.9% | 181.2% |
| FBA Ahorro Pesos | 123,315 | 86,044 | 10,612 | 43.3% | n.m |
| FBA Renta Fija Dólar I | 88,630 | 40,384 | - | 119.5% | N/A |
| FBA Renta Fija Plus | 38,260 | 28,762 | 8,687 | 33.0% | 340.4% |
| FBA Bonos Argentina | 24,573 | 22,285 | 2,628 | 10.3% | n.m |
| FBA Horizonte | 22,937 | 11,508 | 1,056 | 99.3% | n.m |
| FBA Renta Mixta | 17,531 | 9,956 | 4,344 | 76.1% | 303.6% |
| FBA Acciones Latinoamericanas | 9,530 | 7,338 | 9,392 | 29.9% | 1.5% |
| FBA Renta Publica I | 6,048 | 5,399 | 1,215 | 12.0% | 397.8% |
| FBA Gestión I | 11 | 13 | 35 | (15.4%) | (68.6%) |
| FBA Bonos Globales | 10 | 12 | 24 | (16.7%) | (58.3%) |
| FBA Horizonte Plus | 3 | 11 | 28 | (72.7%) | (89.3%) |
| FBA Retorno Total I | - | 82 | 142 | (100.0%) | (100.0%) |
| FBA Calificado | - | - | 34,640 | N/A | (100.0%) |
| FBA Renta Fija Local | - | - | 9 | N/A | (100.0%) |
| Total Equity | 3,038,648 | 2,663,359 | 2,805,916 | 14.1% | 8.3% |
| AMASAU net income | 7,616 | 5,994 | 643 | 27.1% | n.m |
| MARKET SHARE - MUTUAL FUNDS | BBVA ASSET MANAGEMENT | ||||
| In % | ∆ bps | ||||
| 4Q24 | 3Q24 | 4Q23 | QoQ | YoY | |
| Mutual funds | 5.26% | 5.12% | 4.78% | 14 pbs | 34 pbs |
| Source: Cámara Argentina de Fondos Comunes de Inversión | |||||
|
|
Other Events
Main Relevant Events
| · | Changes in management committee. As of December 17, 2024, the Board of Directors decided at its meeting held today, to make modifications within the Front Line Management. In this regard, as from December 31st 2024, Mrs. Mónica Etcheverry shall cease to be Director of Internal Control and Compliance, and Mrs. Beatriz Francia was hereby appointed to perform her duties. For further information click here. |
| · | Banco BBVA Argentina S.A. has accepted an offer to acquire 50% of FCA Compañía Financiera S.A. As of December 18, 2024, Banco BBVA Argentina S.A. has accepted an offer from FIDIS S.p.A to acquire 50% of the share capital of de FCA Compañía Financiera S.A. (“FCA”). FCA is a financial Company authorized by the Board of Directors of the Central Bank through Resolution No.432, dated September 16, 1999. It is part of the global Stellantis automotive group, and its main activity is financing private, non-financial sector residents for the purchase of vehicles of the Fiat, Jeep and RAM brands, all of which are produced and/or marketed by FCA Automobiles Argentina S.A. The acquisition of the shares and payment of the Price will be completed after obtaining authorization from the Central Bank and other applicable regulatory and competition authorizations. The transaction price as of the day of this announcement is estimated at approximately $14.8 billion, based on the latest available closing date, September 30, 2024. However, according to the terms of the offer, the final price will be determined based on the financial statements closest to the closing and will be subject to customary post-closing adjustments for transactions of this type. For further information click here. |
Corporate Bonds
| · | As of December 12, 2024, the Bank issued corporate bonds Class 30 at face value of $15.1 billion, at TEM + 2.75% rate, maturing on September 12, 2025 and interest payments at maturity. |
| · | As of December 12, 2024, the Bank issued corporate bonds Class 31 at face value of $38.7 billion, at TAMAR + 2.74% rate, maturing on December 12, 2025 and quarterly interest payments. This was the first corporate bond with TAMAR rate adjustment in the market. |
| · | As of February 27, 2025, the Bank issued corporate bonds Class 30 at face value of $9.1 billion, at TEM +2.75% rate, maturing on September 12, 2025 and interest payments at maturity. |
| · | As of February 27, 2025, the Bank issued corporate bonds Class 32 at face value of USD 16.5 million (blue-chip swap FX), at 3.5% rate, maturing on June 27, 2025 and interest payments at maturity. |
| · | As of February 27, 2025, the Bank issued corporate bonds Class 33 at face value of USD 20.4 million (local MEP FX), at 4% rate, maturing on August 27, 2025 and interest payments at maturity. |
| · | As of February 27, 2025, the Bank issued corporate bonds Class 34 at face value of $57.0 billion, at TAMAR +2.75% rate, maturing on February 27, 2026 and quarterly interest payments. |
|
|
Main Regulatory Changes
Minimum reserve requirements (Communication “A” 8134, 11.21.2024). Effective as of November 22, 2024, reserve the requirement integrated with National Treasury Bonds in pesos, can also be integrated with public securities in pesos provided for in point 1.3.17 of that regulation
Access to the FX market eased for service exporters (Communication “A” 8153, 12.11.2024). Effective as of January 1, 2025, the amount for individuals who can receive payments for service exports (without the obligation to liquidate them in the official FX market) is increased from USD 24,000 to USD 36,000.
Monetary Policy Rate (Press Release 12.06.2025). The monetary policy rate has been set at 32% (previously 35%)
Net Global foreign currency position. (Communication “A” 8154, 12.12.2024). The Central Bank states that financial institutions should record FX transactions with 24hr settlement within the Daily foreign currency cash position.
Mínimum reserve requirements (Comunicación “A” 8159, 12.19.2024). As of April 1, 2025, deductions for the reduction of reserve requirements in pesos related to investment credit lines, are reduced by 50%. It also revokes, for financing granted as of January 1, 2025, the deduction on reserve requirements from financing of investment projects to SMEs and non-CENDEU clients (financial inclusion). For what was granted up to December 31, 2024, these deductions will still stand for residual value of loans.
Monetary Policy Rate (Press Release 01.30.2025). The monetary policy rate has been set at 29% (previously 32%).
Credit policy. Prohibitions. (Comunicación “A” 8202, 02.20.2024). The Central Bank revokes item 1.4 on the Credit Policy regulation, referred to financing in foreign currency.
Glossary
Active clients: holders of at least one active product. Subgroup of total clients that comply with the requirements of being an account holder with a positive business volume in the last three months. Does not include joint account. Excludes clients with arreas. SMEs includes entrepreneurs.
APR: Annual Percentage Rate
APY: Annual Percentage Yield
Cost of Risk (accumulated): Year to date accumulated loan loss allowances / Average total loans.
Average total loans: average between previous year-end Total loans and other financing and current period Total loans and other financing.
Cost of Risk (quarterly): Current period Loan loss allowances / Average total loans. Average total loans: average between previous quarter-end Total loans and other financing and current period Total loans and other financing.
Coverage ratio: Quarterly allowances under the Expected Credit Loss model / total non-performing portfolio.
Digital clients: we consider a customer to be an active user of online banking when they have been logged at least once within the last three months using the internet or a cell phone and SMS banking.
Efficiency ratio (Excl. inflation adjustments, accumulated): Accumulated (Personnel benefits+ Administrative expenses + Depreciation & Amortization) / Accumulated (Net Interest Income + Net Fee Income + Net Income from measurement of Financial Instruments at Fair Value through P&L + Net income from write-down of assets at amortized cost and at fair value through OCI + Foreign exchange and gold gains + some concepts included in Other net operating income).
|
|
Efficiency ratio (Excl. inflation adjustments, quarterly): (Personnel benefits+ Administrative expenses + Depreciation & Amortization) / (Net Interest Income + Net Fee Income + Net Income from measurement of Financial Instruments at Fair Value through P&L + Net income from write-down of assets at amortized cost and at fair value through OCI + Foreign exchange and gold gains + some concepts included in Other net operating income).
Efficiency ratio (accumulated): Accumulated (Personnel benefits+ Administrative expenses + Depreciation & Amortization) / Accumulated (Net Interest Income + Net Fee Income + Net Income from measurement of Financial Instruments at Fair Value through P&L + Net income from write-down of assets at amortized cost and at fair value through OCI + Foreign exchange and gold gains + some concepts included in Other net operating income+ Income from net monetary position).
Efficiency ratio (quarterly): (Personnel benefits+ Administrative expenses + Depreciation & Amortization) / (Net Interest Income + Net Fee Income + Net Income from measurement of Financial Instruments at Fair Value through P&L + Net income from write-down of assets at amortized cost and at fair value through OCI + Foreign exchange and gold gains + some concepts included in Other net operating income+ Income from net monetary position).
Liquidity Ratio: (Cash and deposits in banks + Debt securities at fair value through P&L (Excl. Private securities) + Net REPO transactions + Other debt securities (Excl. Private securities) + Overnight transactions in foreign banks/ Total Deposits.
Mobile clients: customers who have been active in online banking at least once in the last three months using a mobile device.
Net Interest Margin (NIM) – (quarterly): Quarterly Net Interest Income / Average quarterly interest earning assets.
Public Sector Exposure (excl. BCRA): (National and Provincial Government public debt + Loans to the public sector + REPO transactions) / Total Assets.
ROA (accumulated): Accumulated net Income of the period attributable to owners of the parent / Total Average Assets. Total Average Assets is calculated as the average between total assets on December of the previous year and total assets in the current period, expressed in local currency. Calculated over a 365-day year.
ROA (quarterly): Net Income of the period attributable to owners of the parent / Total Average Assets. Total Average Assets is calculated as the average between total assets on the previous quarter-end and total assets in the current period, expressed in local currency. Calculated over a 365-day year.
ROE (accumulated): Accumulated net Income of the period attributable to owners of the parent / Average Equity attributable to owners of the parent. Average Equity is calculated as the average between equity in December of the previous year and equity in the current period, expressed in local currency. Calculated over a 365-day year.
ROE (quarterly): Net Income of the period attributable to owners of the parent / Average Equity attributable to owners of the parent. Average Equity is calculated as the average between equity on the previous quarter end and equity in the current period, expressed in local currency. Calculated over a 365-day year.
Spread: (Quarterly Interest Income / Quarterly average Interest-earning Assets) – (Quarterly Interest Expenses / Quarterly average interest-bearing liabilities).
Other terms
n.m.: not meaningful. Implies an increase above 500% and a decrease below -500%.
N/A: not applicable.
Bps: basis points.
|
|
Balance Sheet
| BALANCE SHEET | BBVA ARGENTINA CONSOLIDATED | ||||
| In millions of AR$ - Inflation adjusted | ∆ % | ||||
| 4Q24 | 3Q24 | 4Q23 | QoQ | YoY | |
| Assets | |||||
| Cash and deposits in banks | 2,823,884 | 3,267,228 | 2,488,919 | (13.6%) | 13.5% |
| Cash | 1,781,764 | 2,168,876 | 1,583,726 | (17.8%) | 12.5% |
| Financial institutions and correspondents | 1,042,120 | 1,098,352 | 905,193 | (5.1%) | 15.1% |
| BCRA | 758,790 | 970,668 | 783,628 | (21.8%) | (3.2%) |
| Other local and foreign financial institutions | 283,330 | 127,684 | 121,565 | 121.9% | 133.1% |
| Other | - | - | - | N/A | N/A |
| Debt securities at fair value through profit or loss | 91,797 | 89,558 | 492,324 | 2.5% | (81.4%) |
| Derivatives | 9,863 | 9,444 | 21,780 | 4.4% | (54.7%) |
| Repo transactions | - | - | 2,618,427 | N/A | (100.0%) |
| Other financial assets | 253,092 | 230,955 | 198,412 | 9.6% | 27.6% |
| Loans and other financing | 7,538,572 | 5,868,480 | 4,301,897 | 28.5% | 75.2% |
| Non-financial public sector | 965 | 2,187 | 316 | (55.9%) | 205.4% |
| B.C.R.A | - | - | - | N/A | N/A |
| Other financial institutions | 58,268 | 45,127 | 33,647 | 29.1% | 73.2% |
| Non-financial private sector and residents abroad | 7,479,339 | 5,821,166 | 4,267,934 | 28.5% | 75.2% |
| Other debt securities | 2,496,585 | 2,768,933 | 1,650,146 | (9.8%) | 51.3% |
| Financial assets pledged as collateral | 462,968 | 260,450 | 569,743 | 77.8% | (18.7%) |
| Current income tax assets | 45,438 | 49,074 | 349 | (7.4%) | n.m |
| Investments in equity instruments | 12,658 | 10,287 | 11,347 | 23.0% | 11.6% |
| Investments in subsidiaries and associates | 23,818 | 22,985 | 26,929 | 3.6% | (11.6%) |
| Property and equipment | 646,547 | 633,434 | 649,407 | 2.1% | (0.4%) |
| Intangible assets | 69,229 | 72,360 | 72,161 | (4.3%) | (4.1%) |
| Deferred income tax assets | 25,350 | 29,325 | 6,197 | (13.6%) | 309.1% |
| Other non-financial assets | 221,448 | 246,192 | 227,007 | (10.1%) | (2.4%) |
| Non-current assets held for sale | 3,750 | 1,516 | 1,856 | 147.4% | 102.0% |
| Total Assets | 14,724,999 | 13,560,221 | 13,336,901 | 8.6% | 10.4% |
| Liabilities | |||||
| Deposits | 9,929,679 | 9,214,476 | 7,925,054 | 7.8% | 25.3% |
| Non-financial public sector | 120,614 | 183,545 | 74,112 | (34.3%) | 62.7% |
| Financial sector | 4,327 | 2,839 | 5,603 | 52.4% | (22.8%) |
| Non-financial private sector and residents abroad | 9,804,738 | 9,028,092 | 7,845,339 | 8.6% | 25.0% |
| Liabilities at fair value through profit or loss | - | 128 | 22,496 | (100.0%) | (100.0%) |
| Derivatives | 3,859 | 6,615 | 4,671 | (41.7%) | (17.4%) |
| Reverse REPO transactions | - | - | - | N/A | N/A |
| Other financial liabilities | 1,195,339 | 977,136 | 976,140 | 22.3% | 22.5% |
| Financing received from the B.C.R.A. and other financial institutions | 200,931 | 199,857 | 61,387 | 0.5% | 227.3% |
| Corporate bonds issued | 115,899 | 38,553 | 27,910 | 200.6% | 315.3% |
| Current income tax liabilities | 13,774 | 9,991 | 418,468 | 37.9% | (96.7%) |
| Provisions | 47,098 | 39,527 | 45,129 | 19.2% | 4.4% |
| Deferred income tax liabilities | - | - | 50,992 | N/A | (100.0%) |
| Other non-financial liabilities | 597,488 | 491,647 | 703,413 | 21.5% | (15.1%) |
| Total Liabilities | 12,104,067 | 10,977,930 | 10,235,660 | 10.3% | 18.3% |
| Equity | |||||
| Share Capital | 613 | 613 | 613 | - | - |
| Non-capitalized contributions | 6,745 | 6,745 | 6,745 | - | - |
| Capital adjustments | 902,627 | 902,627 | 902,627 | - | - |
| Reserves | 1,266,600 | 1,266,600 | 1,415,790 | - | (10.5%) |
| Retained earnings | - | - | - | N/A | N/A |
| Other accumulated comprehensive income | 49,037 | 74,290 | 378,027 | (34.0%) | (87.0%) |
| Income for the period | 353,242 | 292,090 | 358,311 | 20.9% | (1.4%) |
| Equity attributable to owners of the Parent | 2,578,864 | 2,542,965 | 3,062,113 | 1.4% | (15.8%) |
| Equity attributable to non-controlling interests | 42,068 | 39,326 | 39,128 | 7.0% | 7.5% |
| Total Equity | 2,620,932 | 2,582,291 | 3,101,241 | 1.5% | (15.5%) |
| Total Liabilities and Equity | 14,724,999 | 13,560,221 | 13,336,901 | 8.6% | 10.4% |
|
|
Balance Sheet – Five quarters
| BALANCE SHEET | BBVA ARGENTINA CONSOLIDATED | ||||
| In millions of AR$ - Inflation adjusted | |||||
| 4Q24 | 3Q24 | 2Q24 | 1Q24 | 4Q23 | |
| Assets | |||||
| Cash and deposits in banks | 2,823,884 | 3,267,228 | 1,757,222 | 1,828,233 | 2,488,919 |
| Cash | 1,781,764 | 2,168,876 | 863,981 | 1,037,583 | 1,583,726 |
| Financial institutions and correspondents | 1,042,120 | 1,098,352 | 884,297 | 790,650 | 905,193 |
| B.C.R.A | 758,790 | 970,668 | 797,676 | 668,684 | 783,628 |
| Other local and foreign financial institutions | 283,330 | 127,684 | 86,621 | 121,966 | 121,565 |
| Other | - | - | 8,944 | - | - |
| Debt securities at fair value through profit or loss | 91,797 | 89,558 | 305,526 | 328,340 | 492,324 |
| Derivatives | 9,863 | 9,444 | 6,883 | 17,286 | 21,780 |
| Repo transactions | - | - | 337,807 | 2,919,708 | 2,618,427 |
| Other financial assets | 253,092 | 230,955 | 186,921 | 147,244 | 198,412 |
| Loans and other financing | 7,538,572 | 5,868,480 | 4,621,085 | 3,749,471 | 4,301,897 |
| Non-financial public sector | 965 | 2,187 | 2,061 | 94 | 316 |
| B.C.R.A | - | - | - | - | - |
| Other financial institutions | 58,268 | 45,127 | 26,513 | 24,509 | 33,647 |
| Non-financial private sector and residents abroad | 7,479,339 | 5,821,166 | 4,592,511 | 3,724,868 | 4,267,934 |
| Other debt securities | 2,496,585 | 2,768,933 | 2,733,375 | 1,257,591 | 1,650,146 |
| Financial assets pledged as collateral | 462,968 | 260,450 | 559,906 | 382,279 | 569,743 |
| Current income tax assets | 45,438 | 49,074 | 54,902 | 293 | 349 |
| Investments in equity instruments | 12,658 | 10,287 | 11,386 | 11,155 | 11,347 |
| Investments in subsidiaries and associates | 23,818 | 22,985 | 22,000 | 22,785 | 26,929 |
| Property and equipment | 646,547 | 633,434 | 672,163 | 668,778 | 649,407 |
| Intangible assets | 69,229 | 72,360 | 69,987 | 73,121 | 72,161 |
| Deferred income tax assets | 25,350 | 29,325 | 30,466 | 43,727 | 6,197 |
| Other non-financial assets | 221,448 | 246,192 | 186,154 | 188,005 | 227,007 |
| Non-current assets held for sale | 3,750 | 1,516 | 1,856 | 1,856 | 1,856 |
| Total Assets | 14,724,999 | 13,560,221 | 11,557,639 | 11,639,872 | 13,336,901 |
| Liabilities | |||||
| Deposits | 9,929,679 | 9,214,476 | 7,038,460 | 6,858,649 | 7,925,054 |
| Non-financial public sector | 120,614 | 183,545 | 218,464 | 232,453 | 74,112 |
| Financial sector | 4,327 | 2,839 | 2,333 | 4,458 | 5,603 |
| Non-financial private sector and residents abroad | 9,804,738 | 9,028,092 | 6,817,663 | 6,621,738 | 7,845,339 |
| Liabilities at fair value through profit or loss | - | 128 | 236 | 11,512 | 22,496 |
| Derivatives | 3,859 | 6,615 | 623 | 5,742 | 4,671 |
| Reverse Repo Transactions | - | - | 215,016 | - | - |
| Other financial liabilities | 1,195,339 | 977,136 | 1,077,448 | 776,569 | 976,140 |
| Financing received from the B.C.R.A. and other financial institutions | 200,931 | 199,857 | 57,123 | 30,711 | 61,387 |
| Corporate bonds issued | 115,899 | 38,553 | 13,387 | 17,661 | 27,910 |
| Current income tax liabilities | 13,774 | 9,991 | 5,010 | 275,445 | 418,468 |
| Provisions | 47,098 | 39,527 | 39,174 | 74,765 | 45,129 |
| Deferred income tax liabilities | - | - | - | - | 50,992 |
| Other non-financial liabilities | 597,488 | 491,647 | 557,076 | 537,080 | 703,413 |
| Total Liabilities | 12,104,067 | 10,977,930 | 9,003,553 | 8,588,134 | 10,235,660 |
| Equity | |||||
| Share Capital | 613 | 613 | 613 | 613 | 613 |
| Non-capitalized contributions | 6,745 | 6,745 | 6,745 | 6,745 | 6,745 |
| Capital adjustments | 902,627 | 902,627 | 902,627 | 902,627 | 902,627 |
| Reserves | 1,266,600 | 1,266,600 | 1,266,600 | 1,415,790 | 1,415,790 |
| Retained earnings | - | - | - | 358,311 | - |
| Other accumulated comprehensive income | 49,037 | 74,290 | 153,215 | 279,752 | 378,027 |
| Income for the period | 353,242 | 292,090 | 184,416 | 49,947 | 358,311 |
| Equity attributable to owners of the Parent | 2,578,864 | 2,542,965 | 2,514,216 | 3,013,785 | 3,062,113 |
| Equity attributable to non-controlling interests | 42,068 | 39,326 | 39,870 | 37,953 | 39,128 |
| Total Equity | 2,620,932 | 2,582,291 | 2,554,086 | 3,051,738 | 3,101,241 |
| Total Liabilities and Equity | 14,724,999 | 13,560,221 | 11,557,639 | 11,639,872 | 13,336,901 |
|
|
Balance Sheet – Foreign Currency Exposure
| FOREIGN CURRENCY EXPOSURE | BBVA ARGENTINA CONSOLIDATED | ||||
| In millions of AR$ - Inflation adjusted | ∆ % | ||||
| 4Q24 | 3Q24 | 4Q23 | QoQ | YoY | |
| Assets | |||||
| Cash and deposits in banks | 2,345,963 | 2,731,963 | 2,344,695 | (14.1%) | 0.1% |
| Debt securities at fair value through profit or loss | 66 | 161 | 490,402 | (59.0%) | (100.0%) |
| Other financial assets | 44,402 | 38,677 | 83,355 | 14.8% | (46.7%) |
| Loans and other financing | 1,285,842 | 899,936 | 428,901 | 42.9% | 199.8% |
| Other financial institutions | 4 | 8 | 9 | (50.0%) | (55.6%) |
| Non-financial private sector and residents abroad | 1,285,835 | 899,923 | 428,888 | 42.9% | 199.8% |
| Other debt securities | 71,866 | 80,068 | 161,297 | (10.2%) | (55.4%) |
| Financial assets pledged as collateral | 67,802 | 34,749 | 92,371 | 95.1% | (26.6%) |
| Investments in equity instruments | 770 | 727 | 941 | 5.9% | (18.2%) |
| Total foreign currency assets | 3,816,711 | 3,786,281 | 3,601,962 | 0.8% | 6.0% |
| Liabilities | |||||
| Deposits | 3,595,692 | 3,567,619 | 2,791,387 | 0.8% | 28.8% |
| Non-Financial Public Sector | 90,397 | 90,123 | 48,200 | 0.3% | 87.5% |
| Financial Sector | 1,638 | 933 | 1,376 | 75.6% | 19.0% |
| Non-financial private sector and residents abroad | 3,503,657 | 3,476,562 | 2,741,812 | 0.8% | 27.8% |
| Other financial liabilities | 184,601 | 162,450 | 174,058 | 13.6% | 6.1% |
| Financing received from the B.C.R.A. and other financial institutions | 43,783 | 45,824 | 6,792 | (4.5%) | n.m |
| Other non financial liabilities | 77,400 | 73,120 | 134,778 | 5.9% | (42.6%) |
| Total foreign currency liabilities | 3,901,476 | 3,849,013 | 3,107,015 | 1.4% | 25.6% |
| Foreign Currency Net Position - AR$ | (84,765) | (62,732) | 494,947 | (35.1%) | (117.1%) |
| Foreign Currency Net Position - USD | (82) | (65) | 612 | (27.1%) | (113.4%) |
| *Wholesale U.S. dollar foreign exchange rates on BCRA’s Communication “A” 3500, as of the end of period. | |||||
|
|
Income Statement - Quarterly
| INCOME STATEMENT | BBVA ARGENTINA CONSOLIDATED | ||||
| In millions of AR$ - Inflation adjusted | ∆ % | ||||
| 4Q24 | 3Q24 | 4Q23 | QoQ | YoY | |
| Interest income | 862,656 | 821,194 | 1,915,523 | 5.0% | (55.0%) |
| Interest expense | (380,170) | (323,988) | (836,035) | (17.0%) | 55.0% |
| Net interest income | 482,486 | 497,206 | 1,079,488 | (3.0%) | (55.0%) |
| Fee income | 137,857 | 143,971 | 154,064 | (4.0%) | (11.0%) |
| Fee expenses | (75,884) | (67,122) | (76,546) | (13.0%) | 1.0% |
| Net fee income | 61,973 | 76,849 | 77,518 | (19.0%) | (20.0%) |
| Net income from financial instruments at fair value through P&L | 38,396 | 31,692 | (151,753) | 21.0% | 125.0% |
| Net loss from write-down of assets at amortized cost and fair value through OCI | 74,954 | 59,787 | 64,291 | 25.0% | 17.0% |
| Foreign exchange and gold gains | 8,114 | 7,196 | 429,980 | 13.0% | (98.0%) |
| Other operating income | 35,784 | 31,522 | 47,250 | 14.0% | (24.0%) |
| Loan loss allowances | (84,150) | (44,567) | (45,070) | (89.0%) | (87.0%) |
| Net operating income | 617,557 | 659,685 | 1,501,704 | (6.0%) | (59.0%) |
| Personnel benefits | (144,953) | (108,830) | (145,288) | (33.0%) | - |
| Administrative expenses | (140,848) | (133,237) | (111,404) | (6.0%) | (26.0%) |
| Depreciation and amortization | (25,246) | (17,871) | (16,430) | (41.0%) | (54.0%) |
| Other operating expenses | (141,746) | (82,108) | (187,801) | (73.0%) | 25.0% |
| Operating expenses | (452,793) | (342,046) | (460,923) | (32.0%) | 2.0% |
| Operating income | 164,764 | 317,639 | 1,040,781 | (48.0%) | (84.0%) |
| Income from associates and joint ventures | 808 | 371 | 125 | 118.0% | n.m |
| Income from net monetary position | (154,361) | (184,186) | (774,147) | 16.0% | 80.0% |
| Income before income tax | 11,211 | 133,824 | 266,759 | (92.0%) | (96.0%) |
| Income tax | 53,472 | (26,648) | (160,888) | 301.0% | 133.0% |
| Income for the period | 64,683 | 107,176 | 105,871 | (40.0%) | (39.0%) |
| Owners of the parent | 61,152 | 107,674 | 107,170 | (43.0%) | (43.0%) |
| Non-controlling interests | 3,531 | (498) | (1,299) | n.m | 372.0% |
| Other comprehensive Income (1) | (26,042) | (78,972) | 442,936 | 67.0% | (106.0%) |
| Total comprehensive income | 38,641 | 28,204 | 548,807 | 37.0% | (93.0%) |
| (1) Net of Income Tax. | |||||
|
|
Income Statement – 5 Quarters
| INCOME STATEMENT | BBVA ARGENTINA CONSOLIDATED | ||||
| In millions of AR$ - Inflation adjusted | |||||
| 4Q24 | 3Q24 | 2Q24 | 1Q24 | 4Q23 | |
| Interest income | 862,656 | 821,194 | 1,179,001 | 1,833,391 | 1,915,523 |
| Interest expense | (380,170) | (323,988) | (357,037) | (701,980) | (836,035) |
| Net interest income | 482,486 | 497,206 | 821,964 | 1,131,411 | 1,079,488 |
| Fee income | 137,857 | 143,971 | 142,613 | 130,822 | 154,064 |
| Fee expenses | (75,884) | (67,122) | (71,387) | (58,287) | (76,546) |
| Net fee income | 61,973 | 76,849 | 71,226 | 72,535 | 77,518 |
| Net income from financial instruments at fair value through P&L | 38,396 | 31,692 | 37,548 | 40,030 | (151,753) |
| Net loss from write-down of assets at amortized cost and fair value through OCI | 74,954 | 59,787 | 16,557 | 90,374 | 64,291 |
| Foreign exchange and gold gains | 8,114 | 7,196 | 24,634 | 14,692 | 429,980 |
| Other operating income | 35,784 | 31,522 | 34,720 | 40,765 | 47,250 |
| Loan loss allowances | (84,150) | (44,567) | (50,333) | (38,606) | (45,070) |
| Net operating income | 617,557 | 659,685 | 956,316 | 1,351,201 | 1,501,704 |
| Personnel benefits | (144,953) | (108,830) | (132,828) | (128,984) | (145,288) |
| Administrative expenses | (140,848) | (133,237) | (141,881) | (148,312) | (111,404) |
| Depreciation and amortization | (25,246) | (17,871) | (21,730) | (14,765) | (16,430) |
| Other operating expenses | (141,746) | (82,108) | (118,801) | (152,618) | (187,801) |
| Operating expenses | (452,793) | (342,046) | (415,240) | (444,679) | (460,923) |
| Operating income | 164,764 | 317,639 | 541,076 | 906,522 | 1,040,781 |
| Income from associates and joint ventures | 808 | 371 | 3,016 | (4,144) | 125 |
| Income from net monetary position | (154,361) | (184,186) | (328,049) | (818,980) | (774,147) |
| Income before income tax | 11,211 | 133,824 | 216,043 | 83,398 | 266,759 |
| Income tax | 53,472 | (26,648) | (79,299) | (34,348) | (160,888) |
| Income for the period | 64,683 | 107,176 | 136,744 | 49,050 | 105,871 |
| Owners of the parent | 61,152 | 107,674 | 134,468 | 49,948 | 107,170 |
| Non-controlling interests | 3,531 | (498) | 2,276 | (898) | (1,299) |
| Other comprehensive Income (OCI)(1) | (26,042) | (78,972) | (126,895) | (98,552) | 442,936 |
| Total comprehensive income | 38,641 | 28,204 | 9,849 | (49,502) | 548,807 |
| (1) Net of Income Tax. | |||||
|
|
Ratios
| QUARTERLY ANNUALIZED RATIOS | BBVA ARGENTINA CONSOLIDATED | ||||
| In % | ∆ bps | ||||
| 4Q24 | 3Q24 | 4Q23 | QoQ | YoY | |
| Profitability | |||||
| Efficiency Ratio | 68.6% | 59.2% | 46.4% | 938 pbs | 2.221 pbs |
| ROA | 1.7% | 3.4% | 3.2% | (169)pbs | (152)pbs |
| ROE | 9.5% | 16.9% | 15.3% | (742)pbs | (578)pbs |
| Liquidity | |||||
| Liquid assets / Total Deposits | 54.1% | 67.3% | 91.3% | (1.316)pbs | (3.710)pbs |
| Capital | |||||
| Regulatory Capital Ratio | 19.50% | 22.20% | 32.80% | (275)pbs | (1.327)pbs |
| TIER I Capital Ratio (Ordinary Capital Level 1/ RWA) | 19.50% | 22.20% | 32.80% | (275)pbs | (1.327)pbs |
| Asset Quality | |||||
| Total non-performing portfolio / Total portfolio | 1.13% | 1.18% | 1.29% | (5)pbs | (16)pbs |
| Allowances /Total non-performing portfolio | 177.00% | 152.98% | 165.31% | 2.401 pbs | 1.169 pbs |
| Cost of Risk | 4.88% | 3.31% | 3.95% | 158 pbs | 93 pbs |
| ACCUMULATED ANNUALIZED RATIOS | BBVA ARGENTINA CONSOLIDATED | ||||
| In % | ∆ bps | ||||
| 4Q24 | 3Q24 | 4Q23 | QoQ | YoY | |
| Profitability | |||||
| Efficiency Ratio | 61.8% | 59.7% | 58.6% | 216 pbs | 326 pbs |
| ROA | 2.5% | 2.9% | 2.7% | (38)pbs | (18)pbs |
| ROE | 12.5% | 13.9% | 13.0% | (139)pbs | (52)pbs |
| Liquidity | |||||
| Liquid assets / Total Deposits | 54.1% | 67.3% | 91.3% | (1.316)pbs | (3.710)pbs |
| Capital | |||||
| Regulatory Capital Ratio | 19.5% | 22.2% | 32.8% | (275)pbs | (1.327)pbs |
| TIER I Capital Ratio (Ordinary Capital Level 1/ RWA) | 19.5% | 22.2% | 32.8% | (275)pbs | (1.327)pbs |
| Asset Quality | |||||
| Total non-performing portfolio / Total portfolio | 1.13% | 1.18% | 1.29% | (5)pbs | (16)pbs |
| Allowances /Total non-performing portfolio | 177.00% | 152.98% | 165.31% | 2.401 pbs | 1.169 pbs |
| Cost of Risk | 3.17% | 3.32% | 3.68% | (15)pbs | (50)pbs |
|
|
About BBVA Argentina
BBVA Argentina (NYSE; BYMA; MAE: BBAR; LATIBEX: XBBAR) is a subsidiary of the BBVA Group, the main shareholder since 1996. In Argentina, it is one of the leading private financial institutions since 1886. Nationwide, BBVA Argentina offers retail and corporate banking to a broad customer base, including: individuals, SME’s, and large-sized companies.
BBVA Argentina’s purpose is to bring the age of opportunities to everyone, based on our customers’ real needs, providing the best solutions, and helping them make the best financial decisions through an easy and convenient experience. The institution relies on solid values: “The customer comes first, We think big and We are one team”. At the same time, its responsible banking model aspires to achieve a more inclusive and sustainable society.
Investor Relations Contact
Carmen Morillo Arroyo
Chief Financial Officer
Belén Fourcade
Investor Relations
investorelations-arg@bbva.com
ir.bbva.com.ar
|
|
SIGNATURES
Pursuant to the requirements of the Securities Exchange Act of 1934, the registrant has duly caused this report to be signed on its behalf by the undersigned, thereunto duly authorized.
| Banco BBVA Argentina S.A. | |||||
| Date: | March 5, 2025 | By: | /s/ Carmen Morillo Arroyo | ||
| Name: | Carmen Morillo Arroyo | ||||
| Title: | Chief Financial Officer | ||||