SECURITIES AND EXCHANGE COMMISSION
Washington, D.C. 20549
FORM 6-K
Report of Foreign Private Issuer
Pursuant to Rule 13a-16 or 15d-16 of the
Securities Exchange Act of 1934
For the month of April, 2024
Commission File Number 1-14668
COMPANHIA PARANAENSE DE ENERGIA
(Exact name of registrant as specified in its charter)
Energy Company of Paraná
(Translation of Registrant's name into English)
José Izidoro Biazetto, 158
81200-240 Curitiba, Paraná
Federative Republic of Brazil
+55 (41) 3331-4011
(Address of principal executive offices)
Indicate by check mark whether the registrant files or will file annual reports under cover Form 20-F or Form 40-F. Form 20-F ___X___ Form 40-F _______
Indicate by check mark whether the registrant by furnishing the information contained in this Form is also thereby furnishing the information to the Commission pursuant to Rule 12g3-2(b) under the Securities Exchange Act of 1934.
Yes _______ No ___X____
COMPANHIA
PARANAENSE DE ENERGIA – COPEL
Corporate Taxpayer ID (CNPJ/ME) 76.483.817/0001-20 –
Company Registry (NIRE) 41300036535 - CVM Registration
B3 (CPLE3, CPLE5, CPLE6)
NYSE (ELP, ELPC)
LATIBEX (XCOP, XCOPO)
Copel Distribuição's Grid Market grows 10.3% in 1Q24
COPEL (“Company”), a company that generates, transmits, distributes and trades energy, informs its shareholders and the market in general the performance of the energy market in the first quarter of 2024, compared to the same period of the previous year.
Distribution
Grid Market
Copel Distribuição's grid market, made up of the captive market, supply to concessionaires and licensees within the State of Paraná and all the free customers existing in its concession area, had an increase of 10.3% in electricity consumption in the 1Q24 in relation to the same period of the previous year, mainly due to higher temperatures1. The billed grid market, which considers offset energy from Mini and Micro Distributed Generation – MMGD, increased 7.9% in the quarter2.
| Number of Customers | Consumed Energy (GWh) | |||||||
| Mar-24 | Mar-23 | ∆% | 1Q24 | 1Q23 | ∆% | |||
| Residential | 4,233,587 | 4,149,386 | 2.0 | 2,683 | 2,254 | 19.0 | ||
| Industrial | 69,079 | 69,571 | (0.7) | 3,024 | 2,950 | 2.5 | ||
| Captive | 67,698 | 68,411 | (1.0) | 435 | 474 | (8.3) | ||
| Free | 1,381 | 1,160 | 19.1 | 2,589 | 2,475 | 4.6 | ||
| Commercial | 442,397 | 433,318 | 2.1 | 1,949 | 1,697 | 14.8 | ||
| Captive | 440,550 | 431,819 | 2.0 | 1,302 | 1,167 | 11.6 | ||
| Free | 1,847 | 1,499 | 23.2 | 646 | 530 | 22.1 | ||
| Rural | 321,503 | 329,308 | (2.4) | 740 | 680 | 8.8 | ||
| Captive | 321,421 | 329,257 | (2.4) | 690 | 640 | 7.8 | ||
| Free | 82 | 51 | 60.8 | 50 | 40 | 24.5 | ||
| Others | 55,554 | 54,158 | 2.6 | 648 | 616 | 5.1 | ||
| Captive | 55,537 | 54,146 | 2.6 | 642 | 614 | 4.5 | ||
| Free | 17 | 12 | 41.7 | 5 | 2 | 206.6 | ||
| Total Captive Market | 5,118,793 | 5,033,019 | 1.7 | 5,753 | 5,150 | 11.7 | ||
| Total Free Market | 3,327 | 2,722 | 22.2 | 3,291 | 3,046 | 8.0 | ||
| Supply to Concessionaries | 7 | 7 | - | 240 | 221 | 8.3 | ||
| Total Grid Market | 5,122,127 | 5,035,748 | 1.7 | 9,284 | 8,418 | 10.3 | ||
| MMGD | 336,359 | 249,709 | 34.7 | (667) | (431) | 55.0 | ||
| Total Billed Grid Market | 8,616 | 7,987 | 7.9 | |||||
1 Average temperature in the State of Paraná for the months of January, February and March 2024 compared to the same period in 2023 increased by 0.9°C, 2.3°C and 1.1°C, respectively. Source: Simepar.
2 Considers the availability cost, which is the minimum amount charged for the availability of the distribution grid and is referenced in the input configurations of consumer units: 30 kWh single-phase, 50 kWh two-phase and 100 kWh three-phase circuits (ANEEL Ordinance Nº 1,000/2021 art. 291).
 |
The volume of offset energy, which is the surplus generation from MMGD compensated in billing, grew 55.0% in the quarter. The number of consumers subscribing to MMGD reached 336 thousand in March 2024, 34.7% higher than in March 2023.
| Micro and Mini Distributed Generation | Offset Energy (GWh) | |||
| 1Q24 | 1Q23 | ∆% | ||
| Residential | 203 | 123 | 65.8% | |
| Industrial | 56 | 39 | 42.2% | |
| Commercial | 235 | 147 | 60.3% | |
| Rural | 166 | 118 | 40.4% | |
| Other | 8 | 4 | 87.0% | |
| Total MMGD | 667 | 431 | 55.0% | |
The 1Q24 result is due to the consumption of electricity by the following classes:
| i. | Residential, with an increase 19.0%, due to the increase in average consumption in the period, from 181.1 kWh/month to 211.2 kWh/month, mainly due to the high average temperature in the first quarter of 2024 and the 2.0% increase in the number of consumers; |
| ii. | Commercial, with an increase of 14.8%, mainly due to the growth in Retail Trade consumption by 13.4%, representing 31.3% in the consumption of the class, of Wholesale Trade consumption in 21.3%, representing 15.5% in the consumption of the class, and consumption of Office and Administrative Support Services at 71.3%, representing 3.2% in the consumption of the class; |
| iii. | Rural, with an increase of 8.8%, mainly due to the 7.4% growth in consumption with Agriculture, Livestock and Related Services, representing 88.1% in the consumption of the class and 41.6% % of consumption with Fishing and Aquaculture, representing 5.4% in the consumption of the class; |
| iv. | Other classes, with an increase of 5.1%, mainly as a result of greater consumption by the Public Authorities; and |
| v. | Industrial, with an increase of 2.5%, mainly due to the increase in consumption of Manufacturing of Food Products by 7.9%, representing 40.0% in the consumption of the class, and in the consumption of Wood Products Manufacturing by 14.2%, representing 7.7% in the consumption of the class, partially offset by the reduction of 68.2% in consumption with Metallurgy, representing 1.0% in the consumption of the class, and 17. 4% in the consumption of Chemical Products Manufacturing, representing 4.2% in the consumption of the class. |
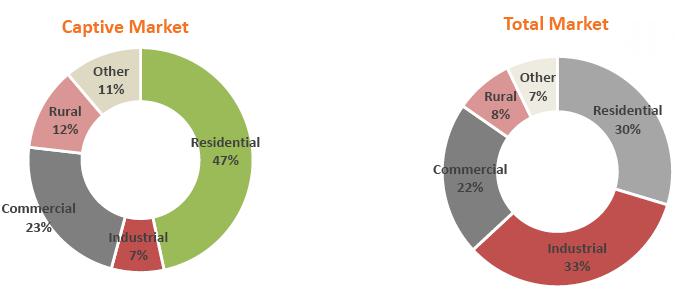
Captive Market
The captive market showed an increase of 11.7% in electricity consumption in the first quarter of 2024. The billed captive market, which considers offset energy from MMGD, increased by 7.7% in the quarter.
The following graphs show the electricity consumed by class in 1Q24:
|
|
Generation
In the first quarter of 2024, Copel Geração e Transmissão (including energy from HPP Foz do Areia – FDA and SHP Bela Vista – BVE, but excluding TPP Araucária) recorded 4,657 GWh of electricity sold, an increase of 2.1%, mainly due to the increase in energy sold to Copel Mercado Livre.
For wind farms, the total electricity sold was 1,121 GWh, an increase of 1.1%, mainly due to the increase in energy sold in regulated auctions (CCEARs) by the Aventura and SRMN Wind Complexes.
There was no dispatch for TPP Araucária, which is in the process of being disinvested by Copel.
Consolidated Generation Sales (GWh)

Trading
Copel Mercado Livre
In 1Q24, Copel Mercado Livre recorded 6,042 GWh of electricity sold, an increase of 2.5%, due to the increase in bilateral contracts.
Copel's Consolidated Market
The total energy sold by Copel, made up of sales from Copel Distribuição, Copel Geração e Transmissão, Wind Complexes and Copel Mercado Livre in all markets, reached 17,678 GWh in 1Q24, an increase of 2.7%.
The following table shows Copel's total energy sales, broken down into Copel Distribuição, Copel Geração e Transmissão, Wind Farms and Copel Mercado Livre:
|
|
| Copel’s Consolidated Market | Nº de customers / contracts | Energy sold (GWh) | ||||||
| Mar 24 | Mar 23 | ∆% | 1Q24 | 1Q23 | ∆% | |||
| Copel DIS | 5,118,975 | 5,033,325 | 1.7 | 5,858 | 5,655 | 3.6 | ||
| Captive Market | 5,118,793 | 5,033,019 | 1.7 | 5,753 | 5,150 | 11.7 | ||
| Concessionariesand Licensees | 2 | 2 | - | 24 | 22 | 8.4 | ||
| CCEE (Assigments MCSD EN) | 180 | 304 | (40.8) | 35 | 48 | (28.1) | ||
| CCEE (MVE) | 0 | 0 | - | 0 | 0 | - | ||
| CCEE (MCP) 2 | 0 | 0 | - | 47 | 435 | (89.2) | ||
| Copel GeT | 532 | 389 | 36.8 | 4,657 | 4,560 | 2.1 | ||
| CCEAR(Copel DIS) | 4 | 3 | 33.3 | 34 | 33 | 3.0 | ||
| CCEAR(other concessionaries) | 119 | 101 | 17.8 | 586 | 569 | 3.0 | ||
| Free Customers | 0 | 0 | - | 0 | 0 | - | ||
| Bilateral Agreements (Copel Mercado Livre) | 403 | 273 | 47.6 | 3,788 | 3,492 | 8.5 | ||
| Bilateral Agreements 1 | 6 | 12 | (50.0) | 50 | 153 | (67.3) | ||
| CCEE (MCP) 2 | 0 | 0 | - | 199 | 313 | (36.4) | ||
| Wind Farms Complexes | 662 | 589 | 12.4 | 1,121 | 1,109 | 1.1 | ||
| CCEAR(Copel DIS) | 19 | 15 | 26.7 | 31 | 23 | 34.8 | ||
| CCEAR(other concessionaries) | 618 | 541 | 14.2 | 568 | 480 | 18.3 | ||
| CER | 10 | 10 | - | 236 | 226 | 4.4 | ||
| Bilateral Agreements (Copel Mercado Livre) | 4 | 8 | (50.0) | 88 | 122 | (27.9) | ||
| Bilateral Agreements | 11 | 15 | (26.7) | 121 | 131 | (7.6) | ||
| CCEE (MCP) 2 | 0 | 0 | - | 77 | 127 | (39.4) | ||
| Copel Mercado Livre | 1,487 | 1,690 | (12.0) | 6,042 | 5,893 | 2.5 | ||
| Free Customers | 1,323 | 1,561 | (15.2) | 2,608 | 2,927 | (10.9) | ||
| Bilateral Agreements (Group Companies) | 0 | 0 | - | 154 | 0 | - | ||
| Bilateral Agreements | 164 | 129 | 27.1 | 3,213 | 2,820 | 13.9 | ||
| CCEE (MCP) 2 | 0 | 0 | - | 67 | 146 | (54.1) | ||
| Total Copel | 5,121,656 | 5,035,993 | 1.7 | 17,678 | 17,217 | 2.7 | ||
| Eliminations (intra-group operations) | - | - | - | 4,095 | 3,776 | 8.4 | ||
| Total Consolidated Copel | - | - | - | 13,583 | 13,441 | 1.1 | ||
Note: Does not consider the energy made available through the MRE (Energy Reallocation Mechanism) and the energy from TPP Araucária.
1 Includes Short-Term Sales Contracts and CBR.
2 Does not consider negative amounts.
CCEE: Electric Energy Trading Chamber / CCEAR: Energy Trading Contracts in the Regulated Environment / MCP: Short-Term Market / CER: Reserve Energy Contract / MCSD EN - Compensation Mechanism for New Energy Surpluses and Deficits / MVE - Sale of energy to the free market through the Surplus Sale Mechanism.
Curitiba, April 18,2024
Adriano Rudek de Moura
Chief Financial and Investor Relations Officer
For further information, please contact the Investor Relations team:
ri@copel.com or (41) 3331-4011
|
|
SIGNATURE
Pursuant to the requirements of the Securities Exchange Act of 1934, the registrant has duly caused this report to be signed on its behalf by the undersigned, thereunto duly authorized.
Date April 18, 2024
| COMPANHIA PARANAENSE DE ENERGIA – COPEL | ||
| By: |
/S/ Daniel Pimentel Slaviero |
|
| Daniel Pimentel Slaviero Chief Executive Officer |
||
FORWARD-LOOKING STATEMENTS
This press release may contain forward-looking statements. These statements are statements that are not historical facts, and are based on management's current view and estimates of future economic circumstances, industry conditions, company performance and financial results. The words "anticipates", "believes", "estimates", "expects", "plans" and similar expressions, as they relate to the company, are intended to identify forward-looking statements. Statements regarding the declaration or payment of dividends, the implementation of principal operating and financing strategies and capital expenditure plans, the direction of future operations and the factors or trends affecting financial condition, liquidity or results of operations are examples of forward-looking statements. Such statements reflect the current views of management and are subject to a number of risks and uncertainties. There is no guarantee that the expected events, trends or results will actually occur. The statements are based on many assumptions and factors, including general economic and market conditions, industry conditions, and operating factors. Any changes in such assumptions or factors could cause actual results to differ materially from current expectations.