As filed with the Securities and Exchange Commission on March 27, 2024.
UNITED STATES SECURITIES AND EXCHANGE COMMISSION
Washington, D.C. 20549
Form 20-F
ANNUAL REPORT PURSUANT TO SECTION 13 OR 15(d)
OF THE SECURITIES EXCHANGE ACT OF 1934
For the fiscal year ended: December 31, 2023
Commission file number: 001-38256
NEXA RESOURCES S.A.
(Exact name of Registrant as specified in its charter)
Grand Duchy of Luxembourg
(Jurisdiction of incorporation or organization)
José Carlos del Valle
Senior Vice President of Finance and Group Chief
Financial Officer
Phone: +352 28 26 37 27
37A, Avenue J.F. Kennedy
L-1855, Luxembourg
Grand Duchy of Luxembourg
(Address of principal registered office)
Securities registered or to be registered pursuant to Section 12(b) of the Act:
|
Title of Each Class |
Trading Symbol |
Name of Each Exchange on Which Registered |
| Common shares, each with par value of US$1.00 | NEXA | New York Stock Exchange |
Securities registered or to be registered pursuant to
Section 12(g) of the Act: None
Securities for which there is a reporting obligation pursuant to Section 15(d) of the Act: None
The number of outstanding shares of each class of stock of Nexa Resources S.A. as of December 31, 2023 was:
132,438,611 common shares, each with par value of US$1.00
Indicate by check mark if the registrant is a well-known seasoned issuer, as defined in Rule 405 of the Securities Act.
Yes o No þ
If this report is an annual or transition report, indicate by check mark if the registrant is not required to file reports pursuant to Section 13 or 15(d) of the Securities Exchange Act of 1934.
Yes o No þ
Indicate by check mark whether the registrant (1) has filed all reports required to be filed by Section 13 or 15(d) of the Securities Exchange Act of 1934 during the preceding 12 months (or for such shorter period that the registrant was required to file such reports) and (2) has been subject to such filing requirements for the past 90 days.
Yes þ No o
Indicate by check mark whether the registrant has submitted electronically every Interactive Data File required to be submitted pursuant to Rule 405 of Regulation S-T (§232.405 of this chapter) during the preceding 12 months (or for such shorter period that the registrant was required to submit such files).
Yes þ No o
Indicate by check mark whether the registrant is a large accelerated filer, an accelerated filer, a non-accelerated filer or an emerging growth company. See definition of “accelerated filer,” “large accelerated filer” and “emerging growth company” in Rule 12b-2 of the Exchange Act. (Check one):
| Large accelerated filer o | Accelerated filer þ | Non-accelerated filer o | Emerging growth company o |
If an emerging growth company that prepares its financial statements in accordance with U.S. GAAP, indicate by check mark if the registrant has elected not to use the extended transition period for complying with any new or revised financial accounting standards† provided pursuant to Section 13(a) of the Exchange Act. ☐ ☐
The term “new or revised financial accounting standard” refers to any update issued by the Financial Accounting Standards Board to its Accounting Standards Codification after April 5, 2012.
Indicate by check mark whether the registrant has filed a report on and attestation to its management’s assessment of the effectiveness of its internal control over financial reporting under Section 404(b) of the Sarbanes-Oxley Act (15 U.S.C. 7262(b)) by the registered public accounting firm that prepared or issued its audit report. þ x
If securities are registered pursuant to Section 12(b) of the Act, indicate by check mark whether the financial statements of the registrant included in the filing reflect the correction of an error to previously issued financial statements. ☐
Indicate by check mark whether any of those error corrections are restatements that required a recovery analysis of incentive-based compensation received by any of the registrant’s executive officers during the relevant recovery period pursuant to § 240.10D-1(b). ☐
Indicate by check mark which basis of accounting the registrant has used to prepare the financial statements included in this filing:
U.S. GAAP ☐ International Financial Reporting Standards as issued by the International Accounting Standards Board þ Other ☐
| |
If “Other” has been checked in response to the previous question, indicate by check mark which financial statement item the registrant has elected to follow.
Item 17 o Item 18 o
If this is an annual report, indicate by check mark whether the registrant is a shell company (as defined in Rule 12b-2 of the Exchange Act).
Yes o No þ
| |
TABLE OF CONTENTS
Page
| Form 20-F cross reference guide | iv | ||
| Forward-looking statements | 1 | ||
| About the Company | 3 | ||
| Presentation of financial and other information | 4 | ||
| Risk factors | 6 |
| I. | Information on the Company | 29 |
| II. | Operating and financial review and prospects | 119 |
| Overview | 119 | ||
| Results of operations | 130 | ||
| Liquidity and capital resources | 142 | ||
| Critical accounting estimates | 148 | ||
| Risk management | 151 |
| III. | Share ownership and trading | 156 |
| Major shareholders | 156 | ||
| Related party transactions | 157 | ||
| Distributions | 159 | ||
| Trading markets | 161 | ||
| Purchases of equity securities by the issuer and affiliated purchasers | 162 |
| IV. | Corporate governance, management and employees | 163 |
| Corporate governance | 163 | ||
| Board of directors | 168 | ||
| Executive officers and Management committee | 178 | ||
| Executive and director compensation | 182 | ||
| Employees | 187 |
| V. | Additional information | 188 |
|
|
Form 20-F Cross Reference Guide |
FORM 20-F CROSS REFERENCE GUIDE
| Item | Form 20-F caption | Location in this report | Page |
| 1 | Identity of directors, senior management and advisers | Not applicable | – |
| 2 | Offer statistics and expected timetable | Not applicable | – |
| 3 | Key information | ||
| 3A Reserved | Not applicable | – | |
| 3B Capitalization and indebtedness | Not applicable | – | |
| 3C Reasons for the offer and use of proceeds | Not applicable | – | |
| 3D Risk factors | Risk factors | 6 | |
| 4 | Information on the Company | ||
| 4A History and development of the Company | About the Company, Business overview, Capital expenditures | 3, 29, 102 | |
| 4B Business overview | Business overview, Mining operations, Smelting operations, Other operations, Mineral Reserves and Resources, Regulatory matters | 29, 35, 78, 82, 87, 112 | |
| 4C Organizational structure | Business overview, List of Subsidiaries | 29, Exhibit 8 | |
| 4D Property, plants and equipment | Mining operations, Smelting operations, Other operations, Capital expenditures, Regulatory matters | 35, 78, 82, 102, 112 | |
| 4A | Unresolved staff comments | None | – |
| 5 | Operating and financial review and prospects | ||
| 5A Operating results | Results of operations | 130 | |
| 5B Liquidity and capital resources | Liquidity and capital resources | 142 | |
| 5C Research and development, patents and licenses, etc. | Business overview | 29 | |
| 5D Trend information | Results of operations | 130 | |
| 5E Critical Accounting Estimates | Critical Accounting Estimates | 148 | |
| 6 | Directors, senior management and employees | ||
| 6A Directors and senior management | Board of directors, Executive officers and Management committee | 168, 178 | |
| 6B Compensation | Executive and director compensation | 182 | |
| 6C Board practices | Corporate governance, Board of directors | 163, 168 | |
| 6D Employees | Employees | 187 | |
| 6E Share ownership | Board of directors—Share ownership | 177 | |
| 6F Disclosure of a registrant’s action to recover erroneously awarded compensation | Not applicable | – | |
| 7 | Major shareholders and related party transactions | ||
| 7A Major shareholders | Major shareholders | 156 | |
| 7B Related party transactions | Related party transactions | 157 | |
| 7C Interests of experts and counsel | Not applicable | – | |
| 8 | Financial information | ||
| 8A Consolidated statements and other financial information | Nexa Resources S.A. Financial Statements, Distributions, Legal proceedings | 213, 159, 188 | |
| 8B Significant changes | Not applicable | – | |
| 9 | The offer and listing | ||
| 9A. Offer and listing details | Trading markets | 161 | |
| 9B Plan of distribution | Not applicable | – |
|
|
Form 20-F Cross Reference Guide |
| 9C Markets | Trading markets | 161 | |
| 9D Selling shareholders | Not applicable | – | |
| 9E Dilution | Not applicable | – | |
| 9F Expenses of the issue | Not applicable | – | |
| 10 | Additional information | ||
| 10A Share capital | Not applicable | – | |
| 10B Memorandum and articles of association | Articles of association | 190 | |
| 10C Material contracts | Business overview, Results of operations, Related party transactions | 29, 130, 157 | |
| 10D Exchange controls | Exchange controls and other limitations affecting security holders | 203 | |
| 10E Taxation | Taxation | 194 | |
| 10F Dividends and paying agents | Not applicable | – | |
| 10G Statement by experts | Not applicable | – | |
| 10H Documents on display | Information filed with securities regulators | 207 | |
| 10I Subsidiary information | Not applicable | – | |
| 10J Annual Report to Security Holders | Not applicable | – | |
| 11 | Quantitative and qualitative disclosures about market risk | Risk management | 151 |
| 12 | Description of securities other than equity securities | Not applicable | – |
| 13 | Defaults, dividend arrearages and delinquencies | Not applicable | – |
| 14 | Material modifications to the rights of security holders and use of proceeds | Not applicable | – |
| 15 | Controls and procedures | Evaluation of disclosure controls and procedures, Internal control over financial reporting | 204, 205 |
| 16A | Audit committee financial expert | Board of directors—Committees of our Board of directors—Audit committee | 173 |
| 16B | Code of ethics | Corporate governance—Code of conduct | 163 |
| 16C | Principal accountant fees and services | Principal accountant fees and services | 206 |
| 16D | Exemptions from the listing standards for audit committees | Not applicable | – |
| 16E | Purchases of equity securities by the issuer and affiliated purchasers | Purchases of equity securities by the issuer and affiliated purchasers | 162 |
| 16F | Change in registrant’s certifying accountant | Not applicable | – |
| 16G | Corporate governance | Corporate governance | 163 |
| 16H | Mine safety disclosure | Not applicable | – |
| 16K | Cybersecurity | Risk management | 151 |
| 16J | Insider trading policies | Executive and Director Compensation | 182 |
| 17 | Financial statements | Not applicable | – |
| 18 | Financial statements | Nexa Resources S.A. Financial Statements | 213 |
| 19 | Exhibits | Exhibits | 211 |
|
|
Forward-Looking Statements |
FORWARD-LOOKING STATEMENTS
This annual report includes statements that constitute estimates and forward-looking statements within the meaning of Section 27A of the Securities Act of 1933, as amended, or Securities Act, and Section 21E of the Securities Exchange Act, as amended, or Exchange Act. The words “believe,” “will,” “may,” “may have,” “would,” “estimate,” “continues,” “anticipates,” “intends,” “plans,” “expects,” “budget,” “scheduled,” “forecasts” and similar words are intended to identify estimates and forward-looking statements. Estimates and forward-looking statements refer only to the date when they were made, and we do not undertake any obligation to update or revise any estimate or forward-looking statement due to new information, future events or otherwise, except as required by law. Estimates and forward-looking statements involve risks and uncertainties and do not guarantee future performance, as actual results or developments may be substantially different from the expectations described in the forward-looking statements.
These statements appear in a number of places in this report and include statements regarding our intent, belief or current expectations, and those of our officers and employees, with respect to, among other things: (i) our future financial or operating performance; (ii) our growth strategy; (iii) future trends that may affect our business and results of operations; (iv) the impact of competition and applicable laws and regulations on our results; (v) planned capital investments; (vi) future of zinc or other metal prices; (vii) estimation of mineral reserves; (viii) mine life; and (ix) our financial liquidity.
Forward-looking statements are not guarantees of future performance and involve risks and uncertainties. Actual results and developments may be substantially different from the expectations described in the forward-looking statements for several reasons, many of which are not under our control, among them the activities of our competition, the future global economic situation, weather conditions, market prices and conditions, exchange rates, and operational and financial risks. The unexpected occurrence of one or more of the abovementioned events may significantly change the results of our operations on which we have based our estimates and forward-looking statements. Our estimates and forward-looking statements may be influenced by the following factors, including, among others:
| · | the cyclical and volatile prices of commodities; |
| · | the changes in the expected level of supply and demand for commodities; |
| · | foreign exchange rates and inflation; |
| · | the risks and uncertainties relating to economic and political conditions in the countries in which we operate; |
| · | changes in global market conditions; |
| · | the impact of expanded regional or global conflict, including the conflicts between Russian and Ukraine and the Israel-Hamas conflict, and the resulting potential impacts on supply and demand for commodities, global security concerns, and market volatility; |
| · | outbreaks of contagious diseases or health crises impacting overall economic activity regionally or globally, such as the coronavirus (“COVID-19”) pandemic, and the potential impact thereof on commodity prices and exchange rate variations in the currencies to which we are exposed to, our business and operating sites, and the global economy; |
| · | increasing demand and evolving expectations from stakeholders with respect to our environmental, social and governance (“ESG”) practices, performance and disclosures, including the ability to meet energy requirements while complying with greenhouse gas emissions regulations and other energy transition policy changes and laws in the countries in which we operate; |
| · | the impact of climate change on our operations, workforce and value chain; |
| · | environmental, safety and engineering challenges and risks inherent to mining; |
|
|
| Forward-Looking Statements |
| · | severe natural disasters, such as storms and earthquakes, disrupting our operations; |
| · | operational risks, such as operator errors, mechanical failures and other accidents; |
| · | the availability of materials, supplies, insurance coverage, equipment, required permits or approvals and financing; |
| · | supply-chain and logistic related interruptions, including impacts to international freight and transportation networks; |
| · | the implementation of our growth strategy, the availability of capital and the risks associated with related capital expenditures; |
| · | failure to obtain financial assurance to meet closure and remediation obligations; |
| · | the possible material differences between our estimates of Mineral Reserves and Mineral Resources and the mineral quantities we actually recover; |
| · | the possibility that our concessions may be terminated or not renewed by governmental authorities in the countries in which we operate; |
| · | the impact of political and government changes in the countries in which we operate, and the effects of potential new legislation, including changes in taxation laws and any related agreements that Nexa has entered or may enter into with local governments; |
| · | legal and regulatory risks, including ongoing or future investigations by local authorities with respect to our business and operations, as well as the conduct of our customers, along with the impact to our financial statements regarding the resolution of any such matters; |
| · | labor disputes or disagreements with local communities or unions in the countries in which we operate; |
| · | loss of reputation due to unanticipated operational failures or significant occupational incidents; |
| · | failure or outage of our digital infrastructure or information and operating technology systems; |
| · | cyber events or attacks (including ransomware, state-sponsored and other cyberattacks) due to negligence or IT security failures; |
| · | the future impact of competition and changes in domestic and international governmental and regulatory policies that apply to our operations; and |
| · | other factors discussed under “Risk Factors.” |
Considering the risks and uncertainties described above, the events referred to in the estimates and forward-looking statements included in this report may or may not occur, and our business performance and results of operation may differ materially from those expressed in our estimates and forward-looking statements, due to factors that include but are not limited to those mentioned above.
These forward-looking statements are made as of the date of this annual report, and we assume no obligation to update them or revise them to reflect new events or circumstances. There can be no assurance that the forward-looking statements will prove to be accurate, as actual results and future events could differ materially from those anticipated in such statements.
|
|
| About the Company |
ABOUT THE COMPANY
We are a large-scale, low-cost, integrated zinc producer with over 65 years of experience developing and operating mining and smelting assets in Latin America. We currently own and operate six long-life underground polymetallic mines – three located in the Central Andes of Peru, two located in the state of Minas Gerais in Brazil, and one in the state of Mato Grosso in Brazil, the Aripuanã mine, currently in the ramp-up phase as of the date of this annual report.
Nexa Resources S.A. is a public limited liability company (société anonyme) incorporated under the laws of Luxembourg on February 26, 2014. Our registered office is located at 37A, Avenue J.F. Kennedy, L-1855, Luxembourg, Grand Duchy of Luxembourg, and we are registered with the Luxembourg Trade and Companies Register under number B185489. Our telephone number at this address is +352 28 26 3727. Our main office outside of Luxembourg is located at Avenida Engenheiro Luís Carlos Berrini, n° 105, 6th floor, São Paulo, State of São Paulo, Brazil. Our website is www.nexaresources.com. None of the information available on our website is incorporated in this annual report and it should not be relied upon in deciding to invest in our common shares.
|
|
| Presentation of Financial and Other Information |
PRESENTATION OF FINANCIAL AND OTHER INFORMATION
Certain definitions
Unless otherwise indicated or the context otherwise requires, the terms below are defined in the following manner.
| · | “Nexa,” “we,” “us” and “our” or similar terms refer to Nexa Resources and, unless the context otherwise requires, its consolidated subsidiaries; |
| · | “Nexa Resources” refers to Nexa Resources S.A., a Luxembourg public limited liability company (société anonyme); |
| · | “Nexa CJM” refers to our subsidiary Nexa Resources Cajamarquilla S.A. (previously known as Votorantim Metais—Cajamarquilla S.A.), a corporation organized as a sociedad anónima under the laws of Peru; |
| · | “Nexa Brazil” refers to our subsidiary Nexa Recursos Minerais S.A. (previously known as Votorantim Metais Zinco S.A.), a corporation organized as a sociedade anônima under the laws of Brazil; |
| · | “Nexa Peru” refers to our subsidiary Nexa Resources Peru S.A.A. (previously known as Compañía Minera Milpo S.A.A.), a corporation organized as a sociedad anónima abierta under the laws of Peru and publicly traded on the Lima Stock Exchange; |
| · | “Pollarix” refers to our subsidiary Pollarix S.A., a corporation organized as a sociedade anônima under the laws of Brazil; |
| · | “VSA” refers to our controlling shareholder Votorantim S.A., a corporation organized as a sociedade anônima under the laws of Brazil; |
| · | the “Votorantim Group” refers to our controlling shareholder VSA and, unless the context otherwise requires, its consolidated subsidiaries; |
| · | the “real,” “reais” or “R$” refers to the Brazilian real, the official currency of Brazil; |
| · | “sol,” “soles” or “S/.” refers to the Peruvian sol, the official currency of Peru; and |
In addition, the meaning of other defined terms used in this report are set out in “Glossary.”
Financial information
Our consolidated financial statements as of December 31, 2023 and 2022 and for each of the three years ended December 31, 2023 are included in this annual report. Our consolidated financial statements are prepared in accordance with IFRS accounting standards and interpretations, as issued by the International Accounting Standards Board (“IASB”) and the IFRS Interpretations Committee (“IFRS Accounting Standards”). References in this report to “our consolidated financial statements” are to our consolidated financial statements as of December 31, 2023 and 2022 and for each of the three years ended December 31, 2023, and the related notes thereto included elsewhere in this report.
The financial information presented in this report should be read in conjunction with our consolidated financial statements, including the related notes, and the section of this report titled “Operating and financial review and prospects.”
The main consolidated companies included in our consolidated financial statements are:
| · | Nexa CJM – a Peruvian company that is 99.997% directly and indirectly owned by Nexa Resources and is mainly engaged in smelting zinc contained in concentrate. Nexa CJM’s functional currency is the U.S. dollar. |
|
|
| Forward-Looking Statements |
| · | Nexa Peru – a Peruvian company that is 83.48% directly and indirectly owned by Nexa Resources and is mainly engaged in exploring, extracting, producing and trading zinc, copper and lead concentrates, extracted from its own three mining sites. Nexa Peru’s functional currency is the U.S. dollar. Nexa Peru is a public company with its shares listed on the Lima Stock Exchange. |
| · | Nexa Brazil – a Brazilian company that is 100% owned by Nexa Resources and is mainly engaged in exploring, extracting and producing zinc, copper and lead concentrates, and smelting zinc contained in concentrate with operations in the states of Minas Gerais and Mato Grosso. Nexa Brazil’s functional currency is the real. |
Non-IFRS Accounting Standards measures
For a discussion of how our management uses non-IFRS Accounting Standards measures as an additional measure of operational performance of the Company’s business, including discussion of our Adjusted EBITDA, reconciliation with most comparable IFRS Accounting Standards figures and changes made in 2023, see “Operating and financial review and prospects—Results of Operations—Non-IFRS Accounting Standards measures and reconciliation.”
All forward-looking non-IFRS Accounting Standards financial measures in this document, including cash cost guidance, are provided only on a non-IFRS Accounting Standards basis. This is due to the inherent difficulty of forecasting the timing or number of items that would be included in the most directly comparable forward-looking IFRS Accounting Standards financial measures. As a result, reconciliation of the forward-looking non-IFRS Accounting Standards financial measures to IFRS Accounting Standards financial measures is not available without unreasonable effort and we are unable to assess the probable significance of the unavailable information.
Country, market and industry information
This report contains and refers to information and statistics regarding the countries in which we operate and the markets for the metals we produce. This data is obtained from independent public sources, including publications and materials from participants in the industry, such as Wood Mackenzie and from governmental entities such as the Brazilian Central Bank, Bloomberg Finance L.P., London Metal Exchange (“LME”), London Bullion Market Association (“LBMA”), Brazilian Ministry of Economy (Ministério da Economia), Brazilian Ministry of Mines and Energy (Ministério de Minas e Energia, or “MME”), National Mining Agency (Agência Nacional de Mineração, or “ANM”), Brazilian Institute of Geography and Statistics (Instituto Brasileiro de Geografia e Estatística, or “IBGE”), the Getulio Vargas Foundation (Fundação Getúlio Vargas, or “FGV”), the Peruvian Stock Market Superintendency (Superintendencia del Mercado de Valores), the Peruvian Central Bank, the Peruvian Ministry of Economy and Finance (Ministerio de Economía y Finanzas) and the Peruvian National Institute of Statistics and Informatics (Instituto Nacional de Estadística e Informática). Some data is also based on our estimates, which are derived from our review of internal reports, as well as independent sources.
Volume information
All tonnage information in this report is expressed in metric tonnes, unless stated otherwise, and all references to ounces are to troy ounces, in each case, unless otherwise specified.
|
|
| Risk Factors |
RISK FACTORS
Nexa and its operations are exposed to several inherent risks and uncertainties, including those described below. The risks described below are not the only ones that we face. Additional risks that we do not presently consider material, or of which we are not currently aware, may also affect us. Our business, results of operations, financial condition and cash flows could be materially and adversely affected if any of these risks materialize. You should carefully consider these risks with respect to an investment in Nexa. This section is divided in two sub-sections: the “Risk Factors Summary”, which provides a brief summary of our Risk Factors and “Detailed Risk Factors,” providing detailed information in relation to each Risk Factor identified.
Risk Factors Summary
The following summarizes the main risks to which we are subject. You should carefully consider all of the information discussed below in “Item 3—Key Information—Risk Factors—Detailed Risk Factors” in this annual report for a comprehensive description of these and other risks.
Business risks
| · | Our business is highly dependent on the international market prices of the metals we produce, which are both cyclical and volatile. |
| · | Changes in the demand for the metals we produce, including as a result of the cyclicality of global economic activity, could adversely affect our sales volume and revenues. |
| · | Adverse economic developments in China could have a negative impact on our revenues, cash flow and profitability. |
| · | The mining industry is highly competitive. |
Operational risks
| · | The mining business is subject to inherent risks, some of which are not insurable. |
| · | We may be materially adversely affected by challenges relating to slope and stability of underground openings. |
| · | Our projects are subject to operational risks that may result in increased costs or delays that prevent their successful implementation. |
| · | We may be adversely affected by the failure or unavailability of adequate infrastructure and skilled labor. |
| · | The failure of a tailings dam could negatively impact our business, reputation and results of operations, and the implementation of associated regulations and decommissioning processes may be expensive. |
| · | A disruption in zinc concentrate supply could have a material adverse effect on our production levels and financial results. |
| · | Inadequate supply of zinc secondary feed materials and zinc calcine could affect the results of our smelters. |
| · | Interruptions of energy supply or increases in energy costs may materially adversely affect our operations. |
| · | Shortages of water supply due to permitting, licensing, and other governmental regulations, explosives, critical spare parts, maintenance service and new equipment and machinery may materially adversely affect our operations and development projects. |
| · | There are unique risks inherent to the development of underground mines, which may have a material adverse impact on our cash flows. |
| · | We may be adversely affected by labor disputes, may be liable for certain payments to individuals employed by third-party contractors and may be subject to misconduct by our employees or third-party contractors. |
| · | The nature of our business includes risks related to litigation and administrative proceedings that could materially adversely affect our business and financial performance in the event of unfavorable rulings. |
Financial risks
| · | Our financial position and results of operations may be materially adversely affected by currency exchange rate fluctuations. |
| · | Fluctuations in interest rates could increase the cost of servicing our debt, affect returns on our financial investments and negatively affect our overall financial performance. |
|
|
| Risk Factors |
| · | We may engage in hedging activity that may not be successful and may result in losses to us. |
| · | Our business requires substantial capital expenditures and is subject to financing risks. |
| · | We are exposed to credit risk in relation to our contractual and trading counterparties as well as to hedging and derivative counterparty risk, and our results of operations may be negatively impacted by increases in expected credit losses. |
| · | Any acquisitions or divestitures we make may not be successful or achieve the expected benefits. |
| · | Changes in the assumptions underlying the carrying amount of certain assets could result in impairment charges. |
| · | We might not be able to pay the principal and interest amounts on our debt obligations in case they are accelerated as a result of the noncompliance with the restrictive covenants and clauses of our debt contracts. |
Risks related to our Mineral Reserves and Resources
| · | Our estimates of Mineral Reserves and Resources may be materially different from the total mineral quantities we actually recover, and changes in metal prices, operating and capital costs, and other assumptions used to calculate these estimates may render certain Mineral Reserves and Resources uneconomical to mine. |
| · | We depend on our ability to replenish our Mineral Reserves for our long-term viability. |
| · | Our mineral exploration efforts are highly speculative in nature and may be unsuccessful. |
Health, safety and environmental risks
| · | Health, safety and environmental laws and regulations, including regulations pertaining to climate change, may increase our costs of doing business, restrict our operations or result in the imposition of fines or revocation of permits. |
| · | ESG issues, including those related to climate change and sustainability, may have an adverse effect on our business, financial condition, and results of operations, could damage our reputation, and may increase costs. |
| · | Failure to meet environmental, social, and governance expectations or standards or achieve the Company’s environmental and social related goals could adversely affect its business, reputation, brand, results of operations, and/or financial condition. |
| · | Natural disasters and climate change could affect our business. |
| · | Global or regional health considerations, including the outbreak of a pandemic or contagious disease, such as the COVID-19 pandemic, have impacted and could continue to impact our business, financial condition and results of operations. |
Political, economic, social and regulatory risks
| · | Political, economic and social conditions in the countries in which we have operations or projects, or in which we do business, could adversely impact our business, financial condition results of operations and the trading price of our securities. |
| · | Recent and potential changes in commercial and mining laws, including trends like resource nationalism, may significantly impact our mining operations. |
| · | Our mineral rights may be terminated or not renewed by governmental authorities. |
| · | Our operations depend on our relations and agreements with local communities, and new projects require carrying out a prior consultation procedure. |
| · | Changes in tax laws, and any related tax agreements we have entered into or may enter into with local governments, may increase our tax burden and, as a result, could adversely affect our business, financial position and results of operations. |
| · | Our business, financial position and results of operations may be adversely affected by inflation. |
| · | We are subject to anti-corruption, anti-bribery and anti-money laundering laws and regulations in various jurisdictions. Any violations of any such laws or regulations could have a material adverse impact on our reputation and results of operations and financial position. |
| · | Political and social opposition to mining activities generally in the regions we operate could adversely impact our business and reputation. |
|
|
| Risk Factors |
| · | Differing interpretations of agency regulations or court rulings and the application of such laws and regulations could result in unintended non-compliance and may have a material effect on our business, results of operations, and financial position. |
| · | Regulation of other activities |
Risks relating to our corporate structure
| · | VSA has substantial control over us, which could limit our shareholders’ ability to influence the outcome of important corporate decisions. |
| · | Dividends or other distributions paid by us on our common shares will generally be subject to Luxembourg withholding tax. |
| · | The rights of our shareholders, and the responsibilities of VSA as our controlling shareholder, are governed by Luxembourg law and differ in some respects from the rights and responsibilities of shareholders under the laws of other jurisdictions, including the United States and Canada, and shareholders may have more difficulty protecting their interests than they would as shareholders of a U.S. corporation. |
| · | Our ability to pay dividends or other distributions and repurchase shares is subject to several factors and conditions. |
| · | It could be difficult for investors to enforce any judgment obtained outside Luxembourg against us or any of our associates. |
Detailed Risk Factors
Nexa and its operations are exposed to several inherent risks and uncertainties, including those described below.
Business risks
Our business is highly dependent on the international market prices of the metals we produce, which are both cyclical and volatile.
Our business and financial performance is significantly affected by market prices of the metals we produce, particularly the market prices of zinc, copper, silver, lead and, to a lesser extent, gold. Historically, prices of such metals have been subject to wide fluctuations and are affected by numerous factors beyond our control, including international economic and political conditions, the cyclicality of consumption, actual or perceived changes in levels of supply and demand, the availability and costs of substitutes, inventory levels maintained by users, actions of participants in the commodities markets and currency exchange rates. We cannot predict whether, and to what extent, metal prices will rise or fall in the future.
In 2023, international prices decreased for zinc, copper and lead, and increased for silver and gold as compared to their respective 2022 averages. Overall, there continued to be downward pressure on international market prices for the base metals we produce, mainly driven by the persistence of negative external factors including inflation and high interest rates, residual economic impacts on key sectors of the Chinese economy, especially civil construction and real estate market, and ongoing variable global macroeconomic conditions relating to conflicts between Russia and Ukraine and the Israel-Hamas conflict.
Mine supply also contributed to the volatility of zinc prices in 2023. The sharp drop in prices from the first to the second quarter, combined with higher levels of production costs around the world, caused a series of zinc mine closures during 2023, as some assets were operating on negative margins. None of Nexa’s mines closed or reduced production in 2023 because of the drop in prices. However, these other mine closures caused zinc prices to slightly rise, especially at the end of 2023, as well as caused the Chinese spot treatment charges to significantly drop throughout the year compared to the 2022 average. There are still assets that may have negative margins at current zinc prices, so further closures of other mines around the globe remains a possibility in 2024.
The ongoing conflict between Russia and Ukraine, and retaliatory measures by the global community have created global security concerns, including the possibility of expanded regional or global conflict, which have had, and may continue to have, adverse impacts around the globe. The fluctuating value of the US dollar, resulting in part from global conflicts, also directly impacts commodities prices.
|
|
| Risk Factors |
Also, on October 7, 2023, Hamas, a terrorist group in control of Gaza, carried out a surprise attack on Israeli cities and towns near the Gaza strip. Following this terrorist attack, Israel declared war on Hamas and other terrorist organizations in Gaza. The military conflict is ongoing, and its length and outcome are highly unpredictable. Further escalation of this conflict could lead to significant disruptions, which could have a material adverse effect on our business, financial position, results of operations and cash flows.
Continued ramifications of these global conflicts include disruption of the supply chain, which has led, and may continue to lead, to impacts on production, investment, and demand and prices for our products; higher and more volatile prices for commodities, including oil and gas; disruption of global financial markets, and further exacerbation of overall macroeconomic trends, including high inflation and rising interest rates. For more information see “Operating and Financial Review and Prospects—Overview”. As of the date of this report, the conflicts between Russia and Ukraine and in the Middle East have had no material impact on our business and operations. However, the conflicts are still ongoing, and we cannot predict the future impact they may have. We continue to monitor developments related to these conflicts as of the day of this report.
Future declines in metal prices, especially with respect to zinc, copper, silver and lead prices, could have an adverse impact on our results of operations and financial position, and we might consider curtailing or modifying certain operations, selling certain operations or not proceeding with our sustaining and/or growth strategy. In addition, we may not be able to adjust production volume in a timely or cost-efficient manner in response to changes in metal prices. Lower utilization of capacity during periods of weak prices may expose us to higher unit production costs since a significant portion of our cost structure is fixed in the short-term due to the high capital intensity of mining operations. Conversely, during periods of high prices, our ability to rapidly increase production capacity may be limited, which could prevent us from selling more products. Moreover, we may be unable to complete expansions and greenfield projects in time to take advantage of rising prices for zinc, copper, lead or other products.
Changes in the demand for the metals we produce, including as a result of the cyclicality of global economic activity, could adversely affect our sales volume and revenues.
Our revenues depend on the volume of metals we sell (and, to a lesser extent, the volume of metals produced by others that are smelted in our facilities), which in turn depend on the level of industrial and consumer demand for these metals. An increase in the production of zinc, copper, silver and lead worldwide, along with reduction in demand for these metals, due to changes in technology, industrial processes or consumer habits, including increased demand for substitute materials, economic slow-downs or other factors, may have the potential to impact these metal prices. In 2023, international prices decreased for zinc, copper and lead, and increased for silver and gold as compared to their respective 2022 averages. The impact of price decreases may also compromise the profitability of smelters, as we might consider reducing the volume of metals we sell and therefore materially adversely impact our operational results and financial position. Even if our volumes are not affected by reduced prices, this decrease can impact our revenues.
The mining industry has historically been highly volatile largely due to the cyclical nature of industrial production, which affects the demand for minerals and metals. Demand for minerals and metals thus generally correlates to macroeconomic fluctuations in the global economy. Changes in the demand for the metals we produce could adversely affect our sales volume and revenues.
Adverse economic developments in China could have a negative impact on our revenues, cash flow and profitability.
China has been the primary source of global demand for commodities over the last few years. According to Wood Mackenzie, in 2023, Chinese demand represented 51% of global demand for refined zinc and 56% of global demand for refined copper. Any slowdown in China’s economic growth that is not offset by increased demand or reduced supply from other regions could have an adverse effect on demand for our products or commodity prices and result in lower revenues, cash flow and profitability.
|
|
| Risk Factors |
The mining industry is highly competitive.
We face competition from other mining, processing, trading and industrial companies in Brazil, Peru and around the world. Competition principally involves the following factors: sales, supply and labor prices; contractual terms and conditions; attracting and retaining qualified personnel; and securing the services, supplies and technologies we need for our operations. Slower development in technology and innovation could impact costs, productivity and competitiveness. In addition, mines have limited lives and, as a result, we must seek to replace and expand our mineral reserves by acquiring new properties. Significant competition exists to acquire mining concessions, land and related assets. We cannot assure shareholders that competition will not adversely affect us in the future.
The international trade environment faces increasing uncertainty. Potential changes to international trade regulations and agreements, as well as other political and economic arrangements (including direct or indirect subsidies), may benefit competitors operating in countries other than where our mining operations are currently located. These changes could also adversely affect the prices we pay for the supplies we need and our export costs when we engage in international transactions. We cannot assure shareholders that we will be able to compete based on price or other factors with companies that in the future may benefit from favorable regulations, lower cost of capital, trading or other arrangements or that we will be able to maintain the cost of the supplies that we require as well as our export costs.
Operational risks
The mining business is subject to inherent risks, some of which are not insurable.
The business of mining zinc, copper, silver, lead and other minerals is generally subject to numerous risks and hazards. Hazards associated with underground mining operations include underground fires and explosions, including those caused by flammable gas, gas and coal outbursts, cave-ins or falls of ground, rock falls, openings collapse, lack of oxygen, air pollution, tailings dam failures or other discharges of tailings, hazardous substances and materials, gases and toxic chemicals, water ingress and flooding, sinkhole formation, ground subsidence, and other accidents and conditions resulting from underground mining activities, such as drilling, blasting, removing and processing material. In addition, we may encounter geotechnical challenges as we continue with and expand our mining activities, including the possibility of failure of underground openings.
Such occurrences could result in damage to, or destruction of, our properties or production facilities, third-party property, human exposure to pollution, personal injury or death, environmental and natural resource damage or contamination, delays in mining, monetary losses and legal liability. In addition, any such occurrences could adversely affect our reputation. Damages to our reputation could result in additional environmental and health and safety legal oversight, and authorities could impose more stringent conditions in connection with the licensing process of our projects and operations. In addition, our customers may be less willing to buy metals from us if we have been subject to significant adverse publicity. We maintain insurance typical in the mining industry, and in amounts that we believe to be adequate, but which may not provide complete coverage in certain circumstances. Insurance against certain risks (including certain liabilities for environmental contamination, tailings dam failures and other hazards as a result of exploration, production or extreme weather) may not be generally available or is uneconomical to afford. If we incur significant liability for which we are not fully insured, we may not be able to finance the uninsured liability amount on acceptable terms to us or at all, and we could be required to divert a significant portion of our cash flow from normal business operations. This could have a material impact on our financial position.
We could also incur additional expenses due to failures in our industrial drainage system or other environmental control equipment. Any such failures could also have adverse impacts on the environment, which could lead to adverse climate changes and further impact our reputation if we are found to contribute, or there is a perception that we have contributed, to adverse environmental impacts in the areas in which we operate.
|
|
| Risk Factors |
We may be materially adversely affected by challenges relating to slope and stability of underground openings.
Our underground mines get deeper, and our waste and tailings deposits increase in size as we continue with and expand our mining activities. This presents certain geotechnical challenges, including the possibility of failure of underground openings. If we are required to further reinforce such openings or take additional actions to prevent such a failure, we could incur additional costs and expenses, and our operations and stated mineral reserves could be negatively affected. We have taken actions we consider appropriate to maintain the stability of underground openings, but additional actions may be required in the future. Unexpected failures or additional requirements to prevent such failures may materially adversely affect our costs and expose us to health, safety and other liabilities in the event of an accident, as well as adversely impact our reputation. These developments may in turn materially adversely affect the results of our operations and financial position, as well as potentially diminish our stated mineral reserves.
Our projects are subject to operational risks that may result in increased costs or delays that prevent their successful implementation.
We invest in sustaining and increasing our mine and metal production capacity and developing new operations. Our projects are subject to several risks that may materially adversely affect our growth prospects and profitability, including the following:
| · | we may encounter delays or higher than expected costs in completing technical and engineering studies and obtaining the necessary equipment, machinery, materials, supplies, labor or services, in project execution by third-party contractors and in implementing new technologies to develop and operate a project; |
| · | we may experience delays in commencing and/or ramping up the operations of a new project or the expansion of an existing operation to its design capacity; |
| · | our efforts to develop projects according to schedule may be hampered by a lack of infrastructure, including a reliable power supply; |
| · | we may fail to obtain or renew, or experience delays or higher than expected costs in obtaining or renewing, the required agreements, authorizations, licenses, approvals and permits to develop a project, including the prior consultation procedure and agreements with local communities; |
| · | changes in market conditions or regulations may make a project less profitable than expected at the time we initiated work on it; |
| · | accidents, natural disasters, labor disputes, equipment failures, water shortages, logistical issues, interruption of energy supply and increase in energy costs; |
| · | adverse mining conditions may delay and hamper our ability to produce the expected quantities and qualities of minerals upon which the project was budgeted; |
| · | mineral reserves and resources are estimates based on the interpretation of limited sampling data and test work that may not be representative of the deposits as a whole, or the technical and economic assumptions used in the estimates may prove to be materially different when the deposits are mined, that could result in materially different economic outcomes; and |
| · | conflicts with local communities, unions and/or strikes or other labor disputes may delay the implementation or the development of projects. |
We may be adversely affected by the failure or unavailability of adequate infrastructure and skilled labor.
Our mining, smelting, processing, development and exploration activities depend to a large degree on adequate infrastructure. The regions where certain of our current operations, projects and prospects are located are sparsely populated and difficult to access. We require reliable roads, bridges, power sources and water supplies to access and properly conduct our operations. As a result, the availability and cost of this infrastructure affects capital and operating costs and our ability to maintain expected levels of production and sales. We could also experience an increase in transit-related accidents due to the need to transport employees to remote areas. Unusual weather, such as excessive rains and flooding, or other natural phenomena, sabotage, government or external interference (including protest activities from local communities that may lead to temporary suspensions of our projects) in the maintenance or provision of such infrastructure could impact the development of a project, reduce mining volumes, increase mining or exploration costs or delay the transportation of raw materials to the mines and projects or concentrates to the customers. See “Risk factors—Health, safety and environmental risks—Natural disasters and climate change could affect our business.”
|
|
| Risk Factors |
In addition, the mining industry is labor intensive, and our success depends to a significant extent on our ability and our contractors’ ability to attract, hire, train and retain qualified employees, including our ability and our contractors’ ability to attract employees with the necessary skills in the regions in which we operate. We could experience increases in our recruiting and training costs and decreases in our operating efficiency, productivity and profit margins if we are unable to attract, hire and retain a sufficient number of skilled employees to support our operations.
The failure of a tailings dam could negatively impact our business, reputation and results of operations, and the implementation of associated regulations and decommissioning processes may be expensive.
Mining companies face inherent risks in their operations of tailings dams—structures built for the containment of the mining or industrial waste, known as tailings—that exposes us to certain risks. Our tailings dams include, in some cases, materials that could increase the hazard potential in the event of unexpected failure. If any such risks were to occur, this could lead to negative environmental effects and materially adversely affect our reputation and our ability to conduct our operations and could make us subject to liability and, as a result, have a material adverse effect on our business, financial position and results of operations.
In addition, the changes in regulation that occurred as a result of recent dam failures, like those that have occurred in Brazil, could increase the time and costs to build, operate, inspect, maintain and decommission tailings dams, obtain new licenses or renew existing licenses to build or expand tailings dams, or require the use of new technologies. Brazilian laws include a requirement for obtaining an environmental license for new dams or for the raising of existing dams. As part of the process, companies must present a proposal for an environmental bond with the purpose of guaranteeing the socio-environmental recovery in the event of an accident or the deactivation of the dam.
In December 2023, the State of Minas Gerais published State Decree No. 48,747/2023, regulating the environmental recovery policies that companies are required to have in place in the event of an accident or deactivation of a dam, pursuant to a prior state law passed in 2019. Under State Decree No. 48,747/2023, any dams that meet the requirements established under the 2019 Dam Safety Policy law must have an environmental guarantee policy in place. Nexa estimates that it will require US$27.3 million to cover the applicable dams under this policy. The guarantee can be made by one of the following methods: (i) cash deposit; (ii) bank deposit certificate – (“CDB”); (iii) bank guarantee; or (iv) guarantee insurance. The Company has until March 29, 2024 to submit an environmental recovery proposal and must contract for 50% of the policy by December 31, 2024, 25% by December 31, 2025 and 25% by December 31, 2026. For more information on State Decree No. 48,747/2023 and its impact on Nexa, see “Information on the Company—Mining operations—Tailings disposal” and Notes 27 and 32(b) of our consolidated financial statements.
The Company has been conducting engineering studies to confirm the construction method of old inactive industrial waste containment structures that have been closed for more than 20 years. None of them contain mining tailings, water or liquid waste. Based on results of the conceptual engineering studies, Nexa recognized a provision for dams obligations in the amount of US$7.0 million in its financial statements for the year ended December 31, 2023 and the Company may reserve additional amounts related to estimated costs of anticipated additional obligations in relation to these closed dams, which could have a material impact on the Company’s financial position.
|
|
| Risk Factors |
Certain regulations, such as those enacted by ANM between 2020 and 2023, may also impose more restrictive requirements that may exceed our current standards, including mandated compliance with emergency plans and increased insurance requirements and premiums, or require us to pay additional fees or royalties to operate tailings dams. We may also be required to facilitate the relocation of communities and facilities impacted by tailings dam failures. Moreover, insurance coverage for damages resulting from tailings dams’ failure may not be available. For more information see “Information on the Company—Mining operations—Tailings disposal.”
A disruption in zinc concentrate supply could have a material adverse effect on our production levels and financial results.
A portion of the zinc concentrate processed in our smelters is obtained from third parties, and we may be adversely affected if we are not able to source adequate supplies of zinc for such operations. In 2023, 49.6% of the zinc concentrate processed in our smelters was obtained from third parties, with the remainder supplied by our own mining operations. The availability and price of zinc concentrate used by our smelters may be negatively affected by several factors largely beyond our control, including interruptions in production in our mines or by our suppliers, decisions by suppliers to allocate supplies of concentrate to other purchasers, price fluctuations and increasing transport cost.
In addition, the efficiency of a smelter’s production over time is affected by the mix of the zinc concentrate qualities and grades it processes. In circumstances where we cannot source adequate supplies of the zinc concentrate qualities and grades that comprise the most efficient mix for our smelters, alternative types of concentrate may be available, but the use thereof may increase our costs of production or reduce the productivity of our smelters and adversely affect our business, results of operations and financial position.
Inadequate supply of zinc secondary feed materials and zinc calcine could affect the results of our smelters.
Zinc sourced from suppliers of secondary feed materials represented approximately 16.5% of the zinc content used by our Juiz de Fora smelter in 2023. The use of zinc secondary feed material is a competitive advantage in relation to the use of zinc concentrate, mainly due to lower acquisition costs and, to a lesser extent, operational gains. In addition, since 2021 we have incorporated zinc calcine processed by third parties into our operations to increase the production in our smelters. Our smelters then use this zinc calcine processed by third parties to produce additional refined zinc products that they would not produce were they to rely solely on other inputs. To the extent we are unable to obtain adequate supplies of zinc secondary feeds or zinc calcine, or if we must pay higher than anticipated prices of these inputs, our business, results of operations and financial position may be adversely affected. In 2021, our calcine supplier in Peru shut down its facilities, impacting our smelter production. In 2021, 2022 and 2023, we were able to partially offset the reduction in calcine availability through the development and consumption of new sources of raw material, such as third party waelz oxide, however, we cannot assure shareholders that we will be able to have secure access to the raw materials required for our operations in the future. For more information, see “Information on the Company—Smelting Operations—Smelter sales.”
Interruptions of energy supply or increases in energy costs may materially adversely affect our operations.
Energy is an important component of our production costs. In Peru, we obtain almost all electric power for our operations from third parties through energy supply contracts. Although we are party to a long-term power purchase agreement with Electroperú S.A., we cannot ensure that we will have secure access to energy sources in Peru at the same prices and conditions in the event of any interruption or failure of our sources of energy, failures or congestion in any part of the Sistema Eléctrico Interconectado Nacional (“SEIN”), any failure to renew or extend our other existing energy supply contracts, or due to any regulatory changes that may impact energy rates. Between May and September 2023, there was an increase in spot prices, mainly explained by the lack of rain in central Peru, given the most energy consumption in the country comes from hydroelectric plants. In addition, the shutdown of certain Peruvian natural gas processing plants due to maintenance occurred in July 2023, led to increase in energy costs reaching US$180/MWh, which was the highest rate in fifteen years. This increase in energy prices in part resulted from inefficient energy generation in the SEIN, which currently lacks renewable energy projects (i.e., hydroelectric, wind and solar). These types of renewable projects are expected to lower the prices that energy generators are able to offer to large industrial users.
|
|
| Risk Factors |
In Brazil, we obtain electric power for our operations from hydroelectric plants grouped into several legal entities—which are directly or indirectly jointly owned by us, our controlling shareholder and its affiliates—pursuant to long-term power purchase agreements. In 2023, self-production plants represented 86.8% of energy supply, in terms of energy acquired via energy purchase and sale contracts. Furthermore, our energy costs under these agreements could increase in the event of differences in the hydrology forecast due to these hydroelectric plants share of the hydrological risk, in addition to payment of higher energy taxes. For more information, see “Information on the Company—Other operations—Power and energy supply.”
Prices and availability of energy resources for our operations may be subject to changes or curtailment due to, among other things, new laws or regulations, the imposition of new taxes or tariffs, supply interruptions, equipment damage, volatility and increase in worldwide price levels for energy and related components, market conditions and any inability to renew our existing supply contracts. Disruptions in energy supply or increases in costs of energy resources could increase our production costs and have a material adverse effect on our financial position and results of operations.
Shortages of water supply due to permitting, licensing, and other governmental regulations, explosives, critical spare parts, maintenance service and new equipment and machinery may materially adversely affect our operations and development projects.
Our mining and smelting operations require the use of significant quantities of water for extraction activities, processing and related auxiliary facilities. Water usage, including extraction, containment, and recycling requires appropriate permits, which are granted by regulatory authorities in Brazil and Peru. The available water supply may be adversely affected by shortages or changes in governmental regulations. We cannot assure shareholders that water will be available in sufficient quantities to meet our future production needs or will prove sufficient to meet our water supply needs. In addition, we cannot assure shareholders that we will maintain our existing licenses related to water rights, particularly if political changes lead to additional regulatory requirements or review of existing licenses. A reduction in our water supply could materially adversely affect our business, results of operations and financial position. In addition, if we are unable to obtain the necessary licenses with respect to water use, we may be prevented from pursuing some of our planned expansion projects.
In addition to water, our mining operations require intensive use of equipment and machinery as well as explosives. To be able to acquire and use explosives, we must first obtain the corresponding authorizations, which are granted by the relevant regulatory authorities in Brazil and Peru. A shortage in the supply of key spare parts, adequate maintenance service, new equipment and machinery to replace old ones and cover expansion requirements, or explosives, including due to the inability to deliver such water, energy, supplies, critical spare parts, explosives, or equipment and machinery to our operations, or regulatory change impacting our ability to obtain authorization for the acquisition of such materials, could materially adversely affect our operations and development projects.
There are unique risks inherent to the development of underground mines, which may have a material adverse impact on our cash flows.
The development of underground mines is subject to other unique risks including, but not limited to, underground floods, issues relating to ventilating harmful gases, fall-of-ground accidents, and seismic activity resulting from unexpected or difficult geological conditions. While we anticipate taking all measures to safely operate, there is no assurance that the effect of these risks will not cause schedule delays, revised mine plans, injuries to persons and property, and/or increased capital costs, any of which may have a material adverse impact on our cash flows.
We may be adversely affected by labor disputes.
Mining is a labor-intensive industry. We depend on more than 14,000 workers, including employees and contractors, to carry out our operations. A portion of our employees are unionized. We cannot assure that we will not experience work slowdowns, work stoppages, strikes or other labor disputes in the future, particularly in the context of the annual renegotiation of our collective bargaining agreements.
|
|
| Risk Factors |
We may also be affected by labor-related disputes that broadly develop in the countries in which we operate. Strikes and other labor disruptions at any of our operations could have a material adverse effect on our business, financial position and results of operations.
We may be liable for certain payments to individuals employed by third-party contractors.
Under Peruvian law, we may become responsible under certain circumstances to pay mandatory labor benefits or other obligations to personnel employed by our third-party contracts or sub-contractors. Although we believe that we are in substantial compliance with Peruvian labor laws, we cannot assure shareholders that any proceedings initiated by outsourced employees will be resolved in our favor and that we will not be liable for any mandatory labor benefits or for-profit sharing benefits. In the beginning of 2022, a new law was published in Peru prohibiting companies from outsourcing core operational activities. More than 70% of our Peruvian workforce is employed by third party contractors. In July 2023, the law was deemed to be unconstitutional because it was determined to be an unenforceable bureaucratic barrier by the National Institute for the Defense of Competition and the Protection of Intellectual Property (“INDECOPI”), and therefore is not expected to have any material impact on Nexa. In addition, a lawsuit was initiated by Nexa which is seeking to declare the unconstitutionality of the aforementioned law. However, any future laws or regulations that would make Nexa responsible under Peruvian law for paying mandatory labor benefits or for-profit sharing benefits for individuals employed by third-party contractors could have an adverse impact on our business, financial position and results of operations. For more information, see “Information on the Company—Regulatory matters—Peruvian regulatory framework—Regulation of other activities.”
Under Brazilian law, outsourcing is also permitted if certain requirements are met. In addition, Brazilian law provides that the contractor will be held liable on a secondary basis if the outsourced or subcontracted companies do not fulfill their labor obligations. In cases where the outsourced or subcontracted companies do not pay the workers the labor sums they are entitled to, the contractor is responsible for those payments. These payments may have an adverse effect on our results of operation and financial position.
We may be subject to misconduct by our employees or third-party contractors.
We may be subject to misconduct by our employees or third-party contractors, such as theft, bribery, sabotage, fraud, insider trading, violation of laws, slander or other illegal actions. Any such misconduct may lead to fines or other penalties, slow-downs in production, increased costs, lost revenues, increased liabilities to third parties, impairment of assets or harmed reputation, any of which may have a material adverse effect on our business, results of operations or financial position.
The nature of our business includes risks related to litigation and administrative proceedings that could materially adversely affect our business and financial performance in the event of unfavorable rulings.
The nature of our business exposes us to various litigation matters, including civil liability claims, environmental matters, health and safety matters, regulatory and administrative proceedings, governmental investigations, tort claims, contract disputes, labor matters and tax matters, among others. We cannot assure shareholders that these or other legal proceedings will not have a material adverse effect on our ability to conduct our business or on our financial position and results of operations, through distraction of our management team, diversion of resources or otherwise. In addition, although we establish provisions as we deem necessary in accordance with IFRS Accounting Standards, the level of provisions that we record could vary significantly from any amounts we actually pay, due to the inherent uncertainties in the estimation process.
Any tax-related investigations carried out by state or local governments may result in a material impact on our business, results of operations and financial condition.
In 2023, Nexa cooperated with the investigation carried out by the Fiscal Office of the State of Minas Gerais and the Public Ministry of Minas Gerais (the “MG Authorities”) of the practices of certain of our former customers with respect to commercial and value added tax (“VAT”), as well as our relationship with such former customers, that could result in liabilities for all parties involved in the commercial relationship. In the third quarter of 2023 and the first quarter of 2024, Nexa and the MG Authorities reached a resolution pursuant to which Nexa, without admitting primary responsibility for the resolved claims, agreed to make certain tax payments, including interest and penalties, to the State of Minas Gerais on behalf of certain former customers that allegedly failed to properly comply with their tax obligations. This resolution concluded the MG Authorities' investigation with respect to the Company, and the Company does not expect any further developments or provisions with respect to these matters. For more information about this investigation and its resolution, see “Additional Information—Legal Proceedings—Other legal proceedings.” For information on the financial effects of the resolution, see Note 9(iv) to our consolidated financial statements. The effects of any future tax-related investigations may have a material impact on our business and financial condition.
|
|
| Risk Factors |
We could be harmed by a failure or interruption of our information technology systems or automated machinery, including system security breaches or other cybersecurity attacks, and we may expend significant resources to modify and improve our cybersecurity measures.
We rely on internal and external information technology systems and automated machinery to effectively manage our production processes and operate our business. Any failure of our or third parties’ information technology systems and automated machinery to perform as we anticipate could disrupt our business and result in production errors, processing inefficiencies and the loss of sales and customers, which in turn could result in decreased revenue, increased overhead costs and excess or out-of-stock inventory levels resulting in a material adverse effect on our business results.
In recent years, there has been an increase in the number of cyberattacks in industrial and corporate environments. The tactics and techniques used by cybercriminals to gain access to and exploit sensitive information by breaching mission critical systems of large organizations have evolved in sophistication. We are dependent on internal information systems, and we are vulnerable to failure of these systems, including through system security breaches, data protection breaches or other cybersecurity attacks. We may be exposed to cyberattacks stemming from unauthorized access to our internal systems, vulnerabilities in critical systems, malware, espionage and sabotage. If these events occur, including a cyberattack causing a loss of critical data, unscheduled downtime/degradation of operations, or the disclosure or use of confidential information, these events could have a material adverse effect on our reputation and market value, which could adversely impact our results of operations. Additionally, we may incur additional costs and expend significant resources in continuing to modify and improve cybersecurity measures and investigate and remediate any weaknesses in our information technology systems.
In addition, privacy, data protection and cybersecurity are subject to frequently changing rules and regulations. The European Union’s General Data Protection Regulation (“GDPR”) took effect in 2018 and introduced increased regulations relating to personal data security. The GDPR requires companies to satisfy new requirements regarding the handling of personal and sensitive data, including its use, protection and the ability of persons whose data is stored to correct or delete such data about themselves. In 2011, Peru enacted the Law for Personal Data Protection No. 29,733, the Ley de Protección de Datos Personales (“LPDP”) and in 2018, the Brazilian president signed Law No. 13,709, the Lei Geral de Proteção de Dados (“LGPD”). Both the LGPD and LPDP represent comprehensive data protection laws, establishing detailed rules for the collection, use, processing and storage of personal data and affecting all economic sectors, including the relationship between customers and suppliers of goods and services, employees and employers and other relationships in which personal data is collected, whether in a digital or physical environment.
In July 2023, the SEC adopted new cybersecurity disclosure rules for public companies that require disclosure regarding cybersecurity risk management (including the corporate board’s role in overseeing cybersecurity risks, management’s role and expertise in assessing and managing cybersecurity risks, and processes for assessing, identifying and managing cybersecurity risks) in annual reports. These new cybersecurity disclosure rules also require the disclosure of material cybersecurity incidents in a Form 6-K promptly after the incident is disclosed or otherwise publicized in a foreign jurisdiction, any stock exchange, or to security holders. Such scrutiny from the SEC increases the risk of investigations into the cybersecurity practices, and related disclosures, of companies within its jurisdiction, which at a minimum can result in an increase in administrative costs, distraction of management and diversion of resources for targeted businesses. Any noncompliance with the GDPR, the LGPD, the LPDP, the SEC cybersecurity rules, or any other privacy, data protection and cybersecurity regulations could result in proceedings or actions against us by governmental entities, the imposition of fines or penalties and damage to our reputation, which could have an adverse effect on us and our business, reputation and results of operations.
|
|
| Risk Factors |
Financial risks
Our financial position and results of operations may be materially adversely affected by currency exchange rate fluctuations.
Our revenues are primarily denominated in U.S. dollars, and certain portions of our operating costs, principally labor costs, are denominated in reais and soles. Accordingly, when inflation in Brazil and Peru increases without a corresponding devaluation of the real or sol, our financial position, results of operations and cash flows could be materially adversely affected. See “Operating and Financial Review and Prospects—Key factors affecting our business and results of operations—Macroeconomic conditions of the countries and regions where we operate” for a discussion of inflation in 2023.
Given the structure of our operations, a decrease in the value of the U.S. dollar relative to the foreign currencies in which we incur costs generally could have a negative impact on our results of operations or financial position. Our foreign currency exposures increase the risk of volatility in our financial position, results of operations and cash flows. We cannot assure shareholders that currency fluctuations, or costs associated with our hedging activities (including fluctuations in exchange rates contrary to our expectations), will not have an impact on our financial position and results of operations.
Fluctuations in interest rates could increase the cost of servicing our debt, affect returns on our financial investments and negatively affect our overall financial performance.
Some of our indebtedness bears interest based on variable interest rates, including the Secured Overnight Financing Rate, or SOFR. As of December 31, 2023, 29.7% of our debt was variable rate debt. Such variable rates have fluctuated in response to changes in economic growth, monetary policy and governmental regulation. A significant increase in underlying interest rates, particularly in SOFR, could have a material adverse effect on our financial expenses and materially adversely affect our overall financial performance. In July 2017, the Financial Conduct Authority (“FCA”) announced its intention to phase out LIBOR by the end of 2021. However, on March 5, 2021, the FCA announced that most tenors of U.S. Dollar LIBOR would continue to be published through June 30, 2023, extending the previously announced deadline of December 2021. For more information, see “Operating and Financial Review and Prospects—Liquidity and Capital Resources—Debt”.
We may engage in hedging activity that may not be successful and may result in losses to us.
We may use foreign exchange and metal commodity non-deliverable forwards to reduce the risk associated with currency and metal price volatility. However, our hedging activities could cause us to lose the benefit of an increase in the prices of the metals we produce if they increase over the price level of hedge positions, or the benefit of an increase in the currency price. The cash flows and the mark-to-market values of our production hedges can be affected by factors such as the volatility of currency and the market price of metals, which are not under our control.
Our hedging agreements contain events of default and termination events that could lead to early close-outs of our hedges such as failure to pay, breach of the agreement, misrepresentation, default under our loans or other hedging agreements and bankruptcy. In the event of an early termination of our hedging agreements, the relevant hedge positions would be required to be settled at that time. In that event, there could be a lump sum payment to be made either to or by us. The magnitude and direction of such a payment would depend upon, among other things, the characteristics of the particular hedge instruments that were terminated and the relevant market prices at the time of termination. Any of the factors described above could have a material adverse effect on our financial position, results of operations or cash flows. See “Operating and financial review and prospects—Risk management—Financial risk—Metal price sensitivity.”
|
|
| Risk Factors |
Our business requires substantial capital expenditures and is subject to financing risks.
Our business is capital intensive. Exploration for and exploitation of mineral deposits, maintenance of machinery and equipment and compliance with applicable laws and regulations require substantial capital expenditures. We must continue to invest capital to maintain and potentially expand our existing brownfield operations, develop our greenfield projects pipeline in order to sustain and grow production, in addition to carrying out investments in sustaining, health, safety and environment. In 2023, we invested US$309.0 million in capital expenditures, US$292.8 million of which was in relation to sustaining investments. We depend partially on our operating cash flows to support our capital expenditures. See “Information on the Company—Capital expenditures.”
No assurance can be given that we will be able to maintain our production levels or generate sufficient cash flow, or have access to sufficient investments, loans or other financing alternatives to finance our capital and other projects expenditure program at a level necessary to sustain and grow our current exploration and exploitation activities. Any equity or debt financing, if available, may not be on terms that are favorable to us. If our access to external financing is limited, we may not be able to execute our strategy, which could adversely affect our business, financial position and results of operations.
We are exposed to credit risk in relation to our contractual and trading counterparties as well as to hedging and derivative counterparty risk, and our results of operations may be negatively impacted by increases in expected credit losses.
We are subject to the risk that the counterparties with whom we conduct our business (in particular our customers) and who are required to make payments to us are unable to make such payment in a timely manner or at all. Credit risk is present in our hedging operations, customer operations and cash management operations. If amounts that are due to us are not paid or not paid in a timely manner, this may impact not only our current trading and cash-flow position but also our financial and business position. In addition, our derivatives, metals hedging, and foreign currency and energy risk management activities expose us to the risk of default by the counterparties to such arrangements. Any such default could have a material adverse effect on our business, financial position and results of operations.
We hold a significant balance of accounts receivable and, therefore, provide an allowance to cover the portion of this amount that may not be received due to customer default. We record expected credit losses at an amount considered sufficient to cover estimated losses in the realization of receivables, taking into account our historical losses and internal risk classification of our customers, although we cannot guarantee that these amounts are sufficient to cover any losses. Additionally, delays in payment cycles from significant customers may adversely affect our liquidity and our ability to obtain financing for working capital, such as receivables sales.
Any acquisitions or divestitures we make may not be successful or achieve the expected benefits.
We regularly consider and evaluate opportunities to acquire assets, companies and operations, as well as constantly review our portfolio of projects and assets in operation. There can be no assurance that we will be able to successfully integrate any acquired assets, companies or operations, nor guarantee success in connection with any divestment or sale of an operational or non-operational project or asset. In addition, any additional debt we incur to finance an acquisition may materially adversely affect our financial position and results of operations. If future acquisitions are significant, they could change the scale of our business and expose us to new geographic, political, operating and financial risks. Similarly, any divestitures we make may not have the anticipated positive impacts and could lead to an impairment charge or other material adverse effects on our business, financial position, and results of operations.
Changes in the assumptions underlying the carrying amount of certain assets could result in impairment charges.
We periodically test whether our tangible and intangible assets have suffered any impairment, in accordance with the accounting policy stated in our consolidated financial statements. If our estimates of the recoverable amount of an asset change or are inaccurate, we may determine that impairment charges are necessary. While impairment does not affect reported cash flows, the decrease in the recoverable amount determined could have a material adverse effect on our results of operations. Assurances cannot be given as to the absence of significant impairment charges in future periods, particularly if market conditions deteriorate.
|
|
| Risk Factors |
We might not be able to pay the principal and interest amounts on our debt obligations in case they are accelerated as a result of the noncompliance with the restrictive covenants and clauses of our debt contracts.
Any default on the contracts governing our debts that is not remedied or waived by loan creditors or noteholders could result in the acceleration of the obligation to pay outstanding amounts owed to holders of such debts. If we are unable to generate sufficient cash flow from our operations and, therefore, unable to obtain the necessary resources to make the principal and interest payments on our debts as a result of such acceleration, our business, financial position and results of operations could be materially and adversely affected. For more information on restrictive covenants in our debt contracts, see “Operating and financial review and prospects—Liquidity and Capital Resources—Debt.”
Risks related to our Mineral Reserves and Resources
Our estimates of Mineral Reserves and Resources may be materially different from the total mineral quantities we actually recover, and changes in metal prices, operating and capital costs, and other assumptions used to calculate these estimates may render certain Mineral Reserves and Resources uneconomical to mine.
There is a degree of uncertainty attributable to the estimation of Mineral Reserves and Resources. Until Mineral Reserves and Resources are actually mined and processed, the quantity of metal and grades must be considered as estimates only and no assurance can be given that the indicated levels of metals will be produced. In making determinations about whether to advance any of our projects to development, we must rely upon estimated calculations for the Mineral Reserves and Mineral Resources and grades of mineralization on our properties.
The estimation of Mineral Reserves and Resources is a subjective process that is partially dependent upon the judgment of the Qualified Persons preparing such estimates. The process relies on the quantity and quality of available data and is based on knowledge, mining experience, statistical analysis of drilling results and industry practices. Valid estimates made at a given time may significantly change when new information becomes available.
Our estimates of Mineral Reserves and Resources are based on geological interpretation and statistical inferences or assumptions drawn from drilling and sampling analysis made as of the date of such estimates. We periodically update our Mineral Reserves and Resources estimates based on the conclusions of the relevant Qualified Persons with respect to new data from exploratory and infill drilling, results from technical studies and the experience acquired during the operation of the mine and metallurgical processing, as well as changes to the assumptions used to calculate these estimates.
Several of the assumptions used to calculate these estimates, including the market prices of commodities and foreign exchange rates, operating and capital costs and mining and metallurgical recovery rates, among others, can greatly fluctuate, which may result in significant changes to our current estimates. These changes may also render some or all of our proven and probable Mineral Reserves and Measured and Indicated Mineral Resources uneconomic to exploit and may ultimately result in a reduction of Mineral Reserves and Resources.
In addition, Inferred Mineral Resources have a massive amount of uncertainty as to their existence and their economic and legal feasibility. You should not assume that any part of an Inferred Mineral Resource will be upgraded to a higher category or that any of the Mineral Resources not already classified as Mineral Reserves will be reclassified as Mineral Reserves.
We depend on our ability to replenish our Mineral Reserves for our long-term viability.
Mineral Reserves data is only indicative of future results of operations at the time the estimates are prepared and are depleted over time as we conduct our mining operations. We use several strategies to replenish and increase our Mineral Reserves that are depleted, including exploration activities and the acquisition of mining concessions. If we are unable to replenish our Mineral Reserves or develop our Mineral Resources, our business, results of operations and prospects would be materially adversely affected.
|
|
| Risk Factors |
Our mineral exploration efforts are highly speculative in nature and may be unsuccessful.
Mineral exploration is highly speculative in nature, involves many uncertainties and risks and may be unsuccessful. It is performed to demonstrate the dimensions, position and mineral characteristics of mineral deposits, estimate Mineral Reserves and Resources, assess amenability of the deposit to mining and processing scenarios and estimate potential deposit value.
Substantial expenditures are required to establish proven and probable Mineral Reserves, to determine processes to extract the metals and, if required, to construct mining and processing facilities and obtain permits to carry on mining activities. Therefore, once the mineralization is discovered, it may take several years from the initial exploration phases and Mineral Resources determination before production is possible, if at all, during which time the project’s feasibility may change adversely.
Health, safety and environmental risks
Health, safety and environmental laws and regulations, including regulations pertaining to climate change, may increase our costs of doing business, restrict our operations or result in the imposition of fines or revocation of permits.
Our mining activities are subject to Brazilian and Peruvian laws and regulations, including health, safety and environmental matters. In March 2022, the Securities and Exchange Commission (“SEC”) proposed a new set of rules regarding disclosure and reporting requirements related to climate change. We will continue to monitor developments related to the new rules, which were adopted by the SEC on March 6, 2024, and subsequently temporarily halted by an administrative stay granted by the Fifth Circuit U.S. Court of Appeals on March 15, 2024. In January 2023, the Directive (EU) 2022/2464 of the European Parliament and of the Council of 14 December 2022 (the “Directive”) entered into force. The Directive modernizes and strengthens the rules concerning certain social and environmental information that the Company has to report, ensuring that investors and other stakeholders can accurately assess the Company’s social and environmental impact. European Union Member States, including Luxembourg, have until July 2024 to adopt the provisions of the Directive into their national law, as resulting obligations will be applied on a staggered basis. The Company will be required to comply with the Directive obligations starting in 2026 with respect to the accounts for the fiscal year ending on December 31, 2025. Additional matters subject to legislation include, but are not limited to, transportation, mineral storage, water use and discharge, use of explosives, hazardous and other non-hazardous waste, and reclamation and remediation measures. Our operations are subject to periodic inspections and special inspections in certain circumstances by governmental authorities and consultation with local communities. In Peru, the Congress began a revision process of a law to prohibit economic activities in the headwaters of basins, which are currently considered vulnerable areas that require protection and mitigation measures. However, the revision process lost momentum and has shown no sign of progress to date. If adopted, this law could have a material impact on our business and projects in case any new projects were to occur in headwaters of basins. For more information about these Peruvian environmental regulations, see “Information on the Company—Regulatory matters—Peruvian regulatory framework—Environmental regulations”. Compliance with these laws and regulations and new or existing regulations that may be applicable to us in the future could increase our operating costs and adversely affect our financial results of operations and cash flows.
Regulatory and industry response to climate change or other controls on greenhouse gas emissions, including limits on emissions from the combustion of carbon-based fuels, controls on effluents and restrictions on the use of certain materials, could significantly increase our operating costs and affect our customers and suppliers. Ongoing international efforts to address greenhouse gas emissions consist of controlling activities that may increase the atmospheric concentration of greenhouse gases. International agreements, like the Paris Agreement, Kyoto Protocol and COP26, are in different stages of negotiation and implementation. The measures included in such agreements may result in an increase of costs related to the implementation of new controls aimed at reducing greenhouse gas emissions, the purchase of credits or licenses for atmospheric emissions and the monitoring and registration of greenhouse gas emissions generated by our operations. These measures could adversely affect our business, financial position and results of operations. In addition, the Brazilian government has initiatives to grant environmental licenses in connection with the license holder’s commitment to reducing greenhouse gases, especially in the state of Minas Gerais. As health, safety, and environmental regulations, requirements, best practices and industry standards are evolving and becoming stricter in Brazil, we may incur increased expenditures for compliance with these increasingly demanding requirements.
|
|
| Risk Factors |
Pursuant to applicable environmental regulations and laws, we could be found liable for all or substantially all the damages caused by mining activities at our current or former facilities or those of our predecessors at disposal sites. We could also be found liable for all incidental damages due to the exposure of individuals to hazardous substances or other environmental damage, all of which could significantly and negatively affect our reputation. We cannot assure shareholders that our costs of complying with current and future environmental and health and safety laws and regulations, including decommissioning and remediation requirements, and any liabilities arising from past or future releases of, or exposure to, hazardous substances will not materially adversely affect our business, financial position and results of operations.
ESG issues, including those related to climate change and sustainability, may have an adverse effect on our business, financial condition, and results of operations, could damage our reputation, and may increase costs.
There is an increasing focus from certain investors, customers, consumers, employees and other stakeholders concerning ESG matters. Additionally, public interest and legislative pressure related to public companies’ ESG practices continue to grow and change, and may continue to shift based on political conditions in the countries in which we operate and do business. If our ESG practices fail to meet regulatory requirements, our medium- and long-term ESG commitments, or investor, customer, consumer, employee or other stakeholders’ evolving expectations and standards for responsible corporate citizenship in areas including environmental stewardship, support for local communities, Board of directors and employee diversity, human capital management, employee health and safety practices, product quality, corporate governance and transparency, our reputation, brand and employee retention may be negatively impacted. Additionally, our customers and suppliers may be unwilling to continue to do business or partner with us.
Customers, consumers, investors and other stakeholders are increasingly focusing on environmental issues, including climate change, dams, energy and water use, and other sustainability concerns. Concern over climate change, in particular, may result in new or increased legal and regulatory requirements to reduce or mitigate impacts to the environment.
If we do not adapt to or comply with new regulations, or if we fail to comply with disclosure requirements and consequently fail to meet evolving regulatory, investor, industry or stakeholder expectations and concerns regarding ESG issues, investors may reconsider their capital investment in Nexa, and customers and consumers may choose to stop purchasing our products, which could have a material adverse effect on our reputation, business or financial condition.
In addition, our ESG practices and initiatives may result in increased operational costs, including monitoring and reporting costs, equipment costs, energy costs, and other costs to comply with our developing practices and initiatives. These additional costs could have a material impact on our business, results of operations and financial condition.
Failure to meet environmental, social, and governance expectations or standards or achieve the Company’s environmental and social related goals could adversely affect its business, reputation, brand, results of operations, and/or financial condition.
Nexa discloses information about its environmental, social and governance goals and initiatives in its annual sustainability report, other non-financial reports, information provided on its website, press statements, and other communications. This disclosure includes voluntary commitments made by the Company regarding greenhouse gas (GHG) emission reductions, water consumption, safety, and diversity.
|
|
| Risk Factors |
Execution and achievement of Nexa’s ESG and GHG goals within the currently estimated costs and expected timeline is subject to risks and uncertainties which include, but are not limited to, availability, development, and affordability of technology needed to keep our commitments; unplanned issues with design, operations, and technology; inability to obtain required permits or licenses; lack of necessary materials and parts; changing products to meet customer needs and their acceptance of environmentally sustainable supply chain solutions; shifts in public opinion and political leadership; our ability to follow new rules, taxes, orders, or regulations related to climate matters.
The Company maintains and will use its best efforts to continue to maintain standards aligned with stakeholder expectations for best practices, and comply with new environmental, social, and governance regulations and expectations, aiming to minimize potential harm to the Company’s reputation, minimize adverse impacts on its ability to attract and retain customers and talents, and minimize exposure to legal and regulatory proceedings.
Natural disasters and climate change could affect our business.
Natural disasters could significantly damage our mining and production facilities and infrastructure and may cause a contraction in sales to countries adversely affected due to, among other factors, power outages and the destruction of industrial facilities and infrastructure. In particular, the Central Andean region, where two of our mines are located, is prone to mudslides and earthquakes of varying magnitudes. Due to the El Niño weather phenomenon, Peru typically experiences extreme weather events that lead to flooding and mudslides, and which could adversely affect our operations. In the past, extreme flooding and mudslides in Peru have interrupted the supply of metal concentrates from our mines and the supply of zinc products to our plants. The physical impact of climate change on our business remains uncertain, but we are likely to experience changes in rainfall patterns, increased temperatures, water shortages, rising sea and river levels, lower water levels in rivers due to natural or operational conditions, increased storm frequency and intensity as a result of climate change, which may adversely affect our operations. For example, in March 2023 production at the Cerro Lindo mine was suspended for approximately two weeks due to unusually heavy rainfall levels and overflowing rivers caused by Cyclone Yaku, which affected the region, as well as other parts of the country. Operations resumed at full capacity in April 2023. For additional information, see “Information on the Company—Mining Operations—Cerro Lindo.” Although we have insurance covering damages caused by natural disasters, extensive damage to our facilities and staff casualties due to natural disasters may not be covered by our insurer and/or could materially adversely affect our ability to conduct our operations and, as a result, reduce our future operating results.
In addition, the potential physical impact of climate change on our operations is highly uncertain and would be particular to the geographic circumstances of our facilities and operations. It may include changes in rainfall patterns, water shortages, rising sea and river levels, changing storm patterns and intensities and changing temperatures. These effects may materially adversely impact the cost, production and financial performance of our operations.
Global or regional health considerations, including the outbreak of a pandemic or contagious disease, such as the COVID-19 pandemic, have impacted and could continue to impact our business, financial condition and results of operations.
The global economy has faced a number of challenges since the outbreak of the COVID-19 pandemic, including disruption to financial markets, rising inflation, and increased volatility due to market expectations for a global recession. The emergence of new variants of COVID-19, the outbreak of another contagious disease, or future pandemics and public crises could present risks to our operations (including the ability of employees to be physically present at work), employee health and safety, mandatory operational closures and general macroeconomic activity, including international market prices for the metals we produce, as well as have a severe impact to our business, customers, or supply chain. This impact could continue for an extended period of time or impact our financial condition and results of operations and continued weak or worsening economic conditions could negatively impact demand for our products.
|
|
| Risk Factors |
Political, economic, social and regulatory risks
Political, economic and social conditions in the countries in which we have operations or projects, or in which we do business, could adversely impact our business, financial condition results of operations and the trading price of our securities.
Political, economic and social conditions in the countries in which we have operations or projects, or in which we do business, may negatively affect our financial performance. Our business, financial position and results of operations may be affected by the general conditions of the Peruvian, Brazilian and other national political conditions, economies, economic recessions, price instability, exchange rate volatility, inflation, interest rates, and domestic regulatory and taxation policies. There can be no assurance that the countries in which we operate or do business will not face political, economic or social problems in the future or that these problems will not increase the volatility of the price of securities of issuers with operations in those countries, like us, or interfere with our ability to operate and service our indebtedness. For additional information, see “Operating and Financial Review and Prospects—Overview—Key factors affecting our business and results of operations.”
In all these countries, we are exposed to various additional risks over which we have no control, such as social unrest, bribery, cyberattacks, extortion, corruption, robbery, sabotage, kidnapping, civil strife, terrorism, acts of war and guerilla activities. These issues may adversely affect the economic and other conditions under which we operate in ways that could have a materially negative effect on our business.
Recent and potential changes in commercial and mining laws, including trends like resource nationalism, may significantly impact our mining operations.
Changes to the Brazilian and Peruvian regulatory framework that could be enacted in the future may result in an increase in our expenses, particularly mining royalties and tax-related expenses, among others. Any changes in the interpretation of Brazilian or Peruvian mining laws and regulations, including changes to our concession agreement and changes in commercial rules and protections, may increase our compliance, operational or other costs. In December 2022, a new tax on mining operations was approved in the state of Mato Grosso, where the Aripuanã project is located. The Brazilian Supreme Court declared the tax unconstitutional, however in December 2023, a new tax replacing the previous tax was approved by the state of Mato Grosso.
In addition, there is a risk that resource nationalism in Brazil or Peru may result in operational limitations, local content requirements, and even expropriations and nationalizations. For additional information, see “Information on the Company—Regulatory matters—Brazilian regulatory framework—Mining rights and regulation of mining activities.”
Our mineral rights may be terminated or not renewed by governmental authorities.
Our business is subject to extensive regulation in Brazil and Peru, including with respect to acquiring and renewing the required authorizations, permits, concessions and/or licenses from the relevant governmental regulatory bodies. We have obtained, or are in the process of obtaining, all material authorizations, permits, concessions and licenses required to conduct our mining and mining related operations.
In Brazil, we may need to renew exploration authorizations related to our Brazilian mining operations 60 days prior to their expiration date if we determine that we continue to have an economic or business interest in the area. If we fail to demonstrate the existence of technical and economically viable mineral deposits in an area covered by an exploration authorization, we may be required to return it to the federal government. The federal government may then grant exploration authorizations to other parties that may conduct other mineral prospecting activities at said area. With respect to mining concessions, there is no renewal requirement once we have obtained such concession. However, we must continue to assess the mineral potential of each mining concession to determine if the costs of maintaining the related exploration authorizations and mining concessions are justified by the results of operations to date. If such costs are not justified and we abandon the mine or suspend the mining activities without the formal consent of the regulatory authority for a period more than six months, we may lose the respective mining concessions. Alternatively, we may elect to withdraw or assign some of our exploration authorizations or mining concessions.
|
|
| Risk Factors |
In Peru, once mineral concessions are granted, they may not be revoked if the titleholder complies with two obligations, (1) payment of an annual fee and (2) either achievement of the minimum annual production target or expenditure of the equivalent amount in exploration or investments before the statutory deadline. If the production, expenditure or investment targets are not met, a statutory penalty must be paid. Accordingly, mineral concessions will lapse automatically if any of these obligations are not met within the statutory period. Mining concessions in Peru may be terminated if the concessionaire does not comply with its obligations.
These authorizations, permits, concessions and environmental licenses are subject to our compliance with conditions imposed and regulations promulgated by the relevant governmental authorities. While we anticipate that all required authorizations, permits, concessions and environmental licenses or their renewals will be granted as and when sought, there is no assurance that these items will be granted as a matter of course, and there is no assurance that new conditions will not be imposed in connection with such renewals. If we were to violate any of the foregoing laws and regulations or the conditions of our concessions, authorizations, and environmental licenses, including the failure to remove all residents who are within the self-rescue zone, we may be subjected to substantial fines or criminal sanctions, revocations of operating permits or licenses and possible closings of certain of our facilities.
Our operations depend on our relations and agreements with local communities, and new projects require carrying out a prior consultation procedure.
There are several local communities that surround our operations in Brazil and Peru, most of which we have entered into agreements with that provide for the use of their land for our operations. We also interact with regional and local governments and depend on our close relations with local communities and such governments to carry out our operations. From time to time, we may experience disputes with local communities and if our relations with the local communities and such governments were to deteriorate, or the local communities do not comply with the existing agreements or renew them upon expiration, it could have a material adverse effect on our business, reputation, properties, operating results, financial position or prospects. In addition, a disruption in the relations between the local communities, governments and other parties may affect us indirectly. For additional information, see “Mining Operations—Atacocha—Production.”
We also may face certain risks in relation to artisanal mining near the areas in which we operate. The increase of artisanal mining activity or the failure of these artisanal miners to abide with our existent agreement may have an adverse effect on the development of our operations. For example, see “Mining Operations—Aripuanã—History.”
Furthermore, to develop new projects in the countries in which we operate on land owned by, or in the possession of, third parties, we need to reach an agreement with such third parties to use that land. Any delay or failure to reach such agreements or obtain governmental approvals for our new projects could result in a material adverse effect on our business, properties, operating results, financial position or prospects.
Changes in tax laws, and any related tax agreements we have entered into or may enter into with local governments, may increase our tax burden and, as a result, could adversely affect our business, financial position and results of operations.
The Brazilian, Peruvian and Luxembourg governments from time to time implement changes to tax laws and regulations. Any such changes, as well as changes in the interpretation of such laws and regulations, or changes to former precedents on tax decisions by authorities or courts, may result in increases to our overall tax burden, which would negatively affect our profitability. Moreover, some tax laws may be subject to controversial interpretation by tax authorities, including, but not limited to, the regulation applicable to corporate restructurings. In the event an interpretation different than the one on which we based our transactions prevails, we may be adversely affected.
In addition, as a result of the VAT tax benefit adopted by Minas Gerais State on the commercialization of several products, including metallic zinc, there has been increased scrutiny by the tax authorities of companies incorporated in this State. For more information about the VAT tax benefit, see “Information on the Company—Regulatory Matters—Brazilian regulatory framework—Royalties and other taxes on mining activities.” See also “Additional Information—Legal Proceedings” for information about the investigation by the Fiscal Office of the State of Minas Gerais and the Public Ministry of Minas Gerais relating to the VAT-related practices of certain of Nexa’s former customers, as well as Nexa’s relationship with such former customers.
|
|
| Risk Factors |
On January 1, 2024, new transfer pricing regulations came into effect in Brazil, which adopted an arm’s length principle to transfer pricing similar to that of the Organization for Economic Co-operation and Development (OECD). Additionally, a substantial VAT tax reform for indirect and consumption taxes that eliminates existing federal, state and municipal indirect taxes and creates three classes of taxes was approved in Brazil in December 2023 and will begin as of 2026. The reform’s goals are simplification, competitiveness and uniformization of legislation, and a long and gradual transition period is expected from 2026 to 2033. The Company is currently assessing the impacts of the reform on its operations and there can be no assurance that these new regulations will not increase taxes for Nexa.
Additionally, the OECD’s Pillar Two tax reform, which establishes a global minimum effective tax rate of 15%, became effective in Luxembourg on January 1, 2024. See “Taxation—Luxembourg tax considerations” for more information about this tax regime and its potential impact on Nexa. Peru and Brazil have not yet enacted the Pillar Two legislation, however adopting this regime in either country could have a potential impact on our business, financial position and results of operations.
Further, we are engaged in ongoing tax-related matters with the Peruvian tax authorities (“SUNAT”) related to the stability agreement of Cerro Lindo’s operations. The Peruvian tax authority issued unfavorable tax decisions against the Company for the years-ended December 31, 2014, 2015, 2016 and 2017. As of the date of this annual report, SUNAT is now auditing the years-ended December 31, 2018 and 2019. Discussions with SUNAT are expected to evolve in 2024, including potential audits of the years-ended December 31, 2020 and 2021, which is the last fiscal year covered by the stability agreement. The Company continues to conclude that there are legal grounds to obtain a favorable outcome in these matters, however, the Company may have to pay the disputed amounts under discussion to continue the legal process either in the judicial or international arbitration levels which may impact Nexa’s results, cash flow and liquidity. For more information, see “Additional Information—Legal Proceedings” and Note 11(d) to our consolidated financial statements.
The Brazilian, Peruvian or Luxembourg governments may implement additional changes to tax regulations in the future, which could adversely affect our business, financial position, and results of operations.
Our business, financial position and results of operations may be adversely affected by inflation.
Certain countries in which we operate are still experiencing or have experienced high levels of inflation in the past and may continue to experience high levels of inflation in the future, which may impact the cost of operation and domestic demand for our products. Inflationary pressures somewhat decreased globally during 2023 compared to 2022 and may moderate further in 2024, but still remain at high levels. This has impacted our operating margins and may impact our ability to access international financial markets. Further, government policies may be implemented that could materially adversely affect the overall performance of the national economy of the countries in which we operate, which in turn may materially adversely affect Nexa. Furthermore, as we follow international market prices, we may not be able to adjust the prices we charge our customers to offset potential effects of inflation on our cost structure. In addition, although the functional currency for our Peruvian operations is the U.S. dollar, high rates of inflation could increase our operating costs and may further adversely impact our operating margins if we are not able to pass the increased costs on to consumers.
We are subject to anti-corruption, anti-bribery and anti-money laundering laws and regulations in various jurisdictions. Any violations of any such laws or regulations could have a material adverse impact on our reputation and results of operations and financial position.
We are subject to anti-corruption, anti-bribery, anti-money laundering and other international laws and regulations and are required to comply with the applicable laws and regulations of Brazil, Peru, Luxembourg, Canada and the United States, among others. In addition, we are subject to economic sanctions regulations that restrict our dealings with certain sanctioned countries, individuals and entities. Our governance and compliance processes may not timely identify or prevent future breaches of legal, accounting or governance standards. We may be subject to instances of fraudulent behavior, corrupt practices and dishonesty by our affiliates, employees, directors, officers, partners, agents and service providers. Any violations by us of anti-bribery and anti-corruption laws, sanctions regulations or other standards could have a material adverse effect on our business, reputation, results of operations and financial position.
|
|
| Risk Factors |
Political and social opposition to mining activities generally in the regions we operate could adversely impact our business and reputation.
Disputes with communities where we operate may arise from time to time. In some instances, our operations and mineral reserves are located on or near lands owned or used by indigenous people or other groups of stakeholders. Some of our mining and other operations are in territories where title may be subject to disputes or uncertainties, or in areas claimed for agriculture or land reform purposes, which may lead to disagreements with organized social movements, local communities and the government. Further social or political changes, particularly in Peru and Brazil, may lead to a potential increase in these claims. We may be required to consult and negotiate with these groups as part of the process to obtain licenses required to operate, to mitigate impact on our operations or to obtain access to their lands. Disagreements or disputes with local groups, including indigenous groups, organized social movements and local communities could cause delays or interruptions to our operations, adversely affect our reputation or otherwise hamper our ability to develop our reserves and conduct our operations. Protesters have taken actions to disrupt our operations and projects, and they may continue to do so in the future, which may harm our operations and could adversely affect our business. In recent years, Peru has experienced protests against mining projects in several regions. On several occasions, local communities have opposed these operations and accused them of polluting the environment and hurting agricultural and other traditional economic activities. For example, production at the Atacocha mine was temporarily suspended in January and June 2023, as well as in February 2024, due to blockades by local communities. For additional information, see “Mining Operations—Atacocha—Operations and infrastructure” Social demands and conflicts could have a material adverse effect on our business and results of operations and the economy in general of the countries in which we operate.
Differing interpretations of agency regulations or court rulings and the application of such laws and regulations could result in unintended non-compliance and may have a material effect on our business, results of operations, and financial position.
The courts in some of the jurisdictions in which we operate may offer less certainty as to the judicial outcome of legal proceedings or a more protracted judicial process than is the case in more established economies. Businesses can become involved in lengthy court cases over simple issues when rulings are not clearly defined, and the poor drafting of laws and excessive delays in the legal process for resolving issues or disputes compound such problems. In addition, there may be limited or no relevant case law providing guidance on how courts would interpret such laws and the application of such laws to our contracts, joint ventures, licenses, license applications or other legal arrangements. Accordingly, there can be no assurance that contracts, joint ventures, licenses, license applications, tax agreements, or other legal arrangements will not be adversely affected by the actions of government authorities and the effectiveness of and enforcement of such arrangements in these jurisdictions. Moreover, the commitment of local businesses, government officials and agencies and the judicial system in these jurisdictions to abide by legal requirements and negotiated agreements may be more uncertain and may be susceptible to revision or cancellation, and legal redress may be uncertain or delayed. These uncertainties and delays could have a material adverse effect on our business and results of operations. Finally, certain interpretations of regulations and laws may lead to increasing governmental fines and sanctions, even for non-material violations of these rules and regulations. If Nexa is deemed to be in violation of agency regulations or court rulings, and is required to make payments in connection with the alleged violations, this may have a material impact on our business, results of operations and financial position.
Regulation of other activities.
We are subject to mining and environmental regulation related to, among other activities, the use of explosives, fuel storage, controlled substances, discharges, telecommunications, archeological remains and energy concessions. We are also subject to more general legislation on data privacy, labor, occupational health and safety, and peasant and indigenous communities, among others, that may adversely affect our business. See “Information on the Company—Regulatory matters—Brazilian regulatory framework” and “Information on the Company—Regulatory matters—Peruvian regulatory framework.
|
|
| Risk Factors |
Risks relating to our corporate structure
VSA has substantial control over us, which could limit our shareholders’ ability to influence the outcome of important corporate decisions.
As of March 27, 2024, VSA owns 64.68% of our issued and outstanding common shares. As a result, VSA can influence or control matters requiring approval by our shareholders, including the election of directors, the allocation of profits, the appointment of external auditors and the approval of mergers, acquisitions or other extraordinary transactions. VSA may also have interests that differ from our other investors and may vote in a way with which our other shareholders disagree, and which may be adverse to the interests of our other investors. Additionally, we may experience a lack of trading liquidity associated with VSA’s control over us.
In addition, we have entered into several shared services contracts and similar agreements with other entities in the Votorantim Group in order to achieve operational economies of scale. Since we rely on the Votorantim Group for negotiation, renewal and extension of these agreements, there can be no assurances that we will always have access to the services procured pursuant to these agreements at the same prices and conditions. See “Share ownership and trading—Related Party Transactions.”
Dividends or other distributions paid by us on our common shares will generally be subject to Luxembourg withholding tax.
Any dividends or other distributions paid by us on our common shares will be subject to a Luxembourg withholding tax at a rate of 15.0% unless an exemption or reduction in rate applies. The withholding tax must be withheld from the gross distribution and paid to the Luxembourg tax authorities. Under certain circumstances, distributions as share capital reductions or share premium reimbursements may not be subject to withholding tax, but there are no assurances that we will be able to make such distributions in the future. See “Additional Information—Taxation—Luxembourg tax considerations—Shareholders.”
The rights of our shareholders, and the responsibilities of VSA as our controlling shareholder, are governed by Luxembourg law and differ in some respects from the rights and responsibilities of shareholders under the laws of other jurisdictions, including the United States and Canada, and shareholders may have more difficulty protecting their interests than they would as shareholders of a U.S. corporation.
Our corporate affairs are governed by our articles of association and by the laws governing limited liability companies organized under the laws of Luxembourg, as well as such other applicable local law, rules and regulations. The rights of our shareholders and the responsibilities of VSA as our controlling shareholder and of our directors and officers under Luxembourg law are different from those applicable to a corporation incorporated in the United States or Canada. There may be less publicly available information about us than is regularly published by or about U.S. or Canadian issuers. Also, Luxembourg regulations governing the securities of Luxembourg companies may not be as extensive as those in effect in the United States or Canada, and Luxembourg law and regulations in respect of corporate governance matters may not be as protective of non-controlling shareholders as corporation laws in the United States or Canada. Therefore, shareholders may have more difficulty protecting their interests in connection with actions taken by us, our directors and officers or our principal shareholders than they would as shareholders of a corporation incorporated in the United States or Canada.
Our ability to pay dividends or other distributions and repurchase shares is subject to several factors and conditions.
The determination to pay dividends and the payment of dividends or other distributions (including reimbursements of share premium) will be subject to the approval of our Board of directors and/or our shareholders, as applicable, and will depend on a number of factors, including, but not limited to, our cash balance, cash flow, earnings, capital investment plans, expected future cash flows from operations, our strategic plans and cash dividend distributions from our subsidiaries, as well as restrictions imposed by applicable law and contractual restrictions (although as of the date of this annual report there are no contractual restrictions on our ability to pay dividends or other distributions to our shareholders), LME metal prices and other factors our Board of directors may deem relevant at the time. Luxembourg law also imposes certain requirements regarding distributions. For additional information, see “Share ownership and trading—Distributions.”
|
|
| Risk Factors |
We are a holding company and have no material assets other than our ownership of shares in our subsidiaries. When we pay a dividend or other distribution on our common shares, we generally cause our operating subsidiaries, including subsidiaries that are not wholly-owned by Nexa, to make distributions to the parent company in an amount sufficient to fund any such dividends or distributions to Nexa’s shareholders. Although as of December 31, 2023, there are no material contractual restrictions on our subsidiaries’ ability to make distributions, their ability to do so is subject to, among other things, their capacity to generate sufficient earnings and cash flow and may also be affected by statutory accounting and tax rules in Brazil and Peru.
The determination to repurchase shares of our common stock is discretionary. Our ability to repurchase shares will depend on a number of factors, including, but not limited to, metal prices, restrictions imposed by applicable law, contractual restrictions, and other factors our Board of directors may deem relevant at the time. Our decision to repurchase shares could have a negative effect on the Company’s free cash flow and/or the liquidity of our common stock.
It could be difficult for investors to enforce any judgment obtained outside Luxembourg against us or any of our associates.
We are organized under the laws of Luxembourg. Furthermore, certain of our directors and officers reside outside the United States and Canada and most of their assets are located outside the United States and Canada. Most of our assets are located outside the United States or Canada. As a result, it may not be possible for investors to effect service of process upon us or our directors and officers within the United States, Canada, or other jurisdictions outside Luxembourg or to enforce against us or our directors and officers, judgments obtained in the United States, Canada or other jurisdictions outside Luxembourg. Because judgments of United States or Canadian courts for civil liabilities based upon the U.S. federal securities laws or Canadian securities laws may only be enforced in Luxembourg if certain requirements are met, investors may face greater difficulties in protecting their interest in actions against us or our directors and officers than would investors in a corporation incorporated in a state or other jurisdiction of the United States or Canada.
|
|
| Business Overview |
BUSINESS OVERVIEW
Overview
We are a leading large-scale, low-cost integrated zinc producer with over 65 years of experience developing and operating mining and smelting assets in Latin America.
We operate and own six long life polymetallic mines, three located in the Central Andes of Peru, two located in the state of Minas Gerais in Brazil and one located in the state of Mato Grosso in Brazil.
Our operations are large-scale, modern, mechanized underground and open pit mines. Our mines are proximately located to one another, which creates efficiencies. Two of our mines, Cerro Lindo in Peru and Vazante in Brazil, are among the top 40 largest zinc-producing mines in the world and, combined with our other mining operations, placed us among the top five producers of mined zinc globally in 2023, according to Wood Mackenzie. In addition to zinc, which accounted for 54.5% of our mined metal production in 2023 measured on a zinc equivalent basis, we produce substantial amounts of copper, lead, silver and gold as by-products, which reduce our overall costs to produce mined zinc.
We also own a zinc smelter in Peru (Cajamarquilla) and two zinc smelters in Brazil (Três Marias and Juiz de Fora), which produce metallic zinc, zinc oxide and several by-products. We were the fifth largest producer of refined zinc globally in 2023, according to Wood Mackenzie. Our smelters are the only units in Latin America (excluding Mexico), resulting in benefits from higher premiums. Cajamarquilla is the only operating zinc smelter in Peru and was the fifth largest globally in 2023 by production volume, according to Wood Mackenzie. Peru is the second largest producer of mined zinc in the world, assuring long-term supply of zinc concentrates to Cajamarquilla. Given our proximity to concentrate producers (our own mines and third-party producers), we also benefit from freight parity.
In 2023, we achieved our guidance despite a challenging global macroeconomic environment and Aripuanã, whose production was behind our initial plan. The persistence of high inflation and high interest rates, ongoing global conflicts, including the Russia-Ukraine war and the conflict in the Middle East, and uncertainties about the performance of key sectors of the Chinese economy, significantly increased commodity price volatility, contributing to a slowdown in global growth, and intensifying inflationary pressures throughout the year. Production of our existing mines were at the high end, or above guidance range, and metal sales were in the middle of the guidance range, while mining and smelting cash costs were slightly above and in line with our guidance, respectively.
Mining production increased in 2023 as compared to 2022, this increase in the mining segment was mainly explained by better performance in the El Porvenir, Vazante, Morro Agudo and Aripuanã mines largely due to higher treated ore, despite lower production in the Atacocha and Cerro Lindo mines. Production in the smelting segment decreased from 2022, due to operational instabilities across our smelters as well as a slowdown in domestic demand.
In January 2023, protest activities by the Machcan community temporarily suspended operations at the Atacocha San Gerardo open pit mine for approximately one week. In June 2023, protest activities by the Machcan community again blocked access to the Atacocha San Gerardo open pit mine, temporarily suspending production for approximately one month. Finally, in February 2024 protests by the Joraoniyoc community temporarily suspended production at the Atacocha San Gerardo open pit mine for approximately three days. During the protests, mining activities were limited to critical operations with a minimal workforce to ensure appropriate maintenance, safety, and security. Even though production was temporally suspended during these periods, we were able to operate at high levels of capacity utilization rates throughout the year.
In March 2023, production at the Cerro Lindo mine was suspended for approximately two weeks due to unusually heavy rainfall levels and overflowing rivers caused by Cyclone Yaku, which affected the region, and other parts of the country. Nonetheless, following the successful underground mine dewatering process, operations resumed at full capacity in April 2023.
In 2023, zinc production increased by 12.4% compared to 2022, mainly due to the increase in production at Aripuanã and Vazante. Our mining operations produced 333.2 thousand tonnes of zinc contained in concentrates, 33.4 thousand tonnes of copper contained in concentrates, 65.2 thousand tonnes of lead contained in concentrates, 10,300.7 thousand ounces of silver and 27.6 thousand ounces of gold, for a total of 611.1 thousand tonnes of metal on a zinc equivalent basis.
|
|
| Business Overview |
Total production (zinc metal + oxide) in 2023 decreased 3.2% compared to 2022. Our smelters produced 587.5 thousand tonnes of zinc metal and oxide available for sale in different formats and sizes during 2023, along with by-products, including sulfuric acid, silver concentrate, copper cement and copper sulfate.
Our smelters process mostly zinc concentrate, 47.9% of which was sourced from our mines during 2023, and 52.1% purchased from third parties or obtained as secondary raw material (excluding oxide). Approximately 94.5% of the total volume of the contained zinc in concentrates produced by our mines was processed by our own smelters in 2023, with the remainder and all our copper and lead concentrates sold to third parties. We market our products in Latin America and globally, through our commercial offices in Luxembourg, the United States, Brazil and Peru. We also own energy assets (hydroelectric power plants) in both Brazil and Peru, which provide access to a reliable and competitive power supply.
The Aripuanã ramp-up activities started in July 2022. In January and February 2023, the plant operated at approximately 57% of nameplate capacity. However, in March 2023, we decided to temporarily halt operations at the plant to clear some bottlenecks, related primarily to pumping and piping systems, and to improve the drainage configuration that presented some limitations after the rainy season, which occurred from December 2022 to March 2023. At the beginning of 3Q23, the plant performance was averaging 75% of nameplate capacity. We then observed design limitations in the capacity of the flotation pumping system, identified during the detection of bottlenecks in March 2023, which required resizing and upgrade along with certain plant processing facilities and systems, as well as the clean-up and upgrading of water treatment facilities. As a result, we reduced plant throughput and the plant performed at an average of 56% in 3Q23. Despite the reduction, we continue to prioritize metal recovery and concentrate quality and grades, aiming to achieve a stable operation. With this revised plan, we achieved an average of 61% capacity utilization level in 4Q23 and expect to reach nameplate capacity in mid-2024.
In 2023, Nexa continued to demonstrate its commitment to ESG as well as its commitment to promoting safe and inclusive workplaces. For example, in April 2023, we committed to reducing CO2 emissions by using natural gas to replace diesel fuel in transport vehicles at mining sites in Peru. We also obtained authorization from the Regional Superintendence for the Environment of the State of Minas Gerais to use biofuel to replace fossil fuels in zinc oxide furnaces at the Três Marias smelter and expand the use of this biofuel to the remaining furnaces at this site over the years. In August 2023, in line with our ESG commitments targeting net-zero greenhouse gas emissions by 2050, we implemented the ON GRID solar system at our Cajamarquilla smelter, providing electric power from solar energy, resulting in a reduced footprint carbon emissions and promoting clean energy production. Further, in October 2023, Nexa announced the successful closing of a US$320 million sustainability-linked revolving credit facility, which replaced Nexa’s 2019 US$300 million revolving credit facility that was set to mature in October 2024. This new revolving credit facility has a term of five years, remains undrawn and amounts drawn are subject to an initial interest rate of 1.60% plus Term SOFR. The applicable margin is subject to compliance with carbon reduction key performance indicators, reflecting the Company’s unwavering commitment to reducing its carbon footprint.
History
We commenced operating in 1956 under the name “Companhia Mineira de Metais”, in the state of Minas Gerais, Brazil. After a series of restructurings in the subsequent fifty-eight years, in 2014, a new corporate governance model was implemented by our controlling shareholder VSA in the corporate group. The main consequence of this new corporate model was that the new governance structure demanded a higher level of empowerment and accountability of senior management, and the establishment of a Board of directors at each company. In addition, in connection with the implementation of the new corporate governance model, VSA’s equity participations in Nexa CJM (formerly Votorantim Metais – Cajamarquilla S.A.) and Nexa Brazil (formerly Votorantim Metais Zinco S.A.) were transferred to Nexa Resources on June 18, 2014 and July 1, 2014, respectively.
In October 2017, we completed our initial public offering and listed our common shares on the New York Stock Exchange (“NYSE”) and on the Toronto Stock Exchange (“TSX”) under the ticker symbol NEXA. In connection with becoming a public company, VM Holding S.A. changed its corporate name to Nexa Resources S.A. and our subsidiaries Votorantim Metais—Cajamarquilla S.A., Votorantim Metais Zinco S.A. and Compañía Minera Milpo S.A.A. changed their corporate names to Nexa CJM, Nexa Brazil and Nexa Peru, respectively.
|
|
| Business Overview |
Following receipt of approval for a voluntary delisting of our common shares from the TSX in Canada, the last trading of our common shares on the TSX took place on November 30, 2021. Nexa received approval for the delisting following an internal assessment of the relative advantages and disadvantages associated with the listing of our common shares on the TSX. Nexa continues to be a reporting issuer in each of the provinces and territories of Canada following the delisting and continues to file in Canada and disseminate to Canadian resident holders of the common shares its continuous and periodic disclosure documents until such time as it ceases to be obligated to do so. Nexa intends to apply to cease to be a reporting issuer in Canada under Canadian securities laws upon being in a position to satisfy or obtain relief from applicable regulatory requirements.
Corporate structure and principal subsidiaries
Nexa CJM
Currently, Nexa Resources is the beneficial owner of 99.916% of the outstanding shares of Nexa CJM, and the remaining outstanding shares are owned by Nexa Recursos Minerais S.A. with 0.081% and by other minority shareholders holding 0.003% in aggregate.
Nexa Peru
Currently, Nexa Peru’s share capital consists of 1,257,754,353 common shares. In addition to common shares, Nexa Peru has issued investment shares that represent a participation in its net worth (patrimonio). Although the investment shares do not represent a participation in the capital of Nexa nor grant any voting rights, they grant their holders the right, among others, to participate in any dividend distributions and liquidation proceeds, pro rata to the percentage they represent in the total net worth of Nexa Peru; as well as to participate in any capital increases (in order to maintain the participation they represent in the total net worth) and the right to have their shares redeemed in certain circumstances. As of December 31, 2023, approximately 67.02% of the investment shares are free float and 32.98% are treasury shares.
Both the common shares and the investment shares of Nexa Peru are registered with the Peruvian Public Registry of Securities (Registro Público del Mercado de Valores) and listed on the Lima Stock Exchange. As a result, Nexa Peru is required to comply with certain disclosure obligations such as filing quarterly and annual financial statements, reporting on material events (hechos de importancia) and disclosing information regarding the economic group to which it belongs.
The following table sets forth information concerning the ownership of the capital stock of Nexa Peru, excluding the investment shares.
|
Shareholder |
Number |
Share Capital (%) |
| Nexa CJM | 1,048,621,896 | 83.37% |
| Nexa Resources | 2,277,601 | 0.18% |
| Public float |
206,854,856 |
16.45% |
| Total |
1,257,754,353 |
100.0% |
Nexa Brazil
On May 1, 2023, Nexa Brazil, which is 100% owned by Nexa Resources, merged its wholly-owned subsidiary Mineração Dardanelos Ltda., which owns 100% of the Aripuanã Mine, into itself.
|
|
| Business Overview |
Producing mines and smelters
Our mines are:
| · | Cerro Lindo. Our Cerro Lindo mine is an underground mine located in Peru wholly-owned by Nexa Peru, which is 83.48% directly and indirectly owned by Nexa Resources. Operations began in 2007 and, in 2023, the Cerro Lindo mine produced approximately 78.2 thousand tonnes of zinc contained in concentrates, 28.6 thousand tonnes of copper contained in concentrates, 13.0 thousand tonnes of lead contained in concentrates, 3,541.0 thousand ounces of silver contained in concentrates and 3.4 thousand ounces of gold contained in concentrates. The ore is treated at a concentrate plant that has a processing capacity of 21.0 thousand tonnes of ore per day. |
| · | Vazante. Our Vazante mine is an underground and open pit mine located in Brazil wholly-owned by Nexa Brazil, which is 100% owned by Nexa Resources. Operations began in 1969 and, in 2023, the Vazante mine produced approximately 145.7 thousand tonnes of zinc contained in concentrates, 1.4 thousand tonnes of lead contained in concentrates and 575.6 thousand ounces of silver contained in concentrates. The ore is treated at a concentrate plant that has a processing capacity of 5.0 thousand tonnes of ore per day. |
| · | El Porvenir. Our El Porvenir mine is an underground mine located in Peru (part of the Cerro Pasco Complex) wholly-owned by Nexa Resources El Porvenir S.A.C., which is 83.48% directly and indirectly owned by Nexa Resources. Operations began in 1949 and, in 2023, the El Porvenir mine produced approximately 55.8 thousand tonnes of zinc contained in concentrates, 0.4 thousand tonnes of copper contained in concentrates, 24.9 thousand tonnes of lead contained in concentrates, 4,270.5 thousand ounces of silver contained in concentrates and 8.7 thousand ounces of gold contained in concentrates. The ore is treated at a concentrate plant that has a processing capacity of 6.5 thousand tonnes of ore per day. |
| · | Atacocha. Our Atacocha mine is an underground and open pit mine located in Peru (part of the Cerro Pasco Complex) wholly-owned by Nexa Resources Atacocha S.A.A. (formerly Compañía Minera Atacocha), which is 75.96% directly and indirectly owned by Nexa Resources. Operations began in 1938 and, in 2023, the Atacocha mine produced approximately 8.2 thousand tonnes of zinc contained in concentrates, 11.1 thousand tonnes of lead contained in concentrates, 1,399.7 thousand ounces of silver contained in concentrates and 7.6 thousand ounces of gold contained in concentrates. The ore is treated at a concentrate plant that has a processing capacity of 4.4 thousand tonnes of ore per day. In 2020, the mine was placed under a mandatory temporary suspension period in response to COVID-19. Due to the effects of COVID-19, the uncertain macroeconomic scenario and our efforts to reduce costs and improve operational efficiency, we decided not to resume the Atacocha underground mine after the mandatory temporary suspension of our operations in Peru and we placed it under care and maintenance, which it remains to date. |
| · | Aripuanã. Our Aripuanã mine is an underground mine located in Brazil wholly-owned by Nexa Brazil, which is 100% owned by Nexa Resources. Ramp-up activities at the Aripuanã mine began in July 2022, and the mine is currently in the ramp-up phase as of the date of this annual report. In 2023, the Aripuanã mine produced approximately 22.1 thousand tonnes of zinc contained in concentrates, 4.4 thousand tonnes of copper contained in concentrates, 6.3 thousand tonnes of lead contained in concentrates, 513.9 thousand ounces of silver contained in concentrates and 8.0 thousand ounces of gold contained in concentrates. The ore is treated at a concentrate plant that has a processing capacity of 6.3 thousand tonnes of ore per day. |
| · | Morro Agudo. Our Morro Agudo mine is an underground mine located in Brazil wholly-owned by Nexa Brazil, which is 100% owned by Nexa Resources. Operations began in 1988 and, in 2023, the Morro Agudo mine produced approximately 23.2 thousand tonnes of zinc contained in concentrates and 8.3 thousand tonnes of lead contained in concentrates. The ore mill feed material is treated at a concentrate plant that has a processing capacity of 3.4 thousand tonnes per day. On March 19, 2024, Nexa announced the suspension of its mining operations in the Morro Agudo Complex effective May 1, 2024 until further notice. The suspension is part of Nexa’s portfolio optimization process to improve free cash flow in line with the Company’s disciplined capital allocation framework, along with its long-term strategy to maximize value for the Company and its shareholders. |
|
|
| Business Overview |
Our smelters are:
| · | Cajamarquilla. Our Cajamarquilla smelter, which is wholly-owned by Nexa CJM, which is 99.997% directly and indirectly owned by Nexa Resources, is located in Peru and began operating in 1981. It is currently the largest zinc smelter in Latin America and was the fifth largest zinc smelter in the world in 2023, according to Wood Mackenzie. Cajamarquilla uses Roast-Leach-Electrowinning technology. With a nominal production capacity of 344.4 thousand tonnes of contained zinc per year, Cajamarquilla produced 323.1 thousand tonnes of zinc metal available for sales in 2023 and 332.8 thousand tonnes in 2022. In 2023, 27.2% of the zinc contained in raw material used by Cajamarquilla was sourced from our mines in Peru and 72.8% was purchased from third parties or obtained from secondary feed materials. |
| · | Três Marias. Our Três Marias smelter, which is wholly-owned by Nexa Brazil, which is 100% owned by Nexa Resources, is located in Brazil and began operating in 1969. Três Marias processes zinc silicate concentrate from our Vazante mine and zinc sulfide concentrate from our Morro Agudo and Aripuanã mines and uses Roast-Leach-Electrowinning technology. With a nominal production capacity of 192.2 thousand tonnes of refined metal per year, Três Marias produced 182.3 thousand tonnes of zinc metal and oxide in 2023 and 189.9 thousand tonnes in 2022. In 2023, 87.3% of the zinc contained in raw materials used by Três Marias was sourced from our mining operations in Brazil and Peru and 12.7% was purchased from third parties or obtained from secondary feed materials. |
| · | Juiz de Fora. Our Juiz de Fora smelter, which is wholly-owned by Nexa Brazil, which is 100% owned by Nexa Resources, is located in Brazil and began operating in 1980. This smelter uses Roast-Leach-Electrowinning and Waelz Furnace technologies. With a nominal production capacity of 96.9 thousand tonnes per year, Juiz de Fora produced 82.1 thousand tonnes of zinc metal in 2023 and 84.2 thousand tonnes in 2022. In 2023, 41.7% the zinc raw material used in Juiz de Fora was zinc concentrate sourced from our mining operations, 41.8% was purchased from third parties and 16.5% was obtained from secondary feed materials from electric arc furnace (“EAF”) and brass oxide. |
Growth Projects
In addition to Nexa’s operating mines and smelters, a component of our business focuses on growth and exploration, which are activities associated with ascertaining the existence, location, extent or quality of a mineral deposit. Our growth and exploration activities encompass brownfield and greenfield projects. Brownfield projects are exploration or development projects near or within our existing operations, which can share infrastructure and management of our existing operations. Greenfield projects are exploration or development projects that are located outside the area of influence of our existing mine operations and/or infrastructure, which will be independently developed and managed from our existing operations. Most of our brownfield and greenfield projects are in the pre-feasibility or feasibility stages.
The evolution of a greenfield project until it reaches full/normal capacity can take decades. The steps that a project typically follows to reach full/normal capacity are: exploration (for mining projects), pre-feasibility, feasibility study, construction/execution, commissioning, ramp-up, and full/normal capacity. Aripuanã is the only greenfield project that Nexa has built in recent decades and was in the ramp-up stage throughout the entirety of 2023. We expect to reach nameplate capacity in mid-2024.
|
|
| Business Overview |
In addition to our operating mines and smelters, we have interests in three greenfield projects in Peru (Magistral, Hilarión and Florida Canyon Zinc) and one in Namibia, as well as a number of prospects in Peru, Brazil and Namibia. For more information about the projects, please see “Information on the Company—Mining operations—Growth projects.” Nexa also owns 18.2% of the issued and outstanding shares of Tinka Resources Limited, which in turn owns 100% of the Ayawilca zinc-silver development project located 40 kilometers northwest of Cerro de Pasco in Central Peru.
|
|
| Mining Operations |
MINING OPERATIONS
Map 1. Mines, Projects and Prospects in Peru
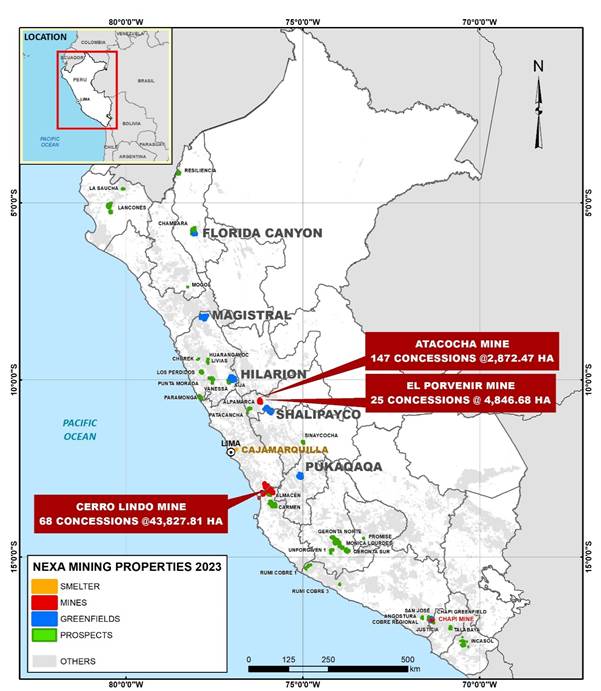
Source: Nexa Resources.
|
|
| Mining Operations |
Map 2. Mines, Projects and Prospects in Brazil

Source: Nexa Resources.
The following table summarizes our concentrate production, metal contained in concentrate production in each metal and zinc equivalent production in each of our operating mines.
To calculate the zinc equivalent production for the years ended December 31, 2023, 2022, and 2021, we convert the relevant metal contained in concentrate production used in the zinc equivalent grade based on the average benchmark prices for 2023, namely, US$2,649.04 per tonne (US$1.20 per pound) for zinc, US$8,483.40 per tonne (US$3.85 per pound) for copper, US$2,137.18 per tonne (US$0.97 per pound) for lead, US$23.39 per ounce for silver and US$1,942.74 per ounce for gold.
|
|
| Mining Operations |
|
For the Year Ended December 31, |
|||
|
2023 |
2022 |
2021 |
|
| Treated Ore (in tonnes) | 13,846,530 | 12,343,018 | 12,330,469 |
| Mining Production—Metal Contained in Concentrate | |||
| Zinc (in tonnes) | 333,154 | 296,403 | 319,950 |
| Copper (in tonnes) | 33,385 | 33,219 | 29,607 |
| Lead (in tonnes) | 65,194 | 57,448 | 45,565 |
| Silver (in oz) | 10,300,672 | 9,974,462 | 8,808,291 |
| Gold (in oz) | 27,627 | 27,216 | 25,501 |
| Mining Production—Zinc Equivalent Production | |||
| Cerro Lindo (in tonnes of zinc equivalent) | 214,068 | 241,438 | 243,069 |
| Vazante (in tonnes of zinc equivalent) | 151,911 | 136,643 | 146,222 |
| El Porvenir (in tonnes of zinc equivalent) | 121,164 | 114,921 | 104,283 |
| Atacocha (in tonnes of zinc equivalent) | 35,068 | 38,767 | 33,382 |
| Aripuanã (in tonnes of zinc equivalent) | 51,815 | 1,676 | - |
| Morro Agudo (in tonnes of zinc equivalent) | 37,049 | 31,218 | 30,110 |
| Total | 611,075 | 564,663 | 557,066 |
The following table summarizes the average ore grade for the periods indicated.
|
For the Year Ended December 31, |
|||
|
2023 |
2022 |
2021 |
|
| Average Ore Grade | |||
| Zinc (%) | 2.89 | 2.78 | 2.98 |
| Copper (%) | 0.34 | 0.34 | 0.31 |
| Lead (%) | 0.66 | 0.62 | 0.51 |
| Silver (in ounces per tonne) | 1.02 | 1.07 | 0.95 |
| Gold (in ounces per tonne) | 0.005 | 0.005 | 0.005 |
Each mine consists of one mine, one treatment plant and related infrastructure. We summarize below information as of December 31, 2023 for each of our six mines, including Aripuanã. For an overview of our reserves and resources, see “Mineral Reserves and Resources—Disclosure of Mineral Reserves and Resources”, “Mineral Reserves and Resources—Mineral Reserves” and “Mineral Reserves and Resources—Mineral Resources.”
Cerro Lindo
Location and means of access
The Cerro Lindo mine is an underground, polymetallic mine located in the Chavín District, Chincha Province, Peru, approximately 268 km southeast of Lima and 60 km from the coast. Access from Lima is available via the paved Pan American Highway south to Chincha, and then via an unpaved road up the Topará River valley to the mine site. Internal roadways connect the various mine site components. The approximate coordinates of the mine are 392,780m East and 8,554,165m North, using the Universal Transverse Mercator WGS84 datum and the mine site is located at an average elevation of 2,000 meters above sea level.
History
Several companies have held interests in the Cerro Lindo mine area, including BTX, Phelps Dodge, and Nexa Peru. Exploration work completed to date includes geological mapping, rock chip and soil sampling, trenching, ground geophysical surveys, and exploration, definition and underground operational core drilling. Feasibility studies were completed in 2002 and 2005, with mine construction commencing in 2006. Formal production started in 2007, and the mine has been operational since that date.
|
|
| Mining Operations |
Title, leases and options
All mineral concessions are held in the name of Nexa Peru. The tenure consists of 68 mining concessions totaling approximately 43,827.8 hectares and one beneficiation concession, covering an area of 518.8 hectares.
Nexa Peru currently holds surface rights or easements for the following infrastructure at Cerro Lindo: mine site, access roads, power transmission line and water pipeline for the mine, old and new power transmission lines to Cerro Lindo, desalination plant, water process plant, and the water pipeline from the desalination plant to the mine site. There is sufficient suitable land available within the mineral tenure held by Nexa Peru for tailings disposal, mine waste disposal and installations such as the process plant and related mine infrastructure.
Cerro Lindo is currently subject to payment of royalties. The tax stability agreement expired on December 31, 2021, and the historical applicability thereof is subject to certain disputes with tax authorities. For more information, see “Additional Information—Legal Proceedings—Other legal proceedings.” As of January 2022, Nexa Peru is required to pay royalties and special mining tax to the Peruvian government. For more information, see “Information on the Company—Regulatory matters—Peruvian regulatory framework.” As of December 31, 2023, Nexa Peru had a total of six water licenses, one for use of seawater, and the remaining five for ground water extraction.
Cerro Lindo holds a number of permits in support of the current operations. The permits are Directorial Resolutions issued by the Peruvian authorities upon approval of mining environmental impact assessments filed by the mining companies. Nexa Peru maintains an up-to-date record of the legal permits obtained to date.
Mineralization
Cerro Lindo is classified as a volcanogenic massive sulfide (“VMS”) deposit. The Cerro Lindo deposit is 1,500 meters long, 1,000 meters wide, and has a current vertical development of 470 meters below the surface. Mineralization consists of at least 10 discrete mineralized zones. The Cerro Lindo deposit comprises lens-shaped massive bodies, composed of pyrite (50.0% to 90.0%), yellow sphalerite, brown sphalerite, chalcopyrite, and minor galena. Significant barite is present mainly in the upper portions of the deposit. A secondary-enrichment zone, composed of chalcocite and covellite, has formed near the surface where massive sulfides have oxidized. Silver-rich powdery barite remains at the surface as a relic of sulfide oxidation and leaching.
In 2023, mineral exploration in Cerro Lindo focused on extensions of known ore bodies to the southeast of Cerro Lindo and on the Pucasalla target, as well as starting drilling tests at the Patahuasi Millay target, located 500 meters to the northwest of Cerro Lindo mine. Underground activities in 2023 included drilling at OB-8 and OB-9 to extend the known mineralized bodies near the mine, at geophysical anomaly zones in Patahuasi Millay, as well as Pucasalla to find new mineralized zones through surface drilling.
During 2023, we completed approximately 27.5 km of diamond drilling in 29 drill holes, divided between surface and underground exploration drillings. By the end of 2023, the drill holes from surface in Pucasalla target and its extensions confirmed evidence of sulfide mineralization with lens of sphalerite, galena and chalcopyrite in a dacite host rock with gangue of barite. In underground, the focus was to confirm the continuity of the mineralization in orebody OB-8 and OB-9.
During 2024, we expect to complete a total of 23.1 km of exploratory drilling. Our goals are to continue the exploratory drilling program to identify new mineralized zones supported by new access and platforms construction in Patahuasi Millay, Pucasalla and extensions, and continue extending the known orebodies such as OB-8 and OB-9.
In 2023, we spent US$6.8 million in exploration expenses for Cerro Lindo, primarily associated with diamond drilling, geochemistry analysis and geological research works. We have budgeted US$7.8 million for 2024 to continue our exploration program, as data interpretations, geochemistry, geophysical and exploratory drilling campaign.
|
|
| Mining Operations |
Operations and infrastructure
The Cerro Lindo mine is substantially mechanized, using rubber-tired equipment for all development and production operations. There is no shaft; all access is through 15 portals servicing adits, drifts and declines. Ore is extracted from nine separate ore bodies and delivered to the process plant via a series of conveyors. All ore is commingled during transport to the concentrator stockpile; ore from different ore bodies is not segregated.
We have completed construction of all key infrastructure required for mining and processing operations, including the underground mine, access roads, power lines, water pipelines, the desalination plant, offices and warehouses, accommodations, the process plant/concentrator, conveyor systems, waste rock facilities, temporary ore stockpiles, the paste-fill plant and the dry-stack tailings storage facilities. A new freshwater pipeline from the desalination plant on the coast to the mine was completed in February 2020 and is operational. The national grid supplies electrical power for the mine site.
In 2023, we spent US$37.7 million on sustaining capital expenditures for Cerro Lindo, primarily associated with mine development, equipment replacement and other major infrastructure projects.
In March 2023, production at the Cerro Lindo mine was suspended due to heavy rainfall levels and overflowing rivers caused by cyclone Yaku, resulting in the partial flooding of some lower levels of the mine. In April 2023, Cerro Lindo resumed operations at full capacity. During the temporary suspension, Nexa remained focused on the security and reparation of the mine and took all measures to ensure the safety and well-being of its employees, contractors and host communities. The temporary suspension of the mine resulted in lower production in 2023 compared to 2022.
Production
The Cerro Lindo mine is in the production stage and has a treatment plant capacity of 21,000 tonnes of ore per day. The Cerro Lindo unit has an authorized capacity of 20,000 tonnes of ore per day, but Peruvian law allows units to operate at a capacity 5.0% higher than their authorized capacity. The table below summarizes the Cerro Lindo mine’s concentrate production, metal contained in concentrates produced and average grades for the periods indicated. Production in 2023 was lower than 2022 primarily as a result of a two-week production suspension in March due to unusual heavy rainfall levels and lower grades.
|
For the Year Ended December 31, |
|||
|
2023 |
2022 |
2021 |
|
| Treatment ore (in tonnes) | 5,991,156 | 6,236,058 | 6,369,044 |
| Average ore grade | |||
| Zinc (%) | 1.51 | 1.55 | 1.79 |
| Copper (%) | 0.57 | 0.61 | 0.54 |
| Lead (%) | 0.31 | 0.33 | 0.28 |
| Silver (ounces per tonne) | 0.80 | 0.89 | 0.79 |
| Gold (ounces per tonne) | 0.002 | 0.002 | 0.002 |
| Metal contained in concentrates production | |||
| Zinc (in tonnes) | 78,209 | 84,392 | 102,275 |
| Copper (in tonnes) | 28,588 | 32,758 | 29,102 |
| Lead (in tonnes) | 13,042 | 15,641 | 12,849 |
| Silver (in oz) | 3,540,975 | 4,129,736 | 3,813,731 |
| Gold (in oz) | 3,418 | 4,146 | 4,829 |
| Cash Cost, net of by-product credits (in US$/t) | (138.6) | (561.4) | (530.1) |
| Cash Cost, net of by-product credits (in US$/lb) | (0.06) | (0.25) | (0.24) |
| Non-Expansion Capital Expenditures (in millions of US$) | 43.3 | 42.5 | 40.5 |
Mineral Reserves and Mineral Resources
The Cerro Lindo Mineral Reserves estimates are based on the definitions for Mineral Reserves in SK-1300 and the tables below are based on costs and modifying factors from the Cerro Lindo mine.
|
|
| Mining Operations |
Cerro Lindo – Year End Mineral Reserves as of December 31, 2023 (on an 83.48% Nexa attributable ownership basis) (1)
| Grade | Contained Metal | ||||||||||
| Class | Tonnage (2) | Zinc | Copper | Silver | Lead | Gold | Zinc | Copper | Silver | Lead | Gold |
| (Mt) | (%) | (%) | (g/t) | (%) | (g/t) | (kt) | (kt) | (koz) | (kt) | (koz) | |
| Proven | 21.83 | 1.68 | 0.61 | 21.2 | 0.20 | - | 367.1 | 132.6 | 14,863 | 44.1 | - |
| Probable | 12.52 | 1.15 | 0.45 | 25.2 | 0.24 | - | 144.3 | 56.8 | 10,154 | 29.9 | - |
| Total | 34.36 | 1.49 | 0.55 | 22.6 | 0.22 | - | 511.4 | 189.4 | 25,017 | 74.1 | - |
Notes:
| 1. | Subpart 1300 of Regulation S-K definitions were followed for Mineral Reserves, which also are consistent with the CIM (2014) definitions. |
| 2. | Mineral Reserves data presented in this table are reported on 83.48% Nexa attributable ownership. |
| 3. | The Qualified Person for the Mineral Reserves estimate is Cristovao Teofilo dos Santos, B.Eng., FAusIMM, a Nexa employee. |
| 4. | Numbers may not add due to rounding. |
| 5. | The point of reference for Mineral Reserves in this table is mill feed materials. |
Cerro Lindo – Year End Mineral Reserves as of December 31, 2023 (on a 100% ownership basis) (1)
| Grade | Contained Metal | ||||||||||
| Class | Tonnage (2) | Zinc | Copper | Silver | Lead | Gold | Zinc | Copper | Silver | Lead | Gold |
| (Mt) | (%) | (%) | (g/t) | (%) | (g/t) | (kt) | (kt) | (koz) | (kt) | (koz) | |
| Proven | 26.15 | 1.68 | 0.61 | 21.2 | 0.20 | - | 439.7 | 158.8 | 17,803 | 52.8 | - |
| Probable | 15.00 | 1.15 | 0.45 | 25.2 | 0.24 | - | 172.9 | 68.1 | 12,163 | 35.9 | - |
| Total | 41.15 | 1.49 | 0.55 | 22.6 | 0.22 | - | 612.6 | 226.9 | 29,966 | 88.7 | - |
Notes:
| 1. | Subpart 1300 of Regulation S-K definitions were followed for Mineral Reserves, which also are consistent with the CIM (2014) definitions. |
| 2. | Mineral Reserves data presented in this table represents 100% of the Mineral Reserves estimates for the property. Nexa owns 83.48% |
| 3. | The Qualified Person for the Mineral Reserves estimate is Cristovao Teofilo dos Santos, B.Eng., FAusIMM, a Nexa employee. |
| 4. | Numbers may not add due to rounding. |
| 5. | The point of reference for Mineral Reserves in this table is mill feed materials. |
The Cerro Lindo Mineral Reserves are estimated at an NSR cut-off value of US$40.86/t processed. A number of incremental material (with values between US$32.99/t and US$40.86/t) was included. A minimum mining width of 5.0 m was used, inclusive of extraction factors and dilution are applied based on stope type and location. The net smelter return (“NSR”) cut-off value is determined using the mineral reserve metal prices, metal recoveries, concentrate transport, treatment and refining costs, as well as mine operating costs. Metal prices used for Mineral Reserves are based on consensus, long term forecasts from banks, financial institutions and other sources. Mineral Reserves estimates are based on average long-term metal prices of: zinc: US$2,799.04/t (US$1.27/lb); copper: US$7,669.61/t (US$3.48/lb); lead: US$2,000.29/t (US$0.91/lb); and silver: US$21.17/oz. Metallurgical recoveries are accounted for in NSR calculations based on historical processing data and are variable as a function of head grade. Recoveries at Life of Mine average head grades are 88.36% for Zn, 85.23% for Cu, 66.53% for Pb, and 68.78% for Ag. The current life of mine (“LOM”) plan continues to 2030.
Cerro Lindo – Net Difference in Mineral Reserves between December 31, 2023 versus December 31, 2022 (on an 83.48% Nexa attributable ownership basis)
| Contained Metal | ||||||||||||
| Class | Tonnage | Zinc | Copper | Silver | Lead | Gold | ||||||
| (Mt) | % | (kt) | % | (kt) | % | (koz) | % | (kt) | % | (koz) | % | |
| Proven | (0.21) | (0.9) | (18.8) | (4.9) | (9.3) | (6.5) | (33) | (0.2) | (2.6) | (5.7) | - | - |
| Probable | (0.03) | (0.2) | (13.2) | (8.4) | (5.5) | (8.8) | 16 | 0.2 | 0.7 | 2.5 | - | - |
| Total | (0.23) | (0.7) | (32.0) | (5.9) | (14.8) | (7.2) | (18) | (0.1) | (1.9) | (2.5) | - | - |
|
|
| Mining Operations |
Cerro Lindo – Net Difference in Mineral Reserves between December 31, 2023 versus December 31, 2022 (on a 100% ownership basis)
| Contained Metal | ||||||||||||
| Class | Tonnage | Zinc | Copper | Silver | Lead | Gold | ||||||
| (Mt) | % | (kt) | % | (kt) | % | (koz) | % | (kt) | % | (koz) | % | |
| Proven | (0.25) | (0.9) | (22.5) | (4.9) | (11.1) | (6.5) | (40) | (0.2) | (3.2) | (5.7) | - | - |
| Probable | (0.03) | (0.2) | (15.8) | (8.4) | (6.6) | (8.8) | 19 | 0.2 | 0.9 | 2.5 | - | - |
| Total | (0.28) | (0.7) | (38.3) | (5.9) | (17.7) | (7.2) | (21) | (0.1) | (2.3) | (2.5) | - | - |
In comparison to 2022, Cerro Lindo’s Mineral Reserves slightly decreased by 0.7% in mass to total 41.2 Mt from 41.4Mt and decreased by 5.9% in zinc content (kt), mainly due to a 5.1% decrease in Mineral Reserves average head grade, as a result of the depletion in higher grade areas, lower grades in areas upgraded from infill drilling and a lower cut-off grade. Mineral Reserve depletion during 2023 represented 6.0Mt containing 90.3kt of zinc.
Cerro Lindo – Year End Mineral Resources as of December 31, 2023 (on an 83.48% Nexa attributable ownership basis) (1)
| Grade | Contained Metal | ||||||||||
| Class | Tonnage (2) | Zinc | Copper | Silver | Lead | Gold | Zinc | Copper | Silver | Lead | Gold |
| (Mt) | (%) | (%) | (g/t) | (%) | (g/t) | (kt) | (kt) | (koz) | (kt) | (koz) | |
| Measured | 3.67 | 1.93 | 0.65 | 23.1 | 0.24 | - | 70.9 | 23.9 | 2,728 | 8.8 | - |
| Indicated | 2.75 | 1.06 | 0.47 | 24.4 | 0.22 | - | 29.2 | 12.9 | 2,161 | 6.1 | - |
| Total | 6.43 | 1.56 | 0.57 | 23.7 | 0.23 | - | 100.1 | 36.8 | 4,889 | 14.9 | - |
| Inferred | 7.75 | 1.54 | 0.25 | 32.6 | 0.42 | - | 119.3 | 19.4 | 8,119 | 32.6 | - |
Notes:
| 1. | Subpart 1300 of Regulation S-K definitions were followed for Mineral Resources, which also are consistent with the CIM (2014) definitions. |
| 2. | Mineral Resources Tonnes and Contained Metal presented in this table are reported on 83.48% Nexa attributable ownership. |
| 3. | Mineral Resources are reported exclusive of those Mineral Resources that were converted to Mineral Reserves, and Mineral Resources are not Mineral Reserves and do not have demonstrated economic viability. |
| 4. | The Qualified Person for the Mineral Resources estimate is Jerry Huaman Abalos, B.Geo., MAusIMM CP(Geo), a Nexa employee. |
| 5. | Numbers may not add due to rounding. |
| 6. | The point of reference for Mineral Resources in this table is mill feed materials. |
Cerro Lindo – Year End Mineral Resources as of December 31, 2023 (on a 100% ownership basis) (1)
| Grade | Contained Metal | ||||||||||
| Class | Tonnage (2) | Zinc | Copper | Silver | Lead | Gold | Zinc | Copper | Silver | Lead | Gold |
| (Mt) | (%) | (%) | (g/t) | (%) | (g/t) | (kt) | (kt) | (koz) | (kt) | (koz) | |
| Measured | 4.40 | 1.93 | 0.65 | 23.1 | 0.24 | - | 84.9 | 28.6 | 3,268 | 10.6 | - |
| Indicated | 3.30 | 1.06 | 0.47 | 24.4 | 0.22 | - | 35.0 | 15.5 | 2,589 | 7.3 | - |
| Total | 7.70 | 1.56 | 0.57 | 23.7 | 0.23 | - | 119.9 | 44.1 | 5,857 | 17.9 | - |
| Inferred | 9.28 | 1.54 | 0.25 | 32.6 | 0.42 | - | 142.9 | 23.2 | 9,726 | 39.0 | - |
|
|
| Mining Operations |
Notes:
| 1. | Subpart 1300 of Regulation S-K definitions were followed for Mineral Resources, which also are consistent with the CIM (2014) definitions. |
| 2. | Mineral Resources data presented in this table represents 100% of the Mineral Resources estimates for the property. Nexa owns 83.48%. |
| 3. | Mineral Resources are reported exclusive of those Mineral Resources that were converted to Mineral Reserves, and Mineral Resources are not Mineral Reserves and do not have demonstrated economic viability. |
| 4. | The Qualified Person for the Mineral Resources estimate is Jerry Huaman Abalos, B.Geo., MAusIMM CP(Geo), a Nexa employee. |
| 5. | Numbers may not add due to rounding. |
| 6. | The point of reference for Mineral Resources in this table is mill feed materials. |
The Cerro Lindo Mineral Resources estimates in the table above were completed using Datamine Studio RM (“Datamine”) and Seequent’s Leapfrog Geo (“Leapfrog”) software. Wireframes for geology and mineralization were constructed in Leapfrog based on geology sections, assay results, lithological information, underground mapping and structural data. Assays were capped to various levels based on exploratory data analysis and then composited to 2.5 m lengths. Wireframes were filled with blocks sub-celled at wireframe boundaries. Blocks were interpolated with grade using the Ordinary Krig (“OK”) and Inverse Distance to the cube (“ID3”) interpolation algorithms. Block estimates were validated using industry standard validation techniques. Classification of blocks used distance-based and other criteria. Mineral Resources estimates were reported using all the material within resource shapes generated in Deswik Stope Optimizer (“DSO”) software. The estimate satisfied the minimum mining width of 4.0 m for resource shapes and used NSR cut-off value of US$40.86/t. Mineral Resources estimates are based on average long-term metal prices of: zinc: US$3,218.90/t (US$1.46/lb); copper: US$8,820.05/t (US$4.00/lb); lead: US$2,300.33/t (US$1.04/lb); and silver: US$24.35/oz. Metallurgical recoveries are accounted for in NSR calculations based on historical processing data and are variable as a function of head grade. Recoveries at Life of Mine average head grades are 88.36% for Zn, 85.23% for Cu, 66.53% for Pb, and 68.78% for Ag.
Cerro Lindo – Net Difference in Mineral Resources between December 31, 2023 versus December 31, 2022 (on an 83.48% Nexa attributable ownership basis)
| Contained Metal | ||||||||||||
| Class | Tonnage | Zinc | Copper | Silver | Lead | Gold | ||||||
| (Mt) | % | (kt) | % | (kt) | % | (koz) | % | (kt) | % | (koz) | % | |
| Measured | (0.82) | (18.2) | (11.7) | (14.2) | (3.9) | (14.1) | (477) | (14.9) | (1.5) | (14.1) | - | - |
| Indicated | 0.06 | 2.4 | (1.7) | (5.4) | (0.3) | (2.0) | (53) | (2.4) | (0.4) | (6.2) | - | - |
| Total | (0.75) | (10.5) | (13.4) | (11.8) | (4.2) | (10.2) | (530) | (9.8) | (1.9) | (11.1) | - | - |
| Inferred | 0.66 | 9.3 | 2.3 | 2.0 | 2.4 | 13.9 | (338) | (4.0) | 0.7 | 2.1 | - | - |
Cerro Lindo – Net Difference in Mineral Resources between December 31, 2023 versus December 31, 2022 (on a 100% ownership basis)
| Contained Metal | ||||||||||||
| Class | Tonnage | Zinc | Copper | Silver | Lead | Gold | ||||||
| (Mt) | % | (kt) | % | (kt) | % | (koz) | % | (kt) | % | (koz) | % | |
| Measured | (0.98) | (18.2) | (14.1) | (14.2) | (4.8) | (14.4) | (572) | (14.9) | (1.8) | (14.5) | - | - |
| Indicated | 0.08 | 2.5 | (2.0) | (5.4) | (0.3) | (1.9) | (61) | (2.3) | (0.4) | (5.2) | - | - |
| Total | (0.90) | (10.5) | (16.1) | (11.8) | (5.1) | (10.4) | (633) | (9.8) | (2.2) | (10.9) | - | - |
| Inferred | 0.79 | 9.3 | 2.8 | 2.0 | 2.8 | 13.7 | (401) | (4.0) | 0.8 | 2.1 | - | - |
In comparison to 2022, Cerro Lindo’s Measured and Indicated Mineral Resources decreased by 10.5% in mass and by 11.8% in zinc content (kt), mainly due to the conversion to Mineral Reserves. In comparison to 2022, Cerro Lindo’s Inferred Mineral Resources increased by 9.3% in mass and by 2.0% in zinc content (kt), due to infill and brownfield drilling.
|
|
| Mining Operations |
For additional information, see the Technical Report Summary on Cerro Lindo, filed as Exhibit 15.1 to Nexa’s annual report on Form 20-F/A for the year-ended December 31, 2020, as filed on November 4, 2021.
Vazante
Location and means of access
The Vazante mine is an underground and open pit, polymetallic mine located about 8.5 km from the municipality of Vazante, in the state of Minas Gerais, Brazil. The approximate coordinates of the mine are 17 57’ 33” S and a longitude of approximately 46° 49’ 42” W, within Zone 23S of the Universal Transverse Mercator coordinate system (Corrego Alegre Datum) at approximately 306,000m E and 8,016,000m N and the mine area has elevations ranging from 690 to 970 meters above sea level. Access from Brasilia is via federal highway BR-040 toward Paracatu. Internal roadways connect the various mine-site components. Concentrates are trucked about 250 km to the Três Marias smelter. The closest commercial airport is located in Brasilia. The Vazante municipal airport for light aircraft is adjacent to the mine site.
History
Mineralization was initially exploited by artisanal miners during the 1950s. Mechanized open pit mining and underground mining commenced in 1969 and 1983, respectively. The current primary ore types mined are hydrothermal zinc silicates and willemite. Initial mining operations exploited supergene calamine ores and a mixture of the zinc secondary minerals hemimorphite and smithsonite, which are derived from the weathering of silicate ore.
Title, leases and options
Nexa Brazil owns 100.0% of the Vazante mine. Mineral concessions are divided into core tenements, where the known mineral deposits are located and where we have active mining operations and the surrounding exploration concessions. Nexa Brazil holds two mining concession applications, two mining concessions, and one group of mining concessions in the core area with a total area of 2,174.5 hectares. The group of mining concessions comprises six mining concessions, totaling an area of 819.5 hectares. The Mineral Reserves and Resources are located within the limits of two mining concession application and seven mining concessions with a total area of 1,864.6 hectares, which host the active mining operations. One mining concession (tenement # 14,840/1967), which is part of the group of mining concessions, has the potential to host zinc and lead mineralization, however it does not yet have associated mineral reserves and resources.
Nearby the main area, Nexa Brazil also holds three exploration applications totaling 1,140.6 hectares, 36 exploration authorizations totaling 25,647.1 hectares, one right to apply for mining concession totaling 344.5 hectares, one mining concession application totaling 190.0 hectares and one mining concession totaling 52.5 hectares, in addition to the core tenements.
Nexa Brazil holds surface rights sufficient to support the current operations. Some surface rights agreements require annual payments to the owners. Two easements have been granted in support of the mining activities. Sufficient suitable land is available within the mineral tenure held by Nexa Brazil for tailings disposal, mine waste disposal, and installations such as the process plant and related mine infrastructure.
Brazilian companies that hold mining concessions are subject to a royalty payment imposed by the National Mining Agency. For more information, see “Information on the Company—Regulatory matters—Brazilian regulatory framework—Royalties and other taxes on mining activities.”
Nexa Brazil holds nine licenses for water management and water use in the operations. Nexa Brazil has lodged renewal applications, where applicable, for the water management.
The Vazante Operation holds several permits in support of the current operations. The main instrument to regulate the Vazante Operation is a set of operating licenses issued by the COPAM from the state of Minas Gerais. The licenses are active, some of them under renewal process.
|
|
| Mining Operations |
Mineralization
The Vazante and Extremo Norte zinc deposits are epigenetic zinc silicate deposits, and Vazante is one of the largest deposits of its type worldwide. Mineralization exists within a sequence of pelitic carbonate rocks belonging to the Serra do Poço Verde formation of the Vazante group. The major structural control is the Vazante fault.
Mineral exploration activities in 2023 were focused on expanding the mineralization of known ore bodies, such as Extremo Norte and Sucuri Norte, and identifying the continuity of mineralized bodies along the Vazante hydrothermal breccia. We are conducting ongoing tests to explore extensions of known mineralization, intensifying drilling in areas near mine where minimal data is currently available, and identifying other areas where mineralization may be present.
In 2023, we completed approximately 7.3 km of diamond drilling, divided between exploratory (1.3 km) and extension drilling (6.0 km). The focus of the near mine extension drilling was on the extension of the Vazante mine ore bodies, exploring the target Extremo Norte and Sucuri Norte, which confirmed the mineralized system and opened lateral and depth continuity. In addition, the mineral exploration team continues to seek to identify new prospective areas, such as Vazante Sul, which confirmed the presence of mineralized breccia more than 10 km from Vazante mine.
In 2024, Nexa intends to continue extending the near mine orebodies such as Sucuri and Sucuri Norte, and to convert inferred resources into indicated resources in the BDMG area, which was acquired in 2022.
In 2023, we spent US$3.5 million on the Cerro Lindo brownfield program for life of mine extension, including drilling program and geological activities. In 2023, we drilled 12 exploration drill holes, totaling 7.3 km. We have budgeted US$4.7 million for the mine during 2024 and we expect to drill 12.4 km.
Operations and infrastructure
The Vazante operation consists of two mechanized underground mines, the Vazante mine and Extremo Norte Mine, currently operating at a rate of approximately 1.5 Mtpy. Production drilling operations have been performed by company personnel using a variety of drilling machines throughout the history of the Vazante mine.
The Vazante underground mine has been in operation since 1983 and is a fully mechanized mine using rubber-tired diesel equipment for development and production activities. Access is through two portals for Vazante and one portal for Extremo Norte. As development progresses at Extremo Norte, a connecting drift will be established from Vazante to Extremo Norte.
All infrastructure required for the current mining and processing operations has been constructed and is operational. This includes the underground mines, access roads, power lines, water pipelines, offices and warehouses, a process plant/concentrator, conveyor systems, waste rock facilities, temporary ore stockpiles, paste-fill plants, and tailings storage facilities.
The power supply to the Vazante operation is provided by one independent 138 kV transmission line that feeds the site and that can provide up to 55 MW. There are two 30/40 MVA and one 18/23 MVA transformers in the surface substation at the Vazante Operation and power is distributed to other areas of the mine at 13.8 kV and 440 V via secondary transformers to power mine equipment. The power demand by 2026 is expected to reach approximately 55 MW as dewatering demands continue to grow. There are two 700 kVA diesel generators on site to provide backup power to pump water out of the mine in case of main line interruption.
In 2023, we spent US$28.0 million on sustaining capital expenditures for this property, primarily associated with mine development, ramp deepening in the “Extremo Norte”, equipment replacement and other major infrastructure. In addition, we invested US$2.5 million in capital expenditures related to the Vazante mine deepening, focusing on expansion. For more information, see “Information on the Company—Mining Operations—Growth Projects—Vazante mine deepening project.”
|
|
| Mining Operations |
Production
The Vazante mine is in the production stage and has a treatment plant with a nominal design processing capacity of approximately 5,000 tonnes of ore per day. The table below summarizes the Vazante mine’s concentrate production, metal contained in concentrates produced and average grades for the periods indicated. Production in 2023 was higher than 2022 due to higher treated ore volumes and higher zinc grades.
|
For the Year Ended December 31, |
|||
|
2023 |
2022 |
2021 |
|
| Treatment ore (in tonnes) | 1,633,357 | 1,524,637 | 1,630,690 |
| Average ore grade | |||
| Zinc (%) | 10.19 | 9.97 | 9.98 |
| Lead (%) | 0.33 | 0.33 | 0.35 |
| Silver (ounces per tonne) | 0.67 | 0.63 | 0.67 |
| Metal contained in concentrate production | |||
| Zinc (in tonnes) | 145,662 | 131,527 | 140,500 |
| Lead (in tonnes) | 1,449 | 1,160 | 1,616 |
| Silver (in oz) | 575,636 | 473,578 | 500,549 |
| Cash cost, net of by-product credits (in US$/t) | 1,343.5 | 1,227.5 | 900.2 |
| Cash cost, net of by-product credits (in US$/lb) | 0.61 | 0.56 | 0.41 |
| Non-Expansion Capital Expenditures (in millions of US$) | 29.1 | 41.9 | 42.0 |
Mineral Reserves and Mineral Resources
The Vazante Mineral Reserves estimates are based on the definitions for Mineral Reserves in SK-1300 and the tables below are based on costs and modifying factors from the Vazante mine and Vazante Aroeira Tailings.
Vazante – Year End Mineral Reserves as of December 31, 2023 (on a 100% ownership basis) (1)
| Grade | Contained Metal | ||||||||||
| Class | Tonnage (2) | Zinc | Copper | Silver | Lead | Gold | Zinc | Copper | Silver | Lead | Gold |
| (Mt) | (%) | (%) | (g/t) | (%) | (g/t) | (kt) | (kt) | (koz) | (kt) | (koz) | |
| Proven | 5.49 | 9.84 | - | 17.1 | 0.23 | - | 539.8 | - | 3,023 | 12.5 | - |
| Probable | 7.96 | 8.00 | - | 9.9 | 0.21 | - | 636.7 | - | 2,521 | 16.6 | - |
| Total | 13.44 | 8.75 | - | 12.8 | 0.22 | - | 1,176.6 | - | 5,544 | 29.1 | - |
Notes:
| 1. | Subpart 1300 of Regulation S-K definitions were followed for Mineral Reserves, which also are consistent with the CIM (2014) definitions. |
| 2. | Mineral Reserves data presented in this table represents 100% of the Mineral Reserves estimates for the property. Nexa owns 100%. |
| 3. | The Qualified Person for the Mineral Reserves estimate is Vitor Marcos Teixeira de Aguilar, B.Eng., FAusIMM, a Nexa employee. |
| 4. | Numbers may not add due to rounding. |
| 5. | The point of reference for Mineral Reserves in this table is mill feed materials. |
| 6. | Mineral Reserves presented in this table include Mineral Reserves from Vazante mine and Vazante Aroeira Tailings. |
The Vazante Mineral Reserves estimates in the table above consider actual costs and modifying factors from the Vazante mine and Vazante Aroeira tailings, as well as operational level mine planning and budgeting. The dilution that has been applied is related to the selected mining method. The NSR cut-off value was determined using the mineral reserve metal prices, metal recoveries, transport, treatment and refining costs, as well as mine operating costs. The Vazante mine Mineral Reserves are estimated at a NSR cut-off value of US$66.31/t processed. A minimum mining width of 4.0 m. Recoveries for the Vazante mine at average head grades are 87.19% for Zn, 23.93% for Pb, and 42.00% for Ag. The Vazante Aroeira Tailings Mineral Reserves estimates in the table above consider actual costs and modifying factors from the Vazante Aroeira tailings, as well as operational level tailings storage facility (“TSF”) reclaiming plan and budgeting. The Vazante Aroeira Tailings Mineral Reserves are estimated at a NSR cut-off value of US$25.44/t processed. A minimum mining unit of 10m x 10m x 2m was applied. Recoveries for Vazante Aroeira Tailings at average head grades are 67.86% for Zn, 40.74% for Pb, and 42.00% for Ag. Metallurgical recoveries are
|
|
| Mining Operations |
accounted for in NSR calculations based on historical processing data and are variable as a function of head grade. Long-term metal prices used for Mineral Reserves are based on consensus and long-term forecasts from banks, financial institutions and other sources. Mineral Reserves estimates are based on average long-term metal prices of: zinc: US$2,799.04/t (US$1.27/lb); lead: US$2,000.29/t (US$0.91/lb); and silver: US$21.17/oz. The current LOM plan, based in our current reserves, continues to 2031.
Vazante – Net Difference in Mineral Reserves between December 31, 2023 versus December 31, 2022 (on a 100% ownership basis)
| Contained Metal | ||||||||||||
| Class | Tonnage | Zinc | Copper | Silver | Lead | Gold | ||||||
| (Mt) | % | (kt) | % | (kt) | % | (koz) | % | (kt) | % | (koz) | % | |
| Proven | (1.33) | (19.6) | (140.8) | (20.7) | - | - | (926) | (23.4) | (8.0) | (39.0) | - | - |
| Probable | 1.28 | 19.1 | 15.5 | 2.5 | - | - | (148) | (5.6) | 1.2 | 7.6 | - | - |
| Total | (0.06) | (0.4) | (125.2) | (9.6) | - | - | (1,074) | (16.2) | (6.8) | (19.0) | - | - |
In comparison to 2022, Vazante’s Mineral Reserves decreased by 0.4% in mass and by 9.6% in zinc content (kt), mainly due to geotechnical restrictions in a high-grade area (Lumiadeira). The decrease in mass was lower than the decrease in zinc content due to the conversion of 2.1Mt from Indicated Mineral Resources to Proven Mineral Reserves from the Vazante Aroeira Tailings. Mineral Reserve depletion during 2023 accounted for 1.7Mt containing 184.3kt of zinc.
Vazante – Year End Mineral Resources as of December 31, 2023 (on an 100% ownership basis) (1)
| Grade | Contained Metal | ||||||||||
| Class | Tonnage (2) | Zinc | Copper | Silver | Lead | Gold | Zinc | Copper | Silver | Lead | Gold |
| (Mt) | (%) | (%) | (g/t) | (%) | (g/t) | (kt) | (kt) | (koz) | (kt) | (koz) | |
| Measured | 0.48 | 8.40 | - | 12.4 | 0.25 | - | 40.3 | - | 191 | 1.2 | - |
| Indicated | 1.40 | 9.64 | - | 4.0 | 0.08 | - | 135.0 | - | 182 | 1.1 | - |
| Total | 1.88 | 9.32 | - | 6.2 | 0.12 | - | 175.3 | - | 373 | 2.3 | - |
| Inferred | 13.43 | 9.97 | - | 12.6 | 0.22 | - | 1,338.8 | - | 5,456 | 29.1 | - |
Notes:
| 1. | Subpart 1300 of Regulation S-K definitions were followed for Mineral Resources, which also are consistent with the CIM (2014) definitions. |
| 2. | Mineral Resources data presented in this table represents 100% of the Mineral Resources estimates for the property. Nexa owns 100% of property. |
| 3. | Mineral Resources are reported exclusive of those Mineral Resources that were converted to Mineral Reserves, and Mineral Resources are not Mineral Reserves and do not have demonstrated economic viability. |
| 4. | The Qualified Person for the Mineral Resources estimate is José Antonio Lopes, B.Geo., FAusIMM, a Nexa employee. |
| 5. | Numbers may not add due to rounding. |
| 6. | The point of reference for Mineral Resources in this table is mill feed materials. |
| 7. | Mineral Resources presented in this table include Mineral Resources from the Vazante mine and Vazante Aroeira Tailings. |
The Vazante Mineral Resources estimates in the table above were completed using Datamine and Leapfrog software. The Mineral Resources at Vazante comprise three styles of mineralization. The first style of mineralization is represented by the hypogene (Willemite) mineralized zones that are found in the underground portions of the Vazante and Extremo Norte deposits. The second style of mineralization is represented by the supergene (Calamine) mineralized zones found in the Cava 3A, Matas dos Paulistas, and Braquiara areas of the Extremo Norte and Vazante deposits. This supergene (Calamine) mineralization is referred to at the Vazante Operation as calamine mineralization and comprises a mixture of smithsonite and hemimorphite minerals. The third type of mineralization comprises tailings that are contained within the Aroeira TSF. The material found in the Aroeira tailings comprise a mixture of hypogene (willemite) and supergene (calamine) minerals. Mineral Resources estimates for the underground hypogene (willemite) mineralization are prepared within reporting panels using the native functions and workflows available through the DSO software package considering spatial continuity, a minimum width of 3.0 m and a NSR cut-off value of US$66.31/t for Hypogene Mineralization (Willemite). The Mineral Resources estimates for the supergene (calamine) mineralization are prepared using an open pit shell that considers appropriate metal prices, mining costs, metallurgical recoveries and geotechnical considerations with NSR cut-off value of US$23.13/t for soil and US$28.38/t for fresh rock and transition material. The Mineral Resources estimates for the tailings at Vazante are reported considering the material with an NSR value of greater than US$29.40/t which lies above the original topographic surface. Mineral Resources estimates are based on average long-term metal prices of: zinc: US$3,218.90/t (US$1.46/lb); lead: US$2,300.33/t (US$1.04/lb); and silver: US$24.35/oz. Metallurgical recoveries are accounted for in NSR calculations based on historical processing data and are variable as a function of head grade. Recoveries at LOM average: hypogene head grades are 87.19% for Zn, 23.93% for Pb, and 42.00% for Ag, supergene (calamine) is 55.00% for Zn, and tailings are 67.86% for Zn, 40.74% for Pb, and 42.00% for Ag.
|
|
| Mining Operations |
Vazante – Net Difference in Mineral Resources between December 31, 2023 versus December 31, 2022 (on an 100% ownership basis)
| Contained Metal | ||||||||||||
| Class | Tonnage | Zinc | Copper | Silver | Lead | Gold | ||||||
| (Mt) | % | (kt) | % | (kt) | % | (koz) | % | (kt) | % | (koz) | % | |
| Measured | (0.15) | (23.8) | (12.1) | (23.1) | - | - | (109) | (36.3) | (0.3) | (20.0) | - | - |
| Indicated | (2.50) | (64.1) | (98.0) | (42.1) | - | - | (676) | (78.8) | (6.5) | (85.5) | - | - |
| Total | (2.65) | (58.5) | (110.1) | (38.6) | - | - | (785) | (67.8) | (6.8) | (74.7) | - | - |
| Inferred | (1.72) | (11.4) | (104.3) | (7.2) | - | - | (728) | (11.8) | (0.1) | (0.3) | - | - |
In comparison to 2022, Vazante’s Inferred Mineral Resources decreased by 11.4% in mass and decreased by 7.2% in zinc content (kt), mainly due to geotechnical restrictions. In comparison to 2022, Vazante’s Measured and Indicated Mineral Resources decreased by 58.5% in mass and decreased by 38.6% in zinc content (kt), mainly as a result of the conversion to Mineral Reserves at tailings dams.
For additional information, see the Technical Report Summary on Vazante, filed as Exhibit 15.3 to Nexa’s annual report on Form 20-F/A for the year-ended December 31, 2020, as filed on November 4, 2021.
Cerro Pasco Complex
The Cerro Pasco Complex consists of the El Porvenir underground mine, which produces zinc, copper, lead, silver and gold; the Atacocha San Gerardo open pit mine, producing zinc, lead, silver and gold; and the Atacocha underground mine, which has been suspended since 2020 and remains under care and maintenance due to our efforts to reduce costs and improve our operational efficiency.
The Atacocha and El Porvenir mines are located in Peru, specifically in the province of Pasco, which is a region recognized for its intensive mineral economic activities, where many polymetallic mines have been operating for several decades.
El Porvenir is an underground mine with multiple accesses and a shaft where the mined ore is extracted and where workers and inputs are also transported. There are multiple accesses to the Atacocha underground mine from the surface and the mine is currently connected to the El Porvenir mine through two active tunnels located at 4070 and 3300 levels. These tunnels are used by operators of heavy mine equipment and conventional trucks, as well as for transporting mining crews between the Atacocha surface and the El Porvenir mine.
Currently, production from the Atacocha San Gerardo open pit mine feeds the Atacocha processing plant with a nominal throughput capacity of 4,400 tonnes of ore per day, while production from the El Porvenir underground mine feeds the El Porvenir processing plant with a nominal throughput capacity of 6,500 tonnes of ore per day. The Atacocha processing plant is expected to be decommissioned by 2027, when the Atacocha San Gerardo pit reaches the end of its mine life based on our current depletion schedule.
|
|
| Mining Operations |
Integration Project
The Cerro Pasco Complex integration project (“Integration Project”) involves the continued integration of the El Porvenir and Atacocha underground mines. The Cerro Pasco Complex is a material property for the purposes of S-K 1300 comprising the two mines, El Porvenir and Atacocha. The Integration Project is intended to continue to capture synergies between the two mining operations, as a result of their proximity and operational similarities, with ore from both the underground mines being processed at the El Porvenir processing plant. The goal of the Integration Project is to achieve cost and investment savings, thereby reducing the environmental footprint and extending the combined life of mine of the two mines.
The Integration Project has been developed over the past few years. The first stage involved the administrative integration of both mines, completed in 2014. The second stage, completed in 2015, involved the integration of the tailings disposal system, which allowed the Atacocha plant to send its tailings to the El Porvenir dam in the short-term, thus contributing to the reduction of our environmental footprint. Operations of the integrated tailings disposal system began in 2016. The third stage, completed in 2016, involved the construction of a new 138-kilovolt (“kV”) energy transmission line connecting both mines, replacing the two previous 50 kV transmission lines. The fourth stage, concluded in 2019, involved the development of a 3.5 km tunnel connecting both underground mines, allowing us to initiate exploration programs in the integration zone between the two mines.
In 2021, modernization and debottlenecking studies to assess the mine deepening and the extension of the LOM of El Porvenir were postponed due to Nexa’s capital allocation strategy and the reassessment of the integration with the Atacocha underground mine. In 2022, we advanced the Integration Project with an optimization study to evaluate the increase in capacity of our tailings and El Porvenir shaft, in addition to enhancing the El Porvenir processing plant to potentially increase production and extend the life of mine of both mines.
In 2023, we continued to advance with the technical studies of the Integration Project, aiming to develop a robust organic growth option for Nexa. The technical studies for the Integration Project covered diverse areas, from mine planning to projects to sustain and expand production, such as studies for underground interconnection, shaft upgrade, engineering assessments, and key routes to increase capacity to provide a long-term solution for tailings disposal. A Front-End Loading 3 (“FEL3”) study to increase the El Porvenir hoisting was completed in 1Q23 and a FEL3 tailings pumping system study was also completed in 2Q23.
The Integration Project plan includes, among others areas: (i) the restart and rehabilitation of the Atacocha underground mine; (ii) the development of an approximately 2 km long connection tunnel (Tunnel 2900), which will connect the Atacocha underground mine to the bottom of the El Porvenir (Picasso) shaft, allowing the production from both underground mines to be hoisted and fed at the El Porvenir processing plant; (iii) the expansion of the Picasso shaft capacity to support production and extraction from both underground mines; (iv) the closure of the Atacocha processing plant, with the depletion of Atacocha’s open pit Mineral Reserves in 2027; and (v) the construction of a new tailings pumping and pipeline system, which will allow the tailings from the El Porvenir processing plant to be sent to the Atacocha tailings storage facility, providing for a long-term solution for our tailings disposal and supporting the extension of the mine life of the combined mines. Nexa also continues to advance on other work fronts related to the Integration Project, including to obtain the required environmental studies and permits.
As a result of the advancements in the technical studies in 2023, we increased the overall Mineral Reserves of the El Porvenir and Atacocha mines in the Cerro Pasco Complex. For additional information on the increase of Mineral Reserves, see “Information on the Company—Mining operations—El Porvenir—Mineral Reserves and Mineral Resources” and “Information on the Company— Mining operations—Atacocha—Mineral Reserves and Mineral Resources”.
For further information about our operations, infrastructure, production, and Mineral Reserves and Mineral Resources at the El Porvenir and Atacocha mines, see the Technical Report Summary on the Cerro Pasco Complex Integration, filed as Exhibit 15.2 of this annual report on Form 20-F. We expect to submit the Integration Project for formal approval by our Sustainability and Capital Projects (“SCP”) committee and our Board of directors in 2024 in order to establish the project’s governance such as: (i) implementation schedule; (ii) organizational chart; (iii) implementation of control routines; (iv) definition of responsibilities for each project component; and (v) cost management implementation.
|
|
| Mining Operations |
El Porvenir
Location and means of access
The El Porvenir mine is an underground, polymetallic mine (located in the Cerro Pasco Complex) in the central Andes mountains region of Peru, specifically in the district of San Francisco de Asís de Yarusyacán, in the province of Pasco, Peru. The approximate coordinates of the mine are 367600m E, 8826850m N, using the Universal Transverse Mercator WGS84 datum, Z18S and the mine site is located at an average elevation of 4,200 meters above sea level. The mine is situated at kilometer 340 of the Carretera Central Highway (Lima—Huánuco route), 13 km from the city of Cerro de Pasco. The mine is located in the Central Cordillera zone, which contains the communities of Parán, Lacsanga and Santo Domingo de Apache.
History
The El Porvenir mine began its operation as small-scale artisanal mine in 1949. We have been investing in the mine since then and, in 2012, production reached its current capacity of 6,500 tonnes per day. In 2014, we commenced the integration process with the Atacocha mine, as described above in “Information on the Company—Mining Operations—Cerro Pasco Complex—Integration Project.
Title, leases and options
The El Porvenir mine is operated by Nexa Resources El Porvenir S.A.C., a subsidiary of Nexa Peru in which Nexa Peru has directly and indirectly a 100% equity interest.
The El Porvenir mine has a total of 25 concessions covering approximately 4,846.7 hectares, as well as a beneficiation plant, “Acumulacion Aquiles 101”. With respect to the surface property at El Porvenir mine, there is a mining site of 450.8 hectares, where the mining concession is located, as well as additional surface property where tailings dams/ponds, camps sites and other ancillary infrastructure are located.
Mining operations at the El Porvenir mine are subject to certain royalties payable by Nexa Resources El Porvenir S.A.C. For more information, see “Information on the Company—Regulatory matters—Peruvian regulatory framework—Royalties and other taxes on mining activities.”
The El Porvenir Mine holds several permits in support of the current operations. The permits are Directorial Resolutions issued by the Peruvian authorities upon approval of mining environmental management instruments filed by the mining companies. Nexa Peru maintains an up-to-date record of the legal permits obtained to date.
Mineralization
The El Porvenir mine is a typical skarn deposit. The mineralization occurs within the contact of the upper Triassic limestone (i.e., exoskarn) and the granodioritic-dacitic intrusive rocks (i.e., endoskarn). There are also recognized veins and replacement manto type, minor disseminated mineralization may occur within the intrusive units. West of the Milpo-Atacocha fault within the Goyllarisquizga Group, mineralization is characterized as veins and disseminations.
Four groups of vein/mineralized structures are reported. Structurally controlled veins are sub-vertical up to 150 meters long, with a vertical extent of 350 meters. Economic mineralogy is mostly comprised of galena, sphalerite, and tetrahedrite, as well as variable and lesser pyrite, quartz and rhodochrosite.
Throughout 2023, the exploration program at El Porvenir was focused on drilling in mineralized zones in the Integration target, seeking to evaluate the mineralization continuity in strike and at depth, with the goal of extending the life of mine. In 2023, we drilled 16 drill holes totaling 9.3 km of exploration drilling, which confirmed the Integration target extensions, with emphasis on the intermediate and lower levels of the unit.
In 2024, we will continue to focus our efforts on expanding mineralized zones in the integration area, with the potential to extend existing Mineral Resources. We expect to also drill other satellite targets such as Don Lucho, Veta AM and Porvenir 9.
|
|
| Mining Operations |
We spent approximately US$1.9 million on the El Porvenir brownfield program in 2023, including the drilling program and geological activities. We have budgeted US$1.6 million for 2024 activities, and we expect to drill 5.5 km.
Operations and infrastructure
Most of the exploration is generally conducted simultaneously with underground development, which involves diamond core drilling and channel sampling following underground drifting.
The El Porvenir mine site consists of an underground mine, tailings pond, waste rock stockpiles, a process facility with associated laboratory and maintenance facilities and maintenance buildings for underground and surface equipment. Facilities and structures include a warehouse, office, change house facilities, main shaft, ventilation shaft, backfill plant, explosives storage area, hydroelectric power generation, power lines and substation, fuel storage tanks, a warehouse and laydown area and a permanent accommodation camp.
The electrical power supply for the mine comes from two sources: connection to the SEIN national power grid by a main substation located near the site, and the Candelaria Hydro, which consists of three turbines connected to the mine through the main substation by a transmission line. All other loads of the mine are fed from the main substation through overhead power lines. These power lines are used to deliver power to various locations to support activities during operation of the mine.
Site roads include main roads suitable for use by mining trucks that transport concentrates to Lima and service roads for use by smaller vehicles. The site roads are used by authorized mine personnel and equipment, with access controlled by Nexa Peru. An approximately 15-to-20-kilometer network of service roads was constructed to provide access to the underground mine, processing plant, tailings facility, waste rock stockpile, mine offices, workshops, mine camps and other surface infrastructure.
In 2023, we spent US$68.7 million on sustaining capital expenditures for this property, primarily associated with mine development, the restoration of tailings dams, equipment replacement and other major infrastructure.
Production
The El Porvenir mine is in the production stage and has a treatment plant capacity of 6,500 tonnes of ore per day. The table below summarizes the El Porvenir mine’s concentrate production, metal contained in concentrates produced and average grades for the periods indicated. Production in 2023 was higher than 2022 due to higher treated ore volumes and higher zinc grades.
|
For the Year Ended December 31, |
|||
|
2023 |
2022 |
2021 |
|
| Treatment ore (in tonnes) | 2,220,011 | 2,111,961 | 2,077,591 |
| Average ore grade | |||
| Zinc (%) | 2.86 | 2.80 | 2.83 |
| Copper (%) | 0.16 | 0.16 | 0.19 |
| Lead (%) | 1.37 | 1.34 | 1.08 |
| Silver (ounces per tonne) | 2.34 | 2.46 | 2.10 |
| Gold (ounces per tonne) | 0.011 | 0.012 | 0.011 |
| Metal contained in concentrate production | |||
| Zinc (in tonnes) | 55,825 | 51,561 | 51,375 |
| Copper (in tonnes) | 355 | 266 | 505 |
| Lead (in tonnes) | 24,937 | 23,195 | 17,700 |
| Silver (in oz) | 4,270,463 | 4,195,649 | 3,467,227 |
| Gold (in oz) | 8,696 | 9,204 | 8,725 |
| Cash Cost, net of by-product credits (in US$/t) | 630.6 | 727.7 | 832.2 |
| Cash Cost, net of by-product credits (in US$/lb) | 0.29 | 0.33 | 0.38 |
| Non-Expansion Capital Expenditures (in millions of US$) | 68.6 | 36.7 | 36.5 |
|
|
| Mining Operations |
Mineral Reserves and Mineral Resources
The El Porvenir Mineral Reserves estimates are based on the definitions for Mineral Reserves in SK-1300 and the tables below are based on costs and modifying factors from the El Porvenir mine.
El Porvenir – Year End Mineral Reserves as of December 31, 2023 (on an 83.48% Nexa attributable ownership basis) (1)
| Grade | Contained Metal | ||||||||||
| Class | Tonnage (2) | Zinc | Copper | Silver | Lead | Gold | Zinc | Copper | Silver | Lead | Gold |
| (Mt) | (%) | (%) | (g/t) | (%) | (g/t) | (kt) | (kt) | (koz) | (kt) | (koz) | |
| Proven | 3.27 | 4.09 | 0.24 | 75.2 | 1.29 | - | 133.8 | 7.9 | 7,907 | 42.0 | - |
| Probable | 8.96 | 4.11 | 0.22 | 72.1 | 1.17 | - | 368.7 | 20.0 | 20,759 | 104.6 | - |
| Total | 12.23 | 4.11 | 0.23 | 72.9 | 1.20 | - | 502.5 | 28.0 | 28,666 | 146.6 | - |
Notes:
| 1. | Subpart 1300 of Regulation S-K definitions were followed for Mineral Reserves, which also are consistent with the CIM (2014) definitions. |
| 2. | Mineral Reserves data presented in this table are reported on 83.48% Nexa attributable ownership. |
| 3. | The Qualified Person for the Mineral Reserves estimate is SLR Consulting (Canada) Ltd., an independent mining consulting firm. |
| 4. | Numbers may not add due to rounding. |
| 5. | The point of reference for Mineral Reserves in this table is mill feed materials. |
El Porvenir – Year End Mineral Reserves as of December 31, 2022 (on a 100% ownership basis) (1)
| Grade | Contained Metal | ||||||||||
| Class | Tonnage (2) | Zinc | Copper | Silver | Lead | Gold | Zinc | Copper | Silver | Lead | Gold |
| (Mt) | (%) | (%) | (g/t) | (%) | (g/t) | (kt) | (kt) | (koz) | (kt) | (koz) | |
| Proven | 3.92 | 4.09 | 0.24 | 75.2 | 1.29 | - | 160.3 | 9.5 | 9,472 | 50.3 | - |
| Probable | 10.73 | 4.11 | 0.22 | 72.1 | 1.17 | - | 441.6 | 24.0 | 24,867 | 125.3 | - |
| Total | 14.65 | 4.11 | 0.23 | 72.9 | 1.20 | - | 601.9 | 33.5 | 34,338 | 175.7 | - |
Notes:
| 1. | Subpart 1300 of Regulation S-K definitions were followed for Mineral Reserves, which also are consistent with the CIM (2014) definitions. |
| 2. | Mineral Reserves data presented in this table represents 100% of the Mineral Reserves estimates for the property. Nexa owns 83.48%. |
| 3. | The Qualified Person for the Mineral Reserves estimate is SLR Consulting (Canada) Ltd., an independent mining consulting firm. |
| 4. | Numbers may not add due to rounding. |
| 5. | The point of reference for Mineral Reserves in this table is mill feed materials. |
The El Porvenir Mineral Reserves estimates in the table above were prepared using DSO software, mine design and scheduling software. Mining methods used are C&F mining, using unconsolidated rock fill and hydraulic backfill, and SLS using unconsolidated rock fill. NSR values were calculated using mineral reserve metal prices, metallurgical recovery and consideration of smelter terms, including revenue from payable metals, price participation, penalties, smelter losses, transportation, treatment, refining and sales charges. A minimum mining width of 5.0 m for C&F mining and 4.0 m for SLS mining were used for reserves shapes and development design and are reported inclusive of extraction losses and dilution. Mineral Reserves were estimated at a NSR cut-off values ranging from US$63.77/t to US$67.04/t for SLS areas and US$65.77/t to US$69.04/t for C&F areas depending on the zone. Mineral Reserves estimates are based on average long-term metal prices of: zinc: US$2,799.04/t (US$1.27/lb); copper: US$7,669.61/t (US$3.48/lb); lead: US$2,000.29/t (US$0.91/lb); and silver: US$21.17/oz. Metallurgical recoveries are accounted for in NSR calculations based on historical processing data and are variable as a function of head grade. Recoveries at Life of Mine average head grades are 89.21% for Zn, 14.60% for Cu, 80.01% for Pb, and 77.51% for Ag. The current LOM plan continues to 2033. We continued to advance with the technical studies to optimize the integration of El Porvenir and Atacocha underground mines, and as a result of the advancements in the technical studies, we increased the overall Mineral Reserves of the Cerro Pasco Complex. For further information see “Information on the Company—Mining Operations—Cerro Pasco Complex—Integration Project.”
|
|
| Mining Operations |
El Porvenir – Net Difference in Mineral Reserves between December 31, 2023 versus December 31, 2022 (on an 83.48% Nexa attributable ownership basis)
| Contained Metal | ||||||||||||
| Class | Tonnage | Zinc | Copper | Silver | Lead | Gold | ||||||
| (Mt) | % | (kt) | % | (kt) | % | (koz) | % | (kt) | % | (koz) | % | |
| Proven | 1.15 | 54.2 | 55.3 | 70.5 | 3.4 | 76.2 | 3,289 | 71.2 | 18.4 | 77.9 | - | - |
| Probable | (1.86) | (17.2) | (19.2) | (4.9) | (0.8) | (4.0) | (2,084) | (9.1) | (10.0) | (8.7) | - | - |
| Total | (0.71) | (5.5) | 36.1 | 7.8 | 2.6 | 10.3 | 1,205 | 4.4 | 8.4 | 6.1 | - | - |
El Porvenir – Net Difference in Mineral Reserves between December 31, 2023 versus December 31, 2022 (on a 100% ownership basis)
| Contained Metal | ||||||||||||
| Class | Tonnage | Zinc | Copper | Silver | Lead | Gold | ||||||
| (Mt) | % | (kt) | % | (kt) | % | (koz) | % | (kt) | % | (koz) | % | |
| Proven | 1.38 | 54.2 | 66.3 | 70.5 | 4.1 | 76.2 | 3,940 | 71.2 | 22.0 | 77.9 | - | - |
| Probable | (2.23) | (17.2) | (23.0) | (4.9) | (1.0) | (4.0) | (2,495) | (9.1) | (12.0) | (8.7) | - | - |
| Total | (0.85) | (5.5) | 43.3 | 7.8 | 3.1 | 10.3 | 1,444 | 4.4 | 10.1 | 6.1 | - | - |
In comparison to 2022, El Porvenir’s Mineral Reserves decreased by 5.5% in mass, while increased by 7.8% in zinc content (kt). The decrease in mass was mainly due to the increase in NSR cut-off values, while the increase in zinc content was mainly due to higher grades as a result of block model improvements as well as additions from infill drilling. Mineral Reserve depletion during 2023 accounted for 2.2Mt containing 63.5kt of zinc.
El Porvenir – Year End Mineral Resources as of December 31, 2023 (on an 83.48% Nexa Attributable ownership basis) (1)
| Grade | Contained Metal | ||||||||||
| Class | Tonnage (2) | Zinc | Copper | Silver | Lead | Gold | Zinc | Copper | Silver | Lead | Gold |
| (Mt) | (%) | (%) | (g/t) | (%) | (g/t) | (kt) | (kt) | (koz) | (kt) | (koz) | |
| Measured | 0.55 | 3.47 | 0.27 | 57.7 | 0.95 | - | 19.1 | 1.5 | 1,023 | 5.3 | - |
| Indicated | 2.69 | 3.25 | 0.20 | 63.2 | 0.97 | - | 87.4 | 5.3 | 5,460 | 26.0 | - |
| Total | 3.24 | 3.29 | 0.21 | 62.2 | 0.97 | - | 106.5 | 6.8 | 6,483 | 31.3 | - |
| Inferred | 9.23 | 3.83 | 0.24 | 82.9 | 1.32 | - | 353.6 | 22.1 | 24,602 | 121.9 | - |
Notes:
| 1. | Subpart 1300 of Regulation S-K definitions were followed for Mineral Resources, which also are consistent with the CIM (2014) definitions. |
| 2. | Mineral Resources Tonnes and Contained Metal presented in this table are reported on 83.48% Nexa attributable ownership. |
| 3. | Mineral Resources are reported exclusive of those Mineral Resources that were converted to Mineral Reserves, and Mineral Resources are not Mineral Reserves and do not have demonstrated economic viability. |
| 4. | The Qualified Person for the Mineral Resources estimate is Jerry Huaman Abalos, B.Geo., MAusIMM CP(Geo), a Nexa employee. |
| 5. | Numbers may not add due to rounding. |
| 6. | The point of reference for Mineral Resources in this table is mill feed materials. |
|
|
| Mining Operations |
El Porvenir – Year End Mineral Resources as of December 31, 2023 (on a 100% ownership basis) (1)
| Grade | Contained Metal | ||||||||||
| Class | Tonnage (2) | Zinc | Copper | Silver | Lead | Gold | Zinc | Copper | Silver | Lead | Gold |
| (Mt) | (%) | (%) | (g/t) | (%) | (g/t) | (kt) | (kt) | (koz) | (kt) | (koz) | |
| Measured | 0.66 | 3.47 | 0.27 | 57.7 | 0.95 | - | 22.9 | 1.8 | 1,225 | 6.3 | - |
| Indicated | 3.22 | 3.25 | 0.20 | 63.2 | 0.97 | - | 104.7 | 6.4 | 6,540 | 31.2 | - |
| Total | 3.88 | 3.29 | 0.21 | 62.2 | 0.97 | - | 127.6 | 8.2 | 7,765 | 37.5 | - |
| Inferred | 11.06 | 3.83 | 0.24 | 82.9 | 1.32 | - | 423.6 | 26.5 | 29,471 | 146.0 | - |
Notes:
| 1. | Subpart 1300 of Regulation S-K definitions were followed for Mineral Resources, which also are consistent with the CIM (2014) definitions. |
| 2. | Mineral Resources data presented in this table represents 100% of the Mineral Resources estimates for the property. Nexa owns 83.48%. |
| 3. | Mineral Resources are reported exclusive of those Mineral Resources that were converted to Mineral Reserves, and Mineral Resources are not Mineral Reserves and do not have demonstrated economic viability. |
| 4. | The Qualified Person for the Mineral Resources estimate is Jerry Huaman Abalos, B.Geo., MAusIMM CP(Geo), a Nexa employee. |
| 5. | Numbers may not add due to rounding. |
| 6. | The point of reference for Mineral Resources in this table is mill feed materials. |
The El Porvenir Mineral Resources estimates in the table above were completed using Datamine and Leapfrog software. Wireframes for geology and mineralization were constructed in Leapfrog based on geology sections, assay results, lithological information, underground mapping and structural data. Assays were capped to various levels based on exploratory data analysis and then composited to 1.0 m lengths. Wireframes were filled with blocks and sub-celling at wireframe boundaries. Blocks were interpolated with grade using the OK and ID3 interpolation algorithms. Block estimates were validated using industry standard validation techniques. Classification of blocks used distance-based and mineralization continuity criteria. Mineral Resources are reported using all the material within resource shapes generated in DSO software, satisfying minimum mining width of 4.0 m in areas with C&F stopes shapes and 3.0 m for SLS stopes. The Mineral Resources are estimated at a NSR cut-off grade values ranging from US$63.77/t to US$67.04/t for SLS areas and US$65.77/t to US$69.04/t for C&F areas depending on the zone. Mineral Resources estimates are based on average long-term metal prices of: zinc: US$3,218.90/t (US$1.46/lb); copper: US$8,820.05/t (US$4.00/lb); lead: US$2,300.33/t (US$1.04/lb); and silver: US$24.35/oz. Metallurgical recoveries are accounted for in NSR calculations based on historical processing data and are variable as a function of head grade. Recoveries at LOM average head grades are 89.21% for Zn, 14.60% for Cu, 80.01% for Pb, and 77.51% for Ag.
El Porvenir – Net Difference in Mineral Resources between December 31, 2023 versus December 31, 2022 (on an 83.48% Nexa attributable ownership basis)
| Contained Metal | ||||||||||||
| Class | Tonnage | Zinc | Copper | Silver | Lead | Gold | ||||||
| (Mt) | % | (kt) | % | (kt) | % | (koz) | % | (kt) | % | (koz) | % | |
| Measured | 0.26 | 90.0 | 9.5 | 99.1 | 0.9 | 150.4 | 366 | 55.7 | 2.1 | 64.4 | - | - |
| Indicated | 0.15 | 5.8 | 10.2 | 13.2 | 0.2 | 4.8 | 797 | 17.1 | 2.6 | 11.3 | - | - |
| Total | 0.41 | 14.5 | 19.7 | 22.7 | 1.1 | 20.1 | 1,163 | 21.9 | 4.7 | 17.7 | - | - |
| Inferred | 0.31 | 3.5 | 12.0 | 3.5 | 5.2 | 30.9 | 3,695 | 17.7 | 28.2 | 30.1 | - | - |
|
|
| Mining Operations |
El Porvenir – Net Difference in Mineral Resources between December 31, 2023 versus December 31, 2022 (on a 100% ownership basis)
| Contained Metal | ||||||||||||
| Class | Tonnage | Zinc | Copper | Silver | Lead | Gold | ||||||
| (Mt) | % | (kt) | % | (kt) | % | (koz) | % | (kt) | % | (koz) | % | |
| Measured | 0.31 | 88.6 | 11.3 | 97.4 | 1.1 | 157.1 | 432 | 54.5 | 2.4 | 61.5 | - | - |
| Indicated | 0.18 | 5.9 | 12.3 | 13.3 | 0.3 | 4.9 | 959 | 17.2 | 3.2 | 11.4 | - | - |
| Total | 0.49 | 14.5 | 23.6 | 22.7 | 1.4 | 20.6 | 1,391 | 21.8 | 5.6 | 17.6 | - | - |
| Inferred | 0.38 | 3.6 | 14.6 | 3.6 | 6.2 | 30.5 | 4,439 | 17.7 | 33.9 | 30.2 | - | - |
In comparison to 2022, El Porvenir’s Inferred Mineral Resources increased by 3.6% in mass and by 3.6% in zinc content (kt), mainly due to infill drilling. In comparison to 2022, El Porvenir’s Measured and Indicated Mineral Resources increased by 14.5% in mass and by 22.7% in zinc content (kt), mainly due to infill drilling.
For additional information, see the Technical Report Summary on the Cerro Pasco Complex Integration, filed as Exhibit 15.2 of this annual report on Form 20-F.
Atacocha
Location and means of access
Atacocha is a polymetallic underground and open pit mine (located in the Cerro Paso Complex) in the district of San Francisco de Asís de Yarusyacán, in the province of Pasco, Peru. The property is located at approximate coordinates of 367160m E, 8,830,400m N, using the UTM WGS84 datum, Z18S and approximately 4,050 meters above sea level.
History
The Atacocha mine began its operation as small-scale artisanal mine in 1936. We have been investing in the mine since then and, in 2012, production reached its current capacity of 4,500 tonnes per day. In 2014, we commenced the Integration Project with the El Porvenir mine, as described above in “Information on the Company—Mining operations—Cerro Pasco Complex—Integration Project.” In 2020, in response to COVID-19 and based on our cost management strategy, the Integration Project was temporarily suspended and Atacocha’s underground operations were not resumed after the mandatory restriction period from the Peruvian Government was lifted in mid-2020. As of the date of this annual report, the Atacocha underground mine is suspended under care and maintenance, and we expect to complete the Integration Project approval process with our technical committee and Board of directors in 2024.
Title, leases and options
The Atacocha mine is operated by Nexa Resources Atacocha S.A.A., which is controlled by Nexa Peru.
The Atacocha mine has a total of 147 concessions covering approximately 2,872.5 hectares, as well as a beneficiation plant, “Chicrin N° 2.” With respect to the surface property at the Atacocha mine, there is a mining site of 1,343.0 hectares, where the mining concession is located, as well as additional surface property where tailings dams/ponds, camps sites and other ancillary infrastructure are located. There are royalties payable in respect of mining operations at the Atacocha mine for the mining concessions held by Nexa Resources Atacocha S.A.A. For more information, see “Information on the Company—Regulatory matters—Peruvian regulatory framework—Royalties and other taxes on mining activities.”
The Atacocha mine holds a number of permits in support of the current operations. The permits are Directorial Resolutions issued by the Peruvian authorities upon approval of mining environmental management instruments filed by the mining companies. Nexa Peru maintains an up-to-date record of the legal permits obtained to date.
|
|
| Mining Operations |
Atacocha operates two mines: the Atacocha underground mine and the San Gerardo open pit mine. The underground mine is currently suspended due to our efforts to reduce costs and improve our operational efficiency and remains under care and maintenance. However, mining continues in the San Gerardo open pit mine. Both mining operations feed the Atacocha processing plant.
Mineralization
In 2023, we spent approximately US$0.2 million on the Atacocha brownfield program for exploration maintenance. In 2023, we had no drilling activities at Atacocha. We have budgeted US$0.4 million for the program during 2024 for maintenance and data interpretations, including 3.0 km of the drilling campaign in the Integration target.
Operations and infrastructure
In 2023, we spent US$16.1 million on sustaining capital expenditures for this property, primarily associated with mine development, equipment replacement and other major infrastructure. In addition to US$0.2 million to maintain the Mineral Exploration structure, a drilling program began in 2024 with the focus on continuing extending the mineralization of the integration target.
In January 2023, protest activities by the Machcan community temporarily suspended operations at the Atacocha San Gerardo open pit mine for approximately one week. In June 2023, protest activities by the Machcan community again blocked access to the Atacocha San Gerardo open pit mine, temporarily suspending production for approximately one month. Operations resumed at the end of July 2023 once protest activities ceased. Finally, in February 2024 protest activities by the Joraoniyoc community blocked road access to the Atacocha San Gerardo open pit mine and suspended operations for approximately three days. In each instance, mining activities were limited to critical operations with a minimum workforce to ensure appropriate maintenance, safety and security. Despite these blockages, the Atacocha mine operated at high levels of capacity utilization rates throughout the year and 2023. In each of these instances, the Company pursued active dialogue with the local community and authorities for a peaceful resolution to this situation. Nexa remains committed to complying with all existing agreements, pursuing an active dialogue with the communities and authorities, and the social development of all its host communities.
Production
The Atacocha mine has a treatment plant capacity of 4,400 tonnes of ore per day. The table below summarizes the Atacocha mine’s concentrate production, metal contained in concentrates produced and average grades for the periods indicated. Production in 2023 was lower than in 2022 due to the temporary suspension of production due to illegal protest activities occurring in different periods throughout first half of 2023.
|
For the Year Ended December 31, |
|||
|
2023 |
2022 |
2021 |
|
| Treatment ore (in tonnes) | 1,397,192 | 1,353,681 | 1,271,107 |
| Average ore grade | |||
| Zinc (%) | 0.77 | 0.89 | 0.88 |
| Lead (%) | 0.93 | 0.97 | 0.82 |
| Silver (ounces per tonne) | 1.21 | 1.05 | 1.01 |
| Gold (ounces per tonne) | 0.010 | 0.015 | 0.014 |
| Metal contained in concentrate production | |||
| Zinc (in tonnes) | 8,193 | 9,552 | 8,522 |
| Lead (in tonnes) | 11,116 | 11,204 | 8,708 |
| Silver (in oz) | 1,399,681 | 1,155,002 | 1,026,783 |
| Gold (in oz) | 7,559 | 13,593 | 11,947 |
| Cash cost, net of by-product credits (in US$/t) | (959.7) | (1,566.2) | (557.7) |
| Cash cost, net of by-product credits (in US$/lb) | (0.44) | (0.71) | (0.25) |
| Non-Expansion Capital Expenditures (in millions of US$) | 16.2 | 4.5 | 11.6 |
|
|
| Mining Operations |
Mineral Reserves and Mineral Resources (Atacocha Underground)
The Atacocha Underground Mineral Reserves estimates are based on the definitions for Mineral Reserves in SK-1300 and the tables below are based on costs and modifying factors from the Atacocha Underground mine.
Atacocha Underground – Year End Mineral Reserves as of December 31, 2023 (on an 75.96% Nexa attributable ownership basis) (1)
| Grade | Contained Metal | ||||||||||
| Class | Tonnage (2) | Zinc | Copper | Silver | Lead | Gold | Zinc | Copper | Silver | Lead | Gold |
| (Mt) | (%) | (%) | (g/t) | (%) | (g/t) | (kt) | (kt) | (koz) | (kt) | (koz) | |
| Proven | 1.30 | 3.86 | 0.34 | 84.9 | 1.45 | - | 50.0 | 4.4 | 3,535 | 18.7 | - |
| Probable | 3.01 | 4.54 | 0.43 | 77.7 | 1.29 | - | 136.6 | 12.8 | 7,509 | 38.8 | - |
| Total | 4.30 | 4.33 | 0.40 | 79.8 | 1.34 | - | 186.5 | 17.2 | 11,044 | 57.5 | - |
Notes:
| 1. | Subpart 1300 of Regulation S-K definitions were followed for Mineral Reserves, which also are consistent with the CIM (2014) definitions. |
| 2. | Mineral Reserves data presented in this table are reported on 75.96% Nexa attributable ownership. |
| 3. | The Qualified Person for the Mineral Reserves estimate is SLR Consulting (Canada) Ltd., an independent mining consulting firm. |
| 4. | Numbers may not add due to rounding. |
| 5. | The point of reference for Mineral Reserves in this table is mill feed materials. |
Atacocha Underground – Year End Mineral Reserves as of December 31, 2023 (on a 100% ownership basis) (1)
| Grade | Contained Metal | ||||||||||
| Class | Tonnage (2) | Zinc | Copper | Silver | Lead | Gold | Zinc | Copper | Silver | Lead | Gold |
| (Mt) | (%) | (%) | (g/t) | (%) | (g/t) | (kt) | (kt) | (koz) | (kt) | (koz) | |
| Proven | 1.71 | 3.86 | 0.34 | 84.9 | 1.45 | - | 65.8 | 5.7 | 4,654 | 24.6 | - |
| Probable | 3.96 | 4.54 | 0.43 | 77.7 | 1.29 | - | 179.8 | 16.9 | 9,886 | 51.1 | - |
| Total | 5.66 | 4.33 | 0.40 | 79.8 | 1.34 | - | 245.6 | 22.6 | 14,540 | 75.7 | - |
Notes:
| 1. | Subpart 1300 of Regulation S-K definitions were followed for Mineral Reserves, which also are consistent with the CIM (2014) definitions. |
| 2. | Mineral Reserves data presented in this table represents 100% of the Mineral Reserves estimates for the property. Nexa owns 75.96%. |
| 3. | The Qualified Person for the Mineral Reserves estimate is SLR Consulting (Canada) Ltd., an independent mining consulting firm. |
| 4. | Numbers may not add due to rounding. |
| 5. | The point of reference for Mineral Reserves in this table is mill feed materials. |
The Atacocha Underground Mineral Reserves estimates in the table above were prepared using DSO software, mine design and scheduling software. Mining methods used are C&F mining, using unconsolidated rock fill and hydraulic backfill, and SLS using unconsolidated rock fill. NSR values were calculated using mineral reserve metal prices, metallurgical recovery and consideration of smelter terms, including revenue from payable metals, price participation, penalties, smelter losses, transportation, treatment, refining and sales charges. A minimum mining width of 5.0 for C&F mining and 4.0 m for SLS mining were used for reserves shapes and development design and are reported inclusive of extraction losses and dilution. The Mineral Reserves were estimated at a NSR cut-off of US$69.00/t for SLS areas and US$71.07/t for C&F areas depending on the zone. A number of incremental material (with values between US$45.09/t and US$69.00/t for SLS and values between US$47.16/t and US$71.07/t for C&F mining) was included in the estimate. Mineral Reserves estimates are based on average long-term metal prices of: zinc: US$2,799.04/t (US$1.27/lb); copper: US$7,669.61/t (US$3.48/lb); lead: US$2,000.29/t (US$0.91/lb); and silver: US$21.17/oz. Metallurgical recoveries are accounted for in NSR calculations based on historical processing data and are variable as a function of head grade. Recoveries at Life of Mine average head grades are 89.30% for Zn, 15.73% for Cu, 80.02% for Pb, and 77.51% for Ag. The current LOM plan continues to 2033. The current LOM production planning goes from 2027 to 2033. We continued to advance with the technical studies to optimize the integration of El Porvenir and Atacocha underground mines, and as a result of the advancements in the technical studies, we increased the overall Mineral Reserves of the Cerro Pasco Complex. For further information see “Information on the Company—Mining Operations—Cerro Pasco Complex—Integration Project.”
|
|
| Mining Operations |
Atacocha Underground – Net Difference in Mineral Reserves between December 31, 2023 versus December 31, 2022 (on an 75.96% Nexa attributable ownership basis)
| Contained Metal | ||||||||||||
| Class | Tonnage | Zinc | Copper | Silver | Lead | Gold | ||||||
| (Mt) | % | (kt) | % | (kt) | % | (koz) | % | (kt) | % | (koz) | % | |
| Proven | 1.30 | - | 50.0 | - | 4.4 | - | 3,535 | - | 18.7 | - | - | - |
| Probable | 3.01 | - | 136.6 | - | 12.8 | - | 7,509 | - | 38.8 | - | - | - |
| Total | 4.30 | - | 186.5 | - | 17.2 | - | 11,044 | - | 57.5 | - | - | - |
Atacocha Underground – Net Difference in Mineral Reserves between December 31, 2023 versus December 31, 2022 (on a 100% ownership basis)
| Contained Metal | ||||||||||||
| Class | Tonnage | Zinc | Copper | Silver | Lead | Gold | ||||||
| (Mt) | % | (kt) | % | (kt) | % | (koz) | % | (kt) | % | (koz) | % | |
| Proven | 1.71 | - | 65.8 | - | 5.7 | - | 4,654 | - | 24.6 | - | - | - |
| Probable | 3.96 | - | 179.8 | - | 16.9 | - | 9,886 | - | 51.1 | - | - | - |
| Total | 5.66 | - | 245.6 | - | 22.6 | - | 14,540 | - | 75.7 | - | - | - |
In 2023, Atacocha’s Underground Mineral Reserves increased compared to 2022 due to the declaration of Mineral Reserves for the first time since 2019.
Atacocha Underground – Year End Mineral Resources as of December 31, 2023 (on an 75.96% Nexa Attributable ownership basis) (1)
| Grade | Contained Metal | ||||||||||
| Class | Tonnage (2) | Zinc | Copper | Silver | Lead | Gold | Zinc | Copper | Silver | Lead | Gold |
| (Mt) | (%) | (%) | (g/t) | (%) | (g/t) | (kt) | (kt) | (koz) | (kt) | (koz) | |
| Measured | 0.80 | 3.47 | 0.27 | 55.0 | 0.98 | - | 27.6 | 2.1 | 1,411 | 7.8 | - |
| Indicated | 1.91 | 3.30 | 0.36 | 54.9 | 0.92 | - | 63.2 | 6.9 | 3,379 | 17.6 | - |
| Total | 2.71 | 3.35 | 0.33 | 54.9 | 0.94 | - | 90.8 | 9.0 | 4,790 | 25.4 | - |
| Inferred | 6.12 | 4.09 | 0.56 | 77.3 | 1.21 | - | 250.4 | 34.3 | 15,216 | 74.1 | - |
Notes:
| 1. | Subpart 1300 of Regulation S-K definitions were followed for Mineral Resources, which also are consistent with the CIM (2014) definitions. |
| 2. | Mineral Resources Tonnes and Contained Metal presented in this table are reported on 75.96% Nexa attributable ownership. |
| 3. | Mineral Resources are reported exclusive of those Mineral Resources that were converted to Mineral Reserves, and Mineral Resources are not Mineral Reserves and do not have demonstrated economic viability. |
| 4. | The Qualified Person for the Mineral Resources estimate is Jerry Huaman Abalos, B.Geo., MAusIMM CP(Geo), a Nexa employee. |
| 5. | Numbers may not add due to rounding. |
| 6. | The point of reference for Mineral Resources in this table is mill feed materials. |
|
|
| Mining Operations |
Atacocha Underground – Year End Mineral Resources as of December 31, 2023 (on a 100% ownership basis) (1)
| Grade | Contained Metal | ||||||||||
| Class | Tonnage (2) | Zinc | Copper | Silver | Lead | Gold | Zinc | Copper | Silver | Lead | Gold |
| (Mt) | (%) | (%) | (g/t) | (%) | (g/t) | (kt) | (kt) | (koz) | (kt) | (koz) | |
| Measured | 1.05 | 3.47 | 0.27 | 55.0 | 0.98 | - | 36.4 | 2.8 | 1,857 | 10.3 | - |
| Indicated | 2.52 | 3.30 | 0.36 | 54.9 | 0.92 | - | 83.2 | 9.1 | 4,448 | 23.2 | - |
| Total | 3.57 | 3.35 | 0.33 | 54.9 | 0.94 | - | 119.6 | 11.9 | 6,305 | 33.5 | - |
| Inferred | 8.06 | 4.09 | 0.56 | 77.3 | 1.21 | - | 329.7 | 45.1 | 20,031 | 97.5 | - |
Notes:
| 1. | Subpart 1300 of Regulation S-K definitions were followed for Mineral Resources, which also are consistent with the CIM (2014) definitions. |
| 2. | Mineral Resources data presented in this table represents 100% of the Mineral Resources estimates for the property. Nexa owns 75.96%. |
| 3. | Mineral Resources are reported exclusive of those Mineral Resources that were converted to Mineral Reserves, and Mineral Resources are not Mineral Reserves and do not have demonstrated economic viability. |
| 4. | The Qualified Person for the Mineral Resources estimate is Jerry Huaman Abalos, B.Geo., MAusIMM CP(Geo), a Nexa employee. |
| 5. | Numbers may not add due to rounding. |
| 6. | The point of reference for Mineral Resources in this table is mill feed materials. |
The Atacocha Underground Mineral Resources estimates in the table above were completed using Datamine and Leapfrog software. Wireframes for geology and mineralization were constructed in Leapfrog based on geology sections, assay results, lithological information, underground mapping and structural data. Assays were capped to various levels based on exploratory data analysis and then composited to 2.0 m lengths. Wireframes were filled with blocks and sub-celling at wireframe boundaries. Blocks were interpolated with grade using the OK and ID3 interpolation algorithms. Block estimates were validated using industry standard validation techniques. Classification of blocks used distance-based and mineralization continuity criteria. Mineral Resources are reported using all the material within resource shapes generated in DSO software, satisfying minimum mining width of 4.0 m in areas with C&F stopes shapes and 3.0 m for SLS stopes. The Mineral Resources are estimated at a NSR cut-off grade values of US$69.00/t for SLS areas and US$71.07/t for C&F areas depending on the zone. Mineral Resources estimates are based on average long-term metal prices of: zinc: US$3,218.90/t (US$1.46/lb); copper: US$8,820.05/t (US$4.00/lb); lead: US$2,300.33/t (US$1.04/lb); and silver: US$24.35/oz. Metallurgical recoveries are accounted for in NSR calculations based on historical processing data and are variable as a function of head grade. Recoveries at LOM average head grades are 89.30% for Zn, 15.73% for Cu, 80.02% for Pb, and 77.51% for Ag.
Atacocha Underground – Net Difference in Mineral Resources between December 31, 2023 versus December 31, 2022 (on an 75.96% Nexa attributable ownership basis)
| Contained Metal | ||||||||||||
| Class | Tonnage | Zinc | Copper | Silver | Lead | Gold | ||||||
| (Mt) | % | (kt) | % | (kt) | % | (koz) | % | (kt) | % | (koz) | % | |
| Measured | (1.30) | (62.0) | (60.1) | (68.5) | 2.1 | 100.0 | (3,916) | (73.5) | (24.1) | (75.5) | - | - |
| Indicated | (1.36) | (41.5) | (72.5) | (53.4) | 6.9 | 100.0 | (4,611) | (57.7) | (29.2) | (62.3) | - | - |
| Total | (2.66) | (49.5) | (132.6) | (59.3) | 9.0 | 100.0 | (8,527) | (64.0) | (53.3) | (67.7) | - | - |
| Inferred | (0.04) | (0.6) | (23.7) | (8.6) | 34.3 | 100.0 | (1,024) | (6.3) | (3.5) | (4.6) | - | - |
|
|
| Mining Operations |
Atacocha Underground – Net Difference in Mineral Resources between December 31, 2023 versus December 31, 2022 (on a 100% ownership basis)
| Contained Metal | ||||||||||||
| Class | Tonnage | Zinc | Copper | Silver | Lead | Gold | ||||||
| (Mt) | % | (kt) | % | (kt) | % | (koz) | % | (kt) | % | (koz) | % | |
| Measured | (1.71) | (62.0) | (78.9) | (68.4) | 2.8 | 100.0 | (5,144) | (73.5) | (31.7) | (75.5) | - | - |
| Indicated | (1.79) | (41.5) | (95.7) | (53.5) | 9.1 | 100.0 | (6,083) | (57.8) | (38.4) | (62.3) | - | - |
| Total | (3.50) | (49.5) | (174.6) | (59.3) | 11.9 | 100.0 | (11,227) | (64.0) | (70.1) | (67.7) | - | - |
| Inferred | (0.05) | (0.6) | (31.2) | (8.6) | 45.1 | 100.0 | (1,350) | (6.3) | (4.7) | (4.6) | - | - |
In comparison to 2022, Atacocha’s Underground Inferred Mineral Resources decreased by 0.6% in mass and by 8.6% in zinc content (kt), mainly due to a classification revision. In comparison to 2022, Atacocha’s Underground Measured and Indicated Mineral Resources decreased by 49.5% in mass and by 59.3% in zinc content (kt), mainly due to the conversion to Mineral Reserves.
For additional information, see the Technical Report Summary on the Cerro Pasco Complex Integration, filed as Exhibit 15.2 of this annual report on Form 20-F.
Mineral Reserves and Mineral Resources (Atacocha Open Pit)
The Atacocha Open Pit Mineral Reserves estimates are based on the definitions for Mineral Reserves in SK-1300 and the tables below are based on costs and modifying factors from the Atacocha Open Pit mine.
Atacocha Open Pit – Year End Mineral Reserves as of December 31, 2023 (on an 75.96% Nexa attributable ownership basis) (1)
| Grade | Contained Metal | ||||||||||
| Class | Tonnage (2) | Zinc | Copper | Silver | Lead | Gold | Zinc | Copper | Silver | Lead | Gold |
| (Mt) | (%) | (%) | (g/t) | (%) | (g/t) | (kt) | (kt) | (koz) | (kt) | (koz) | |
| Proven | 1.45 | 1.02 | - | 38.2 | 1.16 | 0.25 | 14.8 | - | 1,779 | 16.9 | 11.5 |
| Probable | 1.88 | 0.97 | - | 32.4 | 1.14 | 0.29 | 18.2 | - | 1,958 | 21.4 | 17.4 |
| Total | 3.33 | 0.99 | - | 34.9 | 1.15 | 0.27 | 33.1 | - | 3,737 | 38.2 | 28.9 |
Notes:
| 1. | Subpart 1300 of Regulation S-K definitions were followed for Mineral Reserves, which also are consistent with the CIM (2014) definitions. |
| 2. | Mineral Reserves data presented in this table are reported on 75.96% Nexa attributable ownership. |
| 3. | The Qualified Person for the Mineral Reserves estimate is SLR Consulting (Canada) Ltd., an independent mining consulting firm. |
| 4. | Numbers may not add due to rounding. |
| 5. | The point of reference for Mineral Reserves in this table is mill feed materials. |
Atacocha Open Pit – Year End Mineral Reserves as of December 31, 2023 (on a 100% ownership basis) (1)
| Grade | Contained Metal | ||||||||||
| Class | Tonnage (2) | Zinc | Copper | Silver | Lead | Gold | Zinc | Copper | Silver | Lead | Gold |
| (Mt) | (%) | (%) | (g/t) | (%) | (g/t) | (kt) | (kt) | (koz) | (kt) | (koz) | |
| Proven | 1.91 | 1.02 | - | 38.2 | 1.16 | 0.25 | 19.5 | - | 2,342 | 22.2 | 15.2 |
| Probable | 2.47 | 0.97 | - | 32.4 | 1.14 | 0.29 | 24.0 | - | 2,577 | 28.1 | 22.9 |
| Total | 4.38 | 0.99 | - | 34.9 | 1.15 | 0.27 | 43.5 | - | 4,919 | 50.3 | 38.1 |
Notes:
| 1. | Subpart 1300 of Regulation S-K definitions were followed for Mineral Reserves, which also are consistent with the CIM (2014) definitions. |
| 2. | Mineral Reserves data presented in this table represents 100% of the Mineral Reserves estimates for the property. Nexa owns 75.96%. |
| 3. | The Qualified Person for the Mineral Reserves estimate is SLR Consulting (Canada) Ltd., an independent mining consulting firm. |
| 4. | Numbers may not add due to rounding. |
| 5. | The point of reference for Mineral Reserves in this table is mill feed materials. |
|
|
| Mining Operations |
The Atacocha Open Pit Mineral Reserves estimates in the table above were prepared using DSO software, mine design and scheduling software. NSR values were calculated using mineral reserve metal prices, metallurgical recovery and consideration of smelter terms, including revenue from payable metals, price participation, penalties, smelter losses, transportation, treatment, refining and sales charges. The Mineral Reserves were estimated at a NSR cut-off values of US$16.21/t. Mineral Reserves estimates are based on average long-term metal prices of: zinc: US$2,799.04/t (US$1.27/lb); lead: US$2,000.29/t (US$0.91/lb); silver: US$21.17/oz; and gold: US$1,630.93/oz. Metallurgical recoveries are accounted for in NSR calculations based on historical processing data and are variable as a function of head grade. Recoveries at Life of Mine average head grade are 70.44% for Zn, 83.97% for Pb, 75.76% for Ag, and 65.46% for gold. The current LOM plan continues to 2027. We continued to advance with the technical studies to optimize the integration of El Porvenir and Atacocha underground mines, and as a result of the advancements in the technical studies, we increased the overall Mineral Reserves of the Cerro Pasco Complex. For further information see “Information on the Company—Mining Operations—Cerro Pasco Complex—Integration Project.”
Atacocha Open Pit – Net Difference in Mineral Reserves between December 31, 2023 versus December 31, 2022 (on an 75.96% Nexa attributable ownership basis)
| Contained Metal | ||||||||||||
| Class | Tonnage | Zinc | Copper | Silver | Lead | Gold | ||||||
| (Mt) | % | (kt) | % | (kt) | % | (koz) | % | (kt) | % | (koz) | % | |
| Proven | 1.45 | - | 14.8 | - | - | - | 1,779 | - | 16.9 | - | 11.5 | - |
| Probable | 1.88 | - | 18.2 | - | - | - | 1,958 | - | 21.4 | - | 17.4 | - |
| Total | 3.33 | - | 33.1 | - | - | - | 3,737 | - | 38.2 | - | 28.9 | - |
Atacocha Open Pit – Net Difference in Mineral Reserves between December 31, 2023 versus December 31, 2022 (on a 100% ownership basis)
| Contained Metal | ||||||||||||
| Class | Tonnage | Zinc | Copper | Silver | Lead | Gold | ||||||
| (Mt) | % | (kt) | % | (kt) | % | (koz) | % | (kt) | % | (koz) | % | |
| Proven | 1.91 | - | 19.5 | - | - | - | 2,342 | - | 22.2 | - | 15.2 | - |
| Probable | 2.47 | - | 24.0 | - | - | - | 2,577 | - | 28.1 | - | 22.9 | - |
| Total | 4.38 | - | 43.5 | - | - | - | 4,919 | - | 50.3 | - | 38.1 | - |
In 2023, Atacocha’s Open Pit Mineral Reserves increased compared to 2022 due to the declaration of Mineral Reserves for the first time since 2019.
Atacocha Open Pit – Year End Mineral Resources as of December 31, 2023 (on an 75.96% Nexa Attributable ownership basis) (1)
| Grade | Contained Metal | ||||||||||
| Class | Tonnage (2) | Zinc | Copper | Silver | Lead | Gold | Zinc | Copper | Silver | Lead | Gold |
| (Mt) | (%) | (%) | (g/t) | (%) | (g/t) | (kt) | (kt) | (koz) | (kt) | (koz) | |
| Measured | 1.37 | 1.28 | - | 31.4 | 0.87 | 0.19 | 17.5 | - | 1,381 | 11.9 | 8.4 |
| Indicated | 2.95 | 1.05 | - | 29.0 | 0.90 | 0.24 | 30.9 | - | 2,747 | 26.5 | 22.7 |
| Total | 4.31 | 1.12 | - | 29.8 | 0.89 | 0.22 | 48.4 | - | 4,128 | 38.4 | 31.1 |
| Inferred | 1.29 | 1.27 | - | 32.7 | 1.15 | 0.22 | 16.4 | - | 1,357 | 14.9 | 9.1 |
|
|
| Mining Operations |
Notes:
| 1. | Subpart 1300 of Regulation S-K definitions were followed for Mineral Resources, which also are consistent with the CIM (2014) definitions. |
| 2. | Mineral Resources Tonnes and Contained Metal presented in this table are reported on 75.96% Nexa attributable ownership. |
| 3. | Mineral Resources are reported exclusive of those Mineral Resources that were converted to Mineral Reserves, and Mineral Resources are not Mineral Reserves and do not have demonstrated economic viability. |
| 4. | The Qualified Person for the Mineral Resources estimate is Jerry Huaman Abalos, B.Geo., MAusIMM CP(Geo), a Nexa employee. |
| 5. | Numbers may not add due to rounding. |
| 6. | The point of reference for Mineral Resources in this table is mill feed materials. |
Atacocha Open Pit – Year End Mineral Resources as of December 31, 2023 (on a 100% ownership basis) (1)
| Grade | Contained Metal | ||||||||||
| Class | Tonnage (2) | Zinc | Copper | Silver | Lead | Gold | Zinc | Copper | Silver | Lead | Gold |
| (Mt) | (%) | (%) | (g/t) | (%) | (g/t) | (kt) | (kt) | (koz) | (kt) | (koz) | |
| Measured | 1.80 | 1.28 | - | 31.4 | 0.87 | 0.19 | 23.0 | - | 1,818 | 15.7 | 11.0 |
| Indicated | 3.88 | 1.05 | - | 29.0 | 0.90 | 0.24 | 40.7 | - | 3,616 | 34.9 | 29.9 |
| Total | 5.68 | 1.12 | - | 29.8 | 0.89 | 0.22 | 63.7 | - | 5,434 | 50.6 | 40.9 |
| Inferred | 1.70 | 1.27 | - | 32.7 | 1.15 | 0.22 | 21.6 | - | 1,787 | 19.6 | 12.0 |
Notes:
| 1. | Subpart 1300 of Regulation S-K definitions were followed for Mineral Resources, which also are consistent with the CIM (2014) definitions. |
| 2. | Mineral Resources data presented in this table represents 100% of the Mineral Resources estimates for the property. Nexa owns 75.96%. |
| 3. | Mineral Resources are reported exclusive of those Mineral Resources that were converted to Mineral Reserves, and Mineral Resources are not Mineral Reserves and do not have demonstrated economic viability. |
| 4. | The Qualified Person for the Mineral Resources estimate is Jerry Huaman Abalos, B.Geo., MAusIMM CP(Geo), a Nexa employee. |
| 5. | Numbers may not add due to rounding. |
| 6. | The point of reference for Mineral Resources in this table is mill feed materials. |
The Atacocha Open Pit Mineral Resources estimates in the table above were completed using Datamine and Leapfrog software. Wireframes for geology and mineralization were constructed in Leapfrog based on geology sections, assay results, lithological information, underground and open pit mapping and structural data. Assays were capped to various levels based on exploratory data analysis and then composited to 2.0 m lengths. Wireframes were filled with blocks and sub-celling at wireframe boundaries. Blocks were interpolated with grade using the OK and ID3 interpolation algorithms. Block estimates were validated using industry standard validation techniques. Classification of blocks used distance-based and mineralization continuity criteria. Mineral Resources are reported within resources open pit shell. The Mineral Resources are estimated at a NSR cut-off grade values of US$22.44/t. Mineral Resources estimates are based on average long-term metal prices of: zinc: US$3,218.90/t (US$1.46/lb); lead: US$2,300.33/t (US$1.04/lb); and silver: US$24.35/oz. Metallurgical recoveries are accounted for in NSR calculations based on historical processing data and are variable as a function of head grade. Recoveries at Life of Mine average head grades are 70.44% for Zn, 83.97% for Pb, 75.76% for Ag, and 65.46% for Au.
|
|
| Mining Operations |
Atacocha Open Pit – Net Difference in Mineral Resources between December 31, 2023 versus December 31, 2022 (on an 75.96% Nexa attributable ownership basis)
| Contained Metal | ||||||||||||
| Class | Tonnage | Zinc | Copper | Silver | Lead | Gold | ||||||
| (Mt) | % | (kt) | % | (kt) | % | (koz) | % | (kt) | % | (koz) | % | |
| Measured | (1.05) | (43.5) | (7.7) | (30.7) | - | - | (1,490) | (51.9) | (12.8) | (51.7) | (11.1) | (57.2) |
| Indicated | (2.27) | (43.5) | (26.0) | (45.7) | - | - | (2,288) | (45.4) | (22.6) | (46.0) | (9.2) | (28.8) |
| Total | (3.33) | (43.5) | (33.7) | (41.1) | - | - | (3,778) | (47.8) | (35.4) | (47.9) | (20.3) | (39.6) |
| Inferred | (1.63) | (55.8) | (16.6) | (50.2) | - | - | (1,619) | (54.4) | (14.6) | (49.5) | (9.7) | (51.5) |
Atacocha Open Pit – Net Difference in Mineral Resources between December 31, 2023 versus December 31, 2022 (on a 100% ownership basis)
| Contained Metal | ||||||||||||
| Class | Tonnage | Zinc | Copper | Silver | Lead | Gold | ||||||
| (Mt) | % | (kt) | % | (kt) | % | (koz) | % | (kt) | % | (koz) | % | |
| Measured | (1.39) | (43.6) | (10.2) | (30.7) | - | - | (1,966) | (52.0) | (16.8) | (51.7) | (14.6) | (57.0) |
| Indicated | (2.99) | (43.5) | (34.2) | (45.7) | - | - | (3,010) | (45.4) | (29.7) | (46.0) | (12.1) | (28.8) |
| Total | (4.38) | (43.5) | (44.4) | (41.1) | - | - | (4,976) | (47.8) | (46.5) | (47.9) | (26.7) | (39.5) |
| Inferred | (2.14) | (55.7) | (21.8) | (50.2) | - | - | (2,127) | (54.3) | (19.2) | (49.5) | (12.7) | (51.4) |
In comparison to 2022, Atacocha’s Open Pit Inferred Mineral Resources decreased by 55.7% in mass and by 50.2% in zinc content (kt), mainly due to the limits of pit shell constraint. In comparison to 2022, Atacocha’s Open Pit Measured and Indicated Mineral Resources decreased by 43.5% in mass and by 41.1% in zinc content (kt), mainly due to the conversion to Mineral Reserves.
For additional information, see the Technical Report Summary on the Cerro Pasco Complex Integration, filed as Exhibit 15.2 of this annual report on Form 20-F.
Aripuanã
Location and means of access
The Aripuanã mine is located in the northwest corner of the Mato Grosso State in western Brazil, approximately 2,529 km by railroad and road to the Três Marias smelter, 2,831 km to the Juiz de Fora smelter or 2,660 km to the port of Santos. The approximate coordinates of the mine are 226,000m E and 8,888,000m N UTM 21L zone (South American 1969 datum) and the mine is located at an average elevation of 250 meters above sea level. The mine is accessible from the town of Aripuanã via a 25 km unpaved road, which is well maintained in the dry season. Aripuanã can be accessed from the state capital, Cuiabá, via a 16-hour drive (935 km) on paved and unpaved roads. The final 250 km between Cuiabá and Aripuanã are on unpaved roads.
The town of Aripuanã is also serviced by a paved airstrip suitable for light aircraft. There are no commercial flights travelling between Cuiabá and the town of Aripuanã. However, the site can be accessed via a three-hour chartered flight.
History
Aripuanã is an underground polymetallic mine containing zinc, lead and copper, located in the state of Mato Grosso, Brazil. In 2000, Dardanelos was created to represent a joint venture, or “contract of association,” between Karmin and Anglo American, with the intent of exploring the areas adjacent to the town of Aripuanã for base and precious metals. Anglo American and Karmin held 70% and 28.5% of Dardanelos, respectively, with the remaining interest (1.5%) owned by SGV Merchant Bank (SGV).
|
|
| Mining Operations |
In 2004, the initial agreement between Karmin and Anglo American was amended to include Nexa Brazil’s participation. Nexa Brazil subsequently acquired 100% of Anglo American’s interest in the project. In 2007, Karmin purchased SGV’s interests, raising its participation to 30%. In 2015, Nexa Peru acquired 7.7% of Nexa Brazil’s interests in Dardanelos. In 2019, Nexa Brazil became the owner of 100% of the Aripuanã mine.
In 2020, we reached an agreement with artisanal miners working adjacent to the property belonging to our Aripuanã mine, the ANM and the state government whereby Nexa assigned these artisanal miners an area to exercise their activities subject to certain conditions. The increase of artisanal mining activity or the failure of these artisanal miners to abide with our agreement may have an adverse effect on the development of our operations in Aripuanã.
In 2021, Nexa acquired two estates (584.9 hectares) located at the vicinity of the mine and concluded the process of documenting a third acquired in the past (100.0 hectares). The total land purchase of 684.9 hectares was required to meet the Rural Environmental Registration (CAR in Brazil) which requires areas of native vegetation that are not available within the area of enterprise.
In 2022, Nexa acquired six estates (1,332.4 hectares), located at the vicinity of the mine. The Rural Environmental Registry (CAR) was updated by Nexa and is in the process of being approved by the environmental agency and we still do not have a scheduled date for completion. On January 25, 2022, we signed an offtake agreement with a third-party international player (the “offtaker”), in which Nexa agreed to sell 100% of the copper concentrate produced by Aripuanã for a 5-year period starting in February 2023 and limited to 30,810 tonnes, at the lower of current market prices or a price cap. In September 2023, the parties agreed to amend the offtake agreement, which states that no penalty will be applied in case of delays in the agreed shipment schedule per year. However, if lower volumes are delivered in any year within the contract period, at the end of the contract period, the remaining balance will be shipped in a single additional delivery to total the 30,018 tonnes. The offtake agreement was structured to completely extinguish a previous existing future royalty obligation that Nexa had with the offtaker. Additionally, the Company opted to voluntarily and irrevocably designate the entire offtake agreement at fair value through profit and loss within the scope of IFRS Accounting Standards 9 rather than separate the value of the embedded derivative associated with the price cap, recognizing a non-cash accumulated gain of US$2.3 million in the income statement for the period ended on December 31, 2023. For further details on the offtake agreement, see Note 16 to our consolidated financial statements.
Ramp-up activities at the Aripuanã mine started in July 2022, and the mine continued production in the ramp-up phase for the duration of 2023. For further information, see “Project implementation”, below.
Titles, leases and options
The mine holds one mining concession in the core area that has a total area of 3,639.9 hectares, two mining concession applications (1,387.2 hectares), one right to apply for mining concession, (1,000.0 hectares) and nine exploration authorizations (27,025.9 hectares).
The Aripuanã mine holds surface rights sufficient to support the future operations. There is sufficient suitable land available within the mineral rights held by the Company for tailings disposal, mine waste disposal, and installations such as the process plant and related mine infrastructure.
The Aripuanã mine holds several permits and licenses supporting its current operations. The operating license issued by the Environmental Agency from the state of Mato Grosso is valid until October 2024 and will undergo the renewal process in 2024.
Mineralization
The Aripuanã region contains polymetallic VMS deposits with zinc, lead and copper, as well as small amounts of gold and silver, present in the form of massive mantles and veins, located in volcano sedimentary sequences belonging to the Roosevelt Group of Proterozoic age.
|
|
| Mining Operations |
Four main elongated mineralized zones have been defined in the central portion of the mine: (1) Arex, (2) Link, (3) Ambrex and (4) Babaçu. Limited exploration has identified possible additional mineralized bodies including Massaranduba, Boroca and Mocotó to the south and Arpa to the north.
The Aripuanã polymetallic deposits are typical VMS deposits associated with felsic bimodal volcanism. The individual mineralized bodies have complex shapes due to intense tectonic activity. Stratabound mineralized bodies tend to follow the local folds, however, local-scale, tight isoclinal folds are frequently observed, usually with axes parallel to major reverse faults, causing rapid variations in the dips.
Massive, stratabound sulphide mineralization as well as vein and stockwork-type discordant mineralization have been described on the property. The stratabound bodies, consisting of disseminated to massive pyrite and pyrrhotite, with well-developed sphalerite and galena mineralization, are commonly associated with the contact between the middle volcanic and the upper sedimentary units. Discordant stringer bodies of pyrrhotite-pyrite-chalcopyrite mineralization are generally located in the underlying volcanic units or intersect the massive sulphide lenses and have been interpreted as representing feeder zones.
In 2023, Aripuanã’s strategy aimed to increase throughput rate and asset reliability, reduce plant downtime, improve metal recoveries, concentrate grades and quality while consuming our ore stockpile inventory, which was supported by mineral exploration efforts to upgrade the Mineral Resources at the Babaçu target and expand our Mineral Reserves.
The exploratory drilling in 2023 was focused on the infill drilling of the Babaçu target, which is located southeast of the Ambrex orebody, extending the mineralization with high zinc, lead and copper content, which aimed to update the classification and conversion of resources into reserves, as well as starting drilling tests at the Massaranduba target, located southeast of Aripuanã mine.
In 2023, we spent a total of US$7.3 million on the Aripuanã mine, with US$2.0 million spent towards Aripuanã’s exploration program and US$5.2 million on an infill drilling campaign. The total investment included drilling, geological activities, geochemistry, and more. In 2023, we drilled 21.8 km of diamond drilling, including Babaçu infill drilling and Massaranduba exploratory drilling. For 2024, we expect to invest US$4.0 million in the brownfield exploration program to drill 9.0 km focused on the Massaranduba target to validate the presence of mineralization in the southeastern extension of the Aripuanã deposit.
Ramp-up Activities
Ramp-up activities at the Aripuanã mine started in July 2022, and the mine continued in the ramp-up phase through 2023 and into 2024. Ramp-up activities continue to progress and are expected to conclude in mid-2024.
The commissioning of the paste fill circuit was completed in December 2022, the first tests of mine filling started in January 2023 and were concluded in February 2023, with the paste plant becoming fully operational only in 2024. In January and February of 2023, the processing plant performed at around 57% of nameplate capacity. Ramp-up activities focused on steadily increasing the plant throughput rate, asset reliability, as well as concentrate grades and quality. At the end of 2Q23, the plant performed at an average of 76% of nameplate capacity while the average utilization rate was 66%.
In March 2023, we decided to temporarily halt operations at the plant to address some design limitations in the capacity of the flotation pumping system, identified during the detection of bottlenecks, which required resizing and upgrade, along with certain plant processing facilities and systems, as well as the clean-up and upgrading of water treatment facilities, which contributed to a better resiliency during the rainy season (which typically occurs from December to March). Due to the aforementioned limitations, in 3Q23 we reduced plant throughput, and as a result, the utilization rate was also reduced in the period and the plant performed at an average of 56% in the quarter. Despite this reduction, our priority throughout 2023 was to continue improving metal recovery and concentrate quality and grades, aiming to achieve a stable operation and to minimize impacts related to the necessary extension of the ramp-up phase.
|
|
| Mining Operations |
In 4Q23, we achieved an average of 61% of capacity utilization level and we expect to reach nameplate capacity in mid-2024. At the end of February 2024, the average capacity utilization rate was around 61%, maintaining similar levels as in 4Q23, given the usual rainy season period in the region, which impacted our dry disposal capacity. However, during this period the operational focus was to maintain concentrate quality and grades, as well as the metallurgical recovery rates.
At the end of 2023, approximately 106.6kt of ore was stockpiled. Horizontal mine development reached an accumulated of 7,474 meters developed for both mines (Arex and Link). As of the date of this filing, the mine is fully operational, and underground activities are focused on developing and preparing new areas for mining operations.
As of December 31, 2023, 814 people were employed at Aripuanã. Of these employees, 23.7% are women. We also continued the qualification program for future mine and plant operating professionals, which had 146 candidates enrolled in 2023, of which 46 obtained professional qualifications in the areas of maintenance and automation, and geology and surveying. The company hired 65.8% (96) of the attendees from the qualification program, of which 52.1% (50) are men and 47.9% (46) are women.
To date, cumulative incurred expansion capital expenditures on the mine total US$632.7 million, and we did not make any new expansion capital expenditures on the mine in 2023.
Operations and infrastructure
The Aripuanã operation consists of two mechanized underground mines, the Arex Mine and Link Mine, with a rate of approximately 2.3 Mtpy. Production drilling operations have been performed by company personnel using a variety of drilling machines throughout the history of the Aripuanã mine.
The Aripuanã underground mine has been in operation since 2019 and is a fully mechanized mine using rubber-tired diesel equipment for development and production activities. Access to the mine is through one portal for Arex and one portal for Link. The Aripuanã processing plant has been in operation since 2022.
All infrastructure required for the current mining and processing operations has been constructed and is operational. This includes the underground mines, access roads, power lines, water pipelines, offices and warehouses, a process plant/concentrator, conveyor systems, waste rock facilities, temporary ore stockpiles, paste-fill plants, and tailings storage facilities.
The Aripuanã mine is connected to the basic grid at 230 kV. The energy measurement and billing system takes place in SE Dardanelos, 20 km are covered at 69 kV to the unit. Power distribution is carried out at 13.8 kV and the unit has a 25/31 MW transformer. Currently, the power demand contracted with Energisa for the unit is 23 kV, on and off-peak. There are also five 750 kVA diesel generators.
In 2023, we spent US$79.4 million on sustaining capital expenditures for this property, primarily associated with ongoing ramp-up activities, mine development, construction of a waste pile, equipment replacement and other major infrastructure.
Production
The Aripuanã mine is in ramp-up phase and has a treatment plant with a nominal design processing capacity of approximately 6,300 tonnes of ore per day. The table below summarizes the Aripuanã mine’s concentrate production, metal contained in concentrates produced and average grades for the periods indicated. Production in 2023 was higher than 2022 due to the continued progress of the ramp-up phase which was focused on steadily increasing the plant throughput rate, asset reliability, as well as concentrate grades and quality.
|
|
| Mining Operations |
|
For the Year Ended December 31, |
|||
|
2023 |
2022 |
2021 |
|
| Treatment ore (in tonnes) | 1,311,430 | 100,114 | - |
| Average ore grade | |||
| Zinc (%) | 3.31 | 2.44 | - |
| Copper (%) | 0.68 | 0.49 | - |
| Lead (%) | 1.05 | 0.00 | - |
| Silver (ounces per tonne) | 0.96 | 0.61 | - |
| Gold (ounces per tonne) | 0.015 | 0.011 | - |
| Metal contained in concentrate production | |||
| Zinc (in tonnes) | 22,099 | 670 | - |
| Copper (in tonnes) | 4,443 | 195 | - |
| Lead (in tonnes) | 6,331 | 0 | - |
| Silver (in oz) | 513,916 | 20,497 | - |
| Gold (in oz) | 7,954 | 273 | - |
| Cash Cost, net of by-product credits (in US$/t) | - | - | - |
| Cash Cost, net of by-product credits (in US$/lb) | - | - | - |
| Non-Expansion Capital Expenditures (in millions of US$) | 60.1 | 68.4 | - |
Mineral Reserves and Mineral Resources
The Aripuanã Mineral Reserves estimates are based on the definitions for Mineral Reserves in SK-1300 and the tables below are based on costs and modifying factors from the Aripuanã mine.
Aripuanã – Year End Mineral Reserves as of December 31, 2023 (on a 100% ownership basis) (1)
| Grade | Contained Metal | ||||||||||
| Class | Tonnage (2) | Zinc | Copper | Silver | Lead | Gold | Zinc | Copper | Silver | Lead | Gold |
| (Mt) | (%) | (%) | (g/t) | (%) | (g/t) | (kt) | (kt) | (koz) | (kt) | (koz) | |
| Proven | 6.43 | 3.83 | 0.21 | 33.8 | 1.40 | 0.28 | 246.2 | 13.8 | 6,993 | 90.0 | 57.1 |
| Probable | 24.64 | 4.48 | 0.13 | 42.4 | 1.73 | 0.21 | 1,105.0 | 31.8 | 33,610 | 427.3 | 167.3 |
| Total | 31.07 | 4.35 | 0.15 | 40.6 | 1.66 | 0.22 | 1,351.3 | 45.6 | 40,602 | 517.2 | 224.4 |
Notes:
| 1. | Subpart 1300 of Regulation S-K definitions were followed for Mineral Reserves, which also are consistent with the CIM (2014) definitions. |
| 2. | Mineral Reserves data presented in this table represents 100% of the Mineral Reserves estimates for the property. Nexa owns 100% of property. |
| 3. | The Qualified Person for the Mineral Reserves estimate is Vitor Ferraz Viana, B.Eng., FAusIMM, a Nexa employee. |
| 4. | Numbers may not add due to rounding. |
| 5. | The point of reference for Mineral Reserves in this table is mill feed materials. |
The Aripuanã Mineral Reserves estimates are based on four main orebodies: Arex, Link and Ambrex and the two main types of mineralization in the deposit are stratabound and stringer. The main commodities produced are zinc, copper, lead, silver and gold. The dilution that has been applied is related to the selected mining method. The two main mining methods used at Aripuanã are longitudinal longhole retreat (“bench stoping”) and transverse longhole mining (vertical retreat mining, or “VRM”) with primary and secondary stope extraction. Dilution is applied on a percentage basis, with no grade applied to the diluting material. The NSR factors were determined using long term metal price forecasts, metallurgical recoveries, transport, treatment, and refining costs. A break-even NSR cut-off value is US$63.40/t processed was estimated from forecasted operating costs and some incremental material between US$49.20/t and US$63.40/t was included. A minimum mining width of 4.0 m was used. The long-term prices derived are in line with the consensus forecasts from banks and independent institutions. Mineral Reserves estimates are based on average long-term metal prices of: zinc: US$2,799.04/t (US$1.27/lb); copper: US$7,669.61/t (US$3.48/lb); lead: US$2,000.29/t (US$0.91/lb); silver: US$21.17/oz; and gold: US$1,630.93/oz. Metallurgical recoveries are accounted for in NSR calculations based on metallurgical testworks and are variable as a function of head grade and oretype. Recoveries at Life of Mine average head grades for a Mix of 80% Stratabound and 20% Stringer material are 90.06% for Zn, 60.00% for Cu, 84.92% for Pb, 68.00% for Ag, and 67.80% for Au. The current LOM plan continues to 2036.
|
|
| Mining Operations |
Aripuanã – Net Difference in Mineral Reserves between December 31, 2023 versus December 31, 2022 (on a 100% ownership basis)
| Contained Metal | ||||||||||||
| Class | Tonnage | Zinc | Copper | Silver | Lead | Gold | ||||||
| (Mt) | % | (kt) | % | (kt) | % | (koz) | % | (kt) | % | (koz) | % | |
| Proven | (1.98) | (23.5) | (27.2) | (9.9) | (10.2) | (42.7) | (870) | (11.1) | (9.1) | (9.2) | (6.9) | (10.8) |
| Probable | 2.93 | 13.5 | 349.1 | 46.2 | 5.4 | 20.6 | 10,447 | 45.1 | 148.7 | 53.4 | 11.3 | 7.2 |
| Total | 0.95 | 3.2 | 322.0 | 31.3 | (4.8) | (9.5) | 9,576 | 30.9 | 139.5 | 36.9 | 4.4 | 2.0 |
In comparison to 2022, Aripuanã’s Mineral Reserves increased by 3.2% in mass and by 31.3% in zinc content (kt), mainly due to infill drilling at the Babaçu area, focused on the conversion from Inferred Mineral Resources to Indicated Mineral Resources, enabling the increase in Probable Mineral Reserves. Mineral Reserve depletion during 2023 accounted for 1.5Mt containing 43.9kt of zinc.
Aripuanã – Year End Mineral Resources as of December 31, 2023 (on a 100% ownership basis) (1)
| Grade | Contained Metal | ||||||||||
| Class | Tonnage (2) | Zinc | Copper | Silver | Lead | Gold | Zinc | Copper | Silver | Lead | Gold |
| (Mt) | (%) | (%) | (g/t) | (%) | (g/t) | (kt) | (kt) | (koz) | (kt) | (koz) | |
| Measured | 0.35 | 2.60 | 0.39 | 23.1 | 0.86 | 0.36 | 9.1 | 1.4 | 260 | 3.0 | 4.1 |
| Indicated | 5.19 | 3.95 | 0.18 | 35.0 | 1.46 | 0.27 | 205.0 | 9.3 | 5,840 | 75.8 | 45.1 |
| Total | 5.54 | 3.86 | 0.19 | 34.2 | 1.42 | 0.28 | 214.1 | 10.7 | 6,100 | 78.8 | 49.2 |
| Inferred | 38.75 | 3.47 | 0.33 | 45.7 | 1.39 | 0.43 | 1,344.6 | 127.9 | 56,935 | 538.6 | 535.7 |
Notes:
| 1. | Subpart 1300 of Regulation S-K definitions were followed for Mineral Resources, which also are consistent with the CIM (2014) definitions. |
| 2. | Mineral Resources data presented in this table represents 100% of the Mineral Resources estimates for the property. Nexa owns 100% of property. |
| 3. | Mineral Resources are reported exclusive of those Mineral Resources that were converted to Mineral Reserves, and Mineral Resources are not Mineral Reserves and do not have demonstrated economic viability. |
| 4. | The Qualified Person for the Mineral Resources estimate is José Antonio Lopes, B.Geo., FAusIMM, a Nexa employee. |
| 5. | Numbers may not add due to rounding. |
| 6. | The point of reference for Mineral Resources in this table is mill feed materials. |
The Mineral Resources estimates for the Aripuanã mine were completed for Babaçu, Arex, Ambrex and Link. The block models were created using Datamine and Leapfrog software. Wireframes for geology and mineralization were constructed in Leapfrog based on geology sections, assay results, lithological information and structural data. Assays were capped to various levels based on exploratory data analysis and then composited to one-meter lengths. Wireframes were filled with blocks measuring 5 meters by 5 meters by 5 meters for with sub-celling at wireframe boundaries. Blocks were interpolated with grade using the OK and ID3. Blocks estimates were validated using industry standard validation techniques. Classification of blocks was based on distance-based criteria. Potentially mineable shapes of underground mineral resources are generated using DSO software. The Mineral Resources of the Aripuanã mine are reported using a cut-off value of US$63.40/t. Mineral Resources estimates are based on average long-term metal prices of: zinc: US$3,218.90/t (US$1.46/lb); copper: US$8,820.05/t (US$4.00/lb); lead: US$2,300.33/t (US$1.04/lb); silver: US$24.35/oz and gold: US$1,696.11/oz. Metallurgical recoveries are accounted for in NSR calculations based on metallurgical test work and are variable as a function of head grade and oretype. Recoveries at the LOM average head grades for stratabound material are 90.06% for Zn, 84.92% for Pb, 60.00% for Cu, 75.10% for Ag, and 67.80% for Au. Recoveries at the LOM average head grades for stringer material are 88.68% for Cu, 50.00% for Ag, and 63.00% for Au.
|
|
| Mining Operations |
Aripuanã – Net Difference in Mineral Resources between December 31, 2023 versus December 31, 2022 (on a 100% ownership basis)
| Contained Metal | ||||||||||||
| Class | Tonnage | Zinc | Copper | Silver | Lead | Gold | ||||||
| (Mt) | % | (kt) | % | (kt) | % | (koz) | % | (kt) | % | (koz) | % | |
| Measured | (0.05) | (12.5) | 1.6 | 21.3 | (0.2) | (12.5) | (41) | (13.6) | 0.2 | 7.1 | (1.0) | (19.6) |
| Indicated | 2.64 | 103.5 | 147.4 | 255.9 | 4.5 | 93.8 | 4,102 | 236.0 | 54.9 | 262.7 | 19.7 | 77.6 |
| Total | 2.59 | 87.8 | 149.0 | 228.9 | 4.3 | 67.2 | 4,061 | 199.2 | 55.1 | 232.5 | 18.7 | 61.3 |
| Inferred | 0.20 | 0.5 | 415.5 | 44.7 | 12.2 | 10.5 | 20,372 | 55.7 | 145.4 | 37.0 | (34.4) | (6.0) |
In comparison to 2022, Aripuanã’s Inferred Mineral Resources increased by 0.5% in mass and increased by 44.7% in zinc content (kt) in 2023, mainly due to infill drilling at Babaçu resulting in higher average grades. In comparison to 2022, Aripuanã’s Measured and Indicated Mineral Resources increased by 87.8% in mass and increased by 228.9% in zinc content (kt) in 2023, primarily due to infill drilling at Babaçu resulting in higher average grades.
For additional information, see the Technical Report Summary on Aripuanã, filed as Exhibit 15.4 to Nexa’s annual report on Form 20-F/A for the year-ended December 31, 2020, as filed on November 4, 2021.
Morro Agudo
The Morro Agudo Complex consists of an underground mine and open pit, polymetallic mine, as well as three deposits along what is known as the Ambrósia Trend (Ambrósia Sul, Ambrósia Norte, and Bonsucesso). The Morro Agudo mine site is situated on Traíras Farm, about 45 km south of the municipality of Paracatu, Brazil, at a latitude of approximately -17 57’ 33” S and a longitude of approximately 46°49’42” W, within Zone 23S of the Universal Transverse Mercator coordinate system (Corrego Alegre Datum). The Ambrósia Trend deposits are situated about 15 to 20 km northeast of Paracatu.
Nexa Brazil owns 100% of Morro Agudo. The total Morro Agudo mine area is about 80 km long and 10 km wide at the widest extent and covers a significant strike extent of the lithologies that host mineralization at the Morro Agudo mine and along the Ambrósia Trend.
On March 19, 2024, Nexa announced the suspension of its mining operations in the Morro Agudo Complex effective May 1, 2024 until further notice. Between March 19 and April 30, 2024, mining activities will be reduced while limestone production activities will continue at full capacity. The suspension is part of Nexa’s portfolio optimization process to improve free cash flow in line with the Company’s disciplined capital allocation framework, along with its long-term strategy to maximize value for the Company and its shareholders. Nexa is committed to carrying out a structured process, aiming to minimize impacts on the business and, particularly, on its employees and host communities.
Nexa Brazil holds three granted mining concessions in the Morro Agudo mine area of approximately 1,446.1 hectares. In the Ambrósia Trend area, Nexa Brazil has three granted mining concessions totaling 2,495.8 hectares.
Nearby the Morro Agudo mine site and Ambrósia trend areas, Nexa Brazil also holds 44 exploration authorizations totaling 41,414.3 hectares, one right to apply for mining concession totaling 917.0 hectares, three mining applications totaling 2,167.4 hectares and one mining concession totaling 1,000.0 hectares, in addition to the core tenements.
The Morro Agudo operation holds several permits in support of the current operations. The main instrument to regulate the operation is a set of operating licenses issued by the Environmental Agency from the state of Minas Gerais. The licenses are active, some of them under renewal process.
|
|
| Mining Operations |
The Ambrósia mine in Morro Agudo reached the end of its life of mine during the fourth quarter of 2020 and operations were suspended due to the uncertainties associated with the geological model of the area, safety considerations and a greater movement of ore compared to the original plan.
In 2023, we spent US$2.8 million on sustaining capital expenditures for this property, primarily associated with the mine development and maintenance of plant and equipment.
Mineralization Developments
In 2023, no exploratory drilling was carried out in the Morro Agudo area, and for 2024 no exploration activity is expected.
Morro Agudo does not currently have any estimated Mineral Reserves and is considered an exploration stage property under S-K 1300. Morro Agudo is not considered a material property for the purposes of S-K 1300.
Production
The Morro Agudo mine has a treatment plant capacity of 3,400 tonnes of mill feed per day. The table below summarizes the Morro Agudo mine’s concentrate production, metal contained in concentrates produced and average grades for the periods indicated.
|
For the Year Ended December 31, |
|||
|
2023 |
2022 |
2021 |
|
| Treatment ore (in tonnes) | 1,293,383 | 1,016,568 | 982,036 |
| Average ore grade | |||
| Zinc (%) | 1.99 | 2.06 | 2.05 |
| Lead (%) | 0.86 | 0.85 | 0.73 |
| Metal contained in concentrate production | |||
| Zinc (in tonnes) | 23,167 | 18,700 | 17,278 |
| Lead (in tonnes) | 8,320 | 6,247 | 4.691 |
| Cash Cost, net of by-product credits (in US$/t) | 1,796.8 | 2,160.5 | 1,884.1 |
| Cash Cost, net of by-product credits (in US$/lb) | 0.82 | 0.98 | 0.85 |
| Non-Expansion Capital Expenditures (in millions of US$) | 3.0 | 6.8 | 7.6 |
Concentrate Sales
All the metal produced by our mines is processed into concentrates. Our mining operations sell the concentrates that they produce to third parties and to our own smelters pursuant to arm’s length transactions. Each mine bears the cost of transporting the concentrate to the point of sale where the smelter or trader purchases the concentrate. The smelter or trader pays the mine for the percentage of metals contained in the concentrate, net of charges for treating the concentrate and refining the metals. The typical payable percentage is 85% for zinc contained in concentrate and 97% for copper contained in concentrated minus treatment charges.
Growth projects
In addition to Nexa’s operating mines and smelters, a component of our business focuses on growth and exploration, which are activities associated with ascertaining the existence, location, extent or quality of a mineral deposit. Our exploration activities encompass brownfield and greenfield projects. Brownfield projects are exploration or development projects near or within our existing operations, which can share infrastructure and management of our existing operations. Greenfield projects are exploration or development projects that are located outside the area of influence of our existing mine operations and/or infrastructure, which will be independently developed and managed from our existing operations.
Vazante mine deepening project
One of our main brownfield projects is the Vazante mine Deepening Project, which involves extending the mine life of Vazante. The capital expenditures related to this project in 2023 totaled US$2.5 million and we expect to invest an additional US$2.4 million in 2024. This project began in 2013 and the completion of this project, which was expected to occur in 2024, was postponed due to our capital allocation strategy and is now expected to be completed in the second half of 2025.
|
|
| Mining Operations |
In addition, we are conducting exploration activities below the mine’s current operating level and alongside the orebody. As part of this project, we are investing in ongoing exploration activities and infrastructure, including expansion of an underground pumping station, an increase in the capacity of the ventilation system, emergency paths, access ramps, electrical networks and substations. During 2020 and 2021, we assembled and commenced operating the EB347 pumping station and progressed the activities of CEMIG’s electric power line; however, phase 2 of the EB-140 was rescheduled in 2022 due to hydrogeological studies. In 2023, we prepared the area to receive the equipment in accordance with the project’s specifications, in 2024 we expect to complete activities in accordance with the updated project schedule and we expect the pumps to be installed in the second half of 2025.
Cerro Pasco Complex Integration Project
The Cerro Pasco Complex Integration Project is one of our main brownfield projects, which involves the continued integration of the El Porvenir and Atacocha underground mines. The Integration Project is intended to continue to capture synergies between the two mining operations, as a result of their proximity and operational similarities, with ore from both the underground mines being processed at the El Porvenir processing plant. The goal of the Integration Project is to achieve cost and investment savings, thereby reducing the environmental footprint and extending the combined life of mine of the two mines. We expect to submit the project to the formal approval process with our Sustainability and Capital Projects (“SCP”) committee and our Board of directors in 2024. For further information see “Information on the Company—Mining Operations—Cerro Pasco Complex—Integration Project.”
Bonsucesso
The Bonsucesso project is a brownfield underground mine project that belongs to the Morro Agudo complex (Ambrósia Trend). The project is located 8 km north of the Ambrósia Sul mine and approximately 60 km north of the Morro Agudo mine.
In 2023, we had no exploratory activities in the Bonsucesso project and no activities are expected for 2024.
The feasibility study concluded in 2022 with no amount invested in 2023. The total investments related to this project, as of December 31, 2023, totaled US$12.8 million, which includes all project studies (from the scoping study to the feasibility study) and anticipated expenses related to construction and operating infrastructure.
The strategic review of our assets continues with initiatives to optimize our portfolio. We continue to assess risk-return alternatives and we are currently revisiting the project, taking into consideration our capital allocation strategy and our focus on free cash flow generation.
Mining greenfield projects
| Project Name |
Current Project Status |
| Magistral | Under Review |
| Hilarión | Exploration phase |
| Florida Canyon Zinc | Exploration phase |
We summarize below certain information, including the outlook, for each of our greenfield projects. As of the date of this annual report, none of our greenfield projects have Mineral Reserves under S-K 1300.
Magistral
The Magistral mining project is located in the Ancash region of Peru, approximately 450 km northeast of the capital of Lima and approximately 140 km east of the port city of Trujillo. The Magistral property can be reached by vehicle by driving a total of 272 km from Trujillo, much of which consists of poorly maintained roads that traverse steep topography. The Magistral Project consists of a large, irregularly shaped block of contiguous concessions and two smaller, non-contiguous single concessions. The Magistral Project comprises 36 granted concessions, totaling 16,254.2 hectares. The project is an open pit copper mine with molybdenum concentrate as a by-product. In 2016, ProInversión approved an initial feasibility study, which set forth production rates starting at 10 thousand tonnes per day and achieving 30 thousand tonnes per day. In 2016, the MINEM approved an environmental impact assessment (“EIA”), to process up to 30 ktpd. An EIA modification is currently under the government approval process.
|
|
| Mining Operations |
Nexa Peru was awarded the contract to develop the Magistral mining project in 2011, which has been amended from time to time. Nexa made an initial payment of US$8.0 million to acquire the Magistral concessions, subject to a 2.0% NSR royalty upon production. Under the terms of the contract in 2016, Nexa Peru exercised the option by committing to invest a minimum 70% of declared initial capital expenditures by September 2024 and as a result of the COVID-19 pandemic, this term was extended by the government for an additional year, starting in September 2024. In 2023, new alignments were finalized and an additional 35 month extension period was approved by force majeure, extending the period until August 2028. Pursuant to the terms of this commitment with the Peruvian Government, to minimum investments levels in the project during this period, Nexa Peru would be required to pay a penalty of 30% over the unexecuted minimum investment commitment. As of December 31, 2023, the unexecuted minimum investment commitment was US$323.0 million, and if not completed the penalty exposition would be US$97.0 million. Nexa Peru currently holds a 100.0% interest in 15 of the 36 concessions, Nexa holds 21 concessions by way of a lease agreement entered into with Companía Magistral S.A.C., a company also controlled by Nexa Peru. We spent approximately US$0.5 million on the Magistral project in 2023.
The feasibility study of the Magistral project was conducted in 2022 and in 2023, we advanced with the EIA amendment review process by responding to inquiries from the Ministry of the Environment (SENACE). We continue to assess strategic risk-return alternatives to the project by taking into consideration capital allocation decisions and free cash flow generation. In 2024, we expect the final decision relating to the EIA amendment request, which was submitted to SENACE in November 2023 for its assessment.
Exploration Developments
The Magistral property is near the northeastern end of the Cordillera Blanca, a region that is underlain predominantly by Cretaceous carbonate and clastic sequences. These units strike north to northwest and are folded into a series of anticlines and synclines with northwest-trending axes.
Since acquiring the Magistral project in 2011, Nexa has initiated a comprehensive exploration program consisting of geological mapping, prospecting and sampling, ground geophysical surveying, and diamond drilling. Geological mapping at a scale of 1:2,000 was completed in the Ancapata area and the area north-northeast of Magistral. The objective was to verify and supplement the information available from Ancash Cobre’s exploration.
From October 2012 to January 2014, Arce Geofisico SAC was contracted to complete ground magnetic and Induced Polarization (IP) surveying over an area of 520 hectares covering the Magistral deposit and the adjoining Ancapata area. The objective was to characterize the geophysical signature of the Magistral deposit and to survey the Ancapata area. Work was completed on 100 m spaced lines oriented at N125°W. An initial 30 line-km survey was expanded to 55.1 line-km of IP and 57.25 line-km of ground magnetics in order to delineate chargeability and resistivity anomalies.
Through the end of 2015, a total of approximately 101,900 m of surface diamond drilling has been completed in 486 drill holes. In addition, 14 short underground diamond holes were drilled for a total of 1,298.8 m in the San Ernesto, Arizona, and Sara zones between 1969 and 1973. In 1999, 2000, and 2001, Anaconda drilled 76 diamond drill holes totaling 24,640 m. All surface drilling from 2000 onward was carried out on northeast (035o) and northwest (305o) oriented sections. In 2004, Ancash Cobre (or Inca Pacific) completed 34 drill holes, totaling 7,985 m, and in 2005 Ancash Cobre (or Quadra) drilled 14,349 m in 60 holes. Milpo’s drilling in 2012 was contracted to Redrilsa Drilling S.A. (or Redrilsa). Since 2012, the drilling has been contracted to Geotecnia Peruana S.R. Ltda.
Of the 71 holes drilled in 2013, six were drilled to gain geotechnical information and the remainder were infill holes. Drilling in 2014 consisted of a combination of infill, geotechnical, and metallurgical holes. In 2015, drilling consisted entirely of infill holes, drilling ceased on the property in the same year. No exploration drilling program was carried out on since then and no exploratory drilling program is scheduled for 2024.
|
|
| Mining Operations |
Hilarión
The Hilarión project is located in the Department of Ancash, approximately 230 km north of Lima, the capital of Peru, and approximately 80 km south of the city of Huaraz and is accessible by paved road from Lima. It consists of 72 mineral concessions covering an area of approximately 15,841.2 hectares. Hilarión is a skarn mineral deposit made of vertical tabular ore bodies containing sulfide zinc, lead, silver and copper deposits. Hilarión and El Padrino and other occurrences in proximity to them (Mia, Eureka and others) constitute a large mineralized system, open in several directions for a potential increase in resources, extended mine life and increased production capacity in the future. The conceptual plan for the project includes the development of an underground mine that could either use its own processing plant or use one of the several existing plants in the area, such as Pachapaqui, Huanzala and Atalaya plants.
In 2020, we drilled 5 drill holes totaling 4.6 km, completed the sampling for metallurgical test studies, and filed a preliminary economic assessment (“PEA”) for the Hilarión project. In 2021, we executed 21.3 km of diamond drilling to test Hilarión Sur target, totaling 32 drill holes confirming the southeast continuity of the Hilarión deposit towards the edge of the Hilarión stock with multiple thick intersections, in addition to 0.3 km remaining from the 2020 drilling campaign. In 2022, we completed mineral exploration activities including a geological review of recent project data, an aero magnetometry survey to structure the drilling program, found new mineralized zones and expanded the known mineralization at Hilarión West, and drilled 7.2km at the Hilarión West, confirming the presence of mineralization to the west of known bodies and their continuities.
In 2023, we spent approximately US$4.2 million on the Hilarión project, including project maintenance, geology works and drilling campaigns. We completed 4.1 km of diamond drilling, and the focus of the exploratory activities was to identify the mineralization continuity of the deposit in the southeast direction, at the Chaupijanca target, in addition to searching for zones with higher copper content at the El Padrino target.
In 2024, we have budgeted US$1.6 million for the Hilarión project maintenance, and we have planned no drilling activities.
Florida Canyon Zinc
The Florida Canyon Zinc project is located in the Eastern Cordillera of Peru at the sub-Andean front in the upper Amazon River Basin, 680 km north-northeast of Lima and 245 km northeast of Chiclayo and is accessible by paved road from Lima. It is comprised of 13 contiguous mining concessions, covering approximately 10,700.0 hectares, is owned by Minera Bongará S.A. and operated by Nexa Peru, a joint venture between Nexa Peru, Solitario Exploration and Royalty Corp. and Minera Solitario Peru S.A.C. (collectively, Solitario) in existence since 2006. As of December 31, 2023, Nexa Peru owns a 61.00% interest in this joint venture, which may increase up to 70.00% upon Nexa Peru’s satisfaction of certain conditions.
Although a pre-feasibility study relating to the Florida Canyon Zinc was released in 2017, the project continues to be treated as an advanced mineral exploration project.
In 2021, field work focused on mapping access road from 0 km up to 19.5 km; and mapping, sampling and topographic survey of Teodolfo, Matias, Berny, and Pizarro targets, in addition to a new mineral occurrence named Aron, as well as metallurgical testing using historic drill core material.
In 2022, we advanced the opening of the road that connects the project structures to the main camp and carried out geometallurgical tests to establish better mineralogical and metallurgical knowledge of the deposit, which showed high recovery of zinc and lead concentrates, as well as the presentation of the fifth environmental modification to the competent body.
|
|
| Mining Operations |
In 2023, drilling at the Florida Canyon began in the third quarter due to a delay in the drilling program caused by lack of transportation for drilling materials. In September, construction and maintenance of the motorized trail, which aims to reach La Florida Annex, commenced and is expected to be completed in 2024.
We spent approximately US$3.6 million on this project in 2023 to drill 1.4 km and we have budgeted US$2.0 million for the Florida Canyon project in 2024, including road maintenance and construction of the final stretch that connects the road to the main exploration camp in the drilling area, maintenance of the project structure, and social programs. No drilling activities are planned for 2024.
Other Greenfield Exploration Projects
Project in Namibia
We have been developing exploratory work in Namibia since 2015, as part of a joint venture with the Japan, Oil, Gas and Metals National Corporation (“JOGMEC”), a Japanese state-owned company. The project was part of a farm-out process of the Namibian tenements inherited from the former strategy of Votorantim Metals to explore opportunities in Africa, where Nexa has a back-in right to invest and maintain participation depending on exploration results. The exploration area is located 360 km north of Windhoek. This early-stage exploratory program is targeting sediment-hosted copper mineralization, such as the Tsumeb and Kombat mines, both of which contain rocks from the Otavi Mountain land terrain.
Nexa currently holds 560,078.1 hectares in 26 exclusive prospective licenses (“EPL”) for the Otavi and Namibia North targets.
The 2022 exploration expenditures totaled US$3.1 million (US$2.2 million for JOGMEC expenditures and US$0.8 million for Nexa expenditures) with a total of 9.1 km drilled. The focus of the drilling campaign in 2022 was the expansion of mineralization in the Otavi target and the identification of new mineralized zones of the “Deblin” copper trend in the Namibia North target.
The drilling campaign in 2023 was focused on extending the known mineralization from the Deblin trend, intensifying drilling to further investigate polymetallic mineralization identified at the Ondjondjo target and targeting of high-grade copper sediment deposits along the fertile Tsumeb belt. We spent approximately US$2.2 million, divided between Nexa (US$0.3 million) and JOGMEC (US$1.8 million) on this project in 2023 to drill 4.9 km.
To date, we are defining the budget for the project as part of a joint venture with “JOGMEC” as the Japanese fiscal year ends in March 2024. Nexa is currently focusing on mapping and defining regional opportunities and we plan to execute a geophysical survey at Tsumeb Block, conduct exploratory drilling in Tsumeb East and define opportunities in the Namibian Kalahari Copperbelt throughout 2024.
Permits & authorizations for greenfield projects
The following table summarizes the status of the main permits and authorizations for our greenfield projects.
| Project |
Status |
| Magistral | An amendment to the EIA was submitted to the Ministry of the Environment (SENACE) in the fourth quarter of 2021 for its assessment. In October 2023, we responded to SENACE inquiries. The amendment to the EIA is in the final approval stage and a decision is expected in 2024. |
| Hilarión |
The most recent environmental study is the fifth modification to the Hilarión Project’s EIS, which consisted of obtaining approval for new exploration platforms and reviewing the drilling program. It was approved in 2020 and is valid until 2025. The authorization for exploratory activities at the El Padrino deposit was extended until March 2024 and a detailed EIS was approved in 2020, which is valid until 2025. |
| Florida Canyon Zinc | The most recent environmental study is the fifth modification to the Florida Canyon Project’s EIS, which consisted of obtaining approval for new exploration platforms and reviewing the drilling program. It was approved in 2023 and is valid until 2028. |
|
|
| Mining Operations |
Tailings disposal
Regulatory framework
We are subject to several environmental regulations related to the use of tailings dams and effluent dams.
In Brazil, tailings dams’ failures have triggered the issuance of new regulations. On January 25, 2019, there was a tragic failure of a tailings dam in the city of Brumadinho, in the state of Minas Gerais, Brazil. The Brumadinho dam was built using the upstream method and belongs to Vale S.A. A report by a panel of technical experts commissioned by Vale S.A. found that the tailings dam failure was the result of flow liquefaction within the tailings in the dam. Another upstream-method tailings dam in Brazil, the Fundão tailings dam owned by Samarco Mineração S.A., failed in November 2015. Each of these failures released muddy tailings downstream, flooded certain communities, caused fatalities and resulted in extensive environmental damage to the surrounding area.
In response to failures of tailings dams in Brazil, the state of Minas Gerais enacted regulations in February 2019 affecting the use of dams in the state, including tailings dams and effluent dams that mandate the decommissioning of all upstream tailings dams and prohibit construction of new tailings dams using the upstream method. Additionally, a rule approved by the ANM requires all inactive upstream dams to be decommissioned by 2021 and active upstream dams to be decommissioned by 2023.
In addition, in February 2019, the state of Minas Gerais enacted regulations that prohibit the construction of a new dam or the expansion of existing dams if communities are established within its self-rescue zone, an area encompassing the portion of the valley downstream of the dam where timely evacuation and intervention by the competent authorities in emergency situations is not possible. All of the tailings dams located in Minas Gerais have permission to operate, however, future licensing for new tailings storage facilities or new raises must consider any community in the hazardous zone. Due to the difficulty in licensing new dams in the state of Minas Gerais, in February 2023 we began industrial-scale testing the technology developed for dry stacking disposal at the Três Marias unit, which consists of filtering the waste pulp for subsequent disposal through the dry stacking process, as waste disposal in this unit was going directly to its tailings deposit. The initiative achieved excellent results, filtering an average of 74% of the operation’s material throughout the year. In December 2023, filtration reached more than 90% and from 2024 onwards, we expect filtration to reach between 95% and 100%. We expect that the Company will be able to utilize dry disposal in the future to reduce the risks for communities in the hazardous zones. Due to the promising progress of the dry disposal tests and the difficulties in licensing new dams and dam expansion projects, we canceled the licensing request that was in progress in Três Marias for the Central and West 1 module of the Murici Deposit to begin the licensing process of the dry stacking disposal.
In 2020, the mining authorities in Brazil enacted two regulations that establish new procedures related to dams. The first resolution (Resolução ANM 32/2020), decreed in May 2020, determines procedures to develop dam break studies and deadlines to update the Emergency Action Plan (“EAP”) depending on the dam class. This regulation updated previous mining agency standards. We have updated the dam break studies of all mining dams according to these procedures. The second resolution (Resolução ANM 51/2020), decreed in December 2020, defines procedures to certify the EAP. In 2022 the ANM enacted Resolution No. 95/2022, amended by Resolution No. 130/2023, which consolidates all dam safety standards by unifying and regulating the innovations promoted by Law No. 14,006/2020.
At the end of 2020, the Brazilian Federal Authorities decreed that the new dam safety law (Law No. 14,006/2020) updates the previous dam safety Law No. 12,334 enacted in 2010. Similar to the regulation enacted in February 2019, this new law defines that new upstream tailings dams and new raises are no longer permitted and, that the EAP is mandatory for all mining dams that store tailings. This law also limited the construction of new tailings dams if communities are established within its self-rescue zone. In this case, the mining company must remove the residents or reinforce the dam structure according to the technical solution approved by the ANM. In 2022, the mining authorities in Brazil enacted a regulation that establishes new procedures related to dams (Resolution ANM 95/2022), which consolidated the safety standards for mining dams, revoking several previous regulations (Ordinance DNPM No. 70,389/2017 and Resolutions ANM No. 13/2019, 32/2020, 40/2020, 51/2020 and 56/2021) and also regulated items by the national legislation (Law No. 14,066/2020), which modified the National Dam Safety Policy.
|
|
| Mining Operations |
The changes included the alteration of the assumptions of risk category and emergency level classifications, the inclusion of new suspension and interdiction assumptions, and the creation of new obligations such as the Risk Management Process for Mining Dams (“RMPMD”), for high Associated Potential Damage (“APD”) dams. The RMPMD consists of the risk assessment of the structure in acceptable and not acceptable “As Low as Reasonably Practicable” terms and integrates the management and decision-making related to mining dams.
In 2021, we began implementing the requirements covered by these regulations to all mining dams including certification of the EAP, staff safety trainings, and dam break simulations in accordance with the new regulation.
In 2022, Nexa revised the EAP for all mining dams to adapt to the new Brazilian regulations and considering the new EAP guidelines, detailed by specific terms of reference (Termos de Referência), which were published in 2021.We sent the EAP to all relevant public agencies and published the document on our website. In 2023, we also conducted the Compliance and Operational Evaluation (“COA”) of the EAP for mining, which consists of a legal requirement that aims to certify that the EAPs comply and adhere to the legislation and would be operational in practice in case of an emergency. Thus, the EAP was evaluated by an external company that issued the Compliance and Operability Report (“COR”) and Declaration of Conformity and Operability (“DCO”) of the EAP.
On December 30, 2023, the State of Minas Gerais published State Decree No. 48,747/2023, regulating the environmental recovery policies that companies are required to have in place in the event of an accident or deactivation of a dam, pursuant to a prior state law passed in 2019. Under State Decree No. 48,747/2023, any dams that meet the requirements established under the 2019 Dam Safety Policy law must have an environmental guarantee policy in place. Nexa estimates that it will require US$27.3 million to cover the applicable dams under this policy. The guarantee can be made by one of the following methods: (i) cash deposit; (ii) CDB; (iii) bank guarantee; or (iv) guarantee insurance. The Company has until March 29, 2024 to submit an environmental recovery proposal and must contract for 50% of the policy by December 31, 2024, 25% by December 31, 2025 and 25% by December 31, 2026 and expects to comply with this requirement.
In Peru, the upstream method has long been an abandoned practice due to seismic concerns in the region. As of 1995, compulsory guidelines were passed prohibiting the use of such method. Subsequently, in 2014 environmental regulators, and later technical regulators, in 2015, adopted the same guidelines prohibiting construction and operation under the upstream method, allowing only the use and construction under the centerline and downstream methods. A specialized governmental agency carries out periodically inspections of tailings dam and mining infrastructure, ensuring technical and environmental regulations are complied with. In addition, mining operations must submit biannual stability studies, to which they are held liable. We follow these guidelines, and all operative tailings dams use the downstream and centerline lift methods.
El Porvenir’s tailings dam is currently supported by an authorization for operation up to an altitude of 4,064 meters above sea level (“masl”), which was granted by the Ministry of Energy and Mines on May 25, 2023, the previous authorization was for 4,062 masl. Activities to expand the El Porvenir’s tailings dam to an elevation up to 4,066 masl are underway and the approval process for the operation will begin in April 2024, and it is expected to last up to 3 months.
For more information, see “Risk factors—Operational risks—The failure of a tailings dam could negatively impact our business, reputation and results of operations, and the implementation of associated regulations and decommissioning processes may be expensive.”
Nexa’s practices
We monitor tailings and waste dams in accordance with international best practice guidelines for management and project design based on criteria set by the International Commission on Large Dams (“ICOLD”) and the Canadian Dam Association (“CDA”) dam safety guidelines. In 2023, all of our tailings dams in Brazil received Stability Condition Declarations (“DCEs”), certifying that these facilities are safe and stable. In Brazil, these certifications are carried out twice a year for mining and smelting dams. In Peru, they occur once a year. As of the date of this annual report, all tailings dams in Peru have undergone the certification process, and we concluded a technical report for these dams during the first half of 2023. In addition, all our dams and dry stacking structures are monitored under a system known as the Sistema de Gestão de Barragens ou Depósitos / Tailing Dam Management System (“SIGBAR/SIGDEP”), which consists of procedures, tools and key performance indicators, monthly reports and monitoring and analysis by an independent Geotechnical Engineer. The monitoring procedures include regular inspections, as well as internal and external audits.
|
|
| Mining Operations |
In addition to the above-mentioned policies and procedures, our SCP committee assists and advises our Board in supporting safe and sustainable business practices in our conduct and activities, as well as in reviewing technical, economic and social matters with respect to our projects.
In 2020, management reviewed the EAP for all mining dams in accordance with the new Brazilian regulations released midway through 2020 and we trained our internal team in these new procedures. New EAP guidelines, detailed by specific terms of reference, were published in April, May and June 2021. In 2022, all plans for the units in Brazil were reviewed and filed with their respective government’s environmental agencies, and as of the date of this annual report, approval is pending from the respective environmental agencies. In 2023, we began conducting engineering studies to confirm the construction method of inactive industrial waste containment structures that have been closed for more than 20 years.
For more information about our SCP committee and ESG initiatives, see Information on the Company—Environmental, Social and Governance (ESG) and corporate initiatives—Sustainability Committee and Reporting.”
We use four disposal options for tailings. Our preferred option is to convert part or all of the tailings material into a commercially viable product. We use this method at our Morro Agudo mine, where most of the tailings that we produce are ZinCal, a limestone rich in zinc that is used as fertilizer, which we sell, not requiring the disposal of tailings materials.
When the conversion method is not available, we prefer to use the backfill method for our underground mines. This technique involves removing moisture from tailings, creating a mixture with cement and filling open spaces in the mines with this combination. We believe this method reduces safety risks related to tailings disposal given that it provides greater geotechnical stability and does not involve the building of a dam or dry stacking structure.
If neither the conversion nor the backfill method is available, we prefer to use the dry stacking method, which involves removing moisture from tailings and stacking them in layers to form an artificial mountain covered with soil and vegetation, causing it to integrate into the local landscape. We use the dry stacking and backfill methods at our Cerro Lindo mine in Peru since the startup of our mine. In 2019, we started operating a dry stacking facility, which substituted the tailings dam in Vazante. With this new structure, over 74.1% of our tailings disposal is done either through backfill or dry staking, reducing our exposure to dams. We are currently developing the backfill and dry stacking methods at our Aripuanã unit, which began the ramp-up in July 2022, and in February 2023 we started industrial-scale testing for dry stacking disposal at the Três Marias unit.
When neither of these three methods is possible, we use tailings dams. The dam acts as a solid barrier engineered to prevent the tailings material from escaping to the environment around the mine. We use this method in Peru at our El Porvenir and Atacocha mines and at our Cajamarquilla smelter, and in Brazil at our Vazante and Morro Agudo mines and Juiz de Fora and Três Marias smelters. We also use a combination of the backfill method and tailings dams at our El Porvenir and Atacocha mines in Peru. At the Aripuanã mine, we have built a water dam to supply water to our plant. This dam is engineered with borrowed material and uses the technical control of compaction of the soil.
We currently raise our tailings dams using the following two methods: (i) the downstream method, where the building material is disposed downstream of the crest of the dam body; and (ii) the center-line method, where the building material is disposed partially downstream and partially upstream of the crest of the dam body, while maintaining the same centerline of the crest. Historically, we have also used the upstream method – where the building material is disposed upstream of the crest of the dam body – in certain instances.
In addition, we also use effluent dams, which are dams used to treat water that contains tailings particles or other solid particles. The effluent dams separate the tailings particles or other solid particles from the water by retaining the particles and releasing the clean water downstream. Finally, we use products dams for the provisional storage of ZinCal prior to its sale.
|
|
| Mining Operations |
We currently have 24 active and 25 inactive disposal facilities (including tailings dams, dry stacking facilities, effluent dams and products dams), 24 located in Peru and 24 located in Brazil, and we also have one water storage dam at the Aripuanã unit. The following is an overview of the dams we have in place at our principal mining and smelting facilities:
Peru
| · | At Cerro Lindo, we have no tailings dams, and tailings are disposed of using a combination of the backfill method, two dry stacking structures and two effluent dams. |
| · | At El Porvenir and Atacocha, tailings are disposed of using a combination of the backfill method and tailings dams; there are two tailings dams in active use and four non-operational tailings dams, which are in the process of being decommissioned. |
| · | At Cajamarquilla, there are three tailings dams in active use and four non-operational tailings dams, which are in the process of being decommissioned. |
| · | At the Chapi mine property, which is currently inactive, there are five non-operational tailings dams. |
| · | At the Sinaycocha property, which is part of our Atacocha mine property, there are two non-operational tailings dams. |
Brazil
| · | At Morro Agudo, most tailings are converted for sale, and the product is stored temporarily at two products dams until it is sold. A separate tailings dam is used to store tailings that are not convertible into product. |
| · | At Vazante, tailings are disposed of using a combination of tailings dams and dry stacking; there is one tailings dam and two effluent dams in active use. |
| · | At Juiz de Fora, there is one tailings dam in active use, three effluent dams in active use and six non-operational waste dams, one is in the commissioning process and the other five have been decommissioned since 2002. |
| · | At Três Marias, there are three waste dams in active use and three non-operational tailings dams, which are in the process of being decommissioned. |
|
|
| Smelting Operations |
SMELTING OPERATIONS
The table below provides an overview of our smelting facilities:
|
Smelting Unit |
Location |
Smelting |
Principal |
Plant |
Metallic
Zinc |
Zinc Oxide |
Other Products |
| (in tonnes of refined zinc per year) |
(in tonnes of zinc metal available for sale, includes alloys) |
(in tonnes of zinc oxide) |
|||||
| Cajamarquilla | Peru | RLE | Metallic zinc (SHG, CGG jumbos and alloys) | 344,436 | 323,059 | 0 | Sulfuric acid, silver concentrate, copper cement and cadmium sticks |
| Três Marias | Brazil | RLE | Metallic zinc (SHG, CGG jumbos, alloys and Zamac) and zinc oxide | 192,199 | 148,354 | 33,966 | Cadmium and cobalt cement |
| Juiz de Fora | Brazil | Waelz Furnace and RLE | Metallic zinc (SHG, alloys and Zamac) | 96,923 | 82,147(1) | 0 | Sulfuric acid, sulfur dioxide, silver concentrate, copper sulfate and zinc ash |
| Total | 633,588 | 553,559 | 33,966 |
| (1) | Including 1,768 tonnes of zinc cathodes transferred from Três Marias. |
| Notes: |
RLE stands for Roast-Leach-Electrowinning.
Alloys are zinc-based products with the addition of up to 1.0% of a specified metal, which are primarily used in the galvanizing market.
Special alloys are zinc-based products with addition of specified metals, which are primarily used in galvanizing market.
Zamac is a zinc-based product with the addition of specified metals, which are primarily used in the die casting market.
Smelter sales
We produce various kinds of refined zinc products. In 2023, we sold a total of 556.0 thousand tonnes of our metallic zinc line of products (including SHG, CGG jumbos, alloys, Galvalume and Zamac). In addition, we commercialized 33.9 thousand tonnes of zinc oxide at 80.0% standard zinc content in 2023, totaling 589.8 thousand tonnes of zinc metal products sold.
In March 2021, our calcine supplier in Peru shut down its facility, reducing our calcine availability and, consequently, impacting our production and sales going forward. Since 2022, we are mitigating part of this supply decrease by sourcing raw materials from other suppliers.
Cajamarquilla
The Cajamarquilla smelter is located in the district of Lurigancho/Chosica in Lima, Peru, and is accessible by road.
The Cajamarquilla smelter is currently the largest zinc smelter in Latin America and the only zinc smelter in Latin America outside Mexico and Brazil, according to Wood Mackenzie. It uses the RLE process to produce metallic zinc. With an annual production capacity of 344.4 thousand tonnes of metallic zinc, the Cajamarquilla smelter produced 323.1 thousand tonnes of zinc metal available for sale in 2023. In recent years, Cajamarquilla developed operational efficiencies, including debottlenecking projects, which increased the production of calcine from concentrates obtained from Nexa Peru, and the use of calcine and waelz oxide processed by third parties. See “Risk factors—Operational risks—Inadequate supply of zinc secondary feed materials and zinc calcine could affect the results of our smelters.”
The Cajamarquilla smelter produces zinc primarily from zinc contained in concentrates and, to a lesser extent, recycled zinc secondary feeds (also referred to as pre-treated concentrate). In 2023, the Cajamarquilla smelter consumed 341.0 thousand tonnes of zinc contained in concentrates and secondary raw material, which consumed 27.2% of zinc contained in concentrates from our mines, 68.5% of zinc contained in concentrates from third parties and 4.3% from secondary raw material.
|
|
| Smelting Operations |
In 2023, the Cajamarquilla smelter sold approximately 326.4 thousand tonnes of metallic zinc, of which 30.6 % of the volume was sold to Latin America (including Mexico), 19.6% to Europe, 14.7% to the United States, 20.1% to international traders and 15.1% to Asia. The Cajamarquilla smelter also produces sulfuric acid, silver concentrate, copper cement, manganese dioxide, oxides (ashes) and cadmium sticks. These products are sold primarily to international traders and local customers.
The following table presents the historical concentrates processed and zinc recovery rate in Cajamarquilla for the periods indicated.
|
For the Year Ended December 31, |
|||
|
2023 |
2022 |
2021 |
|
| Input (in tonnes) | |||
| Zinc Contained in Concentrate from Our Mines | 92,827 | 104,150 | 130,614 |
| Zinc Contained in Concentrate from Third Parties |
233,425 14,745 |
239,587 17,081 |
213,703 9,583 |
| Secondary Raw Material | |||
| Total Inputs | 340,996 | 360,819 | 353,899 |
| Zinc Recovery (%) | 93.8 | 94.7 | 94.3 |
Brownfield project
Conversion to Jarosite process
In 2017, we announced our intention to convert our Cajamarquilla smelter to the Jarosite process, which would allow for the recovery of a greater percentage of zinc. The project was estimated to improve the zinc recovery rate by 3.0% at the Cajamarquilla smelter. We initiated the construction phase in 2018 and in December 2019, the implementation of the conversion process was suspended due to problems with contractors and suppliers. We wrote off our investment and the project remained on hold following our capital allocation strategy. In 2023, our internal technical and engineering teams considered the engineering studies of the project and detailed engineering was updated. In 2024, we expect to continue working on the execution plan, enhancing the detailing around the piping tie-ins and conducting constructability exercises to optimize the project’s schedule and guarantee operational alignment with the maintenance intervention program. Further decisions on the advancement of this project will remain under review, taking into consideration our capital allocation strategy for the upcoming years.
Três Marias
The Três Marias smelter is located in the municipality of Três Marias in the state of Minas Gerais, Brazil, 250 km from the Morro Agudo mine and 253 km from the Vazante mine and is accessible by road.
The Três Marias smelter was built to treat the zinc silicate concentrates from the Vazante mine (willemite and calamine) and sulfide concentrates from the Morro Agudo and Aripuanã mines, from Nexa Peru and from third-party concentrates. Currently, this smelter is integrated with the operations of the Vazante, Morro Agudo and Aripuanã mines, and it uses the RLE process to produce metallic zinc and zinc oxide. The annual production capacity of our Três Marias smelter is 192.2 thousand tonnes of refined metal per year. Production in 2023 totaled 182.3 thousand tonnes of zinc metal and oxide available for sale.
The Três Marias smelter produces zinc primarily from zinc contained in concentrates and, to a lesser extent, recycled zinc secondary feeds. In 2023, the Três Marias smelter consumed 192.1 thousand tonnes of zinc contained in concentrates and secondary raw material, which consumed 87.3% of zinc contained in concentrates from our mines, 11.7% of zinc contained in concentrates from third parties and 1.0% from secondary raw material.
In 2023, Três Marias sold approximately 147.1 thousand tonnes of metallic zinc and 33.9 thousand tonnes of zinc oxide, of which 65.2% of the volume was sold to Latin America (including Mexico), 14.1% to international traders, 18.2% to Africa, 1.2% to Asia and 1.4% to Europe. The Três Marias smelter also produces copper/cobalt cement, Oxides (ashes) and cadmium briquettes. These products are sold to local customers.
|
|
| Smelting Operations |
The Três Marias smelter contains a zinc oxide production plant intended for the chemical, pneumatic, ceramic, animal feed and fertilizer industries. In 2023, the production of zinc oxide was approximately 34.0 thousand tonnes. In zinc content, approximately 73.3% of the raw material was electrolytic zinc that originated from the melting stage. In addition, we purchased 26.7% of raw material from third parties, in the form of dross and skims, to produce zinc oxide as well as the generation of by-products.
In 2021, the request for environmental licensing for a new expansion of the Três Marias tailings dam was submitted to the environmental agency of the state of Minas Gerais. In 2023, we advanced with the waste dry disposal system on an industrial scale, which consists of filtering the waste pulp for subsequent disposal through the dry stacking process, as waste disposal in this unit was going directly to its tailings deposit. The initiative achieved excellent results, filtering an average of 74% of the operation’s material throughout the year. In December 2023, filtration reached more than 90% and from 2024 onwards, we expect filtration to reach between 95% and 100%. Due to the progress of the dry stacking disposal tests and difficulties in licensing new dams and dam expansion projects, we canceled the licensing request that was in progress in Três Marias for the Central and West 1 module of the Murici Deposit to begin the licensing process of the dry stacking disposal. We expect to begin the licensing process in the first half of 2024 and subsequently will submit the license for government approval. For more information, see “Mining Operations—Tailings Disposals—Regulatory framework.” See also “Risk factors—Operational risks—The failure of a tailings dam could negatively impact our business, reputation and results of operations, and the implementation of associated regulations and decommissioning processes may be expensive.”
The following table presents the historical concentrates processed and zinc recovery rate in Três Marias for the periods indicated.
|
For the Year Ended December 31, |
|||
|
2023 |
2022 |
2021 |
|
| Inputs (in tonnes) | |||
| Zinc Contained in Concentrate from Our Mines | 167,726 | 146,006 | 161,070 |
| Zinc Contained in Concentrate from Third Parties | 22,430 | 38,319 | 30,148 |
| Secondary Raw Material |
1,976 |
3,320 |
3,231 |
| Total Inputs | 192,132 | 187,645 | 194,449 |
| Zinc Recovery (%) | 90.1 | 91.6 | 94.7 |
Juiz de Fora
The Juiz de Fora smelter is located in the municipality of Juiz de Fora in the state of Minas Gerais, Brazil, and is accessible by road.
The Juiz de Fora smelter produces zinc from sulfide concentrates and secondary sources such as EAF dust, batteries, and brass oxide, and uses the RLE process to produce metallic zinc. The annual production capacity of our Juiz de Fora smelter is 96.9 thousand tonnes of metallic zinc per year. In 2023, Juiz de Fora produced 82.1 thousand tonnes of zinc metal available for sale. In recent years, Juiz de Fora used calcine processed by third parties in its production process.
The Juiz de Fora smelter produces zinc primarily from zinc contained in concentrates and, to a lesser extent, recycled zinc secondary feeds. In 2023, the Juiz de Fora smelter consumed 87.4 thousand tonnes of zinc contained in concentrates and secondary raw material, which consumed 41.7% of zinc contained in concentrates from our mines, 41.8% of zinc contained in concentrates from third parties and 16.5% from secondary raw material.
In 2023, the Juiz de Fora smelter sold approximately 82.5 thousand tonnes of metallic zinc, of which 86.1% of the volume was sold to Latin America (including Mexico) and 13.9% to international traders outside of Latin America. This Juiz de Fora smelter also produces sulfuric acid, sulfur dioxide, silver concentrate, copper sulfate and zinc ash. These products are sold primarily to international traders and local customers.
In 2023, 2022 and 2021, although we had planned and unplanned maintenances, the Juiz de Fora Smelter operated at high-capacity utilization rates.
|
|
| Smelting Operations |
The following table presents the historical concentrates processed and zinc recovery rate in Juiz de Fora for the periods indicated.
|
For the Year Ended December 31, |
|||
|
2023 |
2022 |
2021 |
|
| Inputs (in tonnes) | |||
| Zinc Contained in Concentrate from Our Mines | 36,460 | 27,874 | 27,873 |
| Zinc Contained in Concentrate from Third Parties | 36,515 | 43,419 | 40,704 |
| Secondary Raw Material |
14,419 |
17,554 |
16,356 |
| Total Inputs | 87,394 | 88,847 | 84,933 |
| Zinc Recovery (%) | 93.6 | 93.1 | 93.6 |
|
|
| Other Operations |
OTHER OPERATIONS
Transportation and shipping
Concentrates in our mines
Our Cerro Lindo operation transports 100.0% of its concentrates by road. The concentrates are trucked in a dedicated fleet through the Panamericana Sur road to the port of Callao, or to the Cajamarquilla smelter. This transportation is covered by long-term contracts entered with two trucking companies.
Our Atacocha and El Porvenir operations use both road and rail transportation. The concentrates are trucked through the Carretera Central Road to the port of Callao, or to the Cajamarquilla smelter. We also use railway transportation to secure logistic availability and maintain high environmental standards. Our use of railway transportation is covered by a long-term contract.
The zinc concentrate produced in the Cerro Lindo, Atacocha and El Porvenir mines supply both our Peruvian and Brazilian smelters, as well as third-party customers, while the lead and copper concentrates produced by these mines are transported to third-party customers from the port of Callao. Our smelters use zinc concentrate supplied from our mines and from third-party suppliers to meet the blending needs of each smelter.
The Peruvian zinc concentrate supplied to the Brazilian smelters is loaded in bulk and sent to the Port of Rio de Janeiro, where it is cleared through customs and then loaded into railcars to the Juiz de Fora smelter or into trucks and railcars to the Três Marias smelter. The ocean freight for this Peruvian zinc is covered by a long-term freight contract.
All the zinc concentrates produced at our Vazante and Morro Agudo mines are transported by road to the Três Marias smelter using two trucking companies. These mines also produce lead and lead/silver concentrates, which are loaded into containers at the mine and are transported using trucks and trains to the Sepetiba Tecon Terminal in Itaguaí, Rio de Janeiro, Brazil. The lead and lead/silver concentrates are then exported in accordance with our annual contracts with container shipping lines.
All the zinc concentrates produced at our Aripuanã mine are transported by road to the Três Marias and Juiz de Fora smelters. The mine also produces lead and copper concentrates, which are either loaded into containers at the mine or transported by road to the Rondonópolis warehouse to be loaded into containers and are then transported using trucks and trains to the Terminal in Santos, São Paulo, Brazil. A small portion of zinc, and all lead and copper concentrates are then shipped to foreign customers.
Smelters
The metallic zinc produced in the Cajamarquilla smelter is transported by train or truck to the terminals. The material intended for the Peruvian domestic market is distributed by truck from these terminals, while exports to foreign markets are loaded into containers and transported by truck from these terminals to the port of Callao.
The metallic zinc produced in the Juiz de Fora and Três Marias smelters is transported by truck for either local customers or exports. In the case of exports, the material is transported to terminals near the ports of Rio de Janeiro or Itaguaí, both in the state of Rio de Janeiro, or the port of Santos, in the state of São Paulo. The material is then loaded into containers at the terminal and transported to the ports by truck, where it is shipped to customers abroad.
The metallic zinc and zinc oxide production process in our smelters also produces by-products. The most relevant by-products are sulfuric acid and silver concentrate. Sulfuric acid produced in the Cajamarquilla smelter is loaded into dedicated FCCA tank railcars and transported to be stored. The sulfuric acid is then loaded in bulk into chemical ship-tanks destined to our customers and discharged at the Chilean ports of Mejillones and Barquito. The silver concentrate produced in the Cajamarquilla and Juiz de Fora smelters is loaded into containers and are dispatched to the port of Callao in Peru or to the port of Itaguaí.
|
|
| Other Operations |
We ship all our refined zinc and silver concentrate exports in containers. Transportation of this material is covered by annual agreements with the liner shipping providers, which are responsible for 90.0% of these shipments.
Sales and marketing
We sell most of our products through supply contracts with terms between one and three years. Only a small portion of our products is sold on the spot market. The agreements with our customers include customary international commercial terms, such as CIF, FOB and other delivery terms based on Incoterms 2010/2020. Our ability to deliver significant volumes across several regions worldwide makes us a significant supplier to a client base of end users and global traders. As a result, we can obtain competitive commercial terms for our products in the long term. In 2023, our top 10 metallic zinc customers represented approximately 58.0% of the total sales volume for such products, with our top 10 zinc oxide customers representing 57.0% of the total sales volume for that product, and our top five concentrate customers represented approximately 87% of the total sales volume for such products, in each case excluding intercompany sales.
Concentrates
In 2023, 94.5% of our total production volume of zinc concentrates went to our smelting operations in Peru and Brazil. In 2023, we sold Zinc concentrates produced from our Peruvian and Brazilian operations to third-party customers. Sales prices are established mainly by reference to prices quoted on the LME less a discount based on either the treatment charge or smelter charge. The LME price quotes are based on prevailing LME average prices for the period set forth in our sale agreements, and generally refer to either the month following the shipment or the period near the execution date of the relevant agreement.
We also purchase zinc contained in concentrate from third-party suppliers to meet our raw material requirements. In 2023, 47.9% of the total zinc raw material consumption in our smelters was produced by our mines and 52.1% was purchased from third parties or obtained from secondary raw materials (excluding oxide).
Refined Metals
Our metallic zinc and zinc oxide are sold worldwide through our commercial offices located in:
| · | São Paulo, Brazil; |
| · | Lima, Peru; |
| · | Houston, United States; and |
| · | Luxembourg, Grand Duchy of Luxembourg. |
We hold a leadership position in our home market, Latin America (excluding Mexico), with an estimated market share of 78.3% in 2023, according to our sales volume, import databases and demand forecasts sourced from specialized consultancy groups and customs websites. In other regions, we hold a strategic position, with estimated market share of 26.2% in Africa, 4.0% in North America, 3.4% in Europe and 0.6% in Asia, according to our sales volumes, import databases and demand forecasts sourced from specialized consultancy groups and customs websites.
In 2023, 71.5% of our total sales of refined metals were to customers in the continuous galvanizing, general galvanizing, die casting, transformers and alloy segments and 28.5% of our total sales were to international traders. Our products are sold to end users in the transport, construction, infrastructure, consumer goods and industrial machinery industries. Of our volume of metallic zinc and zinc oxide sales in 2023, 48.9% were to Latin America (including Mexico), 11.3% to Europe, 8.1% to the United States, 5.6% to Africa and 8.7% to Asia, with the remaining 17.4% to international traders. Sales prices are mainly established by reference to prices quoted on the LME plus a negotiable premium. Pricing is based on prevailing LME average prices for a period set forth in our sale agreements, which generally refer to the month or month prior to shipment.
|
|
| Other Operations |
By-products
We sell a wide variety of chemical and metallurgic by-products generated during the production processes in our smelters and mines to a broad customer base. Our sales include more than 27 different by-products, most of which are sold based on the characteristics of each market or region.
Power and energy supply
Peru
We contracted for 97.4% (1,835.2 GWh) of energy for our operations in our Peruvian operating units from the SEIN and consumed 100% (1,835.2 GWh) of this energy. The other 2.6% (49.7 GWh) of the energy for our Peruvian operating units was obtained from our own hydroelectric power plants, the Cajamarquilla cogeneration power plant and the micro solar generation in Cajamarquilla. We own three hydroelectric power plants, two at Atacocha and one at El Porvenir, with a total installed gross rated capacity of 9,726 kilowatts, or kW.
We have contracts with Electroperú S.A., a well-known Peruvian state-owned company, which cover 100% (277.5 GWh), 100% (121.7 GWh) and 49.2% (29.3 GWh) of the energy requirements for our Cerro Lindo, El Porvenir and Atacocha units, respectively. In 2023, we consumed 100% of the energy acquired through these contracts.
In June 2021, a spot contract was signed with Kallpa Generación S.A. for the supply of energy to the Cajamarquilla unit. In 2023, 2.9% (40.7 GWh) of the energy requirements for our operations in Cajamarquilla was contracted from Kallpa Generación and 100% of this energy was consumed.
The following table sets forth the energy sources and energy consumption with respect to our Peruvian operating units in 2023.
|
Operating Unit |
Energy Source |
Total Energy |
Percentage of Total Energy Usage in 2023 |
| Third Party | |||
| Cerro Lindo | Third Party (Electroperú S.A.) | 277.5 | 15.1% |
| El Porvenir | Third Party (Electroperú S.A.) | 121.7 | 6.6% |
| Atacocha | Third Party (Electroperú S.A.) | 29.3 | 1.6% |
| Cajamarquilla | Third Party (Kallpa Generación S.A.) | 40.7 | 2.2% |
| Cajamarquilla | Third Party (Electroperú S.A.) | 1,366.0 | 74.5% |
| Total Energy Usage | 1,835.2 | 100% | |
| Own Power Plant | |||
| El Porvenir | Own Power Plant (Candelaria) | 0.0 | 0.0% |
| Atacocha | Own Power Plant (Chaprin and Marcopampa) |
30.3 |
61.0% |
| Cogeneration CJM | Two steam turbines with HRSG from tostación |
19.4 |
39.0% |
| Total Energy Usage | 49.7 | 100% |
Hydroelectric plants
Candelaria
The El Porvenir unit has one hydroelectric plant, the Candelaria Hydroelectric Power Plant, which is located along the Lloclla River. The plant contains three separate hydroelectric turbines, two of which have been operational since 1957 and the third since 1998, and which together have an installed rated capacity of 4.8 MW.
Chaprin and Marcopampa
The Atacocha unit has two hydroelectric plants. The Chaprin Hydroelectric Power Plant is located along the Lagia Ravine near the Huallaga River. The plant has been operating since 1957 and its installed rated capacity is 5.9 MW. The Marcopampa Hydroelectric Power Plant has been operating since 1953, and was overhauled in 1984, increasing its installed rated capacity of 1.2 MW. Since the beginning of 2020, Marcopampa has been shut off indefinitely. During 2023, Atacocha consumed 30.3 GWh from these plants, which represented approximately 50.8% of the energy usage of the mine.
|
|
| Other Operations |
Brazil
With respect to our Brazilian operations, as of December 31, 2023, energy supply comes from various contracts, and our subsidiary Pollarix S.A (“Pollarix”).
The five hydroelectric plants in which our subsidiary Pollarix has directly or indirectly the following interests: a 22.4% equity participation in Enercan (Campos Novos hydroelectric power plant), a 100.0% ownership of the hydroelectric power plant Picada located in Minas Gerais, a 12.6% equity participation in the Amador Aguiar I, a 12.6% equity participation in the Amador Aguiar II and a 23.9% equity participation in the Igarapava. These plants have hydroelectric power facilities in the states of Minas Gerais, Santa Catarina and São Paulo. The hydroelectric power plants of Pollarix provide energy to the five operating units (Vazante, Morro Agudo, Três Marias, Juiz de Fora and Aripuanã).
The only activity of Pollarix is to own our energy assets and sell energy to our Brazilian operating subsidiaries at market prices. We own all the common shares of Pollarix, which represents 33.3% of its total share capital. The remaining shares are preferred shares with limited voting rights, which are owned by Auren Energia S.A (“Auren”). Under the terms of the preferred shares, Auren is entitled to dividends per share equal to 1.93 times the dividends per share payable on the common shares. See “Operating and financial review and prospects—Overview—Key factors affecting our business and results of operations—Operating costs and expenses—Energy costs.”
In November 2023, Nexa finalized a contract rearrangement with Pollarix, in which the energy delivery from the hydroelectric plants (Picada, Igarapava and Amador Aguiar) was centralized through Pollarix. Pollarix is responsible for transferring the energy to Nexa, guaranteeing the right to self-production. In 2023, Pollarix provided 124.8 GWh of energy, which represented 7.3% of Nexa’s total energy purchased.
We have a contract with Auren, which provides energy from several energy generation sites to all Nexa operations in Brazil. In 2023, Auren provided a total of supply of 6.9 MWavg of energy, representing 3.5% of Nexa’s total energy purchased.
In January 2020, we began a 15-year energy supply agreement with Furnas, a Brazilian energy company, controlled by Eletrobras, to help address the increased energy demand in our operations. Nexa Brazil currently consumes nearly all the energy supplied by Pollarix and Auren in its existing operations. Furnas provides energy to the four operating units (Vazante, Morro Agudo, Três Marias and Juiz de Fora).
The following table sets forth our energy sources and consumption with respect to our Brazilian operations in 2023.
|
Operating Unit |
Energy Source |
Total Energy Consumed in 2023 (GWh) |
Percentage of Total Energy Usage in 2023 |
| Third Party and Own Power Plants | Pollarix S.A, Furnas S.A., Auren and Market | ||
| Morro Agudo | 78.9 | 4.8% | |
| Vazante | 297.6 | 18.2% | |
| Três Marias | 751.0 | 46.0% | |
| Juiz de Fora | 410.4 | 25.2% | |
| Aripuanã |
93.9 |
5.8% |
|
| Total Energy Usage | 1,631.8 | 100% |
|
|
| Other Operations |
Hydroelectric plants
Campos Novos
Campos Novos is a hydroelectric plant located along the Canoas River, in the state of Santa Catarina. The plant has an installed capacity of 880 MW and has been authorized by the Brazilian Energy Regulatory Agency (Agência Nacional de Energia Elétrica or ANEEL), to produce 382.2 MWavg. During 2023, our Morro Agudo, Vazante, Três Marias and Juiz de Fora units acquired 676.5 GWh from Campos Novos, which represented approximately 39.7% of our total energy purchased.
Picada
Picada is a hydroelectric plant located along the Peixe River in the state of Minas Gerais. The plant has an installed capacity of 50 MW and has been authorized by ANEEL to produce 29.6 MWavg. During 2023, our Morro Agudo, Vazante, Três Marias and Juiz de Fora units acquired 211.5 GWh, which represented 12.4% of our total energy purchased.
Igarapava
Igarapava is a hydroelectric plant located along the Grande River in the state of Sao Paulo. The plant has an installed capacity of 210 MW and has been authorized by ANEEL to produce 127.5 MWavg. During 2023, our Morro Agudo, Vazante, Três Marias and Juiz de Fora units acquired 218.4 GWh from Igarapava, which represented approximately 12.8% of our total energy purchased.
Amador Aguiar I
Amador Aguiar is a hydroelectric plant located along the Araguari River in the state of Minas Gerais. The plant has an installed capacity of 240 MW and has been authorized by ANEEL to produce 146.7 MWavg. During 2023, our Morro Agudo, Vazante, Três Marias and Juiz de Fora units acquired 132.8 GWh from Amador Aguiar I, which represented 7.8% of our total energy purchased.
Amador Aguiar II
Amador Aguiar is a hydroelectric plant located along the Araguari River in the state of Minas Gerais. The plant has an installed capacity of 210 MW and has been authorized by ANEEL to produce 125.2 MWavg. During 2023, our Morro Agudo, Vazante, Três Marias and Juiz de Fora units acquired 113.4 GWh from Amador Aguiar II, which represented 6.7% of our total energy purchased.
|
|
| Mineral Reserves and Resources |
MINERAL RESERVES AND RESOURCES
Disclosure of Mineral Reserves and Resources
Registrants engaged in mining operations must comply with Regulation S-K Subpart 1300 ("S-K 1300" or the "SEC Mining Modernization Rules"), which came into force on January 1, 2021. S-K 1300 governs the mineral property disclosure requirements for mining registrants.
For the meanings of certain technical terms used in this prospectus, see “Additional Information—Glossary.”
As a reporting issuer in Canada, we are also subject to Canadian National Instrument 43-101—Standards of Disclosure for Mineral Projects (“NI 43-101”), which is an instrument administered by the provincial and territorial securities regulatory authorities that governs how issuers in Canada disclose scientific and technical information about their mineral projects to the public. NI 43-101 imposes certain requirements in respect of such disclosure, including the requirement to have prescribed information prepared by, or under the supervision of, a Qualified Person and the filing of NI 43-101 technical reports in the prescribed circumstances. Any reference to a NI 43-101 report is for informational purposes only, and such reports are not incorporated herein by reference.
Descriptions in this report of our mineral deposits prepared in accordance with S-K 1300, as well as similar information provided by other issuers in accordance with S-K 1300, may not be comparable to similar information prepared in accordance with NI 43-101 that is presented elsewhere outside of this report.
The Qualified Persons that have reviewed and approved the scientific and technical information contained in this annual report are identified in the footnotes to the tables summarizing the Mineral Reserves and Resources estimates below, see “Information on the Company—Mining operations” below. For the meanings of certain technical terms used in this report, see “Additional information—Glossary.”
Presentation of information concerning Mineral Reserves
The estimates of proven and probable reserves at our mines and projects and the estimates of life of mine included in this annual report have been prepared by the Qualified Persons referred to herein, and in accordance with the technical definitions established by the SEC Under S-K 1300:
| · | Proven Mineral Reserves are the economically mineable part of a Measured mineral resource and can only result from conversion of a measured mineral resource. |
| · | Probable Mineral Reserves are the economically mineable part of an indicated and, in some cases, a measured mineral resource. |
| · | Indicated Mineral Resource is that part of a Mineral Resource for which quantity and grade or quality are estimated based on adequate geological evidence and sampling. The level of geological certainty associated with an Indicated Mineral Resource is sufficient to allow a Qualified Person to apply modifying factors in sufficient detail to support mine planning and evaluation of the economic viability of the deposit. Because an Indicated Mineral Resource has a lower level of confidence than the level of confidence of a measured mineral resource, an indicated mineral resource may only be converted to a probable mineral reserve. |
| · | Inferred Mineral Resource is that part of a Mineral Resource for which quantity and grade or quality are estimated based on limited geological evidence and sampling. The level of geological uncertainty associated with an Inferred Mineral Resource is too high to apply relevant technical and economic factors likely to influence the prospects of economic extraction in a manner useful for evaluation of economic viability. Because an Inferred Mineral Resource has the lowest level of geological confidence of all mineral resources, which prevents the application of the modifying factors in a manner useful for evaluation of economic viability, an Inferred Mineral Resource may not be considered when assessing the economic viability of a mining project and may not be converted to a mineral reserve. |
|
|
| Other Operations |
| · | Measured Mineral Resource is that part of a mineral resource for which quantity and grade or quality are estimated based on conclusive geological evidence and sampling. The level of geological certainty associated with a Measured Mineral Resource is sufficient to allow a Qualified Person to apply modifying factors, as defined in S-K 1300, in sufficient detail to support detailed mine planning and final evaluation of the economic viability of the deposit. Because a Measured Mineral Resource has a higher level of confidence than the level of confidence of either an Indicated Mineral Resource or an Inferred Mineral Resource, a Measured Mineral Resource may be converted to a Proven Mineral Reserve or to a Probable Mineral Reserve. |
We periodically update our reserves and resources estimates when we have new geological data, economic assumptions or mining plans. During 2023, we performed an analysis of our reserves and resources estimates for certain operations, which is reflected in new estimates as of December 31, 2023. Reserves and resources estimates for each operation assume that we either have or expect to obtain all the necessary rights and permits to mine, extract and process mineral reserves or resources at each mine. Where we own less than 100% of the operation, reserves and resources estimates have been adjusted to reflect our ownership interest. Certain figures in the tables, discussions and notes have been rounded. For a description of risks relating to our estimates of Mineral Reserves and Resources, see “Risk factors—Risks related to our Mineral Reserves and Resources.”
|
|
| Other Operations |
Mineral Reserves
The following table shows our estimates of Attributable Mineral Reserves for our material mining properties as of December 31, 2023, prepared in accordance with Subpart 1300 of Regulation S-K. The Morro Agudo mine does not have known Mineral Reserves under Subpart 1300 of Regulation S-K.
| Grade | Contained Metal | ||||||||||||
| Ownership Interest (%) | Class | Tonnage (1) | Zinc | Copper | Silver | Lead | Gold | Zinc | Copper | Silver | Lead | Gold | |
| (Mt) | (%) | (%) | (g/t) | (%) | (g/t) | (kt) | (kt) | (koz) | (kt) | (koz) | |||
| Cerro Lindo (3) | 83.48 | Proven | 21.83 | 1.68 | 0.61 | 21.2 | 0.20 | - | 367.1 | 132.6 | 14,863 | 44.1 | - |
| Probable | 12.52 | 1.15 | 0.45 | 25.2 | 0.24 | - | 144.3 | 56.8 | 10,154 | 29.9 | - | ||
| Subtotal | 34.36 | 1.49 | 0.55 | 22.6 | 0.22 | - | 511.4 | 189.4 | 25,017 | 74.1 | - | ||
| Vazante (4) | 100 | Proven | 5.49 | 9.84 | - | 17.1 | 0.23 | - | 539.8 | - | 3,023 | 12.5 | - |
| Probable | 5.85 | 9.40 | - | 10.7 | 0.19 | - | 549.7 | - | 2,003 | 11.3 | - | ||
| Subtotal | 11.33 | 9.62 | - | 13.8 | 0.21 | - | 1,089.5 | - | 5,206 | 23.8 | - | ||
| Vazante Aroeira Tailings (5) | 100 | Proven | - | - | - | - | - | - | - | - | - | - | - |
| Probable | 2.11 | 4.12 | - | 7.6 | 0.25 | - | 87.0 | - | 518 | 5.2 | - | ||
| Subtotal | 2.11 | 4.12 | - | 7.6 | 0.25 | - | 87.0 | - | 518 | 5.2 | - | ||
| El Porvenir (6) | 83.48 | Proven | 3.27 | 4.09 | 0.24 | 75.2 | 1.29 | - | 133.8 | 7.9 | 7,908 | 42.0 | - |
| Probable | 8.96 | 4.11 | 0.22 | 72.1 | 1.17 | - | 368.7 | 20.0 | 20,760 | 104.6 | - | ||
| Subtotal | 12.23 | 4.11 | 0.23 | 72.9 | 1.20 | - | 502.5 | 28.0 | 28,667 | 146.6 | - | ||
| Atacocha (Underground) (7) | 75.96 | Proven | 1.30 | 3.86 | 0.34 | 84.9 | 1.45 | - | 50.0 | 4.4 | 3,535 | 18.7 | - |
| Probable | 3.01 | 4.54 | 0.43 | 77.7 | 1.29 | - | 136.6 | 12.8 | 7,509 | 38.8 | - | ||
| Subtotal | 4.30 | 4.33 | 0.40 | 79.8 | 1.34 | - | 186.5 | 17.2 | 11,044 | 57.5 | - | ||
|
Atacocha (Open pit) (8) |
75.96 | Proven | 1.45 | 1.02 | - | 38.2 | 1.16 | 0.25 | 14.8 | - | 1,178 | 16.9 | 11.5 |
| Probable | 1.88 | 0.97 | - | 32.4 | 1.14 | 0.29 | 18.2 | - | 1,958 | 21.4 | 17.4 | ||
| Subtotal | 3.33 | 0.99 | - | 34.9 | 1.15 | 0.27 | 33.1 | - | 3,737 | 38.2 | 28.9 | ||
| Aripuanã (9) | 100 | Proven | 6.43 | 3.83 | 0.21 | 33.8 | 1.40 | 0.28 | 246.2 | 13.8 | 6,993 | 90.0 | 57.1 |
| Probable | 24.64 | 4.48 | 0.13 | 42.4 | 1.73 | 0.21 | 1,105.0 | 31.8 | 33,610 | 427.3 | 167.3 | ||
| Subtotal | 31.07 | 4.35 | 0.15 | 40.6 | 1.66 | 0.22 | 1,351.3 | 45.6 | 40,602 | 517.2 | 224.4 | ||
| Total | Proven | 39.77 | 3.40 | 0.40 | 29.8 | 0.56 | 0.06 | 1,351.7 | 159.1 | 38,100 | 224.2 | 68.7 | |
| Probable | 58.96 | 4.09 | 0.21 | 40.4 | 1.08 | 0.10 | 2,409.7 | 122.1 | 76,511 | 638.5 | 184.7 | ||
| Total | 98.73 | 3.81 | 0.28 | 36.1 | 0.87 | 0.08 | 3,761.3 | 281.3 | 114,611 | 862.7 | 253.3 | ||
| Notes: |
* Numbers may not add due to rounding.
* The point of reference for Mineral Reserves in this table is mill feed materials.
* The El Porvenir, Atacocha Underground and Atacocha Open Pit mines are part of the Cerro Pasco Complex.
|
|
| Other Operations |
The following table shows our estimates of Mineral Reserves (100% ownership basis) for our material mining properties as of December 31, 2023 prepared in accordance with Subpart 1300 of Regulation S-K. The Morro Agudo mine does not have known Mineral Reserves under Subpart 1300 of Regulation S-K.
| Grade | Contained Metal | |||||||||||||
| Ownership Interest | Class | Tonnage (2) | Zinc | Copper | Silver | Lead | Gold | Zinc | Copper | Silver | Lead | Gold | ||
| (%) | (Mt) | (%) | (%) | (g/t) | (%) | (g/t) | (kt) | (kt) | (koz) | (kt) | (koz) | |||
| Cerro Lindo (3) | 83.48 | Proven | 26.15 | 1.68 | 0.61 | 21.2 | 0.20 | - | 439.7 | 158.8 | 17,803 | 52.8 | - | |
| Probable | 15.00 | 1.15 | 0.45 | 25.2 | 0.24 | - | 172.9 | 68.1 | 12,163 | 35.9 | - | |||
| Subtotal | 41.15 | 1.49 | 0.55 | 22.6 | 0.22 | - | 612.6 | 226.9 | 29,966 | 88.7 | - | |||
| Vazante (4) | 100 | Proven | 5.49 | 9.84 | - | 17.1 | 0.23 | - | 539.8 | - | 3,023 | 12.5 | - | |
| Probable | 5.85 | 9.40 | - | 10.7 | 0.19 | - | 549.7 | - | 2,003 | 11.3 | - | |||
| Subtotal | 11.33 | 9.62 | - | 13.8 | 0.21 | - | 1,089.5 | - | 5,206 | 23.8 | - | |||
| Vazante Aroeira Tailings (5) | 100 | Proven | - | - | - | - | - | - | - | - | - | - | - | |
| Probable | 2.11 | 4.12 | - | 7.6 | 0.25 | - | 87.0 | - | 518 | 5.2 | - | |||
| Subtotal | 2.11 | 4.12 | - | 7.6 | 0.25 | - | 87.0 | - | 518 | 5.2 | - | |||
| El Porvenir (6) | 83.48 | Proven | 3.92 | 4.09 | 0.24 | 75.2 | 1.29 | - | 160.3 | 9.5 | 9,472 | 50.3 | - | |
| Probable | 10.73 | 4.11 | 0.22 | 72.1 | 1.17 | - | 441.6 | 24.0 | 24,867 | 125.3 | - | |||
| Subtotal | 14.65 | 4.11 | 0.23 | 72.9 | 1.20 | - | 601.9 | 33.5 | 34.338 | 175.7 | - | |||
| Atacocha (Underground) (7) | 75.96 | Proven | 1.71 | 3.86 | 0.34 | 84.9 | 1.45 | - | 65.8 | 5.7 | 4,654 | 24.6 | - | |
| Probable | 3.96 | 4.54 | 0.43 | 77.7 | 1.29 | - | 179.8 | 16.9 | 9,886 | 51.1 | - | |||
| Subtotal | 5.66 | 4.33 | 0.40 | 79.8 | 1.34 | - | 245.6 | 22.6 | 14,540 | 75.7 | - | |||
|
Atacocha (Open pit) (8) |
75.96 | Proven | 1.91 | 1.02 | - | 38.2 | 1.16 | 0.25 | 19.5 | - | 2,342 | 22.2 | 15.2 | |
| Probable | 2.47 | 0.97 | - | 32.4 | 1.14 | 0.29 | 24.0 | - | 2,577 | 28.1 | 22.9 | |||
| Subtotal | 4.38 | 0.99 | - | 34.9 | 1.15 | 0.27 | 43.5 | - | 4,919 | 50.3 | 38.1 | |||
| Aripuanã (9) | 100 | Proven | 6.43 | 3.83 | 0.21 | 33.8 | 1.40 | 0.28 | 246.2 | 13.8 | 6,993 | 90.0 | 57.1 | |
| Probable | 24.64 | 4.48 | 0.13 | 42.4 | 1.73 | 0.21 | 1,105.0 | 31.8 | 33,610 | 427.3 | 167.3 | |||
| Subtotal | 31.07 | 4.35 | 0.15 | 40.6 | 1.66 | 0.22 | 1,351.3 | 45.6 | 40,602 | 517.2 | 224.4 | |||
| Total | Proven | 45.60 | 3.23 | 0.41 | 30.2 | 0.55 | 0.05 | 1,471.2 | 188.5 | 44,286 | 252.5 | 72.3 | ||
| Probable | 64.76 | 3.95 | 0.22 | 41.1 | 1.06 | 0.09 | 2,560.2 | 141.6 | 85,623 | 684.2 | 190.2 | |||
| Total | 110.36 | 3.65 | 0.30 | 36.6 | 0.85 | 0.07 | 4,031.4 | 330.1 | 129,910 | 936.7 | 262.5 | |||
| Notes: |
* Numbers may not add due to rounding.
|
|
| Other Operations |
* The point of reference for Mineral Reserves in this table is mill feed materials.
* The El Porvenir, Atacocha Underground and Atacocha Open Pit mines are part of the Cerro Pasco Complex.
| (1) | The total tonnage and content amounts presented in this table represent Nexa’s attributable ownership basis. |
| (2) | The total amounts and content presented in this table have not been adjusted to reflect our ownership interest. The information presented in this table includes 100% of the Mineral Reserve estimates for the property. Please refer to our ownership percentage for the amounts attributable to our ownership interest in the property. |
| (3) | The Qualified Person for the Mineral Reserves estimate is Cristovao Teofilo dos Santos, B.Eng., FAusIMM, a Nexa employee. Subpart 1300 of Regulation S-K definitions were followed for Mineral Reserves, which also are consistent with the CIM (2014) definitions. Mineral Reserves are estimated at an NSR break-even cut-off value of US$40.86/t processed. Some incremental material with values between US$32.99/t and US$40.86/t was included. Mineral Reserves estimates are based on average long-term metal prices of: zinc: US$2,799.04/t (US$1.27/lb); copper: US$7,669.61/t (US$3.48/lb); lead: US$2,000.29/t (US$0.91/lb); and silver: US$21.17/oz. Metallurgical recoveries are accounted for in NSR calculations based on historical processing data and are variable as a function of head grade. Recoveries at Life of Mine average head grades are 88.36% for Zn, 85.23% for Cu, 66.53% for Pb, and 68.78% for Ag. A minimum mining width of 5.0 m was used. Dilution and extraction factors are applied based on stope type and location. Bulk density varies depending on mineralization domain. |
| (4) | The Qualified Person for the Mineral Reserves estimate is Vitor Marcos Teixeira de Aguilar, B.Eng., FAusIMM, a Nexa employee. Subpart 1300 of Regulation S-K definitions were followed for Mineral Reserves, which also are consistent with the CIM (2014) definitions. Mineral Reserves are estimated at a NSR cut-off value of US$66.31/t processed. Mineral Reserves estimates are based on average long-term metal prices of: zinc: US$2,799.04/t (US$1.27/lb); copper: US$7,669.61/t (US$3.48/lb); lead: US$2,000.29/t (US$0.91/lb); and silver: US$21.17/oz. Metallurgical recoveries are accounted for in NSR calculations based on historical processing data and are variable as a function of head grade. Recoveries at Life of Mine average head grades are 87.19% for Zn, 23.93% for Pb, and 42.00% for Ag. A minimum mining width of 4.0 m was applied. |
| (5) | The Qualified Person for the Mineral Reserves estimate is Vitor Marcos Teixeira de Aguilar, B.Eng., FAusIMM, a Nexa employee. Subpart 1300 of Regulation S-K definitions were followed for Mineral Reserves, which also are consistent with the CIM (2014) definitions. Mineral Reserves are estimated at a NSR cut-off value of US$25.44/t processed. Mineral Reserves estimates are based on average long-term metal prices of: zinc: US$2,799.04/t (US$1.27/lb); copper: US$7,669.61/t (US$3.48/lb); lead: US$2,000.29/t (US$0.91/lb); and silver: US$21.17/oz. Metallurgical recoveries are accounted for in NSR calculations based on historical processing data and are variable as a function of head grade. Recoveries at Vazante Aroeira Tailings average head grades are 67.86% for Zn, 40.74% for Pb, and 42.00% for Ag. A minimum mining unit of 10 m x 10m x 2 was applied. |
| (6) | The Qualified Person for the Mineral Reserves estimate is SLR Consulting (Canada) Ltd., an independent mining consulting firm. Subpart 1300 of Regulation S-K definitions were followed for Mineral Reserves, which also are consistent with the CIM (2014) definitions. Mineral Reserves are estimated at NSR cut-off grade values ranging from US$63.77/t to US$67.04/t for SLS areas and US$65.77/t to US$69.04/t for C&F areas depending on the zone. Mineral Reserves estimates are based on average long-term metal prices of: zinc: US$2,799.04/t (US$1.27/lb); copper: US$7,669.61/t (US$3.48/lb); lead: US$2,000.29/t (US$0.91/lb); and silver: US$21.17/oz. Metallurgical recoveries are accounted for in NSR calculations based on historical processing data and are variable as a function of head grade. Recoveries at Life of Mine average head grade are 89.21% for Zn, 14.60% for Cu, 80.01% for Pb, and 77.51% for Ag. Minimum mining width of 5.0 m for C&F mining and 4.0 m for SLS mining were used for reserves shapes and development design and are reported inclusive of extraction losses and dilution. |
| (7) | The Qualified Person for the Mineral Reserves estimate is SLR Consulting (Canada) Ltd., an independent mining consulting firm. Subpart 1300 of Regulation S-K definitions were followed for Mineral Reserves, which also are consistent with the CIM (2014) definitions. Mineral Reserves are estimated at NSR cut-off grade values ranging from US$69.00/t for SLS areas and US$71.07/t for C&F areas depending on the zone. A number of incremental material (with values between US$45.09/t and US$69.00/t for SLS and values between US$47.16/t and US$71.07/t for C&F mining) were included in the estimate. Mineral Reserves estimates are based on average long-term metal prices of: zinc: US$2,799.04/t (US$1.27/lb); copper: US$7,669.61/t (US$3.48/lb); lead: US$2,000.29/t (US$0.91/lb); and silver: US$21.17/oz. Metallurgical recoveries are accounted for in NSR calculations based on historical processing data and are variable as a function of head grade. Recoveries at Life of Mine average head grades are 89.30% for Zn, 15.73% for Cu, 80.02% for Pb, and 77.51% for Ag. Minimum mining width of 5.0 m for C&F mining and 4.0 m for SLS mining were used for reserves shapes and development design and are reported inclusive of extraction losses and dilution. |
| (8) | The Qualified Person for the Mineral Reserves estimate is SLR Consulting (Canada) Ltd., an independent mining consulting firm. Subpart 1300 of Regulation S-K definitions were followed for Mineral Reserves, which also are consistent with the CIM (2014) definitions. Mineral Reserves are estimated at a NSR cut-off values of US$16.21/t. Mineral Reserves estimates are based on average long-term metal prices of: zinc: US$2,799.04/t (US$1.27/lb); lead: US$2,000.29/t (US$0.91/lb); silver: US$21.17/oz; and gold: US$1,630.93/oz. Metallurgical recoveries are accounted for in NSR calculations based on historical processing data and are variable as a function of head grade. Recoveries at Life of Mine average heads grade are 70.44% for Zn, 83.97% for Pb, 75.76% for Ag and 65.46% for Au. |
|
|
| Other Operations |
| (9) | The Qualified Person for the Mineral Reserves estimate is Vitor Ferraz Viana, B.Eng., FAusIMM, a Nexa employee. Subpart 1300 of Regulation S-K definitions were followed for Mineral Reserves, which also are consistent with the CIM (2014) definitions. Mineral Reserves are estimated at a NSR break-even cut-off value of US$63.40/t processed was estimated from forecasted operating costs and some incremental material between US$49.20/t and US$63.40/t was included. A minimum mining width of 4.0 m was used. The long-term prices derived are in line with the consensus forecasts from banks and independent institutions. Mineral Reserves estimates are based on average long-term metal prices of: zinc: US$2,799.04/t (US$1.27/lb); lead: US$2,000.29/t (US$0.91/lb); silver: US$21.17/oz; and gold: US$1,630.93/oz. Metallurgical recoveries are accounted for in NSR calculations based on metallurgical testworks and are variable as a function of head grade and oretype. Recoveries at Life of Mine average head grades for a Mix of 80% Stratabound and 20% Stringer material are 90.06% for Zn, 60.00% for Cu, 84.92% for Pb, 68.00% for Ag, and 67.80% for Au. A minimum mining width of 4.0 m was applied. |
|
|
| Other Operations |
Mineral Resources
The following table shows our estimates of Attributable Mineral Resources for our material mining properties as of December 31, 2023 prepared in accordance with Subpart 1300 of Regulation S-K.
| Grade | Contained Metal | ||||||||||||
| Ownership Interest (%) | Class | Tonnage (1) | Zinc | Copper | Silver | Lead | Gold | Zinc | Copper | Silver | Lead | Gold | |
| (Mt) | (%) | (%) | (g/t) | (%) | (g/t) | (kt) | (kt) | (koz) | (kt) | (koz) | |||
| Cerro Lindo (3) | 83.48 | Measured | 3.67 | 1.93 | 0.65 | 23.1 | 0.24 | - | 70.9 | 23.9 | 2,728 | 8.8 | - |
| Indicated | 2.75 | 1.06 | 0.47 | 24.4 | 0.22 | - | 29.2 | 12.9 | 2,161 | 6.1 | - | ||
| Subtotal | 6.43 | 1.56 | 0.57 | 23.7 | 0.23 | - | 100.1 | 36.8 | 4,889 | 14.9 | - | ||
| Inferred | 7.75 | 1.54 | 0.25 | 32.6 | 0.42 | - | 119.3 | 19.4 | 8,119 | 32.6 | - | ||
| Vazante (4) | 100 | Measured | 0.48 | 8.40 | - | 12.4 | 0.25 | - | 40.3 | - | 191 | 1.2 | - |
| Indicated | 1.40 | 9.64 | - | 4.0 | 0.08 | - | 135.0 | - | 182 | 1.1 | - | ||
| Subtotal | 1.88 | 9.32 | - | 6.2 | 0.12 | - | 175.3 | - | 373 | 2.3 | - | ||
| Inferred | 12.77 | 10.27 | - | 12.9 | 0.21 | - | 1,311.0 | - | 5,289 | 27.4 | - | ||
| Vazante Aroeira Tailings (4) | 100 | Measured | - | - | - | - | - | - | - | - | - | - | - |
| Indicated | - | - | - | - | - | - | - | - | - | - | - | ||
| Subtotal | - | - | - | - | - | - | - | - | - | - | - | ||
| Inferred | 0.66 | 4.21 | - | 7.9 | 0.25 | - | 27.8 | - | 167 | 1.7 | - | ||
| El Porvenir (5) | 83.48 | Measured | 0.55 | 3.47 | 0.27 | 57.7 | 0.95 | - | 19.1 | 1.5 | 1,023 | 5.3 | - |
| Indicated | 2.69 | 3.25 | 0.20 | 63.2 | 0.97 | - | 87.4 | 5.3 | 5,460 | 26.0 | - | ||
| Subtotal | 3.24 | 3.29 | 0.21 | 62.2 | 0.97 | - | 106.5 | 6.8 | 6,483 | 31.3 | - | ||
| Inferred | 9.23 | 3.83 | 0.24 | 82.9 | 1.32 | - | 353.6 | 22.1 | 24,602 | 121.9 | - | ||
| Atacocha (Underground) (6) | 75.96 | Measured | 0.80 | 3.47 | 0.27 | 55.0 | 0.98 | - | 27.6 | 2.1 | 1,411 | 7.8 | - |
| Indicated | 1.91 | 3.30 | 0.36 | 54.9 | 0.92 | - | 63.2 | 6.9 | 3,379 | 17.6 | - | ||
| Subtotal | 2.71 | 3.35 | 0.33 | 54.9 | 0.94 | - | 90.8 | 9.0 | 4,790 | 25.4 | - | ||
| Inferred | 6.12 | 4.09 | 0.56 | 77.3 | 1.21 | - | 250.4 | 34.3 | 15,216 | 74.1 | - | ||
|
Atacocha (Open pit) (7) |
75.96 | Measured | 1.37 | 1.28 | - | 31.4 | 0.87 | 0.19 | 17.5 | - | 1,381 | 11.9 | 8.4 |
| Indicated | 2.95 | 1.05 | - | 29.0 | 0.90 | 0.24 | 30.9 | - | 2,747 | 26.5 | 22.7 | ||
| Subtotal | 4.31 | 1.12 | - | 29.8 | 0.89 | 0.22 | 48.4 | - | 4,128 | 38.4 | 31.1 | ||
| Inferred | 1.29 | 1.27 | - | 32.7 | 1.15 | 0.22 | 16.4 | - | 1,357 | 14.9 | 9.1 | ||
| Aripuanã (8) | 100 | Measured | 0.35 | 2.60 | 0.39 | 23.1 | 0.86 | 0.36 | 9.1 | 1.4 | 260 | 3.0 | 4.1 |
| Indicated | 5.19 | 3.95 | 0.18 | 35.0 | 1.46 | 0.27 | 205.0 | 9.3 | 5,840 | 75.8 | 45.1 | ||
| Subtotal | 5.54 | 3.86 | 0.19 | 34.2 | 1.42 | 0.28 | 214.1 | 10.7 | 6,100 | 78.8 | 49.2 | ||
| Inferred | 38.75 | 3.47 | 0.33 | 45.7 | 1.39 | 0.43 | 1,344.6 | 127.9 | 56,935 | 538.6 | 535.7 | ||
| Total | Measured | 7.22 | 2.56 | 0.40 | 30.1 | 0.53 | 0.05 | 184.5 | 28.9 | 6,994 | 38.1 | 12.5 | |
| Indicated | 16.89 | 3.26 | 0.20 | 36.4 | 0.91 | 0.12 | 550.7 | 34.5 | 19,769 | 153.2 | 67.8 | ||
| Total | 24.11 | 3.05 | 0.26 | 34.5 | 0.79 | 0.10 | 735.2 | 63.4 | 26,763 | 191.3 | 80.3 | ||
| Inferred | 76.57 | 4.47 | 0.27 | 45.4 | 1.06 | 0.22 | 3,423.2 | 203.6 | 111,686 | 811.1 | 544.8 | ||
| Notes: |
* Numbers may not add due to rounding.
* The estimation of Mineral Resources involves assumptions about future commodity prices and technical mining matters. Mineral Resources are reported exclusive of those Mineral Resources that were converted to Mineral Reserves, and Mineral Resources are not Mineral Reserves and do not have demonstrated economic viability.
* The point of reference for Mineral Resources in this table is mill feed materials.
* The El Porvenir, Atacocha Underground and Atacocha Open Pit mines are part of the Cerro Pasco Complex.
|
|
| Other Operations |
The following table shows our estimates of Mineral Resources (100% ownership basis) for our material mining properties as of December 31, 2023 prepared in accordance with Subpart 1300 of Regulation S-K.
| Grade | Contained Metal | ||||||||||||
| Ownership Interest (%) | Class | Tonnage (2) | Zinc | Copper | Silver | Lead | Gold | Zinc | Copper | Silver | Lead | Gold | |
| (Mt) | (%) | (%) | (g/t) | (%) | (g/t) | (kt) | (kt) | (koz) | (kt) | (koz) | |||
| Cerro Lindo (3) | 83.48 | Measured | 4.40 | 1.93 | 0.65 | 23.1 | 0.24 | - | 84.9 | 28.6 | 3,268 | 10.6 | - |
| Indicated | 3.30 | 1.06 | 0.47 | 24.4 | 0.22 | - | 35.0 | 15.5 | 2,589 | 7.3 | - | ||
| Subtotal | 7.70 | 1.56 | 0.57 | 23.7 | 0.23 | - | 119.9 | 44.1 | 5,857 | 17.9 | - | ||
| Inferred | 9.28 | 1.54 | 0.25 | 32.6 | 0.42 | - | 142.9 | 23.2 | 9,726 | 39.0 | - | ||
| Vazante (4) | 100 | Measured | 0.48 | 8.40 | - | 12.4 | 0.25 | - | 40.3 | - | 191 | 1.2 | - |
| Indicated | 1.40 | 9.64 | - | 4.0 | 0.08 | - | 135.0 | - | 182 | 1.10 | - | ||
| Subtotal | 1.88 | 9.32 | - | 6.2 | 0.12 | - | 175.3 | - | 373 | 2.3 | - | ||
| Inferred | 12.77 | 10.27 | - | 12.9 | 0.21 | - | 1,311.0 | - | 5,289 | 27.4 | - | ||
| Vazante Aroeira Tailings (4) | 100 | Measured | - | - | - | - | - | - | - | - | - | - | - |
| Indicated | - | - | - | - | - | - | - | - | - | - | - | ||
| Subtotal | - | - | - | - | - | - | - | - | - | - | - | ||
| Inferred | 0.66 | 4.21 | - | 7.9 | 0.25 | - | 27.8 | - | 167 | 1.7 | - | ||
| El Porvenir (5) | 83.48 | Measured | 0.66 | 3.47 | 0.27 | 57.7 | 0.95 | - | 22.9 | 1.8 | 1,225 | 6.3 | - |
| Indicated | 3.22 | 3.25 | 0.20 | 63.2 | 0.97 | - | 104.7 | 6.4 | 6,540 | 31.2 | - | ||
| Subtotal | 3.88 | 3.29 | 0.21 | 62.2 | 0.97 | - | 127.6 | 8.2 | 7,765 | 37.5 | - | ||
| Inferred | 11.06 | 3.83 | 0.24 | 82.9 | 1.32 | - | 423.6 | 26.5 | 29,471 | 146.0 | - | ||
| Atacocha (Underground) (6) | 75.96 | Measured | 1.05 | 3.47 | 0.27 | 55.0 | 0.98 | - | 36.4 | 2.8 | 1,857 | 10.3 | - |
| Indicated | 2.52 | 3.30 | 0.36 | 54.9 | 0.92 | - | 83.2 | 9.1 | 4,448 | 23.2 | - | ||
| Subtotal | 3.57 | 3.35 | 0.33 | 54.9 | 0.94 | - | 119.6 | 11.9 | 6,305 | 33.5 | - | ||
| Inferred | 8.06 | 4.09 | 0.56 | 77.3 | 1.21 | - | 329.7 | 45.1 | 20,031 | 97.5 | - | ||
|
Atacocha (Open pit) (7) |
75.96 | Measured | 1.80 | 1.28 | - | 31.4 | 0.87 | 0.19 | 23.0 | - | 1,818 | 15.7 | 11.0 |
| Indicated | 3.88 | 1.05 | - | 29.0 | 0.90 | 0.24 | 40.7 | - | 3,616 | 34.9 | 29.9 | ||
| Subtotal | 5.68 | 1.12 | - | 29.8 | 0.89 | 0.22 | 63.7 | - | 5,434 | 50.6 | 40.9 | ||
| Inferred | 1.70 | 1.27 | - | 32.7 | 1.15 | 0.22 | 21.6 | - | 1,787 | 19.6 | 12.0 | ||
| Aripuanã (8) | 100 | Measured | 0.35 | 2.60 | 0.39 | 23.1 | 0.86 | 0.36 | 9.1 | 1.4 | 260 | 3.0 | 4.1 |
| Indicated | 5.19 | 3.95 | 0.18 | 35.0 | 1.46 | 0.27 | 205.0 | 9.3 | 5,840 | 75.8 | 45.1 | ||
| Subtotal | 5.54 | 3.86 | 0.19 | 34.2 | 1.42 | 0.28 | 214.1 | 10.7 | 6,100 | 78.8 | 49.2 | ||
| Inferred | 38.75 | 3.47 | 0.33 | 45.7 | 1.39 | 0.43 | 1,344.6 | 127.9 | 56,935 | 538.6 | 535.7 | ||
| Total | Measured | 8.74 | 2.48 | 0.40 | 30.7 | 0.54 | 0.05 | 216.6 | 34.6 | 8,619 | 47.1 | 15.1 | |
| Indicated | 19.51 | 3.09 | 0.21 | 37.0 | 0.89 | 0.12 | 603.6 | 40.3 | 23,215 | 173.5 | 75.0 | ||
| Total | 28.25 | 2.90 | 0.27 | 35.0 | 0.78 | 0.10 | 820.2 | 74.9 | 31,834 | 220.6 | 90.1 | ||
| Inferred | 82.28 | 4.38 | 0.27 | 46.6 | 1.06 | 0.21 | 3,601.2 | 222.7 | 123,406 | 869.8 | 547.7 | ||
| Notes: |
* Numbers may not add due to rounding.
* The estimation of Mineral Resources involves assumptions about future commodity prices and technical mining matters. Mineral Resources are reported exclusive of those Mineral Resources that were converted to Mineral Reserves, and Mineral Resources are not Mineral Reserves and do not have demonstrated economic viability.
* The point of reference for Mineral Resources in this table is mill feed materials.
* The El Porvenir, Atacocha Underground and Atacocha Open Pit mines are part of the Cerro Pasco Complex.
|
|
| Other Operations |
| (1) | The total tonnage and content amounts presented in this table represents Nexa’s attributable ownership basis. |
| (2) | The tonnage and content amounts presented in this table represents 100% of the Mineral Resources estimates for the property. Please refer to our ownership percentage for the amounts attributable to our ownership interest in the property. |
| (3) | The Qualified Person for the Mineral Resources estimate is Jerry Huaman Abalos, B.Geo., MAusIMM CP(Geo), a Nexa employee. Subpart 1300 of Regulation S-K definitions were followed for Mineral Resources which also are consistent with the CIM (2014) definitions. Mineral Resources are estimated at an NSR cut-off value of US$40.86/t. Mineral Resources estimates are based on average long-term metal prices of: zinc: US$3,218.90/t (US$1.46/lb); copper: US$8,820.05/t (US$3.48/lb); lead: US$2,300.33/t (US$1.04/lb); and silver: US$24.35/oz. Metallurgical recoveries are accounted for in NSR calculations based on historical processing data and are variable as a function of head grade. Recoveries at Life of Mine average head grades are 88.36% for Zn, 85.23% for Cu, 66.53% for Pb, and 68.78% for Ag. A minimum mining width of 4 m was used to create resource shapes. Bulk density varies depending on mineralization domain. |
| (4) | The Qualified Person for the Mineral Resources estimate is José Antonio Lopes, B.Geo., FAusIMM, a Nexa employee. Subpart 1300 of Regulation S-K definitions were followed for Mineral Resources, which also are consistent with the CIM (2014) definitions. Mineral Resources are estimated at various NSR cut-off values appropriate to the mineralization style and mining method. For Supergene Mineralization (Calamine) the resources are estimated at a NSR cut-off value of US$27.91/t for soil and US$32.92/t for fresh rock and transition material. For Aroeira Tailings the resources are estimated ate a NSR cut-off value of US$29.06/t and for Hypogene Mineralization (Willemite) a cut-off value of US$66.31/t for all resources shapes. Mineral Resources are estimates are based on average long-term metal prices of: zinc: US$3,218.90/t (US$1.46/lb); lead: US$2,300.33/t (US$1.04/lb); and silver: US$24.35/oz. Metallurgical recoveries are accounted for NSR calculations based on historical processing data and are variable as a function of head grade. Recoveries at Life of Mine average hypogene mineralization (Willemite) head grades are 87.19% for Zn, 23.93% for Pb, and 42.00% for Ag. Recovery at Life of Mine average supergene mineralization head grade is 55.00% for Zn. Recoveries at Life of Mine average Aroeira Tailings head grades are 67.86% for Zn, 40.74% for Pb and 42.00% for Ag. A minimum thickness of 3.0 m for underground SLS, open pit shell for Calamine and above original topography for tailings was applied. Bulk density was assigned based on rock type. |
|
|
| Other Operations |
| (5) | The Qualified Person for the Mineral Resources estimate is Jerry Huaman Abalos, B.Geo., MAusIMM CP(Geo), a Nexa employee. Subpart 1300 of Regulation S-K definitions were followed for Mineral Resources, which also are consistent with the CIM (2014) definitions. Mineral Resources are estimated at NSR cut-off grade values ranging from of US$63.77/t to US$67.04/t for SLS areas and US$65.77/t to US$69.04for C&F areas depending on the zone. Mineral Resources estimates are based on average long-term metal prices of: zinc: US$3,218.90/t (US$1.46/lb); copper: US$8,820.05/t (US$3.48/lb); lead: US$2,300.33/t (US$1.04/lb); and silver: US$24.35/oz. Metallurgical recoveries are accounted for in NSR calculations based on historical processing data and are variable as a function of head grade. Recoveries at Life of Mine average head grades are 89.21% for Zn, 14.60% for Cu, 80.01% for Pb, and 77.51% for Ag. A minimum mining width of 4.0 m was used for C&F and a minimum mining width of 3.0 m was used for SLS resource stopes shapes respectively. Bulk density varies depending on mineralization domain. |
| (6) | The Qualified Person for the Mineral Resources estimate is Jerry Huaman Abalos, B.Geo., MAusIMM CP(Geo), a Nexa employee. Subpart 1300 of Regulation S-K definitions were followed for Mineral Resources, which also are consistent with the CIM (2014) definitions. Mineral Resources are estimated at a NSR cut-off value of US$69.00/t for SLS, and US$71.07/t for C&F. Mineral Resources estimates are based on average long-term metal prices of: zinc: US$3,218.90/t (US$1.46/lb); copper: US$8,820.05/t (US$3.48/lb); lead: US$2,300.33/t (US$1.04/lb); and silver: US$24.35/oz. Metallurgical recoveries are accounted for in NSR calculations based on historical processing data and are variable as a function of head grade. Recoveries at Life of Mine average head grades are 89.30% for Zn, 15.73% for Cu, 80.02% for Pb, and 77.51% for Ag. A minimum mining width of 4.0 m was used for C&F and a minimum mining width of 3.0 m was used for SLS resource stopes shapes respectively. Density was assigned based on rock type. |
| (7) | The Qualified Person for the Mineral Resources estimate is Jerry Huaman Abalos, B.Geo., MAusIMM CP(Geo), a Nexa employee. Subpart 1300 of Regulation S-K definitions were followed for Mineral Resources, which also are consistent with the CIM (2014) definitions. Mineral Resources are reported within optimized pit shell. Mineral Resources are estimated at a NSR cut-off value of US$22.44/t. Mineral Resources estimates are based on average long-term metal prices of: zinc: US$3,218.90/t (US$1.46/lb); lead: US$2,300.33/t (US$1.04/lb); silver: US$24.35/oz; and gold: US$1,875.57/oz. Metallurgical recoveries are accounted for in NSR calculations based on historical processing data and are variable as a function of head grade. Recoveries at Life of Mine average head grades are 70.44% for Zn, 83.97% for Pb, 75.76% for Ag, and 65.46% for Au. Mineral resources are reported within open pit shell. Density was assigned based on rock type. |
| (8) | The Qualified Person for the Mineral Resources estimate is José Antonio Lopes, B.Geo., FAusIMM, a Nexa employee. Subpart 1300 of Regulation S-K definitions were followed for Mineral Resources, which also are consistent with the CIM (2014) definitions. Mineral Resources reported using a cut-of value of US$63.40/t. Mineral Resources estimates are based on average long-term metal prices of: zinc: US$3,218.90/t (US$1.46/lb); copper: US$8,820.05/t (US$3.48/lb); lead: US$2,300.33/t (US$1.04/lb); silver: US$24.35/oz; and gold: US$1,875.57/oz. Metallurgical recoveries are accounted for in NSR calculations based on historical processing data and are variable as a function of head grade. Recoveries at Life of Mine average head grades are 90.06% for Zn, 60.00% for Cu, 84.92% for Pb, 68.00% for Ag, and 67.80% for Au. A minimum thickness of 3.0 m was used for stopes shapes. Bulk density varies depending on mineralization domain. |
|
|
| Other Operations |
The following table shows our estimates of Attributable Mineral Resources for our other operating mines and zinc projects which do not currently have estimated Mineral Reserves as of December 31, 2023 prepared in accordance with Regulation S-K 1300.
| Grade | Contained Metal | ||||||||||||
| Ownership (%) | Class | Tonnage (1) | Zinc | Copper | Silver | Lead | Gold | Zinc | Copper | Silver | Lead | Gold | |
| (Mt) | (%) | (%) | (g/t) | (%) | (g/t) | (kt) | (kt) | (koz) | (kt) | (koz) | |||
| Morro Agudo (3) | 100 | Measured | - | - | - | - | - | - | - | - | - | - | - |
| Indicated | 12.94 | 3.51 | - | - | 0.59 | - | 454.3 | - | - | 75.9 | - | ||
| Subtotal | 12.94 | 3.51 | - | - | 0.59 | - | 454.3 | - | - | 75.9 | - | ||
| Inferred | 3.91 | 3.91 | - | - | 0.53 | - | 152.7 | - | - | 20.7 | - | ||
| Hilarión (4) | 83.48 | Measured | 12.14 | 3.39 | - | 30.9 | 0.69 | - | 411.5 | - | 12,059 | 83.7 | - |
| Indicated | 28.41 | 3.62 | - | 27.0 | 0.54 | - | 1,028.4 | - | 24,660 | 153.4 | - | ||
| Subtotal | 40.55 | 3.55 | - | 28.2 | 0.58 | - | 1,439.9 | - | 36,719 | 237.2 | - | ||
| Inferred | 35.20 | 4.06 | - | 25.0 | 0.41 | - | 1,429.3 | - | 28,296 | 144.3 | - | ||
| Florida Canyon Zinc (5) | 50.93 | Measured | 0.41 | 11.32 | - | 15.4 | 1.40 | - | 46.7 | - | 204 | 5.8 | - |
| Indicated | 0.83 | 10.28 | - | 14.9 | 1.31 | - | 85.4 | - | 398 | 10.9 | - | ||
| Subtotal | 1.24 | 10.63 | - | 15.1 | 1.34 | - | 132.1 | - | 602 | 16.7 | - | ||
| Inferred | 7.57 | 9.63 | - | 11.3 | 1.26 | - | 728.8 | - | 2,750 | 95.3 | - | ||
| Total | Measured | 12.55 | 3.65 | - | 30.4 | 0.71 | - | 458.2 | - | 12,263 | 89.5 | - | |
| Indicated | 42.18 | 3.72 | - | 18.5 | 0.57 | - | 1,568.0 | - | 25,058 | 240.2 | - | ||
| Total | 54.73 | 3.70 | - | 21.2 | 0.60 | - | 2,026.2 | - | 37,321 | 329.7 | - | ||
| Inferred | 46.68 | 4.95 | - | 20.7 | 0.56 | - | 2,310.8 | - | 31,045 | 260.4 | - | ||
| Notes: |
* Numbers may not add due to rounding.
* The estimation of Mineral Resources involves assumptions about future commodity prices and technical mining matters. Mineral Resources are not mineral reserves and do not have demonstrated economic viability.
* The point of reference for Mineral Resources in this table is mill feed materials.
|
|
| Other Operations |
The following table shows our estimates of Mineral Resources (100% ownership basis) for our other operating mines and zinc projects which do not currently have estimated Mineral Reserves as of December 31, 2023 prepared in accordance with Regulation S-K 1300.
| Grade | Contained Metal | ||||||||||||
| Ownership (%) | Class | Tonnage (2) | Zinc | Copper | Silver | Lead | Gold | Zinc | Copper | Silver | Lead | Gold | |
| (Mt) | (%) | (%) | (g/t) | (%) | (g/t) | (kt) | (kt) | (koz) | (kt) | (koz) | |||
| Morro Agudo (3) | 100 | Measured | - | - | - | - | - | - | - | - | - | - | - |
| Indicated | 12.94 | 3.51 | - | - | 0.59 | - | 454.3 | - | - | 75.9 | - | ||
| Subtotal | 12.94 | 3.51 | - | - | 0.59 | - | 454.3 | - | - | 75.9 | - | ||
| Inferred | 3.91 | 3.91 | - | - | 0.53 | - | 152.7 | - | - | 20.7 | - | ||
| Hilarión (4) | 83.48 | Measured | 14.54 | 3.39 | - | 30.9 | 0.69 | - | 492.9 | - | 14,445 | 100.3 | - |
| Indicated | 34.03 | 3.62 | - | 27.0 | 0.54 | - | 1,231.9 | - | 29,540 | 183.8 | - | ||
| Subtotal | 48.57 | 3.55 | - | 28.2 | 0.58 | - | 1,724.8 | - | 43,985 | 284.1 | - | ||
| Inferred | 42.17 | 4.06 | - | 25.0 | 0.41 | - | 1,712.1 | - | 33,895 | 172.9 | - | ||
| Florida Canyon Zinc (5) | 50.93 | Measured | 0.81 | 11.32 | - | 15.4 | 1.40 | - | 91.7 | - | 401 | 11.3 | - |
| Indicated | 1.63 | 10.28 | - | 14.9 | 1.31 | - | 167.6 | - | 781 | 21.4 | - | ||
| Subtotal | 2.44 | 10.63 | - | 15.1 | 1.34 | - | 259.3 | - | 1,182 | 32.7 | - | ||
| Inferred | 14.86 | 9.63 | - | 11.3 | 1.26 | - | 1,431.0 | - | 5,399 | 187.2 | - | ||
| Total | Measured | 15.35 | 3.81 | - | 30.1 | 0.73 | - | 584.6 | - | 14,846 | 111.6 | - | |
| Indicated | 48.60 | 3.81 | - | 19.4 | 0.58 | - | 1,853.8 | - | 30,321 | 281.1 | - | ||
| Total | 63.95 | 3.81 | - | 22.0 | 0.61 | - | 2,438.4 | - | 45,167 | 392.7 | - | ||
| Inferred | 60.94 | 5.41 | - | 20.1 | 0.62 | - | 3,295.8 | - | 39,294 | 380.8 | - | ||
| Notes: |
* Numbers may not add due to rounding.
* The estimation of Mineral Resources involves assumptions about future commodity prices and technical mining matters. Mineral Resources are not mineral reserves and do not have demonstrated economic viability.
* The point of reference for Mineral Resources in this table is mill feed materials.
| (1) | The tonnage and content amounts presented in this table represents Nexa’s attributable ownership basis. |
| (2) | The tonnage and content amounts presented in this table represents 100% of the Mineral Resources estimates for the property. Please refer to our ownership percentage for the amounts attributable to our ownership interest in the property. |
| (3) | The Qualified Person for the Mineral Resources estimate is José Antonio Lopes, B.Geo., FAusIMM, a Nexa employee. Subpart 1300 of Regulation S-K definitions were followed for Mineral Resources, which also are consistent with the CIM (2014) definitions. Mineral Resources are reported within underground mining shapes and the NSR cut-off values are calculated based on the life of mine costs for each mine. Morro Agudo: US$51.84/t and Bonsucesso: US$55.83/t. Mineral Resources estimates are based on average long-term metal prices of: zinc: US$3,218.90/t (US$1.46/lb) and lead: US$2,300.33/t (US$1.04/lb). Metallurgical recoveries are accounted for in NSR calculations based on historical processing data and are variable as a function of head grade. Recoveries at the LOM average head grades for Morro Agudo are 89.96% for Zn and 71.69% for Pb, and for Bonsucesso are 92.50% for Zn and 61.10% for Pb. A minimum thickness of 3.0 m was applied for Bonsucesso and 4.5 m for Morro Agudo underground. Density was assigned based on rock type. |
|
|
| Other Operations |
| (4) | The Qualified Person for the Mineral Resources estimate is Jerry Huaman Abalos, B.Geo., MAusIMM CP(Geo), a Nexa employee. Subpart 1300 of Regulation S-K definitions were followed for Mineral Resources, which also are consistent with the CIM (2014) definitions. Mineral Resources are estimated at an NSR cut-off value of US$45.00/t. Mineral Resources estimates are based on average long-term metal prices of: zinc: US$3,245.91/t (US$1.47/lb); lead: US$2,332.46/t (US$1.06/lb); and silver: US$22.66/oz. Metallurgical recoveries are accounted for in NSR calculations based on historical processing data and are variable as a function of head grade. Recoveries at the LOM average head grades for Hilarion are 90.00% for Zn, 86.00% for Pb, and 72.00% for Ag. A minimum thickness of 4.0 m was applied. Density was assigned based on rock type. |
| (5) | The Qualified Person for the Mineral Resources estimate is Jerry Huaman Abalos, B.Geo., MAusIMM CP(Geo), a Nexa employee. Subpart 1300 of Regulation S-K definitions were followed for Mineral Resources, which also are consistent with the CIM (2014) definitions. Mineral Resources are estimated at an NSR cut-off value of US$41.40/t NSR for SLS, US$42.93/t for C&F and US$40.61/t for Room & Pillar mine areas. Mineral Resources estimates are based on average long-term metal prices of: zinc: US$2,816.35/t (US$1.27/lb); lead: US$ 2,196.50/t (US$1.00/lb); and silver: US$19.38/oz. Metallurgical recoveries are accounted for in NSR calculations based on historical processing data and are variable as a function of head grade. Recoveries at the LOM average head grades for Florida Canyon are 80.00% for Zn, 74.00% for Pb, and 52.00% for Ag. A minimum thickness of 3.0 m was applied for Bonsucesso and 4.5 m for Morro Agudo underground. Density was assigned based on rock type. |
The following table shows our estimates of Attributable Mineral Resources for our copper project which does not currently have estimated Mineral Reserves as of December 31, 2023 prepared in accordance with Regulation S-K 1300.
| Grade | Contained Metal | ||||||||||||
| Ownership (%) | Class | Tonnage (1) | Zinc | Copper | Silver | Lead | Molybdenum | Zinc | Copper | Silver | Lead | Molybdenum | |
| (Mt) | (%) | (%) | (g/t) | (%) | (g/t) | (kt) | (kt) | (koz) | (kt) | (koz) | |||
| Magistral (3) | 83.48 | Measured | 82.39 | - | 0.52 | 2.8 | - | 0.050 | - | 428.4 | 7,416 | - | 41.2 |
| Indicated | 75.70 | - | 0.43 | 2.8 | - | 0.040 | - | 325.5 | 6,814 | - | 30.3 | ||
| Subtotal | 158.09 | - | 0.48 | 2.8 | - | 0.045 | - | 753.9 | 14,231 | - | 71.5 | ||
| Inferred | 9.24 | - | 0.38 | 3.1 | - | 0.050 | - | 35.1 | 921 | - | 4.6 | ||
| Total | Measured | 82.39 | - | 0.52 | 2.8 | - | 0.050 | - | 428.4 | 7,416 | - | 41.2 | |
| Indicated | 75.70 | - | 0.43 | 2.8 | - | 0.040 | - | 325.5 | 6,814 | - | 30.3 | ||
| Total | 158.09 | - | 0.48 | 2.8 | - | 0.045 | - | 753.9 | 14,231 | - | 71.5 | ||
| Inferred | 9.24 | - | 0.38 | 3.1 | - | 0.050 | - | 35.1 | 921 | - | 4.6 | ||
| Notes: |
* Numbers may not add due to rounding.
* The estimation of Mineral Resources involves assumptions about future commodity prices and technical mining matters. Mineral Resources are not mineral reserves and do not have demonstrated economic viability.
* The point of reference for Mineral Resources in this table is mill feed materials.
The following table shows our estimates of Mineral Resources (100% ownership basis) for our copper project which does not currently have estimated Mineral Reserves as of December 31, 2023 prepared in accordance with Regulation S-K 1300.
|
|
| Other Operations |
| Grade | Contained Metal | ||||||||||||
| Ownership (%) | Class | Tonnage (2) | Zinc | Copper | Silver | Lead | Molybdenum | Zinc | Copper | Silver | Lead | Molybdenum | |
| (Mt) | (%) | (%) | (g/t) | (%) | (g/t) | (kt) | (kt) | (koz) | (kt) | (koz) | |||
| Magistral (3) | 83.48 | Measured | 98.69 | - | 0.52 | 2.8 | - | 0.050 | - | 513.2 | 8,884 | - | 49.3 |
| Indicated | 90.68 | - | 0.43 | 2.8 | - | 0.040 | - | 389.9 | 8,163 | - | 36.3 | ||
| Subtotal | 189.37 | - | 0.48 | 2.8 | - | 0.045 | - | 903.1 | 17,047 | - | 85.6 | ||
| Inferred | 11.06 | - | 0.38 | 3.1 | - | 0.050 | - | 42.0 | 1,103 | - | 5.5 | ||
| Total | Measured | 98.69 | - | 0.52 | 2.8 | - | 0.050 | - | 513.2 | 8,884 | - | 49.3 | |
| Indicated | 90.68 | - | 0.43 | 2.8 | - | 0.040 | - | 389.9 | 8,163 | - | 36.3 | ||
| Total | 189.37 | - | 0.48 | 2.8 | - | 0.045 | - | 903.1 | 17,047 | - | 85.6 | ||
| Inferred | 11.06 | - | 0.38 | 3.1 | - | 0.050 | - | 42.0 | 1,103 | - | 5.5 | ||
| Notes: |
* Numbers may not add due to rounding.
* The estimation of Mineral Resources involves assumptions about future commodity prices and technical mining matters. Mineral Resources are not mineral reserves and do not have demonstrated economic viability.
* The point of reference for Mineral Resources in this table is mill feed materials.
| (1) | The tonnage and content amounts presented in this table represents Nexa’s attributable ownership basis. |
| (2) | The tonnage and content amounts presented in this table represents 100% of the Mineral Resources estimates for the property. Please refer to our ownership percentage for the amounts attributable to our ownership interest in the property. |
| (3) | The Qualified Person for the Mineral Resources estimate is Jerry Huaman Abalos, B.Geo., MAusIMM CP(Geo), a Nexa employee. Subpart 1300 of Regulation S-K definitions were followed for Mineral Resources, which also are consistent with the CIM (2014) definitions. Mineral Resources are estimated at a pit shell constraint and NSR cut-off value: US$5.99/t (Porf San Ernesto, Porf. Sara and Porf. H), US$5.51/t (Mixto), US$5.48/t (Skarn). Mineral Resources estimates are based on average long-term metal prices of: copper: US$8,272.00/t (US$3.75/lb); silver: US$21.34/oz; and molybdenum: US$21,829.00/t (US$ 9.90/lb). Metallurgical recoveries are accounted for in the NSR calculations based on metallurgical data and vary from 79.3% in skarn to 92.5% in San Ernesto porphyry for Cu, 51.3% in skarn and 79.2% in San Ernesto porphyry for Mo, and 70% for Ag. Density was assigned based on rock type. |
Internal Controls Disclosure
Nexa has used well-established quality assurance/quality controls (“QA/QC”) protocols since 2007 for core samples from operating mines and its Brownfield/Greenfield projects. Nexa has used a corporate database (GDMS Fusion) from Datamine since 2017, which replaced the previous corporate database system used from 2007 to 2016. The current database system has several default laboratory packages, specific for different Business Units (ore deposit types/countries) with pre-defined preparation and assay methods, reporting units and over-limit methods. All assay dispatches from all mines and projects follows the same protocols for each medium type (core, rock, soil, stream sediment samples). All written protocols are in a corporate internal system that requires revisions and updates every three years.
|
|
| Other Operations |
Nexa Quality Control include three types of duplicates (pulp, coarse rejects and half core duplicates), blank controls and certified standards. Inter-laboratory checks are also carried out on an annual basis at certified laboratories. Fusion database has a collection of pre-defined QA/QC charts for each type of control where Nexa parameters for each control are built in. All blanks and certified standards are approved and registered in Fusion by the database administrator. Nexa protocols for construction and certification of new standards from operating mines and projects include a minimum of ten laboratories and minimum of ten samples per lab in the Round Robin. Laboratories need to be form different continents and only three laboratories from the same group are allowed.
Every mine and advanced project provides a detailed QA/QC report at least once a year, which is appended to the updated mineral resources technical reports prepared by our engineers.
With respect to the verification of analytical procedures, Nexa carries out periodic reviews of the QA/QC programs to ensure that an adequate level of quality is maintained in the process of sampling, preparing and testing drill core samples and that the QA/QC programs are designed and implemented to prevent or detect contamination and allow analytical precision and accuracy to be quantified. Nexa’s internal qualify person performed this review and concluded that Nexa's QA/QC programs meet or exceed industry standards and the data are suitable for Mineral Resources and Mineral Reserves purposes.
Internally, regular data verification workflows are carried out to ensure the collection of reliable data. Coordinates, core logging, surveying, and sampling are monitored by exploration, mine geologists, and verified routinely for consistency.
The Mineral Resource and Mineral Reserve estimates are supported by a review of the recent operation results including operating costs, production, metallurgical performance and reconciliation. The LOM plan supporting the estimates includes consideration of changes to the permits required, capital costs, tailings capacity and other production constraints. The estimates are subject to normal industry risks including metal prices, metallurgical performance and geological modeling. For geological risk Nexa has modeling and estimation procedures following mining industry best practices including drilling, borehole survey, core logging, sampling, and density protocols.
|
|
| Capital Expenditures |
CAPITAL EXPENDITURES
Our capital expenditures from January 1, 2021 through December 31, 2023 totaled US$1,198.2 million and we expect to invest US$311.0 million in capital expenditures in 2024, maintaining the same levels compared to our 2023 investments, mainly driven by higher HS&E and other non-expansion investments. Our guidance includes US$307.0 million directed towards non-expansion investments and US$4.0 million towards expansion investments. The following table sets forth our capital expenditures for the periods indicated.
|
For the Year Ended December 31, |
|||
|
2023 |
2022 |
2021 |
|
| (in millions of US$) | |||
| Capital Expenditures | |||
| Expansion (1) | 3.7 | 88.5 | 271.2 |
| Modernization | 3.8 | 10.3 | 8.8 |
| Sustaining | 292.8 | 239.7 | 189.0 |
| Health, Safety and Environment (“HS&E”) | 15.7 | 40.1 | 31.6 |
| Others | 3.5 | 1.1 | 3.6 |
| Subtotal | 319.5 | 379.7 | 504.3 |
| Reconciliation to Financial Statements (2) |
(10.5) |
1.6 |
3.6 |
| Total | 309.0 | 381.2 | 507.9 |
| (1) | For a description of the projects, see “Information on the Company—Mining operations.” |
| (2) | The amounts under “Reconciliation to Financial Statements” are mainly related to advance payment of imported materials, capitalization of interest net of advanced payments and tax credits" |
Our main capital expenditures during the years ended December 31, 2023, 2022 and 2021 include the following:
| · | In 2023, our capital expenditures were US$309.0 million, an 18.9% decrease compared to 2022, mainly due to the decrease in expansion investments with the conclusion of construction at Aripuanã, which was partially offset by an increase in sustaining capital expenditures, including US$79.4 million invested in the Aripuanã mine. |
| · | In 2022, our capital expenditures were US$381.2 million, a 24.9% decrease compared to 2021, mainly due to a decrease in growth capital expenditures related to the conclusion of construction at Aripuanã, which was partially offset by an increase in sustaining Capex, including US$45.8 million invested in the Aripuanã mine. |
| · | In 2021, our capital expenditures were US$507.9 million, a 51.0% increase compared to 2020, mainly due to expenditures related to the construction of the Aripuanã project (50.7% of total Capex) and higher non-expansion investments, including an increase in sustaining and HS&E expenses to historical levels, which were lower in 2020 due to the impact of the COVID-19 pandemic. |
We expect to meet these capital expenditure needs from our operating cash flow and our current cash position. We may need to incur indebtedness to finance a portion of these expenditures or also incur indebtedness if financing is available at attractive terms. Our actual capital expenditures may vary from the expected amounts we have described here, both in terms of the aggregate capital expenditures we incur and when we incur them.
|
|
| Environmental, Social and Governance (ESG) |
ENVIRONMENTAL, SOCIAL AND GOVERNANCE (ESG)
We are committed to fully integrating sustainability into our business through a comprehensive approach based on systematic planning and execution, prioritizing risk and impact management, and maintaining a positive social, economic and environmental legacy in the places where we operate. Our practices related to ESG are continuously evolving to adapt to new framework, and regulatory and disclosure requirements, including the SEC’s new environmental rules adopted on March 6, 2024, as well as to consider best practices and respond to stakeholder feedback.
Nexa integrates sustainability practices into its business, focused on generating a positive social, economic and environmental impact in the places where it operates. Within this context, the Company has a multidisciplinary and integrated task force that is continually assessing and refining its Environmental, Social and Governance (“ESG”) strategy and future actions including risks analyses with respect to climate change and global, regional and local weather conditions, as well as those related to the emission of greenhouse gases, among other matters. In October 2022, Nexa formally announced updated medium- and long-term goals regarding its ESG strategy. The Company disclosed updated targets related to key ESG topics, such as climate change, water consumption, safety and diversity, and social commitments. In 2022, Nexa also announced its ESG purpose as “Mining that changes with the world.” Nexa’s ESG strategy takes a long-term approach, and as a result the Company could in the future change its accounting estimates, assumptions and judgments regarding new definitions, practices or commitments that would be assumed by management in relation to its ESG strategy.
In 2023, the Company advanced on its ESG targets by progressing on projects and initiatives and also enhanced its ESG management process. In the second half of 2023, we kicked off the implementation of an ESG Data Management platform (“Deep ESG”), which will support ESG data gathering and control, enabling corporate and operations to improve the ESG strategy management process. We expect to conclude the implementation of Deep ESG by the end of 2024.
During 2023, we also conducted a materiality review process aiming to rediscuss key ESG topics that will support the Company’s strategy. More details on the materiality review process are discussed further in this section.
Our sustainability approach is set out in our Code of Conduct and Compliance and Sustainability policies. We adhere to the United Nation’s Global Compact and the goals related to our material topics discussed below seek to contribute to fulfilling the UN’s Sustainable Development Goals (“SDGs”). Our current material topics and ESG initiatives, as discussed below, strive to meet the SDGs.
We view ESG as core to our efforts to generate shareholder and social-environmental value, including:
| · | Putting the health, safety and well-being of our people first; |
| · | Being environmentally responsible and accountable; |
| · | Respecting and fostering the human rights agenda; and |
| · | Supporting and constantly dialoging with the communities where we operate. |
Board of Directors, SCP Committee, Compensation, Nominating and Governance (“CNG”) Committee, and Audit Committee reporting
Our Board of directors oversees our ESG strategy, given its strategic importance to the Company and our operations. The Board of directors is responsible for guidance, governance and oversight of ESG, and overseeing the Company’s eight current material topics described below. The Board committees, and in particular the CNG committee, the SCP committee and the Audit committee, support the Board in its monitoring and oversight of ESG matters. Specifically, our SCP committee oversees and contributes to our ESG strategy plan, ensuring that we are considering material and relevant topics to Nexa and its stakeholders, as well as proposing reasonable ESG targets and benchmarks.
Our CNG committee assists our Board of directors in fulfilling its governance and supervisory responsibilities and advises our Board of directors with respect to evaluation and monitoring of compensation models and policies and other related matters. The committee’s responsibilities also include the supervision and approval of our social responsibility plans and policies, including, but not limited to, those described in our ESG Strategy (except community related aspects, which are overseen by the SCP committee).
|
|
| Environmental, Social and Governance (ESG) |
Our SCP committee oversees sustainability-related issues, which include the prioritization of safe and sustainable business practices with respect to environmental, health, safety and social matters, as well as the oversight of the management and governance of our tailings disposals. The SCP committee also oversees our capital projects, monitoring technical, economic and social issues with respect to our projects, including exploration, development, licensing, construction and operation of mines and metallurgical plants and key assets for our strategy and growth. In 2022, our SCP committee reaffirmed our ESG strategy, restated our framework, approved new long-term targets and reviewed management’s ESG plan. During 2023, the committee met eight times and discussed ESG topics in four of these meetings. The new ESG materiality review process was also presented to the committees.
In 2022, Nexa completed an internal ESG ownership project, which focused on introducing ESG into Nexa’s overall governance strategy and defining how the Company intends to address ESG internally with respect to key ESG topics. In 2023, we focused on building each operating unit its own ESG strategy to align with the goals and initiatives within Nexa’s ESG strategy. This process consisted of discussing and validating targets for each unit, gathering the information on projects and initiatives that support the goals and targets, discussing the goals’ advancement over time, including the amount to be invested in these projects and other relevant details.
The Audit committee is also involved in ESG matters, in particular with respect to the analysis of the impact on financial reporting, as well as preparedness in order to meet financial reporting and disclosure requirements that may be implemented in the near future.
ESG Commitments
In October 2022, we announced our new long-term ESG commitments, aligned with the Paris Agreement and focused on reducing the impacts of climate change. We adopted a new ESG Governance framework that is intended to enable Nexa to enhance our position in the industry and capture potential opportunities. Nexa’s eight long-term sustainability commitments, which we aim to achieve by 2030, are focused on four areas: emission reduction and neutrality; safety; water usage and disposal; and plurality.
Emission Reduction and Neutrality: Nexa has been reducing GHG emissions for more than a decade, and currently has one of the lowest carbon footprints in the world in the zinc production industry (scopes 1 and 2), according to the International Zinc Association (“IZA”). In alignment with the Paris Agreement, Nexa’s goal is to reach net zero by 2050. Our commitments in this category are:
| · | Absolute reduction of scope 1 emissions by 20% (52 thousand tons of CO2 equivalent), keeping Nexa’s electrical energy matrix almost entirely composed of renewable sources1 by 2030; |
| · | Reach net neutrality – the balance between carbon emissions and absorption – by 2040; and |
| · | Reach net-zero greenhouse gas emissions (“GHG”) by 2050. |
In order to reduce greenhouse gas emissions, Nexa is developing innovative projects in collaboration with different partners to improve its performance towards its decarbonization goals. For example, in 2023 we committed to reducing CO2 emissions by using natural gas to replace diesel fuel in vehicles that transport materials at mining sites in Peru. With this initiative, we expect to reduce approximately 23 tons of CO2 emitted by our vehicles annually. We also acquired 100 units of hydraGENTM equipment to be installed on diesel engines to increase the engines’ combustion efficiency, which is expected to reduce up to 3,200 tCO2eq annually. Furthermore, we obtained government authorization to use biofuel to replace fossil fuels, to be used in all 47 furnaces in the zinc oxide operation in Três Marias, which is expected to offset up to 24,700 tCO2eq annually. As of December 31, 2023, we have successfully utilized biofuel in 12 out of the 47 furnaces (offsetting 6,400 tCO2eq). As of now, we have the potential to replace 30% of the thermal capacity in our zinc recycling kiln, which would be expected to offset up to 25,600 tCO2eq. We also implemented the use of renewable energy at our Cajamarquilla smelter and have initiatives in place to expand the utilization of solar panels installed in deactivated tailings dams in Cajamarquilla.
1 98.8% electric energy from renewable sources in 2022.
|
|
| Environmental, Social and Governance (ESG) |
In 2023, our energy matrix was mainly renewable, with renewable energy accounting for 95.5% of the matrix, emphasizing the company’s commitment to maintaining its electric energy matrix mainly from renewable sources.
In February 2024, we announced that the Carbon Disclosure Project concluded its 2023 evaluation for the year-ended 2022 and upgraded Nexa’s rating in the Climate Change Questionnaire from C to B, reflecting the efforts, disclosure, and transparency of Nexa related to ESG governance, strategy, risk management, metrics, and targets.
As of date of this filling, we are waiting for assurance related to our emissions inventory, which is currently undergoing the assurance process. While we anticipate an increase in scope 1 emissions in 2023 compared to 2022, we remain confident that we are on track to meet our 2030 targets. We expect disclosing this outcome during the first half of 2024 in Nexa’s Sustainability Report for the year-ended 2023.
Safety: Nexa seeks to be a model when it comes to safety, focusing on building a safer environment with zero fatalities and a reduction of severe accidents through a robust cultural transformation program in health and safety, including awareness campaigns, counseling, and monitoring for both employees and third parties. Our commitments in this category are:
| · | Zero fatalities in all operating units (annually); and |
| · | By 2030, consolidate all units in the first quartile of the mining industry with regard to the Total Recordable Injury Frequency Rate (“TRIFR”). |
In 2023, Nexa registered zero fatalities and its 2023 TRIFR final outcome positioned the Company in the industry’s second quartile based on 2022 benchmarks set by the International Council on Mining and Metals. As of the date of this annual report, Nexa registered one fatality in 2024.
During 2023, we continued to implement our G-MIRM project, which is focused on enhancing the culture of safety in Nexa’s operating units by providing training and discussing new safety procedures. This program follows a well-known methodology developed by the University of Queensland.
Water usage and disposal: Nexa prioritizes the responsible management of water and seeks to reduce its consumption by 2030. Our commitment in this category is:
| · | 10% reduction of consumption of water in mining operations (from 1.68 m³/ton of ROM2 to 1.51 m³/ton of ROM) and smelting operations (from 24.01 m³/ton of metal to 21.61 m³/ton of metal). |
In 2023, the average consumption of water in mining operations represented 1.97 m³/ton of ROM and 22.10 m³/ton of metal in smelting operations. The difference in mining operations consumption compared to our commitment baseline is due to the increase in water consumption in our Peruvian assets and in the Aripuanã mine.
Plurality (diversity, equity, and inclusion): Nexa is committed to being an increasingly plural company which emphasizes diversity, equity, and inclusion, to promote an environment of opportunity, recognition, and acceptance for all. Our commitments in this category are:
| · | 30% of women in the workforce by 2030; |
| · | 30% of women in leadership positions by 2030. |
As of December 31, 2023, our workforce was made up of 17.3% women, with 24.6% serving in leadership positions. The mine operations workforce at the Aripuanã mine in Brazil was made up of 23.7% women.
In 2022, alongside the announcement of our ESG commitments, we developed a dedicated website to provide our stakeholders and investors with greater transparency about our ESG initiatives: www.nexaresources.com/esg. Information contained on our website is not incorporated by reference into this report, and you should not consider it to be part of this report. Booklets and videos were also developed to expand the communication of ESG topics internally and externally throughout Nexa.
2 ROM (Run-of-mine): crude ore, extracted directly from the mine without undergoing any kind of processing.
|
|
| Environmental, Social and Governance (ESG) |
On May 9, 2023, we published our 2022 sustainability report that highlights our ongoing commitment to corporate sustainability and socially responsible actions. The report discloses Nexa’s initiatives and achievements related to our business, employees and communities, and also discusses the strategy, risk and governance-related matters that we have implemented or are implementing to accelerate our ESG initiatives. The annual report follows the guidelines of the International Integrated Reporting Council (IIRC) and the Global Reporting Initiative (GRI), in addition to the guidelines of the Sustainability Accounting Standards Board (SASB) and recommendations of the Task Force on Climate-Related Financial Disclosure (TCFD). The information contained is submitted to external assurance.
In 2023, ESG targets were considered in senior leadership goals panels, as well as for employees who were eligible for variable compensation, representing 20% of the executive’s short-term incentives and 20% for other managerial or professional levels. Two components were adopted: (i) a corporate goal based on initiatives connected with key topics on the ESG Strategy; and (ii) specific goals that were unfolded according to the responsibilities of the area and the projects related to the theme to give a sense of responsibility to all employees on the subject.
Other ESG highlights for Nexa in 2023 include:
| · | Nexa was recognized as a leader in Social Governance and awarded “Company of the Year - Mining Sector 2023” by Brasil Mineral (a Brazilian magazine specializing in mining). This recognition was partly in acknowledgement of our training program in Aripuanã. The program trained 1,987 people, of whom 53% were women. Furthermore, 40% of program participants were placed back into the job market. It is estimated that more than 15% of the local population has benefited from this initiative, underscoring our commitment to being a collaborative force in regional development. |
| · | Our project Gente Cuidando das Águas (People Taking Care of Water), in Vazante, was the only Brazilian initiative presented among the 200 initiatives presented at the Regional Water Dialogue organized by the United Nations Economic Commission for Latin America and the Caribbean. The project aims to recover water sources in the Santa Catarina River basin by sealing off areas and activities related to environmental education in schools and surrounding communities. Since 2018, 154 springs have been protected. |
| · | Nexa partnered with Amazon Web Services with the goal of training 100,000 individuals in cloud computing fundamentals in Brazil and Peru by 2025, creating opportunities for skills development and nurturing local talents. |
| · | Nexa registered its carbon emissions on “LMEpassport”, a platform on the London Metal Exchange platform which promotes sustainability and transparency across the base metals sector. Nexa’s zinc production has one of the lowest carbon footprints recorded in the sector, with an emission intensity of 0.36 tons of CO2 equivalent (scopes 1 and 2) according to the GHG protocol methodology, an achievement that positions Nexa as a global leader in carbon reduction within the zinc industry. |
| · | Nexa announced the successful closing of a US$320 million sustainability-linked revolving credit facility. This new revolving credit facility, which remains undrawn, has a term of five years, and amounts drawn are subject to an initial interest rate of 1.60% plus Term SOFR. The applicable margin is subject to compliance with carbon reduction key performance indicators, reflecting the Company's unwavering commitment to reducing its carbon footprint. Such efforts are consistent with Nexa’s ESG ambitions, targeting net-zero greenhouse gas emissions by 2050, in alignment with the Paris Agreement. |
| · | Nexa obtained authorization from the Regional Superintendence for the Environment of the State of Minas Gerais to use biofuel to replace fossil fuels, used in all 47 furnaces in the zinc oxide operation in Três Marias. In 2023, we were able to replace the use of biofuel in 12 out of the 47 furnaces. This initiative supports our goal to reduce scope 1 CO2 emissions by 20% by 2030. |
|
|
| Environmental, Social and Governance (ESG) |
| · | Nexa implemented the ON GRID solar system at our Cajamarquilla smelter, providing electric power from solar energy, resulting in a reduced footprint carbon emissions and promoting clean energy production. |
Nexa Materiality Matrix
The Nexa materiality matrix defines the issues that are most relevant to our business and our stakeholders, guiding how we plan and execute our ESG initiatives. We use this matrix to help inform our sustainability strategies and to ensure that our sustainability disclosures include the issues of most interest to our business and stakeholders in line with the principles established by the International Integrated Reporting Council (“IIRC”) and Global Reporting Initiative (“GRI”). In 2020, we updated our matrix to evaluate the most relevant topics for the mining and metals sector by incorporating the Sustainability Accounting Standards Board (“SASB”) guidelines for the mining and metals sector and other sector benchmarks.
In 2023, we concluded a 6-month materiality review process, focused on determining the most relevant topics to support our ESG practices and guide our reporting and management strategies. This process was conducted by a consultancy company, and we also gathered contributions from different stakeholders. The process consisted of 3 stages: (i) context and definitions, (ii) prioritization and (iii) results validation. In the prioritization stage, we conducted 27 interviews with directors, Board members, investors, sector representatives, team leaders, and others. We also conducted field work in 5 operating units (in Brazil and Peru), accessing 30 focal groups and 20 interviews with community representatives. Finally, we surveyed a wide range of stakeholders focusing on 11 different populations. Based on the results of this prioritization phase, we implemented a methodology to combine the results of these surveys with insights from our SCP committee and leadership teams to define the 8 most relevant material topics for us and our stakeholders.
Nexa’s current material topics support corporate goals and ESG management guidelines towards the following themes: dam, waste and tailings management, climate change, water resources management, social management, health, safety and well-being, plurality (formerly called diversity), innovation, governance and reputation. Nexa’s ESG long-term commitments are an important part of some of these topics, enhancing the Company’s commitment to a more sustainable operation.
Environmental
| · | Dam, waste and tailings management. We aim to reduce our residue footprint. Our activities generate a significant amount of waste. We seek to reduce the generation of mining and metallurgical waste, complying with applicable local legislation, and acting in accordance with our strategic commitment, attempting to co-create a positive legacy for society. Our Morro Agudo site is considered a pioneer in eliminating waste production with one of the main projects being agricultural lime powder, also known as Zincal200. The project is based on technology created to reprocess the tailings produced in the zinc beneficiation process, which used to be dumped in dams. In addition, our Cerro Lindo and Vazante mines already use the dry stacking method for tailings disposal and our Aripuanã mine has also begun its operation using this method. In 2023, we started testing the dry stacking process in Três Marias and we filtered 74.0% of the material from the operation by the end of 2023. Peru’s mining operating units have a significant volume of tailings disposed in the backfill system. Approximately, 25.9% of the tailings generated by Nexa were disposed of in dams in 2023, as compared to 31.8% in 2022. In August 2023, Nexa signed a partnership agreement with a local cement supplier to test and evaluate the feasibility of technological routes for Cajamarquilla’s dried neutral sludge to be used in the cement production chain, thereby reducing waste disposal. |
As tailings disposals are one of the main risks associated with mining activity, we constantly review our dam management policy, which goes beyond the requirements of the legislation of the jurisdictions in which we operate. We apply guidelines from the ICOLD to control, monitor and ensure the safety of our 24 active and 25 inactive disposal facilities (24 in Brazil and 24 in Peru) and one water storage dam at the Aripuanã unit. We also have 7 Golden Rules for Managing Dams and Tailings Sites, which are internal guidelines that we use to ensure the management of geotechnical structures and the safety of all employees and third parties. All of our projects are required to comply with these guidelines and any non-compliance must be analyzed by the audit team.
|
|
| Environmental, Social and Governance (ESG) |
| · | Climate change. We are also committed to reducing greenhouse gas emissions to minimize our impact on climate change, contributing to a low-carbon economy. We consume large amounts of energy due to the nature of our activities and transportation processes, which is why we seek new technologies and progress in sustainable energy generation. Much of the electric energy consumed by our operations is from renewable and low emission sources, predominantly hydroelectricity. In 2020, we implemented a project for a biomass boiler at the Três Marias unit, in which fuel oil was substituted by eucalyptus wood chips and sugar cane bagasse, highlighting our commitment to energy efficiency. At the Juiz de Fora unit, we have an ongoing project to replace natural gas by reusing solid waste as fuel to generate steam. We remain committed to diminish our waste volumes and transforming them into secondary products, reducing the usage of our tailing dams. In 2022, we consolidated the use of tools for calculating GHG emissions following the GHG Protocol in all operating units and corporate areas, as well as progressed on mapping out its strategy with respect to measuring scope 3 emissions. In 2023, we committed to reducing emissions by using natural gas to replace diesel fuel in vehicles that transport materials at mining sites in Peru. Although 25% of the fleet of 20 trucks is already operating using natural gas, our goal is for our fleet to achieve 100% natural gas usage thereby reducing approximately 23 tons of CO2 emitted by our vehicles annually. In 2023 we also obtained authorization from the Regional Superintendence for the Environment of the State of Minas Gerais to use biofuel to replace the fossil fuels used in all furnaces in the zinc oxide operation in Três Marias. In 2023, we were able to use biofuel in 12 of the 47 furnaces. In our Cajamarquilla smelter, we implemented the ON GRID solar system, providing electric power from solar energy, resulting in a reduced carbon footprint and promoting clean energy production. We plan to expand the utilization of this solar system in the available locations of deactivated tailings dams in Cajamarquilla. |
| · | Water resources management. Our target is to reduce water consumption and increase recirculation. Mining activity involves technical procedures in which water assumes an important role, both for extraction and processing, making it even more important to reduce water use and increase reuse throughout the value chain. Advanced investments in efficient water recirculation programs contribute not only to lowering the intake of new water but also reducing the volume of effluents and the environmental impact of the discharge. In 2023, we have allocated approximately 22.0% of our environmental spending resources (as compared to 36.0% in 2022) towards efforts to keep our effluents disposed through proper treatment and to comply with the new dam legislation published in the year. In our Cerro Lindo mine, we have 92.2% of water recirculation. We use a desalination plant, extracting salt by a reverse osmosis process and pumping it up to a plant, at an altitude of 2,200 meters. In an area with scarcity of water resources, this technology is important to avoid competing with the local population in demand for water. In addition, we encourage and guide the community in the region to store rainwater. In February 2023, our project, Gente Cuidando das Águas (People Caring for the Waters), in Vazante, was the only Brazilian initiative selected among the 200 initiatives presented at the Regional Water Dialogue organized by the Economic Commission for Latin America and the Caribbean, of the United Nations. The project aims to recover water springs in the Santa Catarina River basin, through the fencing of areas and activities related to environmental education in schools and surrounding communities. Since 2018, 154 springs have been protected. |
Social
| Social development. We aim to develop mutually beneficial relationships with the communities in which we operate. The object of Nexa’s social strategy to leave a long-lasting relevant legacy for local communities (including rural producers, suppliers and local entrepreneurs) by contributing to the improvement of social indicators and the quality of life of the people living in the municipalities near our operations. In 2022, we re-prioritized our social management strategy with respect to investments, focusing on assertive and value-added projects, which demands a structured partnership with communities to minimize reputational risks and business impacts. As a result, global strategic themes were simplified to foster ongoing business development of Nexa and its host communities, as well as maintaining a social license to operate and co-creating a positive legacy. Four pillars were determined to guide the Company’s plan on social development: (i) Income Generation: to enhance local economic development through the qualification of local suppliers/entrepreneurs and rural producers; (ii) Water: to protect water springs and develop projects focused on revitalization, rainwater harvesting and/or water quality improvement; (iii) Education: to contribute to basic and technical education, aiming at improving the qualification of the local population for the job market, especially young people and adults; and (iv) Social License to Operate: to fulfill social and legal commitments to stakeholders, focused on mitigating impacts and obtaining social licenses to operate in the host communities. |
|
|
| Environmental, Social and Governance (ESG) |
In addition, in 2023, we dedicated over 13,500 hours to volunteer action across our units, benefiting more than 11,500 people. Our focus in 2023 was to carry out volunteer work with greater social impact. In 2023, we partnered with Amazon Web Services with the goal of training 100,000 individuals in cloud computing fundamentals in Brazil and Peru by 2025, creating opportunities for skills development and fostering local talent. In Aripuanã, we have a qualification program for future mine and plant operating professionals In September 2023, Nexa was recognized as a leader in Social Governance and was awarded “Company of the Year-Mining Sector 2023” by Brasil Mineral in acknowledgment of our training program. The program trained 1,987 people, of whom 53% were women. 40% of the program participants were placed back into the job market and it is estimated that more than 15% of the local population has benefitted from this initiative.
| · | Health, safety and well-being. Our goal is to reduce our injury frequency rate and to reduce fatalities to zero. We continuously invest in strengthening a culture focused on safety and health for both our own as well as outsourced employees, through training, especially for risky activities, and in enhancing working conditions. In September 2023, we held our annual Safety Week to share insights and experiences to enhance our culture of safety and to strengthen our awareness of potential risks, promote healthy habits, and encourage safe behaviors. We launched a well-being program in 2021, seeking to emphasize the dimensions of integral health. We also have health initiatives in place for the Aripuanã project, aimed at disease prevention and a much healthier operating environment (i.e., Dust Zero Project). A prominent initiative within the well-being program is Go Nexa which encourages and helps employees monitor physical activities, healthy eating practices and hydration, and rewards users for healthy habits. Nexa also maintains ongoing initiatives related to disease prevention by providing periodic vaccinations for all employees. For further discussion of our safety records, please refer to “Health and safety compliance” in the following section. |
| · | Plurality. We target the increase of diversity in the workplace. Our personnel management model and our policies and tools have guided the development of people based on culture and performance, a focus on guaranteeing employee satisfaction, and the continuity and evolution of the business, in addition to generating an environment that fosters innovation and disruptive solutions. For further information please see “Corporate Governance, management and employees—Board of directors—Diversity” section. In 2021, we established a governance structure for the program to enhance diversity across Nexa. Affinity groups were created, which are formed by employees who are responsible for promoting diversity throughout the Company. These groups coordinate and implement initiatives to promote diversity in a transversal and uniform manner, generating greater impact in all units. |
In 2021, we received the Women on Board certificate, and we also signed the letter of adhesion and the 10 commitments of the LGBTI+ Business and Rights Forum. Additionally, we launched a talent program focused on the admission and training of diverse professionals with disabilities and/or special needs, and the program is ongoing to date.
In 2023, we focused our diversity initiatives on three main areas:
(i) the individual: we believe that an inclusive environment with emotional security encourages creativity, a sense of belonging, and innovation;
(ii) the company: we believe that plurality is a strategic pillar that expands the potential of our teams and multiplies the results of our business; and
|
|
| Environmental, Social and Governance (ESG) |
(iii) the society: we believe that our practices and results contribute to society becoming increasingly ethical, humane, and equitable. Our diversity programming is becoming increasingly more robust and mature and has resulted in significant changes through the actions of affinity groups across the Company.
During 2022, held our first Plurality Week, which focused on fostering a deeper understanding of questions around diversity, inclusion and strengthening a culture of ethics and respect both within and outside the Company. We prepared a “Good Practices Guide” with online training modules to help all employees better understand and achieve these goals.
In 2023, Nexa Peru committed to RED (Red de Empresas y Discapacidad) to improve the employment and inclusion of professionals with disabilities, reaffirming our commitment to providing equal opportunities and promoting a diverse and inclusive organizational culture.
Governance
| · | Governance and reputation. Acting responsibly and transparently is one of our core values. We are committed to high standards of ethics and integrity across the entire company, which principles stated in our Code of Conduct and reflected in our Compliance Program. Our Board of directors is one of the main agents in promoting the program and ensuring compliance with our Code of Conduct, which is a public document shared with all stakeholders, including employees, suppliers, customers, communities, NGOs, government agencies, shareholders and other individuals and organizations with which we have a relationship. In 2021, we updated our Code of Conduct to include topics such as plurality and ESG practices, as well as adaptations to new laws, such as the general law of data. In 2022, Nexa continued to enhance its supplier assessment program to include reviews of ESG indicators and best practices and a new Code of Conduct for Suppliers was also launched in 2022. In 2023, we also launched the Code of Conduct for Customers. In 2023, as in previous years, we disseminated our Code of Conduct among all employees at a global level and started to disseminate the Code of Conduct for Suppliers with strategic vendors. In addition, in 2022, Nexa implemented the following initiatives, among others: (i) created committees against sexual harassment at the Brazilian units, based on those existing in our operations in Peru, and in 2023, this committee was implemented in Brazil’s corporate office, (ii) trained all units in Peru and Brazil on these topics, reinforcing Nexa’s commitment to zero tolerance for any harassment and discrimination, and (iii) appointed “Compliance Influencers”, employees at the units and corporate offices who will support Nexa’s culture and commitment to ethics and integrity. |
In addition, in 2022, we continued to assess the Company’s risks aimed at continuously improving our risk management and governance. We also updated the charters of each of our committees to include the responsibility of supporting the Board in monitoring enterprise risk management in matters related to the responsibilities of each committee. In 2022, we also conducted a review of the Related Party Transaction Policy and approved a new version. We also updated the Audit committee charter to incorporate new NYSE and SEC requirements, including obligations relating to related party transactions.
Regarding reputation we want to stand out from our competitors and be recognized as one of the leading players of the mining of the future, through sustainable production and by co-creating a legacy for society.
For further information on our Company's governance, see “Corporate governance, management and employees”.
Other
| · | Innovation. Enabling the strategic axes of growth and operational excellence makes our operations safer, minimizes waste and optimizes production. For seven years, we have managed a powerful tool for open innovation, the Mining Lab platform, which allows us to deliver projects in energy, circular economy, IT and automation, in Brazil and Peru. |
|
|
| Environmental, Social and Governance (ESG) |
Nexa incorporates and develops innovative practices to extract the mineral resources necessary for its operations and works to continuously reduce the impact of its activities on the environment.
Health and safety compliance
Health and safety in the workplace are among our main values, and our policies and procedures seek to eliminate accidents. We are committed to protecting the health and wellbeing of our employees and contractors and have set standards to identify and assess health risks, manage their impact and monitor the health of our people. Nevertheless, mining is an activity that involves substantial risks. We established a Health and Safety Director Plan (“H&S Director Plan”) focused on the following objectives (i) eliminate fatalities; (ii) reduce the severity and number of accidents and illnesses; and (iii) raise the health, safety and well-being culture standards in our sites. The H&S Director Plan has facilitated the improvement of our health and safety culture and performance, and includes seven pillars of focus: (1) cultural transformation, (2) risk management, (3) emergency response systems, (4) health and safety management systems, (5) infrastructure systems, (6) restructuring of corporate guidelines, and (7) occupational hygiene and wellbeing management.
A main focus of the H&S Director Plan is cultural transformation. In 2022, we started training all leaders in the G-MIRM (“Global Minerals Industry Risk Management”) program. This program started at the University of Queensland (Australia) and currently involves several universities around the world. In Brazil, the representative is the University of São Paulo (USP). Throughout 2022 and 2023, Nexa’s leadership team had the opportunity to participate in this training provided by USP, seeking significant and lasting changes in decision-making at all hierarchical levels, and creating and improving risk management in companies in a sustainable and effective way. The main benefits of the program are: (i) awareness and early recognition at all levels of significant hazards and risks to the enterprise; (ii) development of internal competencies for the scope of a risk assessment and applying tools for comparison with good practice approaches; (iii) providing practical tools to improve risk management and advance security procedures; (iv) improved understanding of a personal commitment to safety and defining responsibilities for risk management leading to better decision-making processes; and (v) identification of new opportunities to strengthen internal security policies and procedures.
In 2023, we continued to reinforce the initiatives which have been set in the creation of the Master Plan in 2020, related to our health and safety culture, which are set to be implemented over a five-year term. Many of the initiatives, such as Global SIPAT (an internal week of discussion forums and seminars related to health and safety across our organization), Safety Workshops at all Nexa units and the PROA Movement (a year-end campaign by our safety department to promote prevention of work accidents), contribute to our enhanced safety culture.
In 2022, we reported three fatalities, two that occurred at the El Porvenir mine and one that occurred at the Cajamarquilla smelter. These incidents in El Porvenir are still under investigation by the Peruvian authorities and as of the date of this filing their work-related status has not yet been established. In 2023, there were zero fatalities within our operations. On March 2, 2024, we registered one fatality in our El Porvenir mine, which as of the date of this annual report is still under investigation.
We have also sought to improve our safety record as it relates to recordable injury frequency, lost worktime incident, and severity rates, in conformity with standards in the mining industry. In 2023, our total recordable injury frequency rate was 2.15 compared to 1.98 in 2022 and 1.92 in 2021. This rate is defined as the number of injuries with and without lost time per one million man-hours worked. In 2023, our lost worktime incident rate was 0.88 compared to 0.75 in 2022 and 0.60 in 2021. This rate is defined as the number of injuries with lost time per one million man-hours worked. Our severity rate for 2023 was 64 compared to 163 in 2022 and 24 in 2021. To calculate the severity rate, we consider the sum of lost, transported and debited days, divided by the total number of man-hours worked times one million. In addition to these efforts, we also operate programs aimed at improving working conditions, including medical services, for our mining operations and monitoring employees’ health.
|
|
| Regulatory Matters |
REGULATORY MATTERS
We are subject to a wide range of governmental regulation in the jurisdictions in which we operate. The following discussion summarizes the kinds of regulation that have the most significant impact on our operations.
Brazilian regulatory framework
Mining rights and regulation of mining activities
Mining activities in Brazil are governed by the Brazilian Federal Constitution of 1988, the Brazilian Mining Code and other decrees, laws, ordinances and regulations, such as Decree nº 9.406/2018 which renewed the regulation of the Mining Code. These regulations impose several obligations on mining companies relating to, among other things, the way mineral deposits are exploited, the health and safety of workers and local communities where mines are located, and environmental protection and remediation measures. They also set forth the Brazilian federal government’s jurisdiction over, and scope of activities within, the industry. The MME and ANM regulate mining activities in Brazil. As of July 2017, the ANM replaced the National Department of Mineral Production (“DNPM”), and is responsible for monitoring, analyzing and promoting the performance of the Brazilian mineral economy, granting rights related to the exploration and exploitation of mineral resources and other related activities in Brazil.
Under the Brazilian Federal Constitution, surface property rights are distinct from mineral rights, which belong exclusively to the Brazilian federal government, the sole entity responsible for governing mineral exploration and mining activity in Brazil.
Summary of Brazilian concessions
In Brazil, we hold 214 exploration authorizations, 17 mining concessions, eight mining concession applications, three rights to apply for mining concession and 41 exploration authorization applications, which we broadly and collectively refer herein to as mineral rights, that cover a total area of 767,289.8 hectares, of which: (i) 500,331.5 hectares, or 65.2%, are exploration authorizations, (ii) 10,725.4 hectares, or 1.4%, are mining concessions, (iii) 3,828.0 hectares, or 0.5%, are mining concession applications, (iv) 2,261.5 hectares, or 0.3%, are rights to apply for mining concession and (v) 250,143.5 hectares, or 32.6%, remain as exploration authorization applications and are presently under initial geological reconnaissance.
The term of each of the mining concessions mentioned above is valid for the life of the mine, evaluated pursuant to the specific mining project. All our mineral rights in Brazil are in good standing. Maintaining our mineral rights in Brazil in good standing involves: (i) maintaining production on the mineral concessions and/or satisfying the ANM’s requirements if production has been suspended; (ii) developing exploration work and paying an annual property fee for the exploration authorizations; and (iii) complying with all the legal requirements, including not only as to mining, but also as to environmental and real estate requirements applicable to claiming a property with respect to exploration applications.
Failure to pay the applicable fees for any given year will result in us forfeiting our mineral rights. As of December 31, 2023, we have paid all applicable royalties, taxes and fees on our mineral rights. Our mineral rights in Brazil that are not currently undergoing exploration or production will not expire unless we fail to timely pay the applicable royalties, taxes and fees, as well as the applicable penalties and meet the ANM’s and environmental authorities’ requirements, as applicable. See “Information on the Company—Regulatory matters—Brazilian regulatory framework—Royalties and other taxes on mining activities.”
The following table summarizes our mineral rights in Brazil.
|
Mineral Right |
|||
|
Project |
Titles |
Area (hectares) |
|
| Mines | Morro Agudo | 3 | 1,446.1 |
| Vazante | 10 | 2,174.5 | |
| Aripuanã | 1 | 3,639.9 | |
| Prospective Projects | Various | 269 |
760,029.3 |
| Total | 283 | 767,289.8 | |
|
|
| Regulatory Matters |
Exploration authorization and mining concession regimes
Exploration authorizations grant the rights to conduct exploration activities for a period from one to four years, which may be renewable for an additional period (and potentially additional renewals on a case-by-case basis). Exploration authorizations are granted on a first come, first serve basis, and the ANM will only grant one exploration authorization for any given area. Mining concessions are currently valid until the mineral deposit reserves are exhausted. Mining concessions may be transferred to eligible third parties with the ANM’s prior approval, pursuant to applicable legislation.
Decommissioning
In Brazil, enterprises dedicated to the exploitation of mineral resources shall submit a recovery plan to receive a mining concession. Accordingly, the environmental recovery of the degraded areas caused by mineral exploitation activities shall have been planned since their conception. According to Minas Gerais law, entrepreneurs must also submit to the environmental agency an environmental plan for closing two years before the planned mine closing.
On October 1, 2020, the Brazilian federal government issued law No. 14,066 which, among other provisions, amended the Brazilian Mining Code in order to explicitly state that all mine closure plans must be approved by the ANM as well as the environmental licensing agency. In addition, on April 30, 2021, the ANM published new rules regarding the Mine Closure Plan – PFM. We have been complying with legal requirements regarding mine closure plans and continue to comply with all regulatory and environmental requirements.
Royalties and other taxes on mining activities
Revenues from mining activities are subject to the Brazilian mining royalty, Compensação Financeira pela Exploração de Recursos Minerais (“CFEM”), which is paid to the ANM. CFEM is a monthly royalty based on gross revenue, excluding taxes on the sale of minerals. When the produced minerals are used in its internal industrial processes, CFEM is determined based on the costs incurred to produce them. CFEM is determined by a reference price of the respective mineral to be defined by the ANM. The applicable rate varies according to the mineral product (currently 2.0% for zinc, lead, copper and silver). In addition, we are required to make certain fee payments for exploration authorizations known as the Annual Fee per Hectare (Taxa I por Hectare). There is also a monthly inspection fee related to the transfer and commercialization of certain minerals in some Brazilian states, such as Minas Gerais and Mato Grosso, where the concessions are located.
In 2019, the State of Minas Gerais ratified a tax benefit that suspended the VAT on the commercialization of several products, including metallic zinc for companies incorporated in the State. There are no formal requirements to obtain the benefit (such as demonstrating that the legal entity is the company actually industrializing the zinc), however the existence of the tax benefit has resulted in increased scrutiny by the tax authorities in the State. We are currently collaborating with all the requested information by the tax authorities in this process of reviewing the commercialization of our products throughout the zinc value chain. In case the buyer does not comply with the VAT deferred regulation, Nexa may be subject to (i) subsidiary liability (pursuant to art. 57, IN, RICMS/MG); or (ii) joint liability (pursuant to art. 124, I of National Tax Code and art. 56, XI, RICMS/MG). For additional information, see “Risk Factors—Changes in tax laws may increase our tax burden and, as a result, could adversely affect our business, financial position and results of operations.”
In December 2022, a new tax on mining operations (the “TRFM”) was approved in the State of Mato Grosso, where the Aripuanã project is located. The regulation came into force in April 2023. The Brazilian Supreme Court held that the tax was unconstitutional in December 2023. However, the state of Mato Grosso approved a new tax to replace the tax that the Court deemed unconstitutional. The new TFRM will be collected according to the nature of the extracted ore. Similar taxes on mining operations have been implemented in other Brazilian states, such as the state of Minas Gerais.
|
|
| Regulatory Matters |
Environmental regulations
We are subject to several environmental regulations related to, among other matters, water resources, caves, waste management, contaminated areas, areas of permanent preservation, conservation of protected areas and environmental recovery policies. For more information on environmental recovery policies that Nexa is subject to, see “Information on the Company—Mining operations—Tailings disposal.” Specifically, we have taken the following actions regarding contaminated areas and areas of permanent preservation:
Contaminated areas. We have carried out environmental assessments on our operation units to verify the existence of contamination in groundwater and soil. The assessments prepared for the Brazilian units identified deviations in soil, groundwater and surface water quality standards. We are committed to improving the management of areas identified as contaminated. For most of the identified deviations, we developed a robust remediation plan in order to comply with all legal requirements. We recorded provisions in our consolidated financial statements in respect of any potential liabilities associated with these deviations from applicable standards. See “Operating and financial review and prospects—Overview—Key factors affecting our business and results of operations—Environmental expenses.” We continue to conduct similar assessments with respect to the Peruvian operating units.
Areas of permanent preservation. Permanent Preservation Areas (Áreas de Preservação Permanente, or APP) are areas that, because of their importance for preserving water resources, geological stability, biodiversity protection and erosion control, receive special legal protection. The existence of such protected areas within a property, whether in urban or rural locations, may cause restrictions to the performance of the intended activities. Interference or removal of APP vegetation is only allowed in cases of public utility (such as mining activities), social interest or low environmental impact, if there is a prior authorization from the applicable environmental authorities. Most of our properties in the state of Minas Gerais interfere in APPs in some way, however all are authorized by environmental agencies. For such properties, we have either already established an advanced ongoing regularization process or have started the process for other properties. The regularization process includes the implementation of rigid controls over the properties.
Environmental licenses
The Brazilian Federal Constitution grants federal, state and municipal governments the authority to issue environmental protection laws and to publish regulations based on those laws. While the Brazilian federal government has authority to issue environmental regulations setting general standards for environmental protection, state governments have the authority to issue stricter environmental regulations. Municipal governments may only issue regulations regarding matters of local interest or as a supplement to federal or state laws.
Under Brazilian law, the construction, installation, expansion and operation of any establishment or activity that uses environmental resources, or is deemed to be actually or potentially polluting, as well as those capable of causing any kind of environmental degradation, is subject to a prior licensing process.
Notably, in addition to the general guidelines set by the Brazilian federal government, each state is legally competent to promulgate specific regulations governing environmental licensing procedures under its jurisdiction. Depending on the level of environmental impact caused by the exploration/exploitation activities, the procedures for obtaining an environmental license may require assessment of the environmental impact and public hearings, which may considerably increase the complexity and duration of the licensing process and expose the exploration/exploitation activities to potential legal claims.
Environmental liability
Environmental liability may be determined by civil, administrative and criminal courts, with the application of administrative and criminal sanctions, in addition to the obligation to redress the damages caused. All our operating units, except for Cerro Lindo, have obtained certification under the ISO 14001 standard.
Regulation of other activities
In addition to mining and environmental regulation, we must abide by regulations related to, among other things, the use of explosives and fuel storage. We are also subject to more general legislation on labor, occupational health and safety, and support of communities near mines, among other matters.
|
|
| Regulatory Matters |
Peruvian regulatory framework
Mining rights and regulation of mining activities
In Peru, surface land is owned by private landowners, while the government retains ownership of all subsurface land and mineral resources. The Natural Resources chapter of the Peruvian Constitution, enacted in 1993, states that mineral resources are the property of the Nation, and the Peruvian State is sovereign in their administration. The Peruvian government may establish by law the conditions for granting exploitation rights and titles to individuals and legal entities.
The General Mining Law (Texto Único Ordenado de la Ley General de Minería) is the primary law governing both metallic and non-metallic mining activities in Peru and is complemented by other regulations approved by the MINEM. Under the General Mining Law, mining activities such as exploration, exploitation, mining labor, beneficiation and mining transport (except sampling, prospecting and trade) are carried out exclusively by means of concessions granted by the Peruvian State. The Dirección General de Minería (“DGM”) is the regulatory body of the MINEM responsible for proposing and evaluating regulations in the Peruvian mining sector as well as authorizing the commencement of mining activities in Peru.
A mining concession allows its holder to carry out exploration and exploitation activities within the area established in the respective concession title, provided that prior to the beginning of any mining activity, such concession title is granted by the Instituto Geológico, Minero y Metalúrgico (“INGEMMET”) and other applicable administrative authorizations are obtained (e.g., mining, environmental, use of water, use of explosives, impact on indigenous communities, etc.). A concession provides its titleholder with the exclusive right to undertake mineral exploration and mining activity within a determined area but does not grant the titleholder the right to own the surface land where the concession is located. Therefore, for the holder of a mining concession to develop exploration and/or exploitation works, the latter must purchase the corresponding surface land from the owners, reach an agreement for its temporary use or obtain the imposition of a legal easement by the MINEM, which is rarely granted. There are special proceedings for purchasing or acquiring temporary rights over barren lands owned by the state.
Mining concessions are irrevocable, provided the holder of a mining concession complies with the obligations set forth in the General Mining Law and applicable regulations. Such concessions have an indefinite term, subject to payment of an annual validity fee per hectare granted and achievement of minimum annual production for each hectare, or payment of a production penalty when applicable. Failure to achieve annual production targets will result in a penalty. Failure to pay annual validity fees or production penalties for two consecutive years in any mining concession will result in the cancellation of such mining concession. Failure to satisfy minimum annual production thresholds for a specified period of time (currently thirty years beginning the year after the mining concessions were granted for mining concessions granted after October 10, 2008, and thirty years beginning on January 1, 2009 for mining concessions granted before October 10, 2008) could result in cancellation of the mining concessions.
Summary of Peruvian concessions
In Peru, we hold, through Nexa Peru and its subsidiaries, 815 mining and exploration concessions, which cover a total area of 345,921.3 hectares and 60 mineral claims totaling 44,352.2 hectares. Of our mines in Peru, the Atacocha mine property includes 147 mining concessions that cover an area of 2,872.5 hectares and one beneficiation concession, the El Porvenir mine property includes 25 mining concessions that cover an area of 4,846.7 hectares and one beneficiation concession, the Cerro Lindo mine has 68 mining concessions that cover an area of 43,827.8 hectares and one beneficiation concession and the inactive Chapi mine property includes 32 mining concessions that cover an area of 4,625.6 hectares and one beneficiation concession. In addition, we have 225 mineral rights concessions for greenfield projects in Peru that cover a total area of 82,596.8 hectares. Our prospective projects include 318 mining concessions that cover an area of 207,152.0 hectares.
All our mining and processing concessions in Peru are in good standing. Maintaining our concessions in Peru in good standing involves, among other requirements, (i) paying the annual validity fee and production penalties (when applicable) for mining concessions with no production or with no effective exploration or (ii) paying the annual validity fee and complying with minimum production or investment requirements established in mining law.
|
|
| Regulatory Matters |
Failure to pay such validity fees or production penalties (when applicable) for two consecutive years results in the cancellation of the respective mining concessions or beneficiation concessions granted by the Peruvian government. Our mining and beneficiation concessions will not expire unless we do not timely comply in paying these fees or with the minimum production or investment as required by law in respect of such rights and depending on the applicable regime.
The following table summarizes our mining concessions in Peru:
|
Concessions |
|||
|
Project |
Titles |
Area (hectares) |
|
| Mines | Atacocha | 147 | 2,872.5 |
| El Porvenir | 25 | 4,846.7 | |
| Cerro Lindo | 68 | 43,827.8 | |
| Chapi (inactive) | 32 | 4,625.6 | |
| Greenfield Projects | Florida Canyon Zinc | 13 | 10,700.0 |
| Hilarión | 72 | 15,841.2 | |
| Magistral | 36 | 16,254.2 | |
| Prospective Projects | Various |
422 |
246,953.4 |
| Total |
815 |
345,921.3 |
|
Exploration and authorization and mining concession regimes
Mining concessions are granted for an indefinite term, though dependent on the fulfillment of certain legal obligations. The commencement and re-commencement of exploration and/or exploitation mining activities are subject to the prior obtainment of an authorization for the commencement of activities before the DGM. Such authorizations could be subject to a prior consultation procedure with indigenous communities, carried out by MINEM, if mining activities were to impact said communities’ collective rights and territories as determined by the Ministry of Culture.
As of December 31, 2023, we primarily owned metallic mining concessions with respect to zinc, copper, silver and lead. Our mining rights and concessions are in full force and effect under applicable Peruvian laws. We believe that we comply in all material respects with the terms and requirements applicable to our mining rights and concessions.
Decommissioning
Title holders of mining exploitation and beneficiation activities, and, in some cases, of exploration activities require the prior approval of a mine closure plan, which includes the environmental rehabilitation, restoration and remediation measures that shall be executed along with the mining operations and until its closure. Once the corresponding mine closure plan is approved, a guarantee (usually a bank performance bond) must be granted in favor of the MINEM to back up the environmental costs associated with the execution of the mine closure plan. Mining exploitation and beneficiation activities may only be initiated once the mine closure plan is approved, and the corresponding environmental guarantee is duly submitted before the competent authority. The referred guarantee is renewed yearly. If the titleholder of an ongoing mining operation fails to comply with this obligation, the MINEM is entitled to suspend the execution of such mining operation. For additional information, see “Risk Factors—Political, economic, social and regulatory risks—Our mineral rights may be terminated or not renewed by governmental authorities”.
Royalties and other taxes on mining activities
Holders of mining concessions are required to pay a mining royalty (regalía minera) to the Peruvian government for the exploitation of metallic and non-metallic resources. The amount of the royalty is payable on a quarterly basis and is equal to the greater of (i) an amount determined in accordance with a statutory scale of marginal tax rates from 1.0% to 12.0% based on a company operating income margin and applied to that company’s operating income and (ii) 1.0% of a company’s sales, in each case during the applicable quarter. We are also required to pay annual fees (derecho de vigencia) for our mining concessions and, in some cases, mining production penalties for not timely reaching the minimum production levels set by Peruvian mining law.
|
|
| Regulatory Matters |
Holders of mining concessions are also required to pay a Special Mining Tax (Impuesto Especial a la Minería) to the Peruvian government. The Special Mining Tax is payable on a quarterly basis and is calculated based on the operating income derived exclusively from the sale of metallic resources, with marginal rates between 2.0% and 8.4%.
Holders of mining concessions that are subject to administrative legal stability (in force as of the effective date) under an Agreement of Guarantees and Measures for Investment Protection entered into with the MINEM shall enter into an agreement with the Peruvian government for the payment of a Special Charge on Mining (Gravamen Especial a la Minería, or “GEM”). The GEM is payable on a quarterly basis and is calculated based on the operating income derived exclusively from the sale of metallic resources, with marginal rates between 4.00% and 13.12%.
Tax stability agreements
On March 26 of 2002, Nexa Peru entered into an Agreement of Guarantees and Measures for Investment Protection with the MINEM with respect to our Cerro Lindo unit. Pursuant to section 9 of said Agreement, until December 31, 2021, certain guarantees and benefits were available with respect to operations of the Cerro Lindo unit including, among others, free commercialization of the products proceeding from such unit, free disposition of the currencies generated from the export of the products proceeding from such unit, the right to use the global depreciation rate applicable on the fixed assets relating to the Cerro Lindo unit up to 20.0% per year, the right to keep the accounting corresponding to the Cerro Lindo unit in U.S. dollars, and tax stability. The tax stability agreement expired on December 31, 2021. As of January 2022, Nexa Peru is required to pay taxes at statutory rates to the Peruvian government. As of the date of this report, there is an ongoing dispute between Nexa and Peruvian tax authorities in respect of the applicability of such agreement. For more information, see “Risk Factors—Changes in tax laws may increase our tax burden and, as a result, could adversely affect our business, financial position and results of operations” and “Additional Information—Legal Proceedings—Other legal proceedings.”
Municipal permits
Under the General Mining Law, all Peruvian mines located in rural areas such as Cerro Lindo, Atacocha, El Porvenir and Chapi are exempted from paying municipal taxes and obtaining municipal permits.
Environmental regulations
The development of economic activities in Peruvian territory, such as those related to the mining industry, are subject to a broad range of general environmental laws and regulations related to the generation, storage, handling, use, disposal and transportation of hazardous and controlled materials; the emission and discharge of hazardous materials into the ground, air or water; and the protection of migratory birds and endangered and threatened species and plants. These regulations also set environmental quality standards for noise, water, air and soil, which shall be considered for the preparation, assessment and approval of the corresponding environmental management instrument, granted by the National Service for Environmental Certification of Sustainable Investments (“SENACE”) for exploitation and beneficiation activities, or the MINEM for exploration activities.
The Ministry of Environment and other administrative entities, such as the Dirección General de Asuntos Ambientales Mineros (“DGAAM”), have the authority to enact regulations related to environmental matters. Additionally, the Environmental Supervision Agency (Organismo de Evaluación y Fiscalización Ambiental, or “OEFA”), is the competent authority in charge of supervising and imposing sanctions on mining companies upon non-compliance of applicable environmental legislation. In addition, there are other competent governmental agencies or authorities on specific environmental matters such as water, forestry resources, protected natural areas and aquatic environment that regulate, authorize and supervise environmental compliance and liability.
On November 23, 2023, Supreme Decree No. 028-2023-EM was enacted, amending the Regulations for Environmental Protection in Mining Exploration Activities in order to allow the simultaneous processing of various enabling permits related to water resources, such as water use authorizations or discharge permits, alongside the evaluation procedure for the respective environmental management instrument.
|
|
| Regulatory Matters |
Additionally, on November 25, 2023, Supreme Decree No. 031-2023-EM was enacted, approving the law that specifies the mandatory environmental protection measures in the transportation and final disposal of tailings and the corresponding environmental management instruments for mining operations.
In addition, as of the date of this filing, a revision process was initiated by the Peruvian Congress of a law to prohibit economic activities in the headwaters of basins, which are considered vulnerable areas that require protection and mitigation measures. However, the revision process lost momentum and has shown no sign of progress to date. If adopted, this law could have a material impact on our business and projects in case any new projects were to occur in headwaters of basins.
Environmental permit regularization processes
Supreme Decree 040-2014-EM provided special procedures allowing us to acquire environmental and operational permits for mining operations and to regularize the mining of certain areas within the Cerro Lindo and Atacocha mines. These regularization procedures, however, are independent from any sanctioning administrative procedure that the OEFA may initiate in connection with the construction and operation of mining components in the first place without the corresponding environmental permits.
Similarly, Supreme Decree 013-2019-EM allowed for further regularization procedures to be carried out as of January 6, 2020, which will also allow us to acquire environmental and operational permits for infrastructure and mining areas in the Cerro Lindo, Atacocha, El Porvenir and Chapi mines. The regularization procedure for Cerro Lindo was denied due to an unfavorable opinion by the National Water Authority, yet proper procedure was not followed for which we have taken judicial measures to appeal the denial. Atacocha’s procedure was carried out to completion while the El Porvenir regularization procedure is currently underway. The Chapi mine procedure did not fall through and the areas subject to the procedure must follow the standard mine closure regulations.
Regulation of other activities
In addition to mining and environmental regulation, we must abide by regulations related to, among other activities, the use of explosives, fuel storage, controlled substances, telecommunications, archeological remains, and energy concessions. We are also subject to more general legislation on labor, occupational health and safety, and indigenous communities, among others. With respect to labor regulations, the Peruvian government enacted Supreme Decree 001-2022-TR in February 2022, establishing a series of measures to eliminate the outsourcing of a company’s “core business” activities, which are defined as the main activities of a company, such as any activities that differentiate and identify it within the market, generate the most income for the company or add the most value for the company’s customers. In July 2023, the law was deemed to be unconstitutional because it was determined to be an unenforceable bureaucratic barrier by INDECOPI, and therefore is not expected to have any material impact on Nexa. In addition, a lawsuit was initiated by Nexa which is seeking to declare the unconstitutionality of the aforementioned law. For additional information, see “Risk Factors—Operational risks—We may be liable for certain payments to individuals employed by third party contractors” and “Risk Factors—Operational risks—The nature of our business includes risks related to litigation and administrative proceedings that could materially adversely affect our business and financial performance in the event of unfavorable rulings.”
Regarding occupational health and safety regulations, on December 30, 2023, Supreme Decree No. 034-2023-EM was enacted, amending the Regulation of Occupational Safety and Health in Mining approved by Supreme Decree No. 024-2016-EM. Among the key modifications made are the inclusion of parameters for the development of geo-mechanical, hydrogeological, seismicity, and stability studies; the elaboration of a monthly report on geotechnical supervision of tailings deposits, pads, leaching heaps, and waste rock deposits; changes regarding which entity should receive the preliminary report on hazardous incidents or fatal accidents; as well as the addition of a chapter on tailings deposit management which includes parameters for the development of a geotechnical monitoring and control program, a risk analysis and assessment, a management plan, among others. A period of 180 calendar days has been granted for mining activity holders to adapt and comply with the new obligations incorporated by the amendment.
|
|
| Overview |
OVERVIEW
Executive summary
The following is an overview of 2023, compared to 2022. For an overview of 2022 compared to 2021, please refer to “Operating and financial review and prospects” in our Annual Report on Form 20-F for the year ended December 31, 2022, filed with the SEC on March 20, 2023, as amended by our Annual Report on Form 20-F/A, filed with the SEC on October 27, 2023. During 2023, we safely operated our assets and delivered a solid operational performance.
In 2023, we had net revenues of US$2,573.2 million, a 15.2% decrease from 2022, mainly due to lower zinc and copper prices and lower smelting sales volume, which was partially offset by higher mining production volumes. We also had net loss of US$289.2 million, a US$365.6 million decrease as compared to 2022, as a result of the decrease in operating income, mainly due to the aforementioned reasons.
Despite rising inflation, high interest rates, aggressive monetary policy tightening, increasing commodity price volatility, and social and political instability, including the ongoing conflict in Russia-Ukraine and the Israel-Hamas conflict, supported by a solid operational performance, we delivered an Adjusted EBITDA of US$391.2 million in 2023, down 48.6% compared to 2022, negatively impacted by the decline in base metal prices, especially the strong decline in zinc prices, and lower smelting sales volume. We use Adjusted EBITDA as an additional measure of operational performance of the Company’s business (used in addition to, and not as substitute for, net income) without the impact of (i) share in the results of associates, depreciation, amortization, net financial results and income taxes, (ii) non-cash events and non-cash gains or losses that do not specifically reflect our operational performance for the specific period, and (iii) the impact of pre-operating and ramp-up expenses incurred during the commissioning and ramp-up phases of greenfield projects (currently, Aripuanã). For a discussion of our Adjusted EBITDA, reconciliation with most comparable IFRS Accounting Standards figures and changes made in 2023, see “Operating and financial review and prospects—Results of operations—Non-IFRS Accounting Standards measures and reconciliation.”
We measure our liquidity by cash flows. For a description of our cash flows, see “Operating and financial review and prospects—Liquidity and Capital Resources—Source of funds.”
Although we believe we are well-positioned, benefitting from our unique position in Latin America, in addition to the strong fundamentals of our business in the long-term, with flagship assets and a strong balance sheet, it is anticipated that challenges such as difficult macroeconomic conditions are likely to continue in 2024, which may affect our operations.
In January and June 2023, as well as in February 2024, protest activities by local communities in Peru temporarily suspended operations at Atacocha. In each of these instances, Nexa complied with all existing agreements, pursued an active dialogue with the communities and authorities, and remained committed to the social development of all its host communities. During the protests, mining activities were limited to critical operations with a minimal workforce to ensure appropriate maintenance, safety, and security. Even though production was temporally suspended during these periods, we were able to operate at high levels of capacity utilization rates throughout the year, but zinc production in Atacocha decreased by 14.2% compared to 2022. There was no material impact of these temporary suspensions, and the Company achieved its full consolidated production guidance for all metals in 2023.
In March 2023, production at the Cerro Lindo mine was suspended due to heavy rainfall levels and overflowing rivers caused by cyclone Yaku, resulting in the partial flooding of some lower levels of the mine. In April 2023, Cerro Lindo resumed its operations, and road access was restored. During the temporary suspension, Nexa remained focused on the security and reparation of the mine and took measures to ensure the safety and well-being of its employees, contractors and host communities. Despite the temporary suspension of the mine, there was no material impact on 2023 production, with Cerro Lindo achieving the upper range of our 2023 production guidance for all metals.
|
|
| Overview |
Aripuanã’s ramp-up activities began in July 2022, and the mine remained in the ramp-up phase throughout 2023. In 3Q23, Aripuanã’s guidance production range was revised downwards for the year, as a result of design limitations in the capacity of the flotation pumping system, identified during the detection of bottlenecks, which required resizing and updating certain plant processing facilities and systems, as well as the clean-up and upgrading of water treatment facilities. In 4Q23, we achieved an average of 61% capacity utilization level and we expect to reach nameplate capacity in mid-2024. The mine is fully operational, and underground activities in 2023 were focused on developing and preparing areas for a ramp-up in mining operations, commissioning the paste back-fill plant and transitioning out a mine development contractor. Our priority in 2023 was, and for the first half of 2024 is to continue improving metal recovery and concentrate quality and grades, aiming to achieve a stable operation. At the end of February 2024, the average capacity utilization rate was around 61%, maintaining similar levels as in 4Q23, given the usual rainy season period in the region, which impacted our dry disposal capacity. However, during this period the operational focus was to maintain concentrate quality and grades, as well as the metallurgical recovery rates.
Regarding our exploration activities, in 2023 we continued to focus our investments on projects around the mines we operate. We believe that our exploration program and disciplined approach on project evaluation, will contribute to replace and increase mineral reserves and resources of our current assets, and define the materiality of exploration stage projects. We will continue to seek new regional targets to identify prospective areas and define materiality for new projects.
In terms of our brownfield projects, our objective is to extend the life of mine, therefore, most of the mineral exploration budget in 2023 was allocated to drilling activities in these projects, with emphasis on Cerro Lindo, Vazante and Aripuanã. In terms of greenfield projects, we direct continuous efforts to define the expansion of the known mineralization and identify new mineralized zones in regional prospective trends, with emphasis on Hilarión and Namibia, as well as focusing on expanding the mineral inventory of Aripuanã.
Our 2023 financial results were affected by factors including: (i) lower LME metal prices, especially zinc; (ii) higher operational costs mainly in Aripuanã during the ramp-up phase related to concentrate and stockpile costs; (iii) lower zinc metal and oxide sales volumes; (iv) lower by-products contribution; and (v) the negative impact of FX variation.
In 2023, we had an 8.2% increase in our zinc equivalent (mine production), from 564.7 thousand tonnes in 2022 to 611.1 thousand tonnes in 2023, mainly driven by the increase in production for all metals, specifically zinc and lead production increasing by 12.4% and 13.5%, respectively, mainly due to the increase in production at Aripuanã. Our total zinc metal (metallic zinc and zinc oxide) sales decreased by 4.3% in our smelting operations, from 616.2 thousand tonnes in 2022 to 589.8 thousand tonnes in 2023.
In 2023, our net revenues were 15.2% lower compared to 2022, reaching US$2,573.2 million, primarily driven by lower LME zinc and copper prices and lower smelting sales volume, which was partially offset by higher zinc mining production. See “Overview—Results of operations—Net revenues” for more information.
Our capital expenditures totaled US$309.0 million in 2023, a 18.9% decrease compared to 2022, mainly due to the decrease in expansion investments with the conclusion of construction at Aripuanã. In 2023, 94.7% of our capital expenditures was allocated to sustaining investments, including US$79.4 million invested in the Aripuanã mine.
Outlook
In 2024, we estimate that we will produce (i) between 323.0 thousand tonnes and 381.0 thousand tonnes of zinc contained in concentrate, (ii) between 30.0 thousand tonnes and 35.0 thousand tonnes of copper contained in concentrate, (iii) between 66.0 thousand tonnes and 82.0 thousand tonnes of lead contained in concentrate and (iv) between 11.0 million ounces to 13.0 million ounces of silver contained in concentrate.
In 2024, zinc production at the mid-range of the guidance is estimated to increase 5.6% over 2023 (18.6kt) mainly driven by the Aripuanã mine. For 2025 and 2026, zinc production is estimated to be similar over 2024. For the forecasted period, zinc head grade is expected to be in the range of 2.86% and 3.18%, copper head grade is expected to be in the range of 0.26% and 0.32% and lead head grade is expected to be in the range of 0.67% and 0.77%.
|
|
| Overview |
In 2024, we expect to sell between 545.0 thousand tonnes and 565.0 thousand tonnes of metallic zinc product volume and between 35.0 thousand tonnes and 40.0 thousand tonnes of zinc oxide product volume.
Metal sales volume at the midpoint of the guidance range of 580.0 to 605.0 thousand tonnes in 2024 is estimated to be similar compared to 2023, as these estimates do not assume the resale of material from third parties. For 2025 and 2026, metal sales volume is forecasted to remain unchanged over 2024 (ranging from 580.0 to 605.0 thousand tonnes).
These estimates are based on several assumptions, including but not limited to metal prices, operational performance, grades, maintenance, input costs, exchange rates, political and social situation in the countries where we operate.
Regarding our cash cost net of by-products credits estimates for 2024, for our mining segment, we estimate cash cost after by-products credits to be between US$0.23-0.42 per pound of zinc sold in 2024. This cost does not include Aripuanã, which is in the ramp-up phase, which is expected to be concluded in mid-2024. The estimated decrease of 19.4% compared to 2023 is mainly driven by higher by-products contribution and lower TCs. For our smelting segment, cash cost after by-products credits in 2024, is estimated to be between US$1.07-1.18 per pound of zinc sold. The estimated cost increase compared to 2023 is mainly driven by lower TCs.
Our estimated capital expenditures for 2024 is US$311.0 million, sustaining investments are expected to total US$261.0 million, with mining accounting for US$200.0 million, including US$39.0 million at Aripuanã, and smelting accounting for US$61.0 million. In 2024, we also expect to incur US$72.0 million in mineral exploration and project evaluation expenses, with US$58.0 million allocated to exploration (including brownfields, greenfields, mineral rights, mine development, business development and administrative issues) and US$14.0 million allocated to project evaluation. In mineral exploration, we plan to continue our efforts to replace and increase mineral reserves and resources in our operating assets and define and expand the mineralized zones in exploration phase projects, focusing on Cerro Lindo, Aripuanã, Vazante and El Porvenir (brownfields) and copper opportunities (exploration phase), respectively.
These estimates should be considered preliminary, subject to change and are based on several assumptions that management believes to be reasonable as of the date of this annual report, which are subject to change based on internal and external developments. As of the date of this annual report, we continue to monitor developments related to the socio-political environment in the countries we operate and the impacts of global conflicts, including the Ukraine-Russia conflict and the Israel-Hamas conflict, on the economy, supply and demand for commodities, global security concerns, and market volatility. We cannot predict how and to what extent global conflicts, any protest activities or other operational issues may impact our current plans and objectives for 2024, including with respect to our consolidated production guidance and our current capital expenditure, mineral exploration, and project evaluation disbursements. See “Forward-looking statements.” For cash cost guidance, see “Presentation of financial and other information—Non-IFRS Accounting Standards measures.”
Key factors affecting our business and results of operations
Reporting segments
We have two reportable segments: mining and smelting. A major part of our zinc mining production, representing approximately 94.5% of production in 2023, is processed in our own smelters. Similarly, a major part of the zinc raw material consumption for our smelting operations, representing approximately 47.9% of zinc contained in raw material (excluding oxide) in 2023, comes from our own mines. As a result, the revenues of our mining segment include sales to the smelting segment, and the costs of our smelting segment include purchases from the mining segment. We calculate internal transfer prices from our mines to the smelters on an arm’s length basis to evaluate the performance of our mining and smelting segments individually. These revenues and costs are eliminated in our consolidated financial statements.
The profitability of our mining segment depends primarily on world prices of the metals we produce, and on our costs to produce concentrates. It is also affected by treatment charges, which are amounts representing the cost of further processing that are applied to reduce the price of concentrate. Other factors affecting pricing are discussed below.
|
|
| Overview |
The profitability of our smelting segment does not depend directly on market prices for metals because they have a similar impact on our revenues and our costs. It is affected primarily by treatment charges (which reduce our costs to acquire concentrates), by the premium over the market price of metals that we can charge for our products, and by the operating costs of our smelters and their efficiency in recovering the metal content of the concentrates we purchase.
Segments are reported in accordance with IFRS Accounting Standards 8 “Operating Segments,” and the information is presented to the chief executive officer, who is the chief operating decision maker in accordance with IFRS Accounting Standards 8. Segment results are derived from the accounting records and are adjusted for reallocations between segments, depreciation and amortization and miscellaneous adjustments, if any, for the period. For more information, see “Operating and Financial Review and Prospects—Results of Operations—Non-IFRS Accounting Standards measures and reconciliation” in this report. See also Note 2 to our consolidated financial statements.
Metal prices
Our financial performance is significantly affected by the market prices of zinc, copper and lead, and, to a lesser extent, silver, gold and the other by-products of our smelting operations. Metal prices have historically been subject to wide fluctuations and are affected by numerous factors beyond our control, including the impact such factors have on industries representing first-uses and end-uses of our products. These factors, which affect each metal to varying degrees, include international economic and political conditions, levels of supply and demand, the availability and cost of substitutes, inventory levels and, to a lesser degree, inventory carrying costs and currency exchange rates. In addition, market prices have on occasion been subject to rapid short-term changes due to speculative activities.
The market prices for zinc, copper and lead are typically quoted as the daily cash seller and settlement price established by the LME. LME zinc prices are influenced by global supply and demand for concentrate and metallic zinc. The supply of metallic zinc depends on the amount of zinc concentrates and secondary feed materials produced and the availability of smelting capacity to convert them into refined metal. This also applies to copper and lead.
The table below sets forth the average published market prices for the metals and periods indicated:
|
For the Year Ended December 31, |
||||
| Average Market |
2023 |
2022 |
||
| Prices of Base Metals | (US$/tonne) | (US¢/lb) | (US$/tonne) | (US¢/lb) |
| Zinc (LME) | 2,646.57 | 120.05 | 3,478.32 | 157.77 |
| Copper (LME) | 8,477.77 | 384.55 | 8,797.01 | 399.03 |
| Lead (LME) | 2,138.18 | 96.99 | 2,150.17 | 97.53 |
|
For the Year Ended December 31, |
|||
| Average Market Prices of Precious Metals |
2023 |
2022 |
|
| (in US$/oz) | |||
| Silver (LBMA) | 23.35 | 21.73 | |
| Gold (Fix) | 1,940.54 | 1,800.09 | |
The key drivers and recent trends of each of the metals that we produce are discussed below.
Zinc
Zinc is a major material for the construction, transport and infrastructure industries, which represent approximately 50%, 21% and 16% of the zinc end-use, respectively, according to Wood Mackenzie.
The annual average price of zinc on the LME as of December 31, 2023, was 23.9% lower when compared to the corresponding period in 2022. In 2023, the main factor contributing to the decrease in price of zinc as compared to 2022 was the lack of demand from traditional sectors such as construction in most of the consuming regions. In China, after the peak in zinc prices in the 1Q23 with expectations of the country’s recovery after the end of lockdowns, disappointing data from the real estate sector caused the steep drop in prices going into 2Q23. In the US and Europe, the high level of inflation and tax rates discouraged the real estate sector. The sectors that had increases in demand were those connected to the energy transition, such as solar power generation and electric vehicles.
|
|
| Overview |
From the supply side, 2022 was a year of smelter closures with the increase in power prices, especially in Europe, but production levels were normalized by the first half of 2023, with some production that remained offline (Nordenham, for example) as demand was weak. On the other hand, as zinc prices came down during 2Q23, reaching a minimum price of US$2,224/t by May 25, many mines ceased production as the continuing high level of costs caused some assets to operate with negative margins. At the end of 2023, approximately 5% of the world’s zinc concentrate production was offline.
Spot treatment charges for imported concentrates in China decreased from US$275 per tonne in January 2023 to US$80 per tonne in December 2023, as reported by Wood Mackenzie, while long-term contract treatment charges increased from US$230 per tonne in 2022 to US$274 per tonne in 2023. The benchmark for long-term treatment charges was set in April reflecting the surplus of concentrate at the time, after Europe’s smelters closures, although this scenario changed rapidly throughout the year, as smelter production declined due to a reduction in concentrate supply, as mines ceased production. Energy prices also presented a major concern throughout the year, with smelters in China and Europe ceasing or reducing production.
According to Wood Mackenzie’s December 2023 report, in 2023, the zinc metal market closed with a surplus of 260 thousand tonnes resulting from a metal production of 13.7 million tonnes and consumption of 13.4 million tonnes (1.6% lower than 2022). Mine supply presented a decrease of 2.3% in 2023, with a total of 12.5 million tonnes, leading to a concentrate deficit of 107 thousand tonnes, which is expected to drive benchmark treatment charges down during the negotiation of contracts in 2024.
Refined zinc supply presented an increase in 2023, mainly because of Europe’s smelters coming back online and an increase in China’s smelter production.
Copper
Copper is used for building construction, power generation and transmission, electronic product manufacturing and the production of industrial machinery and transportation vehicles. The annual average price of copper on the LME as of December 31, 2023 was 3.6% lower than in the corresponding period in 2022. This was mainly a net result of positive effects related to mine disruptions, a falling US dollar value and demand from sectors related to the energy transition, while traditional demand, such as civil construction and real estate, failed to grow at a faster pace. On balance, total mine production, refined production, as well as global demand for refined copper increased in 2023 compared to 2022 according to Wood Mackenzie.
Lead
Lead is used in batteries as energy storage and in other products such as ammunition, oxides in glass and ceramics, casting metals and sheet lead. The annual average price of lead on the LME as of December 31, 2023 was 0.6% lower than in the corresponding period in 2022. This decrease reflects the market moving into surplus during the last year despite only a modest recovery in mine, and therefore primary smelter, output, while secondary output is suffering with raw material supply.
Silver
Silver is considered a precious metal and generally seen as a store of value, so its price tends to be resilient in times of economic uncertainty. In addition, applications in electronics and solar cells have added to the already broad range of uses of silver in currency, jewelry, and silverware. The annual average LBMA silver price for the year ended December 31, 2023 was 7.5% higher than in the corresponding period in 2022. Silver prices hit the highest level of the year on April 14, 2023, US$26.03 per ounce, which was 0.6% below the highest point of the previous year reached on March 09, 2022, but failed to maintain a similar level over the remainder of 2023, nearing US$21 per ounce in October and recovering by the end of December with US$22.73 per ounce. This performance was mainly due to the volatility of the US dollar and geopolitical risks.
|
|
| Overview |
Production volumes, ore grade and metal mix
Our production volumes, the ore grade from our mines and the mix of metals in our product portfolio affect our business performance. For more details, see “Information on the Company—Mining operations.” Our zinc production increased by 12.4%, while copper and lead increased by 0.5%, and 13.5%, respectively, in 2023. Production of silver contained in concentrates increased by 3.3% in 2023.
Commercial terms
We sell our concentrates and metallic zinc and zinc oxide products mostly through supply contracts with terms between one and three years, and only a small portion is sold on the spot market. The agreements with our customers include customary international commercial terms, such as cost, insurance and freight, or CIF; free on board, or FOB; free carrier, or FCA; and cost and freight, or CFR; pursuant to Incoterms 2010/2020, as published by the International Chamber of Commerce. For concentrates, revenues are recorded at provisional prices and, typically, an adjustment is then made after delivery, based on the pricing terms provided for under the relevant contract.
Sales prices for our products are based on LME and/or LBMA quotations. Concentrates are typically sold at the LME price reference minus a discount (treatment charge for zinc and lead; treatment charge and refining charge for copper). Metallic zinc and zinc oxide are typically sold at the LME quotation averaged during a quotation period, such as the month after shipment, the month prior to shipment or another agreed period, plus a negotiable premium that varies based on quality, shape, origin, and delivery terms and also according to the market where metal will be sold. In 2023, 47.1% of the total zinc raw material consumption in our smelters was produced by our mines and 52.9% was purchased from third parties or was obtained from secondary raw materials (including oxide). We buy zinc concentrates from different suppliers in the market to meet our raw material requirements. We sell all our copper and lead concentrates production to metal producers and international traders, on international market terms.
Our sales of metallic zinc are highly diversified. Our customer base is composed mainly of end users. Our products reach the following end use industries: transport, construction, infrastructure, consumer goods and industrial machinery. In 2023, 71.5% of our total sales were to customers in the continuous galvanizing, general galvanizing, die casting, transformers and alloy segments, and 28.5% were to international traders. Our ten largest customers represented approximately 58.0% of our total sales volume in 2023. In 2023, we sold to more than 330 customers across 45 different countries.
Free zinc, treatment charges, premiums and smelter by-products
Smelters are processing businesses that achieve a margin on the concentrates and other feedstocks they process; in large part, the price for the underlying metal is effectively passed through from the miner supplying the concentrate, or the supplier of the secondary feed material, to the smelter’s customer. Our smelters use zinc concentrate as feedstock, which is supplied from our mines and from third-party suppliers. The smelter earns revenue from (i) the treatment charge reflected as a discount in the purchase price it pays, (ii) the refined metal it can produce and sell over and above the metal content it has paid for in concentrates purchased from the miner (free metal) and (iii) any premium it can earn on the refined products it sells to its customers. By-products can also contribute to a smelter’s revenue. By-products from our smelting operations include, among others, silver, gold, copper, cement, sulfuric acid, lead concentrate, lead-silver concentrate, silver concentrates, limestone and copper sulfate.
Free zinc and treatment charges
Free zinc is the difference between the amount of zinc that is paid for in the concentrates and the total zinc recovered for sale by the smelter. The value of the zinc that is paid for corresponds to 85.0% of zinc content, which has historically been the industry standard, multiplied by the LME price of zinc. The zinc content which is not paid for is considered “free zinc.” The margin of a zinc smelter improves as the amount of metal in zinc concentrates that it can recover increases.
The treatment charge (“TC”) is a discount per tonne of concentrates, which is determined by negotiation between the seller (a mine or a trading company) and the buyer (a smelter). Treatment charges can be benchmark TC (negotiated by the major miners and buyers), spot or negotiated.
|
|
| Overview |
We apply a Benchmark TC for our integrated mining and smelter operations in Peru. For our other purchases of zinc concentrate from third-party miners and trading companies, the treatment charge is based on the Benchmark TC, spot treatment charges or treatment charges negotiated annually with miners or trading companies.
In order to reduce volatility, for most of our third-party contracts, which are renewed throughout different periods during the year, we consider the 3-years average TC. The reference (average benchmark TC of 2023, 2022 and 2021) for 2023 stood at US$221/t concentrate, down 3.7% from the previous reference (average benchmark TC of 2022, 2021 and 2020).
The market trend for treatment charges reflects the supply and demand for concentrates in the market. Treatment charges tend to fall when concentrate demand increases relative to supply, and they tend to rise when demand falls. In other words, when there is an excess of concentrate compared to the smelting processing capacity, treatment charges tend to rise and when there is a deficit of concentrate in the market, treatment charges tend to fall. For information regarding our actual treatment charges, see “Information on the Company—Smelting operations.”
The following table sets forth, for the periods indicated, the zinc realized Benchmark TC, expressed in dollars per dry metric tonne (“dmt”) of concentrate.
|
For the Year Ended December 31, |
||
|
2023 |
2022 |
|
| Treatment Charge (in US$/dmt) | 274 | 230 |
Source: Wood Mackenzie.
Premiums
Like other smelters, we sell metallic zinc and zinc oxide products at a premium over the base LME price. The premium reflects a combination of factors, including the service provided by the smelter in delivering zinc of a certain size, shape or quality specified by its customers and transportation costs, as well as the conditions of supply and demand prevailing in the regional or local market where the metal is sold.
Premiums tend to vary from region to region, as transportation costs and the value attributable to customer specifications tend to be influenced by regional or local customs rather than being a function of global market dynamics.
The following table sets forth, for the periods indicated, information on premiums for the markets indicated, expressed in U.S. dollars per tonne.
|
For the Year Ended December 31, |
||
|
2023 |
2022 |
|
| Rotterdam (in US$/tonne) | 371 | 457 |
| Singapore (in US$/tonne) | 131 | 144 |
| United States (in US$/tonne) | 652 | 750 |
Source: Wood Mackenzie.
The following table sets forth, for the periods indicated, the gross premium over the base LME price for zinc oxide realized by our smelting operations in Brazil, expressed in dollars per tonne.
|
For the Year Ended December 31, |
||
|
2023 |
2022 |
|
| Brazilian operations (in US$/tonne) | 714 | 548 |
Smelter by-products
The quantity of by-products produced in our smelters depends on several factors, including the chemical composition of the concentrate and the recovery rates achieved. Concentrates from some mines contain higher levels of by-product metals than concentrates from other mines. In addition, the higher rate of by-product recovery increases the number and volume of by-products that can be produced and sold.
|
|
| Overview |
Sulfuric acid is the principal by-product we sell. It is manufactured from the sulfur dioxide gas generated from roasting zinc concentrates. While the zinc smelters use sulfuric acid in their leach plants, almost all this requirement is generated in each zinc smelter’s electrolysis plant, and only small amounts of the sulfuric acid produced are used in its facilities, leaving the rest available for sale. We sell sulfuric acid under annual or multi-year contracts and spot sales.
Silver concentrate is another relevant by-product that we produce at our Cajamarquilla and Juiz de Fora smelters. Silver concentrate is one of the components of zinc concentrate and is obtained during the zinc metallurgical flotation process. Recovered silver is sold primarily to international traders and local customers.
Operating costs and expenses
Our ability to manage our operating costs and expenses is a significant driver of our business performance. We focus on controlling and limiting our costs and expenses so that we are better prepared to overcome less favorable pricing conditions.
Energy costs
Our total cost of energy is composed of the operating costs of our own hydroelectric power plants, long-term energy supply contracts, transmission and distribution charges and fees.
In Peru, the energy market is more stable in terms of generation (hydrology forecast) and prices. We obtain 2.6% of the energy for our operations from our own hydroelectric power plants and 97.4% from third party contracts with the SEIN.
In Brazil, the energy for our operations comes from five hydroelectric plants in which our subsidiary Pollarix has directly or indirectly the following interests as of December 31, 2023: a 22.4% participation in the consortium Enercan (Campos Novos hydroelectric power plant), 100% ownership of a hydroelectric power plant (Picada) located in Minas Gerais, a 12.6% participation in the consortium Amador Aguiar I, a 12.6% participation in the consortium Amador Aguiar II and a 23.9% participation in the consortium Igarapava. We account for the consortiums as joint operations, as discussed in Note 4(b) to our consolidated financial statements. On a consolidated basis, our costs for energy in Brazil reflect the operating costs of the hydroelectric facilities and are sensitive to a variety of factors, including hydrologic variables.
The only activity of Pollarix is to own our energy assets, and it sells energy to our Brazilian operating subsidiaries at market prices. We own all the common shares of Pollarix, which represents 33.3% of its total share capital and/or its affiliates. The remaining shares are preferred shares with limited voting rights, which are owned by Auren. Under the terms of the preferred shares, Auren is entitled to dividends per share equal to 1.93 times the dividends per share payable on the common shares. See “Information on the Company—Other operations—Power and energy supply—Brazil.” As a result, a substantial part of the profits recognized by Pollarix from selling energy to our Brazilian operating subsidiaries will represent non-controlling interest in our income statement.
Environmental expenses
Our mines and smelters operate under licenses issued by governmental authorities that control, among other things, air emissions and water discharges and are subject to stringent laws and regulations relating to waste materials and various other environmental matters. Additionally, each operation, when it ultimately ceases operations permanently, will need to be rehabilitated.
We have made significant investments to reduce our environmental impact in the areas in which we operate and to ensure that we are able to comply with environmental standards. All our operational units have environmental improvement initiatives relating to reducing emissions and waste and improving the efficiency of use of natural resources and energy.
|
|
| Overview |
Where appropriate, we establish environmental provisions for restoration or remediation of existing contamination and disturbance, with all material issues being reviewed annually. Provisions associated with smelter and mining operations sites primarily relate to soil and groundwater contamination.
Since 2016, we have conducted an extensive study and update of our decommissioning plans, including potential environmental obligations. During this period, we also modified our internal policies for decommissioning and environmental issues, which require frequent updates of environmental studies to reflect the best international practices. As a result of these adjustments, we recorded additional environmental provisions of US$12.6 million and US$6.9 million in 2022 and 2023, respectively. Although not expected in the near future, changes in legislation and adjustments to our internal policies after the ongoing evaluations could require additional provisions.
Macroeconomic conditions of the countries and regions where we operate
Peru
The following table sets forth Peruvian inflation rates, interest rates and exchange rates for the dates and periods indicated.
|
For the Year Ended December 31, |
||
|
2023 |
2022 |
|
| Real GDP growth rate (1)(2) | (0.6%) | 2.7% |
| Internal demand growth rate (2) | (1.7%) | 2.3% |
| Private investment growth rate (2) | (7.2%) | (0.5%) |
| Reference interest rate | 6.8% | 7.50% |
| CPI rate (2) | 6.3% | 7.9% |
| Appreciation (devaluation) of sol against the U.S. dollar | 2.7% | 4.9% |
| Exchange rate of sol to US$1.00 (end of period) (3) | 3.7042 | 3.8061 |
Sources: Central Reserve Bank of Perú, Peruvian Ministry of Economy and Finance.
(1) Preview: Bloomberg consensus rate.
(2) Accumulated during each period.
(3) Official offer exchange rates.
Brazil
The following table sets forth Brazilian inflation rates, interest rates and exchange rates for the dates and periods indicated.
|
For the Year Ended December 31, |
||
|
2023 |
2022 |
|
| Real GDP growth rate (1)(2) | 2.9% | 2.9% |
| Inflation rate (IGP-M) (2) | (3.2%) | 5.9% |
| Inflation rate (IPCA) (2) | 4.7% | 5.8% |
| CDI rate (end of period) | 11.7% | 13.7% |
| SELIC rate (end of period) | 11.8% | 13.8% |
| TJLP | 6.6% | 7.2% |
| Appreciation (devaluation) of real against the U.S. dollar | 7.2% | 6.5% |
| Exchange rate of real to US$1.00 (end of period) (3) | 4.8410 | 5.2174 |
Sources: IBGE, the Central Bank, Cetip, and FGV.
(1) Preview published by the Central Bank official report (Focus) as of December 31, 2023.
(2) Accumulated during each period.
(3) Official offer exchange rates.
|
|
| Overview |
Effects of exchange rate fluctuations
Prices for our products are based on international indices, such as LME prices, and denominated in U.S. dollars. A portion of our production costs, however, is denominated in reais, so there is a mismatch of currencies between our revenue and costs. In 2023, 20.5% of our production costs and operational expenses were denominated in reais and 16.1% of our production costs and operational expenses were denominated in soles, a smaller portion compared to reais, since most of our costs in Peru are in U.S. dollars. As a result, our results of operations are affected by changes in exchange rates between reais and, to a lesser extent, soles, and the U.S. dollar.
The following table sets forth for the periods indicated (i) the high and low exchange rates, (ii) the average of the exchange rates on the last day of each month for each year and daily for each month and (iii) the exchange rate at the end of each period, expressed in soles per U.S. dollar (sol/US$) and reais per U.S. dollar (real/US$) as reported by the Peruvian Central Bank and the Brazilian Central Bank, respectively.
|
Exchange Rates of S/ and R$ per US$1.00 |
||||||||
|
Period-End |
Average (1) |
High |
Low |
|||||
|
S/ |
R$ |
S/ |
R$ |
S/ |
R$ |
S/ |
R$ |
|
| Year ended December 31, | ||||||||
| 2022 | 3.8061 | 5.2174 | 3.8344 | 5.1652 | 4.0005 | 5.7039 | 3.6350 | 4.6172 |
| 2023 | 3.7042 | 4.8410 | 3.7438 | 4.9950 | 3.8953 | 5.4456 | 3.5570 | 4.7199 |
| Month | ||||||||
| January 2024 | 3.8085 | 4.9532 | 3.7416 | 4.9141 | 3.8101 | 4.9712 | 3.6954 | 4.8540 |
| February 2024 | 3.7801 | 4.9830 | 3.8255 | 4.9641 | 3.8835 | 5.0050 | 3.7801 | 4.9300 |
| March 2024 (through March 22nd) | 3.7041 | 4.9894 | 3.7076 | 4.9776 | 3.7700 | 5.0349 | 3.6730 | 4.9361 |
Source: Central Reserve Bank of Peru, Brazilian Central Bank, official offer exchange rates.
(1) Annually, represents the average of the daily exchange rates during the periods presented.
Income taxes
Income taxes in Luxembourg, Peru and Brazil have a significant impact on our results. Due to economic and political conditions, tax rates in various jurisdictions may be subject to significant changes. Our future effective tax rates could be affected by changes in the mix of earnings in countries with different statutory tax rates, changes in the valuation of deferred tax assets and liabilities and changes in tax laws or their interpretation.
Luxembourg
The combined applicable income tax rate (including an unemployment fund contribution) is 24.94% from 2019 onwards for entities having their statutory seat in Luxembourg City.
Brazil
Our Brazilian subsidiaries are subject to corporate income tax on their Brazilian and non-Brazilian income. In addition to corporate income tax, a social contribution tax is imposed on their worldwide income, and the combined applicable rate is 34.0%.
Peru
Our Peruvian subsidiaries are subject to Peruvian income tax on their worldwide income and are eligible for a potential credit for foreign taxes paid on income derived from foreign sources. The general income tax rate is 29.5 % from 2017 onwards.
To promote investments in Peru, investors and Peruvian companies may enter into an agreement with the Peruvian government, a Legal Stability Agreement, to provide a stable legal and tax regime for a specified period. In March 2002, Nexa Peru entered a guarantee and investment protection contract, or the stability agreement. Pursuant to the stability agreement, Nexa Peru applied a special income tax rate of 20.0% from 2007 through 2021. The 29.5% income tax rate is applicable to Nexa Peru from January 1, 2022 onwards. For more information, see “Risk Factors—Changes in tax laws may increase our tax burden and, as a result, could adversely affect our business, financial position and results of operations.”
|
|
| Overview |
Our Peruvian subsidiaries Nexa Resources El Porvenir S.A.C. and Nexa Resources Atacocha S.A.A., do not have stability agreements with the Peruvian government and are therefore subject to a special mining tax (Impuesto Especial a la Minería, or “IEM”), with marginal rates from 2.00% and 8.40% of operating income, depending on the operating margin. In addition, these companies are subject to a mining levy (regalia minera). In 2022, Nexa Peru became subject to an IEM and mining royalties’ tax following the expiration of its tax stability agreement with the Peruvian government on December 31, 2021, and to date remains subject to the IEM and mining royalties tax.
Dividends distributed to us by our Peruvian subsidiaries are subject to withholding tax, at a rate of 5.0 % for profits earned beginning in 2017 and onwards.
|
|
|
Results of Operations |
RESULTS OF OPERATIONS
The following discussion and analysis of our financial position and results of operations is based on our consolidated financial statements. The following table sets forth our summarized results of operations for the periods indicated.
|
For the Year Ended December 31, |
Variation |
% of Net Revenue from Products Sold |
|||
|
2023 |
2022 |
2023/2022 |
2023 |
2022 |
|
| (in millions of US$) | (percentage) | (percentage) | |||
| Consolidated income statement information: | |||||
| Net revenues | 2,573.2 | 3,034.0 | (15.2) | 100.0 | 100.0 |
| Cost of sales |
(2,276.7) |
(2,395.2) |
(4.9) |
(88.5) |
(78.9) |
| Gross profit | 296.5 | 638.8 | (53.6) | 11.5 | 21.1 |
| Operating expenses: | |||||
| Selling, general and administrative | (126.9) | (145.5) | (12.8) | (4.9) | (4.8) |
| Mineral exploration and project evaluation | (99.7) | (98.9) | 0.8 | (3.9) | (3.3) |
| Impairment loss of long-lived assets | (114.6) | (32.5) | 252.6 | (4.5) | (1.1) |
| Other income and expenses, net |
(110.6) |
(2.7) |
4,035.5 |
(4.3) |
(0.1) |
| Operating income (loss) | (155.3) | 359.2 | (143.2) | (6.0) | (11.8) |
| Share in the results of associates | 23.5 | 1.9 | 1,148.6 | 0.9 | 0.1 |
| Results from equity investees | 23.5 | 1.9 | 1,148.6 | 0.9 | 0.1 |
| Financial income | 25.5 | 25.0 | 1.9 | 1.0 | 0.8 |
| Financial expenses | (204.2) | (168.7) | 21.0 | (7.9) | (5.6) |
| Other financial items, net |
17.0 |
9.9 |
71.3 |
0.7 |
0.3 |
| Net financial results | (161.6) | (133.7) | 20.9 | (6.3) | (4.4) |
| (Loss) income before income tax | (293.5) | 227.4 | (229.1) | (11.4) | 7.5 |
| Income tax benefit (expense) | 4.3 | (151.0) | (102.8) | 0.2 | (5.0) |
| Net (loss) income for the year |
(289.2) |
76.4 |
(478.6) |
(11.2) |
2.5 |
Net revenues
In 2023, net revenues decreased by 15.2%, or US$460.8 million, primarily due to the decrease in zinc and copper prices and lower smelting sales volume, which was partially offset by higher mining production volumes. In 2023, zinc average LME prices (which is the key benchmark for our prices) increased by 23.9%, from US$3,478.3 per tonne in 2022 to US$2,646.6 per tonne in 2023. In 2023, this decrease had a negative impact in our net revenues of approximately US$490.6 million, based on our sales volumes of 589.8kt in 2023 and the average LME price difference of US$831.7/t between 2023 and 2022. Additionally, we had a negative impact in our net revenues of approximately US$91.7 million, explained by lower smelting sales volume. Finally, copper prices, which decreased 3.6% from US$8,797.0 per tonne in 2022 to US$8,477.8 per tonne in 2023, had a negative impact of US$11.4 million. The above decrease in our net revenues was partially offset by a positive impact of US$18.1 million, due to higher mining production volumes related to higher copper and lead sales. For a discussion of the underlying reasons driving the change in commodity prices, see “Operating and Financial Review and Prospects—Overview—Key factors affecting our business and results of operations—Metal Prices.”
The following table shows a breakdown of our net revenues by destination of our sales.
|
|
|
Results of Operations |
|
For the Year Ended December 31, |
||
|
2023 |
2022 |
|
| (in millions of US$) | ||
| Peru | 654.2 | 859.8 |
| Brazil | 559.8 | 827.2 |
| Singapore | 229.3 | 166.4 |
| Switzerland | 209.3 | 124.7 |
| United States | 169.0 | 174.5 |
| Argentina | 94.1 | 94.4 |
| Chile | 83.5 | 120.1 |
| Luxembourg | 78.5 | 95.3 |
| China | 65.9 | - |
| Austria | 47.9 | 48.7 |
| South Africa | 41.4 | 55.9 |
| South Korea | 40.0 | 32.4 |
| Colombia | 36.1 | 64.0 |
| Japan | 32.1 | 71.4 |
| Taiwan | 26.9 | 65.0 |
| Turkey | 26.6 | 55.0 |
| Belgium | 19.8 | 17.9 |
| Malaysia | 18.7 | 26.0 |
| Netherlands | 16.0 | 13.6 |
| Ecuador | 14.6 | 15.4 |
| Italy | 9.5 | 9.6 |
| Vietnam | 5.0 | 8.4 |
| Other | 95.2 | 88.4 |
| Net revenues |
2,573.2 |
3,034.0 |
The following table sets forth the components of our production and sales volumes for the metals and periods indicated.
|
For the Year Ended December 31, |
||
|
2023 |
2022 |
|
| Treatment Ore (in tonnes) | 13,846,530 | 12,343,018 |
| Mining Production—Metal Contained in Concentrate | ||
| Zinc contained in concentrates (in tonnes) | 333,154 | 296,403 |
| Copper contained in concentrates (in tonnes) | 33,385 | 33,219 |
| Lead contained in concentrates (in tonnes) | 65,194 | 57,448 |
| Silver contained in concentrates (in oz) | 10,300,672 | 9,974,462 |
| Gold contained in concentrates (in oz) | 27,627 | 27,216 |
| External Mining Sales—Metal Contained in Concentrate (1) | ||
| Zinc contained in concentrates (in tonnes) | 18,321 | 179 |
| Copper contained in concentrates (in tonnes) | 33,379 | 32,931 |
| Lead contained in concentrates (in tonnes) | 65,596 | 59,406 |
| Smelting Production—Zinc Contained in Product Volumes | ||
| Cajamarquilla (metal available for sale in tonnes) | 323,059 | 332,824 |
| Três Marias (metal available for sale in tonnes) | 148,354 | 149,592 |
| Juiz de Fora (2) (metal available for sale in tonnes) |
82,147 |
84,160 |
| Total zinc metal available for sale production (in tonnes) | 553,559 | 566,577 |
| Zinc Oxide Production—Zinc Contained in Product Volumes | ||
| Três Marias (Zinc oxide, contained zinc in tonnes) | 33,966 | 40,322 |
| Smelting Sales—Product Volumes | ||
| Metallic zinc (in tonnes) | 555,957 | 575,886 |
| Zinc oxide (in tonnes) |
33,885 |
40,315 |
| Total smelting sales volumes (in tonnes) | 589,843 | 616,200 |
| (1) | Based on typical zinc contents in metallic zinc products and zinc oxide. For more details, see “Information on the Company—Smelting operations—Zinc contained in smelting products sold.” |
| (2) | Including 3,067 tonnes of zinc ashes and drosses in 2023, and 3,710 in 2022. |
|
|
|
Results of Operations |
Cost of sales
In 2023, our cost of sales decreased by 4.9%, or US$118.4 million, of which approximately US$54.9 million was related to the positive impact of the reversal of the net realizable value provision of Aripuanã’s inventory and the positive impact of approximately US$166.0 million due to lower smelting sales volume and lower third party zinc concentrate prices, which were partially offset by approximately US$102.5 million related to higher operational costs (excluding raw material).
Selling, general and administrative expenses
In 2023, our selling, general and administrative (“SG&A”) expenses decreased by 12.8%, or US$18.6 million, to US$126.9 million mainly as result of our organizational redesign that occurred in 2022 and lower third-party services in support areas.
Mineral exploration and project evaluation
In 2023, our mineral exploration and project evaluation expenses increased by 5.6%, or US$4.9 million, primarily in brownfield investments (mainly El Porvenir, Cerro Lindo, Aripuanã and Vazante) and exploration stage projects due to budget restrictions regarding the decrease in LME of base metals. In 2023, our exploration drilling (including infill drilling in Aripuanã) totaled 85.2 km, compared to 116.7 km in 2022, excluding Aripuanã infill drilling we drilled a total of 64.1 km.
Impairment loss
In 2023, Nexa performed its annual test and analyzed all impairment indicators and recorded a non-cash, pre-tax net impairment loss on long-lived assets of US$114.6 million (after-tax US$90.3 million), comprised of the Morro Agudo unit of Nexa Recursos Minerais S.A, and Nexa Resources Perú S.A.A. and subsidiaries.
For further information about our impairment assessments, please refer to Note 31 to our consolidated financial statements.
Other income and expenses, net
In 2023, our other income and expenses, net negatively impacted our results by US$110.6 million, mainly due to recognition of expenses related to the provisions of VAT discussions totaling US$86.9 million, variation of US$22.0 million in Offtake gains of US$2.3 million in 2023 versus a gain of US$24.3 million in 2022, the recognition of US$15.7 million related to Pollarix’s energy mark-to-market (“MTM”) balance and a variation of US$45.8 million referring to expenses recorded for the pre-operation of Aripuanã, which did not occur in 2023.
The following table sets forth our other income and expenses, net for the periods indicated. For further information, please refer to Note 9 to our consolidated financial statements.
|
For the Year Ended December 31, |
||
|
2023 |
2022 |
|
| (in millions of US$) | ||
| Other income and expenses, net | ||
| ICMS tax incentives | 32.3 | 56.7 |
| Changes in fair value of offtake agreement | 2.3 | 24.3 |
| Changes in fair value of derivative financial instruments | (1.4) | 1.4 |
| Loss on sale of property, plant and equipment | (3.7) | (0.7) |
| Changes in asset retirement and environmental obligations | (3.2) | (1.5) |
| Pre-operating expenses related to Aripuanã | - | (45.8) |
| Slow moving and obsolete inventory | (4.4) | (11.5) |
| Dams obligations | (7.0) | - |
| Provision for legal claims | (13.9) | (7.7) |
| Contribution to communities | (13.1) | (17.2) |
| Impairment of other assets | - | (9.3) |
| Tax voluntary disclosure – VAT discussions | (86.9) | - |
| Energy forward contracts – Changes in Fair Value | (15.7) | - |
| Others | 4.0 | 8.7 |
| Total other income and expenses, net |
(110.6) |
(2.7) |
|
|
|
Results of Operations |
Net financial results
We recognized a net financial expense of US$161.7 million in 2023 compared to a net financial expense of US$133.7 million in 2022. This increase was mainly due to an increase of US$16.0 million related to the financial expenses of VAT discussions, an increase of US$11.8 million in financial expenses from factoring operations and a decrease of US$5.3 million in financial income from investments and, cash and cash equivalents.
In 2023, our financial income increased by 1.9%, or US$0.5 million, to US$25.5 million. This increase was mainly due to the increase of US$5.7 million related to a monetary update on assets, interests and use of public assets, partially offset by the decrease of US$5.3 million in interest on financial investments and, cash and cash equivalents.
In 2023, our financial expenses increased by 21.0%, or US$35.5 million, to US$204.2 million. This increase was mainly due to an increase of US$16.0 million mainly related to VAT discussions and an increase of US$11.8 million from factoring operations.
In 2023, our other financial items, net increased by 71.3%, or US$7.1 million, to US$17.0 million. This increase was mainly due to the net foreign exchange gains reflecting the accounting effect of the appreciation of the Brazilian real against the U.S. dollar on certain U.S. dollar-denominated loans made by Nexa Resources to Nexa Brazil (which uses the Brazilian real as its functional currency). During 2023, the 3.3% average appreciation of the Brazilian real against the U.S. Dollar3 resulted in a foreign exchange gain.
Excluding the effect of foreign exchange variation, the net financial expense in 2023 increased by 23.8% to US$179.8 million compared to US$145.2 million in 2022, as a result of the aforementioned reasons.
(Loss) income before income tax
As a result of the factors described above, our loss before income tax was US$293.5 million in 2023, as compared to income before income tax of US$227.4 million in 2022.
Income tax benefit (expense)
In 2023, we recorded a net income tax benefit of US$4.3 million.
In 2023, our current income tax expense decreased by 48.4%, or US$71.1 million, to US$75.7 million, mainly due to the decrease in income before income tax for the year as a result of lower metal prices and volumes.
3 On December 31, 2023, the Brazilian real / U.S. dollar exchange rate at the end of period was R$4.841/US$1.00 compared to R$5.217/US$1.00 on December 31, 2022.
|
|
|
Results of Operations |
The difference between the nominal and effective tax rates in 2023 and 2022 are primarily a result of permanent items that affect the calculation of current income tax for the period, such as tax payments related to the tax voluntary disclosure agreement made with the State of Minas Gerais, impairment of goodwill in Peru, and special mining levy and mining taxes in Peru, partially offset by permanent tax exclusion of VAT tax incentives in Brazil.
In 2023, we recorded a deferred tax income of US$80.0 million, mainly as a result of the recognition of deferred tax asset over Brazil tax losses for the year and effects of exchange variation in Peru arising from the fluctuation of the historical exchange rate and the current exchange rate of property, plant and equipment and intangible assets.
Net (loss) income for the year
As a result of the foregoing, we had a net loss of US$289.2 million in 2023 as compared to net income of US$76.4 million in 2022.
Results by segment
The following table sets forth our summarized results of operations by segment for the periods indicated.
| For the Year Ended December 31, |
Variation | Variation | ||
| 2023 | 2022 | 2023/2022 | 2023/2022 | |
| Consolidated Income Statement Information: | (in millions of US$) | (percentage) | ||
| Net revenues: | ||||
| Mining | 1,090.3 | 1,248.0 | (157.8) | (12.6) |
| Smelting | 1,946.7 | 2,467.0 | (520.3) | (21.1) |
| Intersegments Sales | (468.3) | (683.6) | 215.3 | (31.5) |
| Adjustments (1) |
4.5 |
2.6 |
2.0 |
76.3 |
| Total | 2,573.2 | 3,034.0 | (460.8) | (15.2) |
| Cost of sales: | ||||
| Mining | (1,028.3) | (905.2) | (123.0) | 13.6 |
| Smelting | (1,726.6) | (2,190.9) | 464.3 | (21.2) |
| Intersegments Sales | 468.3 | 683.6 | (215.3) | (31.5) |
| Adjustments (1) |
9.8 |
17.4 |
(7.5) |
(43.4) |
| Total | (2,276.8) | (2,395.2) | 118.4 | (4.9) |
| Gross profit: | ||||
| Mining | 62.0 | 342.8 | (280.8) | (81.9) |
| Smelting | 220.1 | 276.1 | (56.0) | (20.3) |
| Adjustments (1) |
14.4 |
20.0 |
(5.6) |
(27.9) |
| Total |
296.5 |
638.8 |
(342.3) |
(53.6) |
| (1) | See Note 2 to our consolidated financial statements. |
Mining
Net revenues
In 2023, our net revenues in the mining segment decreased by 12.6%, or US$157.8 million. This decrease was primarily due to lower LME base metal prices, partially offset by higher zinc and lead volumes.
In 2023, our production of zinc contained in concentrates increased by 12.4% to 333.2 thousand tonnes in 2023, primarily due to the increase in production at Aripuanã and Vazante, as a result of higher treated ore volumes and higher average zinc grades. Our production of copper contained in concentrates increased by 0.5% to 33.4 thousand tonnes of metal contained in concentrates, primarily due to the increase in production at Aripuanã, partially offset by the decrease in production at Cerro Lindo. Finally, our production volumes of lead contained in concentrates increased by 13.5% to 65.2 thousand tonnes of metal contained in concentrates in 2023 compared to 2022, primarily due to the increase in production at Aripuanã and Morro Agudo, as a result of higher average lead grades and higher treated ore volumes.
|
|
|
Results of Operations |
In 2023, the only export volumes of zinc contained in concentrates were concentrates from Aripuanã to third parties that were not within market specifications.
Cost of sales
In 2023, our cost of sales in our mining segment increased by 13.6%, or US$123.0 million, mainly due to the effect of Aripuanã ramp-up activities explained by costs associated with a full-year of production in comparison to 2022, which was only a partial year of production.
Smelting
Net revenues
In 2023, our net revenues in the smelting segment decreased by 21.1%, or US$520.3 million, mainly due to lower zinc prices and lower metal sales volumes, which was partially offset by higher metal premium.
Our total metal (zinc metal + zinc oxide) sales were 589.8 thousand tonnes in 2023, down 4.3%, or 26.4 thousand tonnes compared to 2022, affected by lower production volumes of our smelters, in addition to a decrease in global demand, and lower domestic demand for zinc oxide. In 2023, our sales volume of zinc metal of 556.0 thousand tonnes decreased by 3.5%, or 19.9 thousand tonnes versus 2022, following the same trend. In 2023, our sales volumes of zinc oxide decreased by 15.9%, or 6.4 thousand tonnes, to 33.9 thousand tonnes.
Cost of sales
In 2023, our cost of sales in our smelting segment decreased by 21.2%, or US$464.3 million, primarily due to lower sales volumes, the decrease in metal prices and higher zinc TCs, positively impacting the zinc concentrate purchase price.
Non-IFRS Accounting Standards measures and reconciliation
Consolidated Adjusted EBITDA
In this report, we present Consolidated Adjusted EBITDA, which we define as net income (loss) for the year, adjusted by (i) share in the results of associates, depreciation and amortization, net financial results and income tax; (ii) non-cash events and non-cash gains or losses that do not specifically reflect our operational performance for the specific period (including: (loss) gain on sale of investments; impairment and impairment reversals; (loss) gain on sale of long-lived assets; write-offs of long-lived assets; and remeasurement in estimates of asset retirement obligations); and (iii) pre-operating and ramp-up expenses incurred during the commissioning and ramp-up phases of greenfield projects (currently, Aripuanã).
Our management uses Consolidated Adjusted EBITDA as an additional performance measure on a consolidated basis, in addition to, and not as a substitute for, net income. We believe this measure provides useful information about the performance of our operations as it facilitates consistent comparisons between periods, planning and forecasting of future operating results reflecting the operational performance of our existing business without the impact of interest, taxes, amortization, depreciation, non-cash items that do not reflect our operational performance for the specific reporting period and the impact of pre-operating and ramp-up expenses during the commissioning and ramp-up phases of greenfield projects (currently, only Aripuanã has reached these stages). Pre-operating and ramp-up expenses incurred during the commissioning and ramp-up of phases of Aripuanã are not considered infrequent, unusual or non-recurring expenses, as they have recurred in prior years with respect to Aripuanã and may recur in the future with respect to Aripuanã or any other projects that may reach the commissioning or ramp-up phases. Our management believes this adjustment is helpful because it shows our performance without the impact of specific expenses relating to a greenfield project that has reached the commissioning or ramp-up phases, with no connection with the performance of our other existing operations.
|
|
|
Results of Operations |
When applicable, Adjusted EBITDA also excludes the impact of (i) events that are non-recurring, unusual or infrequent, and (ii) other specific events that, by their nature and scope, do not reflect our operational performance for the specific period in our management’s view. These events did not impact our Adjusted EBITDA in 2023 and 2022 but may impact future periods.
Our calculation of Adjusted EBITDA may be different from the calculation used by other companies, including our competitors in the mining industry, so our measures may not be comparable to those of other companies.
A reconciliation of Adjusted EBITDA to our net income for the years indicated is presented below.
|
For the Year Ended December 31, |
||
|
2023 |
2022 |
|
| (in millions of US$) | ||
| Reconciliation of Adjusted EBITDA: | ||
| Net (loss) income for the year | (289.2) | 76.4 |
| Share in the results of associates | (23.5) | (1.9) |
| Depreciation and amortization | 298.4 | 290.9 |
| Net financial results | 161.6 | 133.7 |
| Income tax benefit (expense) | (4.3) | 151.0 |
| Other Adjustments (1) | - | - |
| Change in fair value of offtake agreement (2) | (2.3) | (24.3) |
| Impairment loss of long-lived assets (3) | 114.6 | 32.5 |
| Impairment of other assets (4) | - | 9.3 |
| Loss on sale of property, plant and equipment (5) | 3.7 | 0.7 |
| Remeasurement in estimates of asset retirement obligations (6) | (3.1) | (6.2) |
| Remeasurement adjustment of streaming agreement (7) | 10.1 | 10.6 |
| Ramp-up expenses of greenfield projects (Aripuanã) (8) | 15.5 | 87.5 |
| Energy forward contracts – Changes in Fair Value (9) | 15.7 | - |
| Tax voluntary disclosure – VAT discussion (10) | 87.0 | - |
| Dams obligations (11) | 7.0 | - |
| Adjusted EBITDA |
391.2 |
760.3 |
(1) Non-cash adjustment: Reversal of an impairment relating to immaterial PP&E assets.
(2) Non-cash adjustment: Derivative financial instrument related to an offtake sale contract.
(3) Non-cash adjustment: Cash generating unit and individual PP&E assets impairment loss.
(4) Non-cash adjustment: Value-added-taxes impairment loss.
(5) Non-cash adjustment: Results from sale and disposal of certain non-current assets.
(6) Non-cash adjustment: Asset retirement obligation remeasurement of discount rate and updated studies that are not subject to capitalization.
(7) Non-cash adjustment: Remeasurement of contractual obligation related to the forward sale contract of Cerro Lindo's Silver contained in the ore.
(8) Expenses related to pre-operating and ramp-up expenses incurred during the commissioning and ramp-up phases of greenfield projects which have not achieved their nameplate capacity. Once the Aripuanã operation is stabilized and operational at its nameplate capacity, such effects will no longer be excluded.
(9) Non-cash adjustment: The fair value adjustment of the energy surplus resulting from electric energy purchase contracts of the company’s subsidiary, Pollarix.
(10) Expenses related to the impact of accruals related to VAT discussions.
(11) Expenses related to the impact of the provisions related to dams obligations.
This definition of Adjusted EBITDA reflects a revision we made in December 2022, to exclude certain items, aiming to provide a better understanding of the operational performance of the Company’s business without the potential distortions from (i) pre-operating and ramp-up expenses incurred during the commissioning and ramp-up phases of greenfield projects (Aripuanã is currently the only greenfield project that has reached this phase) and (ii) certain non-cash events that do not specifically reflect our operational performance for the specific period (i.e., loss (gain) on sale property, plant and equipment; remeasurement in estimates of asset retirement obligations, and remeasurement adjustment of streaming agreement).
|
|
|
Results of Operations |
Adjusted EBITDA by Segment
Adjusted EBITDA by segment is the main performance measure used by the chief operating decision maker to assess segment performance and to make decisions about resource allocation. Adjusted EBITDA information for Nexa’s segments is disclosed and reconciled with IFRS Accounting Standards numbers in Note 2 to Nexa’s financial statements. The use of Adjusted EBITDA as a segment performance measure is not considered a non-IFRS Accounting Standards financial measure.
A breakdown of Adjusted EBITDA by segment is presented below.
|
For the Year Ended December 31, |
||
|
2023 |
2022 |
|
| (in millions of US$) | ||
| Breakdown of Adjusted EBITDA by segment: | ||
| Mining | 149.1 | 439.8 |
| Smelting | 247.0 | 326.4 |
| Other (1) |
(4.9) |
(5.9) |
| Adjusted EBITDA | 391.2 | 760.3 |
(1) Represents the residual component of Adjusted EBITDA either not pertaining to the mining or smelting segments, or, represents items that, because of their nature, are not being allocated to a specific segment.
Net Debt
We define net debt as (i) loans and financing and lease liabilities less (ii) cash and cash equivalents, less (iii) financial investments, plus/less (iv) the fair value of derivative financial liabilities or assets, respectively. Our management believes that net debt is an important figure because it indicates our ability to repay outstanding debts that become due simultaneously using available cash and highly liquid assets.
A reconciliation of net debt to loans and financing as of December 31, 2023 and 2022 is presented below.
|
As of December 31, |
||
|
2023 |
2022 |
|
| (in millions of US$) | ||
| Calculation of Net Debt: | ||
| Loans and financings | 1,725.6 | 1,669.3 |
| Derivative financial instruments | 2.6 | 2.6 |
| Lease liabilities | 9.2 | 5.0 |
| Cash and cash equivalents | (457.3) | (497.8) |
| Financial investments |
(11.1) |
(18.1) |
| Net Debt | 1,269.1 | 1,161.0 |
Net Debt to Adjusted EBITDA
We define net debt to Adjusted EBITDA ratio as net debt divided by Adjusted EBITDA.
The calculation of our net debt to Adjusted EBITDA ratio for the periods indicated is presented below.
|
As of and
For the Year |
||
|
2023 |
2022 |
|
| (in millions of US$) | ||
| Calculation of Net Debt to Adjusted EBITDA Ratio: | ||
| Net debt (period end) | 1,269.1 | 1,161.0 |
| Adjusted EBITDA |
391.2 |
760.3 |
| Net Debt to Adjusted EBITDA Ratio | 3.24 | 1.53 |
|
|
|
Results of Operations |
Adjusted EBITDA Margin
We define Adjusted EBITDA margin as Adjusted EBITDA divided by net revenues. The calculation of our Adjusted EBITDA margin for the periods indicated is presented below.
|
For the Year Ended December 31, |
||
|
2023 |
2022 |
|
| (in millions of US$) | ||
| Calculation of Adjusted EBITDA Margin: | ||
| Adjusted EBITDA | 391.2 | 760.3 |
| Net revenues |
2,573.2 |
3,034.0 |
| Adjusted EBITDA Margin | 15.2% | 25.1% |
Adjusted Working Capital
We calculate adjusted working capital as (i) trade accounts receivable, plus (ii) inventory, plus (iii) other assets, less (iv) trade payables, less (v) confirming payable, less (vi) salaries and payroll charges, less (vii) other liabilities. Our management believes that adjusted working capital is an important figure because it provides a relevant metric for the efficiency and liquidity of our operating activities.
The calculation of our adjusted working capital derived from our consolidated financial statements as of December 31, 2023 and 2022 is presented below.
|
As of December 31, |
||
|
2023 |
2022 |
|
| (in millions of US$) | ||
| Calculation of Adjusted Working Capital: | ||
| Trade accounts receivables | 141.9 | 223.7 |
| Inventory | 339.7 | 395.2 |
| Other assets | 216.5 | 210.0 |
| Trade payables | (451.6) | (413.9) |
| Confirming payables | (234.4) | (216.4) |
| Other liabilities |
(123.9) |
(75.7) |
| Adjusted working capital | (111.8) | 123.0 |
Cash cost, net of by-products credits and related measures
In this report, we also present measures of costs that are widely used by peer companies operating in the mining and smelting industries. These performance measures are not IFRS Accounting Standards measures, and they do not have a standard meaning and therefore may not be comparable to similar data presented by other mining and smelting companies. They should not be considered as a substitute for costs of sales, costs of selling and administrative expenses, or as an indicator of costs. Similar measures are also calculated by Wood Mackenzie for many market participants, but Wood Mackenzie’s methodology differs from the methodology we use below.
Our management uses cash cost, net of by-products credits and related measures, among other measures, for internal planning and performance measurement purposes. We believe these measures provide useful information about the operational performance of our operations that facilitates period-to-period comparisons on a consistent basis.
In calculating cash cost, net of by-products credits, we account for transactions between our mining operations and our smelting operations using the same methodology we use to evaluate the performance of our mining and smelting segments. See Note 2 to our consolidated financial statements. We prepare an internal calculation based on transfer pricing adjustments made on an arm’s length principal basis. All information disclosed for cash cost, net of by-products credits is consistent with this methodology.
|
|
|
Results of Operations |
Mining operations
Cash cost, net of by-products credits: For our mining operations, cash cost, net of by-products credits includes all direct costs associated with mining, concentrating, leaching, solvent extraction, on-site administration and general expenses, any off-site services essential to the operation, concentrate freight costs, marketing costs and property and severance taxes paid to state or federal agencies that are not profit-related. Treatment and refining charges on metal sales, which are typically recognized as a deduction component of sales revenues, are added to cash cost. Cash cost is calculated on a contained zinc sold basis, which indicates the percentage of zinc in metal sold, after the deduction of by-products credits attributable to mining operations, such as copper, silver, gold, and lead, which are deducted from total cash cost.
Sustaining cash cost, net of by-products credits: Sustaining cash cost, net of by-products credits is defined as the cash cost, net of by-products credits plus non-expansion capital expenditure, including sustaining health, safety and environment, modernization and other non-expansion-related capital expenditures.
All in sustaining cost, net of by-products credits: All in sustaining cost (“AISC”) is defined as sustaining cash cost, net of by-products credits plus corporate general and administrative expenses, royalties and workers’ participation.
Our cash cost and AISC net of by-products credits are measured with respect to zinc sold.
For mining operations, we present below cash cost, net of by-products credits, sustaining cash cost, net of by-products credits and all-in sustaining cost and a reconciliation to our consolidated financial statements.
For the year ended December 31, 2023
|
Vazante |
Morro Agudo |
Cerro Lindo |
El Porvenir |
Atacocha |
Consolidation of Operations |
Corporate |
Mining |
|
| Operations (in millions of US$, unless otherwise indicated) | ||||||||
| Sales Volume (Zinc Contained in Concentrate) | ||||||||
| Tonnes | 145,662 | 23,167 | 78,388 | 57,673 | 8,486 | 313,376 | 313,376 | |
| Cost of goods sold | 124.7 | 65.0 | 354.8 | 205.1 | 69.9 | 819.5 | (3.2) | 816.3 |
| On-site G&A | 0.5 | 0.5 | 0.7 | 1.5 | 1.0 | 4.2 | 4.2 | |
| By-product credits | (16.2) | (32.0) | (310.1) | (148.3) | (64.1) | (570.6) | 24.5 | (546.1) |
| Treatment and refining charges | 114.2 | 14.9 | 41.6 | 34.9 | 5.2 | 210.8 | 210.8 | |
| Selling expenses | 0.3 | (0.1) | 2.0 | 0.6 | 0.2 | 3.0 | 3.0 | |
| Depreciation and amortization | (24.1) | (4.5) | (86.2) | (45.7) | (17.3) | (177.8) | (0.1) | (177.8) |
| Royalties | (2.2) | (1.4) | (2.0) | (2.5) | (0.4) | (8.4) | (8.4) | |
| Workers’ participation & bonus | (1.9) | (1.0) | (5.2) | (2.8) | (0.9) | (11.7) | (11.7) | |
| Others |
0.5 |
0.1 |
(6.6) |
(6.5) |
(1.8) |
(14.3) |
|
(14.3) |
| Cash cost net of by-product credits (sold) | 195.7 | 41.6 | (10.9) | 36.4 | (8.1) | 254.7 | 21.3 | 276.0 |
| Cash cost net of by-product credits (sold) (US$/tonne) | 1,343.5 | 1,796.8 | (138.6) | 630.6 | (959.7) | 812.7 | 880.6 | |
| Non-expansion capital expenditure |
29.1 |
3.0 |
43.3 |
68.6 |
16.2 |
160.2 |
59.7 |
219.9 |
| Sustaining cash cost net of by-product credits (sold) | 224.8 | 44.6 | 32.4 | 105.0 | 8.1 | 414.8 | 81.0 | 495.8 |
| Sustaining cash cost net of by-product credits (sold) (per tonne) | 1,543.2 | 1,925.1 | 413.1 | 1,820.8 | 949.4 | 1,323.8 | 1,582.2 | |
| Workers’ participation & bonus | 1.9 | 1.0 | 5.2 | 2.8 | 0.9 | 11.7 | 11.7 | |
| Royalties | 2.2 | 1.4 | 2.0 | 2.5 | 0.4 | 8.4 | 8.4 | |
| Corporate G&A |
|
|
|
|
|
|
45.3 |
45.3 |
| AISC net of by-product credits (sold) | 561.2 | |||||||
| AISC net of by-product credits (sold) (per tonne) | 1,790.7 | |||||||
|
|
|
Results of Operations |
For the year ended December 31, 2022
|
Vazante |
Morro Agudo |
Cerro Lindo |
El Porvenir |
Atacocha |
Consolidation of Operations |
Corporate |
Mining |
|
| Operations (in millions of US$, unless otherwise indicated) | ||||||||
| Sales Volume (Zinc Contained in Concentrate) | ||||||||
| Tonnes | 131,527 | 18,700 | 85,910 | 52,001 | 9,560 | 297,699 | 297,699 | |
| Cost of goods sold | 116.0 | 63.8 | 396.5 | 167.9 | 75.4 | 819.6 | (1.8) | 817.8 |
| On-site G&A | 1.2 | 0.8 | 0.5 | 0.7 | 0.3 | 3.4 | 3.4 | |
| By-product credits | (10.3) | (22.6) | (351.2) | (123.3) | (72.2) | (579.7) | 11.7 | (568.0) |
| Treatment and refining charges | 91.3 | 9.6 | 39.9 | 27.6 | 5.1 | 173.5 | 173.5 | |
| Selling expenses | 0.4 | 1.4 | 1.8 | 0.6 | 0.5 | 4.7 | 4.7 | |
| Depreciation and amortization | (24.0) | (9.1) | (117.0) | (27.2) | (14.9) | (192.1) | (0.0) | (192.2) |
| Royalties | (2.1) | (1.4) | (5.6) | (3.8) | (0.9) | (13.8) | (13.8) | |
| Workers’ participation & bonus | (1.6) | (0.9) | (13.3) | (5.2) | (0.8) | (21.8) | (21.8) | |
| Others |
(9.5) |
(1.2) |
0.2 |
0.6 |
(7.3) |
(17.3) |
|
(17.3) |
| Cash cost net of by-product credits (sold) | 161.4 | 40.4 | (48.2) | 37.8 | (15.0) | 176.5 | 9.9 | 186.4 |
| Cash cost net of by-product credits (sold) (US$/tonne) | 1,227.5 | 2,160.5 | (561.4) | 727.7 | (1,566.2) | 592.8 | 626.0 | |
| Non-expansion capital expenditure |
41.9 |
6.8 |
42.5 |
36.7 |
4.5 |
132.4 |
69.4 |
201.8 |
| Sustaining cash cost net of by-product credits (sold) | 203.4 | 47.2 | (5.8) | 74.5 | (10.5) | 308.9 | 79.3 | 388.2 |
| Sustaining cash cost net of by-product credits (sold) (per tonne) | 1,546.2 | 2,523.8 | (67.1) | 1,433.6 | (1,096.6) | 1,037.5 | 1,304.0 | |
| Workers’ participation & bonus | 1.6 | 0.9 | 13.3 | 5.2 | 0.8 | 21.8 | 21.8 | |
| Royalties | 2.1 | 1.4 | 5.6 | 3.8 | 0.9 | 13.8 | 13.8 | |
| Corporate G&A |
52.0 |
52.0 |
||||||
| AISC net of by-product credits (sold) | 475.8 | |||||||
| AISC net of by-product credits (sold) (per tonne) | 1,598.1 | |||||||
Smelting operations
Cash cost, net of by-products credits: For our smelting operations, cash cost, net of by-products credits includes all the costs of smelting, including costs associated with labor, net energy, maintenance, materials, consumables and other on-site costs, as well as raw material costs. Cash cost is calculated on a contained zinc sold basis after the deduction of by-products credits attributable to smelting operations.
Sustaining cash cost, net of by-products credits: Sustaining cash cost, net of by-products credits is defined as the cash cost, after by-products credits plus non-expansion capital expenditure, including sustaining health, safety and environment, modernization and other non-expansion-related capital expenditures.
All in sustaining cost, net of by-products credits: All in sustaining cost is defined as sustaining cash cost, net of by-products credits plus general and administrative expenses and workers’ participation.
Our cash cost and AISC net of by-products credits are measured with respect to contained zinc sold, not considering resale operations of zinc from third parties. For our smelting operations, we present below cash cost, net of by-products credits, sustaining cash cost, net of by-products credits and all in sustaining cost and a reconciliation to our consolidated financial statements.
|
|
|
Results of Operations |
For the year ended December 31, 2023
|
Três |
Juiz de |
Cajamarquilla |
Consolidation |
Corporate |
Smelting |
|
| Operations (in millions of US$, unless otherwise indicated) | ||||||
| Sales Volume (Zinc Contained in Products) | ||||||
| Tonnes | 174,790 | 81,939 | 325,927 | 582,656 | 582,656 | |
| Cost of goods sold | 502.2 | 268.8 | 960.3 | 1,731.4 | (5.3) | 1,726.1 |
| Cost of services rendered | (22.4) | (9.5) | (43.5) | (75.4) | (75.4) | |
| On-site G&A | 1.4 | 0.7 | 5.5 | 7.5 | 7.5 | |
| Depreciation and amortization | (21.2) | (13.1) | (43.1) | (77.3) | (77.3) | |
| By-product credits | (14.2) | (26.9) | (135.6) | (176.7) | 5.3 | (171.4) |
| Workers’ participation & Bonus | (1.5) | (1.6) | (10.8) | (13.9) | (13.9) | |
| Others |
0.8 |
0.1 |
10.9 |
11.8 |
|
11.8 |
| Cash cost, net of by-product credits (sold) | 445.2 | 218.5 | 743.7 | 1,407.3 | 0.0 | 1,407.3 |
| Cash cost, net of by-product credits (sold) (per tonne) | 2,546.9 | 2,666.3 | 2,281.7 | 2,415.4 | 2,415.4 | |
| Non-expansion capital expenditure |
22.2 |
14.4 |
34.5 |
71.1 |
13.9 |
85.0 |
| Sustaining cash cost, net of by-product credits (sold) | 467.4 | 232.9 | 778.1 | 1,478.4 | 13.9 | 1,492.3 |
| Sustaining cash cost net of by-product credits (sold) (per tonne) | 2,673.9 | 2,842.6 | 2,387.5 | 2,537.4 | 2,561.3 | |
| Workers’ participation | 1.5 | 1.6 | 10.8 | 13.9 | 13.9 | |
| Corporate G&A |
|
|
|
|
27.9 |
27.9 |
| AISC net of by-product credits (sold) | 1,534.1 | |||||
| AISC net of by-product credits (sold) (per tonne) | 2,632.9 | |||||
For the year ended December 31, 2022
|
Três |
Juiz de |
Cajamarquilla |
Consolidation |
Corporate |
Smelting |
|
| Operations (in millions of US$, unless otherwise indicated) | ||||||
| Sales Volume (Zinc Contained in Products) | ||||||
| Tonnes | 180,029 | 83,084 | 334,076 | 597,189 | 597,189 | |
| Cost of goods sold | 621.4 | 325.2 | 1,219.4 | 2,166.1 | (6.1) | 2,159.9 |
| Cost of services rendered | (19.5) | (9.9) | (57.0) | (86.4) | (86.4) | |
| On-site G&A | 2.0 | 1.1 | 6.1 | 9.2 | 9.2 | |
| Depreciation and amortization | (18.4) | (13.1) | (47.2) | (78.7) | (78.7) | |
| By-product credits | (9.5) | (36.8) | (180.4) | (226.7) | 6.1 | (220.5) |
| Workers’ participation & Bonus | (1.6) | (1.3) | (13.7) | (16.6) | (16.6) | |
| Others |
(13.5) |
(6.0) |
14.7 |
(4.8) |
|
(4.8) |
| Cash cost, net of by-product credits (sold) | 561.0 | 259.1 | 941.9 | 1,761.9 | 0.0 | 1,761.9 |
| Cash cost, net of by-product credits (sold) (per tonne) | 3,116.0 | 3,118.1 | 2,819.5 | 2,950.4 | 2,950.4 | |
| Non-expansion capital expenditure |
42.1 |
22.4 |
45.3 |
109.9 |
(18.9) |
90.9 |
| Sustaining cash cost, net of by-product credits (sold) | 603.1 | 281.5 | 987.2 | 1,871.8 | (18.9) | 1,852.9 |
| Sustaining cash cost net of by-product credits (sold) (per tonne) | 3,350.1 | 3,387.9 | 2,955.1 | 3,134.4 | 3,102.7 | |
| Workers’ participation | 1.6 | 1.3 | 13.7 | 16.6 | 16.6 | |
| Corporate G&A |
|
|
|
|
31.0 |
31.0 |
| AISC net of by-product credits (sold) | 1,900.6 | |||||
| AISC net of by-product credits (sold) (per tonne) | 3,183.0 | |||||
|
|
|
Liquidity and Capital Resources |
LIQUIDITY AND CAPITAL RESOURCES
Overview
In the ordinary course of business, our principal funding requirements are for working capital, capital expenditures relating to maintenance and expansion investments, servicing our indebtedness and distributions to our shareholders. We typically meet these requirements through operational cash flows, long-term borrowings from private banks, the Brazilian Economic and Social Development Bank (Banco Nacional de Desenvolvimento Econômico e Social, or “BNDES”), international export credit agencies, and the issuance of debt securities in the international capital markets.
In October 2023, Nexa announced the successful closing of a US$320 million sustainability-linked revolving credit facility. The applicable margin is subject to compliance with carbon reduction key performance indicators, reflecting the Company’s commitment to reducing its carbon footprint. Such efforts are consistent with Nexa’s ESG ambitions, targeting net-zero greenhouse gas emissions by 2050, in alignment with the Paris Agreement.
Our financing strategy is to fund our necessary capital expenditures and to preserve our liquidity while meeting our debt payment obligations. We believe that our cash and cash equivalents on hand, cash from operations and available borrowings will be adequate to meet our capital expenditure requirements and liquidity needs for our current obligations. We may require additional capital to meet our longer-term liquidity and future growth requirements. Although we believe that our sources of liquidity are adequate, weaker economic conditions in Brazil, Peru or globally could materially adversely affect our business and liquidity.
Sources of funds
Our principal sources of funds are cash flows from operations and borrowings. The availability of cash flows from operations is affected by our working capital requirements, share premium reimbursements, dividends and investment activities, as well as a need to service our indebtedness. In 2023, we generated net cash from operating activities of US$246.8 million, a 7.4% decrease as compared to US$266.6 million in 2022, which was largely due to continued investments towards sustaining our current operations, including Aripuanã and our working capital needs.
Uses of funds
In the ordinary course of business, our principal funding requirements are related to capital expenditures, dividend payments and debt service. In 2023, we also used funds to invest towards sustaining our current operations, for our working capital needs and for taxes and interest to service debt.
Capital expenditures
Our capital expenditures in 2023 amounted to US$309.0 million. Of this amount, 1.2% was allocated to expansion projects, mainly driven by the Vazante mine deepening project, in line with our annual guidance due to lower than expected HS&E and other non-expansion investments.
Non-expansion projects, which includes sustaining and HS&E, among others, accounted for 98.8% of the total capital expenditures (or US$305.3 million) in 2023, including US$79.4 million of Aripuanã.
For 2024, we have budgeted US$311.0 million to invest in our operations and projects that are currently underway.
Expenses related to exploration and project evaluation
In 2023, exploration expenses were US$57.2 million, mainly driven by brownfield investments with the objective of extending the life of the mines we are currently operating (mainly in Cerro Lindo, Aripuanã, Vazante and El Porvenir) and copper exploration phase projects to support our growth strategy. We continue with efforts to replenish and increase available mineral resources as part of our long-term strategy, advancing mineral exploration activities, focusing mainly on identifying new ore bodies through drilling campaigns and preserving our investments in greenfield projects and business development analysis.
|
|
|
Liquidity and Capital Resources |
Project evaluation investment amounted to US$35.1 million in 2023, including approximately US$27.4 million directed towards brownfield projects in FEL1 and FEL2 stages and US$1.4 million to greenfield projects in the same stages.
We expect to continue to advance with our exploration and drilling campaigns and develop our pipeline of projects. In 2024, we estimate to spend US$58.0 million on expenses relating primarily to drilling campaigns in brownfield projects (mainly in Cerro Lindo, Vazante and Aripuanã) to expand the mineral resources and mineral reserves inventory, and on the development of our copper portfolio in the exploration stage.
Distributions
On March 24, 2023, we paid approximately US$25.0 million (US$0.19 per common share) of share premium (or special dividend) to our shareholders. This share premium will be ratified, in accordance with Luxembourg laws, by our shareholders at the annual shareholders’ meeting for the fiscal year ended December 31, 2023, which will occur on June 13, 2024.
Debt
As of December 31, 2023, our total outstanding consolidated indebtedness (current and non-current loans and financings, including accrued interest as of December 31, 2023) is US$1,725.6 million, consisting of US$143.2 million of short-term indebtedness, including the current portion of long-term indebtedness (or 8.3% of the total indebtedness), and US$1,582.4 million of long-term indebtedness (or 91.7% of the total indebtedness). Our outstanding consolidated indebtedness increased by 3.4% compared to December 31, 2022.
Our U.S. dollar denominated indebtedness as of December 31, 2023 was US$1,446.2 million (or 83.8% of our total indebtedness), our Brazilian real denominated indebtedness was US$279.3 million (or 16.2% of our total indebtedness).
As of December 31, 2023, US$513.0 million, or 29.7% of our total consolidated indebtedness, bears interest at floating rates, including US$279.3 million of real-denominated indebtedness that bear interest at rates based on the CDI rate, SELIC rate or Taxa de Juros de Longo Prazo (“TJLP”) and Taxa de Longo Prazo (“TLP”) rates (the long-term interest rates set by the Brazilian National Monetary Council and the basic costs of financing of the BNDES), and US$233.7 million of foreign currency-denominated indebtedness that bear interest at rates based on SOFR.
Only 8.3% (US$143.2 million) of the total debt matures in 2024, 5.9% (US$101.9 million) matures between 2025 and 2026, while 85.8% (US$1,480.5 million) of total debt matures in and after 2027.
We continuously assess short-term and mid-term commodities prices, Nexa’s capital structure, financial position and the quantum and maturity profile of our debt. Actions in relation to our capital structure, including, but not limited to, improving the profile of outstanding debt, focusing on extending maturity and assessing financing alternatives are constantly being evaluated.
The following table sets forth selected information with respect to our total outstanding consolidated indebtedness as of December 31, 2023.
|
As of December 31, 2023 |
||||
|
Indebtedness |
Average Annual Interest Rate |
Current |
Long-term |
Total |
| (in millions of US$) | ||||
| Eurobonds – USD | Pre-USD + 5.84% | 18.5 | 1,194.0 | 1,212.6 |
| BNDES |
TJLP + 2.82% SELIC + 3.10% TLP – IPCA + 5.46% |
28.6 | 180.3 | 208.9 |
| Export Credit Notes |
SOFR + 1.85% 134.20% CDI SOFR + 2.5% |
95.7 | 142.1 | 237.9 |
| Other | SOFR + 2.57% | 0.3 | 65.9 | 66.2 |
| Total | 143.2 | 1,582.4 | 1,725.6 | |
(1) Includes principal and interest.
|
|
|
Liquidity and Capital Resources |
As of December 31, 2023, US$208.9 million remains outstanding under our loan agreements with BNDES regarding to Nexa Brazil’s facility agreement which are guaranteed only by Nexa Resources.
Some of our debt instruments also contain other covenants that restrict, among other things, our ability and the ability of certain of our subsidiaries to incur liens and merge or consolidate with any other person or sell or otherwise dispose of all or substantially all its assets. These instruments also contained covenants requiring that we comply with certain financial ratios, including:
| · | a debt service coverage ratio of 1.0:1.0; |
| · | a net debt to EBITDA ratio of 4.0:1.0; and |
| · | a total debt to total capitalization ratio of 0.7:1.0. |
As of December 31, 2023 we were in compliance with the above stated ratios.
Short-term indebtedness and revolving credit lines
Our consolidated short-term indebtedness, including the current portion of our long-term debt, was US$143.2 million, including principal and interest, as of December 31, 2023.
In October 2023, we announced the closing of a US$320 million sustainability-linked revolving credit facility, which replaces Nexa’s 2019 US$300 million revolving credit facility that was set to mature in October 2024. The new sustainability-linked credit facility supports Nexa’s liquidity profile and the applicable margin is subject to compliance with carbon reduction key performance indicators, reflecting the Company’s commitment to reducing its carbon footprint. Such efforts are consistent with Nexa’s ESG ambitions, targeting net-zero greenhouse gas emissions by 2050, in alignment with the Paris Agreement. The new facility is guaranteed by Nexa Brazil and Nexa CJM and will mature on October 20, 2028, and amounts drawn are subject to an initial interest rate of 1.60% plus Term SOFR per annum. As of December 31, 2023, no amounts were drawn under this facility.
In March 2024, we entered into a 4131 Note agreement in the total principal amount of R$150 million (approximately €30 million) at an annual gross interest rate of 5.6%, maturing in June 2024. Additionally, a Global Derivatives Contract was established to swap the currency fluctuation of the euro to hedge this loan operation at a cost of CDI + 0.90%.
Also in March 2024, we extended by five years, one of our remaining Export Credit Notes which was maturing on October 2024 with a cost of TERM SOFR + 2.4%, in the total initial facility amount of US$90.0 million.
We believe that we will continue to be able to obtain sufficient credit to finance our working capital needs based on current market conditions and our liquidity position. See “Risk factors—Financial risk— Our business requires substantial capital expenditures and is subject to financing risks.”
Long-term indebtedness
The following discussion briefly describes our principal financing agreements as of the date of this annual report. For additional information, see Note 24 to our consolidated financial statements.
|
|
|
Liquidity and Capital Resources |
Debentures. On March 22, 2024, Nexa Recursos Minerais S.A. (Nexa Brazil), a wholly-owned subsidiary of Nexa Resources, announced the public offering of 650,000 non-convertible ESG-linked debentures, each with a par value of R$1,000.00, totaling R$650 million (approximately US$130 million). The debentures mature on March 28, 2030, are unsecured, bullet, and bear interest at 100% of CDI interest rate plus 1.50% per annum. The settlement date is expected to occur between March 28, 2024 and April 3, 2024, and will be characterized as debentures linked to ESG targets, aligning with the same ESG framework of our US$320 million sustainability-linked revolving credit facility mentioned above. The offering is part of Nexa’s balance sheet and liability management strategy.
4131 Note. In December 2023, we entered into a 4131 Note agreement in the total principal amount of US$50 million with maturity date of five years and costs of 2.57% plus TERM SOFR. As of December 31, 2023, our outstanding principal amount under this 4131 Note was US$50.2 million.
Export Credit Notes. In March and April 2020, we entered into five Export Credit Note agreements in the total principal amount of R$1,477 million (approximately US$300 million) with maturity dates between one and five years and costs between 134.2% of CDI and CDI +1.8% up to CDI + 4.2%. In 2020, we prepaid the principal and accrued interest of two Export Credit Notes. As of December 31, 2023, our outstanding principal amount under the two remaining Export Credit Notes was US$145.8 million. In March 2024, we extended by five years, one of our remaining Export Credit Notes which was maturing on October 2024 with a cost of TERM SOFR + 2.4%, in the total initial facility amount of US$90.0 million.
Export Credit Notes. On March 18, 2022, we entered into an Export Credit Note agreement in the total principal amount of US$90 million with a maturity date of five years and costs of 2.5% plus TERM SOFR. As of December 31, 2023, our outstanding principal amount under these Export Credit Notes was US$92.1 million.
Nexa Resources Bonds due 2028. On June 18, 2020, we issued an aggregate principal amount of US$500.0 million in bonds maturing in 2028 and bearing interest at 6.500% per year. The bonds are guaranteed by our subsidiaries Nexa Brazil, Nexa Peru and Nexa CJM. As of December 31, 2023, the outstanding amount under these bonds was US$510.7 million, which is related to a principal amount of US$500.0 million plus an accrual of US$14.7 million related to interest, net of borrowing costs of US$10.7 million.
Nexa Resources Bonds due 2027. On May 4, 2017, we issued an aggregate principal amount of US$700.0 million in bonds maturing in 2027 and bearing interest at 5.375% per year. The bonds are guaranteed by our subsidiaries Nexa Brazil, Nexa Peru and Nexa CJM. As of December 31, 2023, the outstanding amount under these bonds was US$701.8 million, which is related to a principal amount of US$700.0 million plus an accrual of US$6.0 million related to interest, net of borrowing costs of US$1.8 million.
BNDES and FINEP. BNDES has been an important source of debt financing for our capital expenditures in Brazil. We, through our Brazilian subsidiaries, have entered into several loan agreements with BNDES for the expansion and modernization of certain fixed assets, studies and engineering projects, environmental investments and the acquisition of machinery and equipment. As of December 31, 2023, our aggregate outstanding principal amount under BNDES loan agreements was US$208.9 million. For further details on our long-term financings with BNDES, please see the table below.
In October 2020, we disbursed the first tranche of the Credit Facility Agreement related to the Aripuanã Project signed with BNDES in the amount of approximately R$225.0 million or US$39.9 million. In December 2020, we disbursed the second tranche of this facility in the amount of approximately R$250.0 million or US$47.7 million. In May 2021, we disbursed the third tranche of this facility in the amount of approximately R$160.0 million or US$30.6 million. In June 2021, we disbursed the fourth tranche of this facility in the amount of approximately R$101.3 million or US$20.1 million. This loan was contracted at a cost of TLP plus 3.39%, with maturity in 2040.
In December 2014, Nexa Brazil entered into a loan agreement with the Brazilian Financing Agency for Studies and Projects (Financiadora de Estudos e Projetos or “FINEP”), to finance the research and development of various projects. As of December 31, 2023, our outstanding principal amount under this loan agreement was US$16.0 million.
The following table sets forth selected information with respect to Nexa Brazil’s principal long term financings with BNDES and our outstanding amount under these financings as of December 31, 2023.
|
|
|
Liquidity and Capital Resources |
|
Indebtedness |
Borrower |
Guarantor |
Interest Rate |
Principal Payment Dates |
Maturity |
Principal
Amount |
| (in millions of US$) | ||||||
| R$1,000.0 million BNDES Revolving Credit Agreement | Nexa Brazil | Nexa Resources | TLP plus 2.09% per annum | 120 monthly installments commencing on January 15, 2019 | December 15, 2028 | 17.0 |
| Total | 17.0 | |||||
| R$1,200.0 million BNDES Revolving Credit Agreement (1) | Nexa Brazil | Nexa Resources | SELIC plus 3.10% per annum | 60 monthly installments commencing on October 15, 2021 | September 15, 2026 | 24.4 |
| Nexa Brazil | Nexa Resources | TJLP plus 2.82% per annum | 60 monthly installments commencing on September 15, 2017 | September 15, 2026 | 10.5 | |
| Nexa Brazil | Nexa Resources | TLP plus 2.22% per annum | 120 monthly installments commencing on January 15, 2019 | December 15, 2028 | 12.3 | |
| Total | 47.2 | |||||
| Credit Facility Agreement | Nexa Dardanelos | Nexa Brazil and Nexa Resources | TLP plus 3.39% per annum | 210 monthly installments commencing on March 15, 2023 | August 15, 2040 | 144.7 |
| Total |
144.7 |
|||||
| Total BNDES Long-Term Indebtedness |
208.9 |
(1) Consists of three tranches.
Cash flows
The table below sets forth our cash flows from operating activities, investing activities and financing activities for the years ended December 31, 2023 and 2022.
|
For the Year Ended December 31, |
||
|
2023 |
2022 |
|
| (in millions of US$) | ||
| Consolidated Statement of Cash Flows Information | ||
| Net cash flows provided by (used in): | ||
| Operating activities | 246.8 | 266.6 |
| Investing activities | (270.4) | (378.9) |
| Financing activities | (25.3) | (149.2) |
| Foreign exchange effects on cash and cash equivalents | 8.2 | 15.5 |
| Decrease in cash and cash equivalents | (40.6) | (246.0) |
| Cash and cash equivalents at the beginning of the year | 497.8 | 743.8 |
| Cash and cash equivalents at the end of the year | 457.3 | 497.8 |
In 2023, our net cash flow provided by operating activities was US$246.8 million, primarily due to positive working capital variations, as a result of initiatives deployed throughout the year relating to inventory, as well as trade account receivables payment terms.
|
|
|
Liquidity and Capital Resources |
In 2023, our net cash flow used in investing activities was US$270.4 million to maintain the sustainability of our business and invest in our growth, mainly related to sustaining investments in our operations including Aripuanã.
In 2023, our net cash flow used in financing activities was US$25.3 million due to the payment of share premiums to shareholders, contractual dividends paid to non-controlling interests (Pollarix) and payments of loans and financings, partially offset by new loans and financings.
As a result, at December 31, 2023, our cash and cash equivalents were US$457.3 million, US$40.6 million lower compared to our cash and cash equivalents at December 31, 2022.
|
|
|
Liquidity and Capital Resources |
CRITICAL ACCOUNTING ESTIMATES
The following discussion and analysis of our financial position and results of operations is based on our consolidated financial statements. The preparation of the Company’s consolidated financial statements requires the use of estimates, assumptions, and judgments that affect the reported amounts of revenues, expenses, assets and liabilities, the accompanying disclosures, and the disclosure of contingent liabilities at the date of the consolidated financial statements. By definition, critical estimates, assumptions, and judgments will seldom equal the actual results and are continually evaluated to reflect changing expectations about future events. Management also needs to exercise judgment in applying the Company’s accounting policies.
This note provides an overview of the areas that involve a higher degree of judgment or complexity, and of items which are more likely to be materially adjusted due to estimates and assumptions turning out to be wrong due to their uncertainty. Detailed information about each of these estimates, assumptions and judgments is included in other notes together with information about the basis of calculation for each affected item in the financial statements. Below is a description of our critical accounting policies that require significant estimates and judgments.
Impairment of goodwill
We annually test whether goodwill has suffered any impairment, in accordance with the accounting policy stated in Note 31 to our consolidated financial statements. We assess the recovery of the carrying amount of goodwill of each cash generating unit or group of cash generating units based on value in use or fair value less costs to sell, using a discounted cash flow model.
We also assess at each reporting date, whether there is an indication that goodwill may be impaired. If any indication exists, such as volume and price reductions or unusual events that can affect the business, we estimate the recoverable amount of the cash generating unit or group of cash generating units.
The process of estimating the value in use and the fair value less costs to sell involves assumptions, judgment and projections of future cash flows. Our assumptions and estimates of future cash flow used for impairment testing of goodwill are subject to risk and uncertainties, particularly for markets—such as metals— subject to higher volatilities, which are outside our control. The calculations used for the impairment testing are based on discounted cash flow models as of December 31, 2023 (due to impairment indicators identified during the fourth quarter), market assumptions, such as LME prices, market interest rates and other available data regarding global demand. The discount factor applied to the discounted cash flow model is our pre-tax (for value in use calculation method) or post-tax (for fair value less cost of disposal calculation method) weighted average cost of capital for the applicable region, adjusted for country-specific risk factors. These calculations use cash flow projections before taxes on income, based on financial and operational budgets for a five-year period. After the five-year period, the projections are extended to the end of the mine life for our mines and indefinitely for our smelters. We do not use growth rates in cash flow projections of the terminal value for our smelters.
Impairment analysis
When performing its annual impairment assessments and after analyzing all impairment indicators the Company identified impairment indicators mainly related to the: (i) Três Marias System (“STM”) cash-generating unit (“CGU”) (previously formed by the combined operations of the Três Marias smelter and the Vazante and Morro Agudo mines) split in two for: (a) STM CGU (comprised of the Três Marias smelter and the Vazante mine) and (b) Morro Agudo CGU (comprised of the Morro Agudo mine and Bonsucesso greenfield), based on management's conclusion that the implicit value of Morro Agudo’s zinc concentrate processed in the Três Marias smelter could no longer continue to be recognized, based on an understanding of the current and specific macroeconomic and price scenarios, as well as on possible future operational scenarios; (ii) Aripuanã and Juiz de Fora CGUs – reduction in Aripuanã's life of mine, a lower exchange rate of the Brazilian real against the U.S. dollar and an increase of operational costs for their operations; and (iii) Mining Peru Group of CGUs (comprised of Cerro Pasco and Cerro Lindo CGUs) – increase in operational costs.
The impairment assessment as of December 31, 2023 resulted in a non-cash, pre-tax net impairment loss of US$114.6 million (after-tax US$90.3 million), comprised of (i) an impairment loss of US$59.0 million in the Morro Agudo cash-generating unit (“CGU”); (ii) an impairment loss of US$42.7 million in goodwill in the Mining Peru Group of CGUs; and (iii) individual assets impairment in the amount of US$13.0 million, mainly within assets and projects under construction. For further information, please refer to Note 31 to our consolidated financial statements.
|
|
|
Liquidity and Capital Resources |
Fair value of derivatives and other financial instruments
We determine the fair value of financial instruments not traded in an active market by using valuation techniques. We use judgment to select among a variety of methods and make assumptions that are mainly based on market conditions existing at the end of each reporting period.
The main financial instruments and the assumptions we make for their valuation are described below.
| · | We consider the nature, terms and maturity of cash and cash equivalents, financial investments, trade accounts receivable and other current assets. The carrying amount of these items are similar to their respective fair value. |
| · | Financial liabilities are subject to typical market interest rates. The market value is based on the present value of expected future cash disbursement, at interest rates currently available for debt with similar maturities and terms. We also consider Nexa’s credit risk when assessing the fair value of financial liabilities. |
| · | The fair value of derivative financial instruments that we use for hedging transactions is evaluated by calculating their present value through yield curves at the closing dates. The curves and prices used in the calculation for each group of instruments are developed based on data from the Brazilian Securities, Commodities and Futures Exchange, Central Bank of Brazil, LME and Bloomberg, interpolated between the available maturities. |
| · | Swap contracts: The present value of both the assets and liabilities is calculated through the discount of forecasted cash flows by the interest rate of the currency in which the swap is denominated. The difference between the present value of the assets and the liabilities generates its fair value. |
| · | Forward contracts: The present value is estimated by discounting the notional amount multiplied by the difference between the future price in the reference date and contracted price. The future price is calculated using the convenience yield of the underlying asset. It is common to use Asian non-deliverable forwards for hedging non-ferrous metals positions. Asian contracts are derivatives in which the underlying asset price is the average price of certain assets over a range of days. |
| · | Option contracts: The present value is estimated based on pricing methodologies such as the Black Scholes model, with assumptions that include the underlying asset price, strike price, volatility, time to maturity and interest rate. The underlying asset price is the average price of the foreign exchange rate in the fixing month. |
Asset retirement and environmental obligations
In 2023, as part of its annual asset retirement and environmental obligations review, the Company increased its expected disbursements on decommissioning obligations in certain operations, in accordance with updates in their asset retirement or environmental obligations studies and update in the discount rates. As a result, Nexa recognized a non-cash net expense of US$3.2 million in “Other income and expenses” in 2023, and increased its “Operational assets, property, plant and equipment” by US$12.0 million. In addition, a provision of US$7.0 million was recognized in 2023, based on results of conceptual engineering studies conducted on inactive industrial waste containment structures that do not contain mining tailings, water or liquid waste and that have been closed for more than 20 years. The Company has reserved amounts related to estimated costs of anticipated additional obligations in relation to these closed dams, which may include obligations to de-characterize closed and inactive dams. For further information, please refer to Note 27 to our consolidated financial statements included herein.
|
|
|
Liquidity and Capital Resources |
Tax, civil, labor and environmental provision
We are party to ongoing labor, civil, tax and environmental lawsuits, which are pending at different court levels. We establish provisions for potentially unfavorable outcomes of litigation in progress and update them based on management evaluation, with support from the positions of external legal counsel. For additional information, see Note 28 to our consolidated financial statements.
Income tax and other taxes
We are subject to income tax in all countries in which we operate. Significant judgment is required in determining the income tax provision. The ultimate tax determination is uncertain for many transactions and calculations. We also recognize liabilities for anticipated tax audit issues based on estimates of whether additional taxes will be due. Where the final tax outcome of these matters is different from the amounts that were initially recorded, such differences will impact the current and deferred tax assets and liabilities in the period in which such determination is made. For additional information, see Note 11 to our consolidated financial statements.
Determination of Mineral Reserves and Mineral Resources as basis to determine life of mine
Mineral reserves are deposits estimated to be economically feasible for extraction under economic conditions as of the applicable measurement date. The amortization method and rates applied to the rights to use natural resources reflect the pattern in which the benefits are expected to be used by us and based on the estimated life of mine. Any changes to the life of mine, including as a result of changes in estimates of mineral deposits and mining plans, may affect prospective amortization rates and carrying values of these assets. The process of estimation of mineral deposits is based on a technical evaluation, which includes accepted geological, geophysics, engineering, environmental, legal and economic estimates. These estimates, when evaluated in the aggregate, can have a relevant impact on the economic viability of the mineral deposits. We use various assumptions with respect to conditions, such as metal prices, inflation rates, exchange rates, technology improvements and production costs, among others. Estimates of mineral reserves and resources are reviewed periodically, and any changes are adjusted to reflect life of mine and, consequently, adjustments to amortization periods. Costs for the acquisition of rights to explore and costs to develop mineral properties incurred as of the start of the feasibility study phase known as FEL3, are capitalized. Since April 1, 2018, these costs are amortized using the units of production method over the estimated life of the mines. The impacts of the change in the accounting estimation were not considered to be material, and the change was accounted for prospectively. Once the mine is operational, these costs are amortized and considered a production cost.
Recently issued accounting standards and interpretations
For a discussion of new standards, interpretations and amendments to IFRS Accounting Standards, see Note 5 to our consolidated financial statements.
|
|
|
Risk Management |
RISK MANAGEMENT
Risk management is considered one of the key points in our business strategy and contributes to value creation and increasing the level of confidence in Nexa by its main stakeholders, including shareholders, employees, customers, suppliers and the local communities.
As a result, we have adopted an Enterprise Risk Management (“ERM”) Policy, that describes Nexa’s Risk Management Model, and its activities are an integral part of the processes in our operational units, corporate departments and projects, and provides support for decision-making by our executive officers and Board of directors.
The risk assessment cycle is performed annually focusing on our strategy, operational aspects and key projects. We seek to identify material risks, which are then assessed with consideration of the potential health, safety, environmental, social, reputational, legal and financial impacts. By embedding risk management into our work processes and critical business systems, we work to ensure we make decisions based on our risk appetite, defined in 2022, on relevant inputs and valid data. The material risks identified during the risk management process are monitored and reported to the executive team, Audit committee and Board of directors. We use a risk management platform, BWise, to manage and assess our risks, to monitor our action plans and to create related reports.
We consider market risk to be the potential loss arising from adverse changes in market rates and prices. We are exposed to several market risks arising from our normal business activities. These market risks, which are beyond our control, principally involve the possibility that changes in commodity prices, interest rates or exchange rates will adversely affect the value of our inventory, financial assets and liabilities or future cash flows and earnings. For information on our risk management policies, see Note 12 to our consolidated financial statements.
Financial risk
Our financial risk management policy seeks to preserve our liquidity and protect our cash flow and its operating components (revenues and costs), as well as financial components (financial assets and liabilities) against adverse credit and market events such as fluctuations in currency and interest rates.
A significant portion of the products we sell are commodities, with prices based on international indices and denominated in U.S. dollars. A portion of our costs, however, are denominated in reais and soles, and therefore leads to a mismatch of currencies between our revenues and costs. Additionally, our indebtedness is based on different indices and currencies, which may impact our cash flows.
Our current financial risk management policy includes:
| · | Foreign Exchange Exposure Management. Foreign exchange exposure is our exposure to fluctuations in the currencies that make up our commercial, operational and financial relations (the real and sol), and that may impact our U.S. dollar cash flow. All actions in the financial risk management process are intended to hedge our cash flow in U.S. dollars, to maintain our ability to pay our financial obligations and to comply with liquidity and indebtedness levels defined by our management team. Our foreign exchange hedge mechanisms are based on the foreign exchange exposure that is projected at least for 12 months after a reference date. |
| · | Interest Rate Exposure Management. Exposure to the interest rate is our exposure to fluctuations in each of the indices of interest rates (mainly CDI, LIBOR/SOFR and TJLP) from loans and financing transactions and financial investment that may impact our cash flow. Interest rate fluctuations would also result in gains or losses in the market value of our fixed rate debt portfolio due to differences in market interest rates and the rates at the execution of the debt agreements. |
| · | Commodity Exposure Management. Exposure to commodity prices is our exposure to income and operating costs fluctuations due to changes in the reference prices for commodities (e.g., zinc, copper, silver) based on demand, production capacity, producers’ inventory levels and commercial strategies and the availability of substitutes in the global market. We calculate our exposure at least for 12 months after a reference date, considering any derivative financial instrument that has a certain commodity as the underlying asset. |
|
|
|
Risk Management |
| · | Counterparties’ and Issuers’ Risk Management. This policy establishes exposure limits for financial and non-financial institutions that are counterparties of financial transactions and/or issuers of debt securities. The purpose of our counterparties’ and issuers’ risk management is to mitigate the occurrence of negative impacts on our cash flows from the non-fulfillment of financial obligations by these issuers and counterparties. In the case of financial investments (cash allocation), we measure exposure to credit risk of issuers by the sum of gross balances of financial investments. In the case of derivative transactions, the credit risk exposure of a certain counterparty and transaction is measured by the pre-settlement risk using statistical models. Exposure limits are determined based on ratings assigned by rating agencies and the equity of the relevant financial institution. |
| · | Liquidity and Financial Indebtedness Management. This policy establishes guidelines for managing our liquidity and financial indebtedness. The main instrument for measuring and monitoring liquidity is a cash flow projection, considering a minimum projection period of 12 months from the reference date. Liquidity and debt management considers as an objective the comparable metrics provided by global credit rating agencies for investment grade entities. With respect to indebtedness, metrics considered compatible with the relevant objective are considered. |
All proposals must comply with the guidelines and rules set forth in our Financial Risk Management Policy and subsequently submitted for review by our Finance committee and then for our Board of directors’ approval, under the governance structure set forth in our Financial Risk Management Policy.
Foreign exchange risk
We are subject to foreign exchange risks resulting from the fluctuation of the real and the sol against the U.S. dollar, our functional currency. All actions in the financial risk management process related to our foreign exchange exposure are intended to hedge our cash flow in U.S. dollars, to maintain our ability to pay our financial obligations and to comply with liquidity and indebtedness levels defined by our management. We are also exposed to financial risk associated with changes in foreign currency exchange rates as certain costs incurred are in currencies other than our functional currency.
Assuming an exchange rate appreciation or devaluation of 10.0% of the U.S. dollar against the real as of December 31, 2023, we estimate that our Adjusted EBITDA for the year would have increased or decreased by US$48.4 million for 2023. This calculation assumes that each exchange rate would change in the same direction relative to the U.S. dollar. In addition to the direct effects of changes in exchange rates, changes in exchange rates may also affect the volume of sales as other market participants become more or less competitive. This sensitivity analysis does not factor in a potential change in sales levels or actions that management could take to manage the potential impact. Accordingly, the actual effect of exchange rate fluctuations will vary from period to period. However, assuming all other factors are held constant, we would expect future fluctuations like those analyzed above to have a similar potential impact on our results for future periods. See “Forward-looking statements.”
Interest rate risk
A portion of our outstanding debt bears interest at variable rates and, accordingly, is sensitive to changes in interest rates. Based upon our indebtedness as of December 31, 2023, an increase/(decrease) in SOFR of 25% would impact our net income (loss) before income tax for the year and cash flows by US$3.1/(3.1) million. We calculate our exposure to fluctuations in interest rates at least for 12 months after a reference date, considering any derivative financial instrument that has certain index as the underlying asset. Based on these exposures, we prepare financial protection proposals, which are submitted for our Finance committee’s approval. The hedges of interest rates, in general, seek to exchange fixed interest rate to floating interest rate or vice versa.
Metal price sensitivity
We are subject to financial risks arising from the volatility of prices of zinc, copper, lead and silver, and to a lesser extent gold. Assuming that expected metal production and sales are achieved, that tax rates are unchanged, and giving no effect to potential hedging programs, metal price sensitivity factors would indicate the following change in our 2023 Adjusted EBITDA (as previously defined) attributable to us resulting from metal price changes.
|
|
|
Risk Management |
|
Zinc |
Copper |
Silver |
|
| Change in metal price (in percentage) | 10.0 | 10.0 | 10.0 |
| Change in Adjusted EBITDA (in millions of US$) | 94.5 | 26.4 | 22.8 |
Derivative instruments
To hedge against financial risk, we enter derivative transactions under our Financial Risk Management Policy. Those transactions are carried out in the over-the-counter market under master agreements such as International Swaps and Derivative Association and Brazilian Contrato Geral de Derivativos (“CGD”) Agreements.
None of the derivative transactions we are party to as of December 31, 2023 have corporate guarantees or require margin calls or any kind of collateral. None of the derivatives we were party to as of December 31, 2023 was entered into for speculative or arbitrage purposes.
We have the following recurring hedge programs in place:
| · | Fixed price commercial transactions (customer hedge): Hedging transactions that convert sales at fixed prices to floating prices in commercial transactions with customers interested in purchasing products at fixed prices. The purpose of this strategy is to maintain the revenue flow of the business unit with prices linked to the LME prices. These operations usually relate to purchases of zinc for future settlement on the over-the-counter market. |
| · | Hedges for mismatches of “quotation periods” (book hedge): Hedges that set prices for the different “quotation periods” between the purchases of certain inputs (metal concentrate) and the sale of products arising from the processing of these inputs, or different “quotation periods” between the purchase and the sale of the same product. These operations usually relate to purchases and sales of zinc and silver for future trading on the over-the-counter market. |
To execute our hedge programs, as well as any sporadic hedging demands, we and our subsidiaries mainly enter into average rate (Asian) forwards, collars and swaps and standard interest rate swaps. These are the types of derivatives applicable for the hedge of our exposures, according to our Financial Risk Management Policy.
We initially recognize derivative instruments at fair value on the date a derivative contract is entered into and subsequently re-measure at their fair value. The method of recognizing the resulting gain or loss depends on whether we designate the derivative as a hedging instrument, in the case of adoption of hedge accounting, and if so, the nature of the item being hedged. We adopt the hedge accounting procedure and designate certain derivatives as either:
| · | hedges of the fair value of recognized assets or liabilities or a firm commitment (fair value hedge); or |
| · | hedges of a particular risk associated with a recognized asset or liability or a highly probable forecast transaction (cash flow hedge). |
We document the relationship between hedging instruments and hedged items at the inception of the hedging transaction, as well as the risk management objective and strategy for the undertaking of the various hedge transactions. We also document our assessment, both at the inception of the hedge and on an ongoing basis, of whether the derivatives that are used in hedging transactions have been and will continue to be highly effective in offsetting changes in fair values or cash flows or fair values of hedged items.
Cybersecurity
Risk Management and Strategy
We maintain a comprehensive process for assessing, identifying, recording, addressing and managing material risks associated with cybersecurity that may impact our business, including risks related to disruption of business operations, financial reporting systems or our financial statements, as well as fraud, regulatory, reputational and business continuity risks.
|
|
|
Risk Management |
Nexa prioritizes the identification and management of cyber risks, focusing on adopting controls, technologies and processes that support cybersecurity, developing IT systems and infrastructure, emphasizing the confidentiality and privacy of data and information and complying with legal and regulatory requirements. Nexa’s cybersecurity risk management process includes the following:
| · | Adapting our cybersecurity risk management practices to ISO 27005 and the best practices outlined in the National Institute of Standards and Technology (“NIST”) Framework. We adopted NIST’s framework based on five pillars: Identification, Protection, Detection, Response and Recovery, and in collaboration with external partners, we assess our adherence to the NIST framework through an analysis of our cybersecurity processes and technologies; |
| · | Utilizing material components within our cybersecurity framework, such as firewalls, endpoint detect and response mechanisms, phishing tests and annual penetration and intrusion tests to identify threats and vulnerabilities that could be exploited by cybersecurity attacks and reviewing relevant tactics, techniques, and procedures to prepare for a cyber-attack; |
| · | Involving a dedicated team of professionals who monitor and act on cybersecurity events and risks including the Information Technology and Automation Technology areas. This team is responsible for creating, implementing, overseeing, and managing controls provided for in specific cybersecurity policies and procedures, in addition to presenting priorities and strategies for information and cyber security. This team is overseen by a Chief Information Security Officer (“CISO”) who reports to the Cybersecurity committee (“COSEG”); |
| · | Providing requisite training and ensuring employees comply with cybersecurity programs and policies; |
| · | Utilizing a comprehensive Cybersecurity Materiality Matrix to identify material cybersecurity incidents; |
| · | Maintaining a comprehensive incident response plan in the event of a cyber-attack that consists of defined policies, processes, and protocols for identifying a cybersecurity attack, analyzing the materiality of a cyber incident, responding to and recovering the technological environment, communicating the incidents to internal parties, and if necessary or required under various regulatory regimes, external parties, and completing a closing analysis to identify possible improvements of processes and controls. |
Governance
Board of directors and Audit committee
Nexa’s Board of directors has delegated direct oversight over cybersecurity matters to the Audit committee. The Audit committee is working with management to implement processes to: monitor cybersecurity matters; receive regular updates on cybersecurity tests, the incident response plan and the Company’s cybersecurity policies and procedures from the COSEG; ensure that management is conducting regular risk assessments; receive periodic reports related to designated cybersecurity incidents from management; establish with management an agreed upon approach for communication during a cybersecurity incident; monitor material cybersecurity developments through update calls with management and provide guidance on key decisions; review and debrief with management on post-incident remediation; monitor the content and timing of required cybersecurity disclosures, as well as the Company’s methodology and consistency in its materiality assessment used to disclose material cybersecurity incidents; ensure that the Company is in compliance with the regulations and rules related to cybersecurity, including but not limited to SEC rules; and encourage the Company to provide regular education and training to the Board, the Board committees and management on cybersecurity, consulting with outside experts when appropriate.
|
|
|
Risk Management |
Management
The cybersecurity risk management processes described above are managed by the Management committee through COSEG. COSEG is the executive committee responsible for overseeing the Company’s cybersecurity strategies and policies, including but not limited to, assessing and managing Nexa’s material risks from cybersecurity threats. COSEG is composed of seven senior managers and executives of the Company, including the CIO and CISO. On a regular basis, the results of operational cybersecurity indicators are presented to COSEG by the CISO. Our cybersecurity management is established based on cybersecurity policies and processes, a dedicated cybersecurity budget, technological solutions, human resources, suppliers, and a departmental structure for cybersecurity. COSEG regularly reviews, tests, and updates cybersecurity processes and holds discussions on materiality determinations, ransomware attacks and cybersecurity breaches. Additionally, the Management committee monitors technological, industry, and public policy developments concerning cybersecurity risks, keeping abreast of evolving cybersecurity best practices. The Management committee considers whether engagement with external experts or law enforcement is necessary and conducts investigations to gain a comprehensive understanding of cyber breaches.
As of the date of this filing, Nexa has not identified any incidents that would be deemed material within the context of the SEC's requirements.
|
|
|
Major Shareholders |
MAJOR SHAREHOLDERS
As of March 27, 2024, Nexa Resources has 132,438,611 common shares outstanding, with par value of US$1.00 per share. The table below sets forth the list of our shareholders and their participation in our capital stock.
Votorantim S.A. is Nexa Resources’ controlling shareholder. VSA does not have any different voting rights, but as long as it holds a majority of our voting stock, it can influence or control matters requiring approval by our shareholders, including the appointment of directors. VSA acquired all its shares in Nexa Resources on February 26, 2014.
|
Shareholder |
Number |
Share Capital (%) |
| VSA | 85,655,128 | 64.68% |
| Public |
46,783,483 |
35.32% |
| Total |
132,438,611 |
100.00% |
VSA
As of March 27, 2024, Hejoassu Administração S.A., or Hejoassu, is the sole shareholder of VSA’s capital stock, which consists of 18,278,788,894 common shares. Hejoassu is indirectly wholly owned by a number of individuals, some of whom are related to our Board member Luís Ermíro de Moraes, through controlled companies.
|
|
|
Related Party Transactions |
RELATED PARTY TRANSACTIONS
We enter into transactions with related parties, including VSA and companies that are owned or controlled, directly or indirectly, by VSA, in our ordinary course of business. These transactions are conducted on an arm’s length basis and in accordance with applicable laws and our corporate governance policies. See “Risk factors—Risks relating to our corporate structure—VSA has substantial control over us, which could limit our shareholders’ ability to influence the outcome of important corporate decisions.” In accordance with article 441-7 of the Luxembourg law of August 10, 1915 concerning commercial companies, as amended (“1915 Law”), any member of our Board of directors having a direct or indirect financial interest conflicting with that of Nexa Resources in a transaction put before the Board for consideration must advise the Board thereof and cause a record of such member’s statement to be included in the minutes of the meeting. The director may not take part in these deliberations and at the next following general meeting of shareholders of Nexa Resources, before any other resolution is put to vote, a special report shall be made on any such conflicted transactions. This shall not apply where the decision of the Board relates to ordinary business entered into under normal market conditions. A similar rule is stated in the article 441-12 of the Law 1915 and applies to the members of the Management committee.
Nexa has controls in place in order to identify related parties on a quarterly basis and approve related party transactions in advance. Such controls include an analysis by the related party group, an internal committee, and in certain circumstances, the Audit committee, which is required for the execution of related party transactions.
The table below sets forth the balances of our principal related party transactions as of the dates and periods indicated. The entities disclosed are entities part of the Votorantim Group. The transactions relate to shared project costs such as environmental protection; administrative services provided by the Center of Excellence (Centro de Excelência); sales of limestones and cement purchases, mainly for the Aripuanã project; purchases of energy to be used in Nexa Brazil operation units and construction services for the Aripuanã project, among others.
| Related Party Transaction Balances |
As of December 31, 2023 |
| Related Party Assets | (in millions of US$) |
| Current assets | |
| Trade Accounts Receivables | |
| Companhia Brasileira de Alumínio | 0.2 |
| Auren Comercializadora de Energía Ltda. | - |
| Votorantim Cimentos S.A. | 0.7 |
| Other | - |
| Total | 0.9 |
| Trade payables | |
| Votorantim S.A. | 2.0 |
| Andrade Gutierrez Engenharia Group | 10.9 |
| Companhia Brasileira de Alumínio | - |
| Votorantim Cimentos S.A. | 0.1 |
| Auren Comercializadora de Energía Ltda. | - |
| Campos Novos Energia S.A. | 14.8 |
| Votorantim International CSC S.A.C | - |
| Other | 0.1 |
| Total | 28.0 |
| Dividends payable | |
| Other | 2.8 |
| Total | 2.8 |
| Related parties liabilities | |
| Votorantim International CSC S.A.C | 0.9 |
| Votorantim S.A | 2.5 |
| Other | 0.5 |
| Total | 3.9 |
|
|
|
Related Party Transactions |
We summarize below some of our principal related party transactions.
|
For the Year Ended December 31, |
|
| Related Party Transactions |
2023 |
| Sales | (in millions of US$) |
| Companhia Brasileira de Alumínio | 0.2 |
| Auren Comercializadora de Energía Ltda. | 0.7 |
| Total | 0.9 |
| Purchases | |
| Votorantim S.A. | 7.5 |
| Andrade Gutierrez Engenharia Group | 73.8 |
| Companhia Brasileira de Alumínio | 0.2 |
| Auren Comercializadora de Energía Ltda. | 8.0 |
| Campos Novos Energia S.A. | 61.5 |
| Votorantim Cimentos S.A. | 1.1 |
| Votorantim International CSC S.A.C | 5.1 |
| Other | 0.4 |
| Total | 157.6 |
Andrade Gutierrez Engenharia Group
As part of the execution of the Aripuanã project, in June 2019 we entered into a mining development services agreement with Andrade Gutierrez Engenharia S.A., in which one of our director’s close family members may have significant influence at its holding level. Additionally, in June 2020, Nexa entered into an additional agreement with Consórcio Construtor Nova Aripuanã, a consortium of the Andrade Gutierrez group of companies, in connection with construction and operational services for the Aripuanã project. As of December 2023, the amount of this contract is US$73.8 million.
Shared arrangements
We have entered into a number of shared services contracts with other entities in the Votorantim Group in an effort to achieve operational efficiencies. These include joint contracts for insurance coverage and information technology. Entities in the Votorantim Group with whom we maintain such contracts have access to a substantial level of information about us. In addition, VSA negotiates our insurance coverage at the level of the Votorantim group and we thus depend on choices made by VSA for selecting the service providers to be used for all insurances contracted by us, including coverage related to property, transport, liability, credit and engineering risk insurances. We retain the right of approval of contract renewal terms negotiated by VSA.
In addition, all executive officers participate in the Fundação Senador José Ermírio de Moraes (“FUNSEJEM”) pension fund, a private, closed and not-for-profit pension fund responsible for the management of the pension plans for the employees of companies linked to the Votorantim Group.
See “Risk Factors—Risks relating to our corporate structure—VSA has substantial control over us, which could limit our shareholders’ ability to influence the outcome of important corporate decisions.”
|
|
|
Distributions |
DISTRIBUTIONS
Distributions to our shareholders are subject to the requirements of Luxembourg law and the approval of our Board of directors or our shareholders, as applicable, and will depend on a number of factors, including, but not limited to, our cash balance, cash flow, earnings, capital investment plans, expected future cash flows from operations, our strategic plans and cash dividend distributions from our subsidiaries, as well as legal requirements and other factors we may deem relevant at the time. As of December 31, 2023, there are no contractual restrictions on our ability to make distributions to our shareholders. Subject to these considerations, we estimate to distribute each year amounts equal to at least 2.0% of our average market capitalization.
Each common share entitles the holder to participate equally in distributions, unless the right to distributions has been suspended in accordance with our articles of association or applicable law.
Distributions in our common shares may be made in the form of either dividends or reimbursements of share premium. Under Luxembourg law, dividends are determined by a simple majority vote at a general shareholders’ meeting based on the recommendation of our Board of directors. Furthermore, pursuant to our articles of association, the Board of directors has the power to declare interim dividends and/or proceed with reimbursements of share premium in accordance with the 1915 Law.
We and our subsidiaries are subject to certain legal requirements that may affect our ability to pay dividends or other distributions. Distributions to shareholders (including in the form of dividends or reimbursement of share premium) may only be made from amounts available for distribution in accordance with Luxembourg law, determined based on our standalone statutory accounts prepared under Luxembourg GAAP. Under Luxembourg law, the amount of a distribution paid to shareholders (including in the form of dividends or reimbursement of share premium) may not exceed the amount of the profits at the end of the last financial year plus any profits carried forward and any amounts drawn from reserves that are available for that purpose, less any losses carried forward and sums to be placed in reserve in accordance with Luxembourg law or our articles of association. Furthermore, no distributions (including in the form of dividends or reimbursement of share premium) may be made if at the end of the last financial year the net assets as set out in the standalone statutory accounts prepared under Luxembourg GAAP are, or following such a distribution would become, less than the amount of the subscribed share capital plus the non-distributable reserves. Distributions in the form of dividends may only be made from net profits and profits carried forward, whereas distributions in the form of share premium reimbursements may only be made from available share premium.
Luxembourg law also requires at least 5.0% of our net profits per year to be allocated to the creation of a legal reserve until such reserve has reached an amount equal to 10.0% of our issued share capital. If the legal reserve subsequently falls below the 10.0% threshold, at least 5.0% of net profits again must be allocated toward the reserve. The legal reserve is not available for distribution. As of December 31, 2023, the legal reserve is US$13,332,051.30.
The table below describes the distributions paid to our shareholders. Distributions for 2021 were made in the form of a cash dividend. Distributions for 2022 were made in the form of cash dividend and share premium. Distributions for 2023 were made in the form of share premium.
| For the Year Ended December 31, | |||
|
2023 |
2022 |
2021 |
|
| (in millions of US$) | |||
| Distributions to shareholders | 25.0 | 50.0 | 35.0 |
On March 24, 2023, we paid US$25.0 million (US$0.19 per common share) of share premium (or special dividend) to our shareholders. This share premium will be ratified, in accordance with Luxembourg laws, by our shareholders at the annual shareholders’ meeting for the fiscal year ended December 31, 2023, which will occur on June 13, 2024.
Nexa Resources is a holding company and has no material assets other than its ownership of shares in its subsidiaries. When Nexa Resources pays a dividend or other distribution on its common shares in the future, it generally causes its operating subsidiaries to make distributions to it in an amount sufficient to cover any such dividends or distributions. The ability of subsidiaries of Nexa Resources to make distributions to Nexa Resources is subject to their capacity to generate sufficient earnings and cash flow and may also be affected by statutory accounting and tax rules in Brazil and Peru, as well as any conditions under the corporate law applicable to each subsidiary.
|
|
|
Distributions |
A Luxembourg withholding tax of 15.0% is generally due on dividends and similar distributions made by Nexa Resources to its shareholders. However, distributions on Nexa Resources’ common shares that are sourced from a reduction of share capital or share premium should not be subject to Luxembourg withholding tax if Nexa Resources does not have distributable reserves or profits in its standalone statutory accounts prepared under Luxembourg GAAP and provided that such distributions are made for genuine economic reasons. See “Additional information—Taxation—Luxembourg tax considerations—Shareholders.”
There is no law, governmental decree or regulation in Luxembourg that would affect the remittance of dividends or other distributions by Nexa Resources to non-resident holders of its common shares, other than withholding tax requirements. In certain limited circumstances, the implementation and administration of international financial sanctions may affect the remittance of dividends or other distributions. There are no specified procedures for nonresident holders to claim dividends or other distributions.
Computershare Trust Company, N.A. is the paying agent for shareholders who hold common shares listed on the NYSE. Dividends and other distributions on our common shares will be declared and paid in U.S. dollars.
|
|
|
Trading Markets |
TRADING MARKETS
Our publicly traded share capital consists of common shares with a par value of US$1.00 per share. Our common shares are publicly traded in the United States on the NYSE, under the ticker symbol NEXA. On March 27, 2024, there were 132,438,611 common shares issued and outstanding.
|
|
|
Purchases of Equity Securities by the Issuer and Affiliated Purchasers |
PURCHASES OF EQUITY SECURITIES BY THE ISSUER AND AFFILIATED PURCHASERS
Nexa did not repurchase any shares during 2023. As of December 31, 2023, there were no authorized share buyback programs.
|
|
|
Corporate Governance |
CORPORATE GOVERNANCE
Our corporate governance model is aimed at facilitating the flow of information between our executives and other key decision-makers on our management team, specifically, our Board of directors, Board committees and Management committee. Our corporate governance model also provides a framework for the duties of our management team, including oversight of Nexa’s performance and decision-making. Our main corporate governance activities include support for Board of directors, Board advisory committees and executive Board meetings (management committee); contribution to the process of preparing the annual report on governance practices; and elaboration of governance documents and updating of best practices.
Our corporate governance model is designed to ensure that the proper corporate governance principles are consistently applied within our organization. We have adopted certain corporate governance policies and practices that include internal rules for the Board of directors and key committees that have independent representation and leadership, including an audit committee and a compensation, nominating and governance committee. The charter for the CNG committee includes responsibility for reviewing and assessing the size, composition and operation of the Board of directors to ensure effective and independent decision making, advising on potential conflicts of interest situations and developing corporate governance guidelines and principles, in line with ESG standards. The disclosure set out below describes in further detail our approach to corporate governance.
Code of conduct
We work with all of our employees, as well as third parties who we work with, to ensure they behave in a manner consistent with our values, Code of Conduct and the key principles of our compliance program, particularly as these relate to the environment, human rights and labor related issues, health and safety, and anti-bribery and corruption. The Code of Conduct reflects our commitment to the principles of anti-corruption, anti-money laundering, anti-terrorist financing, integrity, ethics, human rights, social and environmental responsibilities and antitrust policies based on laws in effect in the countries where we operate. Our directors and executives have certified that they have read and that they will comply with our Code of Conduct. Furthermore, our Board of directors periodically monitors compliance related topics. We also launched our Code of Conduct for Suppliers in 2022. A Conduct committee is in charge of promoting the implementation of the code and supervising the application of disciplinary measures. The last update on our Code of Conduct occurred in 2021, since then we continued with its dissemination to current and new employees at a global level and in 2024, we expect to review our Code of Conduct and consequently issue a new version. In 2022, we also launched our Code of Conduct for Suppliers started to disseminate it to any suppliers considered to be strategic vendors. In 2023, we launched the Code of Conduct for Customers and started disseminating it as well.
Anti-corruption, anti-money laundering and antitrust programs have been implemented, including, among other things, ethics and compliance training and an ethics hotline which enables employees and third parties to report misconduct. Information reported through our ethics hotline is investigated and following the investigation, disciplinary action may be taken, if necessary. We have not granted any implicit or explicit waivers from any provision of our Code of Conduct since its adoption.
Our Code of Conduct, Code of Conduct for Suppliers and compliance-related policies are publicly available on our website at https://www.nexaresources.com. We will disclose future amendments to, or waivers of, our Code of Conduct on the same page of our corporate website. Information contained on our website is not incorporated by reference into this report, and you should not consider it to be part of this report.
Foreign private issuer and controlled company exemptions
Because we are a foreign private issuer, the NYSE rules applicable to us are considerably different from those applied to U.S. companies. Accordingly, we have been, and expect to continue, taking advantage of certain exemptions from NYSE governance requirements provided in the NYSE rules for foreign private issuers. Subject to the items listed below, as a foreign private issuer we are permitted to follow home country practice in lieu of the NYSE’s corporate governance standards. Luxembourg law does not require that a majority of our Board consist of independent directors or the implementation of a compensation committee or nominating and corporate governance committee. As a foreign private issuer, we must comply with four principal NYSE corporate governance rules: (i) we must satisfy the requirements of Exchange Act Rule 10A-3 relating to audit committees; (ii) our chief executive officer must promptly notify the NYSE in writing after any executive officer becomes aware of any non-compliance with the applicable NYSE corporate governance rules; (iii) we must provide the NYSE with annual and interim written affirmations as required under the NYSE corporate governance rules; and (iv) we must provide a brief description of any significant differences between our corporate governance practices and those followed by U.S. companies under NYSE listing standards.
|
|
|
Corporate Governance |
In addition, for purposes of the NYSE rules, as VSA beneficially owns a majority of our outstanding common shares, we are a “controlled company.” “Controlled companies” under those rules are companies of which more than 50.0% of the voting power is held by an individual, a group or another company. Accordingly, we are eligible to take advantage of certain exemptions from NYSE governance requirements provided in the NYSE rules. Specifically, as a controlled company under NYSE rules, we are not required to have a majority of independent directors or a compensation, nominating and corporate governance committee composed entirely of independent directors.
As described further above, we recognize that good corporate governance plays an important role in our overall success and in enhancing shareholder value and, accordingly, we have adopted certain corporate governance policies and practices that reflect these considerations. The following table briefly describes the significant differences between our practices and the practices of U.S. domestic issuers under NYSE corporate governance rules.
|
Section |
NYSE corporate
governance rule for |
Our approach |
| 303A.01 | A listed company must have a majority of independent directors. “Controlled companies” and “foreign private issuers” are not required to comply with this requirement. |
We are a controlled company because more than a majority of our voting power for the appointment of directors is controlled by VSA. We are a foreign private issuer because we are incorporated in Luxembourg. As a controlled company and foreign private issuer, we are not required to comply with the majority of independent director requirements. Five of our ten directors are independent. Our Board of directors has adopted internal rules equivalent to a charter. See “Corporate Governance, management and employees—Board of directors” for a description of our Board and processes our Board has implemented to promote the exercise of independent judgment. |
| 303A.03 | The non-management directors of a listed company must meet at regularly scheduled executive sessions without management. | We have no management directors. |
|
|
|
Corporate Governance |
| 303A.04 |
A listed company must have a nominating/corporate governance committee composed entirely of independent directors, with a written charter that covers certain minimum specified duties. “Controlled companies” and “foreign private issuers” are not required to comply with this requirement. |
As a controlled company and foreign private issuer, we are not required to comply with the nominating/corporate governance committee requirements. However, we do have a compensation, nominating and governance committee composed of two independent directors and two non-independent directors, which has adopted a committee charter. As set forth in the committee’s charter, this committee is responsible for, among other matters: · identifying individuals qualified to be nominated as members of the Board of directors; · suggesting names to fill any vacancies on the Board of directors; · developing corporate governance guidelines and principles; and · evaluating the performance and effectiveness of the Board of directors, the CEO and each of committees. See “Corporate Governance, management and employees—Board of directors—Committees of our Board of directors.”
|
| 303A.05 |
A listed company must have a compensation committee composed entirely of independent directors, with a written charter that covers certain minimum specified duties. “Controlled companies” and “foreign private issuers” are not required to comply with this requirement. |
As a controlled company and foreign private issuer, we are not required to comply with the compensation committee requirements. However, we do have a compensation, nominating and governance committee composed of two independent directors and two non-independent directors, which has adopted a committee charter. As set forth in the committee’s charter, this committee is responsible for, among other matters: · reviewing and proposing new compensation models and changes to current compensation models; and · determining compensation of executive officers, directors and committee members. See “Corporate governance, management and employees—Board of directors—Committees of our Board of directors.”
|
|
|
|
Corporate Governance |
|
303A.06 303A.07 |
A listed company must have an audit committee with a minimum of three independent directors who satisfy the independence requirements of Rule 10A-3 under the Exchange Act, with a written charter that covers certain minimum specified duties. |
We have an audit committee composed of three members, all of whom qualify as independent under Rule 10A-3 and applicable NYSE standards. Each member of the Audit committee also satisfies the financial literacy requirement under applicable standards. The Audit committee has adopted a committee charter, which was duly approved by our Board of directors. As set forth in the committee’s charter, the committee shall assist the Board of directors in fulfilling its oversight responsibilities with respect to: · quality and integrity of our financial reporting and related financial disclosures; · the effectiveness of our internal control over financial reporting and disclosure controls and procedures; · our compliance with legal and statutory requirements as they relate to financial statements and related financial disclosures; · our risk management controls and monitoring processes, according to the ERM policy; and · the qualifications, performance and independence of our independent auditors and performance of the internal audit function. See “Corporate governance, management and employees—Board of directors—Committees of our Board of directors.”
|
| 303A.08 | Shareholders must be given the opportunity to vote on all equity-compensation plans and material revisions thereto, with limited exemptions set forth in the NYSE rules. | Our articles of association require shareholder approval of overall remuneration, including any equity-compensation plans of members of the Board of directors and members of Board committees. |
| 303A.09 | A listed company must adopt and disclose corporate governance guidelines that cover certain minimum specified subjects. | We have corporate governance policies in place as described in “Corporate governance, management and employees” in this annual report. |
|
|
|
Corporate Governance |
| 303A.10 | A listed company must adopt and disclose a code of business conduct and ethics for directors, officers and employees, and promptly disclose any waivers of the code for directors or executive officers. | We have adopted a formal Code of Conduct, which applies to our directors, officers, employees and third parties who interact with the Company. Our Code of Conduct has a scope that is similar, but not identical, to that required for a U.S. domestic company under the NYSE rules. |
| 303A.12 |
(a) Each listed company CEO must certify to the NYSE each year that he or she is not aware of any violation by the Company of NYSE corporate governance listing standards. (b) Each listed company CEO must promptly notify the NYSE in writing after any executive officer of the listed company becomes aware of any non-compliance with any applicable provisions of this Section 303A. (c) Each listed company must submit an executed Written Affirmation annually to the NYSE. In addition, each listed company must submit an interim Written Affirmation as and when required by the interim Written Affirmation form specified by the NYSE. |
As a foreign private issuer, we are subject to and comply with (b) and (c) of these requirements, but are not subject to (a). |
|
|
|
Board of directors |
BOARD OF DIRECTORS
Our Board of directors is responsible for the general guidance of our business and affairs, including providing general guidance, governance and strategic oversight to our executives and other members of our management team. It is also responsible for ensuring that we meet our objectives, as well as for monitoring our performance and ensuring business continuity. The Board of directors is vested with broad powers to act on behalf of Nexa and to perform or authorize all acts of administrative or ancillary nature necessary or useful to accomplish our corporate purpose. All powers not expressly reserved by law to the shareholders fall within the competence of our Board of directors.
Appointment and term of members of our Board of directors
In accordance with our articles of association and the 1915 Law, the members of our Board of directors are elected by a resolution of a general meeting of shareholders adopted with a simple majority of the votes validly cast, regardless of the portion of capital represented at such general meeting. Votes are cast for or against each nominee proposed for election to the Board and cast votes shall not include votes attaching to shares for which the shareholder has not participated in the vote, has abstained or has returned a blank or invalid vote.
Our directors are appointed for two-year terms and may be reelected. Members of our Board of directors may be removed at any time, with or without cause, by a resolution adopted at a general meeting of our shareholders. Under Luxembourg law, in the case of a vacancy of the office of a director appointed by the general meeting of shareholders, the remaining directors may, by a simple majority vote of the directors present or represented, fill the vacancy. In these circumstances, the following general meeting of shareholders shall make the final appointment of the director.
Composition of the Board of directors
Our Board of directors is comprised of a minimum of five and a maximum of eleven members and currently has ten members, of which five are independent directors and five are non-independent, as set out below.
The term of each and all of our directors expires at the 2024 annual general meeting of shareholders. The following table sets forth our current directors as of the date of this filing, their respective Board positions and their respective date of election to the Board.
|
Name |
Age |
Principal Residence |
Position |
Elected Since |
| Jaime Ardila (2)(3) | 68 | Aventura, USA | Chair of the Board | June 18, 2019 |
| Daniella Dimitrov (1)(2)* | 54 | Toronto, Canada | Director | December 14, 2017** |
| Diego Hernandez (2) | 75 | Vitacura, Chile | Director | August 25, 2016 |
| Eduardo Borges de Andrade Filho (3)* | 57 | São Paulo, Brazil | Director | August 25, 2016 |
| Edward Ruiz (1)(4)* | 73 | New Jersey, USA | Director | December 14, 2017** |
| Gianfranco Castagnola (4) | 63 | Lima, Peru | Director | June 4, 2020 |
| Hilmar Rode (2)* | 57 | Woluwe-Saint-Pierre, Belgium | Director | June 22, 2023 |
| Jane Sadowsky (1)(3)* | 62 | New York, USA | Director | December 14, 2017** |
| João Henrique Batista de Souza Schmidt (4) | 45 | São Paulo, Brazil | Director | October 18, 2016 |
| Luís Ermírio de Moraes (3) | 63 | São Paulo, Brazil | Director | August 25, 2016 |
(1) Member of the Audit committee.
(2) Member of the SCP committee.
(3) Member of the CNG committee.
(4) Member of the Finance committee.
* Independent pursuant to Rule 10A-3 under the Exchange Act (Rule 10A-3) and applicable NYSE standards, as well as National Instrument 52-110 Audit Committees.
** The Audit Committees’ members were elected in December 2017 and the effective date of the mandate starting period January 2018.
The business address of each member of our Board of directors is our corporate office, which is 37A, Avenue J.F. Kennedy, L-1855, Luxembourg, Grand Duchy of Luxembourg.
|
|
|
Board of directors |
We present below a brief biographical description of each member of our Board of directors:
Jaime Ardila. Mr. Ardila has been a member of our Board of directors since June 2019 and has been Chair of the Board since July 30, 2020. Mr. Ardila founded The Hawksbill Group in 2016, which provides business advisory services, including strategy, operations, public relations, communications and investment advice. Prior to that, he held several positions at General Motors Company in the U.S., Europe and South America in a career spanning 30 years. He also worked at the Planning Department and the Ministry of Industry and Trade for the government of Colombia from 1981 to 1984 and the investment bank Rothschild from 1996 to 1998. At General Motors, Mr. Ardila served CFO of General Motors Chile; President and Managing Director of General Motors Ecuador; President of General Motors Colombia; President of General Motors Argentina; CFO for Latin America, Africa and the Middle East; President for Brazil and Mercosur; and President of General Motors South America from 2010-2016. He is currently a member of the board of directors of Accenture and Chairman of Goldman Sachs, BDC. Mr. Ardila earned his master’s degree in Economics at the London School of Economics in 1981 and his bachelor’s degree in Economics at the University of Bogota in 1977.
Daniella Dimitrov. Ms. Dimitrov has been a member of our Board of directors since January 2018. Ms. Dimitrov has over 25 years of leadership experience in building, leading and operating businesses in mining and financial services, including as CEO, COO and CFO. Ms. Dimitrov’s previous roles include President and CEO, Interim CEO, CFO of multi mine gold/copper producers, partner at a merchant bank with a focus on natural resources, Executive Vice Chair of an iron ore developer through its acquisition following a hostile takeover bid, COO of a Canadian national wealth management and capital markets firm, and various corporate development roles in mining and financial services. Ms. Dimitrov has also been a director of various companies in the mining, oil, gas and chemicals industries and has served as a member and chair of various board committees, including audit, technical, health and safety, compensation and governance. Ms. Dimitrov is currently also a director of Chemtrade Logistics Income Fund. Ms. Dimitrov has received the NACD Directorship Certification and the ESG Global Competent Boards Designation and is a candidate for the Cyber Risk Oversight Certificate from the CERT Division of the Software Engineering Institute at Carnegie Mellon University. She has a Global EMBA from Kellogg School of Management and Schulich School of Business and a law degree. She was chosen as one of the top 100 Global Inspirational Women in Mining in 2016.
Diego Hernandez. Mr. Hernández has been a member of our Board of directors since 2016. He was a member of the board of directors of Nexa Brazil until 2018. Mr. Hernández has 50 years of experience in the mining industry. He is currently Corporate Director of BAL Group in Mexico. He served as President of the Sociedad Nacional de Minería in Chile (2016 to 2022) and CEO of Antofagasta Minerals from August 2012, and CEO of Antofagasta plc from September 2014 to April 2016. He was CEO of CODELCO in 2010/2012 and President of Base Metals in BHP Billiton and Chairman of Minera Escondida during 2004/2010. He served as Executive Director, Non-Ferrous Metals in Vale in 2001/2004, CEO of Compañía Minera Doña Inés de Collahuasi in 1996/2001 and has held other senior positions in Anglo American and Rio Tinto. Mr. Hernandez received a civil mining engineer degree from the University of Chile and from the École Nationale Supérieure des Mines de Paris. In 2010, he received the Ankh award granted by the Copper Club of New York, and in 2013 the Chilean Institute of Engineers awarded him the “Gold Medal” for his distinguished career and important contribution to the development of engineering in Chile.
Eduardo Borges de Andrade Filho. Mr. Andrade has been a member of our Board of directors since 2016. He was a member of the board of directors of Nexa Brazil until 2018 and has been member of the board of directors of CBA since 2017. Mr. Andrade has over 20 years of experience working with large industrial conglomerates and international consulting firms on relevant issues related to strategy, corporate development, corporate finance, governance and organization. He is founder and managing director of Otinga Investimentos, a private equity firm focusing on mid-size companies in Brazil. Between 2011 and 2014, he was corporate planning officer at VSA and served as board member of four other companies of the Votorantim Group. From 2010 to 2011, he was vice president for corporate development at Usiminas, a steel company, where he was responsible for mining and capital goods businesses, as well as strategy, business development and M&A. Prior to that, between 1997 to 2010, he was a Partner at McKinsey & Company, a consulting firm, where he took various leadership roles such as the Basic Materials Practice and the Knowledge Committee in Latin America. He started his professional career as an entrepreneur and engineer in his home state of Minas Gerais. Mr. Andrade received a bachelor’s degree in civil engineering from Fundação Mineira de Educação e Cultura in 1991 and holds an MBA from the University of Chicago in 1995.
|
|
|
Board of directors |
Edward Ruiz. Mr. Ruiz has been a member of our Board of directors since January 2018. Mr. Ruiz brings over 51 years of experience in public and private accounting. Mr. Ruiz currently serves on the audit committee of several publicly traded companies in Brazil, including Iochpe-Maxion SA and Arezzo & Co. He is a Certified Public Accountant since 1972 and has been responsible for audits of companies in the mining and energy sectors in Brazil and the United States. Mr. Ruiz retired from Deloitte in 2012, where he was employed since 1997 and most recently served as an audit partner and member of Deloitte’s IFRS Accounting Standards specialist group. As head of the Capital Markets group for Deloitte, Mr. Ruiz advised companies on financial and regulatory reporting matters related to initial public offerings and secondary offerings in the Brazilian, United States and European capital markets. Prior to Deloitte, he held executive positions in internal audit at JP Morgan and PepsiCo in the United States. He started his career in public accounting with Arthur Young in 1971. Mr. Ruiz obtained his bachelor’s degree from Pace University, New York City in 1971.
Gianfranco Castagnola. Mr. Castagnola has been a member of our Board of directors since June 2020. Mr. Castagnola is partner and CEO of Apoyo Consultoría, a leading firm specialized in economic, business and financial advisory services in Peru. He also serves as chairman of the board of directors of its subsidiary, AC Capitales SAFI, one of the largest Peruvian investment fund managers. He has been a member of the board of directors of the Peruvian Central Bank from 1996 to 2001 and was president of the Universidad del Pacífico board of trustees. He is chairman of the board of directors of Scotiabank Peru S.A., and member of the board of directors of Saga Falabella, the Austral Group and IKSA. Mr. Castagnola’s previous roles include serving as member of the board of directors of Nexa Peru, Nexa Resources Atacocha S.A.A., Lima Airport Partners, Quimica Suiza, Cementos Pacasmayo, Camposol Holding and Redesur. Mr. Castagnola earned his master’s degree in public policy from Harvard University and his bachelor’s degree in Economics from the Universidad del Pacífico.
Hilmar Rode. Mr. Rode has been a member of our Board of directors since June 2023. Mr. Rode has over 30 years of experience in the global mining, materials, chemicals, and industrial gases industries. He began his career in process development and research engineering before joining Anglo American, where he worked for 12 years in leadership positions in its industrial diamonds, base metals and paper divisions in South Africa, United Kingdom and Austria. He joined Glencore in 2007 as CEO of its zinc division in Bolivia, returning in 2019 to the copper division to work on operational strategy, technical services, projects and capital management. Between 2015 and 2019, Mr. Rode was president of BHP’s Minera Escondida Ltda. in Chile and then Chief Executive Officer of zinc producer Nyrstar. Since September 2020, Mr. Rode joined Sibelco as group CEO. Mr. Rode holds a bachelor’s degree in Chemical Engineering from the University of Stellenbosch, South Africa, a Master’s in Environmental Engineering and a Doctorate in Chemical Engineering from State University, Buffalo, New York, and a Certificate in the Advanced Management Program from Harvard Business School.
Jane Sadowsky. Ms. Sadowsky has been a member of our Board of directors since January 2018. Ms. Sadowsky has a broad and diverse range of finance and deal-related expertise and also has sector expertise in power and utilities and the related fields of commodities, renewables, power technology, infrastructure, and energy. She has a depth of knowledge and experience in mergers and acquisitions, public and private debt and equity, corporate restructurings and cross border transactions. Ms. Sadowsky retired from Evercore Partners, after more than 22 years as an investment banker. Prior to Evercore Partners, she worked in Citigroup’s Investment Bank and began her investment-banking career at Donaldson, Lufkin & Jenrette. Currently, Ms. Sadowsky serves on the board, the audit and the compensation committees of Allied Gold, Inc. (former Yamana Gold), and chairs Allied Gold’s nomination and governance committee. She also serves as a senior advisor with responsibility for diversity and inclusion at Moelis &. Company, a U.S. publicly traded company. Ms. Sadowsky also serves on the board and Remuneration Committee of Scientific Games, a PE-backed company based in the US and the NY Chapter of NACD. Ms. Sadowsky earned her MBA from the Wharton School in 1989 and her bachelor’s degree in Political Science and International Relations from the University of Pennsylvania in 1983. Ms. Sadowsky has received the NACD Directorship Certification. She is a National Association of Corporate Directors Governance fellow and a frequent speaker at board governance conferences throughout the United States.
João Henrique Batista de Souza Schmidt. Mr. Schmidt has been a member of our Board of directors since 2016. He has held the position of executive officer for Corporate Development at VSA, and in 2020 he assumed the position of CEO. He is a board member of Auren, a position he has held since 2017. He served as Chairman of the board of directors of CESP – Companhia Energética de São Paulo in part of 2019. He also served as member of the board of directors of Citrosuco S.A. from 2014 to 2019 and Nexa Brazil from 2016 to 2018. Mr. Schmidt was previously a member of the board of directors of Fibria Celulose S.A. from 2014 to 2019. Prior to joining VSA, Mr. Schmidt had 15 years of experience in the financial sector. Mr. Schmidt was a Managing Director of Goldman Sachs do Brasil Banco Múltiplo S.A., where he worked from April 2010 to August 2014, and prior to that worked at Citigroup and Goldman Sachs in different capacities. Mr. Schmidt received a bachelor’s degree in Business Administration from Fundação Getulio Vargas in 2001.
|
|
|
Board of directors |
Luís Ermírio de Moraes. Mr. Moraes has been a member of our Board of directors since 2016, and was the Chair of the Board until July 30, 2020. He was a member and the Chairman of the board of directors of Nexa Brazil until 2018. Mr. Moraes has over 35 years of experience working in mining and metallurgical operations. He is a member of the board of directors of VSA, which is the Portfolio Manager Board of the Votorantim Group. Mr. Moraes is Chairman of the board of directors of CBA, the largest integrated aluminum producer in Brazil. He is a board member of Hejoassu, which is the ownership board of Votorantim. Mr. Moraes previous roles include director of VSA since 2000. Mr. Moraes also worked as an engineer in various processes in the areas of alumina refinery, smelter and aluminum smelting, pyrometallurgical and hydrometallurgical mineral processing of nickel laterites, developing novel projects for the separation and refining of cobalt. In the early 2000s, Mr. Moraes was the shareholder responsible for the creation and development of a new Votorantim business area with investments in IT and biotechnology. Mr. Moraes received a bachelor’s degree in mineral and chemistry engineering from the Colorado School of Mines, in the state of Colorado, United States, in 1982.
Internal rules of the Board of directors
Our Board of directors adopted Board internal rules, which includes the following, among other things:
| · | approve the general guidance of our business, its mission, strategic goals and guidelines; |
| · | ensure that the executive officers comply with such mission, strategic goals and guidelines; |
| · | approve the budget and a strategic plan which takes into account, among other things, the opportunities and risks of the business; |
| · | approve the annual commercial agreements strategy; |
| · | recommend the shareholders to approve mergers, spin-offs, incorporations, acquisitions, divestitures and joint venture operations related to Nexa and its subsidiaries according to our articles of association; |
| · | promote and ensure compliance with our corporate purpose; |
| · | ensure Nexa’s long-term and sustainable continuity with respect to the Company’s ESG and economic goals, including, but not limited to, supporting the Board committees to oversee and revise the implementation of the Company’s ESG strategy pursuant to applicable laws, when applicable; |
| · | develop our approach to corporate governance, including the creation and review, from time to time, of corporate governance principles and guidelines that are specifically applicable to us; |
| · | evaluate the performance of our CEO and executive officers; |
| · | exemplify and, together with the Management committee, implement a culture of integrity throughout the organization; |
| · | approve and monitor compliance, directly and/or through its committees, with the following policies: (a) code of conduct; (b) disclosure policy; (c) insider trading policy; (d) dividend policy; (e) compliance policy; (f) antitrust/competition policy; (g) anti-corruption policy; (h) money laundering and terrorist financing prevention policy; (i) financial risk management policy (and complementary policies proposed by the Management committee, such as the hedge, derivatives, leverage, liquidity and foreign exchange exposure policy); (j) ERM policy; (k) Clawback policy; and (l) authorization policy; |
|
|
|
Board of directors |
| · | approve Board members and executive officers’ compensation, the amount of which shall not exceed the amount determined by the general meeting; |
| · | ensure appropriate succession planning for our Board of directors, CEO and executive officers; |
| · | deliberate and approve the terms and conditions of any compensation arrangements or proposed material amendments to any terms and conditions of existing compensation arrangements entered between Nexa and any of our executive officers; and |
| · | all further tasks as required by applicable laws. |
The Board internal rules are available on our website.
The Board has at its disposal a set of provisions and practices that promotes independence in the decision-making process of the Board. In accordance with the Board’s internal rules, the independent members of the Board may hold separate meetings and each director has a duty to declare, prior to any Board meeting, the existence of a particular reason or conflict of interest with Nexa with respect to a subject matter being discussed or considered by the Board. Accordingly, such Board member would be refrained from discussing and voting on a matter that could present a conflict of interest. Additionally, our Board members are prohibited from holding executive positions with Nexa and/or serving on more than four boards of directors of companies that do not belong to the same conglomerate. As discussed above, our Audit committee is comprised entirely of independent directors and we also have independent representation on all other committees.
Description of the position of Chair
Our Board of directors has developed a written position description for the chair of the Board of directors. The chair of the Board has the following responsibilities, subject to any other matters that may be set forth in our articles of association or provided for under applicable law:
| · | ensure the efficiency and proper performance of the Board of directors; |
| · | preside over the Board meetings; |
| · | prepare, organize, elaborate and distribute the agenda and minutes of the meetings aided by the Board secretary, including all information necessary to discuss the matters on the agenda; |
| · | coordinate the activities of other Board members; |
| · | ensure that all Board members receive comprehensive information about the items on the Board agenda in a timely manner; |
| · | propose the annual corporate calendar to the Board in coordination with Nexa’s CEO, which shall necessarily set forth the dates of corporate events; |
| · | organize the onboarding and education sessions for incoming members of the Board in coordination with Nexa’s CEO; and |
| · | periodically arrange for continuing education opportunities for all Board members, so that individuals may maintain or enhance their skills and abilities as members and ensure that their knowledge and understanding of Nexa’s business remains current. |
The chair of our Board of directors is not an independent director of Nexa Resources. The Board of directors has carefully considered governance issues relating to chair independence and believes that the chair carries out separate responsibilities diligently and that, with the compensating practices in place, the Board of directors operates effectively and in Nexa’s best interest.
|
|
|
Board of directors |
Meetings of the Board of directors and attendance
The Board of directors ordinarily meets in person or by other means of communication as may be required. The frequency of and agenda items for Board meetings will vary depending on the state of affairs, requirements for approvals and opportunities available to Nexa and the risks and issues which Nexa faces. The agenda for meetings places priority and focuses on key issues for Nexa, which are identified by the chair of our Board. Routine business is dealt with after substantive discussions on the key issues.
Under the Board of directors’ internal rules and our articles of association, the Board can validly consider any matters and make decisions provided at least a majority of the members are in attendance in person or by representation. The Board of directors’ internal rules further provides that each member is entitled to one vote either in person or where duly represented as required by the Board’s internal rules. In fiscal year 2023, our Board of directors held eight meetings, in which the rate of attendance in person or by representation was 100% of the directors. In addition, we had (i) nine Audit committee meetings, (ii) five Finance committee meetings, (iii) six CNG committee meetings, and (iv) eight SCP committee meetings.
|
Director |
Board Meetings |
Meetings Attended |
Overall % Attendance |
| Jaime Ardila | 8 | 8 | 100 |
| Daniella Dimitrov | 8 | 8 | 100 |
| Diego Hernandez | 8 | 8 | 100 |
| Eduardo Borges de Andrade Filho | 8 | 8 | 100 |
| Edward Ruiz | 8 | 8 | 100 |
| Gianfranco Castagnola | 8 | 8 | 100 |
| Hilmar Rode | 4 | 4 | 100 |
| Jane Sadowsky | 8 | 8 | 100 |
| João Henrique Batista de Souza Schmidt | 8 | 8 | 100 |
| Luís Ermírio de Moraes | 8 | 8 | 100 |
As set forth in the Board of directors’ internal rules, the independent directors may hold meetings in which members of the management team and the non-independent directors are not present. In 2023, our directors held in camera sessions without members of the management team prior and/or at the conclusion of each Board meeting.
Committees of our Board of directors
Our Board of directors has an Audit committee, a Finance committee, a CNG committee and a SCP committee. Our Board of directors may have other committees as it may determine from time to time. Each of the standing committees of our Board of directors has the composition and responsibilities assigned to them by the meeting of the Board of directors that created such committee and as set forth in their respective committee charters. These charters set out, among other things, the roles and responsibilities of the chair of each committee. As set forth in the respective charters of the committees, each of the committees may meet with or without the management, as the case may be, at the discretion of the committee. The charter for each of the committees of our Board of directors is available on our website.
Audit committee
Our Audit committee is a standing committee established by our Board of directors on March 28, 2017 to assist the Board of directors in fulfilling certain of its oversight responsibilities. The Audit committee may be composed of three to five members, each appointed by our Board of directors for a term of one year. Daniella Dimitrov, Edward Ruiz and Jane Sadowsky currently serve as its members. These individuals are independent under Rule 10A-3 and applicable NYSE standards, as well as Canadian securities regulators’ National Instrument 52-110 Audit Committees. In addition, each of them satisfies the financial literacy requirement under applicable rules. Our Board of directors has determined that Mr. Edward Ruiz qualifies as an “audit committee financial expert.”
|
|
|
Board of directors |
Our Audit committee’s primary responsibilities are to assist the Board of directors’ oversight of: (i) quality and integrity of our financial reporting and related financial disclosure; (ii) the effectiveness of our internal control over financial reporting and disclosure controls and procedures; (iii) our compliance with legal and statutory requirements as they relate to financial statements and related financial disclosures; (iv) the monitoring of risk management controls and processes, according to the ERM policy, and the oversight of financial reporting and related compliance, internal control over financial reporting and fraud risks; (v) the compliance and ethics program; (vi) review of all related party transactions; (vii) the qualifications, performance and independence of our independent auditors and performance of the internal audit function; (viii) the adherence to internal controls related to our ESG disclosures, targets and public commitments, pursuant to applicable laws; and (ix) the Company’s cybersecurity risk management program, including policies, procedures and controls.
Nexa has established policies and procedures that require any engagement of our independent auditor for audit or non-audit services to be submitted to and pre-approved by the Audit committee. In addition, our Audit committee may delegate the authority to pre-approve non-audit services to one or more of its members. All non-audit services that are pre-approved pursuant to such delegated authority must be presented to the full Audit committee at its first scheduled meeting following such pre-approval. Our Audit committee shall pre-approve all audit and non-audit services to be provided to us by our independent auditor and also has the authority to recommend pre-approval policies and procedures to our Board of directors and for the engagement of our independent auditor’s services.
Finance committee
Our Finance committee is a standing committee established by our Board of directors on March 28, 2017 to assist the Board of directors in fulfilling certain of its oversight responsibilities. The Finance committee may be composed of three to five members, each appointed by our Board of directors for a term of one year. Gianfranco Castagnola, Edward Ruiz and João Henrique Batista de Souza Schmidt currently serve as its members. It is also the Finance committee attribution to support the Board in its monitoring of the enterprise risk management in matters related to the responsibility of this committee.
Our Finance committee’s primary responsibilities are to assist the Board of directors in fulfilling its oversight responsibilities with respect to monitoring Nexa’s balance sheet and by providing recommendations on our capital management strategy and capital structure, including indebtedness, investments and returns, support the Board in its monitoring of the enterprise risk management in matters related to the responsibilities of the committee, among others.
CNG committee
Our CNG committee is a standing committee established by our Board of directors on March 28, 2017, to assist the Board of directors in fulfilling certain of its oversight responsibilities. The CNG committee may be composed of two to five members, each appointed by our Board of directors for a term of one year. Luís Ermírio de Moraes, Eduardo Borges de Andrade Filho, Jaime Ardila and Jane Sadowsky currently serve as its members. Two of the four members of the compensation, nominating and governance committee are independent directors.
Our CNG committee is responsible for: (1) new compensation models and changes to compensation models currently used by us, in order to guide and influence our actions; (2) the compensation of the executive officers, of the members of the Board of directors and of the members of the committees of the Board of directors; (3) the proposal of candidates to the chair of chief executive officer, when applicable, or any serious restrictions on the candidates proposed by the chief executive officer to the other chairs of the executive officers; (4) development of corporate governance guidelines and principles; (5) the governance structure related to the Company’s ESG strategy as it applies to the Company and its value chain; (6) identification of individuals qualified to be nominated as members of the Board of directors and suggesting nominees to fill any vacancies on the Board of directors; (7) the structure and composition of Board committees; (8) evaluation of the performance and effectiveness of the Board of directors, the chief executive officer and each of the Board’s standing committees; (9) the supervision and approval of our social responsibility plans and policies (other than community-related aspects which are overseen by the SCP committee), including, but not limited to, our ESG strategy; (10) support the Board in its monitoring of the enterprise risk management in matters related to the responsibilities of the committee; (11) any related matters required by applicable laws; and (12) administering the policy for the recovery of erroneously awarded compensation. For more information regarding our corporate governance policies, see “Information on the Company—Environmental, Social and Governance (ESG)—Nexa Materiality Matrix—Governance.
|
|
|
Board of directors |
SCP committee
Our SCP committee is a standing committee established by our Board of directors on April 29, 2019 to assist the Board of directors in fulfilling certain of its oversight responsibilities. The SCP committee may be composed of at least three and no more than five members, each appointed by our Board of directors for a term of one year. Diego Hernandez, Daniella Dimitrov, Hilmar Rode and Jaime Ardila currently serve as its members.
Our SCP committee’s primary responsibilities are to assist the Board of directors by supporting safe and sustainable business practices in the conduct of our activities in respect of environmental, health, safety and social matters, including relationships with local communities, tailings management, water, waste, biodiversity, and GHG emissions (climate change), as well as with respect to the estimation and disclosure of mineral resources and reserves at all operations and projects (collectively “Sustainability Matters”). The committee also assists the Board with the oversight of our ESG strategy, including its revision and implementation, in connection with the Sustainability Matters and all related applicable laws.
The SCP committee is also responsible for assisting the Board with the review of technical, economic and social matters with respect to our projects, including exploration, development, permitting, construction and operation of our mining and smelting assets, which are core to our strategy and growth. For more information regarding our sustainability policies, see “Information on the Company—Environmental, Social and Governance (ESG)—Nexa Materiality Matrix—Environmental” and “Information on the Company—Environmental, Social and Governance (ESG)—Nexa Materiality Matrix—Social.”
Orientation and continuing education
We implemented an orientation program for new directors under which each new director meets with the chair of our Board of directors and our executives. New directors are provided with comprehensive orientation and education as to our business, operations and corporate governance (including the role and responsibilities of the Board of directors and each committee).
The chair of our Board of directors is responsible for overseeing directors’ continuing education and ensure that it is designed to maintain or enhance the skills and abilities of our directors and to ensure that their knowledge and understanding of our business remains current. The chair of each committee is responsible for coordinating orientation and continuing director development programs relating to the committee’s mandate.
Our ongoing director education programs entails site visits, presentations from outside experts and consultants, discussions on ongoing governance trends and guidelines for public companies, briefings from staff and management, and reports on issues relating to our projects and operations, sustainability and social matters, competitive factors, reserves, legal issues, economic, accounting and financial disclosure, mineral and hydrocarbon education and other initiatives intended to keep the Board abreast of new developments and challenges that we may face. As part of the education session, certain directors obtained international certifications related to the competencies necessary for their activities, such as National Association of Corporate Directors (“NACD”) Directorship Certification.
Evaluation of directors
Our CNG committee established a framework for the implementation and administration of processes to assess the effectiveness of the Board and each of its members. This includes peer reviews of each director’s performance and self-assessments, as well as full Board and committee review of the Board and the respective committees, by way of questionnaires, interviews and sessions with the chair. In addition to hiring external advisors to develop and undertake this assessment, the CNG committee is also responsible for overseeing the process and evaluating the results, with the objective of improving the performance of each director and the Board of directors as a whole.
|
|
|
Board of directors |
Considerations in evaluating director nominees
Our Board of directors is responsible for nominating members for election to the Board and for filling vacancies on the Board that may occur between annual meetings of shareholders. The process for nominating a new director initiates with our CNG committee which evaluates Nexa’s current circumstances and establishes a profile for a director candidate. Such profile is then shared with a specialized external executive search firm, who assists the CNG committee in selecting candidates for interviews. Prior to the interview, the specialized external firm is responsible for a background check with former employers and colleagues of the respective candidates.
Following the interview(s), our CNG committee recommends the nomination of the director candidate to our Board of directors based upon an assessment of the independence, skills, qualifications and experience of such candidate. Specifically, the Board seeks members from diverse professional and personal backgrounds who combine a broad spectrum of experience and expertise with a reputation for integrity.
Diversity
We value diversity of abilities, experience, perspective, education, gender, background, race and national origin. We believe that having a diverse Board of directors can offer a breadth and depth of perspectives that enhance our performance. Recommendations concerning director nominees are based on merit and past performance as well as expected contribution to the Board’s performance and, accordingly, diversity is taken into consideration. We believe that having a diverse and inclusive organization overall is beneficial to our success, and we are committed to diversity and inclusion at all levels of our organization to ensure that we attract, retain and promote the brightest and most talented individuals. We have recruited and selected executives that represent a diversity of business understanding, personal attributes, abilities and experience.
The CNG committee and our Board of directors have the responsibility to review and assess the composition of the Board and each of its committees, and to identify, evaluate and recommend potential new directors. With respect to our executive officers, the CNG committee reviews candidates recommended by the chief executive officer and makes the final recommendation to the Board of directors. In new director and executive officer appointments and ongoing evaluations of the effectives of our Board and management team, each of the Board’s committees and each director, the Board will take into consideration diversity as one of the factors in order to maintain an appropriate mix and balance of diversity, attributes, skills, experience and background on our Board of directors and each of its committees and the management team. Ultimately, appointments to our Board of directors and management team are based on merit against objective criteria and with due regard to the benefits of diversity in Board and management team composition and the desire to maximize the effectiveness of corporate decision making, having regard to our best interests and strategies and objectives, including the interests of our shareholders and other stakeholders. During our selection process for Board appointments, we seek to ensure that women candidates are always considered on the shortlist for nominations. Currently, two (or 20%) of our ten members of the Board are women, and on a general basis, 17.5% of our overall employees are women.
Further, we developed a diversity program in 2019 as part of the Nexa Way program. This program is composed of affinity groups, which are formed by employees on a volunteer basis and divided into five themes: (i) women, (ii) race and ethnicity, (iii) LGBTQIA+, (iv) people with disabilities and (v) multigenerational. The affinity groups are assisted by a technical committee composed of executive officers and employees in key areas such as human resources, compliance, legal and institutional relations.
The program promotes knowledge, improvements and awareness of diversity in the workplace for our employees. In 2023, we held the Plurality Week, a week dedicated to discussions on the 5 affinity groups, including lectures with external guests. We also continued participating in the Companies and Rights Forum LGBTI+ and continued our partnership with Women in Mining (“WIM”) in Brazil and Peru. In 2023, we signed a letter of commitment to expand and strength the representation of women in the mining industry, fostering a dynamic business environment that not only attracts and retains woman employes, but also harnesses their unique strengths and recognizes their significant contributions. Nexa’s Empodera (Empower) group remained active in community events, promoting discussions about motherhood, harassment, female empowerment and women in the local communities in which our projects are located. We also continued working with our affinity group for people with disabilities and carried out an accessibility survey in all units and offices to evaluate how our structures are serving the disabled. We also launched a podcast to discuss the inclusion of people with disabilities and publicized the digital tools we have implemented into our workplaces. In Brazil, 4.2% of our employees identify as people with disabilities, and by 2030 our diversity target is to have a workforce composed 30% of women employees and 30% of women in leadership positions. These targets are frequently monitored both globally and locally, and action plans are currently being implemented to achieve the proposed targets.
|
|
|
Board of directors |
For more information on our practices related to diversity, see “Information on the Company—Environmental, Social and Governance (ESG)—Nexa Materiality Matrix—Social” and “Information on the Company—Environmental, Social and Governance (ESG)—Nexa Materiality Matrix—Governance.”
Compensation-setting process
Our CNG committee is responsible for assisting our Board of directors in fulfilling its governance and supervisory responsibilities and advising our Board of directors with respect to evaluation and monitoring of compensation models and policies performed every two years, which takes into account peer companies and the challenges and opportunities we face. The committee’s responsibilities also include administering and determining our compensation objectives and programs, reviewing and making recommendations to our Board of directors concerning the level and type of the compensation payable, evaluating performance, implementing evaluation and improvement processes, and ensuring that policies and processes are consistent with our philosophy and the objectives of our compensation program.
Share ownership
Luís Ermírio de Moraes, a member of our Board of directors, indirectly owns approximately 2,379,242, or 1.79%, of our common shares. As of December 31, 2023, none of our executive officers own, beneficially or of record, any of our common shares.
|
|
|
Executive Officers and Management Committee |
EXECUTIVE OFFICERS AND MANAGEMENT COMMITTEE
Executive officers
We have global executives and management teams for our main subsidiaries. Each subsidiary team has a management structure that adheres to our corporate governance rules. Our executives currently are as follows:
|
Name |
Age |
Principal Residence |
Position |
| Ignacio Rosado | 54 | São Paulo, Brazil | President and Chief Executive Officer |
| José Carlos del Valle | 54 | Lima, Peru | Senior Vice President of Finance and Group Chief Financial Officer; Chief Executive Officer of Nexa Peru |
| Mauro Davi Boletta | 63 | São Paulo, Brazil | Senior Vice President of Smelting Operations and Commercial |
| Leonardo Nunes Coelho | 46 | Lima, Peru | Senior Vice President of Mining Operations |
| Marcio Luis Silva Godoy | 58 | São Paulo, Brazil | Senior Vice President of Technical Services and Projects |
| Jones Aparecido Belther | 56 | São Paulo, Brazil | Senior Vice President of Mineral Exploration & Business Development |
| Gustavo Cicilini | 48 | São Paulo, Brazil | Vice President of Human Resources and Corporate Affairs |
| Renata Penna Moreira Gunzburger | 40 | São Paulo, Brazil | Vice President of Legal & Governance |
The business address of our executives is Avenida Engenheiro Luís Carlos Berrini, n° 105, 6th floor, São Paulo, State of São Paulo, Brazil.
A brief biographical description of each of our executives is presented below:
Ignacio Rosado. Mr. Rosado has been our Chief Executive Officer since January 2022. He has more than 16 years of experience in the metals and mining industry, and extensive board experience in different countries. Mr. Rosado led the initial public offering of Hochschild Mining Plc, and its acquisition strategy on Canadian Mining Assets. He also led the reorganization and transformation of Volcan Compañia Minera S.A.A. (“Volcan”) which included the construction of two new polymetallic mines and the issuance of bonds for more than US$1 billion. Prior to joining Nexa Resources, Mr. Rosado was the CEO of Volcan since 2014 and its Deputy CEO since 2010. Prior to Volcan, he served as Director and Chief Financial Officer at Hochschild Mining Plc. since 2005 and as a Senior Project Manager at McKinsey & Company since 2000. During his career, he also served on the board of directors of Lake Shore Gold Corp., Zincore Metals, Cordoba Minerals, and Kaizen Discovery. Mr. Rosado graduated with a degree in Economics in 1992 from Universidad del Pacifico and an MBA from the Ross School of Business, University of Michigan in 2000.
José Carlos del Valle. Mr. del Valle has been our Senior Vice President of Finance and Group Chief Financial Officer since October 3, 2022, and he also serves as Chief Executive Officer of Nexa Peru since November 2022. He has extensive knowledge of the metals and mining industry and more than 25 years of experience in finance and planning. Mr. del Valle joined Nexa after spending nine years as CFO at Compañía Minera Antamina, where he led a successful company-wide transformation program and a US$1 billion syndicated loan financing initiative, among other key efforts. Before Antamina, he was the CFO of Volcan Compañía Minera and he held various leadership positions at well-known companies, including McKinsey & Company, Standard Chartered Bank, and Wells Fargo Bank, among others. Mr. del Valle holds a Business Administration degree from California State University, as well as an MBA from The Wharton School. He also graduated from the Advanced Management Program at Harvard Business School.
Mauro Davi Boletta. Mr. Boletta has been our Senior Vice President of Smelting Operations and Commercial since 2016. Mr. Boletta has over 30 years of experience with operations. He joined Votorantim Metais S.A. in 1986, having served in several production areas. Between 2010 and 2011, he was responsible for the design review of an aluminum smelter in Trinidad and Tobago. Mr. Boletta graduated with a degree in electrical engineering from the Federal University of Itajubá, UNIFEI in 1985 and holds an MBA from FGV.
Leonardo Nunes Coelho. Mr. Coelho has been our Senior Vice President of Mining Operations since 2017. Mr. Coelho has over 20 years of experience managing mining operations with focus at gold and zinc. Prior to joining us, Mr. Coelho worked for Anglo Gold Ashanti Ltd. for 15 years, where he initiated his career as a Trainee. In Anglo Gold Ashanti Ltd., Mr. Coelho has led mining operations and the expansion of mining projects and served as General Manager of the Cuiabá and Lamego complexes as his last position at this company. Mr. Coelho graduated with a degree in Mine Engineering in 2001 from the Federal University of the State of Minas Gerais (“UFMG”) and has obtained graduate degrees from the Kellogg Graduate School of Management in 2015 in the United States, the Dom Cabral Foundation in 2009 in Brazil and the University of Cape Town in 2005 in South Africa as well as a qualification at INSEAD in digital transformation in 2018 and MIT in 2019.
|
|
|
Executive Officers and Management Committee |
Marcio Luis Silva Godoy. Mr. Godoy has been our Senior Vice President of Technical Services and Projects since June 2020 and has also been responsible for engineering and IT. Mr. Godoy has over 27 years of experience in the mining industry. He has worked in different roles related to mineral exploration, mineral technology, project development and implementation and mining operations in several countries including Brazil, Mozambique, Chile, Zambia, Australia and Suriname. Mr. Godoy previously worked in well-known companies including Vale, Phelps Dodge, Golden Star Resources and Novo Astro Mining. He was also the chairman of the Agency for the technological development of the Brazilian Mining Industry (“ADIMB”). Mr. Godoy is a graduated Geologist and has a Masters in Geology from the São Paulo State University (“UNESP”).
Jones Aparecido Belther. Mr. Belther has been our Senior Vice President of Mineral Exploration & Business Development since 2014. He has over 28 years of experience in the area. He held the same position at Votorantim Metais S.A. between 2004 and 2014. Prior to joining us, he was country manager at Vale in Peru between 2002 and 2004. He has worked in Brazil and abroad in companies such as Rio Tinto Brasil, Golden Star Resources, in Suriname, Phelps Dodge in Brazil and Chile, Vale in Brazil and Peru, and other companies. Mr. Belther graduated with a degree in Geology in 1991 from the São Paulo State University, UNESP, in Brazil, where he also obtained a Master’s degree in 2000 in Mineral Exploration.
Gustavo Cicilini. Mr. Cicilini became Vice President Human Resources and Corporate Affairs in 2019. Mr. Cicilini joined Nexa Resources in 2018 as senior Human Resources manager for attraction, development and culture and has been responsible for leading a culture transformation program. He has over 20 years of professional experience in various business sectors, including telecommunication, food and beverage, mobility solutions, industrial technology, consumer goods, energy and building technology. He has previously worked in companies including Algar Telecom, AmBev and Robert Bosch and been located throughout Latin America, including in Peru, Colombia, Ecuador, Venezuela, Panama and Costa Rica. Mr. Cicilini previously worked as Regional Corporate Human Resources Project Manager and has been responsible for change management and innovation, business intelligence and cross-selling functions. He holds a degree in Psychology and an MBA in Business Administration.
Renata Penna Moreira Gunzburger. Ms. Penna has been our Vice President of Legal & Governance since April 2023. Ms. Penna joined Nexa as Chief Legal Counsel and Head of Governance in 2017. With more than 20 years of experience, Ms. Penna has focused on M&A, project finance and capital market transactions and she served as counsel and project manager on Nexa’s initial public offering in October 2017. Prior to Nexa, she led LATAM, M&A and Finance divisions within the Legal Department of Votorantim Cimentos for six years, as well as worked for law firms such as Linklaters, Lobo & de Rizzo and Barbosa Mussnich & Aragão Advogados. Ms. Penna has a Bachelor from Pontifícia Universidade Católica de São Paulo and a Master of Law Degree (LL.M.) from the University of Chicago Law School, an Executive MBA from Instituto de Ensino e Pesquisa and completed an Executive Education Program on Women on Board from Harvard Business School.
Evaluation of executive officers
On an annual basis, the performance of our executive officers is evaluated by the chief executive officer, the CNG committee and ultimately, the Board of directors. We strive to create a strong ethical and high-performance culture, as well work to ensure an appropriate succession plan that ensures the continuity of our business. In addition to future business needs, we consider the core skills, experience and diversity necessary to carry out our strategy.
Each year, our chief executive officer presents to the Board of directors a report on potential successors to his position, which considers the ability of succession candidates to succeed the chief executive officer in an emergency, on an interim or permanent basis, as well as critical experiences and other attributes required in order for each candidate to enhance his or her readiness for succession. Our Board of directors discusses potential successors with the chief executive officers, as well as potential successors to each member of the management team.
|
|
|
Executive Officers and Management Committee |
Position descriptions
Our Board of directors has developed position descriptions for each of the chief executive officer and chief financial officer, which are discussed below.
Chief executive officer
Our Board of directors believes that our chief executive officer must have experience in, among other things: leading businesses of a similar complexity and scale; carrying out growth and value creation mandates; participating in mergers and acquisitions; articulating and executing long-term corporate strategies; and facilitating development within high achieving organizations. In addition, our Board of directors expects our chief executive officer to have knowledge of the mining and metals industry, international experience and an extensive global network. According to our Board of directors, our chief executive officer should possess the following attributes, among others: a hands-on approach to the business; an alignment with our values; resiliency and credibility; a good reputation within the market; and the ability to communicate with and influence stakeholders.
Chief financial officer
Our Board of directors believes that our chief financial officer must have experience in, among other things: leading accounting, controllership, financial planning and analysis, investor relations, treasury matters, mergers and acquisitions and risk management activities; formulating a company’s plan and direction for the future; developing financial, operational and tax-related strategies; managing transactions; overseeing internal controls in compliance with applicable laws and regulations; and implementing all financial-related activities within a company. In addition, our Board of directors expects our chief financial officer to have public company experience, strong analytical and business valuation skills and knowledge of national securities exchanges, such as the NYSE, international experience and an extensive global network. According to our Board of directors, our chief financial officer should possess the following attributes, among others: a hands-on approach to the business; an alignment with our values; resiliency and credibility; a good reputation in the market; and the ability to communicate with and influence stakeholders.
Management committee
In accordance with our articles of association, the Board of directors may delegate its powers to conduct our management and affairs, as well as its representation of us with respect to such matters, to a Management committee. The Management committee consists of at least three, and a maximum of seven, members. The members are not required to be shareholders or directors of Nexa. The Board of directors may not delegate its powers related to general guidance of our business or acts reserved to the Board of directors pursuant to the 1915 Law.
The following table sets forth the current members of our Management committee, and their respective positions. The term of the members of our Management committee expires on the day of the first Board meeting held after the 2024 general shareholders’ meeting.
|
Name |
Age |
Principal Residence |
Position |
| Ignacio Rosado | 54 | São Paulo, Brazil | President and Chief Executive Officer |
| José Carlos del Valle | 54 | Lima, Peru | Senior Vice President of Finance and Group Chief Financial Officer |
| Mauro Davi Boletta | 63 | São Paulo, Brazil | Senior Vice President of Smelting Operations and Commercial |
| Leonardo Nunes Coelho | 46 | Lima, Peru | Senior Vice President of Mining Operations |
| Marcio Luis Silva Godoy | 58 | São Paulo, Brazil | Senior Vice President Technical Services and Projects |
| Jones Aparecido Belther | 56 | São Paulo, Brazil | Senior Vice President Mineral Exploration & Business Development |
Conduct Committee
Our Conduct committee reports to the Chief Executive Officer and was created on January 1, 2014. Its internal rules were revised and updated on December 2, 2019.
|
|
|
Executive Officers and Management Committee |
The Conduct committee may be composed of at least seven members, such members being necessarily the Chief Executive Officer, the Vice President of Human Resources, the Vice President of Legal & Governance, the Head of Internal Audit, Compliance and Internal Controls, the Compliance Manager and two representatives of the Ethics Line program, a confidential reporting system managed by a qualified and independent external entity available to internal and external parties designed to allow anonymous reporting of violations of our Code of Conduct, policies and internal procedures or applicable laws.
Our Conduct committee’s primary responsibilities are to assist the Management committee in enforcing the Code of Conduct, reviewing any claims raised through the Ethics Line program, and identifying claims that should be rated as critical. The Conduct committee also assists our Audit committee by ensuring that any claim filed through the Ethics Line program and rated as critical is properly elevated to the Audit committee for further review.
Family relationships among executives
Our executives do not have any family relationships among themselves or with any other of our employees.
|
|
|
Executive and Director Compensation |
EXECUTIVE AND DIRECTOR COMPENSATION
The following discussion describes the significant elements of the compensation of our executive officers and directors for the year ending December 31, 2023.
In 2023 our executive compensation program includes cash compensation in the form of base salary, short-term incentives and long-term incentives. We provide base salary to compensate executives for their day-to-day responsibilities, which is aligned to a market reference based on industry analysis. We evaluate our total compensation practices on an annual basis to ensure that our compensation remains competitive in light of market and industry trends.
Our CNG committee is responsible for assisting our Board of directors in fulfilling its governance and supervisory responsibilities and advising our Board of directors with respect to evaluation and monitoring of compensation models and policies and other related matters. The committee’s responsibilities also include administering and determining our compensation objectives and programs, reviewing and making recommendations to our Board of directors concerning the level and type of the compensation payable, evaluating performance, implementing evaluation and improvement processes, and ensuring that policies and processes are consistent with our philosophy and the objectives of our compensation program.
Compensation framework
Our compensation is comprised of three principal components: (i) base salary, (ii) short-term incentive and (iii) long-term incentive.
Principal elements of compensation
Base salary
Base salaries for executive officers are established based on the scope of their responsibilities and competencies and taking into consideration the median market reference. Adjustments to base salaries are expected to be determined annually and may be increased based on performance, as well as to maintain market competitiveness. Additionally, base salaries may be adjusted as warranted throughout the year to reflect promotions or other changes in the scope or breadth of roles or responsibilities.
Short-term incentive program / bonuses
The annual bonus or short-term incentive program aims to align short-term priorities with our strategic planning by rewarding achievement of our goals and targeted annual results, resulting in an alignment with our interests. Each named executive officer has a panel of individual goals, with scales of minimum performance, target and surpass results. Measurement in these panels is based on financial and non-financial indicators. These indicators represent the specific goals and challenges attributable to the position in alignment with our performance and strategic planning.
Financial indicators are based on internal metrics and represent 40% to 50% of the employee panel for corporate positions. In 2023, the metrics used were Free Cash Flow (“FCF”) and Management Gains (“MGs”). The target of FCF is structured around the combined total of all our revenue versus costs and considers metal prices, and floating exchange rates. For MGs, the target is to capture opportunities for working capital gains, fixed costs, production costs, and synergies, among other metrics, measured in millions of dollars, and it considers fixed metal prices and exchange rates.
Strategic goals represent up to 20% of the individual panel and are comprised of qualitative and quantitative factors. In 2023, the metrics used in this assessment included risk management indicators, heat maps and ESG projects, maps of critical environmental issues, including decarbonization and sustainability initiatives, and work environment. We also recognize individual performance through targets that support different strategies in line with Nexa’s broader plan. The financial indicators applicable to our CEO represented 50% of the individual panel, and the metrics used were FCF and MGs.
|
|
|
Executive and Director Compensation |
In 2023, up to 20% of the compensation of our executive officers was related to the achievement of ESG goals and additional ESG goals have been set for our executive officers in 2024.
Long-term incentive program
Our long-term incentive (“LTI”) program is designed to provide strong incentives for making decisions with a view to creating value for shareholders by linking cash compensation to our long-term performance, and by guiding executive actions towards the achievement of our strategic goals and growth plans.
The LTI program aligns interests among our executives and shareholders to ensure continued value creation. This incentive system is also intended to engage management in developing and delivering a consistent strategic plan, as well to attract and retain executive officers.
In 2023, the LTI program was based on a five-year vesting period and comprised of three parts: (i) restricted grant, (ii) absolute performance grant and (iii) relative performance grant. All grants were defined amounts approved by the Board of directors to be paid out at the end of the five-year vesting period. The restricted grant amount appreciates according to the total shareholder return (“TSR”) over the vesting period. The payment of the absolute performance grant was based on a targeted Company TSR combined with a performance curve, both approved by our Board of directors at each granting period. The performance curve determines the amount to be paid in case of a performance equal or lower than expected in the targeted TSR. If the targeted TSR is achieved, the payment is fully due. If the performance of the TSR was greater than expected, the supplementary grant to be paid will be adjusted by up to 100%. The payment of relative performance grant depended on Nexa’s TSR performance when compared to a selected peer group approved by the Board of directors.
In April 2023, Nexa began a revision process of our LTI program. The new LTI program came into effect in February 2024. The new LTI program is based on a five-year vesting period and comprised of two parts: (i) restricted grant and (ii) absolute performance grant. Both grants are defined amounts approved by the Board of directors to be paid out at the end of the third, fourth and fifth year, considering one third of the total payment to be made on each of the three payments. The restricted grant amount appreciates according to the TSR over each payment period. The payment of the absolute performance grant is based on a targeted Company TSR combined with a performance curve, over each payment period, both approved by our Board of directors at each granting period. The performance curve determines the amount to be paid in case of a performance equal or lower than expected in the targeted TSR. If the targeted TSR is achieved, the payment is fully due. If the performance of the TSR is greater than expected, the supplementary grant to be paid will be adjusted by up to 100%. At the end of the five-year vesting period, the amount paid on the previous two payments will be adjusted with the fifth year TSR result.
The methodology is referenced to the market value of Nexa Resources’ shares at the end of the vesting period, calculated based on the weighted average price of the common shares during the months of October, November and December in the year immediately prior to the year in which the respective settlement date for the award occurs, together with dividends paid during the respective grant cycle.
Change of control
Upon the occurrence of a change of control event, all of the phantom shares will continue under the same terms, conditions and due dates, with the following exceptions:
| · | If Nexa terminates an executive’s employment without cause or if the executive resigns for good reason within 24 months of the change of control event, any unvested phantom shares will immediately fully vest as of the date of such termination or resignation for good reason. The exercise price will be calculated based on the weighted average price of the common shares during the three months immediately preceding the month of termination. In case termination occurs on the same date of the change of control event, the exercise price will be the share price (in US$/share) used as reference for the transaction that resulted in the change of control event. |
| · | If the executive resigns within twelve months of the change of control event, he or she will be entitled to a portion of the granted shares, proportionate to the length of time served (1/60 for each 30-day period served), which will become immediately vested as of the date of resignation. The exercise price will be calculated based on the weighted average price of the common shares during the three months immediately preceding the month of resignation. The Board may approve special cases and adjust the aforementioned rules provided that the basic rights of the new shareholders as well as the executives are preserved. |
|
|
|
Executive and Director Compensation |
Insider trading policies
According to our insider trading policy, directors, officers and employees of Nexa and its subsidiaries must refrain from improper trading, and the appearance of improper trading, in Nexa’s securities. This applies to all transactions in any securities of Nexa, including, but not limited to, any of Nexa’s shares, securities convertible or exchangeable into shares or other securities of Nexa, securities that Nexa may issue from time to time, such as preferred stock, warrants, and convertible debentures, as well as debt instruments, puts, calls, options and any other rights or obligations to buy or sell Nexa’s securities. It also applies to derivative securities relating to Nexa’s securities, including securities exchangeable into Nexa’s securities, whether or not issued by Nexa, such as exchange-traded options and the purchase of the Nexa’s securities with the intention of quickly reselling them. In addition, directors, officers and employees may not purchase financial instruments, such as prepaid variable forward contracts, equity swaps or collars, designed to hedge or offset a decrease in the market value of Nexa’s securities. Our policy applies to not only all securities owned by Nexa directors, officers, and employees, but also all securities owned by others where Nexa directors, officers, or employees have a direct or indirect control over investment decisions.
Our insider trading policy is made available to directors, officers and employees directly or by posting the policy on Nexa’s website and such individuals are informed whenever significant changes are made to the policy. Violations to the policy will result in disciplinary action, including possible termination. Additionally, our policy applies to individuals even after termination of employment or service with Nexa.
2023 executive compensation
During fiscal year 2023, our executive officers received cash compensation in an aggregate amount of approximately US$5,329,512, which includes compensation paid to any officers whose terms ended on the first business day of 2023. The following table summarizes compensation we paid to our executive officers during the fiscal year 2023, including base salary, short-term incentive programs or bonuses, long-term incentive programs and pension value.
| Non-equity Incentive Plan Compensation | |||||
|
Name and Title |
Base Salary (US$) |
Short-term incentive programs / bonuses (US$) |
Long-term incentive programs (US$) |
Pension Value (US$) |
Total Compensation (US$) |
|
Ignacio Rosado President and Chief Executive Officer |
570,359 | 835,193 | - | 33,147 | 1,438,700 |
|
José Carlos del Valle (1) Senior Vice President of Finance and Group Chief Financial Officer |
387,389 | 558,576 | - | - | 945,965 |
|
Mauro Davi Boletta Senior Vice President of Smelting Operations and Commercial |
201,673 | 172,838 | 21,229 | 12,094 | 407,835 |
|
Leonardo Nunes Coelho Senior Vice President of Mining Operations |
369,558 | 420,640 | 32,809 | 10,622 | 833,629 |
|
Marcio Luiz Silva Godoy Senior Vice President of Technical Services and Projects |
331,207 | 327,932 | - | 17,885 | 677,024 |
|
Jones Aparecido Belther Senior Vice President of Mineral Exploration & Business Development |
211,374 | 189,736 | 19,299 | 11,698 | 432,107 |
|
Gustavo Cicilini Vice President of Human Resources and Corporate Affairs |
184,419 | 143,602 | - | 9,704 | 337,725 |
|
Renata Penna Moreira Gunzburger (2) Vice President of Legal & Governance |
152,846 | 93,374 | 3,667 | 6,640 | 256,527 |
| (1) | José Carlos del Valle joined the Company on October 1, 2022; therefore, he was ineligible for long-term incentives paid in 2023 with respect to 2022 performance. |
| (2) | Renata Penna Moreira Gunzburger was promoted from Head of Legal & Governance to Vice President of Legal & Governance in April 2023. |
|
|
|
Executive and Director Compensation |
2023 director compensation
During fiscal year 2023, our directors received total compensation in an aggregate amount of US$2,238,333 for their services as members of our Board of directors. The chair of our Board of directors received US$280,000 in annual fees, while each Board member received an average of US$55,958 per quarter. In addition, each director is entitled to reimbursement for reasonable travel and other expenses incurred in connection with attending Board meetings and meetings for any committee on which he or she serves.
We have no service contracts with members of our Board of directors providing for benefits upon termination of employment.
Annual compensation levels for the directors are as set out below:
|
Name |
Base |
Total Compensation |
| Jaime Ardila (1) | 280,000 | 280,000 |
| Daniella Dimitrov (2) | 230,000 | 230,000 |
| Diego Hernandez (3) | 230,000 | 230,000 |
| Eduardo Borges de Andrade Filho (3) | 230,000 | 230,000 |
| Edward Ruiz (2) | 240,000 | 240,000 |
| Gianfranco Castagnola (3) | 230,000 | 230,000 |
| Hilmar Rode | 128,333 | 128,333 |
| Jane Sadowsky (2) | 230,000 | 230,000 |
| João Henrique Batista de Souza Schmidt | 220,000 | 220,000 |
| Luís Ermírio de Moraes | 220,000 | 220,000 |
| (1) | The chair of the Board is entitled to additional compensation of US$60,000.00 per year. |
| (2) | The Audit committee members are entitled to additional compensation of US$10,000.00 per year. The chair of the Audit committee is entitled to additional compensation of US$20,000.00 per year. |
| (3) | Chairs of the other committees receive compensation of US$10,000.00. There are no additional payments per meeting for members who are members of two committees concurrently. |
Compensation consultants
We retained Korn Ferry in 2023 to provide competitive market analysis to assist in determining the appropriate level of compensation for executives, providing comprehensive competitive market clearing information on incentives, policies and benefits for each executive position. Korn Ferry has over 40 years of experience and deep knowledge in the Brazilian market. We paid Korn Ferry US$52,104 in consulting services fees in 2023.
|
|
|
Executive and Director Compensation |
Retirement benefit plans
All executive officers participate in the FUNSEJEM pension fund, a private, closed and not-for-profit pension fund responsible for the management of the pension plans for the employees of the companies that are linked with the Votorantim group.
The pension plan is a defined contribution plan. Participation is voluntary and thus supplemental to the Brazilian government’s mandatory social security system. The plan is offered to employees through a specific fund that is maintained separately from the funds of each of the sponsoring organizations.
The plan’s assets correspond to 100% of the value of the liabilities. Annually, an actuarial assessment is made in compliance with the current legislation. However, there is no risk of deficit, since it is a defined contribution plan, whose formation of the reserve results from the capitalization of the respective contributions to the plan.
Nexa also matches the contribution made by the participant depending on their salary range. This contribution is monthly and varies between 1.5% and 6.0%, depending on the chosen percentage of the participant’s contribution.
|
|
|
Employees |
EMPLOYEES
As of December 31, 2023, we had 5,771 employees and 8,784 independent contractors. The following tables show the number of employees and contractors as of December 31, 2023, 2022 and 2021.
|
Number of Employees |
|||
|
As of December 31, |
|||
|
2023 |
2022 |
2021 |
|
| Brazil | 3,658 | 3,509 | 3,631 |
| Peru | 2,095 | 2,096 | 2,185 |
| United States and Luxembourg |
18 |
20 |
24 |
| Total | 5,771 | 5,625 | 5,840 |
|
Number of Independent Contractors* |
|||
|
As of December 31, |
|||
|
2023 |
2022 |
2021 |
|
| Brazil | 7,011 | 2,788 | 1,773 |
| Peru |
1,773 |
5,808 |
5,889 |
| Total | 8,784 | 8,596 | 7,662 |
*Refers to fixed-term contracts only.
Most of our employees are represented by labor unions. We negotiate collective bargaining agreements, relating to salaries, working conditions and welfare, with the various unions that represent our employees. Although we believe our present labor relations are good, there can be no assurance that a work slowdown, stoppage or strike will not occur prior to or upon the expiration of the current collective bargaining agreements, and we are unable to estimate the effect of any such work slowdown, stoppage or strike on our production levels, in spite of an established contingency plan.
We regularly invest in programs that ensure employee development and meet our specific business needs while continuously enhancing the qualifications of our staff so as to maintain and reinforce our competitiveness and our know-how as we continue to grow. The training programs include Technical/Operative Trainings, Mentoring Program, Leadership Development Program, Young Professional Training and an Individual Development Plan that, among other things, indicates the training that a given employee requires in order to continue to grow within Nexa Resources. In addition, we have an Academy of Excellence, a program created by Votorantim for leaders within Votorantim.
|
|
|
Legal Proceedings |
LEGAL PROCEEDINGS
As of December 31, 2023, we were party to various legal and administrative proceedings relating to labor, civil, environmental and tax matters in which the disputed amount for probable and possible claims was an aggregate of US$727.8 million. It is our policy to make provisions for legal contingencies when, based upon our judgment and the advice of our legal counsel, the risk of loss is probable. As of December 31, 2023, we had established a net provision in the amount of US$70.6 million to cover contingencies for proceedings for which the risk of loss was deemed probable.
The following tables summarize judicial and administrative proceedings to which we are a party, the amounts in dispute in these proceedings in which a loss is considered probable or possible and the aggregate amount of the net provision established for losses that may arise from these proceedings.
|
As of December 31, 2023 |
||
|
Total |
Total Net |
|
| (in millions of US$) | ||
| Civil and environmental (3) | 162.2 | 24.6 |
| Tax | 495.0 | 23.8 |
| Labor |
70.6 |
22.3 |
| Total |
727.8 |
70.6 |
| (1) | Does not include claims with expectation of loss classified as remote. |
| (2) | Only includes claims with expectation of loss classified as probable, net of judicial deposits. |
| (3) | Includes environmental legal and administrative proceedings. |
Civil and environmental liabilities and contingencies
As of December 31, 2023, we were party to civil judicial proceedings and environmental administrative proceedings, with a probable or possible chance of loss in the aggregate amount of US$162.2 million, for which we have recorded a net provision in the amount of US$24.6 million for proceedings with probable losses. The civil and environmental judicial claims filed against us primarily relate to pollution and collection lawsuits, repossession actions and indemnity actions related to contract disputes.
Tax liabilities and contingencies
As of December 31, 2023, we were party to tax related judicial proceedings, with a probable or possible chance of loss in the aggregate amount of US$495.0 million, for which we have recorded a net provision in the amount of US$23.8 million for proceedings with probable losses.
The tax-related judicial and administrative claims filed against us primarily relate to (i) value added tax on Sales and Services (“VAT”), (ii) corporate income tax and social contribution on net profit (“CIT”), (iii) Brazilian mining royalty (“CFEM”), (iv) Social Contributions (“PIS” and “COFINS”).
Labor liabilities and contingencies
As of December 31, 2023, we were party to labor judicial proceedings related to employment benefits, with a probable or possible chance of loss of a total amount of US$70.6 million, for which we have recorded a net provision in the amount of US$22.3 million for proceedings with probable losses. The judicial and administrative claims related to labor benefits that were filed against us are mainly related to (i) overtime payments, (ii) compensation for illness-related damages and (iii) payment of social benefits.
|
|
|
Legal Proceedings |
Other legal proceedings
VAT investigation
Throughout 2023, Nexa continued to cooperate with the investigation being carried out by the Fiscal Office of the State of Minas Gerais and the Public Ministry of Minas Gerais (the “MG Authorities”) of the practices of certain of Nexa’s former customers with respect to commercial transactions and related value added tax (“VAT”), as well as Nexa’s relationship with such former customers, that could result in liabilities for all parties involved in the commercial relationship.
In the third quarter of 2023, Nexa and the MG Authorities reached a resolution (the “Tax Resolution”) whereby Nexa, without admitting primary responsibility for the resolved claims, agreed to make certain tax payments to the State of Minas Gerais on behalf of certain customers that allegedly failed to properly make their tax payments (“tax portion”), and subsequently on October 20, 2023 entered into a related additional agreement (the “Related Agreement”, and together with the Tax Resolution, the “Agreements”) to make a contribution to the State of Minas Gerais to support its ESG-related efforts (“ESG portion”), recognizing a total amount of US$75.8 million in "Other liabilities”, comprised of US$65.5 million as “Other Income and Expenses, net” and US$10.3 million as “Financial Expenses” related to the interest charged in connection with the VAT-related practices of its former customers. In funding this agreement, the Company applied an offset of US$25.0 million of VAT accumulated credits, paid a portion of US$1.5 million in cash up front, offset an amount of US$6.4 million which was classified as a judicial deposit, and will pay the remainder in up to 46 monthly installments, to be adjusted by the Brazilian federal funds rate (“SELIC”) interest rate.
On February 8, 2024, a second and final Tax Resolution was filed with the MG Authorities whereby Nexa, without admitting primary responsibility for the resolved claims, agreed to make tax payments on behalf of certain customers, including interest and penalties, to the State of Minas Gerais, recognizing a total amount of US$27.1 million in "Other liabilities”, comprised of US$21.4 million as “Other Income and Expenses, net” and US$5.7 million as “Financial Expenses” related to the interest charged in connection with the VAT-related practices of this former customers. In funding this agreement, the Company will apply an offset of US$10.8 million of VAT accumulated credits, will pay US$0.8 million in cash up front, and will pay the remainder in up to 59 monthly installments, to be adjusted by the SELIC interest rate.
This resolution concludes the MG Authorities’ investigation with respect to the Company, and the Company does not expect any further developments or provisions with respect to these matters, although reserves its legal right to recover from certain customers the amounts that it has paid, or will pay, on their behalf in connection with the tax portion of the Agreements. These amounts will only be recognized upon recovery. For further details on this investigation, see Note 9(iv) to our consolidated financial statements.
Cerro Lindo stability agreement
We are engaged in ongoing tax-related discussions with the Peruvian tax authorities SUNAT related to the stability agreement of Cerro Lindo’s operations. The Peruvian tax authority issued unfavorable tax decisions against the Company for the years-ended December 31, 2014, 2015, 2016 and 2017, arguing that the stability income tax rate (20%) granted by the stability agreement applies only to the income generated from 5,000 tons per day of its production (i.e., income exclusively related to the investments informed in the Cerro Lindo Feasibility Study), and not from Cerro Lindo’s entire production capacity expanded over time. The total amount estimated for the contingency materialized from 2014 to 2017 is US$293.1 million.
As of the date of this annual report, SUNAT is now auditing the years-ended December 31, 2018 and 2019. Discussions with SUNAT are expected to evolve in 2024, including potential audits of the years ended December 31, 2020 and 2021, which is the last fiscal year covered by the stability agreement, depending on the ongoing legal proceedings, which may impact Nexa’s results, cash flow and liquidity. For further details on these legal proceedings, see Note 11(d) to our consolidated financial statements.
|
|
|
Articles of Association |
ARTICLES OF ASSOCIATION
Company objectives and purposes
We were incorporated in Luxembourg as a public limited liability company (société anonyme) on February 26, 2014. Our articles of association provide that our corporate purpose is to, among others, (i) carry out any trade, business or commercial activities whatsoever, including but not limited to the purchase, exchange and sale of goods and/or services to third parties; (ii) take participations and interests, in any form whatsoever, in any commercial, industrial, financial or other, Luxembourg or foreign companies or enterprises; (iii) acquire through participations, contributions, underwriting, purchases or options, negotiation or in any other way any securities, rights, patents and licenses and other property, rights and interest in property as we shall deem fit; (iv) generally to hold, manage, develop, sell or dispose of the same, in whole or in part, for such consideration as Nexa Resources may deem fit, and in particular for shares or securities of any company purchasing the same; (v) enter into, assist or participate in financial, commercial and other transactions; (vi) grant to any holding company, subsidiary or sister company, or any other company that belongs to the same group as Nexa Resources, any assistance, loans, advances or guarantees (in the latter case, even in favor of a third-party lender of any affiliates); (vii) borrow and raise money in any manner and to secure the repayment of any money borrowed; and (viii) generally to do all such other things as may appear to Nexa Resources to be incidental or conducive to the attainment of the above objects or any of them. We can perform all commercial, technical and financial operations, connected directly or indirectly in all areas as described above, in order to facilitate the accomplishment of its purpose, provided always that Nexa Resources will not enter into any transaction that would constitute a regulated activity of the financial sector without due authorization under Luxembourg law.
Our common shares are governed by Luxembourg law and our articles of association. Our articles of association were amended in June and August 2021. The following is a summary of the material terms of our common shares based on our articles of association and Luxembourg law. These rights may differ from those typically provided to shareholders of U.S. companies under the corporation laws of some states of the United States. We encourage you to read the complete form of our articles of association, filed as Exhibit 2.4 of this annual report on Form 20-F.
Common shares
On April 11, 2016, our shareholders approved the reduction of our share capital through the cancellation of 350,000,000 common shares, decreasing our share capital from US$1,280,505,254 to US$930,505,254.
On April 19, 2016, our shareholders approved the issuance of 110,910,811 new common shares fully paid via cash contributions by certain shareholders, increasing our capital from US$930,505,254 to US$1,041,416,065.
On June 28, 2017, our shareholders approved the reduction of our share capital through the cancellation of 200,000,000 common shares, decreasing our share capital from US$1,041,416,065 to US$841,416,065.
On September 18, 2017, our shareholders approved the reduction of our share capital through the cancellation of 300,000,000 common shares, decreasing our share capital from US$841,416,065 to US$541,416,065.
On October 6, 2017, our shareholders approved the reduction of our share capital through the cancellation of 428,595,552 common shares, decreasing our share capital from US$541,416,065 to US$112,820,513.
On October 31, 2017, our shareholders approved the issuance of 20,500,000 new common shares fully paid via cash contributions by certain shareholders, increasing our share capital from US$112,820,513 to US$133,320,513.
On September 13, 2018, our shareholders approved a general authorization to the Board of directors to establish share buyback programs for a period of three years. On September 20, 2018, our Board of directors approved a share buyback program under which we, directly or indirectly through our subsidiaries, may repurchase, from time to time, up to US$30.0 million of our outstanding common shares listed on the NYSE over a 12-month period beginning on November 6, 2018 and ending on November 6, 2019. As of March 25, 2019, we have repurchased 466,231 common shares, at an average price of US$10.63 per share, for an aggregate purchase price of US$4.96 million. All of the repurchased common shares were cancelled on June 4, 2020.
|
|
|
Articles of Association |
On June 4, 2020, our shareholders approved the reduction of our share capital through the cancellation of 881,902 treasury shares, decreasing our share capital from US$133,320,513 to US$132,438,611.
As of December 31, 2023, our issued share capital was US$132,438,611 represented by 132,438,611 common shares fully paid, with par value of US$1.00 per share. In addition to our issued share capital, we have an authorized share capital of US$231,924,819, represented by 231,924,819 common shares.
Distributions
Pursuant to our articles of association, the general meeting of shareholders may approve dividends and the Board of directors may declare interim dividends, in each case to the extent permitted by Luxembourg law. Pursuant to our articles of association, the Board of directors may also declare distributions to our shareholders in the form of reimbursement of share premium or interim dividends to the extent permitted by Luxembourg law. Each common share entitles the holder to participate equally in any distributions, if and when declared by the general meeting of shareholders or, in the case of interim dividends or reimbursements of share premium, the Board of directors, out of funds legally available for such purposes.
Declared and unpaid distributions held by us for the account of the shareholders shall not bear interest. Under Luxembourg law, claims for unpaid distributions will lapse in our favor five years after the date such distribution has been declared.
For additional information regarding our policy on distributions, including procedures provided by Luxembourg law, see “Share ownership and trading—Distributions.”
Voting rights
There are no restrictions on the rights of Luxembourg or non-Luxembourg residents to vote our shares. All of our shareholders, including our public shareholders, hold common shares with identical voting rights, preferences and privileges. Each common share entitles the shareholder to attend a general meeting of shareholders in person or by proxy, to address the general meeting of shareholders and to vote. Each common share entitles the holder to one vote at the general meeting of shareholders.
The Board of directors may also decide to allow shareholders to vote by correspondence by means of a proxy form providing for a positive or negative vote or an abstention on each agenda item. The conditions for voting by correspondence are set out in the articles of association and in the convening notice.
The Board of directors may decide to arrange for shareholders to be able to participate in the general meeting by conference call, video conference or similar means of communication, whereby (i) the shareholders attending the meeting can be identified, (ii) all persons participating in the meeting can hear and speak to each other, (iii) the transmission of the meeting is performed on an ongoing basis and (iv) the shareholders can properly deliberate without the need for them to appoint a proxyholder who would be physically present at the meeting.
General meeting of shareholders
In accordance with Luxembourg law and our articles of association, any regularly constituted general meeting of our shareholders has the power to order, carry out or ratify acts relating to our operations to the extent that such decisions are the domain of the shareholders and not the Board of directors.
Our annual general meeting of shareholders shall be held at our registered office, or at such other place in Luxembourg as may be specified in the notice of the meeting, within six months after the end of the relevant financial year. Except as otherwise specified in our articles of association, resolutions at a general meeting of shareholders are adopted by a simple majority of shares present or represented and voting at such meeting.
A shareholder entitled to vote may act at any general meeting of shareholders by appointing another person (who need not be a shareholder) as his proxy, which proxy shall be in writing and comply with such requirements as determined by our Board with respect to the attendance to the general meeting, and proxy forms in order to enable shareholders to exercise their right to vote. All proxies must be received by us (or our agents) no later than the day determined by our Board of directors.
|
|
|
Articles of Association |
Issuance of shares and preferential subscription rights
Our shares may be issued pursuant to a resolution of the general meeting of shareholders. The general meeting of shareholders may also delegate the authority to issue shares to the Board of directors for a renewable period of five years. The Board of directors has been authorized to issue up to 231,924,819 common shares. Such authorization will expire five years after the date publication in the Luxembourg legal gazette (Recueil Electronique des Sociétés et Associations) of the minutes of the of the general meeting of shareholders held on June 4, 2020 (unless amended or extended by the general meeting of shareholders).
Each holder of shares has preferential subscription rights to subscribe for any issue of shares pro rata to the aggregate amount of such holder’s existing holding of the shares. Each shareholder shall, however, have no preferential subscription right on shares issued for a contribution in kind.
Preferential subscription rights may be restricted or excluded by a resolution of the general meeting of shareholders, or by the Board of directors if the shareholders so delegate. The general meeting of shareholders has delegated to the Board of directors the power to cancel or limit the preferential subscription rights of the shareholders when issuing new shares, so long as the issuance of new shares is carried out through a public offering.
If we decide to issue new shares in the future and do not exclude the preferential subscription rights of existing shareholders, we will publish the decision by placing an announcement in the Luxembourg official journal Recueil Electronique des Sociétés et Associations and in a newspaper published in Luxembourg. The announcement will specify the period in which the preferential subscription rights may be exercised. Such period may not be shorter than 14 days from the publication of the offer. The announcement will also specify details regarding the procedure for exercise of the preferential subscription rights. Under Luxembourg law preferential subscription rights are transferable and tradable property rights.
Repurchase of shares
Nexa Resources is prohibited by the 1915 Law from subscribing for its own shares. Nexa Resources may, however, repurchase its own shares or have another person repurchase shares on its behalf, subject to certain conditions, including:
| · | prior authorization of the general meeting of shareholders setting out the terms and conditions of the proposed repurchase, including the maximum number of shares to be repurchased, the duration of the period for which the authorization is given (which may not exceed five years) and the minimum and maximum consideration per share; |
| · | the repurchase may not reduce the net assets of Nexa Resources on a non-consolidated basis to a level below the aggregate of the issued share capital and the reserves that Nexa Resources must maintain pursuant to the 1915 Law or our articles of association; |
| · | only fully paid-up shares may be repurchased; and |
| · | the acquisition offer is made on the same terms and conditions to all the shareholders who are in the same position; however, listed companies may repurchase their own shares on the stock exchange without making an acquisition offer to the shareholders. |
On September 13, 2018, our shareholders authorized us to purchase, acquire, receive or hold and sell shares of Nexa Resources in accordance with the 1915 Law and any other applicable laws and regulations. The authorization was effective immediately after the general meeting and valid for a period of three years. For more information, see “Share ownership and trading—Purchases of equity securities by the issuer and affiliated purchasers.”
|
|
|
Articles of Association |
Form and transfer of shares
Our shares are issued in registered form only and are freely transferable. Luxembourg law does not impose any limitations on the rights of Luxembourg or non-Luxembourg residents to hold or vote our shares.
Under Luxembourg law, the ownership of registered shares is generally evidenced by the inscription of the name of the shareholder, the number of shares held by him or her in the shareholders’ register, which is maintained at our registered office. Each transfer of shares is made by a written declaration of transfer recorded in our shareholders’ register, dated and signed by the transferor and the transferee or by their duly appointed agent. We may accept and enter into its shareholders’ register any transfer based on an agreement between the transferor and the transferee provided a true and complete copy of the agreement is provided to us.
Our articles of association provide that, in case our shares are recorded in the register of shareholders on behalf of one or more persons in the name of a securities settlement system or the operator of such a system, or in the name of a professional depositary of securities or any other depositary or of a sub-depositary designated by one or more depositaries, Nexa—subject to a confirmation in proper form received from the depositary—will permit those persons to exercise the rights attaching to those shares, including admission to and voting at general meetings of shareholders. The Board of directors may determine the requirements with which such confirmations must comply. Shares held in such manner generally have the same rights and obligations as any other shares recorded in our shareholder register(s).
|
|
|
Taxation |
TAXATION
Luxembourg tax considerations
Scope of Discussion
This summary is based on the laws of Luxembourg, including the Income Tax Law of December 4, 1967, as amended, the Municipal Business Tax Act of December 1, 1936, as amended and the Net Wealth Tax Act of October 16, 1934, as amended, to which we jointly refer as the “Luxembourg tax law”, existing and proposed regulations promulgated thereunder, and published judicial decisions and administrative pronouncements, each as in effect on the date of this report or with a known future effective date. This discussion does not generally address any aspects of Luxembourg taxation other than income tax, corporate income tax, municipal business tax, withholding tax and net wealth tax. This discussion, while not being a complete analysis or listing of all of the possible tax consequences of holding and disposing of shares, addresses the material tax issues. Also, there can be no assurance that the Luxembourg tax authorities will not challenge any of the Luxembourg tax consequences described below; in particular, changes in law and/or administrative practice, as well as changes in relevant facts and circumstances, may alter the tax considerations described below.
For purposes of this discussion, a “Luxembourg shareholder” is any beneficial owner of shares that for Luxembourg income tax purposes is:
| § | an individual resident of Luxembourg under article 2 of the Luxembourg Income Tax Law (“LITL”), as amended; or |
| § | a corporation or other entity taxable as a corporation that is organized under the laws of Luxembourg or effectively managed from Luxembourg under article 159 of the Income Tax Law, as amended. |
This discussion does not constitute tax advice and is intended only as a general guide. Shareholders should also consult their own tax advisors as to the Luxembourg tax consequences of the ownership and disposition of our common shares. The summary applies only to shareholders who will own our common shares as capital assets and does not apply to other categories of shareholders, such as dealers in securities, trustees, insurance companies, collective investment schemes and shareholders who have, or who are deemed to have, acquired their shares in the capital of Nexa Resources by virtue of an office or employment.
Shareholders
Luxembourg income tax on dividends and similar distributions
A non-Luxembourg shareholder will not be subject to Luxembourg income taxes on dividend income and similar distributions in respect of our common shares, other than a potential Luxembourg withholding tax as described below, unless the shares are attributable to a permanent establishment or a fixed place of business maintained in Luxembourg by such non-Luxembourg shareholder.
An individual Luxembourg shareholder will be subject to Luxembourg income tax on dividend income and similar distributions in respect of its shares in Nexa Resources at the applicable progressive rates. Such payments may benefit from a 50.0% exemption set forth in Article 115 15a of the LITL, subject to the conditions set out therein. If the 50.0% exemption applies, the applicable income tax will be levied on 50% of the gross amount of the dividends at the applicable progressive rates. Taxable dividends are also subject to dependence insurance contribution levied at a rate of 1.4% on the net income where certain Luxembourg shareholders are affiliated to the Luxembourg social security administration.
A corporate Luxembourg shareholder was subject to Luxembourg corporate income tax (“CIT”) and municipal business tax (“MBT”) at the aggregate rate of 24.94% for entities having their statutory seat in Luxembourg City. The taxable basis of a corporate Luxembourg shareholder will, in principle, correspond to its accounting results, unless a specific treatment is provided for by the LITL. A corporate Luxembourg shareholder may benefit from the Luxembourg participation exemption (the “participation exemption”) with respect to dividends received if the following two conditions are met: (a) the shareholder holds or commits itself to hold at least 10.0% of the share capital of Nexa Resources or a participation with an acquisition price of at least €1.2 million for an uninterrupted period of at least twelve months and (b) the shareholder is a Luxembourg fully taxable corporation. If these cumulative conditions are met, dividends received by the corporate Luxembourg shareholder should be fully exempt from CIT and MBT at the level of the corporate Luxembourg shareholder.
|
|
|
Taxation |
If the conditions with respect to the Luxembourg participation exemption are not met, the corporate Luxembourg shareholders can still benefit from the aforementioned 50.0% exemption, subject to the conditions set out therein.
Luxembourg withholding tax—Share capital reductions or share premium reimbursements
Share capital reductions or share premium reimbursements made by Nexa Resources to the Luxembourg and non-Luxembourg shareholders are in principle subject to a 15% Luxembourg withholding tax, unless they have been motivated by genuine economic reasons. Although genuine economic reasons are not defined by law, Luxembourg tax authorities may examine the given reasons and determine that Nexa Resources does not have distributable reserves or profits in its chart of accounts according to Luxembourg regulations. We do not intend to make capital reductions in the near future. Nexa Resources discloses distributable reserves, retained earnings and profits in its chart of accounts according to Decree dated June 10, 2009. As of December 31, 2023, we have the ability to pay dividends and share premiums. The share premium, if any, may be distributed to the shareholders in accordance with Luxembourg Commercial Companies Act by a resolution of the Board of directors. See “Share ownership and trading—Distributions”.
Luxembourg withholding tax—Distributions to shareholders
A Luxembourg withholding tax of 15.0% is due on dividends and similar distributions made by Nexa Resources to its Luxembourg and non-Luxembourg shareholders unless a Luxembourg domestic dividend withholding tax exemption or a double tax treaty reduction is applicable, as described below. The tax will be withheld by Nexa Resources and remitted to the Luxembourg tax authorities within 8 days as of the date the income is made available to the Luxembourg and non-Luxembourg shareholders.
Exemption from Luxembourg withholding tax—Distributions to shareholders
Dividends paid by Nexa Resources will be exempt from Luxembourg withholding tax provided that the following cumulative conditions are met (or domestic exemption):
| · | at the date of the distribution, the shareholder holds at least 10% of the share capital of Nexa Resources or a participation with an acquisition price of at least €1.2 million for an uninterrupted period of at least twelve months; and |
| · | the dividend is paid to a (i) fully taxable company resident in Luxembourg, (ii) a company resident in a EU Member State fulfilling the conditions of Article 2 of the Parent Subsidiary Directive and listed in the appendix to this directive, (iii) a company resident in a country with which Luxembourg has concluded a double tax treaty and which is fully subject to income tax comparable to the Luxembourg corporate income tax as well as a Luxembourg permanent establishment of such a company, (iv) a company resident of Switzerland and subject to tax without being exempt, (v) a company or a cooperative company resident in a Member State of the European Economic Area, other than a Member State of the EU, and that is fully subject to tax equivalent to the Luxembourg corporate income tax, or (vi) a Luxembourg permanent establishment of a company under (ii) or (v). |
For a shareholder to benefit from such exemption upon a distribution date, Nexa Resources must file a properly competed form 900 with the Luxembourg tax authorities within 8 days following the earlier of (a) the payment date set in the distribution decision or (b) the day following the distribution decision date in case no payment date is fixed. Luxembourg tax authorities may request all relevant documentation showing fulfillment of the above-mentioned conditions (e.g., including a tax residency certificate). Nexa makes no representation that this exemption procedure will be practicable with respect to shares held through a clearing system such as DTC (in the United States).
|
|
|
Taxation |
Alternatively, a shareholder may file a refund request (form 901bis, stamped and validated by the tax authorities of the State of residency of the shareholder) with the Luxembourg tax authorities before December 31 of the year following the taxable event (i.e., the distribution). Nexa makes no representation that this refund procedure will be practicable for a shareholder residing in the United States or any other specific jurisdiction.
A shareholder that does not meet the twelve-month holding period described in the first bullet above can request a refund when the twelve-month period has elapsed. The refund request (form 901bis, stamped and validated by the tax authorities of the State of residency of the shareholder) has to be filed with the Luxembourg tax authorities before December 31 of the year following the taxable event.
Forms 900 and 901bis are generally made available on the website of the Luxembourg tax authorities (Administration des contributions directes).
The application of the dividend withholding tax exemption to taxable companies’ residents in other EU member states or to their EU permanent establishments is not granted if the income allocated is part of a tax avoidance scheme.
Reduction of Luxembourg withholding tax—Distributions to shareholders
As mentioned above, pursuant to the provisions of certain bilateral treaties for the avoidance of double taxation concluded between Luxembourg and other countries, and if certain conditions are met, the aforementioned Luxembourg dividend withholding tax may be reduced. Many such treaties, including the double tax treaty with the United States, provide for a tax rate lower than 15 percent only for a shareholder that holds a substantial (generally, 10 percent or 25 percent) portion of a Luxembourg company’s shares. Shareholders that hold such shares should consult their tax advisors to determine how to benefit from the reduction in withholding tax rates.
A shareholder that is a company resident in a country that has entered a double tax treaty with Luxembourg may qualify for the domestic exemption even if the treaty would not reduce the withholding tax rate applicable to dividends paid to that shareholder.
Luxembourg NWT
A non-Luxembourg shareholder will not be subject to Luxembourg net wealth tax (“NWT”) unless the shares are attributable to a permanent establishment or a fixed place of business maintained in Luxembourg by such non-Luxembourg shareholder.
Luxembourg individual shareholders are not subject to Luxembourg NWT. A Luxembourg corporate shareholder should be subject to Luxembourg NWT in respect of the shares held in the capital of Nexa Resources unless it holds more than 10% or €1.2 million of our common shares.
Luxembourg capital gains tax upon disposal of shares
Capital gains derived by a non-Luxembourg shareholder on the sale of our common shares will not be subject to taxation in Luxembourg, unless one of the following conditions applies:
| · | the shareholder does not benefit from a double tax treaty and (i) holds shares in Nexa Resources representing more than 10% of the share capital of Nexa Resources and such shares were held for less than six months prior to their sale or (ii) has been a resident taxpayer in Luxembourg for at least fifteen years and had acquired nonresident status less than five years prior to the disposal; or |
| · | Our common shares are attributable to a permanent establishment or a fixed place of business maintained in Luxembourg by such non-Luxembourg shareholder. In such case, the non-Luxembourg shareholder is required to recognize capital gains or losses on the sale of such shares, which will be subject to CIT and MBT, unless the participation exemption applies. |
|
|
|
Taxation |
Capital gains realized upon the sale of our common shares by a Luxembourg resident individual will be subject to Luxembourg income tax at the level of the Luxembourg resident individual only in case of (i) speculation gains or (ii) gains realized on a substantial participation.
Speculation gains
Capital gains realized upon the sale of our common shares within a shareholding period not exceeding six months will be subject to personal income taxation (unless such capital gain does not exceed €500) in the hands of a Luxembourg resident individual.
Substantial participation
In case where the Luxembourg resident individual has held the shares for at least six months and had a substantial participation, the capital gains realized will be subject to income tax at a rate equal to half the normal progressive rate applicable. A participation is considered as a substantial participation when a Luxembourg resident individual, jointly with his/her spouse and children under the age of 18, holds or has held, directly or indirectly, at any time during the five years prior to the date of the sale, 10.0% or more of the share capital of Nexa Resources.
Capital gains realized by the Luxembourg corporate shareholder (société de capitaux) should be exempt from capital gains tax in Luxembourg if at the date of the disposal, the Luxembourg shareholder has held or undertakes to hold, for an uninterrupted period of at least 12 months, a direct participation which represents at least 10.0% of the share capital of Nexa Resources, or which acquisition price was at least €6.0 million. If these conditions are not met, the Luxembourg corporate shareholder would be fully taxed on the capital gains realized upon the sale of the common share. The exempt amount of the capital gains realized will be, however, reduced by the amount of any expenses related to the participation, including decreases in the acquisition cost that could have previously reduced such shareholder’s Luxembourg taxable income.
ATAD rules
The European Council has adopted two Anti-Tax Avoidance Directives: Council Directive (EU) 2016/1164 of 12 July 2016 laying down rules against tax avoidance practices that directly affect the functioning of the internal market (“ATAD I”) and Directive 2017/952/EU of 29 May 2017 amending ATAD I as regards hybrid mismatches with third countries (“ATAD II”) that address many of the issues mentioned above. The measures included in ATAD I were implemented into Luxembourg law on December 21, 2018 and almost all of them have been applicable since January 1, 2019. The measures included in ATAD II were implemented into Luxembourg law on December 19, 2019 and almost all of them have been applicable since January 1, 2020, subject to certain exceptions. ATAD I and ATAD II may have a material impact on how returns to shareholders are taxed.
Pillar Two
Pillar Two is focused on implementing a global minimum tax designed to ensure that large multinationals pay a minimum effective tax rate of 15% in every jurisdiction they operate in. Pillar Two is expected to apply to multinational groups with turnover in excess of €750 million. The Pillar Two proposals involve a framework of complex rules which, broadly, would impose top-up taxes on certain entities within a multinational group where the overall tax paid on the group’s profit in any jurisdiction falls below the minimum 15% effective tax rate. The proposed rules for determining whether a top-up tax is required in respect of the group’s profits in a jurisdiction and the allocation of any such top-up tax between the members of the group are detailed and are designed to prevent multinational groups from being able to structure around the rules. It should be noted that a group’s effective tax rate in a jurisdiction may fall below the minimum 15% rate, and therefore a top-up tax may be required, even if that jurisdiction’s statutory headline tax rate is over 15%. On December 15, 2022, the EU Member States adopted a Council Directive (2022/2523) on ensuring a global minimum level of taxation for multinational enterprise (“MNE”) groups and large-scale domestic groups in the EU (“Minimum Tax Directive”). EU Member States had the obligation to implement the Minimum Tax Directive into their national laws before December 31, 2023. The Minimum Tax Directive was implemented into Luxembourg national law on December 22, 2023, and applies to fiscal years starting on or after December 31, 2023.
|
|
|
Taxation |
Peruvian tax considerations
The following is a general summary of material Peruvian tax matters, as in effect on the date of this report, and describes our understanding of the principal tax consequences of an investment in our common shares by a person or entity who is not considered a resident of Peru for tax purposes. This summary is not intended to be a comprehensive description of all the tax considerations that may be relevant to a decision to make an investment in the offered shares.
This summary is based on provisions of the Peruvian income tax law and its regulations in force as of the date hereof. No rulings from the Peruvian tax authorities or judicial rulings address the tax treatment of instruments similar to the shares of Nexa Resources. Accordingly, no assurance can be given that the Peruvian tax authorities will agree with the conclusions described below. If the Peruvian tax authorities were to take a position different from the conclusions described below, the Peruvian income tax consequences of investing in Nexa Resources may differ from those summarized below.
Sale, exchange or disposition of the shares or a beneficial interest therein
Investors who decide to invest in the shares of Nexa Resources hold the shares in book-entry form, in the name of a nominee holding such shares for the investors’ benefit. Any future trading of such shares will be effected through a conveyance of the beneficial interest held by the investors thereupon through the designated clearing mechanism. Because the conveyance of such beneficial interest does not imply the actual transfer of shares, any capital gains resulting from the conveyance of the beneficial interest in such shares, obtained by a person or entity who is not considered a resident of Peru for Peruvian tax purposes, should not be subject to taxation in Peru.
Contrary to the conclusion stated above, if the sale of our common shares were to qualify as an “indirect transfer of Peruvian shares” (and the transfer of the beneficial interest in the shares were to be considered as an actual transfer of such shares), different rules would apply.
According to Peruvian income tax law, an “indirect transfer of Peruvian shares” is deemed to occur when there is a transfer of shares issued by a non-resident company which, in turn, owns—directly or through one or more companies—shares issued by a Peruvian company, and the following two conditions are concurrently met:
(i) during any of the 12 months preceding the transfer, the fair market value (“FMV”) of the shares issued by the Peruvian company held directly or indirectly by the nonresident company which shares are being sold, is equivalent to 50% or more of the FMV of all the shares issued by said non-resident company; and
(ii) during any 12-month period, the shares transferred by a party, including those transferred by its related parties, represent at least 10% of the shares issued by such non-resident company.
Due to recent modifications to Peruvian income tax law, as of January 1, 2019, even if the abovementioned conditions are not met, an indirect transfer of Peruvian shares will also be deemed to exist if the “total value” of shares of the Peruvian company indirectly transferred within any 12-month period is equivalent to or higher than 40,000 Peruvian tax units (S/176 million or US$50.0 million approximately). Said “total value” is determined by multiplying: i) the “percentage” that the FMV of the shares issued by the Peruvian company held (directly or indirectly) by the non-resident company which shares are being transferred, represents with regard to the FMV of all the shares issued by said non-resident company; and ii) the price agreed for the shares issued by the non-resident company directly transferred. To determine the “total value” threshold, transfers made by those parties which qualify as related to the transferor should also be considered. Nonetheless, the “taxable base” shall be determined, in any case, per party, considering the transfers made by the latter within the abovementioned 12-month period, but excluding those transfers previously taxed.
In case the sale of the shares were to qualify as an “indirect transfer of Peruvian shares” (and the transfer of the beneficial interest on the shares were to be considered as an actual transfer of such shares), any capital gain resulting therefrom will be subject to a 30% tax rate in Peru.
In case the corporate investor that makes the indirect transfer of Peruvian shares has a branch or a permanent establishment with assigned assets in Peru, said corporation will be jointly and severally liable for any income tax that resulted from the transfer of Peruvian shares; it will also be obligated to present to the Peruvian tax authority all the information related to the Peruvian shares of the non-resident investor that are being sold, particularly the information referred to the FMV; participation percentages; capital increase or reduction; issuance and placement of shares or participations; reorganization processes; patrimonial values and balance sheets; etc. Investors should consult their own tax advisors about the consequences of the acquisition, ownership, and disposition of their investment in the offered shares or any beneficial interest therein, including the possibility that the tax consequences of investing in the offered shares may differ from the description above.
|
|
|
Taxation |
United States federal income tax considerations
The following is a summary of certain U.S. federal income tax considerations that are likely to be relevant to the purchase, ownership and disposition of our common shares by a U.S. Holder (as defined below).
This summary is based on provisions of the Internal Revenue Code of 1986, as amended (the “Code”), and U.S. Treasury regulations (“Regulations”), rulings and judicial interpretations thereof, in force as of the date hereof, and the U.S.-Luxembourg Treaty dated December 20, 2000 (as amended by any subsequent protocols) (the “Treaty”). Those authorities may be changed at any time, perhaps retroactively, so as to result in U.S. federal income tax consequences different from those summarized below.
This summary is not a comprehensive discussion of all of the tax considerations that may be relevant to a particular investor’s decision to purchase, hold, or dispose of our common shares. In particular, this summary is directed only to U.S. Holders that hold common shares as capital assets and does not address tax consequences to U.S. Holders who may be subject to special tax rules, such as banks, brokers or dealers in securities or currencies, traders in securities electing to mark to market, financial institutions, life insurance companies, tax exempt entities, entities that are treated as partnerships for U.S. federal income tax purposes (or partners therein), holders that own or are treated as owning 10% or more of our common shares by vote or value, persons holding common shares as part of a hedging or conversion transaction or a straddle, nonresident alien individuals present in the United States for more than 182 days in a taxable year, or persons whose functional currency is not the U.S. dollar. Moreover, this summary does not address state, local or foreign taxes, U.S. federal estate and gift taxes, or the Medicare contribution tax applicable to net investment income of certain non-corporate U.S. Holders, or the alternative minimum tax consequences of acquiring, holding or disposing of common shares.
For purposes of this summary, a “U.S. Holder” is a beneficial owner of common shares that is a citizen or resident of the United States, a U.S. domestic corporation or that otherwise is subject to U.S. federal income taxation on a net income basis in respect of such common shares.
U.S. Holders should consult their tax advisors about the consequences of the acquisition, ownership, and disposition of the common shares, including the relevance to their particular situation of the considerations discussed below and any consequences arising under foreign, state, local or other tax laws.
Taxation of dividends
Subject to the discussion below under “Passive Foreign Investment Company Status,” the gross amount of any distribution of cash or property with respect to our common shares that is paid out of our current or accumulated earnings and profits (as determined for U.S. federal income tax purposes) will generally be includible in a U.S. Holder’s taxable income as ordinary dividend income on the day on which the U.S. Holder receives the dividend and will not be eligible for the dividends received deduction allowed to corporations under the Code.
We do not expect to maintain calculations of our earnings and profits in accordance with U.S. federal income tax principles. U.S. Holders therefore should expect that distributions generally will be treated as dividends for U.S. federal income tax purposes.
Subject to certain exceptions for short-term positions, dividends received by an individual with respect to the common shares will be subject to taxation at a preferential rate if the dividends are “qualified dividends.” Dividends paid on the common shares will be treated as qualified dividends if:
| · | the common shares are readily tradable on an established securities market in the United States; and |
|
|
|
Taxation |
| · | we were not, in the year prior to the year in which the dividend was paid, and are not, in the year in which the dividend is paid, a passive foreign investment company (“PFIC”). |
The common shares are listed on the NYSE and will qualify as readily tradable on an established securities market in the United States so long as they are so listed. Based on our consolidated financial statements and certain estimates of our gross income and gross assets, and relying on the Commodity Exception (as defined below under “Passive Foreign Investment Company Status”), we do not believe that we were a PFIC for our 2023 or 2022 taxable years, and we do not anticipate becoming a PFIC for our current taxable year or in the foreseeable future. Accordingly, we expect that dividends paid on the common shares will be treated as qualified dividends. U.S. Holders should consult their tax advisors regarding the availability of the reduced dividend tax rate in light of their own particular circumstances.
Subject to generally applicable limitations and conditions, Luxembourg dividend withholding tax paid at the appropriate rate applicable to the U.S. Holder may be eligible for a credit against such U.S. Holder’s U.S. federal income tax liability. These generally applicable limitations and conditions include new requirements recently adopted by the U.S. Internal Revenue Service (“IRS”) in Regulations promulgated in December 2021, and any Luxembourg tax will need to satisfy these requirements in order to be eligible to be a creditable tax for a U.S. Holder. In the case of a U.S. Holder that either (i) is eligible for, and properly elects, the benefits of the Treaty, or (ii) consistently elects to apply a modified version of these rules under recently issued temporary guidance and complies with specific requirements set forth in such guidance, the Luxembourg tax on dividends will be treated as meeting the new requirements and therefore as a creditable tax. In the case of all other U.S. Holders, the application of these requirements to the Luxembourg tax on dividends is uncertain, and we have not determined whether these requirements have been met. If the Luxembourg dividend tax is not a creditable tax for a U.S. Holder or the U.S. Holder does not elect to claim a foreign tax credit for any foreign income taxes paid or accrued in the same taxable year, the U.S. Holder may be able to deduct the Luxembourg tax in computing such U.S. Holder’s taxable income for U.S. federal income tax purposes. Dividend distributions will constitute income from sources without the United States and, for U.S. Holders that elect to claim foreign tax credits, generally will constitute “passive category income” for foreign tax credit purposes.
The availability and calculation of foreign tax credits and deductions for foreign taxes depend on a U.S. Holder’s particular circumstances and involve the application of complex rules to those circumstances. The temporary guidance discussed above also indicates that the Treasury and IRS are considering proposing amendments to the December 2021 Regulations and that the temporary guidance can be relied upon until additional guidance is issued that withdraws or modifies the temporary guidance. U.S. Holders should consult their own tax advisors regarding the application of these rules to their particular situations.
U.S. Holders that receive distributions of additional common shares or rights to subscribe for common shares as part of a pro rata distribution to all our shareholders generally will not be subject to U.S. federal income tax in respect of the distributions.
Taxation of dispositions of common shares
Subject to the discussion below under “—Passive Foreign Investment Company Status,” a U.S. Holder generally will recognize gain or loss on the sale, exchange or other disposition of common shares in an amount equal to the difference, if any, between the amount realized upon the sale, exchange or other disposition and the U.S. Holder’s adjusted tax basis in the common shares. A U.S. Holder’s adjusted tax basis in its common shares generally will equal the purchase price for the common shares. Any gain or loss will be capital gain or loss and generally will be long-term capital gain or loss if the common shares have been held for more than one year. Long-term capital gain realized by a U.S. Holder that is an individual generally is subject to taxation at a preferential rate. The deductibility of capital losses is subject to limitations. Gain, if any, realized by a U.S. Holder on the sale or other disposition of the common shares generally will be treated as U.S. source income for U.S. foreign tax credit purposes.
Passive foreign investment company status
Special U.S. tax rules apply to companies that are considered to be PFICs. We will be classified as a PFIC in a particular taxable year if either:
|
|
|
Taxation |
| · | 75 percent or more of our gross income for the taxable year is passive income; or |
| · | the average percentage of the value of our assets that produce or are held for the production of passive income is at least 50 percent. |
Passive income generally includes dividends, interest, royalties, rents, annuities, net gains from the sale or exchange of property producing such income, net foreign currency gains, and gains from commodities transactions other than gains that are active business gains from the sale of commodities or arise from “commodity hedging transactions,” within the meaning of the applicable rules (“Commodity Exception”).
Based on our consolidated financial statements and certain estimates of our gross income and gross assets, and relying on the Commodity Exception, we do not believe that we were a PFIC for our 2023 or 2022 taxable years, and we do not anticipate becoming a PFIC for our current taxable year or in the foreseeable future. However, since PFIC status will be determined by us on an annual basis and since such status depends upon the composition of our income and assets, and the nature of our activities (including our ability to qualify for the Commodity Exception or any similar exceptions), from time to time, there can be no assurance that we will not be considered a PFIC for any taxable year. In the event that, contrary to our expectation, we are classified as a PFIC in any year, and a U.S. Holder does not make a mark-to-market election, as described in the following paragraph, the U.S. Holder will be subject to a special tax at ordinary income tax rates on “excess distributions,” including certain distributions by us and gain that the U.S. Holder recognizes on the sale of the common shares. The amount of income tax on any excess distributions will be increased by an interest charge to compensate for tax deferral, calculated as if the excess distributions were earned ratably over the period that the U.S. Holder holds the common shares. Classification as a PFIC may also have other adverse tax consequences.
A U.S. Holder can avoid the unfavorable rules described in the preceding paragraph by electing to mark the common shares to market. If a U.S. Holder makes this mark-to-market election, the U.S. Holder will be required in any year in which we are a PFIC to include as ordinary income the excess of the fair market value of the U.S. Holder’s common shares at year-end over the U.S. Holder’s basis in those shares. If a U.S. Holder’s basis in the common shares exceeds the shares’ fair market value at the end of the U.S. Holder’s taxable year, the U.S. Holder will be entitled to deduct the excess as an ordinary loss, but only to the extent of its net mark-to-market gains from previous years. The U.S. Holder’s basis in the shares will be adjusted to reflect the gain or loss. In addition, any gain that the U.S. Holder recognizes upon the sale of the common shares will be taxed as ordinary income in the year of sale.
A U.S. Holder that owns an equity interest in a PFIC must annually file IRS Form 8621 and may be required to file other IRS forms. A failure to file one or more of these forms as required may toll the running of the statute of limitations in respect of each of the U.S. Holder’s taxable years for which such form is required to be filed. As a result, the taxable years with respect to which the U.S. Holder fails to file the form may remain open to assessment by the IRS indefinitely, until the form is filed.
U.S. Holders should consult their tax advisors regarding the U.S. federal income tax considerations discussed above and the desirability of making a mark-to-market election if we were to be classified as a PFIC.
Foreign financial asset reporting
Individual U.S. Holders that own “specified foreign financial assets” with an aggregate value in excess of US$50,000 on the last day of the taxable year or US$75,000 at any time during the taxable year are generally required to file an information statement along with their tax returns, currently on Form 8938, with respect to such assets. “Specified foreign financial assets” include any financial accounts held at a non-U.S. financial institution, as well as securities issued by a non-U.S. issuer that are not held in accounts maintained by financial institutions. Higher reporting thresholds apply to certain individuals living abroad and to certain married individuals. Regulations extend this reporting requirement to certain entities that are treated as formed or availed of to hold direct or indirect interests in specified foreign financial assets based on objective criteria. U.S. Holders who fail to report the required information could be subject to substantial penalties. In addition, the statute of limitations for assessment of tax would be suspended, in whole or part. Prospective investors are encouraged to consult with their tax advisors regarding the possible application of these rules, including the application of the rules to their particular circumstances.
|
|
|
Taxation |
Backup withholding and information reporting
Dividends paid on, and proceeds from the sale or other disposition of, the common shares to a U.S. Holder generally may be subject to the information reporting requirements of the Code and may be subject to backup withholding unless the U.S. Holder provides an accurate taxpayer identification number and makes any other required certification or otherwise establishes an exemption. Backup withholding is not an additional tax. The amount of any backup withholding from a payment to a U.S. Holder will be allowed as a refund or credit against the U.S. Holder’s U.S. federal income tax liability, provided the required information is furnished to the IRS in a timely manner.
A holder that is a foreign corporation or a non-resident alien individual may be required to comply with certification and identification procedures in order to establish its exemption from information reporting and backup withholding.
|
|
|
Exchange Controls and Other Limitations Affecting Security Holders |
EXCHANGE CONTROLS AND OTHER LIMITATIONS AFFECTING SECURITY HOLDERS
We are not aware of any governmental laws, decrees, regulations or other legislation in Luxembourg that restrict the export or import of capital, including the availability of cash and cash equivalents for use by our affiliated companies, or that affect the remittance of dividends, interest or other payments to non-resident holders of our securities, except for regulations restricting the remittance of dividends and other payments in compliance with United Nations and EU sanctions.
|
|
|
Evaluation of Disclosure Controls and Procedures |
EVALUATION OF DISCLOSURE CONTROLS AND PROCEDURES
Our management, with the participation of our chief executive officer and chief financial officer, has evaluated the effectiveness of our disclosure controls and procedures as of December 31, 2023. There are inherent limitations to the effectiveness of any system of disclosure controls and procedures, including the possibility of human error and the circumvention or overriding of the controls and procedures. Accordingly, even effective disclosure controls and procedures can only provide reasonable assurance of achieving their control objectives.
We have evaluated, with the participation of our chief executive officer and chief financial officer, the effectiveness of our disclosure controls and procedures as of December 31, 2023. Based on our evaluation, our chief executive officer and chief financial officer concluded that our disclosure controls and procedures were effective as of December 31, 2023.
|
|
|
Internal Control Over Financial Reporting |
INTERNAL CONTROL OVER FINANCIAL REPORTING
Management report on internal control over financial reporting
Our management is responsible for establishing and maintaining adequate internal control over financial reporting and for assessing its effectiveness.
Our internal control over financial reporting is a process designed by, or under the supervision of, our chief executive officer and our chief financial officer, and effected by our Board of directors, management and other employees, and is designed to provide reasonable assurance regarding the reliability of financial reporting and of the preparation of our consolidated financial statements, in accordance with IFRS accounting standards and interpretations, as issued by the International Accounting Standards Board (“IASB”) and the IFRS Interpretations Committee (“IFRS Accounting Standards”).
Due to its inherent limitations, internal control over financial reporting may not prevent or detect misstatements. In addition, projections of any evaluation of effectiveness of internal control over financial reporting to future periods are subject to the risk that controls may become inadequate because of changes in conditions, or that the degree of compliance with our policies or procedures may deteriorate.
Our management has assessed the effectiveness of our internal control over financial reporting as of December 31, 2023, based upon the criteria established in Internal Controls—Integrated Framework (2013), issued by the Committee of Sponsoring Organizations of Treadway Commission (“COSO”). Based on this assessment and criteria, our management has concluded that our internal control over financial reporting was effective as of December 31, 2023.
Audit of the effectiveness of internal control over financial reporting
Our independent registered public accounting firm, PricewaterhouseCoopers Auditores Independentes Ltda., has audited the effectiveness of our internal control over financial reporting, as stated in their report as of December 31, 2023.
Changes in internal control over financial reporting
There were no changes in our internal control over financial reporting during the fiscal year of 2023, which have materially affected, or are reasonably likely to materially affect, our internal control over financial reporting.
|
|
|
Principal Accountant Fees and Services |
PRINCIPAL ACCOUNTANT FEES AND SERVICES
The following table summarizes the fees billed to us by our independent auditors PricewaterhouseCoopers Auditores Independentes Ltda. for professional services in 2023 and 2022:
|
For the Year Ended December 31, |
||
|
2023 |
2022 |
|
| (US$ thousand) | ||
| Audit fees | 1,839.7 | 2,132.1 |
| Audit-related fees | 128.4 | 107.0 |
| Tax fees | - | - |
| Other fees |
- |
- |
| Total fees |
1,968.1 |
2,239.1 |
“Audit fees” are the aggregate fees billed by PricewaterhouseCoopers Auditores Independentes Ltda. for the audit of our annual financial statements, the audit of the statutory financial statements of our subsidiaries, and reviews of interim financial statements and attestation services that are provided in connection with statutory and regulatory filings or engagements. They also include fees for services that only the independent auditor reasonably can provide, including the provision of comfort letters and consents in connection with statutory and regulatory filings and the review of documents filed with the SEC and other capital markets or local financial reporting regulatory bodies. “Audit-related fees” are fees charged by PricewaterhouseCoopers Auditores Independentes Ltda. for assurance and related services that are reasonably related to the performance of the audit or review of our consolidated financial statements and are not reported under “Audit fees”. “Tax fees” are the aggregate fees billed by PricewaterhouseCoopers Auditores Independentes Ltda. for services rendered for tax compliance, tax advice and tax planning. “Other fees” are the aggregate fees billed by PricewaterhouseCoopers Auditores Independentes Ltda. for services related with assurance and review procedures not related with regulatory or financial reporting of our consolidated financial statements.
Nexa has established policies and procedures that require any engagement of our independent auditor for audit or non-audit services to be submitted to and pre-approved by the Audit committee. In addition, our Audit committee may delegate the authority to pre-approve non-audit services to one or more of its members. All non-audit services that are pre-approved pursuant to such delegated authority must be presented to the full Audit committee at its first scheduled meeting following such pre-approval. Our Audit committee also has the authority to recommend pre-approval policies and procedures to our Board of directors and for the engagement of our independent auditor’s services.
|
|
|
Information Filed with Securities Regulators |
INFORMATION FILED WITH SECURITIES REGULATORS
We are subject to various information and disclosure requirements in those countries in which our securities are traded, and we file financial statements and other periodic reports with the SEC and Canadian securities regulatory authorities.
| · | United States. We are subject to the information requirements of the Securities Exchange Act of 1934, as amended, and accordingly file reports and other information with the SEC. Our SEC filings are available to the public from the SEC at http://www.sec.gov. You may also inspect Nexa Resources’ reports and other information at the offices of the New York Stock Exchange, 11 Wall Street, New York, New York 10005, on which our common shares are listed. For further information on obtaining copies of Nexa Resources’ public filings at the NYSE, you should call (212) 656-5060. |
| · | Canada. We must comply with certain Canadian periodic and ongoing disclosure rules under applicable Canadian provincial and territorial securities laws. However, with respect to the rules under applicable Canadian provincial and territorial securities laws, we are able to rely on certain exemptions from many of the requirements under such laws through our compliance with U.S. disclosures given our status in the U.S. as a foreign private issuer. Our Canadian filings are available to the public from the website maintained by the Canadian Securities Administrators at www.sedarplus.ca. |
|
|
|
Glossary |
GLOSSARY
Brownfields project: An exploration or development project near or within an existing operation, which can share infrastructure and management.
Concentration: The process by which crushed and ground ore is separated into metal concentrates and reject material through processes such as flotation.
Concentrate plant: A plant where metal concentration occurs.
Cut-off grade: is the grade (i.e., the concentration of metal or mineral in rock) that determines the destination of the material during mining.
Development: The process of constructing a mining facility and the infrastructure to support the facility is known as mine development.
Diamond drilling: A method of drilling that uses a diamond bit, which rotates at the end of a drill rod or pipe.
Exploration: Activities associated with ascertaining the existence, location, extent or quality of a mineral deposit.
Exploration stage property: is a property that has no mineral reserves disclosed.
Greenfields project: An exploration or development project that is located outside the area of influence of existing mine operations and/or infrastructure and will be independently developed and managed.
Indicated Mineral Resource: is that part of a Mineral Resource for which quantity and grade or quality are estimated on the basis of adequate geological evidence and sampling. The level of geological certainty associated with an indicated mineral resource is sufficient to allow a qualified person to apply modifying factors in sufficient detail to support mine planning and evaluation of the economic viability of the deposit.
Inferred Mineral Resource: is that part of a Mineral Resource for which quantity and grade or quality are estimated on the basis of limited geological evidence and sampling. The level of geological uncertainty associated with an inferred mineral resource is too high to apply relevant technical and economic factors likely to influence the prospects of economic extraction in a manner useful for evaluation of economic viability.
km: kilometer.
ktpd: thousand tonnes per day.
LBMA: The London Bullion Market Association.
LME: London Metal Exchange.
LOM: life of mine.
Measured Mineral Resource: is that part of a Mineral Resource for which quantity and grade or quality, are estimated on the basis of conclusive geological evidence and sampling. The level of geological certainty associated with a measured mineral resource is sufficient to allow a qualified person to apply modifying factors, as defined in this section, in sufficient detail to support detailed mine planning and final evaluation of the economic viability of the deposit.
Metal concentrate: The crushed and ground material obtained after concentration, including zinc, lead and copper concentrates. This is the product from our mining operations. Most of the zinc concentrate we produce is used in our smelting operations and the remaining portion, along with our lead and copper concentrates, is sold to our customers.
|
|
|
Glossary |
Metallic zinc: Pure metal (99.995% zinc) obtained from the electrodeposition of a zinc sulfate solution, free of impurities, through the Roaster-Leaching-Electrolysis (“RLE”) process.
Mineralization: The process or processes by which a mineral or minerals are introduced into a rock, resulting in a potentially valuable or valuable deposit.
Mineralized material: Mineral bearing material that has been physically delineated by one or more methods, including drilling and underground work, and is supported by sampling and chemical analysis. This material has been found to contain a sufficient amount of mineralization of an average grade of metal or metals to have economic potential that warrants further exploration evaluation. While this material is not currently or may never be classified as ore reserves, it is reported as mineralized material only if the potential exists for reclassification into the reserves category. This material cannot be classified in the reserves category until final technical, economic and legal factors have been determined. Under the SEC’s standards, a mineral deposit does not qualify as a reserve unless it can be economically and legally extracted at the time of reserve determination and it constitutes a proven or probable reserve (as defined below).
Mineral Reserve: is an estimate of tonnage and grade or quality of indicated and measured mineral resources that, in the opinion of the qualified person, can be the basis of an economically viable project. More specifically, it is the economically mineable part of a measured or indicated mineral resource, which includes diluting materials and allowances for losses that may occur when the material is mined or extracted.
Mineral Resource: is a concentration or occurrence of material of economic interest in or on the Earth's crust in such form, grade or quality, and quantity that there are reasonable prospects for eventual economic extraction. A mineral resource is a reasonable estimate of mineralization, taking into account relevant factors such as cut-off grade, likely mining dimensions, location or continuity that, with the assumed and justifiable technical and economic conditions, is likely to, in whole or in part, become economically extractable.
Mine site: An economic unit comprised of an underground and/or open pit mine, a treatment plant and equipment and other facilities necessary to produce metals concentrates, in existence at a certain location.
NSR: Net Smelter Return is the net revenue that the owner of a mining property receives from the sale of the mine’s metal/nonmetal products less transportation and refining costs.
Open pit: Surface mining in which the ore is extracted from a pit. The geometry of the pit may vary with the characteristics of the ore body.
Ore: A mineral or aggregate of minerals from which metal can be economically mined or extracted.
Ore grade: The average amount of metal expressed as a percentage, grams per tonne or in ounces per tonne.
Ounces or oz: Unit of weight. A troy ounce equals 31.1034 grams. All references to ounces in this report are to troy ounces unless otherwise specified.
Probable Mineral Reserve: is the economically mineable part of an indicated and, in some cases, a measured mineral resource.
Production stage property: is a property with material extraction of mineral reserves.
Proven Mineral Reserve: is the economically mineable part of a measured mineral resource and can only result from conversion of a measured mineral resource.
Qualified Person: An individual who is a mineral industry professional with at least five years of relevant experience in the type of mineralization and type of deposit under consideration in the specific type of activity that person is undertaking on behalf of the registrant and an eligible member or licensee n good standing of a recognized professional organization at the time the technical report is prepared.
Reclamation: The process of stabilizing, contouring, maintaining, conditioning and/or reconstructing the surface of disturbed land (i.e., used or affected by the execution of mining activities) to a state of “equivalent land ” Reclamation standards vary widely, but usually address issues of ground and surface water, topsoil, final slope gradients, overburden and revegetation.
|
|
|
Glossary |
Refining: The process of purifying an impure metal; the purification of crude metallic substances.
Secondary feed materials: By-products of industrial processes such as smelting and refining that are then available for further treatment/recycling. It can cover foundry ashes, zinc oxides from brass and bronze production, electric arc furnace (“EAF”) dust and slags.
SHG: Special High Grade.
Skarn: Metamorphic zone developed in the contact area around igneous rock intrusions when carbonate sedimentary rocks are invaded by large amounts of silicon, aluminum, iron and magnesium. The minerals commonly present in a skarn include iron oxides, calc-silicates, andradite and grossularite garnet, epidote and calcite. Many skarns also include ore minerals. Several productive deposits of copper or other base metals have been found in and adjacent to skarns.
Tailings: Finely ground rock from which valuable minerals have been extracted by concentration.
Tonne: A unit of weight. One metric tonne equals 2,204.6 pounds or 1,000 kilograms. One short tonne equals 2,000 pounds. Unless otherwise specified, all references to “tonnes” in this report refer to metric tonnes.
Zinc equivalent: A metric used to compare mineralization that is comprised of different metals in terms of zinc. Copper, lead, silver and gold contents in our concentrate production have been converted to a zinc equivalent grade at the average benchmark prices for 2023, i.e., US$2,649.04 per tonne (US$1.20 per pound) for zinc, US$8,483.40 per tonne (US$3.85 per pound) for copper, US$2,137.18 per tonne (US$0.97 per pound) for lead, US$23.39 per ounce for silver and US$1,942.74 per ounce for gold.
Zinc oxide: A chemical compound that results from the sublimation of zinc (Zn-metal) by oxygen in the atmosphere. Zinc oxide is in the form of powder or fine grains that is insoluble in water but very soluble in acid solutions.
|
|
|
Exhibits |
EXHIBITS
|
|
|
Signatures |
SIGNATURES
The registrant hereby certifies that it meets all of the requirements for filing on Form 20-F and that it has duly caused and authorized the undersigned to sign this annual report on its behalf.
|
NEXA RESOURCES S.A.
|
|||
| By: |
/s/ Ignacio Rosado |
||
| Name: | Ignacio Rosado | ||
| Title: | President and Chief Executive Officer | ||
| By: |
/s/ José Carlos del Valle |
||
| Name: | José Carlos del Valle | ||
| Title: | Senior Vice President of Finance and Group Chief Financial Officer | ||
Date: March 27, 2024
|
|
|
Financial Statements |
NEXA RESOURCES S.A. FINANCIAL STATEMENTS
|
|

Nexa Resources S.A.
Consolidated financial statements at December 31, 2023 and report of independent registered public accounting firm
Contents
Consolidated financial statements
Notes to the consolidated financial statements
Nexa Resources S.A.
Consolidated income statement
Years ended on December 31
All amounts in thousands of US dollars, unless otherwise stated
| Note | 2023 | 2022 | 2021 | ||||
| Net revenues | 6 | 2,573,233 | 3,033,990 | 2,622,110 | |||
| Cost of sales | 7 | (2,276,757) | (2,395,180) | (1,989,019) | |||
| Gross profit | 296,476 | 638,810 | 633,091 | ||||
| Operating expenses | |||||||
| Selling, general and administrative | 7 | (126,948) | (145,543) | (133,803) | |||
| Mineral exploration and project evaluation | 8 | (99,666) | (98,862) | (85,043) | |||
| Impairment loss of long-lived assets | 31 | (114,643) | (32,512) | - | |||
| Other income and expenses, net | 9 | (110,584) | (2,674) | 31,948 | |||
| Total operating expenses | (451,841) | (279,591) | (186,898) | ||||
| Operating (loss) income | (155,365) | 359,219 | 446,193 | ||||
| Results from associates equity | |||||||
| Share in the results of associates | 23,536 | 1,885 | - | ||||
| Total results from associates' equity | 23,536 | 1,885 | - | ||||
| Net financial results | 10 | ||||||
| Financial income | 25,503 | 25,018 | 11,472 | ||||
| Financial expenses | (204,184) | (168,694) | (142,275) | ||||
| Other financial items, net | 17,040 | 9,949 | (6,099) | ||||
| Total net financial results | (161,641) | (133,727) | (136,902) | ||||
| (Loss) income before income tax | (293,470) | 227,377 | 309,291 | ||||
| Income tax benefit (expense) | 11 (a) | 4,274 | (150,983) | (153,204) | |||
| Net (loss) income for the year | (289,196) | 76,394 | 156,087 | ||||
| Attributable to NEXA's shareholders | (289,354) | 49,101 | 114,332 | ||||
| Attributable to non-controlling interests | 158 | 27,293 | 41,755 | ||||
| Net (loss) income for the year | (289,196) | 76,394 | 156,087 | ||||
| Weighted average number of outstanding shares – in thousands | 132,439 | 132,439 | 132,439 | ||||
| Basic and diluted (losses) earnings per share – USD | 30 (f) | (2.18) | 0.37 | 0.86 |
The accompanying notes are an integral part of these consolidated financial statements
|
|
Nexa Resources S.A.
Consolidated statement of comprehensive income
Years ended on December 31
All amounts in thousands of US dollars, unless otherwise stated
| Note | 2023 | 2022 | 2021 | ||||
| Net (loss) income for the year | (289,196) | 76,394 | 156,087 | ||||
| Other comprehensive income (loss), net of income tax - items that can be reclassified to the income statement | |||||||
| Cash flow hedge accounting | 16 (c) | 732 | (1,329) | 488 | |||
| Deferred income tax | (1,269) | 998 | (161) | ||||
| Translation adjustment of foreign subsidiaries | 30 (e) | 81,315 | 65,243 | (64,575) | |||
| Total Other comprehensive income (loss), net of income tax - items that can be reclassified to the income statement | 80,778 | 64,912 | (64,248) | ||||
| Other comprehensive income (loss), net of income tax - items that will not be reclassified to the income statement | |||||||
| Changes in fair value of financial liabilities related to changes in the Company’s own credit risk | 24 (c) | (583) | 521 | (5,066) | |||
| Deferred income tax | 198 | (178) | (2,375) | ||||
| Changes in fair value of investments in equity instruments | (1,466) | (3,608) | (2,632) | ||||
| Total Other comprehensive loss, net of income tax - items that will not be reclassified to the income statement | (1,851) | (3,265) | (10,073) | ||||
| Other comprehensive income (loss) for the year, net of income tax | 78,927 | 61,647 | (74,321) | ||||
| Total comprehensive (loss) income for the year | (210,269) | 138,041 | 81,766 | ||||
| Attributable to NEXA’s shareholders | (215,324) | 105,972 | 43,828 | ||||
| Attributable to non-controlling interests | 5,055 | 32,069 | 37,938 | ||||
| Total comprehensive (loss) income for the year | (210,269) | 138,041 | 81,766 |
The accompanying notes are an integral part of these consolidated financial statements
|
|
Nexa Resources S.A.
Consolidated statement of balance sheet
Years ended on December 31
All amounts in thousands of US dollars, unless otherwise stated
| Assets | Note | 2023 | 2022 | |
| Current assets | ||||
| Cash and cash equivalents | 15 | 457,259 | 497,826 | |
| Financial investments | 11,058 | 18,062 | ||
| Other financial instruments | 16 (a) | 7,801 | 7,380 | |
| Trade accounts receivables | 17 | 141,910 | 223,740 | |
| Inventory | 18 | 339,671 | 395,197 | |
| Recoverable income tax | 15,193 | 2,455 | ||
| Other assets | 19 | 86,934 | 75,486 | |
| Tatal Current assets | 1,059,826 | 1,220,146 | ||
| Non-current assets | ||||
| Investments in equity instruments | 14 (c) | 5,649 | 7,115 | |
| Other financial instruments | 16 (a) | 92 | 63 | |
| Deferred income tax | 11 (b) | 235,073 | 166,983 | |
| Recoverable income tax | 6,237 | 4,914 | ||
| Other assets | 19 | 129,614 | 134,474 | |
| Investments in associates | 44,895 | 38,990 | ||
| Property, plant and equipment | 21 | 2,438,614 | 2,295,275 | |
| Intangible assets | 22 | 909,279 | 1,016,927 | |
| Right-of-use assets | 23 | 11,228 | 6,895 | |
| Total Non-current assets | 3,780,681 | 3,671,636 | ||
| Total assets | 4,840,507 | 4,891,782 | ||
| Liabilities and shareholders’ equity | ||||
| Current liabilities | ||||
| Loans and financings | 24 (a) | 143,196 | 50,840 | |
| Lease liabilities | 23 (b) | 3,766 | 3,661 | |
| Other financial instruments | 16 (a) | 19,077 | 11,435 | |
| Trade payables | 25 | 451,603 | 413,856 | |
| Confirming payables | 26 | 234,385 | 216,392 | |
| Dividends payable | 2,830 | 7,922 | ||
| Dams, asset retirement and environmental obligations | 27 | 33,718 | 23,646 | |
| Contractual obligations | 29 | 37,432 | 26,188 | |
| Salaries and payroll charges | 68,165 | 79,078 | ||
| Tax liabilities | 49,524 | 40,610 | ||
| Other liabilities | 31,186 | 25,136 | ||
| Total Current liabilities | 1,074,882 | 898,764 | ||
| Non-current liabilities | ||||
| Loans and financings | 24 (a) | 1,582,370 | 1,618,419 | |
| Lease liabilities | 23 (b) | 5,452 | 1,360 | |
| Other financial instruments | 16 (a) | 27,045 | 20,416 | |
| Dams, asset retirement and environmental obligations | 27 | 281,201 | 242,673 | |
| Provisions | 28 | 56,787 | 43,897 | |
| Deferred income tax | 11 (b) | 183,698 | 199,499 | |
| Contractual obligations | 29 | 79,680 | 105,972 | |
| Other liabilities | 92,758 | 50,528 | ||
| Total Non-current liabilities | 2,308,991 | 2,282,764 | ||
| Total liabilities | 3,383,873 | 3,181,528 | ||
| Shareholders’ equity | 30 | |||
| Attributable to NEXA’s shareholders | 1,201,921 | 1,442,245 | ||
| Attributable to non-controlling interests | 254,713 | 268,009 | ||
| Total Shareholders' equity | 1,456,634 | 1,710,254 | ||
| Total liabilities and shareholders’ equity | 4,840,507 | 4,891,782 |
The accompanying notes are an integral part of these consolidated financial statements
|
|
Nexa Resources S.A.
Consolidated statement of cash flow
Years ended on December 31
All amounts in thousands of US dollars, unless otherwise stated
| Note | 2023 | 2022 | 2021 | |
| Cash flows from operating activities | ||||
| (Loss) income before income tax | (293,470) | 227,377 | 309,291 | |
| Depreciation and amortization | 21,22 and 23 | 298,393 | 290,937 | 258,711 |
| Impairment loss of long-lived assets | 31 | 114,643 | 32,512 | - |
| Share in the results of associates | (23,536) | (1,885) | - | |
| Interest and foreign exchange effects | 131,988 | 126,545 | 143,496 | |
| Loss on sale of property, plant and equipment and intangible assets | 9 | 3,734 | 698 | 4,891 |
| Dams obligations | 9 | 6,960 | - | - |
| Changes in provisions and other assets impairments | (37,800) | 84,393 | 21,325 | |
| Tax voluntary disclosure – VAT discussions | 9 (iv) | 102,939 | - | - |
| Changes in fair value of loans and financings | 24 (c) | 525 | 1,472 | (19,380) |
| Changes in fair value of derivative financial instruments | 16 (c) | (12,514) | (14,947) | 26,408 |
| Changes in fair value of energy forward contracts | 16 (d) | 15,663 | - | - |
| Changes in fair value of offtake agreement | 16 (e) | (2,268) | (24,267) | - |
| Contractual obligations | 29 (a) | 10,121 | 10,565 | 19,580 |
| Generation Scaling Factor recovered costs | - | - | (19,407) | |
| Decrease (increase) in assets | ||||
| Trade accounts receivables | 58,067 | (29,215) | (54,684) | |
| Inventory | 127,002 | (75,071) | (102,068) | |
| Other financial instruments | 13,271 | 8,648 | (14,936) | |
| Other assets | (70,948) | (72,607) | (47,312) | |
| Increase (decrease) in liabilities | ||||
| Trade payables | (451) | (32,476) | 44,880 | |
| Confirming payables | 17,074 | (16,348) | 87,565 | |
| Other liabilities | (42,785) | (17,448) | 2,759 | |
| Cash provided by operating activities | 416,608 | 498,883 | 661,119 | |
| Interest paid on loans and financings | 24 (c) | (113,018) | (109,263) | (121,112) |
| Interest paid on lease liabilities | 23 (b) | (553) | (994) | (1,415) |
| Premium paid on bonds repurchase | - | (3,277) | - | |
| Income tax paid | (56,191) | (118,719) | (45,607) | |
| Net cash provided by operating activities | 246,846 | 266,630 | 492,985 | |
| Cash flows from investing activities | ||||
| Additions of property, plant and equipment | (310,150) | (382,468) | (485,204) | |
| Additions of intangible assets | (3,087) | (4,595) | - | |
| Net sales of financial investments | 19,556 | 10,647 | 20,076 | |
| Proceeds from the sale of property, plant and equipment | 1,229 | 751 | 2,210 | |
| Investments in equity instruments | - | (7,000) | (6,356) | |
| Acquisition of additional shares in associates | - | (4,136) | - | |
| Dividends received from associates | 30 (g) | 22,100 | 7,867 | - |
| Net cash used in investing activities | (270,352) | (378,934) | (469,274) | |
| Cash flows from financing activities | ||||
| New loans and financings | 24 (c) | 56,408 | 95,621 | 59,771 |
| Debt issue costs | 24 (c) | (74) | (63) | (178) |
| Payments of loans and financings | 24 (c) | (27,087) | (24,639) | (251,044) |
| Prepayment of fair value debt | - | - | (90,512) | |
| Bonds repurchase | 24 (c) | - | (128,470) | - |
| Payments of lease liabilities | 23 (b) | (5,818) | (17,091) | (9,827) |
| Dividends paid | 30 (g) | (23,713) | (68,466) | (52,344) |
| Payments of share premium | 30 (g) | (25,000) | (6,126) | - |
| Net cash used in financing activities | (25,284) | (149,234) | (344,134) | |
| Foreign exchange effects on cash and cash equivalents | 8,223 | 15,547 | (21,923) | |
| Decrease in cash and cash equivalents | (40,567) | (245,991) | (342,346) | |
| Cash and cash equivalents at the beginning of the year | 497,826 | 743,817 | 1,086,163 | |
| Cash and cash equivalents at the end of the year | 457,259 | 497,826 | 743,817 | |
| Non-cash investing and financing transactions | ||||
| Additions to right-of-use assets | 23 (a) | (10,304) | (2,018) | (5,174) |
| Additions to intangible assets related to GSF recovered costs | - | - | (19,407) | |
| Write-offs of property, plant and equipment | 21 (a) | 4,089 | 1,449 | 3,343 |
| Write-offs of right of use assets | 23 (a) | 874 | - | - |
| Additions to intangible assets related to offtake agreement and other intangibles | - | (52,934) | - | |
| Increase in investment in associates | - | (32,456) | - | |
| Derecognition of Nexa’s share of Enercan’s property, plant and equipment, intangible assets and financial investments | 4(ii) | - | 46,858 | - |
The accompanying notes are an integral part of these consolidated financial statements
|
|
Nexa Resources S.A.
Consolidated statement of changes in shareholders’ equity
At and for the years ended on December 31
All amounts in thousands of US dollars, unless otherwise stated
| Capital | Share premium | Additional paid in capital | Retained earnings (cumulative deficit) | Accumulated other comprehensive loss | Total NEXA’s shareholders | Non-controlling interests | Total shareholders’ equity | |
| At January 1, 2021 | 132,438 | 1,043,755 | 1,245,418 | (814,675) | (229,491) | 1,377,445 | 243,799 | 1,621,244 |
| Net income for the year | - | - | - | 114,332 | - | 114,332 | 41,755 | 156,087 |
| Other comprehensive loss for the year | - | - | - | - | (70,504) | (70,504) | (3,817) | (74,321) |
| Total comprehensive income (loss) for the year | - | - | - | 114,332 | (70,504) | 43,828 | 37,938 | 81,766 |
| Transfer of the changes in fair value of prepaid debt related to changes in the Company’s own credit risk to retained earnings | - | - | - | (10,965) | 10,965 | - | - | - |
| Dividends distribution to NEXA's shareholders - USD 0.26 per share | - | - | - | (35,000) | - | (35,000) | - | (35,000) |
| Dividends distribution to non-controlling interests | - | - | - | - | - | - | (23,730) | (23,730) |
| Total contributions by and distributions to shareholders | - | - | - | (45,965) | 10,965 | (35,000) | (23,730) | (58,730) |
| At December 31, 2021 | 132,438 | 1,043,755 | 1,245,418 | (746,308) | (289,030) | 1,386,273 | 258,007 | 1,644,280 |
| Net income for the year | - | - | - | 49,101 | - | 49,101 | 27,293 | 76,394 |
| Other comprehensive income for the year | - | - | - | - | 56,871 | 56,871 | 4,776 | 61,647 |
| Total comprehensive income (loss) for the year | - | - | - | 49,101 | 56,871 | 105,972 | 32,069 | 138,041 |
|
Dividends distribution to NEXA's shareholders – USD 0.33 per share – note 30 (g) |
- | - | - | (43,874) | - | (43,874) | - | (43,874) |
|
Share premium distribution to NEXA's shareholders – USD 0.05 per share – note 30 (g) |
- | (6,126) | - | - | - | (6,126) | - | (6,126) |
| Dividends distribution to non-controlling interests | - | - | - | - | - | - | (23,075) | (23,075) |
| Other equity movements | - | - | - | - | - | - | 1,008 | 1,008 |
| Total contributions by and distributions to shareholders | - | (6,126) | - | (43,874) | - | (50,000) | (22,067) | (72,067) |
| At December 31, 2022 | 132,438 | 1,037,629 | 1,245,418 | (741,081) | (232,159) | 1,442,245 | 268,009 | 1,710,254 |
The accompanying notes are an integral part of these consolidated financial statements
|
|
Nexa Resources S.A.
Consolidated statement of changes in shareholders’ equity
At and for the years ended on December 31
All amounts in thousands of US dollars, unless otherwise stated
| Capital | Share premium | Additional paid in capital | Retained earnings (cumulative deficit) | Accumulated other comprehensive loss | Total NEXA’s shareholders | Non-controlling interests | Total shareholders’ equity | |
| At January 1, 2023 | 132,438 | 1,037,629 | 1,245,418 | (741,081) | (232,159) | 1,442,245 | 268,009 | 1,710,254 |
| Net (loss) income for the year | - | - | - | (289,354) | - | (289,354) | 158 | (289,196) |
| Other comprehensive income for the year | - | - | - | - | 74,030 | 74,030 | 4,897 | 78,927 |
| Total comprehensive (loss) income for the year | - | - | - | (289,354) | 74,030 | (215,324) | 5,055 | (210,269) |
|
Share premium distribution to NEXA's shareholders – USD 0.19 per share – note 30 (g) |
- | (25,000) | - | - | - | (25,000) | - | (25,000) |
| Dividends distribution to non-controlling interests – note 30 (g) | - | - | - | - | - | - | (18,351) | (18,351) |
| Total distributions to shareholders | - | (25,000) | - | - | - | (25,000) | (18,351) | (43,351) |
| At December 31, 2023 | 132,438 | 1,012,629 | 1,245,418 | (1,030,435) | (158,129) | 1,201,921 | 254,713 | 1,456,634 |
The accompanying notes are an integral part of these consolidated financial statements
|
|
|
Nexa Resources S.A.
Notes to the consolidated financial statements At and for the year ended on December 31, 2023 All amounts in thousands of US dollars, unless otherwise stated |
| 1 | General information |
Nexa Resources S.A. (“NEXA” or “Parent Company”) is a public limited liability company (société anonyme) incorporated and domiciled in the Grand Duchy of Luxembourg. Its shares are publicly traded on the New York Stock Exchange (“NYSE”).
The Company’s registered office is located at 37A, Avenue J. F. Kennedy in the city of Luxembourg in the Grand Duchy of Luxembourg.
NEXA and its subsidiaries (the “Company”) have operations that include large-scale, mechanized underground and open pit mines and smelters. The Company owns and operates three polymetallic mines in Peru, and two polymetallic mines in Brazil and is currently progressing with the ramp-up of its third polymetallic mine in Aripuanã, Brazil. The Company also owns and operates a zinc smelter in Peru and two zinc smelters in Brazil.
NEXA’s majority shareholder is Votorantim S.A. (“VSA”), which holds 64.68% of its equity. VSA is a Brazilian privately-owned industrial conglomerate that holds ownership interests in metal, steel, cement, and energy companies, among others.
| 2 | Information by business segment |
Business segment definition
The Company’s Chief Executive Officer has been identified as the chief operating decision maker (“CODM”) since the role encompasses authority over resource allocation decisions and performance assessment, mainly analyzing performance from the production obtained in the operations. The Company has identified two operating segments:
• Mining: consists of six long-life polymetallic mines, three located in the Central Andes of Peru and three located in Brazil (two in the state of Minas Gerais and one in the state of Mato Grosso). In addition to zinc, the Company produces substantial amounts of copper, lead, silver, and gold as by-products, which reduce the overall cost to produce mined zinc.
• Smelting: consists of three operating units, one located in Cajamarquilla in Peru and two located in the state of Minas Gerais in Brazil. The facilities recover and produce metallic zinc (SHG zinc and zinc alloys), zinc oxide and by-products, such as sulfuric acid.
Accounting policy
Segment performance is assessed based on Adjusted EBITDA, since net financial results, comprising financial income and expenses and other financial items, and income tax are managed at the corporate level and are not allocated to operating segments.
The Company defines Adjusted EBITDA as follows: net income (loss) for the year, adjusted by (i) share in the results of associates, depreciation and amortization, net financial results and income tax; (ii) non-cash events and non-cash gains or losses that do not specifically reflect its operational performance for the specific period, such as: gain (loss) on sale of investments; impairment and impairment reversals; gain (loss) on sale of long-lived assets; write-offs of long-lived assets; remeasurement in estimates of asset retirement obligations; and dams obligations; and (iii) pre-operating and ramp-up expenses incurred during the commissioning and ramp-up phases of greenfield projects. In addition, management may adjust the effect of certain types of transactions that in its judgments are (i) events that are non-recurring, unusual or infrequent, and (ii) other specific events that, by their nature and scope, do not reflect Nexa’s operational performance for the period.
|
|
|
Nexa Resources S.A.
Notes to the consolidated financial statements At and for the year ended on December 31, 2023 All amounts in thousands of US dollars, unless otherwise stated |
The adjusted EBITDA is derived from internal information prepared in accordance with the International Financial Reporting Standards (“IFRS Accounting Standards”) and based on accounting measurements and management reclassifications between income statement lines items, which are reconciled to the consolidated financial statements in the column “Adjustments”, as shown in the tables below. These adjustments include reclassifications of certain overhead costs and revenues from “Other income and expenses, net” to “Net Revenues, Cost of sales and/or Selling”, “general and administrative expenses”.
The Company uses customary market terms for intersegment sales. The Company’s corporate headquarters expenses are allocated to the operating segments to the extent they are included in the measures of performance used by the CODM.
The presentation of segments results and reconciliation to income before income tax in the consolidated income statement is as follows:
| Schedule of segments results and reconciliation to income before income tax | 2023 | ||||
| Mining | Smelting | Intersegment sales |
Adjustments | Consolidated | |
| Net revenues | 1,090,276 | 1,946,661 | (468,250) | 4,546 | 2,573,233 |
| Cost of sales | (1,028,281) | (1,726,568) | 468,250 | 9,842 | (2,276,757) |
| Gross profit | 61,995 | 220,093 | - | 14,388 | 296,476 |
| Selling, general and administrative | (61,903) | (61,233) | - | (3,812) | (126,948) |
| Mineral exploration and project evaluation | (90,297) | (9,369) | - | - | (99,666) |
| Impairment loss of long-lived assets | (109,347) | (5,296) | - | - | (114,643) |
| Other income and expenses, net | (67,876) | (26,412) | - | (16,296) | (110,584) |
| Operating (loss) income | (267,428) | 117,783 | - | (5,720) | (155,365) |
| Depreciation and amortization | 219,957 | 77,585 | - | 851 | 298,393 |
| Miscellaneous adjustments | 196,529 | 51,599 | - | - | 248,128 |
| Adjusted EBITDA | 149,058 | 246,967 | - | (4,869) | 391,156 |
| Changes in fair value of offtake agreement (i) | 2,268 | ||||
| Impairment loss of long-lived assets - note 31 | (114,643) | ||||
| Ramp-up expenses of greenfield projects (Aripuanã) (ii) | (15,494) | ||||
| Loss on sale of property, plant and equipment | (3,734) | ||||
| Remeasurement in estimates of asset retirement obligations | 3,125 | ||||
| Remeasurement adjustment of streaming agreement (iii) | (10,121) | ||||
| Energy forward contracts – Change in fair value (iv) | (15,663) | ||||
| Tax voluntary disclosure – VAT discussions (v) | (86,906) | ||||
| Dams obligations (vi) | (6,960) | ||||
| Miscellaneous adjustments | (248,128) | ||||
| Depreciation and amortization | (298,393) | ||||
| Share in result of associates | 23,536 | ||||
| Net financial results | (161,641) | ||||
| Loss before income tax | (293,470) | ||||
|
|
|
Nexa Resources S.A.
Notes to the consolidated financial statements At and for the year ended on December 31, 2023 All amounts in thousands of US dollars, unless otherwise stated |
| 2022 | |||||
| Mining | Smelting | Intersegment sales |
Adjustments | Consolidated | |
| Net revenues | 1,248,027 | 2,466,967 | (683,583) | 2,579 | 3,033,990 |
| Cost of sales | (905,241) | (2,190,903) | 683,583 | 17,381 | (2,395,180) |
| Gross profit | 342,786 | 276,064 | - | 19,960 | 638,810 |
| Selling, general and administrative | (64,444) | (60,435) | - | (20,664) | (145,543) |
| Mineral exploration and project evaluation | (88,947) | (9,915) | - | - | (98,862) |
| Impairment loss of long-lived assets | (32,276) | (236) | - | - | (32,512) |
| Other income and expenses, net | (32,787) | 43,049 | - | (12,936) | (2,674) |
| Operating (loss) income | 124,332 | 248,527 | - | (13,640) | 359,219 |
| - | |||||
| Depreciation and amortization | 204,514 | 78,727 | - | 7,696 | 290,937 |
| Miscellaneous adjustments | 110,993 | (825) | - | - | 110,168 |
| Adjusted EBITDA | 439,839 | 326,429 | - | (5,944) | 760,324 |
| Changes in fair value of offtake agreement (i) | 24,267 | ||||
| Impairment loss of long-lived assets - note 31 | (32,512) | ||||
| Ramp-up expenses of greenfield projects (Aripuanã) (ii) | (87,540) | ||||
| Impairment of other assets | (9,302) | ||||
| Loss on sale of property, plant and equipment | (698) | ||||
| Remeasurement in estimates of asset retirement obligations | 6,182 | ||||
| Remeasurement adjustment of streaming agreement (iii) | (10,565) | ||||
| Miscellaneous adjustments | (110,168) | ||||
| Depreciation and amortization | (290,937) | ||||
| Share in result of associates | 1,885 | ||||
| Net financial results | (133,727) | ||||
| Income before income tax | 227,377 | ||||
| 2021 | |||||
| Mining | Smelting | Intersegment sales |
Adjustments | Consolidated | |
| Net revenues | 1,165,584 | 2,021,787 | (636,212) | 70,951 | 2,622,110 |
| Cost of sales | (726,653) | (1,842,704) | 636,212 | (55,874) | (1,989,019) |
| Gross profit | 438,931 | 179,083 | - | 15,077 | 633,091 |
| Selling, general and administrative | (64,739) | (51,635) | - | (17,429) | (133,803) |
| Mineral exploration and project evaluation | (75,550) | (9,493) | - | - | (85,043) |
| Other income and expenses, net | (32,286) | 70,874 | - | (6,640) | 31,948 |
| Operating (loss) income | 266,356 | 188,829 | - | (8,992) | 446,193 |
| Depreciation and amortization | 174,891 | 78,861 | - | 4,959 | 258,711 |
| Miscellaneous adjustments | 35,697 | 3,234 | - | - | 38,931 |
| EBITDA | 476,944 | 270,924 | - | (4,033) | 743,835 |
| Aripuanã's pre-operating expenses (ii) | (8,753) | ||||
| Loss on property, plant and equipment | (4,891) | ||||
| Remeasurement in estimates of asset retirement obligations | (6,371) | ||||
| Remeasurement adjustment of streaming agreement (iii) | (19,580) | ||||
| Other adjustments | 664 | ||||
| Miscellaneous adjustments | (38,931) | ||||
| Depreciation and amortization | (258,711) | ||||
| Net financial results | (136,902) | ||||
| Income before income tax | 309,291 | ||||
(i) This amount represents the change in the fair value of the offtake agreement described in note 16, which is being measured at Fair value through profit and loss (“FVTPL”). This change in the fair value is a non-cash item and has not been considered in the Company’s Adjusted EBITDA calculation.
(ii) Excludes the impact of commissioning, pre-operating, and ramp-up expenses of greenfield projects. For the year 2023, corresponds to the effects of idle capacity costs of the Aripuanã of USD 55,615 and excludes the net reversal of the net realizable value provision of Aripuanã’s inventory of USD 40,121 (excluding the depreciation portion).
(iii) Annual remeasurement adjustment of the Company’s silver streaming revenues given the changes in long-term prices and in the mine plan for the Cerro Lindo mining unit.
|
|
|
Nexa Resources S.A.
Notes to the consolidated financial statements At and for the year ended on December 31, 2023 All amounts in thousands of US dollars, unless otherwise stated |
(iv) The fair value adjustment of the energy surplus resulting from electric energy purchase contracts of NEXA’s subsidiary, Pollarix. This adjustment to EBITDA, has the objective to exclude from the current year´s performance the remeasurement effects of energy contracts without cash impact for the specific period.
(v) Impact of accruals related to VAT’s discussions disclosed in note 9 (iv). These liabilities are not directly related to Nexa´s operations and performance and are excluded from EBITDA.
(vi) The impact of the provisions related to dams obligations in Brazil was excluded in Company’s Adjusted EBITDA calculation. This adjustment was made considering these industrial waste containment structures have been closed for more than 20 years, even before they were acquired by Nexa as disclosed in note 27 (a). As such, they have never contributed to Nexa’s operational performance.
| 3 | Basis of preparation of the consolidated financial statements |
These consolidated financial statements have been prepared in accordance with the IFRS accounting standards and interpretations, as issued by the International Accounting Standards Board (“IASB”) and the IFRS Interpretations Committee.
The consolidated financial statements have been prepared under the historical cost convention, except for certain financial assets and financial liabilities (including other financial instruments) measured at fair value at the end of each reporting period.
The consolidated financial statements of the Company for the year ended December 31, 2023, were approved for issue in accordance with a resolution of the Board of Directors on February 21, 2024.
| 4 | Principles of consolidation |
The consolidated financial statements comprise the financial statements of NEXA and its direct and indirect subsidiaries (“subsidiaries”), which reflect the assets, liabilities and transactions of the Parent Company and its subsidiaries. Intercompany balances and transactions, which include unrealized profits, are eliminated. A list of the most relevant companies, including subsidiaries, associates and joint operations, and the accounting policies applied in the preparation of the consolidated financial statements are described below.
| Schedule of ownership percentages | |||||
| Percentage of shares | Company | ||||
| 2023 | 2022 | controls | Headquarter | Activities | |
| Subsidiaries | |||||
| Nexa Recursos Minerais S.A. - "NEXA BR" | 100 | 100 | Directly | Brazil | Mining / Smelting |
| Nexa Resources Cajamarquilla S.A. - "NEXA CJM" | 99.99 | 99.99 | Directly | Peru | Smelting |
| Nexa Resources US. Inc. | 100 | 100 | Directly | United States | Trading |
| Exploraciones Chimborazo Metals & Mining | 100 | 100 | Directly | Ecuador | Holding and others |
| L.D.O.S.P.E. Geração de Energia e Participações Ltda. – “L.D.O.S.P.E." | 100 | 100 | Indirectly | Brazil | Energy |
| L.D.Q.S.P.E. Geração de Energia e Participações Ltda. - "L.D.Q.S.P.E." | 100 | 100 | Indirectly | Brazil | Energy |
| L.D.R.S.P.E. Geração de Energia e Participações Ltda. - "L.D.R.S.P.E." | 100 | 100 | Indirectly | Brazil | Energy |
| Mineração Dardanelos Ltda. - "Dardanelos" (i) | - | 100 | Indirectly | Brazil | Mining projects |
| Mineração Santa Maria Ltda. | 99.99 | 99.99 | Indirectly | Brazil | Mining projects |
| Pollarix S.A. - "Pollarix" (ii) | 33.33 | 33.33 | Indirectly | Brazil | Energy |
| Karmin - Holding Ltda. | 100 | 100 | Indirectly | Brazil | Holding and others |
| Mineração Rio Aripuaña Ltda. | 100 | 100 | Indirectly | Brazil | Holding and others |
| Votorantim Metals Canada Inc. | 100 | 100 | Indirectly | Canada | Holding and others |
| Nexa Resources El Porvenir S.A.C. | 99.99 | 99.99 | Indirectly | Peru | Mining |
| Minera Pampa de Cobre S.A.C | 99.99 | 99.99 | Indirectly | Peru | Mining |
| Nexa Resources Perú S.A.A. - "NEXA Peru" | 83.55 | 83.55 | Indirectly | Peru | Mining |
| Nexa Resources Atacocha S.A.A. - "NEXA Atacocha" | 66.62 | 66.62 | Indirectly | Peru | Mining |
| Nexa Resources UK Ltd. - "NEXA UK" | 100 | 100 | Indirectly | United Kingdom | Mining |
| Joint-operations | |||||
| Cia. Minera Shalipayco S.A.C | 75 | 75 | Peru | Mining Projects | |
| Associates | |||||
| Campos Novos Energia S.A. - "Enercan" (iii) | 22.44 | 22.44 | Brazil | Energy | |
(i) Dardanelos was incorporated on May 1, 2023, by NEXA BR.
(ii) Nexa, through its wholly owned subsidiary NEXA BR, holds 100% of the common shares of Pollarix which carries the total voting rights. Auren a subsidiary of VSA, holds 100% of the preference shares, which carry the right to receive dividends 93% higher than the amount received for each common share.
(iii) On November 17, 2022, NEXA, through Pollarix, acquired 1.46% of Enercan’s additional shares for BRL 21,731 (USD 4,136) by exercising its proportional pre-emptive rights due to the withdrawal of one of Enercan’s previous shareholders. Prior to this date, NEXA and the other shareholders jointly controlled Enercan’s assets and liabilities. However, with the withdrawal, Enercan’s remaining shareholders exercised their option to acquire these additional shares, resulting in the loss of joint control by NEXA. Since then, NEXA ceased recognizing its share of Enercan’s jointly held assets, liabilities, revenues, and expenses, and began treating it as an investment in an associate through the equity method, maintaining significant influence over the entity.
|
|
|
Nexa Resources S.A.
Notes to the consolidated financial statements At and for the year ended on December 31, 2023 All amounts in thousands of US dollars, unless otherwise stated |
| (a) | Subsidiaries |
Subsidiaries include all entities over which the Company has control. The Company controls an entity when it (i) has the power over the entity; (ii) is exposed, or has the right, to variable returns from its involvement with the entity; and (iii) has the ability to affect those returns through its power over the entity. Subsidiaries are fully consolidated from the date on which control is transferred to the Company, except when the predecessor basis of accounting is applied. Subsidiaries are unconsolidated from the date that control ceases.
Accounting policies of subsidiaries are usually consistent with the policies adopted by the Company. If there are differences, to ensure the accounting policies’ standardization, an adjustment is performed in the consolidation process.
Non-controlling interests in the subsidiaries’ equity and results are shown separately in the consolidated balance sheet, income statement, statement of comprehensive income and statement of changes in shareholders’ equity. A change in a subsidiary’s ownership interest, without loss of control, is accounted for as an equity transaction.
If the Company loses control over a subsidiary, it derecognizes the related assets, liabilities, non-controlling interests and other equity components and any resultant gain or loss is recognized in the income statement. Any investment retained is recognized at fair value.
In general, there is a presumption that a majority of voting rights results in control. When the Company has less than a majority of the voting rights of an investee, it considers all relevant facts and circumstances to determine whether it has power over this investee. This may include contractual arrangements with the other holders of voting rights in the investee; rights arising from other contractual arrangements; and the Company’s voting rights and potential voting rights that will give it the practical ability to direct the relevant activities of the investee unilaterally.
Intercompany transactions, balances, and unrealized gains on transactions between companies in the consolidated group are eliminated in full on consolidation. Unrealized losses are also eliminated unless the transaction indicates impairment of the transferred asset.
| (b) | Joint operations |
The Company recognizes its direct right to the assets, liabilities, revenues and expenses of joint operations and its share of any jointly held assets or incurred liabilities or revenues and expenses. These have been included in the consolidated financial statements under the appropriate headings.
A joint operation is a joint arrangement whereby the parties that have joint control of the arrangement have rights to the assets, and obligations for the liabilities, relating to the arrangement.
|
|
|
Nexa Resources S.A.
Notes to the consolidated financial statements At and for the year ended on December 31, 2023 All amounts in thousands of US dollars, unless otherwise stated |
Joint control is the contractually agreed sharing of control of an arrangement, which exists only when decisions about the relevant activities require unanimous consent of the parties sharing control.
| (c) | Associates |
Associates are initially recognized at cost and adjusted thereafter for the equity method, being increased, or reduced from its interest in the investee's income after the acquisition date.
For an entity to become an associate the Company must have significant influence, which is the power to participate in the financial and operating policy decisions of the investee, without having its control or joint control of those policies.
| (d) | Transactions with non-controlling interests |
Transactions with non-controlling interests that do not result in a loss of control are recognized within shareholders’ equity as transactions with equity owners of the consolidated group. A change in ownership interest results in an adjustment between the carrying amounts of the controlling and non-controlling interests to reflect their relative interests in the subsidiary. Any difference between the amount of the adjustment to non-controlling interests and any consideration paid or received is recognized in Additional paid in capital within shareholders’ equity.
| (e) | Foreign currency translation |
| (i) | Functional and presentation currency |
Items included in the financial statements of each of the Company’s entities are measured using the currency of the primary economic environment in which each entity operates (“the functional currency”). The Company’s consolidated financial statements are presented in US Dollars ("USD"), which is NEXA’s functional currency and the Company’s reporting currency.
| (ii) | Transactions and balances |
Foreign currency transactions are initially recorded by each of the Company’s entities at their respective functional currency spot rates at the date the transaction is recognized. Foreign exchange gains and losses resulting from the settlement of such transactions and from the translation of monetary assets and liabilities denominated in foreign currencies at the functional currency spot rate at the end of each reporting period are recognized in the income statement. Non-monetary items that are measured at historical cost in a foreign currency are translated using the exchange rate at the date of the initial transaction. Translation differences on assets and liabilities carried at fair value are reported as part of the fair value gain or loss.
| (iii) | Consolidated entities |
The results of operations and financial position of the Company’s entities that have a functional currency different from the Company’s reporting currency are translated into the reporting currency as follows:
| · | Assets and liabilities for each balance sheet presented are translated at the closing rate at the date of that balance sheet; |
| · | Income and expenses for each income statement and statement of comprehensive income presented are translated at average exchange rates for the annual period of that income statement and statement of comprehensive income, which are a reasonable approximation of the cumulative effect of the rates prevailing on the transaction dates; and |
All resulting exchange differences are recognized in other comprehensive income and accumulated in a separate component of shareholders’ equity. When a foreign operation is totally or partially disposed, the monetary exchange differences that were previously recorded in equity are recognized in the income statement for the respective year.
|
|
|
Nexa Resources S.A.
Notes to the consolidated financial statements At and for the year ended on December 31, 2023 All amounts in thousands of US dollars, unless otherwise stated |
| 5 | Changes in the main accounting policies and disclosures |
| (a) | New standards and amendments – applicable as of January 1, 2023 or thereafter |
There were some new standards and amendments effective for annual periods commencing on January 1, 2023. The adoption of these new standards and amendments did not have a material impact on the Company’s financial statements, except for the amendment for IAS 12, which additional disclosures are required and effective for the Company’s December 31, 2023 financial statements.
IAS 12 – Income taxes
Main aspects introduced by the amendments.
On 23 May 2023, the IASB issued an amendments to IAS 12. The amendments provide a temporary exception from the requirement to recognise and disclose deferred taxes arising from enacted or substantively enacted tax law that implements the Pillar Two model rules published by the Organisation for Economic Co-operation and Development (OECD), including tax law that implements qualifying domestic minimum top-up tax (QDMTT) described in those rules.
The amendments to IAS 12 made narrow-scope amendments to IAS 12 to (a) provide a temporary exception from accounting for deferred taxes arising from legislation enacted to implement OECD’s Pillar Two model rules, and (b) introduce additional disclosure requirements.
The mandatory temporary exception – the use of which is required to be disclosed – applies immediately. The remaining disclosure requirements apply for annual reporting periods beginning on or after 1 January 2023, but not for any interim periods ending on or before 31 December 2023.
Impacts of adoption
The amendments require an entity to provide disclosure on expected impacts, which is presented at note 11(e).
| (b) | Amendments early adopted |
The Company early adopted the following amendment, which has been issued but is not yet effective. Additionally, it has not early adopted any other standards, interpretations, or amendments that have been issued but are not yet effective, and it does not anticipate that the adoption of any of them will materially impact the Company’s financial statements:
IAS 7 – “Statement of Cash Flow” and IFRS 7 - "Financial Instruments: Disclosure"
The amendments are effective for years starting January 1, 2024, and allow early adoption permitted by IFRS. To enhance transparency in confirming payable operations, the Company opted for IFRS 7 and IAS 7 early adoption according to note 26.
Main aspects introduced by the amendments.
On May 25, 2023, the IASB issued the final amendments to IAS 7 and IFRS 7 which addresses the disclosure requirements to improve transparency regarding supplier finance arrangements and their impact on a company’s liabilities, cash flows and exposure to liquidity risk.
Transition method
The Company will early apply IAS 7 and IFRS 7 amendments starting on December 31, 2023, using the simplified transition approach. There will be not restatement of comparative periods for the years preceding the adoption, in accordance with the reliefs available during the initial adoption.
|
|
|
Nexa Resources S.A.
Notes to the consolidated financial statements At and for the year ended on December 31, 2023 All amounts in thousands of US dollars, unless otherwise stated |
Impacts of adoption
The amendments require an entity to provide information about the impact of supplier finance arrangements on liabilities and cash flows, including:
- Terms and conditions of the supplier finance arrangements.
- The carrying amounts of supplier finance arrangement financial liabilities and the line items in which those liabilities are presented;
- The carrying amounts of financial liabilities and the line items, for which the finance providers have already settled the corresponding trade payables;
- The range of payment due dates for financial liabilities owed to the finance providers and for comparable trade payables that are not part of those arrangements;
- The type and effect of non-cash changes in the carrying amounts of supplier finance arrangement financial liabilities, which prevent the carrying amounts of the financial liabilities from being comparable.
| (c) | Critical estimates, assumptions and judgments |
The preparation of the Company’s consolidated financial statements requires the use of estimates, assumptions and judgments that affect the reported amounts of revenues, expenses, assets and liabilities, the accompanying disclosures, and the disclosure of contingent liabilities at the date of the consolidated financial statements. Critical estimates, assumptions and judgments, by definition, will seldom equal the actual results and are continually evaluated to reflect changing expectations about future events. Management also needs to exercise judgment in applying the Company’s accounting policies.
This note provides an overview of the areas that involve a higher degree of judgment or complexity, and of items which are more likely to be materially adjusted due to estimates and assumptions turning out to be wrong due to their uncertainty. Detailed information about each of these estimates, assumptions and judgments is included in other notes together with information about the basis of calculation for each affected item in the financial statements.
The critical accounting estimates, assumptions and judgments applied by the Company in the preparation of these financial statements are as follows:
| • | estimation of current and deferred income taxes – note 11 |
| • | estimation of fair value of financial instruments – note 14 |
| • | estimation of impairment of trade accounts receivables – note 17 |
| · | estimation of the net realizable value of inventories – note 18 |
| • | estimation of quantification of mineral reserves and resources for useful life calculation – note 22 |
| • | estimation of dams, asset retirement and environmental obligations – note 27 |
| • | estimation of provisions for legal claims – note 28 |
| • | estimation of contractual obligations – note 29 |
| • | estimation of impairment of long-lived assets – note 31 |
Estimates, assumptions and judgments are continuously evaluated. They are based on historical experience and other factors, including expectations of future events that may have a financial impact on the Company and that are believed to be reasonable under the circumstances.
Among others, the Company has considered the effects of the Environmental, Social and Governance (“ESG”) commitments when making its critical estimates, assumptions and judgments based on the updated long-term ESG commitments. Events and changes in circumstances arising after December 31, 2023, will be reflected in management’s estimates for future periods, as well as the effective disbursements will be capitalized or expensed, depending on its nature and function, in the period in which they are incurred.
|
|
|
Nexa Resources S.A.
Notes to the consolidated financial statements At and for the year ended on December 31, 2023 All amounts in thousands of US dollars, unless otherwise stated |
| 6 | Net revenues |
Accounting policy
Revenues represent the amount of the consideration received or receivable for the sale of goods in the ordinary course of the Company’s activities. Revenues are shown net of value-added tax, returns, rebates and discounts, after eliminating sales between the consolidated companies.
The Company recognizes revenues when a performance obligation is satisfied by transferring a promised good or service to a customer. The asset is transferred when the customer obtains control of that asset. To determine the point in time at which a customer obtains control of a promised asset the Company considers the following indicators: (i) the Company has a present right to payment for the asset; (ii) the customer has legal title to the asset; (iii) the Company has transferred physical possession of the asset; (iv) the customer has the significant risks and rewards of ownership of the asset; (v) the customer has accepted the asset.
Identification and timing of satisfaction of performance obligations
The Company has two distinct performance obligations included in certain sales contracts:
(i) the promise to provide goods to its customers; and (ii) the promise to provide freight and to contract insurance services to its customers.
Promise to provide goods: this performance obligation is satisfied when the control of such goods is transferred to the final customer, which is substantially determined based on the Incoterms agreed upon in each of the contracts with customers.
Promise to provide freight and contracting insurance services: this performance obligation is satisfied when the freight and insurance services contracted to customers are completed.
As a result of the distinct performance obligations identified, part of the Company’s revenues is presented as revenues from services. Cost related to revenues from services is presented as Cost of sales. Revenues from the sale of goods and from freight and contracting insurance services are recognized at a point in time when control is transferred and when contracted services are provided. It is at this point that a trade receivable is recognized because only the passage of time is required before the consideration is due. The Company does not have any contract assets, which give right to consideration in exchange for goods or services that the Company has transferred to the customer, since all rights to consideration of the contracts are unconditional.
In 2023, revenues of USD 773,230 are derived from two main customers. These revenues are attributed to both segments, mining and smelting.
Contractual obligations are an entity’s obligation to transfer goods or services to a customer for which the entity has received consideration from the customer (or the payment is due) but the transfer has not yet been completed. For contracts where performance obligations are satisfied over a period of time, the stage of completion is required to calculate how much revenue should be recognized to date and revenue shall be deducted from the prepayment to the extent that performance obligations are delivered. Refer to note 29 for the specific accounting policy and information related to NEXA’s contractual obligations.
Determining the transaction price and the amounts allocated to performance obligations
The Company considers the terms of the contract and its customary business practices to determine the transaction price. The transaction price is the amount of consideration that the Company expects to be entitled to receive in exchange for transferring promised goods or services to its customers. Transaction price is allocated to each performance obligation on a relative standalone selling price basis.
|
|
|
Nexa Resources S.A.
Notes to the consolidated financial statements At and for the year ended on December 31, 2023 All amounts in thousands of US dollars, unless otherwise stated |
The transaction prices included in the Company’s sales contracts are mainly based on international prices references and subject to price adjustments based on the market price at the end of the relevant quotation period stipulated in the sales contract. These are referred to as provisional pricing arrangements which are subject to a monthly price adjustment as per the London Metal Exchange (LME) quotational periods. As of December 31, 2023, the pending price adjustments to be made were not material.
Additionally, the Company has a contractual obligation related to a long-term silver streaming arrangement linked to specific production of its Cerro Lindo mine. The Company received an upfront payment in advance of this specific production. The transaction price is linked to the silver production and spot market prices, which change over time and, therefore, it is accounted for as variable consideration. For more details about this streaming transaction see note 29.
| (a) | Composition |
| (i) | Gross billing reconciliation |
| Schedule of net revenues by billing | |||
| 2023 | 2022 | 2021 | |
| Gross billing | 2,839,597 | 3,440,863 | 2,974,850 |
| Billing from products | 2,731,872 | 3,330,975 | 2,898,210 |
| Billing from freight, contracting insurance services and others | 107,725 | 109,888 | 76,640 |
| Taxes on sales | (263,979) | (402,064) | (347,311) |
| Return of products sales | (2,385) | (4,809) | (5,429) |
| Net revenues | 2,573,233 | 3,033,990 | 2,622,110 |
| (ii) | Net revenues breakdown |
| Schedule of net revenues from products | |||
| 2023 | 2022 | 2021 | |
| Zinc | 1,682,711 | 2,093,105 | 1,844,632 |
| Lead | 321,803 | 276,438 | 223,341 |
| Copper | 263,376 | 290,519 | 305,793 |
| Silver | 61,594 | 57,921 | 69,691 |
| Other products | 136,024 | 206,119 | 102,013 |
| Freight, contracting insurance services and others | 107,725 | 109,888 | 76,640 |
| Net revenues | 2,573,233 | 3,033,990 | 2,622,110 |
| Taxes on sales | 263,979 | 402,064 | 347,311 |
| Return of products sales | 2,385 | 4,809 | 5,429 |
| Gross billing | 2,839,597 | 3,440,863 | 2,974,850 |
| (b) | Information on geographical areas in which the Company operates |
The geographical areas are determined based on the location of the Company’s customers. The net revenues of the Company, classified by geographical location and currency, are as follows:
|
|
|
Nexa Resources S.A.
Notes to the consolidated financial statements At and for the year ended on December 31, 2023 All amounts in thousands of US dollars, unless otherwise stated |
| (i) | Net revenues by geographical location |
| Schedule of revenues by geographical location | |||
| 2023 | 2022 | 2021 | |
| Peru | 654,216 | 859,760 | 774,735 |
| Brazil | 559,786 | 827,173 | 753,280 |
| Singapore | 229,278 | 166,412 | 56,879 |
| Switzerland | 209,312 | 124,726 | 78,770 |
| United States | 168,965 | 174,526 | 119,564 |
| Argentina | 94,144 | 94,433 | 93,107 |
| Chile | 83,459 | 120,060 | 54,044 |
| Luxembourg | 78,474 | 95,252 | 97,462 |
| China | 65,910 | - | - |
| Austria | 47,919 | 48,676 | 45,057 |
| South Africa | 41,350 | 55,864 | 25,126 |
| South Korea | 39,985 | 32,406 | 118,596 |
| Colombia | 36,066 | 64,013 | 54,325 |
| Japan | 32,054 | 71,370 | 58,296 |
| Taiwan | 26,901 | 65,036 | 53,752 |
| Turkey | 26,606 | 54,955 | 34,493 |
| Belgium | 19,824 | 17,905 | 13,690 |
| Malaysia | 18,738 | 26,032 | 25,681 |
| Netherlands | 16,045 | 13,623 | 17,693 |
| Ecuador | 14,554 | 15,433 | 15,652 |
| Italy | 9,479 | 9,586 | 14,834 |
| Vietnam | 5,006 | 8,396 | 14,555 |
| Other | 95,162 | 88,353 | 102,519 |
| Net revenues | 2,573,233 | 3,033,990 | 2,622,110 |
| (ii) | Net revenues by currency |
| Schedule of revenues by currency | |||||
| 2023 | 2022 | 2021 | |||
| USD | 2,050,053 | 2,251,866 | 1,914,905 | ||
| Brazilian Real (“BRL”) | 523,180 | 782,124 | 707,205 | ||
| Net revenues | 2,573,233 | 3,033,990 | 2,622,110 |
| 7 | Expenses by nature |
Accounting policy
Cost of sales mainly consists of the cost of manufacturing the products sold by the Company and is recognized in the income statement on the date of delivery to the customer at the same time revenue is recognized from the related sale.
Selling, general and administrative expenses are recognized on the accrual basis and, if applicable, in the same period in which the income they are related to is recognized.
| Schedule of expense by nature | ||||
| 2023 | ||||
| Cost of sales (i/ii) |
Selling, general and administrative |
Mineral exploration and project evaluation |
Total | |
| Raw materials and consumables used | (1,327,680) | - | - | (1,327,680) |
| Third-party services | (436,743) | (20,275) | (73,380) | (530,398) |
| Depreciation and amortization | (295,510) | (2,800) | (83) | (298,393) |
| Employee benefit expenses | (203,835) | (53,442) | (13,786) | (271,063) |
| Others | (12,989) | (50,431) | (12,417) | (75,837) |
| Total | (2,276,757) | (126,948) | (99,666) | (2,503,371) |
|
|
|
Nexa Resources S.A.
Notes to the consolidated financial statements At and for the year ended on December 31, 2023 All amounts in thousands of US dollars, unless otherwise stated |
| 2022 | ||||
| Cost of sales | Selling, general and administrative |
Mineral exploration and project evaluation |
Total | |
| Raw materials and consumables used | (1,463,472) | - | - | (1,463,472) |
| Third-party services | (449,373) | (30,878) | (65,041) | (545,292) |
| Depreciation and amortization | (282,968) | (4,064) | (37) | (287,069) |
| Employee benefit expenses | (182,609) | (58,909) | (18,030) | (259,548) |
| Others | (16,758) | (51,692) | (15,754) | (84,204) |
| Total | (2,395,180) | (145,543) | (98,862) | (2,639,585) |
| 2021 | ||||
| Cost of sales | Selling, general and administrative |
Mineral exploration and project evaluation |
Total | |
| Raw materials and consumables used | (1,188,365) | (1,363) | - | (1,189,728) |
| Third-party services | (381,721) | (32,400) | (52,950) | (467,071) |
| Depreciation and amortization | (254,414) | (4,262) | (35) | (258,711) |
| Employee benefit expenses | (149,560) | (55,867) | (17,688) | (223,115) |
| Others | (14,959) | (39,911) | (14,370) | (69,240) |
| Total | (1,989,019) | (133,803) | (85,043) | (2,207,865) |
(i) As of December 31, 2023, the Company recognized USD 12,455 in Cost of sales related to idle-capacity costs: (a) USD 6,191 in the first quarter in Cerro Lindo, due to the suspension of the mine for almost two weeks caused by unusually heavy rainfall levels and overflowing rivers originated by cyclone Yaku; (b) USD 3,065 in June and July in Atacocha, due to the Unit’s temporary suspension caused by illegal protest activities undertaken by communities (December 31, 2022 was USD 2,197); and, (iii) USD 3,199 in November due to unplanned maintenance in Cajamarquilla. Idle capacity costs are calculated considering the significant reduction in the level of production due to unusual events.
(ii) Cost of sales of 2023 includes: (i)
a reversal of USD 54,906, including depreciation of USD 14,785 (USD 52,215, including depreciation of USD 16,377 as of December 31, 2022)
related to the net realizable value provision of Aripuanã’s inventory, for both its ore stockpile and its produced concentrates,
as explained in note 18; and, (ii) USD 77,639, including depreciation of USD 22,024 (USD 15,681, including depreciation of USD 5,911 as
of December 31, 2022) related to the idleness of the Aripuanã mine and plant capacity incurred during the ramp-up phase.
The Company started to generate revenues in Aripuanã in November of 2022, and before this event idle capacity were recorded
within other income and expenses, net.
| 8 | Mineral exploration and project evaluation |
Accounting policy
Mineral exploration and project evaluation costs are expensed in the year in which they are incurred.
Mineral exploration activities involve the search for mineral resources from potential areas up to the determination of commercial viability and technical feasibility of an identified resource. Mineral exploration costs include gathering exploration data through geological and geophysical studies, conducting exploratory drilling and sampling, and determining and examining the volume and grade of the identified resources.
|
|
|
Nexa Resources S.A.
Notes to the consolidated financial statements At and for the year ended on December 31, 2023 All amounts in thousands of US dollars, unless otherwise stated |
Project evaluation costs are mainly related to scoping, pre-feasibility and feasibility studies for greenfield and brownfield projects. Additionally, these evaluation costs could also include costs incurred for studies related to other corporate projects, research, innovation, automation, and information technology projects.
Note 22 describes when mineral exploration and project evaluation costs begin to be capitalized.
Composition
| Schedule of mineral exploration and project evaluation costs | |||
| 2023 | 2022 | 2021 | |
| Mineral exploration | (58,042) | (61,986) | (55,594) |
| Project evaluation | (41,624) | (36,876) | (29,449) |
| Mineral exploration and Project development | (99,666) | (98,862) | (85,043) |
| 9 | Other income and expenses, net |
| Schedule of other income and expenses, net | |||
| 2023 | 2022 | 2021 | |
| ICMS tax incentives (i) | 32,338 | 56,697 | 71,949 |
| Changes in fair value of offtake agreement - note 16 (e) | 2,268 | 24,267 | - |
| Pre-operating expenses related to Aripuanã (ii) | - | (45,800) | (8,753) |
| Impairment of other assets (iii) | - | (9,302) | - |
| Changes in fair value of derivative financial instruments – note 16 (c) | (1,385) | 1,363 | 7,486 |
| Changes in asset retirement and environmental obligations - note 27 (ii) | (3,165) | (1,512) | (6,664) |
| Loss on sale of property, plant and equipment | (3,734) | (698) | (4,891) |
| Slow moving and obsolete inventory | (4,372) | (11,511) | (985) |
| Dams obligations - note 27 | (6,960) | - | - |
| Contribution to communities | (13,134) | (17,233) | (7,070) |
| Provision for legal claims | (13,892) | (7,664) | (13,173) |
| Energy forward contracts – Changes in fair value – Note 16 (d) | (15,663) | - | - |
| Tax voluntary disclosure – VAT discussions (iv) | (86,906) | - | - |
| Others | 4,021 | 8,719 | (5,951) |
| Total other income and expenses, net | (110,584) | (2,674) | 31,948 |
(i) Between December 2021 and December 2023, the Company adhered to a Brazilian Law that states that government grants of the “Imposto sobre circulação de mercadorias e serviços” (“ICMS”) tax incentives are considered investment subsidies and should be excluded from taxable income for the purpose of calculating the Corporate Income Tax and the Social Contribution on Net Income tax.
On December 29, 2023 a new law No. 14,789/2023 was published, revoking the treatment for purposes of IRPJ and CSLL of subsidies for investments by creating a new tax credit mechanism. The new rule also provides a limited concept of subsidy of investments only covering VAT benefits aimed to implement or expand an economic enterprise.
This new regulation will come into effect in 2024. The Company is still evaluating the impacts of the new Law and legal procedures that should be adopted.
(ii) In 2022, the main amounts were related to the idleness of the Aripuanã mine and plant relative to its nameplate capacity, which were recorded in this account until Aripuanã started to generate revenues in November 2022, when the idleness amounts started to be recorded as Cost of sales.
(iii) Amounts mainly related to the write-off of some non-commercial account receivables and taxes, which the Company does not expect to recover.
(iv) As previously reported throughout 2023, Nexa cooperated with the investigation carried out by the Fiscal Office of the State of Minas Gerais and the Public Ministry of Minas Gerais (the “MG Authorities”) of the practices of certain of Nexa’s former customers with respect to commercial transactions and related value-added tax (VAT), as well as Nexa’s relationship with such former customers.
|
|
|
Nexa Resources S.A.
Notes to the consolidated financial statements At and for the year ended on December 31, 2023 All amounts in thousands of US dollars, unless otherwise stated |
In the third quarter of 2023, Nexa and the MG Authorities reached a resolution (the “Tax Resolution”) whereby, without admitting primary responsibility for the resolved claims, the Company agreed to make tax payments, including interest and penalties, to the State of Minas Gerais on behalf of certain customers that allegedly failed to properly comply with their tax obligations (“tax portion”), and subsequently on October 20, 2023 entered into a related additional agreement (the “Related Agreement”, and together with the Tax Resolution, the “Agreements”) to make a contribution to the State of Minas Gerais to support its ESG-related efforts (“ESG portion”), recognizing a total amount of USD 75,811 in "Other liabilities”, comprised of USD 65,512 as “Other Income and Expenses, net” and USD 10,299 as “Financial Expenses” related to the interest charged in connection with the VAT-related practices of its former customers. In funding this agreement, the Company applied an offset of USD 24,951 of VAT accumulated credits, paid a portion of USD 1,515 in cash up front, offset an amount of USD 6,398 which was classified as a judicial deposit, and will pay the remainder in up to 46 monthly installments, to be adjusted by the SELIC (the Brazilian federal funds rate) interest rate.
In addition to the Agreements, on February 8, 2024, a second and final Tax Resolution was filed with the MG Authorities whereby Nexa, without admitting primary responsibility for the resolved claims, agreed to make tax payments on behalf of certain customers, including interest and penalties, to the State of Minas Gerais, recognizing a total amount of USD 27,128 in "Other liabilities”, comprised of USD 21,394 as “Other Income and Expenses, net” and USD 5,734 as “Financial Expenses” related to the interest charged in connection with the VAT-related practices of this former customers. In funding this agreement, the Company will apply an offset of USD 10,796 of VAT accumulated credits, will pay USD 828 in cash up front, and will pay the remainder in up to 59 monthly installments, to be adjusted by the SELIC (the Brazilian federal funds rate) interest rate.
This resolution concludes the MG Authorities’ investigation with respect to the Company, and the Company does not expect any further developments or provisions with respect to these matters, although reserves its legal right to recover from certain customers the amounts that it has paid, or will pay, on their behalf in connection with the tax portion of the Agreements. These amounts will only be recognized upon recovery.
| 10 | Net financial results |
Accounting policy
(i) Financial expenses
Financial costs of obligations are recognized as expenses when accrued, except for those directly attributable to the acquisition or the construction of qualifying assets, that is, assets that require a substantial time to be ready for use, which are capitalized at cost within property, plant and equipment and/or intangibles assets to which they relate.
(ii) Financial income
Financial income is mainly composed of interest income and is recognized on an accrual basis to reflect the asset’s effective yield under the effective interest rate method.
(iii) Other financial items, net is composed by the net of the income and expenses related to the fair value of loans and financings, derivative financial instruments, and foreign exchange losses.
|
|
|
Nexa Resources S.A.
Notes to the consolidated financial statements At and for the year ended on December 31, 2023 All amounts in thousands of US dollars, unless otherwise stated |
| Schedule of net financial results | ||||
| 2023 | 2022 | 2021 | ||
| Financial income | ||||
| Interest income on financial investments and cash equivalents | 11,622 | 16,913 | 6,074 | |
| Interest on tax credits | 1,012 | 980 | 1,377 | |
| Other financial income | 12,869 | 7,125 | 4,021 | |
| Total Financial income | 25,503 | 25,018 | 11,472 | |
| Financial expenses | ||||
| Interest on loans and financings | (110,734) | (104,689) | (96,565) | |
| Premium paid on bonds repurchase | - | (3,277) | - | |
|
Interest accrual on asset retirement and environmental obligations - note 27 |
(26,969) | (23,662) | (9,667) | |
| Interest on other liabilities | (9,215) | (11,472) | (12,371) | |
| Interest on contractual obligations | (5,329) | (5,801) | (6,936) | |
| Interest on lease liabilities - note 23 (b) | (427) | (542) | (1,272) | |
| Interest on VAT discussions - note 9 (iv) | (16,033) | - | - | |
| Interest on Factoring operations | (16,624) | (4,791) | (2,864) | |
| Other financial expenses | (18,853) | (14,460) | (12,600) | |
| Total Financial expenses | (204,184) | (168,694) | (142,275) | |
| Other financial items, net | ||||
| Changes in fair value of loans and financings – note 24 (c) | (525) | (1,472) | 19,380 | |
| Changes in fair value of derivative financial instruments – note 16 (c) | (606) | (83) | (5,640) | |
| Foreign exchange gain (loss) (i) | 18,171 | 11,504 | (19,839) | |
| Total Other financial items, net | 17,040 | 9,949 | (6,099) | |
| Net financial results | (161,641) | (133,727) | (136,902) |
(i) The amounts for years 2023 and 2022 are mainly due to (i) exchange variation gain on the outstanding USD accounts receivables and accounts payables of NEXA BR with NEXA in the amount of USD 23,662 and USD 24,010, respectively, and (ii) exchange variation loss of USD 3,863 and USD 331, respectively, mainly related to the intercompany loan of Nexa BR with its related parties which is not eliminated in the consolidation process. The transactions were impacted by the volatility of the Brazilian Real (“BRL”), which appreciated against the USD during 2023.
| 11 | Current and deferred income tax |
Accounting policy
The current income tax is calculated based on the tax laws enacted or substantively enacted as of the balance sheet date in the countries where the Company’s entities operate and generate taxable income. Management periodically evaluates positions taken by the Company in the taxes on income returns with respect to situations in which the applicable tax regulations are subject to interpretation.
The Company establishes provisions or records a liability, where appropriate, and when the Company has a present obligation, considering amounts expected to be paid to the tax authorities.
The current income tax is presented net, separated by tax paying entity, in liabilities when there are amounts payable, or in assets when the amounts prepaid exceed the total amount due on the reporting date.
Deferred income tax is provided in full, using the balance sheet liability method, on temporary differences arising between the tax bases of assets and liabilities and their carrying amounts for financial reporting purposes at the reporting date. However, deferred tax liabilities are not recognized if they arise from the initial recognition of goodwill. Deferred income tax is determined using tax rates (and laws), of the Company’s entities, that have been enacted or substantially enacted at the end of the reporting period and that are expected to be applied when the related deferred income tax asset is realized, or the deferred income tax liability is settled.
|
|
|
Nexa Resources S.A.
Notes to the consolidated financial statements At and for the year ended on December 31, 2023 All amounts in thousands of US dollars, unless otherwise stated |
Deferred tax assets are recognized only to the extent it is probable that future taxable income will be available against which the temporary deductible differences and/or tax losses can be utilized. Deferred tax assets and liabilities are offset when there is a legally enforceable right and an intention to offset them in the calculation of current taxes, generally when they are related to the same legal entity and the same tax authority. Accordingly, deferred tax assets and liabilities in different entities or in different countries are generally presented separately, and not on a net basis.
Deferred tax liabilities and assets are not recognized for temporary differences between the carrying amounts and tax bases of investments in foreign operations where the Company is able to control the timing of the reversal of the temporary differences and it is probable that the differences will not be reversed in the foreseeable future.
Current and deferred tax is recognized in profit or loss, except to the extent that it relates to items recognized in other comprehensive income or directly in equity. In this case, the tax is also recognized in other comprehensive income or directly in equity, respectively.
Critical accounting estimates, assumptions and judgments
The Company is subject to income tax in all countries in which it operates where uncertainties arise in the application of complex tax regulations. Significant estimates, assumptions and judgments are required to determine the amount of deferred tax assets that would be recovered since this amount may be affected by factors including, but not limited to: (i) internal assumptions on the projected taxable income, which are based on production and sales planning, commodity prices, operational costs and planned capital costs; (ii) macroeconomic environment; and (iii) trade and tax scenarios.
In addition, there are many transactions and calculations for which the ultimate tax determination is uncertain. The Company also exercises judgment in the identification of these uncertainties over income tax treatments which could impact the consolidated financial statements as the Company operates in a complex multinational environment.
The Company and its subsidiaries are subject to reviews of income tax filings and other tax payments, and disputes can arise with the tax authorities over the interpretation of the applicable laws and regulations.
| (a) | Reconciliation of income tax (expense) benefit |
| Schedule of reconciliation of income tax (expense) benefit | ||||||
| 2023 | 2022 | 2021 | ||||
| (Loss) income before income tax | (293,470) | 227,377 | 309,291 | |||
| Statutory income tax rate | 24.94% | 24.94% | 24.94% | |||
| Income tax benefit (expense) at statutory rate | 73,191 | (56,708) | (77,137) | |||
| ICMS tax incentives permanent difference | 10,995 | 19,277 | 24,463 | |||
|
Tax effects of translation of non-monetary assets/liabilities to functional currency |
13,686 | 6,279 | (32,998) | |||
| Withholding tax over subsidiary capital reduction | - | (5,263) | (10,526) | |||
| Impairment loss of goodwill | (12,585) | (18,247) | - | |||
| Special mining levy and special mining tax | (5,366) | (13,321) | (17,279) | |||
| Difference in tax rate of subsidiaries outside Luxembourg | 24,428 | (10,319) | (3,179) | |||
| Tax voluntary disclosure – VAT Discussions – note 9 (iv) | (34,999) | - | - | |||
| Unrecognized deferred tax on net operating losses (ii) | (52,091) | (66,069) | (36,577) | |||
| Other permanent tax differences | (12,985) | (6,612) | 29 | |||
| Income tax benefit (expense) | 4,274 | (150,983) | (153,204) | |||
| Current | (75,741) | (146,869) | (122,081) | |||
| Deferred | 80,015 | (4,114) | (31,123) | |||
| Income tax benefit (expense) | 4,274 | (150,983) | (153,204) |
(i) VAT expense related to the tax voluntary disclosure (refer to note 9) is not deductible for income tax purposes and, consequently, Nexa did not recognize a deferred tax asset.
(ii) On December 31, 2023 Nexa has not recognized deferred tax on net operating losses over a taxable basis of USD 154,261 (2022: USD 211,780), after an assessment made by management considering the future recoverability of these net operating losses. As of December 31, 2023 the Company has an estimated accumulated amount of USD 861,295 not recognized as deferred taxes on net operating losses. Of the total amount of unused tax losses, USD 86 have an expiration limit of 5 years, USD 481,342 of 17 years, USD 15,695 of 20 years, and USD 364,172 can be carried forward indefinitely.
|
|
|
Nexa Resources S.A.
Notes to the consolidated financial statements At and for the year ended on December 31, 2023 All amounts in thousands of US dollars, unless otherwise stated |
(b) Analysis of deferred income tax assets and liabilities
| Schedule of analysis of deferred income tax assets and liabilities | ||||
| 2023 | 2022 | |||
| Tax credits on net operating losses | 228,283 | 127,016 | ||
| Uncertain income tax treatments | (17,292) | (10,980) | ||
| Tax credits on temporary differences | ||||
| Environmental liabilities | 18,407 | 15,764 | ||
| Asset retirement obligations | 25,492 | 18,175 | ||
| Inventory provisions | 10,850 | 10,569 | ||
| Tax, labor and civil provisions | 9,588 | 8,882 | ||
| Provision for employee benefits | 7,319 | 7,099 | ||
| Revaluation of derivative financial instruments | 111 | 754 | ||
| Others | 16,938 | 12,144 | ||
| Tax debits on temporary differences | ||||
| Capitalized interest | (23,060) | (10,504) | ||
| Foreign exchange gains | (26,766) | (25,542) | ||
| Depreciation, amortization, and asset impairment | (178,410) | (178,041) | ||
| Others | (20,085) | (7,852) | ||
| 51,375 | (32,516) | |||
| Deferred income tax assets | 235,073 | 166,983 | ||
| Deferred income tax liabilities | (183,698) | (199,499) | ||
| 51,375 | (32,516) |
| (c) | Effects of deferred tax on income statement and other comprehensive income |
| Schedule of effects of deferred tax on income statement and other comprehensive income | ||||||
| 2023 | 2022 | 2021 | ||||
| Balance at the beginning of the year | (32,516) | (40,378) | 3,188 | |||
| Effect on income (loss) for the year | 80,015 | (4,114) | (31,123) | |||
| Effect on other comprehensive loss – Fair value adjustment | (1,071) | 820 | (2,536) | |||
| Prior years uncertain income tax treatment payment | - | 1,923 | - | |||
| Effect on other comprehensive income – Translation effect included in cumulative translation adjustment | 9,415 | 8,481 | (9,907) | |||
| Derecognition of Nexa's share of Enercan's deferred income taxes - note 4(ii) | - | 3,338 | - | |||
| Uncertain income tax treatments | (4,468) | (2,586) | - | |||
| Balance at the end of the year | 51,375 | (32,516) | (40,378) |
| (d) | Summary of uncertain tax positions on income tax |
There are discussions and ongoing disputes with tax authorities related to uncertain tax positions adopted by the Company in the calculation of its income tax, and for which management, supported by its legal counsel, has concluded that it is more-likely-than-not that its positions will be sustained upon examination.
As of December 31, 2023, the main legal proceedings are related to: (i) the interpretation of the application of the Cerro Lindo´s stability agreement; and (ii) litigation of transfer pricing adjustments over transactions made with related parties. The estimated amount of these contingent liabilities on December 31, 2023, is USD 478,329 which increased compared to that estimated on December 31, 2022, of USD 349,322, mainly due to the new tax assessment of Cerro Lindo Stability Agreements for 2017 and the change of the risk evaluation from remote to possible of some expenses deductions, in view of the evaluation made by internal and external advisors. In such cases, tax provisions are not recognized.
|
|
|
Nexa Resources S.A.
Notes to the consolidated financial statements At and for the year ended on December 31, 2023 All amounts in thousands of US dollars, unless otherwise stated |
Regarding Cerro Lindo´s stability agreement, the Peruvian tax authority (hereinafter SUNAT) issued unfavorable decisions against the Company for the years 2014, 2015, 2016 and 2017, arguing that the stability income tax rate granted by the stability agreement applies only to the income generated from 5,000 tons per day of its production, and not from its entire production capacity expanded over time. The Company has filed strong appeals against these decisions. SUNAT is currently auditing 2018 and 2019, while the years 2020 and 2021 (when the term of the stability agreement expires) remain open. Although SUNAT maintains its position disregarding the stabilized rate and taxing the Company’s total income at the statutory income tax rate for these years, the Company continues to maintain its position in relation to the applicability of the Cerro Lindo stability agreement. The Company’s Management, supported by the opinion of its external advisors, continues to conclude that there are legal grounds to obtain a favorable outcome in these matters related to the tax stability rate discussion. However, the Company may have to pay the disputed amounts under discussion to continue the legal process either in the judicial or international arbitration levels. Such payments may be made in several installments provided that a guarantee is placed before the courts and may impact the Company’s results.
| (e) | Pillar 2 – analysis on estimated effects |
NEXA is within the scope of the OECD Pillar Two model rules which establish a new global minimum tax framework of 15% minimum tax. Pillar Two legislation was enacted in Luxembourg and will come into effect for financial year beginning 1 January 2024, however, no legislation regarding Pillar Two was enacted in Peru and Brazil yet.
The Company has performed an assessment of the group’s potential exposure to Pillar Two income taxes by running initial testing under the OECD transitional safe harbor rules based on the most recent information available of tax filings, country-by-country reporting and financial statements for the constituent entities in the group. Based on the assessment performed, the jurisdictions where the Company operates should qualify for one of the transitional safe harbor rules and management is not currently aware of any circumstances under which this might change. Therefore, the Company does not expect a potential exposure to Pillar Two top-up tax.
| 12 | Financial risk management |
Financial risk factors
The Company’s activities expose it to a variety of financial risks: a) market risk (including currency risk, interest rate risk and commodities risk); b) credit risk; and c) liquidity risk.
A significant portion of the products sold by the Company are commodities, with prices pegged to international indices and denominated in USD. Part of the production costs, however, is denominated in BRL and Peruvian Soles (“PEN”), and therefore, there is a mismatch of currencies between revenues and costs. Additionally, the Company has debts linked to different indices and currencies, which may impact its cash flows.
In order to mitigate the potential adverse effects of each financial risk factor, the Company follows a Financial Risk Management Policy that establishes governance and guidelines for the financial risk management process, as well as metrics for measurement and monitoring. This policy establishes guidelines and rules for: (i) Commodities Exposure Management, (ii) Foreign Exchange Exposure Management, (iii) Interest Rate Exposure Management, (iv) Issuers and Counterparties Risk Management, and (v) Liquidity and Financial Indebtedness Management. All strategies and proposals must comply with the Financial Risk Management Policy guidelines and rules, be presented to and discussed with the Finance Committee of the Board of Directors, and, when applicable, submitted for the approval of the Board of Directors, under the governance structure described in such Policy.
| (a) | Market risk |
The purpose of the market risk management process and all related actions are intended to protect the Company’s cash flows against adverse events, such as changes in foreign exchange rates, interest rates and commodity prices, to maintain the ability to pay financial obligations, and to comply with liquidity and indebtedness levels defined by management.
|
|
|
Nexa Resources S.A.
Notes to the consolidated financial statements At and for the year ended on December 31, 2023 All amounts in thousands of US dollars, unless otherwise stated |
| (i) | Sensitivity analysis |
Presented below is a sensitivity analysis of the main risk factors that affect the pricing of the outstanding financial instruments related to cash and cash equivalents, financial investments, loans and financings, and other financial instruments. The main sensitivities are the exposure to changes in the USD exchange rate, the Interbank Deposit Certificate (“CDI”) interest rates, the National Broad Consumer Price Index (“IPCA”) and the commodity prices. The scenarios for these factors are prepared using market sources and other relevant sources, in compliance with the Company's policies. The scenarios on December 31, 2023 are described below:
| · | Scenario I: considers a change in the market forward yield curves and quotations as of December 31, 2023, according to the base scenario defined by the Company for March 31, 2024. |
| · | Scenario II: considers a change of + or -25% in the market forward yield curves as of December 31, 2023. |
| · | Scenario III considers a change of + or -50% in the market forward yield curves as of December 31, 2023. |
| Schedule of sensitivity analysis risk factors affecting price of financial instrument | |||||||||||||||
| Impacts on income statement | Impacts on statement of comprehensive income | ||||||||||||||
| Scenarios II and III | Scenarios II and III | ||||||||||||||
| Risk factor | Quotation at December 31, 2023 | Amount | Changes from 2023 | Scenario I | -25% | -50% | +25% | +50% | Scenario I | -25% | -50% | +25% | +50% | ||
| Cash and cash equivalents and financial investments | |||||||||||||||
| Foreign exchange rates | |||||||||||||||
| BRL | 4.8413 | 72,646 | (1.20%) | - | (2) | (5) | 2 | 5 | (870) | (18,159) | (36,318) | 18,159 | 36,318 | ||
| EUR | 1.1054 | 495 | (1.39%) | (7) | (124) | (247) | 124 | 247 | - | - | - | - | - | ||
| PEN | 3.7102 | 29,817 | 0.62% | 184 | (7,454) | (14,909) | 7,454 | 14,909 | - | - | - | - | - | ||
| CAD | 1.3260 | 1,255 | (1.23%) | - | - | - | - | - | (15) | (314) | (627) | 314 | 627 | ||
| NAD | 18.5470 | 1,590 | 1.52% | - | - | - | - | - | 24 | (397) | (795) | 397 | 795 | ||
| Interest rates | |||||||||||||||
| BRL - CDI - SELIC | 11.65% | 70,252 | (69) bps | (482) | (2,046) | (4,092) | 2,046 | 4,092 | - | - | - | - | - | ||
| Loans and financings | |||||||||||||||
| Foreign exchange rates | |||||||||||||||
| BRL | 4.8413 | 280,909 | (1.20%) | - | - | - | - | - | 3,365 | 70,227 | 140,454 | (70,227) | (140,454) | ||
| Interest rates | |||||||||||||||
| BRL - CDI - SELIC | 11.65% | 79,122 | (69) bps | 542 | 2,304 | 4,609 | (2,304) | (4,609) | - | - | - | - | - | ||
| USD - SOFR | 5.28% | 233,671 | 6 bps | (149) | 3,085 | 6,170 | (3,085) | (6,170) | - | - | - | - | - | ||
| IPCA - TLP | 4.62% | 174,971 | 38 bps | (665) | 2,021 | 4,042 | (2,021) | (4,042) | - | - | - | - | - | ||
| TJLP | 6.53% | 26,816 | (2) bps | 5 | 438 | 876 | (438) | (876) | - | - | - | - | - | ||
| Other financial instruments | |||||||||||||||
| Foreign exchange rates | |||||||||||||||
| BRL | 4.8413 | (450) | (1.20%) | 6 | (150) | (450) | 90 | 150 | - | - | - | - | - | ||
| Interest rates | |||||||||||||||
| BRL - CDI - SELIC | 11.65% | (450) | (69) bps | 92 | 622 | 1,307 | (567) | (1,086) | - | - | - | - | - | ||
| USD - SOFR | 5.28% | (2,149) | 6 bps | (8) | (23) | (48) | 23 | 45 | (1) | (27) | (55) | 27 | 54 | ||
| Commodities price | |||||||||||||||
| Zinc | 2,641 | (2,149) | (4.69%) | 3,962 | 9,003 | 18,006 | (9,003) | (18,006) | 263 | 597 | 1,193 | (597) | (1,193) | ||
|
|
|
Nexa Resources S.A.
Notes to the consolidated financial statements At and for the year ended on December 31, 2023 All amounts in thousands of US dollars, unless otherwise stated |
| (ii) | Foreign exchange risk |
Foreign exchange risk is managed through the Company’s Financial Risk Management Policy, which states that the objectives of derivative transactions are to reduce cash flow volatility, hedge against foreign exchange exposure and minimize currency mismatches.
Presented below are the financial assets and liabilities in foreign currencies on December 31, 2023. These mainly result from NEXA BR’s operations, for which the functional currency is the BRL.
Intercompany loans balances are fully eliminated in the consolidated financial statements. However, the related foreign exchange gain or loss is not, and is presented as foreign exchange effects.
| Schedule of foreign exchange effects | ||
| USD amounts of foreign currency balances | 2023 | 2022 |
| Assets | ||
| Cash, cash equivalents and financial investments | 105,802 | 97,397 |
| Other Financial Instruments | 29 | 143 |
| Trade accounts receivables | 19,885 | 19,132 |
| Total Assets | 125,716 | 116,672 |
| Liabilities | ||
| Loans and financings | 279,341 | 276,634 |
| Other Financial Instruments | 479 | 435 |
| Trade payables | 227,687 | 182,275 |
| Lease liabilities | 634 | 2,738 |
| Use of public assets | 22,733 | 23,263 |
| Total Liabilities | 530,874 | 485,345 |
| Net exposure | (405,158) | (368,673) |
| (iii) | Interest rate risk |
The Company's interest rate risk arises mainly from long-term loans. Loans at variable rates expose the Company to cash flow interest rate risk. Loans at fixed rates expose the Company to fair value risk associated with interest rates. For further information related to interest rates, refer to note 24.
The Company’s Financial Risk Management Policy establishes guidelines and rules to hedge against changes in interest rates that impact the Company’s cash flows. Exposure to each interest rate is projected until the maturity of the assets and liabilities exposed to this index. Occasionally the Company enters into floating to fixed interest rate swaps to manage its cash flow interest rate risk. In the case of loans and financings contracted together with swaps, the Company accounts for them under the fair value option to eliminate the accounting mismatch that would arise if amortized cost were used.
| (iv) | Commodity price risk |
The commodity price risk is related to the volatility in the prices of the Company's commodities. Prices fluctuate depending on demand, production capacity, inventory levels, commercial strategies adopted by large producers, and the availability of substitutes for these products in the global market.
The Company’s Financial Risk Management Policy establishes guidelines to mitigate the risk of fluctuations in commodity prices that could impact the Company's cash flows. The exposure to the price of each commodity considers the monthly production projections, inputs purchases and the maturity flows of hedges associated with them.
Commodity prices hedge transactions are classified into the following hedging strategies:
Hedges for sales of zinc at a fixed price (Customer Hedge)
The objective is to convert fixed priced sales to floating prices, observed on the London Metal Exchange (LME). The purpose of the strategy is to maintain the revenues of a business unit linked to the LME prices. These transactions usually relate to purchases of zinc for future settlement on the over-the-counter market.
|
|
|
Nexa Resources S.A.
Notes to the consolidated financial statements At and for the year ended on December 31, 2023 All amounts in thousands of US dollars, unless otherwise stated |
Hedges for mismatches of quotational periods (Hedge Book)
The objective is to hedge quotational periods mismatches arising between the purchases of metal concentrate or processed metal and the sale of the processed metal. These transactions usually relate to purchases and sales of zinc for future trading on the over-the-counter market.
| (b) | Credit risk |
Trade receivables, derivative financial instruments, term deposits, bank deposit certificates ("CDBs") and government securities create exposure to credit risk with respect to the counterparties and issuers. The Company has a policy of making deposits in financial institutions that have, at least, a rating from two of the following international rating agencies: Fitch, Moody’s or Standard & Poor’s. The minimum rating required for counterparties is determined as follows:
- Onshore operations: rating "A", or equivalent, on a local scale by two rating agencies. In the case of foreign financial institutions that have a local rating by only one rating agency, it should be at least "AA-", and its headquarters should have a rating "A" minimum on a global scale.
- Offshore operations: rating "BBB-", or equivalent, on a global scale by two rating agencies.
In the case of financial institutions in Peru or in Luxembourg, local ratings from local agencies associated with rating agencies approved in the Company’s policy are accepted. In case that only a global rating is available, it will be eligible provided that it has a rating "BBB-" at least by one rating agency.
In the case of financial institutions that do not have a rating available for a specific country, it will be eligible provided that its headquarters follow the minimum ratings specified above.
The pre-settlement risk methodology is used to assess counterparty risks in derivative transactions.
This methodology consists of determining the risk associated with the likelihood (via Monte Carlo simulations) of a counterparty defaulting on the financial commitments defined by contract.
The global ratings were obtained from the rating agencies Fitch, Moody’s or Standard & Poor’s ratings and are related to commitments in foreign or local currency and, in both cases, they assess the capacity to honor these commitments, using a scale applicable on a global basis. Therefore, both ratings in foreign currency and in local currency are internationally comparable ratings.
The ratings used by the Company are always the most conservative ratings of the referred agencies.
In the case of credit risk arising from customer credit exposure, the Company assesses the credit quality of the customer, considering mainly the history of the relationship and financial indicators defining individual credit limits, which are continuously monitored.
The Company performs initial analyses of customer credit and, when deemed necessary, guarantees or letters of credit are obtained to mitigate the credit risk. Additionally, most sales to the United States of America, Europe and Asia are collateralized by letters of credit and credit insurance.
The carrying amount of the Company’s financial instruments best represents the maximum exposure to their credit risk.
The following table reflects the credit quality of issuers and counterparties for transactions involving cash and cash equivalents, financial investments and derivative financial instruments. The variations presented are mainly related to the Company's transactions in the year and not to changes in the counterparties’ ratings.
|
|
|
Nexa Resources S.A.
Notes to the consolidated financial statements At and for the year ended on December 31, 2023 All amounts in thousands of US dollars, unless otherwise stated |
| Schedule of credit quality of financial assets | ||||||||||||
| 2023 | 2022 | |||||||||||
| Local rating | Global rating | Total | Local rating | Global rating | Total | |||||||
| Cash and cash equivalents | ||||||||||||
| AAA | 189,582 | - | 189,582 | 191,269 | - | 191,269 | ||||||
| AA | 1 | - | 1 | 10,259 | - | 10,259 | ||||||
| AA- | - | 46,317 | 46,317 | - | 15,958 | 15,958 | ||||||
| A+ | - | 72,315 | 72,315 | - | 117,968 | 117,968 | ||||||
| A | - | 66,342 | 66,342 | - | 93,117 | 93,117 | ||||||
| A- | - | 70,155 | 70,155 | - | 54,737 | 54,737 | ||||||
| BB+ | - | 1 | 1 | - | - | - | ||||||
| No rating (i) | 76 | 12,470 | 12,546 | 8,451 | 6,067 | 14,518 | ||||||
| 189,659 | 267,600 | 457,259 | 209,979 | 287,847 | 497,826 | |||||||
| Financial investments | ||||||||||||
| AAA | 10,994 | - | 10,994 | 18,006 | - | 18,006 | ||||||
| No rating (i) | 64 | - | 64 | 56 | - | 56 | ||||||
| 11,058 | - | 11,058 | 18,062 | - | 18,062 | |||||||
| Derivative financial instruments | ||||||||||||
| AAA | 29 | - | 29 | 144 | - | 144 | ||||||
| A+ | - | 978 | 978 | - | 3,061 | 3,061 | ||||||
| A | - | 53 | 53 | - | - | - | ||||||
| A- | - | 6,667 | 6,667 | - | 4,238 | 4,238 | ||||||
| BBB+ | - | 166 | 166 | - | - | - | ||||||
| 29 | 7,864 | 7,893 | 144 | 7,299 | 7,443 | |||||||
(i) Refers to subsidiaries of international financial institutions that do not have a global rating available in the international rating agencies. According to the Company's policy, for these financial institutions, the rating of the financial institution controlling entities is assumed, which must be at least BBB-.
| (c) | Liquidity risk |
Liquidity risk is managed through the Company's Financial Risk Management Policy, which aims to ensure the availability of funds to meet the Company’s financial obligations. The main liquidity measurement and monitoring instrument is the cash flow projection, using a minimum projection period of 12 months from the benchmark date. Financial institutions that provide the Company with financial services are within Nexa’s rating policies and in the same level of the ones provided for the Company’s credit risk.
A substantial part of the confirming payables arrangement is with one financial institution. However, there are other financial institutions that the Company has relations with that could be considered for future supplier financing transactions. If this service is not available, the entity may be required to increase its debt levels which may negatively impact its leverage ratios.
The table below shows the Company's financial obligations to be settled by the Company based on their maturity (the remaining period from the balance sheet up to the contractual maturity date). The amounts below represent the estimated undiscounted future cash flows, which include interests to be incurred and, accordingly, do not reconcile directly with the amounts presented in the consolidated balance sheet.
|
|
|
Nexa Resources S.A.
Notes to the consolidated financial statements At and for the year ended on December 31, 2023 All amounts in thousands of US dollars, unless otherwise stated |
| Schedule of liquidity risk | ||||||
| 2023 | Less than 1 year | Between 1 and 3 years | Between 3 and 5 years | Over 5 years | Total | |
| Loans and financings | 232,941 | 181,147 | 1,591,705 | 173,436 | 2,179,229 | |
| Lease liabilities | 4,450 | 5,658 | 441 | 117 | 10,666 | |
| Derivative financial instruments | 10,343 | 108 | 42 | - | 10,493 | |
| Trade payables | 451,603 | - | - | - | 451,603 | |
| Confirming payables | 234,385 | - | - | - | 234,385 | |
| Salaries and payroll charges | 68,165 | - | - | - | 68,165 | |
| Dividends payable | 2,830 | - | - | - | 2,830 | |
| Related parties | 1,062 | 2,873 | - | - | 3,935 | |
| Dams, asset retirement and environmental obligations | 33,591 | 85,675 | 95,302 | 358,333 | 572,901 | |
| Use of public assets | 1,902 | 3,240 | 3,921 | 17,570 | 26,633 | |
| 1,041,272 | 278,701 | 1,691,411 | 549,456 | 3,560,840 |
| 2022 | Less than 1 year | Between 1 and 3 years | Between 3 and 5 years | Over 5 years | Total | |
| Loans and financings | 136,348 | 391,201 | 981,759 | 704,944 | 2,214,252 | |
| Lease liabilities | 4,105 | 1,410 | - | - | 5,515 | |
| Derivative financial instruments | 9,712 | 215 | 86 | 5 | 10,018 | |
| Trade payables | 413,856 | 12,154 | - | - | 426,010 | |
| Confirming payables | 216,392 | - | - | - | 216,392 | |
| Salaries and payroll charges | 79,078 | - | - | - | 79,078 | |
| Dividends payable | 7,922 | - | - | - | 7,922 | |
| Related parties | 487 | 546 | - | - | 1,033 | |
| Asset retirement and environmental obligations | 19,360 | 29,625 | 28,868 | 241,258 | 319,111 | |
| Use of public assets | 2,484 | 4,972 | 4,890 | 16,584 | 28,930 | |
| 889,744 | 440,123 | 1,015,603 | 962,791 | 3,308,261 |
| (d) | Capital management |
The Company’s objectives when managing capital are to safeguard its ability to continue as a going concern, so it can continue to provide returns for shareholders and benefits for other stakeholders; and to maintain an optimal capital structure to reduce the cost of capital.
To maintain or adjust the capital structure, the Company may adjust the dividends level paid to shareholders, return capital to shareholders, issue new shares or sell assets to reduce debt. The Company monitors capital mainly using the leverage ratio, calculated as net debt to Adjusted EBITDA.
Net debt and Adjusted EBITDA measures should not be considered in isolation or as a substitute for net income or operating income, as indicators of operating performance, or as alternatives to cash flow as measures of liquidity. Additionally, management’s calculation of Adjusted EBITDA may be different from the calculation used by other companies, including competitors in the mining and smelting industry, so these measures may not be comparable to those of other companies.
| Schedule of leverage ratio | |||||||
| Note | 2023 | 2022 | 2021 | ||||
| Loans and financings | 24 (a) | 1,725,566 | 1,669,259 | 1,699,315 | |||
| Derivative financial instruments | 16 (a) | 2,600 | 2,575 | 6,531 | |||
| Lease liabilities | 23 (b) | 9,218 | 5,021 | 19,639 | |||
| Cash and cash equivalents | 15 | (457,259) | (497,826) | (743,817) | |||
| Financial investments | (11,058) | (18,062) | (19,202) | ||||
| Net debt (i) | 1,269,067 | 1,160,967 | 962,466 | ||||
| Net income (loss) for the year | (289,196) | 76,394 | 156,087 | ||||
| Plus (less): | |||||||
| Depreciation and amortization | 21,22 and 23 | 298,393 | 290,937 | 258,711 | |||
| Share in the results of associates | (23,536) | (1,885) | - | ||||
| Net financial results | 10 | 161,641 | 133,727 | 136,902 | |||
| Income tax expense (benefit) | 11 (a) | (4,274) | 150,983 | 153,204 | |||
| Miscellaneous adjustments | 2 | 248,128 | 110,168 | 38,931 | |||
| Adjusted EBITDA (ii) | 391,156 | 760,324 | 743,835 | ||||
| Leverage ratio (Net debt/Adjusted EBITDA) | 3.24 | 1.53 | 1.29 | ||||
(i) Net debt is defined as (a) loans and financings, plus lease liabilities, plus or minus (b) the fair value of derivative financial instruments, less (c) cash and cash equivalents, less (d) financial investments.
(ii) Adjusted EBITDA for capital management calculation uses the same assumptions described in note 2 for Adjusted EBITDA by segment.
|
|
|
Nexa Resources S.A.
Notes to the consolidated financial statements At and for the year ended on December 31, 2023 All amounts in thousands of US dollars, unless otherwise stated |
| 13 | Financial instruments |
Accounting policy
Normal purchases and sales of financial assets are recognized on the trade date – the date on which the Company commits to purchase or sell the asset. Financial assets are initially recognized at fair value plus transaction costs for all financial assets not carried at fair value through profit or loss. Financial assets carried at fair value through profit or loss, if any, are initially recognized at fair value, and transaction costs are expensed in the income statement.
Financial assets are derecognized when the rights to receive cash flows from the investments have expired or the Company has transferred substantially all the risks and rewards of ownership. Financial assets at fair value through profit or loss and at fair value through other comprehensive income are subsequently carried at fair value. Financial assets at amortized costs are subsequently measured using the effective interest rate method.
Equity instruments may be irrevocably elected on their initial recognition for their fair value changes to be presented in other comprehensive income instead of in the income statement. Since the objective of the Company’s equity instruments is to buy more participation in a project and not sell the investment, they have been classified as fair value through other comprehensive income.
Then, the Company classifies its financial assets and liabilities under the following categories: amortized cost, fair value through profit or loss and fair value through other comprehensive income.
| (i) | Amortized cost |
Financial assets measured at amortized cost are assets held within a business model whose objective is to hold financial assets to collect contractual cash flows and for which the contractual terms of the financial asset give rise on specified dates to cash flows that are solely payments of principal and interest (“SPPI”) on the principal amount outstanding.
Financial liabilities are measured at amortized cost, except for financial liabilities at fair value through profit or loss such as derivatives and some specific loans and financings.
| (ii) | Fair value through profit or loss |
Financial assets measured at fair value through profit or loss are assets which an entity manages with the objective of realizing cash flows through the sale of such assets and financial assets that do not give rise to cash flows that are SPPI on the principal amount outstanding.
Financial liabilities measured at fair value through profit or loss are liabilities which were not measured at amortized cost, such as derivatives and loans and financings that are designated at fair value option when is necessary to eliminate the accounting mismatch that would arise if amortized cost were used.
For these loans and financings, the portion of the variation in credit risk is recorded in the OCI.
|
|
|
Nexa Resources S.A.
Notes to the consolidated financial statements At and for the year ended on December 31, 2023 All amounts in thousands of US dollars, unless otherwise stated |
| (iii) | Fair value through other comprehensive income |
Financial assets measured at fair value through other comprehensive income are held within a business model whose objective is achieved by both collecting contractual cash flows and selling financial assets and for which the contractual terms of the financial asset give rise on specified dates to cash flows that are SPPI on the principal amount outstanding. Investments in equity instruments are measured at fair value through other comprehensive income as mentioned before.
| (a) | Breakdown by category |
The Company’s financial assets and liabilities are classified as follows:
| Schedule of financial instruments breakdown by category | |||||
| 2023 | |||||
| Assets per balance sheet | Note | Amortized cost | Fair value through profit or loss |
Fair value through Other comprehensive income |
Total |
| Cash and cash equivalents | 15 | 457,259 | - | - | 457,259 |
| Financial investments | 11,058 | - | - | 11,058 | |
| Other financial instruments | 16 (a) | - | 7,893 | - | 7,893 |
| Trade accounts receivables | 17 | 53,328 | 88,582 | - | 141,910 |
| Investments in equity instruments | 14 (c) | - | - | 5,649 | 5,649 |
| Related parties (i) | 20 (a) | 3 | - | - | 3 |
| 521,648 | 96,475 | 5,649 | 623,772 | ||
| 2023 | |||||
| Liabilities per balance sheet | Note | Amortized cost | Fair value through profit or loss |
Fair value through Other comprehensive income |
Total |
| Loans and financings | 24 (a) | 1,634,163 | 91,403 | - | 1,725,566 |
| Lease liabilities | 23 (b) | 9,218 | - | - | 9,218 |
| Other financial instruments | 16 (a) | - | 46,122 | - | 46,122 |
| Trade payables | 25 | 451,603 | - | - | 451,603 |
| Confirming payables | 26 | 234,385 | - | - | 234,385 |
| Use of public assets (ii) | 22,733 | - | - | 22,733 | |
| Related parties (ii) | 20 (a) | 3,935 | - | - | 3,935 |
| 2,356,037 | 137,525 | - | 2,493,562 |
| 2022 | |||||
| Assets per balance sheet | Note | Amortized cost | Fair value through profit or loss |
Fair value through Other comprehensive income |
Total |
| Cash and cash equivalents | 15 | 497,826 | - | - | 497,826 |
| Financial investments | 18,062 | - | - | 18,062 | |
| Other financial instruments | 16 (a) | - | 7,443 | - | 7,443 |
| Trade accounts receivables | 17 | 53,123 | 170,617 | - | 223,740 |
| Investments in equity instruments | 14 (c) | - | - | 7,115 | 7,115 |
| Related parties (i) | 20 (a) | 2 | - | - | 2 |
| 569,013 | 178,060 | 7,115 | 754,188 | ||
| 2022 | |||||
| Liabilities per balance sheet | Note | Amortized cost | Fair value through profit or loss |
Fair value through Other comprehensive income |
Total |
| Loans and financings | 24 (a) | 1,578,864 | 90,395 | - | 1,669,259 |
| Lease liabilities | 23 (b) | 5,021 | - | - | 5,021 |
| Other financial instruments | 16 (a) | - | 31,851 | - | 31,851 |
| Trade payables | 25 | 413,856 | - | - | 413,856 |
| Confirming payables | 26 | 216,392 | - | - | 216,392 |
| Use of public assets (ii) | 23,263 | - | - | 23,263 | |
| Related parties (ii) | 20 (a) | 1,033 | - | - | 1,033 |
| 2,238,429 | 122,246 | - | 2,360,675 |
(i) Classified as Other assets in the consolidated balance sheet.
(ii) Classified as Other liabilities in the consolidated balance sheet.
|
|
|
Nexa Resources S.A.
Notes to the consolidated financial statements At and for the year ended on December 31, 2023 All amounts in thousands of US dollars, unless otherwise stated |
| 14 | Fair value estimates |
Critical accounting estimates, assumptions and judgments
The fair value of financial instruments that are not traded in an active market is determined using valuation techniques. The Company uses judgment to select among a variety of methods and makes estimates and assumptions that are mainly based on market conditions existing at the end of each reporting period.
Although management has used its best judgment in estimating the fair value of its financial instruments, any technique for making said estimates and assumptions involves some level of inherent fragility.
| (a) | Analysis |
The main financial instruments and the estimates and assumptions made by the Company for their valuation are described below:
| · | Cash and cash equivalents, financial investments, trade accounts receivables and other current assets – considering their nature, terms and maturity, the carrying amounts approximate their fair value. |
| · | Financial liabilities – these instruments are subject to usual market interest rates. The fair value is based on the present value of expected future cash disbursements, at interest rates currently available for debt with similar maturities and terms and adjusted for the Company’s credit risk. Loans and financings are measured at amortized cost, except for certain contracts for which the Company has elected the fair value option. |
| · | Energy forward contracts - part of the fair value of these financial instruments are estimated based on the published price quotations in the active markets, as far as the data are existent and accessible in the market. The other part is estimated based on the use of valuation techniques that consider: (i) prices established in purchase and sale operations; (ii) supply risk margin; and, (iii) projected market price in the period of availability. |
| · | Other financial instruments – the fair value is determined by calculating their present value through yield curves at the closing dates. The curves and prices used in the calculation for each group of instruments are developed based on data from Brazilian Securities, Commodities and Futures Exchange – B3, Central Bank of Brazil, LME and Bloomberg, interpolated between the available maturities. The main derivative financial instruments are: |
| · | Swap contracts – the present value of both the assets and liabilities are calculated through the discount of forecasted cash flows by the interest rate of the currency in which the swap is denominated. The difference between the present value of the assets and the liabilities generates its fair value. |
| · | Forward contracts – the present value is estimated by discounting the notional amount multiplied by the difference between the future price at the reference date and the contracted price. The future price is calculated using the convenience yield of the underlying asset. It is common to use Asian non-deliverable forwards for hedging non-ferrous metals positions. Asian contracts are derivatives in which the underlying is the average price of certain asset over a range of days. |
| · | Option contracts – the present value is estimated based on the Black and Scholes model, with assumptions that include the underlying asset price, strike price, volatility, time to maturity and interest rate. |
|
|
|
Nexa Resources S.A.
Notes to the consolidated financial statements At and for the year ended on December 31, 2023 All amounts in thousands of US dollars, unless otherwise stated |
| (b) | Fair value by hierarchy |
| Schedule of by fair value hierarchy | |||||||
| 2023 | |||||||
| Note | Level 1 | Level 2 (ii) | Total | ||||
| Assets | |||||||
| Other financial instruments | 16 (a) | - | 7,893 | 7,893 | |||
| Trade accounts receivables | - | 88,582 | 88,582 | ||||
| Investments in equity instruments (i) | 14 (c) | 5,649 | - | 5,649 | |||
| 5,649 | 96,475 | 102,124 | |||||
| Liabilities | |||||||
| Other financial instruments | 16 (a) | - | 46,122 | 46,122 | |||
| Loans and financings designated at fair value (ii) | - | 91,403 | 91,403 | ||||
| - | 137,525 | 137,525 | |||||
| 2022 | |||||||
| Note | Level 1 | Level 2 | Total | ||||
| Assets | |||||||
| Other financial instruments | 16 (a) | - | 7,443 | 7,443 | |||
| Trade accounts receivables | - | 170,617 | 170,617 | ||||
| Investment in equity instruments (i) | 14 (c) | 7,115 | - | 7,115 | |||
| 7,115 | 178,060 | 185,175 | |||||
| Liabilities | |||||||
| Other financial instruments | 16 (a) | - | 31,851 | 31,851 | |||
| Loans and financings designated at fair value (ii) | - | 90,395 | 90,395 | ||||
| - | 122,246 | 122,246 | |||||
(i) To determine the fair value of the investments in equity instruments, the Company uses the share’s quotation as of the last day of the reporting period.
(ii) Loans and financings are measured at amortized cost, except for certain contracts for which the Company has elected the fair value option.
The Company discloses fair value measurements based on their level on the following fair value measurement hierarchy:
Level 1:
When fair value is calculated with quoted prices (unadjusted) in active markets for identical assets and liabilities traded in active markets at the balance sheet date. A market is regarded as active if quoted prices are readily and regularly available from an exchange, dealer, broker, industry group, pricing service, or regulatory agency, and those prices represent actual and regularly occurring market transactions on an arm’s length basis. The quoted market price used for financial assets held by the Company is the current bid price.
Level 2:
When fair value is calculated with valuation techniques since the financial instruments are not traded in an active market and all of the significant inputs required to identify the fair value of an instrument are observable. Specific valuation techniques used to value financial instruments include:
| · | Quoted market prices or dealer quotes for similar instruments are used where available; |
| · | The fair values of interest rate swaps are calculated at the present value of the estimated future cash flow based on observable yield curves; and |
| · | The fair value of forward foreign exchange contracts is determined using forward exchange rates at the balance sheet date, with the resulting value discounted to present value. |
Other techniques, such as discounted cash flows analysis, are used to determine the fair value of the remaining financial instruments.
|
|
|
Nexa Resources S.A.
Notes to the consolidated financial statements At and for the year ended on December 31, 2023 All amounts in thousands of US dollars, unless otherwise stated |
Level 3:
When fair value is calculated with inputs for the asset or liability that are not based on observable market data (that is, unobservable inputs). As of December 31, 2023, there were no financial assets and liabilities carried at fair value classified as Level 3.
| (c) | Investments in equity instruments – Increase of equity interest in Tinka Resources |
In 2021, the Company acquired 9.0% of the issued and outstanding common shares of Tinka Resources Limited (“Tinka”), an exploration and development company which holds 100% of the Ayawilca zinc-silver project in Peru. On May 31, 2022, the Company subscribed to an additional 40,792,541 common shares in a private transaction at a price of CAD 0.22 per share (approximately USD 0.17) for a total consideration of CAD 8,974 thousand (USD 7,000). After this subscription, the Company holds 18.23% of the issued and outstanding common shares of Tinka. Similar to the original acquisitions made in 2021, this transaction has been accounted for as an investment in equity instruments at its acquisition cost and all are being subsequently measured at fair value through other comprehensive income.
| 15 | Cash and cash equivalents |
Accounting policy
Cash and cash equivalents include cash, bank deposits, and highly liquid short-term investments (investments with an original maturity less than 90 days), which are readily convertible into a known amount of cash and subject to an immaterial risk of changes in value. Bank overdrafts are shown within Loans and financings in current liabilities in the balance sheet.
| (a) | Composition |
| Schedule of cash and cash equivalents | ||||
| 2023 | 2022 | |||
| Cash and banks | 352,814 | 330,653 | ||
| Term deposits | 104,445 | 167,173 | ||
| Total cash and cash equivalents | 457,259 | 497,826 |
| 16 | Other financial instruments |
Accounting policy
Derivatives are initially recognized at fair value as at the date on which a derivative contract is entered into and are subsequently measured at fair value. Derivatives are only used for risk mitigation purposes and not as speculative investments. When derivatives do not meet the hedge accounting criteria, they are classified as held for trading and accounted for at fair value through profit or loss.
For derivatives that meet the hedge accounting criteria, the Company documents at the inception of the hedging transaction the relationship between hedging instruments and hedged items, as well as its risk management objectives and strategy for undertaking the hedge transactions. The Company also documents its assessment, both at hedge inception and on an ongoing basis, whether the derivatives that are used in hedging transactions and accounted for as hedge accounting were, and will continue to be, highly effective in offsetting changes in the fair value or cash flow of hedged items.
| (i) | Derivative financial instruments designated as cash flow hedge |
Derivatives that are designated for hedge accounting recognition are qualified as cash flow hedges when they are related to a highly probable forecasted transaction. The effective portion of the changes in fair value is recognized in shareholders’ equity in Accumulated other comprehensive income and is subsequently reclassified to the income statement in the same period when the hedged expected cash flows affect the income statement.
The reclassification adjustment is recognized in the same income statement line item affected by the highly probable forecasted transaction, while gains or losses related to the non-effective portion are immediately recognized as “Other income and expenses, net”.
|
|
|
Nexa Resources S.A.
Notes to the consolidated financial statements At and for the year ended on December 31, 2023 All amounts in thousands of US dollars, unless otherwise stated |
When a hedging instrument expires, is sold or no longer meets the criteria for hedge accounting, any cumulative gain or loss existing in shareholders’ equity at that time remains in shareholders’ equity and is recognized when the forecast transaction is ultimately recognized in the income statement. When a forecasted transaction is no longer expected to occur, the cumulative gain or loss that was previously accounted in shareholders’ equity is immediately transferred to the income statement within Other income and expenses, net.
Currently, the Company classifies as cash flow hedge only some strategies related to mismatches of quotational periods.
| (ii) | Derivative financial instruments designated as fair value hedge |
Derivatives that are designated for hedge accounting recognition are qualified as fair value hedges when they are related to assets or liabilities already recognized in the consolidated balance sheet. Changes in the fair values of derivatives that are designated and qualify as fair value hedges and changes in the fair value of the hedged item are recorded in the income statement in the same period.
Currently, the Company does not have any derivatives designated as fair value hedge.
| (iii) | Derivatives financial instruments not designated as hedge accounting |
Changes in the fair value of derivative financial instruments not designated as hedge accounting are recognized in the income statement in the line affected by the related transaction.
| (iv) | Energy forward contracts |
The Company through its energy subsidiaries is an energy self-producer and authorized to sell energy both in the free and regulated markets as Energy Traders. A portion of these transactions involve contracts for delivery of energy for internal use to meet production demands and are not therefore classified as financial instruments.
Another portion of these transactions consists of sales of energy not used in production process. These transactions take place in an active market meet the definition of financial instruments, because they are settled in energy and readily convertible into cash. Such contracts are recorded as derivatives and are recognized in the Company's statement of balance sheet at fair value on the date on which the derivative is entered, and subsequently revalued at their fair values at the reporting date. The fair value recognition and realization of these financial instruments are recorded under “Other income and expenses, net”.
The fair values of these derivatives are estimated partly based on price quotes in active markets, as long as such market data exists, and partly through the use of valuation techniques, which consider: (i) prices established in the purchase and sale operations; (ii) the risk margin on the supply; and (iii) the projected market price during the period of availability. Whenever the fair value upon initial recognition for these contracts differs from the transaction price, a loss or gain on the fair value is recognized in the profit or loss for the year. The transactions carried out by the company Pollarix S.A. in the Free Contracting Environment (“ACL”) led to a loss from the sale of surplus energy, which was recognized at its fair value on the transaction date.
| (v) | Offtake agreement |
On January 25, 2022, the Company signed an offtake agreement with an international offtaker (the “Offtaker”) a subsidiary of a BBB rated company, in which it agreed to sell 100% of the copper concentrate to be produced by Aripuanã for a 5-year period starting in February 2023 up to a total of 30,810 tons, at the lower of current spot market prices or a price cap.
|
|
|
Nexa Resources S.A.
Notes to the consolidated financial statements At and for the year ended on December 31, 2023 All amounts in thousands of US dollars, unless otherwise stated |
The offtake agreement resulted from negotiations with the Offtaker to sell the copper concentrate in lieu of paying future royalties related to the previous acquisition of the Aripuanã project mining rights from the Offtaker. The amount of USD 46,100, representing the fair value of the agreement at its inception date, was recognized as an intangible asset and will be amortized over the life of the mine according to the Units of Production (“UoP”) method.
Additionally, the Company opted to voluntarily and irrevocably designate the entire offtake agreement at fair value through profit and loss within the scope of IFRS 9, rather than separate the value of the embedded derivative associated with the price cap, recognizing a non-cash accumulated gain of USD 2,268 in the income statement for year ended on December 31, 2023.
| (a) | Composition |
| Schedule of derivative financial instruments | |||||||
| Derivatives financial instruments | Offtake agreement measured at FVTPL | Energy futures contracts at FVTPL (i) |
2023 | ||||
| Current assets | 7,801 | - | - | 7,801 | |||
| Non-current assets | 92 | - | - | 92 | |||
| Current liabilities | (10,343) | (2,091) | (6,643) | (19,077) | |||
| Non-current liabilities | (150) | (17,474) | (9,421) | (27,045) | |||
| Other financial instruments, net | (2,600) | (19,565) | (16,064) | (38,229) |
| Derivatives financial instruments | Offtake agreement measured at FVTPL | Energy futures contracts at FVTPL |
2022 | ||||
| Current assets | 7,380 | - | - | 7,380 | |||
| Non-current assets | 63 | - | - | 63 | |||
| Current liabilities | (9,711) | (1,724) | - | (11,435) | |||
| Non-current liabilities | (307) | (20,109) | - | (20,416) | |||
| Other financial instruments, net | (2,575) | (21,833) | - | (24,408) |
(i) On December 31, 2023, due to the current scenario of high energy supply in Brazil, the Company has a projected energy surplus on forward contracts with some suppliers. Consequently, the Company recognized the fair value arising from the mark-to-market of current purchase until 2026, which resulted in an expense in the amount of USD 15,663. This amount was accounted for as a loss within “Other income and expenses, net” (Note 9) and will vary according to the market’s energy prices.
| (b) | Derivative financial instruments: Fair value by strategy |
| Schedule of fair value by strategy | ||||||||
| 2023 | 2022 | |||||||
| Strategy | Per Unit | Notional | Fair value | Notional | Fair value | |||
| Mismatches of quotational periods | ||||||||
| Zinc forward | ton | 209,951 | (3,175) | 209,319 | (2,357) | |||
| (3,175) | (2,357) | |||||||
| Sales of zinc at a fixed price | ||||||||
| Zinc forward | ton | 7,233 | 1,026 | 8,297 | 74 | |||
| 1,026 | 74 | |||||||
| Interest rate risk | ||||||||
| IPCA vs. CDI | BRL | 100,000 | (451) | 226,880 | (292) | |||
| (451) | (292) | |||||||
| (2,600) | (2,575) | |||||||
| (c) | Derivative financial instruments: Changes in fair value – At the end of each year |
| Schedule of changes in fair value | |||||||
| Strategy | Inventory | Cost of sales |
Net revenues |
Other income and expenses, net |
Net financial results |
Other comprehensive income |
Realized (loss) gain |
| Mismatches of quotational periods | - | 14,988 | 2,676 | (1,385) | - | 732 | 17,829 |
| Sales of zinc at a fixed price | - | - | (3,159) | - | - | - | (4,111) |
| Interest rate risk – IPCA vs. CDI | - | - | - | - | (606) | - | (447) |
| 2023 | - | 14,988 | (483) | (1,385) | (606) | 732 | 13,271 |
| 2022 | 1,014 | 19,394 | (5,727) | 1,363 | (83) | (1,329) | 8,648 |
|
|
|
Nexa Resources S.A.
Notes to the consolidated financial statements At and for the year ended on December 31, 2023 All amounts in thousands of US dollars, unless otherwise stated |
| (d) | Energy forward contracts |
| Schedule of energy forward contracts | ||||
| Notional | Notional | |||
| 2023 | 2022 | 2023 | 2022 | |
| Balance at the beginning of the year | - | - | - | - |
| Changes in fair value | (15,663) | - | - | - |
| Foreign exchanges effects | (401) | - | - | - |
| Energy forward contracts (Megawatts) | - | - | 688,877 | - |
| Balance at the end of the year | (16,064) | - | 688,877 | - |
| (e) | Offtake agreement measured at FVTPL: Changes in fair value |
| Schedule of changes in fair value offtake agreement | ||||
| 2023 | 2022 | Notional 2023 |
Notional 2022 |
|
| Balance at the beginning of the year | (21,833) | (46,100) | 30,810 | 30,810 |
| Changes in fair value | 2,268 | 24,267 | - | - |
| Deliveries of copper concentrates (i) | - | - | (3,248) | - |
| Balance at the end of the year | (19,565) | (21,833) | 27,562 | 30,810 |
(i) On January 25, 2022, the Company signed an offtake agreement with an Offtaker to sell 100% of the copper concentrate produced by Aripuanã for a 5-year period, up to a specified volume, at the lower of current market prices or a price cap. In June 2023, the Company began with the deliveries of copper concentrates in relation to the offtake agreement mentioned above. In 2023, when the sales occurred the copper price was lower than the price cap, and therefore, there was no fair value impact on revenues for these deliveries.
| 17 | Trade accounts receivables |
Accounting policy
Trade accounts receivables are amounts due from customers for goods sold or services provided in the ordinary course of the Company’s business.
Trade accounts receivables are recognized initially at fair value and subsequently measured at:
(i) Fair value through profit or loss when are related to the Company’s accounts receivables portfolio outstanding at the balance sheet date that is designated at inception to be included in a forfaiting program whereby the Company, at its discretion, can discount certain outstanding trade accounts receivables and receive payments in advance. The program is used to meet short-term liquidity needs. Trade accounts receivables within this program are derecognized since all risks and rewards, control of the assets and contractual rights to receive the assets cash flows are transferred to the counterparty.
(ii) Fair value through profit or loss when are related to sales that are subsequently adjusted to changes in LME prices, which is recorded on net revenues. These accounts receivable do not meet the SPPI criteria because there is a component of commodity price risk that modifies the cash flows that otherwise would be required by the sales contract.
(iii) Amortized cost using the effective interest rate method, less impairment, when the receivables do not meet the aforementioned classifications.
Credit risk can arise from non-performance by counterparties of their contractual obligations to the Company. To ensure an effective credit risk evaluation, management applies procedures related to the application for credit granting and approvals, renewal of credit limits, continuous monitoring of credit exposure in relation to established limits and events that trigger requirements for secured payment terms. As part of the Company’s process, the credit exposures with all counterparties are regularly monitored and assessed.
The Company applies the IFRS 9 simplified approach to measure the impairment losses for trade accounts receivables. This approach requires the use of the lifetime expected credit losses on its trade accounts receivables measured at amortized cost. To calculate the lifetime expected credit losses the Company uses a provision matrix and forward-looking information. The additions to impairment of trade accounts receivables are included in selling expenses. Trade accounts receivables are generally written off when there is no expectation of recovering additional cash.
|
|
|
Nexa Resources S.A.
Notes to the consolidated financial statements At and for the year ended on December 31, 2023 All amounts in thousands of US dollars, unless otherwise stated |
| (a) | Composition |
| Schedule of composition of trade accounts receivables | ||
| 2023 | 2022 | |
| Trade accounts receivables | 147,619 | 227,265 |
| Related parties - note 20 | 852 | 801 |
| Impairment of trade accounts receivables | (6,561) | (4,326) |
| 141,910 | 223,740 |
| (b) | Changes in impairment of trade accounts receivables |
| Schedule of changes in impairment of trade accounts receivables | ||
| 2023 | 2022 | |
| Balance at the beginning of the year | (4,326) | (3,465) |
| Additions | (4,101) | (1,793) |
| Reversals | 2,023 | 1,005 |
| Foreign exchange (losses) | (157) | (73) |
| Balance at the end of the year | (6,561) | (4,326) |
| (c) | Analysis by currency |
| Schedule of analysis of trade accounts receivables by currency | ||
| 2023 | 2022 | |
| USD | 122,025 | 204,608 |
| BRL | 19,435 | 18,740 |
| Other | 450 | 392 |
| 141,910 | 223,740 |
| (d) | Aging of trade accounts receivables |
| Schedule of aging of trade accounts receivables | ||
| 2023 | 2022 | |
| Current | 125,625 | 212,814 |
| Up to 3 months past due | 18,529 | 10,495 |
| From 3 to 6 months past due | 1,405 | 2,181 |
| Over 6 months past due | 2,912 | 2,576 |
| 148,471 | 228,066 | |
| Impairment of trade accounts receivables | (6,561) | (4,326) |
| 141,910 | 223,740 |
| 18 | Inventory |
Accounting policy
Inventory is stated at the lower of cost and net realizable value. Cost is determined using the weighted average cost method. The cost of finished goods and work in progress comprises raw materials, direct labor, other direct costs and related fixed production overheads (based on normal operating capacity). The normal operating capacity is supported by the historical annual production. The idle capacity cost is calculated considering the reduction in the level of production due to unusual events and the level of production not achieved in the ramp-up period. Variable production overhead costs are included in inventory costs based on the actual production level. Imports in transit are stated at the accumulated cost of each import. At the end of the reporting period, the net realizable value of inventories is assessed and a provision for non-realizable, losses on obsolete or slow-moving inventory may be recognized.
The provision for net realizable value is estimated considering the current selling price in the ordinary course of business, less any additional selling expenses. The write-downs and reversals are recognized within Cost of sales.
|
|
|
Nexa Resources S.A.
Notes to the consolidated financial statements At and for the year ended on December 31, 2023 All amounts in thousands of US dollars, unless otherwise stated |
A provision for obsolete inventory, finished products, semi-finished products, raw materials and auxiliary materials is recognized when items cannot be used in normal production or sold because they are damaged or do not meet the Company’s specification and is recognized as Other income and expenses.
Slow-moving provision is recognized for inventory items that are in excess of the expected normal use or sale. The amount of slow-moving provision recognized is determined based on 20% of the carrying amount for each six-month period without use or sale and is recognized as Other income and expenses.
| (a) | Composition |
| Schedule of inventories | ||
| 2023 | 2022 | |
| Finished products | 97,396 | 142,935 |
| Semi-finished products | 90,220 | 163,805 |
| Raw materials | 69,439 | 68,497 |
| Auxiliary materials and consumables | 121,126 | 115,562 |
| Inventory provisions | (38,510) | (95,602) |
| Total | 339,671 | 395,197 |
| (b) | Changes in the provision of the year |
| Schedule of changes in the provision for obsolescence | ||
| 2023 | 2022 | |
| Balance at the beginning of the year | (95,602) | (29,749) |
| Additions | (28,428) | (69,761) |
| Reversals | 89,200 | 4,634 |
| Exchange variation (losses) | (3,680) | (726) |
| Balance at the end of the year | (38,510) | (95,602) |
The main amount is related to the reversal of the net realizable value provision of Aripuanã’s inventory for both its ore stockpile and its produced concentrates in the total amount of USD 54,906 (including depreciation of USD 14,785) as of December 31, 2023.
| 19 | Other assets |
| Schedule of the composition of other assets | ||
| 2023 | 2022 | |
| Other recoverable taxes (i) | 128,738 | 139,168 |
| Advances to third parties | 7,452 | 7,057 |
| Prepaid expenses | 9,427 | 9,858 |
| Judicial deposits | 13,740 | 16,753 |
| Works-for-taxes program | - | 7,902 |
| Receivables from mining contractors | 14,722 | 10,028 |
| Other assets | 42,469 | 19,194 |
| Total other assets | 216,548 | 209,960 |
| Current assets | 86,934 | 75,486 |
| Non-current assets | 129,614 | 134,474 |
(i) Other recoverable taxes is composed mainly from tax credits related to ICMS (Tax on Circulation of Goods and Services), primarily generated from purchases. Additionally, there are PIS and COFINS credits, essentially arising from credits on the acquisition of fixed assets.
| 20 | Related parties |
The Company’s related parties are subsidiaries, joint ventures, associates, shareholders and its related entities and key management personnel of the Company.
|
|
|
Nexa Resources S.A.
Notes to the consolidated financial statements At and for the year ended on December 31, 2023 All amounts in thousands of US dollars, unless otherwise stated |
| (a) | Balances |
| Schedule of related parties balances | ||||||||||||||
| Trade accounts receivables | Related parties’ assets | Trade payables | Dividends payable | Related parties’ liabilities | ||||||||||
| Assets and liabilities | 2023 | 2022 | 2023 | 2022 | 2023 | 2022 | 2023 | 2022 | 2023 | 2022 | ||||
| Parent | ||||||||||||||
| Votorantim S.A. | - | - | 3 | 2 | 1,985 | 765 | - | - | 2,522 | - | ||||
| Related parties | ||||||||||||||
| Andrade Gutierrez Engenharia S.A. | - | - | - | - | 10,908 | 3,353 | - | - | - | - | ||||
| Auren Comercializadora de Energia Ltda. | - | 1 | - | - | - | 976 | - | - | - | - | ||||
| Campos Novos Energia S.A. | - | - | - | - | 14,835 | 9,652 | - | - | - | - | ||||
| Companhia Brasileira de Alumínio | 193 | 187 | - | - | - | 263 | - | - | (9) | - | ||||
| Votorantim Cimentos S.A. | 653 | 607 | - | - | 137 | 163 | - | - | - | - | ||||
| Votorantim International CSC S.A.C | - | - | - | - | - | 1 | - | - | 891 | 487 | ||||
| Other | 6 | 6 | - | - | 127 | 164 | 2,830 | 7,922 | 531 | 546 | ||||
| 852 | 801 | 3 | 2 | 27,992 | 15,337 | 2,830 | 7,922 | 3,935 | 1,033 | |||||
| Current | 852 | 801 | - | - | 27,992 | 15,337 | 2,830 | 7,922 | - | - | ||||
| Non-current | - | - | 3 | 2 | - | - | - | - | 3,935 | 1,033 | ||||
| 852 | 801 | 3 | 2 | 27,992 | 15,337 | 2,830 | 7,922 | 3,935 | 1,033 | |||||
| (b) | Transactions |
| Schedule of related parties transactions | ||||||
| Sales | Purchases | |||||
| Profit and loss | 2023 | 2022 | 2021 | 2023 | 2022 | 2021 |
| Parent | ||||||
| Votorantim S.A. | - | - | - | 7,484 | 4,704 | 3,735 |
| Related parties | ||||||
| Andrade Gutierrez Engenharia S.A. Group (i) | - | - | - | 73,757 | 38,907 | 41,498 |
| Auren Comercializadora de Energia Ltda. | 744 | 744 | 5,993 | 7,971 | 4,974 | 16,207 |
| Campos Novos Energia S.A. | - | - | - | 61,545 | 4,954 | - |
| Companhia Brasileira de Alumínio | 161 | 9,708 | 8,988 | 210 | 3,787 | 3,736 |
| Votorantim Cimentos S.A. | - | - | - | 1,050 | 1,494 | 661 |
| Votorantim International CSC S.A.C | - | - | - | 5,122 | 5,049 | 4,278 |
| Other | - | - | 113 | 436 | 1,157 | 1,120 |
| 905 | 10,452 | 15,094 | 157,575 | 65,026 | 71,235 | |
(i) As part of the execution of the Aripuanã project, in June 2019 the Company entered into a mining development services agreement with Andrade Gutierrez Engenharia S.A., in which one of the Company director’s close family members may have significant influence at its holding level. Additionally, in June 2020, NEXA entered into one additional agreement with Consórcio Construtor Nova Aripuanã (a consortium of the Andrade Gutierrez group of companies) in connection with construction and operational services for the Aripuanã project.
|
|
|
Nexa Resources S.A.
Notes to the consolidated financial statements At and for the year ended on December 31, 2023 All amounts in thousands of US dollars, unless otherwise stated |
| (c) | Key management compensation |
Key management includes the members of the Company's global executive team and Board of Directors. Key management compensation, including all benefits, was as follows:
| Schedule of key management compensation | |||
| 2023 | 2022 | ||
| Short-term benefits | 7,276 | 7,371 | |
| Other long-term benefits | 77 | 158 | |
| Total key management compensation | 7,353 | 7,529 |
Short-term benefits include fixed compensation, payroll charges and short-term benefits under the Company’s variable compensation program. Other long-term benefits relate to the variable compensation program.
| 21 | Property, plant and equipment |
Accounting policy
Property, plant and equipment are stated at their historical cost of acquisition or construction less accumulated depreciation and any recognized impairment losses. Historical cost includes expenditures that are directly attributable to the acquisition and construction of the assets. The mining projects development costs that are registered within Property, plant and equipment include (i) direct and indirect costs attributed to building the mining facilities; (ii) financial charges incurred during the construction period; (iii) depreciation of other fixed assets used during construction; and (iv) estimated decommissioning and site restoration expenses.
Subsequent costs are included in the asset’s carrying amount, or recognized as a separate asset as appropriate, only when it is probable that future economic benefits associated with the item will flow to the Company and they can be measured reliably. The carrying amount of any component accounted for as a separate asset is derecognized when replaced. All other repairs and maintenance are charged to the income statement during the reporting period in which they are incurred.
Replacement costs are included in the carrying amount of the asset when it is probable that the Company will realize future economic benefits in excess of the benefits expected from the asset in its current condition. Replacement costs are depreciated over the remaining useful life of the related asset.
Land is not depreciated. Depreciation of other assets is calculated using the straight-line method to reduce their costs to their residual values over their estimated useful lives.
The assets' residual values and useful lives are reviewed annually and adjusted if appropriate.
An asset's carrying amount is reduced to its recoverable amount when it is greater than the estimated recoverable amount, in accordance with the criteria adopted by the Company to determine the recoverable amount.
Gains and losses on disposals are determined by comparing the proceeds with the carrying amount and are recognized within Other income and expenses, net in the income statement.
Loans and financings costs directly related to the acquisition, construction or production of a qualifying asset that requires a substantial period of time to prepare for its intended use or sale are capitalized as part of the cost of that asset when it is probable that future economic benefits associated with the item will flow to the Company and costs can be measured reliably.
|
|
|
Nexa Resources S.A.
Notes to the consolidated financial statements At and for the year ended on December 31, 2023 All amounts in thousands of US dollars, unless otherwise stated |
Stripping costs
In its surface mining operations, the Company must remove overburden and other waste to gain access to mineral ore deposits. The removal process is referred to as stripping. During the development of a mine, before production commences, when the stripping activity improves access to the ore body, the component of the ore body for which access has been improved can be identified and the costs can be measured reliably, a stripping activity asset is capitalized as part of the investment in the construction of the mine and is accounted for as part of Property, plant and equipment within assets and projects under construction. Subsequently, when the operation starts, the stripping costs are transferred to “Dams and Buildings” and are depreciated by a linear calculation considering the asset’s useful life.
Stripping costs incurred during the production phase of operations are treated as production costs and are part of the inventory cost.
Mining Projects
The Company starts to capitalize a project’s mineral exploration and evaluation costs at the beginning of its feasibility study phase, following completion of a pre-feasibility study in which probability of economic feasibility has been established and where there is sufficient geologic and economic certainty of converting mineral resources into proven and probable mineral reserves at a development stage (construction or execution phase) or production stage based on various factors including the known geology, metallurgy and life-of-mine (“LOM”) plans.
Capitalized costs incurred during a project’s mineral exploration and evaluation stages are classified within Mining projects, under Property, plant and equipment until the project starts its development stage and are only depreciated by the UoP method once the development stage finishes and the project’s operation starts.
Costs incurred during a project’s development stage are also capitalized under Property, plant, and equipment but within Assets and projects under construction. In this way, the capitalized mineral exploration and evaluation costs will remain within Mining projects and will only be depreciated by the UoP method once the development stage finishes and the project´s operation starts.
Once the development stage is finished and the project’s operation starts, the capitalized development costs are reclassified to the appropriate group of assets considering their nature and are depreciated on a linear calculation based on the assets’ useful life.
Based on the above, once a project begins operation, there will be depreciation coming from the project’s capitalized mineral exploration and evaluation costs within the Mining projects account and based on the UoP method and from the project’s capitalized development costs within the corresponding group of assets based on their useful life.
The carrying value of the capitalized mineral exploration and evaluation costs, which remain within Mining projects, and the capitalized development costs, which are within Assets and projects under construction, of the projects are assessed for impairment at least annually or whenever evidence indicates that the assets may be impaired in accordance with IFRS 6 and IAS 36. If the Company decides at any moment to discontinue the project, this could be an impairment indicator that will be assessed under the impairment test. For purposes of this impairment assessment, the projects are allocated to cash generating units (“CGUs”) when applicable. The annual impairment test is disclosed in note 31.
Refer to note 8 for the Company’s accounting policy related to expensed mineral exploration and project evaluation costs for mining projects.
|
|
|
Nexa Resources S.A.
Notes to the consolidated financial statements At and for the year ended on December 31, 2023 All amounts in thousands of US dollars, unless otherwise stated |
Costs to acquire exploration legal mining rights are included as Intangible within Rights to use natural resources as explained in note 23.
Asset retirement obligations
An asset retirement obligation is an obligation related to the permanent removal from service of a tangible long-lived asset that results from the acquisition, construction or development, or the normal operations of a tangible long-lived asset. At the initial recognition of an asset retirement obligation and at the periodical revisions of the expected disbursements and the discount rate, the changes in the liability are charged to Property, plant and equipment.
The capitalized amount recognized in Property, plant and equipment is depreciated based on the UoP method. Any reduction in the provision that exceeds the carrying amount of the asset, is immediately recognized in the income statement as “Other income and expenses, net.”
Impairment
Refer to note 31 for the Company’s accounting policy related to impairment of Property, plant and equipment.
|
|
|
Nexa Resources S.A.
Notes to the consolidated financial statements At and for the year ended on December 31, 2023 All amounts in thousands of US dollars, unless otherwise stated |
| (a) | Changes in the year |
| Schedule of detailed information about property, plant and equipment | |||||||
| 2023 | |||||||
| Dam and buildings | Machinery, equipment, and facilities | Assets and projects under construction | Asset retirement obligations |
Mining projects (i) |
Other | Total | |
| Balance at the beginning of the year | |||||||
| Cost | 1,512,360 | 2,636,582 | 521,191 | 200,665 | 221,077 | 44,094 | 5,135,969 |
| Accumulated depreciation and impairment | (671,028) | (1,870,591) | (65,386) | (125,118) | (92,652) | (15,919) | (2,840,694) |
| Balance at the beginning of the year | 841,332 | 765,991 | 455,805 | 75,547 | 128,425 | 28,175 | 2,295,275 |
| Additions | 113 | 953 | 309,039 | 318 | - | 45 | 310,468 |
| Disposals and write-offs | - | (212) | (3,834) | - | - | (43) | (4,089) |
| Depreciation | (90,258) | (121,004) | - | (5,165) | (1,372) | (1,212) | (219,011) |
| Impairment loss of long-lived assets - note 31 | (16,857) | (27,748) | (10,890) | (6,691) | (7,257) | (2,513) | (71,956) |
| Foreign exchange effects | 47,840 | 43,495 | 18,088 | 4,698 | 1,502 | 1,455 | 117,078 |
| Transfers | 132,196 | 186,945 | (322,768) | - | 462 | 2,360 | (805) |
| Remeasurement | - | - | - | 11,654 | - | - | 11,654 |
| Balance at the end of the year | 914,366 | 848,420 | 445,440 | 80,361 | 121,760 | 28,267 | 2,438,614 |
| Cost | 1,710,083 | 2,896,565 | 512,925 | 219,449 | 215,913 | 44,601 | 5,599,536 |
| Accumulated depreciation and impairment | (795,717) | (2,048,145) | (67,485) | (139,088) | (94,153) | (16,334) | (3,160,922) |
| Balance at the end of the year | 914,366 | 848,420 | 445,440 | 80,361 | 121,760 | 28,267 | 2,438,614 |
| Average annual depreciation rates % | 4 | 9 | - | UoP | UoP |
|
|
|
Nexa Resources S.A.
Notes to the consolidated financial statements At and for the year ended on December 31, 2023 All amounts in thousands of US dollars, unless otherwise stated |
| 2022 | |||||||
| Dam and buildings | Machinery, equipment, and facilities | Assets and projects under construction | Asset retirement obligations | Mining projects (i) | Other | Total | |
| Balance at the beginning of the year | |||||||
| Cost | 1,054,413 | 2,330,748 | 874,776 | 202,242 | 181,528 | 35,266 | 4,678,973 |
| Accumulated depreciation and impairment | (615,428) | (1,763,377) | (62,681) | (118,439) | (16,291) | (15,027) | (2,591,243) |
| Balance at the beginning of the year | 438,985 | 567,371 | 812,095 | 83,803 | 165,237 | 20,239 | 2,087,730 |
| Additions | 4 | 706 | 381,223 | 22,252 | 479 | 56 | 404,720 |
| Disposals and write-offs | (568) | (369) | (430) | - | - | (82) | (1,449) |
| Depreciation | (82,293) | (109,009) | - | (5,169) | (2,120) | (1,302) | (199,893) |
| Impairment (loss) reversal of long-lived assets - note 31 | 19,802 | 7,513 | (6,168) | - | (39,910) | - | (18,763) |
| Derecognition of Nexa’s share of Enercan's property, plant and equipment | (19,688) | (8,711) | (634) | - | - | (183) | (29,216) |
| Foreign exchange effects | 18,577 | 23,855 | 37,280 | 3,686 | 1,215 | 839 | 85,452 |
| Transfers | 466,513 | 284,635 | (767,561) | - | 3,524 | 8,608 | (4,281) |
| Remeasurement of asset retirement obligations | - | - | - | (29,025) | - | - | (29,025) |
| Balance at the end of the year | 841,332 | 765,991 | 455,805 | 75,547 | 128,425 | 28,175 | 2,295,275 |
| Cost | 1,512,360 | 2,636,582 | 521,191 | 200,665 | 221,077 | 44,094 | 5,135,969 |
| Accumulated depreciation and impairment | (671,028) | (1,870,591) | (65,386) | (125,118) | (92,652) | (15,919) | (2,840,694) |
| Balance at the end of the year | 841,332 | 765,991 | 455,805 | 75,547 | 128,425 | 28,175 | 2,295,275 |
| Average annual depreciation rates % | 4 | 8 | - | UoP | UoP |
(i) Only the amounts of the operating unit Atacocha are being depreciated under the UoP method.
|
|
|
Nexa Resources S.A.
Notes to the consolidated financial statements At and for the year ended on December 31, 2023 All amounts in thousands of US dollars, unless otherwise stated |
| 22 | Intangible assets |
Accounting policy
Goodwill
Goodwill arising from business combinations is measured as the excess of the sum of the consideration transferred, the amount of any non-controlling interests in the acquiree, and the fair value of the acquirer’s previously held equity interest in the acquiree (if any) over the net assets acquired. Goodwill is not amortized but is tested for impairment annually and whenever circumstances indicate that the carrying amount may not be recovered. Refer to note 31 for the Company’s impairment accounting policy and critical estimates and assumptions and judgments.
Rights to use natural resources
The significant costs incurred for the acquisition of legal rights to explore mining concessions and develop mineral properties are capitalized and are amortized as production costs when the associated projects start their commercial operation using the UoP method over their useful lives. Useful lives consider the period of extraction for both mineral reserves and mineral resources, which includes a portion of the Company’s inferred resources in the Company’s mining operations. The costs for the acquisition of legal rights attributed to mining projects are not depreciated until the project becomes operational and production activities start.
The costs incurred are impaired if the Company determines that the projects and their mineral rights associated have no future economic value. For purposes of impairment assessment, rights to use natural resources are allocated to CGUs. Refer to note 31 for the Company’s impairment accounting policy.
Critical accounting estimates, assumptions and judgments - Quantification of mineral reserves and resources for useful life calculation
The Company classifies proven and probable reserves, and measured, indicated and inferred resources based on the definitions of the United States Securities and Exchange Commission’s (SEC) Modernized Property Disclosure Requirements for Mining Registrants as described in Subpart 229.1300 of Regulation S-K, Disclosure by Registrants Engaged in Mining Operations (S-K 1300) and Item 601 (b)(96) Technical Report Summary.
The useful life determination applied to the rights to use natural resources reflect the pattern in which the benefits are expected to be derived by the Company and is based on the estimated life of mine (“LOM”). Any changes to the LOM, based on new information regarding estimates of mineral reserves and mineral resources and mining plan, may affect prospectively the LOM and amortization rates.
The estimation process of mineral reserves and mineral resources is based on a technical evaluation, which includes geological, geophysics, engineering, environmental, legal and economic estimates and may have relevant impact on the economic viability of the mineral reserves and mineral resources. These estimates are reviewed periodically, and any changes are reflected in the expected LOM. Management is confident based on testing, continuity of the ore bodies and conversion experience that a part of the inferred resources will be converted into measured and indicated resources, and if they are economically recoverable, and such inferred resources may also be classified as proven and probable mineral reserves. Where the Company can demonstrate the expected economic recovery with a high level of confidence, inferred resources are included in the amortization calculation.
|
|
|
Nexa Resources S.A.
Notes to the consolidated financial statements At and for the year ended on December 31, 2023 All amounts in thousands of US dollars, unless otherwise stated |
However, the future conversion of inferred resources is inherently uncertain and involves estimates, assumptions and judgments that could have a material impact on the Company’s results of operations.
| (a) | Changes in the year |
| Schedule of reconciliation of changes in intangible assets | ||||
| 2023 | ||||
| Goodwill (i) |
Rights to use natural resources | Other | Total | |
| Balance at the beginning of the year | ||||
| Cost | 611,909 | 1,855,014 | 65,246 | 2,532,169 |
| Accumulated amortization and impairment | (267,342) | (1,207,596) | (40,304) | (1,515,242) |
| Balance at the beginning of the year | 344,567 | 647,418 | 24,942 | 1,016,927 |
| Additions | - | - | 3,087 | 3,087 |
| Amortization | - | (71,488) | (3,041) | (74,529) |
| Impairment loss of long-lived assets – note 31 | (42,660) | - | (27) | (42,687) |
| Foreign exchange effects | 346 | 3,489 | 1,727 | 5,562 |
| Transfers | 4,859 | 132 | (4,072) | 919 |
| Balance at the end of the year | 307,112 | 579,551 | 22,616 | 909,279 |
| Cost | 630,787 | 1,859,147 | 53,865 | 2,543,799 |
| Accumulated amortization and impairment | (323,675) | (1,279,596) | (31,249) | (1,634,520) |
| Balance at the end of the year | 307,112 | 579,551 | 22,616 | 909,279 |
| Average annual depreciation rates % | - | UoP | - |
| 2022 | ||||
|
Goodwill (i) |
Rights to use natural resources | Other | Total | |
| Balance at the beginning of the year | ||||
| Cost | 673,570 | 1,791,643 | 72,414 | 2,537,627 |
| Accumulated amortization and impairment | (267,342) | (1,179,373) | (34,141) | (1,480,856) |
| Balance at the beginning of the year | 406,228 | 612,270 | 38,273 | 1,056,771 |
| Additions | - | 57,529 | - | 57,529 |
| Amortization | - | (76,695) | (5,639) | (82,334) |
| Impairment (loss) reversal of long-lived assets – note 31 | (61,856) | 48,107 | - | (13,749) |
| Derecognition of Nexa’s share of Enercan's intangible assets | - | - | (9,382) | (9,382) |
| Foreign exchange effects | 195 | 3,661 | (45) | 3,811 |
| Transfers | - | 2,546 | 1,735 | 4,281 |
| Balance at the end of the year | 344,567 | 647,418 | 24,942 | 1,016,927 |
| Cost | 611,909 | 1,855,014 | 65,246 | 2,532,169 |
| Accumulated amortization and impairment | (267,342) | (1,207,596) | (40,304) | (1,515,242) |
| Balance at the end of the year | 344,567 | 647,418 | 24,942 | 1,016,927 |
| Average annual depreciation rates % | - | UoP | - |
(i) At December 31, 2023, the balances of the Company’s recognized goodwill were: USD 95,830 (2022 - USD 95,485) allocated to Cajamarquilla CGU, USD 4,972 (2022 - USD 4,613) allocated to Juiz de Fora, and USD 206,423 (2022 - USD 249,082) allocated to the Mining Peru group of CGU. In 2023, the recoverability of goodwill was tested, as explained in note 31.
| 23 | Right-of-use assets and lease liabilities |
Accounting policy
Right-of-use assets represent the right to use an underlying asset for the lease term and lease liabilities represent the Company’s obligation to make lease payments arising from the lease.
Lease terms are negotiated on an individual asset basis and contractual provisions contain a wide range of different terms and conditions. The lease agreements do not impose any covenants, but leased assets may not be used as security for borrowing purposes.
|
|
|
Nexa Resources S.A.
Notes to the consolidated financial statements At and for the year ended on December 31, 2023 All amounts in thousands of US dollars, unless otherwise stated |
The Company accounts for non-lease components such as service costs separately, whenever applicable. The Company’s lease terms may include options to extend or terminate the lease and when it is reasonably certain that we will exercise that option, the financial effect is included in the contract’s measurement.
Measurement
Liabilities arising from a lease contract are initially measured on a present value basis, using the incremental borrowing rate approach. The incremental borrowing rate is determined by the Company based on equivalent financial costs that would be charged by a counterparty for a transaction with the same currency and a similar amount, term and risk of the lease contract. The finance cost charged to the income statement produces a constant periodic rate of interest over the lease term. On December 31, 2023, incremental borrowing rate were between 5.68% to 11.39% for Brazil; and 2.85% to 9.53% for Peru.
Lease contracts are recognized as a liability with a corresponding right-of-use asset at the date at which the leased asset is available for use by the Company. The right-of-use asset also includes any lease payments made and it is amortized over the shorter of the asset’s useful life and the lease term on a straight-line basis. Amortization expenses are classified either in Cost of sales or Administrative expenses based on the designation of the related assets.
When the lease liability is remeasured, a corresponding adjustment is made to the carrying amount of the right-of-use asset or is recorded in profit or loss if the carrying amount of the right-of-use asset has been reduced to zero.
| (a) | Right-of-use assets - Changes in the year |
| Schedule of rights-of-use-assets - Changes in the year | ||||||
| 2023 | 2022 | |||||
| Buildings | Machinery, equipment, and facilities | IT equipment | Vehicles | Total | Total | |
| Balance at the beginning of the year | ||||||
| Cost | 7,300 | 18,106 | 282 | 18,830 | 44,518 | 50,004 |
| Accumulated amortization | (4,467) | (15,394) | (84) | (17,678) | (37,623) | (37,314) |
| Balance at the beginning of the year | 2,833 | 2,712 | 198 | 1,152 | 6,895 | 12,690 |
| New contracts | 375 | 7,109 | 117 | 2,703 | 10,304 | 2,018 |
| Disposals and write-offs | - | (874) | - | - | (874) | - |
| Amortization | (1,034) | (1,874) | (61) | (1,884) | (4,853) | (8,710) |
| Remeasurement | 197 | (275) | (120) | - | (198) | 419 |
| Transfers | - | (114) | - | - | (114) | - |
| Foreign exchange effects | 17 | 45 | (1) | 7 | 68 | 478 |
| Balance at the end of the year | 2,388 | 6,729 | 133 | 1,978 | 11,228 | 6,895 |
| Cost | 6,278 | 16,079 | 317 | 22,766 | 45,440 | 44,518 |
| Accumulated amortization | (3,890) | (9,350) | (184) | (20,788) | (34,212) | (37,623) |
| Balance at the end of the year | 2,388 | 6,729 | 133 | 1,978 | 11,228 | 6,895 |
| Average annual amortization rates % | 31 | 34 | 33 | 34 |
|
|
|
Nexa Resources S.A.
Notes to the consolidated financial statements At and for the year ended on December 31, 2023 All amounts in thousands of US dollars, unless otherwise stated |
| (b) | Lease liabilities - Changes in the year |
| Schedule of lease liabilities - changes in the year | ||
| 2023 | 2022 | |
| Balance at the beginning of the year | 5,021 | 19,638 |
| New contracts | 10,304 | 2,018 |
| Payments of lease liabilities | (5,818) | (17,091) |
| Interest paid on lease liabilities | (553) | (994) |
| Remeasurement | (198) | 419 |
| Accrued interest– note 10 | 427 | 542 |
| Foreign exchange effects | 35 | 489 |
| Balance at the end of the year | 9,218 | 5,021 |
| Current liabilities | 3,766 | 3,661 |
| Non-current liabilities | 5,452 | 1,360 |
| 24 | Loans and financings |
Accounting policy
Loans and financings are initially recognized at fair value, net of transaction costs incurred, and are subsequently measured at amortized cost, unless they are designated as fair value option, if necessary to eliminate the accounting mismatch that would arise if amortized cost were used. Any difference between the proceeds (net of transaction costs) and the total amount payable is recognized in the income statement as interest expense over the period of the loans using the effective interest rate method, except for the loans measured at fair value.
Loans and financings are classified as current liabilities unless the Company has the unconditional right to defer repayment of the liability for at least 12 months after the reporting period.
Fees paid on the establishment of loan facilities are recognized as transaction costs of the loan to the extent that it is probable that some or all of the facility will be drawn down. In this case, the fee is deferred until the drawdown occurs.
To the extent that there is no evidence that it is probable that some or all of the facility will be drawn down, the fee is capitalized as a prepayment for liquidity services and amortized over the period of the facility to which it relates.
| (a) | Composition |
| Schedule of analysis of the loans and financings | |||||||
| Total | Fair value | ||||||
| 2023 | 2022 | 2023 | 2022 | ||||
| Type | Average interest rate | Current | Non-current | Total | Total | Total | Total |
|
Eurobonds – USD |
Pre-USD 5.84% | 18,539 | 1,194,015 | 1,212,554 | 1,210,483 | 1,207,918 | 1,162,741 |
| BNDES | TJLP + 2.82% SELIC + 3.10% TLP - IPCA + 5.46% |
28,602 | 180,345 | 208,947 | 216,316 | 187,796 | 183,452 |
|
Export credit notes |
LIBOR + 1,54% (i) CDI 134.20% |
95,719 | 142,143 | 237,862 | 232,790 | 237,791 | 227,201 |
| Other | 336 | 65,867 | 66,203 | 9,670 | 64,497 | 7,054 | |
| 143,196 | 1,582,370 | 1,725,566 | 1,669,259 | 1,698,002 | 1,580,448 | ||
|
Current portion of long-term loans and financings (principal) |
115,904 | ||||||
| Interest on loans and financings | 27,292 | ||||||
(i) On June 30, 2023 LIBOR (London Interbank Offered Rate) was last issued and discontinued. The decision to discontinue LIBOR was made due to concerns about a lack of liquidity and the lack of underlying transactions supporting the taxes. As a result, regulators and financial authorities around the world have encouraged the transition to more robust and sustainable alternative benchmark interest rates. The transition involves transferring financial contracts and instruments that rely on LIBOR to other reference rates, such as short-term interest rates based on real transactions, such as SOFR (Secured Overnight Financing Rate).
Therefore, as guided by regulators and financial authorities, the Company adopted the change in indexes in its financial contracts and instruments indexed on LIBOR to SOFR as of July 1, 2023.
|
|
|
Nexa Resources S.A.
Notes to the consolidated financial statements At and for the year ended on December 31, 2023 All amounts in thousands of US dollars, unless otherwise stated |
| (b) | Loans and financing transactions during the year ended on December 31, 2023 |
On October 20, 2023, the Company entered into a sustainability-linked revolving credit facility with a group of financial institutions of lenders, which allows the Company to borrow up to USD 320,000. The revolving credit facility has a term of five years, and the amounts drawn are subject to an initial interest rate of 1.60% plus Term SOFR (Secured Overnight Financing Rate). The applicable margin is subject to compliance with certain sustainability key performance indicators. The new facility replaces Nexa’s 2019 USD 300,000 revolving credit facility, which was set to mature in October 2024.
As of December 31, 2023, the Company has not drawn on this revolving credit facility.
On December 12, 2023, the Company entered into a Bank Credit Note agreement in the total principal amount of USD 50,000 (equivalent to BRL 245,250 thousand) with maturity in 2028, and an interest rate of 2.57% plus the 12-month TERM SOFR (Secured Overnight Financing Rate).
On December 18, 2023, the Company entered into a financing agreement in the total principal amount of USD 6,012 with maturity in 2031, and an interest rate of 0.86% plus TJLP index.
| (c) | Changes in the year |
| Schedule of movements in loans and financings | ||
| 2023 | 2022 | |
| Balance at the beginning of the year | 1,669,259 | 1,699,315 |
| New loans and financings | 56,408 | 95,621 |
| Debt issue costs | (74) | (63) |
| Payments of loans and financings | (27,087) | (24,639) |
| Bonds repurchased | - | (128,470) |
| Foreign exchange effects | 23,996 | 22,695 |
| Changes
in fair value of financing liabilities related to changes in the Company´s own credit risk |
583 | (521) |
| Changes in fair value of loans and financings - note 10 | 525 | 1,472 |
| Interest accrual | 112,612 | 110,679 |
| Interest paid on loans and financings | (113,018) | (109,263) |
| Amortization of debt issue costs | 2,362 | 2,433 |
| Balance at the end of the year | 1,725,566 | 1,669,259 |
| (d) | Maturity profile |
| Schedule of maturity profile of the loans and financings | |||||||
| 2023 | |||||||
| 2024 | 2025 | 2026 | 2027 | 2028 | As from 2029 |
Total | |
| Eurobonds – USD (i) | 18,539 | (2,200) | (2,270) | 698,567 | 499,918 | - | 1,212,554 |
| BNDES | 28,602 | 26,734 | 23,675 | 14,500 | 14,500 | 100,936 | 208,947 |
| Export credit notes | 95,719 | 52,143 | - | 90,000 | - | - | 237,862 |
| Other | 336 | 1,390 | 2,413 | 2,413 | 52,412 | 7,239 | 66,203 |
| 143,196 | 78,067 | 23,818 | 805,480 | 566,830 | 108,175 | 1,725,566 |
(i)The negative balances refer to related funding costs (fee) amortization.
|
|
|
Nexa Resources S.A.
Notes to the consolidated financial statements At and for the year ended on December 31, 2023 All amounts in thousands of US dollars, unless otherwise stated |
| (e) | Analysis by currency |
| Schedule of analysis of the loans and financings, by currency | ||||
| 2023 | 2022 | |||
| Current | Non-current | Total | Total | |
| USD | 112,210 | 1,334,015 | 1,446,225 | 1,392,625 |
| BRL | 30,986 | 248,355 | 279,341 | 276,190 |
| Other | - | - | - | 444 |
| 143,196 | 1,582,370 | 1,725,566 | 1,669,259 |
| (f) | Analysis by index |
| Schedule of analysis of the loans and financings, by index | ||||
| 2023 | 2022 | |||
| Current | Non-current | Total | Total | |
| Fixed rate | 18,540 | 1,194,014 | 1,212,554 | 1,210,972 |
| SOFR | 93,671 | 140,000 | 233,671 | 91,657 |
| TLP | 15,064 | 158,936 | 174,000 | 175,272 |
| CDI | 2,242 | 52,143 | 54,385 | 50,722 |
| BNDES SELIC | 9,455 | 14,990 | 24,445 | 27,796 |
| TJLP | 4,224 | 22,287 | 26,511 | 22,354 |
| LIBOR | - | - | - | 90,411 |
| Other | - | - | - | 75 |
| 143,196 | 1,582,370 | 1,725,566 | 1,669,259 |
| (g) | Guarantees and covenants |
The Company has loans and financings that are subject to certain financial covenants at the consolidated level, such as: (i) leverage ratio; (ii) capitalization ratio; and (iii) debt service coverage ratio. When applicable, these compliance obligations are standardized for all debt agreements. No changes to the contractual guarantees occurred in the year ended on December 31, 2023.
As of December 31, 2023, the Company was in compliance with all its financial covenants, as well as the Company was compliant with other qualitative covenants.
| 25 | Trade Payables |
Accounting policy
Trade payables represent liabilities for goods and services that were provided to the Company before the end of the financial year which are unpaid. Trade and other payables are presented as current liabilities unless payment is not due within 12 months after the reporting period. These amounts are recognized initially at their fair value and subsequently measured at amortized cost using the effective interest method.
| (a) | Composition |
| Schedule of trade payables | ||||
| 2023 | 2022 | |||
| Trade payables | 423,611 | 398,519 | ||
| Related parties - note 20 | 27,992 | 15,337 | ||
| Total | 451,603 | 413,856 |
|
|
|
Nexa Resources S.A.
Notes to the consolidated financial statements At and for the year ended on December 31, 2023 All amounts in thousands of US dollars, unless otherwise stated |
| 26 | Confirming Payables |
Accounting policy
The Company has contracts with some suppliers whose commercial payment varies between 90 and 180 days, which can be negotiated individually with the supplier and reach 210 days, without any additional guarantees, except for a specific supplier for which a letter of guarantees is provided. In these contracts, the supplier has the option to request a bank to advance the payment of their commercial invoice within 180 days, before the invoice matures. As a result of those contracts between the suppliers and the bank, the commercial terms agreed with the Company do not change. In accordance with the commercial agreement, the supplier communicates to the Company its interest in selling the invoice to the bank, and it is only the supplier who can decide to sell its invoice at any time during the commercial period. With this option, suppliers can improve their working capital position. The bank pays the supplier with an interest discount and the Company assumes part of the interest payment to the supplier, in certain cases the supplier assumes the integral payment of interest. The Company, however, understands that the separate presentation of these accounts within “Confirming payables” is relevant to the understanding of the Company's financial position.
Based on concepts of IFRS 9, the Company assesses whether the payment term extension arrangement substantially modifies the original liability based on qualitative and quantitative assessments. If the original liability has not been substantially modified, the original liability remains and is disclosed as “Confirming Payable”. If the original liability has been substantially modified, the Company derecognizes the original liability (confirming payables) and recognizes a new financial liability as “Other financial liabilities”. Any gain/loss is recognized in the “Income Statement”.
The Company concluded that for December 31, 2023, the transactions maintain their essence as “confirming payables” taking into consideration Nexa’s assessment policy.
Payments of the principal amounts and interest reimbursements are presented within the “operating activities group” in the Company's cash flow statement, in accordance with IAS 7, as the Company classifies the actual transactions as confirming payable.
| (a) | Carrying amount of financial liabilities |
| Schedule of carrying amount of financial liabilities | ||
| 2023 | 2022 | |
| Confirming Payables | 234,385 | 216,392 |
As of December 31, 2023, financial institutions have paid the total amount of confirming payables to the suppliers.
| (b) | Range of payments due dates |
| Schedule of range of payments due | |
| 2023 | |
| Days after invoice | |
| Liabilities that are part of confirming payables | 60 - 210 |
| Comparable trade payables thar are not part of a confirming payables | 30 - 120 |
|
|
|
Nexa Resources S.A.
Notes to the consolidated financial statements At and for the year ended on December 31, 2023 All amounts in thousands of US dollars, unless otherwise stated |
| (c) | Non-cash changes |
There were no business combinations or material foreign exchange differences in either periods.
| 27 | Dams, asset retirement and environmental obligations |
Accounting policy
Provision for asset retirement obligations include costs for restoration and closure of the mining assets and is recognized due to the development or mineral production, based on the net present value of estimated closure costs. Dam obligations regarding the de-characterization of their structures includes estimated mandatory costs as required by the Brazilian Government. Management uses its judgment and previous experience to determine the potential scope of rehabilitation work required and the related costs associated with that work, which are recognized as a “Property, plant and equipment” for asset retirement obligations relating to operating mining assets or as “Other income and expenses, net” for non-operating structures and for de-characterization of dams, environmental obligations include costs related to rehabilitation of areas damaged by the Company in its extractive actions (for example - soil contamination, water contamination, among others) or penalties. Therefore, it becomes an event that creates obligations when these environmental damages are detected by the Company, when a new law requires that the existing damage be rectified or when the Company publicly accepts any responsibility for the rectification, creating a constructive obligation. The costs to remedy an eventual unexpected contamination, which give rise to a probable loss and can be reliably estimated, must be recognized in “Other income and expenses, net” in income statement.
In addition, investments in infrastructure, machinery and equipment regarding operational improvements to avoid future environmental damage, are not provisioned, because it is expected that these assets will bring future economic benefits to the operating units, thus it is capitalized as Property, plant and equipment.
The liabilities are discounted to present value using a credit risk-adjusted rate that reflects current market assessments of the time value of the money and the specifics risks for the asset to be restored. The interest rate charges relating to the liability are recognized as an accretion expense in the Net financial results. Difference in the settlement amount of the liability is recognized in the income statement.
Critical accounting estimates, assumptions and judgments
The initial recognition and the subsequent revisions of the asset retirement obligations, dams obligations, and environmental obligations consider critical future closure and repairing costs and several assumptions such as interest rates, inflation, useful lives of the assets and the estimated moment that the expenditure will be executed. These estimates are reviewed annually by the Company or when there is a relevant change in these assumptions.
Cost estimates can vary in response to many factors of each site that include timing, expected LOM, changes to the relevant legal or government requirements and commitments with stakeholders, review of remediation and relinquishment options, emergence of new restoration techniques, stage of engineering evaluation maturity among others. Engineering projects for each liability are in different stages of maturity, some of them still in the conceptual engineering phase, for which the estimation of expenditures includes in its methodology a high degree of uncertainty in the definition of the total cost of the project in accordance with best market practices.
External experts support the cost estimation process where appropriate. These factors either isolated or consolidated could significantly affect the future income statement and balance sheet position.
|
|
|
Nexa Resources S.A.
Notes to the consolidated financial statements At and for the year ended on December 31, 2023 All amounts in thousands of US dollars, unless otherwise stated |
| (a) | Changes in the year |
| Schedule of changes in dams, asset retirement and environmental obligations | |||||
| 2023 | 2022 | ||||
| Asset retirement obligations | Environmental obligations |
Dams Obligations (iii) |
Total | Total | |
|
Balance at the beginning of the year |
219,923 | 46,396 | - | 266,319 | 264,151 |
| Additions (ii) | 4,292 | 2,727 | 6,960 | 13,979 | 35,036 |
| Payments | (6,036) | (6,347) | - | (12,383) | (25,393) |
| Foreign exchange effects | 8,027 | 3,729 | 161 | 11,917 | 9,160 |
| Interest accrual - note 10 | 22,770 | 4,199 | - | 26,969 | 23,662 |
|
Remeasurement – discount rate (i) / (ii) |
4,557 | 3,561 | - | 8,118 | (40,297) |
|
Balance at the end of the year |
253,533 | 54,265 | 7,121 | 314,919 | 266,319 |
| Current liabilities | 24,264 | 8,438 | 1,016 | 33,718 | 23,646 |
| Non-current liabilities | 229,269 | 45,827 | 6,105 | 281,201 | 242,673 |
(i) As of December 31, 2023, the credit risk-adjusted rate used for Peru was between 10.86% and 12.52% (December 31, 2022: 10.92 % and 12.04 %) and for Brazil was between 6.94% and 11.11% (December 31, 2022: 8.22% and 8.61%).
(ii) The change in the year ended on December 31, 2023, was mainly due to the time change in the expected disbursements on decommissioning obligations in certain operations, in accordance with updates in their asset retirement and environmental obligations studies, and by the increase in the discount rates, as described above. In this way, asset retirement obligations for operational assets, increased in an amount of USD 11,972 (December 31, 2022: decrease of USD 6,773) as shown in note 21; and asset retirement and environmental obligations for non-operational assets expense in USD 3,165 (December 31, 2022: expense of USD 1,512) as shown in note 9.
(iii) The Company has been conducting engineering studies to confirm the construction method of some very old inactive industrial waste containment structures that have been closed for more than 20 years. None of them contain mining tailings, water or liquid waste. Based on results of the conceptual engineering studies, the Company has reserved amounts related to estimated costs of anticipated additional obligations in relation to these closed dams.
| 28 | Provisions |
Accounting policy
Provisions for legal claims and judicial deposits
Provisions for legal claims are recognized when there is a combination of the following conditions: (i) the Company has a present legal or constructive obligation as a result of past events; (ii) it is probable (more likely than not) that an outflow of resources will be required to settle the obligation; and (iii) the amount can be reliably estimated. The provisions are periodically estimated, and the likelihood of losses is supported by the Company's legal counsel.
Provisions are measured at the present value of the expenditure expected to be required to settle the obligation using a discount rate that reflects current market assessments of the time value of money and the risks specific to the obligation. The increase in the provision due to the passage of time is recognized as Financial Expenses.
|
|
|
Nexa Resources S.A.
Notes to the consolidated financial statements At and for the year ended on December 31, 2023 All amounts in thousands of US dollars, unless otherwise stated |
When a claim is secured by a judicial deposit, the Company offsets the provision with the judicial deposit amount in the consolidated balance sheet. However, the Company also has judicial deposits for claims for which the likelihood of loss is possible or remote and for which no provision is recognized. In such cases, these amounts are recognized as outstanding judicial deposits in the Company’s assets.
Critical accounting estimates and assumptions – Provisions for legal claims
The Company is part of ongoing tax, labor, civil and environmental lawsuits which are pending at different court levels. The provisions for potentially unfavorable outcomes of litigation in progress are established and updated based on management evaluation and require a high level of judgment regarding the matters involved, supported by the positions of external legal advisors. Income tax claims are discussed at the current and deferred income tax section (note 11).
| (a) | Changes in the year |
| Schedule of changes in provisions | ||||||
| 2023 | 2022 | |||||
| Tax | Labor | Civil | Environmental | Total | Total | |
| Balance at the beginning of the year | 8,159 | 20,520 | 244 | 14,974 | 43,897 | 36,828 |
| Additions | 49 | 10,655 | 53 | 10,200 | 20,957 | 13,148 |
| Derecognition of Nexa’s share of Enercan’s provisions - - note 4(ii) | - | - | - | - | - | (311) |
| Reversals | (186) | (3,960) | (6) | (2,913) | (7,065) | (5,484) |
| Interest accrual | 774 | (382) | 23 | 40 | 455 | 1,754 |
| Payments | (387) | (5,351) | (11) | (1,217) | (6,966) | (4,584) |
| Foreign exchange effects | 1,806 | 1,429 | 19 | 775 | 4,029 | 2,266 |
| Other | (303) | (617) | 438 | 1,962 | 1,480 | 280 |
| Balance at the end of the year | 9,912 | 22,294 | 760 | 23,821 | 56,787 | 43,897 |
| (b) | Breakdown of legal claims provisions |
The provisions and the corresponding judicial deposits are as follows:
| Schedule of provisions | ||||||
| 2023 | 2022 | |||||
| Judicial deposits | Provisions | Carrying amount | Judicial deposits | Provisions | Carrying amount | |
| Tax | (1,372) | 11,284 | 9,912 | (1,200) | 9,359 | 8,159 |
| Labor | (1,810) | 24,104 | 22,294 | (3,399) | 23,919 | 20,520 |
| Civil | - | 760 | 760 | - | 244 | 244 |
| Environmental | - | 23,821 | 23,821 | - | 14,974 | 14,974 |
| Balance at the end of the year | (3,182) | 59,969 | 56,787 | (4,599) | 48,496 | 43,897 |
The outstanding judicial deposits of the Company as of December 31, 2023 that are not presented net of the provisions are USD 20,287 (December 31, 2022: USD 16,753).
| (c) | Contingent liabilities |
Legal claims that have a possible likelihood that an obligation will arise are disclosed in the Company’s financial statements. The Company does not recognize a liability because it is not probable that an outflow of resources will be required or because the amount of the liability cannot be reliably calculated. These legal claims are summarized below:
| Schedule of provisions and judicial deposits | ||
| 2023 | 2022 | |
| Tax (i) | 133,038 | 134,637 |
| Labor (ii) | 48,274 | 41,454 |
| Civil (iii) | 12,823 | 16,946 |
| Environmental (iv) | 124,773 | 112,541 |
| 318,908 | 305,578 |
|
|
|
Nexa Resources S.A.
Notes to the consolidated financial statements At and for the year ended on December 31, 2023 All amounts in thousands of US dollars, unless otherwise stated |
| (i) | Comments on contingent tax liabilities |
The main contingent liabilities relating to tax lawsuits are discussed below.
Income tax over transfers of shares in Peru
Relates to assessments issued by the SUNAT, where the Company was jointly and severally liable for the payment of income tax by a foreign investor, in a supposed capital gain on transfer of shares. The estimated financial effect of this contingent liability is USD 84,050.
Compensation for exploration for mineral resources
Relates to assessments issued by the Brazilian National Department of Mineral Production for the alleged failure to pay or underpayment of financial compensation for the exploration of mineral resources (“CFEM”). The estimated financial effect of this contingent liability is USD 12,927.
Indirect taxes on sales
Relates to assessments issued by the Brazilian Internal Revenues Service concerning certain credits taken by the Company when calculating those indirect taxes on sales. The estimated financial effect of this contingent liability is USD 4,272.
Value-added tax on sales
Relates to assessments issued by the tax authorities of the State of Minas Gerais concerning the following:
| · | Incidence of value-added tax on sales of certain energy contracts. The estimated financial effect of this contingent liability is USD 20,903. |
| · | The Company was challenged by the tax authorities regarding certain credits to the purchases of property, plant and equipment. The estimated financial effect of this contingent liability is USD 8,052. |
| (ii) | Comments on contingent labor liabilities |
Include several claims filed by former employees, third parties and labor unions and labor public attorney’s office mostly claiming the payment of indemnities related to dismissals, such as overtime, work at night hours, commuting hours, health hazard premiums and hazardous duty premiums, as well as indemnity claims by former employees and third parties based on alleged occupational illnesses, work accidents and payment of social benefits. The individual amount of the claims are not material.
| (iii) | Comments on contingent civil liabilities |
The main contingent civil liability is related to indemnity lawsuits against the Company alleging property, contractual and general damages/losses. The estimated financial effect of this contingent liability is USD 12,823.
| (iv) | Comments on contingent environmental liabilities |
The main contingent environmental liabilities in Brazil were filed by fishermen communities against the Company for indemnification, compensation for material and moral damages due to alleged pollution of the São Francisco River close to the Company’s Três Marias operation in Brazil. The estimated financial effect of these contingent liabilities is USD 85,399.
|
|
|
Nexa Resources S.A.
Notes to the consolidated financial statements At and for the year ended on December 31, 2023 All amounts in thousands of US dollars, unless otherwise stated |
| 29 | Contractual obligations |
Accounting policy
Contractual obligations consist of advance payments received by the Company under a silver streaming agreement, signed with a counterparty (the “Streamer”) and by which referential silver contents found in the ore concentrates produced by the Company’s Cerro Lindo mining unit are sold to the Streamer.
Determining the accounting treatment of silver streaming transactions requires the exercise of high degree of judgment.
The Company assesses whether those advances obtained under this agreement should be recognized as contractual obligations (a sale of a non-financial item) or as a financial liability. For that purpose, the Company takes into consideration factors such as which party is exposed to the operational risk, the risk of access to the resources, the price risk, and assesses whether the transaction involves a sale of an own use asset for the counterparty. In those cases, in which the Company concludes that, in essence, the Streamer shares substantially the operational risks, the resource access and price risks, it delivers a non-financial item that qualifies as an “own use” item; any advance payment obtained is recognized as a contractual obligation in the framework of IFRS 15: Revenue from contracts with customers. Otherwise, the Company would recognize a financial liability in the framework of the provisions of IFRS 9: Financial instruments.
When a contractual obligation is recognized, the balance is initially recognized at the amount received, and it is subsequently recognized as revenue when the control of the respective assets is transferred, that is, upon the physical delivery of the nonfinancial item (silver certificate). Contractual obligations are recognized within non-current liabilities, except for the portion of silver certificates that are estimated to be delivered over the 12 months following the balance sheet date.
The advance payment obtained under the silver streaming transaction entered by the Company in 2016 is recognized as contractual obligation to the extent that the risk assessment conducted by the management indicates the relevant risks are substantially shared with the Streamer and the qualifying conditions of a sale of an “own use” item are met.
Determination of the transaction price
The transaction price is the amount of consideration to which the Company expects to be entitled in return for transferring the promised goods to its counterparty. The transaction price is allocated to each performance obligation based on the relative standalone selling prices. In the silver streaming transaction, the Company has variable considerations related to the production capacity of the mine linked to its LOM and to the LME. IFRS 15 requires that for contracts containing variable considerations, the transaction price be continually updated and re-allocated to the transferred goods. For this purpose, the contractual obligations require an adjustment to the transaction price per unit each time there is a change in the underlying production profile of a mine or the expected metal prices. The change in the transaction price per unit results in a retroactive adjustment to revenues in the period in which the change is made, reflecting the new production profile expected to be delivered under the streaming agreement or the expected metal prices. A corresponding retroactive adjustment is made to accretion expenses, reflecting the impact of the change in the contractual obligation balance.
|
|
|
Nexa Resources S.A.
Notes to the consolidated financial statements At and for the year ended on December 31, 2023 All amounts in thousands of US dollars, unless otherwise stated |
Critical accounting estimates, assumptions and judgments
The recognition of revenues and of the contractual obligation related to the silver transaction require the use of critical accounting estimates and assumptions including, but not limited to: (i) allocation of revenues on relative prices; (ii) estimate prices for determining the upfront payment; (iii) discount rates used to measure the present value of future inflows and outflows; and (iv) estimates of LOM, reserves and mineral production.
| (a) | Composition |
In 2016, the Company entered a silver streaming arrangement for the anticipated sale of a portion of the silver contained in the ore concentrates produced by the Cerro Lindo mining unit, which consisted of: i) an upfront payment of USD 250,000 and ii) additional payments at the date of each delivery of the ounces of payable silver equivalent to 10% of the spot price at the date of settlement. In addition, by this agreement, sales of silver certificates to Triple Flag are limited to a total of 19.5 million of the ounces that Nexa Peru sells to its customers. Once that limit is reached, sales under the streaming will be made for 25% of the silver content in the Nexa Peru’s sales of concentrate for a period equivalent to the life of said mining unit.
The advance payment was recognized as a Contractual obligation and the corresponding revenues are recognized as the silver is delivered, which is the time that the contractual performance obligations are satisfied.
The changes in the contractual obligation are shown below:
| Schedule of changes in the contractual obligation | ||
| 2023 | 2022 | |
| Balance at the beginning of the year | 132,160 | 147,232 |
| Revenues recognition upon ore delivery | (30,498) | (31,438) |
| Remeasurement adjustment (i) | 10,121 | 10,565 |
| Accretion for the year - note 10 | 5,329 | 5,801 |
| Balance at the end of year | 117,112 | 132,160 |
| Current | 37,432 | 26,188 |
| Non-current | 79,680 | 105,972 |
(i) In September 2023 and December 2023, the Company recognized a remeasurement adjustment in its contractual obligations of silver streaming with a corresponding reduction in revenues for an amount of USD 2,323 and USD 8,252, respectively, and an increase in accretion for an amount of USD 284 and USD 989 (September 30, 2022: reduction in revenues for an amount of USD 10,565 and an increase in accretion for an amount of USD 1,041), given the higher long-term prices and the updated mine plan for its Cerro Lindo Mining Unit. According to the Company’s silver streaming accounting policy, prices and changes in the LOM given an update in mine plans are variable considerations and then, the recognized income under the streaming agreement should be adjusted to reflect the updated variables.
|
|
|
Nexa Resources S.A.
Notes to the consolidated financial statements At and for the year ended on December 31, 2023 All amounts in thousands of US dollars, unless otherwise stated |
| 30 | Shareholders’ equity |
Accounting policy
Common shares are classified in shareholders’ equity. Each time a share premium is paid to the Company for an issued share, the respective share premium is allocated to the share premium account. Each time the repayment of a share premium is decided, such repayment shall be done pro-rata to the existing shareholders.
The distribution of dividends to the Company’s shareholders is recognized as a liability in the Company’s consolidated financial statements in the period in which the dividends are approved by the Company’s shareholders.
Shares repurchased under buyback programs that are not cancelled, are reported as treasury shares and are deducted from shareholders’ equity. These shares are also deducted in the earnings per share calculation.
| (a) | Capital |
As of December 31, 2023, the outstanding capital of USD 132,439 (2022: USD 132,439) is comprised of 132,439 thousand subscribed and issued common shares (2022: 132,439 thousand), with par value of US$ 1.00 per share. In addition to the subscribed and issued common shares, NEXA also has an authorized, but unissued and unsubscribed share capital set at USD 231,925.
| (b) | Treasury shares |
On June 4, 2020, at NEXA’s Extraordinary General Meeting (“EGM”), the Company’s shareholders approved the cancellation of the 881,902 shares held in treasury, purchased based on a share buyback program in prior years. For this reason, after the cancellation that occurred on June 4, 2020, VSA holds 64.68% of NEXA’s equity.
| (c) | Share premium |
The share premium, if any, may be distributed to the shareholders in accordance with Luxembourg Commercial Companies Act by a resolution of the Board of Directors.
| (d) | Additional paid in capital |
Additional paid in capital arises from transactions recognized in equity that do not qualify as capital or share premium in accordance with Luxembourg Commercial Companies Act and, therefore, cannot be distributed to the shareholders of the Company.
| (e) | Accumulated other comprehensive income |
The changes in the accumulated other comprehensive income are as follows:
|
|
|
Nexa Resources S.A.
Notes to the consolidated financial statements At and for the year ended on December 31, 2023 All amounts in thousands of US dollars, unless otherwise stated |
| Schedule of accumulated other comprehensive income | ||||
| Cumulative translation adjustment | Hedge accounting | Changes in fair value of financial instruments | Total | |
| At January 01, 2021 | (269,743) | 1,266 | (875) | (269,352) |
| Translation adjustment on foreign subsidiaries | (64,575) | - | - | (64,575) |
| Cash flow hedge accounting | - | 327 | - | 327 |
|
Changes in fair value of financial liabilities related to changes in the Company’s own credit risk |
- | - | (7,441) | (7,441) |
| Changes in fair value of investments in equity instruments | - | - | (2,632) | (2,632) |
| At December 31, 2021 | (334,318) | 1,593 | (10,948) | (343,673) |
| Translation adjustment on foreign subsidiaries | 65,243 | - | - | 65,243 |
| Cash flow hedge accounting | - | (331) | - | (331) |
|
Changes in fair value of financial liabilities related to changes in the Company’s own credit risk |
- | - | 343 | 343 |
| Changes in fair value of investments in equity instruments | - | - | (3,608) | (3,608) |
| At December 31, 2022 | (269,075) | 1,262 | (14,213) | (282,026) |
| Translation adjustment on foreign subsidiaries | 81,315 | - | - | 81,315 |
| Cash flow hedge accounting | - | (537) | - | (537) |
|
Changes in fair value of financial liabilities related to changes in the Company’s own credit risk |
- | - | (385) | (385) |
| Changes in fair value of investments in equity instruments | - | - | (1,466) | (1,466) |
| At December 31, 2023 | (187,760) | 725 | (16,064) | (203,099) |
| Attributable to NEXA's shareholders | (169,094) | |||
| Attributable to non-controlling interests | (34,005) |
| (f) | Earnings per share |
Basic earnings per share are computed by dividing the net income attributable to NEXA’s shareholders by the average number of outstanding shares for the year. Diluted earnings per share is computed in a similar way, but with the adjustment in the denominator when assuming the conversion of all shares that may be dilutive. The Company does not have any potentially dilutive shares and consequently the basic and diluted earnings per share are the same.
| Schedule of earnings per share information | |||||
| 2023 | 2022 | 2021 | |||
| Net income (loss) for the year attributable to NEXA's shareholders | (289,354) | 49,101 | 114,332 | ||
| Weighted average number of outstanding shares – in thousands | 132,439 | 132,439 | 132,439 | ||
| Earnings (losses) per share - USD | (2.18) | 0.37 | 0.86 |
| (g) | Dividend distribution |
On February 15, 2023, the Company’s Board of Directors approved, subject to ratification by the Company’s shareholders at the 2024 annual shareholders’ meeting in accordance with Luxembourg laws, a cash distribution to the Company’s shareholders of approximately USD 25,000, which was paid on March 24, 2023 as share premium (special cash dividend).
On May 15, 2023, Enercan’s Board of Directors approved an additional dividend distribution to its shareholders related to the 2022 fiscal year and the Company’s subsidiary Pollarix S.A. (“Pollarix”) will be entitled to receive USD 15,426 (BRL 76,430). Pollarix received in cash the amount of (i) USD 1,059 (BRL 5,245) on April 27, 2023, (ii) USD 5,474 (BRL 27,124) on June 7, 2023, (iii) USD 9,199 (BRL 44,887) on September 20, 2023, (iv) USD 4,556 (BRL 22,567) on November 21, 2023, and (v) USD 1,812 (BRL 8,977) on December 14, 2023, from the outstanding amount of the dividend’s distribution.
On August 2, 2023, Pollarix's Board of Directors approved an additional distribution of dividends to its shareholders for the 2022 fiscal year. Nexa BR will be entitled to receive USD 4,959 (BRL 24,197) for common shares and the non-controlling interest will be entitled to receive USD 12,397 (BRL 60,492) for preferred shares. Pollarix paid in cash the total amount of USD 13,282 (BRL 64,806) by the end of September to the non-controlling interest.
|
|
|
Nexa Resources S.A.
Notes to the consolidated financial statements At and for the year ended on December 31, 2023 All amounts in thousands of US dollars, unless otherwise stated |
On December 15, 2023, Pollarix’s Board of Directors approved an early distribution of dividends to its shareholders for the 2023 fiscal year. Nexa BR will be entitled to receive USD 1,542 (BRL 7,638) for common shares and the non-controlling interest will be entitled to receive USD 5,954 (BRL 29,489) for preferred shares. Pollarix paid in cash the total amount of USD 10,307 (BRL 51,058) by the end of December to the non-controlling interest.
Additionally, it is important to mention that Nexa Peru paid a total amount of USD 124 to the non-controlling interest regarding to the dividends distributed in previous years.
| (h) | Non-controlling interests |
| Schedule of summarized financial information of the non-controlling interests | |||||
| Summarized balance sheet | NEXA PERU | Pollarix S.A. | |||
| 2023 | 2022 | 2023 | 2022 | ||
| Current assets | 581,466 | 658,099 | 12,283 | 9,822 | |
| Current liabilities | 292,067 | 260,980 | 11,734 | 8,820 | |
| Current net assets | 289,399 | 397,119 | 549 | 1,002 | |
| Non-current assets | 1,361,412 | 1,282,556 | 73,312 | 68,984 | |
| Non-current liabilities | 385,208 | 409,106 | 9,421 | - | |
| Non-current net assets | 976,204 | 873,450 | 63,891 | 68,984 | |
| Net assets | 1,265,603 | 1,270,569 | 64,440 | 69,986 | |
| Accumulated non-controlling interests | 207,966 | 217,167 | 46,747 | 50,842 | |
| Summarized income statement | NEXA PERU | Pollarix S.A. | |||
| 2023 | 2022 | 2023 | 2022 | ||
| Net revenues | 735,337 | 892,389 | 11,740 | 6,906 | |
| Net income for the year | 12,491 | 106,501 | 13,700 | 29,635 | |
| Other comprehensive income (loss) | - | 7,308 | 5,606 | 9,686 | |
| Total comprehensive income for the year | 12,491 | 113,809 | 19,306 | 39,321 | |
| Comprehensive income attributable to non-controlling interests | (9,206) | 1,199 | 14,261 | 30,870 | |
| Dividends paid to non-controlling interests | 124 | - | 23,589 | 24,592 | |
| Summarized statement of cash flows | NEXA PERU | Pollarix S.A. | |||
| 2023 | 2022 | 2023 | 2022 | ||
| Net cash provided by (used in) operating activities | 206,163 | 196,850 | (5,189) | 4,474 | |
| Net cash used in investing activities | (226,991) | (86,969) | 36,993 | - | |
| Net cash (used in) provided by financing activities | (3,604) | (137,426) | (32,185) | (6,945) | |
| (Decrease) increase in cash and cash equivalents | (26,145) | (28,582) | (381) | (2,471) | |
| 31 | Impairment of long-lived assets |
Accounting policy
Impairment of goodwill
As part of the impairment testing procedures, the goodwill arising from a business combination is allocated to a CGU or groups of CGUs that are expected to benefit from the related business combination and is tested at the lowest level that goodwill is monitored by management. Goodwill is tested annually for impairment, regardless of whether there has been an impairment indicator or, more frequently, if circumstances indicate that the carrying amount may not be recovered.
|
|
|
Nexa Resources S.A.
Notes to the consolidated financial statements At and for the year ended on December 31, 2023 All amounts in thousands of US dollars, unless otherwise stated |
Impairment of long-lived assets
The Company assesses at each reporting
date, whether there are indicators that the carrying amount of an asset or CGU, including goodwill balance, may not be recovered. If any
indicator exists, such
as a change in forecasted commodity prices, a significant increase in operational costs, a significant decrease in production volumes,
a reduction in LOM, the cancelation or significant reduction in the scope of a project, foreign exchange rate, market conditions or unusual
events that can affect the business, the Company estimates the recoverable amount of the assets or CGUs.
The recoverable amount is estimated by reference to the higher of an asset’s or CGU’s fair value less cost of disposal (“FVLCD”) and its value in use (“VIU”). The recoverable amount is determined for an individual asset unless the asset does not generate cash inflows that are largely independent of those from other assets or groups of assets, in which case, the asset is tested as part of a larger CGU to which it belongs.
If the carrying amount of an asset or CGU exceeds its recoverable amount, the asset or CGU is considered impaired and is reduced to its recoverable amount. Non-financial assets other than goodwill that were adjusted due to impairment are subsequently reviewed for possible reversal of the impairment at each reporting date. Generally, the opposite of indicators that gave rise to an impairment loss would be considered indicators that impairment losses might have to be reversed. If the underlying reasons for the original impairment have been removed or the service potential of the asset or CGU has increased, an assessment of impairment reversals is performed by the Company. Reversals of impairment losses that arise simply from the passage of time or related with prior goodwill impairments are not recognized.
For individual assets, if there is any indicator that an asset become unusable by damage or a decision that would lead the asset to not contribute economically to the Company, it is impaired. In addition, greenfield projects for which the Company decides to quit exploration and there is no expectation that in the future will bring cash inflows are also impaired.
Impairment of exploration and evaluation costs and development projects costs
Exploration assets (greenfield) representing mineral rights acquired in business combinations, mineral rights, and other capitalized exploration and evaluation costs, as well as development projects costs capitalized included in Property, plant and equipment are tested for impairment in aggregation with CGU or groups of CGUs that include producing assets or tested individually through FVLCD when there are indicators that capitalized costs might not be recoverable. The allocation of exploration and evaluation costs, and development project costs to CGUs or group of CGUs is based on 1) expected synergies or share of producing assets infrastructure, 2) legal entity level, and 3) country level. When testing a CGU or a group of CGUs that include exploration and evaluation costs and development project costs, the Company performs the impairment test in two steps. In the first step, producing assets or group of producing assets are tested for impairment on an individual basis. In the second step, exploration and evaluation costs and development project costs are allocated to a CGU or a group of CGUs and tested for impairment on a combined basis.
|
|
|
Nexa Resources S.A.
Notes to the consolidated financial statements At and for the year ended on December 31, 2023 All amounts in thousands of US dollars, unless otherwise stated |
Valuation methods and assumptions for recoverable amount based on FVLCD
FVLCD
FVLCD is an estimate of the price that the Company would receive to sell an asset, CGU or group of CGUs in an orderly transaction between market participants at the measurement date, less the cost of disposal. FVLCD is not an entity-specific measurement but is focused on market participants’ assumptions for a particular asset when pricing the asset. FVLCD is estimated by the Company using discounted cash flows techniques (using a post-tax discount rate) and market past transaction multiples (amount paid per ton of minerals for projects in similar stages) for greenfield projects for which resources allocation is under review, although the Company considers observable inputs, a substantial portion of the assumptions used in the calculations are unobservable. These cash flows are classified as level 3 in the fair value hierarchy. No CGUs are currently assessed for impairment by reference to a recoverable amount based on FVLCD classified as level 1 or level 2.
VIU
VIU is determined as the present value of the estimated future cash flows expected to arise from the continued use of the asset in its current condition and its residual value. VIU is determined by applying assumptions specific to the Company’s continued use and does not consider enhancements or future developments. These assumptions are different from those used in calculating FVLCD and consequently the VIU calculation is likely to give a different result (usually lower) than a FVLCD calculation. Additionally, it is applied to the estimated future cash flows a pre-tax discount rate.
Forecast assumptions
The cash flow forecasts are based on management’s best estimates of expected future revenues and costs, including the future cash costs of production, capital expenditure, and closure, restoration, and environmental costs. The resulting estimates are based on detailed LOM and long-term production plans. When calculating FVLCD, these forecasts include capital and operating expenditures related to expansions and restructurings of both brownfield and greenfield projects that a market participant would consider in seeking to obtain the highest and best use of the asset, considering their evaluation, eventual changes in their scope or feasibility, and their development stage.
The cash flow forecasts may include net cash flows expected to be realized from the extraction, processing and sale of material that does not currently qualify for inclusion in ore reserves. Such non-reserve material is only included if the Company has a high level of confidence that it will be converted to reserves. This expectation is usually based on preliminary drilling and sampling of areas of mineralization that are contiguous with existing ore reserves, as well as on the historical internal conversion ratio. Typically, the additional evaluation required for conversion to reserves of such material has not yet been done because this would involve incurring evaluation costs earlier than is required for the efficient planning and operation of the producing mine.
For purposes of determining FVLCD from a market participant’s perspective, the cash flows incorporate management’s internal price forecasts that also reflects the view of market participants. The internal price forecasts are developed using a robust model that incorporates market-based supply, demand and cost data. The internal price forecasts used for ore reserve estimation testing and the Company’s strategic planning are generally consistent with those used for the impairment testing.
|
|
|
Nexa Resources S.A.
Notes to the consolidated financial statements At and for the year ended on December 31, 2023 All amounts in thousands of US dollars, unless otherwise stated |
Cost levels incorporated in the cash flow forecasts are based on the current LOM plan and long-term production plan for the CGU, which are based on detailed research, analysis and iterative modeling to optimize the level of return from investment, output and sequence of extraction. The mine plan considers all relevant characteristics of the orebody, including waste-to-ore ratios, ore grades, haul distances, chemical and metallurgical properties of the ore, process recoveries and capacities of processing equipment that can be used. The LOM plan and long-term production plans are, therefore, the basis for forecasting production output and production costs in each future year.
The discount rates applied to the future cash flow forecasts represent the Company’s estimate of the rate that a market participant would apply to the time value of money and the risks specific to the asset for which the future cash flow estimates have not been adjusted. The Company’s weighted average cost of capital is generally used for determining the discount rates, with appropriate adjustments for the risk profile of the countries in which the individual CGUs operate.
With respect to the estimated future cash flows of capitalized exploration assets and development projects, for some assets the Company applies a price to net assets value ratio discount in order to reflect the inherent risk of such projects and that are neither adjusted in the discount rate nor in the future cash flows. The discount is based on the stage of the project and the type of metal.
Critical accounting estimates, assumptions and judgments - Impairment of long-lived assets
Impairment is assessed at the CGU level. A CGU is the smallest identifiable asset or group of assets that generates independent cash inflows. Judgment is applied to identify the Company’s CGUs, particularly when assets belong to integrated operations, and changes in CGUs could impact impairment charges and reversals.
External and internal factors are quarterly monitored for impairment indicators. Judgment is required to determine, for example, whether the impact of adverse spot commodity price movements is significant and structural in nature. Also, the Company’s assessment of whether internal factors, such as an increase in production costs and delays in projects, result in impairment indicators requires significant judgment. Among others, the long-term zinc price, foreign exchange rate considering Brazilian real (BRL) per US dollar (USD) for Brazilian operations, and the discount rate may have a significant impact on the Company’s’ impairment estimations.
The process of estimating the recoverable amount involves the use of assumptions, judgment and projections for future cash flows. These calculations use cash flow projections based on financial and operational budgets for a five-year period. After the five-year period, the cash flows are extended until the end of the useful LOM or indefinitely for the smelters. The smelters cash flows do not use growth rates in the cash flow projections of the terminal value. Management’s assumptions and estimates of future cash flows used for the Company’s impairment testing of goodwill and long-lived assets are subject to risk and uncertainties, including metal prices and macroeconomic conditions, which are particularly volatile and partially or totally outside the Company’s control. Future changes in these variables may differ from management’s expectations and may materially change the recoverable amounts of the CGUs.
Impairment test analysis
Along 2023 the Company, at each reporting date, assessed whether there were indicators that the carrying amount of an asset, goodwill, or cash generation unit (CGU) might not be recoverable, or if a previously recorded impairment needed to be reversed for its entire CGU located in Brazil and Peru.
|
|
|
Nexa Resources S.A.
Notes to the consolidated financial statements At and for the year ended on December 31, 2023 All amounts in thousands of US dollars, unless otherwise stated |
Goodwill assessment
As of December 31, 2023, Nexa conducted its annual impairment test for the CGUs to which goodwill has been previously allocated, including Mining Peru group of CGUs (composed of Cerro Pasco and Cerro Lindo CGUs), Cajamarquilla and Juiz de Fora.
As a result, there was an impairment loss of USD 42,660 in the goodwill allocated to the Mining Peru Group of CGUs. The Company assessed for impairment the goodwill allocated to the Cajamarquilla CGU and Juiz de Fora CGU and did not identify any loss to be recognized.
Três Marias System and Morro Agudo CGUs
During 2023, after analyzing the operational optimization and strategic alternatives for the Três Marias System (STM) (previously formed by the combined operations of the Três Marias smelter and the Vazante and Morro Agudo mines), based on the current and projected macroeconomic and price scenarios, as well as on possible future operational scenarios, management concluded that the implied value of processing zinc concentrate from Morro Agudo in the Três Marias smelter could no longer continue to be recognized.
As a result, the Company concluded that there could be scenarios where it was not necessary to consider the two operations in an integrated manner. Thus, the CGU of the STM was split in two: (i) the STM CGU (comprising the Três Marias smelter and the Vazante mine) and (ii) the Morro Agudo CGU (comprised of Morro Agudo mine and Bonsucesso greenfield). This triggered an impairment test for Morro Agudo and Três Marias System CGUs.
Considering key assumptions from the strategic planning process, as of December 31, 2023, the impairment assessment resulted in the recognition of an impairment loss of USD 59,007 for Morro Agudo CGU, concluding that its long-lived assets were entirely impaired. Furthermore, the Company assessed Três Marias System for impairment and did not identify impairment loss to be recognized.
Aripuaña and Juiz de Fora CGUs
The Company tested Juiz de Fora and Aripuanã CGUs after identifying impairment indicators related to (i) reduction in Aripuanã's life of mine; (ii) a lower exchange rate of BRL/USD; and (iii) an increase in operational costs for their operations. No impairment was identified after the impairment assessment for both CGUs.
In addition, in relation to Aripuanã CGU, Nexa observed that there is no more excess over recoverable amount. Based on that, the Company performed a sensitivity analysis and concluded that there is no impairment to be recognized as of December 31, 2023. However, the Company continues to work to finalize the operational ramp-up and stabilize the operation as well as to reduce the operation costs and idle capacity.
Peruvian CGU
As of December 31, 2023, Nexa conducted its annual impairment test for the CGUs Cerro Pasco, Cerro Lindo and Cajamarquilla, after identifying impairment indicators mainly related to increased operational costs. For these CGUs, an impairment assessment was performed, considering key assumptions from the strategic planning process, and as a result, no impairment was identified.
Impairment test summary
In addition to the economic impairments described above, the Company recognized individual assets impairments for USD 12,976, mainly related to “Assets and projects under construction”.
|
|
|
Nexa Resources S.A.
Notes to the consolidated financial statements At and for the year ended on December 31, 2023 All amounts in thousands of US dollars, unless otherwise stated |
In summary, Nexa recognized a net impairment loss of USD 114,643 (after-tax USD 90,349) registered for the year ended on December 31, 2023.
For the year ended on December 31, 2022, the Company recognized an impairment loss of USD 32,512 (after-tax USD 30,971).
| (a) | Key assumptions used in impairment tests |
The recoverable amounts for each CGU were determined based on the FVLCD method, which were higher than those determined based on the VIU method.
The Company identified long-term zinc prices, discount rate, exchange rate considering Brazilian real (BRL) and LOM as key assumptions for the recoverable amounts determination, due to the material impact such assumptions may cause on the recoverable value. Part of these assumptions are summarized below:
| Schedule of key assumptions used in impairment test | |||
| 2023 | 2022 | 2021 | |
| Long-term zinc price (USD/t) | 2,800 | 2,787 | 2,724 |
| Discount rate (Peru) | 7.22% | 6.93% | 6.22% |
| Discount rate (Brazil) | 8.02% | 8.03% | 7.33% |
| Exchange rate (BRL x USD) | 4.84 | 5.22 | 5.58 |
| Brownfield projects - LOM (years) | From 4 to 21 | From 5 to 24 | from 4 to 25 |
| (b) | Impairment loss - Mining Peru group of CGUs Goodwill |
Before the impairment test performed on December 31, 2023, the Mining Peru group of CGU’s, which also includes greenfield projects including the Magistral, Florida Canyon and Hilarion Projects, included a goodwill of USD 249,082. After the impairment loss mentioned above, the goodwill, included in Intangible assets, has a balance of USD 206,423.
| Schedule of impairment loss | |||
| Carrying amount prior to impairment | Impairment | Carrying amount after impairment | |
| Goodwill- Mining Peru | 249,082 | (42,660) | 206,422 |
The Company performed a stress test on the key assumptions used for the calculation of the recoverable amount of the CGU Mining Peru. A decrease of 5% in the long-term LME zinc price to USD 2,660 per ton compared to management´s estimation as of December 31, 2023, would have resulted in an impairment loss of USD 79,590 (or an additional impairment loss of USD 36,931). Also, an increase of 5% in the discount rate compared to management´s estimation as of December 31, 2023, would have resulted in an impairment loss of USD 49,820 (or an additional impairment loss of USD 7,161).
|
|
|
Nexa Resources S.A.
Notes to the consolidated financial statements At and for the year ended on December 31, 2023 All amounts in thousands of US dollars, unless otherwise stated |
| (c) | Sensitivity analysis –Tested CGUs and Cajamarquilla Goodwill |
The Company estimated the amount by which the value assigned to the key assumptions must change in order for the assessed CGU recoverable amount, which was not impaired, to be equal to its carrying amount:
| Schedule of Sensitivity Analysis | ||||||||||
| CGU | Excess over recoverable amount | Decrease in Long term Zinc (USD/t) | Increase in WACC | Appreciation of BRL over USD | ||||||
| Change | Price | Change | Rate | Change | Price | |||||
| Três Marias System | 128,136 | (3.97%) | 2,689 | 43.21% | 11.49% | (3.75%) | 4.66 | |||
| Juiz de fora | 42,469 | (4.42%) | 2,676 | 17.58% | 9.43% | (3.34%) | 4.68 | |||
| Cajamarquilla | 335,380 | (11.40%) | 2,481 | 48.90% | 10.76% | - | - | |||
| Cerro Lindo | 101,871 | (13.43%) | 2,424 | 81.70% | 13.12% | - | - | |||
| 32 | Long-term commitments |
| (a) | Projects evaluation |
As part of NEXA’s activities for the execution of certain greenfield projects, the Company has agreed, with the Peruvian Government, to minimum investments levels in the Magistral Project, that if the Company does not meet by August 2028, would require additional disbursements of 30% over the unexecuted minimum investment commitment. As of December 31, 2023, the unexecuted minimum investment commitment was USD 323,000, and if not completed by August 2028, the penalty exposition would be USD 97,029.
| (b) | Environmental Guarantee for Dams |
On December 30, 2023, the Decree 48,747 of 2023 of Minas Gerais State was published, which regulates the need for an environmental guarantee, provided for in Law 23,291, of February 25, 2019 – State Policy for Dam Safety, to guarantee environmental recovery in the event of an accident or deactivation of the dams. According to the Decree, the environmental guarantee is applicable to all dams that present the characteristics established by the Law. The Company estimates a guarantee need of approximately USD 27,283 (BRL 132,083) for all structures in the state of Minas Gerais which was calculated based on a methodology specified by the decree itself, which takes into account the reservoir area, a cost factor related to the decommissioning of dams, and considerations about risk classification of the dam and inflation for the period. The Company has until March 28, 2024, to submit a proposal and may choose the following methods: (i) cash deposit; (ii) Bank Deposit certificate-CDB; (iii) bank guarantee; and (iv) guarantee insurance. By December 31, 2024, the Company will contract 50% of the guarantee chosen, 25% must be made by December 31, 2025, and 25% by the end of 2026.
*.*.*
|
|
Report of Independent Registered Public Accounting Firm
To the Board of Directors and Shareholders of
Nexa Resources S.A.
Opinions on the Financial Statements and Internal Control over Financial Reporting
We have audited the accompanying consolidated balance sheets of Nexa Resources S.A. and its subsidiaries (the “Company”) as of December 31, 2023 and 2022, and the related consolidated income statement, consolidated statement of comprehensive income, consolidated statement of changes in shareholders’ equity and consolidated statement of cash flows for each of the three years in the period ended December 31, 2023, including the related notes (collectively referred to as the “consolidated financial statements”). We also have audited the Company's internal control over financial reporting as of December 31, 2023, based on criteria established in Internal Control - Integrated Framework (2013) issued by the Committee of Sponsoring Organizations of the Treadway Commission (COSO).
In our opinion, the consolidated financial statements referred to above present fairly, in all material respects, the financial position of the Company as of December 31, 2023 and 2022, and the results of its operations and its cash flows for each of the three years in the period ended December 31, 2023 in conformity with IFRS Accounting Standards as issued by the International Accounting Standards Board. Also in our opinion, the Company maintained, in all material respects, effective internal control over financial reporting as of December 31, 2023, based on criteria established in Internal Control - Integrated Framework (2013) issued by the COSO.
Basis for Opinions
The Company's management is responsible for these consolidated financial statements, for maintaining effective internal control over financial reporting, and for its assessment of the effectiveness of internal control over financial reporting, included in the Management’s Report on Internal Control over Financial Reporting appearing under Item 15. Our responsibility is to express opinions on the Company’s consolidated financial statements and on the Company's internal control over financial reporting based on our audits. We are a public accounting firm registered with the Public Company Accounting Oversight Board (United States) (PCAOB) and are required to be independent with respect to the Company in accordance with the U.S. federal securities laws and the applicable rules and regulations of the Securities and Exchange Commission and the PCAOB.
We conducted our audits in accordance with the standards of the PCAOB. Those standards require that we plan and perform the audits to obtain reasonable assurance about whether the consolidated financial statements are free of material misstatement, whether due to error or fraud, and whether effective internal control over financial reporting was maintained in all material respects.
Our audits of the consolidated financial statements included performing procedures to assess the risks of material misstatement of the consolidated financial statements, whether due to error or fraud, and performing procedures that respond to those risks. Such procedures included examining, on a test basis, evidence regarding the amounts and disclosures in the consolidated financial statements. Our audits also included evaluating the accounting principles used and significant estimates made by management, as well as evaluating the overall presentation of the consolidated financial statements. Our audit of internal control over financial reporting included obtaining an understanding of internal control over financial reporting, assessing the risk that a material weakness exists, and testing and evaluating the design and operating effectiveness of internal control based on the assessed risk. Our audits also included performing such other procedures as we considered necessary in the circumstances. We believe that our audits provide a reasonable basis for our opinions.
Definition and Limitations of Internal Control over Financial Reporting
A company’s internal control over financial reporting is a process designed to provide reasonable assurance regarding the reliability of financial reporting and the preparation of financial statements for external purposes in accordance with generally accepted accounting principles. A company’s internal control over financial reporting includes those policies and procedures that (i) pertain to the maintenance of records that, in reasonable detail, accurately and fairly reflect the transactions and dispositions of the assets of the company; (ii) provide reasonable assurance that transactions are recorded as necessary to permit preparation of financial statements in accordance with generally accepted accounting principles, and that receipts and expenditures of the company are being made only in accordance with authorizations of management and directors of the company; and (iii) provide reasonable assurance regarding prevention or timely detection of unauthorized acquisition, use, or disposition of the company’s assets that could have a material effect on the financial statements.
Because of its inherent limitations, internal control over financial reporting may not prevent or detect misstatements. Also, projections of any evaluation of effectiveness to future periods are subject to the risk that controls may become inadequate because of changes in conditions, or that the degree of compliance with the policies or procedures may deteriorate.
Critical Audit Matters
The critical audit matters communicated below are matters arising from the current period audit of the consolidated financial statements that were communicated or required to be communicated to the audit committee and that (i) relate to accounts or disclosures that are material to the consolidated financial statements and (ii) involved our especially challenging, subjective, or complex judgments. The communication of critical audit matters does not alter in any way our opinion on the consolidated financial statements, taken as a whole, and we are not, by communicating the critical audit matters below, providing separate opinions on the critical audit matters or on the accounts or disclosures to which they relate.
Impairment Assessments – Goodwill and long-lived assets
As described in Notes 22 and 31 to the consolidated financial statements, the Company’s goodwill balance
was US$ 307,112 thousand as of December 31, 2023, comprised by the goodwill allocated to the following cash generating units (CGU): Cajamarquilla in the amount of US$ 95,830 thousand, Juiz de Fora in the amount of US$ 4,972 thousand and Mining Peru in the amount of US$ 206,423 thousand. Management conducts a goodwill impairment test on an annual basis or, more frequently, if circumstances indicate that the carrying value of goodwill may be impaired. Management also evaluates impairment indicators for the long-lived assets, such as intangible, property plant and equipment and investments in associate companies. Potential impairment is identified by comparing the Fair Value Less Cost of Disposal (FVLCD) of a reporting unit to its carrying value, including goodwill, when applicable. Fair value is estimated by management using a discounted cash flow model or by market past transaction multiples. Management’s cash flow projections included significant judgments and assumptions mainly related to long-term zinc price and discount rates. The impairment assessments performed by management resulted in the recognition of an impairment loss of US$ 42,660 thousand on the goodwill allocated to the Mining Peru CGU and US$ 59,007 thousand on Morro Agudo CGU, which long-lived assets were fully impaired.
Additionally, the Company recognized an impairment loss of US$ 12,976 thousand related to individual assets classified in “Assets and projects under construction”. The total impairment loss of US$ 114,643 thousand was recorded in 2023.
The principal considerations for our determination that performing procedures relating to impairment assessments of the goodwill and long-lived assets is a critical audit matter are (i) the significant judgment by management when developing the fair value estimates of the CGUs; (ii) a high degree of auditor judgment, subjectivity, and effort in performing procedures and evaluating management’s significant assumptions related to long-term zinc price and discount rates; and (iii) the audit effort involved the use of professionals with specialized skill and knowledge.
Addressing the matter involved performing procedures and evaluating audit evidence in connection with forming our overall opinion on the consolidated financial statements. These procedures included testing design and the effectiveness of controls relating to management’s impairment assessments, including controls related to the significant assumptions. These procedures also included, among others (i) testing management’s process for developing the fair value estimates; (ii) evaluating the appropriateness of the discounted cash flow model used by management; (iii) testing the completeness and accuracy of underlying data used in the discounted cash flow model; and (iv) evaluating the reasonableness of the significant assumptions used by management related to long-term zinc price and discount rates. Evaluating management’s assumptions related to long-term zinc price and discount rates involved evaluating whether the assumptions used by management were reasonable considering (i) the consistency with external market and industry data; and (ii) whether the assumptions were consistent with evidence obtained in other areas of the audit. Professionals with specialized skill and knowledge were used to assist in evaluating (i) the appropriateness of the discounted cash flow model and (ii) the reasonableness of the long-term zinc price and discount rates used.
VAT discussions
As described in Note 9 to the consolidated financial statements, the Company has incurred costs and recorded provisions, as a result of the investigation being carried out by the Fiscal Office of the State of Minas Gerais and the Public Ministry of Minas Gerais (the “MG Authorities”) with respect to certain commercial transactions and related Value-Added Taxes (VAT) between the Company and certain of its former customers. Nexa and the MG Authorities entered into two main tax agreements whereby the Company, without admitting primary responsibility for the resolved claims, agreed to make tax payments, including interest and penalties, to the State of Minas Gerais on behalf of certain former customers that allegedly failed to properly comply with their tax obligations. In connection with the first agreement signed during the third quarter of 2023, the Company recorded the total amount of US$ 75,811 thousand in "Other liabilities”, of which US$ 24,951 thousand was offset by VAT credits, US$ 6,398 thousand was offset by judicial deposits and the amount of US$ 1,515 thousand was paid in cash, while the remaining amount due will be paid in forty-six consecutive monthly installments. In connection with the second agreement signed on February 8, 2024, the Company recorded the total amount of US$ 27,128 thousand in "Other liabilities", of which US$ 10,796 thousand will be offset by VAT credits and the amount of US$ 828 thousand will be paid in cash, while the remaining amount due will be paid in fifty-nine consecutive monthly installments.
The principal considerations for our determination that performing procedures relating to VAT discussions is a critical audit matter are (i) a high degree of auditor effort in performing procedures and evaluating audit evidence related to management’s assessment of the recorded amounts; (ii) the audit effort involved the use of professionals with specialized skill and knowledge; and (iii) it relates to accounts and disclosures that are material to the consolidated financial statements.
Addressing the matter involved performing procedures and evaluating audit evidence in connection with forming our overall opinion on the consolidated financial statements. These procedures included testing the effectiveness of controls relating to management’s assessment of loss and provision recorded as well as financial statement disclosures. These procedures also included, among others (i) confirming with internal and external legal counsel the possibility or probability of an unfavorable outcome and the extent to which the loss is reasonably estimable; (ii) evaluating the reasonableness of management’s assessment regarding whether an unfavorable outcome is reasonably probable and reasonably estimable; and (iii) evaluating the sufficiency of the Company’s disclosures. In addition, professionals with specialized skills and knowledge were used to assist in the evaluation of the reasonableness of the estimate of loss.
/s/ PricewaterhouseCoopers Auditores Independentes Ltda.
Curitiba, Brazil,
February 21, 2024
We have served as the Company’s auditor since 2001.
Exhibit 2.4
DESCRIPTION OF THE REGISTRANT’S SECURITIES REGISTERED PURSUANT TO SECTION 12 OF THE SECURITIES EXCHANGE ACT OF 1934
As of December 31, 2023, Nexa Resources S.A. (“Nexa Resources,” “we,” “us,” and “our”) had one class of securities registered under Section 12 of the Securities Exchange Act of 1934, as amended: our common shares.
Description of Common Shares
The following description of our common shares is a summary and does not purport to be complete. It is subject to and qualified in its entirety by reference to our amended and restated articles of association, which is incorporated as an exhibit to our most recent Annual Report on Form 20-F, the Luxembourg law of August 10, 1915, on commercial companies, as amended (the “1915 Law”), and by any other applicable Luxembourg corporate law. We encourage you to read our articles of association, the 1915 Law, and applicable provisions of Luxembourg law for additional information.
Share capital
As of December 31, 2023, our issued share capital was US$132,438,611 represented by 132,438,611 common shares fully paid, with par value of US$1.00 per share. In addition to our issued share capital, we have an authorized share capital of US$231,924,819, represented by 231,924,819 common shares. Our common shares are publicly traded in the United States on the New York Stock Exchange (or NYSE), under the ticker symbol NEXA.
Changes to our share capital are decided by our shareholders or, pursuant to our articles of association, by our board of directors within the limits of the authorized share capital. Our shareholders may at any time at a shareholders’ meeting decide to increase or decrease our share capital. Such resolution must satisfy the quorum and majority requirements that apply to an amendment of the articles of association, as described below. No shareholder is liable to make any further contribution to our share capital other than with respect to shares held by such shareholder that are not fully paid-up.
Distributions
Pursuant to our articles of association, the general meeting of shareholders may approve dividends and the board of directors may declare interim dividends, in each case to the extent permitted by Luxembourg law. Under Luxembourg law, dividends are determined by a simple majority vote at a general shareholders’ meeting based on the recommendation of our board of directors. Pursuant to our articles of association, the board of directors may also declare distributions to our shareholders in the form of reimbursement of share premium to the extent permitted by Luxembourg law.
Each common share entitles the holder to participate equally in any distributions, if and when declared by the general meeting of shareholders or, in the case of interim dividends or reimbursements of share premium, the board of directors, out of funds legally available for such purposes. Dividends and other distributions on our common shares will be declared and paid in U.S. dollars. Declared and unpaid distributions held by us for the account of the shareholders shall not bear interest. Under Luxembourg law, claims for unpaid distributions will lapse in our favor five years after the date such distribution has been declared.
We and our subsidiaries are subject to certain legal requirements that may affect our ability to pay dividends or other distributions. Distributions to shareholders (including in the form of dividends or reimbursement of share premium) may only be made from amounts available for distribution in accordance with Luxembourg law, determined based on our standalone statutory accounts prepared under Luxembourg GAAP. Under Luxembourg law, the amount of a distribution paid to shareholders (including in the form of dividends or reimbursement of share premium) may not exceed the amount of the profits at the end of the last financial year plus any profits carried forward and any amounts drawn from reserves that are available for that purpose, less any losses carried forward and sums to be placed in reserve in accordance with Luxembourg law or our articles of association. Furthermore, no distributions (including in the form of dividends or reimbursement of share premium) may be made if at the end of the last financial year the net assets as set out in the standalone statutory accounts prepared under Luxembourg GAAP are, or following such a distribution would become, less than the amount of the subscribed share capital plus the non-distributable reserves.
Distributions in the form of dividends may only be made from net profits and profits carried forward, whereas distributions in the form of share premium reimbursements may only be made from available share premium.
Luxembourg law also requires at least 5.0% of our net profits per year to be allocated to the creation of a legal reserve until such reserve has reached an amount equal to 10.0% of our issued share capital. If the legal reserve subsequently falls below the 10.0% threshold, at least 5.0% of net profits again must be allocated toward the reserve. The legal reserve is not available for distribution.
Voting rights
There are no restrictions on the rights of Luxembourg or non-Luxembourg residents to vote our shares. All of our shareholders, including our public shareholders, hold common shares with identical voting rights, preferences and privileges. Each common share entitles the shareholder to attend a general meeting of shareholders in person or by proxy, to address the general meeting of shareholders and to vote. Each common share entitles the holder to one vote at the general meeting of shareholders.
General meeting of shareholders
In accordance with Luxembourg law and our articles of association, any regularly constituted general meeting of our shareholders has the power to order, carry out or ratify acts relating to our operations to the extent that such decisions are the domain of the shareholders and not the board of directors.
Our annual general meeting of shareholders shall be held at our registered office, or at such other place in Luxembourg as may be specified in the notice of the meeting, within six months after the end of the relevant financial year. Except as otherwise specified in our articles of association, resolutions at a general meeting of shareholders are adopted by a simple majority of shares present or represented and voting at such meeting.
A shareholder entitled to vote may act at any general meeting of shareholders by appointing another person (who need not be a shareholder) as his proxy, which proxy shall be in writing and comply with such requirements as determined by our board with respect to the attendance to the general meeting, and proxy forms in order to enable shareholders to exercise their right to vote. All proxies must be received by us (or our agents) no later than the day determined by our board of directors.
The board of directors may also decide to allow shareholders to vote by correspondence by means of a proxy form providing for a positive or negative vote or an abstention on each agenda item. The conditions for voting by correspondence are set out in the articles of association and in the convening notice.
The board of directors may decide to arrange for shareholders to be able to participate in the general meeting by conference call, video conference or similar means of communication, whereby (i) the shareholders attending the meeting can be identified, (ii) all persons participating in the meeting can hear and speak to each other, (iii) the transmission of the meeting is performed on an ongoing basis and (iv) the shareholders can properly deliberate without the need for them to appoint a proxyholder who would be physically present at the meeting.
Appointment and term limits of members of our board of directors
In accordance with our articles of association and the 1915 Law, the members of our board of directors are elected by a resolution of a general meeting of shareholders adopted with a simple majority of the votes validly cast, regardless of the portion of capital represented at such general meeting. Votes are cast for or against each nominee proposed for election to the board and cast votes shall not include votes attaching to shares for which the shareholder has not participated in the vote, has abstained or has returned a blank or invalid vote.
Our directors are appointed for a mandate of a two-years term and may be reelected. Members of our board of directors may be removed at any time, with or without cause, by a resolution adopted at a general meeting of our shareholders. Under Luxembourg law, in the case of a vacancy of the office of a director appointed by the general meeting of shareholders, the remaining directors may fill the vacancy on a provisional basis. In these circumstances, the following general meeting of shareholders shall make the final appointment of the director.
Issuance of shares and preferential subscription rights
|
|
Our shares may be issued pursuant to a resolution of the general meeting of shareholders. The general meeting of shareholders may also delegate the authority to issue shares to the board of directors for a renewable period of five years. The board of directors has been authorized to issue up to 231,924,819 common shares. Such authorization will expire five years after the date of publication in the Luxembourg legal gazette (Recueil Electronique des Sociétés et Associations) of the minutes of the general meeting of shareholders held on June 4, 2020 (unless amended or extended by the general meeting of shareholders).
Each holder of shares has preferential subscription rights to subscribe for any issue of shares pro rata to the aggregate amount of such holder’s existing holding of the shares. Each shareholder shall, however, have no preferential subscription right on shares issued for a contribution in kind.
Preferential subscription rights may be restricted or excluded by a resolution of the general meeting of shareholders, or by the board of directors if the shareholders so delegate. The general meeting of shareholders has delegated to the board of directors the power to cancel or limit the preferential subscription rights of the shareholders when issuing new shares, so long as the issuance of new shares is carried out through a public offering.
If we decide to issue new shares in the future and do not exclude the preferential subscription rights of existing shareholders, we will publish the decision by placing an announcement in the Luxembourg official journal Recueil Electronique des Sociétés et Associations and in a newspaper published in Luxembourg. The announcement will specify the period in which the preferential subscription rights may be exercised. Such period may not be shorter than 14 days from the publication of the offer. The announcement will also specify details regarding the procedure for exercise of the preferential subscription rights. Under Luxembourg law preferential subscription rights are transferable and tradable property rights.
Repurchase of shares
Nexa Resources is prohibited by the 1915 Law from subscribing for its own shares. Nexa Resources may, however, repurchase its own shares or have another person repurchase shares on its behalf, subject to certain conditions, including:
| · | prior authorization of the general meeting of shareholders setting out the terms and conditions of the proposed repurchase, including the maximum number of shares to be repurchased, the duration of the period for which the authorization is given (which may not exceed five years) and the minimum and maximum consideration per share; |
| · | the repurchase may not reduce the net assets of Nexa Resources on a non-consolidated basis to a level below the aggregate of the issued share capital and the reserves that Nexa Resources must maintain pursuant to the 1915 Law or our articles of association; |
| · | only fully paid-up shares may be repurchased; and |
| · | the acquisition offer is made on the same terms and conditions to all the shareholders who are in the same position; however, listed companies may repurchase their own shares on the stock exchange without making an acquisition offer to the shareholders. |
On September 13, 2018, our shareholders authorized us to purchase, acquire, receive or hold and sell shares of Nexa Resources in accordance with the 1915 Law and any other applicable laws and regulations. The authorization was effective immediately after the general meeting and valid for a period of three years. As of December 31, 2023, there were no authorized share buyback programs.
Form and transfer of shares
Our shares are issued in registered form only and are freely transferable. Luxembourg law does not impose any limitations on the rights of Luxembourg or non-Luxembourg residents to hold or vote our shares.
Under Luxembourg law, the ownership of registered shares is generally evidenced by the inscription of the name of the shareholder, the number of shares held by him or her in the shareholders’ register, which is maintained at
|
|
our registered office. Each transfer of shares is made by a written declaration of transfer recorded in our shareholders’ register, dated and signed by the transferor and the transferee or by their duly appointed agent. We may accept and enter into its shareholders’ register any transfer based on an agreement between the transferor and the transferee provided a true and complete copy of the agreement is provided to us.
Our articles of association provide that, in case our shares are recorded in the register of shareholders on behalf of one or more persons in the name of a securities settlement system or the operator of such a system, or in the name of a professional depositary of securities or any other depositary or of a sub-depositary designated by one or more depositaries, NEXA—subject to a confirmation in proper form received from the depositary—will permit those persons to exercise the rights attaching to those shares, including admission to and voting at general meetings of shareholders. The board of directors may determine the requirements with which such confirmations must comply. Shares held in such manner generally have the same rights and obligations as any other shares recorded in our shareholder register(s).
Liquidation rights
The liquidation of Nexa Resources shall be decided by a general meeting of shareholders fulfilling the conditions as to attendance and majority required for the amendments of the articles of association. The method of liquidation shall be determined, and the liquidators shall be appointed by the general meeting of shareholders. In accordance with the 1915 Law, the assets that remain after payment of all debts and liabilities are distributed to the shareholders, on a pro rata basis.
Other Provisions
Holders of our common shares have no sinking fund, redemption or conversion rights.
Limitations on the right to own securities
Neither Luxembourg law nor our articles of association impose any general limitation on the right of nonresidents or foreign persons to hold our common shares or exercise voting rights on our common shares other than those limitations that would generally apply to all shareholders.
There is no law, governmental decree or regulation in Luxembourg that would affect the remittance of dividends or other distributions by Nexa Resources to nonresident holders of its common shares, other than withholding tax requirements. In certain limited circumstances, the implementation and administration of international financial sanctions may affect the remittance of dividends or other distributions. There are no specified procedures for nonresident holders to claim dividends or other distributions.
Transfer Agent
Computershare Trust Company, N.A. is the paying agent for shareholders who hold common shares listed on the NYSE.
|
|
Exhibit 8
List of Subsidiaries of Nexa Resources S.A.
|
Name of Subsidiary |
Jurisdiction of Incorporation or Organization |
| Campos Novos Energia S.A. | Brazil |
| Compañía Minera Shalipayco S.A.C. | Peru |
| Compañía Magistral S.A.C. | Peru |
| Compañía Minera Doña Isabel Ltda. | Chile |
| Compañía Minera Gaico S.A. | Peru |
| Consórcio Capim Branco Energia | Brazil |
| Consórcio UHE Igarapava | Brazil |
| Exploraciones Chimborazo Metals & Mining S.A. | Ecuador |
| IncPac Holding Limited | British Virgin Islands |
|
Inversiones Garza Azul S.A.C. Karmin Holdings Ltda. |
Peru Brazil |
| L.D.O.S.P.E. Empreendimentos e Participações Ltda. | Brazil |
| L.D.Q.S.P.E. Empreendimentos e Participações Ltda. | Brazil |
| L.D.R.S.P.E. Empreendimentos e Participações Ltda. | Brazil |
| Minera Bongará S.A. | Peru |
| Minera Cerro Colorado S.A.C. | Peru |
| Minera Pampa de Cobre S.A.C. | Peru |
| Mineração Parnamirim | Brazil |
| Mineração Colina Ltda. | Brazil |
| Mineração Santa Maria Ltda. | Brazil |
| Mineração Soledade Ltda. | Brazil |
| Nexa Energy Comercializadora de Energia Ltda. | Brazil |
| Nexa Resources Atacocha S.A.A. | Peru |
| Nexa Resources Cajamarquilla S.A. | Peru |
| Nexa Resources El Porvenir S.A.C. | Peru |
| Nexa Recursos Minerais S.A. | Brazil |
| Nexa Resources Peru S.A.A. | Peru |
| Nexa Resources UK Limited | United Kingdom |
| Nexa Resources US Inc. | United States |
| Nexa Solar Vazante 1 Ltda | Brazil |
| Nexa Solar Vazante 2 Ltda | Brazil |
| Nexa Solar Três Marias 1 Ltda | Brazil |
| Otavi Mining Investments (Proprietary) Ltd. | Namibia |
| Otjitombo Mining (Proprietary) Ltd. | Namibia |
| Pollarix S.A. | Brazil |
| Rayrock Antofagasta S.A.C. | Peru |
| SMRL Ltda. Pepita 1 | Peru |
| SMRL CMA nº 54 | Peru |
| Votorantim Andina S.A. | Chile |
| Votorantim Metals Canada Inc. | Canada |
| Votorantim Metals Namibia (Proprietary) Ltd. | Namibia |
|
|
Exhibit 12.1
I, Ignacio Rosado, certify that:
| 1. | I have reviewed this annual report on Form 20-F of Nexa Resources S.A.; |
| 2. | Based on my knowledge, this report does not contain any untrue statement of a material fact or omit to state a material fact necessary to make the statements made, in light of the circumstances under which such statements were made, not misleading with respect to the period covered by this report; |
| 3. | Based on my knowledge, the financial statements, and other financial information included in this report, fairly present in all material respects the financial condition, results of operations and cash flows of the company as of, and for, the periods presented in this report; |
| 4. | The company’s other certifying officer(s) and I are responsible for establishing and maintaining disclosure controls and procedures (as defined in Exchange Act Rules 13a-15(e) and 15d-15(e)) and internal control over financial reporting (as defined in Exchange Act Rules 13a-15(f) and 15-d-15(f)) for the company and have: |
| (a) | Designed such disclosure controls and procedures, or caused such disclosure controls and procedures to be designed under our supervision, to ensure that material information relating to the company, including its consolidated subsidiaries, is made known to us by others within those entities, particularly during the period in which this report is being prepared; |
| (b) | Designed such internal control over financial reporting, or caused such internal control over financial reporting to be designed under our supervision, to provide reasonable assurance regarding the reliability of financial reporting and the preparation of financial statements for external purposes in accordance with generally accepted accounting principles; |
| (c) | Evaluated the effectiveness of the company’s disclosure controls and procedures and presented in this report our conclusions about the effectiveness of the disclosure controls and procedures, as of the end of the period covered by this report based on such evaluation; and |
| (d) | Disclosed in this report any change in the company’s internal control over financial reporting that occurred during the period covered by the annual report that has materially affected, or is reasonably likely to materially affect, the company’s internal control over financial reporting; and |
| 5. | The company’s other certifying officer(s) and I have disclosed, based on our most recent evaluation of internal control over financial reporting, to the company’s auditors and the audit committee of the company’s board of directors (or persons performing the equivalent functions): |
| (a) | All significant deficiencies and material weaknesses in the design or operation of internal control over financial reporting which are reasonably likely to adversely affect the company’s ability to record, process, summarize and report financial information; and |
| (b) | Any fraud, whether or not material, that involves management or other employees who have a significant role in the company’s internal control over financial reporting. |
/s/ Ignacio Rosado
| Name: | Ignacio Rosado |
| Title: | President and Chief Executive Officer |
| Date: | March 27, 2024 |
Exhibit 12.2
I, José Carlos del Valle, certify that:
| 1. | I have reviewed this annual report on Form 20-F of Nexa Resources S.A.; |
| 2. | Based on my knowledge, this report does not contain any untrue statement of a material fact or omit to state a material fact necessary to make the statements made, in light of the circumstances under which such statements were made, not misleading with respect to the period covered by this report; |
| 3. | Based on my knowledge, the financial statements, and other financial information included in this report, fairly present in all material respects the financial condition, results of operations and cash flows of the company as of, and for, the periods presented in this report; |
| 4. | The company’s other certifying officer(s) and I are responsible for establishing and maintaining disclosure controls and procedures (as defined in Exchange Act Rules 13a-15(e) and 15d-15(e)) and internal control over financial reporting (as defined in Exchange Act Rules 13a-15(f) and 15-d-15(f)) for the company and have: |
| (a) | Designed such disclosure controls and procedures, or caused such disclosure controls and procedures to be designed under our supervision, to ensure that material information relating to the company, including its consolidated subsidiaries, is made known to us by others within those entities, particularly during the period in which this report is being prepared; |
| (b) | Designed such internal control over financial reporting, or caused such internal control over financial reporting to be designed under our supervision, to provide reasonable assurance regarding the reliability of financial reporting and the preparation of financial statements for external purposes in accordance with generally accepted accounting principles; |
| (c) | Evaluated the effectiveness of the company’s disclosure controls and procedures and presented in this report our conclusions about the effectiveness of the disclosure controls and procedures, as of the end of the period covered by this report based on such evaluation; and |
| (d) | Disclosed in this report any change in the company’s internal control over financial reporting that occurred during the period covered by the annual report that has materially affected, or is reasonably likely to materially affect, the company’s internal control over financial reporting; and |
| 5. | The company’s other certifying officer(s) and I have disclosed, based on our most recent evaluation of internal control over financial reporting, to the company’s auditors and the audit committee of the company’s board of directors (or persons performing the equivalent functions): |
| (a) | All significant deficiencies and material weaknesses in the design or operation of internal control over financial reporting which are reasonably likely to adversely affect the company’s ability to record, process, summarize and report financial information; and |
| (b) | Any fraud, whether or not material, that involves management or other employees who have a significant role in the company’s internal control over financial reporting. |
/s/ José Carlos del Valle
| Name: | José Carlos del Valle |
| Title: | Senior Vice President of Finance and Group Chief Financial Officer |
| Date: | March 27, 2024 |
Exhibit 13.1
Certification
Pursuant to Section 906 of the Sarbanes-Oxley Act of 2002 (Subsections (a) and (b) of Section 1350, Chapter 63 of Title 18, United States Code)
Pursuant to section 906 of the Sarbanes-Oxley Act of 2002 (subsections (a) and (b) of section 1350, chapter 63 of Title 18, United States Code), each of the undersigned officers of Nexa Resources S.A. (the “Company”), does hereby certify, to such officer’s knowledge, that:
The Annual Report on Form 20-F for the year ended December 31, 2023 (the “Form 20-F”) of the Company fully complies with the requirements of section 13(a) or 15(d) of the Securities Exchange Act of 1934 and information contained in the Form 20-F fairly presents, in all material respects, the financial condition and results of operations of the Company.
/s/ Ignacio Rosado
| Name: | Ignacio Rosado |
| Title: | President and Chief Executive Officer |
| Date: | March 27, 2024 |
/s/ José Carlos del Valle
| Name: | José Carlos del Valle |
| Title: | Senior Vice President of Finance and Group Chief Financial Officer |
| Date: | March 27, 2024 |
A signed original of this written statement required by Section 906 of the Sarbanes-Oxley Act of 2002 has been provided to the Company and will be retained by the Company and furnished to the Securities and Exchange Commission or its staff upon request.

Technical Report Summary on Cerro Pasco Complex Integration, Pasco Province, Peru
SLR Project No.: 233.065018.00001
Prepared by
SLR Consulting (Canada) Ltd.
55 University Ave., Suite 501
Toronto, ON M5J 2H7
for
Nexa Resources S.A.
Av. Circunvalación del Golf los Incas 170
Santiago de Sucro, Lima
Peru
Effective Date - December 31, 2023
Signature Date – March 27, 2024
| Distribution: | 1 copy - Nexa Resources S.A. |
| 1 copy - SLR Consulting (Canada) Ltd. |
 |
Table of Contents
| 1.0 Executive Summary | 1-1 |
| 1.1 Summary | 1-1 |
| 1.2 Economic Analysis | 1-15 |
| 1.3 Technical Summary | 1-20 |
| 2.0 Introduction | 2-1 |
| 2.1 Site Visits and QPs | 2-2 |
| 2.2 Sources of Information | 2-3 |
| 2.3 List of Abbreviations | 2-5 |
| 3.0 Property Description | 3-1 |
| 3.1 Location | 3-1 |
| 3.2 Mineral Rights in Peru | 3-3 |
| 3.3 Land Tenure | 3-4 |
| 3.4 Annual Fees | 3-30 |
| 3.5 Surface Rights and Easements | 3-33 |
| 3.6 Required Permits and Status | 3-37 |
| 3.7 Other Significant Factors and Risks | 3-45 |
| 4.0 Accessibility, Climate, Local Resources, Infrastructure and Physiography | 4-1 |
| 4.1 Accessibility | 4-1 |
| 4.2 Climate | 4-1 |
| 4.3 Local Resources | 4-2 |
| 4.4 Infrastructure | 4-2 |
| 4.5 Physiography | 4-3 |
| 5.0 History | 5-4 |
| 5.1 Ownership History | 5-4 |
| 5.2 Exploration and Development History | 5-4 |
| 5.3 Past Production | 5-6 |
| 6.0 Geological Setting, Mineralization, and Deposit | 6-1 |
| 6.1 Regional Geology | 6-1 |
| 6.2 Local Geology | 6-4 |
| 6.3 Property Geology | 6-11 |
| 6.4 Alteration | 6-12 |
| 6.5 Mineralization | 6-15 |
| |
|
|
| 6.6 Deposit Types | 6-17 |
| 7.0 Exploration | 7-1 |
| 7.1 Exploration | 7-1 |
| 7.2 Drilling | 7-2 |
| 7.3 Channel Sampling | 7-13 |
| 7.4 Hydrogeology Data | 7-18 |
| 7.5 Geotechnical Data | 7-19 |
| 7.6 Geophysics | 7-20 |
| 7.7 Exploration Target | 7-23 |
| 7.8 Exploration Potential | 7-23 |
| 7.9 Summary | 7-28 |
| 8.0 Sample Preparation, Analyses, and Security | 8-1 |
| 8.1 Laboratories | 8-1 |
| 8.2 Sample Preparation and Analysis | 8-1 |
| 8.3 Sample Security | 8-6 |
| 8.4 Density Determinations | 8-6 |
| 8.5 Quality Assurance and Quality Control | 8-8 |
| 8.6 QP Opinion | 8-46 |
| 9.0 Data Verification | 9-1 |
| 9.1 Databases and Internal Verification | 9-1 |
| 9.2 El Porvenir | 9-1 |
| 9.3 Atacocha | 9-3 |
| 9.4 Data Verification by the QP | 9-4 |
| 9.5 QP’s Opinion and Recommendations | 9-4 |
| 10.0 Mineral Processing and Metallurgical Testing | 10-1 |
| 10.1 El Porvenir | 10-1 |
| 10.2 Atacocha | 10-15 |
| 11.0 Mineral Resource Estimates | 11-1 |
| 11.1 Summary | 11-1 |
| 11.2 Comparison with Previous Estimate | 11-8 |
| 11.3 Reconciliation | 11-12 |
| 11.4 El Porvenir | 11-16 |
| 11.5 Atacocha (San Gerardo) Open Pit | 11-72 |
| 11.6 Atacocha Underground | 11-131 |
| |
|
|
| 11.7 Mineral Resource Uncertainty | 11-182 |
| 12.0 Mineral Reserve Estimates | 12-1 |
| 12.1 Summary | 12-1 |
| 12.2 Comparison with Previous Estimates | 12-5 |
| 12.3 Atacocha and El Porvenir Underground | 12-6 |
| 12.4 Atacocha (San Gerardo) Open Pit | 12-14 |
| 13.0 Mining Methods | 13-1 |
| 13.1 Atacocha and El Porvenir Underground | 13-1 |
| 13.1.6 Infrastructure | 13-18 |
| 13.2 Atacocha Open Pit (San Gerardo) | 13-23 |
| 13.2.3 Open Pit LOM Production Schedule | 13-28 |
| 13.2.4 Infrastructure | 13-28 |
| 13.3 Consolidated Life of Mine Plan | 13-29 |
| 14.0 Processing and Recovery Methods | 14-1 |
| 14.1 El Porvenir | 14-1 |
| 14.2 Atacocha | 14-7 |
| 15.0 Infrastructure | 15-1 |
| 15.1 El Porvenir | 15-3 |
| 15.2 Atacocha | 15-13 |
| 16.0 Market Studies | 16-1 |
| 16.1 Markets | 16-1 |
| 16.2 Contracts | 16-6 |
| 17.0 Environmental Studies, Permitting, and Plans, Negotiations, or Agreements with Local Individuals or Groups | 17-1 |
| 17.1 El Porvenir | 17-1 |
| 17.2 Atacocha | 17-29 |
| 18.0 Capital and Operating Costs | 18-1 |
| 18.1 Capital Costs | 18-1 |
| 18.2 Operating Costs | 18-2 |
| 19.0 Economic Analysis | 19-1 |
| 19.1 Economic Criteria | 19-1 |
| 19.2 Cash Flow Analysis | 19-3 |
| 19.3 Sensitivity Analysis | 19-7 |
| 20.0 Adjacent Properties | 20-1 |
| 21.0 Other Relevant Data and Information | 21-1 |
| |
|
|
| 22.0 Interpretation and Conclusions | 22-1 |
| 22.1 Geology and Mineral Resources | 22-1 |
| 22.2 Mining and Mineral Reserves | 22-1 |
| 22.3 Mineral Processing | 22-3 |
| 22.4 Infrastructure | 22-4 |
| 22.5 Environment, Permitting, and Social Considerations | 22-5 |
| 22.6 Capital and Operating Costs and Economics | 22-7 |
| 22.7 Risks | 22-7 |
| 23.0 Recommendations | 23-1 |
| 23.1 Geology and Mineral Resources | 23-1 |
| 23.2 Mining and Mineral Reserves | 23-2 |
| 23.3 Mineral Processing | 23-2 |
| 23.4 Infrastructure | 23-3 |
| 23.5 Environment, Permitting, and Social Considerations | 23-3 |
| 24.0 References | 24-1 |
| 25.0 Reliance on Information Provided by the Registrant | 25-1 |
| 26.0 Date and Signature Page | 26-1 |
Tables
| Table 1-1: Transportation, Treatment, and Refining Charge Assumptions | 1-16 |
| Table 1-2: Annual After-Tax Cash Flow Summary | 1-18 |
| Table 1-3: Summary of Cerro Pasco Complex Mineral Resource Estimate (Nexa Attributable Ownership Basis) – December 31, 2023 | 1-24 |
| Table 1-4: Summary of Cerro Pasco Complex Mineral Resource Estimate (100% Ownership Basis) – December 31, 2023 | 1-25 |
| Table 1-5: Summary of Cerro Pasco Complex Mineral Reserve Estimate (Nexa Attributable Basis) – December 31, 2023 | 1-27 |
| Table 1-6: Summary of Cerro Pasco Complex Mineral Reserve Estimate (100%) – December 31, 2023 | 1-28 |
| Table 1-7: Sustaining Capital Costs Summary – Cero Pasco Complex | 1-34 |
| Table 1-8: Operating Costs Estimate – Cerro Pasco Complex | 1-34 |
| Table 2-1: QP Responsibilities | 2-3 |
| Table 3-1: El Porvenir Mineral Concessions | 3-6 |
| Table 3-2: El Porvenir Beneficiation Concession | 3-10 |
| Table 3-3: Atacocha Mineral Concessions | 3-11 |
| |
|
|
| Table 3-4: Atacocha Beneficiation Concession | 3-27 |
| Table 3-5: El Porvenir Royalties Payable to Moraima Zevallos and Others | 3-31 |
| Table 3-6: El Porvenir Concessions Subject to Atacocha Royalty Payments | 3-32 |
| Table 3-7: Atacocha Concessions Subject to El Porvenir Royalty Payments | 3-33 |
| Table 3-8: Royalty Percentages | 3-33 |
| Table 3-9: El Porvenir Main Government Consents | 3-37 |
| Table 3-10: Atacocha Main Consents | 3-41 |
| Table 5-1: History of Cerro Pasco Complex | 5-4 |
| Table 5-2: El Porvenir Past Production | 5-6 |
| Table 5-3: Atacocha Past Production | 5-7 |
| Table 7-1: El Porvenir Drilling | 7-2 |
| Table 7-2: El Porvenir Excluded Drill Holes | 7-5 |
| Table 7-3: Atacocha Drilling | 7-7 |
| Table 7-4: El Porvenir Channel Sampling | 7-13 |
| Table 7-5: Atacocha Channel Sampling | 7-16 |
| Table 7-6: El Porvenir Geotechnical Logging Summary Statistics | 7-19 |
| Table 7-7: Atacocha Geotechnical Logging Summary Statistics | 7-19 |
| Table 8-1: El Porvenir and Atacocha Laboratory Detection Limits | 8-4 |
| Table 8-2: El Porvenir Density Measurements | 8-7 |
| Table 8-3: Atacocha Density Measurements | 8-8 |
| Table 8-4: El Porvenir and Atacocha Control Sample Insertion Rate and Failure Criteria | 8-9 |
| Table 8-5: El Porvenir QC Submittals: 2020 to 2023 | 8-10 |
| Table 8-6: El Porvenir Certified Reference Material Performances | 8-11 |
| Table 8-7: El Porvenir Duplicate Types and Descriptions | 8-20 |
| Table 8-8: EL Porvenir Duplicate Performance: 2017 to 2023 | 8-25 |
| Table 8-9: El Porvenir External Check Assay Performance: 2017 to 2023 | 8-28 |
| Table 8-10: Atacocha QC Submittals: 2018 to 2023 | 8-30 |
| Table 8-11: Atacocha CRM Performance: 2018 to 2023 | 8-31 |
| Table 8-12: Atacocha Duplicate Types and Failure Rates | 8-42 |
| Table 8-13: Atacocha External Check Assay Performance: 2018 to 2023 | 8-45 |
| Table 10-1: Algorithms for Pb Recovery in Pb Concentrate and Pb Concentrate Grade | 10-7 |
| Table 10-2: Algorithms for Zn Recovery in Zn Concentrate and Zn Concentrate Grade | 10-7 |
| Table 10-3: Concentrator Operational Performance 2018 - 2023 | 10-9 |
| Table 10-4: Summary of Daily Grade and Recovery Results for 2022 – 2023 | 10-10 |
| |
|
|
| Table 10-5: Atacocha Samples Selected for Metallurgical Test Work | 10-15 |
| Table 10-6: Analysis of Samples Selected for Metallurgical Test Work | 10-16 |
| Table 10-7: Mineralogical Characterization Summary | 10-17 |
| Table 10-8: Comminution Test Work Results | 10-19 |
| Table 10-9: Analysis of Composite Samples | 10-20 |
| Table 10-10: Recovery Curves for the Atacocha Concentrator | 10-21 |
| Table 10-11: Algorithms for Pb Recovery in Pb Concentrate and Pb Concentrate Grade | 10-25 |
| Table 10-12: Algorithms for Zn Recovery in Zn Concentrate and Zn Concentrate Grade | 10-26 |
| Table 10-13: Atacocha Concentrator Production for 2021 - 2023 | 10-28 |
| Table 10-14: Summary of Daily Grade and Recovery Results for 2022 - 2023 | 10-28 |
| Table 11-1: Summary of Cerro Pasco Complex Mineral Resource Estimate (Nexa Attributable Basis) – December 31, 2023 | 11-3 |
| Table 11-2: Summary of Cerro Pasco Complex Mineral Resource Estimate (100%) – December 31, 2023 | 11-5 |
| Table 11-3: El Porvenir Comparison of 2022 Versus 2023 Mineral Resources (83.48% Ownership Basis) | 11-2 |
| Table 11-4: San Gerardo Comparison of 2022 Versus 2023 Mineral Resources (75.96% Ownership Basis) | 11-3 |
| Table 11-5: Atacocha Underground Comparison of 2022 Versus 2023 Mineral Resources (75.96% Ownership Basis) | 11-4 |
| Table 11-6: El Porvenir Data Completed After January 31,2023 Resource Database Closure | 11-9 |
| Table 11-7: El Porvenir Resource Database | 11-9 |
| Table 11-8: El Porvenir Resource Database Tables | 11-9 |
| Table 11-9: El Porvenir Resource Database Assay Summary Statistics | 11-12 |
| Table 11-10: El Porvenir Resource Database Density Summary Statistics | 11-12 |
| Table 11-11: El Porvenir Assay Statistics (Length Weighted) for the Main Domains | 11-19 |
| Table 11-12: El Porvenir Drill Hole (DDH), Channel (CHN), and the Second Level Top-Cut Values for the Main Elements | 11-24 |
| Table 11-13: El Porvenir Capped Statistics for the Main Elements | 11-26 |
| Table 11-14: Capped and Composited Statistics | 11-31 |
| Table 11-15: El Porvenir Variogram Parameters for the Main Domains (Back-Transformed) | 11-35 |
| Table 11-16: El Porvenir Search Parameters for the Main Domains | 11-38 |
| Table 11-17: El Porvenir Statistics of the Density Values for the Main Domains | 11-41 |
| Table 11-18: El Porvenir Grouped Domain Density Statistics | 11-42 |
| Table 11-19: El Porvenir Blocked Model Definition | 11-43 |
| |
|
|
| Table 11-20: El Porvenir NSR Parameters | 11-44 |
| Table 11-21: El Porvenir Cut-off Value Calculation by Mining Zone and Method | 11-45 |
| Table 11-22: El Porvenir Statistical Comparison Between OK, ID3, NN, and the Capped Composites | 11-51 |
| Table 11-23: El Porvenir Underground Mine: Summary of Mineral Resources (on an 83.48% Nexa Attributable Ownership Basis) – December 31, 2023 | 11-63 |
| Table 11-24: El Porvenir Underground Mine: Summary of Mineral Resources (on a 100% Ownership Basis) – December 31, 2023 | 11-64 |
| Table 11-25: Atacocha Data Completed After Resource Database Closure | 11-65 |
| Table 11-26: Atacocha Resource Database | 11-67 |
| Table 11-27: Atacocha Resource Database Tables | 11-67 |
| Table 11-28: Atacocha Resource Database Assay Summary Statistics | 11-68 |
| Table 11-29: Atacocha Resource Database Density Summary Statistics | 11-68 |
| Table 11-30: San Gerardo Assay Statistics (Length-Weighted) for the Main Domains | 11-78 |
| Table 11-31: San Gerardo DDH and CHNL First and Second Level Top-Cut Values | 11-83 |
| Table 11-32: San Gerardo Compositing Statistics for the 25 Main Domains | 11-88 |
| Table 11-33: Atacocha Open Pit Zn Variogram Parameters for Main 25 Domains | 11-93 |
| Table 11-34: San Gerardo Zn Search Parameters for Main 25 Domains | 11-98 |
| Table 11-35: San Gerardo Open Pit Density Statistics | 11-102 |
| Table 11-36: San Gerardo Grouped Density Statistics | 11-103 |
| Table 11-37: San Gerardo Open Pit Sub-Blocked Model Definition | 11-103 |
| Table 11-38: San Gerado Open Pit Re-Blocked Model Definition | 11-104 |
| Table 11-39: San Gerardo NSR Cut-off Value Parameters | 11-105 |
| Table 11-40: San Gerardo Statistical Comparison Between OK, ID3, NN, and the Capped Composites | 11-110 |
| Table 11-41: San Gerardo Open Pit Mine: Summary of Mineral Resources (75.96% Nexa Attributable Ownership Basis) – December 31, 2023 | 11-122 |
| Table 11-42: San Gerardo Open Pit Mine: Summary of Mineral Resources (100% Ownership Basis) – December 31, 2023 | 11-123 |
| Table 11-43: Atacocha Underground Assay Statistics (Length Weighted) for the Main Domains | 11-131 |
| Table 11-44: Atacocha Underground DDH, CHNL, and Second Level Top-Cut Values | 11-136 |
| Table 11-45: Atacocha Underground Compositing Statistics for the 25 Main Domains | 11-140 |
| Table 11-46: Atacocha Underground Zn Variogram Parameters for Main 25 Domains | 11-144 |
| Table 11-47: Atacocha Underground Zn Search Parameters for Main 25 Domains | 11-150 |
| Table 11-48: Atacocha Underground Density Statistics of the Main Domains | 11-154 |
| |
|
|
| Table 11-49: Atacocha Underground Grouped Mean Density | 11-154 |
| Table 11-50: Atacocha Underground Sub-Blocked Model Definition | 11-155 |
| Table 11-51: Atacocha Underground NSR Cut-off Value Parameters | 11-156 |
| Table 11-52: Atacocha Statistical Comparison Between OK, ID3, NN, and the Capped Composites | 11-163 |
| Table 11-53: Atacocha Underground Mine: Summary of Mineral Resources (75.96% Nexa Attributable Ownership Basis)– December 31, 2023 | 11-172 |
| Table 11-54: Atacocha Underground Mine: Summary of Mineral Resources (100% Ownership Basis)– December 31, 2023 | 11-173 |
| Table 12-1: Summary of Cerro Pasco Complex Mineral Reserve Estimate (Nexa Attributable Basis) – December 31, 2023 | 12-2 |
| Table 12-2: Summary of Cerro Pasco Complex Mineral Reserve Estimate (100%) – December 31, 2023 | 12-3 |
| Table 12-3: El Porvenir (100%) Mineral Reserve Estimates Comparison | 12-5 |
| Table 12-4: Summary Atacocha (75.96%) and El Porvenir (83.48%) Underground Mines Mineral Reserves – December 31, 2023 | 12-7 |
| Table 12-5: Summary Atacocha (100%) and El Porvenir (100%) Underground Mines Mineral Reserves – December 31, 2023 | 12-7 |
| Table 12-6: Summary of NSR Parameters | 12-9 |
| Table 12-7: El Porvenir and Atacocha Mining Zones | 12-12 |
| Table 12-8: Cut-off Value Estimates | 12-13 |
| Table 12-9: Open Pit Mineral Reserves (75.96% Nexa Attributable Basis)– as of December 31, 2023 | 12-14 |
| Table 12-10: Open Pit Mineral Reserves (100% Basis) – as of December 31, 2023 | 12-15 |
| Table 12-11: NSR Parameters | 12-16 |
| Table 12-12: NSR Cut-off Value Parameters | 12-17 |
| Table 12-13: Open Pit Reserve Pit Optimization Parameters | 12-18 |
| Table 13-1: Mine Design Parameters | 13-2 |
| Table 13-2: El Porvenir Rock Mass Classification | 13-9 |
| Table 13-3: El Porvenir Geotechnical Parameters | 13-9 |
| Table 13-4: El Porvenir Stress Magnitudes Used for Geotechnical Evaluation | 13-10 |
| Table 13-5: El Porvenir Recommended Stope Dimensions (from BISA, 2022) | 13-11 |
| Table 13-6: El Porvenir Cablebolt Support Recommendations (From BISA, 2022) | 13-11 |
| Table 13-7: El Porvenir Development Support for Permanent Openings | 13-14 |
| Table 13-8: El Porvenir Development Support for Temporary Openings | 13-14 |
| Table 13-9: El Porvenir Support for Intersections (Permanent Limestone and Temporary Ore Openings) | 13-15 |
| |
|
|
| Table 13-10: Atacocha and El Porvenir Underground Mines LOM Plan | 13-16 |
| Table 13-11: Ventilation Balance | 13-18 |
| Table 13-12: Mine Equipment List | 13-21 |
| Table 13-13: Mine Personnel | 13-22 |
| Table 13-14: Pit Slope Domain Sectors Parameters | 13-25 |
| Table 13-15: Open Pit Life of Mine Production Schedule | 13-28 |
| Table 13-16: Open Pit Mine Equipment List | 13-29 |
| Table 13-17: Open Pit Mine Personnel | 13-29 |
| Table 13-18: El Porvenir Plant Consolidated Underground Life of Mine Plan (100% Basis) | 13-32 |
| Table 13-19: Atacocha Plant Open Pit Life of Mine Plan (100% Basis) | 13-32 |
| Table 14-1: Concentrator Plant Operation Stages | 14-1 |
| Table 14-2: Flotation Reagent Consumptions | 14-10 |
| Table 17-1: Summary of Key Environmental Effects and Management Strategies | 17-7 |
| Table 17-2: Water Quality Monitoring Locations | 17-13 |
| Table 17-3: Environmental, Mine Closure, and Tailings Disposal Licences | 17-14 |
| Table 17-4: Summary of Main Closure Activities | 17-26 |
| Table 17-5: Summary of Key Environmental Effects and Management Strategies | 17-34 |
| Table 17-6: Permits and Authorizations | 17-39 |
| Table 17-7: Summary of the Atacocha’s Commitments Acquired by the Right of Land and Right of Way Agreements Celebrated with the Communities of Cajamarquilla and Ticlacayán | 17-45 |
| Table 17-8: Summary of Main Closure Activities | 17-48 |
| Table 18-1: Sustaining Capital Costs Summary – Cerro Pasco Complex | 18-1 |
| Table 18-2: Operating Costs Estimate – Cerro Pasco Complex | 18-2 |
| Table 19-1: Transportation, Treatment, and Refining charges assumptions | 19-2 |
| Table 19-2: Annual After-Tax Cash Flow Summary | 19-5 |
| Table 19-3: After-Tax Sensitivity Analyses – Cerro Pasco Complex | 19-8 |
Figures
| Figure 3-1: Location Map | 3-2 |
| Figure 3-2: El Porvenir Mineral Rights | 3-28 |
| Figure 3-3: Atacocha Mineral Rights | 3-29 |
| Figure 3-4: El Porvenir Surface Rights | 3-35 |
| Figure 3-5: Atacocha Surface Rights | 3-36 |
| |
|
|
| Figure 4-1: Mean Monthly Temperature Range and Mean Precipitation | 4-2 |
| Figure 6-1: Simplified Geological Map of the Central Andes | 6-3 |
| Figure 6-2: Local Geology | 6-6 |
| Figure 6-3: Generalized Stratigraphic Column | 6-7 |
| Figure 6-4: Regional Geological Setting with Major Structures | 6-10 |
| Figure 6-5: Representative Cross Section through El Porvenir Area | 6-13 |
| Figure 6-6: Representative Cross Section through Atacocha Area | 6-14 |
| Figure 6-7: Schematic Diagram of Skarn, Replacement and Hydrothermal Vein Mineralization | 6-20 |
| Figure 6-8: Schematic Diagram through Typical Porphyry System | 6-23 |
| Figure 7-1: El Porvenir Drill Hole Locations | 7-4 |
| Figure 7-2: El Porvenir Core Recovery Distribution | 7-6 |
| Figure 7-3: Atacocha Drill Hole Locations | 7-9 |
| Figure 7-4: Atacocha Core Recovery Distribution | 7-11 |
| Figure 7-5: El Porvenir Channel Sampling Locations | 7-15 |
| Figure 7-6: Atacocha Channel Sampling Locations | 7-17 |
| Figure 7-7: Geophysical Anomalies at Pasco Complex | 7-21 |
| Figure 7-8: Comparison Between Geological and Geophysical Section | 7-22 |
| Figure 7-9: Short Term Exploration Potential | 7-24 |
| Figure 7-10: El Porvenir and Atacocha Mines with Exploration Areas | 7-26 |
| Figure 7-11: Brownfield Exploration Targets | 7-27 |
| Figure 8-1: Nexa Schematic Flow Chart for Sample and Data Controls | 8-2 |
| Figure 8-2: El Porvenir Zn Control Chart for CRM PEPSSTD006 at Inspectorate EP: 2020 to 2023 | 8-14 |
| Figure 8-3: El Porvenir Pb Control Chart for CRM PEPSSTD006 at Inspectorate EP: 2020 to 2023 | 8-15 |
| Figure 8-4: El Porvenir Ag Control Chart for CRM PEPSSTD006 at Inspectorate EP: 2020 to 2023 | 8-15 |
| Figure 8-5: El Porvenir Pb Control Chart for CRM PEPSSTD009 at Inspectorate EP: 2022 to 2023 | 8-16 |
| Figure 8-6: El Porvenir Zn Control Chart for CRM PEPSSTD006 at ALS: 2020 to 2023 | 8-16 |
| Figure 8-7: El Porvenir Pb Control Chart for CRM PEPSSTD006 at ALS: 2020 to 2023 | 8-17 |
| Figure 8-8: El Porvenir Zn Control Chart for CRM PEPSSTD008 at ALS: 2023 | 8-17 |
| Figure 8-9: El Porvenir Pb Coarse Blank PEPSBLK002 at ALS: 2020 – 2023 | 8-19 |
| Figure 8-10: El Porvenir Zn Coarse Blank PEPSBLK002 at Inspectorate EP: 2020 to 2023 | 8-20 |
| |
|
|
| Figure 8-11: El Porvenir Zn Pulp Duplicates at ALS: 2020 to 2023 | 8-22 |
| Figure 8-12: El Porvenir Pb Coarse Duplicates at Inspectorate EP: 2020 to 2023 | 8-23 |
| Figure 8-13: El Porvenir Pb Drilling Field Duplicates at ALS: 2020 to 2023 | 8-24 |
| Figure 8-14: El Porvenir Zn Channel Field Duplicates at Inspectorate EP: 2020 to 2023 | 8-25 |
| Figure 8-15: El Porvenir Check Assay Scatter Plot - Zn | 8-27 |
| Figure 8-16: El Porvenir Check Assay Scatter Plot - Pb | 8-28 |
| Figure 8-17: Atacocha Zn Control Chart for CRM MAT12 at ALS: 2018 to 2019 | 8-34 |
| Figure 8-18: Atacocha Zn Control Chart for CRM PEPSSTD006 at Inspectorate AT: 2019 to 2022 | 8-35 |
| Figure 8-19: Atacocha Zn Control Chart for CRM PEPSSTD005 at Inspectorate AT: 2019 to 2022 | 8-35 |
| Figure 8-20: Atacocha Zn Control Chart for CRM MAT10 at ALS: 2019 | 8-36 |
| Figure 8-21: Atacocha Pb Control Chart for CRM PEPSSTD004 at Inspectorate AT: 2019 to 2021 | 8-36 |
| Figure 8-22: Atacocha Zn Coarse Blank PEPSBLK002 at ALS: 2018 to 2022 | 8-38 |
| Figure 8-23: Atacocha Pb Fine Blank PEPSBLK001 at ALS: 2018 to 2022 | 8-38 |
| Figure 8-24: Atacocha Pb Pulp Duplicates at ALS: 2018 to 2022 | 8-40 |
| Figure 8-25: Atacocha Zn Coarse Duplicates at Inspectorate AT: 2018 to 2022 | 8-41 |
| Figure 8-26: Atacocha Zn Field Duplicates at ALS: 2018 to 2022 | 8-42 |
| Figure 8-27: Atacocha Check Assay Scatter Plot - Zn | 8-44 |
| Figure 8-28: Atacocha Check Assays Scatter Plot - Pb | 8-45 |
| Figure 10-1: Bulk Mineralogical Analysis | 10-2 |
| Figure 10-2: Sulphide Mineral Breakdown | 10-3 |
| Figure 10-3: El Porvenir Head Grade Statistics for 2022 – 2023 | 10-11 |
| Figure 10-4: El Porvenir Recovery Statistics for 2022 – 2023 | 10-11 |
| Figure 10-5: Zinc Head Grade from 2003 - 2023 | 10-12 |
| Figure 10-6: Zinc Recovery from 2003 - 2023 | 10-12 |
| Figure 10-7: Lead Head Grade from 2003 - 2023 | 10-13 |
| Figure 10-8: Lead Recovery from 2003 - 2023 | 10-13 |
| Figure 10-9: Copper Head Grade from 2003 - 2023 | 10-14 |
| Figure 10-10: Copper Recovery from 2003 - 2023 | 10-14 |
| Figure 10-11: Bulk Mineralogical Analysis | 10-18 |
| Figure 10-12: Sulphide Mineral Breakdown | 10-19 |
| Figure 10-13: Monthly Zinc Recovery in 2017 and 2018, and the 2019 NSR Recovery Curve | 10-22 |
| |
|
|
| Figure 10-14: Monthly Lead Recovery in 2017 and 2018, and the 2019 NSR Recovery Curve | 10-23 |
| Figure 10-15: Monthly Copper Recovery in 2017 and 2018, and the 2019 NSR Recovery | 10-24 |
| Figure 10-16: Atacocha Head Grade Statistics for 2022 - 2023 | 10-29 |
| Figure 10-17: Atacocha Recovery Statistics for 2022 - 2023 | 10-30 |
| Figure 10-18: Zinc Head Grade from 2000 to 2023 | 10-30 |
| Figure 10-19: Zinc Recovery from 2000 to 2023 | 10-31 |
| Figure 10-20: Lead Head Grade from 2000 to 2023 | 10-31 |
| Figure 10-21: Lead Recovery from 2000 to 2023 | 10-32 |
| Figure 10-22: Copper Head Grade from 2000 to 2023 | 10-32 |
| Figure 10-23: Copper Recovery from 2000 to 2019 | 10-33 |
| Figure 11-1: El Porvenir and Atacocha Underground Resource Panels, with San Gerardo Mineral Resource Blocks Exclusive of Mineral Reserves | 11-7 |
| Figure 11-2: Zn Long- and Short-Term Grades and Plant Grade for El Porvenir (top) and Atacocha (bottom) | 11-6 |
| Figure 11-3: San Gerardo Blast Hole Zn Grades with Mineralization Wireframes | 11-8 |
| Figure 11-4: El Porvenir Drill Holes Completed After Database Cut-Off | 11-11 |
| Figure 11-5: El Porvenir 25 Main Domains | 11-15 |
| Figure 11-6: El Porvenir Grouped Mineralization | 11-16 |
| Figure 11-7: El Porvenir Underground Mineralization Contact Analysis | 11-17 |
| Figure 11-8: El Porvenir CDF and Histograms for the Drill Holes and Channels Samples | 11-22 |
| Figure 11-9: El Porvenir Scatter Plots for Zn, Ag, Pb, and Cu | 11-23 |
| Figure 11-10: El Porvenir Raw (on the left) and Composited (on the right) Histograms | 11-29 |
| Figure 11-11: El Porvenir Compositing Analysis | 11-29 |
| Figure 11-12: Downhole and Directional Zn Experimental Variograms and Models for "de2" Domain | 11-34 |
| Figure 11-13: Contour Zn Grades for the “de2” (left) and “por9q” (right) Domains | 11-37 |
| Figure 11-14: El Porvenir Density Correlation Matrix and Scatter Plots | 11-39 |
| Figure 11-15: El Porvenir Density Composites | 11-40 |
| Figure 11-16: El Porvenir Boxplots Showing the Density Values for the Main Domains. | 11-41 |
| Figure 11-17: View of the Mineral Resource Reporting Panels at El Porvenir | 11-46 |
| Figure 11-18: Histograms Showing the Number of Samples Used for the Estimation (on the left), and the Estimation Search Volume (on the right) | 11-48 |
| Figure 11-19: Longitudinal and Plan View of the Mineral Resource Classification for the El Porvenir Domains | 11-49 |
| |
|
|
| Figure 11-20: El Porvenir Final Grade Variables and Capped and Composited Samples Comparison | 11-56 |
| Figure 11-21: Longitudinal View of the “de2” Domain – Zn Estimation | 11-58 |
| Figure 11-22: Longitudinal View of the “exito” Domain – Cu Estimation | 11-59 |
| Figure 11-23: El Porvenir Swath Plots for Zn and Cu | 11-60 |
| Figure 11-24: View of the Mineral Resource Blocks | 11-62 |
| Figure 11-25: Atacocha Drill Holes Completed after Database Cut-Off | 11-66 |
| Figure 11-26: San Gerardo Geological Control Type | 11-71 |
| Figure 11-27: San Gerardo Grouped Mineralization | 11-72 |
| Figure 11-28: San Gerardo High Grade and Low Grade Estimation Domains | 11-73 |
| Figure 11-29: San Gerardo 25 Main Domains | 11-74 |
| Figure 11-30: San Gerardo Mineralization Contact Analysis | 11-76 |
| Figure 11-31: San Gerardo CDFs Comparing Declustered and Original data. | 11-81 |
| Figure 11-32: San Gerardo Scatter Plots between the Elements | 11-82 |
| Figure 11-33: San Gerardo Capping Effect on Drill Hole and Channel Distributions | 11-84 |
| Figure 11-34: San Gerardo Open Pit Zn Compositing Analysis | 11-86 |
| Figure 11-35: San Gerardo Drilling Sample Distributions before and after Compositing to 2 m Length | 11-87 |
| Figure 11-36: San Gerardo Variography Grouping | 11-92 |
| Figure 11-37: Downhole and Directional Zn Experimental Variograms and Models for Estimation Group C_ESTIM=306 | 11-95 |
| Figure 11-38: Contour Zn Grades for the “che16” Domain (Orebody=316) | 11-97 |
| Figure 11-39: San Gerardo Correlation Matrix between Density and Other Elements (left) and Scatter Plot between Density and Zn (right) | 11-100 |
| Figure 11-40: San Gerardo Density Composites | 11-101 |
| Figure 11-41: San Gerado Histogram of Number of Samples and Search Pass by Class | 11-107 |
| Figure 11-42: Plan and Longitudinal View of the Reported San Gerardo Classification within Mineral Resources Exclusive of Mineral Reserves | 11-108 |
| Figure 11-43: San Gerardo Final Grade Variables and Capped and Composited Samples Comparison | 11-115 |
| Figure 11-44: San Gerardo Longitudinal View of the Faulting-Controlled “che16” Domain (Orebody=316) – Zn Estimation | 11-117 |
| Figure 11-45: San Gerardo Section View of the Breccia-Controlled “cpo15” Domain (Orebody=2015) – Zn Estimation | 11-118 |
| Figure 11-46: San Gerardo Swath Plots for Zn and Pb | 11-119 |
| Figure 11-47: Longitudinal W-E Section of the Reported San Gerardo Mineral Resources and Mineral Reserves | 11-120 |
| |
|
|
| Figure 11-48: San Gerardo Plan and Longitudinal Views of the NSR Values Above Cut-Off for Mineral Resources Inclusive of Reserves | 11-121 |
| Figure 11-49: Atacocha Underground Lithological Control Type | 11-126 |
| Figure 11-50: Atacocha Underground 25 Main Domains | 11-127 |
| Figure 11-51: Atacocha Underground Grouped Mineralization | 11-128 |
| Figure 11-52: Atacocha Underground Mineralization Contact Analysis | 11-129 |
| Figure 11-53: Atacocha Underground CDF Main Elements, Comparing Declustered and Original Data. | 11-134 |
| Figure 11-54: Atacocha Underground Scatter Plots | 11-135 |
| Figure 11-55: Atacocha Underground Capping Effect on Drill Hole and Channel Distributions | 11-137 |
| Figure 11-56: Atacocha Underground Compositing Analysis | 11-138 |
| Figure -11-57: Sample Distributions before and after Compositing to 2 m Length | 11-139 |
| Figure 11-58: Downhole and Directional Zn Experimental Variograms and Models for Estimation Group 1005. | 11-146 |
| Figure 11-59: Contour Zn Grades for the “sge” Domain (Orebody=1005) (left) and “sgg” Domain (Orebody=1007) (right) | 11-148 |
| Figure 11-60: Atacocha Underground Correlation Matrix (left) and Scatter Plot between Density and Zn (right) | 11-152 |
| Figure 11-61: Atacocha Underground Density Composites | 11-153 |
| Figure 11-62: View of the Mineral Resource Reporting Panels of Atacocha Underground | 11-158 |
| Figure 11-63: Atacocha Underground Histogram of Number of Samples and Search Pass by Class | 11-159 |
| Figure 11-64: Longitudinal View of the Mineral Resource Classification for the Atacocha Underground Resources Exclusive of Reserves | 11-161 |
| Figure 11-65: Atacocha Underground Final Block Grades and Capped and Composited Samples Comparison | 11-168 |
| Figure 11-66: Longitudinal View of the “ing_2” Domain (Orebody=750) Estimated Grades for Zn within Atacocha Underground Mine | 11-170 |
| Figure 11-67: Atacocha Underground Swath Plots for Zn and Pb | 11-171 |
| Figure 11-68: Atacocha Underground Mineral Resources Exclusive of Mineral Reserves | 11-174 |
| Figure 12-1: Waterfall Chart of Change in El Porvenir Mineral Reserves | 12-6 |
| Figure 12-2: Volumetric Comparison of El Porvenir Mineralization and Surveyed Stopes | 12-8 |
| Figure 12-3: Zinc Recovery Curve | 12-11 |
| Figure 12-4: Lead Recovery Curve | 12-11 |
| Figure 12-5: Copper Recovery Curve | 12-12 |
| Figure 13-1: Atacocha Mine Design | 13-3 |
| |
|
|
| Figure 13-2: El Porvenir Mine Design | 13-4 |
| Figure 13-3: Cut-and-Fill Mining Method | 13-7 |
| Figure 13-4: SLS Avoca Mining Method | 13-8 |
| Figure 13-5: El Porvenir Installation of Cablebolts for Veins Dipping Greater Than 80° | 13-12 |
| Figure 13-6: El Porvenir Installation of Cablebolts for Veins Dipping Less Than 80° | 13-13 |
| Figure 13-7: Cerro Pasco Complex Integration LOM Production Plan | 13-18 |
| Figure 13-8: Planned Ventilation Requirements | 13-20 |
| Figure 13-9: San Gerardo Open Pit Layout | 13-24 |
| Figure 13-10: Final Pit Design and Phases Location | 13-26 |
| Figure 13-11: Open Pit Geotechnical Domain Sectors | 13-27 |
| Figure 13-12: Life of Mine Plan | 13-30 |
| Figure 13-13: Plant Production Schedule | 13-31 |
| Figure 14-1: El Porvenir Process Flowsheet | 14-6 |
| Figure 14-2: Atacocha Process Flowsheet | 14-12 |
| Figure 15-1: Cerro Pasco Integration Project | 15-2 |
| Figure 15-2: Power Distribution Single Line Diagram for El Porvenir and Atacocha Mine Sites | 15-4 |
| Figure 15-3: El Porvenir Site Layout | 15-6 |
| Figure 15-4: El Porvenir Tailings Storage Facility Layout with Dam Crest at Elevation 4,064 MASL | 15-10 |
| Figure 15-5: El Porvenir Tailings Storage Facility Layout Main Dam Layout at Crest Elevation 4,064 MASL | 15-11 |
| Figure 15-6: El Porvenir Tailings Storage Facility Main Dam Section to Crest Elevation 4,100 MASL | 15-12 |
| Figure 15-7: Atacocha Site Layout | 15-14 |
| Figure 15-8: Atacocha Tailings Storage Facility Layout with Dam Crest at Elevation 4,128 MASL | 15-16 |
| Figure 15-9: Atacocha Tailings Storage Facility Main Dam Section to Crest Elevation 4,128 MASL | 15-17 |
| Figure 16-1: Zinc Price Outlook | 16-2 |
| Figure 16-2: Copper Price Outlook | 16-4 |
| Figure 16-3: Lead Price Outlook | 16-5 |
| Figure 16-4: Silver Price Outlook | 16-6 |
| Figure 16-5: Gold Price Outlook | 16-6 |
| Figure 19-1: After-Tax Sensitivity Analysis | 19-9 |
| |
|
|
| 1.0 | Executive Summary |
| 1.1 | Summary |
SLR Consulting (Canada) Ltd. (SLR) was retained by Nexa Resources S.A. (Nexa) to prepare a Technical Report Summary (TRS) on the integration of Nexa’s El Porvenir and Atacocha mines into the Cerro Pasco Complex (Cerro Pasco or the Complex), located in Pasco Province, Peru. The purpose of this TRS is to support the disclosure of the Cerro Pasco Mineral Resource and Mineral Reserve estimates with an effective date of December 31, 2023. The Mineral Resource estimate for the Complex was prepared by Jerry Huaman Abalos, B.Geo., AusIMM CP(Geo), Corporate Mineral Resource Manager with Nexa and a Qualified Person (QP) for this TRS. This TRS conforms to United States Securities and Exchange Commission’s (SEC) Modernized Property Disclosure Requirements for Mining Registrants as described in Subpart 229.1300 of Regulation S-K, Disclosure by Registrants Engaged in Mining Operations (S-K 1300) and Item 601 (b)(96) Technical Report Summary. SLR’s qualified persons (QPs) visited the site from January 15 to 17, 2024. Nexa’s QP, Jerry Huaman Abalos, B.Geo., AusIMM CP(Geo), visited the site over the same period.
The Complex consists of the El Porvenir underground zinc (Zn)-copper (Cu)-silver (Ag)-gold (Au) mine (El Porvenir Mine or El Porvenir) and the adjacent Atacocha (San Gerardo) open pit and Atacocha underground Zn-Pb-Ag mines (together Atacocha Mine or Atacocha).
Nexa, as Votorantim Metais Holding S.A. (VM Holding), acquired the El Porvenir Mine in 2010 when it acquired Compañía Minera Milpo S.A. (Milpo). The property is located in the central Andes mountains at an approximate elevation of 4,200 metres above sea level (MASL). El Porvenir commenced production in 1949 with Milpo as the operator. A gravity separation plant was built at the site in 1953, and a flotation plant was completed in 1979. The current production rate of 5,600 tonnes per day (tpd) at El Porvenir was achieved in 2014. In 2023, production at El Porvenir was 2.22 million tonnes (Mt) at grades of 2.86% Zn, 0.16% Cu, 1.37% Pb, 2.34 oz/t Ag, and 0.01 oz/t Au. Mining is carried out by sub-level stoping (SLS) and cut and fill (CAF) mining methods.
Milpo acquired the adjacent Atacocha Mine in 2008 and Nexa acquired Atacocha when it acquired Milpo in 2010. Atacocha is located approximately 16 km from the city of Cerro de Pasco at an altitude of approximately 4,050 MASL. The processing plant is located near the Huallaga River valley. The Atacocha mining unit commenced operation in the first decade of the 20th century producing Pb, Ag, Zn, and Cu ores. Mining at Atacocha was suspended in 2020 in response to COVID-19. When COVID-19 restrictions were lifted, mining resumed at the San Gerardo open pit mine. As of the end of 2023, Nexa has not resumed underground mining. In 2023, production at Atacocha was 1.40 Mt at grades of 0.77% Zn, 0.04% Cu, 0.93% Pb, 1.21 oz/t Ag, and 0.01 oz/t Au.
The El Porvenir Mine is 100% owned by Nexa Resources El Porvenir S.A.C. (Nexa El Porvenir), a 99.99%-owned subsidiary of Nexa Resources Peru S.S.A. (Nexa Peru). Nexa’s resulting interest in the El Porvenir Mine is 83.48% that corresponds to the sum of Nexa’s direct interest in Nexa Peru (0.18%) and indirect interest of Nexa in Nexa Peru (83.37%) through its controlled company Nexa Resources Cajamarquilla S.A. (99.916%), and the remaining 16.45% are floating shares.
The Atacocha Mine is 100% owned by Nexa Resources Atacocha S.A.A. (Nexa Atacocha). Nexa’s resulting interest in the Atacocha Mine is 75.96% that corresponds to the sum of Nexa’s direct interest in Nexa Peru (0.18%), and Nexa Peru’s indirect interest in Nexa Atacocha
| 1- |
|
|
(90.999%) through its controlled company Nexa El Porvenir (99.99%), the remaining 9.001% are floating shares, and indirect participation of Nexa in Nexa Peru (83.37%) through its controlled company Nexa Resources Cajamarquilla S.A. (99.916%), and the remaining 16.45% are floating shares.
The integration project is intended to capture synergies between the two mining operations, resulting from their proximity and operational similarities, with the ore from both underground mines being processed in the El Porvenir treatment plant. The goal is to achieve cost and investment savings, thereby reducing the environmental footprint and extending the combined mine life of the two mines.
The integration project has been developed over the past several years. The first stage involved the administrative integration of both mines, which was completed in 2014. The second stage involved the integration of the tailings disposal system, which allowed the Atacocha plant to send tailings to the El Porvenir dam within the short term, thereby helping reduce the environmental footprint. The third stage, completed in 2016, involved the construction of a new energy transmission line with a 138 kilovolt (kV) connection that supplies both mines, replacing the prior 50 kV transmission lines. The development of a 3.5 km tunnel, connecting both underground mines and enabling exploration program in the Integration Zone between the mines, was part of the fourth stage, concluded in 2019.
In 2021, the modernization and debottleneck studies to evaluate the deepening of the mine and extension of the life of mine (LOM) for El Porvenir were postponed due to the prioritization of a capital allocation strategy and the reassessment of the integration with the Atacocha underground mine. In 2022, Nexa advanced the integration project with an optimization study of the integration of the El Porvenir and Atacocha underground mines by evaluating increasing the capacity of tailings and shaft and optimizing the processing plant, to potentially increase production and extend the LOM.
In 2023, Nexa continued to advance the integration project with technical studies to sustain and expand production, such as mine design and studies for the underground interconnection, shaft upgrade and engineering assessment of the plant, as well as key routes to improve capacity to provide a long-term solution for tailings disposal. A Front-End Loading (FEL) 3 study to increase El Porvenir hoisting was completed in Q1 2023 and a FEL3 tailings pumping system study was completed in early Q2 2023.
The integration plan includes:
| · | restarting and rehabilitation of the Atacocha underground mine, |
| · | development of an approximately 2 km long connection tunnel (Tunnel 2900), linking Atacocha underground to the bottom of Picasso shaft in El Porvenir, allowing the production from both underground mines to be hoisted to feed the El Porvenir processing plant, |
| · | Picasso shaft capacity expansion to support production and extraction at both underground mines, |
| · | closure of the Atacocha processing plant, with the exhaustion of Atacocha open pit reserves, in 2027, |
| · | a new tailing pumping and pipeline system to be built, that will allow tailings from El Porvenir to be sent to the Atacocha dam, bringing a long term solution for tailings, supporting the extension of the combined life of the two mines. |
| 1- |
|
|
| 1.1.1 | Conclusions |
| 1.1.1.1 | Geology and Mineral Resources |
| · | The Mineral Resource estimate was prepared by Nexa. The resource estimate has been audited and accepted by the QP. |
| · | Exclusive of Mineral Reserves, the estimated end of year 2023 (EOY2023) Measured and Indicated Mineral Resources attributable to Nexa comprise: |
| o | El Porvenir underground (83.48% attributable): 3.24 Mt at 3.29% Zn, 0.21% Cu, 62.2 g/t Ag, and 0.97% Pb containing 106.6 thousand tonnes (kt) of Zn, 6.8 kt of Cu, 6,485 koz of Ag, and 31.1 kt of Pb. |
| o | Atacocha underground (75.96% attributable): 2.71 Mt at 3.35% Zn, 0.33% Cu, 55.0 g/t Ag, and 0.94% Pb containing 90.8 kt of Zn, 9.0 kt of Cu, 4,792 koz of Ag, and 25.4 kt of Pb. |
| o | San Gerardo open pit (75.96% attributable): 4.31 Mt at 1.12% Zn, 29.8 g/t Ag, 0.89% Pb, and 0.22 g/t Au containing 48.4 kt Zn, 4,128 koz Ag, 38.4 kt Pb, and 31.1 koz Au. |
| · | In addition, the El Porvenir EOY2023 Inferred Mineral Resources attributable to Nexa total 9.23 Mt at 3.83% Zn, 0.24% Cu, 82.9 g/t Ag, and 1.32% Pb. |
| · | Atacocha EOY2023 Inferred Mineral Resources attributable to Nexa total 6.12 Mt at 4.09% Zn, 0.56% Cu, 77.3 g/t Ag, and 1.21% Pb for Atacocha underground, and 1.29 Mt at 1.27% Zn, 32.7 g/t Ag, 1.15% Pb, and 0.22 g/t Au for San Gerardo open pit. |
| · | El Porvenir and Atacocha feature skarn and hydrothermal vein/breccia-style mineralization. El Porvenir also has stratabound deposits, while Atacocha has porphyry mineralization. Controls on mineralization are lithological, mineralogical, and structural. |
| · | The El Porvenir and Atacocha database closure date was January 31, 2023. Between then and the effective date of this report, 252 drill holes and 1,727 channels were completed at El Porvenir and 32 channels and 18 DDH were completed at Atacocha. SLR does not consider this to have a material impact on the estimated Mineral Resources. |
| · | Protocols for drilling, sampling, analysis, verification, and security meet industry standard practices. The drill hole database was verified by SLR and is suitable for Mineral Resource estimation. |
| · | The Mineral Resource estimates are completed to industry standards using reasonable and appropriate parameters and are acceptable for conversion to Mineral Reserves. |
| · | Nexa has defined several polymetallic prospects located near the deposits, which warrant additional exploration, including the Integration Zone between the El Porvenir and Atacocha underground mines. |
| 1.1.1.2 | Mining and Mineral Reserves |
| · | The Cerro Pasco Complex consists of the El Porvenir underground mine, the Atacocha underground mine, and the San Gerardo open pit mine. |
| o | Production is currently from the San Gerardo mine, which feeds the Atacocha processing plant that has a nominal throughput of 4,400 tpd, and the El Porvenir |
| 1- |
|
|
underground mine, which feeds the El Porvenir processing plant that has a nominal throughput of 6,500 tpd.
| o | The Atacocha underground mine was placed in care and maintenance in 2020 to focus all production at the San Gerardo open pit mine. Atacocha is planned to resume production in 2027 when the San Gerardo pit has reached the end of its mine life. |
| o | The Atacocha Mine will be integrated with the El Porvenir Mine and both will feed the El Porvenir processing plant. |
| · | The Mineral Reserve estimates were prepared by Nexa and reviewed and accepted by SLR. |
| o | On an 83.48% Nexa attributable ownership basis, El Porvenir underground Mineral Reserves total 12.2 Mt averaging 4.11% Zn, 0.23% Cu, 72.9 g/t Ag, and 1.20% Pb. |
| o | On a 75.96% Nexa attributable ownership basis, Atacocha underground Mineral Reserves total 4.3 Mt averaging 4.33% Zn, 0.40% Cu, 79.8 g/t Ag, and 1.34% Pb. |
| o | On a 75.96% Nexa attributable ownership basis, San Gerardo open pit Mineral Reserves total 3.3 Mt at an average grade of 0.99% Zn, 34.9 g/t Ag, 0.27 g/t Au, and 1.15% Pb. |
| · | The assumptions, parameters, and methodology used to estimate Mineral Reserves meet industry standard practices and are appropriate for the style of mineralization and proposed mining methods. |
| · | The underground mines are planned to be mined using CAF and SLS mining methods. Backfill in the form of unconsolidated backfill from waste development and hydraulic fill from tailings will be used for both mining methods. |
| · | Underground mine design and support recommendations have been developed using industry standard geotechnical data and analysis methods. |
| · | The dilution factors assumed for SLS are low when compared to surveyed stopes and planned designs reconciliation data provided by Nexa. |
| o | SLR has investigated the effect of higher dilution and notes that approximately 2% of the total Mineral Reserves would be impacted. This is not considered to be a material difference. |
| · | Mining of the San Gerardo open pit is planned using conventional open pit mining methods with drill and blast operations using excavators and trucks. |
| · | Open pit net smelter return (NSR) block value calculations are based on historical performance of the concentrator, historical operating costs and current smelter contracts. |
| · | Open pit calculated block model NSR values are evaluated against the internal break-even value. Blocks classified as Measured or Indicated Mineral Resources with an NSR value above the internal break-even value are included in the Mineral Reserve. |
| 1- |
|
|
| 1.1.1.3 | Mineral Processing |
El Porvenir
| · | The El Porvenir concentrator processed 2,220,011 tonnes of ore in 2023 with Cu, Pb, and Zn grades of 0.16%, 1.37% and 2.86% respectively. Recoveries to their respective concentrates were 10.1% Cu, 82.1% Pb, and 88.0% Zn. |
| · | The head grades of Zn, Cu, Au, and Ag have been consistent for the period from 2018 through 2023, while Pb has increased from 0.98% to 1.37%. Pb, Ag, and Au recoveries have increased and the recovery of Ag and Au to the Pb concentrate has increased over the period. Cu grades and recoveries have decreased significantly over the period. |
| · | The average head grades of Zn, Pb, and Cu during 2022 and 2023 were 2.83%, 1.36%, and 0.16%, respectively, and the recoveries of Zn, Pb, and Cu for the period were 87.49%, 81.65%, and 8.67%, respectively. |
| · | Nexa began developing a geometallurgical model for El Porvenir in 2017. The objectives of the work were to develop a geometallurgical model able to predict the recovery of lead, zinc, copper, arsenic, and manganese, concentrate grades, as well as abrasiveness (abrasion index (Ai)) and hardness (Bond ball mill work index (BWi)), and therefore throughput, based on ore source within the deposit. |
| · | Prior to the present Phase 6 study, five phases of geometallurgical studies were carried out. Identified risks include the presence of high-hardness material in intrusive materials and limestone, as well as high abrasiveness in sandstone and clastic materials. |
| · | The potential penalty elements that should be monitored in the Cu Concentrate include As, Sb, Bi, Cd, and combined Pb+Zn. The potential penalty elements in the Pb concentrate are low lead concentrate grade, bismuth, and fluorine. The potential penalty elements in the Zn concentrate are copper and manganese. |
Atacocha
| · | The Atacocha concentrator processed 1,397,192 tonnes of ore in 2023 with Pb and Zn grades of 0.93% and 0.77%, respectively. Recoveries to their respective concentrates were 85.7% Pb and 75.9% Zn. |
| · | Head grades of ore being treated in the Atacocha concentrator have changed since the introduction of open pit ore in early 2016. Head grades of Zn have decreased from 1.8% to 0.77%, Cu has decreased from 0.11% to 0.04%, and Pb has decreased from 1.31% to 0.93% from 2016 to 2023. Since 2019, the copper grades have been too low to allow a separate copper concentrate to be produced. |
| · | The average grades of Zn and Pb during 2022 and 2023 were 0.84% and 0.95%, respectively, and the recoveries of Zn and Pb for the period were 76.57% and 83.64%, respectively. The recoveries used for the cut-off grade and resource model at these grades were 70.44% for Zn and 84.06% for Pb, which compares well to the operating data for Pb, the Zn values being somewhat conservative. |
| · | A metallurgical testing program was carried out to characterize the geometallurgical behaviour of the Atacocha San Gerardo ore according to the 2022-2023 mining plan. |
| · | Prior to the present study, three phases of geometallurgical studies were carried out, increasing the available geometallurgical data progressively to reduce the risk in metallurgical predictions. |
| 1- |
|
|
| · | Risks identified include the presence of high hardness and abrasive material in intrusive material and hydrothermal breccias, as well as areas of low Au recovery associated with Au disseminations in pyrite in mainly marble-type material. |
| · | The potential penalty elements in the Pb concentrate are arsenic and fluorine. The potential penalty elements in the Zn concentrate are manganese, silica, and cadmium. |
| 1.1.1.4 | Infrastructure |
Integration of Atacocha and El Porvenir
| · | The Cerro Pasco integration project aims to maximize the synergy of the Atacocha and El Porvenir mines. |
| · | El Porvenir started in 1950 and is an operating underground mine with multiple accesses including a shaft (Picasso shaft) for ore and people transportation. |
| · | Atacocha started in 1937 comprising an underground mine and an open pit mine. The open pit mine, San Gerardo is currently in operation, and the underground mine has been on care and maintenance since 2020. |
| · | Access to Atacocha underground is by multiple surface tunnels, that are in good condition despite the production suspension. |
| · | Atacocha is currently connected to El Porvenir through two active tunnels: at 4070 and 3300 levels, with traffic of heavy mine equipment, conventional trucks, and mining crews, linking Atacocha surface to El Porvenir underground. |
| · | The integration plan comprises restarting of Atacocha underground, development of additional connections between El Porvenir and Atacocha, expand the Picasso shaft capacity, closure of the Atacocha processing plant in 2027, and construction of a new pipeline to pump El Porvenir mine tailings to the Atacocha tailing dam. |
| · | A combination of transportation methods, including road access, aircraft via Huánuco, and rail to Cerro de Pasco are used to supply the Atacocha and Porvenir mines. |
| · | Off-site infrastructure includes facilities for the transfer of concentrate from truck to rail at Cerro de Pasco to transport concentrate for export by train to the port of Callao. Mine access is via a 13 km dirt road northeast from Cerro de Pasco, and paved road from Lima to Cerro de Pasco (approximately 315 km). |
| · | The main road from Lima to Cerro de Pasco is used for personnel transportation, supply of food, reagents, spare parts, mining supplies, and diesel fuel. Huánuco airport can be used for personnel transportation and emergency situations. |
| · | The power supply for the Atacocha and El Porvenir mines comes from two sources: the national power grid via 50/13.8 kV main substations located near each of the mines and the La Candelaria Hydroelectric Plant, which consists of three turbines (0.5 MVA, 1.2 MVA, and 3.5 MVA), and is connected to the Atacocha and El Porvenir main substations by a 4.6 km long 50 kV transmission line. |
| · | Power is generated at 4,660 kV at the La Candelaria Hydroelectric Plant. All other project loads are fed at 13.8 kV from the main substation through overhead power lines. These power lines are used to deliver power to various locations to support activities during operation of the Complex. |
| 1- |
|
|
| · | The El Porvenir TSF receives tailings generated by both the El Porvenir and Atacocha concentrator plants. A portion of tailings is used for hydraulic backfill at El Porvenir. The El Porvenir TSF was originally constructed in the 1970s, and the current elevation of the dam crest is 4,066 MASL. The downstream toe is inferred from available plans to be at 3,920 MASL, resulting in a current dam height of 146 m. |
| · | Nexa is planning to improve the water management system through construction of a perimeter channel (i.e., upstream water diversion) to intercept clean (non-contact water) surface runoff water before it flows into the TSF. Diverted water will be discharged downstream of the TSF in the Lloclla River gorge. |
El Porvenir
| · | The El Porvenir site comprises an underground mine, TSF, waste rock stockpiles, an ore processing facility with associated laboratory and maintenance facilities, and maintenance buildings for underground and surface equipment. |
| · | Additional facilities and structures include an office building, change house facilities, main shaft, ventilation shaft, backfill plant, explosives storage area, hydroelectric power generating plant, power lines and substation, fuel storage tanks, a warehouse and laydown area, and an accommodation camp. |
Atacocha
| · | Atacocha site operations comprise an underground mine, open pit mine, and a process plant facility. |
| · | Supporting on-site infrastructure include maintenance facilities; maintenance buildings for underground and surface equipment, laboratory, and tailings pumping station. Facilities and structures supporting operations include warehouses and laydown areas, offices, dry facilities, hydroelectric generating station, power lines and substation, fuel storage tanks, and accommodations camp. |
| · | A network of site roads that are approximately 6 m wide and total 15 km in length are used by authorized mine personnel and equipment, including ore and waste haul trucks, concentrate haul trucks, support and light duty vehicles to provide access to on-site infrastructure. |
| 1.1.1.5 | Environment, Permitting, and Social Considerations |
| · | No environmental issues were identified from the documentation available for review that could materially impact the ability to extract the Mineral Resources and Mineral Reserves. SLR understands that El Porvenir and Atacocha have the permits required to continue the mining operations in compliance with applicable Peruvian permitting requirements. Of note, expired authorizations under the renewal process do not interrupt the continuity of the operations (for example, the authorization for discharge of industrial effluent for El Porvenir has been filed by Nexa but it is pending approval by the environmental authority). |
| · | Approval of environmental permits required for the Cerro Pasco Complex Integration is critical for its implementation. Nexa’s Environmental Management Superintendent for El Porvenir and Atacocha understands well the environmental permitting requirements and has developed a tracking matrix that identifies the key components of each permit, corrective actions to be implemented to be in compliance, and the status of implementation of each action. All action items are qualified according to a ranking of |
| 1- |
|
|
criticality established (low, medium and high) for continuity of the operation. The matrix includes the planning for the future environmental permits required for implementation of the Cerro Pasco Complex Integration.
| · | The monitoring program at El Porvenir includes meteorology, air quality, non ionized radiation, noise, surface water quality, groundwater quality (only one location), spring water quality, effluent discharges, fauna and flora, and TSF physical stability. El Porvenir reports the results of its monitoring program to the authorities according to the frequency stated in the approved resolutions. SLR is not aware of any non-compliance issues raised by the authorities. |
| · | The monitoring program at Atacocha includes effluent discharges, gas emissions, air quality, non-ionizing radiation, noise, surface water quality, groundwater quality, springs water quality, vibrations, soil quality, terrestrial biology (vegetation and wildlife) and aquatic biology, and TSF physical stability. Atacocha reports the results of its monitoring program to the authorities according to the frequency stated in the approved resolutions. SLR is not aware of any non-compliance issues raised by the authorities. |
| · | Nexa utilizes an Integrated Dam Management System (referred to as SIGBar) for the El Porvenir TSF and the Atacocha TSF, which provides guidelines for document management, monitoring, evaluation, risk analysis, compliance with standards and legislation, training of personnel, operation of structures and other provisions. |
| · | SLR’s social review indicates that, at present, Nexa’s operations at El Porvenir make a positive contribution to sustainability and community well-being. From the review and SLR’s site visit, Nexa appears to have the necessary governance documents and tools to manage social risks associated with the Cerro Pasco Complex operations. A grievance mechanism and Community Relations Plans are in place and implemented by the social teams for each of El Porvenir and Atacocha. |
| · | An independent technical evaluation of key components of the Cerro Pasco Complex Integration project completed in early 2024 by a third party did not find any fatal flaws. The evaluation included the TSFs, social risks and permitting. It resulted in a number of findings and recommendations to be considered by Nexa to derisk the Cerro Pasco Complex Integration project. |
| · | Community discontent represents a future risk for the Cerro Pasco Complex operations. The Cerro Pasco Complex Integration project may increase expectations from the local communities in terms of contracting of local services, employment, training and community investment opportunities. The modification of the Environmental Impact Assessment required for Atacocha and El Porvenir imply processes of consultation and Citizen Participation, which could delay the approval process in the event of social disagreement. |
| · | Although there is no written commitment from Nexa to ensure local procurement, the company retains services from local businesses and from contractors that employ local workforce. |
| · | In 2023, Nexa experienced an increase in local hiring for El Porvenir and Atacocha. Nexa has declared local hiring commitments with eight local communities and has specific local hiring targets with two of them. |
| · | Atacocha acquired rights to land from the community of Cajamarquilla via an agreement to construct tailings facilities and ancillary infrastructure. The agreement included various commitments and obligations, including financial compensation for rights to the land. |
| 1- |
|
|
Atacocha also acquired and subsequently renewed a right-of-way agreement with the community of Ticlacayán associated with hydraulic infrastructure. Community agreements related to rights to land from the community have also been signed for El Porvenir with Comunidad San Francisco de Asís de Yarusyacán y Comunidad Cajamarquilla.
| · | Independent conceptual Mine Closure Plans have been developed for El Porvenir and Atacocha within the context of Peruvian legislation and are periodically updated. The most recent modification to the Mine Closure Plan for El Porvenir and update to the closure cost estimate was completed in 2020. The most recent modification to the Mine Closure Plan for Atacocha and update to the closure cost estimate was completed in 2022. |
| 1.1.1.6 | Capital and Operating Costs and Economics |
| · | Capital and operating cost estimates were prepared based on historical operating performance and the current operating budget for 2024, and the forecasted cost estimates for the integration project. SLR considers these capital and operating cost estimates to be reasonable, provided the operation and production targets are realized. |
| · | The LOM production schedule in the cash flow model, covering a 10-year mine life, is based on the December 31, 2023 Mineral Reserves. |
| · | All costs in this report are expressed in Q4 2023 US dollars. |
| · | The economic analysis at average LOM prices of US$1.24/lb Zn (US$2,741/t Zn), US$0.92/lb Pb (US$2,032/t Pb), US$3.54/lb Cu (US$7,809/t Cu), US$21.72/oz Ag, and US$1,798/oz Au, demonstrated that the Cerro Pasco Mineral Reserves are economically viable. |
| · | On a 100% ownership basis, the pre-tax net present value (NPV) at a 7.22% base discount rate is US$364 million and the after-tax NPV at a 7.22% discount is US$162 million. The undiscounted pre-tax cash flow is US$568 million, and the undiscounted after-tax cash flow is US$290 million. |
| · | There is good potential to extend the mine life through continued conversion of Inferred Resources, with improved economic results. |
| 1.1.1.7 | Risks |
| · | Underground geotechnical risks: |
| o | The impact of faults on the stope stability and equivalent linear overbreak/slough (ELOS) have not been accounted for in the geotechnical empirical analyses. SLR has evaluated the potential underestimate of ELOS, however, dilution in areas affected by faults may increase compared to that currently anticipated. Mitigation can be applied by installing ground support in the faulted walls and/or by reducing the stope size in those locations, which would impact productivity rates. It is considered that this is a low-moderate risk and that these mitigations can be applied during production, so a change to the mine plan/schedule is not required at this stage. |
| o | The project is lacking a geotechnical block model. This is best practice and should be implemented. While its absence is considered a low risk, a geotechnical block model allows for a better understanding of the spatial distribution of the geotechnical |
| 1- |
|
|
conditions and would assist in short-medium term mine planning (and also links back to the point on faults above).
| · | San Gerardo open pit risks: |
| o | Pit slope design outside of the domain sectors was assumed to be 45 degrees for design, this assumption is considered low risk based on the wall height of the north and west satellite pits. |
| o | Open pit mining operating costs are defined as constant values for mine planning. However, there is a variable component associated with the haulage distance of the open pit mining costs that requires a truck haulage distance forecast in the LOM plan. There is a low risk that the estimated mining cost will increase over the LOM due to increased truck haulage distances. |
| · | Process risks: |
| o | There is a risk of lower metal grades and recoveries than planned and the recovery of deleterious elements in the concentrates that may draw penalties. |
| o | The potential penalty elements in the Pb concentrate are arsenic and fluorine. The potential penalty elements in the Zn concentrate are manganese, silica, and cadmium. |
| o | Geometallurgical testing has identified the presence of high-hardness material in intrusive materials and limestone, as well as high abrasiveness in sandstone and clastic materials may result in increased operating power and wear material consumption and costs. |
| o | Geometallurgical work has identified areas of low Au recovery associated with Au disseminations in pyrite in mainly marble-type material. |
| · | Infrastructure risks: |
| o | The age of the current infrastructure and the cost of maintenance is a moderate risk. |
| o | Cost and schedule risk for the design and construction of integration infrastructure including the new tailing pumping station and pipeline from El Porvenir to the Atacocha TSF. |
| · | Risks associated with environmental permitting and community relations: |
| o | The modifications to the Environmental Impact Assessment (EIA) required for both El Porvenir and Atacocha as part of the Cerro Pasco Complex Integration project involve a period of review and approval by the environmental authority. There is a high level of uncertainty associated with the actual duration of the review and approval period due to staffing issues at the National Service of Environmental Certification for Sustainable Investments (SENACE for its acronym in Spanish) and adjustments to its review and approval processes. As a mitigation measure, Nexa has included additional time in its permitting schedule for the Cerro Pasco Complex Integration project to carry a contingency for the permitting process. |
| o | Community discontent represents a future risk for the Cerro Pasco Complex operations since it can lead to blockades and in turn could result in operation interruptions and reputational damage. There is precedent for such conflict given that blockades organized by communities have taken place in the past and, as recently as last year (2023), led to short suspensions of operations. As mitigation measures, Nexa is mainly working towards addressing and closing commitments |
| 1- |
|
|
with the communities in a more efficient manner, and is revisiting its social management approach to be more proactive in preventing potential issues or addressing them early to avoid escalation.
| 1.1.2 | Recommendations |
| 1.1.2.1 | Geology and Mineral Resources |
| 1 | Investigate if capping levels should be applied based on high-grade and low grade domains for Zn, Pb, Cu, and Ag for some domains of San Gerardo open pit. |
| 2 | Fine-tune the estimation workflow and dynamic anisotropy angles calculation to minimize visual grade artifacts observed in some domains (such as “de2” for El Porvenir and “sge” for Atacocha UG). Consider utilizing hangingwall, footwall, and reference surface data to refine local angle precision, alongside auxiliary dip and dip direction charts to identify and rectify any inconsistencies. |
| 3 | Consider incorporating the blast hole samples to define the Long Term Model (LTM) mineralization boundaries given that the Grade Control Model (GCM) performs systematically better than the LTM for the San Gerardo open pit. |
| 4 | Increase the number of density samples to allow more accurate block density estimates. |
| 5 | Adjust the density estimation methodology to only interpolate where supported by sufficient samples. |
| 6 | Improve the Mineral Resource classification post-processing, aiming to clean up the remaining isolated blocks of Measured or Indicated classification, such as in the domain “vcn32” of El Porvenir. |
| 7 | Investigate relaxing the maximum of two composites per drill hole restriction in domain extremities and sparsely drilled areas. |
| 8 | For the Mineral Resource classification, consider excluding drilling intersections that are sub-parallel to tabular mineralized domains as they significantly reduce drill hole spacing calculations in an artificial manner. |
| 9 | Use the production data to monitor the selected drill spacing for the minor continuity zones to determine if sufficient confidence is provided to support detailed mine planning, as these domains show less grade and geological continuity. |
| 10 | In future models, incorporate a structural model to help properly define the estimation trends. |
| 11 | Improve the field duplicate rates of channels by revising the sampling protocol of duplicates in channels. |
| 12 | Increase the frequency of monitoring Inspectorate El Porvenir laboratory (Inspectorate EP) results on a batch basis to preliminarily identify and address instances of failure that may require re-analysis. |
| 13 | Keep monitoring CRMs and other controls to prevent and/or mitigate trends, biases, or other issues which may require sample re-analysis. Continue with periodic external checks across laboratories to ensure the primary laboratory's performance remains satisfactory. |
| 1- |
|
|
| 14 | Ensure all the samples analyzed by ALS are re-assayed using the relevant analytical method when exceeding the detection limit (i.e., samples >10,000 ppm Zn), to prevent few instances detected of incomplete results in the assay database. |
| 15 | Investigate and address sample discrepancies identified during the data verification process, particularly those related to Au values. These discrepancies, however, are minor and have negligible impact on the overall assessment. |
| 16 | Maintain standardization of the format and database structure. |
| 17 | Complete the 2024 exploration program, consisting of an 8,500 m drill program to explore new targets and continue with advanced exploration. The 2024 exploration program budget is approximately US$2.1 million. |
| 18 | Improve the reconciliation between the underground production volumes and the mineralization wireframes, to better understand the differences between the along-strike mineralization, and to better quantify the proportion of the discrepancy resulting from the opportunistic mining of ore from across-strike structures. |
| 19 | To better define mineralized extents, consider completing closer spaced exploration and infill drilling ahead of production, including at orientations better designed to intercept across-strike mineralized structures. |
| 1.1.2.2 | Mining and Mineral Reserves |
| 1. | Review the underground mine designs and mining sequence and incorporate sill pillars where required. |
| 2. | Continue underground geotechnical data capture, specifically seismic monitoring around pillars between stopes. |
| 3. | Develop an underground geotechnical block model to better spatially define the geotechnical variation. |
| 4. | Re-appraise stope stability and ELOS using an updated empirical method, such as the Villaescusa approach, which updates the Potvin approach, particularly the stress factor (A) for the underground. |
| 5. | Assess the impact of faults on the stope stability and ELOS, such as using the approach developed by Suorineni, which applies a fault factor to the analyses depending on the intersection geometry between the faults and the planned stope walls for the underground. |
| 6. | Implement reconciliation analysis between underground designed stopes and surveyed mined-out stopes to estimate overbreak and underbreak quantities to better define dilution and mining recovery factors. |
| 7. | Apply external underground dilution factors as ELOS during the optimization process to capture dilution grade. |
| 8. | Develop grade control practices particularly for planned underground SLS stopes to minimize dilution due to orebody irregularities. |
| 9. | Add a yearly truck haulage distance forecast to the open pit LOM plan. |
| 1- |
|
|
| 1.1.2.3 | Mineral Processing |
| 1 | Investigate the addition of instrumentation and process controls to both El Porvenir and Atacocha concentrators including a SCADA system to retrieve and store process data to support daily operations and planning. |
| 2 | Continue with the geometallurgical program at El Porvenir and Atacocha. |
| 3 | Perform a geological assessment of the Au association to galena and Au associated with pyrite based on deposit genesis and geometallurgical test results for San Gerardo. |
| 4 | Carry out a geological assessment for San Gerardo to identify areas associated with oxides in Phase 2 of mining, which represent a risk to the recovery of Pb, Zn, and Au. |
| 5 | Evaluate the behaviour of low recovery material near upcoming mining phases in the San Gerardo pit. |
| 6 | Perform recovery studies by size with plant feed material to quantify losses in recoveries of valuable metals by size fraction in both mines. |
| 7 | The steel consumption estimation model for El Porvenir was derived in 2018, based on circuit data and operating variables reported by Nexa to date. Update these models by incorporating the operational changes made to date in the grinding circuits of both El Porvenir and Atacocha concentrators. |
| 1.1.2.4 | Infrastructure |
| 1 | Place priority on the ongoing maintenance of older site infrastructure including piping, electrical, roads, and buildings. |
| 2 | Remove abandoned infrastructure such as old pipelines as it is replaced by new, to facilitate future maintenance. |
| 1.1.2.5 | Environment, Permitting, and Social Considerations |
| 1 | Track closely the action items identified for obtention of new permits and renewal of expired permits required for the Cerro Pasco Complex Integration project and follow up on the status of progress regularly to prevent possible delays in the submission of permitting applications. There is a level of uncertainty regarding the amount of time required by the authorities for review and approval of permitting applications. In order to mitigate the risk of delayed approval, initiate the first steps of the approval process for the main permits as early as possible (for example, the engineering design and the baseline field work). |
| 2 | Due to uncertainty regarding the potential for acid generation of the waste rock, geochemical evaluation (including static and kinetic geochemical testing on waste rock samples) should be carried out prior to the next Atacocha dam raise (not permitted yet), and prior to closure to inform closure planning and water quality predictions for post-closure. Carry out additional static and kinetic geochemical testing on waste rock and tailings samples to confirm or revise the geochemical characterization. Robust water quality monitoring should continue during operations to verify compliance with the national environmental standards and the appropriateness of the waste rock disposal and water management procedures that are in place. |
| 3 | Expand the groundwater quality monitoring program at El Porvenir to include additional stations for collection of groundwater quality samples (and subsequent analysis). At a |
| 1- |
|
|
minimum, consideration should be given to the installation of one station upstream of the El Porvenir TSF.
| 4 | Consider conducting a Dam Safety Review (DSR) for El Porvenir TSF and the Atacocha TSF in support of mining operation and ore processing in future years, and in order to finalize the detailed mine closure plan prior to moving into the closure stage. |
| 5 | The following recommendations are proposed for the Atacocha TSF: |
| a) | Develop TARPs for the piezometers for inclusion in the OMS manual and monitoring plan. |
| b) | Capacity assessments of the TSF completed on a bi annual basis with topographic and bathymetric surveys. |
| c) | Complete long term geochemical kinetic testing of the tailings. |
| d) | Monitor the water quality from the TSF subsurface drains. |
| 6 | The same recommendations listed above are proposed for the El Porvenir TSF. In addition, implement a groundwater monitoring program at the El Porvenir TSF to determine levels of metals and sulphates. Monitoring stations should be implemented both upstream and downstream of the El Porvenir TSF. |
| 7 | Implement a water balance for ongoing operations to be updated by Mine personnel using meteorological and water monitored data on a regular basis (at least monthly). The water balance is an important tool to track trends and conduct short term predictions through simulation of variable operating and/or climatic scenarios to support decision making associated with tailings pond operation (e.g., maintaining adequate freeboard at all times). |
| 8 | Develop an integrated water balance that reflects the interaction between the El Porvenir and Atacocha operations from a water balance perspective to identify and predict possible scenarios of interruption of mine operations due to water management issues and/or dam safety concerns (e.g., not maintaining adequate dam freeboard). |
| 9 | El Porvenir and Atacocha have significant social commitments as the needs and expectations of local communities/stakeholders are high. Managing commitments requires an adequate tracking tool and implementation plan to honour commitments. SLR recommends that Nexa considers adopting a robust tracking tool to track commitments and allocate adequate resources to use it and keep it up to date, including an escalation process for overdue commitments. This action will avoid mismanagement of commitments, prevent potential conflicts, and demonstrate Nexa’s efforts to maintain good relationships with host communities. |
| 10 | Review the current social area of influence for both El Porvenir and Atacocha to confirm or update its delineation in case new local communities or Indigenous communities should be added (e.g., Anexo Joraoniyoc, which belongs to Comunidad Campesina de San Francisco de Asis de Yarusyacan for the Atacocha mine site). This is a key action to identify potential impacts and develop social management plans for the newly added communities in the revised area of influence. The determination of the social area of influence is a dynamic matter that requires regular review. SLR understands that Nexa is already planning to review the current social area of influence and it held a meeting on this topic with the environmental authority as one of the initial steps. |
| 1- |
|
|
| 1.2 | Economic Analysis |
The economic analysis contained in this TRS is based on the Cerro Pasco Complex Mineral Reserves on a 100% basis, economic assumptions, and capital and operating costs provided by Nexa corporate finance and technical teams and reviewed by SLR.
All costs are expressed in Q4 2023 US dollars. Unless otherwise indicated, all costs in this section are expressed without allowance for escalation, currency fluctuation, or interest.
A summary of the key criteria is provided below.
| 1.2.1 | Economic Criteria |
| 1.2.1.1 | Physicals |
| · | Mine life: 10 years (between 2024 and 2033). |
| o | Atacocha Open Pit: 4 years (between 2024 and 2027) |
| o | Atacocha and El Porvenir Underground: 10 years (between 2024 and 2033) |
| · | LOM production plan (on a 100% ownership basis) as summarized in Table 1-2. |
| · | LOM processing of 24.70 Mt, grading 3.61% Zn, 1.22% Pb, 0.23% Cu, 67.76 g/t Ag, and 0.06 g/t Au. |
| o | Atacocha Plant (open pit material): 4.38 Mt, grading 0.99% Zn, 1.15% Pb, 0.03% Cu, 34.94 g/t Ag, and 0.27 g/t Au |
| o | El Porvenir Plant (underground material): 20.32 Mt, grading 4.17% Zn, 1.24% Pb, 0.28% Cu, 74.83 g/t Ag, and 0.02 g/t Au |
| · | LOM total contained metal: 891 kt Zn, 302 kt Pb, 57.5 kt Cu, 53.8 Moz Ag, and 50.6 koz Au. |
| · | LOM average metallurgical recoveries: |
| o | Atacocha Plant: 78.5% Zn, 83.0% Pb, 0% Cu, 3.3% Ag in Zn, 76.7% Ag in Pb, and 67.2% Au in Pb. |
| o | El Porvenir Plant: 89.0% Zn, 79.5% Pb, 14.3% Cu, 15.2% Ag in Zn, 66.4% Ag in Pb, 29.4% Au in Pb, 2.0% Ag in Cu, 8.6% Au in Cu. |
| · | LOM realized metal payables (%) of: 84.0% Zn, 94.3% Pb, 95.0% Cu, 84.0% Ag, and 77.1% Au. |
| · | LOM payable metal of: 663 kt Zn, 228 kt Pb, 7.6 kt Cu, 37.6 Moz Ag, and 23.4 koz Au. |
| 1.2.1.2 | Revenue |
| · | All revenues are received in US$. |
| · | Revenue is estimated based on the following LOM weighted average metal prices derived from Nexa’s Internal Projection forecasts: US$1.24/lb Zn (US$2,741/t Zn), US$0.92/lb Pb (US$2,032/t Pb), US$3.54/lb Cu (US$7,809/t Cu), US$21.72/oz Ag, and US$1,798/oz Au. |
| · | Total gross revenue from concentrates of US$3,000 million. |
| 1- |
|
|
| · | Net Revenue includes the benefit of Cerro de Pasco’s zinc concentrate processed at Nexa’s Cajamarquilla (CJM) zinc refinery in Peru. This integration with Nexa’s internal refinery provides the benefit of additional US$94.66/t Zn premium selling price, and zinc smelting at cost (rather than at commercial third-party terms). |
| · | Transportation, Treatment, and Refining charges as defined in Table 1-1: |
Table 1-1: Transportation, Treatment, and Refining Charge Assumptions
| Transportation, Treatment and Refining Charges | Units | LOM Average |
| Transportation - Zn Concentrate Integrated - UG | US$/t conc | 46.65 |
| Transportation - Zn Concentrate Integrated - OP | US$/t conc | 45.52 |
| Transportation - Pb Concentrate - UG | US$/t conc | 45.21 |
| Transportation - Pb Concentrate - OP | US$/t conc | 43.86 |
| Transportation - Cu Concentrate - UG | US$/t conc | 39.21 |
| TC Zn Concentrate - EP Plant (UG) | US$/t conc | 310.56 |
| TC Zn Concentrate - ATA Plant (OP) | US$/t conc | 317.37 |
| TC Pb Concentrate - EP Plant (UG) | US$/t conc | 138.23 |
| TC Pb Concentrate - ATA Plant (OP) | US$/t conc | 183.94 |
| TC Cu at Cu Concentrate | US$/t conc | 195.21 |
| RC Cu at Cu Concentrate | US$/t conc | 50.00 |
| RC Ag at Cu Concentrate | US$/oz | 0.50 |
| RC Au at Cu Concentrate | US$/oz | 8.00 |
| RC Ag at Pb Concentrate | US$/oz | 1.50 |
| RC Au at Pb Concentrate | US$/oz | 10.00 |
| RC Ag at Zn Concentrate | US$/oz | - |
| · | There are no third-party royalties applicable to the Cerro Pasco Complex operations. |
| · | Net revenue after selling costs and royalties of US$2,774 million. |
| · | Average net smelter return of US$137/t processed. |
| · | Revenue is recognized at the time of production. |
| 1.2.1.3 | Costs |
| · | Mine life: 10 years. |
| · | El Porvenir sustaining capital (excluding closure costs) over the LOM totals US$400 million. |
| · | Atacocha sustaining capital (excluding closure costs) over the LOM totals US$222 million. |
| · | El Porvenir concurrent reclamation between 2024 and 2033 of $7.9 million. |
| · | El Porvenir mine closure costs between 2034 and 2037 of $14.6 million. |
| 1- |
|
|
| · | El Porvenir post-closure costs between 2038 and 2042 of $2.3 million. |
| · | Atacocha concurrent reclamation between 2025 and 2033 of $16.2 million. |
| · | Atacocha open pit mine closure costs between 2029 and 2032 of $5.0 million. |
| · | Atacocha underground mine closure costs between 2034 and 2037 of $35.1 million. |
| · | Atacocha post-closure costs between 2038 and 2042 of $2.8 million. |
| · | Total average unit operating costs of US$56.69/t ore processed. |
| o | Open pit mining operating costs: US$3.33 /t mined (or US$19.52/t processed). |
| o | Underground mining operating costs: US$39.25/t mined (or US$39.25/t processed) |
| o | Processing operating costs – Atacocha: US$13.29/t ore processed |
| o | Processing operating costs – El Porvenir: US$12.47/t ore processed. |
| o | General and administrative (G&A) – Atacocha open pit: US$11.85/t ore processed |
| o | G&A – El Porvenir underground: US$7.56/t ore processed. |
| · | LOM site operating costs of $1,400 million. |
| · | Other off-site operating costs: US$2.44/t ore processed. |
| · | Costs were estimated considering an exchange rate of S/.3.67:US$1.00. |
| 1.2.1.4 | Taxation and Royalties |
| · | Corporate income tax rate in Peru is 29.50%. |
| · | Special Mining Tax Contribution (IEM) varies over the LOM between 2% and 3.6% based on the marginal rate. |
| · | Government Mining Tax Royalty varies over the LOM between 1% and 4% based on the marginal rate. |
| · | Employees’ profit sharing participation: 8%. |
| · | There are no third-party royalties applicable to the Cerro Pasco Complex. |
| · | SLR has relied on Nexa’s taxation model for calculation of taxes applicable to the cash flow. |
| 1.2.2 | Cash Flow Analysis |
SLR prepared a LOM unlevered after-tax cash flow model to confirm the economics of the Cerro Pasco Complex over the LOM (between 2024 and 2033). Economics have been evaluated using the discounted cash flow method by considering LOM production at a 100% basis, annual processed tonnages, and gold and silver grades. The associated process recoveries, metal prices, operating costs, treatment, refining and selling charges, sustaining capital costs, and reclamation and closure costs, and taxes and government royalties were also considered.
The base discount rate assumed in this TRS is 7.22% as per Nexa’s corporate guidance, based on Weighted Average Cost of Capital (WACC) analysis. Discounted present values of annual cash flows are summed to arrive at the Cerro Pasco Base Case NPV.
| 1- |
|
|
The economic analysis at average LOM prices of US$1.24/lb Zn (US$2,741/t Zn), US$0.92/lb Pb (US$2,032/t Pb), US$3.54/lb Cu (US$7,809/t Cu), US$21.72/oz Ag, and US$1,798/oz Au, confirmed that the Cerro Pasco Complex Mineral Reserves are economically viable.
The pre-tax NPV at a 7.22% base discount rate is US$364 million and the after-tax NPV at a 7.22% discount is US$162 million. The undiscounted pre-tax cash flow is US$568 million, and the undiscounted after-tax cash flow is US$290 million.
The annual after-tax cash flow summary is presented in Table 1-2.
Table 1-2: Annual After-Tax Cash Flow Summary
| Summary Cash Flow | Units | Total LOM |
| Production | ||
| LOM | years | 10 |
| OP Production | 000 tonnes | 4,380 |
| Au grade | g/t | 0.27 |
| Ag Grade | g/t | 34.94 |
| Cu Grade | % | 0.03% |
| Pb Grade | % | 1.15% |
| Zn Grade | % | 0.99% |
| UG Production | 000 tonnes | 20,316 |
| Au grade | gr/t | 0.02 |
| Ag Grade | gr/t | 74.83 |
| Cu Grade | % | 0.28% |
| Pb Grade | % | 1.24% |
| Zn Grade | % | 4.17% |
| Concentrate Production | ||
| Cu Concentrate | dmt | 40,433 |
| Pb Concentrate | dmt | 462,461 |
| Zn Concentrate | dmt | 1,573,707 |
| Recovered Metal | ||
| Au | oz | 30,364 |
| Ag | oz | 44,782,850 |
| Cu | tonnes | 8,022 |
| Pb | tonnes | 242,046 |
| Zn | tonnes | 788,995 |
| Metal Prices | ||
| LOM weighted average - Au | US$/oz | 1,798 |
| LOM weighted average - Ag | US$/oz | 21.72 |
| 1- |
|
|
| Summary Cash Flow | Units | Total LOM |
| LOM weighted average - Cu | US$/tonne | 7,809 |
| LOM weighted average - Pb | US$/tonne | 2,032 |
| LOM weighted average - Zn | US$/tonne | 2,741 |
| Cash Flow | ||
| Gross Revenue | US$ million | 3,000 |
| Transport / TC-RC Charges | US$ million | (242) |
| Royalties | US$ million | - |
| Net Revenue | US$ million | 2,758 |
| Other Revenues & Compensations | US$ million | 12 |
| Operating Costs | ||
| OP Mining Costs | US$ million | (85) |
| UG Mining Costs | US$ million | (797) |
| Processing Costs - Atacocha | US$ million | (58) |
| Processing Costs - El Porvenir | US$ million | (266) |
| G&A | US$ million | (206) |
| Other Costs | US$ million | (60) |
| Operating Cash Flow | US$ million | 1,298 |
| Capital Costs | ||
| Direct Capital Costs | US$ million | - |
| Sustaining and Expansion Capital Costs – Atacocha | US$ million | (222) |
| Sustaining and Expansion Capital Costs - El Porvenir | US$ million | (400) |
| Reclamation & Closure - Atacocha | US$ million | (59) |
| Reclamation & Closure - El Porvenir | US$ million | (25) |
| Change Working Capital | US$ million | (24) |
| Pre-Tax Net Cash Flow | US$ million | 568 |
| Taxes - Income Tax | US$ million | (178) |
| Taxes - Workers' Participation | US$ million | (52) |
| Taxes - Special Mining Tax & Mining Royalty | US$ million | (47) |
| After-Tax Cashflow | US$ million | 290 |
| Project Economics | ||
| Pre-Tax | ||
| Pre-tax NPV at 7.22% | US$ million | 364 |
| After-Tax |
| 1- |
|
|
| Summary Cash Flow | Units | Total LOM |
| After-Tax NPV at 7.22% | US$ million | 162 |
| 1.2.2.1 | Sensitivity Analysis |
Project risks can be identified in both economic and non-economic terms. Key economic risks were examined by running cash flow sensitivities:
| · | Metal prices |
| · | Head grades |
| · | Metallurgical recoveries |
| · | Operating costs |
| · | Capital costs (Sustaining and Closure) |
After-tax NPV7.22% sensitivities over the base case have been calculated for -20% to +20% for head grade, -5% to +5% for overall recoveries, -20% to +20% for metal prices, and -10% to +15% for operating and capital costs variations to determine Cerro Pasco’s most sensitive parameter.
The sensitivity analysis at Cerro Pasco shows that the after-tax NPV at a 7.22% base discount rate is most sensitive to metal prices, head grade, and metallurgical recoveries, followed by operating costs and capital costs.
| 1.3 | Technical Summary |
| 1.3.1 | Property Description |
The Complex is located in Peru’s Central Andes region at an elevation of approximately 4,050 MASL to 4,200 MASL. It is situated in the districts of San Francisco de Asís de Yarusyacán and Yanacancha, in the province and department of Pasco. El Porvenir and Atacocha are located 13 km and 16 km north of the city of Cerro de Pasco, respectively, which is located approximately 315 km by road from the national capital, Lima, when travelling by the Carretera Central and the La Oroya-Huánuco highway.
El Porvenir’s coordinates are 10°36'36" S, 76°12'37" W (Latitude/Longitude decimals -10.6100, -76.2102), and approximately 367600m E, 8826850m N using Universal Transverse Mercator (UTM) WGS84 datum Zone 18S. Atacocha’s coordinates are 10°34'37" S, 76°11'26" W (Latitude/Longitude decimals -10.5769, -76.1906), and approximately 367160m E, 88304000m N using the UTM WGS84 Zone 18S. The mines are located approximately 3.5 km from each other.
El Porvenir consists of underground Zn, Pb, Ag, and Cu mining operations, producing Cu, Pb, and Zn concentrates via conventional crushing, grinding, and flotation at the El Porvenir processing plant. Atacocha consists of the San Gerardo Zn, Pb, Au, and Ag open pit mining operation and the Atacocha underground Zn, Pb, Cu, and Ag mining operation. Ore is sent to the Atacocha processing plant, which generates Pb, Cu, and Zn concentrates via conventional crushing, grinding, and sequential flotation. Cu and Pb concentrates are sold to traders and delivered by road and rail to Callao (approximately 270 km by road) for shipping overseas, while Zn concentrate is transported by road and rail to Nexa’s Cajamarquilla Zn refinery.
| 1- |
|
|
| 1.3.2 | Land Tenure |
El Porvenir consists of 25 mining concessions covering an area of 4,846.68 ha and one beneficiation concession covering an area of 323.79 ha. As of December 31, 2023, the concessions are held in the name of Nexa El Porvenir, Nexa Atacocha, Nexa Peru, and S.M.R.L. CMA No. 54 (50% Nexa El Porvenir and 50% Nexa Atacocha).
Atacocha consists of 147 mineral concessions covering an area of 2,872.47 ha and one beneficiation concession covering an area of 413.23 ha. As of December 31, 2023, the Atacocha concessions are held in the name of Nexa Atacocha, Nexa Peru, and Nexa El Porvenir.
For El Porvenir, all annual fees applicable to the mineral concessions and beneficiation concessions have been paid in full as of the effective date of the report. These totalled US$14,540.07 and US$4,803.41, respectively, in 2023.
For Atacocha, all annual fees applicable to the mineral concessions and beneficiation concessions have been paid in full as of the effective date of the report. These totalled US$8,617.43 and US$3,716.58, respectively, in 2023.
In 2023, penalties were paid to Instituto Geológico, Minero y Metalúrgico (INGEMMET) of the Peruvian Government, totalling US$4,215.97 for El Porvenir and US$3,829.16 for Atacocha, since minimum required levels of production or exploration expenditures were not met.
| 1.3.3 | History |
Under previous operators, the Atacocha and El Porvenir Mines have operated since 1936 and 1949, respectively.
Compañía Minera Milpo S.A. (Milpo), the operator of El Porvenir at the time, acquired the Atacocha Mine in 2008.
In 2010, the current operator, Nexa (then VM Holding), gained control of Milpo and its assets, including El Porvenir and Atacocha. In 2014, Nexa began integrating the El Porvenir and Atacocha operations, including administration, the TSFs, the electrical power supply, and mineral processing. VM Holding changed its corporate name to Nexa Resources S.A. in 2017, accompanied by initial public offerings on the New York Stock Exchange and Toronto Stock Exchange.
El Porvenir’s operations were interrupted from March 10, 2020 to May 15, 2020, due to the COVID-19 pandemic. Although the San Gerardo open pit remains operational, the Atacocha underground mine did not resume operations after the mandatory restriction period imposed by the Peruvian Government was lifted in June 2020.
Between 1950 and 2023, El Porvenir produced 60.1 Mt treated ore, while Atacocha produced 21.6 Mt treated ore between 2009 and 2023. Production data for Atacocha prior to 2009 is unavailable.
| 1.3.4 | Geological Setting, Mineralization, and Deposit |
The El Porvenir and Atacocha deposits are situated in the Pasco region of the Western Cordillera of the Andes, within the Eocene-Miocene Polymetallic and Miocene Au-Ag Epithermal Belts.
At El Porvenir, the stratigraphic units of primary interest are the Pucará and the Goyllarisquizga groups. The Goyllarisquizga Group outcrops in the area of the deposit comprising quartz rich
| 1- |
|
|
sandstone, corresponding to the Goyllarisquizga Formation. Sandstones vary from quartz arenite to arkose, with an argillaceous to siliceous matrix. Above the 4000 Level, the lithology and stratification are well defined and easy to recognize. Below the 4000 Level, strong alteration of the original rock has formed siliceous breccias and massive silica where it is still possible to recognize quartz grains and in few places the stratification. Intrusive rocks within the property are variably porphyritic dacite to quartz diorite with hornblende and biotite phenocrysts. The Milpo-Atacocha fault is a major structural feature in the region, which can be traced for nearly 15 km from Yarusyacán in the north to Carmen Chico in the south.
At Atacocha, the stratigraphic units of primary interest are the Chambará, Aramachay, and Condorsinga formations, as well as other undifferentiated limestone units of the Pucará Group, the Goyllarisquizga Formation, and stratigraphically overlying basalt layers. The deposit is structurally controlled and the Milpo-Atacocha Fault divides the property into two structural domains; the western San Gerardo Sector, and the eastern Santa Bárbara Sector.
Mineralization at El Porvenir and Atacocha is generally characterized as a skarn, intermediate sulphidation epithermal vein/breccia-style, while El Porvenir also has stratabound mineralization in the Goyllarisquizga Formation, and Atacocha also has porphyry mineralization. Skarn related alteration at Atacocha includes silica- wollastonite, garnet, silica, and pyrite-argillic alteration. Silica-sericite-argillic alteration is associated with hydrothermal mineralization. Phyllic alteration made of sericite, quartz, pyrite, and intense A- and B-types quartz veinlets stockwork is generally associated with porphyry mineralization.
| 1.3.5 | Exploration |
Nexa’s exploration program is based on an integrated strategy of geological and structural interpretation, combined with remote sensing for alteration and magnetic patterns and anomalies.
As of December 31, 2023, a total of 5,683 drill holes totalling 944,070 m and 19,074 channel samples totalling 129,075 m have been completed at El Porvenir.
As of December 31, 2023, a total of 5,206 drill holes totalling 895,504 m, and 69,154 channel samples totalling 262,171 m have been completed at Atacocha.
Exploration at El Porvenir and Atacocha is generally conducted simultaneously with underground development, which involves diamond core drilling, and channel sampling following underground drifting. Geological mapping is completed on paper and digitized for incorporation into three dimensional (3D) models to aid future exploration and mine development planning. Although 35 reverse circulation (RC) drill holes have been completed at Atacocha, drilling is generally diamond coring (DDH).
Grade control at San Gerardo OP is completed with blast holes, although this data is not directly incorporated in the Mineral Resource estimate.
Magnetic surveys correlate with the intrusives, which is an important tool for determining prospective areas for the generation of new targets.
Short-term exploration targets include the upper levels (above 3,300 MASL) of the Integration Zone between El Porvenir and Atacocha, the eastern side of the Santa Bárbara stock at 3,300 MASL and below, and the upper levels (above 3,300 MASL) of San Gerardo.
Six brownfield exploration projects were defined (Machcan, Curiajasha, Longreras, Manuel 05 and Pique Estrella, La Churca, and La Quinua Chicrin Corridor), based on surface mapping, remote sensing, and geophysics.
| 1- |
|
|
Exploration activities for 2023 included 16 exploration diamond drill holes (DDH) for a total of 9,321 m. The drilling programs focused on the extensions of Integration Zone in 3300-3790-4050 Levels, and Porvenir Sur drilling from 3600 Level.
The exploration work planned for the Pasco Complex in 2024 involves a budget of $2.61 million, and includes 8,500 m of diamond drilling, focused on extending known mineralization within the Integration Zone, drilling from 3300 Level, and VAM, DL, and Porv 9 from 3790 Level.
| 1.3.6 | Mineral Resource Estimates |
Mineral Resources have been classified in accordance with the definitions for Mineral Resources in S-K 1300, which are consistent with Canadian Institute of Mining, Metallurgy and Petroleum (CIM) Definition Standards for Mineral Resources and Mineral Reserves dated May 10, 2014 (CIM (2014) definitions).
The El Porvenir and Atacocha database closure date was January 31, 2023. Between then and the effective date of this report, 252 DDH and 1,596 channels were completed at El Porvenir and 18 DDH and 32 channels were completed at the San Gerardo open pit at Atacocha. No drilling or channel data was gathered within the underground portion of Atacocha between the database closure and the effective date of this report. The QP reviewed the additional drilling and channel data for El Porvenir and San Gerardo and is of the opinion that it does not have a material impact on the estimated Mineral Resources.
The Mineral Resource estimates were completed using Datamine Studio RM and Leapfrog Geo software. Wireframes for geology and mineralization were constructed in Leapfrog Geo based on geology sections, assay results, lithological information, pit mapping, and structural data.
Assays were capped to various levels based on exploratory data analysis and then composited to one metre lengths at El Porvenir and two metre lengths at Atacocha. Wireframes were filled with blocks and sub-celling at wireframe boundaries.
Blocks were interpolated with grades using ordinary kriging (OK) and inverse distance cubed (ID3) interpolation algorithms, with the final block grades at Atacocha assigned according to an evaluation of the OK and ID3 estimates, including comparison with a nearest neighbour (NN) estimate. Final grades as El Porvenir used the ID3 results. Block estimates were validated using industry standard validation techniques. Classification of blocks used distance-based and mineralization continuity criteria.
Mineral Resources at El Porvenir and Atacocha underground are reported within optimized underground reporting shapes generated in Deswik Stope Optimizer (DSO) software and satisfying minimum mining width. At El Porvenir, NSR cut-off values of US$67.04/t were used for the SLS Upper Zone, US$63.98/t for the SLS Intermediate Zone, US$63.77/t for the SLS Lower Zone, and US$65.21/t for the SLS Mine Deepening Zone. NSR cut-off values of US$69.04/t were used for the CAF Upper Zone, US$66.25/t for the CAF Intermediate Zone, US$65.77/t for the CAF Lower Zone, and US$67.21/t for the CAF Mine Deepening Zone. At Atacocha, NSR cut-off values of US$71.07/t for CAF stopes, and US$69.00/t for SLS stopes, and continuity criteria.
Mineral Resources at the San Gerardo open pit are reported within a preliminary pit shell generated in Datamine NPV Scheduler software package at a reporting NSR cut-off value of US$22.44/t. The sub-blocked model for the San Gerardo open pit was re-blocked to the selective mining unit (SMU) prior to reporting Mineral Resources.
The QP is of the opinion that any issues relating to all relevant technical and economic factors likely to influence the prospect of economic extraction can be resolved with further work.
| 1- |
|
|
The Cerro Pasco Complex EOY2023 Mineral Resources are summarized in Table 1-3 and Table 1-4 on a Nexa attributable ownership basis and 100% ownership basis, respectively.
Table 1-3: Summary of Cerro Pasco Complex Mineral Resource Estimate (Nexa Attributable Ownership Basis) – December 31, 2023
| Mine | Category | Tonnage (Mt) |
Grade | Contained Metal | ||||||||
| Zn (%) |
Cu (%) |
Ag (g/t) |
Pb (%) |
Au (g/t) |
Zn (kt) |
Cu (kt) |
Ag (koz) |
Pb (kt) |
Au (koz) |
|||
| Total Cerro Pasco | Measured | 2.72 | 2.37 | 0.13 | 43.7 | 0.92 | 0.10 | 64.2 | 3.6 | 3,815 | 25.0 | 8.4 |
| Indicated | 7.55 | 2.40 | 0.16 | 47.7 | 0.93 | 0.09 | 181.5 | 12.3 | 11,586 | 70.2 | 22.7 | |
| Total Measured + Indicated | 10.27 | 2.39 | 0.15 | 46.7 | 0.93 | 0.09 | 245.8 | 15.9 | 15,401 | 95.2 | 31.1 | |
| Inferred | 16.65 | 3.73 | 0.34 | 76.9 | 1.27 | 0.02 | 620.5 | 56.4 | 41,175 | 210.8 | 9.1 | |
Notes:
| 1. | The definitions for Mineral Resources in S-K 1300 were followed for Mineral Resources which are consistent with CIM (2014) definitions. |
| 2. | Mineral Resources are reported on a Nexa attributable ownership basis, 83.48% for El Porvenir and 75.96% for Atacocha. |
| 3. | Mineral Resources are estimated at the following NSR cut-off values, calculated based on the LOM costs: |
| o | El Porvenir UG: varies by mining method from US$63.77/t to US$67.04/t for SLS, and from US$65.77/t to US$69.04/t for CAF, with an average of US$66.04/t. |
| o | Atacocha UG: US$69.00/t for SLS and US$71.07/t for CAF |
| o | Atacocha OP: US$ 22.44/t |
| 4. | Mineral Resources are estimated using average long-term metal prices of Zn: US$3,218.90/t (US$1.46/lb), Cu: US$8,820.05/t (US$4.00/lb), Ag: US$24.35/oz, Pb: US$2,300.33/t (US$1.04/lb), and Au: US$1,875.57/oz. |
| 5. | Metallurgical recoveries are based on historical processing data: |
| o | El Porvenir UG: Zn (89.2%), Pb (80.0%), Cu (14.6%), and Ag (77.5%) |
| o | Atacocha UG: Zn (89.3%), Pb (80.0%), Cu (15.7%), and Ag (77.5%) |
| o | Atacocha OP: Zn (70.4%), Pb (84.0%), Ag (75.8%), and Au (65.5%) |
| 6. | Bulk density is assigned based on rock type and averages: |
| o | El Porvenir UG: 3.13 t/m3 |
| o | Atacocha UG: 3.53 t/m3 |
| o | Atacocha OP: 2.76 t/m3 |
| 7. | The minimum thickness for underground resource reporting panels is 4 m for CAF and 3 m for SLS. For open pit resource reporting, the minimum height is 6 m. |
| 8. | Mineral Resources were depleted according to actual production as of September 30, 2023, and forecast production to the effective date of December 31, 2023. |
| 9. | Mineral Resources are exclusive of Mineral Reserves. |
| 10. | There are no Cu grades estimated for Atacocha OP and no Au grades estimated for Atacocha UG and El Porvenir UG. This has reduced the Cu and Au average grades for the total Cerro Pasco tonnes. |
| 11. | Mineral Resources that are not Mineral Reserves do not have demonstrated economic viability. |
| 12. | Mineral Resources are constrained within optimized underground reporting shapes for El Porvenir and Atacocha UG and an optimized reporting pit shell for Atacocha OP. |
| 13. | Numbers may not add due to rounding. |
| 1- |
|
|
Table 1-4: Summary of Cerro Pasco Complex Mineral Resource Estimate (100% Ownership Basis) – December 31, 2023
| Mine | Category | Tonnage (Mt) |
Grade | Contained Metal | ||||||||
| Zn (%) |
Cu (%) |
Ag (g/t) |
Pb (%) |
Au (g/t) |
Zn (kt) |
Cu (kt) |
Ag (koz) |
Pb (kt) |
Au (koz) |
|||
| Total Cerro Pasco | Measured | 3.51 | 2.34 | 0.13 | 43.4 | 0.92 | 0.10 | 82.3 | 4.6 | 4,900 | 32.3 | 11.0 |
| Indicated | 9.62 | 2.38 | 0.16 | 47.2 | 0.93 | 0.10 | 228.6 | 15.5 | 14,604 | 89.3 | 29.9 | |
| Total Measured + Indicated | 13.13 | 2.37 | 0.15 | 46.2 | 0.93 | 0.10 | 310.9 | 20.1 | 19,504 | 121.6 | 40.9 | |
| Inferred | 20.82 | 3.72 | 0.34 | 76.6 | 1.26 | 0.02 | 774.9 | 71.6 | 51,289 | 263.1 | 12.0 | |
Notes:
| 1. | The definitions for Mineral Resources in S-K 1300 were followed for Mineral Resources which are consistent with CIM (2014) definitions. |
| 2. | Mineral Resources are reported on a 100% ownership basis. |
| 3. | Mineral Resources are estimated at the following NSR cut-off values, calculated based on the LOM costs: |
| o | El Porvenir UG: varies by mining method from US$63.77/t to US$67.04/t for SLS, and from US$65.77/t to US$69.04/t for CAF, with an average of US$66.04/t. |
| o | Atacocha UG: US$69.00/t for SLS and US$71.07/t for CAF |
| o | Atacocha OP: US$ 22.44/t |
| 4. | Mineral Resources are estimated using average long-term metal prices of Zn: US$3,218.90/t (US$1.46/lb), Cu: US$8,820.05/t (US$4.00/lb), Ag: US$24.35/oz, Pb: US$2,300.33/t (US$1.04/lb), and Au: US$1,875.57/oz. |
| 5. | Metallurgical recoveries are based on historical processing data: |
| o | El Porvenir UG: Zn (89.2%), Pb (80.0%), Cu (14.6%), and Ag (77.5%) |
| o | Atacocha UG: Zn (89.3%), Pb (80.0%), Cu (15.7%), and Ag (77.5%) |
| o | Atacocha OP: Zn (70.4%), Pb (84.0%), Ag (75.8%), and Au (65.5%) |
| 6. | Bulk density is assigned based on rock type and averages: |
| o | El Porvenir UG: 3.13 t/m3 |
| o | Atacocha UG: 3.53 t/m3 |
| o | Atacocha OP: 2.76 t/m3 |
| 7. | The minimum thickness for underground resource reporting panels is 4 m for CAF and 3 m for SLS. For open pit resource reporting, the minimum height is 6 m. |
| 8. | Mineral Resources were depleted according to actual production as of September 30, 2023, and forecast production to the effective date of December 31, 2023. |
| 9. | Mineral Resources are exclusive of Mineral Reserves. |
| 10. | There are no Cu grades estimated for Atacocha OP and no Au grades estimated for Atacocha UG and El Porvenir UG. This has reduced the Cu and Au average grades for the total Cerro Pasco tonnes. |
| 11. | Mineral Resources that are not Mineral Reserves do not have demonstrated economic viability. |
| 12. | Mineral Resources are constrained within optimized underground reporting shapes for El Porvenir and Atacocha UG and an optimized reporting pit shell for Atacocha OP. |
| 13. | Numbers may not add due to rounding. |
| 1.3.7 | Mineral Reserve Estimates |
Mineral Reserve estimates for the El Porvenir and Atacocha mines were developed by Nexa and adopted by the SLR QPs.
The El Porvenir and Atacocha underground Mineral Reserves were developed using Deswik’s mining software. Stope designs were prepared using a stope optimization tool and were run using Measured and Indicated Mineral Resources and cut-off values for each mining method. NSR calculation takes into account metal prices, which are based on a 10 year forecast
| 1- |
|
|
average, metallurgical recoveries, and commercial terms for concentrate sales. Cut-off values were estimated from 2022 actual costs.
Development designs were applied to connect the resulting stopes to existing development. Stope designs were reviewed to exclude shapes found to be isolated, low grade, or within areas with poor ground stability. Stope and development designs were fully scheduled in an appropriate LOM plan and applied to a discounted cash flow model. The Mineral Reserve estimate has demonstrated economically viable extraction.
For San Gerardo open pit Mineral Reserves, different nested pits were evaluated by Nexa using the NPV Scheduler software package from Datamine, which employs the Lerchs-Grossmann pit optimization algorithm. A pit shell was selected for reserve pit design based on a revenue factor of 0.90 of the prices from a set of shells generated using only Measured and Indicated Mineral Resources. NSR block value calculations were based on historical performance of the concentrator and current smelter contracts. Calculated block model NSR values were evaluated against the internal break-even value. Blocks classified as Measured or Indicated Mineral Resources with an NSR value above the internal break-even value were included in the Mineral Reserve. The open pit Mineral Reserve estimates support an open pit LOM production plan of approximately four years before the Atacocha underground mine starts production in 2027.
Table 1-5 and Table 1-6 summarize the Mineral Reserve estimates for the El Porvenir and Atacocha mines on a Nexa attributable ownership basis and 100% ownership basis, respectively.
| 1- |
|
|
Table 1-5: Summary of Cerro Pasco Complex Mineral Reserve Estimate (Nexa Attributable Basis) – December 31, 2023
| Category | Tonnage (Mt) |
Grade | Contained Metal | Recoveries | ||||||||||||
| Zn (%) |
Cu (%) |
Ag (g/t) |
Pb (%) |
Au (g/t) |
Zn (kt) |
Cu (kt) |
Ag (koz) |
Pb (kt) |
Au (koz) |
Zn (%) |
Cu (%) |
Ag (%) |
Pb (%) |
Au (%) |
||
| Proven | 6.02 | 3.30 | 0.20 | 68.4 | 1.29 | 0.06 | 198.6 | 12.3 | 13,221 | 77.6 | 11.5 | 87.8 | 15.0 | 77.3 | 80.9 | 65.5 |
| Probable | 13.84 | 3.78 | 0.24 | 67.9 | 1.19 | 0.04 | 523.5 | 32.9 | 30,226 | 164.7 | 17.4 | 88.6 | 15.0 | 77.4 | 80.5 | 65.5 |
| Total | 19.86 | 3.64 | 0.23 | 68.0 | 1.22 | 0.05 | 722.1 | 45.2 | 43,447 | 242.4 | 28.9 | 88.4 | 15.0 | 77.4 | 80.6 | 65.5 |
Notes:
| 1. | The definitions for Mineral Reserves in S-K 1300 were followed for Mineral Reserves which are consistent with CIM (2014) definitions. |
| 2. | Mineral Reserves are reported on an 83.48% and 75.96% Nexa attributable ownership basis for El Porvenir and Atacocha, respectively. |
| 3. | El Porvenir and Atacocha UG Mineral Reserves are estimated at break-even NSR cut-off values between US$63.77/t and US$69.00/t processed for SLS and between US$65.77/t and US$71.07/t processed for CAF depending on the mining zone. A number of marginal stopes with marginal NSR cut-off values between US$39.86/t and US$45.09/t processed for SLS and between US$41.86/t and US$47.16/t processed for CAF are included in the estimate. |
| 4. | Atacocha OP Mineral Reserves are estimated at an NSR cut-off of US$16.21/t. |
| 5. | Mineral Reserves are estimated using average long term prices of Zn: US$2,799.04/t (US$1.27/lb); Cu: US$7,669.61/t (US$3.48/lb); Ag: US$21.17/oz; Pb: US$2,000.29 /t (US$0.91/lb); and Au: US$1,630.93/oz. |
| 6. | Metallurgical recoveries are accounted for in the NSR calculations based on historical processing data and are variable as a function of head grade. |
| o | El Porvenir : Zn (89.2%), Pb (80.0%), Cu (14.6%), and Ag (77.5%) |
| o | Atacocha UG: Zn (89.3%), Pb (80.0%), Cu (15.7%), and Ag (77.5%), |
| o | Atacocha OP: Zn (70.4%), Pb (84.0%), Ag (75.8%), and Au (65.5%) |
| 7. | A minimum mining width of 4.0 m was used for SLS stopes and 5.0 m for CAF stopes. |
| 8. | A dilution equivalent linear overbreak/slough (ELOS) of 1.0 m and a dilution factor of 10% is added to CAF stopes and SLS stopes respectively. |
| 9. | A mining recovery factor of 95% is applied to CAF and 85% is applied to SLS stopes. |
| 10. | No mining dilution was applied to Atacocha OP and a 100% mining recovery was assumed. |
| 11. | There are no Cu grades estimated for Atacocha OP and no Au grades estimated for Atacocha UG and El Porvenir UG. This has reduced the Cu and Au average grades for the total Cerro Pasco tonnes. |
| 12. | Numbers may not add due to rounding. |
| 1- |
|
|
Table 1-6: Summary of Cerro Pasco Complex Mineral Reserve Estimate (100%) – December 31, 2023
| Category | Tonnage (Mt) |
Grade | Contained Metal | Recoveries | |||||||||||||
| Zn (%) |
Cu (%) |
Ag (g/t) |
Pb (%) |
Au (g/t) |
Zn (kt) |
Cu (kt) |
Ag (koz) |
Pb (kt) |
Au (koz) |
Zn (%) |
Cu (%) |
Ag (%) |
Pb (%) |
Au (%) |
|||
| Proven | 7.53 | 3.26 | 0.20 | 68.0 | 1.29 | 0.06 | 245.5 | 15.3 | 16,468 | 97.2 | 15.2 | 87.7 | 15.0 | 77.3 | 80.9 | 65.5 | |
| Probable | 17.16 | 3.76 | 0.24 | 67.6 | 1.19 | 0.04 | 645.5 | 40.9 | 37,330 | 204.5 | 22.9 | 88.5 | 15.1 | 77.4 | 80.6 | 65.5 | |
| Total | 24.70 | 3.61 | 0.23 | 67.8 | 1.22 | 0.05 | 891.0 | 56.1 | 53,797 | 301.7 | 38.1 | 88.3 | 15.1 | 77.4 | 80.7 | 65.5 | |
Notes:
| 1. | The definitions for Mineral Reserves in S-K 1300 were followed for Mineral Reserves which are consistent with CIM (2014) definitions. |
| 2. | Mineral Reserves are reported on a 100% Nexa attributable ownership basis. Nexa owns 83.48% of El Porvenir and 75.96% of Atacocha. |
| 3. | El Porvenir and Atacocha UG Mineral Reserves are estimated at break-even NSR cut-off values between US$63.77/t and US$69.00/t processed for SLS and between US$65.77/t and US$71.07/t processed for CAF depending on the mining zone. A number of marginal stopes with marginal NSR cut-off values between US$39.86/t and US$45.09/t processed for SLS and between US$41.86/t and US$47.16/t processed for CAF are included in the estimate. |
| 4. | Atacocha OP Mineral Reserves are estimated at an NSR cut-off of US$16.21/t. |
| 5. | Mineral Reserves are estimated using average long term prices of Zn: US$2,799.04/t (US$1.27/lb); Cu: US$7,669.61/t (US$3.48/lb); Ag: US$21.17/oz; Pb: US$2,000.29 /t (US$0.91/lb); and Au: US$1,630.93/oz. |
| 6. | Metallurgical recoveries are accounted for in the NSR calculations based on historical processing data and are variable as a function of head grade. |
| o | El Porvenir : Zn (89.2%), Pb (80.0%), Cu (14.6%), and Ag (77.5%) |
| o | Atacocha UG: Zn (89.3%), Pb (80.0%), Cu (15.7%), and Ag (77.5%), |
| o | Atacocha OP: Zn (70.4%), Pb (84.0%), Ag (75.8%), and Au (65.5%) |
| 7. | A minimum mining width of 4.0 m was used for SLS stopes and 5.0 m for CAF stopes. |
| 8. | A dilution equivalent linear overbreak/slough (ELOS) of 1.0 m and a dilution factor of 10% is added to CAF stopes and SLS stopes respectively. |
| 9. | A mining recovery factor of 95% is applied to CAF and 85% is applied to SLS stopes. |
| 10. | No mining dilution was applied to Atacocha OP and a 100% mining recovery was assumed. |
| 11. | There are no Cu grades estimated for Atacocha OP and no Au grades estimated for Atacocha UG and El Porvenir UG. This has reduced the Cu and Au average grades for the total Cerro Pasco tonnes. |
| 12. | Numbers may not add due to rounding. |
| 1- |
|
|
The QPs are not aware of any risk factors associated with, or changes to, any aspects of the modifying factors such as mining, metallurgical, infrastructure, permitting, or other relevant factors that could materially affect the Mineral Reserve estimate with the exception of the impacts of faults on the equivalent linear overbreak/slough (ELOS) that have not been accounted for in the geotechnical empirical analyses for the underground mines. SLR has estimated the impact of an increase in ELOS/dilution, and has reduced the Mineral Reserve by 2%.
| 1.3.8 | Mining Methods |
| 1.3.8.1 | Atacocha and El Porvenir Underground Mines |
The current Atacocha processing plant is being fed by the San Gerardo open pit mine which is scheduled to reach its end of mine life in 2027. Once the pit is depleted, operations at the Atacocha underground mine will be re-started. The underground mine will be integrated with the El Porvenir underground mine, with both mines feeding the El Porvenir processing plant. The Atacocha processing plant and mine site will be shut down and all operations will be transferred to the El Porvenir mine site. As part of the integration plan, a 1,750 m connection ramp between the two mines will be driven on the 2900 Level. The ramp will connect to a system of ore raises and haulage ramps at Atacocha and to the shaft loading pocket at El Porvenir.
Ore from El Porvenir is predominantly mined using overhand CAF mining method, which accounts for approximately 80% of total production. SLS makes up the remainder of ore production. SLS will be increasingly used over the LOM particularly when the veins are steeply dipping. SLS accounts for approximately 55% of ore production over the LOM. The same mining methods were used at Atacocha before the mine closure in 2020 and will continue to be used over the planned LOM.
The ore produced in the CAF and SLS stopes is transported to and dumped in ore passes by load haul dump units (LHD). These ore passes extend to the 2,900 track haulage level where the ore is pulled from chutes and loaded onto mine cars. The mine cars dump at an ore pass grizzly, and the ore is transferred to the shaft's loading pocket on the 2500 Level. From there, the ore is loaded onto skips and hoisted via the shaft to the ore dump. After being discharged at the dump, the ore is transferred to the underground primary crusher. Crushed ore is transported to the processing plant via a conveyor in an inclined drift.
Geotechnical analyses for the underground stope and ground support used a combination of empirical and 2D/3D numerical modelling, based upon core logging, rock testing results, and stress measurements from site.
| 1.3.8.2 | Atacocha (San Gerardo) Open Pit Mine |
The open pit is a conventional open pit mining method with drill and blast operations using excavators and trucks operating on bench heights of six metres. The mining contractor provides operators, equipment, and ancillary facilities required for the mining operation.
Mill feed material produced by San Gerardo is hauled to the ore pass to the east of the pit that reports to the 3600 Level of Atacocha underground, where it is trammed by locomotive and rail car to the Atacocha plant. Waste is hauled to the San Gerardo waste dump, which is adjacent to the Atacocha TSF dam.
| 1- |
|
|
The open pit Mineral Reserve estimates support an open pit LOM production plan of approximately four years before the underground mine starts production in 2027. Total material mined is limited to 10 million tonnes per annum (Mtpa), or approximately 27 ktpd.
| 1.3.9 | Processing and Recovery Methods |
| 1.3.9.1 | El Porvenir |
El Porvenir processing plant is located adjacent to the mine at an altitude of 4,100 MASL to 4,200 MASL. The concentrator has an ore processing capacity of approximately 2.37 Mtpa. The El Porvenir concentrator processed 2,220,011 tonnes of ore in 2023. El Porvenir copper and lead concentrates are sold to traders and delivered by road and rail to Callao (approximately 270 km by road) for shipping overseas, while zinc concentrate is transported by road and rail to Nexa’s Cajamarquilla zinc refinery east of Lima. El Porvenir is approximately 315 km from Lima by road. The current LOM plan continues to 2028. Processing consists of conventional crushing, grinding, and flotation to produce separate copper, lead, and zinc concentrates.
Tailings are cycloned and the coarse fraction is used for mine backfill, which constitutes approximately 35% of tailings produced. Water from tailings dewatering is returned to the process. Overflow from the cyclones containing the fine tailings is deposited in the conventional TSF adjacent to the mine and processing plant. Tailings can be discharged at various points in the TSF by means of valved discharge points on the tailings line. Clarified water discharged from the TSF joins natural water flows.
Make-up water is supplied from various streams around the TSF, as well as the Carmen Chico River, approximately 3.2 km south of the processing facility.
El Porvenir lead and zinc concentrates are generally clean and do not attract penalty charges for deleterious elements. The copper concentrate attracts penalties due to elevated arsenic, antimony, bismuth, and lead plus zinc content (approximately 15% combined). The penalty charges are approximately US$8.00/dry metric tonne (dmt).
| 1.3.9.2 | Atacocha |
The Atacocha concentrator processes ore from the San Gerardo open pit mine. The average daily processing rate is approximately 4,200 tonnes. The Atacocha concentrator processed 1,397,192 tonnes of ore in 2023.
The Atacocha concentrator utilizes a conventional crushing, grinding, and sequential flotation scheme to produce lead and zinc concentrates. A flash-flotation step is included in the grinding circuit that recovers lead at a grade sufficiently high to report directly to the final lead concentrate. Low copper grades resulted in a discontinuation of copper concentrate production in 2020. The majority of gold and silver report to the lead concentrate.
The zinc concentrate is transported to the Cajamarquilla zinc refinery near Lima, while the copper and lead concentrates are sold to concentrate traders.
| 1.3.10 | Infrastructure |
| 1.3.10.1 | El Porvenir |
The El Porvenir infrastructure consists of the following facilities:
| • | Approximately 6,500 tpd underground mine |
| 1- |
|
|
| • | A 2.2 Mtpa processing plant with associated laboratory and maintenance facilities |
| • | Power plant |
| • | Access roads |
| • | Offices and warehouses |
| • | Accommodations |
| • | Waste rock facilities |
| • | Temporary ore stockpiles |
| • | Hydraulic backfill plant |
| • | TSF |
The power supply for the El Porvenir Mine comes from two sources, the national power grid and the La Candelaria Hydroelectric Plant.
Raw water is sourced from Tingovado Creek, as well as from other creeks around the TSF. Fresh water supply is obtained from the Carmen Chico River, approximately 3.2 km south of the processing facility.
The EL Porvenir TSF receives tailings generated by both El Porvenir and Atacocha processing plants. A portion of tailings is used for hydraulic backfill at El Porvenir. The TSF was originally constructed in the 1970s, and the current elevation of the dam crest is 4,064 MASL and the dam height is approximately 140 m.
Waste rock from the underground operations is either used as backfill underground or stockpiled on surface. If waste rock is brought to surface in the future, it will be deposited in a designated area near the secondary TSF embankment southwest of the concentrator plant area.
| 1.3.10.2 | Atacocha |
Site operations comprise an underground mine, open pit mine, and a process plant facility. Supporting on-site infrastructure include maintenance facilities; maintenance buildings for underground and surface equipment, laboratory, and tailings pumping station. Facilities and structures supporting operations include warehouses and laydown areas, offices, dry facilities, hydroelectric generating station, power lines and substation, fuel storage tanks, and accommodation camp. The site has well developed systems in place for water supply and distribution, including fresh water and fire suppression water, sewage collection and disposal, and communications. A network of site roads that are approximately six metres wide and total 15 km in length are used by authorized mine personnel and equipment, including ore and waste haul trucks, concentrate haul trucks, and support and light duty vehicles to provide access to on-site infrastructure.
Power supply for Atacocha comes from three sources, Electroandes, a power supplier located in Paragsha, via a 30 km long 50 kV transmission line, Chaprin Hydro, a hydroelectric generating station with a total capacity of 5.26 MW via a 15 km long 50 kV transmission line, and the Marcopampa hydroelectric generating station with a total capacity of 1.1 MW via a five kilometre long 50 kV transmission line.
Waste rock from the San Gerardo open pit is disposed of in the Atacocha waste dump, which is adjacent to and downstream of the Atacocha TSF. The Atacocha TSF has capacity for expansion to accommodate tailings production over the LOM.
| 1- |
|
|
| 1.3.11 | Market Studies |
The principal commodities produced at El Porvenir and Atacocha mines, Zn, Pb, Cu, Ag, and Au, are freely traded, at prices and terms that are widely known, so that prospects for sale of any Nexa production are virtually assured.
The final sale products for El Porvenir processing plant (for all underground material processed between years 2024 and 2033) are copper, lead, and zinc concentrates. El Porvenir copper and lead concentrates are sold to traders and delivered by road and rail to Callao, which is approximately 270 km by road, for shipping overseas. Zinc concentrate is transported by road and rail to Nexa’s Cajamarquilla zinc refinery near Lima as per Nexa’s internal planning. Over the LOM Zn concentrate represents 60% of El Porvenir’s gross revenue, while Pb concentrate and Cu concentrate represent 37% and 3%, respectively.
The final sales products for the Atacocha processing plant (for open pit material processed between years 2024 and 2027) are lead concentrate and zinc concentrate. Over the LOM of the Atacocha plant Pb concentrate represents 73% of Atacocha’s gross revenue, while Zn concentrate represents 27% of Atacocha’s gross revenue.
Over the LOM for the Cerro Pasco Complex, considering production from both El Porvenir and Atacocha plants, the gross revenue, broken down by metal sold, is as follows: zinc 54%, lead 16%, copper 2%, silver 27%, and gold 1%
Market information is based on the industry scenario analysis prepared by Nexa’s Market Intelligence team for years 2022 and 2023 based on information sourced from different banks and independent financial institutions, economy and politics research groups, and metals consultants.
Metal prices for the economic analysis have been forecasted by Nexa’s Market Intelligence team based on market information sourced by banks and financial institutions.
In terms of material contracts to run the operation, Nexa has negotiated with different known traders (such as Glencore, Trafigura, Humon, and IXM) the sale of their copper and lead concentrates. In addition to concentrate sales, Nexa has numerous contracts with suppliers for the majority of the operating activities at El Porvenir and Atacocha mine sites, such as underground mine development contractors, material transport, drilling, loading and hauling services, plant maintenance, laboratory services, suppliers for consumables, reagents, maintenance, and general services to support the mine operations.
| 1.3.12 | Environmental Studies, Permitting and Plans, Negotiations, or Agreements with Local Individuals or Groups |
Various EIAs and supporting technical reports have been submitted to the regulatory authorities to identify potential environmental effects resulting from project activities for the construction, operation, and closure stages. The monitoring program implemented at the El Porvenir Mine includes monitoring of meteorology, air quality, non-ionizing radiation, noise, surface water quality, springs water quality, effluent discharges, fauna and flora, and physical stability of the tailings dam. The monitoring program implemented at the Atacocha Mine includes effluent discharges, gas emissions, air quality, non-ionizing radiation, noise, surface water quality, groundwater quality, springs water quality, vibrations, soil quality, terrestrial biology (vegetation and wildlife), and aquatic biology. The results of the monitoring program are reported to the Peruvian authorities quarterly.
El Porvenir and Atacocha hold a number of environmental permits and authorizations in support of the current operations. The permits are Directorial Resolutions issued by the Peruvian
| 1- |
|
|
authorities upon approval of mining environmental management instruments filed by the mining companies. Nexa maintains an up-to-date record of the legal permits obtained to date. Additional permits will be required in the future for implementation of the Cerro Pasco Complex Integration project.
According to the annual report for 2022 issued by Nexa, the company seeks to create a positive legacy in host communities and maintain a constant and close dialogue with them, working towards building a positive relationship with stakeholders. Nexa’s ESG strategy is built around nine Environment, Social and Governance pillars.
A social baseline description, assessment of socio-economic impacts, and identification of mitigation/enhancement measures have been carried out for both El Porvenir and Atacocha to mitigate negative impacts and maximize positive benefits of the mines. These components are generally consistent with social impact assessment practices. Community Relations Plans have been developed for El Porvenir and Atacocha as part of the EIAs outlining objectives, strategies, and specific indicators for social programs. Nexa has a permanent information office dedicated to receiving, managing, and addressing complaints, claims, questions, and information requests from the communities. SLR understands that Nexa has implemented a grievance mechanism for receiving local community questions, concerns, and complaints. Nexa has also developed a communications program to facilitate the interaction with the communities.
According to the annual report for 2023 issued by Nexa Peru, one of the key risks for the Cerro Pasco Complex operations to be managed and mitigated is social conflict with communities within the area of influence, which has the potential to result in blockades, project delays, and/or reputational damage.
A conceptual Mine Closure Plan was approved in 2007 for the El Porvenir Mine components within the context of the Peruvian legislation and has subsequently been amended or updated four times. A conceptual Mine Closure Plan was approved in 2007 for the Atacocha Mine components within the context of the Peruvian legislation and has subsequently been amended or updated five times. The Mine Closure Plan addresses temporary, progressive, and final closure actions, and post closure inspection and monitoring. A closure cost estimate was developed and included in the Mine Closure Plan. The total financial assurance for progressive closure, final closure, and post closure is calculated by Nexa according to the Peruvian regulations (Supreme Decree D.S. N° 262-2012-MEM/DM).
| 1.3.13 | Capital and Operating Cost Estimates |
El Porvenir and Atacocha are operating mines, and therefore all capital costs are categorized as sustaining.
Sustaining capital costs have been estimated by Nexa based on historical and actual costs, plus the estimated capital costs for the underground development, infrastructure, and equipment required to complete the Cerro Pasco Complex integration. Based on the SLR QP’s review, the sustaining capital costs are estimated to the equivalent of an Association for the Advancement of Cost Engineering (AACE) Class 2 estimate with an accuracy range of -10% to +15%. All costs are expressed in Q4 2023 US dollars.
The summary breakdown of the estimated sustaining capital costs required to achieve the Mineral Reserve LOM production are presented in Table 1-7.
| 1- |
|
|
Table 1-7: Sustaining Capital Costs Summary – Cero Pasco Complex
| Cost Component | Value (US$ millions) |
| El Porvenir Mine Development | 166 |
| El Porvenir Processing Plant Improvements | 19 |
| El Porvenir Mining Equipment | 17 |
| El Porvenir Infrastructure | 48 |
| El Porvenir Tailings Storage Facilities | 132 |
| El Porvenir Other Projects / Assets Sustaining Capital | 18 |
| Atacocha Mine Development | 137 |
| Atacocha Processing Plant Improvements | 3 |
| Atacocha Mining Equipment | 6 |
| Atacocha Infrastructure | 22 |
| Atacocha Tailings Storage Facilities | 35 |
| Atacocha Other Projects / Assets Sustaining Capital | 20 |
| Total Sustaining Capital Costs | 622 |
Notes: Sum of individual values may not match total due to rounding.
The operating costs were estimated based on the actual operating expenditures and current operating budget for both El Porvenir and Atacocha mines, and the forecasted operating costs, considering the operating synergies once the integration process is completed.
The operating expenses estimated for mining, processing, and G&A activities to support the production of the Cerro Pasco Mineral Reserves over the LOM are summarized in Table 1-8.
Table 1-8: Operating Costs Estimate – Cerro Pasco Complex
| Cost Component | LOM Total (US$ millions) |
Average Annual1,2 (US$ millions) |
LOM Average (US$/t milled) |
| Atacocha Plant (Open Pit material) 1 | |||
| Open Pit Mining (Atacocha Open Pit) | 85 | 21 | 19.52 |
| Processing – Atacocha Plant | 58 | 15 | 13.29 |
| G&A – Open Pit | 52 | 13 | 11.85 |
| El Porvenir Plant (Underground material) 2 | |||
| Underground Mining (El Porvenir & Atacocha) | 797 | 86 | 39.25 |
| Processing – El Porvenir Plant | 266 | 28 | 13.07 |
| G&A – Underground | 154 | 16 | 7.56 |
| Combined Site Operating Costs | 1,412 | 152 | 57.18 |
| 1- |
|
|
Notes:
| 1. | For open pit fully operational years (2024 – 2027) |
| 2. | For underground fully operational years (2025 – 2032) |
| 3. | Sum of individual values may not match total due to rounding. |
| 1- |
|
|
| 2.0 | Introduction |
SLR Consulting (Canada) Ltd. (SLR) was retained by Nexa Resources S.A. (Nexa) to prepare a Technical Report Summary (TRS) on the integration of Nexa’s El Porvenir and Atacocha mines into the Cerro Pasco Complex (Cerro Pasco or the Complex), located in Pasco Province, Peru. The purpose of this TRS is to support the disclosure of the Cerro Pasco Mineral Resource and Mineral Reserve estimates with an effective date of December 31, 2023. The Mineral Resource estimate for the Complex was prepared by Jerry Huaman Abalos, B.Geo., AusIMM CP(Geo), Corporate Mineral Resource Manager with Nexa and a Qualified Person (QP) for this TRS. This TRS conforms to United States Securities and Exchange Commission’s (SEC) Modernized Property Disclosure Requirements for Mining Registrants as described in Subpart 229.1300 of Regulation S-K, Disclosure by Registrants Engaged in Mining Operations (S-K 1300) and Item 601 (b)(96) Technical Report Summary.
Nexa is a publicly traded company on the Toronto Stock Exchange (TSX) and the New York Stock Exchange (NYSE). Nexa is a reporting issuer in all provinces and territories of Canada and is under the jurisdiction of the Ontario Securities Commission.
Nexa is a large-scale, low-cost, integrated Zn producer with over 60 years of experience developing and operating mining and smelting assets in Latin America. Nexa has a diversified portfolio of polymetallic mines (Zn, Pb, Cu, Ag, and Au) and also greenfield projects at various stages of development in Brazil and Peru. In Brazil, Nexa owns and operates three underground mines, Vazante and Morro Agudo (Zn and Pb), and Aripuanã (Zn, Pb, Cu, Au, and Ag). It also operates two zinc smelters in Brazil (Três Marias and Juiz de Fora). In Peru, Nexa operates the Cerro Pasco Complex, which includes the El Porvenir (Zn, Pb, Cu, and Ag) and Atacocha (Zn, Cu, Pb, Au, and Ag) mines, and the Cerro Lindo (Zn, Cu, Pb, and Ag) Mine, as well as the Cajamarquilla zinc smelter near Lima. Nexa’s development projects in Peru include Magistral, Shalipayco, Florida Canyon (JV with Solitario), Hilarión, and Pukaqaqa. .
The El Porvenir Mine is 100% owned by Nexa Resources El Porvenir S.A.C. (Nexa El Porvenir), a 99.99%-owned subsidiary of Nexa Resources Peru S.S.A. (Nexa Peru). Nexa’s resulting interest in the El Porvenir Mine is 83.48% that corresponds to the sum of Nexa’s direct interest in Nexa Peru (0.18%) and indirect interest of Nexa in Nexa Peru (83.37%) through its controlled company Nexa Resources Cajamarquilla S.A. (99.916%), and the remaining 16.45% are floating shares.
The Atacocha Mine is 100% owned by Nexa Resources Atacocha S.A.A. (Nexa Atacocha). Nexa’s resulting interest in the Atacocha Mine is 75.96% that corresponds to the sum of Nexa’s direct interest in Nexa Peru (0.18%), and Nexa Peru’s indirect interest in Nexa Atacocha (90.999%) through its controlled company Nexa El Porvenir (99.99%), the remaining 9.001% are floating shares, and indirect participation of Nexa in Nexa Peru (83.37%) through its controlled company Nexa Resources Cajamarquilla S.A. (99.916%), and the remaining 16.45% are floating shares.
The integration project is intended to capture synergies between the two mining operations, resulting from their proximity and operational similarities, with the ore from both underground mines being processed in the El Porvenir treatment plant. The goal is to achieve cost and investment savings, thereby reducing the environmental footprint and extending the combined mine life of the two mines.
The integration project has been developed over the past several years. The first stage involved the administrative integration of both mines, which was completed in 2014. The second stage involved the integration of the tailings disposal system, which allowed the Atacocha plant to
| 2- |
|
|
send tailings to the El Porvenir dam within the short term, thereby helping reduce the environmental footprint. The third stage, completed in 2016, involved the construction of a new energy transmission line with a 138 kilovolt (kV) connection that supplies both mines, replacing the prior 50 kV transmission lines. The development of a 3.5 km tunnel, connecting both underground mines and enabling exploration program in the Integration Zone between the mines, was part of the fourth stage, concluded in 2019.
In 2021, the modernization and debottleneck studies to evaluate the deepening of the mine and extension of the life of mine (LOM) for El Porvenir were postponed due to the prioritization of a capital allocation strategy and the reassessment of the integration with the Atacocha underground mine. In 2022, Nexa advanced the integration project with an optimization study of the integration of the El Porvenir and Atacocha underground mines by evaluating increasing the capacity of tailings and shaft and optimizing the processing plant, to potentially increase production and extend the LOM.
In 2023, Nexa continued to advance the integration project with technical studies to sustain and expand production, such as mine design and studies for the underground interconnection, shaft upgrade and engineering assessment of the plant, as well as key routes to improve capacity to provide a long-term solution for tailings disposal. A Front-End Loading (FEL) 3 study to increase El Porvenir hoisting was completed in Q1 2023 and a FEL3 tailings pumping system study was completed in early Q2 2023.
The integration plan includes:
| · | restarting and rehabilitation of the Atacocha underground mine, |
| · | development of an approximately 2 km long connection tunnel (Tunnel 2900), linking Atacocha underground to the bottom of Picasso shaft in El Porvenir, allowing the production from both underground mines to be hoisted to feed the El Porvenir processing plant, |
| · | Picasso shaft capacity expansion to support production and extraction at both underground mines, |
| · | closure of the Atacocha processing plant, with the exhaustion of Atacocha open pit reserves, in 2027, |
| · | a new tailing pumping and pipeline system to be built, that will allow tailings from El Porvenir to be sent to the Atacocha dam, bringing a long term solution for tailings, supporting the extension of the combined life of the two mines. |
| 2.1 | Site Visits and QPs |
SLR’s QPs visited the site from January 15 to 17, 2024. Nexa’s QP, Jerry Huaman Abalos, B.Geo., AusIMM CP(Geo), visited the site over the same time period.
During the site visit, the QPs inspected the open pit and underground operations, the processing plants, and the tailings facilities and held discussions with Nexa Perú personnel.
Jerry Huaman Abalos, the geologist QP for this TRS, visited the open pit and underground operations, examined drill holes and mineralized open pit and underground mineralized exposures, reviewed interpreted plans and sections, core logging, sampling, quality assurance and quality control (QA/QC), modelling procedures for long-term and grade control purposes, and discussed the geological setting of the deposit as well as the geological interpretations, mineralization control and mine geology procedures with the El Porvenir and Atacocha mine geology staff.
| 2- |
|
|
The SLR mining engineer QP visited the open pit and underground operation and discussed parameters for Mineral Reserve estimation with El Porvenir and Atachocha mine staff.
The SLR metallurgist QP visited the Atacocha and El Porvenir process facilities including the office facilities, underground crushing and conveying, concentrators, tailings pumping station, electrical substations, and laboratories.
The SLR environmental QP visited the tailings disposal facilities at El Porvenir and Atacocha and some components of the water management infrastructure. The QP had discussions with Nexa Perú personnel responsible for environmental management and community relations activities.
Table 2-1 lists the QPs’ responsibilities for this TRS.
Table 2-1: QP Responsibilities
| Qualified Person | Responsibilities | |
| SLR Consulting (Canada) Ltd. (the SLR QPs) | Sections 1.1.1.2 to 1.1.1.7, 1.1.2.2 to 1.1.2.5, 1.2, 1.3.7 to 1.3.13, 2, 10, 12 to 19, 21, 22.2 to 22.7, 23.2 to 23.5, 25, and relevant references in Section 24. | |
| Jerry Huaman Abalos, B.Geo., AusIMM CP(Geo), Corporate Mineral Resource Manager, Nexa | Sections 1.1.1.1, 1.1.2.1, 1.3.1 to 1.3.6, 3 to 9, 11, 20, 22.1, 23.1, and relevant references in Section 24. | |
| 2.2 | Sources of Information |
During the preparation of this TRS, discussions were held with personnel from Nexa:
| · | Filipe Fonseca Silva, Management and Strategy Manager, Nexa |
| · | Jose Antonio Lopes, Corporate Mineral Resource Manager, Nexa |
| · | Jerry H. Abalos, Corporate Mineral Resource Manager, Nexa Peru |
| · | Vitor Teixeira De Aguilar, Technical Services Manager, Nexa |
| · | Paulo Henrique Araujo Calazans, Mining Engineer, Nexa |
| · | José Cayetano, Environmental Management Superintendent, Nexa |
| · | Carlos Quiñones, Social Management Superintendent, Nexa |
| · | Alder Osorio, El Porvenir Social Management Manager, Nexa |
| · | Daniel Saenz, Corporate Resource Geologist, Nexa Peru |
· Wilfredo Astete, Processing General Manager
· Fernando Villanova, Corporate Geologist, Nexa
| · | Cecilia Pastor, Land and Mineral Rights Manager, Nexa Peru |
· Magaly Bardales Rojas, Corporate Legal Counsel, Nexa Peru
· Renato Piazzon, Legal Counsel, Nexa Peru
| 2- |
|
|
Previously, SLR (which now includes Roscoe Postle Associates Inc. [RPA]) has been involved in the preparation of National Instrument 43-101 Technical Reports for both the Atacocha (RPA, 2019) and El Porvenir (SLR, 2021) mines and an S-K 1300 TRS for the El Porvenir Mine (SLR, 2021).
The documentation reviewed, and other sources of information, are listed at the end of this TRS in Section 24.0 References.
| 2- |
|
|
| 2.3 | List of Abbreviations |
Units of measurement used in this TRS conform to the metric system. All currency in this TRS is US dollars (US$) unless otherwise noted.
| m | micron | kVA | kilovolt-amperes |
| mg | microgram | kW | kilowatt |
| a | annum | kWh | kilowatt-hour |
| A | ampere | L | litre |
| bbl | barrels | lb | pound |
| Btu | British thermal units | L/s | litres per second |
| °C | degree Celsius | m | metre |
| C$ | Canadian dollars | M | mega (million); molar |
| cal | calorie | m2 | square metre |
| cfm | cubic feet per minute | m3 | cubic metre |
| cm | centimetre | MASL | metres above sea level |
| cm2 | square centimetre | m3/h | cubic metres per hour |
| d | day | mi | mile |
| dia | diameter | min | minute |
| dmt | dry metric tonne | mm | micrometre |
| dwt | dead-weight ton | mm | millimetre |
| °F | degree Fahrenheit | mph | miles per hour |
| ft | foot | MVA | megavolt-amperes |
| ft2 | square foot | MW | megawatt |
| ft3 | cubic foot | MWh | megawatt-hour |
| ft/s | foot per second | oz | Troy ounce (31.1035g) |
| g | gram | oz/st, opt | ounce per short ton |
| G | giga (billion) | ppb | part per billion |
| Gal | Imperial gallon | ppm | part per million |
| g/L | gram per litre | psia | pound per square inch absolute |
| Gpm | Imperial gallons per minute | psig | pound per square inch gauge |
| g/t | gram per tonne | RL | relative elevation |
| gr/ft3 | grain per cubic foot | s | second |
| gr/m3 | grain per cubic metre | st | short ton |
| ha | hectare | stpa | short ton per year |
| hp | horsepower | stpd | short ton per day |
| hr | hour | t | metric tonne |
| Hz | hertz | tpa | metric tonne per year |
| in. | inch | tpd | metric tonne per day |
| in2 | square inch | US$ | United States dollar |
| J | joule | USg | United States gallon |
| k | kilo (thousand) | USgpm | US gallon per minute |
| kcal | kilocalorie | V | volt |
| kg | kilogram | W | watt |
| km | kilometre | wmt | wet metric tonne |
| km2 | square kilometre | wt% | weight percent |
| km/h | kilometre per hour | yd3 | cubic yard |
| kPa | kilopascal | yr | year |
| 2- |
|
|
| 3.0 | Property Description |
| 3.1 | Location |
The Complex is located in Peru’s Central Andes region at an elevation of approximately 4,050 MASL to 4,200 MASL. It is situated in the districts of San Francisco de Asís de Yarusyacán and Yanacancha, in the province and department of Pasco (Figure 3-1).
El Porvenir and Atacocha are located 13 km and 16 km north of the city of Cerro de Pasco, which is located approximately 315 km by road from the national capital, Lima, when travelling by the Carretera Central and the La Oroya-Huánuco highway. El Porvenir’s coordinates are 10°36'36" S, 76°12'37" W (Latitude/Longitude decimals -10.6100, -76.2102), and approximately 367,600m E, 8,826,850m N using Universal Transverse Mercator (UTM) WGS84 datum Zone 18S. Atacocha’s coordinates are 10°34'37" S, 76°11'26" W (Latitude/Longitude decimals -10.5769, -76.1906), and approximately 367,160m E, 8,830,400m N using the UTM WGS84 Zone 18S. The mines are located approximately 3.5 km of each other.
| 3- |
|
|
Figure 3-1: Location Map

| 3- |
|
|
| 3.2 | Mineral Rights in Peru |
| 3.2.1 | Mineral Concessions |
According to Peruvian General Mining Law (the Law):
| 1 | Mineral concessions grant their holder the right to explore, develop, and mine metallic or non-metallic minerals located within their internal boundaries. |
| 2 | A mineral claim is an application to obtain a mineral concession. Exploration, development, and exploitation rights are obtained once the title to the concession has been granted, except in those areas that overlap with priority claims or priority mining concessions. Upon completion of the title procedure, resolutions awarding title must be recorded with the Public Registry to create enforceability against third parties and the Peruvian State. |
| 3 | Mineral rights are separate from surface rights. They are freely transferable. |
| 4 | A mineral concession by itself does not authorize the titleholder to carry out exploration or exploitation activities, but rather the titleholder must first: |
| a) | Obtain approval from the Culture Ministry of the applicable archaeological declarations, authorizations, or certificates. |
| b) | Obtain the environmental certification issued by the competent environmental authority, subject to the rules of public participation. |
| c) | Obtain permission for the use of land (i.e., obtain surface rights) by agreement with the owner of the land or the completion of the administrative easement procedure, in accordance with the applicable regulation. |
| d) | Obtain the applicable governmental licences, permits, and authorizations, according to the nature and location of the activities to be undertaken. |
| e) | Carry out consultations with Indigenous Peoples under the Culture Ministry, should there be any communities affected by potential exploitation of the mineral concession, as per International Labour Organization (ILO) Convention 169. |
| 5 | Mineral rights holders must comply with the payment of an annual fee equal to $3.00/ha, on or before June 30 of each year. |
| 6 | Holders of mineral concessions must meet a Minimum Annual Production Target or a Minimum Annual Investment before a statutory deadline. When such deadline is not met, a penalty must be paid as described below: |
| a) | Mineral concessions must meet a statutory Minimum Annual Production Target of 1 Tax Unit (Unidad Impositiva Tributaria, or UIT) per hectare per year for metallic concessions, within a statutory term of ten years from the title date. The applicable penalty is 2% of the Minimum Annual Production Target per hectare per year as of the 11th year until the 15th year. Starting in the 16th year and until the 20th year, the applicable penalty is 5% of the Minimum Annual Production Target per year and starting in the 21st year until the 30th year, the applicable penalty is 10% of the Minimum Annual Production Target per year. After the 30th year, if the Minimum Annual Production Target is not met, the mining concession will lapse automatically. |
| 3- |
|
|
| 7 | Mineral concessions may not be revoked as long as the titleholder complies with the Good Standing Obligations according to which mineral concessions will lapse automatically if any of the following events take place. |
| a) | The annual fee is not paid for two consecutive years. |
| b) | The applicable penalty is not paid for two consecutive years. |
| c) | A concession expires if it does not reach the minimum production in Year 30 and cannot justify the non-compliance up to five additional years due to reasons of force majeure described in the current legislation. |
| 8 | Agreements involving mineral rights (such as an option to acquire a mining lease or the transfer of a mineral concession) must be formalized through a deed issued by a public notary and must be recorded with the Public Registry to create enforceability against third parties and the Peruvian State. |
| 3.2.2 | Beneficiation Concessions |
According to Peruvian General Mining Law (the Law):
| 1 | The beneficiation concession grants the right to use physical, chemical, and physical-chemical processes to concentrate minerals or purify, smelt, or refine metals. |
| 2 | As from the year in which the beneficiation concession was requested, the holder shall be obliged to pay the Mining Concession Fee in an annual amount according to its installed capacity, as follows: |
| a) | 350 tpd or less: 0.0014 of one UIT per tpd. |
| b) | from more than 350 tpd to 1,000 tpd: 1.00 UIT |
| c) | from 1,000 tpd to 5,000 tpd: 1.5 UIT |
| d) | for every 5,000 tpd in excess: 2.00 UIT |
Note. “tpd” refers to the installed treatment capacity. In the case of expansions, the payment that accompanies the application is based on the increase in capacity.
| 3.3 | Land Tenure |
The QPs rely upon a legal opinion provided by Nexa regarding ownership information (Bardales Rojas, 2024).
El Porvenir consists of 25 mining concessions covering an area of 4,846.68 ha and one beneficiation concession covering an area of 323.79 ha. As of December 31, 2023, the concessions are held in the name of Nexa El Porvenir, Nexa Atacocha, Nexa Peru, and S.M.R.L. CMA No. 54 (50% Nexa El Porvenir and 50% Nexa Atacocha).
Atacocha consists of 147 mineral concessions covering an area of 2,872.47 ha and one beneficiation concession covering an area of 413.23 ha. As of December 31, 2023, the Atacocha concessions are held in the name of Nexa Atacocha, Nexa Peru, and Nexa El Porvenir.
The titles of all mineral concessions have been granted and duly recorded in the Public Registry. The UTM coordinates of these mineral concessions, which determine their location within the official grid, have been recorded in the Mining Cadaster.
| 3- |
|
|
None of the concessions are in urban expansion areas, protected natural areas, or archaeological sites.
The mineral concessions for El Porvenir are tabulated in Table 3-1 and for Atacocha in Table 3-3. The beneficiation concessions for El Porvenir are tabulated in Table 3-2 and for Atacocha in Table 3-4.
Mineral rights maps are provided in Figure 3-2 and Figure 3-3 for El Porvenir and Atacocha, respectively.
| 3- |
|
|
Table 3-1: El Porvenir Mineral Concessions
| No | Concession Code | Concession Name |
Title Holder | Status | Date | Public Registry Record | Granted
Area (ha) |
Available
Area (ha) |
2023 Fee (US$) | 2023 Penalty (US$) | 2023
Total Paid (US$) |
| 1 | 010000515L | ACUMULACION EL PORVENIR | NEXA RESOURCES EL PORVENIR S.A.C. | Acumulación D.M. Titulada | 03/04/1877 | P-11248335 | 5,040.79 | 4,600.52 | 13,801.55 | 0.00 | 13,801.55 |
| 2 | 010000116L | ACUMULACION EL PORVENIR 1 | NEXA RESOURCES EL PORVENIR S.A.C. | Acumulación D.M. Titulada | 25/01/2016 | P-11242512 | 7.99 | 7.99 | 23.96 | 0.00 | 23.96 |
| 3 | 04010149X01 | C.M.A. Nº 55 | NEXA RESOURCES ATACOCHA S.A.A. - Assigned to Nexa Resources El Porvenir | D.M. Titulado D.L. 109 | 04/06/1955 | P-02016190 | 1.00 | 1.00 | 3.00 | 0.00 | 3.00 |
| 4 | 04002731X01 | KITTY | NEXA RESOURCES ATACOCHA S.A.A. - Assigned to Nexa Resources El Porvenir | D.M. Titulado D.L. 109 | 24/02/1906 | P-02010298 | 6.00 | 5.99 | 17.98 | 0.00 | 17.98 |
| 5 | 04010070X01 | ATACOCHA Nº 1 | NEXA RESOURCES ATACOCHA S.A.A. - Assigned to Nexa Resources El Porvenir | D.M. Titulado D.L. 109 | 09/11/1954 | P-20000404 | 2.77 | 1.60 | 4.79 | 0.00 | 4.79 |
| 6 | 04013393X01 | CARLITOS | NEXA RESOURCES EL PORVENIR S.A.C. | D.M. Titulado D.L. 109 | 04/05/1987 | P-20002989 | 20.00 | 20.00 | 60.00 | 48.64 | 108.64 |
| 7 | 04013362X01 | PUCAYACU | NEXA RESOURCES EL PORVENIR S.A.C. | D.M. Titulado D.L. 109 | 17/06/1986 | P-20002923 | 36.00 | 36.00 | 108.00 | 87.56 | 195.56 |
| 8 | 04005441X01 | ANGELICA SEGUNDA | NEXA RESOURCES ATACOCHA S.A.A. - Assigned to Nexa Resources El Porvenir | D.M. Titulado D.L. 109 | 06/11/1915 | P-02005830 | 2.00 | 2.00 | 5.99 | 48.58 | 54.57 |
| 3- |
|
|
| No | Concession Code | Concession Name |
Title Holder | Status | Date | Public Registry Record | Granted
Area (ha) |
Available
Area (ha) |
2023 Fee (US$) | 2023 Penalty (US$) | 2023
Total Paid (US$) |
| 9 | 04010249X01 | ATACOCHA Nº 2 | NEXA RESOURCES ATACOCHA S.A.A. - Assigned to Nexa Resources El Porvenir | D.M. Titulado D.L. 109 | 09/12/1955 | P-02014333 | 2.99 | 2.77 | 8.30 | 67.26 | 75.56 |
| 10 | 04010074X01 | C.M.A. Nº 41 | NEXA RESOURCES ATACOCHA S.A.A. - Assigned to Nexa Resources El Porvenir | D.M. Titulado D.L. 109 | 13/11/1954 | P-02013928 | 66.00 | 65.91 | 197.72 | 1,602.99 | 1,800.71 |
| 11 | 04010073X01 | C.M.A. Nº 42 | NEXA RESOURCES ATACOCHA S.A.A. - Assigned to Nexa Resources El Porvenir | D.M. Titulado D.L. 109 | 11/11/1954 | P-02013917 | 3.00 | 3.00 | 8.99 | 72.86 | 81.85 |
| 12 | 04010071X01 | C.M.A. Nº 43 | NEXA RESOURCES ATACOCHA S.A.A. – Assigned to Nexa Resources El Porvenir | D.M. Titulado D.L. 109 | 10/11/1954 | P-02010565 | 5.00 | 4.99 | 14.98 | 121.45 | 136.43 |
| 13 | 04010072X01 | C.M.A. Nº 44 | NEXA RESOURCES ATACOCHA S.A.A. - Assigned to Nexa Resources El Porvenir | D.M. Titulado D.L. 109 | 11/11/1954 | P-02013919 | 8.00 | 7.99 | 23.97 | 194.30 | 218.27 |
| 14 | 04010063X02 | C.M.A. Nº 45 | NEXA RESOURCES ATACOCHA S.A.A. - Assigned to Nexa Resources El Porvenir | D.M. Titulado D.L. 109 | 13/11/1954 | P-02014009 | 24.00 | 23.97 | 71.90 | 582.91 | 654.81 |
| 15 | 04005426X01 | ITHACA | NEXA RESOURCES ATACOCHA S.A.A. - Assigned to Nexa Resources El Porvenir | D.M. Titulado D.L. 109 | 07/10/1915 | P-02010173 | 4.00 | 3.99 | 11.98 | 79.90 | 91.88 |
| 16 | 04002471X01 | KATHLEEN | NEXA RESOURCES ATACOCHA S.A.A. - Assigned to Nexa Resources El Porvenir | D.M. Titulado D.L. 109 | 03/06/1905 | P-02010553 | 6.00 | 5.99 | 17.98 | 119.84 | 137.82 |
| 3- |
|
|
| No | Concession Code | Concession Name |
Title Holder | Status | Date | Public Registry Record | Granted
Area (ha) |
Available
Area (ha) |
2023 Fee (US$) | 2023 Penalty (US$) | 2023
Total Paid (US$) |
| 17 | 04005356X01 | LA TUNDA | NEXA RESOURCES ATACOCHA S.A.A. - Assigned to Nexa Resources El Porvenir | D.M. Titulado D.L. 109 | 28/10/1935 | P-02010176 | 6.00 | 5.99 | 17.98 | 119.84 | 137.82 |
| 18 | 04005383X01 | MANUEL NUMERO DOS | NEXA RESOURCES ATACOCHA S.A.A. - Assigned to Nexa Resources El Porvenir | D.M. Titulado D.L. 109 | 19/06/1915 | P-02005462 | 8.00 | 7.99 | 23.97 | 194.33 | 218.30 |
| 19 | 04005372X01 | MELBOURNE | NEXA RESOURCES ATACOCHA S.A.A. - Assigned to Nexa Resources El Porvenir | D.M. Titulado D.L. 109 | 27/05/1915 | P-02010281 | 12.00 | 11.98 | 35.95 | 239.69 | 275.64 |
| 20 | 04005505X01 | TRALEE | NEXA RESOURCES ATACOCHA S.A.A. - Assigned to Nexa Resources El Porvenir | D.M. Titulado D.L. 109 | 23/02/1916 | P-02010297 | 2.00 | 2.00 | 5.99 | 39.95 | 45.94 |
| 21 | 04012874X01 | C.M.A. Nº 95 | NEXA RESOURCES ATACOCHA S.A.A. / NEXA RESOURCES PERU S.A.A. - Assigned to Nexa Resources El Porvenir | D.M. Titulado D.L. 109 | 07/12/1978 | P-20000331 | 4.00 | 3.96 | 11.89 | 96.38 | 108.27 |
| 22 | 04012875X01 | C.M.A. Nº 96 | NEXA RESOURCES ATACOCHA S.A.A. / NEXA RESOURCES PERU S.A.A. - Assigned to Nexa Resources El Porvenir | D.M. Titulado D.L. 109 | 07/12/1978 | P-20000332 | 4.00 | 3.99 | 11.98 | 97.15 | 109.13 |
| 23 | 010079393 | MACAPATA | NEXA RESOURCES PERU S.A.A. - Assigned to Nexa Resources El Porvenir | D.M. Titulado D.L. 708 | 27/05/1993 | P-20004829 | 100.00 | 14.08 | 42.23 | 342.42 | 384.65 |
| 3- |
|
|
| No | Concession Code | Concession Name |
Title Holder | Status | Date | Public Registry Record | Granted
Area (ha) |
Available
Area (ha) |
2023 Fee (US$) | 2023 Penalty (US$) | 2023
Total Paid (US$) |
| 24 | 04010148X01 | C.M.A. Nº 54 | S.M.R.L. CMA Nº 54 - Assigned to Nexa Resources El Porvenir | D.M. Titulado D.L. 109 | 04/06/1955 | P-11105479 | 2.00 | 2.00 | 5.99 | 39.94 | 45.93 |
| 25 | 04012134X01 | DEMASIA AM-Nº 1 | S.M.R.L. CMA Nº 54 - Assigned to Nexa Resources El Porvenir | D.M. Titulado D.L. 109 | 13/03/1973 | P-20001500 | 1.00 | 1.00 | 3.00 | 19.97 | 22.97 |
| Totals | 5,374.53 | 4,846.68 | 14,540.07 | 4,215.97 | 18,756.04 | ||||||
Note: Exchange rate: 3.782 Peruvian Nuevo Sol per US$
| 3- |
|
|
Table 3-2: El Porvenir Beneficiation Concession
| No. | Concession Code | Concession Name | Title Holder | Status | Date | Public Registry Record | Granted Area (ha) | 2023 Annual Fee (Peruvian Nueva Sol) | 2023 Total Paid (US$) |
| 1 | P000000613 | ACUMULACION AQUILES 101 | NEXA RESOURCES EL PORVENIR S.A.C. | Planta de Beneficio | 21/06/2013 | P-11209158 | 323.79 | 18,166.50 | 4,803.41 |
| Totals | 323.79 | 18,166.50 | 4,803.41 | ||||||
Note: Exchange rate: 3.782 Peruvian Nuevo Sol per US$
| 3- |
|
|
Table 3-3: Atacocha Mineral Concessions
| No. | Concession Code | Concession Name | Title Holder | Status | Date | Public Registry Record | Granted
Area (ha) |
Available
Area (ha) |
2023 Annual Fee (US$) | 2023 Annual Penalty (US$) | 2023 Total Payment (US$) |
| 1 | 010000216L | ACUMULACION ATACOCHA 1 | NEXA RESOURCES ATACOCHA S.A.A. | Acumulación D.M. Titulada | 25/01/2016 | P-11246469 | 43.94 | 43.94 | 131.81 | 0.00 | 131.81 |
| 2 | 04009516X01 | AGUSTIN | NEXA RESOURCES ATACOCHA S.A.A. | D.M. Titulado D.L. 109 | 07/06/1951 | P-02013182 | 4.00 | 3.99 | 11.98 | 0.00 | 11.98 |
| 3 | 04007683X01 | ALICIA | NEXA RESOURCES ATACOCHA S.A.A. | D.M. Titulado D.L. 109 | 27/07/1927 | P-02003967 | 4.00 | 4.00 | 11.99 | 0.00 | 11.99 |
| 4 | 04012577X01 | AMERICA DEL SUR | NEXA RESOURCES ATACOCHA S.A.A. | D.M. Titulado D.L. 109 | 06/06/1979 | P-20004303 | 20.00 | 19.97 | 59.90 | 0.00 | 59.90 |
| 5 | 04005440X01 | ANGELICA | NEXA RESOURCES ATACOCHA S.A.A. | D.M. Titulado D.L. 109 | 06/11/1915 | P-02005828 | 6.00 | 5.99 | 17.98 | 0.00 | 17.98 |
| 6 | 04008194X01 | ANITA | NEXA RESOURCES ATACOCHA S.A.A. | D.M. Titulado D.L. 109 | 17/12/1935 | P-02010141 | 12.00 | 11.98 | 35.95 | 0.00 | 35.95 |
| 7 | 04005504X01 | ANTRIM | NEXA RESOURCES ATACOCHA S.A.A. | D.M. Titulado D.L. 109 | 23/02/1916 | P-02010284 | 2.00 | 2.00 | 5.99 | 0.00 | 5.99 |
| 8 | 04007294X01 | ARDA TROYA | NEXA RESOURCES ATACOCHA S.A.A. | D.M. Titulado D.L. 109 | 05/05/1924 | P-02010189 | 3.45 | 3.60 | 10.81 | 0.00 | 10.81 |
| 9 | 04010250X01 | ATACOCHA Nº 3 | NEXA RESOURCES ATACOCHA S.A.A. | D.M. Titulado D.L. 109 | 09/12/1955 | P-02014140 | 4.89 | 4.91 | 14.72 | 0.00 | 14.72 |
| 3- |
|
|
| No. | Concession Code | Concession Name | Title Holder | Status | Date | Public Registry Record | Granted
Area (ha) |
Available
Area (ha) |
2023 Annual Fee (US$) | 2023 Annual Penalty (US$) | 2023 Total Payment (US$) |
| 10 | 04010501X01 | ATACOCHA Nº 4 | NEXA RESOURCES ATACOCHA S.A.A. | D.M. Titulado D.L. 109 | 19/06/1957 | P-02014782 | 1.93 | 1.69 | 5.06 | 0.00 | 5.06 |
| 11 | 04010502X01 | ATACOCHA Nº 5 | NEXA RESOURCES ATACOCHA S.A.A. | D.M. Titulado D.L. 109 | 19/06/1957 | P-02013944 | 1.75 | 1.70 | 5.11 | 0.00 | 5.11 |
| 12 | 04008462X01 | C.M.A. Nº 1 | NEXA RESOURCES ATACOCHA S.A.A. | D.M. Titulado D.L. 109 | 10/10/1939 | P-02010140 | 4.00 | 4.00 | 11.99 | 0.00 | 11.99 |
| 13 | 04009575X01 | C.M.A. Nº 12 | NEXA RESOURCES ATACOCHA S.A.A. | D.M. Titulado D.L. 109 | 20/10/1951 | P-02013903 | 100.00 | 99.87 | 299.61 | 0.00 | 299.61 |
| 14 | 04009757X01 | C.M.A. Nº 13 | NEXA RESOURCES ATACOCHA S.A.A. | D.M. Titulado D.L. 109 | 24/04/1952 | P-02013942 | 25.00 | 24.97 | 74.90 | 0.00 | 74.90 |
| 15 | 04009758X01 | C.M.A. Nº 14 | NEXA RESOURCES ATACOCHA S.A.A. | D.M. Titulado D.L. 109 | 24/04/1952 | P-02013971 | 21.00 | 20.97 | 62.92 | 0.00 | 62.92 |
| 16 | 04009759X01 | C.M.A. Nº 15 | NEXA RESOURCES ATACOCHA S.A.A. | D.M. Titulado D.L. 109 | 24/04/1952 | P-02014165 | 100.00 | 99.87 | 299.61 | 0.00 | 299.61 |
| 17 | 04009760X01 | C.M.A. Nº 16 | NEXA RESOURCES ATACOCHA S.A.A. | D.M. Titulado D.L. 109 | 24/04/1952 | P-02014115 | 40.00 | 39.95 | 119.84 | 0.00 | 119.84 |
| 18 | 04009837X01 | C.M.A. Nº 17 | NEXA RESOURCES ATACOCHA S.A.A. | D.M. Titulado D.L. 109 | 11/08/1952 | P-02014006 | 1.00 | 1.00 | 3.00 | 0.00 | 3.00 |
| 19 | 04009838X01 | C.M.A. Nº 18 | NEXA RESOURCES ATACOCHA S.A.A. | D.M. Titulado D.L. 109 | 11/08/1952 | P-02013989 | 2.00 | 2.00 | 5.99 | 0.00 | 5.99 |
| 3- |
|
|
| No. | Concession Code | Concession Name | Title Holder | Status | Date | Public Registry Record | Granted
Area (ha) |
Available
Area (ha) |
2023 Annual Fee (US$) | 2023 Annual Penalty (US$) | 2023 Total Payment (US$) |
| 20 | 04009839X01 | C.M.A. Nº 19 | NEXA RESOURCES ATACOCHA S.A.A. | D.M. Titulado D.L. 109 | 11/08/1952 | P-02014005 | 2.00 | 2.00 | 5.99 | 0.00 | 5.99 |
| 21 | 04008508X01 | C.M.A. Nº 2 | NEXA RESOURCES ATACOCHA S.A.A. | D.M. Titulado D.L. 109 | 27/04/1940 | P-02009998 | 8.00 | 7.99 | 23.97 | 0.00 | 23.97 |
| 22 | 04009825X01 | C.M.A. Nº 20 | NEXA RESOURCES ATACOCHA S.A.A. | D.M. Titulado D.L. 109 | 11/07/1952 | P-02014839 | 56.00 | 55.92 | 167.76 | 0.00 | 167.76 |
| 23 | 04009826X01 | C.M.A. Nº 21 | NEXA RESOURCES ATACOCHA S.A.A. | D.M. Titulado D.L. 109 | 11/07/1952 | P-02014328 | 16.00 | 15.98 | 47.94 | 0.00 | 47.94 |
| 24 | 04009908X01 | C.M.A. Nº 24 | NEXA RESOURCES ATACOCHA S.A.A. | D.M. Titulado D.L. 109 | 29/01/1953 | P-02014002 | 36.00 | 35.95 | 107.85 | 0.00 | 107.85 |
| 25 | 04009909X01 | C.M.A. Nº 25 | NEXA RESOURCES ATACOCHA S.A.A. | D.M. Titulado D.L. 109 | 29/01/1953 | P-02014110 | 3.00 | 3.00 | 8.99 | 0.00 | 8.99 |
| 26 | 04009912X01 | C.M.A. Nº 26 | NEXA RESOURCES ATACOCHA S.A.A. | D.M. Titulado D.L. 109 | 11/02/1953 | P-02013931 | 1.00 | 1.00 | 3.00 | 0.00 | 3.00 |
| 27 | 04010002X01 | C.M.A. Nº 28 | NEXA RESOURCES ATACOCHA S.A.A. | D.M. Titulado D.L. 109 | 22/05/1954 | P-02013246 | 80.00 | 79.90 | 239.71 | 0.00 | 239.71 |
| 28 | 04010003X01 | C.M.A. Nº 29 | NEXA RESOURCES ATACOCHA S.A.A. | D.M. Titulado D.L. 109 | 22/05/1954 | P-02013174 | 18.00 | 17.98 | 53.93 | 0.00 | 53.93 |
| 29 | 04009168X01 | C.M.A. Nº 3 | NEXA RESOURCES ATACOCHA S.A.A. | D.M. Titulado D.L. 109 | 16/12/1947 | P-02010179 | 36.00 | 35.95 | 107.86 | 0.00 | 107.86 |
| 3- |
|
|
| No. | Concession Code | Concession Name | Title Holder | Status | Date | Public Registry Record | Granted
Area (ha) |
Available
Area (ha) |
2023 Annual Fee (US$) | 2023 Annual Penalty (US$) | 2023 Total Payment (US$) |
| 30 | 04010004X01 | C.M.A. Nº 30 | NEXA RESOURCES ATACOCHA S.A.A. | D.M. Titulado D.L. 109 | 22/05/1954 | P-02014189 | 200.00 | 199.74 | 599.22 | 0.00 | 599.22 |
| 31 | 04010004X02 | C.M.A. Nº 31 | NEXA RESOURCES ATACOCHA S.A.A. | D.M. Titulado D.L. 109 | 22/05/1954 | P-02014004 | 104.00 | 103.85 | 311.55 | 0.00 | 311.55 |
| 32 | 04010063X01 | C.M.A. Nº 32 | NEXA RESOURCES ATACOCHA S.A.A. | D.M. Titulado D.L. 109 | 04/11/1954 | P-02014026 | 170.00 | 169.78 | 509.33 | 0.00 | 509.33 |
| 33 | 04009169X01 | C.M.A. Nº 4 | NEXA RESOURCES ATACOCHA S.A.A. | D.M. Titulado D.L. 109 | 16/12/1947 | P-02010150 | 30.00 | 29.96 | 89.88 | 0.00 | 89.88 |
| 34 | 04010218X01 | C.M.A. Nº 40 | NEXA RESOURCES ATACOCHA S.A.A. | D.M. Titulado D.L. 109 | 15/11/1955 | P-02014023 | 2.00 | 2.00 | 5.99 | 0.00 | 5.99 |
| 35 | 04010076X01 | C.M.A. Nº 46 | NEXA RESOURCES ATACOCHA S.A.A. | D.M. Titulado D.L. 109 | 20/11/1954 | P-02014003 | 96.00 | 95.86 | 287.59 | 0.00 | 287.59 |
| 36 | 04010116X01 | C.M.A. Nº 48 | NEXA RESOURCES ATACOCHA S.A.A. | D.M. Titulado D.L. 109 | 14/02/1955 | P-02011771 | 3.00 | 3.00 | 8.99 | 0.00 | 8.99 |
| 37 | 04010358X01 | C.M.A. Nº 49 | NEXA RESOURCES ATACOCHA S.A.A. | D.M. Titulado D.L. 109 | 13/08/1956 | P-02013916 | 40.00 | 39.94 | 119.83 | 0.00 | 119.83 |
| 38 | 04009170X01 | C.M.A. Nº 5 | NEXA RESOURCES ATACOCHA S.A.A. | D.M. Titulado D.L. 109 | 16/11/1947 | P-02010000 | 10.00 | 9.99 | 29.96 | 0.00 | 29.96 |
| 39 | 04010132X01 | C.M.A. Nº 50 | NEXA RESOURCES ATACOCHA S.A.A. | D.M. Titulado D.L. 109 | 29/04/1955 | P-02014008 | 8.00 | 7.99 | 23.97 | 0.00 | 23.97 |
| 3- |
|
|
| No. | Concession Code | Concession Name | Title Holder | Status | Date | Public Registry Record | Granted
Area (ha) |
Available
Area (ha) |
2023 Annual Fee (US$) | 2023 Annual Penalty (US$) | 2023 Total Payment (US$) |
| 40 | 04010133X01 | C.M.A. Nº 51 | NEXA RESOURCES ATACOCHA S.A.A. | D.M. Titulado D.L. 109 | 29/04/1955 | P-02014007 | 1.00 | 1.00 | 3.00 | 0.00 | 3.00 |
| 41 | 04010359X01 | C.M.A. Nº 52 | NEXA RESOURCES ATACOCHA S.A.A. | D.M. Titulado D.L. 109 | 13/08/1956 | P-02014091 | 3.00 | 3.00 | 8.99 | 0.00 | 8.99 |
| 42 | 04010360X01 | C.M.A. Nº 53 | NEXA RESOURCES ATACOCHA S.A.A. | D.M. Titulado D.L. 109 | 13/08/1956 | P-02014131 | 1.00 | 1.00 | 3.00 | 0.00 | 3.00 |
| 43 | 04009171X01 | C.M.A. Nº 6 | NEXA RESOURCES ATACOCHA S.A.A. | D.M. Titulado D.L. 109 | 16/12/1947 | P-01010147 | 8.00 | 7.99 | 23.97 | 0.00 | 23.97 |
| 44 | 04010219X01 | C.M.A. Nº 61 | NEXA RESOURCES ATACOCHA S.A.A. | D.M. Titulado D.L. 109 | 15/11/1955 | P-02014268 | 18.00 | 17.98 | 53.93 | 0.00 | 53.93 |
| 45 | 04010220X01 | C.M.A. Nº 62 | NEXA RESOURCES ATACOCHA S.A.A. | D.M. Titulado D.L. 109 | 15/11/1955 | P-02014167 | 3.00 | 3.00 | 8.99 | 0.00 | 8.99 |
| 46 | 04010222X01 | C.M.A. Nº 64 | NEXA RESOURCES ATACOCHA S.A.A. | D.M. Titulado D.L. 109 | 15/11/1955 | P-02014332 | 10.00 | 9.99 | 29.96 | 0.00 | 29.96 |
| 47 | 04010229X01 | C.M.A. Nº 65 | NEXA RESOURCES ATACOCHA S.A.A. | D.M. Titulado D.L. 109 | 15/11/1955 | P-02014341 | 10.00 | 9.99 | 29.96 | 0.00 | 29.96 |
| 48 | 04010224X01 | C.M.A. Nº 66 | NEXA RESOURCES ATACOCHA S.A.A. | D.M. Titulado D.L. 109 | 15/11/1955 | P-02014157 | 12.00 | 11.98 | 35.95 | 0.00 | 35.95 |
| 49 | 04010225X01 | C.M.A. Nº 67 | NEXA RESOURCES ATACOCHA S.A.A. | D.M. Titulado D.L. 109 | 15/11/1955 | P-02014521 | 6.00 | 5.99 | 17.98 | 0.00 | 17.98 |
| 3- |
|
|
| No. | Concession Code | Concession Name | Title Holder | Status | Date | Public Registry Record | Granted
Area (ha) |
Available
Area (ha) |
2023 Annual Fee (US$) | 2023 Annual Penalty (US$) | 2023 Total Payment (US$) |
| 50 | 04010226X01 | C.M.A. Nº 68 | NEXA RESOURCES ATACOCHA S.A.A. | D.M. Titulado D.L. 109 | 15/11/1955 | P-02014118 | 3.00 | 3.00 | 8.99 | 0.00 | 8.99 |
| 51 | 04010227X01 | C.M.A. Nº 69 | NEXA RESOURCES ATACOCHA S.A.A. | D.M. Titulado D.L. 109 | 15/11/1955 | P-02014147 | 16.00 | 15.98 | 47.94 | 0.00 | 47.94 |
| 52 | 04009315X01 | C.M.A. Nº 7 | NEXA RESOURCES ATACOCHA S.A.A. | D.M. Titulado D.L. 109 | 09/06/1949 | P-02011772 | 54.00 | 53.93 | 161.79 | 0.00 | 161.79 |
| 53 | 04010228X01 | C.M.A. Nº 70 | NEXA RESOURCES ATACOCHA S.A.A. | D.M. Titulado D.L. 109 | 15/11/1955 | P-02013990 | 2.00 | 2.00 | 5.99 | 0.00 | 5.99 |
| 54 | 04010229X02 | C.M.A. Nº 71 | NEXA RESOURCES ATACOCHA S.A.A. | D.M. Titulado D.L. 109 | 15/11/1955 | P-02014344 | 2.00 | 2.00 | 5.99 | 0.00 | 5.99 |
| 55 | 04010230X01 | C.M.A. Nº 72 | NEXA RESOURCES ATACOCHA S.A.A. | D.M. Titulado D.L. 109 | 15/11/1955 | P-02014265 | 2.00 | 2.00 | 5.99 | 0.00 | 5.99 |
| 56 | 04010231X01 | C.M.A. Nº 73 | NEXA RESOURCES ATACOCHA S.A.A. | D.M. Titulado D.L. 109 | 15/11/1955 | P-02014178 | 2.00 | 2.00 | 5.99 | 0.00 | 5.99 |
| 57 | 04010232X01 | C.M.A. Nº 74 | NEXA RESOURCES ATACOCHA S.A.A. | D.M. Titulado D.L. 109 | 15/11/1955 | P-02014179 | 1.00 | 1.00 | 3.00 | 0.00 | 3.00 |
| 58 | 04010233X01 | C.M.A. Nº 75 | NEXA RESOURCES ATACOCHA S.A.A. | D.M. Titulado D.L. 109 | 15/11/1955 | P-02014190 | 10.00 | 9.99 | 29.96 | 0.00 | 29.96 |
| 59 | 04010235X01 | C.M.A. Nº 77 | NEXA RESOURCES ATACOCHA S.A.A. | D.M. Titulado D.L. 109 | 25/11/1955 | P-02014116 | 4.00 | 3.99 | 11.98 | 0.00 | 11.98 |
| 3- |
|
|
| No. | Concession Code | Concession Name | Title Holder | Status | Date | Public Registry Record | Granted
Area (ha) |
Available
Area (ha) |
2023 Annual Fee (US$) | 2023 Annual Penalty (US$) | 2023 Total Payment (US$) |
| 60 | 04010236X01 | C.M.A. Nº 78 | NEXA RESOURCES ATACOCHA S.A.A. | D.M. Titulado D.L. 109 | 25/11/1955 | P-02014169 | 1.00 | 1.00 | 3.00 | 0.00 | 3.00 |
| 61 | 04010311X01 | C.M.A. Nº 79 | NEXA RESOURCES ATACOCHA S.A.A. | D.M. Titulado D.L. 109 | 23/05/1956 | P-02010274 | 4.00 | 3.99 | 11.98 | 0.00 | 11.98 |
| 62 | 04009317X01 | C.M.A. Nº 8 | NEXA RESOURCES ATACOCHA S.A.A. | D.M. Titulado D.L. 109 | 15/06/1949 | P-02011770 | 16.00 | 15.98 | 47.94 | 0.00 | 47.94 |
| 63 | 04010312X01 | C.M.A. Nº 80 | NEXA RESOURCES ATACOCHA S.A.A. | D.M. Titulado D.L. 109 | 23/05/1956 | P-02014342 | 2.00 | 2.00 | 5.99 | 0.00 | 5.99 |
| 64 | 04010313X01 | C.M.A. Nº 81 | NEXA RESOURCES ATACOCHA S.A.A. | D.M. Titulado D.L. 109 | 23/05/1956 | P-02013168 | 1.00 | 1.00 | 3.00 | 0.00 | 3.00 |
| 65 | 04010314X01 | C.M.A. Nº 82 | NEXA RESOURCES ATACOCHA S.A.A. | D.M. Titulado D.L. 109 | 23/05/1956 | P-02014122 | 4.00 | 3.99 | 11.98 | 0.00 | 11.98 |
| 66 | 04010316X01 | C.M.A. Nº 83 | NEXA RESOURCES ATACOCHA S.A.A. | D.M. Titulado D.L. 109 | 25/05/1956 | P-02014121 | 2.00 | 2.00 | 5.99 | 0.00 | 5.99 |
| 67 | 04010317X01 | C.M.A. Nº 84 | NEXA RESOURCES ATACOCHA S.A.A. | D.M. Titulado D.L. 109 | 25/05/1950 | P-02013237 | 1.00 | 1.00 | 3.00 | 0.00 | 3.00 |
| 68 | 04010318X01 | C.M.A. Nº 85 | NEXA RESOURCES ATACOCHA S.A.A. | D.M. Titulado D.L. 109 | 25/05/1956 | P-02014335 | 5.00 | 4.99 | 14.98 | 0.00 | 14.98 |
| 69 | 04010320X01 | C.M.A. Nº 86 | NEXA RESOURCES ATACOCHA S.A.A. | D.M. Titulado D.L. 109 | 18/06/1956 | P-02013238 | 18.00 | 17.98 | 53.93 | 0.00 | 53.93 |
| 3- |
|
|
| No. | Concession Code | Concession Name | Title Holder | Status | Date | Public Registry Record | Granted
Area (ha) |
Available
Area (ha) |
2023 Annual Fee (US$) | 2023 Annual Penalty (US$) | 2023 Total Payment (US$) |
| 70 | 04001032X01 | C.M.A. Nº 87 | NEXA RESOURCES ATACOCHA S.A.A. | D.M. Titulado D.L. 109 | 18/06/1956 | P-02013235 | 6.00 | 6.01 | 18.04 | 0.00 | 18.04 |
| 71 | 04010322X01 | C.M.A. Nº 88 | NEXA RESOURCES ATACOCHA S.A.A. | D.M. Titulado D.L. 109 | 18/06/1956 | P-02014132 | 4.00 | 3.99 | 11.98 | 0.00 | 11.98 |
| 72 | 04010323X01 | C.M.A. Nº 89 | NEXA RESOURCES ATACOCHA S.A.A. | D.M. Titulado D.L. 109 | 18/06/1956 | P-02014024 | 3.00 | 3.00 | 8.99 | 0.00 | 8.99 |
| 73 | 04009316X01 | C.M.A. Nº 9 | NEXA RESOURCES ATACOCHA S.A.A. | D.M. Titulado D.L. 109 | 15/06/1949 | P-02009985 | 6.00 | 5.99 | 17.98 | 0.00 | 17.98 |
| 74 | 04010344X01 | C.M.A. Nº 90 | NEXA RESOURCES ATACOCHA S.A.A. | D.M. Titulado D.L. 109 | 07/07/1956 | P-02014030 | 36.00 | 35.95 | 107.86 | 0.00 | 107.86 |
| 75 | 04010345X01 | C.M.A. Nº 91 | NEXA RESOURCES ATACOCHA S.A.A. | D.M. Titulado D.L. 109 | 07/07/1956 | P-02014031 | 4.00 | 4.00 | 11.99 | 0.00 | 11.99 |
| 76 | 04010346X01 | C.M.A. Nº 92 | NEXA RESOURCES ATACOCHA S.A.A. | D.M. Titulado D.L. 109 | 07/07/1956 | P-02014119 | 2.00 | 2.00 | 5.99 | 0.00 | 5.99 |
| 77 | 04010347X01 | C.M.A. Nº 93 | NEXA RESOURCES ATACOCHA S.A.A. | D.M. Titulado D.L. 109 | 07/07/1956 | P-02014017 | 1.00 | 0.62 | 1.85 | 0.00 | 1.85 |
| 78 | 04010906X01 | C.M.A. Nº 94 | NEXA RESOURCES ATACOCHA S.A.A. | D.M. Titulado D.L. 109 | 01/12/1960 | P-20000405 | 12.00 | 11.98 | 35.95 | 0.00 | 35.95 |
| 79 | 04012507X01 | C.M.A. Nº 97 | NEXA RESOURCES ATACOCHA S.A.A. | D.M. Titulado D.L. 109 | 07/12/1978 | P-20000333 | 2.00 | 2.00 | 5.99 | 0.00 | 5.99 |
| 3- |
|
|
| No. | Concession Code | Concession Name | Title Holder | Status | Date | Public Registry Record | Granted
Area (ha) |
Available
Area (ha) |
2023 Annual Fee (US$) | 2023 Annual Penalty (US$) | 2023 Total Payment (US$) |
| 80 | 04008218X01 | CANTABRIA | NEXA RESOURCES ATACOCHA S.A.A. | D.M. Titulado D.L. 109 | 15/09/1915 | P-02010552 | 6.00 | 5.99 | 17.98 | 0.00 | 17.98 |
| 81 | 04008335X01 | CARLOS CHINO | NEXA RESOURCES ATACOCHA S.A.A. | D.M. Titulado D.L. 109 | 05/06/1937 | P-02003965 | 6.00 | 5.99 | 17.98 | 0.00 | 17.98 |
| 82 | 04007322X01 | CARMEN | NEXA RESOURCES ATACOCHA S.A.A. | D.M. Titulado D.L. 109 | 23/12/1924 | P-02003971 | 2.00 | 2.00 | 5.99 | 0.00 | 5.99 |
| 83 | 04009644X01 | CARMEN ROSA | NEXA RESOURCES ATACOCHA S.A.A. | D.M. Titulado D.L. 109 | 22/12/1951 | P-02007797 | 4.00 | 3.99 | 11.98 | 0.00 | 11.98 |
| 84 | 04010284X01 | CARMEN ROSA Nº 2 | NEXA RESOURCES ATACOCHA S.A.A. | D.M. Titulado D.L. 109 | 12/03/1956 | P-02013169 | 2.00 | 2.00 | 5.99 | 0.00 | 5.99 |
| 85 | 04009210X01 | CARMENCITA | NEXA RESOURCES ATACOCHA S.A.A. | D.M. Titulado D.L. 109 | 02/06/1948 | P-02007000 | 2.00 | 2.00 | 5.99 | 0.00 | 5.99 |
| 86 | 04005459X01 | CAVEL | NEXA RESOURCES ATACOCHA S.A.A. | D.M. Titulado D.L. 109 | 17/12/1915 | P-02006247 | 3.99 | 3.42 | 10.27 | 0.00 | 10.27 |
| 87 | 04009528X01 | CHAMACO | NEXA RESOURCES ATACOCHA S.A.A. | D.M. Titulado D.L. 109 | 21/06/1951 | P-02007804 | 60.00 | 59.92 | 179.77 | 0.00 | 179.77 |
| 88 | 04010332X01 | CIPRIANO CUATRO | NEXA RESOURCES ATACOCHA S.A.A. | D.M. Titulado D.L. 109 | 28/06/1956 | P-02013236 | 0.52 | 0.50 | 1.49 | 0.00 | 1.49 |
| 89 | 04010331X01 | CIPRIANO DOS | NEXA RESOURCES ATACOCHA S.A.A. | D.M. Titulado D.L. 109 | 28/06/1956 | P-02013175 | 1.57 | 1.48 | 4.45 | 0.00 | 4.45 |
| 3- |
|
|
| No. | Concession Code | Concession Name | Title Holder | Status | Date | Public Registry Record | Granted
Area (ha) |
Available
Area (ha) |
2023 Annual Fee (US$) | 2023 Annual Penalty (US$) | 2023 Total Payment (US$) |
| 90 | 04008683X01 | CIPRIANO PRIMERO | NEXA RESOURCES ATACOCHA S.A.A. | D.M. Titulado D.L. 109 | 23/02/1942 | P-02003974 | 4.00 | 3.99 | 11.96 | 0.00 | 11.96 |
| 91 | 04010330X01 | CIPRIANO UNO | NEXA RESOURCES ATACOCHA S.A.A. | D.M. Titulado D.L. 109 | 28/06/1956 | P-02013173 | 0.80 | 0.80 | 2.40 | 0.00 | 2.40 |
| 92 | 04003312X01 | COLQUIMARCA | NEXA RESOURCES ATACOCHA S.A.A. | D.M. Titulado D.L. 109 | 06/09/1907 | P-02010327 | 0.90 | 0.90 | 2.70 | 0.00 | 2.70 |
| 93 | 04005371X01 | CRISTINA | NEXA RESOURCES ATACOCHA S.A.A. | D.M. Titulado D.L. 109 | 27/05/1915 | P-02005618 | 42.00 | 41.94 | 125.83 | 0.00 | 125.83 |
| 94 | 04010670X01 | DEMASIA ATACOCHA Nº 6 | NEXA RESOURCES ATACOCHA S.A.A. | D.M. Titulado D.L. 109 | 11/05/1959 | P-02013832 | 0.26 | 0.26 | 0.77 | 0.00 | 0.77 |
| 95 | 04010671X01 | DEMASIA ATACOCHA Nº 7 | NEXA RESOURCES ATACOCHA S.A.A. | D.M. Titulado D.L. 109 | 11/05/1959 | P-20001140 | 2.04 | 2.01 | 6.04 | 0.00 | 6.04 |
| 96 | 04010672X01 | DEMASIA ATACOCHA Nº 8 | NEXA RESOURCES ATACOCHA S.A.A. | D.M. Titulado D.L. 109 | 11/05/1959 | P-02013904 | 1.52 | 1.51 | 4.54 | 0.00 | 4.54 |
| 97 | 04005461X01 | DEWAR | NEXA RESOURCES ATACOCHA S.A.A. | D.M. Titulado D.L. 109 | 07/12/1915 | P-02010504 | 4.24 | 3.94 | 11.82 | 0.00 | 11.82 |
| 98 | 04007291X01 | DORA | NEXA RESOURCES ATACOCHA S.A.A. | D.M. Titulado D.L. 109 | 05/03/1924 | P-02010236 | 20.00 | 19.97 | 59.92 | 0.00 | 59.92 |
| 99 | 04006984X01 | EL PORVENIR | NEXA RESOURCES ATACOCHA S.A.A. | D.M. Titulado D.L. 109 | 01/09/1921 | P-02003970 | 10.00 | 9.99 | 29.96 | 0.00 | 29.96 |
| 3- |
|
|
| No. | Concession Code | Concession Name | Title Holder | Status | Date | Public Registry Record | Granted
Area (ha) |
Available
Area (ha) |
2023 Annual Fee (US$) | 2023 Annual Penalty (US$) | 2023 Total Payment (US$) |
| 100 | 04000425X01 | ESTRELLA | NEXA RESOURCES ATACOCHA S.A.A. | D.M. Titulado D.L. 109 | 18/10/1901 | P-02010178 | 8.00 | 7.99 | 23.97 | 0.00 | 23.97 |
| 101 | 04007292X01 | FRANK | NEXA RESOURCES ATACOCHA S.A.A. | D.M. Titulado D.L. 109 | 05/05/1924 | P-02010145 | 2.00 | 2.00 | 5.99 | 0.00 | 5.99 |
| 102 | 04009460X01 | JUAN ANTONIO | NEXA RESOURCES ATACOCHA S.A.A. | D.M. Titulado D.L. 109 | 03/01/1951 | P-02013167 | 6.00 | 6.00 | 17.99 | 0.00 | 17.99 |
| 103 | 04008684X01 | JUAN MANUEL | NEXA RESOURCES ATACOCHA S.A.A. | D.M. Titulado D.L. 109 | 23/02/1942 | P-02003976 | 4.00 | 3.99 | 11.98 | 0.00 | 11.98 |
| 104 | 04005502X01 | KILKENNY | NEXA RESOURCES ATACOCHA S.A.A. | D.M. Titulado D.L. 109 | 15/02/1916 | P-02010146 | 50.00 | 49.93 | 149.79 | 0.00 | 149.79 |
| 105 | 04005548X01 | LA PRADERA | NEXA RESOURCES ATACOCHA S.A.A. | D.M. Titulado D.L. 109 | 01/03/1916 | P-02004216 | 12.00 | 11.98 | 35.95 | 0.00 | 35.95 |
| 106 | 04007289X01 | LIBERTAD | NEXA RESOURCES ATACOCHA S.A.A. | D.M. Titulado D.L. 109 | 05/03/1924 | P-02010200 | 8.00 | 7.99 | 23.97 | 0.00 | 23.97 |
| 107 | 04007283X01 | LIZANDRO | NEXA RESOURCES ATACOCHA S.A.A. | D.M. Titulado D.L. 109 | 14/04/1924 | P-02003964 | 8.00 | 7.99 | 23.97 | 0.00 | 23.97 |
| 108 | 04005382X01 | MANUEL NUMERO UNO | NEXA RESOURCES ATACOCHA S.A.A. | D.M. Titulado D.L. 109 | 19/06/1915 | P-02006191 | 18.00 | 17.98 | 53.93 | 0.00 | 53.93 |
| 109 | 04005432X01 | MANUEL SEGUNDO | NEXA RESOURCES ATACOCHA S.A.A. | D.M. Titulado D.L. 109 | 16/10/1915 | P-02006197 | 6.22 | 5.79 | 17.38 | 0.00 | 17.38 |
| 3- |
|
|
| No. | Concession Code | Concession Name | Title Holder | Status | Date | Public Registry Record | Granted
Area (ha) |
Available
Area (ha) |
2023 Annual Fee (US$) | 2023 Annual Penalty (US$) | 2023 Total Payment (US$) |
| 110 | 04009209X01 | MARIA | NEXA RESOURCES ATACOCHA S.A.A. | D.M. Titulado D.L. 109 | 02/06/1948 | P-02007001 | 6.00 | 5.99 | 17.98 | 0.00 | 17.98 |
| 111 | 04009461X01 | MARIA CECILIA | NEXA RESOURCES ATACOCHA S.A.A. | D.M. Titulado D.L. 109 | 03/01/1951 | P-02015793 | 10.00 | 9.99 | 29.96 | 0.00 | 29.96 |
| 112 | 04009517X01 | MARUJA | NEXA RESOURCES ATACOCHA S.A.A. | D.M. Titulado D.L. 109 | 07/06/1951 | P-02007796 | 3.00 | 2.92 | 8.76 | 0.00 | 8.76 |
| 113 | 04004256X01 | MIGUEL | NEXA RESOURCES ATACOCHA S.A.A. | D.M. Titulado D.L. 109 | 30/05/1911 | P-02006190 | 2.00 | 2.00 | 5.99 | 0.00 | 5.99 |
| 114 | 04008270X01 | MILAGROS | NEXA RESOURCES ATACOCHA S.A.A. | D.M. Titulado D.L. 109 | 30/11/1936 | P-02007004 | 8.00 | 7.93 | 23.80 | 0.00 | 23.80 |
| 115 | 04005578X01 | MULL | NEXA RESOURCES ATACOCHA S.A.A. | D.M. Titulado D.L. 109 | 08/04/1916 | P-02010177 | 4.74 | 4.45 | 13.35 | 0.00 | 13.35 |
| 116 | 04005577X01 | NELL | NEXA RESOURCES ATACOCHA S.A.A. | D.M. Titulado D.L. 109 | 08/04/1916 | P-02010168 | 12.00 | 11.98 | 35.95 | 0.00 | 35.95 |
| 117 | 04008183X01 | OLVIDADA | NEXA RESOURCES ATACOCHA S.A.A. | D.M. Titulado D.L. 109 | 08/11/1935 | P-02010289 | 0.34 | 0.33 | 0.98 | 0.00 | 0.98 |
| 118 | 04008219X01 | PACO | NEXA RESOURCES ATACOCHA S.A.A. | D.M. Titulado D.L. 109 | 07/05/1936 | P-02010296 | 2.00 | 2.00 | 5.99 | 0.00 | 5.99 |
| 119 | 04007281X01 | PALMIRA | NEXA RESOURCES ATACOCHA S.A.A. | D.M. Titulado D.L. 109 | 01/05/1924 | P-02003972 | 16.00 | 15.98 | 47.94 | 0.00 | 47.94 |
| 3- |
|
|
| No. | Concession Code | Concession Name | Title Holder | Status | Date | Public Registry Record | Granted
Area (ha) |
Available
Area (ha) |
2023 Annual Fee (US$) | 2023 Annual Penalty (US$) | 2023 Total Payment (US$) |
| 120 | 04007293X01 | PHOENIX | NEXA RESOURCES ATACOCHA S.A.A. | D.M. Titulado D.L. 109 | 05/05/1924 | P-02009999 | 2.54 | 2.41 | 7.23 | 0.00 | 7.23 |
| 121 | 010125494 | PORVENIR 62 | NEXA RESOURCES ATACOCHA S.A.A. | D.M. Titulado D.L. 708 | 10/03/1994 | P-11030784 | 1,000.00 | 358.96 | 1,076.87 | 0.00 | 1,076.87 |
| 122 | 010125594 | PORVENIR 63 | NEXA RESOURCES ATACOCHA S.A.A. | D.M. Titulado D.L. 708 | 10/03/1994 | P-11030789 | 1,000.00 | 184.52 | 553.57 | 0.00 | 553.57 |
| 123 | 010373394A | PORVENIR 66A | NEXA RESOURCES ATACOCHA S.A.A. | D.M. Titulado D.L. 708 | 21/06/1994 | P-11030775 | 100.00 | 0.28 | 0.85 | 0.00 | 0.85 |
| 124 | 010683595 | PORVENIR 69 | NEXA RESOURCES ATACOCHA S.A.A. | D.M. Titulado D.L. 708 | 06/03/1995 | P-11031070 | 100.00 | 0.53 | 1.59 | 0.00 | 1.59 |
| 125 | 04009527X01 | PRECAUCION Nº 3 | NEXA RESOURCES ATACOCHA S.A.A. | D.M. Titulado D.L. 109 | 21/06/1951 | P-02007793 | 1.00 | 1.00 | 3.00 | 0.00 | 3.00 |
| 126 | 04007684X01 | PRECAUCION NUMERO UNO | NEXA RESOURCES ATACOCHA S.A.A. | D.M. Titulado D.L. 109 | 27/07/1927 | P-02003966 | 2.00 | 2.00 | 5.99 | 0.00 | 5.99 |
| 127 | 04005802X01 | PURISIMA | NEXA RESOURCES ATACOCHA S.A.A. | D.M. Titulado D.L. 109 | 09/04/1917 | P-02003977 | 16.00 | 15.98 | 47.94 | 0.00 | 47.94 |
| 128 | 04009078X01 | RICARDO | NEXA RESOURCES ATACOCHA S.A.A. | D.M. Titulado D.L. 109 | 13/11/1946 | P-02003973 | 8.00 | 7.99 | 23.97 | 0.00 | 23.97 |
| 129 | 04010305X01 | ROBERTO | NEXA RESOURCES ATACOCHA S.A.A. | D.M. Titulado D.L. 109 | 16/05/1956 | P-02015851 | 0.08 | 0.08 | 0.25 | 0.00 | 0.25 |
| 3- |
|
|
| No. | Concession Code | Concession Name | Title Holder | Status | Date | Public Registry Record | Granted
Area (ha) |
Available
Area (ha) |
2023 Annual Fee (US$) | 2023 Annual Penalty (US$) | 2023 Total Payment (US$) |
| 130 | 04007283X02 | SANTA CESILIA | NEXA RESOURCES ATACOCHA S.A.A. | D.M. Titulado D.L. 109 | 01/03/1924 | P-02003975 | 4.00 | 3.99 | 11.98 | 0.00 | 11.98 |
| 131 | 04005401X01 | SEGUNDA DOCENA | NEXA RESOURCES ATACOCHA S.A.A. | D.M. Titulado D.L. 109 | 26/07/1915 | P-02009700 | 4.00 | 3.99 | 11.98 | 0.00 | 11.98 |
| 132 | 04005373X01 | SIDNEY | NEXA RESOURCES ATACOCHA S.A.A. | D.M. Titulado D.L. 109 | 27/05/1915 | P-02010170 | 6.00 | 5.99 | 17.98 | 0.00 | 17.98 |
| 133 | 04005368X01 | SOCAVON CHERCHERE | NEXA RESOURCES ATACOCHA S.A.A. | D.M. Titulado D.L. 109 | 27/05/1915 | P-02010174 | 8.00 | 7.99 | 23.97 | 0.00 | 23.97 |
| 134 | 04009244X01 | SOL DE PLATA | NEXA RESOURCES ATACOCHA S.A.A. | D.M. Titulado D.L. 109 | 25/10/1948 | P-02010167 | 18.00 | 17.98 | 53.93 | 0.00 | 53.93 |
| 135 | 04005402X01 | TERCERA DOCENA | NEXA RESOURCES ATACOCHA S.A.A. | D.M. Titulado D.L. 109 | 26/07/1915 | P-02010169 | 6.00 | 5.99 | 17.98 | 0.00 | 17.98 |
| 136 | 04005350X01 | TIGER | NEXA RESOURCES ATACOCHA S.A.A. | D.M. Titulado D.L. 109 | 03/05/1915 | P-02005063 | 30.00 | 29.96 | 89.88 | 0.00 | 89.88 |
| 137 | 04007290X01 | TRES MOSQUETEROS | NEXA RESOURCES ATACOCHA S.A.A. | D.M. Titulado D.L. 109 | 05/05/1924 | P-02010188 | 16.00 | 15.98 | 47.94 | 0.00 | 47.94 |
| 138 | 04008217X01 | VASCONIA | NEXA RESOURCES ATACOCHA S.A.A. | D.M. Titulado D.L. 109 | 07/12/1907 | P-20000406 | 2.00 | 2.00 | 5.99 | 0.00 | 5.99 |
| 139 | 04004780X01 | VIOLETA SEGUNDA | NEXA RESOURCES ATACOCHA S.A.A. | D.M. Titulado D.L. 109 | 27/01/1913 | P-02007634 | 12.00 | 11.98 | 35.95 | 0.00 | 35.95 |
| 3- |
|
|
| No. | Concession Code | Concession Name | Title Holder | Status | Date | Public Registry Record | Granted
Area (ha) |
Available
Area (ha) |
2023 Annual Fee (US$) | 2023 Annual Penalty (US$) | 2023 Total Payment (US$) |
| 140 | 04005427X01 | AZTEC | NEXA RESOURCES PERU S.A.A. - Assigned to Nexa Resources Atacocha | D.M. Titulado D.L. 109 | 11/10/1915 | P-02004921 | 2.00 | 2.00 | 5.99 | 0.00 | 5.99 |
| 141 | 04005428X01 | CROW | NEXA RESOURCES PERU S.A.A. - Assigned to Nexa Resources Atacocha | D.M. Titulado D.L. 109 | 11/10/1915 | P-02006258 | 17.55 | 15.58 | 46.75 | 0.00 | 46.75 |
| 142 | 04005460X01 | CURIE | NEXA RESOURCES PERU S.A.A. - Assigned to Nexa Resources Atacocha | D.M. Titulado D.L. 109 | 07/12/1915 | P-02007248 | 1.13 | 1.14 | 3.42 | 0.00 | 3.42 |
| 143 | 04005366X01 | LA FLOR DE ATACOCHA | NEXA RESOURCES PERU S.A.A. - Assigned to Nexa Resources Atacocha | D.M. Titulado D.L. 109 | 27/05/1915 | P-02004495 | 6.00 | 5.99 | 17.98 | 0.00 | 17.98 |
| 144 | 04012661X01 | PORVENIR 29 | NEXA RESOURCES PERU S.A.A. - Assigned to Nexa Resources Atacocha | D.M. Titulado D.L. 109 | 22/10/1979 | P-20000337 | 9.00 | 9.53 | 28.60 | 0.00 | 28.60 |
| 145 | 04012666X01 | PORVENIR 34 | NEXA RESOURCES PERU S.A.A. - Assigned to Nexa Resources Atacocha | D.M. Titulado D.L. 109 | 22/10/1979 | P-20000357 | 8.00 | 7.99 | 23.96 | 0.00 | 23.96 |
| 146 | 04009221X01 | PORVENIR CUATRO | NEXA RESOURCES PERU S.A.A. - Assigned to Nexa Resources Atacocha | D.M. Titulado D.L. 109 | 16/08/1948 | P-02006696 | 24.00 | 23.97 | 71.91 | 0.00 | 71.91 |
| 3- |
|
|
| No. | Concession Code | Concession Name | Title Holder | Status | Date | Public Registry Record | Granted
Area (ha) |
Available
Area (ha) |
2023 Annual Fee (US$) | 2023 Annual Penalty (US$) | 2023 Total Payment (US$) |
| 147 | 010125694A | PORVENIR 64A | NEXA RESOURCES EL PORVENIR S.A.C. - Assigned to Nexa Resources Atacocha | D.M. Titulado D.L. 708 | 10/03/1994 | P-11199132 | 500.00 | 157.43 | 472.30 | 3,829.16 | 4,301.46 |
| Totals | 4,877.38 | 2,872.47 | 8,617.43 | 3,829.16 | 12,446.59 | ||||||
Note: Exchange rate: 3.782 Peruvian Nuevo Sol per US$
| 3- |
|
|
Table 3-4: Atacocha Beneficiation Concession
| No. | Concession Code | Concession Name | Title Holder | Status | Date | Public Registry Record | Granted Area (ha) | 2023 Annual Fee (Peruvian Nueva Sol) |
2023 Total Payment (US$) |
| 1 | P0100471 | CHICRIN Nº 2 | NEXA RESOURCES ATACOCHA S.A.A. | Planta de Beneficio | 8/05/1970 | P-02016586 | 413.2300 | 14,058.00 | 3,716.58 |
| Totals | 14,058.00 | 3,716.58 | |||||||
Note: Exchange rate: 3.782 Peruvian Nuevo Sol per US$
| 3- |
|
|
Figure 3-2: El Porvenir Mineral Rights

| 3- |
|
|
Figure 3-3: Atacocha Mineral Rights

| 3- |
|
|
| 3.4 | Annual Fees |
| 3.4.1 | Fees |
For El Porvenir, all annual fees applicable to the mineral concessions and beneficiation concessions have been paid in full as of the effective date of the report. These totalled US$14,540.07 and US$4,803.41, respectively, in 2023 (Table 3-1 and Table 3-2).
For Atacocha, all annual fees applicable to the mineral concessions and beneficiation concessions have been paid in full as of the effective date of the report. These totalled US$8,617.43 and US$3,716.58, respectively, in 2023 (Table 3-3 and Table 3-4).
| 3.4.2 | Penalties |
Some of the mineral concessions have been subject to penalties, payable to INGEMMET of the Peruvian Government, since the minimum required levels of production or exploration expenditures were not met. The minimum annual production is equal to a UIT per granted hectare. The minimum annual investment is the penalty to be paid multiplied by 10.
All penalties applicable to the El Porvenir mineral concessions comprising the mine have been paid as indicated in Table 3-1. The penalties on concessions included in UEA El Porvenir (Nos. 1 through 5 in Table 3-1) are not due because the Minimum Annual Production Target was met for these concessions. The payment of 2023 penalties for the remaining concessions was US$4,215.97.
All penalties applicable to the Atacocha mineral concessions comprising the mine have been paid as indicated in Table 3-3. The penalties on concessions included in the UEA Atacocha (Nos. 1 through 146 in Table 3-3) are not due because the Minimum Annual Production Target was met for these concessions. The payment of 2023 penalties for the remaining concessions was US$3,829.16.
The penalty amounts shown for these concessions represent the annual amounts that would be payable if the Minimum Annual Production Target was not met.
| 3.4.3 | Recorded Liens and Encumbrances |
Pursuant to the information gathered from the Public Registry, there are the following encumbrances:
| · | Assignment agreement (2006). Concessions assigned to Nexa El Porvenir and Nexa Atacocha as listed in Table 3-1 and Table 3-3. |
| 3.4.4 | Royalties |
According to an agreement signed on July 14, 2010, the portions of El Porvenir listed in Table 3-5 are subject to royalty payments to Moraima Zevallos and others. These are calculated according to 1.5% NSR of the mineral value of the produced ore:
| 3- |
|
|
Table 3-5: El Porvenir Royalties Payable to Moraima Zevallos and Others
| Vertice | East | North |
| A | 370,079.14 | 8,826,116.63 |
| B | 370,232.12 | 8,826,235.63 |
| C | 370,261.09 | 8,826,416.07 |
| D | 370,608.06 | 8,826,360.35 |
| E | 370,354.60 | 8,824,781.89 |
| F | 369,762.67 | 8,824,876.94 |
| G | 369,806.62 | 8,825,150.60 |
| H | 369,993.94 | 8,825,222.05 |
| I | 369,922.72 | 8,825,408.77 |
| J | 370,202.79 | 8,825,515.59 |
| K | 370,293.61 | 8,825,277.49 |
| L | 370,386.97 | 8,825,313.10 |
Note: PSAD56 UTM Zone 18S (EPSG:24878)
According to a lease agreement signed on January 2, 2006, twenty of the El Porvenir mineral concessions are subject to royalty payments to Nexa Atacocha (Table 3-6), while seven of the Atacocha concessions are subject to royalty payments to Nexa Resources El Porvenir (Table 3-7). In each case, these are calculated according to the mineral value of the produced ore (Table 3-8).
| 3- |
|
|
Table 3-6: El Porvenir Concessions Subject to Atacocha Royalty Payments
| No. | Concession Code | Concession Name | Title Holder | Public Registry Record |
| 1 | 04010149X01 | C.M.A. Nº 55 | Payable to Nexa Resources Atacocha | P-02016190 |
| 2 | 04002731X01 | KITTY | Payable to Nexa Resources Atacocha | P-02010298 |
| 3 | 04010070X01 | ATACOCHA Nº 1 | Payable to Nexa Resources Atacocha | P-20000404 |
| 4 | 04005441X01 | ANGELICA SEGUNDA | Payable to Nexa Resources Atacocha | P-02005830 |
| 5 | 04010249X01 | ATACOCHA Nº 2 | Payable to Nexa Resources Atacocha | P-02014333 |
| 6 | 04010074X01 | C.M.A. Nº 41 | Payable to Nexa Resources Atacocha | P-02013928 |
| 7 | 04010073X01 | C.M.A. Nº 42 | Payable to Nexa Resources Atacocha | P-02013917 |
| 8 | 04010071X01 | C.M.A. Nº 43 | Payable to Nexa Resources Atacocha | P-02010565 |
| 9 | 04010072X01 | C.M.A. Nº 44 | Payable to Nexa Resources Atacocha | P-02013919 |
| 10 | 04010063X02 | C.M.A. Nº 45 | Payable to Nexa Resources Atacocha | P-02014009 |
| 11 | 04005426X01 | ITHACA | Payable to Nexa Resources Atacocha | P-02010173 |
| 12 | 04002471X01 | KATHLEEN | Payable to Nexa Resources Atacocha | P-02010553 |
| 13 | 04005356X01 | LA TUNDA | Payable to Nexa Resources Atacocha | P-02010176 |
| 14 | 04005383X01 | MANUEL NUMERO DOS | Payable to Nexa Resources Atacocha | P-02005462 |
| 15 | 04005372X01 | MELBOURNE | Payable to Nexa Resources Atacocha | P-02010281 |
| 16 | 04005505X01 | TRALEE | Payable to Nexa Resources Atacocha | P-02010297 |
| 17 | 04012874X01 | C.M.A. Nº 95 | 50% Payable to Nexa Resources Atacocha | P-20000331 |
| 18 | 04012875X01 | C.M.A. Nº 96 | 50% Payable to Nexa Resources Atacocha | P-20000332 |
| 19 | 04010148X01 | C.M.A. Nº 54 | Payable to S.M.R.L. CMA Nº 54 (accionariado: 50% Atacocha /50% El Porvenir) | P-11105479 |
| 20 | 04012134X01 | DEMASIA AM-Nº 1 | Payable to S.M.R.L. CMA Nº 54 (accionariado: 50% Atacocha /50% El Porvenir) | P-20001500 |
| 3- |
|
|
Table 3-7: Atacocha Concessions Subject to El Porvenir Royalty Payments
| No. | Concession Code | Concession Name | Title Holder | Public Registry Record |
| 1 | 04005427X01 | AZTEC | Payable to Nexa Resources El Porvenir | P-02004921 |
| 2 | 04005428X01 | CROW | Payable to Nexa Resources El Porvenir | P-02006258 |
| 3 | 04005460X01 | CURIE | Payable to Nexa Resources El Porvenir | P-02007248 |
| 4 | 04005366X01 | LA FLOR DE ATACOCHA | Payable to Nexa Resources El Porvenir | P-02004495 |
| 5 | 04012661X01 | PORVENIR 29 | Payable to Nexa Resources El Porvenir | P-20000337 |
| 6 | 04012666X01 | PORVENIR 34 | Payable to Nexa Resources El Porvenir | P-20000357 |
| 7 | 04009221X01 | PORVENIR CUATRO | Payable to Nexa Resources El Porvenir | P-02006696 |
Table 3-8: Royalty Percentages
| Royalty | Mineral Value |
| 7% | Up to US$40/t |
| 8% | US$40/t to US$50/t |
| 10% | US$50/t to US$60/t |
| 12% | US$60/t to US$70/t |
| 13% | US$70/t to US$80/t |
| 15% | US$80/t to US$100/t |
| 18% | Above US$100/t |
| 3.5 | Surface Rights and Easements |
According to the General Mining Law and related legislation, surface rights are independent of mineral rights.
The law requires that the holder of a Mining Concession reach either an agreement with the landowner before starting relevant mining activities (i.e., exploration, exploitation, etc.) or the completion of the administrative easement procedure, in accordance with the applicable regulation.
Surface property is acquired through the transfer of ownership by agreement of the parties (derivative title), or by acquisitive prescription of domain (original title).
| 3- |
|
|
Temporary rights to use and/or enjoy derived powers from a surface property right may be obtained through usufruct and easement rights.
The El Porvenir Mine has 30 related surface rights, with key rights shown in Figure 3-4.
The Atacocha Mine has 18 related surface rights, with key rights shown in Figure 3-5.
| 3- |
|
|
Figure 3-4: El Porvenir Surface Rights

| 3- |
|
|
Figure 3-5: Atacocha Surface Rights

| 3- |
|
|
| 3.6 | Required Permits and Status |
This subsection details the material Governmental Consents required to carry out the operation in compliance with applicable Peruvian laws and regulations. These material Governmental Consents correspond to those permits, licences, authorizations, etc., issued by the applicable governmental authorities, which entitle Nexa Peru to build the components and/or perform the activities that are critical and typical to a mining operation. These components/activities may include: (i) mining activities and related facilities; (ii) beneficiation plant and related activities; (iii) water supply; (iv) effluent discharge and related facilities; (v) use of explosives; and (vi) power supply.
As of December 31, 2023, Nexa El Porvenir and Nexa Atacocha have continued to be in total compliance with their environmental obligations and successfully obtained and/or renewed their main permits and authorizations.
The main consents for El Porvenir are tabulated in Table 3-9.
Table 3-9: El Porvenir Main Government Consents
| No. | Government Consent | Resolution | Approval Date |
| Environmental Certification | |||
| 1 | Adaptation and Environmental Management Program |
Directorate Resolution No. 23-97-EM/DGM |
17/01/1997 |
| 2 | Modification of the Adaptation and Environmental Management Program – Candelaria Power Station |
Directorate Resolution 28-1997-EM/DGM |
23/01/1997 |
| 3 | El Porvenir Environmental Impact Assessment |
Directorate Resolution 379-2001-EM/DGAA |
26/11/2001 |
| 4 | First amendment to El Porvenir Environmental Impact Assessment (expansion of processing capacity to 5,500 tpd). |
Directorate Resolution 271-2011-MEM/AAM |
02/09/2011 |
| 5 | Second amendment to El Porvenir Environmental Impact Assessment (expansion of processing capacity to 7,500 tpd). |
Directorate Resolution 203-2012-MEM/AAM |
25/06/2012 |
| 6 | EIA for the power supply components (transmission power line). |
Directorate Resolution 110-2013-MEM/AAM |
17/04/2013 |
| 7 | Technical Report to Directorate Resolution 110-2013- MEM/AAM (Optimized the design of the power transmission line). |
Directorate Resolution 159-2014-MEM-DGAAM |
02/04/2014 |
| 8 | Technical Report to Directorate Resolution 203-2012- MEM/AAM (integrate the tailings disposals from the Atacocha Mine and the Operation). |
Directorate Resolution 526-2014-MEM-DGAAM |
20/10/2014 |
| 9 | Second Technical Report to Directorate Resolution 110-2013-MEM/AAM (Optimized the design of the power transmission line). |
Directorate Resolution 271-2015-MEM-DGAAM |
09/07/2015 |
| 10 | Technical Report for 9,000 tpd expansion |
Directorate Resolution 319-2017-SENACE-DCA |
24/10/2017 |
| 3- |
|
|
| No. | Government Consent | Resolution | Approval Date |
| 11 | Technical Report for modifications of ancillary components |
Directorate Resolution 058-2018-SENACE-PE/DEAR |
13/12/2018 |
| 12 | Technical Report for modification of the 9,000 tpd expansion and tailings pipe connection to Atacocha |
Directorate Resolution 051-2020-SENACE-PE/DEAR |
10/03/2020 |
| 13 | Seventh Technical Report for modifications of ancillary components |
Directorate Resolution 00036-2021-SENACE-PE/DEAR |
04/03/2021 |
| 14 | Eight Technical Report (Optimized the tailings pipe connection to Atacocha and other ancillary components) | Directorate Resolution | 08/02/2024 |
| Mine Closure Plan | |||
| 1 | El Porvenir Mine Closure Plan. |
Directorate Resolution 166-2009-MEM/AAM |
17/60/2009 |
| 2 | First Amendment to the Mine Closure Plan. |
Directorate Resolution 286-2011-MEM/AAM |
15/09/2011 |
| 3 | Updated Mine Closure Plan |
Directorate Resolution 034-2013-MEM/AAM |
30/01/2013 |
| 4 | Second Amendment to the Mine Closure Plan. |
Directorate Resolution 277-2016-MEM-DGAAM |
15/09/2016 |
| 5 | Third Amendment to the Mine Closure Plan. |
Directorate Resolution 034-2021-MINEM-DGAAM |
20/02/2021 |
| Beneficiation Plant and Tailing Storage Facilities | |||
| 1 | Beneficiation Concession Title. |
Directorate Resolution 1058-1965 |
31/12/1965 |
| 2 | Authorization to operate the beneficiation plant with 2,000 tpd capacity. |
Resolution 180-79- EM/DCFM |
01/10/1979 |
| 3 | Beneficiation Concession Titles “AQUILES 104” (tailings disposal over 18 ha). |
Directorate Resolution 280-97-EM/DGM |
12/08/1997 |
| 4 | Beneficiation Concession Titles “AQUILES 103” (tailings disposal over 48 ha). |
Directorate Resolution 281-97-EM/DGM |
12/08/1997 |
| 5 | Authorization to operate the beneficiation plant at 2,850 tpd. | S/N-99-EM-DGM/DPDM | 03/03/1999 |
| 6 | Authorization to operate the beneficiation plant at 4,000 tpd. | Auto Directorial 113-2004- MEM-DGM/DPM | 08/03/2004 |
| 7 | Authorization to operate the tailing deposit “El Porvenir” to a height of 4,043 MASL |
Resolution 356-2010-MEM |
07/04/2010 |
| 3- |
|
|
| No. | Government Consent | Resolution | Approval Date |
| 8 | Authorization to operate the beneficiation plant at 4,700 tpd. |
Resolution 206-2011- MEM-DGM/V |
23/06/2011 |
| 9 | Authorization to operate additional components for the beneficiation plant without extending the processing capacity. |
Resolution 37-2012- MEM-DGM/V |
18/01/2012 |
| 10 | Authorization to operate the beneficiation plant at 5,600 tpd. |
Resolution 235-2013- MEM-DGM/V |
31/05/2013 |
| 11 | Beneficiation concession “ACUMULACION AQUILES 101” (Accumulate beneficiations concessions “AQUILES 104” and “AQUIES 103”) |
Directorate Resolution 178-2013-MEM/DGM |
04/07/2013 |
| 12 | Authorization to construct the tailing deposit “El Porvenir” to a height of 4,115 MASL |
Resolution 429-2013-MEM-DGM/V |
15/11/2013 |
| 13 | Authorization to operate the tailings deposit “El Porvenir” at a height of 4,047 MASL and extend the area of such beneficiation concession to a total of 323.7932. |
Resolution 612-2015- MEM/DGM |
12/06/2015 |
| 14 | Authorization to operate additional components that integrate the tailings disposal from Atacocha Mine and the Operation into the tailings deposit “El Porvenir”. |
Resolution: 251-2015- MEM-DGM/V |
19/06/2015 |
| 15 | Authorization to operate the beneficiation plant at 6,70 tpd. |
Resolution 597-2015- MEM-DGM/V |
03/12/2015 |
| 16 | Authorization to operate additional components for the beneficiation plant without extending the processing capacity. |
Resolution 635-2015- MEM-DGM/V |
12/12/2015 |
| 17 | Authorization to operate the tailing deposit “El Porvenir” to a height of 4,048.5 MASL |
Resolution 0499-2016-MEM-DGM/V |
18/08/2016 |
| 18 | Authorization to operate the tailing deposit “El Porvenir” to a height of 4,056 MASL |
Resolution 828-2017-MEM-DGM/V |
25/09/2017 |
| 19 | Authorization to increase the tailing deposit “El Porvenir” to a height of 4,060 MASL |
Resolution 0498-2019-MINEM-DGM/V |
07/10/2017 |
| 20 | Authorization to increase the tailing deposit “El Porvenir” to a height of 4,062 MASL |
Resolution 0155-2022-MEM-DGM |
26/04/2022 |
| 21 | Authorization to increase the tailing deposit “El Porvenir” to a height of 4,064 MASL |
Resolution 0278-2023-MINEM-DGM/V |
25/05/2023 |
| 22 | Approval of extension of the Beneficiation Concession area by 53.90 ha | Directorate Resolution | 22 |
| Water Abstraction, Transportation and Usage Facilities | |||
| 3- |
|
|
| No. | Government Consent | Resolution | Approval Date |
| 1 | License to use surface water from the rivers “Lloclla”, “Yanacachi”, “Chuncana” and “Tulluraica” for energetic purposes. |
Directorate Resolution 86-2016-ANA/AAAHUALLAGA |
11/02/2016 |
| 2 |
Update to the Licence to use surface water from the ravines “Pucayacu - Huarmipuquio” and “Pucayacu - Carmen Chico” for mining purposes due to title holder name change |
Directorate Resolution 322-2019-ANA/AAAHUALLAGA-ALA ALTO HUALLAGA |
03/10/2019 |
| Effluent Discharge to the Environmental | |||
| 1 | Authorization to discharge treated industrial effluents to rivers “Huallaga” and “Lloclla”. |
Directorate Resolution 192-2019-ANA-DGCRH |
15/11/2019 |
| Power Generation and Transmission Lines | |||
| 1 | Authorization to generate electricity for 1936 kW in the hydroelectric plant “Candelaria”. |
Ministerial Resolution 395-93-EM/DGE |
31/12/1993 |
| 2 | Authorization to auto-generate electricity in the thermoelectric plant “Milpo”. |
Ministerial Resolution 394-93-EM/DGE |
31/12/1993 |
| 3 | Authorization to generate electricity for 3 187,50 kW in the hydroelectric plant “Candelaria”. |
Supreme Resolution 541-98-EM/VME |
03/11/1998 |
| 4 |
Power transmission concession for the 50 kV Power Transmission Line - Hydroelectric Plant “Candelaria” - S.E. N° 3 at El Porvenir Mine. |
Supreme Resolution 75-2010-EM |
25/11/2010 |
| 5 | Approve the transfer of the power transmission concession to Nexa Resources El Porvenir |
Supreme Resolution 004-2015-EM |
06/03/2015 |
| 6 |
Power transmission concession for the 138 kV Power Transmission Line – Paragsha II - S.E. Milpo and 50 kV Power Transmission Line S.E. Milpo – V1C |
Ministerial Resolution 361-2016-MEM/DM
|
31/08/2016 |
| Use of Explosives | |||
| 1 | Authorization to operate an underground magazine - Explosives |
Management Resolution 01500-2023-SUCAMEC/GEPP |
02/02/2024 |
| 2 | Authorization to operate an underground magazine - Accessories |
Management Resolution 01369-2023-SUCAMEC/GEPP |
16/02/2024 |
| 3 | Authorization to operate an underground magazine - Accessories |
Management Resolution 01368-2023-SUCAMEC/GEPP |
05/02/2024 |
| 4 | Authorization to use and acquire explosives for UEA Milpo No. 1 |
Management Resolution 950-2023-SUCAMEC/GEPP |
08/03/2024 |
| 3- |
|
|
The main consents for Atacocha are tabulated in Table 3-10.
Table 3-10: Atacocha Main Consents
| No. | Government Consent | Resolution | Approval Date |
| Environmental Certification | |||
| 1 | Adaptation and Environmental Management Program |
Directorate Resolution No. 89-97-EM/DGM |
06/03/1997 |
| 2 | Environmental Impact Assessment – Tailing deposit Vaso Cajamarquilla |
Directorate Resolution 234-2005-MEM/DGAAM |
08/06/2005 |
| 3 | Environmental Impact Assessment – Tailing deposit Vaso Atacocha |
Directorate Resolution 361-2007 MEM/AAM |
30/10/2007 |
| 4 | First amendment to Atacocha Environmental Impact Assessment (Expansion of processing capacity to 5,000 tpd) |
Directorate Resolution 284-2012 MEM/AAM |
05/09/2012 |
| 5 | Environmental Impact Assessment for the transmission power line 50 kV S.E. El Porvenir – S.E. Nueva Chicrín |
Directorate Resolution 347-2013 MEM AAM |
13/09/2013 |
| 6 | Technical Report (Optimized open-pit mining exploitation) |
Directorate Resolution 170-2014 MEM-DGAAM |
10/04/2014 |
| 7 | Second Technical Report (Tailings disposal modification) |
Directorate Resolution 527-2014-MEM-DGAAM |
20/10/2014 |
| 8 | Detailed Technical Memorandum |
Directorate Resolution 243-2016-MEM-DGAAM |
11/08/2016 |
| 9 | Second amendment to Atacocha Environmental Impact Assessment |
Directorate Resolution 119-2018 SENACE-JEF/DEAR |
21/08/2018 |
| 10 | Second Technical Report to integrate the tailings disposals from Atacocha Mine into the tailings deposit El Porvenir |
Directorate Resolution 00028-2020-SENACE-PE/DEAR |
10/02/2020 |
| 11 | Third Technical Report for modifications of ancillary components |
Directorate Resolution 0092-2021-SENACE-PE/DEAR |
21/06/2021 |
| Mine Closure Plan | |||
| 1 | Atacocha Mine Closure Plan. |
Directorate Resolution 198-2009-MEM/AAM |
08/07/2009 |
| 2 | First Amendment to the Mine Closure Plan. |
Directorate Resolution 139-2012-MEM/AAM |
03/05/2012 |
| 3 | Updated Mine Closure Plan |
Directorate Resolution 387-2012-MEM/AAM |
22/11/2012 |
| 4 | Second Amendment to the Mine Closure Plan. |
Directorate Resolution 098-2016-MEM-DGAAM |
04/04/2016 |
| 3- |
|
|
| No. | Government Consent | Resolution | Approval Date |
| 5 | Third Amendment to the Mine Closure Plan. |
Directorate Resolution 136-2020-MEM-DGAAM |
09/10/2020 |
| 6 | Fourth Amendment to the Mine Closure Plan. |
Directorate Resolution 0278-2022-MINEM-DGAAM |
29/09/2022 |
| Beneficiation Plant and Tailing Storage Facilities | |||
| 1 | Beneficiation Concession Title |
Resolution 192-74-DGM/DC |
02/10/1974 |
| 2 | Authorization to operate the beneficiation plant at 3,500 tpd. |
Resolution 400-2000-EM-DGM/DPDM |
28/11/2000 |
| 3 | Authorization to construct the tailing deposit “Vaso Atacocha” |
Resolution 1139-2007-MEM-DGM/V |
15/11/2007 |
| 4 | Authorization to construct the tailing deposit “Vaso Atacocha” to a height of 4,081 MASL |
Resolution 001-2008-MEM-DGM/V |
04/01/2008 |
| 5 | Authorization to operate the tailing deposit “Vaso Atacocha” and extend the area of such beneficiation concession |
Resolution 892-2008-MEM-DGM |
21/02/2008 |
| 6 | Authorization to construct the tailing deposit “Vaso Atacocha” to a height of 4,081 MASL (Second Stage) |
Resolution 689-2008-MEM-DGM/V |
18/11/2008 |
| 7 | Authorization to operate the tailing deposit “Vaso Atacocha” to a height of 4,081 MASL (Second Stage) |
Resolution 860-2009-MEM-DGM/V |
03/11/2009 |
| 8 | Authorization to construct the tailing deposit “Vaso Atacocha” to a height of 4,093 MASL |
Resolution 996-2009-MEM-DGM/V |
23/12/2009 |
| 9 | Authorization to operate the beneficiation plant at 4,380 tpd |
Resolution 411-2010-MEM-DGM/V |
08/11/2010 |
| 10 | Authorization to operate the tailing deposit “Vaso Atacocha” to a height of 4,090.50 MASL |
Resolution 021-2011- MEM-DGM/V |
18/01/2011 |
| 11 | Authorization to operate additional components for the beneficiation plant without extending the processing capacity |
Resolution 191-2011-MEM-DGM/V |
24/06/2011 |
| 12 | Authorization to construct the tailing deposit “Vaso Atacocha” to a height of 4,097 MASL |
Resolution 266-2011-MEM-DGM/V |
02/08/2011 |
| 13 | Authorization to operate additional components for the beneficiation plant without extending the processing capacity |
Resolution 326-2011-MEM-DGM/V |
25/08/2011 |
| 14 | Authorization to operate the tailing deposit “Vaso Atacocha” to a height of 4,097 MASL |
Resolution 063-2012-MEM-DGM/V |
21/02/2012 |
| 15 | Authorization to construct the tailing deposit “Vaso Atacocha” to a height of 4,105 MASL |
Resolution 092-2012-MEM-DGM/V |
15/03/2012 |
| 3- |
|
|
| No. | Government Consent | Resolution | Approval Date |
| 16 | Authorization to operate additional components for the beneficiation plant without extending the processing capacity |
Resolution 137-2013- MEM-DGM/V |
25/03/2013 |
| 17 | Authorization to operate additional components for the beneficiation plant without extending the processing capacity |
Resolution 207-2013- MEM-DGM/V |
10/05/2013 |
| 18 | Authorization to construct the tailing deposit “Vaso Atacocha” to a height of 4,105 MASL |
Resolution 263-2013-MEM-DGM/V |
31/05/2013 |
| 19 | Authorization to operate additional components for the beneficiation plant without extending the processing capacity |
Resolution 137-2013-MEM-DGM-V |
25/03/2013 |
| 20 | Authorization to operate additional components for the beneficiation plant without extending the processing capacity |
Resolution 207-2013-MEM-DGM-V |
10/05/2013 |
| 21 | Authorization to operate the tailing deposit “Vaso Atacocha” to a height of 4,105 MASL |
Resolution 236-2013-MEM-DGM-V |
31/05/2013 |
| 22 | Authorization to construct the tailing deposit “Vaso Atacocha” to a height of 4,128 MASL |
Resolution 375-2013-MEM-DGM-V |
19/09/2013 |
| 23 | Authorization to construct components that integrate the tailings disposals from Atacocha Mine into the tailings deposit “El Porvenir”. |
Resolution 594-2014-MEM-DGM-V |
31/12/2014 |
| 24 | Authorization to operate components that integrate the tailings disposals from Atacocha Mine into the tailings deposit “El Porvenir”. |
Resolution 267-2015-MEM-DGM-V |
03/07/2015 |
| 25 | Authorization to construct the beneficiation plant at 5,000 tpd | 120-2016-MEM-DGM-V | 04/04/2016 |
| 26 | Authorization to operate the beneficiation plant at 4,600 tpd | 754-2016-MEM-DGM-V | 22/11/2016 |
| 27 | Authorization to construct the tailing deposit “Vaso Atacocha” to a height of 4,110 MASL | 0210-2016-MEM-DGM/V | 04/05/2016 |
| 28 | Authorization to operate the beneficiation plant at 4,600 tpd (Part I) and additional components | 0754-2016-MEM-DGM/V | 22/11/2016 |
| 29 | Authorization to operate “Glory Hole” | 1158-2017-MEM-DGM/V | 18/12/2017 |
| 30 | Authorization to construct the tailing deposit “Vaso Atacocha” to a height of 4,110 MASL in four stages. | 00064-2018-MEM-DGM/V | 01/02/2019 |
| 31 | Authorization to operate the tailing deposit “Vaso Atacocha” to a height of 4,110 MASL | 0249-2019-MEM-DGM/V | 23/05/2019 |
| 32 | Authorization to construct the tailing deposit “Vaso Atacocha” to a height of 4,128 MASL in four stages. | 238-2020-MEM-DGM/V | 08/09/2020 |
| 33 | Authorization to operate the tailing deposit “Vaso Atacocha” to a height of 4,126 MASL | 0437-2021-MINEM-DGM/V | 15/11/2021 |
| Water Abstraction, Transportation and Usage Facilities | |||
| 3- |
|
|
| No. | Government Consent | Resolution | Approval Date |
| 1 | Licence to use surface water from the “Atoghuarco” stream for domestic purposes |
Administrative Resolution 082-2006-AG-DRA-P/ATDRP |
02/02/2006 |
| 2 | Licence to use surface water from the “Huallpaguaja” ravine for domestic purposes |
Administrative Resolution 012-2006-AG-DRA-P/ATDRP |
03/04/2006 |
| 3 | License to use surface water from “Centro de Explotación Minera” and “Ñahualpum” Lake for domestic purposes |
Administrative Resolution 021-99-CTARP-DRA/INRENA-ATDRP |
12/03/1999 |
| 4 | Licence to use surface water for mining purposes – Don Paco Tunnel |
Administrative Resolution 519-2019-ANA-AAA HUALLAGA |
01/07/2019 |
| 5 | Licence to use surface water for mining purposes – Huallaga River and Ñahualpum Lake |
Directorate Resolution 470-2019-ANA/AAA-HUALLAGA |
03/09/2019 |
| 6 | Licence to use surface water for energetic purposes – Huallaga River |
Administrative Resolution 019-99-CTARP-DRA/INRENA/ATDRP |
12/03/1999 |
| 7 | Licence to use surface water for energetic purposes – Huallaga River (Marcopampa Sector) |
Directorate Resolution 522-2019-ANA/AAA-HUALLAGA |
02/10/2019 |
| Effluent Discharge to the Environmental | |||
| 1 | Wastewater Discharge Permit – Domestic Effluents |
Directorate Resolution 303-2016-ANA-DGCRH |
30/12/2016 |
| 2 | Industrial Wastewater Discharge Permit – Industrial Effluents |
Directorate Resolution 179-2019-ANA-DGCRH |
14/10/2019 |
| Power Generation and Transmission Lines | |||
| 1 | Hydroelectric Power concession for hydroelectric power plant “Marcopampa” |
Supreme Resolution 66 |
07/11/1956 |
| 2 | Hydroelectric Power concession for hydroelectric power plant “Chaprín” |
Supreme Resolution 67 |
07/11/1956 |
| 3 | Authorization to generate electricity in the hydroelectric power plant “Chaprín”. |
Ministerial Resolution 313-94-EM/DGE |
05/07/1994 |
| 4 | Authorization to generate electricity for 1,936 kW in the hydroelectric plant “Marcopampa”. |
Ministerial Resolution 014-95-EM/DGE |
20/01/1995 |
| 5 | Power transmission concession for the 50 kV Power |
Supreme Resolution 016-96-EM |
02/04/1996 |
| Transmission Line – S.E.Paragsha – S.E. Chicrín – C.H. Chaprín – S.E. Atacocha | |||
| 3- |
|
|
| No. | Government Consent | Resolution | Approval Date |
| 6 | Authorization to extending the capacity - Transmission Line “S.E.Nueva Chicrín” |
Ministerial Resolution 152-2008-MEM-DGM/V |
05/02/2008 |
| Use of Explosives | |||
| 1 | Authorization to operate an underground magazine - Explosives |
Management Resolution 1022-2022-SUCAMEC/GEPP |
26/01/2024 |
| 2 | Authorization to operate an underground magazine - Accessories |
Management Resolution 2085-2023-SUCAMEC/GEPP |
12/06/2023 |
| 3 | Authorization to operate an underground magazine - Silos |
Management Resolution 3036-2023-SUCAMEC/GEPP |
21/08/2023 |
| 4 | Authorization to use and acquire explosives for UEA Atacocha |
Management Resolution 00897-2023-SUCAMEC/GEPP |
06/03/2024 |
| 3.7 | Other Significant Factors and Risks |
The QP is not aware of any environmental liabilities on the property. Nexa has all required permits to conduct the proposed work on the property. The QP is not aware of any other significant factors and risks that may affect access, title, or the right or ability to perform the proposed work program on the property.
| 3- |
|
|
| 4.0 | Accessibility, Climate, Local Resources, Infrastructure and Physiography |
| 4.1 | Accessibility |
El Porvenir and Atacocha are located approximately 13 km and 16 km northeast of the city of Cerro de Pasco, respectively. Cerro de Pasco is situated approximately 315 km from Lima, the national capital, when travelling via the Carretera Central and La Oroya-Huanuco highways, which are paved roads. Alternatively, Highway 20A provides a shorter drive from Lima but is mostly unpaved.
The nearest airport to the Complex is Alférez FAP David Figueroa Fernandini Airport (HUU) which is located approximately 130 km to the north of the Complex, just outside of Huanuco. Two regional airlines provide daily flights between the airport and Lima. From the city of Huánuco access is via the Carretera Central highway to the town of Chicrin (at km 324). From the town of Chicrin, an approximately 4.5 km long unpaved road provides access to Atacocha. El Porvenir is accessed by the same unpaved road from Chicrin after approximately 15 km.
| 4.2 | Climate |
The climate at Cerro Pasco is cold and humid and is generally typical of the Central Andes Mountain Region, where elevations exceed 4,000 MASL. The area has an ET Köppen climate classification, corresponding to Polar Tundra (Weather-Atlas.com, 2024). The temperature is relatively uniform throughout the year, ranging from approximately 0°C to +14°C (Figure 4-1). Precipitation in the region totals approximately 1,100 mm annually, mainly falling during the rainy season from November to March; conversely the months of June to August are mostly dry. Snowfall occurs at any time of the year, most commonly at dawn. Relative humidity is uniform throughout the year averaging between 72% and 82%. Mining operations are not affected by the climate and are carried out year-round.
| 4- |
|
|
Figure 4-1: Mean Monthly Temperature Range and Mean Precipitation

Source: Weather-Atlas.com, 2024
| 4.3 | Local Resources |
Various services including temporary and permanent accommodations and medical services are available at the city of Cerro de Pasco, which has a population of approximately 60,000. A greater range of general services are available at Huánuco, which has a population of approximately 190,000. Most supplies used in the mining operation are delivered by truck from Lima.
Raw water is supplied from various creeks. Fresh water is obtained from the Carmen Chico River.
| 4.4 | Infrastructure |
The Complex infrastructure consists of the following facilities:
| · | Power from the national power grid and the La Candelaria Hydroelectric Plant |
| · | Tailings from Atacocha and Porvenir will be combined in the Atacocha TSF |
| · | Atacocha and Porvenir mines to be connected underground allowing production from both mines to be delivered to the Porvenir concentrator for processing. |
| · | El Porvenir: |
| o | Approximately 6,000 tpd underground mine |
| 4- |
|
|
| o | A 6,500 tpd, 2.37 million tonnes per annum (Mtpa) processing plant with associated laboratory and maintenance facilities |
| o | Access roads |
| o | Offices and warehouses |
| o | Accommodations |
| o | Waste rock facilities |
| o | Temporary ore stockpiles |
| o | Hydraulic backfill plant |
| o | Porvenir tailings storage facility |
| · | Atacocha: |
| o | 2,740 tpd underground mine to be processed at the El Porvenir plant concentrator |
| o | 4,400 tpd San Gerardo open pit (including Satellite East and Satellite West open pits) to be processed at the Atacocha concentrator. |
| o | 4,400 tpd, 1.68 Mtpa, Atacocha processing plant with associated laboratory and maintenance facilities |
| o | Atacocha waste dump |
| o | Atacocha tailings storage facility |
| o | Temporary ore stockpile |
| o | Topsoil stockpile |
| o | Sediment pond |
| o | San Felipe and Chicrín camps |
| o | Closed waste dumps (3600, 3900, 4000) |
| o | Inactive tailings storage facilities in closure (Chicrín Antiguo, Chicrín Actual, Cajamarquilla, Titlacayán, Malauchaca) |
Additional information on infrastructure is provided in Section 15.
| 4.5 | Physiography |
El Porvenir and Atacocha are located in a glacial valley with rugged mountains in the central highland of Perú, in the Western Cordillera. There are three geomorphological zones in the Complex area: the Puna surface, the Cordilleran Zone, and the Periglacial Valleys Zone. The elevation at El Porvenir is approximately 4,200 MASL. Atacocha is located at approximately 4,050 MASL. The Atacocha processing plant is located in the Huallaga River valley, surrounded by rugged hills/mountains, at an elevation of approximately 3,600 MASL. El Porvenir’s TSF, processing plant, and other buildings are located at the valley’s base. A creek running through the valley drains into the Huallaga River further downstream at the village of La Quinua. Topographical relief consists of deep, long, narrow valleys with steep slopes. Some rivers cross through the area and have moderate slopes and some scattered peaks. The main valley has a general inclination from south to north.
| 4- |
|
|
| 5.0 | History |
| 5.1 | Ownership History |
In 1936, Compañia Minera Atacocha S.A.A. (Minera Atacocha) was formed to explore, develop, and exploit Cu-Pb-Zn deposits in the Atacocha area, with the Atacocha Mine commencing operations that year. Early work focused on developing the San Ramon tunnel to exploit veins on the 4000 Level. A hydroelectric plant and the first processing plant were built in 1936. The Atacocha flotation plant in Chicrín was built in 1952, with construction of the 3600 Level to a length of 2,700 m completed in the same year, which allowed a new main level of access and transportation to underground work, while facilitating the extraction and transportation of the mineral to the new concentrate plant located in Chicrín.
El Porvenir Mine began operating as a small-scale artisanal mine in 1949, with Compañía Minera Milpo S.A. (Milpo) incorporated the same year to operate it. Exploration was conducted simultaneously with underground development and included geological mapping, diamond core drilling, and channel sampling (SRK, 2017). No documentation on exploration is available prior to 2006.
Milpo conducted exploration and development work in Atacocha from 1949 onwards, with most exploration consisting of diamond drilling conducted simultaneously with underground development and channel sampling following drifting. Prior to 1997, only a small quantity of sporadic drilling was completed and no channel sampling was documented prior to 2001.
A gravity separation plant was built at El Porvenir in 1953, and a flotation plant was completed in 1979. The mine’s output increased steadily over the decades, attaining its current production rate of approximately 5,600 tpd in 2014.
Milpo acquired the Atacocha Mine in 2008.
In 2010, Nexa, then VM Holding, gained control of Milpo and its assets, including El Porvenir and Atacocha. In 2014, VM Holding began integrating the El Porvenir and Atacocha operations, including administration infrastructure, the TSFs, the electrical power supply, and mineral processing. VM Holding changed its corporate name to Nexa Resources S.A. in 2017, accompanied by initial public offerings on the New York Stock Exchange and Toronto Stock Exchange.
El Porvenir’s operations were interrupted from March 10, 2020 to May 15, 2020, due to the COVID-19 pandemic. Although the San Gerardo open pit remains operational, the Atacocha underground mine did not resume operations after the mandatory restriction period imposed by the Peruvian Government was lifted in June 2020.
| 5.2 | Exploration and Development History |
Table 5-1 summarizes the history of the Complex.
Table 5-1: History of Cerro Pasco Complex
| Year | Work Description |
| 1936 |
Atacocha Mine commences operation under Minera Atacocha Construction of a hydroelectric plant and the first processing plant. |
| 5- |
|
|
| Year | Work Description |
| 1939 | The
El Porvenir site is granted June 30, 1939 through Resolución Jefatural N° 076-88-EM-DGM/JRMCP. |
| 1949 | El Porvenir began operating as a small-scale artisanal mine. Milpo was incorporated on April 6, 1949, by founders Mr. Aquiles Venegas, Mr. Amador Nycander, Mr. Ernesto Baertl, Mr. Manuel Montori, and Mr. Luis Cáceres P. |
| 1952 |
Construction of the Atacocha flotation plant in Chicrín. Construction of the 3600 Level to a length of 2,700 m. |
| 1953 | Milpo built a gravity separation plant at El Porvenir, which had a capacity 54,000 t/month. The plant was expanded several times until 1978. |
| 1979 | Construction of the flotation plant at El Porvenir was completed, capacity 1,800 tpd. |
| 1997 | A new mineralized zone called Porvenir Nueve was discovered. |
| 1999 | Production at El Porvenir increased to 3,000 tpd. |
| 2008 | Milpo acquired the Atacocha Mine. |
| 2010 | VM Holding S.A. (now Nexa) gained control of Milpo and its assets, including El Porvenir. |
| 2012 | El Porvenir’s production increased to 5,600 tpd. |
| 2013 | VM Holding S.A. initiated the process of integrating the Atacocha and El Porvenir mines, forming the Cerro Pasco Complex. |
| 2014 | The 1st stage integration was initiated, which consisted of integrating the administrative functions of the two operations. |
| 2015 | The 2nd stage integration was initiated, which consisted of integrating TSFs of Atacocha and El Porvenir. |
| 2016 | The 3rd stage integration was initiated, which consisted of integrating the electric power supply of the two mines. |
| 2017 | VM Holding S.A. changed its name to Nexa. The integration process continued: The two underground mines were connected by a drift allowing an exploration program to proceed in the integration area. |
| 2018 | Nexa implemented the Avoca version of the sub-level stoping (SLS) mining method at El Porvenir. Discovery of the Sara Deposit, in which the mineralization occurs in sandstone. |
| 2019 | The tailings dam level was increased to the 4,060 MASL elevation, which extended it useful life by an additional five years. The Avoca/SLS mining method contributed to 6% of El Porvenir’s total production. Nexa initiated a program called the Nexa Way Experience (La Manera Nexa Experience) aiming to optimize organizational performance through autonomous work groups and employee self-management. |
| 2020 |
The Nexa Way Experience program continued and, at El Porvenir, focused
on lowering costs by reducing shotcrete consumption. Operations at the Atacocha underground mine were not resumed following the mandatory restriction period from the Peruvian Government was lifted in June 2020. |
| 5- |
|
|
| 5.3 | Past Production |
Past production at the El Porvenir Mine is summarized in Table 5-2. Past production at the Atacocha Mine is summarized in Table 5-3.
Table 5-2: El Porvenir Past Production
| Year | Treated Ore Tonnage (t) |
Average Ore Grade | ||||
| Au (oz/t) |
Ag (oz/t) |
Pb (%) |
Zn (%) |
Cu (%) |
||
| 2003 | 1,313,346 | - | 3.51 | 2.45 | 7.69 | - |
| 2004 | 1,342,451 | - | 2.21 | 1.41 | 7.61 | - |
| 2005 | 1,395,991 | - | 2.44 | 1.64 | 6.87 | - |
| 2006 | 1,390,940 | - | 2.51 | 1.68 | 6.1 | - |
| 2007 | 1,333,313 | - | 1.9 | 1.19 | 5.31 | - |
| 2008 | 1,389,947 | - | 1.6 | 0.88 | 4.23 | - |
| 2009 | 1,712,188 | - | 1.3 | 0.68 | 4.07 | - |
| 2010 | 1,712,188 | - | 1.23 | 0.6 | 4.04 | - |
| 2011 | 1,742,129 | - | 1.23 | 0.54 | 4 | - |
| 2012 | 1,898,901 | - | 1.13 | 0.48 | 4.04 | - |
| 2013 | 1,943,490 | - | 1.37 | 0.82 | 3.48 | - |
| 2014 | 2,107,212 | - | 1.49 | 0.88 | 3.39 | - |
| 2015 | 2,106,519 | 0.02 | 1.75 | 0.93 | 3.21 | 0.17 |
| 2016 | 2,154,152 | 0.01 | 1.94 | 0.98 | 3.22 | 0.14 |
| 2017 | 1,834,511 | 0.02 | 2.05 | 1.04 | 2.86 | 0.13 |
| 2018 | 2,149,928 | 0.01 | 1.92 | 0.98 | 3.04 | 0.15 |
| 2019 | 2,120,765 | 0.02 | 2.08 | 1.01 | 2.92 | 0.15 |
| 2020 | 1,502,618 | 0.01 | 2 | 0.93 | 2.65 | 0.17 |
| 2021 | 2,077,591 | 0.01 | 2.1 | 1.08 | 2.83 | 0.19 |
| 2022 | 2,111,961 | 0.01 | 2.46 | 1.34 | 2.8 | 0.16 |
| 2023 | 2,220,011 | 0.01 | 2.34 | 1.37 | 2.86 | 0.16 |
| 5- |
|
|
Table 5-3: Atacocha Past Production
| Year | Treated Ore Tonnage (t) |
Average Ore Grade | ||||
| Au (oz/t) |
Ag (oz/t) |
Pb (%) |
Zn (%) |
Cu (%) |
||
| 2003 | 1,211,200 | 0.02 | 4.58 | 3.53 | 5.79 | 0.33 |
| 2004 | 1,237,184 | 0.01 | 4.76 | 3.25 | 5.24 | 0.32 |
| 2005 | 1,241,967 | 0.01 | 4.57 | 3.45 | 5.00 | 0.31 |
| 2006 | 1,264,387 | 0.01 | 2.57 | 1.66 | 4.96 | 0.27 |
| 2007 | 1,304,279 | 0.01 | 2.15 | 1.19 | 4.77 | 0.35 |
| 2008 | 1,260,388 | 0.01 | 1.60 | 0.98 | 5.14 | 0.27 |
| 2009 | 1,424,995 | 0.01 | 1.2 | 0.72 | 4.7 | 0.26 |
| 2010 | 1,537,390 | 0.01 | 1.24 | 0.72 | 4.26 | 0.24 |
| 2011 | 1,540,647 | 0.01 | 1.39 | 0.73 | 3.37 | 0.27 |
| 2012 | 1,455,482 | 0.01 | 1.27 | 0.76 | 3.43 | 0.22 |
| 2013 | 1,480,429 | 0.01 | 1.4 | 0.79 | 3.34 | 0.24 |
| 2014 | 1,540,713 | 0.01 | 1.48 | 0.89 | 2.74 | 0.2 |
| 2015 | 1,431,315 | 0.01 | 1.54 | 1.1 | 2.4 | 0.16 |
| 2016 | 1,487,390 | 0.02 | 1.73 | 1.31 | 1.8 | 0.11 |
| 2017 | 1,506,830 | 0.02 | 1.43 | 1.22 | 1.42 | 0.09 |
| 2018 | 1,551,470 | 0.02 | 1.42 | 1.18 | 1.43 | 0.1 |
| 2019 | 1,505,428 | 0.01 | 1.52 | 1.3 | 1.43 | 0.08 |
| 2020 | 1,065,363 | 0.01 | 1.39 | 1.15 | 1.2 | 0.05 |
| 2021 | 1,271,107 | 0.01 | 1.01 | 0.82 | 0.88 | 0.03 |
| 2022 | 1,353,681 | 0.01 | 1.05 | 0.97 | 0.89 | 0.03 |
| 2023 | 1,397,192 | 0.01 | 1.21 | 0.93 | 0.77 | 0.04 |
| 5- |
|
|
| 6.0 | Geological Setting, Mineralization, and Deposit |
This section is largely based upon geological descriptions within Nexa internal El Porvenir and Atacocha reports (Nexa, 2023a and Nexa, 2023b).
| 6.1 | Regional Geology |
The South American Platform is mainly composed of metamorphic and igneous complexes from the Archean/Proterozoic era and constitutes the continental interior of South America. The Platform was consolidated during late Proterozoic to early Paleozoic times in the Brasilian/Pan-African orogenic cycle during which the union of different continents and micro-continents with the closure of several ocean basins led to the formation of the supercontinent Gondwana. Archaean and Proterozoic rocks are exposed in three main shield areas within the framework of the Neoproterozoic folding strips (Guiana, Central Brazil, and Atlantic Shields). The western continental margin of the South American Plate developed from approximately Neoproterozoic to early Paleozoic times and constitutes a convergent margin, along which the eastward subduction of the Pacific oceanic plates takes place under the South American plate. Through this process, the Andean Range was developed. The eastern margin of the South American Plate forms a divergent margin more than 10,000 km long, which developed as a result of the separation of the South American Plate and the African Plate from the Mesozoic through the opening of the South Atlantic and the rupture of Gondwana. The northern and southern margins of the South American Plate developed along transform faults in transient tectonic regimes due to the collision of the South American Plate with the Caribbean and Scottish plates. The South American Plate reveals a long and complex geological history (Engler, 2009).
Most of the stratigraphy, tectonics, magmatism, volcanism, and mineralization in Peru is spatially and genetically related to the evolution of the Andean Cordillera off the western coast of South America. The mountain range was formed by actions related to important events (for example subduction) that have continued to the present since approximately the Cambrian (Peterson, 1999) or the late Precambrian (Clark et al., 1990; Benavides-Cáceres, 1999). The formation of the Andean Cordillera is, however, the result of a narrower period extending from the Triassic to the present when the division of the African and South American continents formed the Atlantic Ocean. Two periods of this subsequent subduction activity have been identified (Benavides-Cáceres, 1999): Mariana-type subduction from the late Triassic to the late Cretaceous; and Andean-type subduction from the late Cretaceous to the present.
The geology of Peru, from the Peru-Chile trench in the Pacific to the Brazilian Shield, is defined as three main parallel regions, from west to east: the Andean Antearco, the high Andes, and the Andean Antepaís Basin. All three regions were formed during the Meso-Cenozoic evolution of the central Andes. The property is located within the high Andes region. A simplified geological and structural map of Peru is shown in Figure 6-1.
The Andes can be divided into three sections, from west to east:
| · | The Western Cordillera is formed by rocks of the Mesozoic-Tertiary age, dominated by the coastal batholith, which consists of multiple intrusions with ages ranging from the Lower Jurassic to the Upper Eocene. The belt is up to 65 km wide and 1,600 km long and extends in a sub-parallel direction from the Pacific coast to Ecuador and Chile. El Porvenir is located within the Western Cordillera. |
| · | The Altiplano is a high plain with internal drainage located at an average elevation of almost 4,000 m, slightly below the average altitudes of the Western and Eastern |
| 6- |
|
|
Cordillera. It is 150 km wide and 1,500 km long, stretching from the north of Argentina to the south of Peru.
| · | The Eastern Cordillera forms a plateau 4,000 m high and 150 km wide. During the Cenozoic era, the arch has risen forming the Eastern Cordillera. Stratigraphically, the zone of the high Andes is composed, from west to east, of an intra-arch channel, a deep basin, a continental shelf, and the Marañón metamorphic complex (the Marañón complex). In general, the formations are progressively older from west to east, spanning from the mid-Tertiary to the Neoproterozoic-Paleozoic. |
| 6- |
|
|
Figure 6-1: Simplified Geological Map of the Central Andes

| 6- |
|
|
| 6.2 | Local Geology |
The Complex is situated in the Pasco region of the Western Cordillera of the Andes, within the Eocene-Miocene Polymetallic and Miocene Au-Ag Epithermal Belts.
| 6.2.1 | Stratigraphy |
The oldest rocks in the region are part of the Excelsior Formation (Devonian), comprising metamorphosed siliciclastic sediments or phyllite and quartzite.
The Upper Permian-Middle Triassic Mitu Group comprises clastic and volcanic sediments, including red sandstone, shale, and minor conglomerate. At the base of the Mitu Group there is a polymictic conglomerate unit which is approximately 45 m thick. Conglomerate clasts are sub-angular, comprising shale, phyllite, quartzite, and minor limestone. The conglomerate matrix is a well cemented, fine grained, reddish sandy material. Thin, grey to reddish siltstone layers are also present, and exhibit laminar stratification. The middle part of the Mitu Group comprises sequences of fine grained, reddish sandstone, with cross-stratification and interbedded with polymictic conglomerate layers. The Mitu Group was deposited during the Late Hercynian Tectonic Phase (based on the fossil record, and radiometric age dating). An angular unconformity exists between the underlying Excelsior Formation and overlying Mitu Group. The sediment package has accumulated with increasing thickness to the east, locally up to approximately 2,000 m, thinning to possibly as little as 100 m thickness in areas.
The Norian-Toarcian Pucará Group was deposited in the Pucará Basin, a north-northwest trending trough associated with a transtensional shear zone accommodating rifting and sinistral movement, on the Mitu Group with an erosional and angular unconformity. The Pucará Group is dominated by carbonate platform sequences which were primarily deposited in a shallow water environment during the first marine progression of the Andean Orogenic Cycle from the Upper Triassic to Lower Jurassic. The Pucará comprises interbedded grey to black limestone, dolostone, and shale with varying thicknesses of up to 60 cm, and is sub-divided into three formations: Chambará, Aramachay, and Condorsinga (Mégard, 1968).
The Norian to Rhaetian Chambará Formation overall comprises massive, grey to pale limestone beds with some layers containing chert nodules, and horizons of grey to beige calcareous siltstone with variable oxides and red shale. Thicknesses vary from approximately 600 m to over 3,000 m. This formation is further sub-divided into stratigraphic units at the project scale.
The Hettangian to Sinemurian Aramachay Formation is characterized by dark grey bituminous calcareous shales and limestone beds over 15 cm thick. This formation was deposited in a deeper-water environment.
The Sinemurian to Toarcian Condorsinga Formation comprises beige to grey, thin to massive, interbedded limestone and dolostone. The thicknesses vary from approximately 500 m to over 1,500 m.
The Hauterivian to Aptian Goyllarisquizga Group, composed of siliciclastic sediments, vary from 150 m to 600 m thick and was deposited during the Lower Cretaceous with an erosional and angular unconformity over the Pucará Group during the Lower Cretaceous. Variable and discontinuous units of conglomerate, chert, and/or shale with carbonaceous fragments occur at the base of this group, which correlates with the Chimú Formation. A sequence of approximately 40 m thick comprising bitumen-bearing siltstone, with carbonaceous layers and laminar stratification is located above the Chimú Formation. Continuing up in the stratigraphic sequence is a section approximately 25 m thick comprising medium grain, reddish sandstone with thin
| 6- |
|
|
micro-conglomerate layers, alternating with white sandstone further up in the sequence. These sequences correlate with the Santa and Carhuaz formations. The majority of the Goyllarisquizga Group comprises cross-bedded grey to white, medium to coarse grained, quartz-rich sandstone, approximately 90 m thick or more, which correlates with the Farrat Formation. Over one metre thick limestone units are present locally in the upper parts of this formation. Thin terrestrial red beds and basalt layers one to two metres thick may be interbedded near the upper contact.
A discontinuous, predominantly basaltic flow occurs in the Goyllarisquizga Group. Thin, red beds of sandstone and shale occur within the basalt unit.
The equivalent Machay and Chicrín formations comprise of approximately 250 m of massive to thinly interbedded grey calcareous sandstone, grey to brown marly limestone, grey calcareous conglomerate with clasts of fine to muddy sandstone, and fine-grained red sandstone. These rocks were deposited onto the basalt flows during the Middle Cretaceous.
Another unit of predominantly basalt flows with thin beds of red sandstone and shale was unconformably deposited on top of the Machay/Chicrín Formation.
The Upper Eocene Pocobamba Formation comprises breccias with sub-angular to sub-rounded limestone clasts derived from the Pucará Formation; sub-divided into the Cacuán and Shuco members. The Pocobamba Formation was deposited as debris in a continental environment.
Figure 6-2 illustrates the local geology. The regional stratigraphic column is shown in Figure 6-3.
| 6- |
|
|
Figure 6-2: Local Geology

| 6- |
|
|
Figure 6-3: Generalized Stratigraphic Column

| 6- |
|
|
| 6.2.2 | Intrusive Rocks |
Two generations of magmatism are recognized in the region, including the Milpo-Atacocha-Vinchos (29 Ma to 26 Ma) and Cerro de Pasco-Colquijirca (16 Ma to 10 Ma) belts (Cobeñas, 2008, and references therein). Both magmatic belts are oriented north-northeast to south-southwest, approximately parallel to the Andean trend.
The Milpo-Atacocha-Vinchos intrusive rocks are characterized as small hypabyssal stocks (less than one square kilometre), dikes, and sills of granodiorite (dacite) to diorite and tonalite composition and occur within high-K Calc-Alkaline Series and Shoshonitic Series. These intrusive rocks generally exhibit a porphyritic texture with plagioclase as the dominant mineral forming the matrix, and variable phenocrysts of quartz, hornblende, biotite, and pyroxenes. The matrix comprises fine-grained quartz and feldspar-plagioclase.
Magmatic emplacement occurred during the Oligocene based on two K-Ar age dates of porphyritic granodioritic samples with partially carbonate and sericite altered plagioclase (29.3±2.5 Ma and 25.9±1.5 Ma) (Soler and Bonhomme, 1988). Recently, 12 intrusive rocks samples from the El Porvenir and Atacocha areas were analyzed by U-Pb geochronology at the University of Tasmania and provided age dates of intrusive crystallization from 28.58 ± 0.38 Ma to 30.11 ± 0.23 Ma.
Intrusives in the region exhibit an elongate geometry, trending north-south to northwest-southeast, parallel to the regional fold axis, and are mostly spatially associated with the Milpo-Atacocha fault, suggesting an apparent structural control on magmatic emplacement.
Metamorphic contact aureoles are variably formed around these intrusive bodies. The most intense contact aureole is recognized in the Atacocha area, where Pucará Group rocks are completely silicified with pyrite impregnations for up to 200 m.
The Cerro de Pasco-Colquijirca volcanic to sub-volcanic intrusive rocks are characterized by dacitic, trachytic, and monzonitic composition. Texture varies from porphyritic to aphanitic. Composition is dominated by quartz and plagioclase, with lesser amphiboles, biotite, and K-feldspar. Age dating from the Cerro de Pasco, Marcapunta, and Yanamate complexes reveals ages ranging from 16 Ma to 10 Ma.
| 6.2.3 | Structure |
Regional tectonics during the Mesozoic and Cenozoic are collectively referred to as the Andean Cycle which comprises multiple sedimentation and deformational events. The Andean Cycle is sub-divided into at least seven deformational phases (Ellison et al., 1989):
· Peruana (Upper Cretaceous).
· Incaica (Paleogene/Eocene).
| · | Quechua 1 (early Oligocene). |
| · | Quechua 2 (late Oligocene to early Miocene). |
| · | Quechua 3 (middle Miocene). |
| · | Quechua 4 (late Miocene). |
| · | Quechua 5 (late Miocene). |
Three episodes of regional folding are recognized occurring during the Paleogene and possibly earlier and are separated by periods of tension. Throughout the region, the tectonics are
| 6- |
|
|
characterized by northeast-southwest to east-west oriented compression, which occurred during the second Andean deformation phase (Incaico), from the Eocene to Oligocene. Most Mesozoic rocks appear to have been folded conformably generally forming a series of anticlines and synclines, parallel to the principal Andean trend, with a north-northwest to south-southeast oriented fold-axis, plunging to the south. Most folds described throughout the region have gently to moderately dipping (<60°) limbs.
The Milpo-Atacocha fault is a major structural feature in the region, which can be traced for nearly 15 km from Yarusyacán in the north to Carmen Chico in the south. The Milpo-Atacocha fault strikes north-south, dipping steeply to the east, with as much as 2,000 m of reverse displacement (east-block up) and probable sinistral movement. Mégard (1968) considers that the Milpo-Atacocha fault may be part of a fault system active since at least the Triassic, and during the Upper Cretaceous.
A series of fracture sets reportedly formed in response to the northeast-southwest tectonic compression, including:
| · | North-northeast trending dextral faults. |
| · | Southwest trending sinistral faults. |
| · | Northeast trending tensional joints. |
| · | Northwest trending tensional joints. |
| 6- |
|
|
Figure 6-4: Regional Geological Setting with Major Structures

| 6- |
|
|
| 6.3 | Property Geology |
Figure 6-5 and Figure 6-6 show representative geologic cross sections through the El Porvenir and Atacocha areas, respectively.
Within the property area, the stratigraphic units of primary interest are the Pucará and the Goyllarisquizga groups.
The Pucará Group is sub-divided into six units: A, B, C, D, which correspond to the Chambará Formation; and E and F, which correspond to the Aramachay and Condorsinga formations, respectively:
| · | Unit A is located to the east of the Atacocha fault. It consists of a grey to dark grey limestone with thin dolomite layers, calcarenites and fine, greenish volcanic siltstones at the base of the Chambará Formation. Yellowish grey limonites to compact dolomicrites are also observed. |
| · | Unit B is located to the east of, and stratigraphically above, Unit A. Dark grey to black coloured limestones, dolomicrites, and micrites are observed in thin layers to tabular strata with lenticular bituminous horizons. It can be seen in many parts of the property due to its obliteration of marble and silicification. The more competent rocks are located at the intermediate zone in the Chambará Formation. |
| · | Unit C is located to the east of the mine area. Monotonous grey chertic limestones in metric strata are observed. The unit also contains dolomitic horizons. It represents the intermediate zone of the Chambará Formation. |
| · | Unit D is widely distributed within the Atacocha and Santa Bárbara sections. The limestones are beige varying from mudstone to grainstone with light beige dolomitic intercalations. Cherts and bituminous horizons are also observed. Unit D corresponds to the upper zone of the Chambará Formation. |
| · | Unit E consists of black micritic limestones and black lutite. In many places, this package is obliterated by marble, silica, silica-sericite-clay, etc. In many places of the property, the rock is altered becoming recrystallized and discoloured, adopting clearer tones without converting to marble (loss of calcium). These rocks correspond to the Aramachay Formation of the Pucará Group. |
| · | Unit F is grey to light grey limestones, mudstone to packstone, with fossil horizons and dolomitic levels. |
The Goyllarisquizga Group outcrops in the area of the deposit consisting of quartz rich sandstone, corresponding to the Goyllarisquizga Formation. Sandstones may vary from quartz arenite to arkose. The matrix is argillaceous to siliceous. Above the 4000 Level, the lithology and stratification are well defined and easy to recognize. Below the 4000 Level, strong alteration has obliterated the original rock intensity forming siliceous breccias and massive silica where it is still possible to recognize quartz grains and in few places the stratification.
Localized basalt units are observed in some drill holes to the southwest of the mine, below the Cherchere and San Gerardo zones. The units consist of grey to greenish basalt with green vacuoles of zeolites with traces of flows with olivine phenocrystals, limonite, and magnetite.
Intrusive rocks within the property are variably porphyritic dacite to quartz diorite with hornblende and biotite phenocrysts. Dacitic dikes are sub-divided into two units: porphyritic with feldspar phenocrysts and minor quartz restricted to the groundmass; and porphyritic with abundant quartz phenocrysts, with minor biotite and hornblende. The quartz diorite comprises
| 6- |
|
|
feldspar phenocrysts up to 6 mm long, with variable quartz “eyes”, and aggregates of biotite and hornblende. The groundmass is microcrystalline quartz and plagioclase. These intrusive rocks generally form dikes trending north-south and are observed in three areas: Santa Bárbara/central, south along/parallel to the Atacocha fault, and the southern Section 3. These intrusive rocks are part of the Milpo-Atacocha-Vinchos Belt (28 Ma to 30 Ma).
| 6.4 | Alteration |
Skarn-related alteration has been characterized according to dominant key mineral assemblages: silica-wollastonite, garnet, silica, and pyrite-argillic.
Garnet-skarn is dominated by >50% garnet (by volume), generally brown to greenish and medium to fine grained, or light brown to yellowish (andradite) and light green (grosularia). Pyroxene, where present, is light green, very fine grained, and associated with minor sulphides. Magnetite is spatially associated with green garnet areas, as well as lesser pyrite and pyrrhotite.
Silica-skarn is defined where silica content exceeds 50%. Silica may occur in veinlets or as disseminations. Silica-wollastonite alteration appears to form a sub-division of the silica-dominant group and forms light grey to milky white zones with brecciated to massive/patchy textures. Wollastonite may form radiating fibrous crystals. Locally, a silica-skarn-chlorite assemblage may be present, exhibiting strong structural controls. White to grey silica developed early, followed by green skarn with variably associated chlorite and hematite.
Pyrite-argillic skarn comprises 30% to 80% massive pyrite, with 10% to 30% undistinguished whitish clays, and up to 20% greenish garnet. Locally, pyrite appears to be pseudomorphic replacing garnet.
An alteration assemblage comprising silica-sericite-argillic (halloysite, montmorillonite, and kaolinite) is associated with hydrothermal mineralization. Locally this alteration assemblage is strong, and possibly replaces original rocks completely in areas below the 4000 Level.
West of the Milpo-Atacocha fault below the 4000 Level, strong siliceous alteration has variably obliterated the original rock; within the Goyllarisquizga Group, it is possible to recognize quartz grains and stratification in a few places. Locally, siliceous cemented breccias with silica-sericite-clays matrix (halloysite, montmorillonite, and kaolinite) and massive silica hydrothermal breccias have formed.
Marbleization of limestone and dolomite units appears to be spatially associated with intrusive units and skarn related alteration.
| 6- |
|
|
Figure 6-5: Representative Cross Section through El Porvenir Area

| 6- |
|
|
Figure 6-6: Representative Cross Section through Atacocha Area

| 6- |
|
|
| 6.5 | Mineralization |
| 6.5.1 | El Porvenir |
At El Porvenir, mineralization is characterized as a skarn, intermediate sulphidation epithermal vein/breccia style, or stratabound mineralization in the Goyllarisquizga Formation.
Skarn related mineralization associated with the Milpo stock is paragenetically earlier, followed by hydrothermal mineralization. Skarn-related mineralization is commonly associated with the garnet and silica-skarn-chlorite assemblages, comprising pyrite, chalcopyrite, sphalerite, galena and minor pyrrhotite, pyrite, bornite, covellite, orpiment, and realgar within the Pucará Group sediments around the Milpo stock. Molybdenite may occur proximal to the skarn related mineralization. Elevated Bi and Au contents are reported to be associated with skarn related mineralization. Veins and veinlets with pyrite, chalcopyrite, sphalerite, galena, quartz, and carbonates occur within marble units, and are spatially associated with skarn bodies.
The silica breccia consists of sub-rounded to sub-angular white to milky grey opaline silica clasts, millimetres to centimetres in size, and to a lesser extent, sandstone, and limestone clasts. The silica breccia clasts are cemented by white granular silica, with occasional cross-cutting veins of white silica.
The massive (siliceous) breccia forms zones of pervasive alteration comprising predominantly fine grained and massive white silica.
The granular (siliceous) breccia comprises loose white to grey grains of silica within a poorly cemented (undifferentiated) clay matrix.
The Ag-Pb-Zn breccias are sub-divided into calcareous, polymictic-monomictic, and karst (collapse). Breccia clasts include limestone, marble, silica (massive), and skarn; the composition of the clasts indicates that brecciation occurred later than skarn development. Massive silica alteration may cross-cut skarns.
The calcareous breccia comprises sub-angular to sub-rounded clasts of limestone and marble, cemented by a grey to dark grey calcareous matrix, with occasional bituminous material and rare pyrite. Pyrite, sphalerite, galena, and other sulphides including orpiment, realgar, tetrahedrite, alabandite, stannite, as well as quartz, calcite, rhodochrosite and rhodonite occur within the matrix. The geochemical-mineralogical zoning is evident whereby galena (Pb) and Mn bearing minerals are more abundant distally relative to sphalerite (Zn). Bi and Sn bearing minerals are most elevated in the magmatic-hydrothermal system.
The polymictic to monomictic breccias are overall grey and comprise sub-angular clasts of black limestone, shale, white silica with veins of silica-pyrite, and marble with silica, wollastonite, and calcite. Monomictic breccias comprise sub-angular limestone or intrusive clasts. Polymictic and monomictic breccia clasts vary in size and are cemented with an amorphous black material with disseminated pyrite. Pyrite, chalcopyrite, sphalerite, galena, and possibly other sulphides occur within the matrix, forming veins/veinlets, pockets, or disseminations. Karst breccias contain clasts of limestone, marble, silica, skarn, and intrusive rocks. They are sub-angular to sub-rounded, occurring within a matrix of sub-horizontal laminated limestone and silica-sericite-clay material.
The stratabound Pb-Ag-Zn mineralization occurs in the sandstone strata (mantos) at the base of the Goyllarizquisga Formation (near the contact with the Pucará Group). Several disseminated sulphide mantos have recently been identified at Sara and Porvenir 2W within the quartz
| 6- |
|
|
sandstone, generally in contact with layers of silt and microconglomerates. The minerals include galena with Ag content, sphalerite, and pyrite. Au is also present.
| 6.5.2 | Atacocha |
At Atacocha, mineralization is characterized as a skarn, intermediate sulphidation epithermal vein/breccia-style, or porphyry mineralization.
Skarn/metasomatic-related mineralization spatially associated with the Santa Bárbara stock or San Gerardo stock is paragenetically earlier, followed by the hydrothermal mineralization. Skarn-related mineralization is commonly associated with the garnet and silica-skarn-chlorite assemblages, comprising pyrite, chalcopyrite, sphalerite, galena, and lesser pyrrhotite, pyrite, bournonite, covelite, orpiment, and realgar occurring within the Pucará Group sediments around the Santa Bárbara stock.
Skarn-related mineralization is characterized by pyrite, chalcopyrite, sphalerite, galena, with lesser bismuthinite and a variety of sulphosalts (Bi-bearing) and pyrrhotite, bornite, and covellite at lower elevation. Molybdenite may occur proximal to the skarn-related mineralization. Elevated Bi and Au are reported to be associated with skarn-related mineralization. Veins and veinlets with pyrite, chalcopyrite, sphalerite, galena, with quartz and carbonate occur within marble units, and are spatially associated with skarn bodies.
The intermediate sulphidation epithermal mineralization occurs in the upper part of the system (i.e., at higher elevations) as veins and breccias, characterized by galena, Ag-bearing sulphosalts, sphalerite, and free Au. Gangue mineralogy comprises quartz (silica), pyrite, specularite/hematite, adularia, rhodochrosite, rhodonite, and alabandite. The silica-sericite-halloysite alteration assemblage is generally associated with this epithermal system. These veins and breccias are mostly between the San Gerardo stock and Fault 1, appearing to be at least partly controlled by the northwest-trending Fault 13. Breccias have been grouped into either Ag-Pb-Zn hydrothermal breccias or siliceous breccias based on their mineralogical assemblages and textural characteristics.
Siliceous breccias are further sub-divided into three groups: silica, granular (“terrosa”), and massive. Collectively the siliceous breccias may form large, relatively continuous bodies based on various interpretations; some appear to be spatially associated with the San Gerardo and Santa Bárbara intrusives and structurally controlled by the Milpo-Atacocha, Longreras, 13, 1, and Laquia faults. Veinlets of pyrite, galena, sphalerite, and possibly other fine undistinguished sulphides may occur within the variable silica-sericite-clay matrix.
The silica breccia comprises clasts of milky white to grey opaline silica, sub-rounded to sub-angular, from millimetre to centimetre size; as well as less common sandstone and limestone clasts. The silica-breccia clasts are cemented by a white granular silica, with occasional cross-cutting thin white silica veinlets.
The massive (siliceous) breccia forms zones of pervasive alteration comprising predominantly fine grained and massive white silica.
The granular-(siliceous) breccia comprises loose white to grey silica grains, within a poorly cemented clay (undifferentiated) matrix.
The Ag-Pb-Zn breccias are sub-divided into calcareous, polymictic-monomictic, and karst/collapse. Breccia clasts include limestone, marble, silica (massive), and skarn; the composition of the clasts indicates that brecciation occurred later than skarn development. Massive silica alteration may cross-cut skarns.
| 6- |
|
|
The calcareous breccia comprises sub-angular to sub-rounded clasts of limestone and marble; cemented by a grey to dark grey calcareous matrix, with occasional bituminous material and rare pyrite. Pyrite, sphalerite, galena, and other sulphides/sulphosalts including orpiment, realgar, tetrahedrite, alabandite, stannite, as well as quartz, calcite, rhodochrosite, and rhodonite occur within the matrix. Minor mineralization may occur within marble where the calcareous breccias cross-cut these units. Geochemical/mineralogical zonation is apparent whereby galena (Pb) and Mn-bearing minerals are more abundant distally relative to sphalerite (Zn). Bi- and Sn-bearing minerals are more elevated proximally.
The polymictic to monomictic breccias are overall grey, and comprise sub-angular clasts of black limestone, mudstone, white silica with silica-pyrite veinlets, and marble with silica-wollastonite and calcite. Monomictic breccias comprise sub-angular clasts of limestone or predominantly intrusive rocks. Both polymictic and monomictic breccias clasts vary in size and are cemented with a black amorphous material with disseminated pyrite. Pyrite, chalcopyrite, sphalerite, galena, and possibly other sulphides occur within the matrix forming veins/veinlets, pockets, or disseminations.
Karst/collapse breccias contain clasts of limestone, marble, silica, skarn, and intrusive rocks, are sub-angular to sub-rounded, within a matrix of sub-horizontal laminated limestone and silica-sericite-clay material.
The Cu-Au±Mo porphyry mineralization is found in the Santa Bárbara stock. It consists of porphyry quartz monzodiorite with potentially economic grades (i.e., 0.3% Cu, 0.3 g/t Au) of Cu-Au ± Mo. The San Gerardo stock is made of the same quartz monzodiorite, but with weaker alteration and much lower grades of all metals of interest. In the Milpo stock, the porphyry potential was poorly investigated, however, A- and B-type stockwork veinlets with low Cu grades were recorded in the past and the stock warrants future investigation.
| 6.6 | Deposit Types |
Four types of mineral deposits are recognized at the Complex:
| · | Skarn (exoskarn and endoskarn). |
| · | Intermediate sulphidation epithermal veins and breccias. |
| · | Stratabound (El Porvenir). |
| · | Porphyry (Atacocha). |
The description of the skarn deposit is largely derived from Einaudi and Burt (1982), Hammarstrom et al. (1991), and references therein. The hydrothermal vein deposit description is largely derived from Baumgartner et al. (2008) and references therein.
| 6.6.1 | Skarn |
Skarn deposits are generally considered as replacement style mineralization within or associated with carbonate dominant rocks. Skarns are classified as either endoskarn or exoskarn, referring to the location of skarn related mineralization either within an associated intrusive unit, or within carbonate lithology, respectively. Additionally, skarns can be divided into two broad groups: magnesian and calcic skarns, based on a dolomite dominated or limestone-dominated host lithology, respectively.
Skarn development commonly includes metamorphic and metasomatic processes associated with carbonate and intrusive rocks, and an associated hydrothermal system. Mineralization
| 6- |
|
|
occurs via a physio-chemical reaction between circulating hydrothermal fluids and the host lithology, and results in irregular shaped bodies. The hydrothermal system is generally believed to be related to and expelled from a cooling igneous body, which then undergoes a chemical reaction and cools as the fluid interacts with the usually carbonate dominant host lithology. The lithochemistry of the host rocks (i.e., Ca or Mg rich carbonate, or calc-silicate assemblage) strongly controls or influences mineralization. Replacement mineralogy commonly comprises Ca and Mg bearing silicates, however, Fe, Al, and Mn bearing minerals may also be important. Mineral and metal zonation is common. Three generalized dynamic processes responsible for the formation of all skarns are described as:
| · | Isochemical contact metamorphism during pluton emplacement. |
| · | Prograde metasomatic (infiltration) skarn formation as the pluton cools and an ore fluid develops. |
| · | Retrograde alteration of earlier formed mineral assemblages. |
The style of mineralization at El Porvenir appears to be best represented by the base and precious metal skarn category of the calcic skarn group. In terms of a conceptual model, Zn + Pb combined may average 10% to 15%, commonly with significant Ag (from 30 g/t to 300 g/t) as well as Cu, Au, and W. Cu mineralization commonly occurs proximal to the associated intrusive unit, whereas Zn and Pb mineralization typically occurs more distally to the associated intrusive. Mineralization commonly occurs as sulphides, including sphalerite, galena, chalcopyrite, and a variety of Ag-bearing sulphosalts. Gangue mineralogy may be dominated by Mn-bearing pyroxenes and garnet. Mineral textures vary from commonly coarse grained, associated with Ca rich host lithology and in close proximity to the related intrusion, to fine-grained, more distal and associated with calc-silicate rocks.
The tectonic setting of Zn-Pb skarns are commonly reported at continental margins and formed during syn- to late orogenic processes. Plutons are commonly absent but, if present, occur as stocks and dikes and may vary in composition from granite to granodiorite to syenite to diorite. Replacement mineralogy within carbonates is usually Fe, Mn, and S rich, and low in Al; and alteration within associated intrusions may comprise locally intense epidote, pyroxene, and garnet.
| 6.6.2 | Hydrothermal Vein and Breccia |
The hydrothermal veins and breccias at El Porvenir and Atacocha fall into a class of epithermal polymetallic base metal deposits (also referred to as Cordilleran base metal veins), which form in the upper parts of a magmatic-hydrothermal system (i.e., porphyry environment).
The Cordilleran base metal deposits have the following features:
| · | Close temporal and spatial association with calc-alkaline intrusions. |
| · | Mineralization occurred under epithermal conditions (i.e., near Earth’s surface). |
| · | Sulphide-rich mineralogy, including a Cu-Zn-Pb-(Ag-Au-Bi) metal suite, and high Ag/Au ratio. |
| · | Well-developed mineral zonation and alteration minerals, with Zn-Pb mineralization formed more distally (Pb-Ag-Au assemblage in the upper zone and Cu-Au association in the deeper zones). |
| · | Early pyrite-quartz associated with low sulphidation mineralogy. |
| 6- |
|
|
| · | Mineralization textures may be open-spacing filling in silicate host rocks, or as replacement in carbonate rocks. |
| · | Mineralization occurred late in the temporal evolution of the magmatic-hydrothermal system. |
Figure 6-7 is a schematic diagram showing the spatial relationship of skarn, replacement, and hydrothermal vein mineralization with intrusive rocks.
| 6- |
|
|
Figure 6-7: Schematic Diagram of Skarn, Replacement and Hydrothermal Vein Mineralization

| 6- |
|
|
| 6.6.3 | Stratabound (El Porvenir) |
Stratabound deposits have been described by Fontboté et al. (1990), who defined the stratabound deposit model as deposits formed through volcanogenic, hydrothermal, metamorphic, diagenetic, and sedimentary processes both penecontemporaneously and much later than the host rock, which can be volcanic or sedimentary.
The empirical link of mineralization and host rock can be used to classify the stratabound deposit according to the age and geotectonic position of the enclosing rock. A systematic classification could be achieved with mineral deposits hosted by rocks of the Andean Cycle (Mesozoic-Recent) because the regional geology and geotectonic interpretation of the rocks of this period are well known. According to Fontboté et al. (1990), three metallogenic “stages” can be distinguished in the Central Andes. Each stage is characterized by its tectonic style, magmatic activity, and basin evolution; and in each stage, characteristic types of stratabound deposits occur.
The sandstone hosted stratiform Pb-Zn occurrences in the Goyllarisquizga Formation near Milpo were included by Samaniego (1982) in the Santa Metallotect, however, the possibility that they were formed by impregnation in relation with the Tertiary skarn deposits of the Milpo-Atacocha district (Soler, 1986) is supported by Pb isotopic data (Gunnesch et al., 1990).
| 6.6.4 | Porphyry (Atacocha) |
Porphyry deposits are large, low to medium grade deposits in which primary (hypogene) ore minerals are dominantly structurally controlled and which are spatially and genetically related to felsic to intermediate porphyritic intrusions (Kirkham, 1972). The large size and structural control (e.g., veins, vein sets, stockworks, fractures, “crackle zones”, and breccia pipes) serve to distinguish porphyry deposits from a variety of deposits that may be peripherally associated, including skarns, high temperature mantos, breccia pipes, peripheral mesothermal veins, and epithermal precious metal deposits (Sinclair, 2007).
Porphyry deposits range in age from Archean to Recent, although are predominantly associated with Mesozoic to Cenozoic orogenic belts. They occur throughout the world in a series of extensive, relatively narrow, linear metallogenic provinces. Porphyry deposits occur in close association with porphyritic epizonal and mesozonal intrusions, typically in the root zones of andesitic stratovolcanoes. A close temporal relationship exists between magmatic activity and hydrothermal mineralization in porphyry deposits (Kirkham, 1971). Magma composition and petrogenesis of related intrusions exert a fundamental control on the metal content of porphyry deposits. Intrusive rocks associated with porphyry Cu, porphyry Cu-Mo, porphyry Cu-Au and porphyry Au tend to be low-silica, relatively primitive dioritic to granodioritic plutons whereas porphyry deposits of Mo, W-Mo, W, and Sn are typically associated with high-silica, strongly differentiated granitic plutons.
The overall form of individual porphyry deposits is highly varied and includes irregular, oval, solid, or “hollow” cylindrical and inverted cup shapes. Deposits may occur separately or overlap and, in some cases, are stacked. Individual deposits measure hundreds to thousands of metres in three dimensions. Deposits are characteristically zoned, with barren cores and crudely concentric metal zones that are surrounded by barren pyretic halos with or without peripheral veins, skarns, replacement manto zones and epithermal precious metal deposits. The Cu-Fe sulphides reside primarily in veins and hydrothermal breccias, with lesser amounts occurring as disseminations in the altered wall rocks. Complex, irregular mineralization and alteration patterns are due, in part, to the superposition and spatial separation of mineral and alteration zones of different ages.
| 6- |
|
|
The mineralogy of porphyry deposits is highly varied, although pyrite is typically the dominant sulphide mineral in Cu, Cu-Mo, Cu-Au, Au, and Ag deposits. The principal ore and associated minerals in porphyry Cu-Au deposits are chalcopyrite, bornite, chalcocite, tennantite, enargite, other Cu minerals, native Au, electrum, and tellurides. Associated minerals include pyrite, arsenopyrite, magnetite, quartz, biotite, K-feldspar, anhydrite, epidote, chlorite, scapolite, albite, calcite, fluorite, and garnet.
Hydrothermal alteration is extensive and typically zoned, both on a deposit scale and around individual veins and fractures. In many porphyry deposits, alteration zones on a deposit scale consist of an inner potassic zone and an outer zone of propyllitic alteration. Zones of phyllic alteration and argillic alteration may be part of the zonal pattern between the potassic and propyllitic zones, or can be irregular or tabular, younger zones superimposed on older alteration and sulphide assemblages.
Figure 6-8 is a schematic diagram through a typical porphyry system showing mineral zonation and possible relationship to other deposit types like skarn, manto, "mesothermal", or "intermediate" precious-metal and base-metal vein and replacement, and epithermal precious-metal (Kirkham and Sinclair, 1995).
During the 2018 drilling campaign, an andesitic porphyry was intersected. This andesitic porphyry is associated with the Santa Bárbara diorite intrusive and consists of quartz veins and phyllic alteration.
| 6- |
|
|
Figure 6-8: Schematic Diagram through Typical Porphyry System

| 6- |
|
|
| 7.0 | Exploration |
| 7.1 | Exploration |
Exploration and development work has taken place at El Porvenir and Atacocha since 1936 and 1949, respectively. Exploration by the current operator, Nexa, has taken place since 2010.
Exploration at El Porvenir and Atacocha takes place within the broader context of an integrated exploration program for the Cerro Pasco Complex. This involves diamond drilling, mapping, sampling, and interpretations of known mineralized zones extensions and brownfield-type satellite targets.
Generally, exploration work is conducted simultaneously with underground development, which involves surface and underground diamond core drilling, as well as channel sampling following underground drifting. The channel sampling informs grade control at the El Porvenir and Atacocha underground operations but is also incorporated into the Long-Term Model (LTM). Grade control at San Gerardo is completed using blast hole data although this data is not directly included in the LTM.
Systematic underground geological mapping is completed at a scale of either 1:500 or 1:250, following underground development on all levels and sub-levels. A total of 26 underground levels have been developed at El Porvenir, with additional development on sub-levels. A total of 29 underground levels have been developed at Atacocha, with additional development on sub-levels. Geological mapping is completed by the mine/production geologists, with maps drawn on paper in the field and subsequently digitized with the help of a modelling assistant. The geological level plan maps are updated and incorporated into a three dimensional (3D) geological model daily to aid future exploration and mine development planning.
Airborne and ground magnetic surveys have been completed for the Cerro Pasco Complex, which show good correlation between Magnetization Vector Inversion (MVI) and the intrusives.
The El Porvenir and Atacocha mines are currently connected through two active tunnels; at the 3300 and 4070 levels, with the zone between the two mines termed the Integration Zone. Several additional connections are planned, which will facilitate underground exploration. Drilling within the Integration Zone has subsequently identified mineralization, which forms one of Nexa’s highest priority exploration targets (Section 7.8).
In addition to the Integration Zone, Nexa has identified short term targets for exploration at the eastern side of the Santa Bárbara stock below 3,300 MASL and the San Gerardo above 3,300 MASL. Nexa has also identified several long-term brownfield target areas.
Exploration in 2022 included 1,656 m of diamond core drilling, focused on defining new potential mineralization zones at three different targets; Carmen Norte, Porvenir Sur, and the Integration Zone.
Exploration activities for 2023 included 16 diamond drill holes (DDH) for a total of 9,321 m. The drilling programs focused on the extensions of Integration Zone in 3300-3790-4050 Levels, and Porvenir Sur drilling from 3600 Level.
A total of $2.1 million has been budgeted for planned exploration work in 2024 at the Complex, which includes 8,500 m of diamond drilling focused on delineation of the Integration Zone toward the north and deeper levels.
| 7- |
|
|
| 7.2 | Drilling |
| 7.2.1 | El Porvenir |
As of December 31, 2023, a total of 5,683 drill holes totalling 944,070 m have been completed at El Porvenir (Table 7-1). All drilling was diamond drilling (DDH), with most of the holes (5,544) completed from underground workings and 139 holes completed from surface. Drilling has been completed by various contractors. The indicated year refers to the start date of drilling. Figure 7-1 illustrates the locations of the drill holes at El Porvenir.
SLR was unable to confirm the drilling totals, as excluded drill holes were not included in the provided database, and the HOLE_TYP variable was found to be unreliable (with many supposedly surface drill holes clearly drilled from underground). SLR understands that Nexa is currently in the process of correcting these errors.
The El Porvenir resource database closure date was January 31, 2023. Between then and the effective date of this report, 252 drill holes were completed. This is discussed further in Section 11.4.1 and is not considered to have a material impact on estimated Mineral Resources.
Exploration drilling is generally completed over a 50 m by 50 m grid, whereas infill drilling is designed to cover a 15 m by 15 m grid. The overall distribution of drill holes and channel samples has been concentrated around the Carmen Norte 3, Exito, and Sara zones.
Table 7-1: El Porvenir Drilling
| Year | Surface DDH | Underground DDH | Total | |||
| Number | Metres | Number | Metres | Number | Metres | |
| Historic | 19 | 1,555 | 757 | 140,571 | 776 | 142,127 |
| 2006 | 22 | 2,915 | 22 | 2,915 | ||
| 2008 | 14 | 638 | 86 | 17,310 | 100 | 17,948 |
| 2009 | 142 | 22,877 | 142 | 22,877 | ||
| 2010 | 147 | 24,120 | 147 | 24,120 | ||
| 2011 | 261 | 47,031 | 261 | 47,031 | ||
| 2012 | 320 | 55,979 | 320 | 55,979 | ||
| 2013 | 269 | 43,856 | 269 | 43,856 | ||
| 2014 | 258 | 37,783 | 258 | 37,783 | ||
| 2015 | 301 | 48,859 | 301 | 48,859 | ||
| 2016 | 385 | 64,187 | 385 | 64,187 | ||
| 2017 | 575 | 71,482 | 575 | 71,482 | ||
| 2018 | 527 | 87,536 | 527 | 87,536 | ||
| 2019 | 40 | 15,469 | 491 | 72,142 | 531 | 87,611 |
| 2020 | 38 | 15,221 | 209 | 24,284 | 247 | 39,505 |
| 2021 | 24 | 11,198 | 263 | 43,441 | 287 | 54,640 |
| 2022 | 275 | 51,460 | 275 | 51,460 | ||
| 7- |
|
|
| Year | Surface DDH | Underground DDH | Total | |||
| Number | Metres | Number | Metres | Number | Metres | |
| 2023 | 4 | 255 | 256 | 43,899 | 260 | 44,154 |
| Total | 139 | 44,336 | 5,544 | 899,733 | 5,683 | 944,070 |
| 7- |
|
|
Figure 7-1: El Porvenir Drill Hole Locations

| 7- |
|
|
A total of ten historic holes, with no survey records, missing geological data, and causing grade discrepancy with overlapped new holes, were excluded from the Mineral Resource estimate. In addition to this exclusion, a total of 11 holes were transferred to the Atacocha database, as they were drilled within the Atacocha concession. Table 7-2 summarizes the drill hole data excluded from the El Porvenir resource database:
Table 7-2: El Porvenir Excluded Drill Holes
| Year | Number | Metres | Type |
| Historic | 13 | 3,892 | DDH |
| 2008 | 1 | 245 | DDH |
| 2011 | 2 | 361 | DDH |
| 2012 | 3 | 572 | DDH |
| 2013 | 1 | 171 | DDH |
| 2016 | 1 | 18 | DDH |
| Totals | 21 | 5,258 |
| 7.2.1.1 | Core Recovery |
Core runs are 3.0 m for HQ and NQ and 1.5 m for BQ core size.
Since 2018, core recovery is routinely measured for each hole. Core recovery is available for 155,442 m of drill core at the effective date of the TRS, and 111,537 m of the drill core in the resource database (closed on January, 2023), equivalent to 12% of the database. The available core recovery data provides reasonable coverage for the deposit, although there are notable portions without data (Figure 7-2). Core recovery is generally above 97% and does not indicate any issues that may bias assay results.
| 7- |
|
|
Figure 7-2: El Porvenir Core Recovery Distribution

| 7- |
|
|
| 7.2.2 | Atacocha |
As of December 31, 2023, a total of 5,206 drill holes totalling 895,504 m have been completed at Atacocha (Table 7-5). All drilling was DDH, with 4,254 holes completed from underground workings, and 952 holes completed from surface, of which 917 were DDH and 35 were RC. The indicated year refers to the start date of drilling. Drilling has been completed by various contractors. Figure 7-4 illustrates the locations of the drill holes at Atacocha.
The Atacocha resource database closure date was January 31, 2023. Between then and the effective date of this report, 18 DDH were completed. This was limited to the San Gerardo open pit area. This is discussed further in Section 11.5.1 and is not considered by the QP to have a material impact on estimated Mineral Resources.
Exploration drilling is generally completed over a 50 m by 50 m grid, whereas infill drilling is designed to cover a 15 m by 15 m grid. The overall distribution of drill holes and channel samples has been concentrated around the Santa Bárbara, San Gerardo stock, and Integration zones.
Table 7-3: Atacocha Drilling
| Year | Surface DDH | Surface RC | Underground DDH | Total | ||||
| Number | Metres | Number | Metres | Number | Metres | Number | Metres | |
| 1968 | 4 | 350.00 | 4 | 350.00 | ||||
| 1969 | 3 | 346.20 | 3 | 346.20 | ||||
| 1971 | 1 | 31.08 | 1 | 31.08 | ||||
| 1986 | 1 | 31.09 | 1 | 31.09 | ||||
| 1991 | 2 | 135.02 | 2 | 135.02 | ||||
| 1992 | 1 | 73.16 | 1 | 73.16 | ||||
| 1997 | 4 | 231.67 | 4 | 231.67 | ||||
| 1998 | 17 | 2,247.12 | 17 | 2,247.12 | ||||
| 1999 | 41 | 3,460.20 | 41 | 3,460.20 | ||||
| 2000 | 3 | 397.70 | 45 | 4,600.25 | 48 | 4,997.95 | ||
| 2001 | 94 | 8,756.05 | 94 | 8,756.05 | ||||
| 2002 | 89 | 10,346.50 | 89 | 10,346.50 | ||||
| 2003 | 179 | 20,541.40 | 179 | 20,541.40 | ||||
| 2004 | 2 | 829.45 | 330 | 42,374.15 | 332 | 43,203.60 | ||
| 2005 | 6 | 1,366.75 | 150 | 29,886.65 | 156 | 31,253.40 | ||
| 2006 | 129 | 19,444.60 | 129 | 19,444.60 | ||||
| 2007 | 225 | 29,896.55 | 225 | 29,896.55 | ||||
| 2008 | 27 | 7,263.20 | 317 | 44,908.50 | 344 | 52,171.70 | ||
| 2009 | 13 | 6,236.35 | 107 | 20,222.30 | 120 | 26,458.65 | ||
| 2010 | 22 | 8,882.00 | 121 | 26,172.30 | 143 | 35,054.30 | ||
| 7- |
|
|
| Year | Surface DDH | Surface RC | Underground DDH | Total | ||||
| Number | Metres | Number | Metres | Number | Metres | Number | Metres | |
| 2011 | 9 | 1,406.00 | 179 | 38,558.80 | 188 | 39,964.80 | ||
| 2012 | 274 | 62,253.80 | 274 | 62,253.80 | ||||
| 2013 | 30 | 3,978.10 | 157 | 44,306.20 | 187 | 48,284.30 | ||
| 2014 | 20 | 3,034.60 | 239 | 47,846.05 | 259 | 50,880.65 | ||
| 2015 | 127 | 19,710.40 | 152 | 25,138.10 | 279 | 44,848.50 | ||
| 2016 | 247 | 37,247.00 | 251 | 34,963.95 | 498 | 72,210.95 | ||
| 2017 | 66 | 15,707.30 | 321 | 52,141.45 | 387 | 67,848.75 | ||
| 2017 | 35 | 8,687.00 | 35 | 8,687.00 | ||||
| 2018 | 93 | 16,048.10 | 425 | 64,968.40 | 518 | 81,016.50 | ||
| 2019 | 61 | 12,807.40 | 340 | 70,424.50 | 401 | 83,231.90 | ||
| 2020 | 69 | 12,239.70 | 53 | 8,344.00 | 122 | 20,583.70 | ||
| 2021 | 64 | 13,410.00 | 64 | 13,410.00 | ||||
| 2022 | 40 | 9,466.20 | 3 | 845.50 | 43 | 10,311.70 | ||
| 2023 | 18 | 2,941.60 | 18 | 2,941.60 | ||||
| Total | 917 | 172,971.85 | 35 | 8,687.00 | 4,254 | 713,845.54 | 5,206 | 895,504.39 |
| 7- |
|
|
Figure 7-3: Atacocha Drill Hole Locations

| 7- |
|
|
| 7.2.2.1 | Core Recovery |
Since 2018, core recovery data is routinely gathered for each hole. This is available for 30,725 m of drill core at the effective date of the report, and 27,784 m of drill core within the resource database (closed on January 31, 2023), equivalent to 3% of the database. The underground portion of the mine has no core recovery data (Figure 7-4). Based on the available core recovery data within the open pit area, recovery is generally above 96% and does not indicate any issues that may bias assay results.
| 7- |
|
|
Figure 7-4: Atacocha Core Recovery Distribution

| 7- |
|
|
| 7.2.3 | Drilling Practices |
Drilling procedures are coordinated and supervised by company geologists and overseen by the Superintendent of Geology and Exploration.
Drill hole (and channel sample) identifiers are generated in a systematic and specific format, including codes to reference: country, mining unit, year, and sequential number. All related drill hole data generated is similarly referenced to the corresponding drill hole collar.
Drill hole collar coordinates determined by Total Station and orientation are certified by the surveyor and validated by the responsible geologist. The coordinates and collar orientation data are entered into a master CSV file and subsequently imported into the database (Fusion) and archived within four days of completing the drill hole.
Downhole orientation survey data is collected by various drilling contractors. The survey is generally carried out after the completion of the drill hole. Various survey equipment (i.e., Gyro, Reflex, Flexit, etc.) may be used depending on the drilling contractor and equipment availability. Gyro survey deviation information is archived in pdf format. Survey data are generally collected between approximately 5 m and 10 m downhole (5.4 m on average at El Porvenir and 7.6 m on average at Atacocha), depending on the drilling objective (infill and brownfield). Original survey data is marked on paper, and provided to the supervising geologist, signed by the driller in charge. Survey data is validated by the responsible geologist and recorded in a master CSV file, subsequently imported into the database.
Daily drilling logs completed and provided by the various contracted drilling companies are archived in PDF format.
Following the completion of a drill hole, the logging and core sampling procedures are carried out by a team of logging geologists. Core is logged for geology, lithology, mineralogy, and alteration, which is entered into logging software (Fusion). A complete series of core photos are taken for each drill hole and stored in JPEG or PDF format. Logging is completed within 48 hours after a drill hole is completed. Core sampling for geochemical analysis is carried out under the supervision of the Sampling Geologist Supervisor immediately after completion of the logging and core photography.
Current exploration core sampling follows a written Standard Operation Procedure (SOP) PO-EXP-GTO-009-PT (Nexa, 2024), which specifies sampling intervals between 0.5 m and 1.5 m in length and a recommended length of 1.0 m. Sampling length is variable however, to respect key structural, lithological, and mineralization boundaries.
At El Porvenir and Atacocha, exploration core has HQ (63.5 mm) or NQ (47.6 mm) diameter.
Once the sample length and cut-line have been defined by the supervising geologist, the core is cut longitudinally into two equal parts using an electric diamond drill core saw. If the core is very fractured, the sampler separates and removes 50% of the fragmented material for the sample. The fragments are deposited in a pre-coded polyethylene bag and transported to the laboratory. The remaining half-core is archived.
At El Porvenir, infill and resource definition drilling is typically BQ (36.4 mm) sized core and is sampled in its entirety on 1.5 m intervals, with TT-46 (35.3 mm) diameter core also occasionally used. At Atacocha, infill and resource definition drilling is typically NQ-sized.
As a result of the exploration, infill, and resource definition processes, diamond core sampling at both El Porvenir and Atacocha has mostly been completed on 1.0 m, 1.5 m, and 2.0 m intervals, resulting in a mean of 1.3 m at El Porvenir and 1.2 m at Atacocha.
| 7- |
|
|
At Atacocha, 35 RC drill holes were completed and largely sampled on 1.0 m intervals although further details regarding the sampling procedures are unavailable.
The company personnel responsible for managing the database incorporates the core logging and core sampling information, as well as the subsequent assay results once the analytical work is completed. Sample and assay data are initially combined in a master CSV file, subsequently imported into the database, and geological/mine/modelling software program.
Drilling information is stored in a structured directory and backed up on a central server located in Brazil.
| 7.3 | Channel Sampling |
| 7.3.1 | El Porvenir |
No channel sampling is documented before 2001 and the practice was discontinued in 2017, before being resumed in November 2019.
As of December 31, 2023, a total of 19,074 channel samples totalling 129,075 m have been completed at El Porvenir (Table 7-3).
The El Porvenir resource database closure date was January 31, 2023. Between then and the effective date of this report, 1,596 channels were completed. This is discussed further in Section 11.4.1 and the QP does not consider this to have a material impact on estimated Mineral Resources.
Figure 7-5 shows the distribution of channel sampling at El Porvenir:
Table 7-4: El Porvenir Channel Sampling
| Year | Channels | Metres |
| Historic | 2,906 | 19,442 |
| 2006 | 2,606 | 17,788 |
| 2007 | 998 | 8,915 |
| 2008 | 799 | 7,295 |
| 2009 | 1,097 | 6,982 |
| 2011 | 1,180 | 8,781 |
| 2012 | 1,153 | 7,740 |
| 2013 | 637 | 3,618 |
| 2014 | 607 | 3,702 |
| 2015 | 968 | 7,212 |
| 2016 | 437 | 4,026 |
| 2017 | 28 | 490 |
| 2019 | 135 | 753 |
| 2020 | 452 | 2,723 |
| 2021 | 1,637 | 9,319 |
| 7- |
|
|
| Year | Channels | Metres |
| 2022 | 1,674 | 9,926 |
| 2023 | 1,760 | 10,364 |
| Total | 19,074 | 129,075 |
| 7- |
|
|
Figure 7-5: El Porvenir Channel Sampling Locations

| 7- |
|
|
| 7.3.2 | Atacocha |
As of December 31, 2023, a total of 69,154 channel samples totalling 262,171 m have been completed at Atacocha (Table 7-6). Channel sampling was discontinued in 2016 but resumed in 2022.
The Atacocha resource database closure date was January 31, 2023. Between then and the effective date of the report, 32 channels were completed, which were limited to the San Gerardo open pit area. This is discussed further in Section 11.5.1 and the QP does not consider this to have a material impact on estimated Mineral Resources.
Figure 7-6 shows the distribution of channel sampling locations at the Atacocha Mine.
Table 7-5: Atacocha Channel Sampling
| Year | Quantity | Metres |
| 2001 | 2,406 | 5,737.24 |
| 2002 | 8,523 | 23,044.88 |
| 2003 | 8,358 | 23,094.19 |
| 2004 | 6,316 | 23,035.27 |
| 2005 | 7,105 | 28,203.90 |
| 2006 | 9,505 | 36,975.60 |
| 2007 | 7,360 | 27,625.23 |
| 2008 | 6,141 | 22,777.25 |
| 2009 | 3,446 | 16,523.95 |
| 2010 | 2,357 | 12,879.30 |
| 2011 | 1,824 | 9,549.45 |
| 2012 | 1,949 | 10,376.30 |
| 2013 | 1,463 | 8,531.15 |
| 2014 | 1,290 | 7,652.65 |
| 2015 | 951 | 5,339.45 |
| 2016 | 112 | 648.60 |
| 2022 | 16 | 70.35 |
| 2023 | 32 | 106.40 |
| Total | 69,154 | 262,171.16 |
| 7- |
|
|
Figure 7-6: Atacocha Channel Sampling Locations

| 7- |
|
|
| 7.3.3 | Channel Sampling Practices |
Channel samples are treated as drill holes in the database, with a location, survey (direction: azimuth and inclination), and associated sampling/assay data.
Channel chip samples are generally collected from the face of newly exposed underground workings. The entire process is carried out under the inspection of the sampling supervisor geologist.
Channel samples are collected between the hanging wall and footwall contacts of mineralized zones. A channel sample area is marked, oriented perpendicular to the strike of the mineralized structure.
The sample area is first washed down to provide a clear view of the vein. The width of each channel sample is approximately 0.2 m to 0.3 m wide, and 2.0 cm deep. The channel is sampled by taking a succession of chips in sequence from the hanging wall to the footwall.
Sample collection is normally performed by two samplers, one using the hammer and chisel, and the other holding the receptacle cradle to collect the rock fragments. The cradle consists of a sack, with the mouth kept open by a wire ring. The collected sample material is then placed on a mat measuring 1.0 m by 1.2 m; the larger sample fragments are then broken down to smaller fragments, less than approximately 2.0 cm, using a four- or six-pound hammer. Subsequently, the sample material is mixed, and approximately one quarter of the mixed material is separated to obtain a representative sample (cone-and-quarter method), with a target weight of between 2.5 kg and 3.0 kg.
At El Porvenir, the spacing between each channel sample is generally 1.0 m. If the width of the vein, or length of the channel sample, is longer than 1.0 m, sample lengths shorter than 1.0 m are collected. If the width of the vein is smaller than 0.2 m, the width of the sample is increased to 0.5 m to obtain a sufficient sample size.
At Atacocha, the spacing between each channel sample is generally 2.0 m. If the width of the vein, or length of the channel sample, is longer than 1.5 m, sample lengths shorter than 1.5 m are collected. If the width of the vein is smaller than 0.2 m, the width of the sample is increased to 0.4 m to obtain a sufficient sample size.
The final sample is placed in a bag with a coded ticket and shipped to the Inspectorate laboratory at the mine site.
| 7.4 | Hydrogeology Data |
| 7.4.1 | El Porvenir |
The El Porvenir Mine does not produce significant quantities of water. Details related to mine water drainage are covered in Section 13.1.6.2.
| 7.4.2 | Atacocha |
The Atacocha Mine does not produce significant quantities of water. Details related to hydrogeology are covered in Section 13.1.6.2.
| 7- |
|
|
| 7.5 | Geotechnical Data |
| 7.5.1 | El Porvenir |
Geotechnical studies have been conducted at El Porvenir to characterize the quality of the rock mass to predict the stope and mine workings stability. Underground geotechnical mapping, geotechnical core logging, and laboratory tests are part of Nexa geotechnical procedures. Nexa has performed laboratory testing in combination with geotechnical mapping and geotechnical logging to monitor the ground stability and to define parameters for ground support design of the underground workings as it is described in Section 13.1.4. The geotechnical logging, mapping, testing, and data analysis protocols include industry-standard practices.
| 7.5.1.1 | Geotechnical Logging |
Geotechnical logging information is available for 155,442 m of drill core (Table 7-6).
Table 7-6: El Porvenir Geotechnical Logging Summary Statistics
| Analyte | Count | Length | Mean | StdDev | CV | Variance | Min | Q25 | Median | Q75 | Max |
| Core Recovery (%) | 17,121 | 155,442 | 97.84 | 7.65 | 0.08 | 58.47 | 0 | 97.65 | 99.17 | 100 | 100 |
| RQD (%) | 17,146 | 155,884 | 61.73 | 25.57 | 0.41 | 653.94 | 0 | 25.14 | 57.65 | 79.74 | 100 |
| RMR | 17,146 | 155,884 | 39.93 | 13.23 | 0.33 | 174.91 | 8 | 25 | 35 | 46 | 82 |
| Length (m) | 17,146 | 155,884 | 9.09 | 14.45 | 1.59 | 208.68 | 0.04 | 1.55 | 3.8 | 10.2 | 210.2 |
| 7.5.2 | Atacocha |
Geotechnical studies have been conducted at the Atacocha Mine to characterize the quality of the rock mass to predict the stope and open pit mine workings stability. Underground geotechnical mapping, geotechnical core logging and laboratory tests are part of Nexa geotechnical procedures. Nexa has performed laboratory testing in combination with geotechnical mapping and geotechnical logging to monitor the ground stability and to define parameters for ground support design of the underground workings as it is described in Section 13.2.2. The geotechnical logging, mapping, testing and data analysis protocols include industry-standard practices.
| 7.5.2.1 | Geotechnical Logging |
Geotechnical logging is available for 30,725 m of drill core (Table 7-7). The underground portion of the mine has no geotechnical logging data.
Table 7-7: Atacocha Geotechnical Logging Summary Statistics
| Analyte | Count | Length | Mean | StdDev | CV | Variance | Min | Q25 | Median | Q75 | Max |
| Core Recovery (%) | 5,201 | 30,725 | 97.56 | 6.23 | 0.06 | 38.86 | 0 | 96.55 | 98.57 | 100 | 100 |
| RQD (%) | 5,201 | 30,725 | 58.13 | 27.42 | 0.47 | 751.83 | 0 | 17.27 | 46.67 | 71.43 | 100 |
| RMR (%) | 5,201 | 30,725 | 39.94 | 11.82 | 0.3 | 139.81 | 8 | 25 | 34 | 43 | 73 |
| Length (m) | 5,201 | 30,725 | 5.91 | 8.07 | 1.37 | 65.07 | 0.05 | 1.45 | 3.4 | 7.1 | 115.65 |
Note: CV – coefficient of variation
| 7- |
|
|
| 7.6 | Geophysics |
In 2020, Nexa commissioned a MagDrone magnetometry program covering 488 km of lines over a 7,200 ha area in the Cerro Pasco Complex district extending from the Machcan area to the south of El Porvenir (Figure 7-7). The geophysical survey indicated the possible presence of subcropping intrusives as new exploration targets. The magnetic surveys in the figures are coloured by MVI.
As shown in Figure 7-8, the magnetic surveys correlate with the intrusives, which is an important tool for determining prospective areas for the generation of new targets.
As part of Nexa’s initiative to increase defined mineralization potential – termed the “Full Potential” program - exploration data acquisition and interpretation activities for 2023 focused on identifying mineralogical alteration patterns and included a surface magnetometric geophysical program, aiming to identify and define brownfield exploration targets (Section 7.8.2).
| 7- |
|
|
Figure 7-7: Geophysical Anomalies at Pasco Complex

| 7- |
|
|
Figure 7-8: Comparison Between Geological and Geophysical Section

| 7- |
|
|
| 7.7 | Exploration Target |
Nexa has identified areas of potential mineralization, for which there has been insufficient exploration to estimate a Mineral Resource or an Exploration Target, however, Nexa intends to test these with further exploration (Section 7.8).
| 7.8 | Exploration Potential |
| 7.8.1 | Short Term Exploration Potential |
Short-term opportunities for discovering new and significant mineralization rely on developing exploration platforms and drilling exploration holes at the following locations (Figure 7-9):
| · | The upper levels (above 3,300 MASL) of the Integration Zone between El Porvenir and Atacocha. |
| · | The eastern side of the Santa Bárbara stock, 3,300 MASL and below. |
| · | The upper levels (above 3,300 MASL) of San Gerardo. |
| 7- |
|
|
Figure 7-9: Short Term Exploration Potential

| 7- |
|
|
| 7.8.1.1 | Integration of El Porvenir and Atacocha |
To date, Nexa has developed two underground connections between the El Porvenir and Atacocha mines at the 3300 and 4070 levels. Several other connections were planned and allow ample opportunities to conduct underground exploration drilling to test the volume which lies between the two mines. Figure 7-10 presents the El Porvenir and Atacocha mines with underground workings in relation to the modelled mineralization wireframes, defined by drilling and underground channels and mapping, and to the potential mineralization wireframes, defined by the geological continuity and limited drilling. In 2018, mineralization within the Integration Zone was discovered at the 3300 Level, which consists of one mineralization zone hosted in hydrothermal breccias and another in skarn. Nexa plans to continue exploration towards levels above and below the 3300 Level. Since 2021, exploration has continued, with further drilling completed in 2022 and 2023.
The 2023 exploration program tested extensions of the Integration Zone in the 3300-3790-4050 Levels and confirmed the continuity of mineralization in the 3300 Level.
| 7.8.2 | Long Term Brownfield Exploration Potential |
In addition to brownfield targets in the deeper parts of both the Santa Bárbara skarns and the Integration Zone between Atacocha and El Porvenir, the following brownfield targets (Figure 7-11) have been recognized through surface mapping and subsequent work, including remote sensing process and geophysics:
| · | Machcan: Vein outcrops and mineralized mantle with Ag, Pb, and Zn mineralization, reflected in magnetic anomalies. |
| · | Curiajasha: Northwest faulting, concordant with the dikes and magnetic anomalies. |
| · | Longreras: Silicic breccia extending for more than two kilometres; the presence of Pb and Ag anomalies on surface and a magnetic anomaly to the south. |
| · | Manuel 05 and Pique Estrella: Following the northwest structural trend; supported by historic holes intersecting vein mineralization. |
| · | La Quinua Chicrin Corridor: Remote sensing anomalies, the presence of alunite, illite, and kaolinite, and sandstone host rock, supported by a geophysical anomaly at depth. |
The Machán target is of particular exploration interest. This target is in the early concept phase but was tested by 3,879 m of core drilling during 2001 through 2013. The early results intersected a narrow polymetallic vein system with potential for a completely new skarn system, separate from Atacocha and El Porvenir. Nexa has modelled the vein system based on the drilling intercepts, but the mineralization remains open both laterally and at depth.
| 7- |
|
|
Figure 7-10: El Porvenir and Atacocha Mines with Exploration Areas

| 7- |
|
|
Figure 7-11: Brownfield Exploration Targets

| 7- |
|
|
| 7.8.3 | Planned 2024 Exploration |
A total of $2.1 million has been budgeted for planned exploration work in 2024 at the Complex, which includes approximately 8,500 m of diamond drilling focused on delineation of the Integration Zone toward the north and deeper levels. The program is intended to define new Inferred Mineral Resources where currently only potential mineralization has been identified, and test the extension of VAM, Don Lucho, and Porv 9 to the 3790 Level (Figure 7-11).
The exploration criteria for 2024 drilling are based on:
| · | Structural Analysis: Planned exploration drilling is focused on identifying extensions of known deposits based on structural geology and interpretation. |
| · | Geological Control: Drilling will target skarn mineralization associated with intrusives; aiming to extend mineralized zones. |
| 7.9 | Summary |
Exploration methods used by Nexa at the Complex are consistent with industry practices and the available data indicates further areas of potential mineralization.
Although additional drilling and channel sampling has taken place following the January 31, 2023 closure of the resource database used to estimate Mineral Resources, the QP considers that this information largely supports the existing interpretation and that it does not have a material impact.
| 7- |
|
|
| 8.0 | Sample Preparation, Analyses, and Security |
| 8.1 | Laboratories |
Cerro Pasco has used different independent laboratories including Inspectorate (referred to as Inspectorate AT and Inspectorate EP, at Atacocha and El Porvenir, respectively), ALS Peru S.A. (ALS) in Lima, Certimin S.A. (Certimin) in Lima, and, historically, SGS del Peru S.A.C. (SGS).
Inspectorate is an independent, commercial laboratory and is part of Bureau Veritas S.A., which is a global leader in testing, inspection, and certification ISO 17025:2017 standards for specific analytical procedures.
Certimin Lima holds ISO 9001 and NTP-ISO/IEC 17025 and 17021 certifications and is accredited by the Organismo Peruano de Acreditación (INACAL). ALS laboratories are accredited to ISO/IEC 17025:2005 for specific analytical procedures. Both Certimin and ALS laboratories are independent of Nexa.
SGS was used for sample preparation and analysis during the 2006 to 2009 drilling campaigns running the on-site laboratories at the mine sites. Since 2010, Nexa has generally used Inspectorate EP and AT for exploration sample preparation and analysis, with ALS and Certimin used if Inspectorate is running out of capacity.
| 8.2 | Sample Preparation and Analysis |
Figure 8-1 shows a schematic flow chart of sample control, data transfer, and personnel units responsible for each respective area.
| 8- |
|
|
Figure 8-1: Nexa Schematic Flow Chart for Sample and Data Controls

Source: Nexa, 2023
| 8- |
|
|
El Porvenir and Atacocha both have a contract with Inspectorate, which began its operations in 2011, and with ALS starting in 2018. SGS ran an on-site laboratory from 2006 to 2009. Exploration samples were sent to Certimin in 2017 and 2018.
Sampling was completed by Nexa geologists following standard operating procedures.
Sample preparation and analysis at the on-site Inspectorate EP and Inspectorate AT laboratories consisted of:
| · | Samples were dried at 105ºC, with primary crushing at 85% on a ¼" American Standard Test Sieve Series (ASTM) mesh and secondary crushing at 85% on a 10 mesh ASTM, split using a Jones riffle splitter (250 g to 280 g) and pulverized to 95% passing a 140 mesh screen (-105 µm). |
| · | Samples were analyzed using aqua regia digestion with an atomic absorption spectroscopy (AAS) finish for the elements Zn, Pb, Cu, Ag, and Fe, and samples with over limits were re-assayed by Volumetric/Gravimetric Method. |
Sample preparation and analysis at Certimin consisted of:
| · | Samples were dried at 105ºC and coarse crushed to 90% passing a 10 mesh screen (2.0 mm), riffle split (200 g to 250 g), and pulverized to 85% passing a 200 mesh screen (-75 µm). |
| · | Samples were analyzed using the multielement inductively coupled plasma optical emission spectroscopy (ICP-OES) method with aqua regia digestion. Subsequently, upper limit samples were analyzed using AAS, particularly for the elements Zn, Pb, Cu, Ag, Fe, and Mn. |
| · | Determination of Au using a standard fire assay (FA) fusion and AAS finish. |
Sample preparation and analysis at ALS consisted of:
| · | Samples were dried at 105ºC and coarse crushed to 70% passing a 10 mesh screen (-2.0 mm), riffle split (200 g to 250 g), and pulverized to 85% passing a 200 mesh screen (-75 µm). |
| · | Samples were analyzed by 35 multielement ICP-OES method and aqua regia digestion. For samples with upper limits, assays were conducted using AAS and, where appropriate, the Volumetric/Gravimetric Method, particularly for the elements Zn, Pb, Cu, Ag, Au, Bi, and Mn, as outlined in Table 8-2. |
| · | Assays were also complemented using a standard FA with a 30 g aliquot and AAS finish. |
Detection limits (DL) for Inspectorate EP and AT, ALS, and Certimin are summarized in Table 8-1.
| 8- |
|
|
Table 8-1: El Porvenir and Atacocha Laboratory Detection Limits
| Laboratory | Element | Unit | Method | Detection Lower Limit | Detection Upper Limit | 1st Upper Limit Default Method | 2nd Upper Limit Default Method |
| Inspectorate EP | Ag | ppm | F-AA | 4 | - | GRA | - |
| Cu | % | F-AA | 0.01 | 30 | VOL | - | |
| Fe | % | F-AA | 0.01 | - | VOL | - | |
| Mn | % | F-AA | 0.01 | - | VOL | - | |
| Pb | % | F-AA | 0.01 | 30 | VOL | - | |
| Zn | % | F-AA | 0.01 | 30 | VOL | - | |
| Inspectorate AT | Ag | ppm | F-AA | 2 | - | GRA | - |
| Au | ppm | FA | 0.03 | - | GRA | - | |
| Cu | % | F-AA | 0.001 | 30 | VOL | - | |
| Mn | % | F-AA | 0.001 | - | VOL | - | |
| Pb | % | F-AA | 0.001 | 30 | VOL | - | |
| Zn | % | F-AA | 0.001 | 30 | VOL | - | |
| Bi | % | F-AA | 0.005 | - | - | - |
| 8- |
|
|
| Laboratory | Element | Unit | Method | Detection Lower Limit | Detection Upper Limit | 1st Upper Limit Default Method | 2nd Upper Limit Default Method |
| ALS | Au | ppm | Au-AA23 | 0.005 | 10 | Au-GRA21 | - |
| Ag | ppm | ME-ICP41 | 0.2 | 100 | Ag-OG46 | Ag-GRA21 | |
| Al | % | ME-ICP41 | 0.01 | 25 | - | - | |
| As | ppm | ME-ICP41 | 2 | 10,000 | - | - | |
| B | ppm | ME-ICP41 | 10 | 10,000 | - | - | |
| Ba | ppm | ME-ICP41 | 10 | 10,000 | - | - | |
| Be | ppm | ME-ICP41 | 0.5 | 1,000 | - | - | |
| Bi | % | ME-ICP41 | 0.0002 | 1 | - | - | |
| Ca | % | ME-ICP41 | 0.01 | 25 | - | - | |
| Cd | ppm | ME-ICP41 | 0.5 | 1,000 | - | - | |
| Co | ppm | ME-ICP41 | 1 | 10,000 | - | - | |
| Cr | ppm | ME-ICP41 | 1 | 10,000 | - | - | |
| Cu | % | ME-ICP41 | 0.0001 | 1 | Cu-OG46 | - | |
| Fe | % | ME-ICP41 | 0.01 | 50 | Fe-OG46 | - | |
| Ga | ppm | ME-ICP41 | 10 | 10,000 | - | - | |
| Hg | ppm | ME-ICP41 | 1 | 10,000 | - | - | |
| K | % | ME-ICP41 | 0.01 | 10 | - | - | |
| La | ppm | ME-ICP41 | 10 | 10,000 | - | - | |
| Mg | % | ME-ICP41 | 0.01 | 25 | - | - | |
| Mn | % | ME-ICP41 | 0.0005 | 5 | Mn-OG46 | - | |
| Mo | ppm | ME-ICP41 | 1 | 10,000 | - | - | |
| Na | % | ME-ICP41 | 0.01 | 10 | - | - | |
| Ni | ppm | ME-ICP41 | 1 | 10,000 | - | - | |
| P | ppm | ME-ICP41 | 10 | 10,000 | - | - | |
| Pb | % | ME-ICP41 | 0.0002 | 1 | Pb-OG46 | Pb-VOL70 | |
| S | % | ME-ICP41 | 0.01 | 10 | - | - | |
| Sb | ppm | ME-ICP41 | 2 | 10,000 | - | - | |
| Sc | ppm | ME-ICP41 | 1 | 10,000 | - | - | |
| Sr | ppm | ME-ICP41 | 1 | 10,000 | - | - | |
| Th | ppm | ME-ICP41 | 20 | 10,000 | - | - | |
| Ti | % | ME-ICP41 | 0.01 | 10 | - | - | |
| Tl | ppm | ME-ICP41 | 10 | 10,000 | - | - | |
| U | ppm | ME-ICP41 | 10 | 10,000 | - | - | |
| V | ppm | ME-ICP41 | 1 | 10,000 | - | - | |
| W | ppm | ME-ICP41 | 10 | 10,000 | - | - | |
| Zn | % | ME-ICP41 | 0.0002 | 1 | Zn-OG46 | Zn-VOL70 |
| 8- |
|
|
| Laboratory | Element | Unit | Method | Detection Lower Limit | Detection Upper Limit | 1st Upper Limit Default Method | 2nd Upper Limit Default Method |
| Certimin | Au | ppm | G0108 | 0.005 | 10 | G0014 | - |
| Ag | ppm | G0148 | 0.2 | 100 | G0001 | G0008 | |
| Al | % | G0148 | 0.01 | 15 | - | - | |
| As | ppm | G0148 | 3 | 10,000 | - | - | |
| Ba | ppm | G0148 | 1 | 10,000 | - | - | |
| Be | ppm | G0148 | 0.5 | 10,000 | - | - | |
| Bi | % | G0148 | 0.0005 | 1 | - | - | |
| Ca | % | G0148 | 0.01 | 15 | - | - | |
| Cd | ppm | G0148 | 1 | 10,000 | - | - | |
| Co | ppm | G0148 | 1 | 10,000 | - | - | |
| Cr | ppm | G0148 | 1 | 10,000 | - | - | |
| Cu | % | G0148 | 0.00005 | 1 | G0038 | - | |
| Fe | % | G0148 | 0.01 | 15 | G0051 | - | |
| Ga | ppm | G0148 | 10 | 10,000 | - | - | |
| Hg | ppm | G0148 | 1 | 10,000 | - | - | |
| K | % | G0148 | 0.01 | 15 | - | - | |
| La | ppm | G0148 | 0.5 | 10,000 | - | - | |
| Mg | % | G0148 | 0.01 | 15 | - | - | |
| Mn | % | G0148 | 0.0002 | 1 | G0060 | - | |
| Mo | ppm | G0148 | 1 | 10,000 | - | - | |
| Na | % | G0148 | 0.01 | 15 | - | - | |
| Ni | ppm | G0148 | 1 | 10,000 | - | - | |
| P | % | G0148 | 0.01 | 15 | - | - | |
| Pb | % | G0148 | 0.0002 | 1 | G0076 | G0339 | |
| S | % | G0148 | 0.01 | 10 | - | - | |
| Sb | ppm | G0148 | 5 | 10,000 | - | - | |
| Sc | ppm | G0148 | 0.5 | 10,000 | - | - | |
| Sr | ppm | G0148 | 0.5 | 5,000 | - | - | |
| Th | ppm | G0148 | 50 | 10,000 | - | - | |
| Ti | % | G0148 | 0.01 | 15 | - | - | |
| Tl | ppm | G0148 | 2 | 10,000 | - | - | |
| U | ppm | G0148 | 50 | 10,000 | - | - | |
| V | ppm | G0148 | 2 | 10,000 | - | - | |
| W | ppm | G0148 | 10 | 10,000 | - | - | |
| Zn | % | G0148 | 0.00005 | 1 | G0387 | G0338 |
| 8.3 | Sample Security |
Core boxes were transported daily to the core shed by personnel from the drilling company. Samples were transported by a contractor supervised by company personnel. Core boxes and samples were stored in safe, controlled areas.
Chain-of-custody procedures were followed whenever samples were moved between locations and to and from the laboratory, by the completion of sample submittal forms.
| 8.4 | Density Determinations |
Density samples were collected from 2009 to 2023 for El Porvenir and from 2013 to 2023 for Atacocha and tested by various laboratories. Historically, Nexa used Certimin and ALS as independent laboratories for density determinations. A water immersion method is used, consisting of coating the sample in paraffin wax, weighing the sample in air, then suspending the sample in water, and weighing the sample again. By the end of 2020, dedicated density laboratories were established at El Porvenir and Atacocha to conduct density measurements using the water immersion method, but with a lacquer spray applied to porous samples rather than paraffin wax. To monitor accuracy and precision, quality control (QC) samples are integrated into the process, including certified reference, duplicate readings, and inter-method checks.
Density sample intervals are generally consistent with assay sampling intervals and are approximately one metre in length, although sometimes representative 10 cm to 20 cm lengths of the entire core are used, taken from a variety of lithological and mineralogical types. Photographs and brief descriptions were taken before sending the samples to the laboratory for density determinations. Density data is recorded in the main database.
The ALS and Certimin laboratories used the water immersion method to determine the density of the provided samples.
| 8- |
|
|
| 8.4.1 | El Porvenir |
A total of 14,634 density samples were taken from 2009 to 2023 at the El Porvenir deposit and tested by various laboratories. A summary of the density measurements taken is presented in Table 8-2.
From 2014 to 2016, on-site trained technicians performed density measurements using the water immersion method. Between 2017 and 2020, a team from third-party company Explomin Del Peru S.A.C. carried out density measurements within the El Porvenir core facility, in addition to Certimin and ALS. However, starting from December 2020, density measurements have been exclusively performed at the El Porvenir laboratory.
Table 8-2: El Porvenir Density Measurements
| Phase | Sample Type | Total No. Samples | No. Samples within Mineralization Zones | |
| LOM2009 | Drill Holes | 9 | - | |
| LOM2010 | Drill Holes | 37 | - | |
| LOM2011 | Rock | 686 | 508 | |
| LOM2011 | Drill Holes | 44 | - | |
| LOM2012 | Rock | 18 | 14 | |
| LOM2012 | Drill Holes | 92 | - | |
| LOM2014 | Rock | 62 | 22 | |
| LOM2014 | Drill Holes | 290 | 89 | |
| LOM2015 | Rock | 229 | 158 | |
| LOM2015 | Drill Holes | 828 | 187 | |
| LOM2016 | Rock | 236 | 169 | |
| LOM2016 | Drill Holes | 375 | 148 | |
| LOM2017 | Drill Holes | 386 | 134 | |
| LOM2018 | Rock | 86 | 36 | |
| LOM2018 | Drill Holes | 316 | 41 | |
| LOM2019 | Drill Holes | 834 | 118 | |
| LOM2020 | Drill Holes | 836 | 124 | |
| LOM2021 | Drill Holes | 966 | 86 | |
| LOM2022 | Drill Holes | 3,350 | - | |
| LOM2023 | Drill Holes | 4,954 | - | |
| Total | 14,634 | 1,834 | ||
| 8- |
|
|
| 8.4.2 | Atacocha |
A total of 7,612 density samples were taken from LOM2013 to LOM2023 at the Atacocha deposit and tested by various laboratories. A summary of the density measurements taken is presented in Table 8-3.
Since December 2020, density measurements have been exclusively performed at the Atacocha laboratory.
Table 8-3: Atacocha Density Measurements
| Phase | Sample Type | Total No. Samples | No. Samples within Mineralization Zones | |
| LOM2013 | Rock | 859 | 817 | |
| LOM2013 | Drill Hole | 75 | 1 | |
| LOM2014 | Drill Hole | 89 | - | |
| LOM2015 | Drill Hole | 38 | 12 | |
| LOM2016 | Rock | 720 | 359 | |
| LOM2016 | Drill Hole | 240 | - | |
| LOM2017 | Rock | 152 | - | |
| LOM2017 | Drill Hole | 227 | 45 | |
| LOM2018 | Rock | 97 | - | |
| LOM2018 | Drill Hole | 889 | 130 | |
| LOM2019 | Rock | 20 | 10 | |
| LOM2019 | Drill Hole | 1060 | 102 | |
| LOM2020 | Drill Hole | 1004 | 202 | |
| LOM2021 | Drill Hole | 577 | 27 | |
| LOM2022 | Drill Hole | 659 | - | |
| LOM2023 | Drill Hole | 906 | - | |
| TOTAL | 7,612 | 1,705 | ||
| 8.5 | Quality Assurance and Quality Control |
Both El Porvenir and Atacocha implement quality assurance (QA) and quality control (QC) practices to maintain and monitor sample data quality. The implemented QA practices include standardized operating procedures and maintaining robust data management and transfer systems, while the implemented QC includes sampling to monitor performance of the sampling, sample preparation, and analytical processes. Analysis of QC data is performed to assess the reliability of all sample assay data and the confidence in the data used for resource estimation.
For the current Mineral Resource estimate, SLR was retained to independently review the QA/QC data from El Porvenir (since January 16, 2020) and Atacocha (since September 1,
| 8- |
|
|
2018) until January 31, 2023, the cut-off date for the resource database. The QA/QC program implemented by Nexa complies with current industry best practices which involve appropriate procedures and routine insertion of certified reference materials (CRM), blanks, and duplicates to monitor the sampling, sample preparation, and analytical processes.
QC samples have been inserted into the drill core sample stream since 2014 and the channel sample batches since 2012. The mines routinely send CRMs generated from in-house material, blanks, field duplicates, coarse reject (preparation) duplicates, and pulp (laboratory) duplicates to the laboratory.
During 2018, Nexa incorporated systematic external checks into the QC program. Check assay programs were also carried out prior to 2018, in which pulps were sent to external laboratories for analysis. Currently, Inspectorate and ALS analyze samples from infill drilling and brownfield exploration drilling, respectively.
During the 2006 to 2009 drilling campaign, samples were sent to SGS for analysis. Since 2010, underground infill drilling samples have been sent to Inspectorate EP and Inspectorate AT. If the Inspectorate laboratories are running out of capacity, samples are delivered to Certimin and/or ALS laboratories.
For infill and exploration drilling, one batch of samples is prepared for each drill hole. Field duplicates are inserted directly following the original sample, while coarse blank samples are inserted following a mineralized zone, and CRM samples are inserted randomly.
The insertion of the QC samples into the sample stream follows the sample ID sequence.
Pulp check samples are inserted at a rate of approximately 2% of the total samples submitted, consisting of an additional split of material taken after the pulverizing stage and submitted to a secondary laboratory.
Each batch of check samples submitted to the secondary laboratory includes CRM and blank samples.
A QC report is prepared monthly by the on-site Database Administrator, and subsequently reviewed by the Resource Geologist and Nexa corporate QC coordinator. Batches of samples identified by a QC review as an anomalous result are repeated by the laboratory at the request of the Nexa Geology team. QA/QC databases are maintained within Fusion.
Table 8-4 shows the control sample insertion rate and acceptance criteria followed during Nexa’s QA/QC programs for El Porvenir and Atacocha.
Table 8-4: El Porvenir and Atacocha Control Sample Insertion Rate and Failure Criteria
| Control Sample | Type | Insertion Rate |
Failure Criteria |
Expected/Allowed % Failures |
| Blanks | 1 in 50 (2%) | 5 x DL | <5% | |
| CRMs | 1 in 20 (5%) | Outside 3 SD | <10% | |
| Duplicates | Field | 1 in 100 (1%) | <±30% relative error | <10% |
| Coarse | 1 in 100 (1%) | <±20% relative error | <10% | |
| Pulp | 1 in 20 (5%) | <±10% relative error | <10% | |
| External checks | Pulp | 1 in 50 (2%) | <5% bias | <10% |
| 8- |
|
|
| 8.5.1 | El Porvenir |
El Porvenir QC samples represent approximately 13% to 17% of the total samples (Table 8-5).
Table 8-5: El Porvenir QC Submittals: 2020 to 2023
| Sample Type | Laboratory | Period | Primary Samples | Fine Blanks | Coarse Blanks | Pulp Duplicates | Coarse Duplicates | Field Duplicates | CRM | Check Assay | Insertion Rates (%) |
| Channel | INSP EP | 2020-2023 | 17,316 | 401 | 1,039 | 195 | 182 | 1,058 | 14 | ||
| INSP AT | 2020-2023 | 2 | 3 | 1 | 3 | ||||||
| ALS | 2020-2023 | 3 | 12 | ||||||||
| Drill Hole Sample | ALS | 2020 - 2023 | 48,699 | 6 | 1,418 | 3,546 | 812 | 593 | 2,903 | 639 | 17 |
| Certimin | 2020-2023 | 546 | 9 | 14 | 30 | 14 | 46 | 62 | 24 | ||
| INSP EP | 2020 - 2023 | 35,074 | 794 | 2,074 | 828 | 2 | 1,996 | 634 | 15 | ||
| INSP AT | 2020 - 2023 | 38 | 18 | 10 | 86 | ||||||
| Total Samples | 101,635 | 18 | 2,667 | 6,710 | 1,860 | 777 | 6,104 | 1,335 | 16 | ||
| 8.5.1.1 | Certified Reference Material |
Results of the regular submission of CRMs are used to identify potential issues with specific sample batches and long-term biases associated with the primary assay laboratory.
Nexa regularly uses CRMs prepared from in-house material and certified by eleven reputable laboratories. These CRMs are inserted into the sample streams by technicians trained in QC procedures.
Specific pass/fail criteria were used based on setting the CRM acceptance limits at the mean ±3 standard deviations (SD) as a failure limit threshold. QC failures are re-assayed as well as three shoulder samples from each side at the request of Nexa.
Milpo, 2014 to 2017
This section has mostly been summarized from SRK (2017).
The database recorded 31,314 drill core samples with 1,764 standards (a submission rate of 1 in 18 samples) submitted in 2014 and 2017 and 11,129 channel samples with 753 standards (a submission rate of 1 in 15 samples) submitted between 2014 and 2016. Prior to 2014, El Porvenir did not have a QA/QC program implemented.
Pass rates reported for standards submitted with drill core samples were 99% for Ag, 84% for Pb, 97% for Zn, and 99% for Cu. The accuracy levels were considered acceptable for Ag, Zn, and Cu but below acceptable levels for Pb. Pass rates reported for standards submitted with channel samples were 99% for Ag, 77% for Pb, 96% for Zn, and 99% for Cu. The accuracy levels for Ag, Zn, and Cu can be considered acceptable, however Pb performance should be improved. Both channel and drill core show values below 80% for CRMs MAT-05 (moderate-
| 8- |
|
|
grade), STD2_ACTLABS2015 (moderate-grade), and STD3_ACTLABS2015 (high-grade). SRK identified minor biases in some of the standards.
In SLR’s opinion, the latest results indicate that performance has improved and that the minor biases do not materially impact the results.
Nexa, 2017 to 2020
From November 2017 to 2020, El Porvenir sent to Certimin, Inspectorate EP, and ALS a total of 139,319 drill core samples and 7,799 CRMs resulting in an insertion rate of 5.3%.
SLR reviewed the results returned from the CRMs and notes that Nexa had implemented procedures reducing the CRM failure rates significantly. Results for the CRMs are generally within acceptable limits with a small percentage of failures. The CRMs covered a reasonable range of grades with respect to the overall Mineral Resource grades and no significant bias was observed.
Nexa, 2021 to 2023
A total of five different CRMs were employed for accuracy monitoring purposes. These included high grade (PEPSSTD006), moderate (PEPSSTD005), and low grade (PEPSSTD004) standards. In 2022, standards PEPSSTD008 and PEPSSTD009 were introduced and certified specifically for base metals analysis. Additionally, a separate standard, PLSUL43, was introduced to ensure the accuracy of gold measurements.
Overall, the control charts demonstrate favourable levels of dispersion and accuracy across all participant laboratories, including Inspectorate EP, Certimin, and ALS. The results of all the CRMs utilized between 2021 and 2023 are presented in Table 8-6.
SLR observed that biases exceeding 5% are associated with CRM Cu values close to its detection limit and do not necessarily indicate poor performance.
Table 8-6: El Porvenir Certified Reference Material Performances
| Laboratory | CRM | Element | Unit | Period Range | Num Samples | Std Dev | Mean | Expected Value | Num Outliers | Bias (%) | Outliers (%) |
| ALS | PEPSSTD004 | Ag | ppm | 2020-2022 | 731 | 0.91 | 24.62 | 23.3 | 38 | 5.66 | 5.20 |
| Au | ppm | 2020-2022 | 730 | 0.02 | 0.33 | 0.316 | 41 | 4.02 | 5.62 | ||
| Cu | pct | 2020-2022 | 731 | 0.00 | 0.06 | 0.054 | 40 | 5.57 | 5.47 | ||
| Pb | pct | 2020-2022 | 731 | 0.02 | 0.47 | 0.46 | 27 | 1.18 | 3.69 | ||
| Zn | pct | 2020-2022 | 731 | 0.02 | 0.54 | 0.57 | 32 | -5.51 | 4.38 | ||
| PEPSSTD005 | Ag | ppm | 2020-2022 | 1543 | 1.33 | 42.04 | 40.8 | 76 | 3.05 | 4.93 | |
| Au | ppm | 2020-2022 | 1538 | 0.02 | 0.53 | 0.525 | 78 | 1.18 | 5.07 | ||
| Cu | pct | 2020-2022 | 1543 | 0.00 | 0.06 | 0.055 | 73 | 3.70 | 4.73 | ||
| Pb | pct | 2020-2022 | 1543 | 0.03 | 1.12 | 1.15 | 70 | -2.21 | 4.54 | ||
| Zn | pct | 2020-2022 | 1543 | 0.06 | 1.53 | 1.52 | 18 | 0.47 | 1.17 | ||
| PEPSSTD006 | Ag | ppm | 2020-2023 | 1196 | 4.04 | 185.97 | 185 | 41 | 0.52 | 3.43 | |
| Au | ppm | 2020-2023 | 1194 | 0.01 | 0.45 | 0.438 | 60 | 1.71 | 5.03 | ||
| Cu | pct | 2020-2023 | 1196 | 0.01 | 0.19 | 0.186 | 56 | 2.52 | 4.68 | ||
| Pb | pct | 2020-2023 | 1196 | 0.09 | 4.13 | 4.17 | 52 | -1.03 | 4.35 | ||
| Zn | pct | 2020-2023 | 1196 | 0.22 | 6.85 | 6.63 | 4 | 3.30 | 0.33 | ||
| PEPSSTD008 | Ag | ppm | 2023-2023 | 96 | 1.29 | 41.66 | 40.1 | 3 | 3.89 | 3.13 | |
| Cu | pct | 2023-2023 | 96 | 0.00 | 0.03 | 0.03 | 6 | -12.21 | 6.25 | ||
| Pb | pct | 2023-2023 | 96 | 0.03 | 1.35 | 1.37 | 1 | -1.81 | 1.04 | ||
| Zn | pct | 2023-2023 | 96 | 0.28 | 2.84 | 2.88 | 2 | -1.55 | 2.08 |
| 8- |
|
|
| Laboratory | CRM | Element | Unit | Period Range | Num Samples | Std Dev | Mean | Expected Value | Num Outliers | Bias (%) | Outliers (%) |
| PLSUL43 | Au | ppm | 2023-2023 | 4 | 0.01 | 0.76 | 0.71 | 0 | 6.58 | 0.00 | |
| Certimin | PEPSSTD004 | Ag | ppm | 2020-2021 | 6 | 0.22 | 23.98 | 23.3 | 0 | 2.93 | 0.00 |
| Au | ppm | 2020-2021 | 6 | 0.01 | 0.33 | 0.316 | 0 | 4.85 | 0.00 | ||
| Cu | pct | 2020-2021 | 6 | 0.00 | 0.06 | 0.054 | 0 | 3.56 | 0.00 | ||
| Pb | pct | 2020-2021 | 6 | 0.01 | 0.46 | 0.46 | 0 | -0.15 | 0.00 | ||
| Zn | pct | 2020-2021 | 6 | 0.01 | 0.54 | 0.57 | 0 | -4.45 | 0.00 | ||
| PEPSSTD005 | Ag | ppm | 2020-2021 | 26 | 0.76 | 41.17 | 40.8 | 2 | 0.91 | 7.69 | |
| Au | ppm | 2020-2021 | 26 | 0.01 | 0.51 | 0.525 | 1 | -2.97 | 3.85 | ||
| Cu | pct | 2020-2021 | 26 | 0.00 | 0.06 | 0.055 | 1 | 0.19 | 3.85 | ||
| Pb | pct | 2020-2021 | 26 | 0.02 | 1.14 | 1.15 | 2 | -0.84 | 7.69 | ||
| Zn | pct | 2020-2021 | 26 | 0.03 | 1.49 | 1.52 | 0 | -1.85 | 0.00 | ||
| PEPSSTD006 | Ag | ppm | 2021-2022 | 22 | 3.70 | 185.95 | 185 | 0 | 0.52 | 0.00 | |
| Au | ppm | 2021-2022 | 22 | 0.02 | 0.45 | 0.438 | 0 | 2.00 | 0.00 | ||
| Cu | pct | 2021-2022 | 22 | 0.00 | 0.19 | 0.186 | 1 | 1.53 | 4.55 | ||
| Pb | pct | 2021-2022 | 22 | 0.05 | 4.29 | 4.17 | 3 | 2.76 | 13.64 | ||
| Zn | pct | 2021-2022 | 22 | 0.07 | 6.79 | 6.63 | 2 | 2.37 | 9.09 | ||
| INSP_AT | PEPSSTD004 | Ag | ppm | 2020-2021 | 5 | 0.32 | 23.01 | 23.3 | 0 | -1.25 | 0.00 |
| Au | ppm | 2020-2021 | 5 | 0.00 | 0.30 | 0.316 | 0 | -4.62 | 0.00 | ||
| Cu | pct | 2020-2021 | 5 | 0.00 | 0.06 | 0.054 | 0 | 9.26 | 0.00 | ||
| Pb | pct | 2020-2021 | 5 | 0.00 | 0.48 | 0.46 | 0 | 4.13 | 0.00 | ||
| Zn | pct | 2020-2021 | 5 | 0.00 | 0.58 | 0.57 | 0 | 0.98 | 0.00 | ||
| PEPSSTD005 | Ag | ppm | 2020-2022 | 20 | 0.50 | 39.54 | 40.8 | 1 | -3.09 | 5.00 | |
| Au | ppm | 2020-2022 | 20 | 0.01 | 0.49 | 0.525 | 0 | -6.79 | 0.00 | ||
| Cu | pct | 2020-2022 | 20 | 0.00 | 0.06 | 0.055 | 1 | 8.45 | 5.00 | ||
| Pb | pct | 2020-2022 | 20 | 0.02 | 1.14 | 1.15 | 0 | -0.69 | 0.00 | ||
| Zn | pct | 2020-2022 | 20 | 0.03 | 1.52 | 1.52 | 0 | -0.16 | 0.00 | ||
| PEPSSTD006 | Ag | ppm | 2020-2022 | 54 | 2.59 | 180.71 | 185 | 1 | -2.32 | 1.85 | |
| Au | ppm | 2020-2022 | 54 | 0.01 | 0.44 | 0.438 | 2 | -0.52 | 3.70 | ||
| Cu | pct | 2020-2022 | 54 | 0.00 | 0.18 | 0.186 | 1 | -0.91 | 1.85 | ||
| Pb | pct | 2020-2022 | 54 | 0.07 | 4.17 | 4.17 | 1 | 0.07 | 1.85 | ||
| Zn | pct | 2020-2022 | 54 | 0.12 | 6.66 | 6.63 | 3 | 0.50 | 5.56 |
| 8- |
|
|
| Laboratory | CRM | Element | Unit | Period Range | Num Samples | Std Dev | Mean | Expected Value | Num Outliers | Bias (%) | Outliers (%) |
| PLSUL43 | Au | ppm | 2022-2022 | 10 | 0.01 | 0.69 | 0.71 | 1 | -2.15 | 10.00 | |
| INSP_EP | PEPSSTD004 | Ag | ppm | 2020-2022 | 225 | 0.49 | 24.15 | 23.3 | 8 | 3.63 | 3.56 |
| Cu | pct | 2020-2022 | 225 | 0.00 | 0.06 | 0.054 | 12 | 4.78 | 5.33 | ||
| Pb | pct | 2020-2022 | 225 | 0.01 | 0.46 | 0.46 | 14 | -0.65 | 6.22 | ||
| Zn | pct | 2020-2022 | 225 | 0.01 | 0.57 | 0.57 | 4 | 0.11 | 1.78 | ||
| PEPSSTD005 | Ag | ppm | 2020-2023 | 1251 | 0.77 | 41.11 | 40.8 | 49 | 0.77 | 3.92 | |
| Cu | pct | 2020-2023 | 1251 | 0.00 | 0.06 | 0.055 | 78 | 3.92 | 6.24 | ||
| Pb | pct | 2020-2023 | 1251 | 0.03 | 1.20 | 1.15 | 6 | 4.60 | 0.48 | ||
| Zn | pct | 2020-2023 | 1251 | 0.03 | 1.56 | 1.52 | 24 | 2.96 | 1.92 | ||
| PEPSSTD006 | Ag | ppm | 2020-2023 | 1477 | 2.46 | 185.29 | 185 | 23 | 0.16 | 1.56 | |
| Cu | pct | 2020-2023 | 1477 | 0.00 | 0.19 | 0.186 | 13 | 0.94 | 0.88 | ||
| Pb | pct | 2020-2023 | 1477 | 0.09 | 4.26 | 4.17 | 27 | 2.22 | 1.83 | ||
| Zn | pct | 2020-2023 | 1477 | 0.16 | 6.68 | 6.63 | 9 | 0.81 | 0.61 | ||
| PEPSSTD008 | Ag | ppm | 2022-2023 | 64 | 1.15 | 40.41 | 40.1 | 2 | 0.77 | 3.13 | |
| Cu | pct | 2022-2023 | 64 | 0.00 | 0.03 | 0.03 | 0 | -9.64 | 0.00 | ||
| Pb | pct | 2022-2023 | 64 | 0.03 | 1.44 | 1.37 | 2 | 5.10 | 3.13 | ||
| Zn | pct | 2022-2023 | 64 | 0.06 | 3.02 | 2.88 | 2 | 4.91 | 3.13 | ||
| PEPSSTD009 | Ag | ppm | 2022-2023 | 37 | 0.30 | 25.82 | 26 | 2 | -0.67 | 5.41 | |
| Cu | pct | 2022-2023 | 37 | 0.00 | 0.02 | 0.015 | 2 | 13.33 | 5.41 | ||
| Pb | pct | 2022-2023 | 37 | 0.01 | 0.86 | 0.84 | 0 | 1.99 | 0.00 | ||
| Zn | pct | 2022-2023 | 37 | 0.02 | 1.33 | 1.38 | 2 | -3.84 | 5.41 |
SLR selected three distinct CRMs for an in-depth review, representing the low, average, and high grade ranges. These materials were chosen based on factors such as sample size, the laboratory of origin, and their recent performance.
Figure 8-2 to Figure 8-5 illustrate the CRM performance from Inspectorate EP, indicating generally good accuracy with biases ranging from 0.2% to 2.2% for all the evaluated elements. SLR noted some failures exceeding the ±3SD, particularly detected for Ag and Cu. In 2022, a change in the trend of the standards data is particularly observed for Zn and Ag. This shift is attributed to the scheduled semi-annual maintenance performed on the Inspectorate EP equipment. These slight biases are observed in the high grade range CRM PEPSSTD006 and
| 8- |
|
|
the medium-grade range CRM PEPSSTD005; however, it is still within acceptable limits and is not considered to indicate significantly adverse results obtained from Inspectorate EP.
Figure 8-6 to Figure 8-8 present the CRM performance at ALS, indicating overall good accuracy with biases ranging from -1.6% to 3.3%. In 2023, SLR observed two instances of analyses exceeding the upper limit (>1%) for Zn as demonstrated in Figure 8-8. SLR recommends conducting over-limit re-assays to accurately evaluate standard performance.
Figure 8-2: El Porvenir Zn Control Chart for CRM PEPSSTD006 at Inspectorate EP: 2020 to 2023

| 8- |
|
|

| 8- |
|
|

| 8- |
|
|

| 8- |
|
|
| 8.5.1.2 | Blank Material |
The regular submission of blank material is used to assess contamination during sample preparation and to identify sample numbering errors. Field blank samples are composed of barren material that have grades below the detection limit.
Milpo, 2014 to 2017
Between 2014 and 2017, a total of 1,800 blanks were included with 30,370 drill hole samples (a submission rate of approximately 1 in 17 samples) and 785 blanks were included with 10,213 channel samples (a submission rate of 1 in 13 samples) submitted to Inspectorate EP for analysis.
All the laboratories – Certimin, Inspectorate EP, and ALS - showed a pass rate greater than 99% indicating negligible contamination.
Nexa, November 2017 to 2020
Between November 2017 and 2020, a total of 3,821 coarse blanks (2.3%) and 2,600 fine blanks (1.6%) were inserted with core samples. These indicated that no significant contamination occurred during the preparation and analysis of the samples.
Nexa, 2021 to 2023
A total of 2,685 blanks, including both fine and coarse materials, were utilized. Fine blank PEPSBLK001 has been discontinued, and currently only the coarse material, PEPSBLK002, is used for controlling contamination. This 3/4-inch coarse blank material was acquired from Target Rocks Peru and analyzed by ICP-OES or ICP-mass spectrometry (MS) in six laboratories, all of which confirmed the low content of Zn, Pb, Cu, Ag, and Au.
A review of the blanks revealed that no significant contamination has been detected in either type of blank material as exemplified in Figure 8-9. Only one sample exceeded the Zn limit, as shown in Figure 8-10.
| 8- |
|
|
Figure 8-9: El Porvenir Pb Coarse Blank PEPSBLK002 at ALS: 2020 – 2023

| 8- |
|
|
Figure 8-10: El Porvenir Zn Coarse Blank PEPSBLK002 at Inspectorate EP: 2020 to 2023

| 8.5.1.3 | Duplicates |
Duplicates help assess the natural local-scale grade variance or nugget effect and are also useful for detecting sample numbering mix-ups. The field (core) duplicates help monitor the grade variability as a function of both sample homogeneity and laboratory error.
The precision of sampling and analytical results can be quantified by re-analyzing the same sample using the same methodology. The variance between the measured results will indicate their precision. Precision is affected by mineralogical factors such as grain size, distribution, and inconsistencies in the sample preparation and analysis processes. There are several different duplicate sample types, which can be used to determine the precision of the entire sampling, sample preparation, and analytical process. Blind duplicate samples are submitted to the laboratory. A description of the different types of duplicates used by El Porvenir is provided in Table 8-7.
Table 8-7: El Porvenir Duplicate Types and Descriptions
| Duplicate | Description |
| Field | The sample generated by another sampling operation at the same collection point includes a duplicate sample taken from a quarter of the drill core sample. Since mid-2016, a duplicate sample has been taken from the second half of the drill core sample. |
| Reject | The second sample obtained from splitting the coarse crushed rock during sample preparation and submitted blind to the same laboratory that assayed the original sample. |
| 8- |
|
|
| Duplicate | Description |
| Pulp | The second sample obtained from splitting the pulverized material during sample preparation and later submitted blind to the same laboratory that assayed the original pulp. |
Milpo, 2014 to 2017
This section has mostly been taken from SRK (2017).
SRK calculated Half Absolute Relative Difference (HARD) analysis for the elements Ag, Pb, Zn, and Cu, which had the following detection limits: 4.04 g/t Ag, 0.01% Pb, 0.01% Zn, and 0.01% Cu. SRK filtered all the samples with grades below two times the detection limit. El Porvenir inserted field duplicates with drill core samples and channel samples as part of its QC program.
Field duplicates for drill core sample indicate precision levels outside of the acceptable limits. Additionally, failure results were poor for both Pb and Zn and the duplicate assay results for Pb were outside of acceptable limits. The poor precision levels for the field duplicates have been attributed to the sampling procedures, specifically that Milpo did not mark the cut line on the core before the cutting phase or sending a quarter of the core for analysis as a field duplicate. Precision levels for field duplicates in the channel samples were also outside the acceptable limit and failure results were poor for both Ag and Pb. Duplicate assay results for Cu were slightly out of acceptable limits. To improve field duplicate performance, Nexa began marking the cut line before the cutting process and uses the remaining half core for field duplicates, thereby reducing variability.
Nexa, November 2017 to 2020
Duplicate control charts were prepared for Zn, Au, Ag, Cu, and Pb in both laboratories. A total of 4,685 pulp duplicates (2.8%), 3,640 coarse duplicates (2.2%), and 3,244 field duplicates (2%) were inserted. Overall, the duplicate results indicate relatively good assay precision, except for Zn field duplicates, which showed lower precision due to the variability that is inherent in the samples.
SLR recommended continuing to select duplicates that were representative of the mineralization Zn, Pb, Cu, and Ag grade ranges, and completing ongoing studies to investigate the component of variability that is inherent in the sample, versus the component due to assay precision.
Nexa, 2020 to 2023
A total of 9,347 sample pairs were available for review between February 2020 and January 2023. SLR re-evaluated the duplicate database using the hyperbolic method to calculate the relative error between pairs. A failure rate of 10% was considered the threshold for taking corrective action for a group of samples. Individual failure criteria were set for pulp, coarse reject, and field duplicates, whether from Inspectorate EP, ALS, or Certimin.
Good precision was indicated for pulp, coarse, and field duplicates in general, as illustrated in Figure 8-11 to Figure 8-13. SLR observes that channel field duplicates analyzed at Inspectorate-EP showed higher failure rates (Figure 8-14), reaching up to 42%. However, these rates are likely due to the use of the channel duplicate method, where the duplicate sample is taken from the same location but at a deeper depth. This variation in sampling depth could contribute to increased variability in the results.
| 8- |
|
|
Figure 8-11: El Porvenir Zn Pulp Duplicates at ALS: 2020 to 2023

| 8- |
|
|
Figure 8-12: El Porvenir Pb Coarse Duplicates at Inspectorate EP: 2020 to 2023

| 8- |
|
|
Figure 8-13: El Porvenir Pb Drilling Field Duplicates at ALS: 2020 to 2023

| 8- |
|
|
Figure 8-14: El Porvenir Zn Channel Field Duplicates at Inspectorate EP: 2020 to 2023

Table 8-8 summarizes the statistics of El Porvenir duplicate results from 2017 to 2023.
Table 8-8: EL Porvenir Duplicate Performance: 2017 to 2023
| Period | Laboratory | Duplicate Type | No. Samples | Relative Error Limit % | Failure Rate (%) | |||||
| Au ppm | Ag oz/t | Ag ppm | Cu % | Pb % | Zn % | |||||
| Nov. 2017 – Aug. 2018 | Certimin | Field | 616 | <30% | 4.90% | 9.60% | - | 5.50% | 10.60% | 14.00% |
| Coarse | 612 | <20% | 0.80% | 0.80% | - | 0.70% | 10.60% | 0.30% | ||
| Pulp | 612 | <10% | 1.30% | 1.50% | - | 0.00% | 0.20% | 0.00% | ||
| Inspectorate EP | Field | 340 | <30% | - | 3.80% | - | 2.90% | 7.60% | 11.50% | |
| Coarse | 340 | <20% | - | 0.30% | - | 0.00% | 7.60% | 0.90% | ||
| Pulp | 339 | <10% | - | 0.60% | - | 0.90% | 1.20% | 1.50% | ||
| Aug. 2018 – May. 2019 | Certimin | Field | 322 | <30% | 0.31% | 1.49% | 0.75% | 2.17% | 1.55% | 3.11% |
| Coarse | 330 | <20% | 0.30% | 0.00% | 0.00% | 0.00% | 0.00% | 0.00% | ||
| Pulp | 335 | <10% | 0.60% | 0.00% | 0.00% | 0.00% | 0.00% | 0.00% | ||
| Inspectorate EP | Field | 193 | <30% | - | 5.47% | 4.55% | 3.11% | 11.92% | 11.40% | |
| Coarse | 357 | <20% | - | 0.00% | 0.00% | 0.00% | 0.00% | 0.00% | ||
| Pulp | 340 | <10% | 0.00% | 0.40% | 0.52% | 0.52% | 1.04% | |||
| ALS | Field | 943 | <30% | 0.95% | 2.86% | 1.87% | 2.33% | 3.29% | 6.79% | |
| Coarse | 965 | <20% | 0.10% | 0.00% | 0.32% | 0.10% | 0.00% | 0.21% | ||
| Pulp | 1,012 | <10% | 0.99% | 0.00% | 0.31% | 0.30% | 0.10% | 0.20% | ||
| 8- |
|
|
| Period | Laboratory | Duplicate Type | No. Samples | Relative Error Limit % | Failure Rate (%) | |||||
| Au ppm | Ag oz/t | Ag ppm | Cu % | Pb % | Zn % | |||||
| Jun. 2019 – Feb. 2020 | Inspectorate EP | Field | 23 | <30% | - | - | 0.00% | 4.35% | 21.74% | 30.43% |
| Coarse | 182 | <20% | - | - | 0.00% | 0.00% | 0.00% | 1.10% | ||
| Pulp | 282 | <10% | - | 0.71% | 0% | 0.35% | 0.71% | |||
| ALS | Field | 807 | <30% | 1.24% | - | 2.97% | 2.60% | 4.83% | 5.33% | |
| Coarse | 854 | <20% | 0.12% | - | 0.00% | 0.12% | 0.12% | 0.00% | ||
| Pulp | 1,765 | <10% | 0.62% | - | 0.57% | 0.28% | 0.34% | 0.45% | ||
| Feb 2020 - Jan.2023 | ALS | Field | 593 | <30% | 0.67% | - | 1.52% | 1.18% | 1.85% | 2.19% |
| Coarse | 812 | <20% | 0.37% | - | 0.37% | 0.12% | 0.37% | 0.12% | ||
| Pulp | 3,546 | <10% | 0.87% | - | 0.42% | 0.06% | 0.11% | 0.11% | ||
| Certimin | Field | - | <30% | - | - | - | - | - | - | |
| Coarse | 14 | <20% | 0.00% | - | 0.00% | 0.00% | 0.00% | 0.00% | ||
| Pulp | 30 | <10% | 0.00% | - | 3.33% | 0.00% | 0.00% | 0.00% | ||
| Inspectorate EP | Field | 184 | <30% | - | - | 30.98% | 26.63% | 33.70% | 41.85% | |
| Coarse | 1023 | <20% | 0.00% | - | 0.20% | 0.39% | 0.29% | 0.20% | ||
| Pulp | 3,113 | <10% | 0.00% | - | 0.74% | 0.19% | 0.26% | 0.19% | ||
| Inspectorate AT | Field | - | <30% | - | - | - | - | - | - | |
| Coarse | 11 | <20% | 0.00% | - | 0.00% | 0.00% | 0.00% | 0.00% | ||
| Pulp | 21 | <10% | 0.00% | - | 0.00% | 0.00% | 0.00% | 0.00% | ||
| 8.5.1.4 | Umpire Check Assays |
As part of the Nexa QC program, pulp samples are routinely submitted to a third-party laboratory to verify the accuracy and precision of primary assay results, using the same analytical procedures.
Statistics for the check assay results for El Porvenir are presented in Table 8-9.
SLR is of the opinion that the results of the check assays support the use of the primary assays in the Mineral Resource estimation.
| 8- |
|
|
Nexa, November 2017 to 2020
Nexa sent 1,776 pulp samples analyzed at Inspectorate EP to ALS and analyzed at ALS to Certimin for referee check assays. An approximate insertion rate of 2.0% was used for external check samples.
The check assay results compared well, showing very high overall correlation coefficients. For Ag, a potential positive bias of approximately 5% at Inspectorate EP in comparison to ALS was observed and should be investigated.
Nexa, 2021 to 2023
Between 2021 and 2023, 1,335 samples were collected from drill holes and submitted either to Certimin or ALS as third-party laboratory. These samples were shipped along with blanks and standards to validate the secondary results. The Zn analysis presented in Figure 8-15 revealed strong correlation of 0.999 with a percent mean difference of 0.1% between ALS and Certimin.
Similarly, the Pb analysis displayed in Figure 8-16 achieved a high correlation of 0.994 between Inspectorate EP and ALS, with a difference of 0.3% between means. Furthermore, a variation is observed for grades over 15% Pb, where ALS appears to slightly over-estimate the grades compared to the primary laboratory, Inspectorate EP. However, both datasets are statistically similar, validating the grades reported by the primary laboratory.
Figure 8-15: El Porvenir Check Assay Scatter Plot - Zn

| 8- |
|
|
Figure 8-16: El Porvenir Check Assay Scatter Plot - Pb

Table 8-9: El Porvenir External Check Assay Performance: 2017 to 2023
| Period | Secondary Laboratory | Primary Laboratory | Element | No. Samples |
Bias (%) |
| Nov. 2017 - Aug. 2018 | Certimin | ALS | Au ppm | 432 | -2.15 |
| Ag ppm | 435 | 0.56 | |||
| Cu per | 435 | -1.66 | |||
| Pb per | 435 | -1.1 | |||
| Zn per | 435 | -0.55 | |||
| ALS | Certimin | Au ppm | 202 | -6.68 | |
| Ag ppm | 202 | 0.09 | |||
| Cu per | 202 | 1.59 | |||
| Pb per | 202 | -0.35 | |||
| Zn per | 202 | 2.37 | |||
| Inspectorate EP | Ag ppm | 110 | 4.63 | ||
| Cu per | 110 | 2.25 | |||
| Pb per | 110 | 0.63 | |||
| Zn per | 110 | 3.3 |
| 8- |
|
|
| Period | Secondary Laboratory | Primary Laboratory | Element | No. Samples |
Bias (%) |
| Aug. 2018 - May. 2019 | Certimin | ALS | Au ppm | 280 | 0.32 |
| Ag ppm | 282 | -1.42 | |||
| Cu per | 282 | -1.86 | |||
| Pb per | 282 | -1.03 | |||
| Zn per | 282 | -4.02 | |||
| ALS | Certimin | Au ppm | 162 | -0.26 | |
| Ag ppm | 162 | -0.71 | |||
| Cu per | 162 | -1.75 | |||
| Pb per | 162 | -1.28 | |||
| Zn per | 162 | 1.54 | |||
| Inspectorate EP | Ag ppm | 197 | 4.04 | ||
| Cu per | 197 | 2.63 | |||
| Pb per | 197 | 1.53 | |||
| Zn per | 197 | 2.45 | |||
| Jun. 2019 - Feb. 2020 | Certimin | ALS | Au ppm | 294 | 0.26 |
| Ag ppm | 294 | 2.9 | |||
| Cu per | 294 | -1.8 | |||
| Pb per | 294 | 1.76 | |||
| Zn per | 294 | -1.47 | |||
| ALS | Inspectorate EP | Ag ppm | 94 | 2.23 | |
| Cu per | 94 | 3.44 | |||
| Pb per | 94 | 1.52 | |||
| Zn per | 94 | 4.06 | |||
| Mar. 2020 – Jan. 2023 | Certimin | ALS | Ag ppm | 639 | -0.1 |
| Cu per | 639 | -2.1 | |||
| Pb per | 639 | 2.5 | |||
| Zn per | 639 | 0.1 | |||
| ALS | Inspectorate EP | Ag ppm | 634 | 0.4 | |
| Cu per | 634 | 2.9 | |||
| Pb per | 634 | -0.30 | |||
| Zn per | 634 | 3.9 |
| 8- |
|
|
| 8.5.1.5 | QA/QC Recommendations |
The QP’s QA/QC recommendations for El Porvenir are as follows:
| · | Improve the field duplicate rates of channels by revising the sampling protocol of duplicates in channels. |
| · | Increase the frequency of monitoring Inspectorate EP laboratory results to rectify potential bias trends or address instances of failure that may require re-analysis |
| · | Ensure all the samples analyzed by ALS are re-assayed using the relevant analytical method when exceeding the detection limit (i.e., samples >10,000 ppm Zn), to prevent incomplete results in the assay database. |
| 8.5.2 | Atacocha |
Atacocha QC samples represent approximately 16% of the total samples. The QC sample insertion rate and the acceptance criteria followed during Nexa’s QC program for Atacocha are presented in Table 8-10, with an overview of QC submissions from September 1, 2018 to January 31, 2023.
Table 8-10: Atacocha QC Submittals: 2018 to 2023
| Sample Type | Laboratory | Year | Primary Samples | Fine Blanks | Coarse Blanks | Pulp Duplicates | Coarse Duplicates | Field Duplicates | CRM | Check Assay | Insertion Rate (%) |
| Drill Hole Sample | ALS | 2018-2023 | 47,928 | 821 | 1,282 | 1,296 | 828 | 702 | 2,821 | 1,004 | 15 |
| Certimin | 2018-2023 | 2,303 | 22 | 49 | 114 | 35 | 18 | 143 | 104 | 17 | |
| INSP AT | 2018-2023 | 42,951 | 499 | 1,065 | 2,103 | 1,127 | 229 | 2,359 | 844 | 16 | |
| Total Samples | 93,182 | 1,342 | 2,396 | 3,513 | 1,986 | 949 | 5,323 | 1,952 | 16 | ||
| 8.5.2.1 | Certified Reference Material |
Milpo, 2012 to 2017
Between 2012 and 2017, Nexa sent 2,587 CRMs to Inspectorate AT, with 31,617 drill core samples (a submission rate of 1 in 12 samples) in 2014 to 2017 and 27,307 channel samples with 1,613 CRMs (a submission rate of 1 in 17 samples) from 2012 to 2015.
Nexa sent a total of 1,157 CRMs to the Inspectorate Lima laboratory, with 14,190 drill hole samples (a submission rate of 1 in 12 samples) submitted from November 2015 to August 2016, and a total of 1,289 CRMs to ALS, with 21,648 drill hole samples (a submission rate of 1 in 17 samples) submitted from August 2016 to April 2017.
Overall, most of the CRM results for Zn, Pb, Cu, Ag, and Au were within acceptable limits. SLR (then RPA) noticed some CRM numbering mix-ups during 2016 that were addressed later in the database by Nexa.
| 8- |
|
|
Nexa January to August 2018
During 2018, Atacocha dispatched 66,083 drill core samples and 3,291 CRMs, achieving an insertion rate of 5.0%. As per RPA's evaluation, the CRMs encompassed a satisfactory range of grades in relation to the overall resource grades. RPA recommended that Nexa introduce new high-grade Zn and Pb CRMs, alongside the implementation of procedures aimed at reducing CRM failure rates.
Nexa, September 2018 to January 2023
A total of six different CRMs were employed to monitor accuracy. These included high grade (PEPSSTD006 and MAT 12), moderate grade (PEPSSTD005 and MAT 11), and low grade (PEPSSTD004 and MAT 10) standards. The MAT series CRMs were only used until 2019.
Overall, the control charts demonstrate favourable levels of dispersion and accuracy across all participant laboratories, including Inspectorate AT, Certimin, and ALS. The results of all the CRMs utilized between 2018 and 2023 are presented in Table 8-11. The biases exceeding the 5% threshold are associated with Cu lower grade standards and do not necessarily reflect poor laboratory performance.
Table 8-11: Atacocha CRM Performance: 2018 to 2023
| Lab | CRM | Element | Unit | Period | No. Samples | Std Dev | Mean | Expected Value | No. Outliers | Bias (%) | Percentage Outliers (%) |
| ALS | MAT10 | Ag | ppm | (2019, 2019) | 111 | 0.38 | 9.08 | 8.70 | 6 | 4.38 | 5.41 |
| Au | ppm | (2019, 2019) | 110 | 0.02 | 0.25 | 0.25 | 4 | 1.35 | 3.64 | ||
| Cu | pct | (2019, 2019) | 111 | 0.01 | 0.27 | 0.25 | 7 | 6.70 | 6.31 | ||
| Pb | pct | (2019, 2019) | 111 | 0.01 | 0.11 | 0.11 | 1 | 4.01 | 0.90 | ||
| Zn | pct | (2019, 2019) | 111 | 0.01 | 0.29 | 0.30 | 3 | -4.80 | 2.70 | ||
| MAT11 | Ag | ppm | (2018, 2019) | 490 | 1.80 | 56.61 | 54.60 | 24 | 3.68 | 4.90 | |
| Au | ppm | (2018, 2019) | 488 | 0.03 | 0.94 | 0.93 | 10 | 0.64 | 2.05 | ||
| Cu | pct | (2018, 2019) | 490 | 0.01 | 0.18 | 0.17 | 42 | 4.15 | 8.57 | ||
| Pb | pct | (2018, 2019) | 490 | 0.03 | 1.34 | 1.37 | 21 | -1.96 | 4.29 | ||
| Zn | pct | (2018, 2019) | 490 | 0.05 | 2.10 | 2.19 | 19 | -3.95 | 3.88 | ||
| MAT12 | Ag | ppm | (2018, 2019) | 160 | 6.60 | 273.47 | 268.00 | 8 | 2.04 | 5.00 | |
| Au | ppm | (2018, 2019) | 160 | 0.20 | 9.00 | 8.98 | 8 | 0.27 | 5.00 | ||
| Cu | pct | (2018, 2019) | 160 | 0.01 | 0.18 | 0.18 | 8 | 1.32 | 5.00 | ||
| Pb | pct | (2018, 2019) | 160 | 0.17 | 6.72 | 6.83 | 6 | -1.66 | 3.75 | ||
| Zn | pct | (2018, 2019) | 160 | 0.15 | 6.98 | 6.95 | 6 | 0.39 | 3.75 | ||
| PEPSSTD004 | Ag | ppm | (2019, 2021) | 733 | 0.80 | 24.69 | 23.30 | 27 | 5.95 | 3.68 | |
| Au | ppm | (2019, 2021) | 730 | 0.03 | 0.33 | 0.32 | 40 | 2.12 | 5.48 | ||
| Cu | pct | (2019, 2021) | 733 | 0.00 | 0.06 | 0.05 | 99 | 17.24 | 13.51 | ||
| Pb | pct | (2019, 2021) | 733 | 0.02 | 0.47 | 0.46 | 18 | 1.94 | 2.46 | ||
| Zn | pct | (2019, 2021) | 733 | 0.02 | 0.54 | 0.57 | 37 | -4.52 | 5.05 | ||
| PEPSSTD005 | Ag | ppm | (2019, 2022) | 1028 | 1.28 | 41.96 | 40.80 | 51 | 2.83 | 4.96 | |
| Au | ppm | (2019, 2022) | 1026 | 0.02 | 0.53 | 0.53 | 29 | -0.24 | 2.83 | ||
| Cu | pct | (2019, 2022) | 1028 | 0.00 | 0.06 | 0.06 | 155 | -2.51 | 15.08 | ||
| Pb | pct | (2019, 2022) | 1028 | 0.02 | 1.13 | 1.15 | 38 | -1.51 | 3.70 | ||
| Zn | pct | (2019, 2022) | 1028 | 0.03 | 1.54 | 1.52 | 41 | 1.16 | 3.99 | ||
| PEPSSTD006 | Ag | ppm | (2019, 2022) | 299 | 4.02 | 186.33 | 185.00 | 14 | 0.72 | 4.68 | |
| Au | ppm | (2019, 2022) | 299 | 0.01 | 0.44 | 0.44 | 13 | 0.13 | 4.35 | ||
| Cu | pct | (2019, 2022) | 299 | 0.01 | 0.19 | 0.19 | 4 | 0.42 | 1.34 | ||
| Pb | pct | (2019, 2022) | 299 | 0.09 | 4.13 | 4.17 | 12 | -1.00 | 4.01 | ||
| Zn | pct | (2019, 2022) | 299 | 0.14 | 6.88 | 6.63 | 16 | 3.82 | 5.35 |
| 8- |
|
|
| Lab | CRM | Element | Unit | Period | No. Samples | Std Dev | Mean | Expected Value | No. Outliers | Bias (%) | Percentage Outliers (%) |
| Certimin | MAT11 | Ag | ppm | (2018, 2018) | 11 | 0.51 | 53.43 | 54.60 | 0 | -2.15 | 0.00 |
| Au | ppm | (2018, 2018) | 7 | 0.01 | 0.95 | 0.93 | 0 | 1.69 | 0.00 | ||
| Cu | pct | (2018, 2018) | 11 | 0.01 | 0.18 | 0.17 | 0 | 3.21 | 0.00 | ||
| Pb | pct | (2018, 2018) | 11 | 0.01 | 1.37 | 1.37 | 0 | -0.33 | 0.00 | ||
| Zn | pct | (2018, 2018) | 11 | 0.03 | 2.19 | 2.19 | 1 | -0.17 | 9.09 | ||
| MAT12 | Ag | ppm | (2018, 2018) | 5 | 1.95 | 268.60 | 268.00 | 0 | 0.22 | 0.00 | |
| Au | ppm | (2018, 2018) | 5 | 0.02 | 9.22 | 8.98 | 0 | 2.65 | 0.00 | ||
| Cu | pct | (2018, 2018) | 5 | 0.00 | 0.18 | 0.18 | 0 | 0.00 | 0.00 | ||
| Pb | pct | (2018, 2018) | 5 | 0.03 | 6.77 | 6.83 | 0 | -0.82 | 0.00 | ||
| Zn | pct | (2018, 2018) | 5 | 0.05 | 6.85 | 6.95 | 0 | -1.44 | 0.00 | ||
| PEPSSTD004 | Ag | ppm | (2019, 2021) | 15 | 0.74 | 24.03 | 23.30 | 1 | 3.15 | 6.67 | |
| Au | ppm | (2019, 2021) | 12 | 0.01 | 0.32 | 0.32 | 0 | 0.26 | 0.00 | ||
| Cu | pct | (2019, 2021) | 15 | 0.00 | 0.05 | 0.05 | 0 | 6.67 | 0.00 | ||
| Pb | pct | (2019, 2021) | 15 | 0.01 | 0.46 | 0.46 | 0 | 0.72 | 0.00 | ||
| Zn | pct | (2019, 2021) | 15 | 0.02 | 0.54 | 0.57 | 0 | -5.15 | 0.00 | ||
| PEPSSTD005 | Ag | ppm | (2019, 2021) | 73 | 0.73 | 41.43 | 40.80 | 3 | 1.54 | 4.11 | |
| Au | ppm | (2020, 2021) | 70 | 0.01 | 0.52 | 0.53 | 5 | -1.11 | 7.14 | ||
| Cu | pct | (2019, 2021) | 73 | 0.00 | 0.06 | 0.06 | 0 | -4.79 | 0.00 | ||
| Pb | pct | (2019, 2021) | 73 | 0.01 | 1.17 | 1.15 | 2 | 1.44 | 2.74 | ||
| Zn | pct | (2019, 2021) | 73 | 0.01 | 1.53 | 1.52 | 3 | 0.82 | 4.11 | ||
| PEPSSTD006 | Ag | ppm | (2019, 2022) | 39 | 2.82 | 188.85 | 185.00 | 2 | 2.08 | 5.13 | |
| Au | ppm | (2020, 2022) | 35 | 0.02 | 0.45 | 0.44 | 2 | 2.21 | 5.71 | ||
| Cu | pct | (2019, 2022) | 39 | 0.00 | 0.19 | 0.19 | 0 | 0.00 | 0.00 | ||
| Pb | pct | (2019, 2022) | 39 | 0.06 | 4.24 | 4.17 | 3 | 1.70 | 7.69 | ||
| Zn | pct | (2019, 2022) | 39 | 0.10 | 6.76 | 6.63 | 3 | 1.92 | 7.69 |
| 8- |
|
|
| Lab | CRM | Element | Unit | Period | No. Samples | Std Dev | Mean | Expected Value | No. Outliers | Bias (%) | Percentage Outliers (%) |
| INSP_AT | MAT10 | Ag | ppm | (2019, 2019) | 69 | 0.22 | 9.19 | 8.70 | 8 | 5.59 | 11.59 |
| Au | ppm | (2019, 2019) | 69 | 0.00 | 0.24 | 0.25 | 1 | -4.70 | 1.45 | ||
| Cu | pct | (2019, 2019) | 69 | 0.01 | 0.27 | 0.25 | 1 | 7.07 | 1.45 | ||
| Pb | pct | (2019, 2019) | 69 | 0.01 | 0.12 | 0.11 | 1 | 5.53 | 1.45 | ||
| Zn | pct | (2019, 2019) | 69 | 0.01 | 0.30 | 0.30 | 3 | -1.01 | 4.35 | ||
| MAT11 | Ag | ppm | (2018, 2019) | 114 | 1.24 | 56.75 | 54.60 | 7 | 3.94 | 6.14 | |
| Au | ppm | (2018, 2019) | 237 | 0.02 | 0.95 | 0.93 | 16 | 1.88 | 6.75 | ||
| Cu | pct | (2018, 2019) | 237 | 0.00 | 0.18 | 0.17 | 32 | 5.39 | 13.50 | ||
| Pb | pct | (2018, 2019) | 237 | 0.03 | 1.39 | 1.37 | 4 | 1.32 | 1.69 | ||
| Zn | pct | (2018, 2019) | 237 | 0.04 | 2.25 | 2.19 | 8 | 2.60 | 3.38 | ||
| MAT12 | Ag | ppm | (2018, 2019) | 50 | 1.88 | 276.64 | 268.00 | 1 | 3.23 | 2.00 | |
| Au | ppm | (2018, 2019) | 116 | 0.12 | 8.92 | 8.98 | 3 | -0.67 | 2.59 | ||
| Cu | pct | (2018, 2019) | 116 | 0.00 | 0.18 | 0.18 | 12 | -0.38 | 10.34 | ||
| Pb | pct | (2018, 2019) | 116 | 0.10 | 6.78 | 6.83 | 5 | -0.66 | 4.31 | ||
| Zn | pct | (2018, 2019) | 116 | 0.10 | 6.96 | 6.95 | 4 | 0.16 | 3.45 | ||
| PEPSSTD004 | Ag | ppm | (2019, 2021) | 657 | 0.51 | 22.73 | 23.30 | 24 | -2.46 | 3.65 | |
| Au | ppm | (2019, 2021) | 657 | 0.01 | 0.30 | 0.32 | 0 | -4.73 | 0.00 | ||
| Cu | pct | (2019, 2021) | 657 | 0.00 | 0.06 | 0.05 | 17 | 19.54 | 2.59 | ||
| Pb | pct | (2019, 2021) | 657 | 0.01 | 0.47 | 0.46 | 45 | 2.39 | 6.85 | ||
| Zn | pct | (2019, 2021) | 657 | 0.01 | 0.56 | 0.57 | 8 | -1.16 | 1.22 | ||
| PEPSSTD005 | Ag | ppm | (2019, 2022) | 839 | 0.84 | 39.78 | 40.80 | 21 | -2.50 | 2.50 | |
| Au | ppm | (2019, 2022) | 839 | 0.01 | 0.49 | 0.53 | 13 | -6.76 | 1.55 | ||
| Cu | pct | (2019, 2022) | 839 | 0.00 | 0.06 | 0.06 | 3 | -0.02 | 0.36 | ||
| Pb | pct | (2019, 2022) | 839 | 0.03 | 1.15 | 1.15 | 21 | 0.28 | 2.50 | ||
| Zn | pct | (2019, 2022) | 839 | 0.04 | 1.52 | 1.52 | 22 | 0.08 | 2.62 | ||
| PEPSSTD006 | Ag | ppm | (2019, 2022) | 441 | 3.13 | 182.08 | 185.00 | 19 | -1.58 | 4.31 | |
| Au | ppm | (2019, 2022) | 441 | 0.01 | 0.45 | 0.44 | 8 | 1.42 | 1.81 | ||
| Cu | pct | (2019, 2022) | 441 | 0.01 | 0.19 | 0.19 | 1 | -1.86 | 0.23 | ||
| Pb | pct | (2019, 2022) | 441 | 0.09 | 4.19 | 4.17 | 19 | 0.56 | 4.31 | ||
| Zn | pct | (2019, 2022) | 441 | 0.16 | 6.75 | 6.63 | 7 | 1.78 | 1.59 |
SLR selected five distinct CRMs for an in-depth review, representing the low, average, and high-grade ranges. These materials were chosen based on factors such as sample size, the laboratory of origin, and their recent performance in implementation.
| 8- |
|
|
Figure 8-17 and Figure 8-18 show acceptable biases ranging from 0.4% to 1.8% in high grade CRMs. Generally, the results for the moderate CRMs fall within acceptable boundaries, with only a minor proportion of failures displayed in Figure 8-19.
The low grade MAT10 and PEPSSTD004 have shown good results, as illustrated in Figure 8-20 and Figure 8-21, respectively.
Figure 8-17: Atacocha Zn Control Chart for CRM MAT12 at ALS: 2018 to 2019

| 8- |
|
|

| 8- |
|
|

| 8- |
|
|
| 8.5.2.2 | Blank Material |
Coarse blanks are submitted with core samples to assess contamination during sample preparation and to identify sample numbering errors. The blank utilized consists of barren material with grades below detection limits.
Milpo, 2012 to 2017
Between January 2014 and February 2017, a total of 1,752 blanks were included with 25,925 drill hole samples and 290 blanks were included with 18,993 channel samples (a submission rate of 1 in 15 samples) submitted to Inspectorate AT.
In addition, a total of 1,824 blanks with 30,370 drill hole samples (a submission rate of 1 in 17 samples) were sent to Lima Inspectorate over the same time period.
A total of 1,315 blanks with 22,089 drill hole samples (a submission rate of 1 in 17 samples) were also sent to ALS from August 2016 to April 2017.
The results in all the laboratories show a pass rate greater than 98% indicating negligible contamination.
Nexa, January 2017 to August 2018
A total of 1,304 coarse blanks (2.1%) and 1,374 fine blanks (2.0%) were inserted with core samples and showed no significant contamination during the preparation and analysis. The results of the blanks were within acceptable limits at all three laboratories.
Nexa, 2018 to 2023
A total of 3,738 blanks, encompassing both fine and coarse materials, were utilized. Fine blanks (PEPSBLK001 - BF) were no longer used after September 2019 and are now exclusively inserted during external checks. Currently, only coarse blanks (PEPSBLK002 - BG) are utilized for contamination control. Sourced from Target Rocks Peru, this 3/4-inch coarse blank material underwent analysis by ICP-OES or ICP-MS in six laboratories, all of which validated its low Zn, Pb, Cu, Ag, and Au content.
A review of the blanks revealed that no contamination has been detected in either type of blank material. Only one sample slightly exceeded the Zn limit set as displayed in Figure 8-22. For fine blanks, all samples fall within the limit, as depicted in Figure 8-23.
| 8- |
|
|

| 8- |
|
|
| 8.5.2.3 | Duplicates |
Field duplicates are inserted into the sample streams to monitor the representativeness of sampling and grade variability. Additionally, coarse duplicates and pulp duplicates are included to evaluate precision during both preparation and analysis processes.
Milpo, 2012 to 2017
Atacocha sent duplicate samples to Inspectorate AT, Inspectorate Lima, and ALS. SLR (then RPA) reviewed the duplicate results for Zn, Pb, Cu, Ag, and Au and found that they generally compared well. Some of the pulp duplicates at the Inspectorate AT for Zn, Pb, and Cu fall outside the 10% HARD threshold.
Nexa, 2017 to 2018
Duplicate control charts were prepared for Zn, Au, Ag, Cu, and Pb for the laboratories Certimin, ALS, and Inspectorate AT. Overall, the duplicate results showed relatively good assay precision, except for Zn and Pb field duplicates, the poor performance of which is attributed by Nexa to inherent sample variability within breccia, irregularly distributed veins.
RPA observed that representative duplicates spanning mineralization grade ranges are selected, and a study to investigate the component of variability that is inherent in the sample, versus the component due to assay precision is still ongoing.
Nexa, 2018 to 2023
A total of 6,457 sample pairs were available for review between September 2018 and January 2023. SLR re-evaluated the duplicate database using the hyperbolic method to calculate the relative error between pairs. A failure rate of 10% was considered the threshold for taking corrective action for a group of samples. Individual failure criteria were set for pulp, coarse reject, and field duplicates, whether from Inspectorate AT, ALS, or Certimin.
Good precision rates were obtained from pulp, coarse, and field duplicates in general, as illustrated in Figure 8-24 to Figure 8-26. Overall, the precision of the duplicate assays remained consistent.
| 8- |
|
|
Figure 8-24: Atacocha Pb Pulp Duplicates at ALS: 2018 to 2022

| 8- |
|
|
Figure 8-25: Atacocha Zn Coarse Duplicates at Inspectorate AT: 2018 to 2022

| 8- |
|
|
Figure 8-26: Atacocha Zn Field Duplicates at ALS: 2018 to 2022

Table 8-12 summarizes the statistics of Atacocha duplicate results from 2018 to 2023.
Table 8-12: Atacocha Duplicate Types and Failure Rates
| Period | Laboratory | Element | Field Duplicates | Coarse Duplicates | Pulp Duplicates | ||||||
| Sample | Failure | Failure Rate% | Sample | Failure | Failure Rate % | Sample | Failure | Failure Rate % | |||
| Jan 2018, Aug 2018 | CERTIMIN | Au(g/t) | 42 | 3 | 7% | 51 | 0 | 0% | 76 | 1 | 1% |
| Ag(oz/t) | 42 | 2 | 5% | 51 | 0 | 0% | 76 | 5 | 7% | ||
| Cu (%) | 42 | 2 | 5% | 51 | 0 | 0% | 76 | 0 | 0% | ||
| Pb (%) | 42 | 5 | 12% | 51 | 6 | 12% | 76 | 0 | 0% | ||
| Zn (%) | 42 | 8 | 19% | 51 | 0 | 0% | 76 | 0 | 0% | ||
| ALS | Au(g/t) | 1,092 | 33 | 3% | 1,092 | 3 | 0% | 1,519 | 34 | 2% | |
| Ag(oz/t) | 1,092 | 38 | 4% | 1,092 | 6 | 1% | 1,519 | 4 | 0% | ||
| Cu (%) | 1,092 | 39 | 4% | 1,092 | 4 | 0% | 1,519 | 3 | 0% | ||
| Pb (%) | 1,092 | 123 | 11% | 1,092 | 123 | 11% | 1,519 | 2 | 0% | ||
| Zn (%) | 1,092 | 150 | 14% | 1,092 | 18 | 2% | 1,519 | 1 | 0% | ||
| INSPECTORATE AT | Au(g/t) | 471 | 6 | 1% | 478 | 0 | 0% | 682 | 5 | 1% | |
| Ag(oz/t) | 471 | 11 | 2% | 478 | 0 | 0% | 682 | 0 | 0% | ||
| Cu (%) | 471 | 20 | 4% | 478 | 1 | 0% | 682 | 3 | 0% | ||
| Pb (%) | 471 | 30 | 6% | 478 | 30 | 6% | 682 | 3 | 0% | ||
| Zn (%) | 471 | 65 | 14% | 478 | 1 | 0% | 682 | 1 | 0% | ||
| 8- |
|
|
| Period | Laboratory | Element | Field Duplicates | Coarse Duplicates | Pulp Duplicates | ||||||
| Sample | Failure | Failure Rate% | Sample | Failure | Failure Rate % | Sample | Failure | Failure Rate % | |||
| Set 2018 - Jan 2023 | CERTIMIN | Au(g/t) | 18 | 2 | 11% | 35 | 0 | 0% | 114 | 3 | 3% |
| Ag(oz/t) | 18 | 1 | 6% | 35 | 0 | 0% | 114 | 0 | 0% | ||
| Cu (%) | 18 | 0 | 0% | 35 | 0 | 0% | 114 | 0 | 0% | ||
| Pb (%) | 18 | 1 | 6% | 35 | 0 | 0% | 114 | 0 | 0% | ||
| Zn (%) | 18 | 3 | 17% | 35 | 0 | 0% | 114 | 0 | 0% | ||
| ALS | Au(g/t) | 702 | 44 | 6% | 828 | 21 | 3% | 1,296 | 74 | 6% | |
| Ag(oz/t) | 702 | 19 | 3% | 828 | 3 | 0% | 1,296 | 4 | 0% | ||
| Cu (%) | 702 | 23 | 3% | 828 | 2 | 0% | 1,296 | 0 | 0% | ||
| Pb (%) | 702 | 30 | 4% | 828 | 1 | 0% | 1,296 | 0 | 0% | ||
| Zn (%) | 702 | 51 | 7% | 828 | 0 | 0% | 1,296 | 1 | 0% | ||
| INSPECTORATE AT | Au(g/t) | 230 | 53 | 23% | 1,128 | 6 | 1% | 2,106 | 13 | 1% | |
| Ag(oz/t) | 215 | 33 | 15% | 1,024 | 2 | 0% | 1,953 | 1 | 0% | ||
| Cu (%) | 230 | 27 | 12% | 1,128 | 2 | 0% | 2,106 | 5 | 0% | ||
| Pb (%) | 230 | 38 | 17% | 1,128 | 1 | 0% | 2,106 | 1 | 0% | ||
| Zn (%) | 230 | 48 | 21% | 1,128 | 2 | 0% | 2,106 | 3 | 0% | ||
| 8.5.2.4 | Umpire Check Assays |
As part of the Nexa QA/QC program, pulp samples are routinely submitted to a third-party laboratory to verify the accuracy and precision of primary assay results, using the same analytical procedures. Statistics for the check assay results for Atacocha are presented in Table 8-13.
SLR is of the opinion that the results of the check assays support the use of the primary assays in the Mineral Resource estimation.
Nexa, January to August 2018
Nexa sent 261 pulp samples analyzed at Inspectorate to ALS and 495 sample pulps analyzed at ALS to Certimin for umpire check assays. External check samples were inserted at a rate of approximately 2%.
The results for Zn showed a correlation coefficient of 0.99, which is very good. There were some samples removed as they were at detection limit value. The check assay results compared well, showing very high overall correlation coefficients, except for the ALS Ag value, which was less at 0.96%. For Ag, a potential negative bias of approximately 10% at Inspectorate in comparison to ALS should be investigated.
| 8- |
|
|
Nexa, September 2018 to 2023
Between 2018 and 2023, 1,952 samples were collected from drill holes and submitted either to Certimin or ALS as a third-party laboratory. These samples were shipped along with blanks and standards to validate the secondary results. The Zn analysis illustrated in Figure 8-27 demonstrated a high correlation of 0.999 and a mean percentage difference of 1.6% between ALS and Certimin. Likewise, the Pb analysis shown in Figure 8-28 indicated a strong correlation of 0.996 between Inspectorate AT and ALS, with a 0.7% difference between the mean values. The statistical similarity of both datasets confirms the accuracy of the grades reported by the primary laboratory.
Figure 8-27: Atacocha Check Assay Scatter Plot - Zn

| 8- |
|
|
Figure 8-28: Atacocha Check Assays Scatter Plot - Pb

Table 8-13: Atacocha External Check Assay Performance: 2018 to 2023
| Period | Secondary Laboratory | Primary Laboratory | Element | No. Samples |
Bias (%) |
| Jan 2018 - Sept 2018 | ALS | Inspectorate AT | Au ppm | 226 | 3.50% |
| Ag ppm | 226 | -10.80% | |||
| Cu per | 276 | -3.90% | |||
| Pb per | 286 | -4.00% | |||
| Zn per | 330 | -2.00% | |||
| Certimin | ALS | Au ppm | 431 | -0.70% | |
| Ag ppm | 434 | 0.60% | |||
| Cu per | 333 | 1.40% | |||
| Pb per | 332 | 0.70% | |||
| Zn per | 404 | 0.60% |
| 8- |
|
|
| Period | Secondary Laboratory | Primary Laboratory | Element | No. Samples |
Bias (%) |
| Sept 2018 - Jan 2023 | Inspectorate AT | ALS | Au ppm | 844 | 5.30% |
| Ag ppm | 844 | 0.60% | |||
| Cu per | 844 | 3.10% | |||
| Pb per | 844 | 0.70% | |||
| Zn per | 844 | 2.40% | |||
| ALS | Certimin | Au ppm | 1,004 | 1.40% | |
| Ag ppm | 1,004 | -7.50% | |||
| Cu per | 1,004 | -1.80% | |||
| Pb per | 1,004 | 0.60% | |||
| Zn per | 1,004 | -1.60% | |||
| Certimin | ALS | Au ppm | 104 | -0.50% | |
| Ag ppm | 104 | -0.50% | |||
| Cu per | 104 | 1.20% | |||
| Pb per | 104 | -2.20% | |||
| Zn per | 104 | -0.10% |
| 8.5.2.5 | QA/QC Recommendations |
Prior to preparation of the Mineral Resource estimates for El Porvenir, Atacocha underground, and Atacocha open pit, the QP reviewed the adequacy of Nexa’s sample preparation, analysis, security protocols and procedures and QA/QC program at these operations.
The QP also reviewed the independent audit of the QA/QC program completed by SLR.
The QP’s QA/QC recommendations for Atacocha are as follows:
| · | Keep monitoring CRMs and controls to prevent and/or mitigate trends, biases, or other issues which may require sample re-analysis. Continue to periodically conduct external checks across laboratories to ensure the primary laboratory's performance remains satisfactory. |
| 8.6 | QP Opinion |
In the QP’s opinion, the sample preparation, analysis, and security procedures at El Porvenir and Atacocha are appropriate for use in the estimation of Mineral Resources.
In the QP’s opinion, the QA/QC program as designed and implemented by Nexa is adequate and the assay results within the databases for El Porvenir and Atacocha are suitable for use in a Mineral Resource estimate.
| 8- |
|
|
| 9.0 | Data Verification |
| 9.1 | Databases and Internal Verification |
During the last quarter of 2017, Nexa transferred the El Porvenir and Atacocha databases from their in-house developed Mining Information System (SIOM) , and Excel files to Fusion software and prepared an exhaustive number of checks to confirm the accuracy of the data migration. Nexa has implemented a series of routine verifications to ensure the collection of reliable data. Logging and sampling data are digitally entered into the database by downloading the information from the logging tablets.
Core logging, surveying, and sampling were monitored by exploration and mine geologists and verified routinely for consistency. The El Porvenir and Atacocha resource databases are regularly maintained and validated by the database administrator using Fusion software validation routines and by regularly checking the drill hole data on-screen visually. Personnel from the Geology department conduct daily quality control checks on the data entry. A first check consists of identifying duplicate sample numbers or lack of information for certain intervals. Every month, all the assay data entered in the server are compared with a compilation of individual CSV files issued by the laboratory. Paper records are stored at a safe location at the mines.
Assay data are captured from the Global Laboratory Information Management System (LIMS) server using custom routines, and this information is then entered into the Fusion database. The laboratory also issues CSV and pdf-format certificates, however, only the information that is stored digitally on the local mine servers is considered to be the true record.
Nexa prepared “The Informe de Validación de Base de Datos Atacocha” report containing additional detail regarding the data validation for El Porvenir. During this validation, Nexa found 76 channel samples and one drill hole creating inconsistencies with surrounding data. As a result, these channel samples and hole were removed from the Mineral Resource database.
| 9.2 | El Porvenir |
| 9.2.1 | Previous Verification |
In 2017, Amec Foster Wheeler (Amec) audited the Atacocha database (which also included El Porvenir). Amec reviewed and validated the information from 2011 to 2017 compiled by El Porvenir. Amec used signed assay certificates to verify the assays in the database; some inconsistencies were observed in Zn and Cu assays. Other checks included collar locations, downhole survey measurements, and lithology codes, and some inconsistencies were observed. In addition, a comparison between drill hole assay and channel assay was performed. The test compared results of nearby holes by searching for channel samples within a four-metre distance of drill holes. Amec constructed QQ plots and found that both grade distributions were very similar, with no bias observed (Amec, 2017)
As part of SRK’s 2017 NI 43-101 Technical Report, SRK performed assay data verification by comparing assay certificates with values in the database. SRK found that a significant number of historical samples did not have assay certificates and downgraded some areas to Inferred Resources as a result. Nexa has found more assay certificates since 2017 and completed a statistical and visual study that concluded that there were no significant issues with the historical data. SLR reviewed Nexa’s comparison work and concurred with the inclusion of historical data in the resource estimate with no classification downgrade.
| 9- |
|
|
| 9.2.2 | 2020 SLR Verification |
SLR visited El Porvenir from September 5 to 7, 2018. During the site visit, SLR reviewed plans and sections, visited the core shack, examined some drill cores and mineralization exposures at the underground mine, and held discussions with Nexa personnel.
As part of the data verification process, SLR inspected the drill holes in section and plan view to review geological interpretations related to drill hole and channel databases and found good correlation. SLR queried the database for unique headers, unique samples, duplicate holes, overlapping intervals, blank and zero grade assays, and long interval samples, and reviewed QA/QC data collected by Nexa. SLR did not identify any significant discrepancies.
| 9.2.2.1 | Assay Certificate Verification |
SLR performed checks on the El Porvenir Mineral Resource database by compiling approximately 166,000 assay certificate results from August 2011 to March 2020 and comparing them to the assay database. Approximately 53,000 sample IDs were matched to the assay database for Zn, Cu, Pb, Ag, and Fe. No significant errors were found. There were 629 samples for Ag where the values in the database ranged from 25 g/t Ag to 285 g/t Ag and were lower than the certificate assays. This is likely a result of choosing the lower value of multiple re-assays, which shows a conservative approach since all mismatched values were lower in the Mineral Resource database. SLR did not include the results of re-assay programs in its certificate conversion and compilation exercise.
SLR did not review the pre-2011 certificate data as it is mostly located in mined-out areas. The bulk of the Mineral Resources and Mineral Reserves are supported with data from 2011 to 2020. Note the Mineral Resource and Mineral Reserve solids are well-covered by the 2011-2020 sampling. Assay certificates pre-2011 were not available, with the exception of 2009 certificates, however, Nexa and SLR reviewed this data in sections and plan views. Overall, the data compared well with recent drilling. SLR found no indication of any significant issues with this data. Additionally, Nexa was actively conducting drilling in these areas to validate assay values.
| 9.2.2.2 | Density Certificate Verification |
SLR analyzed 3,553 density measurement certificates from November 2015 to February 2020. Four files from 2011, 2012, and 2014 appear to contain grab samples, and only two of these had sample ID fields which concatenated the index and year in the table. Spot checks of the available sample IDs against the density table in the Mineral Resource database resulted in zero matches.
There were 565 certificate ID matches out of 1,131 in the El Porvenir Mineral Resource database, resulting in a comparison rate of 50%. SLR noted that there was only one density discrepancy greater than 0.2 g/cm3 between the matching certificate and the Mineral Resource sampleIDs. SLR considered this to be a very good result.
| 9- |
|
|
| 9.2.3 | SLR Verification 2021 - 2023 |
SLR found that the database is well maintained and that database verification procedures for El Porvenir comply with industry standards and are adequate for the purposes of Mineral Resource estimation.
| 9.2.3.1 | Assay Certificate Verification |
SLR carried out cross-checks between the El Porvenir assay database and the Inspectorate, Certimin, and ALS assay certificates. SLR compiled 41,816 samples from 282 certificates from 2019 to 2023 and compared values for Au, Ag, Pb, Cu, and Zn against the PS-EP-ASSAY_31-01-2023 assay database. This allowed for approximately 44% of the assay database to be verified. No significant errors were identified.
SLR is the opinion that the database is well supported by the available assay certificates.
| 9.2.3.2 | Density Certificate Verification |
SLR compiled ALS density measurement from original certificates and compared them to the density database.
In 2020, the ALS laboratory conducted tests on 469 samples, across eight certificates, using the wax-coated immersion method. Subsequently, density assessments commenced at the El Porvenir density dedicated laboratory. SLR noted that 46 of the samples were missing from the density database. Nexa attributes this missing information to damage during transport of the samples, which, as a result, were removed from the density database. Additionally, 92 samples measured by ALS were re-analyzed and replaced in the database with the on-site laboratory.
Starting in 2020, density measurements have been exclusively conducted in the El Porvenir density dedicated laboratory, with the results directly recorded into the Fusion database. Consequently, these measurements are not supported by certificates. However, recalculation of initial weights also recorded in the database confirm final density values.
| 9.3 | Atacocha |
| 9.3.1 | 2018 RPA Verification |
RPA visited the Atacocha Mine from September 5 to 7, 2018. During the site visit, RPA reviewed plans and sections, visited the core shack, examined some drill cores and mineralization exposures at the underground mine, and held discussions with Nexa personnel.
RPA performed checks on the Atacocha Mineral Resource database by comparing 2017 assay certificates to the assay values in the database. The database values correspond well with the assay certificate data.
As part of the data verification process, RPA inspected the drill holes in section and plan view to review geological interpretations related to drill hole and channel databases and found good correlation. RPA queried the database for unique headers, unique samples, duplicate holes, overlapping intervals, blank and zero grade assays, and long interval sample, and reviewed QA/QC data collected by Nexa. RPA did not identify any significant discrepancies.
| 9- |
|
|
| 9.3.2 | SLR Verification 2021 - 2023 |
SLR found that the database is well maintained, and generally exceeds industry standards. SLR is of the opinion that database and database verification procedures for Atacocha comply with industry standards and are adequate for the purposes of Mineral Resource estimation.
| 9.3.2.1 | Assay Certificate Verification |
SLR carried out cross-checks between the Atacocha assay database and the Inspectorate, Certimin, and ALS assay certificates. SLR compiled 67,316 samples from 791 certificates from 2019 to 2022 and compared values for Au, Ag, Pb, Cu, and Zn against the PS-AT-ASSAY_31-01-2023 assay database. This allowed for approximately 88% of the assay database to be verified. There is a total of 110 errors found in certificate LI19305593, which is related to the holeID PEATD01284.
SLR completed database validity checks for out-of-range values, gaps, and mismatched sample intervals.
Overall, SLR found no significant issues with the Atacocha drill hole databases.
| 9.3.2.2 | Density Certificate Verification |
SLR conducted an analysis of 6,025 density measurement certificates dated from 2013 to 2021 from ALS, all of which were determined using the wax-coated immersion method. Out of these, 1,975 samples were not found in the database. Nexa attributes this missing information to damage during transport of the samples, leading to its removal from the density database. A total of 3,159 samples matched the results between the certificate measurements and the database records. SLR noted that 30 samples measured by ALS were re-analyzed and replaced in the database with the on-site laboratory measurements.
Since January 2021, density measurements have been conducted exclusively in the El Porvenir density dedicated laboratory, with the results directly recorded into the Fusion database. Consequently, these measurements are not supported by certificates. However, recalculation of initial weights also recorded in the database confirm final density values.
| 9.4 | Data Verification by the QP |
Prior to preparation of the Mineral Resource estimates for El Porvenir, Atacocha underground, and San Gerardo, the QP reviewed the adequacy of Nexa’s data management processes and completed database validity checks on the resource databases used in the estimates.
The QP also reviewed the validation and verification checks completed by SLR.
No limitations were imposed when conducting the QP’s checks.
| 9.5 | QP’s Opinion and Recommendations |
In the QP's opinion, the data verification for El Porvenir and Atacocha revealed no major discrepancies. Therefore, the assay and density results within the database are considered suitable for use in a Mineral Resource estimate.
The QP’s data verification recommendations are as follows:
| · | Confirm whether the 1,975 density samples removed from the Atacocha database were justifiably excluded or, if necessary, consider re-including them in the database. Ensure |
| 9- |
|
|
that this exclusion of density samples is documented within the database's record of changes to track any modifications made to the database.
| · | Investigate and correct the noted sample discrepancies, mostly in Au values. |
| · | Maintain standardization of the format and database structure. |
| 9- |
|
|
| 10.0 | Mineral Processing and Metallurgical Testing |
| 10.1 | El Porvenir |
| 10.1.1 | Geometallurgical Test Work |
Nexa began developing a geometallurgical model for El Porvenir in 2017. The objectives of the work were to develop a geometallurgical model able to predict the recovery of lead, zinc, copper, arsenic, and manganese, concentrate grades, as well as abrasiveness (abrasion index (Ai)) and hardness (Bond ball mill work index (BWi)), and therefore throughput based on ore source within the deposit. The aim of the development work included:
| · | Maximization of operational value of the El Porvenir mining unit. |
| · | Reduction of risks to production related to: |
| o | Plant throughput. |
| o | Grinding media consumption. |
| o | Recovery of valuable minerals. |
| o | Concentrate quality. |
| o | Identification of flaws in the quality and interpretation of the available information. |
| o | Identification of opportunities for improvement and to reduce risk. |
| o | Definition and validation of geometallurgical domains from metallurgical test results. |
| o | Evaluation of contaminants in the deposit. |
The geometallurgical sample selection and test work were performed with the assistance of Transmin Metallurgical Consultants (Transmin). Preliminary results and interpretation were reported by Transmin in the following reports:
· Estudio Geometalurgico Preliminar para Unidad Minera El Porvenir, June 15, 2018 (Transmin, 2018).
· Estudio Geometalúrgico Fase 2 para Unidad Minera El Porvenir, April 29, 2019 (Transmin, 2019)
· Estudio Geometalúrgico Fase 3 para Unidad Minera El Porvenir, May 18, 2020 (Transmin, 2020)
· Estudio Geometalúrgico Fase 4 para Unidad Minera El Porvenir, June 17, 2021 (Transmin, 2021)
· Estudio Geometalúrgico Fase 5 para Unidad Minera El Porvenir, May 5, 2022 (Transmin, 2022)
· Estudio Geometalúrgico Fase 6 para Unidad Minera El Porvenir, April 20, 2023 (Transmin, 2023).
| 10.1.1.1 | Phase 1 Results |
In 2017, fifteen samples from El Porvenir were submitted for metallurgical testing. The samples were intended to be representative of 2018 concentrator feed. Test work included mineralogy, comminution testing (BWi and Ai), and flotation (variability tests, locked cycle tests (LCTs), and grind size evaluation).
| 10- |
|
|
comminution testing (BWi and Ai), and flotation (variability tests, locked cycle tests (LCTs), and grind size evaluation).
Sampling and Mineralogy
Priority was given to samples from holes drilled in 2016 and 2017 to use the freshest possible material for metallurgical test work. Samples were selected to represent areas in the block model with NSR values greater than or equal to $40.94/t, as well as to include the majority of lithologies to be processed in 2018 (predominantly skarn and limestone). Grades of zinc, lead, copper, and silver were also considered in the selection of samples. Mineralogical characterization of the samples is represented in Figure 10-1 and Figure 10-2. The mineralogy is notable for the wide range of sulphide and sulphate content, the presence of sphalerite with manganese inclusions, as well as high levels of manganese sulphide in two samples, PAS-09 and PAS-23.
Figure 10-1: Bulk Mineralogical Analysis

Source: Transmin, 2018
| 10- |
|
|
Figure 10-2: Sulphide Mineral Breakdown

Source: Transmin, 2018
Comminution
Comminution test results ranged from 0.04 g to 0.33 g for Ai and 7.3 kWh/t to 20.6 kWh/t for BWi.
Flotation – Grind Size Optimization
Three composite samples were produced for use in grind size optimization flotation tests and for LCTs. Two composites of plant feed representing October 2017 and November 2017 were collected for repeatability testing and cleaner regrind testing. Bulk rougher flotation was completed at three grind sizes, 80% passing (P80) 100 µm, 150 µm, and 200 µm. The tests indicated that there was a tendency towards higher recoveries of copper and zinc to the bulk rougher concentrate at the finer grind sizes. This would result, however, in the need for more effort to reject the additional zinc from the bulk concentrate. Recovery of lead to the bulk concentrate was less affected but improved at finer grind sizes. Therefore, it was noted that optimization of primary grind size could help to maximize recoveries of valuable minerals and metals, but primary grind size should be considered in conjunction with throughput and energy consumption.
An evaluation of regrind size was conducted by completing cleaner tests on bulk and zinc rougher concentrates at P80 20 µm and 40 µm, as well as without regrinding. The tests indicated that recoveries were lower at finer grind sizes, but also that grades at the finer grind sizes were higher. It was noted that optimization of regrind size could help to reduce energy consumption for regrinding, while still achieving target concentrate grades.
| 10- |
|
|
Locked Cycle Flotation Testing
An LCT was completed which produced a bulk concentrate of 53.8% Pb and zinc concentrate of 52.7% Zn. The limit for bismuth in the bulk concentrate (1,000 ppm Bi) was exceeded at 5,597 ppm Bi, and the limit for cadmium in the zinc concentrate (3,000 ppm Cd) was exceeded at 3,275 ppm Cd. Final recoveries for lead and zinc were 88.2% and 91.5%, respectively.
Variability tests were completed on the 15 variability samples. The tests consisted of bulk and zinc rougher flotation conditions that were adjusted according to the lead and zinc content of the samples, resulting in five different sets of flotation conditions.
Lead recovery to the bulk concentrate averaged 92% (excluding the low lead content samples), while zinc recovery to the zinc rougher concentrate averaged 79%.
Recovery Versus Head Grade
Test work results from the samples were used to derive recovery versus head grade relationships for lead, zinc, copper, manganese, and arsenic. Transmin noted that the number of samples tested was less than the number required to represent the variability of the deposit, and that additional test work would be required to validate and update the geometallurgical model. In addition, it was recommended that arsenopyrite and manganese sulphides be included in the logging of drill core samples, and that the behaviours of bismuth and antimony should be evaluated in future test work.
| 10.1.1.2 | Phase 2 Test Work |
In Phase 2 of the geometallurgical model development, 96 samples were selected for metallurgical test work, including samples from both El Porvenir and Atacocha. Samples were selected to represent the distribution of ore (from different zones within the mines) planned to be mined in 2019 (except for Atacocha where sample material for certain zones to be mined in 2019 was not available), and from blocks in the block model with NSR values greater than or equal to $40.94/t.
Comminution
Samples that underwent comminution testing included 36 samples from El Porvenir and 10 samples from Atacocha. Ai values of the samples ranged from 0.0056 g to 0.47 g, with the majority of samples in the low abrasiveness range of < 0.3 g. BWi for the samples ranged from 5.6 kWh/t to 20.7 kWh/t with the majority of samples in the medium to hard range of 9 kWh/t to 20 kWh/t. Abrasiveness and hardness were found to be related to the SiO2 content of the samples.
Flotation
Flotation test work was completed on 45 variability samples (rougher tests) and a composite produced from 40 individual samples from El Porvenir and 10 individual samples from a blend of 75% El Porvenir and 25% Atacocha material. Three composites (two El Porvenir and one Atacocha) were submitted for mineralogical analysis. The main gangue minerals in the composites were silicates and carbonates and the main sulphide minerals were pyrite, sphalerite, and galena. The flotation test work indicated that lead recovery was related to the
| 10- |
|
|
lead head grade, and silver recovery was related to lead recovery; zinc, manganese, and arsenic recoveries were noted to be related to the source zone of the samples. LCTs conducted on the composites did not achieve stability and were therefore not included in the analysis of results.
| 10.1.1.3 | Phase 3 Test Work |
In Phase 3 of the geometallurgical model development, 46 additional samples representing different zones and lithologies at El Porvenir underwent comminution testing. Ai results ranged from 0.0030 g to 0.68 g and BWi results ranged from 5.67 kWh/t to 23.1 kWh/t. Abrasiveness was found to be related to ore zone, lithology, SiO2 content, and loss on ignition (LOI). BWi was found to be related to ore zone, lithology, and SiO2 content.
Mineralogy
A further 29 samples were used to produce two composites representing ore to be mined from 2020 to 2022, as well as three samples used to produce a composite representing the Don Ernesto zone for flotation test work. Mineralogical analysis of the composites indicated that the main sulphide minerals were pyrite, sphalerite, pyrrhotite, and galena. Compared to the 2020 to 2022 composites (PDFC-01 and PDFC-02), the Don Ernesto composite (PDFC-03) was higher in sulphides and also contained 2.5% bournonite (PbCuSbS3), while PDFC-02 contained 2.1% alabandite (MnS). Gangue minerals were mainly silicates and carbonates.
Flotation
LCTs were completed on PDFC-01 and PDFC-02 to produce bulk copper-lead concentrates and zinc concentrates. These tests produced the following results:
PDFC-01
| · | The bulk concentrate achieved a grade of 6.1% Cu, 41.7% Pb, and 2,623 g/t Ag at recoveries of 50.3% Cu, 91.7% Pb, and 73.6% Ag. |
| · | The zinc concentrate achieved a grade of 49.7% Zn at a recovery of 91%. |
| · | The bulk concentrate consisted mainly of galena (47%), chalcopyrite (16%), and sphalerite (15%, mostly associated with galena). |
| · | The zinc concentrate consisted mainly of sphalerite (85%). |
PDFC-02
| · | The bulk concentrate reached a grade of 1.0% Cu, 42.4% Pb, and 2.808 g/t Ag at recoveries of 34% Cu, 87% Pb, and 70% Ag. It also contained 8% Mn and 11% Zn. |
| · | The Zn concentrate reached a grade of 41.8% Zn at a recovery of 73%. |
| · | The bulk concentrate consisted of galena (44%), alabandite (13%), and sphalerite (21%). Sphalerite was associated equally with galena and pyrite. |
| · | The zinc concentrate consisted mainly of sphalerite (70%) and 5% alabandite. |
Transmin recommended that manganese sulphides, lead oxides, and whole rock analysis, particularly for SiO2, be included in drill core analysis, that manganese be included in the geological model, and that consideration be given to mapping high SiO2 zones.
Based on the results of the test work, Transmin produced relationships for comminution parameters (Ai and BWi) and flotation predictions for recoveries and grades for copper, lead,
| 10- |
|
|
and zinc concentrates using ore zones and grades that could be used in geometallurgical modelling. These relationships were updated through the various phases of test work.
| 10.1.1.4 | Phase 6 Test Work |
The phase 6 metallurgical testing program carried out in 2023 continued the work in the previous phases to characterize the geometallurgical behaviour of the ore from the El Porvenir deposit.
The objective of this geometallurgical program was to maximize the operational value of the Mining Unit by reducing the risk on the production of the 2023-2026 input material including:
| · | Plant tonnage |
| · | Consumption of grinding media |
| · | Recoveries of valuable minerals |
| · | Quality of the final concentrate |
| · | Identification of fatal failures |
| · | Look for flaws in the interpretation of available information |
| · | Validation and definition of geometallurgical domains |
| · | Find opportunities for improvement and reduce existing risks |
Prior to the phase 6 study, five phases of geometallurgical studies were carried out, increasing the available geometallurgical data progressively to reduce the risk in metallurgical predictions. Identified risks include the presence of high-hardness material in intrusive materials and limestone, as well as high abrasiveness in sandstone and clastic materials.
A total of 24 samples were selected for the flotation program, 12 samples for the comminution program, and 25 samples for Wall Rock Analysis (WRA), considering the relevant geological and geochemical parameters according to the available information.
From the individual samples, two El Porvenir geometallurgical (PGC ) flotation composites were formed. Composite PGC-01, corresponding to main bodies to be mined in 2023-2026. Composite PGC-02, corresponding to breccia zone material, (High Cu). Comminution tests were developed on PGS samples.
Comminution
The tests carried out were abrasion, Ai, and Bond work index, BWi. The results of the comminution tests showed that the material from the period 2023-2026 has abrasiveness between 0.01 and 0.18.
The abrasiveness depends on the lithology: the sandstone material at the top is more abrasive, because it is mainly made up of quartz, and this material is more abrasive at fine-grained sizes (lower SiO2 content). The rest of the deposit depends on the content of SiO2 (silicates) and the content of LOI – material with high carbonate content.
Mineralogy
From the mineralogical characterization tests of the composites prepared at 210 μm, the following was observed:
| · | Primary sulphides are sphalerite, galena, and chalcopyrite. |
| 10- |
|
|
| · | Pb is only found as galena in all composites. |
| · | PGC-01 has 56% carbonates and 28% sulfides and sulfates. |
| · | PGC-02 is 39% silicates and 40% sulfides and sulfates. |
| · | Associations with higher percentages: |
| o | Release of "Free" galena more than 75% (PGC-02) and 45% (PGC-01). |
| o | Release of "Free" type sphalerite more than 60% (PGC-02) and 53% (PGC-01). |
| · | Modal mineralogy presents 2% fluorite in PGC-01. |
Risks Identified
From the geometallurgical analysis, the following risks were identified:
| · | Tonnage to plant and steel consumption. |
| · | Areas of high hardness ore, associated with high silicate content, mainly on VCN3 and V5 bodies. |
| · | The Sara body with sandstone lithology has the highest abrasiveness of the deposit. |
| · | Recovery of valuable minerals including lower Zn recovery in RL<36000 |
| · | Concentrate quality |
| o | Presence of Bi in the bulk concentrate of composite PGC-01 |
| o | Presence of Sn in the Zn concentrate of composite PGC-01 |
Recommended Geometallurgical Model for Pb and Zn Recovery
Recommended geometallurgical flotation models for mine planning and production prediction were developed. Table 10-1 presents the values or algorithms for the final Pb recovery to the Pb concentrate and the final Pb concentrate grade for the domains presented.
Table 10-1: Algorithms for Pb Recovery in Pb Concentrate and Pb Concentrate Grade
| Domain | Current | Algorithm | Final Pb Recovery In Pb Concentrate |
| ID | ID | Head | CC Pb_ Rec Pb % |
| CC Pb_Rec Pb | Feed | All | Min(77+9.6*Ln(HA_Pb%); 88.8) |
| CC Pb_Grade Pb | Feed | All | Min(50+9.13*Ln(HA_Pb%); 88.8) |
Table 10-2 presents the values or algorithms for the final Zn recovery to the Zn concentrate and the final Zn concentrate grade for the domains presented.
Table 10-2: Algorithms for Zn Recovery in Zn Concentrate and Zn Concentrate Grade
| Domain | Current | Algorithm | Final Zn Recovery In Zn Concentrate |
| ID | ID | Head | % |
| 10- |
|
|
| CC Zn_Rec Zn %_01 | Feed | Orebody = Exito & RL>36,000 | 72 |
| CC Zn_Rec Zn %_02 | Feed | Orebody = Exito & RL<36,000 | 87 |
| CC Zn_Rec Zn %_03 | Feed | Remainder | 91.2+3.78*Ln(HA_Zn/HA_Fe) |
| CC Zn_Grade Zn %_01 | Feed | All | 47.99+2.7*Ln(HA_Zn/HA_Fe) |
Transmin recommended that the geological data be validated by the Nexa geologists, this could create opportunities to refine and obtain more robust geometallurgical models.
Conclusions
The objective of the phase 6 work was to evaluate the behaviour of the input material for the years 2023 to 2026, as well as to validate the geometallurgical models of comminution and flotation of Unidad Minera El Porvenir (UMEP) material, expanding the dataset with samples of bodies and rock types not evaluated in the previous phases.
From comminution tests, the following was observed:
| · | Abrasion index tests reported values between 0.003 g and 0.14 g. |
| · | The sandstone domain has a relationship between abrasiveness and SiO2 content. The higher the SiO2 content, the greater the abrasiveness. |
| · | The BWi tests reported values between 5.7 kWh/t to 23.1 kWh/t; the results of this phase are consistent and validate the geometallurgical model, the higher values correspond to higher SiO2 content. |
From the results obtained from the composites it was concluded that:
| · | The recovery of Pb varies according to the content of Pb in the feed. |
| · | Ag recovery is related to the Cu/Pb ratio. The higher the Pb content, the higher the Ag content in the feed. |
| · | The recovery of Zn varies according to the ratio of Zn/Fe in the feed for all ore types except Success. Zn recovery in the Success material is proportional to Zn grade. |
| · | Risk zones for Pb and Zn recoveries were identified Veda Éxito. |
From the geometallurgical analysis, the following risks were identified:
| · | Tonnage to plant and steel consumption |
| · | The upper area, with sandstone lithology has the greatest abrasiveness of the deposit. |
| · | Areas of high-hardness ore in the rest of the deposit are associated with a high silicate content. |
| · | Recovery of valuable minerals: |
| o | The intermediate and lower zones of Success present a risk of low Pb and Zn recovery. |
| o | Low Zn recovery in Success Zones |
| · | Concentrate quality: |
| 10- |
|
|
| o | Presence of Bi in the bulk concentrate of the composite PGC-01 |
| o | Presence of Sn in the Zn concentrate of the composite PGC-01 |
| 10.1.2 | Operational Performance |
Production figures for 2018 through 2023 including head grades and recoveries of metals to concentrates are presented in Table 10-3. The El Porvenir concentrator processed 2,220,011 tonnes of ore in 2023 with Cu, Pb, and Zn grades of 0.16%, 1.37%, and 2.86% respectively. Recoveries to their respective concentrates were 10.1% Cu, 82.1% Pb and 88.0% Zn.
The head grades of Zn, Cu, Au, and Ag have been consistent over the period, while Pb has increased from 0.98% to 1.37%. Pb, Ag, and Au recoveries have increased and the recovery of Ag and Au to the Pb concentrate has increased over the period. Cu grades and recoveries have decreased significantly over the period.
Production in 2020 was significantly lower than in 2019 because of the COVID-19 pandemic and associated production interruptions. During that period, mining activities were limited to critical operations with a minimum workforce to ensure appropriate maintenance, safety, and security. On May 6, 2020, the Peruvian Government announced the conditions for the resumption of operations for different sectors, including mining operations above 5,000 tpd. As a result, El Porvenir operations, which were suspended on March 18, 2020, restarted production on May 11, 2020, following the end of the quarantine period. After the resumption of operations, El Porvenir ramped up production to pre-pandemic levels by June 2020.
Table 10-3: Concentrator Operational Performance 2018 - 2023
| Item | Units | 2018 | 2019 | 2020 | 2021 | 2022 | 2023 | |
| Ore Processed | tonnes | 2,149,927 | 2,120,765 | 1,502,618 | 2,077,591 | 2,111,961 | 2,220,011 | |
| Mill Head Grade | Ag | g/t | 59.70 | 64.60 | 62.30 | 65.31 | 76.5 | 72.8 |
| Au | g/t | 0.01 | 0.01 | 0.01 | 0.01 | 0.01 | 0.01 | |
| Cu | % | 0.15 | 0.15 | 0.17 | 0.19 | 0.16 | 0.16 | |
| Pb | % | 0.98 | 1.01 | 0.93 | 1.08 | 1.34 | 1.37 | |
| Zn | % | 3.04 | 2.93 | 2.65 | 2.83 | 2.80 | 2.86 | |
| Cu Concentrate | tonnes | 2,701 | 2,185 | 1,711 | 2,599 | 1,580 | 1,989 | |
| Cu Grade | % | 21.00 | 21.30 | 19.50 | 19.43 | 16.81 | 17.83 | |
| Cu Recovery | % | 18.00 | 14.70 | 12.70 | 12.92 | 7.85 | 10.06 | |
| Ag Grade | oz/t | 55.40 | 81.30 | 89.90 | 81.02 | 91.08 | 69.22 | |
| Ag Recovery (to Cu) | % | 3.70 | 4.10 | 5.10 | 4.82 | 2.77 | 2.65 | |
| Au Grade | oz/t | 0.68 | 0.87 | 0.64 | 0.49 | 0.29 | ||
| Au Recovery (to Cu) | % | 5.80 | 5.00 | 7.08 | 3.10 | 2.43 |
| 10- |
|
|
| Item | Units | 2018 | 2019 | 2020 | 2021 | 2022 | 2023 | |
| Pb Concentrate | tonnes | 31,662 | 33,018 | 21,213 | 34,691 | 45,907 | 48,599 | |
| Pb Grade | % | 52.60 | 51.20 | 51.20 | 51.02 | 50.53 | 51.31 | |
| Pb recovery | % | 79.10 | 79.00 | 77.80 | 78.72 | 81.75 | 82.10 | |
| Ag Grade | oz/t | 75.30 | 78.40 | 80.70 | 75.37 | 74.55 | 70.89 | |
| Ag Recovery (to Pb) | % | 57.80 | 58.80 | 56.90 | 59.91 | 65.80 | 66.20 | |
| Au Grade | oz/t | 0.25 | 0.24 | 0.20 | 0.18 | 0.17 | ||
| Au Recovery (to Pb) | % | 24.70 | 25.50 | 30.01 | 34.02 | 34.28 | ||
| Zn Concentrate | tonnes | 115,256 | 109,976 | 69,891 | 103,994 | 104,507 | 111,566 | |
| Zn Grade | % | 50.20 | 49.70 | 49.90 | 49.40 | 49.34 | 50.04 | |
| Zn Recovery | % | 88.70 | 88.20 | 87.70 | 87.27 | 87.27 | 88.01 |
Table 10-4, Figure 10-3, and Figure 10-4 present the grade and recovery statistics for Au, Ag, Cu, Pb, and Zn using daily results for 2022 and 2023. The box and whisker plots show the grade and recovery ranges including the minimum (bottom horizontal line), 25th percentile (bottom of box), 50th percentile or mean (line in middle of box), 75th percentile (top of the box) and the maximum (top horizontal line) of each metal along with outliers. The following table provides a summary of the data. The average grades of Zn, Pb, and Cu for the period were 2.83%, 1.36% and 0.16% respectively and the recoveries of Zn, Pb, and Cu for the period were 87.49%, 81.65%, and 8.67% respectively.
Table 10-4: Summary of Daily Grade and Recovery Results for 2022 – 2023
| Head Grade | Metal Recovery | |||||||||
| Zn (%) | Pb (%) | Cu (%) | Ag (oz/t) | Au (oz/t) | Zn (%) | Pb (%) | Cu (%) | Ag (%) | Au (%) | |
| 2022 – 2023 | ||||||||||
| Average | 2.83 | 1.36 | 0.16 | 2.41 | 0.01 | 87.49 | 81.65 | 8.67 | 81.10 | 36.80 |
| Maximum | 4.60 | 2.52 | 0.25 | 3.90 | 0.02 | 91.17 | 85.39 | 31.26 | 86.28 | 49.56 |
| Minimum | 1.46 | 0.82 | 0.09 | 1.50 | 0.01 | 83.72 | 73.32 | 0.0 | 73.15 | 22.87 |
| Median | 2.79 | 1.35 | 0.16 | 2.37 | 0.01 | 87.58 | 81.83 | 8.70 | 81.42 | 37.02 |
| 2022 | ||||||||||
| Average | 2.81 | 1.35 | 0.16 | 2.47 | 0.01 | 87.21 | 81.63 | 7.70 | 80.56 | 37.28 |
| Maximum | 4.05 | 1.96 | 0.25 | 3.85 | 0.02 | 90.43 | 85.39 | 23.38 | 86.28 | 49.56 |
| Minimum | 1.46 | 0.82 | 0.09 | 1.72 | 0.01 | 83.72 | 74.80 | 0.0 | 73.15 | 22.87 |
| Median | 2.77 | 1.35 | 0.16 | 2.43 | 0.01 | 87.35 | 81.74 | 7.64 | 80.89 | 37.72 |
| 2023 | ||||||||||
| Average | 2.85 | 1.37 | 0.16 | 2.35 | 0.01 | 87.77 | 81.66 | 9.65 | 81.61 | 36.33 |
| Maximum | 4.60 | 2.52 | 0.25 | 3.90 | 0.02 | 91.17 | 85.39 | 31.26 | 86.28 | 49.56 |
| Minimum | 1.46 | 0.82 | 0.09 | 1.50 | 0.01 | 83.72 | 73.32 | 0.0 | 73.15 | 22.87 |
| Median | 2.82 | 1.36 | 0.16 | 2.31 | 0.01 | 87.82 | 81.89 | 9.72 | 81.72 | 36.74 |
| 10- |
|
|

| 10- |
|
|
Historical annual recoveries at El Porvenir for 2003 – 2023 are presented in Figure 10-5 through Figure 10-10, which show zinc, lead, and copper head grades and recoveries to concentrate.

| 10- |
|
|

| 10- |
|
|

| 10.1.3 | Deleterious Elements |
The potential penalty elements that should be monitored in the copper concentrate include arsenic, antimony, bismuth, cadmium, and combined lead plus zinc.
The potential penalty elements in the lead concentrate are low lead concentrate grade bismuth and fluorine.
| 10- |
|
|
The potential penalty elements in the zinc concentrate are copper and manganese.
| 10.1.4 | QP Opinion |
In the SLR QP’s opinion, the metallurgical recovery data is adequate for the purposes of Mineral Resource and Mineral Reserve estimation.
| 10.2 | Atacocha |
| 10.2.1 | Geometallurgical Test Work |
Nexa has developed geometallurgical models for the Atacocha underground and San Gerardo open pit mines. In 2017, fifteen samples from Atacocha (nine from the open pit and six from the underground mine) were submitted for metallurgical testing. The samples were intended to be representative of the planned 2018 concentrator feed.
Test work included mineralogy, hardness testing (Bond ball mill work index and abrasion index), and flotation testing (variability tests, locked cycle tests, and grind size evaluation).
The geometallurgical sample selection and test work were performed with the assistance of Transmin, and results and interpretation are reported by Transmin in the following reports:
| · | Estudio Geometalurgico Preliminar para Unidad Minera Atacocha, 13 June 2018 |
| · | Estudio Geometalúrgico Fase 2 para Unidad Minera Atacocha, April 29, 2019 (Transmin, 2019) |
| · | Estudio Geometalúrgico Fase 3 para Unidad Minera Atacocha, May 18, 2020 (Transmin, 2020) |
| · | Estudio Geometalúrgico Fase 4 para Unidad Minera Atacocha, June 17, 2021 (Transmin, 2021) |
| 10.2.1.1 | Phase 1 Results |
Initially, 30 samples of drill core were selected to represent ore to be processed by the concentrator in 2018 (six from the underground and 24 from the open pit), however, ultimately only 15 of these samples were selected for test work (five from the underground ore and 10 from the open pit ore). Priority was given to selecting samples from holes drilled in 2016 and 2017, to use the freshest possible material for metallurgical test work. Samples of the underground orebodies were selected to represent key parameters, including orebody, lithology, and grades of Pb, Cu, Zn, Ag, and Mn. Samples from the open pit were selected based on grades of Pb, Cu, Zn, Ag, and Mn; lithology and domain were not available for use in the sample selection for the open pit. Sample selection was also limited to areas in the block model with values of NSR ≥ $47.79/t (underground) or NSR ≥ $22.00/t (open pit) (Transmin, 2018). A summary of the samples selected for metallurgical test work is presented in Table 10-5.
Table 10-5: Atacocha Samples Selected for Metallurgical Test Work
| Sample | Orebody | Lithology | Location | Program |
| AAS-07 | Orebody 10 | intrusive | Open Pit | Comminution |
| AAS-07-01 | Orebody 10 | intrusive | Open Pit | Flotation / comminution |
| AAS-09-01 | Orebody 10 | intrusive | Open Pit | Flotation / comminution |
| 10- |
|
|
| Sample | Orebody | Lithology | Location | Program |
| AAS-10-01 | Orebody 10 | intrusive | Open Pit | Flotation / comminution |
| AAS-24-01 | Vein L | intrusive | Open Pit | - |
| AAS-27 | Vein LA27 | intrusive | Open Pit | Flotation / comminution |
| AAS-28 | Vein LA27 | intrusive | Open Pit | Flotation / comminution |
| AAS-29 | Vein LA27 | limestone | Open Pit | Flotation / comminution |
| AAS-30 | Vein LA27 | intrusive | Open Pit | Flotation / comminution |
| AAS-30-01 | Orebody 10 | intrusive | Open Pit | Flotation / comminution |
| AAS-05 | Anita Orebody | skarn | Underground | Flotation / comminution |
| AAS-31 | Orebody 23 | marble | Underground | Flotation |
| AAS-33 | Orebody 23 | mineralization | Underground | Flotation |
| AAS-34 | Orebody 18 | mineralization | Underground | Flotation |
| AAS-36 | Anita Orebody | mineralization | Underground | Flotation |
Source: Transmin, 2018
Sample AAS-24-01 was not submitted for test work as it was found to have very low grades of Pb, Cu, Zn, and Ag. Chemical analysis of the samples is shown in Table 10-6.
Table 10-6: Analysis of Samples Selected for Metallurgical Test Work
| Sample | Orebody | Lithology | Zone | Au g/t |
Ag g/t |
As % |
Bi ppm |
Cu % |
Fe % |
Mn % |
Pb % |
Zn % |
| AAS-07 | Orebody 10 | intrusive | OP | 0.18 | 6.00 | 0.064 | <5 | 0.0056 | 4.36 | 0.24 | 0.19 | 0.40 |
| AAS-07-01 | Orebody 10 | intrusive | OP | 0.26 | 8.10 | 0.071 | <5 | 0.0055 | 4.73 | 0.15 | 0.14 | 0.11 |
| AAS-09-01 | Orebody 10 | intrusive | OP | 1.99 | 38.2 | 0.12 | 10.0 | 0.041 | 4.12 | 0.23 | 0.94 | 1.64 |
| AAS-10-01 | Orebody 10 | intrusive | OP | 0.65 | 60.2 | 0.17 | 28.0 | 0.061 | 4.89 | 0.16 | 1.54 | 1.29 |
| AAS-24-01 | Vein L | intrusive | OP | <0,005 | 1.00 | 0.0005 | <5 | 0.00093 | 0.44 | 0.017 | 0.0013 | 0.0044 |
| AAS-27 | Vein LA27 | intrusive | OP | 0.14 | 39.3 | 0.065 | 16.0 | 0.035 | 4.24 | 0.48 | 1.81 | 1.18 |
| AAS-28 | Vein LA27 | intrusive | OP | 0.64 | 61.3 | 0.20 | <5 | 0.029 | 4.88 | 0.22 | 3.11 | 1.21 |
| AAS-29 | Vein LA27 | limestone | OP | 0.046 | 30.2 | 0.039 | <5 | 0.0074 | 1.75 | 0.56 | 1.52 | 1.90 |
| AAS-30 | Vein LA27 | intrusive | OP | 0.15 | 41.0 | 0.058 | 13.0 | 0.032 | 4.36 | 0.48 | 1.89 | 1.21 |
| AAS-30-01 | Orebody 10 | intrusive | OP | 0.44 | 80.0 | 0.13 | <5 | 0.047 | 5.39 | 0.22 | 3.96 | 1.70 |
| AAS-05 | Anita Orebody | skarn | UG | 0.098 | 16.6 | 0.022 | <5 | 0.18 | 17.2 | 0.17 | 0.35 | 0.94 |
| AAS-31 | Orebody 23 | marble | UG | 0.34 | 173 | 0.081 | 1,126 | 0.47 | 6.70 | 0.31 | 1.58 | 8.37 |
| AAS-33 | Orebody 23 | mineralization | UG | 0.60 | 89.6 | 0.59 | 1,492 | 0.36 | 19.0 | 1.31 | 0.51 | 6.72 |
| AAS-34 | Orebody 18 | mineralization | UG | 0.17 | 63.6 | 0.14 | 488 | 0.46 | 18.1 | 1.41 | 0.39 | 8.26 |
| AAS-36 | SB Orebody | mineralization | UG | 0.22 | 6.40 | 0.0059 | 7.00 | 0.47 | 16.0 | 0.19 | 0.0039 | 10.1 |
Source: Transmin, 2018
| 10- |
|
|
Mineralogy
Mineralogical analysis of the samples is presented in Figure 10-11 and Figure 10-12. In the open pit samples, silicates make up the majority of the samples, ranging from 71% to 88%, whereas the underground samples typically contain lower amounts of silicates – the samples ranged from 20% to 70% silicates. A major component of the underground samples is carbonates, whereas carbonates are a minor component of the open pit samples. Open pit samples are notable for the presence of sphalerite containing Mn, arsenic containing Pb sulphides, and the lack of chalcopyrite. The mineralogical characterization is summarized in Table 10-7.
Table 10-7: Mineralogical Characterization Summary
| Zone | Sample | Orebody | Tellurides % |
Sulphides & Sulphates % |
Silicates% | Oxides & Hydroxides % |
Carbonate % |
Others % |
| OP | AAS-29 | Vein LA27 | 0.04 | 9.5 | 72.3 | 0.22 | 16.1 | 1.75 |
| AAS-30 | Vein LA27 | 0.020 | 15.1 | 74.5 | 0.35 | 8.3 | 1.71 | |
| AAS-30-01 | Orebody 10 | 0.04 | 24.6 | 71.1 | 0.36 | 2.7 | 1.08 | |
| AAS-28 | Vein LA27 | 0.04 | 17.5 | 78.4 | 0.40 | 2.50 | 0.95 | |
| AAS-07 | Orebody 10 | 0.015 | 11.1 | 84.7 | 0.32 | 2.30 | 1.19 | |
| AAS-09-01 | Orebody 10 | 0.03 | 13.0 | 83.3 | 0.36 | 2.1 | 1.01 | |
| AAS-07-01 | Orebody 10 | 0.00 | 10.7 | 85.6 | 0.312 | 1.6 | 1.05 | |
| AAS-27 | Vein LA27 | 0.03 | 15.2 | 81.8 | 0.36 | 1.4 | 1.01 | |
| AAS-10-01 | Orebody 10 | 0.07 | 17.1 | 80.1 | 0.46 | 1.18 | 0.96 | |
| AAS-24-01 | Vein L | 0,000 | 9.5 | 88.0 | 0.50 | 1.0 | 1.00 | |
| UG | AAS-31 | Orebody 23 | 0.149 | 29.3 | 20.5 | 0.25 | 48.61 | 0.85 |
| AAS-33 | Orebody 23 | 0.109 | 41.82 | 31.7 | 2.15 | 21.9 | 2.19 | |
| AAS-34 | Orebody 18 | 0.12 | 49.7 | 31.1 | 0.44 | 18.0 | 0.61 | |
| AAS-05 | Anita Orebody | 0.03 | 15.6 | 69.6 | 0.66 | 11.66 | 2.42 | |
| AAS-36 | SB Orebody | 0.08 | 30.5 | 63.7 | 0.19 | 4.2 | 1.31 |
| 10- |
|
|
Figure 10-11: Bulk Mineralogical Analysis

Source: Transmin, 2018
| 10- |
|
|
Figure 10-12: Sulphide Mineral Breakdown

Source: Transmin, 2018
Comminution
Comminution test results are shown in Table 10-8. The open pit ore is moderate to hard in terms of grindability, with low abrasiveness. Only one sample of underground ore was tested, and therefore no conclusions can be drawn about the general comminution characteristics of the underground ore.
Table 10-8: Comminution Test Work Results
| Sample | Orebody | Lithology | Zone | Ai g |
BWi kWh/t |
| AAS-05 | Anita Orebody | Skarn | UG | 0.24 | 8.10 |
| AAS-07 | Orebody 10 | Intrusive | OP | 0.24 | 18.1 |
| AAS-07-01 | Orebody 10 | Intrusive | OP | 0.12 | 15.0 |
| AAS-09-01 | Orebody 10 | Intrusive | OP | 0.36 | 16.1 |
| AAS-10-01 | Orebody 10 | Intrusive | OP | 0.13 | 13.1 |
| AAS-27 | Vein LA27 | Intrusive | OP | 0.10 | 12.9 |
| AAS-30 | Vein LA27 | Intrusive | OP | 0.093 | 12.2 |
| AAS-28 | Vein LA27 | Intrusive | OP | 0.22 | 14.1 |
| AAS-30-01 | Orebody 10 | Intrusive | OP | 0.098 | 12.0 |
Source: Transmin, 2018
| 10- |
|
|
Locked Cycle Flotation Test Results
Five composite samples were produced for use in grind optimization and locked cycle flotation tests. Compositions of the composites are provided in Table 10-9.
Table 10-9: Analysis of Composite Samples
| Composite | Zone | Au g/t |
Ag g/t |
Cu % |
Fe % |
Mn % |
Pb % |
Zn % |
| AAC-01 | UG | 0.54 | 342 | 1.05 | 19.3 | 0.48 | 10.1 | 16.8 |
| AAC-02 | UG + OP | 0.87 | 355 | 0.36 | 13.8 | 2.62 | 9.48 | 12.4 |
| AAC-03 | OP | 0.83 | 228 | 0.22 | 4.62 | 0.98 | 8.57 | 12.6 |
| AAC-04 | Plant Oct 17 | 0.49 | 39 | 0.13 | 9.25 | 0.88 | 0.95 | 1.49 |
| AAC-05 | OP + UG | 0.48 | 36.4 | 0.07 | 6.8 | 0.31 | 1.43 | 1.29 |
Source: Transmin, 2018
Bulk rougher flotation was completed at three grind sizes on AAC-01, AAC-02, and AAC-03 at P80 of 100 µm, 150 µm, and 200 µm. The tests indicated little sensitivity in terms of recovery to grind size in the range tested.
AAC-05 was used in locked cycle flotation testing, with six cycles completed. The primary grind size used was 48% passing 74 µm. Pb and Zn concentrates were produced with grades of 61.1% Pb and 53.3% Zn respectively. Final Pb and Zn recoveries to the Pb and Zn concentrates were 84.1% and 85.9% respectively. Penalty elements As and Mn exceeded their respective limits: As in the Pb concentrate exceeded 8,000 ppm at 8,114 ppm, and Mn in the Zn concentrate exceeded the limit (0.5%) at 0.68%.
Flotation Variability Tests
Rougher flotation variability tests were completed on 13 of the 15 variability samples, consisting of bulk and Zn rougher flotation. Flotation conditions were varied based on Pb and Zn grades of the samples, resulting in four different flotation schemes being used during the variability tests.
The effect of the four different flotation schemes on the results is unknown, and therefore, while some general conclusions can be drawn, a comparison of individual results should be treated with care.
Lead recovery to the bulk concentrate averaged 91% for open pit ore and 83% for underground ore (excluding the low lead content samples). Zn recovery to the Zn rougher concentrate averaged 59% for open pit ore and 87% for the underground ore.
With the open pit samples, average Zn recovery to the bulk concentrate was significantly higher than for the underground samples (37% versus 5% respectively), even though the Zn head grades of the underground samples were far higher than those of the open pit samples. This would put more pressure on the bulk cleaning circuit to separate Zn from Pb and Cu.
| 10- |
|
|
Recovery Versus Head Grade
Test work results from the samples were used to derive recovery-versus-head-grade relationships for Pb, Zn, Cu, Mn, and As. Significantly more samples would be required to derive recovery relationships that could be used for long term planning.
As a result of the changes in recoveries brought about by the introduction of San Gerardo ore, recovery curves for Pb and Zn were derived by Transmin to predict future recoveries from the Atacocha concentrator, while copper recoveries have been assumed to average approximately 5.5%. The recovery curves are shown in Table 10-10 and illustrated in Figure 10-13 to Figure 10-15, plotted against monthly recoveries achieved in 2017 and 2018 over the range of head grades realized at the concentrator. The results of the models are similar but slightly higher than 2023 results.
Table 10-10: Recovery Curves for the Atacocha Concentrator
| Recovery Curve | Recovery Cap | |
| (%) | ||
| Zn Recovery | Recovery = - 7.456 (GradeZn)2 + 27.45 (GradeZn) + 54.21 | 79.5 |
| Pb Recovery | Recovery = - 7.47 (GradePb) + 77.08 | 89.0 |
| Cu Recovery | 5.52 | 5.52 |
| 10- |
|
|
Figure 10-13: Monthly Zinc Recovery in 2017 and 2018, and the 2019 NSR Recovery Curve

| 10- |
|
|
Figure 10-14: Monthly Lead Recovery in 2017 and 2018, and the 2019 NSR Recovery Curve

| 10- |
|
|
Figure 10-15: Monthly Copper Recovery in 2017 and 2018, and the 2019 NSR Recovery

| 10.2.1.2 | Phase 4 Results |
The phase 4 metallurgical testing program was carried out in 2021 to characterize the geometallurgical behaviour of the San Gerardo ore according to the 2022-2023 mining plan.
The objective of the geometallurgical program was to:
| · | Maximize the operational value of the mining unit. |
· Reduce risk concerning:
| o | Throughput of the plant. |
| o | Consumption of grinding media. |
| o | Recoveries of valuable minerals. |
| o | Quality of the final concentrate. |
| · | Identification of fatal failures. |
| · | Look for flaws in the interpretation of available information. |
| · | Validation and definition of geometallurgical domains. |
| · | Find opportunities for improvement and reduce existing risks. |
Prior to the phase 4 study, three phases of geometallurgical studies were carried out, increasing the available geometallurgical data progressively to reduce the risk in metallurgical predictions.
| 10- |
|
|
Previously identified risks included the presence of high hardness and abrasiveness material in intrusive material and hydrothermal breccias, as well as areas of low Au recovery associated with Au disseminations in pyrite in mainly marble-type material.
A total of 24 samples were selected for use in comminution tests and 24 samples for flotation tests in the phase 4 work, considering the relevant geological and geochemical parameters according to the available information.
From the individual samples, four flotation composites were formed, in coordination with the unit's geology area:
· The composite AEC-01, corresponding to intrusive and silicification.
· The AEC-02 composite, corresponding to intrusive and other alterations.
· The composite AEC-03, corresponding to sandstones and silicification.
· The AEC-04 composite, corresponding to calcites and marble.
In addition, comminution tests were developed on Atacocha samples. The tests carried out were Ai and BWi.
The results of the comminution tests for the deposit show:
· Abrasion index tests reported values between 0.02 g and 0.71 g. The abrasiveness of the ore depends on the mineralized body, with the Chen1, CPO1, CPO16, and CPO18 bodies having greater abrasiveness.
· BWi tests reported values between 11kWh/t to 22kWh/t. The hardness of the mineral depends on the type of rock, with the highest hardness being DACT, CALC, BRT, and PFQF lithologies.
From the mineralogical characterization tests of the composites, the following was observed:
· The composite AEC-04 was 45% carbonates, mainly calcite, and 48% silicates.
· In the composites the main sulphides are pyrite, galena, and sphalerite.
· Presence of muscovite and silicon and aluminum clays in all four composites.
· All composites have a liberation of 80% galena and 87% sphalerite at a P80 of 180 μm.
Recommended geometallurgical flotation models for mine planning and production prediction were developed. Table 10-11 presents the values or algorithms for the final Pb recovery to the Pb concentrate and the final Pb concentrate grade for the domains presented.
Table 10-11: Algorithms for Pb Recovery in Pb Concentrate and Pb Concentrate Grade
| Domain | Current | Algorithm | Final Pb Recovery In Pb Concentrate |
| Pb_Rec Pb | Feed | Mine – AT OP | Min(88+12.14*Ln(HA_Pb%); 87.8) |
| Pb_Grade Pb | Feed | Mine – AT OP | Min(53.6+4.94*Ln(HA_Pb%); 54) |
Table 10-12 presents the values or algorithms for the final Zn recovery to the Zn concentrate and the final Zn concentrate grade for the domains presented.
| 10- |
|
|
Table 10-12: Algorithms for Zn Recovery in Zn Concentrate and Zn Concentrate Grade
| Domain | Current | Algorithm | Final Zn Recovery In Zn Concentrate |
| Zn_Rec Zn % | Feed | Mine – AT OP | Min(77.84+11.46*Ln(HA_Zn%); 85) |
| Zn_Grade Zn % | Feed | Mine – AT OP | Min(52.6+6.76*Ln(HA_Zn%)+9.07*Ln(HA_Zn/Fe); 53) |
Transmin recommended that the geological data be validated by Nexa geologists, as it could create opportunities to refine and obtain more robust geometallurgical models.
Additionally, Transmin recommended that the implementation of geometallurgical models should be reviewed by the Nexa geometallurgy team to ensure their correct interpretation and consequences for the production plan.
Conclusions
The objective of phase 4 was to validate the geometallurgical models of comminution and flotation, expanding the geometallurgical dataset.
From comminution tests, the following was observed:
· Abrasion index tests reported values between 0.02 g and 0.71 g, the bodies CHEN1, CPO1, CPO16 and CPO18 have higher abrasiveness.
· The BWi tests reported values between 11 kWh/t and 22 kWh/t; the DACT, CALC, BRT and PFQF lithologies presented the highest values.
From the tests on the composites it was concluded that:
· The composite AEC-04 has 45% carbonates, mainly calcite.
· In composites the main sulphides are pyrite, galena and sphalerite.
· Presence of muscovite and silicon and aluminum clays in all four composites.
· All composites have a liberation of more than 80% galena and 87% sphalerite.
From the geometallurgical analysis, the following risks were identified:
· Tonnage to plant and steel consumption
· The abrasiveness of the ore depends on the ore body, presenting greater abrasiveness bodies 10, Chee (Qi), cpo1 and cpo18 for the Open Pit tank.
| · | The hardness of the ore depends on the mining phase and associated lithologies, being the dacites and hydrothermal breccias. |
| · | Recovery of valuable minerals: |
| o | Areas with low Pb floatability were identified, suggesting the presence of oxidized species or complex associations between Pb and gangue. |
| o | Risks to Zn recovery are identified in specific areas of the deposit, in marble-type material. |
| o | It is recommended to evaluate the behaviour of the low-recovery material close to upcoming mining phases. |
| 10- |
|
|
| o | Recoveries and concentrate qualities were evaluated at a P80 out of 180 μm, it is expected that with a coarser grain size decreases in recoveries and obtainable qualities will be observed. |
| · | Concentrate quality: |
| o | Presence of Mn in the Zn concentrate. While these are found in values <1%, does not rule out that there are areas in the deposit where the Mn grades in the head increase and affect the quality of the Zn concentrate. |
| o | Presence of Sn, Sb and Cd in Zn concentrate. |
| o | Presence of As and Sb in the Pb concentrate. |
| o | Sb and As in both concentrates are mainly present as gray coppers and sulfosalts of Pb. |
Recommendations
Based on the results of the study phase, Transmin recommended:
| · | Including in the drill hole database: |
| o | Manganese sulphides, tetrahedrite, and tennantite |
| o | Grades of arsenic, manganese, and antimony |
| o | Chemical analysis: Total rock analysis, mainly SiO2 and LOI for drilling underground |
· Performing a geological assessment of the Au association to galena and Au associated with pyrite based on deposit genesis and geometallurgical results.
· A geological assessment to identify areas associated with oxides in Phase 2 of mining. These areas represent a risk to the recovery of Pb, Zn and Au.
· Evaluating the behaviour of low-recovery material near upcoming mining phases to validate the results obtained.
· Performing recovery studies by size with plant feed material to quantify losses in recoveries of valuable metals by size fraction.
· Updating the steel tonnage and consumption estimation model derived in 2018, based on circuit data and operating variables reported by Nexa to date by incorporating the operational changes made to date in the grinding circuit.
| 10.2.2 | Atacocha Concentrator Production |
Production figures for 2021 through 2023 including head grades and recoveries of metals to concentrates are presented in Table 10-13. The Atacocha concentrator processed 1,397,192 tonnes of ore in 2023 with Pb and Zn grades of 0.93% and 0.77% respectively. Recoveries to their respective concentrates were 85.7% Pb and 75.9% Zn.
Head grades of ore being treated in the Atacocha concentrator have changed since the introduction of open pit ore in early 2016. Head grades of Zn have decreased from 1.8% to 0.77%, Cu has decreased from 0.11 % to 0.04% and Pb has decreased from 1.31% to 0.93% from 2016 to 2023.
| 10- |
|
|
Table 10-13: Atacocha Concentrator Production for 2021 - 2023
| Item | Units | 2021 | 2022 | 2023 | |
| Ore Processed | tonnes | 1,271,107 | 1,353,681 | 1,397,192 | |
| Mill Head Grade | Ag | g/t | 1.01 | 1.05 | 1.21 |
| Au | g/t | 0.014 | 0.015 | 0.010 | |
| Cu | % | 0.03 | 0.03 | 0.04 | |
| Pb | % | 0.82 | 0.97 | 0.93 | |
| Zn | % | 0.88 | 0.89 | 0.77 | |
| Pb Concentrate | tonnes | 16,845 | 20,798 | 20,996 | |
| Pb Grade | % | 51.70 | 53.87 | 52.94 | |
| Pb recovery | % | 83.27 | 85.51 | 85.70 | |
| Ag Grade | oz/t | 57.95 | 53.32 | 64.49 | |
| Ag Recovery (to Pb) | % | 76.00 | 77.65 | 79.98 | |
| Au Grade | g/t | 0.709 | 0.654 | 0.360 | |
| Au Recovery (to Pb) | % | 69.58 | 67.86 | 56.19 | |
| Zn Concentrate | tonnes | 16,908 | 18,809 | 16,172 | |
| Zn Grade | % | 50.40 | 50.79 | 50.66 | |
| Zn Recovery | % | 76.25 | 79.07 | 75.94 |
Table 10-14, Figure 10-16, and Figure 10-17 present the grade and recovery statistics for Au, Ag, Cu, Pb, and Zn using daily results for 2022 and 2023. The box and whisker plots show the grade and recovery ranges including the minimum (bottom horizontal line), 25th percentile (bottom of box), 50th percentile or mean (line in middle of box), 75th percentile (top of the box), and the maximum (top horizontal line) of each metal along with outliers. The average grades of Zn and Pb for the period were 0.84% and 0.95%, respectively and the recoveries of Zn and Pb for the period were 76.57% and 83.64%, respectively. The recoveries used for the cut-off grade and resource model at these grades were 70.44% for Zn and 84.06% for Pb, which compares well to the operating data, the Zn values being somewhat conservative.
Table 10-14: Summary of Daily Grade and Recovery Results for 2022 - 2023
| Head Grade | Metal Recovery | |||||||
| Zn (%) | Pb (%) | Ag (oz/t) | Au (oz/t) | Zn (%) | Pb (%) | Ag (%) | Au (%) | |
| 2022-2023 | ||||||||
| Average | 0.84 | 0.95 | 1.13 | 0.01 | 76.57 | 83.64 | 81.12 | 64.45 |
| Maximum | 1.62 | 1.96 | 2.23 | 0.03 | 86.75 | 90.19 | 89.57 | 84.38 |
| 10- |
|
|
| Head Grade | Metal Recovery | |||||||
| Zn (%) | Pb (%) | Ag (oz/t) | Au (oz/t) | Zn (%) | Pb (%) | Ag (%) | Au (%) | |
| Minimum | 0.25 | 0.43 | 0.56 | 0.00 | 44.97 | 45.35 | 60.31 | 0.00 |
| Median | 0.82 | 0.91 | 1.10 | 0.01 | 77.83 | 85.33 | 81.32 | 67.29 |
| 2022 | ||||||||
| Average | 0.90 | 0.96 | 1.05 | 0.01 | 78.84 | 85.22 | 80.38 | 67.32 |
| Maximum | 1.56 | 1.96 | 2.23 | 0.03 | 86.75 | 89.51 | 87.39 | 84.38 |
| Minimum | 0.45 | 0.43 | 0.56 | 0.01 | 64.68 | 79.75 | 70.42 | 43.12 |
| Median | 0.88 | 0.93 | 1.03 | 0.01 | 79.37 | 85.38 | 80.55 | 68.25 |
| 2023 | ||||||||
| Average | 0.77 | 0.93 | 1.21 | 0.01 | 74.16 | 81.97 | 81.90 | 46.54 |
| Maximum | 1.62 | 1.90 | 2.10 | 0.02 | 84.84 | 90.19 | 89.57 | 65.83 |
| Minimum | 0.25 | 0.44 | 0.59 | 0.00 | 44.97 | 45.35 | 60.31 | 0.00 |
| Median | 0.75 | 0.88 | 1.18 | 0.01 | 75.92 | 85.18 | 82.78 | 46.59 |
Figure 10-16: Atacocha Head Grade Statistics for 2022 - 2023

| 10- |
|
|
Figure 10-17: Atacocha Recovery Statistics for 2022 - 2023

Historical annual recoveries at Atacocha for 2000 - 2023 are presented in Figure 10-18 through Figure 10-23, which show zinc, lead, and copper head grades, and recoveries to concentrate. Copper head grades decreased to the point that a separate copper concentrate was not produced after 2019.
Figure 10-18: Zinc Head Grade from 2000 to 2023

| 10- |
|
|

| 10- |
|
|

| 10- |
|
|
Figure 10-23: Copper Recovery from 2000 to 2019

| 10.2.1 | Deleterious Elements |
The potential penalty elements in the lead concentrate are arsenic and fluorine.
The potential penalty elements in the zinc concentrate are manganese, silica, and cadmium.
| 10.2.2 | QP Opinion |
In the SLR QP’s opinion, the metallurgical recovery data is adequate for the purposes of Mineral Resource and Mineral Reserve estimation.
| 10- |
|
|
| 11.0 | Mineral Resource Estimates |
| 11.1 | Summary |
Mineral Resources have been classified in accordance with the definitions for Mineral Resources in S-K 1300, which are consistent with Canadian Institute of Mining, Metallurgy and Petroleum (CIM) Definition Standards for Mineral Resources and Mineral Reserves dated May 10, 2014 (CIM (2014) definitions).
The Mineral Resource estimate for the El Porvenir Mine was completed using all data available as of January 31, 2023. The estimate was completed by El Porvenir staff, followed by auditing and approval by the QP. Similarly, Mineral Resource estimates for the Atacocha underground (UG) and Atacocha (San Gerardo) open pit (OP) mines were completed in June 2023, using all data available up to January 31, 2023. These estimates were completed by Atacocha staff and underwent auditing and approval by the QP.
Since the closure date of the resource database on January 31, 2023, a small amount of drilling and channel sampling has been produced at El Porvenir and Atacocha OP mines. However, these additional data has been reviewed and determined not to have a material impact on estimated Mineral Resources.
Mineral Resources are reported based on actual production as of September 30, 2023, with production forecast to the effective date of December 31, 2023. Geological wireframes and estimation domains were generated using Leapfrog Geo software, with further refinement using Datamine software. Grade estimation was carried out in Datamine software.
Channel samples were included in the resource databases for the El Porvenir, Atacocha UG, and Atacocha OP estimates, while blast hole data was excluded from the Atacocha OP estimate. Grades were interpolated within the estimation domains using ordinary kriging (OK) and inverse distance cubed (ID3), with nearest neighbour (NN) estimates used for validation purposes. Dynamic anisotropy was used to interpolate grades reflecting vein orientations.
In addition to validation completed by the QP, the database, geological interpretation, and block model validation were also validated by SLR. For block model validation, SLR used visual checks, statistical checks, and swath plots.
NSR cut-off values were determined using a Zn price of US$3,218.90/t, Pb price of US$2,300.33/t, Cu price of US$8,820.05/t, Ag price of US$24.35/oz, and Au price of US$1,875.57/oz. The sub-blocked model for the Atacocha OP was re-blocked to the SMU prior to reporting Mineral Resources, while the El Porvenir and Atacocha UG Mineral Resources were reported from the sub-blocked models.
Mineral Resources at El Porvenir are reported within optimized underground reporting panels generated in Deswik Stope Optimizer (DSO) software, satisfying minimum mining thickness. NSR cut-off values of US$67.04/t were used for the sub-level stoping (SLS) Upper Zone, US$63.98/t for the SLS Intermediate Zone, US$63.77/t for the SLS Lower Zone, and US$65.21/t for the SLS Mine Deepening Zone. NSR cut-off values of US$69.04/t were used for the cut and fill (CAF) Upper Zone, US$66.25/t for the CAF Intermediate Zone, US$65.77/t for the CAF Lower Zone, and US$67.21/t for the CAF Mine Deepening Zone.
Mineral Resources at Atacocha UG are reported within optimized reporting panels generated in DSO software, satisfying minimum mining thickness, NSR cut-off values of US$71.07/t for CAF stopes, NSR cut-off values of US$69.00/t for SLS stopes, and continuity criteria.
| 11- |
|
|
Mineral Resources at the Atacocha OP are reported within a preliminary pit shell generated in Datamine NPV Scheduler software package at a reporting NSR cut-off value of US$22.44/t.
For the Cerro Pasco Complex, Mineral Resources as of December 31, 2023, are summarized in Table 11-1 and Table 11-2 on a Nexa attributable ownership basis and 100% ownership basis, respectively. Figure 11-1 illustrates the El Porvenir and Atacocha underground Mineral Resource reporting panels alongside San Gerardo Mineral Resource blocks exclusive of Mineral Reserves.
The QP is of the opinion that with consideration of the recommendations summarized in Sections 1 and 23 of this TRS, any issues relating to all relevant technical and economic factors likely to influence the prospect of economic extraction can be resolved with further work.
| 11- |
|
|
Table 11-1: Summary of Cerro Pasco Complex Mineral Resource Estimate (Nexa Attributable Basis) – December 31, 2023
| Mine | Owner ship (%) |
Category | Tonnage (Mt) |
Grade | Contained Metal | ||||||||
| Zn (%) |
Cu (%) |
Ag (g/t) |
Pb (%) |
Au (g/t) |
Zn (kt) |
Cu (kt) |
Ag (koz) |
Pb (kt) |
Au (koz) |
||||
| El Porvenir UG | 83.48% | Measured | 0.55 | 3.47 | 0.27 | 57.7 | 0.95 | - | 19.1 | 1.5 | 1,023 | 5.3 | - |
| Indicated | 2.69 | 3.25 | 0.20 | 63.2 | 0.97 | - | 87.4 | 5.3 | 5,460 | 26.0 | - | ||
| Total Measured + Indicated | 3.24 | 3.29 | 0.21 | 62.2 | 0.97 | - | 106.5 | 6.8 | 6,483 | 31.3 | - | ||
| Inferred | 9.23 | 3.83 | 0.24 | 82.9 | 1.32 | - | 353.6 | 22.1 | 24,602 | 121.9 | - | ||
| Atacocha UG | 75.96% | Measured | 0.80 | 3.47 | 0.27 | 55.0 | 0.98 | - | 27.6 | 2.1 | 1,411 | 7.8 | - |
| Indicated | 1.91 | 3.30 | 0.36 | 54.9 | 0.92 | - | 63.2 | 6.9 | 3,379 | 17.6 | - | ||
| Total Measured + Indicated | 2.71 | 3.35 | 0.33 | 54.9 | 0.94 | - | 90.8 | 9.0 | 4,790 | 25.4 | - | ||
| Inferred | 6.12 | 4.09 | 0.56 | 77.3 | 1.21 | - | 250.4 | 34.3 | 15,216 | 74.1 | - | ||
| Atacocha OP | 75.96% | Measured | 1.37 | 1.28 | - | 31.4 | 0.87 | 0.19 | 17.5 | - | 1,381 | 11.9 | 8.4 |
| Indicated | 2.95 | 1.05 | - | 29.0 | 0.90 | 0.24 | 30.9 | - | 2,747 | 26.5 | 22.7 | ||
| Total Measured + Indicated | 4.31 | 1.12 | - | 29.8 | 0.89 | 0.22 | 48.4 | - | 4,128 | 38.4 | 31.1 | ||
| Inferred | 1.29 | 1.27 | - | 32.7 | 1.15 | 0.22 | 16.4 | - | 1,357 | 14.9 | 9.1 | ||
| Total Cerro Pasco | Measured | 2.72 | 2.37 | 0.13 | 43.7 | 0.92 | 0.10 | 64.2 | 3.6 | 3,815 | 25.0 | 8.4 | |
| Indicated | 7.55 | 2.40 | 0.16 | 47.7 | 0.93 | 0.09 | 181.5 | 12.3 | 11,586 | 70.2 | 22.7 | ||
| Total Measured + Indicated | 10.27 | 2.39 | 0.15 | 46.7 | 0.93 | 0.09 | 245.8 | 15.9 | 15,401 | 95.2 | 31.1 | ||
| Inferred | 16.65 | 3.73 | 0.34 | 76.9 | 1.27 | 0.02 | 620.5 | 56.4 | 41,175 | 210.8 | 9.1 | ||
Notes:
| 1. | The definitions for Mineral Resources in S-K 1300 were followed for Mineral Resources which are consistent with CIM (2014) definitions. |
| 2. | Mineral Resources are reported on a Nexa attributable ownership basis. |
| 11- |
|
|
| 3. | Mineral Resources are estimated at the following NSR cut-off values, calculated based on the LOM costs: |
| o | El Porvenir UG: varies by mining method from US$63.77/t to US$67.04/t for SLS, and from US$65.77/t to US$69.04/t for CAF, with an average of US$66.04/t. |
| o | Atacocha UG: US$69.00/t for SLS and US$71.07/t for CAF |
| o | Atacocha OP: US$ 22.44/t |
| 4. | Mineral Resources are estimated using average long-term metal prices of Zn: US$3,218.90/t (US$1.46/lb), Cu: US$8,820.05/t (US$4.00/lb), Ag: US$24.35/oz, Pb: US$2,300.33/t (US$1.04/lb), and Au: US$1,875.57/oz. |
| 5. | Metallurgical recoveries are based on historical processing data: |
| o | El Porvenir UG: Zn (89.2%), Pb (80.0%), Cu (14.6%), and Ag (77.5%) |
| o | Atacocha UG: Zn (89.3%), Pb (80.0%), Cu (15.7%), Ag (77.5%), and Au (30.2%) |
| o | Atacocha OP: Zn (70.4%), Pb (84.0%), Ag (75.8%), and Au (65.5%) |
| 6. | Bulk density is assigned based on rock type and averages: |
| o | El Porvenir UG: 3.13 t/m3 |
| o | Atacocha UG: 3.53 t/m3 |
| o | Atacocha OP: 2.76 t/m3 |
| 7. | The minimum thickness for underground resource reporting panels (El Porvenir and Atacocha UG) is 4 m for CAF and 3 m for SLS. The minimum height for the Atacocha OP resource reporting is 6.0 m. |
| 8. | Mineral Resources were depleted according to actual production as of September 30, 2023, and forecast production to the effective date of December 31, 2023. |
| 9. | Mineral Resources are exclusive of Mineral Reserves. |
| 10. | There are no Cu grades estimated for Atacocha OP and no Au grades estimated for Atacocha UG and El Porvenir UG. This has reduced the Cu and Au average grades for the total Cerro Pasco tonnes. |
| 11. | Mineral Resources that are not Mineral Reserves do not have demonstrated economic viability. |
| 12. | Mineral Resources are constrained within optimized underground reporting shapes for El Porvenir and Atacocha UG and an optimized reporting pit shell for Atacocha OP. |
| 13. | Numbers may not add due to rounding. |
| 11- |
|
|
Table 11-2: Summary of Cerro Pasco Complex Mineral Resource Estimate (100%) – December 31, 2023
| Mine | Category | Tonnage (Mt) |
Grade | Contained Metal | ||||||||
| Zn (%) |
Cu (%) |
Ag (g/t) |
Pb (%) |
Au (g/t) |
Zn (kt) |
Cu (kt) |
Ag (koz) |
Pb (kt) |
Au (koz) |
|||
| El Porvenir UG | Measured | 0.66 | 3.47 | 0.27 | 57.7 | 0.95 | - | 22.9 | 1.8 | 1,225 | 6.3 | - |
| Indicated | 3.22 | 3.25 | 0.20 | 63.2 | 0.97 | - | 104.7 | 6.4 | 6,540 | 31.2 | - | |
| Total Measured + Indicated | 3.88 | 3.29 | 0.21 | 62.2 | 0.97 | - | 127.6 | 8.2 | 7,765 | 37.5 | - | |
| Inferred | 11.06 | 3.83 | 0.24 | 82.9 | 1.32 | - | 423.6 | 26.5 | 29,471 | 146.0 | - | |
| Atacocha UG | Measured | 1.05 | 3.47 | 0.27 | 55.0 | 0.98 | - | 36.4 | 2.8 | 1,857 | 10.3 | - |
| Indicated | 2.52 | 3.30 | 0.36 | 54.9 | 0.92 | - | 83.2 | 9.1 | 4,448 | 23.2 | - | |
| Total Measured + Indicated | 3.57 | 3.35 | 0.33 | 54.9 | 0.94 | - | 119.6 | 11.9 | 6,305 | 33.5 | - | |
| Inferred | 8.06 | 4.09 | 0.56 | 77.3 | 1.21 | - | 329.7 | 45.1 | 20,031 | 97.5 | - | |
| Atacocha OP | Measured | 1.80 | 1.28 | - | 31.4 | 0.87 | 0.19 | 23.0 | - | 1,818 | 15.7 | 11.0 |
| Indicated | 3.88 | 1.05 | - | 29.0 | 0.90 | 0.24 | 40.7 | - | 3,616 | 34.9 | 29.9 | |
| Total Measured + Indicated | 5.68 | 1.12 | - | 29.8 | 0.89 | 0.22 | 63.7 | - | 5,434 | 50.6 | 40.9 | |
| Inferred | 1.70 | 1.27 | - | 32.7 | 1.15 | 0.22 | 21.6 | - | 1,787 | 19.6 | 12.0 | |
| Total Cerro Pasco | Measured | 3.51 | 2.34 | 0.13 | 43.4 | 0.92 | 0.10 | 82.3 | 4.6 | 4,900 | 32.3 | 11.0 |
| Indicated | 9.62 | 2.38 | 0.16 | 47.2 | 0.93 | 0.10 | 228.6 | 15.5 | 14,604 | 89.3 | 29.9 | |
| Total Measured + Indicated | 13.13 | 2.37 | 0.15 | 46.2 | 0.93 | 0.10 | 310.9 | 20.1 | 19,504 | 121.6 | 40.9 | |
| Inferred | 20.82 | 3.72 | 0.34 | 76.6 | 1.26 | 0.02 | 774.9 | 71.6 | 51,289 | 263.1 | 12.0 | |
Notes:
| 1. | The definitions for Mineral Resources in S-K 1300 were followed for Mineral Resources which are consistent with CIM (2014) definitions. |
| 2. | Mineral Resources are reported on a 100% ownership basis. |
| 3. | Mineral Resources are estimated at the following NSR cut-off values, calculated based on the LOM costs: |
| 11- |
|
|
| o | El Porvenir UG: varies by mining method from US$63.77/t to US$67.04/t for SLS, and from US$65.77/t to US$69.04/t for CAF, with an average of US$66.04/t. |
| o | Atacocha UG: US$69.00/t for SLS and US$71.07/t for CAF |
| o | Atacocha OP: US$ 22.44/t |
| 4. | Mineral Resources are estimated using average long-term metal prices of Zn: US$3,218.90/t (US$1.46/lb), Cu: US$8,820.05/t (US$4.00/lb), Ag: US$24.35/oz, Pb: US$2,300.33/t (US$1.04/lb), and Au: US$1,875.57/oz. |
| 5. | Metallurgical recoveries are based on historical processing data: |
| o | El Porvenir UG: Zn (89.2%), Pb (80.0%), Cu (14.6%), and Ag (77.5%) |
| o | Atacocha UG: Zn (89.3%), Pb (80.0%), Cu (15.7%), Ag (77.5%), and Au (30.2%) |
| o | Atacocha OP: Zn (70.4%), Pb (84.0%), Ag (75.8%), and Au (65.5%) |
| 6. | Bulk density is assigned based on rock type and averages: |
| o | El Porvenir UG: 3.13 t/m3 |
| o | Atacocha UG: 3.53 t/m3 |
| o | Atacocha OP: 2.76 t/m3 |
| 7. | The minimum thickness for underground resource reporting panels is 4 m for CAF and 3 m for SLS. For open pit resource reporting, the minimum height is 6 m. |
| 8. | Mineral Resources were depleted according to actual production as of September 30, 2023, and forecast production to the effective date of December 31, 2023. |
| 9. | Mineral Resources are exclusive of Mineral Reserves. |
| 10. | There are no Cu grades estimated for Atacocha OP and no Au grades estimated for Atacocha UG and El Porvenir UG. This has reduced the Cu and Au average grades for the total Cerro Pasco tonnes. |
| 11. | Mineral Resources that are not Mineral Reserves do not have demonstrated economic viability. |
| 12. | Mineral Resources are constrained within optimized underground reporting shapes for El Porvenir and Atacocha UG and an optimized reporting pit shell for Atacocha OP. |
| 13. | Numbers may not add due to rounding. |
| 11- |
|
|
Figure 11-1: El Porvenir and Atacocha Underground Resource Panels, with San Gerardo Mineral Resource Blocks Exclusive of Mineral Reserves

| 11- |
|
|
| 11.2 | Comparison with Previous Estimate |
The effective date of the previous Mineral Resource estimate for El Porvenir, San Gerardo, and Atacocha UG is December 31, 2022.
| 11.2.1 | El Porvenir |
Table 11-3 presents a comparative analysis between the December 31, 2023 Nexa Mineral Resource estimate, exclusive of Mineral Reserves, and the previous estimate from 2022. The comparison reveals an overall increase in both tonnage and grade. The changes are attributed to the following factors:
| · | Continuous drilling and channel program development, which added 274 new drill holes and 1,705 channels, throughout the mineral deposit extension. |
| · | Infill drilling has resulted in an increase of 1.3 Mt across the VCN, POR9, EXITO, and AM domains. |
| · | Exploration areas that are being reported for the first time. |
| · | Depletion of material through mining. |
| 11- |
|
|
Table 11-3: El Porvenir Comparison of 2022 Versus 2023 Mineral Resources (83.48% Ownership Basis)
| Category | Tonnage (Mt) | Zn (%) |
Cu (%) |
Ag (g/t) | Pb (%) |
Zn (kt) |
Cu (kt) |
Ag (koz) | Pb (kt) |
|||
| December 31, 2022 | ||||||||||||
| Measured | 0.29 | 3.31 | 0.21 | 70.5 | 1.10 | 9.6 | 0.6 | 657 | 3.2 | |||
| Indicated | 2.54 | 3.04 | 0.20 | 57.1 | 0.92 | 77.2 | 5.1 | 4,663 | 23.4 | |||
| Measured and Indicated | 2.83 | 3.07 | 0.20 | 58.5 | 0.94 | 86.8 | 5.7 | 5,320 | 26.6 | |||
| Inferred | 8.92 | 3.83 | 0.19 | 72.9 | 1.05 | 341.6 | 16.9 | 20,907 | 93.7 | |||
| December 31, 2023 | ||||||||||||
| Measured | 0.55 | 3.47 | 0.27 | 57.7 | 0.95 | 19.1 | 1.5 | 1,023 | 5.3 | |||
| Indicated | 2.69 | 3.25 | 0.20 | 63.1 | 0.97 | 87.4 | 5.3 | 5,460 | 26.0 | |||
| Measured and Indicated | 3.24 | 3.29 | 0.21 | 62.2 | 0.97 | 106.5 | 6.8 | 6,483 | 31.3 | |||
| Inferred | 9.23 | 3.83 | 0.24 | 82.8 | 1.32 | 353.6 | 22.1 | 24,602 | 121.9 | |||
| DIFFERENCE (NOMINAL) | ||||||||||||
| Measured | 0.26 | 0.16 | 0.06 | -12.8 | -0.15 | 9.52 | 0.90 | 366 | 2.1 | |||
| Indicated | 0.15 | 0.21 | 0.00 | 6.1 | 0.05 | 10.20 | 0.24 | 797 | 2.6 | |||
| Measured and Indicated | 0.41 | 0.22 | 0.01 | 3.7 | 0.02 | 19.72 | 1.15 | 1,163 | 4.7 | |||
| Inferred | 0.31 | 0.00 | 0.05 | 10.0 | 0.27 | 12.02 | 5.22 | 3,695 | 28.2 | |||
| DIFFERENCE (%) | ||||||||||||
| Measured | 90.0% | 4.8% | 28.6% | -18.1% | -13.6% | 99.1% | 150.4% | 55.7% | 64.4% | |||
| Indicated | 5.8% | 6.9% | 0.0% | 10.6% | 5.4% | 13.2% | 4.8% | 17.1% | 11.3% | |||
| Measured and Indicated | 14.5% | 7.2% | 5.0% | 6.3% | 3.2% | 22.7% | 20.1% | 21.9% | 17.7% | |||
| Inferred | 3.5% | 0.0% | 26.3% | 13.7% | 25.7% | 3.5% | 30.9% | 17.7% | 30.1% | |||
| 11- |
|
|
| 11.2.2 | San Gerardo Open Pit |
Table 11-4 presents a comparative analysis between the December 31, 2023 San Gerardo Mineral Resource estimate, exclusive of Mineral Reserves, and the previous estimate from 2022. The comparison reveals an overall decrease in both tonnage and grade. The changes are attributed to the following factors:
| · | The Inferred Mineral Resources decreased mainly due to limit of the pit shell constraint. |
| · | The Measured and Indicated Mineral Resources decreased mainly due to the conversion to Mineral Reserves. |
Table 11-4: San Gerardo Comparison of 2022 Versus 2023 Mineral Resources (75.96% Ownership Basis)
| Category | Tonnage (Mt) | Zn (%) |
Ag (g/t) | Pb (%) | Au (g/t) | Zn (kt) |
Ag (koz) |
Pb (kt) |
Au (koz) |
| December 31, 2022 | |||||||||
| Measured | 2.42 | 1.04 | 36.9 | 1.02 | 0.25 | 25.2 | 2,871 | 24.7 | 19.5 |
| Indicated | 5.22 | 1.09 | 30.0 | 0.94 | 0.19 | 56.9 | 5,035 | 49.1 | 31.9 |
| Measured and Indicated | 7.64 | 1.07 | 32.2 | 0.97 | 0.21 | 82.1 | 7,906 | 73.8 | 51.4 |
| Inferred | 2.92 | 1.13 | 31.7 | 1.01 | 0.20 | 33.0 | 2,976 | 29.5 | 18.8 |
| December 31, 2023 | |||||||||
| Measured | 1.37 | 1.28 | 31.4 | 0.87 | 0.19 | 17.5 | 1,381 | 11.9 | 8.4 |
| Indicated | 2.95 | 1.05 | 29.0 | 0.90 | 0.24 | 30.9 | 2,747 | 26.5 | 22.7 |
| Measured and Indicated | 4.31 | 1.12 | 29.8 | 0.89 | 0.22 | 48.4 | 4,128 | 38.4 | 31.1 |
| Inferred | 1.29 | 1.27 | 32.7 | 1.15 | 0.22 | 16.4 | 1,358 | 14.9 | 9.1 |
| DIFFERENCE (NOMINAL) | |||||||||
| Measured | -1.05 | 0.24 | -5.5 | -0.15 | -0.06 | -7.7 | -1,490 | -12.8 | -11.1 |
| Indicated | -2.27 | -0.04 | -1.0 | -0.04 | 0.05 | -26 | -2,288 | -22.6 | -9.2 |
| Measured and Indicated | -3.33 | 0.05 | -2.4 | -0.08 | 0.01 | -33.7 | -3,778 | -35.4 | -20.3 |
| Inferred | -1.63 | 0.14 | 1.0 | 0.14 | 0.02 | -16.60 | -1,619 | -14.6 | -9.7 |
| DIFFERENCE (%) | |||||||||
| Measured | -43.5% | 23.1% | -14.9% | -14.7% | -24.0% | -30.7% | -51.9% | -51.7% | -57.2% |
| Indicated | -43.5% | -3.7% | -3.4% | -4.3% | 26.3% | -45.7% | -45.4% | -46.0% | -28.8% |
| Measured and Indicated | -43.5% | 4.7% | -7.5% | -8.2% | 4.8% | -41.1% | -47.8% | -47.9% | -39.6% |
| Inferred | -55.8% | 12.4% | 3.2% | 13.9% | 10.0% | -50.2% | -54.4% | -49.5% | -51.5% |
| 11- |
|
|
| 11.2.3 | Atacocha Underground |
Table 11-5 presents a comparative analysis between the December 31, 2023 estimate and the estimate from 2022. The comparison reveals an overall increase in both tonnage and grade. The changes are attributed to the following factors:
| · | The Inferred Mineral Resources decreased mainly due to classification criteria revision. |
| · | The Measured and Indicated Mineral Resources decreased mainly due to the conversion to Mineral Reserves. |
| · | Depletion of material through mining. |
Table 11-5: Atacocha Underground Comparison of 2022 Versus 2023 Mineral Resources (75.96% Ownership Basis)
| Category | Tonnage (Mt) | Zn (%) | Cu (%) | Ag (g/t) | Pb (%) | Zn (kt) | Cu (kt) | Ag (koz) | Pb (kt) | ||||
| December 31, 2022 | |||||||||||||
| Measured | 2.10 | 4.18 | - | 78.9 | 1.52 | 87.7 | - | 5,327 | 31.9 | ||||
| Indicated | 3.27 | 4.15 | - | 76.0 | 1.43 | 135.7 | - | 7,990 | 46.8 | ||||
| Measured and Indicated | 5.37 | 4.16 | - | 77.1 | 1.47 | 223.4 | - | 13,317 | 78.7 | ||||
| Inferred | 6.16 | 4.45 | - | 82.0 | 1.26 | 274.1 | - | 16,240 | 77.6 | ||||
| December 31, 2023 | |||||||||||||
| Measured | 0.80 | 3.47 | 0.27 | 55.0 | 0.98 | 27.6 | 2.1 | 1,411 | 7.8 | ||||
| Indicated | 1.91 | 3.30 | 0.36 | 54.9 | 0.92 | 63.2 | 6.9 | 3,379 | 17.6 | ||||
| Measured and Indicated | 2.71 | 3.35 | 0.33 | 54.9 | 0.94 | 90.8 | 9.0 | 4,790 | 25.4 | ||||
| Inferred | 6.12 | 4.09 | 0.56 | 77.3 | 1.21 | 250.4 | 34.3 | 15,216 | 74.1 | ||||
| DIFFERENCE (NOMINAL) | |||||||||||||
| Measured | -1.30 | -0.71 | - | -23.9 | -0.54 | -60.1 | - | -3,916 | -24.1 | ||||
| Indicated | -1.36 | -0.85 | - | -21.1 | -0.51 | -72.5 | - | -4,611 | -29.2 | ||||
| Measured and Indicated | -2.66 | -0.81 | - | -22.2 | -0.53 | -132.6 | - | -8,527 | -53.3 | ||||
| Inferred | -0.04 | -0.36 | - | -4.7 | -0.05 | -23.7 | - | -1,024 | -3.5 | ||||
| DIFFERENCE (%) | |||||||||||||
| Measured | -62.0% | -17.0% | - | -30.3% | -35.5% | -68.5% | - | -73.5% | -75.5% | ||||
| Indicated | -41.5% | -20.5% | - | -27.8% | -35.7% | -53.4% | - | -57.7% | -62.3% | ||||
| Measured and Indicated | -49.5% | -19.5% | - | -28.8% | -36.1% | -59.3% | - | -64.0% | -67.7% | ||||
| Inferred | -0.6% | -8.1% | - | -5.7% | -4.0% | -8.6% | - | -6.3% | -4.6% | ||||
| 11- |
|
|
| 11.3 | Reconciliation |
Nexa provided reconciliation data comprising tonnages and grades for the main elements for the whole 2023 year. The Long-Term Factor (LTF) denotes the percentage variation between the Resource Model and the Plant Accounted figures, while the Short-Term Factor (STF) indicates the percentage variation between the Grade Control Model and Plant Accounted figures.
The tonnage and LTF and STF at the El Porvenir and Atacocha mines exhibit expected small fluctuations around zero, typically ranging from -5% and 8%, with sporadic occurrences reaching ±11%. This trend is similarly observed for Zn and Ag data for El Porvenir. It is noteworthy that the Atacocha underground mine has been inactive since 2020, and consequently, the reconciliation information represents only the San Gerardo open pit.
Zn STF shows similar behaviour at Atacocha. However, Pb, Cu, and Au at Atacocha exhibit higher monthly variations, ranging between -21% and 42%. Despite the higher variations, the average STFs for 2023 for these variables are -6%, 6%, and 4% for Pb, Cu, and Au, respectively.
For El Porvenir, the LTF also demonstrates expected minor fluctuations around zero for most of the elements, except for Cu, which had an average of 26% at EOY 2023. Conversely, Atacocha’s LTF displays wider variations for grade variables due to the reconciliation methodology, with annual variations ranging between 72% and 218%.
Grade Control models for El Porvenir and Atacocha UG incorporate channel and infill drill holes, while the San Gerardo Grade Control Model relies on blast hole data. Nexa’s Technical Team attributes the increased grades mainly to opportunistic mining of ore within cross-strike mineralization structures, which are not adequately represented in the modelled mineralization, particularly within the LTM. Since the massive sulphides are visually identifiable, machine operators regularly identify such ore on the pit faces.
Figure 11-2 illustrates the Zn grades for the long- and short-term models, and the plant grades by month.
| 11- |
|
|
Figure 11-2: Zn Long- and Short-Term Grades and Plant Grade for El Porvenir (top) and Atacocha (bottom)

Of the three deposits, San Gerardo has the most comprehensive grade control dataset, due to its use of blast holes. Although the vertical holes are oriented parallel to the vertical mineralized structures, comparison of the San Gerardo LTM mineralization wireframes with the blast hole grades indicates significant differences (Figure 11-3). This includes reduced continuity of the along-strike structures and increased presence of across-strike structures, which is likely also the case at El Porvenir and Atacocha UG.
The QP recommends a thorough reconciliation between the underground production volumes and the mineralization wireframes. This would facilitate a better understanding of the reconciliation between the along-strike mineralization, and enable a more precise quantification
| 11- |
|
|
of the proportion of the discrepancy stemming from opportunistic mining of ore from across-strike structures.
To refine the definition of mineralized extents, it is recommended that closer-spaced exploration and infill drilling be carried out ahead of production. This includes drilling at orientations better designed to intercept across-strike mineralized structures.
| 11- |
|
|
Figure 11-3: San Gerardo Blast Hole Zn Grades with Mineralization Wireframes

| 11- |
|
|
| 11.4 | El Porvenir |
| 11.4.1 | Resource Database |
The El Porvenir database closure date is January 31, 2023. Between then and the effective date of this report, 252 drill holes and 1,727 channels were completed ( Table 11-6 and Figure 11-4). The QP reviewed the additional data and is of the opinion that it does not have a material impact on the estimated Mineral Resources. Most of the data consists of channels and infill drilling completed near to existing workings and largely confirms the existing interpretation. Several holes completed in the Integration Zone are largely outside of the existing mineralization domains.
Table 11-6: El Porvenir Data Completed After January 31,2023 Resource Database Closure
| Type | Count | Length (m) |
| Channels | 1,596 | 9,360 |
| DDH | 252 | 43,534 |
As discussed in Section 7.2.1, 21 drill holes were excluded from the El Porvenir resource database. Table 11-7 summarizes the drilling and channel sampling included within the El Porvenir resource database, following exclusions.
Table 11-7: El Porvenir Resource Database
| Type | Count | Length (m) |
| Channels | 17,478 | 119,715 |
| DDH | 5,431 | 900,536 |
Table 11-8 summarizes the quantity of data in the provided resource database, filtered by the El Porvenir site.
Table 11-8: El Porvenir Resource Database Tables
| Table | Count | Collars | Length (m) |
| Collar | 22,909 | 22,909 | - |
| Survey | 153,334 | 22,909 | - |
| Alteration | 34,994 | 3,160 | 179,328 |
| Geology | 291,736 | 5,431 | 899,351 |
| Litho | 97,865 | 5,431 | 900,098 |
| Assay | 390,801 | 22,527 | 522,539 |
| Structural | 22,331 | 1,836 | - |
| Mineralization | 102,931 | 4,249 | 274,924 |
| Geotechnical | 12,902 | 601 | 111,537 |
| Density | 14,793 | 2,646 | 16,471 |
| 11- |
|
|
Table 11-9 summarizes the drilling and channel samples used to estimate the El Porvenir Mineral Resources, while Table 11-10 summarizes the density samples.
| 11- |
|
|
Figure 11-4: El Porvenir Drill Holes Completed After Database Cut-Off

| 11- |
|
|
Table 11-9: El Porvenir Resource Database Assay Summary Statistics
| Analyte | Count | Length | Mean | StdDev | CV | Variance | Min | Q25 | Median | Q75 | Max |
| Zn (%) | 390,595 | 522,211 | 1.84 | 4.35 | 2.37 | 18.94 | 0.00 | 0.02 | 0.11 | 1.14 | 63.35 |
| Pb (%) | 385,765 | 514,832 | 0.62 | 2.30 | 3.70 | 5.28 | 0.00 | 0.01 | 0.03 | 0.19 | 75.00 |
| Cu (%) | 382,903 | 510,619 | 0.13 | 0.33 | 2.49 | 0.11 | 0.00 | 0.01 | 0.02 | 0.14 | 35.00 |
| Ag (g/t) | 390,330 | 521,881 | 37.84 | 123.47 | 3.26 | 15,244.28 | 0.09 | 2.00 | 5.70 | 24.88 | 14,727.19 |
| Au (g/t) | 130,351 | 168,515 | 0.12 | 0.58 | 4.97 | 0.33 | 0.00 | 0.01 | 0.03 | 0.08 | 55.50 |
| Length (m) | 390,801 | 522,539 | 1.34 | 0.53 | 0.40 | 0.28 | 0.01 | 1.00 | 1.40 | 1.68 | 35.80 |
Table 11-10: El Porvenir Resource Database Density Summary Statistics
| Analyte | Count | Length | Mean | StdDev | CV | Variance | Min | Q25 | Median | Q75 | Max |
| Density (g/cm3) | 14,793 | 16,471 | 2.94 | 0.46 | 0.16 | 0.21 | 0.85 | 2.69 | 2.81 | 3.23 | 6.17 |
| Length (m) | 14,793 | 16,471 | 1.11 | 0.49 | 0.44 | 0.24 | 0.20 | 0.85 | 1.10 | 1.50 | 6.40 |
| 11- |
|
|
| 11.4.2 | Geological Interpretation |
The El Porvenir UG Mineral Resource estimate relies on assay and geological interpretations conducted for each distinct mineralized domain. Geologists at El Porvenir built geological models utilizing assay results from drilling and channel sampling, alongside pertinent geological parameters. These models incorporate various geological domains, including rock types (such as sandstone, calcareous breccia, marble, and skarn), mineralization structure types (including veins, orebodies, and mantos), as well as structural and lithological features observed in underground workings and drill core logging data.
Based on observations of the drill core and underground mineralization exposures, discussions with the geologists on site, 3D data visualization, and statistical evaluations, the consensus regarding El Porvenir mineralization is that it is predominantly influenced by lithological and structural factors. The primary concentration of mineralization occurs within the “Porvenir 9”, “Don Ernesto”, “Exito”, “Veta Carmen Norte 3”, “Veta Progreso”, and “Sara” zones, while secondary occurrences are noted in the “Veta 5”, “Veta 1204”, “Veta 1204 Inferior”, “Veta 1204 Superior”, “Veta Carmen 1”, “Don Lucho”, and “SSM” domains. Additionally, there are minor mineralization occurrences in the “Veta VR” and “Integracion AT-EP” domains.
During the interpretation process, three main styles of mineralization were identified at the El Porvenir deposit:
| · | Skarn: mineralized zones of irregular to structurally controlled geometry, primarily contained within the Pucará Group, comprising garnet with associated metallic mineralization of galena, sphalerite, chalcopyrite, and Ag-bearing sulphosalts (i.e., tetrahedrite). |
| · | Structurally controlled zones (i.e., veins): mineralization comprising galena, sphalerite, and Ag-bearing sulphosalts (i.e., tetrahedrite) with quartz, rhodochrosite, and pyrite that forms structurally controlled shoots with lengths of up to 150 m and vertical extents of up to 350 m. |
| · | Replacement: lenses to irregular geometry contacts within the Pucará Group, comprising metallic mineralization of galena, sphalerite, chalcopyrite, and Ag-bearing sulphosalts (i.e., tetrahedrite), and lenses or “mantos” in stratabound galena, sphalerite, and pyrite mineralization hosted in the Goyllarisquizga sandstone. |
Skarn bodies are highly irregular in geometry and structurally controlled by variable trends (north-south to northwest-southeast) around the Milpo stock. For the vein mineralization, at least three groups were identified:
| · | East-west striking. |
| · | Replacement-style structures striking northwest-southeast dipping to the north. |
| · | Veins associated with intrusive dikes striking northeast-southwest; dipping to the south, and for the “mantos”, a northwest trending with shallow dipping to the south was recognized. |
Nexa executed the geological modelling of the El Porvenir deposit using Leapfrog Geo software. Contact surfaces were modelled upon drilling and channel sampling assay data, alongside structural and lithological controls gleaned from underground workings and drill core logging data. A total of 109 levels with underground mapping guided the modelling process, with polylines utilized to refine contacts in areas with sparse data and to replicate underground mapping for mineralization displacement adjustments. SLR observed that in certain locations,
| 11- |
|
|
wireframes were not aligned with available drill hole and channel data but instead relied solely on polylines. Mineralization wireframes were not subject to a minimum mining thickness constraint due to the utilization of DSO shapes for reporting Mineral Resources.
Although extrapolation of the mineralization wireframes was generally limited to within approximately 30 m to 40 m from the last mineralized intercept, SLR noted that some domains were extended beyond this. Nonetheless, such extrapolations were deemed reasonable, and their extent was duly considered during the classification of Mineral Resources. Leapfrog's vein and intrusion tools were employed for modelling mineralization, with additional boundary control imposed using polylines as required. The modelled mineralized zones were subsequently exported to Datamine software for block model encoding.
A total of 522 individual mineralization domains comprising 23 mineralization groups were interpreted and modelled (Figure 11-6), with most group zones situated within the operational area. Figure 11-5 illustrates the modelled mineralization domains, with the 25 most significant in terms of Mineral Resource tonnage (approximately 46%) highlighted in red. For this TRS, these domains will be referred to as the main domains for El Porvenir.
Upon thorough examination, SLR has assessed the mineralization wireframes of the El Porvenir underground mine and has deemed them suitable for Mineral Resource estimation. However, it was observed that numerous drill holes lacking assay data intersected the modelled wireframes. The rationale behind the absence of assays in these instances remains unclear, whether due to the absence of identified mineralization or other factors such as time constraints. Following estimation, Nexa excluded regions surrounding the non-assayed holes from the block model using an NN approach to delineate the influence area, which, as observed by SLR, resulted in irregularly shaped final domains in the block models. While this was not deemed to significantly impact the estimated Mineral Resources, SLR recommends that in future Mineral Resource updates, veins be set to pinch out upon non-assayed samples, to refine the grade estimate. The QP concurs with this recommendation.
SLR observed that certain mineralization wireframes, such as “wf_prog_3tr,” were solely based on polylines without snapping to drill hole and channel sample contacts. These discrepancies contributed to a large proportion of snapping inconsistencies between the intervals assigned to a domain (referred to as “OB” in the drill hole and block model) and the resultant OB wireframes. An assessment revealed that 91% of intervals assigned to an OB were accurately captured within a modelled OB, while 97% of waste intervals were appropriately classified as waste. Although most discrepancies were located outside the Mineral Resource constraining shapes, it is recommended that these discrepancies be rectified in future Mineral Resource updates.
Contact analysis conducted by SLR on the mineralization domains indicated effective separation between mineralized and unmineralized populations, as illustrated in Figure 11-7. Nonetheless, opportunities were identified in certain areas to extend wireframes to incorporate additional mineralized intercepts. Notably, the populations within the modelled mineralization demonstrated approximately lognormal distributions.
Nexa created Zn, Pb and Ag, and Cu estimation domain groups using several geological parameters, which include geological domains (lithological control and mineralization type), and the anisotropy and orientation of the estimation domains. A total of 93 Zn, 96 Pb, 89 Ag, and 88 Cu estimation domain groups were defined, and subsequently used for variography and capping, although estimation was completed within the individual domains.
| 11- |
|
|
Figure 11-5: El Porvenir 25 Main Domains

| 11- |
|
|
Figure 11-6: El Porvenir Grouped Mineralization

| 11- |
|
|
Figure 11-7: El Porvenir Underground Mineralization Contact Analysis

| 11.4.3 | Resource Assays |
The database used for generating the mineralization wireframes consists of both drill holes and channel samples. For the exploratory data analysis (EDA) process, the database is exported
| 11- |
|
|
from Leapfrog Geo and imported into Datamine Studio software. Non-sampled intervals are substituted by the half of the detection limits of the chemical elements. Univariate and bivariate statistics are then calculated for the assays, with separate assessments conducted for drill hole and channel samples due to their distinct natures.
For this TRS, Zn, Cu, Ag, and Pb, referred to as the main elements for El Porvenir, will be detailed in tables and figures, along with the 25 grade shells (main domains) that contribute most significantly to the Mineral Resource and Mineral Reserves, approximately 46% of the tonnage.
Table 11-11 presents the length-weighted statistics of the drill holes and channels combined.
| 11- |
|
|
Table 11-11: El Porvenir Assay Statistics (Length Weighted) for the Main Domains
| Domain | Zn (%) - Assay (length weighted) | Cu (%) - Assay (length weighted) | ||||||||||
| Count | Mean | StdDev | CV | Min | Max | Count | Mean | StdDev | CV | Min | Max | |
| amsk14 | 97 | 2.75 | 4.25 | 1.55 | 0.00 | 21.32 | 97 | 0.41 | 0.55 | 1.34 | 0.00 | 2.91 |
| de2 | 2,873 | 2.30 | 3.45 | 1.5 | 0.00 | 35.00 | 2,873 | 0.07 | 0.18 | 2.5 | 0.00 | 3.44 |
| dl05 | 434 | 2.19 | 3.28 | 1.5 | 0.02 | 28.60 | 434 | 0.18 | 0.19 | 1.1 | 0.01 | 1.45 |
| exiti1 | 53 | 3.35 | 6.89 | 2.06 | 0.01 | 29.96 | 53 | 0.92 | 0.85 | 0.92 | 0.01 | 6.25 |
| exito | 2,393 | 3.89 | 4.18 | 1.07 | 0.00 | 38.40 | 2,393 | 0.36 | 0.48 | 1.32 | 0.00 | 10.04 |
| exitoa | 905 | 3.37 | 4.07 | 1.21 | 0.00 | 42.50 | 905 | 0.52 | 0.5 | 0.95 | 0.00 | 5.18 |
| ints26 | 148 | 4.41 | 5.61 | 1.27 | 0.00 | 26.84 | 148 | 0.15 | 0.17 | 1.15 | 0.00 | 0.94 |
| p2sw1 | 217 | 0.84 | 1.22 | 1.45 | 0.00 | 11.41 | 217 | 0.03 | 0.06 | 2.13 | 0.00 | 1.39 |
| p2sw2 | 249 | 0.89 | 1.15 | 1.29 | 0.00 | 9.52 | 249 | 0.03 | 0.12 | 3.61 | 0.00 | 2.24 |
| por9 | 860 | 5.73 | 5.33 | 0.93 | 0.00 | 40.58 | 860 | 0.40 | 0.56 | 1.42 | 0.00 | 13.25 |
| por928 | 83 | 4.86 | 5.59 | 1.15 | 0.00 | 25.60 | 83 | 0.25 | 0.32 | 1.29 | 0.00 | 2.7 |
| por929 | 85 | 8.41 | 7.58 | 0.9 | 0.00 | 30.00 | 85 | 0.30 | 0.21 | 0.7 | 0.00 | 1.00 |
| por95 | 86 | 3.10 | 6.08 | 1.96 | 0.00 | 41.45 | 86 | 0.15 | 0.18 | 1.19 | 0.00 | 1.01 |
| por9p | 1,767 | 4.68 | 5.83 | 1.25 | 0.00 | 41.95 | 1,767 | 0.30 | 0.28 | 0.94 | 0.00 | 2.23 |
| por9q | 383 | 4.77 | 7.10 | 1.49 | 0.00 | 42.38 | 383 | 0.35 | 0.59 | 1.69 | 0.00 | 10.55 |
| por9v | 88 | 7.07 | 7.09 | 1.00 | 0.04 | 31.35 | 88 | 0.46 | 1.12 | 2.42 | 0.00 | 16.55 |
| por9w | 47 | 3.96 | 5.48 | 1.38 | 0.13 | 24.00 | 47 | 0.31 | 0.31 | 0.99 | 0.01 | 1.30 |
| prog | 6,176 | 5.24 | 6.37 | 1.22 | 0.00 | 43.94 | 6,176 | 0.4 | 0.54 | 1.35 | 0.00 | 17.23 |
| sara2 | 185 | 2.11 | 3.26 | 1.55 | 0.01 | 19.75 | 185 | 0.04 | 0.1 | 2.43 | 0.00 | 1.52 |
| v12i1 | 2,743 | 7.41 | 6.96 | 0.94 | 0.00 | 50.00 | 2,743 | 0.27 | 0.51 | 1.91 | 0.00 | 12.29 |
| v12ne | 221 | 4.31 | 6.32 | 1.47 | 0.00 | 34.92 | 221 | 0.21 | 0.36 | 1.69 | 0.00 | 5.93 |
| v5i | 3,317 | 7.15 | 6.60 | 0.92 | 0.00 | 63.35 | 3,317 | 0.40 | 0.46 | 1.15 | 0.00 | 13.12 |
| 11- |
|
|
| Domain | Zn (%) - Assay (length weighted) | Cu (%) - Assay (length weighted) | ||||||||||
| Count | Mean | StdDev | CV | Min | Max | Count | Mean | StdDev | CV | Min | Max | |
| vcarmen | 1,368 | 5.53 | 7.81 | 1.41 | 0.00 | 44.47 | 1,368 | 0.09 | 0.14 | 1.63 | 0.00 | 1.90 |
| vcn31 | 3,553 | 4.25 | 5.15 | 1.21 | 0.00 | 39.31 | 3,553 | 0.24 | 0.35 | 1.47 | 0.00 | 14.81 |
| vcn3ei1 | 2,360 | 6.92 | 7.26 | 1.05 | 0.00 | 47.61 | 2,360 | 0.26 | 0.33 | 1.27 | 0.00 | 4.53 |
| Domain | Ag (g/t) - Assay (length weighted) | Pb (%) - Assay (length weighted) | ||||||||||
| Count | Mean | StdDev | CV | Min | Max | Count | Mean | StdDev | CV | Min | Max | |
| amsk14 | 97 | 72.87 | 108.42 | 1.49 | 0.00 | 637.00 | 97 | 0.22 | 0.54 | 2.45 | 0.00 | 3.69 |
| de2 | 2,873 | 265.22 | 499.08 | 1.88 | 0.00 | 6,760.00 | 2,873 | 3.61 | 5.18 | 1.43 | 0.00 | 57.66 |
| dl05 | 434 | 77.40 | 103.1 | 1.33 | 2.00 | 1,100.44 | 434 | 1.02 | 2.58 | 2.52 | 0.00 | 24.2 |
| exiti1 | 53 | 14.98 | 11.53 | 0.77 | 2.02 | 74.96 | 53 | 0.02 | 0.05 | 2.65 | 0.01 | 0.52 |
| exito | 2,393 | 75.60 | 87.9 | 1.16 | 0.00 | 2,032.30 | 2,393 | 0.97 | 2.13 | 2.21 | 0.00 | 31.16 |
| exitoa | 905 | 45.46 | 70.38 | 1.55 | 0.00 | 939.64 | 905 | 0.52 | 1.84 | 3.52 | 0.00 | 20.98 |
| ints26 | 148 | 20.28 | 40.7 | 2.01 | 0.00 | 284.60 | 148 | 0.31 | 1.08 | 3.5 | 0.00 | 8.25 |
| p2sw1 | 217 | 94.57 | 152.31 | 1.61 | 0.00 | 3,484.21 | 217 | 1.54 | 1.81 | 1.18 | 0.00 | 26.73 |
| p2sw2 | 249 | 122.25 | 322.95 | 2.64 | 0.00 | 4,379.99 | 249 | 1.59 | 2.51 | 1.58 | 0.00 | 42.96 |
| por9 | 860 | 22.57 | 121.86 | 5.4 | 0.00 | 2,715.98 | 860 | 0.21 | 1.32 | 6.23 | 0.00 | 17.17 |
| por928 | 83 | 31.33 | 47.31 | 1.51 | 0.00 | 200.00 | 83 | 0.53 | 1.39 | 2.61 | 0.00 | 7.80 |
| por929 | 85 | 64.27 | 74.78 | 1.16 | 0.00 | 307.92 | 85 | 1.29 | 3.78 | 2.94 | 0.00 | 25.50 |
| por95 | 86 | 12.57 | 42.47 | 3.38 | 0.00 | 368.89 | 86 | 0.11 | 0.64 | 5.59 | 0.00 | 5.79 |
| por9p | 1,767 | 23.86 | 43.99 | 1.84 | 0.00 | 855.03 | 1,767 | 0.28 | 1.29 | 4.64 | 0.00 | 22.59 |
| por9q | 383 | 19.31 | 39.48 | 2.04 | 0.00 | 566.39 | 383 | 0.21 | 1.23 | 5.79 | 0.00 | 23.97 |
| por9v | 88 | 78.37 | 128.96 | 1.65 | 2.02 | 811.18 | 88 | 1.50 | 3.75 | 2.49 | 0.01 | 26.23 |
| por9w | 47 | 54.00 | 58.23 | 1.08 | 1.56 | 220.21 | 47 | 0.70 | 1.33 | 1.91 | 0.01 | 5.77 |
| 11- |
|
|
| Domain | Ag (g/t) - Assay (length weighted) | Pb (%) - Assay (length weighted) | ||||||||||
| Count | Mean | StdDev | CV | Min | Max | Count | Mean | StdDev | CV | Min | Max | |
| prog | 6,176 | 49.19 | 87.93 | 1.79 | 0.00 | 2,901.95 | 6,176 | 0.78 | 2.56 | 3.29 | 0.00 | 37.60 |
| sara2 | 185 | 209.01 | 377.09 | 1.8 | 1.80 | 5640.00 | 185 | 2.50 | 5.9 | 2.36 | 0.02 | 58.28 |
| v12i1 | 2,743 | 43.08 | 65.28 | 1.52 | 0.00 | 1,100.13 | 2,743 | 0.33 | 1.37 | 4.18 | 0.00 | 36.40 |
| v12ne | 221 | 128.07 | 150.29 | 1.17 | 0.00 | 786.92 | 221 | 2.56 | 4.58 | 1.79 | 0.00 | 28.09 |
| v5i | 3,317 | 41.64 | 66.15 | 1.59 | 0.00 | 1,060.63 | 3,317 | 0.48 | 2.39 | 4.97 | 0.00 | 73.34 |
| vcarmen | 1,368 | 258.4 | 377.57 | 1.46 | 0.00 | 4,965.00 | 1,368 | 3.72 | 5.68 | 1.53 | 0.00 | 36.65 |
| vcn31 | 3,553 | 24.70 | 73.17 | 2.96 | 0.00 | 1,100.75 | 3,553 | 0.45 | 2.16 | 4.85 | 0.00 | 40.80 |
| vcn3ei1 | 2,360 | 69.09 | 126.48 | 1.83 | 0.00 | 2,059.05 | 2,360 | 1.43 | 3.55 | 2.48 | 0.00 | 37.26 |
| 11- |
|
|
In the El Porvenir mineral deposit, approximately 53% of the samples are derived from drill holes, while 47% originate from channels samples. Statistical differences are noticeable between them, with channel samples exhibiting generally higher grades for the most part of the statistical population. Figure 11-8 illustrates the cumulative distribution functions (CDF) and histograms of the samples within the mineralization wireframes.
Figure 11-8: El Porvenir CDF and Histograms for the Drill Holes and Channels Samples

| 11- |
|
|
Given the polymetallic nature of the mineralization, a bivariate statistical analysis was conducted to evaluate the relationships between the variables. Figure 11-9 provides scatter plots for the main elements, alongside their correlation coefficients. Generally, stronger correlations are observed between Zn and Pb, as well as between Ag and Pb. Correlation between the remaining elements range from weak to negligible.
Figure 11-9: El Porvenir Scatter Plots for Zn, Ag, Pb, and Cu

| 11.4.4 | Treatment of High Grade Assays |
The main elements have a positively skewed distribution, as illustrated in Figure 11-4. Within these distributions, anomalous and extreme high grade values may be present, potentially impacting estimation accuracy and leading to a "blowing out" effect, smearing the high grades more than their actual continuity.
To address this issue and mitigate potential impacts, Nexa staff conducted a comprehensive assessment of the raw statistical distributions for the grouped mineralization domains. Probability plots and histograms were employed to identify anomalous values, particularly in the upper percentiles of the distribution. This evaluation was carried out separately for drill holes
| 11- |
|
|
and channel samples. Any identified outliers were capped to ensure their influence on trend analysis and resource estimation was controlled.
Additionally, a second-level capping approach was implemented to further mitigate the influence of these values during the final estimation pass. Table 11-12 provides details of the top-cuts applied to both drill holes and channels for the main domains, as well as the second-level capping criteria utilized.
Table 11-12: El Porvenir Drill Hole (DDH), Channel (CHN), and the Second Level Top-Cut Values for the Main Elements
| Domain | Zn DDH | Zn CHN | Zn 2nd Level | Cu DDH | Cu CHN | Cu CHN 2nd Level | Ag DDH | Ag CHN | Ag CHN 2nd Level | Pb DDH | Pb CHN | Pb CHN 2nd Level |
| amsk14 | 21.45 | 5.61 | 5.61 | 1.94 | 0.63 | 0.47 | 397.80 | 1,156.00 | 552.90 | 2.89 | 0.22 | 0.21 |
| de2 | 15.95 | 16.64 | 10.44 | 0.56 | 1.24 | 0.33 | 1,196.00 | 2,030.00 | 1,396.00 | 16.20 | 18.46 | 16.39 |
| dl05 | 19.93 | 12.36 | 9.50 | 1.01 | 0.59 | 0.43 | 839.00 | 355.40 | 273.40 | 15.04 | 6.58 | 3.82 |
| exiti1 | 19.74 | 7.56 | 6.98 | 3.25 | 1.79 | 1.77 | 125.70 | 45.83 | 36.25 | 0.59 | 1.31 | 0.14 |
| exito | 23.40 | 18.98 | 14.52 | 2.11 | 1.57 | 1.13 | 552.40 | 342.60 | 280.70 | 12.86 | 11.63 | 7.00 |
| exitoa | 23.40 | 18.98 | 14.52 | 2.09 | 1.72 | 1.52 | 275.60 | 93.78 | 93.78 | 9.69 | 8.31 | 3.38 |
| ints26 | 17.98 | 7.81 | 7.81 | 1.41 | 0.49 | 0.48 | 127.90 | 19.74 | 18.90 | 4.34 | 0.09 | 0.08 |
| p2sw1 | 6.01 | 2.27 | 2.27 | 0.42 | 0.41 | 0.27 | 613.80 | 630.30 | 630.30 | 15.56 | 8.46 | 6.06 |
| p2sw2 | 6.01 | 2.27 | 2.27 | 0.42 | 0.41 | 0.27 | 613.80 | 630.30 | 630.30 | 15.56 | 8.46 | 6.06 |
| por9 | 33.61 | 24.32 | 17.26 | 3.63 | 1.24 | 0.87 | 806.60 | 145.10 | 47.07 | 10.98 | 6.30 | 0.21 |
| por928 | 33.61 | 24.32 | 17.26 | 3.63 | 1.24 | 0.87 | 444.50 | 183.70 | 168.00 | 10.98 | 6.30 | 0.21 |
| por929 | 33.61 | 24.32 | 17.26 | 3.63 | 1.24 | 0.87 | 444.50 | 183.70 | 168.00 | 23.61 | 14.24 | 7.85 |
| por95 | 20.03 | --- | --- | 1.03 | --- | --- | 214.90 | --- | --- | 1.73 | --- | --- |
| por9p | 29.98 | 30.03 | 15.81 | 2.67 | 1.38 | 0.74 | 509.70 | 172.20 | 94.13 | 14.83 | 12.92 | 0.90 |
| por9q | 29.98 | 30.03 | 15.81 | 2.67 | 1.38 | 0.74 | 509.70 | 172.20 | 94.13 | 14.83 | 12.92 | 0.90 |
| por9v | 29.98 | 30.03 | 15.81 | 2.67 | 1.38 | 0.74 | 509.70 | 172.20 | 94.13 | 4.92 | 2.73 | 2.73 |
| por9w | 23.68 | 27.07 | 20.40 | 3.31 | 2.72 | 1.09 | 312.60 | 747.70 | 260.80 | 14.26 | 23.12 | 5.58 |
| prog | 23.68 | 27.07 | 20.40 | 3.31 | 2.72 | 1.09 | 312.60 | 747.70 | 260.80 | 14.26 | 23.12 | 5.58 |
| sara2 | 15.95 | 16.64 | 10.44 | 0.56 | 1.24 | 0.33 | 1,196.00 | 2,030.00 | 1,396.00 | 16.20 | 18.46 | 16.39 |
| v12i1 | 34.63 | 29.67 | 20.90 | 2.10 | 1.60 | 0.58 | 91.23 | 275.50 | 155.10 | 1.38 | 9.50 | 1.57 |
| v12ne | 23.29 | 21.42 | 18.00 | 1.21 | 0.61 | 0.58 | 841.00 | 483.20 | 435.40 | 16.14 | 12.12 | 11.00 |
| v5i | 20.76 | 30.22 | 19.17 | 1.64 | 2.09 | 0.98 | 72.65 | 320.80 | 159.50 | 5.88 | 33.59 | 2.38 |
| vcarmen | 35.82 | 29.57 | 17.16 | 1.07 | 0.52 | 0.26 | 1,533.00 | 939.10 | 718.30 | 25.57 | 24.70 | 11.97 |
| vcn31 | 35.82 | 29.57 | 17.16 | 3.53 | 4.86 | 0.75 | 1,333.00 | 1,050.00 | 356.00 | 18.35 | 17.77 | 6.59 |
| vcn3ei1 | 30.01 | 30.49 | 24.14 | 3.53 | 4.86 | 0.75 | 1,333.00 | 1,050.00 | 356.00 | 25.57 | 24.70 | 11.97 |
| 11- |
|
|
Table 11-13 shows the statistics for the capped samples, as well as the metal loss for each of the main mineralization domains.
| 11- |
|
|
Table 11-13: El Porvenir Capped Statistics for the Main Elements
| Domain | Zn (%) capped - Length weighted | Cu (%) capped - Length weighted | ||||||||||||||||
| Count | Mean | StdDev | CV | Min | Max | Uncapped Mean | Uncapped Max | Metal Loss | Count | Mean | StdDev | CV | Min | Max | Uncapped Mean | Uncapped Max | Metal Loss | |
| amsk14 | 97 | 2.75 | 4.25 | 1.55 | 0.00 | 21.32 | 2.75 | 21.32 | 0.00% | 97 | 0.39 | 0.47 | 1.21 | 0.00 | 1.94 | 0.41 | 2.91 | -4.88% |
| de2 | 2,873 | 2.24 | 3.16 | 1.41 | 0.00 | 16.64 | 2.30 | 35.00 | -2.61% | 2,873 | 0.07 | 0.14 | 2.09 | 0.00 | 1.24 | 0.07 | 3.44 | 0.00% |
| dl05 | 434 | 2.13 | 2.93 | 1.37 | 0.02 | 19.93 | 2.19 | 28.60 | -2.74% | 434 | 0.17 | 0.16 | 0.93 | 0.01 | 1.01 | 0.18 | 1.45 | -5.56% |
| exiti1 | 53 | 3.02 | 5.84 | 1.94 | 0.01 | 19.74 | 3.35 | 29.96 | -9.85% | 53 | 0.89 | 0.68 | 0.76 | 0.01 | 3.25 | 0.92 | 6.25 | -3.26% |
| exito | 2,393 | 3.86 | 4.03 | 1.04 | 0.00 | 23.40 | 3.89 | 38.40 | -0.77% | 2,393 | 0.34 | 0.36 | 1.04 | 0.00 | 2.11 | 0.36 | 10.04 | -5.56% |
| exitoa | 905 | 3.35 | 3.96 | 1.18 | 0.00 | 23.40 | 3.37 | 42.50 | -0.59% | 905 | 0.51 | 0.43 | 0.84 | 0.00 | 2.09 | 0.52 | 5.18 | -1.92% |
| ints26 | 148 | 4.06 | 4.81 | 1.18 | 0.00 | 17.98 | 4.41 | 26.84 | -7.94% | 148 | 0.15 | 0.17 | 1.14 | 0.00 | 0.94 | 0.15 | 0.94 | 0.00% |
| p2sw1 | 217 | 0.81 | 1.02 | 1.26 | 0.00 | 6.01 | 0.84 | 11.41 | -3.57% | 217 | 0.03 | 0.05 | 1.74 | 0.00 | 0.41 | 0.03 | 1.39 | 0.00% |
| p2sw2 | 249 | 0.89 | 1.11 | 1.25 | 0.00 | 6.01 | 0.89 | 9.52 | 0.00% | 249 | 0.03 | 0.05 | 1.97 | 0.00 | 0.42 | 0.03 | 2.24 | 0.00% |
| por9 | 860 | 5.71 | 5.23 | 0.92 | 0.00 | 33.61 | 5.73 | 40.58 | -0.35% | 860 | 0.38 | 0.41 | 1.07 | 0.00 | 3.63 | 0.40 | 13.25 | -5.00% |
| por928 | 83 | 4.86 | 5.59 | 1.15 | 0.00 | 25.60 | 4.86 | 25.60 | 0.00% | 83 | 0.25 | 0.32 | 1.29 | 0.00 | 2.70 | 0.25 | 2.70 | 0.00% |
| por929 | 85 | 8.41 | 7.58 | 0.90 | 0.00 | 30.00 | 8.41 | 30.00 | 0.00% | 85 | 0.30 | 0.21 | 0.70 | 0.00 | 1.00 | 0.30 | 1.00 | 0.00% |
| por95 | 86 | 2.85 | 4.84 | 1.70 | 0.00 | 20.03 | 3.10 | 41.45 | -8.06% | 86 | 0.15 | 0.18 | 1.19 | 0.00 | 1.01 | 0.15 | 1.01 | 0.00% |
| por9p | 1,767 | 4.65 | 5.69 | 1.22 | 0.00 | 30.03 | 4.68 | 41.95 | -0.64% | 1,767 | 0.29 | 0.27 | 0.91 | 0.00 | 2.10 | 0.30 | 2.23 | -3.33% |
| por9q | 383 | 4.71 | 6.85 | 1.45 | 0.00 | 29.98 | 4.77 | 42.38 | -1.26% | 383 | 0.33 | 0.46 | 1.38 | 0.00 | 2.67 | 0.35 | 10.55 | -5.71% |
| por9v | 88 | 7.04 | 7.01 | 1.00 | 0.04 | 29.98 | 7.07 | 31.35 | -0.42% | 88 | 0.39 | 0.53 | 1.36 | 0.00 | 2.67 | 0.46 | 16.55 | -15.22% |
| por9w | 47 | 3.96 | 5.46 | 1.38 | 0.13 | 23.68 | 3.96 | 24.00 | 0.00% | 47 | 0.31 | 0.31 | 0.99 | 0.01 | 1.30 | 0.31 | 1.30 | 0.00% |
| prog | 6,176 | 5.20 | 6.23 | 1.20 | 0.00 | 27.07 | 5.24 | 43.94 | -0.76% | 6,176 | 0.39 | 0.42 | 1.08 | 0.00 | 3.31 | 0.40 | 17.23 | -2.50% |
| sara2 | 185 | 2.08 | 3.13 | 1.50 | 0.01 | 15.95 | 2.11 | 19.75 | -1.42% | 185 | 0.04 | 0.06 | 1.64 | 0.00 | 0.56 | 0.04 | 1.52 | 0.00% |
| v12i1 | 2,743 | 7.38 | 6.85 | 0.93 | 0.00 | 34.63 | 7.41 | 50.00 | -0.40% | 2,743 | 0.24 | 0.29 | 1.20 | 0.00 | 2.10 | 0.27 | 12.29 | -11.11% |
| v12ne | 221 | 4.18 | 5.82 | 1.39 | 0.00 | 23.29 | 4.31 | 34.92 | -3.02% | 221 | 0.20 | 0.24 | 1.21 | 0.00 | 1.21 | 0.21 | 5.93 | -4.76% |
| v5i | 3,317 | 7.10 | 6.38 | 0.90 | 0.00 | 30.22 | 7.15 | 63.35 | -0.70% | 3,317 | 0.39 | 0.33 | 0.86 | 0.00 | 2.09 | 0.40 | 13.12 | -2.50% |
| vcarmen | 1,368 | 5.52 | 7.75 | 1.40 | 0.00 | 35.82 | 5.53 | 44.47 | -0.18% | 1,368 | 0.08 | 0.12 | 1.44 | 0.00 | 1.07 | 0.09 | 1.90 | -11.11% |
| vcn31 | 3,553 | 4.25 | 5.14 | 1.21 | 0.00 | 35.82 | 4.25 | 39.31 | 0.00% | 3,553 | 0.23 | 0.23 | 1.00 | 0.00 | 3.53 | 0.24 | 14.81 | -4.17% |
| 11- |
|
|
| Domain | Zn (%) capped - Length weighted | Cu (%) capped - Length weighted | ||||||||||||||||
| Count | Mean | StdDev | CV | Min | Max | Uncapped Mean | Uncapped Max | Metal Loss | Count | Mean | StdDev | CV | Min | Max | Uncapped Mean | Uncapped Max | Metal Loss | |
| vcn3ei1 | 2,360 | 6.89 | 7.12 | 1.03 | 0.00 | 30.49 | 6.92 | 47.61 | -0.43% | 2,360 | 0.26 | 0.33 | 1.27 | 0.00 | 4.53 | 0.26 | 4.53 | 0.00% |
| Domain | Ag (g/t) capped - Length weighted | Pb (%) capped - Length weighted | ||||||||||||||||
| Count | Mean | StdDev | CV | Min | Max | Uncapped Mean | Uncapped Max | Metal Loss | Count | Mean | StdDev | CV | Min | Max | Uncapped Mean | Uncapped Maximum | Metal Loss | |
| amsk14 | 97 | 70.02 | 96.79 | 1.38 | 0.00 | 397.80 | 72.87 | 637.00 | -3.91% | 97 | 0.21 | 0.49 | 2.32 | 0.00 | 2.89 | 0.22 | 3.69 | -4.55% |
| de2 | 2,873 | 245.14 | 376.95 | 1.54 | 0.00 | 2,030.00 | 265.22 | 6,760.00 | -7.57% | 2,873 | 3.40 | 4.20 | 1.24 | 0.00 | 18.46 | 3.61 | 57.66 | -5.82% |
| dl05 | 434 | 76.22 | 96.10 | 1.26 | 2.00 | 839.00 | 77.40 | 1,100.44 | -1.52% | 434 | 0.95 | 2.13 | 2.25 | 0.00 | 15.04 | 1.02 | 24.20 | -6.86% |
| exiti1 | 53 | 14.98 | 11.53 | 0.77 | 2.02 | 74.96 | 14.98 | 74.96 | 0.00% | 53 | 0.02 | 0.05 | 2.65 | 0.01 | 0.52 | 0.02 | 0.52 | 0.00% |
| exito | 2,393 | 73.52 | 72.15 | 0.98 | 0.00 | 552.40 | 75.60 | 2,032.30 | -2.75% | 2,393 | 0.93 | 1.86 | 2.00 | 0.00 | 12.86 | 0.97 | 31.16 | -4.12% |
| exitoa | 905 | 41.97 | 53.73 | 1.28 | 0.00 | 275.60 | 45.46 | 939.64 | -7.68% | 905 | 0.47 | 1.43 | 3.03 | 0.00 | 9.69 | 0.52 | 20.98 | -9.62% |
| ints26 | 148 | 17.84 | 29.68 | 1.66 | 0.00 | 127.90 | 20.28 | 284.60 | -12.03% | 148 | 0.27 | 0.85 | 3.18 | 0.00 | 4.34 | 0.31 | 8.25 | -12.90% |
| p2sw1 | 217 | 89.59 | 105.52 | 1.18 | 0.00 | 630.30 | 94.57 | 3,484.21 | -5.27% | 217 | 1.53 | 1.70 | 1.11 | 0.00 | 12.21 | 1.54 | 26.73 | -0.65% |
| p2sw2 | 249 | 95.75 | 126.31 | 1.32 | 0.00 | 630.30 | 122.25 | 4,379.99 | -21.68% | 249 | 1.54 | 1.93 | 1.25 | 0.00 | 15.56 | 1.59 | 42.96 | -3.14% |
| por9 | 860 | 18.03 | 50.78 | 2.82 | 0.00 | 806.60 | 22.57 | 2,715.98 | -20.12% | 860 | 0.17 | 0.91 | 5.34 | 0.00 | 10.98 | 0.21 | 17.17 | -19.05% |
| por928 | 83 | 31.33 | 47.31 | 1.51 | 0.00 | 200.00 | 31.33 | 200.00 | 0.00% | 83 | 0.53 | 1.39 | 2.61 | 0.00 | 7.80 | 0.53 | 7.80 | 0.00% |
| por929 | 85 | 56.97 | 55.93 | 0.98 | 0.00 | 183.70 | 64.27 | 307.92 | -11.36% | 85 | 1.08 | 2.61 | 2.41 | 0.00 | 14.24 | 1.29 | 25.50 | -16.28% |
| por95 | 86 | 10.86 | 29.23 | 2.69 | 0.00 | 214.90 | 12.57 | 368.89 | -13.60% | 86 | 0.07 | 0.27 | 4.08 | 0.00 | 1.73 | 0.11 | 5.79 | -36.36% |
| por9p | 1,767 | 22.26 | 31.84 | 1.43 | 0.00 | 315.39 | 23.86 | 855.03 | -6.71% | 1,767 | 0.26 | 1.10 | 4.18 | 0.00 | 14.01 | 0.28 | 22.59 | -7.14% |
| por9q | 383 | 19.25 | 38.68 | 2.01 | 0.00 | 509.70 | 19.31 | 566.39 | -0.31% | 383 | 0.20 | 1.03 | 5.16 | 0.00 | 14.83 | 0.21 | 23.97 | -4.76% |
| por9v | 88 | 72.88 | 102.45 | 1.41 | 2.02 | 509.70 | 78.37 | 811.18 | -7.01% | 88 | 0.93 | 1.55 | 1.67 | 0.01 | 4.92 | 1.50 | 26.23 | -38.00% |
| por9w | 47 | 54.00 | 58.23 | 1.08 | 1.56 | 220.21 | 54.00 | 220.21 | 0.00% | 47 | 0.70 | 1.33 | 1.91 | 0.01 | 5.77 | 0.70 | 5.77 | 0.00% |
| prog | 6,176 | 48.50 | 77.60 | 1.60 | 0.00 | 747.70 | 49.19 | 2,901.95 | -1.40% | 6,176 | 0.76 | 2.42 | 3.17 | 0.00 | 23.12 | 0.78 | 37.60 | -2.56% |
| sara2 | 185 | 190.24 | 263.89 | 1.39 | 1.80 | 1,196.00 | 209.01 | 5,640.00 | -8.98% | 185 | 2.08 | 3.28 | 1.58 | 0.02 | 16.20 | 2.50 | 58.28 | -16.80% |
| v12i1 | 2,743 | 41.00 | 51.55 | 1.26 | 0.00 | 275.50 | 43.08 | 1,100.13 | -4.83% | 2,743 | 0.30 | 1.00 | 3.33 | 0.00 | 9.50 | 0.33 | 36.40 | -9.09% |
| v12ne | 221 | 128.07 | 150.29 | 1.17 | 0.00 | 786.92 | 128.07 | 786.92 | 0.00% | 221 | 2.39 | 3.95 | 1.65 | 0.00 | 16.14 | 2.56 | 28.09 | -6.64% |
| 11- |
|
|
| Domain | Ag (g/t) capped - Length weighted | Pb (%) capped - Length weighted | ||||||||||||||||
| Count | Mean | StdDev | CV | Min | Max | Uncapped Mean | Uncapped Max | Metal Loss | Count | Mean | StdDev | CV | Min | Max | Uncapped Mean | Uncapped Maximum | Metal Loss | |
| v5i | 3,317 | 39.74 | 53.76 | 1.35 | 0.00 | 320.80 | 41.64 | 1,060.63 | -4.56% | 3,317 | 0.46 | 1.86 | 4.06 | 0.00 | 33.59 | 0.48 | 73.34 | -4.17% |
| vcarmen | 1,368 | 242.67 | 305.39 | 1.26 | 0.00 | 1,533.00 | 258.40 | 4,965.00 | -6.09% | 1,368 | 3.67 | 5.49 | 1.49 | 0.00 | 25.57 | 3.72 | 36.65 | -1.34% |
| vcn31 | 3,553 | 24.70 | 73.17 | 2.96 | 0.00 | 1,100.75 | 24.70 | 1,100.75 | 0.00% | 3,553 | 0.43 | 1.95 | 4.56 | 0.00 | 18.35 | 0.45 | 40.80 | -4.44% |
| vcn3ei1 | 2,360 | 68.43 | 118.48 | 1.73 | 0.00 | 1,333.00 | 69.09 | 2,059.05 | -0.96% | 2,360 | 1.41 | 3.44 | 2.43 | 0.00 | 25.57 | 1.43 | 37.26 | -1.40% |
| 11- |
|
|
| 11.4.5 | Compositing |
The average sample length within the mineralized domains is 1.43 m, with most occurrences around 1.5 m. Nexa opted to composite the capped assays downhole to 1.0 m lengths, which corresponds to half of the parent block size height for the deposit. The remaining end lengths were then added to the previous interval. Composites were created within the mineralization domain wireframes and were flagged accordingly.
Figure 11-10 showcases the length histograms of both the raw and composited samples for reference.
Figure 11-10: El Porvenir Raw (on the left) and Composited (on the right) Histograms

Unsampled core intervals were assigned grades equal to half of the detection limit value for each of the elements.
The composite length was selected based on analysis of three composite lengths (0.1 m, 0.5 m, and 1.0 m). Figure 11-11 illustrates a comparison of the mean Zn relative error between length-weighted raw assay mean versus composite mean by mineralization domain for the different composite lengths.
Figure 11-11: El Porvenir Compositing Analysis

Source: Nexa, 2023
| 11- |
|
|
Table 11-14 shows the summary length-weighted statistics for the capped variables for the main domains.
| 11- |
|
|
Table 11-14: Capped and Composited Statistics
| Domain | Zn (%) Capped - Length weighted | Cu (%) Capped - Length weighted | ||||||||||
| Count | Mean | StdDev | CV | Min | Max | Count | Mean | StdDev | CV | Min | Max | |
| amsk14 | 121 | 2.75 | 3.87 | 1.41 | 0.00 | 18.00 | 121 | 0.39 | 0.44 | 1.13 | 0.00 | 1.89 |
| de2 | 3,721 | 2.24 | 2.95 | 1.32 | 0.00 | 16.64 | 3,721 | 0.07 | 0.13 | 1.93 | 0.00 | 1.24 |
| dl05 | 502 | 2.13 | 2.65 | 1.24 | 0.02 | 19.93 | 502 | 0.17 | 0.15 | 0.86 | 0.01 | 1.01 |
| exiti1 | 74 | 3.02 | 5.49 | 1.82 | 0.02 | 19.74 | 74 | 0.89 | 0.63 | 0.71 | 0.01 | 2.67 |
| exito | 3,425 | 3.86 | 3.73 | 0.97 | 0.00 | 23.40 | 3,425 | 0.34 | 0.33 | 0.97 | 0.00 | 2.11 |
| exitoa | 1,165 | 3.35 | 3.59 | 1.07 | 0.00 | 20.85 | 1,165 | 0.51 | 0.40 | 0.79 | 0.00 | 2.09 |
| ints26 | 180 | 4.06 | 4.33 | 1.07 | 0.00 | 17.98 | 180 | 0.15 | 0.15 | 1.05 | 0.00 | 0.76 |
| p2sw1 | 284 | 0.81 | 0.95 | 1.17 | 0.00 | 6.01 | 284 | 0.03 | 0.04 | 1.65 | 0.00 | 0.36 |
| p2sw2 | 334 | 0.89 | 1.01 | 1.14 | 0.00 | 5.23 | 334 | 0.03 | 0.05 | 1.82 | 0.00 | 0.41 |
| por9 | 1,049 | 5.71 | 4.79 | 0.84 | 0.00 | 32.60 | 1,049 | 0.38 | 0.37 | 0.96 | 0.00 | 3.63 |
| por928 | 152 | 4.86 | 5.42 | 1.12 | 0.00 | 25.60 | 152 | 0.25 | 0.30 | 1.20 | 0.00 | 2.64 |
| por929 | 113 | 8.41 | 7.19 | 0.86 | 0.00 | 29.98 | 113 | 0.30 | 0.20 | 0.67 | 0.00 | 1.00 |
| por95 | 101 | 2.85 | 4.46 | 1.56 | 0.00 | 19.77 | 101 | 0.15 | 0.16 | 1.07 | 0.00 | 0.97 |
| por9p | 2,626 | 4.65 | 5.41 | 1.16 | 0.00 | 30.03 | 2,626 | 0.29 | 0.25 | 0.86 | 0.00 | 2.10 |
| por9q | 472 | 4.71 | 6.20 | 1.32 | 0.00 | 29.98 | 472 | 0.33 | 0.43 | 1.27 | 0.00 | 2.58 |
| por9v | 84 | 7.04 | 6.12 | 0.87 | 0.09 | 29.98 | 84 | 0.39 | 0.47 | 1.19 | 0.00 | 2.18 |
| por9w | 60 | 3.96 | 4.72 | 1.19 | 0.13 | 20.84 | 60 | 0.31 | 0.28 | 0.90 | 0.01 | 1.30 |
| prog | 10,639 | 5.20 | 6.14 | 1.18 | 0.00 | 27.07 | 10,639 | 0.39 | 0.40 | 1.04 | 0.00 | 3.31 |
| sara2 | 198 | 2.08 | 2.87 | 1.38 | 0.02 | 15.95 | 198 | 0.04 | 0.05 | 1.37 | 0.00 | 0.46 |
| v12i1 | 4,914 | 7.38 | 6.71 | 0.91 | 0.00 | 34.63 | 4,914 | 0.24 | 0.28 | 1.16 | 0.00 | 2.10 |
| v12ne | 289 | 4.18 | 5.22 | 1.25 | 0.00 | 23.29 | 289 | 0.20 | 0.21 | 1.07 | 0.00 | 1.21 |
| 11- |
|
|
| Domain | Zn (%) Capped - Length weighted | Cu (%) Capped - Length weighted | ||||||||||
| Count | Mean | StdDev | CV | Min | Max | Count | Mean | StdDev | CV | Min | Max | |
| v5i | 6,269 | 7.10 | 6.30 | 0.89 | 0.00 | 30.22 | 6,269 | 0.39 | 0.33 | 0.85 | 0.00 | 2.09 |
| vcarmen | 1,735 | 5.52 | 7.05 | 1.28 | 0.00 | 32.07 | 1,735 | 0.08 | 0.11 | 1.30 | 0.00 | 1.07 |
| vcn31 | 4,613 | 4.25 | 4.74 | 1.12 | 0.00 | 34.80 | 4,613 | 0.23 | 0.22 | 0.95 | 0.00 | 3.53 |
| vcn3ei1 | 3,693 | 6.89 | 6.78 | 0.98 | 0.00 | 30.49 | 3,693 | 0.26 | 0.32 | 1.21 | 0.00 | 4.53 |
| Domain | Ag (g/t) Capped - Length weighted | Pb (%) Capped - Length-weighted | ||||||||||
| Count | Mean | StdDev | CV | Min | Max | Count | Mean | StdDev | CV | Min | Max | |
| amsk14 | 121 | 70.02 | 90.15 | 1.29 | 0.10 | 397.8 | 121 | 0.21 | 0.44 | 2.11 | 0.00 | 2.89 |
| de2 | 3,721 | 245.14 | 351.46 | 1.43 | 0.00 | 2030 | 3,721 | 3.40 | 3.91 | 1.15 | 0.00 | 18.46 |
| dl05 | 502 | 76.22 | 82.59 | 1.08 | 2.00 | 674.19 | 502 | 0.95 | 1.89 | 2.00 | 0.00 | 15.04 |
| exiti1 | 74 | 14.98 | 10.51 | 0.70 | 2.02 | 60.28 | 74 | 0.02 | 0.04 | 2.26 | 0.01 | 0.40 |
| exito | 3,425 | 73.52 | 66.56 | 0.91 | 0.00 | 501.51 | 3,425 | 0.93 | 1.73 | 1.86 | 0.00 | 12.86 |
| exitoa | 1,165 | 41.97 | 50.98 | 1.21 | 0.00 | 275.6 | 1,165 | 0.47 | 1.34 | 2.85 | 0.00 | 9.69 |
| ints26 | 180 | 17.84 | 28.97 | 1.62 | 0.00 | 127.9 | 180 | 0.27 | 0.82 | 3.07 | 0.00 | 4.34 |
| p2sw1 | 284 | 89.59 | 98.38 | 1.10 | 0.31 | 630.3 | 284 | 1.53 | 1.53 | 1.00 | 0.00 | 12.11 |
| p2sw2 | 334 | 95.75 | 118.45 | 1.24 | 0.20 | 630.3 | 334 | 1.54 | 1.71 | 1.11 | 0.00 | 13.03 |
| por9 | 1,049 | 18.03 | 44.22 | 2.45 | 0.00 | 806.6 | 1,049 | 0.17 | 0.80 | 4.66 | 0.00 | 10.98 |
| por928 | 152 | 31.33 | 46.19 | 1.47 | 0.00 | 200 | 152 | 0.53 | 1.35 | 2.53 | 0.00 | 7.80 |
| por929 | 113 | 56.97 | 55.30 | 0.97 | 0.00 | 183.7 | 113 | 1.08 | 2.60 | 2.40 | 0.00 | 14.24 |
| por95 | 101 | 10.86 | 25.72 | 2.37 | 0.00 | 214.9 | 101 | 0.07 | 0.24 | 3.53 | 0.00 | 1.73 |
| por9p | 2,626 | 22.26 | 30.57 | 1.37 | 0.00 | 218.66 | 2,626 | 0.26 | 1.06 | 4.02 | 0.00 | 12.99 |
| por9q | 472 | 19.25 | 34.00 | 1.77 | 0.00 | 283.35 | 472 | 0.20 | 0.95 | 4.71 | 0.00 | 14.83 |
| por9v | 84 | 72.88 | 85.48 | 1.17 | 2.02 | 509.7 | 84 | 0.93 | 1.39 | 1.50 | 0.01 | 4.92 |
| por9w | 60 | 54.00 | 54.47 | 1.01 | 1.92 | 220.21 | 60 | 0.70 | 1.23 | 1.77 | 0.01 | 5.77 |
| 11- |
|
|
| Domain | Ag (g/t) Capped - Length weighted | Pb (%) Capped - Length-weighted | ||||||||||
| Count | Mean | StdDev | CV | Min | Max | Count | Mean | StdDev | CV | Min | Max | |
| prog | 10,639 | 48.50 | 76.52 | 1.58 | 0.00 | 747.7 | 10,639 | 0.76 | 2.38 | 3.12 | 0.00 | 23.12 |
| sara2 | 198 | 190.24 | 234.10 | 1.23 | 7.40 | 1196 | 198 | 2.08 | 3.01 | 1.45 | 0.02 | 16.20 |
| v12i1 | 4,914 | 41.00 | 51.30 | 1.25 | 0.00 | 275.5 | 4,914 | 0.30 | 1.00 | 3.31 | 0.00 | 9.50 |
| v12ne | 289 | 128.07 | 135.05 | 1.05 | 0.00 | 786.92 | 289 | 2.39 | 3.60 | 1.51 | 0.00 | 16.14 |
| v5i | 6,269 | 39.74 | 53.51 | 1.35 | 0.00 | 320.8 | 6,269 | 0.46 | 1.85 | 4.05 | 0.00 | 33.59 |
| vcarmen | 1,735 | 242.67 | 273.23 | 1.13 | 0.00 | 1,533 | 1,735 | 3.67 | 4.94 | 1.35 | 0.00 | 25.57 |
| vcn31 | 4,613 | 24.70 | 69.09 | 2.80 | 0.00 | 1,100.75 | 4,613 | 0.43 | 1.82 | 4.28 | 0.00 | 18.35 |
| vcn3ei1 | 3,693 | 68.43 | 113.02 | 1.65 | 0.00 | 1,050 | 3,693 | 1.41 | 3.28 | 2.32 | 0.00 | 24.70 |
| 11- |
|
|
| 11.4.6 | Trend Analysis |
| 11.4.6.1 | Variography |
Nexa staff generated downhole and directional variograms for each domain utilizing the one-metre composites for each variable. These variograms served to improve the understanding and quantification of spatial grade variability within the mineralization domains. Variograms were standardized and modelled using three spherical structures and served as a guide when selecting search ellipse ranges. Figure 11-12 illustrates the normal-score variograms for the “de2” domain.
Figure 11-12: Downhole and Directional Zn Experimental Variograms and Models for "de2" Domain

Table 11-15 presents the back-transformed variogram parameters for Zn corresponding to the 25 largest domain tonnage contributors to the Mineral Resource.
| 11- |
|
|
Table 11-15: El Porvenir Variogram Parameters for the Main Domains (Back-Transformed)
| Domain | Datamine Rotation | Datamine Axis | Nugget Effect | Structure 1 | Structure 2 | Structure 3 | ||||||||||||
| VANGLE1 | VANGLE2 | VANGLE3 | VAXIS1 | VAXIS2 | VAXIS3 | ST1PAR1 | ST1PAR2 | ST1PAR3 | C1 | ST2PAR1 | ST2PAR2 | ST2PAR3 | C2 | ST3PAR1 | ST3PAR2 | ST3PAR3 | ||
| amsk14 | -115.506 | 67.731 | -62.727 | 3 | 2 | 1 | 0.271 | 13 | 5 | 5 | 0.57 | 24 | 14 | 8 | 0.056 | 30 | 20 | 12 |
| de2 | 5.34 | 48.974 | 168.308 | 3 | 2 | 1 | 0.118 | 8 | 2 | 5 | 0.337 | 39 | 19 | 10 | 0.297 | 66 | 31 | 22 |
| dl05 | 146.781 | 62.009 | -43.219 | 3 | 2 | 1 | 0.182 | 15 | 3 | 6 | 0.668 | 26 | 5 | 11 | 0.075 | 32 | 12 | 14 |
| exiti1 | -74.561 | 75.894 | -44.561 | 3 | 2 | 1 | 0.031 | 16 | 30 | 10 | 0.667 | 19 | 32 | 17 | 0.164 | 31 | 33 | 18 |
| exito | 125.506 | 67.731 | -117.273 | 3 | 2 | 1 | 0.069 | 5 | 4 | 4 | 0.506 | 26 | 9 | 16 | 0.288 | 37 | 26 | 19 |
| exitoa | 125.506 | 67.731 | -117.273 | 3 | 2 | 1 | 0.069 | 5 | 4 | 4 | 0.506 | 26 | 9 | 16 | 0.288 | 37 | 26 | 19 |
| ints26 | 139.107 | 48.59 | 139.107 | 3 | 2 | 1 | 0.048 | 9 | 15 | 3 | 0.579 | 27 | 21 | 9 | 0.183 | 34 | 26 | 11 |
| p2sw1 | -77.24 | 33.826 | -127.005 | 3 | 2 | 1 | 0.249 | 10 | 14 | 8 | 0.362 | 25 | 20 | 14 | 0.199 | 45 | 21 | 18 |
| p2sw2 | -77.24 | 33.826 | -127.005 | 3 | 2 | 1 | 0.249 | 10 | 14 | 8 | 0.362 | 25 | 20 | 14 | 0.199 | 45 | 21 | 18 |
| por9 | -106.74 | 58.525 | -70.575 | 3 | 2 | 1 | 0.124 | 6 | 6 | 6 | 0.418 | 25 | 12 | 14 | 0.24 | 36 | 22 | 22 |
| por928 | -106.74 | 58.525 | -70.575 | 3 | 2 | 1 | 0.124 | 6 | 6 | 6 | 0.418 | 25 | 12 | 14 | 0.24 | 36 | 22 | 22 |
| por929 | -106.74 | 58.525 | -70.575 | 3 | 2 | 1 | 0.124 | 6 | 6 | 6 | 0.418 | 25 | 12 | 14 | 0.24 | 36 | 22 | 22 |
| por95 | 105.725 | 29.499 | 78.492 | 3 | 2 | 1 | 0.095 | 6 | 4 | 4 | 0.449 | 29 | 15 | 7 | 0.22 | 35 | 20 | 12 |
| por9p | 132.727 | 67.731 | 25.506 | 3 | 2 | 1 | 0.145 | 21 | 7 | 10 | 0.653 | 44 | 16 | 12 | 0.1 | 52 | 23 | 16 |
| por9q | 132.727 | 67.731 | 25.506 | 3 | 2 | 1 | 0.145 | 21 | 7 | 10 | 0.653 | 44 | 16 | 12 | 0.1 | 52 | 23 | 16 |
| por9v | 132.727 | 67.731 | 25.506 | 3 | 2 | 1 | 0.145 | 21 | 7 | 10 | 0.653 | 44 | 16 | 12 | 0.1 | 52 | 23 | 16 |
| por9w | 130 | 70 | -90 | 3 | 2 | 1 | 0.15 | 2 | 6 | 11 | 0.241 | 18 | 23 | 20 | 0.24 | 42 | 27 | 21 |
| prog | 130 | 70 | -90 | 3 | 2 | 1 | 0.15 | 2 | 6 | 11 | 0.241 | 18 | 23 | 20 | 0.24 | 42 | 27 | 21 |
| sara2 | 5.34 | 48.974 | 168.308 | 3 | 2 | 1 | 0.118 | 8 | 2 | 5 | 0.337 | 39 | 19 | 10 | 0.297 | 66 | 31 | 22 |
| v12i1 | 104.561 | 75.894 | 44.561 | 3 | 2 | 1 | 0.186 | 12 | 8 | 11 | 0.549 | 26 | 18 | 18 | 0.13 | 37 | 25 | 23 |
| v12ne | 150 | 80 | 90 | 3 | 2 | 1 | 0.148 | 5 | 3 | 4 | 0.466 | 23 | 8 | 10 | 0.234 | 36 | 12 | 12 |
| v5i | 135.439 | 75.894 | -44.561 | 3 | 2 | 1 | 0.152 | 10 | 4 | 6 | 0.445 | 28 | 13 | 25 | 0.192 | 52 | 40 | 29 |
| vcarmen | 142.727 | 67.731 | -154.494 | 3 | 2 | 1 | 0.168 | 2 | 2 | 5 | 0.572 | 15 | 9 | 14 | 0.157 | 27 | 21 | 16 |
| vcn31 | 142.727 | 67.731 | -154.494 | 3 | 2 | 1 | 0.168 | 2 | 2 | 5 | 0.572 | 15 | 9 | 14 | 0.157 | 27 | 21 | 16 |
| vcn3ei1 | 132.727 | 67.731 | 25.506 | 3 | 2 | 1 | 0.124 | 4 | 4 | 6 | 0.45 | 26 | 26 | 12 | 0.274 | 47 | 33 | 20 |
| 11- |
|
|
| 11.4.6.2 | Grade Contouring |
Grade contours play an important role in aiding the initial detection of preferential grade patterns within mineralization domains. A brief assessment was carried out for the “de2” and “por9q” domains to assess potential grade trends.
Figure 11-13 illustrates the Zn contours for these domains. While the “de2” domain exhibits no clear trend, the “por9q” domain shows a more distinct trend extending northward and down-dip.
| 11- |
|
|
Figure 11-13: Contour Zn Grades for the “de2” (left) and “por9q” (right) Domains

| 11- |
|
|
| 11.4.7 | Search Strategy and Grade Interpolation Parameters |
The final estimated values for Zn, Cu, Ag, and Pb grades at El Porvenir are determined by ID3. Initially, the estimation process incorporates OK, ID3, and NN interpolators, followed by an individual domain analysis to select between OK or ID3 results. This selection is based on domain-specific criteria such as sample quantity, average difference between OK and ID3 compared to NN, and domain size/volume. Variograms are defined based on estimation groups, allowing even domains with limited samples to be estimated via OK for comparison and validation purposes. Grade variables are not density or length-weighted during estimation.
To capture domain trends, dynamic anisotropy angles are calculated in Studio RM using domain wireframes. The estimation process includes three passes: the first pass utilizes search ellipse radii equivalent to variogram ranges for each variable; the second pass increases the radii by a factor of 1.5 to 2.5; and the third pass employs radii ten times larger than the first pass.
The minimum and maximum sample numbers typically range from eight to 12 for the first pass, six to eight for the second pass, and one to six for the third pass, with a maximum of two samples per drill hole. Minor adjustments are made as needed to improve the final estimation result. Table 11-16 presents the search parameters for Zn in the main estimation domains.
Table 11-16: El Porvenir Search Parameters for the Main Domains
| Domain |
Search Ellipse (m) |
Pass 1 | No. Composites | Pass 2 | No. Composites | Pass 3 | No. Composites | Max Per Hole | |||||
| X | Y | Z | S-Vol | Min | Max | S-Vol | Min | Max | S-Vol | Min | Max | ||
| amsk14 | 25 | 14 | 15 | 1 | 8 | 12 | 2 | 6 | 8 | 10 | 1 | 6 | 2 |
| de2 | 30 | 20 | 10 | 1 | 8 | 12 | 2 | 6 | 8 | 10 | 1 | 6 | 2 |
| dl05 | 30 | 20 | 10 | 1 | 8 | 12 | 2 | 6 | 8 | 10 | 1 | 6 | 2 |
| exiti1 | 30 | 20 | 10 | 1 | 8 | 12 | 2 | 6 | 8 | 10 | 1 | 6 | 2 |
| exito | 30 | 20 | 10 | 1 | 8 | 12 | 2 | 6 | 8 | 10 | 1 | 6 | 2 |
| exitoa | 30 | 20 | 10 | 1 | 8 | 12 | 2 | 6 | 8 | 10 | 1 | 6 | 2 |
| ints26 | 26 | 16 | 10 | 1 | 8 | 12 | 2 | 6 | 8 | 10 | 1 | 6 | 2 |
| p2sw1 | 30 | 20 | 10 | 1 | 8 | 12 | 2 | 6 | 8 | 10 | 1 | 6 | 2 |
| p2sw2 | 65 | 18 | 6 | 1 | 6 | 16 | 2 | 6 | 16 | 10 | 1 | 4 | 2 |
| por9 | 30 | 20 | 17 | 1 | 8 | 12 | 2 | 6 | 8 | 10 | 1 | 6 | 2 |
| por928 | 30 | 20 | 10 | 1 | 8 | 12 | 2 | 6 | 8 | 10 | 1 | 6 | 2 |
| por929 | 16 | 12 | 8 | 1 | 8 | 12 | 2 | 6 | 8 | 10 | 1 | 6 | 2 |
| por95 | 30 | 20 | 10 | 1 | 8 | 12 | 2 | 6 | 8 | 10 | 1 | 6 | 2 |
| por9p | 30 | 20 | 10 | 1 | 8 | 12 | 2 | 6 | 8 | 10 | 1 | 6 | 2 |
| por9q | 30 | 20 | 10 | 1 | 8 | 12 | 2 | 6 | 8 | 10 | 1 | 6 | 2 |
| por9v | 30 | 20 | 10 | 1 | 8 | 12 | 2 | 6 | 8 | 10 | 1 | 6 | 2 |
| por9w | 30 | 20 | 10 | 1 | 8 | 12 | 2 | 6 | 8 | 10 | 1 | 6 | 2 |
| prog | 30 | 20 | 20 | 1 | 8 | 12 | 2 | 6 | 8 | 10 | 1 | 6 | 2 |
| sara2 | 80 | 30 | 10 | 1 | 5 | 16 | 2 | 6 | 12 | 10 | 1 | 4 | 2 |
| 11- |
|
|
| Domain |
Search Ellipse (m) |
Pass 1 | No. Composites | Pass 2 | No. Composites | Pass 3 | No. Composites | Max Per Hole | |||||
| X | Y | Z | S-Vol | Min | Max | S-Vol | Min | Max | S-Vol | Min | Max | ||
| v12i1 | 30 | 20 | 10 | 1 | 8 | 12 | 2 | 6 | 8 | 10 | 1 | 6 | 2 |
| v12ne | 30 | 20 | 10 | 1 | 8 | 12 | 2 | 6 | 8 | 10 | 1 | 6 | 2 |
| v5i | 30 | 20 | 10 | 1 | 8 | 12 | 2 | 6 | 8 | 10 | 1 | 6 | 2 |
| vcarmen | 30 | 20 | 10 | 1 | 8 | 12 | 2 | 6 | 8 | 10 | 1 | 6 | 2 |
| vcn31 | 30 | 20 | 10 | 1 | 8 | 12 | 2 | 6 | 8 | 10 | 1 | 6 | 2 |
| vcn3ei1 | 30 | 20 | 10 | 1 | 8 | 12 | 2 | 6 | 8 | 10 | 1 | 6 | 2 |
For the samples with missing values, half of the detection limit was used for the estimation, and for the final block model, the influence of theses samples was calculated in the blocks using NN, and those blocks were excluded from the block model.
The QP is of the opinion that the current search parameters are reasonable and provide an acceptable level of local precision for the estimate.
| 11.4.8 | Bulk Density |
A total of 2,909 density measurements were taken across the various zones within the El Porvenir deposit. These measurements provide data for 301 of the 522 mineralization domains and the capped values range from 2.69 t/m3 and 4.34 t/m3.
Density values are best correlated with the Zn grades, as demonstrated in Figure 11-14.
Figure 11-14: El Porvenir Density Correlation Matrix and Scatter Plots

Figure 11-15 shows a plan and isometric view of density composites in relation to the mineralized domains, indicating relatively widespread coverage but with some significant gaps where mineralized bodies are lacking informing density samples, although the largest of these are located outside of the Mineral Resource and Mineral Reserve reporting shapes.
| 11- |
|
|
Figure 11-15: El Porvenir Density Composites

| 11- |
|
|
Considering the main domains, 17 of the 25 have density values, totalling 942 density samples. Figure 11-16 and Table 11-17 show the boxplots and statistics for density values of the 17 main domains with available density samples.
Figure 11-16: El Porvenir Boxplots Showing the Density Values for the Main Domains.

Table 11-17: El Porvenir Statistics of the Density Values for the Main Domains
| Domain | Count | Mean (t/m³) |
StdDev (t/m³) |
Minimum (t/m³) |
Maximum (t/m³) |
| de2 | 91 | 2.60 | 0.15 | 2.44 | 2.98 |
| p2sw1 | 9 | 2.62 | 0.05 | 2.59 | 2.75 |
| sara2 | 11 | 2.69 | 0.20 | 2.42 | 3.01 |
| p2sw2 | 14 | 2.69 | 0.09 | 2.59 | 2.86 |
| dl05 | 40 | 3.13 | 0.24 | 2.92 | 3.81 |
| amsk14 | 25 | 3.25 | 0.61 | 2.72 | 4.45 |
| por9 | 34 | 3.26 | 0.24 | 2.75 | 3.86 |
| vcarmen | 105 | 3.33 | 0.58 | 2.73 | 4.54 |
| ints26 | 44 | 3.34 | 0.34 | 2.8 | 4.1 |
| exito | 85 | 3.34 | 0.39 | 2.7 | 3.95 |
| vcn31 | 167 | 3.45 | 0.43 | 2.9 | 4.42 |
| v5i | 18 | 3.50 | 0.40 | 2.69 | 3.93 |
| prog | 108 | 3.52 | 0.49 | 2.74 | 4.35 |
| por9p | 10 | 3.57 | 0.18 | 3.28 | 3.89 |
| vcn3ei1 | 54 | 3.62 | 0.45 | 2.9 | 4.35 |
| exitoa | 97 | 3.62 | 0.34 | 2.7 | 3.95 |
| 11- |
|
|
| Domain | Count | Mean (t/m³) |
StdDev (t/m³) |
Minimum (t/m³) |
Maximum (t/m³) |
| v12i1 | 30 | 3.68 | 0.22 | 3.41 | 4.2 |
Similar mineralization domains were grouped (previously shown in Figure 11-6) and an average density value calculated for each group (Table 11-18). To assign density values to the block model, a local ID3 estimation method was used with a search neighbourhood radii equivalent to that applied to the Indicated Mineral Resources. For blocks situated beyond these radii or within domains lacking samples, the grouped domain's average density value was assigned.
Table 11-18: El Porvenir Grouped Domain Density Statistics
| Group | No. Samples |
Mean (t/m³) |
StdDev (t/m³) |
Minimum (t/m³) |
Maximum (t/m³) |
| AM | 113 | 3.27 | 0.52 | 2.49 | 4.63 |
| DE | 80 | 2.59 | 0.21 | 2.11 | 3.70 |
| DL | 72 | 3.11 | 0.40 | 2.31 | 4.25 |
| EXPLO | 120 | 2.97 | 0.38 | 2.39 | 4.38 |
| INTEG | 90 | 3.23 | 0.50 | 2.43 | 4.56 |
| PORV2SE | 50 | 2.86 | 0.28 | 2.47 | 3.84 |
| PORV2SW | 44 | 2.66 | 0.13 | 2.40 | 3.58 |
| PORV3 | 49 | 2.88 | 0.24 | 2.23 | 4.38 |
| PORV9 | 304 | 3.34 | 0.37 | 1.74 | 4.78 |
| SARA | 75 | 2.56 | 0.36 | 2.12 | 5.01 |
| SOC | 53 | 3.21 | 0.54 | 2.44 | 4.66 |
| VCN1 | 207 | 3.31 | 0.65 | 2.28 | 4.74 |
| VCN3 | 366 | 3.41 | 0.54 | 1.57 | 5.09 |
| VCN4 | 23 | 3.14 | 0.50 | 2.63 | 4.38 |
| VC1 | 17 | 3.69 | 0.75 | 2.55 | 4.76 |
| VC2 | 88 | 3.24 | 0.55 | 2.43 | 4.89 |
| VC3 | 70 | 3.41 | 0.68 | 2.57 | 5.18 |
| VPROG | 143 | 3.56 | 0.52 | 2.36 | 4.66 |
| V12 | 328 | 3.17 | 0.39 | 2.35 | 4.30 |
| V12i | 47 | 3.69 | 0.39 | 2.72 | 4.48 |
| V12s | 208 | 2.93 | 0.43 | 2.52 | 5.98 |
| V5 | 121 | 3.11 | 0.57 | 2.32 | 5.22 |
| ÉXITO | 241 | 3.50 | 0.49 | 2.62 | 5.36 |
| 11- |
|
|
| 11.4.9 | Block Models |
A non-rotated blocked model was generated in Studio RM with parent blocks size of 2 m x 2 m x 2 m and a minimum sub-cell size of 0.5 m x 0.5 m x 0.5 m. Sub-blocking took place at mineralization domain wireframe boundaries.
Table 11-19 shows the parameters of the block model.
Table 11-19: El Porvenir Blocked Model Definition
| X | Y | Z | |
| Base Point | 367,000 | 8,826,060 | 2,400 |
| Boundary Size (m) | 1,780 | 3,340 | 2,150 |
| Number of Blocks | 890 | 1,670 | 1,075 |
| Parent Block (m) | 2 | 2 | 2 |
| Minimum Sub-Block (m) | 0.5 | 0.5 | 0.5 |
| 11.4.10 | Net Smelter Return and Cut-off Value |
NSR values were calculated using the Mineral Resource metal prices, metallurgical recovery rates, transportation, treatment, and refining costs, for the different mining methods and regions of the mine. Metal prices applied to Mineral Resources are 15% greater than Mineral Reserves, which are derived from consensus long-term forecasts obtained from financial institutions, banks, and other reliable sources. The NSR value is denominated in US$/t and is computed for Mineral Resources to enable a meaningful comparison with production costs, helping to ascertain the economic viability of mining the mineralized material.
Currently, the mine yields Zn concentrate containing Ag, Pb concentrate containing Ag and Au, and Cu concentrate containing Ag and Au as saleable products. The payable metals in these concentrates include transportation costs, refining charges, deductions, and penalty elements, as outlined in sales agreements established between the mine and smelters or traders.
The NSR factors are determined based on the smelter terms and metal prices, detailed in Table 11-20.
| 11- |
|
|
Table 11-20: El Porvenir NSR Parameters
| Item | Unit | Value | Item | Unit | Value | |
| Plant Metallurgical Recovery* | Pb Concentrate Payable % | |||||
| Zn | % | 89.21 | Pb | % | 95 | |
| Cu | % | 14.60 | Ag | % | 95 | |
| Ag | % | 77.51 | Logistics and TC | |||
| Pb | % | 80.02 | Zn concentrate | US$/t conc | 356.63 | |
| Metal Prices | Cu concentrate | US$/t conc | 279.33 | |||
| Zn | US$/t | 3,218.90 | Pb concentrate | US$/t conc | 221.10 | |
| Cu | US$/t | 8,820.05 | Integrated Zn | |||
| Ag | US$/t | 24.35 | Conversion cost | US$/t Zn prod | 655.83 | |
| Pb | US$/t | 2,300.33 | Premium | US$/t Zn prod | 103.18 | |
| Zn Concentrate Payable % | Refining cost | |||||
| Zn | % | 85 | Au in Pb conc | US$/oz | 10.00 | |
| Ag | % | 70 | Ag in Pb conc | US$/oz | 1.00 | |
| Cu Concentrate Payable % | Ag in Cu conc | US$/oz | 0.50 | |||
| Cu | % | 96.7 | ||||
| Ag | % | 90 | ||||
* Based on LOM average metal grades.
Nexa assessed supply and demand dynamics for Zn, Pb, and Cu, alongside consensus long-term (ten-year) metal price forecasts. The QP verified that the metal prices chosen for Mineral Reserve estimation align with independent forecasts provided by banks and other credible sources. Metal prices selected for Mineral Resource estimation purposes are set 15% higher, a standard practice within the industry.
The average NSR factors are derived by calculating the LOM revenue contribution from each metal, net of off-site costs and factors, and then dividing it by the reserve grade for that specific metal. These factors serve to highlight the relative economic significance of each metal unit to the mine's overall financial performance. For most metals, a variable recovery rate (as a function of head grade) was employed. Therefore, the average NSR factors should not be applied to head grades without considering the head grade and recovery.
Various cut-off NSR values have been calculated for El Porvenir, contingent upon the mining zone and the chosen mining method, which can be either SLS or CAF. Each zone is subject to distinct material movement costs, determined by whether truck haulage, shaft, or a combination of both methods is employed. The break-even cut-off grade reflects direct and indirect mining costs, processing costs, as well as general and administrative (G&A) expenses, as presented in Table 11-21.
| 11- |
|
|
Table 11-21: El Porvenir Cut-off Value Calculation by Mining Zone and Method
| Item | Unit | Value | Item | Unit | Value | |
| SLS - Upper Zone | CAF - Upper Zone | |||||
| Mine cost | US$/t | 50.24 | Mine cost | US$/t | 52.24 | |
| Development | US$/t | 23.91 | Development | US$/t | 23.91 | |
| Plant costs | US$/t | 10.43 | Plant costs | US$/t | 10.43 | |
| G&A | US$/t | 6.37 | G&A | US$/t | 6.37 | |
| Cut-off Value | US$/t | 67.04 | Cut-off Value | US$/t | 69.04 | |
| SLS - Intermediate Zone | CAF - Intermediate Zone | |||||
| Mine cost | US$/t | 47.18 | Mine cost | US$/t | 49.95 | |
| Development | US$/t | 23.91 | Development | US$/t | 23.91 | |
| Plant costs | US$/t | 10.43 | Plant costs | US$/t | 10.43 | |
| G&A | US$/t | 6.37 | G&A | US$/t | 6.37 | |
| Cut-off Value | US$/t | 63.98 | Cut-off Value | US$/t | 66.25 | |
| SLS - Lower Zone | CAF - Lower Zone | |||||
| Mine cost | US$/t | 46.97 | Mine cost | US$/t | 48.97 | |
| Development | US$/t | Development | US$/t | 23.91 | ||
| Plant costs | US$/t | 10.43 | Plant costs | US$/t | 10.43 | |
| G&A | US$/t | 6.37 | G&A | US$/t | 6.37 | |
| Cut-off Value | US$/t | 63.77 | Cut-off Value | US$/t | 65.77 | |
| SLS - Mine Deepening Zone | CAF - Mine Deepening Zone | |||||
| Mine cost | US$/t | 48.41 | Mine cost | US$/t | 50.41 | |
| Development | US$/t | 23.91 | Development | US$/t | 23.91 | |
| Plant costs | US$/t | 10.43 | Plant costs | US$/t | 10.43 | |
| G&A | US$/t | 6.37 | G&A | US$/t | 6.37 | |
| Cut-off Value | US$/t | 65.21 | Cut-off Value | US$/t | 67.21 | |
Figure 11-17 illustrates the Mineral Resource panels calculated for El Porvenir, based on the NSR values discussed above.
| 11- |
|
|
Figure 11-17: View of the Mineral Resource Reporting Panels at El Porvenir

| 11- |
|
|
| 11.4.11 | Classification |
The Mineral Resource categories and classification criteria utilized in this TRS are consistent with the definitions outlined by the SEC in S-K 1300, with Mineral Resources assigned to Measured, Indicated, and Inferred categories. The following factors were considered for the classification:
| · | Confidence in the modelling of mineralization domains. |
| · | Reliability of sampling data, including database integrity and absence of significant bias observed in QA/QC analysis results. |
| · | Confidence in the estimation of block grades for the various metals. |
| · | Variogram model parameters. |
| · | Visual assessments of the geometries of mineralized domains in relation to drill hole spacing. |
| · | Production experience in the deposit. |
Three groups were established based on geology, grade continuity, and volume of the domains. The classification between the resource categories is based on the number of holes and the distances between them according to the variogram ranges. Separate classification interpolation passes were conducted to designate the resource categories for each group, these being:
Major Continuity Group (domains with volumes more than 95,000 m3):
| · | Measured Mineral Resource: Composites from a minimum of three holes within a 25 m by 25 m by 12.5 m radii search. |
| · | Indicated Mineral Resource: Composites from a minimum of three holes within a 50 m by 50 m by 25 m radii search. |
| · | Inferred Mineral Resource: Composites from a minimum of two holes within a 100 m by 100 m by 50 m radii search. |
Medium Continuity Group (domains with volumes between 20,000 m3 and 95,000 m3):
| · | Measured Mineral Resource: Composites from a minimum of three holes within a 20 m by 20 m by 10 m radii search. |
| · | Indicated Mineral Resource: Composites from a minimum of three holes within a 50 m by 50 m by 25 m radii search. |
| · | Inferred Mineral Resource: Composites from a minimum of two holes within a 100 m by 100 m by 50 m radii search. |
Minor Continuity Group (domains with volumes less than 20,000 m3):
| · | Measured Mineral Resource: Composites from a minimum of three holes within a 15 m by 15 m by 10 m radii search. |
| · | Indicated Mineral Resource: Composites from a minimum of three holes within a 40 m by 40 m by 20 m radii search. |
| · | Inferred Mineral Resource: Composites from a minimum of two holes within a 60 m by 60 m by 30 m radii search. |
| 11- |
|
|
In addition to the criteria mentioned above, the classification of Measured Mineral Resources relies on data with low uncertainty levels, particularly in well-drilled areas, thereby enhancing confidence in geological modelling and grade estimation. The classification of Indicated Mineral Resources is based on data with varying levels of uncertainty, ranging from low to medium, typically supported by a minimum of three drill holes. For areas with fewer drill holes than Measured regions, particularly at mineralization boundaries, there is generally good to acceptable consistency between drill holes and underground geological mapping. Inferred Mineral Resources exhibit the lowest confidence level compared to Measured and Indicated categories, often confined to areas with sparse drilling. Nonetheless, results from estimation validation remain reasonable, providing support for the grade and tonnage estimates within these regions.
A post-processing clean-up script was applied to the classification model to reduce the "spotted dog" effect and to demonstrate a better continuity between categories. Figure 11-18 illustrates histograms showing the number of samples used for estimation, and the Mineral Resource classification related to the search pass.
Figure 11-18: Histograms Showing the Number of Samples Used for the Estimation (on the left), and the Estimation Search Volume (on the right)

Figure 11-19 illustrates the Mineral Resource classification for the El Porvenir domains.
| 11- |
|
|
Figure 11-19: Longitudinal and Plan View of the Mineral Resource Classification for the El Porvenir Domains

| 11- |
|
|
The QP is of the opinion that employing various approaches tailored to the size of domains and the spatial variability of variograms is a more robust way to address the uncertainty associated with the resource estimation and geological modelling in the mineral deposit.
In a few regions, artifacts such as isolated drill holes with isolated Measured classifications (“spotted dog” effect) are observed, demonstrating inadequate post-processing. Though these artifacts constitute a small portion of the Mineral Resource classification, the QP recommends to enhance the post-processing workflow to mitigate these issues.
| 11.4.12 | Block Model Validation |
The QP performed several validations of the geological modelling and block model estimation, grade shell volume comparison against the previous version, visual inspections of the dynamic anisotropy angles, estimation statistics by search volume, global statistics, visual validations, and swath plots. These aim to confirm the consistency of the estimation process and the results.
SLR reviewed the files provided by Nexa staff, such as validation tables and figures, and performed extensive independent validations, including statistical correlations, visual validations, statistic validations, and swath plot analysis. The main checks are discussed in the following sections.
| 11.4.12.1 | Global Statistics |
Global statistics of the interpolated OK, ID3, and NN grades were compared with those of the capped composites, assessing performance of the different estimators and confirming the estimate’s reproduction of the samples used for the estimation. Global statistics also help to identify inconsistencies in the estimation process.
Statistics for the main variables and domains are shown in Table 11-22. The capped and composited values are weighted by decluster weights.
| 11- |
|
|
Table 11-22: El Porvenir Statistical Comparison Between OK, ID3, NN, and the Capped Composites
| Domain | Zn (%) - OK | Zn (%) - ID3 | Zn (%) - NN | Zn (%) - Composites | ||||||||
| Mean | Minimum | Maximum | Mean | Minimum | Maximum | Mean | Minimum | Maximum | Mean | Minimum | Maximum | |
| amsk14 | 2.22 | 0.10 | 11.41 | 2.05 | 0.00 | 14.03 | 1.94 | 0.00 | 18.00 | 2.36 | 0.00 | 18.00 |
| de2 | 1.40 | 0.01 | 12.24 | 1.33 | 0.01 | 15.89 | 1.29 | 0.00 | 16.64 | 1.81 | 0.00 | 16.64 |
| dl05 | 2.24 | 0.25 | 13.87 | 2.25 | 0.03 | 19.70 | 2.30 | 0.02 | 19.93 | 2.02 | 0.02 | 19.93 |
| exiti1 | 3.12 | 0.03 | 18.38 | 3.60 | 0.02 | 19.73 | 3.52 | 0.02 | 19.74 | 1.56 | 0.02 | 19.74 |
| exito | 3.75 | 0.03 | 17.39 | 3.61 | 0.02 | 21.06 | 3.70 | 0.00 | 23.40 | 3.43 | 0.00 | 23.40 |
| exitoa | 3.63 | 0.06 | 17.19 | 3.33 | 0.00 | 20.46 | 3.39 | 0.00 | 20.85 | 3.13 | 0.00 | 20.85 |
| ints26 | 4.15 | 0.48 | 15.41 | 4.42 | 0.03 | 17.63 | 4.37 | 0.00 | 17.98 | 4.03 | 0.00 | 17.98 |
| p2sw1 | 0.79 | 0.03 | 4.18 | 0.81 | 0.00 | 5.92 | 0.78 | 0.00 | 6.01 | 0.81 | 0.00 | 6.01 |
| p2sw2 | 1.01 | 0.01 | 3.89 | 1.08 | 0.00 | 5.20 | 0.98 | 0.00 | 5.23 | 0.96 | 0.00 | 5.23 |
| por9 | 6.82 | 0.01 | 26.27 | 6.85 | 0.00 | 28.58 | 6.79 | 0.00 | 32.60 | 6.53 | 0.00 | 32.60 |
| por928 | 5.74 | 0.51 | 20.55 | 5.28 | 0.05 | 24.62 | 5.62 | 0.00 | 25.60 | 5.69 | 0.00 | 25.60 |
| por929 | 7.73 | 1.44 | 24.46 | 9.62 | 0.80 | 29.21 | 11.08 | 0.00 | 29.98 | 9.20 | 0.00 | 29.98 |
| por95 | 3.66 | 0.24 | 13.06 | 2.92 | 0.00 | 18.06 | 3.13 | 0.00 | 19.77 | 1.88 | 0.00 | 19.77 |
| por9p | 4.19 | 0.07 | 23.77 | 4.08 | 0.00 | 29.34 | 4.08 | 0.00 | 30.03 | 4.13 | 0.00 | 30.03 |
| por9q | 4.73 | 0.13 | 23.45 | 4.50 | 0.00 | 27.80 | 4.63 | 0.00 | 29.98 | 3.93 | 0.00 | 29.98 |
| por9v | 6.42 | 1.13 | 22.33 | 6.10 | 0.32 | 29.32 | 6.13 | 0.09 | 29.98 | 4.94 | 0.09 | 29.98 |
| por9w | 4.11 | 0.49 | 13.04 | 4.52 | 0.14 | 20.72 | 4.98 | 0.13 | 20.84 | 3.59 | 0.13 | 20.84 |
| prog | 4.53 | 0.00 | 23.30 | 4.39 | 0.00 | 26.98 | 4.37 | 0.00 | 27.07 | 3.96 | 0.00 | 27.07 |
| sara2 | 1.54 | 0.07 | 9.04 | 1.73 | 0.03 | 15.79 | 1.85 | 0.02 | 15.95 | 1.67 | 0.02 | 15.95 |
| v12i1 | 5.71 | 0.01 | 26.36 | 5.90 | 0.00 | 33.68 | 5.64 | 0.00 | 34.63 | 6.38 | 0.00 | 34.63 |
| v12ne | 4.67 | 0.40 | 17.85 | 4.61 | 0.04 | 22.86 | 4.36 | 0.00 | 23.29 | 4.38 | 0.00 | 23.29 |
| 11- |
|
|
| Domain | Zn (%) - OK | Zn (%) - ID3 | Zn (%) - NN | Zn (%) - Composites | ||||||||
| Mean | Minimum | Maximum | Mean | Minimum | Maximum | Mean | Minimum | Maximum | Mean | Minimum | Maximum | |
| v5i | 5.95 | 0.01 | 24.23 | 5.94 | 0.00 | 29.05 | 6.03 | 0.00 | 30.22 | 6.17 | 0.00 | 30.22 |
| vcarmen | 6.35 | 0.00 | 25.31 | 6.50 | 0.00 | 31.17 | 6.54 | 0.00 | 32.07 | 5.98 | 0.00 | 32.07 |
| vcn31 | 4.13 | 0.06 | 22.81 | 4.21 | 0.01 | 31.40 | 4.28 | 0.00 | 34.28 | 3.64 | 0.00 | 34.80 |
| vcn3ei1 | 6.63 | 0.03 | 26.05 | 6.64 | 0.00 | 30.05 | 6.69 | 0.00 | 30.49 | 6.45 | 0.00 | 30.49 |
| Domain | Cu (%) - OK | Cu (%) - ID3 | Cu (%) - NN | Cu (%) - Composites | ||||||||
| Mean | Minimum | Maximum | Mean | Minimum | Maximum | Mean | Minimum | Maximum | Mean | Minimum | Maximum | |
| amsk14 | 0.34 | 0.03 | 1.56 | 0.48 | 0.00 | 1.84 | 0.50 | 0.00 | 1.89 | 0.34 | 0.00 | 1.89 |
| de2 | 0.05 | 0.00 | 0.80 | 0.05 | 0.00 | 1.20 | 0.05 | 0.00 | 1.24 | 0.05 | 0.00 | 1.24 |
| dl05 | 0.19 | 0.04 | 0.83 | 0.21 | 0.01 | 1.01 | 0.21 | 0.01 | 1.01 | 0.16 | 0.01 | 1.01 |
| exiti1 | 0.93 | 0.18 | 1.82 | 0.91 | 0.03 | 2.12 | 0.89 | 0.01 | 2.40 | 1.18 | 0.01 | 2.67 |
| exito | 0.31 | 0.02 | 1.74 | 0.30 | 0.00 | 2.10 | 0.31 | 0.00 | 2.11 | 0.29 | 0.00 | 2.11 |
| exitoa | 0.45 | 0.03 | 1.73 | 0.46 | 0.00 | 2.06 | 0.47 | 0.00 | 2.09 | 0.45 | 0.00 | 2.09 |
| ints26 | 0.15 | 0.01 | 0.59 | 0.15 | 0.00 | 0.67 | 0.16 | 0.00 | 0.76 | 0.16 | 0.00 | 0.76 |
| p2sw1 | 0.02 | 0.00 | 0.16 | 0.02 | 0.00 | 0.32 | 0.02 | 0.00 | 0.36 | 0.02 | 0.00 | 0.36 |
| p2sw2 | 0.02 | 0.00 | 0.19 | 0.02 | 0.00 | 0.30 | 0.02 | 0.00 | 0.41 | 0.03 | 0.00 | 0.41 |
| por9 | 0.43 | 0.08 | 2.92 | 0.43 | 0.00 | 3.62 | 0.43 | 0.00 | 3.63 | 0.40 | 0.00 | 3.63 |
| por928 | 0.34 | 0.02 | 1.57 | 0.28 | 0.01 | 2.21 | 0.27 | 0.00 | 2.64 | 0.28 | 0.00 | 2.64 |
| por929 | 0.21 | 0.10 | 0.56 | 0.24 | 0.10 | 0.82 | 0.27 | 0.00 | 1.00 | 0.28 | 0.00 | 1.00 |
| por95 | 0.17 | 0.01 | 0.60 | 0.15 | 0.00 | 0.78 | 0.16 | 0.00 | 0.97 | 0.13 | 0.00 | 0.97 |
| por9p | 0.33 | 0.01 | 1.46 | 0.32 | 0.00 | 1.68 | 0.31 | 0.00 | 2.10 | 0.33 | 0.00 | 2.10 |
| por9q | 0.34 | 0.00 | 2.05 | 0.33 | 0.00 | 2.39 | 0.36 | 0.00 | 2.58 | 0.43 | 0.00 | 2.58 |
| por9v | 0.34 | 0.03 | 1.54 | 0.32 | 0.00 | 1.82 | 0.34 | 0.00 | 1.94 | 0.29 | 0.00 | 2.18 |
| 11- |
|
|
| Domain | Cu (%) - OK | Cu (%) - ID3 | Cu (%) - NN | Cu (%) - Composites | ||||||||
| Mean | Minimum | Maximum | Mean | Minimum | Maximum | Mean | Minimum | Maximum | Mean | Minimum | Maximum | |
| por9w | 0.34 | 0.04 | 1.05 | 0.40 | 0.01 | 1.30 | 0.42 | 0.01 | 1.30 | 0.32 | 0.01 | 1.30 |
| prog | 0.34 | 0.00 | 2.56 | 0.34 | 0.00 | 3.30 | 0.34 | 0.00 | 3.31 | 0.33 | 0.00 | 3.31 |
| sara2 | 0.03 | 0.00 | 0.28 | 0.03 | 0.00 | 0.34 | 0.04 | 0.00 | 0.46 | 0.04 | 0.00 | 0.46 |
| v12i1 | 0.40 | 0.00 | 1.90 | 0.42 | 0.00 | 2.10 | 0.39 | 0.00 | 2.10 | 0.30 | 0.00 | 2.10 |
| v12ne | 0.22 | 0.02 | 0.89 | 0.22 | 0.00 | 1.21 | 0.21 | 0.00 | 1.21 | 0.18 | 0.00 | 1.21 |
| v5i | 0.40 | 0.02 | 1.85 | 0.41 | 0.00 | 1.92 | 0.41 | 0.00 | 2.09 | 0.41 | 0.00 | 2.09 |
| vcarmen | 0.09 | 0.00 | 0.70 | 0.09 | 0.00 | 1.04 | 0.10 | 0.00 | 1.07 | 0.09 | 0.00 | 1.07 |
| vcn31 | 0.25 | 0.00 | 1.84 | 0.26 | 0.00 | 3.44 | 0.26 | 0.00 | 3.53 | 0.25 | 0.00 | 3.53 |
| vcn3ei1 | 0.23 | 0.00 | 1.45 | 0.24 | 0.00 | 2.75 | 0.24 | 0.00 | 3.30 | 0.23 | 0.00 | 4.53 |
| Domain | Ag (g/t) - OK | Ag (g/t) - ID3 | Ag (g/t) - NN | Ag (g/t) - Composites | ||||||||
| Mean | Minimum | Maximum | Mean | Minimum | Maximum | Mean | Minimum | Maximum | Mean | Minimum | Maximum | |
| amsk14 | 48.87 | 1.67 | 289.89 | 55.57 | 0.10 | 375.20 | 55.72 | 0.10 | 397.80 | 59.45 | 0.10 | 397.80 |
| de2 | 166.71 | 3.66 | 1,495.40 | 167.65 | 0.30 | 1,973.91 | 169.17 | 0.00 | 2,030.00 | 180.52 | 0.00 | 2,030.00 |
| dl05 | 80.36 | 14.91 | 374.65 | 78.43 | 2.00 | 556.82 | 78.27 | 2.00 | 674.19 | 65.02 | 2.00 | 674.19 |
| exiti1 | 14.52 | 5.54 | 35.38 | 13.81 | 2.05 | 49.07 | 14.04 | 2.02 | 60.28 | 17.02 | 2.02 | 60.28 |
| exito | 72.95 | 6.63 | 311.86 | 74.08 | 0.28 | 409.02 | 74.59 | 0.00 | 501.51 | 65.39 | 0.00 | 501.51 |
| exitoa | 47.44 | 2.62 | 257.68 | 48.64 | 0.04 | 273.97 | 48.01 | 0.00 | 275.60 | 35.57 | 0.00 | 275.60 |
| ints26 | 16.21 | 1.90 | 109.27 | 19.95 | 0.13 | 127.57 | 24.51 | 0.00 | 127.90 | 16.33 | 0.00 | 127.90 |
| p2sw1 | 66.50 | 6.21 | 393.69 | 69.05 | 1.01 | 574.36 | 68.85 | 0.31 | 630.30 | 64.58 | 0.31 | 630.30 |
| p2sw2 | 76.78 | 13.52 | 442.21 | 77.46 | 0.39 | 563.24 | 73.08 | 0.20 | 630.30 | 75.45 | 0.20 | 630.30 |
| por9 | 19.43 | 1.37 | 333.13 | 19.16 | 0.01 | 469.31 | 19.76 | 0.00 | 539.33 | 22.14 | 0.00 | 806.60 |
| por928 | 42.76 | 2.31 | 115.16 | 24.13 | 0.49 | 155.06 | 22.32 | 0.00 | 176.67 | 27.71 | 0.00 | 200.00 |
| por929 | 25.21 | 7.58 | 136.55 | 25.72 | 6.22 | 169.42 | 28.78 | 0.00 | 183.70 | 42.57 | 0.00 | 183.70 |
| 11- |
|
|
| Domain | Ag (g/t) - OK | Ag (g/t) - ID3 | Ag (g/t) - NN | Ag (g/t) - Composites | ||||||||
| Mean | Minimum | Maximum | Mean | Minimum | Maximum | Mean | Minimum | Maximum | Mean | Minimum | Maximum | |
| por95 | 7.60 | 1.49 | 130.66 | 7.58 | 0.08 | 151.92 | 7.95 | 0.00 | 214.90 | 8.77 | 0.00 | 214.90 |
| por9p | 21.38 | 1.48 | 156.48 | 21.83 | 0.01 | 208.43 | 21.26 | 0.00 | 218.66 | 19.14 | 0.00 | 218.66 |
| por9q | 20.63 | 0.90 | 182.30 | 20.34 | 0.02 | 280.33 | 21.60 | 0.00 | 283.35 | 16.09 | 0.00 | 283.35 |
| por9v | 77.29 | 12.17 | 349.66 | 61.94 | 2.23 | 431.16 | 62.35 | 2.02 | 509.70 | 60.55 | 2.02 | 509.70 |
| por9w | 61.60 | 8.04 | 190.94 | 69.44 | 4.41 | 219.19 | 72.54 | 3.76 | 220.21 | 49.80 | 1.92 | 220.21 |
| prog | 46.14 | 0.00 | 616.10 | 43.20 | 0.00 | 723.26 | 41.79 | 0.00 | 747.70 | 40.63 | 0.00 | 747.70 |
| sara2 | 157.69 | 22.95 | 988.81 | 163.65 | 10.77 | 1,195.37 | 172.73 | 7.40 | 1,196.00 | 163.77 | 7.40 | 1,196.00 |
| v12i1 | 28.07 | 0.33 | 248.54 | 27.81 | 0.00 | 274.07 | 27.28 | 0.00 | 275.50 | 34.64 | 0.00 | 275.50 |
| v12ne | 140.71 | 3.89 | 561.26 | 159.53 | 0.38 | 783.45 | 152.22 | 0.00 | 786.92 | 141.74 | 0.00 | 786.92 |
| v5i | 30.62 | 1.52 | 256.99 | 29.93 | 0.02 | 306.32 | 30.57 | 0.00 | 320.80 | 32.14 | 0.00 | 320.80 |
| vcarmen | 254.51 | 0.00 | 1,166.86 | 257.89 | 0.00 | 1,495.17 | 262.12 | 0.00 | 1,533.00 | 303.41 | 0.00 | 1,533.00 |
| vcn31 | 21.52 | 0.74 | 481.82 | 21.06 | 0.03 | 724.78 | 22.54 | 0.00 | 1,100.75 | 19.78 | 0.00 | 1,100.75 |
| vcn3ei1 | 75.19 | 1.44 | 653.16 | 78.37 | 0.08 | 829.11 | 79.02 | 0.00 | 1,050.00 | 77.59 | 0.00 | 1,050.00 |
| Domain | Pb (%) - OK | Pb (%) - ID3 | Pb (%) - NN | Pb (%) - Composites | ||||||||
| Mean | Minimum | Maximum | Mean | Minimum | Maximum | Mean | Minimum | Maximum | Mean | Minimum | Maximum | |
| amsk14 | 0.24 | 0.02 | 1.54 | 0.17 | 0.00 | 2.52 | 0.14 | 0.00 | 2.89 | 0.23 | 0.00 | 2.89 |
| de2 | 2.20 | 0.10 | 15.19 | 2.19 | 0.01 | 18.17 | 2.14 | 0.00 | 18.46 | 2.47 | 0.00 | 18.46 |
| dl05 | 1.06 | 0.02 | 10.81 | 1.00 | 0.01 | 14.88 | 0.95 | 0.00 | 15.04 | 0.79 | 0.00 | 15.04 |
| exiti1 | 0.01 | 0.01 | 0.03 | 0.01 | 0.01 | 0.04 | 0.02 | 0.01 | 0.04 | 0.03 | 0.01 | 0.40 |
| exito | 0.90 | 0.00 | 10.14 | 0.91 | 0.00 | 12.35 | 0.94 | 0.00 | 12.86 | 0.86 | 0.00 | 12.86 |
| exitoa | 0.51 | 0.00 | 8.07 | 0.42 | 0.00 | 9.37 | 0.40 | 0.00 | 9.69 | 0.29 | 0.00 | 9.69 |
| ints26 | 0.23 | 0.00 | 3.73 | 0.30 | 0.00 | 4.33 | 0.43 | 0.00 | 4.34 | 0.23 | 0.00 | 4.34 |
| 11- |
|
|
| Domain | Pb (%) - OK | Pb (%) - ID3 | Pb (%) - NN | Pb (%) - Composites | ||||||||
| Mean | Minimum | Maximum | Mean | Minimum | Maximum | Mean | Minimum | Maximum | Mean | Minimum | Maximum | |
| p2sw1 | 1.37 | 0.21 | 7.14 | 1.50 | 0.01 | 12.00 | 1.49 | 0.00 | 12.11 | 1.27 | 0.00 | 12.11 |
| p2sw2 | 1.55 | 0.09 | 7.20 | 1.71 | 0.00 | 12.84 | 1.53 | 0.00 | 13.03 | 1.39 | 0.00 | 13.03 |
| por9 | 0.19 | 0.01 | 7.39 | 0.20 | 0.00 | 9.60 | 0.23 | 0.00 | 10.98 | 0.24 | 0.00 | 10.98 |
| por928 | 0.86 | 0.00 | 5.23 | 0.33 | 0.00 | 6.47 | 0.34 | 0.00 | 7.80 | 0.49 | 0.00 | 7.80 |
| por929 | 0.27 | 0.00 | 9.74 | 0.30 | 0.00 | 12.14 | 0.29 | 0.00 | 14.24 | 0.62 | 0.00 | 14.24 |
| por95 | 0.03 | 0.01 | 0.90 | 0.03 | 0.00 | 1.21 | 0.03 | 0.00 | 1.73 | 0.05 | 0.00 | 1.73 |
| por9p | 0.25 | 0.01 | 8.74 | 0.24 | 0.00 | 12.48 | 0.24 | 0.00 | 12.99 | 0.19 | 0.00 | 12.99 |
| por9q | 0.33 | 0.01 | 7.46 | 0.33 | 0.00 | 14.67 | 0.32 | 0.00 | 14.83 | 0.14 | 0.00 | 14.83 |
| por9v | 1.18 | 0.04 | 4.16 | 0.97 | 0.01 | 4.92 | 0.94 | 0.01 | 4.92 | 0.99 | 0.01 | 4.92 |
| por9w | 0.87 | 0.02 | 4.61 | 1.29 | 0.01 | 5.73 | 1.29 | 0.01 | 5.77 | 0.47 | 0.01 | 5.77 |
| prog | 0.77 | 0.00 | 19.12 | 0.70 | 0.00 | 23.07 | 0.66 | 0.00 | 23.12 | 0.70 | 0.00 | 23.12 |
| sara2 | 1.62 | 0.10 | 10.84 | 1.78 | 0.02 | 15.48 | 1.90 | 0.02 | 16.20 | 1.98 | 0.02 | 16.20 |
| v12i1 | 0.17 | 0.00 | 7.87 | 0.16 | 0.00 | 9.26 | 0.17 | 0.00 | 9.50 | 0.23 | 0.00 | 9.50 |
| v12ne | 2.22 | 0.02 | 13.19 | 2.45 | 0.01 | 16.05 | 2.43 | 0.00 | 16.14 | 2.62 | 0.00 | 16.14 |
| v5i | 0.31 | 0.00 | 27.07 | 0.30 | 0.00 | 29.00 | 0.32 | 0.00 | 33.59 | 0.36 | 0.00 | 33.59 |
| vcarmen | 3.94 | 0.00 | 15.21 | 4.06 | 0.00 | 23.00 | 4.10 | 0.00 | 24.84 | 4.03 | 0.00 | 25.57 |
| vcn31 | 0.32 | 0.00 | 10.57 | 0.32 | 0.00 | 17.64 | 0.35 | 0.00 | 18.35 | 0.30 | 0.00 | 18.35 |
| vcn3ei1 | 1.67 | 0.00 | 16.46 | 1.77 | 0.00 | 23.54 | 1.79 | 0.00 | 24.70 | 1.78 | 0.00 | 24.70 |
| 11- |
|
|
As expected, the comparisons of the OK and ID3 estimates with the NN estimate show less variation than a comparison with the capped composites. The most significant disparities are noted in the “por929” and “por95” domains for both comparisons, against NN and the capped composites. Visual assessments indicate a reasonable correspondence between samples and estimated blocks, with further investigation suggesting that this reflects the distribution of samples throughout the domain, which is highly clustered in certain instances.
Figure 11-20 illustrates the comparison between final main grades estimated in the block model and the capped and composited samples. In general, the estimated grades and composites show good agreement, while differences observed do not suggest any consistent bias.
Figure 11-20: El Porvenir Final Grade Variables and Capped and Composited Samples Comparison

SLR observes that these variations fall within the expected range, and the larger discrepancies may be attributed to either the degree of sample clustering or the dynamic anisotropy angles. To some extent, the decluster weights for the capped and composited samples may also impact these variations.
| 11.4.12.2 | Visual Validation |
The QP conducted random checks across various estimation domains, comparing the samples utilized for estimation with the block model. Particular emphasis was placed on the main domains owing to their significance for Mineral Resources and Mineral Reserves.
Overall, the block grades correspond well with the surrounding samples. However, in certain areas, particularly those with limited information, some artifacts were observed. These included grade stripes exhibiting abrupt transitions between high and low grade areas. Some of these artifacts can be seen in Figure 11-21.
| 11- |
|
|
Figure 11-21 and Figure 11-22 show longitudinal sections of some of the main veins for Zn and Cu, “de2” and “exito”, respectively.
| 11- |
|
|
Figure 11-21: Longitudinal View of the “de2” Domain – Zn Estimation

| 11- |
|
|
Figure 11-22: Longitudinal View of the “exito” Domain – Cu Estimation

| 11- |
|
|
SLR observes that the visual artifacts beforementioned do not significantly affect the Mineral Resource assessment. However, the QP is of the opinion that there is room for improvement in the estimation workflow to prevent or minimize such instances. Enhancements to the dynamic anisotropy angles and adjustments to the minimum and maximum samples utilized in the estimation process may help mitigate these occurrences.
| 11.4.12.3 | Swath Plots |
Swath plots were generated for the entire block model to evaluate the global grade trend within the mineral deposit. Figure 11-23 illustrates swath plots for Zn and Cu in the X, Y, and Z directions.
Figure 11-23: El Porvenir Swath Plots for Zn and Cu

| 11- |
|
|
Overall, the trend in capped and composited grades is reflected by the estimated grades. Similar discrepancies in average grades between the capped composites and block grades, as discussed previously, are also evident in these charts. The charts reveal a consistent positive bias in the estimation, which is attributed to the use of decluster weights for the average calculation of capped and composited grades. SLR conducted an analysis of the capped and composited grade averages, both with and without decluster weights, employing different decluster methodologies. It was concluded that this apparent bias stems from limitations in the cell decluster method. A more suitable approach would involve calculating decluster weights for each individual grade shell, which is expected to yield a better fit with the estimated grades.
| 11.4.13 | Mineral Resource Reporting |
Mineral Resources have been classified in accordance with the definitions for Mineral Resources in S-K 1300, which are consistent with Canadian Institute of Mining, Metallurgy and Petroleum (CIM) Definition Standards for Mineral Resources and Mineral Reserves dated May 10, 2014 (CIM (2014) definitions).
Mineral Resources are reported exclusive of Mineral Reserves, within underground resource reporting shapes calculated as described in Section 11.4.10, using a minimum thickness of 4.0 m. Figure 11-24 illustrates the Mineral Resource blocks.
| 11- |
|
|
Figure 11-24: View of the Mineral Resource Blocks

| 11- |
|
|
In the QP’s opinion, the assumptions, parameters, and methodology used for the El Porvenir Mineral Resource estimate are appropriate for the style of mineralization and mining methods. The QP is not aware of any environmental, permitting, legal, title, taxation, socio-economic, political, or other relevant factors that could significantly affect the El Porvenir Mineral Resource at the Cerro Pasco operation.
The QP is of the opinion that with consideration of the recommendations summarized in Sections 1 and 23 of this TRS, any issues relating to all relevant technical and economic factors likely to influence the prospect of economic extraction can be resolved with further work
Mineral Resources with an effective date of December 31, 2023 for El Porvenir underground mine are shown in Table 11-23 on an 83.48% Nexa attributable ownership basis and Table 11-24 on a 100% ownership basis:
Table 11-23: El Porvenir Underground Mine: Summary of Mineral Resources (on an 83.48% Nexa Attributable Ownership Basis) – December 31, 2023
| Category |
Tonnage (Mt) |
Grade | Contained Metal | ||||||
| Zn | Cu | Ag | Pb | Zn | Cu | Ag | Pb | ||
| (%) | (%) | (g/t) | (%) | (000 t) | (000 t) | (000 oz) | (000 t) | ||
| Measured | 0.55 | 3.47 | 0.27 | 57.7 | 0.95 | 19.1 | 1.5 | 1,030 | 5.3 |
| Indicated | 2.69 | 3.25 | 0.20 | 63.2 | 0.97 | 87.4 | 5.3 | 5,460 | 26.0 |
| M&I | 3.24 | 3.29 | 0.21 | 62.2 | 0.97 | 106.5 | 6.8 | 6,483 | 31.3 |
| Inferred | 9.23 | 3.83 | 0.24 | 82.9 | 1.32 | 353.6 | 22.1 | 24,602 | 121.9 |
Notes:
| 1. | The definitions for Mineral Resources in S-K 1300 were followed for Mineral Resources which are consistent with CIM (2014) definitions. |
| 2. | Mineral Resources are estimated at an NSR cut-off value of US$66.04/t, calculated based on the LOM costs. It represents the average NSR for both the SLS (that ranges from US$63.77/t to US$67.04/t) and for CAF (that ranges from US$65.77/t to US$69.04/t). |
| 3. | Mineral Resources are estimated using average long-term metal prices of Zn: US$ 3,218.90/t (US$1.46/lb), Pb: US$2,300.33/t (US$1.04/lb), Cu: US$ 8,820.05/t (US$4.00/lb), and Ag: US$24.35/oz. |
| 4. | Metallurgical recoveries are based on historical processing data: 89.2% for Zn, 80.0% for Pb, 14.6% for Cu, and 77.5% for Ag. |
| 5. | Bulk density is assigned based on rock type and averages 3.13 t/m3. |
| 6. | Mineral Resources were depleted according to actual production as of September 30, 2023, and forecast production to the effective date of December 31, 2023. |
| 7. | The minimum thickness for the resource panels are 4.0 m for CAF and 3 m for SLS. |
| 8. | Mineral Resources are exclusive of Mineral Reserves. |
| 9. | Mineral Resources that are not Mineral Reserves do not have demonstrated economic viability. |
| 10. | Mineral Resources are constrained by optimized underground reporting shapes. |
| 11. | Numbers may not add due to rounding. |
| 11- |
|
|
Table 11-24: El Porvenir Underground Mine: Summary of Mineral Resources (on a 100% Ownership Basis) – December 31, 2023
| Category |
Tonnage (Mt) |
Grade | Contained Metal | |||||||
| Zn | Cu | Ag | Pb | Zn | Cu | Ag | Pb | |||
| (%) | (%) | (g/t) | (%) | (000 t) | (000 t) | (000 oz) | (000 t) | |||
| Measured | 0.66 | 3.47 | 0.27 | 57.7 | 0.95 | 22.9 | 1.8 | 1,225 | 6.3 | |
| Indicated | 3.22 | 3.25 | 0.20 | 63.2 | 0.97 | 104.7 | 6.4 | 6,540 | 31.2 | |
| M&I | 3.88 | 3.29 | 0.21 | 62.2 | 0.97 | 127.6 | 8.2 | 7,765 | 37.5 | |
| Inferred | 11.06 | 3.83 | 0.24 | 82.9 | 1.32 | 423.6 | 26.5 | 29,471 | 146.0 | |
Notes:
| 1. | The definitions for Mineral Resources in S-K 1300 were followed for Mineral Resources which are consistent with CIM (2014) definitions. |
| 2. | Mineral Resources are estimated at an NSR cut-off value of US$66.04/t, calculated based on the LOM costs. It represents the average NSR for both the SLS (that ranges from US$63.77/t to US$67.04/t) and for CAF (that ranges from 65.77 to 69.04). |
| 3. | Mineral Resources are estimated using average long-term metal prices of Zn: US$ 3,218.90/t (US$1.46/lb), Pb: US$2,300.33/t (US$1.04/lb), Cu: US$ 8,820.05/t (US$4.00/lb), and Ag: US$24.35/oz. |
| 4. | Metallurgical recoveries are based on historical processing data: Zn (89.2%), Pb (80.0%), Cu (14.6%), and Ag (77.5%). |
| 5. | Bulk density is assigned based on rock type and averages 3.13 t/m3. |
| 6. | Mineral Resources were depleted according to actual production as of September 30, 2023, and forecast production to the effective date of December 31, 2023. |
| 7. | The minimum thickness for the resource shapes are 4.0 m for CAF and 3 m for SLS. |
| 8. | Mineral Resources are exclusive of Mineral Reserves. |
| 9. | Mineral Resources that are not Mineral Reserves do not have demonstrated economic viability. |
| 10. | Mineral Resources are constrained by optimized underground reporting shapes. |
| 11. | Numbers may not add due to rounding. |
| 11- |
|
|
| 11.5 | Atacocha (San Gerardo) Open Pit |
| 11.5.1 | Resource Database |
Although the Atacocha OP and UG Mineral Resources were estimated separately, a unified resource database was utilized. All drilling and sampling data available within the Atacocha concession were included in the resource database, except for data completed after the closure date of the database.
The Atacocha database closure date was January 31, 2023. Subsequent to this date and up to the effective date of the TRS, 32 channels and 18 DDH were completed in the San Gerardo open pit area ( Table 11-25 and Figure 11-25). The QP reviewed the additional data and is of the opinion that it would not have a material impact on the estimated Mineral Resources.
Table 11-25: Atacocha Data Completed After Resource Database Closure
| Type | Count | Length (m) |
| Channels | 32 | 106 |
| DDH | 18 | 2,942 |
| 11- |
|
|
Figure 11-25: Atacocha Drill Holes Completed after Database Cut-Off

| 11- |
|
|
Table 11-26 summarizes the drilling and channel sampling used to estimate Mineral Resources at the Atacocha mineral deposit.
Table 11-26: Atacocha Resource Database
| Type | Count | Length |
| Channels | 69,122 | 262,065 |
| DDH Holes | 5,153 | 883,875 |
| RC Holes | 35 | 8,687 |
Table 11-27 summarizes the quantity of data in the provided resource database, filtered by the Atacocha site.
Table 11-27: Atacocha Resource Database Tables
| Table | Count | Holes | Length (m) |
| collar | 74,310 | 74,310 | - |
| survey | 117,574 | 74,310 | - |
| alteration | 38,939 | 2,658 | 228,488 |
| geology | 141,202 | 5,188 | 892,066 |
| litho | 99,924 | 5,188 | 892,563 |
| assay | 518,145 | 74,146 | 687,400 |
| structural | 20,289 | 1,243 | - |
| mineralisation | 88,901 | 3,324 | 361,620 |
| geotech | 4,875 | 127 | 27,784 |
| density | 7,612 | 2,902 | 7,211 |
Table 11-28 summarizes the statistics of the drilling and channel samples used to estimate the Atacocha Mineral Resources, while Table 11-29 summarizes the statistics for the density samples.
| 11- |
|
|
Table 11-28: Atacocha Resource Database Assay Summary Statistics
| Analyte | Count | Length | Mean | StdDev | CV | Variance | Min | Q25 | Median | Q75 | Max |
| ZN_PER | 518,088 | 687,327 | 2.31 | 5.08 | 2.20 | 25.85 | 0.00 | 0.03 | 0.17 | 1.41 | 60.00 |
| PB_PER | 518,143 | 687,398 | 1.01 | 2.99 | 2.96 | 8.92 | 0.00 | 0.01 | 0.04 | 0.29 | 70.35 |
| CU_PER | 518,145 | 687,400 | 0.19 | 0.49 | 2.61 | 0.24 | 0.00 | 0.01 | 0.03 | 0.16 | 40.00 |
| AG_PPM | 518,145 | 687,400 | 47.69 | 125.91 | 2.64 | 15,853.83 | 0.09 | 2.02 | 5.29 | 23.02 | 6,236.25 |
| AU_GR | 242,034 | 298,014 | 0.13 | 1.00 | 7.55 | 0.99 | 0.00 | 0.02 | 0.04 | 0.10 | 171.50 |
| Length | 518,145 | 687,400 | 1.33 | 0.54 | 0.41 | 0.30 | 0.05 | 1.00 | 1.35 | 1.50 | 12.10 |
Table 11-29: Atacocha Resource Database Density Summary Statistics
| Analyte | Count | Length | Mean | StdDev | CV | Variance | Min | Q25 | Median | Q75 | Max |
| GE_gcm3 | 7,612 | 7,211 | 2.93 | 0.44 | 0.15 | 0.19 | 1.41 | 2.68 | 2.78 | 3.21 | 5.73 |
| Length | 7,612 | 7,211 | 0.95 | 0.52 | 0.55 | 0.27 | 0.10 | 0.30 | 1.00 | 1.44 | 2.60 |
| 11- |
|
|
| 11.5.2 | Geological Interpretation |
The 2023 Mineral Resource estimation included a full review of the mineralized domains previously modelled in 2021, in 3D, section, and plan views by the QP and by SLR. Mineralized wireframes were constructed using the interpretations on cross sections and plans generated by the mine geologists. The strike of some mineralized domains was modified based on the observations and interpretations from these sections.
Mineralized wireframes within the operational area of the pit were reinterpreted in consideration of sectional interpretation, bench mapping, blast holes, and mining polygons. Mineralization was generally not extrapolated beyond 30 m to 40 m from the last composite. SLR noted that some domains were extended beyond this, however, distance from composites was also considered during classification of Mineral Resources. The southern part of the pit was revised for 2023 with the same procedures used in 2022.
Eight lithological domains were modelled: skarn, San Gerardo intrusive, hydrothermal breccia, tectonic breccia, marble, sandstone, limestone, and conglomerate.
Two main mineralization types were modelled: “fault” type mineralization modelled using the Leapfrog vein tool, and “brecciation” type mineralization modelled using the Leapfrog intrusion tool (Figure 11-26). The first group is mostly composed of narrow tabular planes oriented northwest-southeast, with steep angles of inclination. The second group are massive mineralized bodies, rounded in shape, which usually possess greater volume than the fault-controlled veins.
Interpretation of the 220 mineralized wireframes was completed in consideration of other geological parameters including structural type (mineralized body and vein), type of emplacements (hydrothermal gap, structural, and replacement), lithological control (fault or brecciation), and the anisotropy and orientation of the mineralization. A minimum NSR cut-off value of US$15.66/t was used when interpreting the mineralized wireframes, although considering as low as US$10.00/t in some cases, depending on the mineralization continuity.
Drill holes lacking assays were treated as barren and veins were set to pinch out when modelling the mineralization domains.
The modelled mineralization consists of eleven large groups (Figure 11-27), mostly vein systems and a small number of bodies: “Asuncion Vein System”, “Chercher Vein System”, “OB10 Vein System”, “Lizzy Vein System”, Vetas V Vein System”, “Vetas Norte Vein System”, “Rubi Vein System”, “Claudia Vein System”, “Zoe Vein System”, “Milpo-Atacocha Vein System” and mineralized bodies called “Cuerpos”. These groups were used as the basis for establishing average density values.
Each orebody containing more than 200 representative samples and with a coefficient of variation (CV) greater than 1.8 was split into high grade and low grade sub-domains using the intrusion tool in Leapfrog (Figure 11-28). The individual high grade cut-off values were based on the distribution within each domain and the variable in question. SLR observed that some of the resulting high and low grade sub-domain volumes were supported by as few as one drill hole and sometimes resulted in discontinuous shapes. Although SLR considers the sub-domains acceptable for use in the estimate, SLR recommends that the sub-domaining be improved in future Mineral Resource updates, particularly as hard boundaries are applied to the sub-domains. The QP agrees with this recommendation.
| 11- |
|
|
Each of the modelled mineralization wireframes was treated as a separate estimation domain for Zn, Pb, Cu, Ag, and Au, except for where the high grade and low grade sub-domains were implemented on a case-by-case basis for the different variables.
In the estimation nomenclature, the estimation process considers “OB” as the name of each mineralization domain, “COD_OB” as the numerical code for each mineralization domain and “C_DOM” as the numerical code for each estimation domain. “C_ANIS” refers to an initial grouping of mineralization domains based on structural anisotropy, while “C_ESTIM” refers to a subsequent sub-grouping used for variography.
The 25 largest contributors to the San Gerardo Mineral Resources are shown in red in Figure 11-29.
| 11- |
|
|
Figure 11-26: San Gerardo Geological Control Type

| 11- |
|
|
Figure 11-27: San Gerardo Grouped Mineralization

| 11- |
|
|
Figure 11-28: San Gerardo High Grade and Low Grade Estimation Domains

| 11- |
|
|
Figure 11-29: San Gerardo 25 Main Domains

| 11- |
|
|
The QP reviewed the mineralization wireframes for the San Gerardo open pit and considers them acceptable for the estimation of Mineral Resources. Unlike the approach taken for Atacocha UG and El Porvenir, mineralization wireframes for the San Gerardo model pinch out for non-assayed drill holes. Although this has resulted in some isolated holes in the resulting domains, this is not considered to have a material impact on Mineral Resources and is considered preferable to the subsequent post-processing of the domains undertaken for Atacocha UG and El Porvenir.
It was identified that mineralized bodies crossing the arbitrary model boundary between the Atacocha UG and OP models had not been modelled as continuous shapes. This is most obvious in the San Gerardo “wf_10_2r” and Atacocha UG “OB_10” intrusion-style wireframes, however, it is noted that several veins have also not been modelled across the boundary. This is not considered to have a material impact on estimated Mineral Resources but should be addressed in future Mineral Resource updates.
Extrapolation of the wireframes was considered reasonable and was subsequently considered during Mineral Resource classification.
An analysis of snapping discrepancies showed that 99% of intervals assigned to an OB were correctly modelled as such, while 99% of waste intervals were correctly modelled. This is considered acceptable by the QP, especially as many of the discrepancies were located outside of the Mineral Resource constraining reporting shapes.
Contact analysis completed by SLR on the mineralization domains indicates that they are generally effective in separating mineralized and unmineralized populations (Figure 11-30), although it was identified in some areas that opportunities existed to extend the wireframes to include additional mineralized intercepts. The populations within the modelled mineralization were approximately lognormal.
| 11- |
|
|
Figure 11-30: San Gerardo Mineralization Contact Analysis

| 11- |
|
|
| 11.5.3 | Resource Assays |
The database flagged and used for generating the mineralization wireframes consists of both drill holes and channel samples. For the EDA process, the database is exported from Leapfrog Geo and imported into Datamine Studio software. Non-sampled intervals are substituted with the half of the detection limits of the chemical elements.
For the purpose of this TRS, Zn, Au, Ag, and Pb, referred to as the main elements for San Gerardo, will be detailed in tables and figures, along with the 25 grade shells (main domains) that contribute most significantly to the Mineral Resource and Mineral Reserves, approximately 46% of the tonnage.
Table 11-30 presents the length-weighted statistics of the drill holes and channels combined.
| 11- |
|
|
Table 11-30: San Gerardo Assay Statistics (Length-Weighted) for the Main Domains
| Domain Code | Orebody | Zn (%) - Assay (2 m composites) | Ag (g/t) - Assay (2 m composites) | ||||||||||
| Count | Mean | StdDev | CV | Min | Max | Count | Mean | StdDev | CV | Min | Max | ||
| asu8 | 208 | 213 | 1.08 | 1.5 | 1.39 | 0 | 9.62 | 213 | 57.93 | 158.54 | 2.74 | 0.4 | 1393.04 |
| che1 | 301 | 194 | 1.49 | 2.57 | 1.72 | 0 | 19.03 | 194 | 33.4 | 59.17 | 1.77 | 0.27 | 545.55 |
| che2 | 302 | 276 | 1.34 | 2.77 | 2.07 | 0 | 26.36 | 276 | 35.98 | 243.04 | 6.76 | 0.1 | 4475.79 |
| che3 | 303 | 504 | 2.75 | 4.47 | 1.63 | 0.01 | 31.67 | 504 | 21.39 | 35.32 | 1.65 | 0.31 | 356.57 |
| che4 | 304 | 249 | 1.32 | 2.23 | 1.69 | 0 | 26.35 | 249 | 33.61 | 41.49 | 1.23 | 0.72 | 260.49 |
| che6 | 306 | 922 | 1.54 | 2.49 | 1.62 | 0 | 21.01 | 922 | 37.08 | 67 | 1.81 | 0.1 | 730.29 |
| che7 | 307 | 399 | 2.76 | 5.27 | 1.91 | 0 | 34.27 | 399 | 44.4 | 125.31 | 2.82 | 0.1 | 1809.87 |
| che10 | 310 | 363 | 1.5 | 3.42 | 2.28 | 0 | 41.47 | 363 | 28.71 | 70.06 | 2.44 | 0.1 | 1163.89 |
| che14 | 314 | 553 | 2.01 | 3.8 | 1.89 | 0.01 | 34.38 | 553 | 36.41 | 77.91 | 2.14 | 0.34 | 1855.16 |
| che15 | 315 | 195 | 0.88 | 1.57 | 1.79 | 0 | 18 | 195 | 41.7 | 97.72 | 2.34 | 0.1 | 1296 |
| che16 | 316 | 456 | 1.47 | 2.55 | 1.73 | 0 | 29.8 | 456 | 52.37 | 95.31 | 1.82 | 0.1 | 998.2 |
| che22 | 322 | 17 | 1.38 | 1.01 | 0.74 | 0.04 | 4.31 | 17 | 25.77 | 20.01 | 0.78 | 2.02 | 92.69 |
| che24 | 324 | 252 | 0.79 | 1.22 | 1.55 | 0.01 | 9.94 | 252 | 34.49 | 68.05 | 1.97 | 0.58 | 796.87 |
| che27 | 327 | 179 | 1.26 | 2.84 | 2.25 | 0 | 26.8 | 179 | 41.11 | 66.42 | 1.62 | 0.2 | 646.01 |
| n1 | 601 | 215 | 1.27 | 1.91 | 1.5 | 0 | 20.24 | 215 | 29.13 | 43.58 | 1.5 | 1.2 | 762.97 |
| n2 | 602 | 378 | 0.89 | 1.81 | 2.03 | 0 | 30.89 | 378 | 28.64 | 44.43 | 1.55 | 0.1 | 507 |
| n3 | 603 | 259 | 1.26 | 3.2 | 2.54 | 0 | 28.1 | 259 | 57.07 | 162.39 | 2.85 | 0.09 | 2056.56 |
| n9 | 609 | 101 | 1.07 | 2.93 | 2.73 | 0 | 32.67 | 101 | 29.58 | 72.16 | 2.44 | 0.31 | 1011.43 |
| n12 | 612 | 166 | 0.83 | 2.4 | 2.88 | 0 | 25.1 | 166 | 35.93 | 79.27 | 2.21 | 0.41 | 610.29 |
| n22 | 622 | 85 | 0.89 | 1.55 | 1.74 | 0 | 10.26 | 85 | 41.63 | 89.54 | 2.15 | 0.69 | 667.85 |
| cpo2 | 2002 | 1,500 | 1.33 | 2.32 | 1.74 | 0 | 30.95 | 1500 | 41.6 | 74.06 | 1.78 | 0.1 | 1046.32 |
| 11- |
|
|
| Domain Code | Orebody | Zn (%) - Assay (2 m composites) | Ag (g/t) - Assay (2 m composites) | ||||||||||
| Count | Mean | StdDev | CV | Min | Max | Count | Mean | StdDev | CV | Min | Max | ||
| cpo5 | 2005 | 1,128 | 1.94 | 3.12 | 1.61 | 0 | 33.57 | 1128 | 43.17 | 59.2 | 1.37 | 1.01 | 540.89 |
| cpo7 | 2007 | 294 | 3.54 | 4.1 | 1.16 | 0.03 | 22.04 | 294 | 11.53 | 38.7 | 3.36 | 2.02 | 442.6 |
| cpo15 | 2015 | 735 | 1.39 | 1.99 | 1.43 | 0.01 | 25.04 | 735 | 24.47 | 48.45 | 1.98 | 0.62 | 781.32 |
| cpo16 | 2016 | 909 | 0.78 | 1.47 | 1.89 | 0 | 15.46 | 909 | 66.55 | 95.41 | 1.43 | 1.58 | 1045.39 |
| Domain Code | Orebody | Pb (%) - Assay (2 m composites) | Au (g/t) - Assay (2 m composites) | ||||||||||
| Count | Mean | StdDev | CV | Min | Max | Count | Mean | StdDev | CV | Min | Max | ||
| asu8 | 208 | 213 | 1.53 | 3.21 | 2.1 | 0.01 | 33.5 | 213 | 0.37 | 1.05 | 2.83 | 0.02 | 16.5 |
| che1 | 301 | 194 | 0.93 | 1.77 | 1.89 | 0 | 17.86 | 194 | 0.33 | 0.41 | 1.25 | 0 | 3.36 |
| che2 | 302 | 276 | 0.61 | 1.57 | 2.58 | 0 | 19.66 | 276 | 0.63 | 2.09 | 3.31 | 0.01 | 23.1 |
| che3 | 303 | 504 | 0.7 | 1.48 | 2.12 | 0.01 | 14.05 | 504 | 0.63 | 1.37 | 2.2 | 0.01 | 15.3 |
| che4 | 304 | 249 | 1.04 | 1.56 | 1.49 | 0 | 12.47 | 249 | 0.33 | 0.36 | 1.1 | 0.01 | 3.38 |
| che6 | 306 | 922 | 1.27 | 2.54 | 1.99 | 0 | 28.71 | 922 | 0.29 | 0.56 | 1.95 | 0 | 4.9 |
| che7 | 307 | 399 | 1.46 | 3.07 | 2.11 | 0 | 28.67 | 399 | 1.05 | 9.47 | 9.03 | 0 | 128.4 |
| che10 | 310 | 363 | 0.76 | 2.11 | 2.79 | 0 | 37.11 | 363 | 0.35 | 0.73 | 2.09 | 0.01 | 13.35 |
| che14 | 314 | 553 | 1.03 | 1.89 | 1.84 | 0 | 16.46 | 553 | 0.66 | 1.22 | 1.84 | 0 | 9 |
| che15 | 315 | 195 | 1.26 | 2.81 | 2.23 | 0 | 25.18 | 195 | 0.24 | 0.45 | 1.85 | 0 | 4.34 |
| che16 | 316 | 456 | 1.63 | 3.59 | 2.21 | 0 | 45.8 | 456 | 0.43 | 1.28 | 2.95 | 0.01 | 25.4 |
| che22 | 322 | 17 | 0.87 | 0.92 | 1.06 | 0.03 | 2.7 | 17 | 0.49 | 0.1 | 0.21 | 0.34 | 0.62 |
| che24 | 324 | 252 | 1.17 | 2.36 | 2.02 | 0.01 | 33.9 | 252 | 0.65 | 3.27 | 5.06 | 0 | 54.3 |
| che27 | 327 | 179 | 1.41 | 2.51 | 1.78 | 0 | 26.88 | 179 | 0.52 | 0.68 | 1.3 | 0.01 | 6.9 |
| n1 | 601 | 215 | 1.09 | 1.52 | 1.39 | 0.01 | 20.22 | 215 | 0.75 | 2.97 | 3.98 | 0.01 | 42.5 |
| n2 | 602 | 378 | 1.13 | 2.02 | 1.8 | 0 | 23.14 | 378 | 0.58 | 0.78 | 1.35 | 0 | 16 |
| n3 | 603 | 259 | 1.95 | 4.6 | 2.36 | 0 | 34.91 | 259 | 0.88 | 5.26 | 5.95 | 0 | 78.6 |
| 11- |
|
|
| Domain Code | Orebody | Pb (%) - Assay (2 m composites) | Au (g/t) - Assay (2 m composites) | ||||||||||
| Count | Mean | StdDev | CV | Min | Max | Count | Mean | StdDev | CV | Min | Max | ||
| n9 | 609 | 101 | 0.98 | 1.78 | 1.82 | 0 | 20 | 101 | 0.34 | 0.52 | 1.5 | 0.01 | 5.71 |
| n12 | 612 | 166 | 1.34 | 2.7 | 2.02 | 0 | 28.99 | 166 | 0.3 | 0.4 | 1.35 | 0 | 3.46 |
| n22 | 622 | 85 | 1.12 | 1.6 | 1.43 | 0.01 | 8.54 | 85 | 1.63 | 12.16 | 7.46 | 0.01 | 115.7 |
| cpo2 | 2002 | 1,500 | 1.29 | 2.68 | 2.08 | 0 | 42.44 | 1,500 | 0.37 | 1.69 | 4.53 | 0 | 42 |
| cpo5 | 2005 | 1,128 | 1.35 | 2 | 1.48 | 0.01 | 24.33 | 1,128 | 0.34 | 0.93 | 2.77 | 0 | 8.4 |
| cpo7 | 2007 | 294 | 0.29 | 1.5 | 5.18 | 0.01 | 18.86 | 294 | 0.53 | 0.56 | 1.05 | 0.04 | 3.4 |
| cpo15 | 2015 | 735 | 0.81 | 2.02 | 2.49 | 0.01 | 25.59 | 735 | 0.27 | 0.38 | 1.39 | 0 | 2.82 |
| cpo16 | 2016 | 909 | 1.51 | 3.1 | 2.05 | 0.01 | 33.05 | 909 | 0.44 | 0.9 | 2.06 | 0 | 10.45 |
| 11- |
|
|
In the San Gerardo deposit, approximately 78% of the samples are derived from drill holes, which consist of RC and DDH from both surface and underground, while 22% originate from channel samples. Grade control is mainly based on blast hole sampling, which is not directly incorporated in the LTM, although is reportedly used in conjunction with bench mapping as a guide when constructing mineralization wireframes. Sampling is uneven across the open pit, as it is usually the case for mining operations. Figure 11-31 shows CDFs of the samples with and without declustering weights. The declustered statistics have a slightly lower mean for all variables, proving the preferential bias for sampling mineralized locations.
Figure 11-31: San Gerardo CDFs Comparing Declustered and Original data.

Given the polymetallic nature of the mineralization, a bivariate statistical analysis is conducted to evaluate the relationships between the variables. Figure 11-32 provides scatter plots for the main elements, in addition to their correlation coefficients. Generally, intermediate to strong correlations are observed between most elements, with the exception of Au, which is uncorrelated to other variables.
| 11- |
|
|
Figure 11-32: San Gerardo Scatter Plots between the Elements

| 11.5.4 | Treatment of High Grade Assays |
After completing 3D solid models, Nexa assesses the assay data contained inside the solid models to determine whether any additional domaining is required prior to capping. Typically, raw assay data are extracted from each domain and are then assessed using histograms and cumulative probability plots.
Where the assay distribution is positively skewed or approaches lognormal, erratic high grade values can have a disproportionate effect on the average grade of a deposit. One method of treating these outliers to reduce their influence on the average grade is to cap them at a specific grade level.
Atacocha staff evaluated the raw grades using log-probability plots to assess the influence of higher grades for each element using the estimation domains. The approach applied by Atacocha staff for restricting outliers was to identify a pronounced break in the probability curve that occurs above the 95th percentile.
| 11- |
|
|
A second capping level is applied for the third interpolation pass in channel composites to restrict the high grade influence.
Table 11-31 lists the capping levels for drill hole, channel raw data determined for each high grade estimation for the main domains, and the second capping levels applied to samples used for the third interpolation pass.
Table 11-31: San Gerardo DDH and CHNL First and Second Level Top-Cut Values
| Domain | Zn DDH | Zn CHNL | Zn CHNL 2nd Level | Ag DDH | Ag CHNL | Ag CHNL 2nd Level | Pb DDH | Pb CHNL | Pb CHNL 2nd Level | Au DDH | Au CHN | Au CHN 2nd Level |
| asu8 | 7.20 | - | - | 690.00 | - | - | 12.50 | - | - | 6.00 | - | - |
| che1 | 8.00 | - | 15.26 | 200.00 | - | 203.73 | 9.20 | - | 7.91 | 2.30 | - | - |
| che2 | 15.00 | 12.00 | 9.57 | 500.00 | 75.00 | 46.66 | 14.00 | - | 1.72 | 14.50 | - | - |
| che3 | 15.00 | 17.50 | 16.59 | 165.00 | 100.00 | 56.06 | 9.30 | 5.70 | 4.39 | 9.00 | - | - |
| che4 | 11.00 | - | 6.33 | 145.00 | 140.00 | 136.17 | 7.00 | - | 4.35 | 1.60 | - | - |
| che6 | 10.30 | 12.00 | 8.37 | 400.00 | 330.00 | 273.21 | 12.80 | 18.50 | 8.75 | 3.00 | - | 4.31 |
| che7 | 8.00 | 26.00 | 25.32 | 680.00 | 270.00 | 243.23 | 16.00 | 14.50 | 12.96 | 10.00 | - | 1.28 |
| che10 | 18.00 | 15.50 | 13.72 | 600.00 | - | 108.78 | 16.50 | - | 1.90 | 4.30 | - | 1.05 |
| che14 | 14.50 | 22.00 | 12.94 | 450.00 | 255.00 | 159.39 | 11.00 | 12.50 | 5.94 | 5.60 | - | 0.25 |
| che15 | 8.70 | - | - | 520.00 | - | - | 12.00 | - | - | 3.00 | - | - |
| che16 | 10.40 | 6.00 | 5.98 | 540.00 | 350.00 | 239.31 | 18.00 | 11.50 | 5.15 | 8.00 | - | 0.78 |
| che22 | 13.00 | 20.00 | 14.47 | 270.00 | 78.00 | 53.65 | 6.30 | - | 2.60 | 3.50 | - | - |
| che24 | 6.00 | - | - | 420.00 | - | - | 16.50 | - | - | 12.00 | - | - |
| che27 | 13.50 | - | - | 240.00 | - | - | 13.00 | - | - | 2.80 | - | - |
| n1 | 8.00 | - | - | 200.00 | - | - | 7.00 | - | - | 5.00 | - | - |
| n2 | 10.00 | - | - | 310.00 | - | - | 12.00 | - | - | 4.00 | - | - |
| n3 | 13.00 | - | - | 850.00 | - | - | 18.00 | - | - | 20.00 | - | - |
| n9 | 15.00 | - | - | 550.00 | - | - | 9.30 | - | - | 2.30 | - | - |
| n12 | 7.00 | - | - | 340.00 | - | - | 15.00 | - | - | - | - | - |
| n22 | 5.00 | - | - | 380.00 | - | - | 5.80 | - | - | 16.00 | - | - |
| cpo2 | 10.00 | 12.00 | 6.61 | 730.00 | 380.00 | 175.02 | 27.00 | 9.20 | 4.52 | 9.00 | - | - |
| cpo5 | 12.50 | 13.50 | 9.27 | 140.00 | 220.00 | 170.14 | 7.00 | 14.00 | 6.06 | 5.20 | - | - |
| cpo7 | 13.20 | 17.00 | 16.32 | - | 160.00 | 139.23 | 13.00 | - | 4.63 | - | - | - |
| cpo15 | 10.50 | 6.50 | 5.05 | 27.00 | - | 2.68 | 13.00 | - | - | 2.10 | - | - |
| cpo16 | 7.50 | 2.10 | 1.33 | 500.00 | 370.00 | 301.95 | 16.50 | 9.30 | 6.84 | 6.60 | - | - |
Figure 11-33 shows the capping effect on overall distribution of grades for drill holes and channels within the San Gerardo open pit. Since channel distributions have higher grade-values on average, they are more affected by capping limits than the drill holes. Historically, channels
| 11- |
|
|
from underground have not been assayed for Au in Atacocha, therefore the capping analysis for channels does not include Au.
Figure 11-33: San Gerardo Capping Effect on Drill Hole and Channel Distributions

| 11- |
|
|

| 11.5.5 | Compositing |
The average length of samples within the mineralized domains is 1.16 m. Assay data was composited to two metre lengths, which corresponds to one third of the parent block heights. The composite length was selected based on the analysis of eight compositing lengths (0.5 m, 1.0 m, 1.5 m, 2.0 m, 2.5 m, 3.0 m, 3.5 m, and 4.0 m). Figure 11-34 illustrates a comparison of the mean relative error for Zn between length-weighted raw assay mean versus composite mean by mineralization domain for the different composite lengths.
| 11- |
|
|
Figure 11-34: San Gerardo Open Pit Zn Compositing Analysis

Source: Nexa, 2023
Figure 11-35 shows the drill hole sample distributions both before and after compositing to 2.0 m lengths. The QP finds that the composites acceptably reproduce the raw distributions, with only minor decreases observed in the averages of composited data distribution for Ag, Pb, and Zn. For Au, while neither the mean nor the variance undergoes significant changes, the composited distributions exhibit a relatively higher proportion of data with grades close to the detection limit.
| 11- |
|
|
Figure 11-35: San Gerardo Drilling Sample Distributions before and after Compositing to 2 m Length

Table 11-32 shows the summary statistics for the 25 largest tonnage contributors to the Mineral Resource, before and after compositing. Summary statistics indicate that the composites are representative of the raw samples.
| 11- |
|
|
Table 11-32: San Gerardo Compositing Statistics for the 25 Main Domains
| Domain | Domain Code |
Zn (%) - Assay (2 m composites) | Au (g/t) - Assay (2 m composites) | ||||||||||
| Count | Mean | StdDev | CV | Min | Max | Count | Mean | StdDev | CV | Min | Max | ||
| asu8 | 208 | 118 | 1.47 | 1.62 | 1.1 | 0.01 | 7.17 | 118 | 0.2 | 0.32 | 1.58 | 0.01 | 3.74 |
| che1 | 301 | 125 | 1.52 | 1.9 | 1.25 | 0 | 11.73 | 125 | 0.2 | 0.23 | 1.15 | 0.01 | 1.19 |
| che2 | 302 | 179 | 1.89 | 2.8 | 1.48 | 0 | 12.6 | 179 | 0.42 | 1.36 | 3.24 | 0.01 | 11.95 |
| che3 | 303 | 333 | 2.08 | 3.12 | 1.5 | 0 | 17.01 | 333 | 0.22 | 0.43 | 2.01 | 0.01 | 5.05 |
| che4 | 304 | 161 | 1.09 | 1.79 | 1.64 | 0 | 8.27 | 161 | 0.19 | 0.22 | 1.15 | 0.01 | 1.13 |
| che6 | 306 | 562 | 1.36 | 1.8 | 1.33 | 0 | 10.3 | 563 | 0.18 | 0.35 | 1.97 | 0.01 | 2.63 |
| che7 | 307 | 244 | 1.99 | 2.85 | 1.43 | 0 | 25.47 | 244 | 0.37 | 0.66 | 1.79 | 0.01 | 5.72 |
| che10 | 310 | 214 | 1.47 | 2.12 | 1.44 | 0 | 16.54 | 213 | 0.2 | 0.35 | 1.7 | 0.01 | 3.24 |
| che14 | 314 | 350 | 2.08 | 2.72 | 1.31 | 0 | 14.8 | 350 | 0.27 | 0.62 | 2.27 | 0.01 | 4.82 |
| che15 | 315 | 117 | 0.77 | 1.06 | 1.37 | 0 | 4.66 | 117 | 0.27 | 0.38 | 1.42 | 0.01 | 2.14 |
| che16 | 316 | 257 | 1.18 | 1.47 | 1.25 | 0 | 8.68 | 257 | 0.26 | 0.49 | 1.88 | 0.01 | 5.82 |
| che22 | 322 | 349 | 1.46 | 2.25 | 1.54 | 0 | 14.72 | 348 | 0.16 | 0.29 | 1.88 | 0.01 | 3.5 |
| che24 | 324 | 164 | 0.78 | 0.88 | 1.12 | 0 | 4.21 | 164 | 0.38 | 0.85 | 2.2 | 0.01 | 6.73 |
| che27 | 327 | 125 | 1.83 | 2.8 | 1.53 | 0.01 | 12.94 | 125 | 0.34 | 0.39 | 1.12 | 0.01 | 2.67 |
| n1 | 601 | 136 | 1.66 | 1.86 | 1.12 | 0.01 | 8 | 136 | 0.37 | 0.54 | 1.46 | 0.01 | 5 |
| n2 | 602 | 243 | 1.03 | 1.09 | 1.06 | 0 | 8.12 | 243 | 0.38 | 0.43 | 1.14 | 0.01 | 2.71 |
| n3 | 603 | 157 | 1.91 | 2.76 | 1.45 | 0 | 12.05 | 157 | 0.5 | 1.33 | 2.66 | 0.01 | 18.15 |
| n9 | 609 | 62 | 1.89 | 3.68 | 1.95 | 0 | 15 | 62 | 0.31 | 0.3 | 0.96 | 0.01 | 1.57 |
| n12 | 612 | 108 | 0.94 | 1.2 | 1.28 | 0 | 6.5 | 108 | 0.25 | 0.34 | 1.34 | 0.01 | 1.29 |
| n22 | 622 | 53 | 0.77 | 0.91 | 1.17 | 0 | 4.26 | 53 | 0.58 | 1.34 | 2.3 | 0.01 | 8.65 |
| cpo2 | 2002 | 946 | 1.01 | 1.34 | 1.32 | 0 | 10.63 | 948 | 0.18 | 0.42 | 2.35 | 0.01 | 5.4 |
| 11- |
|
|
| Domain | Domain Code |
Zn (%) - Assay (2 m composites) | Au (g/t) - Assay (2 m composites) | ||||||||||
| Count | Mean | StdDev | CV | Min | Max | Count | Mean | StdDev | CV | Min | Max | ||
| cpo5 | 2005 | 765 | 1.6 | 2.09 | 1.3 | 0.01 | 13.5 | 765 | 0.12 | 0.29 | 2.41 | 0.01 | 4.23 |
| cpo7 | 2007 | 183 | 3.35 | 3.07 | 0.92 | 0.1 | 16.13 | 183 | 0.16 | 0.37 | 2.34 | 0.01 | 2.52 |
| cpo15 | 2015 | 422 | 1.12 | 1.31 | 1.16 | 0.01 | 7.78 | 424 | 0.07 | 0.16 | 2.34 | 0.01 | 1.4 |
| cpo16 | 2016 | 507 | 0.78 | 1.14 | 1.47 | 0 | 7.5 | 507 | 0.12 | 0.32 | 2.61 | 0.01 | 6.13 |
| Domain | Domain Code |
Ag (g/t) - Assay (2 m composites) | Pb (%) - Assay (2 m composites) | ||||||||||
| Count | Mean | StdDev | CV | Min | Max | Count | Mean | StdDev | CV | Min | Max | ||
| asu8 | 208 | 118 | 35.22 | 43.06 | 1.22 | 1 | 598.67 | 118 | 1.2 | 1.46 | 1.22 | 0.01 | 9.48 |
| che1 | 301 | 125 | 29.19 | 30.5 | 1.04 | 1 | 163.2 | 127 | 0.93 | 1.21 | 1.29 | 0 | 6.08 |
| che2 | 302 | 179 | 29.71 | 44.05 | 1.48 | 1 | 272.15 | 179 | 0.79 | 1.41 | 1.78 | 0 | 7.6 |
| che3 | 303 | 333 | 21.46 | 30.14 | 1.4 | 1 | 165 | 333 | 0.88 | 1.61 | 1.83 | 0 | 9.3 |
| che4 | 304 | 161 | 28.44 | 26.54 | 0.93 | 1 | 118.73 | 161 | 0.99 | 1.1 | 1.11 | 0 | 5.08 |
| che6 | 306 | 562 | 33.22 | 41.39 | 1.25 | 1 | 330 | 562 | 1.08 | 1.48 | 1.38 | 0 | 16.17 |
| che7 | 307 | 243 | 44.57 | 63.6 | 1.43 | 1 | 559.75 | 243 | 1.42 | 1.94 | 1.37 | 0 | 16 |
| che10 | 310 | 214 | 29.55 | 37.83 | 1.28 | 1 | 192.27 | 213 | 0.81 | 1.16 | 1.44 | 0 | 8 |
| che14 | 314 | 351 | 35.09 | 44.19 | 1.26 | 1 | 304.76 | 350 | 1.33 | 2.1 | 1.58 | 0 | 9.63 |
| che15 | 315 | 117 | 36.79 | 41.95 | 1.14 | 1 | 229.6 | 117 | 0.95 | 1.1 | 1.16 | 0 | 6.65 |
| che16 | 316 | 257 | 56.61 | 91.56 | 1.62 | 1 | 466.29 | 257 | 1.76 | 3.13 | 1.78 | 0 | 14.46 |
| che22 | 322 | 348 | 18.67 | 21.93 | 1.17 | 1 | 270 | 348 | 0.56 | 0.74 | 1.32 | 0 | 6.3 |
| che24 | 324 | 164 | 31.74 | 39.77 | 1.25 | 1 | 288.94 | 164 | 1.27 | 1.75 | 1.38 | 0.01 | 10.8 |
| che27 | 327 | 125 | 47.2 | 38.32 | 0.81 | 1 | 141.69 | 125 | 1.9 | 2.02 | 1.06 | 0.01 | 8 |
| n1 | 601 | 136 | 41.3 | 32.13 | 0.78 | 2.02 | 131.04 | 136 | 1.43 | 1.45 | 1.02 | 0.01 | 7 |
| n2 | 602 | 243 | 27.01 | 26.11 | 0.97 | 1 | 194.97 | 243 | 0.88 | 1 | 1.15 | 0 | 8.47 |
| n3 | 603 | 157 | 66.15 | 106.39 | 1.61 | 1 | 710.07 | 157 | 2.43 | 3.88 | 1.6 | 0 | 16.94 |
| 11- |
|
|
| Domain | Domain Code |
Ag (g/t) - Assay (2 m composites) | Pb (%) - Assay (2 m composites) | ||||||||||
| Count | Mean | StdDev | CV | Min | Max | Count | Mean | StdDev | CV | Min | Max | ||
| n9 | 609 | 62 | 35.88 | 43.55 | 1.21 | 2.12 | 155.21 | 62 | 1.25 | 1.85 | 1.49 | 0 | 7.68 |
| n12 | 612 | 108 | 31.81 | 38.24 | 1.2 | 1 | 226.19 | 108 | 1.03 | 1.29 | 1.25 | 0 | 12.13 |
| n22 | 622 | 53 | 60.71 | 98.46 | 1.62 | 1 | 380 | 53 | 0.98 | 1.13 | 1.15 | 0.01 | 5.21 |
| cpo2 | 2002 | 949 | 27.93 | 38.14 | 1.37 | 1 | 428.09 | 949 | 0.82 | 1.41 | 1.71 | 0 | 20.03 |
| cpo5 | 2005 | 765 | 36.6 | 37.99 | 1.04 | 2.02 | 220 | 765 | 1.09 | 1.24 | 1.14 | 0.01 | 9.27 |
| cpo7 | 2007 | 183 | 19.4 | 45.53 | 2.35 | 2.02 | 281.74 | 182 | 0.54 | 1.42 | 2.63 | 0.01 | 8.26 |
| cpo15 | 2015 | 424 | 31.49 | 38.97 | 1.24 | 1.7 | 279.64 | 424 | 1.07 | 1.73 | 1.61 | 0 | 13 |
| cpo16 | 2016 | 507 | 57.21 | 61.97 | 1.08 | 1.14 | 348.99 | 507 | 1.37 | 2.05 | 1.5 | 0.01 | 13.99 |
| 11- |
|
|
| 11.5.6 | Trend Analysis |
| 11.5.6.1 | Variography |
Variograms were used to characterize the spatial continuity of grade within the mineralization domains.
San Gerardo generated downhole and directional variograms using the two-metre capping and composite values in groups. Since the small number of samples inside each individual structure were insufficient to generate robust variograms, the structures were instead grouped according to their anisotropy and statistics. An initial “C_ANIS” grouping was based on structural anisotropy (Figure 11-36), which was then analyzed further using box plots to define a smaller grouping. The resulting grouping was assigned code “C_ESTIM” and used for the variography.
Variograms were standardized and modelled using two or three spherical structures in three directions. The variograms were used for OK interpolation and as a guide for selecting search ellipse ranges.
The results for variogram parameters for the 25 largest tonnage contributors to the San Gerardo Mineral Resource are tabulated in Table 11-33. An example of downhole and directional variogram models for the three main directions of continuity in C_ESTIM=306 is shown in Figure 11-37.
| 11- |
|
|
Figure 11-36: San Gerardo Variography Grouping

| 11- |
|
|
Table 11-33: Atacocha Open Pit Zn Variogram Parameters for Main 25 Domains
| Mineralization Domain | ESTIM | Datamine Rotation | Nugget | Structure 1 | Structure 2 | ||||||||
| 1 | 2 | 3 | ST1PAR1 | ST1PAR2 | ST1PAR3 | C1 | ST2PAR1 | ST2PAR2 | ST2PAR3 | C2 | |||
| asu8 | 207 | -27.73 | -67.73 | -154.49 | 0.21 | 3 | 15 | 9 | 0.29 | 40 | 32 | 20 | 0.50 |
| che1 | 322 | 6.53 | -69.41 | -104.35 | 0.19 | 17 | 9 | 7 | 0.39 | 58 | 35 | 20 | 0.42 |
| che10 | 306 | -0.51 | -67.73 | -117.27 | 0.24 | 13 | 8 | 6 | 0.38 | 46 | 36 | 13 | 0.39 |
| che14 | 314 | -5.42 | -65.19 | -128.08 | 0.28 | 11 | 4 | 10 | 0.35 | 58 | 36 | 20 | 0.37 |
| che15 | 316 | -0.51 | -67.73 | -117.27 | 0.19 | 11 | 18 | 8 | 0.28 | 52 | 40 | 22 | 0.54 |
| che16 | 316 | -0.51 | -67.73 | -117.27 | 0.19 | 11 | 18 | 8 | 0.28 | 52 | 40 | 22 | 0.54 |
| che2 | 322 | 6.53 | -69.41 | -104.35 | 0.19 | 17 | 9 | 7 | 0.39 | 58 | 35 | 20 | 0.42 |
| che22 | 322 | 6.53 | -69.41 | -104.35 | 0.19 | 17 | 9 | 7 | 0.39 | 58 | 35 | 20 | 0.42 |
| che24 | 324 | 46.30 | -78.83 | -63.26 | 0.21 | 8 | 11 | 18 | 0.42 | 34 | 26 | 20 | 0.37 |
| che27 | 324 | 46.30 | -78.83 | -63.26 | 0.21 | 8 | 11 | 18 | 0.42 | 34 | 26 | 20 | 0.37 |
| che3 | 303 | -6.30 | -78.83 | -116.74 | 0.17 | 24 | 32 | 16 | 0.35 | 50 | 38 | 22 | 0.48 |
| che4 | 322 | 6.53 | -69.41 | -104.35 | 0.19 | 17 | 9 | 7 | 0.39 | 58 | 35 | 20 | 0.42 |
| che6 | 306 | -0.51 | -67.73 | -117.27 | 0.24 | 13 | 8 | 6 | 0.38 | 46 | 36 | 13 | 0.39 |
| che7 | 314 | -5.42 | -65.19 | -128.08 | 0.28 | 11 | 4 | 10 | 0.35 | 58 | 36 | 20 | 0.37 |
| cpo15 | 2015 | 45.00 | -70.00 | -90.00 | 0.19 | 53 | 32 | 25 | 0.17 | 60 | 45 | 26 | 0.64 |
| cpo16 | 2016 | -30.65 | -69.41 | -166.53 | 0.15 | 43 | 10 | 17 | 0.50 | 66 | 40 | 34 | 0.35 |
| cpo2 | 2002 | 31.98 | -74.21 | -108.68 | 0.17 | 29 | 12 | 12 | 0.38 | 40 | 20 | 15 | 0.45 |
| cpo5 | 2005 | 79.56 | -75.89 | -44.56 | 0.15 | 11 | 10 | 6 | 0.56 | 34 | 24 | 14 | 0.30 |
| cpo7 | 2007 | 71.30 | -78.83 | -63.26 | 0.20 | 15 | 21 | 6 | 0.13 | 40 | 34 | 20 | 0.66 |
| n1 | 602 | 21.42 | -59.62 | -99.93 | 0.26 | 8 | 10 | 8 | 0.43 | 50 | 28 | 16 | 0.31 |
| n12 | 612 | -140.02 | -44.78 | 97.05 | 0.20 | 11 | 7 | 5 | 0.28 | 50 | 30 | 20 | 0.52 |
| n2 | 602 | 21.42 | -59.62 | -99.93 | 0.26 | 8 | 10 | 8 | 0.43 | 50 | 28 | 16 | 0.31 |
| 11- |
|
|
| Mineralization Domain | ESTIM | Datamine Rotation | Nugget | Structure 1 | Structure 2 | ||||||||
| 1 | 2 | 3 | ST1PAR1 | ST1PAR2 | ST1PAR3 | C1 | ST2PAR1 | ST2PAR2 | ST2PAR3 | C2 | |||
| n22 | 602 | 21.42 | -59.62 | -99.93 | 0.26 | 8 | 10 | 8 | 0.43 | 50 | 28 | 16 | 0.31 |
| n3 | 602 | 21.42 | -59.62 | -99.93 | 0.26 | 8 | 10 | 8 | 0.43 | 50 | 28 | 16 | 0.31 |
| 609 | 612 | -140.02 | -44.78 | 97.05 | 0.20 | 11 | 7 | 5 | 0.28 | 50 | 30 | 20 | 0.52 |
| 11- |
|
|
Figure 11-37: Downhole and Directional Zn Experimental Variograms and Models for Estimation Group C_ESTIM=306

| 11- |
|
|
| 11.5.6.2 | Grade Contouring |
Grade contours play an important role in aiding the initial detection of preferential grade patterns within mineralization domains. A brief assessment was carried out for Zn within the “che16” domain (Orebody=316) to assess potential grade trends (Figure 11-38). While grades are generally much higher in the lower portion, the domain exhibits no clear trend.
| 11.5.7 | Search Strategy and Grade Interpolation Parameters |
The final estimated values for Zn, Au, Ag, and Pb grades at San Gerardo are determined by OK or ID3. Initially, the estimation process incorporates OK, ID3, and NN interpolators, followed by an individual domain analysis to select between OK and ID3 results. This selection is based on domain-specific criteria such as sample quantity, average difference between OK and ID3 compared to NN, and domain size/volume. Variograms are defined based on estimation groups, allowing even domains with limited samples to be estimated via OK for comparison and validation purposes. Grade variables are not density or length-weighted during estimation.
To capture domain trends, dynamic anisotropy angles are calculated in Studio RM using domain wireframes. The estimation process includes three passes: the first pass utilizes search ellipse radii equivalent to variogram ranges for each variable; the second pass increases the radii by a factor of 1.5 to 10; and the third pass employs radii 10 to 30 times larger than the first pass.
The minimum and maximum sample numbers range from two to 15 for the first pass, one to 12 for the second pass, and one to 10 for the third pass, with a maximum of two samples per drill hole. Minor adjustments are made as needed to improve the final estimation result (Figure 11-38).
| 11- |
|
|
Figure 11-38: Contour Zn Grades for the “che16” Domain (Orebody=316)

| 11- |
|
|
Table 11-34: San Gerardo Zn Search Parameters for Main 25 Domains
|
Mineralization Domain |
C_DOM | Search Ellipse | Pass 1 | No. Composites | Pass 2 | No. Composites | Pass 3 | No. Composites | |||||
| 1 | 2 | 3 | S-Vol | Min | Max | S-Vol | Min | Max | S-Vol | Min | Max | ||
| asu8 | 2080 | 40 | 32 | 15 | 1 | 7 | 15 | 2 | 6 | 10 | 20 | 3 | 6 |
| che1 | 3010 | 32 | 25 | 10 | 1 | 10 | 15 | 2 | 9 | 10 | 20 | 3 | 5 |
| che10 | 3100 | 45 | 30 | 15 | 1 | 4 | 8 | 2 | 3 | 6 | 30 | 1 | 2 |
| che10 | 3101 | 35 | 22 | 15 | 1 | 7 | 14 | 2.2 | 4 | 7 | 20 | 3 | 4 |
| che14 | 3140 | 30 | 20 | 10 | 1 | 6 | 10 | 2 | 5 | 8 | 20 | 3 | 5 |
| che14 | 3141 | 30 | 22 | 10 | 1 | 9 | 15 | 2 | 7 | 10 | 20 | 3 | 6 |
| che15 | 3150 | 32 | 20 | 11 | 1 | 8 | 15 | 2 | 7 | 10 | 20 | 3 | 6 |
| che16 | 3160 | 36 | 24 | 13 | 1 | 9 | 15 | 2 | 8 | 10 | 20 | 3 | 6 |
| che2 | 3020 | 30 | 18 | 10 | 1 | 6 | 15 | 2 | 5 | 8 | 20 | 3 | 5 |
| che2 | 3021 | 32 | 18 | 10 | 1 | 8 | 15 | 2 | 7 | 10 | 20 | 3 | 6 |
| che22 | 3220 | 28 | 18 | 10 | 1 | 6 | 15 | 2 | 5 | 8 | 20 | 3 | 5 |
| che22 | 3221 | 30 | 19 | 12 | 1 | 10 | 15 | 2 | 9 | 10 | 20 | 3 | 6 |
| che24 | 3240 | 31 | 19 | 12 | 1 | 10 | 15 | 2 | 8 | 10 | 20 | 3 | 6 |
| che27 | 3270 | 25 | 15 | 10 | 1 | 7 | 15 | 2 | 5 | 10 | 20 | 3 | 6 |
| che3 | 3030 | 28 | 19 | 12 | 1 | 10 | 15 | 2 | 8 | 10 | 20 | 3 | 5 |
| che4 | 3040 | 32 | 20 | 12 | 1 | 9 | 15 | 2 | 7 | 10 | 20 | 3 | 6 |
| che6 | 3060 | 32 | 23 | 12 | 1 | 9 | 12 | 2 | 7 | 10 | 20 | 3 | 6 |
| che7 | 3070 | 53 | 38 | 25 | 1 | 5 | 12 | 2 | 4 | 8 | 20 | 3 | 5 |
| che7 | 3071 | 36 | 24 | 12 | 1 | 10 | 15 | 2 | 9 | 10 | 20 | 3 | 6 |
| cpo15 | 20150 | 30 | 20 | 10 | 1 | 9 | 15 | 2 | 8 | 10 | 20 | 3 | 5 |
| cpo16 | 20160 | 30 | 20 | 15 | 1 | 10 | 15 | 2 | 9 | 10 | 20 | 3 | 5 |
| 11- |
|
|
|
Mineralization Domain |
C_DOM | Search Ellipse | Pass 1 | No. Composites | Pass 2 | No. Composites | Pass 3 | No. Composites | |||||
| 1 | 2 | 3 | S-Vol | Min | Max | S-Vol | Min | Max | S-Vol | Min | Max | ||
| cpo2 | 20020 | 32 | 22 | 12 | 1 | 10 | 15 | 2 | 9 | 10 | 20 | 3 | 5 |
| cpo5 | 20050 | 26 | 22 | 10 | 1 | 9 | 15 | 2 | 8 | 10 | 20 | 3 | 5 |
| cpo7 | 20070 | 30 | 22 | 10 | 1 | 8 | 15 | 2 | 8 | 10 | 20 | 3 | 5 |
| n1 | 6010 | 28 | 23 | 13 | 1 | 8 | 15 | 2 | 7 | 10 | 20 | 3 | 10 |
| n12 | 6120 | 34 | 26 | 12 | 1 | 8 | 15 | 2 | 6 | 10 | 20 | 3 | 10 |
| n2 | 6020 | 28 | 23 | 14 | 1 | 7 | 15 | 2 | 6 | 10 | 20 | 3 | 10 |
| n22 | 6220 | 32.5 | 17 | 8.5 | 1 | 4 | 7 | 2 | 3 | 4 | 20 | 1 | 3 |
| n3 | 6030 | 33 | 27 | 15 | 1 | 6 | 15 | 2 | 5 | 10 | 20 | 3 | 10 |
| n9 | 6090 | 30 | 20 | 10 | 1 | 8 | 14 | 2 | 5 | 10 | 20 | 3 | 10 |
| 11- |
|
|
| 11.5.8 | Bulk Density |
A total of 5,748 density measurements were taken in San Gerardo, 1,107 of those occurring within 137 of the 220 mineralized bodies.
In a quantitative analysis, the density values are better correlated with the Zn grades, as demonstrated in Figure 11-39.
Figure 11-39: San Gerardo Correlation Matrix between Density and Other Elements (left) and Scatter Plot between Density and Zn (right)

Figure 11-40 shows a plan and isometric view of density composites in relation to the mineralized domains, indicating relatively widespread coverage but with some significant gaps where mineralized bodies are lacking informing density samples, although the largest of these are located outside of the Mineral Resource shell and Mineral Reserve pit design.
| 11- |
|
|
Figure 11-40: San Gerardo Density Composites

| 11- |
|
|
Of the 25 main domains, 23 have density values, totalling 282 density samples. Table 11-35 shows the statistics for the density values for the 23 domains. Density values do not exhibit significant variance across different domains, having means between 2.6 g/cm3 and 2.95 g/cm3.
Table 11-35: San Gerardo Open Pit Density Statistics
| Orebody | Count |
Mean (g/cm3) |
StdDev (g/cm3) |
CV |
Minimum (g/cm3) |
Maximum (g/cm3) |
||
| asu8 | 26 | 2.75 | 0.12 | 0.04 | 2.54 | 3.07 | ||
| che1 | 7 | 2.71 | 0.08 | 0.03 | 2.62 | 2.86 | ||
| che10 | 14 | 2.9 | 0.2 | 0.07 | 2.68 | 3.41 | ||
| che14 | 14 | 2.77 | 0.24 | 0.09 | 2.49 | 3.55 | ||
| che15 | 9 | 2.64 | 0.12 | 0.05 | 2.46 | 2.83 | ||
| che16 | 16 | 2.66 | 0.17 | 0.06 | 2.44 | 3.03 | ||
| che2 | 6 | 2.8 | 0.29 | 0.1 | 2.59 | 3.42 | ||
| che22 | 13 | 2.77 | 0.06 | 0.02 | 2.68 | 2.84 | ||
| che24 | 3 | 2.72 | 0.04 | 0.01 | 2.69 | 2.78 | ||
| che27 | 4 | 2.67 | 0.04 | 0.01 | 2.63 | 2.73 | ||
| che3 | 5 | 2.75 | 0.08 | 0.03 | 2.65 | 2.87 | ||
| che4 | 1 | 2.67 | 0 | 0 | 2.67 | 2.67 | ||
| che6 | 11 | 2.8 | 0.11 | 0.04 | 2.68 | 3.06 | ||
| che7 | 10 | 2.68 | 0.07 | 0.03 | 2.48 | 2.76 | ||
| cpo16 | 5 | 2.71 | 1.09 | 0.4 | 1.41 | 4 | ||
| cpo2 | 15 | 2.82 | 0.21 | 0.07 | 2.53 | 3.24 | ||
| cpo5 | 3 | 2.72 | 0.09 | 0.03 | 2.62 | 2.83 | ||
| n1 | 6 | 2.71 | 0.13 | 0.05 | 2.61 | 2.95 | ||
| n12 | 17 | 2.98 | 0.11 | 0.04 | 2.78 | 3.17 | ||
| n2 | 40 | 2.81 | 0.18 | 0.07 | 2.51 | 3.4 | ||
| n22 | 18 | 2.75 | 0.22 | 0.08 | 2.58 | 3.33 | ||
| n3 | 31 | 2.94 | 0.57 | 0.19 | 2.48 | 4.65 | ||
| n9 | 8 | 2.76 | 0.09 | 0.03 | 2.64 | 2.94 | ||
Similar mineralization domains were grouped (previously shown in Figure 11-27) and an average density value calculated for each group (Table 11-36). To assign density values to the block model, a local ID3 estimation method was used with a search neighbourhood radii equivalent to that applied to the Indicated Mineral Resources. For blocks situated beyond these radii or within domains lacking samples, the grouped domain's average density value was assigned.
| 11- |
|
|
Table 11-36: San Gerardo Grouped Density Statistics
| Group | Mean (g/cm3) |
CV | Minimum (g/cm3) |
Maximum (g/cm3) |
| 10 | 134 | 5.07 | 2.84 | 2.41 |
| ASUNCION | 190 | 3.29 | 2.74 | 2.29 |
| CHERCHER | 278 | 4.55 | 2.72 | 1.41 |
| VETA1 | 185 | 3.38 | 2.78 | 2.25 |
| ZOE | 53 | 4.19 | 2.66 | 2.2 |
| GLOBAL | 1086 | 5.58 | 2.77 | 1.41 |
| VETASN | 118 | 4.78 | 2.86 | 2.48 |
| VETASV | 94 | 5.58 | 2.76 | 2.4 |
| CLAUDIA | 6 | 3.09 | 2.79 | 2.69 |
| RUBI | 18 | 3.17 | 2.81 | 2.55 |
| MA | 10 | 3.59 | 2.89 | 2.6 |
Although the QP recommends the acquisition of additional density data to provide improved coverage and enable a more robust spatial estimate, the approach used by Nexa site team is considered acceptable for estimating Mineral Resources.
| 11.5.9 | Block Models |
A sub-blocked model was generated with parent blocks size of 4 m x 4 m x 6 m and a minimum sub-cell size of 0.5 m x 0.5 m x 0.5 m. Sub-blocking took place at mineralization domain wireframe boundaries (Table 11-37).
The sub-blocked model was re-blocked for the reporting of Mineral Resource, with block sizes equal to the parent blocks (Table 11-38). The re-blocked grades were assigned based on tonnage weighting the original block grades, and the geology and other codes were assigned based on majority rules.
Table 11-37: San Gerardo Open Pit Sub-Blocked Model Definition
| X | Y | Z | |
| Base Point | 366,461.5 | 8,829,676 | 4,390 |
| Boundary Size (m) | 1,328 | 1,036 | 390 |
| Parent Block (m) | 4 | 4 | 6 |
| Minimum Sub-Block (m) | 0.5 | 0.5 | 0.5 |
| 11- |
|
|
Table 11-38: San Gerado Open Pit Re-Blocked Model Definition
| X | Y | Z | |
| Base Point | 366,400 | 8,829,400 | 4,408 |
| Boundary Size (m) | 1,600 | 1,500 | 408 |
| Parent Block (m) | 4 | 4 | 6 |
| 11.5.10 | Net Smelter Return and Cut-off Value |
An NSR value was calculated using the Mineral Resource metal prices, metallurgical recovery rates, transportation, treatment, and refining costs. Metal prices applied to Mineral Resources are 15% greater than Mineral Reserves, which are derived from consensus long-term forecasts obtained from financial institutions, banks, and other reliable sources. The NSR value is denominated in US$/t and is computed for Mineral Resources to enable a meaningful comparison with production costs, helping to ascertain the economic viability of mining the mineralized material.
Currently, the mine yields Zn concentrate containing Zn and Ag, and Pb concentrate containing Pb, Ag, and Au as saleable products. The payable metals in these concentrates include transportation costs, refining charges, deductions, and penalty elements, as outlined in sales agreements established between the mine and smelters or traders.
The NSR factors are determined based on the smelter terms and metal prices, detailed in Table 11-39.
| 11- |
|
|
Table 11-39: San Gerardo NSR Cut-off Value Parameters
| Item | Unit | Value |
| Plant Metallurgical Recovery* | ||
| Zn | % | 70.44 |
| Pb | % | 83.97 |
| Ag | % | 75.76 |
| Au | % | 65.46 |
| Zn Concentrate Payable % | ||
| Zn | % | 85 |
| Ag | % | 70 |
| Pb Concentrate Payable % | ||
| Pb | % | 95 |
| Ag | % | 95 |
| Au | % | 95 |
| Metal Prices | ||
| Zn | US$/t | 3,218.90 |
| Pb | US$/t | 2,300.33 |
| Cu | US$/t | 8,820.05 |
| Ag | US$/oz | 24.35 |
| Au | US$/oz | 1,875.57 |
| Open Pit Costs | ||
| Mine cost | US$/t ore | 6.23 |
| US$/t waste | 2.27 | |
| Plant costs | US$/t | 10.65 |
| G&A | US$/t | 5.56 |
| Cut-off Value | US$/t | 22.44 |
* Based on LOM average metal grades.
| 11.5.11 | Classification |
Definitions for resource categories used in this TRS are those defined by the SEC in S-K 1300. Mineral Resources are classified into Measured, Indicated, and Inferred categories.
The following factors were considered when classifying the Mineral Resources:
| · | Confidence in modelling of mineralization domains. |
| · | Reliability of sampling data, including database integrity and lack of significant bias observed in QA/QC analysis results. |
| 11- |
|
|
| · | Confidence in estimation of block grades for the various metals. |
| · | Variogram model parameters. |
| · | Visual assessments of the geometries of mineralized domains in relation to drill hole spacing. |
| · | Production experience in the deposit. |
Two classification groups were defined based on geology and grade continuity. Blocks were classified as Measured, Indicated, and Inferred according to the number of holes and distances to holes determined by variogram ranges. Separate classification interpolation passes were run to flag the resource categories for each group:
Major Continuity Zones:
| · | Measured Mineral Resource: Composites from a minimum of three holes within a 25 m by 25 m by 12 m radii search. |
| · | Indicated Mineral Resource: Composites from a minimum of three holes within a 50 m by 50 m by 25 m radii search. |
| · | Inferred Mineral Resource: Composites from a minimum of two holes within a 100 m by 100 m by 50 m radii search. |
Minor Continuity Zones:
| · | Measured Mineral Resource: Composites from a minimum of three holes within a 20 m by 20 m by 10 m radii search. |
| · | Indicated Mineral Resource: Composites from a minimum of three holes within a 40 m by 40 m by 20 m radii search. |
| · | Inferred Mineral Resource: Composites from a minimum of two holes within a 80 m by 80 m by 40 m radii search. |
A post-processing, clean-up script was applied to the classification model to reduce a "spotted dog" effect and to demonstrate continuity between samples. Figure 11-41 shows histogram validations of the classification based on the distance of each block to its closest sample for the major, medium, and minimum continuity domains, respectively. The figure shows the number of samples and search passes used to estimate blocks by resource category. The data exhibits the expected trend, where Measured blocks are estimated using more samples within a shorter distance, with the opposite effect happening for Inferred category. However, overlaps occur for all categories, for example Measured blocks are estimated on the third pass and/or with five samples or less.
Figure 11-42 shows a vertical and plan view of the Mineral Resource classification applied at San Gerardo.
During review, SLR observed artifacts such as isolated drill holes used to support classification, resulting in a “spotted dog” effect in some areas. In addition, it was observed that drilling and channel samples completed along strike of the mineralization had been used to support the Mineral Resource classification, which SLR recommends should be discontinued. The QP concurs with this recommendation.
The QP considers the Mineral Resource classification applied to the San Gerardo deposit to be acceptable, however, recommends that the approach be improved in future Mineral Resource estimates to remove artifacts.
| 11- |
|
|
Figure 11-41: San Gerado Histogram of Number of Samples and Search Pass by Class

| 11- |
|
|
Figure 11-42: Plan and Longitudinal View of the Reported San Gerardo Classification within Mineral Resources Exclusive of Mineral Reserves

| 11- |
|
|
| 11.5.12 | Block Model Validation |
Nexa staff and the QP perform several validations of the geological modelling and block model estimation, including grade shell volume comparison against the previous version, visual inspections of the dynamic anisotropy angles, estimation statistics by search volume, global statistics, visual validations, and swath plots. These aim to confirm the consistency of the estimation process and the results.
SLR reviewed the files provided by Nexa staff, such as validation tables and figures, and performed extensive independent validations, including statistical correlations, visual validations, statistic validations, and swath plot analysis. The main checks are discussed in the following sections.
| 11.5.12.1Global | Statistics |
Global statistics of the interpolated OK, ID3 grades were compared with those of the NN estimation, which serves as a reference, assessing performance of the different estimators and confirming the estimate’s reproduction of the samples used for the estimation. Global statistics also help to identify inconsistencies in the estimation process.
Statistics for the main variables within the 25 main domains are shown in Table 11-40.
| 11- |
|
|
Table 11-40: San Gerardo Statistical Comparison Between OK, ID3, NN, and the Capped Composites
| Domain | Au (g/t) - OK | Au (g/t) - ID3 | Au (g/t) - NN | |||||||||
| Mean | CV | Min | Max | Mean | CV | Min | Max | Mean | CV | Min | Max | |
| asu8 | 0.2 | 0.89 | 0.03 | 1.52 | 0.2 | 1.09 | 0.02 | 2.58 | 0.19 | 1.37 | 0.01 | 2.05 |
| che1 | 0.2 | 0.72 | 0.01 | 0.78 | 0.2 | 0.88 | 0.01 | 1.02 | 0.19 | 1.14 | 0.01 | 1 |
| che10 | 0.23 | 1.09 | 0.01 | 1.7 | 0.23 | 1.19 | 0.01 | 2.15 | 0.24 | 1.46 | 0.01 | 2.59 |
| che14 | 0.33 | 1.03 | 0.01 | 2.53 | 0.3 | 1.31 | 0.01 | 3.93 | 0.29 | 1.67 | 0.01 | 2.72 |
| che15 | 0.22 | 0.75 | 0.02 | 1.37 | 0.25 | 1.16 | 0.02 | 2.13 | 0.26 | 1.26 | 0.01 | 2.14 |
| che16 | 0.34 | 1.11 | 0.01 | 3.45 | 0.33 | 1.33 | 0.01 | 4.53 | 0.32 | 1.66 | 0.01 | 3.88 |
| che2 | 0.46 | 1.29 | 0.01 | 4.7 | 0.44 | 1.71 | 0.01 | 8.57 | 0.44 | 2.18 | 0.01 | 6.07 |
| che22 | 0.24 | 0.95 | 0.01 | 1.3 | 0.22 | 1.08 | 0.01 | 1.87 | 0.23 | 1.36 | 0.01 | 3.5 |
| che24 | 0.36 | 0.95 | 0.03 | 2.59 | 0.35 | 1.15 | 0.02 | 3.59 | 0.33 | 1.75 | 0.01 | 6.73 |
| che27 | 0.39 | 0.48 | 0.06 | 1.27 | 0.37 | 0.66 | 0.02 | 1.4 | 0.37 | 1.01 | 0.01 | 1.86 |
| che3 | 0.23 | 1.06 | 0.01 | 1.63 | 0.23 | 1.21 | 0.01 | 2.51 | 0.23 | 1.44 | 0.01 | 2.94 |
| che4 | 0.18 | 0.8 | 0.01 | 0.8 | 0.19 | 0.9 | 0.01 | 0.95 | 0.19 | 1.12 | 0.01 | 0.96 |
| che6 | 0.22 | 1.13 | 0.01 | 1.68 | 0.23 | 1.26 | 0.01 | 2.51 | 0.23 | 1.73 | 0.01 | 2.63 |
| che7 | 0.33 | 1 | 0.01 | 2.8 | 0.35 | 1.23 | 0.01 | 4.99 | 0.33 | 1.81 | 0.01 | 5.72 |
| cpo15 | 0.12 | 1.52 | 0.01 | 1.02 | 0.09 | 1.66 | 0.01 | 1.29 | 0.09 | 1.79 | 0.01 | 1.11 |
| cpo16 | 0.15 | 1.45 | 0.01 | 2.31 | 0.15 | 1.63 | 0.01 | 3.43 | 0.15 | 1.95 | 0.01 | 2.78 |
| cpo2 | 0.24 | 1.22 | 0.01 | 2.51 | 0.24 | 1.39 | 0.01 | 3.74 | 0.24 | 1.7 | 0.01 | 2.89 |
| cpo5 | 0.22 | 0.96 | 0.01 | 2 | 0.25 | 1.08 | 0.01 | 2.76 | 0.25 | 1.26 | 0.01 | 2.41 |
| cpo7 | 0.24 | 1.23 | 0.01 | 1.75 | 0.28 | 1.33 | 0.01 | 2.18 | 0.31 | 1.55 | 0.01 | 2.39 |
| n1 | 0.43 | 0.74 | 0.06 | 2.58 | 0.43 | 1.21 | 0.02 | 4.92 | 0.43 | 1.61 | 0.01 | 5 |
| n12 | 0.03 | 0.83 | 0 | 0.15 | 0.03 | 1.11 | 0 | 0.2 | 0.02 | 1.57 | 0 | 0.2 |
| 11- |
|
|
| Domain | Au (g/t) - OK | Au (g/t) - ID3 | Au (g/t) - NN | |||||||||
| Mean | CV | Min | Max | Mean | CV | Min | Max | Mean | CV | Min | Max | |
| n2 | 0.01 | 0.64 | 0 | 0.14 | 0.01 | 1.1 | 0 | 0.22 | 0.01 | 1.26 | 0 | 0.13 |
| n22 | 0.04 | 1.03 | 0 | 0.2 | 0.04 | 1.21 | 0 | 0.22 | 0.04 | 1.32 | 0 | 0.22 |
| n3 | 0.04 | 0.94 | 0 | 0.31 | 0.04 | 1.41 | 0 | 0.44 | 0.04 | 1.64 | 0 | 0.39 |
| n9 | 0.03 | 0.75 | 0 | 0.12 | 0.02 | 0.79 | 0 | 0.13 | 0.03 | 1.46 | 0 | 0.2 |
| Domain | Zn (%) - OK | Zn (%) - ID3 | Zn (%) - NN | |||||||||
| Mean | CV | Min | Max | Mean | CV | Min | Max | Mean | CV | Min | Max | |
| asu8 | 1.18 | 0.53 | 0.11 | 4.45 | 1.1 | 0.78 | 0.03 | 6.93 | 1.17 | 1.19 | 0.01 | 7.17 |
| che1 | 1.64 | 0.64 | 0.05 | 7.28 | 1.57 | 0.79 | 0.03 | 7.67 | 1.57 | 1.17 | 0 | 7.42 |
| che10 | 1.54 | 0.87 | 0.02 | 8.58 | 1.57 | 1.03 | 0.01 | 11.64 | 1.4 | 1.42 | 0 | 13.18 |
| che14 | 2.04 | 0.77 | 0.03 | 9.6 | 2.01 | 0.89 | 0.01 | 10.82 | 1.98 | 1.16 | 0 | 13.12 |
| che15 | 0.66 | 0.85 | 0.04 | 3.69 | 0.75 | 1.09 | 0.02 | 4.64 | 0.7 | 1.38 | 0 | 4.66 |
| che16 | 1.3 | 0.7 | 0.04 | 5.33 | 1.35 | 0.86 | 0.01 | 6.9 | 1.36 | 1.14 | 0 | 7 |
| che2 | 1.51 | 1 | 0.01 | 9.36 | 1.46 | 1.04 | 0.01 | 11.77 | 1.51 | 1.28 | 0 | 12.6 |
| che22 | 1.4 | 0.93 | 0.02 | 9.21 | 1.34 | 1.04 | 0.01 | 10.02 | 1.4 | 1.38 | 0 | 12.62 |
| che24 | 0.85 | 0.58 | 0.06 | 2.75 | 0.81 | 0.71 | 0.05 | 3.64 | 0.87 | 1.09 | 0 | 4.21 |
| che27 | 1.31 | 0.82 | 0.1 | 7.37 | 1.47 | 1.16 | 0.05 | 10.16 | 1.5 | 1.43 | 0.01 | 8.49 |
| che3 | 2.14 | 0.85 | 0.1 | 11.81 | 2.23 | 0.82 | 0.02 | 14.71 | 2.15 | 1.25 | 0 | 17.01 |
| che4 | 1.16 | 0.79 | 0.1 | 6.09 | 1.16 | 1.15 | 0.03 | 7.88 | 1.1 | 1.71 | 0 | 8 |
| che6 | 1.28 | 0.67 | 0.04 | 6.96 | 1.27 | 0.85 | 0.01 | 9.13 | 1.24 | 1.17 | 0 | 9.2 |
| che7 | 2.34 | 0.97 | 0.04 | 16.15 | 2.36 | 1.17 | 0.01 | 23.15 | 2.54 | 1.79 | 0 | 25.34 |
| cpo15 | 1.27 | 0.56 | 0.08 | 5.72 | 1.37 | 0.62 | 0.02 | 7.23 | 1.33 | 0.97 | 0.02 | 7.47 |
| cpo16 | 0.79 | 0.91 | 0.01 | 5.75 | 0.82 | 0.97 | 0 | 6.88 | 0.81 | 1.23 | 0 | 6.5 |
| cpo2 | 1.02 | 0.78 | 0.05 | 6.63 | 1.01 | 0.89 | 0.02 | 7.85 | 0.98 | 1.29 | 0 | 9.56 |
| 11- |
|
|
| Domain | Zn (%) - OK | Zn (%) - ID3 | Zn (%) - NN | |||||||||
| Mean | CV | Min | Max | Mean | CV | Min | Max | Mean | CV | Min | Max | |
| cpo5 | 1.5 | 0.7 | 0.05 | 7.34 | 1.44 | 0.76 | 0.06 | 8.07 | 1.38 | 1.13 | 0.01 | 10.13 |
| cpo7 | 3.27 | 0.47 | 0.79 | 13.92 | 3.28 | 0.54 | 0.28 | 15.77 | 3.39 | 0.7 | 0.33 | 13.23 |
| n1 | 1.22 | 0.5 | 0.19 | 4.05 | 1.45 | 0.81 | 0.03 | 6.44 | 1.48 | 1.02 | 0.02 | 5.38 |
| n12 | 0.84 | 0.73 | 0.03 | 4.59 | 0.92 | 1.07 | 0.02 | 6 | 0.98 | 1.21 | 0.01 | 4.9 |
| n2 | 0.89 | 0.45 | 0.11 | 2.93 | 0.95 | 0.76 | 0.01 | 4.61 | 1.1 | 1.03 | 0.01 | 4.64 |
| n22 | 0.89 | 0.54 | 0.07 | 2.61 | 0.93 | 0.66 | 0.02 | 3.24 | 0.84 | 0.97 | 0 | 3.02 |
| n3 | 1.39 | 0.78 | 0.07 | 8.81 | 1.6 | 1.23 | 0.01 | 11.43 | 1.8 | 1.4 | 0 | 11.39 |
| n9 | 1.38 | 0.88 | 0.17 | 8.72 | 1.19 | 0.91 | 0.01 | 9.91 | 1.72 | 1.88 | 0 | 15 |
| Domain | Pb (%) - OK | Pb (%) - ID3 | Pb (%) - NN | |||||||||
| Mean | CV | Min | Max | Mean | CV | Min | Max | Mean | CV | Min | Max | |
| asu8 | 1.17 | 0.59 | 0.09 | 5.84 | 1.08 | 0.84 | 0.03 | 7.52 | 1.18 | 1.23 | 0.01 | 7.12 |
| che1 | 1 | 0.9 | 0.01 | 5.03 | 1.02 | 0.97 | 0 | 5.96 | 0.99 | 1.15 | 0 | 6.08 |
| che10 | 0.71 | 0.77 | 0.01 | 4.3 | 0.71 | 0.92 | 0 | 6.24 | 0.7 | 1.26 | 0 | 6.66 |
| che14 | 1.16 | 0.88 | 0.01 | 7.5 | 1.1 | 0.9 | 0 | 9.22 | 1.2 | 1.52 | 0 | 9.63 |
| che15 | 0.92 | 0.64 | 0.09 | 3.78 | 1 | 0.78 | 0.04 | 5.17 | 0.9 | 1.11 | 0 | 5.26 |
| che16 | 1.57 | 0.88 | 0.03 | 7.61 | 1.61 | 1.04 | 0 | 9.55 | 1.68 | 1.23 | 0 | 10.03 |
| che2 | 0.6 | 0.92 | 0.01 | 4.3 | 0.58 | 1.04 | 0.01 | 5.88 | 0.61 | 1.26 | 0.01 | 4.99 |
| che22 | 0.64 | 0.79 | 0.01 | 3.27 | 0.62 | 0.84 | 0 | 3.56 | 0.64 | 1.12 | 0 | 6.3 |
| che24 | 1.24 | 0.74 | 0.03 | 6.99 | 1.23 | 0.8 | 0.06 | 8.24 | 1.14 | 1.09 | 0.02 | 7.22 |
| che27 | 1.53 | 0.71 | 0.06 | 4.73 | 1.57 | 0.86 | 0.06 | 5.68 | 1.65 | 1.08 | 0.01 | 5.85 |
| che3 | 0.76 | 1.17 | 0.02 | 7.69 | 0.72 | 1.23 | 0.02 | 9.11 | 0.79 | 1.61 | 0 | 9.3 |
| che4 | 0.91 | 0.75 | 0.12 | 3.77 | 0.88 | 0.86 | 0.01 | 4.77 | 0.97 | 1.17 | 0 | 5.08 |
| che6 | 1.11 | 0.8 | 0 | 6.81 | 1.11 | 0.91 | 0 | 8.77 | 1.09 | 1.23 | 0 | 9.03 |
| 11- |
|
|
| Domain | Pb (%) - OK | Pb (%) - ID3 | Pb (%) - NN | |||||||||
| Mean | CV | Min | Max | Mean | CV | Min | Max | Mean | CV | Min | Max | |
| che7 | 1.49 | 0.93 | 0.01 | 8.59 | 1.5 | 1.03 | 0 | 9.84 | 1.4 | 1.39 | 0 | 16 |
| cpo15 | 1.23 | 0.92 | 0.01 | 8.28 | 1.28 | 1.08 | 0.01 | 10.38 | 1.29 | 1.31 | 0.01 | 10.66 |
| cpo16 | 1.5 | 0.78 | 0.03 | 8.86 | 1.5 | 0.89 | 0.03 | 10.51 | 1.44 | 1.35 | 0.01 | 10.98 |
| cpo2 | 0.91 | 1.08 | 0.01 | 10.38 | 0.92 | 1.26 | 0 | 12.53 | 0.9 | 1.64 | 0 | 16.97 |
| cpo5 | 1.16 | 0.56 | 0.09 | 4.96 | 1.13 | 0.65 | 0.04 | 5.64 | 1.09 | 0.96 | 0.01 | 8.21 |
| cpo7 | 0.54 | 1.82 | 0.02 | 5.42 | 0.64 | 2.14 | 0.02 | 7.21 | 0.65 | 2.26 | 0.01 | 4.97 |
| n1 | 1.17 | 0.34 | 0.1 | 3.13 | 1.24 | 0.68 | 0.02 | 5.36 | 1.27 | 0.88 | 0.03 | 4.28 |
| n12 | 1.15 | 0.59 | 0.08 | 6.49 | 1.15 | 0.84 | 0.05 | 8.36 | 0.99 | 1.31 | 0.01 | 9.79 |
| n2 | 0.85 | 0.46 | 0.12 | 3.65 | 0.82 | 0.74 | 0 | 6.24 | 0.88 | 0.97 | 0 | 4.7 |
| n22 | 1.13 | 0.58 | 0.24 | 3.68 | 1.21 | 0.73 | 0.05 | 4.51 | 1.24 | 0.94 | 0.01 | 3.37 |
| n3 | 2.04 | 0.76 | 0.13 | 11.67 | 2.34 | 1.14 | 0.02 | 16.3 | 2.23 | 1.44 | 0 | 16.24 |
| n9 | 1.06 | 0.52 | 0.22 | 4.22 | 0.94 | 0.61 | 0.01 | 5.01 | 1.19 | 1.38 | 0 | 7.68 |
| Domain | Ag (g/t) - OK | Ag (g/t) - ID3 | Ag (g/t) - NN | |||||||||
| Mean | CV | Min | Max | Mean | CV | Min | Max | Mean | CV | Min | Max | |
| asu8 | 32.57 | 0.62 | 3.95 | 232.11 | 31.02 | 0.84 | 1.28 | 392.75 | 32.16 | 1.19 | 1 | 508.34 |
| che1 | 31.26 | 0.72 | 1.21 | 114.39 | 31 | 0.86 | 1.01 | 135.44 | 30.35 | 0.99 | 1 | 133.25 |
| che10 | 26.64 | 0.74 | 2.46 | 98.72 | 26.44 | 0.91 | 1.09 | 154.97 | 26.02 | 1.22 | 1 | 165.46 |
| che14 | 35.16 | 0.61 | 1.35 | 177.42 | 34.44 | 0.78 | 1.02 | 254.18 | 33.67 | 1.21 | 1 | 304.76 |
| che15 | 33.99 | 0.63 | 2.89 | 113.41 | 36.67 | 0.69 | 1.77 | 150.37 | 35.03 | 0.95 | 1 | 140.84 |
| che16 | 48.62 | 0.79 | 1 | 245.28 | 50.87 | 0.89 | 1 | 349.41 | 51.05 | 1.12 | 1 | 335.99 |
| che2 | 24.47 | 0.55 | 4.92 | 125.01 | 23.96 | 0.76 | 2.02 | 203.7 | 24.61 | 1.01 | 1 | 145.68 |
| che22 | 21.58 | 0.56 | 2.16 | 127.41 | 20.66 | 0.68 | 2.1 | 146.56 | 21.22 | 1 | 1 | 270 |
| che24 | 37.67 | 0.59 | 6.49 | 132.77 | 37.94 | 0.66 | 4.1 | 204.24 | 35.85 | 1.03 | 1 | 236.24 |
| 11- |
|
|
| Domain | Ag (g/t) - OK | Ag (g/t) - ID3 | Ag (g/t) - NN | |||||||||
| Mean | CV | Min | Max | Mean | CV | Min | Max | Mean | CV | Min | Max | |
| che27 | 43.31 | 0.5 | 7.92 | 101.05 | 42.58 | 0.63 | 5.37 | 121.5 | 44.78 | 0.82 | 1 | 126.34 |
| che3 | 20.24 | 0.86 | 1.78 | 140.15 | 20.03 | 0.87 | 1.51 | 162.13 | 20.43 | 1.23 | 1 | 165 |
| che4 | 26.16 | 0.46 | 7.3 | 77.33 | 26.62 | 0.65 | 1.91 | 103.15 | 26.75 | 0.87 | 1 | 109.05 |
| che6 | 34.47 | 0.75 | 1 | 182.35 | 34.22 | 0.86 | 1 | 248.08 | 34.72 | 1.07 | 1 | 232.69 |
| che7 | 42.83 | 0.87 | 1.18 | 314.63 | 42.3 | 1.11 | 1 | 390.09 | 39.87 | 1.52 | 1 | 521.76 |
| cpo15 | 36.04 | 0.79 | 1.93 | 170.84 | 37.14 | 0.88 | 1.93 | 196.31 | 38.97 | 1.08 | 1.9 | 212.82 |
| cpo16 | 61.42 | 0.56 | 4.73 | 231.33 | 61.62 | 0.62 | 2.35 | 279.3 | 55.18 | 0.89 | 2.02 | 318.64 |
| cpo2 | 31.08 | 0.92 | 1.32 | 274.48 | 30.95 | 1.01 | 1 | 299.14 | 29.65 | 1.24 | 1 | 316.17 |
| cpo5 | 37.84 | 0.51 | 3.37 | 155.32 | 36.47 | 0.6 | 2.02 | 200.54 | 35.33 | 0.91 | 2.02 | 220 |
| cpo7 | 23.15 | 1.38 | 2.02 | 203.98 | 26.72 | 1.71 | 2.02 | 244.96 | 26.87 | 1.82 | 2.02 | 167.17 |
| n1 | 33.48 | 0.28 | 9.02 | 69.1 | 35.73 | 0.56 | 2.23 | 108.77 | 38.23 | 0.73 | 2.02 | 109.03 |
| n12 | 33.29 | 0.59 | 5.16 | 141.04 | 34.3 | 0.85 | 4.36 | 178.11 | 29.01 | 1.3 | 1 | 202.28 |
| n2 | 23.73 | 0.44 | 5.98 | 86.07 | 25.07 | 0.6 | 1.02 | 141.63 | 25.74 | 0.73 | 1 | 115.88 |
| n22 | 52.74 | 0.76 | 9.33 | 238.11 | 56.33 | 1.18 | 2.84 | 376.02 | 67.29 | 1.46 | 1 | 380 |
| n3 | 58.17 | 0.92 | 6.64 | 371.22 | 66.7 | 1.19 | 1.24 | 502.56 | 60.54 | 1.42 | 1 | 458.49 |
| n9 | 33.75 | 0.39 | 8.65 | 88.75 | 31.24 | 0.63 | 3.73 | 121.15 | 37.34 | 1.06 | 6.79 | 155.21 |
| 11- |
|
|
Figure 11-43 illustrates the comparison between final grades estimated in the block model and the capped and composited samples. In general, the estimated grades and composites show good agreement, while the differences observed do not suggest any consistent bias or errors of great magnitude.
Figure 11-43: San Gerardo Final Grade Variables and Capped and Composited Samples Comparison

| 11.5.12.2Visual | Validation |
SLR conducted random checks across various estimation domains, comparing the samples utilized for estimation with the block model. Particular emphasis was placed on the main domains owing to their significance for Mineral Resources and Mineral Reserves.
A visual comparison on longitudinal section along two veins found good overall correlations between the blocks and composite grades. Example longitudinal sections for the fault-controlled
| 11- |
|
|
“che16” domain and breccia “cpo15” domain are shown in Figure 11-44 and Figure 11-45, respectively. These demonstrate that block grades generally reflect the surrounding sample data, with good local reproduction of sample grades in both types of mineralization. Fault-controlled domains are more prone to exhibit visual artifacts in estimated grades due to their thin, tabular, and occasionally folded shape. However, the breccia-type mineralization is more massive and greater in volume than the fault-controlled veins, and therefore accounts for most of the Mineral Resource tonnage.
| 11- |
|
|
Figure 11-44: San Gerardo Longitudinal View of the Faulting-Controlled “che16” Domain (Orebody=316) – Zn Estimation

| 11- |
|
|
Figure 11-45: San Gerardo Section View of the Breccia-Controlled “cpo15” Domain (Orebody=2015) – Zn Estimation

| 11- |
|
|
| 11.5.12.3 | Swath Plots |
Swath plots were generated for the entire block model to evaluate global grade trends within the mineral deposit. Figure 11-46 illustrates swath plots for Zn and Pb in the X, Y, and Z directions.
In general, the estimated OK and ID3 block grades show good agreement with the NN block grades and composite grades. The largest divergences are often observed in regions of the model with few blocks and contributing little tonnage to the Mineral Resource.
Figure 11-46: San Gerardo Swath Plots for Zn and Pb

| 11.5.13 | Mineral Resource Reporting |
Mineral Resources have been classified in accordance with the definitions for Mineral Resources in S-K 1300, which are consistent with CIM (2014) definitions.
Figure 11-47 shows an example west-east section through the San Gerardo Mineral Resource and Mineral Reserve, while Figure 11-48 illustrates NSR values of the San Gerardo Mineral Resource inclusive of Mineral Reserve.
| 11- |
|
|
Figure 11-47: Longitudinal W-E Section of the Reported San Gerardo Mineral Resources and Mineral Reserves

| 11- |
|
|
Figure 11-48: San Gerardo Plan and Longitudinal Views of the NSR Values Above Cut-Off for Mineral Resources Inclusive of Reserves

| 11- |
|
|
In the QP’s opinion, the assumptions, parameters, and methodology used for the San Gerardo Mineral Resource estimate are appropriate for the style of mineralization and mining methods.
The QP is not aware of any environmental, permitting, legal, title, taxation, socio-economic, political, or other relevant factors that could significantly affect the San Gerardo Mineral Resource.
The QP is of the opinion that with consideration of the recommendations summarized in Sections 1 and 23 of this TRS, any issues relating to all relevant technical and economic factors likely to influence the prospect of economic extraction can be resolved with further work.
Mineral Resources with an effective date of December 31, 2023 for San Gerardo are summarized in Table 11-41 on a 75.96% Nexa attributable ownership basis and Table 11-42 on a 100% ownership basis.
Table 11-41: San Gerardo Open Pit Mine: Summary of Mineral Resources (75.96% Nexa Attributable Ownership Basis) – December 31, 2023
| Category | Tonnage (Mt) |
Grade | Contained Metal | ||||||
| Zn (%) |
Ag (g/t) |
Pb (%) |
Au (g/t) |
Zn (kt) |
Ag (koz) |
Pb (kt) |
Au (koz) |
||
| Measured | 1.37 | 1.28 | 31.4 | 0.87 | 0.19 | 17.5 | 1,381 | 11.9 | 8.4 |
| Indicated | 2.95 | 1.05 | 29.0 | 0.90 | 0.24 | 30.9 | 2,747 | 26.5 | 22.7 |
| Total Measured + Indicated | 4.31 | 1.12 | 29.8 | 0.89 | 0.22 | 48.4 | 4,128 | 38.4 | 31.1 |
| Inferred | 1.29 | 1.27 | 32.7 | 1.15 | 0.22 | 16.4 | 1,358 | 14.9 | 9.1 |
Notes:
| 1. | The definitions for Mineral Resources in S-K 1300 were followed for Mineral Resources which are consistent with CIM (2014) definitions. |
| 2. | The NSR cut-off value is calculated based on the LOM costs: US$22.44/t. |
| 3. | Mineral Resources are estimated using average long-term metal prices of Zn: US$3,218.90/t (US$1.46/lb), Pb: US$2,300.33/t (US$1.04/lb), Cu: US$8,820.05/t (US$4.00/lb), Ag: US$24.35/oz, and Au: US$1,875.57. |
| 4. | Metallurgical recoveries are based on historical processing data: Zn (70.4%), Pb (84.0%), Ag (75.8%), and Au (65.5%). |
| 5. | Bulk density was assigned based on rock type and averages 2.76 t/m3. |
| 6. | Mineral Resources were depleted according to actual production as of September 30, 2023, and forecast production to the effective date of December 31, 2023. |
| 7. | The minimum height for resource reporting is 6.0 m. |
| 8. | Mineral Resources are exclusive of Mineral Reserves. |
| 9. | Mineral Resources that are not Mineral Reserves do not have demonstrated economic viability. |
| 10. | Mineral Resources are constrained within an optimized reporting pit shell. |
| 11. | Numbers may not add due to rounding. |
| 11- |
|
|
Table 11-42: San Gerardo Open Pit Mine: Summary of Mineral Resources (100% Ownership Basis) – December 31, 2023
| Category | Tonnage (Mt) |
Grade | Contained Metal | ||||||
| Zn (%) |
Ag (g/t) |
Pb (%) |
Au (g/t) |
Zn (kt) |
Ag (koz) |
Pb (kt) |
Au (koz) |
||
| Measured | 1.80 | 1.28 | 31.4 | 0.87 | 0.19 | 23.0 | 1,818 | 15.7 | 11.00 |
| Indicated | 3.88 | 1.05 | 29.0 | 0.90 | 0.24 | 40.7 | 3,616 | 34.9 | 29.9 |
| Total Measured + Indicated | 5.68 | 1.12 | 29.8 | 0.89 | 0.22 | 63.8 | 5,434 | 50.6 | 40.9 |
| Inferred | 1.70 | 1.27 | 32.7 | 1.15 | 0.22 | 21.6 | 1,787 | 19.6 | 12.0 |
Notes:
| 1. | The definitions for Mineral Resources in S-K 1300 were followed for Mineral Resources which are consistent with CIM (2014) definitions. |
| 2. | The NSR cut-off is calculated based on the LOM costs: US$22.44/t. |
| 3. | Mineral Resources are estimated using average long-term metal prices of Zn: US$3,218.90/t (US$1.46/lb), Pb: US$2,300.33/t (US$1.04/lb), Cu: US$8,820.05/t (US$4.00/lb), Ag: US$24.35/oz, and Au: US$1,875.57. |
| 4. | Metallurgical recoveries are based on historical processing data: Zn (70.4%), Pb (84.0%), Ag (75.8%), and Au (65.5%). |
| 5. | Bulk density was assigned based on rock type and averages 2.76 t/m3. |
| 6. | Mineral Resources were depleted according to actual production as of September 30, 2023, and forecast production to the effective date of December 31, 2023. |
| 7. | Mineral Resources are exclusive of Mineral Reserves. |
| 8. | The minimum height for resource reporting is 6.0 m. |
| 9. | Mineral Resources that are not Mineral Reserves do not have demonstrated economic viability. |
| 10. | Mineral Resources are constrained within an optimized reporting pit shell. |
| 11. | Numbers may not add due to rounding. |
| 11- |
|
|
| 11.6 | Atacocha Underground |
| 11.6.1 | Resource Database |
Although the San Gerardo and Atacocha UG Mineral Resources were estimated separately, a combined resource database was used. The database is discussed in Section 11.5.1.
While a small quantity of exploration work has been completed at Atacocha after the January 31, 2023 resource database closure date, the additional data is limited to the San Gerardo open pit area and does not affect Atacocha UG.
| 11.6.2 | Geological Interpretation |
The Atacocha UG Mineral Resource estimate is based on assay and geological interpretation for each individual mineralized domain. Geological models were built by Atacocha geologists using the drilling and channel sampling assay results, as well as the structural and lithological controls observed in underground workings and drill core logging data. Geological model for lithological domains and the mineralization model were built using Leapfrog Geo software with some adjustments performed in Datamine software.
Eight lithological domains were modelled for Atacocha UG: skarn, intrusive, siliceous breccia, massive silica, marble, sandstone, limestone, and basalt. Three other domains were modelled which contain potentially economic mineralization: skarn, siliceous/massive breccia, and limestone replacement.
The mineralization wireframes were originally built based on information from mineralized zones and mapping within the underground levels and extrapolated. No minimum mining thickness was used. Once these solids were created, explicit modelling techniques were used to adjust the boundaries of the initial mineralization wireframes. The final mineralization wireframes were verified with drilling information on level plan views every 20 m. A total of 239 mineralization wireframes were modelled using a US$15/t NSR cut-off value to determine whether any given sample intersection would be considered for inclusion in a mineralized domain. Nexa calculated an NSR value for all assay intervals that takes into account all four economic metals (Zn, Pb, Cu, and Ag).
During the modelling process, three styles of mineralization were identified at the Atacocha deposit:
| · | Skarn: mineralized zones of irregular to structurally controlled geometry, primarily contained within the Pucará Group, comprising garnet with associated metallic mineralization of galena, sphalerite, chalcopyrite, and Ag-bearing sulphosalts (i.e., tetrahedrite). |
| · | Replacement: lenses to irregular geometry contacts within the Pucará Group, comprising metallic mineralization of galena, sphalerite, chalcopyrite, and Ag- bearing sulphosalts (i.e., tetrahedrite). |
| · | Structurally controlled zones (i.e., veins): mineralization comprising galena, sphalerite, and Ag-bearing sulphosalts (i.e., tetrahedrite) with quartz, rhodochrosite, and pyrite that forms structurally controlled shoots with lengths of up to 150 m and vertical extents of up to 350 m. |
Mineralized domain wireframes were constructed based upon the geologists’ interpretation of the mineralization observed in the underground workings and extrapolated approximately 40 m
| 11- |
|
|
from the last mineralized drill hole intercept. SLR reviewed the mineralized domains and noted that some domains were extended further, however, extrapolation was generally considered reasonable and the degree of extrapolation was considered during classification of Mineral Resources. SLR also identified that some very small OB wireframes had been constructed, with volumes less than 1,000 m3.
Drill holes lacking assays were not treated as barren and veins were allowed to pass through the modelled mineralization domains. The rationale behind the absence of assays in these instances remains unclear, whether due to the absence of identified mineralization or other factors such as time constraints. Following estimation, regions around the non-assayed holes were removed from the final block model by an NN approach to delineate the influence area, however, SLR observed that this produced unusually shaped final domains in the block models. While this was not deemed to significantly impact the estimated Mineral Resources, SLR recommends that veins be set to pinch out upon non-assayed samples, to refine the grade estimate in future Mineral Resource updates. The QP agrees with this recommendation.
Figure 11-49 shows the lithological control types for each of the 239 modelled mineralization domains. Figure 11-50 highlights the 25 main domain contributors to Mineral Resource tonnage.
Mineralization domains were grouped into 67 groups, which were used for variography, capping, and to determine average density values (Figure 11-51). These were created in consideration of geological zones (Atacocha, San Gerardo, and Santa Bárbara), type of structures (mineralized body or vein), type of emplacements (exoskarn, distal skarn, and endoskarn), type of lithological controls (contact, fault, brecciation, intrusive, contact fault), and the anisotropy and orientation of the mineralization domains.
The nomenclature used in the estimation process considers “OB” as the name of each mineralization domain, “COD_OB” as the numerical code for each mineralization domain, and “C_ESTIM” as the numerical code for grouped domains. Unlike San Gerado, no high grade/low grade sub-domains were established.
An analysis of snapping discrepancies showed that 96% of intervals assigned to an OB were correctly modelled as such, while 87% of waste intervals were correctly modelled. This is considered acceptable by the QP, especially as many of the discrepancies were located outside of the Mineral Resource constraining reporting shapes. The QP recommends, however, that snapping be improved in future Mineral Resource updates.
Contact analysis completed by SLR on the mineralization domains indicates that they are generally effective in separating mineralized and unmineralized populations (Figure 11-52), although it was identified in some areas that opportunities existed to extend the wireframes to include additional mineralized intercepts. In particular, Cu and Ag consistently display a tail of low grade values outside of the mineralized zones. The populations within the modelled mineralization were approximately lognormal.
The QP considers that the modelled mineralization domains are suitable for the estimation of Mineral Resources.
| 11- |
|
|
Figure 11-49: Atacocha Underground Lithological Control Type

| 11- |
|
|
Figure 11-50: Atacocha Underground 25 Main Domains

| 11- |
|
|
Figure 11-51: Atacocha Underground Grouped Mineralization

| 11- |
|
|
Figure 11-52: Atacocha Underground Mineralization Contact Analysis

| 11- |
|
|
| 11.6.3 | Resource Assays |
After completing 3D solid models, Nexa assess the assay data contained inside the solid models to determine whether any additional domaining is required prior to capping. Typically, raw assay data are extracted from each domain and are then assessed using histograms and cumulative probability plots.
For the EDA process, the database is exported from Leapfrog Geo and imported into Datamine Studio software. Non-sampled intervals are substituted with the detection limits of the chemical elements.
For the purpose of this TRS, Zn, Cu, Ag, and Pb, referred to as the main elements, will be detailed in tables and figures, along with the 25 grade shells (main domains) that contribute most significantly to the Mineral Resource and Mineral Reserves, approximately 75% of the volume.
Table 11-43 presents the length-weighted statistics of the drill holes and channels combined.
| 11- |
|
|
Table 11-43: Atacocha Underground Assay Statistics (Length Weighted) for the Main Domains
| Domain Code |
Orebody | Zn (%) - Assay (length weighted) | Cu (%) - Assay (length weighted) | ||||||||||
| Count | Mean | StdDev | CV | Min | Max | Count | Mean | StdDev | CV | Min | Max | ||
| 13 | 150 | 1,638 | 6.5 | 8.87 | 1.36 | 0.01 | 52.34 | 1,638 | 0.43 | 0.72 | 1.69 | 0 | 9.66 |
| 13b | 152 | 2,276 | 7.77 | 9.36 | 1.21 | 0.01 | 48.54 | 2,276 | 0.42 | 0.83 | 1.97 | 0.01 | 17.02 |
| 13r8 | 180 | 18 | 6.95 | 4.4 | 0.63 | 0.08 | 13.09 | 18 | 0.36 | 0.35 | 0.95 | 0.03 | 1.17 |
| 13r72 | 182 | 71 | 4.81 | 5.81 | 1.21 | 0.01 | 20.93 | 71 | 0.58 | 0.88 | 1.54 | 0.01 | 4 |
| 13u | 186 | 2,086 | 6.18 | 7.25 | 1.17 | 0 | 47.08 | 2,086 | 0.45 | 0.9 | 1.97 | 0 | 19.28 |
| 13w | 188 | 33 | 5.91 | 8.74 | 1.48 | 0.01 | 36.48 | 33 | 0.41 | 0.53 | 1.28 | 0.01 | 1.92 |
| 18 | 300 | 165 | 3.16 | 4.68 | 1.48 | 0.01 | 34.23 | 165 | 0.25 | 0.33 | 1.3 | 0.01 | 3.1 |
| 18b | 302 | 65 | 2.56 | 2.49 | 0.97 | 0.23 | 12.83 | 65 | 0.23 | 0.17 | 0.72 | 0.03 | 0.78 |
| 18f | 306 | 131 | 3.14 | 3.3 | 1.05 | 0.09 | 24.4 | 131 | 0.28 | 0.25 | 0.9 | 0.01 | 1.63 |
| 23 | 350 | 568 | 3.32 | 3.84 | 1.15 | 0.02 | 29.94 | 568 | 0.21 | 0.26 | 1.24 | 0.01 | 3.95 |
| 91 | 400 | 15 | 7.98 | 5.81 | 0.73 | 0.3 | 18.3 | 15 | 0.32 | 0.18 | 0.56 | 0.11 | 0.71 |
| 251 | 450 | 94 | 5.45 | 7.22 | 1.33 | 0.01 | 40.92 | 94 | 0.74 | 1.15 | 1.56 | 0.01 | 6.88 |
| 251c | 453 | 61 | 4.57 | 5.65 | 1.24 | 0.05 | 28.63 | 61 | 0.65 | 0.72 | 1.11 | 0.02 | 3.68 |
| 251d | 454 | 31 | 7.09 | 10.25 | 1.45 | 0.59 | 33.84 | 31 | 0.97 | 0.86 | 0.89 | 0.08 | 2.87 |
| ani | 500 | 170 | 3.51 | 4.17 | 1.19 | 0.05 | 22.28 | 170 | 0.3 | 0.49 | 1.6 | 0.01 | 3.48 |
| ania | 501 | 146 | 5.2 | 6.34 | 1.22 | 0.17 | 54.67 | 146 | 0.36 | 0.51 | 1.41 | 0.01 | 4.15 |
| cher | 550 | 55 | 9.81 | 9.58 | 0.98 | 0.01 | 27.15 | 55 | 0.83 | 2.64 | 3.19 | 0.01 | 15.38 |
| cne | 600 | 661 | 2.93 | 4.66 | 1.59 | 0.02 | 40.28 | 661 | 0.25 | 0.47 | 1.9 | 0.01 | 5.74 |
| ing | 750 | 159 | 6.18 | 7.28 | 1.18 | 0.01 | 37.53 | 159 | 0.59 | 1.3 | 2.2 | 0.01 | 12.2 |
| sb | 950 | 4,207 | 6.11 | 6.53 | 1.07 | 0.01 | 42.77 | 4,207 | 0.35 | 0.5 | 1.42 | 0.01 | 8.13 |
| sga | 1001 | 35 | 11.62 | 12.79 | 1.1 | 0.11 | 48.54 | 35 | 0.24 | 0.22 | 0.94 | 0.01 | 0.87 |
| 11- |
|
|
| Domain Code |
Orebody | Zn (%) - Assay (length weighted) | Cu (%) - Assay (length weighted) | ||||||||||
| Count | Mean | StdDev | CV | Min | Max | Count | Mean | StdDev | CV | Min | Max | ||
| sge | 1005 | 871 | 5.79 | 7.83 | 1.35 | 0.01 | 36.45 | 871 | 0.34 | 0.68 | 1.98 | 0.01 | 7.46 |
| sgf | 1006 | 157 | 12.59 | 11.68 | 0.93 | 0.01 | 41.38 | 157 | 0.45 | 0.72 | 1.6 | 0.01 | 5.53 |
| sgg | 1007 | 53 | 8.06 | 8.96 | 1.11 | 0.04 | 36.12 | 53 | 0.45 | 0.46 | 1.02 | 0.01 | 2.13 |
| sgq | 1017 | 10 | 4.98 | 7.51 | 1.51 | 0.04 | 28.6 | 10 | 0.34 | 0.59 | 1.75 | 0.01 | 2 |
| Domain Code | Orebody | Ag (g/t) - Assay (length weighted) | Pb (%) - Assay (length weighted) | ||||||||||
| Count | Mean | StdDev | CV | Min | Max | Count | Mean | StdDev | CV | Min | Max | ||
| 13 | 150 | 1,638 | 97.91 | 134.38 | 1.37 | 1 | 1,461.55 | 1,638 | 2.06 | 4.61 | 2.23 | 0.01 | 63.89 |
| 13b | 152 | 2,276 | 113.55 | 141.5 | 1.25 | 2.02 | 1,652.84 | 2,276 | 2.66 | 4.67 | 1.76 | 0.01 | 32.02 |
| 13r8 | 180 | 18 | 55.8 | 65.76 | 1.18 | 2.02 | 215.24 | 18 | 1.23 | 2.74 | 2.22 | 0.01 | 8.14 |
| 13r72 | 182 | 71 | 58.58 | 84.53 | 1.44 | 2.02 | 317.26 | 71 | 0.67 | 1.86 | 2.76 | 0.01 | 8.11 |
| 13u | 186 | 2,086 | 130.56 | 162.87 | 1.25 | 0.1 | 2,235.41 | 2,086 | 2.42 | 4.37 | 1.8 | 0 | 42.65 |
| 13w | 188 | 33 | 64.96 | 50.85 | 0.78 | 2.02 | 254.74 | 33 | 0.28 | 0.33 | 1.19 | 0.02 | 1.82 |
| 18 | 300 | 165 | 115.85 | 153.08 | 1.32 | 2.02 | 1,065.45 | 165 | 2.5 | 3.53 | 1.41 | 0.01 | 19.49 |
| 18b | 302 | 65 | 144.35 | 189.45 | 1.31 | 1.99 | 1,304.88 | 65 | 2.37 | 3.1 | 1.31 | 0.01 | 18.29 |
| 18f | 306 | 131 | 125.21 | 114.91 | 0.92 | 2.02 | 602.79 | 131 | 2.38 | 2.26 | 0.95 | 0.01 | 13.33 |
| 23 | 350 | 568 | 103.69 | 161.3 | 1.56 | 1.99 | 1,711.19 | 568 | 2.19 | 2.97 | 1.35 | 0.01 | 21.02 |
| 91 | 400 | 15 | 188.71 | 169.82 | 0.9 | 2.78 | 646.33 | 15 | 1.96 | 3.57 | 1.82 | 0.01 | 11.57 |
| 251 | 450 | 94 | 72.56 | 80.2 | 1.11 | 2.02 | 390.97 | 94 | 0.35 | 0.75 | 2.12 | 0.01 | 5.15 |
| 251c | 453 | 61 | 73.6 | 73 | 0.99 | 2.02 | 494.23 | 61 | 0.59 | 1.63 | 2.74 | 0.02 | 10.51 |
| 251d | 454 | 31 | 73.01 | 45.49 | 0.62 | 5.91 | 175.73 | 31 | 0.33 | 0.61 | 1.88 | 0.01 | 3.5 |
| ani | 500 | 170 | 37.99 | 79.02 | 2.08 | 2.02 | 545.21 | 170 | 0.95 | 2.43 | 2.56 | 0.01 | 17.59 |
| ania | 501 | 146 | 87.26 | 150.33 | 1.72 | 2.02 | 1,118.85 | 146 | 2.49 | 4.17 | 1.67 | 0.02 | 29.07 |
| 11- |
|
|
| Domain Code | Orebody | Ag (g/t) - Assay (length weighted) | Pb (%) - Assay (length weighted) | ||||||||||
| Count | Mean | StdDev | CV | Min | Max | Count | Mean | StdDev | CV | Min | Max | ||
| cher | 550 | 55 | 135.32 | 116.45 | 0.86 | 1.61 | 403.72 | 55 | 4.99 | 8.52 | 1.71 | 0 | 38.7 |
| cne | 600 | 661 | 21.42 | 29.12 | 1.36 | 2.02 | 246.65 | 661 | 0.8 | 1.68 | 2.1 | 0.01 | 19.77 |
| ing | 750 | 159 | 60.34 | 95.59 | 1.58 | 2.02 | 807.45 | 159 | 0.51 | 1.8 | 3.5 | 0.01 | 17.7 |
| sb | 950 | 4,207 | 166.88 | 240.3 | 1.44 | 1 | 3,165.09 | 4,207 | 4.35 | 5.87 | 1.35 | 0.01 | 44.18 |
| sga | 1001 | 35 | 56.47 | 60.69 | 1.07 | 2.02 | 257.85 | 35 | 0.58 | 1.91 | 3.27 | 0.02 | 11.11 |
| sge | 1005 | 871 | 112.34 | 213.11 | 1.9 | 0.27 | 3,800.84 | 871 | 2.48 | 4.38 | 1.77 | 0 | 32.6 |
| sgf | 1006 | 157 | 108.68 | 158.55 | 1.46 | 1 | 893.03 | 157 | 2.3 | 5.01 | 2.18 | 0.01 | 21.76 |
| sgg | 1007 | 53 | 155.81 | 237.43 | 1.52 | 1 | 1,152.69 | 53 | 2.74 | 3.75 | 1.37 | 0.02 | 18.66 |
| sgq | 1017 | 10 | 74.39 | 71.14 | 0.96 | 2.02 | 200.31 | 10 | 0.15 | 0.28 | 1.82 | 0.01 | 1.04 |
| 11- |
|
|
In the Atacocha underground deposit, approximately 80% of the samples are derived from drill holes, which consist of diamond drilling from both surface and underground, while 20% originate from channel samples. Sampling is naturally denser within developed galleries and mined stopes, as it is usually the case for underground mining. Figure 11-53 shows CDFs for the samples, with and without declustering weights. The declustered statistics have a lower mean for most variables, except for Cu, confirming the preferential bias for sampling mineralized areas.
Figure 11-53: Atacocha Underground CDF Main Elements, Comparing Declustered and Original Data.

Given the polymetallic nature of the mineralization, a bivariate statistical analysis is conducted to evaluate the relationships between the variables. Figure 11-54 shows scatter plots for the main elements, alongside their correlation coefficients. Generally, intermediate correlations are observed for most elements, apart from Cu, which shows less correlation.
| 11- |
|
|
Figure 11-54: Atacocha Underground Scatter Plots

| 11.6.4 | Treatment of High Grade Assays |
Where the assay distribution is skewed positively or approaches lognormal, erratic high grade values can have a disproportionate effect on the average grade of a deposit. One method of treating these outliers to reduce their influence on the average grade is to cut or cap them at a specific grade level.
Atacocha staff evaluated the raw grades using log-probability plots to assess the influence of higher grades for each element using estimation domains. The approach, applied by Atacocha staff, for restricting outliers was to identify a pronounced break in the probability curve that occurs above the 95th percentile.
A second capping level for the third interpolation pass in channel composites was applied to restrict the high grade influence.
Table 11-44 lists the capping levels for drill hole (“CAPD”), channel (“CAPC”) raw data determined for each estimation domain, and the second capping levels applied to samples used for the third interpolation pass.
| 11- |
|
|
Table 11-44: Atacocha Underground DDH, CHNL, and Second Level Top-Cut Values
| Domain | Zn DDH | Zn CHNL | Zn 2nd Level | Ag DDH | Ag CHNL | Ag CHNL 2nd Level | Pb DDH | Pb CHNL | Pb CHNL 2nd Level | Cu DDH | Cu CHNL | Cu CHNL 2nd Level |
| 13 | 36 | 46.2 | 27.1 | 620 | 590 | 118 | 10.6 | - | 1.97 | 9.4 | - | 1.33 |
| 18 | 17.9 | 15.8 | 13.5 | 551 | 637 | 585.8 | 14 | 14 | 13.91 | 2.5 | 1 | 0.69 |
| 23 | 20.17 | 18 | 12.13 | 710 | 798 | 511.6 | 10.6 | 15 | 8.38 | - | 2.4 | 1.07 |
| 91 | - | 12.71 | 12.41 | - | 215 | 185.7 | - | 14 | 7.49 | - | 1.07 | 0.685 |
| 251 | - | - | - | 230.2 | - | - | 1.788 | - | - | 4.41 | - | - |
| 13b | - | 48.5 | 28.54 | - | - | 521.1 | - | - | 5.8 | - | 18 | 2.1 |
| 13r72 | 37.2 | 22 | 12.1 | 662 | 980 | 254.1 | 19.8 | 22.4 | 5.4 | 9.4 | 6 | 1.7 |
| 13r8 | 31.1 | 40 | 19.7 | 748 | 1,194 | 392.3 | 20.5 | 24.5 | 10.5 | 8.1 | 13.1 | 3.2 |
| 13u | 32.5 | 41.5 | 21.9 | - | 1,232 | 545.2 | 20.4 | 22.2 | 13.3 | 5 | 6 | 1.5 |
| 13w | 32.5 | 41.5 | 21.9 | - | 1,232 | 545.2 | 20.4 | 22.2 | 13.3 | 5 | 6 | 1.5 |
| 18b | 15.86 | 10.83 | 9.6 | 1,243 | 1,399 | 651.8 | 15.5 | 15.6 | 10.06 | 1.32 | - | 0.62 |
| 18f | 17.9 | 15.8 | 13.5 | 551 | 637 | 585.8 | 14 | 14 | 13.91 | 2.5 | 1 | 0.69 |
| 251c | - | - | - | 230.2 | - | - | 1.788 | - | - | 4.41 | - | - |
| 251d | - | - | - | 230.2 | - | - | 1.788 | - | - | 4.41 | - | - |
| ani | 20.35 | 18.93 | 11.46 | 400 | 420 | 88.06 | - | 18.91 | 3 | 9.42 | - | 0.88 |
| ania | 20.35 | 18.93 | 11.46 | 400 | 420 | 88.06 | - | 18.91 | 3 | 9.42 | - | 0.88 |
| cher | 5 | - | 2.5 | 270 | - | 175 | - | - | 4 | 0.6 | - | 0.16 |
| cne | 16 | 18 | 10 | 115 | 150 | 34 | 3 | 5 | 0.77 | 1.2 | 0.8 | 0.49 |
| ing | 28 | - | - | 310 | - | - | 10 | - | - | 1.8 | - | - |
| sb | 23 | 30 | 17 | 715 | 700 | 200 | 14 | 23 | 7 | 4 | 4.7 | 0.99 |
| sga | 15 | - | - | - | - | - | 6.6 | - | - | 2.5 | - | - |
| sge | 26 | - | - | 570 | - | - | 12.7 | - | 8.7 | 4.3 | - | - |
| sgf | 26 | - | - | 570 | - | - | 12.7 | - | 8.7 | 4.3 | - | - |
| sgg | 26 | - | - | 570 | - | - | 12.7 | - | 8.7 | 4.3 | - | - |
| sgq | 12.6 | 30 | 15.8 | - | - | - | 14 | 18 | 12 | 2 | 2.7 | 1 |
Figure 11-55 shows the capping effect on overall distribution of grades for drill holes and channels together within Atacocha UG. The capped distributions show only minor reductions in their means.
| 11- |
|
|
Figure 11-55: Atacocha Underground Capping Effect on Drill Hole and Channel Distributions

| 11.6.5 | Compositing |
The average length of samples within the mineralized domains is 1.50 m. Capped sample data was composited to two metre lengths, which corresponds to half of the parent block size height for the deposit.
The composite length was selected based on analysis of four composite length levels (1 m, 2 m, 3 m, and 4 m). Figure 11-56 illustrates a comparison of the mean relative error of Zn between length-weighted raw assay mean versus composite mean, by mineralization domain for the different composite lengths.
Atacocha staff generated statistics to compare the distribution of the raw assays and the composites (Figure -11-57). An approximately less than two percent increase in means after compositing was observed.
| 11- |
|
|
Figure 11-56: Atacocha Underground Compositing Analysis

Source: Nexa, 2023
| 11- |
|
|
Figure 11-11-57: Sample Distributions before and after Compositing to 2 m Length

Table 11-45 shows the summary statistics for the 25 largest domain contributors to the Mineral Resource tonnage, before and after compositing.
| 11- |
|
|
Table 11-45: Atacocha Underground Compositing Statistics for the 25 Main Domains
| Domain | Zn (%) - Assay (2 m composites) | Cu (%) - Assay (2 m composites) | ||||||||||
| Count | Mean | StdDev | CV | Min | Max | Count | Mean | StdDev | CV | Min | Max | |
| 13 | 3,711 | 4.07 | 5.94 | 1.46 | 0 | 46.2 | 3,711 | 0.44 | 0.65 | 1.48 | 0 | 7.01 |
| 13b | 5,960 | 8.02 | 8.72 | 1.09 | 0 | 48.5 | 5,960 | 0.53 | 1.32 | 2.47 | 0 | 18 |
| 13r72 | 93 | 3.27 | 3.36 | 1.02 | 0 | 22.3 | 93 | 0.17 | 0.24 | 1.47 | 0 | 1.47 |
| 13r8 | 459 | 4.21 | 4.73 | 1.12 | 0 | 40 | 459 | 0.07 | 0.11 | 1.61 | 0 | 1.54 |
| 13u | 4,577 | 4.76 | 6.7 | 1.41 | 0 | 41.5 | 4,577 | 0.46 | 0.59 | 1.3 | 0 | 6 |
| 13w | 1,533 | 5.41 | 4.6 | 0.85 | 0 | 34.27 | 1,533 | 0.05 | 0.06 | 1.12 | 0 | 1.04 |
| 18 | 671 | 2.74 | 2.94 | 1.07 | 0 | 17.9 | 671 | 0.45 | 0.45 | 1.01 | 0 | 2.5 |
| 18b | 319 | 2.09 | 1.61 | 0.77 | 0 | 7.72 | 319 | 0.11 | 0.06 | 0.54 | 0 | 1.09 |
| 18f | 100 | 1.62 | 1.9 | 1.17 | 0 | 9.3 | 100 | 0.22 | 0.34 | 1.53 | 0 | 1.7 |
| 23 | 823 | 2.6 | 3.37 | 1.29 | 0 | 18 | 823 | 0.19 | 0.26 | 1.4 | 0 | 2.38 |
| 251 | 103 | 5.93 | 7.77 | 1.31 | 0 | 28.95 | 103 | 0.4 | 0.32 | 0.8 | 0 | 1.23 |
| 251c | 19 | 3.63 | 5.02 | 1.38 | 0 | 25.93 | 19 | 0.71 | 0.74 | 1.03 | 0 | 2.98 |
| 251d | 12 | 4.08 | 4.51 | 1.1 | 0.45 | 16.47 | 12 | 1.85 | 1.41 | 0.76 | 0.04 | 3.58 |
| 91 | 91 | 1.35 | 1.06 | 0.79 | 0 | 12.13 | 91 | 0.11 | 0.11 | 1.07 | 0 | 0.97 |
| ani | 314 | 4.36 | 2.45 | 0.56 | 0 | 20.01 | 314 | 0.2 | 0.17 | 0.85 | 0 | 2.03 |
| ania | 1,363 | 4.25 | 3.3 | 0.78 | 0 | 20.35 | 1,363 | 0.23 | 0.22 | 0.96 | 0 | 4.9 |
| cher | 47 | 0.61 | 0.65 | 1.06 | 0.02 | 5 | 47 | 0.07 | 0.03 | 0.35 | 0.01 | 0.47 |
| cne | 4,993 | 3.5 | 2.95 | 0.84 | 0 | 18 | 4,993 | 0.18 | 0.18 | 0.98 | 0 | 1.2 |
| ing | 89 | 2.66 | 2.98 | 1.12 | 0.04 | 15.07 | 89 | 0.13 | 0.16 | 1.2 | 0.01 | 0.96 |
| sb | 6,448 | 3.59 | 4.1 | 1.14 | 0 | 29.99 | 6,448 | 0.33 | 0.39 | 1.19 | 0 | 4.7 |
| sga | 61 | 4.78 | 4.89 | 1.02 | 0 | 13.79 | 61 | 0.51 | 0.46 | 0.91 | 0 | 2.07 |
| 11- |
|
|
| Domain | Zn (%) - Assay (2 m composites) | Cu (%) - Assay (2 m composites) | ||||||||||
| Count | Mean | StdDev | CV | Min | Max | Count | Mean | StdDev | CV | Min | Max | |
| sge | 54 | 6.78 | 7.13 | 1.05 | 0.01 | 23.7 | 54 | 1.1 | 1 | 0.91 | 0.07 | 4.24 |
| sgf | 41 | 3.01 | 4.97 | 1.65 | 0.03 | 26 | 41 | 0.71 | 1 | 1.41 | 0.03 | 4.3 |
| sgg | 37 | 7.26 | 6.12 | 0.84 | 0.06 | 16.69 | 37 | 1.49 | 0.82 | 0.55 | 0.01 | 3.37 |
| sgq | 6 | 7.2 | 3.87 | 0.54 | 2.51 | 11.82 | 6 | 0.53 | 0.15 | 0.28 | 0.02 | 0.76 |
| Domain | Ag (g/t) - Assay (2 m composites) | Pb (%) - Assay (2 m composites) | ||||||||||
| Count | Mean | StdDev | CV | Min | Max | Count | Mean | StdDev | CV | Min | Max | |
| 13 | 3,711 | 47.14 | 64.57 | 1.37 | 0 | 620 | 3,711 | 0.57 | 1.34 | 2.33 | 0 | 12.21 |
| 13b | 5,960 | 152.86 | 182.94 | 1.2 | 0 | 3,800.84 | 5,960 | 1.2 | 2.84 | 2.37 | 0 | 39.7 |
| 13r72 | 93 | 18.62 | 33.23 | 1.78 | 0 | 313.99 | 93 | 0.3 | 0.81 | 2.65 | 0 | 12.85 |
| 13r8 | 459 | 55.13 | 52.22 | 0.95 | 0 | 979.01 | 459 | 1.61 | 1.82 | 1.14 | 0 | 23.35 |
| 13u | 4,577 | 118.56 | 142.55 | 1.2 | 0 | 1232 | 4,577 | 2.3 | 4.14 | 1.8 | 0 | 22.2 |
| 13w | 1,533 | 217.25 | 202.82 | 0.93 | 0 | 1232 | 1,533 | 4.4 | 4.03 | 0.92 | 0 | 22.2 |
| 18 | 671 | 68.65 | 80.75 | 1.18 | 0 | 607.33 | 671 | 0.57 | 1.22 | 2.12 | 0 | 14 |
| 18b | 319 | 89.98 | 74.09 | 0.82 | 0 | 1243 | 319 | 1.3 | 1.1 | 0.85 | 0 | 10.73 |
| 18f | 100 | 34.76 | 47.91 | 1.38 | 0 | 375.18 | 100 | 0.5 | 0.76 | 1.52 | 0 | 5.82 |
| 23 | 823 | 88.62 | 117.45 | 1.33 | 0 | 790.51 | 823 | 1.26 | 2.02 | 1.61 | 0 | 15 |
| 251 | 103 | 19.04 | 18.09 | 0.95 | 0 | 88.76 | 103 | 0.12 | 0.22 | 1.77 | 0 | 1.17 |
| 251c | 19 | 34.23 | 34.19 | 1 | 0 | 177.99 | 19 | 0.07 | 0.1 | 1.38 | 0 | 0.47 |
| 251d | 12 | 83.69 | 53.53 | 0.64 | 4.63 | 215 | 12 | 0.28 | 0.34 | 1.22 | 0.03 | 1.26 |
| 91 | 91 | 21.32 | 11.18 | 0.52 | 0 | 202.4 | 91 | 0.98 | 0.56 | 0.57 | 0 | 11.23 |
| ani | 314 | 40.08 | 33.43 | 0.83 | 0 | 344.57 | 314 | 0.97 | 0.75 | 0.77 | 0 | 10.63 |
| ania | 1,363 | 23.18 | 31.87 | 1.38 | 0 | 364.33 | 1,363 | 0.77 | 1.44 | 1.87 | 0 | 16.28 |
| cher | 47 | 39.24 | 10.11 | 0.26 | 2.02 | 212.46 | 47 | 0.77 | 0.7 | 0.91 | 0.01 | 7.16 |
| 11- |
|
|
| Domain | Ag (g/t) - Assay (2 m composites) | Pb (%) - Assay (2 m composites) | ||||||||||
| Count | Mean | StdDev | CV | Min | Max | Count | Mean | StdDev | CV | Min | Max | |
| cne | 4,993 | 10.18 | 13.34 | 1.31 | 0 | 150 | 4,993 | 0.17 | 0.37 | 2.18 | 0 | 5 |
| ing | 89 | 27.13 | 33.64 | 1.24 | 2.02 | 218.17 | 89 | 0.86 | 1.28 | 1.48 | 0.01 | 7.79 |
| sb | 6,448 | 27.78 | 53.84 | 1.94 | 0 | 707.39 | 6,448 | 0.78 | 1.8 | 2.33 | 0 | 23 |
| sga | 61 | 52.09 | 39.31 | 0.75 | 0 | 1,251.5 | 61 | 0.11 | 0.09 | 0.8 | 0 | 6.6 |
| sge | 54 | 187.19 | 125.78 | 0.67 | 13.7 | 492.23 | 54 | 1.02 | 1.21 | 1.19 | 0.11 | 7.12 |
| sgf | 41 | 102.7 | 109.85 | 1.07 | 2.42 | 486.94 | 41 | 1.52 | 1.25 | 0.82 | 0.02 | 9.5 |
| sgg | 37 | 54.22 | 37.27 | 0.69 | 13.07 | 535 | 37 | 0.29 | 0.53 | 1.81 | 0 | 12.45 |
| sgq | 6 | 7.18 | 1.59 | 0.22 | 1.8 | 10.98 | 6 | 0.01 | 0 | 0.37 | 0.01 | 0.09 |
| 11- |
|
|
| 11.6.6 | Trend Analysis |
| 11.6.6.1 | Variography |
Atacocha staff generated downhole and directional variograms using the two metre composite values building a variogram for each estimation domain and each element. The variograms were used to support the characterization and quantification of the variance of mineralization within the spatial continuity of the mineralization domains being analyzed.
Variograms were standardized and modelled using two spherical structures in three directions. The variograms were used for OK interpolation and as a guide for selecting search ellipse ranges.
The results for variogram parameters for the 25 largest domain tonnage contributors to the Mineral Resource are tabulated in Table 11-46. An example of downhole and directional variogram models for the three main directions of continuity is shown in Figure 11-58.
| 11- |
|
|
Table 11-46: Atacocha Underground Zn Variogram Parameters for Main 25 Domains
| Domain | ESTIM | Datamine Rotation V-ANGLE | Nugget | Structure 1 | Structure 2 | ||||||||
| 1 | 2 | 3 | ST1PAR1 | ST1PAR2 | ST1PAR3 | C1 | ST2PAR1 | ST2PAR2 | ST2PAR3 | C2 | |||
| 13 | 150 | -134.36 | -54.47 | -53.95 | 0.17 | 7 | 8 | 13 | 0.29 | 33 | 23 | 17 | 0.55 |
| 18 | 300 | -100.82 | 39.82 | -96.52 | 0.10 | 31 | 12 | 4 | 0.66 | 33 | 21 | 20 | 0.25 |
| 23 | 350 | 28.08 | 65.19 | -35.42 | 0.13 | 21 | 13 | 10 | 0.37 | 42 | 27 | 13 | 0.50 |
| 91 | 400 | -14.01 | -68.91 | -135.99 | 0.20 | 21 | 28 | 10 | 0.30 | 32 | 32 | 16 | 0.50 |
| 251 | 450 | 84.01 | 68.91 | -135.99 | 0.17 | 45 | 44 | 10 | 0.46 | 59 | 48 | 16 | 0.37 |
| 13b | 152 | 52.86 | 47.73 | -67.37 | 0.17 | 15 | 24 | 8 | 0.25 | 34 | 30 | 10 | 0.58 |
| 13r72 | 156 | 79.03 | 61.10 | -122.38 | 0.14 | 13 | 6 | 6 | 0.51 | 31 | 32 | 20 | 0.35 |
| 13r8 | 153 | -153.02 | 74.21 | 108.68 | 0.19 | 11 | 9 | 8 | 0.55 | 42 | 50 | 11 | 0.25 |
| 13u | 157 | 130.00 | 75.00 | 180.00 | 0.16 | 8 | 15 | 4 | 0.54 | 50 | 38 | 14 | 0.30 |
| 13w | 157 | 130.00 | 75.00 | 180.00 | 0.16 | 8 | 15 | 4 | 0.54 | 50 | 38 | 14 | 0.30 |
| 18b | 301 | 67.33 | -24.90 | 95.51 | 0.28 | 62 | 12 | 13 | 0.24 | 65 | 49 | 20 | 0.48 |
| 18f | 300 | -100.82 | 39.82 | -96.52 | 0.10 | 31 | 12 | 4 | 0.66 | 33 | 21 | 20 | 0.25 |
| 251c | 450 | 84.01 | 68.91 | -135.99 | 0.17 | 45 | 44 | 10 | 0.46 | 59 | 48 | 16 | 0.37 |
| 251d | 450 | 84.01 | 68.91 | -135.99 | 0.17 | 45 | 44 | 10 | 0.46 | 59 | 48 | 16 | 0.37 |
| ani | 500 | 148.02 | -74.21 | -71.32 | 0.19 | 11 | 7 | 11 | 0.29 | 26 | 23 | 14 | 0.52 |
| ania | 500 | 148.02 | -74.21 | -71.32 | 0.19 | 11 | 7 | 11 | 0.29 | 26 | 23 | 14 | 0.52 |
| cher | 550 | 30.00 | -5.00 | -90.00 | 0.22 | 24 | 10 | 5 | 0.32 | 41 | 50 | 10 | 0.47 |
| cne | 600 | 10.00 | -65.00 | -90.00 | 0.11 | 13 | 12 | 8 | 0.41 | 36 | 22 | 17 | 0.48 |
| ing | 750 | -118.07 | 41.56 | -30.79 | 0.25 | 65 | 45 | 6 | 0.27 | 88 | 69 | 10 | 0.49 |
| sb | 950 | -90.00 | 90.00 | -90.00 | 0.12 | 25 | 12 | 14 | 0.40 | 63 | 66 | 28 | 0.48 |
| sga | 1000 | 8.52 | 31.32 | -60.35 | 0.29 | 48 | 37 | 16 | 0.56 | 76 | 63 | 20 | 0.16 |
| sge | 1003 | 20.00 | -75.00 | -90.00 | 0.17 | 6 | 4 | 3 | 0.37 | 33 | 19 | 13 | 0.46 |
| 11- |
|
|
| Domain | ESTIM | Datamine Rotation V-ANGLE | Nugget | Structure 1 | Structure 2 | ||||||||
| 1 | 2 | 3 | ST1PAR1 | ST1PAR2 | ST1PAR3 | C1 | ST2PAR1 | ST2PAR2 | ST2PAR3 | C2 | |||
| sgf | 1003 | 20.00 | -75.00 | -90.00 | 0.17 | 6 | 4 | 3 | 0.37 | 33 | 19 | 13 | 0.46 |
| sgg | 1003 | 20.00 | -75.00 | -90.00 | 0.17 | 6 | 4 | 3 | 0.37 | 33 | 19 | 13 | 0.46 |
| sgq | 1005 | -59.27 | -72.04 | 147.05 | 0.10 | 10 | 9 | 5 | 0.42 | 44 | 27 | 12 | 0.48 |
| 11- |
|
|
Figure 11-58: Downhole and Directional Zn Experimental Variograms and Models for Estimation Group 1005.

| 11- |
|
|
| 11.6.6.2 | Grade Contouring |
Grade contours play an important role in aiding the initial detection of preferential grade patterns within mineralization domains. A brief assessment was carried out for Zn within the “sgg” and “sge” domains to assess potential grade trends (Figure 11-59). Grades exhibit a strong vertical trend and vertical anisotropy within the “sgg” domain. Grades are concentrated towards the central portion of the “sge” domain, which exhibits a slight vertical anisotropy.
| 11- |
|
|
Figure 11-59: Contour Zn Grades for the “sge” Domain (Orebody=1005) (left) and “sgg” Domain (Orebody=1007) (right)

| 11- |
|
|
| 11.6.7 | Search Strategy and Grade Interpolation Parameters |
Orientation of the search ellipse and search parameters were based on the modelled variograms and the geometry of the modelled mineralization wireframes.
The final estimated values for Zn, Cu, Ag, and Pb grades at Atacocha UG are determined by OK and ID3. Initially, the estimation process incorporates OK, ID3, and NN interpolators, followed by an individual domain analysis to select between OK or ID3 results. This selection is based on domain-specific criteria such as sample quantity, average difference between OK and ID3 compared to NN, and domain size/volume. Variograms are defined based on estimation groups, allowing even domains with limited samples to be estimated via OK for comparison and validation purposes. Grade variables are not density or length-weighted during estimation.
To capture domain trends, dynamic anisotropy angles are calculated in Studio RM using domain wireframes. The estimation process includes three passes: the first pass utilizes search ellipse radii equivalent to variogram ranges for each variable; the second pass increases the radii by a factor of 1.25 to 3; and the third pass employs radii 10 to 100 times larger than the first pass.
The minimum and maximum sample numbers range from two to 25 for the first pass, two to 20 for the second pass, and two to 20 for the third pass, with a maximum of two samples per drill hole. Minor adjustments are made as needed to improve the final estimation result (Table 11-47).
| 11- |
|
|
Table 11-47: Atacocha Underground Zn Search Parameters for Main 25 Domains
| Mineralization Domain |
C_ESTIM | Search Ellipse (m) |
Pass 1 | No. Composites | Pass 2 | No. Composites | Pass 3 | No. Composites | |||||
| 1 | 2 | 3 | S-Vol | Min | Max | S-Vol | Min | Max | S-Vol | Min | Max | ||
| 13 | 150 | 23 | 13 | 7.5 | 1 | 6 | 16 | 2 | 6 | 16 | 20 | 2 | 8 |
| 18 | 300 | 25 | 15.5 | 10 | 1 | 6 | 16 | 2 | 6 | 16 | 20 | 2 | 8 |
| 23 | 350 | 17 | 12.5 | 6.5 | 1 | 6 | 16 | 2 | 6 | 16 | 10 | 2 | 8 |
| 91 | 400 | 18 | 30 | 8 | 1 | 6 | 16 | 2 | 6 | 16 | 20 | 2 | 8 |
| 251 | 450 | 30 | 30 | 8 | 1 | 4 | 8 | 2 | 6 | 16 | 20 | 2 | 8 |
| 13b | 152 | 39.5 | 34 | 6 | 1 | 6 | 16 | 2 | 4 | 8 | 20 | 2 | 4 |
| 13r72 | 156 | 13.5 | 13 | 10 | 1 | 6 | 12 | 2 | 6 | 12 | 20 | 2 | 4 |
| 13r8 | 153 | 21 | 25 | 5.5 | 1 | 6 | 16 | 2 | 6 | 16 | 20 | 2 | 8 |
| 13u | 157 | 25 | 19 | 7 | 1 | 6 | 16 | 2.5 | 4 | 8 | 10 | 1 | 3 |
| 13w | 157 | 25 | 19 | 7 | 1 | 6 | 16 | 2 | 6 | 16 | 20 | 2 | 8 |
| 18b | 301 | 15 | 10 | 8 | 1 | 10 | 15 | 2 | 6 | 10 | 10 | 4 | 10 |
| 18f | 300 | 20 | 15 | 10 | 1 | 10 | 15 | 2 | 7 | 10 | 20 | 5 | 10 |
| 251c | 450 | 30 | 30 | 8 | 1 | 6 | 16 | 2 | 6 | 16 | 10 | 2 | 8 |
| 251d | 450 | 30 | 30 | 8 | 1 | 6 | 16 | 2 | 6 | 16 | 10 | 2 | 8 |
| ani | 500 | 25 | 10 | 7 | 1 | 10 | 20 | 2 | 7 | 15 | 10 | 5 | 15 |
| ania | 500 | 25 | 10 | 7 | 1 | 15 | 20 | 2 | 10 | 15 | 30 | 5 | 15 |
| cher | 550 | 20 | 25 | 5 | 1 | 6 | 16 | 2 | 4 | 8 | 40 | 1 | 3 |
| cne | 600 | 32 | 16 | 10 | 1 | 10 | 20 | 2 | 7 | 15 | 10 | 5 | 15 |
| ing | 750 | 15 | 25 | 10 | 1 | 6 | 16 | 2 | 6 | 16 | 20 | 1 | 8 |
| sb | 950 | 40 | 48 | 14 | 1 | 6 | 16 | 2 | 8 | 16 | 10 | 2 | 4 |
| sga | 1000 | 30 | 20 | 10 | 1 | 6 | 10 | 2 | 4 | 7 | 10 | 2 | 7 |
| 11- |
|
|
| Mineralization Domain |
C_ESTIM | Search Ellipse (m) |
Pass 1 | No. Composites | Pass 2 | No. Composites | Pass 3 | No. Composites | |||||
| 1 | 2 | 3 | S-Vol | Min | Max | S-Vol | Min | Max | S-Vol | Min | Max | ||
| sge | 1003 | 70 | 50 | 30 | 1 | 6 | 15 | 2 | 4 | 10 | 10 | 2 | 7 |
| sgf | 1003 | 70 | 50 | 30 | 1 | 6 | 10 | 2 | 4 | 7 | 10 | 2 | 7 |
| sgg | 1003 | 70 | 50 | 30 | 1 | 6 | 10 | 2 | 4 | 7 | 10 | 2 | 7 |
| sgq | 1005 | 50 | 30 | 20 | 1 | 3 | 10 | 2 | 2 | 7 | 10 | 2 | 7 |
| 11- |
|
|
| 11.6.8 | Bulk Density |
A total of 1,083 density measurements were taken within the underground mineralization zones and 2,853 density measurements, within the wall rock.
The density values vary from 1.54 g/cm3 to 5.73 g/cm3, with an approximate global average of 3.46 g/cm3 within the mineralization and 2.89 g/cm3 within the wall rock.
Density values are unevenly distributed across the main domains, and some of the domains either do not have any density measurement or have very few. The QP notes that density distributions per domain have low CV.
In a quantitative analysis, the density values are better correlated with the Zn and Pb grades, as demonstrated in Figure 11-60.
Figure 11-60: Atacocha Underground Correlation Matrix (left) and Scatter Plot between Density and Zn (right)

Figure 11-61 shows an isometric view of density composites in relation to the domains.
| 11- |
|
|
Figure 11-61: Atacocha Underground Density Composites

| 11- |
|
|
Of the 25 main domains, 18 have density values, totalling 655 density samples. Density varies across different domains, having means between 2.91 g/cm3 and 4.03 g/cm3.
Table 11-48 summarizes the density sample statistics of the main domains.
Table 11-48: Atacocha Underground Density Statistics of the Main Domains
| Domain | Count | Mean | CV | Min | Max |
| 13 | 95 | 3.4 | 0.14 | 2.37 | 4.66 |
| 13r72 | 12 | 3.46 | 0.05 | 3.19 | 3.7 |
| 13r8 | 8 | 3.53 | 0.2 | 2.55 | 4.31 |
| 18 | 120 | 3.56 | 0.14 | 2.67 | 4.59 |
| 18b | 4 | 3.39 | 0.1 | 2.86 | 3.72 |
| 23 | 59 | 3.36 | 0.21 | 2.48 | 4.99 |
| 91 | 38 | 3.14 | 0.09 | 2.62 | 4.14 |
| ani | 33 | 3.54 | 0.13 | 2.68 | 4.37 |
| ania | 39 | 3.48 | 0.09 | 2.77 | 4.48 |
| cne | 102 | 3.71 | 0.13 | 1.54 | 4.8 |
| ing | 6 | 4.03 | 0.17 | 2.59 | 4.68 |
| sb | 87 | 3.69 | 0.12 | 2.68 | 4.51 |
| sga | 20 | 3.36 | 0.1 | 2.72 | 4.25 |
| sge | 16 | 3.37 | 0.09 | 2.63 | 3.87 |
| sgf | 7 | 3.42 | 0.12 | 3.03 | 4.16 |
| sgg | 8 | 2.91 | 0.08 | 2.68 | 3.49 |
| sgq | 1 | 3.98 | 0 | 3.98 | 3.98 |
Similar mineralization domains were grouped to form “C_ESTIM” domains (previously shown in Figure 11-27) and an average density value calculated for each group (Table 11-49). To assign density values to the block model, a local ID3 estimation method was used with a search neighbourhood radii equivalent to that applied to the Indicated Mineral Resources. For blocks situated beyond these radii or within domains lacking samples, the grouped domain's average density value was assigned.
Table 11-49: Atacocha Underground Grouped Mean Density
| C_Estim | Mean (g/cm3) |
C_Estim | Mean (g/cm3) |
C_Estim | Mean (g/cm3) |
C_Estim | Mean (g/cm3) |
| 100 | 2.73 | 253 | 3.30 | 505 | 3.17 | 1002 | 3.32 |
| 13 | 3.49 | 254 | 3.46 | 503 | 3.31 | 1003 | 3.27 |
| 151 | 3.60 | 255 | 3.51 | 506 | 3.39 | 1004 | 3.27 |
| 152 | 3.49 | 300 | 3.58 | 550 | 3.48 | 1005 | 3.37 |
| 11- |
|
|
| C_Estim | Mean (g/cm3) |
C_Estim | Mean (g/cm3) |
C_Estim | Mean (g/cm3) |
C_Estim | Mean (g/cm3) |
| 153 | 3.92 | 301 | 3.33 | 600 | 3.74 | 1050 | 3.48 |
| 154 | 3.62 | 507 | 3.02 | 6050 | 3.69 | 1150 | 3.39 |
| 155 | 3.49 | 508 | 3.21 | 650 | 3.39 | 1151 | 3.06 |
| 156 | 3.44 | 350 | 3.37 | 750 | 3.49 | 11680 | 3.36 |
| 150 | 3.49 | 351 | 3.21 | 850 | 3.48 | 1152 | 3.42 |
| 1650 | 3.44 | 352 | 3.53 | 900 | 3.70 | 1153 | 3.87 |
| 1680 | 3.62 | 400 | 3.15 | 901 | 3.55 | 1154 | 2.90 |
| 157 | 4.04 | 401 | 3.36 | 903 | 3.72 | 1300 | 3.21 |
| 200 | 3.31 | 450 | 3.44 | 902 | 3.57 | 1350 | 3.21 |
| 201 | 3.30 | 4520 | 3.44 | 904 | 3.79 | 1401 | 3.30 |
| 250 | 3.28 | 500 | 3.80 | 950 | 3.79 | 1400 | 3.30 |
| 251 | 3.30 | 501 | 3.32 | 1000 | 3.32 | 1500 | 3.39 |
| 252 | 3.42 | 502 | 3.25 | 1001 | 3.47 |
| 11.6.9 | Block Models |
A sub-blocked model was generated with parent blocks size of 2 m x 2 m x 2 m and a minimum sub-cell size of 0.5 m x 0.5 m x 0.5 m. Sub-blocking took place at mineralization domain wireframe boundaries (Table 11-50).
Table 11-50: Atacocha Underground Sub-Blocked Model Definition
| X | Y | Z | |
| Base Point | 366,480.5 | 8,829,157.5 | 4,378.5 |
| Boundary Size (m) | 2,108 | 1,780 | 1,932 |
| Parent Block (m) | 4 | 4 | 4 |
| Minimum Sub-Block (m) | 0.5 | 0.5 | 0.5 |
| 11.6.10 | Net Smelter Return and Cut-off Value |
An NSR value was calculated using the Mineral Resource metal prices, metallurgical recovery rates, transportation, treatment, and refining costs. Metal prices applied to Mineral Resources are 15% greater than Mineral Reserves, which are derived from consensus long-term forecasts obtained from financial institutions, banks, and other reliable sources. The NSR value is denominated in US$/t and is computed for Mineral Resources to enable a meaningful comparison with production costs, helping to ascertain the economic viability of mining the mineralized material.
Currently, the mine yields Zn concentrate containing Zn and Ag, Cu concentrate containing Cu and Ag, and Pb concentrate containing Pb and Ag as saleable products. The payable metals in
| 11- |
|
|
these concentrates include transportation costs, refining charges, deductions, and penalty elements, as outlined in sales agreements established between the mine and smelters or traders.
The NSR factors are determined based on the smelter terms and metal prices, detailed in Table 11-51.
Table 11-51: Atacocha Underground NSR Cut-off Value Parameters
| Item | Unit | Value |
| Plant Metallurgical Recovery | ||
| Zn | % | 89.30 |
| Pb | % | 80.02 |
| Cu | % | 15.73 |
| Ag | % | 77.51 |
| Au | % | 30.19 |
| Zn Concentrate Payable % | ||
| Zn | % | 85 |
| Ag | % | 70 |
| Cu Concentrate Payable % | ||
| Cu | % | 97 |
| Ag | % | 90 |
| Pb Concentrate Payable % | ||
| Pb | % | 95 |
| Ag | % | 95 |
| Metal Prices | ||
| Zn | US$/t | 3,218.90 |
| Pb | US$/t | 2,300.33 |
| Cu | US$/t | 8,820.05 |
| Ag | US$/oz | 24.35 |
| SLS | ||
| Mine cost | US$/t | 52.20 |
| Development | US$/t | 23.91 |
| Plant costs | US$/t | 10.43 |
| G&A | US$/t | 6.37 |
| Cut-off Value | US$/t | 69.00 |
| CAF | ||
| Mine cost | US$/t | 54.27 |
| Development | US$/t | 23.91 |
| Plant costs | US$/t | 10.43 |
| 11- |
|
|
| Item | Unit | Value |
| G&A | US$/t | 6.37 |
| Cut-off Value | US$/t | 71.07 |
* Based on LOM average metal grades.
Figure 11-62 illustrates the Mineral Resource panels calculated for Atacocha UG, based on the NSR discussed above.
| 11- |
|
|
Figure 11-62: View of the Mineral Resource Reporting Panels of Atacocha Underground

| 11- |
|
|
| 11.6.11 | Classification |
Two classification groups were defined based on geology and grade continuity. Blocks were classified as Measured, Indicated, and Inferred according to the number of holes and distances to holes determined by variogram ranges. Separate classification interpolation passes were run to flag the resource categories for each group:
Major Continuity Zones:
| · | Measured Mineral Resource: Composites from a minimum of three holes within a 26 m by 26 m by 13 m radii search. |
| · | Indicated Mineral Resource: Composites from a minimum of three holes within a 51 m by 51 m by 26 m radii search. |
| · | Inferred Mineral Resource: Composites from a minimum of two holes within a 102 m by 102 m by 51 m radii search. |
Minor Continuity Zones:
| · | Measured Mineral Resource: Composites from a minimum of three holes within a 24 m by 24 m by 12 m radii search. |
| · | Indicated Mineral Resource: Composites from a minimum of three holes within a 45 m by 45 m by 23 m radii search. |
| · | Inferred Mineral Resource: Composites from a minimum of two holes within a 90 m by 90 m by 45 m radii search. |
Figure 11-63 shows histogram validations of the classification based on the average number of samples and the search pass used to estimate each block by Mineral Resource category. The number of samples used is on average between five and 15 samples in most scenarios. The resource categories largely reflect the search passes, with most Measured blocks estimated on the first search pass, most Indicated blocks on the second pass, and most Inferred on the third. Despite this, there is a substantial spread of classes within the passes.
Figure 11-63: Atacocha Underground Histogram of Number of Samples and Search Pass by Class

The Mineral Resource classification applied to the Atacocha underground deposit is shown in Figure 11-64.
| 11- |
|
|
Although the QP considers the classification to be acceptable, the QP recommends that holes drilled parallel to mineralization be filtered out when calculating drill hole spacing for resource classification purposes.
| 11- |
|
|
Figure 11-64: Longitudinal View of the Mineral Resource Classification for the Atacocha Underground Resources Exclusive of Reserves

| 11- |
|
|
| 11.6.12 | Block Model Validation |
Nexa staff and the QP perform several validations of the geological modelling and block model estimation, including grade shell volume comparison against the previous version, visual inspections of the dynamic anisotropy angles, estimation statistics by search volume, global statistics, visual validations, swath plots, and others, aiming to certify the consistency of the estimation process and the results.
SLR reviewed the files provided by Nexa staff containing validation tables, and figures, as well as performed independent extensive validations, including statistical correlations, visual validations, statistic validations, and swath plot analysis. The main checks are discussed in the following sections.
| 11.6.12.1Global | Statistics |
Global statistics of the interpolated OK and ID3 were compared with those of an NN estimation which serves as the reference, assessing performance of the different estimators and confirming the estimate’s reproduction of the samples used for the estimation. Global statistics also help to identify inconsistencies in the estimation process.
Statistics for the main variables within the 25 main domains are demonstrated in Table 11-52.
| 11- |
|
|
Table 11-52: Atacocha Statistical Comparison Between OK, ID3, NN, and the Capped Composites
| Domain | Cu (%) - OK | Cu (%) - ID3 | Cu (%) - NN | |||||||||
| Mean | CV | Min | Max | Mean | CV | Min | Max | Mean | CV | Min | Max | |
| 13 | 0.39 | 0.95 | 0 | 4.84 | 0.39 | 1.11 | 0 | 6.4 | 0.38 | 1.45 | 0 | 5.7 |
| 13b | 0.43 | 1.63 | 0 | 15.02 | 0.42 | 1.63 | 0 | 14.23 | 0.42 | 2.37 | 0 | 18 |
| 13r72 | 0.19 | 0.78 | 0 | 0.73 | 0.21 | 1.01 | 0 | 0.89 | 0.21 | 1.28 | 0 | 1.47 |
| 13r8 | 0.05 | 1.28 | 0 | 0.7 | 0.06 | 1.65 | 0 | 0.68 | 0.06 | 2.15 | 0 | 1.02 |
| 13u | 0.5 | 0.86 | 0 | 3.38 | 0.5 | 0.88 | 0 | 4.03 | 0.49 | 1.29 | 0 | 6 |
| 13w | 0.05 | 0.74 | 0 | 0.36 | 0.05 | 0.78 | 0 | 0.43 | 0.05 | 1.3 | 0 | 1.04 |
| 18 | 0.44 | 0.67 | 0.01 | 2.13 | 0.45 | 0.74 | 0 | 2.29 | 0.47 | 0.99 | 0 | 2.39 |
| 18b | 0.12 | 0.68 | 0.02 | 0.67 | 0.12 | 0.75 | 0 | 0.88 | 0.12 | 1.03 | 0 | 1.04 |
| 18f | 0.13 | 0.68 | 0 | 0.96 | 0.13 | 0.96 | 0 | 1.26 | 0.16 | 1.48 | 0 | 1.38 |
| 23 | 0.2 | 0.73 | 0 | 1.19 | 0.19 | 0.85 | 0 | 1.33 | 0.19 | 1.38 | 0 | 2.38 |
| 251 | 0.24 | 0.75 | 0 | 1 | 0.26 | 0.9 | 0 | 1.14 | 0.25 | 1.14 | 0 | 1.13 |
| 251c | 0.94 | 0.3 | 0.2 | 1.91 | 1.04 | 0.48 | 0 | 2.24 | 1.04 | 0.61 | 0 | 1.91 |
| 251d | 1.93 | 0.23 | 0.2 | 3.15 | 1.97 | 0.54 | 0.08 | 3.47 | 1.97 | 0.66 | 0.2 | 3.15 |
| 91 | 0.22 | 0.55 | 0.02 | 0.68 | 0.24 | 0.69 | 0 | 0.91 | 0.26 | 1.03 | 0 | 0.97 |
| ani | 0.33 | 0.39 | 0.06 | 0.89 | 0.31 | 0.54 | 0.03 | 1.05 | 0.32 | 0.8 | 0 | 1.33 |
| ania | 0.35 | 0.48 | 0 | 3.67 | 0.36 | 0.63 | 0 | 4.76 | 0.33 | 0.95 | 0 | 3.15 |
| cher | 0.11 | 0.62 | 0.01 | 0.3 | 0.11 | 0.67 | 0.01 | 0.4 | 0.11 | 0.79 | 0.01 | 0.27 |
| cne | 0.22 | 0.6 | 0.02 | 0.91 | 0.21 | 0.68 | 0 | 1.17 | 0.22 | 0.97 | 0 | 1.2 |
| ing | 0.19 | 0.54 | 0.02 | 0.71 | 0.24 | 0.81 | 0.01 | 0.9 | 0.24 | 0.92 | 0.01 | 0.75 |
| sb | 0.34 | 0.67 | 0 | 2.63 | 0.34 | 0.72 | 0 | 2.89 | 0.33 | 1.03 | 0 | 4 |
| sga | 0.51 | 0.69 | 0.02 | 1.4 | 0.52 | 0.74 | 0 | 1.79 | 0.53 | 0.97 | 0 | 1.66 |
| 11- |
|
|
| Domain | Cu (%) - OK | Cu (%) - ID3 | Cu (%) - NN | |||||||||
| Mean | CV | Min | Max | Mean | CV | Min | Max | Mean | CV | Min | Max | |
| sge | 1.29 | 0.59 | 0.15 | 3.45 | 1.28 | 0.74 | 0.07 | 4.02 | 1.24 | 0.82 | 0.07 | 3.56 |
| sgf | 0.85 | 0.58 | 0.12 | 3.35 | 0.81 | 0.96 | 0.07 | 4.06 | 0.71 | 1.22 | 0.07 | 3.81 |
| sgg | 0.98 | 0.29 | 0.19 | 2.97 | 0.98 | 0.55 | 0.01 | 3.35 | 0.97 | 0.68 | 0.01 | 3.12 |
| sgq | 0.31 | 0.26 | 0.09 | 0.68 | 0.33 | 0.52 | 0.02 | 0.7 | 0.22 | 1.1 | 0.02 | 0.67 |
| Domain | Zn (%) - OK | Zn (%) - ID3 | Zn (%) - NN | ||||||||||
| Mean | CV | Min | Max | Mean | CV | Min | Max | Mean | CV | Min | Max | ||
| 13 | 3.61 | 1 | 0 | 31.36 | 3.48 | 1.14 | 0 | 36.2 | 3.26 | 1.54 | 0 | 45.53 | |
| 13b | 7.23 | 0.82 | 0 | 37.29 | 7.41 | 0.8 | 0 | 37.36 | 7.06 | 1.19 | 0 | 47.2 | |
| 13r72 | 2.69 | 1.11 | 0 | 17.68 | 2.47 | 1.19 | 0 | 21.26 | 2.38 | 1.47 | 0 | 20.28 | |
| 13r8 | 4.68 | 0.55 | 0.15 | 20.98 | 4.64 | 0.64 | 0 | 21.29 | 4.46 | 0.98 | 0 | 23.45 | |
| 13u | 5.35 | 0.95 | 0 | 35.24 | 5.35 | 1.01 | 0 | 34.76 | 5.04 | 1.43 | 0 | 41.5 | |
| 13w | 5.16 | 0.71 | 0.32 | 20.92 | 5.06 | 0.78 | 0 | 20.41 | 4.81 | 1.03 | 0 | 34.27 | |
| 18 | 2.6 | 0.63 | 0.03 | 11.53 | 2.76 | 0.74 | 0.01 | 13.95 | 2.72 | 1.01 | 0 | 14.51 | |
| 18b | 1.66 | 0.46 | 0.15 | 5.17 | 1.67 | 0.54 | 0.01 | 6.66 | 1.55 | 0.83 | 0 | 7.72 | |
| 18f | 1.51 | 0.44 | 0.14 | 5.71 | 1.49 | 0.69 | 0.02 | 7.24 | 1.51 | 1.02 | 0 | 8.25 | |
| 23 | 2.18 | 0.71 | 0 | 13.79 | 2.19 | 0.82 | 0 | 15.5 | 2.18 | 1.27 | 0 | 16.36 | |
| 251 | 2.96 | 1.01 | 0 | 25.98 | 2.77 | 1.5 | 0 | 28.87 | 3.23 | 1.71 | 0 | 28.9 | |
| 251c | 3.38 | 0.62 | 0.46 | 22.25 | 4 | 0.86 | 0 | 23.46 | 4.22 | 0.97 | 0 | 14.33 | |
| 251d | 5.06 | 0.28 | 1.61 | 11.27 | 5.03 | 0.53 | 1.11 | 14.11 | 4.96 | 0.7 | 1.29 | 10.26 | |
| 91 | 3.59 | 0.37 | 0.46 | 8.55 | 3.69 | 0.6 | 0 | 10.04 | 3.73 | 0.87 | 0 | 12.13 | |
| ani | 3.49 | 0.41 | 0.69 | 14.03 | 3.65 | 0.54 | 0.25 | 14.83 | 3.74 | 0.79 | 0 | 18.93 | |
| ania | 3.36 | 0.44 | 0.41 | 14.51 | 3.4 | 0.52 | 0.02 | 18.92 | 3.43 | 0.78 | 0 | 18.93 | |
| cher | 1.45 | 0.65 | 0.05 | 4.41 | 1.5 | 0.69 | 0.03 | 5 | 1.58 | 0.83 | 0.02 | 5 | |
| 11- |
|
|
| cne | 3.11 | 0.47 | 0.22 | 12.92 | 3.23 | 0.54 | 0.02 | 13.57 | 3.15 | 0.79 | 0 | 18 |
| ing | 3.44 | 0.34 | 0.72 | 9.88 | 3.18 | 0.6 | 0.23 | 12.66 | 3.23 | 0.83 | 0.33 | 10.49 |
| sb | 3.76 | 0.71 | 0 | 22.39 | 3.81 | 0.72 | 0 | 22.61 | 3.71 | 1.12 | 0 | 27.4 |
| sga | 3.58 | 0.56 | 0.21 | 10.53 | 3.55 | 0.77 | 0.02 | 13.65 | 3.88 | 1.11 | 0 | 13.79 |
| sge | 6.09 | 0.58 | 0.44 | 15.14 | 5.88 | 0.79 | 0.01 | 18.48 | 5.74 | 0.92 | 0.01 | 17.78 |
| sgf | 3.95 | 0.8 | 0.16 | 16.83 | 3.52 | 1.32 | 0.05 | 24.37 | 3.04 | 1.67 | 0.07 | 20.19 |
| sgg | 4.34 | 0.33 | 0.8 | 10.31 | 4.27 | 0.68 | 0.06 | 16.68 | 3.94 | 1.07 | 0.06 | 16.69 |
| sgq | 5.47 | 0.29 | 2.99 | 9.95 | 5.39 | 0.4 | 2.51 | 10.81 | 4.91 | 0.46 | 2.51 | 9.93 |
| Domain | Zn (%) - OK | Zn (%) - ID3 | Zn (%) - NN | |||||||||
| Mean | CV | Min | Max | Mean | CV | Min | Max | Mean | CV | Min | Max | |
| 13 | 3.61 | 1 | 0 | 31.36 | 3.48 | 1.14 | 0 | 36.2 | 3.26 | 1.54 | 0 | 45.53 |
| 13b | 7.23 | 0.82 | 0 | 37.29 | 7.41 | 0.8 | 0 | 37.36 | 7.06 | 1.19 | 0 | 47.2 |
| 13r72 | 2.69 | 1.11 | 0 | 17.68 | 2.47 | 1.19 | 0 | 21.26 | 2.38 | 1.47 | 0 | 20.28 |
| 13r8 | 4.68 | 0.55 | 0.15 | 20.98 | 4.64 | 0.64 | 0 | 21.29 | 4.46 | 0.98 | 0 | 23.45 |
| 13u | 5.35 | 0.95 | 0 | 35.24 | 5.35 | 1.01 | 0 | 34.76 | 5.04 | 1.43 | 0 | 41.5 |
| 13w | 5.16 | 0.71 | 0.32 | 20.92 | 5.06 | 0.78 | 0 | 20.41 | 4.81 | 1.03 | 0 | 34.27 |
| 18 | 2.6 | 0.63 | 0.03 | 11.53 | 2.76 | 0.74 | 0.01 | 13.95 | 2.72 | 1.01 | 0 | 14.51 |
| 18b | 1.66 | 0.46 | 0.15 | 5.17 | 1.67 | 0.54 | 0.01 | 6.66 | 1.55 | 0.83 | 0 | 7.72 |
| 18f | 1.51 | 0.44 | 0.14 | 5.71 | 1.49 | 0.69 | 0.02 | 7.24 | 1.51 | 1.02 | 0 | 8.25 |
| 23 | 2.18 | 0.71 | 0 | 13.79 | 2.19 | 0.82 | 0 | 15.5 | 2.18 | 1.27 | 0 | 16.36 |
| 251 | 2.96 | 1.01 | 0 | 25.98 | 2.77 | 1.5 | 0 | 28.87 | 3.23 | 1.71 | 0 | 28.9 |
| 251c | 3.38 | 0.62 | 0.46 | 22.25 | 4 | 0.86 | 0 | 23.46 | 4.22 | 0.97 | 0 | 14.33 |
| 251d | 5.06 | 0.28 | 1.61 | 11.27 | 5.03 | 0.53 | 1.11 | 14.11 | 4.96 | 0.7 | 1.29 | 10.26 |
| 91 | 3.59 | 0.37 | 0.46 | 8.55 | 3.69 | 0.6 | 0 | 10.04 | 3.73 | 0.87 | 0 | 12.13 |
| ani | 3.49 | 0.41 | 0.69 | 14.03 | 3.65 | 0.54 | 0.25 | 14.83 | 3.74 | 0.79 | 0 | 18.93 |
| ania | 3.36 | 0.44 | 0.41 | 14.51 | 3.4 | 0.52 | 0.02 | 18.92 | 3.43 | 0.78 | 0 | 18.93 |
| cher | 1.45 | 0.65 | 0.05 | 4.41 | 1.5 | 0.69 | 0.03 | 5 | 1.58 | 0.83 | 0.02 | 5 |
| cne | 3.11 | 0.47 | 0.22 | 12.92 | 3.23 | 0.54 | 0.02 | 13.57 | 3.15 | 0.79 | 0 | 18 |
| 11- |
|
|
| Domain | Zn (%) - OK | Zn (%) - ID3 | Zn (%) - NN | |||||||||
| Mean | CV | Min | Max | Mean | CV | Min | Max | Mean | CV | Min | Max | |
| ing | 3.44 | 0.34 | 0.72 | 9.88 | 3.18 | 0.6 | 0.23 | 12.66 | 3.23 | 0.83 | 0.33 | 10.49 |
| sb | 3.76 | 0.71 | 0 | 22.39 | 3.81 | 0.72 | 0 | 22.61 | 3.71 | 1.12 | 0 | 27.4 |
| sga | 3.58 | 0.56 | 0.21 | 10.53 | 3.55 | 0.77 | 0.02 | 13.65 | 3.88 | 1.11 | 0 | 13.79 |
| sge | 6.09 | 0.58 | 0.44 | 15.14 | 5.88 | 0.79 | 0.01 | 18.48 | 5.74 | 0.92 | 0.01 | 17.78 |
| sgf | 3.95 | 0.8 | 0.16 | 16.83 | 3.52 | 1.32 | 0.05 | 24.37 | 3.04 | 1.67 | 0.07 | 20.19 |
| sgg | 4.34 | 0.33 | 0.8 | 10.31 | 4.27 | 0.68 | 0.06 | 16.68 | 3.94 | 1.07 | 0.06 | 16.69 |
| sgq | 5.47 | 0.29 | 2.99 | 9.95 | 5.39 | 0.4 | 2.51 | 10.81 | 4.91 | 0.46 | 2.51 | 9.93 |
| Domain | Ag (g/t) - OK | Ag (g/t) - ID3 | Ag (g/t) - NN | |||||||||
| Mean | CV | Min | Max | Mean | CV | Min | Max | Mean | CV | Min | Max | |
| 13 | 35.98 | 0.98 | 0.25 | 360.9 | 35.2 | 1.19 | 0.01 | 477.96 | 34.13 | 1.59 | 0 | 586.28 |
| 13b | 138.57 | 0.78 | 0 | 1,446.77 | 139.89 | 0.78 | 0 | 1,552.39 | 140.29 | 1.34 | 0 | 3,800.84 |
| 13r72 | 17.28 | 1.34 | 0 | 211.25 | 15.89 | 1.27 | 0 | 181.12 | 15.45 | 1.92 | 0 | 199.68 |
| 13r8 | 61.88 | 0.58 | 1.28 | 478.32 | 61.3 | 0.6 | 0.02 | 372.67 | 56.84 | 0.85 | 0 | 485.84 |
| 13u | 117.99 | 0.81 | 0 | 584.04 | 119.35 | 0.87 | 0 | 648.92 | 111.52 | 1.24 | 0 | 1232 |
| 13w | 256.15 | 0.56 | 14.84 | 906.33 | 251.14 | 0.64 | 0.09 | 1,067.65 | 240.86 | 0.95 | 0 | 1232 |
| 18 | 68.56 | 0.78 | 1.32 | 437.48 | 73.49 | 0.94 | 0.19 | 460.22 | 73.57 | 1.35 | 0 | 551 |
| 18b | 113.54 | 0.69 | 14.06 | 715.47 | 105.34 | 0.79 | 0.47 | 1,056.14 | 92 | 1.27 | 0 | 1243 |
| 18f | 45.41 | 0.71 | 3.78 | 260.66 | 58.8 | 1.18 | 0.27 | 374.88 | 66.13 | 1.41 | 0 | 375.18 |
| 11- |
|
|
| Domain | Ag (g/t) - OK | Ag (g/t) - ID3 | Ag (g/t) - NN | |||||||||
| Mean | CV | Min | Max | Mean | CV | Min | Max | Mean | CV | Min | Max | |
| 23 | 93.76 | 0.59 | 0.48 | 400.91 | 94.33 | 0.71 | 0.48 | 501.41 | 89.89 | 1.18 | 0 | 567.87 |
| 251 | 11.2 | 0.64 | 0 | 66.47 | 12.18 | 0.77 | 0 | 76.67 | 12.19 | 0.94 | 0 | 66.64 |
| 251c | 41.49 | 0.27 | 6.68 | 141.16 | 45.69 | 0.43 | 0 | 163.61 | 46.99 | 0.53 | 0 | 110.62 |
| 251d | 98.36 | 0.23 | 10.04 | 179.72 | 99.34 | 0.55 | 7.6 | 206.78 | 98.9 | 0.66 | 10.04 | 176.28 |
| 91 | 54.21 | 0.44 | 6 | 149.84 | 57.44 | 0.6 | 0.05 | 193.2 | 60.77 | 0.93 | 0 | 202.4 |
| ani | 27.57 | 0.64 | 3.9 | 138.63 | 28.47 | 0.86 | 1.3 | 188.61 | 29.71 | 1.14 | 0 | 238.58 |
| ania | 26.13 | 0.92 | 1.86 | 232.91 | 26.82 | 1.08 | 0.04 | 248.98 | 26.02 | 1.53 | 0 | 312.9 |
| cher | 53.16 | 0.56 | 9.44 | 143.14 | 54.66 | 0.6 | 7.69 | 179.81 | 54.1 | 0.76 | 4.12 | 119.62 |
| cne | 10.43 | 0.63 | 0.99 | 76.05 | 10.48 | 0.73 | 0.12 | 98.95 | 10.71 | 1.09 | 0 | 95.39 |
| ing | 33.28 | 0.47 | 6.84 | 151.33 | 33.86 | 0.72 | 4.06 | 192 | 34.02 | 0.99 | 4.04 | 166.24 |
| sb | 29.51 | 1.22 | 0 | 460.37 | 29.62 | 1.22 | 0 | 439.57 | 27.77 | 2 | 0 | 700 |
| sga | 92.59 | 0.84 | 4.19 | 714.47 | 79.47 | 0.92 | 0.13 | 1,089.43 | 81.77 | 2.01 | 0 | 1251.5 |
| sge | 147.4 | 0.33 | 35.75 | 338.75 | 161.19 | 0.54 | 13.86 | 418 | 163.54 | 0.66 | 13.7 | 362.11 |
| sgf | 91.77 | 0.53 | 20.64 | 336.81 | 90.42 | 0.81 | 3.93 | 389.91 | 88.33 | 1.01 | 5.55 | 373.73 |
| sgg | 101.69 | 0.44 | 14.88 | 376.53 | 98.65 | 0.7 | 13.81 | 534.21 | 98.88 | 1.06 | 14.1 | 535 |
| sgq | 6.3 | 0.2 | 2.68 | 9.86 | 6.95 | 0.37 | 1.8 | 10.98 | 6.13 | 0.65 | 1.8 | 10.98 |
| 11- |
|
|
Figure 11-65 illustrates the comparison between final grades estimated in the block model and the capped and composited samples. In general, the estimated grades and composites show good agreement, while the differences do not suggest any consistent bias.
Figure 11-65: Atacocha Underground Final Block Grades and Capped and Composited Samples Comparison

| 11.6.12.2Visual | Validation |
The QP conducted random checks across various estimation domains, comparing the samples utilized for estimation with the block model. Particular emphasis was placed on the main domains owing to their significance for Mineral Resources and Mineral Reserves.
A visual comparison on a longitudinal section along two veins found good overall correlations between the blocks and composite grades. Example longitudinal sections for the “ing_2” domain are shown in Figure 11-66 for Zn grades, demonstrating that block grades generally reflect the surrounding sample data, although some visual artifacts are observed - especially within vein-
| 11- |
|
|
type tabular mineralized zones. The stripes in grade estimations appear more pronounced along the subtle folding of the vein and result from restriction of only two samples per drill hole combined with the short, 2 m length composites, resulting in estimation bias on the borders of domains and in areas with wide sample spacing.
| 11- |
|
|
Figure 11-66: Longitudinal View of the “ing_2” Domain (Orebody=750) Estimated Grades for Zn within Atacocha Underground Mine

| 11- |
|
|
| 11.6.12.3 | Swath Plots |
Swath plots were generated for the entire block model to evaluate global grade trends within the mineral deposit. Figure 11-67 shows swath plots for Zn and Pb in the X, Y, and Z directions.
In general, the estimated methods OK and ID3 block grades correlate well with the NN block grades and composite grades. The largest divergences are often observed in borders or regions of the model with few blocks or samples, contributing little tonnage to the Mineral Resources.
Figure 11-67: Atacocha Underground Swath Plots for Zn and Pb

| 11- |
|
|
| 11.6.13 | Mineral Resource Reporting |
The same classification criteria were applied to the Atacocha OP (San Gerardo) and Atacocha UG Mineral Resources, and are discussed in Section 11.5.11.
In the QP’s opinion, the assumptions, parameters, and methodology used for the Atacocha Underground Mineral Resource estimate are appropriate for the style of mineralization and mining methods. The QP is not aware of any environmental, permitting, legal, title, taxation, socio-economic, political, or other relevant factors that could significantly affect the Atacocha underground Mineral Resource.
The QP is of the opinion that with consideration of the recommendations summarized in Sections 1 and 23 of this TRS, any issues relating to all relevant technical and economic factors likely to influence the prospect of economic extraction can be resolved with further work.
Figure 11-68 illustrates the Atacocha underground Mineral Resources exclusive of Mineral Reserves, coloured by NSR.
Mineral Resources with an effective date of December 31, 2023 for Atacocha UG are shown in Table 11-53 on a 75.96% Nexa attributable ownership basis and Table 11-54 on a 100% ownership basis.
Table 11-53: Atacocha Underground Mine: Summary of Mineral Resources (75.96% Nexa Attributable Ownership Basis)– December 31, 2023
| Category | Tonnage (Mt) |
Grade | Contained Metal | ||||||
| Zn (%) |
Cu (%) |
Ag (g/t) |
Pb (%) |
Zn (kt) |
Cu (kt) |
Ag (koz) |
Pb (kt) |
||
| Measured | 0.80 | 3.47 | 0.27 | 55.0 | 0.98 | 27.7 | 2.2 | 1,411 | 7.8 |
| Indicated | 1.91 | 3.30 | 0.36 | 54.9 | 0.92 | 63.2 | 6.9 | 3,381 | 17.6 |
| Total Measured + Indicated | 2.71 | 3.35 | 0.33 | 55.0 | 0.94 | 90.8 | 9.0 | 4,792 | 25.4 |
| Inferred | 6.12 | 4.09 | 0.56 | 77.3 | 1.21 | 250.4 | 34.3 | 15,214 | 74.1 |
Notes:
| 1. | The definitions for Mineral Resources in S-K 1300 were followed for Mineral Resources which are consistent with CIM (2014) definitions. |
| 2. | The NSR cut-off is calculated based on the LOM costs: US$ 69.00/t for SLS and US$71.07/t for CAF. |
| 3. | Mineral Resources are estimated using average long-term metal prices of Zn: US$ 3,218.90/t (US$1.46/lb), Pb US$2,300.33/t (US$1.04/lb), and Ag US$ 24.35/oz. |
| 4. | Metallurgical recoveries are based on historical processing data: Zn (89.3%), Pb (80.0%), Cu (15.7%), Ag (77.5%), and Au (30.2%). |
| 5. | Bulk density was assigned based on rock type and averages 3.53 t/m3. |
| 6. | Mineral Resources were depleted according to actual production as of September 30, 2023, and forecast production to the effective date of December 31, 2023. |
| 7. | Mineral Resources are exclusive of Mineral Reserves. |
| 8. | The minimum thickness for underground resource reporting panels is 4 m for CAF and 3 m for SLS. |
| 9. | Mineral Resources that are not Mineral Reserves do not have demonstrated economic viability. |
| 10. | Mineral Resources were constrained by optimized underground reporting shapes. |
| 11. | Numbers may not add due to rounding. |
| 11- |
|
|
Table 11-54: Atacocha Underground Mine: Summary of Mineral Resources (100% Ownership Basis)– December 31, 2023
| Category | Tonnage (Mt) |
Grade | Contained Metal | ||||||
| Zn (%) |
Cu (%) |
Ag (g/t) |
Pb (%) |
Zn (000 t) |
Cu (000 t) |
Ag (000 oz) |
Pb (000 t) |
||
| Measured | 1.05 | 3.47 | 0.27 | 55.0 | 0.98 | 36.4 | 2.8 | 1,858 | 10.3 |
| Indicated | 2.52 | 3.30 | 0.36 | 54.9 | 0.92 | 83.2 | 9.1 | 4,450 | 23.2 |
| Total Measured + Indicated | 3.57 | 3.35 | 0.33 | 55.0 | 0.94 | 119.6 | 11.9 | 6,308 | 33.5 |
| Inferred | 8.06 | 4.09 | 0.56 | 77.3 | 1.21 | 329.7 | 45.1 | 20,029 | 97.5 |
Notes:
| 1. | The definitions for Mineral Resources in S-K 1300 were followed for Mineral Resources which are consistent with CIM (2014) definitions. |
| 2. | The NSR cut-off is calculated based on the LOM costs: US$69.00/t for SLS and US$71.07/t for CAF. |
| 3. | Mineral Resources are estimated using average long-term metal prices of Zn: US$ 3,218.90/t (US$1.46/lb), Pb US$2,300.33/t (US$1.04/lb), and Ag US$ 24.35/oz. |
| 4. | Metallurgical recoveries are based on historical processing data: Zn (89.3%), Pb (80.0%), Cu (15.7%), Ag (77.5%), and Au (30.2%). |
| 5. | Bulk density was assigned based on rock type and averages 3.53 t/m3. |
| 6. | Mineral Resources were depleted according to actual production as of September 30, 2023, and forecast production to the effective date of December 31, 2023. |
| 7. | Mineral Resources are exclusive of Mineral Reserves. |
| 8. | The minimum thickness for underground resource reporting panels is 4 m for CAF and 3 m for SLS. |
| 9. | Mineral Resources that are not Mineral Reserves do not have demonstrated economic viability. |
| 10. | Mineral Resources were constrained by optimized underground reporting shapes. |
| 11. | Numbers may not add due to rounding. |
| 11- |
|
|
Figure 11-68: Atacocha Underground Mineral Resources Exclusive of Mineral Reserves

| 11- |
|
|
| 11.7 | Mineral Resource Uncertainty |
The classification of Mineral Resources serves to convey the degree of uncertainty inherent in the geological interpretation and estimation process, which is largely a function of the available data. In addition to the drill hole density and distribution, other factors such as drilling and sampling methodologies, QA/QC procedures, confidence in geological interpretation and grade continuity, metal prices, mining methods, and density measurements impact the levels of uncertainty associated with the Mineral Resource categories, and are considered in Mineral Resource classification.
Standard industry practices were followed for drilling, sampling, sample preparation and assay procedures, ensuring database integrity and representativeness. Analysis of the QC sample results confirm the absence of significant biases. Confidence in geological interpretation, modeling, and grade estimation is largely dependent on the available information such as drilling density and geological mapping. Varied drill hole spacing results in differing confidence levels, influencing variography, geological modeling, grade estimation, and consequently, the confidence in estimated metal grade and tonnage for each block. The uncertainty varies from high to low for the Measured, Indicated, and Inferred categories, reflecting the anticipated sensitivity of the estimate to the addition of new field data.
Adjustments to parameters such as estimation strategy, including the minimum and maximum number of drill holes and samples for estimation, handling of absent values/assays, and choice of estimation interpolator, are made based on geological information available and can be used to improve the reliability of local and global estimation. Nexa adopts a conservative approach by utilizing half of the detection limit for absent values/assays and excluding estimated blocks influenced by these samples, contributing to reduced estimation uncertainty.
Block model validation through comparison of different estimation techniques, swath plots, and visual validation against composites yields acceptable results across all Mineral Resource categories and indicates that the estimated grades are a reasonable representation of the available data. Nexa has systematically taken density measurements, however, there are insufficient samples for the estimation for all domains and for the majority of the blocks, which results in higher levels of uncertainty for the estimated tonnage. Average density is calculated and assigned for grouped mineralization domains, although density is also interpolated locally where data is available.
The metal prices used for Mineral Resource NSR calculation are set 15% higher than Mineral Reserve prices, reflecting consensus long-term forecasts from financial institutions, banks, and other sources, along with supply and demand dynamics for zinc, lead, silver, gold, and copper. The associated uncertainty pertains to commodity risk and reflects current forecasts.
The QP is of the opinion that the uncertainty levels related to geological modelling and estimation are adequately reflected in the Mineral Resource classification categories, providing sufficient support for the Mineral Resource estimate. Any necessary adjustments aimed at improvement are outlined in preceding chapters and should be addressed in future updates.
| 11- |
|
|
| 12.0 | Mineral Reserve Estimates |
| 12.1 | Summary |
The Mineral Reserve estimate for the Cerro Pasco Complex, including the El Porvenir and Atacocha underground and Atacocha (San Gerardo) open pit mines, with an effective date of December 31, 2023, is summarized in Table 12-1 and Table 12-2 on a Nexa attributable ownership basis and 100% ownership basis, respectively.
The SLR QPs are not aware of any risk factors associated with, or changes to, any aspects of the modifying factors such as mining, metallurgical, infrastructure, permitting, or other relevant factors that could materially affect the Mineral Reserve estimate with the exception of the impacts of faults on the stope stability and equivalent linear overbreak/slough (ELOS) that have not been accounted for in the geotechnical empirical analyses for the underground mines. SLR has estimated the impact of an increase in ELOS/dilution, and has reduced the Mineral Reserve by 2%; see Section 12.3.2 for more detail.
| 12- |
|
|
Table 12-1: Summary of Cerro Pasco Complex Mineral Reserve Estimate (Nexa Attributable Basis) – December 31, 2023
| Mine | Owner ship (%) |
Category | Tonnage (Mt) |
Grade | Contained Metal | Recoveries | ||||||||||||
| Zn (%) |
Cu (%) |
Ag (g/t) |
Pb (%) |
Au (g/t) |
Zn (kt) |
Cu (kt) |
Ag (koz) |
Pb (kt) |
Au (koz) |
Zn (%) |
Cu (%) |
Ag (%) |
Pb (%) |
Au (%) |
||||
| El Porvenir UG | 83.48% | Proven | 3.27 | 4.09 | 0.24 | 75.2 | 1.29 | --- | 133.8 | 7.9 | 7,907 | 42.0 | --- | 89.21 | 14.60 | 77.51 | 80.01 | --- |
| Probable | 8.96 | 4.11 | 0.22 | 72.1 | 1.17 | --- | 368.7 | 20.0 | 20,759 | 104.6 | --- | 89.21 | 14.60 | 77.51 | 80.01 | --- | ||
| Sub-Total | 12.23 | 4.11 | 0.23 | 72.9 | 1.20 | --- | 502.5 | 28.0 | 28,666 | 146.6 | --- | 89.21 | 14.60 | 77.51 | 80.01 | --- | ||
| Atacocha UG | 75.96% | Proven | 1.30 | 3.86 | 0.34 | 84.9 | 1.45 | --- | 50.0 | 4.4 | 3,535 | 18.7 | - | 89.30 | 15.73 | 77.51 | 80.02 | --- |
| Probable | 3.01 | 4.54 | 0.43 | 77.7 | 1.29 | --- | 136.6 | 12.8 | 7,509 | 38.8 | - | 89.30 | 15.73 | 77.51 | 80.02 | --- | ||
| Sub-Total | 4.30 | 4.33 | 0.40 | 79.8 | 1.34 | --- | 186.5 | 17.2 | 11,044 | 57.5 | - | 89.30 | 15.73 | 77.51 | 80.02 | --- | ||
| Atacocha OP | 75.96% | Proven | 1.45 | 1.02 | --- | 38.2 | 1.16 | 0.25 | 14.8 | - | 1,779 | 16.9 | 11.5 | 70.44 | - | 75.76 | 83.97 | 65.46 |
| Probable | 1.88 | 0.97 | --- | 32.4 | 1.14 | 0.29 | 18.2 | - | 1,958 | 21.4 | 17.4 | 70.44 | - | 75.76 | 83.97 | 65.46 | ||
| Sub-Total | 3.33 | 0.99 | --- | 34.9 | 1.15 | 0.27 | 33.1 | - | 3,737 | 38.2 | 28.9 | 70.44 | - | 75.76 | 83.97 | 65.46 | ||
| Total Cerro Pasco | Proven | 6.02 | 3.30 | 0.20 | 68.4 | 1.29 | 0.06 | 198.6 | 12.3 | 13,221 | 77.6 | 11.5 | 87.83 | 15.00 | 77.27 | 80.87 | 65.46 | |
| Probable | 13.84 | 3.78 | 0.24 | 67.9 | 1.19 | 0.04 | 523.5 | 32.9 | 30,226 | 164.7 | 17.4 | 88.58 | 15.04 | 77.40 | 80.53 | 65.46 | ||
| Total | 19.86 | 3.64 | 0.23 | 68.0 | 1.22 | 0.05 | 722.1 | 45.2 | 43,447 | 242.4 | 28.9 | 88.37 | 15.03 | 77.36 | 80.64 | 65.46 | ||
Notes:
| 1. | The definitions for Mineral Reserves in S-K 1300 were followed for Mineral Reserves which are consistent with CIM (2014) definitions. |
| 1. | Mineral Reserves are reported on an 83.48% and 75.96% Nexa attributable ownership basis for El Porvenir and Atacocha, respectively. |
| 2. | El Porvenir and Atacocha UG Mineral Reserves are estimated at break-even NSR cut-off values between US$63.77/t and US$69.00/t processed for SLS and between US$65.77/t and US$71.07/t processed for CAF depending on the mining zone. A number of marginal stopes with marginal NSR cut-off values between US$39.86/t and US$45.09/t processed for SLS and between US$41.86/t and US$47.16/t processed for CAF are included in the estimate. |
| 3. | Atacocha OP Mineral Reserves are estimated at an NSR cut-off value of US$16.21/t. |
| 4. | Mineral Reserves are estimated using average long term prices of Zn: US$2,799.04/t (US$1.27/lb); Cu: US$7,669.61/t (US$3.48/lb); Ag: US$21.17/oz; Pb: US$2,000.29 /t (US$0.91/lb); and Au: US$1,630.93/oz. |
| 5. | Metallurgical recoveries are accounted for in the NSR calculations based on historical processing data and are variable as a function of head grade. |
| 12- |
|
|
| o | El Porvenir : Zn (89.2%), Pb (80.0%), Cu (14.6%), and Ag (77.5%) |
| o | Atacocha UG: Zn (89.3%), Pb (80.0%), Cu (15.7%), Ag (77.5%), |
| o | Atacocha OP: Zn (70.4%), Pb (84.0%), Ag (75.8%), and Au (65.5%) |
| 6. | A minimum mining width of 4.0 m was used for SLS stopes and 5.0 m for the CAF stopes. |
| 7. | A dilution equivalent linear overbreak/slough (ELOS) of 1.0 m is added to CAF stopes and a dilution factor of 10% is added to SLS stopes. |
| 8. | Mining recovery factors of 95% and 85% are applied to CAF and SLS stopes respectively. |
| 9. | No mining dilution was applied to Atacocha OP and a 100% mining recovery was assumed. |
| 10. | There are no Cu grades estimated for Atacocha OP and no Au grades estimated for Atacocha UG and El Porvenir UG. This has reduced the Cu and Au average grades for the total Cerro Pasco tonnes. |
| 11. | Numbers may not add due to rounding. |
Table 12-2: Summary of Cerro Pasco Complex Mineral Reserve Estimate (100%) – December 31, 2023
| Mine | Category | Tonnage (Mt) |
Grade | Contained Metal | Recoveries | ||||||||||||
| Zn (%) |
Cu (%) |
Ag (g/t) |
Pb (%) |
Au (g/t) |
Zn (kt) |
Cu (kt) |
Ag (koz) |
Pb (kt) |
Au (koz) |
Zn (%) |
Cu (%) |
Ag (%) |
Pb (%) |
Au (%) |
|||
| El Porvenir UG | Proven | 3.92 | 4.09 | 0.24 | 75.2 | 1.29 | - | 160.3 | 9.5 | 9,472 | 50.3 | - | 89.21 | 14.6 | 77.51 | 80.0 | - |
| Probable | 10.73 | 4.11 | 0.22 | 72.1 | 1.17 | - | 441.6 | 24.0 | 24,867 | 125.3 | - | 89.21 | 14.6 | 77.51 | 80.0 | - | |
| Sub-Total | 14.65 | 4.11 | 0.23 | 72.9 | 1.20 | - | 601.9 | 33.5 | 34,338 | 175.7 | - | 89.21 | 14.6 | 77.51 | 80.0 | - | |
| Atacocha UG | Proven | 1.71 | 3.86 | 0.34 | 84.9 | 1.45 | - | 65.8 | 5.7 | 4,654 | 24.6 | - | 89.3 | 15.73 | 77.51 | 80.0 | - |
| Probable | 3.96 | 4.54 | 0.43 | 77.7 | 1.29 | - | 179.8 | 16.9 | 9,886 | 51.1 | - | 89.3 | 15.73 | 77.51 | 80.0 | - | |
| Sub-Total | 5.66 | 4.33 | 0.40 | 79.8 | 1.34 | - | 245.6 | 22.6 | 14,540 | 75.7 | - | 89.3 | 15.73 | 77.51 | 80.0 | - | |
| Atacocha OP | Proven | 1.91 | 1.02 | - | 38.2 | 1.16 | 0.25 | 19.5 | - | 2,342 | 22.2 | 15.2 | 70.44 | - | 75.76 | 84.0 | 65.46 |
| Probable | 2.47 | 0.97 | - | 32.4 | 1.14 | 0.29 | 24.0 | - | 2,577 | 28.1 | 22.9 | 70.44 | - | 75.76 | 84.0 | 65.46 | |
| Sub-Total | 4.38 | 0.99 | - | 34.9 | 1.15 | 0.27 | 43.5 | - | 4,919 | 50.3 | 38.1 | 70.44 | - | 75.76 | 84.0 | 65.46 | |
| Total Cerro Pasco | Proven | 7.53 | 3.26 | 0.20 | 68.0 | 1.29 | 0.06 | 245.5 | 15.3 | 16,468 | 97.2 | 15.2 | 87.7 | 15.0 | 77.3 | 80.9 | 65.46 |
| Probable | 17.16 | 3.76 | 0.24 | 67.6 | 1.19 | 0.04 | 645.5 | 40.9 | 37,330 | 204.5 | 22.9 | 88.5 | 15.1 | 77.4 | 80.6 | 65.46 | |
| Total | 24.70 | 3.61 | 0.23 | 67.8 | 1.22 | 0.05 | 891.0 | 56.1 | 53,797 | 301.7 | 38.1 | 88.3 | 15.1 | 77.4 | 80.7 | 65.46 | |
| 12- |
|
|
Notes:
| 1. | The definitions for Mineral Reserves in S-K 1300 were followed for Mineral Reserves which are consistent with CIM (2014) definitions. |
| 2. | Mineral Reserves are reported on a 100% Nexa attributable ownership basis. Nexa owns 83.48% of El Porvenir and 75.96% of Atacocha. |
| 3. | El Porvenir and Atacocha UG Mineral Reserves are estimated at break-even NSR cut-off values between US$63.77/t and US$69.00/t processed for SLS and between US$65.77/t and US$71.07/t processed for CAF depending on the mining zone. A number of marginal stopes with marginal NSR cut-off values between US$39.86/t and US$45.09/t processed for SLS and between US$41.86/t and US$47.16/t processed for CAF are included in the estimate. |
| 4. | Atacocha OP Mineral Reserves are estimated at an NSR cut-off value of US$16.21/t. |
| 5. | Mineral Reserves are estimated using average long term prices of Zn: US$2,799.04/t (US$1.27/lb); Cu: US$7,669.61/t (US$3.48/lb); Ag: US$21.17/oz; Pb: US$2,000.29 /t (US$0.91/lb); and Au: US$1,630.93/oz. |
| 6. | Metallurgical recoveries are accounted for in the NSR calculations based on historical processing data and are variable as a function of head grade. |
| o | El Porvenir : Zn (89.2%), Pb (80.0%), Cu (14.6%), and Ag (77.5%) |
| o | Atacocha UG: Zn (89.3%), Pb (80.0%), Cu (15.7%), Ag (77.5%), |
| o | Atacocha OP: Zn (70.4%), Pb (84.0%), Ag (75.8%), and Au (65.5%) |
| 7. | A minimum mining width of 4.0 m was used for SLS stopes and 5.0 m for CAF stopes. |
| 8. | A dilution equivalent linear overbreak/slough (ELOS) of 1.0 m is added to CAF stopes and a dilution factor of 10% is added to SLS stopes. |
| 9. | Mining recovery factors of 95% and 85% are applied to CAF and SLS stopes, respectively. |
| 10. | No mining dilution was applied to Atacocha OP and a 100% mining recovery was assumed. |
| 11. | There are no Cu grades estimated for Atacocha OP and no Au grades estimated for Atacocha UG and El Porvenir UG. This has reduced the Cu and Au average grades for the total Cerro Pasco tonnes. |
| 12. | Numbers may not add due to rounding. |
| 12- |
|
|
| 12.2 | Comparison with Previous Estimates |
| 12.2.1 | El Porvenir |
A comparison of the El Porvenir underground Mineral Reserve estimates between December 31, 2023 and December 31, 2022 is presented in Table 12-3. Since the Atacocha underground mine was placed into care and maintenance in 2020, there were no Mineral Reserves declared in 2022. Mineral Reserves have decreased by approximately 5%. Figure 12-1 shows the additions and reductions contributing to the change in Mineral Reserves.
Table 12-3: El Porvenir (100%) Mineral Reserve Estimates Comparison
| Category | Tonnage (Mt) |
Grade | Contained Metal | |||||||
| Zn (%) |
Cu (%) |
Ag (g/t) |
Pb (%) |
Zn (kt) |
Cu (kt) |
Ag (Moz) |
Pb (kt) |
|||
| December 31, 2023 | ||||||||||
| Proven | 3.92 | 4.09 | 0.24 | 75.2 | 1.29 | 160.3 | 9.5 | 9,472 | 50.3 | |
| Probable | 10.73 | 4.11 | 0.22 | 72.1 | 1.17 | 441.6 | 24.0 | 24,867 | 125.3 | |
| Total | 14.65 | 4.11 | 0.23 | 72.9 | 1.20 | 601.9 | 33.5 | 34,338 | 175.7 | |
| December 31, 2022 | ||||||||||
| Proven | 2.54 | 3.70 | 0.21 | 67.7 | 1.12 | 94.0 | 5.4 | 5,532 | 28.3 | |
| Probable | 12.96 | 3.58 | 0.19 | 65.7 | 1.06 | 464.6 | 25.0 | 27,362 | 137.3 | |
| Total | 15.50 | 3.60 | 0.19 | 66.0 | 1.07 | 558.6 | 30.4 | 32,894 | 165.6 | |
| Difference 2023 vs 2022 | ||||||||||
| Proven | 1.38 | 0.39 | 0.03 | 7.5 | 0.17 | 66.3 | 4.1 | 3,940 | 22.0 | |
| Probable | -2.23 | 0.53 | 0.03 | 6.4 | 0.11 | -23.0 | -1.0 | -2,495 | -12.0 | |
| Total | -0.85 | 0.51 | 0.04 | 6.9 | 0.13 | 43.3 | 3.1 | 1,444 | 10.1 | |
| Difference % | ||||||||||
| Proven | 54.2% | 10.6% | 15.7% | 11.1% | 14.8% | 70.5% | 76.2% | 71.2% | 77.9% | |
| Probable | -17.2% | 14.9% | 17.7% | 9.7% | 10.1% | -4.9% | -4.0% | -9.1% | -8.7% | |
| Total | -5.5% | 14.1% | 20.4% | 10.5% | 12.0% | 7.8% | 10.3% | 4.4% | 6.1% | |
| 12- |
|
|
Figure 12-1: Waterfall Chart of Change in El Porvenir Mineral Reserves

| 12.2.2 | Atacocha |
There was no previously reported Mineral Reserve. The current Mineral Reserve with the 2023 Mineral Reserve shows contained Proven and Probable Mineral Reserves of 43.5 kt of zinc, 50.3 kt of lead, 4.9 Moz of silver, and 38 koz of gold. Changes have occurred as a result of the Cerro Pasco Complex Integration, allowing San Gerardo open pit material to be processed at the Atacocha plant until the Atacocha underground mine is re-opened.
| 12.3 | Atacocha and El Porvenir Underground |
| 12.3.1 | Summary |
The Atacocha and El Porvenir mines are underground polymetallic mines operated by Nexa in the Pasco mining district in the Central Andes area of Peru. The mines have been in operation for several decades with mining operations starting in 1938 and 1949 for Atacocha and El Porvenir respectively.
The El Porvenir Mine is still in operation and feeds the El Porvenir processing plant which has a maximum milling capacity of 6,400 tpd. The Atacocha Mine was placed in care and maintenance in 2020 in order to focus mining operations at the San Gerardo open pit mine. While in operation, the combined Atacocha underground mine and San Gerardo open mine production fed the Atacocha processing plant with a nominal capacity of 4,500 tpd.
The Atacocha Mine is planned to re-start operations in 2027 at which point the San Gerardo open pit mine will have reached the end of its mine life. Production at Atacocha will then be integrated with El Porvenir operations to feed the El Porvenir processing plant. Both mines are envisaged to be mined using cut and fill (CAF) and sub-level stoping (SLS) mining methods. A summary of the Mineral Reserves for the two mines are presented in Table 12-4 and Table 12-5 on a Nexa attributable ownership basis and 100% ownership basis, respectively.
| 12- |
|
|
Table 12-4: Summary Atacocha (75.96%) and El Porvenir (83.48%) Underground Mines Mineral Reserves – December 31, 2023
| Category | Tonnage (Mt) |
Grade | Contained Metal | ||||||||
| Zn (%) |
Cu (%) |
Ag (g/t) |
Pb %) |
Au (g/t) |
Zn (kt) |
Cu (kt) |
Ag (Moz) |
Pb (kt) |
Au (koz) |
||
| Proven | 4.57 | 4.02 | 0.27 | 78.0 | 1.33 | - | 183.7 | 12.3 | 11,442 | 60.7 | - |
| Probable | 11.97 | 4.22 | 0.27 | 73.5 | 1.20 | - | 505.3 | 32.9 | 28,268 | 143.4 | - |
| Total | 16.53 | 4.17 | 0.27 | 74.7 | 1.23 | - | 689.0 | 45.2 | 39,710 | 204.1 | - |
Notes:
| 1. | The definitions for Mineral Reserves in S-K 1300 were followed for Mineral Reserves which are consistent with CIM (2014) definitions. |
| 2. | Mineral Reserves are reported on a 75.96% and 80.48% Nexa attributable ownership basis for Atacocha and El Porvenir respectively. |
| 3. | Mineral Reserves are estimated at break-even NSR cut-off values between US$63.77/t and US$69.00/t processed for SLS and between US$65.77/t and US$71.07/t processed for CAF depending on the mining zone. A number of marginal stopes with marginal NSR cut-off values between US$39.86/t and US$45.09/t processed for SLS and between US$41.86/t and US$47.16/t processed for CAF are included in the estimate. |
| 4. | Mineral Reserves are estimated using average long term prices of Zn: US$2,799.04/t (US$1.27/lb); Cu: US$7,669.61/t (US$3.48/lb); Ag: US$21.17/oz; and Pb: US$2,000.29 /t (US$0.91/lb). |
| 5. | Metallurgical recoveries are accounted for in the NSR calculations based on historical processing data and are variable as a function of head grade. |
| o | El Porvenir : Zn (89.2%), Pb (80.0%), Cu (14.6%), and Ag (77.5%) |
| o | Atacocha UG: Zn (89.3%), Pb (80.0%), Cu (15.7%), Ag (77.5%), |
| 6. | A minimum mining width of 4.0 m was used for SLS stopes and 5.0 m for CAF stopes. |
| 7. | A dilution ELOS of 1.0 m and a dilution factor of 10% is added to CAF stopes and SLS stopes respectively. |
| 8. | A mining recovery factor of 95% and 85% is applied to CAF and SLS stopes respectively. |
| 9. | Numbers may not add due to rounding. |
Table 12-5: Summary Atacocha (100%) and El Porvenir (100%) Underground Mines Mineral Reserves – December 31, 2023
| Category | Tonnage (Mt) |
Grade | Contained Metal | ||||||||
| Zn (%) |
Cu (%) |
Ag (g/t) |
Pb (%) |
Au (g/t) |
Zn (kt) |
Cu (kt) |
Ag (Moz) |
Pb (kt) |
Au (koz) |
||
| Proven | 5.62 | 4.02 | 0.27 | 78.1 | 1.33 | - | 226.0 | 15.3 | 14,125 | 75.0 | - |
| Probable | 14.69 | 4.23 | 0.28 | 73.6 | 1.20 | - | 621.5 | 40.9 | 34,753 | 176.4 | - |
| Total | 20.32 | 4.17 | 0.28 | 74.8 | 1.24 | - | 847.5 | 56.1 | 48,878 | 251.4 | - |
Notes:
| 1. | The definitions for Mineral Reserves in S-K 1300 were followed for Mineral Reserves which are consistent with CIM (2014) definitions. |
| 2. | Mineral Reserves are reported on a 100% Nexa attributable ownership basis. Nexa owns 83.48% of El Porvenir and 75.96% of Atacocha. |
| 3. | Mineral Reserves are estimated at break-even NSR cut-off values between US$63.77/t and US$69.00/t processed for SLS and between US$65.77/t and US$71.07/t processed for CAF depending on the mining zone. A number of marginal stopes with marginal NSR cut-off values between US$39.86/t and US$45.09/t processed for SLS and between US$41.86/t and US$47.16/t processed for CAF are included in the estimate. |
| 4. | Mineral Reserves are estimated using average long term prices of Zn: US$2,799.04/t (US$1.27/lb); Cu: US$7,669.61/t (US$3.48/lb); Ag: US$21.17/oz; and Pb: US$2,000.29 /t (US$0.91/lb). |
| 12- |
|
|
| 5. | Metallurgical recoveries are accounted for in the NSR calculations based on historical processing data and are variable as a function of head grade. |
| o | El Porvenir : Zn (89.2%), Pb (80.0%), Cu (14.6%), and Ag (77.5%) |
| o | Atacocha UG: Zn (89.3%), Pb (80.0%), Cu (15.7%), Ag (77.5%), |
| 6. | A minimum mining width of 4.0 m was used for SLS stopes and 5.0% for CAF stopes. |
| 7. | A dilution ELOS of 1.0 m is added to CAF stopes and a dilution factor of 10% is added to SLS stopes. |
| 8. | Mining recovery factors of 95% and 85% are applied to CAF and SLS stopes, respectively. |
| 9. | Numbers may not add due to rounding. |
| 12.3.2 | Dilution |
Dilution at Atacocha and El Porvenir has been applied based on mining methods. CAF and SLS are the two mining methods planned to be used at both mines. CAF has historically been the primary mining method used, however, over the past few years SLS has been used in areas where veins are steeply dipping. Over the LOM, approximately 40% of the total ore will be from SLS stopes and primarily from El Porvenir.
Planned or internal dilution is accounted for within the stope designs which considers minimum mining widths and appropriate stope angles. Unplanned or external dilution is applied by using either a dilution factor or adding a dilution “skin” in the form of an ELOS on the footwall or hanging wall of the stope designs.
Unplanned dilution for CAF stopes is applied as a total ELOS of 1.0 m (0.5 m along the hanging wall and 0.5 m along footwall), while a dilution factor of 10% at zero grade was applied to SLS stopes. CAF stopes have been extensively used at Atacocha and El Porvenir mines and is generally well understood. In SLR’s opinion, the dilution factor applied is within industry standards for this type of mining method.
The SLS stope widths average 5.50 m indicating that a 10% dilution factor would result in an ELOS dilution skin of 0.55 m or approximately 0.28 m for the hanging wall and footwall. SLR has reviewed dilution analysis files provided by Nexa, summarized in Figure 12-2. The analysis compares the volumes between the mineralized structures and the surveyed mined-out stope. The data collected in 2023 shows an average dilution of approximately 20%.
Figure 12-2: Volumetric Comparison of El Porvenir Mineralization and Surveyed Stopes

In SLR’s opinion, based on the volume comparison analysis and SLR’s experience with operations with similar mining methods, and the potential impact from faults, the dilution being applied is low for narrow veins mining using the SLS mining method. Since reconciliation data
| 12- |
|
|
between designed stopes and surveyed stopes is not available, SLR recommends using a more conservative dilution ELOS of 1.20 m which is equivalent to approximately 20% dilution. It is recommended to apply this dilution as ELOS during the optimization process instead of a factor so that any dilution grade will be captured. Furthermore, since unconsolidated backfill will be used for CAF and SLS stopes, SLR recommends applying an additional 3% factor to capture backfill dilution.
SLR has investigated the effect of applying the additional SLS and backfill dilution quantities and notes a reduction of approximately 2% in Mineral Reserves. While the effect on the overall Mineral Reserve estimate is not significant, the effect should be reviewed on a stope by stope basis. SLR recommends undertaking reconciliation analysis between planned designed stopes and surveyed stopes and estimating overbreak and underbreak quantities to support dilution and mining recovery factors for future Mineral Reserve estimation work.
| 12.3.3 | Mining Extraction |
Mining recovery factors were applied by mining method; 95% and 85% for CAF and SLS respectively. For development in ore, a factor of 100% was applied. In SLR’s opinion, the mining recovery factors are appropriate for the selected mining methods.
| 12.3.4 | Net Smelter Return |
An NSR value was calculated for all blocks in the resource model taking into account metal grades, metallurgical recoveries, metal prices, and commercial terms and conditions.
The NSR value is expressed as US$/t and is calculated for Mineral Reserves to make an adequate comparison with production costs in order to determine whether mined material is ore (economically minable) or waste.
The sellable products from the mines are zinc concentrate, lead concentrate with silver content, and copper concentrate with silver content. The payable metals in concentrates include the applicable concentrate treatment, transportation, refining charges, deductions, and penalty elements. The zinc concentrate produced at the Atacocha and El Porvenir mines will be sent to Nexa’s Cajamarquilla smelter. As such a premium, representing the smelter revenue, is added to zinc metal price. Lead and copper concentrates are sold to Traders and will be exported and have market based commercial terms applied.
Costs and other parameters used to calculate the NSR cut-off value are shown in Table 12-6. The metal prices are based on a 10 year average (2024 – 2033) of projected metal prices. Nexa has obtained metal prices from various sources and has internally reviewed them to produce a consensus pricing model to be used across all mining units. SLR verified that Nexa’s selected metal prices for estimating Mineral Reserves are in line with independent forecasts from banks and other lenders.
Table 12-6: Summary of NSR Parameters
| Item | Units | Value |
| Metal Prices | ||
| Zn | US$/lb | 1.27 |
| Pb | US$/lb | 0.91 |
| Cu | US$/lb | 3.48 |
| 12- |
|
|
| Item | Units | Value |
| Ag | US$/oz | 21.17 |
| Zn premium | US$/lb | 0.05 |
| Net Metallurgical Recovery * | ||
| Zn | % | 89.2 |
| Pb | % | 80.0 |
| Cu | % | 15.7 |
| Ag | % | 77.5 |
| Zn Concentrate Payable | ||
| Zn - Integrated | % | 95.3 |
| Smelter Conversion Cost | US$/t Zn prod | 656 |
| Ag | Minimum of Payable (%) or Deduction (oz/t) | 70 or 3.00 |
| Pb Concentrate Payable | ||
| Pb | Minimum of Payable (%) or Deduction (%) | 95 or 3 |
| Ag | Minimum of Payable (%) or Deduction (oz/t) | 95 or 1.61 |
| Cu Concentrate Payable | ||
| Cu | Minimum of Payable (%) or Deduction (%) | 97 or 1.00 |
| Ag | Minimum of Payable (%) or Deduction (oz/t) | 90 or 1.00 |
| Logistics | ||
| Zn Concentrate - Integrated | US$/t conc | 46.7 |
| Pb Concentrate | US$/t conc | 44.1 |
| Cu Concentrate ** | US$/t conc | 38.1 |
| Refining Cost | ||
| Ag in Pb conc | US$/oz | 1.0 |
| Ag in Cu conc | US$/oz | 0.5 |
| Treatment Cost | ||
| Pb conc | US$/t conc | 177 |
| Cu conc | US$/t conc | 241.0 |
Metallurgical recoveries used for Mineral Reserves vary by head grade and are based on historical data which has been consolidated by Nexa. Ore head grade versus recovery curves are presented in Figure 12-3, Figure 12-4, and Figure 12-5.
| 12- |
|
|

| 12- |
|
|
Figure 12-5: Copper Recovery Curve

| 12.3.5 | Cut-off Values |
Cut-off values were calculated for each mine based on mining method and zone. The mines were divided into four zones based on their elevations. The elevation intervals are presented in Table 12-7. The material movement at the mines involves a combination of trucking, transfer via orepasses and rail cars, and skipping via the Picasso shaft located at El Porvenir. The shaft loading pocket is located on the 2800 Level, therefore ore mined in zones located below that level will have to be trucked via haulage ramps, effectively resulting in higher mining costs. Mining costs have been adjusted for each mining zone to reflect the number of transfers or haulage required for each mining zone.
The Atacocha mining costs include the transfer of ore by trucks to the El Porvenir loading pockets whereas the mining costs at El Porvenir have been defined by zones. Nexa is currently evaluating a similar approach by zones for the Atacocha Mine. For the purposes of the current Mineral Reserve estimates at Atacocha, the average mining costs for El Porvenir were considered to be representative of the Atacocha underground mining costs with the addition of haulage costs. The operating costs were based on 2022 actual costs. The estimated cut-off values (COV) are presented in Table 12-8.
Table 12-7: El Porvenir and Atacocha Mining Zones
| Original Name | El Porvenir | Atacocha |
| Zona Alta | Above 3,700 m | Above 3,700 m |
| Zona Intermedia | Between 3,400 m and 3,700 m | Between 3,100 m and 3,700 m |
| Zona Baja | Between 2,900 m and 3,400 m | Between 2,900 m and 3,700 m |
| Profundizacion | Below 2,900 m | Below 2,900 m |
| 12- |
|
|
Table 12-8: Cut-off Value Estimates
| Item | Units | SLS Costs | C&F Cost |
| Mining Costs - EP | |||
| Zona Alta | US$/t | 50.24 | 52.24 |
| Zona Intermedia | US$/t | 47.18 | 49.45 |
| Zona Baja | US$/t | 46.97 | 48.97 |
| Profundizacion | US$/t | 48.41 | 50.41 |
| Mining Costs - AT | US$/t | 52.20 | 54.27 |
| Development Costs (incl in Mining costs) | US$/t | 23.91 | 23.91 |
| Processing Costs | US$/t | 10.43 | 10.43 |
| G&A | US$/t | 6.37 | 6.37 |
| Break-even COV - EP | |||
| Zona Alta | US$/t | 67.04 | 69.04 |
| Zona Intermedia | US$/t | 63.98 | 66.25 |
| Zona Baja | US$/t | 63.77 | 65.77 |
| Profundizacion | US$/t | 65.21 | 67.21 |
| Break-even COV - AT | US$/t | 69.00 | 71.07 |
| Marginal COV - EP | |||
| Zona Alta | US$/t | 43.13 | 45.13 |
| Zona Intermedia | US$/t | 40.07 | 42.34 |
| Zona Baja | US$/t | 39.86 | 41.86 |
| Profundizacion | US$/t | 41.30 | 43.30 |
| Marginal COV - AT | US$/t | 45.09 | 47.16 |
| 12.3.6 | Mineral Reserve Estimation |
The Mineral Reserves were estimated by Nexa and reviewed and accepted by SLR. Reserve NSR factors were first added to the resource model. Deswik Stope Optimizer (DSO) was used to generate mining shapes using marginal cut-off values presented in Section 12.3.5. DSO was run separately depending on the orebody’s strike direction and dip angles to optimize the results.
The resulting optimized shapes were then depleted against as-built wireframes. Surveyed mined-out stope and development wireframes to the end of September 2023 and forecasted stope and development wireframes to December 31, 2023 were used to deplete the optimized shapes. The depleted shapes were interrogated against the block model and average grades and NSR values were calculated. The shapes were then reviewed and excluded from Mineral Reserve estimates where appropriate.
| 12- |
|
|
The retained stopes were used to guide the development designs, and dilution and extraction factors were applied. The development and stope designs were then added to Deswik Scheduler to generate a production schedule. Mineral Reserves are reported as diluted and extracted stope and ore development tonnes and grades. These were fully scheduled in an appropriate LOM plan and applied to a discounted cash flow model. The Mineral Reserve estimate has demonstrated economically viable extraction.
In the SLR QP’s opinion, the assumptions, parameters, and estimation methodology used for the Atacocha and El Porvenir underground Mineral Reserve estimates are appropriate for the style of mineralization and mining methods.
The SLR QP is not aware of any environmental, permitting, legal, title, taxation, socio-economic, political, or other relevant factors that could significantly affect the Atacocha and El Porvenir Mineral Reserves.
| 12.4 | Atacocha (San Gerardo) Open Pit |
| 12.4.1 | Summary |
The open pit Mineral Reserves were developed based on the October, November, and December forecast; end of year was projected using the September 30, 2023 surface. The total Mineral Reserve (100% basis) for San Gerardo open pit is estimated to be 4.4 Mt at an average grade of 0.99% Zn, 1.15%Pb, 1.12 oz/t Ag, and 0.27 g/t Au.
The open pit Mineral Reserve estimates were prepared by Nexa and have been classified in accordance with S-K 1300 and were confirmed by the SLR QP. A summary of the open pit Mineral Reserve estimate is shown in Table 12-9 and Table 12-10 on a Nexa attributable ownership basis and 100% ownership basis, respectively.
Table 12-9: Open Pit Mineral Reserves (75.96% Nexa Attributable Basis)– as of December 31, 2023
| Category | Tonnage (000 t) |
Grade | Contained Metal | ||||||||
| Zn (%) |
Cu (%) |
Ag g/t) |
Pb (%) |
Au (g/t) |
Zn (000 t) |
Cu (000 t) |
Ag (000 oz) |
Pb (000 t) |
Au (000 oz) |
||
| Proven | 1,450 | 1.02 | - | 38.2 | 1.16 | 0.25 | 14.84 | - | 1,779 | 16.86 | 11.54 |
| Probable | 1,876 | 0.97 | - | 32.4 | 1.14 | 0.29 | 18.24 | - | 1,958 | 21.36 | 17.41 |
| Total | 3,327 | 0.99 | - | 34.9 | 1.15 | 0.27 | 33.08 | - | 3,737 | 38.22 | 28.95 |
Notes:
| 1. | The definitions for Mineral Reserves in S-K 1300 were followed for Mineral Reserves which are consistent with CIM (2014) definitions. |
| 2. | Mineral Reserves are reported on a 75.96% Nexa attributable ownership basis. |
| 3. | Open pit Mineral Reserves are estimated at an NSR cut-off value of US$16.21/t. |
| 4. | Mineral Reserves are estimated using average long term prices of Zn: US$2,799.04/t (US$1.27/lb); Ag: US$21.17/oz; Pb: US$2,000.29/t (US$0.91/lb); and Au: US$1,631.93/oz with allowances for payable deductions and transport applied to the NSR calculation. |
| 5. | The NSR calculations do not include the impact of royalties, severance taxes, or any streaming agreements. |
| 6. | NSR calculations are based on historical performance of the concentrator. Metal recoveries are calculated based on grade-recovery relationships. |
| 7. | Metallurgical recoveries are accounted for in the NSR calculations based on historical processing data and are variable as a function of head grade. Atacocha OP: Zn (70.4%), Pb (84.0%), Ag (75.8%), and Au (65.5%) |
| 12- |
|
|
| 8. | The Mineral Reserves were scheduled based on the end of September 2023 surface. Small differences between the Mineral Reserve statement and the production schedule may occur because of the difference between the actual end of December 2023 topography surface and the projected end of year 2023 forecast. |
| 9. | Numbers may not add due to rounding. |
Table 12-10: Open Pit Mineral Reserves (100% Basis) – as of December 31, 2023
| Category | Tonnage (000 t) |
Grade | Contained Metal | ||||||||
| Zn (%) |
Cu (%) |
Ag (g/t) |
Pb (%) |
Au (g/t) |
Zn (000 t) |
Cu (000 t) |
Ag (000 oz) |
Pb (000 t) |
Au (000 oz) |
||
| Proven | 1,909 | 1.02 | - | 38.2 | 1.16 | 0.25 | 65.76 | - | 4,654 | 24.64 | 4.89 |
| Probable | 2,470 | 0.97 | - | 32.4 | 1.14 | 0.29 | 179.81 | - | 9,886 | 51.06 | 7.61 |
| Total | 4,380 | 0.99 | - | 34.9 | 1.15 | 0.27 | 245.57 | - | 14,540 | 75.70 | 12.49 |
Notes:
| 1. | The definitions for Mineral Reserves in S-K 1300 were followed for Mineral Reserves which are consistent with CIM (2014) definitions. |
| 2. | Mineral Reserves are reported on a 100% ownership basis. |
| 3. | Open pit Mineral Reserves are estimated at an NSR cut-off of US$16.21/t. |
| 4. | Mineral Reserves are estimated using average long term prices of Zn: US$2,799.04/t (US$1.27/lb); Ag: US$21.17/oz; Pb: US$2,000.29/t (US$0.91/lb); and Au: US$1,631.93/oz with allowances for payable deductions and transport applied to the NSR calculation. |
| 5. | Metallurgical recoveries are accounted for in the NSR calculations based on historical processing data and are variable as a function of head grade. Atacocha OP: Zn (70.4%), Pb (84.0%), Ag (75.8%), and Au (65.5%) |
| 6. | NSR calculations are based on historical performance of the concentrator. Metal recoveries are calculated based on grade-recovery relationships. |
| 7. | The Mineral Reserves were scheduled based on the end of September 2023 surface. Small differences between the Mineral Reserve statement and the production schedule may occur because of the difference between the actual end of December 2023 topography surface and the projected end of year 2023 forecast. |
| 8. | Numbers may not add due to rounding. |
| 12.4.2 | Dilution |
No open pit mining dilution was applied to the grade of the cells. Dilution intrinsic to the Mineral Resource model is considered sufficient to represent the stated mining selectivity.
| 12.4.3 | Mining Extraction |
Mining extraction was assumed to be 100% of the Measured and Indicated Mineral Resources. Inferred Mineral Resources were considered waste.
| 12.4.4 | Net Smelter Return |
NSR block value calculations are based on historical performance of the concentrator and current smelter contracts. NSR values represent the estimated dollar value per tonne of mineralized material after allowance for metallurgical recovery and consideration of smelter terms, including revenue from payable metals, treatment charges, refining charges transportation, and sales charges. The calculations do not include the impact of royalties, severance taxes, or any streaming agreements.
Metal prices used for reserves are based on a long term forecast. The NSR value for the Mineral Reserve estimates is based on a silver price of US$21.17/oz, gold price of US$1,630.93/oz, lead price of US$0.91/lb (US$2,000.29/t), and zinc price of US$1.2/lb
| 12- |
|
|
(US$2,799.04/t). There is no copper in the NSR cut-off grade calculations for the San Gerardo open pit.
Table 12-11: NSR Parameters
| Parameter | Unit | Input | Note |
| Gold Price | $/oz | 1,630.93 | |
| Silver Price | $/oz | 21.17 | |
| Lead Price | $/lb | 0.91 | (2,000.29 $/t) |
| Zinc Price | $/lb | 1.27 | (2,799.04 $/t) |
| Metallurgical Recovery | |||
| Pb (Pb Concentrate) | % | 84.06% | Pb > 1.2912 |
| % | -4.35xPb2+11.24xPb+76.81 | 0.68 < Pb < 1.2912 | |
| % | ((Pb-0.12)/0.12) x 100 % | 0.12 < Pb < 0.68 | |
| 0% | Pb < 0.12 | ||
| Ag (Pb Concentrate) | % | 75.76% | Ag > 0.2 |
| Au (Pb Concentrate) | % | 65.46% | Au > 0.12 |
| Zn (Zn Concentrate) | % | 70.44% | Zn > 0.62 |
| ((Zn-0.17)/0.17) x 100 % | 0.17 < Zn < 0.62 | ||
| 0% | Zn < 0.17 | ||
| Ag (Zn Concentrate) | % | 3.55% | Ag > 0.2 |
| Au (Zn Concentrate) | % | 0% | - |
| Concentrate Grade | |||
| Pb (Pb Concentrate) | % | 53.71% | |
| Zn (Zn Concentrate) | % | 48.98% | |
| Pb Concentrate Payable % | |||
| Au - Max. Payable % | % | 95% | Min Deduct 0.03 oz/t |
| Ag - Max. Payable % | % | 95% | Min Deduct 1.6 oz/t |
| Pb - Max. Payable % | % | 95% | Min Deduct 3.0% |
| Zn Concentrate Payable % |
| 12- |
|
|
| Parameter | Unit | Input | Note |
| Ag – Max Payable | % | 70% | Min Deduct 3.0 oz/t |
| Zn – Max Payable | % | 85% | Min Deduct 8.0% |
| Logistics | |||
| Zn Concentrate | US$/t conc | ||
| Pb Concentrate | US$/t conc | $43 | |
| Refining Cost | |||
| Au in Pb conc | US$/oz | $10.00 | |
| Ag in Pb conc | US$/oz | $1.00 | |
| Treatment Cost | |||
| Pb conc | US$/t conc | $177 | |
| Zn conc | US$/t conc | $314 |
| 12.4.5 | NSR Cut-off Grade |
Calculated block model NSR values were evaluated against the internal break-even value. Blocks classified as Measured or Indicated Mineral Resources with an NSR value above the internal break-even value, are included in the Mineral Reserve.
Block NSR values are expressed in US$/t and calculated from mineralization grades to make an adequate comparison with production cost in order to determine whether the mined material is categorized as potentially economic mineralization or waste. Blocks with an NSR value greater than or equal to the NSR cut-off value are categorized as mill feed and block value less than the NSR cut-off value is considered waste material. Table 12-12 summarizes the costs included in the NSR cut-off value.
Table 12-12: NSR Cut-off Value Parameters
| Parameter | Unit | Input |
| Process Cost (1) | US$/t | 10.65 |
| General and Administrative Cost (2) | US$/t | 5.56 |
| NSR Cut-off Value (1)+(2) | US$/t | 16.21 |
| 12.4.6 | Open Pit Optimization |
Different nested pits were evaluated by Nexa using the NPV Scheduler software package from Datamine, which employs the Lerchs-Grossmann pit optimization algorithm. A pit shell was selected for the reserve pit design based on a revenue factor of 0.90 of the prices from a set of shells generated using only Measured and Indicated Mineral Resources.
| 12- |
|
|
The pit optimization process considered an NSR cut-off values of US$22.44/t. The Mineral Reserve estimation included the incremental material with values between US$16.21/t and US$22.44/t.
Slope angles are based on the updated geotechnical assessment completed in February 2019 by SRK. Table 12-13 shows mine operating costs based on 2023 actual operating data from first six months and last six months of the forecasted budget. Open pit mining operating cost are defined as a constant value. However, there is a variable component associated with haulage distance of the open pit mining cost that requires a yearly truck haulage distance forecast in the LOM plan.
Table 12-13: Open Pit Reserve Pit Optimization Parameters
| Parameter | Unit | Input |
| Open Pit Mining Cost (Mill Feed) | US$/t | 6.23 |
| Open Pit Mining Cost (Waste) | US$/t | 2.27 |
| Process Cost | US$/t | 10.65 |
| General and Administrative Cost | US$/t | 5.56 |
| Block Size | M | 4x4x6 |
| Overall Slope Angle | degrees | 39/45 |
SLR received the San Gerardo depleted block model, historical underground mining as-built shapes, open pit design, and production schedule in Deswik format. SLR imported the block model and all wireframes into Vulcan. SLR also evaluated potential pits using the Whittle 4.7.3 software package, employing the Lerchs-Grossmann pit optimization algorithm, and produced optimization results consistent with those provided by Nexa. The open pit design applies design parameters consistent with the optimization parameters, and interrogation of the design yielded Mineral Reserve tonnes and grade consistent with those produced by Nexa using Deswik software.
| 12- |
|
|
| 13.0 | Mining Methods |
| 13.1 | Atacocha and El Porvenir Underground |
The Atacocha and El Porvenir mines are polymetallic underground mines in Peru.
The Atacocha underground mine has been in operation since 1938. Operations at the mine were suspended in 2020 in an effort to reduce costs and improve operational efficiency by shifting all production to the San Gerardo open pit mine. The underground mine is planned to restart production in 2027 at which point the open pit mine will be depleted. Over the planned LOM, Atacocha will be mined to a depth of approximately 1,500 m below surface. CAF will be the primary mining method used at the mine with a few areas mined using SLS. Mined-out stopes are backfilled using unconsolidated backfill and hydraulic fill using tailings.
The El Porvenir Mine is currently in production and is planned to extend 1,600 m below surface over its LOM. The mine currently feeds the El Porvenir processing plant at a nominal rate of 6,500 tpd. Similar to Atacocha, the two mining methods used at Porvenir are CAF and SLS. While CAF has historically been the primary mining method used at the mine, SLS will be increasingly used over the LOM particularly where the veins are steeply dipping. SLS will account for approximately 55% of ore production over the LOM.
| 13.1.1 | Cerro Pasco Complex Integration |
The current Atacocha processing plant is being fed by the San Gerardo open pit mine. Once the pit is depleted in 2027, operations at the underground Atacocha mine will be re-started. The underground mine will be integrated with the El Porvenir underground mine, with both mines feeding the El Porvenir processing plant. The Atacocha processing plant and mine site will be shut down and all operations will be transferred to the El Porvenir mine site. This scenario will be more efficient both operationally and economically. The tailings storage facility at Atacocha will still be operational and will accept tailings from the El Porvenir processing plant.
As part of the integration plan, a 1,750 m connection ramp between the two mines is being built on the 2,900 m level. The ramp will connect to a system of ore raises and haulage ramps at Atacocha and to the shaft loading pocket at El Porvenir. Since Atacocha has not been in operation since 2020, the mine will be rehabilitated where required prior to and during mining operations. The mine will contribute approximately 23% of the ore production during the first two years, then ramping up to 45%.
| 13.1.2 | Mine Design |
The mine designs for Atacocha and El Porvenir underground mines were prepared by Nexa using Deswik’s mining software package. SLR has reviewed and validated the mine designs and Mineral Reserve estimates provided by Nexa.
Veins were initially reviewed to identify areas amenable to SLS mining methods, taking into account vein geometry and dip angles. Stope designs were prepared using a stope optimization tool. The optimization was run on Measured and Indicated Resources only. The NSR value of each block was calculated based on the parameters discussed in Section 12.3.4 and stope optimizations were completed using marginal cut-off values for each mining zone as presented in Table 12-7 and Table 12-8.
The mine design parameters applied to the DSO settings are presented in Table 13-1. The resulting shapes were depleted against mined-out wireframes and reviewed against
| 13- |
|
|
development designs for inclusion of marginal stopes, which make up approximately 12% of Mineral Reserves. Stope shapes were further reviewed to remove stopes that were found to be isolated and far from existing development, low grade or uneconomic when reviewed against development requirements, within crown or sill pillars, or within ground with poor stability. Development designs were completed to connect to existing development and provide access to all stopes.
SLR has reviewed the mine designs, mining sequence, and production schedule and is of the opinion that they appropriately reflect current mining operations. The planned mining sequence assumes the use of unconsolidated backfill, therefore mining progresses in a bottom up method. SLR has identified some areas where a sill pillar is required as mining on an upper panel takes place before the lower panel is mined. The areas identified by SLR represent approximately 2% of the total reported Mineral Reserves. The SLR QP recommends reviewing the mining sequences against pillar locations and adjusting the sequence or pillar location accordingly. A longitudinal section of the Atacocha and El Porvenir mine designs are illustrated in Figure 13-1 and Figure 13-2, respectively.
Table 13-1: Mine Design Parameters
| Item | Unit | CAF | SLS |
| Stope Design Parameters | |||
| Min. Mining Width | m | 5 | 4 |
| Max. Mining Width | m | 10 | 8 |
| Length | m | 4 | 10 |
| Height | m | 5 | 20 |
| Development Design | |||
| Main Ramps and Ore access | mH x mW | 4.5 x 4.5 | |
| Level development | mH x mW | 4.0 x 4.0 | |
| Ventilation Raise | m dia. | 3.1 | |
| Ore Pass | m dia. | 2.1 | |
| 13- |
|
|
Figure 13-1: Atacocha Mine Design

| 13- |
|
|
Figure 13-2: El Porvenir Mine Design

| 13- |
|
|
| 13.1.3 | Mining Method |
Ore from El Porvenir is predominantly mined using overhand CAF mining methods, which accounts for approximately 80% of total production. SLS makes up the remainder of ore production. SLS was introduced to El Porvenir in 2018 and is planned to be used more extensively where the geometry of mineralization is amenable to this mining method. The same mining methods were used at Atacocha before the mine closure in 2020 and will continue to be used over the planned LOM.
The ore produced in the CAF and SLS stopes is transported to and dumped in orepasses by load-haul-dump units (LHDs). These orepasses extend to the 2,900 track haulage level where the ore is pulled from chutes and loaded onto mine cars. The mine cars dump at an orepass grizzly, and the ore is transferred to the shaft's loading pocket on the 2,500 Level. From there, the ore is loaded onto skips and hoisted via the shaft to the ore dump. After being discharged at the dump, the ore is transferred to the underground primary crusher. Crushed ore is transported to the surface and the processing plant via a conveyor in an inclined drift.
| 13.1.3.1 | Overhand Cut and Fill |
CAF mining is completed using horizontal cuts following the strike of the orebody. Each mining panel consists of four to five cuts. The first cut will be mined on the lowest level of each panel and subsequent cuts will be mined in an ascending manner. Once a cut is mined, it is backfilled with a combination of unconsolidated backfill from waste development and hydraulic fill using tailings. The cut is backfilled, leaving a one-metre gap between the next cut. The gap provides a free face to allow for efficient blasting for the next cut and also provides a platform on which the next cut can be mined.
The mining panels are accessed via 4.5 m x 4.0 m attack ramps that branch off the main ramp. The first ramp is driven at a gradient of -15% and each subsequent ramps are driven off the first attack ramp at a gradient of 15%. In order to mitigate dilution from backfill, red markers are placed along the walls of each cut, just above the planned backfill height, to provide a visual cue to operators when the cuts are being mined out.
In the SLR QP’s opinion, the CAF mining method is well suited for the mines given the irregular and sinusoidal nature of the veins present at both Atacocha and El Porvenir. CAF allows for a greater level of selectivity and ability for operators to reduce dilution. CAF mining method setup is presented in Figure 13-3.
| 13.1.3.2 | Sub-level Stoping |
SLS is used only in areas where the veins are steeply dipping and have fairly constant strike directions. Two variations of SLS mining methods called Avoca and modified Avoca are used at the Atacocha and El Porvenir underground mines.
The Avoca method consists of developing ore drives at the bottom and top of the level in operation to provide mucking and drilling accesses. The level is typically accessed in the middle and the drives are developed along the length of the veins. A separate footwall drive is developed at the top of the level to access the end of the vein. This drive will be used for backfilling. Stopes are mined starting from the end of the vein and retreating towards the middle access. As mining progresses in retreat, the mined out stopes can simultaneously be backfilled via the top footwall access. This setup allows for high productivity rates as drilling, mining, and backfilling activities can happen at the same time. However, this method requires more development.
| 13- |
|
|
The modified Avoca approach eliminates the use of a top footwall access for backfilling and instead uses the middle access on top of the level. Using this approach, mining activities must stop while the stopes are being backfilled.
Nexa uses the Avoca method for veins with long strike lengths to provide working areas with high productivity rates and uses modified Avoca for veins with short strike lengths to reduce development requirements. The Avoca mining method sequence is presented in Figure 13-4.
| 13- |
|
|
Figure 13-3: Cut-and-Fill Mining Method

| 13- |
|
|
Figure 13-4: SLS Avoca Mining Method

| 13- |
|
|
| 13.1.4 | Geotechnical Considerations |
The underground mine design for El Porvenir is based upon the geotechnical study described in BISA, 2022, and summarized in this section.
Geotechnical data collection for El Porvenir includes window mapping at 51 locations, 11 line mapping surveys of underground exposures, and relogging of 18 historical drill holes including 1,372 m of core.
The rock mass at El Porvenir has been classified according to Bieniawski’s Rock Mass Rating System (RMR) (Bieniawski, 1989) and converted to Barton’s Q-System (Barton et al., 1974), and the Geological Strength Index (GSI) (Hoek et al., 1995) using established relationships.
Rock mass classification parameters derived from geotechnical mapping and logging for each of the geotechnical domains is presented in Table 13-2.
Table 13-2: El Porvenir Rock Mass Classification
| Geotechnical Domain | RMR | Q-System | ||||||
| Ave. | Std. Dev. | Min. | Max. | Ave. | Std. Dev. | Min. | Max. | |
| Mineralized Vein | 53 | 3.8 | 49 | 57 | 0.875 | 0.301 | 0.574 | 1.335 |
| Skarn | 54 | 5.7 | 48 | 60 | 1.000 | 0.469 | 0.531 | 1.884 |
| Limestone | 54 | 5.3 | 48 | 59 | 0.946 | 0.421 | 0.525 | 1.705 |
| Intrusive | 50 | 6.2 | 43 | 56 | 0.611 | 0.304 | 0.307 | 1.216 |
| Breccia | 28 | 3.4 | 25 | 31 | 0.056 | 0.018 | 0.038 | 0.081 |
Geotechnical laboratory testing was completed on representative samples from each of the lithologies including physical density, Uniaxial Compressive Strength (UCS), direct shear testing of discontinuities, Triaxial Compressive Strength (TCS), and elastic properties Young’s modulus and Poisson’s Ratio. Samples for the limestone and ore rocks were collected from rock blocks, approximately 0.3 m x 0.3 m x 0.3 m in size, other samples were collected from diamond drill core.
The strength of the fill material was determined through Consolidated Undrained (CU) triaxial testing, classification according to the Unified Soil Classification System was completed through particle size distribution, and Atterberg limits testing.
The Hoek-Brown strength criterion was used to define the strength of the rock mass, presented in Table 13-3, for geotechnical analysis of the underground excavation. Properties were based upon analysis of the rock mass characterization and laboratory testing data. A disturbance factor, D, has been applied to account for disturbance of the rock mass due to blasting and excavation.
Table 13-3: El Porvenir Geotechnical Parameters
| Geomechanical Domian | GSI | UCS (MPa) | Parameter mi | Unit Weight (kN/m3) | Disturbance Factor D |
| Mineralized Vein | 56 | 91 | 17 | 34.0 | 0.8 |
| Skarn | 57 | 82 | 29 | 34.2 | 0.8 |
| 13- |
|
|
| Geomechanical Domian | GSI | UCS (MPa) | Parameter mi | Unit Weight (kN/m3) | Disturbance Factor D |
| Limestone | 57 | 112 | 22 | 26.5 | 0.8 |
| Intrusive | 53 | 60 | 28 | 28.7 | 0.8 |
| Breccia | 31 | 56 | 19 | 23.7 | 0.8 |
Induced stresses were assessed using the over-coring method during a study by INGEROC (2017 and 2018) allowing the magnitude and direction of the three principal stress components σ1, σ2 and σ3 to be resolved through direct measurement with a triaxial strain gauge. A total of seven tests were completed. The results were verified through the use of the drill hole detonation method whereby the pattern of fracturing post detonation is used to estimate the minimum and maximum stress directions.
The stress magnitudes used for the evaluation of underground mine design are presented in Table 13-4.
Table 13-4: El Porvenir Stress Magnitudes Used for Geotechnical Evaluation
| Sector | Zone | Level | Depth (m) | σ3 vertical |
σ1 east-west |
σ2 north-south |
| Porvenir | Intermediate – High | 3440 | 650 | 19.04 | 25.51 | 21.71 |
| Low | 2995 | 1095 | 31.37 | 42.03 | 35.76 | |
| CN 3 | Intermediate – High | 3600 | 650 | 19.04 | 25.51 | 21.71 |
| Low | 2995 | 1185 | 33.86 | 45.37 | 38.60 | |
| Éxito | Intermediate | 3600 | 700 | 20.43 | 27.37 | 23.29 |
| Low | 2995 | 1305 | 37.18 | 49.83 | 42.39 | |
| CN 1-2, Carmen, V5 Cola, V1204 | Intermediate | 3600 | 610 | 17.93 | 24.03 | 20.44 |
Numerical modelling of the behaviour of the rock mass at different stages of excavation was completed using Rocscience RS2 (2-dimensional) and RS3 (3-dimensional) finite element analysis software. This allows the stability of the excavation to be understood, and the Strength Reduction Factor (SRF) to be calculated, which can be considered to be equivalent to the Factor of Safety (FOS). The results of modelling indicate SRF values of less than 1 in the stope backs and advance ends due to high stresses and the stope walls due to tensile stress.
The stope dimensions were reviewed using the empirical charts developed by Potvin (1988), Potvin and Milne (1992), and Nickson (1992) following the work initiated by Mathews et al. (1981). Based on the analysis results BISA recommends the stope dimensions presented in Table 13-5.
| 13- |
|
|
Table 13-5: El Porvenir Recommended Stope Dimensions (from BISA, 2022)
| Sector | Domain | Level | Maximum Longitudinal Span (m) for Height of: | Maximum Longitudinal Span (m) for Stope Width of: | ||
| 20 m | 23 m | 5 m | 6 m | |||
| CN 03 | Limestone | 3760 | - | 27 | No Restriction | 54 |
| Éxito | Limestone | 3650 | - | 27.4 | No Restriction | 54 |
| Éxito | Limestone - Intrusive | 3690 | - | 23.8 | No Restriction | 174 |
| Porvenir 09 | Limestone | 2995 | 23 | - | 120 | 24 |
| CN 03 | Limestone | 3120 | 20 | - | 120 | 24 |
Cablebolt spacing and lengths for stope support have been determined according to the method by Hutchinson and Diederichs (1996) using the charts developed by Nickson (1992). Recommendations for cablebolt support provided by BISA are presented in Table 13-6.
Table 13-6: El Porvenir Cablebolt Support Recommendations (From BISA, 2022)
| Zone | Level | Domain | Description | N’ | S (m) | N’/S | Cablebolt / m2 | Mesh (m) |
Length (m) |
| Porvenir 09 | 2995 | Limestone | Roof | 0.3 | 2.25 | 0.13 | 0.27 – 0.32 | 1.80 – 1.90 | 3.4 |
| Hangingwall | 2.81 | 4.8 | 0.59 | 0.20 – 0.25 | 2.0 – 2.2 | 7.2 | |||
| Footwall | 2.81 | 4.8 | 0.59 | 0.20 – 0.25 | 2.0 – 2.2 | 7.2 | |||
| CN 03 | 3120 | Limestone – Intrusive | Roof | 0.3 | 2.1 | 0.14 | 0.27 – 0.32 | 1.80 -1.90 | 3.2 |
| Hangingwall | 4.11 | 5.4 | 0.76 | 0.20 – 0.25 | 2.10 – 2.25 | 8.1 | |||
| Footwall | 0.67 | 3.15 | 0.21 | 0.21 – 0.27 | 1.90 – 2.10 | 4.7 | |||
| Limestone | Roof | 0.3 | 2.1 | 0.14 | 0.27 – 0.32 | 1.80 -1.90 | 3.2 | ||
| Hangingwall | 4.11 | 5.6 | 0.73 | 0.18 – 0.25 | 2.0- 2.25 | 8.4 | |||
| Footwall | 2.41 | 4.8 | 0.50 | 0.21 – 0.26 | 2.0 -2.2 | 7.2 | |||
| 3760 | Limestone | Roof | 0.39 | 2.6 | 0.15 | 0.24 – 0.28 | 1.95 – 2.10 | 3.9 | |
| Hangingwall | 9.01 | 5.6 | 1.61 | 0.18 – 0.25 | 2.0 -2.2 | 8.4 | |||
| Footwall | 4.47 | 5 | 0.89 | 0.20 – 0.25 | 2. -2.25 | 7.5 | |||
| 3790 | Intrusive | Roof | 0.3 | 2.3 | 0.13 | 2.24 – 2.28 | 1.90 – 2.10 | 4.1 | |
| Hangingwall | 2.08 | 4.2 | 0.50 | 0.20 – 0.26 | 2.0 – 2.20 | 6.3 | |||
| Footwall | 1.22 | 3.5 | 0.35 | 0.22- 0.28 | 2.0 – 2.2 | 5.3 |
| 13- |
|
|
| Zone | Level | Domain | Description | N’ | S (m) | N’/S | Cablebolt / m2 | Mesh (m) |
Length (m) |
| Éxito | 2995 | Intrusive | Roof | 0.7 | 2.7 | 0.26 | 0.24 – 0.28 | 1.90-2.10 | 4.1 |
| Hangingwall | 2.55 | 5 | 0.51 | 0.18 0.25 | 2.0 – 2.25 | 7.5 | |||
| Footwall | 1.68 | 4.15 | 0.40 | 0.20-0.26 | 2.05 – 2.20 | 6.2 | |||
| 3650 | Limestone – Intrusive | Roof | 0.64 | 2.9 | 0.22 | 0.22 -0.258 | 1.95 – 2.15 | 4.4 | |
| Hangingwall | 5.89 | 5.6 | 1.05 | 0.18 – 0.25 | 2.0 – 2.2 | 8.4 | |||
| Footwall | 3.9 | 5.1 | 0.76 | 0.20 -0.25 | 2.0 -2.2 | 7.7 | |||
| 3690 | Limestone | Roof | 0.64 | 2.9 | 0.22 | 0.22 -0.258 | 1.95 – 2.15 | 4.4 | |
| Hangingwall | 7.91 | 5.2 | 1.52 | 0.18 – 0.25 | 2.0 – 2.2 | 7.8 | |||
| Footwall | 1.29 | 4 | 0.32 | 0.22 – 0.27 | 2.0- 2.15 | 6.0 |
Figure 13-5: El Porvenir Installation of Cablebolts for Veins Dipping Greater Than 80°

| 13- |
|
|
Figure 13-6: El Porvenir Installation of Cablebolts for Veins Dipping Less Than 80°

To determine the sill pillar thickness required for CAF mining, a sensitivity analysis was completed through numerical modelling using Rocscience RS2 finite element software for excavations backfilled with 25 m, 50 m, and 100 m of fill. The database of historic seismic events has also been interrogated to correlate the concentration of events with stopes that have already been mined and backfilled. As a result of this assessment, BISA recommends a filled column height of no greater than 100 m with a sill pillar thickness of 10 m between filled stopes.
In some areas, the mineralized structures bifurcate, which would require parallel mining with a waste rock pillar remaining between stopes. To account for this, the bench and fill variant of the bottom up cut and fill mining was assessed through numerical analysis based upon the following:
| · | Mining to comply with the excavation dimensions recommended using the Matthews stability chart |
| · | Pillar width dimension to be a minimum of two times the stope width |
| · | Mine the bottom panel first |
| · | Mine the central panel after filling the lower panel |
| · | Mine the top panel after the middle panel is filled |
Development support requirements were determined from Q-System rock mass classification and the use of the Grimstad and Barton (1993) design charts. The developments must be assessed by a geotechnical engineer to define the rock class and degree of support required
| 13- |
|
|
using Table 13-7 for permanent openings and Table 13-8 for temporary openings. Supports for intersections are presented in Table 13-9.
Table 13-7: El Porvenir Development Support for Permanent Openings
| RMR Classification | Q-System Classification | GSI Index | Support | |||
| 81 – 100 | 61 – 503 | LF/B | - | - | Spot Anchor Bolts | |
| 61 – 80 | 6.61 – 54.6 | LF/R | F/B | - | Systematic anchor bolts. 1.5m x 1.5m + electrowelded mesh | |
| 51 – 60 | 2.18 – 5.92 | LF/P | F/R | MF/B | Systematic anchor bolts. 1.2m x 1.2m + electrowelded mesh | |
| 41 – 50 | 0.72 – 1.95 | F/P | IF/B | MF/R | Shotcrete 2” + Systematic Anchor Bolts 1.5 m x 1.5 m | |
| 31 – 40 | 0.24 – 0.64 | F/MP | IF/R | MF/P | Shotcrete 2” + Systematic Anchor Bolts 1.2 m x 1.2 m | |
| 21 – 30 | 0.08 – 0.21 | IF/P | MF/MP | - | 3” Shotcrete + Systematic Anchor Bolts 1.0 m x 1.0 m | |
| 0 – 20 | 0.01 – 0.07 | IF/MP | - | - | 2” shotcrete + falsework (spaced 1 to 1.2m apart) | |
Table 13-8: El Porvenir Development Support for Temporary Openings
| RMR Classification | Q-System Classification | GSI Index | Support | |||
| 81 – 100 | 61 – 503 | LF/B | - | - | Spot Anchor Bolts | |
| 61 – 80 | 6.61 – 54.6 | LF/R | F/B | - | Systematic anchor bolts. 1.5m x 1.5m + electrowelded mesh | |
| 51 – 60 | 2.18 – 5.92 | LF/P | F/R | MF/B | Systematic anchor bolts. 1.2m x 1.2m + electrowelded mesh | |
| 41 – 50 | 0.72 – 1.95 | F/P | IF/B | MF/R | Systematic anchor bolts. 1.1m x 1.1m + electrowelded mesh | |
| 31 – 40 | 0.24 – 0.64 | F/MP | IF/R | MF/P | Shotcrete 2” + Systematic Anchor Bolts 1.2m x 1.2m | |
| 21 – 30 | 0.08 – 0.21 | IF/P | MF/MP | - | 3” Shotcrete + Systematic Anchor Bolts 1.0m x 1.0m | |
| 0 – 20 | 0.01 – 0.07 | IF/MP | - | - | 2” shotcrete + falsework (spaced 1 to 1.2m apart) | |
| 13- |
|
|
Table 13-9: El Porvenir Support for Intersections (Permanent Limestone and Temporary Ore Openings)
| Geotechnical Domain | Q | Correction Factor | Q fixed for Intersections | Anchor Bolts (2.10m) | Shotcrete Thickness (in.) | |
| Limestone | 0.946 | 0.33 | 0.315 | 1 x 1 m | 3 | |
| Mineralized | 0.875 | 0.33 | 0.292 | 1 x 1 m | 3 | |
The following conclusions are drawn from the underground geotechnical analyses:
| · | Geomechanical domains have been delineated using lithological and structural wireframes. |
| · | Rock mass characterization and structural data has been collected from mapping of underground openings and logging of historical drill core. |
| · | Geomechanical testing has been completed to provide intact rock strength properties and joint strengths. |
| · | Seismic hazard has been considered in underground mine for a 475-year return period earthquake. |
| · | In situ stress has been estimated using the over-coring method and verified using the drill hole detonation method. |
| · | Stope dimensions and cablebolt support have been defined using the Matthews stability chart method and verified using numerical modelling with Rocscience RS2 and RS3 software. |
| · | Maximum filled stope height and sill pillar width requirements have been determined from numerical modelling using Rocscience RS2 and RS3 software. |
| · | A mining methodology has been developed for mining of parallel stopes where the orebody bifurcates. |
| · | Support requirements of permanent and temporary development has been provided using the Grimstad and Barton (1993) support chart. |
| 13.1.5 | Underground LOM Production |
The underground LOM production plan for El Porvenir and Atacocha was prepared using Deswik software. The underground Mineral Reserve estimates support a LOM production plan of approximately 10 years. The LOM plan assumes that the Atacocha underground mine will be operational starting in 2027 and will ramp up from 0.5 Mtpa in 2027 to 1.0 Mtpa in 2029. The El Porvenir Mine will operate at current production rates until the Atacocha underground mine is operational. A lower production rate of 1.8 Mtpa is planned for 2026 due to a major upgrade scheduled for the El Porvenir processing plant.
The LOM plan assumes stope mining rates of 1,500 tpd and 267 tpd and backfill rates of 860 tpd and 667 tpd for SLS and CAF stopes, respectively. Table 13-10 and Figure 13-7 show the LOM production plan for the Atacocha and El Porvenir underground mines.
| 13- |
|
|
Table 13-10: Atacocha and El Porvenir Underground Mines LOM Plan
| Units | Total | 2024 | 2025 | 2026 | 2027 | 2028 | 2029 | 2030 | 2031 | 2032 | 2033 | |
| El Porvenir | ||||||||||||
| Total Ore | kt | 14,651 | 2,250 | 2,200 | 1,858 | 1,700 | 1,700 | 1,200 | 1,200 | 1,200 | 1,192 | 151 |
| CAF | kt | 5,550 | 1,043 | 932 | 1,265 | 630 | 458 | 387 | 300 | 351 | 142 | 42 |
| SLS | kt | 6,973 | 769 | 1,000 | 383 | 682 | 941 | 739 | 786 | 670 | 895 | 108 |
| Ore Dev | kt | 2,127 | 437 | 269 | 210 | 388 | 301 | 74 | 113 | 180 | 155 | - |
| Avg Zn | % | 4.11 | 3.71 | 3.84 | 3.37 | 3.92 | 4.22 | 4.28 | 4.43 | 4.18 | 6.03 | 4.24 |
| Avg Pb | % | 1.2 | 1.55 | 1.5 | 2 | 0.95 | 1.03 | 1.06 | 0.8 | 0.95 | 0.21 | 0.37 |
| Avg Cu | % | 0.23 | 0.21 | 0.22 | 0.12 | 0.22 | 0.22 | 0.2 | 0.26 | 0.25 | 0.45 | 0.31 |
| Avg Ag | g/t | 72.9 | 88.7 | 78.5 | 115.1 | 68.6 | 63.2 | 63.4 | 59.8 | 64.5 | 23.4 | 33.50 |
| Atacocha | ||||||||||||
| Total Ore | kt | 5,665 | - | - | - | 500 | 500 | 1,000 | 1,000 | 1,000 | 1,000 | 665 |
| CAF | kt | 4,386 | - | - | - | 453 | 244 | 808 | 942 | 707 | 846 | 387 |
| SLS | kt | 930 | - | - | - | - | 224 | 130 | 11 | 226 | 86 | 254 |
| Ore Dev | kt | 349 | - | - | - | 47 | 32 | 62 | 48 | 68 | 68 | 24 |
| Avg Zn | % | 4.33 | - | - | - | 3.26 | 3.28 | 4.06 | 4.05 | 4.27 | 4.82 | 6.16 |
| Avg Pb | % | 1.34 | - | - | - | 1.93 | 1.09 | 1.36 | 1.54 | 1.28 | 1.29 | 0.90 |
| Avg Cu | % | 0.4 | - | - | - | 0.17 | 0.32 | 0.43 | 0.39 | 0.39 | 0.52 | 0.42 |
| Avg Ag | g/t | 79.8 | - | - | - | 111.9 | 85.3 | 78.1 | 92.7 | 69.8 | 78.3 | 52.26 |
| Total | ||||||||||||
| Total Ore | kt | 20,316 | 2,250 | 2,200 | 1,858 | 2,200 | 2,200 | 2,200 | 2,200 | 2,200 | 2,192 | 816 |
| CAF | kt | 9,936 | 1,043 | 932 | 1,265 | 1,083 | 702 | 1,195 | 1,242 | 1,057 | 988 | 429 |
| SLS | kt | 7,903 | 769 | 1,000 | 383 | 682 | 1,165 | 869 | 797 | 895 | 981 | 362 |
| 13- |
|
|
| Units | Total | 2024 | 2025 | 2026 | 2027 | 2028 | 2029 | 2030 | 2031 | 2032 | 2033 | |
| Ore Dev | kt | 2,476 | 437 | 269 | 210 | 435 | 333 | 136 | 161 | 248 | 223 | 24 |
| Avg Zn | % | 4.17 | 3.71 | 3.84 | 3.37 | 3.77 | 4.01 | 4.18 | 4.26 | 4.22 | 5.48 | 5.80 |
| Avg Pb | % | 1.24 | 1.55 | 1.5 | 2 | 1.18 | 1.05 | 1.2 | 1.13 | 1.1 | 0.7 | 0.80 |
| Avg Cu | % | 0.28 | 0.21 | 0.22 | 0.12 | 0.21 | 0.24 | 0.3 | 0.32 | 0.32 | 0.48 | 0.40 |
| Avg Ag | g/t | 74.83 | 88.69 | 78.48 | 115.06 | 78.4 | 68.2 | 70.09 | 74.76 | 66.91 | 48.41 | 48.79 |
| Development | ||||||||||||
| El Porvenir | ||||||||||||
| Capital Dev | m | 59,611 | 4,950 | 9,438 | 11,622 | 7,429 | 7,119 | 7,647 | 8,308 | 2,886 | 213 | - |
| Operating Dev | m | 83,380 | 16,993 | 12,363 | 10,174 | 10,772 | 11,081 | 8,553 | 4,309 | 5,754 | 3,206 | 176 |
| Total | m | 142,992 | 21,943 | 21,801 | 21,795 | 18,201 | 18,200 | 16,200 | 12,616 | 8,640 | 3,418 | 176 |
| Atacocha | ||||||||||||
| Capital Dev | m | 48,086 | - | - | 2,660 | 6,513 | 6,704 | 8,017 | 11,986 | 9,880 | 1,797 | 530 |
| Operating Dev | m | 7,488 | - | - | 502 | 1,207 | 1,016 | 1,702 | 964 | 657 | 1,062 | 377 |
| Total | m | 55,574 | - | - | 3,162 | 7,720 | 7,720 | 9,720 | 12,950 | 10,537 | 2,859 | 907 |
| 13- |
|
|
Figure 13-7: Cerro Pasco Complex Integration LOM Production Plan

| 13.1.6 | Infrastructure |
| 13.1.6.1 | Ventilation |
Atacocha’s and El Porvenir’s ventilation systems together circulate approximately 50,000 m3/min of airflow through the mines. The two mines are currently connected on two levels and part of the ventilation circuits are shared between them. Table 13-11 shows the fresh air intake and air exhaust locations and respective air flows at each of the monitoring points.
Table 13-11: Ventilation Balance
| Air Intake Locations | Flow (m3/min) |
Air Exhaust Locations | Flow (m3/min) |
| El Porvenir Mine | |||
| Mine Entrance San Carlos 4070 level | 2,225 | Vent Raise 4120 level | 592 |
| Phase 1 Adit 4070 level | 663 | Vent Raise 4120 level | 3,278 |
| Main Drift 4170 level | 3,465 | Vent Raise 4240 level | 2,900 |
| Main drift 4120 level | 1,754 | Vent Raise 3970 level | 5,412 |
| Mine Entrance 4020 level | 4,583 | Vent Raise 4150 level | 6,470 |
| Porvenir II Ramp 3990 level | 745 | Tunnel n.° 1 sur - 1, 3100 level | 665 |
| Main Drift 4150 level | 5,641 | Tunnel n.° 1 sur - 2 2900 level | 974 |
| La Quiñua Tunnel 3620 level | 4,751 | Tunnel n.° 2 sur 3630 level | 654 |
| Connecting Drift to Atacocha 4070m level | 1,628 | Tunnel n.° 4 norte 3630 level | 1,979 |
| Connecting Drift to Atacocha 3370m level | 4,290 | Tunnel n.° 5 norte 3630 level | 1,657 |
| Don Ernesto Raise 4050 level | 1,637 | Alimak 2 4150 level | 7,423 |
| 13- |
|
|
| Air Intake Locations | Flow (m3/min) |
Air Exhaust Locations | Flow (m3/min) |
| Mine Portal 4090 level | 577 | Alimak Don Ernesto 4250 level | 2,228 |
| El Porvenir Intake | 31,959 | El Porvenir Exhaust | 34,232 |
| Atacocha Mine | |||
| Mine Portal 3900 level/Main Ramp | 2,966 | Mine Portal 4000 Level - San Ramon | 1,101 |
| Mine Portal 3600 Level - Portaro | 1,240 | Mine Portal 4020 level | 3,926 |
| Mine Portal 3600 Level - Don Paco | 1,778 | Alimak 392 | 1,599 |
| Vent Raise 77 | 459 | Mine Portal 4103 level | 881 |
| 3620 Level | 3,431 | RB OP-1 | 3,396 |
| Mine Portal 3950 Level | 310 | Tunnel 3300 level to El Porvenir | 2,006 |
| Mine Portal 3570 level | 2,765 | Tunnel 4050 level to El Porvenir | 1,436 |
| Mine Portal 4050 level | 2,853 | Mine Portal 4226 level OP-2 | 2,355 |
| Mine Portal 4154 level | 1,757 | RB 140 | 1,547 |
| Mine Portal 4218 level | 1,099 | ||
| Atacocha Intake | 18,658 | Atacocha Exhaust | 18,247 |
| Total Intake | 50,617 | Total Exhaust | 52,479 |
JCI Ingenieria & Servicios Ambientales (JCI) has completed a review of the ventilation in September 2023 and analyzed the planned demand based on future production. The analysis considered the number of people working in the mines, utilization ratios of diesel equipment, and requirements for maintaining an adequate temperature level in working areas. The results are presented in Figure 13-8. The air flow requirements are expected to reach a maximum of 1.50 million cubic feet per minute (Mcfm) which is equivalent to approximately 42,500 m3/min. The current ventilation system is able to cover 117% of the maximum demand, however, JCI estimates that additional auxiliary fans will have to be added to the current ventilation network to supply all of the working areas.
| 13- |
|
|
Figure 13-8: Planned Ventilation Requirements

Source. Nexa, 2023
| 13.1.6.2 | Mine Water Drainage |
The pumping system at Atacocha is carried out in two areas: Atacocha and Santa Bárbara. Mine and surface water from San Gerardo drains into the Atacocha underground mine, where it is collected in settling sumps and subsequently reports by gravity to the Don Paco tunnel at the 3,600 m elevation. Water collected in the Atacocha area is pumped through five pumping stations from the 2940 Level to 3600 Level, while water from the Santa Bárbara area is pumped through one station from the 3420 Level to 3600 Level, wherefrom it is sent to the Atacocha processing plant for filtration. The mine dewatering system has a design capacity of 120 L/s.
El Porvenir's dewatering system discharges water via the La Quinua tunnel. Mine water occurring above the tunnel's elevation drains to it by gravity via drain holes. Water occurring in the levels below the tunnel is pumped to it by the mine's pumping system. The water occurring in the stopes, sub-levels, and work headings flows by gravity or is pumped to the auxiliary sumps present on each sub-level. The water is then conducted via drain holes and ditches to one of the main sumps and pumping stations.
Each pumping station has three stationary, multi stage pumps with a pumping capacity between 70 m3/h and 90 m3/h. Two pumps work alternatively, with one pump on standby. The pumping system uses 10” diameter Schedule 80 steel pipes.
| 13- |
|
|
| 13.1.7 | Mine Equipment |
The current mine equipment list is presented in Table 13-12. Since only the El Porvenir Mine is currently in operation, most of the active equipment is located at El Porvenir. Nexa has included in its capital expenditure budget the purchase of additional equipment to support the re-opening and operation of the Atacocha underground mine. Contractors are responsible for providing and maintaining their respective equipment.
Table 13-12: Mine Equipment List
| Type | Make | Model | Nexa | Contractors | ||||||
| Ferreyros | Seprocal | Iesa | Miro Vidal | Unicon | Orica | Others | ||||
| LHD | Caterpillar | R1300 | 1 | |||||||
| LHD | Caterpillar | R1600 | 9 | 4 | 6 | 1 | ||||
| Jumbo | Sandvik | DD321 | 3 | |||||||
| Jumbo | Sandvik | DD421 | 2 | |||||||
| Jumbo | Sandvik | DD411 | 1 | |||||||
| Jumbo | EPIROC | Boomer S1D | 4 | 5 | ||||||
| Scaler | BTI | 5 | ||||||||
| Scaler | Resemin | 2 | ||||||||
| Scaler | Paus | 4 | 3 | |||||||
| Bolter | MacLean | MEM-946 & 975 | 3 | |||||||
| Bolter | Sandvik | DS 411, 421 & 312 | 3 | |||||||
| Bolter | Resemin | Bolter 99 | 3 | 5 | ||||||
| ANFO Loader | Normet | SF 505 | 5 | |||||||
| Forklift | Caterpillar | 3 | ||||||||
| Dump Trucks | VOLVO | FM500 6X4R | 3 | 16 | ||||||
| Dump Trucks | EPIROC | MT2010 | 1 | 1 | ||||||
| Dump Trucks | EPIROC | MT2200 | 1 | |||||||
| Dump Trucks | Atlas Copco | MT-2010/2011 | 3 | |||||||
| Shotcrete Sprayer | Putzmeister | Wetcret SPM 4210 | 5 | |||||||
| Shotcrete Mixer | Putzmeister | Mixkret4 | 11 | |||||||
| Utility Trucks | Toyota | Hilux | 4 | 2 | 12 | 16 | 8 | 6 | 6 | 36 |
| Utility Trucks | Isuzu | 3 | 4 | 1 | 1 | 2 | 3 | |||
| Grader | Caterpillar | 2 | ||||||||
| Manitou | 3 | 4 | 3 | 2 | ||||||
| 13.1.8 | Personnel |
The mine personnel will be a combination of Nexa workforce and contractors. A list of the mine personnel is shown in Table 13-13.
| 13- |
|
|
Table 13-13: Mine Personnel
| Company | Area | Number |
| Nexa | Mine Geology | 23 |
| Underground Mine | 219 | |
| Technical Services | 32 | |
| Maintenance | 128 | |
| Supervision | 23 | |
| Explomin | Infill Drilling | 50 |
| Exsa | Explosives nd Blasting | 67 |
| IESA | General Mine Services | 363 |
| Miro Vidal | Ramp Maintenance | 38 |
| Auxiliary Services | 193 | |
| Ore and Waste Transport | 82 | |
| Seprocal | Stope Mining | 260 |
| Tumi | Raise bore | 15 |
| Unicon | Shotcrete | 128 |
| Total | 1,621 |
| 13- |
|
|
13.2 Atacocha Open Pit (San Gerardo)
San Gerardo is a conventional open pit drill and blast operation using excavators and trucks operating on bench heights of six metres. The open pit is operated by a contractor, that provides operators, equipment, and ancillary facilities required for the mining operation.
Mill feed material produced by San Gerardo is hauled to the orepass at the east of the pit that reports to the 3600 Level of Atacocha UG, where it is trammed by locomotive and rail car to the Atacocha plant. Waste is hauled to the San Gerardo waste dump, which is adjacent to the Atacocha TSF dam. Average single direction haul distances for ore and waste are approximately 1.0 km and 4.7 km, respectively. Figure 13-9 presents open pit location and waste dump location.
| 13- |
|
|
Figure 13-9: San Gerardo Open Pit Layout

| 13- |
|
|
| 13.2.1 | Open Pit Design |
A pit design was created based on the NPV Scheduler output shell using Deswik mine planning software in four phases. The final pit outline with topography and phases is presented in Figure 13-10.
The San Gerardo pit is excavated with variable pit floor elevations and an ultimate pit bottom at 4,114 MASL. Ramps are 12 m wide at a 10% gradient that allow bi-directional haul truck travel. The mine is designed with a six-metre bench height, utilizing 127 mm vertical drill holes on 4.8 m x 5.8 m drill pattern with 0.5 m of sub-drilling.
| 13.2.2 | Geotechnical Considerations |
A geotechnical study was completed by SRK in February 2019. The analyses utilized data including diamond drill core inspections, mapping of exposed pit walls and the surrounding area, and laboratory testing of rock properties. Slope and bench design parameters were updated by Nexa in 2023 for each geotechnical domain, which are summarized in Table 13-14 with geotechnical domain sectors illustrated in Figure 13-11. Pit slope design outside of the domain sectors was assumed to be 45 degrees for design and this assumption is considered low risk based on the wall height of the north and west satellite pits.
Table 13-14: Pit Slope Domain Sectors Parameters
| Pit Slope Domain Sectors | Overall Slope Design Parameters | Inter-ramp Design Parameters | Bench Design Parameters | ||||
| Overall Slope (°) |
Max Slope Height (m) |
Slope (°) | Max Slope Height (m) |
Bench Height (m) |
Bech Face Angle (°) |
Berm Width (m) |
|
| SD-01 | 40 | 250.0 | 45 | 60 | 6.0 | 65° | 4.0 |
| SD-02 | 43 | 165.0 | 47 | 60 | 6.0 | 65° | 3.2 |
| SD-03 | 42 | 110.0 | 46 | 60 | 6.0 | 65° | 3.6 |
| SD-04 | 45 | 80.0 | 46 | 60 | 6.0 | 65° | 3.6 |
| SD-05 | 39 | 170.0 | 45 | 60 | 6.0 | 65° | 4.0 |
| SD-06 | 39 | 150.0 | 45 | 60 | 6.0 | 65° | 4.0 |
| SD-07 | 45 | 70.0 | 45 | 60 | 6.0 | 65° | 4.0 |
| SD-08 | 40 | 270.0 | 45 | 60 | 6.0 | 65° | 4.0 |
| 13- |
|
|
Figure 13-10: Final Pit Design and Phases Location

| 13- |
|
|
Figure 13-11: Open Pit Geotechnical Domain Sectors

| 13- |
|
|
| 13.2.3 | Open Pit LOM Production Schedule |
Nexa has prepared the open pit production schedules. Table 13-15 shows open pit mine production including tonnages and grades for each metal contained on a 100% basis. Copper grade was included as part of the open pit LOM production report, however, the NSR calculation does not include copper recovery.
The production schedules are based on Proven and Probable Mineral Reserves only. No Inferred Mineral Resources were used in the production schedules.
The open pit LOM production for San Gerardo was prepared using Deswik software. The open pit Mineral Reserve estimate supports an open pit LOM production plan of approximately four years before the underground mine starts production in 2027. Total material mined does not exceed 10 Mtpa (approximately 27 ktpd).
Open pit mining operating costs are defined as constant values for pit optimization. However, for the cash flow, there is a variable component associated with the haulage distance of the open pit mining costs that requires a truck haulage distance forecast in the LOM plan. The LOM plan should include a truck haulage distance forecast.
Table 13-15: Open Pit Life of Mine Production Schedule
| Atacocha | Units | Total | 2024 | 2025 | 2026 | 2027 |
| San Gerardo | ||||||
| Mill Feed | t | 4,379,705 | 1,240,719 | 1,305,750 | 1,108,584 | 724,652 |
| Zn | % | 0.99 | 0.86 | 0.81 | 1.18 | 1.26 |
| Pb | % | 1.15 | 0.98 | 1.09 | 1.23 | 1.40 |
| Cu | % | 0.03 | 0.03 | 0.02 | 0.04 | 0.05 |
| Ag | g/t | 34.94 | 32.91 | 31.04 | 36.03 | 43.75 |
| Au | g/t | 0.27 | 0.36 | 0.36 | 0.19 | 0.09 |
| Waste | t | 21,323,607 | 8,771,261 | 6,802,299 | 4,500,000 | 1,250,048 |
| Total | 25,703,312 | 10,011,980 | 8,108,048 | 5,608,584 | 1,974,700 | |
| W/O Ratio | 4.9 | 7.1 | 5.2 | 4.1 | 1.7 |
| 13.2.4 | Infrastructure |
Open pit truck shop and contractor facilities are located to the west of the current pit at approximately 4,300 MASL. Relocation of these facilities will be required to mine phase 4 to reach the final pit design.
Mine rock disposal is downstream of the existing Atacocha TSF dam. The access road from the open pit to the waste rock storage facility is operational. The Atacocha TSF dam study has been prepared by Ausenco (Ausenco, 2018a), including roads to raise the dam to the elevation of 4,180 MASL.
An orepass is connecting the open pit to the 3600 Level of Atacocha UG, wherefrom mill feed material is trammed by locomotive and rail car to the Atacocha plant.
| 13- |
|
|
| 13.2.5 | Mine Equipment |
San Gerardo surface mining is carried out by contractor (PEVOEX Contratistas Sac.), including drilling, blasting, loading, hauling, and support.
Loading is with excavators ranging from 3.4 m3 to 6 m3 and haulage of ore and waste is by 24 m3 and 26 m3 trucks respectively. Table 13-16 presents a summary of the contractor equipment list.
Table 13-16: Open Pit Mine Equipment List
| Manufacturer | Model Type | Equipment Type | Quantity |
| Caterpillar | 395JC | 6 m3 Excavator | 1 |
| Caterpillar | 374FL | 4.2 m3 Excavator | 1 |
| Caterpillar | 349D | 3.4 m3 Excavator | 1 |
| Sandvik | DP 1500i | Production Drill 4”-6” | 2 |
| Volvo | FMX8x4R | 26 m3 Haul Truck | 8 |
| Mercedez | AROCS 4151K | 24 m3 Haul Truck | 7 |
| 13.2.6 | Personnel |
The Atacocha open pit personnel is made up of the mine owner employees and a significant number of contract employees as presented in Table 13-17.
Table 13-17: Open Pit Mine Personnel
| Company | Area | Number |
| NEXA | Open Pit Mine Administration | 2 |
| NEXA | Mine Geology | 14 |
| Contractors | ||
| PEVOEX CONTRATISTA S.A. | Open Pit Mining Contractor | 194 |
| FAMESA | Explosives Loading and Transport | 7 |
| SINCO | Waste Dump Construction Supervision | 3 |
| Total | 220 |
| 13.3 | Consolidated Life of Mine Plan |
Nexa prepared production schedules for the two underground mines, El Porvenir and Atacocha UG, and a production schedule for the San Gerardo open pit mine. The Mineral Reserves will be processed in two different plants. San Gerardo open pit material is processed at the Atacocha processing plant ending in 2027. Ore from the current El Porvenir underground mine is processed at the El Porvenir plant and the Atacocha underground ore will be processed at the El Porvenir processing plant starting in 2027.
| 13- |
|
|
| 13.3.1 | Scheduling Assumptions |
The production schedules are based on Proven and Probable Mineral Reserves only. No Inferred Mineral Resources were used in the production schedules.
The input assumptions for the Mineral Reserves were adjusted based on current mine and production performances including throughput rates and recoveries.
The LOM plan assumes that Atacocha UG will be operational starting in 2027 and will ramp up from 0.5 Mtpa in 2027 to 1.0 Mtpa in 2029. The El Porvenir Mine will operate at current production rates until Atacocha UG is operational. A lower production rate of 1.8 Mtpa is planned for 2026 due to a major maintenance scheduled for the El Porvenir shaft (Pique Picasso).
The LOM plan assumes stope mining rates of 1,500 tpd and 267 tpd and backfill rates of 860 tpd and 667 tpd for SLS and CAF stopes, respectively.
| 13.3.2 | Mine Production and Processing Schedule |
Figure 13-12 shows total mine production and the tonnages and grades for each mine on a 100% ownership basis.
Figure 13-12: Life of Mine Plan

The Atacocha processing plant will be running until the last year of operation of San Gerardo open pit in 2027. The El Porvenir plant will operate at a production rate of 1.8 Mtpa during 2026 due to a major upgrade scheduled for the processing plant. Based on the current Mineral Reserves, El Porvenir plant will finish processing underground ore in 2033.
A combined processing schedule will be limited to 2.2 Mtpa from 2028, after the San Gerardo open pit and Atacocha plant final year of the operation. Figure 13-13 shows the El Porvenir and Atacocha plant production schedules and mill feed annual rates.
| 13- |
|
|
Figure 13-13: Plant Production Schedule

Table 13-18 presents a consolidated production schedule including Atacocha and El Porvenir underground mines, to be processed by El Porvenir plant, and Table 13-19 presents a production schedule for the open pit mine, to be processed by Atacocha plant.
| 13- |
|
|
Table 13-18: El Porvenir Plant Consolidated Underground Life of Mine Plan (100% Basis)
| Units | Total | 2024 | 2025 | 2026 | 2027 | 2028 | 2029 | 2030 | 2031 | 2032 | 2033 | |
| Atacocha & El Porvenir UG Mill Feed - El Porvenir Plant | ||||||||||||
| Total Ore | kt | 20,316 | 2,250 | 2,200 | 1,858 | 2,200 | 2,200 | 2,200 | 2,200 | 2,200 | 2,192 | 816 |
| Avg Zn | % | 4.17 | 3.71 | 3.84 | 3.37 | 3.77 | 4.01 | 4.18 | 4.26 | 4.22 | 5.48 | 5.80 |
| Avg Pb | % | 1.24 | 1.55 | 1.50 | 2.00 | 1.18 | 1.05 | 1.20 | 1.13 | 1.10 | 0.70 | 0.80 |
| Avg Cu | % | 0.28 | 0.21 | 0.22 | 0.12 | 0.21 | 0.24 | 0.30 | 0.32 | 0.32 | 0.48 | 0.40 |
| Avg Ag | g/t | 74.83 | 88.69 | 78.48 | 115.06 | 78.40 | 68.20 | 70.09 | 74.76 | 66.91 | 48.41 | 48.79 |
Table 13-19: Atacocha Plant Open Pit Life of Mine Plan (100% Basis)
| Units | Total | 2024 | 2025 | 2026 | 2027 | 2028 | 2029 | 2030 | 2031 | 2032 | 2033 | |
| San Gerardo OP Mill Feed - Atacocha Plant | ||||||||||||
| Total Ore | kt | 4,380 | 1,241 | 1,306 | 1,109 | 725 | - | - | - | - | - | - |
| Avg Zn | % | 0.99 | 0.86 | 0.81 | 1.18 | 1.26 | - | - | - | - | - | - |
| Avg Pb | % | 1.15 | 0.98 | 1.09 | 1.23 | 1.40 | - | - | - | - | - | - |
| Avg Ag | g/t | 34.94 | 32.91 | 31.04 | 36.03 | 43.75 | - | - | - | - | - | - |
| Avg Au | g/t | 0.27 | 0.36 | 0.36 | 0.19 | 0.09 | - | - | - | - | - | - |
| 13- |
|
|
| 14.0 | Processing and Recovery Methods |
| 14.1 | El Porvenir |
The concentrator at El Porvenir has an ore processing capacity of approximately 6,500 tpd, or 2.37 Mtpa, and consists of conventional crushing, grinding, and flotation to produce copper, lead, and zinc concentrates. The mineralogy is primarily sphalerite, galena and chalcopyrite, with associated pyrite, pyrrhotite, and limonite. Approximately 35% of the concentrator tailings are used for hydraulic backfill and the remainder is pumped to the TSF. El Porvenir copper and lead concentrates are sold to traders and delivered by road and rail to Callao, which is approximately 270 km by road, for shipping overseas. Zinc concentrate is transported by road and rail to Nexa’s Cajamarquilla zinc refinery near Lima. El Porvenir is approximately 315 km from Lima by road.
| 14.1.1 | Main Facilities |
For a treatment of 6,500 tpd ore, the plant has the following unit operations (Table 14-1).
Table 14-1: Concentrator Plant Operation Stages
| Stages | Metallurgical Operations | |
| Liberation of the sulphide minerals from the gangue material | Crushing |
Primary Secondary Tertiary |
| Milling |
Primary Secondary Bulk & Zn Concentrate Regrinding |
|
| Concentration and Recovery of Valuable Sulphides | Flotation |
Lead Unit Cells SK-240 Lead Flash Cells Bulk Circuit Pb-Cu Separation Circuit Zn Circuit |
| Concentrate Water Removal | Filtration |
Lead Concentrate Copper Concentrate Zinc Concentrate |
| Product and/or Waste Management | Cyclone Classification |
Underflow (35%) sent to Mine Overflow (65%) to TSF |
| 14.1.2 | Process Description |
A simplified flowsheet for El Porvenir concentrator is provided in Figure 14-1. The concentrator processes on average approximately 6,500 t.
| 14- |
|
|
| 14.1.2.1 | Primary, Secondary, and Tertiary Crushing |
Primary crushing takes place underground at El Porvenir using a Hewitt Robins 30 in. x 42 in. jaw crusher. The product of the primary crusher with a top size of approximately 4.0 in. to 4.5 in. (100 mm to 125 mm) is transported by conveyor to the 30,000 t coarse ore stockpile at surface.
Ore is reclaimed from the coarse ore stockpile by two reciprocating feeders beneath the stockpile and transferred to a conveyor feeding a Metso primary double deck screen. Oversize from the two decks reports to the Sandvik 600 secondary cone crusher while the bottom deck screen undersize (P95 9.5 mm) reports to the two 1,500 t grinding circuit feed bins. Secondary crusher product with a top size of 30 mm is conveyed to a three-way splitter that distributes the material to two Allis Chalmers 6 ft x 16 ft and one Metso 8 ft x 16 ft secondary double deck screens. Oversize material from the secondary screens is fed to two Sandvik CH 660 tertiary crushers, while bottom deck screen undersize (P95 9.5mm) reports to the two grinding circuit feed bins. Tertiary crusher product is returned by conveyor to the distributor feeding the secondary screens, closing the tertiary crushing circuit.
| 14.1.2.2 | Grinding |
The grinding circuit consists of two Koppers 9.5 ft dia. x 12 ft primary ball mills and five secondary ball mills. Crushed ore with a P95 9.5 mm is fed from the two grinding circuit feed bins to the two primary ball mills.
Primary Mill 1 works with three secondary mills, Secondary Mill 1 is an 8 ft x 4 ft Hardinge mill, Secondary Mill 2 is an 8 ft x 4 ft Comesa mill, and Secondary Mill 3 is a 6 ft x 7 ft Comesa mill. The discharge of Primary Mill 1 flows to two Sub A 1500 unit flotation cells. The lead concentrate produced flows to the final lead concentrate storage tank and the cell tailings flow into the secondary ball mill discharge pump box. Part of the slurry is pumped to a hydro cyclone classifier and the remainder to the high frequency Derrik vibrating screen feed distributor. The cyclone underflow discharges into the Derrick screen distributor along with the secondary ball mill discharge slurry and is fed to the high frequency Derrik screens.
Coarse material from the Derrik screens feeds the secondary ball mills while fine screen undersize material and overflow from the cyclone classifiers is combined in a mixing box, a portion of which is directed to the additional SK1 flash flotation cell. The lead concentrate produced is pumped to the final concentrate. The remainder of the cyclone overflow and the tailings from the SK1 flotation cell report to bulk flotation conditioning.
The secondary ball mill discharge slurry is pumped to the Derrick screens closing the circuit.
Primary Mill 2 works with two secondary mills, one is a Comesa 8 ft x 10 ft mill, which began operation in December 2011, and the other is an 8 ft x 5 ft Hardinge mill. The discharge of Primary Mill 2 goes to two Sub A 1500 unit cells. The lead concentrate reports to final concentrate and the flotation tailings are pumped to a second bank of high frequency Derrick screens for classification. The screen undersize is pumped to the flotation circuit and screen oversize flows to Secondary Mills 4 and 5. The discharge of Secondary Mill 4 goes to an SK-240 cell, the lead concentrate of which reports to final concentrate and the flotation cell tailings are combined in the secondary ball mill discharge sump and pumped to the Derrick screens for classification, closing the grinding circuit.
The addition of Secondary Mills 4 and 5 and optimizations of the milling circuit contributed to the increase in tonnage from 5,800 tpd to 6,500 tpd.
| 14- |
|
|
Instrumentation and control systems in the grinding circuit include nuclear density meters, automatic water controls in the mill feed, electronic scales, pulp level sensors, and a PSI-200 particle size analyzer.
Daily ball charge mixture to primary mills is in 2.5 in. (20%) and 3 in. (80%) sizes while secondary milling is with 1.5 in. and 2 in. ball sizes. The steel consumption in the ball mills is 0.380 kg/t. The required product granulometry is 12% +70 mesh (210 µm) and 52% -200 mesh (74 µm).
Among the most significant factors that contributed to the increase in tonnage are:
| · | The improvement of phase II granulometry. |
| · | The improvement in the load distribution to the two secondary mills and the increase in the discharge density of the primary mills to ranges of 1,950 g/L to 2,050 g/L. |
| · | The sorting density in the screens is in the range of 1,700 g/L on average, allowing for better classification with less return of fines to the secondary mills. |
| · | The repowering of the motors and the increase in the revolutions of the primary pumps 1 A, B (100HP) and 2 A, B (70HP). |
| 14.1.2.3 | Bulk Flotation |
The bulk flotation circuit consists of bulk rougher, scavenger, and cleaner cells and produces a copper and lead concentrate. Bulk scavenger concentrate is reground before being returned to the roughers. Bulk flotation is followed by copper-lead separation consisting of copper roughers, scavengers, and cleaners, during which copper minerals are floated while lead minerals are depressed to produce separate copper and lead concentrates. Tailings from the bulk flotation circuit feed the zinc flotation circuit.
The first rougher is an FM-100 cell, the second rougher is an OK-30, the third rougher is an OK-50 cell, the first scavenger is made up of two DR-300 cells, the second scavenger of six DR-100 cells, and the third Scavenger of six DR-100 cells.
Zinc sulphate and sodium cyanide are used as depressants of zinc and iron minerals in the bulk flotation circuit.
Xanthate Z-11, Aerphine-3418, and methyl isobutyl carbinol (MIBC) are used as collectors of lead minerals in the unit cells located in the discharges of the primary mills.
Xanthate Z-11 is the main collector and Aerophine-3418 is the secondary collector used in bulk Cu-Pb-Ag flotation. The pH ranges from 7.5 to 11.5.
| 14.1.2.4 | Lead – Copper Separation |
The concentrates from the third bulk cleaner circuit enter the lead copper separation circuit. The bulk concentrates pass through five OK-1.5 copper rougher cells. The tailings are the lead concentrate, and the concentrate is the copper concentrate. The copper concentrate passes through two stages of cleaning before the final copper concentrate is produced.
The reagents used for separation are:
| · | MIBC |
| · | A mixture of carboxymethyl cellulose (CMC), Sodium Silicate and Sodium Bichromate |
| 14- |
|
|
| 14.1.2.5 | Zinc Flotation |
Tailings from the bulk flotation circuit undergo three stages of conditioning prior to zinc flotation. The zinc flotation circuit consists of zinc roughers, scavengers, and three stages of cleaning to produce zinc concentrate and final tails.
Lime is used in zinc flotation as a pH modifier (9.5-11.5), copper sulphate as a reactivator of zinc minerals, xanthate as the main collector, and Flottec-4234 as secondary collectors. The only frother used in both circuits is MIBC.
The circuit consists of two OK-100 cells as the first and second roughers and one OK-50 as the third rougher, and for the first scavenger there is an OK–30. For the medium cleaner circuit, there is an OK-20, five DR-300 cells, eight DR-100 cells as cleaner scavengers, and eight DR-100 cells as second cleaner scavengers. The first cleaner is a column cell that works with the concentrate of the first and second rougher. The second cleaners consist of two OK-10 cells, and the third cleaners have an OK-5 cell and five DR-24 cells.
| 14.1.2.6 | Concentrate Dewatering |
Concentrates are dewatered in thickeners (lead and zinc) and a dewatering cone (copper) followed by a filter press for zinc concentrate and disc filters for lead and copper concentrates. The filtered concentrates are stored in covered stockpiles prior to being loaded into trucks using a front-end loader. Water from concentrate dewatering is recycled for use in the process. Lead and zinc concentrate moisture content is approximately 8% to 9%, and copper concentrate moisture content is approximately 11%.
The water obtained from machinery cooling is recovered in the order of 20.5 L/s in the dry season. In addition, a system has been implemented to recover water from the filtration operations as well as water from the wastewater treatment plant, which are used in the hydraulic backfill plant.
| 14.1.2.7 | Concentrate Shipping |
The concentrates produced by the processing plant are transported to Callao via the central highway in private trucks and via the central railroad and are sold to national or foreign smelters.
| 14.1.2.8 | Tailings |
Tailings at approximately 22% solids are classified in cyclones with coarse material in the underflow at approximately 62% solids sent to the hydraulic backfill plant for use in the mine as backfill. Mine backfill constitutes approximately 50% of tailings produced. Water from tailings dewatering is returned to the process. Overflow from the cyclones containing the fine tailings is deposited in the conventional TSF adjacent to the mine and processing plant. Tailings can be discharged at various points in the TSF by means of valved discharge points on the tailings line. Clarified water discharged from the TSF joins natural water flows used to generate electricity in Nexa’s La Candelaria Hydroelectric Plant.
| 14.1.3 | Energy, Water, and Process Materials Requirements |
Power requirements for the processing facilities are not anticipated to change significantly in the foreseeable future from the current power requirements.
Make-up water is supplied from various creeks around the TSF, as well as the Carmen Chico River, approximately 3.2 km south of the processing facility. Water consumption is not expected
| 14- |
|
|
to change significantly from the recent historical water usage and no supply concerns have been noted.
Key reagents used in the process include lime, sodium cyanide, sodium isopropyl xanthate (SIPX) Z-11, MIBC, copper sulphate, zinc sulphate, and collectors for copper, lead, and zinc.
| 14.1.4 | Manpower |
The processing plant personnel number 63. Maintenance (124), technical services (28), and projects personnel (9) service the mine and other departments in addition to the processing plant. These numbers are not anticipated to change significantly in the foreseeable future.
| 14- |
|
|
Figure 14-1: El Porvenir Process Flowsheet

| 14- |
|
|
| 14.2 | Atacocha |
| 14.2.1 | History |
The Atacocha Mine is located in the Department of Pasco, province of Pasco, district of Yanacancha. The concentrator is located in the Chicrín ravine at kilometre 324 of the Lima-Huánuco central highway on the left bank of the Huallaga River.
Minera Atacocha was founded on February 8, 1936. The first concentrator called No. 1 began operations in 1937 with a treatment capacity of 100 tpd for the beneficiation of lead ores by flotation. Lead-zinc extraction by differential flotation has been done since 1941. Plant No. 1 operated for thirty years, ending operations in 1968 with a capacity of 200 tpd. Plant No. 1 is 90% dismantled and some of the equipment is for sale since it cannot be used in the currently operating Plant No 2. Plant No. 2 began operations in 1950 with an initial capacity of 375 tpd. In 1968, Plant No. 2 was expanded to 1,500 tpd, making it possible to shut down Plant No. 1.
Concentrator No. 2 began gradually increasing its treatment tonnage; in 2007 it processed 3,750 tpd due to process improvements. In November 2008, the SY-STD Short Head tertiary crusher was replaced by a Nordberg HP500, which improved the granulometry of the crushing product, and increased the production rate to 4,380 tpd. By November 2016, the P80 of the crushed product was reduced to 5,000 µm and by January 2017, the production rate increased to 4,600 tpd. An additional OK-100 flotation cell was installed in the zinc flotation circuit to maintain the flotation residence time, and an additional two holding tanks were installed for the lead concentrate to provide uniform pulp density and improve filtration efficiency.
Concentrator No. 2 currently treats an average of 4,400 tpd of ore producing two concentrates: lead concentrate (48% to 55% Pb) and zinc concentrate (48% to 55% Zn).
| 14.2.2 | San Gerardo Open Pit Ore Processing |
By 2019, Atacocha underground reserves were nearly depleted, and the plant began treating ore from the San Gerardo open pit mine. The amount of San Gerardo ore treated progressively increased through May 2020, after which all ore supplied to the Atacocha plant was from the open pit. The open pit ore characteristics were different than Atacocha underground ore, so the production rate was restricted to 4,100 tpd. In addition, the open pit copper head grades were too low to make saleable concentrate grade, so copper concentrate production was discontinued, leaving only the lead concentrate and zinc concentrate products. The operational process was then optimized to resume the treatment of 4,400 tpd at the end of 2023.
| 14.2.3 | Mineralogy |
Mineralization in the Atacocha area consists primarily of veins and bodies of massive galena, black sphalerite and cubic pyrite, emplaced in green garnet skarn zones, breccia marble, and in contact with siliceous breccias. In the Santa Bárbara area, the recurrent mineral is argentiferous galena, with a lower proportion of blond sphalerite and fine pyrite, mainly located in calcareous breccias. Mineralization at San Gerardo consists of narrow veins of massive galena, blond sphalerite, freibergite, and fine pyrite, emplaced in brecciated carbonate rocks and dacitic intrusive rocks.
It is worth mentioning that gold is found as structural impurities in all sulphides, economic and non-economic, including alabandite.
The mineral contribution for the processing is from the Atacocha and San Gerardo areas.
| 14- |
|
|
| 14.2.4 | Process Description |
The capacity of the Atacocha concentrator is approximately 4,400 tpd, or 1.68 Mtpa, and consists of conventional crushing, grinding, and flotation to produce lead and zinc concentrates.
Simplified process flow diagram for the concentrator is shown in Figure 14-2.
The Atacocha processing plant is divided into sections, which are described below.
| 14.2.4.1 | Crushing |
The mined ore is stored in four coarse underground hoppers located at the 3600 Level. Hopper No. 1 has a capacity of 1,600 t. Hopper No. 2 has a capacity of 1,900 t. Hopper No. 3 has a capacity of 800 t, and Hopper No. 5 has a capacity of 700 t.
The ore accumulated in the coarse hoppers is fed to the crushing section by conveyor. The new No. 1 and No. 2 coarse hoppers each work with a 42 in. x 12 ft Comesa apron feeder; the No. 3 and No. 5 coarse hopper each work with 60 in. x 16 ft Comesa apron feeders.
The ore is conveyed to a 1,100 mm x 850 mm, Nordberg C110 B primary jaw crusher. The crusher product is conveyed to the primary Simplicity double deck screen. The screen undersize is conveyed to the fine ore storage bins. The upper deck screen oversize feeds the secondary Sandvik CH660 cone crusher. The lower deck screen oversize discharges onto belt No. 4, which is joined with the product of the secondary CH660 crusher and both products are conveyed to the secondary 8 ft x 20 ft double deck banana type screen via belts 5, 6A, and 6B.
The secondary banana screen – 3/8 in. bottom deck screen undersize material reports to the fine ore storage bin and the top and bottom deck screen oversize material feeds the tertiary Nordberg HP-500 cone crusher. The tertiary crusher product is conveyed to the tertiary Simplicity screen via conveyors 8, 5, and 6. The tertiary Simplicity screen undersize reports to the fine ore bins and the screen oversize from both decks feeds the tertiary crusher, closing the tertiary crushing circuit.
Product conveyor No. 9 distributes the ore to each of the six 450 t fine ore bins using a tripper conveyor.
| 14.2.4.2 | Grinding |
The grinding circuit comprises six ball mills, two Hardinge 8 ft x 5 ft conical mills and four Comesa 8 ft x 10 ft mills as primary mills, and one Hardinge 8 ft x 5 ft conical ball mill used as a secondary mill.
Five of the primary mills operate in closed circuit. The discharge of each mill is fed to an SK-80 flash flotation cell that recovers coarse lead concentrate which is pumped directly to lead concentrate storage. The tailings from these cells are pumped to a 15 in. hydrocyclone classifier. The cyclone underflow feeds the primary ball mill and the hydrocyclone overflow feeds a 10 ft dia. by 12 ft high lead-copper flotation conditioner in the flotation circuit.
The sixth primary mill operates in series with a secondary mill. The primary mill discharge feeds an SK-80 flash flotation cell. The SK-80 tailings are pumped to a 15 in. hydrocyclone. The cyclone underflow feeds the single secondary ball mill, which is closed by a 20 in. hydrocyclone.
Each primary mill is fed by variable speed conveyor belts and tonnage is automatically controlled by Ramsey scales. The following flotation reagents are added to each primary mill: zinc sulphate (depressant), sodium cyanide (depressant), and in each flash flotation cell: xanthate (Z11 or Z14) and MIBC are added.
| 14- |
|
|
| 14.2.4.3 | Flotation |
The flotation plant consists of three circuits that are controlled by a Courier 6SL inline analyzer that was installed in September 2004 (currently only the multiplexer operates). The bulk rougher circuit produces a bulk copper-lead concentrate that is then separated in the lead circuit to produce the copper and lead concentrates. The zinc circuit processes the tailings from the copper and lead circuits, and including a regrinding stage, produces the zinc concentrate and the final tails.
Bulk Rougher Circuit
The bulk rougher flotation circuit treats the whole ore, obtaining lead concentrates, made up of the concentrates of the grinding circuit SK-80 flash flotation cells plus the OK-8 and OK-20 cleaner concentrates and the OK-30 I and 1st OK-8 scavenger concentrates. To this are added the concentrates of the RCS-30 and 2nd + 3rd OK-8 scavenger cells (may or may not include cleaners); the cleaner tailings are recycled to the bulk rougher feed. The feed to the cleaners is made up of rougher concentrates. The concentrates from the OK-30 I cells are fed to the OK-3 cells (lead cleaning), the concentrate from these cells also forms the lead concentrate and the tailings returns to the rougher feed.
Bulk-Scavenger Flotation Circuit
The tailings from the bulk rougher OK-30 II cells feed the bulk scavenger flotation circuit consisting of an OK-20 cell followed by a bank of six OK-8 cells and one OK-16 cells. The OK-20 scavenger concentrate flows to a bank of five cleaner scavenger OK-8 cells. The bulk scavenger tailings feed the zinc circuit.
Pb/Cu Separation Circuit
Since July 2019, no Pb/Cu separation has been carried out due to a copper head grade of less than 0.10%, ranging from 0.06% to 0.08%. The Pb/Cu separation can be resumed when the copper head grade improves.
Zinc Circuit
The zinc rougher circuit processes the tailings from the bulk lead-copper scavenger circuit with conditioning in two 16 ft dia. x16 ft agitated tanks operated in series. The zinc rougher circuit consists of one OK-100 cell and one OK-50 cell operated in series. The scavenger circuit consists of a bank of three OK-16 cells, a bank of four OK-16 cells and one OK-50 cells, and the cleaning circuit consists of one stage using an OK-10 cell and a bank of five OK-3 cells. The zinc scavenger tailings are final tailings. The first rougher concentrate and the cleaner concentrate are the final zinc concentrates.
The scavenger concentrates return to the second scavenger feed (OK-16) and tailings from the first scavenger are recycled to the second rougher feed.
| 14.2.4.4 | Flotation Reagents |
The following reagents are used in the concentrator:
| · | Main collector: sodium isopropyl xanthate (Z11); 2.2% solution, for rougher - scavenger stages, bulk lead-zinc and zinc stages. |
| · | Frother: MIBC is used for both lead and zinc circuits and is added neat. |
| 14- |
|
|
| · | Depressants: sodium cyanide (1% solution), zinc sulphate (3.30% solution) is added in milling. |
| · | Zinc activator: copper sulphate (4.50% solution) is used in the zinc circuit. |
| · | Hydrated lime Ca(OH)2 powder (65% CaO) is added for pH control in the zinc circuit. |
The reagent consumptions are presented in Table 14-2.
Table 14-2: Flotation Reagent Consumptions
| Reagent | Consumption, g/t |
| Nitric acid | 17 |
| Hydrated lime, mill | 10 |
| Sodium cyanide | 22 |
| Methyl isobutyl carbinol, MIBC | 45 |
| Copper sulphate pentahydrate | 62 |
| Zn sulphate | 140 |
| Sodium Isopropyl Xanthate, Z-11 | 30 |
| 14.2.4.5 | Thickeners and Filters |
Lead an zinc flotation concentrate are pumped to two parallel concentrate thickeners for each metal for dewatering. The thickener underflow slurry from the lead and zinc thickener underflows are pumped to the lead and zinc concentrate storage tanks respectively for density control. The slurry is then pumped to a CC-45 ceramic disc filter, which reduces the moisture in each of the concentrates to approximately 8.2% for transportation. Filter aid at 20 g/t is added to improve the filtration process. There are two drum filters that can be used for either lead or copper concentrate dewatering. The filtered concentrates are discharged to the concentrate storage areas for shipping. The concentrates are loaded into trucks by front end loader when being despatched to customers.
| 14.2.5 | Tailings Pumping System |
Atacocha's tailings transport system is a high pressure pumping system using Geho positive displacement pumps designed to pump thickened tailings at a density 55%-65% solids to the Atacocha tailings dam. A project is being developed for a treatment rate of 5,000 dry tpd, i.e. 4,500 tpd of tailings.
The concentrator's general tailings are fed to the 125 ft thickener at a density of 1,250 g/L to reduce the total volume of material that must be transported to the Atacocha TSF. The tailings pulp is temporarily stored in the thickener-clarifier. Flocculant is dosed at a rate of 30 L/min at a concentration of 0.025%. The underflow of the thickener is recirculated with HR-200 pumps until it reaches 55% to 65% solids. When the pulp reaches the appropriate density, it is fed into the linear sieve, to store clean pulp of adequate granulometry in the storage tanks, and when the density decreases, the pulp is recirculated to the thickener until it reaches the adequate density again. The overflow with < 50 ppm solids is stored in a tank and then recirculated to the concentrator, and excess water is sent to the settling ponds.
The pumped tailings are disposed of in the basin of the Atacocha TSF.
| 14- |
|
|
| 14.2.6 | Water Consumption |
The water consumption of the Atacocha processing plant is approximately 2 m3/t of concentrate produced.
| 14.2.7 | Power Consumption |
The power consumption in the plant is 32.5 kWh/t to 33 kWh/t.
| 14- |
|
|
Figure 14-2: Atacocha Process Flowsheet

| 14- |
|
|
| 15.0 | Infrastructure |
The Cerro Pasco Complex Integration project aims to maximize the synergy of the Atacocha and El Porvenir mines.
El Porvenir started in 1950 and is in operation. It is an underground mine, with multiple accesses including a shaft (Picasso shaft) for ore and people transportation.
Atacocha started in 1937. The Atacocha open pit mine (San Gerardo) is in operation, while Atacocha UG has been on care and maintenance since 2020.
Accesses to Atacocha UG are made by multiple tunnels, well preserved despite its production suspension.
Atacocha is currently connected to El Porvenir through two active tunnels: at the 4070 and 3300 levels, with traffic of heavy mine equipment, conventional trucks, and transportation of mining crews (linking Atacocha surface to El Porvenir underground).
The integration plan currently includes:
· restarting and rehabilitation of the Atacocha underground mine,
· development of an approximately 2 km long connection tunnel (Tunnel 2900), linking Atacocha underground to the bottom of the Picasso shaft at El Porvenir, allowing the production from both underground mines to be hoisted and to feed El Porvenir processing plant,
· Picasso shaft capacity expansion to support production and extraction at both underground mines,
· closure of the Atacocha processing plant, with the exhaustion of Atacocha open pit reserves, in 2027,
· a new tailing pumping and pipeline system to be built, that will allow tailings from El Porvenir to be sent to the Atacocha dam, bringing a long term solution for tailings, supporting the extension of the combined life of the two mines.
The general location of the mines, processing plants, and tailings dams is provided in Figure 15-1.
| 15- |
|
|
Figure 15-1: Cerro Pasco Integration Project

| 15- |
|
|
| 15.1 | El Porvenir |
A combination of transportation methods, including road access, aircraft via Huánuco, and rail to Cerro de Pasco are used to supply the mine. Off-site infrastructure includes facilities for the transfer of concentrate from truck to rail at Cerro de Pasco to transport concentrate for export by train to the port of Callao. Mine access is via a 13 km dirt road northeast from Cerro de Pasco, and paved road from Lima to Cerro de Pasco (approximately 315 km).
The main road from Lima to Cerro de Pasco is used for personnel transportation, supply of food, reagents, spare parts, mining supplies, and diesel fuel. Huánuco airport can be used for personnel transportation and emergency situations.
The site comprises an underground mine, TSF, waste rock stockpiles, an ore processing facility with associated laboratory and maintenance facilities, and maintenance buildings for underground and surface equipment. Additional facilities and structures include an office building, change house facilities, main shaft, ventilation shaft, backfill plant, explosives storage area, hydroelectric power generating plant, power lines and substation, fuel storage tanks, a warehouse and laydown area, and an accommodation camp.
| 15.1.1 | Power Plant and Distribution |
The power supply for both El Porvenir and Atacocha mines mainly comes from the national power grid. The connection via PARAGSHA II substation (138 kV bar) feeds via 138 kV transmission line the main substation located near El Porvenir (MILPO substation).
From MILPO substation (138/50 kV), electricity is distributed to the El Porvenir and Atacocha substations, both with 50 kV/13.8 kV transformation.
All other project loads are fed at 13.8 kV from the El Porvenir and Atacocha substation through overhead power lines. These power lines are used to deliver power to various locations to support activities during operation of the Mines.
Beyond national grid, the mine complex has three small power plants connected behind the meter.
A simplified electrical single line diagram showing power generation and distribution from the grid and the Candelaria Hydroelectric Plant to the El Porvenir and Atacocha mine sites is presented in Figure 15-2.
La Candelaria Hydroelectric Plant with 4.6 MW distributed in three turbines (0.5 MW, 0.96 MW, and 3.2 MW), is connected to the El Porvenir Mine through MILPO substation by a 2.58 km long 50 kV transmission line. However, this small power plant does not operate due to social issues since July 2020.
| 15- |
|
|
Figure 15-2: Power Distribution Single Line Diagram for El Porvenir and Atacocha Mine Sites

| 15.1.2 | On-Site Roads |
Mine site roads include main roads suitable for mining trucks that transport concentrates to Cerro de Pasco and Lima and service roads for smaller vehicles. The site roads are used by authorized mine personnel and equipment, with access controlled by Nexa.
A network of approximately 15 km to 20 km of service roads has been built providing access to the underground mine, processing plant, TSF, waste rock stockpiles, mine offices, workshops, mine camps, and other surface infrastructure. The roads are approximately six metres wide designed for two-way 15 m3 truck traffic and road maintenance equipment.
| 15.1.3 | Utilities and Services |
Raw water is sourced from a small creek, Tingovado, as well as from other creeks around the TSF.
Fresh water supply is obtained from the Carmen Chico River, approximately 3.2 km south of the processing facility. This water is primarily for use in the mine camps and make-up requirements for the processing facility and industrial area.
| 15.1.4 | Sewage Collection and Disposal |
A sewage treatment facility has been constructed south of the industrial and mine camp sites at a lower elevation. Buried sewer pipes collect sewage from the site and transfer it to the treatment facility. The treatment facility consists of two independent containerized treatment lagoon systems providing redundancy if one unit must be shut down for maintenance. The system is capable of treating all of the wastewater generated in the camp, industrial, and office areas. Treated effluent is released to the TSF via a small stream.
| 15- |
|
|
| 15.1.4.1 | Site Security |
The principal site entry point on the access road from Cerro de Pasco consists of a lighted security gate and vehicle access barrier. A gatehouse provides sanitary facilities, communications equipment, and search facilities including metal detection. A weighbridge is located close to the gatehouse to enable load monitoring of incoming and outgoing vehicles.
| 15.1.5 | Communication and IT Systems |
Point-to-point satellite communication is the main communication system between the El Porvenir Mine and the outside world. The system includes voice/data/video/fax, internet, and VPN services, including bidirectional links between the Mine site and Lima.
Satellite television for entertainment, cellular communication, and FM radio is provided by local service providers.
| 15.1.6 | Vehicle Fuelling Facility and Mine Equipment Ready Line |
The vehicle fuelling facility and ready line is located adjacent to the processing plant. The fuelling facility stores diesel and gasoline. Smaller tanks hold a variety of oils and lubricants.
| 15.1.7 | Site Buildings and Facilities |
A plan of the site buildings and facilities is provided in Figure 15-3.
| 15- |
|
|
Figure 15-3: El Porvenir Site Layout

| 15- |
|
|
| 15.1.7.1 | Operations and Maintenance Building |
The Operations and Maintenance building is a masonry building that provides offices for mine management, administration, and technical staff, including environmental, administrative management, training, accounting, safety, and security. It includes staff support facilities such as a conference room, printing room, and lunchroom.
The underground mine operations building, electrical room, trackless equipment workshop, tire shop, air compressor shop, maintenance shop, lamp house, lockers, and washrooms are constructed adjacent to the main entrance to the underground mine at a 50 m distance, as approved by Peruvian safety regulations.
To the south of the main entrance to the mine are the main mine supplies storage, processing plant building, electrical workshop, backfill plant, and laboratory facilities.
| 15.1.7.2 | Accommodation Facilities |
The permanent accommodation complex has been constructed on an approximately 60 ha site north of the mine. The accommodation complex incorporates the following camp sites:
| · | Type A: staff houses, and staff hotel where dormitories are private, single occupancy rooms. |
| · | Type B: three story building blocks are semi-private and have single occupancy rooms with two rooms sharing one shower and a washroom. |
| · | Type C: three story blocks of dormitories are double occupancy rooms with a central shower and washroom facility shared by ten rooms. |
The accommodation complex also includes the following facilities:
| · | Kitchen, bakery, dining hall. |
| · | Recreation, exercise, and entertainment facility including a cinema that can also be used for meetings and training. |
| · | Three soccer fields. |
| · | Workers union building. |
| · | Hospital equipped with trauma treatment facilities as well as life support equipment. The hospital is comprised of a waiting and reception area, doctor's office, operating theatre, two bed wards, washroom facilities, storage room, and ambulance parking. |
| 15.1.7.3 | Explosives Magazine |
The explosives magazine has been constructed and operated in accordance with Peruvian law.
| 15.1.7.4 | Solid Waste Disposal and Recycling Facility |
Non-recyclable, non-toxic solid waste is disposed of in an on-site lined landfill. Used tires are shredded and placed in the landfill.
| 15.1.8 | Tailings Storage |
The El Porvenir TSF receives tailings generated by both El Porvenir and Atacocha concentrator plants. A portion of tailings is used for hydraulic backfill at El Porvenir. The El Porvenir TSF was originally constructed in the 1970s, and the current elevation of the dam crest is 4,064
| 15- |
|
|
MASL. The downstream toe is inferred to be less than 3,920 m from available plans, resulting in a dam height of 140 m.
Nexa is planning to improve the water management system through construction of a perimeter channel (i.e., upstream water diversion) to intercept clean (non-contact water) surface runoff water preventing its entrance to the TSF. Diverted water will be discharged downstream of the TSF in the Lloclla River gorge.
Contact water is recycled via a decant pumping system to the concentrator for use in the processing facility. The diversion on the western side of the TSF will be raised for the ultimate dam (Ausenco, 2016b). A lined seepage collection monitoring pond is located at the downstream toe of the main embankment to control water quality prior to water release to the environment. The monitoring pond is equipped with an overflow spillway and outlet channel for discharge into a local tributary creek of the Lloclla River.
A decant overflow system located on the left side of the main embankment conveys surplus flows from the tailings pond to the monitoring pond through the Lloclla Tunnel. Operation of a sluice gate at the pond location allows for the diversion of decanted water into the monitoring pond or bypass it, discharging directly into a local tributary creek of the Lloclla River. The water intake of the decant overflow system is a hydraulic structure consisting of two concrete towers with a series of inlets stacked vertically. Inlets must be progressively blocked and rendered inactive as the deposited tailings reach certain elevation.
A channeling structure, consisting of two breakwaters, direct flows towards the emergency spillway. The spillway is an overflow tunnel located in the right abutment. It is reportedly designed to convey flows from probable maximum precipitation (SRK, 2017). The tunnel discharges via a tunnel daylighting at elevation 4,035 MASL.
The layout of the TSF with its crest elevation of 4,064 MASL is presented on Figure 15-4. The intention is to raise the main embankment in 10 m increments with intermediate raises of four metres. It is noted that the expansion of the TSF to contain the LOM tailings requires a rockfill embankment dam and seepage collection pond at the northeast corner of the TSF to prevent tailings from impacting the concentrator plant area, as well as the northwest where the Tingovado Creek is diverted. The embankment located at the process pond is raised progressively in a downstream direction and its upstream slope is lined with a two millimetre thick high density polyethylene (HDPE) geomembrane. The detailed design of the El Porvenir TSF to its final elevation of 4,100 MASL has been completed (Ausenco, 2016b). The current plan is for Nexa to raise the dam up to dam crest elevation 4,070 MASL as part of the Cerro Pasco Complex Integration project. Determination to raise the dam beyond that elevation will be made in the future. Upgrades to the pumping and piping systems at El Porvenir will allow disposal of the El Porvenir tailings, not used for hydraulic backfill, at the Atacocha TSF.
Figure 15-5 shows the main TSF dam with a crest elevation of 4,064 MASL in plan view. The average crest width is approximately 15 m, with an overall downstream fill slope of 2.5H:1V and 1.5H:1V upstream; with an average interbank slope of 2H:1V.
Surface preparation for dam raises includes the removal of topsoil and unsuitable soils and compaction to provide a suitable foundation. For cases where there are cavities, a product of karst processes, the sealing of the openings with mortar or cyclopean concrete is required. To SLR’s knowledge the measures to address seepage through karst rocks have been implemented through recent TSF construction including a sandy gravel platform around the perimeter of the TSF (SRK, 2017), and bedrock foundation grouting of the dam abutments in 2015. Ongoing operations will require continuous tailings deposition planning and pond management to maintain the design beach widths to limit seepage through the permeable dam.
| 15- |
|
|
A cross section of the main dam at its ultimate crest elevation is shown on Figure 15-6. The initial TSF dam raises were performed using mainly compacted coarse tailings (cyclone underflow) with the centreline construction method. Due to a shortfall of the coarse fraction of the tailings to be used in the dam raises from 4,043 MASL, further raises used compacted rockfill and structural fill.
The crest of the dam is a horizontal platform of 15 m width and is composed of structural fill, which is mainly made up of sandy gravel. At the final elevation of the dam crest of 4,100 MASL, the height of the dam will be 187 m above the natural ground level of the gorge in which the dam is constructed.
In the design of the TSF, expansion plans considered that the processing rate would increase to 9,000 tpd in 2019 (3.24 Mtpa). Tailings produced would amount to 95.38% of ore processed. The design also considered the integration of El Porvenir with the Atacocha Mine and the disposal of Atacocha tailings in the El Porvenir TSF from 2016 onward. The Atacocha ore processing rate considered was 4,500 tpd (1.62 Mtpa) with plans for this to be increased to 5,000 tpd (1.8 Mtpa). Tailings produced would amount to 95% of ore processed.
Monthly and annual dam safety inspections are currently being conducted by Geoconsultoria Ltda, an external consultant, for the El Porvenir TSF dam. The SLR QP has relied on the statements and conclusions of reports provided by Nexa and its consultants and provides no conclusions or opinions regarding the stability or performance of the dams and impoundments listed in this TRS.
| 15- |
|
|
Figure 15-4: El Porvenir Tailings Storage Facility Layout with Dam Crest at Elevation 4,064 MASL

| 15- |
|
|
Figure 15-5: El Porvenir Tailings Storage Facility Layout Main Dam Layout at Crest Elevation 4,064 MASL

| 15- |
|
|
Figure 15-6: El Porvenir Tailings Storage Facility Main Dam Section to Crest Elevation 4,100 MASL

| 15- |
|
|
| 15.1.9 | Waste Rock Storage Facilities |
Historically, the volume of waste rock deposited on surface has been minor given that the El Porvenir operation is an underground mine. In the past, waste rock has been deposited in two areas within the TSF, and La Quinua waste rock dump (WRD) located outside the TSF. The La Quinua WRD is currently inactive.
Currently, waste rock is only brought to surface for storage if backfilling is not possible. If waste rock is brought to surface in the future, it will be deposited in a designated area near the secondary TSF embankment (southwest of the concentrator plant area), approved in Directorial Resolution R.D. 693-2012 MEM-AAM/LCD/RPP/MPC.
| 15.2 | Atacocha |
| 15.2.1 | On-site Infrastructure |
Site operations comprise an underground mine, open pit mine, and a process plant facility. Supporting on-site infrastructure include maintenance facilities; maintenance buildings for underground and surface equipment, laboratory, and tailings pumping station. Facilities and structures supporting operations include warehouses and laydown areas, offices, dry facilities, hydroelectric generating station, power lines and substation, fuel storage tanks, and accommodations camp. A network of site roads that are approximately 6 m wide and total 15 km in length are used by authorized mine personnel and equipment, including ore and waste haul trucks, concentrate haul trucks, support and light duty vehicles to provide access to on-site infrastructure.
Figure 15-7 shows the general layout of the Atacocha infrastructure.
| 15- |
|
|
Figure 15-7: Atacocha Site Layout

| 15- |
|
|
| 15.2.2 | Power Plant and Distribution |
Power supply for the Project comes from two sources, Electroandes, a power supplier located in Paragsha via a 30 km long 50 kV transmission line and two small hydro power plants connected to Atacocha Substation.
The first hydro power plant is the Chaprin hydro power plant that has 5.2 MW (3 x 1.8 MW). It produces almost 30 GWh per year. Is it connected to Atacocha substation via a 14 km long 50 kV transmission line.
The second one is Marcopampa hydroelectric generating station with a total capacity of 1.2 MW via a 2 km long 4.16 kV transmission line. However, this hydroelectric generating station is not in operation because of social problems.
Nexa has performed studies to retrofit these power plants and solve the social problems. However these improvements are not considered in the current plan.
A simplified electrical single line diagram showing power generation and distribution from the grid and the Candelaria Hydroelectric Plant to the El Porvenir and Atacocha mine sites is presented in Figure 15-2.
| 15.2.3 | Tailings Storage Facility and Waste Rock Storage |
The Atacocha TSF embankment crest was raised to an elevation of 4,128 MASL, the dam crest elevation currently permitted. Mine rock disposal takes place downstream of the existing Atacocha TSF dam, which also serves to buttress the dam to enhance stability. The Atacocha TSF dam has been raised in at least six stages by the downstream method, with a 2H:1V overall downstream slope and a 1.5H:1V upstream slope. The upstream slope is lined with a geomembrane. The Atacocha TSF is shown in Figure 15-8 and a dam cross section in Figure 15-9.
It is understood that the first of four stages of dam raising included geosynthetic clay liner (GCL) on both the upstream and downstream faces of the dam and around the perimeter of the TSF (SRK, 2017). The GCL was reportedly installed for the initial TSF development over concerns about potential acid generation in the tailings and in order to meet permitting conditions. The GCL lining on geogrid support layers around the TSF also serves to mitigate potential issues with karst terrain.
The Atacocha TSF is not equipped with an emergency spillway. It has a contingency pumping system that, when operating at the maximum combined pumping rate, reportedly provides capacity to handle the probable maximum flood. The Atacocha TSF has a perimeter diversion channel to intercept non-contact water and minimize the catchment area of the TSF.
Monthly and annual dam safety inspections are currently being conducted by Geoconsultoria Ltda, an external consultant, for the Atacocha TSF dam. The SLR QP has relied on the statements and conclusions of reports provided by Nexa and its consultants and provides no conclusions or opinions regarding the stability or performance of the dams and impoundments listed in this TRS.
Mine waste rock management planning includes encapsulation of potentially acid generating waste rock within a non-potentially acid generating waste rock surround and the waste rock dump area is provided with a sub-drain seepage collection system (Ausenco, 2018b).
| 15- |
|
|
Figure 15-8: Atacocha Tailings Storage Facility Layout with Dam Crest at Elevation 4,128 MASL

| 15- |
|
|
Figure 15-9: Atacocha Tailings Storage Facility Main Dam Section to Crest Elevation 4,128 MASL

| 15- |
|
|
| 16.0 | Market Studies |
| 16.1 | Markets |
The principal commodities produced at El Porvenir and Atacocha, Zn, Pb, Cu, Ag, and Au, are freely traded, at prices and terms that are widely known, so that prospects for sale of any Nexa production are virtually assured.
The final sale products for El Porvenir processing plant (for all underground material processed between years 2024 and 2033) are copper, lead, and zinc concentrates. El Porvenir copper and lead concentrates are sold to traders and delivered by road and rail to Callao, which is approximately 270 km by road, for shipping overseas. Zinc concentrate is transported by road and rail to Nexa’s Cajamarquilla zinc refinery near Lima as per Nexa’s internal planning. Over the LOM, zinc concentrate represents 60% of El Porvenir’s gross revenue, while lead concentrate and copper concentrate represent 37% and 3%, respectively.
The final sales products for the Atacocha processing plant (for open pit material processed between years 2024 and 2027) are lead concentrate and zinc concentrate. Over the LOM of the Atacocha plant, the sale of lead concentrate represents 73% of Atacocha’s gross revenue, while zinc concentrate represents 27% of Atacocha’s gross revenue.
Over the LOM for the Cerro Pasco Complex, considering production from both El Porvenir and Atacocha plants, the gross revenue, broken down by metal sold is as follows: zinc 54%, lead 16%, copper 2%, silver 27%, gold 1%.
SLR has reviewed the concentrate terms provided by Nexa and found them to be consistent with current industry norms.
Market information in this section is based on the industry scenario analysis prepared by Nexa’s Market Intelligence team for years 2022 and 2023 based on information sourced from different banks and independent financial institutions, economy and politics research groups, and metals consultants.
Nexa’s Market Intelligence team notes that during the last two years the short-term market scenario is still challenging due to volatility in markets, uncertainty due to fear of a decrease in global demand, inflation affecting major economies and potential US recession in the short term, and geopolitical risks such as the war between Russia and Ukraine, and recent conflict in the Gaza Strip. All these factors are affecting the market fundamentals.
The SLR QP has reviewed the market studies and analyses and is of the opinion that the results support the assumptions in the TRS.
| 16.1.1 | Zinc |
| 16.1.1.1 | Zinc Demand |
The major market drivers for zinc demand are construction and infrastructure, transportation and vehicles production, industrial machinery production, batteries, and renewable energy. According to Nexa’s Market Intelligence team, zinc demand growth will be moderate but will remain strong, supported in part, by government backed stimulus in infrastructure/urbanization and the energy transition, and also supported by China and emerging markets economy.
| 16- |
|
|
| 16.1.1.2 | Zinc Supply |
Nexa’s Market Intelligence team’s supply forecast analysis was based on the following industry information: zinc mine start-up and closure, mine production guidance, disruption allowance evaluation, project pipeline, and cost evaluation. Nexa’s analysis results are summarized as follows:
| · | Mine supply increasing until 2026: operations achieving regular output, projects coming online and ramp-ups, compensating mine grades reduction. Additional volume after 2025 coming from projects at early stages of development . |
| · | Metal production with an average growth of 1.9% from 2023 to 2027, as Europeans smelters overcome energy challenges and return to regular output. Market deficit expected until 2024 and a tight balance afterwards. |
| · | Prices remaining at higher levels throughout the cycle, as refined zinc market remains tight, with inventories at a lower range. |
| 16.1.1.3 | Zinc Price Outlook |
Zinc prices depend mainly on variations in supply, demand, and the perceived supply/demand balance. The most commonly referenced currency for zinc transactions is US dollars. Nexa forecasts a long-term price of US$2,800/t for its base case price scenario. Figure 16-1 shows the results of Nexa’s analysis.
Figure 16-1: Zinc Price Outlook

According to Nexa’s team, prices are expected to remain at good margin levels, but not elevated.
| 16- |
|
|
| 16.1.2 | Copper |
| 16.1.2.1 | Copper Demand |
The major market drivers for Cu demand are power generation and transmission, construction, factory equipment, and the electronics industry. Nexa foresees that after a sharp recovery in 2021, year over year demand may return to the pre-pandemic levels. Copper demand will be mostly driven by Electric Vehicles (EVs), renewables, and grid expansion. Major analysts foresee copper’s role over the longer term will intensify as a result of decarbonization and the ‘greening’ of the economy.
| 16.1.2.2 | Copper Supply |
Nexa’s Market Intelligence team’s supply forecast analysis was based on the following industry information: copper mine start-up and closure, mine production guidance, project pipeline, and cost evaluation for the last two years. Nexa’s forecast analysis results are summarized as follows:
| · | Big-scale brownfield and greenfield projects are expected until 2025, contributing to a concentrate surplus. |
| · | Supply risks: environmental requirements and permitting processes become increasingly stringent and investors demand green credentials. Some projects will also be halted by environmental opposition. |
| · | Among other sources of supply that could come online, scrap is expected to play an important part (32% of world’s demand by 2027). China remains the main player for copper scrap: volumes consumed and regulations/standards established. |
| 16.1.2.3 | Copper Price Outlook |
The main factors that drive copper prices are variations in supply, demand, and the perceived supply/demand balance. Nexa forecasts a long-term price of US$7,612/t for copper. Figure 16-2 shows the results of Nexa’s analysis.
| 16- |
|
|
Figure 16-2: Copper Price Outlook

| 16.1.3 | Lead, Silver, and Gold |
Nexa has based its lead and silver price forecast solely on consensus prices and correlation analysis published by metal market analysts and financial institutions.
| 16.1.3.1 | Lead Price Outlook |
Recently, lead prices have been supported by a reduction in metal inventories due to the post-pandemic effects in the supply chains (higher freight and storage costs).
Recent price movements haven’t climbed as sharply as other metals, which has increased lead–zinc spreads to unusual (high) levels. For that reason, lead may be less vulnerable to a further price correction in the mid term.
As fundamentals are concerned, the Chinese and Indian automotive sectors will be the main drivers of global demand growth.
Nexa forecasts a long-term price of US$2,030/t for lead. Figure 16-3 presents the results of Nexa’s lead analysis.
| 16- |
|
|
Figure 16-3: Lead Price Outlook

| 16.1.3.2 | Silver and Gold Price Outlook |
Silver and gold represent 27% and 1% of Cerro Pasco’s gross revenue, respectively. Nexa’s silver and gold prices were chosen based on the median of consensus prices published by banks and institutions on a monthly basis.
Nexa forecasts a declining silver price from 2026 onwards (between US$20.50/oz Ag and US$21.11/oz Ag). For silver, current price movements are more based on investors optimism and less on increase in demand.
For gold, Nexa forecasts declining prices from 2026 onwards, from US$1,945/oz Au in the short term to US$1,619/oz Au in the long term. For gold, prices may lose strength throughout the cycle 2023 – 2027 as economies recover from current recession scenario and investors migrate to other types of assets.
The silver and gold forecast curves in Figure 16-4 and Figure 16-5, respectively, present the median silver and gold prices based on a consensus of institutional sources.
| 16- |
|
|

| 16.2 | Contracts |
Nexa has negotiated contracts for the sale of its copper and lead concentrates with several known traders (such as Glencore, Trafigura, Humon, and IXM). SLR has reviewed the agreement terms and found these to be in accordance with industry standards.
| 16- |
|
|
In addition to concentrate sales, Cerro Pasco has numerous contracts with suppliers for the majority of the operating activities at El Porvenir and Atacocha mine sites, such as:
| · | Mining operations: Drilling, explosives, loading, hauling, underground mine development, maintenance, etc. |
| · | Processing: Plant maintenance, and laboratory services |
| · | Suppliers for consumables, reagents, maintenance and general services |
| · | General and administrative (G&A) requirements, and other services to support a remote mine operation. |
SLR has not reviewed the various support service contract details at the Cerro Pasco Complex, however, Nexa has used these contractors in the past and continues to do so.
| 16- |
|
|
| 17.0 | Environmental Studies, Permitting, and Plans, Negotiations, or Agreements with Local Individuals or Groups |
Nexa has several corporate policies, including a Compliance Policy. SLR understands that Nexa does not have a specific environmental policy.
Nexa announced an Environmental, Social and Governance (ESG) strategy based on nine pillars, commitments and indicators in 2022 as per the 2022 Annual Report and on the company website. Environmental commitments include:
| · | Reducing green house gas emissions to reach net zero by 2050 |
| · | Optimising water management |
| · | Ensuing full recovery of biodiversity in areas impacted by Nexa activities |
| · | Be recognized as an engaged and transparent company in dam safety and management |
| · | Be a global benchmark waste management and the circular economy |
| · | Implement a decommissioning management system in a responsible manner. |
Social commitments include:
| · | Ensure compliance with international and national Human Rights practices |
| · | Maintain a social licence to operate |
| · | Build social legacy with communities in affected areas |
| · | Ensuring the health and well being of company workers |
| · | Increase diversity and inclusion within the company |
| · | Be recognised for attracting and retaining talent. |
Governance commitments include:
| · | Raise awareness within the company sphere of influence about good business conduct and human rights practices |
| · | Promote good business practices related to ethical, labour, environmental, community and human rights issues |
| · | Transparent management of the ESG program. |
Nexa is implementing initiatives and projects in several operations towards achieving these commitments.
| 17.1 | El Porvenir |
| 17.1.1 | Environmental Aspects |
| 17.1.1.1 | Environmental Setting |
Environmental baseline studies have been completed as part of the Environmental Impact Assessment (EIA). A summary of the existing conditions in the El Porvenir area based on
| 17- |
|
|
information included in Ecotec (2018) and KCB (2020) is presented below, sourced from SLR (2021).
Climate
The climate is cold and dry throughout the year, which is typical of the Central Andes Mountain Region. Approximately 80% of the annual rainfall takes place between October and March. From June to August there are generally minimal rainfalls. Based on data from the Cerro de Pasco regional meteorological station operated by the government (data record from 1975 to 2017), the average temperature ranges from 4°C in July to 6°C in November. The average annual precipitation is 943 mm, with maximum monthly precipitation of 135 mm in March and minimum monthly precipitation of 15 mm in July.
Air Quality
Air quality has been characterized using records from eight monitoring stations for the period 2016 to 2018. The monitoring results are compared against national environmental quality standards for air quality (D.S. No. 003-2017-MINAM). Measured concentrations for particulate matter less than 10 μm (PM10), particulate matter less than 2.5 μm (PM2.5), gases (sulphur dioxide, nitrogen dioxide, carbon monoxide, ozone, hydrogen sulphide) and benzene were below the limit set in the standard.
Surface Water Quality
The existing conditions presented in Ecotec (2018) and KCB (2020) are based on surface water quality monitoring conducted at five sampling locations in three natural waterbodies (Lloclla River, Tingovado Creek, and Huallaga River). Four of these stations are located upstream of the mining activities and one is located downstream. Surface water quality is compared with the national environmental quality standards for water: D.S. No. 002-2008-MINAM for monitoring records from 2013 and 2014, D.S. No. 015-2015-MINAM for monitoring records from 2015 and 2016, and D.S. No. 004-2017-MINAM for monitoring records from 2017 and 2018. The reference values selected from the standards correspond to class 3-D1 for irrigation of high and low stem crops, and class 4-E2 for the Huallaga River.
Results from monitoring of water quality in the Lloclla and Huallaga rivers indicate a reduction of exceedances over time. Monitoring data from 2016 to 2018 (Ecotec, 2018) indicate some exceedances associated with zinc and lead in the Huallaga River, and some exceedances for pH, lead and manganese in the Lloclla River.
The water quality analysis included in Ecotec (2018) presents an individual discussion for each parameter explaining how the exceedances are associated with geological and morphological conditions inherent to the El Porvenir location. From the data presented in the Ecotec report exceedances are observed for short periods of time and are not simultaneously occurring for all the monitored parameters.
Effluent Water Quality
Effluent water quality is monitored at two discharge locations: water discharge from the underground mine to the Huallaga River, and water discharge from the TSF to the Lloclla River. The water quality at the effluent discharge locations complies with the maximum permissible limits established by the current Peruvian Legislation (D.S. No. 010-2010-MINAM and D.S. 003-2010-MINAM).
Groundwater Quality
No groundwater quality monitoring has been carried out prior to 2020 with the exception of monitoring at two locations where discharge of groundwater to surface from the aquifer takes
| 17- |
|
|
place (i.e. springs). According to Ecotec (2018), one of the springs (station 13MM) has the potential to influence concentrations of arsenic, manganese, and lead in the waters of the Lloclla and Huallaga rivers. The second spring (station 14MM) has the potential to influence concentrations of arsenic in the water of the Lloclla and Huallaga rivers. Comparison against national standards is not applicable because no standards for groundwater quality have been developed for Peru.
Soils and Land Use
There are two types of soils in the El Porvenir area, mineral and organic, derived from residual and transported soils. Actual land use corresponds to five categories: urban development (populated centers) and private facilities (mining activity), cultivated land, natural pastures, arboreal vegetation, and unproductive land (rock outcrops).
Soils at El Porvenir have concentrations of arsenic, cadmium, and lead that exceed the national environmental quality standards (D.S. No. 011-2017-MINAM for industrial use), at some sampling points. According to the baseline characterization, high values of arsenic and lead could be attributed to the local lithology and mineralization. High values of cadmium could be of natural origin since cadmium is associated with zinc and lead impurities.
Noise and Vibrations
Ambient noise has been characterized using records from eight monitoring stations for the period 2016 to 2018. Exceedances were registered in three stations during the day and four stations at night when comparing the monitoring results against the national environmental noise quality standards (D.S. No. 085-2003-PCM) for an Industrial Zone. Exceedances were attributed to human activities and vehicular traffic (Ecotec, 2018). The ambient vibrations monitored at three locations meet international standards used as a reference (BS7385 Part 2-1993).
Aquatic Biology
Aquatic communities account for plankton, periphyton, macroinvertebrates (benthos), and fish. According to KCB (2020), during the wet season in 2015 the phytoplankton was represented by 56 species, the zooplankton by 16 species, the periphyton by 45 species, the benthos by 30 species, and the fish by one specie (Oncorhynchus mykiss [rainbow trout]). During the wet season in 2016 the phytoplankton was represented by 27 species, zooplankton by nine species, periphyton by 11 species, and benthos by 14 species. None of the species identified in the El Porvenir area of influence are included in the list of protected species within the Peruvian legislation.
Flora
There are five species included in the national protection list approved under Supreme Decree D.S. No. 043-2006-AG that are found in the El Porvenir area: Ephedra rupestris (CR), Senecio nivalis (VU), Chuquiraga spinosa (NT), Baccharis genistelloides (NT), and Buddleja coriácea (CR). One specie was identified as endemic: Plantago serícea (Plantaginaceae), and two species are used for medicinal purposes by local communities: Minthostachys mollis and Ephedra rupestris.
Fauna
Fauna in the El Porvenir area is represented by six species of mammals, 34 species of birds, one specie of amphibian, and one specie of reptiles. Four species of mammals, eight species of birds, one specie of amphibian, and one specie of reptiles are included in the national protection list approved under Supreme Decree D.S. No. 004-2014-MINAGRI. The endemic
| 17- |
|
|
species include two species of mammals, two species of birds, one specie of amphibian, and one specie of reptiles.
Fragile Ecosystems
The high elevation wetlands (referred to as bofedales in Spanish) are present within the area of indirect influence of El Porvenir (i.e., they are located outside the direct area of influence). Ecosystems considered as fragile in Perú are recognized by Law No. 28611 – Environment General Law.
Social
The El Porvenir area of influence encompasses the following rural communities and populated centers:
· Comunidad de San Francisco de Asís de Yarusyacán,
· Comunidad de Cajamarquilla,
· Comunidad Santa Rosa de Pitic,
· Comunidad San Miguel,
· Comunidad La Candelaria,
· Centro Poblado La Quinua, and
| · | Cooperativa Pucayacu. |
| 17.1.1.2 | Environmental Studies and Management Plans |
SLR has been provided with the following documents and reports to conduct its review:
| · | Modification of the Environmental Impact Assessment for Capacity Expansion of the Concentrator Plant to 5,500 tpd (Compañía Minera Milpo, 2011) |
| · | Modification of the Environmental Impact Assessment for Capacity Expansion to 7,500 tpd (Cesel Ingenieros, 2011) |
| · | Fifth Supporting Technical Report (Quinto Informe Técnico Sustentatorio in Spanish) for Modification of Auxiliary Components of El Porvenir Mine (Ecotec, 2018) |
| · | Sixth Supporting Technical Report (Sexto Informe Técnico Sustentatorio in Spanish) for Introduction of Technical Improvements to the Concentrator Plant (Escegis S.R.L, 2020) |
| · | Regulatory report regarding the evaluation of the Sevent Supporting Technical Report (Septimo Informe Técnico Sustentatorio in Spanish) for Introduction of Technical Improvements to the Concentrator Plant (SENACE, 2021) |
| · | Regulatory report regarding the evaluation of the Eighth Supporting Technical Report (Octavo Informe Técnico Sustentatorio in Spanish) for Introduction of Technical Improvements to the Concentrator Plant (SENACE, 2024) |
| · | Annual Report on Compliance with the Environmental Management Strategy in 2018 (Nexa El Porvenir, 2019) |
| · | Annual Report on Compliance with the Environmental Management Strategy in 2019 (Nexa El Porvenir, 2020) |
· Environmental Management Plan included in the Eight Supporting Technical Report
| · | Quarterly environmental monitoring reports for 2023 |
| 17- |
|
|
| · | Sustainability reports for El Porvenir for 2021 and 2022 |
| · | Emergency response plan for El Porvenir |
El Porvenir is managed according to the environmental and closure considerations presented in four type of documents, which must be approved by directorial resolutions (RD for its acronym in Spanish) from the Peruvian government (see Section 17.1.3):
| · | Environmental Adjustment and Management Plan |
| · | EIA and subsequent modifications |
| · | Supporting Technical Reports (ITS for its acronym in Spanish) |
| · | Mine Closure Plan |
Various EIA modifications and ITSs have been submitted and approved between 2001 and 2024. The most recent EIA approved in 2012 corresponds to the expansion of the concentrator plant production rate to 7,500 tpd.
The key project effects and associated management strategies are presented in Table 17-1, as described in the EIA and ITS documents reviewed by SLR. Prevention and mitigation measures identified for soils, air quality, water quality, biology, socio-economic aspects, landscape, and archeological remains are presented in the Environmental Management Plans included in the EIA and ITS documents. Mitigation measures against vibrations are not considered in the environmental studies provided to SLR. The monitoring program includes meteorology, air quality and gas emissions, non-ionizing radiation, ambient noise, surface water quality, spring water quality, effluent discharges, flora and fauna.
The monitoring program includes the following:
| · | Air quality at nine locations |
| · | Non-ionizing radiation at two locations |
| · | Gas emissions at six locations |
| · | Ambient noise at 11 locations |
| · | Surface water quality in receiving water bodies at five locations |
| · | Groundwater quality daylighting at surface from springs at three locations |
| · | Industrial effluent water quality at two locations |
| · | Treated wastewater effluent water quality at two locations |
| · | Monitoring of flora at four locations |
| · | Monitoring of fauna at four locations |
| · | Hydrobiology monitoring at four locations |
The environmental monitoring is conducted by an external consultant (SGS del Perú) responsible for preparing quarterly reports for Nexa. The results of the monitoring program are reported quarterly to the Agency for Environmental Assessment and Enforcement (OEFA for its acronym in Spanish) and the National Water Authority (ANA for its acronym in Spanish).
The conclusions presented by SGS del Perú in the quarterly reports prepared for Nexa in 2023 are summarized as follows:
| 17- |
|
|
| · | Water quality for industrial effluent discharge was in compliance with maximum permissible limits established in Peruvian norm D.S. No. 010-2010-MINAM. |
| · | Water quality for treated wastewater discharge from domestic use was in compliance with maximum permissible limits established in Peruvian norm D.S. No. 003-2010-MINAM. |
| · | The water quality values measured in receiving water courses (Llocla River, Huallaga River, Tingovado Creek) are compared against the Peruvian Environmental Quality Standards for water quality established in norm D.S. No. 004-2017-MINAM. The measured values for total metals met the applicable standards for water quality. However, exceedances in pH values were identified at all water quality monitoring locations both upstream and downstream of the operations. |
| · | Water quality monitored at two springs was in compliance Peruvian norm D.S. No. 004-2017-MINAM. |
| · | The non-ionizing radiation values measured at two locations are compared against the Peruvian Environmental Quality Standards for non-ionizing radiation established in norm D.S. No. 010-2005-PCM. Non-ionizing radiation was in compliance with the applicable standards. |
| · | Air quality was in compliance with Peruvian norms D.S. No. 074-2001-PCM, R.M. No. 315-96-EM/VMM and D.S. No. 003-2017-MINAM. |
| · | Ambient noise was in compliance with Peruvian norm D.S. No. 085-2003-PCM. |
| 17- |
|
|
Table 17-1: Summary of Key Environmental Effects and Management Strategies
| Environmental Component |
Potential Impact | Mitigation Measures / Management Strategies |
| Topography and landscape | Relief alteration changes in landscape’s visual quality. |
No specific measures or strategies are proposed. |
| Soils | Changes to soil uses. Changes to soil quality. |
Mitigation measures imbedded in the infrastructure design to minimize spill accidents. Appropriate management of industrial and domestic waste. Appropriate management of oils and fuels. Appropriate management of hazardous waste. Development and implementation of spills management plan. Removal of soils exposed to spills and storage in sealed containers for appropriate disposal in agreement with applicable legislation. Activities for vehicle maintenance are restricted to designated areas. |
| Surface water | Changes to surface water flows. Changes to surface water quality. |
Appropriate management of chemical substances. Development and implementation of spills management plan. Domestic wastewater treatment. Mine water sedimentation ponds. Diversion of non-contact water around the TSF. Inspection and maintenance of the TSF diversion channel. Collection of surface runoff in the concentrator plant area. Sediment and erosion control measures. Tailings sub-drainage is captured in a monitoring pond and recirculated or discharged according to its quality, considering sediment control. Monthly water quality monitoring for receiving water bodies and effluent discharges. Currently Nexa reports monitoring results from 11 stations (five of them are effluent discharges). Quarterly reporting of monitoring results. |
| Groundwater | Changes to phreatic level. Changes to groundwater quality. |
No specific measures or strategies are proposed. Monthly water quality monitoring in two springs and one piezometer (see Table 17-2). Quarterly reporting of monitoring results. |
| Air quality | Changes from particulate and gas emissions. | Regular irrigation of access roads with tanker trucks during the dry season. Wet grinding. Traffic speed control. Regular preventive maintenance of vehicles and equipment. Use of personal protective equipment by mine staff and training. Monitoring of particulate matter (PM10 and PM2.5), metals (lead, arsenic and zinc) and gases during the construction and operation phases. Monthly air quality monitoring at six stations located leeward and windward of the Concentrator Plant and the TSF. Quarterly reporting of monitoring results. |
| 17- |
|
|
| Environmental Component |
Potential Impact | Mitigation Measures / Management Strategies |
| Noise | Disturbances resulting from changes to ambient noise levels. |
Use of hearing protection devices in the concentrator plant area. Controlled time of exposition of workers to noise sources. Appropriate planning and scheduling of operation of noise sources. Regular preventive maintenance of vehicles and equipment. Use of vehicle horns limited to emergency situations. Quarterly monitoring at six stations. Quarterly reporting of monitoring results. |
| Flora and fauna | Changes to vegetation cover. Alterations to habitat. Disturbance of wild fauna. |
Prohibition to disturb fauna. Land clearing limited to authorized areas. Prohibition to collect flora. Prohibition to extract species of flora and fauna. Noise control measures. Sediment control measures to protect natural streams. Traffic speed limits. Prohibition to use vehicle horns except in case of emergency. Monitoring of phytoplankton, zooplankton, benthic organisms, perifiton and macrofitas at four stations. Monitoring of metals content in sediment samples. Monitoring of flora at four stations. Monitoring of fauna at four stations. Bi-annual monitoring (dry and wet season). |
| 17- |
|
|
| 17.1.1.3 | Key Environmental Issues |
SLR is not aware of any recent or ongoing environmental issues taking place associated with the El Porvenir operations. In the SLR QP’s opinion, there are no environmental issues that could materially impact the ability to extract the Mineral Resources and Mineral Reserves based on the review of the available documentation.
| 17.1.1.4 | Environmental Management System |
Nexa uses an ISO 14001 compliant environmental management system at all of its operations to support environmental management, monitoring and compliance with applicable regulatory requirements during operation. Each operation undergoes an annual independent assessment with environmental laws, regulations and commitments.
Nexa utilizes an Integrated Dam Management System (referred to as SIGBar) for the TSF, which provides guidelines for document management, monitoring, evaluation, risk analysis, compliance with standards and legislation, training of personnel, operation of structures and other provisions.
The environmental monitoring program established at El Porvenir and the environmental audits performed annually (aiming to identify critical environmental risks in the operations) are the main tools of the El Porvenir’s Environmental Management System to track the implementation of high environmental standards and the continuous compliance with the environmental commitments. The environmental audit matrix includes the evaluation of:
| · | Audit results to comply with legal requirement for environmental audit. |
| · | Environmental monitoring activities. |
| · | Environmental incidents. |
According to Nexa’s website and the Nexa Annual Report, the company maintains an active risk assessment, monitoring, and updating process as part of the environmental management system, considering all operating units and corporate areas. This is how the company identifies and manages the main risks from both an operational and strategic point of view, reducing and mitigating impacts to maintain business sustainability. All risks are assigned a “risk owner” and risks rated as high or critical require action plans. Nexa has an integrated management system that establishes the guidelines that govern the conduct of the businesses, with a focus on quality management of environmental, health and workplace safety, and social responsibility issues. In addition, Nexa follows applicable environmental laws and regulations pertaining to its business in each country where it operates.
| 17.1.2 | Tailings Disposal, Water Management and Monitoring |
| 17.1.2.1 | Environmental Geochemistry |
Geochemical testing of the cyclone tailings underflow by Ausenco (2013) determined that the tailings have a high potential for generating acid drainage in the long term. While the leaching tests do not indicate potential for metal solubilization in the short term, kinetic tests, that demonstrate the evolution of the quality of the leachates over time, have not been completed. Geochemical testing by the Universidad Nacional de Ingenieria (Ausenco, 2018c) of the waste rock used for dam construction concluded that the rock was non acid generating.
According to information included in the initial Mine Closure Plan (KCB, 2006), the waste rock deposited on surface (mostly in the La Quinua WRD) is non acid generating. SLR is not aware
| 17- |
|
|
of geochemistry analysis of the rock walls of the El Porvenir underground mine having been conducted. If the rock is similar to the material disposed in the La Quinua WRD, then it is either non acid generating or has an uncertain potential for acid generation. Due to high neutralization potential of the rock identified from early testing, no acid rock drainage (ARD) is anticipated to occur in the short or mid term. The Mine Closure Plan recommends carrying out additional geochemical studies to confirm the rock acid generation potential before closure in order to define and appropriate closure strategy and management measures to achieve geochemical stability.
| 17.1.2.2 | Tailings Management |
SRK (2017) reported that crest settlements at the left side of the dam were reportedly noted in a 2008 report by Golder Associates that was not available for review. No issues regarding crest settlements were noted in recent dam safety surveillance reports. SLR notes however that bedrock foundation grouting of the left and right abutments carried out in 2015 observed very significant grout takes in numerous grout hole stages indicating the filling of voids. A series of seepage collection sub-drainage pipes were also installed on the downstream shell of the dam prior to raising the rockfill to the crest elevation of 4,056 MASL (Ausenco, 2016a).
According to a teleconference held with Nexa staff on March 14, 2024, the rock used to raise the dam is non-potentially acid generating rock taken from a quarry.
Tailings disposal at El Porvenir is performed in subaerial conditions which allows a beach with a gentle slope towards supernatant pond (settling pond). The safety of operating a centerline raised tailings dam depends on the ability to maintain wide tailings beach and a low phreatic level in the dam for stability. Tailings deposition plan considers deposition from three main locations to create the settling pond to be centrally located within the TSF and a tailings beach to form in front of the main embankment. The minimum beach width targeted by Nexa for operations in the OMS manual is 320 m. A capacity assessment of the TSF by Nexa (2020) recommends topographic and bathymetric surveys every six months to assess the available capacity.
The Cerro Pasco Complex Integration project provides Nexa with flexibility for tailings management by making possible the discharge of tailings from El Porvenir to the Atacocha TSF. It relies mostly on the storage capacity of the Atacocha TSF for tailings disposal in the future. It is not dependent on a raise of the El Porvenir dam above crest elevation 4,070 MASL.
Dam surveillance at El Porvenir consists of instrumentation measurements and field inspections. Field inspections (regular routine inspections) are carried out by Nexa personnel responsible for its operation, and monthly by an external consultant (Geoconsultoria). Piezometers and water level indicators are measured every two weeks, surface landmarks monthly. Pluviometry (precipitation) and the level of the pond within the TSF are read daily. The data are reviewed by an external consultant (Geoconsultoría) on a monthly basis. It is noted that Geoconsultoría has been conducting the monthly reviews for Nexa for various years now, which provides consistency to the review.
Nexa utilizes an Integrated Dam Management System (referred to as SIGBar) which provides guidelines for document management, monitoring, evaluation, risk analysis, compliance with standards and legislation, training of personnel, operation of structures and other provisions. An Operation, Maintenance, and Surveillance (OMS) manual is available that describes roles and responsibilities of personnel assigned to the operation and maintenance for the TSF. It includes an emergency response plan. A dam breach analysis was completed in 2022 considering the crest elevation 4,062 MASL to inform the emergency preparedness and response plan. Nexa
| 17- |
|
|
reportedly considered the results of the dam breach analysis to inform the hazard potential classification of the TSF dam. SLR is not aware of a Trigger Action Response Plan (TARP) being established for the instrumentation system.
A Failure Mode and Effects Analysis (FMEA) was conducted by Ausenco in 2022 for the El Porvenir TSF dam raise to elevation 4,064 MASL. The level of risk was assessed considering four categories: Low, Medium, High and Extreme. Based on consideration of design and operation changes, operational controls, monitoring of geotechnical instrumentation and detailed studies completed for the TSF, all the risks ratings were either Low or Medium. No High or Extreme risks were identified. Ausenco concluded that the actions implemented and planned by Nexa appear to be adequate to mitigate the risks considered in the evaluation.
The risk status of failure modes is dynamic. All analyzes carried out are based on the conditions of the tanks in their current condition, so it is required to periodically review the failure modes, with the aim of identifying any variation in operating conditions and re-evaluating if necessary.
According to the OMS manual, the El Porvenir tailings dam design takes into consideration international standards (such as Canadian Dam Association, ICOLD, ICMM) in terms of geotechnical stability and flood management. A hazard consequence classification of ‘Extreme’ has been adopted for seismicity (maximum credible earthquake) and hydrological (probable maximum flood) design criteria. Nexa’s governance practices for El Porvenir aim to follow international standards and common practices by having appointed an Engineer of Record, implementing quality assurance during construction, preparing a monthly dam safety evaluation report, and conducting regular geotechnical monitoring. The SLR QP has relied on the statements and conclusions of reports provided by Nexa and its consultants and provides no conclusions or opinions regarding the stability or performance of the dams and impoundments listed in this TRS.
SLR understands that annual dam safety inspections were temporarily interrupted due the COVID pandemic that started in 2020 but have now been resumed and an annual dam safety inspection report for 2023 is being prepared by Geoconsultoría. It is noted that no annual inspection reports were included within the documentation provided to SLR for review for this TRS. Two recent monthly inspection reports by Geoconsultoría for December 2023 and January 2024 were provided to SLR. Geoconsultoría stated in the January report that the safety condition of the dam is satisfactory, and no non-conformities were identified from the monitoring data and the inspections. Of note, the target freeboard and minimum tailings beach width (measured relative to the dam) for operations were not met in December 2023 but corrective actions were implemented by Nexa and both were met in January 2024.
The following recommendations are proposed for the El Porvenir TSF:
| · | Develop TARPs for the piezometers for inclusion in the OMS manual and monitoring plan. |
| · | Capacity assessments of the TSF completed on a bi annual basis with topographic and bathymetric surveys. |
| · | Complete long term geochemical kinetic testing of the tailings. |
| · | Implement a groundwater monitoring program at the TSF to determine levels of metals and sulphates. Monitoring stations should be implemented both upstream and downstream of the TSF. |
| · | Monitor the water quality from the TSF subsurface drains. |
| 17- |
|
|
Hatch (2024) noted that for the emergency spillway channel, post-seismic and pseudo-static conditions were not analyzed for all types of sliding surfaces. Nexa indicated to Hatch that these analyses were not performed because they are not permanent structures and would be repaired if there were potential damages. Hatch recommended conducting studies on post-seismic and pseudo-static conditions for sliding surfaces of fault blocks, both globally and locally, regardless of the temporality of the structure.
| 17.1.2.3 | Water Management |
Freshwater is withdrawn at the Yanamachay pumping station from the Carmen Chico River and the Huarmipuquio Spring for distribution to the potable water tank and three water supply ponds that feed the concentrator plant for industrial processes. These water supply ponds also receive water from the Milpo Creek via the Socorro Pond. Water from the potable water tank is supplied to the mine camp and neighbouring communities (Vista Alegre, San Carlos, San Juan).
Water for underground mine operations activities is taken from the water supply ponds of the concentrator plant. Underground mine water is pumped to the La Quinua Sedimentation Pond to promote settling of solid particles before being discharged to the Huallaga River.
Tailings discharged to the TSF come from the El Porvenir and Atacocha concentrator plants. Tailings water and surface runoff resulting from direct rainfall over the TSF footprint are collected in the tailings pond. Water from the tailings pond is recirculated to the El Porvenir concentrator plant as make-up water for ore processing via the three water supply ponds of the concentrator plant area. Seepage water intercepted by the TSF underdrain system is captured in a lined monitoring pond and recirculated to the tailings pond or discharged into a local tributary of the Lloclla River if the water quality meets the applicable standards for direct discharge to the environment. Surplus water collected in the TSF pond is discharged through a decant overflow system that conveys flows to the monitoring pond. Operation of a sluice gate at that location allows for discharge control of decanted water into the monitoring pond or directly into a local tributary of the Lloclla River. As a contingency measure, the water management system allows conveyance of water collected in the monitoring pond to the sediment ponds located near the La Quinua WRD.
Nexa is planning to improve the TSF water management system through construction of a perimeter channel to intercept non-contact water (freshwater) from the sub-watershed that contributes natural surface runoff towards the TSF footprint. The Chinchao and Tingovado creeks will be intercepted by this diversion channel that will redirect water from the creeks towards the Lloclla River.
Sanitary wastewater generated at El Porvenir is collected and treated in a wastewater treatment plant. Treated water is conveyed to the tailings pond of the TSF for re-use in mine operation activities.
Furthermore, it is unclear if the water balance for El Porvenir is continuously tracked during operation to support decision making associated with water management and dam safety. A water balance for ongoing operations to be updated regularly by mine operations personnel (or a designated consultant) is an important tool to ensure that sufficient water is available for ore processing and that pond water levels are adequate for safe operation of the TSF. The water balance makes it possible to track trends and conduct short term predictions through the simulation of variable operating and/or climatic scenarios to support decision making associated with tailings pond operation (e.g., maintaining adequate dam freeboard at all times).
As indicated in Hatch (2023), there is no integrated water balance for the entire operation after the integration of both units. SLR recommends developing a comprehensive water balance
| 17- |
|
|
assessment to confirm that sufficient water will be available to meet the ore processing water demand and the safe operation of both the El Porvenir TSF and the Atacocha TSF.
SLR recommends Nexa develop an integrated water balance that reflects the interaction between the El Porvenir and Atacocha operations in regard to water balance, to identify and predict possible scenarios of interruption of mine operations due to water management issues and/or dam safety concerns (e.g., not maintaining adequate dam freeboard).
According to the Nexa 2020 (Annual Report on Compliance with the Environmental Management Strategy in 2019), water quality monitoring currently takes place at the 14 locations listed in Table 17-2. Based on the documentation available for review, SLR is not aware of any non-compliance issues raised by the authorities associated with the El Porvenir water quality monitoring program.
Based on the Environmental Management Plans presented in the EIA and ITS documents, only one groundwater quality monitoring location is included in the environmental monitoring program. Monitoring results at this location are not included in the quarterly monitoring reports on water quality.
Typical practice for environmental monitoring of groundwater involves the installation of wells upstream and downstream of the mine site to compare water quality results and identify potential impacts of the mine operation to groundwater. It is unclear how El Porvenir currently verifies that no changes to groundwater due to mining activities are taking place within the area of influence of the operation. SLR recommends expanding the groundwater quality monitoring program to include additional stations for collection of groundwater quality samples (and subsequent analysis). As a minimum, consideration should be given to the installation of one station upstream of El Porvenir.
Table 17-2: Water Quality Monitoring Locations
| Station ID | Type of Water | Location |
| 5MM | Surface water effluent | Underground mine discharge at La Quinua tunnel outlet. |
| 5AMM | Surface water effluent | Discharge from sedimentation pond to the Huallaga River. |
| 6MM | Surface water effluent | Discharge from the TSF to the Lloclla River. |
| 6CH-F4 | Surface water effluent | La Candelaria Hydroelectric Plant - Station 4. |
| 16MM | Surface water effluent | Inflow to the Sanitary Wastewater Treatment Plant from the mine camp. |
| 7MM | Receiving water body | Lloclla River upstream of the TSF. |
| 8MM | Receiving water body | Lloclla River downstream of the TSF. |
| 9MM | Receiving water body | Huallaga River upstream of the La Quinua tunnel outlet. |
| 10MM | Receiving water body | Huallaga River downstream of the La Quinua tunnel outlet. |
| 11MM1 | Diverted water | TSF diversion channel before the discharge to the Lloclla River. |
| 12MM | Surface water body | Tingovado Creek upstream of the diversion channel. |
| 13MM | Groundwater | Spring. |
| 14MM | Groundwater | Spring. |
| 15MM | Groundwater | Piezometer. |
| 17- |
|
|
| 17.1.3 | Environmental Permitting |
| 17.1.3.1 | Current Permits, Approvals and Authorizations |
The El Porvenir operation is managed according to the environmental and closure considerations presented in three types of documents, which must be approved by directorial resolutions from the Peruvian government:
| · | EIA and subsequent amendments and modifications |
| · | Supporting Technical Reports (ITS for its acronym in Spanish) |
| · | Mine Closure Plan |
SLR understands that El Porvenir has the permits required to continue the mining operations in compliance with applicable Peruvian permitting requirements. The permits are RDs issued by the Peruvian authorities upon approval of mining environmental management instruments filed by the mining companies such as EIAs, ITSs, and Mine Closure Plans. The approved permits address the authority’s requirements for operation of the El Porvenir underground mine, TSF, concentrator plant, water usage, and effluents discharge.
Nexa maintains an up-to-date record of the legal permits obtained to date, documenting the approving authority, validity period and expiry dates, status (current, canceled or superseded), and indicating if renewal is required or not.
The El Porvenir directorial resolutions on environmental certifications, effluent discharge, water use, mine closure and tailings management are listed in Table 17-3. According to the record of the legal permits provided by Nexa in February 2024, the approved environmental certifications (i.e., EIA and ITS) do not have expiry dates and therefore renewal dates are not applicable.
With the approval of the eighth ITS, Nexa can operate El Porvenir TSF until 2037, whereas prior to its approval the operation was authorized until 2026.
Table 17-3: Environmental, Mine Closure, and Tailings Disposal Licences
| Authority | Obligation/Licence | Date of Issue (DD/MM/YYYY) |
Expiration Date (DD/MM/YYYY) |
Status |
| Environmental Certifications | ||||
| MINEM-DGM | PAMA (Programa de Adecuación y Manejo Ambiental) Approval RD 023-1997-EM/DGM |
17/1/1997 | None | Active |
| MINEM-DGE | PAMA Approval - Electric System (CH Candelaria + CT Milpo) RD 028-1997-EM/DGE |
23/1/1997 | None | Active |
| MINEM-DGAAM | EIA for Production Expansion of the Plant to 3,100 tpd RD 379-2001-EM/DGAA |
26/11/2001 | None | Active |
| MINEM-DGM | PAMA Approval of Execution RD 288-2002-MEM/DGM |
7/11/2002 | None | Active |
| 17- |
|
|
| Authority | Obligation/Licence | Date of Issue (DD/MM/YYYY) |
Expiration Date (DD/MM/YYYY) |
Status |
| MINEM-DGAAM | Modification
of the EIA for Production Expansion of the Concentrator Plant to 5,500 tpd RD 271-2011-MEM/AAM |
2/9/2011 | None | Active |
| MINEM-DGAAM | EIA for Capacity Expansion of the Concentrator Plant to 7,500 tpd and Expansion of Cyclone Tailings RD 203-2012-MEM/AAM |
25/6/2012 | None | Active |
| MINEM-DGAAM | 1st ITS El Porvenir – Transmission Line 220 kV Substation Paragsha II – Substation El Porvenir and Transmission Line 50 kV RD 159-2014-MEM/DGAAM |
2/4/2014 | None | Active |
| MINEM-DGAAM | 2nd ITS El Porvenir – Integration Tailings Storage/Tailings Line Atacocha-El Porvenir (El Porvenir Zone) RD 526-2014-MEM/DGAAM | 20/10/2014 | None | Active |
| MINEM-DGAAM | IGA Ownership Change Record 647-2015-MEM/DGAAM |
2/3/2015 | None | Active |
| MINEM-DGAAM | 3rd ITS El Porvenir – Approval “Variant to Ends of Transmission Line 220 kV-S.E. Paragsha II-SE El Porvenir and SE Milpo (El Porvenir), and tension reduction of Transmission Line from 220 kV to 138 kV" RD 271-2015-MEM-DGAAM |
9/7/2015 | None | Active |
| SENACE | 4th ITS El Porvenir – Capacity Expansion of the Concentrator Plant to 9,000 tpd RD 319-2017-SENACE-DCA |
24/10/2017 | None | Active |
| SENACE | 5th ITS El Porvenir – Auxiliary Components RD 058-2018-SENACE-PE/DEAR |
13/12/2018 | None | Active |
| SENACE | 6th ITS El Porvenir – Introduction of Technical Improvements to the Concentrator Plant RD 51-2020-SENACE-PE/DEAR |
10/3/2020 | None | Active |
| SENACE | 7th ITS El Porvenir – Drilling Pads and Modification to General Offices RD 36-2021-SENACE-PE/DEAR |
04/03/2021 | None | Active |
| SENACE | 8th ITS El Porvenir – Auxiliary Components RD 23-2024-SENACE-PE/DEAR |
07/02/2024 | None | Active |
| 17- |
|
|
| Authority | Obligation/Licence | Date of Issue (DD/MM/YYYY) |
Expiration Date (DD/MM/YYYY) |
Status |
| Effluent Discharge and Reuse Authorizations | ||||
| ANA-DGCRH | Authorization for Discharge of Treated Industrial Residual Water from the Concentrator Plant RD 014-2010-ANA-DGCRH |
10/8/2010 | 10/8/2012 | Inactive Modified |
| ANA-DGCRH | Authorization for Domestic Residual Water Reuse for Irrigation RD 005-2013-ANA-DGCRH |
7/1/2013 | 7/1/2015 | Inactive Renewed |
| ANA | Renewal of Authorization for Discharge from LQ and Porvenir Underground Mine Portals RD 172-2015-ANA-DGCRH |
15/6/2015 | 15/6/2019 | Expired Not Renewed |
| AAA-HUALLAGA | Authorization for Water Reuse RD 165-2015-ANA/AAA-HUALLAGA |
7/7/2015 | 7/5/2019 | Expired Not Renewed |
| ANA | Renewal of Authorization for Discharge from LQ and Porvenir Underground Mine Portals RD 192-2019-ANA-DCERH |
16/6/2019 | 16/6/2022 | Active |
| ANA | Renewal of Authorization for Domestic Residual Water Reuse for Mining Purposes (Irrigation) RD 600-2019-ANA/AAA-HUALLAGA |
6/7/2019 | 7/6/2025 | Active |
| Water Use Licences | ||||
| ANA | Mine Water Licence RS 0392-1974-AG |
08/4/1974 | None | Inactive |
| ANA | Mine and Camp Water Licence RS 0057-76-AG/DGA |
4/3/1976 | None | Inactive |
| ANA | Mine and Population Water Licence RS 307-76-AG/DGA |
14/12/1976 | None | Inactive |
| ANA | Power Generation Water Licence RD 0020-92-AG-DGAS |
30/6/1992 | None | Active |
| ANA | Power Generation Water Licence RD 0029-92-AG-DGAS |
17/7/1992 | None | Active |
| ANA | Population Industrial Water Licence RA 0014-92-SRP-DGA/RN Y DR SAS |
13/12/1992 | None | Inactive |
| ANA | Power Generation Water Licence RA 001-93-DGA-SRPRN |
15/2/1993 | None | Active |
| 17- |
|
|
| Authority | Obligation/Licence | Date of Issue (DD/MM/YYYY) |
Expiration Date (DD/MM/YYYY) |
Status |
| ANA | Population
Camp Water Licence RA 011-98-AG-DSRAP/INRENA-ATDRP |
9/7/1998 | None | Inactive |
| MINAGRI-ANA | Power Water Use Licence (Modification Ar1) RD 127-2006-AG-DRA-P-A-TPDR |
22/12/2006 | None | Inactive Modified |
| MINAGRI-ANA | Water for Population Use Licence (Modification Ar1) RD 125-2006-AG-DRA-P/ATPDR |
22/12/2006 | None | Inactive Modified |
| MINAGRI-ANA | Water for Mining Use Licence (Modification Ar1) RD 126-2006-AG-DRA-P/ATPDR |
22/12/2006 | None | Inactive Modified |
| ANA | Approval of Ownership Change to MAP - Water for Population Use Licence RD 264-2015-ANA-AAA-X-MANTARO |
6/4/2015 | None | Inactive |
| ANA/AAA-HUALLAGA | Approval of Ownership Change to MAP – Power Use RD 086-2016-ANA/AAA-HUALLAGA |
11/2/2016 | None | Not Applicable |
| ANA | Approval of Ownership Change to MAP - Water for Mining Use Licence RD N° 399-2016-ANA/AAA-HUALLAGA |
13/6/2016 | None | Inactive |
| ANA | Approval of Ownership Change to Nexa El Porvenir– Surface Water for Mining Use RA 322-2019-ANA-AAA-HUALLAGA-ALA ALTO HUALLAGA |
3/10/2019 | None | Active |
| Mine Closure Plans | ||||
| MINEM-DGAAM | El Porvenir Mine Closure Plan Approval RD 166-2009-MEM/AAM |
17/6/2009 | 9/15/2019 | Active Renewable |
| MINEM-DGAAM | El Porvenir Mine Closure Plan First Amendment RD 286-2011-MEM/AAM |
15/9/2011 | 9/15/2019 | Active Renewable |
| MINEM-DGAAM | El Porvenir Mine Closure Plan Update RD 034-2013-MEM/AAM |
30/1/2013 | 9/15/2019 | Active Renewable |
| MINEM-DGAAM | El Porvenir Mine Closure Plan Second Amendment RD 277-2016-MEM/DGAAM |
15/9/2016 | 9/15/2019 | Active Renewable |
| 17- |
|
|
| Authority | Obligation/Licence | Date of Issue (DD/MM/YYYY) |
Expiration Date (DD/MM/YYYY) |
Status |
| Tailings Management | ||||
| MINEM-DGM | Beneficiation Concession for the Tailings Storage Facility RD 280-97-EM/DGM |
12/8/1997 | None | Active |
| MINEM-DGM | Beneficiation Concession for the Tailings Storage Facility RD 281-97-EM/DGM |
12/9/1997 | None | Active |
| MINEM-DGM | Construction Authorization for Expansion of Tailings Storage Facility to Dam Elevation 4,043 RD 178-2010-MEM |
7/4/2010 | None | Active |
| MINEM-DGM | Authorization for Operation of Tailings Storage Facility to Dam Elevation 4,043 RD 356-2010-MEM-DGM/V |
18/9/2010 | None | Active |
| MINEM-DGM | Modification of Schedule for Expansion of the Tailings Storage Facility RD 252-2014-MEM-DGM/V |
9/7/2014 | None | Active |
| MINEM-DGM | Construction Authorization for New Components of Tailings Line from Profile Alignment Station 1+524m to El Porvenir Tailings Storage Facility RD 0584-2014-MEM-DGM/V |
29/12/2014 | None | Active |
| MINEM-DGM | Authorization for Operation of El Porvenir Tailings Storage Facility to Dam Elevation 4,047 and Expansion of the Beneficiation Concession "Aquiles 1 Accumulation" to 183.28 ha RD 612-2015-MEM/DGM |
12/6/2015 | None | Active |
| MINEM-DGM | Authorization for Operation of Tailings Pipeline El Porvenir RD 194-2015-MEM-DGM-DTM/PB |
19/6/2015 | None | Active |
| MINEM-DGM | Authorization for Operation of New Components of Tailings Line from Profile Alignment Station 1+524m to El Porvenir Tailings Storage Facility RD 0251-2015-MEM-DGM/V |
19/6/2015 | None | Active |
| MINEM-DGM | Authorization for Operation of Tailings Storage Facility Expansion to Dam Elevation 4,048.5 RD 0499-2016-MEM-DGM/V |
18/8/2016 | None | Active |
| 17- |
|
|
| Authority | Obligation/Licence | Date of Issue (DD/MM/YYYY) |
Expiration Date (DD/MM/YYYY) |
Status |
| MINEM-DGM | Construction
of Tailings Storage Facility Expansion to Dam Elevation 4,100 and Secondary Embankment at the Process Plant Side RD 006-2017-MEM-DGM/V |
9/1/2017 | None | Active |
| MINEM-DGM | Authorization for Operation of Tailings Storage Facility Expansion to Dam Elevation 4,056 and Extension of Diversion Channel RD 828-2017-MEM-DGM/V |
25/9/2017 | None | Active |
| MINEM-DGM | Authorization for Operation of Tailings Storage Facility to Dam Elevation 4,060 RD 0498-2019-MEM-DGM/V |
7/10/2019 | None | Active |
| 17.1.3.2 | Future Permits and Authorizations |
The main future permits to be obtained by Nexa for the implementation of the Cerro Pasco Complex integration include (Hatch, 2024):
| · | Modification of the EIA for El Porvenir (environmental certification) |
| · | Amendment to the El Porvenir Mine Closure Plan to reflect the integration of both mining units and the modification of the EIA |
| · | Water use authorization |
| · | Renewal of industrial effluent discharge authorization |
The effluent discharge authorization involves carrying out an assessment of the treatment system for discharge at monitoring stations 5MM and 6MM.
An independent technical evaluation of key components of the Cerro Pasco Complex Integration project was completed in early 2024 considering both El Porvenir and Atacocha. It included, among others, the TSFs, social risks and permitting (Hatch, 2024). No fatal flaws were found by Hatch. The evaluation resulted in a number of findings and recommendations to be considered by Nexa to derisk the Cerro Pasco Complex Integration project.
It is noted that the authorization for discharge of industrial effluent is expired. Nexa informed that the file for renewal of the authorization is under review by the environmental authority (Hatch, 2024).
Nexa should track closely the action items identified for obtention of new permits and renewal of expired permits required for the Cerro Pasco Complex Integration project and follow up on the status of progress regularly to prevent possible delays in the submission of permitting applications. Completion of permitting approvals within the project schedule developed by Nexa is critical to the success of the Cerro Pasco Complex Integration. There is a level of uncertainty regarding the amount of time required by the authorities for review and approval of permitting applications. In order to mitigate the risk of delayed approval, Nexa should initiate the first steps
| 17- |
|
|
of the approval process for the main permits as early as possible (for example, the engineering design and the baseline field work) in order to build a buffer in the schedule.
| 17.1.3.3 | Permitting Schedule |
The main permits required for the implementation of the Cerro Pasco Complex Integration project are the modification of the EIA and the associated modification of the Mine Closure Plan for El Porvenir. The modification of the EIA from beginning to end, culminating with the approval, is anticipated to take approximately three years. This period includes the field work (collection of baseline data), development of supporting studies, the preparation of the EIA report, the submission of the report to SENACE, and the evaluation period involving the review from SENACE followed by Nexa addressing the comments resulting from the review. The review process is anticipated to take approximately one year but it could take less or longer.
Nexa initiated work on the EIA amendment during Q4 2023. Its approval by late Q1 or early Q2 2027 represents the critical path for the Cerro Pasco Complex Integration project from an environmental permitting perspective. Other environmental management instruments such as new ITS submissions and the Mine Closure Plan amendment have a shorter process of completion to receive approval from the regulators.
There is a high level of uncertainty associated with the actual duration of the review and approval period due to staffing issues SENACE and adjustments to its review and approval processes. As a mitigation measure, Nexa has included additional time in its permitting schedule for the Cerro Pasco Complex Integration project to carry a contingency for the permitting process. In addition, SLR understands that the storage capacity of the El Porvenir TSF will provide additional contingency by allowing to continue disposal of tailings at the El Porvenir TSF for approximately six months beyond the timeline set for approval of the EIA amendments for the two mining units.
| 17.1.4 | Social or Community Requirements |
| 17.1.4.1 | Social Setting |
The El Porvenir mine is located in the central Andes mountains region of Peru, specifically in the district of San Francisco de Asís de Yarusyacán, in the province of Pasco, Peru. The mine is situated 13 km from the town of Cerro de Pasco.
Its area of influence encompasses the rural communities and populated centers listed at the end of Section 17.1.1.1.
| 17.1.4.2 | Key Social Issues |
Regarding social issues for the Cerro Pasco Complex, Nexa’s social team has noticed an increasing population around its operations (due to the influx of newcomers) and the overall perception of contamination from the mine operations, especially lead-related contamination to water bodies. The Cerro Pasco Complex project may increase expectations from the local communities in terms of contracting, employment, training and community investment opportunities (e.g., water, health, housing, and community infrastructure-projects). As of September 2023, El Porvenir had approximately 322 open commitments agreed with the communities from its area of influence (Nexa, 2023).
According to the annual report for 2023 issued by Nexa Resources Peru, one of the key risks for the Cerro Pasco operations (both El Porvenir and Atacocha mining units) is social conflict with communities within the area of influence, which can lead to blockades and in turn could result in
| 17- |
|
|
operation interruptions and reputational damage. There is precedent for such conflict given that blockades organized by communities have taken place in the past and as recently as last year (2023) leading to short suspensions of operations.
The company has implemented the following mitigation measures to counterbalance this risk (Nexa Resources Peru, 2024):
| · | Mapping stakeholders to avoid, identify and alert potential conflicts proactively |
| · | Having a commitment tracking tool to register and track the implementation of commitments |
| · | Conducting ongoing and proactive dialogue with local stakeholders to ensure adequate and timely information. |
| 17.1.4.3 | Social Management System |
At a corporate level, Nexa has adopted the International Integrated Reporting Council (IIRC) guidelines and the Global Reporting Initiative (GRI) standards. The IIRC guidelines promote a cohesive and integrated approach to reporting on organizational activities. The GRI standards provide best practices for public reporting on economic, environmental, and social impacts to aid Nexa and its shareholders in understanding their corporate contribution to sustainable development. Nexa reported on these standards in its most recent annual report for 2023 (Nexa Resources Peru, 2024).
According to the annual report for 2022 issued by Nexa, the company seeks to create a positive legacy in host communities and maintain a constant and close dialogue with them, working towards building a positive relationship with stakeholders. Nexa’s ESG strategy is built around nine Environment, Social and Governance pillars. The Social Component includes the following four pillars (Nexa, 2023):
| · | People and Culture focuses on training and development and building a diverse, inclusive, and plural company. |
| · | Health, Safety and Well-Being seeks to build a robust safety, health and well-being culture and environment. |
| · | Social Legacy includes two sub-pillars: (i) Local Development, and (ii) Social License to Operate |
· Human Rights to ensure compliance with international and local human rights practices.
The Social Legacy pillar is built around local development and the social license to operate sub-pillars. While local development aims to support income generation in host communities towards economic and social empowerment, the social license to operate is a desired outcome to be recognized as a trusted company by stakeholders.
Regarding Human Rights, Nexa became a signatory of the United Nations Global Compact and has developed training and procedures to avoid and prevent human rights violations. Nexa Resources is committed to respecting and complying with the requirements of ILO 169 (Indigenous and Tribal Peoples Convention, 1989) and the host country's regulations. It also strives to obtain the free, prior and informed consent of Indigenous Peoples in the locations it operates. In these territories, Nexa's approach is to have formal social investment agreements with local communities validated by the community's own governance as required by the laws of Peru for the collective lands of original communities (Nexa, 2023).
| 17- |
|
|
Nexa has a Corporate Compliance Program to guide Nexa’s employee’s behaviour and interactions with stakeholders. The Compliance Program includes the following policies and procedures:
| · | Code of Conduct |
| · | Compliance Policy |
| · | Anti-Corruption Policy |
| · | Antitrust Policy |
| · | Policy on Preventing Money Laundering and Terrorist Financing |
| · | Disclosures Policy |
| · | Insider Trading Policy |
| · | Integrated Management Policy |
| · | Information Security Policy |
Specifically, for El Porvenir mine, a social baseline description, assessment of socio-economic impacts, and identification of mitigation/enhancement measures have been carried out to mitigate negative impacts and maximize positive benefits of the mine. These components are generally consistent with social impact assessment practices. A Community Relations Plan has been developed (included in the EIA amendment from 2011) outlining objectives, strategies and specific indicators for the following programs: information and communication; support to social projects and productive investment projects; health services; education; technical training; training for social and environmental participatory monitoring; promotion of environmental awareness; compensation for land use; and improvement of houses in surrounding communities.
Nexa has a permanent information office dedicated to receiving, managing, and addressing complaints, claims, questions and information requests from the communities. To be proactive, Nexa has also developed a communications program that involves the following activities (SLR, 2021):
| · | Distribution of informative material (Quarterly) |
| · | Social concern monitoring (Quarterly) |
| · | A complaint management process aimed at preventing and managing possible social conflicts in the area |
| · | Meetings with local authorities (Quarterly) |
| · | Guided tours (Quarterly) |
Nexa Resources Peru has a Social Management Team of approximately 10 people led by a Social Manager and three Superintendents. They are accountable for building and maintaining positive relationships with local communities for Peru’s operations (Nexa Resources Peru, 2023a).
| 17.1.4.4 | Community Engagement and Agreements |
Nexa works closely with the communities in the area of influence, respecting their internal governance through their elected representatives and authorities when engaging with them for an environmental license or social negotiation. In addition, Nexa encourages local communities
| 17- |
|
|
to raise questions and concerns independently through its permanent offices or virtual communication.
SLR understands that Nexa has undertaken three community consultation activities for each of its mining units in Peru, including El Porvenir, and the recurring topics raised are local employment and contracting, monitoring of social commitments, local environmental monitoring, and social investment. In 2023, Nexa used a variety of stakeholder engagement mechanisms such as meetings with local leaders, public consultation activities, surveys and interviews, public participation committees, and environmental participatory monitoring to inform, receive feedback and involve local stakeholders in their activities (Nexa Resources Peru, 2024).
El Porvenir has signed agreements with Comunidad San Francisco de Asís de Yarusyacán y Comunidad Cajamarquilla associated with rights to land from the communities.
Regarding land use-related agreements/payments such as rights of way or usufruct with local communities, El Porvenir spent S/2,461,000 sol in 2023 to accommodate its operation expansions.
Nexa funds social investment initiatives in education, capacity building and training, water and sanitation, healthcare, transportation, and infrastructure. In 2023, El Porvenir spent approximately S/6,418,971 sol in social investment initiatives for communities within the area of influence.
Examples of social investment include the construction of a sports centre in the San Juan de Milpo community, the delivery of career counselling workshops for 69 senior high students, and the provision of music, computer, English and sports workshops for students of the San Juan de Milpo school (Nexa Resources Peru, 2024).
SLR understands that Nexa has a grievance mechanism for receiving local community questions, concerns, and complaints. In 2023, El Porvenir received 95 questions and 58 concerns and complaints. They were related to subcontractors, project updates, compensation, and environmental concerns (Nexa Resources Peru, 2024).
| 17.1.4.5 | Indigenous Peoples |
According to the annual report for 2022 issued by Nexa, El Porvenir and Atacocha’s mines are close to Quechuas populations, which were recognized as indigenous by the Peruvian government after Nexa started operation of those mines in Peru.
The indigenous communities are identified in Nexa’s social relationship strategies. In some cases, they own the surface rights for land where Nexa carries out mining activities and receive compensation under agreements and contracts (Nexa, 2023).
Nexa is planning to carry out an evaluation of which communities in the surroundings of the El Porvenir and Atacocha operations meet the regulatory criteria for indigenous communities.
| 17.1.4.6 | Local Procurement and Hiring |
SLR understands that local hiring is a key priority for Nexa as a mechanism to create value and deliver economic benefits to the local communities in the area of influence. The community relations team is accountable for proposing candidates from the direct and indirect areas of influence to Nexa and its subcontractors to meet their unskilled workforce demands.
In 2023, Nexa experienced an increase in local hiring for its three mine operations in Peru (El Porvenir, Atacocha, and Cerro Lindo). In 2023 El Porvenir employed 927 local workers from
| 17- |
|
|
which 131 were employed by El Porvenir directly, and the remaining 796 workers were employed by its subcontractors (Nexa Resources Peru, 2024).
For the Cerro Pasco Complex, Nexa has declared local hiring commitments with eight local communities. Nexa has specific local hiring targets with Anexo San Juan de Milpo (30%) and Comunidad Matriz San Francisco de Asis de Yarusyacan (60%). To date, community members from Comunidad Matriz San Francisco de Asis de Yarusyacan represent 21% of the total local hires for the Cerro Pasco Complex.
As with local hiring, Nexa prioritizes local contracting to maximize benefits for local communities. Seven local businesses are serving the Cerro Pasco Complex. Approximately 50% of the workforce these local businesses hire are community members. Of note, 100% of the workforce hired by ECOSEM Yanapampa, owned by Anexo Yanapampa, is from the community (Nexa Resources Peru, 2023b)
In 2023 El Porvenir spent approximately S/347,527 sol on local purchases and support to community businesses (Nexa Resources Peru, 2024).
| 17.1.5 | Mine Closure Requirements |
| 17.1.5.1 | Mine Closure Plan and Regulatory Requirements |
The Mine Closure Plan is periodically updated over the LOM. A conceptual Mine Closure Plan was prepared in 2006 for the Mine components within the context of the Peruvian legislation (KCB, 2006) and has subsequently been amended or updated four times. The Mine Closure Plan addresses temporary, progressive, and final closure actions, and post-closure inspection and monitoring. Under Article 20 of the Peruvian mine closure regulations, the first update of the Mine Closure Plan must be submitted to the Peruvian Ministry of Energy and Mines three years after approval of the initial Mine Closure Plan, and every five years thereafter. Two years before final closure, a detailed version of the Mine Closure Plan will have to be prepared and submitted to the Peruvian Ministry of Energy and Mines for review and approval. The following is a summary of the El Porvenir Mine Closure Plan updates and modifications to date:
| · | Initial Closure Plan approved in 2007 by R.D. No. 318-2007-MEM/AAM and prepared according to the modification of Supreme Decree D.S. No. 033 2005 EM (Mine Closure Law). |
| · | Feasibility level Mine Closure Plan approved in 2009 by R.D. No. 166-2009-MEM-AAM. |
| · | First amendment to the Mine Closure Plan approved in 2011 by R.D. No. 286-2011-MEM-AAM. |
| · | Update of the Mine Closure Plan approved in 2013 by R.D. No. 034-2013-MEM-AAM. |
| · | Second amendment to the Mine Closure Plan approved in 2016 by R.D. No. 277-2016-MEM-AAM. |
| · | Third amendment to the Mine Closure Plan prepared in January 2020 and submitted to the Peruvian Ministry of Energy and Mines for approval. |
The Conceptual Mine Closure Plan approved in 2007 (KCB, 2006), the R.D. from 2009, the update to the Mine Closure Plan approved in 2013 (Schlumberger Water Services, 2012), and the third amendment to the Mine Closure Plan (KCB, 2020) were available for review.
The Third amendment to the Mine Closure Plan includes five years of progressive closure (2021 to 2025), two years of final closure (2026 and 2027), and five years of post-closure (2028 to
| 17- |
|
|
2032). Post-closure monitoring, assumed to extend for five years after closure, will include monitoring of physical, geochemical, hydrological, and biological stability.
The specific objectives of the El Porvenir Mine Closure Plan are as follows:
| · | Health and safety – Assure public health and safety during execution of closure and post-closure activities, recovering the original environmental quality of the surroundings and developing feasible rehabilitation works from a biological, technical and financial perspective. Protect the human health and the environment by maintaining physical and chemical stability of Mine components. |
| · | Physical stability – Geotechnical stability of earth structures implementing designs that minimize short term and long term risks of failure following the applicable Peruvian legislation and best international practices. |
| · | Geochemical stability – Feasibility design of encapsulating covers for hazardous materials and materials with potential to cause contamination of the environment. The covers should be designed to employ local materials with physical and geochemical characteristics resistant to degradation and erosion through time. The covers should be compatible with the landscape, favourable to the growth of local vegetation species. |
| · | Hydrological stability – Adequate management of surface runoff. Design flows with adequate return period according to the applicable Peruvian legislation should be evaluated. The need for closure water management structures should be identified. |
| · | Land use – Recovery of original levels for ground surface to the extent feasible in order to make it compatible with predevelopment land uses in the project area. |
| · | Waterbodies use – Maintain equilibrium in the micro basins located in the mine area, preserving water quantity and quality, and implementing adequate water management. |
| · | Social objectives – Minimize socio economic impacts creating conditions that promote sustainability for the social stakeholders through execution of social programs. |
The Mine Closure Plan promotes to the extent feasible a passive condition that minimizes the efforts required for care and maintenance of the closed Mine components during post-closure.
The closure criteria for each component of El Porvenir are defined according to the following aspects:
| · | Dismantling |
| · | Demolition, salvage and disposal |
| · | Physical stabilization |
| · | Geochemical stabilization |
| · | Hydrological stability (water management) |
| · | Re-establishing the landscape contour |
| · | Re-vegetation |
| · | Rehabilitation of aquatic habitats |
| · | Social programs |
| · | Post-closure maintenance and monitoring |
| 17- |
|
|
The Mine Closure Plan concentrates on the decommissioning and closure of primary facilities and elements of infrastructure at El Porvenir, which include:
| · | Underground mine and associated portal, ventilation shafts, support facilities, and underground infrastructure |
| · | Processing facilities (concentrator plant and associated infrastructure) |
| · | WRDs |
| · | TSF |
| · | Water management facilities and infrastructure |
| · | Borrow areas and quarries |
| · | Mine camps (San Juan de Milpo and Carmen Chico) and administrative buildings |
| · | Access roads |
| · | Ancillary buildings |
Ancillary infrastructure including among others:
| · | Electrical and ventilation systems |
| · | Transportation systems |
| · | Communication systems |
| · | Domestic waste landfill |
| · | Waste management facilities. |
| · | Organic waste management facilities |
| · | La Candelaria Hydroelectric Plant |
| · | Power transmission lines and electrical sub-stations |
| · | Topsoil deposits |
A summary of the main proposed closure activities is presented in Table 17-4. Of note, the water supply to the San Juan de Milpo community from the Carmen Chico spring will be retained during post-closure.
Table 17-4: Summary of Main Closure Activities
| Mine Component | Closure Activities | |
| Mine | Underground mine | Redirection of underground mine water discharge towards the TSF. Flooding of underground works (recovery of phreatic level). Plugging or filling of mine openings. Disconnection, dismantling and removal of equipment and water management infrastructure. Soil sampling to evaluate contamination. Excavation/removal of contaminated material (including concrete) for appropriate disposal. |
| 17- |
|
|
| Mine Component | Closure Activities | |
| Waste disposal facilities | La Quinua WRD | Slope
contouring for physical stability. Cover installation and revegetation. Construction of an erosion prevention structure on the slope adjacent of the Huallaga River. |
| TSF | Dam reconfiguration, if required for physical stability. Leveling and recontouring of the disposed tailings surface. Cover installation to prevent oxidation of the deposited tailings. Re-vegetation. Replacement of the overflow tunnel with a closure overflow spillway that discharges surface runoff to the Milpo Creek. Improvements to the drainage system near the confluence of the Milpo Creek and the Lloclla River to prevent flooding the area of the San Miguel community. |
|
| Other infrastructure | Concentrator plant Shops Water management infrastructure Power transmission lines Hazardous waste storage areas Access roads La Candelaria Hydroelectric Plant |
Dismantling, demolition, salvaging and disposal of structures. (Donation of facilities to the local community will be considered on grounds of safety). Disposal of concrete in the underground mine. Removal of equipment for recycling, salvaging or disposal. Removal of contaminated soils. Transportation to authorized disposal areas. Cleaning and purification of tanks and deposits. Removal of Socorro pond. Recontouring of terrain and re-vegetation. Sale of the hydroelectric power plant to a third-party that could continue the power supply to local communities. |
| Staff facilities | Mine camp Administrative buildings Potable water and septic systems |
Mobilization of equipment, machinery, and personnel. De-energization. Dismantling and removal of structures and equipment to authorized disposal areas. Dismantling and demolition of concrete structures for disposal in the underground mine. Recontouring of terrain and re-vegetation. |
It is noted that the design criteria for the El Porvenir TSF closure planning have been defined according to Peruvian Standards, which are less stringent than Canadian dam safety guidelines. For example, the El Porvenir TSF dam has been designed to meet stability requirements for a 2,500-year return earthquake with estimated peak ground acceleration of 0.4 times the acceleration due to gravity, which is significant. Post-seismic stability analyses for El Porvenir dam were carried out by Ausenco (2016) to demonstrate dam stability but no information was provided related to the risk of failure of the emergency spillway inlet control structure and the
| 17- |
|
|
potential for liquefied tailings release through the spillway tunnel. The ultimate tailings level is some 50 m above the spillway tunnel invert.
The El Porvenir TSF emergency spillway has been designed to pass the Probable Maximum Flood resulting from 146 mm of precipitation in 6 hours, which is appropriate given the size of the dam. It is not clear that the post closure flood routing assumed the perimeter watershed diversion channels would still be in service in the long term. The risk of diversion channel blockage and potentially higher inflows to the TSF should be evaluated with additional freeboard added to the dam crest, if required, to ensure the dam is not overtopped.
A comprehensive dam safety review is recommended in support of operation in future years and in order to finalize the detailed closure plan prior to moving into the closure stage.
Physical, chemical, hydrological, and biological stability conditions following closure will be verified through implementation of the post-closure maintenance and monitoring program. Monitoring will also support the evaluation and verification of compliance with closure activities, and the identification of deviations leading to the adoption of corrective measures. The monitoring activities will be carried out considering the Peruvian Environmental Quality Standards and Maximum Permissible Limits, as well as criteria set in the Mine Closure Plan for physical, chemical, hydrological, and biological stability.
No specific details of the post-closure monitoring programs for physical stability, water quality, biology and social were found in the Mine Closure Plan reports provided to SLR. Hence, SLR recommends to either confirm if these programs have been sufficiently advanced at a concept level or if details should be incorporated to the next update of the Mine Closure Plan for El Porvenir. As a minimum, it is recommended that post-closure monitoring programs include the following:
| · | Specific activities and frequency to monitor physical and hydrological stability (mainly focused on inspections). |
| · | Locations and frequency for water quality sampling (surface water and groundwater). |
| · | Biology campaigns and frequency. |
| · | Indicators to track progress with social initiatives and programs implemented during the operations phase towards achieving social objectives at closure and post-closure. |
| · | Proposed documentation and reporting. |
| 17.1.5.2 | Closure Cost Estimate and Financial Assurance for Closure |
A closure cost estimate was developed and included in the Mine Closure Plans. The total value estimated in 2020 for the remaining LOM presented in the third amendment to the Mine Closure Plan is as follows (excluding local taxes):
| · | Progressive Closure (2021 to 2027) US$10,990,121 |
| · | Final Closure (2028 to 2029) US$12,583,266 |
| · | Post-Closure (2030 to 2034) US$ 1,622,646 |
| · | Total US$25,196,033 |
According to Supreme Decree D.S. N° 262-2012-MEM/DM, the financial assurance is calculated based on inflation and discount rates in order to estimate the net present value (NPV) for the mine closure cost. The total financial assurance (progressive closure, final closure, and post closure) calculated in 2020 considering an inflation rate of 2.37% and a discount rate of
| 17- |
|
|
2.14%, is US$20,635,472 (including local taxes). A detailed breakdown of the cost estimate is provided in the third amendment to the El Porvenir Mine Closure Plan (KCB, 2020). The closure cost estimate was not reviewed by SLR for this TRS.
| 17.1.6 | Qualified Person’s Opinion on the Adequacy of Current Plans to Address any Issues Related to Environmental Compliance, Permitting and Local Individuals or Groups |
In the SLR QP’s opinion, the Environmental Management Plan at El Porvenir is adequate to address potential issues related to environmental compliance according to the commitments captured in the regulatory permitting approvals.
No issues or concerns associated with environmental permitting planning were identified by the SLR QP based on the documentation provided by Nexa to SLR for review, and a meeting held with Nexa staff in support of this TRS. Nexa’s Environmental Management Superintendent for El Porvenir and Atacocha understands well the environmental permitting requirements and has developed a tracking matrix that identifies the key components of each permit, corrective actions to be implemented to be in compliance, and the status of implementation of each action. All action items are qualified according to a ranking of criticality established (low, medium and high) for continuity of the operation.
In the SLR QP’s opinion, the plans developed as part of the Social Management System are adequate to pursue positive relations with the communities located in the area of influence, promote social benefits, and contribute to reduce social risk for the El Porvenir operations.
| 17.2 | Atacocha |
| 17.2.1 | Environmental Aspects |
| 17.2.1.1 | Environmental Setting |
Environmental baseline studies have been completed as part of the EIA. The detailed baseline characterization is included in the EIA reports. A summary of the existing conditions in the Atacocha area is presented below, sourced from RPA (2019).
Terrain
Topographical relief comprises deep, long, narrow valleys with steep slopes. Some rivers cross through the area and have moderate slopes and some scattered peaks. The main valley has a general inclination from south to north. The Atacocha processing plant is located near the Huallaga River valley (3,600 MASL) surrounded by rugged hills/mountains.
Climate
The climate is cold and dry throughout the year, which is typical of the Central Andes Mountain Region. The rainy season occurs from December to April. From June to August there are generally minimal rainfalls. Based on data from the Cerro de Pasco regional meteorological station operated by the government, the average temperature ranges from 4°C in July to 6°C in November; the maximum monthly precipitation is 163 mm in February and the minimum monthly precipitation is 18 mm in July.
Air Quality
Air quality has been characterized using records from seven monitoring stations for the period 2012 to 2016. The monitoring results are compared against national environmental quality
| 17- |
|
|
standards (R.M. No. 181 2016 MINAM). According to SRK (2017), particulate material less than 10 μm (PM10), less than 2.5 μm (PM2.5), and Ozone (O3) rates as "Good” for the 2011-2016 in all cases, except for some measurements which qualify as "Moderate”. The concentrations of the variables Carbon Monoxide (CO), Nitrogen Dioxide (NO2), Sulfur Dioxide (SO2) and Hydrogen Sulfide (SH2)2 are all classified as "Good" quality. No values have been registered that indicate "Poor” quality, nor "Threshold of care".
Surface Water Quality
Surface water quality monitoring is conducted at eight sampling locations in three natural waterbodies (i.e., Atacocha Creek, Lalaquia Creek and Huallaga River). Three of these stations are located upstream of the mining activities (one on each waterbody) and the rest are located downstream. Surface water quality is compared with the national environmental quality standards for water (D.S. No. 015 2015 MINAM, D.S. No. 004 2017 MINAM) for irrigation of high and low stem crops (class 3--D1), animal beverage (class 3-D2) and conservation of the aquatic environment (class 4-E2). The environmental standards correspond to "Uses of Water" and do not seek to establish Maximum Permissible Limits for watercourses given that natural watercourses, even those exempt from any anthropogenic influence, do not necessarily meet the values established by the environmental standards (SRK, 2017).
Results from monitoring conducted in 2015 and 2016 showed concentrations of manganese and lead that exceed the national environmental quality standards for class 3 and 4; and concentrations of Cadmium, Thallium, Zinc, and Nickel for class 4. There were also exceedances in parameters such as pH, conductivity and total suspended solids. Monitoring results from 2018 showed exceedances for Manganese, Lead, Cadmium, and Zinc. The water quality analysis included in the 2018 EIA presented an individual discussion for each parameter explaining how the exceedances are associated with geological and morphological conditions inherent of the mine location. It is noted that exceedances are observed for short periods of time and are not simultaneously happening for all the monitored parameters.
Effluent Water Quality
It is noted that effluent water quality is monitored at two locations: discharge from the sediment pond to the Huallaga River, and treated sewage discharge. The water quality at the effluent discharge locations complies with the maximum permissible limits established by the current Peruvian Legislation (D.S. No. 010-2010-MINAM and D.S. No. 003-2010-MINAM). Monitoring results from 2018 showed no exceedances.
Groundwater Quality
Groundwater quality standards from Brazil and Dominican Republic are used by the Peruvian Ministry of Energy and Mines for evaluation of compliance in absence of similar standards for Perú.
Groundwater quality monitoring conducted between 2014 and 2016 upstream of the Atacocha TSF showed concentrations of fluoride and of several total metals (Aluminum, Manganese, Nickel, Zinc, Arsenic and Iron) exceeding the environmental quality standards of Brazil and Dominican Republic. The monitoring conducted downstream of the Atacocha TSF showed short term exceedances of iron and lead (SRK, 2017).
Groundwater quality monitoring was conducted in 2018 at two locations equipped with piezometers, downstream of the Atacocha TSF. The monitoring results showed exceedances of Arsenic, Iron, Manganese, and Turbidity in one of the two piezometers. The water quality analysis completed by Nexa in December 2018 proposes the installation of monitoring locations
| 17- |
|
|
upstream of the tailings storage facility to understand the comparative influence of seepage on the water quality results.
Soils
There are two types of soils in the mine site area, mineral and organic, derived from residual and transported soils. Actual land use corresponds to five categories: private facilities (mining activity), natural pastures, arboreal vegetation, terrain with hydromorphic vegetation (areas located in wet environments), and lithic outcrops (rock outcrops in top and hillside of mountains).
Soils at the site have concentrations of arsenic, cadmium and lead that exceed the national environmental quality standards (D.S. No. 002-2013-MINAM), at some sampling points; these high values could be attributed to the local lithology (SRK, 2017).
Noise and Vibrations
Ambient noise has been characterized using records from seven monitoring stations for the period 2012 to 2016. Exceedances were registered in three stations when comparing the monitoring results against the national environmental quality standards for Residential Zone. The exceedances were attributed in the 2018 EIA to human activities and vehicular traffic. The ambient vibrations monitored at 18 locations meet the national environmental quality standards.
Aquatic Biology
According to SRK (2017), the only reported fish species, Orestias agassizii, is not registered in any national conservation category. Likewise, two species of macrophytes have been reported and none have been registered with any category of national (D.S. No. 004-2014-MINAGRI) or international conservation (CITES 2017, IUCN 2016.3).
Terrestrial Biology
According to SRK (2017), the fauna is represented by 10 species of mammals; 24, of birds; one specie of amphibian; and 51 taxa of insects. It is worth mentioning that some species such as camelid and sheep cattle belonging to residents of areas bordering the project have been introduced. None of the species reported are categorized as threatened by the national standard (D.S. No. 004-2014-MINAGRI) nor international lists (CITES 2016 and IUCN 2016.I). Nevertheless, consider that two species of rodents are endemic for Peru: Akodon juninesis and Calomys sorellus.
A total of 112 species of vascular flora have been registered. It is worth mentioning that some species corresponding to vegetation of rural areas have been introduced.
According to international criteria for endangered species only one specie has been recorded: the Plantago, of Minor Concern, according to IUCN 2016.1. As to the national standard, D.S. No. 043-2006-AG, four species were registered as Endangered: Perezia pinnatifida, Ephedra rupestris, Buddleja coriaceae and Buddleja incana. The first two species are native and the Buddlejas have been introduced / naturalized and were reported only in ruderal areas as part of the grassland. Likewise, the national standard recognizes Chuquiraga spinosa as a species Near Threatened (NT), reported associated with rocky areas at high altitude that provide a favorable microclimate for its development.
There is no evidence of endemic species as to the Red Book of Endemic Species of Peru (Leon et al, 2006).
Metals in Plant and Animal Tissue
| 17- |
|
|
According to SRK (2017), concentration of metals in fish tissue (Orestias agassizii) exceed international standards for arsenic, lead, antimony and zinc, such as European legislation (European Commission, 2005), Brazilian legislation (Brazil, Laws, etc., 1965), and FAO (Nauen C. E., 1983) for the content of metals in fish for direct human consumption; these same elements are also highly concentrated in the macrophytes and in sediments (exceeding the Canadian standards); also, the concentration of arsenic, lead, and zinc in vegetal tissue in Mimulus glabratus and Cardamine bonariensis surpasses those referred by the Mercosur Technical Regulation, WHO and FAO (2008) as corresponds.
Sensitive Areas. The Atacocha mine does not overlap with any recognized protected or sensitive areas.
Social
The direct area of influence of the mine encompasses the following rural communities:
· Comunidad de San Francisco de Asís de Yarusyacán,
· Comunidad de Cajamarquilla,
· Comunidad de San Antonio de Malauchaca, and
· Comunidad de Ticlacayán.
| 17.2.1.2 | Environmental Studies and Management Plans |
SLR has been provided with the following documents and reports to conduct its review:
| · | Regulatory technical report regarding the evaluation of the second modification of the EIA for the expansion of the Atacocha mineral processing plant to 5.000 tonnes per day (SENACE, 2018) |
| · | Environmental Management Strategy included in the second modification of the EIA for the expansion of the Atacocha mineral processing plant to 5.000 tonnes per day (SRK Consulting, 2018) |
| · | Regulatory report regarding the evaluation of the Second Supporting Technical Report (Segundo Informe Técnico Sustentatorio in Spanish) for Introduction of Technical Improvements to the Concentrator Plant (SENACE, 2020) |
| · | Regulatory report regarding the evaluation of the Third Supporting Technical Report (Tercer Informe Técnico Sustentatorio in Spanish) for Introduction of Technical Improvements to the Concentrator Plant (SENACE, 2021) |
· Environmental Management Plan included in the Third Supporting Technical Report
| · | Quarterly environmental monitoring reports for 2022 and 2023 |
| · | Sustainability reports for Atacocha for 2021 and 2022 |
| · | Emergency response plan for Atacocha |
Same as El Porvenir, Atacocha is managed according to the environmental and closure considerations presented in four type of documents, which must be approved by directorial resolutions (RD for its acronym in Spanish) from the Peruvian government (see Section 17.2.3):
| · | Environmental Adjustment and Management Plan |
| · | EIA and subsequent modifications |
| · | Supporting Technical Reports (ITS for its acronym in Spanish) |
| 17- |
|
|
| · | Mine Closure Plan |
Various Environmental Impact Assessments (EIA) and modifications have been submitted and approved between 2005 and 2018. The most recent modifications involve the implementation of a new power transmission line from El Porvenir mine site to the Atacocha mine site, and the expansion of the Atacocha processing plant capacity. Three Supporting Technical Reports have been prepared to date in addition to the EIAs.
The key project effects and associated management strategies, as described in the EIA modification from 2018, are presented in Table 17-5. An Environmental Management Plan including a monitoring program was prepared as part of the Environmental Impact Assessment. The most recent version is part of the Third Supporting Technical Report from 2021. The monitoring program includes air quality and gas emissions, non-ionizing radiation, noise, surface water quality, groundwater quality, springs water quality, effluent discharges water quality, vibrations, soil quality, terrestrial biology (vegetation and wildlife) and aquatic biology.
The environmental monitoring program established at Atacocha and the environmental audits performed annually (aiming to identify critical environmental risks in the operations) are the main tools of the Atacocha’s Environmental Management System to track the implementation of high environmental standards and the continuous compliance with the environmental commitments. The environmental audit matrix includes the evaluation of legal requirement audit results, monitoring activities and environmental incidents.
The monitoring program includes the following:
| · | Air quality at four locations |
| · | Non-ionizing radiation at one location |
| · | Ambient noise at four locations |
| · | Vibrations at three locations |
| · | Surface water quality in receiving water bodies at eight locations |
| · | Groundwater quality at five locations |
| · | Industrial effluent discharge water quality at one location |
| · | Treated wastewater effluent water quality at two locations |
| · | Monitoring of flora at 10 locations |
| · | Monitoring of fauna at 39 locations (11 for mammals, 10 for birds, nine for reptiles and amphibians, and nine for insects) |
| · | Soil quality at eight locations |
The environmental monitoring is conducted by an external consultant (SGS del Perú) responsible for preparing quarterly reports for Nexa. The results of the monitoring program are reported quarterly to OEFA and ANA.
The conclusions presented by SGS del Perú in the quarterly reports prepared for Nexa in 2023 are summarized as follows:
| · | Water quality for industrial effluent discharge was in compliance with maximum permissible limits established in Peruvian norm D.S. No. 010-2010-MINAM. |
| 17- |
|
|
| · | Water quality for treated wastewater discharge from domestic use was in compliance with maximum permissible limits established in Peruvian norm D.S. No. 003-2010-MINAM. |
| · | The water quality values measured in receiving water courses (Atacocha Creek, Huallaga River and Lalaquia Creek) are compared against the Peruvian Environmental Quality Standards for water quality established in norm D.S. No. 004-2017-MINAM. The measured values for total metals met the applicable standards for water quality except occasional exceedances for Manganese and Lead at three locations. Exceedances in pH values were identified at all water quality monitoring locations both upstream and downstream of the operations. |
| · | Water quality monitored at two springs was in compliance Peruvian norm D.S. No. 004-2017-MINAM. |
| · | Groundwater quality measured values are compared against the Brazilian Environmental Quality Standards for groundwater quality (norm CONAMA No. 396) because there are no such standards defined by the Peruvian legislation. Groundwater quality values were below the reference values from CONAMA No. 396. |
| · | The non-ionizing radiation values measured at one location are compared against the Peruvian Environmental Quality Standards for non-ionizing radiation established in norm D.S. No. 010-2005-PCM. Non-ionizing radiation was in compliance with the applicable standards. |
| · | Air quality was in compliance with Peruvian norms D.S. No. 074-2001-PCM, R.M. No. 315-96-EM/VMM, D.S. No. 003-2008-MINAM and D.S. No. 003-2017-MINAM. |
| · | Ambient noise was in compliance with Peruvian norm D.S. No. 085-2003-PCM. |
| · | Vibrations were below the reference values from the Peruvian Environmental Guideline for Drilling Blasting in Mining Operations. |
Table 17-5: Summary of Key Environmental Effects and Management Strategies
| Environmental Component | Potential Impact | Management Strategies |
| Topography and landscape | Relief alteration Changes in landscape’s visual quality |
Pre-planning to minimize impact Management of construction activities to minimize impacts (delimitations of work areas, minimization of stripping and earth works, regular inspection) Controlled perforation and blasting Design and monitoring of slope stability Re-conformation of the landscape Revegetation |
| 17- |
|
|
| Environmental Component | Potential Impact | Management Strategies |
| Soils | Changes to soil uses Changes to soil quality |
Rehabilitation of temporary areas used during construction Inherent design measures to minimize soil disturbance Development of topsoil deposits Revegetation Appropriate slope design to prevent landslides Appropriate management of industrial and domestic waste Appropriate management of oils and fuels Appropriate management of hazardous waste Development of spills management plan Prohibition to circulate outside established roads |
| Surface water |
Changes to surface water flows Changes to surface water quality |
Environmental controls for construction activities Diversion of non-contact water Collection of contact water and maximization of water re-use in the mine operation Water quality treatment prior to discharging excess contact water to the Huallaga River Sewage treatment Implementation of oil and grease traps Sediment and erosion control measures Regular inspection and maintenance of water management facilities and associated infrastructure Monthly monitoring program for surface flows and water quality sampling (including effluent discharges) Additional geochemistry testing to verify acid generation and leaching potentials of waste rock |
| Groundwater |
Changes to phreatic level Changes to groundwater quality |
Reduction of deep infiltration through design features such as geomembrane liners and construction of underdrain systems Monthly monitoring program for water levels and water quality sampling |
| Air quality | Changes from particulate and gas emissions |
Appropriate planning of work fronts to reduce truck circulation frequency and route distances Irrigation of access roads with tanker trucks Controlled perforation and blasting Traffic speed and load control Covered hoppers Regular preventive maintenance of vehicles and motorized equipment Prohibition to circulate outside established roads Revegetation Quaternary air quality monitoring |
| Noise and vibration | Disturbances resulting from changes to ambient noise levels and generation of vibrations |
Use of hearing protection devices Appropriate planning of vehicle circulation Appropriate planning and scheduling of blasting activities Regular vehicle maintenance Control measures to attenuate noise at the sources Quaternary noise and vibrations monitoring |
| 17- |
|
|
| Environmental Component | Potential Impact | Management Strategies |
| Fish | Changes in abundance and diversity of aquatic species |
Inherent design measures to minimize negative impacts to aquatic habitat Meeting water quality standards at points of effluent discharge to the environment Prohibition to dispose of solid or liquid waste in natural waterbodies Prohibition to capture fish in the mine concession area Personnel training Bi-annual monitoring (dry and wet season) |
| Vegetation |
Changes to vegetation cover and diversity of terrestrial flora Changes to sensitive species of wild flora |
Fencing of work areas Inherent design measures to minimize disturbance area Revegetation Environmental controls for protection of local sensitive ecosystems (bofedales) Prohibition to collect flora and cut trees Personnel training Rescue of relocation of species as required Bi-annual monitoring (dry and wet season) |
| Wildlife |
Changes in abundance and diversity of terrestrial fauna Alterations to habitat of terrestrial fauna |
Inspection prior to construction activities Appropriate fencing and signalling Traffic speed limits Prohibition to capture and or extract fauna Prohibition to hunt Personnel training Rescue of relocation of species as required Bi-annual monitoring (dry and wet season) |
| 17.2.1.3 | Key Environmental Issues |
SLR is not aware of any recent or ongoing environmental issues taking place associated with the Atacocha operations. In the SLR QP’s opinion, there are no environmental issues that could materially impact the ability to extract the Mineral Resources and Mineral Reserves based on the review of the available documentation.
| 17.2.1.4 | Environmental Management System |
Refer to Section 17.1.1.4 of this TRS.
| 17.2.2 | Tailings Disposal, Water Management and Monitoring |
| 17.2.2.1 | Environmental Geochemistry |
Geochemistry information provided for review included two reports from 2015 on laboratory analysis conducted with rock samples taken from the San Gerardo open pit (formerly named Glory Hole), and one report from 2018 on hydrogeochemical modelling based on five samples to characterize the waste rock to be deposited in the Atacocha waste dump.
| 17- |
|
|
From the 2015 reports, two samples presented low acid generating potential and one sample presented high acid generating potential. From the 2018 report, the most representative lithologies are non acid generating and show low metal leaching potential. However, sandstones with high sulphide content have potential to be acid generating, and dacites showed inconclusive results.
The detailed design report for phase 5 of the Atacocha waste dump (Ausenco, 2018b), refers to results of static and kinetic testing from 2017 indicating that the waste rock is potentially acid generating.
According to the second modification of the Environmental Impact Assessment (EIA) of the expansion of the Atacocha processing plant (2018), geotechnical analysis from eight samples obtained from the San Gerardo open pit and in pit waste dumps showed uncertain acid generation potential due to the variability of the analysis results. The 2018 EIA also states that there was no acid generation from samples analyzed during a complementary evaluation.
| 17.2.2.2 | Tailings Management |
The Atacocha TSF dam has been raised in stages by the downstream method, with a 2H:1V overall downstream slope and a 1.5H:1V upstream slope, which is inherently safer than upstream raising with tailings. SLR is not aware of any issues regarding crest settlements (and none were noted in the monthly dam safety surveillance reports provided to SLR).
SRK (2017) describes the mine waste rock as uncertain with regard to acid generation potential, whereas Ausenco (2018) refers to geochemistry testing that shows the waste rock as acid generating. It is also understood that the first stage of dam raising included a geosynthetic clay liner (GCL) on both the upstream and downstream faces of the dam, and around the perimeter of the TSF (SRK, 2017). Lining both faces of the dam is not conventional and may be an indication of concerns that the mine rock is potentially acid generating (PAG). GCL lining on geogrid support layers around the TSF indicates that karst terrain likely controls TSF seepage and warranted serious concern.
Although the rock from the San Gerardo open pit was characterized as either non-potentially acid generating (non-PAG) or with uncertain acid generation potential, Nexa decided to assume that the latter is PAG rock. According to a teleconference held with Nexa staff on March 14, 2024, the rock used to raise the dam involves both PAG rock and non-PAG rock taken from the San Gerardo open pit. The PAG rock is encapsulated within non-PAG rock when the material is placed for dam raising. Based on the geochemistry evaluation conducted for the San Gerardo open pit, Nexa reportedly understands the location of PAG and non-PAG blocks within the pit, which allows Nexa to segregate the material to be used for dam construction according to the geochemical characterization.
It is noted that Hatch (2024) recommended to avoid PAG material for the construction of the tailings dam in Atacocha, as this may lead to water seepage with low pH and dissolved metal content issues, which would result in seepage flows that need to be collected, treated, and monitored. Additional laboratory testing in support of geochemical characterization of waste rock is recommended to achieve a better understanding of acid generation potential. Hatch also recommended conducting additional tests for tailings characterization because the humidity cell tests were only conducted for 20 weeks instead of a minimum of 40 weeks. This means that the data are less useful for assessing potential water quality issues, which may take longer to manifest in the test.
| 17- |
|
|
Given that the Atacocha dam has already been raised to the permitted crest elevation of 4,128 MASL, additional testing and characterization will be conducted by Nexa as part of the permitting process to obtain regulatory approval for a dam crest elevation of 4,155 MASL.
Tailings disposal at Atacocha is performed in subaerial conditions which allows a beach with a gentle slope towards the water or supernatant pond (settling pond). Tailings deposition planning considers deposition from spigots along the dam crest in such a way that a tailings beach forms in front of the embankment. The minimum beach width targeted by Nexa for operations in the OMS manual is 100 m.
Dam surveillance at Atacocha consists of instrumentation measurements and field inspections. Field inspections (regular routine inspections) are carried out by Nexa personnel responsible for its operation, and monthly by an external consultant (Geoconsultoria). Piezometric data are downloaded monthly. The data are reviewed by an external consultant (Geoconsultoría) on a monthly basis. It is noted that Geoconsultoría has been conducting the monthly reviews for Nexa for various years now, which provides consistency to the review.
Nexa utilizes an Integrated Dam Management System (referred to as SIGBar) which provides guidelines for document management, monitoring, evaluation, risk analysis, compliance with standards and legislation, training of personnel, operation of structures and other provisions. An OMS manual is available that describes roles and responsibilities of personnel assigned to the operation and maintenance for the TSF. It includes an emergency response procedure and strategy. A dam breach analysis was completed in 2022 considering crest elevation 4,128 MASL to inform the emergency preparedness and response plan. Nexa reportedly considered the results of the dam breach analysis to inform the hazard potential classification of the TSF dam. SLR is not aware of a TARP being established for the instrumentation system.
According to the OMS manual, the Atacocha tailings dam design takes into consideration international standards (such as Canadian Dam Association, ICOLD, ICMM) in terms of geotechnical stability and flood management. According to a teleconference with Nexa staff on March 14, 2024, a hazard consequence classification of ‘High’ has been adopted for the Atacocha TSF dam. However, Nexa decided to be more conservative and follow the design criteria of ‘Extreme’. As a result, maximum credible earthquake for seismicity and probable maximum flood for hydrology apply as design criteria. Nexa’s governance practices for Atacocha aim to follow international standards and common practices by having appointed an Engineer of Record, implementing quality assurance during construction, preparing a monthly dam safety evaluation report, and conducting regular geotechnical monitoring.
SLR understands that annual dam safety inspections were temporarily interrupted due the COVID pandemic that started in 2020 but have now been resumed and an annual dam safety inspection report for 2023 is being prepared by Geoconsultoría. It is noted that no annual inspection reports were included within the documentation provided to SLR for review for this TRS. Two recent monthly inspection reports by Geoconsultoría for December 2023 and January 2024 were provided to SLR. Geoconsultoría stated in both reports that the safety condition of the dam is satisfactory, based on monitoring data and absence of signs of instability. The SLR QP has relied on the statements and conclusions of reports provided by Nexa and its consultants and provides no conclusions or opinions regarding the stability or performance of the dams and impoundments listed in this TRS.
The following recommendations are proposed for the Atacocha TSF:
| · | Develop TARPs for the piezometers for inclusion in the OMS manual and monitoring plan. |
| 17- |
|
|
| · | Capacity assessments of the TSF completed on a bi annual basis with topographic and bathymetric surveys. |
| · | Complete long term geochemical kinetic testing of the tailings. |
| · | Monitor the water quality from the TSF subsurface drains. |
| 17.2.3 | Environmental Permitting |
| 17.2.3.1 | Current Permits, Approvals and Authorizations |
The Atacocha operation is managed according to the environmental and closure considerations presented in three types of documents, which must be approved by directorial resolutions from the Peruvian government:
| · | EIA and subsequent amendments and modifications |
| · | Supporting Technical Reports (ITS for its acronym in Spanish) |
| · | Mine Closure Plan |
SLR understands that Atacocha has the permits required to continue the mining operations in compliance with applicable Peruvian permitting requirements. The permits are RDs issued by the Peruvian authorities upon approval of mining environmental management instruments filed by the mining companies such as EIAs, ITSs, and Mine Closure Plans. The approved permits address the authority’s requirements for operation of the Atacocha open pit mine, TSF and effluents discharge.
Nexa maintains an up-to-date record of the legal permits obtained to date, documenting the approving authority, validity period and expiry dates, status (current, canceled or superseded), and indicating if renewal is required or not.
The Atacocha RDs on environmental certifications, water use and mine closure are listed in Table 17-6. According to the record of the legal permits provided by Nexa in February 2024, the approved environmental certifications (i.e., EIA and ITS) do not have expiry dates and therefore renewal dates are not applicable.
Table 17-6: Permits and Authorizations
| Governmental Consent | Resolution | Approval Date | |
| Environmental certification | |||
| 1 | Atacocha´s Adaptation and Environmental Management Program (PAMA) | DR 89-97-EM-DGM | 06/03/1997 |
| 2 | First Amendment to Atacocha´s PAMA | DR 313-2002-EM-DGAA | 22/10/2002 |
| 3 | Second Amendment to Atacocha´s PAMA | DR 154-2004-MEM-AAM | 20/04/2004 |
| 4 |
EIA for the Tailing Deposit denominated "Depósito de Relaves Vaso Cajamarquilla" |
DR 234-2005-MEM-AAM | 08/06/2005 |
| 5 | Amendment to the EIA for the Tailing Deposit denominated "Depósito de Relaves Vaso Cajamarquilla". | DR 242-2007-MEM-AAM | 19/07/2007 |
| 17- |
|
|
| Governmental Consent | Resolution | Approval Date | |
| 6 | EIA for the Tailing Deposit denominated "Depósito de Relaves Vaso Atacocha". | DR 361-2007-MEM-AAM | 30/10/2007 |
| 7 | Amendment to the EIA for the Tailing Deposit denominated "Depósito de Relaves Vaso Atacocha" | DR 380-2012-MEM-AAM | 19/11/2012 |
| 8 | Amendment to the EIA for the expansion of the capacity of the beneficiation plant of the beneficiation concession "Chicrin No. 2” up to 5,000 tpd. | DR 284-2012-MEM-AAM | 05/09/2012 |
| 9 | EIA for the 50 kV power transmission line SE El Porvenir - SE Chicrin | DR 347-2013-MEM-AAM | 13/09/2013 |
| 10 | Technical Report (ITS) for the exploitation of San Gerardo. | DR 170-2014-MEM-DGAAM | 10/04/2014 |
| 11 | Technical Report (ITS) for the tailings integration project. | DR 527-2014-MEMDGAAM-V | 20/10/2014 |
| 12 | Detailed Technical Report (MTD) | DR 243-2016-MEMDGAAM | 11/08/2016 |
| 13 | Second Amendment to the EIA for the expansion of the capacity of the beneficiation plant of the beneficiation concession "Chicrin No. 2” up to 5,000 tpd. | DR 119-2018-SENACE-JEF/DEAR | 21/08/2018 |
| 14 | Technical Report (ITS) for the Pumping System from El Porvenir TSF to Atacocha TSF, and Atacocha Diversion Channel | DR 28-2020-SENACE-PE/DEAR | 10/02/202 |
| 15 | Technical Report (ITS) for Auxiliary Components | DR 92-2021-SENACE-PE/DEAR | 21/06/2021 |
| 16 | Detailed Environmental Management Plan | DR 120-2023/MINEM/DGAAM | 23/06/2023 |
| Mine closure plan | |||
| 1 | Mine Closure Plan | DR 198-2009-MEM-AAM | 8/07/2009 |
| 2 | First Amendment to the Mine Closure Plan | DR139-2012-MEM-AAM | 03/05/2012 |
| 3 | First Mine Closure Plan Update | DR 387-2012-MEM-AAM | 22/11/2012 |
| 4 | Second Amendment to the Mine Closure Plan | DR 98-MEM-DGAAM | 04/04/2016 |
| 5 | Third Amendment to the Mine Closure Plan | DR 136-2020/MINEM-DGAAM | 09/10/2020 |
| 6 | Fourth Amendment to the Mine Closure Plan | DR 278-2022/MIMEM-DGAAM | 29/09/2022 |
| Beneficiation plant and tailings disposal facilities | |||
| 1 | Beneficiation Concession Title | R 192-74-DGM-DC | 02/10/1974 |
| 17- |
|
|
| Governmental Consent | Resolution | Approval Date | |
| 2 | Authorization to operate the facilities to expand the production capacity of the beneficiation plant up to 3,500 tpd. | Resolution s/n | 28/11/2000 |
| 3 | Authorization to operate the tailings deposit denominates “Vaso Atacocha” at 4,069 MASL | R 892-2008-MEM-DGM | 21/02/2008 |
| 4 | Authorization to construct the facilities to extend the Capacity of the tailings deposit denominated “Vaso Atacocha” at 4,081 MASL | R 689-2008-MEM-DGM-V | 18/11/2008 |
| 5 | Authorization to construct the facilities extend the capacity of the tailings deposit denominated “Vaso Atacocha” at 4,093 MASL | R 996-2009-MEM-DGM-V | 23/12/2009 |
| 6 | Authorization to construct the facilities to expand the production capacity of the beneficiation plant up to 4,380 tpd. | R 411-2010-MEM-DGM-V | 8/11/2010 |
| 7 | Authorization to operate the facilities to expand the production capacity of the beneficiation plant up to 4,380 tpd. | R 191-2011-MEM-DGM-V | 14/06/2011 |
| 7 | Authorization to construct the facilities to modify the beneficiation concession without changing the production capacity. | R 326-2011-MEM-DGM-V | 25/08/2011 |
| 8 | Authorization to construct the facilities to expand the tailings deposit denominated “Vaso Atacocha” at 4,105 MASL | R 92-2012-MEM-DGM-V | 15/03/2012 |
| 9 |
Authorization to operate new infrastructure related to the beneficiation concession without expanding the authorized production capacity |
R 137-2013-MEM-DGM-V | 25/03/2013 |
| 10 |
Authorization to operate new infrastructure related to the beneficiation concession without expanding the authorized production capacity. |
R 207-2013-MEM-DGM-V | 10/05/2013 |
| 11 | Authorization to operate the tailings deposit denominated “Vaso Atacocha” al 4,105 MASL | R 236-2013-MEM-DGM-V | 31/05/2013 |
| 12 | Authorization to construct the facilities to expand the tailings deposit denominated “Vaso Atacocha” at 4,128 MASL | R 375-2013-MEM-DGM-V | 19/09/2013 |
| 13 | Precisions to the R 375-2013-MEM-DGM-V | R 417-2013-MEM-DGM-V | 4/11/2013 |
| 14 | Authorization to construct the facilities to transport the tailing generated in the beneficiation concession denominated “Chicrín No. 2” to the beneficiation concession denominated owned by the mine “El Porvenir”. | R 594-2014-MEM-DGM-V | 31/12/2014 |
| 17- |
|
|
| Governmental Consent | Resolution | Approval Date | |
| 15 |
Authorization to operate the facilities to transport the tailings generated in the beneficiation concession denominated “Chicrín No. 2” to the beneficiation concession denominated owned by the mine “El Porvenir”. |
R 267-2015-MEM-DGM-V | 3/07/2015 |
| 16 | Authorization to construct the facilities to expand the production capacity of the beneficiation plant up to 5,000 tpd | R 120-2016-MEM-DGM-V | 4/04/2016 |
| 17 | Authorization to operate the beneficiation plant with a processing capacity of 4,600 tpd. | R 754-2016-MEM-DGM-V | 22/11/2016 |
| 18 | Authorization to construct the facilities to expand the tailing facilities denominated “Vaso Atacocha” at 4,110 MASL | R 210-2006-MEM-DGM-V | 4/05/2016 |
| 19 | Authorization to exploit Glory Hole as open pit | R 1158-2017-MEM-DGM/V | 18/12/2017 |
| 20 | Authorization to modify construction of Vaso Atacocha | R 64-2018-MEM-DGM | 01/02/2018 |
| Water Supply | |||
| 1 | Water license for mining purposes | AR 20-99-CTARP-INRENAATDRP | 12/03/1999 |
| 2 | Water license for mining purposes | AR 134-2011-ANA-ALAPASCO | 26/05/2011 |
| 3 | Water license for human consumption purposes |
AR 21-99-CTARP-DRAINRENA- ATDRP |
12/03/1999 |
| 4 | Water license for human consumption purposes |
AR 12-2006-AG-DRAP/ ATDRP |
3/04/2006 |
| 5 | Water license for energy purposes | AR 19-99-CTARP-INRENAATDRP | 12/03/1999 |
| Effluent Discharge to the Environment | |||
| 1 | Authorization to discharge treated domestic waste waters from Campamentos Chicrií Bajo y Chicrín Artesanos | R 303-2016-ANA-DGCRH | 30/12/2016 |
| 2 | Authorization to discharge treated industrial waste waters from pond E09 | R 69-2015-ANA-DGCRH | 6/03/2015 |
| 3 | Authorization to discharge treated industrial waste waters from Tailings Dam Atacocha | R 68-2015-ANA-DGCRH | 6/03/2015 |
| 17.2.3.2 | Future Permits and Authorizations |
The main future permits to be obtained by Nexa for the implementation of the Cerro Pasco Complex integration include (Hatch, 2024):
| · | Modification of the EIA for Atacocha (environmental certification) |
| · | Amendment to the Atacocha Mine Closure Plan to reflect the integration of both mining units and the modification of the EIA |
| · | Water use authorization |
| 17- |
|
|
| · | Renewal of industrial effluent discharge authorization |
The effluent discharge authorization involves carrying out an assessment of the treatment system for discharge at monitoring station E09.
An independent technical evaluation of key components of the Cerro Pasco Complex Integration project was completed in early 2024 considering both El Porvenir and Atacocha. It included, among others, the TSFs, social risks and permitting (Hatch, 2024). No fatal flaws were found by Hatch. The evaluation resulted in a number of findings and recommendations to be considered by Nexa to derisk the Cerro Pasco Complex Integration project.
Nexa should track closely the action items identified for obtention of new permits and renewal of expired permits required for the Cerro Pasco Complex Integration project and follow up on the status of progress regularly to prevent possible delays in the submission of permitting applications. Completion of permitting approvals within the project schedule developed by Nexa is critical to the success of the Cerro Pasco Complex Integration. There is a level of uncertainty regarding the amount of time required by the authorities for review and approval of permitting applications. In order to mitigate the risk of delayed approval, Nexa should initiate the first steps of the approval process for the main permits as early as possible (for example, the engineering design and the baseline field work) in order to build a buffer in the schedule.
| 17.2.3.3 | Permitting Schedule |
The main permits required for the implementation of the Cerro Pasco Complex Integration project are the modification of the EIA and the associated modification of the Mine Closure Plan for Atacocha. The modification of the EIA from beginning to end, culminating with the approval, is anticipated to take approximately three years. This period includes the field work (collection of baseline data), development of supporting studies, the preparation of the EIA report, the submission of the report to SENACE, and the evaluation period involving the review from SENACE followed by Nexa addressing the comments resulting from the review. The review process is anticipated to take approximately one year but it could take less or longer.
Nexa initiated work on the EIA amendment during Q4 2023. Its approval by late Q1 or early Q2 2027 represents the critical path for the Cerro Pasco Complex Integration project from an environmental permitting perspective. Other environmental management instruments such as new ITS submissions and the Mine Closure Plan amendment have a shorter process of completion to receive approval from the regulators.
There is a high level of uncertainty associated with the actual duration of the review and approval period due to staffing issues SENACE and adjustments to its review and approval processes. As a mitigation measure, Nexa has included additional time in its permitting schedule for the Cerro Pasco Complex Integration project to carry a contingency for the permitting process. In addition, SLR understands that the storage capacity of the El Porvenir TSF will provide additional contingency by allowing to continue disposal of tailings at the El Porvenir TSF for approximately six months beyond the timeline set for approval of the EIA amendments for the two mining units. The storage capacity of the Atacocha TSF does not have influence in the critical path for permitting because the two facilities have not been integrated and discharge of tailings from the El Porvenir plant to the Atacocha TSF is not yet possible.
| 17- |
|
|
| 17.2.4 | Social or Community Requirements |
| 17.2.4.1 | Social Setting |
The Atacocha mine is located in the central Andes mountains region of Peru, specifically in the district of San Francisco de Asís de Yarusyacán, in the province of Pasco, Peru. The mine is situated 17 km from the town of Cerro de Pasco.
Its area of influence encompasses the rural communities and populated centers listed at the end of Section 17.2.1.1.
| 17.2.4.2 | Key Social Issues |
The social issues for the Cerro Pasco Complex are discussed in Section 17.1.4.2. SLR understands that the Atacocha mine has experienced blockades and social conflicts with communities from and beyond its area of influence, which has led to short suspensions of its operations. Recent events include blockades conducted by residents from Anexo Joraoniyoc (part of Comunidad Campesina de San Franciso de Asis de Yarusyacan) in March 2023 and February 2024 as reported online by Energiminas.
| 17.2.4.3 | Social Management System |
The social management system is discussed in Section 17.1.4.3. SLR understands that the Social Management Plan for Atacocha was developed with input (i.e., interviews and surveys) from local authorities and stakeholders. The objectives of the Social Management Plan for Atacocha are (RPA, 2019):
| · | Maximize positive social impacts and prevent or minimize negative social impacts resulting from the operational activities, thereby contributing to the welfare of society through dialogue and respect for people, society and the environment. |
| · | Develop and maintain constructive relationships between the mining company, the population and interest groups in the area of influence. |
| · | Channel and handle appropriately and timely questions, complaints, concerns and queries related to Atacocha’s activities. |
| · | Contribute to developing human and social capital in direct area of influence. |
| 17.2.4.4 | Community Engagement and Agreements |
In 2004, Atacocha acquired rights to land from the community of Cajamarquilla via an agreement to construct tailings facilities and ancillary infrastructure. The agreement included various commitments and obligations, including financial compensation for rights to the land. Subsequently (2006, 2008, and 2012), the original agreement was amended and ratified by the community, and compliance with the commitments and obligations assumed by Atacocha in the original agreement and its amendments was confirmed. The agreements are in effect for the entire deposit's end of life.
Similarly, Atacocha acquired and subsequently renewed a right-of-way agreement with the community of Ticlacayán for its hydraulic infrastructure, routing water from the Huallaga River to two hydroelectric facilities at Marcopampa and Chaprín. The most recent renewal is for 20 years and will be in effect until 2033.
Atacocha's financial commitments under these agreements are summarized in Table 17-7.
| 17- |
|
|
Table 17-7: Summary of the Atacocha’s Commitments Acquired by the Right of Land and Right of Way Agreements Celebrated with the Communities of Cajamarquilla and Ticlacayán
| Agreements and amendments | Objectives | Community | Commitments acquired by Atacocha | Date/Term |
| Right of land celebrated with the community of Cajamarquilla (10/20/2004) | Right of land (13 hectares) for the construction of the Cajamarquilla’s tailings deposit and auxiliary infrastructure |
The community authorizes Right of land (13 hectares) for the construction and operation of the Cajamarquilla’s tailings deposit and auxiliary infrastructure |
Payment of 730,605.74 Soles, in works established in the Original Agreement and in its three (03) amendments. | Until the end of life of the deposit |
| First amendment (10/04/2006) | Each document records the progress in the fulfillment of the Commitments acquired by Atacocha. In the Third amendment, clause 5.1 the Community ratifies the fulfillment of all the commitments and obligations assumed by the Atacocha in the Original Agreement and its amendments. | |||
| Second amendment (06/03/2008) | ||||
| Third amendment (10/23/2012) | ||||
| Renewal of the right of way celebrated with the community of Ticlacayán and its amendments (04/15/2013) | Renewal of the right of way celebrated with the community of Ticlacayán for Atacocha’s hydraulic infrastructure to conduct water from the Huallaga river to the hydroelectric schemes Marcopampa and Chaprín for the period of 4/15/2013 - 4/15/2033 | The community recognizes the agreement for the right of way for Atacocha’s hydraulic infrastructure to conduct water from the Huallaga River to the hydroelectric schemes Marcopampa and Chaprín for the period 1951 – 2008, its renewal for the period 2009 ongoing, and the renewal for the period of 4/15/2013 - 4/15/2033 | Payment of 1 600,000.00 Soles, at the signing of the contract. In addition: 120,000 Soles performing works in the 7 neighbourhoods of the Community; 100,000 Soles for the electric power services; 680,000 Soles, for the development of projects in the Community (in two years); 1 000,000 Soles for work per concept of Taxes; Contracting of the communal enterprise in works realized by Atacocha; Hire people from the community in the different jobs that are generated | 20 Years |
Source: SRK (2017).
As indicated in Section 17.1.4.4, Nexa has a grievance mechanism for receiving local community questions, concerns, and complaints. In 2023, Atacocha received 74 questions and 35 concerns and complaints. They were related to subcontractors, project updates, compensation, and environmental concerns (Nexa Resources Peru, 2024).
| 17.2.4.5 | Indigenous Peoples |
Refer to Section 17.1.4.5 of this TRS.
| 17- |
|
|
| 17.2.4.6 | Local Procurement and Hiring |
Atacocha has experienced an increase in local hiring from communities within its area of influence. In 2023, Atacocha employed 496 local workers from which 76 were employed by the Atacocha mine directly, and the remaining 420 workers were employed by its subcontractors (Nexa Resources Peru, 2024).
In 2023 Atacocha spent approximately S/2,662,945 sol on local purchases and support to community businesses (Nexa Resources Peru, 2024).
Further details about local hiring and procurement are presented in Section 17.1.4.6.
| 17.2.5 | Mine Closure Requirements |
| 17.2.5.1 | Mine Closure Plan and Regulatory Requirements |
The Mine Closure Plan is periodically updated over the LOM. A conceptual Mine Closure Plan was prepared in 2006 for the Mine components within the context of the Peruvian legislation and has subsequently been amended or updated five times. The Mine Closure Plan addresses temporary, progressive, and final closure actions, and post-closure inspection and monitoring. Under Article 20 of the Peruvian mine closure regulations, the first update of the Mine Closure Plan must be submitted to the Peruvian Ministry of Energy and Mines three years after approval of the initial Mine Closure Plan, and every five years thereafter. Two years before final closure, a detailed version of the Mine Closure Plan will have to be prepared and submitted to the Peruvian Ministry of Energy and Mines for review and approval. The following is a summary of the Atacocha Mine Closure Plan updates and modifications to date:
| · | Initial Closure Plan approved in 2007 by R.D. No. 319-2007-MEM/AAM and prepared according to the modification of Supreme Decree D.S. No. 033-2005-EM (Mine Closure Law). |
| · | Feasibility Level Mine Closure Plan approved in 2009 by R.D. No. 198-2009-MEM-AAM. |
| · | First amendment to the Mine Closure Plan approved in 2012 by R.D. No. 139-2012-MEM/AAM. |
| · | Update of the Mine Closure Plan approved in 2012 by R.D. No. 387-2012-MEM/AAM. |
| · | Second amendment to the Mine Closure Plan approved in 2016 by R.D. No. 098-2016-MEM-DGAAM. |
| · | Third amendment to the Mine Closure Plan approved in 2020 by R.D. No. 136-2020/MINEM-DGAAM. |
| · | Fourth amendment to the Mine Closure Plan approved in 2022 by R.D. No. 278-2022/MINEM-DGAAM |
The regulatory reports regarding the evaluation of the Second and Fourth amendments to the Mine Closure Plan (MINEM, 2016 and MINEM, 2022) were available for review.
The fourth amendment to the Mine Closure Plan indicated that progressive closure extends until 2017 and includes two years of final closure (2028 and 2029), and five years of post-closure (2030 to 2034). Post-closure monitoring, assumed to extend for five years after closure, will include monitoring of physical, geochemical, hydrological, and biological stability.
The specific objectives of the Atacocha mine Closure Plan are as follows:
| 17- |
|
|
| · | Health and safety – Securing public health and safety during execution of closure and post closure activities, recovering the original environmental quality of the surroundings and developing feasible rehabilitation works from a biological, technical and financial perspective. |
| · | Physical stability – Long term closure design and measures adopting proper factors of safety for events with long recurrence periods. |
| · | Geochemical stability – Long term closure design and measures to prevent acid rock drainage that could impact natural waterbodies. |
| · | Land use – Proper uses following completion of rehabilitation activities in order to preserve the habitats for flora and fauna in the mine area of influence. |
| · | Waterbodies use – Maintain equilibrium in the micro basins located in the mine area, preserving water quantity and quality, and implementing adequate water management. |
| · | Social objectives – Minimize socio economic impacts as much as possible by executing social programs that preserve the way of life of local communities. |
Maximizing the number of mine components that can be subject to a walk-away closure scenario is one of the main closure criteria for Atacocha.
The minimum closure activities to be considered are:
| · | Demobilization of machinery and equipment |
| · | Dismantling |
| · | Demolition and salvage |
| · | Physical stabilization |
| · | Geochemical stabilization |
| · | Water management |
| · | Re-establishing the landscape contour |
| · | Social programs |
| · | Post closure maintenance and monitoring |
Where possible, the surface water drainage pattern would need to be re-established to a condition similar to the original hydrological system.
During site construction activities, topsoil is being stored separately to be used later for re vegetation purposes.
Waste materials will be decontaminated (if required), recycled when cost effective, and disposed at a licensed facility. Facilities containing petroleum products, chemicals, solid waste, hazardous waste, and/or contaminated soil or materials will be dismantled and managed according to regulatory requirements. All hazardous waste will need to be managed according to existing laws and regulations and will be transported off site.
The Mine Closure Plan concentrates on the decommissioning and closure of primary facilities and elements of infrastructure at Atacocha, which include:
| · | San Gerardo open pit; |
| · | Underground mine and associated portal, ventilation shafts, support facilities and underground infrastructure; |
| 17- |
|
|
| · | Waste rock dumps; |
| · | Tailings storage facilities; |
| · | Ore and topsoil stockpiles; |
| · | The old (Chicrín No. 1, not active) and current (Atacocha, or Chicrín No. 2, active, including ore sorting, crushing, flotation circuit, thickener and filters, repulping pond) processing plants; |
| · | Industrial water systems (intake, storage, distribution and waste water treatment); |
| · | Quarries; |
| · | Laydown areas and warehouses; |
| · | Mechanical and maintenance shops; |
| · | The fuel storage tank farm, secondary containments, and fueling station; |
| · | Solid waste landfill; |
| · | Hazardous waste storage facility area; |
| · | The diesel power plant, power distribution substation, and power transmission lines; |
| · | Mine access roads; |
| · | Huallaga River derivation tunnel; |
| · | Mine camp and administrative buildings; and |
| · | Potable water and septic systems. |
A summary of the main proposed closure activities is presented in Table 17-8.
Table 17-8: Summary of Main Closure Activities
| Mine Component | Closure Activities | |
| Mine | Open pits |
Slope stability analysis and slope contouring if required (physical stability) Fencing Removal of equipment Dismantling and demolition of structures |
| Underground mine |
Plugging or filling of mine openings Dismantling and demolition of metallic and concrete structures Construction of drainage channels Placing of topsoil Re-vegetation |
|
| Waste disposal facilities |
Waste dumps Landfills |
Slope contouring (physical stability) Cover installation and revegetation Post-closure water monitoring Implementation of dykes for surface water runoff control |
| 17- |
|
|
| Mine Component | Closure Activities | |
|
Tailings storage facilities (Atacocha & El Porvenir) |
Leveling and recontouring Cover installation and re-vegetation Construction of perimeter channels |
|
| Other infrastructure |
Ore stockpile Shotcrete plant Process plant Shops Power transmission lines Hazardous waste storage areas Laydown areas Access roads |
Removal of low-grade ore Dismantling, demolition, salvaging and disposal of structures Removal of equipment Removal of contaminated soils Transportation to authorized disposal areas Cleaning and purification of tanks and deposits Recontouring of terrain, re-vegetation and habitat rehabilitation |
| Staff facilities |
Mine camp Administrative buildings Potable water and septic systems |
Mobilization of equipment, machinery and personnel De-energization Dismantling and removal of structures and equipment to authorized disposal areas Dismantling and demolition of concrete structures Recontouring of terrain and re-vegetation |
| Borrow Areas | Quarries |
Cut and fill (physical stability) Fencing Construction of drainage channels Re-vegetation |
It is noted that the design criteria for the Atacocha TSF closure planning have been defined according to Peruvian Standards, which are less stringent than Canadian dam safety guidelines.
A comprehensive dam safety review is recommended in support of operation in future years and in order to finalize the detailed closure plan prior to moving into the closure stage.
Physical, chemical, biological and social stability conditions following closure will be verified through implementation of the post closure maintenance and monitoring program. Monitoring will also support the evaluation and verification of compliance with closure activities, and the identification of deviations leading to the adoption of corrective measures. The monitoring activities will be carried out considering the Peruvian Environmental Quality Standards and Maximum Permissible Limits, as well as criteria set in the Mine Closure Plan for physical, chemical, biological and social stability.
Post closure monitoring activities involve the following:
| · | Physical – Displacements and settlements on slopes; the monitoring frequency will be quarterly during the first two years and biannually the following three years. |
| · | Geochemical – Surface water quality monitoring in order to evaluate the effectiveness of the measures established; the monitoring frequency will be biannually for five years. |
| · | Hydrological – Technical inspections programmed to identify possible erosions, settlements, collapses and obstructions; the monitoring frequency will be biannually for five years. |
| 17- |
|
|
| · | Biological – Verify the effectiveness of the designed coverage and rehabilitation systems, evaluate the success of the systems of re vegetation and evaluate the need of complementary sowing, fertilization and weed control; the monitoring frequency will be biannually for five years (dry and wet season). |
| · | Social – Development of a set of actions that will allow to verify the efficiency and effectiveness of the social programs at mine closure in accordance with established objectives, and adoption of corrective measures as required. |
| 17.2.5.2 | Closure Cost Estimate and Financial Assurance for Closure |
A closure cost estimate was developed and included in the Mine Closure Plans. The total value estimated in 2022 for the remaining LOM presented in the fourth amendment to the Mine Closure Plan is as follows (excluding local taxes):
| · | Progressive Closure (until 2027) US$17,309,137 |
| · | Final Closure (2028 and 2029) US$42,538,865 |
| · | Post-Closure (2030 to 2034) US$ 2,850,228 |
| · | Total US$62,698,230 |
According to Supreme Decree D.S. N° 262-2012-MEM/DM, the financial assurance is calculated based on inflation and discount rates in order to estimate the net present value (NPV) for the mine closure cost. The total financial assurance (progressive closure, final closure, and post closure) calculated in 2022 considering inflation rate and discount rate is US$34,869,854 (including local taxes). A detailed breakdown of the cost estimate is provided in the fourth amendment to the Atacocha Mine Closure Plan. The closure cost estimate was not reviewed by SLR for this TRS.
| 17.2.6 | Qualified Person’s Opinion on the Adequacy of Current Plans to Address any Issues Related to Environmental Compliance, Permitting and Local Individuals or Groups |
In the SLR QP’s opinion, the Environmental Management Plan developed for Atacocha is adequate to address potential issues related to environmental compliance according to the commitments captured in the regulatory permitting approvals.
No issues or concerns associated with environmental permitting planning were identified by the SLR QP based on the documentation provided by Nexa to SLR for review, and a meeting held with Nexa staff in support of this TRS. Nexa’s Environmental Management Superintendent for El Porvenir and Atacocha understands well the environmental permitting requirements and has developed a tracking matrix that identifies the key components of each permit, corrective actions to be implemented to be in compliance, and the status of implementation of each action. All action items are qualified according to a ranking of criticality established (low, medium and high) for continuity of the operation.
In the SLR QP’s opinion, the plans developed as part of the Social Management System are adequate to pursue positive relations with the communities located in the area of influence, promote social benefits, and contribute to reduce social risk for the Atacocha operations.
| 17- |
|
|
| 18.0 | Capital and Operating Costs |
| 18.1 | Capital Costs |
The capital costs required to achieve the Cerro Pasco Complex Mineral Reserve LOM production were estimated by Nexa and reviewed by SLR. Since El Porvenir and Atacocha are operating mines, all capital costs are categorized as sustaining. Sustaining capital costs have been estimated by Nexa based on historical and actual costs, plus the estimated capital costs for the underground development, infrastructure and equipment required to complete the Cerro Pasco Complex integration. Based on the SLR QP’s review, the sustaining capital costs are estimated to the equivalent of an Association for the Advancement of Cost Engineering (AACE) Class 2 estimate with an accuracy range of -10% to +15%. The sustaining capital costs include:
| · | Mine development |
| · | Processing plants improvements. |
| · | Mining equipment overhaul and replacement. |
| · | Underground infrastructure and surface facilities. |
| · | Tailings storage facilities. |
| · | Other projects/assets sustaining costs. |
All costs in this section are expressed in Q4 2023 US dollars. The summary breakdown of the estimated sustaining capital costs required to achieve the Mineral Reserve LOM production are presented in Table 18-1.
Table 18-1: Sustaining Capital Costs Summary – Cerro Pasco Complex
| Cost Component | Value (US$ millions) |
| El Porvenir Mine Development | 166 |
| El Porvenir Processing Plant Improvements | 19 |
| El Porvenir Mining Equipment | 17 |
| El Porvenir Infrastructure | 48 |
| El Porvenir Tailings Storage Facilities | 132 |
| El Porvenir Other Projects / Assets Sustaining Capital | 18 |
| Atacocha Mine Development | 137 |
| Atacocha Processing Plant Improvements | 3 |
| Atacocha Mining Equipment | 6 |
| Atacocha Infrastructure | 22 |
| Atacocha Tailings Storage Facilities | 35 |
| Atacocha Other Projects / Assets Sustaining Capital | 20 |
| Total Sustaining Capital Costs | 622 |
Notes: Sum of individual values may not match total due to rounding.
| 18- |
|
|
| 18.2 | Operating Costs |
The operating costs were estimated based on the actual operating expenditures and current operating budget for both El Porvenir and Atacocha mines, and the forecasted operating costs, considering the operating synergies once the integration process is completed. The costs were estimated by Nexa and reviewed by SLR. Both El Porvenir and Atacocha mines have been in operation for a number of years; therefore, the level of project definition for the operating cost estimates is high. The operating costs are estimated to the equivalent of an AACE Class 2 estimate with an accuracy range of -5% to +10%, although it is noted that AACE does not typically apply to operating costs.
The operating expenses estimated for mining, processing, and G&A activities to support the production of the Cerro Pasco Mineral Reserves over the LOM are summarized in Table 18-2. Operating costs total US$1,412 million over the LOM, averaging US$152million per year between years 2024 and 2033, which are years at full production.
The mining costs include all labour, supplies, consumables, and equipment maintenance to complete open pit mining related activities, such as drilling, blasting, loading, and hauling; and underground mining related activities, such as stopping, development, shaft and hoist, and shotcrete. The processing costs include all labour, supplies, consumables to complete processing related activities at the plants. The administrative expense includes all labour, supplies, consumables, and equipment maintenance to complete administrative, finance, human resources, environmental, safety, supply chain, security, site services, camp and kitchen, and travel related activities.
Table 18-2: Operating Costs Estimate – Cerro Pasco Complex
| Cost Component | LOM Total (US$ millions) |
Average Annual1,2 (US$ millions) |
LOM Average (US$/t milled) |
| Atacocha Plant (Open Pit material) 1 | |||
| Open Pit Mining (Atacocha Open Pit) | 85 | 21 | 19.52 |
| Processing – Atacocha Plant | 58 | 15 | 13.29 |
| G&A – Open Pit | 52 | 13 | 11.85 |
| El Porvenir Plant (Underground material) 2 | |||
| Underground Mining (El Porvenir & Atacocha) | 797 | 86 | 39.25 |
| Processing – El Porvenir Plant | 266 | 28 | 13.07 |
| G&A – Underground | 154 | 16 | 7.56 |
| Combined Site Operating Costs | 1,412 | 152 | 57.18 |
Notes:
| 1. | For Open Pit fully operational years (2024 – 2027) |
| 2. | For Underground fully operational years (2025 – 2032) |
| 3. | Sum of individual values may not match total due to rounding. |
| 18- |
|
|
| 19.0 | Economic Analysis |
The economic analysis contained in this TRS is based on the Cerro Pasco Complex Mineral Reserves on a 100% basis, economic assumptions, and capital and operating costs provided by Nexa corporate finance and technical teams and reviewed by SLR. All costs are expressed in Q4 2023 US dollars. Unless otherwise indicated, all costs in this section are expressed without allowance for escalation, currency fluctuation, or interest.
A summary of the key criteria is provided below.
| 19.1 | Economic Criteria |
| 19.1.1 | Physicals |
| · | Mine life: 10 years (between 2024 and 2033). |
| o | Atacocha Open Pit: 4 years (between 2024 and 2027) |
| o | Atacocha and El Porvenir Underground: 10 years (between 2024 and 2033) |
| · | LOM production plan (on a 100% ownership basis) as summarized in Table 19-2. |
| · | LOM processing of 24.70 Mt, grading 3.61% Zn, 1.22% Pb, 0.23% Cu, 67.76 g/t Ag, and 0.06 g/t Au. |
| o | Atacocha Plant (open pit material): 4.38 Mt, grading 0.99% Zn, 1.15% Pb, 0.03% Cu, 34.94 g/t Ag, and 0.27 g/t Au |
| o | El Porvenir Plant (underground material): 20.32 Mt, grading 4.17% Zn, 1.24% Pb, 0.28% Cu, 74.83 g/t Ag, and 0.02 g/t Au |
| · | LOM total contained metal of: 891 kt Zn, 302 kt Pb, 57.5 kt Cu, 53.8 Moz Ag, and 50.6 koz Au. |
| · | Metallurgical recoveries at the LOM average of: |
| o | Atacocha Plant: 78.5% Zn, 83.0% Pb, 0% Cu, 3.3% Ag in Zn, 76.7% Ag in Pb, and 67.2% Au in Pb. |
| o | El Porvenir Plant: 89.0% Zn, 79.5% Pb, 14.3% Cu, 15.2% Ag in Zn, 66.4% Ag in Pb, 29.4% Au in Pb, 2.0% Ag in Cu, 8.6% Au in Cu. |
| · | LOM realized metal payables (%) of: 84.0% Zn, 94.3% Pb, 95.0% Cu, 84.0% Ag, and 77.1% Au. |
| · | LOM payable metal of: 663 kt Zn, 228 kt Pb, 7.6 kt Cu, 37.6 Moz Ag, and 23.4 koz Au. |
| 19.1.2 | Revenue |
| · | All revenues are received in US$. |
| · | Revenue is estimated based on the following LOM weighted average metal prices derived from Nexa’s Internal Projection forecasts: US$1.24/lb Zn (US$2,741/t Zn), US$0.92/lb Pb (US$2,032/t Pb), US$3.54/lb Cu (US$7,809/t Cu), US$21.72/oz Ag, and US$1,798/oz Au. |
| · | Total gross revenue from concentrates of US$3,000 million. |
| 19- |
|
|
| · | Net Revenue includes the benefit of Cerro Pasco’s zinc concentrate processed at Nexa’s Cajamarquilla (CJM) zinc refinery in Peru. This integration with Nexa’s internal refinery provides the benefit of additional US$94.66/t Zn premium selling price, and zinc smelting at cost (rather than at commercial third-party terms). |
| · | Transportation, Treatment, and Refining charges as defined in Table 19-1. |
Table 19-1: Transportation, Treatment, and Refining charges assumptions
| Transportation, Treatment and Refining charges | Units | LOM average |
| Transportation - Zn Concentrate Integrated - UG | US$/t conc | 46.65 |
| Transportation - Zn Concentrate Integrated - OP | US$/t conc | 45.52 |
| Transportation - Pb Concentrate - UG | US$/t conc | 45.21 |
| Transportation - Pb Concentrate - OP | US$/t conc | 43.75 |
| Transportation - Cu Concentrate - UG | US$/t conc | 39.21 |
| TC Zn Concentrate - EP Plant (UG) | US$/t conc | 310.56 |
| TC Zn Concentrate - ATA Plant (OP) | US$/t conc | 315.36 |
| TC Pb Concentrate - EP Plant (UG) | US$/t conc | 182.96 |
| TC Pb Concentrate - ATA Plant (OP) | US$/t conc | 179.48 |
| TC Cu at Cu Concentrate | US$/t conc | 195.21 |
| RC Cu at Cu Concentrate | US$/t conc | 50.00 |
| RC Ag at Cu Concentrate | US$/oz | 0.50 |
| RC Au at Cu Concentrate | US$/oz | 8.00 |
| RC Ag at Pb Concentrate | US$/oz | 1.50 |
| RC Au at Pb Concentrate | US$/oz | 10.00 |
| RC Ag at Zn Concentrate | US$/oz | - |
| · | There are no third-party royalties applicable to the Cerro Pasco Complex operations. |
| · | Net revenue after selling costs and royalties of US$2,758 million. |
| · | Average net smelter return of US$112/t processed. |
| · | Revenue is recognized at the time of production. |
| 19.1.3 | Costs |
| · | Mine life: 10 years. |
| · | El Porvenir sustaining and expansion capital (excluding closure costs) over the LOM totals US$400 million. |
| · | Atacocha sustaining and expansion capital (excluding closure costs) over the LOM totals US$222 million. |
| · | El Porvenir concurrent reclamation between 2024 and 2033 of US$7.9 million. |
| · | El Porvenir mine closure costs between 2034 and 2037 of US$14.6 million. |
| 19- |
|
|
| · | El Porvenir post-closure costs between 2038 and 2042 of US$2.3 million. |
| · | Atacocha concurrent reclamation between 2025 and 2033 of US$16.2 million. |
| · | Atacocha open pit mine closure costs between 2029 and 2032 of US$5.0 million. |
| · | Atacocha underground mine closure costs between 2034 and 2037 of US$35.1 million. |
| · | Atacocha post-closure costs between 2038 and 2042 of US$2.8 million. |
| · | Total average unit operating costs US$57.18/t ore processed. |
| o | Open pit mining operating costs: US$3.33 /t mined (or US$19.52/t processed). |
| o | Underground mining operating costs: US$39.25/t mined (or US$39.25/t processed) |
| o | Processing operating costs – Atacocha: US$13.29/t ore processed |
| o | Processing operating costs – El Porvenir: US$13.07/t ore processed. |
| o | G&A – Atacocha open pit: US$11.85/t ore processed |
| o | G&A – El Porvenir underground: US$7.56/t ore processed. |
| · | LOM site operating costs of US$1,412 million. |
| · | Other Off-site operating costs: US$2.44/t ore processed. |
| · | Costs were estimated considering an exchange rate of S/.3.67:US$1.00. |
| 19.1.4 | Taxation and Royalties |
| · | Corporate income tax rate in Peru is 29.50%. |
| · | Special Mining Tax Contribution (IEM) varies over the LOM between 2% and 3.6% based on the marginal rate. |
| · | Government Mining Tax Royalty varies over the LOM between 1% and 4% based on the marginal rate. |
| · | Employees’ profit sharing participation: 8%. |
| · | There are no third-party royalties applicable to the Cerro Pasco Complex. |
| · | SLR has relied on Nexa’s taxation model for calculation of taxes applicable to the cash flow. |
| 19.2 | Cash Flow Analysis |
SLR prepared a LOM unlevered after-tax cash flow model to confirm the economics of the Cerro Pasco Complex over the LOM (between 2024 and 2033). Economics have been evaluated using the discounted cash flow method by considering LOM production at a 100% basis, annual processed tonnages, and gold and silver grades. The associated process recoveries, metal prices, operating costs, treatment, refining and selling charges, sustaining capital costs, and reclamation and closure costs, and taxes and government royalties were also considered.
The base discount rate assumed in this TRS is 7.22% as per Nexa’s corporate guidance, based on Weighted Average Cost of Capital (WACC) analysis. Discounted present values of annual cash flows are summed to arrive at the Cerro Pasco Base Case NPV.
| 19- |
|
|
The economic analysis at the LOM weighted average prices of US$1.24/lb Zn, US$0.92/lb Pb, US$3.54/lb Cu, US$21.72/oz Ag, and US$1,798/oz Au, confirmed that the Cerro Pasco Mineral Reserves are economically viable.
The pre-tax NPV at a 7.22% base discount rate is US$364 million and the after-tax NPV at a 7.22% discount is US$162 million. The undiscounted pre-tax cash flow is US$568 million, and the undiscounted after-tax cash flow is US$290 million.
The annual after-tax cash flow summary is presented in Table 19-2.
| 19- |
|
|
Table 19-2: Annual After-Tax Cash Flow Summary

| 19- |
|
|

| 19- |
|
|
| 19.3 | Sensitivity Analysis |
Project risks can be identified in both economic and non-economic terms. Key economic risks were examined by running cash flow sensitivities:
| · | • Metal prices |
| · | • Head grades |
| · | • Metallurgical recoveries |
| · | • Operating costs |
| · | • Capital costs (Sustaining and Closure) |
After-tax NPV7.22% sensitivities over the base case have been calculated for -20% to +20% for head grade, -5% to +5% for overall recoveries, -20% to +20% for metal prices, and -10% to +15% for operating and capital costs variations to determine Cerro Pasco’s most sensitive parameter. The sensitivities are shown in Figure 19-1 and Table 19-3
The sensitivity analysis at Cerro Pasco shows that the after-tax NPV at a 7.22% base discount rate is most sensitive to metal prices, head grade, and metallurgical recoveries, followed by operating costs and capital costs.
| 19- |
|
|
Table 19-3: After-Tax Sensitivity Analyses – Cerro Pasco Complex
| Variance | Head Grade (% Zn) |
NPV at 7.22% (US$ million) |
| 80% | 2.89% | (117) |
| 90% | 3.25% | 31 |
| 100% | 3.61% | 162 |
| 110% | 3.97% | 289 |
| 120% | 4.33% | 414 |
| Variance | Recovery (% Zn) |
NPV at 7.22% (US$ million) |
| 94% | 83.6% | 89 |
| 97% | 86.1% | 126 |
| 100% | 88.6% | 162 |
| 103% | 91.0% | 198 |
| 106% | 93.5% | 234 |
| Variance | Metal Prices (US$/lb Zn) |
NPV at 7.22% (US$ million) |
| 80% | $0.99 | (188) |
| 90% | $1.12 | (3) |
| 100% | $1.24 | 162 |
| 110% | $1.37 | 319 |
| 120% | $1.49 | 472 |
| Variance | Operating Costs (US$/t) |
NPV at 7.22% (US$ million) |
| 85% | $51.46 | 270 |
| 93% | $54.32 | 216 |
| 100% | $57.18 | 162 |
| 118% | $61.47 | 82 |
| 135% | $65.76 | 1 |
| Variance | Capital Costs (US$000) |
NPV at 7.22% (US$ million) |
| 85% | $657 | 220 |
| 93% | $693 | 191 |
| 100% | $730 | 162 |
| 118% | $785 | 119 |
| 135% | $839 | 76 |
| 19- |
|
|
Figure 19-1: After-Tax Sensitivity Analysis

| 19- |
|
|
| 20.0 | Adjacent Properties |
As indicated in Figure 20-1, El Porvenir and Atacocha are surrounded by other mineral properties. The following companies that hold properties in the vicinity are subsidiaries of the Volcan Group:
| · | Compañía Minera Vichaycocha. |
| · | Empresa Exploradora de Vinchos. |
| · | Empresa Minera Paragsha. |
| · | Minera San Sabastián AMC S.C.R.L. |
The Volcan Group operates the Cerro de Pasco Mine in the nearby city of Cerro de Pasco. Nexa maintains a group of mining concessions located within the boundaries of some of the Volcan Group’s properties.
Other local property holders include:
| · | Sociedad Minera El Brocal |
| · | David Prospero Rudas y otros. |
· Corporación Minera Centauro S.A.C. (Centauro).
Centauro is a Peruvian capital corporation that focuses on exploration, mining, and processing of polymetallic minerals, such as Au, Ag, and Cu.
SLR has not independently verified this information and this information is not necessarily indicative of the mineralization at El Porvenir.
| 20- |
|
|
Figure 20-1: Adjacent Properties

| 20- |
|
|
| 21.0 | Other Relevant Data and Information |
No additional information or explanation is necessary to make this TRS understandable and not misleading.
| 21- |
|
|
| 22.0 | Interpretation and Conclusions |
| 22.1 | Geology and Mineral Resources |
| · | The Mineral Resource estimate was prepared by Nexa. The resource estimate has been audited and accepted by the QP. |
| · | Exclusive of Mineral Reserves, the estimated EOY2023 Measured and Indicated Mineral Resources attributable to Nexa comprise: |
| o | El Porvenir underground (83.48% attributable): 3.24 Mt at 3.29% Zn, 0.21% Cu, 62.2 g/t Ag, and 0.97% Pb containing 106.6 kt of Zn, 6.8 kt of Cu, 6,485 koz of Ag, and 31.1 kt of Pb. |
| o | Atacocha underground (75.96% attributable): 2.71 Mt at 3.35% Zn, 0.33% Cu, 55.0 g/t Ag, and 0.94% Pb containing 90.8 kt of Zn, 9.0 kt of Cu, 4,792 koz of Ag, and 25.4 kt of Pb. |
| o | San Gerardo open pit (75.96% attributable): 4.31 Mt at 1.12% Zn, 29.8 g/t Ag, 0.89% Pb, and 0.22 g/t Au containing 48.4 kt Zn, 4,128 koz Ag, 38.4 kt Pb, and 31.1 koz Au. |
| · | In addition, the El Porvenir EOY2023 Inferred Mineral Resources attributable to Nexa total 9.23 Mt at 3.83% Zn, 0.24% Cu, 82.9 g/t Ag, and 1.32% Pb. |
| · | Atacocha EOY2023 Inferred Mineral Resources attributable to Nexa total 6.12 Mt at 4.09% Zn, 0.56% Cu, 77.3 g/t Ag, and 1.21% Pb for Atacocha underground, and 1.29 Mt at 1.27% Zn, 32.7 g/t Ag, 1.15% Pb, and 0.22 g/t Au for San Gerardo open pit. |
| · | El Porvenir and Atacocha feature skarn and hydrothermal vein/breccia-style mineralization. El Porvenir also has stratabound deposits, while Atacocha has porphyry mineralization. Controls on mineralization are lithological, mineralogical, and structural. |
| · | The El Porvenir and Atacocha database closure date was January 31, 2023. Between then and the effective date of this report, 252 drill holes and 1,727 channels were completed at El Porvenir and 32 channels and 18 DDH were completed at Atacocha. SLR does not consider this to have a material impact on the estimated Mineral Resources. |
| · | Protocols for drilling, sampling, analysis, verification, and security meet industry standard practices. The drill hole database was verified by SLR and is suitable for Mineral Resource estimation. |
| · | The Mineral Resource estimates are completed to industry standards using reasonable and appropriate parameters and are acceptable for conversion to Mineral Reserves. |
| · | Nexa has defined several polymetallic prospects located near the deposits, which warrant additional exploration, including the Integration Zone between the El Porvenir and Atacocha underground mines. |
| 22.2 | Mining and Mineral Reserves |
| · | The Cerro Pasco Complex consists of the El Porvenir underground mine, the Atacocha underground mine, and the San Gerardo open pit mine. |
| o | Production is currently from the San Gerardo mine, which feeds the Atacocha processing plant that has a nominal throughput of 4,400 tpd, and the El Porvenir |
| 22- |
|
|
underground mine, which feeds the El Porvenir processing plant that has a nominal throughput of 6,500 tpd.
| o | The Atacocha underground mine was placed in care and maintenance in 2020 to focus all production at the San Gerardo open pit mine. Atacocha is planned to resume production in 2027 when the San Gerardo pit has reached the end of its mine life. |
| o | The Atacocha Mine will be integrated with the El Porvenir Mine and both will feed the El Porvenir processing plant. |
| · | The Mineral Reserve estimates were prepared by Nexa and reviewed and accepted by SLR. |
| o | On an 83.48% Nexa attributable ownership basis, El Porvenir underground Mineral Reserves total 12.2 Mt averaging 4.11% Zn, 0.23% Cu, 72.9 g/t Ag, and 1.20% Pb. |
| o | On a 75.96% Nexa attributable ownership basis, Atacocha underground Mineral Reserves total 4.3 Mt averaging 4.33% Zn, 0.40% Cu, 79.8 g/t Ag, and 1.34% Pb. |
| o | On a 75.96% Nexa attributable ownership basis, San Gerardo open pit Mineral Reserves total 3.3 Mt at an average grade of 0.99% Zn, 34.9 g/t Ag, 0.27 g/t Au, and 1.15% Pb. |
| · | The assumptions, parameters, and methodology used to estimate Mineral Reserves meet industry standard practices and are appropriate for the style of mineralization and proposed mining methods. |
| · | The underground mines are planned to be mined using CAF and SLS mining methods. Backfill in the form of unconsolidated backfill from waste development and hydraulic fill from tailings will be used for both mining methods. |
| · | Underground mine design and support recommendations have been developed using industry standard geotechnical data and analysis methods. |
| · | The dilution factors assumed for SLS are low when compared to surveyed stopes and planned designs reconciliation data provided by Nexa. |
| o | SLR has investigated the effect of higher dilution and notes that approximately 2% of the total Mineral Reserves would be impacted. This is not considered to be a material difference. |
| · | Mining of the San Gerardo open pit is planned using conventional open pit mining methods with drill and blast operations using excavators and trucks. |
| · | Open pit NSR block value calculations are based on historical performance of the concentrator, historical operating costs and current smelter contracts. |
| · | Open pit calculated block model NSR values are evaluated against the internal break-even value. Blocks classified as Measured or Indicated Mineral Resources with an NSR value above the internal break-even value are included in the Mineral Reserve. |
| 22- |
|
|
| 22.3 | Mineral Processing |
| 22.3.1 | El Porvenir |
| · | The El Porvenir concentrator processed 2,220,011 tonnes of ore in 2023 with Cu, Pb, and Zn grades of 0.16%, 1.37% and 2.86% respectively. Recoveries to their respective concentrates were 10.1% Cu, 82.1% Pb, and 88.0% Zn. |
| · | The head grades of Zn, Cu, Au, and Ag have been consistent for the period from 2018 through 2023, while Pb has increased from 0.98% to 1.37%. Pb, Ag, and Au recoveries have increased and the recovery of Ag and Au to the Pb concentrate has increased over the period. Cu grades and recoveries have decreased significantly over the period. |
| · | The average head grades of Zn, Pb, and Cu during 2022 and 2023 were 2.83%, 1.36%, and 0.16%, respectively, and the recoveries of Zn, Pb, and Cu for the period were 87.49%, 81.65%, and 8.67%, respectively. |
| · | Nexa began developing a geometallurgical model for El Porvenir in 2017. The objectives of the work were to develop a geometallurgical model able to predict the recovery of lead, zinc, copper, arsenic, and manganese, concentrate grades, as well as abrasiveness (abrasion index (Ai)) and hardness (Bond ball mill work index (BWi)), and therefore throughput, based on ore source within the deposit. |
| · | Prior to the present Phase 6 study, five phases of geometallurgical studies were carried out. Identified risks include the presence of high-hardness material in intrusive materials and limestone, as well as high abrasiveness in sandstone and clastic materials. |
| · | The potential penalty elements that should be monitored in the Cu Concentrate include As, Sb, Bi, Cd, and combined Pb+Zn. The potential penalty elements in the Pb concentrate are low lead concentrate grade, bismuth, and fluorine. The potential penalty elements in the Zn concentrate are copper and manganese. |
| 22.3.2 | Atacocha |
| · | The Atacocha concentrator processed 1,397,192 tonnes of ore in 2023 with Pb and Zn grades of 0.93% and 0.77%, respectively. Recoveries to their respective concentrates were 85.7% Pb and 75.9% Zn. |
| · | Head grades of ore being treated in the Atacocha concentrator have changed since the introduction of open pit ore in early 2016. Head grades of Zn have decreased from 1.8% to 0.77%, Cu has decreased from 0.11% to 0.04%, and Pb has decreased from 1.31% to 0.93% from 2016 to 2023. Since 2019, the copper grades have been too low to allow a separate copper concentrate to be produced. |
| · | The average grades of Zn and Pb during 2022 and 2023 were 0.84% and 0.95%, respectively, and the recoveries of Zn and Pb for the period were 76.57% and 83.64%, respectively. The recoveries used for the cut-off grade and resource model at these grades were 70.44% for Zn and 84.06% for Pb, which compares well to the operating data for Pb, the Zn values being somewhat conservative. |
| · | A metallurgical testing program was carried out to characterize the geometallurgical behaviour of the Atacocha San Gerardo ore according to the 2022-2023 mining plan. |
| · | Prior to the present study, three phases of geometallurgical studies were carried out, increasing the available geometallurgical data progressively to reduce the risk in metallurgical predictions. |
| 22- |
|
|
| · | Risks identified include the presence of high hardness and abrasive material in intrusive material and hydrothermal breccias, as well as areas of low Au recovery associated with Au disseminations in pyrite in mainly marble-type material. |
| · | The potential penalty elements in the Pb concentrate are arsenic and fluorine. The potential penalty elements in the Zn concentrate are manganese, silica, and cadmium. |
| 22.4 | Infrastructure |
| 22.4.1 | Integration of Atacocha and El Porvenir |
| · | The Cerro Pasco integration project aims to maximize the synergy of the Atacocha and El Porvenir mines. |
| · | El Porvenir started in 1950 and is an operating underground mine with multiple accesses including a shaft (Picasso shaft) for ore and people transportation. |
| · | Atacocha started in 1937 comprising an underground mine and an open pit mine. The open pit mine, San Gerardo is currently in operation, and the underground mine has been on care and maintenance since 2020. |
| · | Access to Atacocha underground is by multiple surface tunnels, that are in good condition despite the production suspension. |
| · | Atacocha is currently connected to El Porvenir through two active tunnels: at 4070 and 3300 levels, with traffic of heavy mine equipment, conventional trucks, and mining crews, linking Atacocha surface to El Porvenir underground. |
| · | The integration plan comprises restarting of Atacocha underground, development of additional connections between El Porvenir and Atacocha, expand the Picasso shaft capacity, closure of the Atacocha processing plant in 2027, and construction of a new pipeline to pump El Porvenir mine tailings to the Atacocha tailing dam. |
| · | A combination of transportation methods, including road access, aircraft via Huánuco, and rail to Cerro de Pasco are used to supply the Atacocha and Porvenir mines. |
| · | Off-site infrastructure includes facilities for the transfer of concentrate from truck to rail at Cerro de Pasco to transport concentrate for export by train to the port of Callao. Mine access is via a 13 km dirt road northeast from Cerro de Pasco, and paved road from Lima to Cerro de Pasco (approximately 315 km). |
| · | The main road from Lima to Cerro de Pasco is used for personnel transportation, supply of food, reagents, spare parts, mining supplies, and diesel fuel. Huánuco airport can be used for personnel transportation and emergency situations. |
| · | The power supply for the Atacocha and El Porvenir mines comes from two sources: the national power grid via 50/13.8 kV main substations located near each of the mines and the La Candelaria Hydroelectric Plant, which consists of three turbines (0.5 MVA, 1.2 MVA, and 3.5 MVA), and is connected to the Atacocha and El Porvenir main substations by a 4.6 km long 50 kV transmission line. |
| · | Power is generated at 4,660 kV at the La Candelaria Hydroelectric Plant. All other project loads are fed at 13.8 kV from the main substation through overhead power lines. These power lines are used to deliver power to various locations to support activities during operation of the Complex. |
| 22- |
|
|
| · | The El Porvenir TSF receives tailings generated by both the El Porvenir and Atacocha concentrator plants. A portion of tailings is used for hydraulic backfill at El Porvenir. The El Porvenir TSF was originally constructed in the 1970s, and the current elevation of the dam crest is 4,066 MASL. The downstream toe is inferred from available plans to be at 3,920 MASL, resulting in a current dam height of 146 m. |
| · | Nexa is planning to improve the water management system through construction of a perimeter channel (i.e., upstream water diversion) to intercept clean (non-contact water) surface runoff water before it flows into the TSF. Diverted water will be discharged downstream of the TSF in the Lloclla River gorge. |
| 22.4.2 | El Porvenir |
| · | The El Porvenir site comprises an underground mine, TSF, waste rock stockpiles, an ore processing facility with associated laboratory and maintenance facilities, and maintenance buildings for underground and surface equipment. |
| · | Additional facilities and structures include an office building, change house facilities, main shaft, ventilation shaft, backfill plant, explosives storage area, hydroelectric power generating plant, power lines and substation, fuel storage tanks, a warehouse and laydown area, and an accommodation camp. |
| 22.4.3 | Atacocha |
| · | Atacocha site operations comprise an underground mine, open pit mine, and a process plant facility. |
| · | Supporting on-site infrastructure include maintenance facilities; maintenance buildings for underground and surface equipment, laboratory, and tailings pumping station. Facilities and structures supporting operations include warehouses and laydown areas, offices, dry facilities, hydroelectric generating station, power lines and substation, fuel storage tanks, and accommodations camp. |
| · | A network of site roads that are approximately 6 m wide and total 15 km in length are used by authorized mine personnel and equipment, including ore and waste haul trucks, concentrate haul trucks, support and light duty vehicles to provide access to on-site infrastructure. |
| 22.5 | Environment, Permitting, and Social Considerations |
| · | No environmental issues were identified from the documentation available for review that could materially impact the ability to extract the Mineral Resources and Mineral Reserves. SLR understands that El Porvenir and Atacocha have the permits required to continue the mining operations in compliance with applicable Peruvian permitting requirements. Of note, expired authorizations under the renewal process do not interrupt the continuity of the operations (for example, the authorization for discharge of industrial effluent for El Porvenir has been filed by Nexa but it is pending approval by the environmental authority). |
| · | Approval of environmental permits required for the Cerro Pasco Complex Integration is critical for its implementation. Nexa’s Environmental Management Superintendent for El Porvenir and Atacocha understands well the environmental permitting requirements and has developed a tracking matrix that identifies the key components of each permit, corrective actions to be implemented to be in compliance, and the status of |
| 22- |
|
|
implementation of each action. All action items are qualified according to a ranking of criticality established (low, medium and high) for continuity of the operation. The matrix includes the planning for the future environmental permits required for implementation of the Cerro Pasco Complex Integration.
| · | The monitoring program at El Porvenir includes meteorology, air quality, non ionized radiation, noise, surface water quality, groundwater quality (only one location), spring water quality, effluent discharges, fauna and flora, and TSF physical stability. El Porvenir reports the results of its monitoring program to the authorities according to the frequency stated in the approved resolutions. SLR is not aware of any non-compliance issues raised by the authorities. |
| · | The monitoring program at Atacocha includes effluent discharges, gas emissions, air quality, non-ionizing radiation, noise, surface water quality, groundwater quality, springs water quality, vibrations, soil quality, terrestrial biology (vegetation and wildlife) and aquatic biology, and TSF physical stability. Atacocha reports the results of its monitoring program to the authorities according to the frequency stated in the approved resolutions. SLR is not aware of any non-compliance issues raised by the authorities. |
| · | Nexa utilizes an Integrated Dam Management System (referred to as SIGBar) for the El Porvenir TSF and the Atacocha TSF, which provides guidelines for document management, monitoring, evaluation, risk analysis, compliance with standards and legislation, training of personnel, operation of structures and other provisions. |
| · | SLR’s social review indicates that, at present, Nexa’s operations at El Porvenir make a positive contribution to sustainability and community well-being. From the review and SLR’s site visit, Nexa appears to have the necessary governance documents and tools to manage social risks associated with the Cerro Pasco Complex operations. A grievance mechanism and Community Relations Plans are in place and implemented by the social teams for each of El Porvenir and Atacocha. |
| · | An independent technical evaluation of key components of the Cerro Pasco Complex Integration project completed in early 2024 by a third party did not find any fatal flaws. The evaluation included the TSFs, social risks and permitting. It resulted in a number of findings and recommendations to be considered by Nexa to derisk the Cerro Pasco Complex Integration project. |
| · | Community discontent represents a future risk for the Cerro Pasco Complex operations. The Cerro Pasco Complex Integration project may increase expectations from the local communities in terms of contracting of local services, employment, training and community investment opportunities. The modification of the Environmental Impact Assessment required for Atacocha and El Porvenir imply processes of consultation and Citizen Participation, which could delay the approval process in the event of social disagreement. |
| · | Although there is no written commitment from Nexa to ensure local procurement, the company retains services from local businesses and from contractors that employ local workforce. |
| · | In 2023, Nexa experienced an increase in local hiring for El Porvenir and Atacocha. Nexa has declared local hiring commitments with eight local communities and has specific local hiring targets with two of them. |
| · | Atacocha acquired rights to land from the community of Cajamarquilla via an agreement to construct tailings facilities and ancillary infrastructure. The agreement included various |
| 22- |
|
|
commitments and obligations, including financial compensation for rights to the land. Atacocha also acquired and subsequently renewed a right-of-way agreement with the community of Ticlacayán associated with hydraulic infrastructure. Community agreements related to rights to land from the community have also been signed for El Porvenir with Comunidad San Francisco de Asís de Yarusyacán y Comunidad Cajamarquilla.
| · | Independent conceptual Mine Closure Plans have been developed for El Porvenir and Atacocha within the context of Peruvian legislation and are periodically updated. The most recent modification to the Mine Closure Plan for El Porvenir and update to the closure cost estimate was completed in 2020. The most recent modification to the Mine Closure Plan for Atacocha and update to the closure cost estimate was completed in 2022. |
| 22.6 | Capital and Operating Costs and Economics |
| · | Capital and operating cost estimates were prepared based on historical operating performance and the current operating budget for 2024, and the forecasted cost estimates for the integration project. SLR considers these capital and operating cost estimates to be reasonable, provided the operation and production targets are realized. |
| · | The LOM production schedule in the cash flow model, covering a 10-year mine life, is based on the December 31, 2023 Mineral Reserves. |
| · | All costs in this report are expressed in Q4 2023 US dollars. |
| · | The economic analysis at average LOM prices of US$1.24/lb Zn (US$2,741/t Zn), US$0.92/lb Pb (US$2,032/t Pb), US$3.54/lb Cu (US$7,809/t Cu), US$21.72/oz Ag, and US$1,798/oz Au, demonstrated that the Cerro Pasco Mineral Reserves are economically viable. |
| · | On a 100% ownership basis, the pre-tax NPV at a 7.22% base discount rate is US$364 million and the after-tax NPV at a 7.22% discount is US$162 million. The undiscounted pre-tax cash flow is US$568 million, and the undiscounted after-tax cash flow is US$290 million. |
| · | There is good potential to extend the mine life through continued conversion of Inferred Resources, with improved economic results. |
| 22.7 | Risks |
| · | Underground geotechnical risks: |
| o | The impact of faults on the stope stability and ELOS have not been accounted for in the geotechnical empirical analyses. SLR has evaluated the potential underestimate of ELOS (see Section 12.3.2), however, dilution in areas affected by faults may increase compared to that currently anticipated. Mitigation can be applied by installing ground support in the faulted walls and/or by reducing the stope size in those locations, which would impact productivity rates. It is considered that this a low-moderate risk and that these mitigations can be applied during production, so a change to the mine plan/schedule is not required at this stage. |
| o | The project is lacking a geotechnical block model. This is best practice and should be implemented. While its absence is considered a low risk, a geotechnical block model allows for a better understanding of the spatial distribution of the geotechnical |
| 22- |
|
|
conditions and would assist in short-medium term mine planning (and also links back to the point on faults above).
| · | San Gerardo open pit risks: |
| o | Pit slope design outside of the domain sectors was assumed to be 45 degrees for design, this assumption is considered low risk based on the wall height of the north and west satellite pits. |
| o | Open pit mining operating costs are defined as constant values for mine planning. However, there is a variable component associated with the haulage distance of the open pit mining costs that requires a truck haulage distance forecast in the LOM plan. There is a low risk that the estimated mining cost will increase over the LOM due to increased truck haulage distances. |
| · | Process risks: |
| o | There is a risk of lower metal grades and recoveries than planned and the recovery of deleterious elements in the concentrates that may draw penalties. |
| o | The potential penalty elements in the Pb concentrate are arsenic and fluorine. The potential penalty elements in the Zn concentrate are manganese, silica, and cadmium. |
| o | Geometallurgical testing has identified the presence of high-hardness material in intrusive materials and limestone, as well as high abrasiveness in sandstone and clastic materials may result in increased operating power and wear material consumption and costs. |
| o | Geometallurgical work has identified areas of low Au recovery associated with Au disseminations in pyrite in mainly marble-type material. |
| · | Infrastructure risks: |
| o | The age of the current infrastructure and the cost of maintenance is a moderate risk. |
| o | Cost and schedule risk for the design and construction of integration infrastructure including the new tailing pumping station and pipeline from El Porvenir to the Atacocha TSF. |
| · | Risks associated with environmental permitting and community relations: |
| o | The modifications to the EIA required for both El Porvenir and Atacocha as part of the Cerro Pasco Complex Integration project involve a period of review and approval by the environmental authority. There is a high level of uncertainty associated with the actual duration of the review and approval period due to staffing issues at the SENACE and adjustments to its review and approval processes. As a mitigation measure, Nexa has included additional time in its permitting schedule for the Cerro Pasco Complex Integration project to carry a contingency for the permitting process. |
| o | Community discontent represents a future risk for the Cerro Pasco Complex operations since it can lead to blockades and in turn could result in operation interruptions and reputational damage. There is precedent for such conflict given that blockades organized by communities have taken place in the past and, as recently as 2023, led to short suspensions of operations. As mitigation measures, Nexa is mainly working towards addressing and closing commitments with the communities in a more efficient manner, and is revisiting its social management |
| 22- |
|
|
approach to be more proactive in preventing potential issues or addressing them early to avoid escalation.
| 22- |
|
|
| 23.0 | Recommendations |
| 23.1 | Geology and Mineral Resources |
| 1 | Investigate if capping levels should be applied based on high-grade and low grade domains for Zn, Pb, Cu, and Ag for some domains of San Gerardo open pit. |
| 2 | Fine-tune the estimation workflow and dynamic anisotropy angles calculation to minimize visual grade artifacts observed in some domains (such as “de2” for El Porvenir and “sge” for Atacocha UG). Consider utilizing hangingwall, footwall, and reference surface data to refine local angle precision, alongside auxiliary dip and dip direction charts to identify and rectify any inconsistencies. |
| 3 | Consider incorporating the blast hole samples to define the LTM mineralization boundaries given that the GCM performs systematically better than the LTM for the San Gerardo open pit. |
| 4 | Increase the number of density samples to allow more accurate block density estimates. |
| 5 | Adjust the density estimation methodology to only interpolate where supported by sufficient samples. |
| 6 | Improve the Mineral Resource classification post-processing, aiming to clean up the remaining isolated blocks of Measured or Indicated classification, such as in the domain “vcn32” of El Porvenir. |
| 7 | Investigate relaxing the maximum of two composites per drill hole restriction in domain extremities and sparsely drilled areas. |
| 8 | For the Mineral Resource classification, consider excluding drilling intersections that are sub-parallel to tabular mineralized domains as they significantly reduce drill hole spacing calculations in an artificial manner. |
| 9 | Use the production data to monitor the selected drill spacing for the minor continuity zones to determine if sufficient confidence is provided to support detailed mine planning, as these domains show less grade and geological continuity. |
| 10 | In future models, incorporate a structural model to help properly define the estimation trends. |
| 11 | Improve the field duplicate rates of channels by revising the sampling protocol of duplicates in channels. |
| 12 | Increase the frequency of monitoring Inspectorate El Porvenir laboratory (Inspectorate EP) results on a batch basis to preliminarily identify and address instances of failure that may require re-analysis. |
| 13 | Keep monitoring CRMs and other controls to prevent and/or mitigate trends, biases, or other issues which may require sample re-analysis. Continue with periodic external checks across laboratories to ensure the primary laboratory's performance remains satisfactory. |
| 14 | Ensure all the samples analyzed by ALS are re-assayed using the relevant analytical method when exceeding the detection limit (i.e., samples >10,000 ppm Zn), to prevent few instances detected of incomplete results in the assay database. |
| 23- |
|
|
| 15 | Investigate and address sample discrepancies identified during the data verification process, particularly those related to Au values. These discrepancies, however, are minor and have negligible impact on the overall assessment. |
| 16 | Maintain standardization of the format and database structure. |
| 17 | Complete the 2024 exploration program, consisting of an 8,500 m drill program to explore new targets and continue with advanced exploration. The 2024 exploration program budget is approximately US$2.1 million. |
| 18 | Improve the reconciliation between the underground production volumes and the mineralization wireframes, to better understand the differences between the along-strike mineralization, and to better quantify the proportion of the discrepancy resulting from the opportunistic mining of ore from across-strike structures. |
| 19 | To better define mineralized extents, consider completing closer spaced exploration and infill drilling ahead of production, including at orientations better designed to intercept across-strike mineralized structures. |
| 23.2 | Mining and Mineral Reserves |
| 1. | Review the underground mine designs and mining sequence and incorporate sill pillars where required. |
| 2. | Continue underground geotechnical data capture, specifically seismic monitoring around pillars between stopes. |
| 3. | Develop an underground geotechnical block model to better spatially define the geotechnical variation. |
| 4. | Re-appraise stope stability and ELOS using an updated empirical method, such as the Villaescusa approach, which updates the Potvin approach, particularly the stress factor (A) for the underground. |
| 5. | Assess the impact of faults on the stope stability and ELOS, such as using the approach developed by Suorineni, which applies a fault factor to the analyses depending on the intersection geometry between the faults and the planned stope walls for the underground. |
| 6. | Implement reconciliation analysis between underground designed stopes and surveyed mined-out stopes to estimate overbreak and underbreak quantities to better define dilution and mining recovery factors. |
| 7. | Apply external underground dilution factors as ELOS during the optimization process to capture dilution grade. |
| 8. | Develop grade control practices particularly for planned underground SLS stopes to minimize dilution due to orebody irregularities. |
| 9. | Add a yearly truck haulage distance forecast to the open pit LOM plan. |
| 23.3 | Mineral Processing |
| 1 | Investigate the addition of instrumentation and process controls to both El Porvenir and Atacocha concentrators including a SCADA system to retrieve and store process data to support daily operations and planning. |
| 2 | Continue with the geometallurgical program at El Porvenir and Atacocha. |
| 23- |
|
|
| 3 | Perform a geological assessment of the Au association to galena and Au associated with pyrite based on deposit genesis and geometallurgical test results for San Gerardo. |
| 4 | Carry out a geological assessment for San Gerardo to identify areas associated with oxides in Phase 2 of mining, which represent a risk to the recovery of Pb, Zn, and Au. |
| 5 | Evaluate the behaviour of low recovery material near upcoming mining phases in the San Gerardo pit. |
| 6 | Perform recovery studies by size with plant feed material to quantify losses in recoveries of valuable metals by size fraction in both mines. |
| 7 | The steel consumption estimation model for El Porvenir was derived in 2018, based on circuit data and operating variables reported by Nexa to date. Update these models by incorporating the operational changes made to date in the grinding circuits of both El Porvenir and Atacocha concentrators. |
| 23.4 | Infrastructure |
| 1 | Place priority on the ongoing maintenance of older site infrastructure including piping, electrical, roads, and buildings. |
| 2 | Remove abandoned infrastructure such as old pipelines as it is replaced by new, to facilitate future maintenance. |
| 23.5 | Environment, Permitting, and Social Considerations |
| 1 | Track closely the action items identified for obtention of new permits and renewal of expired permits required for the Cerro Pasco Complex Integration project and follow up on the status of progress regularly to prevent possible delays in the submission of permitting applications. There is a level of uncertainty regarding the amount of time required by the authorities for review and approval of permitting applications. In order to mitigate the risk of delayed approval, initiate the first steps of the approval process for the main permits as early as possible (for example, the engineering design and the baseline field work). |
| 2 | Due to uncertainty regarding the potential for acid generation of the waste rock, geochemical evaluation (including static and kinetic geochemical testing on waste rock samples) should be carried out prior to the next Atacocha dam raise (not permitted yet), and prior to closure to inform closure planning and water quality predictions for post-closure. Carry out additional static and kinetic geochemical testing on waste rock and tailings samples to confirm or revise the geochemical characterization. Robust water quality monitoring should continue during operations to verify compliance with the national environmental standards and the appropriateness of the waste rock disposal and water management procedures that are in place. |
| 3 | Expand the groundwater quality monitoring program at El Porvenir to include additional stations for collection of groundwater quality samples (and subsequent analysis). At a minimum, consideration should be given to the installation of one station upstream of the El Porvenir TSF. |
| 4 | Consider conducting a Dam Safety Review (DSR) for El Porvenir TSF and the Atacocha TSF in support of mining operation and ore processing in future years, and in order to finalize the detailed mine closure plan prior to moving into the closure stage. |
| 5 | The following recommendations are proposed for the Atacocha TSF: |
| 23- |
|
|
| a) | Develop TARPs for the piezometers for inclusion in the OMS manual and monitoring plan. |
| b) | Capacity assessments of the TSF completed on a bi annual basis with topographic and bathymetric surveys. |
| c) | Complete long term geochemical kinetic testing of the tailings. |
| d) | Monitor the water quality from the TSF subsurface drains. |
| 6 | The same recommendations listed above are proposed for the El Porvenir TSF. In addition, implement a groundwater monitoring program at the El Porvenir TSF to determine levels of metals and sulphates. Monitoring stations should be implemented both upstream and downstream of the El Porvenir TSF. |
| 7 | Implement a water balance for ongoing operations to be updated by Mine personnel using meteorological and water monitored data on a regular basis (at least monthly). The water balance is an important tool to track trends and conduct short term predictions through simulation of variable operating and/or climatic scenarios to support decision making associated with tailings pond operation (e.g., maintaining adequate freeboard at all times). |
| 8 | Develop an integrated water balance that reflects the interaction between the El Porvenir and Atacocha operations from a water balance perspective to identify and predict possible scenarios of interruption of mine operations due to water management issues and/or dam safety concerns (e.g., not maintaining adequate dam freeboard). |
| 9 | El Porvenir and Atacocha have significant social commitments as the needs and expectations of local communities/stakeholders are high. Managing commitments requires an adequate tracking tool and implementation plan to honour commitments. SLR recommends that Nexa considers adopting a robust tracking tool to track commitments and allocate adequate resources to use it and keep it up to date, including an escalation process for overdue commitments. This action will avoid mismanagement of commitments, prevent potential conflicts, and demonstrate Nexa’s efforts to maintain good relationships with host communities. |
| 10 | Review the current social area of influence for both El Porvenir and Atacocha to confirm or update its delineation in case new local communities or Indigenous communities should be added (e.g., Anexo Joraoniyoc, which belongs to Comunidad Campesina de San Francisco de Asis de Yarusyacan for the Atacocha mine site). This is a key action to identify potential impacts and develop social management plans for the newly added communities in the revised area of influence. The determination of the social area of influence is a dynamic matter that requires regular review. SLR understands that Nexa is already planning to review the current social area of influence and it held a meeting on this topic with the environmental authority as one of the initial steps. |
| 23- |
|
|
| 24.0 | References |
Amec, 2017: Revisión de la Base de Datos – 2017 Atacocha P00044-0000-DT30-RPT-0001 prepared in June 2017.
Ausenco Vector, 2013, Ingeniería de Detalle para el Crecimiento de la Presa de Relaves El Porvenir, Anexo F – Caracterización Geoquí0ica del Relave Cicloneado, Report No. J09.82.12.03 Rev. 0 prepared for Compañía Minería Milpo S.A.A., February 2013.
Ausenco, 2016a, Milpo Andina Perú S.A.C. Ingeniería de Detalle Recrecimiento del Dique El Porvenir – Cota 4056. Report No. 101521-01-RPT-005 Rev. B, prepared for Compañía Minería Milpo S.A.A., August 2016.
Ausenco, 2016b, Milpo Andina Perú S.A.C. Ingeniería de Detalle del Recrecimiento de la Presa de Relaves El Porvenir – Cota 4100. Report No. 101521-01-RPT-002 Rev. 0, prepared for Compañía Minería Milpo S.A.A., August 2016.
Ausenco, 2018a, Informe Ingenieria, Cía. Minera Atacocha S.A.A. Ingeniería de detalle del Depósito de desmonte Atacocha a la cota (Niv.) 4180 – Área 5.
Ausenco, 2018b, Cía. Minera Atacocha S.A.A. Ingeniería de Detalle del Depósito de Desmonte Atacocha – Fase 5 – Etapa B. Informe de Ingeniería. Report No. 102377-01-RPT-003 Rev. 0. May 2018.
Ausenco, 2018c, Milpo Andina Perú S.A.C. Ingeniería de Detalle Recrecimiento del Dique El Porvenir – Cota 4064. Report No. 102378-01-RPT-004 Rev. 1, prepared for Compañía Minería Milpo S.A.A., September 7, 2018.
Ausenco, 2020, Compañía Minera Atacocha S.A.A. Ingeniería de Detalle del Recrecimiento de la Relavera Atacocha desde la Cota 4110 a la Cota 4128. Report No. 102377-01-RPT-006 Rev. 0, prepared for Compañía Minera Atacocha S.A.A., March 17, 2020.
Bardales Rojas, M., 2024, PE_ATA_EP_REL_ANUAL_PM_2023 Legal Opinion, Nexa Resources S.A., March 6, 2024. 42 p.
Barton, N., Lein, R., and Lunde, J. 1974. Engineering Classification of Rock Masses for Design of Tunnel Support. Rock Mechanics, 6(4): 189-236.
Baumgartner, R., Fontboté, L., and Vennemann, T., 2008, Mineral Zoning and Geochemistry of Epithermal Polymetallic Zn-Pb-Ag-Cu-Bi Mineralization at Cerro de Pasco. Economic Geology, Vol. 103, pp 493-537.
Benavides-Caceres, V.,1999, Orogenic Evolution of the Peruvian Andes. in Geology and Ore Deposits of the Central Andes, Soc. Econ. Geo. Special Pub. No. 7, Skinner, B.J. (Ed), pp. 61-107.
Bieniawski, Z.T., 1988. The Rock Mass Rating (RMR) System (Geomechanics Classification) in Engineering Practice, Rock Classification Systems for Engineering Purposes, ASTM STP 984, ed. Louis Kirkaldie, American Society for Testing and Materials, Philadelphia, pp. 17-34.
BISA, 2022. Estudio Geomecánico de la Unidad Minera El Porvenir. Report submitted to Nexa dated 23 June 2022.
Canadian Institute of Mining, Metallurgy and Petroleum (CIM), 2014, CIM Definition Standards for Mineral Resources and Mineral Reserves, adopted by the CIM Council on May 10, 2014.
| 24- |
|
|
Cesel Ingenieros, 2011, Modificación del EIA para la Ampliación de la Capacidad Instalada a 7,500 TMD Unidad Minera El Porvenir, prepared for Compañía Minería Milpo S.A.A., December 2011.
CIM, 2019, CIM Estimation of Mineral Resources & Mineral Reserves Best Practice Guidelines, adopted by the CIM Council on November 29, 2019.
Clark, A.H., Farrar, E., Kontak, D.J., Langridge, R.J., Arena, F., Francem L.J., McBride, S.L., Woodman, P.L., Wasteneys, H.A., Sandeman, H.A. and Archibald, D.A., 1990, Geologic and Geochronological Constraints on the Metallogenic Evolution of the Andes of Southern Peru. Econ. Geo., Vol. 85, pp. 1520-1583.
Cobeñas, B.G.R., 2008, Cinturonas metalogénicos cenozoicos en Pasy y Huánuco: tipos de yacimientos y naturaleza geoquímica de los magmas asociados: Universidad Nacional Mayor do San Marcos, Facultad de Ingeniera Geologica, Minera, Metalurgica y Geográfica, Tesis, 75 p.
Compañía Minera Milpo, 2011, Modificación del EIA por Ampliación de Capacidad Instalada de la Planta Concentradora a 5,500 TMPD de la U.M. El Porvenir (UEA Milpo No. 1), February 2011.
Ecotec, 2018, Quinto Informe Técnico Sustentatorio (ITS) para la Modificación de Componentes Auxiliares de la Unidad Minera El Porvenir, Report No. 290463-200-103-INF-001 Rev. 1 prepared for Nexa Resources El Porvenir S.A.C., December 4, 2018.
Einaudi, M.T. and Burt, D.M., 1982, Introduction; Terminology, Classification, and Composition of Skarn Deposits. Economic Geology, 77, 745-754.
Ellison, R.A., Klink, B.A., and Hawkins, 1989, Deformation events in the Andean cycle in the Altiplano and Western Cordillera, southern Peru. Journal of South American Earth Sciences, Vol. 3 pp. 263-276.
Engler, A., 2009, The Geology of South America. GEOLOGY Vol. IV, pp. 374-405.
Escegis, 2020, Sexto Informe Técnico Sustentatorio de la Unidad Minera El Porvenir, prepared for Nexa Resources El Porvenir S.A.C., January 2020.
Fontboté, L., Amstutz, G.C., Cardozo, M., Cedillo, E., and Frutos, J. (eds), 1990, Stratabound Ore Deposits in the Andes. Special Publication no. 8 of the Society for Geology Applied to Mineral Deposits, 815.
Gilbert, J.M., and Lowell, J.D., 1974, Variations in zoning patterns pattern in porphyry ore deposits: Can. Inst. Mining Metall., 67, 742, 99-104.
Grimstad, E. and Barton, N., 1993. Updating the Q-System for NTM. Proc. Int. Symp. On Sprayed Concrete – Modern Use of Sprayed Concrete for Underground Support, Fagernes, (eds Kompen, Opsahl and Berg), Oslo: Norwegian Concrete Assn.
Gunnesch, K.A., Baumann, A., and Gunnesch, M., 1990, Lead isotope variations across the central Peruvian Andes. Economic Geology; 85 (7), 1384–1401.
Hammarstrom, J.M., Kotlyar, B.B., Theodore, T.G., Elliott, J.E., John, D.A., Doebrich, J.L., Nash, J.T., Carlson, R.R., Lee, G.K., Livo, K.E., and Klein, D.P., 1991, Cu-Au and Zn-Pb Skarn Deposits: U.S. Geological Survey Open File Report 95-0831, Ch. 12, 90-111.
Hatch, 2024, Debottlenecking Project – Cerro Pasco Unit, Final Report Rev. C, January 24, 2024.
| 24- |
|
|
Hoek, E., Kaiser P. K., Bawden W. F., 1995. Support of Underground Excavations in Hard Rock. Balkema, Rotterdam.
Hutchison, D. J. , and Diederichs, M. S., 1996. Cablebolting in Underground Mines. Bi Tech Publishers, Richmond.
INGEROC SpA. 2017. Medición de Esfuerzo Unidad Porvenir. (P-IDR-339-131-16-01-00).
INGEROC SpA. 2018. Análisis Método de Explotación, Mina Porvenir.
Kirkham, R.V., 1971, Intermineral intrusions and their bearing on the origin of porphyry copper and molybdenum deposits: Economic Geology, 66, 1244-1250.
Kirkham, R.V., 1972, Porphyry deposits, in Blackadar, R.G., ed., Report of Activities Part B, November 1971 to March 1972: Geological Survey of Canada, Paper 72-1b, 62-64.
Kirkham, R.V., and Sinclair, W.D., 1995, Porphyry copper, gold, molybdenum, tungsten, tin, silver, in Eckstrand, O.R., Sinclair, W.D., and Thorpe, R.I., eds., Geology of Canadian Mineral Deposit Types: Geological Survey of Canada, Geology of Canada, 8, 421-446.
Klohn Crippen Berger (KCB), 2006, Plan de Cierre Conceptual de la U.E.A. Milpo No. 1, prepared for Compañía Minería Milpo S.A.A., August 16, 2006.
KCB, 2020, Tercera Modificación de Plan de Cierre El Porvenir, Report No. ZC1365A01 prepared for Nexa Resources El Porvenir S.A.C., January 2020.
Mathews, K.E., Hoek, E., Wyllie, D.C. and Stuart, S.B.V. 1981. Prediction of Stable Excavations for mining at Depths below 1000 m in Hard Rock. CNMET Report. Ottawa. Dept. Energy, Mines and Resources.
Mégard, F., 1968, Geologia de Cuadrángulo de Huandayo: Boletin del Servicio de Geologia y Mineria 18, 123p.
MINEM, 2016, Evaluación Final de la Segunda Modificación del Plan de Cierre de Minas de la Unidad Minera Atacocha de Compañía Minera Atacocha S.A.A., Informe No. 321-2016-MEM-DGAAM//DGAM/PC, Referencias 2561699, 2573110, 2585342, March 30, 2016.
MINEM, 2022, Evaluación de la Cuarta Modificación del Plan de Cierre de Minas de la Unidad Minera Atacocha de Nexa Resources Atacocha S.A.A., Informe No. 0552-2022/MINEM-DGAAM-DEAM-DGAM, Referencia 3235318, September 29, 2022.
Nexa Resources El Porvenir S.A.C., 2019, Annual Report on Compliance with the Environmental Management Strategy in 2018. El Porvenir Mining Unit. June, 2019.
Nexa Resources El Porvenir S.A.C., 2020, Annual Report on Compliance with the Environmental Management Strategy in 2019. El Porvenir Mining Unit. September, 2020.
Nexa Resources Peru, 2023a, Social Management: Integrated Social System for the Pasco Complex (slide deck), December 2023.
Nexa Resources Peru, 2023b, Management of Local Employment and Hiring for the Pasco Complex (slide deck).
Nexa Resources Peru, 2024, 2023 Annual Report. Retrieved at 7dde03ee-6fc5-df35-f25b-1d7d2cc0a431 (mziq.com)
Nexa Resources S.A., 2020, Estudio de la Vida Útil da estrutura: Barragem de Relaves de la Unidad El Porvenir.
| 24- |
|
|
Nexa Resources S.A., 2024, Amostragem de testemunhos de sondagem diamantada, PO-EXP-GTO-009-PT, March 3, 2024.
Nexa Resources S.A., 2023, 2022 Nexa Annual Report. Retrieved at 2022 Annual Report Nexa (nexaresources.com)
Nexa Resources S.A., 2023a, Technical Report on the El Porvenir Mine, Department of Pasco, Peru, NI 43-101 Technical Report, Issue Date January 15, 2023.
Nexa Resources S.A., 2023b, Technical Report on the Atacocha Mine, Pasco Province, Central Peru, NI 43-101 Technical Report, Issue Date January 31, 2023.
Nexa Resources S.A., 2024, PE_ATA_EP_REL_ANUAL_PM_2023 Legal Opinion, March 6, 2024.
Nickson, S.D. 1992. Cablebolt support guidelines for underground hard rock mine operations. MSc thesis (unpublished), University of British Columbia, Vancouver, British Columbia, Canada.
Peterson, U., 1999, Magmatic and metallogenic evolution of the Central Andes. In Geology and ore deposits of the Central Andes (Skinner, B.; editor). Society of Economic Geology, Special Publication, No. 7, pp. 109-153.
Pfiffner, O.A., and Gonzalez, L., 2013, Mesozoic–Cenozoic Evolution of the Western Margin of South America: Case Study of the Peruvian Andes. Geosciences 2013, 3, 262-310. https://doi.org/10.3390/geosciences3020262.
Potvin, Y. 1988. Empirical open stope design in Canada. PhD thesis. Vancouver. Dept Mining & Minerals Processing, University of British Columbia.
Potvin, Y., and Milne, D. 1992. Empirical Cable Bolt Support Design. In Rock Support in Mining and Construction, proc. Int. symp. on rock support, Sudbury, (eds P. K. Kaiser and D. R. McCreath), 269-275. Rotterdam: Balkema
Roscoe Postle Associates Inc. (RPA), 2019. Technical Report on the Atacocha Mine, Pasco Province, Central Peru, NI 43-101 Report prepared by Ladd, S., et al. for Nexa Resources S.A., March 22, 2019. 339 p.
Samaniego, A., 1982, Correlation of stratabound mineral deposits in the Early Cretaceous Santa Metallotect of north and central Peru. In: Amstutz GC, El Goresy A, Frenzel G, Kluth C, Moh G, Wauschkuhn A, Zimmermann RA (eds) Ore genesis, the state of the art. Springer, Berlin Heidelberg New York Tokyo, pp 508–527.
Schlumberger Water Services, 2012, Actualización de Plan de Cierre de Minas Unidad Minera El Porvenir (U.E.A. Milpo No. 1), Report No. 51739 prepared for Compañía Minería Milpo S.A.A., June 2012.
SENACE, 2018, Informe Técnico Final de Evaluación de la Segunda Modificacion del Estudio de Impacto Ambiental de la Ampliacion de Capacidad de Producción de la Planta Concentradora de la Concesión de Beneficio Chicrin No. 2 a 5,000 TMD, presentado por Compañía Minera Atacocha S.A.A., Informe No. 529-2018-SENACE-JEF/DEAR, Referencia 06366-2017, August 21, 2018.
SENACE, 2020, Evaluación del Segundo Informe Técnico Sustentatorio de la Unidad Minera Atacocha, presentado por Nexa Resources Atacocha S.A.A., Informe No. 00096-2020-SENACE-PE/DEAR, Referencia M-ITS-00278-2019, February 10, 2020.
| 24- |
|
|
SENACE, 2021, Evaluación del Séptimo Informe Técnico Sustentatorio de la Unidad Minera El Porvenir, Informe No. 00159-2020-SENACE-PE/DEAR, Referencia M-ITS-00014-2021, March 4, 2021.
SENACE, 2021, Evaluación del Tercer Informe Técnico Sustentatorio de la Unidad Minera Atacocha, Informe No. 427-2021-SENACE-PE/DEAR, Referencia M-ITS-00102-2021, June 21, 2021.
SENACE, 2024, Evaluación de la Solicitud de Aprobación del Octavo Informe Técnico Sustentatorio de la Unidad Minera El Porvenir, presentado por Nexa Resources El Porvenir S.A.C., Informe No. 00117-2024-SENACE-PE/DEAR, Referencia M-ITS-00121-2023, February 7, 2024.
Sinclair, W.D., 2007, Porphyry Deposits. In: Goodfellow, W.D., Ed., Mineral Deposits of Canada: A Synthesis of Major Deposit-Types, District Metallogeny, the Evolution of Geological Provinces, and Exploration Methods, Geological Association of Canada, Mineral Deposits Division, Special Publication, Canada, Newfoundland, 223-243.
SLR Consulting (Canada) Ltd., 2021, Technical Report Summary on the El Porvenir Mine, Department of Pasco, Peru, S-K 1300 Report prepared for Nexa Resources S.A. January 15, 2021 as amended October 18, 2021. 372 p.
SLR Consulting (Canada) Ltd., 2021, Technical Report on the El Porvenir Mine, Department of Pasco, Peru, NI 43-101 Report prepared for Nexa Resources S.A. January 15, 2021. Effective Date December 31, 2020. 404 p.
Soler, P., 1986, La province polymétallique des Andes du Pérou central : synthèse gîtologique.
Soler, P. & Bonhomme, M., 1988, Oligocene magmatic activity and associated mineralization in the polymetallic belt of central Peru. Economic Geology, 83(3), 657-663.
SRK Consulting (Peru) S.A., 2017, Independent Technical Report pursuant to National Instrument 43-101 of the Canadian Securities Administrators for El Porvenir Mine, Perú, prepared for VM Holding S.A., filed on SEDAR/ available at www.sedar.com (August 15, 2017).
SRK Consulting (Perú) S.A., 2018, Segunda Modificacion del Estudio de Impacto Ambiental de la Ampliacion de Capacidad de Producción de la Planta Concentradora de la Concesión de Beneficio Chicrin No. 2 a 5,000 TMD, Capítulo 6 Estrategia de Manejo Ambiental. Agosto, 2018.
Transmin Metallurgical Consultants, 2018, Estudio Geometalurgico Preliminar para Unidad Minera El Porvenir, June 15, 2018.
Transmin Metallurgical Consultants, 2019, Estudio Geometalúrgico Fase 2 para Unidad Minera El Porvenir, April 29, 2019.
Transmin Metallurgical Consultants, 2020, Estudio Geometalúrgico Fase 3 para Unidad Minera El Porvenir, May 18, 2020.
Transmin Metallurgical Consultants, 2021, Estudio Geometalúrgico Fase 4 para Unidad Minera El Porvenir, June 17, 2021.
Transmin Metallurgical Consultants, 2022, Estudio Geometalúrgico Fase 5 para Unidad Minera El Porvenir, May 5, 2022.
Transmin Metallurgical Consultants, 2023, Estudio Geometalúrgico Fase 6 para Unidad Minera El Porvenir, April 20, 2023.
| 24- |
|
|
US Securities and Exchange Commission, 2018, Regulation S-K, Subpart 229.1300, Item 1300 Disclosure by Registrants Engaged in Mining Operations and Item 601 (b)(96) Technical Report Summary.
Weather-Atlas.com, 2024, Climate and Monthly Weather Forecast Cerro de Pasco, Peru.
| 24- |
|
|
| 25.0 | Reliance on Information Provided by the Registrant |
This TRS has been prepared by SLR and by Nexa. The information, conclusions, opinions, and estimates contained herein are based on:
| · | Information available to SLR at the time of preparation of this TRS. |
| · | Assumptions, conditions, and qualifications as set forth in this TRS. |
| · | Data, reports, and other information supplied by Nexa and other third-party sources. |
For the purpose of this TRS, the QP has relied on ownership information provided by Nexa in a legal opinion by the Legal Corporate Manager and Institutional Affairs of Nexa Peru dated March 6, 2024 entitled “PE_ATA_EP_REL_ANUAL_PM_2023 Legal Opinion” (Bardales Rojas, 2024). The QP has not researched property title or mineral rights for Cerro Pasco as we consider it reasonable to rely on Nexa’s legal counsel who is responsible for maintaining this information.
SLR has relied on Nexa for guidance on applicable taxes, royalties, and other government levies or interests, applicable to revenue or income from the Cerro Pasco Complex in the Executive Summary and Section 19. As the Complex has been in operation for over ten years, Nexa has considerable experience in this area.
The Qualified Persons have taken all appropriate steps, in their professional opinion, to ensure that the above information from Nexa is sound.
Except as provided by applicable laws, any use of this TRS by any third party is at that party’s sole risk.
| 25- |
|
|
| 26.0 | Date and Signature Page |
This report titled “Technical Report Summary on Cerro Pasco Complex Integration, Pasco Province, Peru” with an effective date of December 31, 2023 was prepared and signed by:
| (Signed) SLR Consulting (Canada) Ltd | ||
| Dated at Toronto, ON | SLR Consulting (Canada) Ltd. | |
| March 27, 2024 | ||
| (Signed) Jerry Huaman Abalos | ||
| Dated at Lima, Peru | ||
| March 27, 2024 | Jerry Huaman Abalos, B.Geo., AusIMM CP(Geo), | |
| Corporate Mineral Resource Manager, | ||
| Nexa Resources S.A. |
| 26- |
|
|


SLR Consulting (Canada) Ltd. 55 University Ave., Suite 501, Toronto, ON M5J 2H7 March 27, 2024 Consent of Qualified Person Re: Form 20-F of Nexa Resources S.A. (the “Company”) SLR Consulting (Canada) Ltd. (“SLR”), in connection with the Company’s Annual Report on Form 20-F for the year ended December 31, 2023 (the “Form 20-F”), consents to: • The public filing by the Company and use of the technical report titled “Technical Report Summary on the Cerro Pasco Complex Integration, Pasco Province, Peru” (the “Technical Report Summary”), with an effective date of December 31, 2023 and issue date of March 27, 2024, that was prepared in accordance with Subpart 1300 of Regulation S-K promulgated by the U.S. Securities and Exchange Commission, as an exhibit to and referenced in the Company’s Form 20-F; • the use of and references to our name, including our status as an expert or “qualified person” (as defined in Subpart 1300 of Regulation S-K promulgated by the U.S. Securities and Exchange Commission), in connection with the Form 20-F and any such Technical Report Summary; and • any extracts from or a summary of the Technical Report Summary in the Form 20-F and the use of any information derived, summarized, quoted, or referenced from the sections of the Technical Report Summary, or portions thereof, that were prepared by us, that we supervised the preparation of, and/or that was reviewed and approved by us, that is included or incorporated by reference in the Form 20-F. SLR is responsible for authoring sections of the Technical Report Summary, and this consent pertains to, those sections of the Technical Report Summary. SLR certifies that it has read the Form 20-F and that it fairly and accurately represents the information in the Technical Report Summary for which it is responsible. SLR Consulting (Canada) Ltd. Per: (Signed) Jason J. Cox Jason J. Cox, P.Eng. Global Technical Director
Exhibit 15.6


NEXA RESOURCES S.A.
POLICY FOR THE RECOVERY OF ERRONEOUSLY AWARDED COMPENSATION
1.Purpose. The purpose of this Policy is to describe the circumstances in which Executive Officers will be required to repay or return Erroneously Awarded Compensation to the Company Group in accordance with the Clawback Rules. Each Executive Officer shall be required to sign and return to the Company the Acknowledgement Form attached hereto as Exhibit A pursuant to which such Executive Officer will acknowledge that he or she is bound by the terms of this Policy; provided, however, that this Policy shall apply to, and be enforceable against, any Executive Officer and his or her successors (as specified in Section 11 of this Policy), including those who succeed any Executive Officer on an interim basis, regardless of whether or not such Executive Officer properly signs and returns to the Company such Acknowledgement Form and regardless of whether or not such Executive Officer is aware of his or her status as an Executive Officer. This Policy is designed to comply with the Clawback Rules.
2.Administration. Except as specifically set forth herein, this Policy shall be administered by the Compensation, Nominating and Governance (CNG) Committee of the Board unless the Board determines to administer this Policy itself. Any determinations made by the CNG Committee shall be final and binding on all affected individuals and need not be uniform with respect to each individual covered by this Policy. Subject to any limitation under applicable law, the Board and/or the CNG Committee may authorize and empower any officer or employee of the Company Group to take any and all actions necessary or appropriate to carry out the purpose and intent of this Policy (other than with respect to any recovery under this Policy involving such officer or employee).
3.Definitions. For purposes of this Policy, the following capitalized terms shall have the meanings set forth below.
(a) “Accounting Restatement” shall mean an accounting restatement: (i) due to the material noncompliance of the Company with any financial reporting requirement under the securities laws (as used in the Clawback Rules), including any required accounting restatement to correct an error in previously issued financial statements that is material to the previously issued financial statements (a “Big R” restatement); or (ii) that would result in a material misstatement if the error were corrected in the current period or left uncorrected in the current period (a “little r” restatement). For the avoidance of doubt, financial statements to be considered in the previous paragraph are Company’s consolidated financial statements for the relevant fiscal year(s) prepared in accordance with International Financial Reporting Standards as issued by the International Accounting Standards Board (“Consolidated IASB IFRS”) included in the relevant fillings of the Company under the securities laws.
(b) “Board” shall mean the Board of Directors of the Company.
(c) “Clawback Eligible Incentive Compensation” shall mean, with respect to each individual who served as an Executive Officer at any time during the applicable performance period for any Incentive-based Compensation (whether or not such Executive Officer is serving at the time the Erroneously Awarded Compensation is required to be repaid to the Company Group),
|
|
all Incentive-based Compensation Received by such Executive Officer: (i) on or after the Effective Date; (ii) after beginning service as an Executive Officer; (iii) while the Company has a class of securities listed on the NYSE; and (iv) during the applicable Clawback Period.
(d) “Clawback Period” shall mean, with respect to any Accounting Restatement, the three completed fiscal years of the Company immediately preceding the Restatement Date and any transition period (that results from a change in the Company’s fiscal year) of less than nine months within or immediately following those three completed fiscal years.
(e) “Clawback Rules” shall mean Section 10D of the Exchange Act and any applicable rules or standards adopted by the SEC (including Rule 10D-1 under the Exchange Act), the NYSE (including Section 303A.14 of the NYSE Listed Company Manual) or the rules of any other U.S. national securities exchange or national securities association on which the Company’s securities are listed, in each case as may be in effect from time to time.
(f) “CNG Committee” shall mean the Compensation, Nominating and Governance Committee of the Board, or any other committee designated by the Board to administer the Policy, and in the absence of such a committee, a majority of the independent directors serving on the Board.
(g) “Company” shall mean Nexa Resources S.A.
(h) “Company Group” shall mean the Company, together with each of its direct and indirect subsidiaries.
(i) “Effective Date” shall mean October 2, 2023.
(j) “Erroneously Awarded Compensation” shall mean, with respect to each Executive Officer in connection with an Accounting Restatement, the amount of Clawback Eligible Incentive Compensation that exceeds the amount of Incentive-based Compensation that otherwise would have been Received had it been determined based on the restated amounts, computed without regard to any taxes paid.
(k) “Exchange Act” shall mean the Securities Exchange Act of 1934, as amended, and the rules and regulations promulgated thereunder.
(l) “Executive Officer” shall mean any individual who is (or was at any time during the applicable Clawback Period) a managing or executive officer as determined in the Company’s Article of Association or by the Board or the CNG Committee in accordance with the definition of “executive officer” as set forth in the Clawback Rules and any other senior executive, employee or other personnel of the Company Group who may from time to time be deemed subject to the Policy by the CNG Committee. For the avoidance of doubt, the CNG Committee shall have full discretion to determine which individuals in the Company Group shall be considered an “Executive Officer” for purposes of this Policy. Individuals serving in the following roles at the Company Group shall be deemed to be an Executive Officer for the purposes of this Policy: the Company’s president, principal financial officer, principal accounting officer (or if there is no such accounting officer, the controller), any vice-president of the Company in charge of a principal business unit, division, or function (such as sales, administration, or finance), any other officer
|
|
who performs a policy-making function, or any other person who performs similar policymaking functions for the Company or Company Group.
(m) “Financial Reporting Measures” shall mean measures that are determined and presented in accordance with the accounting principles used in preparing the Company’s financial statements, and any measures that are derived wholly or in part from such measures. Stock price and total shareholder return shall for purposes of this Policy be considered Financial Reporting Measures. For the avoidance of doubt, a Financial Reporting Measure need not be presented within the Company’s financial statements or included in a filing with the SEC.
(n) “Incentive-based Compensation” shall mean any compensation that is granted, earned or vested based wholly or in part upon the attainment of a Financial Reporting Measure.
(o) “Impracticable” shall mean, in accordance with the good faith determination of the independent directors of the CNG Committee that either: (i) the direct expenses paid to a third party to assist in enforcing the Policy against an Executive Officer would exceed the amount to be recovered, after the Company has made a reasonable attempt to recover the applicable Erroneously Awarded Compensation, documented such reasonable attempt(s) and provided such documentation to the NYSE (ii) recovery would violate Luxembourg law where that law was adopted prior to November 28, 2022, provided that, before concluding that it would be impracticable to recover any amount of Erroneously Awarded Compensation based on violation of Luxembourg law, the Company has obtained an opinion of Luxembourg counsel, acceptable to the NYSE, that recovery would result in such a violation and a copy of the opinion is provided to the NYSE; or (iii) recovery would likely cause an otherwise tax-qualified retirement plan, under which benefits are broadly available to employees of the Company Group, to fail to meet the requirements of 26 U.S.C. 401(a)(13) or 26 U.S.C. 411(a) and regulations thereunder.
(p) “Method of Recovery” shall include, but is not limited to: (i) requiring reimbursement of Erroneously Awarded Compensation; (ii) seeking recovery of any gain realized on the vesting, exercise, settlement, sale, transfer, or other disposition of any equity-based awards; (iii) offsetting the Erroneously Awarded Compensation from any compensation otherwise owed by the Company Group to the Executive Officer; (iv) cancelling outstanding vested or unvested equity awards; and (v) taking any other remedial and recovery action permitted by applicable law, as determined by the CNG Committee.
(q) “NYSE” shall mean the New York Stock Exchange.
(r) “Policy” shall mean this Policy for the Recovery of Erroneously Awarded Compensation, as the same may be amended and/or restated from time to time.
(s) “Received” shall, with respect to any Incentive-based Compensation, mean deemed receipt and Incentive-based Compensation shall be deemed received in the Company’s fiscal period during which the Financial Reporting Measure specified in the Incentive-based Compensation award is attained, even if the payment or grant of the Incentive-based Compensation occurs after the end of that period. For the avoidance of doubt, Incentive-Based Compensation that is subject to both a Financial Reporting Measure vesting condition and a service-based vesting
|
|
condition shall be considered received when the Financial Reporting Measure is achieved, even if the Incentive-Based Compensation continues to be subject to the service-based vesting condition.
(t) “Restatement Date” shall mean the earlier to occur of: (i) the date the Board, a committee of the Board or the Executive Officer or Executive Officers of the Company authorized to take such action if Board action is not required, concludes, or reasonably should have concluded, that the Company is required to prepare an Accounting Restatement; or (ii) the date a court, regulator or other legally authorized body directs the Company to prepare an Accounting Restatement.
(u) “SEC” shall mean the U.S. Securities and Exchange Commission.
4.Repayment of Erroneously Awarded Compensation.
(a) In the event the Company is required to prepare an Accounting Restatement, the CNG Committee shall reasonably promptly (in accordance with the applicable Clawback Rules) determine the amount of any Erroneously Awarded Compensation for each Executive Officer in connection with such Accounting Restatement and shall reasonably promptly thereafter provide each Executive Officer with notice containing the amount of Erroneously Awarded Compensation and a demand for repayment or return, as applicable. For Incentive-based Compensation based on stock price or total shareholder return where the amount of Erroneously Awarded Compensation is not subject to mathematical recalculation directly from the information in the applicable Accounting Restatement, the amount shall be determined by the CNG Committee based on a reasonable estimate of the effect of the Accounting Restatement on the stock price or total shareholder return upon which the Incentive-based Compensation was Received (in which case, the Company shall maintain documentation of such determination of that reasonable estimate and provide such documentation to the NYSE). The CNG Committee is authorized to engage, on behalf of the Company, any third-party advisors it deems advisable in order to perform any calculations contemplated by this Policy. For the avoidance of doubt, recovery under this Policy with respect to an Executive Officer shall not require the finding of any misconduct by such Executive Officer or such Executive Officer being found responsible for the accounting error leading to an Accounting Restatement.
(b) In the event that any repayment of Erroneously Awarded Compensation is owed to the Company Group, the CNG Committee shall, or shall cause one or more other members of the Company Group to, recover reasonably promptly the Erroneously Awarded Compensation through any Method of Recovery it deems reasonable and appropriate in its discretion based on all applicable facts and circumstances and taking into account the time value of money and the cost to shareholders of delaying recovery. For the avoidance of doubt, except to the extent permitted pursuant to the Clawback Rules, in no event may the Company Group accept an amount that is less than the amount of Erroneously Awarded Compensation in satisfaction of an Executive Officer’s obligations hereunder. Notwithstanding anything herein to the contrary, the Company shall not be required to take the actions contemplated in this Section 4(b) if the independent directors serving on the CNG Committee determines in good faith that recovery would be Impracticable. In implementing the actions contemplated in this Section 4(b), the CNG Committee will act in accordance with the listing standards and requirements of the NYSE and with the applicable Clawback Rules.
|
|
5. Reporting and Disclosure. The Company shall file all disclosures with respect to this Policy in accordance with the requirements of U.S. federal securities laws, including any disclosure required by applicable SEC rules.
6.Indemnification Prohibition. No member of the Company Group shall be permitted to indemnify any Executive Officer against the loss of any Erroneously Awarded Compensation that is repaid, returned or recovered pursuant to the terms of this Policy and/or pursuant to the Clawback Rules, including any payment or reimbursement for the cost of third-party insurance purchased by any Executive Officer to cover any such loss under this Policy and/or pursuant to the Clawback Rules. Further, no member of the Company Group shall enter into any agreement that exempts any Incentive-based Compensation from the application of this Policy or that waives the Company Group’s right to recovery of any Erroneously Awarded Compensation and this Policy shall supersede any such agreement (whether entered into before, on or after the Effective Date). Any such purported indemnification (whether oral or in writing) shall be null and void.
7.Interpretation. The CNG Committee is authorized to interpret and construe this Policy and to make all determinations necessary, appropriate, or advisable for the administration of this Policy. It is intended that this Policy be interpreted in a manner that is consistent with the requirements of the Clawback Rules. The terms of this Policy shall also be construed and enforced in such a manner as to comply with applicable law, including the Sarbanes-Oxley Act of 2002, the Dodd-Frank Wall Street Reform and Consumer Protection Act, and any other law or regulation that the CNG Committee determines is applicable. In the event any provision of this Policy is determined to be unenforceable or invalid under applicable law (including under Luxembourg law)), such provision shall be applied to the maximum extent permitted by applicable law and shall automatically be deemed amended in a manner consistent with its objectives to the extent necessary to conform to any limitations required by applicable law.
8.Effective Date. This Policy shall be effective as of the Effective Date.
9.Amendment; Termination. The Board may modify, amend or terminate this Policy, in whole or in part, from time to time in its discretion and shall amend any or all of the provisions of this Policy as it deems necessary, including as and when it determines that it is legally required by any federal securities law, SEC rule or NYSE rule. Notwithstanding anything in this Section 9 to the contrary, no amendment or termination of this Policy shall be effective if such amendment or termination would (after taking into account any actions taken by the Company contemporaneously with such amendment or termination) cause the Company to violate the Clawback Rules, or any federal securities law, SEC rule or NYSE rule. Furthermore, unless otherwise determined by the Board or as otherwise amended, this Policy shall automatically be deemed amended in a manner necessary to comply with any change in the Clawback Rules.
10.Other Recoupment Rights; No Additional Payments. The Board and the CNG Committee intends that this Policy will be applied to the fullest extent permitted by applicable law. The CNG Committee may require that any employment agreement, equity award agreement, or any other agreement entered into on or after the Effective Date shall, as a condition to the grant of any benefit thereunder, require an Executive Officer to agree to abide by the terms of this Policy. Executive Officers shall be deemed to have accepted continuing employment on terms that include compliance with the Policy, to the extent of its otherwise applicable provisions, and to be
|
|
contractually bound by its enforcement provisions. Executive Officers who cease employment or service with the Company Group shall continue to be bound by the terms of the Policy with respect to Incentive Compensation subject to this Policy. Any right of recoupment under this Policy is in addition to, and not in lieu of, any other remedies or rights of recoupment that may be available to the Company Group under applicable law, regulation or rule or pursuant to the terms of any similar policy in any employment agreement, cash-based bonus plan, equity award agreement or similar agreement and any other legal remedies available to the Company Group. Nothing in this Policy precludes the Company from implementing any additional Clawback or recoupment policies with respect to Executive Officers. Application of this Policy does not preclude the Company Group from taking any other action to enforce any Executive Officer’s obligations to the Company or the Company Group, including termination of employment or institution of civil or criminal proceedings or any other remedies that may be available to the Company or Company Group with respect to any Executive Officer.
11.Successors. This Policy shall be binding and enforceable against all Executive Officers and their beneficiaries, estates, heirs, executors, administrators or other legal representatives to the extent required by the Clawback Rules or as otherwise determined by the CNG Committee.
* * *
|
|
Exhibit A
NEXA RESOURCES S.A.
POLICY FOR THE RECOVERY OF ERRONEOUSLY AWARDED COMPENSATION
ACKNOWLEDGEMENT FORM
By signing below, the undersigned executive officer (the “Executive Officer”) acknowledges and confirms that the Executive Officer has received and reviewed a copy of the Nexa Resources S.A. Policy for the Recovery of Erroneously Awarded Compensation (the “Policy”). Capitalized terms used but not otherwise defined in this Acknowledgement Form (this “Acknowledgement Form”) shall have the meanings ascribed to such terms in the Policy.
By signing this Acknowledgement Form, the Executive Officer acknowledges and agrees as follows:
| (a) | the Executive Officer is and will continue to be subject to the Policy and that the Policy will apply both during and after the Executive Officer’s employment with the Company Group; |
| (b) | to the extent necessary to comply with the Policy, the Policy hereby amends any employment agreement, equity award agreement or similar agreement that the Executive Officer is a party to with the Company Group; |
| (c) | the Executive Officer shall abide by the terms of the Policy, including, without limitation, by returning any Erroneously Awarded Compensation to the Company Group to the extent required by, and in a manner permitted by, the Policy; |
| (d) | any amounts payable to the Executive Officer, including any compensation that is granted, earned, or vested based wholly or in part upon the attainment of a Financial Reporting Measure or based on the Company Group’s performance shall be subject to the Policy as may be in effect and modified from time to time in the sole discretion of the Company or as required by applicable law or the requirements of an exchange on which the Company’s shares are listed for trading, and that such modification will be deemed to amend this acknowledgment; |
| (e) | the Company Group may recover compensation paid to the Executive Officer through any Method of Recovery the CNG Committee deems appropriate, and the Executive Officer agrees to comply with any request or demand for repayment by the Company Group in order to comply with the Policy; |
| (f) | the Company Group may, to the greatest extent permitted by applicable law, reduce any amount that may become payable to the Executive Officer by any amount to be recovered by the Company Group pursuant to the Policy to the extent such amount has not been returned by the Executive Officer to the Company Group prior to the date that any subsequent amount becomes payable to the Executive Officer. |
[Signature page follows]
|
|
|
Signature |
|
|
Print Name |
|
|
Date |
|
|