UNITED STATES
SECURITIES AND EXCHANGE COMMISSION
Washington, D.C. 20549
FORM 6-K
Report of Foreign Issuer
Pursuant to Rule 13a-16 or 15d-16
of the Securities Exchange Act of 1934
For the month of November, 2023
Commission File Number: 001-15276
Itaú Unibanco Holding S.A.
(Exact name of registrant as specified in its charter)
Itaú Unibanco Holding S.A.
(Translation of Registrant’s Name into English)
Praça Alfredo Egydio de Souza Aranha, 100-Torre Conceicao
CEP 04344-902 São Paulo, SP, Brazil
(Address of principal executive office)
Indicate by check mark whether the registrant files or will file annual reports under cover Form 20-F or Form 40-F.
Form 20-F ☒ Form 40-F ☐
Indicate by check mark if the registrant is submitting the Form 6-K in paper as permitted by Regulation S-T Rule 101(b)(1):
Yes ☐ No ☒
Indicate by check mark if the registrant is submitting the Form 6-K in paper as permitted by Regulation S-T Rule 101(b)(7):
Yes ☐ No ☒
Indicate by check mark whether by furnishing the information contained in this Form, the registrant is also thereby furnishing information to the Commission pursuant to Rule 12g3-2(b) under the Securities Exchange Act of 1934.
Yes ☐ No ☒
If “Yes” is marked, indicate below the file number assigned to the registrant in connection with Rule 12g3-2(b):
82–
SIGNATURES
Pursuant to the requirements of the Securities Exchange Act of 1934, the registrant has duly caused this report to be signed on its behalf by the undersigned, thereunto duly authorized.
Date: November 7, 2023.
| Itaú Unibanco Holding S.A. | ||
| By: | /s/ Renato Lulia Jacob |
|
| Name: | Renato Lulia Jacob | |
| Title: | Group Head of Investor Relations and Market Intelligence | |
| By: | /s/ Alexsandro Broedel |
|
| Name: | Alexsandro Broedel | |
| Title: | Chief Financial Officer | |

ITAÚ UNIBANCO HOLDING S.A. CNPJ 60.872.504/0001-23 A Publicly-Listed Company NIRE 35300010230 ANNOUNCEMENT TO THE MARKET Itaú Unibanco Holding S.A. 3rd Quarter 2023 Result Itaú Unibanco Holding S.A. (“Company”) announces to its shareholders and the market at large that the Complete Financial Statements and the Management Discussion and Analysis for the 3rd quarter of 2023 ending September 30, 2023, are already available on the Investor Relations website (www.itau.com.br/investor-relations). Additionally, we forward the information described below: • Press Presentation on the quarterly result, scheduled for 11/07/2023 at 07:00 a.m. (EST) (Attachment 01); • Presentation of the virtual meeting on the quarterly result, scheduled for Tuesday, 11/07/2023 at 08:00 a.m. (EST) (Attachment 02); • Institutional Presentation of the 3rd quarter of 2023 (Attachment 03). The expectations and tendencies presented are based on information available up to the moment and involve risks, uncertainties, and assumptions that may be beyond our control. These information’s strengthen our commitment to transparency in our disclosures to the many strategic audiences we have. São Paulo ‐ SP, November 07, 2023. Renato Lulia Jacob Group Head of Investor Relations and Market Intelligence conferência com a imprensa 3T23 São Paulo, 7 de novembro de 2023
Attachment 01 (portuguese only)


destaques do trimestre consolidado ROE recorrente gerencial receita de serviços e seguros ¹ custo do crédito NPL > 90 dias índice de capital nível 1 R$ 9,0 bilhões 3,4 R$ 12,9 bilhões 3,6% 3,0% 0,1 p.p R$ 9,3 bilhões 1,9 14,6% 1,0 p.p resultado recorrente gerencial estável 0,5 p.p 22,0% Brasil 21,1% consolidado 2 Nota: Em agosto de 2023, celebramos um acordo para a venda da totalidade das ações do Banco Itaú Argentina. Em função dessa a lie nação, o balanço patrimonial consolidado do Itaú Unibanco da data base de setembro de 2023 não apresenta os saldos patrimoniais do Banco Itaú Argentina, enquanto a demonstração de resultado do tercei ro trimestre levou em conta somente o resultado do mês de julho de 2023.

(1) Receitas de prestação de serviços (+) resultado de operações de seguros, previdência e capitalização ( (--) despesas com sinist ros ( (--) despesas de comercialização de seguros, previdência e Corporativo | Interno set/23 jun/23 D set/22 D pessoas físicas 408,0 405,4 0,6% 385,0 6,0% cartão de crédito 127,7 128,4 -0,5% 128,8 -0,8% crédito pessoal 60,7 58,2 4,2% 51,5 17,9% crédito consignado 73,8 74,9 -1,4% 72,2 2,3% veículos 32,8 32,4 1,0% 31,8 3,1% crédito imobiliário 112,9 111,5 1,3% 100,7 12,1% micro, pequenas e médias empresas 175,6 170,0 3,3% 170,2 3,2% grandes empresas 370,4 359,6 3,0% 345,1 7,3% total Brasil 954,0 935,0 2,0% 900,3 6,0% América Latina 209,2 216,6 -3,4% 210,7 -0,7% total 1.163,2 1.151,6 1,0% 1.111,0 4,7% total (ex-variação cambial) 1.163,2 1.148,3 1,3% 1.100,3 5,7% 100 117 126 100 105 118 1T23 2T23 3T23 carteira de crédito em R$ bilhões ¹ (1) Inclui títulos privados. total vs jun/23 vs set/22 cartões carteira de crédito pessoas físicas - Brasil crescimento crediário 17,5% 15,3% 24,0% 3,7% 3,6% 6,1% Personnalité e Uniclass crédito consignado INSS orgãos públicos 2,9% 2,0% - + 1,5% 13,3% - + empresas privadas + 2,6% + 12,6% Set/23 – Jun/23 Set/23 – Set/22 originação de crédito Empresas – Base 100 1T23 Micro, Pequenas e Médias Empresas Grandes Empresas 4 margem financeira com clientes (1) Inclui o capital alocado às áreas de negócio (exceto tesouraria), além do capital de giro da corporação; (2) Mudança na composição dos ativos com risco de crédito entre períodos no Brasil; (3)América latina e outros considera operações estruturadas do atacado.


margem com clientes margem com clientes ajustada ao risco margem média anualizada Brasil margem média anualizada consolidado R$ 0,7 bi (+3,2%) ¹ 2 ¹ 3 8,6% 8,7% 8,7% 8,8% 8,9% 5,6% 5,1% 5,3% 5,4% 5,6% 3T22 4T22 1T23 2T23 3T23 9,4% 9,4% 9,4% 9,6% 9,7% 6,0% 5,3% 5,6% 5,6% 5,9% 3T22 4T22 1T23 2T23 3T23 24,9 21,8 22,5 25,6 -2,9 -0,3 -0,1 0,3 0,2 0,2 0,1 0,1 3,0 2T23 Capital de Giro Próprio e outros 2T23 Argentina Operações Sensíveis a Spreads 2T23 mix de produtos volume médio spreads e margem de passivos maior quantidade de dias corridos América Latina (ex- Argentina) e outros Operações Sensíveis a Spreads 3T23 Argentina Capital de Giro Próprio e outros 3T23 3T23 4 5 receita de serviços e resultado de seguros ¹ ² em R$ bilhões administração de recursos- saldo em R$ bilhões 2.094 346 2.048 326 2.440 2.374 jun/23 set/23 2,2% 6,3% produtos próprios plataforma aberta 2,8% total 3T23 2T23 D 3T22 D cartões de crédito e débito 4,2 4,0 4,0% 3,9 7,0% emissão 3,0 2,9 4,5% 2,9 2,9% adquirência 1,2 1,2 2,8% 1,0 18,9% conta corrente 1,6 1,7 -2,3% 1,8 -8,9% administração de recursos 1,5 1,4 1,4% 1,4 3,8% assessoria econômico-financeira e corretagem 1,0 0,8 22,8% 0,8 20,9% operações de crédito e garantias prestadas 0,7 0,7 0,2% 0,7 -1,4% serviços de recebimento 0,5 0,5 -0,9% 0,5 3,6% outros 0,4 0,4 9,0% 0,4 -6,4% América Latina (ex-Brasil) 0,8 0,8 -3,7% 0,8 -4,4% receitas de serviços 10,7 10,4 3,2% 10,4 2,7% resultado de seguros, previdência e capitalização 2,2 2,1 5,4% 1,8 19,0% serviços e seguros 12,9 12,4 3,6% 12,3 5,2% renda variável - ECM R$ 3,8 bi 18% market share fusões e aquisições renda fixa - DCM 1º lugar nos rankings de banco de investimento no 3T23³ - volumes R$ 6,6 bi 15% market share R$ 23,5 bi 29% market share emissor R$ 205 bi 2,7% adquirência cartões – volumes transacionados variação vs 2T23 R$ 219 bi 5,3% 5 6(1)Considera receitas de administração de fundos e de administração de consórcios; (2) Inclui as receitas de seguros, previdência e capitalização, após as despesas com sinistros e de comercialização; (3) no Brasil.

qualidade do crédito Brasil Brasil Impacto cessão de créditos¹ consolidado consolidado +0,01 p.p. 3,0%3,1% 2,7% 2,2% 2,3%2,3%2,3% 2,6% 2,5%2,6% 2,7%2,8%2,9%2,9% 3,0%3,0% 3,4%3,5% 3,2% 2,6%2,7% 2,7%2,7%2,8%2,8% 2,9% 3,0% 3,2% 3,4% 3,4% 3,5%3,5% 1,9% 2,0% 1,4% 1,2% 1,3% 1,5% 1,4% 2,0% 1,6%1,6% 1,7% 1,3% 1,3% 1,4%1,3% 1,3% dez/19mar/20 jun/20 set/20 dez/20mar/21 jun/21 set/21 dez/21mar/22 jun/22 set/22 dez/22mar/23 jun/23 set/23 4,8% 5,1%5,0% 4,3%4,2% 3,9% 3,6%3,6%3,8% 4,1% 4,4% 4,7%4,9%4,9%4,9%4,9% 2,3%2,3% 2,0% 1,4% 1,7% 2,5%2,6%2,6% 2,3%2,3%2,2%2,3%2,4%2,3%2,5%2,6% 0,5% 1,1% 0,7%0,5%0,4%0,4%0,3% 1,1% 0,5%0,5% 0,1%0,1%0,0%0,1%0,1%0,1% dez/19mar/20 jun/20 set/20 dez/20mar/21 jun/21 set/21 dez/21mar/22 jun/22 set/22 dez/22mar/23 jun/23 set/23 2,3% 2,6% 1,7%1,9%1,8% 2,0% 2,5% 1,7%1,8% 2,1% 2,1% 2,3% 2,2% 2,5% 2,5%2,3% 2,4% 2,4% 1,7% 2,0% 1,8%2,0%1,9% 1,7% 1,8% 2,2% 2,2% 2,2% 2,3% 2,5%2,5% 2,3% 2,3% 3,0% 1,9% 1,7% 1,9% 2,0% 3,9% 1,7% 1,5% 1,9% 2,0% 2,6% 1,9% 2,4% 2,5% 2,3% dez/19mar/20 jun/20 set/20 dez/20mar/21 jun/21 set/21 dez/21 mar/22 jun/22 set/22 dez/22mar/23 jun/23 set/23 3,1% 3,5% 2,4% 3,0% 2,4% 2,8% 2,6%2,4% 2,7% 3,1% 3,1% 3,2% 3,2% 3,5% 3,4% 3,2% 1,6% 1,9% 1,0%1,1% 1,8% 1,6% 1,4% 1,3% 1,2% 1,6%1,6%1,5% 1,6% 1,8% 1,8% 1,7% 1,2% 0,7% 0,9% 0,7%0,6%0,5% 0,8%0,2%0,2%0,2%0,1%0,1% 0,2%0,2% 0,3%0,2% dez/19mar/20 jun/20 set/20 dez/20mar/21 jun/21 set/21 dez/21 mar/22 jun/22 set/22 dez/22mar/23 jun/23 set/23 (1) No terceiro trimestre de 2023, realizamos vendas de créditos com baixa probabilidade de recuperação para empresas não ligadas e sem retenção de riscos, que estariam ativos ao final de setembro/23 no valor de R$ 19 milhões das carteiras de grandes empresas. 6 despesas não decorrentes de juros (1) Considera despesas operacionais, despesas de provisão e outras despesas tributárias (Inclui IPTU, IPVA, IOF e outros.

Não inclui PIS, COFINS e ISS. variação com destaque para investimentos 9M23 vs. 9M22 (40,1) América Latina Brasil 9M22 9M22 América Latina 6,4 (33,7) (6,3) Core: (0,4) | 1,1% negócios e tecnologia (2,4) Brasil 9M23 (36,5) programa eficiência 1,0 9M23 (42,8) Brasil com investimentos (36,1) (1,3) transacionais e demais em R$ bilhões Investimentos 1 em R$ bilhões consolidado Brasil índice de eficiência 3T19 3T20 3T21 3T22 3T23 3T23 2T23 D 9M23 9M22 D despesas de pessoal (6,6) (6,2) 7,2% (18,7) (16,4) 13,8% despesas administrativas e outras (6,0) (6,0) 1,0% (17,8) (17,3) 3,2% total - Brasil (12,7) (12,2) 4,2% (36,5) (33,7) 8,4% América Latina (ex-Brasil) (2,1) (2,1) -1,7% (6,3) (6,4) -1,1% despesas não decorrentes de juros (14,7) (14,3) 3,3% (42,8) (40,1) 6,9% 7 8 Corporativo | Interno (1) Inclui garantias financeiras prestadas e títulos privados; (2) Composto pelo resultado de créditos de liquidação duvidosa , impairment e descontos concedidos; (3) Receitas de prestação de serviços (+) resultado de operações de seguros, previdência e capitalização ( (--) despesas com sinistros (--) despesas de comercialização de seguros, previdência e capitalização ; (4) Projeção dos resultados entre agosto e dezembro de 2023 e do saldo da carteira de crédito de dezembro de 2023 do Banco Itaú Argentina.

carteira de crédito total ¹ margem financeira com clientes margem financeira com o mercado custo do crédito² receita de prestação de serviços e resultado de seguros 3 despesas não decorrentes de juros a líquota efetiva de IR/CS crescimento entre 6,0% e 9,0% crescimento entre 13,5% e 16,5% entre 27,0% e 29,0% c rescimento entre 5,0% e 9,0% crescimento entre 5,0 e 7,0% entre R$ 36,5 bi e R$ 40,5 bi entre R$ 2,0 bi e R$ 4,0 bi Índice de eficiência abaixo de 40% no consolidado e abaixo de 38% no Brasil g uidance guidance normalizado crescimento entre 5,7% e 8,7% crescimento entre 1 2 e 15,5% entre 26,7% e 28,7% crescimento entre 4,0% e 8,0% crescimento entre 4,7 e 6,7% entre R$ 36,5 bi e R$ 40,5 bi entre R$ 1,6 bi e R$ 3,6 bi impacto Itaú Argentina 4 0,35 p.p 0,97 p.p R$ 0,40 bi R$ 0,01 bi 0,35 p.p 0,96 p.p 0,31 p.p guidance conferência com a imprensa 3 T23 São Paulo, 7 de novembro de 2023 Milton Maluhy Filho Presidente Alexsandro Broedel Chief Financial Officer (CFO)


Attachment 02

earnings review 3 Q 23 São Paulo, November 7 th 2023

c ommissions and insurance¹ cost of credit +90 d ays NPL tier 1 c apital ratio R$ 9.0 billion 3.4% R$12.9 billion 3 3 21.1% 0.1 p.p. R$ 9.3 billion 1.9 14.6% 1.0 p.p. recurring managerial result stable 0.5 p.p 22.0% Brazil consolidated 3Q23 vs. 2Q23 change credit portfolio in R$ billion ¹ (1) includes private securities.

Sep-23 Jun-23 D Sep-22 D individuals 408.0 405.4 0.6% 385.0 6.0% credit card loans 127.7 128.4 -0.5% 128.8 -0.8% personal loans 60.7 58.2 4.2% 51.5 17.9% payroll loans 73.8 74.9 -1.4% 72.2 2.3% auto loans 32.8 32.4 1.0% 31.8 3.1% mortgage 112.9 111.5 1.3% 100.7 12.1% very small, small and middle market loans 175.6 170.0 3.3% 170.2 3.2% corporate loans 370.4 359.6 3.0% 345.1 7.3% total Brazil 954.0 935.0 2.0% 900.3 6.0% Latin America 209.2 216.6 -3.4% 210.7 -0.7% total 1,163.2 1,151.6 1.0% 1,111.0 4.7% total (ex-fx variation) 1,163.2 1,148.3 1.3% 1,100.3 5.7% 100 117 126 100 105 118 1T23 2T23 3T23 total vs Jun-23 vs Sep-22 credit cards individuals credit portfolio- Brazil growth personal loans - unsecured 17.5% 15.3% 24.0% 3.7% 3.6% 6.1% Personnalitéand Uniclass payroll loans INSS (public pension) public sector 2.9% 2.0% - + 1.5% 13.3% - + private sector + 2.6% + 12.6% Sep-23 – Jun-23 Sep-23 – Sep-22 credit origination Companies – Base 100 1Q23 Very Small, Small and Middle Market companies Corporate 1Q23 2Q23 3Q23 financial margin with clients margin with clients risk-adjusted financial margin with clients annualized average margin Brazil 4 annualized average margin consolidated 8.6% 8.7% 8.7% 8.8% 8.9% 5.6% 5.1% 5.3% 5.4% 5.6% 3T22 4T22 1T23 2T23 3T23 R$0.7 bn (+3.2%) 3Q22 4Q22 1Q23 2Q23 3Q23 9.4% 9.4% 9.4% 9.6% 9.7% 6.0% 5.3% 5.6% 5.6% 5.9% 3T22 4T22 1T23 2T23 3T23 ¹ 2 ¹ 3 (1) Includes capital allocated to the business areas (except treasury), in addition to working capital of the corporation; (2) Change in the composition of assets with credit risk between periods in Brazil; (3) Latin America and others considers structured 3Q22 4Q22 1Q23 2Q23 3Q23 wholesale operations.

24.9 21.8 22.5 25.6 -2.9 -0.3 -0.1 0.3 0.2 0.2 0.1 0.1 3.0 2Q23 working capital and others 2Q23 Argentina spread-sensitive operations 2Q23 product mix average volume spreads and liabilities margin greater number of calendar days Latin America (ex- Argentina) and others spread-sensitive operations 3Q23 Argentina working capital and others 3Q23 3Q23 5 financial margin with the market In R$ billion 0.5 0.4 0.2 0.5 0.1 0.2 0.1 1.0 0.8 0.9 0.8 1.0 1.3 1.0 1.0 0.6 0.5 0.7 0.6 1.1 0.7 -0.4 -0.5 -0.6 -0.5 -0.5 -0.4 -0.4 11QT2222 22QT2222 33TQ2222 44TQ2222 11TQ2233 22TQ2233 3T23 Brazil capital index hedge Latin America 3Q23 5


commissions, fees and result from insurance In R$ billion 3Q23 2Q23 D 3Q22 D credit and debit cards 4.2 4.0 4.0% 3.9 7.0% card issuance 3.0 2.9 4.5% 2.9 2.9% acquiring 1.2 1.2 2.8% 1.0 18.9% current account services 1.6 1.7 -2.3% 1.8 -8.9% asset management¹ 1.5 1.4 1.4% 1.4 3.8% advisory services and brokerage 1.0 0.8 22.8% 0.8 20.9% credit operations and guarantees provided 0.7 0.7 0.2% 0.7 -1.4% collection services 0.5 0.5 -0.9% 0.5 3.6% other 0.4 0.4 9.0% 0.4 -6.4% Latin America (ex-Brazil) 0.8 0.8 -3.7% 0.8 -4.4% commissions and fees 10.7 10.4 3.2% 10.4 2.7% insurance, pension plans and premium bonds² 2.2 2.1 5.4% 1.8 19.0% commissions and insurance 12.9 12.4 3.6% 12.3 5.2% assets under management - balance In R$ billion 2,094 346 2,048 326 2,440 2,374 Jun-23 Sep-23 2.2% 6.3% own products open platform 2.8% total equities - ECM R$ 3.8 bn 18% market share mergers and acquisitions fixed income - DCM #1 in investment banking in Brazil in 3Q23³- volumes R$ 6.6 bn 15% market share R$ 23.5 bn 29% market share issuance R$ 205 bn 2.7% acquiring cards – transaction volumes change vs 2Q23 R$ 219 bn 5.3% credit quality Brazil Brazil 3.1% 3.5% 2.4% 3.0% 2.4% 2.8% 2.6%2.4% 2.7% 3.1% 3.1% 3.2% 3.2% 3.5% 3.4% 3.2% 1.6% 1.9% 1.0%1.1% 1.8% 1.6% 1.4% 1.3% 1.2% 1.6%1.6%1.5% 1.6% 1.8% 1.8% 1.7% 1.2% 0.7% 0.9% 0.7%0.6%0.5% 0.8%0.2%0.2%0.2%0.1%0.1% 0.2%0.2% 0.3%0.2% dez/19mar/20 jun/20 set/20 dez/20mar/21 jun/21 set/21 dez/21 mar/22 jun/22 set/22 dez/22mar/23 jun/23 set/23 4.8% 5.1%5.0% 4.3%4.2% 3.9% 3.6%3.6%3.8% 4.1% 4.4% 4.7%4.9%4.9%4.9%4.9% 2.3%2.3% 2.0% 1.4% 1.7% 2.5%2.6%2.6% 2.3%2.3%2.2%2.3%2.4%2.3%2.5%2.6% 0.5% 1.1% 0.7%0.5%0.4%0.4%0.3% 1.1% 0.5%0.5% 0.1%0.1%0.0%0.1%0.1%0.1% dez/19mar/20 jun/20 set/20 dez/20mar/21 jun/21 set/21 dez/21mar/22 jun/22 set/22 dez/22mar/23 jun/23 set/3.0%3.1% 2.7% 2.2% 2.3%2.3%2.3% 2.6% 2.5%2.6% 2.7%2.8%2.9%2.9% 3.0%3.0% 3.4%3.5% 3.2% 2.6%2.7% 2.7%2.7%2.8%2.8% 2.9% 3.0% 3.2% 3.4% 3.4% 3.5%3.5% 1.9% 2.0% 1.4% 1.2% 1.3% 1.5% 1.4% 2.0% 1.6%1.6% 1.7% 1.3% 1.3% 1.4%1.3% 1.3% dez/19mar/20 jun/20 set/20 dez/20mar/21 jun/21 set/21 dez/21mar/22 jun/22 set/22 dez/22mar/23 jun/23 set/23 impact of sale of loans¹ (1) In the third quarter of 2023, we sold loans with low probability of recovery to unrelated companies and without risk retention, which would be active at the end of September-23 worth R$19 million of the corporate portfolio.

consolidated consolidated Mar -20 Dec-20 Mar-21 Dec-21 Mar-Sep -20 Jun-21 Sep-21 22 Jun-22 Sep-22 Dec-22 Mar-23 Jun-23 +0.01 p.p. Dec-19 Mar -20 Jun -20 Sep -20 Dec-20 Mar-21 Jun-21 Sep-21 Dec-21 Mar-22 Jun-22 Sep-22 Dec-22 Mar-23 Jun-23 Sep23 Dec-19 Mar -20 Jun -20 Sep -20 Dec-20 Mar-21 Jun-21 Sep-21 Dec-21 Mar-22 Jun-22 Sep-22 Dec-22 Mar-23 Jun-23 Sep23 Dec-19 Mar -20 Jun -20 Sep -20 Dec-20 Mar-21 Jun-21 Sep-21 Dec-21 Mar-22 Jun-22 Sep-22 Dec-22 Mar-23 Jun-23 Sep23 Dec-19 Mar -20 Jun -20 Sep -20 Dec-20 Mar-21 Jun-21 Sep-21 Dec-21 Mar-22 Jun-22 Sep-22 Dec-22 Mar-23 Jun-23 Sep23 quality and cost of credit annualized cost of credit/ loan portfolio² - (%) cost of credit¹ (in R$ billion) (1) provision for loan losses + recovery of loans + impairment + discounts granted; (2) average loan portfolio balance with financial guarantees provided and corporate securities considers the last two quarters.
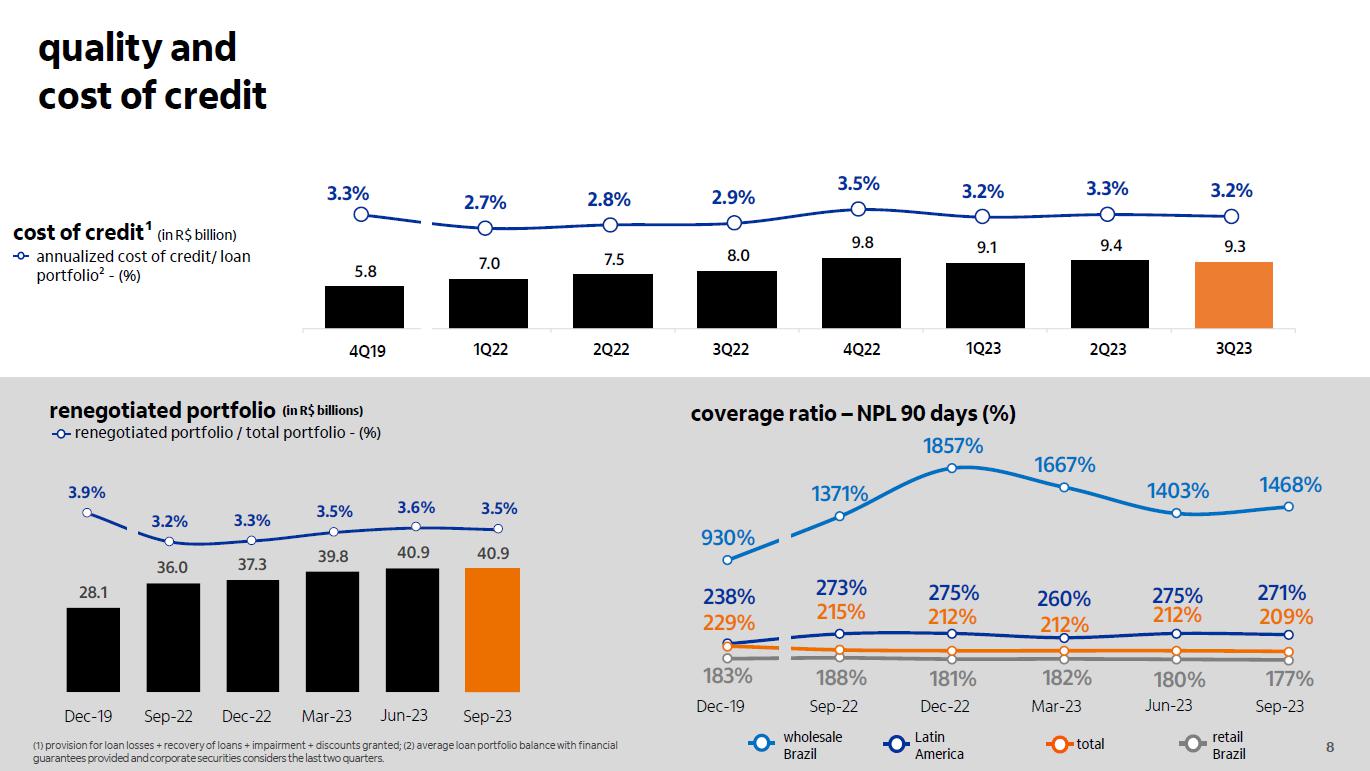
238% 273% 275% 260% 275% 271% 183% 188% 181% 182% 180% 177% 229% 215% 212% 212% 212% 209% 930% 1371% 1857% 1667% 1403% 1468% 150% dez/19 set/22 dez/22 mar/23 jun/23 set/23 28.1 36.0 37.3 39.8 40.9 40.9 Dec-19 Sep-22 Dec-22 Mar-23 Jun-23 Sep-23 3.9% 3.2% 3.3% 3.5% 3.6% 3.5% wholesale Brazil Latin America total retail Brazil Dec-19 Sep-22 Dec-22 Mar-23 Jun-23 Sep-23 Dec-19 Sep-22 Dec-22 Mar-23 Jun-23 Sep-23 4Q19 1Q22 2Q22 3Q22 4Q22 1Q23 2Q23 3Q23 renegotiated portfolio (in R$ billions) coverage ratio – NPL 90 days (%) renegotiated portfolio / total portfolio - (%) (1) provision for loan losses + recovery of loans + impairment + discounts granted; (2) average loan portfolio balance with financial 8 guarantees provided and corporate securities considers the last two quarters.
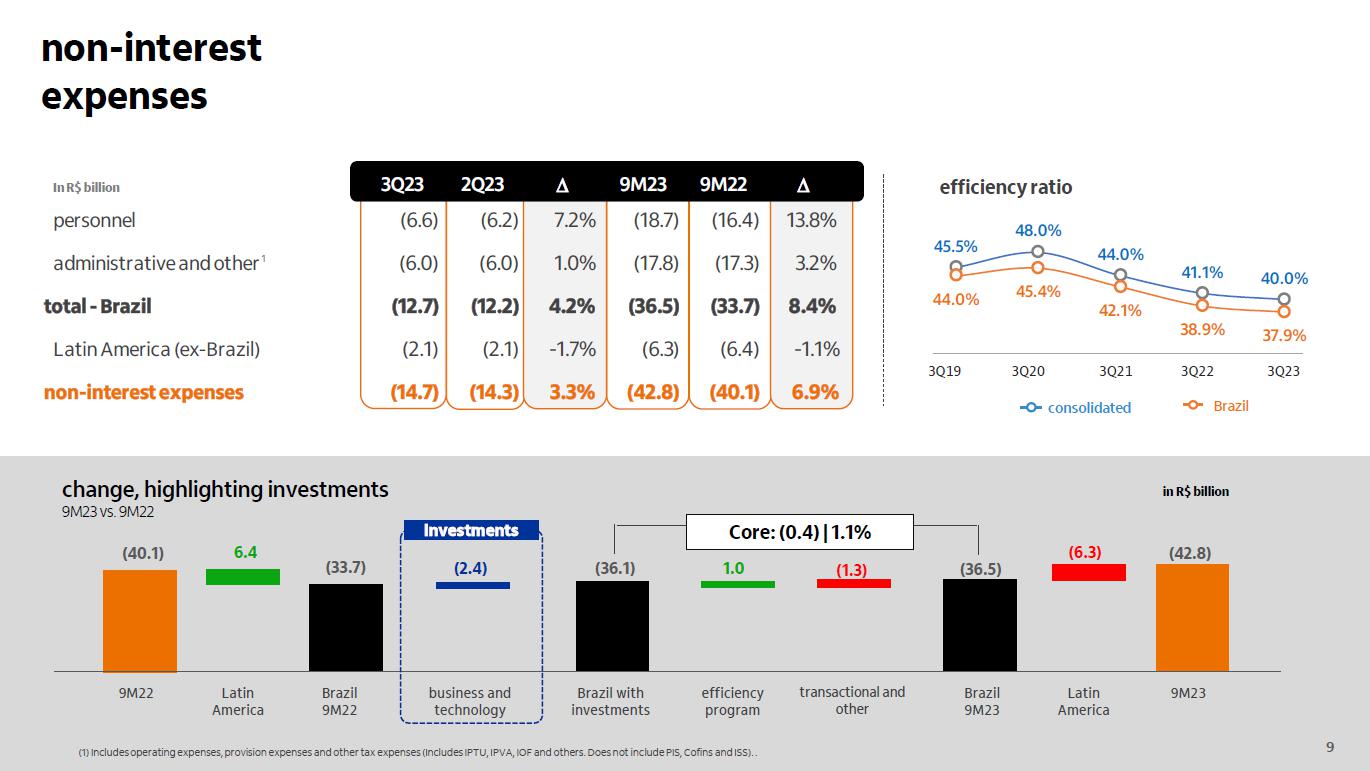
non-interest expenses change, highlighting investments 9M23 vs. 9M22 (40.1) Latin America Brazil 9M22 9M22 Latin America 6.4 (33.7) (6.3) Core: (0.4) | 1.1% business and technology (2.4) Brazil 9M23 (36.5) efficiency program 1.0 9M23 (42.8) Brazil with investments (36.1) transactional and other In R$ billion Investments 1 in R$ billion 45.5% 48.0% 44.0% 41.1% 40.0% 44.0% 45.4% 42.1% 38.9% 37.9% efficiency ratio 1T19 1T20 1T21 1T22 1T23 consolidated Brazil 3Q19 3Q20 3Q21 3Q22 3Q23 (1) Includes operating expenses, provision expenses and other tax expenses (Includes IPTU, IPVA, IOF and others. Does not include PIS, Cofins and ISS). . (1.3) 3Q23 2Q23 D 9M23 9M22 D personnel (6.6) (6.2) 7.2% (18.7) (16.4) 13.8% administrative and other (6.0) (6.0) 1.0% (17.8) (17.3) 3.2% total - Brazil (12.7) (12.2) 4.2% (36.5) (33.7) 8.4% Latin America (ex-Brazil) (2.1) (2.1) -1.7% (6.3) (6.4) -1.1% non-interest expenses (14.7) (14.3) 3.3% (42.8) (40.1) 6.9% 9 10 artificial intelligence 570+ AI models currently in use More security to our customers Use of AI for voice interpretation and detection of possible fraud attempts.

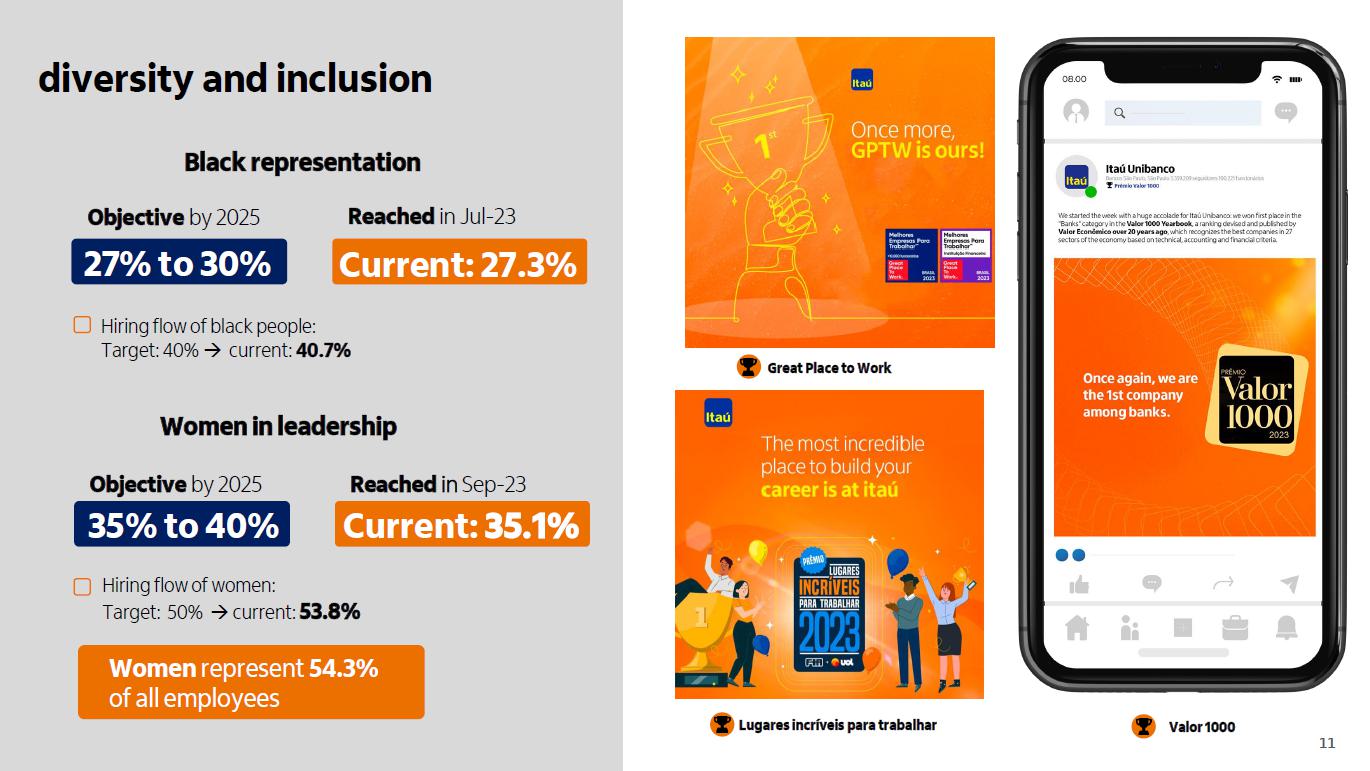
Generative AI improves productivity and corporate customer experience Highly accurate (+97%) reading and analysis of corporate information and documents +45 p.p. since 2021, the share of inbound customer service with AI has advanced and corresponds to 72% of total customer service Chatbot assists customers in their banking experience More than 10 MM conversations per month, 60% fully served by AI 98% of client onboarding for investment products done with up to 4 clicks, NPS +10 points customer service and experience 200+ Initiatives using Generative AI diversity and inclusion Objective by 2025 Hiring flow of black people: Target: 40% current: 40.7% 35% to 40% 27% to 30% Current: 35.1% Valor 1000 Great Place to Work Lugares incríveis para trabalhar Current: 27.3% Reached in Jul 23 Black representation Women in leadership Objective by 2025 Reached in Sep 23 Hiring flow of women: Target: 50% current: 53.8% Women represent 54.3% of all employees 12


capital Jun 23 common equity Tier I (CET I) n et income, dividends and interest on own capital Sep 23 Tier I capital 11,3% 12.2% + 0 4% r isk weighted assets 1 - 0.3% 1.5% 13.1% 14.6% + 0.9% Basel III, evolution of internal models and corporate events common equity Tier I (CET I) a dditional Tier I (AT1) (1) excluding the exchange rate variation of the period. 12 Banco Itaú Argentina R$ 4.0 billion Credit portfolio as of Jul-23 Operating revenues R$ 1.9 billion R$ 648 million Non-interest expenses Recurring managerial result R$ 578 million The result of the sale was a negative in R$1.2 billion and considered as an extraordinary item in 3Q23 Itaú Unibanco's Balance Sheet of 09/30/2023 does not consider the balances of Itaú Argentina Itaú Unibanco's 3Q23 recurring income statement considers only the July-23 result, R$ 101 million, from Itaú Argentina Itaú Argentina main figures in 7M23: FX variation and inflation (recognized on shareholders' equity) R$ (691) million Impact of Banco Itaú Argentina in the first seven months of 2023: Net impact R$ (113) million Recurring managerial result R$ 578 million 14 Corporativo | Interno (1) Includes financial guarantees provided and corporate securities; (2) Composed of result from loan losses, impairment and dis counts granted; (3) commissions and fees (+) income from insurance, pension plan and premium bonds operations ( (--) expenses for claims (--) insurance, pension plan and premium bonds selling expenses.

(4) Forecast of the results b etween August and December 2023 and the credit portfolio of 12/31/2023 of Banco Itaú Argentina. total credit portfolio¹ financial margin with clients financial margin with the market cost of credit² commissions and fees and results from insurance operations 3 non interest expenses effective tax rate growth between 6.0% and 9.0% growth between 13.5% and 16.5% between 27.0% and 29.0% growth between 5.0% and 9.0% growth between 5.0 and 7.0% between R$36.5 bn and R$40.5 bn between R$2.0 bn and R$4.0 bn consolidated efficiency ratio below 40% and below 38% in Brazil guidance n ormalized guidance Itaú Argentina impact 4 0.35 p.p. 0.97 p.p. R$0.40 bn R$0.01 bn 0.35 p.p. 0.96 p.p. 0.31 p.p. growth between 5.7% and 8.7% gro wth between 12.5% and 15.5% between 26.7% and 28.7% g rowth between 4.0% and 8.0% g rowth between 4.7% and 6.7% between R$36.5 bn and R$40.5 bn between R$1.6 bn and R$3.6 bn 2023 guidance:

earnings review 3Q23 São Paulo, November 7 th 2023

16 Corporativo | Interno São Paulo, November 7 th 2023

results 3Q23 2Q23 D 3Q22 D 9M23 9M22 D operating revenues 39.5 38.8 1.8% 36.6 8.1% 115.8 104.9 10.5% managerial financial margin 26.3 26.0 1.1% 23.9 9.9% 77.0 67.6 13.9% financial margin with clients 25.6 24.9 2.5% 23.4 9.3% 74.5 65.4 13.9% financial margin with the market 0.7 1.1 -33.1% 0.5 38.6% 2.4 2.2 11.8% commissions and fees 10.7 10.4 3.2% 10.4 2.7% 31.4 30.7 2.4% revenues from insurance 2.6 2.5 4.1% 2.3 13.9% 7.4 6.6 13.1% cost of credit (9.3) (9.4) -1.9% (8.0) 15.9% (27.8) (22.5) 23.5% provision from loan losses (9.2) (9.6) -4.1% (8.3) 11.3% (27.8) (23.1) 20.5% impairment (0.1) (0.0) 1760.9% 0.2 -163.1% (0.1) 0.3 -140.1% discounts granted (1.0) (0.8) 26.2% (0.9) 19.4% (2.7) (2.1) 32.0% recovery of loans written off as losses 1.1 1.0 9.1% 1.0 9.1% 2.9 2.3 24.6% retained claims (0.4) (0.4) -2.9% (0.4) -9.8% (1.1) (1.1) 0.2% other operating expenses (17.0) (16.7) 2.0% (16.1) 5.6% (49.9) (46.5) 7.3% non-interest expenses (14.7) (14.3) 3.3% (13.9) 5.8% (42.8) (40.1) 6.9% tax expenses and other (2.3) (2.4) -5.3% (2.2) 4.4% (7.1) (6.4) 10.2% income before tax and minority interests 12.9 12.3 4.5% 12.0 7.0% 37.0 34.7 6.5% income tax and social contribution (3.7) (3.4) 8.6% (3.7) -1.7% (10.2) (10.7) -4.6% minority interests in subsidiaries (0.1) (0.2) -17.2% (0.2) -28.6% (0.5) (0.9) -39.9% recurring managerial result 9.0 8.7 3.4% 8.1 11.9% 26.2 23.1 13.4% 17 18 business model the allocation of principal capital (Common Equity Tier 1) in the bank’s business was made at 12% until the first quarter of 2022 and at 11.5% from the second quarter of 2022 on, according to our risk appetite.

in R$ billion Total Credit Trading Insurance & services Excess capital Total Credit Trading Insurance & services Excess capital Total Credit Trading Insurance & services Excess capital Operating revenues 115.8 66.7 1.6 46.6 1.0 104.9 61.0 1.6 42.3 (0.1) 11.0 5.6 0.0 4.3 1.0 Managerial financial margin 77.0 55.0 1.6 19.4 1.0 67.6 49.8 1.6 16.2 (0.1) 9.4 5.2 0.0 3.2 1.0 Commissions and fees 31.4 11.7 0.0 19.7 - 30.7 11.2 0.0 19.5 - 0.7 0.5 0.0 0.3 - Revenues from insurance ¹ 7.4 - - 7.4 - 6.6 - - 6.6 - 0.9 - - 0.9 - Cost of credit (27.8) (27.8) - - - (22.5) (22.5) - - - (5.3) (5.3) - - - Retained claims (1.1) - - (1.1) - (1.1) - - (1.1) - (0.0) - - (0.0) - Non-interested expenses and other² (50.4) (26.8) (0.6) (23.0) (0.0) (47.4) (24.6) (0.5) (22.3) 0.1 (3.1) (2.2) (0.1) (0.7) (0.1) Recurring managerial result 26.2 8.6 0.7 16.3 0.7 23.1 8.9 0.7 13.8 (0.3) 3.1 (0.3) (0.0) 2.4 0.9 Average regulatory capital 168.6 107.5 4.2 47.7 9.3 149.3 103.3 3.4 46.7 (4.1) 19.3 4.2 0.7 1.0 13.4 Value creation 9.0 (2.1) 0.2 11.1 (0.3) 8.0 (1.3) 0.3 8.9 0.1 0.9 (0.8) (0.1) 2.2 (0.4) Recurring managerial ROE 20.9% 10.7% 21.0% 45.4% 9.6% 20.7% 11.5% 25.7% 39.5% 8.9% 0.2 p.p. -0.8 p.p. -4.7 p.p. 6.0 p.p. 0.6 p.p. 9M23 9M22 Change (9M23 x 9M22) 18 (1) Revenues from Insurance includes the Revenues from Insurance, Pension Plan and Premium Bonds Operations before Retained Claims and Selling Expenses. (2) Include Tax Expenses (ISS, PIS, COFINS and other), Insurance Selling Expenses and Minority Interests in Subsidiaries.

earnings review 3Q23 São Paulo, November 7 th 2023

Attachment 03

3Q23 institutional presentation
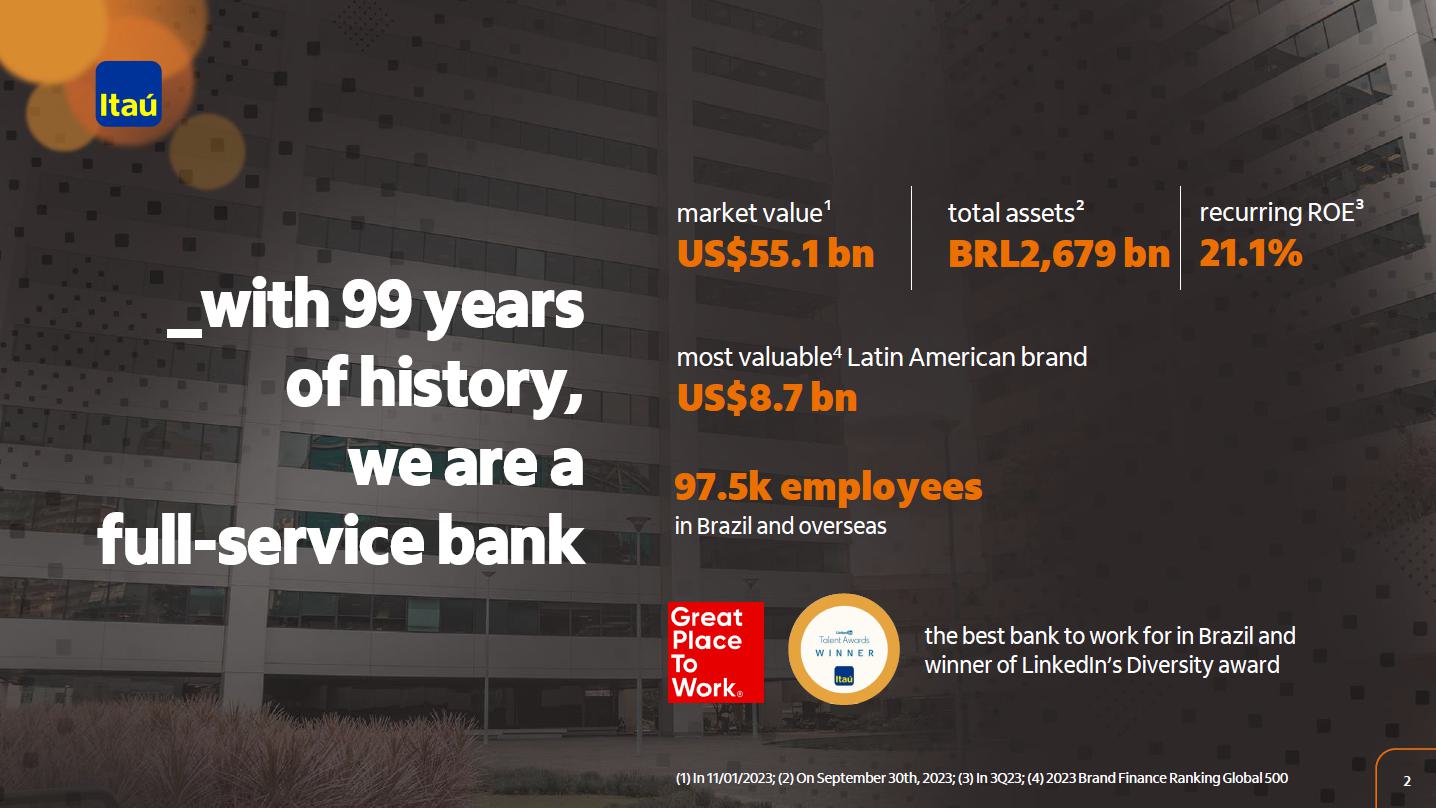
_ with 99 years of history, we are a full service bank most valuable 4 Latin American brand US$8.7 bn ( 1 ) In 11/01/2023 ; (2) On September 30th, 2023; (3) I n 3Q23; (4) 2023 Brand Finance Ranking Global 500 the best bank to work for in Brazil and winner of LinkedIn’s Diversity award 97.5 k employees in Brazil and overseas market value¹ US$55.1 bn recurring ROE³ 21.1% total assets ² BRL2,679 bn 2 Corporativo we are present in 18 countries (1) Considers financial guarantees provided and private securities.
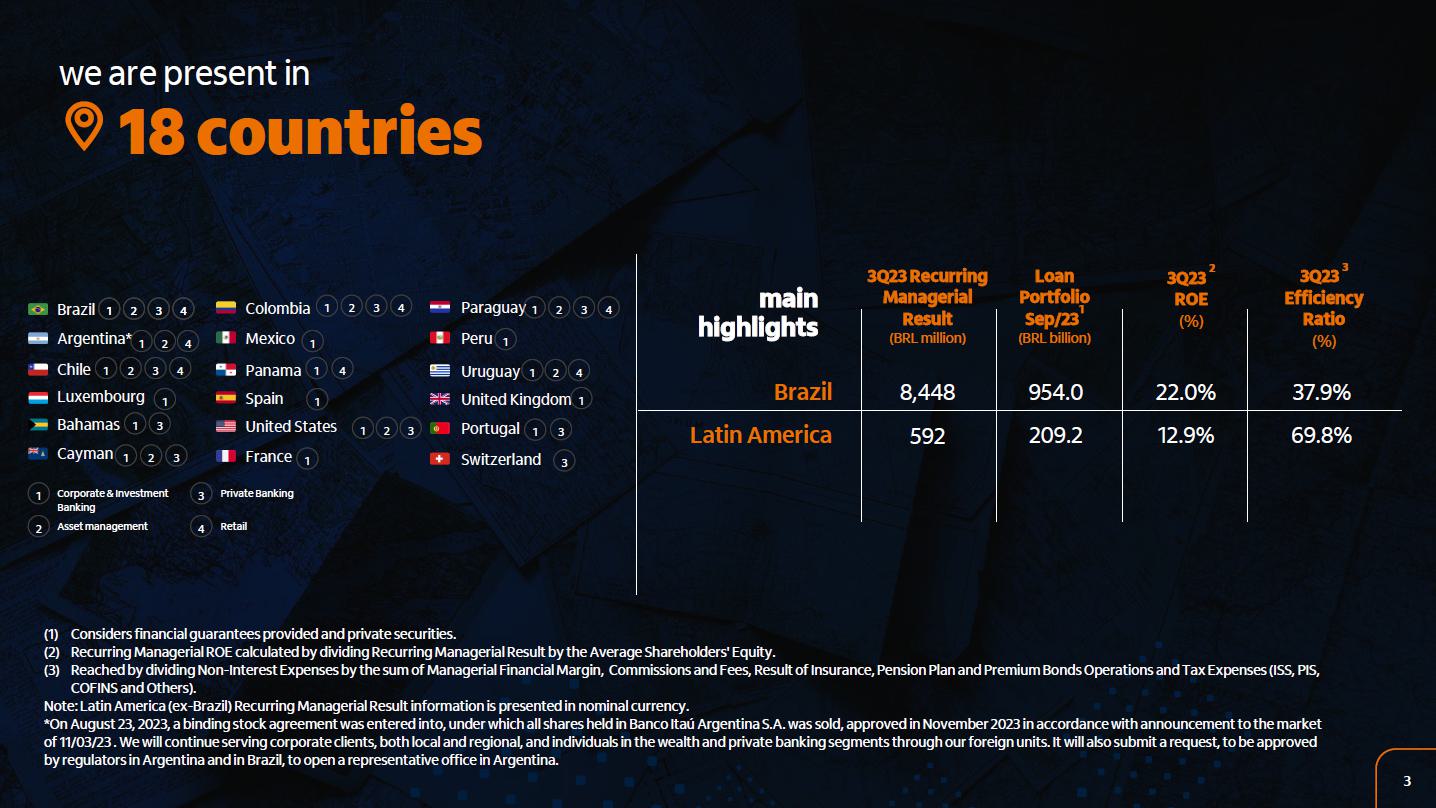
(2) Recurring Managerial ROE calculated by dividing Recurring Managerial Result by the Average Shareholders' Equity. (3) Reached by dividing Non-Interest Expenses by the sum of Managerial Financial Margin, Commissions and Fees, Result of Insurance, Pension Plan and Premium Bonds Operations and Tax Expenses (ISS, PIS, COFINS and Others). Note: Latin America (ex-Brazil) Recurring Managerial Result information is presented in nominal currency. *On August 23, 2023, a binding stock agreement was entered into, under which all shares held in Banco Itaú Argentina S.A. was sold, approved in November 2023 in accordance with announcement to the market of 11/03/23 . We will continue serving corporate clients, both local and regional, and individuals in the wealth and private banking segments through our foreign units. It will also submit a request, to be approved by regulators in Argentina and in Brazil, to open a representative office in Argentina. 3 3Q23 Recurring Managerial Result (BRL million) Loan Portfolio Sep/23 1 (BRL billion) 3Q23 2 ROE (%) 3Q23 3 Efficiency Ratio (%) main highlights Brazil Latin America 954.0 209.2 37.9% 69.8% 8,448 592 22.0% 12.9% Switzerland Luxembourg Bahamas Cayman United States France United Kingdom Portugal Peru Brazil Colombia Argentina* Chile Mexico Panama Paraguay Spain Uruguay 1 2 3 1 2 4 1 2 3 4 1 1 3 1 2 3 1 1 4 1 1 1 2 3 4 1 1 1 3 1 2 3 4 1 2 3 4 Corporate & Investment Banking Asset management Retail Private Banking 1 2 3 4 1 2 4 3 with the most complete portfolio of products and services...
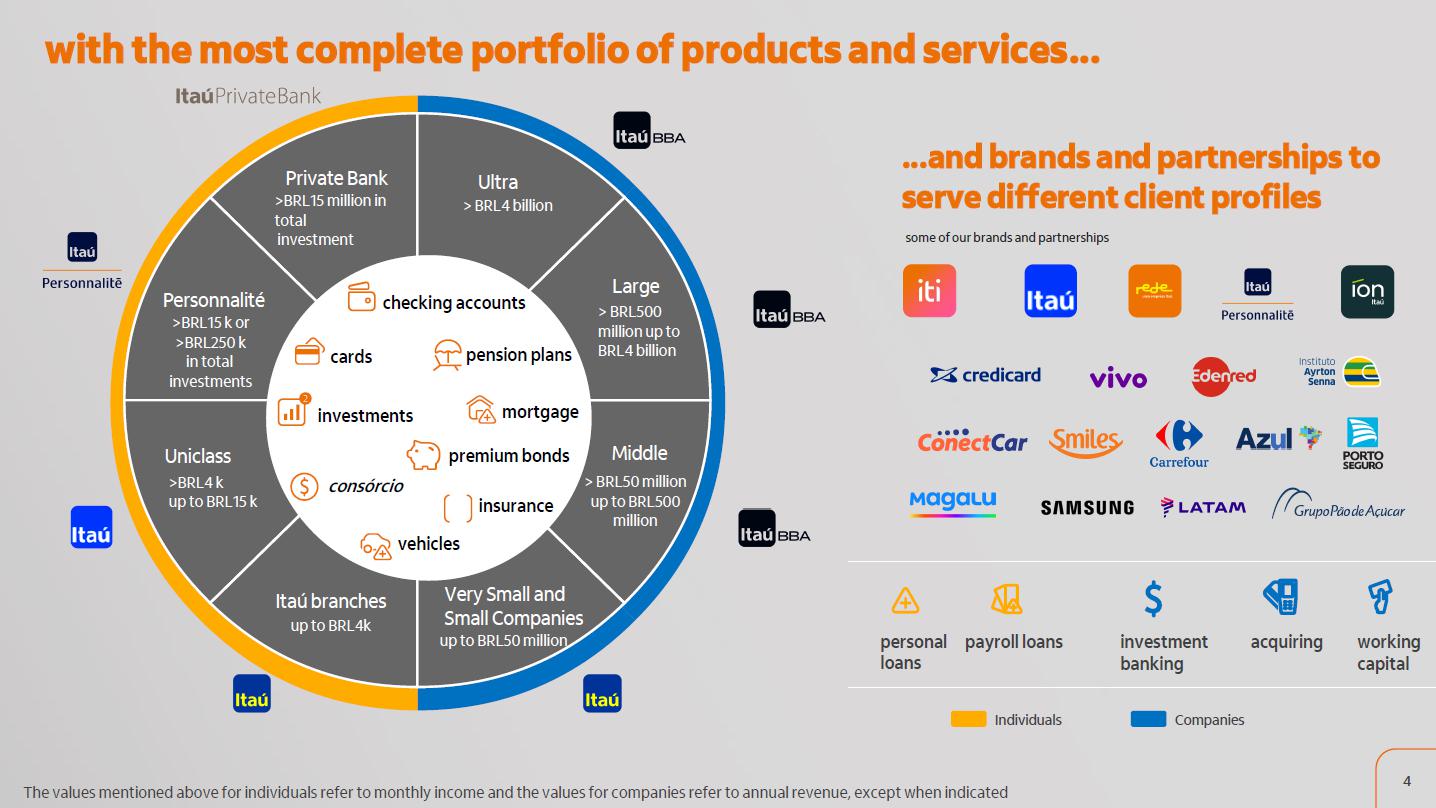
...and brands and partnerships to serve different client profiles working capital investment acquiring banking Individuals Companies The values mentioned above for individuals refer to monthly income and the values for companies refer to annual revenue, except when indicated Ultra > BRL4 billion Large > BRL500 million up to BRL4 billion Middle > BRL50 million up to BRL500 million Very Small and Small Companies up to BRL50 million Itaú branches up to BRL4k Uniclass >BRL4 k up to BRL15 k Personnalité >BRL15 k or >BRL250 k in total investments Private Bank >BRL15 million in total investment cards mortgage vehicles checking accounts consórcio pension plans investments insurance premium bonds personal loans payroll loans some of our brands and partnerships Corporativo Corporate development 5 Corporate venture capital Commercial partnerships M&A and Joint Ventures products distribution channels technology & people Corporativo


our clients choose how they want to be served 6 (1) Chile, Colombia, Paraguay and Uruguay, (2) for individuals; (3) Comparing 3Q23x3Q22. It includes unsecured loans, payroll loans, personalized credit, renegotiation, investments, funds, time deposits, savings accounts, pension plans, foreign exchange, premium bonds, credit card, consórcio, overdraft, card bill installment, vehicles, receivables, AplicAut, Conta Garantida, discounts, working capital and card protection, residential, travel, credit life insurance policies. our retai l footprint is constantly optimized for our c l i e n t s ’ b e h a v i o r and needs 24% of physical branches in Brazil (3Q23 vs.

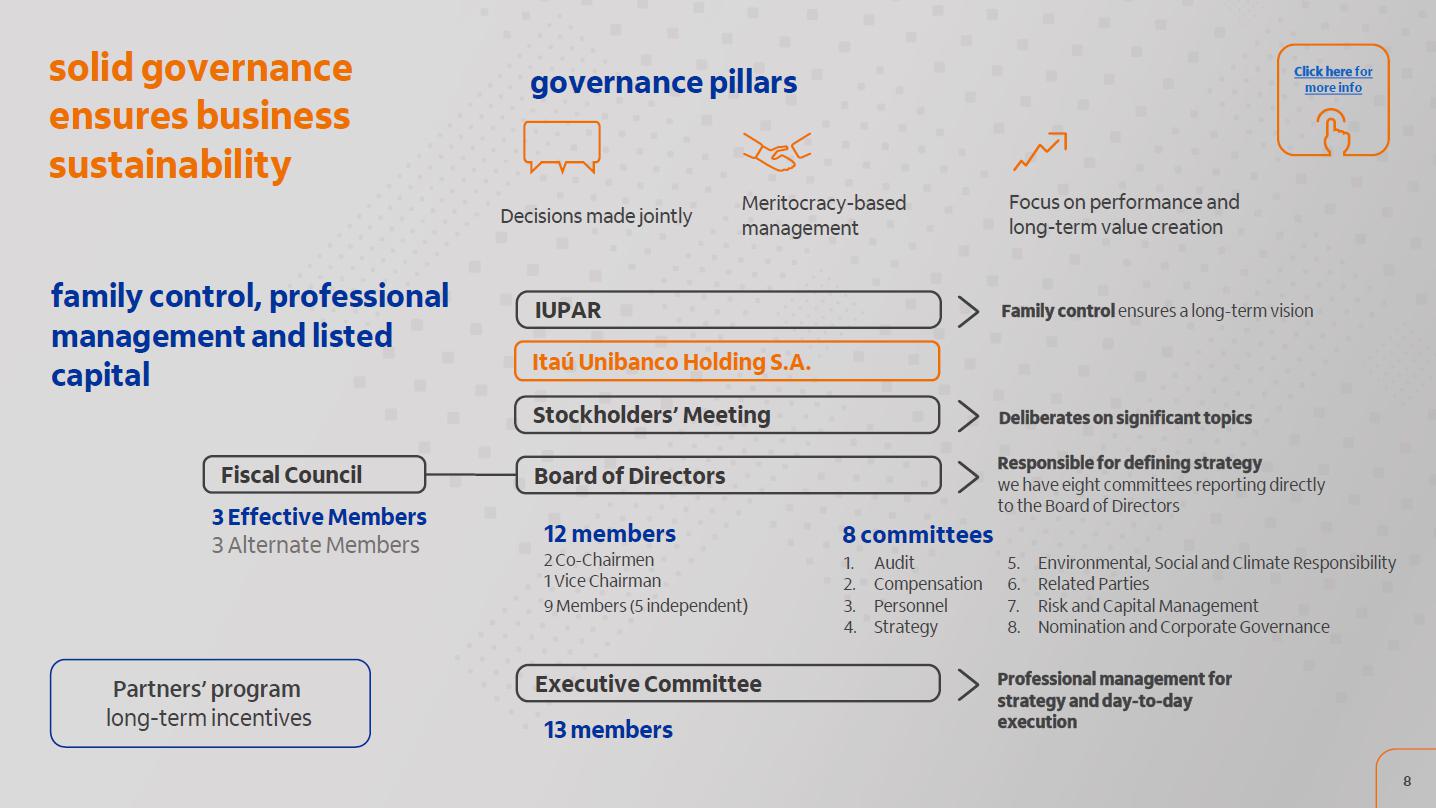
4Q18) digital interactions(4) (4) It considers total contracts, transfers and payments made in all channels, except for cash Company Individuals 3Q21 3Q22 3Q23 3Q21 3Q22 3Q23 Corporativo 1924 first credit and debit cards new Brazilian Payment System is set up banking automation begins Technical Operations Center (CTO) is set up 1980 first Internet providers mobile banking in Brazil 1990 first iPhone is launched 1983 first ATM in Brazil 1960 1970 one of the four top data processing centers in Brazil is set up Casa Moreira Salles (Unibanco) opens the banking division in 1924 and the opening of Banco Central de Crédito (Itaú) in 1943 1979 Itautec is created first bank with no physical branches in Brazil, the Banco1.net 2002 acquisition of BBA gives rise to the largest investment bank in Brazil acquisition of ZUP speeds up digital transformation corporate development • Ideal • TOTVS beyond banking (iPhone pra sempre) is launched 2019 2022 merger of Banco Itaú and Unibanco creates Brazil’s largest private bank Itaú launches the first banking app 2008 2012 Itaú announces a BRL11.1 billion investment in technology, innovation and client service solid governance governance pillars ensures business sustainability Partners’ program long-term incentives Deliberates on significant topics Itaú Unibanco Holding S.A. Stockholders’ Meeting 3 Effective Members 3 Alternate Members Fiscal Council IUPAR Family control ensures a long-term vision Responsible for defining strategy we have eight committees reporting directly to the Board of Directors Board of Directors Professional management for strategy and day-to-day execution

supported by our risk culture, we operate based on strict models Capital and Risk Management Committee Audit Committee Independent review of the activities developed by the institution Monthly risk appetite monitoring Discussion of metrics and the outcome of Risk Appetite, as well as the main risks factors Internal Audit Itaú Unibanco Holding Manages the risks generated, responsible for identifying, assessing, controlling and reporting 1st line of defense Ensures that risks are managed and sustained on the principles of risk management: • Risk appetite • Policies • Procedures • Disseminating risk culture in business risk appetite Defines the nature and level of the risks acceptable to our organization, delimiting the conditions in which management will strive to maximize value creation, consisting of a four-layer structure: (1) risk management principles (2) board of Directors’ statement (3) risk and metrics dimensions (4) coordinate the set of risk taking guidelines Business departments Risk department Board of Directors 3rd line of defense It is monitored, discussed and reported periodically to the executive levels, Board of Directors and Audit Committee 2nd line of defense risk appetite global limits specific limits authority levels and policies Board of Directors Executive Level Where is Risk Appetite inserted? 9 Corporativo Corporativo | Interno 10 values that guide our cultural transformation journey Itubers are ambitious in their goals a nd efficient in their execution are committed to sustainable growth strive to make a positive impact on society Itubers are as diverse as our clients welcome different points of view stay true to who we are and express ourselves openly Itubers trust in each other and are autonomous help each other and ask for help together , make one Itaú Itubers are curious about the world and are always learning experiment, make mistakes, learn and improve use data intensively, to learn and to make better decisions Itubers are determined to wow the client innovate based on the client’s needs always make things simple we are_ driven by results we_ value diversity and inclusion we_ have each other’s back we_ don’t have all the answers we_ put the client first itub


Corporativo | Interno 1. client centricity We want to be the benchmark in satisfaction, transforming our culture so that the client is at the center of everything. Our actions and efforts are designed for our clients’ satisfaction, a key metric for the entire organization. 4. growth Intensify the relationship with our clients, in addition to offering solutions that go beyond traditional banking needs aiming to maximize the customer experience. 2. digital transformation Technology is the great enabler of this transformation, leveraging our commercial potential. We invest tirelessly to find the best services and solutions for our clients. 3. efficiency Key to be competitive in pricing and agile in customer service. This ranges from internal process automation to new ways of interacting with customers. 11 +793k¹ calls +1,100¹visits _commitments assumed by branches employees, aligned with learnings, aiming to improve the client experience.

+50k¹ initiatives products and services _the most complete product portfolio in the Brazilian financial sector, using data to provide the best offers. we are determined to wow the client… _ robust ecossystem to innovate starting from cliente’s needs ... and are committed to sustainable growth. _Broad covery in businesses and journeys’ NPS, adding up to 150 sensors. _Structured feedback cycle throughout the organization, focused on our products and services’ evolution.

NPS Global We put the client first + 20 points Dec/22 vs 2018 + 25 points 2023 vs 2018 Our commitment: to serve our clients where, when and how they want to be served the client is at the center of everything we do Access to the same type of service regardless of channel _Omnichannel Freedom to choose the type of relationship: we are a digital bank with the advantage of in-person service technology enabling our clients to have the best service growth in the volume of our implementations in the first nine months of 2023, 13 times more than in 2018¹ -98% reduction in high client impact incidents compared to 2018¹ + + = Artificial intelligence and Data Integrated into our work methodology and development Products Proprietary methodology for the development of products that our clients love Greater value generation for our clients and competitiveness for the business Speed Quality + Tecnology Modernization of systems and focus on quick resolution of problems ¹9M2023 x 9M2018 ² 9M2023 x 9M2020 more than 50% of our platform modernized which represents approximately 70% of the services that most impact our competitiveness, businesses and clients Design Client Products Data and AI Tecnology Quality Efficiency Speed Itaú + Cubo Over 480 members startups, 104 large players between maintainers, membership and partners and 10 hubs focused in various market segments _Itaú Future Day: event focused on connections and business, which took place on September 26th, jointly organized by Cubo and Itaú BBA (replacing this year's Cubo Conecta). On this day we had more than 75 panelists, bringing more than 16 hours of high quality content. The audience was 890 people in person and 480 participants online.

client centricity and digital transformation with efficiency gains reviewing, streamlining and optimizing processes, automating activities, using data and analytics progressively reducing the bank’s core costs in the coming five years ongoing challenging activities and processes to seek efficiency gains strengthening culture _goal _>1,783 planned initiatives > 1,491 initiatives under implementation we create value in a consistent way efficiency ratio (Brazil) below 38% + 2.1x - 37% solution development investments infrastructure costs 14 non-interest expenses growth compared to the same period of the previous year - Brazil non-interest expenses growth compared to the same period of the previous year (deflated by IPCA¹) - Brazil efficiency ratio - Brazil ¹IPCA: Brazilian consumer price index leadership in several business and growth opportunities Market leader Card payments grow 4.2% in 2Q23 in Brazil4 The most complete shelf of cards 27.9% market share in revenue in Jun/23 Cards 12.3% market share in credit porfolio in Jun/23 Ranked #1 in private sector and INSS (Jun/23)6 Payroll Loans with growth opportunities in the public sector #2 in Brazil7 Full ecosystem of products and services SMEs Our credit portfolio grew 85% in the last three years Agribusiness GDP is expected to reach BRL2.63tn in 20235 Tripled the number of clients in two years Agribusiness ¹In total origination; ² Brazilian Association of Real State Developers (ABRAINC - Associação Brasileira de Incorporadoras Imobiliárias); ³ Fundação João Pinheiro, 2021.

2019 data; 4 Brazilian association of services and credit card companies (ABECS - Associação Brasileira das Empresas de Cartões de Crédito e Serviços); 5 Center for Advanced Studies in Applied Economics (CEPEA - Centro de Estudos Avançados em Economia Aplicada) 2023; Corporativo | Interno 2011 2012 2013 2014 2015 2016 2017 2018 2019 2020 2021 1 Brazilian association of services and credit card companies (ABECS - Associação Brasileira das Empresas de Cartões de Crédito e Serviços); 2 ANBIMA Ranking; 3 By Guia de Fundos FGV 4 Dealogic and Anbima rankings of volumes and operations.

M&A, DCM and ECM correspond to “Mergers and Acquisitions”, “Debt Capital Markets” and “Equity Capital Markets” respectively. Largest private asset manager in Latin America Investment experience integrated with Brokerage for account holders and soon for non-account holders. 15 times elected as best fund manager³ 11 times in a row BRL2.4 trillion assets under custody 10.5% market share in Sep/23 2 Asset Management 23.8% market share in acquiring in 2Q/23 TPV in Brazil estimated between BRL3.77 trillion and BRL3.91 trillion in 2023¹ vs BRL3.31 trillion in 2022 #1 player Insurance >20 products and services sold at our open platform and >15 partners Potential growth in the sector revenue/GDP (Brazil, in %) Complete portfolio with proprietary and thirdparty products Investment Banking 14 consecutive years in the Top 5 in Brazil of DCM and ECM4 (by Dealogic and Anbima) In the 3Q23 we advised 12 transactions in Brazil, totaling BRL6.6 billion in mergers and acquisitions In the 3Q23, we entered into 10 transactions, totaling BRL3.8 billion in equities Top 5 in DCM, ECM and M&A growth alongside innovation new products, channels and services launched Specialized investment platform: • Global visualization of portfolios • Products from Itaú and peers • Digital and human interaction channels • Financial Education Platform: íon Edu investment platform 2.9 million app downloads +540k clients with dedicated specialist service Around 1.9 thousand specialists with portfolio 285 specialists with on-demand service relationship platform A free of charge account for clients demanding simple products and services 24,2 million clients in Sep/23 new products and services Beyond banking: an ecosystem of partnerships to serve all the needs of our clients client base strength of client relationship solutions offer that goes beyond the banking needs of our clients solutions platform Itaú Meu Negócio 17


ESG initiatives integrated into business ensure the bank’s sustainabilitystrategy based on ten positive impact commitments financial citizenship To take care of people's financial health inclusion and entrepreneurship To support entrepreneurship to enhance social development responsible investment To offer products and services for a more sustainable economy responsible management To work with more ecoefficiency and good practices in our value chain private social investment To reaffirm our pact with Brazilian society financing positive impact sectors + To finance sectors of the economy that encourage social and environmental development transparency in communication To reinforce the transparency of our business beyond the financial results Amazon To preserve and promote a positive impact in the region ethics in relations and business To maintain an ethical financial ecosystem inclusive management (employees) To promote a diverse, inclusive and healthy work environment strategy based on ten positive impact commitments 18 ESG initiatives integrated into business ensure the bank’s sustainability Corporativo | Interno Corporativo | Interno corporate corporate behaviorbehavior accountability accountability business business ESG initiatives integrated into business ensure the bank’s sustainability discover some of our initiatives business In August, we held the Itaú BBA Experience 2023, an event aimed at black university students.

The goal of the event was to introduce the Itaú BBA to students interested in the financial market. country development 19 discover some of our initiatives ESG initiatives integrated into business ensure the bank’s sustainability According to the Merco ranking, we ranked second among the most responsible ESG companies in Brazil and first in the financial services category. We launched the Sports Call for Proposals, an initiative that will allocate approximately R$30 million to support projects in the areas of education and participatory sports. BRL327 billion consumed for sustainable development by Sep/23 (82% of the target by 2025). We've launched a new series of podcasts dedicated to agribusiness, Prosa Agro , covering topics such as technology, big data and ESG. Itaú BBA was chosen by the Treasury as one of the banks responsible for issuing Brazil's first sustainable bonds, which should take place by the end of the year.

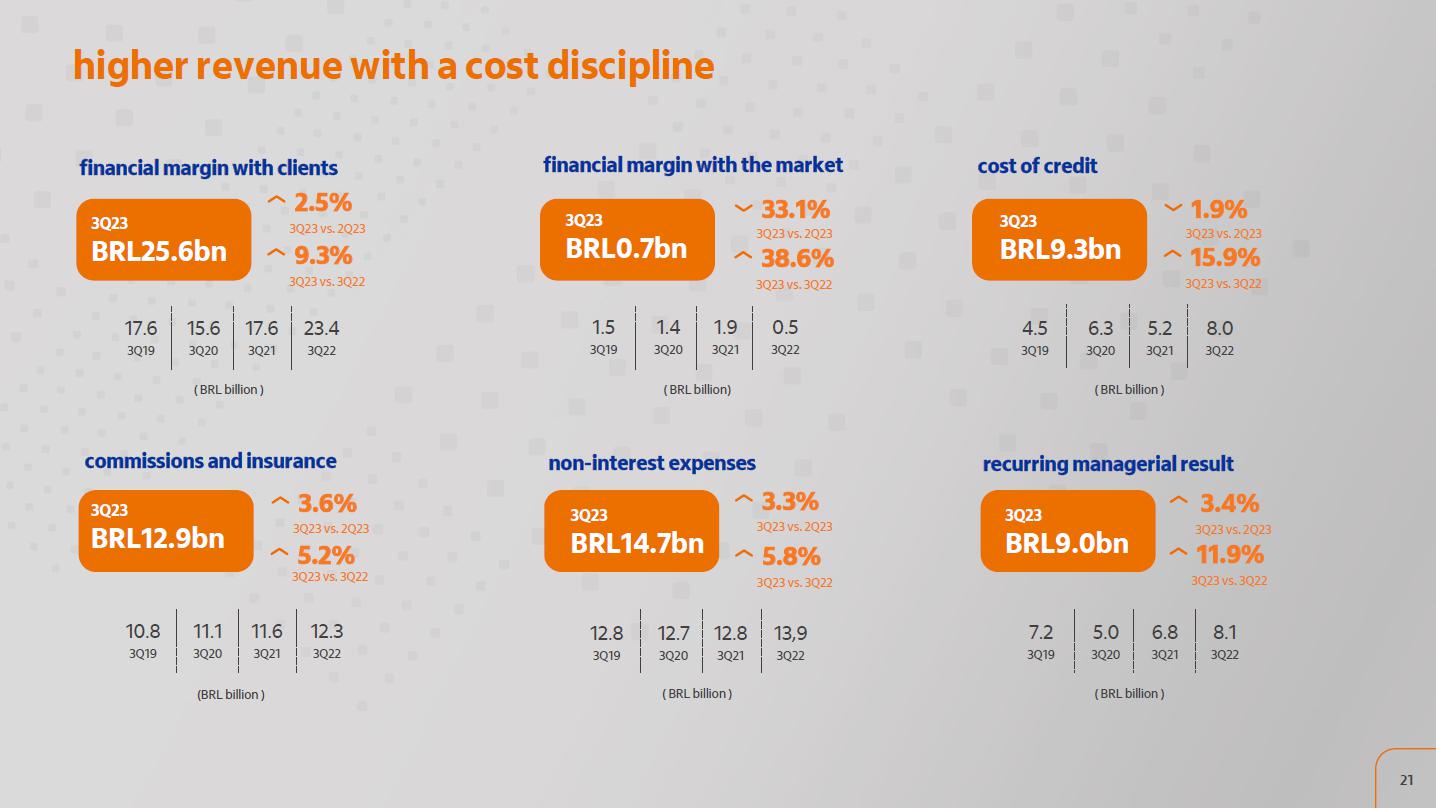
solid results and sustainable value creation 20 2013 2014 2015 2016 2017 2018 2019 2020 2021 2022 9M22 9M23 average cost of capital ROE BRL billion recurring managerial result value creation cost of capital higher revenue with a cost discipline 17.6 3Q19 15.6 3Q20 17.6 3Q21 23.4 3Q22 3Q23 BRL25.6bn financial margin with clients 2.5% 3Q23 vs. 2Q23 1.5 3Q19 1.4 3Q20 1.9 3Q21 0.5 3Q22 3Q23 BRL0.7bn financial margin with the market 33.1% 3Q23 vs. 2Q23 4.5 3Q19 6.3 3Q20 5.2 3Q21 8.0 3Q22 3Q23 BRL9.3bn cost of credit 1.9% 3Q23 vs. 2Q23 10.8 3Q19 11.1 3Q20 11.6 3Q21 12.3 3Q22 3Q23 BRL12.9bn commissions and insurance 3.6% 3Q23 vs. 2Q23 12.8 3Q19 12.7 3Q20 12.8 3Q21 13,9 3Q22 3Q23 BRL14.7bn non-interest expenses 3.3% 3Q23 vs. 2Q23 7.2 3Q19 5.0 3Q20 6.8 3Q21 8.1 3Q22 3Q23 BRL9.0bn recurring managerial result 3.4% 3Q23 vs. 2Q23 21 ( BRL billion ) ( BRL billion) ( BRL billion ) (BRL billion ) ( BRL billion ) ( BRL billion )
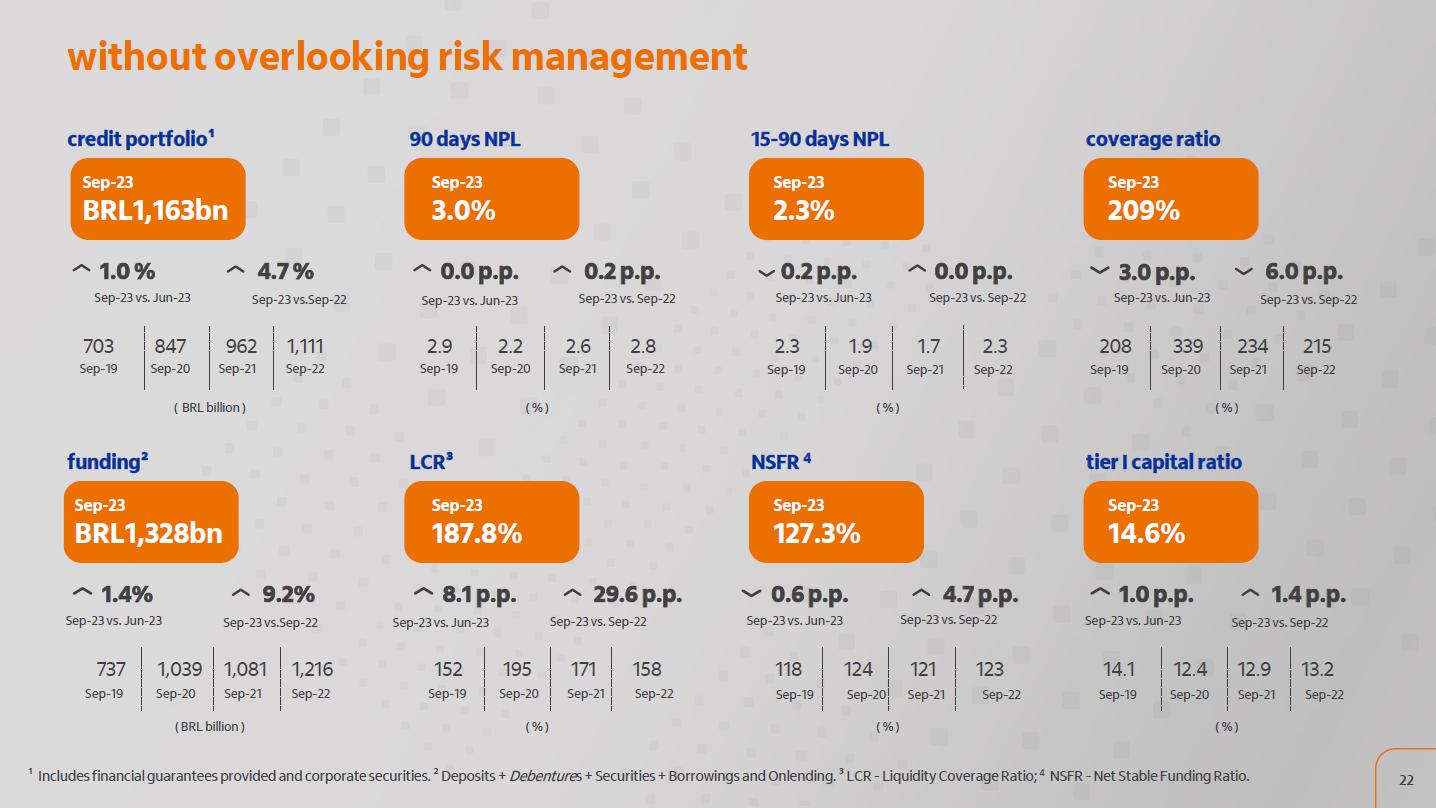
without overlooking risk management 703 Sep-19 847 Sep-20 962 Sep-21 1,111 Sep-22 Sep-23 BRL1,163bn credit portfolio¹ 1.0 % Sep-23 vs. Jun-23 4.7 % Sep-23 vs.Sep-22 Sep-23 3.0% 90 days NPL 0.0 p.p. 0.2 p.p. Sep-23 vs. Sep-22 ¹ Includes financial guarantees provided and corporate securities. ² Deposits + Debentures + Securities + Borrowings and Onlending. ³ LCR - Liquidity Coverage Ratio; 4 NSFR - Net Stable Funding Ratio. 2.3 1.9 1.7 2.3 Sep-23 2.3% 15-90 days NPL 0.2 p.p. Sep-23 vs. Jun-23 0.0 p.p. Sep-23 vs. Sep-22 Sep-23 209% coverage ratio 3.0 p.p. Sep-23 vs. Jun-23 6.0 p.p. Sep-23 vs. Sep-22 737 1,039 1,081 1,216 Sep-23 BRL1,328bn funding² 1.4% 9.2% 152 195 171 158 Sep-23 187.8% LCR³ 8.1 p.p. 29.6 p.p. Sep-23 127.3% NSFR 4 0.6 p.p. 4.7 p.p. 14.1 12.4 12.9 13.2 Sep-23 14.6% tier I capital ratio 1.0 p.p. 1.4 p.p. 2.9 2.2 2.6 2.8 208 339 234 215 118 124 121 123 22 ( BRL billion ) ( % ) ( % ) ( % ) ( BRL billion ) ( % ) ( % ) ( % ) Sep-23 vs. Jun-23 Sep-23 vs. Jun-23 Sep-23 vs.Sep-22 Sep-23 vs. Sep-22 Sep-23 vs. Jun-Sep-23 vs. Jun-23 23 Sep-23 vs. Sep-22 Sep-23 vs. Jun-23 Sep-23 vs. Sep-22 Sep-19 Sep-20 Sep-21 Sep-22 Sep-19 Sep-20 Sep-21 Sep-22 Sep-19 Sep-20 Sep-21 Sep-22 Sep-19 Sep-20 Sep-21 Sep-22 Sep-19 Sep-20 Sep-21 Sep-22 Sep-19 Sep-20 Sep-21 Sep-22 Sep-19 Sep-20 Sep-21 capital structure suitable for carrying out our growth strategy Basel ratio Minimum required capital Itaú Unibanco 23 Corporativo | Interno Corporativo | Interno diversified shareholders


diversified shareholders base with high liquidity Daily average volume of shares traded (BRL million) ITUB4 480 k direct shareholders in September 2023 F ree float* | Non voting shares 4.8 billion of shares Brazilians B3 Foreigners B3 NYSE we are listed at B3 and NYSE and make up top market indices we are the only Latin America bank making up the Dow Jones Sustainability Index since it was launched 24 2023 guidance: reaffirmed and normalized 25 (1) Includes financial guarantees provided and corporate securities; (2) Composed of result from loan losses, impairment and dis counts granted; (3) commissions and fees (+) income from insurance, pension plan and premium bonds operations ( (--) expenses for claims (--) insurance, pension plan and premium bonds selling expenses.

(4) Forecast of the results between August and December 2023 and the credit portfolio of 12/31/2023 of Banco Itaú Argentina. total credit portfolio¹ financial margin with clients financial margin with the market cost of credit² commissions and fees and results from insurance operations 3 non interest expenses effective tax rate growth between 6.0% and 9.0% growth between 13.5% and 16.5% between 27.0% and 29.0% growth between 5.0% and 9.0% growth between 5.0% and 7.0% between R$36.5 bn and R$40.5 bn between R$2.0 bn and R$4.0 bn consolidated efficiency ratio below 40% and below 38% in Brazil guidance n ormalized guidance Itaú Argentina impact 4 0.35 p.p. 0.97 p.p. R$0.40 bn R$0.01 bn 0.35 p.p. 0.96 p.p. 0.31 p.p. growth between 5.7% and 8.7% growth between 12.5% and 15.5% between 26.7% and 28.7% g rowth between 4.0% and 8.0% g rowth between 4.7% and 6.7% between R$36.5 bn and R$40.5 bn between R$1.6 bn and R$3.6 bn Corporativo | Interno Corporativo | Interno (11) 2794 (11) 2794--35473547 || ri@itauri@itau--unibanco.com.brunibanco.com.br || www.itau.com.brwww.itau.com.br/ri/ri Investor Relations Investor Relations (11) 2794 3547 ri@itau unibanco.com.br www.itau.com.br /ri
