UNITED STATES
SECURITIES AND EXCHANGE COMMISSION
Washington, D.C. 20549
FORM 6-K
REPORT OF FOREIGN PRIVATE ISSUER
PURSUANT TO RULE 13a-16 OR 15d-16 UNDER
THE SECURITIES EXCHANGE ACT OF 1934
For
the month of July 2023
Commission File Number 1-12260
COCA-COLA FEMSA, S.A.B. de C.V.
(Translation of registrant’s name into English)
United Mexican States
(Jurisdiction of incorporation or organization)
Calle Mario Pani No. 100,
Santa Fe Cuajimalpa,
Cuajimalpa de Morelos,
05348, Ciudad de México,
México
(Address of principal executive offices)
Indicate by check mark whether the registrant files or will file annual reports under cover of Form 20-F or Form 40-F.
Form 20-F X Form 40-F
Indicate by check mark if the registrant is submitting the Form 6-K in paper as permitted by Regulation S-T Rule 101(b)(1)
Yes No X
Indicate by check mark if the registrant is submitting the Form 6-K in paper as permitted by Regulation S-T Rule 101(b)(7)
Yes No X
Indicate by check mark whether the registrant by furnishing the information contained in this Form is also thereby furnishing the information to the Commission pursuant to Rule 12g3-2(b) under the Securities Exchange Act of 1934.
Yes No X
If "Yes" is marked, indicate below the file number assigned to the registrant in connection with Mexico City, July 25, 2023, Coca-Cola FEMSA, S.A.B.
Rule 12g3-2(b): 82-__.

de C.V. (BMV: KOFUBL, NYSE: KOF) (“Coca-Cola FEMSA”, “KOF” or the “Company”), the largest Coca-Cola franchise bottler in the world by sales volume, announces results for the second quarter of 2023.
|
SECOND QUARTER HIGHLIGHTS |
| · | Volume growth 7.0% — achieved a record of one billion unit cases for the first time during a quarter |
| · | Revenue growth 7.2% |
| · | Operating income growth 11.9% |
| · | Majority net income growth 6.5% |
| · | Earnings per share1 were Ps. 0.29. (Earnings per unit were Ps. 2.34 and per ADS were Ps. 23.45.) |
| · | Achieved more than 910 thousand monthly active buyers on Juntos+, our omnichannel B2B platform |
|
FIRST SIX MONTHS HIGHLIGHTS |
| · | Volume growth 6.8% |
| · | Revenue growth 9.2% |
| · | Operating income growth 12.1% |
| · | Majority net income growth 17.3% |
| · | Earnings per share1 were Ps. 0.53. (Earnings per unit were Ps. 4.21 and per ADS were Ps. 42.07.) |
| · | Achieved more than US$ 1 billion in digital revenues through Juntos+ |
| FINANCIAL SUMMARY FOR THE SECOND QUARTER RESULTS | ||||||||||||
| Change vs. same period of last year | ||||||||||||
| Total Revenues | Gross Profit | Operating Income | Majority Net Income | |||||||||
| 2Q23 | YTD 2023 | 2Q23 | YTD 2023 | 2Q23 | YTD 2023 | 2Q23 | YTD 2023 | |||||
| As Reported | Consolidated | 7.2% | 9.2% | 7.9% | 9.9% | 11.9% | 12.1% | 6.5% | 17.3% | |||
| Mexico & Central America | 13.4% | 14.7% | 13.0% | 13.3% | 13.7% | 7.9% | ||||||
| South America | (2.2%) | 1.6% | (1.6%) | 3.9% | 6.6% | 23.8% | ||||||
| Comparable (2) | Consolidated | 16.9% | 19.2% | 16.9% | 19.2% | 18.7% | 19.4% | |||||
| Mexico & Central America | 15.1% | 16.4% | 14.6% | 14.9% | 15.1% | 9.2% | ||||||
| South America | 20.3% | 23.9% | 22.1% | 28.5% | 31.5% | 54.5% | ||||||
Ian Craig, Coca-Cola FEMSA’s CEO, commented:
“We are pleased to report another set of positive results. During the quarter, our volume grew across all territories, and surpassed a billion unit cases for the first time during a quarter. Notably, our efforts to optimize costs and generate efficiencies, resulted in sequential margin improvements. On the digital front, the rollout of Juntos+, our B2B omnichannel platform, enabled us to reach more than US$ 1 billion in digital sales during the first six months of year. All this, as we continue bolstering our customer centricity to deepen our connection with our customers and improve their overall experience. As we enter the second half of the year, we are confident in our ability to maintain our growth momentum.
Finally, I want to congratulate our team at Coca-Cola FEMSA Argentina, which was recognized by The Coca-Cola Company with the Candler Cup 2022 due to its excellence in execution, talent, and culture. Working together as one single team with our colleagues from The Coca-Cola Company, our team in Argentina have made this recognition possible.”
| (1) | Quarterly earnings / outstanding shares. Earnings per share (EPS) were calculated using 16,806.7 million shares outstanding. For the convenience of the reader, as a KOFUBL Unit is comprised of 8 shares (3 Series B shares and 5 Series L shares), earnings per unit are equal to EPS multiplied by 8. Each ADS represents 10 KOFUBL Units. |
| (2) | Please refer to page 10 for our definition of “comparable” and a description of the factors
affecting the comparability of our financial and operating performance. |
|
Coca-Cola FEMSA Reports 2Q23 Results July 25, 2023 |
Page |
RECENT DEVELOPMENTS
| · | On May 3, 2023, Coca-Cola FEMSA paid the first installment of the dividend declared in the Annual Ordinary General Shareholders’ Meeting in the amount of Ps. 0.3625 per share, for a total cash distribution of Ps. 6,092 million. |
| · | On June 12, 2023, Coca-Cola FEMSA provided an update on the previously disclosed cybersecurity incident. In this update, the Company announced that its investigation determined that the party responsible for the incident extracted and published certain Company data. Importantly, the Company also announced that this cybersecurity incident did not materially adversely impact Coca-Cola FEMSA’s business operations or related functions, and our service to customers continues uninterrupted. Data security is extremely important to us. Our team, including third party experts, has been working to enhance our cybersecurity risk management program and security posture. |
| · | On July 12, 2023, Coca-Cola FEMSA, The Coca-Cola Company, and other leading bottling partners announced the creation of a sustainability-focused venture capital fund in partnership with Greycroft. The creation of the US$137.7 million fund will focus on key investments in packaging, decarbonization, and other initiatives with the potential to reduce the Coca-Cola system’s carbon footprint. The fund’s US$137.7 million in capital comes primarily from US$15 million of committed capital from each of the participating companies. |
| · | On July 18, 2023, Coca-Cola FEMSA Argentina was awarded by The Coca-Cola Company with the Candler Cup 2022. The Candler cup, named after Asa Candler, founder of The Coca-Cola Company and who granted the first Coca-Cola franchise, is an award given to a bottler in recognition for its excellence in execution, coupled with its investments behind its people’s development, training, and culture. |
CONFERENCE CALL INFORMATION

|
Coca-Cola FEMSA Reports 2Q23 Results July 25, 2023 |
Page |
CONSOLIDATED SECOND QUARTER RESULTS
| CONSOLIDATED SECOND QUARTER RESULTS | ||||||
| As Reported | Comparable (1) | |||||
| Expressed in millions of Mexican pesos | 2Q 2023 | 2Q 2022 | Δ% | Δ% | ||
| Total revenues | 61,428 | 57,311 | 7.2% | 16.9% | ||
| Gross profit | 27,267 | 25,271 | 7.9% | 16.9% | ||
| Operating income | 8,562 | 7,652 | 11.9% | 18.7% | ||
| EBITDA (2) | 11,439 | 10,607 | 7.8% | 16.0% | ||
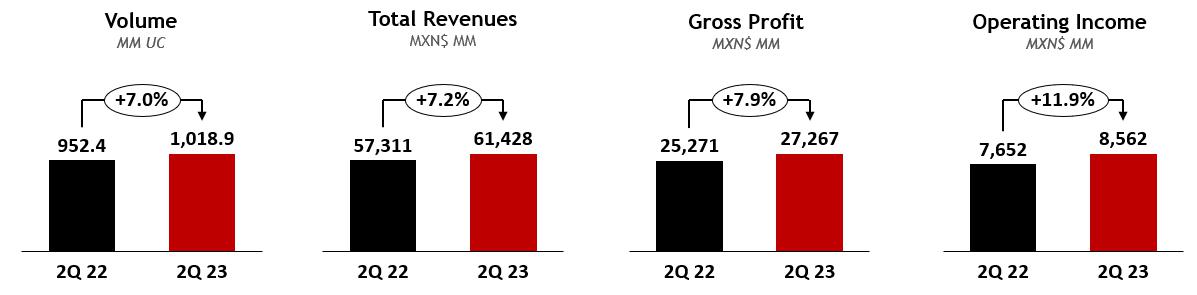
Volume increased 7.0% to 1,018.9 million unit cases, driven by volume growth in all of our territories, including strong performances in Mexico, Brazil, Guatemala, and Uruguay. Excluding the acquisition of the Cristal bulk water business in Mexico, total volume would have increased 5.2%.
Total revenues increased 7.2% to Ps. 61,428 million. Volume growth, revenue management initiatives, and favorable mix effects drove this increase. These factors were partially offset by an unfavorable currency translation into Mexican Pesos. On a comparable basis, excluding currency translations, total revenues increased 16.9%.
Gross profit increased 7.9% to Ps. 27,267 million, and gross margin increased 30 basis points to 44.4%. This gross profit increase was driven mainly by our top-line growth and favorable raw material hedging initiatives, partially offset by higher sweetener costs across our territories. On a comparable basis, gross profit increased 16.9%
Operating income increased 11.9% to Ps. 8,562 million, and operating margin increased 50 basis points to 13.9%. This expansion was driven mainly by a solid top-line performance and an operating foreign exchange gain in Mexico as a result of the appreciation of the Mexican Peso. These effects were partially offset by an increase in raw material costs, mainly sweeteners, coupled with an increase in operating expenses such as labor, marketing, and maintenance. On a comparable basis, operating income increased 18.7%.
| (1) | Please refer to page 10 for our definition of “comparable” and a description of the factors affecting the comparability of our financial and operating performance. |
| (2) | EBITDA = operating income + depreciation + amortization & other operating non-cash charges. |
|
Coca-Cola FEMSA Reports 2Q23 Results July 25, 2023 |
Page |
Comprehensive financing result recorded an expense of Ps. 1,377 million, compared to an expense of Ps. 574 million in the previous year. This increase was driven mainly by a foreign exchange loss of Ps. 437 million as compared to a gain of Ps. 80 million, as our net cash exposure in U.S. dollars was negatively impacted by the appreciation of the Mexican Peso and the Brazilian Real.
Additionally, we recorded a loss of Ps. 68 million in financial instruments as compared to a gain of Ps. 355 million due to a one-off market value gain recognized during the same period of 2022. In accordance with IFRS 9, as of the second quarter 2022, we are recognizing the hedging gain or loss on the debt instrument that is being hedged using interest rate derivatives.
These effects were partially offset by a decrease in our interest expense, net, mainly as a result of a higher gain in our interest income that was driven by an increase in interest rates.
Finally, we recognized a lower gain in monetary position in inflationary subsidiaries during the second quarter of 2023 as compared to the same period of the previous year.
Income tax as a percentage of income before taxes was 27.2% as compared to 35.5% during the same period of 2022. This decrease was driven mainly by favorable inflationary effects in Mexico and deferred taxes.
Net income attributable to equity holders of the company was Ps. 4,926 million as compared to Ps. 4,627 million during the same period of the previous year. This increase was driven mainly by operating income growth, partially offset by an increase in our comprehensive financing result. Earnings per share1 were Ps. 0.29 (Earnings per unit were Ps. 2.34 and per ADS were Ps. 23.45.).
| (1) | Quarterly earnings / outstanding shares. Earnings per share (EPS) were calculated using 16,806.7 million shares outstanding. For the convenience of the reader, as a KOFUBL Unit is comprised of 8 shares (3 Series B shares and 5 Series L shares), earnings per unit are equal to EPS multiplied by 8. Each ADS represents 10 KOFUBL Units. |
|
Coca-Cola FEMSA Reports 2Q23 Results July 25, 2023 |
Page |
CONSOLIDATED FIRST SIX MONTHS RESULTS

| CONSOLIDATED FIRST SIX MONTHS RESULTS | ||||||
| As Reported | Comparable (1) | |||||
| Expressed in millions of Mexican pesos | YTD 2023 | YTD 2022 | Δ% | Δ% | ||
| Total revenues | 118,641 | 108,635 | 9.2% | 19.2% | ||
| Gross profit | 52,657 | 47,933 | 9.9% | 19.2% | ||
| Operating income | 16,269 | 14,512 | 12.1% | 19.4% | ||
| EBITDA (2) | 21,930 | 20,461 | 7.2% | 15.6% | ||
Volume increased 6.8% to 1,958.5 million unit cases, driven by volume growth in all of our territories, including strong performances in Mexico, Brazil, and Guatemala. Excluding the acquisition of the Cristal bulk water business in Mexico, total volume increased 5.0%.
Total revenues increased 9.2% to Ps. 118,641 million. Volume growth, revenue management initiatives, and favorable mix effects drove this increase. These factors were partially offset by an unfavorable currency translation into Mexican Pesos. On a comparable basis, total revenues increased 19.2%.
Gross profit increased 9.9% to Ps. 52,657 million, and gross margin expanded 30 basis points to 44.4%. This gross profit increase was driven mainly by our top-line growth and favorable raw material hedging initiatives. These effects were partially offset by higher sweetener costs across our territories. On a comparable basis, gross profit increased 19.2%.
Operating income increased 12.1% to Ps. 16,269 million, and operating margin expanded 30 basis points to 13.7%. This was driven mainly by a solid top-line performance and an operating foreign exchange gain in Mexico as a result of the appreciation of the Mexican Peso. These effects were partially offset by an increase in raw material costs, mainly sweeteners, coupled with an increase in operating expenses such as labor, marketing, and maintenance. On a comparable basis, operating income increased 19.4%.
| (1) | Please refer to page 10 for our definition of “comparable” and a description of the factors affecting the comparability of our financial and operating performance. |
| (2) | EBITDA = operating income + depreciation + amortization & other operating non-cash charges. |
|
Coca-Cola FEMSA Reports 2Q23 Results July 25, 2023 |
Page |
Comprehensive financing result recorded an expense of Ps. 2,774 million, compared to an expense of Ps. 2,765 million in the previous year. This is explained mainly by a higher foreign exchange loss of Ps. 1,066 million as compared to a loss of Ps. 85 million during the first six months of the previous year, as our net cash exposure in U.S. dollars was negatively impacted by the appreciation of the Mexican Peso and the Brazilian Real. In addition, we recorded a lower gain in monetary position in inflationary subsidiaries of Ps. 120 million as compared to a gain of Ps. 292 million during the same period of the previous year.
These effects were partially offset by a decrease in our interest expense, net, mainly as a result of a gain in our interest income of Ps. 1,866 million as compared to a gain of Ps. 948 million that was driven by an increase in interest rates.
Finally, we recorded a lower loss in financial instruments of Ps. 15 million as compared to a loss of Ps. 581 million during the same period of the previous year. This was driven mainly by a market value loss recorded during the first quarter of 2022, partially offset by a market value gain recognized during the second quarter of 2022. In accordance with IFRS 9, as of the second quarter of 2022, we are recognizing the hedging gain or loss on the debt instrument that is being hedged using interest rate derivatives.
Income tax as a percentage of income before taxes was 29.6% as compared to 33.2% during the same period of 2022. This decrease was driven mainly by favorable inflationary effects in Mexico and deferred taxes.
Net income attributable to equity holders of the company increased 17.3% to reach Ps. 8,837 million during the first six months of 2023, as compared to Ps. 7,532 million during the same period of the previous year. This increase was driven mainly by operating income growth. Earnings per share1 were Ps. 0.53 (Earnings per unit were Ps. 4.21 and per ADS were Ps. 42.07.).
| (1) | Quarterly earnings / outstanding shares. Earnings per share (EPS) were calculated using 16,806.7 million shares outstanding. For the convenience of the reader, as a KOFUBL Unit is comprised of 8 shares (3 Series B shares and 5 Series L shares), earnings per unit are equal to EPS multiplied by 8. Each ADS represents 10 KOFUBL Units. |
|
Coca-Cola FEMSA Reports 2Q23 Results July 25, 2023 |
Page |
MEXICO & CENTRAL AMERICA DIVISION SECOND QUARTER RESULTS
(Mexico, Guatemala, Costa Rica, Panama, and Nicaragua)


| MEXICO & CENTRAL AMERICA DIVISION RESULTS | ||||||
| As Reported | Comparable (1) | |||||
| Expressed in millions of Mexican pesos | 2Q 2023 | 2Q 2022 | Δ% | Δ% | ||
| Total revenues | 39,088 | 34,475 | 13.4% | 15.1% | ||
| Gross profit | 18,635 | 16,495 | 13.0% | 14.6% | ||
| Operating income | 6,509 | 5,727 | 13.7% | 15.1% | ||
| EBITDA (2) | 8,229 | 7,533 | 9.2% | 10.8% | ||
Volume increased 8.9% driven by growth across all of our territories in the division, including solid performance from Mexico and Guatemala. These volumes include the integration of the Cristal bulk water business, excluding these volumes, volume increased 6.0% in the division and 4.5% in Mexico.
Total revenues increased 13.4% to Ps. 39,088 million, driven by volume growth and revenue management initiatives. These effects were partially offset by unfavorable currency translation effects from most of our operating currencies in Central America. On a comparable basis, excluding currency translation effects, total revenues increased 15.1%.
Gross profit increased 13.0% to Ps. 18,635 million, and gross margin contracted 10 basis points to 47.7%. This margin decrease was driven mainly by an increase in raw material costs such as sweeteners and concentrate in Mexico. These effects were partially offset by our top-line growth, favorable raw material hedging initiatives, and the appreciation of the Mexican Peso as applied to our U.S. dollar-denominated raw material costs. On a comparable basis, gross profit increased 14.6%.
Operating income increased 13.7% to Ps. 6,509 million, and operating margin expanded 10 basis points to 16.7%, driven mainly by our top-line growth and an operating foreign exchange gain in Mexico. These effects were partially offset by an increase in operating expenses such as labor, marketing, and maintenance. On a comparable basis, operating income increased 15.1%.
| (1) | Please refer to page 10 for our definition of “comparable” and a description of the factors affecting the comparability of our financial and operating performance. |
| (2) | EBITDA = operating income + depreciation + amortization & other operating non-cash charges. |
|
Coca-Cola FEMSA Reports 2Q23 Results July 25, 2023 |
Page |
SOUTH AMERICA DIVISION SECOND QUARTER RESULTS
(Brazil, Argentina, Colombia, and Uruguay)


| SOUTH AMERICA DIVISION RESULTS | ||||||
| As Reported | Comparable (1) | |||||
| Expressed in millions of Mexican pesos | 2Q 2023 | 2Q 2022 | Δ% | Δ% | ||
| Total revenues | 22,341 | 22,835 | (2.2%) | 20.3% | ||
| Gross profit | 8,632 | 8,776 | (1.6%) | 22.1% | ||
| Operating income | 2,053 | 1,926 | 6.6% | 31.5% | ||
| EBITDA (2) | 3,209 | 3,074 | 4.4% | 32.0% | ||
Volume increased 3.8% driven by growth across all of our territories in the division.
Total revenues decreased 2.2% to Ps. 22,341 million. This decline was driven mainly by unfavorable currency translation effects of all of our operating currencies in the division into Mexican Pesos. These effects were partially offset by a positive underlying operating performance that includes volume growth, revenue management, and favorable mix effects. On a comparable basis, total revenues increased 20.3%.
Gross profit decreased 1.6% to Ps. 8,632 million, and gross margin expanded 20 basis points to 38.6%. This decrease was driven mainly by increases in raw material costs such as sweeteners that were partially offset by our top-line growth, favorable mix effects, and raw material hedging strategies. On a comparable basis, gross profit increased 22.1%.
Operating income increased 6.6% to Ps. 2,053 million in the second quarter of 2023, resulting in an operating margin expansion of 80 basis points to 9.2%. This increase was driven mainly by operating expense efficiencies and an increase in operating leverage resulting from volume growth. These effects were partially offset by higher labor and marketing expenses. On a comparable basis, operating income increased 31.5%.
| (1) | Please refer to page 10 for our definition of “comparable” and a description of the factors affecting the comparability of our financial and operating performance. |
| (1) | EBITDA = operating income + depreciation + amortization & other operating non-cash charges. |
|
Coca-Cola FEMSA Reports 2Q23 Results July 25, 2023 |
Page |
DEFINITIONS
Volume is expressed in unit cases. Unit case refers to 192 ounces of finished beverage product (24 eight-ounce servings) and, when applied to soda fountains, refers to the volume of syrup, powders, and concentrate that is required to produce 192 ounces of finished beverage product.
Transactions refers to the number of single units (e.g., a can or a bottle) sold, regardless of their size or volume or whether they are sold individually or in multipacks, except for soda fountains, which represent multiple transactions based on a standard 12 oz. serving.
Operating income is a non-GAAP financial measure computed as “gross profit – operating expenses – other operating expenses, net + operative equity method (gain) loss in associates.”
EBITDA is a non-GAAP financial measure computed as “operating income + depreciation + amortization & other operating non-cash charges.”
Earnings per share are equal to “quarterly earnings / outstanding shares.” Earnings per share (EPS) for all periods are adjusted to give effect to the stock split resulting in 16,806,658,096 shares outstanding. For the convenience of the reader, as a KOFUBL Unit is comprised of 8 shares (3 Series B shares and 5 Series L shares), earnings per unit are equal to EPS multiplied by 8. Each ADS represents 10 KOFUBL Units.
COMPARABILITY
Our “comparable” term means, with respect to a year-over-year comparison, the change of a given measure excluding the effects of: (i) mergers, acquisitions, and divestitures, in this case the acquisition of CVI in Brazil, integrated as of February 2022; and (ii) translation effects resulting from exchange rate movements. In preparing this measure, management has used its best judgment, estimates, and assumptions in order to maintain comparability.
|
Coca-Cola FEMSA Reports 2Q23 Results July 25, 2023 |
Page |
ABOUT THE COMPANY
Stock listing information: Mexican Stock Exchange, Ticker: KOFUBL | NYSE (ADS), Ticker: KOF | Ratio of KOFUBL to KOF = 10:1
Coca-Cola FEMSA files reports, including annual reports and other information, with the U.S. Securities and Exchange Commission, or the “SEC,” and the Mexican Stock Exchange (Bolsa Mexicana de Valores, or the “BMV”) pursuant to the rules and regulations of the SEC (that apply to foreign private issuers) and of the BMV. Filings we make electronically with the SEC and the BMV are available to the public on the Internet at the SEC’s website at www.sec.gov, the BMV’s website at www.bmv.com.mx, and our website at www.coca-colafemsa.com.
Coca-Cola FEMSA, S.A.B. de C.V. is the largest Coca-Cola franchise bottler in the world by sales volume. The Company produces and distributes trademark beverages of The Coca-Cola Company, offering a wide portfolio of 131 brands to a population of more than 266 million. With over 80 thousand employees, the Company markets and sells approximately 3.5 billion unit cases through 2 million points of sale a year. Operating 49 manufacturing plants and 260 distribution centers, Coca-Cola FEMSA is committed to generating economic, social, and environmental value for all of its stakeholders across the value chain. The Company is a member of the Dow Jones Sustainability Emerging Markets Index, Dow Jones Sustainability MILA Pacific Alliance Index, FTSE4Good Emerging Index, and the Mexican Stock Exchange’s IPC and Social Responsibility and Sustainability Indices, among others. Its operations encompass franchise territories in Mexico, Brazil, Guatemala, Colombia, and Argentina, and, nationwide, in Costa Rica, Nicaragua, Panama, Uruguay, and Venezuela through its investment in KOF Venezuela. For further information, please visit www.coca-colafemsa.com.

ADDITIONAL INFORMATION
All of the financial information presented in this report was prepared under International Financial Reporting Standards (IFRS).
This news release may contain forward-looking statements concerning Coca-Cola FEMSA’s future performance, which should be considered as good faith estimates by Coca-Cola FEMSA. These forward-looking statements reflect management’s expectations and are based upon currently available data. Actual results are subject to future events and uncertainties, many of which are outside Coca-Cola FEMSA’s control, which could materially impact the Company’s actual performance. References herein to “US$” are to United States dollars. This news release contains translations of certain Mexican peso amounts into U.S. dollars for the convenience of the reader. These translations should not be construed as representations that Mexican peso amounts actually represent such U.S. dollar amounts or could be converted into U.S. dollars at the rate indicated.
(6 pages of tables to follow)
|
Coca-Cola FEMSA Reports 2Q23 Results July 25, 2023 |
Page |
| COCA-COLA FEMSA | ||||||||||||||
| CONSOLIDATED INCOME STATEMENT | ||||||||||||||
| Millions of Pesos (1) | ||||||||||||||
| For the Second Quarter of: | For the First six months of: | |||||||||||||
| 2023 | % of Rev. | 2022 | % of Rev. | Δ% Reported | Δ% Comparable (7) | 2023 | % of Rev. | 2022 | % of Rev. | Δ% Reported | Δ% Comparable (7) | |||
| Transactions (million transactions) | 5,933.0 | 5,636.1 | 5.3% | 5.3% | 11,500.2 | 10,847.6 | 6.0% | 5.8% | ||||||
| Volume (million unit cases) | 1,018.9 | 952.4 | 7.0% | 7.0% | 1,958.5 | 1,834.1 | 6.8% | 6.6% | ||||||
| Average price per unit case | 58.31 | 60.05 | -2.9% | 58.70 | 59.10 | -0.7% | ||||||||
| Net revenues | 61,283 | 57,190 | 7.2% | 118,285 | 108,395 | 9.1% | ||||||||
| Other operating revenues | 145 | 121 | 20.5% | 356 | 239 | 48.7% | ||||||||
| Total revenues (2) | 61,428 | 100.0% | 57,311 | 100.0% | 7.2% | 16.9% | 118,641 | 100.0% | 108,635 | 100.0% | 9.2% | 19.2% | ||
| Cost of goods sold | 34,161 | 55.6% | 32,039 | 55.9% | 6.6% | 65,984 | 55.6% | 60,702 | 55.9% | 8.7% | ||||
| Gross profit | 27,267 | 44.4% | 25,271 | 44.1% | 7.9% | 16.9% | 52,657 | 44.4% | 47,933 | 44.1% | 9.9% | 19.2% | ||
| Operating expenses | 18,796 | 30.6% | 17,448 | 30.4% | 7.7% | 36,571 | 30.8% | 33,249 | 30.6% | 10.0% | ||||
| Other operative expenses, net | (46) | -0.1% | 260 | 0.5% | NA | (78) | -0.1% | 282 | 0.3% | NA | ||||
| Operative equity method (gain) loss in associates(3) | (44) | -0.1% | (89) | -0.2% | -50.6% | (105) | -0.1% | (109) | -0.1% | -4.4% | ||||
| Operating income (5) | 8,562 | 13.9% | 7,652 | 13.4% | 11.9% | 18.7% | 16,269 | 13.7% | 14,512 | 13.4% | 12.1% | 19.4% | ||
| Other non operative expenses, net | 228 | 0.4% | 70 | 0.1% | 227.1% | 351 | 0.3% | 249 | 0.2% | 41.0% | ||||
| Non Operative equity method (gain) loss in associates (4) | 31 | 0.1% | (25) | 0.0% | NA | 165 | 0.1% | (29) | 0.0% | NA | ||||
| Interest expense | 1,769 | 1,688 | 4.8% | 3,678 | 3,339 | 10.2% | ||||||||
| Interest income | 834 | 541 | 54.3% | 1,866 | 948 | 96.8% | ||||||||
| Interest expense, net | 935 | 1,147 | -18.5% | 1,812 | 2,391 | -24.2% | ||||||||
| Foreign exchange loss (gain) | 437 | (80) | NA | 1,066 | 85 | 1151.4% | ||||||||
| Loss (gain) on monetary position in inflationary subsidiaries | (63) | (138) | -54.3% | (120) | (292) | -59.0% | ||||||||
| Market value (gain) loss on financial instruments | 68 | (355) | NA | 15 | 581 | NA | ||||||||
| Comprehensive financing result | 1,377 | 574 | 139.9% | 2,774 | 2,765 | 0.3% | ||||||||
| Income before taxes | 6,926 | 7,034 | -1.5% | 12,978 | 11,526 | 12.6% | ||||||||
| Income taxes | 1,881 | 2,458 | -23.5% | 3,860 | 3,787 | 1.9% | ||||||||
| Result of discontinued operations | - | - | NA | - | - | NA | ||||||||
| Consolidated net income | 5,045 | 4,576 | 10.3% | 9,118 | 7,740 | 17.8% | ||||||||
| Net income attributable to equity holders of the company | 4,926 | 8.0% | 4,627 | 8.1% | 6.5% | 12.0% | 8,837 | 7.4% | 7,532 | 6.9% | 17.3% | 27.8% | ||
| Non-controlling interest | 119 | 0.2% | (51) | -0.1% | NA | 281 | 0.2% | 208 | 0.2% | 35.1% | ||||
| EBITDA & CAPEX | 2023 | % of Rev. | 2022 | % of Rev. | Δ% Reported | Δ% Comparable (7) | 2023 | % of Rev. | 2022 | % of Rev. | Δ% Reported | Δ% Comparable (7) | ||
| Operating income (5) | 8,562 | 13.9% | 7,652 | 13.4% | 11.9% | 18.7% | 16,269 | 13.7% | 14,512 | 13.4% | 12.1% | 19.4% | ||
| Depreciation | 2,397 | 2,399 | -0.1% | 4,717 | 4,755 | -0.8% | ||||||||
| Amortization and other operative non-cash charges | 480 | 556 | -13.7% | 945 | 1,195 | -20.9% | ||||||||
| EBITDA (5)(6) | 11,439 | 18.6% | 10,607 | 18.5% | 7.8% | 16.0% | 21,930 | 18.5% | 20,461 | 18.8% | 7.2% | 15.6% | ||
| CAPEX(8) | 4,252 | 4,052 | 4.9% | 6,749 | 7,157 | -5.7% | ||||||||
(1) Except volume and average price per unit case figures.
(2) Please refer to page 15 for revenue breakdown.
(3) Includes equity method in Jugos del Valle and Leão Alimentos, among others.
(4) Includes equity method in PIASA, IEQSA, Beta San Miguel, IMER, and KSP Participacoes, among others.
(5) The operating income and EBITDA lines are presented as non-GAAP measures for the convenience of the reader.
(6) EBITDA = operating income + depreciation, amortization & other operating non-cash charges.
(7) Please refer to page 10 for our definition of “comparable” and a description of the factors affecting the comparability of our financial and operating performance.
(8) As of June 30, 2023, the investment in fixed assets effectively paid is equivalent to Ps. 6,503 million.
|
Coca-Cola FEMSA Reports 2Q23 Results July 25, 2023 |
Page |
| MEXICO & CENTRAL AMERICA DIVISION | ||||||||||||||
| RESULTS OF OPERATIONS | ||||||||||||||
| Millions of Pesos (1) | ||||||||||||||
| For the Second Quarter of: | For the First Six Months of: | |||||||||||||
| 2023 | % of Rev. | 2022 | % of Rev. | Δ% Reported | Δ% Comparable (6) | 2023 | % of Rev. | 2022 | % of Rev. | Δ% Reported | Δ% Comparable (6) | |||
| Transactions (million transactions) | 3,303.6 | 3,126.6 | 5.7% | 5.7% | 6,130.4 | 5,774.9 | 6.2% | 6.2% | ||||||
| Volume (million unit cases) | 643.3 | 590.7 | 8.9% | 8.9% | 1,180.7 | 1,084.7 | 8.8% | 8.8% | ||||||
| Average price per unit case | 60.44 | 58.35 | 3.6% | 61.40 | 58.44 | 5.1% | ||||||||
| Net revenues | 39,081 | 34,466 | 72,693 | 63,393 | ||||||||||
| Other operating revenues | 6 | 9 | 12 | 17 | ||||||||||
| Total Revenues (2) | 39,088 | 100.0% | 34,475 | 100.0% | 13.4% | 15.1% | 72,705 | 100.0% | 63,410 | 100.0% | 14.7% | 16.4% | ||
| Cost of goods sold | 20,452 | 52.3% | 17,980 | 52.2% | 38,151 | 52.5% | 32,908 | 51.9% | ||||||
| Gross profit | 18,635.4 | 47.7% | 16,495.0 | 47.8% | 13.0% | 14.6% | 34,554.2 | 47.5% | 30,501.8 | 48.1% | 13.3% | 14.9% | ||
| Operating expenses | 12,251.8 | 31.3% | 10,562.0 | 30.6% | 23,310.5 | 0.3 | 19,667.5 | 0.3 | ||||||
| Other operative expenses, net | (101) | -0.3% | 236 | 0.7% | (212) | -0.3% | 234 | 0.4% | ||||||
| Operative equity method (gain) loss in associates (3) | (24) | -0.1% | (30) | -0.1% | (64) | -0.1% | (76) | -0.1% | ||||||
| Operating income (4) | 6,509 | 16.7% | 5,727 | 16.6% | 13.7% | 15.1% | 11,520 | 15.8% | 10,677 | 16.8% | 7.9% | 7.9% | ||
| Depreciation, amortization & other operating non-cash charges | 1,720 | 4.4% | 1,806 | 5.2% | 3,415 | 4.7% | 3,579 | 5.6% | ||||||
| EBITDA (4)(5) | 8,229 | 21.1% | 7,533 | 21.9% | 9.2% | 10.8% | 14,935 | 20.5% | 14,256 | 22.5% | 4.8% | 4.8% | ||
(1) Except volume and average price per unit case figures.
(2) Please refer to page 15 for revenue breakdown.
(3) Includes equity method in Jugos del Valle, among others.
(4) The operating income and EBITDA lines are presented as non-GAAP measures for the convenience of the reader.
(5) EBITDA = operating income + depreciation, amortization & other operating non-cash charges.
(6) Please refer to page 10 for our definition of “comparable” and a description of the factors affecting the comparability of our financial and operating performance.
| SOUTH AMERICA DIVISION | ||||||||||||||
| RESULTS OF OPERATIONS | ||||||||||||||
| Millions of Pesos (1) | ||||||||||||||
| For the Second Quarter of: | For the First Six Months of: | |||||||||||||
| 2023 | % of Rev. | 2022 | % of Rev. | Δ% Reported | Δ% Comparable (6) | 2023 | % of Rev. | 2022 | % of Rev. | Δ% Reported | Δ% Comparable (6) | |||
| Transactions (million transactions) | 2,629.4 | 2,509.5 | 4.8% | 4.8% | 5,369.8 | 5,072.6 | 5.9% | 5.4% | ||||||
| Volume (million unit cases) | 375.7 | 361.7 | 3.8% | 3.8% | 777.9 | 749.4 | 3.8% | 3.3% | ||||||
| Average price per unit case | 54.66 | 59.27 | -7.8% | 54.60 | 56.68 | -3.7% | ||||||||
| Net revenues | 22,202 | 22,724 | 45,592 | 45,003 | ||||||||||
| Other operating revenues | 139 | 111 | 344 | 222 | ||||||||||
| Total Revenues (2) | 22,341 | 100.0% | 22,835 | 100.0% | -2.2% | 20.3% | 45,936 | 100.0% | 45,225 | 100.0% | 1.6% | 23.9% | ||
| Cost of goods sold | 13,709 | 61.4% | 14,059 | 61.6% | 27,833 | 60.6% | 27,793 | 61.5% | ||||||
| Gross profit | 8,632 | 38.6% | 8,776 | 38.4% | -1.6% | 22.1% | 18,103 | 39.4% | 17,431 | 38.5% | 3.9% | 28.5% | ||
| Operating expenses | 6,544 | 29.3% | 6,886 | 30.2% | 13,261 | 28.9% | 13,581 | 30.0% | ||||||
| Other operative expenses, net | 55 | 0.2% | 23 | 0.1% | 134 | 0.3% | 48 | 0.1% | ||||||
| Operative equity method (gain) loss in associates (3) | (20) | -0.1% | (59) | -0.3% | (41) | -0.1% | (33) | -0.1% | ||||||
| Operating income (4) | 2,053.2 | 9.2% | 1,925.7 | 8.4% | 6.6% | 31.5% | 4,748.7 | 10.3% | 3,835.3 | 8.5% | 23.8% | 54.5% | ||
| Depreciation, amortization & other operating non-cash charges | 1,156 | 5.2% | 1,148 | 5.0% | 2,246 | 4.9% | 2,370 | 5.2% | ||||||
| EBITDA (4)(5) | 3,209 | 14.4% | 3,074 | 13.5% | 4.4% | 32.0% | 6,995 | 15.2% | 6,206 | 13.7% | 12.7% | 42.6% | ||
| (1) | Except volume and average price per unit case figures. |
| (2) | Please refer to page 15 for revenue breakdown. |
| (3) | Includes equity method in Leão Alimentos, among others. |
| (4) | The operating income and EBITDA lines are presented as non-GAAP measures for the convenience of the reader. |
| (5) | EBITDA = operating income + depreciation, amortization & other operating non-cash charges. |
| (6) | Please refer to page 10 for our definition of “comparable”
and a description of the factors affecting the comparability of our financial and operating performance. |
|
Coca-Cola FEMSA Reports 2Q23 Results July 25, 2023 |
Page |
| COCA-COLA FEMSA | ||||||||||
| CONSOLIDATED BALANCE SHEET | ||||||||||
| Millions of Pesos | ||||||||||
| Assets | Jun-23 | Dec-22 | % Var. | Liabilities & Equity | Jun-23 | Dec-22 | % Var. | |||
| Current Assets | Current Liabilities | |||||||||
| Cash, cash equivalents and marketable securities | Short-term bank loans and notes payable | 387 | 8,524 | -95% | ||||||
| 30,949 | 40,277 | -23% | Suppliers | 22,949 | 26,834 | -14% | ||||
| Total accounts receivable | 13,779 | 16,318 | -16% | Short-term leasing Liabilities | 609 | 472 | 29% | |||
| Inventories | 12,067 | 11,888 | 2% | Other current liabilities | 31,061 | 22,129 | 40% | |||
| Other current assets | 8,902 | 10,729 | -17% | Total current liabilities | 55,006 | 57,959 | -5% | |||
| Total current assets | 65,697 | 79,211 | -17% | Non-Current Liabilities | - | - | ||||
| Non-Current Assets | - | - | Long-term bank loans and notes payable | 65,371 | 70,146 | -7% | ||||
| Property, plant and equipment | 125,650 | 125,293 | 0% | Long Term Leasing Liabilities | 1,817 | 1,663 | 9% | |||
| Accumulated depreciation | (54,627) | (54,088) | 1% | Other long-term liabilities | 17,436 | 16,351 | 7% | |||
| Total property, plant and equipment, net | 71,023 | 71,205 | 0% | Total liabilities | 139,630 | 146,119 | -4% | |||
| Right of use assets | 2,325 | 2,069 | 12% | Equity | - | - | ||||
| Investment in shares | 8,442 | 8,452 | 0% | Non-controlling interest | 6,465 | 6,491 | 0% | |||
| Intangible assets and other assets | 101,043 | 103,122 | -2% | Total controlling interest | 117,221 | 125,384 | -7% | |||
| Other non-current assets | 14,784 | 13,936 | 6% | Total equity | 123,685 | 131,876 | -6% | |||
| Total Assets | 263,315 | 277,995 | -5% | Total Liabilities and Equity | 263,315 | 277,995 | -5% | |||
| June 30, 2023 | ||||||||||
| Debt Mix | % Total Debt (1) | % Interest Rate Floating (1) (2) | Average Rate | Debt Maturity Profile | ||||||
| Currency |
 |
|||||||||
| Mexican Pesos | 62.4% | 7.2% | 8.7% | |||||||
| U.S. Dollars | 16.2% | 37.4% | 4.7% | |||||||
| Colombian Pesos | 1.2% | 0.0% | 6.3% | |||||||
| Brazilian Reals | 19.7% | 67.3% | 10.7% | |||||||
| Uruguayan Pesos | 0.5% | 0.0% | 6.3% | |||||||
| Total Debt | 100% | 25.0% | 8.4% | |||||||
| (1) After giving effect to cross- currency swaps. | ||||||||||
| (2) Calculated by weighting each year´s outstanding debt balance mix. | ||||||||||
| Financial Ratios | 2Q 2023 | FY 2022 | Δ% | |||||||
| Net debt including effect of hedges (1)(3) | 37,209 | 38,104 | -2.3% | |||||||
| Net debt including effect of hedges / EBITDA (1)(3) | 0.84 | 0.89 | ||||||||
| EBITDA/ Interest expense, net (1) | 12.10 | 10.34 | ||||||||
| Capitalization (2) | 34.8% | 38.9% | ||||||||
| (1) Net debt = total debt - cash | ||||||||||
| (2) Total debt / (total debt + shareholders' equity) | ||||||||||
| (3) After giving effect to cross-currency swaps. | ||||||||||
|
Coca-Cola FEMSA Reports 2Q23 Results July 25, 2023 |
Page |
| COCA-COLA FEMSA | ||||||||||||||
| QUARTERLY- VOLUME, TRANSACTIONS & REVENUES | ||||||||||||||
| Volume | ||||||||||||||
| 2Q 2023 | 2Q 2022 | YoY | ||||||||||||
| Sparkling | Water (1) | Bulk (2) | Stills | Total | Sparkling | Water (1) | Bulk (2) | Stills | Total | Δ % | ||||
| Mexico (3) | 375.9 | 37.0 | 104.4 | 38.1 | 555.5 | 366.8 | 31.3 | 81.9 | 34.9 | 514.8 | 7.9% | |||
| Guatemala | 40.5 | 2.0 | - | 2.3 | 44.8 | 33.9 | 1.1 | - | 2.4 | 37.3 | 20.1% | |||
| CAM South | 34.9 | 1.7 | 0.6 | 5.7 | 43.0 | 31.2 | 1.9 | 0.2 | 5.3 | 38.6 | 11.4% | |||
| Mexico and Central America | 451.3 | 40.7 | 105.1 | 46.2 | 643.3 | 431.8 | 34.3 | 82.1 | 42.5 | 590.7 | 8.9% | |||
| Colombia | 63.9 | 9.3 | 3.5 | 7.5 | 84.2 | 64.6 | 8.4 | 2.9 | 7.6 | 83.4 | 0.9% | |||
| Brazil (4) | 203.5 | 15.2 | 2.0 | 19.7 | 240.4 | 193.8 | 14.5 | 3.4 | 18.9 | 230.7 | 4.2% | |||
| Argentina | 30.0 | 4.3 | 1.1 | 3.6 | 39.0 | 30.2 | 3.3 | 0.8 | 3.2 | 37.5 | 3.8% | |||
| Uruguay | 8.8 | 2.9 | - | 0.5 | 12.2 | 8.6 | 1.1 | - | 0.4 | 10.1 | 20.3% | |||
| South America | 306.1 | 31.8 | 6.5 | 31.2 | 375.7 | 297.3 | 27.4 | 7.1 | 30.1 | 361.7 | 3.8% | |||
| TOTAL | 757.5 | 72.5 | 111.6 | 77.4 | 1,018.9 | 729.1 | 61.6 | 89.1 | 72.6 | 952.4 | 7.0% | |||
| (1) Excludes water presentations larger than 5.0 Lt ; includes flavored water. | ||||||||||||||
| (2) Bulk Water = Still bottled water in 5.0, 19.0 and 20.0 - liter packaging presentations; includes flavored water | ||||||||||||||
| (3) Includes 17.4 million unit cases corresponding to the acquisition of Cristal from Embotelladoras Bepensa | ||||||||||||||
| Transactions | ||||||||||||||
| 2Q 2023 | 2Q 2022 | YoY | ||||||||||||
| Sparkling | Water | Stills | Total | Sparkling | Water | Stills | Total | Δ % | ||||||
| Mexico (3) | 2,102.2 | 258.6 | 268.0 | 2,628.9 | 2,061.6 | 216.9 | 250.5 | 2,528.9 | 4.0% | |||||
| Guatemala | 305.7 | 15.6 | 23.6 | 344.9 | 261.0 | 11.0 | 23.4 | 295.5 | 16.7% | |||||
| CAM South | 255.5 | 14.2 | 60.1 | 329.8 | 230.5 | 12.3 | 59.4 | 302.2 | 9.1% | |||||
| Mexico and Central America | 2,663.5 | 288.4 | 351.7 | 3,303.6 | 2,553.0 | 240.2 | 333.3 | 3,126.6 | 5.7% | |||||
| Colombia | 472.7 | 98.3 | 79.4 | 650.4 | 464.7 | 90.9 | 80.1 | 635.8 | 2.3% | |||||
| Brazil (4) | 1,346.4 | 135.2 | 223.3 | 1,704.9 | 1,279.2 | 127.5 | 205.7 | 1,612.5 | 5.7% | |||||
| Argentina | 158.4 | 28.6 | 31.6 | 218.5 | 161.6 | 22.5 | 27.5 | 211.5 | 3.3% | |||||
| Uruguay | 41.4 | 10.4 | 3.9 | 55.6 | 42.0 | 4.4 | 3.4 | 49.7 | 11.8% | |||||
| South America | 2,018.8 | 272.4 | 338.2 | 2,629.4 | 1,947.5 | 245.3 | 316.7 | 2,509.5 | 4.8% | |||||
| TOTAL | 4,682.3 | 560.8 | 689.9 | 5,933.0 | 4,500.5 | 485.5 | 650.1 | 5,636.1 | 5.3% | |||||
| Revenues | ||||||||||||||
| Expressed in million Mexican Pesos | 2Q 2023 | 2Q 2022 | Δ % | |||||||||||
| Mexico | 32,299 | 28,505 | 13.3% | |||||||||||
| Guatemala | 3,316 | 3,071 | 8.0% | |||||||||||
| CAM South | 3,473 | 2,899 | 19.8% | |||||||||||
| Mexico and Central America | 39,088 | 34,475 | 13.4% | |||||||||||
| Colombia | 4,041 | 4,584 | -11.9% | |||||||||||
| Brazil (5) | 15,109 | 14,982 | 0.8% | |||||||||||
| Argentina | 2,220 | 2,349 | -5.5% | |||||||||||
| Uruguay | 971 | 920 | 5.5% | |||||||||||
| South America | 22,341 | 22,835 | -2.2% | |||||||||||
| TOTAL | 61,428 | 57,311 | 7.2% | |||||||||||
| (4) Volume and transactions in Brazil do not include beer | ||||||||||||||
| (5) Brazil includes beer revenues of Ps. 1,511.3 million for the second quarter of 2023 and Ps.1,282.1 million for the same period of the previous year. | ||||||||||||||

| (1) | Volume is expressed in unit cases. Unit case refers to 192 ounces of finished beverage product (24 eight-ounce servings) and, when applied to soda fountains, refers to the volume of syrup, powders, and concentrate that is required to produce 192 ounces of finished beverage product. |
| (2) | Transactions refers to the number of single units (e.g., a can or a bottle) sold, regardless of their size or volume or whether they are sold individually or in multipacks, except for soda fountains, which represent multiple transactions based on a standard 12 oz. serving. |
|
Coca-Cola FEMSA Reports 2Q23 Results July 25, 2023 |
Page |
| COCA-COLA FEMSA | ||||||||||||||
| YTD- VOLUME, TRANSACTIONS & REVENUES | ||||||||||||||
| Volume | ||||||||||||||
| YTD 2023 | YTD 2022 | YoY | ||||||||||||
| Sparkling | Water (1) | Bulk (2) | Stills | Total | Sparkling | Water (1) | Bulk (2) | Stills | Total | Δ % | ||||
| Mexico (3) | 685.4 | 63.4 | 192.0 | 73.4 | 1,014.2 | 668.7 | 52.6 | 149.4 | 67.6 | 938.3 | 8.1% | |||
| Guatemala | 75.8 | 3.6 | - | 4.6 | 84.0 | 64.5 | 2.3 | - | 4.3 | 71.0 | 18.3% | |||
| CAM South | 66.5 | 3.5 | 1.0 | 11.3 | 82.4 | 61.0 | 3.8 | 0.4 | 10.2 | 75.4 | 9.2% | |||
| Mexico and Central America | 827.8 | 70.5 | 193.1 | 89.3 | 1,180.7 | 794.2 | 58.7 | 149.8 | 82.1 | 1,084.7 | 8.8% | |||
| Colombia | 125.2 | 18.1 | 6.8 | 14.5 | 164.6 | 126.8 | 16.1 | 5.9 | 15.0 | 163.8 | 0.5% | |||
| Brazil (4) | 421.8 | 34.6 | 4.7 | 40.2 | 501.3 | 400.5 | 31.6 | 5.8 | 43.6 | 481.6 | 4.1% | |||
| Argentina | 65.9 | 9.8 | 2.5 | 8.5 | 86.7 | 66.0 | 7.4 | 2.0 | 7.0 | 82.4 | 5.1% | |||
| Uruguay | 19.1 | 5.0 | - | 1.1 | 25.3 | 18.1 | 2.8 | - | 0.7 | 21.5 | 17.4% | |||
| South America | 632.1 | 67.5 | 13.9 | 64.3 | 777.9 | 611.3 | 57.9 | 13.7 | 66.4 | 749.4 | 3.8% | |||
| TOTAL | 1,459.8 | 138.1 | 207.0 | 153.6 | 1,958.5 | 1,405.5 | 116.6 | 163.5 | 148.4 | 1,834.1 | 6.8% | |||
| (1) Excludes water presentations larger than 5.0 Lt ; includes flavored water. | ||||||||||||||
| (2) Bulk Water = Still bottled water in 5.0, 19.0 and 20.0 - liter packaging presentations; includes flavored water | ||||||||||||||
| (3) Includes 32.6 million unit cases corresponding to the acquisition of Cristal from Embotelladoras Bepensa | ||||||||||||||
| Transactions | ||||||||||||||
| YTD 2023 | YTD 2022 | YoY | ||||||||||||
| Sparkling | Water | Stills | Total | Sparkling | Water | Stills | Total | Δ % | ||||||
| Mexico (3) | 3,867.4 | 449.9 | 522.7 | 4,840.0 | 3,760.2 | 371.1 | 488.1 | 4,619.4 | 4.8% | |||||
| Guatemala | 573.0 | 28.9 | 46.3 | 648.2 | 499.5 | 22.7 | 42.9 | 565.2 | 14.7% | |||||
| CAM South | 491.2 | 27.5 | 123.5 | 642.2 | 450.8 | 25.0 | 114.5 | 590.4 | 8.8% | |||||
| Mexico and Central America | 4,931.6 | 506.3 | 692.5 | 6,130.4 | 4,710.5 | 418.9 | 645.5 | 5,774.9 | 6.2% | |||||
| Colombia | 920.8 | 189.8 | 157.0 | 1,267.7 | 894.5 | 173.5 | 161.7 | 1,229.7 | 3.1% | |||||
| Brazil (4) | 2,749.5 | 305.4 | 449.5 | 3,504.4 | 2,586.1 | 275.8 | 430.1 | 3,292.0 | 6.5% | |||||
| Argentina | 341.7 | 63.4 | 73.0 | 478.1 | 340.2 | 47.5 | 57.3 | 445.0 | 7.4% | |||||
| Uruguay | 91.6 | 18.3 | 9.6 | 119.5 | 89.1 | 10.7 | 6.1 | 105.9 | 12.9% | |||||
| South America | 4,103.7 | 577.0 | 689.1 | 5,369.8 | 3,909.8 | 507.6 | 655.2 | 5,072.6 | 5.9% | |||||
| TOTAL | 9,035.2 | 1,083.3 | 1,381.6 | 11,500.2 | 8,620.4 | 926.5 | 1,300.7 | 10,847.6 | 6.0% | |||||
| Revenues | ||||||||||||||
| Expressed in million Mexican Pesos | YTD 2023 | YTD 2022 | Δ % | |||||||||||
| Mexico | 59,528 | 51,727 | 15.1% | |||||||||||
| Guatemala | 6,333 | 5,847 | 8.3% | |||||||||||
| CAM South | 6,844 | 5,837 | 17.3% | |||||||||||
| Mexico and Central America | 72,705 | 63,410 | 14.7% | |||||||||||
| Colombia | 7,784 | 8,860 | -12.1% | |||||||||||
| Brazil (5) | 31,078 | 29,370 | 5.8% | |||||||||||
| Argentina | 4,975 | 5,150 | -3.4% | |||||||||||
| Uruguay | 2,098 | 1,845 | 13.7% | |||||||||||
| South America | 45,936 | 45,225 | 1.6% | |||||||||||
| TOTAL | 118,641 | 108,635 | 9.2% | |||||||||||
| (4) Volume and transactions in Brazil do not include beer | ||||||||||||||
| (5) Brazil includes beer revenues of Ps.2,961.0 million for the first six months of 2023 and Ps.2,532.3 million for the same period of the previous year. | ||||||||||||||

| (1) | Volume is expressed in unit cases. Unit case refers to 192 ounces of finished beverage product (24 eight-ounce servings) and, when applied to soda fountains, refers to the volume of syrup, powders, and concentrate that is required to produce 192 ounces of finished beverage product. |
| (2) | Transactions refers to the number of single units (e.g., a can or a bottle) sold, regardless of their size or volume or whether they are sold individually or in multipacks, except for soda fountains, which represent multiple transactions based on a standard 12 oz. serving. |
|
Coca-Cola FEMSA Reports 2Q23 Results July 25, 2023 |
Page |
| COCA-COLA FEMSA | ||||||||
| MACROECONOMIC INFORMATION | ||||||||
| Inflation (1) | ||||||||
| LTM | 2Q23 | YTD | ||||||
| Mexico | 5.18% | 0.30% | 1.27% | |||||
| Colombia | 12.56% | 1.95% | 6.26% | |||||
| Brasil | 4.30% | 1.72% | 3.38% | |||||
| Argentina | 117.97% | 23.76% | 50.10% | |||||
| Costa Rica | 1.31% | -0.79% | -1.14% | |||||
| Panama | 0.14% | 0.70% | 1.82% | |||||
| Guatemala | 7.02% | 0.14% | 2.10% | |||||
| Nicaragua | 9.92% | 1.69% | 3.21% | |||||
| Uruguay | 7.10% | 1.49% | 4.63% | |||||
| (1) Source: inflation estimated by the company based on historic publications from the Central Bank of each country. | ||||||||
| Average Exchange Rates for each period (2) | ||||||||
| Quarterly Exchange Rate (Local Currency per USD) | Year to Date Exchange Rate (Local Currency per USD) | |||||||
| 2Q23 | 2Q22 | Δ % | YTD 23 | YTD 22 | Δ % | |||
| México | 17.72 | 20.04 | -11.6% | 18.21 | 20.28 | -10.2% | ||
| Colombia | 4,426.37 | 3,915.49 | 13.0% | 4,592.50 | 3,915.18 | 17.3% | ||
| Brasil | 4.95 | 4.92 | 0.6% | 5.07 | 5.08 | -0.1% | ||
| Argentina | 232.18 | 117.95 | 96.8% | 212.30 | 112.27 | 89.1% | ||
| Costa Rica | 544.44 | 677.15 | -19.6% | 555.87 | 662.13 | -16.0% | ||
| Panama | 1.00 | 1.00 | 0.0% | 1.00 | 1.00 | 0.0% | ||
| Guatemala | 7.82 | 7.69 | 1.6% | 7.82 | 7.69 | 1.7% | ||
| Nicaragua | 36.40 | 35.78 | 1.7% | 36.35 | 35.70 | 1.8% | ||
| Uruguay | 38.61 | 40.56 | -4.8% | 38.89 | 41.94 | -7.3% | ||
| End-of-period Exchange Rates | ||||||||
| Closing Exchange Rate (Local Currency per USD) | Closing Exchange Rate (Local Currency per USD) | |||||||
| Jun-23 | Jun-22 | Δ % | Mar-23 | Mar-22 | Δ % | |||
| México | 17.07 | 19.98 | -14.6% | 18.11 | 19.99 | -9.4% | ||
| Colombia | 4,191.28 | 4,127.47 | 1.5% | 4,627.27 | 3,748.15 | 23.5% | ||
| Brasil | 4.82 | 5.24 | -8.0% | 5.08 | 4.74 | 7.2% | ||
| Argentina | 256.70 | 125.23 | 105.0% | 209.01 | 111.01 | 88.3% | ||
| Costa Rica | 549.48 | 692.25 | -20.6% | 545.95 | 667.10 | -18.2% | ||
| Panama | 1.00 | 1.00 | 0.0% | 1.00 | 1.00 | 0.0% | ||
| Guatemala | 7.85 | 7.76 | 1.2% | 7.80 | 7.68 | 1.6% | ||
| Nicaragua | 36.44 | 35.87 | 1.6% | 36.35 | 35.69 | 1.8% | ||
| Uruguay | 37.41 | 39.86 | -6.2% | 38.65 | 41.12 | -6.0% | ||
| (2) Average exchange rate for each period computed with the average exchange rate of each month. | ||||||||
|
Coca-Cola FEMSA Reports 2Q23 Results July 25, 2023 |
Page |
SIGNATURES
Pursuant to the requirements of the Securities Exchange Act of 1934, the registrant has duly caused this report to be signed on its behalf by the undersigned, thereunto duly authorized.
| COCA-COLA FEMSA, S.A.B. DE C.V. | |
| By: /s/ Gerardo Cruz Celaya | |
|
Gerardo Cruz Celaya Chief Financial Officer |
|
| Date: July 25, 2023 |