0001285785false2025FY12/31/202512/31317,505,25811.5P3YP03Yhttp://fasb.org/us-gaap/2025#OtherAssetsNoncurrenthttp://fasb.org/us-gaap/2025#AccruedLiabilitiesCurrenthttp://fasb.org/us-gaap/2025#AccruedLiabilitiesCurrenthttp://fasb.org/us-gaap/2025#OtherLiabilitiesNoncurrenthttp://fasb.org/us-gaap/2025#OtherLiabilitiesNoncurrenthttp://fasb.org/us-gaap/2025#LiabilitiesTotalMemberhttp://fasb.org/us-gaap/2025#LiabilitiesTotalMemberhttp://fasb.org/us-gaap/2025#PropertyPlantAndEquipmentNethttp://fasb.org/us-gaap/2025#PropertyPlantAndEquipmentNethttp://fasb.org/us-gaap/2025#LongTermDebtAndCapitalLeaseObligationsCurrenthttp://fasb.org/us-gaap/2025#LongTermDebtAndCapitalLeaseObligationsCurrenthttp://fasb.org/us-gaap/2025#LongTermDebtAndCapitalLeaseObligationshttp://fasb.org/us-gaap/2025#LongTermDebtAndCapitalLeaseObligationshttp://fasb.org/us-gaap/2025#LiabilitiesTotalMemberhttp://fasb.org/us-gaap/2025#LiabilitiesTotalMemberhttp://fasb.org/us-gaap/2025#OtherAssetsNoncurrenthttp://fasb.org/us-gaap/2025#OtherAssetsNoncurrenthttp://fasb.org/us-gaap/2025#AccruedLiabilitiesCurrenthttp://fasb.org/us-gaap/2025#AccruedLiabilitiesCurrenthttp://fasb.org/us-gaap/2025#OtherLiabilitiesNoncurrent3iso4217:USDxbrli:sharesxbrli:pureiso4217:USDxbrli:sharesutr:MMBTUmos:financialinstitution00012857852025-01-012025-12-3100012857852025-06-3000012857852026-02-2000012857852025-10-012025-12-310001285785mos:MaadenWaadAlShamalPhosphateCompanyMembermos:MaadenWaadAlShamalPhosphateCompanyMember2025-12-3100012857852024-01-012024-12-3100012857852023-01-012023-12-3100012857852025-12-3100012857852024-12-3100012857852023-12-3100012857852022-12-310001285785us-gaap:CommonStockMember2022-12-310001285785us-gaap:AdditionalPaidInCapitalMember2022-12-310001285785us-gaap:RetainedEarningsMember2022-12-310001285785us-gaap:AccumulatedOtherComprehensiveIncomeMember2022-12-310001285785us-gaap:NoncontrollingInterestMember2022-12-310001285785us-gaap:RetainedEarningsMember2023-01-012023-12-310001285785us-gaap:AccumulatedOtherComprehensiveIncomeMember2023-01-012023-12-310001285785us-gaap:NoncontrollingInterestMember2023-01-012023-12-310001285785us-gaap:CommonStockMember2023-01-012023-12-310001285785us-gaap:AdditionalPaidInCapitalMember2023-01-012023-12-310001285785us-gaap:CommonStockMember2023-12-310001285785us-gaap:AdditionalPaidInCapitalMember2023-12-310001285785us-gaap:RetainedEarningsMember2023-12-310001285785us-gaap:AccumulatedOtherComprehensiveIncomeMember2023-12-310001285785us-gaap:NoncontrollingInterestMember2023-12-310001285785us-gaap:RetainedEarningsMember2024-01-012024-12-310001285785us-gaap:AccumulatedOtherComprehensiveIncomeMember2024-01-012024-12-310001285785us-gaap:NoncontrollingInterestMember2024-01-012024-12-310001285785us-gaap:CommonStockMember2024-01-012024-12-310001285785us-gaap:AdditionalPaidInCapitalMember2024-01-012024-12-310001285785us-gaap:CommonStockMember2024-12-310001285785us-gaap:AdditionalPaidInCapitalMember2024-12-310001285785us-gaap:RetainedEarningsMember2024-12-310001285785us-gaap:AccumulatedOtherComprehensiveIncomeMember2024-12-310001285785us-gaap:NoncontrollingInterestMember2024-12-310001285785us-gaap:RetainedEarningsMember2025-01-012025-12-310001285785us-gaap:AccumulatedOtherComprehensiveIncomeMember2025-01-012025-12-310001285785us-gaap:NoncontrollingInterestMember2025-01-012025-12-310001285785us-gaap:CommonStockMember2025-01-012025-12-310001285785us-gaap:AdditionalPaidInCapitalMember2025-01-012025-12-310001285785us-gaap:CommonStockMember2025-12-310001285785us-gaap:AdditionalPaidInCapitalMember2025-12-310001285785us-gaap:RetainedEarningsMember2025-12-310001285785us-gaap:AccumulatedOtherComprehensiveIncomeMember2025-12-310001285785us-gaap:NoncontrollingInterestMember2025-12-310001285785mos:MiskiMayoJointVentureMember2018-01-080001285785srt:MaximumMember2025-01-012025-12-310001285785mos:CustomerRiskMemberus-gaap:CreditConcentrationRiskMemberus-gaap:AccountsReceivableMember2025-01-012025-12-310001285785mos:CustomerRiskMemberus-gaap:CreditConcentrationRiskMemberus-gaap:AccountsReceivableMember2024-01-012024-12-310001285785mos:CanpotexMember2025-12-310001285785mos:CanpotexMember2024-12-310001285785mos:CanpotexMember2025-01-012025-12-310001285785mos:CanpotexMember2024-01-012024-12-310001285785mos:CanpotexMember2023-01-012023-12-310001285785srt:MinimumMemberus-gaap:MachineryAndEquipmentMember2025-12-310001285785srt:MaximumMemberus-gaap:MachineryAndEquipmentMember2025-12-310001285785srt:MinimumMemberus-gaap:LandAndBuildingMember2025-12-310001285785srt:MaximumMemberus-gaap:LandAndBuildingMember2025-12-310001285785us-gaap:LandMember2025-12-310001285785us-gaap:LandMember2024-12-310001285785us-gaap:MiningPropertiesAndMineralRightsMember2025-12-310001285785us-gaap:MiningPropertiesAndMineralRightsMember2024-12-310001285785us-gaap:BuildingImprovementsMember2025-12-310001285785us-gaap:BuildingImprovementsMember2024-12-310001285785us-gaap:MachineryAndEquipmentMember2025-12-310001285785us-gaap:MachineryAndEquipmentMember2024-12-310001285785us-gaap:ConstructionInProgressMember2025-12-310001285785us-gaap:ConstructionInProgressMember2024-12-310001285785mos:MaadenWaadAlShamalPhosphateCompanyMember2025-12-310001285785mos:EquityMethodInvesteeRiverBendAgMember2025-12-310001285785mos:EquityMethodInvesteeIFCMember2025-12-310001285785mos:EquityMethodInvesteeCanpotexMember2025-12-310001285785us-gaap:EquityMethodInvestmentsMember2025-01-012025-12-310001285785us-gaap:EquityMethodInvestmentsMember2024-01-012024-12-310001285785us-gaap:EquityMethodInvestmentsMember2023-01-012023-12-310001285785mos:RiverBendAgLLCIFCS.A.CanpotexMember2025-01-012025-12-310001285785mos:RiverBendAgLLCIFCS.A.CanpotexMember2024-01-012024-12-310001285785us-gaap:EquityMethodInvestmentsMember2025-12-310001285785us-gaap:EquityMethodInvestmentsMember2024-12-310001285785us-gaap:EquityMethodInvestmentsMember2023-12-310001285785mos:MaadenWaadAlShamalPhosphateCompanyMemberus-gaap:EquityMethodInvesteeMember2023-12-310001285785mos:MaadenWaadAlShamalPhosphateCompanyMemberus-gaap:EquityMethodInvesteeMember2024-01-012024-12-310001285785mos:MaadenWaadAlShamalPhosphateCompanyMemberus-gaap:EquityMethodInvesteeMember2023-01-012023-12-310001285785mos:MaadenWaadAlShamalPhosphateCompanyMember2024-12-310001285785mos:PotashSegmentMember2023-12-310001285785mos:MosaicFertilizantesMember2023-12-310001285785mos:CorporateEliminationsAndOtherSegmentMember2023-12-310001285785mos:PotashSegmentMember2024-01-012024-12-310001285785mos:MosaicFertilizantesMember2024-01-012024-12-310001285785mos:CorporateEliminationsAndOtherSegmentMember2024-01-012024-12-310001285785mos:PotashSegmentMember2024-12-310001285785mos:MosaicFertilizantesMember2024-12-310001285785mos:CorporateEliminationsAndOtherSegmentMember2024-12-310001285785mos:PotashSegmentMember2025-01-012025-12-310001285785mos:MosaicFertilizantesMember2025-01-012025-12-310001285785mos:CorporateEliminationsAndOtherSegmentMember2025-01-012025-12-310001285785mos:PotashSegmentMember2025-12-310001285785mos:MosaicFertilizantesMember2025-12-310001285785mos:CorporateEliminationsAndOtherSegmentMember2025-12-310001285785srt:MinimumMember2025-01-012025-12-3100012857852025-05-160001285785us-gaap:RevolvingCreditFacilityMember2025-12-310001285785us-gaap:RevolvingCreditFacilityMember2024-12-3100012857852025-01-012025-05-1600012857852025-05-172025-12-310001285785us-gaap:RevolvingCreditFacilityMember2025-01-012025-12-310001285785us-gaap:RevolvingCreditFacilityMember2023-01-012023-12-310001285785us-gaap:RevolvingCreditFacilityMember2024-01-012024-12-310001285785mos:MosaicCreditFacilityMember2025-12-3100012857852020-01-070001285785mos:InventoryFinancingArrangementMember2025-01-012025-12-310001285785mos:InventoryFinancingArrangementMember2024-01-012024-12-310001285785mos:ReceivablePurchasingAgreementDomain2025-01-012025-12-310001285785mos:ReceivablePurchasingAgreementMember2025-01-012025-12-310001285785mos:ReceivablePurchasingAgreementMember2024-01-012024-12-310001285785us-gaap:CommercialPaperMember2025-12-310001285785us-gaap:CommercialPaperMember2025-01-012025-12-310001285785us-gaap:CommercialPaperMember2024-12-310001285785us-gaap:CommercialPaperMember2024-01-012024-12-310001285785us-gaap:ShortTermDebtMember2025-12-310001285785mos:SeniorNotesDue2029Memberus-gaap:SeniorNotesMember2025-12-310001285785mos:SeniorNotesDue2030Memberus-gaap:SeniorNotesMember2025-12-310001285785mos:SeniorNotesDue2027Memberus-gaap:SeniorNotesMember2025-12-310001285785mos:SeniorNotesDue2028Memberus-gaap:SeniorNotesMember2025-12-310001285785mos:SeniorNotesDue2033Memberus-gaap:SeniorNotesMember2025-12-310001285785mos:SeniorNotesDue2043Memberus-gaap:SeniorNotesMember2025-12-310001285785mos:SeniorNotesDue2041Memberus-gaap:SeniorNotesMember2025-12-310001285785mos:SeniorUnsecuredTermLoanFacilityMemberus-gaap:SeniorLoansMember2025-12-310001285785mos:DebenturesDue2028Memberus-gaap:NotesPayableOtherPayablesMember2025-12-310001285785srt:MinimumMembermos:UnsecuredNotesMember2025-12-310001285785srt:MaximumMembermos:UnsecuredNotesMember2025-12-310001285785mos:UnsecuredNotesMember2025-12-310001285785mos:UnsecuredNotesMember2024-12-310001285785srt:MaximumMembermos:UnsecuredDebenturesMember2025-12-310001285785mos:UnsecuredDebenturesMember2025-12-310001285785mos:UnsecuredDebenturesMember2024-12-310001285785mos:TermLoanMember2025-12-310001285785mos:SeniorUnsecuredTermLoanFacilityMember2025-12-310001285785mos:SeniorUnsecuredTermLoanFacilityMember2024-12-310001285785srt:MinimumMemberus-gaap:CapitalLeaseObligationsMember2025-12-310001285785srt:MaximumMemberus-gaap:CapitalLeaseObligationsMember2025-12-310001285785us-gaap:CapitalLeaseObligationsMember2025-12-310001285785us-gaap:CapitalLeaseObligationsMember2024-12-310001285785srt:MinimumMembermos:OtherTypesOfDebtMember2025-12-310001285785srt:MaximumMembermos:OtherTypesOfDebtMember2025-12-310001285785mos:OtherTypesOfDebtMember2025-12-310001285785mos:OtherTypesOfDebtMember2024-12-310001285785mos:StructuredAccountsPayableArrangementMember2025-01-012025-12-310001285785mos:StructuredAccountsPayableArrangementMember2024-01-012024-12-3100012857852016-08-310001285785us-gaap:CashAndCashEquivalentsMemberus-gaap:FairValueInputsLevel1Member2025-12-310001285785us-gaap:CorporateDebtSecuritiesMemberus-gaap:FairValueInputsLevel2Member2025-12-310001285785us-gaap:MunicipalBondsMemberus-gaap:FairValueInputsLevel2Member2025-12-310001285785us-gaap:USTreasuryAndGovernmentMemberus-gaap:FairValueInputsLevel2Member2025-12-310001285785us-gaap:CashAndCashEquivalentsMemberus-gaap:FairValueInputsLevel1Member2024-12-310001285785us-gaap:CorporateDebtSecuritiesMemberus-gaap:FairValueInputsLevel2Member2024-12-310001285785us-gaap:MunicipalBondsMemberus-gaap:FairValueInputsLevel2Member2024-12-310001285785us-gaap:USTreasuryAndGovernmentMemberus-gaap:FairValueInputsLevel2Member2024-12-310001285785us-gaap:CorporateDebtSecuritiesMember2025-12-310001285785us-gaap:CorporateDebtSecuritiesMember2024-12-310001285785us-gaap:MunicipalBondsMember2025-12-310001285785us-gaap:MunicipalBondsMember2024-12-310001285785us-gaap:USTreasuryAndGovernmentMember2025-12-310001285785us-gaap:USTreasuryAndGovernmentMember2024-12-310001285785us-gaap:DebtSecuritiesMember2025-12-310001285785country:BRus-gaap:ForeignCountryMember2025-01-012025-12-310001285785country:CAus-gaap:ForeignCountryMember2025-01-012025-12-310001285785country:PEus-gaap:ForeignCountryMember2025-01-012025-12-310001285785mos:CarlsbadMemberus-gaap:DomesticCountryMember2025-01-012025-12-310001285785us-gaap:DomesticCountryMember2025-01-012025-12-310001285785country:BR2025-01-012025-12-310001285785us-gaap:ForeignCountryMember2025-01-012025-12-310001285785mos:USAndNonUSMember2025-01-012025-12-310001285785us-gaap:ForeignCountryMember2024-01-012024-12-310001285785mos:USAndNonUSMember2024-01-012024-12-310001285785country:BR2024-01-012024-12-310001285785us-gaap:DomesticCountryMember2024-01-012024-12-310001285785us-gaap:DomesticCountryMember2023-01-012023-12-310001285785country:BR2023-01-012023-12-310001285785mos:CanadaFederalMember2025-01-012025-12-310001285785mos:CanadaFederalMember2024-01-012024-12-310001285785mos:CanadaFederalMember2023-01-012023-12-310001285785stpr:CA-SK2025-01-012025-12-310001285785stpr:CA-SK2024-01-012024-12-310001285785stpr:CA-SK2023-01-012023-12-310001285785mos:CanadaOtherProvincialMember2025-01-012025-12-310001285785mos:CanadaOtherProvincialMember2024-01-012024-12-310001285785mos:CanadaOtherProvincialMember2023-01-012023-12-310001285785country:PE2025-01-012025-12-310001285785country:PE2024-01-012024-12-310001285785country:PE2023-01-012023-12-310001285785us-gaap:ForeignTaxJurisdictionOtherMember2025-01-012025-12-310001285785us-gaap:ForeignTaxJurisdictionOtherMember2024-01-012024-12-310001285785us-gaap:ForeignTaxJurisdictionOtherMember2023-01-012023-12-310001285785us-gaap:AccountingStandardsUpdate202309Member2025-01-012025-12-310001285785us-gaap:AccountingStandardsUpdate202309Member2024-01-012024-12-310001285785us-gaap:AccountingStandardsUpdate202309Member2023-01-012023-12-310001285785mos:AnticipatoryForeignTaxCreditCarryforwardMember2025-12-310001285785mos:AnticipatoryForeignTaxCreditCarryforwardMember2024-12-310001285785mos:NetOperatingLossCarryforwardMember2025-12-310001285785us-gaap:CapitalLossCarryforwardMember2025-12-310001285785mos:ForeignTaxCreditCarryforwardMember2025-12-310001285785us-gaap:NonUsMember2025-12-310001285785us-gaap:ForeignCountryMembermos:NetOperatingLossCarryforwardMember2025-12-310001285785us-gaap:ForeignCountryMember2025-01-012025-12-310001285785us-gaap:ForeignCountryMembermos:ForeignTaxCreditCarryforwardMember2025-12-310001285785mos:TaxYear2026OrEarlierMembermos:ForeignTaxCreditCarryforwardMember2025-12-310001285785mos:TaxYear2029OrEarlierMembermos:ForeignTaxCreditCarryforwardMember2025-12-310001285785mos:TaxYear2030OrEarlierMembermos:ForeignTaxCreditCarryforwardMember2025-12-310001285785mos:TaxYear2034OrEarlierMembermos:ForeignTaxCreditCarryforwardMember2025-12-310001285785mos:TaxYear2035OrEarlierMembermos:ForeignTaxCreditCarryforwardMember2025-12-310001285785country:BR2025-01-012025-12-310001285785us-gaap:DomesticCountryMember2025-12-310001285785us-gaap:DomesticCountryMember2024-12-310001285785country:BR2024-01-012024-12-310001285785us-gaap:ForeignCountryMember2023-01-012023-12-310001285785country:BR2023-01-012023-12-310001285785us-gaap:NonUsMember2025-01-012025-12-310001285785us-gaap:UnfavorableRegulatoryActionMember2025-12-310001285785mos:A2015ConsentDecreesWithEPAMemberus-gaap:UnfavorableRegulatoryActionMember2025-12-310001285785mos:BonnieFacilityTrustMember2018-07-270001285785mos:PlantCityandBonnieFacilitiesMember2025-12-310001285785mos:PlantCityandBonnieFacilitiesMember2024-12-310001285785us-gaap:InterestRateSwapMember2024-12-310001285785us-gaap:InterestRateSwapMember2025-12-310001285785us-gaap:ForeignExchangeContractMember2025-12-310001285785us-gaap:ForeignExchangeContractMember2024-12-310001285785us-gaap:CommodityContractMember2025-12-310001285785us-gaap:CommodityContractMember2024-12-310001285785us-gaap:ForeignExchangeContractMemberus-gaap:FairValueMeasurementsRecurringMember2025-01-012025-12-310001285785us-gaap:ForeignExchangeContractMemberus-gaap:FairValueMeasurementsRecurringMember2025-12-310001285785us-gaap:ForeignExchangeContractMemberus-gaap:FairValueMeasurementsRecurringMember2024-12-310001285785us-gaap:CommodityContractMemberus-gaap:FairValueMeasurementsRecurringMember2025-12-310001285785us-gaap:CommodityContractMemberus-gaap:FairValueMeasurementsRecurringMember2024-12-310001285785us-gaap:CarryingReportedAmountFairValueDisclosureMember2025-12-310001285785us-gaap:EstimateOfFairValueFairValueDisclosureMember2025-12-310001285785us-gaap:CarryingReportedAmountFairValueDisclosureMember2024-12-310001285785us-gaap:EstimateOfFairValueFairValueDisclosureMember2024-12-310001285785us-gaap:PensionPlansDefinedBenefitMember2025-01-012025-12-310001285785us-gaap:PensionPlansDefinedBenefitMember2024-12-310001285785us-gaap:PensionPlansDefinedBenefitMember2023-12-310001285785us-gaap:PensionPlansDefinedBenefitMember2024-01-012024-12-310001285785us-gaap:PensionPlansDefinedBenefitMember2025-12-310001285785us-gaap:FixedIncomeSecuritiesMember2025-12-310001285785us-gaap:EquitySecuritiesMember2025-12-310001285785us-gaap:CashMember2025-12-310001285785mos:NorthAmericanOtherPostretirementBenefitsPlanMember2025-12-310001285785mos:NorthAmericanOtherPostretirementBenefitsPlanMember2024-12-310001285785srt:MinimumMembermos:NorthAmericanOtherPostretirementBenefitsPlanMember2025-12-310001285785mos:BrazilOtherPostretirementBenefitsPlanMember2025-12-310001285785mos:BrazilOtherPostretirementBenefitsPlanMember2024-12-310001285785mos:BrazilOtherPostretirementBenefitsPlanMember2023-12-310001285785mos:BrazilOtherPostretirementBenefitsPlanMember2025-01-012025-12-310001285785mos:BrazilOtherPostretirementBenefitsPlanMember2024-01-012024-12-310001285785us-gaap:AccumulatedTranslationAdjustmentMember2022-12-310001285785us-gaap:AccumulatedDefinedBenefitPlansAdjustmentMember2022-12-310001285785us-gaap:AociDerivativeQualifyingAsHedgeExcludedComponentParentMember2022-12-310001285785us-gaap:AccumulatedNetUnrealizedInvestmentGainLossMember2022-12-310001285785us-gaap:AccumulatedTranslationAdjustmentMember2023-01-012023-12-310001285785us-gaap:AccumulatedDefinedBenefitPlansAdjustmentMember2023-01-012023-12-310001285785us-gaap:AociDerivativeQualifyingAsHedgeExcludedComponentParentMember2023-01-012023-12-310001285785us-gaap:AccumulatedNetUnrealizedInvestmentGainLossMember2023-01-012023-12-310001285785us-gaap:AccumulatedTranslationAdjustmentMember2023-12-310001285785us-gaap:AccumulatedDefinedBenefitPlansAdjustmentMember2023-12-310001285785us-gaap:AociDerivativeQualifyingAsHedgeExcludedComponentParentMember2023-12-310001285785us-gaap:AccumulatedNetUnrealizedInvestmentGainLossMember2023-12-310001285785us-gaap:AccumulatedTranslationAdjustmentMember2024-01-012024-12-310001285785us-gaap:AccumulatedDefinedBenefitPlansAdjustmentMember2024-01-012024-12-310001285785us-gaap:AociDerivativeQualifyingAsHedgeExcludedComponentParentMember2024-01-012024-12-310001285785us-gaap:AccumulatedNetUnrealizedInvestmentGainLossMember2024-01-012024-12-310001285785us-gaap:AccumulatedTranslationAdjustmentMember2024-12-310001285785us-gaap:AccumulatedDefinedBenefitPlansAdjustmentMember2024-12-310001285785us-gaap:AociDerivativeQualifyingAsHedgeExcludedComponentParentMember2024-12-310001285785us-gaap:AccumulatedNetUnrealizedInvestmentGainLossMember2024-12-310001285785us-gaap:AccumulatedTranslationAdjustmentMember2025-01-012025-12-310001285785us-gaap:AccumulatedDefinedBenefitPlansAdjustmentMember2025-01-012025-12-310001285785us-gaap:AociDerivativeQualifyingAsHedgeExcludedComponentParentMember2025-01-012025-12-310001285785us-gaap:AccumulatedNetUnrealizedInvestmentGainLossMember2025-01-012025-12-310001285785us-gaap:AccumulatedTranslationAdjustmentMember2025-12-310001285785us-gaap:AccumulatedDefinedBenefitPlansAdjustmentMember2025-12-310001285785us-gaap:AociDerivativeQualifyingAsHedgeExcludedComponentParentMember2025-12-310001285785us-gaap:AccumulatedNetUnrealizedInvestmentGainLossMember2025-12-310001285785mos:ShareRepurchaseProgram2022Member2025-12-310001285785mos:ShareRepurchaseProgram2022Member2024-01-012024-12-310001285785mos:A2023StockAndIncentivePlanMember2025-12-310001285785mos:A2014StockandIncentivePlanMember2025-12-310001285785us-gaap:EmployeeStockOptionMember2025-01-012025-12-310001285785us-gaap:EmployeeStockOptionMember2022-01-012022-12-310001285785us-gaap:EmployeeStockOptionMember2024-12-310001285785us-gaap:EmployeeStockOptionMember2025-12-310001285785us-gaap:EmployeeStockOptionMember2024-01-012024-12-310001285785us-gaap:RestrictedStockUnitsRSUMember2025-01-012025-12-310001285785us-gaap:RestrictedStockUnitsRSUMember2024-12-310001285785us-gaap:RestrictedStockUnitsRSUMember2025-12-310001285785mos:TSRPerformanceUnitsMember2025-01-012025-12-310001285785mos:PerformanceUnitsCashSettledMember2025-01-012025-12-310001285785mos:PerformanceUnitsCashSettledMember2024-01-012024-12-310001285785mos:PerformanceUnitsCashSettledMember2023-01-012023-12-310001285785mos:TSRPerformanceUnitsMember2024-01-012024-12-310001285785mos:TSRPerformanceUnitsMember2023-01-012023-12-310001285785us-gaap:PerformanceSharesMember2024-12-310001285785us-gaap:PerformanceSharesMember2025-01-012025-12-310001285785us-gaap:PerformanceSharesMember2025-12-310001285785mos:PerformanceUnitsCashSettledMember2025-12-310001285785mos:PerformanceUnitsCashSettledMember2024-12-310001285785mos:NewWalesPhaseIIEastStackMember2025-12-310001285785mos:NewWalesPhaseIIWestStackMember2025-12-310001285785mos:BraziliansubsidiaryjudicialandadministrativeproceedingsMembersrt:MaximumMember2025-12-310001285785mos:BraziliansubsidiaryjudicialandadministrativeproceedingsMember2025-12-310001285785mos:BraziliansubsidiarylaborclaimsMembersrt:MaximumMember2025-12-310001285785mos:BraziliansubsidiarylaborclaimsMember2025-12-310001285785mos:BrazilianNonIncomeTaxProceedingsMembersrt:MaximumMember2025-12-310001285785mos:BrazilianNonIncomeTaxProceedingsMemberus-gaap:IndemnificationGuaranteeMembersrt:MaximumMember2025-12-310001285785mos:BrazilianNonIncomeTaxProceedingsMembermos:PISAndCofinsCasesMembersrt:MaximumMember2025-12-310001285785us-gaap:RelatedPartyMember2025-12-310001285785us-gaap:RelatedPartyMember2024-12-310001285785us-gaap:RelatedPartyMember2025-01-012025-12-310001285785us-gaap:RelatedPartyMember2024-01-012024-12-310001285785us-gaap:RelatedPartyMember2023-01-012023-12-310001285785mos:PhosphatesSegmentMember2025-01-012025-12-310001285785mos:PhosphatesSegmentMember2024-01-012024-12-310001285785mos:PhosphatesSegmentMember2023-01-012023-12-310001285785mos:PotashSegmentMember2023-01-012023-12-310001285785mos:MosaicFertilizantesMember2023-01-012023-12-310001285785mos:CorporateEliminationsAndOtherSegmentMember2023-01-012023-12-310001285785mos:PhosphatesSegmentMember2025-12-310001285785mos:PhosphatesSegmentMember2024-12-310001285785mos:PhosphatesSegmentMember2023-12-310001285785mos:ChinaandIndiadistributionoperationsMembermos:CorporateEliminationsAndOtherSegmentMember2025-01-012025-12-310001285785mos:ChinaandIndiadistributionoperationsMembermos:CorporateEliminationsAndOtherSegmentMember2024-01-012024-12-310001285785mos:ChinaandIndiadistributionoperationsMembermos:CorporateEliminationsAndOtherSegmentMember2023-01-012023-12-310001285785country:BRus-gaap:TransferredAtPointInTimeMember2025-01-012025-12-310001285785country:BRus-gaap:TransferredAtPointInTimeMember2024-01-012024-12-310001285785country:BRus-gaap:TransferredAtPointInTimeMember2023-01-012023-12-310001285785mos:CanpotexMemberus-gaap:TransferredAtPointInTimeMember2025-01-012025-12-310001285785mos:CanpotexMemberus-gaap:TransferredAtPointInTimeMember2024-01-012024-12-310001285785mos:CanpotexMemberus-gaap:TransferredAtPointInTimeMember2023-01-012023-12-310001285785country:CNus-gaap:TransferredAtPointInTimeMember2025-01-012025-12-310001285785country:CNus-gaap:TransferredAtPointInTimeMember2024-01-012024-12-310001285785country:CNus-gaap:TransferredAtPointInTimeMember2023-01-012023-12-310001285785country:CAus-gaap:TransferredAtPointInTimeMember2025-01-012025-12-310001285785country:CAus-gaap:TransferredAtPointInTimeMember2024-01-012024-12-310001285785country:CAus-gaap:TransferredAtPointInTimeMember2023-01-012023-12-310001285785country:PYus-gaap:TransferredAtPointInTimeMember2025-01-012025-12-310001285785country:PYus-gaap:TransferredAtPointInTimeMember2024-01-012024-12-310001285785country:PYus-gaap:TransferredAtPointInTimeMember2023-01-012023-12-310001285785country:ARus-gaap:TransferredAtPointInTimeMember2025-01-012025-12-310001285785country:ARus-gaap:TransferredAtPointInTimeMember2024-01-012024-12-310001285785country:ARus-gaap:TransferredAtPointInTimeMember2023-01-012023-12-310001285785country:JPus-gaap:TransferredAtPointInTimeMember2025-01-012025-12-310001285785country:JPus-gaap:TransferredAtPointInTimeMember2024-01-012024-12-310001285785country:JPus-gaap:TransferredAtPointInTimeMember2023-01-012023-12-310001285785country:COus-gaap:TransferredAtPointInTimeMember2025-01-012025-12-310001285785country:COus-gaap:TransferredAtPointInTimeMember2024-01-012024-12-310001285785country:COus-gaap:TransferredAtPointInTimeMember2023-01-012023-12-310001285785country:INus-gaap:TransferredAtPointInTimeMember2025-01-012025-12-310001285785country:INus-gaap:TransferredAtPointInTimeMember2024-01-012024-12-310001285785country:INus-gaap:TransferredAtPointInTimeMember2023-01-012023-12-310001285785country:AUus-gaap:TransferredAtPointInTimeMember2025-01-012025-12-310001285785country:AUus-gaap:TransferredAtPointInTimeMember2024-01-012024-12-310001285785country:AUus-gaap:TransferredAtPointInTimeMember2023-01-012023-12-310001285785country:PEus-gaap:TransferredAtPointInTimeMember2025-01-012025-12-310001285785country:PEus-gaap:TransferredAtPointInTimeMember2024-01-012024-12-310001285785country:PEus-gaap:TransferredAtPointInTimeMember2023-01-012023-12-310001285785country:MXus-gaap:TransferredAtPointInTimeMember2025-01-012025-12-310001285785country:MXus-gaap:TransferredAtPointInTimeMember2024-01-012024-12-310001285785country:MXus-gaap:TransferredAtPointInTimeMember2023-01-012023-12-310001285785country:HNus-gaap:TransferredAtPointInTimeMember2025-01-012025-12-310001285785country:HNus-gaap:TransferredAtPointInTimeMember2024-01-012024-12-310001285785country:HNus-gaap:TransferredAtPointInTimeMember2023-01-012023-12-310001285785country:DOus-gaap:TransferredAtPointInTimeMember2025-01-012025-12-310001285785country:DOus-gaap:TransferredAtPointInTimeMember2024-01-012024-12-310001285785country:DOus-gaap:TransferredAtPointInTimeMember2023-01-012023-12-310001285785mos:OtherForeignMemberus-gaap:TransferredAtPointInTimeMember2025-01-012025-12-310001285785mos:OtherForeignMemberus-gaap:TransferredAtPointInTimeMember2024-01-012024-12-310001285785mos:OtherForeignMemberus-gaap:TransferredAtPointInTimeMember2023-01-012023-12-310001285785mos:TotalForeignMemberus-gaap:TransferredAtPointInTimeMember2025-01-012025-12-310001285785mos:TotalForeignMemberus-gaap:TransferredAtPointInTimeMember2024-01-012024-12-310001285785mos:TotalForeignMemberus-gaap:TransferredAtPointInTimeMember2023-01-012023-12-310001285785country:USus-gaap:TransferredAtPointInTimeMember2025-01-012025-12-310001285785country:USus-gaap:TransferredAtPointInTimeMember2024-01-012024-12-310001285785country:USus-gaap:TransferredAtPointInTimeMember2023-01-012023-12-310001285785country:CA2025-12-310001285785country:CA2024-12-310001285785country:BR2025-12-310001285785country:BR2024-12-310001285785mos:OtherForeignMember2025-12-310001285785mos:OtherForeignMember2024-12-310001285785mos:TotalForeignMember2025-12-310001285785mos:TotalForeignMember2024-12-310001285785country:US2025-12-310001285785country:US2024-12-310001285785mos:ProductTypeOneMemberus-gaap:TransferredAtPointInTimeMember2025-01-012025-12-310001285785mos:ProductTypeOneMemberus-gaap:TransferredAtPointInTimeMember2024-01-012024-12-310001285785mos:ProductTypeOneMemberus-gaap:TransferredAtPointInTimeMember2023-01-012023-12-310001285785mos:ProductTypeTwoMemberus-gaap:TransferredAtPointInTimeMember2025-01-012025-12-310001285785mos:ProductTypeTwoMemberus-gaap:TransferredAtPointInTimeMember2024-01-012024-12-310001285785mos:ProductTypeTwoMemberus-gaap:TransferredAtPointInTimeMember2023-01-012023-12-310001285785mos:ProductTypeThreeMemberus-gaap:TransferredAtPointInTimeMember2025-01-012025-12-310001285785mos:ProductTypeThreeMemberus-gaap:TransferredAtPointInTimeMember2024-01-012024-12-310001285785mos:ProductTypeThreeMemberus-gaap:TransferredAtPointInTimeMember2023-01-012023-12-310001285785mos:ProductTypeFourMemberus-gaap:TransferredAtPointInTimeMember2025-01-012025-12-310001285785mos:ProductTypeFourMemberus-gaap:TransferredAtPointInTimeMember2024-01-012024-12-310001285785mos:ProductTypeFourMemberus-gaap:TransferredAtPointInTimeMember2023-01-012023-12-310001285785mos:ProductTypeFiveMemberus-gaap:TransferredAtPointInTimeMember2025-01-012025-12-310001285785mos:ProductTypeFiveMemberus-gaap:TransferredAtPointInTimeMember2024-01-012024-12-310001285785mos:ProductTypeFiveMemberus-gaap:TransferredAtPointInTimeMember2023-01-012023-12-310001285785mos:OtherProductTypesMemberus-gaap:TransferredAtPointInTimeMember2025-01-012025-12-310001285785mos:OtherProductTypesMemberus-gaap:TransferredAtPointInTimeMember2024-01-012024-12-310001285785mos:OtherProductTypesMemberus-gaap:TransferredAtPointInTimeMember2023-01-012023-12-310001285785mos:PatosDeMinasMember2025-01-012025-12-310001285785mos:PatosDeMinasMember2025-10-030001285785mos:TaquariMember2025-01-012025-12-310001285785mos:TaquariMember2025-11-030001285785mos:CarlsbadMember2025-01-012025-12-310001285785mos:CarlsbadMember2025-12-31
UNITED STATES
SECURITIES AND EXCHANGE COMMISSION
Washington, D.C. 20549
______________________________
FORM 10-K
______________________________
☒ ANNUAL REPORT PURSUANT TO SECTION 13 OR 15(d) OF
THE SECURITIES EXCHANGE ACT OF 1934
For the year ended December 31, 2025
☐ TRANSITION REPORT PURSUANT TO SECTION 13 OR 15(d) OF
THE SECURITIES EXCHANGE ACT OF 1934
For the transition period from _____ to _____
Commission file number 001-32327
______________________________
The Mosaic Company
(Exact name of registrant as specified in its charter)
______________________________
|
|
|
|
|
|
|
|
|
| Delaware |
|
20-1026454 |
(State or other jurisdiction of
incorporation or organization) |
|
(I.R.S. Employer
Identification No.) |
101 East Kennedy Blvd
Suite 2500
Tampa, Florida 33602
(800) 918-8270
(Address and zip code of principal executive offices and registrant’s telephone number, including area code)
______________________________
Securities registered pursuant to Section 12(b) of the Act:
|
|
|
|
|
|
|
|
|
| Title of each class |
Trading symbol |
Name of each exchange on which registered |
| Common Stock, par value $0.01 per share |
MOS |
New York Stock Exchange |
______________________________
Securities registered pursuant to Section 12(g) of the Act: NONE
Indicate by check mark if the registrant is a well-known seasoned issuer, as defined in Rule 405 of the Securities Act. Yes ☒ No ☐
Indicate by check mark if the registrant is not required to file reports pursuant to Section 13 or Section 15(d) of the Act. Yes ☐ No ☒
Indicate by check mark whether the registrant: (1) has filed all reports required to be filed by Section 13 or 15(d) of the Securities Exchange Act of 1934 during the preceding 12 months (or for such shorter period that the registrant was required to file such reports); and (2) has been subject to such filing requirements for the past 90 days. Yes ☒ No ☐
Indicate by check mark whether the registrant has submitted electronically every Interactive Data File required to be submitted pursuant to Rule 405 of Regulation S-T (§232.405 of this chapter) during the preceding 12 months (or for such shorter period that the registrant was required to submit such files). Yes ☒ No ☐
Indicate by check mark whether the registrant is a large accelerated filer, an accelerated filer, a non-accelerated filer, a smaller reporting company, or an emerging growth company. See the definitions of “large accelerated filer,” “accelerated filer,” “smaller reporting company,” and “emerging growth company” in Rule 12b-2 of the Exchange Act. (Check one): Large accelerated filer ☒ Accelerated filer ☐ Non-accelerated filer ☐ Smaller reporting company ☐ Emerging growth company ☐
If an emerging growth company, indicate by check mark if the registrant has elected not to use the extended transition period for complying with any new or revised financial accounting standards provided pursuant to Section 13(a) of the Exchange Act. ☐
Indicate by check mark whether the registrant has filed a report on and attestation to its management’s assessment of the effectiveness of its internal control over financial reporting under Section 404(b) of the Sarbanes-Oxley Act (15 U.S.C. 7262(b)) by the registered public accounting firm that prepared or issued its audit report. ☒
If securities are registered pursuant to Section 12(b) of the Act, indicate by check mark whether the financial statements of the registrant included in the filing reflect the correction of an error to previously issued financial statements. ☐
Indicate by check mark whether any of those error corrections are restatements that required a recovery analysis of incentive-based compensation received by any of the registrant’s executive officers during the relevant recovery period pursuant to §240.10D-1(b) ☐
Indicate by check mark whether the registrant is a shell company (as defined in Rule 12b-2 of the Exchange Act). Yes ☐ No ☒
As of June 30, 2025, the aggregate market value of the registrant’s voting common stock held by stockholders, other than directors, executive officers, subsidiaries of the Registrant and any other person known by the Registrant as of the date hereof to beneficially own ten percent or more of any class of Registrant’s outstanding voting common stock, and consisting of shares of Common Stock, was approximately $11.5 billion based upon the closing price of a share of Common Stock on the New York Stock Exchange on that date.
Indicate the number of shares outstanding of each of the registrant’s classes of common stock: 317,505,258 shares of Common Stock as of February 20, 2026.
DOCUMENTS INCORPORATED BY REFERENCE
1.Portions of the registrant’s definitive proxy statement to be delivered in conjunction with the 2026 Annual Meeting of Stockholders (Part III)
2025 ANNUAL REPORT ON FORM 10-K CONTENTS
|
|
|
|
|
|
|
|
|
| Part I: |
|
Page |
| Item 1. |
|
|
|
|
|
|
|
|
|
|
|
|
|
|
|
|
|
|
|
|
|
|
|
| Item 1A. |
|
|
| Item 1B. |
|
|
| Item 1C. |
|
|
| Item 2. |
|
|
| Item 3. |
|
|
| Item 4. |
|
|
| Part II: |
|
|
| Item 5. |
|
|
| Item 6. |
|
|
| Item 7. |
|
|
| Item 7A. |
|
|
| Item 8. |
|
|
| Item 9. |
|
|
| Item 9A. |
|
|
| Item 9B. |
|
|
| Item 9C. |
|
|
| Part III: |
|
|
| Item 10. |
|
|
| Item 11. |
|
|
| Item 12. |
|
|
| Item 13. |
|
|
| Item 14. |
|
|
| Part IV. |
|
|
| Item 15. |
|
|
| Item 16. |
|
|
|
|
|
|
PART I.
Item 1. Business.
OVERVIEW
The Mosaic Company is the world’s leading producer and marketer of concentrated phosphate and potash crop nutrients. Through our broad product offering, we are a single source supplier of phosphate- and potash-based crop nutrients and animal feed ingredients. We serve customers in approximately 40 countries. We are the second largest integrated phosphate producer in the world and one of the largest producers and marketers of phosphate-based animal feed ingredients in North America and Brazil. We are the leading fertilizer production and distribution company in Brazil. We mine phosphate rock in Florida, Brazil and Peru. We process rock into finished phosphate products at facilities in Florida, Louisiana and Brazil. We are typically one of the top four global potash producers in the world. We mine potash in Saskatchewan and New Mexico. We have other production, blending or distribution operations in Brazil, China, India and Paraguay. Our operations serve the top four nutrient-consuming countries in the world: China, India, U.S. and Brazil.
The Mosaic Company is a Delaware corporation that was incorporated in March 2004 and serves as the parent company of the business that was formed through the October 2004 combination of IMC Global Inc. (“IMC”) and the fertilizer businesses of Cargill, Incorporated. We are publicly traded on the New York Stock Exchange under the ticker symbol “MOS” and are headquartered in Tampa, Florida.
We conduct our business through wholly- and majority-owned subsidiaries as well as businesses in which we own less than a majority or a non-controlling interest. We are organized into three reportable business segments: Phosphate, Potash and Mosaic Fertilizantes. Intersegment eliminations, unrealized mark-to-market gains/losses on derivatives and investment in equity securities of Saudi Arabian Mining Company (“Ma’aden”), debt expenses and the results of the China and India distribution businesses and Mosaic Biosciences are included within Corporate, Eliminations and Other.
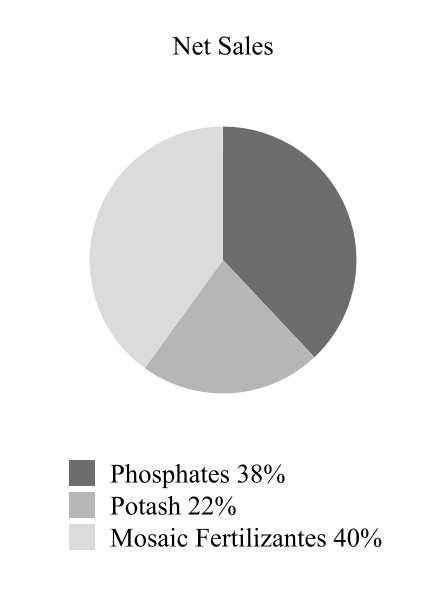
The following charts show the respective contributions to 2025 sales volumes, net sales and gross margin for each of our business segments in effect at December 31, 2025:
We account for approximately 10% of estimated global annual phosphate production. We also account for approximately 12% of estimated global annual potash production.
Phosphate Segment–We sell phosphate-based crop nutrients and animal feed ingredients throughout North America and internationally. We account for approximately 72% of estimated North American annual production of concentrated phosphate crop nutrients.
Potash Segment–We sell potash throughout North America and internationally, principally as fertilizer, but also for use in industrial applications and, to a lesser degree, as animal feed ingredients. We account for approximately 34% of estimated North American annual potash production.
Mosaic Fertilizantes Segment–We produce and sell phosphate- and potash-based crop nutrients, and animal feed ingredients, in Brazil. In addition to five phosphate rock mines and four chemical plants in Brazil, this segment consists of sales offices, crop nutrient blending and bagging facilities, port terminals and warehouses in Brazil and Paraguay. The Mosaic Fertilizantes segment also serves as a distribution outlet for our Phosphate and Potash segments. We account for approximately 73% of estimated annual production of concentrated phosphate crop nutrients in Brazil.
As used in this report:
•“Mosaic” or “Company” means The Mosaic Company;
•“we,” “us” and “our” refer to Mosaic and its direct and indirect subsidiaries, individually or in any combination;
•“Cargill” means Cargill, Incorporated and its direct and indirect subsidiaries, individually or in any combination;
•“Cargill Crop Nutrition” means the crop nutrient business we acquired from Cargill in the Combination;
•“Combination” means the October 22, 2004 combination of IMC and Cargill Crop Nutrition; and
statements as to our industry position reflect information from the most recent period available.
Business Developments During 2025
•In October 2025, we completed the sale of our idled Patos de Minas phosphate mining unit in Brazil for $111 million, with $51 million paid at closing and the balance of the purchase price to be paid in installments over the next four years. The sale resulted in a gain of $94 million.
•In November 2025, we completed the sale of our interest in the Taquari potash mine in Brazil for proceeds of up to $27 million, with $12 million received at closing. We recorded an impairment loss of approximately $66 million related to the sale.
•In November 2025, we completed a $900 million public bond offering, consisting of $500 million aggregate principal amount of 4.350% senior notes due 2029 and $400 million aggregate principal amount of 4.600% senior notes due 2030.
•In December 2025, we entered into an agreement to sell our Carlsbad, New Mexico potash mine for approximately $30 million. The transaction includes initial proceeds of $20 million at closing and deferred consideration of $10 million payable in three equal installments beginning in 2029. The sale is expected to be completed in the first half of 2026. As of December 31, 2025, the assets and liabilities are considered held for sale and we recorded an impairment loss of approximately $185.0 million.
We have included additional information about these and other developments in our business during 2025 in our Management’s Discussion and Analysis of Financial Condition and Results of Operations (“Management’s Analysis”) and in the Notes to Consolidated Financial Statements.
Throughout the discussion below, we measure units of production, sales and raw materials in metric tonnes, which are the equivalent of 2,205 pounds, or 1.102 tons (U.S. standard), unless we specifically state that we mean short or long ton(s), which are the equivalent of 2,000 pounds and 2,240 pounds, respectively. In addition, we measure natural gas, a raw material used in the production of our products, in MM BTU, which stands for one million British Thermal Units (“BTU”). One BTU is equivalent to 1.06 Joules.
Information concerning our mining properties in this Annual Report on Form 10-K has been prepared in accordance with Subpart 1300 of Regulation S-K (“S-K 1300”). S-K 1300 requires us to disclose our mineral resources, in addition to our mineral reserves, as of the end of our most recently completed fiscal year, both in the aggregate and for each of our individually material mining properties. We have four material properties: Belle Plaine, Esterhazy, Florida and Tapira. See Item 2. “Properties,” for further information regarding mineral reserves and resource and discussion of our material mining properties.
This report includes market share and industry data and forecasts that we obtained from publicly available information and industry publications, surveys, market research, internal company surveys and consultant surveys. We believe these sources to be reliable, but there can be no assurance as to the accuracy and completeness of such information.
We have not independently verified the data from third-party sources, nor have we ascertained the underlying economic assumptions relied upon therein. Similarly, internal company surveys, industry forecasts and market research, which we believe to be reliable based upon management’s knowledge of the industry, have not been verified by any independent sources.
BUSINESS SEGMENT INFORMATION
The discussion below of our business segment operations should be read in conjunction with the following information that we have included in this report:
•The risk factors discussed in this report in Part I, Item 1A, “Risk Factors”.
•Our Management’s Analysis.
•The financial statements and supplementary financial information in our Consolidated Financial Statements (“Consolidated Financial Statements”).
This information is incorporated by reference into this section from Part II, Item 8, “Financial Statements and Supplementary Data”.
Phosphate Segment
Our Phosphate business segment owns and operates mines and production facilities in Florida which produce concentrated phosphate crop nutrients and phosphate-based animal feed ingredients, and processing plants in Louisiana which produce concentrated phosphate crop nutrients. We have a 75% economic interest in the Miski Mayo Phosphate Mine in Peru (“Miski Mayo Mine”), which is included in the results of our Phosphate segment.
The following map shows the locations of each of our phosphate concentrates plants in the U.S. and each of our active, temporarily idled, and planned phosphate mine locations, including beneficiation plants, in Florida. The reserves associated with our Ona, Florida location have been allocated to other active mines based on our future mining plans:
U.S. Phosphate Crop Nutrients and Animal Feed Ingredients
Our U.S. Phosphate operations have capacity to produce approximately 4.5 million tonnes of phosphoric acid (“P2O5”) per year, or about 7% of world annual capacity and about 60% of North American annual capacity. P2O5 is produced by reacting finely ground phosphate rock with sulfuric acid. P2O5 is the key building block for the production of high analysis or concentrated phosphate crop nutrients and animal feed products and is the most comprehensive measure of phosphate capacity and production and a commonly used benchmark in our industry. Our U.S. P2O5 production totaled approximately 2.9 million tonnes during 2025. Our U.S. operations account for approximately 6% of estimated global annual production and 55% of estimated North American annual output of P2O5.
Our phosphate crop nutrient products are marketed worldwide to crop nutrient manufacturers, distributors, retailers and farmers. Our principal phosphate crop nutrient products are:
•Diammonium Phosphate (18-46-0): Diammonium Phosphate (“DAP”) is the most widely used high-analysis phosphate crop nutrient worldwide. DAP is produced by first combining phosphoric acid with anhydrous ammonia in a reaction vessel. This initial reaction creates a slurry that is then pumped into a granulation plant where it is reacted with additional ammonia to produce DAP. DAP is a solid granular product that is applied directly or blended with other solid plant nutrient products, such as urea and potash.
•Monoammonium Phosphate (11-52-0): Monoammonium Phosphate (“MAP”) is the second most widely used high-analysis phosphate crop nutrient. MAP is also produced by first combining phosphoric acid with anhydrous ammonia in a reaction vessel. The resulting slurry is then pumped into the granulation plant where it is reacted with additional P2O5 to produce MAP. MAP is a solid granular product that is applied directly or blended with other solid plant nutrient products.
•MicroEssentials® is a value-added ammoniated phosphate product that is enhanced through a patented process that creates very thin platelets of sulfur and other micronutrients, such as zinc, on the granulated product. The patented process incorporates both the sulfate and elemental forms of sulfur, providing season-long availability to crops.
Production of our animal feed ingredients products is located at our New Wales, Florida facility. We market our feed phosphate primarily under the leading brand names of Biofos® and Nexfos®.
Annual capacity by plant as of December 31, 2025 and production volumes by plant for 2025 are listed below:
|
|
|
|
|
|
|
|
|
|
|
|
|
|
|
|
|
|
|
|
|
|
|
|
|
|
|
| (tonnes in millions) |
|
Phosphoric Acid |
|
Processed Phosphate(a)/DAP/MAP/ MicroEssentials®/Feed Phosphate |
| |
|
Operational Capacity(b) |
|
|
|
Operational Capacity(b) |
|
|
| Facility |
|
Production(c) |
|
Production(c) |
| Florida: |
|
|
|
|
|
|
|
|
| Bartow |
|
1.1 |
|
|
0.8 |
|
|
2.5 |
|
|
1.9 |
|
| New Wales |
|
1.7 |
|
|
1.0 |
|
|
4.0 |
|
|
2.1 |
|
| Riverview |
|
0.9 |
|
|
0.6 |
|
|
1.8 |
|
|
1.2 |
|
|
|
3.7 |
|
|
2.4 |
|
|
8.3 |
|
|
5.2 |
|
| Louisiana: |
|
|
|
|
|
|
|
|
| Faustina |
|
— |
|
|
— |
|
|
1.6 |
|
|
1.1 |
|
| Uncle Sam |
|
0.8 |
|
|
0.5 |
|
|
— |
|
|
— |
|
|
|
0.8 |
|
|
0.5 |
|
|
1.6 |
|
|
1.1 |
|
| Total |
|
4.5 |
|
|
2.9 |
|
|
9.9 |
|
|
6.3 |
|
______________________________
(a)Our ability to produce processed phosphate has been less than our annual operational capacity stated in the table above, except to the extent we purchase P2O5. Factors affecting actual production are described in note (c) below.
(b)Operational capacity is our estimated long-term capacity based on an average amount of scheduled down time, including maintenance and scheduled turnaround time, and product mix, and no significant modifications to operating conditions, equipment or facilities.
(c)Actual production varies from annual operational capacity shown in the above table due to factors that include, among others, the level of demand for our products, maintenance and turnaround time, accidents, mechanical failure, product mix, and other operating conditions.
The P2O5 produced at Uncle Sam is shipped to Faustina, where it is used to produce DAP, MAP and MicroEssentials®. Our Faustina plant also manufactures ammonia that is mostly consumed in our concentrate plants.
We produced approximately 6.3 million tonnes of concentrated phosphate crop nutrients during 2025 and accounted for approximately 72% of estimated North American annual production.
Phosphate Rock
Phosphate rock is the key mineral used to produce phosphate crop nutrients and feed phosphate. Our Florida phosphate rock mines produced approximately 9.5 million tonnes in 2025 and accounted for approximately 47% of estimated North American annual production. We are the world’s second largest miner of phosphate rock (excluding China) and currently operate four mines in North America with a combined annual capacity of 17.2 million tonnes. Additionally, we own 75% of the Miski Mayo Mine, which has an annual capacity of 4.8 million tonnes. Production of one tonne of DAP requires between 1.6 and 1.7 tonnes of phosphate rock.
All of our wholly-owned phosphate mines and related mining operations in North America are located in central Florida. During 2025, we operated three active mines in Florida: Four Corners, South Fort Meade and Wingate. We plan to explore and develop the DeSoto property, the Pioneer property and the South Pasture property, which was previously idled, to offset future depletion at our Florida properties. We have a 75% economic interest in the Miski Mayo Mine, which allows us to supplement our other produced rock to meet our overall fertilizer production needs and is the primary source of rock for our Louisiana operations. We have the right to use or sell to third parties 75% of the Miski Mayo Mine’s annual production.
See “Item 2. Properties” for a discussion of our phosphate mining properties, including processing methods, facilities, production and summaries of our mineral resources and reserves, both in the aggregate and for our individual material phosphate mining properties.
Sulfur
We use molten sulfur at our phosphate concentrates plants to produce sulfuric acid, primarily for use in our production of P2O5. We purchased approximately 2.9 million long tons of sulfur during 2025. We purchase the majority of this sulfur from North American oil and natural gas refiners who are required to remove or recover sulfur during the refining process. Production of one tonne of DAP requires approximately 0.40 long tons of sulfur. We procure our sulfur from multiple sources and receive it by truck, rail, barge and vessel, either directly at our phosphate plants or have it sent for gathering to terminals that are located on the U.S. gulf coast. In addition, we use formed sulfur received through Tampa, Florida ports, which are delivered by truck to our New Wales facility and melted through our sulfur melter.
We own and operate sulfur terminals in Riverview and Tampa, Florida, along with Galveston, Texas and Faustina, Louisiana. We also lease terminal space in Beaumont, Texas. We have long-term time charters on two ocean-going tugs/barges and one ocean-going vessel that transports molten sulfur from the Texas terminals to Tampa. We then further transport by truck to our Florida phosphate plants. Our sulfur logistic assets also include a large fleet of leased railcars that supplement our marine sulfur logistic system. Our Louisiana operations are served by truck from nearby refineries.
Although sulfur is readily available from many different suppliers and can be transported to our phosphate facilities by a variety of means, sulfur is an important raw material used in our business that has in the past been, and may in the future, be the subject of volatile pricing and availability. Alternative transportation and terminaling facilities might not have sufficient capacity to fully serve all of our facilities in the event of a disruption to current transportation or terminaling facilities. Changes in the price of sulfur or disruptions to sulfur transportation or terminaling facilities could have a material impact on our business. We have included a discussion of sulfur prices in our Management’s Analysis.
Ammonia
We use ammonia together with P2O5 to produce DAP, MAP and MicroEssentials®. We consumed approximately 0.9 million tonnes of ammonia during 2025. Production of one tonne of DAP requires approximately 0.23 tonnes of ammonia. We purchase approximately one-third of our ammonia from various suppliers in the spot market with the remaining two-thirds either purchased through supply agreements or produced internally at our Faustina, Louisiana location.
Our Florida ammonia needs are currently supplied under multi-year contracts with both domestic and offshore producers. Ammonia for our Florida plants is terminaled through owned ammonia facilities at the Port of Tampa and Port Sutton, Florida. Ammonia is transported by pipeline from the terminals to our production facilities. We have service agreements with the operators of the pipelines for Bartow, New Wales and Riverview, which provide service through June 30, 2026 with two year auto-renewal provisions unless either party objects.
We have agreements with various suppliers to ensure we have reliable sources of supply for ammonia to support competitive pricing in various market conditions. These agreements covered approximately 497,000 tonnes of ammonia.
We produce ammonia at Faustina, Louisiana primarily for our own consumption. Our annual capacity is approximately 510,000 tonnes. From time to time, we sell surplus ammonia to unrelated parties and/or may transport surplus ammonia to the Port of Tampa. In certain circumstances, we source ammonia from alternative sources to receive at Faustina.
Although ammonia is readily available from many different suppliers and can be transported to our Phosphate facilities by a variety of means, ammonia is an important raw material used in our business that has in the past been, and may in the future be, the subject of volatile pricing. In addition, alternative transportation and terminaling facilities might not have sufficient capacity to fully serve all of our facilities in the event of a disruption to existing transportation or terminaling facilities. Changes in the price of ammonia or disruptions to ammonia transportation or terminaling could have a material impact on our business. We have included a discussion of ammonia prices in our Management’s Analysis.
Natural Gas for Phosphate
Natural gas is the primary raw material used to manufacture ammonia. At our Faustina facility, ammonia is manufactured on site. The majority of natural gas is purchased through firm delivery contracts based on published index-based prices and is sourced from Texas and Louisiana via pipelines interconnected to the Henry Hub.
We use over-the-counter swap and/or option contracts to forward price portions of future natural gas purchases. We typically purchase approximately 12.7 million MM BTU of natural gas per year for use in ammonia production at Faustina.
Our ammonia requirements for our Florida operations are purchased rather than manufactured on site. Therefore, while we typically purchase approximately 3.0 million MM BTU of natural gas per year in Florida, it is only used as a thermal fuel for various phosphate production processes.
Florida Land Holdings
We are a significant landowner in the State of Florida, which has in the past been considered one of the fastest areas of population growth in the U.S. We have land holdings totaling over 368,000 acres. These land holdings give Mosaic access to phosphate rock reserves and exist as fee simple, mining agreements or mineral rights. Some of our land holdings are needed to operate our Phosphate business, while a portion of our land assets, such as certain reclaimed properties, are no longer required for our ongoing operations. As a general matter, more of our reclaimed property becomes available for uses other than for phosphate operations each year. Our real property assets are generally comprised of concentrates plants, port facilities, phosphate mines and other property which we have acquired through our presence in Florida. Our long-term future land use strategy is to optimize the value of our land assets.
Potash Segment
We are one of the leading potash producers in the world. We mine and process potash in Canada and the U.S. and sell potash in North America and internationally. Our Potash business segment operates three mines in Canada, including two shaft mines and one solution mine, as well as one potash shaft mine in the U.S. The term “potash” applies generally to the common salts of potassium. Muriate of potash (“MOP”) is the primary source of potassium for the crop nutrient industry. Red MOP has traces of iron oxide. The granular and standard grade red MOP products are well suited for direct fertilizer application and bulk blending. White MOP has a higher percent potassium oxide (“K2O”). White MOP, besides being well suited for the agricultural market, is used in many industrial applications. We also produce a double sulfate of potash magnesia product, which we market under our brand name K-Mag®, at our Carlsbad, New Mexico facility. The Carlsbad facility is classified as held for sale at December 31, 2025.
Our potash products are marketed worldwide to crop nutrient manufacturers, distributors and retailers and are also used in the manufacturing of mixed crop nutrients and, to a lesser extent, in animal feed ingredients. We also sell potash to customers for industrial use. In addition, our potash products are used for de-icing and as a water softener regenerant.
Mosaic leases approximately 291,500 acres of mineral rights from the government of Saskatchewan, and approximately 99,300 acres of freehold mineral rights in the Kronau/Regina area, which have not been developed.
We pay Canadian resource taxes consisting of the Potash Production Tax and resource surcharge. The Potash Production Tax is a Saskatchewan provincial tax on potash production and consists of a base payment and a profits tax. We also pay a percentage of the value of resource sales from our Saskatchewan mines. In addition to the Canadian resource taxes, royalties are payable to the mineral owners in respect of potash reserves or production of potash. We have included a further discussion of the Canadian resource taxes and royalties in our Management’s Analysis.
The map below shows the location of each of our potash properties in North America:

Our North American potash annualized operational capacity totals 11.5 million tonnes of product per year and accounts for approximately 13% of world annual capacity and 38% of North American annual operational capacity. Production during 2025 totaled 8.8 million tonnes. We account for approximately 12% of estimated world annual production and 34% of estimated North American annual production.
The following table shows, for each of our potash mines, annual capacity as of December 31, 2025 and finished product output for 2025:
|
|
|
|
|
|
|
|
|
|
|
|
|
|
|
|
|
|
|
|
|
|
|
|
|
|
|
|
|
|
|
|
|
| (tonnes in millions) |
|
|
|
|
|
|
|
|
|
|
|
|
| Facility |
Annualized
Proven
Peaking
Capacity
(a)(c)
|
|
Annual
Operational
Capacity
(a)(b)(e)
|
|
|
|
|
Finished
Product(b)
|
|
|
|
|
|
|
|
|
|
|
|
|
| Canada |
|
|
|
|
|
|
|
|
|
|
|
|
|
|
|
|
|
|
|
|
Belle Plaine—MOP(d) |
3.9 |
|
|
3.0 |
|
|
|
|
|
3.0 |
|
|
|
|
|
|
|
|
|
|
|
|
|
Colonsay—MOP (d)(f) |
2.6 |
|
|
1.5 |
|
|
|
|
|
0.8 |
|
|
|
|
|
|
|
|
|
|
|
|
|
Esterhazy—MOP(d)(g) |
6.3 |
|
|
6.3 |
|
|
|
|
|
4.7 |
|
|
|
|
|
|
|
|
|
|
|
|
|
| Canadian Total |
12.8 |
|
|
10.8 |
|
|
|
|
|
8.5 |
|
|
|
|
|
|
|
|
|
|
|
|
|
| United States |
|
|
|
|
|
|
|
|
|
|
|
|
|
|
|
|
|
|
|
|
Carlsbad—K-Mag®(h) |
0.9 |
|
|
0.7 |
|
|
|
|
|
0.3 |
|
|
|
|
|
|
|
|
|
|
|
|
|
| United States Total |
0.9 |
|
|
0.7 |
|
|
|
|
|
0.3 |
|
|
|
|
|
|
|
|
|
|
|
|
|
| Totals |
13.7 |
|
|
11.5 |
|
|
|
|
|
8.8 |
|
|
|
|
|
|
|
|
|
|
|
|
|
______________________________
(a)Finished product.
(b)Actual production varies from annual operational capacity shown in the above table due to factors that include, among others, the level of demand for our products, maintenance and turnaround time, the quality of the reserves and the nature of the geologic formations we are mining at any particular time, accidents, mechanical failure, product mix and other operating conditions.
(c)Represents full capacity assuming no turnaround or maintenance time.
(d)The annualized proven peaking capacity shown above is the capacity currently used to determine our share of Canpotex, Limited (“Canpotex”) sales. Canpotex members’ respective shares of Canpotex sales are based upon the members’ respective proven peaking capacities for producing potash. When a Canpotex member expands an existing mine, the new capacity is added to that member’s proven peaking capacity based on either a 90-day production run at the maximum production levels or an engineering audit of the expansion performed by an independent engineering firm in accordance with approved protocols. The annual operational capacity of a mine reported in the table above can exceed the annualized proven peaking capacity until the proving run or engineering audit has been completed. Our entitlement percentage of Canpotex was 36.2%, however in 2025 the percentage was 35.9% as a result of production shortages.
(e)Annual operational capacity is our estimated potash production capacity based on the quality of reserves and the nature of the geologic formations expected to be mined, milled and/or processed over the long term, average amount of scheduled down time, including maintenance and scheduled turnaround time, and product mix, and no significant modifications to operating conditions, equipment or facilities. Operational capacities will continue to be updated to the extent new production results impact ore grades assumptions.
(f)Our Colonsay mine operates as a swing mine to meet market demands. We have the ability to reach an annual operating capacity of 2.1 million tonnes over time by increasing our staffing levels and investment in mine development activities.
(g)Following completion of our Esterhazy K3 expansion project, a third-party audit assessed our Esterhazy Facility’s nameplate capacity at 7.8 million tonnes. To date, we have been unable to rely upon this audit as a basis for an increase to our Canpotex entitlement percentage.
(h)K-Mag® is a specialty product that we produce at our Carlsbad facility. The Carlsbad facility is classified as held for sale at December 31, 2025.
See Item 2. “Properties” for a discussion of our potash mining properties, including processing methods, facilities, production and summaries of our mineral resources and reserves, both in the aggregate and for our individual material potash mining properties.
Natural Gas
Natural gas is used at our Belle Plaine solution mine as a fuel to produce steam and to dry potash products. The steam is used to generate electricity and provide thermal energy to the evaporation, crystallization and solution mining processes. The Belle Plaine solution mine typically accounts for approximately 80% of our Potash segment’s total natural gas requirements for potash production. At our shaft mines, natural gas is used as a fuel to heat fresh air supplied to the shaft mines and for drying potash products. Combined natural gas usage for both the solution and shaft mines totaled 17.1 million MM BTU during 2025. We purchase our natural gas requirements on firm delivery index price-based physical contracts and on short-term spot-priced physical contracts. Our Canadian operations purchase physical natural gas from companies in Alberta and Saskatchewan using AECO price indices references and transport the gas to our plants via the TransGas pipeline system.
The U.S. potash operation in New Mexico purchases physical gas in the southwest respective regional market using the El Paso San Juan Basin market pricing reference. We use financial derivative contracts to manage the pricing on portions of our natural gas requirements.
Mosaic Fertilizantes Segment
Our Mosaic Fertilizantes segment owns and operates mines, chemical plants, crop nutrient blending and bagging facilities, port terminals and warehouses in Brazil and Paraguay, which produce and sell concentrated phosphate- and potash-based crop nutrients and phosphate-based animal feed ingredients. We also operated the Taquari potash mine in Brazil which we sold in November 2025. The following map shows the locations of our operations in Brazil and Paraguay:
We are the largest producer and one of the largest distributors of blended crop nutrients for agricultural use in Brazil. We produce and sell phosphate- and potash-based crop nutrients, and animal feed ingredients through our operations. Our operations in Brazil include five phosphate mines and four chemical plants.
We own and operate ten blending plants in Brazil and one blending plant and port in Paraguay. In 2025, we completed construction of a one million tonne distribution facility in northern Brazil in Palmeirante. In addition, we lease several other warehouses and blending units depending on sales and production levels. We also have a 62% ownership interest in Fospar, S.A. (“Fospar”). Fospar owns and operates an SSP (defined below) granulation plant, which produces approximately 0.5 million tonnes of SSP per year, and a deep-water port and throughput warehouse terminal facility in Paranagua, Brazil. The port facility at Paranagua handles approximately 3.2 million tonnes of imported crop nutrients. In 2025, Mosaic Fertilizantes sold approximately 9.0 million tonnes of crop nutrient products and accounted for approximately 17% of fertilizer shipments in Brazil.
We have the capability to annually produce approximately 4.5 million tonnes of phosphate- and potash-based crop nutrients and animal feed ingredients. Crop nutrient products produced are marketed to crop nutrient manufacturers, distributors, retailers and farmers.
In addition to producing crop nutrients, Mosaic Fertilizantes purchases phosphate, potash and nitrogen products which are either used to produce blended crop nutrients (“Blends”) or for resale. In 2025, Mosaic Fertilizantes purchased 1.0 million tonnes of phosphate-based products, primarily MicroEssentials®, from our Phosphate segment, and 2.0 million tonnes of potash products from our Potash segment and Canpotex.
Phosphate Crop Nutrients and Animal Feed Ingredients
Our Brazilian phosphate operations have capacity to produce approximately 1.1 million tonnes of P2O5 per year, or about 62% of Brazilian annual capacity. Phosphoric acid is produced by reacting ground phosphate rock with sulfuric acid. P2O5 is the key building block for the production of high analysis or concentrated phosphate crop nutrients and animal feed products and is the most comprehensive measure of phosphate capacity and production and a commonly used benchmark in our industry. Our Brazilian phosphoric acid production totaled approximately 1.0 million tonnes in 2025 and accounted for approximately 86% of Brazilian annual output.
Our principal phosphate crop nutrient products in Brazil are:
•Monoammonium Phosphate (11-52-0) (“MAP”): MAP is a crop nutrient composed of two macronutrients, nitrogen and phosphoric acid. This slurry is added inside a rotary drum type granulator with ammonia to complete the neutralization reaction and produce MAP.
•Triple superphosphate (“TSP”): TSP is a highly concentrated phosphate crop nutrient. TSP is produced from the phosphate rock reaction with phosphoric acid in a kuhlmann type reactor. The process for the production of TSP in Brazil is run of pile where the product undergoes a curing process of approximately seven days for later granulation.
•Single superphosphate (“SSP”): SSP is a crop nutrient with a low concentration of phosphorus that is used in agriculture because of the sulfur content in its formulation. SSP is produced from mixing phosphate rock with sulfuric acid in a kuhlmann or malaxador type reactor. After the reaction, the product goes to the curing process and then feeds the granulation units.
•Dicalcium phosphate (“DCP”): Dicalcium phosphate is produced by the reaction of desulphurized phosphoric acid with limestone. At Uberaba, it is produced from the reaction of concentrated phosphoric acid with limestone slurry. At Cajati, the phosphoric acid is diluted with dry limestone. The reaction of the DCP occurs in a kuhlmann or spinden type reactor.
Our primary mines and chemical plants are located in the states of Minas Gerais, São Paulo and Goias. Production of our animal feed ingredients products is located at our Uberaba, Minas Gerais and Cajati, São Paulo facilities. We market our feed phosphate primarily under the brand name Foscálcio.
Annual capacity and production volume by plant as of December 31, 2025 are listed below:
|
|
|
|
|
|
|
|
|
|
|
|
|
|
|
|
|
|
|
|
|
|
|
|
| (tonnes of ore in millions) |
|
Phosphoric Acid |
|
Processed Phosphate(a) (MAP/TSP/SSP/DCP/Feed) |
| Facility |
|
Capacity(b) |
|
Production(c) |
|
Capacity(b) |
Production(c) |
| Phosphate |
|
|
|
|
|
|
|
| Uberaba |
|
0.9 |
|
|
0.8 |
|
|
2.0 |
|
1.6 |
|
| Cajati |
|
0.2 |
|
|
0.2 |
|
|
0.5 |
|
0.4 |
|
| Araxá |
|
— |
|
|
— |
|
|
1.1 |
|
0.7 |
|
| Catalão |
|
— |
|
|
— |
|
|
0.4 |
|
0.4 |
|
| Total |
|
1.1 |
|
|
1.0 |
|
|
4.0 |
|
3.1 |
|
______________________________
(a)Our ability to produce processed phosphate has been less than our annual operational capacity as stated in the table above, except to the extent we purchase phosphoric acid. Factors affecting actual production are described in note (c) below.
(b)The annual production capacity was calculated using the hourly capacity, days stopped for annual maintenance and OEE (historical utilization factor and capacity factor).
(c)Actual production varies from annual operational capacity shown in the table above due to factors that include, among others, the level of demand for our products, maintenance and turnaround time, accidents and mechanical failure.
The phosphoric acid produced at Cajati is used to produce DCP. The phosphoric acid produced at Uberaba is used to produce MAP, TSP and DCP.
We produced approximately 2.6 million tonnes of concentrated phosphate crop nutrients during 2025 which accounted for approximately 46% of estimated Brazilian annual production.
Phosphate Rock
Phosphate rock is the key mineral used to produce phosphate crop nutrients and animal feed product. Our phosphate rock production in Brazil totaled approximately 4.2 million tonnes in 2025, which accounted for approximately 71% of estimated Brazilian annual production. We are the largest producer of phosphate rock in Brazil and currently have an annual capacity of approximately 4.6 million tonnes. During 2025, we operated five properties; Araxá, Patrocínio and Tapira in the state of Minas Gerais; Catalão in the state of Goiás; and Cajati in the state of São Paulo.
Production of one tonne of MAP requires 1.6 to 1.7 tonnes of phosphate rock. Production of one tonne of SSP requires between 0.6 to 0.7 tonnes of phosphate rock. Production of one tonne of TSP requires 1.4 tonnes of phosphate rock.
See Item 2. “Properties” for a discussion of our Brazilian mining properties, including processing methods, facilities, production and summaries of our mineral resources and reserves, both in the aggregate and for our individually material Brazilian properties.
We are required to pay royalties to mineral owners and resource taxes to the Brazilian government for phosphate and potash production. The resource taxes, known as Compensação Financeira pela Exploração de Recursos Minerais or CFEM, are regulated by the National Mining Agency. In 2025, we paid royalties and resource taxes of approximately $25.5 million.
Sulfur
We use molten sulfur at our phosphate concentrates plants to produce sulfuric acid, one of the key components used in the production of phosphoric acid. We consumed approximately 0.9 million long tons of sulfur for our own production during 2025. We purchase approximately 20% of the volume under annual supply agreements from oil and natural gas refiners, who are required to remove or recover sulfur during the refining process. The remaining 80% is purchased in the spot market. Sulfur is imported through the Tiplam port and transported by rail to the Uberaba plant and by truck to the Araxá and Cajati locations.
Although sulfur is readily available from many different suppliers and can be transported to our phosphate facilities by a variety of means, sulfur is an important raw material used in our business that has in the past been, and could in the future be, subject to volatile pricing and availability.
Alternative transportation and terminaling facilities might not have sufficient capacity to fully serve all of our facilities in the event of a disruption to current transportation or terminaling facilities. Changes in the price of sulfur or disruptions to sulfur transportation or terminaling facilities could have a material impact on our business.
Ammonia
We use ammonia, together with phosphoric acid, to produce MAP, and to a lesser extent for SSP production. We consumed approximately 103,390 tonnes of ammonia during 2025. Production of one tonne of MAP requires approximately 0.137 tonnes of ammonia. We purchase all of our ammonia under a long-term supply agreement with two suppliers. Ammonia is imported through the Tiplam port and transported by truck to Uberaba, Araxá and Catalão.
We own approximately 1% of the Tiplam terminal in Santos, São Paulo. Our ownership percentage, along with a contractual agreement, guarantee us unloading priority for ammonia and also provide us unloading capacity for rock, sulfur and crop nutrients.
Although ammonia is readily available from many different suppliers and can be transported to our phosphate facilities by a variety of means, ammonia is an important raw material used in our business that has in the past been, and in the future could be, subject to volatile pricing. Alternative transportation and terminaling facilities might not have sufficient capacity to fully serve all of our facilities in the event of a disruption to existing transportation or terminaling facilities. Changes in the price of ammonia or disruptions to ammonia transportation or terminaling could have a material impact on our business.
Land Holdings
Mosaic Fertilizantes owns properties and the surface rights of certain rural lands comprising over 34,000 hectares (84,000 acres) in the States of São Paulo, Minas Gerais, Goiás, Paraná, Mato Grosso, Santa Catarina, Bahia and Sergipe, and has the right to mine additional properties which contain phosphate rock or potash reserves. Most of our land holdings are needed to operate our phosphate and potash production and fertilizer distribution businesses. A portion of our land assets may no longer be required for our current operations and may be leased to third parties, for agricultural or other purposes, or may be set aside for mineral or environmental conservation. Our real property assets are generally comprised of concentrates plants, port facilities and phosphate and potash mines, crop nutrient blending and bagging facilities and other properties which we have acquired through our presence in Brazil.
India and China Distribution Businesses
Our China and India distribution businesses market phosphate-, potash- and nitrogen-based crop nutrients and provide other ancillary services to wholesalers, cooperatives, independent retailers and farmers in the Asia-Pacific regions. These operations provide our Phosphate and Potash segments access to key markets outside of North and South America and serve as a marketing agent for our Phosphate segment. In 2025, the India and China operations purchased 48,745 tonnes of phosphate-based products from our Phosphate segment, and 1,017,741 tonnes of potash products from our Potash segment and Canpotex. They also purchase phosphate, potash and nitrogen products from unrelated third parties, which we either use to produce blended crop nutrients or for resale.
In China, we own two 300,000-tonne per year capacity blending plants. In 2025, we sold approximately 383,000 tonnes of Blends and distributed another 862,000 tonnes of phosphate and potash crop nutrients in China.
In India, we have distribution facilities to import and sell crop nutrients. In 2025, we distributed approximately 189,000 tonnes of potash crop nutrient products in India.
SALES AND DISTRIBUTION ACTIVITIES
United States and Canada
We have a U.S. and Canada sales and marketing team that serves our business segments. We sell to wholesale distributors, retail chains, cooperatives, independent retailers and national accounts.
Customer service and the ability to effectively minimize the overall supply chain costs are key competitive factors in the crop nutrient and animal feed ingredients businesses. In addition to our production facilities, to service the needs of our customers, we own or have contractual throughput or other arrangements at strategically located distribution warehouses along or near the Mississippi and Ohio Rivers, as well as in other key agricultural regions of the U.S. and Canada. From these facilities, we distribute Mosaic-produced phosphate and potash products for customers who in turn resell the product into the distribution channel or directly to farmers in the U.S. and Canada.
We own port facilities in Tampa, Florida which have deep water berth capabilities providing access to the Gulf Coast of the United States. We also own warehouse distribution facilities in: Rosemount, Minnesota; Pekin, Illinois; and Henderson, Kentucky.
In addition to the facilities that we own, our U.S. distribution operations also include leased distribution space or contractual throughput agreements in other key geographical areas including California, Florida, Illinois, Indiana, Iowa, Kentucky, Louisiana, Minnesota, Missouri, Nebraska, North Dakota, Ohio, Oklahoma, Texas and Wisconsin.
Our Canadian customers include independent dealers and national accounts. We also lease or own warehouse facilities in Saskatchewan, Ontario, Quebec and Manitoba in Canada.
International
Outside of the U.S. and Canada, we market our Phosphate segment’s products through our Mosaic Fertilizantes segment and our China and India distribution businesses, as well as a sales force focused on geographies outside of North America. The countries that account for the largest amount of our phosphates sales outside the U.S., by volume, are Canada, Brazil, Colombia, Australia and Argentina.
Our sales of potash products outside of the U.S. and Canada are made through Canpotex. Canpotex sales are allocated among its members based on peaking capacity. Our entitlement percentage of Canpotex was 36.2%, however in 2025 the percentage was 35.9% as a result of production shortages.
Our potash exports from Carlsbad are sold through our own sales force. We also market our Potash segment’s products through our Mosaic Fertilizantes segment and our China and India distribution businesses, which acquire potash primarily through Canpotex. The countries that account for the largest amount of international potash sales, by volume, are Brazil, China, Indonesia, India and Belgium.
To service the needs of our customers, our Mosaic Fertilizantes segment includes a network of strategically located sales offices, crop nutrient blending and bagging facilities, port terminals and warehouse distribution facilities that we own and operate. The blending and bagging facilities primarily produce Blends from phosphate, potash and nitrogen. The average product mix in our Blends (by volume) contains approximately 21% nitrogen, 52% phosphate and 27% potash, although this mix differs based on seasonal and other factors. All of our production in Brazil is consumed within the country.
Our India and China distribution businesses also includes a network of strategically located sales offices, crop nutrient blending and bagging facilities, port terminals and warehouse distribution facilities. These businesses serve primarily as a sales outlet for our North American phosphate production, both for resale and as an input for Blends. Our Potash segment also has historically furnished the majority of the raw materials needs for the production of Blends, primarily via Canpotex, and is expected to continue to do so in the future.
Other Products
With a strong brand position in a multi-billion dollar animal feed ingredients global market, our Phosphate segment supplies animal feed ingredients for poultry and livestock to customers in North America, Latin America and Asia. Our potash sales to non-agricultural users are primarily to large industrial accounts and the animal feed industry. Additionally, in North America, we sell potash for de-icing and as a water softener regenerant. In Brazil, we also sell phosphogypsum.
In 2023, we announced the formation of the Mosaic Biosciences platform, a global initiative to bring the latest science and innovation to the agricultural market. The Mosaic Biosciences portfolio includes biological fertilizer complements which improve nutrient use efficiency and enhance plant growth and vigor.
The Mosaic Biosciences platform has grown through the acquisition of Plant Response in late 2021 and organically from the addition of new products. Our portfolio of products has been successful with customers and benefits greatly from our existing fertilizer distribution network to our customers. Mosaic Biosciences is included within our Mosaic Fertilizantes segment and Corporate, Eliminations and Other which includes Mosaic Biosciences sales in China, India and North America.
COMPETITION
Because crop nutrients are global commodities available from numerous sources, crop nutrition companies compete primarily on the basis of delivered price. Other competitive factors include product quality, cost and availability of raw materials, customer service, plant efficiency and availability of product. As a result, markets for our products are highly competitive. We compete with a broad range of domestic and international producers, including farmer cooperatives, subsidiaries of larger companies, and independent crop nutrient companies. Foreign competitors may have access to less expensive raw materials, may not have to comply with as stringent regulatory requirements or are owned or subsidized by governments and, as a result, may have cost advantages over North American companies. We believe that our extensive North American and international production and distribution system provides us with a competitive advantage by allowing us to achieve economies of scale, transportation and storage efficiencies, and obtain market intelligence. Also, we believe our performance products, such as MicroEssentials®, provide us a competitive advantage with customers in North and South America.
Unlike many of our competitors, we have our own distribution system to sell phosphate- and potash-based crop nutrients and animal feed ingredients, whether produced by us or by other third parties, around the globe. In North America, we have one of the largest and most strategically located distribution systems for crop nutrients, including warehouse facilities in key agricultural regions. We also have an extensive network of distribution facilities internationally, including in the key growth regions of South America and Asia, with port terminals, warehouses and blending plants in Brazil, Paraguay, China and India. Our global presence allows us to efficiently serve customers in approximately 40 countries.
Phosphate Segment
Our Phosphate segment operates in a highly competitive global market. Among the competitors in the global phosphate industry are domestic and foreign companies, as well as foreign government-supported producers in Asia and North Africa. Phosphate producers compete primarily based on price, as well as product quality, service and innovation. Major integrated producers of feed phosphate are located in the U.S., Europe and China. Many smaller producers are located in emerging markets around the world. Many of these smaller producers are not miners of phosphate rock or manufacturers of phosphoric acid and are required to purchase this material on the open market.
We believe that we are a low-cost integrated producer of phosphate-based crop nutrients, due in part to our scale, vertical integration and strategic network of production and distribution facilities. As the world’s second largest producer of concentrated phosphate, as well as the second largest miner of phosphate rock in the world and the largest in the U.S., we maintain an advantage over some competitors as the scale of operations effectively reduces production costs per unit. We are also vertically integrated to captively supply one of our key inputs, phosphate rock, to our phosphate production facilities. We believe that our position as an integrated producer of phosphate rock provides us with a significant cost advantage over competitors that are non-integrated phosphate producers. In addition, our ownership in the Miski Mayo Mine allows us to supplement our overall phosphate rock needs.
We produce ammonia at our Faustina, Louisiana concentrates plant in quantities sufficient to meet approximately one third of our total ammonia needs in North America. We do not have ammonia production capacity within Florida to serve our Florida operations, but we have capacity to supply a portion of our requirements by transporting produced ammonia from Louisiana to Florida. We purchase additional ammonia from world markets and thus are subject to significant volatility in our purchase price of ammonia. Our ammonia supply agreements provide us with a supply of a substantial volume of ammonia at prices based on the price of natural gas.
With our dedicated sulfur transportation barges and tugs, we are also well-positioned to source an adequate, flexible and cost-effective supply of sulfur, our third key input, to our Florida and Louisiana phosphate production facilities. We believe that our investments in sulfur logistical and melting assets continue to afford us a competitive advantage compared to other producers in cost and access to sulfur.
With facilities in both central Florida and Louisiana, we are logistically well positioned to fulfill our material needs at very competitive prices. Those multiple production points also afford us the flexibility to optimally balance supply and demand.
Potash Segment
Potash is a commodity available from several geographical regions around the world and, consequently, the market is highly competitive. Through our participation in Canpotex, we compete outside of North America against various independent and state-owned potash producers.
Canpotex has substantial expertise and logistical resources for the international distribution of potash, including strategically located export assets in Portland, Oregon, St. John, New Brunswick and Vancouver, British Columbia. Our principal methods of competition with respect to the sale of potash include product pricing and offering consistent, high-quality products and superior service. We believe that our potash cost structure is competitive in the industry and should improve as we continue to complete our potash expansion projects.
Mosaic Fertilizantes
The Mosaic Fertilizantes segment operates in a highly competitive market in Brazil. We compete with a broad range of domestic and international producers, including farmer cooperatives, subsidiaries of larger companies, and independent crop nutrient companies. We believe that having a vertically integrated business, internationally but also in Brazil, provides us with a competitive advantage by allowing us to achieve economies of scale, transportation and storage efficiencies, and obtain market intelligence.
Mosaic Fertilizantes has a wide variety of customers including farmers, blenders and other local distributors. We compete with local businesses that offer a wide variety of products that are available from many sources. We believe the strategic location of our mines and chemical plants, in close proximity to our customers, and the benefit of our own distribution network, gives us an advantage over most of our competitors. The vertical integration of our wholly-owned production, along with our distribution network, as well as our focus on product innovation and customer solutions, position us with an advantage over many of our competitors. We have a strong brand in Brazil. In addition to having access to our own production, our distribution activities have the capability to supply a wide variety of crop nutrients to our dealer and farmer customer base.
FACTORS AFFECTING DEMAND
Our results of operations historically have reflected the effects of several external factors which are beyond our control and have in the past produced significant downward and upward swings in operating results. Revenues are highly dependent upon conditions in the agriculture industry and can be affected by, among other factors: crop conditions; changes in agricultural production practices; worldwide economic conditions, including the increasing world population, household incomes and demand for more protein-rich food, particularly in developing regions such as China, India and Latin America; changing demand for biofuels; variability in commodity pricing; governmental policies; the level of inventories in the crop nutrient distribution channels; customer expectations regarding farmer economics, future crop nutrient prices and availability, and transportation costs, among other matters; market trends in raw material costs; market prices for crop nutrients; and weather. Furthermore, our crop nutrients business is seasonal to the extent farmers and agricultural enterprises in the markets in which we compete purchase more crop nutrient products during the spring and fall. The international scope of our business, spanning the northern and southern hemispheres, reduces to some extent the seasonal impact on our business. The degree of seasonality of our business can change significantly from year to year due to conditions in the agricultural industry and other factors. The seasonal nature of our businesses requires significant working capital for inventory in advance of the planting seasons.
We sell products throughout the world. Unfavorable changes in trade protection laws, policies and measures, government policies and other regulatory requirements affecting trade, including the imposition of tariffs; unexpected changes in tax and trade treaties; and strengthening or weakening of foreign economies, as well as political relations with the U.S. may cause sales trends to customers in one or more foreign countries to differ from sales trends in the U.S.
Our international operations are subject to risks from changes in foreign currencies, or government policy, which can affect local farmer economics.
OTHER MATTERS
Employees
We had 13,249 employees as of December 31, 2025, consisting of approximately 9,914 salaried and 3,335 hourly employees. This includes approximately 719 salaried employees at the Miski Mayo Mine, of which we own 75% and its results are consolidated within our results of operations.
Labor Relations
As of December 31, 2025:
•We had eight collective bargaining agreements with unions covering certain hourly employees in the U.S. and Canada. Of these employees, approximately 51% are covered under agreements that expire in 2026. All are expected to collectively bargain for new contracts in 2026.
•We had agreements with 33 unions covering all employees in Brazil. More than one agreement may govern our relations with each of these unions. In general, the agreements are renewable on an annual basis.
Failure to renew any of our union agreements could result in a strike or labor stoppage that could have a material adverse effect on our operations. However, we have not experienced a significant work stoppage in many years and historically have had good labor relations.
Information Available on our Website
Our Annual Report Form on 10-K (“Form 10-K”), Quarterly Reports on Form 10-Q (“Form 10-Q”), Current Reports on Form 8-K (“Form 8-K”), and amendments thereto, filed with the Securities and Exchange Commission (“SEC”) pursuant to Section 13(a) of the Securities Exchange Act of 1934, as amended, and the rules and regulations thereunder are made available free of charge on our website (www.mosaicco.com) as soon as reasonably practicable after we electronically file such material with, or furnish it to, the SEC. These reports are also available on the SEC’s website (www.sec.gov). The information contained on our website and the SEC’s website is not being incorporated in this report.
HUMAN CAPITAL
Our employees are the foundation of our Company. Our 13,249 colleagues embody Mosaic’s core principles of responsibility, reliability and future-focus, and are the key to enabling us to execute our mission to help the world grow the food it needs.
As of December 31, 2025, our regular employee base was made up of the following:
|
|
|
|
|
|
|
|
|
|
|
|
|
|
|
|
|
|
Country |
Male |
|
Female |
|
Total |
| Brazil |
4,968 |
|
|
1,219 |
|
|
6,187 |
|
| United States |
3,375 |
|
|
646 |
|
|
4,021 |
|
| Canada |
1,690 |
|
|
315 |
|
|
2,005 |
|
| Peru |
649 |
|
|
70 |
|
|
719 |
|
| China |
121 |
|
|
61 |
|
|
182 |
|
| India |
70 |
|
|
7 |
|
|
77 |
|
| Paraguay |
35 |
|
|
17 |
|
|
52 |
|
| Saudi Arabia |
6 |
|
|
— |
|
|
6 |
|
Total |
10,914 |
|
|
2,335 |
|
|
13,249 |
|
Mosaic is committed to the wellbeing and development of our employees, whose collective experiences and perspectives drive innovation, operational excellence and sustained business value.
As part of Mosaic’s strategic priorities, we are committed to a culture of safety, instilling a digital mindset, and collaborating globally to drive enterprise value.
Employee Health and Safety–Safety is a top priority and we strive for zero harm to people and zero environmental incidents. Through the Mosaic Management System, we have established a structured approach to effectively manage and control risk for the safety and wellbeing of our colleagues, the environment and our stockholders. The management system defines processes that help support a safe work environment and establish a continuous improvement cycle to adjust for changing conditions and identified risks.
Global Worker Wellness–Extending beyond safety, our wellness programs are designed to enhance the well-being of our employees – and their families – in the areas of physical and psychological health, and financial security. These programs include health screenings, insurance plans, psychological health training and mental health resources, as well as our Environmental, Health and Safety (“EHS”) Risk Reduction Program, various trainings and flexible schedules. In 2025 we provided additional flexibility to our U.S. employees with regard to their health needs by adding an additional benefits plan option. Likewise, hospitalization insurance was added to the U.S. plans in 2025. Preventative health programs, including step challenges and wellness resources, are also available to employees.
Development–Mosaic believes in continually investing in people and their lifelong learning. Mosaic holds training events throughout the year across all of our locations, invests in leadership competencies through facilitated learning opportunities and hosts an online education platform through Workday Learning, which all employees are encouraged to access for mandatory and self-guided education. Mosaic offers companywide educational reimbursement programs to help employees in each of our operating areas acquire new skills and capabilities to better meet their job responsibilities and provide for future career opportunities within the Company. Mosaic supports membership in numerous professional associations and encourages participation in work-related external networking groups.
•In 2025, Mosaic continued to invest in leadership development programs designed to equip employees with the knowledge and skills needed for the future of our business. These programs address the unique needs of emerging leaders, front-line supervisors, mid-level managers and senior leaders through targeted career-stage development initiatives. Like any company, Mosaic experiences turnover and the need to replace talent related to retirement and succession. Mosaic seeks to minimize unwanted turnover through its talent review, succession management, performance management and compensation processes. We seek to build our talent pipeline through student programs by designing career paths that will enable our employees to grow and evolve their careers at Mosaic.
Community–Mosaic is a thoughtful and engaged neighbor who invests carefully and generously through long-term partnerships with organizations that are making a difference. We are proud to support organizations and initiatives that create growth and leave a lasting impact in our communities in three main focus areas: food, water and local community. In 2024, we invested $16.7 million. While the official 2025 investment data will be available in February 2026, preliminary data indicates continued strong support in these areas with investments of over $15 million. In addition to philanthropic grants and sponsorships of local programs, we also support and facilitate volunteerism by our employees. Similarly, we are active with local committees, boards and associations focused on contributing to the vitality of the people and communities around us.
•2025 was the fifth year of the Mosaic Employee Giving Program (the “Program”) that provides employees with flexibility to connect their personal causes to corporate giving, matching and volunteerism opportunities. The Program aligns to Mosaic’s strategic priorities and our 2025 Environmental, Social and Governance performance goals. Employees can take advantage of Company matching funds through financial contributions, volunteering on personal time, or both. In North America, this can be up to $2,000 annually per employee.
Driving an Inclusive Culture–In 2025, Mosaic continued to make progress in creating a more engaged workforce through our executive-led Employee Inclusion Networks (“EIN”) which are open and available to all employees and by taking action to improve the workplace and employee experience based on insights learned through our 2024 Voice of the Employee survey. Ongoing awareness and education continue to be a cornerstone of Mosaic’s journey to build and promote a more inclusive culture. We continue to focus and expand our recruitment efforts to build awareness and interest in our industry and to attract and retain the best, qualified candidates from a broad variety of sources.
Pay equity is fundamental to our compensation philosophy and our commitment to our employees. Mosaic annually evaluates pay equity and compensation practices to ensure fair and equitable treatment of employees based on our pay-for-performance framework. In 2025, Mosaic engaged an external consultant to conduct our pay equity audit, bringing an independent view of our global pay equity. The results of our 2025 audit revealed .5% outliers, both men and women, who did not have adequate business justifications that will be addressed during our 2026 compensation cycle. Pay equity will continue to be audited every year with periodic external independent reviews to validate our internal observations.
Further information on our human capital practices is available in our sustainability report. Information contained in our sustainability report, or on our website, is not incorporated by reference into, and does not constitute a part of, this Form 10-K.
INFORMATION ABOUT OUR EXECUTIVE OFFICERS
Information regarding our executive officers as of February 27, 2026 is set forth below:
|
|
|
|
|
|
|
|
|
|
|
|
|
|
|
| Name |
|
Age |
|
Position |
| Philip E. Bauer |
|
53 |
|
|
Senior Vice President, General Counsel and Corporate Secretary |
| Bruce M. Bodine Jr. |
|
54 |
|
|
Chief Executive Officer, President and Director |
| Walter F. Precourt III |
|
61 |
|
|
Senior Vice President and Chief Administrative Officer |
| Luciano Siani Pires |
|
56 |
|
|
Executive Vice President and Chief Financial Officer |
| Karen A. Swager |
|
55 |
|
|
Executive Vice President - Operations |
| Yijun (“Jenny”) Wang |
|
58 |
|
|
Executive Vice President - Commercial |
Philip E. Bauer. Mr. Bauer was promoted to Senior Vice President, General Counsel and Corporate Secretary in January 2023. Since joining Mosaic in 2007, Mr. Bauer has managed legal support for business development activities, potash operations, offshore finance, commercial transactions and corporate governance. Before assuming his current role, Mr. Bauer was the Vice President and Deputy General Counsel from October 2022 through December 2022 and immediately prior to that role he served as the Vice President - Growth and Development on Mosaic’s Strategy and Growth team from May 2019 to September 2022. Prior to Mosaic, he was a partner at an international law firm where he focused his practice on mergers and acquisitions, public and private securities offerings and public company compliance matters, as well as general business advising.
Bruce M. Bodine Jr. Mr. Bodine was elected our Chief Executive Officer effective January 2024 and our President effective August 2023. He previously served as our Senior Vice President - North America from April 2020 to August 2023, and as our Senior Vice President - Phosphate from January 2019 to April 2020 during which time he also provided executive oversight for the corporate procurement organization. Prior to that, Mr. Bodine served as Senior Vice President - Potash (from June 2016 to December 31, 2018); as Vice President - Potash (from April to May 2016); as Vice President - Supply Chain (from August 2015 to March 2016); as Vice President - Operations Business Development (from October 2014 to August 2015); as Vice President - Operations for our Esterhazy and Colonsay potash production facilities (from July 2013 to October 2014); as the General Manager, Esterhazy (from September 2012 to June 2013); and as the General Manager, Four Corners (from March 2010 to August 2012). Before that, Mr. Bodine held various plant and mine development management positions in the Phosphate segment beginning with Mosaic’s formation in 2004.
Walter F. Precourt III. Mr. Precourt was elected our Senior Vice President and Chief Administrative Officer in November 2023. In this role, Mr. Precourt has responsibility for the Company’s Human Resources, Public Affairs, Procurement and Shared Services teams. He had previously served as our Senior Vice President - Strategy and Growth since January 1, 2019. From June 2016 through March 2020 he also provided executive oversight for the EHS organization. He previously served as Senior Vice President - Phosphate and provided executive oversight for the corporate procurement organization from June 2016 until January 1, 2019, as Senior Vice President - Potash Operations from May 2012 to June 2016, and before that he led the Environment, Health and Safety (“EHS”) organization since joining Mosaic in 2009. Prior to joining Mosaic, Mr. Precourt was employed by cement and mineral component producer Holcim (U.S.) where he initially led its safety transformation and later became Vice President of Environment and Government Affairs. Mr. Precourt started his career at The Dow Chemical Company where he served in a variety of roles in Operations, Technology, Capital Project Management and Environmental, Health and Safety. Mr. Precourt served as a director and was the past Chairman of the Board of the Saskatchewan Potash Producers Association and was a director of Fertilizer Canada.
Luciano Siani Pires. Mr. Siani Pires was elected as our Executive Vice President and Chief Financial Officer in January 2025 and previously elected as our Executive Vice President and Chief Financial Officer – Designate in November 2024. Mr. Siani Pires previously served on The Mosaic Company’s Board of Directors from 2018 to 2022. Prior to joining Mosaic, Mr. Siani Pires served as Executive Vice President of Strategy and Business Development, Chief Financial Officer and other strategic roles for Vale S.A., a global mining company. He also served as the chairman of the Board of Directors of VLI S.A., as a senior business development advisor for the Natural Resources Group of Accenture and was a consultant at McKinsey and Company and at various leadership roles in The Brazilian Development Bank in the areas of capital markets, export finance and infrastructure. He serves on the board of Vallourec Societe Anonime, has served as a member of the executive council of o9 solutions, as a member of the advisory board at Barbosa Mello, and as a board member of Suzano Papel e Celulose.
Karen A. Swager. Ms. Swager was elected our Executive Vice President - Operations in November 2023. In this role, Ms. Swager is responsible for the Company’s enterprise-wide operations, including the EHS organization and the North America Supply Chain organization. Ms. Swager had previously served as our Senior Vice President - Supply Chain, including executive oversite for the Procurement and corporate EHS teams, since April 1, 2020. From January 1, 2019 until her appointment as Senior Vice President - Supply Chain, she served as Senior Vice President - Potash. Previously, Ms. Swager held leadership positions at Mosaic, including Vice President - Minerals, Vice President - Mining Operations and General Manager in our Phosphate business. She also led the mine planning and strategy group for the Phosphate business. Ms. Swager serves as director of SSR Mining Inc., a publicly traded company.
Yijun (“Jenny”) Wang. Ms. Wang was elected Executive Vice President - Commercial in January 2024 after serving as the Company’s Senior Vice President - Global Strategic Marketing since May 2023. From January 2022 until May 2023, Ms. Wang served as our Senior Vice President - Global Strategic Marketing, Head of China and India. From October 15, 2020 until her current appointment, Ms. Wang served as Vice President - Global Strategic Marketing. Prior to October 2020, Ms. Wang served as Vice President - Global Product Management and International Distribution and before May 2019, Ms. Wang served as Country Head for China. Ms. Wang serves on the Board of Directors of Canpotex Limited, the Canadian potash marketing association.
Our executive officers are generally elected to serve until their respective successors are elected and qualified or until their earlier death, resignation or removal. No “family relationships,” as that term is defined in Item 401(d) of Regulation S-K, exist among any of the listed officers or between any such officer and any member of our Board of Directors.
Item 1A. Risk Factors.
Our business, financial condition or results of operations could be materially adversely affected by any of the risks and uncertainties described below.
Operational Risks
Our operating results are highly dependent upon and fluctuate based upon business, economic and other conditions and governmental policies affecting the agricultural industry in which we or our customers operate. These factors are outside of our control and may significantly affect our profitability.
The most important factors are:
•weather and field conditions (particularly during periods of traditionally high crop nutrients application);
•quantities of crop nutrients imported and exported;
•current and projected inventories and prices, which are heavily influenced by U.S. exports and world-wide markets; and
•governmental policies, including farm and biofuel policies, which may directly or indirectly influence the number of acres planted, the level of inventories, the mix of crops planted or crop prices or otherwise negatively affect our operating results.
International market conditions and the effects of countervailing duty orders, which are also outside of our control, may also significantly influence our operating results. The international market for crop nutrients is influenced by such factors as the relative value of the U.S. dollar and its impact upon the cost of importing crop nutrients, foreign agricultural policies, including subsidy policies, the existence of, or changes in, import or foreign currency exchange barriers in certain foreign markets, changes in the hard currency demands of certain countries and other regulatory policies of foreign governments, as well as the laws and policies of the U.S. affecting foreign trade and investment, including use of tariffs.
In 2021, the U.S. Department of Commerce (“DOC”) issued countervailing duty (“CVD”) orders on imports of phosphate fertilizers from Morocco and Russia, in response to petitions filed by Mosaic. The orders were based on DOC’s determination that the imports were unfairly subsidized, and the U.S. International Trade Commission’s (“ITC”) determination that the imports materially injured the U.S. phosphate fertilizer industry. The purpose of the CVD orders was to remedy the injury and thereby restore fair competition. CVD orders normally stay in place for at least five years, with possible extensions.
Moroccan and Russian producers initiated federal court actions seeking to overturn the orders. Mosaic also made claims contesting certain aspects of DOC’s final determinations that, we believe, failed to capture the full extent of Moroccan and Russian subsidies. These litigation challenges remain underway as further described in Item 3 of this Form 10-K.
The applicable final CVD assessment rates and cash deposit rates for imports of phosphate fertilizer from Morocco and Russia could change as a result of these various proceedings and potential associated appeals, whether in federal courts or at the World Trade Organization. A reversal of, or change in, the ITC’s or DOC’s prior determination in the CVD investigations could have an adverse effect on our business, financial condition or operating results.
U.S. tariffs on Canadian potash and retaliatory tariffs could materially adversely affect our business operations and financial condition.
In February 2025, the U.S. imposed a 25% tariff on most imports from Canada, including potash crop nutrients. This tariff went into effect on March 4, 2025, but beginning March 7, 2025, the U.S. exempted from this tariff goods that qualify as wholly originating in Canada under the United States‑Mexico‑Canada Agreement, including potash from Mosaic’s Canadian operations. The U.S. continues to assess the imposition of tariffs on Canadian potash. There is a risk that such tariffs may be imposed and sustained for an extended period. If tariffs are reintroduced, they could significantly increase the cost of importing potash from Canada. Higher potash prices may lead to reduced usage by U.S. farmers and negatively impact demand. Additionally, retaliatory tariffs imposed by Canada on U.S. exports could further exacerbate these challenges. The prolonged imposition of these tariffs could have a material adverse effect on our business, financial condition and results of operations.
Unfavorable worldwide economic and market conditions could adversely affect our business, financial condition or operating results.
Economic and market conditions, including inflation, supply chain challenges, high interest rates and foreign exchange volatility, have and may continue to have an impact on our business. Our production costs have increased due to higher prices for raw materials, including purchased nitrogen, sulfur and ammonia, as well as supply chain challenges, including increased costs and delays caused by transportation and labor shortages. These adverse economic events have adversely affected, and may continue to adversely affect, our operating results.
Our crop nutrient business is seasonal and varies based on application rates, which may result in carrying significant amounts of inventory and seasonal variations in working capital, and our inability to predict future seasonal crop nutrient demand accurately may result in excess inventory or product shortages.
The use of crop nutrients is seasonal and varies based on application rates. Farmers tend to apply crop nutrients during two short application periods, the strongest one in the spring, before planting, and the other in the fall, after harvest. As a result, the strongest demand for our products typically occurs during the spring planting season, with a second period of strong demand following the fall harvest. In contrast, we generally produce our products throughout the year. As a result, we and our customers generally build inventories during the low demand periods of the year in order to provide timely product availability during the peak sales seasons. The seasonality of crop nutrient demand results in our sales volumes and net sales typically being the highest during the North American spring season and our working capital requirements typically being the highest just prior to the start of the spring season. Our quarterly financial results can vary significantly from one year to the next due to weather-related shifts in planting schedules and purchasing patterns.
If seasonal demand exceeds our projections, we will not have enough product, which would limit our profitability. If seasonal demand is less than we expect, we will have excess inventory and higher working capital and liquidity requirements. The degree of seasonality of our business can change significantly from year to year due to conditions in the agricultural industry and other factors.
Changes in transportation costs can affect our sales volumes and selling prices.
Delivery costs are a significant factor in the total cost to customers. As a result, changes in transportation costs, or in customer expectations about them, may adversely affect our sales volumes and prices.
A disruption at our production, distribution or terminaling facilities could have a material adverse impact on our business. The risk of material disruption increases when demand for our products results in high operating rates at our facilities.
We conduct our operations through a limited number of key production, distribution and terminaling facilities. These facilities include our phosphate mines and concentrates plants; our potash mines; and the ports and other distribution facilities through which we, Canpotex and the other joint ventures in which we participate, conduct our respective businesses, as well as other commercial arrangements with third parties.
Any disruption of operations at any of these facilities may significantly negatively affect our production or our ability to distribute our products.
Examples of the types of events that could result, and have, in the past, resulted, in a disruption at these facilities include: adverse weather; strikes or other work stoppages; civil unrest; deliberate, malicious acts, including acts of terrorism and armed conflict; political or economic instability; cyberattacks; changes in permitting, financial assurance or certain environmental, health and safety laws or other changes in the regulatory environment in which we operate; legal and regulatory proceedings; our relationships with the other member of Canpotex and the other joint ventures in which we participate and their or our exit from participation in such joint ventures; other changes in our commercial arrangements with unrelated third parties; brine inflows at our Esterhazy, Saskatchewan mine or our other shaft mines; mechanical failure and accidents or other failures occurring in the course of operating activities, including at our gypstacks, clay settling areas and tailing dams and mine shafts; accidents occurring in the course of operating activities; lack of truck, rail, barge or ship transportation; and other factors.
Reduced oil refinery operating rates in North America could have a material adverse impact on our business, financial condition or operating results.
Reduced oil refinery operating rates in the U.S. and Canada could result, and have, in the past, resulted in decreased availability of molten sulfur, which could increase costs of sulfur procurement or decrease availability of sulfur needed in our phosphate fertilizer production operations. If it becomes necessary to procure sulfur at higher costs, and if we are unable to pass those costs on in our product prices, or if we are unable to procure sulfur at volumes necessary for our operations, such events could have a material adverse effect on our phosphate business, and/or our financial condition or operating results.
Key inputs for the production of our finished goods, including fertilizer, sulfur and ammonia, and energy used in our businesses in the past have been and may in the future be the subject of volatile pricing and availability. Changes in the price or availability of these key inputs for production of finished goods have had, and could again have, a material adverse impact on our businesses.
Fertilizer is a key input for production of our blended finished goods products. Natural gas, ammonia and sulfur are key raw materials used in the manufacture of phosphate crop nutrient products. Natural gas is used as both a chemical feedstock and a fuel to produce anhydrous ammonia, which is a raw material used in the production of concentrated phosphate products. Natural gas is also a significant energy source used in the potash solution mining process. From time to time, our profitability has been and may in the future be adversely impacted by the price and availability of these key inputs and other energy costs. For example, the ongoing conflict between Russia and Ukraine and the related sanctions have led, and may continue to lead, to disruption and instability in global markets, supply chains and volatile pricing and availability of these key inputs and raw materials. Because most of our products are commodities, there can be no assurance that we will be able to pass through increased costs to our customers. A significant increase in the price of fertilizer, natural gas, ammonia, sulfur or energy that is not recovered through an increase in the price of our related crop nutrients products could have a material adverse impact on our business.
We are subject to risks associated with our international sales and operations, which could negatively affect our sales to customers in foreign countries as well as our operations and assets in foreign countries. Some of these factors may also make it less attractive to distribute cash generated by our operations outside the U.S. to our stockholders, or to utilize cash generated by our operations in one country to fund our operations or repayments of indebtedness in another country or to support other corporate purposes.
In 2025, we derived approximately 64% of our net sales from customers located outside of the U.S. As a result, we are subject to numerous risks and uncertainties relating to international sales and operations, including:
•difficulties and costs associated with complying with a wide variety of complex laws, treaties and regulations;
•unpredictable changes in regulatory environments;
•increased government regulation of the economy in the countries we serve;
•political and economic instability, inflation and adverse economic conditions resulting from governmental attempts to reduce inflation, such as imposition of higher interest rates and wage and price controls;
•unpredictable tax audit practices of various governments;
•nationalization of properties by foreign governments;
•the imposition of tariffs, exchange controls, trade barriers or other restrictions, or government-imposed increases in the cost of resources and materials necessary for the conduct of our operations or the completion of strategic initiatives, including with respect to our joint ventures; and
•currency exchange rate fluctuations between the U.S. dollar and foreign currencies, particularly the Brazilian real and the Canadian dollar.
The occurrence of any of the above in the countries in which we operate or elsewhere could jeopardize or affect our ability to transact business there and could adversely affect our revenues and operating results and the value of our assets located outside of the U.S.
In addition, tax regulations and tax audit practices, currency exchange controls and other restrictions may also make it economically unattractive to:
•distribute cash generated by our operations outside the U.S. to our stockholders; or
•utilize cash generated by our operations in one country to fund our operations or repayments of indebtedness in another country or to support other corporate purposes.
Our assets outside of North America are located in countries with volatile conditions, which could subject us and our assets to significant risks.
We are a global business with substantial assets located outside of North America. Our operations in Brazil, China, India and Paraguay are fundamental to our business. We have a majority interest in the joint venture entity operating the Miski Mayo Mine that supplies phosphate rock to us. Volatile economic, market and political conditions may have a negative impact on our operations, operating results and financial condition. In addition, unfavorable changes in trade protection laws, policies and measures, or governmental actions and policies and other regulatory requirements affecting trade and the pricing and sourcing of our raw materials, may also have a negative impact on our operations, operating results and financial condition.
Natural resource extraction is an important part of the economy in Peru and, in the past, there have been protests against other natural resource operations in Peru. There remain numerous social conflicts that exist within the natural resource extraction sector in Peru, and there is potential for active protests against natural resource extraction companies. If the Government of Peru’s proactive efforts to address the social and environmental issues surrounding natural resource activities are not successful, protests could extend to or impact the Miski Mayo Mine and adversely affect our interest in the Miski Mayo joint venture or the supply of phosphate rock to us from the mine.
Adverse weather conditions, including hurricanes, and excess heat, cold, snow, rainfall and drought, have in the past, and may in the future, adversely affect our operations, and result in increased costs, decreased sales or production and potential liabilities.
Adverse weather conditions have in the past and may in the future adversely affect our operations, particularly our Phosphate operations. In the past, hurricanes have resulted in physical damage to and outages at our facilities in Florida and Louisiana.
Additionally, water treatment costs tend to increase significantly following excess rainfall. Some of our Florida and Louisiana facilities have had, and others could have, high water levels that have required, or may require, treatment. High water balances in the past at phosphate facilities in Florida also led the Florida Department of Environmental Protection (“FDEP”) to adopt rules requiring phosphate production facilities to meet more stringent process water management objectives for phosphogypsum stack systems. In addition to the FDEP, the U.S. Environmental Protection Agency (“EPA”) and the Louisiana Department of Environmental Quality also have similar requirements for water management objectives as outlined in our U.S. Resource Conservation and Recovery Act (“RCRA”) Consent Decrees.
If adverse weather conditions occur, as they have in the past, our facilities may be required to take additional measures to manage process water to comply with existing or future requirements and these measures could potentially have a material effect on our business and financial condition.
Adverse weather conditions may also cause a loss of production and may disrupt our supply chain or adversely affect delivery of our products to our customers. For example, oil refineries that supply sulfur to us may suspend operations as a result of a hurricane, and incoming shipments of ammonia can be delayed, disrupting production at our Florida or Louisiana facilities and delivery of our products. In 2021, we experienced production impacts related to Hurricane Ida at our Louisiana operations.
We also experienced down time and delayed shipments caused by impacts from Hurricane Ian which occurred in 2022. In 2024, we experienced production and distribution impacts related to Hurricanes Francine, Helene and Milton.
Excess rainfall and drought have in the past, and may in the future, adversely affect us. For example, in 2019 we experienced the wettest year in North America in nearly 50 years, which reduced fertilizer applications by farmers. Excess rainfall also resulted in higher river levels which adversely affected delivery of our products. Drought can reduce farmers’ crop yields and the uptake of phosphate and potash, reducing the need for application of additional phosphate and potash for the next planting season. Drought can also lower river levels, adversely affecting delivery of our products to our customers. For example, the Mississippi River was in drought condition for parts of 2022 and 2023, affecting barge movement on the river.
Climate change could adversely affect us.
The impacts of climate change on our operations and those of our customers remains uncertain. The impacts of climate change could include changes in rainfall patterns, water shortages, changing sea levels, changing storm patterns and intensities, and changing temperature levels, and these changes could be severe. These impacts could vary by geographic location. Severe climate change could impact our costs and operating activities, the location and cost of global grain and oilseed production, and the supply and demand for grains and oilseeds. A number of our sites are located in areas that are exposed to weather events and have been adversely impacted by hurricanes and excessive rainfall as described elsewhere in these risk factors. To the extent climate change exacerbates these weather events, our operations could experience increased costs and disruptions to our business, which could be material. At the present time, we cannot predict the prospective impacts of climate change on our results of operations, liquidity or capital resources, or whether any such effects could be material to us.
We do not own a controlling equity interest in our non-consolidated companies, some of which are foreign companies, and therefore our operating results and cash flow may be materially affected by how the governing boards and majority owners operate such businesses. There may also be limitations on monetary distributions from these companies that are outside of our control. Together, these factors may lower our equity earnings or cash flow from such businesses and negatively impact our results of operations.
We hold minority ownership interests in other companies that are not controlled by us. The operations and results of Ma’aden and some other companies are significant to us, and their operations can affect earnings. Because we do not control these companies either at the board or stockholder levels and because local laws in foreign jurisdictions and contractual obligations may place restrictions on monetary distributions by these companies, we cannot ensure that these companies will operate efficiently, pay dividends or generally follow the desires of our management by virtue of our board or stockholder representation. As a result, these companies may contribute less than anticipated to our earnings and cash flow, negatively impacting our results of operations and liquidity. In addition, our investment in Ma’aden is subject to stock‑market volatility, and declines in the market value of its publicly traded shares could reduce the value of our investment and negatively impact our results of operations and liquidity.
Strikes or other forms of work stoppage or slowdown could disrupt our business and lead to increased costs.
Our financial performance is dependent on a reliable and productive work force. A significant portion of our workforce, and that of the joint ventures in which we participate, is covered by collective bargaining agreements with unions. Unsuccessful contract negotiations or adverse labor relations could result in strikes or slowdowns. Any disruption may decrease our production and sales or impose additional costs to resolve disputes. The risk of adverse labor relations may increase as our profitability increases because labor unions’ expectations and demands generally rise at those times.
Our underground potash shaft mines are subject to risks of water inflows.
Over the past century, several potash mines experiencing water inflow problems have flooded. Since December 1985, we have had inflows of brine water into our Esterhazy, Saskatchewan K1 and K2 potash mines. Due to an acceleration of brine inflows, on June 4, 2021, the Company announced a closure of our K1 and K2 potash mine shafts. Our potash mines at Colonsay, Saskatchewan, Carlsbad, New Mexico and our Esterhazy, Saskatchewan K3 mine (though not contiguous with the K1/K2 underground inflow region) are also subject to risks from inflow. Though minor inflows are regularly managed, it is possible that significant water inflows could occur which may present risks to our employees and our operations, and which may require us to incur brine management costs, change our mining processes, or abandon our operating mines.
See “Key Factors that can Affect Results of Operations and Financial Condition” and “Potash Net Sales and Gross Margin” sections of our Management’s Analysis in this Form 10-K.
Accidents or equipment failures occurring in the course of our operating activities could result in significant liabilities, interruptions or shutdowns of facilities or the need for significant safety or other expenditures.
We engage in mining and industrial activities, including rail transportation, that can result in serious accidents or experience equipment failures. If our procedures are not effective, or if an accident or equipment failure were to occur, we could be subject to liabilities arising out of property damage, personal injuries or death, our operations could be interrupted and we might have to shut down or abandon affected facilities. Accidents could cause us to expend significant amounts to remediate safety issues or to repair damaged facilities and could result in significant liabilities and/or impact on the financial performance of the Company, including material adverse effects on our results of operations, liquidity or financial condition. For example:
•Some of our facilities are subject to potential damage from seismic activity or other geologic concerns.
Mining activities in some parts of the world can result in potential seismic events or can increase the likelihood or potential severity of a seismic event. Our Esterhazy mine and Louisiana facilities have experienced minor seismic events from time to time. A significant seismic event at one our facilities or mines could result in serious injuries or death, or damage to or flooding of operations, or damage to adjoining properties or facilities of unrelated third parties. Geologic features may affect the integrity of our impoundments, particularly in central Florida. Our efforts to deploy new technologies to identify and repair features to mitigate impacts and risk may not be successful, adversely impacting our operations or could cause us to incur significant costs.
•Our underground potash shaft mines are subject to risk from fire. In addition, fire at one of our underground shaft mines could halt our operations at the affected mine or for longer periods for remedial work or otherwise.
Our underground potash shaft mines are subject to risk from fire. In the event of a fire, if our emergency procedures are not successful, we could have significant injuries or deaths, or shutdowns of our facilities, or could cause us to expend significant amounts to remediate safety issues or repair damaged facilities.
•We handle significant quantities of ammonia at several of our facilities.
We produce ammonia at our Faustina, Louisiana phosphate concentrates plant, use ammonia in significant quantities at all of our Florida and Louisiana phosphates concentrates plants and store ammonia at some of our distribution facilities. In Florida, ammonia is received at coastal terminals around Tampa and transported by pipelines and trucks to our facilities. We also use ammonia in our Brazil phosphate operations. Our ammonia is generally stored and transported at high pressures or cryogenically. Accidents at any of our ammonia facilities could result in serious injury or death and could adversely impact our operations.
•We also use or produce other hazardous chemicals at some of our facilities. If our safety procedures are not effective, an accident involving these other hazardous chemicals could result in serious injuries or death, or result in the shutdown of our facilities.
We use sulfuric acid to produce concentrated phosphate in our Florida and Louisiana operations and our Brazil operations. We also use or produce other hazardous chemicals at some of our facilities. An accident involving any of these chemicals could result in serious injuries or death, or evacuation of areas near an accident. An accident could also result in property damage or shutdown of our facilities, or cause us to expend significant amounts to remediate safety issues or to repair damaged facilities.
Our business operations rely on our information systems and any material disruption or slowdown of our systems could cause operational delays or loss of revenue.
We depend on information systems to, among other things, manage our inventory, process transactions, operate our websites, purchase and ship goods on a timely basis, and maintain cost-effective operations. We have invested significant capital associated with the implementation and integration of our information technology systems across our businesses. This process involves the replacement and consolidation of technology platforms, resulting in operational efficiencies and reduced costs.
Our inability to effectively implement or convert our operations to the new systems could cause delays in product fulfillment and reduced efficiency in our operations and could have a material impact on our financial condition or operating results.
A shortage or unavailability of trucks, railcars, tugs, barges and ships for carrying our products and the raw materials we use in our business could result in customer dissatisfaction, loss of production or sales and higher transportation or equipment costs.
We rely heavily upon truck, rail, tug, barge and ocean freight transportation to move raw materials needed at our mines and concentrates facilities and to deliver our products to our customers. In addition, the cost of transportation is an important part of the final sale price of our products. Finding affordable and dependable transportation is important in obtaining our raw materials and to supply our customers. Higher costs for these transportation services or an interruption or slowdown due to factors including high demand, high fuel prices, labor disputes, layoffs or other factors affecting the availability of qualified transportation workers, adverse weather or other environmental events, or changes to rail, barge or ocean freight systems, could negatively affect our ability to produce our products or deliver them to our customers, which could affect our performance and results of operations.
Strong demand for grain and other products and a strong world economy increases the demand for and reduces the availability of transportation assets, both domestically and internationally. Shortages of railcars, barges and ocean transport for carrying product and increased transit time may result in customer dissatisfaction, loss of sales and higher equipment and transportation costs. In addition, during periods when the shipping industry has a shortage of ships, the substantial time needed to build new ships prevents rapid market response. Delays and missed shipments due to transportation shortages, including vessels, barges, railcars and trucks, could result in customer dissatisfaction or loss of sales potential, which could negatively affect our performance and results of operations.
Our success will continue to depend on our ability to attract and retain highly qualified and motivated employees.
Our continued success depends on the collective abilities and efforts of our employees. We compete for a talented workforce with other businesses, particularly within the mining and chemicals industries, in general, and the crop nutrients industry, in particular. Our expansion plans are highly dependent on our ability to attract, retain and train highly qualified and motivated employees who are essential to the success of our ongoing operations as well as to our expansion plans. If we were to be unsuccessful in attracting, retaining and training the employees we require, our ongoing operations and expansion plans could be materially and adversely affected.
Regulatory Risks
Environmental, health and safety regulations and requirements to which we are subject may have a material adverse effect on our business, financial condition and results of operations.
We are subject to numerous environmental, health and safety laws and regulations (“EHS laws”) in countries in which we operate. These EHS laws govern a wide range of matters, including environmental controls, land reclamation, discharges to air and water, remediation of hazardous substance releases and in some cases, demonstration of financial assurance. They significantly affect our operating activities as well as the level of our operating costs and capital expenditures. In some jurisdictions, environmental laws change frequently and it may be challenging for us to achieve and maintain compliance with all material environmental laws at all times. If we are not in compliance, we may be subject to enforcement or third-party claims, and may require new investment in our business. In those circumstances, our financial condition and results of operations may be materially adversely affected.
The U.S. Comprehensive Environmental Response, Compensation, and Liability Act (“CERCLA”) imposes liability, including for cleanup costs, without regard to fault or to the legality of a party’s conduct, on certain categories of persons, including current and former owners and operators of a site and parties who are considered to have contributed to the release of “hazardous substances” into the environment. Under CERCLA, or various U.S. state analogues, a party may, under certain circumstances, be required to bear more than its proportional share of cleanup costs at a site where it has liability if payments cannot be obtained from other responsible parties. We periodically have incurred and may incur liabilities and cleanup costs, under CERCLA and other environmental laws, with regard to our current or former facilities, adjacent or nearby third-party facilities or offsite disposal locations.
Our operations depend on having the required permits and approvals from governmental authorities. Denial or delay by a government agency in issuing any of our permits and approvals or imposition of restrictive conditions in those permits and approvals may impair our business and operations.
Our operations, including our mines, are dependent on having the required permits and approvals from governmental authorities. Denial or delay by a government agency in issuing, modifying or renewing any of our permits and approvals or imposition of restrictive or cost prohibitive conditions on us with respect to these permits and approvals may impair our business and operations and could have a material adverse effect on our business, financial condition or results of operations. For example, in Florida, local community involvement has become an increasingly important factor in the permitting process for mining companies, and various counties and other parties in Florida have in the past filed and continue to file lawsuits challenging the issuance or renewal of some of the permits we require. A recent federal court decision invalidated Florida’s assumption of the Clean Water Act Section 404 “dredge and fill” permitting program and returned that permitting authority to the federal agencies. While that decision is under appeal, the change in permitting authority may complicate and delay the receipt of 404 permit approvals.
We are, and may in the future be, involved in legal and regulatory proceedings that could be material to us.
We have in the past been, are currently, and in the future may be, subject to legal and regulatory proceedings that could be material to our business, results of operations, liquidity or financial condition. Joint ventures in which we participate could also become subject to these sorts of proceedings. These proceedings may be brought by the government or private parties and may arise out of a variety of matters, including:
•Allegations that we have violated environmental, health and safety laws and regulations or that we are responsible for adversely affecting nearby properties. We are currently involved in proceedings alleging that, or to review whether, we have violated environmental laws in the U.S. and Brazil.
•Allegations by private parties that our operations have resulted in personal injury, property damage or damage to business operations.
•Antitrust, commercial, tax (including tax audits) and other disputes.
The legal and regulatory proceedings to which we are currently or may in the future be subject may, depending on the circumstances, result in monetary damage awards, fines, penalties, other liabilities, injunctions or other court or administrative rulings that interrupt, impede or otherwise materially affect our business operations or criminal sanctions.
We have included additional information with respect to pending legal and regulatory proceedings in Note 23 of our Notes to Consolidated Financial Statements and in this Form 10-K in Part I, Item 3. “Legal Proceedings”.
Environmental, health and safety and food and crop laws and regulations to which we are subject may become more stringent over time. This could increase the effects on us of these laws and regulations, and the increased effects could be materially adverse to our business, operations, liquidity and/or results of operations.
Heightened regulation on food and crop inputs (including crop nutrients) and environmental, health and safety issues in countries in which we operate can be expected to result in requirements that apply to us and our operations that may be more stringent than those described elsewhere in this report. These requirements may include:
•Increased levels of future investments and expenditures for environmental controls at ongoing operations, which will be charged against income from future operations; increased levels of the financial assurance requirements to which we are subject, and increased efforts or costs to obtain permits or denial of permits.
•New or interpretations of existing statutes or regulations that impose new or more stringent standards, restrictions or liabilities related to elevated levels of naturally-occurring radiation that arise on formerly mined land and other matters that could increase our expenses, capital requirements or liabilities or adversely affect our business, liquidity or financial condition.
Environmental justice considerations could have a material adverse effect on our business, financial condition or results of operations.
Some state governments are adopting standards or policies requiring environmental justice reviews in some permitting actions. In general, they require governmental agencies to evaluate projects for disproportionate impacts to disadvantaged or already burdened communities. If such conditions are found, they might result in a permit denial, or restrictive or cost prohibitive conditions imposed on our operations and may impair our business and operations and could have a material adverse effect on our business, financial condition or results of operations.
We are subject to financial assurance requirements as part of our routine business operations. If we were unable to satisfy financial assurance requirements, we might not be able to obtain or maintain permits we need to operate our business as we have in the past. In addition, our compliance with these requirements could materially affect our business, results of operations or financial condition.
In many cases, as a condition to obtaining or maintaining permits and approvals or otherwise, we are required to comply with financial assurance requirements of governmental authorities. The purpose of these requirements is to provide comfort to the government that sufficient funds will be available for the ultimate closure, post-closure care or reclamation of our facilities.
In some cases, we comply through the satisfaction of applicable state financial strength tests; but if we are unable to do so, we must utilize alternative methods of complying with these requirements; if we do not, we would be prevented from continuing our operations and also could be subject to enforcement proceedings brought by relevant government agencies. Alternative compliance methods include providing credit support in the form of cash escrows or trusts, surety bonds from surety or insurance companies, letters of credit from banks, or other forms of financial instruments or collateral to satisfy the financial assurance requirements. Use of alternative means of financial assurance imposes additional expense on us and could affect our liquidity.
We have included additional discussion about financial assurance requirements under “Off-Balance Sheet Arrangements and Obligations–Other Commercial Commitments” in our Management’s Analysis.
Regulatory restrictions on greenhouse gas emissions and climate change regulations in the U.S., Canada or elsewhere could adversely affect us, and these effects could be material.
Various governmental initiatives to limit greenhouse gas emissions are under way or under consideration around the world. These initiatives could restrict our operating activities, require us to make changes in our operating activities that would increase our operating costs, reduce our efficiency or limit our output, require us to make capital improvements to our facilities, increase our energy, raw material and transportation costs or limit their availability, or otherwise adversely affect our results of operations, liquidity or capital resources, and these effects could be material to us.
Governmental greenhouse gas emission initiatives include, among others, the December 2015 agreement (the “Paris Agreement”) which was the outcome of the 21st session of the Conference of the Parties under the United Nations Framework Convention on Climate Change (“UNFCCC”). The Paris Agreement, which was signed by nearly 200 nations, including the U.S. and Canada, entered into force in late 2016 and sets out a goal of limiting the average rise in temperatures for this century to below 2 degrees Celsius. Each signatory is expected to develop its own plan (referred to as a Nationally Determined Contribution, or “NDC”) for reaching that goal. The U.S. withdrew from the Paris Agreement in January 2025.
Various legislative or regulatory initiatives relating to greenhouse gases have been adopted or considered by the U.S. Congress, the EPA or various states and those initiatives already adopted may be used to implement a U.S. NDC. Additionally, in the future, more stringent laws and regulations may be enacted to accomplish the goals set out in the NDC.
Brazil ratified the Paris Agreement in September 2016, committing to an NDC that includes economy-wide greenhouse gas reduction targets by 2035. The NDC further commits to achieving climate neutrality in 2060. Complete details surrounding Brazil’s plan for achieving the greenhouse gas emissions reductions and climate neutrality are uncertain. The government of Brazil may intervene with new or different policy instruments to meet the goals set out in the 2024 NDC.
Canada’s intended NDC aims to achieve significant greenhouse gas emissions reductions. The Canadian federal government has also introduced legislation establishing a long-term target of “net-zero” greenhouse gas emissions by 2050. More stringent laws and regulations may be enacted to accomplish the goals set out in Canada’s NDC and Canada’s own long-term emissions reduction targets.
In March 2024, the SEC issued final rules on climate-related disclosures that would require disclosure of extensive detailed climate-related information by domestic and foreign registrants. Following legal challenges consolidated in the U.S. Court of Appeals for the Eighth Circuit, the SEC issued a voluntary stay of the climate rules. In March 2025, the SEC announced that it would end its defense of the climate-related disclosures. In September 2025, the Eight Circuit continued to hold the litigation in abeyance, pending definitive action by the SEC on the climate rules. The Company is monitoring the SEC’s climate-related disclosure standards and recently enacted standards in the European Union and California on climate change disclosure and is taking necessary steps to plan for the anticipated or adopted disclosure requirements. It is possible that such legislation and other future legislation or regulation addressing climate change, including the Paris Agreement or any new international agreements, could adversely affect our operating activities, energy, raw material and transportation costs, results of operations, liquidity or capital resources, and these effects could be material or adversely impact our competitive advantage. In addition, to the extent climate change restrictions imposed in countries where our competitors operate such as India, China, Russia, Belarus or Morocco are less stringent than in the U.S., Canada or Brazil, our competitors could gain cost or other competitive advantages over us.
We use tailings, sediments and water dams and other impoundments to manage residual materials generated by our facilities, including Brazilian mining operations. If our safety procedures are not effective, an accident involving these impoundments could result in serious injuries or death, damage to property or the environment, or result in the shutdown of our facilities, any of which could materially adversely affect our results of operations.
Mining and processing of potash and phosphate generate residual materials that must be managed both during the operation of the facility and upon facility closure. Potash tailings, consisting primarily of salt and clay, are stored in surface disposal sites. Phosphate residuals from mining or processing are deposited in tailings dams or clay settling areas and phosphogypsum stacks. Mosaic manages its structures in accordance with legal requirements and is implementing actions to be aligned with the major principles from the Global Industry Standard on Tailings Management – GISTM (established in 2020 by the ICMM – International Council of Metals and Mining, the UN environment program and the PRI – Principles of Responsible Investment). The failure of or a breach at any of our impoundments at any of our operations could cause severe property and environmental damage and loss of life, could result in the shut down or idling of our facilities and could have a material adverse effect on our results of operations.
Competitive Risks
Our competitive position could be adversely affected if we are unable to participate in continuing industry consolidation.
Most of our commodity products are readily available from a number of competitors, and price and other competition in the crop nutrient industry is intense. In addition, crop nutrient production facilities and distribution activities frequently benefit from economies of scale. As a result, particularly during pronounced cyclical troughs, the crop nutrient industry has a long history of consolidation. Mosaic itself is the result of a number of industry consolidations. We expect consolidation among crop nutrient producers to continue. Our competitive position could suffer to the extent we are not able to expand our own resources either through consolidations, acquisitions, joint ventures or partnerships. In the future, we may not be able to find suitable companies to combine with, assets to purchase or joint venture or partnership opportunities to pursue. Even if we are able to locate desirable opportunities, we may not be able to enter into transactions on economically acceptable terms. If we do not successfully participate in continuing industry consolidation, our ability to compete successfully could be adversely affected and result in the loss of customers or an uncompetitive cost structure, which could adversely affect our sales and profitability.
Our most important products are global commodities, and we face intense global competition from other crop nutrient producers that can affect our prices and volumes.
Our most important products are concentrated phosphate crop nutrients, including diammonium phosphate, or DAP, monoammonium phosphate, or MAP, MicroEssentials® and muriate of potash, or MOP. We sell most of our DAP, MAP and MOP as global commodities. Our sales of these products face intense global competition from other crop nutrient producers.
Changes in competitors’ production or shifts in their marketing focus have in the past significantly affected both the prices at which we sell our products and the volumes that we sell, and are likely to continue to do so in the future. Increases in the global supply of DAP, MAP and MOP or competitors’ increased sales into regions in which we have significant sales could adversely affect our prices and volumes.
Competitors and new entrants in the markets for both concentrated phosphate crop nutrients and potash have in recent years expanded capacity, or begun, or announced plans, to expand capacity or build new facilities. The extent to which current global or local economic and financial conditions, changes in global or local economic and financial conditions, or other factors may cause delays or cancellation of some of these ongoing or planned projects, or result in the acceleration of existing or new projects, is unclear. In addition, certain of our products sold to China may be subject to additional tariffs due to ongoing trade tensions between China and the U.S. The level of exports by Chinese producers of concentrated phosphate crop nutrients depends to a significant extent on Chinese government actions to curb exports through, among other measures, prohibitive export taxes at times when the government believes it desirable to assure ample domestic supplies of concentrated phosphate crop nutrients to stimulate grain and oilseed production.
The other member of Canpotex is among our competitors who may, in the future, independently expand its potash production capacity at a time when each Canpotex member’s respective shares of Canpotex sales is based upon that member’s respective proven peaking capacity for producing potash. When a Canpotex member expands its production capacity, the new capacity is added to that member’s proven peaking capacity based on a proving run at the maximum production level. Alternatively, Canpotex members may elect to rely on an independent engineering firm and approved protocols to calculate their proven peaking capacity. Antitrust and competition laws prohibit the members of Canpotex from coordinating their production decisions, including the timing of their respective proving runs. Worldwide potash production levels could exceed then-current market demand, resulting in an oversupply of potash and lower potash prices.
All of the foregoing events are beyond our control. The effects of any of these events occurring could be materially adverse to our results of operations.
Some of our competitors and potential competitors have greater resources than we do, which may place us at a competitive disadvantage and adversely affect our sales and profitability. These competitors include state-owned and government-subsidized entities in other countries.
We compete with a number of producers throughout the world, including state-owned and government-subsidized entities. Some have greater total resources than we do, and may be less dependent on earnings from crop nutrients sales than we are. In addition, some of these entities have access to lower cost or government-subsidized natural gas supplies, mining rights and reserves, financing, transportation and tax incentives, placing us at a competitive disadvantage. Furthermore, certain governments as owners of some of our competitors may be willing to accept lower prices and profitability on their products in order to support domestic employment or other political or social goals. To the extent other producers of crop nutrients enjoy competitive advantages or are willing to accept lower profit levels, the price of our products, our sales volumes and our profits may be adversely affected.
Industry Risks
Future product or technological innovation could affect our business.
Future product or technological innovations by third parties, such as the development of seeds that require less crop nutrients, the development of substitutes for our products or developments in the application of crop nutrients, if they occur, could have the potential to adversely affect the demand for our products and our results of operations, liquidity and capital resources.
The success of our strategic initiatives depends on our ability to effectively manage them, and to successfully integrate and grow acquired businesses.
We have significant ongoing strategic initiatives. They involve capital and other expenditures and require effective project management and, in the case of potential strategic acquisitions, successful integration. To the extent the processes we (or, for our joint venture, we together with our joint venture partners) put in place to manage these initiatives or integrate and grow acquired businesses are not effective, our capital expenditure and other costs may exceed our expectations or the benefits we expect from these initiatives might not be fully realized, or both, thereby resulting in adverse effects on our operating results and financial condition.
Cyberattacks could disrupt our operations and have a material adverse impact on our business.
We utilize and rely upon information technology systems in many aspects of our business, including internal and external communications and the management of our accounting, financial, production and supply chain functions. As we become more dependent on information technologies to conduct our operations, and as the number and sophistication of cyberattacks increase, the risks associated with cybersecurity increase.
These risks apply to us, our employees, and to third parties on whose systems we rely to conduct our business. To our knowledge, we have not experienced any material cybersecurity incidents of our technology systems. Failure to effectively anticipate, prevent, detect and recover from the increasing number and sophistication of cyberattacks could result in theft, loss or misuse of, or damage or modification of our information, and cause disruptions or delays in our business, reputational damage and third-party claims, which could have a material adverse effect on our results of operations or financial condition.
Our crop nutrients and other products are subject to price and demand volatility resulting from periodic imbalances of supply and demand, which may cause our results of operations to fluctuate.
Historically, the market for crop nutrients has been cyclical, and prices and demand for our products have fluctuated significantly. Periods of high demand, increasing profits and high capacity utilization tend to lead to new plant investment and increased production in the industry. This growth increases supply until the market is over-saturated, leading to declining prices and declining capacity utilization until the cycle repeats.
As a result, crop nutrient prices and volumes have been, and are expected to continue to be, volatile. This volatility may cause our results of operations to fluctuate and potentially deteriorate. The price at which we sell our crop nutrient products and our sales volumes could fall in the event of industry oversupply conditions, which could have a material adverse effect on our business, financial condition and results of operations. In contrast, high prices may lead our customers and farmers to delay purchasing decisions in anticipation of future lower prices, thus impacting our sales volumes.
Due to reduced market demand, depressed agricultural economic conditions and other factors, we have at various times suspended or curtailed production at some of our facilities. The extent to which we utilize available capacity at our facilities will cause fluctuations in our results of operations, as we will incur costs for any temporary or indefinite shutdowns of our facilities. In addition, lower sales tend to lead to higher fixed costs as a percentage of sales.
Financial Risks
During periods when the prices for our products are falling because of falling raw material prices, we could be required to write-down the value of our inventories. Any such write-down could adversely affect our results of operations and the value of our assets.
We carry our inventories at net realizable value. In periods when the market prices for our products are falling rapidly, including in response to falling market prices for raw materials, we have in the past, and it is possible that in the future we could be required to write-down the value of our inventories if market prices fall below our costs. Any such write-down could adversely affect our results of operations and the value of our assets. Any such effect could be material.
Our estimates of future selling prices reflect in part the purchase commitments we have from our customers. As a result, defaults on these existing purchase commitments because of the global or local economic and financial conditions or for other reasons could adversely affect our estimates of future selling prices and require additional inventory write-downs.
We may incur significant non-cash charges if our goodwill or long-lived assets become impaired in the future.
Under accounting principles generally accepted in the U.S. (“GAAP”), we review goodwill for impairment on an annual basis or more frequently if events or circumstances indicate that their carrying value may not be recoverable. Other long-lived assets, including property, plant and equipment, are reviewed if events or circumstances indicate that their carrying value may not be recoverable. The process of impairment testing involves a number of judgments and estimates made by management, including the fair values of assets and liabilities, future cash flows, our interpretation of current economic indicators and market conditions, overall economic conditions and our strategic operational plans with regard to our business units. If the judgments and estimates used in our analysis are not realized or change due to external factors, then actual results may not be consistent with these judgments and estimates, and our goodwill and intangible assets may become impaired in future periods. If our goodwill or long-lived assets are determined to be impaired in the future, we may be required to record non-cash charges to earnings during the period in which the impairment is determined, which could be significant and have an adverse effect on our financial condition and results of operations. We have, in the past, and may in the future, be required to write down the value of our goodwill or other long-lived assets, and such future write downs could be material.
Changes in tax laws or regulations or their interpretation, or exposure to additional tax liabilities, could materially adversely affect our operating results and financial condition.
We are subject to taxes, including income taxes, resource taxes and royalties, and non-income based taxes in countries where we operate. Changes in tax laws or regulations or their interpretation could result in higher taxes, which could materially adversely affect our operating results and financial condition.
We are subject to periodic audits by various tax authorities in all countries where we have meaningful operations. The due process, audit and appeal practices and procedures of such authorities may vary significantly by jurisdiction, may be unpredictable (and unreliable) in nature and may result in significant risk to us. For various reasons, some governments may issue significant reassessments on audit based positions not fully grounded in law or fact, even though, upon disputing the reassessments, a great many are overturned on administrative appeal and through the court system. Certain systems involve tax litigation as a common practice. In certain countries, there are requirements to pay a reassessment (even though the matter has not been finally decided by the tax administration or a court of law) while the taxpayer has a well-supported objection and appeals administratively or in court. This may result in tying up significant funds and/or creating adverse treasury and credit risks that may interrupt, impede or otherwise materially affect our business operations.
Capital markets access, liquidity and credit ratings.
Our ability to fund operations, meet obligations, and pursue strategic initiatives depends on maintaining sufficient liquidity and access to capital markets. We rely on cash generated from operations, committed credit facilities, and debt financing. Adverse conditions in global credit markets, disruptions in banking systems, or a deterioration in our financial performance could limit our ability to obtain financing on acceptable terms or at all.
Our credit ratings significantly affect our cost of borrowing and access to financing. A downgrade by any major rating agency—whether due to industry conditions, commodity price volatility, or company-specific factors—could increase our borrowing costs and restrict access to credit markets.
If we are unable to maintain adequate liquidity or favorable credit ratings, we may be forced to reduce capital expenditures, delay strategic projects, or seek alternative financing under unfavorable terms. Any of these outcomes could materially and adversely affect our business, financial condition, and results of operations.
Our strategy for managing market and interest rate risk may not be effective.
Our businesses are affected by fluctuations in market prices for our products, the purchase price of key inputs to operations, freight and shipping costs, foreign currency exchange rates and interest rates. We periodically enter into derivatives and forward purchase contracts to mitigate some of these risks. However, our strategy may not be successful in minimizing our exposure to these fluctuations. See “Market Risk” in our Management’s Analysis and Note 15 of our Notes to Consolidated Financial Statements which sections are incorporated herein by reference.
We extend trade credit to our customers and guarantee the financing that some of our customers use to purchase our products. Our results of operations may be adversely affected if these customers are unable to repay the trade credit from us or financing from their banks. Increases in prices for crop nutrient, other agricultural inputs and grain may increase this risk.
We extend trade credit to our customers throughout the world, in some cases for extended periods of time. In Brazil, where there are fewer third-party financing sources available to farmers, we also have several programs under which we guarantee customers’ financing from financial institutions that they use to purchase our products. As our exposure to longer trade credit extends throughout the world and use of guarantees in Brazil increases, we are increasingly exposed to the risk that some of our customers will not pay us or the amounts we have guaranteed. Additionally, we become increasingly exposed to risk due to weather and crop growing conditions, fluctuations in crop nutrient prices, commodity prices or foreign currencies, and other factors that influence the price, supply and demand for agricultural commodities. Significant defaults by our customers, have in the past, and may in the future adversely affect our financial condition and results of operations.
Due to the global nature of our operations, we are exposed to currency exchange rate changes, which may cause fluctuations in earnings and cash flows.
Our primary foreign currency exposures are the Canadian dollar and Brazilian real. The functional currency for our Brazilian subsidiaries is the Brazilian real. However, we finance our Brazilian inventory purchases with U.S. dollar-denominated liabilities. The functional currency of several of our Canadian entities is the Canadian dollar.
For those entities, sales are primarily denominated in U.S. dollars, but the costs are paid principally in Canadian dollars. Canadian entities have significant U.S. dollar denominated intercompany loans and U.S. entities, with the U.S. dollar as functional currency, have Brazilian real denominated loans. During periods of local or global economic crises, local currencies may be devalued significantly against the U.S. dollar. During times of a strengthening dollar, our net earnings can be reduced due to transaction currency losses arising from these exposures of U.S. dollar denominated liabilities held in the Brazilian and Canadian entities and Brazilian real denominated assets held in U.S. entities. To reduce economic risk and volatility on expected cash flows that are denominated in the Canadian dollar and Brazilian real, we use financial instruments that may include forward contracts, options or collars when unable to naturally offset the exposures.
Item 1B. Unresolved Staff Comments.
None.
Item 1C. Cybersecurity.
Risk Management and Strategy
As a global company, we utilize and rely upon information technology systems in many aspects of our business, including internal and external communications and the management of our accounting, financial, production and supply chain functions. As we become more dependent on information technologies to conduct our operations, and as the number of cyberattacks increase and their sophistication evolves, the risks associated with cybersecurity also increase and evolve. Failure to effectively anticipate, prevent, detect and recover from the increasing number and sophistication of cyberattacks could have a material adverse effect on our results of operations or financial condition. To our knowledge, we have not experienced any material cybersecurity incidents of our technology systems.
Mosaic’s cybersecurity program is comprised of people, processes and technology that are designed to adequately protect the confidentiality, integrity and availability of information technology systems and data. Mosaic has strategically integrated cybersecurity risk management into our broader risk management framework to promote a company-wide culture of cybersecurity risk awareness. This integration ensures that cybersecurity considerations are an integral part of our decision-making processes at every level. We have a Governance Risk and Compliance team which is a dedicated team within the cybersecurity department that focuses on identifying and mitigating cybersecurity and compliance risk. The team works closely with the Operations Technology and Information Technology department to continuously evaluate and address cybersecurity risks in alignment with our business objectives and operational needs. As part of our third-party risk management program, we review risk ratings and control assessments of pertinent vendors and other third-parties. Our Enterprise Risk Management committee, which is comprised of members of our executive leadership team, reviews and evaluates key risks identified through cybersecurity risk management processes. Mosaic develops and continues to refine mitigation plans that adhere to industry best practices.
Regularly, Mosaic regularly engages external vendors to provide independent insight to overall cybersecurity program effectiveness and to assist with evaluating response preparedness.
Governance
Board of Director Oversight
The Board of Directors oversees Mosaic’s Enterprise Risk Management program, and the Audit Committee is tasked with oversight of risk from cybersecurity threats. The Board receives an annual cybersecurity update while the Audit Committee regularly receives reports from the Chief Information Security Officer (“CISO”) and Chief Information Officer (“CIO”). The reports to the Audit Committee include updates on key performance indicators and key risk indicators, including short-term, intermediate-term and emerging risks. The Audit Committee then briefs the Board on these matters. Ad hoc updates occur as needed.
Management’s Role in Managing Risk
The Information Technology organization is led by the CIO who is responsible for cybersecurity and risk management, with oversight by the Audit Committee. The cybersecurity program is overseen by the Mosaic’s CISO and supporting cybersecurity leadership, who lead teams to protect and preserve the confidentiality, integrity and continued availability of all information owned by, or in the care of, Mosaic. The CISO, along with the leadership team, possess many years of relevant information technology, cybersecurity and risk management experience in the manufacturing, electric, defense, financial and retail sectors.
Educational backgrounds include advanced degrees and certifications, such as Certified Information Systems Security Professional. During the course of leadership team’s careers, they have built and sustained programs protecting other Fortune 500 companies, critical national infrastructure and military defense systems.
The CIO and CISO regularly update the Board and/or the Audit Committee on cybersecurity matters and the effectiveness of the cybersecurity program. The Board and Audit Committee also engage directly with senior leaders from the Information Technology department.
Item 2. Properties.
SUMMARY OVERVIEW OF MINING
As used in this Form 10-K, the terms “mineral resource,” “measured mineral resource,” “indicated mineral resource,” “inferred mineral resource,” “mineral reserve,” “proven mineral reserve” and “probable mineral reserve” are defined and used in accordance with S-K 1300. All determinates of mineral resources and mineral reserves have been prepared by qualified persons. Under S-K 1300, mineral resources may not be classified as “mineral reserves” unless the determination has been made by a qualified person that the mineral resources can be the basis of an economically viable project. Mineral resources are not mineral reserves and do not meet the threshold for mineral reserve modifying factors, such as estimated economic viability, that would allow for conversion to mineral reserves. There is no certainty that any part of the mineral resources estimated will be converted into mineral reserves.
Except for that portion of mineral resources classified as mineral reserves, mineral resources have not demonstrated economic value. Inferred mineral resources are estimates based on limited geological evidence and sampling and have too high of a degree of uncertainty to apply relevant technical and economic factors likely to influence the prospects of economic extraction in a manner useful for evaluation of economic viability. Estimates of inferred mineral resources may not be converted to a mineral reserve. It cannot be assumed that all or any part of an inferred mineral resource will be upgraded to a higher category. A significant amount of exploration must be completed to determine whether an inferred mineral resource may be upgraded to a higher category. Therefore, you are cautioned not to assume that all or any part of an inferred mineral resource can be the basis of an economically viable project, or that it will be upgraded to a higher category.
Properties
The subsections below describe the property locations, overviews and mineral resource and mineral reserve estimates. Our material properties, as determined pursuant to S-K 1300, are Florida Phosphate, Esterhazy, Belle Plaine and Tapira. Further information about these properties can be found in the technical report summaries (“TRSs” or “TRS”) filed as exhibits to this Form 10-K.
Except as otherwise stated, the scientific and technical information relating to Florida Phosphate contained in this Form 10-K is derived from the 2022 S-K 1300 report for Florida Phosphate titled “Florida Phosphate Mining Technical Report Summary” effective December 31, 2022 prepared by employees of Mosaic. Except as otherwise stated, the scientific and technical information relating to Belle Plaine is derived from the 2024 S-K 1300 report titled “Belle Plaine Potash Facility Technical Report Summary” prepared by employees of Mosaic and the scientific and technical information relating to Esterhazy in this Form 10-K is derived from the 2025 S-K 1300 report titled “Esterhazy Potash Facility Technical Report Summary” effective December 31, 2025 prepared by employees of Mosaic.
Except as otherwise stated, the scientific and technical information relating to Tapira contained in this Form 10-K is derived from the 2023 S-K 1300 report for Tapira titled “SEC S-K 1300 Technical Report Summary Mosaic Fertilizantes: Complexo Mineração de Tapira” effective December 31, 2023 prepared by qualified persons who are employees of WSP USA Inc., which is not affiliated with Mosaic.
Except as otherwise stated, the mineral resource and reserve estimates are prepared by people who are qualified persons in accordance with subpart 1300 of Regulation S-K 1300 who are employees of the Company, and who have reviewed the mineral reserve estimates and mineral resource estimates and the material assumptions underlying the estimates and determined that the estimates and material assumptions remain current as of December 31, 2025.
Property Locations
Figure 2.1 and Figure 2.2 show the locations of each Resource and Reserve property.
Figure 2.1: North America Resource and Reserve Location Map
Figure 2.2: South America Resource and Reserve Location Map
Property Overview
Annual Production
Table 2.1 shows the production tonnage and grade for all phosphate properties for 2025, 2024 and 2023.
|
|
|
|
|
|
|
|
|
|
|
|
|
|
|
|
|
|
|
|
|
|
|
|
|
|
|
|
|
|
|
|
|
|
|
|
|
|
|
|
|
|
|
|
| Table 2.1 Summary of Production - Phosphate Properties |
|
|
|
|
|
| (in millions of tonnes) |
|
December 31, |
|
| Mine Property |
Annual Operational Capacity (tonnes)(a)(b) |
2025 |
|
|
2024 |
|
2023 |
|
| Production (tonnes) |
%P2O5(c) |
|
|
Production (tonnes) |
%P2O5(c) |
|
Production (tonnes) |
%P2O5(c) |
|
|
|
|
|
|
|
|
|
|
|
|
|
Phosphate (Grade: P2O5)(c) |
|
|
|
|
|
|
|
|
|
|
|
Florida(d) |
14.0 |
9.5 |
27.9 |
|
|
8.9 |
28.3 |
|
9.1 |
27.8 |
|
| Total United States |
14.0 |
9.5 |
27.9 |
|
|
8.9 |
28.3 |
|
9.1 |
27.8 |
|
Miski Mayo (e)(f) |
4.8 |
5.1 |
19.7 |
|
|
4.8 |
29.7 |
|
4.7 |
29.7 |
|
| Total Peru |
4.8 |
5.1 |
19.7 |
|
|
4.8 |
29.7 |
|
4.7 |
29.7 |
|
| Araxá / Patrocinio |
1.1 |
1.0 |
35.1 |
|
|
0.8 |
34.5 |
|
0.9 |
34.7 |
|
| Cajati |
0.5 |
0.5 |
34.0 |
|
|
0.4 |
34.3 |
|
0.3 |
33.7 |
|
| Catalão |
1.0 |
0.9 |
34.7 |
|
|
0.9 |
34.7 |
|
1.0 |
34.8 |
|
| Tapira |
2.0 |
1.8 |
34.9 |
|
|
1.8 |
35.0 |
|
1.7 |
35.2 |
|
| Total Brazil |
4.6 |
4.2 |
34.8 |
|
|
3.9 |
34.8 |
|
3.9 |
34.9 |
|
| Total Phosphate |
23.4 |
18.8 |
27.2 |
|
|
17.6 |
30.1 |
|
17.7 |
29.9 |
|
______________________________
(a)Annual operational capacity is the expected average long-term annual capacity for finished goods considering constraints represented by the grade, quality and quantity of the reserves being mined as well as equipment performance and other operational factors.
(b)Actual production varies from annual operational capacity shown in the above table due to factors that include, among others, the level of demand for our products, the quality of the reserves, the nature of the geologic formations we are mining at any particular time, maintenance and turnaround time, mechanical failure, weather conditions and other operating conditions.
(c)The percent of P2O5 represents a measure of the phosphate content in phosphate rock or a phosphate ore body. A higher percentage corresponds to a higher percentage of phosphate content in phosphate rock or a phosphate ore body.
(d)Excludes the South Pasture, Florida location which was temporarily idled August 2018 for an indefinite period of time. Annual operating capacity for this site was 3.2 million tonnes.
(e)We have a 75% economic interest in the Miski Mayo Mine and consolidate its results. Miski Mayo’s annual operating capacity and production tonnes are presented at 100% economic interest. These amounts are presented in wet tonnes based on average moisture levels of 3.0% to 5.0%. These quantities are the production of the drying plant.
(f)Higher ore grade and processing improvements allowed for improved metallurgical recovery resulting in higher production in 2025.
Table 2.2 shows the production tonnage and grade for the potash properties for 2025, 2024 and 2023.
|
|
|
|
|
|
|
|
|
|
|
|
|
|
|
|
|
|
|
|
|
|
|
|
|
|
|
|
|
|
|
|
|
|
|
|
|
|
|
| Table 2.2 Summary of Production - Potash Properties |
|
|
|
|
|
|
|
| (in millions of tonnes) |
|
|
|
December 31, |
| Facility |
Annualized Proven Peaking Capacity (tonnes)(a)(b) |
|
Annual Operational Capacity (tonnes) (b)(c)(d) |
|
2025 |
|
2024 |
|
2023 |
|
|
Ore Mined (tonnes) |
Grade % K2O(e) |
|
Ore Mined (tonnes) |
Grade % K2O(e) |
|
Ore Mined (tonnes) |
Grade % K2O(e) |
Belle Plaine – MOP(f) |
3.9 |
|
3.0 |
|
11.0 |
19.3 |
|
11.6 |
19.3 |
|
10.2 |
19.3 |
Esterhazy – MOP(g) |
6.3 |
|
6.3 |
|
15.5 |
21.9 |
|
15.6 |
22.2 |
|
14.1 |
23.4 |
Colonsay – MOP(h) |
2.6 |
|
1.5 |
|
2.5 |
25.4 |
|
1.8 |
26.5 |
|
1.8 |
25.6 |
| Total Canada |
12.8 |
|
10.8 |
|
29.0 |
21.2 |
|
29.0 |
21.3 |
|
26.1 |
21.9 |
Carlsbad – K-Mag®(i) |
0.9 |
|
0.7 |
|
1.7 |
6.8 |
|
2.3 |
6.6 |
|
2.3 |
6.7 |
| Total United States |
0.9 |
|
0.7 |
|
1.7 |
6.8 |
|
2.3 |
6.6 |
|
2.3 |
6.7 |
Taquari – MOP(j) |
— |
|
|
— |
|
|
1.5 |
16.7 |
|
1.7 |
16.4 |
|
1.9 |
14.7 |
| Total Brazil |
0.0 |
|
0.0 |
|
1.5 |
16.7 |
|
1.7 |
16.4 |
|
1.9 |
14.7 |
| Total Potash |
13.7 |
|
11.5 |
|
32.2 |
20.2 |
|
33.0 |
20.0 |
|
30.3 |
20.3 |
______________________________
(a)Represents full capacity based on 350 operating days per annum.
(b)Capacity is based on finished goods capacity, not ore mined. The annualized proven peaking capacity shown above is the capacity currently used to determine our share of Canpotex sales. Canpotex members’ respective shares of Canpotex sales are based upon the members’ respective proven peaking capacities for producing potash. When a Canpotex member expands its production capacity, the new capacity is added to that member’s proven peaking capacity based on a proving run at the maximum production level. Alternatively, after January 2017, Canpotex members may elect to rely on an independent engineering firm and approved protocols to calculate their proven peaking capacity. The annual operational capacity reported in the table above can exceed the annualized proven peaking capacity until the proving run has been completed.
(c)Annual operational capacity is the expected average long-term annual capacity considering constraints represented by the grade, quality and quantity of the reserves being mined as well as equipment performance and other operational factors.
(d)Actual production varies from annual operational capacity shown in the above table due to factors that include, among others, the level of demand for our products, the quality of the reserves, the nature of the geologic formations we are mining at any particular time, maintenance and turnaround time, mechanical failure, weather conditions and other operating conditions, as well as the effect of recent initiatives intended to improve operational excellence.
(e)Grade % K2O is a traditional reference to the percentage (by weight) of potassium oxide contained in the ore. A higher percentage corresponds to a higher percentage of potassium oxide in the ore.
(f)Equivalent to tonnes hoisted to surface at an underground shaft mine. Ore mined for Belle Plaine is calculated (KCl concentrate mined by solution divided by the estimated global grade of the deposit). The calculation is based on actual KCl tonnes mined for January 1, 2025 through December 31, 2025.
(g)Following completion of our Esterhazy K3 expansion project, a third-party audit assessed our Esterhazy Facility's nameplate capacity at 7.8 million tonnes. To date, we have been unable to rely upon this audit as a basis for an increase to our Canpotex entitlement percentage.
(h)We have the ability to reach an annual operating capacity of 2.1 million tonnes over time at Colonsay by increasing our staffing levels and investment in mine development activities.
(i)K-Mag® is a specialty product that we produce at our Carlsbad facility.
(j)The Taquari facility was sold in 2025. The 2025 amounts represent production from the beginning of the year until the selling date of November 4, 2025.
Overview
Overviews for Phosphate, Potash and Mosaic Fertilizantes are shown in Table 2.3, Table 2.4, and Table 2.5 below. All properties are operated by Mosaic. All properties listed below are production stage, except Araxá/Patrocínio. Araxá/Patrocínio is an operating mine but is considered an exploration stage mine because Mosaic is extracting minerals from this mine without having determined there are mineral reserves under S-K 1300. Information concerning our material properties is located in this Item 2 under the headings “Florida Phosphate,” “Esterhazy,” “Belle Plaine” and “Tapira”.
Table 2.3: Phosphate Overview
|
|
|
|
|
|
|
|
|
| Florida Phosphate |
| See Florida Phosphate Individual Property Disclosure below. |
Peru - Compañía Minera Miski Mayo S.R.L. (“Miski Mayo”) |
| Location |
|
Sechura Province in the Piura Region, Peru |
| Type and amount of ownership interests |
|
75% owned by Compañía Minera Miski Mayo S.R.L., a wholly-owned indirect subsidiary of Mosaic. |
| Titles, mineral rights, leases or options and acreage |
|
Miski Mayo is the holder of 20 non-metallics mining concessions (76,000 hectares). |
| Key permit conditions |
|
Permit conditions are dictated by operating licenses, which are maintained and renewed on a regular basis. As of December 31, 2025, all environmental licenses were either still valid or were being renewed pursuant to applications with the Peruvian Environmental Agency within the legal deadlines.
In general, environmental commitments are being met; however, there are environmental requirements and commitments related to the expansion of Miski Mayo Line 3 of the Second Amendment of the EIA (2015) that have to be verified and implemented.
Miski Mayo’s environmental controls are related to monitoring the quality of wastewater, surface water, groundwater and air, as well as waste management. Additional environmental controls are in place for air emissions, air quality and noise.
Tailings storage facilities and other impoundment’s stability are monitored through specified routine internal and third party inspections.
|
| Mine types and mineralization styles |
|
Miski Mayo is a surface mine. The phosphate deposits of Peru are located within the shallow north-trending Sechura Basin, in the Piura region, hosting successive inter-layered marine sediments of phosphate. We extract phosphate ore from Miski Mayo using excavators. The ore is then transported by truck for beneficiation in a plant that we own. The beneficiated concentrate is then shipped to North America for use in our own production or sold to third parties. |
| Processing plants and other facilities |
|
Beneficiation plant |
Table 2.4: North America Potash Overview
|
|
|
|
|
|
|
|
|
Belle Plaine Potash Facility (“Belle Plaine Facility”) |
| See Belle Plaine Individual Property Disclosure below. |
Esterhazy Potash Facility (“Esterhazy Facility”) |
| See Esterhazy Individual Property Disclosure below. |
Colonsay Potash Facility (“Colonsay Facility”) |
| Location |
|
Saskatchewan, Canada |
| Type and amount of ownership interests |
|
100% owned by Mosaic Potash Colonsay ULC, a wholly-owned, indirect subsidiary of Mosaic. |
|
|
|
|
|
|
|
|
|
| Titles, mineral rights, leases or options and acreage |
|
We lease approximately 118,378 acres of mineral rights for the Colonsay Facility from the Province of Saskatchewan (the “Crown”) under Subsurface Mineral Lease KL 108. The lease term is for a period of 21 years, with renewals at our option for additional 21-year lease periods.
In addition, we own or lease approximately 14,451 acres of mineral rights within the Colonsay area. All mineral properties owned or leased by Mosaic are for the “subsurface mineral” commodity as defined in The Subsurface Mineral Tenure Regulations (Saskatchewan).
We own approximately 5,972 acres of surface rights in the Colonsay area. All infrastructure including the processing plant and tailings management areas ( “TMAs” or “TMA”) are located on our owned land.
|
| Key permit conditions |
|
A water rights license issued by the Saskatchewan Water Security Agency is in place and expires in 2032. The license is associated with the allocation of surface water rights for the site. An Approval to Operate Pollutant Control Facilities, issued by the Saskatchewan Ministry of Environment, is also in place and expires in July 2028. It is expected to be renewed at or before expiration.
There are no other significant encumbrances, including permitting requirements (existing or anticipated in the future) associated with the Colonsay Facility. Except for the royalties, we do not anticipate any future significant encumbrances based on current known regulations and existing permitting processes. There are no outstanding violations and fines. |
| Mine types and mineralization styles |
|
The intracratonic Elk Point Basin is a major sedimentary geological feature in western Canada and the northwest U.S. It contains one of the world’s largest stratabound potash resources that represents almost 25% of the global potash production. The Prairie Evaporite hosts rich deposits of evaporite minerals including NaCl, KCl and locally, carnallite that occur in three potash deposits: the Esterhazy, Belle Plaine and Patience Lake members.
The Colonsay deposit includes two potash-bearing members within its local stratigraphy; the Patience Lake Member and the Belle Plaine Member. Mining at Colonsay is conducted within the upper portion of the Patience Lake Member using a room and pillar mining method.
The Colonsay Facility uses an underground room and pillar mining method to extract potash. After being transported along a network of conveyor systems to the shaft, it is hoisted to the surface for onsite processing.
|
| Processing plants and other facilities |
|
Mill facility, beneficiation plant |
Carlsbad Potash Facility (“Carlsbad Facility”) |
| Location |
|
New Mexico, U.S. |
| Type and amount of ownership interests |
|
100% owned by Mosaic Potash Carlsbad Inc., a wholly-owned, indirect subsidiary of Mosaic. |
| Titles, mineral rights, leases or options and acreage |
|
The property consists of 89% federally owned and 11% state owned land, and 40 acres of privately owned mineral rights that Mosaic leases. We lease approximately 64,267 acres of mineral rights from the U.S. Department of Interior Bureau of Land Management (“BLM”). These lease terms are for a period of 20 years and are reviewed and renewed at their end of term.
Surface rights are subject to separate ownership and title from subsurface mineral rights.
We own 8,370 acres of surface rights. All infrastructure, including the processing plant, TMA, cluster sites, and pipeline rights of way, are located on Mosaic-owned land.
|
|
|
|
|
|
|
|
|
|
| Key permit conditions |
|
Primary environmental resource areas identified include groundwater quality and shorebird habitat. Environmental monitoring for effluents, air and surface/groundwater is in place.
Currently, 11 permits or approvals are active for the property. We are in compliance with all such permits or approvals. One of the 11, groundwater discharge permit (DP-1399) issued by the New Mexico Environmental Department (“NMED”), is currently being renewed. The discharge permit governs operation of the TMA. A tailings management and inspection plan is in place and active. The permit includes closure and post-closure requirements and financial assurance requirements.
A mining and reclamation plan has been developed and approved by the BLM. This plan includes standards for operation and closure of the mine that comply with federal and state of New Mexico environmental regulations. Current and final mine closure plans and reclamation cost estimates are completed and the closure plans have been approved by NMED and the BLM.
There are no significant environmental permitting encumbrances (existing or anticipated in the future) associated with the Carlsbad Facility. We do not anticipate any future encumbrances based on current known regulations and existing permitting processes. There are no outstanding violations and fines.
|
| Mine types and mineralization styles |
|
The Carlsbad potash district is located within the northern New Mexico portion of the Delaware Basin. The Delaware Basin is the western subdivision of the greater Permian Basin, one of the deepest intracratonic basins in North America.
Potash mineralization at Carlsbad occurs in the Ochoan Epoch (Upper Permian Age) Salado Formation. The Salado Formation, up to a maximum of 2,200 feet (671 m) ft. thick, is an evaporite sequence dominated by 650 to 1,300 feet (198 to 396 m) of halite and muddy halite. It hosts 12 ore zones, 11 in the middle or McNutt Member and the 12th in the Upper Member. The area underlain by the 12 ore zones is about 1,900 sq. miles (4,920 sq. km). The 400 foot (122 m) thick McNutt Member is at a depth of 300 to 1,500 feet (91 to 457 m) below the surface.
The Carlsbad Facility utilizes an underground room-and-pillar mining method. Pillars are cut in a manner that creates a panel; panel sizes can be changed based on grade, ground conditions and lease or oil and gas boundaries. The mine currently has five mine panels that consist of nine to 11 rooms. Drum-style continuous miners are utilized for mining. As the continuous miner advances, ore is fed off a boom located at the back of the miner into battery-powered ore haulage units. These units transport the ore through the open mine workings and dump it onto an extensive belt system that conveys the ore to the surface for milling.
|
| Processing plants and other facilities |
|
Langbeinite (K-Mag®) refinery and a granulation plant |
Table 2.5: Mosaic Fertilizantes Overview
|
|
|
|
|
|
|
|
|
Complexo Mineroquímic de Araxá (“Araxá”) / Complexo de Mineração de Patrocínio (“Patrocínio”) |
| Location |
|
Near Araxá / Patrocínio, Minas Gerais, Brazil |
| Type and amount of ownership interests |
|
100% owned by Mosaic Fertilizantes P&K S.A., a wholly-owned indirect subsidiary of Mosaic. |
| Titles, mineral rights, leases or options and acreage |
|
Mining rights in Brazil are governed by the Mining Code, Decree 227, dated February 27, 1967, and further regulation enacted by Agência Nacional de Mineração (the “ANM”). All subsoil situated within Brazilian territory is deemed state property, with the mining activities subject to specific permits granted by the ANM. |
|
|
|
|
|
|
|
|
|
| Key permit conditions |
|
Mosaic currently holds a total of four mining permits within the Araxá area (2,769 hectares) and two mining permits and two exploration permits within the Patrocínio area (3,480 hectares). Permit conditions are dictated by operating licenses, which are maintained and renewed on a regular basis. As of December 31, 2025, all environmental licenses were valid or were being renewed pursuant to applications filed with the Brazilian Environmental Agency.
There are action plans in progress to comply with the environmental conditions of the permits that are not met yet within the applicable regulations. Araxá and Patrocínio’s environmental controls are related to monitoring the quality of wastewater, surface water, groundwater and air, as well as waste management. Additional environmental controls are in place for air emissions, air quality and noise.
Tailings storage facilities and other impoundment’s stability are monitored through a continuous monitoring program, as well as routine inspections.
|
| Mine types and mineralization styles |
|
The Araxá and Patrocínio phosphate deposits are part of a series of Late-Cretaceous, carbonatite-bearing alkaline ultramafic plutonic complexes belong to the Alto Paranaiba Igneous Province.
The tropical weather regime prevailing in the region and the inward drainage patterns developed from the weather-resistant quartzite margins of the dome structures resulted in the development of an extremely thick soil cover in most of the complexes. The extreme weathering was responsible for the residual concentration of apatite.
The phosphate ore is extracted through surface mining by limited drilling and blasting, loaded into trucks and transported to the beneficiation plants. Patrocinio does not have its own beneficiation plant, so the ore is transported by rail to Araxá for processing.
|
| Processing plants and other facilities |
|
Two beneficiation plants at Araxá |
Complexo Mineroquímico de Cajati (“Cajati”) |
| Location |
|
Near Cajati, São Paulo, Brazil |
| Type and amount of ownership interests |
|
100% owned by Mosaic Fertilizantes P&K S.A., a wholly-owned indirect subsidiary of Mosaic. |
| Titles, mineral rights, leases or options and acreage |
|
Mining rights in Brazil are governed by the Mining Code, Decree 227, dated February 27, 1967, and further regulation enacted by the ANM. All subsoil situated within Brazilian territory is deemed state property, with the mining activities subject to specific permits granted by the ANM.
|
| Key permit conditions |
|
Mosaic currently holds a total of eight permits within the CMC area (2,131 hectares). Permit conditions are dictated by operating licenses, which are maintained and renewed on a regular basis. As of December 31, 2025, all environmental licenses were either valid or were being renewed pursuant to applications filed with the Brazilian Environmental Agency.
There are action plans in progress to comply with the environmental conditions of the permits that are not met yet within the environmental permits. Cajati’s environmental controls are related to monitoring the quality of wastewater, surface and groundwater and air, as well as waste management. Additional environmental controls are in place for air emissions, air quality and noise.
Tailings storage facilities and other impoundment’s stability are strictly monitored through a continuous monitoring program as well as routine inspections. |
| Mine types and mineralization styles |
|
The primary alkaline intrusive complex of interest for Cajati is the Jacupiranga Ultramafic-Carbonatitic Mesozoic Complex. The economically exploitable portion of the Jacupiranga Alkaline Complex is focused on phosphate mineralization within the carbonatite domain of the complex.
The phosphate ore is extracted through surface mining by drilling and blasting, loaded into trucks and transported to the beneficiation plant onsite at Cajati.
|
|
|
|
|
|
|
|
|
|
| Processing plants and other facilities |
|
Beneficiation plant |
Complexo Mineração de Catalão (“CMC”) |
| Location |
|
Near Catalão, Minas Gerais (and Goias), Brazil |
| Type and amount of ownership interests |
|
100% owned by Mosaic Fertilizantes P&K S.A., a wholly-owned indirect subsidiary of Mosaic. |
| Titles, mineral rights, leases or options and acreage |
|
Mining rights in Brazil are governed by the Mining Code, Decree 227, dated February 27, 1967, and further regulation enacted by the ANM. All subsoil situated within Brazilian territory is deemed state property, with the mining activities subject to specific permits granted by the ANM.
|
| Key permit conditions |
|
Mosaic currently holds a total of eight permits within the CMC area (2,131 hectares). Permit conditions are dictated by operating licenses, which are maintained and renewed on a regular basis. As of December 31, 2025, all environmental licenses were either valid or were being renewed pursuant to applications filed with the Brazilian Environmental Agency.
There are action plans in progress to comply with the environmental conditions that are not met yet within the environmental permits. CMC’s environmental controls are related to monitoring the quality of wastewater, surface and groundwater and air, as well as waste management. Additional environmental controls are in place for air emissions, air quality and noise.
Tailings storage facilities and other impoundment’s stability are monitored through a continuous monitoring program as well as routine inspections.
|
| Mine types and mineralization styles |
|
The CMC phosphate deposit is part of a series of Late-Cretaceous, carbonatite-bearing alkaline ultramafic plutonic complexes belong to the Alto Paranaiba Igneous Province.
The tropical weather regime prevailing in the region and the inward drainage patterns developed from the weather-resistant quartzite margins of the dome structures resulted in the development of an extremely thick soil cover in most of the complexes. The extreme weathering process was responsible for the residual concentration of apatite.
The phosphate ore is extracted through surface mining by limited drilling and blasting, loaded into trucks and transported to the beneficiation plant onsite at CMC.
|
| Processing plants and other facilities |
|
Beneficiation plant |
|
|
|
| Complexo Mineração de Tapira (“Tapira”) |
| See the Tapira Individual Property Disclosure below. |
Mineral Resource and Mineral Reserve Estimates
Table 2.6 shows the Mineral Resource tonnage and grade for all properties as of December 31, 2025.
Table 2.6 Summary of Mineral Resources as of December 31, 2025(a)
|
|
|
|
|
|
|
|
|
|
|
|
|
|
|
|
|
|
|
|
|
|
|
|
|
|
|
|
| (in millions of tonnes) |
|
|
|
|
|
|
|
| Commodity/Geography/Mine Property Name |
|
Measured Mineral
Resources |
Indicated Mineral Resources |
Measured + Indicated Mineral Resources |
Inferred Mineral
Resources |
|
tonnes |
Grade |
tonnes |
Grade |
tonnes |
Grade |
tonnes |
Grade |
Phosphate (Grade: P2O5 )(b) |
|
|
|
|
|
|
|
|
|
| United States |
|
|
|
|
|
|
|
|
|
Florida(c) |
|
102.0 |
|
29.9 |
|
415.0 |
|
30.1 |
|
517.0 |
|
30.0 |
|
83.0 |
|
30.0 |
|
| Peru |
|
|
|
|
|
|
|
|
|
Miski Mayo(d) |
|
157.7 |
|
16.7 |
|
139.0 |
|
16.3 |
|
296.7 |
|
16.5 |
|
27.7 |
|
16.0 |
|
| Brazil |
|
|
|
|
|
|
|
|
|
Araxá/Patrocínio(e)(f) |
|
206.5 |
|
12.9 |
|
303.3 |
|
13.7 |
|
509.8 |
|
13.4 |
|
7.0 |
|
13.0 |
|
Cajati(e)(g) |
|
25.0 |
|
5.2 |
|
14.9 |
|
5.3 |
|
39.9 |
|
5.3 |
|
4.2 |
|
5.3 |
|
Catalão(e)(h) |
|
58.9 |
|
9.9 |
|
102.4 |
|
10.5 |
|
161.3 |
|
10.3 |
|
17.9 |
|
8.7 |
|
Tapira(e)(i) |
|
21.3 |
|
8.6 |
|
54.9 |
|
8.6 |
|
76.2 |
|
8.6 |
|
180.5 |
|
9.2 |
|
| Total Phosphate |
|
571.4 |
|
16.2 |
|
1,029.5 |
|
20.0 |
|
1,600.9 |
|
18.6 |
|
320.3 |
|
15.2 |
|
|
|
|
|
|
|
|
|
|
|
Potash (Grade: K2O)(j) |
|
|
|
|
|
|
|
|
|
| Canada |
|
|
|
|
|
|
|
|
|
Belle Plaine(k) |
|
— |
|
— |
|
— |
|
— |
|
— |
|
— |
|
4,647.0 |
|
19.0 |
|
Esterhazy(l) |
|
255.0 |
|
23.2 |
|
2,094.0 |
|
22.8 |
|
2,350.0 |
|
22.9 |
|
— |
|
— |
|
Colonsay(l) |
|
— |
|
— |
|
— |
|
— |
|
— |
|
— |
|
977.0 |
|
29.0 |
|
| United States |
|
|
|
|
|
|
|
|
|
Carlsbad(m) |
|
— |
|
— |
|
— |
|
— |
|
— |
|
— |
|
39.0 |
|
6.0 |
|
| Total Potash |
|
255.0 |
|
23.3 |
|
2,094.0 |
|
22.8 |
|
2,350.0 |
|
22.9 |
|
5,663.0 |
|
20.6 |
|
______________________________
(a)Mineral resources are reported exclusive of mineral reserves, and except as otherwise noted, are stated in-situ. Mineral resources are not mineral reserves and do not meet the threshold for mineral reserve modifying factors, such as estimated economic viability, that would allow for conversion to mineral reserves. There is no certainty that any part of the mineral resources estimated will be converted into mineral reserves.
(b)The percentage of P2O5 represents a measure of the phosphate content in phosphate rock or a phosphate ore body. A higher percentage corresponds to a higher percentage of phosphate content in phosphate rock or a phosphate ore body. Brazilian grades, except for Cajati, are P2O5ap, which represents the P2O5 associated with apatite and was calculated by the evaluation of the CaO / P2O5 ratio. Where CaO / P2O5 ratio was greater than or equal to 1.35, P2O5ap was equal to the total of P2O5; where the CaO / P2O5 ratio was less than 1.35, P2O5ap was equal to the CaO / 1.35 ratio.
(c)Mineral resource tonnages and grade are reported as a beneficiation plant product (phosphate rock) tonnage and P2O5 grade. The cut-offs used to estimate mineral resources include, minimum beneficiation plant concentrate BPL (27.45% P2O5), minimum pebble BPL (18.30% P2O5, except 22.88% P2O5 for DeSoto and Pioneer), maximum pebble magnesium oxide concentration and a maximum clay content cut-off for a logged matrix layer and the composite matrix volume. A Life of Mine (“LOM”) commodity price of US$148/tonne of phosphate rock was used for 2026 to 2037 to assess prospects for economic extraction but is not used for cut-off purposes.
(d)Mineral resources are presented on the basis of our 75% interest. Cut-off grade of > 8% P2O5 was applied for mineral resources. A breakeven pit shell was developed with costs, grade requirements and a sales price of US$97.69/tonne of phosphate concentrate (2022 price evaluation) to develop the mineral resource pit shell.
(e)Measured, indicated and inferred blocks were included in mineral resource estimates if they were inside mining concessions and exploration permits with a final report approved by the ANM, but exclusive of physical structures. For example, depending on the site, a physical structure may consist of a beneficiation plant, crusher or waste pile.
(f)Araxá Oxidized Cut-off grade: Mass Recovery (rend_t) > 0, P2O5 ≥ 4.0, Fe2O3 ≥ 4.0, SiO2 ≥ 0.05, BaO ≤ 18.0. Araxá Micaceous Cut-off grade: Cut-off grade for Micaceous: Mass Recovery (rend_t) > 0, P2O5 ≥ 3.0, Fe2O3 ≥ 6.0, SiO2 ≥ 1.0, BaO ≤ 13.0. For Araxá, a revenue factor of 1.0 with sales price in Brazilian Reais ($R) of R$1,953 per tonne of phosphate concentrate was used to develop mineral resource pit shell. Patrocínio BEB-OXI Cut-off grade: P2O5 ≥ 2.5, Fe2O3 ≤ 62.0. Patrocínio CBN-OXI Cut-off grade: P2O5 ≥ 3.2, SiO2 ≥ 0.1. Patrocínio BEB-MIC Cut-off grade: P2O5 ≥ 3.0, SiO2 ≥ 0.8. Patrocínio FET Cut-off grade: P2O5 > 0.0. Patrocínio RSI Cut-off grade: P2O5 ≥ 2.9. For Patrocínio, a revenue factor of 1.0 with a sales price of R$1,869.84 per tonne of phosphate concentrate (2023 LOM price evaluation) was used to develop mineral resource pit shell.
(g)Cut-off grade of > 3% P2O5 was applied for mineral resources. A revenue factor of 1.0 with sales price of R$2,963.40 per tonne of phosphate concentrate (2023 LOM price evaluation) was used to develop the mineral resource pit shell.
(h)Cut-off grade of P2O5ap ≥ 5.0% and 0.8 ≤ RCP ≤ 1.6 and MgO < 12% was applied to mineral resources. A revenue factor of 1.0 with a constant sales price of R$1,918.75 per tonne of phosphate concentrate was used to develop mineral resource pit shell.
(i)Cut-off grade of P2O5ap ≥ 5.0% and 0.9 ≤ RCP ≤ 3.0 was applied to mineral resources. A revenue factor of 1.0 with a sales price of R$1,940 per tonne of phosphate concentrate (2023 LOM price evaluation) was used to develop the mineral resource pit shell.
(j)%K2O refers to the total %K2O of the samples.
(k)No cut-off grade is used to estimate mineral resources as the solution mining method used at the Belle Plaine Facility is not selective. At no point in the cavern development and mining process can a decision be made to mine or not mine the potash mineralization that is in contact with the mining solution. The mining solution dissolves the potash, regardless of its grade, to make a concentrate that is pumped to the surface from the mining caverns for processing. A KCl commodity price of US $255/tonne was used for 2026 to 2084 to assess prospects for economic extraction for the mineral resources but is not used for cut-off purposes. A US$/CAD$ exchange rate of 1.37 was used to assess prospects for economic extraction for the mineral resources but was not used for cut-off purposes.
(l)No cut-off grade or value based on commodity price is used to estimate mineral resources as the mining method used at Colonsay or Esterhazy is not grade selective. The potash mineralization is mined on one level by continuous miners following the well-defined and continuous beds of mineralization with relatively consistent grades. The following KCl commodity prices were used to assess prospects for economic extraction for the mineral resources but are not used for cut-off purposes: 2026-$244/tonne, 2027-$243/tonne, 2028-$224/tonne, 2029-$188/tonne, 2030-$223/tonne and for the LOM plan $251/tonne for Esterhazy and US$256/tonne for 2026 to 2116 for Colonsay. A US$/CAD$ exchange rate of 1.37 was used to assess prospects for economic extraction for the mineral resources but was not used for cut-off purposes.
(m)A 4% K2O cut-off grade with less than 2% kieserite is used to estimate mineral resources. This is consistent with the definition of mineable potash established by the U.S. Geological Survey. A US$305/tonne price was used for 2026 to 2064 to assess economic viability for the mineral resources, but was not used for cut-off purposes.
Table 2.7 shows the Mineral Reserve tonnage and grade for all properties as of December 31, 2025.
Table 2.7: Summary of Mineral Reserves as of December 31, 2025(a)
|
|
|
|
|
|
|
|
|
|
|
|
|
|
|
|
|
|
|
|
|
| (in millions of tonnes) |
|
|
|
|
|
| Commodity/Geography/Mine Property Name |
Proven Mineral Reserves |
Probable Mineral Reserves |
Total Mineral Reserves |
| tonnes |
Grade |
tonnes |
Grade |
tonnes |
Grade |
Phosphate (Grade: P2O5)(b) |
|
|
|
|
|
|
| United States |
|
|
|
|
|
|
Florida(c) |
38.0 |
27.6 |
58.0 |
26.9 |
96.0 |
27.0 |
| Peru |
|
|
|
|
|
|
Miski Mayo(d) |
84.2 |
15.6 |
54.1 |
15.0 |
138.3 |
15.4 |
| Brazil |
|
|
|
|
|
|
Cajati(e) |
32.7 |
5.5 |
18.5 |
5.5 |
51.2 |
5.5 |
Catalão(f) |
52.7 |
10.5 |
8.1 |
9.9 |
60.8 |
10.4 |
Tapira(g) |
106.8 |
9.0 |
310.3 |
8.9 |
417.1 |
9.0 |
| Total Phosphate |
314.4 |
12.9 |
449.0 |
11.8 |
763.4 |
12.3 |
|
|
|
|
|
|
|
Potash (Grade: K2O) |
|
|
|
|
|
|
| Canada |
|
|
|
|
|
|
Belle Plaine(h) |
268.1 |
19.3 |
370.9 |
19.3 |
639.0 |
19.3 |
Esterhazy(i) |
158.0 |
22.2 |
318.0 |
20.0 |
476.0 |
20.8 |
Colonsay(i) |
99.0 |
26.0 |
163.0 |
27.2 |
262.0 |
26.5 |
| United States |
|
|
|
|
|
|
Carlsbad(j) |
160.6 |
6.5 |
0.0 |
0.0 |
160.6 |
6.5 |
| Total Potash |
685.7 |
17.9 |
851.9 |
|
21.1 |
1,537.6 |
|
19.7 |
______________________________
(a)A mineral reserve is the economically mineable part of a measured or indicated mineral resource, which includes diluting materials and allowances for losses that may occur when the material is mined or extracted. Reserves are measured as Run of Mine (“ROM”) unless otherwise noted.
(b)Brazil grades except for Cajati are P2O5ap, which represents the P2O5 associated with apatite and was calculated by the evaluation of the CaO / P2O5 ratio. Where CaO / P2O5 ratio was greater than or equal to 1.35, P2O5ap was equal to the total of P2O5; where the CaO / P2O5 ratio was less than 1.35, P2O5ap was equal to the CaO / 1.35 ratio.
(c)Mineral reserve tonnages and grade are reported as a beneficiation plant product (phosphate rock) tonnage and P2O5 grade. A LOM commodity price of US$143/tonne of phosphate rock was used to assess prospects for economic extraction but is not used for cut-off purposes. Cut-off based on productivity factors per site have been applied to estimate mineral reserves. Recoverable Finished Product tonnes vs. Matrix Volume Mined ranges from 9.4 to 9.9%. Recoverable Finished Product tonnes vs. Total Volume Mined is 2.2%.
(d)Mineral reserves are presented on the basis of our 75% interest. The reference point for cut-off grade and pit optimization analysis is tonnes of concentrate at a price of US$97.69/tonne concentrate (2022 LOM price evaluation). We applied a cut-off grade of > 8% P2O5 mineral reserves. Additionally, we used a phosphate concentrate grade limitation of a minimum P2O5 concentrate grade of 29.5% in the LOM plan.
(e)The reference point for cut-off grade and pit optimization analysis is tonnes of concentrate at a price of R$2,963.40/tonne concentrate (2023 price evaluation). Cut-off grade of > 3% P2O5 and < 11% SiO2 was applied to mineral reserves. Mineral reserves were proven to be economic based on an internal transfer price of R$1,067/tonne of phosphate rock (2023 LOM price evaluation) that was derived in the discounted cash flow and compared to the gross margin available.
(f)The reference point for cut-off grade and pit optimization analysis is tonnes of concentrate at a price of R$1,918.75/tonne concentrate (2023 LOM price evaluation). Cut-off grade of P2O5ap ≥ 5.0% and 0.8 ≤ RCP ≤ 1.6 and MgO < 12% was applied to mineral reserves. Mineral reserves were proven to be economic based on internal transfer price of R$656/tonne of phosphate rock (2025 LOM price evaluation) that was derived in the discounted cash flow and compared to the gross margin available.
(g)The reference point for cut-off grade and pit optimization analysis is tonnes of concentrate at a price of R$1,940/tonne concentrate (2023 price evaluation). Cut-off grade of P2O5ap ≥ 5.0% and 0.9 ≤ RCP ≤ 3.0 was applied to mineral reserves. Mineral reserves were proven to be economic based on internal transfer price of R$605.3/tonne of phosphate rock (2024 LOM price evaluation) that was derived in the discounted cash flow and compared to the gross margin available.
(h)No cut-off grade is used to estimate mineral reserves as the solution mining method used at the Belle Plaine Facility is not selective. At no point in the cavern development and mining process can a decision be made to mine or not mine the potash mineralization that is in contact with the mining solution. The mining solution dissolves the potash, regardless of its grade, to make a concentrate that is pumped to surface from the mining cavities for processing. Mine designs based on a solution mining method and design criteria are used to constrain mineral reserves within mineable shapes. The following KCl commodity prices were used to assess economic viability for the mineral reserves, but were not used for cut-off purposes: 2026-$244/tonne, 2027-$243/tonne, 2028-$224/tonne, 2029-$188/tonne, 2030-$223/tonne and for the LOM $255/tonne. A US$/CAD$ exchange rate of 1.37 was used to assess economic viability for the mineral reserves but was not used for cut-off purposes.
(i)The following KCl commodity prices were used to assess economic viability for the mineral reserves: US$251/tonne for Esterhazy, US$255/tonne for Belle Plaine, and US$256/tonne for Colonsay. A US$/CAD$ exchange rate of 1.37 was used to assess economic viability for the Esterhazy and Belle Plaine mineral reserves.
(j)A 4% K2O cut-off grade with less than 2% kieserite is used to estimate mineral reserves. This is consistent with the definition of mineable potash established by the U.S. Geological Survey. A US$305/tonne price was used to assess economic viability for the mineral resources but was not used for cut-off purposes.
FLORIDA PHOSPHATE
Our three phosphate production stage mining facilities (South Fort Meade, Four Corners and Wingate) and three exploration properties (DeSoto, Pioneer and South Pasture) in Florida consist of over 210,000 acres of property in central Florida (Table 2.8 and Figure 2.3). We idled the mining and beneficiation activities at South Pasture. The facilities and properties are in DeSoto, Hardee, Hillsborough, Manatee and Polk counties. Even though we continue to add real property to one or more of these locations, most of the property currently being mined or planned for future mining have been in industry ownership for over 50 years. The mining facilities and exploration properties are owned by or have controlling interest granted to Mosaic Fertilizer LLC, South Ft. Meade Land Management or South Ft. Meade Land Partnership, L.P. (“SFMLP”), each a subsidiary of Mosaic.
We either own or have a controlling interest in the mineral rights to the current and future facilities. Mineral and surface rights are joined at the Four Corners, Wingate, Pioneer and South Pasture properties. Portions of the DeSoto property and South Fort Meade facility have the surface and mineral interests severed.
The net book value for our Florida phosphate mining facilities and exploration properties is $2.0 billion as of December 31, 2025.
Table 2.9 lists the land status and acreages for the facilities and properties.
Table 2.8: Property Locations
|
|
|
|
|
|
|
|
|
|
|
| Property |
|
Location |
|
|
| South Fort Meade Facility |
|
Straddles the county line road beginning 1.3 miles (2.1 km) east of the City of Bowling Green and continuing another five miles (8 km). Located at 27.667195 N, 81.761349 W. |
|
|
| Four Corners Facility |
|
Located in southeast Hillsborough County, northeast Manatee County and southwest Polk County. Located at 27.646144 N, 82.087305 W. |
|
|
| Wingate Facility |
|
Most of the property associated with this mine is west of Duette Road and north of State Road 64. There is a portion of this property that exists on the east side of Duette Road that begins approximately three miles (2 km) north of State Road 64. Located at 27.504452 N, 82.132221 W. |
|
|
|
|
|
|
|
| DeSoto Property |
|
This exploration property is bisected by State Road 70 and State Road 72 running east and west and the county line running north and south. A portion of the DeSoto property is owned fee simple and the mining interests on the remaining portion is secured by mineral rights. Located at 27.263018 N, 82.035208 W. |
|
|
| Pioneer Property |
|
This exploration property is bisected by County Road 663 running north and south. Several local roads (Murphy, Bridges, Bennett and Post Plant) cross this parcel. Located at 27.439391 N, 81.940020 W. |
|
|
| South Pasture Property |
|
The property is situated along a ten mile stretch of State Road 64 and a seven mile stretch along County Road 663. All parcels are bisected by County Road 663, State Road 62, State Road 64 and several local roads. The mining and beneficiation activities at this location have been idled. Located at 27.585787 N, 81.942888 W. |
|
|
Figure 2.3: Location Plan
The table below includes only land holdings associated with our mining properties.
Table 2.9: Property Status and Acreages
|
|
|
|
|
|
|
|
|
|
|
|
|
|
|
|
|
|
|
|
|
|
|
|
|
|
|
|
|
|
|
|
|
|
|
|
|
|
|
Status (Acres) |
|
|
|
Florida Phosphate Property Status and Acreages |
|
|
|
|
|
|
|
|
|
Fee Simple |
|
Mining Agreement |
|
Mineral Rights (b) |
|
Lease |
|
Total |
|
|
|
|
|
|
|
|
| South Fort Meade Facility |
15,984 |
|
|
25,528 |
|
(a) |
92 |
|
|
711 |
|
|
42,315 |
|
|
|
|
|
|
|
|
|
| Four Corners Facility |
55,659 |
|
|
— |
|
|
— |
|
|
— |
|
|
55,659 |
|
|
|
|
|
|
|
|
|
| Wingate Facility |
8,761 |
|
|
— |
|
|
— |
|
|
— |
|
|
8,761 |
|
|
|
|
|
|
|
|
|
| DeSoto Property |
24,113 |
|
|
8 |
|
|
18,943 |
|
|
— |
|
|
43,064 |
|
|
|
|
|
|
|
|
|
| Pioneer Property |
26,017 |
|
|
— |
|
|
— |
|
|
— |
|
|
26,017 |
|
|
|
|
|
|
|
|
|
| South Pasture Property |
39,043 |
|
|
— |
|
|
— |
|
|
— |
|
|
39,043 |
|
|
|
|
|
|
|
|
|
| Total |
169,577 |
|
|
25,536 |
|
|
19,035 |
|
|
711 |
|
|
214,859 |
|
|
|
|
|
|
|
|
|
______________________________
(a) The mining agreement relates to the SFMLP which is 100% controlled by Mosaic or its subsidiaries.
(b) All acres include surface rights with the exception of the DeSoto mineral rights.
Governmental permits and approvals for mining are obtained from federal, state and county authorities, including the Environmental Resource Permit (“ERP”) issued by FDEP and permits required by Section 404 of the federal Clean Water Act. In connection with these permits, we are required to develop a reclamation plan with respect to these areas. The ERP is associated with a FDEP-approved reclamation plan that requires “acre for acre and type for type” reclamation to reclaim mined areas. Mitigation may also be required by ERP conditions which may also require conservation easements to provide permanent protection.
The integrated water use permit (“IWUP”) issued by the Southwest Florida Water Management District (“SWFWMD”) in 2012 authorizes the withdrawal of groundwater from underground aquifers through permitted wells to provide potable and production-water supplies in support of mining and other operations. The IWUP addresses all of our active mining operations. A separate water use permit (“WUP”) was issued by SWFWMD for the South Pasture property in 2017. The IWUP and the South Pasture WUP also regulate mine dewatering to avoid adverse impacts to wetlands and offsite properties. Both the IWUP and the WUP are 20 year permits expiring in 2032 and 2037, respectively.
Pre-mining development follows the issuance of regulatory permits. This involves ditch and berm construction for stormwater control, groundwater draw down mitigation where applicable, land clearing, installation of infrastructure and pre-mining dewatering (only for dragline mining).
There are no significant environmental permitting encumbrances, existing or anticipated, associated with the mining facilities and exploration properties. We do not anticipate any future encumbrances based on current known regulations and existing permitting processes. There are no material outstanding violations and fines.
Existing Infrastructure
The three mining facilities are in rural central Florida located southeast of Tampa in Hardee, Hillsborough, Manatee and Polk counties. The sites are located in agricultural zones with associated population centers and easy access to multiple transportation hubs in central Florida. The three exploration properties are located south of the mining facilities. Each will utilize the same water, electrical, railway and road networks as the active mines.
The mining facilities at South Fort Meade, Four Corners, Wingate and South Pasture commenced operations between 1981 and 1995, as noted below under “History and Exploration”. The phosphate mines have the infrastructure to meet our current production plans and long-range production goals. The current infrastructure includes major roads and highway access, railway support from CSX Transportation and electricity supplied by Duke Energy, TECO, PRECO, Florida Power and Mosaic cogeneration in associated distribution areas. Water supply is from Mosaic-owned deep wells and recycle sources. Current clay and tailings management areas footprints are expected to meet present demands, with additional capacity planned to meet the maximum volume and deposition rates from the 2025 LOM plan. An integrated operations center remotely controls certain functions at our Florida phosphate mines.
Additional infrastructure may be added to increase production reliability or flexibility. The assets currently in place are maintained through a workflow process that focuses on proactive inspections and preventative maintenance, while trying to minimize reactive maintenance. Except for South Pasture, which is currently idled, minimal infrastructure is currently in place at the other exploration properties.
We expect the sites to continue to operate effectively during the LOM while continuing to maintain the built infrastructure and renewing the long-term agreements in place for the site’s water, electricity and logistics needs.
We focus on reliability-centered maintenance with the goal of extending the life of the majority of assets to align with the LOM plan. We expect that some infrastructure will need to be replaced as it reaches end of life and has been factored into the relevant capital cost requirements.
Phosphate mining in central Florida is a mature industry. A network of suppliers, machine shops, fabricators and specialty contractors exist to support mining, and post-mining, land reclamation activities. Many large component vendors have branch offices in either Lakeland or Tampa, Florida. Engineering, design and technical services are readily available in Bartow, Lakeland and Tampa, Florida.
Mining Method
Our mining operations in central Florida extract phosphate using surface mining techniques. The active mines utilize either electric walking draglines or dredges to remove overburden and mine phosphate ore (matrix). Matrix is hydraulically transported via centrifugal pumping systems to the beneficiation plant.
Pre-mining development follows the issuance of regulatory permits. This involves ditch and berm construction for stormwater control, groundwater draw down mitigation where applicable, land clearing, installation of infrastructure and pre-mining dewatering (only for dragline mining).
Development of the mine plan is based on several factors, including geological data, equipment, property boundaries, geotechnical considerations, clay impoundment, reclamation schedule, production (volume and quality) demands, permits (local, state and federal) and third-party agreements, such as agreements with local community groups, neighboring properties or NGO’s which do not materially impair the mine plan. Production is monitored through dragline/dredge monitoring systems, mass-flow instrumentation on slurry pumping systems and pit surveys. In addition to draglines and dredges, heavy mobile equipment is used to support mining activities. While each mine is staffed with Mosaic personnel to handle production and maintenance, contractors are used on an as-needed basis.
Processing Recovery Method
Phosphate matrix mined at the three mining facilities is processed through onsite beneficiation plants. The principal production components of the beneficiation plants consist of a washer, sizing system and flotation plant.
Matrix at each mine is slurried for transport to the beneficiation plant. After receiving matrix, washers separate minerals into four separate material groups. These are debris, pebbles, clay and under-sized flotation feed. The pebble is one of the final products and the under-sized flotation feed material contains recoverable phosphate rock. The washers separate >1.0 mm phosphate product and the <1.0 mm slurry of liberated clay, sand and phosphate particles. The clay is removed with hydrocyclones and pumped to clay settling areas while the >0.1 mm sand and phosphate move on to the sizing section.
The >0.1 mm sand and phosphate is separated into different size fractions using hydrosizers. An upward flow of water is injected into the hydrosizer that forces the fine particles to rise and overflow the sizer, while the coarse particles gently fall and flow out the sizer’s underflow. The segregated fine and coarse particles are then sent to the flotation plant so the phosphate can be separated from the sand.
The two-step flotation process, rougher flotation and cleaning flotation, is next utilized to separate phosphate from the sand. In the rougher flotation process, the phosphate mineral is recovered using flotation machines by adding fatty acid, oil, soda ash and sodium silicate. To increase the recovered rougher phosphate grade, a second cleaning flotation process is used to remove the residual sand using amine.
History and Exploration
Table 2.10 lists the important historical dates and events relevant to the mining facilities and exploration properties:
Table 2.10: History
|
|
|
|
|
|
|
|
|
| Date |
|
Event/Activity |
| 1881 |
|
Pebble phosphate discovered along the Peace River south of Fort Meade by Captain J. Francis LeBaron, chief engineer of a detachment of the Engineering Corps, United States Army. |
| 1888 |
|
Phosphate rock first commercially mined along the Peace River. |
| 1977 |
|
Farmland Industries purchased the Pioneer (eastern portion a.k.a. Hickory Creek) property. |
| 1981 |
|
Beker Phosphate Company opened Wingate. |
| 1983 |
|
Four Corners construction was completed. The operation was an equal partnership between IMC and W.R. Grace Corporation. |
| 1985 |
|
Wingate was closed after Beker Phosphate Company filed for bankruptcy. |
| 1985 |
|
Four Corners started production. |
| 1986 |
|
IMC purchased Brewster Phosphates and closed the Lonesome Mine which would later be consolidated into Four Corners. |
| 1986 |
|
Four Corners is idled due to market conditions. |
| 1986 |
|
The DeSoto (also known as Pine Level) property is sold by AMAX Chemical Company to Consolidated Minerals, Incorporated. |
| 1988 |
|
IMC gained 100% control of Four Corners. |
| 1989 |
|
IMC restarted Four Corners. |
| 1990 |
|
Wingate is acquired by Nu-Gulf. |
| 1992 |
|
Wingate is reopened after a joint venture by Nu-Gulf and Royster Industries but closed later that year. |
| 1993 |
|
IMC-Agrico is created by a joint venture between IMC and Agrico Chemical Company (a subsidiary of Freeport McMoRan). |
| 1995 |
|
CF Industries opened and started production at South Pasture. |
| 1995 |
|
Mobil Chemical Corporation opened and started production at South Fort Meade. |
| 1996 |
|
Cargill Fertilizer (later Cargill Crop Nutrition) acquired South Fort Meade. |
| 1996 |
|
DeSoto (a.k.a. Pine Level) and Ona (includes western portion of the Pioneer property) properties are sold by CMI to IMC-Agrico. |
| 1997 |
|
IMC acquired Freeport McMoRan’s share of IMC-Agrico. |
| 1998 |
|
Wingate is reopened. |
| 1999 |
|
Wingate is closed. |
| 2002 |
|
Cargill Crop Nutrition acquired the Pioneer property (eastern portion a.k.a. Hickory Creek) from Farmland-Hydro. |
| 2004 |
|
Cargill Crop Nutrition acquired and reopened the Wingate Facility. |
| 2004 |
|
Mosaic created out of a combination between IMC and Cargill Crop Nutrition. |
| 2005 |
|
Wingate is shutdown. |
| 2006 |
|
The Fort Green site is closed permanently, and the property is consolidated into Four Corners and Wingate. |
| 2008 |
|
Wingate is reopened. |
| 2014 |
|
Mosaic acquired CF Industries’ phosphate business in Florida, which included the South Pasture property. |
| 2018 |
|
South Pasture Facility is idled. |
| 2018 |
|
Ona (western portion) property is consolidated into Four Corners. |
| 2020 |
|
South Fort Meade acquired the Eastern Reserves Phase I. |
| 2022 |
|
South Fort Meade acquired the Eastern Reserves Phase II. |
Geology and Mineralization
The phosphate deposits of Florida are sedimentary in origin and part of a phosphate-bearing province that extends from southern Florida north along the Atlantic coast into southern Virginia. Sedimentary phosphate deposits consist of rock in which the phosphate mineral(s) occur in grains, pellets, nodules and as phosphate replacement of calcium in the remains of animal skeletal material and excrement.
Florida has phosphate rock distributed along the entire peninsula with varying lateral extents and abundance. There are five phosphate districts recognized in Florida identified as Northern, Northeast, Hardrock, Southeast and Central. The phosphate of Florida occur in sedimentary rocks and are of secondary origin, having been redeposited either by mechanical or chemical action. During deposition, most of the carbonate platform was drowned, and deposition was widespread. The intensity of reworking by marine processes allows some deposits to remain relatively near their origins and contribute to massive deposits while others were transported and winnowed into deposits of nodules, grains and pellets.
All our phosphate deposits are located in the central Florida Phosphate District. The general description of the phosphatic deposits in central Florida consist of two geological facies. The phosphate bearing units are within the Bone Valley Member of the Peace River Formation and the Undifferentiated Member of the Peace River Formation within the South Florida Extension region of the Central District. The deposit characteristics transition from northeast to the southwest. The major phosphate bearing units in the northeast consist of a productive Bone Valley Member with limited production in the Undifferentiated Member. The phosphate bearing units in the southwest exhibit limited production in the Bone Valley Member and a productive Undifferentiated Member of the Peace River Formation.
The phosphate stratigraphy consists of 5 to 50 feet (1.5 to 15.2 m) thick, white to brown poorly graded quartz sand with varying abundance of reworked phosphate grains as waste overburden. The economic zone is 13 to 50 feet (4.0 to 15.2 m) thick, with a grade ranging from 27% to 35% P2O5. It consists of tan-gray to gray quartz sands, dark gray to dark gray-blue-green clays and silts with phosphate nodules and pellets present with phosphate grains and clasts predominate. There can be interbedded waste zones of 0 to 15 feet (0.0 to 4.6 m) thick comprised of beds of cream to green barren sandy clay, clays or dense dolomitic clays. The basal units are dark gray to black clays to phosphatic limestone rubble to beds of phosphatic limestone.
Mineral Resource and Mineral Reserve Assumptions and Modifying Factors
The key mineral resource and mineral reserve assumptions and modifying factors are listed in Table 2.11.
Table 2.11: Key Assumptions and Modifying Factors:
|
|
|
|
|
|
|
|
|
|
|
|
|
|
|
| Parameter |
|
Value |
|
TRS Section |
| Supporting Information |
|
Regional geologic studies, 56,972 drill holes and greater than 40 years of mining history. |
|
Section 7 |
| Average total thickness of the phosphate mineralization |
|
13 to 50 feet (4 to 15 m) |
|
Section 6 |
Minimum Concentrate %P2O5 |
|
27.5% |
|
Section 11 |
Minimum Pebble %P2O5 |
|
18.3 to 22.9% |
|
Section 11 |
Maximum pebble magnesium oxide (“MgO”) cut-off volume |
|
2.5% |
|
Section 11 |
| Maximum Clay Content |
|
40 to 50% |
|
Section 11 |
| Maximum Dragline Mining depth |
|
85 feet (26 m) |
|
Section 11 |
| Maximum dredge mining depth |
|
109 feet (33 m) |
|
Section 11 |
| Production Days per Year |
|
365 days |
|
Section 11 |
| Mining Method |
|
Dredge and dragline mining |
|
Section 13 |
| Production Rate |
|
Approximately 9 to 13 million tonnes per year (2023-2033). |
|
Section 13 |
| Mineral Resource Cut-offs |
|
The cut-offs used to estimate mineral resources by site include, the minimum beneficiation plant concentrate BPL (%P2O5), minimum pebble BPL (%P2O5), maximum pebble magnesium oxide concentration and a maximum clay content cut-off for a logged matrix layer and the composite matrix volume. |
|
Section 11 |
| Mineral Reserve Cut-off |
|
Cut-off based on productivity factors per site have been applied to estimate mineral reserves. |
|
Section 12 |
| Mining Dilution |
|
11 to 18.9% minimum pebble volume dilution and 10.5 to 12.1% minimum concentrate volume dilution. |
|
Section 11 |
| Mineral Resource Impurity Recovery |
|
100% |
|
Section 11 |
| Mineral Reserve Pebble Impurity Recovery |
|
88 to 103% Fe2O3, 102 to 114% aluminum oxide (“Al2O3”), 92 to 100% CaO, 90 to 110% MgO |
|
Section 12 |
| Mineral Reserve Concentrate Impurity Recovery |
|
85 to 94% Fe2O3, 90 to 101% Al2O3, 94 to 100% CaO, 88 to 100% MgO |
|
Section 12 |
| Processing Method |
|
Beneficiation plants at the facilities consisting of washer, sizing and flotation processes. |
|
Section 14 |
| Mineral Resource Beneficiation Plant Recovery |
|
100% |
|
Section 11 |
| Mineral Reserves Beneficiation Plant Recovery |
|
Pebble: 80.3 to 100%, Concentrate: 70.8 to 76.4% |
|
Section 12 |
| Deleterious Elements and Impact |
|
Major elements include MgO, pyrite (FeS2) and Al2O3 affecting flotation and filtering processes. |
|
Section 10, 11,12 |
| Environmental Requirements, Permits etc. |
|
No significant environmental permitting encumbrances. |
|
Section 17 |
| Geotechnical Factors (if any) |
|
No concerns. |
|
Section 13 |
| Hydrological or hydrogeological factors (if any) |
|
Water inflow onto mining areas can impact recovery and dilution. |
|
Section 13 |
| Commodity Price |
|
$103/tonne of phosphate rock for 2022 mineral resources and $148/tonne for mineral reserves. |
|
Section 16 |
Mineral Resource Estimates
Mosaic’s phosphate mineral resources are reported as a beneficiation plant product (phosphate rock) tonnage and P2O5 grade, including a total primary impurities ratio (“MER”).
The geological information used to estimate the phosphate mineral resources for the mining facilities and exploration properties is based on drilling and sampling. The mineral resource estimates are completed using a proprietary software that applies specific grade, physical and impurity limits to the raw drill data of the property. These factors are used to select material that contains sufficient grade, limited impurities and is physically extractable to be included in the mineral resource estimate. The confidence and classification of the mineral resources is estimated based on the drill density of the evaluated area.
Mineral resources that are not mineral reserves have not demonstrated economic viability utilizing the criteria and assumptions required.
The methodology for estimating mineral resources consists of interpreting the available geological data to create composites of lithological units that meet the specified criteria. These composites are then mapped to determine the mineral resource boundary. The boundary is then trimmed to account for permit and mine boundary limitations. The composite data is also used to create a geologic model composed of volume, density, grade and impurity grids created using inverse distance weighted as the interpolation method. Elevation grids are created using triangulation based on LiDAR (Light Detection and Ranging) or survey data assigned to each drill hole. A utility macro is used to adjust elevations to account for holes with no matrix that meets the mine requirements. The data from each grid is then volumetrically combined using product volumes for the specific mineral resource shape and mineral resource classification creating a block of uniform constituents. Estimation of mineralization tonnage, grade and impurities is done by applying the volume weight percent of pebble, feed and clay for the given mineral resource shape.
Additional details regarding the estimation methodology are listed in Section 11 of the 2022 Florida Phosphate Mining TRS filed as an Exhibit to this Form 10-K.
Table 2.12 lists the total mineral resource estimates. Mineral resources are reported exclusive of the mineral reserves.
Table 2.12: Mineral Resources at the End of the Fiscal Year Ended December 31, 2025 Based on a LOM Plan Phosphate Rock Price of $148 per tonne(a)(b)(c)(d)(f)
|
|
|
|
|
|
|
|
|
|
|
|
|
|
|
|
|
|
|
|
|
|
|
|
|
|
|
|
|
|
|
| (tonnes in millions) |
|
|
|
|
|
|
|
|
|
|
| Category |
|
Tonnes(e) |
|
Grade %P2O5(e) |
|
Cut-off Grade |
|
Metallurgical Recovery % |
|
|
| Measured |
|
102.0 |
|
29.9 |
|
n/a |
|
100 |
% |
|
|
| Indicated |
|
415.0 |
|
30.1 |
|
n/a |
|
100 |
% |
|
|
| Measured + Indicated |
|
517.0 |
|
30.0 |
|
n/a |
|
100 |
% |
|
|
| Inferred |
|
83.0 |
|
30.0 |
|
n/a |
|
100 |
% |
|
|
______________________________
(a)Mineral resources are not mineral reserves and do not meet the threshold for mineral reserve modifying factors, such as estimated economic viability, that would allow for conversion to mineral reserves. There is no certainty that any part of the mineral resources estimated will be converted into mineral reserves. Mineral resources are reported exclusive of mineral reserves.
(b)Mineral resources are reported as mineralization (matrix) tonnage, grade and impurities after beneficiation.
(c)Mineral resources assume dragline mining at all sites except Wingate mine where dredging is assumed.
(d)Mineral resources amenable to a dragline mining method are contained within a conceptual mine pit design using the same technical parameters as used for mineral reserves.
(e)The cut-offs used to estimate mineral resources include: minimum beneficiation plant concentrate BPL (27.45%P2O5), minimum pebble BPL (18.30%P2O5, except 22.88%P2O5 for DeSoto and Pioneer), maximum pebble magnesium oxide concentration and a maximum clay content cut-off for a logged matrix layer, and the composite matrix volume.
(f)A LOM commodity price of $148 per tonne of phosphate rock was used to assess prospects for economic extraction but is not used for cut-off purposes.
Mineral Reserve Estimates
Mosaic’s estimated mineral reserves are located at the South Fort Meade, Four Corners and Wingate mine facilities and are reported as a beneficiation plant product (phosphate rock) tonnage and P2O5 grade including a total MER. Mineral reserves have demonstrated economic viability utilizing the criteria and assumptions required at each phosphate facility and meet all the mining criteria required including, but not limited to mining, processing, metallurgical, infrastructure, economic, marketing, legal, environmental, social and governmental factors.
The methodology for estimating mineral reserves consists of interpreting the available geological data to create composites of lithological units that meet the specified reserve criteria. A utility macro is used to apply reserve plant volume recoveries, adjust insoluble limits to the geologic model and to adjust elevations grids to account for holes with no matrix that meets the mine requirements. Dragline or dredge pit design work and scheduling are applied to the geologic model by the mine planner. Tonnes, grades and product quality are estimated by applying the mining shapes to the geological model. The data from each grid is then volumetrically combined using product volumes for the specific mine pit shape creating a block of uniform constituents. The recoverable tonnes of pebble and feed for the entire mine pit are calculated based on the area of the mine pit. The beneficiation plant grade recoveries are then applied to the recoverable feed tonnes to estimate the mineral reserves and recoverable concentrate tonnes.
Additional details regarding the estimation methodology are listed in Section 12 of the 2022 Florida Phosphate Mining TRS filed as an Exhibit to this Form 10-K.
The mineral reserve estimates are listed in Table 2.13.
Table 2.13: Mineral Reserves at the End of the Fiscal Year Ended December 31, 2025 Based on a LOM Plan Phosphate Rock Price of $148 per tonne(a)(b)(c)(d)(e)
|
|
|
|
|
|
|
|
|
|
|
|
|
|
|
|
|
|
|
|
|
| (tonnes in millions) |
|
|
|
|
|
|
| Category |
|
Tonnes |
|
Grade
%P2O5
|
|
Metallurgical Recovery % |
| Proven |
|
38 |
|
27.6 |
|
Pebble: 80.3 to 100%, Concentrate: 70.8 to 76.4% |
| Probable |
|
58 |
|
26.9 |
|
Pebble: 80.3 to 100%, Concentrate: 70.8 to 76.4% |
| Proven + Probable |
|
96 |
|
27 |
|
Pebble: 80.3 to 100%, Concentrate: 70.8 to 76.4% |
___________________________
(a)South Fort Meade and Four Corners mineral reserves are mined by a dragline mining method. Wingate mineral reserves are mined by dredge mining.
(b)Cut-off based on productivity factors per site have been applied to estimate mineral reserves. Recoverable finished product tonnes vs. matrix volume mined ranges from 9.4-9.9%. Recoverable finished product tonnes vs. total volume mined is 2.2%.
(c)Mine designs are used to constrain measured and indicated mineral resources within mineable pit shapes.
(d)Only after a positive economic test and inclusion in the LOM plan are the mineral reserve estimates considered and disclosed as mineral reserves.
(e)A commodity price of $148 per tonne of phosphate rock was used to assess the economic viability of the mineral reserves in the LOM (2025 price estimate).
Mineral Resources and Mineral Reserves Comparison
The mineral resource estimated tonnage and grades did not change from 2024 to 2025.
As of December 31, 2025, we had mineral reserves of 96 million tonnes compared to 100 million in the prior year, resulting in a decrease of 7% for proven reserves and a decrease of 2% for probable reserves. Changes in mineral reserve tonnage from the prior year are the result of mining depletion and re-evaluations.
BELLE PLAINE
The Belle Plaine Facility is in the rural municipality of Pense (No. 160) in the province of Saskatchewan, Canada. It is located north of the TransCanada Highway (Hwy. 1) approximately 32 miles (51 km) west of Regina (Figure 2.4). It is the oldest and largest potash solution mine in the world. Coordinates for the Belle Plaine Facility are +50° 25’ 39.57, -105° 11’ 53.87” +50° 25’ 39.57,” -105° 11’ 53.87”.
We lease 53,131 acres of mineral rights from the Crown under Subsurface Mineral Lease KL 106-R. Table 2.14 lists additional information regarding the lease. Table 2.15 outlines the lease acreage designated by township and section. The lease term is for a period of 21 years from July 2012, with renewals at the Company’s option for additional 21-year periods.
In addition, we own 19,284 acres of mineral rights within the Belle Plaine area as shown in Table 2.16 below. All mineral titles owned or leased by us include “subsurface minerals,” which under The Subsurface Mineral Tenure Regulations, 2015 (Saskatchewan) means “all-natural mineral salts of boron, calcium, lithium, magnesium, potassium, sodium, bromine, chlorine, fluorine, iodine, nitrogen, phosphorus and sulfur, and their compounds, occurring more than 197.0 feet (60.0 m) below the surface of the land”. Other commodities (e.g., petroleum and natural gas, coal, etc.) may be included within mineral rights we lease or own but are not specifically sought after when acquired.
Within the total acreage leased from the Crown or owned by us are parcels of land where we own or lease less than a 100% share of the mineral rights. 100% control by lease or ownership is required for mineral extraction. Acreages currently not mineable for this reason are listed in Table 2.17 below.
There are no significant environmental permitting encumbrances, existing or anticipated in the future, associated with the Belle Plaine Facility. We do not anticipate any future encumbrances based on current known regulations and existing permitting processes. There are no outstanding fines or material violations.
The net book value for Belle Plaine is $0.9 billion as of December 31, 2025.
Figure 2.4: Location Plan
Table 2.14: Mineral Lease
|
|
|
|
|
|
|
|
|
|
|
|
|
|
|
|
|
|
|
|
|
| Crown Lease Number |
|
Type |
|
Area (Ha) |
E |
Expiration Date |
| KL 106-R |
|
Subsurface Mineral Lease |
|
21,501 |
|
|
July 1, 2033 |
Table 2.15: Sections and Acreages Owned by the Crown
|
|
|
|
|
|
|
|
|
|
|
|
|
|
|
| Township/Range |
|
Sections of Mineral Rights Owned by Crown* |
|
Area of Mineral Rights Owned by Crown (acres) |
| 18/21 |
|
2/100 |
|
12 |
| 19/21 |
|
4-13/16 |
|
3,087 |
| 17/22 |
|
4-14/16 |
|
3,118 |
| 18/22 |
|
9-10/16 |
|
6,166 |
| 19/22 |
|
9-6/16 |
|
5,991 |
| 17/23 |
|
9-11/16 |
|
6,201 |
| 18/23 |
|
14-13/16 |
|
9,475 |
| 17/24 |
|
7-1/16 |
|
4,500 |
| 18/24 |
|
18-7/16 |
|
11,813 |
| 18/25 |
|
4-5/16 |
|
2,768 |
| Total |
|
83-2/100 |
|
53,131 |
*Full sections range from 640 acres to 644 acres; total acreage shown above is based on 640 acres per section where actual survey acreage is not available.
Table 2.16: Sections and Acreages of Mosaic Owned Mineral Rights
|
|
|
|
|
|
|
|
|
|
|
|
|
|
|
|
|
|
|
|
|
| Township/Range |
|
Sections of Mineral Rights Owned by Mosaic* |
|
Area of Mineral Rights Owned by Mosaic (acres) |
|
Area of Full Quarter Sections Owned by Mosaic (acres) |
| 17/23 |
|
10-14/16 |
|
6,962 |
|
5,910 |
| 18/23 |
|
6-11/16 |
|
4,275 |
|
3,817 |
| 17/24 |
|
7-7/16 |
|
4,762 |
|
3,526 |
| 18/24 |
|
5-2/2016 |
|
3,285 |
|
2,871 |
| Total |
|
30-2/16 |
|
19,284 |
|
16,124 |
*Full sections range from 640 acres to 644 acres; total acreage shown above is based on 640 acres per section where actual survey acreage is not available.
Table 2.17: Partial Mineral Rights Area
|
|
|
|
|
|
|
|
|
|
|
|
|
|
|
| Township/Range |
|
Sections of Crown Mineral Rights Leased by Mosaic, Currently Not Mineable* |
|
Crown Mineral Rights Leased by Mosaic, Currently Not Mineable (acres) |
| 18/22 |
|
1-2/100 |
|
652 |
| 19/22 |
|
1-7/100 |
|
682 |
| 18/23 |
|
38/100 |
|
241 |
| 18/24 |
|
48/100 |
|
307 |
| Total |
|
2-94/100 |
|
1,882 |
*Full sections range from 640 acres to 644 acres; total acreage shown above is based on 640 acres per section where actual survey acreage is not available.
Existing Infrastructure
The Belle Plaine Facility consists of a mining area and a processing plant. Based on the current mine life, the mineral reserves support mining for 61 years. The processing plant consists of a refinery and cooling pond. The Belle Plaine Facility has the infrastructure in place to meet the current production goals and LOM plan. The current infrastructure includes major road and highway access, railway support from Canadian National Railway (“CNR”) and Canadian Pacific Railway (“CPR”), SaskPower-supplied electricity, Trans Gas-supplied natural gas and potable and non-potable water supplied from a local fresh water source.
The current Tailings Management Area (“TMA”) footprint is designed to support the volume and deposition rates indicated in the 2025 LOM plan.
The main source of water (non-potable) required for production is provided by SaskWater from Buffalo Pound Lake, an 18 mile (29 km) long, 0.6 mile (1 km) wide lake with an average depth of 10 ft. (3 m), located northwest of the mine (Figure 15-1). Buffalo Pound Lake also supplies potable water for the cities of Regina, Moose Jaw and surrounding regions. Water levels are controlled by the SaskWater Security Agency and managed through the Lake Diefenbaker Dam. SaskWater operates a dedicated pumping station located on the south shore of Buffalo Pound Lake near the eastern edge of the lake with capacity of approximately 13,000 U.S. gallons per minute. There are three on duty pumps and a fourth on standby to ensure steady supply. Belle Plaine typically runs two pumps to meet the current water needs with the other pumps providing peaking capacity for future mining. Potable water is supplied for the site from the Buffalo Pound Water Treatment facility that is operated by SaskWater. Belle Plaine also has a tie-in to the potable water line that feeds the City of Regina.
SaskPower provides a portion of the power required to run the Belle Plaine Facility. This power comes in off their main grid that could be fed from any number of power plants, along the highline running north and south along Kalum Road. A total of 138 kV comes into the Belle Plaine substation through overhead lines where it is then stepped down to 13.8 kV using two transformers (28 MVA and 33.3 MVA) to their substation where there is also a 138 kV grounding transformer and a 138 kV gas insulated switchgear lineup. The Belle Plaine Facility generates power from the site powerhouse from two turbine generators. Typically, the total required Belle Plaine power requirement is 90% in-house generated power with the remaining being 10% fed from SaskPower. Belle Plaine does not have the option to send power back to the SaskPower grid.
From the on-site substation, 13.8 kV transformer secondary wires are fed to 13.8 kV switchgear lineup in the powerhouse to MCC rooms throughout the plant area and mine area. Belle Plaine uses overhead and buried cables throughout the mine area and cable trays in the refinery for the 13.8 kV wires. Belle Plaine owns a 138 kV air disconnect that is tied into SaskPower.
SaskEnergy supplies natural gas to the Belle Plaine Facility. The gas flows from the main lines into a local regulator station situated just north of the administration building and powerhouse. This station takes the high-pressure feed from the main lines and cuts it down through on-site filtration and also does some pre-heating to provide low pressure gas directly to the facility.
There are a variety of local or site roads on or to the Belle Plaine property. These are typically gravel roads. Roads around the processing plant are paved.
CNR and CPR are available to the Belle Plaine Facility to move final product to port. There is a tri-party joint operating agreement among Mosaic, CPR and CNR which governs the joint operation and interaction of all parties for freight services at the Belle Plaine Facility.
The Belle Plaine Facility is located between the cities of Moose Jaw and Regina, Saskatchewan. Moose Jaw has a population of approximately 34,000 people and is located 17 miles (28 km) west of the Belle Plaine Facility.
The Belle Plaine Facility workforce primarily lives in Regina and Moose Jaw. Belle Plaine Facility personnel are typically trained through a variety of trades programs offered at the Saskatchewan Polytechnic campuses, the University of Regina or the University of Saskatchewan.
The province of Saskatchewan offers a large variety of suppliers for the potash mine operators. The potash industry in Saskatchewan is very mature which makes it easier to attract vendors to support the needs of the various mine sites throughout the province.
Saskatoon and Regina both have large industrial sectors with a variety of machine shops and industrial support services. Some specialty services are provided from the Alberta or Manitoba oil and gas industry.
Supplies are sourced locally, regionally and internationally based on availability or commercial considerations. Lead times and on-hand inventory are balanced to meet the needs of the site.
Mining Method
The Belle Plaine Facility accesses the potash mineral reserves remotely by solution mining the ore. Paired wells are directionally drilled, cased and cemented to the base of the potash beds and are then connected underground using proprietary potash mining techniques.
Solution mining can target extraction of the potash (“KCl”) beds. Current mining practices allow for all three potash beds in the Prairie Evaporite formation to be recovered. Water, or a weaker brine, is injected into the cavern to return a salt saturated and potash rich brine. This fluid is pumped through pipelines from the mining area and sent to the refinery complex as raw feed for further processing. The total life cycle of each cavern is approximately 25 years. Once the potash recovery is exhausted, each cavern is plugged and decommissioned in accordance with local government regulations.
The current production capacity of the Belle Plaine Facility is 3.2 million finished KCl tons/year (2.9 million finished tonnes/year).
Capability is scheduled to ramp up to support a finished tonnage projection of 3.3 million tons (3.0 million tonnes) per year and will do so until drilling is completed in the year 2066 at which point there will be a ramp down in production until 2084.
The 2025 Belle Plaine LOM plan based on mineral reserves has a total mine life of 59 years, ending in 2084.
Processing Recovery Method
The Belle Plaine Facility processing plant receives KCl-NaCl rich brine, known as raw feed, from the mine and achieves KCl recovery through the refinery and cooling pond areas. Well established solubility curves of H2O-NaCl-KCl systems are utilized to monitor the selective dropout of products in the process.
The refinery subjects the raw feed brine from the mining area to changing temperatures and pressures that selectively precipitates the NaCl and then the KCl out of solution in different stages of the process. Selective drop out of NaCl is achieved through two parallel lines of evaporators that heat the brine with steam that is generated on-site through natural gas fired boilers. The heating of the raw feed brine results in water liberation, causing NaCl to concentrate in the brine and then precipitate out of solution. After the brine is conditioned in the evaporator circuit, it is pumped to the thickener area for clarification and then pumped into a crystallizer circuit for KCl recovery. The crystallizer circuit subjects the process brine to a vacuum that allows further boiling, creating a cooling effect on the brine. As the brine cools, the KCl is forced to precipitate out of solution. The solid KCl is withdrawn from the crystallizer vessel as a slurry and pumped to the dewatering and drying area. The brine that overflows the crystallizer circuit, which still contains some dissolved KCl and NaCl, is fed to the cooling pond area for further KCl recovery.
The cooling pond area consists of multiple ponds that are fed with brine from the refinery and with raw feed brine from the mining area. The ponds facilitate atmospheric cooling, which allows KCl to preferentially precipitate out of the brine and then settle to the bottom of the ponds. The cooling pond area contains several KCl dredges that are comprised of a cutter wheel that fluidizes the deposited KCl from the bottom of a cooling pond and a slurry pump that moves the KCl slurry toward the dewatering and drying areas.
The dewatering and drying area removes the bulk of the brine in the slurry through process equipment and then conveys the KCl product into natural gas fired industrial dryers. The dried KCl product is then fed into the sizing area or compaction area for compacting, crushing, and screening processes to achieve product size specifications. Finished product is then conveyed to the on-site storage area, where it is held until being reclaimed, rescreened and shipped off-site, primarily through rail.
Site production is expected to increase to a stabilized 3.0 million tonnes per year until the year 2066, at which time the site will stop drilling new cavities and ramp down production to 2084. The site’s ability to produce at a sustained 3.0 million tonnes per year in future years is backed by a Canpotex proving run in 2016/2017, in which the Belle Plaine Facility achieved a production nameplate of 12,179 tons/day. Total site processing recovery will average approximately 79% throughout the remaining life of the mine and is dependent on sustained drilling activities. Future projections are modeled with mass and energy balance software to predict the future production and recovery capabilities.
History and Exploration
The Belle Plaine Facility started production in 1964, after a period of significant research into solution mining, potash recovery and processing plant construction. Table 2.18 summarizes the important historical dates and events for the Belle Plaine Facility.
Table 2.18: History
|
|
|
|
|
|
|
|
|
| Date |
|
Event/Activity |
| 1928 |
|
Discovery of evaporites in the sedimentary sequence in Saskatchewan. |
| 1956 to 1966 |
|
Pittsburgh Plate Glass completed significant research and development over a decade and published several research papers concerning solution mining and potash recovery. |
| 1960 |
|
A pilot solution mining project located at the current site was constructed, convincing Pittsburgh Plate Glass to develop the first commercial potash solution mining operation in the world based on the pilot plant results. The first exploration well drilled at the Belle Plaine property was Standard Chemical Stony Beach #1 in August 1960. Fourteen additional exploration wells were drilled from August 1960 to June 1968. |
| 1963 |
|
Kalium Chemicals, Ltd, a joint subsidiary of Pittsburgh Plate Glass and Armour and Co. started construction of the original processing plant for a capacity of 0.544 million tonnes annually. The main plant construction consisted of the North and South evaporators (all 8), crystallizers #1 to #4, #1 and #2 compactor systems, #1 to #5 beehive warehouses, loadout building and the office and maintenance buildings. |
| 1964 |
|
Mine and processing plant construction completed and production commences. The first rail car of potash was produced and shipped in August. |
| 1968 |
|
Capacity expansion to 0.9 million tonnes per year. Main assets added included three more crystallizers (#5, #6 and #7), a third cooling tower, a sixth beehive warehouse and a barn style warehouse #7, a fluid bed dryer and filter table and a third boiler. |
| 1980 to 1984 |
|
Two capacity expansions, first to 1.1 million tonnes and the second to 1.5 million tonnes per year. The major assets added included bucket elevators for each product, the fine fluid bed dryer, #4 compactor, reheat system barometric, additional galleries and conveyors to the warehouse (1A), cooling ponds, scrubbers and the Cold Leach Area. |
| 1989 |
|
Belle Plaine Facility sold to Sullivan & Proops (Vigoro). |
| 1990s |
|
Capacity expansion to 2.0 million tonnes per year. Assets added included the K-Life System, #4 Turbo Generator, dual conveyors, conversion of the compaction system and additional compactors installed. |
| 1995 |
|
IMC purchased Belle Plaine. |
| 1998 |
|
The first 2D seismic survey at the Belle Plaine mine site was completed. A total of 160 line km was completed covering an area of approximately 5.4 sq. miles (14 sq. km). |
| 2000 |
|
The first 3D seismic survey at the Belle Plaine Facility was completed, providing critical geological information about the geology of the potash members. This has become a critical tool used to provide confidence in the interpretation of the potash mineralization. |
| 2001 |
|
The 2001 Belle Plaine Facility 3D seismic survey was completed. The survey covered approximately 5 sq. miles (13 sq. km) and was adjacent to and merged with the 2000 survey. This survey program utilized 35 miles (56 km) of source lines and 45 miles (72 km) of receiver lines. |
| 2004 |
|
The Mosaic Company formed from a combination of IMC Global and Cargill’s Crop Nutrition business. |
| 2005 |
|
The 2005 Belle Plaine Facility 3D seismic survey was completed. The survey covered approximately 4 sq. miles (11 sq. km) and was adjacent to and merged with previous 3D surveys. This survey program utilized 29 miles (47 km) of source lines and 34 miles (55 km) of receiver lines. |
| 2008 |
|
The 2008 3D seismic survey covered approximately 28 sq. miles (72 sq. km) and was adjacent to and merged with previous 3D surveys. This survey program utilized 239 miles (385 km) of source lines and 235 miles (378 km) of receiver lines. |
| 2008 to 2012 |
|
Capacity was expanded to 2.86 million tonnes per year. Assets added the injection wells 3 and 4, reclaim brine system, #4 boiler, process water building, cold leach motor control center room, #5 compaction system, #8 warehouse building, #2 reclaim, reclaim losses system, pond return slurry tank and centrifuge upgrades, rotary dryer #3, #2 loadout system, 37 miles (60 km) of new mine field pipelines, a drilling rig, new substation and replacement of the #4 crystallizer. |
|
|
|
|
|
|
|
|
|
| 2010 |
|
The Pense 3D seismic survey was completed that covered approximately 15 sq. miles (40 sq. km) and was adjacent to and merged with the previous 3D surveys. This survey program consisted of 136 miles (219 km) of source lines and 129 miles (208 km) of receiver lines. |
| 2014 |
|
Plant upgrades included the adding and commissioning of Compaction #6. |
| 2016/2017 |
|
The site’s ability to produce at a sustained 3.0 million tonnes per year in future years was validated through a “proving run” completed in 2016 when the Belle Plaine Facility achieved a proven peak capacity of 3.9 million tonnes per year. |
| 2019 |
|
Plant upgrades were completed, consisting of adding the east thickener and advanced dewatering techniques. |
| 2020 |
|
Two production wells were cored in 2020 to support the grade interpretation and calibration of the gamma geophysical logging system. The recent calibration check has been evaluated by a third party potash consultant to ensure applicability of the method regarding sample quality grade estimation. |
Geology and Mineralization
The intracratonic Elk Point Basin is a major sedimentary geological feature in western Canada and the northwest U.S. It contains one of the world’s largest stratabound potash resources. The nature of this type of deposition is largely continuous with predictable depths and thickness. It is mined at several locations, including Mosaic's Esterhazy Facility.
Potash at the Belle Plaine Facility occurs conformably within Middle Devonian-age sedimentary rocks ranging in thicknesses from approximately 100 to 131 feet (30.0 to 40.0 m) at a depth of approximately 5,345 to 5,740 feet (1,630 to 1,750 m).
The Prairie Evaporite Formation, host to the potash mineralization, is divided into a basal lower salt and an overlying unnamed unit containing three potash-bearing units and one unit containing thin marker beds. In ascending order, the potash horizons in the upper unit are the Esterhazy Member, White Bear Marker Beds, Belle Plaine Member and Patience Lake Member. Mineralogically, these members consist of sylvite and halite with minor amounts of carnallite (KCl, MgCl2, 6H2O).
The Esterhazy, Belle Plaine and Patience Lake members underly the Belle Plaine property. Also present are the White Bear Formation marker beds which occur between the Belle Plaine and Esterhazy members but are of insufficient thickness to be minable.
The following is a summary of the key stratigraphic units for the Belle Plaine Facility area:
•Patience Lake Member: The uppermost member of the Prairie Evaporite Formation with potash production potential. Between the top of the Prairie Evaporite and the top of the Patience Lake Member is a 0 to 45 feet (0.0 to 14.0 m) thick unit of halite with clay bands called the Salt Back. The sylvite-rich horizons within the Patience Lake Member are mined using conventional underground mining techniques along a trend from Vanscoy to Lanigan in the Saskatoon area and by solution mining techniques at Belle Plaine.
•Belle Plaine Member: The Belle Plaine Member underlies the Patience Lake Member and is separated from it by a zone of low grade sylvinite. The Belle Plaine Member is mined using solution mining techniques at the Belle Plaine Facility.
•White Bear Formation: The White Bear Formation consists of marker beds that are a distinctive unit of thin interbedded clay, halite, and sylvinite horizons that are not minable due to insufficient thicknesses of only 4.0 to 5.0 feet (1.2 to 1.5 m).
•Esterhazy Member: The Esterhazy Member is separated from the Belle Plaine Member by the White Bear Formation marker beds, a sequence of clay seams, low-grade sylvinite, and halite. The Esterhazy Member is mined using conventional underground techniques at the Esterhazy Facility in southeastern Saskatchewan, and by solution mining techniques at the Belle Plaine Facility.
The mineable potash mineralization at Belle Plaine occurs in the three major potash bearing members, all of which are included in the solution mining. The potash mined at Belle Plaine is a mixture of halite and sylvite and in some parts of the mining area, small amounts of carnallite. There are several clay-rich zones that are not recovered in the solution mining process which recovers a concentrate portion of the minerals rather than the entire bed.
When considering the sequence of mining at the Belle Plaine Facility, the following terminology is applied to the beds. This describes the geology in a way that best summarizes the grades that are available for solution mining.
•The Upper Mining Zone consists of beds 38 to 31 of the Patience Lake Member and beds 23 to 21 of the Belle Plaine Member. The Upper Mining Zone is about 90 feet (27.4 m) thick.
•The Salt Stringer is a thin bed of salt located between Beds 31 and 23 in the Upper Mining Zone. The Salt Stringer is approximately 10 feet (3.0 m) thick.
•The Interzonal Salt is a thick bed of salt located between the Lower and Upper Mining Zones.
•The Marker Bed is a small, very rich potash bed located midway through the Interzonal Salt.
•The Lower Mining Zone consists of beds 13, 12 and 11 of the Esterhazy Member. The Lower Mining Zone is approximately 20 feet (6.1 m) thick.
Potash mineralization contains sylvinite: a mixture of the iron oxide-stained halite, sylvite and local carnallite. When present interstitially or as massive pods, carnallite can deteriorate rapidly or be preferentially dissolved. The color of the potash can vary from light orange to deep red rimmed crystals. The mineralization can be locally bedded or massive. The halite and sylvite crystals can range from small to more typically coarse to large which can be attributed to the conditions during deposition as there has been no alteration.
Mineral Resource and Mineral Reserve Assumption and Modifying Factors
The key mineral resource and mineral reserve assumptions and modifying factors are listed in Table 2.19.
Table 2.19: Key Assumptions and Modifying Factors
|
|
|
|
|
|
|
|
|
|
|
|
|
|
|
| Parameter |
|
Value |
|
TRS Section |
| Supporting Information |
|
Regional geologic studies, 700 production wells, seismic surveys and greater than 55 years of mining history from approximately 350 caverns. |
|
Section 7, 11 |
| Average composited total thickness of the potash mineralization amenable to solution mining |
|
102.2 feet (31.1 m) |
|
Section 11 |
| Tonnage Factor |
|
17.2 cu ft./tonne (2,054 kilograms per cubic meter). |
|
Section 11 |
| Average KCl grade from all drilling |
|
30.6% (19.3% K2O) |
|
Section 11 |
| Operating Days per Year |
|
365 days |
|
Section 13 |
| Mining Method |
|
Solution mining from surface installations. |
|
Section 13 |
| Production Rate |
|
3.0 million tonnes per year. |
|
Section 13 |
| Cut-off |
|
No cut-off grade or value based on commodity price is used to estimate mineral resources. This is because the solution mining method used at Belle Plaine mining is not grade selective. |
|
Section 11, 12 |
| Mining Recovery |
|
21.5% |
|
Section 13 |
| External Dilution |
|
None |
|
Section 12 |
| Processing Method |
|
KCl recovered from brine solution. |
|
Section 14 |
| Processing Recovery |
|
79 to 90% |
|
Section 14 |
| Deleterious Elements and Impact |
|
Trace NaCl and MgCl2 |
|
Section 10 |
| Environmental Requirements – Permits, etc. |
|
No significant environmental permitting encumbrances. |
|
Section 17 |
| Geotechnical Factors (if any) |
|
No concerns. |
|
Section 13 |
| Hydrological or Hydrogeological Factors (if any) |
|
No concerns. |
|
Section 13 |
| Commodity Prices |
|
KCl commodity prices of US$255 for mineral reserves. |
|
Section 17 |
| Exchange Rate (US$/C$) |
|
1.37 |
|
Section 17 |
Mineral Resource Estimates
The Belle Plaine Facility mineral resources are reported as in-situ mineralization and are exclusive of mineral reserves. The mineral resources occur in the Esterhazy, Belle Plaine and Patience Lake members. Mineral resources that are not mineral reserves have demonstrated economic viability utilizing the criteria and assumptions required at the Belle Plaine Facility.
Mineral resources that are not mineral reserves have demonstrated economic viability utilizing the criteria and assumptions required at Esterhazy.
The methodology for estimating mineral resources consists of interpreting the available geological data in plan view using AutoCAD 2020 software. The plan is updated to include the current mineral rights status, seismic survey interpretations, the limits of the current mining footprint, known areas (geological anomalies, town sites and other surface infrastructure) that make the mineral resource inaccessible and the planned cluster sites.
Additional details regarding the estimation methodology is listed in Section 11 of the 2024 Belle Plaine Facility TRS.
The mineral resource estimates for the Belle Plaine Facility are listed in Table 2.20.
Table 2.20: Mineral Resources as of December 31, 2025 Based on LOM Plan KCI Price of $255 per tonne(a)(b)(c)(d)(e)(g)(h)(i)
|
|
|
|
|
|
|
|
|
|
|
|
|
|
|
|
|
|
|
|
|
|
|
|
|
|
|
|
|
|
|
|
|
| (tonnes in millions) |
|
|
|
|
|
|
|
|
|
|
| Category |
|
Tonnes |
|
Grade
%K2O
|
|
Grade
%KCl |
|
Cut-off
Grade(f)
|
|
Metallurgical
Recovery |
| Inferred |
|
4,647 |
|
|
19 |
|
31 |
|
n/a |
|
79 to 90% |
___________________________
(a)The mineral resources are reported as in-situ mineralization.
(b)Mineral resources are reported exclusive of those mineral resources that have been converted to mineral reserves.
(c)Mineral resources are not mineral reserves and do not meet the threshold for mineral reserve modifying factors, such as estimated economic viability, that would allow for conversion to mineral reserves. There is no certainty that any part of the mineral resources estimated will be converted into mineral reserves.
(d)Mineral resources assume solution mining.
(e)Mineral resources amenable to a solution mining method are contained within a conceptual cluster and cavern design using the same technical parameters as used for mineral reserves.
(f)No cut-off grade is used to estimate mineral resources. This is because the solution mining method used at the Belle Plaine Facility is not selective. At no point in the cavern development and mining process can a decision be made to mine or not mine the potash mineralization that is in contact with the mining solution. There is no control on what potash grade the mining solution dissolves to make a concentrate that is pumped to surface from the mining caverns for processing.
(g)Tonnages are in U.S. Customary and metric units and are rounded to the nearest million tonnes.
(h)Rounding as required by reporting guidelines may result in apparent summation differences.
(i)2025 LOM price evaluation.
Mineral Reserve Estimates
The Belle Plaine Facility mineral reserves are reported as in-situ mineralization accounting for all applicable modifying factors. Mineral reserves meet all the mining criteria required at the Belle Plaine Facility including, but not limited to mining, processing, metallurgical, infrastructure, economic, marketing, legal, environmental, social and governmental factors.
The methodology for estimating mineral reserves consists of solution mining design work and scheduling and the application of mining recovery and unplanned dilution. Additional details regarding the estimation methodology are listed in Section 12 of the 2024 Belle Plaine Facility TRS.
The mineral reserve estimates for the Belle Plaine Facility are listed in Table 2.21.
Table 2.21: Mineral Reserves at the End of the Fiscal Year Ended December 31, 2025 Based on a LOM Plan KCl Price of $255 per tonne(a)(b)(c)(d)(e)(f)
|
|
|
|
|
|
|
|
|
|
|
|
|
|
|
|
|
|
|
|
|
|
|
|
|
|
|
| (tonnes in millions) |
|
|
|
|
|
|
|
|
| Category |
|
KCl Tonnes |
|
Grade
%KCl |
|
Grade
%K2O
|
|
Metallurgical
Recovery % |
| Proven |
|
268 |
|
|
30.6 |
|
19.3 |
|
21.5% |
| Probable |
|
371 |
|
|
30.6 |
|
19.3 |
|
21.5% |
| Proven + Probable |
|
639 |
|
|
30.6 |
|
19.3 |
|
21.5% |
___________________________
(a)Mineral reserves are based on measured and indicated mineral resources only.
(b)All mineral reserves are mined by a solution mining method.
(c)No cut-off grade is used to estimate mineral reserves. This is because the solution mining method used at the Belle Plaine Facility is not selective. At no point in the cavern development and mining process can a decision be made to mine or not mine the potash mineralization that is in contact with the mining solution. There is no control on what potash grade the mining solution dissolves to make a concentrate that is pumped to surface from the mining cavities for processing.
(d)Only after a positive economic test and inclusion in the LOM plan is the mineral reserve estimate included as a mineral reserve.
(e)Tonnages are in U.S. Customary and metric units and are rounded to the nearest million tonnes. The grades are rounded to one decimal place.
(f)The average LOM plan KCl price of $255/tonne was used to assess economic viability for the mineral reserves, but were not used for cut-off purposes.
Mineral Resources and Mineral Reserves Comparison
There were no changes in the mineral resource estimates from 2024 to 2025.
As of December 31, 2025, our estimated mineral reserves were 639 million tonnes compared to 654 million as of the prior year-end, resulting in an increase of 1% for proven reserves and a decrease of 4.3% for probable reserves.The year-over-year change is due to mining depletion.
ESTERHAZY
The Esterhazy Facility is approximately 10 miles (16 km) to the east of the town of Esterhazy in Saskatchewan, Canada, 56 miles (90 km) southeast of the city of Yorkton and 137 miles (220 km) east of the city of Regina (Figure 2.5). The K1 mill site is located nine miles (14 km) northeast of Esterhazy. The K2 mill site is located 12 miles (19 km) east of Esterhazy. The K3 mine site is located four miles east (six km) of Esterhazy and the K4 mineral resources are located 18 miles northeast of Esterhazy. The geographic coordinates for K1 are latitude 50.726463 N and longitude -101.933506 W, the K2 coordinates are latitude 50.6574 N and longitude -101.8422 W and the K3 coordinates are latitude 50.64623 N and longitude -101.99346 W.
Mosaic, through Mosaic Potash Esterhazy Limited Partnership, a wholly-owned indirect subsidiary of Mosaic, leases 197,940.75 acres of mineral rights from the Crown under Subsurface Mineral Leases KL 105, KL 126, and KLSA 003. Table 2.22 lists additional information regarding the three Crown leases. Table 2.23 outlines the total acreage of the Crown leases designated by township and range. The lease terms are 21 years, with renewals at our option for successive 21-year periods.
We also own or lease 212,890.71 acres of freehold mineral rights within the Esterhazy area as shown in Table 2.24 below. All mineral titles owned or leased by Mosaic include the “subsurface mineral” which under The Subsurface Mineral Tenure Regulations (Saskatchewan) means all natural mineral salts of boron, calcium, lithium, magnesium, potassium, sodium, bromine, chlorine, fluorine, iodine, nitrogen, phosphorus and sulfur, and their compounds, occurring more than 60 m below the surface of the land. Other commodities (e.g., petroleum and natural gas, coal, etc.) that are not specifically sought after when acquired may be on mineral titles that Mosaic leases or owns.
Within the total acreage leased from the Crown or owned/leased by us are parcels of land where we own or lease less than a 100% share of the mineral rights. To mine these properties, we would need to acquire 100% control either by lease or ownership. Acres currently not mineable for this reason are listed in Table 2.25 below.
There are no significant environmental permitting encumbrances (existing or anticipated in the future) associated with the Esterhazy Facility. Except for royalties, we do not anticipate any future encumbrances based on current known regulations and existing permitting processes. There are no outstanding fines or material violations.
The net book value for Esterhazy is $3.3 billion as of December 31, 2025.
Figure 2.5: Location Plan
Table 2.22: Mineral Lease
|
|
|
|
|
|
|
|
|
|
|
|
|
|
|
|
|
|
|
|
|
| Crown Lease Number |
|
Type |
|
Area (Hectares) |
|
Expiration Date |
| KL 105 |
|
Subsurface Mineral Lease |
|
26,198 |
|
|
October 31, 2044 |
| KL 126 |
|
Subsurface Mineral Lease |
|
28,473 |
|
|
October 25, 2026 |
| KLSA 003 |
|
Subsurface Mineral Lease |
|
25,433 |
|
|
November 18, 2030 |
Table 2.23: Sections and Acreages Owned by the Crown
|
|
|
|
|
|
|
|
|
|
|
|
|
|
|
| Township/Range |
|
Sections of Mineral Rights Owned by Crown* |
|
Area of Mineral Rights Owned by Crown (acres) |
| 19/30 |
|
19-2/16 |
|
12,221 |
| 20/30 |
|
18-1/16 |
|
11,542 |
| 21/30 |
|
18-6/16 |
|
11,753 |
| 22/30 |
|
2-1/16 |
|
1,331 |
| 19/31 |
|
18-1/16 |
|
11,561 |
| 20/31 |
|
19-3/16 |
|
12,265 |
| 21/31 |
|
13-7/16 |
|
8,613 |
| 22/31 |
|
15-15/16 |
|
10,238 |
| 18/32 |
|
5-7/16 |
|
3,471 |
| 19/32 |
|
18-15/16 |
|
12,116 |
| 20/32 |
|
14-11/16 |
|
9,388 |
| 21/32 |
|
17-2/16 |
|
10,970 |
| 22/32 |
|
4-6/16 |
|
2,799 |
| 18/33 |
|
5-12/16 |
|
3,662 |
| 19/33 |
|
10-11/16 |
|
6,850 |
| 20/33 |
|
11-7/16 |
|
7,326 |
| 21/33 |
|
8-5/16 |
|
5,313 |
| 22/33 |
|
1-6/16 |
|
878 |
| 18/1 |
|
15-9/16 |
|
9,969 |
| 19/1 |
|
15-14/16 |
|
10,158 |
| 20/1 |
|
16-7/16 |
|
10,533 |
| 21/1 |
|
14-6/16 |
|
9,207 |
| 22/1 |
|
4-3/16 |
|
2,668 |
| 19A/1 |
|
2-12/16 |
|
1,762 |
| 18/2 |
|
6-1/16 |
|
3,865 |
| 19/2 |
|
4-13/16 |
|
3,083 |
| 19A/2 |
|
1-12/16 |
|
1,130 |
| Total |
|
309-4/16 |
|
194,672 |
*Full sections range from 640 acres to 644 acres; total acreage shown above is based on 640 acres per section where actual survey acreage is not available.
Table 2.24: Sections and Acreages of Mosaic-Owned Mineral Rights
|
|
|
|
|
|
|
|
|
|
|
|
|
|
|
| Township/Range |
|
Sections of Mineral Rights Owned/ Leased by Mosaic* |
|
Area of Mineral Rights Owned/Leased by Mosaic (acres) |
| 19/30 |
|
17-14/16 |
|
11,420 |
| 20/30 |
|
19-7/16 |
|
12,430 |
| 21/30 |
|
18-8/16 |
|
11,822 |
| 19/31 |
|
16-13/16 |
|
10,760 |
| 20/31 |
|
17-13/16 |
|
11,389 |
| 21/31 |
|
23-6/16 |
|
14,954 |
| 22/31 |
|
4-7/16 |
|
2,846 |
| 18/32 |
|
4-15/16 |
|
3,168 |
| 19/32 |
|
18-8/16 |
|
11,843 |
| 20/32 |
|
22-12/16 |
|
14,553 |
| 21/32 |
|
19-12/16 |
|
12,624 |
| 22/32 |
|
4-8/16 |
|
2,868 |
| 18/33 |
|
5-14/16 |
|
3,764 |
| 19/33 |
|
10-6/16 |
|
6,631 |
| 20/33 |
|
9-8/16 |
|
6,087 |
| 21/33 |
|
12-10/16 |
|
8,075 |
| 22/33 |
|
2-3/16 |
|
1,390 |
| 18/1 |
|
2-8/16 |
|
1,583 |
| 19/1 |
|
18-14/16 |
|
12,084 |
| 19A/1 |
|
4-15/16 |
|
3,177 |
| 20/1 |
|
20-8/16 |
|
13,134 |
| 21/1 |
|
21-7/16 |
|
13,707 |
| 22/1 |
|
9-15/16 |
|
6,343 |
| 18/2 |
|
2-9/16 |
|
1,631 |
| 19/2 |
|
10-4/16 |
|
6,579 |
| 19A/2 |
|
2-2/16 |
|
1,365 |
| Total |
|
30-2/16 |
|
206,227 |
*Full sections range from 640 acres to 644 acres; total acreage shown above is based on 640 acres per section where actual survey acreage is not available.
Table 2.25: Partial Mineral Rights Area
|
|
|
|
|
|
|
|
|
|
|
|
|
|
|
| Township/Range |
|
Crown Mineral Rights Leased by Mosaic, Currently Not Mineable (acres)* |
|
Mineral Rights Owned/Leased by Mosaic, Currently Not Mineable (acres)* |
| 21/30 |
|
321 |
|
— |
| 20/31 |
|
80 |
|
— |
| 21/31 |
|
80 |
|
— |
| 22/31 |
|
80 |
|
514 |
| 21/32 |
|
321 |
|
— |
| 21/33 |
|
— |
|
74 |
| 18/1 |
|
150 |
|
— |
| 19/1 |
|
1209 |
|
138 |
| 19A/1 |
|
322 |
|
— |
| 20/1 |
|
221 |
|
— |
| 21/1 |
|
80 |
|
159 |
| 18/2 |
|
160 |
|
— |
| 19/2 |
|
161 |
|
— |
| 19A/2 |
|
61 |
|
— |
| Total |
|
3246 |
|
885 |
*Less than 100% share of a mineral rights parcel.
Existing Infrastructure
The Esterhazy Facility consists of an underground mine and two processing plants that started production in 1962. The mine has an additional expected life, based on mineral reserves of to 2049. The Esterhazy Facility has the infrastructure in place to meet the current production goals and LOM plan. The current infrastructure includes: major road and highway access; railway support from CNR and CPR; SaskPower supplied electricity; TransGas and SaskEnergy supplied natural gas; and potable and non-potable water supplied from local fresh water sources. The long-term TMA development plan is being revised to support production at the levels indicated in the LOM plan.
Process and potable water for the K1 mill is provided by three 200 ft (61 m) deep wells drilled into the upper Dundurn aquifer. The K2 mill water supply comes from the Cutarm Creek dam reservoir that is owned and operated by Mosaic. Located 1.5 miles (2.4 km) northeast of the K2 site, the dam forms a reservoir approximately 5.25 miles (8.5 km) long and 650 feet (200 m) wide. K3 mine water is supplied from K2 via a 7.4 mile (11.8 km) long pipeline.
The power to operate the Esterhazy Facility is supplied by the provincial utility, SaskPower. The K1 mill is serviced by a 72 kV line with approximately 36 MVA capacity. The K2 mill has two services at 72 kV and 138 kV respectively, with a combined capacity of 125 MVA. The K3 mine is serviced by a 230 kV line from SaskPower with 140 MVA capacity. Two transformers step down the voltage, each rated at 70 MVA.
TransGas provides an uninterrupted supply of natural gas to the Esterhazy Facility. SaskEnergy also supplies natural gas to a few outlying areas at K2. Esterhazy has regulator stations for the natural gas at each of the sites, with a low-pressure distribution piping network.
The K1 and K2 sites are serviced by the CNR main line, and by spur lines to the CPR. The surrounding area is developed for agriculture with a road network, villages and towns.
Regina International Airport is 140 miles (225 km) by highway west of the Esterhazy mine sites, while Yorkton municipal airport is 55 miles (90 km) to the northwest. The Town of Esterhazy maintains a paved 3,000 feet (914 m) long airstrip, located eight miles (13 km) southwest of the K1 mill.
The Esterhazy Facility’s workforce lives throughout the area, generally within 62 miles (100 km) of the mine sites. This includes the Russell and Binscarth areas of western Manitoba. Education and healthcare facilities are in Esterhazy, Russell, Melville and Yorkton.
The province of Saskatchewan offers a large variety of suppliers for the potash mine operators. The potash industry in Saskatchewan is very mature, making it easier to attract vendors to support the needs of the various mine sites throughout the province.
Saskatoon and Regina have large industrial sectors with a variety of machine shops and industrial support services. Some specialty services are provided from the Alberta oil and gas industry.
Supplies are sourced locally, regionally and internationally based on availability or commercial considerations. Lead times and on-hand inventory are balanced to meet the needs of the site.
Mining Method
At Esterhazy, potash is extracted by underground mining using the room-and-pillar method. The average planned extraction quality of the potash ore is 28.4%. Pillars are left in place between mining rooms to support the overlying rock to prevent a failure of the upper rock formations preventing an inflow of brine from any overlying water bearing zones.
The 2025 LOM plan for the Esterhazy Facility includes the K3 mineral reserves and the K4 mineral resources. It is based on an average production rate of 6.1 million tonnes per year based on 320 production days per year.
The K3 mineral reserves production is in full production and is expected to ramp down starting in 2045, with mining anticipated to be completed in 2049.
The K4 mining resources are currently scheduled to start mining in 2045 and is expected to ramp up to full production in 2050 and ending in 2078.
Processing Recovery Method
The Esterhazy Facility’s processing plant consists of two separate mill facilities, designated as K1 and K2. Each mill processes the raw ore feed stock received from the underground mining operations through crushing, separation, screening and compaction unit operations to produce on-grade, saleable product. The plants utilize online grade analyzers to monitor the process as well as routine samples that are analyzed by the onsite lab. The milling can be broken down into two main functions: the wet end separates potash and salt, while the dry end sizes potash for sale.
The wet end of the mill begins with raw ore sizing and crushing to prepare it for the separation processes. In heavy media, the larger size fraction is separated into potash and salt through dense media separation that is driven by differences of buoyancy in salt and potash. Flotation receives the smaller size fraction and has specific reagents added that allow the potash crystals to float while the salt is rejected as tailings material. At K2 there is also a crystallizer circuit that produces potash using solubility, temperature and pressure differences. Dewatering and drying is the final stage in the wet end, where potash is sent through centrifuges and industrial driers to remove all moisture.
Once the product is dried, it is sent to a screen to separate the right sized material from the over and undersize material for all the different product grades. Oversized material is sent through a crushing circuit to break it down to right sized material. The undersize material is upgraded through compaction to a larger product.
The site’s ability to produce at the increasing rates being forecasted in the LOM plan are supported by equipment design capacities and capacity proving runs and also include the capacity added by a newly commissioned hydrofloat flotation circuit.
History and Exploration
The Esterhazy Facility K1 started production in 1962 and K2 started production in 1967. Table 2.26 lists the important historical dates and events for Esterhazy.
Table 2.26: History
|
|
|
|
|
|
|
|
|
| Date |
|
Event/Activity |
| 1928 |
|
Discovery of evaporites in the sedimentary sequence in Saskatchewan. |
| 1955 |
|
International Minerals and Chemicals (IMC, Canada) Ltd. acquired >500,000 acre lease in Esterhazy area and started drilling. |
| 1957 to 1962 |
|
IMC Corporation begins shaft sinking at K1. The first official K1 mine production started September at a capacity of 0.9 million tonnes per year. |
| 1965 |
|
K2 TMA Phase I expansion. |
| 1966 |
|
The K1 mine capacity was expanded to 1.5 million tonnes per year. |
| 1967 |
|
The K2 shaft sinking was completed to a capacity of 2.4 million tonnes per year. The first potash production from K2 was in April/May. |
| 1968 |
|
The K2 TMA Phase II expansion was completed. |
| 1974 |
|
K2 mill expansion, heavy media circuit. |
| 1981 |
|
The K2 TMA Phase III expansion was completed. |
| 1985 |
|
Inflow 10B was detected December 29, 1985 in the D400 entry at a point 3.5 miles (5.6 km) southwest of the K2 shaft. Initial inflow was estimated to be 1,000 gpm. Information obtained using seismic surveys allowed for targeted drilling and placement of calcium chloride and various grouts to reduce the inflow to manageable levels. The pumping capacity was increased through a series of stages to bring online a total of 22 pumps, to a maximum capacity of 4,000 gpm. As a result of these efforts, K1 and K2 sites continued normal mining operations. |
| 1987 |
|
Mineral Resource Location Study – Vibroseis Study was completed. |
| 1989 |
|
12 exploration drill holes to delineate the K1 and K2 mining area were completed. |
| 1991 to 1998 |
|
Seismic surveys in the Gerald, Gerald West and Cutarm areas. |
| 1997 |
|
IMC Kalium merged with IMC Global and Freeport-McMoRan. |
| 1999 |
|
Company renamed to IMC Potash. |
| 2000-03 |
|
Seismic surveys: 2D and 3D (K1 and K2). |
| 2004 |
|
Mosaic formed from combination of IMC Global and Cargill Crop Nutrition. |
| 2005 |
|
3D seismic surveys completed at K1 (7.5 sq. miles, 19.5 sq. km) and K2 (4.0 sq. miles, 10.3 sq. km). |
| 2006-09 |
|
Various seismic surveys completed. Hoist expansion at K2. Processing plant capacity increased to 4.8 million tonnes per year. K2 TMA expansion completed. Exploration drilling of ten holes including two shaft pilot holes completed as part of the K3 expansion project. |
| 2010 |
|
Completion of the crushing expansion at K1. |
| 2011 |
|
3D seismic surveys at K1 North (19.7 sq. miles, 51.4 sq. km) and Perrin Lake (14.4 sq. miles, 37.3 sq. km). |
| 2012 |
|
K3 south shaft pre-sink was completed. Esterhazy exits Tolling Agreement with PCS. A number of 3D seismic surveys were completed including Saskman, K1 NW, K1 SWD Field. Seven brine injection wells were drilled at Farfield. |
| 2013 |
|
K3 south shaft sunk to the potash level. 3D seismic survey at Panel 11Q (9.2 sq. km) completed. Completion of mill expansion at K2 for an additional 0.7 million tonnes per year. |
| 2014 |
|
3D seismic survey at Panel 11Q 3C (3.6 sq. miles, 9.3 sq. km) completed. |
| 2015 |
|
3D seismic surveys at Gerald (4.7 sq. miles, 12.1 sq. km) and K3 (89.7 sq. miles, 232.4 sq. km) completed. |
| 2016 |
|
Nine exploration drill holes completed. |
| 2017 |
|
The K3 north shaft sinking was completed and the first K3 ore from the South shaft was skipped to surface and trucked to the K1 mill. |
|
|
|
|
|
|
|
|
|
| 2018 |
|
The K3 to K2 overland conveyor construction was completed. The K3 North shaft steel and Keope hoist rope up were completed. The K3 North shaft first ore skipped in December 18 and trucked to the K2 mill.
The first K2 ore was conveyed on the overland conveyor to the K2 mill in December. |
| 2019 |
|
Commissioned the K3 Koepe production and Blair service hoists. Four drum miners cutting K3 shaft pillar development started. Two four rotor miner assembly completed. The K3 South shaft sinking was completed in November. |
| 2020 |
|
Completion of the K3 south shaft bottom steel, added a third four-rotor miner, installed the Mainline conveyor, added a fourth rotor miner cutting and completed the K3 south headframe concrete slip. K3 shaft pillar development was completed in December. The K3 fifth four-rotor miner started cutting in October. The first ore from K3 conveyed to K1. |
| 2021-2023 |
|
The sixth K3 four-rotor miner started cutting in January and the seventh four rotor-miner started cutting in May. The K1 and K2 mines were closed eight months ahead of schedule in response to brine inflow conditions. |
| 2025 |
|
New compaction circuit commissioned at K1. Hydrofloat circuit commissioned at K2, increasing total Esterhazy site throughput capability to 3000 ore tons per hour. |
Geology and Mineralization
The intracratonic Elk Point Basin is a major sedimentary geological feature in western Canada and the northwest U.S. It contains one of the world’s largest stratabound potash resources. The nature of this type of deposition is largely continuous with predictable depths and thickness. It is mined at several locations, including the Esterhazy Facility.
Potash at the Esterhazy Facility area occurs conformably within Middle Devonian-age sedimentary rocks and is found in total thicknesses ranging from approximately 100 to 131 feet (30 to 40 m) at a depth of approximately 3,100 to 3,800 feet (950 to 1,150 m).
The Prairie Evaporite Formation, host to the potash mineralization, is divided into a basal “lower salt” and an overlying unnamed unit containing three potash-bearing units and one unit containing thin marker beds. In ascending order, the potash horizons in the upper unit are the Esterhazy Member, White Bear Marker Beds, Belle Plaine Member and Patience Lake Member. Mineralogically, these members consist of sylvite and halite, with minor amounts of carnallite (KCl, MgCl2, 6H2O).
In the Esterhazy area, the Esterhazy, White Bear and Belle Plaine members are present, and the Patience Lake member is absent. The following is a summary of the key stratigraphic units for the Esterhazy Facility area:
•Belle Plaine Member: The Belle Plaine Member underlies Second Red Bed and makes up part of the salt back that is critical to isolating the mining horizon from the formations above. The Belle Plaine Member is mined using solution mining techniques at the Belle Plaine Facility and is not mined at the Esterhazy Facility.
•White Bear Member: The White Bear Member consists of marker beds that are a distinctive unit of thin interbedded clay, halite, and sylvinite horizons that are not minable due to insufficient thickness of only 4.0 to 5.0 feet (1.2 to 1.5 m).
•Esterhazy Member: The Esterhazy Member is separated from the Belle Plaine Member by the White Bear Member marker beds, a sequence of clay seams, low-grade sylvinite and halite. The Esterhazy Member is mined using conventional underground techniques at the Esterhazy Facility in southeastern Saskatchewan, and by solution mining techniques at the Belle Plaine Potash Facility.
The sylvinite intervals within the Prairie Evaporite Formation consist of a mass of interlocked sylvite crystals that range from pink to translucent and may be rimmed by greenish-grey clay or bright red iron insoluble material, with minor halite randomly disseminated throughout the mineralized zones. Local large one inch (2.5 cm) cubic translucent to cloudy halite crystals may be present within the sylvite groundmass, and overall, the sylvinite ranges from a dusky brownish red color (lower grade, 23% to 27% K2O with an increase in the amount of insoluble material) to a bright, almost translucent pinkish orange color (high grade, 30%+ K2O). Carnallite is also present locally in the Prairie Evaporite Formation as a mineral fraction of the depositional sequence. The intervening barren salt beds consist of brownish red, vitreous to translucent halite with minor sylvite and carnallite and increased insoluble materials content.
Mineral Resource and Mineral Reserve Assumptions and Modifying Factors
The key mineral resource and mineral reserve assumptions and modifying factors are listed in Table 2.27.
Table 2.27: Key Assumptions and Modifying Factors
|
|
|
|
|
|
|
|
|
|
|
|
|
|
|
| Parameter |
|
Value |
|
TRS Section |
| Supporting Information |
|
Regional geologic studies, 59 exploration holes, seismic surveys, in-mine channel samples and 50 years of mining history at K1 and K2. |
|
Section 7 |
| Average total thickness of the potash mineralization |
|
8.64 feet (2.6 m)., based on the ratio of 8.5 feet (2.6 m). production panel mining height and 9.0 feet (2.7 m) development mining heights. |
|
Section 11 |
| Density |
|
129.878 lbs./cu ft. (2,080.446 kg/cu m) |
|
Section 11 |
| In-mine channel samples grade |
|
23.4% K2O |
|
Section 11 |
| Operating Days per Year |
|
320 days |
|
Section 13 |
| Mining Method |
|
Underground room and pillar mining. |
|
Section 13 |
| Production Rate |
|
6.1 million tonnes per year. |
|
Section 13 |
| Cut-off |
|
No cut-off grade or value based on commodity price is used to estimate mineral resources. This is because the mining method used at Esterhazy is not grade selective. Potash mineralization is mined on one level by continuous miners following the well-defined and continuous beds of mineralization with relatively consistent grades. |
|
Section 11 |
| Mining Recovery |
|
28.9% |
|
Section 12, 13 |
| External Dilution |
|
0% |
|
Section 12, 13 |
| Processing Method |
|
Two mill facilities that crush, float, screen and compact KCl. |
|
Section 14 |
| Processing Recovery |
|
85 to 88% (86.1% average) |
|
Section 14 |
| Deleterious Elements and Impact |
|
Increased amounts of NaCl can significantly impact production volumes. |
|
Section 10 |
| Environmental Requirements, Permits, etc. |
|
No significant environmental permitting encumbrances. |
|
Section 17 |
| Geotechnical Factors (if any) |
|
No concerns/issues. |
|
Section 13 |
| Hydrological or Hydrogeological Factors (if any) |
|
Undersaturated brines from adjacent aquifers. |
|
Section 13 |
| Commodity Prices |
|
$251/tonne for the economic evaluation of the 2025 mineral resources and $251/tonne for the mineral reserves. |
|
Section 16 |
| Exchange Rate (US$/CAD$) |
|
1.37 for mineral resources and mineral reserves. |
|
Section 16 |
Mineral Resource Estimates
The Esterhazy Facility’s mineral resources are reported as in-situ mineralization and are exclusive of mineral reserves. The mineral resources occur in the Esterhazy, White Bear and Belle Plaine members. The mineralization is assumed to be laterally continuous and consistent, based on publicly available regional geological information and Mosaic's knowledge of the local geology and area.
Mineral resources that are not mineral reserves have not demonstrated economic viability utilizing the criteria and assumptions required at Esterhazy.
The methodology for estimating mineral resources consists of interpreting the available geological data in plan view using AutoCAD 2020 software. The plan is updated to include the current mineral rights status, seismic survey interpretations, the limits of the current mining footprint, known areas (geological anomalies, town sites and other surface infrastructure) that make the mineral resource inaccessible, property boundary pillars, pillars around exploration holes and infrastructure, “no mining” areas in the uncontrolled mineral rights locations and a pillar between the K1 and K2 mining area and the adjacent K4 mineral resource areas.
Additional details regarding the estimation methodology are listed in Section 11 of the 2025 Esterhazy Facility TRS filed as an Exhibit to the 2025 Form 10-K.
The mineral resource estimates for the Esterhazy Facility are listed in Table 2.28.
Table 2.28: Mineral Resources at the End of the Fiscal Year Ended December 31, 2025 Based on a LOM Plan KCl Price of $251 per tonne(a)(b)(c)(d)(e)(g)(h)(i)(j)(k)
|
|
|
|
|
|
|
|
|
|
|
|
|
|
|
|
|
|
|
|
|
|
|
| (tonnes in millions) |
|
|
|
|
|
|
|
|
| Category |
|
Tonnes |
|
Grade
%K2O(f)
|
|
|
|
Metallurgical
Recovery |
| Measured |
|
255.0 |
|
|
23.2 |
|
|
|
86.1 |
| Indicated |
|
2,094.0 |
|
|
22.8 |
|
|
|
86.1 |
| Measured + Indicated |
|
2,350.0 |
|
|
22.9 |
|
|
|
86.1 |
___________________________
(a)The mineral resources are reported as in-situ mineralization.
(b)Mineral resources have an effective date of December 31, 2025. Mineral resources are reported exclusive of those mineral resources that have been converted to mineral reserves. Unlike mineral reserves, mineral resources do not have demonstrated economic viability, but they do demonstrate reasonable prospects for economic extraction.
(c)Mineral resources are not mineral reserves and do not meet the threshold for mineral reserve modifying factors, such as estimated economic viability, that would allow for conversion to mineral reserves. There is no certainty that any part of the mineral resources estimated will be converted into mineral reserves.
(d)Mineral resources assume an underground room and pillar mining method.
(e)Mineral resources amenable to underground mining methods are accessed via shaft and scheduled for extraction based on a conceptual room and pillar design using the same technical parameters as for mineral reserves.
(f)No cut-off grade or value based on commodity price is used to estimate mineral resources. This is because the mining method used at Esterhazy is not grade selective. The potash mineralization is mined on one level by continuous miners following the well-defined and continuous beds of mineralization with relatively consistent grades (Section 11.2 and Section 13.3.10).
(g)Tonnages are in U.S. Customary and metric units and are rounded to the nearest million tonnes.
(h)Rounding as required by reporting guidelines may result in apparent summation differences.
(i)%K2O refers to the total %K2O of the sample.
(j)The percent carnallite refers to the mineral associated with potash ore at Esterhazy (KCl.MgCl3.6H2O). It is considered an impurity.
(k)The following KCl commodity prices were used to assess prospects for economic extraction for the mineral resources but are not used for cut-off purposes, 2026-$244/tonne, 2027-$243/tonne, 2028-$224/tonne, 2029-$188/tonne, 2030-$223/tonne and for the LOM plan $251/tonne.
(l)A US$/CAD$ exchange rate of 1.37 was used to assess prospects for economic extraction for the mineral resources but were not used for cut-off purposes.
Mineral Reserve Estimates
The Esterhazy Facility’s mineral reserves are reported as in-situ mineralization, accounting for all applicable modifying factors. Mineral reserves meet all the mining criteria required at Esterhazy including, but not limited to mining, processing, metallurgical, infrastructure, economic, marketing, legal, environmental, social and governmental factors.
The methodology for estimating mineral reserves consists of post pillar mine design work and scheduling and the application of mining recovery and unplanned dilution. Additional details regarding the estimation methodology are listed in Section 12 of the 2025 Esterhazy Facility TRS filed as an Exhibit to this Form 10-K.
The mineral reserve estimates for the Esterhazy Facility are listed in Table 2.29.
Table 2.29: Mineral Reserves at the End of the Fiscal Year Ended December 31, 2025 Based on a LOM Plan KCl Price of $251 per tonne(a)(b)(d)(e)(f)(g)(h)
|
|
|
|
|
|
|
|
|
|
|
|
|
|
|
|
|
|
|
|
|
| (tonnes in millions) |
|
|
|
|
|
|
| Category |
|
Tonnes |
|
Grade
%K2O(c)
|
|
Metallurgical
Recovery % |
| Proven |
|
159.0 |
|
|
22.2 |
|
29.0 |
| Probable |
|
319.0 |
|
|
20.0 |
|
29.0 |
| Proven + Probable |
|
478.0 |
|
|
20.8 |
|
29.0 |
___________________________
(a)Mineral reserves have an effective date of December 31, 2025.
(b)Underground mining standards and design criteria are used to constrain measured and indicated mineral resources within mineable shapes. Only after a positive economic test and inclusion in the LOM plan is the mineral reserve estimate included as mineral reserves.
(c)Tonnages are in US Customary and metric units and are rounded to the nearest million tonnes.
(d)Rounding as required by reporting guidelines may result in apparent summation differences.
(e)%K2O refers to the total %K2O of the samples.
(f)The percent carnallite refers to the mineral associated with potash ore at Esterhazy (KCl.MgCl3.6H2O). It is considered an impurity.
(g)The following KCl commodity prices were used to assess prospects for economic extraction for the mineral resources but are not used for cut-off purposes, 2026-$244/tonne, 2027-$243/tonne, 2028-$224/tonne, 2029-$188/tonne, 2030-$223/tonne and for the LOM plan $251/tonne. All prices are per finished product tonne.
(h)We used a US$/CAD$ exchange rate of 1.37 to assess economic viability for the mineral reserves but was not used for cut-off purposes.
Mineral Resources and Mineral Reserves Comparison
There were no material changes in the mineral resource estimates from 2024 to 2025.
At December 31, 2025, we had mineral reserves of 476 million tonnes compared to 500 million tonnes in the prior year, resulting in a decrease of 4.8%. Proven reserves decreased by <1% while probable reserves decreased 7%. The year over year changes are due to mining depletion, changes in mineral reserve category and increased sterilization of mineral reserves due to unmineable buffer areas.
TAPIRA
Tapira is located in the western portion of the state of Minas Gerais, in the southeast of Brazil, to the north of the town of Tapira, and approximately 22 miles (35 km) south-southeast of the city of Araxá (Figure 2.6). The mine is 261 miles (420 km) by road to the Minas Gerais state capital of Belo Horizonte, via the BR-262 highway to Araxá and then the BR 146 highway to Tapira. The property extends from approximately UTM 7,805,000 N to 7,799,500 N, and from 304,000 E to 310,000 E (Corrego Alegre 1961, UTM Zone 23 South), and is centered approximately at 19º52’S/46º51’W. The Tapira complex consists of a mine and a phosphate beneficiation plant. The plant produces phosphate conventional and ultrafine concentrate, which is sent by pipeline (conventional) and truck (ultrafine) to local Mosaic chemical plants for finished product production.
Figure 2.6: Project Location Plan
Infrastructure
Tapira is located in a highly developed region known as Alto Parnaíba. This region is known for its modern infrastructure with high standards of living compared with other regions in Brazil. The local infrastructure available to Tapira is situated within a well-established mining area, 22 miles (35 km) from the city of Araxá and within 16 miles (25 km) of two other mining operations.
The supply of electricity occurs via a 13.8 kiloVolt (“kV”) transmission line that is operated by CEMIG and Vale Energia Concessionaires. Tapira has a total receipt of 40 megawatts (“MW”) and an annual power usage around 305 gigawatts (“GW”). The main substation receives 13.8 kV in three oil-type transformers which is transferred to secondary substations. From the secondary substations, power is distributed to the end-use areas at 110 volts (“V”), 220 V, 280 V, 440 V or 4,160 V.
Water intake comes from the Ribeirão do Inferno and artesian wells, as well as recovered water from the tailings dams. Additionally, there are four artesian wells at Tapira. The industrial reuse system used to recover water from the dams includes ten pumps (four operating and six on stand-by) and 36-inch (91 cm) pipes covering varying distances to the different dam areas. The distance from BR1 dam is approximately six miles (nine km) with a rated capacity of 4,400 cubic meters per hour (“m3/hr”). The distance from BL1 dam is approximately two miles (three km) with a rated capacity of 10,400 m3/hr. The distance from BR dam is approximately 2.5 miles (four km) with a rated capacity of 4,900 m3/hr.
There is currently no rail or airport access at Tapira. The closest rail and airport access is in the city of Araxá.
Infrastructure includes a phosphate beneficiation plant with associated support infrastructure, including tailings storage facilities, maintenance facilities, warehouses, and various administrative and other support facilities. The mine infrastructure includes overburden storage and other material storage facilities, surface water management features and maintenance, warehouses and other typical support infrastructure.
Tapira includes an impoundment stability monitoring system that covers all the operating impoundments at Tapira.
Network connectivity is in place at the mine buildings and a telephone system provides coverage throughout the mine unit. A radio system provides the ability to dispatch and control the mining equipment and transport trucks as well as communicate with the control room in the beneficiation plant.
Mineral and Surface Rights
Mining rights in Brazil are governed by the Mining Code, Decree 227, dated February 27, 1967, and further regulation enacted by the ANM. This governmental agency, which controls the mining activities throughout Brazil, was recently created as a replacement of the former National Department of Mineral Production (“DNPM”). All sub-soil situated within Brazilian territory is deemed state property, with the mining activities subject to specific permits granted by the ANM.
We currently hold a total of nine mining permits within the Tapira area (3,853 hectares (“ha”)). The Tapira mineral assets are part of a consortium named Consórcio Vale Fosfértil Tapira created by Decree Number 98.962 (February 16, 1990), Process Number 930.785/1988 (4,355.76 ha) granted to Vale S.A. (previously Vale do Rio Doce S.A.) and Vale Fertilizantes Fosfatados S.A. – Fosfértil.
The Tapira Mining Consortium and all mining permits have transferred from Vale S.A to Mosaic Fertilizantes P&K Ltda.
Tapira has an overall surface rights area of 8,008 ha distributed in 18 different property registrations. The surface area within the ultimate pit is currently mostly controlled by Mosaic. There is a small area near a local village that is not within the current property rights. The relocation of the village and State Highway MG-146 will be necessary to fully realize the LOM tonnages. The area surrounding the village and State Highway MG-146 is included in the currently controlled mining permits, and is therefore not seen as a significant encumbrance to Tapira.
The capacity requirements are not currently in place for all tailings disposal for total LOM capacity requirements. However, Tapira has an ongoing permitting and development plan to support the mining operations that will continue through the LOM requirements.
Present Condition of the Property
The Tapira mine has been in operation since 1978 and is a production stage property.
All required fixed and permanent infrastructure of power, pipelines and primary roadways, and project access are established. Drainage, water controls and mine access roads and ramps are established for current operations and will be expanded and continued as the pit progresses through its planned life of operations.
The ore at Tapira is recovered using open-pit conventional truck and shovel mining methods, due to the proximity of the ore to the surface and the physical characteristics of the deposit. The ore is transported via truck to a homogenization pile where it is later fed to the beneficiation plant via conveyors. The beneficiation plant produces phosphate conventional and ultrafine concentrate which is sent by pipeline (conventional) and truck (ultrafine) to local Mosaic chemical plants for finished product production.
The mining equipment at Tapira is leased and therefore not owned by us. The beneficiation plant has been in operation since Tapira started 45 years ago. The tailings dams, water dams and sedimentation ponds have been active at Tapira since mining started 45 years ago as well. Currently the BR1 dam is being raised to its final design height to accommodate the LOM plan.
The total book value for Tapira is R$2.2 billion (US$406 million with exchange rate of 1 U.S. dollar = 5.5024 Brazilian Real) as of December 31, 2025.
Exploration activities are ongoing for in-fill drilling for phosphate production to complete the current LOM. Additional areas of exploration and research include better understanding the non-weathered material and titanium ore for future mining prospects.
History of Previous Operations
Tapira has been in operation since 1978 and has produced more than 70 million tonnes (“Mt”) of phosphate concentrate. Since 1978, Titanium Dioxide (TiO2) bearing material, mainly in the form of anatase, has been stockpiled, with more than 130,000 tonnes awaiting the implementation of an economical beneficiation method.
The geological structure of the alkaline complex of Tapira was first recognized in 1953 through magnetometric and radiometric investigations carried out by the Brazil-Germany Project. There was an agreement between the two countries to carry out regional geophysical aero-survey programs, performed by the Geological Survey of Brazil in the 1950s, 1960s and 1970s.
In 1968, three major private groups – Pedro Maciel, Companhia Meridional de Mineração, and Companhia Brasileira de Metalurgia e Mineração – had exploration research requests granted by DNPM. In early1971, Vale (previously known as Companhia Vale do Rio Doce) joined Pedro Maciel to create the company Titan International S.A., which changed its name to Rio Doce Titânio in later years. Vale acquired the rights of Pedro Maciel at the end of 1971, with the mining rights incorporated into the company Mineração Rio Paranaíba. At the time, a series of intensive and detailed systematic works were undertaken, and important occurrences of phosphate, titanium, niobium, rare earths and vermiculite were identified.
Extensive exploration works were undertaken between 1971 and 1973, with particular focus on the occurrences of titanium. From 1973 to 1977, the exploration priorities changed to occurrences of phosphate, with the aim of replacing the massive imports of fertilizers in the agricultural sector that was then undergoing a period of expansion in Brazil. In 1977, the Fosfértil (Fertilizantes Fosfatados S.A.) company was created under the administration of Petrofértil (a subsidiary of Petrobras, the Brazilian state oil company). In 1992, Fosfértil was privatized, and a pool of investors held the company shares.
In 2010, Vale S.A. acquired complete control of Fósfertil and after created a new company, Vale Fertilizantes S.A., which included other fertilizer assets. At the start of 2018, Mosaic Fertilizantes P&K S.A. acquired the assets of Vale Fertilizantes including the Tapira mineral deposit.
Mineral Resources and Mineral Reserves
The regional and local geology, mineral resources and mineral reserves are detailed in the sub-sections below.
Regional and Local Geology
The Tapira phosphate deposit is part of a series of Late-Cretaceous, carbonatite-bearing alkaline ultramafic plutonic complexes belong to the Alto Paranaiba Igneous Province. The Tapira igneous rocks intrude the phyllites, schists and quartzites of the Late-Proterozoic Brasília mobile belt. The Tapira igneous complex is roughly elliptical, 35 square kilometers (“km2”) in area and consists predominantly of alkaline pyroxenite rocks with subordinate carbonatite, serpentinite (dunite), glimmerite, syenite and ultramafic potassic dikes.
The tropical weathering regime prevailing in the region and the inward drainage patterns developed from the weathering-resistant quartzite margins of the dome structures resulted in the development of an extremely thick soil cover in most of the complexes. The extreme weathering process was responsible for the residual concentration of apatite. The main geological types identified in the deposit are a combination of the igneous protoliths (bebedourites, phoscorites and carbonatites) and the products of the weathering process.
Mineral Resources
The mineral resources at Tapira were estimated based on the long-standing exploration drilling and sampling completed at Tapira since 1967. The drilling results were loaded into the geological database, verified and vetted for errors, and then used in the geological model to create the lithology and weathering surfaces. The geological model was used in creating the block model, where geological domains based on the lithology and weathering surfaces were utilized to interpret grade, density and mass recovery in a geologically appropriate manner. Exploratory Data Analysis and geostatistical analysis were completed on the raw and composite data sets to help define interpolation parameters and mineral resource classifications. The mineral resources were restricted based on an optimized pit limit that took into account cut-off grade, price, mining costs, infrastructure limitations and mineral licenses. The mineral resources are exclusive of mineral reserves and include approximately 76.2 Mt of measured and indicated mineral resources with a P2O5ap grade of 8.6%. There are an additional 180.5 Mt of inferred mineral resources with a P2O5ap grade of 9.2% (Table 2.30).
Table 2.30: Mineral Resources at the End of the Fiscal Year Ended 2025 Based on R$ 1,940/tonne of Phosphate Concentrate(a)(b)(c)(d)
|
|
|
|
|
|
|
|
|
|
|
|
|
|
|
|
|
|
|
|
|
| (tonnes in millions) |
|
|
|
|
|
|
| Category |
|
Tonnes |
|
Grade (%P2O5ap) |
|
Metallurgical Recovery (%P2O5ap) |
| Measured |
|
21.3 |
|
8.6 |
|
47.9 |
| Indicated |
|
54.9 |
|
8.6 |
|
48.9 |
| Measured + Indicated |
|
76.2 |
|
8.6 |
|
38.6 |
| Inferred |
|
180.5 |
|
9.2 |
|
63.0 |
___________________________
(a)Additional details are described in the TRS filed as an Exhibit to our 2023 Form 10-K.
(b)Mineral resources are reported exclusive of mineral reserves. Mineral resources are not mineral reserves and do not meet the threshold for mineral reserve modifying factors, such as estimated economic viability, that would allow for conversion to mineral reserves. There is no certainty that any part of the mineral resources estimated will be converted into mineral reserves.
(c)Grades are P2O5ap, which represents the P2O5 associated with apatite and was calculated by the evaluation of the CaO / P2O5 ratio. Where CaO / P2O5 ratio was greater than or equal to 1.35, P2O5ap was equal to the total of P2O5; where the CaO / P2O5 ratio was less than 1.35, P2O5ap was equal to the CaO / 1.35 ratio.
(d)Mineral resource tonnages and grade are stated in-situ. Cut-off grade of P2O5ap ≥ 5.0% and 0.9 ≤ Ratio of CaO to P2O5 (RCP) ≤ 3.0 was applied to mineral resources. Measured, indicated and inferred blocks were included in mineral resource estimates if they were inside mining concessions and exploration permits with a final report approved by ANM, but exclusive of physical structures such as the crusher and waste piles. A revenue factor of 1.0 with sales price of R$1,940 per tonne of phosphate concentrate (2025 price evaluation) was used to develop the mineral resource pit shell.
Mineral Reserves
A mineral reserve estimate has been prepared for Tapira. Mineral reserves are limited by the Tapira property boundary, and the ultimate pit designed for the LOM plan, which was limited with an economic optimized pit analysis.
The mineral reserve estimate includes mining modifying adjustments for mining ore recovery, mining dilution and ore concentration recovery factors. The mineral reserve estimate is limited to a cut-off grade of 5.0% P2O5ap, as well as certain geometallurgical beneficiation criteria, including:
a.Diluted ratio of CaO to P2O5 (RCP) between 0.9 and 3.0; and
b.The four mineralized domains characterized by lithology and alteration.
The beneficiation plant generates conventional (coarse) and ultrafine concentrates from the Tapira ore. The mass recovery of coarse concentrate is forecast based on the results of laboratory flotation tests performed on drill core samples. The test database was subdivided into metallurgical recovery domains treating isalterite and semi-weathered horizons separately. For each metallurgical recovery domain, a linear regression was developed, capable of predicting mass recovery based on the P2O5 grade of the ROM ore.
The metallurgical recovery is calculated from the mass recovery, the concentrate % P2O5, and the ROM % P2O5 according to the following equation:
Metallurgical recovery = 100 x Mass recovery x Concentrate % P2O5 / ROM % P2O5
The annual production estimates were used to determine annual estimates of capital and operating costs. All cost estimates were in Brazilian real 2025 R$ terms. Total capital costs included R$4.7 billion of sustaining capital and opportunity costs. Annual operating costs were based predominantly on historical consumption factors and unit costs. They included costs for ongoing, final reclamation and closure. Annual total cost of rock production varied from R$291 per concentrate tonne to R$425 per concentrate tonne, with an average total cost of production for a tonne of phosphate rock concentrate at R$370.
For the purpose of reporting our total financial statistics, the discounted cash flow was converted from Reals to U.S. dollars at an exchange rate of R$5.76 = US$1.00.
Because Tapira is a captive operation supplying rock to other Mosaic-owned chemical plants, there is no transparent mined phosphate rock commodities price market in Brazil. Mineral reserves for Tapira were estimated based on an internal transfer price. This internal transfer price was set as a constant number of US$105.1 per tonne (R$605.3 per tonne).
The Tapira mineral reserve as of December 31, 2025 is estimated to be 417.1 Mt ROM (dry), with a dry grade of 9.3% P2O5ap delivered to the concentrator plant, and 63.4 Mt (dry) concentrated phosphate tonnes at 34.7% P2O5 post-concentration process plant. This includes (Table 2.31):
a.106.8 Mt of Proven Mineral Reserve at a 9.0% P2O5ap dry grade, resulting in 15.7 Mt of concentrate with a 34.6% P2O5 post beneficiation plant; and
b.310.3 Mt of Probable Mineral Reserve with a 8.9% P2O5ap dry grade, resulting in 47.7 Mt of concentrate at 34.7% P2O5.
Table 2.31 Mineral Reserves at the End of the Fiscal Year Ended 2025 Based on R$1,940/tonne of Phosphate Concentrate(a)(b)(c)(d)(e)
|
|
|
|
|
|
|
|
|
|
|
|
|
|
|
|
|
|
|
|
|
| (tonnes in millions) |
|
|
|
|
|
|
| Category |
|
Tonnes (Dry) |
|
Grade
(%P2O5ap Dry)
|
|
Metallurgical Recovery (%P2O5) |
| Proven |
|
106.8 |
|
9 |
|
55.2 |
| Probable |
|
310.3 |
|
8.9 |
|
58.8 |
| Proven + Probable |
|
417.1 |
|
9.0 |
|
57.9 |
___________________________
(a)Additional details are described in the TRS filed as an Exhibit to our 2023 Form 10-K.
(b)Mineral reserves are within measured and indicated mineral resource limits.
(c)Only after a positive economic test and inclusion in the LOM plan is the mineral reserve estimate included as a mineral reserve.
(d)Grades are P2O5ap, which represents the P2O5 associated with apatite and was calculated by the evaluation of the CaO / P2O5 ratio. Where CaO / P2O5 ratio was greater than or equal to 1.35, P2O5ap was equal to the total of P2O5; where the CaO / P2O5 ratio was less than 1.35, P2O5ap was equal to the CaO / 1.35 ratio.
(e)Mineral reserve tonnages and grade are stated as ROM tonnages. The mineral reserves are constrained by a pit design that honors site specific geotechnical designs by pit sector. The mine plan considers constraints required for surface and groundwater management, appropriate extraction methodology, labor and equipment requirements, beneficiation plant mass and metallurgical recoveries, and are dependent upon all permits and environmental licenses in place and continued approved status. The reference point for cut-off grade and pit optimization analysis is tonnes of concentrate at a price of R$1,940/tonne concentrate (2025 price evaluation). Cut-off grade of P2O5ap ≥ 5.0% and 0.9 ≤ RCP ≤ 3.0 was applied to mineral reserves. Mineral reserves were proven to be economic based on internal transfer price that was derived in the discounted cash flow and compared to the gross margin available.
Mineral Resources and Mineral Reserves Comparison
The comparison of the Mineral Resources as of December 31, 2024 and December 31, 2025 can be found in Table 2.32. The Measured and Indicated Mineral Resources and Inferred Resources remained materially unchanged since December 31, 2024.
Table 2.32: Mineral Resources Comparison
|
|
|
|
|
|
|
|
|
|
|
|
|
|
|
|
|
|
|
|
|
|
|
|
|
|
|
|
|
|
|
|
|
| (tonnes in millions) |
|
December 31, 2025 |
|
December 31, 2024 |
|
Percent Difference |
| Category |
|
Tonnes |
|
Grade (%P2O5ap) |
|
Tonnes |
|
Grade (%P2O5ap) |
|
|
| Measured |
|
21.3 |
|
8.6 |
|
21.1 |
|
8.6 |
|
|
| Indicated |
|
54.9 |
|
8.6 |
|
54.9 |
|
8.6 |
|
|
| Measured + Indicated |
|
76.2 |
|
8.6 |
|
76.0 |
|
8.7 |
|
— |
% |
| Inferred |
|
180.5 |
|
9.2 |
|
180.5 |
|
9.2 |
|
— |
% |
The comparison of the Mineral Reserves as of December 31, 2024 and December 31, 2025 can be found in Table 2.33. The Mineral Reserves have decreased in tonnage by 4% from the December 31, 2024 estimate due to mining depletion. This change is not considered a material change.
Table 2.33: Mineral Reserves Comparison
|
|
|
|
|
|
|
|
|
|
|
|
|
|
|
|
|
|
|
|
|
|
|
|
|
|
|
|
|
|
|
|
|
| (tonnes in millions) |
|
December 31, 2025 |
|
December 31, 2024 |
|
Percent Difference |
| Category |
|
Tonnes |
|
Grade (%P2O5ap) |
|
Tonnes |
|
Grade (%P2O5ap) |
|
|
| Proven |
|
106.8 |
|
9.0 |
|
121.2 |
|
9.1 |
|
|
| Probable |
|
310.3 |
|
8.9 |
|
311.3 |
|
8.9 |
|
|
| Proven+Probable |
|
417.1 |
|
9.0 |
|
432.5 |
|
9.0 |
|
-4 |
% |
REGULATION S-K 1300 INTERNAL CONTROLS DISCLOSURE
Qualified persons, including third parties and Mosaic employees, are responsible for estimating mineral resources and reserves. Mosaic has a Global Review Team, consisting of a broad spectrum of internal personnel outside the operating organization whose primary responsibilities include review of the mineral resources and reserves estimation reporting for compliance with SEC rules and regulations. The Global Review Team includes members from Mosaic’s accounting, finance, business units and legal departments. Reports prepared by qualified persons and third parties are reviewed at various levels of the Global Review Team before they are ultimately reviewed and approved by our senior leadership team.
Item 3. Legal Proceedings.
We have included information about legal and environmental proceedings in Note 23 of our Notes to Consolidated Financial Statements. That information is incorporated herein by reference.
We are also subject to the following legal and environmental proceedings in addition to those described in Note 23 of our Consolidated Financial Statements included in this Form 10-K:
Countervailing Duty Orders. In April 2021, the U.S. Department of Commerce (“DOC”) issued countervailing duty (“CVD”) orders on imports of phosphate fertilizers from Morocco and Russia in response to petitions filed by Mosaic. The purpose of the CVD order is to remedy the injury to the U.S. phosphate fertilizer industry caused by imports that benefit from unfair foreign subsidies, and thereby restore fair competition. CVD orders normally stay in place for at least five years, with possible extensions.
Moroccan and Russian producers have initiated actions at the U.S. Court of International Trade (“CIT”) and the U.S. Court of Appeals for the Federal Circuit (“CAFC”) seeking to overturn the orders. Mosaic has also made claims contesting certain aspects of DOC’s final determinations that, we believe, failed to capture the full extent of Moroccan and Russian subsidies.
These litigation challenges remain underway. The CAFC is reviewing a challenge to DOC’s final determination in the first administrative review for Morocco; the CIT is reviewing the DOC’s second remand redetermination for the CVD investigation for Morocco, the DOC’s first remand redetermination for the first administrative review for Russia, and the DOC’s final determinations for the second administrative reviews for Morocco and Russia; and the ITC recently reaffirmed its original affirmative injury finding in a second remand redetermination, which is also being reviewed by the CIT and briefing is underway.
When a CVD order is in place, DOC normally conducts annual administrative reviews, which establish a final CVD assessment rate for past imports during a defined period, and a CVD cash deposit rate for future imports. In November 2023, DOC announced the final results of the first administrative reviews for the CVD orders on phosphate fertilizers for Russia and Morocco covering the period November 30, 2020 to December 31, 2021. DOC calculated new subsidy rates of 2.12% for Moroccan producer OCP and 28.50% for Russian producer PhosAgro. In November and December 2024 DOC announced the final results of the second administrative reviews for the CVD orders on phosphate fertilizers for Russia and Morocco covering calendar year 2022. DOC calculated subsidy rates of 16.60% for OCP and 18.21% for PhosAgro. Mosaic, as well as parties that oppose the duties, have appealed the final results of DOC’s first and second administrative reviews to the CIT. Currently, DOC is conducting an administrative review for imports from Russia, covering calendar year 2023. DOC is not conducting an administrative review for Morocco for this period. The applicable final CVD assessment rates and cash deposit rates for imports of phosphate fertilizer from Morocco and Russia could change as a result of these various proceedings and potential associated appeals.
The South Pasture Mine – Hardee County Enforcement Action. On January 8, 2020, Hardee County issued a Notice of Violation (“NOV”) for Mosaic’s delay in meeting the required reclamation schedule for two designated reclamation units within the South Pasture Mine. The delay resulted from idling the South Pasture beneficiation plant in 2018; because the plant was idled, no sand was available for reclamation activities.
Acting on Mosaic’s “Application for Waiver and Reclamation Schedule Extension,” in May 2020, the Hardee County Board of County Commissioners approved: (1) a waiver of the applicable reclamation deadlines of the South Pasture Development Order and Land Development Code; (2) an alternative reclamation schedule; and (3) a settlement agreement that resolved the NOV. Mosaic timely paid the civil penalty required by the settlement agreement and continues to implement the approved alternative reclamation schedule, as required. Monitoring programs are in place to ensure continued compliance with the waiver and settlement agreement.
Cruz Litigation. On August 27, 2020, a putative class action complaint was filed in the Circuit Court of the Thirteenth Judicial Circuit in Hillsborough County, Florida against our wholly-owned subsidiary, Mosaic Global Operations Inc., and two unrelated co-defendants. The complaint alleges claims related to elevated levels of radiation at two manufactured housing communities located on reclaimed mining land in Mulberry, Polk County, Florida, allegedly due to phosphate mining and reclamation activities occurring decades ago. Plaintiffs seek monetary damages, including punitive damages, injunctive relief requiring remediation of their properties and a medical monitoring program funded by the defendants. On October 14, 2021, the court substantially granted a motion to dismiss we filed late in 2020, with leave for the plaintiffs to amend their complaint.
On November 3, 2021, plaintiffs filed an amended complaint and in response, Mosaic filed a motion to dismiss that complaint with prejudice on November 15, 2021. On December 23, 2021, plaintiffs opposed that motion and Mosaic replied to that opposition on January 26, 2022. On April 6, 2022, the court heard argument on the motions to dismiss filed by Mosaic and each other co-defendant. In late March 2023, the court denied Mosaic’s motions to dismiss.
On December 22, 2025, the court heard argument on co-defendants’ motion for partial summary judgement based on their claim that the court lacked subject matter jurisdiction over the plaintiffs’ demands for injunctive relief. Under the state’s Local Action Rule, where the relief being sought would directly affect real property (here, in Polk County), the court must have territorial jurisdiction over the property in order to have the requisite subject matter jurisdiction. Because the plaintiffs seek to excavate real property in Polk County, the court concluded on February 20, 2026 it did not have jurisdiction. It granted the summary judgement motion based on the local action rule, and not on the merits of plaintiffs’ claims.
We continue to vigorously defend this matter.
Faustina Plant Risk Management Plan. On September 14, 2022, EPA Region 6 issued a Notice of Potential Violation and Opportunity to Confer (“NOPVOC”) regarding compliance of our Faustina Plant with Section 112(r) of the Federal Clean Air Act and 40 C.F.R.
Part 68, commonly known as the Risk Management Plan Rule (“RMP Rule”). The NOPVOC relates to a compliance evaluation inspection conducted by the EPA at the Faustina Plant from February 22-25, 2022 and alleges violations of the RMP Rule. We conferred with the EPA regarding the allegations in the NOPVOC on November 30, 2022. We negotiated a Consent Agreement and Final Order (“CAFO”) with the agency that was filed on January 30, 2024. As required by the CAFO, we paid a penalty in the amount of $217,085. The CAFO also requires the completion of two supplemental environmental projects: (1) installation of ammonia monitors and monitoring at the plant for a period of two years, and (2) donation of two generators to the St. James Parish Department of Emergency Preparedness. We completed the donation to the St. James Parish Department of Emergency Preparedness on March 14, 2024, and we completed installation and began operation of the ammonia monitors on April 24, 2024.
Item 4. Mine Safety Disclosures.
Information concerning mine safety violations or other regulatory matters required by Section 1503(a) of the Dodd-Frank Wall Street Reform and Consumer Protection Act and Item 104 of Regulation S-K is included in Exhibit 95 to this report.
PART II.
Item 5. Market for Registrant’s Common Equity, Related Stockholder Matters and Issuer Purchases of Equity Securities.
The principal stock exchange on which our common stock is traded is The New York Stock Exchange under the symbol “MOS”.
The following provides information related to equity compensation plans:
|
|
|
|
|
|
|
|
|
|
|
|
|
|
|
|
|
|
|
|
|
| Plan category |
|
Number of shares to be
issued upon exercise of
outstanding options,
warrants and rights (a)
|
|
Weighted-average
exercise price of
outstanding options,
warrants and rights (b)
|
|
Number of shares remaining
available for future issuance
under equity compensation plans
(excluding shares reflected
in first column) |
| Equity compensation plans approved by stockholders |
|
4,757,057 |
|
|
$ |
29.80 |
|
|
13,077,090 |
|
| Equity compensation plans not approved by stockholders |
|
— |
|
|
— |
|
|
— |
|
| Total |
|
4,757,057 |
|
|
$ |
29.80 |
|
|
13,077,090 |
|
______________________________
(a)Includes grants of 334,175 stock options, 2,159,334 time-based restricted stock units and 2,263,548 total stockholder return (“TSR”) performance units settled in stock. The total does not include cash-settled TSR performance units. For purposes of the table above, the number of shares to be issued under a performance unit award reflects the maximum number of shares of our common stock that may be issued pursuant to such performance award. The actual number of shares to be issued under a TSR performance unit award will depend on the change in the market price of our common stock over a three-year vesting period. No shares will be issued if the market price of a share of our common stock at the vesting date plus dividends thereon is less than 50% of its market price on the date of grant and the maximum number will be issued only if the market price of one share of our common stock at the vesting date plus dividends thereon is at least twice its market price on the date of grant.
(b)Includes weighted average exercise price of stock options only.
Pursuant to our equity compensation plans, we have granted and may in the future grant employee stock options to purchase shares of common stock of Mosaic for which the purchase price may be paid by means of delivery to us by the optionee of shares of common stock of Mosaic that are already owned by the optionee (at a value equal to market value on the date of the option exercise). During the period covered by this report, no options to purchase shares of common stock of Mosaic were exercised for which the purchase price was so paid.
Item 6. Reserved.
Item 7. Management’s Discussion and Analysis of Financial Condition and Results of Operations.
The Management’s Discussion and Analysis of Financial Condition and Results of Operations listed in the Financial Table of Contents included in this report is incorporated herein by reference.
Item 7A. Quantitative and Qualitative Disclosures about Market Risk.
We have included a discussion about market risks under “Market Risk” in the Management’s Analysis that is included in this report in Part II, Item 7. “Management’s Discussion and Analysis of Financial Condition and Results of Operations”. This information is incorporated herein by reference.
Item 8. Financial Statements and Supplementary Data.
Our Consolidated Financial Statements, the Notes to Consolidated Financial Statements, the report of our Independent Registered Public Accounting Firm and the information under “Quarterly Results” listed in the Financial Table of Contents included in this report are incorporated herein by reference. All other schedules for which provision is made in the applicable accounting regulation of the SEC are not required under the related instructions or are inapplicable, and therefore, have been omitted.
Item 9. Changes in and Disagreements with Accountants on Accounting and Financial Disclosures.
None.
Item 9A. Controls and Procedures.
(a)Disclosure Controls and Procedures
We maintain disclosure controls and procedures designed to ensure that information required to be disclosed in our filings under the Exchange Act is (i) recorded, processed, summarized and reported within the time periods specified in the SEC’s rules and forms, and (ii) accumulated and communicated to management, including our principal executive officer and our principal financial officer, to allow timely decisions regarding required disclosures. Our management, with the participation of our principal executive officer and our principal financial officer, has evaluated the effectiveness of our disclosure controls and procedures as of the end of the period covered by this Form 10-K. Our principal executive officer and our principal financial officer have concluded, based on such evaluations, that our disclosure controls and procedures were effective for the purpose for which they were designed as of the end of such period.
(b)Management’s Report on Internal Control Over Financial Reporting
We have included management’s report on internal control over financial reporting under “Management’s Report on Internal Control Over Financial Reporting” listed in the Financial Table of Contents included in this Form 10-K.
We have included our registered public accounting firm’s attestation report on our internal controls over financial reporting under “Report of Independent Registered Public Accounting Firm” listed in the Financial Table of Contents included in this Form 10-K.
This information is incorporated herein by reference.
(c)Changes in Internal Control Over Financial Reporting
Our management, with the participation of our principal executive officer and our principal financial officer, have evaluated any changes in our internal control over financial reporting that occurred during the three months ended December 31, 2025 that have materially affected, or are reasonably likely to materially affect, our internal control over financial reporting. There were no changes in internal control over financial reporting identified in connection with management’s evaluation that occurred during the quarter ended December 31, 2025 that have materially affected, or are reasonably likely to materially affect, our internal control over financial reporting.
Item 9B. Other Information.
During the quarter ended December 31, 2025, none of our directors or officers informed us of the adoption or termination of a “Rule 10b5-1 trading arrangement” or “non-Rule 10b5-1 trading arrangement” as those terms are defined in Item 408(a) of Regulation S-K.
Item 9C: Disclosure Regarding Foreign Jurisdictions That Prevent Inspections
Not Applicable.
PART III.
Item 10. Directors, Executive Officers and Corporate Governance.
The information contained under the headings “Proposal No. 1–Election of Directors,” “Corporate Governance–Committees of the Board of Directors,” “Beneficial Ownership of Securities,” and “Delinquent Section 16 Reports” included in our definitive proxy statement for our 2026 annual meeting of stockholders and the information contained under “Information About our Executive Officers” in Part I, Item 1. “Business,” in this report is incorporated herein by reference.
The information under the heading “Corporate Governance - Insider Trading Policy” included in our definitive proxy statement for our 2026 annual meeting of stockholders is incorporated herein by reference. A copy of our insider trading policy is filed as Exhibit 19 to this Form 10-K.
We have a Code of Business Conduct and Ethics within the meaning of Item 406 of Regulation S-K adopted by the SEC under the Exchange Act that applies to our principal executive officer, principal financial officer and principal accounting officer. Our Code of Business Conduct and Ethics is available on Mosaic’s website (www.mosaicco.com) and we intend to satisfy the disclosure requirement under Item 5.05 of Form 8-K regarding any amendment to, or waiver from, a provision of our code of ethics by posting such information on our website. The information contained on Mosaic’s website is not being incorporated herein.
Item 11. Executive Compensation.
The information under the headings “Director Compensation” and “Executive Compensation” included in our definitive proxy statement for our 2026 annual meeting of stockholders is incorporated herein by reference.
Item 12. Security Ownership of Certain Beneficial Owners and Management and Related Stockholder Matters.
The information under the headings “Beneficial Ownership of Securities” and “Certain Relationships and Related Transactions” included in our definitive proxy statement for our 2026 annual meeting of stockholders is incorporated herein by reference. The table containing information related to equity compensation plans set forth in Part II, “Item 5. Market for Registrant’s Common Equity, Related Stockholder Matters and Issuer Purchases of Equity Securities” of this report is also incorporated herein by reference.
Item 13. Certain Relationships and Related Transactions, and Director Independence.
The information under the headings “Corporate Governance–Board Independence,” “Corporate Governance–Committees of the Board of Directors,” “Corporate Governance–Other Policies Relating to the Board of Directors–Policy and Procedures Regarding Transactions with Related Persons,” and “Certain Relationships and Related Transactions” included in our definitive proxy statement for our 2026 annual meeting of stockholders is incorporated herein by reference.
Item 14. Principal Accounting Fees and Services.
Our independent registered public accounting firm is KPMG LLP, Tampa, FL, Auditor Firm ID: 185.
The information included under “Audit Committee Report and Payment of Fees to Independent Registered Public Accounting Firm–Fees Paid to Independent Registered Public Accounting Firm” and “Audit Committee Report and Payment of Fees to Independent Registered Public Accounting Firm–Pre-approval of Independent Registered Public Accounting Firm Services” is included in our definitive proxy statement for our 2026 annual meeting of stockholders is incorporated herein by reference.
PART IV.
Item 15. Exhibits and Financial Statement Schedules.
|
|
|
|
|
|
|
|
|
|
|
|
|
|
|
|
|
|
|
|
|
| (a) |
(1) |
Consolidated Financial Statements filed as part of this report are listed in the Financial Table of Contents included in this report and incorporated by reference in this report in Part II, Item 8, “Financial Statements and Supplementary Data”. |
|
(2) |
All schedules for which provision is made in the applicable accounting regulations of the SEC are listed in this report in Part II, Item 8, “Financial Statements and Supplementary Data”. |
|
(3) |
Reference is made to the Exhibit Index in (b) below. |
| (b) |
Exhibits |
|
|
|
|
| Exhibit No. |
|
Description |
|
Incorporated Herein by
Reference to |
|
Filed with
Electronic
Submission |
| 3.i. |
|
|
|
Exhibit 3.i to Mosaic’s Current Report on Form 8-K dated May 19, 2016 and filed on May 23, 2016(2) |
|
|
|
|
|
|
|
|
|
| 3.ii. |
|
|
|
Exhibit 3.1 to Mosaic’s Current Report on Form 8-K dated December 15, 2023 and filed on December 20, 2023(2) |
|
|
|
|
|
|
|
|
|
| 4.i |
|
|
|
Exhibit 4.i to Mosaic’s Current Report on Form 8-K dated August 23, 2021 and filed on August 23, 2021(2) |
|
|
|
|
|
|
|
|
|
| 4.ii |
|
|
|
Exhibit 10.1 to Mosaic’s Current Report on Form 8-K dated May 10, 2023, and filed on May 10, 2023 |
|
|
|
|
|
|
|
|
|
| 4.iii |
|
|
|
Exhibit 10.1 to Mosaic’s Current Report on Form 8-K dated May 16, 2025 and filed on May 21, 2025 |
|
|
|
|
|
|
|
|
|
| 4.iv |
|
Registrant hereby agrees to furnish to the Commission, upon request, all other instruments defining the rights of holders of each issue of long-term debt of the Registrant and its consolidated subsidiaries
|
|
Exhibit 4.1 to Mosaic’s Current Report on Form 8-K dated October 24, 2011 and filed on October 24, 2011(2) |
|
|
|
|
|
|
|
|
|
| 4.v |
|
|
|
Exhibit 4.iii to Mosaic’s Annual Report on Form 10-K for the fiscal year ended December 31, 2019
|
|
|
|
|
|
|
|
|
|
10.iii.c.1(3) |
|
|
|
Exhibit 10.iii.c.i to Mosaic’s Annual Report on Form 10-K for the Fiscal Year ended December 31, 2023 |
|
|
|
|
|
|
|
|
|
|
|
|
|
|
|
|
|
|
|
|
|
|
|
|
|
|
|
|
|
|
10.iii.c.2(3) |
|
|
|
Exhibit 10.1 to Mosaic’s Current Report on Form 8-K dated March 5, 2015 and filed on March 11, 2015(2) |
|
|
|
|
|
|
|
|
|
10.iii.c.3(3) |
|
|
|
Exhibit 10.iii.c.4 to Mosaic’s Quarterly Report on Form 10-Q for the Quarterly Period ended March 31, 2017(2) |
|
|
|
|
|
|
|
|
|
10.iii.c.4(3) |
|
|
|
Exhibit 10.iii.c.4 to Mosaic's Annual Report on Form 10-K for the Fiscal Year ended December 31, 2024 |
|
|
|
|
|
|
|
|
|
10.iii.d.1(3) |
|
|
|
Exhibit 10.iii.d to Mosaic’s Quarterly Report on Form 10-Q for the Quarterly Period ended March 31, 2023 |
|
|
|
|
|
|
|
|
|
| 10.iii.d.2 |
|
|
|
Exhibit 10.iii.d.2. to Mosaic’s Quarterly Report on Form 10-Q of Mosaic for the Quarterly Period ended March 31, 2023(2) |
|
|
|
|
|
|
|
|
|
|
|
|
|
|
|
|
|
|
|
|
|
|
|
10.iii.d.3(3) |
|
|
|
Exhibit 10.1 to Mosaic’s Current Report on Form 8-K dated October 31, 2019 and filed on November 4, 2019 |
|
|
|
|
|
|
|
|
|
10.iii.d.4(3) |
|
|
|
Exhibit 10.iii.d to Mosaic’s Quarterly Report on Form 10-Q for the Quarterly Period ended March 31, 2022 |
|
|
|
|
|
|
|
|
|
10.iii.e.1(3) |
|
|
|
Exhibit 10.iii.b. to Mosaic’s Quarterly Report on Form 10-Q for the Quarterly Period ended August 31, 2012(2) |
|
|
|
|
|
|
|
|
|
10.iii.e.2(3) |
|
|
|
Exhibit 10.iii.x. to Mosaic’s Annual Report on Form 10-K of Mosaic for the fiscal year ended May 31, 2013(2) |
|
|
|
|
|
|
|
|
|
10.iii.f.(3) |
|
|
|
Exhibit 10.iii. to Mosaic’s Current Report on Form 8-K dated October 8, 2008, and filed on October 14, 2008(2) |
|
|
|
|
|
|
|
|
|
10.iii.i.(3) |
|
|
|
Appendix B to Mosaic’s Proxy Statement dated April 2, 2014(2) |
|
|
|
|
|
|
|
|
|
10.iii.j.(3) |
|
|
|
Exhibit 10.iii.j to Mosaic’s Annual Report on Form 10-K for the fiscal year ended December 31, 2019 |
|
|
|
|
|
|
|
|
|
|
|
|
|
|
|
|
|
|
|
|
|
|
|
|
|
|
|
|
|
|
10.iii.k.1(3) |
|
|
|
Exhibit 10.iii.a. to Mosaic’s Quarterly Report on Form 10-Q for the Quarterly Period ended March 31, 2015(2) |
|
|
|
|
|
|
|
|
|
10.iii.k.2(3) |
|
|
|
Exhibit 10.iii.a. to Mosaic’s Quarterly Report on Form 10-Q for the Quarterly Period ended March 31, 2016(2) |
|
|
|
|
|
|
|
|
|
10.iii.k.7(3) |
|
|
|
Exhibit 10.iii.k.1 to Mosaic’s Quarterly Report on Form 10-Q for the Quarterly Period Ended March 31, 2023 |
|
|
|
|
|
|
|
|
|
10.iii.k.8(3) |
|
|
|
Exhibit 10.iii.k.2 to Mosaic’s Quarterly Report on Form 10-Q for the Quarterly Period Ended March 31, 2023 |
|
|
|
|
|
|
|
|
|
10.iii.k.9(3) |
|
|
|
Exhibit 10.iii.k.3 to Mosaic’s Quarterly Report on Form 10-Q for the Quarterly Period Ended March 31, 2023 |
|
|
|
|
|
|
|
|
|
10.iii.l.1(3) |
|
|
|
Appendix B to Mosaic’s Proxy Statement dated April 12, 2023 |
|
|
|
|
|
|
|
|
|
10.iii.l.2(3) |
|
|
|
Exhibit 10.iii.i to Mosaic’s Quarterly Report on Form 10-Q for the Quarterly Period Ended September 30, 2023 |
|
|
|
|
|
|
|
|
|
10.iii.l.3(3) |
|
|
|
Exhibit 10.1 to Mosaic’s Current Report on Form 8-K dated December 15, 2023 and filed on December 20, 2023 |
|
|
|
|
|
|
|
|
|
| 10.iii.l.4(3) |
|
|
|
Exhibit 10.iii.i to Mosaic’s Quarterly Report on Form 10-Q for the Quarterly Period Ended March 31, 2024 |
|
|
|
|
|
|
|
|
|
| 10.iii.l.5(3) |
|
|
|
Exhibit 10.iii.ii to Mosaic's Quarterly Report on Form 10-Q for the Quarterly Period Ended March 31, 2024 |
|
|
|
|
|
|
|
|
|
| 10.iv.a |
|
|
|
Exhibit 10.1. to Mosaic’s Current Report on Form 8-K dated September 30, 2015 and filed on October 6, 2015(2) |
|
|
|
|
|
|
|
|
|
| 10.iv.b |
|
|
|
Exhibit 10.v.i to Mosaic’s Quarterly Report on Form 10-Q for the Quarterly Period Ended June 30, 2016(2)
|
|
|
|
|
|
|
|
|
|
|
|
|
|
|
|
|
|
|
|
|
|
|
|
|
|
|
|
|
|
|
| 10.iv.c |
|
|
|
Exhibit 10.2. to Mosaic’s Current Report on Form 8-K dated September 30, 2015 and filed on October 6, 2015(2) |
|
|
|
|
|
|
|
|
|
| 10.iv.d |
|
|
|
Exhibit 10.v.ii to Mosaic’s Quarterly Report on Form 10-Q for the Quarterly Period Ended June 30, 2016(2) |
|
|
|
|
|
|
|
|
|
| 19 |
|
|
|
|
|
X |
|
|
|
|
|
|
|
| 21 |
|
|
|
|
|
X |
|
|
|
|
|
|
|
| 23.1 |
|
|
|
|
|
X |
|
|
|
|
|
|
|
| 23.2 |
|
|
|
Exhibit 23.2 to Mosaic’s Annual Report on Form 10-K for the fiscal year ended December 31, 2022 |
|
|
|
|
|
|
|
|
|
| 23.3 |
|
|
|
Exhibit 23.3 to Mosaic’s Annual Report on Form 10-K for the fiscal year ended December 31, 2023 |
|
|
|
|
|
|
|
|
|
| 23.4 |
|
|
|
Exhibit 23.4 to Mosaic’s Annual Report on Form 10-K for the fiscal year ended December 31, 2024 |
|
|
|
|
|
|
|
|
|
| 23.5 |
|
|
|
|
|
X |
|
|
|
|
|
|
|
| 24 |
|
|
|
|
|
X |
|
|
|
|
|
|
|
| 31.1 |
|
|
|
|
|
X |
|
|
|
|
|
|
|
| 31.2 |
|
|
|
|
|
X |
|
|
|
|
|
|
|
| 32.1 |
|
|
|
|
|
X |
|
|
|
|
|
|
|
| 32.2 |
|
|
|
|
|
X |
|
|
|
|
|
|
|
| 95 |
|
|
|
|
|
X |
|
|
|
|
|
|
|
|
|
|
|
|
|
|
|
|
|
|
|
|
|
|
|
|
|
|
|
|
| 96.1 |
|
|
|
Exhibit 96.1 to Mosaic’s Annual Report on Form 10-K for the fiscal year ended December 31, 2022 |
|
|
|
|
|
|
|
|
|
| 96.2 |
|
|
|
|
|
X |
|
|
|
|
|
|
|
| 96.3 |
|
|
|
Exhibit 96.3 to Mosaic's Annual Report on Form 10-K for the fiscal year ended December 31, 2024 |
|
|
|
|
|
|
|
|
|
| 96.4 |
|
|
|
Exhibit 96.4 to Mosaic's Annual Report on Form 10-K for the fiscal year ended December 31, 2023 |
|
|
|
|
|
|
|
|
|
| 97.1 |
|
|
|
Exhibit 97.1 to Mosaic’s Annual Report on Form 10-K for the fiscal year ended December 31, 2023 |
|
|
|
|
|
|
|
|
|
| 101.INS |
|
Inline XBRL Instance Document (the instance document does not appear in the Interactive Data File because its XBRL tags are embedded within the Inline XBRL document) |
|
|
|
X |
|
|
|
|
|
|
|
| 101.SCH |
|
Inline XBRL Taxonomy Extension Schema Document |
|
|
|
X |
|
|
|
|
|
|
|
| 101.CAL |
|
Inline XBRL Taxonomy Extension Calculation Linkbase Document |
|
|
|
X |
| 101.LAB |
|
Inline XBRL Taxonomy Extension Label Linkbase Document |
|
|
|
X |
|
|
|
|
|
|
|
| 101.PRE |
|
Inline XBRL Taxonomy Extension Presentation Linkbase Document |
|
|
|
X |
|
|
|
|
|
|
|
| 101.DEF |
|
Inline XBRL Taxonomy Extension Definition Linkbase Document |
|
|
|
X |
|
|
|
|
|
|
|
| 104 |
|
Cover Page Interactive Data File (formatted as Inline XBRL and contained in Exhibit 101) |
|
|
|
X |
|
|
|
|
|
|
|
| (c) |
Summarized financial information of 50% or less owned persons is included in Note 9 of Notes to Consolidated Financial Statements. Financial statements and schedules are omitted as none of such persons are significant under the tests specified in Regulation S-X under Article 3.09 of general instructions to the financial statements. |
*********************************************
|
|
|
|
|
|
| (1) |
Mosaic agrees to furnish supplementally to the SEC a copy of any omitted schedules and exhibits to the extent required by rules of the Commission upon request. |
| (2) |
SEC File No. 001-32327. |
| (3) |
Denotes management contract or compensatory plan. |
| (4) |
Confidential information has been omitted from this Exhibit and filed separately with the SEC pursuant to a confidential treatment request under Rule 24b-2 of the Exchange Act. |
Item 16. Annual Report on Form 10-K Summary.
None.
*********************************************
SIGNATURES
Pursuant to the requirements of Section 13 or 15(d) of the Securities Exchange Act of 1934, the registrant has duly caused this report to be signed on its behalf by the undersigned, thereunto duly authorized.
|
|
|
| THE MOSAIC COMPANY |
| (Registrant) |
|
| /s/ Bruce M. Bodine |
| Bruce M. Bodine |
| Chief Executive Officer and President |
Date: February 27, 2026
Pursuant to the requirements of the Securities Exchange Act of 1934, this report has been signed below by the following persons on behalf of the registrant and in the capacities and on the dates indicated:
|
|
|
|
|
|
|
|
|
|
|
|
|
|
|
| Name |
|
Title |
|
Date |
|
|
|
|
|
| /s/ Bruce M. Bodine |
|
Chief Executive Officer and President and Director (principal executive officer) |
|
February 27, 2026 |
| Bruce M. Bodine |
|
|
|
|
|
|
|
|
| /s/ Luciano Siani Pires |
|
Executive Vice President and Chief Financial Officer (principal financial officer) |
|
February 27, 2026 |
| Luciano Siani Pires |
|
|
|
|
|
|
|
|
| /s/ Russell A. Flugel |
|
Vice President—Controller and Chief Accounting Officer (principal accounting officer) |
|
February 27, 2026 |
| Russell A. Flugel |
|
|
|
|
|
|
|
|
| * |
|
Chairman of the Board of Directors |
|
February 27, 2026 |
| Gregory L. Ebel |
|
|
|
|
|
|
|
|
|
| * |
|
Director |
|
February 27, 2026 |
| Cheryl K. Beebe |
|
|
|
|
|
|
|
|
|
| * |
|
Director |
|
February 27, 2026 |
| Timothy S. Gitzel |
|
|
|
|
|
|
|
|
|
| * |
|
Director |
|
February 27, 2026 |
| Emery N. Koenig |
|
|
|
|
|
|
|
|
|
| * |
|
Director |
|
February 27, 2026 |
| Jody L. Kuzenko |
|
|
|
|
|
|
|
|
|
| * |
|
Director |
|
February 27, 2026 |
| Sonya C. Little |
|
|
|
|
|
|
|
|
|
| * |
|
Director |
|
February 27, 2026 |
| David T. Seaton |
|
|
|
|
|
|
|
|
|
| * |
|
Director |
|
February 27, 2026 |
| Kathleen M. Shanahan |
|
|
|
|
|
|
|
|
|
| * |
|
Director |
|
February 27, 2026 |
| João Roberto Gonçalves Teixeira |
|
|
|
|
|
|
|
|
|
| * |
|
Director |
|
February 27, 2026 |
| Gretchen H. Watkins |
|
|
|
|
|
|
|
|
|
| * |
|
Director |
|
February 27, 2026 |
| Kelvin R. Westbrook |
|
|
|
|
|
|
|
|
|
|
|
|
|
|
|
|
|
|
| *By: |
|
/s/ Philip E. Bauer |
|
|
|
|
|
Philip E. Bauer
Attorney-in-Fact |
Financial Table of Contents
Management’s Discussion and Analysis of Financial Condition and Results of Operations
Introduction
The Mosaic Company (before or after the Cargill Transaction, as defined below, “Mosaic,” and with its consolidated subsidiaries, “we,” “us,” “our” or the “Company”) is the parent company of the business that was formed through the business combination (“Combination”) of IMC Global Inc. and the Cargill Crop Nutrition fertilizer businesses of Cargill, Incorporated and its subsidiaries (collectively, “Cargill”) on October 22, 2004. In May 2011, Cargill divested its approximately 64% equity interest in us in a split-off to its stockholders and a debt exchange with certain Cargill debt holders.
We produce and market concentrated phosphate and potash crop nutrients. We conduct our business through wholly- and majority-owned subsidiaries as well as businesses in which we own less than a majority or a non-controlling interest, including consolidated variable interest entities and investments accounted for by the equity method.
We are organized into the following business segments:
•Our Phosphate business segment owns and operates mines and production facilities in Florida, which produce concentrated phosphate crop nutrients and phosphate-based animal feed ingredients, and processing plants in Louisiana, which produce concentrated phosphate crop nutrients for sale domestically and internationally. We have a 75% economic interest in the Miski Mayo Phosphate Mine (“Miski Mayo Mine”) in Peru. These results are consolidated in the Phosphate segment. Through December 24, 2024, the Phosphate segment included our 25% interest in the Ma’aden Wa’ad Al Shamal Phosphate Company (“MWSPC”), a joint venture to develop, own and operate integrated phosphate production facilities in the Kingdom of Saudi Arabia. On December 24, 2024, we exchanged our ownership of MWSPC for shares of Saudi Arabian Mining Company (“Ma’aden”). Our equity in the net earnings or losses relating to MWSPC were recognized on a one-quarter lag in our Consolidated Statements of Earnings.
•Our Potash business segment owns and operates potash mines and production facilities in Canada and the U.S. which produce potash-based crop nutrients, animal feed ingredients and industrial products. Potash sales include domestic and international sales. We are a member of Canpotex, Limited (“Canpotex”), an export association of Canadian potash producers through which we sell our Canadian potash outside the U.S. and Canada.
•Our Mosaic Fertilizantes business segment includes five phosphate rock mines and four phosphate chemical plants in Brazil. The segment also includes our distribution business in South America, which consists of sales offices, crop nutrient blending and bagging facilities, port terminals and warehouses in Brazil and Paraguay. We also have a majority interest in Fospar S.A., which owns and operates a single superphosphate granulation plant and a deep-water port and throughput warehouse terminal facility in Brazil. This segment also includes the results of Mosaic Biosciences sales in Brazil.
Intersegment eliminations, unrealized mark-to-market gains/losses on derivatives and investment in equity securities of Ma'aden, debt expenses, the results of the China and India distribution businesses and Mosaic Biosciences sales in China, India and North America are included within Corporate, Eliminations and Other. See Note 25 of the Consolidated Financial Statements in this Form 10-K for segment results.
Key Factors That Can Affect Results of Operations and Financial Condition
Our primary products, phosphate and potash crop nutrients, are, to a large extent, global commodities that are also available from a number of domestic and international competitors, and are sold by negotiated contracts or by reference to published market prices. The markets for our products are highly competitive, and the most important competitive factor for our products is delivered price. Business and economic conditions and governmental policies affecting the agricultural industry and customer sentiment are the most significant factors affecting worldwide demand for crop nutrients with the impact of demand for biofuels and batteries also playing an increasing role. The profitability of our businesses is heavily influenced by worldwide supply and demand for our products, which affects our sales prices and volumes. Our costs per tonne to produce our products are also heavily influenced by fixed costs associated with owning and operating our major facilities, significant raw material costs in our Phosphate and Mosaic Fertilizantes businesses, water treatment costs in our Phosphate business and fluctuations in currency exchange rates.
Our products are generally sold based on the market prices prevailing at the time the sales contract is signed or through contracts which are priced at the time of shipment. Additionally, in certain circumstances the final price of our products is determined after shipment based on the current market at the time the price is agreed to with the customer. Forward sales programs at fixed prices increase the lag between prevailing market prices and our average realized selling prices. The mix and parameters of these sales programs vary over time based on our marketing strategy, which considers factors that include, among others, optimizing our production and operating efficiency within warehouse limitations, as well as customer requirements. The use of forward sales programs and the level of customer prepayments may vary from period to period due to changing supply and demand environments, seasonality and market sentiments.
World prices for the key raw material inputs for concentrated phosphate products, including ammonia, sulfur and phosphate rock, have an effect on industry-wide phosphate prices and production costs. The primary feedstock for producing ammonia is natural gas. The product price for ammonia is generally highly dependent on the supply and demand balance for ammonia. In North America, two-thirds of our ammonia is sourced either through ammonia supply agreements or produced internally at our Faustina, Louisiana, location with the remaining one-third purchased from various suppliers in the spot market. We have agreements with various suppliers to ensure we have reliable sources of supply for ammonia to support competitive pricing in various market conditions. In Brazil, we purchase all our ammonia from a single supplier.
Sulfur is a global commodity that is primarily produced as a by-product of oil refining. The market price is based primarily on the supply and demand balance for sulfur. We believe our current and future investments in sulfur transformation and transportation assets will enhance our competitive advantage.
We produce and procure most of our phosphate rock requirements through either wholly or partly owned mines. In addition to producing phosphate rock, Mosaic Fertilizantes purchases phosphate, potash and nitrogen products which are either used to produce blended crop nutrients (“Blends”) or for resale.
Our per tonne selling prices for potash are affected by shifts in the product mix, geography and customer mix. Our Potash business is significantly affected by Canadian resource taxes that we pay to the Province of Saskatchewan and royalties we pay to mineral holders in order for us to mine and sell our potash products. In addition, cost of goods sold is affected by a number of factors, including: fluctuations in the Canadian dollar; the level of periodic inflationary pressures on resources in western Canada, where we produce most of our potash; and natural gas costs for operating our potash solution mine at Belle Plaine, Saskatchewan. In the past, we have also incurred operating costs to manage salt saturated brine inflows at our Esterhazy, Saskatchewan K1 and K2 mine shafts, which we closed in June 2021, due to an acceleration of brine inflows. We have now transitioned mining to the K3 mine shaft, which has replaced production from the K1 and K2 shafts.
Our results of operations are also affected by changes in currency exchange rates due to our international footprint. The most significant currency impacts are generally from the Canadian dollar and the Brazilian real.
A discussion of these and other factors that affected our results of operations and financial condition for the periods covered by this Management’s Discussion and Analysis of Financial Condition and Results of Operations is set forth in further detail below. This Management’s Discussion and Analysis of Financial Condition and Results of Operations should also be read in conjunction with the narrative description of our business in Item 1, and the risk factors described in Item 1A, of Part I of this Annual Report on Form 10-K (“Form 10-K”), and our Consolidated Financial Statements, accompanying notes and other information listed in the accompanying Financial Table of Contents.
This section of this Form 10-K discusses 2025 and 2024 items and year-to-year comparisons between 2025 and 2024. Discussions of 2023 items and year-to-year comparisons between 2024 and 2023 that are not included in this Form 10-K can be found in “Management’s Discussion and Analysis of Financial Condition and Results of Operations” in Part II, Item 7 of the Company’s Form 10-K for the year ended December 31, 2024 and are incorporated by reference herein.
Throughout the discussion below, we measure units of production, sales and raw materials in metric tonnes which are the equivalent of 2,205 pounds, unless we specifically state that we mean short or long ton(s), which are the equivalent of 2,000 pounds and 2,240 pounds, respectively. In addition, we measure natural gas, a raw material used in the production of our products, in MM BTU, which stands for one million British Thermal Units (“BTU”). One BTU is equivalent to 1.06 Joules. Management uses the following metrics to monitor segment performance: production volume, sales volume, average finished product selling price and average cost per unit consumed.
In the following table, there are certain percentages that are not considered to be meaningful and are represented by “NM”.
Results of Operations
The following table shows the results of operations for the years ended December 31, 2025, 2024, and 2023:
|
|
|
|
|
|
|
|
|
|
|
|
|
|
|
|
|
|
|
|
|
|
|
|
|
|
|
|
|
|
|
|
|
|
|
|
|
|
|
|
|
|
| |
Years Ended December 31, |
|
2025-2024 |
|
2024-2023 |
| (in millions, except per share data) |
2025 |
|
2024 |
|
2023 |
|
Change |
|
Percent |
|
Change |
|
Percent |
| Net sales |
$ |
12,052.4 |
|
|
$ |
11,122.8 |
|
|
$ |
13,696.1 |
|
|
$ |
929.6 |
|
|
8 |
% |
|
$ |
(2,573.3) |
|
|
(19) |
% |
| Cost of goods sold |
10,150.5 |
|
|
9,610.9 |
|
|
11,485.5 |
|
|
539.6 |
|
|
6 |
% |
|
(1,874.6) |
|
|
(16) |
% |
| Gross margin |
1,901.9 |
|
|
1,511.9 |
|
|
2,210.6 |
|
|
390.0 |
|
|
26 |
% |
|
(698.7) |
|
|
(32) |
% |
| Gross margin percentage |
15.8 |
% |
|
13.6 |
% |
|
16.1 |
% |
|
2.2 |
% |
|
|
|
(2.5) |
% |
|
|
| Selling, general and administrative expenses |
533.9 |
|
|
496.9 |
|
|
500.5 |
|
|
37.0 |
|
|
7 |
% |
|
(3.6) |
|
|
(1) |
% |
| Loss (gain) on assets sold and to be sold |
157.3 |
|
|
— |
|
|
(56.5) |
|
|
157.3 |
|
|
NM |
|
56.5 |
|
|
NM |
| Impairment of goodwill |
99.9 |
|
|
— |
|
|
— |
|
|
99.9 |
|
|
NM |
|
— |
|
|
NM |
| Other operating expenses |
289.3 |
|
|
393.5 |
|
|
428.5 |
|
|
(104.2) |
|
|
(26) |
% |
|
(35.0) |
|
|
(8) |
% |
| Operating earnings |
821.5 |
|
|
621.5 |
|
|
1,338.1 |
|
|
200.0 |
|
|
32 |
% |
|
(716.6) |
|
|
(54) |
|
|
|
|
|
|
|
|
|
|
|
|
|
|
|
| Interest expense, net |
(187.7) |
|
|
(182.8) |
|
|
(129.4) |
|
|
(4.9) |
|
|
3 |
% |
|
(53.4) |
|
|
41 |
% |
| Foreign currency transaction gain (loss) |
271.7 |
|
|
(685.8) |
|
|
194.0 |
|
|
957.5 |
|
|
(140) |
% |
|
(879.8) |
|
|
NM |
| Gain on sale of equity investment |
— |
|
|
522.2 |
|
|
— |
|
|
(522.2) |
|
|
(100) |
% |
|
522.2 |
|
|
NM |
| Other income (expense) |
307.4 |
|
|
40.3 |
|
|
(76.8) |
|
|
267.1 |
|
|
NM |
|
117.1 |
|
|
(152) |
% |
| Earnings from consolidated companies before income taxes |
1,212.9 |
|
|
315.4 |
|
|
1,325.9 |
|
|
897.5 |
|
|
NM |
|
(1,010.5) |
|
|
(76) |
|
| Provision for income taxes |
639.8 |
|
|
186.7 |
|
|
177.0 |
|
|
453.1 |
|
|
NM |
|
9.7 |
|
|
5 |
|
| Earnings from consolidated companies |
573.1 |
|
|
128.7 |
|
|
1,148.9 |
|
|
444.4 |
|
|
NM |
|
(1,020.2) |
|
|
(89) |
% |
| Equity in net earnings of nonconsolidated companies |
2.3 |
|
|
73.3 |
|
|
60.3 |
|
|
(71.0) |
|
|
(97) |
% |
|
13.0 |
|
|
22 |
% |
| Net earnings including noncontrolling interests |
575.4 |
|
|
202.0 |
|
|
1,209.2 |
|
|
373.4 |
|
|
185 |
% |
|
(1,007.2) |
|
|
(83) |
% |
| Less: Net earnings attributable to noncontrolling interests |
34.7 |
|
|
27.1 |
|
|
44.3 |
|
|
7.6 |
|
|
28 |
% |
|
(17.2) |
|
|
(39) |
% |
| Net earnings attributable to Mosaic |
$ |
540.7 |
|
|
$ |
174.9 |
|
|
$ |
1,164.9 |
|
|
$ |
365.8 |
|
|
NM |
|
$ |
(990.0) |
|
|
(85) |
% |
| Diluted net earnings per share attributable to Mosaic |
$ |
1.70 |
|
|
$ |
0.55 |
|
|
$ |
3.50 |
|
|
$ |
1.15 |
|
|
NM |
|
$ |
(2.95) |
|
|
(84) |
% |
| Diluted weighted average number of shares outstanding |
318.9 |
|
|
320.7 |
|
|
333.2 |
|
|
|
|
|
|
|
|
|
Overview of the Years ended December 31, 2025 and 2024
Net earnings attributable to Mosaic for the year ended December 31, 2025 were $540.7 million, or $1.70 per diluted share, compared to $174.9 million, or $0.55 per diluted share for 2024. Gross margin for the current year increased $390.0 million from the prior year driven by higher finished good sales pricing across our segments, as discussed further below. Net income for the year ended December 31, 2025 was favorably impacted by a foreign currency transaction gain of $271.7 million, compared to a foreign currency transaction loss of $685.8 million in the prior year period and an unrealized mark-to-market gain of approximately $317.0 million on the investment in Ma’aden shares, included in other income (expense). These benefits were partially offset by a loss on assets sold and to be sold of $157.3 million and an impairment of goodwill of $99.9 million.
Significant factors that affected our results of operations and financial condition in 2025 and 2024 are listed below. These factors are discussed in more detail in the following sections of this Management’s Discussion and Analysis of Financial Condition and Results of Operations.
Year ended December 31, 2025
In our Phosphate segment, operating earnings were $135 million for 2025 compared to $225 million in the prior year period. Current year operating results reflect lower sales volumes which were impacted by supply losses due to extended downtime as we focused on improving asset integrity, and lower demand in North America in the fourth quarter of 2025 compared to the prior year period. Phosphate operating results were also unfavorably impacted by higher raw material costs, primarily sulfur, compared to the prior year period. These impacts were partially offset by the benefit of higher average selling prices which continued the upward trend that began in the second half of 2023, reflecting strong global demand and low inventory levels. Operating results were also unfavorably impacted by higher maintenance turnaround costs and water treatment costs compared to the prior year period.
In our Potash segment, operating earnings were $638 million for 2025, compared to $605 million in the prior year period. Operating results benefited from higher average selling prices and sales volumes in the current year period. Prices and sales volumes improved due to continued strength in international demand. Sales volumes also benefitted due to our recovery from production challenges and supply chain delays experienced in the prior year. Current year operating results were unfavorably impacted by a loss on assets held for sale related to the Carlsbad, New Mexico facility.
In our Mosaic Fertilizantes segment, operating earnings were $277 million for 2025 compared to $238 million in the prior year period. Operating results reflected higher average selling prices compared to the prior year period benefiting from a favorable global pricing environment that was driven by healthy demand and tight supply. This benefit was partially offset by the impact of higher costs of purchased products for resale. We saw a slight decrease in sales volumes compared to the prior year which was driven by grower caution and increased credit constraints in Brazil. Operating earnings were stronger in the first three quarters of 2025 compared to the prior year but declined in the fourth quarter due to lower volumes. Sales volumes were negatively impacted by challenging credit conditions for customers, weaker margins, in part due to higher sulfur raw material cost and higher turnaround and idle costs due to downtime. Due to the increase in sulfur costs seen in the fourth quarter of 2025, we temporarily idled production at our Fospar and Araxa facilities in Brazil. Operating results in 2025 were also impacted by a gain on the sale of the Patos de Minas mine and a loss on the sale of the Taquari mine.
Corporate, Eliminations and Other had an operating loss of $(229) million for 2025 compared to a loss of $(446) million in the prior year. Corporate, Eliminations and Other includes the results of the China and India distribution businesses, intersegment eliminations, including profit on intersegment sales, unrealized mark-to-market gains and losses on derivatives and debt expenses.
In addition to the items mentioned above:
•In October 2025, we completed the sale of our idled Patos de Minas phosphate mining unit in Brazil for $111 million, with $51 million paid at closing and the balance of the purchase price to be paid in installments over the next four years. The sale resulted in a gain of $94 million.
•In November 2025, we completed the sale of our interest in the Taquari potash mine in Brazil for proceeds of up to $27 million, with $12 million received at closing and an additional $10 million due in one year. The remaining $5 million is contingent upon future potash pricing benchmarks. We recorded an impairment loss of approximately $66 million related to the sale.
•In November 2025, we completed a $900 million public bond offering, consisting of $500 million aggregate principal amount of 4.350% senior notes due 2029 and $400 million aggregate principal amount of 4.600% senior notes due 2030.
•In December 2025, we entered into an agreement to sell our Carlsbad, New Mexico potash mine for approximately $30 million. The transaction includes initial proceeds of $20 million at closing and deferred consideration of $10 million, payable in three equal installments beginning in 2029. The sale is expected to be completed in the first half of 2026. As of December 31, 2025, the assets and liabilities are considered held for sale and we recorded an impairment loss of approximately $185 million.
Year ended December 31, 2024:
For the year ended December 31, 2024, operating results were driven by lower finished good sales pricing in our Potash and Mosaic Fertilizantes segments and lower sales volumes across our segments as discussed further below. Net earnings were unfavorably impacted by a foreign currency translation loss and benefited from a gain on sale of the equity investment in MWSPC.
In our Phosphate segment, operating results for 2024 were unfavorable compared to the prior year due to lower finished goods sales volumes partially offset by higher average selling prices. Sales volumes were unfavorably impacted by planned maintenance and turnaround activity at our sites as well as impacts from hurricanes in Florida in the second half of the year. Phosphate operating results were also unfavorably impacted by increased product costs due to our sales volumes including a larger proportion of purchased tonnes than in the prior year. We increased our purchases in 2024 to offset lost production in the first quarter from a fire at our Riverview, Florida facility. Average selling prices for 2024 were favorable versus the prior year as prices continued trending upwards since the third quarter of 2023, driven by strong demand in North America. Operating results also benefited from lower raw material costs, primarily sulfur, compared to the prior year period.
In our Potash segment, operating results for 2024 were unfavorably impacted by lower global average selling prices, resulting from improved global supply. Operating results were also unfavorably impacted by lower sales volumes in the second half of the year resulting from production challenges in the third quarter due to electrical issues at two of our mines and supply chain delays caused by a port strike in Vancouver, Canada.
In our Mosaic Fertilizantes segment, operating results for 2024 were unfavorably impacted by a decrease in average selling prices compared to the prior year period. Sales prices of potash and nitrogen in Brazil decreased as global supply improved. Sales volumes were down compared to the prior year period as a result of our decision to prioritize sales to lower credit-risk customers, and to focus on obtaining improved gross margin over sales volumes.
Corporate, Eliminations and Other had an operating loss of $(446) million in 2024 compared to a loss of $(264) million in the prior year. Corporate, Eliminations and Other includes the results of the China and India distribution businesses, intersegment eliminations, including profit on intersegment sales, unrealized mark-to-market gains and losses on derivatives and debt expenses.
Phosphate Net Sales and Gross Margin
The following table summarizes the Phosphate segment’s net sales, gross margin, sales volume, selling prices and raw material prices:
|
|
|
|
|
|
|
|
|
|
|
|
|
|
|
|
|
|
|
|
|
|
|
|
|
|
|
|
|
|
|
|
|
|
|
|
|
|
|
|
|
|
|
Years Ended December 31, |
|
2025-2024 |
|
2024-2023 |
(in millions, except price per tonne or unit) |
2025 |
|
2024 |
|
2023 |
|
Change |
|
Percent |
|
Change |
|
Percent |
| Net sales: |
|
|
|
|
|
|
|
|
|
|
|
|
|
North America |
$ |
3,933.9 |
|
|
$ |
3,772.9 |
|
|
$ |
3,749.8 |
|
|
$ |
161.0 |
|
|
4 |
% |
|
$ |
23.1 |
|
|
1 |
% |
International |
642.6 |
|
|
745.9 |
|
|
974.5 |
|
|
(103.3) |
|
|
(14) |
% |
|
(228.6) |
|
|
(23) |
% |
Total |
4,576.5 |
|
|
4,518.8 |
|
|
4,724.3 |
|
|
57.7 |
|
|
1 |
% |
|
(205.5) |
|
|
(4) |
% |
| Cost of goods sold |
4,139.2 |
|
|
3,924.8 |
|
|
4,022.2 |
|
|
214.4 |
|
|
5 |
% |
|
(97.4) |
|
|
(2) |
% |
| Gross margin |
$ |
437.3 |
|
|
$ |
594.0 |
|
|
$ |
702.1 |
|
|
$ |
(156.7) |
|
|
(26) |
% |
|
$ |
(108.1) |
|
|
(15) |
|
| Gross margin as a percentage of net sales |
9.6 |
% |
|
13.1 |
% |
|
14.9 |
% |
|
|
|
|
|
|
|
|
Sales volumes(a) (in thousands of metric tonnes) |
|
|
|
|
|
|
|
|
|
|
|
|
|
DAP/MAP |
2,935 |
|
|
3,133 |
|
|
3,625 |
|
|
(198) |
|
|
(6) |
% |
|
(492) |
|
|
(14) |
% |
Performance and Other(b) |
3,010 |
|
|
3,304 |
|
|
3,366 |
|
|
(294) |
|
|
(9) |
% |
|
(62) |
|
|
(2) |
% |
| Total finished product tonnes |
5,945 |
|
|
6,437 |
|
|
6,991 |
|
|
(492) |
|
|
(8) |
% |
|
(554) |
|
|
(8) |
% |
Rock(c) |
1,760 |
|
|
1,795 |
|
|
1,622 |
|
|
(35) |
|
|
(2) |
% |
|
173 |
|
|
11 |
% |
Total Phosphate Segment Tonnes(a) |
7,705 |
|
|
8,232 |
|
|
8,613 |
|
|
(527) |
|
|
(6) |
% |
|
(381) |
|
|
(4) |
% |
| Realized prices ($/tonne) |
|
|
|
|
|
|
|
|
|
|
|
|
|
Average finished product selling price (destination)(d) |
$ |
667 |
|
|
$ |
589 |
|
|
$ |
566 |
|
|
$ |
78 |
|
|
13 |
% |
|
$ |
23 |
|
|
4 |
% |
| DAP selling price (fob mine) |
$ |
670 |
|
|
$ |
585 |
|
|
$ |
573 |
|
|
$ |
85 |
|
|
15 |
% |
|
$ |
12 |
|
|
2 |
% |
| Average cost per unit consumed in cost of goods sold: |
|
|
|
|
|
|
|
|
|
|
|
|
|
Ammonia (metric tonne) |
$ |
468 |
|
|
$ |
435 |
|
|
$ |
426 |
|
|
$ |
33 |
|
|
8 |
% |
|
$ |
9 |
|
|
2 |
% |
Sulfur (long ton) |
$ |
237 |
|
|
$ |
132 |
|
|
$ |
181 |
|
|
$ |
105 |
|
|
80 |
% |
|
$ |
(49) |
|
|
(27) |
% |
Blended rock (metric tonne) |
$ |
80 |
|
|
$ |
85 |
|
|
$ |
75 |
|
|
$ |
(5) |
|
|
(6) |
% |
|
$ |
10 |
|
|
13 |
% |
| Production volume (in thousands of metric tonnes) - North America |
6,272 |
|
|
6,290 |
|
|
6,568 |
|
|
(18) |
|
|
— |
% |
|
(278) |
|
|
(4) |
% |
(a) Includes intersegment sales volumes.
(b) Includes sales volumes of MicroEssentials® and animal feed ingredients.
(c) Sales volumes of rock are presented on a wet tonne basis based on average moisture levels of 3.5% to 4.5% as it exits the drying process and is prepared for shipping.
(d) Excludes sales revenue and tonnes associated with rock sales.
Year Ended December 31, 2025 compared to Year Ended December 31, 2024
The Phosphate segment’s net sales were $4.6 billion for the year ended December 31, 2025, compared to $4.5 billion for the same period a year ago. The increase in net sales was driven by higher average finished product selling prices, which favorably impacted net sales by approximately $450 million. This benefit was partially offset by lower finished goods sales volumes, which resulted in an unfavorable impact of approximately $280 million. Additionally, lower rock sales had an unfavorable impact of approximately $50 million and lower freight and other product revenue had an unfavorable impact of approximately $60 million compared to the prior year period.
Our average finished product selling price increased 13%, to $667 per tonne for the year ended December 31, 2025, compared to $589 per tonne for the same period a year ago, due to the factors discussed in the Overview.
The Phosphate segment’s sales volumes of finished products decreased to 5.9 million tonnes for the year ended December 31, 2025, compared to 6.4 million tonnes in 2024, due to the factors discussed in the Overview.
Gross margin for the Phosphate segment decreased to $437.3 million in the current year compared with $594.0 million for the prior year. The decrease was primarily driven by unfavorable cost impacts, including approximately $285 million from higher sulfur and ammonia input costs, and approximately $140 million from higher conversion costs, compared to the prior year period.
Higher expenses, resulting from maintenance turnarounds and initiatives to enhance asset integrity, further reduced gross margin by approximately $60 million. Gross margin was also unfavorably impacted by higher water treatment costs of approximately $70 million, higher plant-related costs of approximately $30 million, higher demurrage and port costs of approximately $30 million and higher land reclamation costs of approximately $10 million. In addition, lower finished goods and rock sales volumes unfavorably impacted gross margin by approximately $45 million. These impacts were partially offset by favorable impacts from higher finished goods selling prices of approximately $450 million and lower blended rock costs of approximately $65 million.
Our average consumed price for ammonia in our North American operations increased to $468 per tonne in 2025 from $435 a year ago. The average consumed price for sulfur for our North American operations increased to $237 per long ton for the year ended December 31, 2025, from $132 in the prior year period. The purchase price of these raw materials is driven by global supply and demand. The consumed ammonia and sulfur prices also include transportation, transformation and storage costs.
The average consumed cost of purchased and produced rock decreased to $80 per tonne in the current year, from $85 a year ago. For the year ended December 31, 2025, our North American phosphate rock production increased to 9.5 million tonnes from 9.0 million tonnes in the prior year.
The Phosphate segment’s production of crop nutrient dry concentrates and animal feed ingredients remained materially unchanged at 6.3 million tonnes for both the current and prior year periods. For the year ended December 31, 2025, our operating rate for processed phosphate production was 63%, compared to 64% in the same period of the prior year.
Potash Net Sales and Gross Margin
The following table summarizes the Potash segment’s net sales, gross margin, sales volume and selling price:
|
|
|
|
|
|
|
|
|
|
|
|
|
|
|
|
|
|
|
|
|
|
|
|
|
|
|
|
|
|
|
|
|
|
|
|
|
|
|
|
|
|
|
Years Ended December 31, |
|
2025-2024 |
|
2024-2023 |
(in millions, except price per tonne or unit) |
2025 |
|
2024 |
|
2023 |
|
Change |
|
Percent |
|
Change |
|
Percent |
| Net sales: |
|
|
|
|
|
|
|
|
|
|
|
|
|
North America |
$ |
1,370.1 |
|
|
$ |
1,452.3 |
|
|
$ |
1,899.9 |
|
|
$ |
(82.2) |
|
|
(6) |
% |
|
$ |
(447.6) |
|
|
(24) |
% |
International |
1,291.6 |
|
|
936.4 |
|
|
1,333.7 |
|
|
355.2 |
|
|
38 |
% |
|
(397.3) |
|
|
(30) |
% |
| Total |
2,661.7 |
|
|
2,388.7 |
|
|
3,233.6 |
|
|
273.0 |
|
|
11 |
% |
|
(844.9) |
|
|
(26) |
% |
| Cost of goods sold |
1,791.7 |
|
|
1,745.5 |
|
|
2,018.6 |
|
|
46.2 |
|
|
3 |
% |
|
(273.1) |
|
|
(14) |
% |
| Gross margin |
$ |
870.0 |
|
|
$ |
643.2 |
|
|
$ |
1,215.0 |
|
|
$ |
226.8 |
|
|
35 |
% |
|
$ |
(571.8) |
|
|
(47) |
% |
| Gross margin as a percentage of net sales |
32.7 |
% |
|
26.9 |
% |
|
37.6 |
% |
|
|
|
|
|
|
|
|
|
|
|
|
|
|
|
|
|
|
|
|
|
|
|
|
|
|
|
|
|
|
|
|
|
|
|
|
|
|
|
|
|
|
|
|
|
|
|
|
|
|
Sales volume(a) (in thousands of metric tonnes) |
|
|
|
|
|
|
|
|
|
|
|
|
|
MOP |
8,262 |
|
|
7,879 |
|
|
7,969 |
|
|
383 |
|
|
5 |
% |
|
(90) |
|
|
(1) |
% |
Performance and Other(b) |
706 |
|
|
865 |
|
|
901 |
|
|
(159) |
|
|
(18) |
% |
|
(36) |
|
|
(4) |
% |
| Total Potash Segment Tonnes |
8,968 |
|
|
8,744 |
|
|
8,870 |
|
|
224 |
|
|
3 |
% |
|
(126) |
|
|
(1) |
% |
| Realized prices ($/tonne) |
|
|
|
|
|
|
|
|
|
|
|
|
|
| Average finished product selling price (destination) |
$ |
266 |
|
|
$ |
236 |
|
|
$ |
323 |
|
|
$ |
30 |
|
|
13 |
% |
|
$ |
(87) |
|
|
(27) |
% |
| MOP selling price (fob mine) |
$ |
255 |
|
|
$ |
222 |
|
|
$ |
308 |
|
|
$ |
33 |
|
|
15 |
% |
|
$ |
(86) |
|
|
(28) |
% |
| Production volume (in thousands of metric tonnes) |
8,797 |
|
|
8,798 |
|
|
8,246 |
|
|
(1) |
|
|
— |
% |
|
552 |
|
|
7 |
% |
(a) Includes intersegment sales volumes.
(b) Includes sales volumes of K-Mag®, Aspire® and animal feed ingredients.
Year Ended December 31, 2025 compared to Year Ended December 31, 2024
The Potash segment’s net sales increased to $2.7 billion for the year ended December 31, 2025, compared to $2.4 billion in the prior year. The increase was due to higher average selling prices and sales volumes, which favorably impacted net sales by approximately $265 million and $50 million, respectively, compared to the prior year period. This was partially offset by an approximate $45 million reduction in freight revenue, reflecting lower freight rates and lower domestic sales volumes in the current year period.
Our average finished product selling price was $266 per tonne for the year ended December 31, 2025, an increase of $30 per tonne compared with the prior year period, due to the factor discussed in the Overview.
The Potash segment’s sales volumes increased to 9.0 million tonnes for the year ended December 31, 2025, compared to 8.7 million tonnes in the same period a year ago, due to the factors discussed in the Overview.
Gross margin for the Potash segment increased to $870.0 million in the current year, from $643.2 million in the prior year period. The increase was primarily driven by favorable finished goods pricing, which contributed approximately $265 million, and higher sales volumes, which contributed approximately $20 million, compared to the prior year period. This was partially offset by higher Canadian resource taxes and royalty expenses of approximately $43 million, as discussed below, and higher conversion costs of approximately $25 million, compared to the prior year period.
We incurred $272.8 million of Canadian resource taxes for the year ended December 31, 2025 compared to $232.2 million in the prior year. Canadian royalty expense also increased to $42.8 million for the year ended December 31, 2025 from $40.5 million in the prior year. The fluctuations in Canadian resource taxes and royalties are a result of increases in our sales revenue and margins in the current year period compared to the prior year.
For the year ended December 31, 2025, potash production remained unchanged at 8.8 million tonnes, compared to the prior year period, resulting in an operating rate of 76% for 2025, compared to 77% for 2024.
Mosaic Fertilizantes Net Sales and Gross Margin
The following table summarizes the Mosaic Fertilizantes segment’s net sales, gross margin, sales volume and selling price.
|
|
|
|
|
|
|
|
|
|
|
|
|
|
|
|
|
|
|
|
|
|
|
|
|
|
|
|
|
|
|
|
|
|
|
|
|
|
|
|
|
|
|
Years Ended December 31, |
|
2025-2024 |
|
2024-2023 |
(in millions, except price per tonne or unit) |
2025 |
|
2024 |
|
2023 |
|
Change |
|
Percent |
|
Change |
|
Percent |
| Net Sales |
$ |
4,847.3 |
|
|
$ |
4,422.3 |
|
|
$ |
5,684.7 |
|
|
$ |
425.0 |
|
|
10 |
% |
|
$ |
(1,262.4) |
|
|
(22) |
% |
| Cost of goods sold |
4,355.3 |
|
|
4,015.7 |
|
|
5,473.1 |
|
|
339.6 |
|
|
8 |
% |
|
(1,457.4) |
|
|
(27) |
% |
| Gross margin |
$ |
492.0 |
|
|
$ |
406.6 |
|
|
$ |
211.6 |
|
|
$ |
85.4 |
|
|
21 |
% |
|
$ |
195.0 |
|
|
92 |
% |
| Gross margin as a percent of net sales |
10.1 |
% |
|
9.2 |
% |
|
3.7 |
% |
|
|
|
|
|
|
|
|
| Sales volume (in thousands of metric tonnes) |
|
|
|
|
|
|
|
|
|
|
Phosphate produced in Brazil |
1,204 |
|
|
1,701 |
|
|
2,235 |
|
|
(497) |
|
|
(29) |
% |
|
(534) |
|
|
(24) |
% |
Potash produced in Brazil |
166 |
|
|
201 |
|
|
195 |
|
|
(35) |
|
|
(17) |
% |
|
6 |
|
|
3 |
% |
Purchased nutrients |
7,587 |
|
|
7,128 |
|
|
7,253 |
|
|
459 |
|
|
6 |
% |
|
(125) |
|
|
(2) |
% |
| Total Mosaic Fertilizantes Segment Tonnes |
8,957 |
|
|
9,030 |
|
|
9,683 |
|
|
(73) |
|
|
(1) |
% |
|
(653) |
|
|
(7) |
% |
| Realized prices ($/tonne) |
|
|
|
|
|
|
|
|
|
|
|
|
|
Average finished product selling price (destination) |
$ |
488 |
|
|
$ |
440 |
|
|
$ |
543 |
|
|
$ |
48 |
|
|
11 |
% |
|
$ |
(103) |
|
|
(19) |
% |
| Brazil MAP price (delivered price to third party) |
$ |
714 |
|
|
$ |
605 |
|
|
$ |
597 |
|
|
$ |
109 |
|
|
18 |
% |
|
$ |
8 |
|
|
1 |
% |
Purchases (’000 tonnes) |
|
|
|
|
|
|
|
|
|
|
|
|
|
DAP/MAP from Mosaic |
133 |
|
|
195 |
|
|
341 |
|
|
(62) |
|
|
(32) |
% |
|
(146) |
|
|
(43) |
% |
MicroEssentials® from Mosaic |
883 |
|
|
989 |
|
|
1,019 |
|
|
(106) |
|
|
(11) |
% |
|
(30) |
|
|
(3) |
% |
Potash from Mosaic/Canpotex |
2,019 |
|
|
2,195 |
|
|
2,067 |
|
|
(176) |
|
|
(8) |
% |
|
128 |
|
|
6 |
% |
| Average cost per unit consumed in cost of goods sold: |
|
|
|
|
|
|
|
|
|
|
|
|
|
| Ammonia (metric tonne) |
$ |
624 |
|
|
$ |
627 |
|
|
$ |
807 |
|
|
$ |
(3) |
|
|
— |
% |
|
$ |
(180) |
|
|
(22) |
% |
| Sulfur (long ton) |
$ |
296 |
|
|
$ |
173 |
|
|
$ |
232 |
|
|
$ |
123 |
|
|
71 |
% |
|
$ |
(59) |
|
|
(25) |
% |
| Blended rock (metric tonne) |
$ |
97 |
|
|
$ |
109 |
|
|
$ |
122 |
|
|
$ |
(12) |
|
|
(11) |
% |
|
$ |
(13) |
|
|
(11) |
% |
| Production volume (in thousands of metric tonnes) |
3,488 |
|
|
3,501 |
|
|
3,457 |
|
|
(13) |
|
|
— |
% |
|
44 |
|
|
1 |
% |
Year Ended December 31, 2025 compared to Year Ended December 31, 2024
The Mosaic Fertilizantes segment’s net sales increased to $4.8 billion for the year ended December 31, 2025, from $4.4 billion for 2024. The increase in net sales was driven by approximately $420 million of higher finished product sales prices, partially offset by lower finished good sales volumes, which unfavorably impacted net sales by approximately $25 million. Additionally, both higher sales prices and volumes of other products, primarily gypsum, contributed positively, adding approximately $30 million to net sales.
The overall average finished product selling price increased $48 per tonne, to $488 per tonne for 2025, due to the factors discussed in the Overview.
The Mosaic Fertilizantes segment’s sales volume remained materially unchanged at 9.0 million tonnes for the year ended December 31, 2025, compared to the prior year period.
Gross margin for the Mosaic Fertilizantes segment increased to $492.0 million for the year ended December 31, 2025, from $406.6 million in the prior year. This increase was primarily driven by higher average selling prices of approximately $420 million during the current year period. This benefit was partially offset by approximately $280 million of higher production costs, primarily in our distribution operations, along with a decrease in sales volumes, which reduced gross margin by approximately $80 million, higher turnaround and idle costs of approximately $35 million and higher freight expenses of approximately $20 million. Additionally, foreign currency changes positively impacted gross margin by approximately $80 million in the current year period. Although gross margin increased from the prior year, our margin declined in the fourth quarter of 2025, in part due to higher sulfur raw material cost and higher turnaround and idle costs due to downtime.
In December 2025, we temporarily idled our Fospar and Araxa facilities due to the high sulfur costs.
The average consumed price for ammonia for our Brazilian operations was $624 per tonne for the year ended December 31, 2025, compared to $627 per tonne in the prior year. The average consumed sulfur price for our Brazilian operations was $296 per long tonne for the year ended December 31, 2025, compared to $173 in the prior year. The purchase prices of these raw materials are driven by global supply and demand, and include transportation, transformation and storage costs.
The Mosaic Fertilizantes segment’s production of crop nutrient dry concentrates and animal feed ingredients remained materially unchanged from the prior year period at 3.5 million tonnes. For the years ended December 31, 2025 and 2024 our phosphate operating rate was 78%.
Our Brazilian phosphate rock production increased to 4.2 million tonnes for the year ended December 31, 2025 compared to 3.9 million for the prior year period.
Corporate, Eliminations and Other
In addition to our three operating segments, we assign certain costs to Corporate, Eliminations and Other, which is presented separately in Note 25 of our Notes to Consolidated Financial Statements. The Corporate, Eliminations and Other category includes intersegment eliminations, including profit on intersegment sales, unrealized mark-to-market gains and losses on derivatives and the investment in equity securities of Ma’aden, debt expenses, corporate functional costs, the results of the China and India distribution businesses and Mosaic Biosciences sales in China, India and North America.
Gross margin for Corporate, Eliminations and Other was a gain of $102.6 million for the year ended December 31, 2025, compared to a loss of $131.9 million in the same period a year ago. Gross margin was favorably impacted by a $84.7 million net unrealized gain on derivatives in the current year period, primarily foreign currency derivatives, compared to an unrealized loss of $101 million in the prior year period. Distribution operations in India and China had revenues and gross margin of $640.0 million and $88.0 million, respectively, for the year ended December 31, 2025, compared to revenues and gross margin of $519.6 million and $39.7 million, respectively, for the year ended December 31, 2024. China and India gross margin was favorably impacted by higher selling prices, partially offset by the impact of higher product costs in the current year period compared to the prior year.
Other Income Statement Items
|
|
|
|
|
|
|
|
|
|
|
|
|
|
|
|
|
|
|
|
|
|
|
|
|
|
|
|
|
|
|
|
|
|
|
|
|
|
|
|
|
|
| |
Years Ended December 31, |
|
2025-2024 |
|
2024-2023 |
| (in millions) |
2025 |
|
2024 |
|
2023 |
|
Change |
|
Percent |
|
Change |
|
Percent |
| Selling, general and administrative expenses |
$ |
533.9 |
|
|
$ |
496.9 |
|
|
$ |
500.5 |
|
|
$ |
37.0 |
|
|
7 |
% |
|
$ |
(3.6) |
|
|
(1) |
% |
| Impairment of goodwill |
99.9 |
|
|
— |
|
|
— |
|
|
99.9 |
|
|
NM |
|
— |
|
|
NM |
| Loss (gain) on assets sold and to be sold |
157.3 |
|
|
— |
|
|
(56.5) |
|
|
157.3 |
|
|
NM |
|
56.5 |
|
|
(100) |
% |
| Other operating expenses |
289.3 |
|
|
393.5 |
|
|
428.5 |
|
|
(104.2) |
|
|
(26) |
% |
|
(35.0) |
|
|
(8) |
% |
| Interest (expense) |
(241.5) |
|
|
(230.0) |
|
|
(189.0) |
|
|
(11.5) |
|
|
5 |
% |
|
(41.0) |
|
|
22 |
% |
| Interest income |
53.8 |
|
|
47.2 |
|
|
59.6 |
|
|
6.6 |
|
|
14 |
% |
|
(12.4) |
|
|
(21) |
% |
| Interest expense, net |
(187.7) |
|
|
(182.8) |
|
|
(129.4) |
|
|
(4.9) |
|
|
3 |
% |
|
(53.4) |
|
|
41 |
% |
| Foreign currency transaction gain (loss) |
271.7 |
|
|
(685.8) |
|
|
194.0 |
|
|
957.5 |
|
|
(140) |
% |
|
(879.8) |
|
|
NM |
| Gain on sale of equity investment |
— |
|
|
522.2 |
|
|
— |
|
|
(522.2) |
|
|
(100) |
% |
|
522.2 |
|
|
NM |
| Other income (expense) |
307.4 |
|
|
40.3 |
|
|
(76.8) |
|
|
267.1 |
|
|
NM |
|
117.1 |
|
|
NM |
| Provision for income taxes |
639.8 |
|
|
186.7 |
|
|
177.0 |
|
|
453.1 |
|
|
NM |
|
9.7 |
|
|
5 |
|
| Equity in net earnings of nonconsolidated companies |
2.3 |
|
|
73.3 |
|
|
60.3 |
|
|
(71.0) |
|
|
(97) |
% |
|
13.0 |
|
|
22 |
% |
Selling, General and Administrative Expenses
Selling, general and administrative expenses were $533.9 million for the year ended December 31, 2025, compared to $496.9 million for the same period a year ago. The increase was primarily due to approximately $13 million in higher employee benefit costs and approximately $13 million in higher stock-based compensation compared to the prior year period, which reflected a benefit from a decline in the company’s stock price. Additionally, we had approximately $12 million of higher amortization related to cloud computing arrangements compared to the prior year period.
Loss (Gain) on Assets Sold and to be Sold
In December 2025, we entered into an agreement to sell our Carlsbad, New Mexico potash mine. As of December 31, 2025, the assets and liabilities are considered held for sale and we recorded an impairment loss of approximately 185.0 million. In 2025, we also completed the sale of our interest in the Taquari potash mine in Brazil, which resulted in a loss of approximately $66 million. These losses were partially offset by a gain of approximately $94 million related to the completion of the sale of our idled Patos de Minas phosphate mining unit in Brazil. See further discussion in Note 26 of our Notes to Consolidated Financial Statements.
Impairment of Goodwill
In 2025, we recognized a goodwill impairment charge of $96.3 million in our Mosaic Fertilizantes reporting unit. We determined that its carrying value exceeded its estimated fair value due to a reduction in our long-term forecast based on recent market forecasts. We also recorded an impairment of $3.6 million in our Potash reporting unit related to the anticipated sale and classification of our Carlsbad, New Mexico mine as held for sale as of December 31, 2025. See further discussion in Note 10 of our Notes to Consolidated Financial Statements.
Other Operating Expenses
Other operating expenses were $289.3 million for the year ended December 31, 2025, compared to $393.5 million for the prior year period. Other operating expenses typically relate to five major categories: (1) AROs, (2) environmental and legal reserves, (3) idle facility costs, (4) insurance reimbursements, and (5) gain/loss on sale or disposal of fixed assets. The change from the prior year was primarily due to lower environmental reserves in our Phosphate segment of approximately $33 million and lower asset retirement obligations (“AROs”) net present value adjustments of approximately $29 million. The prior year included approximately $43 million related to an arbitration reserve for Miski Mayo.
Interest Expense, Net
Net interest expense increased to $187.7 million for the year ended December 31, 2025, compared to $182.8 million in 2024. The increase was primarily due to higher debt levels in the current year period.
Foreign Currency Transaction Gain (Loss)
In 2025, we recorded a foreign currency transaction gain of $271.7 million, compared to a loss of $685.8 million in 2024. The gain was the result of the effect of the weakening of the U.S. dollar relative to the Brazilian real on intercompany loans and U.S. dollar-denominated payables held by our Brazilian subsidiaries and the impact of the U.S. dollar relative to the Canadian dollar on intercompany loans. Our reported foreign currency gains and losses are often non-cash in nature because they are related to intercompany transactions.
Other Income (Expense)
For the year ended December 31, 2025, we had other income of $307.4 million, compared to expense of $40.3 million in the prior year. The significant increase from the prior year is primarily due to an unrealized gain of approximately $317 million related to our investment in shares of Ma’aden being marked to market at year-end, compared to an unrealized gain of approximately $28 million in the prior year period.
Provision for Income Taxes
|
|
|
|
|
|
|
|
|
|
|
|
|
|
|
|
|
Effective
Tax Rate |
|
Provision for
Income Taxes |
| Year Ended December 31, 2025 |
|
52.7 |
% |
|
$ |
639.8 |
|
| Year Ended December 31, 2024 |
|
59.2 |
% |
|
186.7 |
|
| Year Ended December 31, 2023 |
|
13.3 |
% |
|
177.0 |
|
For all years, our income tax is impacted by the mix of earnings across jurisdictions in which we operate, by a benefit associated with depletion and by the impact of certain entities being taxed in both their foreign jurisdiction and the U.S., including foreign tax credits for various taxes incurred.
For the year ended December 31, 2025, tax expense specific to the period included a net expense of $189.3 million. The net expense relates to the following: $212.1 million primarily related to changes to valuation allowances in Brazil, $6.4 million related to share-based excess benefit, $23.3 million related to adjustments to accrued foreign tax credits, and $4.0 million related to other miscellaneous expenses. The tax expenses are partially offset by a net tax benefit related to the tax effects of one-time notable items booked as discrete of $54.2 million, and the true-up of estimates from our U.S. and non-U.S. tax return provisions of $2.3 million.
On July 4, 2025, the U.S. enacted budget reconciliation package H.R. 1 otherwise known as the One Big Beautiful Bill Act (“OBBBA”). The OBBBA includes a broad range of tax law changes, including the permanent extension of certain expired or expiring provisions of the Tax Cuts and Jobs Act and changes to certain other U.S. tax provisions. The legislation has multiple effective dates, with provisions effective beginning in 2025 and 2026. The Company reflected the impact of the enacted provisions in its financial statements beginning in the third quarter, and there is no material change to our effective income tax rate for 2025.
In December 2023, the Financial Accounting Standards Board (“FASB”) issued guidance to provide more disaggregation of income tax disclosures mainly related to the reconciliations of the income tax rate and income taxes paid by jurisdiction. We adopted this standard for the year ended December 31, 2025, and applied the new disclosure requirements prospectively to the current annual period. Prior period disclosures have not been adjusted to reflect the new disclosure requirements. While adoption of this standard resulted in enhanced disclosures, it did not have any impact to our results of operations, cash flows or financial condition. See further discussion in Note 13 of our Notes to Consolidated Financial Statements.
Equity in Net Earnings of Nonconsolidated Companies
For the year ended December 31, 2025, we had a gain from equity in net earnings of nonconsolidated companies of $2.3 million, net of tax, compared to a gain of $73.3 million, net of tax, for the prior year. Prior year results were primarily related to the operations of MWSPC.
Critical Accounting Estimates
We prepare our Consolidated Financial Statements in conformity with accounting principles generally accepted in the United States of America which requires us to make various judgments, estimates and assumptions that could have a significant impact on our reported results and disclosures. We base these estimates on historical experience and other assumptions we believe to be reasonable at the time we prepare our financial statements. Changes in these estimates could have a material effect on our Consolidated Financial Statements.
Our significant accounting policies can be found in Note 2 of our Notes to Consolidated Financial Statements. We believe the following accounting policies include a higher degree of judgment and complexity in their application and are most critical to aid in fully understanding and evaluating our reported financial condition and results of operations.
Recoverability of Goodwill
Goodwill is the excess of the purchase price consideration over the estimated fair value of net assets of acquired businesses. The carrying value of goodwill in our reporting units is tested annually as of October 31 for possible impairment. We typically use an income approach valuation model, representing present value of future cash flows, to determine the fair value of a reporting unit. Growth rates for sales and profits are determined using inputs from our annual strategic and long range planning process. The rates used to discount projected future cash flows reflect a weighted average cost of capital based on the Company’s industry, capital structure and risk premiums, including those reflected in the current market capitalization.
When preparing these estimates, management considers each reporting unit’s historical results, current operating trends and specific plans in place. These estimates are impacted by various factors, including inflation, the general health of the economy and market competition. In addition, events and circumstances that might be indicators of possible impairment are assessed during other interim periods. As of October 31, 2025, the date of our annual impairment testing, the Company concluded that the carrying value of the Mosaic Fertilizantes reporting unit exceeded its estimated fair value due to a combination of an increase in carrying value and a reduction in our long-term forecast. Therefore, we recorded a goodwill impairment charge of $96.3 million, representing the amount by which the carrying value exceeded the Mosaic Fertilizantes fair value. Based on our quantitative analysis, we determined that our Potash and Corporate, Eliminations and Other, reporting units were in substantial excess of their respective carrying values and the goodwill for those units was not impaired.
See Note 10 of our Notes to Consolidated Financial Statements for additional information regarding the goodwill impairment analysis, including the methodologies and assumptions used in estimating the fair values of our reporting units. As of December 31, 2025, we had $1.0 billion of goodwill.
Environmental Liabilities and Asset Retirement Obligations
We record accrued liabilities for various environmental and reclamation matters, including the demolition of former operating facilities, and AROs.
Contingent environmental liabilities are described in Note 23 of our Notes to Consolidated Financial Statements. Accruals for environmental matters are based primarily on third-party estimates for the cost of remediation at previously operated sites and estimates of legal costs for ongoing environmental litigation. We regularly assess the likelihood of material adverse judgments or outcomes and the effects of potential indemnification, as well as potential ranges or probability of losses. We determine the amount of accruals required, if any, for contingencies after carefully analyzing each individual matter. Estimating the ultimate settlement of environmental matters requires us to develop complex and interrelated assumptions based on experience with similar matters, our history, precedents, evidence and facts specific to each matter. Actual costs incurred in future periods may vary from the estimates, given the inherent uncertainties in evaluating environmental exposures. As of December 31, 2025 and 2024, we had accrued $192.2 million and $197.5 million, respectively, for environmental matters.
As indicated in Note 14 of our Notes to Consolidated Financial Statements, we recognize AROs in the period in which we have an existing legal obligation, and the amount of the liability can be reasonably estimated. We utilize internal engineering experts as well as third-party consultants to assist in determining the costs of retiring certain of our long-term operating assets. Assumptions and estimates reflect our historical experience and our best judgments regarding future expenditures. The assumed costs are inflated based on an estimated inflation factor and discounted based on a credit-adjusted risk-free rate. For active facilities, fluctuations in the estimated costs (including those resulting from a change in environmental regulations), inflation rates and discount rates can have a significant impact on the corresponding assets and liabilities recorded in the Consolidated Balance Sheets. However, changes in the assumptions for our active facilities would not have a significant impact on the Consolidated Statements of Earnings in the year they are identified. For closed facilities, fluctuations in the estimated costs, inflation and discount rates have an impact on the Consolidated Statements of Earnings in the year they are identified as there is no asset related to these items. Phosphate land reclamation activities in North America generally occur concurrently with mining operations; as such, we accrue and expense reclamation costs as we mine. In addition, we regularly perform post-mining evaluations to ensure we have established a sufficient liability to meet permitting requirements. As of December 31, 2025 and 2024, $2.6 billion was accrued for AROs (including both current and noncurrent amounts) in North and South America. In August 2016, Mosaic deposited $630 million into two trust funds as financial assurance to support certain estimated future AROs. See Note 14 of our Notes to Consolidated Financial Statements for additional information regarding the Environmental Protection Agency (“EPA”) RCRA Initiative.
Income Taxes
We make estimates for income taxes in three major areas: valuation allowances, uncertain tax positions, and U.S. deferred income taxes on our non-U.S. subsidiaries’ undistributed earnings.
A valuation allowance is provided for deferred tax assets for which it is more likely than not that the related tax benefits will not be realized. Significant judgment is required in evaluating the need for and magnitude of appropriate valuation allowances.
The realization of the Company’s deferred tax assets, specifically the evaluation of net operating loss carryforwards and foreign tax credit carryforwards, is dependent on generating certain types of future taxable income, using both historical and projected future operating results, the source of future income, the reversal of existing taxable temporary differences, taxable income in prior carry-back years (if permitted) and the availability of tax planning strategies. As of December 31, 2025 and 2024, we had a valuation allowance of $1.9 billion and $1.5 billion, respectively. Changes in tax laws, assumptions with respect to future taxable income, tax planning strategies, resolution of matters under tax audit and foreign currency exchange rates could result in adjustment to these allowances.
Due to Mosaic’s global operations, we assess uncertainties and judgments in the application of complex tax regulations in a multitude of jurisdictions. Future changes in judgment related to the expected ultimate resolution of uncertain tax positions will affect earnings in the quarter of such change. While it is often difficult to predict the final outcome or the timing of resolution of any particular uncertain tax position, our liabilities for income taxes reflect what we believe to be the more likely than not outcome. We adjust these liabilities, as well as the related interest, in light of changing facts and circumstances, including negotiations with taxing authorities in various jurisdictions, outcomes of tax litigation and resolution of disputes arising from tax audits in the normal course of business. Settlement of any particular position may require the use of cash. Based upon an analysis of tax positions taken on prior year returns and expected positions to be taken on the current year return, management has identified gross uncertain income tax positions of $1.4 billion as of December 31, 2025.
Any dividends from controlled foreign corporations are tax-free from a U.S. income tax perspective. Additionally, there will not be any foreign tax credits associated with foreign, non-branch, dividends. Therefore, there are no material federal U.S. implications of future repatriations on non-U.S. subsidiaries’ undistributed earnings. However, since there are no U.S. foreign tax credits associated with foreign dividends, any foreign withholding tax associated with a future repatriation will need to be accrued if the earnings are not permanently reinvested.
We have included a further discussion of income taxes in Note 13 of our Notes to Consolidated Financial Statements.
Liquidity and Capital Resources
We define liquidity as the ability to generate or access adequate amounts of cash to meet current cash needs. We remain committed to a disciplined capital allocation strategy and assess our liquidity in terms of our ability to fund working capital requirements, fund sustaining and opportunistic capital projects, pursue strategic opportunities and make capital management decisions, which include making payments on and issuing indebtedness and making distributions to our stockholders, either in the form of share repurchases or dividends. Our liquidity is subject to general economic, financial, competitive and other factors that are beyond our control.
We have a target liquidity buffer of up to $3.0 billion, including cash and available credit facilities. We expect our liquidity to fluctuate from time to time, especially in the first quarter of each year, to manage through the seasonality of our business. We also target debt leverage ratios that are consistent with investment grade credit metrics. Our capital allocation priorities include maintaining our target investment grade metrics and financial strength, sustaining our assets, including ensuring the safety and reliability of our assets, investing to grow our business, either through organic growth or taking advantage of strategic opportunities, and returning excess cash to stockholders, including paying our dividend. During 2025 we returned capital to our stockholders by paying dividends of $280.4 million.
As of December 31, 2025, we had cash and cash equivalents of $276.6 million, marketable securities held in trusts to fund future obligations of $743.3 million, long-term debt including current maturities of $4.3 billion, short-term debt of $759.9 million and stockholders’ equity of $12.2 billion. In addition, we had $480.1 million of commercial arrangements for certain customer purchases in Brazil through structured payable arrangements, as discussed in Note 11 of our Notes to Consolidated Financial Statements.
All of our cash and cash equivalents are diversified in highly rated investment vehicles. Our cash and cash equivalents are held either in the U.S. or held by non-U.S. subsidiaries and are not subject to significant foreign currency exposures, as the majority are held in investments denominated in U.S. dollars as of December 31, 2025. These funds may create foreign currency transaction gains or losses, however, depending on the functional currency of the entity holding the cash. In addition, there are no significant restrictions that would preclude us from bringing funds held by non-U.S. subsidiaries back to the U.S., aside from withholding taxes.
Sources and Uses of Cash
As of December 31, 2025, we had cash and cash equivalents and restricted cash of $276.6 million. Funds generated by operating activities, available cash and cash equivalents and our revolving credit facility continue to be our most significant sources of liquidity. We believe funds generated from the expected results of operations and available cash, cash equivalents and borrowings, either under our revolving credit facility or through long-term borrowings, will be sufficient to finance our operations, including our expansion plans, existing strategic initiatives and expected dividend payments for the next twelve months and the foreseeable future. We expect our capital expenditures to be approximately $1.5 billion in 2026. There can be no assurance, however, that we will continue to generate cash flows at or above current levels. At December 31, 2025, we had $2.5 billion available under our $2.5 billion revolving credit facility. See Note 11 of our Notes to Consolidated Financial Statements for additional information relating to our financing arrangements, which is hereby incorporated by reference.
We have certain contractual obligations that require us to make cash payments on a scheduled basis. These include, among other things, long-term debt payments, interest payments, operating leases, unconditional purchase obligations and funding requirements of pension and postretirement obligations. Our long-term debt has maturities ranging from one year to 18 years. Unconditional purchase obligations are our largest contractual cash obligations. These include obligations for contracts to purchase raw materials such as sulfur, ammonia, phosphate rock and natural gas, obligations to purchase raw materials for our international distribution activities and maintenance and services. Other large cash obligations are our AROs and other environmental obligations, primarily related to our Phosphate and Mosaic Fertilizantes segments. We expect to fund our AROs and other environmental obligations, purchase obligations, long-term debt and capital expenditures with a combination of operating cash flows, cash and cash equivalents and borrowings.
The following is a summary of our material contractual cash obligations as of December 31, 2025:
|
|
|
|
|
|
|
|
|
|
|
|
|
|
|
|
|
|
|
|
|
|
|
|
|
|
|
|
|
|
|
|
|
| |
|
|
|
Payments by Calendar Year |
| (in millions) |
|
Total |
|
Less than 1
year |
|
1 - 3
years |
|
3 - 5
years |
|
More than 5
years |
Long-term debt(a) |
|
$ |
4,294.0 |
|
|
$ |
43.1 |
|
|
$ |
1,302.6 |
|
|
$ |
973.4 |
|
|
$ |
1,974.9 |
|
Estimated interest payments on long-term debt(b) |
|
1,604.0 |
|
|
220.0 |
|
|
387.0 |
|
|
253.1 |
|
|
743.9 |
|
| Operating leases |
|
225.6 |
|
|
59.6 |
|
|
79.0 |
|
|
40.5 |
|
|
46.5 |
|
Purchase commitments(c) |
|
8,611.9 |
|
|
4,887.8 |
|
|
3,014.9 |
|
|
684.4 |
|
|
24.8 |
|
Pension and postretirement liabilities(d) |
|
136.5 |
|
|
4.2 |
|
|
21.8 |
|
|
26.0 |
|
|
84.5 |
|
| Total contractual cash obligations |
|
$ |
14,872.0 |
|
|
$ |
5,214.7 |
|
|
$ |
4,805.3 |
|
|
$ |
1,977.4 |
|
|
$ |
2,874.6 |
|
______________________________
(a)Long-term debt primarily consists of unsecured notes, finance leases, unsecured debentures and secured notes.
(b)Based on interest rates and debt balances as of December 31, 2025.
(c)Based on prevailing market prices as of December 31, 2025. For additional information related to our purchase commitments, see Note 22 of our Notes to Consolidated Financial Statements.
(d)The 2026 pension plan payments are based on minimum funding requirements. For years thereafter, pension plan payments are based on expected benefits paid. The postretirement plan payments are based on projected benefit payments. The above amounts include our North America and Brazil plans.
See Off-Balance Sheet Arrangements and Obligations below for more information on other environmental obligations.
Summary of Cash Flows
The following table represents a comparison of the net cash provided by operating activities, net cash used in investing activities and net cash used in financing activities for calendar years 2025, 2024 and 2023:
|
|
|
|
|
|
|
|
|
|
|
|
|
|
|
|
|
|
|
|
|
|
|
|
|
|
|
|
|
|
|
|
|
|
|
|
|
|
|
|
|
|
|
|
|
|
|
Years Ended December 31, |
|
|
|
|
|
|
|
|
| (in millions) |
|
|
2025-2024 |
|
2024-2023 |
| Cash Flow |
|
2025 |
|
2024 |
|
2023 |
|
Change |
|
Percent |
|
Change |
|
Percent |
| Net cash provided by operating activities |
|
$ |
824.8 |
|
|
$ |
1,299.2 |
|
|
$ |
2,407.2 |
|
|
$ |
(474.4) |
|
|
(37) |
% |
|
$ |
(1,108.0) |
|
|
(46) |
% |
| Net cash used in investing activities |
|
(1,309.5) |
|
|
(1,261.0) |
|
|
(1,317.2) |
|
|
(48.5) |
|
|
(4) |
% |
|
56.2 |
|
|
4 |
% |
| Net cash provided by (used in) financing activities |
|
452.0 |
|
|
(131.9) |
|
|
(1,480.5) |
|
|
583.9 |
|
|
443 |
% |
|
1,348.6 |
|
|
91 |
% |
Operating Activities
In 2025, net cash flow from operating activities provided us with a significant source of liquidity. For the year ended December 31, 2025, net cash provided by operating activities was $0.8 billion, compared to $1.3 billion in the prior year. Our results of operations, after non-cash adjustments to net earnings, contributed $1.8 billion to cash flows from operating activities during 2025, compared to $1.3 billion during 2024. During 2025, we had a unfavorable change in assets and liabilities of $1.0 billion, compared to a favorable change of $21.1 million in 2024.
The change in assets and liabilities for the year ended December 31, 2025, was primarily driven by unfavorable changes in inventories of $761.5 million and in accounts payable and accrued liabilities of $359.6 million. These changes were partially offset by favorable changes in accounts receivable of $75.7 million and other noncurrent liabilities of $76.0 million. The change in inventories was driven primarily by an increase in inventory levels primarily in Phosphate and Brazil due to slow market demand in the fourth quarter of 2025 and higher raw material prices across our segments in the current year. The decrease in accounts payable and accrued liabilities were primarily driven by the timing of taxes and other payments. The decrease in accounts receivable was primarily driven by lower sales at the end of 2025 compared to 2024. The increase in other noncurrent liabilities was primarily related to increases in ARO obligations and environmental reserves in the current year.
Investing Activities
Net cash used in investing activities for the year ended December 31, 2025 was comparable to the same period a year ago at $1.3 billion, primarily driven by capital expenditures of $1.36 billion partially offset by proceeds from the sale of assets of $79.0 million in 2025.
Financing Activities
Net cash provided by financing activities was $452.0 million for the year ended December 31, 2025, compared to net cash used in financing activities of $131.9 million in the prior year. In 2025,we received net proceeds on long-term debt of $831.3 million primarily due to new senior notes of $900 million issued in November 2025. We also received net proceeds of $100.7 million under our inventory financing arrangement and had net proceeds on structured accounts payable of $55.7 million in 2025. This was partially offset by dividend payments of $300.6 million and net payments from short-term borrowings of $188.8 million.
Debt Instruments, Guarantees and Related Covenants
See Note 11 and Note 16 of our Notes to Consolidated Financial Statements for additional information relating to our financing arrangements and fair value measurements, which is hereby incorporated by reference.
Financial Assurance Requirements
In addition to various operational and environmental regulations primarily related to our Phosphate segment, we incur liabilities for reclamation activities under which we are subject to financial assurance requirements. In various jurisdictions in which we operate, particularly Florida and Louisiana, we are required to pass a financial strength test or provide credit support, typically in the form of cash deposits, surety bonds or letters of credit. See Other Commercial Commitments under Off-Balance Sheet Arrangements and Obligations and Note 22 of our Notes to Consolidated Financial Statements for additional information about these requirements, which is hereby incorporated by reference.
Off-Balance Sheet Arrangements and Obligations
Off-Balance Sheet Arrangements
In accordance with the definition under rules of the Securities and Exchange Commission (“SEC”), the following qualify as off-balance sheet arrangements:
•certain obligations under guarantee contracts that have “any of the characteristics identified in Financial Accounting Standards Board (“FASB”) Accounting Standards Codification (“ASC”) paragraph ASC 460-10-15-4 (Guarantees Topic)”;
•a retained or contingent interest in assets transferred to an unconsolidated entity or similar arrangement that serves as credit, liquidity or market risk support to that entity for such assets;
•any obligation, including a contingent obligation, under a contract that would be accounted for as derivative instruments except that it is both indexed to the registrant’s own stock and classified as equity; and
•any obligation, arising out of a variable interest in an unconsolidated entity that is held by, and material to, the registrant, where such entity provides financing, liquidity, market risk or credit risk support to the registrant, or engages in leasing, hedging or research and development services with the registrant.
Information regarding guarantees that meet the above requirements is included in Note 17 of our Notes to Consolidated Financial Statements and is hereby incorporated by reference. We do not have any contingent interest in assets transferred, derivative instruments or variable interest entities that qualify as off-balance sheet arrangements under SEC rules.
Other Commercial Commitments
The following is a summary of our other commercial commitments as of December 31, 2025:
|
|
|
|
|
|
|
|
|
|
|
|
|
|
|
|
|
|
|
|
|
|
|
|
|
|
|
|
|
|
|
|
|
| |
|
|
|
Commitment Expiration by Calendar Year |
| (in millions) |
|
Total |
|
Less than 1
year |
|
1 - 3
years |
|
3 - 5
years |
|
More than 5
years |
| Letters of credit |
|
$ |
64.6 |
|
|
$ |
64.6 |
|
|
$ |
— |
|
|
$ |
— |
|
|
$ |
— |
|
| Surety bonds |
|
829.9 |
|
|
829.9 |
|
|
— |
|
|
— |
|
|
— |
|
| Total |
|
$ |
894.5 |
|
|
$ |
894.5 |
|
|
$ |
— |
|
|
$ |
— |
|
|
$ |
— |
|
The surety bonds and letters of credit generally expire within one year or less but a substantial portion of these instruments provide financial assurance for continuing obligations and, therefore, in most cases, must be renewed on an annual basis. We issue letters of credit through our revolving credit facility and bilateral agreements. As of December 31, 2025, we had no outstanding letters of credit through our credit facility and $64.6 million outstanding through bilateral agreements. We primarily incur liabilities for reclamation activities in our Florida operations and for phosphogypsum management system (“Gypstack” or “Gypstacks”) closure in our Florida and Louisiana operations where, for permitting purposes, we must either pass a test of financial strength or provide credit support, typically in the form of cash deposits, surety bonds or letters of credit. As of December 31, 2025, we had $428.2 million in surety bonds and a $50 million letter of credit included in the total amount above. These bonds and letters of credit are outstanding for reclamation obligations, primarily related to mining in Florida. We also have a surety bond of $337.6 million with the EPA which was delivered as a substitute for the financial assurance provided through a trust (the “Plant City Trust”). The surety bonds generally require us to obtain a discharge of the bonds or to post additional collateral (typically in the form of cash or letters of credit) at the request of the issuer of the bonds.
We are subject to financial assurance requirements related to the closure and post-closure care of our Gypstacks in Florida and Louisiana. These requirements include Florida and Louisiana state financial assurance regulations, and financial assurance requirements under the terms of consent decrees that we have entered into with respect to our facilities in Florida and Louisiana. These include a consent decree (the “Plant City Consent Decree”) with EPA and the Florida Department of Environmental Protection (“FDEP”) relating to the Plant City, Florida Phosphate Concentrates facility (the “Plant City Facility”) we acquired as part of an acquisition (the “CF Phosphate Assets Acquisition”) and two separate consent decrees (collectively, the “2015 Consent Decrees”) with federal and state regulators that include financial assurance requirements for the closure and post-closure care of substantially all of our Gypstacks in Florida and Louisiana, other than those acquired as part of the CF Phosphate Assets Acquisition, which are discussed separately below.
See Note 14 of our Notes to Consolidated Financial Statements for additional information relating to our financial assurance obligations, including the Plant City Consent Decree and the 2015 Consent Decrees, which information is incorporated by reference.
Currently, state financial assurance requirements in Florida and Louisiana for the closure and post-closure care of Gypstacks are, in general terms, based upon the same assumptions and associated estimated values as the AROs recognized for financial reporting purposes. For financial reporting purposes, we recognize the AROs based on the estimated future closure and post-closure costs of Gypstacks, the undiscounted value of our North America Gypstacks is approximately $3.1 billion. The value of the AROs for closure and post-closure care of our North America Gypstacks, discounted to the present value, based on a credit-adjusted, risk-free rate, is reflected on our Consolidated Balance Sheets in the amount of approximately $1.5 billion as of December 31, 2025. Compliance with the financial assurance requirements in Florida and Louisiana is generally based on the undiscounted Gypstack closure estimates.
We satisfy substantially all of our Florida, Louisiana and federal financial assurance requirements through compliance with the financial assurance requirements under the 2015 Consent Decrees by providing third-party credit support in the form of surety bonds (including under the Plant City Consent Decree), and a financial test mechanism supported by a corporate guarantee (“Bonnie Financial Test”) related to a closed Florida phosphate concentrates facility in Bartow, Florida (the “Bonnie Facility”) as discussed below. We comply with our remaining state financial assurance requirements because our financial strength permits us to meet applicable financial strength tests. There have been times in the past that we have not met the applicable financial strength tests and there can be no assurance that we will be able to meet the applicable financial strength tests in the future. In the event we do not meet either financial strength test, we could be required to seek an alternate financial strength test acceptable to state regulatory authorities or provide credit support, which may include surety bonds, letters of credit and cash escrows or trust funds. Cash escrows or trust funds would be classified as restricted cash on our Consolidated Balance Sheets. Assuming we maintain our current levels of liquidity and capital resources, we do not expect that these Florida and Louisiana requirements will have a material effect on our results of operations, liquidity or capital resources.
As part of the CF Phosphate Assets Acquisition, we assumed certain AROs related to the estimated costs (“Gypstack Closure Costs”) at both the Plant City Facility and the Bonnie Facility. Associated with these assets are two related financial assurance arrangements for which we became responsible and that provided sources of funds for the estimated Gypstack Closure Costs for these facilities, pursuant to federal or state law, which the government can draw against in the event we cannot perform such closure activities. One was initially the Plant City Trust established to meet the requirements under a consent decree with EPA and the FDEP with respect to U.S. Resource Conservation and Recovery Act (“RCRA”) compliance at Plant City that also satisfied Florida financial assurance requirements at that site. Beginning in September 2016, as a substitute for the financial assurance provided through the Plant City Trust, we have provided financial assurance for Plant City in the form of a surety bond delivered to EPA (the “Plant City Bond”). The amount of the Plant City Bond is $337.6 million at December 31, 2025, which reflects our closure cost estimates at that date. The other was also a trust fund (the “Bonnie Facility Trust”) established to meet the requirements under Florida financial assurance regulations that apply to the Bonnie Facility. On July 27, 2018, we received $21.0 million from the Bonnie Facility Trust by substituting the trust fund for the Bonnie Financial Test supported by a corporate guarantee as allowed by state regulations. Both financial assurance funding obligations require estimates of future expenditures that could be impacted by refinements in scope, technological developments, new information, cost inflation, changes in regulations, discount rates and the timing of activities. Under our current approach to satisfying applicable requirements, additional financial assurance would be required in the future if increases in cost estimates exceed the face amount of the Plant City Bond or the amount supported by the Bonnie Financial Test.
Other Long-Term Obligations
The following is a summary of our other long-term obligations, including Gypstacks and land reclamation, as of December 31, 2025:
|
|
|
|
|
|
|
|
|
|
|
|
|
|
|
|
|
|
|
|
|
|
|
|
|
|
|
|
|
|
|
|
|
| |
|
|
|
Payments by Calendar Year |
| (in millions) |
|
Total |
|
Less than 1
year |
|
1 - 3
years |
|
3 - 5
years |
|
More than 5
years |
ARO(a) |
|
$ |
4,661.6 |
|
|
$ |
282.3 |
|
|
$ |
387.5 |
|
|
$ |
325.5 |
|
|
$ |
3,666.3 |
|
______________________________
(a)Represents the undiscounted estimated cash outflows required to settle the AROs. For the Potash segment, this excludes the subsequent years of tailings area management for activities such as dissolution and reclamation of land, which are estimated to require an additional 160 to 375 years until completion. The corresponding present value of all future expenditures is $2.6 billion as of December 31, 2025 and is reflected in our accrued liabilities and other noncurrent liabilities in our Consolidated Balance Sheets.
Most of our export sales of potash crop nutrients are marketed through a North American export association, Canpotex, which funds its operations in part through third-party financing facilities. As a member, Mosaic and our subsidiaries are subject to certain conditions and exceptions and contractually obligated to reimburse Canpotex for their pro rata share of any operating expenses or other liabilities incurred. The reimbursements are made through reductions to members’ cash receipts from Canpotex.
Commitments are set forth in Note 22 of our Notes to Consolidated Financial Statements and are hereby incorporated by reference.
Income Tax Obligations
Gross uncertain tax positions as of December 31, 2025 of $1.4 billion are not included in the other long-term obligations table presented above because the timing of the settlement of unrecognized tax benefits cannot be reasonably determined. For further discussion, refer to Note 13 of our Notes to Consolidated Financial Statements.
Market Risk
We are exposed to the impact of fluctuations in the relative value of currencies, fluctuations in interest rates, fluctuations in the purchase prices of natural gas, nitrogen, ammonia and sulfur consumed in operations, and changes in freight costs, as well as changes in the market value of our financial instruments. We periodically enter into derivatives in order to mitigate our interest rate risks, foreign currency risks and the effects of changing commodity prices and freight prices, but not for speculative purposes. Unrealized mark-to-market gains and losses on derivatives are recorded in Corporate, Eliminations and Other. Once realized, they are recorded in the related business segment.
Foreign Currency Exchange Rates
Due to the global nature of our operations, we are exposed to currency exchange rate changes, which may cause fluctuations in our earnings and cash flows. Our primary foreign currency exposures are the Canadian dollar and Brazilian real. To reduce economic risk and volatility on expected cash flows that are denominated in the Canadian dollar and Brazilian real, we use financial instruments that may include forward contracts, zero-cost collars and/or futures.
The functional currency of several of our Canadian entities is the Canadian dollar. For those entities, sales are primarily denominated in U.S. dollars, but the costs are paid principally in Canadian dollars. In July 2025, we discontinued hedging Canadian dollar transactions. As of December 31, 2025, we continue to have open hedges remaining from the previous hedging program when we hedged cash flows on a declining basis, over 12 months. A stronger Canadian dollar generally reduces these entities’ operating earnings. A weaker Canadian dollar has the opposite effect. Depending on the underlying exposure, such derivatives can create additional earnings volatility because we do not apply hedge accounting. Gains or losses on these derivative contracts, both for open contracts at quarter-end (unrealized) and settled contracts (realized), are recorded in either cost of goods sold or foreign currency transaction gain (loss).
The functional currency of our Brazilian subsidiaries is the Brazilian real. We finance our Brazilian inventory purchases with U.S. dollar-denominated liabilities. We hedge the net Brazilian real exposure of our inventory production activities for up to four months, covering the operational cycle of the business. A strengthening of the Brazilian real relative to the U.S. dollar has the impact of reducing these liabilities on a functional-currency basis.
When this occurs, the related foreign currency transaction gain is recorded as non-operating income. A weakening of the Brazilian real generally has the opposite effect.
As discussed above, we have Canadian dollar, Brazilian real and other foreign currency exchange contracts. As of December 31, 2025 and 2024, the fair value of our major foreign currency exchange contracts was an asset of $1.0 million and a liability of $82.6 million, respectively. We recorded an unrealized gain of $83.4 million in cost of goods sold and recorded an unrealized loss of $4.2 million in foreign currency transaction gain (loss) in the Consolidated Statements of Earnings for 2025.
The table below provides information about Mosaic’s significant foreign exchange derivatives.
|
|
|
|
|
|
|
|
|
|
|
|
|
|
|
|
|
|
|
|
|
|
|
|
|
|
|
|
|
|
|
|
|
|
|
|
|
|
|
|
|
|
|
|
|
|
|
|
|
|
|
| |
|
As of December 31, 2025 |
|
As of December 31, 2024 |
|
|
Expected
Maturity Date
Years ending
December 31, |
|
Fair
Value |
|
Expected
Maturity Date
Years ending
December 31, |
|
Fair
Value |
| (in millions) |
|
2026 |
|
2027 |
|
2028 |
|
|
2025 |
|
2026 |
|
2027 |
|
| Foreign Currency Exchange Forwards |
|
|
|
|
|
|
|
|
|
|
|
|
|
|
|
|
| Canadian Dollar |
|
|
|
|
|
|
|
$ |
2.4 |
|
|
|
|
|
|
|
|
$ |
(32.6) |
|
| Notional (million US$) - short Canadian dollars |
|
$ |
— |
|
|
$ |
— |
|
|
$ |
— |
|
|
|
|
$ |
51.6 |
|
|
$ |
— |
|
|
$ |
— |
|
|
|
| Weighted Average Rate - Canadian dollar to U.S. dollar |
|
— |
|
|
— |
|
|
— |
|
|
|
|
1.3771 |
|
|
— |
|
|
— |
|
|
|
| Notional (million US$) - long Canadian dollars |
|
$ |
181.1 |
|
|
$ |
— |
|
|
$ |
— |
|
|
|
|
$ |
638.3 |
|
|
$ |
— |
|
|
$ |
— |
|
|
|
| Weighted Average Rate - Canadian dollar to U.S. dollar |
|
1.3859 |
|
|
— |
|
|
— |
|
|
|
|
1.3504 |
|
|
— |
|
|
— |
|
|
|
| Indian Rupee |
|
|
|
|
|
|
|
$ |
0.5 |
|
|
|
|
|
|
|
|
$ |
— |
|
| Notional (million US$) - short Indian rupee |
|
$ |
42.0 |
|
|
$ |
— |
|
|
$ |
— |
|
|
|
|
$ |
2.0 |
|
|
$ |
— |
|
|
$ |
— |
|
|
|
| Weighted Average Rate - Indian rupee to U.S. dollar |
|
89.0340 |
|
|
— |
|
|
— |
|
|
|
|
84.0382 |
|
|
— |
|
|
— |
|
|
|
|
|
|
|
|
|
|
|
|
|
|
|
|
|
|
|
|
|
|
|
|
|
|
|
|
|
|
|
|
|
|
|
|
|
|
|
|
|
|
|
|
|
|
|
|
|
|
|
|
|
|
|
|
|
|
|
|
|
|
|
|
|
|
|
|
|
|
|
|
|
|
|
|
|
|
|
|
|
|
|
|
|
|
|
|
| Foreign Currency Exchange Non-Deliverable Forwards |
|
|
|
|
|
|
|
|
|
|
|
|
|
|
|
|
| Brazilian Real |
|
|
|
|
|
|
|
$ |
(1.4) |
|
|
|
|
|
|
|
|
$ |
(51.2) |
|
|
|
|
|
|
|
|
|
|
|
|
|
|
|
|
|
|
|
|
|
|
|
|
|
|
|
|
|
|
|
|
|
|
|
| Notional (million US$) - long Brazilian real |
|
$ |
95.0 |
|
|
$ |
— |
|
|
$ |
— |
|
|
|
|
$ |
563.4 |
|
|
$ |
— |
|
|
$ |
— |
|
|
|
| Weighted Average Rate - Brazilian real to U.S. dollar |
|
5.6132 |
|
|
— |
|
|
— |
|
|
|
|
5.8279 |
|
|
— |
|
|
— |
|
|
|
| Indian Rupee |
|
|
|
|
|
|
|
$ |
— |
|
|
|
|
|
|
|
|
$ |
1.1 |
|
| Notional (million US$) - short Indian rupee |
|
$ |
28.8 |
|
|
$ |
— |
|
|
$ |
— |
|
|
|
|
$ |
89.1 |
|
|
$ |
— |
|
|
$ |
— |
|
|
|
| Weighted Average Rate - Indian rupee to U.S. dollar |
|
90.1810 |
|
|
— |
|
|
— |
|
|
|
|
84.7720 |
|
|
— |
|
|
— |
|
|
|
|
|
|
|
|
|
|
|
|
|
|
|
|
|
|
|
|
|
|
|
|
|
|
|
|
|
|
|
|
|
|
|
|
|
| China Renminbi |
|
|
|
|
|
|
|
$ |
(0.5) |
|
|
|
|
|
|
|
|
$ |
0.1 |
|
| Notional (million US$) - short China renminbi |
|
$ |
86.4 |
|
|
$ |
— |
|
|
$ |
— |
|
|
|
|
$ |
33.0 |
|
|
$ |
— |
|
|
$ |
— |
|
|
|
| Weighted Average Rate - China renminbi to U.S. dollar |
|
7.0585 |
|
|
— |
|
|
— |
|
|
|
|
7.1923 |
|
|
— |
|
|
— |
|
|
|
| Total Fair Value |
|
|
|
|
|
|
|
$ |
1.0 |
|
|
|
|
|
|
|
|
$ |
(82.6) |
|
Commodities
We use forward purchase contracts, swaps and occasionally three-way collars to reduce the risk related to significant price changes in our inputs and product prices.
All gains and losses on commodities contracts are recorded in cost of goods sold in the Consolidated Statements of Earnings.
As of December 31, 2025 and 2024, the fair value of our major commodities contracts was ($0.4) million and ($1.8) million, respectively. We recorded an unrealized gain of $1.3 million in cost of goods sold in the Consolidated Statements of Earnings for 2025.
Our primary commodities exposure relates to price changes in natural gas.
The table below provides information about Mosaic’s natural gas derivatives which are used to manage the risk related to significant price changes in natural gas.
|
|
|
|
|
|
|
|
|
|
|
|
|
|
|
|
|
|
|
|
|
|
|
|
|
|
|
|
|
|
|
|
|
|
|
|
|
|
|
|
|
|
|
|
|
|
|
|
|
|
|
|
|
|
|
| |
|
As of December 31, 2025 |
|
As of December 31, 2024 |
|
|
Expected Maturity Date
Years ending
December 31, |
|
Fair Value |
|
Expected Maturity Date
Years ending
December 31, |
|
|
|
Fair Value |
| (in millions) |
|
2026 |
|
2027 |
|
2028 |
|
|
|
|
2025 |
|
2026 |
|
2027 |
|
|
|
| Natural Gas Swaps |
|
|
|
|
|
|
|
|
|
$ |
(0.4) |
|
|
|
|
|
|
|
|
|
|
$ |
(1.8) |
|
| Notional (million MMBTU) - long |
|
0.9 |
|
|
— |
|
|
— |
|
|
|
|
|
|
2.5 |
|
|
— |
|
|
— |
|
|
|
|
|
| Weighted Average Rate (US$/MM BTU) |
|
$ |
2.53 |
|
|
$ |
— |
|
|
$ |
— |
|
|
|
|
|
|
$ |
2.73 |
|
|
$ |
— |
|
|
$ |
— |
|
|
|
|
|
| Total Fair Value |
|
|
|
|
|
|
|
|
|
$ |
(0.4) |
|
|
|
|
|
|
|
|
|
|
$ |
(1.8) |
|
Interest Rates
From time to time, we enter into interest rate swap agreements to hedge our exposure to changes in future interest rates related to anticipated debt issuances. At December 31, 2025 and 2024, we had no interest rate swap agreements in effect.
Summary
Overall, there have been no material changes in our primary market risk exposures since the prior year. In 2026, we do not expect any material changes in our primary risk exposures. Additional information about market risk associated with our investments held in the RCRA Trusts is provided in Note 12 of our Notes to Consolidated Financial Statements. For additional information related to derivatives, see Notes 15 and 16 of our Notes to Consolidated Financial Statements.
Environmental, Health, Safety and Security Matters
We are subject to complex and evolving international, federal, state, provincial and local environmental, health, safety and security (“EHS”) policies that govern the production, distribution and use of crop nutrients and animal feed ingredients. These EHS standards regulate or propose to regulate: (i) conduct of mining, production and supply chain operations, including employee safety and facility security procedures; (ii) management or remediation of potential impacts to air, soil and water quality from our operations; (iii) disposal of waste materials; (iv) beneficial use of co-products and residuals; (v) reclamation of lands after mining; (vi) management and handling of raw materials; (vii) product content; and (viii) use of products by both us and our customers.
We have a comprehensive EHS management program that seeks to achieve sustainable, predictable and verifiable EHS performance. Key elements of our EHS program include: (i) identifying and managing EHS risk; (ii) complying with legal requirements; (iii) improving our EHS procedures and protocols; (iv) educating employees regarding EHS obligations; (v) retaining and developing professional qualified EHS staff; (vi) evaluating facility conditions; (vii) evaluating and enhancing safe workplace behaviors; (viii) performing audits; (ix) formulating EHS action plans; and (x) assuring accountability of all managers and other employees for EHS performance. Our business units are responsible for implementing day-to-day elements of our EHS program, assisted by integrated EHS professionals. We conduct audits to verify that each facility has identified risks, achieved regulatory compliance, improved EHS performance and incorporated EHS management systems into day-to-day business functions.
New or proposed regulatory programs or policies can present significant challenges in ascertaining future compliance obligations, implementing compliance plans, and estimating future costs until implementing regulations are finalized and definitive regulatory interpretations are adopted. New or proposed regulatory standards may require modifications to our facilities or to operating procedures and these modifications may involve significant capital costs or increases in operating costs. For example the Company is monitoring recently enacted standards in the European Union and California on climate change disclosure and is taking steps to address those new requirements.
We expect to continue investing significant financial and managerial resources to meet EHS requirements and strengthen our environmental stewardship efforts. For 2026, excluding capital spending required under the consent decrees discussed in Note 14 (“EPA RCRA Initiative”), we project approximately $750 million in environmental capital expenditures. These costs will primarily support:
•Waste management infrastructure and water treatment system upgrades or construction
•Construction and modification of Gypstacks and clay settling ponds at our Phosphate facilities, and tailings management areas at our Potash facilities
•Upgrades or new construction of air pollution control equipment at certain concentrates plants
•Remediation projects at current or former operating sites
Additional expenditures for land reclamation, Gypstack closure and water treatment activities are expected to total approximately $260 million in 2026. In 2027, we estimate environmental capital expenditures will be approximately $565 million and expenditures for land reclamation activities, Gypstack closure and water treatment activities are expected to be approximately $215 million. We spent approximately $796 million and $545 million for the years ended December 31, 2025 and 2024, respectively, for environmental capital expenditures, land reclamation activities, Gypstack closure and water treatment activities.
Operating Requirements and Impacts
Permitting. We hold numerous environmental, mining and other permits and approvals authorizing operations at our facilities. Our ability to continue operations at a facility could be materially affected by a government agency decision to deny or delay issuing a new or renewed permit or approval, to revoke or substantially modify an existing permit or approval or to substantially change conditions applicable to a permit modification, or by legal actions that successfully challenge our permits.
Expanding our operations or extending operations into new areas is also predicated upon securing the necessary environmental or other permits or approvals. We have been engaged in, and over the next several years will be continuing, efforts to obtain permits in support of our planned Florida operations at certain of our properties. For years, we have successfully permitted properties and anticipate that we will be able to permit these properties as well.
A denial of our permits, the issuance of permits with cost-prohibitive conditions, substantial delays in issuing key permits, legal actions that prevent us from relying on permits or revocation of permits can prevent or delay our mining or operations at the affected properties and thereby materially affect our business, results of operations, liquidity or financial condition.
In addition, in the U.S., local stakeholder involvement has become an increasingly important factor in the permitting process for companies like ours, and various counties and other parties, particularly in Florida, have in the past filed and continue to file lawsuits or administrative appeals challenging the issuance of some of the permits we require. These actions can significantly delay permit issuance. Additional information regarding certain potential or pending permit challenges is provided in Note 23 to our Consolidated Financial Statements and is incorporated herein by reference.
Federal Initiatives to Define “Waters of the United States”. Following the U.S. Supreme Court’s 2023 decision in Sackett v. EPA, the scope of “waters of the United States” (WOTUS) under the Clean Water Act has been significantly narrowed, limiting the water features subject to federal jurisdiction and affecting requirements for Mosaic’s permitting. The Court’s decision invalidated EPA’s January 2023 WOTUS rule, leading EPA to issue a conforming final rule in September 2023 and, subsequently, joint EPA–U.S. Army Corps guidance in March 2025 on applying Sackett’s “continuous surface connection” test, which clarified limits on adjacency and excluded ditches and intermittent features from jurisdiction. A proposed revised WOTUS definition published in November 2025 aims to fully implement the Sackett decision and provide regulatory clarity, but until finalized, Sackett‑based interpretation remains the nationwide standard, resulting in more limited federal permitting requirements and a regulatory environment that continues to evolve as rulemaking and litigation progress.
Water Quality Regulations for Nutrient Discharges. New nutrient regulatory initiatives could have a material effect on either us or our customers. For example, the Mississippi River/Gulf of America Hypoxia Task Force was established by The Environmental Protection Agency in 1997 to coordinate activities with twelve states within the Mississippi River Basin to reduce nutrient loading in streams and tributaries through regulatory and voluntary actions. The strategy calls for, among other matters, reduction of the flow of excess nutrients into the Gulf of America through state nutrient reduction frameworks, new nutrient reduction approaches and reduction of agricultural and urban sources of excess nutrients. Implementation of the strategy will require legislative or regulatory action at the state level. Through these heightened actions by the states, some are also leveraging groundwater protection initiatives to mandate nutrient use restrictions for fall applications in specific agricultural regions to limit nutrient losses. While some of the legislative actions have changed application timing of nutrient use, we cannot overall predict what the requirements of any such legislative or regulatory action could be or whether or how it would affect us or our customers.
Reclamation Obligations. During phosphate mining we remove overburden to retrieve phosphate rock reserves. Once we have finished mining in an area, we use the overburden and sand tailings produced by the beneficiation process to reclaim the area in accordance with approved reclamation plans and applicable laws. We have incurred and will continue to incur significant costs to fulfill our reclamation obligations.
Management of Residual Materials and Closure of Management Areas. Mining and processing of potash and phosphate generate residual materials that must be managed both during the operation of the facility and after facility closure. Potash tailings, consisting primarily of salt and clay, are stored in surface disposal sites. Phosphate clay residuals from mining are deposited in clay storage areas (“CSAs”). Processing of phosphate rock with sulfuric acid generates phosphogypsum that currently is stored in Gypstacks.
During the life of the tailings management areas, CSAs and Gypstacks, we have incurred and will continue to incur significant costs to manage residual materials in accordance with environmental laws and regulations and with permit requirements. Additional legal and permit requirements will take effect when these facilities are closed. Our AROs are further discussed in Note 14 of our Notes to Consolidated Financial Statements.
New Wales Water Loss Incident. In August 2016, a sinkhole developed under one of the two cells of the Phase II Gypstack at our New Wales facility in Polk County, Florida, resulting in process water from the stack draining into the sinkhole. The incident was reported to the FDEP and EPA. In connection with the incident, our subsidiary, Mosaic Fertilizer, LLC (“Mosaic Fertilizer”), entered into a consent order (“Order”) with the FDEP in October 2016. Pursuant to the Order, Mosaic Fertilizer agreed to, among other things, implement an approved repair plan to close the sinkhole; perform additional water monitoring and if necessary, assessment and rehabilitation activities in the event of identified offsite impacts; provide financial assurance; and evaluate the risk of potential future sinkhole formation at our active Florida Gypstack operations.
Financial Assurance. Separate from our accounting treatment for reclamation and closure liabilities, some jurisdictions in which we operate require us either to pass a test of financial strength or provide credit support, typically cash deposits, surety bonds, financial guarantees or letters of credit, to address phosphate mining reclamation liabilities and closure liabilities for clay settling areas and Gypstacks. See “Other Commercial Commitments” under “Off-Balance Sheet Arrangements and Obligations” above for additional information about these requirements. We also have obligations under certain consent decrees and a separate financial assurance arrangement relating to our facilities in Florida and Louisiana. Two consent decrees that became effective in 2016 resolved claims under RCRA and state hazardous waste laws relating to our management of certain waste materials onsite at certain fertilizer manufacturing facilities in Florida and Louisiana. Under these consent decrees, in 2016, we deposited $630 million in cash into two trust funds to provide additional financial assurance for the estimated costs of closure and post-closure care of our phosphogypsum management systems. In addition, in 2017 we issued a letter of credit in the amount of $50 million to further support our financial assurance obligation under the Florida 2015 Consent Decree. While our actual Gypstack Closure Costs are generally expected to be paid by us in the normal course of our Phosphate business over a period that may not end until three decades or more after a Gypstack has been closed, the funds on deposit in the RCRA Trusts can be drawn by the applicable governmental authority in the event we cannot perform our closure and long-term care obligations. If and when our estimated Gypstack Closure Costs with respect to the facilities associated with a RCRA Trust are sufficiently lower than the amount on deposit in that RCRA Trust, we have the right to request that the excess funds be released to us. The same is true for the RCRA Trust balance remaining after the completion of our obligations, which will be performed over a period that may not end until three decades or more after a Gypstack has been closed. See the discussion under “EPA RCRA Initiative” in Note 14 of our Notes to Consolidated Financial Statements for additional information about these matters.
We have fully funded a trust valued at $25 million (Canadian dollars) in satisfaction of financial assurance requirements for closure of our Saskatchewan Potash facilities. Trust performance is subject to review by the Province of Saskatchewan every five years during its existence.
In 2020, we executed and thereafter have maintained a surety bond in the amount of approximately $82 million to establish financial assurance for closure of our Carlsbad, New Mexico potash facility with the U.S. Department of the Interior, Bureau of Land Management and the New Mexico Environment Department.
Climate Change
We are focused on strengthening our competitive position by meeting the evolving demands of crop nutrient and animal feed ingredient production while driving greater operating efficiency, thereby mitigating greenhouse gas emissions. We have implemented innovative energy recovery technologies that result in our generation of much of the energy we need, particularly in our U.S. Phosphate operations, from high efficiency heat recovery systems.
Climate Change Regulation. Various governmental initiatives to limit greenhouse gas emissions are under way or under consideration around the world. These initiatives could restrict our operating activities, require us to make changes in our operating activities that would increase our operating costs, reduce our efficiency or limit our output, require us to make capital improvements to our facilities, increase our energy, raw material and transportation costs or limit their availability, or otherwise adversely affect our results of operations, liquidity or capital resources, and these effects could be material to us.
The direct greenhouse gas emissions from our operations result primarily from:
•Combustion of natural gas to produce steam and dry potash products at our Belle Plaine, Saskatchewan potash solution mine. To a lesser extent, at our potash shaft mines, natural gas is used as a fuel to heat fresh air supplied to the shaft mines and for drying potash products.
•The use of natural gas as a feedstock in the production of ammonia at our Faustina, Louisiana facility.
•Process reactions from naturally occurring carbonates in phosphate rock.
•Operation of transport trucks, mining and construction equipment and other machinery powered by internal combustion engines utilizing fossil fuels.
In addition, the production of energy and raw materials that we purchase from unrelated parties for use in our business and energy used in the transportation of our products and raw materials are sources of greenhouse gas emissions.
Governmental greenhouse gas emission initiatives include, among others, the December 2015 agreement (the “Paris Agreement”) which was the outcome of the 21st session of the Conference of the Parties under the United Nations Framework Convention on Climate Change. The Paris Agreement, which was signed by nearly 200 nations, including the U.S. and Canada, entered into force in 2016 and sets out a goal of limiting the average rise in temperatures for this century to below 2 degrees Celsius. Each signatory is expected to develop its own plan (referred to as a Nationally Determined Contribution, or “NDC”) for reaching that goal. The U.S. withdrew from the Paris Agreement in January 2025.
Various legislative or regulatory initiatives relating to greenhouse gases have been adopted or considered by the U.S. Congress, EPA or various states and those initiatives already adopted may be used to implement a U.S. NDC in the future. We will continue to monitor climate-related policy in the U.S.
Brazil ratified the Paris Agreement in September 2016, committing to a NDC that includes economy-wide greenhouse gas reduction targets by 2035. Brazil expanded its climate and sustainability regulatory framework during 2024–2025. In 2025, the government enacted a law that established the Brazilian Greenhouse Gas Emissions Trading System, which provides the basis for a regulated national carbon market. Brazil also submitted an updated NDC in late 2024 that increases its 2035 greenhouse gas reduction target. In 2025, Brazil adopted the National Energy Transition Policy, which introduces additional measures to accelerate renewable energy deployment and industrial decarbonization.
Canada’s intended NDC aims to achieve significant greenhouse gas emission reductions. In 2016, the Canadian federal government announced plans for a comprehensive tax on carbon emissions, under which provinces opting out of the tax would have the option of adopting a cap-and-trade system. In the plans, the federal government also committed to implementing a federal carbon pricing backstop system that will apply in any province or territory that does not have a carbon pricing system in place by 2018. In 2025, the federal minimum (benchmark) carbon price increased to $95 per tonne and will continue to rise annually until it reaches $170 per tonne in 2030. Our Saskatchewan Potash facilities are subject to the Saskatchewan climate change plan regarding emissions at our facilities; however, indirect costs from the carbon tax associated with electricity, natural gas consumption and transportation are passed through to Mosaic. More stringent laws and regulations may be enacted to accomplish the goals set out in Canada’s NDC.
It is possible that future legislation or regulation addressing climate change, including in response to the Paris Agreement or any new international agreements, could adversely affect our operating activities, energy, raw material and transportation costs, results of operations, liquidity or capital resources, and these effects could be material or adversely impact our competitive advantage.
In addition, to the extent climate change restrictions imposed in countries where our competitors operate, such as China, India, former Soviet Union countries or Morocco, are less stringent than in our production regions, our competitors could gain cost or other competitive advantages over us.
Operating Impacts Due to Climate Change. The prospective impact of climate change on our operations and those of our customers and farmers remains uncertain. The impacts of climate change could include changes in rainfall patterns, water shortages, changing sea levels, changing storm patterns and intensities and changing temperature levels. These changes could be severe. These impacts could vary by geographic location. Severe climate change could impact our costs and operating activities, the location and cost of global grain and oilseed production, and the supply and demand for grains and oilseeds. At the present time, we cannot predict the prospective impact of climate change on our results of operations, liquidity or capital resources, or whether any such effects could be material to us.
Remedial Activities
Comprehensive Environmental Response, Compensation and Liability Act (“CERCLA”) (aka Superfund) and state analogues impose liability, without regard to fault or to the legality of a party’s conduct, on certain categories of persons, including those who have disposed of “hazardous substances” at a location. Under Superfund, or its various state analogues, one party may be responsible for the entire site, regardless of fault or the locality of its disposal activity. We have contingent environmental remedial liabilities that arise principally from three sources which are further discussed below: (i) facilities currently or formerly owned by our subsidiaries or their predecessors; (ii) facilities adjacent to currently or formerly owned facilities; and (iii) third-party Superfund or state equivalent sites where we are alleged to have disposed of hazardous materials. Taking into consideration established accruals for environmental remedial matters of approximately $192.2 million as of December 31, 2025, expenditures for these known conditions currently are not expected, individually or in the aggregate, to have a material effect on our business or financial condition. However, material expenditures could be required in the future to remediate the contamination at known sites or at other current or former sites.
Remediation at Our Facilities. Many of our formerly owned or current facilities have been in operation for decades. The historical use and handling of regulated chemical substances, crop and animal nutrients and additives as well as by-product or process tailings at these facilities by us and predecessor operators have resulted in soil, surface water and groundwater impacts.
At many of these facilities, spills or other releases of regulated substances have occurred previously and potentially could occur in the future, possibly requiring us to undertake or fund cleanup efforts under Superfund or otherwise. In some instances we have agreed, pursuant to consent orders or agreements with the appropriate governmental agencies, to undertake certain investigations, which currently are in progress, to determine whether remedial action may be required to address site impacts. At other locations, we have entered into consent orders or agreements with appropriate governmental agencies to perform required remedial activities that will address identified site conditions. Taking into account established accruals, future expenditures for these known conditions currently are not expected, individually or in the aggregate, to have a material adverse effect on our business or financial condition. However, material expenditures by us could be required in the future to remediate the environmental impacts at these or at other current or former sites.
Remediation at Third-Party Facilities. Various third parties have alleged that our historical operations have impacted neighboring offsite areas or nearby third-party facilities. In some instances we have agreed, pursuant to orders from or agreements with appropriate governmental agencies or agreements with private parties, to undertake or fund investigations, some of which currently are in progress, to determine whether remedial action, under Superfund or otherwise, may be required to address offsite impacts. Our remedial liability at these sites, either alone or in the aggregate, taking into account established accruals, currently is not expected to have a material adverse effect on our business or financial condition. As more information is obtained regarding these sites, this expectation could change.
Liability for Offsite Disposal Locations. Currently, we are involved or concluding involvement for offsite disposal at several Superfund or equivalent state sites. Moreover, we previously have entered into settlements to resolve liability with regard to Superfund or equivalent state sites. In some cases, such settlements have included “reopeners,” which could result in additional liability at such sites in the event of newly discovered contamination or other circumstances. Our remedial liability at such disposal sites, either alone or in the aggregate, currently is not expected to have a material adverse effect on our business or financial condition. As more information is obtained regarding these sites and the potentially responsible parties involved, this expectation could change.
Product Requirements and Impacts
International, federal, state and provincial standards require us to register many of our products before these products can be sold. The standards also impose labeling requirements on these products and require us to manufacture the products to formulations set forth on the labels. We believe that, when handled and used as intended, based on the available data, crop nutrient materials do not pose harm to human health or the environment and that any additional standards or regulatory requirements relating to product requirements and impacts will not have a material adverse effect on our business or financial condition.
Environmental Justice
Some state governments have adopted or are adopting standards or policies requiring environmental justice reviews in some permitting actions. In general, they require governmental agencies to evaluate projects for disproportionate impacts to disadvantaged or already burdened communities. If such conditions are found, they might result in a permit denial, or restrictive or cost prohibitive conditions imposed on our operations and may impair our business and operations and could have a material adverse effect on our business, financial condition or results of operations.
Sustainability
We are committed to making informed choices that improve our corporate governance, financial strength, operational efficiency, environmental stewardship, community engagement and resource management. Through these efforts, we intend to sustain our business and experience lasting success.
We have included, or incorporated by reference, throughout this Form 10-K discussions of various matters relating to our sustainability, in its broadest sense, that we believe may be material to our investors. These matters include, but are not limited to, discussions about: corporate governance, including the leadership and respective roles of our Board of Directors and its committees, and management; recent and prospective developments in our business; product development; risk, enterprise risk management and risk oversight; the regulatory and permitting environment for our business and ongoing regulatory and permitting initiatives; executive compensation practices; employee and contractor safety; human capital matters and other EHS matters, including climate change, water management, energy and other operational efficiency initiatives: reclamation and AROs. Other matters relating to sustainability are included in our sustainability reports that are available on our website at www.mosaicco.com/ourresponsibility. Our sustainability reports are not incorporated by reference in this Form 10-K.
Additional Information
For additional information about phosphate mine permitting in Florida, our environmental liabilities, the environmental proceedings in which we are involved, our AROs related to environmental matters and our related accounting policies, see Environmental Liabilities and AROs under Critical Accounting Estimates above and Notes 2, 14, and 23 of our Notes to Consolidated Financial Statements.
Contingencies
Information regarding contingencies in Note 23 of our Notes to Consolidated Financial Statements is incorporated herein by reference.
Related Parties
Information regarding related party transactions is set forth in Note 24 of our Notes to Consolidated Financial Statements and is incorporated herein by reference.
Recently Issued Accounting Guidance
Recently issued accounting guidance is set forth in Note 3 of our Notes to Consolidated Financial Statements and is incorporated herein by reference.
Cautionary Statement Regarding Forward Looking Information
All statements, other than statements of historical fact, appearing in this report constitute “forward-looking statements” within the meaning of the Private Securities Litigation Reform Act of 1995. These forward looking statements include, among other things, statements about our expectations, beliefs, intentions or strategies for the future, including statements about proposed or pending future transactions or strategic plans, statements concerning our future operations, financial condition and prospects, statements regarding our expectations for capital expenditures, statements concerning our level of indebtedness and other information, and any statements of assumptions regarding any of the foregoing. In particular, forward-looking statements may include words such as “anticipate,” “believe,” “could,” “estimate,” “expect,” “intend,” “may,” “potential,” “predict,” “project” or “should”. These statements involve certain risks and uncertainties that may cause actual results to differ materially from expectations as of the date of this filing.
Factors that could cause reported results to differ materially from those expressed or implied by the forward-looking statements include, but are not limited to, the following:
•business and economic conditions and governmental policies affecting the agricultural industry where we or our customers operate, including price and demand volatility resulting from periodic imbalances of supply and demand;
•because of political and economic instability, civil unrest or changes in government policies in Brazil, Peru or other countries in which we do business, our operations could be disrupted as higher costs of doing business could result, including those associated with implementation of new freight tables and new mining legislation;
•potential U.S. imposed tariffs on Canadian potash imports and retaliatory tariffs by Canada or other countries on U.S. phosphates exports;
•changes in farmers’ application rates for crop nutrients;
•changes in the operation of world phosphate or potash markets, including consolidation in the crop nutrient industry, particularly if we do not participate in the consolidation;
•the expansion or contraction of production capacity or selling efforts by competitors or new entrants in the industries in which we operate, including the effects of actions by members of Canpotex to prove the production capacity of potash expansion projects, through proving runs or otherwise;
•the effect of future product innovations or development of new technologies on demand for our products;
•seasonality in our business that results in the need to carry significant amounts of inventory and seasonal peaks in working capital requirements, which may result in excess inventory or product shortages;
•changes in the costs, or constraints on supplies, of raw materials or energy used in manufacturing our products, or in the costs or availability of transportation for our products;
•economic and market conditions including supply chain challenges and increased costs and delays caused by transportation and labor shortages;
•declines in our selling prices or significant increases in costs that can require us to write down our inventories to the lower of cost or market, or require us to impair goodwill or other long-lived assets, or establish a valuation allowance against deferred tax assets;
•the lag in realizing the benefit of falling market prices for the raw materials we use to produce our products that can occur while we consume raw materials that we purchased or committed to purchase in the past at higher prices;
•disruptions of our operations at any of our key production, distribution, transportation or terminaling facilities, including those of Canpotex or any joint venture in which we participate;
•shortages or other unavailability of trucks, railcars, tugs, barges and ships for carrying our products and raw materials;
•the effects of and change in trade, monetary, environmental, tax and fiscal policies, laws and regulations;
•foreign exchange rates and fluctuations in those rates;
•maintaining strong liquidity, reliable access to capital markets and favorable credit ratings, as any constraints or downgrades could increase financing costs and limit our ability to execute strategic initiatives;
•tax regulations, currency exchange controls and other restrictions that may affect our ability to optimize the use of our liquidity;
•adverse weather and climate conditions affecting our operations, including the impact of potential hurricanes, excessive heat, cold, snow, rainfall or drought;
•difficulties or delays in receiving, challenges to, increased costs of obtaining or satisfying conditions of, or revocation or withdrawal of required governmental and regulatory approvals, including permitting activities;
•changes in the environmental and other governmental regulation that applies to our operations, including federal legislation or regulatory action expanding the types and extent of water resources regulated under federal law and the possibility of further federal or state legislation or regulatory action affecting or related to greenhouse gas emissions, including carbon taxes or other measures that may be implemented in Canada or other jurisdictions in which we operate, or of restrictions or liabilities related to elevated levels of naturally-occurring radiation that arise from disturbing the ground in the course of mining activities or possible efforts to reduce the flow of nutrients into the Gulf of America, the Mississippi River basin or elsewhere;
•the potential costs and effects of implementation of federal or state water quality standards for the discharge of nitrogen and/or phosphorus into Florida waterways;
•the financial resources of our competitors, including state-owned and government-subsidized entities in other countries;
•the possibility of defaults by our customers on trade credit that we extend to them or on indebtedness that they incur to purchase our products and that we guarantee;
•any significant reduction in customers’ liquidity or access to credit that they need to purchase our products;
•the effectiveness of the processes we put in place to manage our significant strategic priorities and to successfully integrate and grow acquired businesses;
•actual costs of various items differing from management’s current estimates, including, among others, asset retirement, environmental remediation, reclamation or other environmental obligations;
•the costs and effects of legal and administrative proceedings and regulatory matters affecting us, including environmental, tax or administrative proceedings, complaints that our operations are adversely impacting nearby farms, businesses, other property uses or properties, settlements thereof and actions taken by courts with respect to approvals of settlements, costs related to defending and resolving global audit, appeal or court activity and other further developments in legal proceedings and regulatory matters;
•the success of our efforts to attract and retain highly qualified and motivated employees;
•strikes, labor stoppages or slowdowns by our work force or increased costs resulting from unsuccessful labor contract negotiations, and the potential costs and effects of compliance with new regulations affecting our workforce, which increasingly focus on wages and hours, healthcare, retirement and other employee benefits;
•brine inflows at our potash mines;
•accidents or other incidents involving our properties or operations, including potential fires, explosions, seismic events, sinkholes, unsuccessful tailings management, ineffective mine safety procedures or releases of hazardous or volatile chemicals;
•terrorism, armed conflict or other malicious intentional acts, including cybersecurity risks such as attempts to gain unauthorized access to, or disable, our information technology systems, or our costs of addressing malicious intentional acts;
•actions by the holders of controlling equity interests in businesses in which we hold a noncontrolling interest;
•changes in our relationship with the other member of Canpotex or any joint venture in which we participate or their or our exit from participation in Canpotex or any such export association or joint venture, and other changes in our commercial arrangements with unrelated third parties; and
•other risk factors reported from time to time in our SEC reports.
Material uncertainties and other factors known to us are discussed in Item 1A, “Risk Factors,” of our Form 10-K for the year ended December 31, 2025 and incorporated by reference herein as if fully stated herein.
We base our forward-looking statements on information currently available to us, and we undertake no obligation to update or revise any of these statements, whether as a result of changes in underlying factors, new information, future events or other developments.
Report of Independent Registered Public Accounting Firm
To the Stockholders and Board of Directors
The Mosaic Company:
Opinion on the Consolidated Financial Statements
We have audited the accompanying consolidated balance sheets of The Mosaic Company and subsidiaries (the Company) as of December 31, 2025 and 2024, the related consolidated statements of earnings, comprehensive income (loss), equity, and cash flows for each of the years in the three-year period ended December 31, 2025, and the related notes (collectively, the consolidated financial statements). In our opinion, the consolidated financial statements present fairly, in all material respects, the financial position of the Company as of December 31, 2025 and 2024, and the results of its operations and its cash flows for each of the years in the three-year period ended December 31, 2025, in conformity with U.S. generally accepted accounting principles.
We also have audited, in accordance with the standards of the Public Company Accounting Oversight Board (United States) (PCAOB), the Company’s internal control over financial reporting as of December 31, 2025, based on criteria established in Internal Control – Integrated Framework (2013) issued by the Committee of Sponsoring Organizations of the Treadway Commission, and our report dated February 27, 2026 expressed an unqualified opinion on the effectiveness of the Company’s internal control over financial reporting.
Basis for Opinion
These consolidated financial statements are the responsibility of the Company’s management. Our responsibility is to express an opinion on these consolidated financial statements based on our audits. We are a public accounting firm registered with the PCAOB and are required to be independent with respect to the Company in accordance with the U.S. federal securities laws and the applicable rules and regulations of the Securities and Exchange Commission and the PCAOB.
We conducted our audits in accordance with the standards of the PCAOB. Those standards require that we plan and perform the audit to obtain reasonable assurance about whether the consolidated financial statements are free of material misstatement, whether due to error or fraud. Our audits included performing procedures to assess the risks of material misstatement of the consolidated financial statements, whether due to error or fraud, and performing procedures that respond to those risks. Such procedures included examining, on a test basis, evidence regarding the amounts and disclosures in the consolidated financial statements. Our audits also included evaluating the accounting principles used and significant estimates made by management, as well as evaluating the overall presentation of the consolidated financial statements. We believe that our audits provide a reasonable basis for our opinion.
Critical Audit Matter
The critical audit matter communicated below is a matter arising from the current period audit of the consolidated financial statements that was communicated or required to be communicated to the audit committee and that: (1) relates to accounts or disclosures that are material to the consolidated financial statements and (2) involved our especially challenging, subjective, or complex judgments. The communication of a critical audit matter does not alter in any way our opinion on the consolidated financial statements, taken as a whole, and we are not, by communicating the critical audit matter below, providing a separate opinion on the critical audit matter or on the accounts or disclosures to which it relates.
Evaluation of asset retirement obligations for water treatment costs
As discussed in Note 14 to the consolidated financial statements, the Company has recorded asset retirement obligations (AROs) of $2,601.9 million as of December 31, 2025. The ARO includes the planned treatment of contaminated water (“water treatment costs”) and other asset retirement activities at the Company’s Florida and Louisiana facilities.
We identified the evaluation of asset retirement obligations for water treatment costs as a critical audit matter. Specialized skills and knowledge were required to evaluate the Company’s selection of planned water treatment activities to satisfy their legal obligation. In addition, there was a high degree of subjective auditor judgment due to the sensitivity of the AROs to minor changes to significant assumptions, such as the volume of contaminated water and the forecasted level of contamination used to estimate the water treatment costs per thousand gallons (“unit costs”).
The following are the primary procedures performed to address this critical audit matter. We evaluated the design and tested the operating effectiveness of certain internal controls related to the Company’s ARO process.
This included controls related to the knowledge, skill, and ability of third-party specialists and their relationship to the Company, determination of necessary activities required to treat contaminated water, and the development of the significant assumptions utilized in the process. We compared water treatment unit cost estimates to actual spending and water quality measurements. We evaluated the Company’s ability to accurately estimate water treatment costs by comparing the Company’s prior year estimates to the actual water treatment costs incurred. Due to the specialized skills and knowledge used by the Company to select water treatment activities, we involved an environmental engineering professional with specialized skills and knowledge. This professional assisted in assessing the professional qualifications of the Company’s environmental engineers and engineering firm, including the knowledge, skill, and ability of the engineers, and the relationship of the engineers and engineering firm to the Company. In addition, the environmental engineering professional evaluated the Company’s planned asset retirement activities by analyzing the Company’s specialist’s reports. This professional evaluated significant engineering assumptions listed above and compared the planned activities per the specialist’s reports to other information obtained during the audit, such as:
- permits obtained which specify the Company’s legal obligations
- reports to state regulators on the level of contamination in water balances.
We evaluated the Company’s changes in assumptions for the volume of contaminated water and the forecasted level of contamination by comparing them to actual results from the prior year, as well as assessing operational changes that could impact estimated water volumes, contamination levels, or necessary treatment activities.
/s/ KPMG LLP
We have served as the Company’s auditor since 2004.
Tampa, Florida
February 27, 2026
Report of Independent Registered Public Accounting Firm
To the Stockholders and Board of Directors
The Mosaic Company:
Opinion on Internal Control Over Financial Reporting
We have audited The Mosaic Company and subsidiaries' (the Company) internal control over financial reporting as of December 31, 2025, based on criteria established in Internal Control – Integrated Framework (2013) issued by the Committee of Sponsoring Organizations of the Treadway Commission. In our opinion, the Company maintained, in all material respects, effective internal control over financial reporting as of December 31, 2025, based on criteria established in Internal Control – Integrated Framework (2013) issued by the Committee of Sponsoring Organizations of the Treadway Commission.
We also have audited, in accordance with the standards of the Public Company Accounting Oversight Board (United States) (PCAOB), the consolidated balance sheets of the Company as of December 31, 2025 and 2024, the related consolidated statements of earnings, comprehensive income (loss), equity, and cash flows for each of the years in the three-year period ended December 31, 2025, and the related notes (collectively, the consolidated financial statements), and our report dated February 27, 2026 expressed an unqualified opinion on those consolidated financial statements.
Basis for Opinion
The Company’s management is responsible for maintaining effective internal control over financial reporting and for its assessment of the effectiveness of internal control over financial reporting, included in the accompanying Management's Report on Internal Control Over Financial Reporting. Our responsibility is to express an opinion on the Company’s internal control over financial reporting based on our audit. We are a public accounting firm registered with the PCAOB and are required to be independent with respect to the Company in accordance with the U.S. federal securities laws and the applicable rules and regulations of the Securities and Exchange Commission and the PCAOB.
We conducted our audit in accordance with the standards of the PCAOB. Those standards require that we plan and perform the audit to obtain reasonable assurance about whether effective internal control over financial reporting was maintained in all material respects. Our audit of internal control over financial reporting included obtaining an understanding of internal control over financial reporting, assessing the risk that a material weakness exists, and testing and evaluating the design and operating effectiveness of internal control based on the assessed risk. Our audit also included performing such other procedures as we considered necessary in the circumstances. We believe that our audit provides a reasonable basis for our opinion.
Definition and Limitations of Internal Control Over Financial Reporting
A company’s internal control over financial reporting is a process designed to provide reasonable assurance regarding the reliability of financial reporting and the preparation of financial statements for external purposes in accordance with generally accepted accounting principles. A company’s internal control over financial reporting includes those policies and procedures that (1) pertain to the maintenance of records that, in reasonable detail, accurately and fairly reflect the transactions and dispositions of the assets of the company; (2) provide reasonable assurance that transactions are recorded as necessary to permit preparation of financial statements in accordance with generally accepted accounting principles, and that receipts and expenditures of the company are being made only in accordance with authorizations of management and directors of the company; and (3) provide reasonable assurance regarding prevention or timely detection of unauthorized acquisition, use, or disposition of the company’s assets that could have a material effect on the financial statements.
Because of its inherent limitations, internal control over financial reporting may not prevent or detect misstatements. Also, projections of any evaluation of effectiveness to future periods are subject to the risk that controls may become inadequate because of changes in conditions, or that the degree of compliance with the policies or procedures may deteriorate.
/s/ KPMG LLP
Tampa, Florida
February 27, 2026
Consolidated Statements of Earnings
In millions, except per share amounts
|
|
|
|
|
|
|
|
|
|
|
|
|
|
|
|
|
|
| |
Years Ended December 31, |
| |
2025 |
|
2024 |
|
2023 |
| Net sales |
$ |
12,052.4 |
|
|
$ |
11,122.8 |
|
|
$ |
13,696.1 |
|
| Cost of goods sold |
10,150.5 |
|
|
9,610.9 |
|
|
11,485.5 |
|
| Gross margin |
1,901.9 |
|
|
1,511.9 |
|
|
2,210.6 |
|
| Selling, general and administrative expenses |
533.9 |
|
|
496.9 |
|
|
500.5 |
|
| Loss (gain) on assets sold and to be sold |
157.3 |
|
|
— |
|
|
(56.5) |
|
|
|
|
|
|
|
| Impairment of goodwill |
99.9 |
|
|
— |
|
|
— |
|
| Other operating expenses |
289.3 |
|
|
393.5 |
|
|
428.5 |
|
| Operating earnings |
821.5 |
|
|
621.5 |
|
|
1,338.1 |
|
|
|
|
|
|
|
| Interest expense, net |
(187.7) |
|
|
(182.8) |
|
|
(129.4) |
|
| Foreign currency transaction gain (loss) |
271.7 |
|
|
(685.8) |
|
|
194.0 |
|
| Gain on sale of equity investment |
— |
|
|
522.2 |
|
|
— |
|
| Other income (expense) |
307.4 |
|
|
40.3 |
|
|
(76.8) |
|
| Earnings from consolidated companies before income taxes |
1,212.9 |
|
|
315.4 |
|
|
1,325.9 |
|
| Provision for income taxes |
639.8 |
|
|
186.7 |
|
|
177.0 |
|
| Earnings from consolidated companies |
573.1 |
|
|
128.7 |
|
|
1,148.9 |
|
| Equity in net earnings of nonconsolidated companies |
2.3 |
|
|
73.3 |
|
|
60.3 |
|
| Net earnings including noncontrolling interests |
575.4 |
|
|
202.0 |
|
|
1,209.2 |
|
| Less: Net earnings attributable to noncontrolling interests |
34.7 |
|
|
27.1 |
|
|
44.3 |
|
| Net earnings attributable to Mosaic |
$ |
540.7 |
|
|
$ |
174.9 |
|
|
$ |
1,164.9 |
|
| Basic net earnings per share attributable to Mosaic |
$ |
1.70 |
|
|
$ |
0.55 |
|
|
$ |
3.52 |
|
| Basic weighted average number of shares outstanding |
317.3 |
|
|
319.8 |
|
|
331.3 |
|
| Diluted net earnings per share attributable to Mosaic |
$ |
1.70 |
|
|
$ |
0.55 |
|
|
$ |
3.50 |
|
| Diluted weighted average number of shares outstanding |
318.9 |
|
|
320.7 |
|
|
333.2 |
|
See Accompanying Notes to Consolidated Financial Statements
Consolidated Statements of Comprehensive Income (Loss)
In millions
|
|
|
|
|
|
|
|
|
|
|
|
|
|
|
|
|
|
| |
Years Ended December 31, |
| |
2025 |
|
2024 |
|
2023 |
| Net earnings including noncontrolling interest |
$ |
575.4 |
|
|
$ |
202.0 |
|
|
$ |
1,209.2 |
|
| Other comprehensive income (loss), net of tax |
|
|
|
|
|
| Foreign currency translation gain (loss) |
307.1 |
|
|
(495.6) |
|
|
154.1 |
|
| Net actuarial gain (loss) and prior service cost |
(2.7) |
|
|
10.9 |
|
|
20.1 |
|
| Realized gain (loss) on interest rate swap |
(0.1) |
|
|
(0.1) |
|
|
1.4 |
|
| Net gain (loss) on marketable securities held in trust fund |
15.3 |
|
|
(14.8) |
|
|
23.7 |
|
| Other comprehensive income (loss) |
319.6 |
|
|
(499.6) |
|
|
199.3 |
|
| Comprehensive income (loss) |
895.0 |
|
|
(297.6) |
|
|
1,408.5 |
|
| Less: Comprehensive income attributable to noncontrolling interest |
37.2 |
|
|
21.6 |
|
|
46.3 |
|
| Comprehensive income (loss) attributable to Mosaic |
$ |
857.8 |
|
|
$ |
(319.2) |
|
|
$ |
1,362.2 |
|
See Accompanying Notes to Consolidated Financial Statements
Consolidated Balance Sheets
In millions, except per share amounts
|
|
|
|
|
|
|
|
|
|
|
|
| |
December 31, |
| |
2025 |
|
2024 |
| Assets |
|
|
|
| Current assets: |
|
|
|
| Cash and cash equivalents |
$ |
276.6 |
|
|
$ |
272.8 |
|
| Receivables, net |
1,078.6 |
|
|
1,113.3 |
|
| Inventories |
3,363.0 |
|
|
2,548.4 |
|
|
|
|
|
| Assets held for sale |
73.5 |
|
|
— |
|
| Other current assets |
445.8 |
|
|
563.8 |
|
| Total current assets |
5,237.5 |
|
|
4,498.3 |
|
| Property, plant and equipment, net |
13,982.6 |
|
|
13,352.6 |
|
| Equity securities and investments in nonconsolidated companies |
1,848.2 |
|
|
1,533.4 |
|
| Goodwill |
1,005.1 |
|
|
1,061.1 |
|
| Deferred income taxes |
811.6 |
|
|
958.3 |
|
| Other assets |
1,595.1 |
|
|
1,520.3 |
|
| Total assets |
$ |
24,480.1 |
|
|
$ |
22,924.0 |
|
| Liabilities and Equity |
|
|
|
| Current liabilities: |
|
|
|
| Short-term debt |
$ |
759.9 |
|
|
$ |
847.1 |
|
| Current maturities of long-term debt |
43.1 |
|
|
45.3 |
|
| Structured accounts payable arrangements |
480.1 |
|
|
402.3 |
|
| Accounts payable |
1,171.9 |
|
|
1,156.5 |
|
| Accrued liabilities |
1,472.5 |
|
|
1,720.1 |
|
|
|
|
|
|
|
|
|
| Liabilities held for sale |
55.3 |
|
|
— |
|
| Total current liabilities |
3,982.8 |
|
|
4,171.3 |
|
| Long-term debt, less current maturities |
4,250.9 |
|
|
3,332.3 |
|
| Deferred income taxes |
1,000.8 |
|
|
942.8 |
|
| Other noncurrent liabilities |
3,011.4 |
|
|
2,862.9 |
|
| Equity: |
|
|
|
Preferred stock, $0.01 par value, 15,000,000 shares authorized, none issued and outstanding as of December 31, 2025 and 2024 |
— |
|
|
— |
|
Common stock, $0.01 par value, 1,000,000,000 shares authorized, 395,125,254 shares issued and 317,408,647 shares outstanding as of December 31, 2025, 394,648,654 shares issued and 316,932,047 shares outstanding as of December 31, 2024 |
3.2 |
|
|
3.2 |
|
| Capital in excess of par value |
29.2 |
|
|
2.1 |
|
| Retained earnings |
14,184.4 |
|
|
13,926.1 |
|
| Accumulated other comprehensive loss |
(2,131.9) |
|
|
(2,449.0) |
|
| Total Mosaic stockholders’ equity |
12,084.9 |
|
|
11,482.4 |
|
| Non-controlling interests |
149.3 |
|
|
132.3 |
|
| Total equity |
12,234.2 |
|
|
11,614.7 |
|
| Total liabilities and equity |
$ |
24,480.1 |
|
|
$ |
22,924.0 |
|
See Accompanying Notes to Consolidated Financial Statements
Consolidated Statements of Cash Flows
In millions, except per share amounts
|
|
|
|
|
|
|
|
|
|
|
|
|
|
|
|
|
|
| |
Years Ended December 31, |
| |
2025 |
|
2024 |
|
2023 |
| Cash Flows from Operating Activities |
|
|
|
|
|
| Net earnings including noncontrolling interests |
$ |
575.4 |
|
|
$ |
202.0 |
|
|
$ |
1,209.2 |
|
| Adjustments to reconcile net earnings including noncontrolling interests to net cash provided by operating activities: |
|
|
|
|
|
| Depreciation, depletion and amortization |
1,049.9 |
|
|
1,025.5 |
|
|
960.6 |
|
|
|
|
|
|
|
| Deferred and other income taxes |
251.8 |
|
|
(142.9) |
|
|
(261.2) |
|
| Equity in net (earnings) of nonconsolidated companies, net of dividends |
0.6 |
|
|
(55.7) |
|
|
(31.8) |
|
| Accretion expense for asset retirement obligations |
129.7 |
|
|
111.2 |
|
|
96.1 |
|
| Amortization of debt financing fees |
43.0 |
|
|
36.5 |
|
|
21.4 |
|
| Share-based compensation expense |
30.7 |
|
|
31.8 |
|
|
33.0 |
|
| Impairment of goodwill |
99.9 |
|
|
— |
|
|
— |
|
| Unrealized (gain) loss on derivatives |
(85.7) |
|
|
104.1 |
|
|
(29.0) |
|
| Foreign currency adjustments |
(267.1) |
|
|
462.7 |
|
|
(94.0) |
|
| Loss (gain) on assets sold and to be sold |
157.3 |
|
|
— |
|
|
(56.5) |
|
|
|
|
|
|
|
|
|
|
|
|
|
| Pension settlement loss |
— |
|
|
— |
|
|
42.4 |
|
|
|
|
|
|
|
| Gain on sale of equity investment |
— |
|
|
(538.2) |
|
|
— |
|
| Unrealized (gain) loss on equity securities |
(317.4) |
|
|
(28.3) |
|
|
— |
|
| Other |
118.0 |
|
|
69.4 |
|
|
115.3 |
|
| Changes in assets and liabilities: |
|
|
|
|
|
| Receivables, net |
75.7 |
|
|
59.2 |
|
|
526.3 |
|
| Inventories, net |
(761.5) |
|
|
(275.6) |
|
|
1,061.4 |
|
| Other current assets and noncurrent assets |
8.1 |
|
|
(79.2) |
|
|
(239.2) |
|
| Accounts payable and accrued liabilities |
(359.6) |
|
|
96.4 |
|
|
(1,055.1) |
|
| Other noncurrent liabilities |
76.0 |
|
|
220.3 |
|
|
108.3 |
|
| Net cash provided by operating activities |
824.8 |
|
|
1,299.2 |
|
|
2,407.2 |
|
| Cash Flows from Investing Activities |
|
|
|
|
|
| Capital expenditures |
(1,359.4) |
|
|
(1,251.8) |
|
|
(1,402.4) |
|
| Purchases of available-for-sale securities - restricted |
(975.6) |
|
|
(1,529.7) |
|
|
(1,240.8) |
|
| Proceeds from sale of available-for-sale securities - restricted |
949.1 |
|
|
1,501.1 |
|
|
1,209.1 |
|
| Proceeds from sale of business |
— |
|
|
— |
|
|
158.4 |
|
| Acquisition of business |
— |
|
|
— |
|
|
(41.0) |
|
| Proceeds from sale of assets |
79.0 |
|
|
16.8 |
|
|
4.8 |
|
| Other |
(2.6) |
|
|
2.6 |
|
|
(5.3) |
|
| Net cash used in investing activities |
(1,309.5) |
|
|
(1,261.0) |
|
|
(1,317.2) |
|
| Cash Flows from Financing Activities |
|
|
|
|
|
| Payments of short-term debt |
(16,471.4) |
|
|
(16,779.6) |
|
|
(9,832.0) |
|
| Proceeds from issuance of short-term debt |
16,282.6 |
|
|
17,032.8 |
|
|
10,007.1 |
|
| Payments from inventory financing arrangement |
(2,005.8) |
|
|
(1,805.0) |
|
|
(601.4) |
|
| Proceeds from inventory financing arrangement |
2,106.5 |
|
|
2,004.5 |
|
|
601.4 |
|
| Payments of structured accounts payable arrangements |
(906.1) |
|
|
(755.0) |
|
|
(1,432.9) |
|
| Proceeds from structured accounts payable arrangements |
961.8 |
|
|
737.3 |
|
|
1,048.2 |
|
| Collections of transferred receivables |
572.5 |
|
|
425.5 |
|
|
1,468.6 |
|
| Payments of transferred receivables |
(572.5) |
|
|
(425.5) |
|
|
(1,468.6) |
|
| Payments of long-term debt |
(73.4) |
|
|
(67.2) |
|
|
(995.3) |
|
| Proceeds from issuance of long-term debt |
904.7 |
|
|
70.3 |
|
|
900.0 |
|
| Repurchases of stock |
— |
|
|
(235.4) |
|
|
(756.0) |
|
| Cash dividends paid |
(280.4) |
|
|
(270.7) |
|
|
(351.6) |
|
| Dividends paid to non-controlling interest |
(20.2) |
|
|
(31.9) |
|
|
(41.5) |
|
| Other |
(46.3) |
|
|
(32.0) |
|
|
(26.5) |
|
| Net cash provided by (used in) financing activities |
452.0 |
|
|
(131.9) |
|
|
(1,480.5) |
|
| Effect of exchange rate changes on cash |
26.3 |
|
|
37.9 |
|
|
(2.8) |
|
| Net change in cash, cash equivalents and restricted cash |
(6.4) |
|
|
(55.8) |
|
|
(393.3) |
|
| Cash, cash equivalents and restricted cash—beginning of year |
305.0 |
|
|
360.8 |
|
|
754.1 |
|
| Cash, cash equivalents and restricted cash—end of year |
$ |
298.6 |
|
|
$ |
305.0 |
|
|
$ |
360.8 |
|
See Accompanying Notes to Consolidated Financial Statements
Consolidated Statements of Cash Flows (Continued)
In millions, except per share amounts
|
|
|
|
|
|
|
|
|
|
|
|
|
|
|
|
|
|
|
Years Ended December 31, |
|
2025 |
|
2024 |
|
2023 |
| Reconciliation of cash, cash equivalents and restricted cash reported within the consolidated balance sheets to the consolidated statements of cash flows: |
|
|
|
|
|
| Cash and cash equivalents |
$ |
276.6 |
|
|
$ |
272.8 |
|
|
$ |
348.8 |
|
| Restricted cash in other current assets |
7.8 |
|
|
14.9 |
|
|
8.6 |
|
| Restricted cash in other assets |
14.2 |
|
|
17.3 |
|
|
3.4 |
|
| Total cash, cash equivalents and restricted cash shown in the statement of cash flows |
$ |
298.6 |
|
|
$ |
305.0 |
|
|
$ |
360.8 |
|
See Accompanying Notes to Consolidated Financial Statements
Consolidated Statements of Equity
In millions, except per share data
|
|
|
|
|
|
|
|
|
|
|
|
|
|
|
|
|
|
|
|
|
|
|
|
|
|
|
|
|
|
|
|
|
|
|
|
|
|
|
|
|
|
| |
|
|
Dollars |
| |
Shares |
|
Mosaic Stockholders |
|
|
|
|
|
Common
Stock |
|
Common
Stock |
|
Capital in
Excess
of Par Value |
|
Retained
Earnings |
|
Accumulated
Other
Comprehensive
Loss |
|
Non-
Controlling
Interests |
|
Total
Equity |
| Balance as of December 31, 2022 |
339.1 |
|
|
$ |
3.4 |
|
|
$ |
— |
|
|
$ |
14,203.4 |
|
|
$ |
(2,152.2) |
|
|
$ |
139.6 |
|
|
$ |
12,194.2 |
|
| Total comprehensive income |
— |
|
|
— |
|
|
— |
|
|
1,164.9 |
|
|
197.3 |
|
|
46.3 |
|
|
1,408.5 |
|
| Vesting of restricted stock units |
1.9 |
|
|
— |
|
|
(0.8) |
|
|
(53.4) |
|
|
— |
|
|
— |
|
|
(54.2) |
|
| Stock based compensation |
— |
|
|
— |
|
|
33.0 |
|
|
— |
|
|
— |
|
|
— |
|
|
33.0 |
|
|
|
|
|
|
|
|
|
|
|
|
|
|
|
Share repurchases, including tax of $6.4 million |
(16.9) |
|
|
(0.2) |
|
|
(32.2) |
|
|
(722.0) |
|
|
— |
|
|
— |
|
|
(754.4) |
|
Dividends ($0.85 per share) |
— |
|
|
— |
|
|
— |
|
|
(351.0) |
|
|
— |
|
|
— |
|
|
(351.0) |
|
|
|
|
|
|
|
|
|
|
|
|
|
|
|
| Equity to noncontrolling interests |
— |
|
|
— |
|
|
— |
|
|
— |
|
|
— |
|
|
(43.3) |
|
|
(43.3) |
|
| Balance as of December 31, 2023 |
324.1 |
|
|
3.2 |
|
|
— |
|
|
14,241.9 |
|
|
(1,954.9) |
|
|
142.6 |
|
|
12,432.8 |
|
| Total comprehensive income |
— |
|
|
— |
|
|
— |
|
|
174.9 |
|
|
(494.1) |
|
|
21.6 |
|
|
(297.6) |
|
| Vesting of restricted stock units |
0.7 |
|
|
— |
|
|
— |
|
|
(10.5) |
|
|
— |
|
|
— |
|
|
(10.5) |
|
|
|
|
|
|
|
|
|
|
|
|
|
|
|
| Stock based compensation |
— |
|
|
— |
|
|
31.8 |
|
|
— |
|
|
— |
|
|
— |
|
|
31.8 |
|
Share repurchases, including tax of $2.1 million |
(7.9) |
|
|
— |
|
|
(29.7) |
|
|
(207.8) |
|
|
— |
|
|
— |
|
|
(237.5) |
|
Dividends ($0.85 per share) |
— |
|
|
— |
|
|
— |
|
|
(272.4) |
|
|
— |
|
|
— |
|
|
(272.4) |
|
| Dividends for noncontrolling interests |
— |
|
|
— |
|
|
— |
|
|
— |
|
|
— |
|
|
(31.9) |
|
|
(31.9) |
|
|
|
|
|
|
|
|
|
|
|
|
|
|
|
| Balance as of December 31, 2024 |
316.9 |
|
|
3.2 |
|
|
2.1 |
|
|
13,926.1 |
|
|
(2,449.0) |
|
|
132.3 |
|
|
11,614.7 |
|
| Total comprehensive income |
— |
|
|
— |
|
|
— |
|
|
540.7 |
|
|
317.1 |
|
|
37.2 |
|
|
895.0 |
|
| Vesting of restricted stock units |
0.5 |
|
|
— |
|
|
(3.6) |
|
|
— |
|
|
— |
|
|
— |
|
|
(3.6) |
|
|
|
|
|
|
|
|
|
|
|
|
|
|
|
| Stock based compensation |
— |
|
|
— |
|
|
30.7 |
|
|
— |
|
|
— |
|
|
— |
|
|
30.7 |
|
|
|
|
|
|
|
|
|
|
|
|
|
|
|
Dividends ($0.88 per share) |
— |
|
|
— |
|
|
— |
|
|
(282.4) |
|
|
— |
|
|
— |
|
|
(282.4) |
|
| Dividends for noncontrolling interests |
— |
|
|
— |
|
|
— |
|
|
— |
|
|
— |
|
|
(20.2) |
|
|
(20.2) |
|
|
|
|
|
|
|
|
|
|
|
|
|
|
|
| Balance as of December 31, 2025 |
317.4 |
|
|
$ |
3.2 |
|
|
$ |
29.2 |
|
|
$ |
14,184.4 |
|
|
$ |
(2,131.9) |
|
|
$ |
149.3 |
|
|
$ |
12,234.2 |
|
See Accompanying Notes to Consolidated Financial Statements
Notes to Consolidated Financial Statements
Tables in millions, except per share amounts
1. ORGANIZATION AND NATURE OF BUSINESS
The Mosaic Company (“Mosaic,” and, with its consolidated subsidiaries, “we,” “us,” “our” or the “Company”) produces and markets concentrated phosphate and potash crop nutrients. We conduct our business through wholly- and majority-owned subsidiaries and businesses in which we own less than a majority or a noncontrolling interest, including consolidated variable interest entities and investments accounted for by the equity method.
We are organized into the following business segments:
•Our Phosphate business segment owns and operates mines and production facilities in Florida which produce concentrated phosphate crop nutrients and phosphate-based animal feed ingredients, and processing plants in Louisiana which produce concentrated phosphate crop nutrients. We have a 75% economic interest in the Miski Mayo Phosphate Mine in Peru. These results are consolidated in the Phosphate segment. Through December 24, 2024, the Phosphate segment included our prior 25% interest in the Ma’aden Wa’ad Al Shamal Phosphate Company (“MWSPC”), a joint venture to develop, own and operate integrated phosphate production facilities in the Kingdom of Saudi Arabia. On December 24, 2024, we exchanged our ownership of MWSPC for shares of Ma’aden. Our equity in the net earnings or losses relating to MWSPC were recognized on a one-quarter lag in our Consolidated Statements of Earnings.
•Our Potash business segment owns and operates potash mines and production facilities in Canada and the U.S. which produce potash-based crop nutrients, animal feed ingredients and industrial products. Potash sales include domestic and international sales. We are a member of Canpotex, Limited (“Canpotex”), an export association of Canadian potash producers through which we sell our Canadian potash outside the U.S. and Canada.
•Our Mosaic Fertilizantes business segment includes five Brazilian phosphate rock mines and four phosphate chemical plants in Brazil. The segment also includes our distribution business in South America, which consists of sales offices, crop nutrient blending and bagging facilities, port terminals and warehouses in Brazil and Paraguay. We also have a majority interest in Fospar S.A., which owns and operates a single superphosphate granulation plant and a deep-water port and throughput warehouse terminal facility in Brazil. It also includes the results of Mosaic Biosciences sales in Brazil.
Intersegment eliminations, unrealized mark-to-market gains/losses on derivatives and investment in equity securities of Ma’aden, debt expenses, the results of the China and India distribution businesses and Mosaic Biosciences sales in China, India and North America are included within Corporate, Eliminations and Other.
2. SUMMARY OF SIGNIFICANT ACCOUNTING POLICIES
Statement Presentation and Basis of Consolidation
The accompanying Consolidated Financial Statements have been prepared in accordance with accounting principles generally accepted in the United States of America (“U.S. GAAP”). Throughout the Notes to Consolidated Financial Statements, amounts in tables are in millions of dollars except for per share data and as otherwise designated.
The accompanying Consolidated Financial Statements include the accounts of Mosaic and its majority-owned subsidiaries. Certain investments in companies in which we do not have control but have the ability to exercise significant influence are accounted for by the equity method. All significant intercompany balances and transactions have been eliminated in consolidation.
Accounting Estimates
Preparation of the Consolidated Financial Statements in conformity with U.S. GAAP requires management to make estimates and assumptions that affect the reported amounts of assets and liabilities and disclosure of contingent assets and liabilities at the date of the financial statements and the reported amounts of net sales and expenses during the reporting periods. The most significant estimates made by management relate to the recoverability of non-current assets including goodwill, the useful lives and net realizable values of long-lived assets, environmental and reclamation liabilities, including asset retirement obligations (“ARO”), and income tax-related accounts, including the valuation allowance against deferred income tax assets.
Actual results could differ from these estimates.
Revenue Recognition
We generate revenues primarily by producing and marketing phosphate and potash crop nutrients. Revenue is recognized when control of the product is transferred to the customer, which is generally upon transfer of title to the customer based on the contractual terms of each arrangement. Title is typically transferred to the customer upon shipment of the product. In certain circumstances, which are referred to as final price deferred arrangements, we ship product prior to the establishment of a valid sales contract. In such cases, we retain control of the product and do not recognize revenue until a sales contract has been agreed to with the customer.
Revenue is measured as the amount of consideration we expect to receive in exchange for the transfer of our goods. Our products are generally sold based on market prices prevailing at the time the sales contract is signed or through contracts which are priced at the time of shipment, except for the final priced deferred arrangements discussed above. Sales incentives are volumetric based annual programs and recorded as a reduction of revenue at the time of sale. We estimate the variable consideration related to our sales incentive programs based on the sales terms with customers and historical experience. Historically, sales incentives have represented 1% or less of total revenue and there have not been significant adjustments to such estimates in the financial statements.
We sell Canadian-sourced potash outside Canada and the U.S. exclusively through Canpotex distribution. Canpotex sells potash to buyers in export markets pursuant to term and spot contracts at agreed upon prices. For sales through this channel, our revenue is recognized at the amount received from Canpotex representing proceeds from their sale of potash, less net costs of Canpotex. Sales are recognized when control is transferred to Canpotex, typically upon shipment of the product to Canpotex, and adjusted at the end of each reporting period based upon the updated estimated pricing or final pricing from Canpotex. Prior to final pricing, revenue is recognized only to the extent that it is probable a significant reversal of revenue will not occur. The constraint is estimated each period based on historical experience, market trends and industry data. The estimated constraint is not material to the Company’s financial statements.
Due to our membership in Canpotex, we eliminate the intra-entity profit with Canpotex at the end of each reporting period and present that profit elimination by reversing revenue and cost of goods sold for the inventory remaining at Canpotex. For more information regarding our relationship with Canpotex and accounting considerations, see Note 9 of our Notes to Consolidated Financial Statements. For information regarding sales by product type and by geographic area, see Note 25 of our Notes to Consolidated Financial Statements.
The timing of recognition of revenue related to our performance obligations may be different than the timing of collection of cash related to those performance obligations. Payment terms vary by contract. Specifically, we collect prepayments from certain customers in Brazil. In addition, cash collection from Canpotex may occur prior to delivery of product to the end customer. We generally satisfy our contractual liabilities within one quarter of incurring the liability. To the extent prepayments are not collected from customers, payment terms are established based on the type of product, distributor capabilities and competitive market conditions, and do not exceed one year.
Other key revenue recognition accounting policies include:
•Trade accounts receivable are recorded at the invoiced amount. Taxes collected from customers relating to product sales and remitted to governmental authorities are excluded from revenue.
•We generally expense sales commissions when incurred because the amortization period would have been one year or less. These costs are recorded within sales and marketing expenses.
•We have elected to recognize the cost for freight and shipping as an expense in cost of sales, when control over the product has passed to the customer.
Non-Income Taxes
We pay Canadian resource taxes consisting of the Potash Production Tax and resource surcharge. The Potash Production Tax is a Saskatchewan provincial tax on potash production and consists of a base payment and a profits tax. In addition to the Canadian resource taxes, royalties are payable to the mineral owners with respect to potash reserves or production of potash. These resource taxes and royalties are recorded in our cost of goods sold. Our Canadian resource tax and royalty expenses were $315.6 million, $272.7 million and $457.0 million during 2025, 2024 and 2023, respectively.
We have approximately $60.8 million of assets recorded as of December 31, 2025 related to PIS and Cofins, which is a Brazilian federal value-added tax. This amount was mostly earned in 2008 through 2022; we believe that it will be realized through offsetting income tax payments or other federal taxes or receiving cash refunds. As of December 31, 2024 we had approximately $96.2 million of assets recorded for these matters. Should the Brazilian government determine that these are not valid credits upon audit, this could impact our results in such period. We have recorded the PIS and Cofins credits at amounts which we believe are probable of collection. Information regarding PIS and Cofins taxes already audited is included in Note 23 of our Notes to Consolidated Financial Statements.
Foreign Currency Translation
The Company’s reporting currency is the U.S. dollar; however, for operations located in Canada and Brazil, the functional currency is the local currency. Assets and liabilities of these foreign operations are translated to U.S. dollars at exchange rates in effect at the balance sheet date, while income statement accounts and cash flows are translated to U.S. dollars at the average exchange rates for the period. For these operations, translation gains and losses are recorded as a component of accumulated other comprehensive income in equity until the foreign entity is sold or liquidated. Transaction gains and losses result from transactions that are denominated in a currency other than the functional currency of the operation, primarily accounts receivable and intercompany loans in our Canadian entities denominated in U.S. dollars, intercompany loans receivable in our U.S. entities denominated in Brazilian real, and accounts payable in Brazil denominated in U.S. dollars. These foreign currency transaction gains and losses are presented separately in the Consolidated Statement of Earnings.
Cash and Cash Equivalents
Cash and cash equivalents include short-term, highly liquid investments with original maturities of 90 days or less and other highly liquid investments that are payable on demand such as money market accounts, certain certificates of deposit and repurchase agreements. The carrying amount of such cash equivalents approximates their fair value due to the short-term and highly liquid nature of these instruments.
Concentration of Credit Risk
In the U.S., we sell our products to manufacturers, distributors and retailers primarily in the Midwest and Southeast. We generally sell our principal products to a large number of customers. At December 31, 2025 and 2024, one customer accounted for approximately 12% and 11%, respectively, of our trade accounts receivable. We continually monitor the creditworthiness of our customers and general economic conditions to manage our credit risk exposure. As such, we do not believe there is any significant collection risk.
Internationally, our potash products are sold primarily through Canpotex, an export association. A concentration of credit risk arises from our sales and accounts receivable associated with the international sales of potash product through Canpotex. We consider our concentration risk related to the Canpotex receivable to be mitigated by their credit policy, which requires the underlying receivables to be substantially insured or secured by letters of credit. As of December 31, 2025 and 2024, there were $73.0 million and $65.1 million, respectively, of trade accounts receivable due from Canpotex. During 2025, 2024 and 2023, sales to Canpotex were $1.2 billion, $884.3 million and $1.3 billion, respectively.
Inventories
Inventories of raw materials, work-in-process products, finished goods and operating materials and supplies are stated at the lower of cost or net realizable value. Costs for substantially all inventories are determined using the weighted average cost basis. To determine the cost of inventory, we allocate fixed expense to the costs of production based on the normal capacity, which refers to a range of production levels and is considered the production expected to be achieved over a number of periods or seasons under normal circumstances, taking into account the loss of capacity resulting from planned maintenance. Fixed overhead costs allocated to each unit of production should not increase due to abnormally low production. Those excess costs are recognized as a current period expense. When a production facility is completely shut down temporarily, it is considered “idle”, and all related expenses are charged to cost of goods sold.
Net realizable value of our inventory is defined as forecasted selling prices less reasonably predictable selling costs. Significant management judgment is involved in estimating forecasted selling prices including various demand and supply variables. Examples of demand variables include grain and oilseed prices, stock-to-use ratios and changes in inventories in the crop nutrients distribution channels. Examples of supply variables include forecasted prices of raw materials, such as phosphate rock, sulfur, ammonia and natural gas, estimated operating rates and industry crop nutrient inventory levels. Results could differ materially if actual selling prices differ materially from forecasted selling prices. Charges for lower of cost or market are recognized in our Consolidated Statements of Earnings in the period when there is evidence of a decline of market value below cost.
Property, Plant and Equipment and Recoverability of Long-Lived Assets
Property, plant and equipment are stated at cost. Costs of significant assets include capitalized interest incurred during the construction and development period. Repairs and maintenance, including planned major maintenance and plant turnaround costs, are expensed when incurred.
Currently, we do not have any material exploration or development stage mining projects. When we transition to new mining areas within our current properties, we incur minimal pre-mining costs related to the permitting process and land preparation activities, such as water management control and construction of roads and access points. These costs are capitalized as part of our mineral properties and rights. Mineral properties and rights at our operations include mineral reserves and mineral resources. Mineral resources have not yet been scheduled in formal mine plans and therefore are not subject to depletion. Depletion expenses for mining operations, including mineral reserves, are generally determined using the units-of-production method based on estimates of proven and probable reserves. Depreciation is computed principally using the straight-line method and units-of-production method over the following useful lives: machinery and equipment: three to 25 years; and buildings and leasehold improvements: three to 40 years.
We estimate initial useful lives based on experience and current technology. These estimates may be extended through sustaining capital programs. Factors affecting the fair value of our assets or periods of expected use may also affect the estimated useful lives of our assets and these factors can change. Therefore, we periodically review the estimated remaining lives of our facilities and other significant assets and adjust our depreciation rates prospectively where appropriate.
Long-lived assets, including fixed assets and right-of-use assets, are reviewed for impairment whenever events or changes in circumstances indicate that the carrying amount may not be recoverable. An impairment assessment involves management judgment and estimates of factors such as industry and market conditions, the economic life of the asset, sales volume and prices, inflation, raw materials costs, cost of capital, tax rates and capital spending. The carrying amount of a long-lived asset group is not recoverable if it exceeds the sum of the undiscounted cash flows expected to result from the use and eventual disposition of the asset group. If it is determined that an impairment loss has occurred, the loss is measured as the amount by which the carrying amount of the long-lived asset group exceeds its fair value.
Leases
Right of use (“ROU”) assets represent our right to use an underlying asset for the lease term. Lease liabilities represent our obligation to make lease payments arising from the lease. Operating lease ROU assets and liabilities are recognized at the commencement date of the lease, based on the present value of lease payments over the lease term. As most of our leases do not provide an implicit rate, we use our incremental borrowing rate based on the information available at the commencement date in determining the present value of lease payments. The Company’s incremental borrowing rate for a lease is the rate of interest it would have to pay on a collateralized basis to borrow an amount equal to the lease payments under similar terms. For both operating and finance leases, the initial ROU asset equals the lease liability, plus initial direct costs, less lease incentives received. Our lease agreements may include options to extend or terminate the lease, which are included in the lease term at the commencement date when it is reasonably certain that we will exercise that option. In general, we do not consider optional periods included in our lease agreements as reasonably certain of exercise at inception.
At inception, we determine whether an arrangement is a lease and the appropriate lease classification. Operating leases with terms greater than twelve months are included as operating lease ROU assets within other assets and the associated lease liabilities within accrued liabilities and other noncurrent liabilities on our consolidated balance sheets. Finance leases with terms greater than twelve months are included as finance ROU assets within property and equipment and the associated finance lease liabilities within current maturities of long-term debt and long-term debt on our consolidated balance sheets.
Leases with terms of less than twelve months, referred to as short-term leases, do not create a ROU asset or lease liability on the balance sheet.
We have lease agreements with lease and non-lease components, which are generally accounted for separately. For full-service railcar leases, we account for the lease and non-lease components as a single lease component. Additionally, for certain equipment leases, we apply assumptions using a portfolio approach, given the generally consistent terms of the agreements. Lease payments based on usage (for example, per-mile or per-hour charges), referred to as variable lease costs, are recorded separately from the determination of the ROU asset and lease liability.
Contingencies
Accruals for environmental remediation efforts are recorded when costs are probable and can be reasonably estimated. In determining these accruals, we use the most current information available, including similar past experiences, available technology, consultant evaluations, regulations in effect, the timing of remediation and cost-sharing arrangements. Adjustments to accruals, recorded as needed in our Consolidated Statement of Earnings each quarter, are made to reflect changes in and current status of these factors.
We are involved from time to time in claims and legal actions incidental to our operations, both as plaintiff and defendant. We have established what we currently believe to be adequate accruals for pending legal matters. These accruals are established as part of an ongoing worldwide assessment of claims and legal actions that takes into consideration such items as advice of legal counsel, individual developments in court proceedings, changes in the law, changes in business focus, changes in the litigation environment, changes in opponent strategy and tactics, new developments as a result of ongoing discovery and our experience in defending and settling similar claims. The litigation accruals at any time reflect updated assessments of the then-existing claims and legal actions. The final outcome or potential settlement of litigation matters could differ materially from the accruals which we have established. Legal costs are expensed as incurred.
Pension and Other Postretirement Benefits
Mosaic offers a number of benefit plans that provide pension and other benefits to qualified employees. These plans include defined benefit pension plans, supplemental pension plans, defined contribution plans and other postretirement benefit plans.
We accrue the funded status of our plans, which is representative of our obligations under employee benefit plans and the related costs, net of plan assets measured at fair value. The cost of pensions and other retirement benefits earned by employees is generally determined with the assistance of an actuary using the projected benefit method prorated on service and management’s best estimate of expected plan investment performance, salary escalation, retirement ages of employees and expected healthcare costs.
Additional Accounting Policies
To facilitate a better understanding of our consolidated financial statements we have disclosed the following significant accounting policies (with the exception of those identified above) throughout the following notes, with the related financial disclosures by major caption:
|
|
|
|
|
|
|
|
|
|
|
|
|
|
|
| Note |
|
Topic |
|
Page |
| 9 |
|
|
|
|
| 10 |
|
|
|
|
| 11 |
|
|
|
|
| 12 |
|
|
|
|
| 13 |
|
|
|
|
| 14 |
|
|
|
|
| 15 |
|
|
|
|
| 16 |
|
|
|
|
3. RECENTLY ISSUED ACCOUNTING GUIDANCE
In December 2023, the Financial Accounting Standards Board (“FASB”) issued guidance to provide more disaggregation of income tax disclosures mainly related to the reconciliations of the income tax rate and income taxes paid by jurisdiction. We adopted this standard for the year ended December 31, 2025, and applied the new disclosure requirements prospectively to the current annual period. Prior period disclosures have not been adjusted to reflect the new disclosure requirements. While adoption of this standard resulted in enhanced disclosures, it did not have any impact to our results of operations, cash flows or financial condition.
In November 2024, the FASB issued guidance which requires more detailed disclosure about specified categories of expenses (purchases of inventory, employee compensation, depreciation, intangible asset amortization and depletion) included in certain expense captions on the face of the income statement. Additionally, the amendments require disclosure of the total amount of selling expenses and an annual disclosure of the definition of selling expenses. These amendments are effective for fiscal years beginning after December 15, 2026, and for interim periods within fiscal years beginning after December 15, 2027, with early adoption permitted.
The disclosures may be applied either prospectively or retrospectively to any or all prior periods presented in the financial statements. We intend to apply this standard on a prospective basis and continue to evaluate the impact this new guidance will have on our disclosures.
4. LEASES
Leasing Activity
We have operating and finance leases for heavy mobile equipment, railcars, fleet vehicles, field and plant equipment, river and cross-gulf vessels, corporate offices, land and computer equipment. Our leases have remaining lease terms of one year to 37 years, some of which include options to extend the lease for up to 20 years and some of which include options to terminate the lease within one year.
Supplemental balance sheet information related to leases as of December 31, 2025 and December 31, 2024 is as follows:
|
|
|
|
|
|
|
|
|
|
|
|
|
|
|
|
|
|
|
|
|
|
|
December 31, |
|
|
| Type of Lease Asset or Liability |
|
2025 |
|
2024 |
|
Balance Sheet Classification |
|
|
(in millions) |
|
|
| Operating Leases |
|
|
|
|
|
|
| Right-of-use assets |
|
$ |
223.6 |
|
|
$ |
220.0 |
|
|
Other assets |
| Lease liabilities: |
|
|
|
|
|
|
| Short-term |
|
59.6 |
|
|
43.9 |
|
|
Accrued liabilities |
| Long-term |
|
166.0 |
|
|
181.2 |
|
|
Other noncurrent liabilities |
| Total |
|
$ |
225.6 |
|
|
$ |
225.1 |
|
|
|
| Finance Leases |
|
|
|
|
|
|
| Right-of-use assets: |
|
|
|
|
|
|
| Gross assets |
|
$ |
532.6 |
|
|
$ |
452.0 |
|
|
|
| Less: accumulated depreciation |
|
249.3 |
|
|
205.3 |
|
|
|
| Net assets |
|
$ |
283.3 |
|
|
$ |
246.7 |
|
|
Property, plant and equipment, net |
| Lease liabilities: |
|
|
|
|
|
|
| Short-term |
|
$ |
32.1 |
|
|
$ |
30.6 |
|
|
Current maturities of long-term debt |
| Long-term |
|
143.9 |
|
|
114.2 |
|
|
Long-term debt, less current maturities |
| Total |
|
$ |
176.0 |
|
|
$ |
144.8 |
|
|
|
Lease expense is generally included within cost of goods sold and selling, general and administrative expenses, except for interest on lease liabilities, which is recorded within net interest. The components of lease expense were as follows:
|
|
|
|
|
|
|
|
|
|
|
|
|
|
|
|
|
|
|
|
|
|
|
|
|
December 31, |
|
|
| (in millions) |
|
2025 |
|
2024 |
|
2023 |
|
|
| Operating lease cost |
|
$ |
101.9 |
|
|
$ |
87.2 |
|
|
$ |
86.9 |
|
|
|
| Finance lease cost: |
|
|
|
|
|
|
|
|
| Amortization of right-of-use assets |
|
52.0 |
|
|
45.5 |
|
|
45.8 |
|
|
|
| Interest on lease liabilities |
|
14.5 |
|
|
6.1 |
|
|
7.1 |
|
|
|
| Short-term lease cost |
|
— |
|
|
0.2 |
|
|
0.1 |
|
|
|
| Variable lease cost |
|
21.1 |
|
|
19.5 |
|
|
19.8 |
|
|
|
| Total lease cost |
|
$ |
189.5 |
|
|
$ |
158.5 |
|
|
$ |
159.7 |
|
|
|
Rental expense for 2025, 2024 and 2023 was $269.7 million, $269.4 million and $252.1 million, respectively.
Supplemental cash flow information related to leases was as follows:
|
|
|
|
|
|
|
|
|
|
|
|
|
|
|
|
|
|
|
|
|
|
|
December 31, |
| (In millions) |
|
2025 |
|
2024 |
|
2023 |
| Cash paid for amounts included in the measurement of lease liabilities: |
|
|
|
|
|
|
| Operating cash flows from operating leases |
|
$ |
89.3 |
|
|
$ |
90.4 |
|
|
$ |
89.2 |
|
| Operating cash flows from finance leases |
|
14.6 |
|
|
6.1 |
|
|
7.1 |
|
| Financing cash flows from finance leases |
|
39.6 |
|
|
42.9 |
|
|
78.8 |
|
| |
|
|
|
|
|
|
| Right-of-use assets obtained in exchange for lease obligations: |
|
|
|
|
|
|
| Operating leases |
|
$ |
66.9 |
|
|
$ |
70.4 |
|
|
$ |
54.5 |
|
| Finance leases |
|
86.2 |
|
|
9.0 |
|
|
35.8 |
|
Other information related to leases was as follows:
|
|
|
|
|
|
|
|
|
|
|
December 31, 2025 |
| Weighted Average Remaining Lease Term |
|
|
| Operating leases |
|
5.9 years |
| Finance leases |
|
4.2 years |
|
|
|
| Weighted Average Discount Rate |
|
|
| Operating leases |
|
7.2 |
% |
| Finance leases |
|
7.9 |
% |
Future lease payments under non-cancellable leases recorded as of December 31, 2025, were as follows:
|
|
|
|
|
|
|
|
|
|
|
|
|
|
|
|
|
Operating Leases |
|
Finance Leases |
| (in millions) |
|
|
|
|
| 2026 |
|
$ |
71.9 |
|
|
$ |
44.6 |
|
| 2027 |
|
55.2 |
|
|
38.6 |
|
| 2028 |
|
36.9 |
|
|
36.9 |
|
| 2029 |
|
32.0 |
|
|
72.8 |
|
| 2030 |
|
13.6 |
|
|
6.7 |
|
| Thereafter |
|
58.3 |
|
|
10.4 |
|
| Total future lease payments |
|
$ |
267.9 |
|
|
$ |
210.0 |
|
| Less imputed interest |
|
(42.3) |
|
|
(34.0) |
|
| Total |
|
$ |
225.6 |
|
|
$ |
176.0 |
|
5. OTHER FINANCIAL STATEMENT DATA
The following provides additional information concerning selected balance sheet accounts:
|
|
|
|
|
|
|
|
|
|
|
|
| |
December 31, |
| (in millions) |
2025 |
|
2024 |
| Receivables |
|
|
|
| Trade - External |
$ |
887.8 |
|
|
$ |
969.1 |
|
| Trade - Affiliate |
82.2 |
|
|
67.1 |
|
| Non-trade |
109.6 |
|
|
78.1 |
|
|
1,079.6 |
|
|
1,114.3 |
|
| Less allowance for doubtful accounts |
1.0 |
|
|
1.0 |
|
|
$ |
1,078.6 |
|
|
$ |
1,113.3 |
|
| Inventories |
|
|
|
| Raw materials |
$ |
285.7 |
|
|
$ |
148.6 |
|
| Work in process |
1,150.2 |
|
|
941.1 |
|
| Finished goods |
1,587.6 |
|
|
1,239.8 |
|
Final price deferred (a) |
133.8 |
|
|
53.5 |
|
| Operating materials and supplies |
205.7 |
|
|
165.4 |
|
|
$ |
3,363.0 |
|
|
$ |
2,548.4 |
|
| Other current assets |
|
|
|
|
|
|
|
| Income and other taxes receivable |
$ |
230.6 |
|
|
$ |
234.9 |
|
| Prepaid expenses |
194.6 |
|
|
299.8 |
|
|
|
|
|
| Other |
20.6 |
|
|
29.1 |
|
|
$ |
445.8 |
|
|
$ |
563.8 |
|
| Other assets |
|
|
|
| Restricted cash |
$ |
14.2 |
|
|
$ |
17.3 |
|
| MRO inventory |
141.9 |
|
|
169.0 |
|
| Marketable securities held in trust - restricted |
758.4 |
|
|
708.7 |
|
| Operating lease right-of-use assets |
223.6 |
|
|
220.0 |
|
| Indemnification asset |
26.9 |
|
|
18.4 |
|
| Long-term receivable |
14.7 |
|
|
12.9 |
|
Cloud computing cost (b) |
140.7 |
|
|
166.3 |
|
| Other |
274.7 |
|
|
207.7 |
|
|
$ |
1,595.1 |
|
|
$ |
1,520.3 |
|
|
|
|
|
|
|
|
|
|
|
|
|
| |
December 31, |
| (in millions) |
2025 |
|
2024 |
| Accrued liabilities |
|
|
|
| Accrued dividends |
$ |
75.9 |
|
|
$ |
74.1 |
|
| Payroll and employee benefits |
168.8 |
|
|
161.8 |
|
| Asset retirement obligations |
271.3 |
|
|
352.8 |
|
| Customer prepayments |
297.3 |
|
|
270.7 |
|
| Accrued income and other taxes |
34.3 |
|
|
204.7 |
|
| Operating lease obligation |
59.6 |
|
|
43.9 |
|
|
|
|
|
| Other |
565.3 |
|
|
612.1 |
|
|
$ |
1,472.5 |
|
|
$ |
1,720.1 |
|
| Other noncurrent liabilities |
|
|
|
| Asset retirement obligations |
$ |
2,330.6 |
|
|
$ |
2,219.4 |
|
| Operating lease obligation |
166.0 |
|
|
181.2 |
|
| Accrued pension and postretirement benefits |
102.8 |
|
|
91.6 |
|
| Unrecognized tax benefits |
23.1 |
|
|
17.7 |
|
| Other |
388.9 |
|
|
353.0 |
|
|
$ |
3,011.4 |
|
|
$ |
2,862.9 |
|
______________________________
(a)Final price deferred is product that has shipped to customers, but we retain control and do not recognize revenue until a sales contract has been agreed to with the customer.
(b)Implementation costs eligible for capitalization related to cloud computing arrangements that are a service contract are recorded within Prepaid expenses and Other assets in the Consolidated Balance Sheets and amortized over the reasonably certain term of the associated hosting arrangement.
Interest expense, net was comprised of the following in 2025, 2024 and 2023:
|
|
|
|
|
|
|
|
|
|
|
|
|
|
|
|
|
|
| |
Years Ended December 31, |
| (in millions) |
2025 |
|
2024 |
|
2023 |
| Interest income |
$ |
53.8 |
|
|
$ |
47.2 |
|
|
$ |
59.6 |
|
| Less interest expense |
241.5 |
|
|
230.0 |
|
|
189.0 |
|
| Interest expense, net |
$ |
(187.7) |
|
|
$ |
(182.8) |
|
|
$ |
(129.4) |
|
6. PROPERTY, PLANT AND EQUIPMENT
Property, plant and equipment consist of the following:
|
|
|
|
|
|
|
|
|
|
|
|
| |
December 31, |
| (in millions) |
2025 |
|
2024 |
| Land |
$ |
364.7 |
|
|
$ |
352.5 |
|
| Mineral properties and rights |
7,254.0 |
|
|
6,831.3 |
|
| Buildings and leasehold improvements |
4,079.4 |
|
|
3,836.4 |
|
| Machinery and equipment |
12,406.3 |
|
|
11,684.0 |
|
| Construction in-progress |
1,004.2 |
|
|
1,148.1 |
|
|
25,108.6 |
|
|
23,852.3 |
|
| Less: accumulated depreciation and depletion |
11,126.0 |
|
|
10,499.7 |
|
|
$ |
13,982.6 |
|
|
$ |
13,352.6 |
|
Depreciation and depletion expense was $1,022.1 million, $1,012.5 million, and $958.9 million for 2025, 2024 and 2023, respectively. Interest capitalized on major construction projects was $31.7 million, $42.3 million, and $35.2 million for 2025, 2024 and 2023, respectively.
7. EARNINGS PER SHARE
The numerator for basic and diluted earnings per share (“EPS”) is net earnings attributable to Mosaic. The denominator for basic EPS is the weighted average number of shares outstanding during the period. The denominator for diluted EPS also includes the weighted average number of additional common shares that would have been outstanding if the dilutive potential common shares had been issued, unless the shares are anti-dilutive.
The following is a reconciliation of the numerator and denominator for the basic and diluted EPS computations:
|
|
|
|
|
|
|
|
|
|
|
|
|
|
|
|
|
|
| |
Years Ended December 31, |
| (in millions) |
2025 |
|
2024 |
|
2023 |
| Net earnings attributable to Mosaic |
$ |
540.7 |
|
|
$ |
174.9 |
|
|
$ |
1,164.9 |
|
| Basic weighted average number of shares outstanding attributable to common stockholders |
317.3 |
|
|
319.8 |
|
|
331.3 |
|
| Dilutive impact of share-based awards |
1.6 |
|
|
0.9 |
|
|
1.9 |
|
| Diluted weighted average number of shares outstanding |
318.9 |
|
|
320.7 |
|
|
333.2 |
|
| Basic net earnings per share |
$ |
1.70 |
|
|
$ |
0.55 |
|
|
$ |
3.52 |
|
| Diluted net earnings per share |
$ |
1.70 |
|
|
$ |
0.55 |
|
|
$ |
3.50 |
|
A total of 0.2 million shares for 2025, 1.0 million shares for 2024 and 0.5 million shares for 2023 of common stock subject to issuance related to share-based awards have been excluded from the calculation of diluted EPS because the effect would have been anti-dilutive.
8. CASH FLOW INFORMATION
Supplemental disclosures of cash paid for interest and income taxes and non-cash investing and financing information is as follows:
|
|
|
|
|
|
|
|
|
|
|
|
|
|
|
|
|
|
|
Years Ended December 31, |
| (in millions) |
2025 |
|
2024 |
|
2023 |
| Cash paid during the period for: |
|
|
|
|
|
| Interest |
$ |
223.9 |
|
|
$ |
228.7 |
|
|
$ |
204.7 |
|
| Less amount capitalized |
31.7 |
|
|
42.3 |
|
|
35.2 |
|
| Cash interest, net |
$ |
192.2 |
|
|
$ |
186.4 |
|
|
$ |
169.5 |
|
| Income taxes |
$ |
321.3 |
|
|
$ |
337.0 |
|
|
$ |
385.6 |
|
Acquiring or constructing property, plant and equipment by incurring a liability does not result in a cash outflow for us until the liability is paid. In the period the liability is incurred, the change in operating accounts payable on the Consolidated Statements of Cash Flows is adjusted by such amount. In the period the liability is paid, the amount is reflected as a cash outflow from investing activities. The applicable net change in operating accounts payable that was classified to investing activities on the Consolidated Statements of Cash Flows was $8.4 million, $(20.3) million, and $(19.5) million for 2025, 2024 and 2023, respectively.
We accrued $75.9 million related to the dividends declared in 2025 that will be paid in 2026. At December 31, 2024 and 2023, we had accrued dividends of $74.1 million and $72.3 million which were paid in 2025 and 2024, respectively.
Included in proceeds from issuance of short-term debt and payments of short-term debt were $16.1 billion and ($16.2) billion and $16.8 billion and ($16.6) billion for 2025 and 2024, respectively, related to our commercial paper arrangement.
We had non-cash investing and financing transactions related to right-of-use assets obtained in exchange for lease obligations assets under finance leases in 2025 of $86.2 million. Non-cash investing and financing transactions related to assets acquired under capital leases were $9.0 million and $35.8 million for 2024 and 2023, respectively.
In 2024,we had a non-cash transaction related to the exchange of our 25% ownership MWSPC for 111,012,433 shares of Ma’aden at a value of approximately $1.5 billion, resulting in a gain before transaction expenses of $538.2 million.
Depreciation, depletion and amortization includes $1,022.1 million, $1,012.5 million and $958.9 million related to depreciation and depletion of property, plant and equipment and $27.8 million, $13.0 million and $1.7 million related to the amortization of intangible assets and cloud computing costs for 2025, 2024 and 2023, respectively.
9. EQUITY SECURITIES AND INVESTMENTS IN NON-CONSOLIDATED COMPANIES
We have investments in various international and domestic entities and ventures. The equity method of accounting is applied to such investments when the ownership structure prevents us from exercising a controlling influence over operating and financial policies of the businesses but still allow us to have significant influence. Under this method, our equity in the net earnings or losses of the investments is reflected as equity in net earnings of non-consolidated companies on our Consolidated Statements of Earnings. The effects of material intercompany transactions with these equity method investments are eliminated, including the the Company's economic interest in the gross profit on sales to and purchases from our equity-method investments which is deferred until the time of sale to the final third-party customer. The cash flow presentation of dividends received from equity method investees is determined by evaluation of the facts, circumstances and nature of the distribution.
A summary of our equity-method investments, which were in operation as of December 31, 2025, is as follows:
|
|
|
|
|
|
|
|
|
| Entity |
|
Economic Interest |
| River Bend Ag, LLC |
|
50.0 |
% |
| IFC S.A. |
|
45.0 |
% |
| Canpotex |
|
36.2 |
% |
The summarized financial information shown below includes all non-consolidated companies carried on the equity method.
|
|
|
|
|
|
|
|
|
|
|
|
|
|
|
|
|
|
|
Years Ended December 31, |
| (in millions) |
2025 |
|
2024 |
|
2023 |
| Net sales |
$ |
4,256.1 |
|
|
$ |
3,601.9 |
|
|
$ |
7,055.1 |
|
| Net earnings |
5.8 |
|
|
6.2 |
|
|
317.9 |
|
| Mosaic’s share of equity in net earnings |
2.9 |
|
|
3.1 |
|
|
60.3 |
|
| Total assets |
2,328.4 |
|
|
1,883.8 |
|
|
9,900.6 |
|
| Total liabilities |
2,308.9 |
|
|
1,865.1 |
|
|
7,014.1 |
|
| Mosaic’s share of equity in net assets |
9.8 |
|
|
9.4 |
|
|
725.9 |
|
MWSPC owns and operates a mine and two chemical complexes that produce phosphate fertilizers and other downstream phosphate products in the Kingdom of Saudi Arabia. As of December 31, 2023, our cash investment was $770.0 million and we marketed approximately 25% of the phosphate production of this joint venture. As of December 31, 2023, MWSPC represented 77% of the total assets and 68% of the total liabilities in the table above. In 2024 and 2023 our share of equity in net earnings of MWSPC was $70.8 million, and $57.6 million, respectively. On April 29, 2024, Saudi Arabian Mining Company (“Ma’aden”) and Mosaic entered into a Share Purchase and Subscription Agreement to exchange our 25% ownership of the Ma’aden Wa’ad al Shamal Phosphate Company for 111,012,433 shares of Ma’aden. This transaction closed on December 24, 2024, at a value of approximately $1.5 billion, resulting in a gain of $522.2 million, net of transaction costs. The shares received by Mosaic are subject to transfer and sale restrictions, which will be released over a five-year period. The shares are included in equity securities and investments in nonconsolidated companies on our Consolidated Balance Sheets. They are carried at fair value based on the unadjusted quoted price on the Saudi Exchange (Tadawul), with the changes in fair value reported in non-operating income (expense). During 2025 and 2024, we had unrealized gains on the Ma’aden shares of $317.4 million and $28.3 million, respectively.
Canpotex is a Saskatchewan export association used by two Canadian potash producers to market, sell and distribute Canadian potash products outside of Canada and the U.S. It operates as a break-even entity and therefore has insignificant equity earnings or loss. We have concluded that the sales to Canpotex are not at arm’s-length, due to the unique pricing and payment structure and financial obligations of the stockholders. Therefore, the Company's economic interest in the profit on sales to Canpotex is eliminated until Canpotex no longer has control of the related inventory and has sold it to an unrelated third-party customer. We eliminate the intra-entity profit with Canpotex at the end of each reporting period and present that profit elimination by reversing revenue and cost of goods sold for the inventory remaining at Canpotex.
10. GOODWILL
Goodwill is carried at cost, not amortized, and represents the excess of the purchase price and related costs over the fair value assigned to the net identifiable assets of a business acquired. We test goodwill for impairment on a quantitative basis at the reporting unit level on an annual basis or upon the occurrence of events that may indicate possible impairment. Impairment is measured as the excess carrying value over the fair value of goodwill.
The changes in the carrying amount of goodwill, by reporting unit, as of December 31, 2025 and 2024, are as follows:
|
|
|
|
|
|
|
|
|
|
|
|
|
|
|
|
|
|
|
|
|
|
|
|
|
|
| (in millions) |
|
|
Potash |
|
Mosaic Fertilizantes |
|
Corporate, Eliminations and Other |
|
Total |
| Balance as of December 31, 2023 |
|
|
$ |
1,026.9 |
|
|
$ |
99.6 |
|
|
$ |
12.1 |
|
|
$ |
1,138.6 |
|
| Foreign currency translation |
|
|
(71.5) |
|
|
(6.0) |
|
|
— |
|
|
(77.5) |
|
|
|
|
|
|
|
|
|
|
|
| Balance as of December 31, 2024 |
|
|
$ |
955.4 |
|
|
$ |
93.6 |
|
|
$ |
12.1 |
|
|
$ |
1,061.1 |
|
| Foreign currency translation |
|
|
41.2 |
|
|
2.7 |
|
|
— |
|
|
43.9 |
|
|
|
|
|
|
|
|
|
|
|
| Impairment |
|
|
(3.6) |
|
|
(96.3) |
|
|
— |
|
|
(99.9) |
|
| Balance as of December 31, 2025 |
|
|
$ |
993.0 |
|
|
$ |
— |
|
|
$ |
12.1 |
|
|
$ |
1,005.1 |
|
As of October 31, 2025, we performed our annual quantitative assessment. In performing our assessment, we estimated the fair value of each of our reporting units using the income approach, also known as the discounted cash flow (“DCF”) method. Our reporting unit fair value measurements are classified as Level 3 in the fair value hierarchy because they involve significant unobservable inputs and internal projections. The future cash flows for our reporting units were projected based on our estimates, at that time, for revenue, operating income and other factors (such as working capital and capital expenditures for each reporting unit). To determine if the fair value of each of our reporting units with goodwill exceeded its carrying value, we assumed sales volume growth rates based on our long-term expectations, our internal selling prices and projected raw material prices for years one through five, which were anchored in projections from CRU International Limited (“CRU”), an independent third party data source. Selling prices and raw material prices for years six and beyond were based on anticipated market growth and long-term CRU outlooks. The discount rates used in our DCF method were based on a weighted-average cost of capital (“WACC”), determined from relevant market comparisons. A terminal value growth rate of 2% was applied to all years thereafter for the projected period and reflected our estimate of stable growth. We then calculated a present value of the respective cash flows for each reporting unit to arrive at an estimate of fair value under the income approach. Finally, we compared our estimates of fair values for our reporting units, to our October 31, 2025 total public market capitalization, based on our common stock price at that date.
In making this assessment, we considered, among other things, expectations of projected net sales and cash flows, assumptions impacting WACC, changes in our stock price and changes in the carrying values of our reporting units with goodwill. We also considered overall business conditions. As a result of our test, we concluded that the carrying value of our Mosaic Fertilizantes reporting unit was in excess of its fair value due to a combination of an increase in carrying value and a reduction in our long-term forecast due to recent market forecasts. Therefore, we recognized a goodwill impairment charge of $96.3 million. We also recognized an impairment of $3.6 million in our Potash reporting unit related to classifying our Carlsbad, New Mexico facility as held for sale.
The Potash and Corporate, Eliminations and Other reporting units were evaluated and not considered at risk of goodwill impairment at October 31, 2025.
As of December 31, 2025, $15.6 million of goodwill was deductible for tax purposes.
11. FINANCING ARRANGEMENTS
Mosaic Credit Facility
On May 16, 2025, we amended our committed, unsecured five-year revolving credit facility of up to $2.5 billion (the “Amended and Restated Mosaic Credit Facility”), extending the maturity date to May 16, 2030, from August 19, 2026. This facility is intended to serve as our primary unsecured bank credit facility. The Amended and Restated Mosaic Credit Facility also reduces the rates applicable to the unused commitment fees and provides us with additional flexibility under other restrictive covenants, compared to the facility prior to this amendment.
The Amended and Restated Mosaic Credit Facility has cross-default provisions that, in general, provide that a failure to pay principal or interest under, or any other amount payable under, any indebtedness with outstanding principal amount of $100 million or more, or breach or default under such indebtedness that permits the holders thereof to accelerate the maturity thereof, will result in a cross-default.
The Amended and Restated Mosaic Credit Facility requires Mosaic to maintain certain financial ratios, including a ratio of Consolidated Indebtedness (as defined), which has been redefined to exclude unrestricted cash and cash equivalents, to Consolidated Capitalization Ratio (as defined) of no greater than 0.65 to 1.0, as well as a minimum Interest Coverage Ratio (as defined) of not less than 3.0 to 1.0. We were in compliance with these ratios as of December 31, 2025.
The Amended and Restated Mosaic Credit Facility also contains other events of default and covenants that limit various matters. These provisions include limitations on indebtedness, liens, investments and acquisitions (other than capital expenditures), certain mergers, certain sales of assets and other matters customary for credit facilities of this nature.
As of December 31, 2025 and 2024, we had no outstanding letters of credit that reduced the availability of revolving loans under the Amended and Restated Mosaic Credit Facility. The net availability for revolving borrowings under this facility was approximately $2.50 billion as of both December 31, 2025 and December 31, 2024. In 2025, unused commitment fees accrued at a rate of 0.15% through May 16, 2025, the date the credit facility was amended, and at a rate of 0.125% thereafter, resulting in total expense of $3.4 million for the year. For the years ended December 31, 2024 and 2023 unused commitment fees accrued at an average rate of 0.15%, resulting in expenses of $3.8 million in each period.
Short-Term Debt
Short-term debt consists of the revolving credit facility under the Amended and Restated Mosaic Credit Facility, under which there were no borrowings as of December 31, 2025, working capital financing arrangements and various other short-term borrowings related to our international operations in India, China and Brazil. These other short-term borrowings outstanding were $759.9 million and $847.1 million as of December 31, 2025 and 2024, respectively.
We have an inventory financing arrangement whereby we can sell up to $625 million of certain inventory for cash and subsequently repurchase the inventory at an agreed upon price and time in the future, not to exceed 180 days. Under the terms of the agreement, we may borrow up to 90% of the value of the inventory. It is later repurchased by Mosaic at the original sale price plus interest and any transaction costs. As of December 31, 2025 and 2024, we had financed inventory of $300.2 million and $199.5 million, respectively, under this arrangement, which is included in short-term debt on the Consolidated Balance Sheet.
We have Receivable Purchasing Agreements (“RPAs”), with banks whereby, from time-to-time, we sell certain receivables. The net face value of the purchased receivables may not exceed $500 million at any point in time. The purchase price of the receivable sold under the RPA is the face value of the receivable less an agreed upon discount. The receivables sold under the RPAs are accounted for as true sales. Upon sale, these receivables are removed from the Consolidated Balance Sheets. Cash received is presented as cash provided by operating activities in the Consolidated Statements of Cash Flows.
The Company sold approximately $668.9 million and $430.7 million during 2025 and 2024, respectively, of accounts receivable under these arrangements. Discounts on sold receivables were not material for any period presented. Following the sale to the banks, we continue to service the collection of the receivables on behalf of the banks without further consideration. As of December 31, 2025 and 2024, there was no amount outstanding to be remitted to the bank. Any outstanding amount would be classified in accrued liabilities on the Consolidated Balance Sheets. Cash collected and remitted is presented as cash used in financing activities in the Consolidated Statements of Cash Flows.
We have a commercial paper program which allows us to issue unsecured commercial paper notes with maturities that vary, but do not exceed 397 days from the date of issue, up to a maximum aggregate face or principal amount outstanding at any time of $2.5 billion. We plan to use the revolving credit facility as a liquidity backstop for borrowings under the commercial paper program. As of December 31, 2025, we had $459.5 million outstanding under this program, with a weighted average interest rate of 3.99% and a remaining average term of 10 days. As of December 31, 2024, we had $609.2 million outstanding under this program, with a weighted average interest rate of 4.74% and a remaining average term of 10 days.
We had additional outstanding bilateral letters of credit of $64.6 million as of December 31, 2025, which includes $50.0 million as required by the 2015 Consent Decrees as described further in Note 14 of our Consolidated Financial Statements.
Long-Term Debt, including Current Maturities
On, November 10, 2025, we issued new senior notes consisting of $500 million aggregate principal amount of 4.350% due 2029 and $400 million aggregate principal amount of 4.60% due 2030 (the “Senior Notes of 2025”). We have the following additional senior notes outstanding: $700 million aggregate principal amount of 4.050% senior notes due 2027 (the “Senior Notes of 2017”), $400 million aggregate principal amount of 5.375% due 2028 (the “Senior Notes of 2023”); and $500 million aggregate principal amount of 5.45% senior notes due 2033 and $600 million aggregate principal amount of 5.625% senior notes due 2043 (collectively, the “Senior Notes of 2013”); and $300 million aggregate principal amount of 4.875% senior notes due 2041 (the “Senior Notes of 2011”).
The Senior Notes of 2011, the Senior Notes of 2013, the Senior Notes of 2017, the Senior Notes of 2023 and the Senior Notes of 2025 are Mosaic’s senior unsecured obligations and rank equally in right of payment with Mosaic’s existing and future senior unsecured indebtedness. The indenture governing these notes contains restrictive covenants limiting debt secured by liens, sale and leaseback transactions and mergers, consolidations and sales of substantially all assets, as well as other events of default.
In May 2023, we entered into a ten year senior unsecured term loan facility pursuant to which we can draw up to $700 million. The term loan matures on May 18, 2033. We may voluntarily prepay the outstanding principal without premium or penalty. As of December 31, 2025 and 2024, $570 million has been drawn under this facility. Interest rates for the term loan are variable and are based on the Secured Overnight Financing Rate (“SOFR”) plus credit spread adjustments.
A debenture issued by Mosaic Global Holdings, Inc., one of our consolidated subsidiaries, due in 2028 (the “2028 Debenture”), is outstanding as of December 31, 2025, with a balance of $147.1 million. The indenture governing the 2028 Debenture also contains restrictive covenants limiting debt secured by liens, sale and leaseback transactions and mergers, consolidations and sales of substantially all assets, as well as events of default. The obligations under the 2028 Debenture are guaranteed by the Company and several of its subsidiaries.
Long-term debt primarily consists of unsecured notes, unsecured debentures, our term loan, finance leases, and secured notes. Long-term debt as of December 31, 2025 and 2024, respectively, consisted of the following:
|
|
|
|
|
|
|
|
|
|
|
|
|
|
|
|
|
|
|
|
|
|
|
|
|
|
|
|
|
|
|
|
|
|
|
|
|
|
|
|
|
|
|
|
|
|
|
|
|
|
|
|
|
|
|
|
|
|
|
|
|
|
|
|
|
|
|
|
|
|
|
|
|
|
|
|
|
2025 |
|
2024 |
| (in millions) |
|
Stated Interest Rate |
|
Effective Interest Rate |
|
Maturity Date |
|
Stated Value |
|
Combination Fair
Market
Value Adjustment |
|
Discount on Notes Issuance |
|
Carrying Value |
|
Stated Value |
|
Combination Fair
Market
Value Adjustment |
|
Discount on Notes Issuance |
|
Carrying Value |
| Unsecured notes |
|
4.05% -
5.63%
|
|
5.26% |
|
2027-
2043 |
|
$ |
3,400.0 |
|
|
$ |
— |
|
|
$ |
(5.6) |
|
|
$ |
3,394.4 |
|
|
$ |
2,500.0 |
|
|
$ |
— |
|
|
$ |
(5.1) |
|
|
$ |
2,494.9 |
|
| Unsecured debentures |
|
7.30% |
|
7.19% |
|
2028 |
|
147.1 |
|
|
0.2 |
|
|
— |
|
|
147.3 |
|
|
147.1 |
|
|
0.3 |
|
|
— |
|
|
147.4 |
|
| Term Loan |
|
30 Day SOFR |
|
6.27% |
|
2033 |
|
570.0 |
|
|
— |
|
|
— |
|
|
570.0 |
|
|
570.0 |
|
|
— |
|
|
— |
|
|
570.0 |
|
| Finance leases |
|
0.77% -
13.02%
|
|
7.82% |
|
2026-
2034 |
|
176.0 |
|
|
— |
|
|
— |
|
|
176.0 |
|
|
144.8 |
|
|
— |
|
|
— |
|
|
144.8 |
|
Other(a) |
|
6.53% -
8.00%
|
|
5.00% |
|
2026-
2027 |
|
3.3 |
|
|
3.0 |
|
|
— |
|
|
6.3 |
|
|
17.1 |
|
|
3.4 |
|
|
— |
|
|
20.5 |
|
Total long-term debt |
|
|
|
4,296.4 |
|
|
3.2 |
|
|
(5.6) |
|
|
4,294.0 |
|
|
3,379.0 |
|
|
3.7 |
|
|
(5.1) |
|
|
3,377.6 |
|
Less current portion |
|
|
|
43.0 |
|
|
0.8 |
|
|
(0.7) |
|
|
43.1 |
|
|
45.4 |
|
|
0.4 |
|
|
(0.5) |
|
|
45.3 |
|
Total long-term debt, less current maturities |
|
|
|
$ |
4,253.4 |
|
|
$ |
2.4 |
|
|
$ |
(4.9) |
|
|
$ |
4,250.9 |
|
|
$ |
3,333.6 |
|
|
$ |
3.3 |
|
|
$ |
(4.6) |
|
|
$ |
3,332.3 |
|
______________________________
(a) Includes deferred financing fees related to our long-term debt.
Scheduled maturities of long-term debt are as follows for the periods ending December 31:
|
|
|
|
|
|
| (in millions) |
|
| 2026 |
$ |
43.1 |
|
| 2027 |
727.4 |
|
| 2028 |
575.2 |
|
| 2029 |
569.1 |
|
| 2030 |
404.3 |
|
| Thereafter |
1,974.9 |
|
| Total |
$ |
4,294.0 |
|
Structured Accounts Payable Arrangements
In Brazil, we finance some of our potash-based fertilizer, sulfur, ammonia and other raw material product purchases through third-party contractual arrangements. These arrangements provide that the third-party intermediary advance the amount of the scheduled payment to the vendor, less an appropriate discount, at a scheduled payment date and Mosaic makes payment to the third-party intermediary at dates ranging from 119 to 193 days from date of shipment. At December 31, 2025 and 2024, these structured accounts payable arrangements were $480.1 million and $402.3 million, respectively. Payments and proceeds rollforward information on structured payable arrangements are provided on the Consolidated Statements of Cash Flows. During 2025 and 2024, the interest expense component of such programs were $21.9 million and $22.9 million, respectively.
Intercompany Loans
A portion of our debt is denominated in Brazilian reals. We manage the net foreign currency exposure created by this debt through various means, including the designation of certain intercompany loans as permanent loans because they are not expected to be repaid in the foreseeable future. Foreign currency transaction gains and losses on intercompany loans that are not designated as permanent loans are recorded in earnings. Foreign currency transaction gains and losses on intercompany loans that are designated as permanent loans are recorded in other comprehensive income (loss).
12. MARKETABLE SECURITIES HELD IN TRUSTS
In August 2016, Mosaic deposited $630 million into two trust funds (together, the “RCRA Trusts”) created to provide additional financial assurance in the form of cash for the estimated costs (“Gypstack Closure Costs”) of closure and long-term care of our Florida and Louisiana phosphogypsum management systems (“Gypstacks”), as described further in Note 14 of our Notes to Consolidated Financial Statements. Our actual Gypstack Closure Costs are generally expected to be paid by us in the normal course of our Phosphate business; however, funds held in each of the RCRA Trusts can be drawn by the applicable governmental authority in the event we cannot perform our closure and long-term care obligations. When our estimated Gypstack Closure Costs with respect to the facilities associated with a RCRA Trust are sufficiently lower than the amount on deposit in that RCRA Trust, we have the right to request that the excess funds be released to us. The same is true for the RCRA Trust balance remaining after the completion of our obligations, which will be performed over a period that may not end until three decades or more after a Gypstack has been closed. The investments held by the RCRA Trusts are managed by independent investment managers with discretion to buy, sell and invest pursuant to the objectives and standards set forth in the related trust agreements. Amounts reserved to be held or held in the RCRA Trusts (including losses or reinvested earnings) are included in other assets on our Consolidated Balance Sheets.
The RCRA Trusts hold investments, which are restricted from our general use, in marketable debt securities classified as available-for-sale and are carried at fair value. As a result, unrealized gains and losses are included in other comprehensive income until realized, unless it is determined that the entire unamortized cost basis of the investment is not expected to be recovered. A credit loss would then be recognized in operations for the amount of the expected credit loss. As of December 31, 2025, we expect to recover our amortized cost on all available-for-sale securities and have not established an allowance for credit loss.
We review the fair value hierarchy classification on a quarterly basis. Changes in the ability to observe valuation inputs may result in a reclassification of levels for certain securities within the fair value hierarchy. We determine the fair market values of our available-for-sale securities and certain other assets based on the fair value hierarchy described below:
Level 1: Values based on unadjusted quoted prices in active markets that are accessible at the measurement date for identical assets or liabilities.
Level 2: Values based on quoted prices for similar instruments in active markets, quoted prices for identical or similar instruments in markets that are not active, or model-based valuation techniques for which all significant assumptions are observable in the market.
Level 3: Values generated from model-based techniques that use significant assumptions not observable in the market. These unobservable assumptions reflect our own estimates of assumptions that market participants would use in pricing the asset or liability. Valuation techniques include use of option pricing models, discounted cash flow models and similar techniques.
The estimated fair value of the investments in the RCRA Trusts as of December 31, 2025 and December 31, 2024 are as follows:
|
|
|
|
|
|
|
|
|
|
|
|
|
|
|
|
|
|
|
|
|
|
|
|
|
December 31, 2025 |
| (in millions) |
Amortized
Cost |
|
Gross
Unrealized
Gains |
|
Gross
Unrealized
Losses |
|
Fair
Value |
| Level 1 |
|
|
|
|
|
|
|
| Cash and cash equivalents |
$ |
4.8 |
|
|
$ |
— |
|
|
$ |
— |
|
|
$ |
4.8 |
|
| Level 2 |
|
|
|
|
|
|
|
| Corporate debt securities |
218.8 |
|
|
3.4 |
|
|
(2.8) |
|
|
219.4 |
|
| Municipal bonds |
208.3 |
|
|
3.9 |
|
|
(1.3) |
|
|
210.9 |
|
| U.S. government bonds |
308.7 |
|
|
— |
|
|
(0.5) |
|
|
308.2 |
|
|
|
|
|
|
|
|
|
| Total |
$ |
740.6 |
|
|
$ |
7.3 |
|
|
$ |
(4.6) |
|
|
$ |
743.3 |
|
|
|
|
|
|
|
|
|
|
December 31, 2024 |
| (in millions) |
Amortized
Cost |
|
Gross
Unrealized
Gains |
|
Gross
Unrealized
Losses |
|
Fair
Value |
| Level 1 |
|
|
|
|
|
|
|
| Cash and cash equivalents |
$ |
3.1 |
|
|
$ |
— |
|
|
$ |
— |
|
|
$ |
3.1 |
|
| Level 2 |
|
|
|
|
|
|
|
| Corporate debt securities |
203.3 |
|
|
0.8 |
|
|
(6.8) |
|
|
197.3 |
|
| Municipal bonds |
210.8 |
|
|
0.7 |
|
|
(4.0) |
|
|
207.5 |
|
| U.S. government bonds |
295.1 |
|
|
— |
|
|
(7.8) |
|
|
287.3 |
|
|
|
|
|
|
|
|
|
| Total |
$ |
712.3 |
|
|
$ |
1.5 |
|
|
$ |
(18.6) |
|
|
$ |
695.2 |
|
The following tables show gross unrealized losses and fair values of the RCRA Trusts’ available-for-sale securities that have been in a continuous unrealized loss position for which an allowance for credit losses has not been recorded as of December 31, 2025 and December 31, 2024.
|
|
|
|
|
|
|
|
|
|
|
|
|
|
|
|
|
|
|
|
|
|
|
|
|
December 31, 2025 |
|
December 31, 2024 |
Securities that have been in a continuous loss position for less than 12 months (in millions): |
Fair
Value |
|
Gross
Unrealized
Losses |
|
Fair
Value |
|
Gross
Unrealized
Losses |
| Corporate debt securities |
$ |
17.0 |
|
|
$ |
(0.2) |
|
|
$ |
53.4 |
|
|
$ |
(0.7) |
|
| Municipal bonds |
14.0 |
|
|
— |
|
|
102.4 |
|
|
(1.7) |
|
| U.S. government bonds |
306.2 |
|
|
(0.5) |
|
|
280.9 |
|
|
(7.8) |
|
| Total |
$ |
337.2 |
|
|
$ |
(0.7) |
|
|
$ |
436.7 |
|
|
$ |
(10.2) |
|
|
|
|
|
|
|
|
|
|
December 31, 2025 |
|
December 31, 2024 |
Securities that have been in a continuous loss position for more than 12 months (in millions): |
Fair
Value |
|
Gross
Unrealized
Losses |
|
Fair
Value |
|
Gross
Unrealized
Losses |
| Corporate debt securities |
$ |
48.3 |
|
|
$ |
(2.7) |
|
|
$ |
81.3 |
|
|
$ |
(6.1) |
|
| Municipal bonds |
40.2 |
|
|
(1.2) |
|
|
55.6 |
|
|
(2.3) |
|
| U.S. government bonds |
— |
|
|
— |
|
|
— |
|
|
— |
|
| Total |
$ |
88.5 |
|
|
$ |
(3.9) |
|
|
$ |
136.9 |
|
|
$ |
(8.4) |
|
The following table summarizes the balance by contractual maturity of the available-for-sale debt securities invested by the RCRA Trusts as of December 31, 2025. Actual maturities may differ from contractual maturities because the issuers of the securities may have the right to prepay obligations before the underlying contracts mature.
|
|
|
|
|
|
| (in millions) |
December 31, 2025 |
| Due in one year or less |
$ |
13.1 |
|
| Due after one year through five years |
308.6 |
|
| Due after five years through ten years |
373.8 |
|
| Due after ten years |
43.0 |
|
| Total debt securities |
$ |
738.5 |
|
For the year ended December 31, 2025, realized gains and (losses) were $10.4 million and $(8.9) million, respectively. For the year ended December 31, 2024, realized gains and (losses) were $17.5 million and $(15.1) million, respectively and for the year ended December 31, 2023, realized gains and (losses) were $9.5 million and $(28.9) million, respectively.
13. INCOME TAXES
In preparing our Consolidated Financial Statements, we utilize the asset and liability approach in accounting for income taxes. We recognize income taxes in each of the jurisdictions in which we have a presence. For each jurisdiction, we estimate the actual amount of income taxes currently payable or receivable, as well as deferred income tax assets and liabilities attributable to temporary differences between the financial statement carrying amounts of existing assets and liabilities and their respective tax bases. Deferred income tax assets and liabilities are measured using enacted tax rates expected to apply to taxable income in the years in which these temporary differences are expected to be recovered or settled. The effect on deferred tax assets and liabilities of a change in tax rates is recognized in income in the period that includes the enactment date.
Income (loss) before income taxes for 2025, 2024 and 2023 consisted of the following:
|
|
|
|
|
|
|
|
|
|
|
|
|
|
|
|
|
|
|
Years Ended December 31, |
| (in millions) |
2025 |
|
2024 |
|
2023 |
| Domestic earnings |
$ |
159.5 |
|
|
$ |
(557.8) |
|
|
$ |
121.6 |
|
| Foreign earnings |
1,053.4 |
|
|
873.2 |
|
1,204.3 |
|
| Earnings (loss) from consolidated companies before income taxes |
$ |
1,212.9 |
|
|
$ |
315.4 |
|
|
$ |
1,325.9 |
|
The provision for income taxes for 2025, 2024 and 2023 consisted of the following:
|
|
|
|
|
|
|
|
|
|
|
|
|
|
|
|
|
|
| |
Years Ended December 31, |
| (in millions) |
2025 |
|
2024 |
|
2023 |
| Current: |
|
|
|
|
|
| Federal |
$ |
42.1 |
|
|
$ |
(11.7) |
|
|
$ |
86.4 |
|
| State |
3.3 |
|
|
10.7 |
|
|
1.5 |
|
| Non-U.S. |
331.5 |
|
|
339.2 |
|
|
357.4 |
|
| Total current |
376.9 |
|
|
338.2 |
|
|
445.3 |
|
| Noncurrent: |
|
|
|
|
|
| Federal |
$ |
(1.9) |
|
|
$ |
(0.1) |
|
|
$ |
0.3 |
|
| State |
9.4 |
|
|
— |
|
|
— |
|
| Non-U.S. |
(1.8) |
|
|
(10.8) |
|
|
(3.0) |
|
| Total noncurrent |
5.7 |
|
|
(10.9) |
|
|
(2.7) |
|
| Deferred: |
|
|
|
|
|
| Federal |
$ |
(1.4) |
|
|
$ |
(41.7) |
|
|
$ |
(35.4) |
|
| State |
7.5 |
|
|
(29.0) |
|
|
(4.2) |
|
| Non-U.S. |
251.1 |
|
|
(69.9) |
|
|
(226.0) |
|
| Total deferred |
257.2 |
|
|
(140.6) |
|
|
(265.6) |
|
| Total: |
|
|
|
|
|
| Federal |
$ |
38.8 |
|
|
$ |
(53.5) |
|
|
$ |
51.3 |
|
| State |
20.2 |
|
|
(18.3) |
|
|
(2.7) |
|
| Non-U.S. |
580.8 |
|
|
258.5 |
|
|
128.4 |
|
| Provision for income taxes |
$ |
639.8 |
|
|
$ |
186.7 |
|
|
$ |
177.0 |
|
The table below provides the updated requirements of ASU 2023-09 for 2025. The effects of significant adjustments to tax computed at the federal statutory rate were as follows:
|
|
|
|
|
|
|
|
|
|
|
|
|
Years Ended December 31, 2025 |
| (in millions) |
Amount |
|
Percent |
| Computed tax at the U.S. federal statutory rate |
$ |
254.7 |
|
|
21.0 |
% |
State and local income taxes, net of federal income tax effect(1) |
14.5 |
|
|
1.2 |
% |
| Effect of changes in tax laws or rates enacted in the current period |
— |
|
|
— |
% |
| Effect of cross-border tax laws |
|
|
|
| U.S. tax on Canadian branches, net of credits |
(95.5) |
|
|
(7.9) |
% |
| Global Intangible Low-Taxed Income, net of credits |
42.3 |
|
|
3.5 |
% |
| Other |
23.1 |
|
|
1.9 |
% |
| Tax credits |
|
|
|
| U.S. general basket foreign tax credits |
(45.4) |
|
|
(3.7) |
% |
| Other |
(7.3) |
|
|
(0.6) |
% |
| Changes in valuation allowances |
101.8 |
|
|
8.4 |
% |
| Nontaxable or nondeductible items |
|
|
|
| Percentage depletion in excess of basis |
(20.5) |
|
|
(1.7) |
% |
| Corporate expenses paid on behalf of foreign subsidiaries |
15.5 |
|
|
1.3 |
% |
| Other |
10.7 |
|
|
0.9 |
% |
| Foreign tax effects |
|
|
|
| Brazil |
|
|
|
| Book loss on sale of the Taquari mine |
22.3 |
|
|
1.8 |
% |
| Changes in valuation allowances |
207.3 |
|
|
17.1 |
% |
| Other |
53.7 |
|
|
4.4 |
% |
| Withholding tax on interest |
18.7 |
|
|
1.5 |
% |
| Canada |
|
|
|
| Statutory tax rate difference between Canada and U.S. |
(40.1) |
|
|
(3.3) |
% |
| Provincial taxes |
68.1 |
|
|
5.6 |
% |
| Other |
(14.7) |
|
|
(1.2) |
% |
| Withholding tax on dividends |
14.1 |
|
|
1.2 |
% |
| Peru |
|
|
|
| Statutory tax rate difference between Peru and U.S. |
14.3 |
|
|
1.2 |
% |
| Other |
15.4 |
|
|
1.3 |
% |
| Other foreign jurisdictions |
7.7 |
|
|
0.6 |
% |
| Worldwide changes in unrecognized tax benefits |
(3.1) |
|
|
(0.3) |
% |
| Other Adjustments |
|
|
|
| Domestic federal |
|
|
|
| Estimated loss on sale of Carlsbad |
(24.3) |
|
|
(2.0) |
% |
| Other |
6.5 |
|
|
0.5 |
% |
| Effective tax rate |
$ |
639.8 |
|
|
52.7 |
% |
|
|
|
|
(1)State taxes in Minnesota made up the majority (greater than 50 percent) of the tax effect in this category.
As previously disclosed for the years ended December 31, 2024 and 2023, prior to the adoption of ASU 2023-09, the effects of significant adjustments to tax computed at the federal statutory rate, were as follows:
|
|
|
|
|
|
|
|
|
|
|
|
| |
Years Ended December 31, |
| (in millions) |
2024 |
|
2023 |
| Computed tax at the U.S. federal statutory rate |
21.0 |
% |
|
21.0 |
% |
| State and local income taxes, net of federal income tax benefit |
(5.7) |
% |
|
0.4 |
% |
| Percentage depletion in excess of basis |
(13.8) |
% |
|
(4.9) |
% |
| Impact of non-U.S. earnings |
23.8 |
% |
|
8.7 |
% |
| Change in valuation allowance |
13.0 |
% |
|
(1.7) |
% |
| Non-U.S. incentives |
(42.6) |
% |
|
(11.5) |
% |
| Withholding tax |
13.6 |
% |
|
6.3 |
% |
| U.S. general basket foreign tax credits |
(12.6) |
% |
|
(4.0) |
% |
| Tax legislation change impacts |
(5.7) |
% |
|
(1.6) |
% |
| Undistributed earnings |
33.0 |
% |
|
2.2 |
% |
| Tax on dividends, deemed dividends, and GILTI |
16.2 |
% |
|
0.7 |
% |
| Nondeductible expenses |
20.0 |
% |
|
0.2 |
% |
| Other items (none in excess of 5% of computed tax) |
(1.0) |
% |
|
(2.5) |
% |
| Effective tax rate |
59.2 |
% |
|
13.3 |
% |
2025 Effective Tax Rate
In the year ended December 31, 2025, there were two items impacting the effective tax rate: 1) items attributable to ordinary business operations during the year, and 2) other items specific to the period.
The tax impact of our ordinary business operations is affected by the mix of earnings across jurisdictions in which we operate, by a benefit associated with depletion, changes in valuation allowances and by the impact of certain entities being taxed in both their foreign jurisdiction and the U.S., including foreign tax credits for various taxes incurred.
For the year ended December 31, 2025, tax expense specific to the period included a net expense of $189.3 million. The net expense relates to the following: $212.1 million primarily related to changes to valuation allowances in Brazil, $6.4 million related to share-based excess benefit, $23.3 million related to adjustments to accrued foreign tax credits, and $4.0 million related to other miscellaneous expenses. The tax expenses are partially offset by a net tax benefit related to the tax effects of one-time notable items booked as discrete of $54.2 million, and the true-up of estimates from our U.S. and non-U.S. tax return provisions of $2.3 million.
2024 Effective Tax Rate
In the year ended December 31, 2024, there were two items impacting the effective tax rate: 1) items attributable to ordinary business operations during the year, and 2) other items specific to the period.
The tax impact of our ordinary business operations is affected by the mix of earnings across jurisdictions in which we operate, by a benefit associated with depletion, changes in valuation allowances and by the impact of certain entities being taxed in both their foreign jurisdiction and the U.S., including foreign tax credits for various taxes incurred.
For the year ended December 31, 2024, tax expense specific to the period included a net expense of $125.9 million. The net expense relates to the following: $99.9 million related to the impact of accruing withholding tax expense on expected foreign distributions associated with changes in management’s indefinite reinvestment assertion on select foreign earnings under ASC 740-30 (formerly APB 23), $7.1 million related to true-up of estimates from our U.S. and non-U.S. tax return provisions, $24.2 million related to changes to valuation allowances in Brazil, the Netherlands and the U.S., $4.0 million related to share-based excess benefit, $2.5 million related to changes in tax rates and $6.2 million related to other miscellaneous expenses. The tax expenses are partially offset by a net tax benefit related to changes in U.S. state tax law of $18.1 million.
2023 Effective Tax Rate
In the year ended December 31, 2023, there were two items impacting the effective tax rate: 1) items attributable to ordinary business operations during the year, and 2) other items specific to the period.
The tax impact of our ordinary business operations is affected by the mix of earnings across jurisdictions in which we operate, by a benefit associated with depletion, by a benefit associated with non-U.S. incentives, changes in valuation allowances, and by the impact of certain entities being taxed in both their foreign jurisdiction and the U.S., including foreign tax credits for various taxes incurred.
Tax expense specific to the period included a net benefit of $43.4 million. The net benefit relates to the following: $38.1 million related to true-up of estimates primarily related to our U.S. tax return, $24.4 million related to changes to valuation allowances in Brazil, and $11.6 million related to an increase in a U.S. deferred tax asset. The tax benefits are partially offset by a net tax cost of $29.3 million related to income tax expense on undistributed earnings and $1.4 million of other miscellaneous costs.
Net cash paid (refunds received) for income taxes consisted of the following:
|
|
|
|
|
|
|
|
|
|
|
|
|
|
|
|
|
|
|
Years Ended December 31, |
(in millions) |
2025 |
|
2024 |
|
2023 |
U.S. federal |
$ |
(10.8) |
|
|
$ |
— |
|
|
$ |
— |
|
U.S. state and local |
7.0 |
|
|
— |
|
|
— |
|
Foreign |
|
|
|
|
|
| Canada federal |
148.7 |
|
|
— |
|
|
— |
|
| Saskatchewan |
80.5 |
|
|
— |
|
|
— |
|
Canada other provincial |
4.3 |
|
|
— |
|
|
— |
|
Peru |
53.7 |
|
|
— |
|
|
— |
|
Brazil |
19.5 |
|
|
— |
|
|
— |
|
Other |
18.4 |
|
|
— |
|
|
— |
|
Cash paid (refunds received) for income taxes (prior to ASU 2023-09) |
— |
|
|
337.0 |
|
|
385.6 |
|
Net cash paid (refunds received) for income taxes |
$ |
321.3 |
|
|
$ |
337.0 |
|
|
$ |
385.6 |
|
Deferred Tax Liabilities and Assets
Significant components of our deferred tax liabilities and assets were as follows as of December 31:
|
|
|
|
|
|
|
|
|
|
|
|
| |
December 31, |
| (in millions) |
2025 |
|
2024 |
| Deferred tax liabilities: |
|
|
|
| Depreciation and amortization |
$ |
601.9 |
|
|
$ |
614.5 |
|
| Depletion |
593.5 |
|
|
573.4 |
|
| Partnership tax basis differences |
63.5 |
|
|
80.6 |
|
| Undistributed earnings of non-U.S. subsidiaries |
47.4 |
|
|
84.4 |
|
| Other liabilities |
61.8 |
|
|
78.6 |
|
| Total deferred tax liabilities |
$ |
1,368.1 |
|
|
$ |
1,431.5 |
|
| Deferred tax assets: |
|
|
|
|
|
|
|
| Capital loss carryforwards |
12.3 |
|
|
15.0 |
|
| Foreign tax credit carryforwards |
1,553.2 |
|
|
1,431.8 |
|
| Net operating loss carryforwards |
479.8 |
|
|
450.6 |
|
| Pension plans and other benefits |
17.7 |
|
|
13.9 |
|
| Asset retirement obligations |
538.2 |
|
|
547.4 |
|
| Disallowed interest expense under §163(j) |
24.7 |
|
|
20.3 |
|
| Other assets |
418.9 |
|
|
497.3 |
|
| Subtotal |
3,044.8 |
|
|
2,976.3 |
|
| Valuation allowance |
1,866.0 |
|
|
1,529.3 |
|
| Net deferred tax assets |
1,178.8 |
|
|
1,447.0 |
|
| Net deferred tax assets/(liabilities) |
$ |
(189.3) |
|
|
$ |
15.5 |
|
We have certain non-U.S. entities that are taxed in both their local jurisdiction and the U.S. As a result, we have deferred tax balances for both jurisdictions. As of December 31, 2025 and 2024, these non-U.S. deferred taxes are offset by approximately $202.5 million and $199.6 million, respectively, of anticipated foreign tax credits included within our depreciation and depletion components of deferred tax liabilities above. We have recorded a valuation allowance against the anticipated foreign tax credits of $202.5 million and $199.6 million for December 31, 2025 and 2024, respectively.
Tax Carryforwards
As of December 31, 2025, we had estimated carryforwards for tax purposes as follows: net operating losses of $1.8 billion, capital losses of $51.9 million, foreign tax credits of $1.6 billion and $3.6 million of non-U.S. business credits. These carryforward benefits may be subject to limitations imposed by the Internal Revenue Code, and in certain cases, provisions of foreign law. Approximately $1.2 billion of our net operating loss carryforwards relate to Brazil and can be carried forward indefinitely but are limited to 30 percent of taxable income each year. The Company established a valuation allowance against a portion of Brazil’s net operating loss carryforwards and other deferred tax assets of $261 million as of December 31, 2025 based on the likelihood that the net operating losses will not be used in the future. The majority of the remaining net operating loss carryforwards relate to U.S. federal and certain U.S. states and can be carried forward indefinitely. Of the $1.6 billion of foreign tax credits, approximately $320.8 million relates to general basket foreign tax credits of which $228.1 million have an expiration date of 2026, approximately $16.2 million have an expiration date of 2029, approximately $14.7 million have an expiration date of 2030, approximately $31.1 million have an expiration date of 2034, and approximately $30.7 million have an expiration date of 2035. The realization of our foreign tax credit carryforwards is dependent on market conditions, tax law changes and other business outcomes including our ability to generate certain types of taxable income in the future. Due to current business operations and future forecasts, the Company has determined that no valuation allowance is required on its general basket foreign tax credits. As a result of changes in U.S. tax law due to the Tax Cuts and Jobs Act, the Company recorded valuation allowances against its branch basket foreign tax credits of $1.2 billion as of December 31, 2025.
As of December 31, 2025, we have not recognized a deferred tax liability for un-remitted earnings from certain foreign operations because we believe our subsidiaries have invested the undistributed earnings indefinitely, or the earnings will be remitted in a tax-neutral transaction. It is not practicable for us to determine the amount of unrecognized deferred tax liability on these reinvested earnings. As part of the accounting for the Tax Cuts and Jobs Act, we recorded local country withholding taxes related to certain entities from which we began repatriating undistributed earnings and will continue to record local country withholding taxes, including foreign exchange impacts, on all future earnings.
Valuation Allowance
In assessing the need for a valuation allowance, we consider whether it is more likely than not that some portion or all of the deferred tax assets will not be realized. We evaluate our ability to realize the tax benefits associated with deferred tax assets by analyzing the relative impact of all the available positive and negative evidence regarding our forecasted taxable income using both historical and projected future operating results, the reversal of existing taxable temporary differences, taxable income in prior carry-back years (if permitted) and the availability of tax planning strategies. The ultimate realization of deferred tax assets is dependent upon the generation of certain types of future taxable income during the periods in which those temporary differences become deductible. In making this assessment, we consider the scheduled reversal of deferred tax liabilities, our ability to carry back the deferred tax asset, projected future taxable income, and tax planning strategies. A valuation allowance will be recorded in each jurisdiction in which a deferred income tax asset is recorded when it is more likely than not that the deferred income tax asset will not be realized. Changes in deferred tax asset valuation allowances typically impact income tax expense.
For the year ended December 31, 2025, the valuation allowance increased by $336.7 million, of which a $110.8 million increase related to changes in the valuation allowance to U.S. branch foreign tax credits, $229.6 million related to changes in valuation allowances and currency translation in Brazil and a $5.3 million increase related to changes in valuation allowances in Peru. These increases to the valuation allowance were partially offset by a decrease of $1.5 million related to changes in the valuation allowance to U.S. state net operating losses and tax credits, $6.0 million related to changes in valuation allowances in Canada and $1.5 million related to changes in valuation allowances in other foreign jurisdictions.
For the year ended December 31, 2024, the valuation allowance increased by $107.4 million, of which a $105.4 million increase related to changes in the valuation allowance to U.S. branch foreign tax credits, $11.3 million related to changes in the valuation allowance to U.S. state net operating losses and tax credits and a $2.8 million increase related to changes in valuation allowances in Canada. These increases to the valuation allowance were partially offset by a decrease of $9.0 million related to changes in valuation allowances and currency translation in Brazil and $3.1 million changes in valuation allowances in other foreign jurisdictions.
For the year ended December 31, 2023, the valuation allowance increased by $512.0 million, of which a $531.0 million increase related to changes in the valuation allowance to U.S. branch foreign tax credits, and a $0.2 million increase related to changes in valuation allowances in other foreign jurisdictions. These increases to the valuation allowance were partially offset by a decrease of $12.7 million related to changes in valuation allowances and currency translation in Brazil and $6.5 million changes in valuation allowances in other foreign jurisdictions.
Changes to our income tax valuation allowance were as follows:
|
|
|
|
|
|
|
|
|
|
|
|
|
|
|
|
|
|
|
Years Ended December 31, |
| (in millions) |
2025 |
|
2024 |
|
2023 |
| Income tax valuation allowance, related to deferred income taxes |
|
|
|
|
|
| Balance at beginning of period |
$ |
1,529.3 |
|
|
$ |
1,421.9 |
|
|
$ |
909.9 |
|
| Charges or (reductions) to costs and expenses |
336.7 |
|
|
107.4 |
|
|
512.0 |
|
| Balance at end of period |
$ |
1,866.0 |
|
|
$ |
1,529.3 |
|
|
$ |
1,421.9 |
|
Uncertain Tax Positions
Accounting for uncertain income tax positions is determined by prescribing a minimum probability threshold that a tax position must meet before a financial statement benefit is recognized. This minimum threshold is that a tax position is more likely than not to be sustained upon examination by the applicable taxing authority, including resolution of any related appeals or litigation processes, based on the technical merits of the position.
The tax benefit to be recognized is measured as the largest amount of benefit that is greater than a fifty percent likelihood of being realized upon ultimate settlement.
During 2025, gross unrecognized tax benefits increased to $1.4 billion. The increase is primarily related to establishing an unrecognized tax benefit on a potential tax loss in the U.S. associated with the expected divestiture of the Taquari mine that was acquired as part of the Vale acquisition. In December, the Company applied to the Internal Revenue Services’ Pre-Filing Agreement Program to evaluate the amount and nature of the loss. If recognized, approximately $1.4 billion in unrecognized tax benefits would affect our effective tax rate, other deferred tax assets, and net earnings in future periods.
A summary of gross unrecognized tax benefit activity is as follows:
|
|
|
|
|
|
|
|
|
|
|
|
|
|
|
|
|
|
| |
Years Ended December 31, |
| (in millions) |
2025 |
|
2024 |
|
2023 |
| Gross unrecognized tax benefits, beginning of period |
$ |
14.2 |
|
|
$ |
25.8 |
|
|
$ |
25.2 |
|
| Gross increases: |
|
|
|
|
|
| Prior period tax positions |
— |
|
|
— |
|
|
0.9 |
|
| Current period tax positions |
1,401.1 |
|
|
1.6 |
|
|
3.0 |
|
| Gross decreases: |
|
|
|
|
|
| Prior period tax positions |
(2.3) |
|
|
(11.5) |
|
|
(3.8) |
|
| Currency translation |
0.5 |
|
|
(1.7) |
|
|
0.5 |
|
| Gross unrecognized tax benefits, end of period |
$ |
1,413.5 |
|
|
$ |
14.2 |
|
|
$ |
25.8 |
|
We recognize interest and penalties related to unrecognized tax benefits as a component of our income tax expense. Interest and penalties accrued in our Consolidated Balance Sheets as of December 31, 2025 and 2024 were $6.0 million and $5.4 million, respectively, and are included in other noncurrent liabilities in the Consolidated Balance Sheets.
Open Tax Periods
We operate in multiple tax jurisdictions, both within the U.S. and outside the U.S., and face audits from various tax authorities regarding transfer pricing, deductibility of certain expenses and intercompany transactions, as well as other matters. With few exceptions, we are no longer subject to examination for tax years prior to 2022.
Mosaic is continually under audit by various tax authorities in the normal course of business. Such tax authorities may raise issues contrary to positions taken by the Company. If such positions are ultimately not sustained by the Company, this could result in material assessments to the Company. The costs related to defending, if needed, such positions on appeal or in court may be material. The Company believes that any issues considered are properly accounted for.
We are currently under audit by the Internal Revenue Service for the tax years ended December 31, 2022 and December 31, 2023. Based on the information available, we do not anticipate significant changes to our unrecognized tax benefits as a result of these examinations other than the amounts discussed above.
14. ASSET RETIREMENT OBLIGATIONS
We recognize our estimated ARO’s in the period in which we have an existing legal obligation associated with the retirement of a tangible long-lived asset and the amount of the liability can be reasonably estimated. The ARO is recognized at fair value when the liability is incurred with a corresponding increase in the carrying amount of the related long lived asset. We depreciate the tangible asset over its estimated useful life. The liability is adjusted in subsequent periods through accretion expense which represents the increase in the present value of the liability due to the passage of time. Such depreciation and accretion expenses are included in cost of goods sold for operating facilities and other operating expense for indefinitely closed facilities.
Our legal obligations related to asset retirement require us to: (i) reclaim lands disturbed by mining as a condition to receive permits to mine phosphate ore reserves; (ii) treat low pH process water in Gypstacks to neutralize acidity; (iii) close and monitor Gypstacks at our Florida and Louisiana facilities at the end of their useful lives; (iv) remediate certain other conditional obligations; (v) remove all surface structures and equipment, plug and abandon mine shafts, contour and revegetate, as necessary, and monitor for five years after closing our Carlsbad, New Mexico facility; (vi) decommission facilities, manage tailings and execute site reclamation at our Saskatchewan potash mines at the end of their useful lives; (vii) decommission mines in Brazil and Peru; and (viii) decommission plant sites and closed Gypstacks in Brazil.
The estimated liability for these legal obligations is based on the estimated cost to satisfy the above obligations which is discounted using a credit-adjusted risk-free rate.
A reconciliation of our AROs is as follows:
|
|
|
|
|
|
|
|
|
|
|
|
| |
Years Ended December 31, |
| (in millions) |
2025 |
|
2024 |
| AROs, beginning of period |
$ |
2,572.2 |
|
|
$ |
2,213.4 |
|
|
|
|
|
| Liabilities incurred |
22.7 |
|
|
29.8 |
|
| Liabilities settled |
(288.9) |
|
|
(253.8) |
|
| Accretion expense |
129.7 |
|
|
111.2 |
|
| Revisions in estimated cash flows |
190.5 |
|
|
541.4 |
|
| Foreign currency translation |
37.8 |
|
|
(69.8) |
|
| Held for sale/disposed |
(62.1) |
|
|
— |
|
| AROs, end of period |
2,601.9 |
|
|
2,572.2 |
|
| Less current portion |
271.3 |
|
|
352.8 |
|
| Non-current portion of AROs |
$ |
2,330.6 |
|
|
$ |
2,219.4 |
|
North America Gypstack Closure Costs
A majority of our ARO relates to Gypstack Closure Costs in Florida and Louisiana. For financial reporting purposes, we recognize our estimated Gypstack Closure Costs at their present value. This present value determined for financial reporting purposes is reflected on our Consolidated Balance Sheets in accrued liabilities and other non-current liabilities. As of December 31, 2025 and 2024, the present value of our North American Gypstack Closure Costs ARO reflected in our Consolidated Balance Sheet was approximately $1.5 billion, respectively.
As discussed below, we have arrangements to provide financial assurance for the estimated Gypstack Closure Costs associated with our facilities in Florida and Louisiana.
EPA RCRA Initiative. On September 30, 2015, we and our subsidiary, Mosaic Fertilizer, LLC (“Mosaic Fertilizer”), reached agreements with the U.S. Environmental Protection Agency (“EPA”), the U.S. Department of Justice (“DOJ”), the Florida Department of Environmental Protection (“FDEP”) and the Louisiana Department of Environmental Quality on the terms of two consent decrees (collectively, the “2015 Consent Decrees”) to resolve claims relating to our management of certain waste materials onsite at our Riverview, New Wales, Green Bay, South Pierce and Bartow fertilizer manufacturing facilities in Florida and our Faustina and Uncle Sam facilities in Louisiana. This followed a 2003 announcement by the EPA Office of Enforcement and Compliance Assurance that it would be targeting facilities in mineral processing industries, including phosphoric acid producers, for a thorough review under the U.S. Resource Conservation and Recovery Act (“RCRA”) and related state laws. As discussed below, a separate consent decree was previously entered into with the EPA and the FDEP with respect to RCRA compliance at the Plant City Facility that we acquired as part of our acquisition of the Florida phosphate assets and assumption of certain related liabilities of CF Industries, Inc. (“CF”).
The remaining monetary obligations under the 2015 Consent Decrees include a provision of additional financial assurance for the estimated Gypstack Closure Costs for Gypstacks at the covered facilities. The RCRA Trusts are discussed in Note 12 to our Consolidated Financial Statements. In addition, we have agreed to guarantee the difference between the amounts held in each RCRA Trust (including any earnings) and the estimated closure and long-term care costs.
As of December 31, 2025 the undiscounted amount of our Gypstack Closure Costs ARO associated with the facilities covered by the 2015 Consent Decrees, determined using the assumptions used for financial reporting purposes, was approximately $2.3 billion, and the present value of our Gypstack Closure Costs ARO reflected in our Consolidated Balance Sheet for those facilities was approximately $1.1 billion.
Plant City and Bonnie Facilities. As part of the CF Phosphate Assets Acquisition, we assumed certain AROs related to Gypstack Closure Costs at both the Plant City Facility and a closed Florida phosphate concentrates facility in Bartow, Florida (the “Bonnie Facility”) that we acquired. Associated with these assets are two related financial assurance arrangements for which we became responsible and that provided sources of funds for the estimated Gypstack Closure Costs for these facilities.
Pursuant to federal or state laws, the applicable government entities are permitted to draw against such amounts in the event we cannot perform such closure activities. One of the financial assurance arrangements was initially a trust (the “Plant City Trust”) established to meet the requirements under a consent decree with the EPA and the FDEP with respect to RCRA compliance at the Plant City Facility. The Plant City Trust also satisfied Florida financial assurance requirements at that site. Beginning in September 2016, as a substitute for the financial assurance provided through the Plant City Trust, we have provided financial assurance for the Plant City Facility in the form of a surety bond (the “Plant City Bond”). The amount of the Plant City Bond is $337.6 million, which reflects our closure cost estimates as of December 31, 2025. The other financial assurance arrangement was also a trust fund (the “Bonnie Facility Trust”) established to meet the requirements under Florida financial assurance regulations that apply to the Bonnie Facility. In July 2018, we received $21.0 million from the Bonnie Facility Trust by substituting for the trust fund a financial test mechanism (“Bonnie Financial Test”) supported by a corporate guarantee as allowed by state regulations. Both financial assurance funding obligations require estimates of future expenditures that could be impacted by refinements in scope, technological developments, new information, cost inflation, changes in regulations, discount rates and the timing of activities. Under our current approach to satisfying applicable requirements, additional financial assurance would be required in the future if increases in cost estimates exceed the face amount of the Plant City Bond or the amount supported by the Bonnie Financial Test.
As of December 31, 2025 and 2024, the aggregate amounts of AROs associated with the combined Plant City Facility and Bonnie Facility Gypstack Closure Costs included in our consolidated balance sheet were $387.9 million and $368.7 million, respectively. The aggregate amount represented by the Plant City Bond exceeds the present value of the aggregate amount of ARO associated with that facility. This is because the amount of financial assurance we are required to provide represents the aggregate undiscounted estimated amount to be paid by us in the normal course of our Phosphate business over a period that may not end until three decades or more after the Gypstack has been closed, whereas the ARO included in our Consolidated Balance Sheet reflects the discounted present value of those estimated amounts.
15. DERIVATIVE INSTRUMENTS AND HEDGING ACTIVITIES
We periodically enter into derivatives to mitigate our exposure to foreign currency risks, interest rate movements and the effects of changing commodity prices. We record all derivatives on the Consolidated Balance Sheets at fair value. The fair value of these instruments is determined by using quoted market prices, third-party comparables or internal estimates. We net our derivative asset and liability positions when we have a master netting arrangement in place. Changes in the fair value of the foreign currency, commodity and freight derivatives are immediately recognized in earnings. As of December 31, 2025 and 2024, the gross asset position of our derivative instruments was $3.3 million and $3.1 million, respectively, and the gross liability position of our liability instruments was $2.7 million and $87.8 million, respectively.
We do not apply hedge accounting treatments to our foreign currency exchange contracts, commodities contracts or freight contracts. Unrealized gains and (losses) on foreign currency exchange contracts used to hedge cash flows related to the production of our products are included in cost of goods sold in the Consolidated Statements of Earnings. Unrealized gains and (losses) on commodities contracts and certain forward freight agreements are also recorded in cost of goods sold in the Consolidated Statements of Earnings. Unrealized gains or (losses) on foreign currency exchange contracts used to hedge cash flows that are not related to the production of our products are included in the foreign currency transaction gain/(loss) caption in the Consolidated Statements of Earnings.
From time to time, we enter into fixed-to-floating interest rate contracts. We apply fair value hedge accounting treatment to these contracts. Under these arrangements we agree to exchange, at specified intervals, the difference between fixed and floating interest amounts calculated by reference to an agreed-upon notional principal amount. The mark-to-market of these fair value hedges is recorded as gains or (losses) in interest expense. We had no fixed-to-floating interest rate swap agreements in effect as of December 31, 2025 and 2024.
The following is the total absolute notional volume associated with our outstanding derivative instruments:
|
|
|
|
|
|
|
|
|
|
|
|
|
|
|
|
|
|
|
|
|
|
|
|
|
|
|
| (in millions of Units) |
|
|
|
|
|
|
|
|
| Instrument |
|
Derivative Category |
|
Unit of Measure |
|
December 31,
2025 |
|
December 31,
2024 |
| Foreign currency derivatives |
|
Foreign Currency |
|
U.S. Dollars |
|
433.3 |
|
|
1,377.3 |
|
|
|
|
|
|
|
|
|
|
| Natural gas derivatives |
|
Commodity |
|
MM BTU |
|
0.9 |
|
|
2.5 |
|
Credit-Risk-Related Contingent Features
Certain of our derivative instruments contain provisions that are governed by International Swap and Derivatives Association agreements with the counterparties. These agreements contain provisions that allow us to settle for the net amount between payments and receipts, and also state that if our debt were to be rated below investment grade, certain counterparties to the derivative instruments could request full collateralization on derivative instruments in net liability positions. The aggregate fair value of all derivative instruments with credit-risk-related contingent features that were in a liability position as of December 31, 2025 and 2024 was $0.6 million and $58.1 million, respectively. We have no cash collateral posted in association with these contracts. If the credit-risk-related contingent features underlying these agreements were triggered on December 31, 2025 we would have been required to post an additional $0.5 million of collateral assets, which are either cash or U.S. Treasury instruments, to the counterparties.
Counterparty Credit Risk
Financial instruments that may subject us to concentrations of credit risk consist primarily of derivatives, cash and cash equivalents and accounts receivable. We enter into foreign exchange, certain commodity and interest rate derivatives, and place our cash and cash equivalents with a diversified group of highly rated counterparties. We have a diverse base of customers to which we grant credit terms in the normal course of business which are designed to mitigate concentrations of credit risk. We continually monitor our positions and the credit ratings of the counterparties involved and limit the amount of credit exposure to any one party. We manage our exposure to counterparty credit risk through specific minimum credit standards, establishing credit limits, diversification of counterparties, monitoring procedures and utilization of credit insurance or cash collateral in certain circumstances. While we may be exposed to potential losses due to the credit risk of non-performance by these counterparties, material losses are not anticipated. We closely monitor the credit risk associated with our counterparties and customers and to date have not experienced material losses.
16. FAIR VALUE MEASUREMENTS
Following is a summary of the valuation techniques for assets and liabilities recorded in our Consolidated Balance Sheets at fair value on a recurring basis:
Foreign Currency Derivatives–The foreign currency derivative instruments that we currently use are forward contracts and zero-cost collars, which typically expire within 18 months. Most of the valuations are adjusted by a forward yield curve or interest rates. In such cases, these derivative contracts are classified within Level 2. Some valuations are based on exchange-quoted prices, which are classified as Level 1. As of December 31, 2025, our foreign currency contracts were Level 2. Changes in the fair market values of these contracts are recognized in the Consolidated Financial Statements as a component of cost of goods sold in our Corporate, Eliminations and Other segment or foreign currency transaction gain (loss). As of December 31, 2025 and 2024, the gross asset position of our foreign currency derivative instruments was $3.3 million and $3.1 million, respectively, and the gross liability position of our foreign currency derivative instruments was $2.3 million and $86.1 million, respectively and is included in Accrued Liabilities in the Consolidated Balance Sheets.
Commodity Derivatives–The commodity contracts primarily relate to natural gas. The commodity derivative instruments that we currently use are forward purchase contracts, swaps and three-way collars. The natural gas contracts settle using NYMEX futures or AECO price indexes, which represent fair value at any given time. The contracts’ maturities and settlements are scheduled for future months and settlements are scheduled to coincide with anticipated gas purchases during those future periods. Quoted market prices from NYMEX and AECO are used to determine the fair value of these instruments. These market prices are adjusted by a forward yield curve and are classified within Level 2. Changes in the fair market values of these contracts are recognized in the Consolidated Financial Statements as a component of cost of goods sold in our Corporate, Eliminations and Other segment. As of December 31, 2025 and 2024, the gross asset position of our commodity derivative instruments was zero, and the gross liability position of our commodity derivative instruments was $0.4 million and $1.7 million, respectively.
Interest Rate Derivatives–We manage interest expense through interest rate contracts to convert a portion of our fixed-rate debt into floating-rate debt. From time to time, we also enter into interest rate swap agreements to hedge our exposure to changes in future interest rates related to anticipated debt issuances. Valuations are based on external pricing sources and are classified as Level 2. Changes in the fair market values of these contracts are recognized in the Consolidated Financial Statements as a component of interest expense. We did not hold any interest rate derivative positions as of December 31, 2025 or 2024.
Financial Instruments
The carrying amounts and estimated fair values of our financial instruments are as follows:
|
|
|
|
|
|
|
|
|
|
|
|
|
|
|
|
|
|
|
|
|
|
|
|
| |
December 31, |
| |
2025 |
|
2024 |
| |
Carrying |
|
Fair |
|
Carrying |
|
Fair |
| (in millions) |
Amount |
|
Value |
|
Amount |
|
Value |
| Cash and cash equivalents |
$ |
276.6 |
|
|
$ |
276.6 |
|
|
$ |
272.8 |
|
|
$ |
272.8 |
|
| Accounts receivable |
1,078.6 |
|
|
1,078.6 |
|
|
1,113.3 |
|
|
1,113.3 |
|
| Equity securities |
1,804.2 |
|
|
1,804.2 |
|
|
1,486.8 |
|
|
1,486.8 |
|
| Accounts payable |
1,171.9 |
|
|
1,171.9 |
|
|
1,156.5 |
|
|
1,156.5 |
|
| Structured accounts payable arrangements |
480.1 |
|
|
480.1 |
|
|
402.3 |
|
|
402.3 |
|
| Short-term debt |
759.9 |
|
|
759.9 |
|
|
847.1 |
|
|
847.1 |
|
| Long-term debt, including current portion |
4,294.0 |
|
|
4,311.0 |
|
|
3,377.6 |
|
|
3,324.1 |
|
For cash and cash equivalents, accounts receivable, net, accounts payable, structured accounts payable arrangements and short-term debt, the carrying amount approximates fair value because of the short-term maturity of those instruments. Equity securities represent our Ma’aden shares and are carried at fair value based on the unadjusted quoted price on the Saudi Exchange (Tadawul), which results in a Level 1 classification. For more information on the Ma’aden shares, see Note 9 of our Notes to Consolidated Financial Statements. Included in long-term debt is floating rate debt of $570 million. Our floating rate debt is non-public and bears a variable SOFR based rate and consists of our borrowings under our term loan facility. The fair value of our floating rate debt approximates the carrying value and is estimated based on market-based inputs including interest rates and credit spreads, which results in a Level 2 classification. The fair value of fixed rate long-term debt, including the current portion, is estimated using quoted market prices for the publicly registered notes and debentures, classified as Level 1 and Level 2, respectively, within the fair value hierarchy, depending on the market liquidity of the debt. For information regarding the fair value of our marketable securities held in trusts, see Note 12 of our Notes to Consolidated Financial Statements.
17. GUARANTEES AND INDEMNITIES
We enter into various contracts that include indemnification and guarantee provisions as a routine part of our business activities. Examples of these contracts include asset purchase and sale agreements, surety bonds, financial assurances to regulatory agencies in connection with reclamation and closure obligations, commodity sale and purchase agreements and other types of contractual agreements with vendors and other third parties. These agreements indemnify counterparties for matters such as reclamation and closure obligations, tax liabilities, environmental liabilities, litigation and other matters, as well as breaches by Mosaic of representations, warranties and covenants set forth in these agreements. In many cases, we are essentially guaranteeing our own performance, in which case the guarantees do not fall within the scope of the accounting and disclosures requirements under U.S. GAAP. Our maximum potential exposure under our indemnification arrangements can range from a specified dollar amount to an unlimited amount, depending on the nature of the transaction. Many of the guarantees and indemnities we issue to third parties do not limit the amount or duration of our obligations to perform under them. For these guarantees and indemnities, we may not be able to estimate what our liability would be until a claim is made for payment or performance due to the contingent nature of these arrangements. Based on our current understanding of the relevant facts, we do not believe that we will be required to make any material payments under these indemnity provisions.
18. PENSION PLANS AND OTHER BENEFITS
We sponsor pension and postretirement benefits through a variety of plans, including defined benefit plans, defined contribution plans and postretirement benefit plans in North America and certain of our international locations. We reserve the right to amend, modify or terminate the Mosaic sponsored plans at any time, subject to provisions of the Employee Retirement Income Security Act of 1974 (“ERISA”), prior agreements and our collective bargaining agreements.
Defined Benefit
We sponsor various defined benefit pension plans in Canada, which are closed to new participants. Benefits are based on different combinations of years of service and compensation levels, depending on the plan. Generally, contributions to Canadian plans are made in accordance with the Pension Benefits Act instituted by the province of Saskatchewan. Certain employees in Canada, whose pension benefits exceed Canada Revenue Agency limitations, are covered by supplementary non-qualified, unfunded pension plans. During 2023, we terminated certain defined pension plans in Canada by transferring remaining benefit obligations for participants to a third-party insurance company under a group annuity contract. As a result of these actions, we recognized a non-cash pre-tax settlement charge of $42.4 million in our 2023 Consolidated Statements of Earnings in Other income (expense).
We sponsor various defined benefit pension plans in Brazil, and we acquired multi-employer pension plans for certain of our Brazil associates. All our pension plans are governed by the Brazilian pension plans regulatory agency, National Superintendence of Supplementary Pensions. Our Brazil plans are not individually significant to the Company’s consolidated financial statements after factoring in the multi-employer pension plan indemnification that we acquired through an acquisition. We made contributions to these plans, net of indemnification, of $0.3 million and $0.4 million for the years ended December 31, 2025 and 2024, respectively.
Accounting for Pension Plans
The year-end status of the North American pension plans was as follows:
|
|
|
|
|
|
|
|
|
|
|
|
| |
Pension Plans |
| |
Years Ended December 31, |
| (in millions) |
2025 |
|
2024 |
| Change in projected benefit obligation: |
|
|
|
| Benefit obligation at beginning of period |
$ |
114.6 |
|
|
$ |
119.6 |
|
| Service cost |
2.7 |
|
|
3.0 |
|
| Interest cost |
5.2 |
|
|
5.5 |
|
| Actuarial loss |
(3.7) |
|
|
0.2 |
|
| Currency fluctuations |
5.5 |
|
|
(9.4) |
|
| Benefits paid and transfers |
(3.2) |
|
|
(4.3) |
|
| Plan amendments |
1.5 |
|
|
— |
|
|
|
|
|
| Projected benefit obligation at end of period |
$ |
122.6 |
|
|
$ |
114.6 |
|
| Change in plan assets: |
|
|
|
| Fair value at beginning of period |
$ |
146.3 |
|
|
$ |
157.1 |
|
| Currency fluctuations |
6.9 |
|
|
(12.2) |
|
| Actual return |
1.1 |
|
|
12.8 |
|
| Company contribution |
0.4 |
|
|
(7.1) |
|
| Benefits paid and transfers |
(3.3) |
|
|
(4.3) |
|
| Fair value at end of period |
$ |
151.4 |
|
|
$ |
146.3 |
|
| Funded status of the plans as of the end of period |
$ |
28.8 |
|
|
$ |
31.7 |
|
| Amounts recognized in the consolidated balance sheets: |
|
|
|
| Noncurrent assets |
$ |
34.6 |
|
|
$ |
37.4 |
|
| Current liabilities |
(0.4) |
|
|
(0.4) |
|
| Noncurrent liabilities |
(5.4) |
|
|
(5.3) |
|
| Amounts recognized in accumulated other comprehensive (income) loss |
|
|
|
| Prior service cost |
$ |
12.2 |
|
|
$ |
11.9 |
|
| Actuarial loss |
17.3 |
|
|
14.8 |
|
The accumulated benefit obligation for the defined benefit pension plans was $122.6 million and $114.6 million as of December 31, 2025 and 2024, respectively. In 2026, we expect the related plans to pay benefit payments of approximately $4.7 million and to contribute cash of at least $1.0 million to the pension plans to meet minimum funding requirements.
Plan Assets and Investment Strategies
The Company’s overall investment strategy is to obtain sufficient return and provide adequate liquidity to meet the benefit obligations of our pension plans. The primary investment objective is to secure the promised pension benefits through capital preservation and appreciation to better manage the asset/liability gap and interest rate risk. A secondary investment objective is to most effectively manage investment volatility to reduce the variability of the Company’s required contributions. A significant amount of the assets are invested in funds that are managed by Mosaic’s investment advisor and reviewed by Mosaic management. Plan assets are primarily valued based on external pricing sources and are classified as Level 2. We do not have significant concentrations of credit risk or industry sectors within the plan assets. Fair value measurements of plan assets was $151.4 million at December 31, 2025 and was invested approximately 85% in fixed income securities, 10% in equity securities, and 5% in other investment funds and cash.
Defined Contribution Plans
Eligible salaried and non-union hourly employees in the U.S. participate in a defined contribution investment plan which permits employees to defer a portion of their compensation through payroll deductions and provides matching contributions. We match 100% of the first 3% of the participant’s contributed pay plus 50% of the next 3% of the participant’s contributed pay, subject to Internal Revenue Service limits. Participant contributions, matching contributions and the related earnings immediately vest. Mosaic also provides an annual non-elective employer contribution feature for eligible salaried and non-union hourly employees based on the employee’s age and eligible pay. Participants are generally vested in the non-elective employer contributions after three years of service. In addition, a discretionary feature of the plan allows the Company to make additional contributions to employees. Certain union employees participate in a defined contribution retirement plan based on collective bargaining agreements.
Canadian salaried and non-union hourly employees participate in an employer funded plan with employer contributions similar to the U.S. plan. The plan provides a profit sharing component which is paid each year. We also sponsor one mandatory union plan in Canada. Benefits in these plans vest after two years of consecutive service.
The expense attributable to defined contribution plans in the U.S. and Canada was $63.9 million, $60.8 million and $61.7 million for 2025, 2024 and 2023, respectively.
Postretirement Medical Benefit Plans
We provide certain health care benefit plans for certain retired employees (“Retiree Health Plans”) which may be either contributory or non-contributory and contain certain other cost-sharing features such as deductibles and coinsurance.
The North American Retiree Health Plans are unfunded and the projected benefit obligation was $20.3 million and $20.6 million as of December 31, 2025 and 2024, respectively. This liability should continue to decrease due to our limited exposure. The related income statement effects of the Retiree Health Plans are not material to the Company. We anticipate contributing cash of at least $1.9 million in 2026 to the postretirement medical benefit plans to fund anticipated benefit payments.
The year-end status of the Brazil postretirement medical benefit plans with a discount rate of 11.70% and 9.95% on each of December 31, 2025 and 2024, respectively was as follows:
|
|
|
|
|
|
|
|
|
|
|
|
|
Postretirement Medical Benefits |
|
Years Ended December 31, |
| (in millions) |
2025 |
|
2024 |
Change in accumulated postretirement benefit obligation (“APBO”): |
|
|
|
| APBO at beginning of year |
$ |
54.3 |
|
|
$ |
74.4 |
|
|
|
|
|
| Interest cost |
6.6 |
|
|
7.4 |
|
| Actuarial (gain) loss |
(1.8) |
|
|
(11.2) |
|
| Currency fluctuations |
7.2 |
|
|
(15.2) |
|
| Benefits paid |
(1.4) |
|
|
(1.1) |
|
|
|
|
|
| Net increase (decrease) in liability from acquisitions/disposals |
0.3 |
|
|
— |
|
|
|
|
|
| APBO at end of year |
$ |
65.2 |
|
|
$ |
54.3 |
|
| Change in plan assets: |
|
|
|
|
|
|
|
|
|
|
|
|
|
|
|
| Company contribution |
$ |
1.4 |
|
|
$ |
1.1 |
|
| Benefits paid |
(1.4) |
|
|
(1.1) |
|
|
|
|
|
| Unfunded status of the plans as of the end of the year |
$ |
(65.2) |
|
|
$ |
(54.3) |
|
| Amounts recognized in the consolidated balance sheets: |
|
|
|
|
|
|
|
| Current liabilities |
$ |
(1.4) |
|
|
$ |
(1.4) |
|
| Noncurrent liabilities |
(63.8) |
|
|
(52.9) |
|
| Amounts recognized in accumulated other comprehensive income |
|
|
|
| Prior service credit |
$ |
(8.2) |
|
|
$ |
(8.8) |
|
| Actuarial (gain) loss |
$ |
(2.5) |
|
|
$ |
(0.6) |
|
19. ACCUMULATED OTHER COMPREHENSIVE INCOME (LOSS) (“AOCI”)
The following table sets forth the changes in AOCI by component during the years ended December 31, 2025, 2024 and 2023:
|
|
|
|
|
|
|
|
|
|
|
|
|
|
|
|
|
|
|
|
|
|
|
|
|
|
|
|
|
|
| (in millions) |
Foreign Currency Translation Gain (Loss) |
|
Net Actuarial Gain and Prior Service Cost |
|
Amortization of Gain on Interest Rate Swap |
|
Net Gain (Loss) on Marketable Securities Held in Trust |
|
Total |
| Balance at December 31, 2022 |
$ |
(2,082.3) |
|
|
$ |
(53.1) |
|
|
$ |
6.7 |
|
|
$ |
(23.5) |
|
|
(2,152.2) |
|
| Other comprehensive income (loss) |
152.0 |
|
|
31.1 |
|
|
1.8 |
|
|
30.6 |
|
|
215.5 |
|
| Tax (expense) or benefit |
2.1 |
|
|
(11.0) |
|
|
(0.4) |
|
|
(6.9) |
|
|
(16.2) |
|
| Other comprehensive income (loss), net of tax |
154.1 |
|
|
20.1 |
|
|
1.4 |
|
|
23.7 |
|
|
199.3 |
|
| Less: (Gain) Loss attributable to noncontrolling interest |
(2.0) |
|
|
— |
|
|
— |
|
|
— |
|
|
(2.0) |
|
| Balance at December 31, 2023 |
$ |
(1,930.2) |
|
|
$ |
(33.0) |
|
|
$ |
8.1 |
|
|
$ |
0.2 |
|
|
$ |
(1,954.9) |
|
| Other comprehensive income (loss) |
(478.6) |
|
|
16.8 |
|
|
(0.1) |
|
|
(19.6) |
|
|
(481.5) |
|
| Tax (expense) or benefit |
(17.0) |
|
|
(5.9) |
|
|
— |
|
|
4.8 |
|
|
(18.1) |
|
| Other comprehensive income (loss), net of tax |
(495.6) |
|
|
10.9 |
|
|
(0.1) |
|
|
(14.8) |
|
|
(499.6) |
|
| Less: (Gain) Loss attributable to noncontrolling interest |
5.5 |
|
|
— |
|
|
— |
|
|
— |
|
|
5.5 |
|
| Balance at December 31, 2024 |
$ |
(2,420.3) |
|
|
$ |
(22.1) |
|
|
$ |
8.0 |
|
|
$ |
(14.6) |
|
|
$ |
(2,449.0) |
|
| Other comprehensive income (loss) |
307.4 |
|
|
(4.6) |
|
|
(0.1) |
|
|
19.8 |
|
|
322.5 |
|
| Tax (expense) or benefit |
(0.3) |
|
|
1.9 |
|
|
— |
|
|
(4.5) |
|
|
(2.9) |
|
| Other comprehensive income (loss), net of tax |
307.1 |
|
|
(2.7) |
|
|
(0.1) |
|
|
15.3 |
|
|
319.6 |
|
| Less: (Gain) Loss attributable to noncontrolling interest |
(2.5) |
|
|
— |
|
|
— |
|
|
— |
|
|
(2.5) |
|
| Balance at December 31, 2025 |
$ |
(2,115.7) |
|
|
$ |
(24.8) |
|
|
$ |
7.9 |
|
|
$ |
0.7 |
|
|
$ |
(2,131.9) |
|
20. SHARE REPURCHASES
In 2022, our Board of Directors approved two share repurchase programs for a total of $3.0 billion. Our repurchase programs allow the Company to repurchase shares of our Common Stock through open market purchases, accelerated share repurchase arrangements, privately negotiated transactions or otherwise and have no set expiration date.
During the year ended December 31, 2025, we made no share repurchases. During the year ended December 31, 2024, we repurchased 7,944,507 shares of Common Stock in the open market for approximately $235.4 million, at an average purchase price per share of $29.63.
The extent to which we repurchase our shares and the timing of any such repurchases depend on a number of factors, including market and business conditions, the price of our shares, our ability to access capital resources, our liquidity and corporate, regulatory and other considerations.
21. SHARE-BASED PAYMENTS
The Mosaic Company 2023 Stock and Incentive Plan (the “2023 Stock and Incentive Plan”) was approved by our stockholders and became effective on May 25, 2023. It permits up to 18 million shares of common stock to be issued under share-based awards granted under this plan. The 2023 Stock and Incentive Plan provides for grants of stock options, restricted stock, restricted stock units, performance units and a variety of other share-based and non-share-based awards. Our employees, officers, directors, consultants, agents, advisors and independent contractors, as well as other designated individuals, are eligible to participate in the 2023 Stock and Incentive Plan.
The Mosaic Company 2014 Stock and Incentive Plan (the “2014 Stock and Incentive Plan”) was approved by our stockholders and became effective on May 15, 2014. It permits up to 25 million shares of common stock to be issued under share-based awards granted under this plan. The 2014 Stock and Incentive Plan provides for grants of stock options, restricted stock, restricted stock units, performance units and a variety of other share-based and non-share-based awards. Our employees, officers, directors, consultants, agents, advisors and independent contractors, as well as other designated individuals, are eligible to participate in the 2014 Stock and Incentive Plan.
Mosaic settles stock option exercises, restricted stock units and certain performance units and performance shares with newly issued common shares. The Compensation Committee of the Board of Directors administers these plans subject to their respective provisions and applicable law.
Stock Options
Stock options are granted with an exercise price equal to the market price of our stock at the date of grant and have a ten-year contractual term. The fair value of each option award is estimated on the date of the grant using the Black-Scholes option valuation model. Stock options generally vest in equal annual installments in the first three years following the date of grant (graded vesting). Stock options are expensed on a straight-line basis over the required service period, based on the estimated fair value of the award on the date of grant, net of estimated forfeitures.
Valuation Assumptions
Assumptions used to calculate the fair value of stock options awarded in 2017 are noted in the following table. Expected volatility is based on the simple average of implied and historical volatility using the daily closing prices of the Company’s stock for a period equal to the expected term of the option. The risk-free interest rate is based on the U.S. Treasury rate at the time of the grant for instruments of comparable life.
|
|
|
|
|
|
| |
Year Ended December 31, 2017 |
| Weighted average assumptions used in option valuations: |
|
| Expected volatility |
35.35 |
% |
| Expected dividend yield |
1.97 |
% |
| Expected term (in years) |
7 |
| Risk-free interest rate |
2.34 |
% |
A summary of the status of our stock options as of December 31, 2025, and activity during 2025, is as follows:
|
|
|
|
|
|
|
|
|
|
|
|
|
|
|
|
|
|
|
|
|
|
|
|
|
Shares
(in millions) |
|
Weighted
Average
Exercise
Price |
|
Weighted Average Remaining Contractual Term (Years) |
|
Aggregate
Intrinsic
Value |
| Outstanding as of December 31, 2024 |
0.5 |
|
|
$ |
32.68 |
|
|
|
|
|
| Granted |
— |
|
|
— |
|
|
|
|
|
| Exercised |
(0.1) |
|
|
$ |
28.49 |
|
|
|
|
|
| Cancelled or forfeited |
(0.1) |
|
|
$ |
50.43 |
|
|
|
|
|
| Outstanding as of December 31, 2025 |
0.3 |
|
|
$ |
29.80 |
|
|
0.85 |
|
$ |
— |
|
| Exercisable as of December 31, 2025 |
0.3 |
|
|
$ |
29.80 |
|
|
0.85 |
|
$ |
— |
|
There were no stock options granted or issued in 2024 or 2023.
Restricted Stock Units
Restricted stock units are issued to various employees, officers and directors at a value equal to the market price of our stock at the date of grant. The fair value of restricted stock units is equal to the market price of our stock at the date of grant. Restricted stock units generally cliff vest after three years of continuous service and are expensed on a straight-line basis over the required service period, based on the estimated grant date fair value, net of estimated forfeitures.
A summary of the status of our restricted stock units as of December 31, 2025, and activity during 2025, is as follows:
|
|
|
|
|
|
|
|
|
|
|
|
|
Shares
(in millions) |
|
Weighted Average
Grant Date Fair
Value Per Share |
| Restricted stock units as of December 31, 2024 |
1.6 |
|
|
$ |
41.61 |
|
| Granted |
1.0 |
|
|
23.87 |
|
| Issued and cancelled or forfeited |
(0.4) |
|
|
$ |
49.48 |
|
| Restricted stock units as of December 31, 2025 |
2.2 |
|
|
$ |
31.74 |
|
Performance Units
During the years ended December 31, 2025, 2024 and 2023, 818,382, 496,367 and 1,206,263 total stockholder return (“TSR”) performance units were granted, respectively. Final performance units are awarded based on the increase or decrease, subject to certain limitations, in Mosaic’s share price from the grant date to the third anniversary of the award, plus dividends (a measure of total stockholder return or TSR). The beginning and ending stock prices are based on a 30 trading-day average stock price. Holders of the awards must be employed at the end of the performance period in order for any units to vest, except in the event of death, disability or retirement at or after age 60, certain changes in control or the exercise of Committee or Board discretion as provided in the related award agreements.
The fair value of each TSR performance unit is determined using a Monte Carlo simulation. This valuation methodology utilizes assumptions consistent with those of our other share-based awards and a range of ending stock prices; however, the expected term of the awards is three years, which impacts the assumptions used to calculate the fair value of performance units as shown in the table below. 193,384, 241,189 and 354,500 of the TSR performance awards issued in 2025, 2024 and 2023, respectively, are to be settled in cash, and are therefore accounted for as a liability with changes in value recorded through earnings during the service period. The remaining TSR performance units issued in 2025, 2024 and 2023 are considered equity-classified fixed awards measured at grant-date fair value and not subsequently re-measured. All of the TSR performance units cliff vest after three years of continuous service and are expensed on a straight-line basis over the required service period, based on the estimated grant date fair value of the award net of estimated forfeitures.
A summary of the assumptions used to estimate the fair value of TSR performance units is as follows:
|
|
|
|
|
|
|
|
|
|
|
|
|
|
|
|
|
|
|
Years Ended December 31, |
|
2025 |
|
2024 |
|
2023 |
| Performance units granted |
818,382 |
|
|
496,367 |
|
|
1,206,283 |
|
| Average fair value of performance units on grant date |
$ |
21.3 |
|
|
$ |
31.02 |
|
|
$ |
50.56 |
|
| Weighted average assumptions used in performance unit valuations: |
|
|
|
|
|
| Expected volatility |
39.71 |
% |
|
40.95 |
% |
|
48.33 |
% |
| Expected dividend yield |
3.64 |
% |
|
2.59 |
% |
|
1.52 |
% |
| Expected term (in years) |
3 |
|
3 |
|
3 |
| Risk-free interest rate |
3.90 |
% |
|
4.48 |
% |
|
4.52 |
% |
A summary of our performance unit activity during 2025 is as follows:
|
|
|
|
|
|
|
|
|
|
|
|
|
Shares
(in millions) |
|
Weighted Average
Grant Date Fair
Value Per Share |
| Outstanding as of December 31, 2024 |
1.1 |
|
|
$ |
44.15 |
|
| Granted |
0.8 |
|
|
21.30 |
|
| Issued and cancelled or forfeited |
(0.2) |
|
|
$ |
54.16 |
|
| Outstanding as of December 31, 2025 |
1.7 |
|
|
$ |
31.26 |
|
The outstanding performance units as of December 31, 2025 and 2024 include 593,968 and 463,410 cash-settled performance units, respectively.
Share-Based Compensation Expense
We recorded share-based compensation expense of $33.7 million, $20.2 million and $37.8 million for 2025, 2024 and 2023, respectively. The tax benefit related to share exercises and lapses in the year was $5.1 million, $1.0 million and $9.0 million for 2025, 2024 and 2023, respectively.
As of December 31, 2025, there was $1.5 million of total unrecognized compensation cost related to options, restricted stock units and performance units and shares granted under the 2014 Stock and Incentive Plan and the Omnibus Plan. The unrecognized compensation cost is expected to be recognized over a weighted-average period of one year.
There was $0.6 million in cash received from exercises of share-based payment arrangements for 2025. There was no cash received from exercises of share-based payment arrangements for 2024 and 2023. We incurred a tax benefit for tax deductions from options of $6.9 million, $4.1 million and $7.9 million in 2025, 2024 and 2023, respectively.
22. COMMITMENTS
We lease certain plants, warehouses, terminals, office facilities, railcars and various types of equipment under operating leases, some of which include rent payment escalation clauses, with lease terms ranging from one to 43 years. In addition to minimum lease payments, some of our office facility leases require payment of our proportionate share of real estate taxes and building operating expenses. Our future obligations under these leases are included in Note 4 of our Notes to Consolidated Financial Statements.
We also have purchase obligations to purchase goods and services, primarily for raw materials used in products sold to customers. We have long-term agreements for the purchase of sulfur, which is used in the production of phosphoric acid, and natural gas, which is a significant raw material used primarily in the solution mining process in our Potash segment as well as in our phosphate concentrates plants.
A schedule of future minimum long-term purchase commitments, based on expected market prices as of December 31, 2025 is as follows:
|
|
|
|
|
|
| (in millions) |
Purchase
Commitments |
| 2026 |
$ |
4,887.8 |
|
| 2027 |
2,245.4 |
|
| 2028 |
769.5 |
|
| 2029 |
449.8 |
|
| 2030 |
234.6 |
|
| Subsequent years |
24.8 |
|
|
$ |
8,611.9 |
|
Purchases made under long-term commitments were $2.7 billion in 2025, $2.1 billion in 2024 and $3.0 billion in 2023.
Most of our export sales of potash crop nutrients are marketed through a North American export association, Canpotex, which may fund its operations in part through third-party financing facilities. As a member, Mosaic or our subsidiaries are contractually obligated to reimburse Canpotex for their pro rata share of any operating expenses or other liabilities incurred. The reimbursements are made through reductions to members’ cash receipts from Canpotex.
We incur liabilities for reclamation activities and Gypstack closures in our Florida and Louisiana operations where, in order to obtain necessary permits, we must either pass a test of financial strength or provide credit support, typically in the form of cash deposits, surety bonds or letters of credit. The surety bonds generally expire within one year or less but a substantial portion of these instruments provide financial assurance for continuing obligations and therefore, in most cases, must be renewed on an annual basis. As of December 31, 2025 we had $829.9 million in surety bonds outstanding, of which $428.2 million is for reclamation obligations primarily related to mining in Florida. In addition, included in the total amount is $337.6 million, reflecting our updated closure cost estimates, delivered to the EPA as a substitute for the financial assurance provided through the Plant City Trust. The remaining balance in surety bonds outstanding of $64.1 million is for other matters.
23. CONTINGENCIES
We have described below the material judicial and administrative proceedings to which we are subject.
Environmental Matters
We have contingent environmental liabilities that arise principally from three sources: (i) facilities currently or formerly owned by our subsidiaries or their predecessors; (ii) facilities adjacent to currently or formerly owned facilities; and (iii) third-party Superfund or state equivalent sites. At facilities currently or formerly owned by our subsidiaries or their predecessors, the historical use and handling of regulated chemical substances, crop and animal nutrients and additives and by-product or process tailings have resulted in soil, surface water or groundwater impacts. Spills or other releases of regulated substances, subsidence at our facilities and other incidents arising out of operations, including accidents, have occurred previously at these facilities, and potentially could occur in the future, possibly requiring us to undertake or fund cleanup or result in monetary damage awards, fines, penalties, other liabilities, injunctions or other court or administrative rulings. In some instances, pursuant to consent orders or agreements with governmental agencies, we are undertaking certain remedial actions or investigations to determine whether remedial action may be required to address contamination. At other locations, we have entered into consent orders or agreements with appropriate governmental agencies to perform required remedial activities that will address identified site conditions. Taking into consideration established reserves of approximately $192.2 million and $197.5 million as of December 31, 2025 and 2024, respectively, of which $87.9 million and $90.8 million are included in Accrued Liabilities and $104.3 million and $106.7 million in Other Non Current Liabilities in the Consolidated Balance Sheets as of December 31, 2025 and 2024, respectively, expenditures for these known conditions currently are not expected, individually or in the aggregate, to have a material effect on our business or financial condition. However, material expenditures could be required in the future to remediate the impacts at known sites or at other current or former sites or as a result of other environmental, health and safety matters. Below is a discussion of the more significant environmental matters.
New Wales Phase II East Stack. In April 2022 we confirmed the presence of a cavity in and liner tear beneath the southern part of the active phosphogypsum stack at the Company’s New Wales facility in Florida. This resulted in process water draining beneath the stack.
The circumstances were reported to the FDEP and EPA. Phase I of the repairs, consisting of stabilizing the cavity by depositing low pressure grout into it, began in July 2022 and now is complete. Phase II work, which consists of injecting high pressure grout beneath the stack to restore the geological confining layer beneath it, began in early in 2023 and the work is now complete.
As of December 31, 2025 we have a reserve of $3.4 million, for estimated water management and other costs associated with this event. We are unable to estimate at this time potential future additional financial impacts or a range of loss, if any.
New Wales Phase II West Stack. In October 2023, we observed a series of seismic acoustic emissions and changes to piezometric water levels in a part of the Phase II West phosphogypsum stack at the New Wales, Florida facility. These observations may be an indication of a breach in the stack liner system and were reported to the FDEP and EPA. We have begun repairs; stabilization grouting is complete and high-pressure grouting, which began in October 2024, is expected to conclude in the first half of 2026. The area of the stack is not in use for either process water storage or additional gypsum placement. It lies within a zone of capture of a recovery groundwater well, which is operating as intended. No offsite impacts are known or expected.
As of December 31, 2025 we have a reserve of $65.1 million, for estimated repairs. We are unable to estimate at this time potential future additional financial impacts or a range of loss.
EPA RCRA Initiative. We have certain financial assurance and other obligations under consent decrees and a separate financial assurance arrangement relating to our facilities in Florida and Louisiana. These obligations are discussed in Note 14 of our Notes to Consolidated Financial Statements in this Form 10-K.
Other Environmental Matters. Superfund and equivalent state statutes impose liability without regard to fault or to the legality of a party’s conduct on certain categories of persons who are considered to have contributed to the release of “hazardous substances” into the environment. Under Superfund, or its various state analogues, one party may, under certain circumstances, be required to bear more than its proportionate share of cleanup costs at a site where it has liability if payments cannot be obtained from other responsible parties. Currently, certain of our subsidiaries are involved or concluding involvement at several Superfund or equivalent state sites. Our remedial liability from these sites, alone or in the aggregate, currently is not expected to have a material effect on our business or financial condition. As more information is obtained regarding these sites and the potentially responsible parties involved, this expectation could change.
We believe that, pursuant to several indemnification agreements, our subsidiaries are entitled to at least partial, and in many instances complete, indemnification for the costs that may be expended by us or our subsidiaries to remedy environmental issues at certain facilities. These agreements address issues that resulted from activities occurring prior to our acquisition of facilities or businesses from parties including, but not limited to: ARCO (BP); Beatrice Fund for Environmental Liabilities; Conoco; Conserv; Estech, Inc.; Kaiser Aluminum & Chemical Corporation; Kerr-McGee Inc.; PPG Industries, Inc.; The Williams Companies; CF; and certain other private parties. Our subsidiaries have already received and anticipate receiving amounts pursuant to the indemnification agreements for certain of their expenses incurred to date as well as future anticipated expenditures. We record potential indemnifications as an offset to the established accruals when they are realizable or realized. The failure of an indemnitor to fulfill its obligations could result in future costs that could be material.
Brazil Legal Contingencies
Our Brazilian subsidiaries are engaged in a number of judicial and administrative proceedings regarding labor, environmental, mining and civil claims that allege aggregate damages or fines of approximately $531.8 million. We estimate that our probable aggregate loss with respect to these claims is approximately $69.4 million, which is included in our accrued liabilities in our Consolidated Balance Sheets at December 31, 2025. Approximately $387.6 million of the maximum potential loss above relates to labor claims, of which approximately $50.3 million is included in accrued liabilities in our Consolidated Balance Sheets at December 31, 2025.
Based on Brazil legislation and the current status of similar labor cases involving unrelated companies, we believe we have recorded adequate loss contingency reserves sufficient to cover our estimate of probable losses. If the status of similar cases involving unrelated companies were to adversely change in the future, our maximum exposure could increase and additional accruals could be required.
Brazil Tax Contingencies
Our Brazilian subsidiaries are engaged in a number of judicial and administrative proceedings relating to various non-income tax matters. We estimate that our maximum potential liability with respect to these matters is approximately $751.9 million, of which $200.1 million is subject to an indemnification agreement entered into with Vale S.A in connection with the acquisition of certain mining assets and facilities.
Approximately $431.4 million of the maximum potential liability relates to a Brazilian federal value added tax, PIS and COFINS, and tax credit cases, while the majority of the remaining amount relates to various other non-income tax cases. The maximum potential liability can increase with new audits from Brazilian tax authorities. Based on Brazil tax legislation and the current status of similar tax cases involving unrelated taxpayers, we believe we have recorded adequate loss contingency reserves sufficient to cover our estimate of probable losses, which are immaterial. If the status of similar tax cases involving unrelated taxpayer changes in the future, additional accruals could be required.
Other Claims
We also have certain other contingent liabilities with respect to judicial, administrative and arbitration proceedings and claims of third parties, including tax matters, arising in the ordinary course of business. We do not believe that any of these contingent liabilities will have a material adverse impact on our business or financial condition, results of operations, and cash flows.
24. RELATED PARTY TRANSACTIONS
We enter into transactions and agreements with certain of our non-consolidated companies and other related parties from time to time. As of December 31, 2025, we had amounts included in Accounts Receivable and Accounts Payable on our Consolidated Balances due from our non-consolidated companies of which the net amount totaled $10.0 million. As of December 31, 2024, the net amount due to our non-consolidated companies totaled $46.5 million.
The Consolidated Statements of Earnings included the following transactions with our non-consolidated companies:
|
|
|
|
|
|
|
|
|
|
|
|
|
|
|
|
|
|
|
|
|
| |
|
Years Ended December 31, |
| (in millions) |
|
2025 |
|
2024 |
|
2023 |
| Transactions with non-consolidated companies included in net sales |
|
$ |
1,274.9 |
|
|
$ |
931.0 |
|
|
$ |
1,321.0 |
|
| Transactions with non-consolidated companies included in cost of goods sold |
|
$ |
1,015.6 |
|
|
$ |
1,082.7 |
|
|
$ |
1,465.2 |
|
______________________________
(a) Amounts included in net sales primarily relate to sales from our Potash segment to Canpotex.
(b) Amounts included in cost of goods sold primarily relate to purchases from Canpotex by our Mosaic Fertilizantes segment and India and China distribution businesses. Prior year amounts also includes purchases from MWSPC.
25. BUSINESS SEGMENTS
The reportable segments are determined by management based upon factors such as products and services, production processes, technologies, market dynamics and for which segment financial information is available for our chief operating decision maker. Our chief operating decision maker is our chief executive officer.
For a description of our business segments, see Note 1 of our Notes to Consolidated Financial Statements. The accounting policies of the segments are the same as those described in the summary of significant accounting policies. We evaluate performance based on the gross margin and operating earnings of the respective business segments, which includes certain allocations of corporate selling, general and administrative expenses. The segment results may not represent the actual results that would be expected if they were independent, stand-alone businesses. Intersegment eliminations, including profit on intersegment sales, mark-to-market gains/losses on derivatives, debt expenses and the results of the China and India distribution business are included within Corporate, Eliminations and Other. Certain selling, general and administrative costs that are not controllable by the business segments are included within Corporate, Eliminations and Other.
For the Phosphate, Potash and Mosaic Fertilizantes segments, the chief operating decision maker uses both segment gross margin and operating earnings to allocate resources to each segment, predominantly in the annual budget and forecasting process. The chief operating decision maker considers forecast-to-actual variances on a monthly basis for both profit measures when making decisions about allocating capital and personnel to the segments. The chief operating decision maker also uses segment gross margin for evaluating product pricing and segment profit or loss from operations to assess the performance for each segment by comparing the results and return on assets of each segment with one another.
Segment information for the years 2025, 2024 and 2023 is as follows:
|
|
|
|
|
|
|
|
|
|
|
|
|
|
|
|
|
|
|
|
|
|
|
|
|
|
|
|
|
|
|
|
|
| (in millions) |
|
Phosphate |
|
Potash |
|
Mosaic Fertilizantes |
|
Corporate,
Eliminations
and Other (a)
|
|
Total |
| Year Ended December 31, 2025 |
|
|
|
|
|
|
|
|
|
|
| Net sales to external customers |
|
$ |
3,877.8 |
|
|
$ |
2,658.7 |
|
|
$ |
4,847.3 |
|
|
$ |
668.6 |
|
|
$ |
12,052.4 |
|
| Intersegment net sales |
|
698.7 |
|
|
3.0 |
|
|
— |
|
|
(701.7) |
|
|
— |
|
| Net sales |
|
4,576.5 |
|
|
2,661.7 |
|
|
4,847.3 |
|
|
(33.1) |
|
|
12,052.4 |
|
Cost of goods sold(b) |
|
4,139.2 |
|
|
1,791.7 |
|
|
4,355.3 |
|
|
(135.7) |
|
|
10,150.5 |
|
| Gross margin |
|
437.3 |
|
|
870.0 |
|
|
492.0 |
|
|
102.6 |
|
|
1,901.9 |
|
| Canadian resource taxes |
|
— |
|
|
272.8 |
|
|
— |
|
|
— |
|
|
272.8 |
|
| Gross margin (excluding Canadian resource taxes) |
|
437.3 |
|
|
1,142.8 |
|
|
492.0 |
|
|
102.6 |
|
|
2,174.7 |
|
Selling, general and administrative(c) |
|
45.8 |
|
|
30.1 |
|
|
147.9 |
|
|
310.1 |
|
|
533.9 |
|
| Loss (gain) on assets sold and to be sold |
|
— |
|
|
185.0 |
|
|
(27.7) |
|
|
— |
|
|
157.3 |
|
| Impairment of goodwill |
|
— |
|
|
3.6 |
|
|
96.3 |
|
|
— |
|
|
99.9 |
|
Other operating expenses(d) |
|
256.0 |
|
|
13.6 |
|
|
(1.4) |
|
|
21.1 |
|
|
289.3 |
|
| Operating earnings |
|
135.4 |
|
|
637.7 |
|
|
277.0 |
|
|
(228.6) |
|
|
821.5 |
|
| Capital expenditures |
|
848.9 |
|
|
243.5 |
|
|
260.5 |
|
|
6.5 |
|
|
1,359.4 |
|
| Depreciation, depletion and amortization expense |
|
500.7 |
|
|
336.5 |
|
|
174.2 |
|
|
38.5 |
|
|
1,049.9 |
|
| Equity in net earnings of nonconsolidated companies |
|
— |
|
|
— |
|
|
— |
|
|
2.3 |
|
|
2.3 |
|
| Year Ended December 31, 2024 |
|
|
|
|
|
|
|
|
|
|
| Net sales to external customers |
|
$ |
3,793.3 |
|
|
$ |
2,371.0 |
|
|
$ |
4,422.3 |
|
|
$ |
536.2 |
|
|
$ |
11,122.8 |
|
| Intersegment net sales |
|
725.5 |
|
|
17.7 |
|
|
— |
|
|
(743.2) |
|
|
— |
|
| Net sales |
|
4,518.8 |
|
|
2,388.7 |
|
|
4,422.3 |
|
|
(207.0) |
|
|
11,122.8 |
|
Cost of goods sold(b) |
|
3,924.8 |
|
|
1,745.5 |
|
|
4,015.7 |
|
|
(75.1) |
|
|
9,610.9 |
|
| Gross margin |
|
594.0 |
|
|
643.2 |
|
|
406.6 |
|
|
(131.9) |
|
|
1,511.9 |
|
| Canadian resource taxes |
|
— |
|
|
232.2 |
|
|
— |
|
|
— |
|
|
232.2 |
|
| Gross margin (excluding Canadian resource taxes) |
|
594.0 |
|
|
875.4 |
|
|
406.6 |
|
|
(131.9) |
|
|
1,744.1 |
|
|
|
|
|
|
|
|
|
|
|
|
Selling, general and administrative(c) |
|
45.3 |
|
|
31.1 |
|
|
134.7 |
|
|
285.8 |
|
|
496.9 |
|
Other operating expenses(d) |
|
323.7 |
|
|
7.7 |
|
|
34.2 |
|
|
27.9 |
|
|
393.5 |
|
| Operating earnings |
|
225.1 |
|
|
604.5 |
|
|
237.6 |
|
|
(445.7) |
|
|
621.5 |
|
| Gain on sale of equity method investment |
|
522.2 |
|
|
— |
|
|
— |
|
|
— |
|
|
522.2 |
|
| Capital expenditures |
|
660.7 |
|
|
297.5 |
|
|
242.8 |
|
|
50.8 |
|
|
1,251.8 |
|
| Depreciation, depletion and amortization expense |
|
505.6 |
|
|
336.5 |
|
|
159.3 |
|
|
24.1 |
|
|
1,025.5 |
|
| Equity in net earnings of nonconsolidated companies |
|
70.9 |
|
|
— |
|
|
— |
|
|
2.4 |
|
|
73.3 |
|
| Year Ended December 31, 2023 |
|
|
|
|
|
|
|
|
|
|
| Net sales to external customers |
|
$ |
3,894.5 |
|
|
$ |
3,203.1 |
|
|
$ |
5,684.7 |
|
|
$ |
913.8 |
|
|
$ |
13,696.1 |
|
| Intersegment net sales |
|
829.8 |
|
|
30.5 |
|
|
— |
|
|
(860.3) |
|
|
— |
|
| Net sales |
|
4,724.3 |
|
|
3,233.6 |
|
|
5,684.7 |
|
|
53.5 |
|
|
13,696.1 |
|
Cost of goods sold(b) |
|
4,022.2 |
|
|
2,018.6 |
|
|
5,473.1 |
|
|
(28.4) |
|
|
11,485.5 |
|
| Gross margin |
|
702.1 |
|
|
1,215.0 |
|
|
211.6 |
|
|
81.9 |
|
|
2,210.6 |
|
| Canadian resource taxes |
|
— |
|
|
403.4 |
|
|
— |
|
|
— |
|
|
403.4 |
|
| Gross margin (excluding Canadian resource taxes) |
|
702.1 |
|
|
1,618.4 |
|
|
211.6 |
|
|
81.9 |
|
|
2,614.0 |
|
|
|
|
|
|
|
|
|
|
|
|
Selling, general and administrative(c) |
|
42.0 |
|
|
30.0 |
|
|
110.1 |
|
|
318.4 |
|
|
500.5 |
|
|
|
|
|
|
|
|
|
|
|
|
|
|
|
|
|
|
|
|
|
|
|
|
|
|
|
|
|
|
|
|
|
|
| Loss (gain) on assets sold and to be sold |
|
— |
|
|
— |
|
|
— |
|
|
(56.5) |
|
|
(56.5) |
|
Other operating expenses(d) |
|
284.3 |
|
|
33.5 |
|
|
27.0 |
|
|
83.7 |
|
|
428.5 |
|
| Operating earnings |
|
375.7 |
|
|
1,151.5 |
|
|
74.5 |
|
|
(263.6) |
|
|
1,338.1 |
|
| Capital expenditures |
|
625.9 |
|
|
357.4 |
|
|
336.3 |
|
|
82.8 |
|
|
1,402.4 |
|
| Depreciation, depletion and amortization expense |
|
485.7 |
|
|
299.0 |
|
|
165.5 |
|
|
10.4 |
|
|
960.6 |
|
| Equity in net earnings of nonconsolidated companies |
|
56.4 |
|
|
— |
|
|
— |
|
|
3.9 |
|
|
60.3 |
|
| Total assets as of December 31, 2025 |
|
$ |
10,239.0 |
|
|
$ |
6,610.6 |
|
|
$ |
4,618.5 |
|
|
$ |
3,012.0 |
|
|
$ |
24,480.1 |
|
Total assets as of December 31, 2024(e) |
|
9,419.5 |
|
|
6,480.6 |
|
|
4,372.0 |
|
|
2,651.9 |
|
|
22,924.0 |
|
Total assets as of December 31, 2023(e) |
|
9,494.9 |
|
|
6,914.7 |
|
|
5,205.7 |
|
|
1,417.5 |
|
|
23,032.8 |
|
______________________________
(a)The “Corporate, Eliminations and Other” category includes the results of our ancillary distribution operations in India and China. For the years ended December 31, 2025, 2024 and 2023, distribution operations in India and China had revenues of $640.0 million, $519.6 million and $898.9 million, respectively, and gross margins of $88.0 million, $39.7 million and $(16.8) million, respectively. These operations do not meet the quantitative thresholds for determining reportable segments.
(b)The primary components of cost of goods sold are raw material purchases, including sulfur and ammonia, conversion costs and transportation costs.
(c)Selling, general and administrative expenses include nonmanufacturing payroll expense and professional services expense.
(d)Other operating expenses typically relate to five major categories: (1) AROs, (2) environmental and legal reserves, (3) idle facility costs, (4) insurance reimbursements, and (5) gain/loss on sale or disposal of fixed assets.
(e)In 2025, the information about segment assets regularly provided to and reviewed by our CODM was revised to no longer include intercompany assets and segment cash, and to include an allocation of certain fixed assets from Corprate to the Phosphate and Potash segments. As a result, the December 31, 2024 and 2023 balances have been recast to reflect these changes.
Financial information relating to our operations by geographic area is as follows:
|
|
|
|
|
|
|
|
|
|
|
|
|
|
|
|
|
|
|
Years Ended December 31, |
| (in millions) |
2025 |
|
2024 |
|
2023 |
Net sales(a): |
|
|
|
|
|
| Brazil |
$ |
4,678.5 |
|
|
$ |
4,296.2 |
|
|
$ |
5,480.9 |
|
Canpotex(b) |
1,247.8 |
|
|
884.3 |
|
|
1,275.7 |
|
| China |
551.3 |
|
|
536.9 |
|
|
556.1 |
|
| Canada |
387.6 |
|
|
520.1 |
|
|
411.6 |
|
| Paraguay |
148.0 |
|
|
178.5 |
|
|
222.8 |
|
| Argentina |
133.4 |
|
|
141.8 |
|
|
75.2 |
|
| Japan |
122.5 |
|
|
130.8 |
|
|
157.7 |
|
| Colombia |
89.1 |
|
|
118.7 |
|
|
103.2 |
|
| India |
70.9 |
|
|
72.8 |
|
|
350.8 |
|
| Australia |
65.6 |
|
|
57.9 |
|
|
69.0 |
|
| Peru |
62.1 |
|
|
49.2 |
|
|
77.5 |
|
| Mexico |
29.0 |
|
|
42.2 |
|
|
125.5 |
|
| Honduras |
32.4 |
|
|
25.7 |
|
|
30.0 |
|
| Dominican Republic |
22.3 |
|
|
14.7 |
|
|
16.7 |
|
| Other |
89.0 |
|
|
82.3 |
|
|
64.3 |
|
| Total international countries |
7,729.5 |
|
|
7,152.1 |
|
|
9,017.0 |
|
| United States |
4,322.9 |
|
|
3,970.7 |
|
|
4,679.1 |
|
| Consolidated |
$ |
12,052.4 |
|
|
$ |
11,122.8 |
|
|
$ |
13,696.1 |
|
______________________________
(a)Revenues are attributed to countries based on location of customer.
(b)Canpotex sales to the ultimate third-party customers are made to customers in various countries. The countries with the largest portion of third-party customer sales are Brazil, China, India and Indonesia.
|
|
|
|
|
|
|
|
|
|
|
|
|
|
|
|
|
December 31, |
| (in millions) |
|
2025 |
|
2024 |
| Long-lived assets: |
|
|
|
|
| Canada |
|
$ |
5,837.8 |
|
|
$ |
5,390.5 |
|
| Brazil |
|
2,372.9 |
|
|
2,012.8 |
|
| Other |
|
630.5 |
|
|
545.8 |
|
| Total international countries |
|
8,841.2 |
|
|
7,949.1 |
|
| United States |
|
8,584.7 |
|
|
8,457.2 |
|
| Consolidated |
|
$ |
17,425.9 |
|
|
$ |
16,406.3 |
|
Excluded from the table above as of December 31, 2025 and 2024, are goodwill of $1,005.1 million and $1,061.1 million and deferred income tax assets of $811.6 million and $958.3 million, respectively.
Net sales by product type for the years 2025, 2024 and 2023 are as follows:
|
|
|
|
|
|
|
|
|
|
|
|
|
|
|
|
|
|
|
Years Ended December 31, |
| (in millions) |
2025 |
|
2024 |
|
2023 |
| Sales by product type: |
|
|
|
|
|
| Phosphate Crop Nutrients |
$ |
3,273.4 |
|
|
$ |
2,978.7 |
|
|
$ |
3,277.5 |
|
| Potash Crop Nutrients |
2,920.4 |
|
|
2,808.6 |
|
|
4,107.7 |
|
| Crop Nutrient Blends |
1,380.6 |
|
|
1,253.4 |
|
|
2,107.4 |
|
Performance Products(a) |
2,635.1 |
|
|
2,264.2 |
|
|
2,453.3 |
|
| Phosphate Rock |
132.1 |
|
|
217.2 |
|
|
125.9 |
|
Other(b) |
1,710.8 |
|
|
1,600.7 |
|
|
1,624.3 |
|
|
$ |
12,052.4 |
|
|
$ |
11,122.8 |
|
|
$ |
13,696.1 |
|
______________________________
(a)Includes sales of MicroEssentials®, K-Mag® and Aspire®.
(b)Includes sales of industrial potash, feed products, nitrogen and other products.
26. Assets Sold and Held for Sale
On October 3, 2025, we completed the sale of our idled Patos de Minas phosphate mining unit in Brazil. Under terms of the agreement, we expect to receive a total of $111 million, with $51 million received at closing and the balance of the purchase price to be paid in installments over the next four years. We recorded a gain of approximately $94 million at closing
On November 3, 2025, we completed the sale of our interest in the Taquari potash mine in Brazil for proceeds of up to $27 million with $12 million received at closing and an additional $10 million due in one year. The remaining $5 million is contingent upon future potash pricing benchmarks. We recorded a loss of approximately $66 million related to the transaction.
On December 19, 2025, we entered into an agreement to sell our Carlsbad potash mine in New Mexico for $20.0 million, subject to adjustment, along with a deferred payment of $10.0 million payable in three installments from 2029 to 2031. Consequently, Carlsbad was reclassified as held for sale, and an impairment loss of approximately $185.0 million was recorded as of December 31, 2025. The fair value of Carlsbad was determined based on the terms of the sale, working capital adjustments and discounted deferred payments, and is classified as Level 3 within the fair value hierarchy due to reliance on unobservable inputs. Any subsequent changes to net assets or significant assumptions may result in further adjustments to the recognized impairment prior to closing. The transaction is expected to close in the first half of 2026, subject to customary closing conditions.
The carrying amounts of the major classes of assets and liabilities of the Carlsbad disposal group classified as held for sale as of December 31, 2025 are as follows:
|
|
|
|
|
|
| (in millions) |
|
| Assets |
|
| Accounts receivable, net |
$ |
15.7 |
|
| Inventories, net |
44.5 |
|
| Other assets |
14.2 |
|
| Property, plant and equipment, net |
184.1 |
|
| Valuation allowance on assets held for sale |
(185.0) |
|
| Current assets held for sale |
$ |
73.5 |
|
|
|
| Liabilities |
|
| Accounts payable and accrued expenses |
$ |
14.3 |
|
| Deferred tax liability |
20.2 |
|
| Asset retirement obligations |
20.8 |
|
| Current liabilities held for sale |
$ |
55.3 |
|
Management’s Report on Internal Control Over Financial Reporting
The Company’s management is responsible for establishing and maintaining effective internal control over financial reporting, as defined in Rule 13a-15(f) under the Securities Exchange Act of 1934. The Company’s internal control system is a process designed to provide reasonable assurance to our management, Board of Directors and stockholders regarding the reliability of financial reporting and the preparation and fair presentation of our consolidated financial statements for external reporting purposes in accordance with U.S. GAAP and includes those policies and procedures that:
•Pertain to the maintenance of records that, in reasonable detail, accurately and fairly reflect the transactions and dispositions of our assets;
•Provide reasonable assurance that transactions are recorded as necessary to permit preparation of financial statements in conformity with U.S. GAAP, and that receipts and expenditures are being made only in accordance with authorizations from our management and Board of Directors; and
•Provide reasonable assurance regarding prevention or timely detection of unauthorized acquisition, use or disposition of our assets that could have a material effect on the financial statements.
Because of its inherent limitations, internal control over financial reporting may not prevent or detect misstatements. Also, projections of any evaluation of effectiveness to future periods are subject to the risk that controls may become inadequate because of changes in conditions, or that the degree of compliance with the policies or procedures may deteriorate.
Management assessed the effectiveness of the Company’s internal control over financial reporting as of December 31, 2025. In assessing the effectiveness of our internal control over financial reporting as of December 31, 2025 management used the control criteria framework of the Committee of Sponsoring Organizations (COSO) of the Treadway Commission published in its report entitled Internal Control—Integrated Framework (2013). Based on their evaluation, management concluded that the Company’s internal control over financial reporting was effective as of December 31, 2025. KPMG LLP, the independent registered public accounting firm that audited the financial statements included in this Form 10-K, has issued an auditors’ report on the Company’s internal control over financial reporting as of December 31, 2025.
EX-19
2
exhibit1920251231.htm
EX-19
Document
|
|
|
|
|
|
|
Insider Trading and Tipping Policy |
Policy Owner General Counsel and Corporate Secretary
Version Effective March 1, 2024; Reviewed March 2025; Version 1.0
Next Revision: March 2026; one year from last revision
1.Purpose/Objective
1.1 The purpose of this policy is to require that all Officers, Directors, and employees of the Company comply with applicable laws and regulations relating to insider trading. Federal securities laws prohibit employees and others from buying or selling securities based on information that is not publicly available and that could affect the price of those securities.
2. Policy Scope
2.1 This policy applies to every Officer, Director, and Company employee, including employees of any Company subsidiary, division, business unit or facility, whether domestic or foreign, except to the extent this policy conflicts with any obligation of the Company under federal, state or local labor law.
3. Administration
3.1 The Board administers this policy.
3.2 Statement of Policy.
a.It is the policy of the Company that no Officer, Director, or employee of the Company or any of its subsidiaries may purchase or sell securities of the Company (other than pursuant to a Pre-Arranged Trading Program) when in possession of Material Non-Public Information. If Material Non-Public Information relating to the Company has not been available to the public for at least one (1) full trading day, Officers, Directors, and such employees are prohibited from trading in Company securities or directly or indirectly disclosing the Material Non-Public Information to any other persons that may trade in Company securities. In order to avoid even the appearance of illegal trading, all Officers and Directors (and any additional employees notified by the General Counsel from time to time) may purchase or sell Company securities only during a quarterly trading window, which shall commence on the second trading day after the release of quarterly earnings results to the public and shall cease fourteen (14) calendar days prior to the end of the then-current fiscal quarter; provided, however, that if the 14th calendar day falls on a day when markets are closed for trading, then
the trading window shall cease as of the close of business on the immediately preceding trading day.
Notwithstanding the prior paragraph, if an Officer, Director or other employee of the Company has established a Pre-Arranged Trading Program, then the Officer, Director or other Company employee may sell or purchase Company securities while in possession of Material Non-Public Information or during other periods in which the Company has required or recommended the suspension of trading by Officers and Directors (and any additional employees notified by the General Counsel from time to time), so long as such sales or purchases are made pursuant to such Pre-Arranged Trading Program.
In addition, it is the policy of the Company that no Officer, Director, or employee of the Company or any of its subsidiaries who, in the course of working for the Company, has obtained any Material Non-Public Information relating to another company with which the Company has done or is doing business (including a customer or supplier of the Company), may buy or sell securities of such other company or engage in any other action to take advantage of, or pass on to others, that information until the information becomes public or is no longer material. Transactions that may be necessary or justifiable for independent reasons (such as the need to raise money for an emergency expenditure) are no exception. The securities laws do not recognize such mitigating circumstances and, in any event, even the appearance of an improper transaction must be avoided to preserve the Company’s reputation for adhering to the highest standards of conduct.
3.3 Requirements and Illustrations.
a.Prohibition Against Trading on Material Non-Public Information. Any Officer, Director, or employee of the Company or any of its subsidiaries who is aware of Material Non-Public Information related to the Company or to any other company with which the Company does business, which has not yet been available to the public for at least one (1) full trading day, may not trade in securities of the Company (unless such trading is pursuant to a Pre-Arranged Trading Program) or directly or indirectly disclose such information to any other persons that may trade in such securities. If the released information is particularly complex or voluminous, a longer period of time may be appropriate.
b.Illustration – Access to Material Non-Public Information. Access to Material Non-Public Information may be experienced in circumstances like the following:
1.If an employee of the Company becomes aware of favorable or unfavorable financial results for the Company (or any other public company that could affect the price of the stock of such company).
2.If an employee becomes aware of a company’s potential acquisition before it is disclosed to the press.
3.If an employee becomes aware that a company is about to announce a new product, enter into or terminate a significant commercial contract or make a decision that could affect the price of the stock of a competitor or supplier.
4.If an employee becomes aware that a company is about to make an announcement that could affect the price of its stock.
c.No Trading Securities of Certain Other Companies. If the Company is involved in a significant acquisition, merger, joint venture or other such business transaction with another public company, whether or not the transaction has been announced, no Officer, Director, or employee of the Company or any of its subsidiaries who is aware of the transaction or
|
|
|
|
|
|
Page 2 of 7 |
The Mosaic Company |
possible transaction, may purchase or sell any securities (whether common or preferred stock or derivative securities, such as options to buy or sell such stock)of the other public company until after the closing or termination of such transaction has been publicly announced.
d.No Trading By Officers or Directors in Securities Except During a Quarterly Trading Window. The Company’s announcement of quarterly financial results almost always has the potential to have a material effect on the market for the Company’s securities. To avoid the appearance of trading on Material Non-Public Information relating to earnings, all Officers and Directors (and any additional employees of the Company or any of its subsidiaries notified by the General Counsel from time to time) may purchase or sell securities of the Company only during a quarterly “trading window” as described in Section 3.2(a) of this policy, unless the purchases or sales are pursuant to a Pre-Arranged Trading Program. Trading in these window periods will not relieve liability for trading on or tipping Material Non-Public Information or if such trading results in recoverable “short-swing profits”.
e.No Trading by Officers or Directors in Company Securities During a Pension Plan Blackout. In accordance with the Sarbanes-Oxley Act of 2002, Officers and Directors are prohibited from trading in Company’s equity securities when a substantial number of Company employees are unable to engage in transactions in Company equity securities through their individual pension plan accounts (including 401(k) plan or other retirement plan accounts) due to a pension plan blackout period. Such blackouts may occur for a variety of reasons and will be communicated to Officers and Directors and to Company employees in advance.
f.Notify the Company’s General Counsel Prior to any Transaction in Securities. Even though a quarterly trading window may be open, there are a number of other restrictions which may prohibit any trading by certain individuals, including trading restrictions relating to “short-swing” profits, trading restrictions relating to pension fund blackout periods and trading restrictions imposed because of confidential material transactions. To avoid any inadvertent violation of trading prohibitions, unless the purchases or sales are pursuant to a Pre-Arranged Trading Program, no Officer or Director may purchase or sell securities (including through the allocation of funds contributed to a pension or 401(k) plan) unless the Company’s General Counsel or, in his or her absence, the Company’s Chief Financial Officer, is advised at least two (2) business days in advance of such intent and approves the transaction.
g.Event-Specific Black-Out Periods. From time to time, an event may occur that is material to the Company and is known by only a few Directors or Officers. So long as the event remains material and nonpublic, Officers and Directors and such other persons as are designated by the General Counsel may not trade in the Company’s securities. The existence of an event-specific “black-out” will not be announced, other than to those who are aware of the event giving rise to the black-out. If, however, a person whose trades are subject to pre-clearance (as described above) requests permission to trade in the Company’s securities during an event-specific black-out, the General Counsel will inform the requester of the existence of a black-out period, without disclosing the reason for the black-out. Any person made aware of the existence of an event-specific black-out should not disclose the existence of the black-out to any other person. The failure of the General Counsel to designate a person as being subject to an event-specific black-out will not relieve that person of the obligation not to trade while aware of the Material Non-Public Information. “Black-out” periods also include periods during which participants in a Company pension plan (such as a 401(k) plan or other retirement plan) are prohibited from engaging in transactions in Company equity securities through their pension plan accounts. Approved transactions should be completed within three (3) trading days of approval. All employees are encouraged to seek the advice of the General Counsel or, in his or her absence, the Company’s Chief Financial Officer, prior to effecting any transaction in securities of the Company during any “black-out period”.
|
|
|
|
|
|
Page 3 of 7 |
The Mosaic Company |
h.Short-Swing Profits for Directors and Officers. Under federal law, “short-swing” profits belong to and are recoverable by the Company. The Company cannot waive its right to recover short-swing profits; if the Company fails or refuses to collect the profits, a shareholder may commence a lawsuit for collection on behalf of the Company. This federal law applies regardless of whether the Director or Officer was actually in possession of Material Non-Public Information. Lack of intent to trade on Material Non-Public Information is similarly irrelevant. Trades made through a Pre-Arranged Trading Program are not exempt from the short-swing profit rules.
Short-swing profits include any “profit” resulting from any combination of purchase and sale or sale and purchase of Company securities, including derivative securities, within six-months of each other. The highest sale price of any securities sold during the six month period will be matched against the lowest purchase price of any securities purchased during that period to determine if a short-swing profit exists. The order in which the purchase and sale occurred and the fact that they may have involved different shares in the Company are both irrelevant to whether a “profit” exists.
3.4 Special Requirements for Pre-Approved Trading Programs.
a.All Pre-Arranged Trading Programs must be reviewed and approved by the Company’s General Counsel prior to entering into or amending such Pre-Arranged Trading Program.
b.Officer, Directors, and employees may not adopt multiple Pre-Arranged Trading Programs without approval from the Company’s General Counsel.
c.Officers and Directors are prohibited from trading in Company securities pursuant to a newly adopted or amended Pre-Arranged Trading Program from the later of (i) 90 days after adoption or amendment of the Pre-Arranged Trading Program and (ii) two business days after the Company files its financial results for the fiscal quarter in which such Pre-Arranged Trading Program was adopted or modified,
d.Company employees that are not Officers or Directors are prohibited from trading in Company securities pursuant to a newly adopted or amended Pre-Arranged Trading Program for 30 days after adoption or amendment of the Pre-Arranged Trading Program.
e.Officers, Directors, and employees must promptly notify the Company’s General Counsel of any intention to modify or terminate a previously approved Pre-Arranged Trading Program.
3.5 Transactions Under Company Plans.
a.Stock Option Exercises. This policy does not apply to the exercise of an employee stock option paid for in cash, or to the exercise of a tax withholding right pursuant to which you elect to have the Company withhold shares subject to an option to satisfy tax withholding requirements. The policy does apply, however, to any sale of stock as part of a broker-assisted cashless exercise of an option, any other market sale for the purpose of generating the cash needed to pay the exercise price of an option, or the payment of the exercise price with previously-owned shares.
b.Stock-Based Employee Benefit Plans; 401(k) Plan. This policy does not apply to purchases of Company stock in a stock-based employee benefit plan, including the Company’s 401(k) plan, resulting from your periodic contribution of money to the plan pursuant to your payroll deduction election. The policy does apply, however, to certain elections you may make under the 401(k) plan, including (a) an election to increase or decrease the percentage of your periodic contributions that will be allocated to the Company stock fund, (b) an election to make an intra-plan transfer of an existing account balance out of the Company stock fund, (c)
|
|
|
|
|
|
Page 4 of 7 |
The Mosaic Company |
an election to borrow money against your 401(k) plan account if the loan will result in a liquidation of some or all of your Company stock fund balance, and (d) your election to pre-pay a plan loan if the pre-payment will result in allocation of loan proceeds to the Company stock fund.
3.6 Additional Prohibited Transactions. The Company considers it improper and inappropriate for any Officer or Director to engage in short-term or speculative transactions in the Company’s securities. It therefore is the Company’s policy that Officers and Directors may not engage in any of the following transactions:
a.Short Sales. Federal law prohibits Directors and Officers from making Short Sales of Company securities. It is unlawful and improper for a Director or Officer to sell Company securities which he or she does not own.
b.Publicly Traded Options. A transaction in publicly traded options is, in effect, a bet on the short-term movement of the Company’s stock and therefore creates the appearance that the Officer or Director is trading based on inside information. Transactions in publicly traded options also may focus the Officer’s or Director’s attention on short-term performance at the expense of the Company’s long-term objectives. Accordingly, transactions in puts, calls or other derivative securities, of the Company, on an exchange or in any other organized market, are prohibited by this policy.
c.Hedging Transactions. Certain forms of hedging or monetization transactions, such as zero-cost collars and forward sale contracts, allow an individual to lock in much of the value of his or her stock holdings, often in exchange for all or part of the potential for upside appreciation of stock. These transactions allow the Officer or Director to continue to own the covered securities, but without the full risks and rewards of ownership. When that occurs, the Officer or Director may no longer have the same objectives as the Company’s other stockholders. Therefore, Officers and Directors are prohibited from engaging in any such transactions.
3.7 Margin Accounts and Pledges. Securities held in a margin account may be sold by the broker without the customer’s consent if the customer fails to meet a margin call. Similarly, securities pledged (or hypothecated) as collateral for a loan may be sold in foreclosure if the borrower defaults on the loan. Because a margin sale or foreclosure sale may occur at a time when the pledger is aware of Material Non-Public Information or otherwise is not permitted to trade in Company’s securities, Directors, Officers and other employees of the Company or any of its subsidiaries are prohibited from holding Company securities in a margin account or pledging Company securities as collateral for a loan. An exception to this prohibition may be granted where a person wishes to pledge Company securities as collateral for a loan (not including margin debt) and clearly demonstrates the financial capacity to repay the loan without resort to the pledged securities. Any person who wishes to pledge Company securities as collateral for a loan must submit a request for approval to the General Counsel at least two weeks prior to the proposed execution of documents evidencing the proposed pledge.
3.8 Tipping Information to Others. Officers, Directors, and employees are prohibited from communicating Material Non-Public Information on to others, including family members and friends. Penalties under federal securities laws apply whether or not the employee derives an economic benefit from another’s actions. The SEC has imposed substantial penalties on tippers even though they did not profit from their tippee’s trading.
3.9 Transaction by Family Members. The very same restrictions in this policy against purchasing or selling Company securities or securities of certain other public companies when in possession of Material Non-Public Information, or “tipping” information to others, apply to family members and any other individuals living in an Officer, Director, or employee’s household. Officers, Directors, and employees are expected to be responsible for the compliance of their immediate family and
|
|
|
|
|
|
Page 5 of 7 |
The Mosaic Company |
personal household. Family members and any other individuals living in an Officer’s or Director’s household are required to comply with the preclearance procedures outlined in Section 3.3(f) of this policy prior to engaging in any transactions in Company securities.
3.10 Confidentiality of Information. Serious problems could be caused for the Company by unauthorized disclosure of internal information about the Company, whether or not for the purpose of facilitating improper trading in shares of Company securities. Company personnel should not discuss internal Company matters or developments with anyone outside of the Company, except as required in performance of regular corporate duties.
This prohibition applies specifically (but not exclusively) to inquiries about the Company which may be made by the financial press, investment analysts or others in the financial community. It is important that all such communications on behalf of the Company be through an appropriately designated officer under carefully controlled circumstances. Unless you are expressly authorized to the contrary, if you receive any inquiries of this nature, you should decline comment and refer the inquirer to a designated Company spokesperson.
3.11 Post-Termination Transactions. This policy continues to apply to your transactions in Company securities even after you have terminated employment or terminated your position as a Director. If you are in possession of Material Non-Public Information when your employment or directorship terminates, you may not trade in Company securities until that information has become public or is no longer material.
3.12 This policy will be reviewed on a periodic basis by the Governance Committee to determine whether any modifications or revisions are required or appropriate.
4. Related Policies/References
1.1Code of Business Conduct and Ethics
5.Definitions
5.1The following terms used in this policy have the following meanings:
a.“Company” means The Mosaic Company.
b.“Director” means a member of the Company’s Board of Directors.
c.“Material Non-Public Information” is any information about a company, or its business, not generally available to the public which a reasonable investor would consider important in deciding whether to buy, hold or sell any securities of a public company. In other words, any information that could reasonably affect the market price of a security is material information. The U.S. Securities and Exchange Commission and the courts have generally given a broad interpretation to what is considered “material information”.
Common examples of “material information” include:
▪Information about a transaction that will significantly affect the financial condition of a company;
▪Projections of future earnings or losses;
▪Monthly earnings results for a company of its subsidiaries;
|
|
|
|
|
|
Page 6 of 7 |
The Mosaic Company |
▪News of a pending or proposed merger, acquisition or tender offer;
▪News of a significant sale of assets or the disposition of a subsidiary;
▪Dividend actions, the declaration of a stock split, or an offering of additional securities;
▪Changes in senior management;
▪Development of a significant new product or process;
▪Impending bankruptcy or financial liquidity problems;
▪The gain or loss of a substantial contract, customer or supplier; or
▪Important financing transactions.
The foregoing list is not exhaustive. Any information that might be considered significant to an investor may be considered “material.” Any questions as to what might be considered “material information” should be directed to the Company’s Law Department, who will provide guidance on the issue.
d.“Officer” means any person who is designated as an executive officer by the Company’s Board of Directors.
e.“Pre-Arranged Trading Program” means a trading program that (a) meets the requirements of Rule 10b5-1 promulgated under the Securities Exchange Act of 1934, as amended, (b) was established at a time when the Officer, Director or Company employee was not in possession of Material Non-Public Information, (c) was approved in advance by the Company’s General Counsel, and (d) meets the requirements set forth in Section 3.4 hereof, including the waiting period between the date on which any Officer, Director or Company employee enters into a Pre-Arranged Trading Program agreement and the effective date of the Pre-Arranged Trading Program
f.“Short Sale” is the sale of securities where Company securities are not actually owned and where delivery on the sale is made with borrowed or subsequently purchased securities.
|
|
|
|
|
|
Page 7 of 7 |
The Mosaic Company |
EX-21
3
exhibit21_20251231.htm
EX-21
Document
Exhibit 21
Subsidiary Information for The Mosaic Company
Certain subsidiaries of the Mosaic Company are listed below. Unnamed subsidiaries, considered in the aggregate as a single subsidiary, would not constitute a “significant subsidiary” as defined in Regulation S-X promulgated by the Securities and Exchange Commission.
|
|
|
|
|
|
|
|
|
| Subsidiary Name |
|
Jurisdiction of Incorporation |
| The Mosaic Company |
|
Delaware |
| Mosaic Global Sales, LLC |
|
Delaware |
| Mosaic Crop Nutrition, LLC |
|
Delaware |
| Mosaic Fertilizer, LLC |
|
Delaware |
| Mosaic Global Holdings Inc. |
|
Delaware |
| Mosaic USA Holdings Inc. |
|
Delaware |
| The Vigoro Corporation |
|
Delaware |
| Mosaic Global Operations Inc. |
|
Delaware |
| Mosaic Netherlands Holding Company |
|
Delaware |
| Mosaic Potash Esterhazy Limited Partnership |
|
Saskatchewan |
| Mosaic Canada ULC |
|
Nova Scotia |
| Mosaic Esterhazy Holdings ULC |
|
Alberta |
| Mosaic Fertilizantes P&K Ltda. |
|
Brazil |
| Mosaic Potash B.V. |
|
Netherlands |
| Mosaic Fertilizantes Netherlands C.V. |
|
Netherlands |
| Mosaic Fertilizantes do Brasil Ltda. |
|
Brazil |
| Mosaic Canada Crop Nutrition, LP |
|
Manitoba |
| Compañia Minera Miski Mayo S.R.L. |
|
Peru |
| Mosaic India Private Limited |
|
India |
| Phosphate Acquisition Partners L.P. |
|
Delaware |
| PRP-GP LLC |
|
Delaware |
| Mosaic Sales Netherlands C.V. |
|
Netherlands |
| Mosaic Potash Carlsbad Inc. |
|
Delaware |
| Mosaic Berg B.V. |
|
Netherlands |
| Tampa Port Services, LLC |
|
Delaware |
| Mosaic Potash Colonsay ULC |
|
Nova Scotia |
| IMC Chemical North America LLC |
|
Delaware |
| Mosaic Fertilizantes Bahamas Limited |
|
Bahamas |
| Mosaic Fertilizers (Hong Kong) Limited |
|
Hong Kong |
| South Ft. Meade Land Management, Inc. |
|
Delaware |
EX-23.1
4
exhibit231_20251231.htm
EX-23.1
Document
Exhibit 23.1
Consent of Independent Registered Public Accounting Firm
We consent to the incorporation by reference in the registration statements (No. 333-175087, 333-177251, 333-216133, 333-260777 and 333-291349) on Form S-3 and registration statements (No. 333-120501, 333-120503, 333-120878, 333-142268, 333-198332, and 333-272271) on Form S-8 of our reports dated February 27, 2026, with respect to the consolidated financial statements of The Mosaic Company and the effectiveness of internal control over financial reporting.
/s/ KPMG LLP
Tampa, Florida
February 27, 2026
EX-23.5
5
exhibit235_20251231.htm
EX-23.5
Document
Oryan Duff Senior Geologist
The Mosaic Company
101 East Kennedy BLVD, Suite 2500
Tampa FL 33602 CONSENT OF QUALIFIED PERSON
I, Oryan Duff, state that I am responsible for preparing or supervising the preparation of part(s) of the 2025 Mineral Resource Mineral Reserve Update (MRMR) Memorandum for the Esterhazy Potash Facility with an effective date of December 31, 2025, as signed and certified by me (the “Project Memorandum”).
Furthermore, I state that:
a.I consent to the public filing of the Project Memorandum by The Mosaic Company;
b.the document that the Project Memorandum supports is the annual report on Form 10-K for the year ended December 31, 2025 (the “Document”);
c.I consent to the use of my name, or any quotation from or summarization in the Document of the parts of the Project Memorandum for which I am responsible, to the filing of the Project Memorandum as an exhibit to the Document, and to the incorporation of such information into the following registration statements: Nos. 333-260777, 333-175087, 333-177251, 333-
216133 and 333-291349 on Form S-3, and registration statements Nos. 333-120501, 333-
120503, 333-120878, 333-142268, 333-198332 and 333-272271 on Form S-8; and
d.I confirm that I have read the Document, and that the Document fairly and accurately reflects, in the form and context in which it appears, the information in the Project Memorandum or in the part(s) thereof for which I am responsible.
Dated at Saskatchewan this 17 day of February, 2026.
/s/Oryan Duff Oryan Duff
Professional Geologist
Lorelei Duke, Senior Manager Geotechnical Engineering & Planning The Mosaic Company
101 East Kennedy BLVD, Suite 2500
Tampa FL 33602 CONSENT OF QUALIFIED PERSON
I, Lorelei Duke, state that I am responsible for preparing or supervising the preparation of part(s) of the 2025 Mineral Resource Mineral Reserve Update (MRMR) Memorandum for the Esterhazy Potash Facility with an effective date of December 31, 2025, as signed and certified by me (the “Project Memorandum”).
Furthermore, I state that:
a.I consent to the public filing of the Project Memorandum by The Mosaic Company;
b.the document that the Project Memorandum supports is the annual report on Form 10-K for the year ended December 31, 2025 (the “Document”);
c.I consent to the use of my name, or any quotation from or summarization in the Document of the parts of the Project Memorandum for which I am responsible, to the filing of the Project Memorandum as an exhibit to the Document, and to the incorporation of such information into the following registration statements: Nos. 333-260777, 333-175087, 333-177251, 333-
216133 and 333-291349 on Form S-3, and registration statements Nos. 333-120501, 333-
120503, 333-120878, 333-142268, 333-198332 and 333-272271 on Form S-8; and
d.I confirm that I have read the Document, and that the Document fairly and accurately reflects, in the form and context in which it appears, the information in the Project Memorandum or in the part(s) thereof for which I am responsible.
Dated at Saskatchewan this 15th day of February, 2026.
/s/Lorelei Duke Lorelei Duke, P. Eng.
Association of Professional Engineers and Geoscientists of Saskatchewan (APEGS), License #13944
Aimee Ottenbreit Environmental Compliance Lead
The Mosaic Company
101 East Kennedy BLVD, Suite 2500
Tampa FL 33602 CONSENT OF QUALIFIED PERSON
I, Aimee Ottenbreit, state that I am responsible for preparing or supervising the preparation of part(s) of the 2025 Mineral Resource Mineral Reserve Update (MRMR) Memorandum for the Esterhazy Potash Facility with an effective date of December 31, 2025, as signed and certified by me (the “Project Memorandum”).
Furthermore, I state that:
a.I consent to the public filing of the Project Memorandum by The Mosaic Company;
b.the document that the Project Memorandum supports is the annual report on Form 10-K for the year ended December 31, 2025 (the “Document”);
c.I consent to the use of my name, or any quotation from or summarization in the Document of the parts of the Project Memorandum for which I am responsible, to the filing of the Project Memorandum as an exhibit to the Document, and to the incorporation of such information into the following registration statements: Nos. 333-260777, 333-175087, 333-177251, 333-
216133 and 333-291349 on Form S-3, and registration statements Nos. 333-120501, 333-
120503, 333-120878, 333-142268, 333-198332 and 333-272271 on Form S-8; and
d.I confirm that I have read the Document, and that the Document fairly and accurately reflects, in the form and context in which it appears, the information in the Project Memorandum or in the part(s) thereof for which I am responsible.
Dated at Saskatchewan this 16th day of February, 2026.
/s/Aimee Ottenbreit Aimee Ottenbreit
Association of Professional Engineers and Geoscientists of Saskatchewan (APEGS), License #13249
Jason Polvi
Engineering Superintendent - Mechanical Integrity The Mosaic Company
Hwy 80 East Esterhazy Sask. S0A 0Xo
CONSENT OF QUALIFIED PERSON
I, Jason Polvi, state that I am responsible for preparing or supervising the preparation of part(s) of the 2025 Mineral Resource Mineral Reserve Update (MRMR) Memorandum for the Esterhazy Potash Facility with an effective date of December 31, 2025, as signed and certified by me (the “Project Memorandum”).
Furthermore, I state that:
a.I consent to the public filing of the Project Memorandum by The Mosaic Company;
b.the document that the Project Memorandum supports is the annual report on Form 10-K for the year ended December 31, 2025 (the “Document”);
c.I consent to the use of my name, or any quotation from or summarization in the Document of the parts of the Project Memorandum for which I am responsible, to the filing of the Project Memorandum as an exhibit to the Document, and to the incorporation of such information into the following registration statements: Nos. 333-260777, 333-175087, 333-177251, 333-
216133 and 333-291349 on Form S-3, and registration statements Nos. 333-120501, 333-
120503, 333-120878, 333-142268, 333-198332 and 333-272271 on Form S-8; and
d.I confirm that I have read the Document, and that the Document fairly and accurately reflects, in the form and context in which it appears, the information in the Project Memorandum or in the part(s) thereof for which I am responsible.
Dated at Saskatchewan this 23 day of February, 2026.
APEGS 21217
Grant Shaver, Professional Engineer The Mosaic Company
101 East Kennedy BLVD, Suite 2500
Tampa FL 33602 CONSENT OF QUALIFIED PERSON
/s/Jason Polvi Jason Polvi P.Eng I, Grant Shaver, state that I am responsible for preparing or supervising the preparation of part(s) of the 2025 Mineral Resource Mineral Reserve Update (MRMR) Memorandum for the Esterhazy Potash Facility with an effective date of December 31, 2025, as signed and certified by me (the “Project Memorandum”).
Furthermore, I state that:
a.I consent to the public filing of the Project Memorandum by The Mosaic Company;
b.the document that the Project Memorandum supports is the annual report on Form 10-K for the year ended December 31, 2025 (the “Document”);
c.I consent to the use of my name, or any quotation from or summarization in the Document of the parts of the Project Memorandum for which I am responsible, to the filing of the Project Memorandum as an exhibit to the Document, and to the incorporation of such information into the following registration statements: Nos. 333-260777, 333-175087, 333-177251, 333-
216133 and 333-291349 on Form S-3, and registration statements Nos. 333-120501, 333-
120503, 333-120878, 333-142268, 333-198332 and 333-272271 on Form S-8; and
d.I confirm that I have read the Document, and that the Document fairly and accurately reflects, in the form and context in which it appears, the information in the Project Memorandum or in the part(s) thereof for which I am responsible.
Dated at Saskatchewan this 17 day of February, 2026.
/s/Grant Shaver Grant Shaver, P.Eng.
Association of Professional Engineers and Geoscientists of Saskatchewan (APEGS), License #14724
Monica Tochor, Professional Geoscientist Manager, Geology & Reserves
The Mosaic Company
101 East Kennedy BLVD, Suite 2500
Tampa FL 33602 CONSENT OF QUALIFIED PERSON
I, Monica Tochor, state that I am responsible for preparing or supervising the preparation of part(s) of the 2025 Mineral Resource Mineral Reserve Update (MRMR) Memorandum for the Esterhazy Potash Facility with an effective date of December 31, 2025, as signed and certified by me (the “Project Memorandum”).
Furthermore, I state that:
a.I consent to the public filing of the Project Memorandum by The Mosaic Company;
b.the document that the Project Memorandum supports is the annual report on Form 10-K for the year ended December 31, 2025 (the “Document”);
c.I consent to the use of my name, or any quotation from or summarization in the Document of the parts of the Project Memorandum for which I am responsible, to the filing of the Project Memorandum as an exhibit to the Document, and to the incorporation of such information into the following registration statements: Nos. 333-260777, 333-175087, 333-177251, 333-
216133 and 333-291349 on Form S-3, and registration statements Nos. 333-120501, 333-
120503, 333-120878, 333-142268, 333-198332 and 333-272271 on Form S-8; and
d.I confirm that I have read the Document, and that the Document fairly and accurately reflects, in the form and context in which it appears, the information in the Project Memorandum or in the part(s) thereof for which I am responsible.
Dated at Saskatchewan this 23 day of February, 2026.
/s/Monica Tochor Monica Tochor
Association of Professional Engineers and Geoscientists of Saskatchewan (APEGS) License #12338
David Vaughn, Professional Engineer Senior Manager, Mine Engineering The Mosaic Company
101 East Kennedy BLVD, Suite 2500
Tampa FL 33602 CONSENT OF QUALIFIED PERSON
I, David Vaughn, state that I am responsible for preparing or supervising the preparation of part(s) of the 2025 Mineral Resource Mineral Reserve Update (MRMR) Memorandum for the Esterhazy Potash Facility with an effective date of December 31, 2025, as signed and certified by me (the “Project Memorandum”).
Furthermore, I state that:
a.I consent to the public filing of the Project Memorandum by The Mosaic Company;
b.the document that the Project Memorandum supports is the annual report on Form 10-K for the year ended December 31, 2025 (the “Document”);
c.I consent to the use of my name, or any quotation from or summarization in the Document of the parts of the Project Memorandum for which I am responsible, to the filing of the Project Memorandum as an exhibit to the Document, and to the incorporation of such information into the following registration statements: Nos. 333-260777, 333-175087, 333-177251, 333-
216133 and 333-291349 on Form S-3, and registration statements Nos. 333-120501, 333-
120503, 333-120878, 333-142268, 333-198332 and 333-272271 on Form S-8; and
d.I confirm that I have read the Document, and that the Document fairly and accurately reflects, in the form and context in which it appears, the information in the Project Memorandum or in the part(s) thereof for which I am responsible.
Dated at Saskatchewan this 23 day of February, 2026.
/s/David Vaughn David Vaughn
Association of Professional Engineers and Geoscientists of Saskatchewan (APEGS) License #35243
EX-24
6
exhibit24_20251231.htm
EX-24
Document
Exhibit 24
POWER OF ATTORNEY
The undersigned, being a Director and/or Officer of The Mosaic Company, a Delaware corporation (the "Company"), hereby constitutes and appoints Bruce M. Bodine, Luciano Siani Pires and Philip E. Bauer his/her true and lawful attorneys and agents, each with full power and authority (acting alone and without the others) to execute and deliver in the name and on behalf of the undersigned as such Director and/or Officer, the Annual Report of the Company on Form 10-K for the calendar year ended December 31, 2025 (the "Annual Report") under the Securities Exchange Act of 1934, as amended, and to execute and deliver any and all amendments to the Annual Report for filing with the Securities and Exchange Commission; and in connection with the foregoing, to do any and all acts and things and execute any and all instruments which such attorneys and agents may deem necessary or advisable to enable the Company to comply with the securities laws of the United States and of any state or other political subdivision thereof. The undersigned hereby grants unto such attorney and agents, and each of them, full power of substitution and revocation in the premises and hereby ratifies and confirms all that such attorneys and agents may do or cause to be done by virtue of these presents.
|
|
|
|
|
|
|
|
|
|
|
|
|
|
|
| /s/ Cheryl K. Beebe |
|
|
/s/ Gregory L. Ebel |
|
| Cheryl K. Beebe |
|
|
Gregory L. Ebel |
|
|
|
|
|
|
| /s/ Timothy S. Gitzel |
|
|
/s/ Emery N. Koenig |
|
| Timothy S. Gitzel |
|
|
Emery N. Koenig |
|
|
|
|
|
|
| /s/ Jody L. Kuzenko |
|
|
/s/ Sonya C. Little |
|
| Jody L. Kuzenko |
|
|
Sonya C. Little |
|
|
|
|
|
|
| /s/ David T. Seaton |
|
|
/s/ Kathleen M. Shanahan |
| David T. Seaton |
|
|
Kathleen M. Shanahan |
|
|
|
|
|
|
| /s/ João Roberto Gonçalves Teixeira |
|
|
/s/ Gretchen H. Watkins |
| João Roberto Gonçalves Teixeira |
|
|
Gretchen H. Watkins |
|
|
|
|
|
|
| /s/ Kelvin R. Westbrook |
|
|
|
| Kelvin R. Westbrook |
|
|
|
|
EX-31.1
7
exhibit311_20251231.htm
EX-31.1
Document
Exhibit 31.1
Certification Required by Rule 13a-14(a)
I, Bruce M. Bodine, certify that:
|
|
|
|
|
|
| 1. |
I have reviewed this annual report on Form 10-K of The Mosaic Company; |
|
|
|
|
|
|
| 2. |
Based on my knowledge, this report does not contain any untrue statement of a material fact or omit to state a material fact necessary to make the statements made, in light of the circumstances under which such statements were made, not misleading with respect to the period covered by this report; |
|
|
|
|
|
|
| 3. |
Based on my knowledge, the financial statements, and other financial information included in this report, fairly present in all material respects the financial condition, results of operations and cash flows of the registrant as of, and for, the periods presented in this report; |
|
|
|
|
|
|
| 4. |
The registrant’s other certifying officer(s) and I are responsible for establishing and maintaining disclosure controls and procedures (as defined in Exchange Act Rules 13a-15(e) and 15d-15(e)) and internal control over financial reporting (as defined in Exchange Act Rules 13a-15(f) and 15d-15(f)) for the registrant and have: |
|
|
|
|
|
|
|
|
|
| |
a) |
Designed such disclosure controls and procedures, or caused such disclosure controls and procedures to be designed under our supervision, to ensure that material information relating to the registrant, including its consolidated subsidiaries, is made known to us by others within those entities, particularly during the period in which this report is being prepared; |
|
|
|
|
|
|
|
|
|
| |
b) |
Designed such internal control over financial reporting, or caused such internal control over financial reporting to be designed under our supervision, to provide reasonable assurance regarding the reliability of financial reporting and the preparation of financial statements for external purposes in accordance with generally accepted accounting principles; |
|
|
|
|
|
|
|
|
|
| |
c) |
Evaluated the effectiveness of the registrant’s disclosure controls and procedures and presented in this report our conclusions about the effectiveness of the disclosure controls and procedures, as of the end of the period covered by this report based on such evaluation; and |
|
|
|
|
|
|
|
|
|
| |
d) |
Disclosed in this report any change in the registrant’s internal control over financial reporting that occurred during the registrant’s most recent fiscal quarter (the registrant’s fourth fiscal quarter in the case of an annual report) that has materially affected, or is reasonably likely to materially affect, the registrant’s internal control over financial reporting; and |
|
|
|
|
|
|
| 5. |
The registrant’s other certifying officer(s) and I have disclosed, based on our most recent evaluation of internal control over financial reporting, to the registrant’s auditors and the audit committee of the registrant’s board of directors (or persons performing the equivalent function): |
|
|
|
|
|
|
|
|
|
| |
a) |
All significant deficiencies and material weaknesses in the design or operation of internal control over financial reporting which are reasonably likely to adversely affect the registrant’s ability to record, process, summarize and report financial information; and |
|
|
|
|
|
|
|
|
|
| |
b) |
Any fraud, whether or not material, that involves management or other employees who have a significant role in the registrant’s internal control over financial reporting. |
|
|
|
Date: February 27, 2026 |
|
| /s/ Bruce M. Bodine |
| Bruce M. Bodine |
| Chief Executive Officer and President |
| The Mosaic Company |
EX-31.2
8
exhibit312_20251231.htm
EX-31.2
Document
Exhibit 31.2
Certification Required by Rule 13a-14(a)
I, Luciano Siani Pires, certify that:
|
|
|
|
|
|
| 1. |
I have reviewed this annual report on Form 10-K of The Mosaic Company; |
|
|
|
|
|
|
| 2. |
Based on my knowledge, this report does not contain any untrue statement of a material fact or omit to state a material fact necessary to make the statements made, in light of the circumstances under which such statements were made, not misleading with respect to the period covered by this report; |
|
|
|
|
|
|
| 3. |
Based on my knowledge, the financial statements, and other financial information included in this report, fairly present in all material respects the financial condition, results of operations and cash flows of the registrant as of, and for, the periods presented in this report; |
|
|
|
|
|
|
| 4. |
The registrant’s other certifying officer(s) and I are responsible for establishing and maintaining disclosure controls and procedures (as defined in Exchange Act Rules 13a-15(e) and 15d-15(e)) and internal control over financial reporting (as defined in Exchange Act Rules 13a-15(f) and 15d-15(f)) for the registrant and have: |
|
|
|
|
|
|
|
|
|
| |
a) |
Designed such disclosure controls and procedures, or caused such disclosure controls and procedures to be designed under our supervision, to ensure that material information relating to the registrant, including its consolidated subsidiaries, is made known to us by others within those entities, particularly during the period in which this report is being prepared; |
|
|
|
|
|
|
|
|
|
| |
b) |
Designed such internal control over financial reporting, or caused such internal control over financial reporting to be designed under our supervision, to provide reasonable assurance regarding the reliability of financial reporting and the preparation of financial statements for external purposes in accordance with generally accepted accounting principles; |
|
|
|
|
|
|
|
|
|
| |
c) |
Evaluated the effectiveness of the registrant’s disclosure controls and procedures and presented in this report our conclusions about the effectiveness of the disclosure controls and procedures, as of the end of the period covered by this report based on such evaluation; and |
|
|
|
|
|
|
|
|
|
| |
d) |
Disclosed in this report any change in the registrant’s internal control over financial reporting that occurred during the registrant’s most recent fiscal quarter (the registrant’s fourth fiscal quarter in the case of an annual report) that has materially affected, or is reasonably likely to materially affect, the registrant’s internal control over financial reporting; and |
|
|
|
|
|
|
| 5. |
The registrant’s other certifying officer(s) and I have disclosed, based on our most recent evaluation of internal control over financial reporting, to the registrant’s auditors and the audit committee of the registrant’s board of directors (or persons performing the equivalent function): |
|
|
|
|
|
|
|
|
|
| |
a) |
All significant deficiencies and material weaknesses in the design or operation of internal control over financial reporting which are reasonably likely to adversely affect the registrant’s ability to record, process, summarize and report financial information; and |
|
|
|
|
|
|
|
|
|
| |
b) |
Any fraud, whether or not material, that involves management or other employees who have a significant role in the registrant’s internal control over financial reporting. |
|
|
|
Date: February 27, 2026 |
|
| /s/ Luciano Siani Pires |
| Luciano Siani Pires |
| Executive Vice President and Chief Financial Officer |
| The Mosaic Company |
EX-32.1
9
exhibit321_20251231.htm
EX-32.1
Document
Exhibit 32.1
Certification of Chief Executive Officer Required by Rule 13a-14(b)
and Section 1350 of Chapter 63 of Title 18 of the United States Code
I, Bruce M. Bodine, the Chief Executive Officer and President of The Mosaic Company, certify that (i) the Annual Report on Form 10-K for the year ended December 31, 2025 of The Mosaic Company fully complies with the requirements of Section 13(a) or 15(d) of the Securities Exchange Act of 1934 and (ii) the information contained in such report fairly presents, in all material respects, the financial condition and results of operations of The Mosaic Company.
|
|
|
| February 27, 2026 |
|
| /s/ Bruce M. Bodine |
| Bruce M. Bodine |
| Chief Executive Officer and President |
| The Mosaic Company |
EX-32.2
10
exhibit322_20251231.htm
EX-32.2
Document
Exhibit 32.2
Certification of Chief Financial Officer Required by Rule 13a-14(b)
and Section 1350 of Chapter 63 of Title 18 of the United States Code
I, Luciano Siani Pires, the Executive Vice President and Chief Financial Officer of The Mosaic Company, certify that (i) the Annual Report on Form 10-K for the year ended December 31, 2025 of The Mosaic Company fully complies with the requirements of Section 13(a) or 15(d) of the Securities Exchange Act of 1934 and (ii) the information contained in such report fairly presents, in all material respects, the financial condition and results of operations of The Mosaic Company.
|
|
|
|
| February 27, 2026 |
|
| /s/ Luciano Siani Pires |
| Luciano Siani Pires |
| Executive Vice President and Chief Financial Officer |
| The Mosaic Company |
EX-95
11
exhibit9520251231.htm
EX-95
Document
Exhibit 95
MINE SAFETY DISCLOSURES
The following table shows, for each of our U.S. mines that is subject to the Federal Mine Safety and Health Act of 1977 (“MSHA”), the information required by Section 1503(a) of the Dodd-Frank Wall Street Reform and Consumer Protection Act and Item 104 of Regulation S-K. Section references are to sections of MSHA.
|
|
|
|
|
|
|
|
|
|
|
|
|
|
|
|
|
|
|
|
|
|
|
|
|
|
|
|
|
|
|
|
|
|
|
|
|
|
|
|
|
|
|
|
|
|
|
|
|
|
|
|
|
|
|
|
|
|
|
|
|
Potash Mine |
|
Florida Phosphate Rock Mines |
Year Ended December 31, 2025 |
|
Carlsbad,
New Mexico
|
|
Four Corners |
|
South Fort Meade |
|
Wingate |
|
South Pasture |
|
Section 104 citations for violations of mandatory health or safety standards that could significantly and substantially contribute to the cause and effect of a mine safety or health hazard (#) |
|
42 |
|
4 |
|
13 |
|
1 |
|
1 |
|
|
Section 104(b) orders (#) |
|
0 |
|
0 |
|
2 |
|
0 |
|
0 |
|
|
Section 104(d) citations and orders (#) |
|
0 |
|
0 |
|
0 |
|
0 |
|
0 |
|
|
Section 110(b)(2) violations (#) |
|
0 |
|
0 |
|
0 |
|
0 |
|
0 |
|
|
Section 107(a) orders (#) |
|
0 |
|
0 |
|
0 |
|
0 |
|
0 |
|
|
Proposed assessments under MSHA (whole dollars) |
|
$538,836 |
|
$17,776 |
|
$30,109 |
|
$1,325 |
|
$1,966 |
|
|
Mining-related fatalities (#) |
|
0 |
|
0 |
|
0 |
|
0 |
|
0 |
|
|
Section 104(e) notice |
|
No |
|
No |
|
No |
|
No |
|
No |
|
Notice of the potential for a pattern of violations under Section 104(e) |
|
No |
|
No |
|
No |
|
No |
|
No |
|
Legal actions before the Federal Mine Safety and Health Review Commission (“FMSHRC”) initiated (#) |
|
3 |
|
0 |
|
0 |
|
0 |
|
0 |
|
|
Legal actions before the FMSHRC resolved (#) |
|
5 |
|
0 |
|
0 |
|
0 |
|
0 |
|
|
Legal actions pending before the FMSHRC, end of period: |
|
|
|
|
|
|
|
|
|
|
|
|
Contests of citations and orders referenced in Subpart B of 29 CFR Part 2700 (#) |
|
0 |
|
0 |
|
0 |
|
0 |
|
0 |
|
|
|
Contests of proposed penalties referenced in Subpart C of 29 CFR Part 2700 (#) |
|
2 |
|
0 |
|
0 |
|
0 |
|
0 |
|
|
|
Complaints for compensation referenced in Subpart D of 29 CFR Part 2700 (#) |
|
0 |
|
0 |
|
0 |
|
0 |
|
0 |
|
|
|
Complaints of discharge, discrimination or interference referenced in Subpart E of 29 CFR Part 2700 (#) |
|
0 |
|
0 |
|
0 |
|
0 |
|
0 |
|
|
|
Applications for temporary relief referenced in Subpart F of 29 CFR Part 2700 (#) |
|
0 |
|
0 |
|
0 |
|
0 |
|
0 |
|
|
|
Appeals of judges’ decisions or orders referenced in Subpart H of 29 CFR Part 2700 (#) |
|
0 |
|
0 |
|
0 |
|
0 |
|
0 |
|
|
|
Total pending legal actions (#) |
|
2 |
|
0 |
|
0 |
|
0 |
|
0 |
|
EX-96.2
12
a2025esterhazysk1300tech.htm
EX-96.2
a2025esterhazysk1300tech

Esterhazy Potash Facility Saskatchewan, Canada Technical Report Summary Esterhazy Potash Facility Technical Report Summary Effective December 31, 2025 CONTENTS 1.0 Executive Summary ................................................................................................................................. 1-1 1.1 Introduction .............................................................................................................................................. 1-1 1.2 Property Location ..................................................................................................................................... 1-1 1.3 Ownership and Status ............................................................................................................................... 1-1 1.4 Mineral Tenure, Surface Rights, Water Rights, Royalties and Agreements ............................................ 1-1 1.5 Geology and Mineralization ..................................................................................................................... 1-2 1.6 Mineral Resource Estimate ...................................................................................................................... 1-3 1.7 Mineral Reserve Estimation ..................................................................................................................... 1-6 1.8 Mining Method ........................................................................................................................................ 1-7 1.9 Recovery Methods ................................................................................................................................... 1-7 1.10 Infrastructure ............................................................................................................................................ 1-7 1.11 Markets and Contracts .............................................................................................................................. 1-8 1.12 Environmental, Permitting and Social Considerations ............................................................................. 1-8 1.13 Capital Cost and Operating Cost Estimates.............................................................................................. 1-8 1.14 Economic Analysis................................................................................................................................... 1-9 1.15 Interpretations and Conclusions ............................................................................................................... 1-9 1.16 Recommendations .................................................................................................................................... 1-9 2.0 Introduction .............................................................................................................................................. 2-1 2.1 Registrant ................................................................................................................................................. 2-1 2.2 Purpose and Terms of Reference ............................................................................................................. 2-1 2.3 Abbreviations and Units ........................................................................................................................... 2-1 2.4 Qualified Persons (QP) ............................................................................................................................ 2-2 2.5 Effective Dates ......................................................................................................................................... 2-3 2.6 Information Sources and References ........................................................................................................ 2-3 2.7 Previous Technical Report Summaries .................................................................................................... 2-3 3.0 Property Description ................................................................................................................................ 3-1 3.1 Introduction .............................................................................................................................................. 3-1 3.2 Property and Title ..................................................................................................................................... 3-2 3.2.1 Mineral Title ........................................................................................................................................ 3-2 3.2.2 Surface Rights ...................................................................................................................................... 3-8 3.2.3 Water Rights ........................................................................................................................................ 3-8 3.2.4 Royalties .............................................................................................................................................. 3-8 3.3 Encumbrances .......................................................................................................................................... 3-8 3.4 Significant Factors and Risks That May Affect Access, Title or Work Programs ................................... 3-8 4.0 Accessibility, Climate, Local Resources, Infrastructure and Physiography ............................................. 4-1 4.1 Physiography ............................................................................................................................................ 4-1 4.1.1 Topography, Elevation and Vegetation ............................................................................................... 4-1 4.2 Accessibility ............................................................................................................................................. 4-1 4.3 Climate ..................................................................................................................................................... 4-3 4.3.1 Climate ................................................................................................................................................. 4-3 4.3.2 Length of Operating Season ................................................................................................................ 4-3 4.4 Infrastructure/Local Resources ................................................................................................................ 4-3 4.4.1 Water ................................................................................................................................................... 4-3 4.4.2 Power and Electricity ........................................................................................................................... 4-3 4.4.3 Natural Gas .......................................................................................................................................... 4-3 4.4.4 Roads and Logistics ............................................................................................................................. 4-3 4.4.5 Personnel ............................................................................................................................................. 4-4 4.4.6 Supplies ............................................................................................................................................... 4-4 5.0 History ...................................................................................................................................................... 5-1 6.0 Geological Setting, Mineralization and Deposit ...................................................................................... 6-1 6.1 Deposit Type ............................................................................................................................................ 6-1 6.2 Regional Geology..................................................................................................................................... 6-1 6.3 Local Geology .......................................................................................................................................... 6-6 6.3.1 Stratigraphy ......................................................................................................................................... 6-6 6.3.2 Stratigraphic Anomalies ...................................................................................................................... 6-7 6.4 Property Geology ..................................................................................................................................... 6-9 6.4.1 Esterhazy Potash Deposit ..................................................................................................................... 6-9 6.4.2 Deposit Dimensions ........................................................................................................................... 6-10 6.4.3 Lithologies ......................................................................................................................................... 6-10 6.4.4 Structure ............................................................................................................................................. 6-12 6.4.5 Mineralization .................................................................................................................................... 6-12 7.0 Exploration ............................................................................................................................................... 7-1 7.1 Exploration ............................................................................................................................................... 7-1 7.1.1 Grids and Surveys ................................................................................................................................ 7-1 7.1.2 Geological Mapping ............................................................................................................................ 7-1 7.1.3 Geochemistry ....................................................................................................................................... 7-1 7.1.4 Seismic Survey Geophysics ................................................................................................................. 7-1 7.1.5 Petrology, Mineralogy and Research Studies ...................................................................................... 7-3 7.1.6 Exploration Potential ........................................................................................................................... 7-3 7.2 Drilling ..................................................................................................................................................... 7-3 7.2.1 Overview ............................................................................................................................................. 7-3 7.2.2 Drilling Supporting Mineral Resource Estimates ................................................................................ 7-3 7.2.3 Drilling Excluded from the Mineral Resource Estimates .................................................................... 7-5 7.2.4 Drill Methods ....................................................................................................................................... 7-9 7.2.5 Geological Logging ............................................................................................................................. 7-9 7.2.6 Recovery ............................................................................................................................................ 7-11 7.2.7 Collar Surveys ................................................................................................................................... 7-11 7.3 Chip Sampling ........................................................................................................................................ 7-11 7.4 QP Interpretation of the Exploration Information .................................................................................. 7-12 8.0 Sample Preparation, Analyses and Security ............................................................................................. 8-1 8.1 Introduction .............................................................................................................................................. 8-1 8.2 Sampling Method ..................................................................................................................................... 8-1 8.2.1 Procedures: Core .................................................................................................................................. 8-1 8.2.2 Quality Control: Core .......................................................................................................................... 8-2 8.2.3 Procedure: In-Mine Chip Samples ....................................................................................................... 8-2 8.2.4 Quality Control: In-Mine Chip Samples .............................................................................................. 8-3 8.3 Sample Preparation .................................................................................................................................. 8-4 8.3.1 Procedures: Core .................................................................................................................................. 8-4 8.3.2 Quality Assurance and Quality Control: Core ..................................................................................... 8-4 8.3.3 Procedures: In-Mine Chip Samples ..................................................................................................... 8-4 8.3.4 Quality Assurance and Quality Control: In-Mine Chip Samples ......................................................... 8-5 8.4 Assaying and Analytical Procedures ........................................................................................................ 8-6 8.4.1 Procedures: Core .................................................................................................................................. 8-6 8.4.2 Quality Assurance and Quality Control: Core ..................................................................................... 8-6 8.4.3 Procedures: In-Mine Chip Samples ..................................................................................................... 8-6 8.4.4 Quality Assurance and Quality Control: In-Mine Chip Samples ......................................................... 8-6 8.5 Sample Security ....................................................................................................................................... 8-7 8.5.1 Core ..................................................................................................................................................... 8-7 8.5.2 In-Mine Chip Samples ......................................................................................................................... 8-7 8.6 Database ................................................................................................................................................... 8-8 8.6.1 Core ..................................................................................................................................................... 8-8 8.6.2 In-Mine Chip Samples ......................................................................................................................... 8-8 8.7 QP Opinion on Sample Preparation, Security and Analytical Procedures ............................................... 8-8 9.0 Data Verification ...................................................................................................................................... 9-1 9.1 QP and Internal Data Verification ............................................................................................................ 9-1 9.2 External Data Verification ....................................................................................................................... 9-2 9.3 QP Opinion on Data Adequacy ................................................................................................................ 9-2 10.0 Mineral Processing and Metallurgical Testing ....................................................................................... 10-1 10.1 Introduction ............................................................................................................................................ 10-1 10.2 On Site Laboratories .............................................................................................................................. 10-1 10.3 Quality Control ...................................................................................................................................... 10-2 10.4 Database and Records ............................................................................................................................ 10-3 10.5 Metallurgical Test Work ........................................................................................................................ 10-3 10.6 Recovery Estimates ................................................................................................................................ 10-3 10.7 Metallurgical Variability ........................................................................................................................ 10-4 10.8 Deleterious Elements ............................................................................................................................. 10-4 10.9 QP Opinion on Data Adequacy .............................................................................................................. 10-4 11.0 Mineral Resource Estimates ................................................................................................................... 11-1 11.1 Introduction ............................................................................................................................................ 11-1 11.2 Key Assumptions ................................................................................................................................... 11-1 11.3 Estimation Methodology ........................................................................................................................ 11-1 11.4 Exploratory Data Analysis ..................................................................................................................... 11-3 11.5 Validation ............................................................................................................................................... 11-3 11.6 Confidence Classification of Mineral Resource Estimate ...................................................................... 11-4 11.7 Reasonable Prospects of Economic Extraction ...................................................................................... 11-5 11.8 Mineral Resource Statement .................................................................................................................. 11-6 11.9 Uncertainties (Factors) That May Affect the Mineral Resource Estimate ............................................. 11-9 12.0 Mineral Reserve Estimates ..................................................................................................................... 12-1 12.1 Introduction ............................................................................................................................................ 12-1 12.2 Key Assumptions ................................................................................................................................... 12-1 12.3 Estimation Methodology ........................................................................................................................ 12-1 12.4 Mineral Reserve Statement .................................................................................................................... 12-2 12.5 Uncertainties (Factors) That May Affect the Mineral Reserve Estimate ............................................... 12-5 13.0 Mining Methods ..................................................................................................................................... 13-1 13.1 Introduction ............................................................................................................................................ 13-1

13.2 Underground Mining and Development Process ................................................................................... 13-1 13.2.1 ROGA (Rotating Ore Grade Analyzer) ............................................................................................. 13-8 13.2.2 Geotechnical Considerations ............................................................................................................. 13-9 13.2.3 Hydrogeological Considerations ...................................................................................................... 13-10 13.3 Mine Design and Operations ................................................................................................................ 13-11 13.3.1 Production Plan/Life of Mine Plan .................................................................................................. 13-11 13.3.2 Planning Assumptions ..................................................................................................................... 13-13 13.3.3 Mining Sequence ............................................................................................................................. 13-14 13.3.4 Blasting and Explosives ................................................................................................................... 13-16 13.3.5 Ventilation ....................................................................................................................................... 13-16 13.3.6 Ore and Waste Handling .................................................................................................................. 13-17 13.3.7 Backfill ............................................................................................................................................ 13-18 13.3.8 Water Management .......................................................................................................................... 13-18 13.3.9 Underground Infrastructure Facilities .............................................................................................. 13-19 13.3.10 Operational Cut-off Grades ............................................................................................................. 13-19 13.3.11 Mine Production Monitoring ........................................................................................................... 13-19 13.3.12 Equipment ........................................................................................................................................ 13-19 13.3.13 Personnel ......................................................................................................................................... 13-20 14.0 Recovery Methods ................................................................................................................................. 14-1 14.1 Introduction ............................................................................................................................................ 14-1 14.2 Flowsheets .............................................................................................................................................. 14-1 14.3 Plant Throughput and Design ................................................................................................................. 14-5 14.3.1 Key Metrics ....................................................................................................................................... 14-5 14.3.2 Equipment Characteristics and Specifications ................................................................................... 14-7 14.3.3 Water and Energy Requirements ....................................................................................................... 14-8 14.3.4 Personnel ......................................................................................................................................... 14-10 15.0 Infrastructure .......................................................................................................................................... 15-1 15.1 Introduction ............................................................................................................................................ 15-1 15.2 Roads and Logistics ............................................................................................................................... 15-5 15.3 Tailings Storage Facilities ...................................................................................................................... 15-5 15.4 Brine Management Structures ................................................................................................................ 15-6 15.5 Built Infrastructure ................................................................................................................................. 15-6 15.6 Power and Electrical .............................................................................................................................. 15-7 15.7 Natural Gas ............................................................................................................................................ 15-7 15.8 Water Supply .......................................................................................................................................... 15-7 16.0 Market Studies and Contracts ................................................................................................................ 16-1 16.1 Markets .................................................................................................................................................. 16-1 16.2 Commodity Price Forecasts ................................................................................................................... 16-1 16.3 Contracts ................................................................................................................................................ 16-2 17.0 Environmental Studies, Permitting and Plans, Negotiations or Agreements with Local Individuals or Groups ................................................................................................................................................... 17-1 17.1 Introduction ............................................................................................................................................ 17-1 17.2 Baseline and Supporting Studies ............................................................................................................ 17-1 17.3 Environmental Considerations/Monitoring Programs ............................................................................ 17-3 17.3.1 Environmental Considerations ........................................................................................................... 17-3 17.3.2 Environmental Monitoring ................................................................................................................ 17-4 17.3.3 Incidents and Releases ....................................................................................................................... 17-6 17.4 Stockpiles ............................................................................................................................................... 17-6 17.4.1 General Waste Management .............................................................................................................. 17-6 17.4.2 Hazardous Substances and Waste Dangerous Goods ........................................................................ 17-6 17.5 Waste Rock Storage Facilities ................................................................................................................ 17-6 17.6 Tailings Storage Facility ........................................................................................................................ 17-6 17.6.1 Tailings Pile ....................................................................................................................................... 17-6 17.6.2 Brine Pond and Flood Containment Pond.......................................................................................... 17-7 17.6.3 Solids and Surface Brine Control ...................................................................................................... 17-7 17.6.4 Deep Well Injection ........................................................................................................................... 17-7 17.7 Water Management ................................................................................................................................ 17-8 17.7.1 Freshwater ......................................................................................................................................... 17-8 17.7.2 Runoff ................................................................................................................................................ 17-9 17.7.3 Wastewater ........................................................................................................................................ 17-9 17.8 Closure and Reclamation Considerations ............................................................................................... 17-9 17.8.1 Decommissioning and Reclamation Guidelines ................................................................................ 17-9 17.8.2 Site Investigation and Reclamation Plan ......................................................................................... 17-10 17.9 Permitting ............................................................................................................................................. 17-14 17.10 Social Considerations, Plans, Negotiations and Agreements ............................................................... 17-14 18.0 Capital and Operating Costs ................................................................................................................... 18-1 18.1 Capital Cost Estimates ........................................................................................................................... 18-1 18.1.1 Basis of Estimate ............................................................................................................................... 18-1 18.1.2 Exclusions for the Capital Cost Estimate ........................................................................................... 18-1 18.1.3 Capital Cost Estimate......................................................................................................................... 18-2 18.2 Operating Cost Estimates ....................................................................................................................... 18-2 18.2.1 Basis of Estimate ............................................................................................................................... 18-2 18.2.2 Mine Operating Costs ........................................................................................................................ 18-3 19.0 Economic Analysis ................................................................................................................................. 19-1 19.1 Methodology Used ................................................................................................................................. 19-1 19.2 Financial Model Inputs, Parameters and Assumptions .......................................................................... 19-1 19.3 Economic Analysis................................................................................................................................. 19-3 19.4 Sensitivity Analysis ................................................................................................................................ 19-5 20.0 Adjacent Properties ................................................................................................................................ 20-1 21.0 Other Relevant Data and Information .................................................................................................... 21-1 22.0 Interpretation and Conclusions ............................................................................................................... 22-1 22.1 Mineral Resources .................................................................................................................................. 22-1 22.2 Mineral Reserves .................................................................................................................................... 22-2 23.0 Recommendations .................................................................................................................................. 23-1 24.0 References .............................................................................................................................................. 24-1 25.0 Reliance on Information Provided by the Registrant ............................................................................. 25-1 TABLES Table 1-1: 2025 Mineral Resources ........................................................................................................................... 1-4 Table 1-2: 2025 Mineral Reserves ............................................................................................................................. 1-6 Table 2-1: List of Units and Abbreviations ............................................................................................................... 2-1 Table 2-2: Qualified Persons ..................................................................................................................................... 2-2 Table 2-3: Reliance on Other Experts ........................................................................................................................ 2-3 Table 3-1: Crown Mineral Leases ............................................................................................................................. 3-4 Table 3-2: Sections and Acreages Owned by the Crown ........................................................................................... 3-4 Table 3-3: Sections and Acreages of Mosaic Owned Mineral Rights ....................................................................... 3-5 Table 3-4: Partial Mineral Rights Area ...................................................................................................................... 3-6 Table 5-1: Esterhazy History Summary ..................................................................................................................... 5-1 Table 5-2: Esterhazy Production History (1962 to 2025) .......................................................................................... 5-3 Table 7-1: Drill Summary Table Supporting Mineral Resource Estimates ............................................................... 7-6 Table 8-1: Digital Photograph Records ..................................................................................................................... 8-2 Table 8-2: Esterhazy Geological Bed Names and Average Thickness ...................................................................... 8-3 Table 10-1: Regular On-Site Laboratory Testing .................................................................................................... 10-1 Table 10-2: Notable Frequency of Samples............................................................................................................. 10-2 Table 10-3: Sample Accuracy and Precision ........................................................................................................... 10-3 Table 11-1: 2025 Mineral Resources ....................................................................................................................... 11-7 Table 12-1: 2025 Mineral Reserves ......................................................................................................................... 12-3 Table 13-1: Development Design Criteria ............................................................................................................... 13-5 Table 13-2: Production Panel Development Design Criteria ................................................................................... 13-8 Table 13-3: 2025 LOM Plan and K4 Resources for Conceptual Purposes ............................................................ 13-12 Table 13-4: Major Mining Equipment ................................................................................................................... 13-20 Table 13-5: Mine Personnel - Current and Forecasted .......................................................................................... 13-20 Table 14-1: K1 Key Processing Plant Metrics ......................................................................................................... 14-6 Table 14-2: K2 Key Processing Plant Metrics ......................................................................................................... 14-6 Table 14-3: Process Plants Equipment .................................................................................................................... 14-7 Table 14-4: Processing Plant Personnel ................................................................................................................. 14-10 Table 15-1: Infrastructure Maintained by Third Parties .......................................................................................... 15-1 Table 16-1: Commodity Prices and Exchange Rates ............................................................................................... 16-2 Table 17-1: Esterhazy Brine Injection License Summary ....................................................................................... 17-7 Table 17-2: Water License Summary ...................................................................................................................... 17-8 Table 18-1: Historical, LOM Plan Project Capital .................................................................................................. 18-2 Table 18-2: Historical and LOM Plan Cash Costs ................................................................................................... 18-4 Table 19-1: Break Even Price Analysis ................................................................................................................... 19-4 Table 25-1: Information Provided by the Registrant ............................................................................................... 25-1 FIGURES Figure 1-1: General Ore Geology .............................................................................................................................. 1-3 Figure 1-2: Location and Distribution of Mineral Resources and Mineral Reserves ................................................ 1-5 Figure 3-1: Location Map .......................................................................................................................................... 3-1 Figure 3-2: Esterhazy Lease Boundaries (KL 105, KL 126, KLSA 003) .................................................................. 3-3 Figure 3-3: 2025 Mineral Rights Location and Status ............................................................................................... 3-7 Figure 4-1: Location and Accessibility ...................................................................................................................... 4-2 Figure 6-1: Regional Geology Plan of the Elk Point Basin (RESPEC 2021) ............................................................ 6-2 Figure 6-2: Regional Central Saskatchewan Stratigraphy ......................................................................................... 6-3 Figure 6-3: Regional Cross Section Illustrating the Stratigraphic Relationships of the Prairie Evaporite Formation (RESPEC 2021) ....................................................................................................................................... 6-5 Figure 6-4: Local Stratigraphy (modified from RESPEC 2021) ............................................................................... 6-6 Figure 6-5: Types of Stratigraphic Anomalies (RESPEC 2021) ............................................................................... 6-7 Figure 6-6: Wash-out Anomaly ................................................................................................................................. 6-8 Figure 6-7: Leach Anomaly ....................................................................................................................................... 6-9 Figure 6-8: General Ore Geology ............................................................................................................................ 6-10 Figure 6-9: Deposit Stratigraphy ............................................................................................................................. 6-11 Figure 7-1: Seismic Surveys ...................................................................................................................................... 7-2 Figure 7-2: Exploration Hole Locations .................................................................................................................... 7-4 Figure 7-3: In-Mine Chip Sample Assay Results and Statistics .............................................................................. 7-12 Figure 8-1: Esterhazy Member Potash Mineralization .............................................................................................. 8-3 Figure 11-1: Location and Distribution of Mineral Resources and Mineral Reserves............................................. 11-8 Figure 12-1: Location and Distribution of Mineral Resources and Mineral Reserves............................................. 12-4 Figure 13-1: Four Rotor Continuous Miner ............................................................................................................. 13-1 Figure 13-2: Production Room Section View .......................................................................................................... 13-2 Figure 13-3: Plan View of a Four Rotor Setup ........................................................................................................ 13-2 Figure 13-4: Section View of a Four Rotor Setup ................................................................................................... 13-2 Figure 13-5: Mining Area Terminology .................................................................................................................. 13-3 Figure 13-6: Mine Development Overview ............................................................................................................. 13-4 Figure 13-7: Configuration for Single Panel Mining ............................................................................................... 13-6 Figure 13-8: Configuration for Multiple Panel Mining ........................................................................................... 13-7 Figure 13-9: Esterhazy Member Potash Mineralization .......................................................................................... 13-9 Figure 13-10: Stratigraphy Above Esterhazy Mining Horizon .............................................................................. 13-11 Figure 13-11: LOM plan Mining Sequence ........................................................................................................... 13-15 Figure 13-12: Surface Fan General Arrangement .................................................................................................. 13-16 Figure 13-13: Four Rotor Set Up ........................................................................................................................... 13-18 Figure 14-1: K1 Processing Plant Flow Sheet ......................................................................................................... 14-1 Figure 14-2: K2 Processing Plant Flow Sheet ......................................................................................................... 14-2 Figure 15-1: Esterhazy K1 Infrastructure Plan ........................................................................................................ 15-2 Figure 15-2: Esterhazy K2 Infrastructure Plan ........................................................................................................ 15-3 Figure 15-3: Esterhazy K3 Infrastructure Plan ........................................................................................................ 15-4 Figure 19-1: Sensitivity Results on NPV ..................................................................... Error! Bookmark not defined. Figure 20-1: Adjacent Properties ............................................................................................................................. 20-2

FORWARD LOOKING INFORMATION CAUTION All statements, other than statements of historical fact, appearing in this report constitute “forward-looking statements” within the meaning of the Private Securities Litigation Reform Act of 1995. Statements regarding results depend on inputs that are subject to known and unknown risks, uncertainties and other factors that may cause actual results to differ materially from those presented in this Report. Information that is forward-looking includes, but is not limited to, the following: • Mineral resource and mineral reserve estimates. • Assumed commodity prices and exchange rates. • Assumed freight charges. • Proposed and scheduled mine production plan. • Projected mining and processing recovery rates. • Capital cost estimates and schedule. • Operating cost estimates. • Closure costs estimates and closure requirements assumptions. • Environmental, permitting and social risk assumptions. Additional risks to the forward-looking information include: • Changes to costs of production from what is assumed. • Unrecognized environmental risks. • Unanticipated reclamation expenses. • Unexpected variations in production tonnage, grade or recovery rates. • Failure of plant, equipment or processes to operate as anticipated. • Accidents, labor disputes and other risks of the mining industry. • Changes to tax rates. Date: December 31, 2025 1-1 1.0 Executive Summary 1.1 Introduction Potash is the generic term used to describe potassium chloride, also known as muriate of potash. It is one of the three primary crop nutrients required for plant growth and is not substitutable. Potash (and other fertilizer products derived from it) provides the overwhelming majority of potassium nutrient worldwide. Potash is mined globally with the most significant mineral reserves and mineral resources deposited in Saskatchewan, Canada. Most potash deposits are a mixture of potassium chloride (KCl), sodium chloride (NaCl) and clay. The Mosaic Company is a leading producer of Canadian potash utilizing underground and solution mining methods. The Esterhazy Potash Facility, located in Saskatchewan, Canada started production at K1 in 1962 and at K2 in 1967. For approximately 60 years it consisted of two interconnected mines, K1 and K2. In 2010, work began to expand the mine into a new area of the potash deposit. The K3 mine is accessed with separate shafts and provides ore to the existing processing plants at K1 and K2 via overland conveyor. Production at the K3 mine began in 2018 and is expected to operate until 2049. The K1 and K2 mines ceased production in June 2021. K4, an area consisting of mineral resources has been scheduled in the 2025 LOM plan after mining depletion of the K3 mineral reserves. The mineral resources are tentatively scheduled to start production in 2045 and expected to last until 2078. The processing plants at K1 and K2 are expected to be accessed via overland conveyors to receive the ore from K4. The 2025 LOM plan for the Esterhazy Potash Facility includes the K3 mineral reserves. The K4 mineral resources are currently scheduled after depletion of the K3 mineral resources. Production is based on an average production rate of 6.7 M finished product tons per year (6.1 M tonnes per year), based on 320 production days per year. Processing for the LOM plan continues at the K1 and K2 processing plants. The Esterhazy mineral resources and mineral reserves are reported with reference to the SEC Regulation S-K, Subpart 1300. 1.2 Property Location The Esterhazy Potash Facility is located in an area overlapping the Rural Municipalities of Fertile Belt, Langenburg and Spy Hill in the province of Saskatchewan, Canada. The K1 Mill is located 9 miles (15 km) northeast of Esterhazy. The K2 Mill is located 12 miles (19 km) east of Esterhazy. The K3 site is located 4 miles (7 km) east of Esterhazy and the K4 mineral resources are located 18 miles (30 km) northeast of Esterhazy. 1.3 Ownership and Status The Esterhazy Potash Facility is 100% owned by Mosaic Potash Esterhazy Limited Partnership, a wholly owned indirect subsidiary of The Mosaic Company. For the purposes of this Report, unless otherwise noted, The Mosaic Company and Potash Esterhazy Limited Partnership will each be referred to interchangeably as Mosaic, as the context requires. 1.4 Mineral Tenure, Surface Rights, Water Rights, Royalties and Agreements Mosaic leases approximately 197,920 acres of mineral rights for the Esterhazy Potash Facility from the Crown under Subsurface Mineral Leases KL 105, KL 126 and KLSA 003. The lease terms are for 21 years, with renewals at Mosaic’s option for additional 21-year lease periods. In addition, Mosaic owns or leases approximately 206,228 acres of freehold mineral rights within the Esterhazy area. All mineral properties owned or leased by Mosaic include the “subsurface mineral” commodity as defined in The Subsurface Mineral Tenure Regulations (Saskatchewan). Date: December 31, 2025 1-2 Mosaic owns approximately 20,059 acres of surface rights in the Esterhazy area. All infrastructure including the processing plant, TMAs (Tailings Management Areas) and overland conveyors are located on Mosaic-owned land. Mosaic-owned land not used for infrastructure is leased for agricultural use. Mosaic holds multiple Water Rights Licenses issued by the Saskatchewan Water Security Agency for the Esterhazy sites. The Licenses are associated with the allocation and withdrawal of ground water and surface water for the sites. The Potash Crown Royalty is payable under The Subsurface Mineral Royalty Regulations, 2017 (Saskatchewan). Mosaic pays royalties that are based on a royalty rate of 3% on the value of the potash produced from Crown mineral lands. Value is determined as the average price realized by the producer in the year, as determined by revenues and sales under The Potash Production Tax Regulations, 1990 (Saskatchewan). Non-crown royalties are also paid based on each individual freeholder ownership at a rate of 3% of the value of potash produced. Value is determined as the average price realized by the producer in the year, as determined by revenues and sales under The Potash Production Tax Regulations, 1990 (Saskatchewan). 1.5 Geology and Mineralization The intracratonic Elk Point Basin is a major sedimentary geological feature in western Canada and the northwestern United States. It contains one of the world’s largest stratabound potash resources. The nature of this type of deposition is largely continuous with predictable depths and thickness. It is estimated to host >5 billion tonnes of ore (Orris, 2014) and is mined at a number of locations, including Mosaic’s Esterhazy potash facility. Saskatchewan potash represents almost 25% of the global potash production due to its relatively low-cost, bulk tonnage mining methods. (Orris, 2014.) The Esterhazy Potash Facility is situated in the eastern extent of what is commonly termed the “Commercial Potash Mining Belt” where potash is mined by conventional underground means. The total thickness of potash beds in the Prairie Evaporate at Esterhazy ranges from approximately 100 to 131 ft. (30 to 40 m) at a depth of approximately 3,100 to 3,800. (950 to 1,150 m). In the Esterhazy area, the Esterhazy, White Bear and Belle Plaine Members are present within the Prairie Evaporite Formation. All mining activity at Esterhazy is contained within the Esterhazy Member. The naming convention at site refers to the beds in the Esterhazy Member as beds 50, 45, 40, 35 and 30 (in ascending order). The highest-grade potash is hosted in Bed 40. It has an average thickness of 4.3 ft. (1.3 m). Figure 1-1 shows the thickness and grades for each of the beds. It is possible to encounter variation in the thickness and grade of these beds, but usually, the normal stratigraphy is present. Date: December 31, 2025 1-3 Figure 1-1: General Ore Geology The potash deposit at Esterhazy is uniform and laterally continuous. Potash mineralization contains sylvinite, a mixture of iron oxide stained halite and sylvite. There are also minor amounts of carnallite and insoluble minerals present. The color of the potash can vary from light orange to deep red rimmed crystals. The mineralization can be locally bedded or massive. The halite and sylvite crystals can range from small to more coarse to large. This is attributed to the conditions during deposition since there has been no alteration to affect grain size. When carnallite is present, it occurs interstitially or as more massive pods that can deteriorate rapidly. Carnallite as a mineral contains KCl, however that material is not recoverable in the existing milling operations. High levels of carnallite can impact flotation performance resulting in lower overall plant recoveries or higher reagent costs. The gamma response from well log data can be converted to indicate the amount of potash in the formation as a %K2O. Gamma Ray Equivalent Calculation (GREC) can be applied to interpret and verify the quality of the ore where core may not be available. The neutron-density log is used to indicate the presence of carnallite. These correlations are possible based on understanding from examination of core. 1.6 Mineral Resource Estimate The mineral resource estimates for the Esterhazy Potash Facility are listed in Table 1-1. Mineral resources are reported exclusive of the mineral reserves. Figure 1-2 shows the distribution of the mineral resources and mineral reserves on the Esterhazy property.

Date: December 31, 2025 1-4 Table 1-1: 2025 Mineral Resources Location Measured Mineral Resources Indicated Mineral Resources Measured + Indicated Mineral Resources Inferred Mineral Resources Tons (M) Tonnes (M) % K2O % Carnallite Tons (M) Tonnes (M) % K2O % Carnallite Tons (M) Tonnes (M) % K2O % Carnallite Tons (M) Tonnes (M) % K2O % Carnallite K4 282 255 23.2 9.8 2,309 2,094 22.8 5.9 2,590 2,350 22.9 6.4 0 0 0 0 Total 282 255 23.2 9.8 2,309 2,094 22.8 5.9 2,590 2,350 22.9 6.4 0 0 0 0 Notes to accompany mineral resource table: 1. Mineral resource estimates were prepared by QP O. Duff, a Mosaic employee. 2. The mineral resources are reported as in-situ mineralization and are exclusive of mineral reserves. 3. Mineral resources have an effective date of December 31, 2025. Mineral resources are reported exclusive of those mineral resources that have been converted to mineral reserves. Mineral resources that are not mineral reserves do not have demonstrated economic viability. 4. Mineral resources are not mineral reserves and do not meet the threshold for mineral reserve modifying factors, such as estimated economic viability, that would allow for conversion to mineral reserves. There is no certainty that any part of the mineral resources estimated will be converted into mineral reserves. 5. Mineral resources assume an underground room and pillar mining method. 6. Mineral resources amenable to underground mining method are accessed via shaft and scheduled for extraction based on a conceptual room and pillar design using the same technical parameters as for mineral reserves. 7. No cut-off grade or value based on commodity price is used to estimate mineral resources. This is because the mining method used at Esterhazy is not grade selective. The potash mineralization is mined on one level by continuous miners following the well-defined and continuous beds of mineralization with relatively consistent grades (Section 11.2). 8. Tonnage measurements are in US Customary and metric units and are rounded to the nearest million tonnes 9. Rounding as required by reporting guidelines may result in apparent summation differences. 10. %K2O refers to the total %K2O of the samples. 11. The percent carnallite refers to the mineral associated with potash ore at Esterhazy (KCl.MgCl3.6H2O). It is considered an impurity. 12. The following KCl commodity prices were used to assess prospects for economic extraction for the mineral resources but are not used for cut-off purposes, 2026-$244/tonne, 2027-$243/tonne, 2028-$224/tonne, 2029-$188/tonne, 2030-$223/tonne and for the LOM plan $251/tonne. 13. A US$/C$ exchange rate of 1.37 was used to assess prospects for economic extraction for the mineral resources but were not used for cut-off purposes. Date: December 31, 2025 1-5 Figure 1-2: Location and Distribution of Mineral Resources and Mineral Reserves Date: December 31, 2025 1-6 1.7 Mineral Reserve Estimation The mineral reserve estimate for the Esterhazy Potash Facility is listed in Table 1-2. Figure 1-2 shows the distribution of the mineral resources and mineral reserves on the Esterhazy property. Mineral reserves are sub-divided into two confidence categories in Regulation S-K 1300, proven and probable. Table 1-2: 2025 Mineral Reserves Location Proven Mineral Reserves Probable Mineral Reserves Total Mineral Reserves % Mining Recovery % Dilution Ore Tons (M) Ore Tonnes (M) % K2O % Carnallite Ore Tons (M) Ore Tonnes (M) % K2O % Carnallite Ore Tons (M) Ore Tonnes (M) % K2O % Carnallite K3 Mine Footprint 134 122 23.2 3.6 48 43 22.9 4.3 182 165 23.1 3.8 33.7% 0% K3 Outside Footprint 42 38 19.2 5.3 304 275 19.6 6.1 345 313 19.6 6.0 27.1% 0% Total 176 159 22.2 4.0 351 319 20.0 5.8 527 478 20.8 5.2 29.0% 0% Notes to accompany mineral reserves table: 1. Mineral reserve estimates were prepared by QP O. Duff, a Mosaic employee. 2. The mineral reserves are based on measured and indicated resources only and are reported as in-situ mineralization. 3. Mineral reserves have an effective date of December 31, 2025. 4. Underground mining standards and design criteria are used to constrain measured and indicated mineral resources within mineable shapes. 5. Only after a positive economic test and inclusion in the LOM plan is the mineral reserve estimate included as mineral reserves. 6. Tonnage measurements are in US Customary and metric units and are rounded to the nearest million tonnes. 7. Rounding as required by reporting guidelines may result in apparent summation differences. 8. %K2O refers to the total %K2O of the samples. 9. The percent carnallite refers to the mineral associated with potash ore at Esterhazy (KCl.MgCl3.6H2O). It is considered an impurity. 10. The following KCl commodity prices were used to assess prospects for economic extraction for the mineral resources but are not used for cut-off purposes, 2026-$244/tonne, 2027-$243/tonne, 2028-$224/tonne, 2029-$188/tonne, 2030-$223/tonne and for the LOM plan $251/tonne. All prices are per finished product tonne. 11. A US$/C$ exchange rate of 1.37 was used to assess economic viability for the mineral reserves but were not used for cut-off purposes. Date: December 31, 2025 1-7 1.8 Mining Method Since mining began in Esterhazy in 1962, a room and pillar mining method has been used to extract the potash. This method consists of mining parallel rooms, separated by left in place pillars. The design of this method has evolved over the years. Current designs are a nominal room length of 6,000 ft. (3,229 m) and width of 66 ft. (20.1m). Geophysical and geological investigations, including 3D seismic surveys, are performed to identify potentially problematic features. Mine engineering incorporates this information into the design of the mine workings and overall mine plans. Ore grade optimization via gamma detection at the mining face is achieved through the use of a Rotating Ore Grade Analyzer (ROGA). The mine production equipment used has evolved over the years. Currently the ore is mined using four Rotor Mining Machines that break up the potash rock as the machines mine through it. These machines discharge the mined ore onto a conveyor system directly behind the mining machine. The ore is then conveyed through a network of conveyors to the shafts, where it is hoisted to surface, then discharged onto the overland conveyors for transport to the processing plants at K1 and K2. The 2025 LOM plan for the Esterhazy Potash Facility includes the K3 mineral reserves and the K4 mineral resources. The LOM plan is based on an average production rate of 6.7 M finished product tons per year (6.1 M tonnes per year), based on 320 production days per year. The K3 mineral reserves are currently in full production. Production from the K3 mineral reserves is expected to ramp down starting in 2045, with mining anticipated to be completed in 2049. Mining of the K4 mineral resources is currently scheduled to commence in 2045, with full production in 2050 and production ending in 2078. 1.9 Recovery Methods The Esterhazy processing plant, or Mill Area, consists of two separate mill facilities, designated as K1 and K2. Each of these mills processes the raw ore feed stock received from the underground mining operations through crushing, separation, screening and compaction unit operations to produce on grade saleable product. The mills utilize online grade analyzers to monitor the process as well as routine samples that are analyzed by the onsite lab. The Mill Area can be broken down into two main functions: the wet end separates potash and salt while the dry end sizes potash for sale. The wet end of the mill begins with raw ore sizing and crushing to prepare it for the separation processes. In heavy media the larger size fraction is separated into potash and salt through dense media separation that is driven by differences of buoyancy in salt and potash. Flotation receives the smaller size fraction and has specific reagents added that allow the potash crystals to float while the salt is rejected as tailings material. At K2 there is also a crystallizer circuit that produces potash using solubility, temperature and pressure differences. Dewatering and drying is the final stage in the wet end where potash is sent through centrifuges and industrial driers to remove all moisture. Once the product is dried it is sent to screen to separate right sized material from the over and undersize material for all the different product grades. Oversize material is sent through a crushing circuit to break it down to right sized material. The undersize material is upgraded through compaction to a larger product. The site’s ability to produce at the increasing rates being forecasted in the LOM plan is based on production plans and supported by equipment design capacities and capacity proving runs and also include the capacity added by a newly commissioned Hydrofloat flotation circuit. 1.10 Infrastructure The Esterhazy Potash Facility is situated in close proximity to relevant existing infrastructure. The TransGas natural gas pipelines pass through the area, the Cutarm Reservoir is located 1.5 miles (2.0 km) from the K2 plant site and the K1 site is located over the Upper Dundurn aquifer. The sites are located in an agricultural zone with associated population centers and serviced by nearby rail lines.

Date: December 31, 2025 1-8 The Esterhazy Potash Facility has the infrastructure in place to meet the current production plans and 2026 LOM plan production goals. The current infrastructure includes major road and highway access, railway support from Canadian National and Canadian Pacific railways, SaskPower supplied electricity, TransGas supplied natural gas and water supplied from local fresh water sources. Additional infrastructure may be added to increase reliability of the existing product lines or add additional production flexibility. The assets currently in place are maintained through a robust workflow process that focuses on proactive inspections and preventative maintenance while trying to minimize reactive maintenance. Looking to the future, the site is projected to continue to operate effectively while continuing to maintain the built infrastructure and renewing the long-term agreements in place for the site’s water, electricity, natural gas and logistics needs. The long-term Tailings Management Area Development Plan is being revised to support the production at the levels indicated in the 2026 LOM plan. A focus on reliability centered maintenance will extend the life of the majority of assets to align with the 2026 LOM plan. It is expected that some infrastructure will need to be replaced as it reaches end of life and this has been factored into the capital cost requirements and planned. 1.11 Markets and Contracts The Esterhazy Potash Facility produces several specifications of potash that are primarily sold into the crop nutrient (to be utilized as fertilizer) market, domestically, defined as the U.S. and Canada, as well as export markets. The conventional mining and milling practices at Esterhazy result in a potash product with a grade of ~60% K2O. This is the typical nutrient specification of most potash operations worldwide. Esterhazy produces a combination of granular and standard grade products – i.e., the potash is marketed either in its standard form as produced at the mill or compacted at the mill and sold as a granular product. Potash prices vary due to this differing physical sizing of the product, with a price premium ascribed to granular (blend) grade product versus standard grade product. The global market for potash is estimated to be approximately 70 M tonnes in 2025 and has grown at a compound annual growth rate of around 2.5% over the past 30 years. In other words, potash demand over the long term has been rather linear, though with significant year-to-year variability. Going forward, global potash demand growth is expected to continue this trend, with Mosaic and independent analysts projecting a growth rate of >2% per annum. This growth provides sufficient market demand for continued production at the Esterhazy Potash Facility. 1.12 Environmental, Permitting and Social Considerations All potash facilities and processing plants operate pursuant to federal, provincial and local environmental regulations. Accordingly, permits, licenses and approvals are obtained specific to each site, based on project specific requirements. Mosaic also has routine interactions with government officials and agencies related to agency inspections, permitting and other environmental matters. The information as supplied regarding the management of all environmental aspects, permitting and social considerations at Mosaic facilities is guided by Mosaic’s Environmental, Health and Safety Policy, the Mosaic Management System Program and Procedures and current regulatory requirements. 1.13 Capital Cost and Operating Cost Estimates The capital cost estimates include mine, processing plant, loading, maintenance, mobile equipment, land management and regulatory capital. The total capital cost for the 2025 LOM plan (2026 to 2049) and 2025 mineral reserves is estimated at US$2,230 M. The Esterhazy mining cash costs, processing cash costs, Central and Functional Overhead indirect allocated costs, selling, general and administrative costs and taxes and other non-production costs include Canadian Resource Taxes, Canadian Income Taxes and any other non-production costs are estimated at US$11,869 M for the 2025 mineral Date: December 31, 2025 1-9 reserves and LOM plan. The operating cost forecasts are based on a combination of historical performance and calculations from first principles to take account variation in production rates and expected process improvements. 1.14 Economic Analysis The minimum sale price needed to achieve an after-tax net present value equal to zero (USD $0) was calculated. Such Life of Mine (LOM) price identified, if met, will provide a return on a present value equivalent to the current cost of capital. This is referred to as the “Internal Transfer Price” or ITP. If ITP < LOM price, then the operation is profitable. The greater the difference between those two values the more profitable it is. If ITP > LOM price, then the operation is not profitable. The ITP and LOM price do not influence each other, they are simply two values used for comparison. ITP depends on actual costs and LOM price depends on market conditions (Refer to Section 16.0). With an ITP of $104 USD and a projected of LOM price of $251 USD, the economic prospects for the Esterhazy operation are robust. The discount rate associated with this analysis is 11.4%. 1.15 Interpretations and Conclusions Under the assumptions and technical data outlined in this Technical Report Summary, the Esterhazy Potash Facility LOM plan utilizing K3 mineral reserves only, yields a robust margin between internal transfer price and projected potash sales price. These economic assessments support the 2025 SEC Regulation S-K, Subpart 1300 disclosure of the Esterhazy Potash Facility mineral resource and mineral reserve estimates. 1.16 Recommendations The following recommendations for additional work are focused on improving and maintaining important mineral resource and mineral reserve processes and estimates. • The Land and Minerals team will continue to align with the LOM plan to provide timely acquisition of surface and mineral rights as required. • Mosaic should continue to investigate and consider new innovations in mining and processing technology. • The global density estimate has been based on a subset of the exploration data. Additional study based on in- mine sampling could be completed to increase confidence. • A thorough production reconciliation process will continue to be refined to improve and support the mineral resource and mineral reserve estimates. • Modeling software is being used and will be considered for mineral resource estimates as the models are refined and validated. • Continue duplicate analysis comparing results from the internal metallurgical lab with those from a third- party analytical lab. • Continue to update and maintain the geological databases. • Continual evaluation and QA/QC of chip sampling program with a third-party sample analysis to verify the accuracy of the current in-mine chip sampling. Date: December 31, 2025 1-10 • Continue review of the GREC calculation applied at Esterhazy to include all exploration drilling. Future coring should be assayed to confirm that the GREC calculation applied at Esterhazy is sufficient for estimating the mineral reserves and mineral resources. • Additional 3D seismic data should be collected and processed in strategic areas so that there is continuity of available data for mine planning. • The seismic model supporting the mineral resource and mineral reserve estimates will continue to develop and improve as seismic data collection and interpretation improves. Date: December 31, 2025 2-1 2.0 Introduction 2.1 Registrant The 2025 Esterhazy Potash Facility Technical Report Summary has been prepared by the Esterhazy Qualified Persons for The Mosaic Company, headquartered in Tampa Florida, USA. 2.2 Purpose and Terms of Reference The Report was prepared to support the mineral resource and mineral reserve estimates for the year ending December 31, 2025. The mineral resources and mineral reserves are reported in accordance with SEC Regulation S-K, Subpart 1300. Where practicable, measurement units used are US Customary units with metric unit conversions included. US Customary units are used in this Report when discussing the mining and processing facilities, including equipment capacities, pumping rates and equipment capacities. Some analytical results are also reported using US Customary units. Unless otherwise noted, monetary units are in United States dollars (US$). 2.3 Abbreviations and Units Table 2-1: List of Units and Abbreviations 3D Three dimensional AER Annual Environmental Report AFIA American Fertilizer Industry Association AOI areas of interest ATO Approval to Operate Pollutant Control Facilities Avg average API An API unit is a unit of radioactivity used for measuring natural gamma rays in the ground BOL Bill of Lading °C degree Celsius C$ Canadian dollar(s) CBL Cement Bond Log) cdam Cubic decameter CFIA Canadian Fertilizer Industry Association cm centimeter CNSC Canadian Nuclear Safety Commission COPC constituents of potential concern CRF Combined Return Flow Crown The Province of Saskatchewan CS cluster sites D & R Decommissioning and Reclamation DDR Discharge Reporting EA Environmental Assessment EIA Environmental Impact Assessment EIS Environmental Impact Statement El elevation EM electromagnetic EPA Environmental Protection Agency EPCM Engineering, Procurement and Construction Management EPP Environmental Protection Plan °F degree Fahrenheit Fcast. Forecast FOS Factor of Safety ft. foot, feet ft2 square feet, foot ft3 Cubic foot g/L grams per litre gal US gallon GJ giga joules gm gram(s) US gpm US gallon per minute GREC Gamma Ray Equivalent Calculation ha hectare hp horsepower hr hour(s) HREM High resolution electromagnetic IEC International Electrotechnical Commission IRR internal rate of return ISO International Standards Organization

Date: December 31, 2025 2-2 K2O Potassium Oxide, K2O = 0.6317 x KCl. KCl Potassium Chloride kcfm 1,000 cubic feet per minute kg kilogram km kilometer(s) kV kilovolt kVA kilovolt x amps kW kilowatt kWh kilowatt hour kWh/t kilowatt hour per ton lbs. pound(s) LOM Life of Mine m meters M million(s) MCC Motor Control Center MD Measured Depth MER Ministry of Energy and Resources mg/drm3 milligrams per dry reference cubic meter. MOE Ministry of Environment MRMR Mineral Resources, Mineral Reserves MVA mega volt amp MW mega watt NPV net present value OCHL Original Cased Hole Log P. Eng. Professional Engineer P. Geo. Professional Geoscientist PCB Polychlorinated biphenyls PLS Product Loading System ppm parts per million psi pounds per square inch psi, g Pounds per square inch gauge pressure QA Quality assurance QC Quality control QCL Quality Control Lab QP Qualified Person SAP Enterprise software to manage business operations and customer relations SEC U.S. Securities and Exchange Commission SGS Inspection, verification, testing and certification company TMA Tailings Management Area tonnes metric tonnes (2,204 lbs.) tons US Customary short tons (2,000 lbs.) tons/hour tons per hour (US) tons/year tons per year (US) tpd tons per day (US) TVD True Vertical Depth US$ United States dollar(s) V volt(s) W watt(s) wt.% weight percent Yr. year(s) 2.4 Qualified Persons (QP) Table 2-2 outlines the people that served as Qualified Persons (QPs) for the Esterhazy Potash Facility Technical Report Summary as defined in SEC Reg. S-K, Subpart 1300. Table 2-2: Qualified Persons QP Name Company Qualification Position/Title Site Visit/ Inspection Dates Section(s) of Responsibility David Vaughn The Mosaic Company P.Eng. Senior Manager Mine Engineering Full Time on-site employee 3 Oryan Duff The Mosaic Company P. Geo. Sr. Geologist Full time on-site employee 6, 11, 12 Monica Tochor The Mosaic Company P. Geo. Manager Geology and Reserves Full time on-site employee 7, 8, 9 Grant Shaver The Mosaic Company P. Eng. Senior Manager Process Engineering Full time employee 10, 14, 16, 18, 19 Scott McMillen The Mosaic Company P. Eng. Engineering Manager Full time on-site employee 13 Jason Polvi The Mosaic Company P. Eng. Superintendent Engineering, Mechanical Integrity Full time on-site employee 15 Aimee Ottenbreit The Mosaic Company P. Eng. Environmental Engineer Lead March 25, 2025 17.1, 17.2, 17.3, 17.4, 17.5, 17.7, 17.8, 17.9, 17.10,17.11 Date: December 31, 2025 2-3 QP Name Company Qualification Position/Title Site Visit/ Inspection Dates Section(s) of Responsibility Lorelei Duke The Mosaic Company P. Eng. Senior Manager, Geotechnical Engineering and Planning August 25, 2025 17.3, 17.6, 17.8 2.5 Effective Dates There are a number of effective dates: • Date of the mineral resource estimates: December 31, 2025. • Date of the mineral reserve estimates: December 31, 2025. • Date of supply of the last information on mineral tenure and permitting: December 2025. • Date of capital estimation: September 2025. • Date of operating cost estimation: September 2025. • Date of reclamation cost estimate: December 2025. • Date of market analysis: February 2025. • Date of economic analysis: December 2025. The overall effective date of the Report is taken to be the date of the mineral resource and mineral reserve estimates and is December 31, 2025. 2.6 Information Sources and References The reports and documents listed in Table 2-3 and Section 24.0 (References) of this Report were used to support the preparation of the Report. Table 2-3: Reliance on Other Experts Expert Title Topic Date Received RESPEC GREC evaluation – Farfield Include gamma derived grades 2021 Tetra Tech Inc. (formerly RPS Energy Canada Ltd.) 2015 K3 3D Final Interpretation Report 3D seismic review to support mineral reserves estimate 2015 2.7 Previous Technical Report Summaries The previous Technical Report Summary for the Esterhazy Potash Facility was December 31, 2021. Date: December 31, 2025 3-1 3.0 Property Description 3.1 Introduction The Esterhazy Potash Facility is located in an area overlapping the Rural Municipalities of Fertile Belt, Langenberg and Spy Hill in the province of Saskatchewan, Canada. (Figure 3-1). The K1 site is located 9 miles (15 km) northeast of Esterhazy. The K2 site is located 12 miles (19 km) east of Esterhazy. The currently active K3 site is located 4 miles (7 km) east of Esterhazy and the K4 mineral resources are located 18 miles (30 km) northeast of Esterhazy. The geographic coordinates for K1 are latitude 50.726463 N and longitude -101.933506 W. The K2 coordinates are latitude 50.6574 N and longitude -101.8422 W and the K3 coordinates are latitude 50.64623 N and longitude - 101.99346 W. Figure 3-1: Location Map Date: December 31, 2025 3-2 3.2 Property and Title 3.2.1 Mineral Title In Saskatchewan, the Dominion Land Survey is the method used to divide the province into one-square-mile (2.6 sq. km) sections for land grid purposes. Township lines are established six miles (9.7 km) apart from south to north starting at the U.S. border and range lines are established six miles (9.7 km) apart east to west starting at key meridians aligned with lines of longitude. This frames a six mile by 6 mile (9.7 by 9.7 km) township grid, containing 36 one square mile (approximately 640 acre) sections. Sections are further subdivided into 160 acre quarter sections and can be again subdivided into 40 acre legal subdivisions (LSD). In Saskatchewan, Information Services Corporation (ISC), a registry and information management services company, provides land title management services for all surface and mineral properties on behalf of the Province of Saskatchewan. Saskatchewan land titles registry can be accessed at isc.ca. Subsurface mineral rights are subject to separate ownership and title from surface mineral rights. Mosaic, through its wholly-owned indirect subsidiary Mosaic Potash Esterhazy Limited Partnership, leases 197,940.75 acres of mineral rights from the Crown under Subsurface Mineral Leases KL 105, KL 126 and KLSA 003 (Figure 3-2). Table 3-1 outlines additional information regarding the three Crown leases. Table 3-2 outlines the total acreage of the Crown leases split by township and range. The Esterhazy Crown lease terms are for a period of 21 years, with renewals at the Company’s option for successive 21-year periods. In addition, Mosaic owns or leases 212,890.71 acres (86,153.95 ha) of freehold mineral rights (Figure 3-3) within the Esterhazy area (Table 3-3). All mineral titles owned or leased by Mosaic include “subsurface minerals”, which under The Subsurface Mineral Tenure Regulations (Saskatchewan) means all natural mineral salts of boron, calcium, lithium, magnesium, potassium, sodium, bromine, chlorine, fluorine, iodine, nitrogen, phosphorus and sulfur and their compounds, occurring more than 60 m below the surface of the land. Other commodities (e.g., petroleum and natural gas, coal, etc.) may be on mineral titles Mosaic leases or owns but are not specifically sought after when acquired. Within the total acreage leased from the Crown or owned/leased by Mosaic are parcels of land where Mosaic owns or leases less than a 100% share of the mineral rights. To potentially mine these properties, Mosaic will need to acquire 100% control either by lease or ownership. Acres currently not mineable due to less than 100% control are shown in Table 3-4.

Date: December 31, 2025 3-3 Figure 3-2: Esterhazy Lease Boundaries (KL 105, KL 126, KLSA 003) Date: December 31, 2025 3-4 Table 3-1: Crown Mineral Leases Crown Lease Number Type Area (ha) Expiration Date KL 105 Subsurface Mineral Lease 26,197.81 October 31, 2044 KL 126 Subsurface Mineral Lease 28,473.06 October 25, 2026 KLSA 003 Subsurface Mineral Lease 25,432.92 November 18, 2030 Table 3-2: Sections and Acreages Owned by the Crown Township/Range Sections of Mineral Rights Owned by Crown* Area of Mineral Rights Owned by Crown (acres) 19/30 19-2/16 12,221.33 20/30 18-1/16 11,541.89 21/30 18-6/16 11,752.78 22/30 2-1/16 1,331.05 19/31 18-1/16 11,561.32 20/31 19-3/16 12,264.88 21/31 13-7/16 8,613.35 22/31 15-15/16 10,238.25 18/32 5-7/16 3,470.88 19/32 18-15/16 12,116.02 20/32 14-11/16 9,388.00 21/32 17-2/16 10,969.57 22/32 4-6/16 2,798.88 18/33 5-12/16 3,661.78 19/33 10-11/16 6,849.92 20/33 11-7/16 7,326.00 21/33 8-5/16 5,313.21 22/33 1-6/16 878.14 18/1 15-9/16 9,969.15 19/1 15-14/16 10,157.53 20/1 16-7/16 10,533.41 21/1 14-6/16 9,207.34 22/1 4-3/16 2,668.21 19A/1 2-12/16 1,761.70 18/2 6-1/16 3,865.46 19/2 4-13/16 3,083.28 19A/2 1-12/16 1,130.17 Total 309-4/16 194,763.50 *Full sections range from 640 acres to 644 acres; total acreage shown above is based on 640 acres per section where actual survey acreage is not available. Date: December 31, 2025 3-5 Table 3-3: Sections and Acreages of Mosaic Owned Mineral Rights Township/Range Sections of Mineral Rights Owned/ Leased by Mosaic* Area of Mineral Rights Owned/Leased by Mosaic (acres) 19/30 17-14/16 11,420.16 20/30 19-7/16 12,430.39 21/30 18-8/16 11,821.53 19/31 16-13/16 10,760.43 20/31 17-13/16 11,388.77 21/31 23-6/16 14,954.27 22/31 4-7/16 2,846.02 18/32 4-15/16 3,167.59 19/32 18-8/16 11,842.69 20/32 22-12/16 14,553.00 21/32 19-12/16 12,623.64 22/32 4-8/16 2,868.44 18/33 5-14/16 3,764.03 19/33 10-6/16 6,631.30 20/33 9-8/16 6,087.17 21/33 12-10/16 8,075.09 22/33 2-3/16 1,390.29 18/1 2-8/16 1,582.66 19/1 18-14/16 12,084.41 19A/1 4-15/16 3,177.08 20/1 20-8/16 13,133.70 21/1 21-7/16 13,707.29 22/1 9-15/16 6,342.55 18/2 2-9/16 1,630.85 19/2 10-4/16 6,579.42 19A/2 2-2/16 1,365.26 Total 322-4/16 206,228.04 *Full sections range from 640 acres to 644 acres; total acreage shown above is based on 640 acres per section where actual survey acreage is not available. Date: December 31, 2025 3-6 Table 3-4: Partial Mineral Rights Area Township/Range Crown Mineral Rights Leased by Mosaic, Currently Not Mineable (acres)* Mineral Rights Owned/Leased by Mosaic, Currently Not Mineable (acres)* 21/30 320.95 20/31 80.40 21/31 80.43 22/31 80.23 513.85 21/32 321.08 21/33 74.29 18/1 149.55 19/1 1209.02 137.54 19A/1 322.31 20/1 220.96 21/1 80.04 159.44 18/2 160.06 19/2 160.59 19A/2 60.83 Total 3,246.44 885.12 *Less than 100% share of a mineral rights parcel.

Date: December 31, 2025 3-7 Figure 3-3: 2025 Mineral Rights Location and Status Date: December 31, 2025 3-8 3.2.2 Surface Rights Surface rights are subject to separate ownership and title from subsurface mineral rights. At Esterhazy, Mosaic owns 20,059.39 acres (8,117.74 ha) of surface rights. All material infrastructure including the processing plants, TMA (tailings management area), cluster sites and pipeline rights of way are located on Mosaic owned land. Owned land not used for infrastructure is leased for agricultural use. 3.2.3 Water Rights Mosaic holds multiple Water Rights Licenses issued by the Saskatchewan Water Security Agency for the Esterhazy sites. The Licenses are associated with the allocation and withdrawal of ground water and surface water for the sites. 3.2.4 Royalties Mosaic pays the Potash Crown Royalty under The Subsurface Mineral Royalty Regulations, 2017(Saskatchewan) on all potash produced from Esterhazy Crown mineral lands. Royalties are based on a royalty rate of 3% on the value of potash produced from Crown mineral lands. Value is determined as the average price realized by the producer in the year, as determined by revenues and sales under The Potash Production Tax Regulations, 1990 (Saskatchewan). Non-crown royalties are also paid based on each individual freeholder ownership at a rate of 3% of the value of potash produced. Value is determined as the average price realized by the producer in the year, as determined by revenues and sales under The Potash Production Tax Regulations, 1990 (Saskatchewan). 3.3 Encumbrances There are no other significant encumbrances, including permitting requirements (existing or anticipated in the future) associated with the Esterhazy Potash Facility. Except for royalties, Mosaic does not anticipate any future significant encumbrances based on current known regulations and existing permitting processes. There are no outstanding violations and fines. 3.4 Significant Factors and Risks That May Affect Access, Title or Work Programs Surface rights acquisition is important for the continued operation of the Esterhazy Potash Facility. All surface rights in the Esterhazy area are privately owned, so Mosaic is required to negotiate land purchases for any infrastructure requirements. Although successful to date in the history of operation of the mines, there is a risk that at some point in the future Mosaic may not be able to acquire the surface land it requires. Approximately 98.5% of mineral rights in the Esterhazy lease area are controlled. Any inability to acquire the remaining 1.5% would not be a significant risk to the LOM plan. Date: December 31, 2025 4-1 4.0 Accessibility, Climate, Local Resources, Infrastructure and Physiography 4.1 Physiography 4.1.1 Topography, Elevation and Vegetation Overall, the Esterhazy lands consist of flat, cleared farmland with a knob-and kettle topography and occasional rows of trees planted to serve as windbreaks. The area was settled by farmers beginning in the late-1880s after the arrival of the Canadian Pacific Railway (CP) and is primarily crop land used to grow wheat, canola, canary seed and flax, although there are scattered pastures and grazing lands. 4.2 Accessibility The Esterhazy Property is located in east central Saskatchewan approximately 20 km south of Highway #16 and 50 km north of Highway #1, the two major east-west transportation routes in the province. Figure 4-1 shows the Esterhazy Facility area railways and major roadways. Date: December 31, 2025 4-2 Figure 4-1: Location and Accessibility

Date: December 31, 2025 4-3 4.3 Climate 4.3.1 Climate The climate is typical of the Canadian prairies and consists of a winter period (November-March) of snow with a mean temperature of -11°C and a warm 15° to 35°C summer period (June to early September) with moderate precipitation. Spring (April to May) and autumn (late-September to October) are cool with precipitation in the form of rain and occasional snow. Exploration operations and construction of the processing plant and other surface facilities are limited by weather conditions during the spring and fall periods when soft ground conditions due to thawing and/or precipitation create difficulties in moving heavy machinery. During the winter and summer months, access is largely restricted only by local conditions, periodic rains or snowfalls, or environmentally sensitive ground conditions. 4.3.2 Length of Operating Season The length of the operating season for the Esterhazy Potash Facility is the full year. Esterhazy operates for an average 365 days per year, including maintenance and production activities. 4.4 Infrastructure/Local Resources 4.4.1 Water The water source for the K1 processing plant is a set of three approximately 200 ft. (61 m) deep wells drilled into the upper Dundurn aquifer. These wells supply process and potable water. The K2 processing plant water supply comes from the Cutarm Creek dam reservoir, owned and operated by Mosaic. Located 1.5 miles (2.4 km) northeast of the K2 shaft, the dam forms a reservoir approximately 5.25 miles (8.5 km) long and 650 ft. (200 m) wide. K3 water is supplied from K2 via a 7.4 mile (11.8 km) long pipeline. 4.4.2 Power and Electricity The power required to operate the Esterhazy Potash Facility is supplied by the provincial utility, SaskPower. The K1 site is serviced by a 72 kV line with approximately 36 MVA capacity. The K2 site has two services at 72 kV and 138 kV respectively, with a combined capacity of 125 MVA. K3 is serviced by a 230 kV line from SaskPower with 140 MVA capacity. Two transformers step down the voltage, each rated at 70 MVA. 4.4.3 Natural Gas TransGas pipelines provide an uninterrupted supply of natural gas to the Esterhazy Potash Facility. Esterhazy has regulator stations for the natural gas at each of the sites, with a low-pressure distribution piping network. 4.4.4 Roads and Logistics The Esterhazy Potash Facility consisting of the K1, K2 and K3 sites, is located in east central Saskatchewan approximately 32 miles (20 km) south of highway #16 and 31 miles (50 km) north of highway #1, the two major east- west transportation routes in the province. The K1 and K2 sites are serviced by the Canadian National Railway main line and by spur lines to the Canadian Pacific Railway. The surrounding area is developed for agriculture, with the required road network, villages and towns. Date: December 31, 2025 4-4 Regina International Airport is 140 miles (225 km) by highway west of the Esterhazy mine sites, while Yorkton municipal airport is 55 miles (90 km) to the northwest. The Town of Esterhazy maintains a paved 3,000 ft. (914 m) long airstrip, located 8 miles (13 km) southwest of K1. 4.4.5 Personnel The Esterhazy Potash Facility is located within ten miles (16 km) to the east of the Town of Esterhazy. They are 56 miles (90 km) southeast of the city of Yorkton and 137 miles (220 km) east of the city of Regina, the provincial capital. In addition, there are a number of towns and villages within a 31-mile (50 km) radius, including Gerald, Churchbridge, Langenburg, Bredenbury, Saltcoats and Stockholm. Esterhazy and Yorkton local areas have a combined population of approximately 40,000 people. The Esterhazy workforce lives throughout the area, including rural and farm properties, generally within 62 miles (100 km) of the mine sites. This includes the Russell and Binscarth areas of western Manitoba. Education and healthcare facilities are located in Esterhazy, Russell, Melville and Yorkton. Yorkton Regional Hospital is a large modern facility serving the east central Saskatchewan region. 4.4.6 Supplies The province of Saskatchewan offers a large variety of suppliers for the potash mine operators. The potash industry in Saskatchewan is very mature making it easier to attract vendors to support the needs of the various mine sites throughout the province. Trade associations, notably the Saskatchewan Mining Association, the Saskatchewan Ministry of Trade and Export Development and the Saskatchewan Industrial and Mining Suppliers Association, put on an annual Supply Chain Forum for vendors and potash producers. Saskatoon and Regina have large industrial sectors with a variety of machine shops and industrial support services. Some specialty services are provided from Alberta or Manitoba. The Mosaic Company procurement team focuses on setting up longer term contracts with vendors to ensure an uninterrupted supply of required resources for the site is maintained. Several large industrial supply vendors have established branches in Esterhazy to provide services to Mosaic. Small steel fabricators and machine shops located in Esterhazy, Rocanville, Yorkton and surrounding area provide custom fabrication and repair services. Date: December 31, 2025 5-1 5.0 History Table 5-1: Esterhazy History Summary Date Event/Activity 1928 Discovery of evaporites in the sedimentary sequence in Saskatchewan. 1943 Discovery of potash in the evaporite bed. 1955 International Minerals and Chemicals (IMC, Canada) Ltd. acquired >500,000-acre lease in Esterhazy area and started drilling. 1957 IMC Corporation begins shaft sinking at the K1 mine site in Yarbo. 1961 The K1 Shaft sinking successfully advanced through the water bearing Blairmore Formation. 1962 The K1 shaft sinking was completed and the K2 site development started in the town of Gerald. The first official K1 mine production started September at a capacity of 1.0 M tons/year. 1965 K2 Tailings Management Area (TMA) Phase I Expansion. 1966 The K1 mine capacity was expanded to 1.6 M tons/year. 1967 The K2 shaft sinking was completed to a capacity of 2.6 M tons/year. The first potash production from K2 was in April/May. 1968 The K2 Tailings Management Area (TMA) Phase II Expansion was completed. 1974 K2 Mill Expansion, heavy media circuit. 1978 IMC had a reserve and production agreement with Amax Potash. In January 1978, the Saskatchewan Government under Potash Company of Saskatchewan purchased the AMAX agreement (part of the Govt Deal in Obtaining Sask Potash). 1981 The K2 Tailings Management Area (TMA) Phase III Expansion was completed. 1985 Inflow 10B was detected December 29, 1985 in the D400 entry at a point 3.5 miles (5.6 km) southwest of the K2 shaft. Initial inflow was estimated to be 1,000 gpm. Information obtained using seismic surveys allowed for targeted drilling and placement of calcium chloride and various grouts to reduce the inflow to manageable levels. The pumping capacity was increased through a series of stages to bring online a total of 22 pumps, to a maximum capacity of 4,000 gpm. As a result of these efforts, K1 and K2 sites continued normal mining operations. 1987 Mineral Resource Location Study – Vibroseis Study was completed. 1989 12 exploration drill holes to delineate the K1 and K2 mining area were completed. 1991 3D seismic survey (3 sq. mile) in the Gerald area. 1992 2D seismic survey (67.5 sq. km) in the Gerald West area. 1995 2D seismic survey (81 sq. km) in the Cutarm area. 1996 Ownership changed to IMC Kalium in a stock exchange for Vigoro Corp. 1997 IMC Kalium Merged with IMC Global and Freeport-McMorRan. 1998 2D seismic survey (191 sq. km) NE of Cutarm ‘95, West of Gerald 3D, SE of Gerald West 2D areas. 1999 Company renamed to IMC Potash. 2000 2D seismic survey at (75 km) East of Cutarm 1995 area, East of K1 and K2. 3D seismic survey (37 sq. km) east of Cutarm Creek, 3 miles (5 km) north-east of K2, 5 km east of K1. 2001 3D seismic survey (13 sq. km), south of Gerald 1991 3D area. 2002 3D seismic survey completed at Q Block, S Block (44 km) and T Block (25 sq. km). 2003 3D seismic surveys completed at V Block (56.7 sq. km) and W Block (28 sq. km). 2004 Mosaic Company was formed from a merger between IMC Global and Cargill Crop Nutrition, 2005 3D seismic surveys completed at K1 (19.5 sq. km) and K2 (10.3 sq. km). 2006 3D (31.5 sq. km) and 2D (10.3 sq. km) seismic surveys were completed at K2. An Esterhazy plant expansion added an additional 1.116 M tonnes/year. Inflow 13D was detected. Source was located with a seismic survey. Drilling and grouting began in February 2007 to control the inflow. Completion of a hoist expansion at K2. Date: December 31, 2025 5-2 Date Event/Activity 2007 3D (46.8 sq. km) seismic survey completed at K2. A Canpotex proving run was successfully completed increasing the site nameplate processing plant capacity from 4.1 M tons per year (3.7 M tonnes per year) to 5.3 M tons per year (4.8 M tonnes per year). 2008 3D seismic surveys completed at K1 (73 sq. km) SW, K2 (11.9 sq. km) and K2 East (53.8 sq. km). 2009 3D seismic surveys completed at Esterhazy SE (19.3 sq. km) and Yarbo South (13.3 sq. km). Inflow 12F was detected. Used a seismic survey to pinpoint the inflow source and drilling and grouting activities were used to successfully control the inflow. K2 Tailings Management Area (TMA) Phase IV Expansion was completed. Esterhazy K3 Project Stage 2 Expansion proposal presented to the Board of Directors. Exploration drilling of 10 holes including two shaft pilot holes was completed as part of the K3 Expansion Project. 2010 Completion of the crushing expansion at K1. 2011 3D seismic surveys at K1 North (51.4 sq. km) and Perrin Lake (37.3 sq. km). 2012 K3 South shaft pre-sink was completed. Esterhazy exits Tolling agreement with PCS. 3D seismic survey Saskman, K1 NW, K1 SWD Field. Seven brine injection wells were drilled at Farfield. 2013 K3 South Shaft sunk to the potash level. 3D seismic survey at Panel 11Q (9.2 sq. km) completed. Completion of mill expansion at K2 for an additional 0.8 M tons/year. A Canpotex proving run was successfully completed increasing the site nameplate processing plant capacity from 5.3 M tons per year (4.8 M tonnes per year) to 7.0 M tons per year (6.3 M tonnes per year). 2014 3D seismic survey at Panel 11Q 3C (9.3 sq. km) completed. 2015 3D seismic surveys at Gerald (12.1 sq. km) and K3 (232.4 sq. km) completed. 2016 Nine exploration drill holes completed. 2017 The K3 north shaft sinking was completed and the first K3 ore from the South Shaft was skipped to surface and trucked to the K1 Mill. 2018 The K3 to K2 overland conveyor construction was completed in September. The K3 North Shaft steel and Keope hoist rope up were completed in November. The K3 North Shaft first ore was skipped on December 18 and trucked to the K2 Mill. The first K3 ore was conveyed on the overland conveyor to the K2 mill in December. 2019 Commissioned K3 Koepe production and Blair service hoists. Four drum miners cutting K3 shaft pillar development started. First four rotor miner assemblies completed and began cutting in October. The second four rotor miner assembly completed and began cutting in December. The K3 South shaft sinking was completed in November. 2020 Completion of the South shaft bottom steel, added a third four rotor miner, installed the Mainline conveyor, added a fourth rotor miner cutting and completed the K3 South Headframe concrete slip. In July, the K1 overland conveyor started conveying ore to K1 and in May, the K3 South Sinking Headframe demo was completed. K3 shaft pillar development was completed in December. The K3 fifth four rotor miner started cutting in October. The first ore from K3 to K1 on the overland belt was conveyed. 2021-2023 The sixth through thirteenth four rotor miners are commissioned at K3, bringing the operation up to full production. K1 and K2 mine closed 9 months ahead of schedule in June 2021 to mitigate brine inflow risk. 2025 New compaction circuit commissioned at K1 and newhydrofloat circuit commissioned at K2, increasing total Esterhazy site throughput capability to 3000 ore tons per hour. The Esterhazy Potash Facility K1 started production in 1962, K2 started production in 1967, and K3 started production in 2018. Table 5-2 outlines the K1, K2 and K3 production history to the end of 2025.

Date: December 31, 2025 5-3 Table 5-2: Esterhazy Production History (1962 to 2025) Year K1 Mineral Reserves Mined K2 Mineral Reserves Mined K3 Mineral Reserves Mined Total Mineral Reserves Mined Total Product Tons M Tonnes M %K2O Tons M Tonnes M %K2O Tons M Tonnes M %K2O Tons M Tonnes M Tons M Tonnes M 1962 to 2000 166.8 151.3 26.0 148.3 134.5 23.9 n/a n/a n/a 315.0 285.8 115.4 104.7 2001 to 2010 49.4 44.8 25.6 60.4 54.8 23.6 n/a n/a n/a 109.8 99.6 38.2 34.7 2011 6.0 5.4 24.4 7.7 7.0 23.4 n/a n/a n/a 13.7 12.4 4.5 4.1 2012 5.6 5.1 23.6 7.8 7.1 22.0 n/a n/a n/a 13.4 12.2 4.2 3.8 2013 5.1 4.6 25.3 8.2 7.4 22.9 n/a n/a n/a 13.3 12.0 4.4 4.0 2014 5.1 4.7 26.3 8.0 7.3 23.3 n/a n/a n/a 13.2 12.0 4.4 4.0 2015 5.5 5.0 24.1 8.7 7.9 23.7 n/a n/a n/a 14.2 12.9 4.7 4.3 2016 5.7 5.2 24.4 8.3 7.5 24.4 n/a n/a n/a 14.0 12.7 4.6 4.2 2017 6.4 5.8 23.6 8.2 7.4 24.3 n/a n/a n/a 14.6 13.2 4.7 4.3 2018 5.8 5.3 23.5 9.5 8.6 23.8 0.1 0.1 22.0 15.4 13.9 5.0 4.6 2019 4.8 4.4 23.5 6.7 6.0 23.6 1.6 1.4 20.3 13.0 11.8 4.3 3.9 2020 4.8 4.3 23.1 7.2 6.5 24.5 4.6 4.2 22.4 16.5 15.0 5.5 5.0 2021 0.9 0.8 23.5 3.5 3.2 24.6 10.3 9.3 24.5 14.7 13.3 4.8 4.3 2022 15.5 14.0 24.5 15.5 14.0 5.2 4.7 2023 15.6 14.1 23.4 15.6 14.1 4.9 4.4 2024 17.2 15.6 22.2 17.2 15.6 5.2 4.7 2025 17.1 15.5 21.9 17.7 15.5 5.2 4.7 Total 271.8 246.6 25.5 292.4 265.3 23.7 81.9 74.3 23.0 646.1 586.1 225.4 204.5 Date: December 31, 2025 6-1 6.0 Geological Setting, Mineralization and Deposit 6.1 Deposit Type Potash at the Esterhazy Potash Facility area occurs conformably within Middle Devonian-age sedimentary rocks and is found in total thicknesses ranging from approximately 100 to 131 ft. (30 to 40 m) at a depth of approximately 3,280 to 3,855 ft. (1,000 to 1,175 m). Evaporites are generally formed by seawater flowing into landlocked basins, followed by the evaporation of the seawater and precipitation of the dissolved salts. Progressive solar distillation of these salt- rich brines results in sequentially precipitated beds of limestone (CaCO3), dolomite (CaCO3·MgCO3), anhydrite (CaSO4), halite (NaCl), carnallite (KCl·MgCl2·6H2O), sylvite (KCl), kieserite (MgSO4.H2O) and other calcium and magnesium salts. The term potash is the common name for various compounds that contain the element potassium. Potash is expressed and reported in K2O equivalents. Since commercial potash minerals include chlorides and sulfates containing varying quantities of potassium, potassium-bearing minerals are compared on the basis of their K2O contents. The term muriate of potash (MOP) is used for commercial grade fertilizer containing potassium chloride. The product mined and sold is KCl. A tonne of KCl contains an equivalent of 0.6963 tons (0.6317 tonnes) of K2O. Sylvinite is a rock comprising a mixture of sylvite and halite that is the source of potash. The Prairie Evaporites may also contain carnallite and insoluble materials such as clay, anhydrite and dolomite crystals. The widespread consistency of the potash-bearing Prairie Evaporite Formation sub-members and the flat lying bedded nature of the sylvinite intervals result in highly mechanized conventional underground mining operations. Where underground operations are not economically viable due to depth of deposition, other mining sites have safely and productively developed solution mining with an efficient process for recovering otherwise inaccessible minerals. 6.2 Regional Geology The intracratonic Elk Point Basin is a major sedimentary geological feature in western Canada and the northwest US (Figure 6-1). It contains one of the world’s largest stratabound potash resources. The nature of this type of deposition is largely continuous with predictable depths and thickness. It is estimated to host >5 billion tonnes of ore (Orris, 2014) and is mined at several locations, including the Esterhazy Potash Facility. Saskatchewan potash represents almost 25% of the global potash production due to its relatively low-cost, bulk tonnage mining methods. (Orris, 2014.) Date: December 31, 2025 6-2 Figure 6-1: Regional Geology Plan of the Elk Point Basin (RESPEC 2021) The regional subsurface stratigraphic column of central Saskatchewan is presented in Figure 6-2. The geological column may be subdivided into three broad intervals. 1. An uppermost sequence extending from surface to an approximate depth of 525 to 590 ft. (160 to 180 m) and consisting of glacial tills, gravels and clays and containing freshwater aquifers. 2. A medial sequence extending from the base of the glacial sediments to an approximate depth of 1870 ft. (570 m) and consisting of Tertiary to Jurassic shales, siltstones and sandstones with limited aquifers of brackish water. 3. A lowermost sequence extending from the Mississippian Unconformity to below 5,415 ft. (1,650 m) depth and consisting of Cambrian to Mississippian carbonates, evaporites and basal shales and sandstones. Date: December 31, 2025 6-3 Figure 6--2: Regional Central Saskatchewan Stratigraphy The Interlake Formation carbonate lies above the Precambrian and Ordovician and is used for disposal of excess salt brines from the mine and mill. Laterally extensive, evaporite beds containing deposits of halite, sylvite and carnallite are found within the Middle Devonian Elk Point Group, whose top ranges from a depth of 8,200 ft. (2,500 m) in southern Saskatchewan to surface outcrop in northwestern Manitoba. The Elk Point Group lies unconformably on the Silurian-age Interlake Formation and is overlain unconformably by carbonate deposits of the Middle Devonian-age Dawson Bay Formation. The evaporite beds are contained within the Prairie Evaporite Formation that overly the Winnipegosis Formation within the Elk Point Group. The basal contact between the Prairie Evaporite and the Winnipegosis Formation is marked by a sharp transition from halite of the Prairie Evaporite Formation to mixed limestone, dolomite and anhydrite of the Potash Beds

Date: December 31, 2025 6-4 Winnipegosis Formation. The uppermost contact between the Prairie Evaporite and the Dawson Bay formations consists of shale and poorly consolidated silty detrital deposits named the “Second Red Beds”. Regionally, the underlying Winnipegosis Formation forms a broad flat basin to platform deposit with local development of limestone/dolomite “reefs”. The Elk Point Group was deposited within a broad mid-continental basin extending from North Dakota and northeastern Montana at its southern extent in a northwest direction through southwestern Manitoba, southern and central Saskatchewan, to eastern and northern Alberta. The evaporite strata in the basin are restricted to the southern third of the Elk Point Basin in south-central Saskatchewan, southwestern Manitoba, northeastern Montana and northwestern North Dakota (Holter 1969). The Manitoba Group that overlies the Elk Point Basin consists of the Dawson Bay Formation and overlying Souris River Formation. Present within this sequence are two halite beds: 1. The Hubbard Salt, the uppermost bed of the Dawson Bay Formation. 2. The Davidson Evaporite overlies the First Red Beds within the Souris River Formation. These halite beds are important from an underground mining viewpoint as they form a flood protection zone that separates the Prairie Evaporite Formation mining horizon from the overlying water and brine aquifers present within the Cretaceous sands, especially the Mannville Group (formerly known as the Blairmore Formation). The Prairie Evaporite Formation is divided into a basal “Lower Salt” and an overlying unit containing three potash- bearing units and one unit containing thin “marker beds”. In ascending order, the potash horizons in the upper unit are the Esterhazy Member, White Bear Marker Beds, Belle Plaine Member and Patience Lake Member. Mineralogically, these Members consist of sylvite and halite with minor amounts of carnallite (KCl MgCl2 6H2O). Potash mineralogy in Saskatchewan locally includes high concentrations of carnallite. Carnallite is considered an impurity because it can negatively impact the effective recovery of potash in the milling process. Carnallite dissolves preferentially to sylvite. This can reduce the concentration of sylvite in suspension in solution mining efforts and process recovery. There is currently no remote sensing application that effectively identifies the presence of carnallite in the Prairie Evaporite. Fuzesy (1982) and others have shown areas of high carnallite grade on regional maps based on interpretations of downhole gamma and neutron geophysical logs and assay records maintained for historical drill holes by Saskatchewan Ministry of Energy and Resources. Figure 6-3 shows a regional cross section showing the potash bearing members being mined at the Mosaic Company Saskatchewan operations. The Esterhazy Potash Facility mines the Esterhazy Member. Date: December 31, 2025 6-5 Figure 6-3: Regional Cross Section Illustrating the Stratigraphic Relationships of the Prairie Evaporite Formation (RESPEC 2021) Date: December 31, 2025 6-6 6.3 Local Geology 6.3.1 Stratigraphy In the Esterhazy area, the Esterhazy, White Bear and Belle Plaine Members are present and the Patience Lake Member is missing (Figure 6-4, modified from a RESPEC, LLC image). The following is a summary of the key stratigraphic units for the Esterhazy Potash Facility area: • Belle Plaine Member: The Belle Plaine Member underlies Second Red Bed and makes up part of the salt back that is critical to isolating the mining horizon from the formations above. The Belle Plaine Member is mined using solution mining techniques at the Belle Plaine Potash Facility and is not mined at the Esterhazy Facility. • White Bear Member: The White Bear Member consists of marker beds that are a distinctive unit of thin interbedded clay, halite and sylvinite horizons that are not minable due to insufficient thickness 4.0 to 5.0 ft. (1.2 to 1.5 m). • Esterhazy Member: The Esterhazy Member is separated from the Belle Plaine Member by the White Bear Member marker beds, a sequence of clay seams, low-grade sylvinite and halite. The Esterhazy Member is mined using conventional underground techniques at the Esterhazy Potash Facility in southeastern Saskatchewan and by solution mining techniques at the Belle Plaine Potash Facility. Figure 6-4: Local Stratigraphy (modified from RESPEC 2021) Date: December 31, 2025 6-7 The typical sylvinite intervals within the Prairie Evaporite Formation consists of a mass of interlocked sylvite crystals that range from pink to translucent and may be rimmed by greenish-grey clay or bright red iron insoluble material, with minor halite disseminated throughout the mineralized zones. Local large one inch (2.5 cm) cubic translucent to cloudy halite crystals may be present within the sylvite groundmass and overall, the sylvinite ranges from a brownish red color (lower grade, 20% to 27% K2O with an increase in the amount of insoluble material) to a bright, almost translucent pinkish orange color (high grade, 30%+ K2O). Carnallite is also present locally in the Prairie Evaporite Formation as a mineral fraction of the depositional sequence. The intervening barren salt beds consist of vitreous to translucent halite with minor sylvite and carnallite and increased insoluble materials content. 6.3.2 Stratigraphic Anomalies Potash-bearing horizons may be affected by three general types of anomalies. In general, any disturbance that affects the normal mineability of the sylvinite-bearing horizons is considered an “anomaly”. Figure 6-5 illustrates the typical disturbances that create anomalous altered zones within the main sylvinite-bearing horizons at Saskatchewan potash mining properties. These anomalies range from localized features less than a square kilometer in extent to disturbances that are regional (i.e., several square kilometers in extent) and can result in local disruptions to the grade of the ore body (either leaching or in some cases, enrichment). Figure 6-5: Types of Stratigraphic Anomalies (RESPEC 2021) Dissolution and collapse anomalies, or simply “collapse” anomalies, are those formed by the absence of a portion or the entire mass of evaporite salts. In the case of these anomalies, the overlying beds slump down into the void thus formed, creating a rubble pile or “breccia chimney” where normally the evaporite beds would be expected. In contrast to the leach or washout anomaly, the collapse anomaly can be identified by means of seismic reflection surveys and can thus be avoided through mine design by defining exclusions. Collapse anomalies are considered high risk to

Date: December 31, 2025 6-8 conventional underground potash mining operations as they breach all overlying aquitards and aquicludes, thus forming conduits for overlying brines and freshwaters to flow downward into potential mine workings. Individual collapse occurrences are reviewed and categorized based on their potential impact to the mining operation and exclusion areas are added to the mine plan to provide for the safety of the mining area. A “washout anomaly” is an anomaly wherein the typical sylvinite horizon has been replaced or altered to a halite mass that consists of medium to large ½ inch (1 cm) halite crystals within a groundmass of smaller intermixed halite and insoluble clay. Clay intrusions up to ½ inch (1 cm) long may be present and there is a concentration of clay at the top and base of the altered zone. Mackintosh and McVittie (1983) describe these disturbances as “salt-filled V- or U- shaped structures (Figure 6-6), that transect the normal bedded sequence and obliterate the stratigraphy”. Washouts may extend laterally for considerable distances but generally appear over short intervals. These features are easily identified in a conventional mining operation through visual inspection but are not detectable by seismic interpretation. Figure 6-6: Wash-out Anomaly A “leach anomaly” is an anomaly wherein the typical sylvinite bed has been altered in such a manner that the sylvite mineral has been removed and replaced by halite (Figure 6-7). Such anomalies are also colloquially termed “salt horses” or “salt horsts” by mine operators. If the altered zone crosses any stratigraphic boundaries, these boundaries are commonly unaltered. This type of disturbance is generally considered post depositional (i.e., formed after deposition of the primary sylvinite). These anomalies are commonly associated with underlying Winnipegosis reefs, that may have some formative influence upon the anomaly. There are many examples at the Esterhazy Potash Facility where a leach anomaly is encountered and there is partial or complete remineralization of the in-situ sylvite. These anomalies are local in extent ranging in diameter from a few meters to as much as 400 m. Date: December 31, 2025 6-9 Figure 6-7: Leach Anomaly The above-described anomalies can impact mining operations by potentially reducing the in situ grade of the potash ore. Identification of any disruption to normal continuous deposition requires evaluation prior to developing a mine plan. Surface seismic reflection surveys (2D and 3D) can be used to identify and, in the case of 3D seismic, delineate large scale collapse zones. Careful examination of core or logged data from surface drill holes can identify anomalous grade conditions if they are intersected but provide no information on their shape or extent. 6.4 Property Geology The Esterhazy Potash Facility is situated in the eastern extent of what is commonly termed the “Commercial Potash Mining Belt” where potash is mined by conventional underground means. The total thickness of potash beds in the Prairie Evaporate at Esterhazy ranges from approximately 100 to 131 ft. (30 to 40 m) at a depth of approximately 3,100 to 3,800 ft. (950 to 1,150 m). In the Esterhazy area, the Esterhazy and White Bear Marker Beds are present (Figure 6-4). The White Bear Marker Beds, a distinctive unit of thin interbedded clay, halite and sylvinite horizons between the Belle Plaine and Esterhazy Members is insufficient in thickness and grade to be attractive for mining. The potash mineralization in the Esterhazy Member includes five major potash bearing beds that are extracted by conventional mining machines. The key mining horizons are initially delineated using information gathered during production drilling using geophysical logging technology. These logs are compared to physical core to evaluate the quality of the mineralization. 6.4.1 Esterhazy Potash Deposit The potash mined at Esterhazy is a mixture of halite and sylvite and in some parts of the mining area, moderate amounts of carnallite. The key mining horizons are initially delineated using information gathered during exploration drilling using geophysical logging technology. These logs are compared to physical core to evaluate the quality of the mineralization. The potash deposit is generally uniform and laterally continuous. The grade is estimated using geochemical assays of core or chip samples. Properly calibrated, the gamma response from well log data can be converted to indicate the amount of potash in the formation as a %K2O. Gamma Ray Equivalent Calculation (GREC) can be applied to interpret Date: December 31, 2025 6-10 and verify the quality of the ore where core may not be available. The neutron-density log is used to indicate the presence of carnallite. Confidence in this correlation is gained by comparing GREC to assay results. 6.4.2 Deposit Dimensions In the Esterhazy area the potash mineralization is from the Esterhazy Member. It includes five major potash bearing beds that are extracted by conventional mining machines. The naming convention at site refers to the beds in the Esterhazy Member as beds 50, 45, 40, 35 and 30 (in ascending order). The highest-grade potash is hosted in Bed 40. It has an average thickness of 4.3 ft. (1.3 m). Figure 6-8 outlines the thickness and grades for each of the beds. It is possible to encounter variation in the thickness and grade of these beds, but usually the normal stratigraphy is present. Figure 6-8: General Ore Geology 6.4.3 Lithologies The Esterhazy general ore geology and lithologies are shown in Figure 6-9. The deposit geology is described as a series of beds. • 30 Bed: 30 Bed consists of clear to pink halite, sylvite that is cloudy to milky and rimmed by orange to red iron oxides. Carnallite when present is red. The insoluble content is the 30 Bed is high. • 35 Bed: 35 Bed consists of clear to light grey and milky white halite and clear to light pink sylvite. Carnallite when present is light orange. The insoluble content is very low. • 40 Bed: 40 Bed consists of milky white halite, cubic in shape and gritty when scratched. The sylvite is clear to pinkish orange, rimmed by light orange iron oxides and waxy when scratched. Carnallite when present is orange and infilling between the crystals. The insoluble content is very low and the light from a miner lamp diffuses easily. • 45 Marker Bed: The 45 Marker Bed consists of clear halite, clear to pinkish orange, sylvite rimmed by red iron oxides, that give this bed a darker appearance. Carnallite when present is dark red and infilling between Date: December 31, 2025 6-11 the crystals. The insoluble content is much higher than bed 40 and the light from a miner lamp does not diffuse. • 50 Bed: 50 Bed is very similar in appearance to 40 Bed. The insoluble content is slightly higher. Bed 45 ore is present as fill material in desiccation cracks. • 55 Bed (Floor Salt): 55 Bed consists of mainly halite; the insoluble content is brown and sometimes bedding is present. In sylvite, the contact with 50 Bed is generally sharp. In carnallite rich ore, the contact with 50 Bed is gradational. Figure 6-9: Deposit Stratigraphy

Date: December 31, 2025 6-12 6.4.4 Structure The Prairie Evaporite is a relatively flat-lying deposit with uniform bedding across the property. The 3D seismic interpretation is used to describe the structure within mining zone. Evaluation of Winnipegosis mounds, collapse features and the total salt isopach supports mine planning activities at Esterhazy. The underlying Winnipegosis Formation locally affects the elevation topography of the mining horizon. These local inflections result from compaction on the reef/mound structures found in the Winnipegosis carbonates and can affect the potash zones. There is limited impact to mining based on the occurrence of these mounds, that are well defined by 3D seismic interpretation. Geological expertise at Mosaic potash mines in Saskatchewan has resulted in an evolved internal registry of mound encounters. Appropriate operational strategy and mine planning controls are effective in limiting the impact of the local bed dip inflections and mineralogical variance associated with mound encounters in both the conventional and solution environments. 6.4.5 Mineralization Potash mineralization contains sylvinite, a mixture of the iron oxide-stained halite, sylvite and carnallite. Minor amounts of insoluble minerals are also present, most notably in the 45 Bed. When present interstitially or as more massive pods, carnallite can deteriorate rapidly or be preferentially dissolved. The color of the potash can vary from light orange to deep red rimmed crystals. The mineralization can be locally bedded or massive. The halite and sylvite crystals can range from small to more typically coarse to large. This can be attributed to the conditions during deposition as there has been no alteration. Date: December 31, 2025 7-1 7.0 Exploration 7.1 Exploration 7.1.1 Grids and Surveys The UTM grid (NAD83 Zone 13N) is used for all exploration drilling as well as all seismic surveys. 7.1.2 Geological Mapping There has been no geological mapping completed at Esterhazy since there is no bedrock exposure. 7.1.3 Geochemistry No significant surface rock or drill core geochemistry surveys have been completed at Esterhazy. 7.1.4 Seismic Survey Geophysics Over the past 30 years, the surface seismic method has gained widespread recognition in the potash industry, as a valuable mine planning tool and as an analytical tool for anomalous underground encounters at the mining level. Today, problems such as analysis of site-specific solution collapse anomalies, void space mapping and brine inflow site identification are being solved through the use of surface seismic investigations. International Minerals and Chemical Corporation (Canada) Ltd. (“IMC”), a predecessor company of Mosaic started 2D seismic surveying in the Esterhazy area in 1985 with a targeted 9 line survey. During the period of 1985 to 1990, five additional 2D programs were completed. Four programs were run between 1997 and 2000, and a small 6.4 miles (10.3 km) 2D program were completed in 2006. An additional 106 miles (170 km) of vintage 1986-88 trade data was purchased in 2008 for coverage in the K3 area. Over the course of 23 years, a total of 1,440 miles (2,319 km) was either run or purchased and then merged and reprocessed. Over time, advancement of seismic technology has evolved from 2D to 3D methodology, which is now the primary exploration tool at Esterhazy. The first 3D seismic survey at the Esterhazy Potash Facility was done in 1991 as a test of technology at the time. This was followed by the first full scale 3D seismic survey in 2000. During the period of 2000 to 2015, 24 more 3D seismic surveys were completed, ending with the extensive K3 3D survey in 2015 covering 90 sq. miles (232 sq. km). In total, there are 411 sq. miles (1,065 sq. km.) of 3D seismic coverage at Esterhazy. The seismic survey coverage is shown in Figure 7-1. Mosaic contracts all seismic work including surveys, interpretation and maintenance of the seismic model to a qualified third party, currently Tetra Tech Inc. based in Calgary, Alberta. Date: December 31, 2025 7-2 Figure 7-1: Seismic Surveys Date: December 31, 2025 7-3 7.1.5 Petrology, Mineralogy and Research Studies The petrology or mineralogy studies that have been done in the exploration stage and early production years (1960s) are no longer available for review. There have been no recent studies completed. A tonnage factor is used to estimate ore tons from volume and is defined as the reciprocal of ore density. The ore tonnage factor is expressed as cubic feet per ton. A recent study was completed to determine if the historical tonnage factor and density used at the K1/K2 mining operation was applicable to the K3 area. Calculations were carried out using the assay data from 17 exploration holes drilled over the K3 mining lease area. The density value for ore recovered from each exploration well was calculated using established densities for all minerals contained in the ore, as per concentrations determined analytically. Ore density was considered to be the mean average density of this data set. The mean average of the well data set was determined to be 129.878 lbs./cu ft. (2080.446 kg/ cubic m). The corresponding reciprocal ore tonnage factor is 15.40 cu ft. per ton. This compares favorably to the historical K1/K2 value of 15.10 cu ft. per ton. The new K3 ore tonnage factor is used in the 2025 mineral resource and mineral reserve calculation. 7.1.6 Exploration Potential There is potential for expansion to the north-east into an undisposed area. Mosaic has first rights to lease this area from the Crown as it is within the Mosaic Esterhazy Development Zone (Subsurface Mineral Tenure Regulations, 2015 C-50.2 Reg 30, Section 33(2)). The remaining minerals in this area are controlled by other entities. In addition, as the remaining uncontrolled mineral rights within the lease area are acquired, more mineral resources or mineral reserves will be delineated. 7.2 Drilling 7.2.1 Overview The first potash exploration drilling was completed by IMC in 1956. Fourteen exploration drill holes were drilled prior to production starting at K1 in 1962. Exploration drilling has continued through to 2015 with an additional 57 holes drilled. Drill programs of note were the K3 Phase I drilling in 2009 to 2010 when 10 holes were drilled to evaluate the proposed K3 Shaft site and the K3 Phase II drilling in 2016 when 9 drill holes were drilled to evaluate the K3 mining area. These drilling campaigns were completed under Mosaic supervision with the field work, core logging and sampling being performed by professional consulting geologists at RESPEC (North Rim Exploration Limited) and Norwest Corporation respectively. The potash mineralization in the majority of drill holes was cored and the potash bearing zones were analyzed. In most cases a full suite of geophysical logs was run, particularly in the more recent holes. Ten holes drilled in 2012 to 2015 to create a brine injection field were not cored and have been evaluated through the use of GREC (Gamma Ray Equivalent Calculation) to determine potash grade so that they can be utilized in the estimation of mineral resources. 7.2.2 Drilling Supporting Mineral Resource Estimates The exploration drill holes used to support the Esterhazy K3 and K4 mineral resource and mineral reserve estimates are shown with a “Y” in the “Used for MRMR” column in Table 7-1. Included is whether the well core samples were assayed or grade was estimated from downhole gamma logging (GREC).

Date: December 31, 2025 7-4 Figure 7-2: Exploration Hole Locations Date: December 31, 2025 7-5 7.2.3 Drilling Excluded from the Mineral Resource Estimates The exploration drilling used to support the Esterhazy K3 and K4 mineral resource and mineral reserve estimates are listed in Table 7-1. Included is whether the hole core samples were assayed or grade was estimated from downhole gamma logging (GREC). Drilling that was excluded for mineral resource estimation purposes is shown with a “N” in the “Used for MRMR” column in Table 7-1. In most cases, the assay data for these exploration holes was either not available or incomplete through the potash ore zone. It is important to note that the mining zone thickness and grade defined by the exploration drilling is 8.5 ft. (2.6 m) at an average grade of 23.4% K2O. These support the thickness and grade assumptions used to estimate mineral resources. Date: December 31, 2025 7-6 Table 7-1: Drill Summary Table Supporting Mineral Resource Estimates Location Well Identifier Legal Subdivision Section Township Range Year Drilled Total Depth (ft.) Total Depth (m.) Used for MRMR (Y/N) Total Mining Zone Grade (%K2O) Grade Analysis Method K4 50I004 6 8 22 32 W1 1950 2,905 885 N K4 57H085 1 16 20 30 W1 1957 4,315 1,315 N K4 60H003 1 24 20 32 W1 1960 3,081 939 Y 34.8 Assay K4 60I013 16 36 20 32 W1 1960 3,139 957 N K4 60I024 13 15 21 32 W1 1960 3,082 939 Y 25.2 Assay K4 60J011 13 35 20 32 W1 1960 3,089 942 Y 32.0 Assay K4 62B002 9 14 19 30 W1 1962 3,058 932 Y 28.7 Assay K4 62B022 11 2 20 30 W1 1962 3,015 919 Y 18.3 Assay K4 62B021 2 29 20 30 W1 1962 2,959 902 Y 32.5 Assay K4 62H070 16 7 21 30 W1 1962 2,882 878 Y 20.0 Assay K4 62H072 4 25 20 30 W1 1962 2,918 889 Y 30.4 Assay K4 62H071 1 2 21 31 W1 1962 2,987 910 Y 28.2 Assay K4 62H068 9 24 21 30 W1 1962 2,792 851 N K4 62H069 4 2 21 30 W1 1962 2,863 873 Y 17.7 Assay K4 62J033 4 2 22 31 W1 1962 2,865 873 Y 31.2 Assay K4 63E084 4 26 21 31 W1 1963 2,870 875 Y 18.5 Assay K4 63E083 16 11 21 31 W1 1963 2,943 897 Y 17.2 Assay K4 63E090 14 32 20 30 W1 1963 2,919 890 Y 20.9 Assay K4 63E080 13 6 22 30 W1 1963 2,831 863 Y 18.0 Assay K4 63E092 5 21 21 31 W1 1963 2,991 912 Y 29.8 Assay K4 63F001 4 4 22 31 W1 1963 2,908 886 Y 19.4 Assay K4 63E093 8 14 20 30 W1 1963 2,966 904 Y 21.8 Assay K4 63F002 2 14 22 31 W1 1963 2,843 867 Y 22.8 Assay K4 63E081 4 20 22 31 W1 1963 2,926 892 Y 23.0 Assay K4 63E094 13 12 22 32 W1 1963 3,014 919 Y 20.3 Assay K4 63H050 16 4 21 31 W1 1963 3,028 923 N K4 63H051 4 22 20 30 W1 1963 2,980 908 N K4 63I037 14 22 20 30 W1 1963 2,920 890 N K4 63I038 11 25 20 31 W1 1963 2,985 910 Y 24.3 Assay K4 63J101 2 16 22 31 W1 1963 2,914 888 Y 27.9 Assay K4 63J096 10 18 21 31 W1 1963 3,022 921 Y 18.5 Assay Date: December 31, 2025 7-7 Location Well Identifier Legal Subdivision Section Township Range Year Drilled Total Depth (ft.) Total Depth (m.) Used for MRMR (Y/N) Total Mining Zone Grade (%K2O) Grade Analysis Method K4 63J115 13 29 21 31 W1 1963 2,960 902 Y 22.3 Assay K4 65D001 3 10 22 31 W1 1965 2,837 865 Y 18.6 Assay K4 65C080 9 10 21 31 W1 1965 2,982 909 Y 22.3 Assay K4 65D003 15 28 21 31 W1 1965 2,900 884 Y 29.3 Assay K4 65D002 8 36 20 31 W1 1965 2,934 894 Y 20.0 Assay K4 65F111 4 10 22 32 W1 1965 4,429 1,350 N K4 65I098 13 28 20 31 W1 1965 3,045 928 N K3 65J030 2 17 22 1 W2 1965 3,097 944 N K3 65J064 1 34 21 33 W1 1965 3,061 933 N K3 65K071 13 23 21 1 W2 1965 3,228 984 N K4 89G049 13 29 19 30 W1 1989 3,123 952 N K4 89G048 14 8 19 30 W1 1989 3,140 957 N K4 89I068 1 8 20 30 W1 1989 3,022 921 N K4 92F060 5 17 20 31 W1 1992 3,333 1,016 Y 41.1 Assay K3 09K092 13 14 19 1 W2 2009 3,535 1,078 Y 23.6 Assay K3 09K217 4 34 19 33 W1 2009 3,409 1,039 Y 28.9 Assay K3 09J166 5 25 19 33 W1 2010 3,615 1,102 Y 23.7 Assay K3 09L134 4 11 19 1 W2 2010 3,596 1,096 Y 24.5 Assay K3 10A046 15 24 19 1 W2 2010 3,465 1,056 Y 33.9 Assay K3 10B222 13 23 19 33 W1 2010 3,423 1,043 Y 23.5 Assay K3 10B221 12 22 19 33 W1 2010 3,442 1,049 Y 34.8 Assay K3 10E268 12 22 19 33 W1 2010 3,609 1,100 Y 19.1 Assay K3 10F031 2 4 19 1 W2 2010 3,714 1,132 Y 25.4 Assay K3 10E269 12 22 19 33 W1 2010 3,661 1,116 Y 30.4 Assay K3 12F347 1 28 21 1 W2 2012 4,006 1,221 Y 21.3 GREC K3 12G178 14 16 21 1 W2 2012 4,062 1,238 Y 9.4 GREC K3 12H036 3 20 21 1 W2 2012 4,096 1,249 Y 20.3 GREC K3 12H053 14 20 21 1 W2 2012 4,078 1,243 Y 20.6 GREC K3 12G205 15 29 21 1 W2 2012 4,052 1,235 Y 22.4 GREC K3 12I209 16 32 21 1 W2 2012 3,980 1,213 Y 21.3 GREC K3 12K047 9 33 21 1 W2 2012 3,976 1,212 Y 9.2 GREC K3 15F233 8 16 21 1 W2 2015 4,085 1,245 Y 23.1 GREC K3 15F234 8 18 21 1 W2 2015 4,117 1,255 Y 26.2 GREC K3 15F235 10 30 21 1 W2 2015 4,101 1,250 Y 15.5 GREC

Date: December 31, 2025 7-8 Location Well Identifier Legal Subdivision Section Township Range Year Drilled Total Depth (ft.) Total Depth (m.) Used for MRMR (Y/N) Total Mining Zone Grade (%K2O) Grade Analysis Method K3 15J304 15 36 18 1 W2 2016 3,693 1,126 Y 14.1 Assay K3 15J288 1 5 19A 1 W2 2016 3,791 1,156 Y 28.2 Assay K3 15J300 13 36 18 2 W2 2016 3,881 1,183 Y 14.9 Assay K3 51680 16 16 19 1 W2 2016 3,609 1,100 Y 20.3 Assay K3 15J308 4 3 20 1 W2 2016 3,435 1,047 Y 26.2 Assay K3 51678 16 2 19 2 W2 2016 3,885 1,184 Y 18.3 Assay K3 51698 16 17 20 1 W2 2016 3,399 1,036 Y 23.8 Assay K3 51666 16 14 19 2 W2 2016 3,681 1,122 Y 23.0 Assay K3 51662 14 5 19 1 W2 2016 3,681 1,122 Y 19.7 Assay Total 243,272 74,149 Average 23.4 Date: December 31, 2025 7-9 7.2.4 Drill Methods All historical exploration drill holes were drilled vertically using standard oil and gas well drilling techniques of the day. Modern drilling uses standard rotary techniques combined with directional drilling utilizing mud motors and MWD (Measurement While Drilling) equipment. Single shot, multi shot and MWD directional surveys are run during the drilling process. A final multi-shot directional survey is completed when total depth is reached. In all exploration holes drilled prior to 2015, hydrogeology was evaluated by drill stem tests. In 2015 to 2016, the Phase II drilling at K3 utilized Modular Formation Dynamics testing (MDT). This newer technology was used as it can isolate and test zones in specific intervals, multiple samples can be collected from specific intervals within one wellbore and the MDT tool is run on wireline rather than on the drill string. Early potash exploration drilling in the Esterhazy area focused on hydrogeological testing of the Mannville Group and Dawson Bay formations, with isolated testing on the Nisku and Souris River formations. The hydrogeology portion of the drilling campaign in the 1980’s focused specifically on the Souris River and Dawson Bay Formations to evaluate the presence of formational water immediately above the Prairie Evaporite. This continued into the K3 Phase I and II drilling from 2009 to 2016. The only exception was the “Farfield” brine injection drilling program that only tested the target Winnipeg Formation. Any geotechnical studies done on core from the pre-1980 exploration holes are no longer available for review. Three shaft pilot drill holes were drilled in 2009 and 2010 as part of the K3 Phase I drilling program – PH1 (09J166), 2EH (10E269) and 3EH (10E268). All three were cored for the entire length of the well to provide representative samples for shaft design purposes. Extensive geotechnical studies were done including the measurement/calculation of the following properties: • Mass – density relations (specific gravity, moisture content, wet and dry density, void ratio and porosity). • Grain size. • Discontinuities and Joint Sets. • Point load (PL). • Unconfined compressive strength (UCS). • Elastic Properties (Young’s Modulus and Poisson’s Ratio). • Rock Classification – RMR (Rock Mass Rating), RQD (Rock Quality Designation) and Q (Rock Mass Quality) ratings. • Tri-axial testing. • The data was used to develop shaft design and excavation plans, including freeze hole design for shaft sinking through the formational water bearing Lower Mannville Group. It was also used for shaft liner design and formational grouting design. 7.2.5 Geological Logging Core Logging Core was retrieved from all potash exploration drill holes at Esterhazy. Core was not retrieved from the ten holes drilled for the Farfield brine injection field. A grade estimation process using gamma logs was used for the brine injection holes so that they could be used in the mineral reserve estimation process. Government drilling regulations require cutting samples to be obtained every 16.4 ft. (5 m) from the Second White Specks Formation down to bottom hole. Samples and a complete set of drilling data are submitted to the government drilling authority as required by the Regulations. Date: December 31, 2025 7-10 Core logging procedures for the oldest drilling (approximately 1960 to 1980) are no longer available for review. The following procedures were used in the K3 Phase I and II drilling programs: • The field recovery of the core was technically managed by a core retrieval specialist. The initial core review and handling was supervised by geological consultants to confirm a high-quality physical record was maintained. All standard procedures and quality control measures were adhered to for each drilling campaign. • The drill core was secured for shipping with the appropriate chain of custody documents and delivered from the site to the geological consultant’s core facility in Saskatoon, SK. • As soon as the core arrived in Saskatoon, the geological consultant’s staff inspected the shipment and unloaded the core onto the tables in stratigraphic order. From this point forward, the consulting geologists were responsible for supervising the core. • Prior to commencement of any technical work, the core samples require some degree of cleaning to remove any material adhering to the core surface that may interfere with core logging and analysis. It is important that all cleaning procedures focus only on one core segment at a time and appropriate cleaning methods for different core type are followed. • After the core boxes were laid out in stratigraphic order, the core segments in each box were re-fitted together in the best possible manner to restore the core to its original condition and length. • Once the logging geologist was satisfied with the organization of the core, properly marked final labels were added to supplement any markings or labels placed onto the box at the well site. Each core box was assigned its own unique information, including depths corrected (in feet below Kelly Bushing) using available geophysical logs. • After the initial assessment was performed, the consulting geologists proceeded with the detailed core logging process. Core descriptions were entered directly into the consultant’s core logging database. Geologists adhered to the following format and sequence of elements where applicable. o Lithology (major), then minor lithology (if applicable). o Rock color. o Rock texture. o Rock hardness and competency. o Structural deformation. o Mineralogy and fossils. o Other special features. o Porosity and permeability. o Basal contact. Geophysical Logging A variety of geophysical logs have been run on potash exploration holes at Esterhazy. Information from the early drilling period (1960–1980) is very limited, but the provincial government well data repository, Integrated Resource Information System (IRIS) indicates a typical suite of logs would include “electrical”, “gamma ray – neutron”, “sonic – caliper” and “induction”. In the drilling that occurred during 1989 – 1992 the standard set of geophysical logs run were GR (Gamma Ray), CNL (Compensated Neutron Log), DIL (Dual Induction Laterolog) and BHC (Borehole Compensated Sonic). The K3 Phase I and II drilling programs utilized a modern suite of geophysical logs including Spectral Pe Density Compensated Neutron Gamma Ray Log (SPED), Monopole Dipole Acoustic Semblance Log (MDA), Borehole Compensated Sonic Log (BCS), Simultaneous Triple Induction SFL Log (STI) and High Resolution Micro Imager Log (HMI). All geophysical logs are submitted to the government drilling authority as required by the applicable regulations. Date: December 31, 2025 7-11 Grade estimation utilizing gamma logs was evaluated at Esterhazy for the purpose of including the 10 holes drilled for the Farfield brine injection drilling program in the Mineral Reserve and Mineral Resource estimation. The potash assay results from three holes in the K3 Phase I drilling program (EH1, EH4 and EH6) were compared to the grade interpreted from gamma logs. Mosaic relied on the expertise of a third-party potash consultant (RESPEC) to complete the GREC analysis at Esterhazy. Two methods of correlating gamma ray API and %K2O were reviewed. The first, described as the “Alger and Crain method” (Alger and Crain, 1966) uses the following data to determine the correlation between gamma ray API and %K2O: • Borehole diameter at depth of interest. • Mud weight. • Downhole logging speed. • Centralization or decentralization of gamma tool downhole. • Calipers – hole condition, shape of hole (washouts, etc.). The second, described at the “Bannatyne method” (after Bannatyne, 1983) uses a linear relationship between gamma ray API and %K2O and does not consider borehole diameter, mud weight or other downhole parameters. An analysis was completed and it was determined the Alger-Crain method provided better correlation between assayed grade and gamma grade. Gamma derived potash grades are used for the 10 Farfield drill holes in the mineral resource estimation, as shown in Table 7.1. 7.2.6 Recovery Core recovery during the history of drilling in the Esterhazy area has been excellent due to well established drilling procedures and the use of drilling fluids that protect the target Prairie Evaporite Formation from dissolution during coring. In the early drilling period (1960 to 1980) recoveries averaged 98.4% in available records from 48 drill holes. Data from 11 holes drilled during the period of 1989 to 1992 indicated core recovery was 99%. Core recovery in the K3 Phase I drilling was 98.0% and 99.1% in the Phase II drilling. 7.2.7 Collar Surveys Historical exploration holes were located by a Land Surveyor registered in the Province of Saskatchewan. The current standard operating procedure is for the exploration well collars to be surveyed by a third party licensed survey contractor using GPS. 7.3 Chip Sampling In-mine chip sampling is completed to support the grade interpretation for the active mining areas. The samples are collected by mine engineering technical employees under the supervision of the mine geologist following a standard procedure. These samples are prepared and analyzed at Mosaic’s K1 and K2 Esterhazy Quality Control Laboratories. Samples are taken at 200 ft. (61 m) intervals along all development entryways and at 400’intervals (122 m) intervals along production rooms. At the sample location the geological beds are marked and a representative sample is taken from each bed. Geochemical analysis of the samples and weighting by bed thickness provides an average grade of the mining horizon at the sample location.

Date: December 31, 2025 7-12 In-mine chip sample results (Figure 7-3) are used to estimate the average potash grade along the development drifts. The mean average of these samples is used to represent the average grade of the mineral reserve within 0.5 mile (800 m) of the development drifts inside the active mining area including the last room in an active panel. Figure 7-3: In-Mine Chip Sample Assay Results and Statistics 7.4 QP Interpretation of the Exploration Information In the opinion of the QP for this section, the quantity and quality of the lithological, collar and drilling data collected in the exploration program prior to 1962 and the definition drilling completed to date (2015) are sufficient to support mineral resource and mineral reserve estimation. The reasons for this are as follows: • The post 1980 core logging meets industry standards for this type of deposit. There is some uuncertainty regarding the core logging procedures for the oldest 1960 to 1980 drilling. The procedures are no longer available for review. • The collar surveys have been performed using industry-standard instrumentation. • Down-hole surveys were performed using industry-standard instrumentation. • Drill orientations are appropriate for the mineralization style and have been drilled at orientations that are acceptable for the orientation of mineralization for the bulk of the deposit area. • Drill orientations appropriately test the mineralization. • Recovery data from core drilling programs is acceptable. • The drilling pattern and density are consistent with industry standard. • The recorded data and classification of core constituents are in line with industry practice. Date: December 31, 2025 7-13 • The drilling process and equipment are consistent with industry standards for this type of deposit. • The data that is determined to be defective is not used in the estimation process. Date: December 31, 2025 8-1 8.0 Sample Preparation, Analyses and Security 8.1 Introduction The potash mineralization at Esterhazy was evaluated by collecting core samples from 59 exploration drill holes and from in-mine chip samples collected underground from the main infrastructure drives. There have been two additional substantial exploration drilling programs to further define the remaining mineral reserves and mineral resources in the Esterhazy lease area: The K4 area is located on the eastern side of the previous mining operation (K1/K2). The area was largely explored in 1989 with 17 additional holes added to the interpretation. There are partial and complete records from the historic drilling with the records being archived in Integrated Resource Information System (IRIS). There are limited records regarding the standard processes that were in place regarding the sampling, assay and data collection methods. The QP considers the processes that were in place acceptable for the time of collection. The K3 area is located on the western side of the previous mining operation (K1/K2). In 2009, Mosaic commenced a multi-stage exploration drilling program to define the mineral resource potential for K3. A total of 19 holes were drilled and evaluated to define the mineral reserves currently being mined at K3; 16 were partially cored and three were cored from surface to total depth. Core sample preparation, analysis and security was performed by Accredited Laboratory No. 537 – ISO/IEC 17025:2017, Geoanalytical Laboratories, Saskatchewan Research Council (SRC). This lab is based in Saskatoon, Saskatchewan and is considered a global leader in the analysis of potash samples. The in-mine chip sampling is completed to support the grade interpretation for the active mining area (mine footprint). The samples are collected following a standard procedure by mine engineering technical employees under the supervision of the mine geologist. These samples are prepared and analyzed at the K1 and K2 Quality Control laboratories. 8.2 Sampling Method 8.2.1 Procedures: Core Determining individual sample locations was based on visually inspecting the core and consulting the respective geophysical logs. This information was used by geologists to assess changes in mineralogy, lithology and grade. Individual samples were selected according to the following process: • Changes in lithology, mineralogy, K2O grade, crystal size, or insoluble content warranted a new sample. • Clay seams were broken out as their own samples, with approximately 0.4 inches (1 cm) overlap on either side of the seam. • Samples were limited to a range of 3 to 12 inches (10 to 30 cm). Within barren intervals, sampling limits did not exceed 30 inches (75 cm) and the minimum sample length was no less than 3 inches (10 cm). • Prior to sample cutting, the core was divided into individually marked samples with straight lines perpendicular to core axis, by the geologist. The upper half of the core with the marked sample intervals was then cut with the band saw, where no natural breaks occur. Only one piece of core was removed from the core box at any one time and cut across the marked sample lines. This cutting process was repeated throughout the assay interval. • Once the sample interval to be assayed was chosen, the core was slabbed lengthwise into halves with the use of a guide to provide a straight cut across the diameter of the core. The core was cut with the dry band saw equipped with a dust collection system at the core logging facility. As stated above, only one piece of core was removed from the core box at any one time and slabbed down the vertical orientation lines marked on Date: December 31, 2025 8-2 the core. Once slabbed, the two complimentary core halves must be placed back into their respective box, with both cut surfaces facing up, prior to the next piece being taken to provide proper stratigraphic order. This process was repeated until the cored interval was slabbed. The cutting process was always supervised by the geologist. • Slabbed core samples selected for analysis were bagged, labeled and sent to the SRC laboratory for processing and analysis. The suite of analyses included the following standard package of potash analysis provided by SRC: o Soluble Digestion and ICP-OES analysis. o Insoluble Determination (filtered). o Moisture Content (wt.%). 8.2.2 Quality Control: Core The following quality control practices are in place supporting the core sampling process. • The SRC laboratory is temperature and humidity controlled to prevent core from rapidly deteriorating. • Depth correcting of the core to the wireline log depth is a quality assurance quality control (QA/QC) measure undertaken by the geologists so that accurate depths are recorded for critical elements observed in core. Depth correcting must be performed prior to any further geological analysis of the core and all depth corrections must be peer reviewed. Where appropriate, a correction factor is applied to the measured depth to calculate the true vertical depth over the cored interval. • Digital photographic records of the core and sample intervals systematically collected and compiled by the geologists (Table 8-1)to avoid confusion sample location and depth intervals. Table 8-1: Digital Photograph Records Photo Series Interval Location Core Condition Moisture Content Primary Cored Interval Field / Lab Whole Wet / Dry Assayed Assayed Interval Lab Slabbed Dry (Brine) Assayed- Tagged Assayed Interval Lab Slabbed Dry (Brine) • With each set of 40 samples, two potash standards, one quartz blank and one sample pulp replicate analysis are completed. After processing the entire group of samples, a split sample replicate is also completed. After receiving all results from the Geoanalytical Lab, the QA/QC department completes checks to confirm accuracy. 8.2.3 Procedure: In-Mine Chip Samples The following outlines the procedure for the collection of in-mine chip samples. • Samples are collected at 200 ft. intervals in all development entries and 400 ft. intervals in all production rooms, termed sample stations. • The geological beds are identified at each sample station (Figure 8-1) using the average thickness as a guide (Table 8-2) to provide consistency of bed identification. • Once all mined beds are identified, a rock hammer is used to chisel a representative sample from each bed. • The samples are collected in separate linen sample bags and have individual sample tags placed in each bag.

Date: December 31, 2025 8-3 • Each sample station is documented with the overall thickness and is checked to confirm that it matches the mining height. • The sample set from a sample station is tied together and placed in a pail for transport to the on-site laboratory facility. Figure 8-1: Esterhazy Member Potash Mineralization Table 8-2: Esterhazy Geological Bed Names and Average Thickness Bed Name Average Thickness (ft) Average Thickness (m) 50 2 to 2.5 0.61 to 0.76 45 1.7 0.52 40 4.3 1.31 35 1.5 0.46 30 2 0.61 8.2.4 Quality Control: In-Mine Chip Samples Underground chip sample collection is completed by trained personnel who hold a technical diploma or a degree from a recognized educational institution. Bed identification is a routine procedure for the mining personnel. Sample locations are marked with paint for confirmation by the geologist as required. Date: December 31, 2025 8-4 Supervision of sampling by the geologist is not required for all sampling, but frequent informal internal auditing includes sample recollection and comparison to ROGA results. 8.3 Sample Preparation 8.3.1 Procedures: Core At the (SRC) laboratory, samples were prepared for assaying and analytical procedures following the process below. • Rock samples were jaw crushed and a subsample split out using a riffler. The subsample was pulverized using a puck and ring grinding mill. The pulp was transferred to a barcode labeled plastic snap top vial. • All samples are kept in their original bags throughout all preparation procedures. • Samples are dried in their original bags. • The entire dried sample was crushed to 95% minus 2 mm. • A representative subsample was taken by passing the samples through a riffle splitter to riffle out an aliquot for mill grinding. The riffle has 10 riffle banks per side with ½ inch (1.3 cm) openings. All crushed “rejects” were vacuum sealed and returned to the original pails. The lab will place coarse rejects into storage until requested by the customer. • Homogenization of the subsample was achieved by mild steel grind to 95% minus 0.106 mm. • Transfer a portion of the homogenized aliquot to a barcode labeled plastic snap top vial. The remaining ground material (pulp) was sealed in the pulp bag. 8.3.2 Quality Assurance and Quality Control: Core Quality control performed during the sample preparation process at the SRC lab includes: • Screen size analysis on 5% of samples is performed, after crushing to minus 2 mm and after pulverization to minus 0.106 mm, 95% passing. All data will be tracked and available to client. • Loss of mass monitoring on 5% of samples is performed after crushing to minus 2 mm and after pulverization to minus 0.106 mm, 95% passing. All data is tracked and available to client. • Silica sand is used at the start of every group to clean the grinding mills. Silica sand is used to clean grinding mills between samples as required (sticky samples). Sample blanks (quintus quartz) are inserted at a rate of 5% per group. All data is available when requested. • A quintus quartz sand blank is inserted at a rate of one per 20 samples or one per group in the case there are less than 20 samples. • A pulp repeat (R) is included with every set of 36 samples and there is one split sample repeat (SSR) with every group. • Results will also include one reagent blank per group being processed. 8.3.3 Procedures: In-Mine Chip Samples All in-mine chip samples are prepared for analysis at the K1 and K2 Esterhazy analytical laboratories using the following procedures: • The in-mine samples are delivered from underground to the control room by the mine technicians and transported to the lab by Mosaic’s internal site delivery service. Date: December 31, 2025 8-5 • Once received, the samples are dried. Sample material and sample ID tags are placed in a plastic cup to confirm proper sample ID. • Sample material is split to ~100g using a splitter or riffle to distribute a larger sample into smaller representative samples for pulverization. (SOP # 1935 – Splitting Samples) • Pulverizers are used to finely grind samples for chemical analysis. The sample enters the pulverizer chamber by filling the hopper and is fed using a feed screw into a rotating pulverizer blade. A motor on the pulverizer rotates the blades generating enough pressure and frictional forces on the sample to pulverize it. The pulverized sample exits the chamber through the mesh screen at the base of the pulverizing chamber and is collected in a sample cup. The mesh screen confirms that oversized product is held in the pulverizing chamber until the appropriate particle size is obtained. (SOP# 1615 – Pulverizing Samples). The samples must be dry prior to pulverizing and large sample chunks are put through the disc mill prior to feeding it into the pulverizer. Carry over contamination between samples is reduced by blowing out the pulverizer hopper, side access door and under mesh screen before use and between samples. • The pulverized product is prepared into XRF pellets using the Angstrom 4451AE Briquet Press. To prepare a pellet, an aluminum cup is filled with pulverized sample and placed onto the piston. The press must reach 30,000 psi for four seconds. The pellet is then removed from the press and ready for XRF analysis. (Procedure # 1630 – Pressing Samples for XRF Analysis using Angstrom Sample Press (PDCA)). Th die is cleaned between samples by wiping on a Kim wipe cleaning pad. Regular maintenance is performed on the die and press to avoid rust contamination of pellets. 8.3.4 Quality Assurance and Quality Control: In-Mine Chip Samples Quality control performed during the sample preparation process at the Mosaic metallurgical lab includes: • Chip Samples are dried in their original bags before being prepared for analysis. • Chip samples are jaw crushed and a subsample is split out to approximately 100 g using a riffle splitter if the original sample is too large to properly prepare. • Sample tags are taken from mine sample bags and placed into the sample’s container. • Pulverized material is ~ 200 mesh for XRF usage. • High pressure air nozzles are used to clean pulverizer chamber and hopper in between each sample. • Pulverized samples are then mixed thoroughly to achieve homogenization before being made into the pressed pellets that will be run on the XRF. • A glass bead control sample is run at the start and end of every batch of chip samples that is run on the XRF. Batch is re-run if control sample parameters are not met. • XRF QC samples are pressed in triplicate. The standard deviation of the %K2O of the three pellets must be less than <0.15. If the standard deviation is greater than 0.15 between the triplicate samples the sample is re- split and new pellets are prepared. • Control sample data is recorded and tracked in excel spreadsheets. The control sample analysis must be in range for samples to be reported. Control charts are reviewed twice per week by the QC Specialist/QC Supervisor. • Original chip samples and analyzed portions are not kept for retention. • QC records are kept for two years. Date: December 31, 2025 8-6 8.4 Assaying and Analytical Procedures 8.4.1 Procedures: Core The basic Potash Exploration Package (ICP 2 Geo Chem) offered by SRC was used to analyze the core samples. The assaying and analytical procedures performed at the SRC lab utilizes soluble and insoluble digestion and ICP- OES analysis. An aliquot of the sample pulp was weighed and placed in a volumetric flask. Deionized water from a thermostatically controlled system was added to the flask then shaken and placed in an agitated thermostatically controlled water bath. The volumetric flask was allowed to cool then topped to volume with deionized water and shaken. The solution was then vacuumed filtered. The reweighed filter paper was dried overnight cooled in a desiccator and weighed. The weight percent insoluble are then calculated. The detection limit for this method is 0.1 wt.%. Only calibrated glassware is used aligning with ISO 17025 requirements. A moisture determination is also completed. An aliquot pulp is placed into a pre-weighed crucible and heated. The sample was then weighed again and the moisture is calculated as wt.% with a detection limit 0.1 wt.%. Assay standards are labeled with the sample number in which they were inserted after with a corresponding A to denote no thickness is given to the standard sample. 8.4.2 Quality Assurance and Quality Control: Core Reference materials POT004B (higher grade) and POT003B (lower grade) were developed and are alternately inserted by SRC every twenty samples. In addition to the inserted QA/QC samples, all SRC instruments were calibrated using commercial standards. Quality control samples from the Lab are prepared and analyzed with each batch of submitted samples. One in every 40 samples is analyzed in duplicate. All quality Lab control results must be within specified limits otherwise corrective action is taken. 8.4.3 Procedures: In-Mine Chip Samples At the Esterhazy Quality Control Lab, the Potassium Oxide (K2O) content of samples is determined using the Thermo Scientific® ARL ADVANT’X Sequential XRF (X-ray fluorescence) IntelliPower with X-Y Sample Changer. The XRF instrument is prepared for sample analysis by inputting the sample batch that includes location information and unique sample identification number into the system; in-mine samples are analyzed for K2O and Mg content. XRF Pellets are loaded into cassettes and the analysis process is initiated. A control pellet is run with each batch before and/or after samples. The control pellet (glass bead pellet) is commercially prepared by Thermo Scientific®. Results from external control samples are recorded in Mosaic’s Livelink data repository. Data results are immediately available for review. Any anomalous analyses are flagged by the instrument. These individual sample canisters will be repositioned and re-run for analysis. This process is repeated until the lab technician is satisfied with the quality of the results. Sample pellets are discarded. The %K2O and %Mg are transcribed and entered into the Mine Ore database. A paper copy is returned to the mine engineering technical group at the mine site for verification. 8.4.4 Quality Assurance and Quality Control: In-Mine Chip Samples The XRF instrument is calibrated using matrix matched samples of KCl with known concentrations. The standards used to assemble the calibration curve are stored in XRF room in a desiccant chamber. The concentrations are determined using STPB (Sodium tetraphenyl boron) titration. As per the IFA Method Harmonization Working Group’s evaluation of analytical methods used globally for the quality testing of potassium content in Potassium Chloride Fertilizer the STPB method is the preferred method or best practice methodology for use in international

Date: December 31, 2025 8-7 fertilizer trade. The KCl can be calculated by determining the amount of minor impurities that are Ca, Mg, NaCl, Bromide, Sulfate and Insol. This value is compared to the KCl analysis on each sample. Control samples are prepared in the same manner as product samples to achieve accurate sample preparation. XRF matrix matched controls are prepared internally by the QCL Technologist and run each shift by the QCL Operators with a run of samples. Statistical Quality Control (SQC) practices are in place in the Esterhazy Quality Control Laboratory, where control sample values are plotted on SQC charts and maintained in Mosaic’s document control database. SQC charts are created for analytical methods and reviewed by the QCL Technologist, QC Supervisor or QC Specialist. Each analytical procedure at Esterhazy lists the method accuracy and precision as determined by the Six Sigma Measurement Systems Analysis, summarized in Table XX. QC Laboratory audits are completed yearly by Mosaic’s Quality Assurance team. The audit findings are given to the QC Supervisor and tracked in Content Server. Esterhazy participates in a potash producer round robin sample exchange program using the Sodium Tetraphenylborate (STPB) method. The round robin analysis is performed by all producers to verify the analytical methods as standardized methods. As per the International Fertilizer Association Method Harmonization Working Group’s evaluation of analytical methods, used globally for the quality testing of potassium content in Potassium Chloride Fertilizer, the STPB method is the preferred method or best practice methodology for use in international fertilizer trade. Instrument calibration curves are based off of generic methods. The XRF instrument used to analyze samples has a service agreement with the manufacturer which includes two preventative maintenance visits per year as well as emergency visits to troubleshoot instrument issues. Routine instrument maintenance is carried out by QCL Technologist and Operators and the instrument specific log books document daily maintenance. Maintenance procedures for QCL equipment and instrument trouble shooting procedures and are stored in Mosaic’s document control database. For in-mine samples, %K2O and %Mg is reported back to Mine Engineering for validation. Results are also entered into the secure Mine Ore database. 8.5 Sample Security 8.5.1 Core Samples collected for geochemical assay were secured in plastic bags to avoid being exposed to moisture. To preserve the sample identification, the sample number was written on the sample in permanent ink, a sample tag was placed inside the bag and the bag was labeled with the sample number. The sample bags were sealed and packed in numbered plastic pails and the pails were labeled with the client’s contact information. The samples remained sealed until they were opened for processing at the geochemical laboratory. Samples were delivered securely to the International Organization for Standardization (ISO) 17025 accredited facility at SRC Geoanalytical Laboratories at Suite 125, 15 Innovation Boulevard in Saskatoon, Saskatchewan, for analysis. Upon completion of the assaying and QA/QC procedures, the geochemical results were e-mailed to the client contact list in a password-protected zip file. 8.5.2 In-Mine Chip Samples Chip samples collected from each in-mine location at K3, are secured in a linen bag with a tie. All beds are sampled separately and the individual bags are tied together for each location and placed in a large water-proof bag for transport to surface. Once on surface, the samples are delivered to the Mosaic monitored control room. The samples are retrieved by Mosaic’s delivery service and delivered to the K2 Lab. Date: December 31, 2025 8-8 8.6 Database 8.6.1 Core All the assayed intervals are compiled into the drilling database for further evaluation and compositing. The data is managed in a geological database management system called GeoSequel®. The historic assay data has been reviewed by the QP and digitized to be included with recent drilling information. The geological database includes all available exploration drilling and is a combination of assayed core data and interpreted geophysical log data. The information has been audited by the QP with respect to the ore zone interval selected and associated grade interpretation. Pertinent geological details are included in the database including elevation, formation tops and grade interpretation to allow for confirmation of the average global grade and deposit dimensions used for the mineral reserves and mineral resources estimates. 8.6.2 In-Mine Chip Samples The lab results from the in-mine chip samples get entered in the Mine Ore database that populates a secure internal Data Management and Reporting (DMR) program. All departments access their required reports from this source. The information has been audited by the Mine Engineering technical staff with respect to the ore zone intervals and associated grade analysis. Pertinent geological details from the in-mine samples are entered in the database including elevation, formation tops and grade interpretation for the active mining area. The average grade from these samples is used for the mineral reserves and mineral resources estimates. 8.7 QP Opinion on Sample Preparation, Security and Analytical Procedures It is the opinion of the Section 8 QP that the sample preparation, security and analytical procedures are suitable to support mineral resource and mineral reserve estimation. The rational for this is as follows: • The post-2009 core sampling, sample preparation, security and analytical procedures were conducted using industry standard procedures by RESPEC (formerly North Rim Exploration Ltd.) or Norwest and SRC. RESPEC and Norwest had industry recognized potash QP’s overseeing all aspects of the exploration program on behalf of Mosaic. • It is assumed based on a review of existing documents and compilation reporting, that the historical (pre- 2009) core sampling, sample preparation, security and assaying processes were appropriate for the time of data collection. The majority of the historic drilling areas have been mined and through production records, the QP has gained confidence that these estimations reconcile with realized mining expectations and results. • Internal sampling and laboratory procedures are standardized with the intention of providing accurate and representative samples of the material being mined. Date: December 31, 2025 9-1 9.0 Data Verification 9.1 QP and Internal Data Verification The following regular data validations are completed by the QP and Mosaic personnel: • The density of the minable mineralization in all cored exploration holes used for the K3 mineral resource and mineral reserve estimates have been reviewed by internal senior geology personnel to verify that the most representative value was used to estimate the mineral resource and mineral reserves at Esterhazy. • The logged depths from wireline and geological interpretations from core are compared to the predicted elevations generated in the 3D seismic model. All new elevation information is provided to seismic consultants for inclusion in the 3D seismic model to maintain current interpretation for mine planning. • All new grade and thickness information from core is included in the GeoSequel® drilling database. Average thickness and grade are recalculated to verify the most accurate estimate is applied to the mineral reserve and mineral resource estimates. • All new grade information from in-mine sampling is tabulated for the main entries and select panel rooms to verify the most accurate grade interpretation is applied to the mineral reserve estimates for the active mining area (mine footprint). • The QP has reviewed the in-mine sampling process and the lab facility procedures. • The QP has visited the mining areas to visually inspect and verify the sampling process and competencies of the technicians responsible for this sample collection. • Copies of the original analytical lab results are available internally and in the IRIS data repository. The data has been digitized for further interpretation and verification of the mineral resource estimates. Any drill holes with no data files have been excluded from the current mineral resource and mineral reserve estimates. Internal checks were completed on the location, area of influence and assay interval selected. • Exploration coring was supervised by the consulting geologists and the past and present QPs. Core retrieval, field logging and storage was verified by the consulting geological team. Site visits were made by the QP to each core retrieval during the most recent drilling campaign in 2015. • The QP visited the core logging and sampling facilities during the 2015 drilling campaign. • The QP verified all the sample intervals, reviewed the assay results and re-ran selected samples to verify the sample analysis. • The QP has reviewed the existing copies of the original analytical lab results for the historic and recent drilling data used in the mineral resource and mineral reserve estimates. There is limited historic core remaining from the original drilling campaigns, but the logged results and assays are available and included in the mineral resource and reserve estimation. • Drill core recovered from the mineralized zone post 2009 was examined by the QP. Assay intervals and stratigraphic markers were confirmed to verify that the correct interpretation was made to correlate with the underground mining horizon. The drill core has been analyzed and is preserved in the sample repository of the Saskatchewan Subsurface Geological Laboratory as a permanent record. • The QP has conducted discussion with past professionals and original site experts regarding historic data. Numerous academic reviews of the application of logging processes and the internally generated research have been performed to validate the data included in the MRMR estimation process. Date: December 31, 2025 9-2 9.2 External Data Verification The following external data verifications have been completed supporting the Esterhazy mineral resource and mineral reserve estimates. • All the exploration core for K3 was logged by qualified geological consultants with sample analysis being completed by an accredited lab. Pre-2009 exploration data has not been formally reviewed by an external consultant for the current TRS. • A review and audit of the internal GREC (Gamma Ray Equivalent Calculation) applied at Mosaic was completed to verify the process relied upon at Esterhazy. This was completed by the qualified independent geological consultants. • Exploration coring was supervised by the qualified consulting geologists and Mosaic QP. Core retrieval, field logging and storage was supervised by the qualified geologists. Site visits were made by the QP to each core retrieval during the 2015 drilling campaign. • All drilling results have been tabulated and provided to independent geophysical consultants. This geological data is used to validate the 3D seismic model and refine the interpretation used for mine planning. All seismic interpretations are produced by qualified independent experts • Pulps and rejects are bagged and sent to SRC for assay to compare the Mosaic internal lab results. Similarly, existing Mosaic samples were requested from SRC for the Mosaic internal lab to analyze. 9.3 QP Opinion on Data Adequacy It is the opinion of the Section 9 QP that the data being used and relied upon in the Technical Report Summary is adequate to support mineral resource and mineral reserve estimation. The rational for this is as follows: • The data quality and quantity are aligned with potash industry standards. • There is adequate drilling information to produce accurate mineral resource and mineral reserve estimates. • The verification process is adequate to validate the data used as part of the mineral resource and mineral reserve estimation process. • During the preparation of the report, the QP has reviewed the historical data set used to confirm the potash intervals included in the mineral resource calculation, however there is no formal documentation regarding the quality control measures and data verification procedures applied by the initial assayer. • The pre-2009 exploration results have been reviewed and there is confidence in the interpretations, however the QP has not independently verified the information by means of check assay results. • Through the existing 3D seismic interpretation, combined with the regional geology interpretation, the QP is able to verify that potash is present with a level confidence that supports the mineral resource and mineral reserve estimates. • The QP has reviewed select internal reports and memos prepared by Mosaic staff and notes that those reports and memos have not identified any material deficiencies with the adequacy of the data at the time the Technical Report Summary was prepared. • Pulps and rejects were bagged and sent to SRC for assay to compare the Mosaic internal lab results. The results of this comparison provide confidence in the results for the in-mine chip samples form the Esterhazy labs being used in the grade estimation of the mineral resources. • Over 50 years of mining history supports the geological interpretations being used to estimate the mineral resources and mineral reserves.

Date: December 31, 2025 10-1 10.0 Mineral Processing and Metallurgical Testing 10.1 Introduction Metallurgical testing and quality control are crucial to the processing of Esterhazy potash ore. Metallurgical performance of the processing facilities is monitored through a combination of online (instrumentation) and offline (laboratory) analysis. Esterhazy has onsite metallurgical and QAQC laboratories at K1 and K2 to confirm operating targets are being met throughout the process while maintaining calibration of online measurements and to confirm final product purity/quality. 10.2 On Site Laboratories The labs operate 24 hours/day, seven days a week. They are owned and operated by Mosaic and are not certified labs. The QC Supervisor and QC Specialist are responsible for training and onboarding new employees at both labs. One- on-one training is provided until competency has been demonstrated in required job duties and proficiency examinations for each training area are conducted and maintained in Mosaic’s training database. A review of the quality manual is done on an annual basis by the QC Laboratory Supervisor, where any updates must go through a formal controlled document change procedure. These changes must be approved by the QA/QC Manager. Changes to the lab standard operating procedures are under the control of the QC Supervisor and the QC Specialist. Quality control worksheets are also filed and records maintained for a minimum of one year. The labs are located within the K1 and K2 administrative buildings, making them central to the many groups accessing their services. The labs consist of numerous types of industry standard benchtop lab equipment, as well as some notably larger footprint analytical equipment. The labs are well equipped with fume hoods, chemical storage and PPE to safely perform analyses. Lab analyses are employed throughout the entire mining process (mining to shipping). Samples are primarily collected by the Operations group and brought to the labs for analysis on a set routine. These routines have been established by engineering and operations personnel, based on the criticality and variability of each specific stream, noted over the site’s decades of operation. The labs receive solid and liquid samples, each analyzed following well defined procedures that are subject to the Mosaic document control standards. Major analyses utilized are summarized in Table 10-1 and the frequency of the analyses is listed in Table 10-2. Processing related lab results are imported into a Laboratory Information Management System (LIMS) called LabVantage (Sapphire), that feeds the site’s larger reporting-based database. Shipping related lab results are entered into a PLS (Potash Loading System) system. This creates a history of the values and also provides a certificate of analysis to customers through the Mosaic SAP billing system. Table 10-1: Regular On-Site Laboratory Testing Analysis/ Equipment Sample Type Available Measurement Application XRF (X-Ray Fluorescence) Solid NaCl (wt.%) K2O (wt.%) Mg (wt.%) Ca (wt.%) Insolubles (wt.%) • Process Streams • Screening and Compaction Streams • Shipping area streams • In-mine chip samples ICP (Inductively Coupled Plasma) Spectroscopy Solids/Liquids/Brine B (wt.%) NaCl (g/L) K2O (g/L) MgCl2 (g/L) Br- (g/L) CaCl2 (g/L) SO4-2 (g/L) • Aspire® product • Process Brine • Reclaim Brine Date: December 31, 2025 10-2 Analysis/ Equipment Sample Type Available Measurement Application Manual Sieves/ CPA Solids Size Distribution over broad mesh sizes • Screening and compaction Samples • Shipping Area Streams Table 10-2: Notable Frequency of Samples Sample Name Minimum Frequency of Samples Analysis Type Mine chip samples As required and supplied Chemistry Raw Ore, x daily Chemistry Heavy Media Feed x 1 per day Chemistry Heavy Media Tailings x 6 per 12 hour shift Chemistry Heavy Media Rougher Float x 6 per 12 hour shift Chemistry Heavy Media Middlings x 6 per 12 hour shift Chemistry Flotation Tailings x 6 per 12 hour shift Chemistry Thickener Underflows x 1 per 12 hour shift Chemistry Product Screening Area x 6 per 12 hour shift Chemistry Size Compaction Area x 4 per 12 hour shift Chemistry Size Shipping Every rail car Every bulk truck Per Customer Requirements: Chemistry • K2O Equivalent Content • Impurity Concentrations Size 10.3 Quality Control Instrument calibration is performed with standards prior to each sample run on the ICP and Flame photometer. Standards of known concentration are purchased and run to verify calibration curves for the ICP. In addition to this, controls are used to confirm the validity of the in-house preparation, prior to running the XRF and ICP equipment. Control samples are prepared in the same manner as product samples to confirm accurate sample preparation. Known control samples are purchased for ICP, while XRF controls are prepared internally by QCL Technologists and run with each batch of samples. Statistical Quality Control (SQC) practices are in place in the Esterhazy Quality Control Laboratory, where control sample values are plotted on SQC charts and maintained in Mosaic’s document control database. SQC charts are created for analytical methods and reviewed by the QCL Technologists, QC Supervisor or QC Specialist. Each analytical procedure at Esterhazy lists the method accuracy and precision as determined by the Six Sigma Measurement Systems Analysis. Summarized in Table 10-3. QC Laboratory audits are completed yearly by Mosaic’s Quality Assurance team. The audit findings are given to the QC Supervisor and tracked in a software package. The Esterhazy Potash Facility also participates in a potash producers sample exchange program using the Sodium Tetraphenylborate (STPB) analytical method. The round robin analysis is performed by all producers to verify the analytical methods as standardized methods. As per the International Fertilizer Association Method Harmonization Working Group’s evaluation of analytical methods, used globally for the quality testing of potassium content in Potassium Chloride Fertilizer, the STPB method is the preferred method or best practice methodology for use in the international fertilizer trade. Instrument calibration curves are based off generic methods. Date: December 31, 2025 10-3 Table 10-3: Sample Accuracy and Precision Equipment Descriptor Accuracy XRF Solids – In house control including chip samples +/- 3.0 Standard deviation of the mean ICP Certified Control +/- 10% from control value In house control +/- 3.0 Standard deviation of the mean Flame Photometer Certified Control +/-0.045 from control value The ICP and XRF used to analyze samples have service agreements with the manufacturer that include two preventative maintenance visits per year as well as emergency visits to troubleshoot instrument issues. Routine instrument maintenance is carried out by QCL Technologists and instrument specific log books document daily maintenance. Maintenance procedures for QCL equipment and instrument trouble shooting procedures and are stored in the Mosaic document control database. Heavy metal analysis is conducted by an independent laboratory on an annual basis on all final products, including Fine, Standard, Crystal Granular, Compacted Granular and Aspire®. 10.4 Database and Records Composite samples are collected for each rail car and truck loaded at Esterhazy. They are stored by QCL personnel in the shipment and truck storage rooms. Every tenth sample for each product grade is analyzed as per the shipment standard operating procedure. The samples are retained for a period of time based on the destination of the product shipment, three months for domestic shipments and six months for export shipments. Certificates of analysis are prepared and issued by the Quality Control Laboratory (QCL) and are double checked by QCL Technologists and signed off by QCL Supervisor. Customers can obtain their Certificate of analysis from Mosaic Online, Mosaic’s sales and marketing web tool, while certificates of analysis are filed and records maintained in Mosaic’s document management system for a minimum of three years. The American Fertilizer Industry Association (AFIA) requires that the bills of lading (BOL) must contain the guaranteed product grade information as required by Canadian Fertilizer Industry Association (CFIA), AFIA and State regulations in the United States. Changes to the bill of lading information are under the control of the QA Specialists or QA/QC Manager. As product is unloaded at ports for international shipment it is sampled and analyzed by a third-party laboratory. This analysis is compared to the analysis on the product as the train was loaded to confirm accuracy. This provides third party confirmation of final product purity, by SGS. The SGS lab has ISO/IEC 17025:2005 accreditation for the analysis of Potassium (K2O) and sodium chloride (NaCl) in potassium chloride and other fertilizers. Composite samples and certificates of analysis are tracked by SAP Material ID numbers for each grade of product, rail car product labels, rail and truck scale tickets and shipments load lists. 10.5 Metallurgical Test Work Metallurgical analysis is performed throughout the Esterhazy processing facilities. Samples are taken by metallurgical or operational personnel. Samples collected by operational personnel are brought to either the K1 or K2 labs for analysis (either chemistry or particle size analysis). This analysis is subjected to the rigor discussed in the above section. Operator sampling locations and frequencies are noted above, providing the minimum amount of information to understand process performance. Samples collected by metallurgical personnel may be analyzed for density, percent solids, particle size analysis, chemistry, viscosity etc. Metallurgical samples are collected from a significantly larger set of locations, primarily to understand performance of individual pieces of equipment in the process. 10.6 Recovery Estimates Recovery is estimated at Esterhazy on a shift-by-shift basis. The amount of ore processed is measured by online belt scales on the incoming belts. The K2O grade is determined by using a weighted average of the online ore K2O analyzers Date: December 31, 2025 10-4 and the online belt scales. The K2O measurement is converted to a sylvite K2O utilizing the Mg analysis performed on the raw ore by the QA/QC labs once per shift. Finished product tons are measured by online belt scales and are determined on a shift basis. The K2O concentration for each product is determined based on chemical analysis performed on 12-hour composite samples by the QA/QC labs. Losses to tailings are monitored based on the sample collected by operational personnel and analyzed by the QA/QC labs. Those values are used by operations personnel to adjust process operating conditions to minimize losses to tailings. Overall finished production inventories are measured at a minimum of quarterly, those values are compared with measured production volumes and product shipment volumes to reconcile total production. Actual monthly or quarterly production and/or recovery are recalculated based on adjustments made as a result of that reconciliation. 10.7 Metallurgical Variability There are tendencies for small amounts of variation in process recoveries on shift or daily basis due to variations in milling adjustments, impacts of the deleterious elements listed below and typical drift in process instrumentation. Larger variations in recovery would be caused by larger planned production outages or unplanned interruptions caused by unexpected failure of process equipment. Monthly or annualized recoveries are quite consistent year over year and are rarely impacted by the characteristics of the material processed from the K3 mine. 10.8 Deleterious Elements The mineralization at Esterhazy contains certain deleterious elements that are monitored in several brine streams, the solid stream and finished products. The major elements of this group include sodium chloride (NaCl) and magnesium chloride (MgCl2) and insoluble clay minerals. Under normal operations only increased amounts of NaCl can significantly impact production volumes. NaCl NaCl is the primary component in the raw ore mined at Esterhazy. Depending on the area that is mined, higher concentrations of NaCl in mined ore results in lower milling rates and production volumes. Small amounts of NaCl are not separated from KCl and can be found in finished products. MgCl2 This compound is found in high carnallite regions of the mining area. Carnallite as a mineral contains KCl, however that material is not recoverable in the existing milling operations. High levels of carnallite can impact flotation performance resulting in lower overall plant recoveries or higher reagent costs. Insoluble Clay Minerals The Esterhazy milling process is limited at removing insoluble clay minerals from the process. Higher levels of clay minerals will increase operating costs due to the increased usage of flotation depressants and will have a negative impact on recovery. 10.9 QP Opinion on Data Adequacy It is the opinion of the Section 10 QP that the mineral processing, metallurgical testing and analytical procedures used and relied upon in the Technical Report Summary is adequate to support mineral resource and mineral reserve estimation. The rational for this is as follows: • The metallurgical and QA/QC procedures used in the K1 and K2 QC labs are conventional and are aligned with industry practice, meeting domestic and international requirements. • The chip sample analytical results from the Esterhazy analytical labs are adequate to be used for mineral resource estimation. • The data quality and quantity are aligned with industry standards and are reasonably practicable.

Date: December 31, 2025 10-5 • Test work programs, internal and external, continue to be performed to support current operations and potential improvements. • The QA/QC processes for analyzing product and confirming accuracy is adequate. • The metallurgical analyses and their respective analysis frequencies are appropriate for optimizing processing conditions and informing site personnel of anomalous conditions. • Processing recovery projections are based on appropriate metallurgical test work and compared against historical production data for validity. Date: December 31, 2025 11-1 11.0 Mineral Resource Estimates 11.1 Introduction The Esterhazy mineral resources are reported as in-situ mineralization and are exclusive of mineral reserves. Unlike mineral reserves, mineral resources do not have demonstrated economic viability, but they do demonstrate reasonable prospects for economic extraction utilizing the criteria and assumptions required at Esterhazy. A total of 59 property exploration holes and 50 years mining history from adjacent operations at Esterhazy were considered when developing the criteria and methodology for the estimation of the mineral resources. Potash in Saskatchewan, including the mineralization at Esterhazy, has been described as having “remarkable consistency of grade and thickness over many tens of kilometers” (as stated in the Best Practices Estimation of Mineral Resources and Mineral Reserves, Page 36 in the Guidelines specific to Particular Commodities, Potash and adopted by the CIM Council November 2003). This regional interpretation is used to interpolate the quality of the potash between data points used at Esterhazy for mineral resource estimation. The geological information used to estimate the potash mineral resources at Esterhazy includes core drilling, gamma-ray logging and 3D seismic modeling. The Esterhazy property is divided into two areas, the eastern and western. The eastern portion is referred to as “K4”. The current mining operations are focused within a mineral area referred to as “K3” that includes the western portion of the Esterhazy property. These two areas are separated by the historical mine workings referred to as “K1/K2” that were shut down in June 2021. 11.2 Key Assumptions The following outlines the key assumptions used for the estimation of mineral resources at Esterhazy. • The mineralization is assumed to be laterally continuous and consistent based on publicly available regional geological information and Mosaic’s knowledge of the local geology and area. Local seismic studies are used to refine the property geology for mineral resource consideration. Areas where mineralization is not present are geologically excluded from the mineral resource estimation. • The average total thickness of the potash mineralization used to determine the total mineral resources is 8.64 ft. (2.6 m). This thickness is based on the ratio of 8.5 ft. (2.6 m) production panel mining height to the development 9.0 ft. (3.1 m) mining height. • No cut-off grade or value based on commodity price is used to estimate mineral resources. This is because the mining method used at Esterhazy is not grade selective. The potash mineralization is mined on one level by continuous miners following the well-defined and continuous beds of mineralization with relatively consistent grades. At no point in the mine development and mining processes is a decision made to mine or not mine the potash mineralization in advance of the miners, unless it is defined by a mining layout for mining, geotechnical or infrastructure reason as discussed in Section 13.3.10 Operational Cut Off Grades. • A density of 129.878 lbs./cu ft. (2080.446 kg/cu m) is used to estimate the mineral resource tonnage. This was determined analytically by calculating the mean average of the density for the mining interval from 17 cored K3 exploration holes. 11.3 Estimation Methodology The methodology for estimating mineral resources at Esterhazy is described as follows: 1. The spatial location, continuity and thickness of the potash mineralization is interpreted in plan view using AutoCAD 2023 software. This plan interpretation is based on existing drill holes, 3D seismic geophysical surveys and regional geological studies. Date: December 31, 2025 11-2 The seismic surveys also provide information regarding the possible location of structural disturbances and geologic anomalies (dissolution or non-deposition) of the potash horizons. The 3D seismic survey interpretation serves as the geologic model and provides the highest resolution detail of the potash horizon. Mosaic has thoroughly compared survey results and predicted interpretations to actual locations (drill hole intersections) and characteristics of the potash horizons in the underground operations. The understanding gained from comparing predicted to actual geological conditions allows for increased confidence in areas covered by 3D seismic surveys across all Mosaic potash properties. 2. The property AutoCAD map is updated as follows: o To show the current mineral rights status. o To show the limits of the current mining footprint. o To include all completed seismic survey results. o To confirm known areas (geological anomalies, town sites and other known surface features that make the resource inaccessible) that are excluded from the mineral resource estimation process. o To include a barrier pillar of no mining for a distance of 0.5 mile (0.8 km) against the Nutrien Controlled leases and a barrier pillar of 100.0 ft. (30.5 m) against the adjacent controlled leases. o To delineate the no mining areas in the uncontrolled mineral rights areas. o To confirm the mineral resources occur only within the Esterhazy lease. o To include a 2,500 ft. (762 m) radius pillar surrounding the Esterhazy shafts, 3,000 ft. (914 m) wide pillars surrounding the towns of Langenburg and Marchwell and 2200 ft. (671 m) wide pillar surrounding the town of Esterhazy. o To include a 500 ft. (152 m) radius pillar around the exploration drill holes. o To include the Type 1, 2 and 3 collapse zones identified from the seismic surveys where no mining can be completed. At Esterhazy once collapse features are identified, a restricted mining buffer varying from 330 to 1,310 ft. (100 to 400 m) is placed around it to confirm the integrity of the mine workings. o To include a 1.0 mile (1.6 km) pillar between the K1/K2 mining area and the adjacent K4 mineral resource areas. 3. Any areas not considered to be mineable resources are excluded from the mineral resource estimate. 4. A 0.5 mile (800 m) radius is drawn around each drill hole to identify the measured resource area. For each hole, the area is estimated and the average thickness of 8.64 ft. (2.6 m) is applied to estimate a volume and the tonnage factor is applied to estimate the mineral resources tons. 5. The grade for each drill hole is applied to each polygon area to estimate the average measured mineral resource grade. 6. A polygonal estimation has been applied to the remaining mineralization. Polygons are drawn around each drill hole. The individual polygon areas and volumes are estimated and the tonnage factor is applied to estimate the tonnage for each polygon. The drill hole grade for each hole is applied to each associated polygon. 7. Chip sampling grade was used for mineralization that is outside the area of influence of a drill hole within 0.5 miles (0.8 km) of the mine footprint. 8. The average grade of all major infrastructure in-mine chip samples was used for mineralization that is outside the area of influence of a drill hole within 0 to 0.75 mile (0 to 1.2 km) of the mine footprint. 9. The drill core assay grade was used for mineralization that is within 0.75 to 1 mile (1.2 to 1.6 km) of the mine footprint by polygon area. 10. The mineral resource is categorized as measured, indicated or inferred based on the amount and quality of the supporting data. Date: December 31, 2025 11-3 11.4 Exploratory Data Analysis At the Esterhazy Potash Facility, over 114 drill holes have been drilled and 648 M tons (588 M tonnes) of potash has been mined in the over 60 years of mining. The potash mineralization has been assayed in cored holes that intersect the Esterhazy Member to verity the mineral grade of the potash deposit. These drill holes were also logged with a calibrated gamma ray tool. A Gamma Ray Equivalent Calculation (GREC) was developed to quantitatively relate potash grade to the gamma ray readings. Exploration drilling is minimized for the estimation of potash reserves due to the risk posed by overlying water-bearing formations. Safety pillars are required to offset mining from these cross-formational conduits resulting in sterilization of ground. Surface seismic data has been collected and analyzed by independent seismic consulting professionals. These seismic interpretations confirm the extent and continuity of the potash stratigraphy between known sample points without increasing risk to mining. The following outlines the exploratory data analysis completed supporting the mineral resources. • Drill hole assay data was verified and mineral resource interval was recalculated to reflect current mining conditions. • The mining zone thickness and grade defined by the drilling is 8.5 ft. (2.6 m) at an average grade of 23.4% K2O. This supports the 2025 mineral resource estimates. The following verifications of the in-mine chip sampling were completed to support accurate grade interpretation: o Standard data collection standards in place and training completed by technicians. o Supervisor audit of sampling procedures for consistency between technicians. o Re-sampled near original location to duplicate analysis • ROGA – on-board ore grade analyzer data is continuously logged to compare with results. • Mill Head Grade – monthly review of data points tabulated by the belt ore grade analyzers to express mill feed grade. • Composite exploration data compared to chip sample results – results from subset exploration holes compared to close in-mine sampling results. • The location of the in-mine chip samples are verified to confirm only samples from the conveyor drifts, boundary rooms and select rooms were used in the estimate of the measured and indicated mineral resource grade. Chip samples from within the active mining panels are not used for the estimation of the mineral resources. • Seismic data is depth corrected with known drilling intersections to allow for the best interpretation of the potash horizon. • Geophysical and geological investigations are completed to identify the integrity and thickness of the salt back and to identify potentially problematic areas because of high carnallite content or non-typical geology in the block entries before panel development can commence. 11.5 Validation The validation completed for the mineral resource estimates are: • Comparisons of the chip sample grades and the mill head grades are completed monthly to confirm reasonableness of the mineral resource estimates. • An annual MRMR forum is held internally at Mosaic to align QPs regarding mineral resources and reserves calculations. This includes a review of proposed workflow, source data inputs and industry best-practices interpretation.

Date: December 31, 2025 11-4 • The QP reviews the lease area with the Land and Mineral team to confirm alignment on property limits, mineral rights control and ownership. • So that the active mining area limits are accurate, there is a review completed of all producing and sterilized areas for inclusion in the updated property map. • A review is completed to verify the mineral resource estimates align with the established definitions for each mineral resource category. • Mineral resources estimates are peer-reviewed by an alternate site QP and the Senior Mine Engineering Manager to verify alignment regarding mining reconciliation. • Mineral resource estimates are reviewed with the Senior Mine Engineering Manager and site senior management. • All exploration data included in the mineral resource estimations were reviewed and verified with respect to current mining standards. • Mining heights were reviewed and applied to the assayed data to estimate the average grade for the mineral resources. • All assay files were reviewed and are considered suitable for inclusion in the mineral resource estimations by the QP. • The data collection standards applied at the time the exploration results were generated is deemed suitable for inclusion in the mineral resource estimations by the QP. 11.6 Confidence Classification of Mineral Resource Estimate Mineral Resource classifications are defined in SEC Regulation S-K, Subpart 1300. Mosaic adheres to these definitions when assigning confidence and classification to their mineral resource estimates. The SEC Regulation S- K, Subpart 1300 definitions of measure, indicated and inferred mineral resources are as follows. Measured Mineral Resource A measured mineral resource is that part of a mineral resource for which quantity and grade or quality are estimated on the basis of conclusive geological evidence and sampling. The level of geological certainty associated with a measured mineral resource is sufficient to allow a qualified person to apply modifying factors, as defined in this section, in sufficient detail to support detailed mine planning and final evaluation of the economic viability of the deposit. Because a measured mineral resource has a higher level of confidence than the level of confidence of either an indicated mineral resource or an inferred mineral resource, a measured mineral resource may be converted to a proven mineral reserve or to a probable mineral reserve. At Esterhazy, a measured mineral resource is defined as mineralization that is confirmed by a 2D or 3D seismic interpretation and is within 0.5 mile (0.8 km) of drilling or sampled and analyzed mine development. Indicated Mineral Resource An indicated mineral resource is that part of a mineral resource for which quantity and grade or quality are estimated on the basis of adequate geological evidence and sampling. The level of geological certainty associated with an indicated mineral resource is sufficient to allow a qualified person to apply modifying factors in sufficient detail to support mine planning and evaluation of the economic viability of the deposit. Because an indicated mineral resource has a lower level of confidence than the level of confidence of a measured mineral resource, an indicated mineral resource may only be converted to a probable mineral reserve. At Esterhazy, an indicated mineral resource is defined as mineralization that is confirmed by a 2D seismic grid or 3D seismic interpretation or is within 1.0 mile (1.6 km) of drilling or sampled and analyzed mine development. Date: December 31, 2025 11-5 Inferred Mineral Resource An inferred mineral resource is that part of a mineral resource for which quantity and grade or quality are estimated on the basis of limited geological evidence and sampling. The level of geological uncertainty associated with an inferred mineral resource is too high to apply relevant technical and economic factors likely to influence the prospects of economic extraction in a manner useful for evaluation of economic viability. Because an inferred mineral resource has the lowest level of geological confidence of all mineral resources, which prevents the application of the modifying factors in a manner useful for evaluation of economic viability, an inferred mineral resource may not be considered when assessing the economic viability of a mining project and may not be converted to a mineral reserve. At Esterhazy, an inferred mineral resource is defined as mineralization that has been investigated through a regional geological study but has limited exploration drilling, limited 2D seismic coverage and no 3D seismic interpretation. 11.7 Reasonable Prospects of Economic Extraction Regulation S-K, Subpart 1300 requires that an evaluation be conducted as to the prospect of eventual economic extraction for mineral resources. The Esterhazy K4 mineral resources are reported exclusive of the K3 mineral reserves. The parameters and assumptions supporting the mineral resource estimates are as follows: • The mineral resources are expected to be recovered by an underground room and pillar mining method. • The average thickness of the potash mineralization estimated for underground mining is 8.64 ft. (2.6 m) based on the ratio of development mining 9.0 ft. (2.7 m) to panel production mining 8.5 ft. (2.6 m). The mining equipment is only capable of mining a static dimension; this equipment has been designed to accommodate the most economical fraction of the Esterhazy Member. • A new shaft to a depth of 3,500 ft. (1,067 m) is expected to be required to access the K4 mineral resources. The associated supporting exploration drilling of 10,000 ft. (3,050 m) to support this new shaft location has been included in the assessment. • The mine design criteria for the mineral resources are as follows: o The three-entry development consists of 46.3 ft. (14.1 m) wide drifts, 300 ft. (91.4 m) wide pillars and a 9.0 ft. (2.7 m) mining height. o The mainline conveyor standard length is approximately 6,000 ft. (1,829 m) but varies from 4,000 to 8,000 ft. (1,219 to 2,438 m) dependent on the panel layout. o The room and pillar mine design consists of 66.5 ft (20.3 m) wide rooms with a height if 8.5 ft. (2.6 m). o The mining room nominal length is 6,000 ft. (1,829 m). The minimum length is 4,000 ft. (1,219 m), the maximum length is 9,000 ft. (2,743 m) and will vary in certain circumstances. o A 1,000 ft. (305 m) barrier pillar is established between long term greater than 10 year mining entries and mining panel rooms. • Production is assumed at achieving 6.7 M tons per year (6.1 M tonnes per year) of finished product from the surface processing plants. • A mining recovery of 28.9% is assumed to estimate the K4 minable mineral resource for inclusion in an economic model. • Based on the current drilling, carnallite is not expected to be a concern at K4. • An average finished product production rate of 6.7 M tons per year (6.1 M tonnes per year) is assumed based on 320 production days per year. Date: December 31, 2025 11-6 • The current K1 and K2 mills and Tailings Management Areas are expected to be used for the processing of the K4 mineral resources after the mining of the K3 mineral reserves production ramp down starts in 2045 and is completed in 2049. • The K4 mineral resources are scheduled to start mining in 2045, ramping up to full production in 2050 and ending in 2078. • A land conveyor is assumed to be constructed to move K4 production to K1 and K2. • The processing recovery for the K4 mineralization is assumed to be 86%. This is consistent with the K3 processing recoveries. • There are no known expected deleterious elements that will adversely impact the recovery of the mineral resources. • There are no known environmental, geotechnical and hydrogeological factors and concerns that will impact the prospects for economic extraction of the K4 mineral resources. • The current K1 and K2 Esterhazy surface infrastructure is assumed to be maintained and available for eventual extraction of the mineral resources. • The mining and surface rights are expected to be in place for the areas of mineral resource. The completed K4 mineral resource economic assessment supports reasonable prospects of economic extraction and the reporting of the K4 mineral resources. The assessment reflects a positive after tax NPV and positive total cash flow. 11.8 Mineral Resource Statement The mineral resource estimates for the Esterhazy Potash Facility are listed in Table 11-1. Mineral resources are reported as in-situ mineralization and are exclusive of the mineral reserves. Figure 11-1 shows the distribution of the Esterhazy Potash Facility mineral resources and mineral reserves. Date: December 31, 2025 11-7 Table 11-1: 2025 Mineral Resources Location Measured Mineral Resources Indicated Mineral Resources Measured + Indicated Mineral Resources Inferred Mineral Resources Ore Tons (M) Ore Tonnes (M) % K2O % Carnallite Ore Tons (M) Ore Tonnes (M) % K2O % Carnallite Ore Tons (M) Ore Tonnes (M) % K2O % Carnallite Ore Tons (M) Ore Tonnes (M) % K2O % Carnallite K4 282 255 23.2 9.8 2,309 2,094 22.8 5.9 2,590 2,350 22.9 6.4 0 0 0 0 Total 282 255 23.2 9.8 2,309 2,094 22.8 5.9 2,590 2,350 22.9 6.4 0 0 0 0 Notes to accompany mineral resource table: 1. Mineral resource estimates were prepared by QP O. Duff, a Mosaic employee. 2. The mineral resources are reported as in-situ mineralization and are exclusive of mineral reserves. 3. Mineral resources have an effective date of December 31, 2025. Mineral resources are reported exclusive of those mineral resources that have been converted to mineral reserves. Unlike mineral reserves, mineral resources do not have demonstrated economic viability, but they do demonstrate reasonable prospects for economic extraction. 4. Mineral resources are not mineral reserves and do not meet the threshold for mineral reserve modifying factors, such as estimated economic viability, that would allow for conversion to mineral reserves. There is no certainty that any part of the mineral resources estimated will be converted into mineral reserves. 5. Mineral resources assume an underground room and pillar mining method. 6. Mineral resources amenable to underground mining method are accessed via shaft and scheduled for extraction based on a conceptual room and pillar design using the same technical parameters as for mineral reserves. 7. No cut-off grade or value based on commodity price is used to estimate mineral resources. This is because the mining method used at Esterhazy is not grade selective. The potash mineralization is mined on one level by continuous miners following the well-defined and continuous beds of mineralization with relatively consistent grades (Section 11.2). 8. Tonnages are in US Customary and metric units and are rounded to the nearest million tonnes. 9. Rounding as required by reporting guidelines may result in apparent summation differences. 10. %K2O refers to the total %K2O of the sample. 11. The percent carnallite refers to the mineral associated with potash ore at Esterhazy (KCl.MgCl3.6H2O). It is considered an impurity. 12. The following KCl commodity prices were used to assess prospects for economic extraction for the mineral resources but are not used for cut-off purposes, 2026-$244/tonne, 2027-$243/tonne, 2028-$224/tonne, 2029-$188/tonne, 2030-$223/tonne and for the LOM plan $251/tonne. 13. A US$/C$ exchange rate of 1.37 was used to assess prospects for economic extraction for the mineral resources but were not used for cut-off purposes.

Date: December 31, 2025 11-8 Figure 11-1: Location and Distribution of Mineral Resources and Mineral Reserves Date: December 31, 2025 11-9 11.9 Uncertainties (Factors) That May Affect the Mineral Resource Estimate A mineral resource is an estimate only and not a precise and completely accurate calculation, being dependent on the interpretation of limited information on the quality and continuity of the occurrence and on the available sampling results. Actual mineralization can be more or less than estimated depending upon actual geological conditions. The following outlines a number of uncertainties identified by the QP that exist at Esterhazy and could impact the mineral resource estimates. • Actual geological interpretations including thickness and grades of the potash mineralization are proven to be relatively uniform but can vary locally across the Esterhazy property. • The grade is estimated based on widely spaced exploration holes. Although the distance between data points is deemed suitable to define the quality of the ore in the potash deposit at Esterhazy, there could be local fluctuations affecting the overall average grade estimation. • The average grade is estimated by selecting the highest-grade continuous section from the core at that location. There could be circumstances where the highest-grade mining interval is not recovered because of local elevation changes or operator error. • The seismic model includes some areas with only 2D seismic information. Prior to mining, 3D seismic interpretation is required to confirm no undetected risk exists. Additional seismic interpretation could affect the total resource estimate if geologically anomalous conditions are identified. • Actual geological interpretations related to carnallite can vary locally across the Esterhazy property. • Density may vary from K3 exploration drilling and should be verified with in mine channel sampling at K4. • A review and audit of the internal GREC (Gamma Ray Equivalent Calculation) applied at Mosaic was completed to verify the process relied upon at Esterhazy. Most of the exploration data used in the mineral reserves and mineral resources estimation calculation is determined from core and assay results. The application of GREC has been made in some cases where there was minor core loss and in the case of drill holes where no core was recovered, but geophysical logs exist. • In some cases, drill holes encounter anomalous conditions in the core. Based on the ground-truthing at the K1/K2 site, these have been removed from the mineral resource estimation database. Ground-truthing refers to the correlation of in-mine encounters (drill holes or excavations) with the seismic model. • There are a small number of potential mineral acquisitions that could increase the mineral resources for the Esterhazy Potash Facility. Date: December 31, 2025 12-1 12.0 Mineral Reserve Estimates 12.1 Introduction The Esterhazy mineral reserves are reported as in-situ mineralization accounting for all applicable modifying factors. They are estimated by identifying economically mineable portions of the mineral resources and applying modifying factors. Mineral reserves meet all the mining criteria required at Esterhazy including, but not limited to mining, processing, metallurgical, infrastructure, economic, marketing, legal, environmental, social and governmental factors. 12.2 Key Assumptions The following outlines the key assumptions used for the estimation of mineral reserves at Esterhazy. • The mineral resources are assumed to be laterally continuous and consistent based on local mining activity. • Seismic survey results are used to plan the details for mining. • An average mining recovery of 28.9% is applied in the conversion of mineral resources to mineral reserves. • The mineral reserves are recoverable by an underground room and pillar mining method. • There is no unplanned or external dilution applied because all development and mining panels are planned in mineable ore. There is no overbreak due to the controlled cutting limits of the rotary miners. In addition, Rotating Ore Grade Analyzers (ROGA) are used to guide mining activity, by providing grade optimization via gamma detection. 12.3 Estimation Methodology The following outlines the methodology used for the estimation of the Esterhazy mineral reserves and development of a mining plan to support the mineral reserve estimates. 1. The seismic surveys provide information regarding the possible location of structural disturbances and geologic anomalies (dissolution or non-deposition) of the potash horizons. 2. Mine design work is completed utilizing the following design criteria. o The three entry development consists of 46.3 ft. (14.1 m) wide drifts, 300 ft. (91 m) wide pillars and a 9.0 ft. (2.7 m) mining height. o The mainline conveyor standard length is approximately 6,000 ft. (1,829 m) but varies from 4,000 to 8,000 ft. (1,219 to 2,438 m) dependent on the panel layout. o The room and pillar mine design consists of 66.5 ft (20.3 m) wide rooms with a height if 8.5 ft (2.6 m). o The mining room nominal length is 6,000 ft. (1,829 m). The minimum length is 4,000 ft. (1,219 m), the maximum length is 9,000 ft. (2,743 m) and will vary in certain circumstances. o A 1,000 ft. (305 m) barrier pillar is established between long term, greater than ten year mining entries and mining panel rooms. 3. A mining recovery of 28.9% is applied to the mineral resource tonnage to estimate the proven and probable mineral reserve tonnages. 4. The estimated mineral reserves are scheduled in the 2025 LOM plan using the anticipated annual grade until 2031, then using an average grade of the total remaining mineral reserves thereafter. No local grades were used. The following steps are completed to estimate the tonnage and grade of the mine footprint. Date: December 31, 2025 12-2 o Proven mineral reserves: The 2025 mining limits were extended 0.5 mile (0.8 km) from the workings and assigned a new polygon area referred to as “Proven Mine Footprint”. Panel areas inside the proven mine footprint are assigned the average grade of all major infrastructure in-mine chip samples. Mining recovery was based on the actual planned extraction in each panel. Any area with 0.5 mile (0.8 km) from a drill hole but outside of the proven mine footprint area is assigned a grade based on the core assay and a 28.9% mining recovery. o Probable mineral reserves: The 2025 mining limits were extended from 0.5 to 1 mile from the workings, areas within the influence of a drill hole were excluded and the remaining was assigned a new polygon area referred to as “Probable Mine Footprint”. The 0.5 to 0.75 mile (0.8 to 1.2 km) area of the probable mine footprint was assigned and a 28.9% mining recovery. The 0.75 to 1 mile (1.2 to 1.6 km) area of the probable mine footprint was assigned the exploration grade from their associated original polygon and drill hole intersection. o The total mine footprint grade is a weighted average of these areas together. 5. The average grade estimated from the drill holes is applied to each remaining polygon outside of the mine footprint. The weighted average is calculated and applied to the total probable reserves. 12.4 Mineral Reserve Statement The mineral reserves estimate for the Esterhazy Potash Facility is listed in Table 12-1. Figure 12-1 shows the distribution of the mineral resources and mineral reserves on the Esterhazy property. Mineral reserves are sub-divided into two confidence categories in Regulation S-K 1300, proven and probable. Proven Mineral Reserve A proven mineral reserve is the economically mineable part of a measured mineral resource and can only result from conversion of a measured mineral resource. Regulation S-K 1300 provides additional guidance that for a proven mineral reserve, the qualified person must have a high degree of confidence in the results obtained from the application of the modifying factors and in the estimates of tonnage and grade or quality. At Esterhazy, a proven mineral reserve is described as the mineable portion of the measured mineral resource. Probable Mineral Reserve A probable mineral reserve is the economically mineable part of an indicated and, in some cases, a measured mineral resource. Regulation S-K 1300 provides additional guidance that for a probable mineral reserve, the qualified person’s confidence in the results obtained from the application of the modifying factors and in the estimates of tonnage and grade or quality is lower than what is sufficient for a classification as a proven mineral reserve, but is still sufficient to demonstrate that, at the time of reporting, extraction of the mineral reserve is economically viable under reasonable investment and market assumptions. The lower level of confidence is due to higher geologic uncertainty when the qualified person converts an indicated mineral resource to a probable reserve or higher risk in the results of the application of modifying factors at the time when the qualified person converts a measured mineral resource to a probable mineral reserve. At Esterhazy, a probable mineral reserve is described as the mineable portion of the indicated mineral resource.

Date: December 31, 2025 12-3 Table 12-1: 2025 Mineral Reserves Location Proven Mineral Reserves Probable Mineral Reserves Total Mineral Reserves % Mining Recovery % Dilution Ore Tons (M) Ore Tonnes (M) % K2O % Carnallite Ore Tons (M) Ore Tonnes (M) % K2O % Carnallite Ore Tons (M) Ore Tonnes (M) % K2O % Carnallite K3 Mine Footprint 134 122 23.2 3.6 48 43 22.9 4.3 182 165 23.1 3.8 33.7% 0% K3 Outside Footprint 42 38 19.2 5.3 304 275 19.6 6.1 345 313 19.6 6.0 27.1% 0% Total 176 159 22.2 4.0 351 319 20.0 5.8 527 478 20.8 5.2 29.0% 0% Notes to accompany mineral reserves table: 1. Mineral reserve estimates were prepared by QP O. Duff, a Mosaic employee. 2. The mineral reserves are based on measured and indicated resources only. 3. Mineral reserves have an effective date of December 31, 2025. 4. Underground mining standards and design criteria are used to constrain measured and indicated mineral resources within mineable shapes. Only after a positive economic test and inclusion in the LOM plan is the mineral reserve estimate included as mineral reserves. 5. Tonnages are in US Customary and metric units and are rounded to the nearest million tonnes. 6. Rounding as required by reporting guidelines may result in apparent summation differences. 7. %K2O refers to the total %K2O of the samples. 8. The percent carnallite refers to the mineral associated with potash ore at Esterhazy (KCl.MgCl3.6H2O). It is considered an impurity. 9. The following KCl commodity prices were used to assess prospects for economic extraction for the mineral resources but are not used for cut-off purposes, 2026-$244/tonne, 2027-$243/tonne, 2028-$224/tonne, 2029-$188/tonne, 2030-$223/tonne and for the LOM plan $251/tonne. 10. A US$/C$ exchange rate of 1.37 was used to assess prospects for economic extraction for the mineral resources but were not used for cut-off purposes. Date: December 31, 2025 12-4 Figure 12-1: Location and Distribution of Mineral Resources and Mineral Reserves Date: December 31, 2025 12-5 12.5 Uncertainties (Factors) That May Affect the Mineral Reserve Estimate A mineral reserve is an estimate only. It is based on applying modifying factors to the resources determined to be measured and indicated. Actual mineralization can be more or less than estimated depending upon actual geological conditions. The following outlines uncertainties identified by the QP that exist at Esterhazy and could impact the mineral reserve estimates. • Actual geological interpretations including thickness and grades of the potash mineralization are proven to be relatively uniform but can vary locally across the Esterhazy property. • The average grade of the potash outside the mine footprint is based on widely spaced exploration holes. Although the distance between data points is deemed suitable to define the quantity and quality of the ore in the potash deposit at Esterhazy, there could be local fluctuations affecting the overall average grade estimation. • Locally, chip samples grades can vary considerably but the average of all samples is considered reasonable and representative of the grade. • The average grade of the core is calculated by selecting the representative mining interval from the core at that location. There could be circumstances where the highest-grade mining envelope is not recovered because of local elevation changes or operator error. • Density may vary from K3 exploration drilling and should be verified with in mine channel sampling. • The seismic model includes some areas with only 2D seismic information. Prior to mining, 3D seismic interpretation is required to confirm no undetected risk exists. Additional seismic interpretation could affect the total mineral reserve estimate if geologically anomalous conditions are identified. • Mining recovery is described as an average recovery factor. A particular part of the mining area may be higher or lower from the designed production expectations. A change to the average mining recovery factor could result in a change to the mineral reserve estimate. • As mining advances deeper at K3, mining recoveries may need to be adjusted to account for the effects of depth and mineralogy of the potash mineralization. The mining recovery may be subject to change for safety and panel optimization reasons. • Panel mining recoveries have been adjusted to account for the effects of depth and mineralogy of the potash mineralization. The local mining recovery is subject to change for safety and panel optimization reasons. • Minor amounts of localized dilution are expected in areas where salt anomalies are encountered. This dilution is blended with other material from the mine. Date: December 31, 2025 13-1 13.0 Mining Methods 13.1 Introduction Mining at Esterhazy has always used the room and pillar method. The planned total extraction of the in-situ potash ore is 29.3%. Pillars are left in place between mining rooms to support the overlying rock. This is intended to prevent a failure of the upper rock formations and to prevent an inflow of brine from any overlying water bearing zones. These pillars also help minimize localized rock movement and maintain safe working conditions for the underground work force. The room and pillar mining is completed on a single level. The rooms are cut at 8.5 to 9.0 ft high (2.6 to 2.7 m) in the highest potash ore grade zone of the Esterhazy salt member. Historically this has been done manually by visual observations of the ore zone while mining through it. Recent developments on ROGA (Rotating Ore Grade Analyses) systems have been instituted to automate this process to help achieve the highest ore grade possible. 13.2 Underground Mining and Development Process The Esterhazy K3 Potash Facility utilizes a retreat room and pillar mining method that is mined with a four-rotor continuous mining machine transferring on an extensible conveyance (Figure 13-1). Figure 13-1: Four Rotor Continuous Miner The drift design calls for a width that is greater than the width of the miner so multiple cutting passes are required to achieve the extra width. A section view of the cutting sequence is shown in Figure 13-2. The first pass will consist of the miner cutting full face for approximately 6,000 ft. (1,825 m) depending on the panel design. The miner will then turn around at the end of first pass and cut a second pass back towards the start of the room. The third pass will be cut on the opposite side of the belt and follow the first pass direction. Rooms are designed to be either two or three passes wide and the miner will cut the side pass that consists of a partial face. Overlapping of mining is required to maintain a level back.

Date: December 31, 2025 13-2 Figure 13-2: Production Room Section View A typical room setup is shown in Figures 13-3 and 13-4. A room set up involves installation of support equipment to cut the room. This equipment is installed in a short room (breakthrough) that is cut between the central beltline entry and an outside fresh air/travel entry. Between the beltline and the miner are the extensible drive, take-up/belt storage magazine, high stands, HWI and the tow tub. Figure 13-3: Plan View of a Four Rotor Setup Figure 13-4: Section View of a Four Rotor Setup In general, the K3 Mine can be separated into three distinct mining areas (Figure 13-5). These include the: • Shaft Pillar • Development Drifts • Production Panels Date: December 31, 2025 13-3 Figure 13-5: Mining Area Terminology Shaft Pillar Area The shaft pillar area was developed to include the following infrastructure: • 4 Rotor Build Shop • Auxiliary equipment build shop • Diesel Bay • Electrical Substation • Fuel Bay • Ore Storage Bins • Mainline Conveyance • Warehouse • Offices and lunchrooms Date: December 31, 2025 13-4 After initial development is completed no mining or rehabilitation cutting is to be done in the shaft pillar without approval of the General Manager. Development Drifts Development mining consists of a three-entry system. This system consists of: 1. A central entry cut for the mainline conveyance and exhaust air. 2. Two outside entries are cut for fresh air and travel ways. 3. Dead-end turnarounds to allow room for the four-rotor miner to turn around to cut additional width. 4. Breakthroughs connecting the three entries to allow access to the belt entry and minimize dead end turnaround. 5. Underpasses connecting the fresh air entries to allow for ventilation and travel isolated from the belt entries. 6. Mainline drive sites. On average these drifts are developed in 6,000 ft. (1,829 m) lengths. These drifts are approximately 46 ft. (14.0 m) wide and require two passes with the mining machine to reach the design width. The initial entry requires a dead-end turnaround to be cut to allow the miner to turn and cut the second pass. After the second pass is completed, the miner will tram back to the end of the drift and cut a series of breakthroughs that extend into the adjacent fresh air entries. The miner utilizes a Flexiveyor (a mobile flexible conveyor) to transport the muck from the miner onto the extensible belt. After the central drift has been cut, the miner will then relocate to one of the fresh air entries and repeat the process of cutting two passes to reach design width. On the first pass the miner will break into the crosscuts, forgoing the need to cut a dead-end turnaround when cutting the fresh air entries. The typical cut height for the development entries is 9 ft. (2.7 m). An overview of the mine development cutting/excavation requirements is shown in Figure 13-6. Figure 13-6: Mine Development Overview Table 13-1 outlines the design criteria for the different types of development at Esterhazy K3 Mine. Date: December 31, 2025 13-5 Table 13-1: Development Design Criteria Type of Development Maximum Width (ft.) Nominal Cutting Length (ft.) Height (ft.) Minimum Pillar/Beam Thickness (ft.) Comments Fresh Air 46.3 6,000 9.0 250 Spaced on 300 ft. centers Belt 46.3 6,000 9.0 250 Spaced on 300 ft. centers Breakthroughs 40.0 to 46.3 250 to 300 9.0 250 Spaced on 300 ft. centers Underpass 29.5 550 9.0 10 Beam measure from top of underpass to bottom of Belt entry Drive site 63.0 305 13.5 n/a Production Panels Production panels are designed to allow the production miners to effectively cut ore while minimizing ineffective tasks such as completing miner turns, or room to room moves. Production panels are designed to be mined as retreat room and pillar. Production panels consist of the following development (Figure 13-7). • Fresh air entry: This is a standard development entry to allow fresh air and access to the production miner. • Exhaust/Belt entry: A panel belt is installed in this room and is connected to the fresh air entry through a series of crosscuts. These crosscuts provide room for the miner extensible setups and allow exhaust air to flow out of the panel. • Breakthrough: These are utilized for miner and ventilation setups and allows muck from the miner to be transported to the panel belt. They are cut in advance of the miner to minimize miner move times. • Production room: These are located between the fresh air entry and boundary drifts. Panels are cut wider than development entries to maximize ore production per miner setup. The normal cutting height for a production room is 8.5 ft (2.6 m) to minimize unplanned dilution and maximize grade. • Boundary drift: These are located at the far end of the production panel and are used to allow the miners to complete their turns for cutting additional passes and providing ventilation. • Underpass: These are only utilized in panels where two miners are cutting off the same belt entry. They are used to provide access and ventilation for both sides of the panel.

Date: December 31, 2025 13-6 Figure 13-7: Configuration for Single Panel Mining Production panels can be designed to accommodate one or two production miners cutting at the same time. Setup for a single miner panel requires one fresh air, belt and boundary drift. To accommodate a second miner another fresh air entry and boundary drift on the opposite side of the belt entry need to be developed. An underpass is also required to provide fresh air and access to both sides of the panel. Single and multiple mining configurations are shown in Figure 13-8. Date: December 31, 2025 13-7 Figure 13-8: Configuration for Multiple Panel Mining Panel design is based on criteria established by the geotechnical department. Overall panels are designed utilizing a mining extraction ratio. This ratio is calculated as the ratio of the room and pillar width inside the panel and excludes development, entries and pillars. Typically, a 1,000 ft. (305 m) barrier pillar is left between the last production room and adjacent long-term entry system but can vary based on circumstances. The design criteria for production panel development are summarized in Table 13-2. Date: December 31, 2025 13-8 Table 13-2: Production Panel Development Design Criteria Type of Development Maximum Width (ft.) Nominal Cutting Length (ft.) Height (ft.) Minimum Pillar/Beam Thickness (ft.) Comments Fresh Air 46.3 6,000 9.0 218.7 Spaced on 265 ft. centers Belt 46.3 6,000 9.0 218.7 Spaced on 265 ft. centers Production Room 66.3 6,000 to 6,500 8.5 Varies Determined based on extraction ratio for the panel Boundary Drift 46.3 to 66.3 6,000 to 6,500 8.5 500.0 Pillar between adjacent panes Breakthrough 40.0 to 46.3 220 9.0 Varies Determined based on extraction ratio for the panel Underpass 29.5 485 9.0 10.0 Beam measure from top of underpass to bottom of Belt entry Drive Site 63 305 13.5 n/a 13.2.1 ROGA (Rotating Ore Grade Analyzer) The mining zone of the Esterhazy Member is divided into five bedding units that are distinguished by their differences in geological character. A schematic cross section of the Esterhazy Member mining zone is shown in Figure 13-9. Since the degree of potash mineralization not only varies between beds but also within each individual bedding unit, achieving optimal grade is dependent on the proportions of each that are included within the mining face at any given location. Though it accounts for only a minor percentage of the total potassium present, the Potassium-40 (K-40) isotope in potash is radioactive and releases gamma energy through a process of electron capture. Since the amount of gamma radiation is directly proportional to the quantity of potassium present, a measurement of its levels can be used to gauge potash ore quality. Grade optimization via gamma detection at the mining face is achieved through the use of a Rotating Ore Grade Analyzer or ROGA which is an on-vehicle gamma grade detector designed to improve the grade of the potash ore that is mined by the rotary miner. It is mounted on the outside cutting rotors of a borer miner. Scintillating sodium iodine (NaI) crystals found within each ROGA detect the gamma ray distribution in the roof, walls and floor providing the operator with the most ideal horizon to follow to achieve optimal grade. Potash ore exists as an 11.7 ft (3.6 m) thick seam, under and overlain by salt. The mining horizon is currently determined by following an insoluble rich seam (marker bed) in the ore zone. The optimum mining horizon is loosely correlated to the marker bed and is known to vary. Optimizing ore grade cannot be done visually. A schematic cross section of the K3 potash mineralization is shown in Figure 13-9. The mineralization contains K-40, a potassium isotope, that emits naturally occurring gamma radiation. The emitted radiation is directly proportional to the K2O grade that can be detected with scintillating sodium iodine (NaI) crystals. Date: December 31, 2025 13-9 Figure 13-9: Esterhazy Member Potash Mineralization The gamma detectors are mounted on each of the outside rotors of the miners. They detect and measure the amount of natural radiation that exists in the minerals in the back, walls and floor that is being mined. The data in the form of relative gamma count is then viewed on the operator’s screen and the cutting is adjusted. Information is collected sequentially as the rotor arm and the detector rotate from the back to the floor. This information is then used by the mining machine’s operators as guidance so that the best mining horizon grade is extracted. 13.2.2 Geotechnical Considerations The pseudo-plastic behavior of salt and potash present unique mining challenges. Rock deformation within the mine is dependent on multiple factors that contribute to ore strength as well as the magnitude and distribution of stresses over time. Rock creep, or time-dependent deformation, occurs immediately after mining and continues indefinitely for the life of an excavation. This process results in vertical and horizontal convergence that will reduce room widths and heights. At increased rates of creep, as can occur under greater stresses and/or weaker rock, micro-fracturing and slip along crystal boundaries begins to occur, resulting in volume-increasing dilation and damage that accumulates over time. If stress loads exceed rock strength, fractures will develop and may ultimately lead to ground failure. The K3 Mine operates within the Esterhazy Member of the Prairie Evaporite Formation. Since this basin-style deposit is void of any appreciable tectonic influence, pre-mining stresses are derived solely from mining depth. Consequently, the effects of increased stress levels must be considered as mining advances towards deeper areas of the property. Locally, stress conditions are also influenced by their proximity to adjacent mining activities, current and past. This is mitigated during planning so that unfavorable stress interactions between mining areas are minimized. Despite its relative consistency, ore from the Esterhazy Member does demonstrate some mineral variability that warrants geotechnical consideration. Ore strength and, by extension, its ability to withstand the effects of stress, is dependent on the properties and proportions of the minerals that comprise it. When the mineralogy demonstrates

Date: December 31, 2025 13-10 variation beyond what is deemed typical, additional investigation and/or measures may be required so that mining conditions remain safe. Such variation may include increased amounts of salt or insoluble components such as clays, carbonates, or sulfates that can introduce weaknesses in the rock by altering its strength or introducing bedding planes or seams that would not normally be present. These situations are often associated with geological features found above or below the actual mining zone. Though the extent and degree of their influence cannot be accurately determined in advance, guidance as to where conditions might be impacted by such features is obtained using 3D seismic data. Though almost always present to some degree, the mineral carnallite (KMgCl3•6H2O) has been demonstrated to significantly impact ore strength when in greater quantities. Mining rooms with carnallite rich ore are also more prone to the development of bedding separations within the roof. As with anomalous conditions, the presence and distribution of carnallite cannot be accurately predicted, however, sampling conducted within the immediate mining area does provide some measure of guidance that can be used during the mine planning process. 13.2.3 Hydrogeological Considerations Undersaturated brines from adjacent aquifers have long been recognized to be of significant risk to conventional mining in the Esterhazy area. It is therefore pertinent that measures be taken so that mining activities are carried out in such a fashion so as to minimize their impact. Brine inflow into the mine may occur as a result of breaching the protective salt layers that exist above and below the mining horizon. A breach through the salt to the ore zone may result from mining activities (i.e., exploration drilling, extraction, etc.) or be naturally occurring (i.e., collapse features) and these must be carefully considered during the planning process. Boundary pillars are used to isolate drill holes from the mine workings as well as minimize the influence of stresses and subsequent rock deformation that may be imparted. Collapse features are post-depositional structures that result from rock dissolution and vertical failure. Their size and extent are variable and may transition through a number of stratigraphic units including those with water-bearing zones. Similar to drill holes, boundary pillars are implemented to physically isolate collapses from the workings as well as reduce mining-related stresses in that area. The size of the pillar employed is dependent on the extent of disruption, volume of upper salt loss and the degree of breaching or fracturing in the aquifers. These factors are determined in advance of mining through the use of 3D seismic analysis. 3D seismic information is also utilized to help define salt back thickness and the likelihood of water-bearing zones being present within the carbonate Dawson Bay Formation. Special consideration is given to areas where the remaining evaporites between the mine horizon and Dawson Bay Formation are found to be less than 75 ft. thick or if the Dawson Bay Formation itself is damaged or determined to contain water (Figure 13-10). When identified, mining in such areas may be reduced or possibly eliminated should conditions suggest the potential risk for flooding is high. Date: December 31, 2025 13-11 Figure 13-10: Stratigraphy Above Esterhazy Mining Horizon 13.3 Mine Design and Operations 13.3.1 Production Plan/Life of Mine Plan The 2025 LOM plan for the Esterhazy Potash Facility includes the K3 mineral reserves. The K4 mineral resources are also shown for conceptual purposes, but they are not included in the economic analysis. It is based on an average production rate of 23.249 M ore tons per year (21.901 M tonnes per year), based on 320 production days per year, with the remaining calendar days typically utilized for maintenance activities. The K3 mineral reserves production is ramped up to full production and is expected to ramp down starting in 2045, with mining completed in 2049. Date: December 31, 2025 13-12 The K4 mineral resources are conceptually starting to mine in 2045, ramping up to full production in 2050, and ending in 2078. Table 13-3 outlines the 2025 LOM plan for the K3 mineral reserves. *The K4 measured and indicated mineral resources are included for conceptual purposes. Table 13-3: 2025 LOM Plan and K4 Resources for Conceptual Purposes Year Total Ore Tons (‘000) %K2O Total Ore Tonnes (‘000) Site Ore Tons (‘000) Ore Tonnes (‘000) K3 K4* K3 K4* 2026 21,719 22.7 19,703 K3 21,719 19,703 2027 21,859 22.5 19,830 k3 21,859 19,830 2028 22,786 22.3 20,671 K3 22,786 20,671 2029 23,346 22.2 21,179 K3 23,346 21,179 2030 22,731 21.8 20,621 K3 22,731 20,621 2031 23,808 20.4 21,598 K3 23,808 21,598 2032 23,501 20.4 21,320 K3 23,501 21,320 2033 23,346 20.4 21,179 K3 23,346 21,179 2034 23,657 20.4 21,462 K3 23,657 21,462 2035 23,562 20.4 21,375 K3 23,562 21,375 2036 23,562 20.4 21,375 K3 23,562 21,375 2037 23,570 20.4 21,382 K3 23,570 21,382 2038 23,511 20.4 21,329 K3 23,511 21,329 2039 23,550 20.4 21,364 K3 23,550 21,364 2040 23,552 20.4 21,366 K3 23,552 21,366 2041 23,536 20.4 21,352 K3 23,536 21,352 2042 23,525 20.4 21,341 K3 23,525 21,341 2043 23,512 20.4 21,329 K3 23,512 21,329 2044 23,263 20.4 21,104 K3 23,263 21,104 2045 23,429 20.4 21,255 K3/K4 23,279 150 21,119 136 2046 23,506 20.2 21,324 K3/K4 22,006 1,500 19,964 1,361 2047 23,093 19.6 20,950 K3/K4 16,093 7,000 14,600 6,350 2048 22,220 21.4 20,158 K3/K4 13,220 9,000 11,993 8,165 2049 21,656 21.9 19,646 K3/K4 8,332 13,324 7,558 12,087 2050 23,324 22.9 21,159 K4 23,324 21,159 2051 23,324 22.9 21,159 K4 23,324 21,159 2052 23,324 22.9 21,159 K4 23,324 21,159 2053 23,324 22.9 21,159 K4 23,324 21,159 2054 23,324 22.9 21,159 K4 23,324 21,159 2055 23,324 22.9 21,159 K4 23,324 21,159 2056 23,324 22.9 21,159 K4 23,324 21,159 2057 23,324 22.9 21,159 K4 23,324 21,159 2058 23,324 22.9 21,159 K4 23,324 21,159 2059 23,324 22.9 21,159 K4 23,324 21,159 2060 23,324 22.9 21,159 K4 23,324 21,159 2061 23,324 22.9 21,159 K4 23,324 21,159 Date: December 31, 2025 13-13 Year Total Ore Tons (‘000) %K2O Total Ore Tonnes (‘000) Site Ore Tons (‘000) Ore Tonnes (‘000) K3 K4* K3 K4* 2062 23,324 22.9 21,159 K4 23,324 21,159 2063 23,324 22.9 21,159 K4 23,324 21,159 2064 23,324 22.9 21,159 K4 23,324 21,159 2065 23,324 22.9 21,159 K4 23,324 21,159 2066 23,324 22.9 21,159 K4 23,324 21,159 2067 23,324 22.9 21,159 K4 23,324 21,159 2068 23,324 22.9 21,159 K4 23,324 21,159 2069 23,324 22.9 21,159 K4 23,324 21,159 2070 23,324 22.9 21,159 K4 23,324 21,159 2071 23,324 22.9 21,159 K4 23,324 21,159 2072 23,324 22.9 21,159 K4 23,324 21,159 2073 23,324 22.9 21,159 K4 23,324 21,159 2074 23,324 22.9 21,159 K4 23,324 21,159 2075 23,324 22.9 21,159 K4 23,324 21,159 2076 23,324 22.9 21,159 K4 23,324 21,159 2077 23,324 22.9 21,159 K4 23,324 21,159 2078 23,324 22.9 21,159 K4 23,324 21,159 13.3.2 Planning Assumptions The following outlines the planning assumptions incorporated into the Esterhazy K3 2025 LOM plan. • An underground room and pillar mining method is used. • The production plan goal is to achieve 23,249 M tons per year (21,091 M tonnes per year) of ore to supply the surface processing plants. This is the result of 1.4 to 1.8 M tons/year (1.3 to 1.6 M tonnes/year) from four rotor miners in three entry development areas and 1.8 to 2.1 M tons/year (1.6 to 1.9 M tonnes/year) from four rotor miners in the production panels. • Mine design work is completed utilizing the following design criteria. o The three-entry development consists of 46.3 ft. (14.1 m) wide drifts, 300 ft. (91.4 m) wide pillars and a 9 ft. (2.7 m) mining height. o The mainline conveyor standard length is approximately 6,000 ft. (1,829 m) but varies from 4,000 to 8,000 ft. (1,219 to 2,438 m) dependent on the panel layout. o The room and pillar mine design consists of 66.5 ft (20.3 m) wide rooms with a height if 8.5 ft (2.6 m). o The mining room nominal length is 6,000 ft. (1,829 m). The minimum length is 4,000 ft. (1,219 m), the maximum length is 9,000 ft. (2,743 m) and will vary in certain circumstances. Rooms shorter than 4,000 ft. (1,220 m) will result in excessive miner moves and setups that would adversely affect miner productivity. If a mining room is longer than 9,000 ft. (2,743 m) the standard mining rate from the four-rotor miner will exceed the room conveyor capacity, thereby reducing the miner productivity by reducing the four rotor mining rate. o A 1,000 ft. (305 m) barrier pillar is established between long term (greater than 10 year) mining entries and mining panel rooms.

Date: December 31, 2025 13-14 • A total continuous miner fleet of 13 four rotor miners with 11 to 12 miners setup to cut and one to two in maintenance/overhaul is assumed. There is a limit of one miner per single panel and a limit of two miners per double panel. Four rotor miners are expected to have shutdowns for a six-month overhaul after cutting 12.0 M tons (13.2 M tonnes). Four rotor miners are expected to have a minor overhaul shutdown for one month after cutting 6.0 M tons (6.6 M tonnes). • No development advances until a 3D seismic survey has been completed to identify geological anomalies that may interfere with development entries. 13.3.3 Mining Sequence The Esterhazy 2025 LOM plan mining sequence is summarized in Figure 13-11. Date: December 31, 2025 13-15 Figure 13-11: LOM Plan Mining Sequence Date: December 31, 2025 13-16 13.3.4 Blasting and Explosives There is very little blasting that takes place for mining at Esterhazy K3. Blasting occasionally occurs when the ore storage bins are blocked. Explosives are sometimes used to loosen the blockage allowing the ore to flow in the bin. One other use is to remove loosened rock in the roof, floors and walls in underground openings that cause a safety hazard and other means of removal have been unsuccessful. These operations occur very infrequently. No explosives are permanently stored underground. When, required, explosives that have been stored in a surface magazine are taken underground for use. There are strict operational procedures regarding the safe storage, transport and use of explosives. Only those trained and holders of a valid blasting certificate are authorized to handle explosives. 13.3.5 Ventilation The underground ventilation circuit at Esterhazy K3 consists of two surface fresh air fans that run in parallel to direct air into the mine through the South Shaft plenum into the South Downcast Shaft. Underground there are two large booster fans that direct the fresh air either North or South into the mine workings (Figure 13-12). Once the air has transferred through the mine and has completed the air circuit, it returns to the North shaft as return air. The return air is then pulled from the North shaft by two exhaust air fans that also run in parallel. Figure 13-12: Surface Fan General Arrangement The South shaft intake fans are two full bladed fans that run in parallel to each other to push fresh air into the South shaft. The fresh air moves through a Burner Housing Building where the air is heated when outside ambient temperatures are consistently below 0° C. After the intake air moves through the heating house, the air is then moved through the plenum and enters the shaft at the sub-collar level of the South headframe. Running at full capacity, the fans are designed to move a nominal 470 kcfm (221.8 m3/s) into the underground workings. These fans are also fitted with a Variable Frequency Drive (VFD) so that the air volume can be adjusted based on underground requirements and head frame pressures. The South headframe is designed to operate in a positive pressure state with standard pressure differential units of 0.0 to 0.3 inches of water gauge (0 to 7.62 mm H2O). The North exhaust fans are two full bladed fans that run in parallel to draw air from the underground workings and back into atmosphere. The fan blades are set at 31.6 degrees and are capable of drawing upwards of 250 kcfm (110.9 Date: December 31, 2025 13-17 m3/s) each on a variable frequency drive. The exhaust fans are also designed to pull air from the North headframe and maintain a negative pressure with standard pressure differential units of -0.25 to -0.50 inch water gauge (-6.35 to - 12.7 mm H2O) within the headframe. This negative pressure is to keep dust, created by the skips and chimney effect of the mine exhaust air, off the mechanics and hoisting equipment on the upper levels of the North head frame. The overall mine ventilation strategy has travel ways (or outer drifts) used as fresh air paths and center drifts (or belt drifts) used as exhaust air paths. Underpass drifts are utilized to cross fresh air from one travel way to another, without the use of fan and ducting crossover air path. Due to the dust that gets stirred during ore haulage along the belt lines, it makes the most sense to keep that dust paired with exhaust air and the fresh air paths free from unnecessary dust. There are two full bladed booster axial fans that move air North and South underground in a main airway to supply fresh air into the mine workings. The underground booster fans are designed to move upwards of 250 kcfm (118 m3/s) each and are VFD controlled to adjust to underground air requirements. There are three different types of ventilation doors underground at K3; high pressure steel doors and low pressure solid roll up doors high pressure steel doors are used directly around the North and South shafts to prevent the short circuiting of fresh air and the recirculation of exhaust air. The high pressure doors are designed to withstand a pressure with standard pressure differential units of five inch water gauge (127 mm H2O) and are installed closest to the shaft areas to withstand the positive and negative pressures created by the surface and underground booster fans. Low pressure solid roll up doors, are designed to withstand a pressure with standard pressure differential units of 1 inch water gauge (25.4 mm H2O) are placed in areas where there is little pressure due to ventilation infrastructure. The opening and closing of these doors for brief periods will not disrupt the overall ventilation system. The shaft pillar at K3 is split between a fresh air and an exhaust air side. The combination of high pressure steel doors and low pressure roll up doors (solid and pivoting) create the barrier. Fresh air moves from the South Shaft and gets distributed North and South via the underground booster fans. Fresh air to the north takes two paths through the pillar area before entering the Northern mine workings. The first path is through a main airway and moves directly north to the mine workings. The second path has air diverting through the shops area before heading to the north production area. Once the air moves through the shop and office areas, it joins the other direct air path and gets sent to the North mine workings. Air that distributes through the South booster fan takes one path to get distributed into the South Mine workings via fresh air travel ways and underpasses that connect the travel ways. Room ventilation is achieved through means of fans, brattice lines, vent tubing, vent doors and vent stoppings at strategic locations to achieve the desired ventilation flow. The main goal is to provide adequate air volume, approximately 50,000 cfm (23.6 m3/s) of fresh air, to remove dust generated at the mining face, along with removal of heat generated by the mining machine. Fresh air is brought to the mining face from the rear of the miner and flushed over the face as cutting progresses. For the case of first pass, dead end mining, a fan mounted on the miner draws air from the mining face and exhausts to a brattice line that runs the length of the room behind the miner. Flow into and out of the room is controlled by fans and controls. For the case of second and third pass mining, flow through ventilation is provided, again with fresh air approaching from the rear of the miner and flows through over the miner to eventual exhaust. Once exhausted from the mining room, the air then is routed to the main exhaust system, usually the belt drift network. Air then arrives back in the shaft pillar area and is routed up the north shaft for exhaust to surface. As the mine expands to the west, north and south, it is estimated that more booster fan setups, similar to what was described above, will be required. Allowances have been made in the LOM Capital estimate for the installation of these setups. 13.3.6 Ore and Waste Handling A four-rotor miner must be set up with various pieces of support equipment to function to maximize productivity. A typical miner setup can be seen in Figure 13-13. An automatic hardware installer is positioned right behind a miner. The function of this is to install panel belt posts/idlers in the ground as the miner progresses. Autonomous operation allows un-crewed operation over shift change and will increase first pass production and reduce exposure to moving equipment.

Date: December 31, 2025 13-18 Figure 13-13: Four Rotor Set Up Behind the belt storage magazine there is the belt extensible drive. A belt extensible drive is used to run extensible belts. They are placed in the break-through of the room being mined. This is the discharge end of the extensible belt. Workers confirm before starting to cut that the transfer chute on the extensible is not plugged and properly aligned with the conveyor. For the safety aspect, a pull cord runs along the length of the extensible. Pulling this cord will stop the extensible. Workers check this safety cord making sure it is in working condition before the equipment is turned on. Extensible belts are temporary and are installed/ taken out whenever a miner moves from room to room. Extensible belts discharge onto panel belts that are semi-permanent belts that will last the lifetime of a panel, approximately five years. The panel belts discharge onto the mainline belts that may extend multiple kilometers. They run throughout the length of the mine. These belts are suspended from the back of the underground working. After the ore mined in an active mining area, the ore is conveyed through a network of main line conveyors back to the shaft pillar area. The mainline belts dump into the underground bins. K3 has two ore bins and two surge bins. These bins allow ore to be stored underground, allowing mining to continue when the shaft is not available for hoisting. All underground conveying systems discharge into the north and south raw ore bins. Ore is reclaimed from the bottom of the ore bins with rotating plow feeders that discharge onto a reclaim belt that transfers the ore to the surge bin. Ore is reclaimed from the bottom of the surge bin with apron feeders that discharge onto a shaft feed belt. Ore from the shaft feed belt is discharged into two weigh bins located in the shaft loading pocket. Theses bins then load the skips for transportation to surface. Esterhazy K3 has two shafts in operation. The North shaft is equipped with two skips and a hoist to operate the skips. In addition, the north shaft has a four-compartment cage, operated by a hoist capable of load ups to 27 tons (24.5 tonnes), for the transportation of personnel and materials. The South shaft will be equipped with two skips and a hoist. The skips discharge into a 300 ton (272 tonne) bin located in each headframe. Ore is reclaimed from these bins using apron feeders and loaded on the overland conveying system for transport to K1 and K2 mills. 13.3.7 Backfill There is no backfilling of underground openings performed at the Esterhazy Potash Facility. 13.3.8 Water Management Nominal seepage is observed in the shaft liners. It is collected and transferred to the K2 tailings pond. Date: December 31, 2025 13-19 13.3.9 Underground Infrastructure Facilities Power is supplied to the K3 site from a 70MVA 138 kV/14.4 kV (GIS Substation). Power is routed to the underground through six 15 kV feeder lines to underground 15 KV Switchgear consisting of 600 A,15 kV, 25 KA isolation switches, vacuum circuit breakers and accessories. There is then a network of 15 kV cable lines to a series of 14.4 kV to 4.16 kV transformers to power the four rotor miners and 14.4 kV-600 V transformers to power auxiliary. 13.3.10 Operational Cut-off Grades There may be times when areas are encountered where salt mineralization has replaced potash mineralization. When encountered, decisions are made whether to continue mining through the area (that contains little to no potash) to access potash deposits on the other side of the encountered zone, or to abandon the area. This is a very infrequent occurrence. The decision to cut through salt mineralization is dependent on the mine plan. 13.3.11 Mine Production Monitoring To monitor ongoing changes in the production grade of the Esterhazy Member, chip samples of each mineralized bed are collected by Mine Engineering personnel in each production and development entry at 200 ft. (61 m) intervals. The sampling and analysis process consists of: • Identifying each distinct geological bed (30, 35, 40 and 50). • Gathering chips from wall sampling (using a chisel hammer) into a sample bag. • Filling out the sample tag with proper location and stratigraphic information. • Submitting the samples at the end of each shift to either the K1 or K2 lab for analysis where the samples are pulverized and standard K2O% and Mg% are analyzed using XRF techniques (X-Ray Fluorescence). This allows for the sylvite and carnallite concentration calculation. • Once the sample results are given to the technical services department, they are examined and corrected for any errors or omissions. The production sample results are used to create interpolated contour maps of sylvite and carnallite for the mine. Based on these maps, a general prediction for sylvite and carnallite content is made for adjacent unmined rooms. In addition to regular chip sampling, mapping is also conducted to identify any off-grade cutting, salt anomalies, or other anomalous geology that could adversely affect the mine grade. The grade results and any anomalous geology are taken into consideration when reviewing the mine plan. At surface, at the outlet of the Headframe apron feeder, the hoisted ore grade is determined by the use of a Potassium Meter 444 M-40. The concentration of potassium in bulk materials or liquid solution is measured by detecting gamma radiation of the natural isotope K-40. This isotope is contained in natural potassium in a constant percentage (0.0119%). As the isotope K-40 decays, it emits gamma radiation with an energy of 1.46 MeV. The detector LB 5340 detects radiation using an organic scintillator (PVT), the detector LB 5402 using a NaI crystal. The radiation triggers tiny flashes of light in the scintillator that are converted into electrical pulses by the photomultiplier. The count rate of this radiation is a direct measure for the potassium concentration. 13.3.12 Equipment The Esterhazy Potash Facility owns all the equipment necessary to execute the primary operational functions in the mine. Mining is completed via continuous mining machines, predominantly four-rotor miners. There is also a fleet of cutting and mobile equipment used to support the operations, construction and maintenance activities of the underground mine. Table 13-4 outlines the amount of major mining equipment and their associated estimated useful life. Date: December 31, 2025 13-20 In addition, it is estimated that in the future, K3 will need to purchase a mobile equipment unit to trim floor from travel ways and belt drifts to maintain operationally effective drift heights. Allowance for this unit(s) has been made in the capital estimate. Table 13-4: Major Mining Equipment Major Assets in Current Equipment Fleet Quantity Estimated Useful Life (Years) Drum Miner 3 30 Alpine Miner 1 30 Four Rotor Miner 13 30 Two Rotor Miner 2 30 Scoop Tram 2.5 Yd 12 10 Scoop Tram 6 Yd 1 10 Scoop Tram 3 Yd 6 10 Scoop Tram 4 Yd 2 10 13.3.13 Personnel Table 13-5 outlines the Esterhazy current and forecasted mining personnel requirements. It excludes Capital and personnel reporting offsite to a centralized Capital workforce. The bulk of the mining workforce is positioned as operational workforce, support to the operational workforce, or supervisory roles. Table 13-5: Mine Personnel - Current and Forecasted Area 2024 2025 2026 + Actual Fcast. Plan Maintenance 165 173 173 Operations 171 175 175 Other 47 70 70 Total 383 418 418 Date: December 31, 2025 14-1 14.0 Recovery Methods 14.1 Introduction The Esterhazy Potash Facility includes two independent mills, designated as K1 and K2, each receiving raw ore feed from underground mining operations. Both mills utilize a series of unit operations - including crushing, separation, screening and compaction - to produce saleable potash product that meets grade specifications. Each mill is equipped with online grade analyzers that continuously monitor ore quality and process performance. In addition to automated monitoring, routine sampling is conducted and analyzed by the onsite laboratory to verify product quality and process control. The metallurgical department also performs targeted sampling and analysis to validate operating conditions and verify optimal performance across the processing circuits. 14.2 Flowsheets The flowsheets for the Esterhazy processing plants at K1 and K2 are outlined in Figures 14-1 and 14-2. Figure 14-1: K1 Processing Plant Flow Sheet

Date: December 31, 2025 14-2 Figure 14-2: K2 Processing Plant Flow Sheet Crushing The crushing circuit processes raw ore supplied by the underground operations, which contains potash (potassium chloride, KCl), salt (sodium chloride, NaCl) and clays. The objective of the crushing circuit is to reduce the ore size to less than 9.5 mm to liberate potash and salt crystals for downstream separation. Potash concentration in the ore feed stream is continuously monitored using an online ore analyzer. Raw ore is conveyed from the headframe bins to a screening system that separates on-size and oversized material. Oversized ore is directed to a crusher for size reduction. Material that remains oversized after initial crushing is recycled through the crushing loop until it meets the required specification. On-size material is slurried and transferred to the heavy media circuit for further classification by particle size. Heavy Media The heavy media circuit begins with vibratory sizing screens that separate ore into two fractions: material greater than 1.7 mm is retained for heavy media processing, while finer material is directed to flotation. Heavy media separation exploits differences in buoyancy between potash and salt using a magnetite slurry as the separation medium. On-size ore is mixed with a magnetite slurry to achieve a specific gravity of 2.05 and processed through rougher cyclones to reject salt to tailings. The ore is then dewatered and re-slurried to a specific gravity of 1.95 for further separation and washing. Rejected material from this stage still contains potash that is not fully liberated from salt crystals; this middlings material is sent through an impactor and associated sizing screens to be further processed using flotation. Magnetite slurry recovered from various process streams is collected and reconcentrated for reuse via magnetic separation drums. Brine from the system is also recycled as wash brine to minimize reagent consumption and water usage. Date: December 31, 2025 14-3 Hydrofloat (K2 Processing Plant) In 2025, a Hydrofloat flotation column was installed and commissioned at the K2 processing plant as part of ongoing process optimization efforts to increase throughput and improve operational efficiency. The unit was integrated into the existing processing circuit to enhance recovery of coarse potash material and to alleviate loading on the conventional flotation system. Supporting upgrades, including improvements to one of the heavy media product dryers, were completed concurrently to accommodate the increased material flow. No downstream process constraints were introduced as a result of the installation. As a result of this integration, the mill crushing rate capability at K2 increased from approximately 1,800 tons per hour to 2,000 tons per hour. The resulting increase in final product volume has been incorporated into the updated Esterhazy production plan. Flotation Flotation receives the -1.7 mm size fraction from the sizing screens and the crushed middlings from the Heavy Media and Hydrofloat screening processes. The feed stream is further classified into fine and coarse fractions to confirm appropriate reagent dosing for each segment. Four reagents are used in flotation: • Depressant: Binds clays to prevent downstream reagent consumption. • Collector: Coats negatively charged potash crystals to render them hydrophobic. • Extender oil: Enhances collector performance, particularly for coarse particles. • Frother: Generates stable bubbles to facilitate flotation of potash particles. After reagent addition, the fine and coarse fractions are recombined into a single flotation feed stream and processed through rougher flotation cells, where salt is rejected. The overflow from the rougher cells contains product mixed with fine salt. This stream is passed over stationary screens to separate fine salt and small potash particles. The undersize fraction is slurried and sent to cleaner flotation cells for final product recovery Crystallizer Circuit (K2 Processing Plant) A key distinction between the K1 and K2 processing plants is the presence of a crystallizer circuit at K2. The K2 facility utilizes three growth crystallizers, classified as suspension product removal crystallizers. These units feature well-developed bed fluidization and slurry circulation to promote crystal growth and product recovery. Fresh feed is introduced into the recirculation stream, which is directed into the crystallizer dome. The recirculation flow rate is maintained at approximately seven to ten times the rate of the fresh feed, ensuring sufficient mixing and residence time. This high-volume flow enters the dome through a specially designed nozzle that diffuses velocity, minimizing turbulence at the liquid surface. Vapor evolves from the liquid surface as pressure within the dome is reduced. This pressure drop is driven by the temperature differential between the crystallizer dome and the condenser, as well as by vapor compression, which reduces vapor volume. As vapor is removed, the liquid cools, driving the brine toward supersaturation—where the solution can no longer retain dissolved salt - and initiating precipitation of potassium chloride (KCl). Precipitation occurs both through nucleation of new crystals and growth on existing crystals that are recirculated from the retention tank. Crystals formed in the dome descend with the recirculation flow through the downcomer into the retention tank. Due to the high flow rate and the proximity of the downcomer outlet to the tank bottom, the crystal bed within the retention tank becomes fluidized. This fluidized bed promotes classification by particle size: smaller crystals remain near the top of the tank, where they are subject to continued recirculation and growth, while larger crystals settle toward the bottom. These mature crystals are withdrawn from the vessel via a slurry pump for downstream processing. Date: December 31, 2025 14-4 Dewatering and Drying Circuits The K1 and K2 processing plants each operate distinct dewatering and drying circuits tailored to the origin of the product stream - either from flotation or heavy media. K2 includes an additional circuit to handle crystallizer product. Dewatering is performed using centrifuges to separate process brine from KCl solids. Potash from the various process streams is routed through appropriate centrifuge systems to remove moisture. Effluent from all centrifuges, composed of process brine, is routed to the scavenger cell circuit. K1 and K2 handle this effluent differently: K1 uses it for brine clarification before returning it to the process brine holding tank. K2 further separates fine particles, which are sent to a string filter and then to the crystallizer feed. Drying is performed using natural gas-fired fluidized bed and rotary dryers, each equipped with individual burners for direct contact heating. All dryers are fitted with wet scrubber systems to meet environmental emission standards. Annual third-party testing is conducted and submitted to the Ministry of Environment for compliance verification. Dried product exits with minimal moisture and elevated temperature, then moves via shared or dedicated elevators to the Sizing Area for final classification. Process Brine and Thickener Process brine is utilized throughout the various processing stages as a slurry medium and must be continuously clarified and recycled to maintain high plant recoveries. Brine separated from slurries is collected and directed to the tailings thickener, where suspended solids and impurities are removed prior to reuse. Within the thickener, flocculant is added to promote agglomeration of fine particles, enhancing their ability to settle. Settled solids are removed from the bottom of the thickener and pumped to the tailings management area for disposal. The clarified brine is then returned to the process brine holding tank for reuse in upstream operations Screening Area The screening area consists of multiple screen decks and gate systems used to classify product by particle size. Each circuit delivers its product stream to dedicated screening sections, where material is separated into on-size and oversize fractions. Oversize material is conveyed to a crushing circuit for size reduction and then recycled back to the screening section for reclassification. On-size product from each screening section is directed to the appropriate dispatch bins within the mill. From the dispatch bins, product is either routed to the compaction area or sent to the storage and loadout area for shipment Compaction Area The compaction area compresses fine dry KCl particles into larger flakes, which are then crushed and screened to meet product size specifications. This process upgrades smaller fractions into higher-value product. K1 operates three compaction circuits and K2 operates four. Each compactor uses rotating corrugated rolls to compress feed material into solid flakes. Feed consists of a blend of fresh product from the dryers and recycled undersize from downstream screens. On-size product proceeds to dispatch, while undersize is recycled to the compactors and oversize is re-crushed and returned to the screens. One compaction circuit at K1 is capable of adding sodium tetraborate to the feed to produce a specialty product. Storage and Shipping Area Product is weighed and conveyed into the Esterhazy warehouses via belt conveyors, then distributed through gates, trippers and chutes to designated storage areas. Each product type is stored in dedicated warehouses to prevent cross- contamination. K1 has five warehouses with a total capacity of 184,000 tons, while K2 has six warehouses totaling 262,000 tons. Reclaiming begins with bucket loaders moving product to floor openings covered by grizzly bars. These feed the reclaim conveyors, which weigh the product and transfer it to the loadout building for final screening and treatment. Each reclaim system includes dedicated screens and elevators, allowing simultaneous loading of different products. Screened product is conveyed to loadout bins, which serve as surge capacity during railcar or truck loading. Final weights are verified using government-regulated scales. Date: December 31, 2025 14-5 14.3 Plant Throughput and Design 14.3.1 Key Metrics The historical and planned future key performance metrics for the Esterhazy processing plants have been tabulated in Table 14-1 and Table 14-2. Future tonnage and recoveries are projected based on mine plan information and historical performance to match production capacity with sales demand. The average LOM plan processing recovery for the mineral reserves sent to K1 and K2 is 86%.

Date: December 31, 2025 14-6 Table 14-1: K1 Key Processing Plant Metrics K1 Plant 2021 2022 2023 2024 2025 2026 2027 2028 2029 2030 2031- Actual Actual Actual Actual Actual Plan Plan Plan Plan Plan Plan Total Milled Ore Tons (000s) 5,118 5,606 5,556 6,101 6,088 7,363 7,410 7,724 7,914 7,706 8,071 Total Finished Product Tons (000s) 1,709 1,933 1,771 1,854 1,818 2,368 2,362 2,440 2,489 2,380 2,332 Recovery 85.2% 84.5% 83.4% 83.1% 82.4% 86.0% 86.0% 86.0% 86.0% 86.0% 86.0% Total Shipped Product Tons (000s) 1,661 1,912 1,829 1,834 1,859 2,396 2,362 2,440 2,489 2,380 2,332 Table 14-2: K2 Key Processing Plant Metrics K2 Plant 2021 2022 2023 2024 2025 2026 2027 2028 2029 2030 2031- Actual Actual Actual Actual Actual Plan Plan Plan Plan Plan Plan Total Milled Ore Tons (000s) 9,546 9,880 10,009 11,070 11,624 13,021 13,105 13,661 13,996 13,628 14,274 Total Finished Product Tons (000s) 3,121 3,287 3,114 3,321 3,380 4,575 4,564 4,715 4,809 4,598 4,506 Recovery 81.3% 83.5% 80.9% 82.7% 81.3% 86.0% 86.0% 86.0% 86.0% 86.0% 86.0% Total Shipped Product Tons (000s) 3,100 3,224 3,214 3,260 3,247 4,672 4,564 4,715 4,809 4,598 4,506 Date: December 31, 2025 14-7 Historically, plant recovery trends are very consistent and have only shown variance that correlates to plant upgrades. The ability to produce at the increasing rates being forecasted in the LOM Plan are supported by a Canpotex proving run in 2013, when the Esterhazy plants achieved a production nameplate capacity of 7.0 million tons (6.3 million tonnes) overall. The K1 plant achieved 2.9 million finished tons (2.6 million tonnes) and the K2 plant achieved 4.1 million finished tons (3.7 million tonnes). 14.3.2 Equipment Characteristics and Specifications Table 14-3 outlines and summarizes the K1 and K2 process plants main equipment characteristics and specifications. Table 14-3: Process Plants Equipment Circuit/Area Equipment Name Crushing Raw Ore Warehouses Raw Ore Screens Raw Ore Bins Raw Ore Analyzer Crushers Centrifugal Pumps Heavy Media Sizing Screens Rougher Cyclones Cleaner Cyclones Product Screens Tailings Screens Magnetic Separators Middlings Crushers Middlings Screens Centrifugal Pumps Hydrofloat (K2) Reagent Mixers Hydrofloat Cell Dewatering Cyclones Sizing Screens Centrifugal Pumps Deslime & Flotation Desliming Screens and Cyclones Thickeners Hydro Separators (K2) Reagent Mixers Rougher Flotation Cells Cleaner Flotation Cells Scavenger/Re-cleaner Flotation Cells Centrifugal Pumps Crystallizers (K2) String Filters Dust and Dissolver Tanks Date: December 31, 2025 14-8 Circuit/Area Equipment Name Crystallizer Vessels Thickener Product Centrifuges Industrial Dryer Industrial Cooler Centrifugal Pumps Dewatering & Drying Product Centrifuges Industrial Dryers Centrifugal Pumps Sizing & Compaction Area Sizing Area Screens Compactors Crushers Compaction Area Screens Annealing Tumblers Industrial Dryers Final Product Screens Dust Collection Systems Weightometers Storage and Shipping Product Warehouses Reclaim System Conveyance and Screens Product Treatment Systems Rail & Truck Loading Tracks 14.3.3 Water and Energy Requirements The Esterhazy mining and milling process is an energy and water intensive process. Over the many years of production, upgrades have been implemented to increase the efficiency of the overall process. The historical and the projected future water and energy requirements to meet production requirements are listed in Tables 14-4, 14-5 and 14-6. Date: December 31, 2025 14-9 Table 14.4: Water Requirements 2021 2022 2023 2024 2025 2026 2027 2028 2029 2030 2031 Actual Actual Actual Actual Actual Plan Plan Plan Plan Plan Plan Freshwater Usage (000, cu. m) 3,039 3,170 3,365 3,219 3,277 4,480 4,474 4,560 4,614 4,493 4,441 Table 14.5: Natural Gas Requirements 2021 2022 2023 2024 2025 2026 2027 2028 2029 2030 2031 Actual Actual Actual Actual Actual Plan Plan Plan Plan Plan Plan K1 (000’s GJ) 839 919 850 877 825 911 911 911 911 911 911 K2 (000’s GJ) 2,134 2,151 1,922 2,133 2,453 2,453 2,453 2,453 2,453 2,453 2,453 K3 (000’s GJ) 123 174 187 168 143 132 132 132 132 132 132 Total (000’s GJ) 3,096 3,243 2,959 3,177 3,170 3,497 3,497 3,497 3,497 3,497 3,497 Table 14.6: Electricity Requirements 2021 2022 2023 2024 2025 2026 2027 2028 2029 2030 2031 Actual Actual Actual Actual Actual Plan Plan Plan Plan Plan Plan K1 (000’s kWh) 162,255 98,501 91,764 101,622 118,836 153,998 158,011 158,329 158,011 158,011 158,011 K2 (000’s kWh) 394,745 231,902 216,535 230,570 239,566 305,735 302,832 302,508 302,832 302,832 302,832 K3 (000’s kWh) 102,277 149,282 155,902 170,274 173,905 199,917 202,112 204,262 205,607 206,806 206,806 Total (000’s kWh) 659,277 479,685 464,201 502,466 532,307 659,650 662,954 665,098 666,450 667,648 667,648

Date: December 31, 2025 14-10 14.3.4 Personnel The Esterhazy processing plant workforce consists of Mosaic personnel. The breakdown of current and projected headcount for the K1 and K2 processing plants is listed in Table 14-7 and excludes Capital and personnel reporting offsite to a centralized Capital workforce. Table 14-4: Processing Plant Personnel Milling 2021 2022 2023 2024 2025 2026 + Actual Actual Actual Actual Actual Plan Maintenance 232 215 188 194 240 240 Operations 205 201 198 206 191 191 Other 88 80 93 111 95 95 Total 525 496 479 511 526 526 Date: December 31, 2025 15-1 15.0 Infrastructure 15.1 Introduction The Esterhazy Potash Facility consist of three sites, K1, K2 and K3, located in east central Saskatchewan approximately 12 miles (20 km) south of Highway #16 and 31 miles (50 km) north of Highway #1, the two major east-west transportation routes in the province. The mine site is situated in close proximity to a reliable high-tension power grid, natural gas pipelines, freshwater bodies and communications networks. The sites are in close proximity to the Canadian National Railway main line and are serviced by spur lines to the Canadian Pacific Railway. The surrounding area is developed for agriculture, with the required road network, villages and towns to accommodate the workforce. The Esterhazy operation has the infrastructure in place to meet current and anticipated production targets. The assets currently in place are maintained through a robust workflow process that focuses on proactive inspections and preventative maintenance while trying to minimize reactive maintenance. Mosaic uses qualitative and quantitative inspections to identify the current condition and remaining life of the assets. The assets are inspected using a risk-based approach following the American Petroleum Institute Recommended Practice – API RP 580 and there is a dedicated mechanical integrity team on site that are focused on inspections and creating remediation plans when deficiencies are found. The site’s major structural assets have been inspected by third party professional engineers and models of the main structures are available to quickly and accurately determine member by member fitness for service. Figure 15-1 shows the location of the major Esterhazy K1 infrastructure. Figure 15-2 shows the location of the major Esterhazy K2 infrastructure and Figure 15-3 shows the location of the major Esterhazy K3 infrastructure. The infrastructure at each of these sites is discussed further below. Off site infrastructure and distribution networks maintained by third parties are listed in Table 15-1. Table 15-1: Infrastructure Maintained by Third Parties Infrastructure Supplied and Maintained by Rail Network Canadian Pacific Railway, Canadian National Railway Road Network Rural Municipality of Spy Hill, Rural Municipality of Langenburg, Rural Municipality of Fertile Belt and the Saskatchewan Ministry of Highways Electric Power SaskPower Natural Gas TransGas and SaskEnergy Communications SaskTel Date: December 31, 2025 15-2 Figure 15-1: Esterhazy K1 Infrastructure Plan Date: December 31, 2025 15-3 Figure 15-2: Esterhazy K2 Infrastructure Plan

Date: December 31, 2025 15-4 Figure 15-3: Esterhazy K3 Infrastructure Plan Date: December 31, 2025 15-5 15.2 Roads and Logistics The main road access to the K1 site is via Saskatchewan Highway #80, running from the intersection with Highway #22 at the town of Esterhazy to the Yellowhead Highway #16 at Churchbridge. Access to K2 and K3 is off SK Highway #22 that runs east/west and connects to north/south SK highways #8 and #9 which in turn connects to the TransCanada Highway #1 and Yellowhead Highway #16. Access to site is maintained throughout the year with snow clearing and grading being a normal routine practiced. There are a variety of rural municipality-maintained roads through the area that are part of the rural township grid road system common on the prairies. These are all-weather gravel roads. Canadian National and Canadian Pacific Railways are available to K1 and K2 to move final product to port and North American distribution terminals. The majority of finished product is transported by rail. Mosaic owns a portion of the tracks on site that are operated by a third-party switching provider. The remainder of the tracks are owned by CN and CP, but Mosaic has running rights and lease agreements to operate on the tracks. Product is then moved via CP Rail to port or south into the US. Regina International Airport is located 140 miles (225 km) by highway west of the Esterhazy operation, while the Yorkton municipal airport is 55 miles (90 km) to the northwest. The Town of Esterhazy maintains a paved 3,000 ft. (914 m) long airstrip, located 8 miles (13 km) southwest of K1. 15.3 Tailings Storage Facilities The K1 tailings management area (TMA) is located 450 ft. (137 m) west of the mill building. It consists of a tailings pile, brine ponds and surrounding containment dykes and covers an area of 538 hectares. The tailings pumping system has two parallel pipelines to provide redundancy. There are three pumping stations on each line, located in the mill, midpoint on the east slope of the tailings pile and at the east crest of the tailings pile. The tailings pipelines from the mill to the TMA are made of basalt lined steel pipe to provide wear resistance and minimize the potential for failures. High density polyethylene piping is used within the TMA. The HDPE pipes are regularly rotated to achieve even wear and have a life cycle of two years. The K2 tailings management area is located 1,000 ft. (305 m) northwest of the mill building. It consists of a tailings pile, brine ponds and surrounding containment dykes and covers an area of 468 hectares. The tailings pumping system has two parallel 16 inch and one 14 inch (355mm) pipeline to provide redundancy. There are two pumping stages on each line, located in the mill. The tailings pipelines from the mill to the TMA are made of basalt lined steel pipe to provide wear resistance and minimize the potential for failures. High density polyethylene piping is used within the TMA. The HDPE pipes are regularly rotated to achieve even wear and have a life cycle of two years. Monitoring of the TMA includes, but is not limited to: • Site visits and review by operations personnel on a daily basis. • Monthly inspections of the TMA. • Quarterly monitoring performed by a Mosaic environmental consultant. • An annual inspection completed by a Mosaic environmental consultant, focusing on the TMA dykes. • Various forms of instrumentation, including real time instrumentation monitoring of portions of the TMA dykes and tailings pile. The instrumentation includes vibrating wire piezometers and slope inclinometers, that monitor and measure any movement and provide alarms. There is no requirement for tailings handling or storage at K3 since there is no processing plant. Refer to Section 17 for additional information about the TMA. Date: December 31, 2025 15-6 15.4 Brine Management Structures Brine management structures for the K1 site consist of TMA dykes and brine ponds, collection ditches, French drains, sewage lagoon and a catchment area for impacted surface runoff water. High pressure pumps, pipelines and deep formation injection wells dispose of produced water and impacted surface runoff water. K1 mill produced brine water is pumped to the TMA through the tailings pumping system. Collection ditch, French drain and catchment area water is pumped to the TMA via surface and submersible pumps and associated pipelines. Brine management structures for the K2 site consist of TMA dykes and brine ponds, collection ditches, sewage lagoon and a catchment area for impacted surface runoff water. High pressure pumps, pipelines and deep formation injection wells dispose of produced water and impacted surface runoff water. The K2 mill produced brine is pumped to the TMA through the tailings pumping system. Collection ditch and catchment area water is pumped to the TMA via surface and submersible pumps and associated pipelines. Brine collected in both the K1 and K2 TMAs is disposed of through injection wells into a porous water bearing formation below the mining horizon. Surface water management structures at K3 include a perimeter ditch system, berms, catchment area, waste-water handling station and pipeline. All water collected at the K3 site is pumped to the K2 TMA through a buried polyethylene pipeline from the waste- water handling facility at K3. 15.5 Built Infrastructure The infrastructure built at the Esterhazy Potash Facility includes: • Office and administration buildings, change rooms, maintenance shops, parts warehouses, parking lots and security fences. • Sanitary waste handling facilities for office, refinery, shops and warehouse buildings. K1 and K2 have lift stations that pump to a lagoon. K3 uses septic tanks, with the effluent being trucked to the K2 sewage lagoon. • A fire water system with diesel powered booster pumps at each site. The fire water system is supplied by the water towers at K1 and K2 and from the water storage and handling facility at K3. The fire water piping is separate from process water at K1 and K2, while it is a combined piping loop at the K3 site. The fire water piping supplies hydrants and automatic sprinkler systems for buildings and certain process equipment. Annual tests are performed on fire hydrants and sprinklers. • High Temperature Hot Water (HTHW) boilers and distribution piping supply process and space heating requirements at K1 and K2. K1 has three natural gas fired boilers producing HTHW at 375° F and 305 psi (190° C @ 2.1 MPa). K2 has four boilers that produce HTHW at 450° F and 405 psi (232° C @ 2.8 MPa). • Direct gas fired heating is in place for mine air and space heating requirements at K3. • A chilled glycol system for at K2 for surface space cooling requirements. This system consists of evaporative chillers, cooling towers, distribution piping and heat exchangers. The two chiller units are rated at 900 tons per day (816 tonnes per day) refrigeration capacity each. • An ammonia refrigerant/chilled glycol plant at K3, rated at 2,200 pounds per day (1,000 kg per day) refrigeration capacity, to provide cooling to the hoists. • Inter-site fibre-optic data and communications lines with external connection to the SaskTel network. There is also an on-site radio system in place with repeaters to boost the signal and available cellular coverage provided by SaskTel. Date: December 31, 2025 15-7 15.6 Power and Electrical Electric power to the three Esterhazy sites is provided by the provincial utility, SaskPower. K1 is serviced by a 72 kV line with about 22 MVA demand. SaskPower can supply around 36 MVA presently with their current infrastructure. K2 has 138 kV line from SaskPower capable of 75 MVA. K3 is serviced by a 230 kV line from SaskPower with 140 MVA capacity. Two transformers step down the voltage, each rated at 70 MVA. 15.7 Natural Gas TransGas provides a continuous natural gas supply to the Esterhazy sites through its pipeline network. The TransGas system delivers to a metering station at each site. Gas then enters Mosaic owned piping for site distribution. This piping is inspected regularly by the site mechanical integrity team. K1 is fed from the utility metering station by an eight inch main pipe to the Mosaic regulating station located immediately west of the K1 mill building. Low pressure gas is distributed from the regulating station to five product dryers in the mill and three hot water boilers located in the K1 powerhouse. A small portion of gas goes to space heating, although most heating is provided by the boilers. Gas supply is adequate to meet anticipated future demand. K2 is fed from the metering station by a 12 inch (30 cm) main to the regulating station in the K2 powerhouse. Gas is distributed to five product dryers and four hot water boilers. A small portion of gas goes to space heating, although most heating is provided by the boilers. Gas supply is adequate to meet anticipated future demand. K3 is supplied from the TransGas line that runs parallel to Highway 22. Gas is supplied from the metering station to the mine air heating facility and surface buildings for space heating. 15.8 Water Supply Water supply for the K1 plant site is provided by wells located on the plant site, within 1,650 ft (500 m) of the mill. There are three operating wells supplying process water to the K1 water tower, with a combined permitted diversion rate of 1,545 US GPM (97.5 L/S) and one out of service well. The wells are approximately 200 ft. (61 m) deep and draw from the Upper Dundurn aquifer. Well casing is 10 inch (254 mm) and equipped with submersible pumps. There are also four smaller wells located beside brine injection pumphouses to supply gland water for the pumps. Total permitted water withdrawal is 1,380,000 m3 per year. The K1 water tower is 28 ft. (8.5 m) in diameter with 122 ft. (37.1 m) of elevation above grade to the bottom of the bowl. This provides a steady head to the process and fire water piping circuits. Potable water is provided to site personnel by drawing water from the tower into a water treatment facility, consisting of a reverse osmosis membrane bank followed by sodium hypochlorite treatment. The potable water system is operated and maintained by employees certified to government standards. Mosaic owns and operates the Cutarm Creek Dam, that was constructed in 1965 and provides freshwater for the mining operations at the K2 plant site. The dam is located approximately 0.5 miles (0.8 km) east and 0.9 miles (1.5 km) north of the K2 mine site (NW35-19-32-W1). The dam is a rip rap protected earth filled dam with a 120 ft. (36.6 m) wide chute spillway designed to handle approximately 6,500 cubic ft. of water per second (183 m3/s). A 3.9 ft. (1.2 m) diameter riparian discharge line passes through the dam to provide the minimum riparian flow downstream, if required. The dam forms a reservoir approximately 5.3 miles (8.5 km) long and 650 ft. (200 m) wide. The Cutarm dam creates a reservoir that provides fresh water for K2 and K3. A pumphouse has three electric pumps and a diesel backup pump that supplies water to the K2 plant water tower through a 16 inch (406 mm) buried pipeline. The water tower is 32 ft. (9.8 m) in diameter with 132 ft. (40 m) of elevation above grade to the bottom of the bowl. This provides a steady head to the process and fire water piping circuits. Potable water is provided to site personnel by drawing water from the tower into a water treatment facility, consisting of a nano-filtration system followed by

Date: December 31, 2025 15-8 sodium hypochlorite treatment. The potable water system is operated and maintained by employees certified to government standards. K3 water is supplied from K2 through a 6 inch (150 mm) buried polyethylene pipe, approximately 7.4 miles (12 km) in length, to the K3 water handling facility. This facility consists of a 200,000 US gallon concrete storage tank, an adjacent pumphouse with electric process water distribution pumps, a diesel powered fire booster pump and a shaft wash water heater with storage tank. The water storage and handling facility is located approximately 250 ft. (76.2 m) north of the K3 north shaft. K3 potable water is produced by ultra-filtration followed by reverse osmosis and chlorination using sodium hypochlorite. The filtration plant is located on the north side of the site, fed from the process water loop. The potable water system is operated and maintained by employees certified to government standards. Date: December 31, 2025 16-1 16.0 Market Studies and Contracts 16.1 Markets Potassium is one of the three primary crop nutrients required for plant growth and is not substitutable. Potassium chloride, otherwise referred to as muriate of potash (MOP), as well as other fertilizer products derived from it, provides the overwhelming majority of potassium nutrient worldwide. While the term potash can be used to refer to a number of salts that contain potassium in a water-soluble form, it is common practice to refer to MOP as potash. Relatively small volumes of potash are also utilized in industrial applications and as a mineral supplement for livestock. The global market for potash is estimated to be approximately 70 M tonnes in 2025 and has grown at a compound annual growth rate of around 2.5% over the past 30 years. In other words, potash demand over the long term has been rather linear, though with significant year-to-year variability. Going forward, global potash demand growth is expected to continue this trend, with ourselves and independent analysts projecting a growth rate of >2% per annum. This growth predicts sufficient market demand for continued production at the Esterhazy Potash Facility. In fact, such demand growth will necessitate some a combination of new mining capacity or higher operating rates at existing mines to meet the growing demand. The Esterhazy Potash Facility produces several specifications of potash that are primarily sold into the crop nutrient (to be utilized as fertilizer) market, domestically, defined as the U.S. and Canada as well as export markets. Mosaic’s overall sales of potash are split about evenly between domestic and offshore markets. The conventional mining and milling practices at Esterhazy result in a potash product with a grade of ~60% K2O. This is the typical nutrient specification of most potash operations worldwide. Esterhazy produces a combination of granular and standard grade products – i.e., the potash is marketed either in its standard form as produced at the mill or compacted at the mill and sold as a granular product. Potash prices vary due to this differing physical sizing of the product, with a price premium ascribed to granular (blend) grade product versus standard grade product. For the purposes of this analysis, Esterhazy’s production is assumed as representative of the FOB Vancouver price benchmark published by an independent third party that includes standard and granular potash sales. 16.2 Commodity Price Forecasts Table 16-1 outlines the Mosaic potash commodity prices and exchange rate forecasts to be used in the economic assessment for support of the Esterhazy Potash Facility 2025 mineral resource and mineral reserve estimates. The commodity price forecasts utilized in the analysis are derived from an independent third party, CRU, a reputable supplier of market forecasts across a range of commodities including potash. Specifically, CRU publishes a regular forecast of potash pricing on a Free on Board, port of Vancouver (FOB, Vancouver) basis. In addition, CRU publishes potash production cost estimates for most mines around the world, including Esterhazy. These cost estimates include figures on a FOB, Vancouver basis as well a site cost (ex-works) basis at Esterhazy, the difference provides an estimate of the handling and transport cost from the mine to port. Utilizing the CRU price forecast FOB, Vancouver less this handling/transport cost estimate yields a price forecast at the Esterhazy site. The price forecast is inherently conservative, as the price reflects export sales (FOB, Vancouver) and does not account for the higher mine netbacks that are achieved with domestic market sales. The US dollar / Canadian dollar exchange rate utilized in the analysis is derived as the arithmetic average of the three years 2023 to 2025, with the actuals sourced from Bloomberg. Date: December 31, 2025 16-2 Table 16-1: Commodity Prices and Exchange Rates 2021 2022 2023 2024 2025 2026 2027 2028 2029 2030 LOM Actual Actual Actual Actual Fcast. Fcast. Fcast. Fcast. Fcast. Fcast. Fcast. Foreign Exchange (US$/C$) 1.25 1.30 1.35 1.37 1.40 1.37 1.37 1.37 1.37 1.37 1.37 Potash K2O ($/tonne) 210 571 355 207 226 244 243 224 188 223 258 Sources: Exchange Rate: (Actual) Bloomberg – arithmetic average of the end-of-day spot rate; (Forecast) Arithmetic average of the three years 2023 to 2025. Potash: CRU Potassium Chloride Market Outlook, FOB, Vancouver minus an estimate of the cost of freight/handling from mine to port via the CRU Potash Cost Service (FOB cost minus cost ex-works at realized production). 16.3 Contracts Potash sales from Esterhazy are split into two general categories: domestic and export. The export sales mechanism utilizes Canpotex Limited, a joint venture between potash producers Mosaic and Nutrien that undertakes all sales of the member producers’ potash outside of the U.S. and Canada. All Esterhazy export sales are made to Canpotex, which then undertakes the logistics to move product to offshore markets as well as undertaking the sales function. Domestic sales are managed by Mosaic’s internal sales function. Date: December 31, 2025 17-1 17.0 Environmental Studies, Permitting and Plans, Negotiations or Agreements with Local Individuals or Groups 17.1 Introduction The information as supplied regarding the management of all environmental aspects, permitting and social considerations at Mosaic facilities is guided by Mosaic’s Environmental, Health and Safety Policy, the Mosaic Management System Program and Procedures and current regulatory requirements. 17.2 Baseline and Supporting Studies Groundwater Studies Investigation of groundwater at the Esterhazy Potash Facility has been a continual process since mining began with many boreholes and wells installed over the operational history. To date there have been over 1,200 boreholes drilled for various environmental purposes and over 600 installations completed including monitoring wells, dewatering wells, vibrating wire piezometers, pneumatic piezometers, slope inclinometers, EM39 ports, etc. The drilling, instrumentation and testing programs, coupled with ongoing groundwater level and chemistry monitoring and periodic electromagnetic (EM) surveys have characterized the hydrogeology and are used for environmental monitoring purposes. The following discussion provides supporting groundwater studies that have been instrumental in environmental investigations and permitting to date. Hydrogeological and geotechnical investigations between 2010 and 2017 established the hydrogeology and geology in the vicinity of the K3 site, K3-K2 conveyor and K3-K1 conveyor; they provide the most recent and comprehensive hydrogeological framework in the vicinity of these features. Background / pre-operational groundwater conditions were determined for general chemistry parameters, petroleum hydrocarbons (PHCs), select pesticides and herbicides, polychlorinated biphenyls (PCBs) and dissolved metals based on data collected from monitoring wells at the K3 site and along the K3-K2 conveyor prior to 2016. In 2017 and 2019, baseline / pre-operational groundwater monitoring was obtained from existing wells in the vicinity of the K3-K1 conveyor. Baseline EM surveys have also been obtained for the K3 site / K3 to K2 conveyor and K3-K1 conveyors. Water user baseline studies have been completed for 3rd party wells near the K3 site and conveyors (SNC-Lavalin 2017c), as well as the Far Field site. These documents provide baseline information on third party groundwater wells in the vicinity of these features. At Esterhazy, the most comprehensive groundwater assessments completed to date included mapping of aquifer limits, groundwater surface elevations and chloride concentrations based on all the available data; chloride concentration and groundwater level trends were also assessed in conjunction with EM survey data to evaluate potential migration, impacts and the groundwater monitoring network itself at the sites. These reports provide proposed site-specific background chloride concentrations for each aquifer, monitoring rationalization and recommended decommissioning and instrumentation to optimize monitoring efforts. At the K1 Site, there have been a series of groundwater and/or surface water investigations focusing on data gaps and impacts east of the tailings management area (TMA) and plant. Mosaic is in the process of designing and implementing groundwater and surface water mitigations to improve environmental performance in this area. While there are still several shallow and deeper groundwater monitoring data gaps to be filled, groundwater flow and solute migration in the vicinity of the Esterhazy sites are generally well understood. Air Baseline and Supporting Studies Air dispersion modelling (AERMOD) was completed as part of the Esterhazy Stage 2 Expansion Project Environmental Impact Statement (MDH, 2010a). AERMOD was completed to assess the relative impact of the then- proposed K3 site and haul road on the air shed. The model examined existing and project post expansion emissions from K3 and the expanded K2 mine site. We also completed an air dispersion modelling project for the K2 Mill Expansion Project in order to evaluate impacts from the processing plant expansion.

Date: December 31, 2025 17-2 Dust modelling has been completed for the K3 to K2 conveyor and the K3 to K1 conveyor, to establish baseline dustfall levels. Dustfall and soil sampling has been completed along the conveyors to support dust models. The Mosaic Potash Esterhazy K1, K2 and K3 Annual Environmental Reports (AER) include air management commitments and strategies. The reports also contain the results of a dryer compliance stack sampling program at the K1 and K2 Sites. The sampling programs include the testing of dryer exhaust stacks to show that particulate emissions complied with the Ministry of Environment (MOE) Saskatchewan Environmental Quality Guidelines. The K3 site does not have dryer exhaust stacks, so annual tests are not required, however baseline tests have been completed on the mine exhaust vents and headframe scrubbers. Biophysical Baseline and Supporting Studies Numerous and extensive baseline biophysical studies have been completed to support continued operations and expansion of Mosaic’s Esterhazy operations. Most of these studies contain field and desktop assessments of the terrain and soils, terrestrial and wetland vegetation, wildlife and wildlife habitat, fish and fish habitat if applicable, species at risk and species of conservation concern, land cover mapping exercises and general mitigation strategies for reducing environmental impacts that may be caused by ongoing developments and operations. This includes the following: • Esterhazy Stage 2 Expansion Project Environmental Impact Statement (MDH 2010a), • Mosaic Potash Esterhazy K2 Phase V TMA and Mill Expansion (MDH 2009a), • Mosaic Potash Esterhazy K2 Phase Vb TMA Project Updated 2021 Environmental Baseline Studies (CanNorth, 2022), • Biological Assessment, Phase IV Brine Pond Mosaic Potash Esterhazy K2 (MDH 2008), • Biological and Heritage Screening. Proposed Exploration Hole Leases Mosaic Potash Esterhazy K2, • Mosaic Potash Esterhazy K2 Biological and Heritage Assessment Injection Well #13, • K1 Far-Field Completion Project Technical Project Proposal, • K3 to K2 Technical Project Proposal (SNC-Lavalin 2015ba), • K3 to K1 Technical Proposal (SNC-Lavalin 2017c), • Mosaic Potash Esterhazy K1 Surface Water Mitigation Project 2024 Environmental Studies (CanNorth 2024), • Mosaic Potash Esterhazy K1 Groundwater Mitigation Project 2024 Environmental Studies (CanNorth 2024), and • Mosaic Wildlife Management Plan (CanNorth 2024). Surface Water Baseline and Supporting Studies Regional hydrology and surface water assessments have been completed as part of the environmental assessments and baseline testing for EIAs and Technical Proposals. These assessments included some or all of the following: a study and description of the dominant hydrological processes, topography, inventory of local hydrological features, soils and land use, and delineation and classification of wetlands (where applicable) within the proposed expansion area using desktop and/or field-based methods. Some of these assessments also featured field sampling programs that established baseline water quality for the surface water features in the regional and local study areas, as well as mitigation strategies to reduce the impacts to surface water features in the area. Baseline soil and/or surface water chemistry has been obtained at select locations in the vicinity of the Sites. In the spring of 2011, baseline soil, groundwater and surface water chemistry was obtained in vicinity of the K3 Site. Baseline soil and water chemistry was obtained at several locations north of the K2 site in 2013. In 2016, background soil chemistry was obtained for FF1 injection well 8, 10 and 11 and the K1 Pump-up Well containment sites; it is noted that soil sampling may have also been completed as part of the permitting of the other injection wells at the Date: December 31, 2025 17-3 Sites. Various reports summarize baseline soil and surface water chemistry in the vicinity of the K3-K2 and K3-K1 conveyors. Heritage Assessments When undertaking a new development, Mosaic adheres to provisions of The Heritage Property Act to protect any heritage resources, in alignment with requirements set forth by the Government of Saskatchewan. The heritage screening process within a project area includes partnering with a third-party expert and consulting with the Saskatchewan Heritage Conservation Branch of the Government of Saskatchewan. This information is included in a comprehensive report that is subsequently provided to the Saskatchewan Ministry of the Environment for review and approval prior to development. 17.3 Environmental Considerations/Monitoring Programs 17.3.1 Environmental Considerations Legacy Information Constituents of potential concern (COPC), existing assessment data, known and/or potential impacts and exposure pathways, assessment needs and risks, required actions, etc. associated with areas of interest (AOI) have been documented by Mosaic in draft for the K2 site and K1 site. Compilation and refinement of legacy information is ongoing at these two sites and has not been started for the K3 site and ancillary infrastructure as it was only recently commissioned. Any remaining COPCs will be addressed at the final decommissioning & reclamation phase. Permitting Approval to Operate Pollutant Control Facilities Pursuant to the Environmental Management and Protection Act, 2010, and regulations thereunder, the K1, K2 and K3 Site has Approval to Operate (ATO) Pollutant Control Facilities No. PO18-111, PO18-104, PO18-078, respectively, with an expiry date of July 1, 2028, issued by the Ministry of Environment. Note that it is expected to be renewed on or before the expiry date. These permits provide the terms and conditions for operation of each site with respect to: • tailings management; • materials, storage, handling and transportation; • waste management, transportation and disposal; • air quality management; • water management; • pipelines; • inspections, monitoring and reporting; • decommissioning and reclamation; • contingency planning and reporting; • alterations; and • other site specific conditions. Approval for Hazardous Substances and/or Waste Dangerous Goods Approval no. PO18-111, PO18-104, PO18-078 also provides the Approval to Construct, Alter, Expand, Operate and Decommission a Hazardous Substances and/or Waste Dangerous Goods Storage Facility, pursuant to the Hazardous Substances and Waste Dangerous Goods Regulations; Chapter E-10.2 Reg 3, issued by the Saskatchewan Ministry of Environment. This is included in the ATOs for the Sites. Date: December 31, 2025 17-4 17.3.2 Environmental Monitoring Groundwater Quality Monitoring There are hundreds of standpipe piezometer / monitoring wells across the facility. These wells are generally monitored for potentiometric elevation (i.e., groundwater level) and/or routine water chemistry analysis (i.e., Cl, Na, K, Ca, Mg, CO3, SO4, HCO3, sum of ions, conductivity and ionic balance) annually to every five years depending on the location, assessment of results and stipulations in the ATOs. The 2024 Annual Environmental Reports (AERs) provides the most recent groundwater monitoring data. Horizontal Pathway Monitoring Water chemistry data is used in conjunction with EM31 and EM34 surveys to monitor horizontal brine migration. Horizontal migration in and around the mine facilities is generally slow due to the confining properties associated with the native soils and operation of mitigation measures (e.g., French Drain at K1, pumping wells at K1 and K2). The EM surveys are scheduled every 5 years with the latest completed in 2025 at the K1, K2 and K1-K3 conveyor. EM surveys were last completed for the K3 site / K3 to K2 conveyor in 2023. Vertical Pathway Monitoring Water chemistry data is used in conjunction with EM39 surveys are utilized to gauge vertical brine migration within selected on-site monitoring casings. Monitoring is completed on a re-occurring five-year schedule with the latest completed in 2025 at the K1 site and K2 site. Surface Water Quality Monitoring Surface water sampling locations are monitored for routine chemistry analysis in spring and fall at a minimum. In 2025 background surface water concentrations were re-evaluated. The Sites also perform weekly monitoring of Cl and conductivity at select locations along Cutarm Creek. The AERs provide recent surface water monitoring results. Soils Monitoring Unlike surface water or groundwater monitoring, soil monitoring is not a regulatory requirement. Rather, soil sampling is completed as part of specific assessment programs for a variety of purposes (e.g., geotechnical, environmental, etc.) on an as required basis. Soil sampling and geochemical or geotechnical analysis has been completed for numerous programs. Air Emission Monitoring Annual air emission tests are conducted for product dryers in compliance with the Saskatchewan Industrial Source (Air Quality) Chapter and the results are submitted to the Saskatchewan Ministry of Environment. For the K1and K2 Site, particulate tests on all sources showed concentrations below the Saskatchewan Environmental Quality Guidelines’ potash mining emission limit standards of 570 milligrams per dry reference cubic meter (mg/drm3). SRC obtained stack testing results that gave representative concentrations and emission rates for the sampling periods. Environmental Protection Plans (EPPs) for the Saskatchewan Potash Producers Association (SPPA) related to The Industrial Source (Air) Chapter of the Saskatchewan Environmental Code have been prepared and are provided in the AERs. Subsidence Monitoring Monitoring of surface subsidence is conducted as per the regulatory requirements to determine surface subsidence induced by mining. Subsidence has not, nor is expected to significantly alter drainage patterns on surface, impact groundwater, or structurally impact any surface facilities in the Mining Area according to Mosaic. Brine Pond Monitoring TMA brine pond levels are monitored to confirm that freeboard is maintained as per the 2018 Saskatchewan Potash Industry Brine Pond Freeboard Guidelines and Reporting Requirements and readings are provided on an annual basis to the MOE as part of the AER. When operating levels exceed Notification Level 1 (reporting level reached when the freeboard in any potash brine pond has exceeded the Normal Freeboard level by any amount for a period longer than Date: December 31, 2025 17-5 30 consecutive days), or Notification Level 2 (reporting level reached when the freeboard in any potash brine pond has exceeded the Minimum Freeboard level) Mosaic submits weekly Notification Level communications to the MOE. Mosaic completed the K1 dyke improvement project in 2024. The project consisted of the K1 Main Pond perimeter top of dyke increased to an elevation of 512.90 meters above sea level to increase the flood storage capacity and allow site to operate within Normal Freeboard.. Mosaic substantially completed the K2 dyke improvement project in 2025, with top of dyke elevation increases having been completed for all brine ponds excluding Reclaim Brine Pond and the Phase III return channel. Completion of the project requires the new mill intake to be fully commissioned, which is on target for mid to late 2026. Note that there are no brine ponds at K3. Dyke Instrumentation and Monitoring Visual inspections of the TMA dykes and ditches at K1 and K2 are completed as per the ATO (K3 does not have a TMA). On an annual basis, an independent engineering firm is contracted to conduct a comprehensive annual visual dyke inspection (AVDI) which is provided in the AER. Dyke and tailings instrumentation consists of slope inclinometers, vibrating wire piezometers, standpipe piezometers and shape acceleration arrays (SAA) at K1 and K2. As per the ATO, a minimum calculated Factor of Safety (FOS) equal to or greater than 1.5 is required for containment dykes. The most recent FOS calculations for the TMA dykes indicate that there is one segment of the K2 dyke that is at 1.45. The FOS calculations assume brine pond levels at the maximum flood storage level. The K2 dyke improvement project, scheduled for completion in 2026, is intended to achieve compliance. Tailings Pile Instrumentation and Monitoring Tailings pile stability monitoring at K1 and K2 is conducted as per the ATO and includes real time and quarterly monitoring. Monitoring consists of collecting data at slope inclinometer casings, piezometers or SAA’s installed at various locations within and around the perimeter of the existing TMAs. The instrumentation network is reviewed and inspected on an annual basis and recommendations for replacement, maintenance, or expansion are provided. Results of the monitoring are reviewed quarterly by a qualified third party and included in the annual TMA report that is provided in the AER submitted to the MOE. As per the ATO, a minimum calculated Factor of Safety (FOS) equal to or greater than 1.3 is required for all segments of the tailings pile. There are currently 5 segments of the K2 tailings pile that have a Factor of Safety (FOS) less than 1.3. Work to increase the FOS in these segments relies on operational factors and future tailings deposition. The tailings deposition plan for these areas incorporates this work and interim mitigation measures have been identified and are being implemented. The Ministry of Environment has been updated and is aware of the mitigation plans. A summary of the calculated FOS for the tailings pile segments is provided in AER. The geotechnical instrumentation network has experienced functional fluctuations over time, primarily due to periodic instrument malfunction. Maintenance and replacement of instrumentation is a routine and expected activity. Additional instrumentation has been recommended in the AER for the few areas of the tailings pile that are not currently monitored and/or replacement of failed instrumentation. Mosaic annually works with the third-party TMA consultant to address the AER instrumentation recommendations. General Waste Management Mosaic’s operations generate a variety of nonhazardous solid wastes, including domestic refuse, construction and demolition debris and waste lubricants. Mosaic’s waste management program provides assurance that all our locations have a process in place to minimize waste generation, maximize recycling and to confirm that waste management practices do not adversely affect the environment or health and safety of employees and the public. The AERs provide a general summary of the site waste management program for the 2024 calendar year. All hazardous substances and waste dangerous goods in the storage facilities listed in Appendix C of ATOs are stored in accordance with The Hazardous Substances Waste Dangerous Goods Regulations according to the 2024 AERs.

Date: December 31, 2025 17-6 Generated wastes appear to be managed in compliance with applicable environmental legislation through facility inspections conducted by Saskatchewan Ministry of Environment, as well as monitoring and documentation policies instituted by Mosaic and internal/external audits. 17.3.3 Incidents and Releases The AERs provides a summary of events, releases, incidents and reclamation activities in 2024. All reporting was completed as required by ATOs. Known historical releases are provided in the legacy information. There was one reportable incident (releases to secondary containment over a reportable regulatory quantity) and no reportable spills (releases to the environment over a reportable quantity) at the K1 site in 2025. At the K2 site there were two reportable incidents and no reportable spills that occurred in 2020. All reporting for these events was completed as required by the site ATO. There were no reportable incidents or reportable spills at the K3 site in 2025 17.4 Stockpiles 17.4.1 General Waste Management The Sites generate a variety of nonhazardous solid wastes, including domestic refuse, construction and demolition debris and waste lubricants. The waste management programs provide an assurance that processes are in place to minimize waste generation, maximize recycling and to confirm that waste management practices do not adversely affect the environment or health and safety of employees and the public. 17.4.2 Hazardous Substances and Waste Dangerous Goods Current Hazardous Substances and Waste Dangerous Goods stored on the Sites are listed in the ATOs and discussed in the Mosaic AERs. Storage of these substances are reported to and approved by Saskatchewan Ministry of Environment annually. Hazardous waste is periodically removed by a qualified third-party contractor. The total amount of hazardous substances and waste dangerous goods removed from the Sites are reported in the AERs. Until 2014 and 2016, waste asbestos was disposed of in the asbestos disposal area and buried upon placement at the K1 and K2 sites, respectively. These sites are demarcated with a sign and was only used for the disposal of asbestos. Survey records of these previous asbestos burial areas are retained within the environmental files, on Livelink and available upon request. In 2020, asbestos was disposed of offsite at the Mosaic’s waste management contractor, which has been a standard practice since 2014 and 2016, respectively. 17.5 Waste Rock Storage Facilities Waste rock is not produced at the Site. 17.6 Tailings Storage Facility 17.6.1 Tailings Pile Salt tailings are hydraulically transported (via brine slurry) to the K1 and K2 TMAs. The TMAs consists of a salt pile, brine and flood storage ponds and control structures that limit migration of process brines from the TMAs. The tailings placement on the pile utilizes spigots and loaders to form the pile. The brine used to transport the tailings runs off the tailings pile where it collects within the TMAs. Brine is produced primarily by tailings dissolution during processing and, to a lesser extent, by precipitation falling on the salt tailings pile. Containment for tailings and brine is controlled by a combination of dykes, seepage and interceptor ditches and interceptor ditch pump back wells at the K1 and K2 sites. The K1 site also utilizes French drains to control brine. Excess brine is disposed of by deep well injection into the Interlake, Stonewall and /or Stony Mountain formations. Date: December 31, 2025 17-7 17.6.2 Brine Pond and Flood Containment Pond The mining operation makes extensive use of ditches, drains and collection ponds to capture process fluids and site runoff for re-use in the process. The overall drainage collection is operated as a closed loop system. The brine pond is impounded by the perimeter dykes of the TMAs. Brine pond levels or freeboard in the TMAs are monitored as per the ATO. 17.6.3 Solids and Surface Brine Control The primary brine and tailings control structures at the K1 and K2 sites are the perimeter containment dykes. A system of open interceptor ditches have been constructed around the perimeter of the TMAs to collect seepage. The seepage water collected in the ditches flows by gravity and is pumped back to the TMA. The ditches are maintained to confirm adequate flow. At the K1 site, sub-surface brine seepage is controlled by a combination of seepage interception ditches and French drains. The French drains are deep, narrow (1 m) trenches that are keyed into an unoxidized glacial till material and filled with an engineered drainage aggregate. The bottoms of the trenches are graded to a collection point (i.e., pumphouse) and most contain a perforated pipe along the base to collect and promote drainage. 17.6.4 Deep Well Injection The K1 and K2 sites dispose of excess brine into the Interlake, Stonewall and /or Stony Mountain formations (the deepest possible disposal horizon in the area). The amount of brine injected is controlled to maintain brine levels in the TMA, sufficient flood storage and production requirements. The total brine injection required per year varies with precipitation, evaporation and potash production. Injection wells are operated and permitted as per the requirements of the Saskatchewan Ministry of Energy and Resources pursuant to The Oil and Gas Conservation Act. The table below summarizes the current injection wells at the sites, associated Ministerial Order / Approval and regulated injection pressures. Monitoring data shows the daily measured injection pressures below the Regulated Well Head Injection Pressure (RWHIP), with the exception of occasional atypical pressure spikes (i.e., above the (RWHIP)) that Mosaic attributes to gauge malfunctions because of extreme cold. Table 17-1: Esterhazy Brine Injection License Summary Mosaic Well No. Location Ministers Order No. Maximum Injection Pressure (kPa) FF-1 21-1-28-21-1-2 MRO 509/12 9,100 RWHIP FF-2 11-9-33-21-1-2 MRO 771/12 9,100 RWHIP FF-4 41-16-32-21-1-2 MRO 670/12 9,200 RWHIP FF-5 31-14-20-21-1-2 MRO 616/12 9,250 RWHIP FF-6 41-14-16-21-1-2 MRO 568/12 9,250 RWHIP FF-7 11-3-20-21-1-2 MRO 615/12 9,300 RWHIP FF-8 11-8-16-21-1-2 MRO 281/15 9,150 RWHIP FF-10 21-8-18-21-1-2 MRO 281/15 9,150 RWHIP K1-2 11-01-26-20-33-1 MA 56/86 9,000 RWHIP K1-3 11-16A-26-20-33-1 MRO 203/07 9,100 RWHIP K1-4 21-11-26-20-33-1 MA 64/86 9,000 RWHIP K1-5B 14-26-20-33-1 MRO 109/15 9,050 RWHIP K1-6 11-23-20-33-1 MA 12/87 9,000 RWHIP K1-7 10-25-20-33-1 MRO 1074/07 9,100 RWHIP K2-14 4-25-19-33-1 MRO 673/12 9,550 RWHIP K2-1 11-14-27-19-32-1 MRO 35/72 A 12 None Listed Date: December 31, 2025 17-8 RWHIP – Regulated well head injection pressure 17.7 Water Management 17.7.1 Freshwater The Esterhazy Potash Facility monitors and evaluates water use to confirm it is minimized and water recycling and reuse are being maximized according to Mosaic. Water use, including source and allocated volumes, are subject to site-specific regulations and permits. The Esterhazy Potash Facility is subject to multiple licenses to withdraw groundwater as listed in the table below, from the 2019 and 2020 Saskatchewan Water Security Agency (WSA) Report(s) for Mosaic Potash Esterhazy K1, K2 and K3 (dated February 27, 2020 and January 8, 2021, respectively). It is noted that Mosaic is responsible for adhering to general and special conditions to each of these licenses. General and specific conditions are provided in the license and approval. Annual water usage is reported in the AERs and to the WSA as per licensing conditions. Table 17-2: Water License Summary cdam - cubic decameter A - total allocation from all these wells is 1,380 cdam The K2 Site is also subject to license E2-10587 issued on February 14, 2022, for the operation of surface water works and pursuant to The Saskatchewan Watershed Authority Act and regulations under that Act. The license is for the operation of the K2 Cutarm Creek intake, plant and associated pipelines to supply surface water to the K2 Site. Under the license, Mosaic can use up to a maximum of 3,014 cubic decameters annually. According to the 2024 Saskatchewan Water Agency Report for Mosaic Potash Esterhazy K1, K2 and K3, dated January 31, 2025, 2,434 cdam of water was used at the K2 site. Mosaic Well No. Location Ministers Order No. Maximum Injection Pressure (kPa) K2-2 31-11-27-19-32-1 MA 3/81 20,400 K2-3 91-5-33-19-32-1 MA 22/86 9,500 RWHIP K2-4 42-4-33-19-32-1 MA 48/86 10,100 RWHIP K2-5 41-12-26-19-32-1 MRO 311/07 9,100 RWHIP K2-6 31-6-26-19-32-1 MRO 253/07 9,100 RWHIP K2-7 31-7-22-19-32-1 MRO 251/07 9,100 RWHIP K2-8 31-10-22-19-32-1 MRO 251/07 9,100 RWHIP K2-9 11-13-15-19-32-1 MRO 134/09 9,100 RWHIP K2-10B 21-2-15-19-32-1 MRO 831/09 9,300 RWHIP K2-2B 11-27-019-32W1 6,890 MWHIP K2-3B 05-33-019-32W WSA File Well ID Land Location Purpose Allocation E3/3201 K1-5092 SE 26-20-33-1 Industrial A E3/3203 K1-9206 SE 24-20-33-1 Industrial A E3/4546 K1-9298 NE 14-20-33-1 Industrial A E3/4548 K1-9254 NE 14-20-33-1 Industrial A E3/4596 K1-9209 SE 24-20-33-1 Industrial A E3/4804 K1-612461-02-PW SE 26-20-33-1 Industrial A E3/4833 K1-614873-PW SE 26-20-33-1 Industrial 36.9 cdam E3/4973 K1-9203 SE-24-20-33-1 Industrial A E3/3199 K2-20232 SW 33-19-32-1 Industrial A E3/3385 K2-M1385-2007-03 SW 22-19-32-1 Drainage 44.15 litres/second E3/5468 K3 - Well Field (37, 40 and 41) NW 22-19-33-1 Drainage Pumping capacity E3/4522 K3-677530-01 NW 22-19-33-1 Drainage Pumping capacity Date: December 31, 2025 17-9 17.7.2 Runoff The runoff from the TMAs drain into the brine pond system and is managed through a network of control structures. The plant site surface water runoff is collected in drainage ditch systems and ponds which are equipped to pump water into the TMA, ponds, or into the processing plants where it can be stored and reused, while excess brine is disposed of via the deep well disposal system. The drainage from other site infrastructure such as injection well sites is designed so that runoff is contained within a local perimeter berm system. 17.7.3 Wastewater Sewage lagoons are present at the Sites and operated as per the site ATOs. 17.8 Closure and Reclamation Considerations The Esterhazy Potash Facility maintains Decommissioning and Reclamation (D&R) Plans that are updated every five years. Mosaic actively participates in the D&R Potash Technical Working Group which drives the plan updates and incorporation of best management practices across the potash industry in Saskatchewan. Mosaic maintains financial assurance to support its D&R obligations as required by The Mineral Industry Environmental Protection Regulations 1996 (Saskatchewan). This financial assurance is in the form of a trust fund which was established in YEAR by way of a trust agreement between Mosaic and the Province of Saskatchewan. The C$25 M trust fund is intended to cover Mosaic’s financial assurance requirements for all Mosaic Saskatchewan potash facilities. The evaluation of the performance of the fund to date will be undertaken as part of the 2026 reporting cycle and the review will address any new liabilities that may affect the fund and the growth potential of the fund over the 100-year time frame. Mosaic transitioned to mining at the K3 Mine Site in 2021. The K3 mine provides raw ore via overland conveyors to the K1and K2 processing plants for processing. Mosaic completed the underground closure at K1 and K2 in 2021 and shaft decommissioning at K1 and K2 in 2023. Mosaic is continuing to advance closure and decommissioning of the grout site at K2 and surplus infrastructure associated with these facilities. K1 and K2 will continue to process the raw ore provided by the K3 mine site via the overland conveyor system and associated infrastructure (e.g., transfer houses). The overland conveyors and transfer houses are included as part of the K3 D&R Plan. 17.8.1 Decommissioning and Reclamation Guidelines Mosaic acknowledges responsibility for all aspects of its operations and works with the Province of Saskatchewan to address and resolve environmental issues. The objective of the most recent D&R Plans was to meet the requirements of Section 16 of The Mineral Industry Environmental Protection Regulations 1996 (Saskatchewan), with respect to review and resubmission of the D&R Plans and financial assurance fund once every five years. In addition to meeting all applicable regulatory requirements, Mosaic is committed to the following Decommissioning and Reclamation (D&R) principles: • Protect the environment. • Decommissioning the sites, not including the TMA, to a state environment compatible with the surrounding land use (safe and stable environment) following mine closure. • Reclamation of the TMA to an engineered saline wetland environment following TMA decommissioning. • Establish a means of measuring the effectiveness of the D&R plans. • Provide an action plan with costs for the determination of a suitable Financial Assurance. Assumptions The development of the decommissioning, demolition, remediation and reclamation plans was based on the following: • Decommissioning and demolition of all existing structures currently on the Sites,

Date: December 31, 2025 17-10 • Decommissioning and reclamation of the processing plants to a stable environment compatible with the surrounding land use following mine closure, and • Reclamation of the TMA to an engineered saline wetland environment following TMA decommissioning. Monitoring, Inspections, Evaluation and Reporting Monitoring is expected to be conducted during the course of the decommissioning and reclamation, with monitoring results provided on an agreed upon timeline with the Saskatchewan Ministry of Environment. Inspections of tailings pile dissolution and dyke integrity are expected to be conducted by Mosaic on an agreed upon schedule and scope with the Saskatchewan Ministry of Environment. Soils, surface water and groundwater monitoring and acceptance criteria are expected to be developed through discussions with the Saskatchewan Ministry of Environment. 17.8.2 Site Investigation and Reclamation Plan Environmental Reporting Technical proposals will be prepared to determine if a proposed project poses a significant environmental impact and considered as a “development”. The technical proposals will document physical, biological and human environment features within the Project area and present an evaluation of the potential, residual and cumulative environmental and socio-economic effects of the Project and mitigation measures that will be applied. An environmental site assessment will be conducted to assess the soil and groundwater impacts associated with the current and historic operation of the facilities. A sampling rationale plan will be developed to determine potential contaminants of concern. Primary potential contaminants of concern will include petroleum hydrocarbons and chlorides. Corrective action plans will follow the environmental site assessment to reclaim each site to a stable environment compatible with the surrounding land use. Following the corrective actions, Mosaic is then expected to seek to be released from additional environmental responsibility at the site. An environmental monitoring program approved by the Saskatchewan Ministry of Environment is expected to be conducted during reclamation to determine the effectiveness of the reclamation process. Processing Plant Sites On-Site Landfill On-site landfills will be designed, constructed and used for the disposal of materials during the demolition activities at the Sites. The landfill will be a non-engineered facility, waste disposal and will be limited to inert non-recyclable, non-hazardous materials. A recycle station will be established during demolition activities to recover recyclable materials (i.e., metal and corrugated metals panels, jacketed cable, etc.). Should the ministry interpret some inert waste as ‘industrial’, the Sites commit to ensuring all regulatory requirements for the construction, operation and decommissioning of an industrial waste landfill is met should the Sites pursue this remedial option. Processing Plants / Other Buildings Facilities associated with the processing plant sites and ancillary buildings will be decommissioned. Prior to commencing demolition, the Sites will be secured. Hazardous materials including fuels, lubricants, hydraulic oil, reagents, chemicals, etc., will be inventoried and removed by an environmental contractor licensed in the management and disposal of these materials. Asbestos containing materials encountered during demolition will be managed in accordance with standard industry practices under the direction of a licensed asbestos abatement contractor. Asbestos waste will be hauled to an approved off-site landfill facility for disposal. Buildings will be demolished using a combination of mechanical demolition, hydraulic shearing of structural steel and felling demolition techniques. Deconstruction or controlled demolition may be required during the early stages of demolition to remove salvageable equipment and to remove remaining asbestos containing materials and recyclable materials. The steel structures will be sheared and recycled as scrap. Date: December 31, 2025 17-11 Miscellaneous building debris including fiberglass panels, masonry, wood, insulation, electrical cable, equipment and instrumentation, etc. is expected to be removed and hauled to the designated recycle station with all non- recyclable non-hazardous materials hauled to an on-site landfill for disposal. Slab-on-grade and below-grade concrete floors will be perforated or cracked to provide permeability and left in-place. Where applicable, foundation walls will be folded into basements, sumps and/or tunnels and left in-place. Excavations will be backfilled with fill soils from the Sites and compacted so that that voids in the backfill do not occur. Miscellaneous Surface Infrastructure Mosaic-owned near-surface pipelines not required during the reclamation activities will purged and capped at their existing depths. Mosaic-owned buried power and communication lines will be de-energized, isolated and left in place. Third party utilities will remain in service during the decommissioning and reclamation activities to support electrical power, heating and communication needs during this time. Where applicable, water utilities will be disconnected at the property line. Following completion of the saline wetland development, a component of the reclamation activities, the remaining third-party utilities will be disconnected by the appropriate utility provider at the mine site property line and left in place. Overland Conveyors The overland conveyors from the K3 to K1 and K2 will be dismantled. The gravel pad constructed to support the conveyors and service roads will be reclaimed and re-contoured to reflect the natural topography. The highway, grid road, cattle and railway crossings will be reclaimed to their original elevations. Reservoir and Lagoon Wastewater lagoons are located at the K1 and K2 mine sites. Water from the lagoons will be pumped into the respective TMAs and the dykes will be used to backfill the lagoon. The associated underground pipelines will be flushed and capped at depth. Regulated Storage Vessels & Materials An application to decommission the vessels is expected to be submitted to the Saskatchewan Ministry of Environment prior to any decommissioning activities. Upon approval, any remaining products in the vessels will be removed and the vessels purged, cleaned and made inert. Any residual product will likely either be recycled or disposed of in accordance with the applicable regulations by an appropriate qualified person or contractor. The vessels will be reused or destroyed and recycled as scrap under the direction of an approved environmental contractor. Waste Management Systems Hazardous materials storage compounds are located on the Sites. Regular and hazardous waste will be hauled off-site to an approved disposal site. The existing facilities will be assessed as part of the environmental site assessments to determine the presence or absence of impacts. The processing plant site reclamation plan may include actions to remediate the areas to the applicable guidelines. Scrap yards and laydown areas are located at the Sites. Existing materials will either be recycled or returned to the appropriate suppliers. These areas will be assessed as part of the processing plant site investigation to determine the presence or absence of impacts. The processing plant site reclamation plan will include actions to remediate the areas to the applicable guidelines. Roads, Rail, Grounds and Supporting Infrastructure Roads, including access, operations and parking lots not required for post-decommissioning site activities, will be removed and contoured to meet site grades as part of processing plant site reclamation activities. Topsoil and seed will be placed where required to support vegetation. Mine owned rail will be recycled as scrap and railway ties recycled. The remaining roadbed will be graded and contoured to meet site grades as part of processing plant site reclamation activities. The remaining rail facilities will be decommissioned by the owner of the facilities. Date: December 31, 2025 17-12 Underground Shaft and Underground Workings Decommissioning of the underground mine workings will consider all underground materials and equipment including all regulated materials. Mining equipment such as miners, conveyors, support vehicles, equipment stores, electrical cable and equipment, etc., will be left in-place. Brine Injection Wells at K1 Mosaic K1 operates three brine injection pump houses and four injection wells to dispose of excess brine at the mine site and Farfield injection well fields. Mosaic will continue to work with the Saskatchewan Ministry of Energy and Resources on licensing brine injection wells, reporting, monitoring, maintenance and well replacement. Brine Injection Wells at K2 Mosaic K2 operates five brine injection pump houses and four injection wells to dispose of excess brine, as well as utilizing Farfield injection wells when needed. Two wells originally installed for brine injection purposes in the grout site have been repurposed as observation wells. Mosaic will continue to work with the Saskatchewan Ministry of Energy and Resources on licensing brine injection wells, reporting, monitoring, maintenance and well replacement. Environmental Monitoring Wells There are hundreds of environmental monitoring wells for the Esterhazy Potash Facility. The environmental monitoring well system is expected to be modified on an ongoing basis to reflect changing conditions encountered during the reclamation of the processing plant sites, dissolution of the tailings pile and reclamation of the TMA as an engineered saline wetland environment. Fifty new environmental monitoring wells are expected to be installed as part of the processing plant environmental site assessments at each of the K1 and K2 sites. Twenty new wells are expected for the environmental site assessment for the K3 site. The monitoring wells will be incorporated into the overall mine site monitoring program. The wells will be decommissioned after 15 years, assuming that the processing plant site meets applicable reclamation criteria established by the Saskatchewan Ministry of Environment. It is assumed that 70% of the wells associated with the Sites will be decommissioned at processing plant closures with the remaining wells repurposed to track the effectiveness of the decommissioning and reclamation strategies. The remaining 30% of the wells are projected to be decommissioned after mine site closures following approval from the Saskatchewan Ministry of Environment that the reclamation criterion for the engineered saline wetland has been achieved. The wells will be decommissioned in accordance with applicable Saskatchewan Ministry of Environment guidelines. Water Wells The K1 mine site operates seven water wells: three potable water wells and four brine injection pump house gland wells. Seven of the wells at K1 will be decommissioned during processing plant reclamation with one brine injection pump house gland well to remain operational during dissolution of the tailings pile. The K2 site operates two water wells: a production well to provide cooling water for the injection wells and charge pumps at Brine Injection Pump House #2 and a mitigation well installed into the K2 aquifer to manage the lateral migration of brine. The production well will be decommissioned at the processing plant closure and the mitigation well at TMA closure. The K3 site operates four dewatering wells and an observation well. The wells will be decommissioned at site closure. The water wells will be decommissioned in accordance with Saskatchewan Ministry of Environment and Water Security Agency guidelines. Date: December 31, 2025 17-13 Grout and Backfill Wells The Esterhazy site operated grout and backfill wells, associated with a historical mine inflow. The mines associated with this inflow have ceased operation. Decommissioning activities are currently underway to remove a majority of the grout and backfill wells with substantial work completed in accordance with Ministry of Energy and Resource requirements. These wells will remain part of the D&R plan until the decommissioning has been completed. Tailings Management Area Decommissioning Sequence The general decommissioning sequence prior to the development of the K1 and K2 TMAs as an engineered saline wetland will be as follows: • Production ceases • Dissolution of tailings continues • Brine injection continues • Drainage ditch collection/pump back continues • Dyke maintenance continues • Tailing salts all dissolve • Insolubles contained within dykes • Seepage/runoff collected/injected • Salinity reduced – injection discontinued • Injection pump houses demolished and wells decommissioned • Drainage ditch system decommissioned Tailings Pile at K1 Site The K1 TMA consists of a tailings pile and brine ponds and covers an area of approximately 538 hectares. The salt inventory in the K1 TMA is 130,417,549 tonnes of salt based on the most recent mass salt balance. The average annual salt addition to the K1 TMA is projected to equal 2,909,121 tonnes per year for use in estimating the final pile configuration at the end of life for the Esterhazy mine. Following the ultimate mine closure, both active and passive dissolution strategies will be used to dissolve the salt pile. The duration associated with salt dissolution is based on pile configuration and inventory at time of closure. Following dissolution of the TMA, an engineered saline wetland will be constructed. Tailings Pile at K2 Site* The K2 TMA consists of a tailings pile and brine ponds and covers an area of approximately 562 hectares. The salt inventory in the K2 TMA is 168,759,253 tonnes of salt based on the most recent mass salt balance. The average annual salt addition to the TMA is projected to equal 5,050,704 tonnes per year for use in estimating the final pile configuration at the end of life for the Esterhazy mine. Following the ultimate mine closure, both active and passive dissolution strategies will be used to dissolve the salt pile. The duration associated with salt dissolution is based on pile configuration and inventory at time of closure. Following dissolution of the TMA, an engineered saline wetland will be constructed.

Date: December 31, 2025 17-14 17.9 Permitting All Mosaic mines and processing plants operate pursuant to federal, provincial and local environmental regulations. Accordingly, permits, licenses and approvals are obtained specific to each site, based on project specific requirements. Mosaic also has routine interactions with government officials and agencies related to agency inspections, permitting and other environmental matters. 17.10 Social Considerations, Plans, Negotiations and Agreements Mosaic understands the sustainability of their business and communities are indelibly linked. Mosaic strives to be a thoughtful and engaged neighbor who invests carefully and generously and seeks long-term partnerships with organizations that are making a difference. Mosaic is also committed to building strong relationships with the communities that surround their operations. On an annual basis, Mosaic’s Sustainability Report is released, providing additional insight and information on the commitments, engagement and progressive leadership on sustainability issues. When undertaking a new development, Mosaic also adheres to provisions of the provincial and federal environmental assessment regulatory requirements, which include a review of socio-economic considerations. This information is included in a comprehensive report that is subsequently provided to the appropriate levels of government for review and approval prior to development. Date: December 31, 2025 18-1 18.0 Capital and Operating Costs 18.1 Capital Cost Estimates 18.1.1 Basis of Estimate The basis of estimate used to estimate the Esterhazy Potash Facility capital expenditures is as follows: • The target accuracy level is at a pre-feasibility level, -25% to +25%. • The estimate was prepared in C$ and converted to US$ at an exchange rate of 1 US$ = 1.37 C$ or 1 C$ = 0.73 US$. • The estimates have been compiled and organized by asset and aligned with re-build / replacement schedules and fixed asset replacement and refurbishment schedules. • Mine capital costs include only capital expenditures related to the extraction of mineral reserves. Expenditures are classified as mine capital if they relate to physical assets, exceed C$10,000 and have a minimum expected useful life of two years. • The mine capital costs are broken into two major categories: Sustaining and Expansion. Sustaining capital is defined as “ongoing” capital expenditures required for maintaining current production levels while project capital expands production capacity. • Sustaining capital for the Esterhazy mills is based on scheduled maintenance and re-builds and the Asset Management Framework system, that is used to assess the condition and associated risks of fixed assets. A fixed amount per plant is scheduled to account for the general capital cost of maintaining them. Sustaining estimates are prepared by asset and have been built up from realized historical capital costs. • Mine Sustaining capital costs are based on the sustaining mine development plans. These costs are a makeup of routine infrastructure repairs and/or replacements related to hoisting, belting and mining machines • TMA expansions in 2037 to 2040 are assumed to be sufficient to support the K1 and K2 mill operations for the LOM. • The estimate is inclusive of all project indirects and owner costs as these costs are captured in the historical cost analysis used to prepare the estimate. • An annual rate of 2% inflation was used to bring historical cost to current dollars (2025). • Provincial Sales Tax (PST) has been included. • Freight and installation were included. • Contingency has not been included. 18.1.2 Exclusions for the Capital Cost Estimate The following has not been included in the Esterhazy Potash Facility capital cost estimate. • Goods and Services Tax (GST). • Foreign currency exchange fluctuations. • Schedule delays and associated costs, such as those caused by: o Unexpected conditions o Labor disputes • Future Inflation and escalation. Date: December 31, 2025 18-2 • Capital expenditures related fire, flood and severe weather events. • General and Administrative are not allocated to capital projects at Mosaic and have not been included in this cost estimate. 18.1.3 Capital Cost Estimate The capital cost estimates for Esterhazy Potash Facility 2025 LOM plan based on mineral reserves are listed by category in Table 18-2. The total capital for the 2025 LOM plan (2026 to 2049) is estimated at US$2,203 M. Historical costs from 2021 to 2024 and a forecast for 2025 are included. Table 18-1: Historical, LOM Plan Project Capital Year Status Expansion M US$ Mine Sustaining M US$ Processing Plant M US$ Other M US$ Total M US$ 2021 Actual 209.81 0 71.53 12.40 293.74 2022 Actual 124.67 1.95 56.09 11.00 193.71 2023 Actual 135.86 8.88 73.06 17.21 235.01 2024 Actual 55.19 31.31 52.28 25.62 164.40 2025 Fcast. 13.09 35.86 50.86 44.37 144.17 2026 Plan 0 77.81 22.92 31.87 132.60 2027 Plan 0 88.06 25.94 21.07 135.07 2028 Plan 0 88.84 26.17 13.32 128.32 2029 Plan 0 86.64 64.36 1.29 152.29 2030 Plan 0 88.83 26.17 0.34 115.34 2031 to 2049 Plan 0 165.26 1169.17 204.51 1538.94 LOM Total Plan 0 595.45 1334.71 272.41 2202.57 18.2 Operating Cost Estimates 18.2.1 Basis of Estimate The basis of estimate used for the Esterhazy Potash Facility operating costs are as follows: • The estimate was prepared in Canadian dollars and converted to US dollars at an exchange rate of 1 C$ = 0.73 US$, 1 US$ = 1.37 C$. • Operating costs do not include inflation and are in today’s dollars over the LOM plan. • Historical costs are used as the basis for mining operating forecasts and adjustments are made by using a variable cost per tonne. The accuracy of the operating costs is within the required parameters for a pre- feasibility level estimate, -25% to +25%. • The latest sales and market prices are estimated for the next five years and then projected over the remaining LOM plan for royalties, natural gas and other goods and services. • Mosaic and contractor labor headcount complement are assumed to remain relatively constant and fixed in total over the LOM plan. • Indirect site overhead selling, general, administrative and cost of goods sold costs are allocated to Esterhazy based on a percentage of its total direct operating spend compared to the other operating potash sites. Date: December 31, 2025 18-3 • Depreciation, depletion and accretion are excluded from the operating cost estimates listed below. Section 18.1 outlines the expected future capital expenditures and outlay of cashflows over the 2025 LOM plan. • Freight charges are excluded from the operating costs and are shown net of the sales price. • Contingency has not been included. 18.2.2 Mine Operating Costs Historical costs are used as the basis for mine operating cost forecasts, that are estimated using a long-term cost model. This model accounts for the impact of varying production rates and labor complement. The Esterhazy costs are grouped in the following categories: • Mining cash costs include underground development and production mining and hoist/shaft operating, maintenance including the overland conveyor belt transportation costs to the K1 and K2 mills. In addition, it includes the K3 direct overhead costs including the surface infrastructure and facilities required to support the K3 underground mining operations. • Processing cash costs include the K1 and K2 mills and surface buildings and loading cash costs applied to the mineral reserves mined throughout the LOM plan. The cash costs include variable operating and fixed maintenance and direct overhead costs that directly relate processing the ore to its finished product and storing it in the Esterhazy K1 and K2 warehouses. • Other Operating Costs are central and functional overhead allocated costs, that include site warehousing, purchasing, accounting, information technology, environmental and safety, engineering, mechanical integrity and asset reliability and quality control labs. • Resource taxes, royalties and other Government levies or interests include Crown and Freehold royalty payments, mineral lease payments and Canadian resource taxes, and excludes income taxes. The total operating costs supporting the 2025 LOM plan are estimated for 2025 to 2049 at US$11,869 M. Table 18-2 summarizes the Esterhazy Potash Facility mine operating and processing costs (US$/tonne).

Date: December 31, 2025 18-4 Table 18-2: Historical and LOM Plan Cash Costs Year Status Production M tonnes Mining and Processing Cash Costs M US$ Brine Cash Costs M US$ Other Operating Costs M US$ Resource Taxes, Royalties and Other Government Levies or Interests M US$ Total Cash Costs of Production M US$ 2021 Actual 4.4 282 28 46 140 496 2022 Actual 4.7 299 0 11 480 790 2023 Actual. 4.4 305 0 25 46 376 2024 Actual 4.7 324 0 42 116 482 2025 Actual 4.7 351 0 29 30 410 2026 Plan 6.3 386 0 42 195 623 2027 Plan 6.3 386 0 42 192 620 2028 Plan 6.5 390 0 42 178 610 2029 Plan 6.6 392 0 42 135 569 2030 Plan 6.3 387 0 42 176 605 2031 to 2049 Plan 115.9 7,286 0 796 4,034 12,116 Total LOM Plan 148 9,226 0 1,006 4,922 15,154 Date: December 31, 2025 19-1 19.0 Economic Analysis 19.1 Methodology Used The analysis determines the minimum sales price required to achieve an after‑tax net present value (NPV) of zero (USD $0). This price represents a return, on a present value basis, equal to the current cost of capital and is referred to as the Internal Transfer Price (ITP). If ITP < LOM (Life of Mine) sales price, then the operation is profitable. The greater the difference between those two values the more profitable it is. If ITP > LOM sales price, then the operation is not profitable. The ITP and LOM sales price do not influence each other; they are simply two values used for comparison. ITP depends on actual costs and LOM sales price depends on market conditions (Refer to Section 16.0). With an ITP of $104 USD and a projected LOM sales price of $251 USD, the economic prospects for the Esterhazy operation are robust. This economic analysis includes sensitivities to variations in operating parameters to assist the reader in understanding the sensitivities that model has with respect to changes in material economic assumptions and drivers. All monetary amounts are presented in United States dollars (US$) and were converted using a foreign exchange rate assumption of 1 US$ = 1.37 C$ or 1 C$ = 0.73 US$ that is based on the average historical rate 2023 to 2025. 19.2 Financial Model Inputs, Parameters and Assumptions The financial model treats 2026 as the base year cash flows and does not discount these results. The model projects the cashflows generated from the Esterhazy Potash Facility from the base year to the end of assumed mineral reserve K3 mine life in 2049. The sum of the discounted cashflows reflects the discounted value as at December 31, 2025. The following outlines the input, parameters and assumptions used in the financial model. • The mineral reserve life is estimated to extend to Year 2049 based in the 2025 LOM plan. The LOM plan assumes that K3 begins a production ramp down approximately 5 years prior to end of mine life. • The planned production life based on mineral reserves is from 2026 to 2049. • The LOM plan potash prices and exchange rates are discussed in Section 16 and applied in the financial model. • Total capital for the LOM plan is estimated as $2,203 M (Table 18-1). This includes all the sustaining capital required to maintain the equipment and infrastructure and to support continuing operations through to 2049. • The operating costs reflect mining, refining and processing; central administrative and allocated costs as well as SG&A as listed in Section 18. • Royalties are calculated using the royalty structure discussed in Section 3.2.4. They are impacted by the quantity of tonnes produced as well as the assumed sales price in each period. The 2026 to 2049 royalty cost assumptions are using 3% of the average sales price per the cashflow analysis divide by 61.15% the K2O factor times the K2O production tonnes times the percentage of crown land assumed to be produced and mined over the LOM plan. For non-crown royalties, the cost assumptions are using quantity of potash produced pertaining to each individual freeholder ownership times the average sales price per K2O times the regulation royalty rate of 3%. The quantity is express in K2O tonnes and the average factor is approximately 61%. • Mosaic pays Canadian resource taxes consisting of the Potash Production Tax and resource surcharge. The Potash Production Tax is a Saskatchewan provincial tax on potash production and consists of a base payment Date: December 31, 2025 19-2 and a profits tax. Mosaic also pays a resource surcharge equal to 3% of the value of resource sales from the Saskatchewan potash facilities. • A 5% federal value (GST) added tax applies to most goods and services acquired by Esterhazy. The GST paid is recoverable in the form of an input tax credit. • A 6% Saskatchewan provincial sales tax (PST) applies to most goods and services acquired by Esterhazy. The PST is not a recoverable tax and is charged to the corresponding expense account of the good or service acquired. The economic cash flows over the LOM plan assumes Esterhazy’s operating, maintenance supplies and contract service costs that are normally charged PST will continue. • Provincial property taxes applicable to the Esterhazy land, buildings and resource production equipment (i.e., mining equipment) are payable annually by the end of September to the Village of Yarbo, the Rural Municipality of Fertile Belt, the Rural Municipality of Langenburg and the Rural Municipality of Spy Hill. • The Saskatchewan provincial carbon tax applies to site emissions that exceed established standards under the Saskatchewan Output Based Pricing System (OBPS). Indirect carbon tax impacts from energy consumption has been assumed in the cash flow analysis as it is known today. Due to the uncertainty of the impact that direct carbon tax will have on operations through these regulations - the current economic analysis does not include any carbon tax costs based on emissions. • Supply chain costs that are not recoverable from customers are included within Other Costs in the model based on historical cost experience for tonnes sold in North America. • The income taxes included in the cash flow model include the following: o Esterhazy is subject to income tax at the federal and provincial level on its taxable income. The total tax rate is 27% and consists of 15% federal tax rate and 12% provincial tax rate. o Esterhazy income may be subject to immediate U.S. taxation under the U.S. Internal Revenue Code’s Net CFC Tested Income (NCTI). However, it is expected that foreign tax credits would be allowed to offset the US calculated income tax liability. As a result, the cashflow model assumes that Esterhazy’s tax obligation ultimately reflects the income tax liability incurred in the local jurisdiction (Canada). • Provisional closure costs of approximately US$776 M were included in the financial model. This estimate is informed from the work undertaken each year to estimate the asset retirement obligations for financial and compliance reporting purposes. The costs relating to closure of the facilities include all demolition, reclamation and decommissioning costs, net of the estimated salvage and scrap proceeds. Since many of the reclamation and retirement obligations extend well beyond the mine closure date, these cashflow obligations were discounted back to 2049 ($106 M) in the cashflows analysis. • Changes in working capital investment were calculated within the model using assumed balances based on the below assumptions. Since the levels of sales and volumes were relatively stable across most of the analysis period, the changes in working capital investment assumed in the model were immaterial to the cashflow analysis. ▪ Accounts Receivable = 35 days sales outstanding ▪ Inventory = 15 days on hand ▪ Accounts Payable = 50 days on hand. • The economic analysis is based on 100% equity financing. • The financing and capital structure of the Esterhazy Potash Facility was not considered in the analysis. The earnings are reduced for a notional cash income tax expense. • The economic analysis is based on 2025 price levels and future values have not been adjusted for inflation. • The discounted cashflow analysis applies end of year discounting and uses a discount rate of 11.4%. Date: December 31, 2025 19-3 19.3 Economic Analysis The break even analysis reflects that there is significant economic value associated with mining, refining and selling the potash mineral reserves at Esterhazy, given the economic assumptions and operating parameters considered. The financial model reflects an internal transfer price of $104 USD per tonne compared to a projected Life of Mine sales price of $251 USD per tonne, utilizing a discount rate of 11.4%. Table 19-1 shows the break even cash flow analysis for the 2025 LOM plan.

Date: December 31, 2025 19-4 Table 19-1: Break Even Price Analysis Date: December 31, 2025 19-5 19.4 Sensitivity Analysis A sensitivity analysis is shown in the Figure 19-1 utilizing the following factors. • Potash commodity price • Foreign exchange rate • Total operating cost • Total capital cost The sensitivity analysis of the 2025 LOM plan is presented in Figure 19-1. The commodity price sensitivity tests the impact that a 20% change would have on margin from internal transfer price along with the resulting expense impacts of royalties, resource taxes and income taxes. A 20% decrease in commodity price still shows a significant margin between. • The exchange rate sensitivity indicates that a +-20% variation in the exchange rate would yield a positive margin comparing potash price to break even price (also called Internal Transfer Price). • If the operating costs were to increase 20% from those currently estimated, the Facility would remain economically viable, yielding a positive margin comparing potash price to break even price (also called Internal Transfer Price). • The capital spending sensitivity assumes a 20% change to annual capital spending requirements each year. If the capital costs were to increase 20% from those currently estimated, the Facility would remain economically viable, yielding a margin comparing potash price to break even price (also called Internal Transfer Price). Figure 19-1: Sensitivity Results on NPV Date: December 31, 2025 20-1 20.0 Adjacent Properties No information from adjacent properties has been included in the preceding sections of this Report. All information used and included in this report is the result of geology, engineering, mining, environmental and processing etc. activities completed on the Esterhazy property. The adjacent properties to the Esterhazy Potash Facility are indicated in Figure 20-1. These include: Producing Subsurface Mineral Leases • Nutrien Potash Lease KL 305 - 54183.83 ha. Non-producing Potash Exploration Permits and Subsurface Mineral Leases • BHP Billiton Ltd. Crown Potash Exploration Permit KP 342 – Active Pending Lease – 21427.57 ha. • Nutrien Potash Lease KL 125 – 14577.13 ha. • Nutrien Potash Lease KL 200 – 14794.62 ha. • Nutrien Potash Lease KL 279 – 26350.73 ha. The Nutrien potash mine at Rocanville is located 50 km from Esterhazy. The Esterhazy Member is mined and accessed via two shaft locations, Rocanville and Scissors Creek. Mining methods are similar to that at Esterhazy and the facility has a reported operational capacity is 6.0 M tons (5.4 M tonnes) of finished product in the Nutrien 2018 NI 43-101 publication, the property was described as hoisting 606 M tons (550 M tonnes) of mineral reserves at an average grade of 23.4% K2O equivalent. The mine has been in production since 1970 and over 253 M tons (230 M tonnes) of potash ore has been mined to produce over 82 M tons (75 M tonnes) of finished product. (2018, NI 43-101 Technical Report on Rocanville Potash Deposit KL 305). The Rocanville mine shares a boundary with Mosaic Potash Esterhazy. Nutrien and Mosaic have negotiated a safety pillar of 1 mile (800 m) between the mining leases to eliminate risk of impact from operations. Previous exploration in the Melville/Bredenbury area by BHP (Athabasca Potash) and Nutrien (Agrium) included 2D and 3D seismic surveys and exploration core drilling. No published summary work was available for discussion in this report. Date: December 31, 2025 20-2 Figure 20-1: Adjacent Properties

Date: December 31, 2025 21-1 21.0 Other Relevant Data and Information All data relevant to the estimation of the Esterhazy mineral resources and mineral reserves has been included in the sections of this Technical Report Summary. Date: December 31, 2025 22-1 22.0 Interpretation and Conclusions 22.1 Mineral Resources The following is a summary of the key interpretations and conclusions relating to the Esterhazy mineral resource estimates: • Approximately 98.5% of mineral rights in the Esterhazy Lease area are controlled. Any inability to acquire the remaining 1.5% would not be a significant risk to the LOM plan. • The geology team at Esterhazy has a strong understanding of the lithology, stratigraphy and potash mineralization. The available data is appropriate to support the geological interpretation for this style of mineralization. • The geology and deposit related knowledge has been considered and applied in support of exploration, interpretation and mineral resource estimation processes used by the Esterhazy geology team. • Exploration data collection methods follow industry standard practices that were in place at the time of the various past and current exploration campaigns. • Data that does not meet the standards for reliability are removed from the mineral resource estimation process. • The QPs have conducted appropriate internal data verification and data validation work on historical and recent exploration data to confirm the geological information is reliable, representative and free of material errors or omissions. • The sample preparation, security and analytical procedures that have been utilized at Esterhazy are suitable to support mineral resource and mineral reserve estimation. • The validated geological information is considered reliable, representative and is fit for purpose in developing a geological model and for mineral resource estimates, as well as for use in other modifying factors studies including mine design, scheduling and mineral reserve estimation. • The mature nature of the Esterhazy Potash Facility and the good understanding of the continuity of the potash mineralization, supports the establishment of reasonable prospects for economic extraction for the K4 mineral resource estimates. • The Esterhazy Potash Facility is a well-established operation that has been producing for over 60 years. There are no issues that require further work relating to relevant technical and economic factors that are likely to influence the prospect of economic extraction. • The classification of mineral resources into confidence classes measured, indicated and inferred considered geological confidence, uncertainty and the distribution of the geological and mining data. Risks or uncertainties associated with the Esterhazy mineral resource estimates are: • There are a number of uncertainties (Section 11.9) that exist at Esterhazy that could impact the mineral resource estimates. They are considered as areas of future process improvements. • The exploration data collection methods and results are documented. A fully updated potash database to include all historical and recent exploration campaigns is recommended to allow for improved data retention standards. • Historically, there has not been external third-party data verification and mineral resource estimation audits completed. Date: December 31, 2025 22-2 22.2 Mineral Reserves The following is a summary of the key interpretations and conclusions relating to the mineral reserve estimates and supporting modifying factors. • The Esterhazy Potash Facility is a well-established operation. The mineralization, mining, processing and environmental aspects of the facility are very well understood. The operational and technical knowledge has been appropriately used in the development of the LOM plan and mineral reserve estimates. • Years of historical operational data and observations have been adequately documented. • The mineral reserve estimate has been prepared to comply with all disclosure standards for mineral reserves under S-K 1300 reporting requirements. • The mineral reserve estimates are based on a 2025 LOM plan, employing proven industry and practical methods of mining applicable to the type of mineralization and are demonstrated to be economic through a supporting economic evaluation. • Esterhazy has the appropriate equipment for underground mining and has identified and scheduled the capital spending required to provide the required equipment fleet size and capacity and labor staffing to support the LOM plan. • Process recovery relies upon standardized metallurgical and analytical testing. The metallurgical and analytical testing and historical data is adequate for the estimation of recovery factors supporting the mineral reserves. • There is sufficient infrastructure in place to support the mining and processing activities at the Esterhazy Potash Facility. • The management of all environmental aspects, permitting and social considerations at all Mosaic facilities is guided by Mosaic’s Environmental, Health and Safety Policy, the Mosaic Management System Program and Procedures and current regulatory requirements. Mosaic understands the sustainability of their business and communities are indelibly linked and strives to be a thoughtful and engaged neighbor who invests carefully and generously and seeks long-term partnerships with organizations that are making a difference. • Mosaic has monitoring plans in place to evaluate the environmental performance to standards as prescribed by applicable law and permit conditions. • Closure plans are completed, representing current land disturbance conditions and anticipated land disturbance conditions at the end of the LOM plan. • The economic results and sensitivity analysis for the mineral reserves indicates that the Esterhazy Potash Facility is a robust potash producing facility that can withstand 20% variations in the key cash flow components. • Over such a long mine life, the potential new technology and innovations that could come to bear on this facility are difficult to conceptualize. The technological and process efficiencies that are being targeted by the site have not been factored into this analysis. The benefit of achieving these targets along with the operational efficiencies that will be enabled by new technologies in the years that follow, create potential for significant upside to the cashflows presented. Risks or uncertainties associated with the Esterhazy mineral reserve estimates are: • There are a number of uncertainties (Section 12.5) that exist at Esterhazy that could impact the mineral reserve estimates. They are considered as areas of future process improvements. • A possible future uncertainty to the economic analysis is the uncertain impact that the carbon tax policy will have on the Esterhazy Potash Facility. At the present time, the future direct and indirect impacts of carbon taxation in Canada are still evolving and subject to further discussion and review before accurate long-term forecasts are possible. Date: December 31, 2025 22-3 • There is a risk and opportunity associated with the variation of pricing on product sale prices and the prices of operational and capital materials and services. The sensitivity analysis is provided to help the reader understand the impact that this risk could have on net present value. • Over the lengthy time span there is risk that the amount of annually invested capital required to sustain the plant could fluctuate above the levels estimated.

Date: December 31, 2025 23-1 23.0 Recommendations The following recommendations for additional work are focused on improving and maintaining important MRMR processes and estimates. • The Land and Minerals team will continue to align with the LOM plan to provide for timely acquisition of surface and mineral rights as required. • Mosaic should continue to investigate and consider new innovations in mining and processing technology. • The global density estimate has been based on a subset of the exploration data. Additional study based on in- mine sampling could be completed to increase confidence. • A thorough production reconciliation process will be considered to further improve and support the mineral resource and mineral reserve estimates. • A suitable modeling software for potash mineral resource estimates is being considered. • Continue duplicate analysis comparing results from the internal metallurgical lab with those from a third- party analytical lab. • Continue to update and maintain the geological databases. • Evaluate the chip sampling program with a third-party sample analysis to verify the accuracy of the current in-mine chip sampling. • Continue review of the GREC calculation applied at Esterhazy to include all exploration drilling. Future coring should be assayed to confirm that the GREC calculation applied at Esterhazy is sufficient for estimating the mineral reserves and mineral resources. • Additional 3D seismic data should be collected and processed in strategic areas to provide continuity of available data for mine planning. • The seismic model supporting the mineral resource and mineral reserve estimates will continue to develop and improve as seismic data collection and interpretation improves. Date: December 31, 2025 24-1 24.0 References Alger, R.P. and Crain, E.R., 1966. Defining evaporite deposits with electrical well logs. In: L.L. Raymer, W.R. Hoyle and M.P. Tixier (Editors), Second Symposium on Salt. North Ohio Geol. Soc., pp. 116-130. Bannatyne, B.B. (1983), Devonian Potash Deposits in Manitoba, Manitoba Department of Energy and Mines: Mineral Resources Division - Open File Report of 83-3. CIM Council, 2003. Estimation of Mineral Resources and Mineral Reserves Best Practice Guidelines – Guidelines Specific to Particular Commodities, p.36-37. Crain, E.R. and Anderson, W.B. (1966), Quantitative Log Evaluation of the Prairie Evaporite Formation in Saskatchewan, 17th Annual Technical Meeting, The Petroleum Society of C.I.M. Danyluk, T. K., G. D. Phillips, A. F. Prugger and M. S. Pesowski (1999), “Geophysical Analysis of an Unusual Collapse Structure at PCS Potash, Lanigan Division,” Mining: Catalyst for Social and Economic Growth, 101st Annual General Meeting of CIM, May 2–5. Fuzesy, A. (1982). Potash in Saskatchewan, Saskatchewan Industry and Resources Report 181, pp. 44. Holter, M. E. (1969), The Middle Devonian Prairie Evaporite of Saskatchewan, Report No. 123, Department of Mineral Resources, Regina, Saskatchewan, pp. 133. Mackintosh, A. D. and G. A. McVittie (1983), “Geological Anomalies Observed at the Cominco, Ltd., Saskatchewan Potash Mine,” Potash 83 Potash Technology—Mining, Processing, Maintenance, Transportation, Occupational Health and Safety, Environment, Pergamon Press, Toronto, pp. 59–64. MDH Engineered Solutions Ltd. (MDH), 2008. Biological Assessment Proposed Phase IV Brine Pond Mosaic Potash Esterhazy K2. File No. M1465-1500408 MDH, 2009a. Mosaic Potash Esterhazy K2 Phase V TMA and Mill Expansion. File No. M1639-1500408. MDH, 2009b. Mosaic Potash Esterhazy K2 Phase IV Tailings Expansion Environmental Impact Statement. File No. M1465-1500408. MDH, 2010a. Mosaic Potash Esterhazy Stage 2 Expansion Project. Environmental Impact Statement Volume I – Main Document. November 2010. File No. M1980-1500409. Orris, G. J., Cocker, M. D., Dunlap, P., Wynn, J. Spanski, G. T., Briggs, D. A. and Gass, L. with contributions from Bliss, J. D., Bolm, K. S., Yang, C., Lipin, B. R., Ludington, S., Miller, R. J. and Slowakiewicz, M. (2014) Potash—A Global Overview of Evaporite-Related Potash Resources, Including Spatial Databases of Deposits, Occurrences, and Permissive Tracts, Scientific Investigations Report 2010–5090–S. SNC-Lavalin 2015b. K3 to K2 Conveyor Project. Technical Project Proposal. File No. 619342. SNC-Lavalin, 2017c. K3 to K1 Conveyor Project. Technical Proposal. File No. 628475. Yang, C., G. Jensen and Berenyi, J,2009. “The Stratigraphic Framework of the Potash-rich Members of the Middle Devonian Upper Prairie Evaporite Formation, Saskatchewan,” Summary of Investigations 2009, Volume 1, Saskatchewan Geological Survey, Sask. Ministry of Energy and Resources, Misc. Rep. 2009-4. 1, CD-ROM, Paper A-4, pp. 28. Date: December 31, 2025 25-1 25.0 Reliance on Information Provided by the Registrant Table 25-1 outlines the information provided from the Registrant (Mosaic) for use by the QPs in the writing of the Esterhazy Potash Facility TRS. Table 25-1: Information Provided by the Registrant The QP considers it reasonable to rely on the information provided by the registrant. QP Name TRS Section Subjects Grant Shaver 16. Market Studies Marketing information including commodity price and exchange rates Grant Shaver 18.Capital and Operating Costs 19. Economic Analysis Royalties and other accommodations; Taxes and other governmental factors Mine closure costs SIGNATURE PAGE This report titled “Esterhazy Potash Facility Technical Report Summary” with an effective date of December 31, 2025, was prepared and signed by: QP Name Section(s) of Responsibility Signature David Vaughn 3 /s/David Vaughn Oryan Duff 6, 11, 12 /s/Oryan Duff Monica Tochor 7, 8, 9 /s/Monica Tochor Grant Shaver 10, 14, 16, 18, 19 /s/Grant Shaver Scott McMillen 13 /s/Scott McMillen Jason Polvi 15 /s/Jason Polvi Aimee Ottenbreit 17.1, 17.2, 17.3, 17.4, 17.5, 17.7, 17.8, 17.9, 17.10,17.11 /s/Aimee Ottenbreit Lorelei Duke 17.3, 17.6, 17.8 /s/Lorelei Duke