
| Delaware | 1-33409 | 20-0836269 | ||||||||||||
| (State or other jurisdiction | (Commission File Number) | (I.R.S. Employer | ||||||||||||
of incorporation) |
Identification No.) | |||||||||||||
☐ |
Written communications pursuant to Rule 425 under the Securities Act (17 CFR 230.425) | ||||
☐ |
Soliciting material pursuant to Rule 14a-12 under the Exchange Act (17 CFR 240.14a-12) | ||||
☐ |
Pre-commencement communications pursuant to Rule 14d-2(b) under the Exchange Act (17 CFR 240.14d-2(b)) | ||||
☐ |
Pre-commencement communications pursuant to Rule 13e-4(c) under the Exchange Act (17 CFR 240.13e-4(c)) | ||||
| Title of each class | Trading Symbol(s) | Name of each exchange on which registered | ||||||||||||
| Common Stock, par value $0.00001 per share | TMUS | The NASDAQ Stock Market LLC | ||||||||||||
| 3.550% Senior Notes due 2029 | TMUS29 | The NASDAQ Stock Market LLC | ||||||||||||
| 3.700% Senior Notes due 2032 | TMUS32 | The NASDAQ Stock Market LLC | ||||||||||||
| 3.150% Senior Notes due 2032 | TMUS32A | The NASDAQ Stock Market LLC | ||||||||||||
| 3.850% Senior Notes due 2036 | TMUS36 | The NASDAQ Stock Market LLC | ||||||||||||
| 3.500% Senior Notes due 2037 | TMUS37 | The NASDAQ Stock Market LLC | ||||||||||||
| 3.800% Senior Notes due 2045 | TMUS45 | The NASDAQ Stock Market LLC | ||||||||||||
| 6.250% Senior Notes due 2069 | TMUSL | The NASDAQ Stock Market LLC | ||||||||||||
| 5.500% Senior Notes due March 2070 | TMUSZ | The NASDAQ Stock Market LLC | ||||||||||||
| 5.500% Senior Notes due June 2070 | TMUSI | The NASDAQ Stock Market LLC | ||||||||||||
| Exhibit | Description | |||||||
| 104 | Cover Page Interactive Data File (formatted as inline XBRL and contained in Exhibit 101) | |||||||
| SIGNATURES | |||||||||||
T-MOBILE US, INC. |
|||||||||||
| October 23, 2025 | /s/ Peter Osvaldik | ||||||||||
| Peter Osvaldik Executive Vice President and Chief Financial Officer |
|||||||||||

| Quarter | Nine Months Ended September 30, | ||||||||||||||||||||||||||||
| (in thousands, except churn) | Q3 2025 | Q2 2025 | Q3 2024 | 2025 | 2024 | ||||||||||||||||||||||||
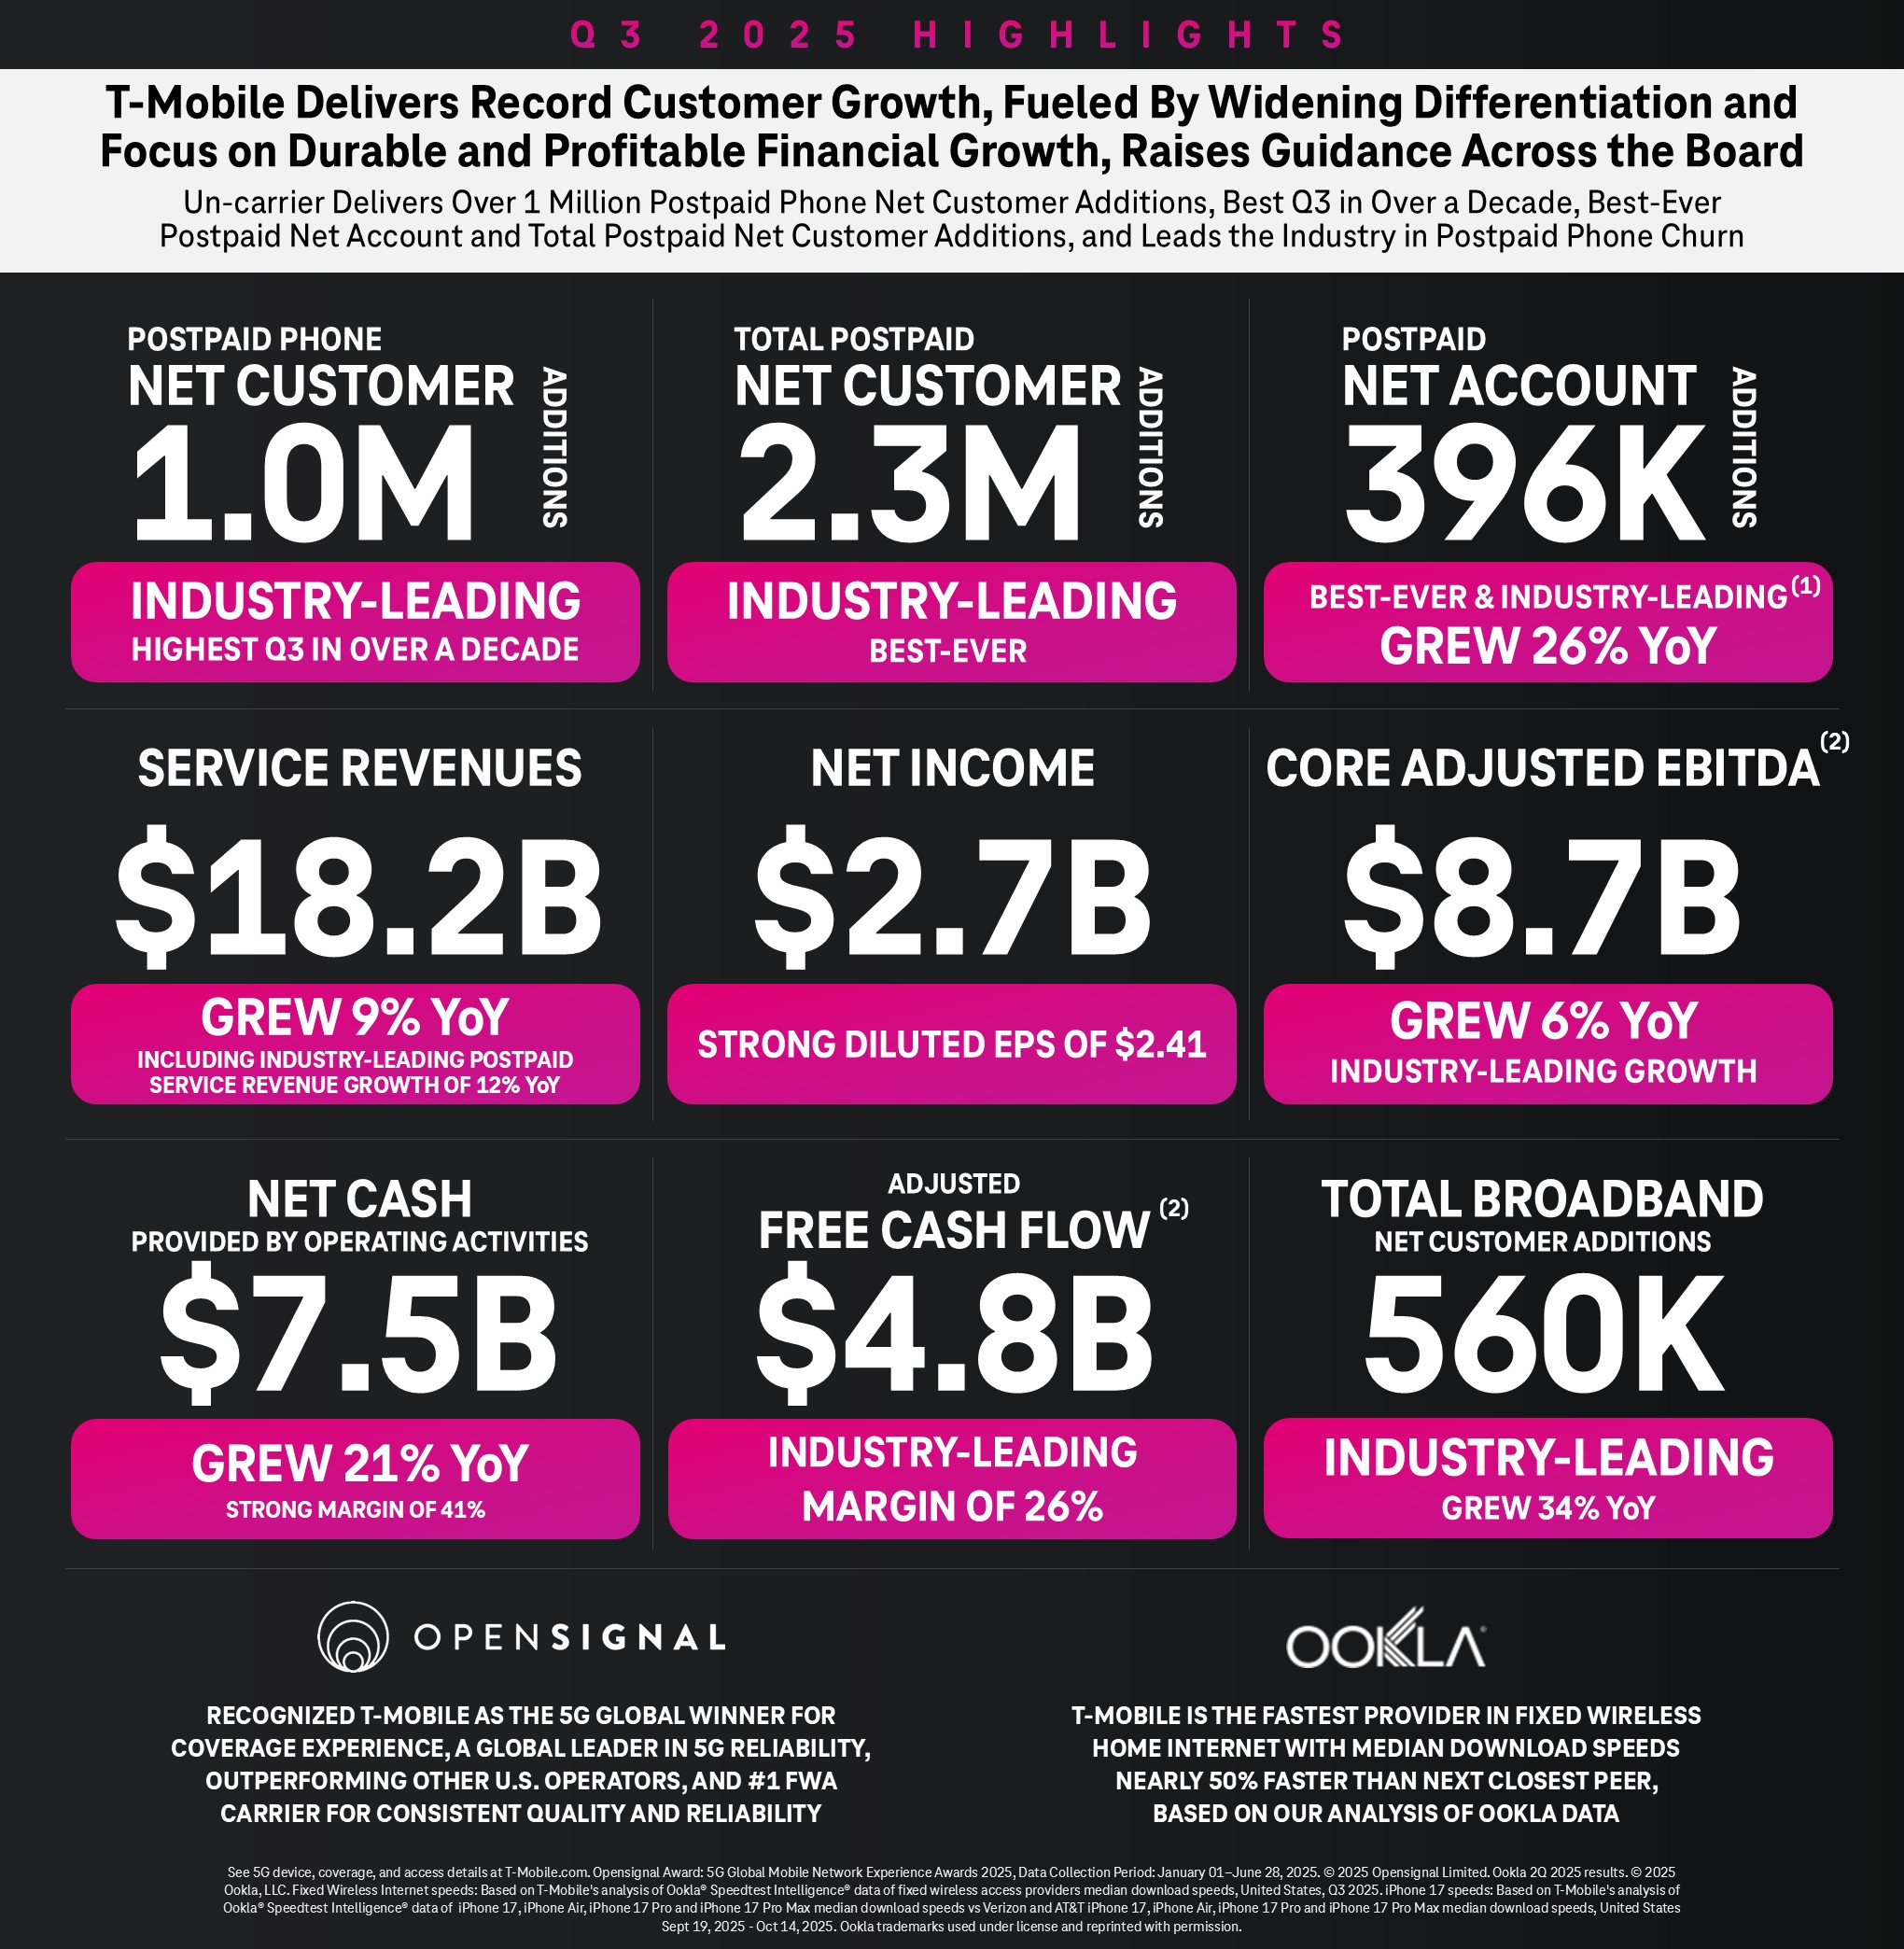
| Postpaid net account additions | 396 | 318 | 315 | 919 | 834 | ||||||||||||||||||||||||
| Total net customer additions | 2,390 | 1,771 | 1,599 | 5,543 | 4,288 | ||||||||||||||||||||||||
Postpaid net customer additions (2) |
2,347 | 1,732 | 1,575 | 5,416 | 4,133 | ||||||||||||||||||||||||
Postpaid phone net customer additions (3) |
1,007 | 830 | 865 | 2,332 | 2,174 | ||||||||||||||||||||||||
Postpaid other net customer additions (2) (3) (4) (5) |
1,340 | 902 | 710 | 3,084 | 1,959 | ||||||||||||||||||||||||
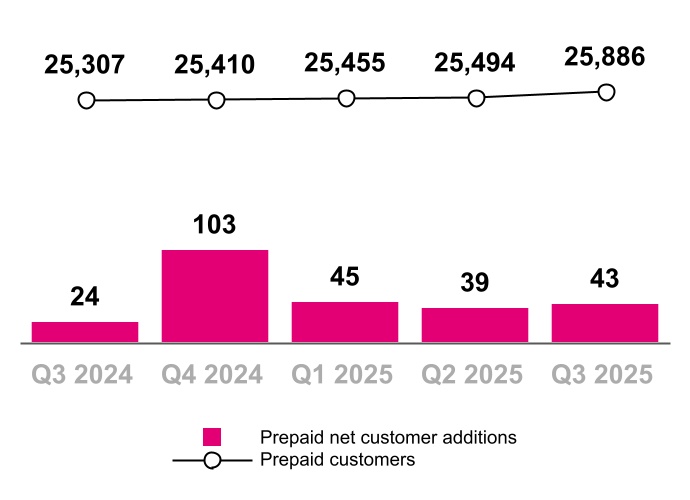
Prepaid net customer additions (2) (3) (6) |
43 | 39 | 24 | 127 | 155 | ||||||||||||||||||||||||
Total customers, end of period (2) |
139,949 | 132,778 | 127,492 | 139,949 | 127,492 | ||||||||||||||||||||||||
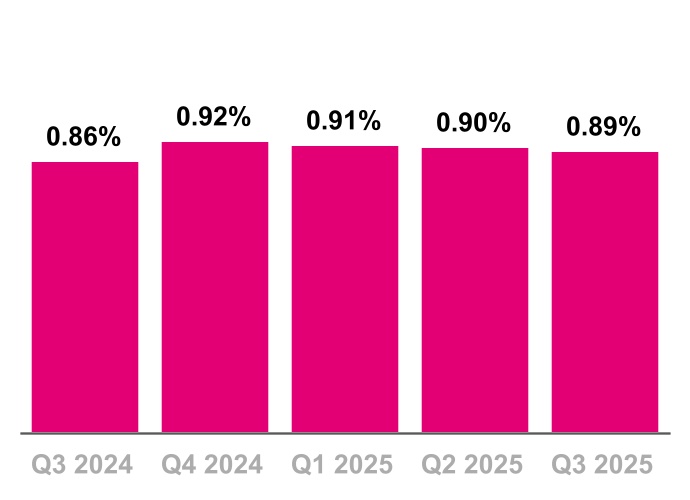
| Postpaid phone churn | 0.89 | % | 0.90 | % | 0.86 | % | 0.90 | % | 0.84 | % | |||||||||||||||||||
| Prepaid churn | 2.77 | % | 2.65 | % | 2.78 | % | 2.70 | % | 2.69 | % | |||||||||||||||||||
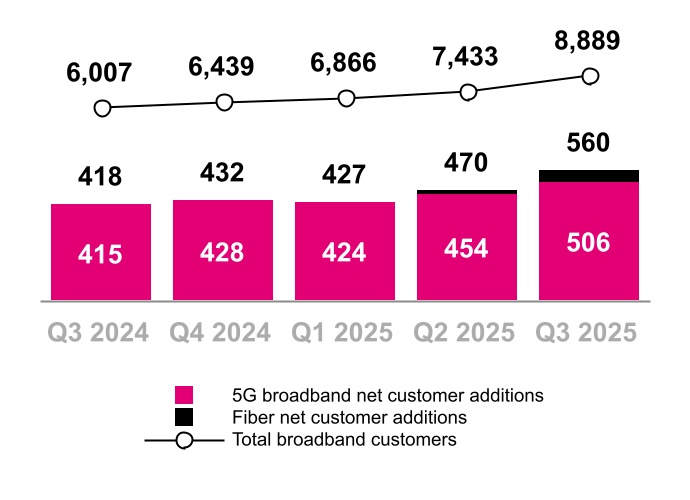
| Total broadband net customer additions | 560 | 470 | 418 | 1,457 | 1,230 | ||||||||||||||||||||||||
| 5G broadband net customer additions | 506 | 454 | 415 | 1,384 | 1,226 | ||||||||||||||||||||||||
| Total broadband customers, end of period | 8,889 | 7,433 | 6,007 | 8,889 | 6,007 | ||||||||||||||||||||||||
| Total 5G broadband customers, end of period | 7,955 | 7,308 | 6,002 | 7,955 | 6,002 | ||||||||||||||||||||||||
| Quarter | Nine Months Ended September 30, |
Q3 2025
vs.
Q2 2025
|
Q3 2025
vs.
Q3 2024
|
YTD 2025
vs.
YTD 2024
|
|||||||||||||||||||||||||||||||||||||||||||
| (in millions, except EPS) | Q3 2025 | Q2 2025 | Q3 2024 | 2025 | 2024 | ||||||||||||||||||||||||||||||||||||||||||
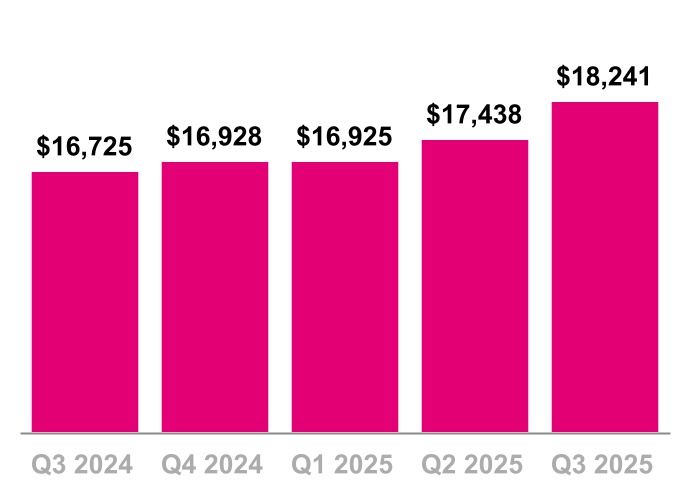
| Total service revenues | $ | 18,241 | $ | 17,438 | $ | 16,725 | $ | 52,604 | $ | 49,250 | 4.6 | % | 9.1 | % | 6.8 | % | |||||||||||||||||||||||||||||||
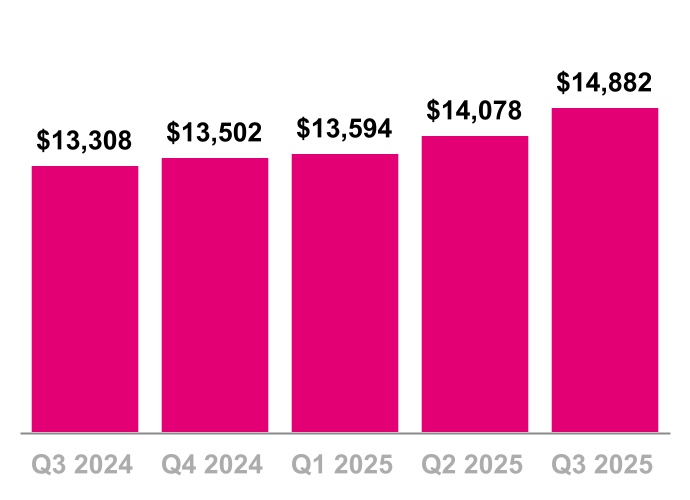
| Postpaid service revenues | 14,882 | 14,078 | 13,308 | 42,554 | 38,838 | 5.7 | % | 11.8 | % | 9.6 | % | ||||||||||||||||||||||||||||||||||||
| Total revenues | 21,957 | 21,132 | 20,162 | 63,975 | 59,528 | 3.9 | % | 8.9 | % | 7.5 | % | ||||||||||||||||||||||||||||||||||||
| Net income | 2,714 | 3,222 | 3,059 | 8,889 | 8,358 | (15.8) | % | (11.3) | % | 6.4 | % | ||||||||||||||||||||||||||||||||||||
| Diluted EPS | 2.41 | 2.84 | 2.61 | 7.82 | 7.10 | (15.1) | % | (7.7) | % | 10.1 | % | ||||||||||||||||||||||||||||||||||||
| Adjusted EBITDA | 8,684 | 8,547 | 8,243 | 25,490 | 23,948 | 1.6 | % | 5.3 | % | 6.4 | % | ||||||||||||||||||||||||||||||||||||
| Core Adjusted EBITDA | 8,680 | 8,541 | 8,222 | 25,479 | 23,866 | 1.6 | % | 5.6 | % | 6.8 | % | ||||||||||||||||||||||||||||||||||||
Net cash provided by operating activities (2) |
7,457 | 6,992 | 6,139 | 21,296 | 16,744 | 6.7 | % | 21.5 | % | 27.2 | % | ||||||||||||||||||||||||||||||||||||
| Cash purchases of property and equipment, including capitalized interest | 2,639 | 2,396 | 1,961 | 7,486 | 6,628 | 10.1 | % | 34.6 | % | 12.9 | % | ||||||||||||||||||||||||||||||||||||
Adjusted Free Cash Flow |
4,818 | 4,596 | 5,162 | 13,810 | 12,948 | 4.8 | % | (6.7) | % | 6.7 | % | ||||||||||||||||||||||||||||||||||||
| (in millions, except Postpaid net customer additions and Effective tax rate) | Previous | Current | Change (Mid-point) | ||||||||||||||||||||||||||
| Postpaid net customer additions (thousands) | 6,100 | 6,400 | 7,200 | 7,400 | 1,050 | ||||||||||||||||||||||||
Net income (1) |
N/A | N/A | N/A | N/A | N/A | ||||||||||||||||||||||||
| Effective tax rate | 24% | 26% | 23% | 24% | (150) bps | ||||||||||||||||||||||||
Core Adjusted EBITDA (2) |
$33,300 | $33,700 | $33,700 | $33,900 | $300 | ||||||||||||||||||||||||
| Net cash provided by operating activities | 27,100 | 27,500 | 27,800 | 28,000 | 600 | ||||||||||||||||||||||||
Capital expenditures (3) |
~9,500 | ~10,000 | 500 | ||||||||||||||||||||||||||
| Adjusted Free Cash Flow | 17,600 | 18,000 | 17,800 | 18,000 | 100 | ||||||||||||||||||||||||
| Quarter | Nine Months Ended September 30, | ||||||||||||||||||||||||||||||||||||||||||||||||||||
| (in millions) | Q1 2024 | Q2 2024 | Q3 2024 | Q4 2024 | Q1 2025 | Q2 2025 | Q3 2025 | 2024 | 2025 | ||||||||||||||||||||||||||||||||||||||||||||
| Net income | $ | 2,374 | $ | 2,925 | $ | 3,059 | $ | 2,981 | $ | 2,953 | $ | 3,222 | $ | 2,714 | $ | 8,358 | $ | 8,889 | |||||||||||||||||||||||||||||||||||
| Adjustments: | |||||||||||||||||||||||||||||||||||||||||||||||||||||
| Interest expense, net | 880 | 854 | 836 | 841 | 916 | 922 | 924 | 2,570 | 2,762 | ||||||||||||||||||||||||||||||||||||||||||||
| Other (income) expense, net | (20) | 8 | (7) | (94) | 46 | 11 | 78 | (19) | 135 | ||||||||||||||||||||||||||||||||||||||||||||
| Income tax expense | 764 | 843 | 908 | 858 | 885 | 1,058 | 814 | 2,515 | 2,757 | ||||||||||||||||||||||||||||||||||||||||||||
| Operating income | 3,998 | 4,630 | 4,796 | 4,586 | 4,800 | 5,213 | 4,530 | 13,424 | 14,543 | ||||||||||||||||||||||||||||||||||||||||||||
| Depreciation and amortization | 3,371 | 3,248 | 3,151 | 3,149 | 3,198 | 3,146 | 3,408 | 9,770 | 9,752 | ||||||||||||||||||||||||||||||||||||||||||||
Stock-based compensation (1) |
140 | 147 | 143 | 156 | 168 | 178 | 217 | 430 | 563 | ||||||||||||||||||||||||||||||||||||||||||||
Merger-related costs (gain), net (2) (3) |
130 | (9) | 16 | 10 | 14 | 33 | 73 | 137 | 120 | ||||||||||||||||||||||||||||||||||||||||||||
Legal-related expenses (recoveries), net (4) |
— | 15 | 1 | (105) | 6 | (4) | 8 | 16 | 10 | ||||||||||||||||||||||||||||||||||||||||||||
| Impairment expense | — | — | — | — | — | — | 278 | — | 278 | ||||||||||||||||||||||||||||||||||||||||||||
Other, net (5) |
13 | 22 | 136 | 120 | 73 | (19) | 170 | 171 | 224 | ||||||||||||||||||||||||||||||||||||||||||||
| Adjusted EBITDA | 7,652 | 8,053 | 8,243 | 7,916 | 8,259 | 8,547 | 8,684 | 23,948 | 25,490 | ||||||||||||||||||||||||||||||||||||||||||||
Lease revenues |
(35) | (26) | (21) | (11) | (1) | (6) | (4) | (82) | (11) | ||||||||||||||||||||||||||||||||||||||||||||
| Core Adjusted EBITDA | $ | 7,617 | $ | 8,027 | $ | 8,222 | $ | 7,905 | $ | 8,258 | $ | 8,541 | $ | 8,680 | $ | 23,866 | $ | 25,479 | |||||||||||||||||||||||||||||||||||
| Quarter | Nine Months Ended September 30, | ||||||||||||||||||||||||||||||||||||||||||||||||||||
| (in millions, except percentages) | Q1 2024 | Q2 2024 | Q3 2024 | Q4 2024 | Q1 2025 | Q2 2025 | Q3 2025 | 2024 | 2025 | ||||||||||||||||||||||||||||||||||||||||||||
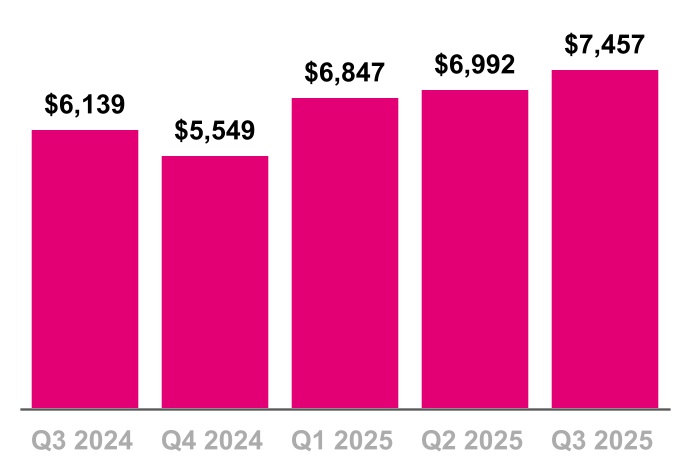
| Net cash provided by operating activities | $ | 5,084 | $ | 5,521 | $ | 6,139 | $ | 5,549 | $ | 6,847 | $ | 6,992 | $ | 7,457 | $ | 16,744 | $ | 21,296 | |||||||||||||||||||||||||||||||||||
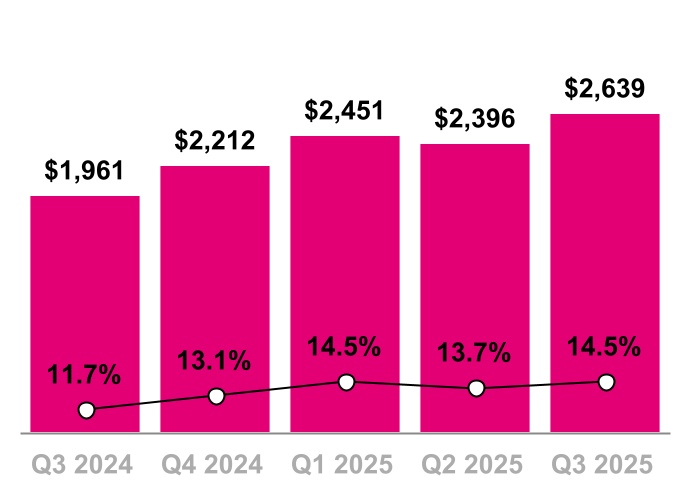
| Cash purchases of property and equipment, including capitalized interest | (2,627) | (2,040) | (1,961) | (2,212) | (2,451) | (2,396) | (2,639) | (6,628) | (7,486) | ||||||||||||||||||||||||||||||||||||||||||||
| Proceeds related to beneficial interests in securitization transactions | 890 | 958 | 984 | 747 | — | — | — | 2,832 | — | ||||||||||||||||||||||||||||||||||||||||||||
Adjusted Free Cash Flow |
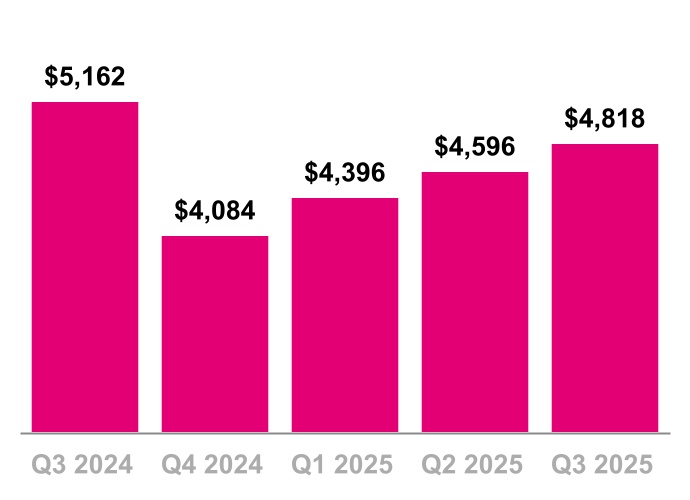
$ | 3,347 | $ | 4,439 | $ | 5,162 | $ | 4,084 | $ | 4,396 | $ | 4,596 | $ | 4,818 | $ | 12,948 | $ | 13,810 | |||||||||||||||||||||||||||||||||||
| Net cash provided by operating activities margin (Net cash provided by operating activities divided by Service revenues) | 31.6 | % | 33.6 | % | 36.7 | % | 32.8 | % | 40.5 | % | 40.1 | % | 40.9 | % | 34.0 | % | 40.5 | % | |||||||||||||||||||||||||||||||||||
| Adjusted Free Cash Flow margin (Adjusted Free Cash Flow divided by Service revenues) | 20.8 | % | 27.0 | % | 30.9 | % | 24.1 | % | 26.0 | % | 26.4 | % | 26.4 | % | 26.3 | % | 26.3 | % | |||||||||||||||||||||||||||||||||||
| FY 2025 | |||||||||||
| (in millions) | Guidance Range | ||||||||||
| Net cash provided by operating activities | $ | 27,800 | $ | 28,000 | |||||||
| Cash purchases of property and equipment, including capitalized interest | (10,000) | (10,000) | |||||||||
| Adjusted Free Cash Flow | $ | 17,800 | $ | 18,000 | |||||||
| FY 2025 | |||||||||||
| (in millions) | Guidance Range | ||||||||||
| Net cash provided by operating activities | $ | 27,100 | $ | 27,500 | |||||||
| Cash purchases of property and equipment, including capitalized interest | (9,500) | (9,500) | |||||||||
| Adjusted Free Cash Flow | $ | 17,600 | $ | 18,000 | |||||||
| Quarter | Nine Months Ended September 30, | ||||||||||||||||||||||||||||||||||||||||||||||||||||
| (in dollars) | Q1 2024 | Q2 2024 | Q3 2024 | Q4 2024 | Q1 2025 | Q2 2025 | Q3 2025 | 2024 | 2025 | ||||||||||||||||||||||||||||||||||||||||||||
| Postpaid ARPA | $ | 140.88 | $ | 142.54 | $ | 145.60 | $ | 146.28 | $ | 146.22 | $ | 149.87 | $ | 149.44 | $ | 143.02 | $ | 148.54 | |||||||||||||||||||||||||||||||||||
| Postpaid phone ARPU | 48.79 | 49.07 | 49.79 | 49.73 | 49.38 | 50.62 | 50.71 | 49.22 | 50.25 | ||||||||||||||||||||||||||||||||||||||||||||
| Prepaid ARPU | 37.18 | 35.94 | 35.81 | 35.49 | 34.67 | 34.63 | 33.93 | 36.27 | 34.41 | ||||||||||||||||||||||||||||||||||||||||||||

 |
2 |
||||
| Highlights | ||||||||
| Customer Metrics | ||||||||
| Financial Metrics | ||||||||
| Capital Structure | ||||||||
| Guidance | ||||||||
| Contacts | ||||||||
| Financial and Operational Tables | ||||||||
 | ||
 |
3 |
||||
 | ||||||||
| ||
 |
4 |
||||
|
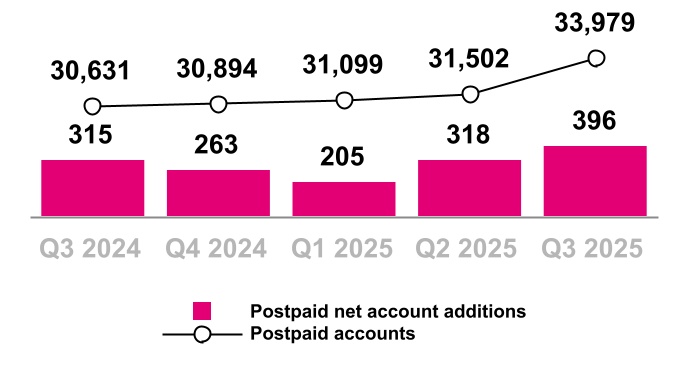
Postpaid Accounts
(in thousands)
|
|||||
| Year-Over-Year | ||
| Sequential | ||
| Year-Over-Year | ||
| Sequential | ||
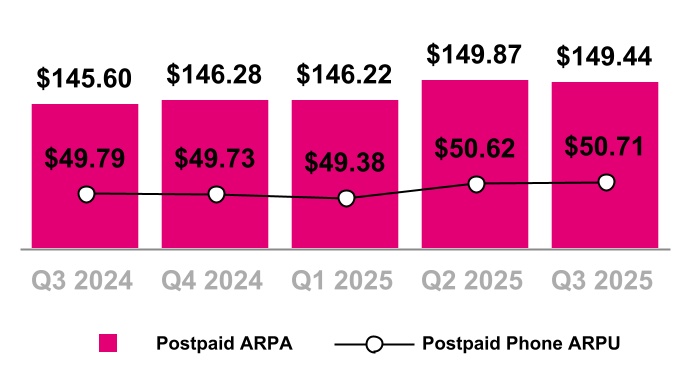
| Postpaid ARPA & Postpaid Phone ARPU | |||||
| ||
|
5 |
||||
|
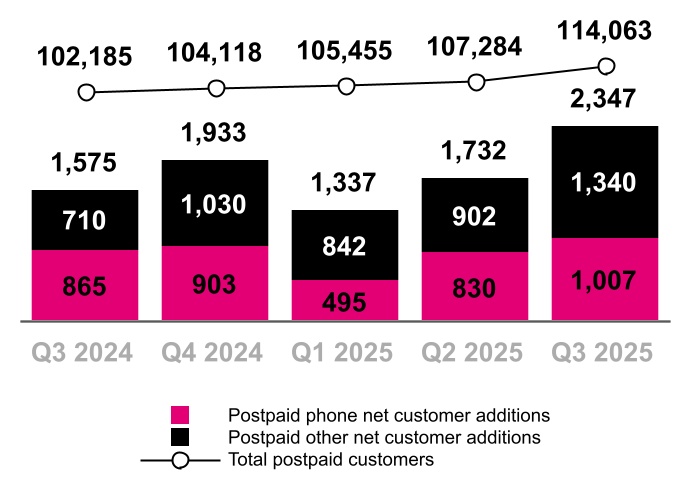
Postpaid Customers
(in thousands)
|
|||||
| Year-Over-Year | ||
| Sequential | ||
| Year-Over-Year | ||
| Sequential | ||
| Postpaid Phone Churn | |||||
| ||
|
6 |
||||
|
Prepaid Customers
(in thousands)
|
|||||
| Year-Over-Year | ||
| Sequential | ||
| Year-Over-Year | ||
| Sequential | ||
|
Broadband Customers
(in thousands)
|
|||||
| ||
 |
7 |
||||
|
Service Revenues
($ in millions)
|
|||||
| Year-Over-Year | ||
| Sequential | ||
| Year-Over-Year | ||
| Sequential | ||
|
Postpaid Service Revenues
($ in millions)
|
|||||
| ||
|
8 |
||||
|
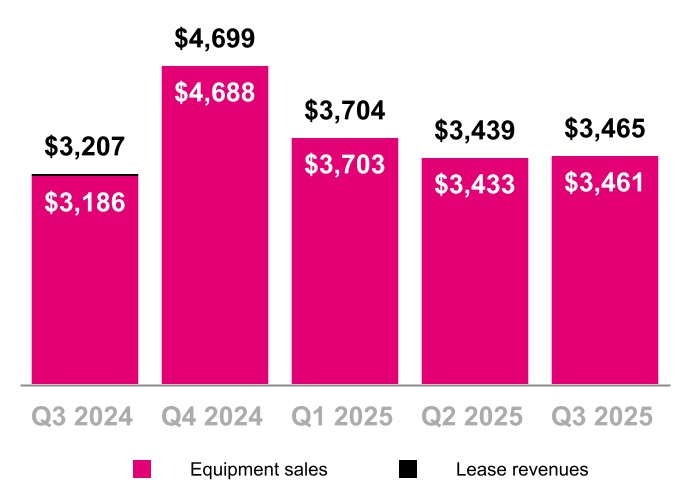
Equipment Revenues
($ in millions)
|
|||||
| Year-Over-Year | ||
| Sequential | ||
| Year-Over-Year | ||
| Sequential | ||
|
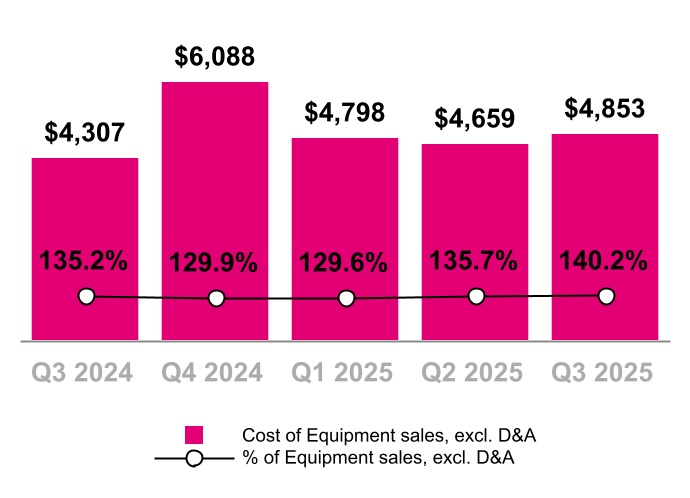
Cost of Equipment Sales, exclusive of D&A
($ in millions, % of Equipment sales)
|
|||||
| ||
|
9 |
||||
|
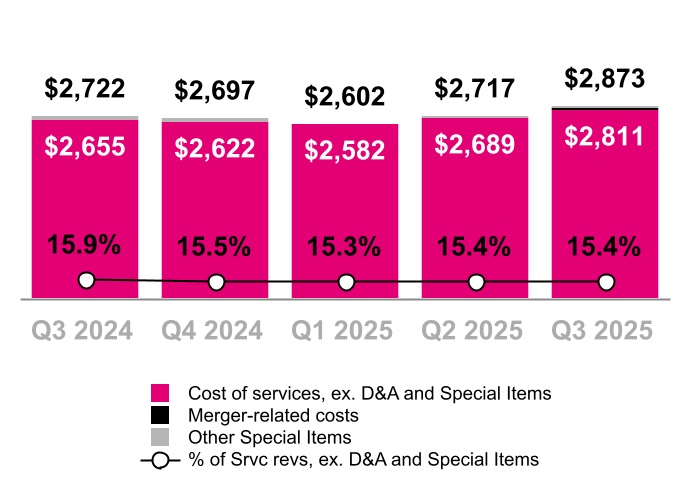
Cost of Services, exclusive of D&A
($ in millions, % of Service revenues)
|
|||||
| Year-Over-Year | ||
| Sequential | ||
| Year-Over-Year | ||
| Sequential | ||
|
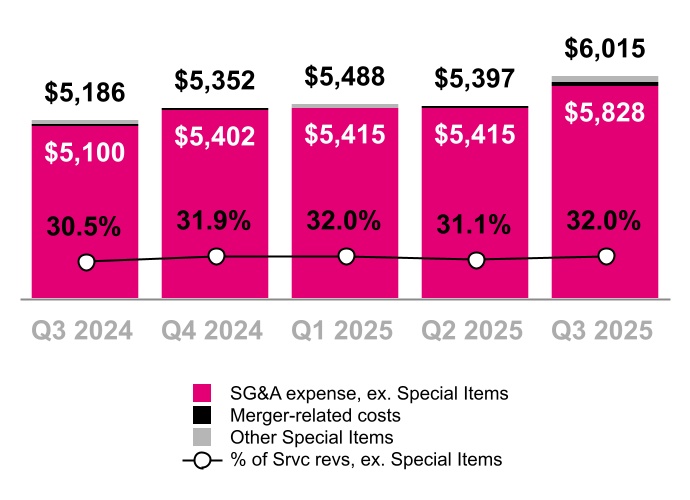
Selling, General and Administrative (SG&A) Expense
($ in millions, % of Service revenues)
|
|||||
| ||
|
10 |
||||
|
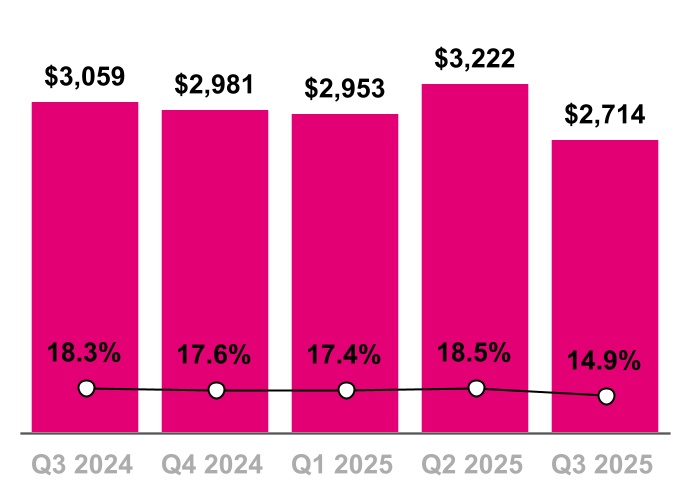
Net Income
($ in millions, % of Service revenues)
|
|||||
|
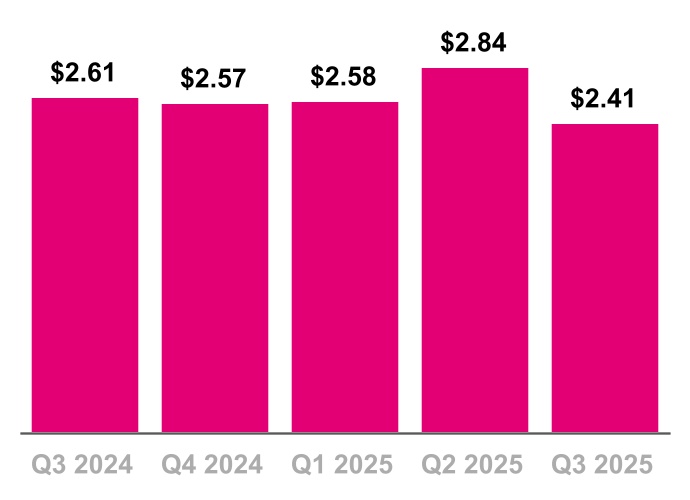
Diluted Earnings Per Share
(Diluted EPS)
|
|||||
| Year-Over-Year | ||
| Sequential | ||
| ||
|
11 |
||||
|
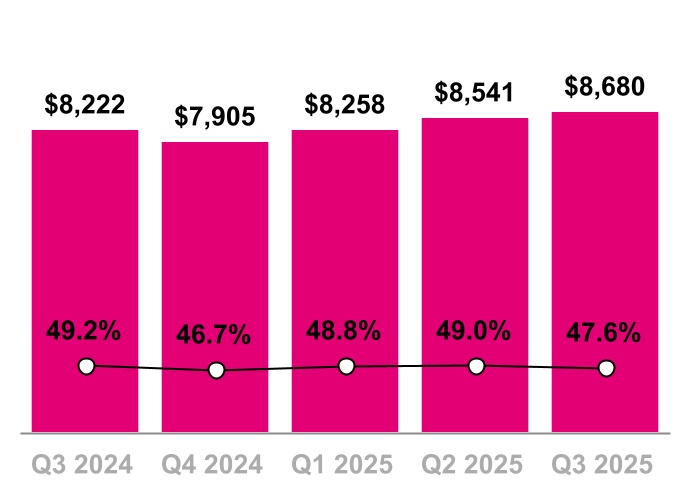
Core Adjusted EBITDA*
($ in millions, % of Service revenues)
|
|||||
| Year-Over-Year | ||
| Sequential | ||
| Year-Over-Year | ||
| Sequential | ||
|
Net Cash Provided by Operating Activities
($ in millions)
|
|||||
| ||
|
12 |
||||
|
Cash Purchases of Property and Equipment, incl. Capitalized Interest
($ in millions, % of Service revenues)
|
|||||
| Year-Over-Year | ||
| Sequential | ||
| Year-Over-Year | ||
| Sequential | ||
|
Adjusted Free Cash Flow
($ in millions)
|
|||||
| ||
 |
13 |
||||
|
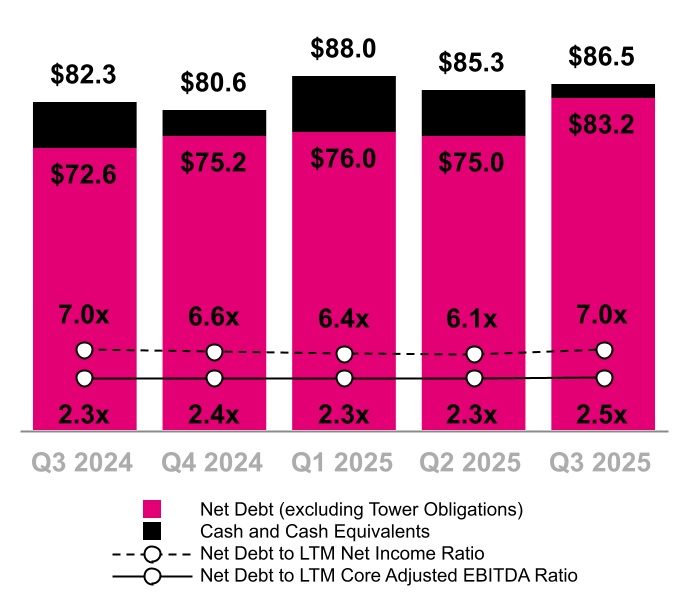
Total Debt (Excluding Tower Obligations),
Net Debt (Excluding Tower Obligations), and
Net Debt to LTM Net Income and Core Adj. EBITDA Ratios
($ in billions)
|
|||||
|
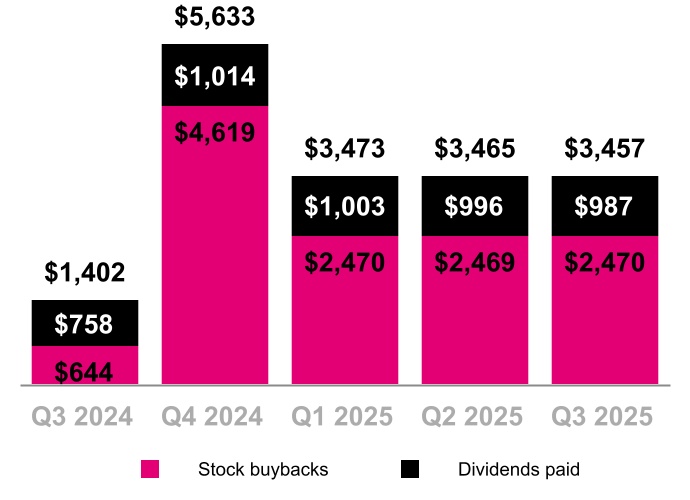
Stockholder Returns
($ in millions)
|
|||||
| ||
 |
14 |
||||
| Metric | Previous | Revised | Change at Midpoint | ||||||||
| Postpaid net customer additions | 6.1 to 6.4 million |
7.2 to 7.4 million |
1.05 million |
||||||||
Net income (1) |
N/A | N/A | N/A | ||||||||
| Effective tax rate | 24% to 26% |
23% to 24% |
(150) bps | ||||||||
Core Adjusted EBITDA (2) |
$33.3 to $33.7 billion |
$33.7 to $33.9 billion |
$300 million |
||||||||
| Net cash provided by operating activities | $27.1 to $27.5 billion |
$27.8 to $28.0 billion |
$600 million |
||||||||
Capital expenditures (3) |
~$9.5 billion |
~$10.0 billion |
$500 million |
||||||||
| Adjusted Free Cash Flow | $17.6 to $18.0 billion |
$17.8 to $18.0 billion |
$100 million |
||||||||
| ||
 |
15 |
||||
 |
 |
 |
||||||||||||||||||
| Cathy Yao | Matthew Hale | Jon Lanterman | ||||||||||||||||||
| Senior Vice President | Senior Director | Senior Director | ||||||||||||||||||
| Investor Relations | Investor Relations | Investor Relations | ||||||||||||||||||
 |
 |
 |
 |
|||||||||||||||||||||||
| Chris Lo | Rose Kopecky | Charles Buffum | Danna Tao | |||||||||||||||||||||||
| Investor Relations | Investor Relations | Investor Relations | Investor Relations | |||||||||||||||||||||||
| Manager | Manager | Manager | Manager | |||||||||||||||||||||||
| ||
 |
16 |
||||
| (in millions, except share and per share amounts) | September 30, 2025 |
December 31, 2024 |
|||||||||
| Assets | |||||||||||
| Current assets | |||||||||||
| Cash and cash equivalents | $ | 3,310 | $ | 5,409 | |||||||
| Accounts receivable, net of allowance for credit losses of $206 and $176 | 5,084 | 4,276 | |||||||||
Equipment installment plan receivables, net of allowance for credit losses and imputed discount of $646 and $656 |
4,599 | 4,379 | |||||||||
| Inventory | 2,370 | 1,607 | |||||||||
| Prepaid expenses | 1,128 | 880 | |||||||||
| Other current assets | 5,212 | 1,853 | |||||||||
| Total current assets | 21,703 | 18,404 | |||||||||
| Property and equipment, net | 38,718 | 38,533 | |||||||||
| Operating lease right-of-use assets | 26,070 | 25,398 | |||||||||
| Financing lease right-of-use assets | 2,955 | 3,091 | |||||||||
| Goodwill | 13,690 | 13,005 | |||||||||
| Spectrum licenses | 97,749 | 100,558 | |||||||||
| Other intangible assets, net | 4,117 | 2,512 | |||||||||
Equipment installment plan receivables due after one year, net of allowance for credit losses and imputed discount of $186 and $158 |
2,316 | 2,209 | |||||||||
| Other assets | 9,862 | 4,325 | |||||||||
| Total assets | $ | 217,180 | $ | 208,035 | |||||||
| Liabilities and Stockholders' Equity | |||||||||||
| Current liabilities | |||||||||||
| Accounts payable and accrued liabilities | $ | 9,193 | $ | 8,463 | |||||||
| Short-term debt | 6,333 | 4,068 | |||||||||
| Deferred revenue | 1,487 | 1,222 | |||||||||
| Short-term operating lease liabilities | 3,550 | 3,281 | |||||||||
| Short-term financing lease liabilities | 1,157 | 1,175 | |||||||||
| Other current liabilities | 2,581 | 1,965 | |||||||||
| Total current liabilities | 24,301 | 20,174 | |||||||||
| Long-term debt | 76,365 | 72,700 | |||||||||
| Long-term debt to affiliates | 1,498 | 1,497 | |||||||||
| Tower obligations | 3,568 | 3,664 | |||||||||
| Deferred tax liabilities | 19,222 | 16,700 | |||||||||
| Operating lease liabilities | 26,780 | 26,408 | |||||||||
| Financing lease liabilities | 1,186 | 1,151 | |||||||||
| Other long-term liabilities | 3,783 | 4,000 | |||||||||
| Total long-term liabilities | 132,402 | 126,120 | |||||||||
| Commitments and contingencies | |||||||||||
| Stockholders' equity | |||||||||||
| Common stock, par value $0.00001 per share, 2,000,000,000 shares authorized; 1,275,435,436 and 1,271,074,364 shares issued, 1,118,506,240 and 1,144,579,681 shares outstanding | — | — | |||||||||
| Additional paid-in capital | 69,267 | 68,798 | |||||||||
| Treasury stock, at cost, 156,929,196 and 126,494,683 shares issued | (28,064) | (20,584) | |||||||||
| Accumulated other comprehensive loss | (881) | (857) | |||||||||
| Retained earnings | 20,155 | 14,384 | |||||||||
| Total stockholders' equity | 60,477 | 61,741 | |||||||||
| Total liabilities and stockholders' equity | $ | 217,180 | $ | 208,035 | |||||||
| ||
|
17 |
||||
| Three Months Ended | Nine Months Ended September 30, | ||||||||||||||||||||||||||||
| (in millions, except share and per share amounts) | September 30, 2025 |
June 30, 2025 |
September 30, 2024 |
2025 | 2024 | ||||||||||||||||||||||||
| Revenues | |||||||||||||||||||||||||||||
| Postpaid revenues | $ | 14,882 | $ | 14,078 | $ | 13,308 | $ | 42,554 | $ | 38,838 | |||||||||||||||||||
| Prepaid revenues | 2,625 | 2,643 | 2,716 | 7,911 | 7,711 | ||||||||||||||||||||||||
| Wholesale and other service revenues | 734 | 717 | 701 | 2,139 | 2,701 | ||||||||||||||||||||||||
| Total service revenues | 18,241 | 17,438 | 16,725 | 52,604 | 49,250 | ||||||||||||||||||||||||
| Equipment revenues | 3,465 | 3,439 | 3,207 | 10,608 | 9,564 | ||||||||||||||||||||||||
| Other revenues | 251 | 255 | 230 | 763 | 714 | ||||||||||||||||||||||||
| Total revenues | 21,957 | 21,132 | 20,162 | 63,975 | 59,528 | ||||||||||||||||||||||||
| Operating expenses | |||||||||||||||||||||||||||||
| Cost of services, exclusive of depreciation and amortization shown separately below | 2,873 | 2,717 | 2,722 | 8,192 | 8,074 | ||||||||||||||||||||||||
| Cost of equipment sales, exclusive of depreciation and amortization shown separately below | 4,853 | 4,659 | 4,307 | 14,310 | 12,794 | ||||||||||||||||||||||||
| Selling, general and administrative | 6,015 | 5,397 | 5,186 | 16,900 | 15,466 | ||||||||||||||||||||||||
| Impairment expense | 278 | — | — | 278 | — | ||||||||||||||||||||||||
| Depreciation and amortization | 3,408 | 3,146 | 3,151 | 9,752 | 9,770 | ||||||||||||||||||||||||
| Total operating expenses | 17,427 | 15,919 | 15,366 | 49,432 | 46,104 | ||||||||||||||||||||||||
| Operating income | 4,530 | 5,213 | 4,796 | 14,543 | 13,424 | ||||||||||||||||||||||||
| Other expense, net | |||||||||||||||||||||||||||||
| Interest expense, net | (924) | (922) | (836) | (2,762) | (2,570) | ||||||||||||||||||||||||
| Other (expense) income, net | (78) | (11) | 7 | (135) | 19 | ||||||||||||||||||||||||
| Total other expense, net | (1,002) | (933) | (829) | (2,897) | (2,551) | ||||||||||||||||||||||||
| Income before income taxes | 3,528 | 4,280 | 3,967 | 11,646 | 10,873 | ||||||||||||||||||||||||
| Income tax expense | (814) | (1,058) | (908) | (2,757) | (2,515) | ||||||||||||||||||||||||
| Net income | $ | 2,714 | $ | 3,222 | $ | 3,059 | $ | 8,889 | $ | 8,358 | |||||||||||||||||||
| Net income | $ | 2,714 | $ | 3,222 | $ | 3,059 | $ | 8,889 | $ | 8,358 | |||||||||||||||||||
| Other comprehensive income (loss), net of tax | |||||||||||||||||||||||||||||
Reclassification of loss from cash flow hedges, net of tax effect of $16, $16, $15, $48 and $45 |
48 | 47 | 44 | 141 | 130 | ||||||||||||||||||||||||
(Losses) gains on fair value hedges, net of tax effect of $(7), $13, $(5), $(55) and $(15) |
(20) | 37 | (12) | (160) | (42) | ||||||||||||||||||||||||
Unrealized loss on foreign currency translation adjustment, net of tax effect of $0, $0, $0, $0 and $0 |
— | (1) | — | (1) | — | ||||||||||||||||||||||||
Amortization of actuarial gain, net of tax effect of $0, $(1), $(2), $(1) and $(5) |
(1) | (2) | (4) | (4) | (13) | ||||||||||||||||||||||||
| Other comprehensive income (loss) | 27 | 81 | 28 | (24) | 75 | ||||||||||||||||||||||||
| Total comprehensive income | $ | 2,741 | $ | 3,303 | $ | 3,087 | $ | 8,865 | $ | 8,433 | |||||||||||||||||||
| Earnings per share | |||||||||||||||||||||||||||||
| Basic | $ | 2.42 | $ | 2.84 | $ | 2.62 | $ | 7.84 | $ | 7.12 | |||||||||||||||||||
| Diluted | $ | 2.41 | $ | 2.84 | $ | 2.61 | $ | 7.82 | $ | 7.10 | |||||||||||||||||||
| Weighted-average shares outstanding | |||||||||||||||||||||||||||||
| Basic | 1,123,754,096 | 1,132,760,465 | 1,166,961,755 | 1,133,743,367 | 1,174,069,336 | ||||||||||||||||||||||||
| Diluted | 1,126,627,708 | 1,134,846,966 | 1,170,649,561 | 1,136,920,521 | 1,177,637,145 | ||||||||||||||||||||||||
| ||
|
18 |
||||
| Three Months Ended | Nine Months Ended September 30, | ||||||||||||||||||||||||||||
| (in millions) | September 30, 2025 |
June 30, 2025 |
September 30, 2024 |
2025 | 2024 | ||||||||||||||||||||||||
| Operating activities | |||||||||||||||||||||||||||||
| Net income | $ | 2,714 | $ | 3,222 | $ | 3,059 | $ | 8,889 | $ | 8,358 | |||||||||||||||||||
| Adjustments to reconcile net income to net cash provided by operating activities | |||||||||||||||||||||||||||||
| Depreciation and amortization | 3,408 | 3,146 | 3,151 | 9,752 | 9,770 | ||||||||||||||||||||||||
| Stock-based compensation expense | 227 | 200 | 170 | 613 | 474 | ||||||||||||||||||||||||
| Deferred income tax expense | 797 | 937 | 817 | 2,505 | 2,279 | ||||||||||||||||||||||||
| Bad debt expense | 337 | 265 | 299 | 925 | 836 | ||||||||||||||||||||||||
| Losses from sales of receivables | 17 | 19 | 23 | 58 | 69 | ||||||||||||||||||||||||
| Impairment expense | 278 | — | — | 278 | — | ||||||||||||||||||||||||
| Changes in operating assets and liabilities | |||||||||||||||||||||||||||||
| Accounts receivable | (366) | (338) | (734) | (797) | (2,436) | ||||||||||||||||||||||||
| Equipment installment plan receivables | 44 | 65 | (72) | 133 | 360 | ||||||||||||||||||||||||
| Inventory | (537) | 264 | (448) | (591) | (57) | ||||||||||||||||||||||||
| Operating lease right-of-use assets | 929 | 883 | 877 | 2,667 | 2,605 | ||||||||||||||||||||||||
| Other current and long-term assets | (322) | (671) | (19) | (983) | (275) | ||||||||||||||||||||||||
| Accounts payable and accrued liabilities | 890 | 107 | (165) | 729 | (1,861) | ||||||||||||||||||||||||
| Short- and long-term operating lease liabilities | (936) | (886) | (805) | (2,720) | (2,970) | ||||||||||||||||||||||||
| Other current and long-term liabilities | (239) | (82) | (125) | (409) | (657) | ||||||||||||||||||||||||
| Other, net | 216 | (139) | 111 | 247 | 249 | ||||||||||||||||||||||||
| Net cash provided by operating activities | 7,457 | 6,992 | 6,139 | 21,296 | 16,744 | ||||||||||||||||||||||||
| Investing activities | |||||||||||||||||||||||||||||
Purchases of property and equipment, including capitalized interest of $(13), $(10), $(9), $(33) and $(26) |
(2,639) | (2,396) | (1,961) | (7,486) | (6,628) | ||||||||||||||||||||||||
| Purchases of spectrum licenses and other intangible assets, including deposits | (1,590) | (842) | (2,419) | (2,505) | (2,636) | ||||||||||||||||||||||||
| Proceeds from the sale of property, equipment and intangible assets | 18 | 2,066 | 15 | 2,091 | 38 | ||||||||||||||||||||||||
| Proceeds related to beneficial interests in securitization transactions | — | — | 984 | — | 2,832 | ||||||||||||||||||||||||
| Acquisition of companies, net of cash acquired | (2,797) | 1 | — | (3,523) | (390) | ||||||||||||||||||||||||
| Investments in unconsolidated affiliates, net | (3,072) | (908) | — | (4,055) | — | ||||||||||||||||||||||||
| Other, net | (59) | 520 | 74 | 371 | 12 | ||||||||||||||||||||||||
| Net cash used in investing activities | (10,139) | (1,559) | (3,307) | (15,107) | (6,772) | ||||||||||||||||||||||||
| Financing activities | |||||||||||||||||||||||||||||
| Proceeds from issuance of long-term debt, net | 498 | (6) | 2,480 | 8,266 | 8,089 | ||||||||||||||||||||||||
| Repayments of financing lease obligations | (318) | (331) | (347) | (964) | (1,025) | ||||||||||||||||||||||||
| Repayments of long-term debt | (828) | (3,257) | (223) | (4,564) | (3,169) | ||||||||||||||||||||||||
| Repurchases of common stock | (2,479) | (2,555) | (560) | (7,528) | (6,541) | ||||||||||||||||||||||||
| Dividends on common stock | (987) | (996) | (758) | (2,986) | (2,286) | ||||||||||||||||||||||||
| Tax withholdings on share-based awards | (92) | (30) | (36) | (394) | (244) | ||||||||||||||||||||||||
| Other, net | (32) | (30) | (49) | (80) | (117) | ||||||||||||||||||||||||
| Net cash (used in) provided by financing activities | (4,238) | (7,205) | 507 | (8,250) | (5,293) | ||||||||||||||||||||||||
| Effect of exchange rate changes on cash and cash equivalents, including restricted cash | — | 13 | — | 13 | — | ||||||||||||||||||||||||
| Change in cash and cash equivalents, including restricted cash | (6,920) | (1,759) | 3,339 | (2,048) | 4,679 | ||||||||||||||||||||||||
| Cash and cash equivalents, including restricted cash | |||||||||||||||||||||||||||||
| Beginning of period | 10,585 | 12,344 | 6,647 | 5,713 | 5,307 | ||||||||||||||||||||||||
| End of period | $ | 3,665 | $ | 10,585 | $ | 9,986 | $ | 3,665 | $ | 9,986 | |||||||||||||||||||
| ||
|
19 |
||||
| Three Months Ended | Nine Months Ended September 30, | ||||||||||||||||||||||||||||
| (in millions) | September 30, 2025 |
June 30, 2025 |
September 30, 2024 |
2025 | 2024 | ||||||||||||||||||||||||
| Supplemental disclosure of cash flow information | |||||||||||||||||||||||||||||
| Interest payments, net of amounts capitalized | $ | 997 | $ | 992 | $ | 947 | $ | 2,923 | $ | 2,778 | |||||||||||||||||||
| Operating lease payments | 1,269 | 1,202 | 1,127 | 3,685 | 3,928 | ||||||||||||||||||||||||
| Income tax payments | 65 | 347 | 50 | 427 | 164 | ||||||||||||||||||||||||
| Non-cash investing and financing activities | |||||||||||||||||||||||||||||
| Non-cash beneficial interest obtained in exchange for securitized receivables | $ | — | $ | — | $ | 789 | $ | — | $ | 2,283 | |||||||||||||||||||
| Change in accounts payable and accrued liabilities for purchases of property and equipment | 136 | (131) | 41 | (458) | (1,085) | ||||||||||||||||||||||||
| Operating lease right-of-use assets obtained in exchange for lease obligations | 1,064 | 593 | 469 | 2,138 | 1,300 | ||||||||||||||||||||||||
| Financing lease right-of-use assets obtained in exchange for lease obligations | 324 | 430 | 409 | 1,002 | 983 | ||||||||||||||||||||||||
| Deferred consideration related to the Ka’ena Acquisition | — | — | — | — | 210 | ||||||||||||||||||||||||
| Debt assumed in the UScellular Acquisition | 1,653 | — | — | 1,653 | — | ||||||||||||||||||||||||
| ||
|
20 |
||||
| Quarter | Nine Months Ended September 30, | ||||||||||||||||||||||||||||||||||||||||||||||||||||
| (in thousands) | Q1 2024 | Q2 2024 | Q3 2024 | Q4 2024 | Q1 2025 | Q2 2025 | Q3 2025 | 2024 | 2025 | ||||||||||||||||||||||||||||||||||||||||||||
| Customers, end of period | |||||||||||||||||||||||||||||||||||||||||||||||||||||
Postpaid phone customers (1) |
76,468 | 77,245 | 78,110 | 79,013 | 79,508 | 80,338 | 84,632 | 78,110 | 84,632 | ||||||||||||||||||||||||||||||||||||||||||||
Postpaid other customers (1) (2) (3) |
22,804 | 23,365 | 24,075 | 25,105 | 25,947 | 26,946 | 29,431 | 24,075 | 29,431 | ||||||||||||||||||||||||||||||||||||||||||||
| Total postpaid customers | 99,272 | 100,610 | 102,185 | 104,118 | 105,455 | 107,284 | 114,063 | 102,185 | 114,063 | ||||||||||||||||||||||||||||||||||||||||||||
Prepaid customers (1) (4) |
21,600 | 25,283 | 25,307 | 25,410 | 25,455 | 25,494 | 25,886 | 25,307 | 25,886 | ||||||||||||||||||||||||||||||||||||||||||||
| Total customers | 120,872 | 125,893 | 127,492 | 129,528 | 130,910 | 132,778 | 139,949 | 127,492 | 139,949 | ||||||||||||||||||||||||||||||||||||||||||||
Adjustments to customers (1) (2) (3) (4) |
— | 3,504 | — | — | — | 97 | 4,781 | 3,504 | 4,878 | ||||||||||||||||||||||||||||||||||||||||||||
| Quarter | Nine Months Ended September 30, | ||||||||||||||||||||||||||||||||||||||||||||||||||||
| (in thousands) | Q1 2024 | Q2 2024 | Q3 2024 | Q4 2024 | Q1 2025 | Q2 2025 | Q3 2025 | 2024 | 2025 | ||||||||||||||||||||||||||||||||||||||||||||
| Net customer additions (losses) | |||||||||||||||||||||||||||||||||||||||||||||||||||||
| Postpaid phone customers | 532 | 777 | 865 | 903 | 495 | 830 | 1,007 | 2,174 | 2,332 | ||||||||||||||||||||||||||||||||||||||||||||
| Postpaid other customers | 688 | 561 | 710 | 1,030 | 842 | 902 | 1,340 | 1,959 | 3,084 | ||||||||||||||||||||||||||||||||||||||||||||
| Total postpaid customers | 1,220 | 1,338 | 1,575 | 1,933 | 1,337 | 1,732 | 2,347 | 4,133 | 5,416 | ||||||||||||||||||||||||||||||||||||||||||||
| Prepaid customers | (48) | 179 | 24 | 103 | 45 | 39 | 43 | 155 | 127 | ||||||||||||||||||||||||||||||||||||||||||||
| Total net customer additions | 1,172 | 1,517 | 1,599 | 2,036 | 1,382 | 1,771 | 2,390 | 4,288 | 5,543 | ||||||||||||||||||||||||||||||||||||||||||||
| Migrations from prepaid to postpaid plans | 145 | 140 | 175 | 160 | 115 | 205 | 215 | 460 | 535 | ||||||||||||||||||||||||||||||||||||||||||||
| Quarter | Nine Months Ended September 30, | ||||||||||||||||||||||||||||||||||||||||||||||||||||
| Q1 2024 | Q2 2024 | Q3 2024 | Q4 2024 | Q1 2025 | Q2 2025 | Q3 2025 | 2024 | 2025 | |||||||||||||||||||||||||||||||||||||||||||||
| Churn | |||||||||||||||||||||||||||||||||||||||||||||||||||||
| Postpaid phone churn | 0.86 | % | 0.80 | % | 0.86 | % | 0.92 | % | 0.91 | % | 0.90 | % | 0.89 | % | 0.84 | % | 0.90 | % | |||||||||||||||||||||||||||||||||||
| Prepaid churn | 2.75 | % | 2.54 | % | 2.78 | % | 2.85 | % | 2.68 | % | 2.65 | % | 2.77 | % | 2.69 | % | 2.70 | % | |||||||||||||||||||||||||||||||||||
| Quarter | Nine Months Ended September 30, | ||||||||||||||||||||||||||||||||||||||||||||||||||||
| Q1 2024 | Q2 2024 | Q3 2024 | Q4 2024 | Q1 2025 | Q2 2025 | Q3 2025 | 2024 | 2025 | |||||||||||||||||||||||||||||||||||||||||||||
| Postpaid upgrade rate | |||||||||||||||||||||||||||||||||||||||||||||||||||||
| Postpaid device upgrade rate | 2.4 | % | 2.3 | % | 2.6 | % | 3.6 | % | 2.8 | % | 2.5 | % | 2.7 | % | 7.5 | % | 8.0 | % | |||||||||||||||||||||||||||||||||||
| ||
|
21 |
||||
| Quarter | Nine Months Ended September 30, | ||||||||||||||||||||||||||||||||||||||||||||||||||||
| (in thousands) | Q1 2024 | Q2 2024 | Q3 2024 | Q4 2024 | Q1 2025 | Q2 2025 | Q3 2025 | 2024 | 2025 | ||||||||||||||||||||||||||||||||||||||||||||
| Accounts, end of period | |||||||||||||||||||||||||||||||||||||||||||||||||||||
Total postpaid accounts (1) (2) (3) |
30,015 | 30,316 | 30,631 | 30,894 | 31,099 | 31,502 | 33,979 | 30,631 | 33,979 | ||||||||||||||||||||||||||||||||||||||||||||
| Quarter | Nine Months Ended September 30, | ||||||||||||||||||||||||||||||||||||||||||||||||||||
| (in thousands) | Q1 2024 | Q2 2024 | Q3 2024 | Q4 2024 | Q1 2025 | Q2 2025 | Q3 2025 | 2024 | 2025 | ||||||||||||||||||||||||||||||||||||||||||||
| Net account additions | |||||||||||||||||||||||||||||||||||||||||||||||||||||
| Postpaid net account additions | 218 | 301 | 315 | 263 | 205 | 318 | 396 | 834 | 919 | ||||||||||||||||||||||||||||||||||||||||||||
| Quarter | Nine Months Ended September 30, | ||||||||||||||||||||||||||||||||||||||||||||||||||||
| (in thousands) | Q1 2024 | Q2 2024 | Q3 2024 | Q4 2024 | Q1 2025 | Q2 2025 | Q3 2025 | 2024 | 2025 | ||||||||||||||||||||||||||||||||||||||||||||
| Broadband customers, end of period | |||||||||||||||||||||||||||||||||||||||||||||||||||||
Postpaid 5G broadband customers (1) |
4,634 | 4,992 | 5,377 | 5,742 | 6,129 | 6,556 | 7,163 | 5,377 | 7,163 | ||||||||||||||||||||||||||||||||||||||||||||
| Prepaid 5G broadband customers | 547 | 595 | 625 | 688 | 725 | 752 | 792 | 625 | 792 | ||||||||||||||||||||||||||||||||||||||||||||
| Total 5G broadband customers, end of period | 5,181 | 5,587 | 6,002 | 6,430 | 6,854 | 7,308 | 7,955 | 6,002 | 7,955 | ||||||||||||||||||||||||||||||||||||||||||||
Fiber customers (2) (3) |
1 | 2 | 5 | 9 | 12 | 125 | 934 | 5 | 934 | ||||||||||||||||||||||||||||||||||||||||||||
| Total broadband customers, end of period | 5,182 | 5,589 | 6,007 | 6,439 | 6,866 | 7,433 | 8,889 | 6,007 | 8,889 | ||||||||||||||||||||||||||||||||||||||||||||
Adjustments to customers (1) (2) (3) |
— | — | — | — | — | 97 | 896 | — | 993 | ||||||||||||||||||||||||||||||||||||||||||||
| Quarter | Nine Months Ended September 30, | ||||||||||||||||||||||||||||||||||||||||||||||||||||
| (in thousands) | Q1 2024 | Q2 2024 | Q3 2024 | Q4 2024 | Q1 2025 | Q2 2025 | Q3 2025 | 2024 | 2025 | ||||||||||||||||||||||||||||||||||||||||||||
| Broadband - net customer additions | |||||||||||||||||||||||||||||||||||||||||||||||||||||
| Postpaid 5G broadband customers | 346 | 358 | 385 | 365 | 387 | 427 | 466 | 1,089 | 1,280 | ||||||||||||||||||||||||||||||||||||||||||||
| Prepaid 5G broadband customers | 59 | 48 | 30 | 63 | 37 | 27 | 40 | 137 | 104 | ||||||||||||||||||||||||||||||||||||||||||||
| Total 5G broadband net customer additions | 405 | 406 | 415 | 428 | 424 | 454 | 506 | 1,226 | 1,384 | ||||||||||||||||||||||||||||||||||||||||||||
| Fiber customers | — | 1 | 3 | 4 | 3 | 16 | 54 | 4 | 73 | ||||||||||||||||||||||||||||||||||||||||||||
| Total broadband net customer additions | 405 | 407 | 418 | 432 | 427 | 470 | 560 | 1,230 | 1,457 | ||||||||||||||||||||||||||||||||||||||||||||
| ||
|
22 |
||||
| Quarter | Nine Months Ended September 30, | ||||||||||||||||||||||||||||||||||||||||||||||||||||
| (in millions) | Q1 2024 | Q2 2024 | Q3 2024 | Q4 2024 | Q1 2025 | Q2 2025 | Q3 2025 | 2024 | 2025 | ||||||||||||||||||||||||||||||||||||||||||||
| Device financing - equipment installment plans | |||||||||||||||||||||||||||||||||||||||||||||||||||||
| Gross EIP financed | $ | 3,218 | $ | 3,037 | $ | 3,304 | $ | 4,689 | $ | 3,565 | $ | 3,503 | $ | 3,871 | $ | 9,559 | $ | 10,939 | |||||||||||||||||||||||||||||||||||
| EIP billings | 3,880 | 3,604 | 3,423 | 3,509 | 3,551 | 3,553 | 3,766 | 10,907 | 10,870 | ||||||||||||||||||||||||||||||||||||||||||||
| EIP receivables, net | 5,967 | 5,556 | 5,347 | 6,588 | 6,405 | 6,201 | 6,915 | 5,347 | 6,915 | ||||||||||||||||||||||||||||||||||||||||||||
| Device financing - leased devices | |||||||||||||||||||||||||||||||||||||||||||||||||||||
| Lease revenues | $ | 35 | $ | 26 | $ | 21 | $ | 11 | $ | 1 | $ | 6 | $ | 4 | $ | 82 | $ | 11 | |||||||||||||||||||||||||||||||||||
| Leased device depreciation | 22 | 15 | 11 | 6 | 4 | 1 | — | 48 | 5 | ||||||||||||||||||||||||||||||||||||||||||||
| Quarter | Nine Months Ended September 30, | ||||||||||||||||||||||||||||||||||||||||||||||||||||
| (in dollars) | Q1 2024 | Q2 2024 | Q3 2024 | Q4 2024 | Q1 2025 | Q2 2025 | Q3 2025 | 2024 | 2025 | ||||||||||||||||||||||||||||||||||||||||||||
| Operating measures | |||||||||||||||||||||||||||||||||||||||||||||||||||||
| Postpaid ARPA | $ | 140.88 | $ | 142.54 | $ | 145.60 | $ | 146.28 | $ | 146.22 | $ | 149.87 | $ | 149.44 | $ | 143.02 | $ | 148.54 | |||||||||||||||||||||||||||||||||||
| Postpaid phone ARPU | 48.79 | 49.07 | 49.79 | 49.73 | 49.38 | 50.62 | 50.71 | 49.22 | 50.25 | ||||||||||||||||||||||||||||||||||||||||||||
| Prepaid ARPU | 37.18 | 35.94 | 35.81 | 35.49 | 34.67 | 34.63 | 33.93 | 36.27 | 34.41 | ||||||||||||||||||||||||||||||||||||||||||||
| ||
|
23 |
||||
| Quarter | Nine Months Ended September 30, | ||||||||||||||||||||||||||||||||||||||||||||||||||||
| (in millions, except percentages) | Q1 2024 | Q2 2024 | Q3 2024 | Q4 2024 | Q1 2025 | Q2 2025 | Q3 2025 | 2024 | 2025 | ||||||||||||||||||||||||||||||||||||||||||||
| Financial measures | |||||||||||||||||||||||||||||||||||||||||||||||||||||
| Service revenues | $ | 16,096 | $ | 16,429 | $ | 16,725 | $ | 16,928 | $ | 16,925 | $ | 17,438 | $ | 18,241 | $ | 49,250 | $ | 52,604 | |||||||||||||||||||||||||||||||||||
| Equipment revenues | $ | 3,251 | $ | 3,106 | $ | 3,207 | $ | 4,699 | $ | 3,704 | $ | 3,439 | $ | 3,465 | $ | 9,564 | $ | 10,608 | |||||||||||||||||||||||||||||||||||
| Lease revenues | 35 | 26 | 21 | 11 | 1 | 6 | 4 | 82 | 11 | ||||||||||||||||||||||||||||||||||||||||||||
| Equipment sales | $ | 3,216 | $ | 3,080 | $ | 3,186 | $ | 4,688 | $ | 3,703 | $ | 3,433 | $ | 3,461 | $ | 9,482 | $ | 10,597 | |||||||||||||||||||||||||||||||||||
| Total revenues | $ | 19,594 | $ | 19,772 | $ | 20,162 | $ | 21,872 | $ | 20,886 | $ | 21,132 | $ | 21,957 | $ | 59,528 | $ | 63,975 | |||||||||||||||||||||||||||||||||||
| Net income | $ | 2,374 | $ | 2,925 | $ | 3,059 | $ | 2,981 | $ | 2,953 | $ | 3,222 | $ | 2,714 | $ | 8,358 | $ | 8,889 | |||||||||||||||||||||||||||||||||||
| Net income margin | 14.7 | % | 17.8 | % | 18.3 | % | 17.6 | % | 17.4 | % | 18.5 | % | 14.9 | % | 17.0 | % | 16.9 | % | |||||||||||||||||||||||||||||||||||
| Adjusted EBITDA | $ | 7,652 | $ | 8,053 | $ | 8,243 | $ | 7,916 | $ | 8,259 | $ | 8,547 | $ | 8,684 | $ | 23,948 | $ | 25,490 | |||||||||||||||||||||||||||||||||||
| Adjusted EBITDA margin | 47.5 | % | 49.0 | % | 49.3 | % | 46.8 | % | 48.8 | % | 49.0 | % | 47.6 | % | 48.6 | % | 48.5 | % | |||||||||||||||||||||||||||||||||||
| Core Adjusted EBITDA | $ | 7,617 | $ | 8,027 | $ | 8,222 | $ | 7,905 | $ | 8,258 | $ | 8,541 | $ | 8,680 | $ | 23,866 | $ | 25,479 | |||||||||||||||||||||||||||||||||||
| Core Adjusted EBITDA margin | 47.3 | % | 48.9 | % | 49.2 | % | 46.7 | % | 48.8 | % | 49.0 | % | 47.6 | % | 48.5 | % | 48.4 | % | |||||||||||||||||||||||||||||||||||
| Cost of services, exclusive of depreciation and amortization | $ | 2,688 | $ | 2,664 | $ | 2,722 | $ | 2,697 | $ | 2,602 | $ | 2,717 | $ | 2,873 | $ | 8,074 | $ | 8,192 | |||||||||||||||||||||||||||||||||||
| Merger-related costs | 107 | 73 | — | — | — | — | 7 | 180 | 7 | ||||||||||||||||||||||||||||||||||||||||||||
| Other Special Items | 1 | — | 67 | 75 | 20 | 28 | 55 | 68 | 103 | ||||||||||||||||||||||||||||||||||||||||||||
| Cost of services, excluding depreciation and amortization and Special Items | $ | 2,580 | $ | 2,591 | $ | 2,655 | $ | 2,622 | $ | 2,582 | $ | 2,689 | $ | 2,811 | $ | 7,826 | $ | 8,082 | |||||||||||||||||||||||||||||||||||
| Cost of equipment sales, exclusive of depreciation and amortization | $ | 4,399 | $ | 4,088 | $ | 4,307 | $ | 6,088 | $ | 4,798 | $ | 4,659 | $ | 4,853 | $ | 12,794 | $ | 14,310 | |||||||||||||||||||||||||||||||||||
| Merger-related costs | — | — | — | — | — | — | 2 | — | 2 | ||||||||||||||||||||||||||||||||||||||||||||
| Cost of equipment sales, exclusive of depreciation and amortization and Special Items | $ | 4,399 | $ | 4,088 | $ | 4,307 | $ | 6,088 | $ | 4,798 | $ | 4,659 | $ | 4,851 | $ | 12,794 | $ | 14,308 | |||||||||||||||||||||||||||||||||||
| Selling, general and administrative | $ | 5,138 | $ | 5,142 | $ | 5,186 | $ | 5,352 | $ | 5,488 | $ | 5,397 | $ | 6,015 | $ | 15,466 | $ | 16,900 | |||||||||||||||||||||||||||||||||||
| Merger-related costs (gain), net | 23 | (82) | 16 | 10 | 14 | 33 | 64 | (43) | 111 | ||||||||||||||||||||||||||||||||||||||||||||
| Other Special Items | 12 | 37 | 70 | (60) | 59 | (51) | 123 | 119 | 131 | ||||||||||||||||||||||||||||||||||||||||||||
| Selling, general and administrative, excluding Special Items | $ | 5,103 | $ | 5,187 | $ | 5,100 | $ | 5,402 | $ | 5,415 | $ | 5,415 | $ | 5,828 | $ | 15,390 | $ | 16,658 | |||||||||||||||||||||||||||||||||||
| Total bad debt expense and losses from sales of receivables | $ | 303 | $ | 280 | $ | 322 | $ | 349 | $ | 345 | $ | 284 | $ | 354 | $ | 905 | $ | 983 | |||||||||||||||||||||||||||||||||||
| Bad debt and losses from sales of receivables as a percentage of Total revenues | 1.5 | % | 1.4 | % | 1.6 | % | 1.6 | % | 1.7 | % | 1.3 | % | 1.6 | % | 1.5 | % | 1.5 | % | |||||||||||||||||||||||||||||||||||
| Cash purchases of property and equipment including capitalized interest | $ | 2,627 | $ | 2,040 | $ | 1,961 | $ | 2,212 | $ | 2,451 | $ | 2,396 | $ | 2,639 | $ | 6,628 | $ | 7,486 | |||||||||||||||||||||||||||||||||||
| Capitalized interest | 9 | 8 | 9 | 8 | 10 | 10 | 13 | 26 | 33 | ||||||||||||||||||||||||||||||||||||||||||||
| Net cash proceeds from securitization | $ | (29) | $ | (30) | $ | (29) | $ | (27) | $ | (26) | $ | (23) | $ | (25) | $ | (88) | $ | (74) | |||||||||||||||||||||||||||||||||||
| Net cash payments for Merger-related costs | $ | 293 | $ | 241 | $ | 132 | $ | 123 | $ | 70 | $ | 92 | $ | 96 | $ | 666 | $ | 258 | |||||||||||||||||||||||||||||||||||
| ||
|
24 |
||||
| Quarter | Nine Months Ended September 30, | ||||||||||||||||||||||||||||||||||||||||||||||||||||
| (in millions, except share and per share amounts) | Q1 2024 | Q2 2024 | Q3 2024 | Q4 2024 | Q1 2025 | Q2 2025 | Q3 2025 | 2024 | 2025 | ||||||||||||||||||||||||||||||||||||||||||||
| Stockholder returns | |||||||||||||||||||||||||||||||||||||||||||||||||||||
| Total repurchases | $ | 3,568 | $ | 2,277 | $ | 644 | $ | 4,619 | $ | 2,470 | $ | 2,469 | $ | 2,470 | $ | 6,489 | $ | 7,409 | |||||||||||||||||||||||||||||||||||
| Total shares repurchased | 21,933,790 | 13,979,843 | 3,179,707 | 20,283,582 | 10,091,227 | 10,148,791 | 10,204,072 | 39,093,340 | 30,444,090 | ||||||||||||||||||||||||||||||||||||||||||||
| Average purchase price per share | $ | 162.69 | $ | 162.85 | $ | 202.45 | $ | 227.72 | $ | 244.77 | $ | 243.32 | $ | 242.01 | $ | 165.98 | $ | 243.36 | |||||||||||||||||||||||||||||||||||
| Total dividends paid | $ | 769 | $ | 759 | $ | 758 | $ | 1,014 | $ | 1,003 | $ | 996 | $ | 987 | $ | 2,286 | $ | 2,986 | |||||||||||||||||||||||||||||||||||
| Dividends per share | $ | 0.65 | $ | 0.65 | $ | 0.65 | $ | 0.88 | $ | 0.88 | $ | 0.88 | $ | 0.88 | $ | 1.95 | $ | 2.64 | |||||||||||||||||||||||||||||||||||
| Total stockholder returns | $ | 4,337 | $ | 3,036 | $ | 1,402 | $ | 5,633 | $ | 3,473 | $ | 3,465 | $ | 3,457 | $ | 8,775 | $ | 10,395 | |||||||||||||||||||||||||||||||||||
| Cumulative total repurchases | $ | 19,775 | $ | 22,052 | $ | 22,696 | $ | 27,315 | $ | 29,785 | $ | 32,254 | $ | 34,724 | $ | 22,696 | $ | 34,724 | |||||||||||||||||||||||||||||||||||
| Cumulative shares repurchased | 136,220,243 | 150,200,086 | 153,379,793 | 173,663,375 | 183,754,602 | 193,903,393 | 204,107,465 | 153,379,793 | 204,107,465 | ||||||||||||||||||||||||||||||||||||||||||||
| Cumulative stockholder returns | $ | 21,291 | $ | 24,327 | $ | 25,729 | $ | 31,362 | $ | 34,835 | $ | 38,300 | $ | 41,757 | $ | 25,729 | $ | 41,757 | |||||||||||||||||||||||||||||||||||
| ||
|
25 |
||||
| Quarter | Nine Months Ended September 30, | ||||||||||||||||||||||||||||||||||||||||||||||||||||
| (in millions, except percentages) | Q1 2024 | Q2 2024 | Q3 2024 | Q4 2024 | Q1 2025 | Q2 2025 | Q3 2025 | 2024 | 2025 | ||||||||||||||||||||||||||||||||||||||||||||
| Net income | $ | 2,374 | $ | 2,925 | $ | 3,059 | $ | 2,981 | $ | 2,953 | $ | 3,222 | $ | 2,714 | $ | 8,358 | $ | 8,889 | |||||||||||||||||||||||||||||||||||
| Adjustments: | |||||||||||||||||||||||||||||||||||||||||||||||||||||
| Interest expense, net | 880 | 854 | 836 | 841 | 916 | 922 | 924 | 2,570 | 2,762 | ||||||||||||||||||||||||||||||||||||||||||||
| Other (income) expense, net | (20) | 8 | (7) | (94) | 46 | 11 | 78 | (19) | 135 | ||||||||||||||||||||||||||||||||||||||||||||
| Income tax expense | 764 | 843 | 908 | 858 | 885 | 1,058 | 814 | 2,515 | 2,757 | ||||||||||||||||||||||||||||||||||||||||||||
| Operating income | 3,998 | 4,630 | 4,796 | 4,586 | 4,800 | 5,213 | 4,530 | 13,424 | 14,543 | ||||||||||||||||||||||||||||||||||||||||||||
| Depreciation and amortization | 3,371 | 3,248 | 3,151 | 3,149 | 3,198 | 3,146 | 3,408 | 9,770 | 9,752 | ||||||||||||||||||||||||||||||||||||||||||||
Stock-based compensation (1) |
140 | 147 | 143 | 156 | 168 | 178 | 217 | 430 | 563 | ||||||||||||||||||||||||||||||||||||||||||||
Merger-related costs (gain), net (2) |
130 | (9) | 16 | 10 | 14 | 33 | 73 | 137 | 120 | ||||||||||||||||||||||||||||||||||||||||||||
Legal-related expenses (recoveries), net (3) |
— | 15 | 1 | (105) | 6 | (4) | 8 | 16 | 10 | ||||||||||||||||||||||||||||||||||||||||||||
| Impairment expense | — | — | — | — | — | — | 278 | — | 278 | ||||||||||||||||||||||||||||||||||||||||||||
Other, net (4) |
13 | 22 | 136 | 120 | 73 | (19) | 170 | 171 | 224 | ||||||||||||||||||||||||||||||||||||||||||||
| Adjusted EBITDA | 7,652 | 8,053 | 8,243 | 7,916 | 8,259 | 8,547 | 8,684 | 23,948 | 25,490 | ||||||||||||||||||||||||||||||||||||||||||||
| Lease revenues | (35) | (26) | (21) | (11) | (1) | (6) | (4) | (82) | (11) | ||||||||||||||||||||||||||||||||||||||||||||
| Core Adjusted EBITDA | $ | 7,617 | $ | 8,027 | $ | 8,222 | $ | 7,905 | $ | 8,258 | $ | 8,541 | $ | 8,680 | $ | 23,866 | $ | 25,479 | |||||||||||||||||||||||||||||||||||
| Net income margin (Net income divided by Service revenues) | 14.7 | % | 17.8 | % | 18.3 | % | 17.6 | % | 17.4 | % | 18.5 | % | 14.9 | % | 17.0 | % | 16.9 | % | |||||||||||||||||||||||||||||||||||
| Adjusted EBITDA margin (Adjusted EBITDA divided by Service revenues) | 47.5 | % | 49.0 | % | 49.3 | % | 46.8 | % | 48.8 | % | 49.0 | % | 47.6 | % | 48.6 | % | 48.5 | % | |||||||||||||||||||||||||||||||||||
| Core Adjusted EBITDA margin (Core Adjusted EBITDA divided by Service revenues) | 47.3 | % | 48.9 | % | 49.2 | % | 46.7 | % | 48.8 | % | 49.0 | % | 47.6 | % | 48.5 | % | 48.4 | % | |||||||||||||||||||||||||||||||||||
| ||
|
26 |
||||
| (in millions, except net debt ratios) | Mar 31, 2024 | Jun 30, 2024 | Sep 30, 2024 | Dec 31, 2024 | Mar 31, 2025 | Jun 30, 2025 | Sep 30, 2025 |
||||||||||||||||||||||||||||||||||
| Short-term debt | $ | 5,356 | $ | 5,867 | $ | 5,851 | $ | 4,068 | $ | 8,214 | $ | 6,408 | $ | 6,333 | |||||||||||||||||||||||||||
| Short-term financing lease liabilities | 1,265 | 1,252 | 1,252 | 1,175 | 1,136 | 1,157 | 1,157 | ||||||||||||||||||||||||||||||||||
| Long-term debt | 71,361 | 70,203 | 72,522 | 72,700 | 76,033 | 75,018 | 76,365 | ||||||||||||||||||||||||||||||||||
| Long-term debt to affiliates | 1,496 | 1,496 | 1,497 | 1,497 | 1,497 | 1,497 | 1,498 | ||||||||||||||||||||||||||||||||||
| Financing lease liabilities | 1,163 | 1,133 | 1,185 | 1,151 | 1,117 | 1,188 | 1,186 | ||||||||||||||||||||||||||||||||||
| Total debt (excluding tower obligations) | $ | 80,641 | $ | 79,951 | $ | 82,307 | $ | 80,591 | $ | 87,997 | $ | 85,268 | $ | 86,539 | |||||||||||||||||||||||||||
| Less: Cash and cash equivalents | (6,708) | (6,417) | (9,754) | (5,409) | (12,003) | (10,259) | (3,310) | ||||||||||||||||||||||||||||||||||
| Net debt (excluding tower obligations) | $ | 73,933 | $ | 73,534 | $ | 72,553 | $ | 75,182 | $ | 75,994 | $ | 75,009 | $ | 83,229 | |||||||||||||||||||||||||||
| Divided by: Last twelve months Net income | $ | 8,751 | $ | 9,455 | $ | 10,372 | $ | 11,339 | $ | 11,918 | $ | 12,215 | $ | 11,870 | |||||||||||||||||||||||||||
| Net debt (excluding tower obligations) to LTM Net income Ratio | 8.4 | 7.8 | 7.0 | 6.6 | 6.4 | 6.1 | 7.0 | ||||||||||||||||||||||||||||||||||
| Divided by: Last twelve months Adjusted EBITDA | $ | 29,881 | $ | 30,529 | $ | 31,172 | $ | 31,864 | $ | 32,471 | $ | 32,965 | $ | 33,406 | |||||||||||||||||||||||||||
| Net debt (excluding tower obligations) to LTM Adjusted EBITDA Ratio | 2.5 | 2.4 | 2.3 | 2.4 | 2.3 | 2.3 | 2.5 | ||||||||||||||||||||||||||||||||||
| Divided by: Last twelve months Core Adjusted EBITDA | $ | 29,681 | $ | 30,372 | $ | 31,047 | $ | 31,771 | $ | 32,412 | $ | 32,926 | $ | 33,384 | |||||||||||||||||||||||||||
| Net debt (excluding tower obligations) to LTM Core Adjusted EBITDA Ratio | 2.5 | 2.4 | 2.3 | 2.4 | 2.3 | 2.3 | 2.5 | ||||||||||||||||||||||||||||||||||
| Quarter | Nine Months Ended September 30, | ||||||||||||||||||||||||||||||||||||||||||||||||||||
| (in millions, except percentages) | Q1 2024 | Q2 2024 | Q3 2024 | Q4 2024 | Q1 2025 | Q2 2025 | Q3 2025 | 2024 | 2025 | ||||||||||||||||||||||||||||||||||||||||||||
Net cash provided by operating activities (1) |
$ | 5,084 | $ | 5,521 | $ | 6,139 | $ | 5,549 | $ | 6,847 | $ | 6,992 | $ | 7,457 | $ | 16,744 | $ | 21,296 | |||||||||||||||||||||||||||||||||||
| Cash purchases of property and equipment, including capitalized interest | (2,627) | (2,040) | (1,961) | (2,212) | (2,451) | (2,396) | (2,639) | (6,628) | (7,486) | ||||||||||||||||||||||||||||||||||||||||||||
Proceeds related to beneficial interests in securitization transactions (1) |
890 | 958 | 984 | 747 | — | — | — | 2,832 | — | ||||||||||||||||||||||||||||||||||||||||||||
| Adjusted Free Cash Flow | $ | 3,347 | $ | 4,439 | $ | 5,162 | $ | 4,084 | $ | 4,396 | $ | 4,596 | $ | 4,818 | $ | 12,948 | $ | 13,810 | |||||||||||||||||||||||||||||||||||
Net cash provided by operating activities margin |
31.6 | % | 33.6 | % | 36.7 | % | 32.8 | % | 40.5 | % | 40.1 | % | 40.9 | % | 34.0 | % | 40.5 | % | |||||||||||||||||||||||||||||||||||
Adjusted Free Cash Flow margin |
20.8 | % | 27.0 | % | 30.9 | % | 24.1 | % | 26.0 | % | 26.4 | % | 26.4 | % | 26.3 | % | 26.3 | % | |||||||||||||||||||||||||||||||||||
| ||
|
27 |
||||
| FY 2025 | |||||||||||
| (in millions) | Guidance Range | ||||||||||
| Net cash provided by operating activities | $ | 27,800 | $ | 28,000 | |||||||
| Cash purchases of property and equipment, including capitalized interest | (10,000) | (10,000) | |||||||||
| Adjusted Free Cash Flow | $ | 17,800 | $ | 18,000 | |||||||
| FY 2025 | |||||||||||
| (in millions) | Guidance Range | ||||||||||
| Net cash provided by operating activities | $ | 27,100 | $ | 27,500 | |||||||
| Cash purchases of property and equipment, including capitalized interest | (9,500) | (9,500) | |||||||||
| Adjusted Free Cash Flow | $ | 17,600 | $ | 18,000 | |||||||
| ||
|
28 |
||||
| ||
|
29 |
||||
| ||
|
30 |
||||
| ||