Document
EXHIBIT 99.1
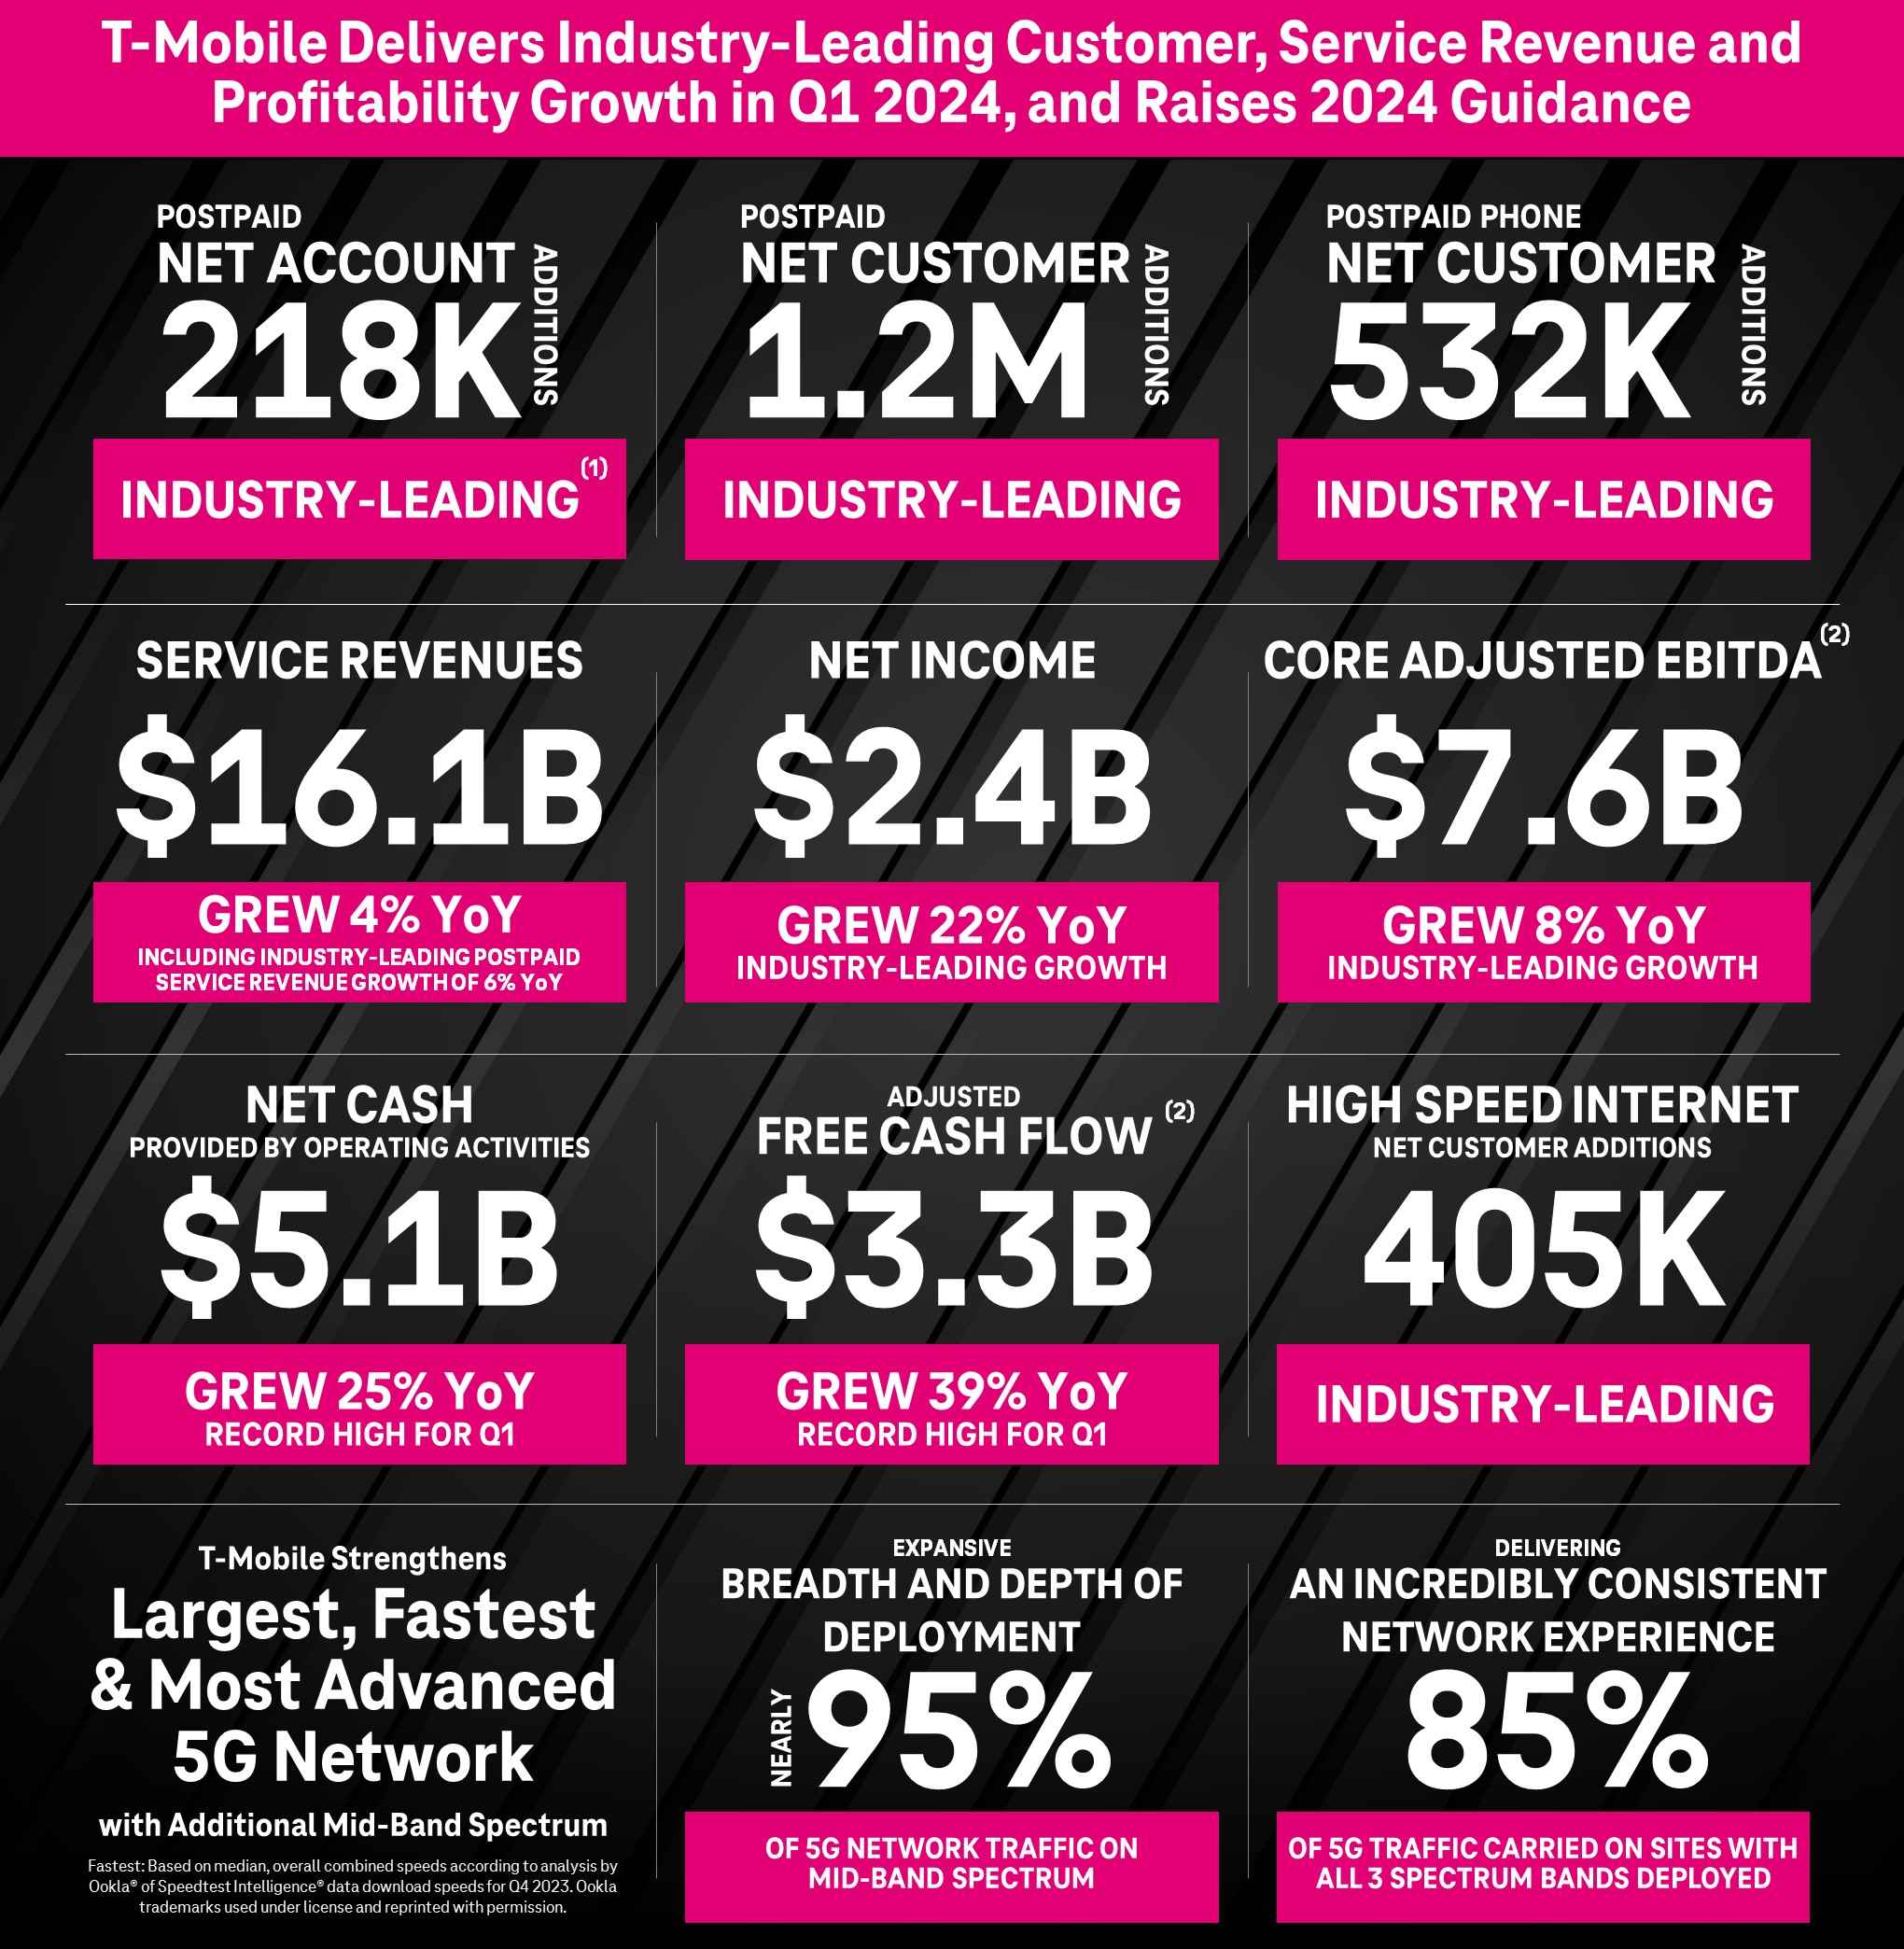
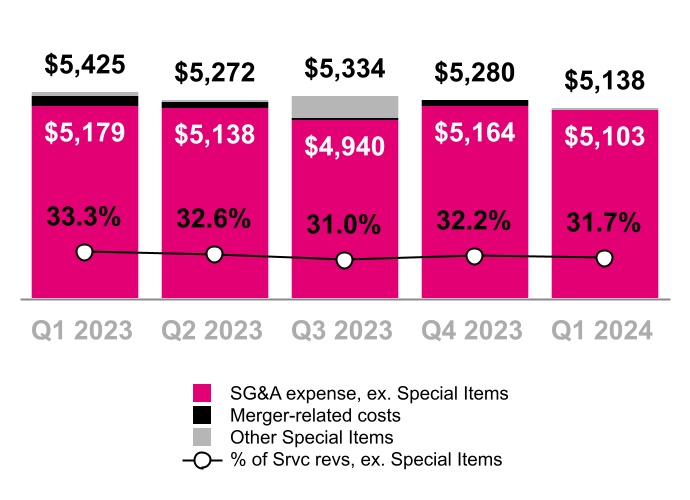
T-Mobile Delivers Industry-Leading Customer, Service Revenue and Profitability Growth in Q1 2024, and Raises 2024 Guidance
Un-carrier Matches Lowest Ever Q1 Postpaid Phone Churn and Surpasses 5 Million High Speed Internet Customers While Returning $4.3 Billion to Stockholders in Q1
Industry-Leading Customer Growth Fueled by Best Network and Best Value Combination(1)
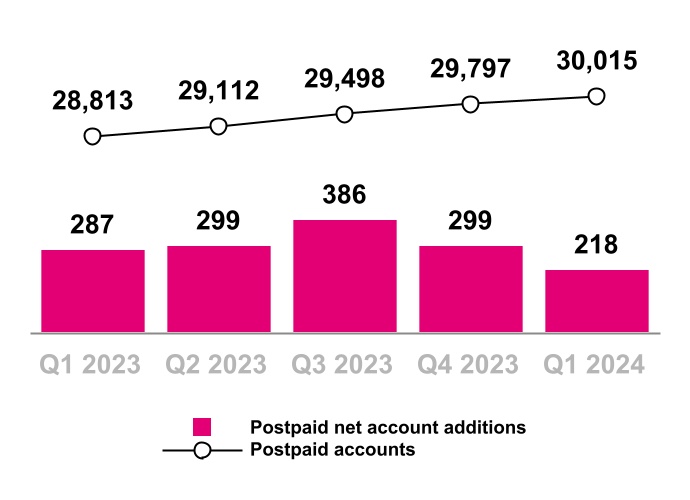
•Postpaid net account additions of 218 thousand, best in industry
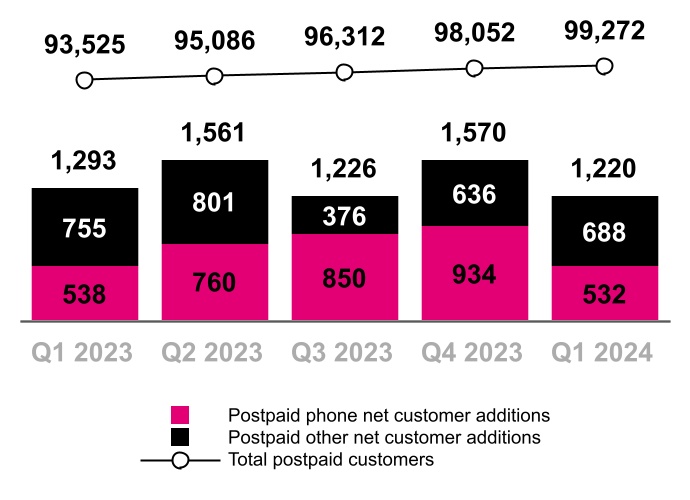
•Postpaid net customer additions of 1.2 million, best in industry
•Postpaid phone net customer additions of 532 thousand, best in industry and higher share of industry net adds year-over-year
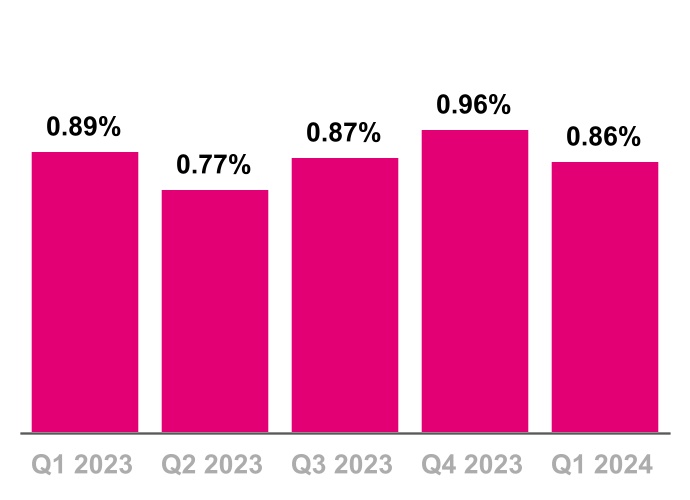
•Postpaid phone churn of 0.86%, matches record low for Q1
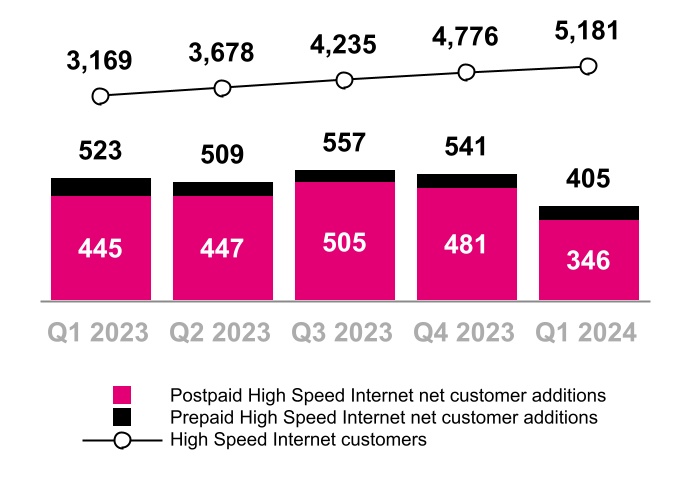
•High Speed Internet net customer additions of 405 thousand, best in industry, passing 5 million customers
Translating Industry-Leading Customer Growth Into Industry-Leading Financial Performance
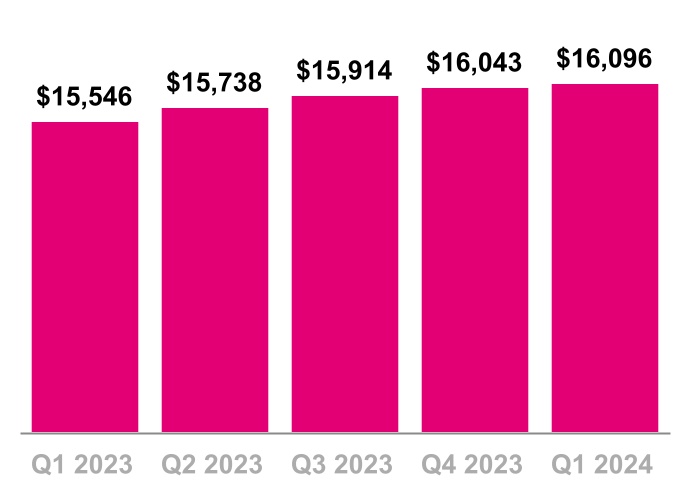
•Service revenues of $16.1 billion grew 4% year-over-year, best in industry growth
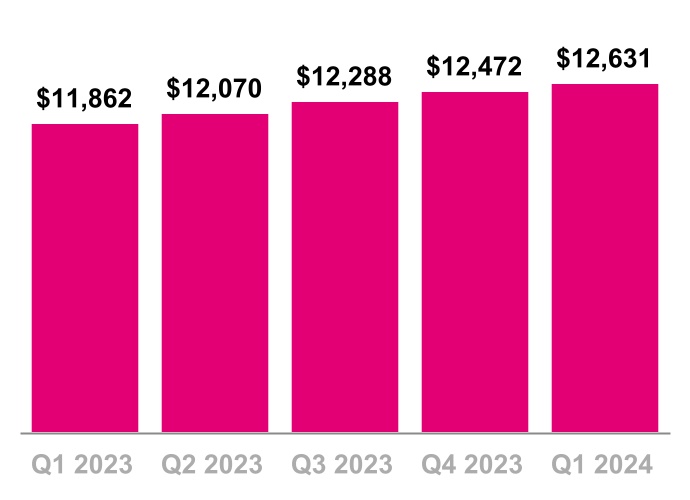
•Postpaid service revenues of $12.6 billion grew 6% year-over-year, best in industry growth
•Net income of $2.4 billion grew 22% year-over-year, best in industry growth
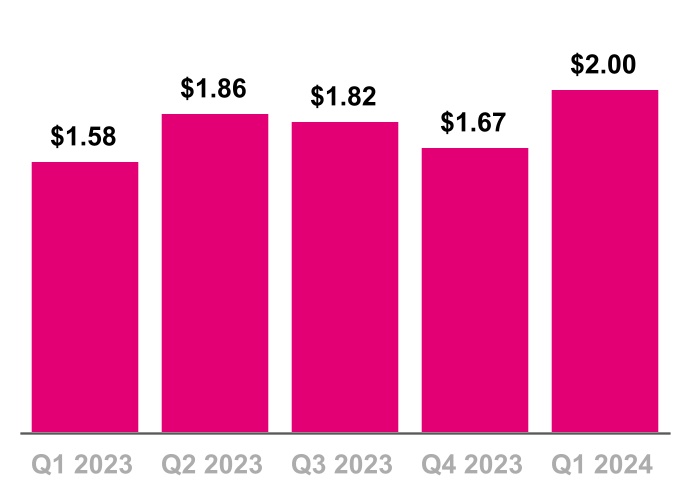
•Diluted earnings per share (“EPS”) of $2.00 grew 27% year-over-year, best in industry growth
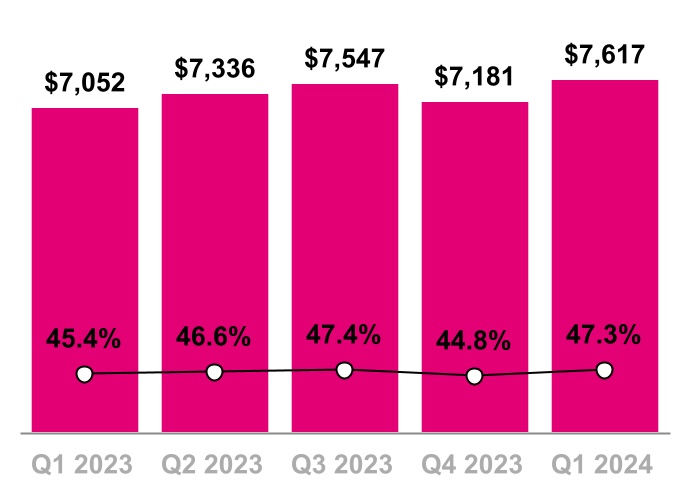
•Core Adjusted EBITDA(2) of $7.6 billion grew 8% year-over-year, best in industry growth
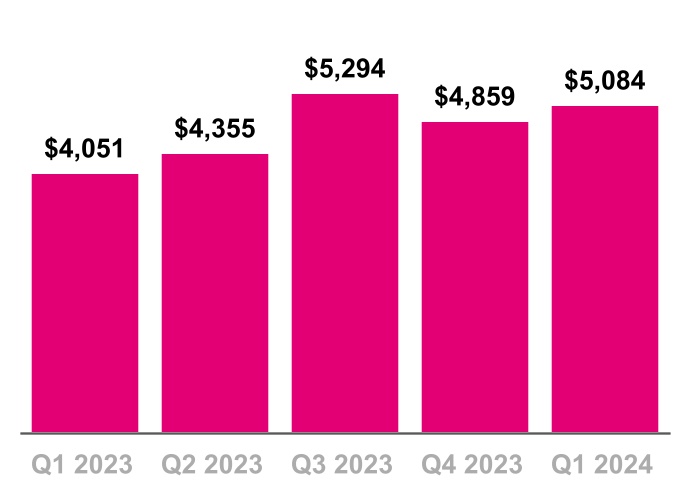
•Net cash provided by operating activities of $5.1 billion grew 25% year-over-year, record high for Q1
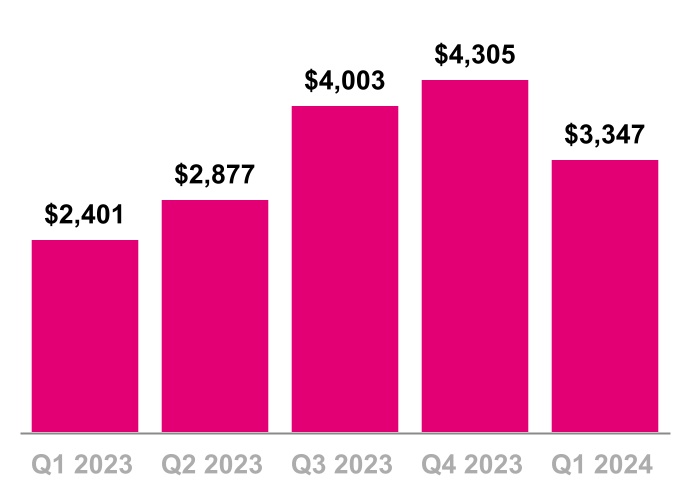
•Adjusted Free Cash Flow(2) of $3.3 billion grew 39% year-over-year, record high for Q1
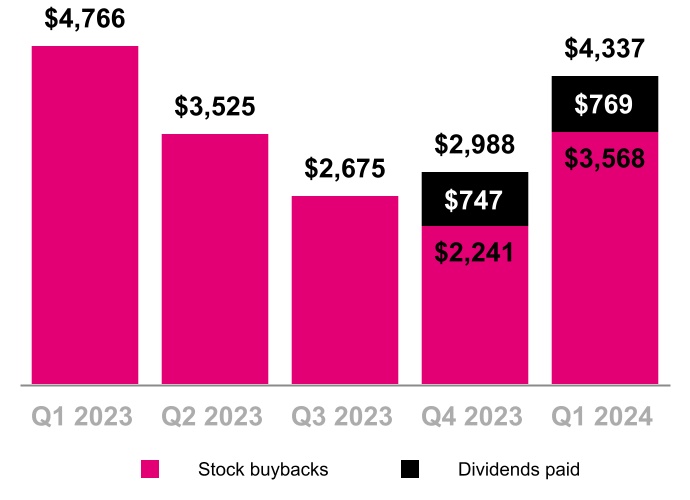
•Returned $4.3 billion to stockholders in Q1 2024, including repurchases of $3.6 billion of common stock and its second quarterly dividend payment of $769 million
T-Mobile Strengthens Largest, Fastest and Most Advanced 5G Network with Additional Mid-Band Spectrum
•Nearly 95% of 5G network traffic on mid-band spectrum given the expansive breadth and depth of deployment
•85% of 5G traffic carried on sites with all three spectrum layers, delivering an incredibly consistent network experience
Bellevue, WA — April 25, 2024 — T-Mobile US, Inc. (NASDAQ: TMUS) reported first quarter 2024 results today,
raising full-year guidance and delivering industry-leading customer growth, including taking a higher share of postpaid phone net additions year-over-year and matching its lowest ever Q1 postpaid phone churn. The company translated best-in-class customer growth into industry-leading growth in service revenues and profitability, while returning $4.3 billion to stockholders in the quarter. The Un-carrier continues to build on its recent successes as a top broadband provider by surpassing 5 million High Speed Internet customers.
“T-Mobile had a great start to 2024 with industry-leading growth in service revenues and profitability,” said Mike Sievert, CEO of T-Mobile. “Even as the rest of wireless saw moderated customer growth, our momentum continued thanks to our increasingly differentiated combination of the best value, best network, and best experiences that customers love. We’re excited about our path forward and our raised guidance for 2024 reflects our confidence in what’s to come.”
___________________________________________________________
(1)AT&T Inc. does not disclose postpaid net account additions. Comcast and Charter do not disclose postpaid phone net customer additions. Industry-leading claims are based on consensus expectations if results are not yet reported.
(2)Core Adjusted EBITDA and Adjusted Free Cash Flow are non-GAAP financial measures. These non-GAAP financial measures should be considered in addition to, but not as a substitute for, the information provided in accordance with GAAP. Reconciliations for these non-GAAP financial measures to the most directly comparable GAAP financial measures are provided in the Reconciliation of Non-GAAP Financial Measures to GAAP Financial Measures tables. We are not able to forecast Net income on a forward-looking basis without unreasonable efforts due to the high variability and difficulty in predicting certain items that affect Net income, including, but not limited to, Income tax expense and Interest expense. Core Adjusted EBITDA should not be used to predict Net income as the difference between this measure and Net income is variable.
Industry-Leading Customer Growth Fueled by Best Network and Best Value Combination(1)
•Postpaid net account additions of 218 thousand decreased 69 thousand year-over-year.
•Postpaid net customer additions of 1.2 million decreased 73 thousand year-over-year.
•Postpaid phone net customer additions of 532 thousand decreased 6 thousand year-over-year. Postpaid phone churn of 0.86% improved 3 basis points year-over-year.
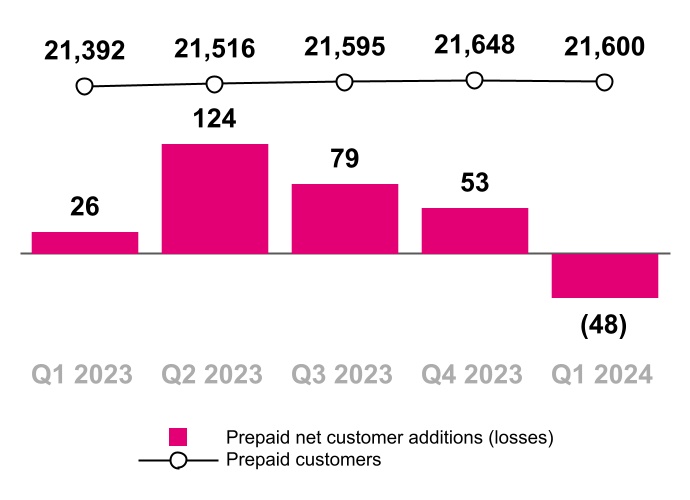
•Prepaid net customer losses of 48 thousand decreased 74 thousand year-over-year. Prepaid churn of 2.75% improved 1 basis point year-over-year.
•High Speed Internet net customer additions of 405 thousand decreased 118 thousand year-over-year. T-Mobile ended the quarter with 5.2 million High Speed Internet customers.
•Total net customer additions of 1.2 million decreased 147 thousand year-over-year. Total customer connections increased to a record high of 120.9 million.
|
|
|
|
|
|
|
|
|
|
|
|
|
|
|
|
|
|
|
|
|
|
|
|
|
|
Quarter |
|
|
|
|
|
| (in thousands, except churn) |
Q1 2024 |
|
Q4 2023 |
|
Q1 2023 |
|
|
|
|
|
| Postpaid net account additions |
218 |
|
|
299 |
|
|
287 |
|
|
|
|
|
|
|
|
| Total net customer additions |
1,172 |
|
|
1,623 |
|
|
1,319 |
|
|
|
|
|
|
|
|
| Postpaid net customer additions |
1,220 |
|
|
1,570 |
|
|
1,293 |
|
|
|
|
|
|
|
|
| Postpaid phone net customer additions |
532 |
|
|
934 |
|
|
538 |
|
|
|
|
|
|
|
|
Postpaid other net customer additions (2) |
688 |
|
|
636 |
|
|
755 |
|
|
|
|
|
|
|
|
Prepaid net customer (losses) additions (2) |
(48) |
|
|
53 |
|
|
26 |
|
|
|
|
|
|
|
|
Total customers, end of period (2)(3) |
120,872 |
|
|
119,700 |
|
|
114,917 |
|
|
|
|
|
|
|
|
| Postpaid phone churn |
0.86 |
% |
|
0.96 |
% |
|
0.89 |
% |
|
|
|
|
|
|
|
| Prepaid churn |
2.75 |
% |
|
2.86 |
% |
|
2.76 |
% |
|
|
|
|
|
|
|
| High Speed Internet net customer additions |
405 |
|
|
541 |
|
|
523 |
|
|
|
|
|
|
|
|
| Total High Speed Internet customers, end of period |
5,181 |
|
|
4,776 |
|
|
3,169 |
|
|
|
|
|
|
|
|
|
|
|
|
|
|
|
|
|
|
|
|
|
|
|
|
|
|
|
|
|
|
|
|
|
|
|
|
|
|
|
|
|
|
|
|
|
|
|
|
|
|
|
|
|
|
|
|
|
|
|
|
|
|
|
|
|
|
|
|
|
|
|
|
|
|
|
|
|
|
|
|
|
|
|
|
|
|
|
|
|
|
|
|
|
|
|
|
|
|
|
|
|
|
|
|
|
|
|
|
|
|
|
|
|
|
|
|
|
|
|
|
|
|
|
|
|
(1)AT&T Inc. does not disclose postpaid net account additions. Comcast and Charter do not disclose postpaid phone net customer additions. Industry-leading claims are based on consensus expectations if results are not yet reported.
(2)Includes High Speed Internet customers.
(3)In the fourth quarter of 2023, we recognized an additional base adjustment to increase postpaid phone customers by 20,000 and increase postpaid other customers by 150,000 due to fewer customers than expected whose service was deactivated as a result of the network shutdowns.
Translating Industry-Leading Customer Growth Into Industry-Leading Financial Performance(1)
•Total service revenues of $16.1 billion increased 4% year-over-year, and Postpaid service revenues of $12.6 billion increased 6% year-over-year.
•Net income of $2.4 billion increased 22% year-over-year, which included Merger-related costs, net of tax, of $97 million.
•Diluted EPS of $2.00 per share increased 27% year-over-year.
•Core Adjusted EBITDA of $7.6 billion increased 8% year-over-year.
•Net cash provided by operating activities of $5.1 billion increased 25% year-over-year, which included cash payments for Merger-related costs of $293 million.
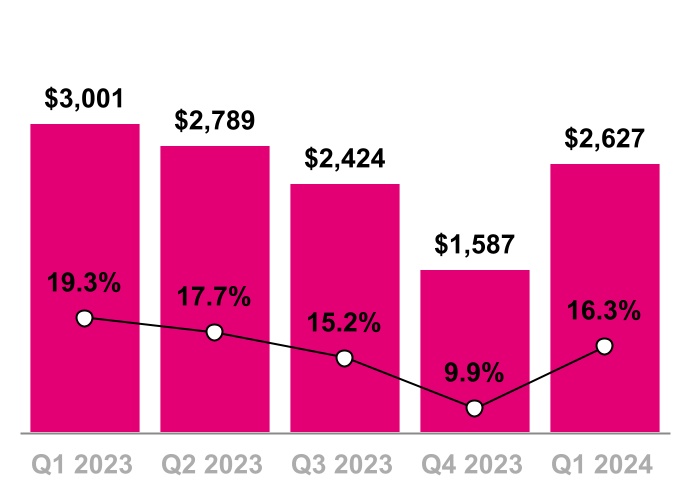
•Cash purchases of property and equipment, including capitalized interest, of $2.6 billion decreased 12% year-over-year.
•Adjusted Free Cash Flow of $3.3 billion increased 39% year-over-year, which included cash payments for Merger-related costs of $293 million.
•Stockholder Returns included 21.9 million shares of common stock repurchased for $3.6 billion in Q1 2024, with 136.2 million cumulative shares repurchased for $19.8 billion as of March 31, 2024. The remaining authorization for stock repurchases and quarterly cash dividends through December 2024 is $11.7 billion, with the next dividend payable on June 13, 2024.
|
|
|
|
|
|
|
|
|
|
|
|
|
|
|
|
|
|
|
|
|
|
|
|
|
|
|
|
|
|
|
|
|
|
|
|
|
Quarter |
|
|
|
Q1 2024
vs.
Q4 2023
|
|
Q1 2024
vs.
Q1 2023
|
|
|
| (in millions, except EPS) |
Q1 2024 |
|
Q4 2023 |
|
Q1 2023 |
|
|
|
|
|
| Total service revenues |
$ |
16,096 |
|
|
$ |
16,043 |
|
|
$ |
15,546 |
|
|
|
|
|
|
0.3 |
% |
|
3.5 |
% |
|
|
| Postpaid service revenues |
12,631 |
|
|
12,472 |
|
|
11,862 |
|
|
|
|
|
|
1.3 |
% |
|
6.5 |
% |
|
|
| Total revenues |
19,594 |
|
|
20,478 |
|
|
19,632 |
|
|
|
|
|
|
(4.3) |
% |
|
(0.2) |
% |
|
|
| Net income |
2,374 |
|
|
2,014 |
|
|
1,940 |
|
|
|
|
|
|
17.9 |
% |
|
22.4 |
% |
|
|
| Diluted EPS |
2.00 |
|
|
1.67 |
|
|
1.58 |
|
|
|
|
|
|
19.8 |
% |
|
26.6 |
% |
|
|
| Adjusted EBITDA |
7,652 |
|
|
7,224 |
|
|
7,199 |
|
|
|
|
|
|
5.9 |
% |
|
6.3 |
% |
|
|
| Core Adjusted EBITDA |
7,617 |
|
|
7,181 |
|
|
7,052 |
|
|
|
|
|
|
6.1 |
% |
|
8.0 |
% |
|
|
| Net cash provided by operating activities |
5,084 |
|
|
4,859 |
|
|
4,051 |
|
|
|
|
|
|
4.6 |
% |
|
25.5 |
% |
|
|
| Cash purchases of property and equipment, including capitalized interest |
2,627 |
|
|
1,587 |
|
|
3,001 |
|
|
|
|
|
|
65.5 |
% |
|
(12.5) |
% |
|
|
Adjusted Free Cash Flow |
3,347 |
|
|
4,305 |
|
|
2,401 |
|
|
|
|
|
|
(22.3) |
% |
|
39.4 |
% |
|
|
|
|
|
|
|
|
|
|
|
|
|
|
|
|
|
|
|
|
|
|
|
|
|
|
|
|
|
|
|
|
|
|
|
|
|
|
|
|
|
|
|
|
|
|
|
|
|
|
|
|
|
|
|
|
|
|
|
|
|
|
|
|
|
|
|
|
|
|
|
|
|
|
|
|
|
|
|
|
|
|
|
|
|
|
|
|
|
|
|
|
|
|
|
|
|
|
|
|
|
|
|
|
|
|
|
|
|
|
|
|
|
|
|
|
|
|
|
|
|
|
|
|
|
|
|
|
|
|
|
|
|
|
|
|
|
|
|
|
|
|
|
|
|
|
|
|
|
|
|
|
|
|
|
|
|
|
|
|
|
|
|
|
|
|
|
|
|
|
|
|
|
|
|
|
|
|
|
|
|
|
|
|
|
|
|
|
|
|
|
|
|
|
|
|
|
|
|
|
|
|
|
|
|
|
|
|
|
|
|
|
|
|
|
|
|
|
|
|
|
|
|
|
|
|
|
|
|
|
|
|
|
|
|
|
|
|
|
|
|
|
|
|
|
|
|
|
|
|
|
|
|
|
|
|
|
|
|
|
|
|
|
|
|
|
|
|
|
|
|
|
|
|
|
|
|
|
|
|
|
|
|
|
|
|
|
|
|
|
|
|
|
|
|
|
|
|
|
|
|
|
|
|
|
|
|
|
|
|
|
|
|
|
|
|
|
|
|
|
|
|
|
|
|
|
|
|
|
|
|
|
|
|
|
|
|
|
|
|
|
|
|
|
|
|
|
|
|
|
|
|
|
|
|
|
|
|
|
|
|
|
|
|
|
|
|
|
|
|
|
|
|
|
|
|
|
|
|
|
|
|
|
|
|
|
(1) Industry-leading claims are based on consensus expectations if results are not yet reported.
T-Mobile Strengthens Largest, Fastest and Most Advanced 5G Network with Additional Mid-Band Spectrum
T-Mobile’s best-in-class Ultra Capacity 5G network has the deepest dedicated mid-band 5G spectrum deployment, with nearly 95% of 5G network traffic on mid-band including the recently deployed Auction 108 spectrum. The company’s unique multi-layer approach to 5G, with dedicated standalone 5G deployed nationwide across 600MHz, 1.9GHz, and 2.5GHz delivers customers a consistently strong experience, with 85% of 5G traffic on sites with all three spectrum bands deployed.
T-Mobile’s 5G leadership has translated into overall network leadership, while 5G is increasingly becoming the overall network experience for customers. Approximately 75% of postpaid phone customers are on a 5G device and the company has earned third-party recognition for its overall network performance.
Note: See 5G device, coverage, & access details at T-Mobile.com. Fastest: Based on median, overall combined speeds according to analysis by Ookla® of Speedtest Intelligence® data download speeds for Q4 2023. Ookla trademarks used under license and reprinted with permission. Opensignal Awards: USA: Mobile Network Experience Report January 2024, based on independent analysis of mobile measurements recorded during the period September 16 - December 14, 2023. © 2024 Opensignal Limited.
Raising 2024 Guidance
•Postpaid net customer additions are expected to be between 5.2 million and 5.6 million, an increase from prior guidance of 5.0 million to 5.5 million.
•Core Adjusted EBITDA, which is Adjusted EBITDA less lease revenues, is expected to be between $31.4 billion and $31.9 billion, an increase from prior guidance of $31.3 billion to $31.9 billion.
•Net cash provided by operating activities, including payments for Merger-related costs, is expected to be between $21.6 billion and $22.3 billion, an increase from prior guidance of $21.5 billion to $22.3 billion.
•Cash purchases of property and equipment, including capitalized interest, are expected to be between $8.6 billion and $9.4 billion.
•Adjusted Free Cash Flow, including payments for Merger-related costs, is expected to be between $16.4 billion and $16.9 billion, an increase from prior guidance of $16.3 billion to $16.9 billion. Adjusted Free Cash Flow guidance does not assume any material net cash inflows from securitization.
|
|
|
|
|
|
|
|
|
|
|
|
|
|
|
|
|
|
|
|
|
|
|
|
|
|
|
|
|
|
| (in millions, except Postpaid net customer additions and Effective tax rate) |
Previous |
|
Current |
|
Change (Mid-point) |
| Postpaid net customer additions (thousands) |
5,000 |
|
|
5,500 |
|
|
5,200 |
|
|
5,600 |
|
|
150 |
|
Net income (1) |
N/A |
|
N/A |
|
N/A |
|
N/A |
|
N/A |
| Effective tax rate |
24 |
% |
|
26 |
% |
|
24 |
% |
|
26 |
% |
|
— |
% |
Core Adjusted EBITDA (2) |
$ |
31,300 |
|
|
$ |
31,900 |
|
|
$ |
31,400 |
|
|
$ |
31,900 |
|
|
$ |
50 |
|
|
|
|
|
|
|
|
|
|
|
|
|
| Net cash provided by operating activities |
21,500 |
|
|
22,300 |
|
|
21,600 |
|
|
22,300 |
|
|
50 |
|
Capital expenditures (3) |
8,600 |
|
|
9,400 |
|
|
8,600 |
|
|
9,400 |
|
|
— |
|
Adjusted Free Cash Flow (4) |
16,300 |
|
|
16,900 |
|
|
16,400 |
|
|
16,900 |
|
|
50 |
|
(1)T-Mobile is not able to forecast Net income on a forward-looking basis without unreasonable efforts due to the high variability and difficulty in predicting certain items that affect GAAP Net income, including, but not limited to, Income tax expense and Interest expense. Core Adjusted EBITDA should not be used to predict Net income as the difference between this measure and Net income is variable.
(2)Management uses Core Adjusted EBITDA as a measure to monitor the financial performance of Company operations, excluding the impact of lease revenues from related device financing programs. Guidance ranges assume lease revenues of approximately $100 million for 2024.
(3)Capital expenditures means cash purchases of property and equipment, including capitalized interest.
(4)Adjusted Free Cash Flow guidance does not assume any material net cash inflows from securitization in 2024.
Financial Results
For more details on T-Mobile’s Q1 2024 financial results, including the Investor Factbook with detailed financial tables, please visit T-Mobile US, Inc.’s Investor Relations website at https://investor.t-mobile.com.
Earnings Call Information
Date/Time
•Thursday, April 25, 2024, at 4:30 p.m. (EDT)
Pre-registration link for dial-in access
Participants can pre-register for the conference call here in order to receive dial-in information.
Access via Phone (audio only)
Please plan on accessing the call 10 minutes prior to the scheduled start time.
•Toll Free: 1-866-777-2509
•International: 1-412-317-5413
Access via Webcast
The earnings call will be broadcasted live and can be replayed via the Investor Relations website at https://investor.t-mobile.com.
Submit Questions via X
Send a post to @TMobileIR or @MikeSievert using $TMUS
Contact Information
•Media Relations: mediarelations@t-mobile.com
•Investor Relations: investor.relations@t-mobile.com
T-Mobile Social Media
Investors and others should note that we announce material financial and operational information to our investors using our investor relations website (https://investor.t-mobile.com), newsroom website (https://t-mobile.com/news), press releases, SEC filings and public conference calls and webcasts. We also intend to use certain social media accounts as a means of disclosing information about us and our services and for complying with our disclosure obligations under Regulation FD (the @TMobileIR X account (https://twitter.com/TMobileIR), the @MikeSievert X account (https://twitter.com/MikeSievert), which Mr. Sievert also uses as a means for personal communications and observations, and the @TMobileCFO X account (https://twitter.com/tmobilecfo), and our CFO’s LinkedIn account (https://www.linkedin.com/in/peter-osvaldik-3887394), both of which Mr. Osvaldik also uses as a means for personal communication and observations). The information we post through these social media channels may be deemed material. Accordingly, investors should monitor these social media channels in addition to following our press releases, SEC filings and public conference calls and webcasts. The social media channels that we intend to use as a means of disclosing the information described above may be updated from time to time as listed on our investor relations website.
About T-Mobile US, Inc.
T-Mobile US, Inc. (NASDAQ: TMUS) is America’s supercharged Un-carrier, delivering an advanced 4G LTE and transformative nationwide 5G network that will offer reliable connectivity for all. T-Mobile’s customers benefit from its unmatched combination of value and quality, unwavering obsession with offering them the best possible service experience and undisputable drive for disruption that creates competition and innovation in wireless and beyond. Based in Bellevue, Wash., T-Mobile provides services through its subsidiaries and operates its flagship brands, T-Mobile and Metro by T-Mobile. For more information please visit: https://www.t-mobile.com.
Forward-Looking Statements
This communication includes forward-looking statements within the meaning of the Private Securities Litigation Reform Act of 1995. All statements other than statements of historical fact, including information concerning T-Mobile US, Inc.’s future results of operations, are forward-looking statements. These forward-looking statements are generally identified by the words “anticipate,” “believe,” “estimate,” “expect,” “intend,” “may,” “could” or similar expressions.
Forward-looking statements are based on current expectations and assumptions, which are subject to risks and uncertainties and may cause actual results to differ materially from the forward-looking statements. Important factors that could affect future results and cause those results to differ materially from those expressed in the forward-looking statements include, among others, the following: competition, industry consolidation and changes in the market for wireless communications services and other forms of connectivity; criminal cyberattacks, disruption, data loss or other security breaches; our inability to take advantage of technological developments on a timely basis; our inability to retain or motivate key personnel, hire qualified personnel or maintain our corporate culture; system failures and business disruptions, allowing for unauthorized use of or interference with our network and other systems; the scarcity and cost of additional wireless spectrum, and regulations relating to spectrum use; the impacts of the actions we have taken and conditions we have agreed to in connection with the regulatory proceedings and approvals of the Transactions (as defined below), including the acquisition by DISH Network Corporation (“DISH”) of the prepaid wireless business operated under the Boost Mobile and Sprint prepaid brands (excluding the Assurance brand Lifeline customers and the prepaid wireless customers of Shenandoah Personal Communications Company LLC and Swiftel Communications, Inc.), including customer accounts, inventory, contracts, intellectual property and certain other specified assets, and the assumption of certain related liabilities (collectively, the “Prepaid Transaction”), the complaint and proposed final judgment agreed to by us, Deutsche Telekom AG (“DT”), Sprint Corporation, now known as Sprint LLC (“Sprint”), SoftBank Group Corp. (“SoftBank”) and DISH with the U.S. District Court for the District of Columbia, which was approved by the Court on April 1, 2020, the proposed commitments filed with the Secretary of the Federal Communications Commission (“FCC”), which we announced on May 20, 2019, certain national security commitments and undertakings, and any other commitments or undertakings entered into, including, but not limited to, those we have made to certain states and nongovernmental organizations (collectively, the “Government Commitments”), and the challenges in satisfying the Government Commitments in the required time frames and the significant cumulative costs incurred in tracking and monitoring compliance over multiple years; adverse economic, political or market conditions in the U.S. and international markets, including changes resulting from increases in inflation or interest rates, supply chain disruptions, and impacts of geopolitical instability, such as the Ukraine-Russia war and Israel-Hamas war; sociopolitical volatility and polarization; our inability to manage the ongoing commercial services arrangements entered into in connection with the Prepaid Transaction, and known or unknown liabilities arising in connection therewith; the timing and effects of any future acquisition, divestiture, investment, or merger involving us; any disruption or failure of our third parties (including key suppliers) to provide products or services for the operation of our business; our substantial level of indebtedness and our inability to service our debt obligations in accordance with their terms; changes in the credit market conditions, credit rating downgrades or an inability to access debt markets; the risk of future material weaknesses we may identify, or any other failure by us to maintain effective internal controls, and the resulting significant costs and reputational damage; any changes in regulations or in the regulatory framework under which we operate; laws and regulations relating to the handling of privacy and data protection; unfavorable outcomes of and increased costs from existing or future regulatory or legal proceedings; difficulties in protecting our intellectual property rights or if we infringe on the intellectual property rights of others; our offering of regulated financial services products and exposure to a wide variety of state and federal regulations; new or amended tax laws or regulations or administrative interpretations and judicial decisions affecting the scope or application of tax laws or regulations; our wireless licenses, including those controlled through leasing agreements, are subject to renewal and may be revoked; our exclusive forum provision as provided in our Certificate of Incorporation; interests of DT, our controlling stockholder, which may differ from the interests of other stockholders; the dollar amount authorized for our 2023-2024 Stockholder Return Program may not be fully utilized, and our share repurchases and dividend payments pursuant thereto may fail to have the desired impact on stockholder value; future sales of our common stock by DT and SoftBank and our inability to attract additional equity financing outside the United States due to foreign ownership limitations by the FCC; and other risks as disclosed in our most recent annual report on Form 10-K, 10-Q and other filings with the Securities and Exchange Commission. Given these risks and uncertainties, readers are cautioned not to place undue reliance on such forward-looking statements. We undertake no obligation to revise or publicly release the results of any revision to these forward-looking statements, except as required by law.
T-Mobile US, Inc.
Reconciliation of Non-GAAP Financial Measures to GAAP Financial Measures
(Unaudited)
This Press Release includes non-GAAP financial measures. The non-GAAP financial measures should be considered in addition to, but not as a substitute for, the information provided in accordance with GAAP. Reconciliations for the non-GAAP financial measures to the most directly comparable GAAP financial measures are provided below. T-Mobile is not able to forecast Net income on a forward-looking basis without unreasonable efforts due to the high variability and difficulty in predicting certain items that affect GAAP net income, including, but not limited to, Income tax expense and Interest expense. Adjusted EBITDA and Core Adjusted EBITDA should not be used to predict Net income as the difference between either of these measures and Net income is variable.
Adjusted EBITDA and Core Adjusted EBITDA are reconciled to Net income as follows:
|
|
|
|
|
|
|
|
|
|
|
|
|
|
|
|
|
|
|
|
|
|
|
|
|
|
|
|
|
|
|
|
|
|
|
|
|
|
|
|
|
|
|
|
|
|
|
|
|
|
|
Quarter |
|
|
| (in millions) |
|
|
|
|
|
|
|
|
Q1 2023 |
|
Q2 2023 |
|
Q3 2023 |
|
Q4 2023 |
|
Q1 2024 |
|
|
|
|
|
|
|
|
|
|
|
|
|
|
|
|
|
|
|
|
|
|
|
|
|
|
| Net income |
|
|
|
|
|
|
|
|
$ |
1,940 |
|
|
$ |
2,221 |
|
|
$ |
2,142 |
|
|
$ |
2,014 |
|
|
$ |
2,374 |
|
|
|
|
|
| Adjustments: |
|
|
|
|
|
|
|
|
|
|
|
|
|
|
|
|
|
|
|
|
|
|
|
|
|
|
|
|
|
|
|
|
|
|
|
|
|
|
|
|
|
|
|
|
|
|
|
|
|
|
|
|
|
|
|
|
|
|
|
|
|
|
|
|
|
| Interest expense, net |
|
|
|
|
|
|
|
|
835 |
|
|
861 |
|
|
790 |
|
|
849 |
|
|
880 |
|
|
|
|
|
|
|
|
|
|
|
|
|
|
|
|
|
|
|
|
|
|
|
|
|
|
|
|
|
|
|
|
|
|
|
|
|
|
|
|
|
|
|
|
|
|
|
|
|
| Other income, net |
|
|
|
|
|
|
|
|
(9) |
|
|
(6) |
|
|
(41) |
|
|
(12) |
|
|
(20) |
|
|
|
|
|
| Income tax expense |
|
|
|
|
|
|
|
|
631 |
|
|
717 |
|
|
705 |
|
|
629 |
|
|
764 |
|
|
|
|
|
| Operating income |
|
|
|
|
|
|
|
|
3,397 |
|
|
3,793 |
|
|
3,596 |
|
|
3,480 |
|
|
3,998 |
|
|
|
|
|
| Depreciation and amortization |
|
|
|
|
|
|
|
|
3,203 |
|
|
3,110 |
|
|
3,187 |
|
|
3,318 |
|
|
3,371 |
|
|
|
|
|
|
|
|
|
|
|
|
|
|
|
|
|
|
|
|
|
|
|
|
|
|
|
Stock-based compensation (1) |
|
|
|
|
|
|
|
|
173 |
|
|
155 |
|
|
152 |
|
|
164 |
|
|
140 |
|
|
|
|
|
Merger-related costs |
|
|
|
|
|
|
|
|
358 |
|
|
276 |
|
|
152 |
|
|
248 |
|
|
130 |
|
|
|
|
|
|
|
|
|
|
|
|
|
|
|
|
|
|
|
|
|
|
|
|
|
|
|
|
|
|
|
|
|
|
|
|
|
|
|
|
|
|
|
|
|
|
|
|
|
Legal-related (recoveries) expenses, net (2) |
|
|
|
|
|
|
|
|
(43) |
|
|
— |
|
|
— |
|
|
1 |
|
|
— |
|
|
|
|
|
| (Gain) loss on disposal group held for sale |
|
|
|
|
|
|
|
|
(42) |
|
|
17 |
|
|
— |
|
|
— |
|
|
— |
|
|
|
|
|
Other, net (3) |
|
|
|
|
|
|
|
|
153 |
|
|
54 |
|
|
513 |
|
|
13 |
|
|
13 |
|
|
|
|
|
| Adjusted EBITDA |
|
|
|
|
|
|
|
|
7,199 |
|
|
7,405 |
|
|
7,600 |
|
|
7,224 |
|
|
7,652 |
|
|
|
|
|
Lease revenues |
|
|
|
|
|
|
|
|
(147) |
|
|
(69) |
|
|
(53) |
|
|
(43) |
|
|
(35) |
|
|
|
|
|
| Core Adjusted EBITDA |
|
|
|
|
|
|
|
|
$ |
7,052 |
|
|
$ |
7,336 |
|
|
$ |
7,547 |
|
|
$ |
7,181 |
|
|
$ |
7,617 |
|
|
|
|
|
|
|
|
|
|
|
|
|
|
|
|
|
|
|
|
|
|
|
|
|
|
|
|
|
|
|
|
|
|
|
|
|
|
|
|
|
|
|
|
|
|
|
|
|
|
|
|
|
|
|
|
|
|
|
|
|
|
|
|
|
|
|
|
|
|
|
|
|
|
|
|
|
|
|
|
|
|
|
|
|
|
|
|
|
|
|
|
|
|
|
|
|
|
|
|
|
|
|
|
|
|
|
|
|
|
|
|
|
|
|
|
|
|
|
|
|
|
|
|
|
|
|
|
|
|
|
|
|
|
|
|
|
|
|
|
|
|
|
|
|
|
|
|
|
|
|
|
|
|
|
|
|
|
|
|
|
|
|
|
|
|
|
|
|
|
|
|
|
|
|
|
|
|
|
|
|
|
|
|
|
|
|
|
|
|
|
|
|
|
|
|
|
|
|
|
|
|
|
|
|
|
|
|
|
|
|
|
|
|
|
|
|
|
|
|
|
|
|
|
|
|
|
|
|
|
|
|
|
|
|
|
|
|
|
|
|
|
|
|
|
|
|
|
|
|
|
|
|
|
|
|
|
|
|
|
|
|
|
|
|
|
|
|
|
|
|
|
|
|
|
|
|
|
|
|
|
|
|
|
|
|
|
|
|
|
|
|
|
|
|
|
|
|
|
|
|
|
|
|
|
|
|
|
|
|
|
|
|
|
|
|
|
|
|
|
|
|
|
|
|
|
|
|
|
|
|
|
|
|
|
|
|
|
|
|
|
|
|
|
|
|
|
|
|
|
|
|
|
|
|
|
|
|
|
|
|
|
|
|
|
|
|
|
|
|
|
|
|
|
|
|
|
|
|
|
|
|
|
|
|
|
|
|
|
|
|
|
|
|
|
|
|
|
|
|
|
|
|
|
|
|
|
|
|
|
|
|
|
|
|
|
|
|
|
|
|
|
|
|
|
|
|
|
|
|
|
|
|
|
|
|
|
|
|
|
|
|
|
|
|
|
|
|
|
|
|
|
|
|
|
|
|
|
|
|
|
|
|
|
|
|
|
|
|
|
|
|
|
|
|
|
|
|
|
|
|
|
|
|
|
|
|
|
|
|
|
|
|
|
|
|
|
|
|
|
|
|
|
|
|
|
|
|
|
|
|
|
|
|
|
|
|
|
|
|
|
|
|
|
|
|
|
|
|
|
|
|
|
|
|
|
|
|
|
|
|
|
|
|
|
|
|
|
|
|
|
|
|
|
|
|
|
|
|
|
|
|
|
|
|
|
|
|
|
|
|
|
|
|
|
|
|
|
|
|
|
|
|
|
|
|
|
|
|
|
|
|
|
|
|
|
|
|
|
|
|
|
|
|
|
|
|
|
|
|
|
|
|
|
|
|
|
|
|
|
|
|
|
|
|
|
|
|
|
|
|
|
|
|
|
|
|
|
|
|
|
|
|
|
|
|
|
|
|
|
|
|
|
|
|
|
|
|
|
|
|
|
|
|
|
|
|
|
|
|
|
|
|
|
|
|
|
|
|
|
|
|
|
|
|
|
|
|
|
|
|
|
|
|
|
|
|
|
|
|
|
|
|
|
|
|
|
|
|
|
|
|
|
|
|
|
|
|
|
|
|
|
|
|
|
|
|
|
|
|
|
|
|
|
|
|
|
|
|
|
|
|
|
|
|
|
|
|
|
|
|
|
|
|
|
|
|
|
|
|
|
|
|
|
|
|
|
|
|
|
|
|
|
|
|
|
|
|
|
|
|
|
|
|
|
|
|
|
|
|
|
|
|
|
|
|
|
|
|
|
|
|
|
|
|
|
|
|
|
|
|
|
|
|
|
|
|
|
|
|
|
|
|
|
|
|
|
|
|
|
|
|
|
|
|
|
|
|
|
|
|
|
|
|
|
|
|
|
|
|
|
|
|
|
|
|
|
|
|
|
|
|
|
|
|
|
|
|
|
|
|
|
|
|
|
|
|
|
|
|
|
|
|
|
|
|
|
|
|
|
|
|
|
|
|
|
|
|
|
|
|
|
|
|
|
|
|
|
|
|
|
|
|
|
|
|
|
|
|
|
|
|
|
|
|
|
|
|
|
|
|
|
|
|
|
|
|
|
|
|
|
|
|
|
|
|
|
|
|
|
|
|
|
|
|
|
|
|
|
|
|
|
|
|
|
|
|
|
|
|
|
|
|
(1)Stock-based compensation includes payroll tax impacts and may not agree to stock-based compensation expense in the consolidated financial statements. Additionally, certain stock-based compensation expenses associated with the Sprint Merger have been included in Merger-related costs.
(2)Legal-related (recoveries) expenses, net consists of the settlement of certain litigation associated with the August 2021 cyberattack, net of insurance recoveries.
(3)Other, net, primarily consists of certain severance, restructuring and other expenses, gains and losses, including severance and related costs associated with the August 2023 workforce reduction, not directly attributable to the Merger, which are not reflective of T-Mobile’s core business activities and are, therefore, excluded from Adjusted EBITDA and Core Adjusted EBITDA.
Adjusted EBITDA represents earnings before Interest expense, net of Interest income, Income tax expense, Depreciation and amortization, stock-based compensation and certain expenses, gains and losses, which are not reflective of our ongoing operating performance (“Special Items”). Special Items include Merger-related costs, gain on disposal groups held for sale, certain legal-related recoveries and expenses, restructuring costs not directly attributable to the Merger (including severance), and other non-core gains and losses. Core Adjusted EBITDA represents Adjusted EBITDA less device lease revenues. Core Adjusted EBITDA and Adjusted EBITDA are non-GAAP financial measures utilized by T-Mobile’s management to monitor the financial performance of our operations. T-Mobile uses Core Adjusted EBITDA and Adjusted EBITDA as benchmarks to evaluate T-Mobile’s operating performance in comparison to its competitors. T-Mobile also uses Core Adjusted EBITDA internally as a measure to evaluate and compensate its personnel and management for their performance. Management believes analysts and investors use Core Adjusted EBITDA and Adjusted EBITDA as supplemental measures to evaluate overall operating performance and to facilitate comparisons with other wireless communications services companies because they are indicative of T-Mobile’s ongoing operating performance and trends by excluding the impact of Interest expense from financing, non-cash depreciation and amortization from capital investments, non-cash stock-based compensation, and Special Items. Management believes analysts and investors use Core Adjusted EBITDA because it normalizes for the transition in the company’s device financing strategy, by excluding the impact of device lease revenues from Adjusted EBITDA, to align with the related depreciation expense on leased devices, which is excluded from the definition of Adjusted EBITDA. Core Adjusted EBITDA and Adjusted EBITDA have limitations as analytical tools and should not be considered in isolation or as substitutes for Net income or any other measure of financial performance reported in accordance with U.S. Generally Accepted Accounting Principles (“GAAP”).
T-Mobile US, Inc.
Reconciliation of Non-GAAP Financial Measures to GAAP Financial Measures (continued)
(Unaudited)
Adjusted Free Cash Flow is calculated as follows:
|
|
|
|
|
|
|
|
|
|
|
|
|
|
|
|
|
|
|
|
|
|
|
|
|
|
|
|
|
|
|
|
|
|
|
|
|
|
|
|
|
|
|
|
|
|
|
|
|
|
|
Quarter |
|
|
| (in millions, except percentages) |
|
|
|
|
|
|
|
|
Q1 2023 |
|
Q2 2023 |
|
Q3 2023 |
|
Q4 2023 |
|
Q1 2024 |
|
|
|
|
|
|
|
|
|
|
|
|
|
|
|
|
|
|
|
|
|
|
|
|
|
|
| Net cash provided by operating activities |
|
|
|
|
|
|
|
|
$ |
4,051 |
|
|
$ |
4,355 |
|
|
$ |
5,294 |
|
|
$ |
4,859 |
|
|
$ |
5,084 |
|
|
|
|
|
| Cash purchases of property and equipment, including capitalized interest |
|
|
|
|
|
|
|
|
(3,001) |
|
|
(2,789) |
|
|
(2,424) |
|
|
(1,587) |
|
|
(2,627) |
|
|
|
|
|
| Proceeds from sales of tower sites |
|
|
|
|
|
|
|
|
6 |
|
|
2 |
|
|
2 |
|
|
2 |
|
|
— |
|
|
|
|
|
| Proceeds related to beneficial interests in securitization transactions |
|
|
|
|
|
|
|
|
1,345 |
|
|
1,309 |
|
|
1,131 |
|
|
1,031 |
|
|
890 |
|
|
|
|
|
|
|
|
|
|
|
|
|
|
|
|
|
|
|
|
|
|
|
|
|
|
|
Adjusted Free Cash Flow |
|
|
|
|
|
|
|
|
$ |
2,401 |
|
|
$ |
2,877 |
|
|
$ |
4,003 |
|
|
$ |
4,305 |
|
|
$ |
3,347 |
|
|
|
|
|
| Net cash provided by operating activities margin (Net cash provided by operating activities divided by Service revenues) |
|
|
|
|
|
|
|
|
26.1 |
% |
|
27.7 |
% |
|
33.3 |
% |
|
30.3 |
% |
|
31.6 |
% |
|
|
|
|
| Adjusted Free Cash Flow margin (Adjusted Free Cash Flow divided by Service revenues) |
|
|
|
|
|
|
|
|
15.4 |
% |
|
18.3 |
% |
|
25.2 |
% |
|
26.8 |
% |
|
20.8 |
% |
|
|
|
|
|
|
|
|
|
|
|
|
|
|
|
|
|
|
|
|
|
|
|
|
|
|
|
|
|
|
|
|
|
|
|
|
|
|
|
|
|
|
|
|
|
|
|
|
|
|
|
|
|
|
|
|
|
|
|
|
|
|
|
|
|
|
|
|
|
|
|
|
|
|
|
|
|
|
|
|
|
|
|
|
|
|
|
|
|
|
|
|
|
|
|
|
|
|
|
|
|
|
|
|
|
|
|
|
|
|
|
|
|
|
|
|
|
|
|
|
|
|
|
|
|
|
|
|
|
|
|
|
|
|
|
|
|
|
|
|
|
|
|
|
|
|
|
|
|
|
|
|
|
|
|
|
|
|
|
|
|
|
|
|
|
|
|
|
|
|
|
|
|
|
|
|
|
|
|
|
|
|
|
|
|
|
|
|
|
|
|
|
|
|
|
|
|
|
|
|
|
|
|
|
|
|
|
|
|
|
|
|
|
|
|
|
|
|
|
|
|
|
|
|
|
|
|
|
|
|
|
|
|
|
|
|
|
|
|
|
|
|
|
|
|
|
|
|
|
|
|
|
|
|
|
|
|
|
|
|
|
|
|
|
|
|
|
|
|
|
|
|
|
|
|
|
|
|
|
|
|
|
|
|
|
|
|
|
|
|
|
|
|
|
|
|
|
|
|
|
|
|
|
|
|
|
|
|
|
|
|
|
|
|
|
|
|
|
|
|
|
|
|
|
|
|
|
|
|
|
|
|
|
|
|
|
|
|
|
|
|
|
|
|
|
|
|
|
|
|
|
|
|
|
|
|
|
|
|
|
|
|
|
|
|
|
|
|
|
|
|
|
|
|
|
|
|
|
|
|
|
|
|
|
|
|
|
|
|
|
|
|
|
|
|
|
|
|
|
|
|
|
|
|
|
|
|
|
|
|
|
|
|
|
|
|
|
|
|
|
|
|
|
|
|
|
|
|
|
|
|
|
|
|
|
|
|
|
|
|
|
|
|
|
|
|
|
|
|
|
|
|
|
|
|
|
|
|
|
|
|
|
|
|
|
|
|
|
|
|
|
|
|
|
|
|
|
|
|
|
|
|
|
|
|
|
|
|
|
|
|
|
|
|
|
|
|
|
|
|
|
|
|
|
|
|
|
|
|
|
|
|
|
|
|
|
|
|
|
|
|
|
|
|
|
|
|
|
|
|
|
|
|
|
|
|
|
|
|
|
|
|
|
|
|
|
|
|
|
|
|
|
|
|
|
|
|
|
|
|
|
|
|
|
|
|
|
|
|
|
|
|
|
|
|
|
|
|
|
|
|
|
|
|
|
|
|
|
|
|
|
|
|
|
|
|
|
|
|
|
|
|
|
|
|
|
|
|
|
|
|
|
|
|
|
|
|
|
|
|
|
|
|
|
|
|
|
|
|
|
|
|
|
|
|
|
|
|
|
|
|
|
|
|
|
|
|
|
|
|
|
|
|
|
|
|
|
|
|
|
|
|
|
|
|
|
|
|
|
|
|
|
|
|
|
|
|
|
|
|
|
|
|
|
|
|
Adjusted Free Cash Flow - Net cash provided by operating activities less Cash purchases of property and equipment, plus Proceeds from sales of tower sites and Proceeds related to beneficial interests in securitization transactions and less Cash payments for debt prepayment or debt extinguishment costs. Adjusted Free Cash Flow is utilized by T-Mobile’s management, investors and analysts to evaluate cash available to pay debt, repurchase shares, pay dividends and provide further investment in the business.
Adjusted Free Cash Flow margin - Adjusted Free Cash Flow divided by Service revenues. Adjusted Free Cash Flow Margin is utilized by T-Mobile’s management, investors, and analysts to evaluate the company’s ability to convert service revenue efficiently into cash available to pay debt, repurchase shares and provide further investment in the business.
The guidance range for Adjusted Free Cash Flow is calculated as follows:
|
|
|
|
|
|
|
|
|
|
|
|
|
FY 2024 |
| (in millions) |
Guidance Range |
|
|
|
|
| Net cash provided by operating activities |
$ |
21,600 |
|
|
$ |
22,300 |
|
| Cash purchases of property and equipment, including capitalized interest |
(8,600) |
|
|
(9,400) |
|
Proceeds related to beneficial interests in securitization transactions (1) |
3,400 |
|
|
4,000 |
|
|
|
|
|
|
|
|
|
|
|
|
|
| Adjusted Free Cash Flow |
$ |
16,400 |
|
|
$ |
16,900 |
|
|
|
|
|
|
|
|
|
|
|
|
|
|
|
|
|
|
|
|
|
|
|
|
|
|
|
|
|
(1)Adjusted Free Cash Flow guidance does not assume any material net cash inflows from securitization in 2024.
The previous guidance range for Adjusted Free Cash Flow was calculated as follows:
|
|
|
|
|
|
|
|
|
|
|
|
|
FY 2024 |
| (in millions) |
Guidance Range |
|
|
|
|
| Net cash provided by operating activities |
$ |
21,500 |
|
|
$ |
22,300 |
|
| Cash purchases of property and equipment, including capitalized interest |
(8,600) |
|
|
(9,400) |
|
Proceeds related to beneficial interests in securitization transactions (1) |
3,400 |
|
|
4,000 |
|
|
|
|
|
|
|
|
|
|
|
|
|
| Adjusted Free Cash Flow |
$ |
16,300 |
|
|
$ |
16,900 |
|
|
|
|
|
|
|
|
|
|
|
|
|
|
|
|
|
|
|
|
|
|
|
|
|
|
|
|
|
(1)Adjusted Free Cash Flow guidance does not assume any material net cash inflows from securitization in 2024.
T-Mobile US, Inc.
Operating Measures
(Unaudited)
The following table sets forth company operating measures ARPA and ARPU:
|
|
|
|
|
|
|
|
|
|
|
|
|
|
|
|
|
|
|
|
|
|
|
|
|
|
|
|
|
|
|
|
|
|
|
|
|
|
|
|
|
|
|
|
|
|
|
|
|
|
|
Quarter |
|
|
| (in dollars) |
|
|
|
|
|
|
|
|
Q1 2023 |
|
Q2 2023 |
|
Q3 2023 |
|
Q4 2023 |
|
Q1 2024 |
|
|
|
|
|
|
|
|
|
|
|
|
|
|
|
|
|
|
|
|
|
|
|
|
|
|
|
|
|
|
|
|
|
|
|
|
|
|
|
|
|
|
|
|
|
|
|
|
|
|
|
|
|
|
|
|
|
|
|
|
|
|
|
|
|
|
|
|
|
|
|
|
|
|
|
|
|
|
|
|
|
|
|
|
|
|
|
|
|
|
|
|
|
|
|
|
|
|
|
|
|
|
|
|
|
|
|
|
|
|
|
|
|
|
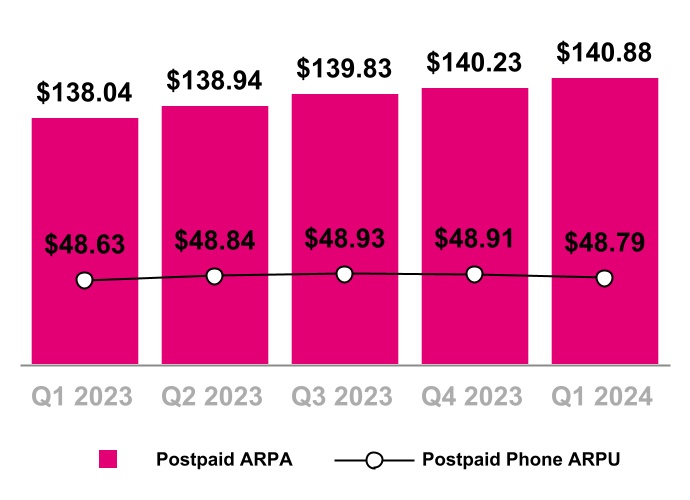
| Postpaid ARPA |
|
|
|
|
|
|
|
|
$ |
138.04 |
|
|
$ |
138.94 |
|
|
$ |
139.83 |
|
|
$ |
140.23 |
|
|
$ |
140.88 |
|
|
|
|
|
|
|
|
|
|
|
|
|
|
|
|
|
|
|
|
|
|
|
|
|
|
|
|
|
|
|
|
|
|
|
|
|
|
|
|
|
|
|
|
|
|
|
|
|
|
|
|
|
|
|
|
|
|
|
|
|
|
|
|
|
|
|
|
|
|
|
|
|
|
|
|
|
|
|
|
|
|
|
|
|
|
|
|
|
|
|
|
|
|
|
|
|
|
|
|
|
|
|
|
|
|
|
|
|
|
|
|
|
|
|
|
|
|
|
|
|
|
|
|
|
|
|
|
|
|
|
|
|
|
|
|
|
|
|
|
|
|
|
|
|
|
|
|
|
|
|
|
|
|
|
|
|
|
|
| Postpaid phone ARPU |
|
|
|
|
|
|
|
|
48.63 |
|
|
48.84 |
|
|
48.93 |
|
|
48.91 |
|
|
48.79 |
|
|
|
|
|
|
|
|
|
|
|
|
|
|
|
|
|
|
|
|
|
|
|
|
|
|
|
|
|
|
|
|
|
|
|
|
|
|
|
|
|
|
|
|
|
|
|
|
|
|
|
|
|
|
|
|
|
|
|
|
|
|
|
|
|
|
|
|
|
|
|
|
|
|
|
|
|
|
|
|
|
|
|
|
|
|
|
|
|
|
|
|
|
|
|
|
|
|
|
|
|
|
|
|
|
|
|
|
|
|
|
|
|
|
|
|
|
|
|
|
|
|
|
|
|
|
|
|
|
|
|
|
|
|
|
|
|
|
|
|
|
|
|
|
|
|
|
|
|
|
|
|
|
|
|
|
|
|
|
|
|
|
|
|
|
|
|
|
|
|
|
|
|
|
|
|
|
|
|
|
|
|
|
|
|
|
|
|
|
|
|
|
|
|
|
|
|
|
|
|
|
|
|
|
|
|
|
|
|
|
|
|
|
|
|
|
|
|
|
|
|
|
|
|
|
|
|
|
|
|
|
|
|
|
|
|
|
|
|
|
|
|
|
|
|
|
|
|
|
|
|
|
|
|
|
|
|
|
|
|
|
|
|
|
|
|
|
|
|
|
|
|
|
|
|
|
|
|
|
|
|
|
|
|
|
|
|
|
|
|
|
|
|
|
|
|
|
|
|
|
|
|
|
|
|
|
|
|
|
|
|
|
|
|
|
|
|
|
|
|
|
|
|
|
|
|
|
|
|
|
|
|
|
|
|
| Prepaid ARPU |
|
|
|
|
|
|
|
|
37.98 |
|
|
37.98 |
|
|
38.18 |
|
|
37.55 |
|
|
37.18 |
|
|
|
|
|
|
|
|
|
|
|
|
|
|
|
|
|
|
|
|
|
|
|
|
|
|
|
|
|
|
|
|
|
|
|
|
|
|
|
|
|
|
|
|
|
|
|
|
|
|
|
|
|
|
|
|
|
|
|
|
|
|
|
|
|
|
|
|
|
|
|
|
|
|
|
|
|
|
|
|
|
|
|
|
|
|
|
|
|
|
|
|
|
|
|
|
|
|
|
|
|
|
|
|
|
|
|
|
|
|
|
|
|
|
|
|
|
|
|
|
|
|
|
|
|
|
|
|
|
|
|
|
|
|
|
|
|
|
|
|
|
|
|
|
|
|
|
|
|
|
|
|
|
|
|
|
|
|
|
|
|
|
|
|
|
|
|
|
|
|
|
|
|
|
|
|
|
|
|
|
|
|
|
|
|
|
|
|
|
|
|
|
|
|
|
|
|
|
|
|
|
|
|
|
|
|
|
|
|
|
|
|
|
|
|
|
|
|
|
|
|
|
|
|
|
|
|
|
|
|
|
|
|
|
|
|
|
|
|
|
|
|
|
|
|
|
|
|
|
|
|
|
|
|
|
|
|
|
|
|
|
|
|
|
|
|
|
|
|
|
|
|
|
|
|
|
|
|
|
|
|
|
|
|
|
|
|
|
|
|
|
|
|
|
|
|
|
|
|
|
|
|
|
|
|
|
|
|
|
|
|
|
|
|
|
|
|
|
|
|
|
|
|
|
|
|
|
|
|
|
|
|
|
|
|
|
|
|
|
|
|
|
|
|
|
|
|
|
|
|
|
|
|
|
|
|
|
|
|
|
|
|
|
|
|
|
|
|
|
|
|
|
|
|
|
|
|
|
|
|
|
|
|
|
|
|
|
|
|
|
|
|
|
|
|
|
|
|
|
|
|
|
|
|
|
|
|
|
|
|
|
|
|
|
|
|
|
|
|
|
|
|
|
|
|
|
|
|
|
|
|
|
|
|
|
|
|
|
|
|
|
|
|
|
|
|
|
|
|
|
|
|
|
|
|
|
|
|
|
|
|
|
|
|
|
|
|
|
|
|
|
|
|
|
|
|
|
|
|
|
|
|
|
|
|
|
|
|
|
|
|
|
|
|
|
|
|
|
|
|
|
|
|
|
|
|
|
|
|
|
|
|
|
|
|
|
|
|
|
|
|
|
|
|
|
|
|
|
|
|
|
|
|
|
|
|
|
|
|
|
|
|
|
|
|
|
|
|
|
|
|
|
|
|
|
|
|
|
|
|
|
|
|
|
|
|
|
|
|
|
|
|
|
|
|
|
|
|
|
|
|
|
|
|
|
|
|
|
|
|
|
|
|
|
|
|
|
|
|
|
|
|
|
|
|
|
|
|
|
|
|
|
|
|
|
|
|
|
|
|
|
|
|
|
|
|
|
|
|
|
|
|
|
|
|
|
|
|
|
|
|
|
|
|
|
|
|
|
|
|
|
|
|
|
|
|
|
|
|
|
|
|
|
|
|
|
|
|
|
|
|
|
|
|
|
|
|
|
|
|
|
|
|
|
|
|
|
|
|
|
|
|
|
|
|
|
|
|
|
|
|
|
|
|
|
|
|
|
|
|
|
|
|
|
|
|
|
|
|
|
|
|
|
|
|
|
|
|
|
|
|
Postpaid Average Revenue Per Account (Postpaid ARPA) - Average monthly postpaid service revenue earned per account. Postpaid service revenues for the specified period divided by the average number of postpaid accounts during the period, further divided by the number of months in the period.
Average Revenue Per User (ARPU) - Average monthly service revenue earned per customer. Service revenues for the specified period divided by the average number of customers during the period, further divided by the number of months in the period.
Postpaid phone ARPU excludes postpaid other customers and related revenues.