
| Delaware | 1-33409 | 20-0836269 | ||||||||||||
| (State or other jurisdiction | (Commission File Number) | (I.R.S. Employer | ||||||||||||
of incorporation) |
Identification No.) | |||||||||||||
☐ |
Written communications pursuant to Rule 425 under the Securities Act (17 CFR 230.425) | ||||
☐ |
Soliciting material pursuant to Rule 14a-12 under the Exchange Act (17 CFR 240.14a-12) | ||||
☐ |
Pre-commencement communications pursuant to Rule 14d-2(b) under the Exchange Act (17 CFR 240.14d-2(b)) | ||||
☐ |
Pre-commencement communications pursuant to Rule 13e-4(c) under the Exchange Act (17 CFR 240.13e-4(c)) | ||||
| Title of each class | Trading Symbol | Name of each exchange on which registered | ||||||||||||
| Common Stock, par value $0.00001 per share | TMUS | The NASDAQ Stock Market LLC | ||||||||||||
| Exhibit | Description | |||||||
| 104 | Cover Page Interactive Data File (formatted as inline XBRL and contained in Exhibit 101) | |||||||
| SIGNATURES | |||||||||||
T-MOBILE US, INC. |
|||||||||||
| April 27, 2023 | /s/ Peter Osvaldik | ||||||||||
| Peter Osvaldik Executive Vice President and Chief Financial Officer |
|||||||||||

| Quarter | |||||||||||||||||
| (in thousands, except churn) | Q1 2023 | Q4 2022 | Q1 2022 | ||||||||||||||
| Postpaid net account additions | 287 | 314 | 348 | ||||||||||||||
| Total net customer additions | 1,319 | 1,843 | 1,380 | ||||||||||||||
| Postpaid net customer additions | 1,293 | 1,818 | 1,318 | ||||||||||||||
| Postpaid phone net customer additions | 538 | 927 | 589 | ||||||||||||||
Postpaid other net customer additions (2) |
755 | 891 | 729 | ||||||||||||||
Prepaid net customer additions (2) |
26 | 25 | 62 | ||||||||||||||
Total customers, end of period (2)(3) |
114,917 | 113,598 | 109,541 | ||||||||||||||
| Postpaid phone churn | 0.89 | % | 0.92 | % | 0.93 | % | |||||||||||
| Prepaid churn | 2.76 | % | 2.93 | % | 2.67 | % | |||||||||||
| High Speed Internet net customer additions | 523 | 524 | 338 | ||||||||||||||
| Total High Speed Internet customers, end of period | 3,169 | 2,646 | 984 | ||||||||||||||
| Quarter |
Q1 2023
vs.
Q4 2022
|
Q1 2023
vs.
Q1 2022
|
|||||||||||||||||||||||||||
| (in millions, except EPS) | Q1 2023 | Q4 2022 | Q1 2022 | ||||||||||||||||||||||||||
| Total service revenues | $ | 15,546 | $ | 15,518 | $ | 15,128 | 0.2 | % | 2.8 | % | |||||||||||||||||||
| Postpaid service revenues | 11,862 | 11,725 | 11,201 | 1.2 | % | 5.9 | % | ||||||||||||||||||||||
| Total revenues | 19,632 | 20,273 | 20,120 | (3.2) | % | (2.4) | % | ||||||||||||||||||||||
| Net income | 1,940 | 1,477 | 713 | 31.3 | % | 172.1 | % | ||||||||||||||||||||||
| Diluted EPS | 1.58 | 1.18 | 0.57 | 33.9 | % | 177.2 | % | ||||||||||||||||||||||
| Adjusted EBITDA | 7,199 | 6,828 | 6,950 | 5.4 | % | 3.6 | % | ||||||||||||||||||||||
| Core Adjusted EBITDA | 7,052 | 6,582 | 6,463 | 7.1 | % | 9.1 | % | ||||||||||||||||||||||
| Net cash provided by operating activities | 4,051 | 4,336 | 3,845 | (6.6) | % | 5.4 | % | ||||||||||||||||||||||
| Cash purchases of property and equipment, including capitalized interest | 3,001 | 3,383 | 3,381 | (11.3) | % | (11.2) | % | ||||||||||||||||||||||
Adjusted Free Cash Flow |
2,401 | 2,184 | 1,649 | 9.9 | % | 45.6 | % | ||||||||||||||||||||||
| (in millions, except Postpaid net customer additions) | Previous | Current | Change (Mid-point) | ||||||||||||||||||||||||||
| Postpaid net customer additions (thousands) | 5,000 | 5,500 | 5,300 | 5,700 | 250 | ||||||||||||||||||||||||
Net income (1) |
N/A | N/A | N/A | N/A | N/A | ||||||||||||||||||||||||
Core Adjusted EBITDA (2) |
$ | 28,700 | $ | 29,200 | $ | 28,800 | $ | 29,200 | $ | 50 | |||||||||||||||||||
| Merger synergies | 7,200 | 7,500 | 7,300 | 7,500 | 50 | ||||||||||||||||||||||||
Merger-related costs (3) |
~1,000 |
~1,000 |
— | ||||||||||||||||||||||||||
| Net cash provided by operating activities | 17,800 | 18,300 | 17,900 | 18,300 | 50 | ||||||||||||||||||||||||
Capital expenditures (4) |
9,400 | 9,700 | 9,400 | 9,700 | — | ||||||||||||||||||||||||
Adjusted Free Cash Flow (5) |
13,100 | 13,600 | 13,200 | 13,600 | 50 | ||||||||||||||||||||||||
| Quarter | |||||||||||||||||||||||||||||
| (in millions) | Q1 2022 | Q2 2022 | Q3 2022 | Q4 2022 | Q1 2023 | ||||||||||||||||||||||||
| Net income (loss) | $ | 713 | $ | (108) | $ | 508 | $ | 1,477 | $ | 1,940 | |||||||||||||||||||
| Adjustments: | |||||||||||||||||||||||||||||
| Interest expense, net | 864 | 851 | 827 | 822 | 835 | ||||||||||||||||||||||||
| Other expense (income), net | 11 | 21 | 3 | (2) | (9) | ||||||||||||||||||||||||
| Income tax expense (benefit) | 218 | (55) | (57) | 450 | 631 | ||||||||||||||||||||||||
| Operating income | 1,806 | 709 | 1,281 | 2,747 | 3,397 | ||||||||||||||||||||||||
| Depreciation and amortization | 3,585 | 3,491 | 3,313 | 3,262 | 3,203 | ||||||||||||||||||||||||
Stock-based compensation (1) |
136 | 149 | 145 | 146 | 173 | ||||||||||||||||||||||||
Merger-related costs |
1,413 | 1,668 | 1,296 | 592 | 358 | ||||||||||||||||||||||||
| Impairment expense | — | 477 | — | — | — | ||||||||||||||||||||||||
Legal-related expenses (recoveries), net (2) |
— | 400 | (19) | 10 | (43) | ||||||||||||||||||||||||
| Loss (gain) on disposal group held for sale | — | — | 1,071 | 16 | (42) | ||||||||||||||||||||||||
Other, net (3) |
10 | 110 | (48) | 55 | 153 | ||||||||||||||||||||||||
| Adjusted EBITDA | 6,950 | 7,004 | 7,039 | 6,828 | 7,199 | ||||||||||||||||||||||||
Lease revenues |
(487) | (386) | (311) | (246) | (147) | ||||||||||||||||||||||||
| Core Adjusted EBITDA | $ | 6,463 | $ | 6,618 | $ | 6,728 | $ | 6,582 | $ | 7,052 | |||||||||||||||||||
| Quarter | |||||||||||||||||||||||||||||
| (in millions) | Q1 2022 | Q2 2022 | Q3 2022 | Q4 2022 | Q1 2023 | ||||||||||||||||||||||||
| Net cash provided by operating activities | $ | 3,845 | $ | 4,209 | $ | 4,391 | $ | 4,336 | $ | 4,051 | |||||||||||||||||||
| Cash purchases of property and equipment, including capitalized interest | (3,381) | (3,572) | (3,634) | (3,383) | (3,001) | ||||||||||||||||||||||||
| Proceeds from sales of tower sites | — | — | — | 9 | 6 | ||||||||||||||||||||||||
| Proceeds related to beneficial interests in securitization transactions | 1,185 | 1,121 | 1,308 | 1,222 | 1,345 | ||||||||||||||||||||||||
Adjusted Free Cash Flow |
$ | 1,649 | $ | 1,758 | $ | 2,065 | $ | 2,184 | $ | 2,401 | |||||||||||||||||||
| Net cash provided by operating activities margin (Net cash provided by operating activities divided by Service revenues) | 25.4 | % | 27.5 | % | 28.6 | % | 27.9 | % | 26.1 | % | |||||||||||||||||||
| Adjusted Free Cash Flow margin (Adjusted Free Cash Flow divided by Service revenues) | 10.9 | % | 11.5 | % | 13.4 | % | 14.1 | % | 15.4 | % | |||||||||||||||||||
| FY 2023 | |||||||||||
| (in millions) | Guidance Range | ||||||||||
| Net cash provided by operating activities | $ | 17,900 | $ | 18,300 | |||||||
| Cash purchases of property and equipment, including capitalized interest | (9,400) | (9,700) | |||||||||
Proceeds related to beneficial interests in securitization transactions (1) |
4,700 | 5,000 | |||||||||
| Adjusted Free Cash Flow | $ | 13,200 | $ | 13,600 | |||||||
| FY 2023 | |||||||||||
| (in millions) | Guidance Range | ||||||||||
| Net cash provided by operating activities | $ | 17,800 | $ | 18,300 | |||||||
| Cash purchases of property and equipment, including capitalized interest | (9,400) | (9,700) | |||||||||
Proceeds related to beneficial interests in securitization transactions (1) |
4,700 | 5,000 | |||||||||
| Adjusted Free Cash Flow | $ | 13,100 | $ | 13,600 | |||||||
| Quarter | |||||||||||||||||||||||||||||
| (in dollars) | Q1 2022 | Q2 2022 | Q3 2022 | Q4 2022 | Q1 2023 | ||||||||||||||||||||||||
| Postpaid ARPA | $ | 136.53 | $ | 137.92 | $ | 137.49 | $ | 137.78 | $ | 138.04 | |||||||||||||||||||
| Postpaid phone ARPU | 48.41 | 48.96 | 48.89 | 48.86 | 48.63 | ||||||||||||||||||||||||
| Prepaid ARPU | 39.19 | 38.71 | 38.86 | 38.29 | 37.98 | ||||||||||||||||||||||||

 |
2 |
||||
| Highlights | ||||||||
| Customer Metrics | ||||||||
| Financial Metrics | ||||||||
| Capital Structure | ||||||||
| Merger & Integration | ||||||||
| Guidance | ||||||||
| Contacts | ||||||||
| Financial and Operational Tables | ||||||||
 | ||
 |
3 |
||||
T-Mobile Delivers Industry-Leading Growth in Customers and Profitability in Q1 2023 and Raises 2023 Guidance |
||||||||
 | ||||||||
| ||
 |
4 |
||||
|
Postpaid Accounts
(in thousands)
|
|||||

| Year-Over-Year | ||
| Sequential | ||
| Year-Over-Year | ||
| Sequential | ||
| Sequential | ||
| Postpaid ARPA & Postpaid Phone ARPU | |||||

| ||
|
5 |
||||
|
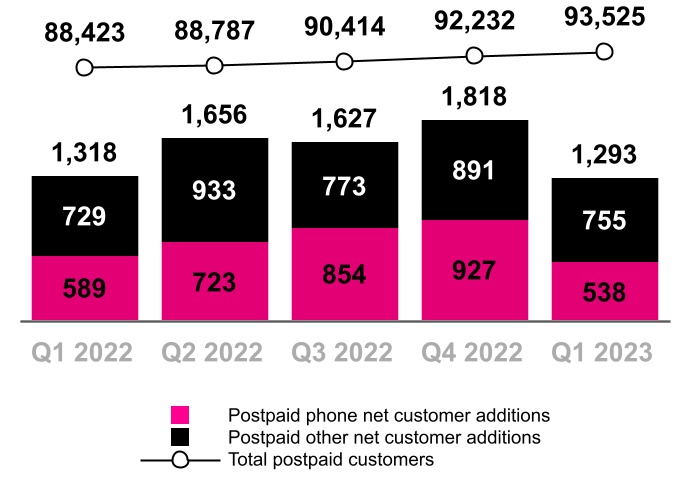
Postpaid Customers
(in thousands)
|
|||||
| Year-Over-Year | ||
| Sequential | ||
| Year-Over-Year | ||
| Sequential | ||
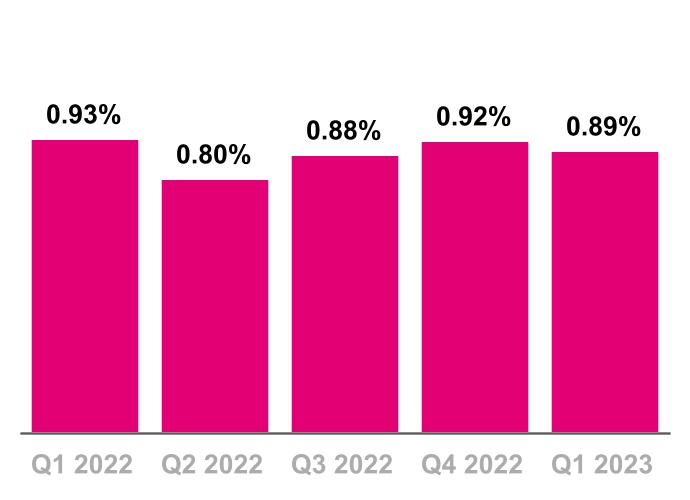
| Postpaid Phone Churn | |||||
| ||
|
6 |
||||
|
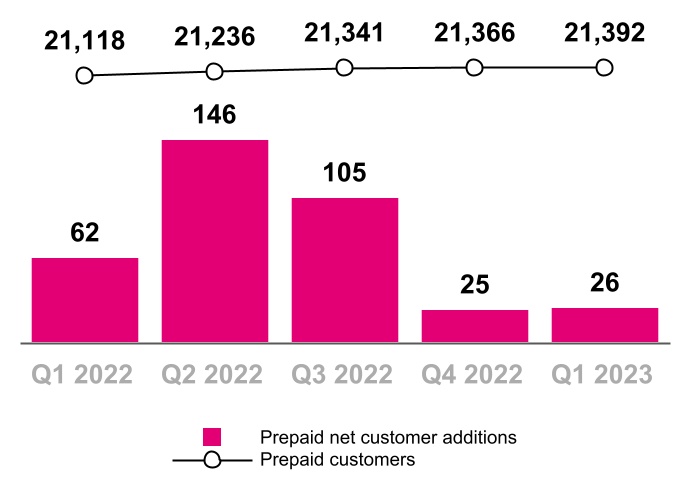
Prepaid Customers
(in thousands)
|
|||||
| Year-Over-Year | ||
| Sequential | ||
| Year-Over-Year | ||
| Sequential | ||
|
High Speed Internet Customers
(in thousands)
|
|||||

| ||
 |
7 |
||||
|
Service Revenues
($ in millions)
|
|||||

| Year-Over-Year | ||
| Sequential | ||
| Year-Over-Year | ||
| Sequential | ||
|
Postpaid Service Revenues
($ in millions)
|
|||||

| ||
|
8 |
||||
|
Equipment Revenues
($ in millions)
|
|||||

| Year-Over-Year | ||
| Sequential | ||
| Year-Over-Year | ||
| Sequential | ||
|
Cost of Equipment Sales, exclusive of D&A
($ in millions)
|
|||||

| ||
|
9 |
||||
|
Cost of Services, exclusive of D&A
($ in millions, % of Service revenues)
|
|||||

| Year-Over-Year | ||
| Sequential | ||
| Year-Over-Year | ||
| Sequential | ||
|
Selling, General and Administrative (SG&A) Expense
($ in millions, % of Service revenues)
|
|||||

| ||
|
10 |
||||
|
Net Income (Loss)
($ in millions, % of Service revenues)
|
|||||

|
Diluted Earnings (Loss) Per Share
(Diluted EPS)
|
|||||

| Year-Over-Year | ||
| Sequential | ||
| ||
|
11 |
||||
|
Core Adjusted EBITDA*
($ in millions, % of Service revenues)
|
|||||

| Year-Over-Year | ||
| Sequential | ||
| Year-Over-Year | ||
| Sequential | ||
|
Net Cash Provided by Operating Activities
($ in millions)
|
|||||

| ||
|
12 |
||||
|
Cash Purchases of Property and Equipment, incl. Capitalized Interest
($ in millions, % of Service revenues)
|
|||||

| Year-Over-Year | ||
| Sequential | ||
| Year-Over-Year | ||
| Sequential | ||
|
Adjusted Free Cash Flow
($ in millions)
|
|||||

| ||
 |
13 |
||||
|
Net Debt (Excluding Tower Obligations) & Net Debt to LTM Net Income and Core Adj. EBITDA Ratios
($ in billions)
|
|||||

| ||
 |
14 |
||||
| Merger-Related Synergies Guidance | ||
|
Merger synergies are expected to be between $7.3 billion to $7.5 billion in 2023:
▪$2.6 billion to $2.7 billion of SG&A expense reductions
▪$3.1 billion to $3.2 billion of cost of service expense reductions achieved through network efficiencies
▪Approximately $1.6 billion of savings related to avoided network expenses
| ||
| Merger-Related Costs | |||||||||||||||||||||||||||||||||||||||||||||||||||||
| (in millions, excl. EPS) | |||||||||||||||||||||||||||||||||||||||||||||||||||||
| Sequential Change | Year-Over-Year Change | ||||||||||||||||||||||||||||||||||||||||||||||||||||
| Q1 2022 | Q2 2022 | Q3 2022 | Q4 2022 | Q1 2023 | $ | % | $ | % | |||||||||||||||||||||||||||||||||||||||||||||
| Cost of services | $ | 607 | $ | 961 | $ | 812 | $ | 290 | $ | 208 | $ | (82) | (28) | % | $ | (399) | (66) | % | |||||||||||||||||||||||||||||||||||
| Cost of equipment sales | 751 | 459 | 258 | 56 | (9) | (65) | (116) | % | (760) | (101) | % | ||||||||||||||||||||||||||||||||||||||||||
| Selling, general & administrative | 55 | 248 | 226 | 246 | 159 | (87) | (35) | % | 104 | 189 | % | ||||||||||||||||||||||||||||||||||||||||||
| Total Merger-related costs | $ | 1,413 | $ | 1,668 | $ | 1,296 | $ | 592 | $ | 358 | $ | (234) | (40) | % | $ | (1,055) | (75) | % | |||||||||||||||||||||||||||||||||||
| Total Merger-related costs, net of tax |
$ | 1,059 | $ | 1,252 | $ | 972 | $ | 444 | $ | 268 | $ | (176) | (40) | % | $ | (791) | (75) | % | |||||||||||||||||||||||||||||||||||
| Diluted EPS impact of Merger-related costs | $0.84 | $1.00 | $0.77 | $0.36 | $0.22 | $ | (0.14) | (39) | % | $ | (0.62) | (74) | % | ||||||||||||||||||||||||||||||||||||||||
| Net cash payments for Merger-related costs |
$ | 893 | $ | 907 | $ | 942 | $ | 622 | $ | 484 | $ | (138) | (22) | % | $ | (409) | (46) | % | |||||||||||||||||||||||||||||||||||
| ||
 |
15 |
||||
| Metric | Previous | Revised | Change at Midpoint | ||||||||
| Postpaid net customer additions | 5.0 to 5.5 million |
5.3 to 5.7 million |
250 thousand |
||||||||
Net income (1) |
N/A | N/A | N/A | ||||||||
Core Adjusted EBITDA (2) |
$28.7 to $29.2 billion |
$28.8 to $29.2 billion |
$50 million |
||||||||
| Merger synergies | $7.2 to $7.5 billion |
$7.3 to $7.5 billion |
$50 million |
||||||||
Merger-related costs (3) |
~$1.0 billion |
~$1.0 billion |
No change |
||||||||
| Net cash provided by operating activities | $17.8 to $18.3 billion |
$17.9 to $18.3 billion |
$50 million |
||||||||
Capital expenditures (4) |
$9.4 to $9.7 billion |
$9.4 to $9.7 billion |
No change |
||||||||
Adjusted Free Cash Flow (5) |
$13.1 to $13.6 billion |
$13.2 to $13.6 billion |
$50 million |
||||||||
| ||
 |
16 |
||||
 |
 |
 |
||||||||||||||||||
| Jud Henry | Justin Taiber | Trina Schurman | ||||||||||||||||||
| Senior Vice President | Senior Director | Senior Director | ||||||||||||||||||
| Investor Relations | Investor Relations | Investor Relations | ||||||||||||||||||
 |
 |
 |
||||||||||||||||||
| Zach Witterstaetter | Rose Kopecky | Jacob Marks | ||||||||||||||||||
| Investor Relations | Investor Relations | Investor Relations | ||||||||||||||||||
| Manager | Manager | Manager | ||||||||||||||||||
| ||
 |
17 |
||||
| (in millions, except share and per share amounts) | March 31, 2023 |
December 31, 2022 |
|||||||||
| Assets | |||||||||||
| Current assets | |||||||||||
| Cash and cash equivalents | $ | 4,540 | $ | 4,507 | |||||||
| Accounts receivable, net of allowance for credit losses of $152 and $167 | 4,366 | 4,445 | |||||||||
Equipment installment plan receivables, net of allowance for credit losses and imputed discount of $647 and $667 |
5,012 | 5,123 | |||||||||
| Inventory | 1,741 | 1,884 | |||||||||
| Prepaid expenses | 674 | 673 | |||||||||
| Other current assets | 2,543 | 2,435 | |||||||||
| Total current assets | 18,876 | 19,067 | |||||||||
| Property and equipment, net | 42,053 | 42,086 | |||||||||
| Operating lease right-of-use assets | 28,146 | 28,715 | |||||||||
| Financing lease right-of-use assets | 3,282 | 3,257 | |||||||||
| Goodwill | 12,234 | 12,234 | |||||||||
| Spectrum licenses | 95,878 | 95,798 | |||||||||
| Other intangible assets, net | 3,245 | 3,508 | |||||||||
Equipment installment plan receivables due after one year, net of allowance for credit losses and imputed discount of $139 and $144 |
2,250 | 2,546 | |||||||||
| Other assets | 4,209 | 4,127 | |||||||||
| Total assets | $ | 210,173 | $ | 211,338 | |||||||
| Liabilities and Stockholders' Equity | |||||||||||
| Current liabilities | |||||||||||
| Accounts payable and accrued liabilities | $ | 11,091 | $ | 12,275 | |||||||
| Short-term debt | 5,215 | 5,164 | |||||||||
| Deferred revenue | 804 | 780 | |||||||||
| Short-term operating lease liabilities | 3,441 | 3,512 | |||||||||
| Short-term financing lease liabilities | 1,180 | 1,161 | |||||||||
| Other current liabilities | 2,115 | 1,850 | |||||||||
| Total current liabilities | 23,846 | 24,742 | |||||||||
| Long-term debt | 68,035 | 65,301 | |||||||||
| Long-term debt to affiliates | 1,495 | 1,495 | |||||||||
| Tower obligations | 3,897 | 3,934 | |||||||||
| Deferred tax liabilities | 11,510 | 10,884 | |||||||||
| Operating lease liabilities | 29,379 | 29,855 | |||||||||
| Financing lease liabilities | 1,284 | 1,370 | |||||||||
| Other long-term liabilities | 3,802 | 4,101 | |||||||||
| Total long-term liabilities | 119,402 | 116,940 | |||||||||
| Commitments and contingencies | |||||||||||
| Stockholders' equity | |||||||||||
| Common stock, par value $0.00001 per share, 2,000,000,000 shares authorized; 1,260,606,989 and 1,256,876,527 shares issued, 1,204,696,325 and 1,233,960,078 shares outstanding | — | — | |||||||||
| Additional paid-in capital | 74,043 | 73,941 | |||||||||
| Treasury stock, at cost, 55,910,664 and 22,916,449 shares issued | (7,831) | (3,016) | |||||||||
| Accumulated other comprehensive loss | (1,004) | (1,046) | |||||||||
| Retained earnings (accumulated deficit) | 1,717 | (223) | |||||||||
| Total stockholders' equity | 66,925 | 69,656 | |||||||||
| Total liabilities and stockholders' equity | $ | 210,173 | $ | 211,338 | |||||||
| ||
|
18 |
||||
| Three Months Ended | |||||||||||||||||
| (in millions, except share and per share amounts) | March 31, 2023 |
December 31, 2022 |
March 31, 2022 |
||||||||||||||
| Revenues | |||||||||||||||||
| Postpaid revenues | $ | 11,862 | $ | 11,725 | $ | 11,201 | |||||||||||
| Prepaid revenues | 2,417 | 2,449 | 2,455 | ||||||||||||||
| Wholesale and other service revenues | 1,267 | 1,344 | 1,472 | ||||||||||||||
| Total service revenues | 15,546 | 15,518 | 15,128 | ||||||||||||||
| Equipment revenues | 3,719 | 4,451 | 4,694 | ||||||||||||||
| Other revenues | 367 | 304 | 298 | ||||||||||||||
| Total revenues | 19,632 | 20,273 | 20,120 | ||||||||||||||
| Operating expenses | |||||||||||||||||
| Cost of services, exclusive of depreciation and amortization shown separately below | 3,061 | 3,167 | 3,727 | ||||||||||||||
| Cost of equipment sales, exclusive of depreciation and amortization shown separately below | 4,588 | 5,504 | 5,946 | ||||||||||||||
| Selling, general and administrative | 5,425 | 5,577 | 5,056 | ||||||||||||||
| (Gain) loss on disposal group held for sale | (42) | 16 | — | ||||||||||||||
| Depreciation and amortization | 3,203 | 3,262 | 3,585 | ||||||||||||||
| Total operating expenses | 16,235 | 17,526 | 18,314 | ||||||||||||||
| Operating income | 3,397 | 2,747 | 1,806 | ||||||||||||||
| Other expense, net | |||||||||||||||||
| Interest expense, net | (835) | (822) | (864) | ||||||||||||||
| Other income (expense), net | 9 | 2 | (11) | ||||||||||||||
| Total other expense, net | (826) | (820) | (875) | ||||||||||||||
| Income before income taxes | 2,571 | 1,927 | 931 | ||||||||||||||
| Income tax expense | (631) | (450) | (218) | ||||||||||||||
| Net income | $ | 1,940 | $ | 1,477 | $ | 713 | |||||||||||
| Net income | $ | 1,940 | $ | 1,477 | $ | 713 | |||||||||||
| Other comprehensive income, net of tax | |||||||||||||||||
Reclassification of loss from cash flow hedges, net of tax effect of $14, $13 and $13 |
40 | 38 | 37 | ||||||||||||||
Unrealized gain (loss) on foreign currency translation adjustment, net of tax effect of $0, $0 and $0 |
2 | 2 | (1) | ||||||||||||||
Net unrecognized gain on pension and other postretirement benefits, net of tax effect of $0, $61 and $0 |
— | 177 | — | ||||||||||||||
| Other comprehensive income | 42 | 217 | 36 | ||||||||||||||
| Total comprehensive income | $ | 1,982 | $ | 1,694 | $ | 749 | |||||||||||
| Earnings per share | |||||||||||||||||
| Basic | $ | 1.59 | $ | 1.19 | $ | 0.57 | |||||||||||
| Diluted | $ | 1.58 | $ | 1.18 | $ | 0.57 | |||||||||||
| Weighted-average shares outstanding | |||||||||||||||||
| Basic | 1,219,608,362 | 1,240,827,732 | 1,250,505,999 | ||||||||||||||
| Diluted | 1,224,604,698 | 1,246,880,141 | 1,255,368,592 | ||||||||||||||
| ||
|
19 |
||||
| Three Months Ended | |||||||||||||||||
| (in millions) | March 31, 2023 |
December 31, 2022 |
March 31, 2022 |
||||||||||||||
| Operating activities | |||||||||||||||||
| Net income | $ | 1,940 | $ | 1,477 | $ | 713 | |||||||||||
| Adjustments to reconcile net income to net cash provided by operating activities | |||||||||||||||||
| Depreciation and amortization | 3,203 | 3,262 | 3,585 | ||||||||||||||
| Stock-based compensation expense | 177 | 150 | 141 | ||||||||||||||
| Deferred income tax expense | 611 | 419 | 185 | ||||||||||||||
| Bad debt expense | 222 | 266 | 210 | ||||||||||||||
| Losses from sales of receivables | 38 | 46 | 46 | ||||||||||||||
| (Gain) loss on remeasurement of disposal group held for sale | (13) | 6 | — | ||||||||||||||
| Changes in operating assets and liabilities | |||||||||||||||||
| Accounts receivable | (1,268) | (1,377) | (984) | ||||||||||||||
| Equipment installment plan receivables | 152 | (383) | (535) | ||||||||||||||
| Inventory | 129 | 360 | (93) | ||||||||||||||
| Operating lease right-of-use assets | 1,008 | 952 | 1,469 | ||||||||||||||
| Other current and long-term assets | (142) | (304) | (4) | ||||||||||||||
| Accounts payable and accrued liabilities | (882) | 239 | (59) | ||||||||||||||
| Short- and long-term operating lease liabilities | (1,009) | (729) | (771) | ||||||||||||||
| Other current and long-term liabilities | (183) | (128) | (163) | ||||||||||||||
| Other, net | 68 | 80 | 105 | ||||||||||||||
| Net cash provided by operating activities | 4,051 | 4,336 | 3,845 | ||||||||||||||
| Investing activities | |||||||||||||||||
Purchases of property and equipment, including capitalized interest of $(14), $(17) and $(15) |
(3,001) | (3,383) | (3,381) | ||||||||||||||
| Purchases of spectrum licenses and other intangible assets, including deposits | (73) | (12) | (2,843) | ||||||||||||||
| Proceeds from sales of tower sites | 6 | 9 | — | ||||||||||||||
| Proceeds related to beneficial interests in securitization transactions | 1,345 | 1,222 | 1,185 | ||||||||||||||
| Acquisition of companies, net of cash and restricted cash acquired | — | — | (52) | ||||||||||||||
| Other, net | (5) | 11 | (1) | ||||||||||||||
| Net cash used in investing activities | (1,728) | (2,153) | (5,092) | ||||||||||||||
| Financing activities | |||||||||||||||||
| Proceeds from issuance of long-term debt | 3,013 | 742 | — | ||||||||||||||
| Repayments of financing lease obligations | (306) | (338) | (302) | ||||||||||||||
| Repayments of long-term debt | (131) | (2,411) | (1,632) | ||||||||||||||
| Repurchases of common stock | (4,619) | (2,443) | — | ||||||||||||||
| Tax withholdings on share-based awards | (187) | (18) | (172) | ||||||||||||||
| Other, net | (43) | (30) | (30) | ||||||||||||||
| Net cash used in financing activities | (2,273) | (4,498) | (2,136) | ||||||||||||||
| Change in cash and cash equivalents, including restricted cash and cash held for sale | 50 | (2,315) | (3,383) | ||||||||||||||
| Cash and cash equivalents, including restricted cash and cash held for sale | |||||||||||||||||
| Beginning of period | 4,674 | 6,989 | 6,703 | ||||||||||||||
| End of period | $ | 4,724 | $ | 4,674 | $ | 3,320 | |||||||||||
| ||
|
20 |
||||
| Three Months Ended | |||||||||||||||||
| (in millions) | March 31, 2023 |
December 31, 2022 |
March 31, 2022 |
||||||||||||||
| Supplemental disclosure of cash flow information | |||||||||||||||||
| Interest payments, net of amounts capitalized | $ | 840 | $ | 937 | $ | 778 | |||||||||||
| Operating lease payments | 1,314 | 1,042 | 1,048 | ||||||||||||||
| Income tax payments | 27 | 1 | — | ||||||||||||||
| Non-cash investing and financing activities | |||||||||||||||||
| Non-cash beneficial interest obtained in exchange for securitized receivables | $ | 1,119 | $ | 1,003 | $ | 1,018 | |||||||||||
| Change in accounts payable and accrued liabilities for purchases of property and equipment | (329) | (6) | (183) | ||||||||||||||
| Increase in Tower obligations from contract modification | — | — | 1,158 | ||||||||||||||
| Operating lease right-of-use assets obtained in exchange for lease obligations | 439 | 417 | 5,975 | ||||||||||||||
| Financing lease right-of-use assets obtained in exchange for lease obligations | 239 | 59 | 298 | ||||||||||||||
| ||
|
21 |
||||
| Quarter | |||||||||||||||||||||||||||||
| (in thousands) | Q1 2022 | Q2 2022 | Q3 2022 | Q4 2022 | Q1 2023 | ||||||||||||||||||||||||
| Customers, end of period | |||||||||||||||||||||||||||||
Postpaid phone customers (1) |
70,656 | 71,053 | 71,907 | 72,834 | 73,372 | ||||||||||||||||||||||||
Postpaid other customers (1) |
17,767 | 17,734 | 18,507 | 19,398 | 20,153 | ||||||||||||||||||||||||
| Total postpaid customers | 88,423 | 88,787 | 90,414 | 92,232 | 93,525 | ||||||||||||||||||||||||
Prepaid customers (1) |
21,118 | 21,236 | 21,341 | 21,366 | 21,392 | ||||||||||||||||||||||||
| Total customers | 109,541 | 110,023 | 111,755 | 113,598 | 114,917 | ||||||||||||||||||||||||
Adjustments to customers (1) |
(558) | (1,320) | — | — | — | ||||||||||||||||||||||||
| Quarter | |||||||||||||||||||||||||||||
| (in thousands) | Q1 2022 | Q2 2022 | Q3 2022 | Q4 2022 | Q1 2023 | ||||||||||||||||||||||||
| Net customer additions | |||||||||||||||||||||||||||||
| Postpaid phone customers | 589 | 723 | 854 | 927 | 538 | ||||||||||||||||||||||||
| Postpaid other customers | 729 | 933 | 773 | 891 | 755 | ||||||||||||||||||||||||
| Total postpaid customers | 1,318 | 1,656 | 1,627 | 1,818 | 1,293 | ||||||||||||||||||||||||
| Prepaid customers | 62 | 146 | 105 | 25 | 26 | ||||||||||||||||||||||||
| Total customers | 1,380 | 1,802 | 1,732 | 1,843 | 1,319 | ||||||||||||||||||||||||
| Migrations from prepaid to postpaid plans | 165 | 155 | 155 | 175 | 145 | ||||||||||||||||||||||||
| Quarter | |||||||||||||||||||||||||||||
| (in millions, except percentages) | Q1 2022 | Q2 2022 | Q3 2022 | Q4 2022 | Q1 2023 | ||||||||||||||||||||||||
Devices sold or leased (1) |
|||||||||||||||||||||||||||||
| Phones | 9.7 | 8.8 | 8.4 | 8.3 | 7.6 | ||||||||||||||||||||||||
| Mobile broadband and IoT devices | 1.8 | 1.9 | 2.0 | 2.2 | 2.0 | ||||||||||||||||||||||||
| Total | 11.5 | 10.7 | 10.4 | 10.5 | 9.6 | ||||||||||||||||||||||||
| Postpaid device upgrade rate | 4.8 | % | 4.1 | % | 3.8 | % | 3.9 | % | 3.2 | % | |||||||||||||||||||
| Quarter | |||||||||||||||||||||||||||||
| Q1 2022 | Q2 2022 | Q3 2022 | Q4 2022 | Q1 2023 | |||||||||||||||||||||||||
| Churn | |||||||||||||||||||||||||||||
| Postpaid phone churn | 0.93 | % | 0.80 | % | 0.88 | % | 0.92 | % | 0.89 | % | |||||||||||||||||||
| Prepaid churn | 2.67 | % | 2.58 | % | 2.88 | % | 2.93 | % | 2.76 | % | |||||||||||||||||||
| ||
|
22 |
||||
| Quarter | |||||||||||||||||||||||||||||
| (in thousands) | Q1 2022 | Q2 2022 | Q3 2022 | Q4 2022 | Q1 2023 | ||||||||||||||||||||||||
| Accounts, end of period | |||||||||||||||||||||||||||||
Total postpaid customer accounts (1) |
27,507 | 27,818 | 28,212 | 28,526 | 28,813 | ||||||||||||||||||||||||
| Quarter | |||||||||||||||||||||||||||||
| (in thousands) | Q1 2022 | Q2 2022 | Q3 2022 | Q4 2022 | Q1 2023 | ||||||||||||||||||||||||
| Net account additions | |||||||||||||||||||||||||||||
| Postpaid net account additions | 348 | 380 | 394 | 314 | 287 | ||||||||||||||||||||||||
| Quarter | |||||||||||||||||||||||||||||
| (in thousands) | Q1 2022 | Q2 2022 | Q3 2022 | Q4 2022 | Q1 2023 | ||||||||||||||||||||||||
| High speed internet customers, end of period | |||||||||||||||||||||||||||||
| Postpaid high speed internet customers | 975 | 1,472 | 1,960 | 2,410 | 2,855 | ||||||||||||||||||||||||
| Prepaid high speed internet customers | 9 | 72 | 162 | 236 | 314 | ||||||||||||||||||||||||
| Total high speed internet customers, end of period | 984 | 1,544 | 2,122 | 2,646 | 3,169 | ||||||||||||||||||||||||
| Quarter | |||||||||||||||||||||||||||||
| (in thousands) | Q1 2022 | Q2 2022 | Q3 2022 | Q4 2022 | Q1 2023 | ||||||||||||||||||||||||
| High speed internet - net customer additions | |||||||||||||||||||||||||||||
| Postpaid high speed internet customers | 329 | 497 | 488 | 450 | 445 | ||||||||||||||||||||||||
| Prepaid high speed internet customers | 9 | 63 | 90 | 74 | 78 | ||||||||||||||||||||||||
| Total high speed internet net customer additions | 338 | 560 | 578 | 524 | 523 | ||||||||||||||||||||||||
| Quarter | |||||||||||||||||||||||||||||
| (in millions, except percentages) | Q1 2022 | Q2 2022 | Q3 2022 | Q4 2022 | Q1 2023 | ||||||||||||||||||||||||
| Device Financing - Equipment Installment Plans | |||||||||||||||||||||||||||||
| Gross EIP financed | $ | 4,247 | $ | 3,580 | $ | 3,758 | $ | 4,103 | $ | 3,335 | |||||||||||||||||||
| EIP billings | 3,333 | 3,447 | 3,717 | 3,889 | 3,871 | ||||||||||||||||||||||||
| EIP receivables, net | 7,898 | 7,734 | 7,562 | 7,669 | 7,262 | ||||||||||||||||||||||||
| EIP receivables classified as prime | 61 | % | 61 | % | 61 | % | 59 | % | 59 | % | |||||||||||||||||||
| EIP receivables classified as prime (including EIP receivables sold) | 58 | % | 57 | % | 58 | % | 57 | % | 56 | % | |||||||||||||||||||
| Device Financing - Leased Devices | |||||||||||||||||||||||||||||
| Lease revenues | $ | 487 | $ | 386 | $ | 311 | $ | 246 | $ | 147 | |||||||||||||||||||
| Leased device depreciation | 445 | 317 | 226 | 141 | 58 | ||||||||||||||||||||||||
| ||
|
23 |
||||
| Quarter | |||||||||||||||||||||||||||||
| (in millions, except percentages) | Q1 2022 | Q2 2022 | Q3 2022 | Q4 2022 | Q1 2023 | ||||||||||||||||||||||||
| Financial Measures | |||||||||||||||||||||||||||||
| Service revenues | $ | 15,128 | $ | 15,316 | $ | 15,361 | $ | 15,518 | $ | 15,546 | |||||||||||||||||||
| Equipment revenue | $ | 4,694 | $ | 4,130 | $ | 3,855 | $ | 4,451 | $ | 3,719 | |||||||||||||||||||
| Lease revenues | 487 | 386 | 311 | 246 | 147 | ||||||||||||||||||||||||
| Equipment sales | $ | 4,207 | $ | 3,744 | $ | 3,544 | $ | 4,205 | $ | 3,572 | |||||||||||||||||||
| Total revenues | $ | 20,120 | $ | 19,701 | $ | 19,477 | $ | 20,273 | $ | 19,632 | |||||||||||||||||||
| Net income (loss) | $ | 713 | $ | (108) | $ | 508 | $ | 1,477 | $ | 1,940 | |||||||||||||||||||
| Net income (loss) margin | 4.7 | % | (0.7) | % | 3.3 | % | 9.5 | % | 12.5 | % | |||||||||||||||||||
| Adjusted EBITDA | $ | 6,950 | $ | 7,004 | $ | 7,039 | $ | 6,828 | $ | 7,199 | |||||||||||||||||||
| Adjusted EBITDA margin | 45.9 | % | 45.7 | % | 45.8 | % | 44.0 | % | 46.3 | % | |||||||||||||||||||
| Core Adjusted EBITDA | $ | 6,463 | $ | 6,618 | $ | 6,728 | $ | 6,582 | $ | 7,052 | |||||||||||||||||||
| Core Adjusted EBITDA margin | 42.7 | % | 43.2 | % | 43.8 | % | 42.4 | % | 45.4 | % | |||||||||||||||||||
| Cost of services | $ | 3,727 | $ | 4,060 | $ | 3,712 | $ | 3,167 | $ | 3,061 | |||||||||||||||||||
| Merger-related costs | 607 | 961 | 812 | 290 | 208 | ||||||||||||||||||||||||
| Cost of services excluding Merger-related costs | $ | 3,120 | $ | 3,099 | $ | 2,900 | $ | 2,877 | $ | 2,853 | |||||||||||||||||||
| Cost of equipment sales | $ | 5,946 | $ | 5,108 | $ | 4,982 | $ | 5,504 | $ | 4,588 | |||||||||||||||||||
| Merger-related costs | 751 | 459 | 258 | 56 | (9) | ||||||||||||||||||||||||
| Cost of equipment sales excluding Merger-related costs | $ | 5,195 | $ | 4,649 | $ | 4,724 | $ | 5,448 | $ | 4,597 | |||||||||||||||||||
| Selling, general and administrative | $ | 5,056 | $ | 5,856 | $ | 5,118 | $ | 5,577 | $ | 5,425 | |||||||||||||||||||
| Merger-related costs | 55 | 248 | 226 | 246 | 159 | ||||||||||||||||||||||||
| Selling, general and administrative excluding Merger-related costs | $ | 5,001 | $ | 5,608 | $ | 4,892 | $ | 5,331 | $ | 5,266 | |||||||||||||||||||
| Total bad debt expense and losses from sales of receivables | $ | 256 | $ | 373 | $ | 300 | $ | 311 | $ | 260 | |||||||||||||||||||
| Bad debt and losses from sales of receivables as a percentage of Total revenues | 1.3 | % | 1.9 | % | 1.5 | % | 1.5 | % | 1.3 | % | |||||||||||||||||||
| Cash purchases of property and equipment including capitalized interest | $ | 3,381 | $ | 3,572 | $ | 3,634 | $ | 3,383 | $ | 3,001 | |||||||||||||||||||
| Capitalized interest | 15 | 13 | 16 | 17 | 14 | ||||||||||||||||||||||||
| Net cash proceeds from securitization | (3) | (10) | (18) | (26) | (29) | ||||||||||||||||||||||||
| Operating Measures | |||||||||||||||||||||||||||||
| Postpaid ARPA | $ | 136.53 | $ | 137.92 | $ | 137.49 | $ | 137.78 | $ | 138.04 | |||||||||||||||||||
| Postpaid phone ARPU | 48.41 | 48.96 | 48.89 | 48.86 | 48.63 | ||||||||||||||||||||||||
| Prepaid ARPU | 39.19 | 38.71 | 38.86 | 38.29 | 37.98 | ||||||||||||||||||||||||
| ||
|
24 |
||||
| Quarter | |||||||||||||||||||||||||||||
| (in millions) | Q1 2022 | Q2 2022 | Q3 2022 | Q4 2022 | Q1 2023 | ||||||||||||||||||||||||
| Net income (loss) | $ | 713 | $ | (108) | $ | 508 | $ | 1,477 | $ | 1,940 | |||||||||||||||||||
| Adjustments: | |||||||||||||||||||||||||||||
| Interest expense, net | 864 | 851 | 827 | 822 | 835 | ||||||||||||||||||||||||
| Other expense (income), net | 11 | 21 | 3 | (2) | (9) | ||||||||||||||||||||||||
| Income tax expense (benefit) | 218 | (55) | (57) | 450 | 631 | ||||||||||||||||||||||||
| Operating income | 1,806 | 709 | 1,281 | 2,747 | 3,397 | ||||||||||||||||||||||||
| Depreciation and amortization | 3,585 | 3,491 | 3,313 | 3,262 | 3,203 | ||||||||||||||||||||||||
Stock-based compensation (1) |
136 | 149 | 145 | 146 | 173 | ||||||||||||||||||||||||
| Merger-related costs | 1,413 | 1,668 | 1,296 | 592 | 358 | ||||||||||||||||||||||||
| Impairment expense | — | 477 | — | — | — | ||||||||||||||||||||||||
Legal-related expenses (recoveries), net (2) |
— | 400 | (19) | 10 | (43) | ||||||||||||||||||||||||
| Loss (gain) on disposal group held for sale | — | — | 1,071 | 16 | (42) | ||||||||||||||||||||||||
Other, net (3) |
10 | 110 | (48) | 55 | 153 | ||||||||||||||||||||||||
| Adjusted EBITDA | 6,950 | 7,004 | 7,039 | 6,828 | 7,199 | ||||||||||||||||||||||||
| Lease revenues | (487) | (386) | (311) | (246) | (147) | ||||||||||||||||||||||||
| Core Adjusted EBITDA | $ | 6,463 | $ | 6,618 | $ | 6,728 | $ | 6,582 | $ | 7,052 | |||||||||||||||||||
| ||
|
25 |
||||
| (in millions, except net debt ratios) | Mar 31, 2022 |
Jun 30, 2022 |
Sep 30, 2022 |
Dec 31, 2022 |
Mar 31, 2023 |
||||||||||||||||||||||||
| Short-term debt | $ | 2,865 | $ | 2,942 | $ | 7,398 | $ | 5,164 | $ | 5,215 | |||||||||||||||||||
| Short-term debt to affiliates | 1,250 | — | — | — | — | ||||||||||||||||||||||||
| Short-term financing lease liabilities | 1,121 | 1,220 | 1,239 | 1,161 | 1,180 | ||||||||||||||||||||||||
| Long-term debt | 66,861 | 66,552 | 64,834 | 65,301 | 68,035 | ||||||||||||||||||||||||
| Long-term debt to affiliates | 1,494 | 1,495 | 1,495 | 1,495 | 1,495 | ||||||||||||||||||||||||
| Financing lease liabilities | 1,447 | 1,597 | 1,590 | 1,370 | 1,284 | ||||||||||||||||||||||||
| Less: Cash and cash equivalents | (3,245) | (3,151) | (6,888) | (4,507) | (4,540) | ||||||||||||||||||||||||
| Net debt (excluding tower obligations) | $ | 71,793 | $ | 70,655 | $ | 69,668 | $ | 69,984 | $ | 72,669 | |||||||||||||||||||
| Divided by: Last twelve months Net income | $ | 2,804 | $ | 1,718 | $ | 1,535 | $ | 2,590 | $ | 3,817 | |||||||||||||||||||
| Net debt (excluding tower obligations) to LTM Net income Ratio | 25.6 | 41.1 | 45.4 | 27.0 | 19.0 | ||||||||||||||||||||||||
| Divided by: Last twelve months Adjusted EBITDA | $ | 26,969 | $ | 27,067 | $ | 27,295 | $ | 27,821 | $ | 28,070 | |||||||||||||||||||
| Net debt (excluding tower obligations) to LTM Adjusted EBITDA Ratio | 2.7 | 2.6 | 2.6 | 2.5 | 2.6 | ||||||||||||||||||||||||
| Divided by: Last twelve months Core Adjusted EBITDA | $ | 24,175 | $ | 24,801 | $ | 25,488 | $ | 26,391 | $ | 26,980 | |||||||||||||||||||
| Net debt (excluding tower obligations) to LTM Core Adjusted EBITDA Ratio | 3.0 | 2.8 | 2.7 | 2.7 | 2.7 | ||||||||||||||||||||||||
| Quarter | |||||||||||||||||||||||||||||
| (in millions) | Q1 2022 | Q2 2022 | Q3 2022 | Q4 2022 | Q1 2023 | ||||||||||||||||||||||||
| Net cash provided by operating activities | $ | 3,845 | $ | 4,209 | $ | 4,391 | $ | 4,336 | $ | 4,051 | |||||||||||||||||||
| Cash purchases of property and equipment, including capitalized interest | (3,381) | (3,572) | (3,634) | (3,383) | (3,001) | ||||||||||||||||||||||||
| Proceeds from sales of tower sites | — | — | — | 9 | 6 | ||||||||||||||||||||||||
| Proceeds related to beneficial interests in securitization transactions | 1,185 | 1,121 | 1,308 | 1,222 | 1,345 | ||||||||||||||||||||||||
| Adjusted Free Cash Flow | $ | 1,649 | $ | 1,758 | $ | 2,065 | $ | 2,184 | $ | 2,401 | |||||||||||||||||||
Net cash provided by operating activities margin |
25.4 | % | 27.5 | % | 28.6 | % | 27.9 | % | 26.1 | % | |||||||||||||||||||
Adjusted Free Cash Flow margin |
10.9 | % | 11.5 | % | 13.4 | % | 14.1 | % | 15.4 | % | |||||||||||||||||||
| ||
|
26 |
||||
| FY 2023 | |||||||||||
| (in millions) | Guidance Range | ||||||||||
| Net cash provided by operating activities | $ | 17,900 | $ | 18,300 | |||||||
| Cash purchases of property and equipment, including capitalized interest | (9,400) | (9,700) | |||||||||
Proceeds related to beneficial interests in securitization transactions (1) |
4,700 | 5,000 | |||||||||
| Adjusted Free Cash Flow | $ | 13,200 | $ | 13,600 | |||||||
| FY 2023 | |||||||||||
| (in millions) | Guidance Range | ||||||||||
| Net cash provided by operating activities | $ | 17,800 | $ | 18,300 | |||||||
| Cash purchases of property and equipment, including capitalized interest | (9,400) | (9,700) | |||||||||
Proceeds related to beneficial interests in securitization transactions (1) |
4,700 | 5,000 | |||||||||
| Adjusted Free Cash Flow | $ | 13,100 | $ | 13,600 | |||||||
| ||
|
27 |
||||
| ||
|
28 |
||||
| ||
|
29 |
||||
| ||