
| Delaware | 1-33409 | 20-0836269 | ||||||||||||
| (State or other jurisdiction | (Commission File Number) | (I.R.S. Employer | ||||||||||||
of incorporation) |
Identification No.) | |||||||||||||
☐ |
Written communications pursuant to Rule 425 under the Securities Act (17 CFR 230.425) | ||||
☐ |
Soliciting material pursuant to Rule 14a-12 under the Exchange Act (17 CFR 240.14a-12) | ||||
☐ |
Pre-commencement communications pursuant to Rule 14d-2(b) under the Exchange Act (17 CFR 240.14d-2(b)) | ||||
☐ |
Pre-commencement communications pursuant to Rule 13e-4(c) under the Exchange Act (17 CFR 240.13e-4(c)) | ||||
| Title of each class | Trading Symbol | Name of each exchange on which registered | ||||||||||||
| Common Stock, par value $0.00001 per share | TMUS | The NASDAQ Stock Market LLC | ||||||||||||
| Exhibit | Description | |||||||
| 104 | Cover Page Interactive Data File (formatted as inline XBRL and contained in Exhibit 101) | |||||||
| SIGNATURES | |||||||||||
T-MOBILE US, INC. |
|||||||||||
| October 27, 2022 | /s/ Peter Osvaldik | ||||||||||
| Peter Osvaldik Executive Vice President and Chief Financial Officer |
|||||||||||

| Quarter | Nine Months Ended September 30, | ||||||||||||||||||||||||||||
| (in thousands, except churn) | Q3 2022 | Q2 2022 | Q3 2021 | 2022 | 2021 | ||||||||||||||||||||||||
| Postpaid net account additions | 394 | 380 | 268 | 1,122 | 873 | ||||||||||||||||||||||||
| Total net customer additions | 1,732 | 1,802 | 1,325 | 4,914 | 4,038 | ||||||||||||||||||||||||
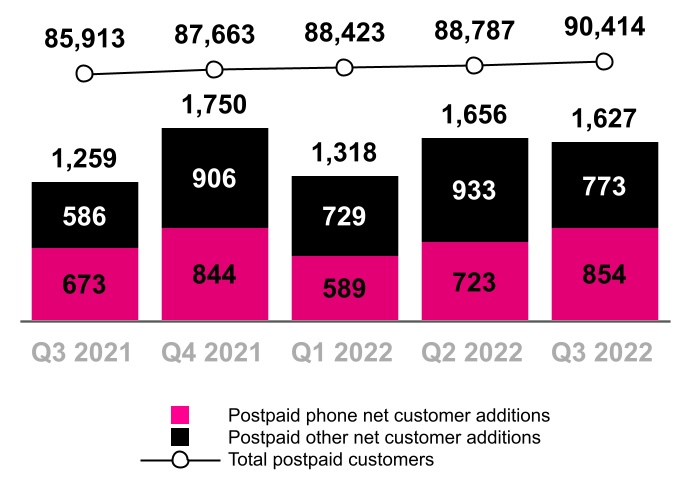
| Postpaid net customer additions | 1,627 | 1,656 | 1,259 | 4,601 | 3,745 | ||||||||||||||||||||||||
| Postpaid phone net customer additions | 854 | 723 | 673 | 2,166 | 2,073 | ||||||||||||||||||||||||
Postpaid other net customer additions (1) |
773 | 933 | 586 | 2,435 | 1,672 | ||||||||||||||||||||||||
Prepaid net customer additions (1) |
105 | 146 | 66 | 313 | 293 | ||||||||||||||||||||||||
Total customers, end of period (1)(2)(3) |
111,755 | 110,023 | 106,920 | 111,755 | 106,920 | ||||||||||||||||||||||||
| Postpaid phone churn | 0.88 | % | 0.80 | % | 0.96 | % | 0.87 | % | 0.93 | % | |||||||||||||||||||
| Prepaid churn | 2.88 | % | 2.58 | % | 2.90 | % | 2.71 | % | 2.76 | % | |||||||||||||||||||
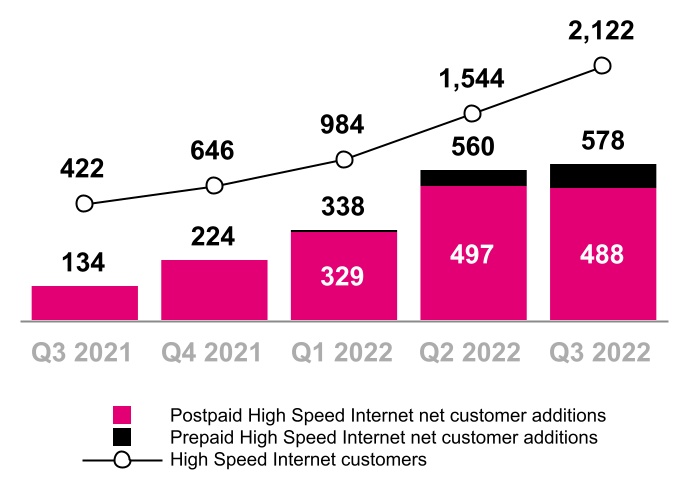
| High Speed Internet net customer additions | 578 | 560 | 134 | 1,476 | 322 | ||||||||||||||||||||||||
| Total High Speed Internet customers, end of period | 2,122 | 1,544 | 422 | 2,122 | 422 | ||||||||||||||||||||||||
| (in millions, except EPS) | Quarter | Nine Months Ended September 30, |
Q3 2022 vs.
Q2 2022
|
Q3 2022 vs.
Q3 2021
|
YTD 2022 vs.
YTD 2021
|
||||||||||||||||||||||||||||||||||||||||||
| Q3 2022 | Q2 2022 | Q3 2021 | 2022 | 2021 | |||||||||||||||||||||||||||||||||||||||||||
| Total service revenues | $ | 15,361 | $ | 15,316 | $ | 14,722 | $ | 45,805 | $ | 43,406 | 0.3 | % | 4.3 | % | 5.5 | % | |||||||||||||||||||||||||||||||
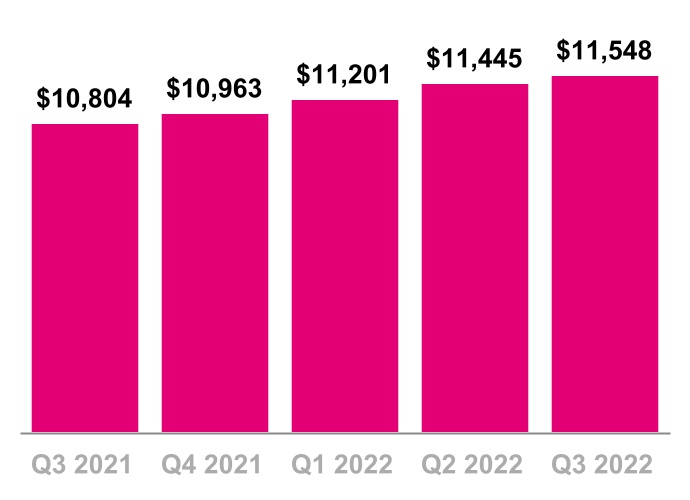
| Postpaid service revenues | 11,548 | 11,445 | 10,804 | 34,194 | 31,599 | 0.9 | % | 6.9 | % | 8.2 | % | ||||||||||||||||||||||||||||||||||||
| Total revenues | 19,477 | 19,701 | 19,624 | 59,298 | 59,333 | (1.1) | % | (0.7) | % | (0.1) | % | ||||||||||||||||||||||||||||||||||||
| Net (loss) income | 508 | (108) | 691 | 1,113 | 2,602 | NM | (26.5) | % | (57.2) | % | |||||||||||||||||||||||||||||||||||||
| Diluted EPS | 0.40 | (0.09) | 0.55 | 0.88 | 2.07 | NM | (27.3) | % | (57.5) | % | |||||||||||||||||||||||||||||||||||||
| Adjusted EBITDA | 7,039 | 7,004 | 6,811 | 20,993 | 20,622 | 0.5 | % | 3.3 | % | 1.8 | % | ||||||||||||||||||||||||||||||||||||
| Core Adjusted EBITDA | 6,728 | 6,618 | 6,041 | 19,809 | 17,897 | 1.7 | % | 11.4 | % | 10.7 | % | ||||||||||||||||||||||||||||||||||||
| Net cash provided by operating activities | 4,391 | 4,209 | 3,477 | 12,445 | 10,917 | 4.3 | % | 26.3 | % | 14.0 | % | ||||||||||||||||||||||||||||||||||||
| Cash purchases of property and equipment, including capitalized interest | 3,634 | 3,572 | 2,944 | 10,587 | 9,397 | 1.7 | % | 23.4 | % | 12.7 | % | ||||||||||||||||||||||||||||||||||||
Free Cash Flow |
2,065 | 1,758 | 1,559 | 5,472 | 4,534 | 17.5 | % | 32.5 | % | 20.7 | % | ||||||||||||||||||||||||||||||||||||
| (in millions, except Postpaid net customer additions) | Previous | Current | Change (Mid-point) | ||||||||||||||||||||||||||
| Postpaid net customer additions (thousands) | 6,000 | 6,300 | 6,200 | 6,400 | 150 | ||||||||||||||||||||||||
Net income (1) |
N/A | N/A | N/A | N/A | N/A | ||||||||||||||||||||||||
Core Adjusted EBITDA (2) |
$26,000 | $26,300 | $26,200 | $26,400 | $150 | ||||||||||||||||||||||||
| Merger synergies | 5,400 | 5,600 | 5,700 | 5,800 | 250 | ||||||||||||||||||||||||
Merger-related costs (3) |
4,700 | 5,000 | 4,800 | 5,000 | 50 | ||||||||||||||||||||||||
| Net cash provided by operating activities | 16,000 | 16,300 | 16,300 | 16,500 | 250 | ||||||||||||||||||||||||
Capital expenditures (4) |
13,500 | 13,700 | 13,700 | 13,900 | 200 | ||||||||||||||||||||||||
Free Cash Flow (5) |
7,300 | 7,600 | 7,400 | 7,600 | 50 | ||||||||||||||||||||||||
| Quarter | Nine Months Ended September 30, | ||||||||||||||||||||||||||||||||||||||||||||||||||||
| (in millions) | Q1 2021 | Q2 2021 | Q3 2021 | Q4 2021 | Q1 2022 | Q2 2022 | Q3 2022 | 2021 | 2022 | ||||||||||||||||||||||||||||||||||||||||||||
| Net income (loss) | $ | 933 | $ | 978 | $ | 691 | $ | 422 | $ | 713 | $ | (108) | $ | 508 | $ | 2,602 | $ | 1,113 | |||||||||||||||||||||||||||||||||||
| Adjustments: | |||||||||||||||||||||||||||||||||||||||||||||||||||||
| Interest expense, net | 835 | 850 | 836 | 821 | 864 | 851 | 827 | 2,521 | 2,542 | ||||||||||||||||||||||||||||||||||||||||||||
| Other expense, net | 125 | 1 | 60 | 13 | 11 | 21 | 3 | 186 | 35 | ||||||||||||||||||||||||||||||||||||||||||||
| Income tax expense (benefit) | 246 | 277 | (3) | (193) | 218 | (55) | (57) | 520 | 106 | ||||||||||||||||||||||||||||||||||||||||||||
| Operating income | 2,139 | 2,106 | 1,584 | 1,063 | 1,806 | 709 | 1,281 | 5,829 | 3,796 | ||||||||||||||||||||||||||||||||||||||||||||
| Depreciation and amortization | 4,289 | 4,077 | 4,145 | 3,872 | 3,585 | 3,491 | 3,313 | 12,511 | 10,389 | ||||||||||||||||||||||||||||||||||||||||||||
Stock-based compensation (1) |
130 | 129 | 127 | 135 | 136 | 149 | 145 | 386 | 430 | ||||||||||||||||||||||||||||||||||||||||||||
Merger-related costs |
298 | 611 | 955 | 1,243 | 1,413 | 1,668 | 1,296 | 1,864 | 4,377 | ||||||||||||||||||||||||||||||||||||||||||||
| Impairment expense | — | — | — | — | — | 477 | — | — | 477 | ||||||||||||||||||||||||||||||||||||||||||||
Legal-related expenses (recoveries), net (2) |
— | — | — | — | — | 400 | (19) | — | 381 | ||||||||||||||||||||||||||||||||||||||||||||
| Loss on disposal group held for sale | — | — | — | — | — | — | 1,071 | — | 1,071 | ||||||||||||||||||||||||||||||||||||||||||||
Other, net (3) |
49 | (17) | — | (11) | 10 | 110 | (48) | 32 | 72 | ||||||||||||||||||||||||||||||||||||||||||||
| Adjusted EBITDA | 6,905 | 6,906 | 6,811 | 6,302 | 6,950 | 7,004 | 7,039 | 20,622 | 20,993 | ||||||||||||||||||||||||||||||||||||||||||||
Lease revenues |
(1,041) | (914) | (770) | (623) | (487) | (386) | (311) | (2,725) | (1,184) | ||||||||||||||||||||||||||||||||||||||||||||
| Core Adjusted EBITDA | $ | 5,864 | $ | 5,992 | $ | 6,041 | $ | 5,679 | $ | 6,463 | $ | 6,618 | $ | 6,728 | $ | 17,897 | $ | 19,809 | |||||||||||||||||||||||||||||||||||
| Quarter | Nine Months Ended September 30, | ||||||||||||||||||||||||||||||||||||||||||||||||||||
| (in millions) | Q1 2021 | Q2 2021 | Q3 2021 | Q4 2021 | Q1 2022 | Q2 2022 | Q3 2022 | 2021 | 2022 | ||||||||||||||||||||||||||||||||||||||||||||
| Net cash provided by operating activities | $ | 3,661 | $ | 3,779 | $ | 3,477 | $ | 3,000 | $ | 3,845 | $ | 4,209 | $ | 4,391 | $ | 10,917 | $ | 12,445 | |||||||||||||||||||||||||||||||||||
| Cash purchases of property and equipment, including capitalized interest | (3,183) | (3,270) | (2,944) | (2,929) | (3,381) | (3,572) | (3,634) | (9,397) | (10,587) | ||||||||||||||||||||||||||||||||||||||||||||
| Proceeds from sales of tower sites | — | 31 | — | 9 | — | — | — | 31 | — | ||||||||||||||||||||||||||||||||||||||||||||
| Proceeds related to beneficial interests in securitization transactions | 891 | 1,137 | 1,071 | 1,032 | 1,185 | 1,121 | 1,308 | 3,099 | 3,614 | ||||||||||||||||||||||||||||||||||||||||||||
| Cash payments for debt prepayment or debt extinguishment costs | (65) | (6) | (45) | — | — | — | — | (116) | — | ||||||||||||||||||||||||||||||||||||||||||||
Free Cash Flow |
$ | 1,304 | $ | 1,671 | $ | 1,559 | $ | 1,112 | $ | 1,649 | $ | 1,758 | $ | 2,065 | $ | 4,534 | $ | 5,472 | |||||||||||||||||||||||||||||||||||
| FY 2022 | |||||||||||
| (in millions) | Guidance Range | ||||||||||
| Net cash provided by operating activities | $ | 16,300 | $ | 16,500 | |||||||
| Cash purchases of property and equipment, including capitalized interest | (13,700) | (13,900) | |||||||||
Proceeds related to beneficial interests in securitization transactions (1) |
4,800 | 5,000 | |||||||||
| Free Cash Flow | $ | 7,400 | $ | 7,600 | |||||||
| FY 2022 | |||||||||||
| (in millions) | Guidance Range | ||||||||||
| Net cash provided by operating activities | $ | 16,000 | $ | 16,300 | |||||||
| Cash purchases of property and equipment, including capitalized interest | (13,500) | (13,700) | |||||||||
Proceeds related to beneficial interests in securitization transactions (1) |
4,800 | 5,000 | |||||||||
| Free Cash Flow | $ | 7,300 | $ | 7,600 | |||||||
| (in dollars) | Quarter | Nine Months Ended September 30, | |||||||||||||||||||||||||||||||||||||||||||||||||||
| Q1 2021 | Q2 2021 | Q3 2021 | Q4 2021 | Q1 2022 | Q2 2022 | Q3 2022 | 2021 | 2022 | |||||||||||||||||||||||||||||||||||||||||||||
| Postpaid ARPA | $ | 132.91 | $ | 133.55 | $ | 134.54 | $ | 135.04 | $ | 136.53 | $ | 137.92 | $ | 137.49 | $ | 133.68 | $ | 137.32 | |||||||||||||||||||||||||||||||||||
| Postpaid phone ARPU | 47.30 | 47.61 | 48.06 | 48.03 | 48.41 | 48.96 | 48.89 | 47.66 | 48.75 | ||||||||||||||||||||||||||||||||||||||||||||
| Prepaid ARPU | 37.81 | 38.53 | 39.49 | 39.32 | 39.19 | 38.71 | 38.86 | 38.61 | 38.92 | ||||||||||||||||||||||||||||||||||||||||||||

 |
2 |
||||
| Highlights | ||||||||
| Customer Metrics | ||||||||
| Financial Metrics | ||||||||
| Capital Structure | ||||||||
| 5G Network Leadership | ||||||||
| Merger & Integration | ||||||||
| Guidance | ||||||||
| Contacts | ||||||||
| Financial and Operational Tables | ||||||||
 | ||
 |
3 |
||||
|
T-Mobile Delivers Industry-Leading Customer and Cash Flow Growth in Q3 2022 and Raises 2022 Guidance
for the Third Consecutive Quarter
|
||||||||||||||||||||
 | ||||||||||||||||||||
|
“We’ve always said our aspiration was to be the first and only provider to offer customers both the best network and the best value without having to sacrifice one for the other — and based on another set of standout customer and financial results for Q3, it's clear we’re delivering on that promise. On the heels of our highest ever postpaid account net additions and industry-leading postpaid and broadband customer growth, we are raising guidance for the third time this year. Our Un-carrier playbook continues to win in this ever-changing competitive and macro-economic climate and our momentum is only getting stronger.”
|
||||||||||||||||||||
| Mike Sievert, CEO | ||||||||||||||||||||
| ||
 |
4 |
||||
|
Postpaid Accounts
(in thousands)
|
|||||

| Year-Over-Year | ||
| Sequential | ||
| Year-Over-Year | ||
| Sequential | ||
| Postpaid ARPA & Postpaid Phone ARPU | |||||

| ||
|
5 |
||||
|
Postpaid Customers
(in thousands)
|
|||||
| Year-Over-Year | ||
| Sequential | ||
| Year-Over-Year | ||
| Sequential | ||
| Postpaid Phone Churn | |||||

| ||
|
6 |
||||
|
Prepaid Customers
(in thousands)
|
|||||

| Year-Over-Year | ||
| Sequential | ||
| Year-Over-Year | ||
| Sequential | ||
|
High Speed Internet Customers
(in thousands)
|
|||||
| ||
 |
7 |
||||
|
Service Revenues
($ in millions)
|
|||||

| Year-Over-Year | ||
| Sequential | ||
| Year-Over-Year | ||
| Sequential | ||
|
Postpaid Service Revenues
($ in millions)
|
|||||
| ||
|
8 |
||||
|
Equipment Revenues
($ in millions)
|
|||||

| Year-Over-Year | ||
| Sequential | ||
| Year-Over-Year | ||
| Sequential | ||
|
Cost of Equipment Sales, exclusive of D&A
($ in millions)
|
|||||

| ||
|
9 |
||||
|
Cost of Services, exclusive of D&A
($ in millions, % of Service revenues)
|
|||||

| Year-Over-Year | ||
| Sequential | ||
| Year-Over-Year | ||
| Sequential | ||
|
Selling, General and Administrative (SG&A) Expense
($ in millions, % of Service revenues)
|
|||||

| ||
|
10 |
||||
|
Net Income (Loss)
($ in millions, % of Service revenues)
|
|||||

|
Diluted Earnings (Loss) Per Share
(Diluted EPS)
|
|||||

| Year-Over-Year | ||
| Sequential | ||
| ||
|
11 |
||||
|
Core Adjusted EBITDA*
($ in millions, % of Service revenues)
|
|||||

| Year-Over-Year | ||
| Sequential | ||
| Year-Over-Year | ||
| Sequential | ||
|
Net Cash Provided by Operating Activities
($ in millions)
|
|||||

| ||
|
12 |
||||
|
Cash Purchases of Property and Equipment
($ in millions, % of Service revenues)
|
|||||

| Year-Over-Year | ||
| Sequential | ||
| Year-Over-Year | ||
| Sequential | ||
|
Free Cash Flow
($ in millions)
|
|||||

| ||
 |
13 |
||||
|
Net Debt (Excluding Tower Obligations) & Net Debt to LTM Core Adj. EBITDA Ratio
($ in billions)
|
|||||

| ||
 |
14 |
||||

| ||
 |
15 |
||||
|
Based on the continued strength of execution,
T-Mobile is raising its merger synergies guidance range to $5.7 billion to $5.8 billion in 2022.
|
||||||||||||||
|
The company expects full-year 2022 Merger synergies to be $5.7 billion to $5.8 billion:
▪Approximately $2.4 billion of SG&A expense reductions.
▪Approximately $2.0 billion to $2.1 billion of cost of service expense reductions achieved through network efficiencies
▪Approximately $1.3 billion of savings related to avoided network site builds
| ||||||||||||||
| Merger-Related Costs | |||||||||||||||||||||||||||||||||||||||||||||||||||||
| (in millions, excl. EPS) | |||||||||||||||||||||||||||||||||||||||||||||||||||||
| Sequential Change | Year-Over-Year Change | ||||||||||||||||||||||||||||||||||||||||||||||||||||
| Q3 2021 | Q4 2021 | Q1 2022 | Q2 2022 | Q3 2022 | $ | % | $ | % | |||||||||||||||||||||||||||||||||||||||||||||
| Cost of services | $ | 279 | $ | 327 | $ | 607 | $ | 961 | $ | 812 | $ | (149) | (16) | % | $ | 533 | 191 | % | |||||||||||||||||||||||||||||||||||
| Cost of equipment sales | 236 | 678 | 751 | 459 | 258 | (201) | (44) | % | 22 | 9 | % | ||||||||||||||||||||||||||||||||||||||||||
| Selling, general & administrative | 440 | 238 | 55 | 248 | 226 | (22) | (9) | % | (214) | (49) | % | ||||||||||||||||||||||||||||||||||||||||||
| Total Merger-related costs | $ | 955 | $ | 1,243 | $ | 1,413 | $ | 1,668 | $ | 1,296 | $ | (372) | (22) | % | $ | 341 | 36 | % | |||||||||||||||||||||||||||||||||||
| Total Merger-related costs, net of tax |
$ | 707 | $ | 950 | $ | 1,059 | $ | 1,252 | $ | 972 | $ | (280) | (22) | % | $ | 265 | 37 | % | |||||||||||||||||||||||||||||||||||
| Diluted EPS impact of Merger-related costs | $0.56 | $0.76 | $0.84 | $1.00 | $0.77 | $ | (0.23) | (23) | % | $ | 0.21 | 38 | % | ||||||||||||||||||||||||||||||||||||||||
| Net cash payments for Merger-related costs |
$ | 617 | $ | 1,086 | $ | 893 | $ | 907 | $ | 942 | $ | 35 | 4 | % | $ | 325 | 53 | % | |||||||||||||||||||||||||||||||||||
| ||
 |
16 |
||||
| Metric | Previous | Revised | Change at Midpoint | ||||||||
| Postpaid net customer additions | 6.0 to 6.3 million |
6.2 to 6.4 million |
150 thousand |
||||||||
Net income (1) |
N/A | N/A | N/A | ||||||||
Core Adjusted EBITDA (2) |
$26.0 to $26.3 billion |
$26.2 to $26.4 billion |
$150 million |
||||||||
| Merger synergies | $5.4 to $5.6 billion |
$5.7 to $5.8 billion |
$250 million |
||||||||
Merger-related costs (3) |
$4.7 to $5.0 billion |
$4.8 to $5.0 billion |
$50 million |
||||||||
| Net cash provided by operating activities | $16.0 to $16.3 billion |
$16.3 to $16.5 billion |
$250 million |
||||||||
Capital expenditures (4) |
$13.5 to $13.7 billion |
$13.7 to $13.9 billion |
$200 million |
||||||||
Free Cash Flow (5) |
$7.3 to $7.6 billion |
$7.4 to $7.6 billion |
$50 million |
||||||||
| ||
 |
17 |
||||
 |
 |
 |
||||||||||||||||||
| Jud Henry | Justin Taiber | Trina Schurman | ||||||||||||||||||
| Senior Vice President | Senior Director | Senior Director | ||||||||||||||||||
| Investor Relations | Investor Relations | Investor Relations | ||||||||||||||||||
 |
 |
 |
 |
|||||||||||||||||||||||
| Samia Bhatti | Zach Witterstaetter | Rose Kopecky | Jacob Marks | |||||||||||||||||||||||
| Investor Relations | Investor Relations | Investor Relations | Investor Relations | |||||||||||||||||||||||
| Manager | Manager | Manager | Manager | |||||||||||||||||||||||
| ||
| (in millions, except share and per share amounts) | September 30, 2022 |
December 31, 2021 |
|||||||||
| Assets | |||||||||||
| Current assets | |||||||||||
| Cash and cash equivalents | $ | 6,888 | $ | 6,631 | |||||||
| Accounts receivable, net of allowance for credit losses of $161 and $146 | 4,324 | 4,194 | |||||||||
Equipment installment plan receivables, net of allowance for credit losses and imputed discount of $624 and $494 |
5,048 | 4,748 | |||||||||
| Inventory | 2,247 | 2,567 | |||||||||
| Prepaid expenses | 711 | 746 | |||||||||
| Other current assets | 2,209 | 2,005 | |||||||||
| Total current assets | 21,427 | 20,891 | |||||||||
| Property and equipment, net | 41,034 | 39,803 | |||||||||
| Operating lease right-of-use assets | 29,264 | 26,959 | |||||||||
| Financing lease right-of-use assets | 3,619 | 3,322 | |||||||||
| Goodwill | 12,234 | 12,188 | |||||||||
| Spectrum licenses | 95,767 | 92,606 | |||||||||
| Other intangible assets, net | 3,763 | 4,733 | |||||||||
Equipment installment plan receivables due after one year, net of allowance for credit losses and imputed discount of $125 and $136 |
2,514 | 2,829 | |||||||||
| Other assets | 3,877 | 3,232 | |||||||||
| Total assets | $ | 213,499 | $ | 206,563 | |||||||
| Liabilities and Stockholders' Equity | |||||||||||
| Current liabilities | |||||||||||
| Accounts payable and accrued liabilities | $ | 11,971 | $ | 11,405 | |||||||
| Short-term debt | 7,398 | 3,378 | |||||||||
| Short-term debt to affiliates | — | 2,245 | |||||||||
| Deferred revenue | 777 | 856 | |||||||||
| Short-term operating lease liabilities | 3,367 | 3,425 | |||||||||
| Short-term financing lease liabilities | 1,239 | 1,120 | |||||||||
| Other current liabilities | 1,610 | 1,070 | |||||||||
| Total current liabilities | 26,362 | 23,499 | |||||||||
| Long-term debt | 64,834 | 67,076 | |||||||||
| Long-term debt to affiliates | 1,495 | 1,494 | |||||||||
| Tower obligations | 3,970 | 2,806 | |||||||||
| Deferred tax liabilities | 10,397 | 10,216 | |||||||||
| Operating lease liabilities | 30,271 | 25,818 | |||||||||
| Financing lease liabilities | 1,590 | 1,455 | |||||||||
| Other long-term liabilities | 4,430 | 5,097 | |||||||||
| Total long-term liabilities | 116,987 | 113,962 | |||||||||
| Commitments and contingencies | |||||||||||
| Stockholders' equity | |||||||||||
| Common Stock, par value $0.00001 per share, 2,000,000,000 shares authorized; 1,256,555,323 and 1,250,751,148 shares issued, 1,250,104,426 and 1,249,213,681 shares outstanding | — | — | |||||||||
| Additional paid-in capital | 73,797 | 73,292 | |||||||||
| Treasury stock, at cost, 6,450,896 and 1,537,468 shares issued | (685) | (13) | |||||||||
| Accumulated other comprehensive loss | (1,263) | (1,365) | |||||||||
| Accumulated deficit | (1,699) | (2,812) | |||||||||
| Total stockholders' equity | 70,150 | 69,102 | |||||||||
| Total liabilities and stockholders' equity | $ | 213,499 | $ | 206,563 | |||||||
| ||
| Three Months Ended | Nine Months Ended September 30, | ||||||||||||||||||||||||||||
| (in millions, except share and per share amounts) | September 30, 2022 |
June 30, 2022 |
September 30, 2021 |
2022 | 2021 | ||||||||||||||||||||||||
| Revenues | |||||||||||||||||||||||||||||
| Postpaid revenues | $ | 11,548 | $ | 11,445 | $ | 10,804 | $ | 34,194 | $ | 31,599 | |||||||||||||||||||
| Prepaid revenues | 2,484 | 2,469 | 2,481 | 7,408 | 7,259 | ||||||||||||||||||||||||
| Wholesale and other service revenues | 1,329 | 1,402 | 1,437 | 4,203 | 4,548 | ||||||||||||||||||||||||
| Total service revenues | 15,361 | 15,316 | 14,722 | 45,805 | 43,406 | ||||||||||||||||||||||||
| Equipment revenues | 3,855 | 4,130 | 4,660 | 12,679 | 15,221 | ||||||||||||||||||||||||
| Other revenues | 261 | 255 | 242 | 814 | 706 | ||||||||||||||||||||||||
| Total revenues | 19,477 | 19,701 | 19,624 | 59,298 | 59,333 | ||||||||||||||||||||||||
| Operating expenses | |||||||||||||||||||||||||||||
| Cost of services, exclusive of depreciation and amortization shown separately below | 3,712 | 4,060 | 3,538 | 11,499 | 10,413 | ||||||||||||||||||||||||
| Cost of equipment sales, exclusive of depreciation and amortization shown separately below | 4,982 | 5,108 | 5,145 | 16,036 | 15,740 | ||||||||||||||||||||||||
| Selling, general and administrative | 5,118 | 5,856 | 5,212 | 16,030 | 14,840 | ||||||||||||||||||||||||
| Impairment expense | — | 477 | — | 477 | — | ||||||||||||||||||||||||
| Loss on disposal group held for sale | 1,071 | — | — | 1,071 | — | ||||||||||||||||||||||||
| Depreciation and amortization | 3,313 | 3,491 | 4,145 | 10,389 | 12,511 | ||||||||||||||||||||||||
| Total operating expenses | 18,196 | 18,992 | 18,040 | 55,502 | 53,504 | ||||||||||||||||||||||||
| Operating income | 1,281 | 709 | 1,584 | 3,796 | 5,829 | ||||||||||||||||||||||||
| Other expense, net | |||||||||||||||||||||||||||||
| Interest expense, net | (827) | (851) | (836) | (2,542) | (2,521) | ||||||||||||||||||||||||
| Other expense, net | (3) | (21) | (60) | (35) | (186) | ||||||||||||||||||||||||
| Total other expense, net | (830) | (872) | (896) | (2,577) | (2,707) | ||||||||||||||||||||||||
| Income (loss) before income taxes | 451 | (163) | 688 | 1,219 | 3,122 | ||||||||||||||||||||||||
| Income tax benefit (expense) | 57 | 55 | 3 | (106) | (520) | ||||||||||||||||||||||||
| Net income (loss) | $ | 508 | $ | (108) | $ | 691 | $ | 1,113 | $ | 2,602 | |||||||||||||||||||
| Net income (loss) | $ | 508 | $ | (108) | $ | 691 | $ | 1,113 | $ | 2,602 | |||||||||||||||||||
| Other comprehensive income, net of tax | |||||||||||||||||||||||||||||
Reclassification of loss from cash flow hedges, net of tax effect of $13, $13, $12, $39, and $36 |
39 | 37 | 35 | 113 | 103 | ||||||||||||||||||||||||
Unrealized loss on foreign currency translation adjustment, net of tax effect of $0, $(1), $0, $(1) and $0 |
(7) | (3) | (3) | (11) | — | ||||||||||||||||||||||||
| Other comprehensive income | 32 | 34 | 32 | 102 | 103 | ||||||||||||||||||||||||
| Total comprehensive income (loss) | $ | 540 | $ | (74) | $ | 723 | $ | 1,215 | $ | 2,705 | |||||||||||||||||||
| Earnings (loss) per share | |||||||||||||||||||||||||||||
| Basic | $ | 0.40 | $ | (0.09) | $ | 0.55 | $ | 0.89 | $ | 2.09 | |||||||||||||||||||
| Diluted | $ | 0.40 | $ | (0.09) | $ | 0.55 | $ | 0.88 | $ | 2.07 | |||||||||||||||||||
| Weighted-average shares outstanding | |||||||||||||||||||||||||||||
| Basic | 1,253,873,429 | 1,253,932,986 | 1,248,189,719 | 1,252,783,140 | 1,246,441,464 | ||||||||||||||||||||||||
| Diluted | 1,259,210,271 | 1,253,932,986 | 1,253,661,245 | 1,258,061,478 | 1,254,391,787 | ||||||||||||||||||||||||
| ||
| Three Months Ended | Nine Months Ended September 30, | ||||||||||||||||||||||||||||
| (in millions) | September 30, 2022 |
June 30, 2022 |
September 30, 2021 |
2022 | 2021 | ||||||||||||||||||||||||
| Operating activities | |||||||||||||||||||||||||||||
| Net income (loss) | $ | 508 | $ | (108) | $ | 691 | $ | 1,113 | $ | 2,602 | |||||||||||||||||||
| Adjustments to reconcile net income to net cash provided by operating activities | |||||||||||||||||||||||||||||
| Depreciation and amortization | 3,313 | 3,491 | 4,145 | 10,389 | 12,511 | ||||||||||||||||||||||||
| Stock-based compensation expense | 150 | 154 | 131 | 445 | 403 | ||||||||||||||||||||||||
| Deferred income tax (benefit) expense | (36) | (76) | (27) | 73 | 410 | ||||||||||||||||||||||||
| Bad debt expense | 239 | 311 | 105 | 760 | 259 | ||||||||||||||||||||||||
| Losses (gains) from sales of receivables | 60 | 62 | 4 | 168 | (26) | ||||||||||||||||||||||||
| Losses on redemption of debt | — | — | 55 | — | 184 | ||||||||||||||||||||||||
| Impairment expense | — | 477 | — | 477 | — | ||||||||||||||||||||||||
| Loss on remeasurement of disposal group held for sale | 371 | — | — | 371 | — | ||||||||||||||||||||||||
| Changes in operating assets and liabilities | |||||||||||||||||||||||||||||
| Accounts receivable | (1,224) | (1,573) | (454) | (3,781) | (2,197) | ||||||||||||||||||||||||
| Equipment installment plan receivables | (77) | (189) | (530) | (801) | (1,825) | ||||||||||||||||||||||||
| Inventories | (7) | 484 | 41 | 384 | 904 | ||||||||||||||||||||||||
| Operating lease right-of-use assets | 1,113 | 1,693 | 1,334 | 4,275 | 3,730 | ||||||||||||||||||||||||
| Other current and long-term assets | (334) | (112) | (88) | (450) | (188) | ||||||||||||||||||||||||
| Accounts payable and accrued liabilities | 342 | 36 | 111 | 319 | (1,245) | ||||||||||||||||||||||||
| Short- and long-term operating lease liabilities | (700) | (747) | (2,046) | (2,218) | (4,411) | ||||||||||||||||||||||||
| Other current and long-term liabilities | 550 | 200 | (87) | 587 | (351) | ||||||||||||||||||||||||
| Other, net | 123 | 106 | 92 | 334 | 157 | ||||||||||||||||||||||||
| Net cash provided by operating activities | 4,391 | 4,209 | 3,477 | 12,445 | 10,917 | ||||||||||||||||||||||||
| Investing activities | |||||||||||||||||||||||||||||
Purchases of property and equipment, including capitalized interest of $(16), $(13), $(46), $(44) and $(187) |
(3,634) | (3,572) | (2,944) | (10,587) | (9,397) | ||||||||||||||||||||||||
| Purchases of spectrum licenses and other intangible assets, including deposits | (360) | (116) | (407) | (3,319) | (9,337) | ||||||||||||||||||||||||
| Proceeds from sales of tower sites | — | — | — | — | 31 | ||||||||||||||||||||||||
| Proceeds related to beneficial interests in securitization transactions | 1,308 | 1,121 | 1,071 | 3,614 | 3,099 | ||||||||||||||||||||||||
| Acquisition of companies, net of cash and restricted cash acquired | — | — | (1,886) | (52) | (1,916) | ||||||||||||||||||||||||
| Other, net | 131 | 8 | 14 | 138 | 46 | ||||||||||||||||||||||||
| Net cash used in investing activities | (2,555) | (2,559) | (4,152) | (10,206) | (17,474) | ||||||||||||||||||||||||
| Financing activities | |||||||||||||||||||||||||||||
| Proceeds from issuance of long-term debt | 2,972 | — | 1,989 | 2,972 | 11,758 | ||||||||||||||||||||||||
| Repayments of financing lease obligations | (311) | (288) | (266) | (901) | (822) | ||||||||||||||||||||||||
| Repayments of short-term debt for purchases of inventory, property and equipment and other financial liabilities | — | — | (76) | — | (167) | ||||||||||||||||||||||||
| Repayments of long-term debt | (132) | (1,381) | (4,600) | (3,145) | (9,969) | ||||||||||||||||||||||||
| Repurchases of common stock | (557) | — | — | (557) | — | ||||||||||||||||||||||||
| Tax withholdings on share-based awards | (10) | (43) | (14) | (225) | (308) | ||||||||||||||||||||||||
| Cash payments for debt prepayment or debt extinguishment costs | — | — | (45) | — | (116) | ||||||||||||||||||||||||
| Other, net | (35) | (32) | (48) | (97) | (139) | ||||||||||||||||||||||||
| Net cash provided by (used in) financing activities | 1,927 | (1,744) | (3,060) | (1,953) | 237 | ||||||||||||||||||||||||
| Change in cash and cash equivalents, including restricted cash and cash held for sale | 3,763 | (94) | (3,735) | 286 | (6,320) | ||||||||||||||||||||||||
| Cash and cash equivalents, including restricted cash and cash held for sale | |||||||||||||||||||||||||||||
| Beginning of period | 3,226 | 3,320 | 7,878 | 6,703 | 10,463 | ||||||||||||||||||||||||
| End of period | $ | 6,989 | $ | 3,226 | $ | 4,143 | $ | 6,989 | $ | 4,143 | |||||||||||||||||||
| ||
| Three Months Ended | Nine Months Ended September 30, | ||||||||||||||||||||||||||||
| (in millions) | September 30, 2022 |
June 30, 2022 |
September 30, 2021 |
2022 | 2021 | ||||||||||||||||||||||||
| Supplemental disclosure of cash flow information | |||||||||||||||||||||||||||||
| Interest payments, net of amounts capitalized | $ | 781 | $ | 989 | $ | 884 | $ | 2,548 | $ | 2,742 | |||||||||||||||||||
| Operating lease payments | 1,073 | 1,042 | 2,251 | 3,163 | 5,165 | ||||||||||||||||||||||||
| Income tax payments | 12 | 63 | 38 | 75 | 123 | ||||||||||||||||||||||||
| Non-cash investing and financing activities | |||||||||||||||||||||||||||||
| Non-cash beneficial interest obtained in exchange for securitized receivables | $ | 1,181 | $ | 990 | $ | 891 | $ | 3,189 | $ | 3,361 | |||||||||||||||||||
| Change in accounts payable and accrued liabilities for purchases of property and equipment | 390 | (68) | 113 | 139 | (427) | ||||||||||||||||||||||||
| Leased devices transferred from inventory to property and equipment | 67 | 83 | 214 | 279 | 1,032 | ||||||||||||||||||||||||
| Returned leased devices transferred from property and equipment to inventory | (65) | (95) | (309) | (343) | (1,170) | ||||||||||||||||||||||||
| Increase in Tower obligations from contract modification | — | — | — | 1,158 | — | ||||||||||||||||||||||||
| Operating lease right-of-use assets obtained in exchange for lease obligations | 479 | 591 | 985 | 7,045 | 2,939 | ||||||||||||||||||||||||
| Financing lease right-of-use assets obtained in exchange for lease obligations | 348 | 551 | 623 | 1,197 | 1,109 | ||||||||||||||||||||||||
| ||
| Quarter | Nine Months Ended September 30, | ||||||||||||||||||||||||||||||||||||||||||||||||||||
| (in thousands) | Q1 2021 | Q2 2021 | Q3 2021 | Q4 2021 | Q1 2022 | Q2 2022 | Q3 2022 | 2021 | 2022 | ||||||||||||||||||||||||||||||||||||||||||||
| Customers, end of period | |||||||||||||||||||||||||||||||||||||||||||||||||||||
Postpaid phone customers (1)(2) |
67,402 | 68,029 | 69,418 | 70,262 | 70,656 | 71,053 | 71,907 | 69,418 | 71,907 | ||||||||||||||||||||||||||||||||||||||||||||
Postpaid other customers (1)(2) |
15,170 | 15,819 | 16,495 | 17,401 | 17,767 | 17,734 | 18,507 | 16,495 | 18,507 | ||||||||||||||||||||||||||||||||||||||||||||
| Total postpaid customers | 82,572 | 83,848 | 85,913 | 87,663 | 88,423 | 88,787 | 90,414 | 85,913 | 90,414 | ||||||||||||||||||||||||||||||||||||||||||||
Prepaid customers (1) |
20,865 | 20,941 | 21,007 | 21,056 | 21,118 | 21,236 | 21,341 | 21,007 | 21,341 | ||||||||||||||||||||||||||||||||||||||||||||
| Total customers | 103,437 | 104,789 | 106,920 | 108,719 | 109,541 | 110,023 | 111,755 | 106,920 | 111,755 | ||||||||||||||||||||||||||||||||||||||||||||
Adjustments to customers (1)(2) |
12 | — | 806 | — | (558) | (1,320) | — | 818 | (1,878) | ||||||||||||||||||||||||||||||||||||||||||||
| Quarter | Nine Months Ended September 30, | ||||||||||||||||||||||||||||||||||||||||||||||||||||
| (in thousands) | Q1 2021 | Q2 2021 | Q3 2021 | Q4 2021 | Q1 2022 | Q2 2022 | Q3 2022 | 2021 | 2022 | ||||||||||||||||||||||||||||||||||||||||||||
| Net customer additions | |||||||||||||||||||||||||||||||||||||||||||||||||||||
| Postpaid phone customers | 773 | 627 | 673 | 844 | 589 | 723 | 854 | 2,073 | 2,166 | ||||||||||||||||||||||||||||||||||||||||||||
| Postpaid other customers | 437 | 649 | 586 | 906 | 729 | 933 | 773 | 1,672 | 2,435 | ||||||||||||||||||||||||||||||||||||||||||||
| Total postpaid customers | 1,210 | 1,276 | 1,259 | 1,750 | 1,318 | 1,656 | 1,627 | 3,745 | 4,601 | ||||||||||||||||||||||||||||||||||||||||||||
| Prepaid customers | 151 | 76 | 66 | 49 | 62 | 146 | 105 | 293 | 313 | ||||||||||||||||||||||||||||||||||||||||||||
| Total customers | 1,361 | 1,352 | 1,325 | 1,799 | 1,380 | 1,802 | 1,732 | 4,038 | 4,914 | ||||||||||||||||||||||||||||||||||||||||||||
| Migrations from prepaid to postpaid plans | 170 | 190 | 175 | 205 | 165 | 155 | 155 | 535 | 475 | ||||||||||||||||||||||||||||||||||||||||||||
| Quarter | Nine Months Ended September 30, | ||||||||||||||||||||||||||||||||||||||||||||||||||||
| (in millions, except percentages) | Q1 2021 | Q2 2021 | Q3 2021 | Q4 2021 | Q1 2022 | Q2 2022 | Q3 2022 | 2021 | 2022 | ||||||||||||||||||||||||||||||||||||||||||||
| Devices sold or leased | |||||||||||||||||||||||||||||||||||||||||||||||||||||
| Phones | 9.6 | 9.6 | 9.8 | 11.6 | 9.7 | 8.8 | 8.4 | 29.0 | 26.9 | ||||||||||||||||||||||||||||||||||||||||||||
| Mobile broadband and IoT devices | 1.0 | 1.4 | 1.5 | 2.2 | 1.8 | 1.9 | 2.0 | 3.9 | 5.7 | ||||||||||||||||||||||||||||||||||||||||||||
| Total | 10.6 | 11.0 | 11.3 | 13.8 | 11.5 | 10.7 | 10.4 | 32.9 | 32.6 | ||||||||||||||||||||||||||||||||||||||||||||
| Postpaid device upgrade rate | 4.8 | % | 4.7 | % | 4.3 | % | 5.8 | % | 4.8 | % | 4.1 | % | 3.8 | % | 13.8 | % | 12.7 | % | |||||||||||||||||||||||||||||||||||
| Quarter | Nine Months Ended September 30, | ||||||||||||||||||||||||||||||||||||||||||||||||||||
| Q1 2021 | Q2 2021 | Q3 2021 | Q4 2021 | Q1 2022 | Q2 2022 | Q3 2022 | 2021 | 2022 | |||||||||||||||||||||||||||||||||||||||||||||
| Churn | |||||||||||||||||||||||||||||||||||||||||||||||||||||
| Postpaid phone churn | 0.98 | % | 0.87 | % | 0.96 | % | 1.10 | % | 0.93 | % | 0.80 | % | 0.88 | % | 0.93 | % | 0.87 | % | |||||||||||||||||||||||||||||||||||
| Prepaid churn | 2.78 | % | 2.62 | % | 2.90 | % | 3.01 | % | 2.67 | % | 2.58 | % | 2.88 | % | 2.76 | % | 2.71 | % | |||||||||||||||||||||||||||||||||||
| ||
| Quarter | Nine Months Ended September 30, | ||||||||||||||||||||||||||||||||||||||||||||||||||||
| (in thousands) | Q1 2021 | Q2 2021 | Q3 2021 | Q4 2021 | Q1 2022 | Q2 2022 | Q3 2022 | 2021 | 2022 | ||||||||||||||||||||||||||||||||||||||||||||
| Accounts, end of period | |||||||||||||||||||||||||||||||||||||||||||||||||||||
Total postpaid customer accounts (1)(2) |
26,014 | 26,363 | 26,901 | 27,216 | 27,507 | 27,818 | 28,212 | 26,901 | 28,212 | ||||||||||||||||||||||||||||||||||||||||||||
| Quarter | Nine Months Ended September 30, | ||||||||||||||||||||||||||||||||||||||||||||||||||||
| (in thousands) | Q1 2021 | Q2 2021 | Q3 2021 | Q4 2021 | Q1 2022 | Q2 2022 | Q3 2022 | 2021 | 2022 | ||||||||||||||||||||||||||||||||||||||||||||
| Net account additions | |||||||||||||||||||||||||||||||||||||||||||||||||||||
| Postpaid net account additions | 257 | 348 | 268 | 315 | 348 | 380 | 394 | 873 | 1,122 | ||||||||||||||||||||||||||||||||||||||||||||
| Quarter | Nine Months Ended September 30, | ||||||||||||||||||||||||||||||||||||||||||||||||||||
| (in thousands) | Q1 2021 | Q2 2021 | Q3 2021 | Q4 2021 | Q1 2022 | Q2 2022 | Q3 2022 | 2021 | 2022 | ||||||||||||||||||||||||||||||||||||||||||||
| High speed internet customers, end of period | |||||||||||||||||||||||||||||||||||||||||||||||||||||
| Postpaid high speed internet customers | 193 | 288 | 422 | 646 | 975 | 1,472 | 1,960 | 422 | 1,960 | ||||||||||||||||||||||||||||||||||||||||||||
| Prepaid high speed internet customers | — | — | — | — | 9 | 72 | 162 | — | 162 | ||||||||||||||||||||||||||||||||||||||||||||
| Total high speed internet customers, end of period | 193 | 288 | 422 | 646 | 984 | 1,544 | 2,122 | 422 | 2,122 | ||||||||||||||||||||||||||||||||||||||||||||
| Quarter | Nine Months Ended September 30, | ||||||||||||||||||||||||||||||||||||||||||||||||||||
| (in thousands) | Q1 2021 | Q2 2021 | Q3 2021 | Q4 2021 | Q1 2022 | Q2 2022 | Q3 2022 | 2021 | 2022 | ||||||||||||||||||||||||||||||||||||||||||||
| High speed internet - net customer additions | |||||||||||||||||||||||||||||||||||||||||||||||||||||
| Postpaid high speed internet customers | 93 | 95 | 134 | 224 | 329 | 497 | 488 | 322 | 1,314 | ||||||||||||||||||||||||||||||||||||||||||||
| Prepaid high speed internet customers | — | — | — | — | 9 | 63 | 90 | — | 162 | ||||||||||||||||||||||||||||||||||||||||||||
| Total high speed internet net customer additions | 93 | 95 | 134 | 224 | 338 | 560 | 578 | 322 | 1,476 | ||||||||||||||||||||||||||||||||||||||||||||
| Quarter | Nine Months Ended September 30, | ||||||||||||||||||||||||||||||||||||||||||||||||||||
| (in millions, except percentages) | Q1 2021 | Q2 2021 | Q3 2021 | Q4 2021 | Q1 2022 | Q2 2022 | Q3 2022 | 2021 | 2022 | ||||||||||||||||||||||||||||||||||||||||||||
| Device Financing - Equipment Installment Plans | |||||||||||||||||||||||||||||||||||||||||||||||||||||
| Gross EIP financed | $ | 3,379 | $ | 3,348 | $ | 3,434 | $ | 5,282 | $ | 4,247 | $ | 3,580 | $ | 3,758 | $ | 10,161 | $ | 11,585 | |||||||||||||||||||||||||||||||||||
| EIP billings | 2,556 | 2,639 | 2,795 | 3,126 | 3,333 | 3,447 | 3,717 | 7,990 | 10,497 | ||||||||||||||||||||||||||||||||||||||||||||
| EIP receivables, net | 6,062 | 6,348 | 6,586 | 7,577 | 7,898 | 7,734 | 7,562 | 6,586 | 7,562 | ||||||||||||||||||||||||||||||||||||||||||||
| EIP receivables classified as prime | 57 | % | 61 | % | 60 | % | 62 | % | 61 | % | 61 | % | 61 | % | 60 | % | 61 | % | |||||||||||||||||||||||||||||||||||
| EIP receivables classified as prime (including EIP receivables sold) | 56 | % | 59 | % | 57 | % | 58 | % | 58 | % | 57 | % | 58 | % | 57 | % | 58 | % | |||||||||||||||||||||||||||||||||||
| Device Financing - Leased Devices | |||||||||||||||||||||||||||||||||||||||||||||||||||||
| Lease revenues | $ | 1,041 | $ | 914 | $ | 770 | $ | 623 | $ | 487 | $ | 386 | $ | 311 | $ | 2,725 | $ | 1,184 | |||||||||||||||||||||||||||||||||||
| Leased device depreciation | 897 | 842 | 755 | 627 | 445 | 317 | 226 | 2,494 | 988 | ||||||||||||||||||||||||||||||||||||||||||||
| Leased devices transferred from inventory to property and equipment | 485 | 333 | 214 | 166 | 129 | 83 | 67 | 1,032 | 279 | ||||||||||||||||||||||||||||||||||||||||||||
| Returned leased devices transferred from property and equipment to inventory | (445) | (416) | (309) | (267) | (183) | (95) | (65) | (1,170) | (343) | ||||||||||||||||||||||||||||||||||||||||||||
| Leased devices included in property and equipment, net | 3,962 | 3,037 | 2,188 | 1,459 | 960 | 631 | 408 | 2,188 | 408 | ||||||||||||||||||||||||||||||||||||||||||||
| Leased devices (units) included in property and equipment, net | 12.4 | 10.7 | 9.0 | 7.1 | 5.5 | 4.4 | 3.6 | 9.0 | 3.6 | ||||||||||||||||||||||||||||||||||||||||||||
| ||
| Quarter | Nine Months Ended September 30, | ||||||||||||||||||||||||||||||||||||||||||||||||||||
| (in millions, except percentages) | Q1 2021 | Q2 2021 | Q3 2021 | Q4 2021 | Q1 2022 | Q2 2022 | Q3 2022 | 2021 | 2022 | ||||||||||||||||||||||||||||||||||||||||||||
| Financial Measures | |||||||||||||||||||||||||||||||||||||||||||||||||||||
| Service revenues | $ | 14,192 | $ | 14,492 | $ | 14,722 | $ | 14,963 | $ | 15,128 | $ | 15,316 | $ | 15,361 | $ | 43,406 | $ | 45,805 | |||||||||||||||||||||||||||||||||||
| Equipment revenue | $ | 5,346 | $ | 5,215 | $ | 4,660 | $ | 5,506 | $ | 4,694 | $ | 4,130 | $ | 3,855 | $ | 15,221 | $ | 12,679 | |||||||||||||||||||||||||||||||||||
| Lease revenues | 1,041 | 914 | 770 | 623 | 487 | 386 | 311 | 2,725 | 1,184 | ||||||||||||||||||||||||||||||||||||||||||||
| Equipment sales | $ | 4,305 | $ | 4,301 | $ | 3,890 | $ | 4,883 | $ | 4,207 | $ | 3,744 | $ | 3,544 | $ | 12,496 | $ | 11,495 | |||||||||||||||||||||||||||||||||||
| Total revenues | $ | 19,759 | $ | 19,950 | $ | 19,624 | $ | 20,785 | $ | 20,120 | $ | 19,701 | $ | 19,477 | $ | 59,333 | $ | 59,298 | |||||||||||||||||||||||||||||||||||
| Net income (loss) | $ | 933 | $ | 978 | $ | 691 | $ | 422 | $ | 713 | $ | (108) | $ | 508 | $ | 2,602 | $ | 1,113 | |||||||||||||||||||||||||||||||||||
| Net income (loss) margin | 6.6 | % | 6.7 | % | 4.7 | % | 2.8 | % | 4.7 | % | (0.7) | % | 3.3 | % | 6.0 | % | 2.4 | % | |||||||||||||||||||||||||||||||||||
| Adjusted EBITDA | $ | 6,905 | $ | 6,906 | $ | 6,811 | $ | 6,302 | $ | 6,950 | $ | 7,004 | $ | 7,039 | $ | 20,622 | $ | 20,993 | |||||||||||||||||||||||||||||||||||
| Adjusted EBITDA margin | 48.7 | % | 47.7 | % | 46.3 | % | 42.1 | % | 45.9 | % | 45.7 | % | 45.8 | % | 47.5 | % | 45.8 | % | |||||||||||||||||||||||||||||||||||
| Core Adjusted EBITDA | $ | 5,864 | $ | 5,992 | $ | 6,041 | $ | 5,679 | $ | 6,463 | $ | 6,618 | $ | 6,728 | $ | 17,897 | $ | 19,809 | |||||||||||||||||||||||||||||||||||
| Core Adjusted EBITDA margin | 41.3 | % | 41.3 | % | 41.0 | % | 38.0 | % | 42.7 | % | 43.2 | % | 43.8 | % | 41.2 | % | 43.2 | % | |||||||||||||||||||||||||||||||||||
| Cost of services | $ | 3,384 | $ | 3,491 | $ | 3,538 | $ | 3,521 | $ | 3,727 | $ | 4,060 | $ | 3,712 | $ | 10,413 | $ | 11,499 | |||||||||||||||||||||||||||||||||||
| Merger-related costs | 136 | 273 | 279 | 327 | 607 | 961 | 812 | 688 | 2,380 | ||||||||||||||||||||||||||||||||||||||||||||
| Cost of services excluding Merger-related costs | $ | 3,248 | $ | 3,218 | $ | 3,259 | $ | 3,194 | $ | 3,120 | $ | 3,099 | $ | 2,900 | $ | 9,725 | $ | 9,119 | |||||||||||||||||||||||||||||||||||
| Cost of equipment sales | $ | 5,142 | $ | 5,453 | $ | 5,145 | $ | 6,931 | $ | 5,946 | $ | 5,108 | $ | 4,982 | $ | 15,740 | $ | 16,036 | |||||||||||||||||||||||||||||||||||
| Merger-related costs | 17 | 87 | 236 | 678 | 751 | 459 | 258 | 340 | 1,468 | ||||||||||||||||||||||||||||||||||||||||||||
| Cost of equipment sales excluding Merger-related costs | $ | 5,125 | $ | 5,366 | $ | 4,909 | $ | 6,253 | $ | 5,195 | $ | 4,649 | $ | 4,724 | $ | 15,400 | $ | 14,568 | |||||||||||||||||||||||||||||||||||
| Selling, general and administrative | $ | 4,805 | $ | 4,823 | $ | 5,212 | $ | 5,398 | $ | 5,056 | $ | 5,856 | $ | 5,118 | $ | 14,840 | $ | 16,030 | |||||||||||||||||||||||||||||||||||
| Merger-related costs | 145 | 251 | 440 | 238 | 55 | 248 | 226 | 836 | 529 | ||||||||||||||||||||||||||||||||||||||||||||
| Selling, general and administrative excluding Merger-related costs | $ | 4,660 | $ | 4,572 | $ | 4,772 | $ | 5,160 | $ | 5,001 | $ | 5,608 | $ | 4,892 | $ | 14,004 | $ | 15,501 | |||||||||||||||||||||||||||||||||||
| Total bad debt expense and losses from sales of receivables | $ | 64 | $ | 60 | $ | 109 | $ | 234 | $ | 256 | $ | 373 | $ | 300 | $ | 233 | $ | 929 | |||||||||||||||||||||||||||||||||||
| Bad debt and losses from sales of receivables as a percentage of Total revenues | 0.32 | % | 0.30 | % | 0.56 | % | 1.13 | % | 1.27 | % | 1.89 | % | 1.54 | % | 0.39 | % | 1.57 | % | |||||||||||||||||||||||||||||||||||
| Cash purchases of property and equipment including capitalized interest | $ | 3,183 | $ | 3,270 | $ | 2,944 | $ | 2,929 | $ | 3,381 | $ | 3,572 | $ | 3,634 | $ | 9,397 | $ | 10,587 | |||||||||||||||||||||||||||||||||||
| Capitalized interest | 84 | 57 | 46 | 23 | 15 | 13 | 16 | 187 | 44 | ||||||||||||||||||||||||||||||||||||||||||||
| Net cash proceeds from securitization | 22 | 18 | (2) | 1 | (3) | (10) | (18) | 38 | (31) | ||||||||||||||||||||||||||||||||||||||||||||
| Operating Measures | |||||||||||||||||||||||||||||||||||||||||||||||||||||
| Postpaid ARPA | $ | 132.91 | $ | 133.55 | $ | 134.54 | $ | 135.04 | $ | 136.53 | $ | 137.92 | $ | 137.49 | $ | 133.68 | $ | 137.32 | |||||||||||||||||||||||||||||||||||
| Postpaid phone ARPU | 47.30 | 47.61 | 48.06 | 48.03 | 48.41 | 48.96 | 48.89 | 47.66 | 48.75 | ||||||||||||||||||||||||||||||||||||||||||||
| Prepaid ARPU | 37.81 | 38.53 | 39.49 | 39.32 | 39.19 | 38.71 | 38.86 | 38.61 | 38.92 | ||||||||||||||||||||||||||||||||||||||||||||
| ||
| Quarter | Nine Months Ended September 30, | ||||||||||||||||||||||||||||||||||||||||||||||||||||
| (in millions) | Q1 2021 | Q2 2021 | Q3 2021 | Q4 2021 | Q1 2022 | Q2 2022 | Q3 2022 | 2021 | 2022 | ||||||||||||||||||||||||||||||||||||||||||||
| Net income (loss) | $ | 933 | $ | 978 | $ | 691 | $ | 422 | $ | 713 | $ | (108) | $ | 508 | $ | 2,602 | $ | 1,113 | |||||||||||||||||||||||||||||||||||
| Adjustments: | |||||||||||||||||||||||||||||||||||||||||||||||||||||
| Interest expense, net | 835 | 850 | 836 | 821 | 864 | 851 | 827 | 2,521 | 2,542 | ||||||||||||||||||||||||||||||||||||||||||||
| Other expense, net | 125 | 1 | 60 | 13 | 11 | 21 | 3 | 186 | 35 | ||||||||||||||||||||||||||||||||||||||||||||
| Income tax expense (benefit) | 246 | 277 | (3) | (193) | 218 | (55) | (57) | 520 | 106 | ||||||||||||||||||||||||||||||||||||||||||||
| Operating income | 2,139 | 2,106 | 1,584 | 1,063 | 1,806 | 709 | 1,281 | 5,829 | 3,796 | ||||||||||||||||||||||||||||||||||||||||||||
| Depreciation and amortization | 4,289 | 4,077 | 4,145 | 3,872 | 3,585 | 3,491 | 3,313 | 12,511 | 10,389 | ||||||||||||||||||||||||||||||||||||||||||||
Stock-based compensation (1) |
130 | 129 | 127 | 135 | 136 | 149 | 145 | 386 | 430 | ||||||||||||||||||||||||||||||||||||||||||||
| Merger-related costs | 298 | 611 | 955 | 1,243 | 1,413 | 1,668 | 1,296 | 1,864 | 4,377 | ||||||||||||||||||||||||||||||||||||||||||||
| Impairment expense | — | — | — | — | — | 477 | — | — | 477 | ||||||||||||||||||||||||||||||||||||||||||||
Legal-related expenses (recoveries), net (2) |
— | — | — | — | — | 400 | (19) | — | 381 | ||||||||||||||||||||||||||||||||||||||||||||
| Loss on disposal group held for sale | — | — | — | — | — | — | 1,071 | — | 1,071 | ||||||||||||||||||||||||||||||||||||||||||||
Other, net (3) |
49 | (17) | — | (11) | 10 | 110 | (48) | 32 | 72 | ||||||||||||||||||||||||||||||||||||||||||||
| Adjusted EBITDA | 6,905 | 6,906 | 6,811 | 6,302 | 6,950 | 7,004 | 7,039 | 20,622 | 20,993 | ||||||||||||||||||||||||||||||||||||||||||||
| Lease revenues | (1,041) | (914) | (770) | (623) | (487) | (386) | (311) | (2,725) | (1,184) | ||||||||||||||||||||||||||||||||||||||||||||
| Core Adjusted EBITDA | $ | 5,864 | $ | 5,992 | $ | 6,041 | $ | 5,679 | $ | 6,463 | $ | 6,618 | $ | 6,728 | $ | 17,897 | $ | 19,809 | |||||||||||||||||||||||||||||||||||
| ||
| (in millions, except net debt ratios) | Mar 31, 2021 |
Jun 30, 2021 |
Sep 30, 2021 |
Dec 31, 2021 |
Mar 31, 2022 |
Jun 30, 2022 |
Sep 30, 2022 |
||||||||||||||||||||||||||||||||||
| Short-term debt | $ | 4,423 | $ | 4,648 | $ | 2,096 | $ | 3,378 | $ | 2,865 | $ | 2,942 | $ | 7,398 | |||||||||||||||||||||||||||
| Short-term debt to affiliates | — | 2,235 | 2,240 | 2,245 | 1,250 | — | — | ||||||||||||||||||||||||||||||||||
| Short-term financing lease liabilities | 1,013 | 1,045 | 1,154 | 1,120 | 1,121 | 1,220 | 1,239 | ||||||||||||||||||||||||||||||||||
| Long-term debt | 66,395 | 65,897 | 66,645 | 67,076 | 66,861 | 66,552 | 64,834 | ||||||||||||||||||||||||||||||||||
| Long-term debt to affiliates | 4,721 | 2,490 | 1,494 | 1,494 | 1,494 | 1,495 | 1,495 | ||||||||||||||||||||||||||||||||||
| Financing lease liabilities | 1,316 | 1,376 | 1,587 | 1,455 | 1,447 | 1,597 | 1,590 | ||||||||||||||||||||||||||||||||||
| Less: Cash and cash equivalents | (6,677) | (7,793) | (4,055) | (6,631) | (3,245) | (3,151) | (6,888) | ||||||||||||||||||||||||||||||||||
| Net debt (excluding tower obligations) | $ | 71,191 | $ | 69,898 | $ | 71,161 | $ | 70,137 | $ | 71,793 | $ | 70,655 | $ | 69,668 | |||||||||||||||||||||||||||
| Divided by: Last twelve months Adjusted EBITDA | $ | 27,797 | $ | 27,686 | $ | 27,368 | $ | 26,924 | $ | 26,969 | $ | 27,067 | $ | 27,295 | |||||||||||||||||||||||||||
| Net debt (excluding tower obligations) to LTM Adjusted EBITDA Ratio | 2.6 | 2.5 | 2.6 | 2.6 | 2.7 | 2.6 | 2.6 | ||||||||||||||||||||||||||||||||||
| Divided by: Last twelve months Core Adjusted EBITDA | $ | 22,740 | $ | 23,136 | $ | 23,398 | $ | 23,576 | $ | 24,175 | $ | 24,801 | $ | 25,488 | |||||||||||||||||||||||||||
| Net debt (excluding tower obligations) to LTM Core Adjusted EBITDA Ratio | 3.1 | 3.0 | 3.0 | 3.0 | 3.0 | 2.8 | 2.7 | ||||||||||||||||||||||||||||||||||
| Quarter | Nine Months Ended September 30, | ||||||||||||||||||||||||||||||||||||||||||||||||||||
| (in millions) | Q1 2021 | Q2 2021 | Q3 2021 | Q4 2021 | Q1 2022 | Q2 2022 | Q3 2022 | 2021 | 2022 | ||||||||||||||||||||||||||||||||||||||||||||
| Net cash provided by operating activities | $ | 3,661 | $ | 3,779 | $ | 3,477 | $ | 3,000 | $ | 3,845 | $ | 4,209 | $ | 4,391 | $ | 10,917 | $ | 12,445 | |||||||||||||||||||||||||||||||||||
| Cash purchases of property and equipment, including capitalized interest | (3,183) | (3,270) | (2,944) | (2,929) | (3,381) | (3,572) | (3,634) | (9,397) | (10,587) | ||||||||||||||||||||||||||||||||||||||||||||
| Proceeds from sales of tower sites | — | 31 | — | 9 | — | — | — | 31 | — | ||||||||||||||||||||||||||||||||||||||||||||
| Proceeds related to beneficial interests in securitization transactions | 891 | 1,137 | 1,071 | 1,032 | 1,185 | 1,121 | 1,308 | 3,099 | 3,614 | ||||||||||||||||||||||||||||||||||||||||||||
| Cash payments for debt prepayment or debt extinguishment costs | (65) | (6) | (45) | — | — | — | — | (116) | — | ||||||||||||||||||||||||||||||||||||||||||||
| Free Cash Flow | $ | 1,304 | $ | 1,671 | $ | 1,559 | $ | 1,112 | $ | 1,649 | $ | 1,758 | $ | 2,065 | $ | 4,534 | $ | 5,472 | |||||||||||||||||||||||||||||||||||
| ||
| FY 2022 | |||||||||||
| (in millions) | Guidance Range | ||||||||||
| Net cash provided by operating activities | $ | 16,300 | $ | 16,500 | |||||||
| Cash purchases of property and equipment, including capitalized interest | (13,700) | (13,900) | |||||||||
Proceeds related to beneficial interests in securitization transactions (1) |
4,800 | 5,000 | |||||||||
| Free Cash Flow | $ | 7,400 | $ | 7,600 | |||||||
| FY 2022 | |||||||||||
| (in millions) | Guidance Range | ||||||||||
| Net cash provided by operating activities | $ | 16,000 | $ | 16,300 | |||||||
| Cash purchases of property and equipment, including capitalized interest | (13,500) | (13,700) | |||||||||
Proceeds related to beneficial interests in securitization transactions (1) |
4,800 | 5,000 | |||||||||
| Free Cash Flow | $ | 7,300 | $ | 7,600 | |||||||
| ||
| ||
| ||