UNITED STATES
SECURITIES AND EXCHANGE COMMISSION
Washington, D.C. 20549
Form 6-K
REPORT OF FOREIGN PRIVATE ISSUER PURSUANT TO RULE
13a-16 OR 15d-16 UNDER
THE SECURITIES EXCHANGE ACT OF 1934
For the month of April 2025
Commission File Number: 001-39966
| New Found Gold Corp. |
| (Exact name of registrant as specified in its charter) |
|
1055 West Georgia Street, Suite 2129 Vancouver,
British Columbia |
| (Address of principal executive office) |
Indicate by check mark whether the registrant files or will file annual reports under cover Form 20-F or 40-F:
Form 20-F o Form 40-F þ Pursuant to the requirements of the Securities Exchange Act of 1934, the registrant has duly caused this report to be signed on behalf by the undersigned, thereunto duly authorized.
EXHIBIT INDEX
|
Exhibit |
Description |
|
| 99.1 | New Found Gold Corp. - NI 43-101 Technical Report - Queensway Gold Project, Newfoundland and Labrador, Canada | |
SIGNATURES
| NEW FOUND GOLD CORP. | ||||
| (Registrant) | ||||
| Date: | April 23, 2025 | By: | /s/ Keith Boyle | |
| Keith Boyle | ||||
| Chief Executive Officer | ||||
EXHIBIT 99.1

| New Found Gold Corp. | Queensway Gold Project NI 43-101 Technical Report |
April 15, 2025 SLR Project No.: 233.065300.00001 |
NI 43-101 Technical Report for the Queensway Gold Project, Newfoundland and Labrador, Canada
SLR Project No.: 233.065300.00001
Prepared by
SLR Consulting (Canada) Ltd.
55 University Ave., Suite 501
Toronto, ON M5J 2H7
and
Stantec Consulting Limited
300-125 Commerce Valley Drive West
Markham ON L3T 7W4
for
New Found Gold Corp.
1055 West Georgia Street
Suite 2129
Vancouver, BC V6E 3P3
Effective Date - March 18, 2025
Signature Date - April 15, 2025
|
Prepared by: Pierre Landry, P.Geo. Lance Engelbrecht, P.Eng. David M. Robson, P.Eng. Sheldon H. Smith, P.Geo. (Stantec)
Peer Reviewed by: Reno Pressacco, P.Geo.
|
Approved by:
Project Manager David M. Robson, P.Eng., MBA,
Project Director Jason J. Cox, P.Eng. |
 |
| New Found Gold Corp. | Queensway Gold Project NI 43-101 Technical Report |
April 15, 2025 SLR Project No.: 233.065300.00001 |
Table of Contents
| 1.0 | Summary | 1-1 |
| 1.1 | Executive Summary | 1-1 |
| 1.2 | Technical Summary | 1-8 |
| 2.0 | Introduction | 2-1 |
| 2.1 | Sources of Information | 2-1 |
| 2.2 | List of Abbreviations | 2-3 |
| 3.0 | Reliance on Other Experts | 3-1 |
| 4.0 | Property Description and Location | 4-1 |
| 4.1 | Description and Location | 4-1 |
| 4.2 | Property Ownership Summary | 4-11 |
| 4.3 | Mineral Tenure Information and Maintenance | 4-12 |
| 4.4 | Access and Surface Rights | 4-13 |
| 4.5 | Option Agreement (the VOA Option) | 4-14 |
| 4.6 | Royalties | 4-15 |
| 4.7 | Permits | 4-15 |
| 4.8 | Environmental Assessment and Significant Factors | 4-18 |
| 5.0 | Accessibility, Climate, Local Resources, Infrastructure and Physiography | 5-1 |
| 5.1 | Accessibility | 5-1 |
| 5.2 | Site Topography, Elevation and Vegetation | 5-1 |
| 5.3 | Climate | 5-4 |
| 5.4 | Local Resources and Infrastructure | 5-5 |
| 6.0 | History | 6-1 |
| 6.1 | Ownership History | 6-1 |
| 6.2 | Exploration History | 6-1 |
| 6.3 | Historical Resource Estimates | 6-7 |
| 6.4 | Past Production | 6-7 |
| 7.0 | Geological Setting and Mineralization | 7-1 |
| 7.1 | Regional Geology | 7-1 |
| 7.2 | Property Geology | 7-4 |
| 8.0 | Deposit Types | 8-1 |
| 8.1 | Orogenic Gold Deposits | 8-1 |
| 9.0 | Exploration | 9-1 |
| 9.1 | New Found Gold Exploration Overview – Surface Exploration | 9-2 |
| |
|
| New Found Gold Corp. | Queensway Gold Project NI 43-101 Technical Report |
April 15, 2025 SLR Project No.: 233.065300.00001 |
| 9.2 | New Found Gold Exploration Overview – Geophysical Surveys | 9-14 |
| 9.3 | Exploration Potential | 9-27 |
| 10.0 | Drilling | 10-1 |
| 10.1 | Introduction | 10-1 |
| 10.2 | Drilling Procedures and Core Sampling | 10-13 |
| 11.0 | Sample Preparation, Analyses, and Security | 11-1 |
| 11.1 | Sample Collection | 11-1 |
| 11.2 | Sample Security | 11-3 |
| 11.3 | Analytical and Test Laboratories Accreditation | 11-3 |
| 11.4 | Sample Preparation and Analysis | 11-4 |
| 11.5 | Density Determination | 11-8 |
| 11.6 | Quality Assurance and Quality Control | 11-9 |
| 12.0 | Data Verification | 12-1 |
| 12.1 | NFG Data Verification | 12-1 |
| 12.2 | SLR Data Verification | 12-2 |
| 13.0 | Mineral Processing and Metallurgical Testing | 13-1 |
| 13.1 | Historical Metallurgical Work | 13-1 |
| 13.2 | Sample Selection | 13-1 |
| 13.3 | Sample Preparation | 13-11 |
| 13.4 | Metallurgical Testing | 13-12 |
| 13.5 | Reagent Consumptions | 13-23 |
| 13.6 | Summary | 13-23 |
| 13.7 | Future Metallurgical Testing | 13-24 |
| 14.0 | Mineral Resource Estimates | 14-1 |
| 14.1 | Summary | 14-1 |
| 14.2 | Resource Database | 14-4 |
| 14.3 | Geological Interpretation | 14-6 |
| 14.4 | Estimation Domains | 14-21 |
| 14.5 | Assay Statistics and Capping | 14-21 |
| 14.6 | Density | 14-26 |
| 14.7 | Compositing | 14-34 |
| 14.8 | Trend Analysis | 14-38 |
| 14.9 | Search Strategy and Grade Interpolation Parameters | 14-45 |
| 14.10 | Block Models | 14-52 |
| |
|
| New Found Gold Corp. | Queensway Gold Project NI 43-101 Technical Report |
April 15, 2025 SLR Project No.: 233.065300.00001 |
| 14.11 | Classification | 14-54 |
| 14.12 | Block Model Validation | 14-70 |
| 14.13 | Cut-off Grade and Whittle Parameters | 14-86 |
| 14.14 | Mineral Resource Reporting | 14-88 |
| 14.15 | Additional Information | 14-98 |
| 15.0 | Mineral Reserve Estimates | 15-1 |
| 16.0 | Mining Methods | 16-1 |
| 17.0 | Recovery Methods | 17-1 |
| 18.0 | Project Infrastructure | 18-1 |
| 19.0 | Market Studies and Contracts | 19-1 |
| 20.0 | Environmental Studies, Permitting, and Social or Community Impact | 20-1 |
| 21.0 | Capital and Operating Costs | 21-1 |
| 22.0 | Economic Analysis | 22-1 |
| 23.0 | Adjacent Properties | 23-1 |
| 24.0 | Other Relevant Data and Information | 24-1 |
| 24.1 | Introduction | 24-1 |
| 24.2 | Environmental Setting | 24-1 |
| 24.3 | Jurisdiction, Applicable Laws and Regulations | 24-5 |
| 24.4 | Permitting Process | 24-10 |
| 24.5 | Environmental Baseline Studies | 24-12 |
| 24.6 | Surface Water Resources | 24-16 |
| 24.7 | Hydrogeology | 24-17 |
| 24.8 | Acid Rock Drainage/Metal Leaching | 24-18 |
| 24.9 | Community, Indigenous and Regulatory Relations and Engagement | 24-21 |
| 24.10 | Rehabilitation and Closure | 24-21 |
| 25.0 | Interpretation and Conclusions | 25-1 |
| 25.1 | Geology and Mineral Resources | 25-1 |
| 25.2 | Mineral Processing | 25-1 |
| 25.3 | Other Relevant Data and Information | 25-3 |
| 26.0 | Recommendations | 26-1 |
| 26.1 | Geology and Mineral Resources | 26-1 |
| 26.2 | Mineral Processing | 26-1 |
| 26.3 | Budget | 26-2 |
| 27.0 | References | 27-1 |
| |
|
| New Found Gold Corp. | Queensway Gold Project NI 43-101 Technical Report |
April 15, 2025 SLR Project No.: 233.065300.00001 |
| 28.0 | Date and Signature Page | 28-1 |
| 29.0 | Certificate of Qualified Person | 29-1 |
| 29.1 | Pierre Landry | 29-1 |
| 29.2 | David M. Robson | 29-2 |
| 29.3 | Lance Engelbrecht | 29-3 |
| 29.4 | Sheldon H. Smith | 29-4 |
| 30.0 | Appendix 1 | 30-1 |
| 30.1 | Modelled Mineralization Domain Block Model Code | 30-1 |
Tables
| Table 1-1: | Budget of Recommendations | 1-5 |
| Table 1-2: | Summary of Mineral Resources – Effective Date March 15, 2025 | 1-12 |
| Table 2-1: | Qualified Persons and Responsibilities | 2-2 |
| Table 4-1: | Queensway Project Mineral Licence Description and Status by Blocks of Contiguous Licences/Claims | 4-4 |
| Table 4-2: | Minimum Expenditures for Mineral Claims in Newfoundland and Labrador | 4-12 |
| Table 4-3: | Renewal Fees for Mineral Claims in Newfoundland and Labrador | 4-13 |
| Table 4-4: | Environmental Permits, Licences, and Approvals | 4-16 |
| Table 6-1: | Summary of Historic Exploration Work Completed on the Queensway Property | 6-4 |
| Table 6-2: | Summary of Historic Drilling at Queensway | 6-7 |
| Table 9-1: | Sampling Summary from NFG’s Exploration at the Queensway Property | 9-1 |
| Table 9-2: | Airborne Geophysical Survey Summary | 9-18 |
| Table 10-1: | Summary of Drilling on the Queensway Project | 10-3 |
| Table 11-1: | Analytical Methods Used at the NFG Queensway Project | 11-7 |
| Table 11-2: | QA/QC Sample Insertion Rates for the Queensway Project | 11-10 |
| Table 11-3: | Summary of CRM Samples Analyzed by Fire Assay: 2019 to 2024 | 11-11 |
| Table 11-4: | Summary of CRM Samples Analyzed by Photon Assay: 2022-2024 | 11-12 |
| Table 11-5: | Statistics of Check Assays by Laboratory: 2022-2024 | 11-21 |
| Table 12-1: | Summary of NFG Assay Verification for Gold | 12-5 |
| Table 13-1: | Mineralized Zone and Number of Variability Composites | 13-2 |
| Table 13-2: | Master Composite Summary | 13-12 |
| Table 13-3: | Master Composite Comminution Test Summary | 13-17 |
| Table 13-4: | Master Composite Gravity Tails CIL and Direct Leach Extractions (approximately 75 µm grind) | 13-18 |
| |
|
| New Found Gold Corp. | Queensway Gold Project NI 43-101 Technical Report |
April 15, 2025 SLR Project No.: 233.065300.00001 |
| Table 13-5: | Summary of Keats West Master Composite Testing | 13-19 |
| Table 13-6: | Keats West Master Composite Comminution Test Summary | 13-19 |
| Table 13-7: | Summary of Variability Composite Gravity/CIL Extractions | 13-20 |
| Table 13-8: | Arsenic Versus Gold Tails Grade Relationship | 13-21 |
| Table 13-9: | Summary of Alternative Process Test Results | 13-22 |
| Table 14-1: | Summary of Mineral Resources – Effective Date March 15, 2025 | 14-3 |
| Table 14-2: | Resource Database | 14-4 |
| Table 14-3: | Drill Hole Assay Status | 14-5 |
| Table 14-4: | Drill Hole Exclusions | 14-5 |
| Table 14-5: | Modelled Geological Domain Block Model Code | 14-8 |
| Table 14-6: | Modelled Mineralization Types. | 14-21 |
| Table 14-7: | Sample Capping Groups | 14-21 |
| Table 14-8: | Comparison of Length-Weighted Uncapped Raw Assay and Capped Assay Au Statistics for Selected Domains in the AFZ Core Area | 14-23 |
| Table 14-9: | Sample Capping Groups – AFZ Peripheral | 14-24 |
| Table 14-10: | Comparison of Length-Weighted Uncapped Raw Assay and Capped Assay Statistics for Selected Domains in the AFZ Peripheral Area | 14-24 |
| Table 14-11: | Sample Capping Groups - JBP | 14-25 |
| Table 14-12: | Comparison of Length-Weighted Uncapped Raw Assay and Capped Assay Statistics for the Domains in the JBP Area | 14-25 |
| Table 14-13: | Comparison of Gamma-Gamma and Pycnometer Density Measurements | 14-27 |
| Table 14-14: | Pycnometer Density Measurements for SDG and SIL | 14-28 |
| Table 14-15: | Pycnometer and Wax Immersion Density Comparison for SDG and SIL | 14-29 |
| Table 14-16: | Comparison of Pycnometer vs. Archimedes – Logged Quartz Vein within Mineralized Wireframes | 14-30 |
| Table 14-17: | Metallurgical Testing Density | 14-32 |
| Table 14-18: | Assigned Average Bulk Density by Domain. | 14-34 |
| Table 14-19: | Comparison of Length-Weighted Capped Assay and Composite Au Statistics for AFZ Core Area Selected Domains | 14-35 |
| Table 14-20: | Comparison of Length-Weighted Capped Assay and Composite Au Statistics for Selected Domains in the AFZ Peripheral Area | 14-36 |
| Table 14-21: | Comparison of Length-Weighted Capped Assay and Composite Au Statistics for JBP Domains | 14-38 |
| Table 14-22: | Search Parameters for Key Vein Domains – AFZ Core Area | 14-47 |
| Table 14-23: | Search Parameters for Halo Domains and Buffer Domain – AFZ Core Area | 14-48 |
| Table 14-24: | Search Parameters for Key Vein Domains – AFZ Peripheral | 14-49 |
| |
|
| New Found Gold Corp. | Queensway Gold Project NI 43-101 Technical Report |
April 15, 2025 SLR Project No.: 233.065300.00001 |
| Table 14-25: | Search Parameters for Key Vein Domains – JBP | 14-50 |
| Table 14-26: | High Grade Restriction Parameters for Key Domains | 14-51 |
| Table 14-27: | AFZ Core Estimation Block Model | 14-53 |
| Table 14-28: | AFZ Core Area Block Model Variables | 14-53 |
| Table 14-29: | AFZ Peripheral Estimation Block Model | 14-54 |
| Table 14-30: | JBP Estimation Block Model | 14-54 |
| Table 14-31: | AFZ Core Area Block Model Validation Statistical Checks | 14-76 |
| Table 14-32: | AFZ Peripheral Area Block Model Validation Statistical Checks for Select Domains | 14-81 |
| Table 14-33: | JBP Area Block Model Validation Statistical Checks for Select Domains | 14-84 |
| Table 14-34: | Cut-off Grade Parameters | 14-86 |
| Table 14-35: | Preliminary Open Pit Optimization Parameters | 14-87 |
| Table 14-36: | Underground Reporting Panel Optimization Parameters | 14-88 |
| Table 14-37: | Summary of Mineral Resources – Effective Date March 15, 2025 | 14-93 |
| Table 14-38: | Open Pit Indicated Grade-Tonnage Table | 14-97 |
| Table 14-39: | Open Pit Inferred Grade-Tonnage Table | 14-97 |
| Table 24-1: | Potential Approvals, Authorizations, and Permits – for Mine Development at the Queensway Property | 24-10 |
| Table 24-2: | Environmental Studies and Data Collection | 24-13 |
| Table 24-3: | Major Prospects and Lithologies Characterized | 24-18 |
| Table 26-1: | Budget of Recommendations | 26-2 |
Figures
| Figure 4-1: | Queensway Project and Five Contiguously Defined Sub-property ‘Blocks’ of Contiguous Mineral Licences | 4-3 |
| Figure 4-2: | Queensway North Mineral Licences, and the Separate Licences of Twin Ponds, Ten Mile-Duder Lake, Bellman’s Pond, and Little Rocky Brook | 4-9 |
| Figure 4-3: | Queensway South Mineral Licences | 4-10 |
| Figure 5-1: | Access to the Queensway Property | 5-2 |
| Figure 5-2: | Shaded Relief Image for the Queensway Project Area, with Outline of the Queensway Mineral Licences and Bodies of Water | 5-3 |
| Figure 5-3: | Climate Data for Gander International Airport | 5-4 |
| Figure 6-1: | Location of Historical Exploration Programs Conducted by Prior Owners | 6-3 |
| Figure 7-1: | Correlation of Major Suture Zones across the Atlantic Ocean | 7-2 |
| Figure 7-2: | Newfoundland’s Bedrock Geology and Major Tectonic Zones | 7-3 |
| |
|
| New Found Gold Corp. | Queensway Gold Project NI 43-101 Technical Report |
April 15, 2025 SLR Project No.: 233.065300.00001 |
| Figure 7-3: | Bedrock Geology of the Queensway Area | 7-6 |
| Figure 7-4: | Stratigraphic Column Describing the Rocks Underlying the Queensway Property | 7-7 |
| Figure 7-5: | Interpretation of Structure and Lithology on a North-facing Queensway North Block Cross-section | 7-8 |
| Figure 7-6: | Interbedded Siltstone and Greywacke of the AFZ Footwall, Outflow Formation from Drill Hole NFGC-23-1416 | 7-9 |
| Figure 7-7: | Interbedded Black Siltstone and Greywacke of the AFZ Hanging Wall, Main Point Formation from Drill Hole NFGC-24-2116 | 7-9 |
| Figure 7-8: | Typical Gold-bearing Quartz Vein Styles Observed at Queensway | 7-10 |
| Figure 7-9: | Images of Core from Mineralized Intervals in Drill Hole NFGC-19-01 | 7-11 |
| Figure 7-10: | Integrated Geological Map of Lithology, Regional Faults and Gold-bearing Faults in Queensway North Block | 7-12 |
| Figure 7-11: | Queensway North AFZ Prospects with Major Structures and Gold Vein-Filled Faults on Surface | 7-1 |
| Figure 7-12: | Core Photographs from NFGC-19-01 (Keats Prospect): Visible Gold (A, C, and D); Vuggy Quartz Texture (B) | 7-2 |
| Figure 7-13: | Photos of Mineralization from Drill Hole NFGC-21-204 at Keats Zone (approximately 280 m to 296 m) | 7-3 |
| Figure 7-14: | Photos of Mineralization from Drill Hole NFGC-23-1210 at Iceberg (approximately 58 m to 82 m) | 7-4 |
| Figure 7-15: | Photos of Mineralization from Drill Hole NFGC-22-960 at Keats West (approximately 149 m to 182 m) | 7-6 |
| Figure 7-16: | Photos of Mineralization from Drill Hole NFGC-23-1986 at K2 (approximately 140 m to 182 m) | 7-8 |
| Figure 7-17: | Photos of Mineralization from Drill Hole NFGC-21-304 at Pocket Pond (approximately 82 m to 91 m) | 7-9 |
| Figure 7-18: | Integrated Geological Map of Lithology, Regional Faults, and Gold Trends in Queensway South, Pauls Pond Region | 7-10 |
| Figure 7-19: | Select Photographs of Drill Core from the Astronaut and Nova Prospects | 7-11 |
| Figure 7-20: | Photos of Mineralization from Drill Hole NFGC-QS-22-32 at Aztec (approximately 102 m to 113 m) | 7-12 |
| Figure 7-21: | Fault Zone in Oxidized Granite (A) and Chalcedonic Quartz Breccia Veins (B) at Mars | 7-12 |
| Figure 7-22: | Core Photo of Quartz Vein Zone Breccia, Cockade, and Banded Textures within Twin Ponds Drill Hole NFGC-TP-22-01, 173.3 m to 183.85 m | 7-13 |
| Figure 7-23: | Schematic Illustration of Mineralogical Changes in White Micas Identified by Hyperspectral Imaging of Core near Strong Gold Mineralization | 7-15 |
| Figure 7-24: | Examples of Deformation at Queensway | 7-19 |
| Figure 8-1: | Schematic for Orogenic Gold Deposits at Various Depths | 8-2 |
| |
|
| New Found Gold Corp. | Queensway Gold Project NI 43-101 Technical Report |
April 15, 2025 SLR Project No.: 233.065300.00001 |
| Figure 8-2: | Comparison of Drill Core Samples from Queensway Drill Hole NFGC-19-01 with Core from the Eagle Zone of the Fosterville Mine, Australia | 8-3 |
| Figure 9-1: | Locations of Rock Samples Collected from NFG’s Prospecting Programs, Colour Coded by Sampling Year | 9-4 |
| Figure 9-2: | Surface Rock Samples with Gold Grades Greater than 0.5 ppm Au | 9-5 |
| Figure 9-3: | Location of Glacial Till Samples at the Queensway Property, Colour Coded by Sampling Year | 9-6 |
| Figure 9-4: | Till Samples with Gold Grades above 1 ppm Au | 9-7 |
| Figure 9-5: | Locations of Soil Samples, Colour Coded by Sampling Year | 9-8 |
| Figure 9-6: | Soil Sample Gold Assay Results | 9-9 |
| Figure 9-7: | Location of Trenches at the Queensway Property, Colour Coded by Excavation Year | 9-10 |
| Figure 9-8: | Keats Trench Plan View Map with Location of Visible Gold Mineralization in the East-West Vein | 9-12 |
| Figure 9-9: | Type, Location, and Extent of NFG Geophysical Surveys | 9-15 |
| Figure 9-10: | Merged NFG Magnetic Reduced to Pole Data | 9-21 |
| Figure 9-11: | Lithological and Structural Geophysical Interpretation for the Queensway Property | 9-22 |
| Figure 9-12: | Preliminary 3D Cube Cross-section Interpretation Using Pre-stack Depth Migration and Pseudo Relief, Looking North | 9-24 |
| Figure 9-13: | 2023 LiDAR Bare Earth Image over the Queensway Property | 9-26 |
| Figure 9-14: | QWN AFZ East Long Section with Drilling Highlights Currently Excluded from the Mineral Resource Estimate | 9-30 |
| Figure 9-15: | QWN AFZ 3D Inclined View with Modelled Au Mineralization and Drilling Highlights Currently Excluded from the Mineral Resource Estimate | 9-31 |
| Figure 10-1: | Drill Collar Locations from NFG and Previous Operator Drilling Programs Completed at the Queensway Property | 10-7 |
| Figure 10-2: | Drill Holes at AFZ Core, Appleton Fault Zone | 10-8 |
| Figure 10-3: | Drill Holes at AFZ Peripheral and VOA (Queensway North), Appleton Fault Zone | 10-9 |
| Figure 10-4: | Drill Holes at Queensway North, JBP Fault Zone | 10-10 |
| Figure 10-5: | Drill Holes at Queensway South | 10-11 |
| Figure 10-6: | Drill Holes at Twin Ponds | 10-12 |
| Figure 11-1: | Sample Collection and Security | 11-2 |
| Figure 11-2: | NFG CRM Z-Score by Method | 11-13 |
| Figure 11-3: | Control Chart of CRM OREAS 230 in ALS Fire Assay: 2021 – 2023 | 11-14 |
| Figure 11-4: | Control Chart of CRM OREAS 239 in Eastern Analytical Fire Assay: Nov 2020 – July 2024 | 11-14 |
| |
|
| New Found Gold Corp. | Queensway Gold Project NI 43-101 Technical Report |
April 15, 2025 SLR Project No.: 233.065300.00001 |
| Figure 11-5: | Control Chart of CRM OREAS 236 in MSALAB Photon Assay: 2022 – 2024 | 11-15 |
| Figure 11-6: | 2019 - 2024 Results of Coarse Blank Samples in ALS | 11-16 |
| Figure 11-7: | 2019 - 2024 Results of Coarse Blank Samples in MSALAB | 11-16 |
| Figure 11-8: | Field Duplicates Scatter Plot by Method: 2020 – 2024 | 11-18 |
| Figure 11-9: | Coarse Duplicates (CD) Scatter Plot and HARD Plot: 2023–2024 | 11-19 |
| Figure 11-10: | Quantile-quantile Plots (FA vs. FA and SFA - AAS Finish): ALS vs. EAL | 11-21 |
| Figure 11-11: | Quantile-quantile Plots (FA vs. FA & SFA - Gravimetric Finish): ALS vs. SGS | 11-22 |
| Figure 11-12: | Quantile-quantile Plots (Photon Assay vs. FA and SFA): MSALABS vs. ALS | 11-22 |
| Figure 12-1: | Collar Location Field Check (NFGC-23-1279) | 12-3 |
| Figure 13-1: | Plan View Map of Metallurgical Sections from Keats, Golden Joint, Lotto, Iceberg, Iceberg East, and Keats West | 13-3 |
| Figure 13-2: | Cross-section of Keats Main 1 Illustrating Drill Holes Selected for Metallurgical Testing (view looking northeast) | 13-4 |
| Figure 13-3: | Cross-section of Keats Main 2 Illustrating Drill Holes Selected for Metallurgical Testing (view looking northeast) | 13-5 |
| Figure 13-4: | Cross-section of Keats Main 4 Illustrating Drill Holes Selected for Metallurgical Testing (view looking northeast) | 13-6 |
| Figure 13-5: | Cross-section of Lotto Illustrating Drill Holes Selected for Metallurgical Testing (view looking northeast) | 13-7 |
| Figure 13-6: | Cross-section of Golden Joint Illustrating Drill Holes Selected for Metallurgical Testing (view looking northeast) | 13-8 |
| Figure 13-7: | Cross-section of Iceberg #3 Illustrating Drill Holes Selected for Metallurgical Testing (view looking northeast) | 13-9 |
| Figure 13-8: | Cross section of Keats West 1 Illustrating Drill Holes Selected for Metallurgical Testing (view looking northwest) | 13-10 |
| Figure 13-9: | Cross section of Keats West 2 Illustrating Drill Holes Selected for Metallurgical Testing (view looking northwest) | 13-11 |
| Figure 13-10: | Gold Deportment and Gold Grain Size for the Keats, Lotto and Iceberg Zones | 13-14 |
| Figure 13-11: | Gold Deportment and Gold Grain Size for Keats West and Iceberg | 13-16 |
| Figure 13-12: | Gold Tails Grade versus Arsenic Content for Gold Head Grades Ranging from 2.0 ppm to 4 ppm | 13-21 |
| Figure 14-1: | AFZ Core Area Selected Mineralized Faults Shown with All Veins | 14-7 |
| Figure 14-2: | AFZ Core Area Geological Model | 14-10 |
| Figure 14-3: | AFZ Peripheral Geological Model | 14-12 |
| Figure 14-4: | Vertical Section Showing AFZ Core Area Mineralization Domains | 14-15 |
| |
|
| New Found Gold Corp. | Queensway Gold Project NI 43-101 Technical Report |
April 15, 2025 SLR Project No.: 233.065300.00001 |
| Figure 14-5: | Plan View Showing AFZ Core Area Mineralization Domains | 14-16 |
| Figure 14-6: | Plan View Showing AFZ Peripheral Area Mineralization Domains | 14-18 |
| Figure 14-7: | Vertical Section Showing AFZ Peripheral Area Mineralization Domains | 14-19 |
| Figure 14-8: | Plan View Showing JBP Area Mineralization Domains | 14-20 |
| Figure 14-9: | Cumulative Distribution Functions for Capping Groups 1 and 9 | 14-22 |
| Figure 14-10: | Close-up of Cut Vein Surface from Hole NFGC-20-45 | 14-31 |
| Figure 14-11: | Close-up of Core Surface from Hole NFGC-21-80 | 14-32 |
| Figure 14-12: | Raw Assay Length Histogram. | 14-35 |
| Figure 14-13: | Keats Main Normal Scores Variogram | 14-39 |
| Figure 14-14: | Keats Main >5 g/t Au Indicator Contour Compared with Related Vein Intersections | 14-40 |
| Figure 14-15: | Iceberg Normal Scores Variogram | 14-41 |
| Figure 14-16: | Iceberg 3 g/t Au and 15 g/t Indicator Contours Compared with KN_Occult Vein Intersection | 14-42 |
| Figure 14-17: | Inclined Long Section Showing Untrended Au Grade Contours for Keats_Main Vein Domain | 14-44 |
| Figure 14-18: | Long Section Showing Estimation Passes for the GJ Main Vein Domain | 14-46 |
| Figure 14-19: | Drill Hole Spacing Cumulative Frequency by Class for Parent Block Regularized Block Model | 14-56 |
| Figure 14-20: | Drill Hole Spacing Cumulative Frequency for Parent Block Regularized Block Model | 14-57 |
| Figure 14-21: | Vertical Section Showing Classified Open Pit and Underground Mineral Resource | 14-58 |
| Figure 14-22: | GJ_Main Long Sections Showing Classification Before (Left) and After (Right) Application of RPEEE Constraints | 14-59 |
| Figure 14-23: | Keats_Main Long Section Showing Classified Open Pit and Underground Mineral Resource | 14-60 |
| Figure 14-24: | Iceberg Long Section Showing Classified Open Pit and Underground Mineral Resource | 14-61 |
| Figure 14-25: | Lotto Long Section Showing Classified Open Pit and Underground Mineral Resource | 14-62 |
| Figure 14-26: | Jackpot Long Section Showing Classified Open Pit and Underground Mineral Resource | 14-63 |
| Figure 14-27: | Long Section Showing Classified Open Pit and Underground Mineral Resources in the Centre of the AFZ Peripheral Area | 14-65 |
| Figure 14-28: | Disco Shear 3 Long Section Showing Classified Open Pit and Underground Mineral Resource | 14-66 |
| Figure 14-29: | Doyle Plan Section Showing Classified Open Pit Mineral Resource | 14-67 |
| |
|
| New Found Gold Corp. | Queensway Gold Project NI 43-101 Technical Report |
April 15, 2025 SLR Project No.: 233.065300.00001 |
| Figure 14-30: | Vertical Sections Through the Open Pit and Underground Mineral Resources in Select Pits at JBP | 14-68 |
| Figure 14-31: | PN2A and PN_2 Long Sections Showing Classified Open Pit and Underground Mineral Resource | 14-69 |
| Figure 14-32: | Largest 20 Domains by Contained Au Metal (ID3 and NN) | 14-70 |
| Figure 14-33: | Keats_Main Long Section and Vertical Section | 14-71 |
| Figure 14-34: | Iceberg Long Section | 14-72 |
| Figure 14-35: | GJ_Main and Lotto Long Sections | 14-73 |
| Figure 14-36: | Jackpot Long Section | 14-74 |
| Figure 14-37: | Core Area Au ID3 and NN Contained Metal | 14-77 |
| Figure 14-38: | Keats_Main Histograms of Block Grades and 1 m Composites | 14-77 |
| Figure 14-39: | Keats_Main Domain Au Swath Plots | 14-78 |
| Figure 14-40: | Block Grades and Full Width Composites for Disco Shear 3 and Doyle Veins | 14-80 |
| Figure 14-41: | Disco Shear Swath Plots | 14-82 |
| Figure 14-42: | PN Swath Plots | 14-85 |
| Figure 14-43: | AFZ Core Area Mineral Resource Reporting Area | 14-89 |
| Figure 14-44: | Isometric View of the AFZ Core Area Mineral Resource | 14-90 |
| Figure 14-45: | Isometric View of the AFZ Peripheral Area Mineral Resource | 14-91 |
| Figure 14-46: | Isometric View of the JBP Area Mineral Resource | 14-92 |
| Figure 14-47: | Indicated Grade-Tonnage Curve | 14-95 |
| Figure 14-48: | Inferred Grade-Tonnage Curve | 14-95 |
| Figure 14-49: | Open Pit Indicated Grade-Tonnage Curve | 14-96 |
| Figure 14-50: | Open Pit Inferred Grade-Tonnage Curve | 14-97 |
| Figure 23-1: | Adjacent Properties to the Queensway Gold Property | 23-3 |
| Figure 24-1: | Acid Potential vs Modified Sobek Neutralization Potential – Waste Rock and Overburden | 24-19 |
| Figure 24-2: | Acid Potential vs Modified Sobek Neutralization Potential – Tailings | 24-20 |
Appendix Tables
| Table 30-1: | Modelled Mineralization Domain Block Model Code | 30-2 |
| |
|
| New Found Gold Corp. | Queensway Gold Project NI 43-101 Technical Report |
April 15, 2025 SLR Project No.: 233.065300.00001 |
| 1.0 | Summary |
| 1.1 | Executive Summary |
SLR Consulting (Canada) Ltd. (SLR) was retained by New Found Gold Corp. (NFG or the Company) to prepare an independent Technical Report on the wholly owned Queensway Gold Project (the Project or the Property), located in the province of Newfoundland and Labrador, Canada. The purpose of this Technical Report is to support the disclosure of an initial Mineral Resource estimate for the Property. This Technical Report conforms to National Instrument 43-101 Standards of Disclosure for Mineral Projects (NI 43-101). Two Qualified Persons (QP) from SLR visited the Property on October 24 and 25, 2024.
The Property consists of 7,024 claims across 103 mineral licences, covering a total area of 175,600 hectares (ha). It includes three main Mineral Resource areas: AFZ Core, AFZ Peripheral, and JBP. AFZ Core hosts several key gold (Au) zones, including Keats, Iceberg, Keats West, Lotto, Golden Joint, K2, etc. AFZ Peripheral contains the Big Vein, Pristine, HM, and Midway zones, while JBP features the H Pond, 1744, and Pocket Pond zones. The distance from AFZ Core to AFZ Peripheral is approximately 7.5 km, and from AFZ Core to JBP, approximately 5.5 km. The Project is in an early exploration stage.
The Project is located approximately 15 km west of the town of Gander in the province of Newfoundland and Labrador (NL), and is accessible via the Trans-Canada Highway (TCH), with additional infrastructure including gravel resource roads, high-voltage transmission lines, and proximity to the Gander International Airport and local shipping ports.
NFG has completed a number of baseline environmental and social studies within the Property and surrounding areas, which have been reviewed by Stantec Consulting Ltd. (Stantec) and a summary is included in Section 24 of this Technical Report. The Qualified Person from Stantec visited the Property on March 18, 2025.
| 1.1.1 | Conclusions |
The SLR QPs make the following conclusions:
| 1.1.1.1 | Geology and Mineral Resources |
| • | As of March 15, 2025, the NFG Queensway Project Mineral Resources are estimated as follows: |
| o | Open pit Indicated Mineral Resources are estimated to total approximately 17,267 thousand dry metric tonnes (kt) grading 2.25 g/t Au containing approximately 1,249 thousand ounces (koz), and Inferred Mineral Resources are estimated to total approximately 8,960 kt grading 1.24 g/t Au containing approximately 358 koz Au. |
| o | Underground Indicated Mineral Resources are estimated to total approximately 771 kt grading 5.76 g/t Au containing approximately 142 koz, and Inferred Mineral Resources are estimated to total approximately 1,749 kt grading 4.44 g/t Au containing approximately 250 koz Au. |
| • | The geology of the Project is well understood and constitutes a poly-deformed fold and thrust belt that overprints Ordovician ophiolitic and marine carbonate/siliciclastic rocks, Silurian shallow marine/terrestrial sequences, and Silurian magmatic rocks. Gold mineralization typically occurs as coarse grains of free visible gold in multiphase quartz-carbonate veins that are brecciated, massive-vuggy, laminated, or that have a closely spaced stockwork texture. |
| 1- |
|
| New Found Gold Corp. | Queensway Gold Project NI 43-101 Technical Report |
April 15, 2025 SLR Project No.: 233.065300.00001 |
| • | Within the AFZ Core area, mineralization was modelled as 308 veins and nine additional halo zones. Within the Queensway North peripheral areas, mineralization domains consist of 17 veins in the JBP area and 33 veins in the AFZ Peripheral area. All areas also include a 2 m buffer around the veins capturing adjacent low-grade mineralization. Au grades were estimated using Inverse Distance cubed (ID3) and a four pass search strategy. |
| • | Average density values applied to the domains are supported by wax-coated water immersion density measurements on core samples, with 2.7 g/cm3 applied to the mineralized domains. |
| • | Protocols for drilling, sample preparation and analysis, verification, and security meet industry standard practices and are appropriate for the purposes of a Mineral Resource estimate. |
| • | Mineral Resource classification was based primarily on drill hole spacing, applied to designate contiguous zones of like classification. |
| • | Open pit Mineral Resources were reported within a preliminary optimized pit shell generated at a cut-off grade of 0.3 g/t Au, while underground Mineral Resources were constrained within reporting panels generated at a cut-off grade of 1.65 g/t Au with heights of 10 m, lengths of 5 m, and minimum widths of 1.8 m. |
| 1.1.1.2 | Mineral Processing |
| • | Test work to date on samples from the Keats, Lotto, Golden Joint, and Iceberg zones has focused on a gravity concentration-carbon-in-leach (CIL) flowsheet and included exploratory test work using master composites and variability test work using variability composites. The master composites for each zone were produced by combining portions from all of the variability composites from their respective zones. The variability test work on Iceberg composites included a pre-aeration step prior to cyanide leaching, while the variability test work on Keats, Lotto, and Golden Joint composites did not. |
| • | Exploratory test work using the Keats and Lotto master composites returned high gravity recoverable gold (GRG) recoveries, while indicating that preg-robbing affected cyanide leaching extractions from the gravity tails. Therefore, subsequent variability testing on composites from these zones, Golden Joint, and Iceberg used gravity concentration followed by CIL of the gravity tails. The GRG tests for the variability test work was conducted at a target P80 of 212 µm while the CIL tests were conducted at three target P80 grind sizes for each composite, 212 µm, 75 µm, and 37 µm to assess the effect of grind size on gold recovery, with 80% passing (P80) 75 µm ultimately being chosen as the optimum grind size. GRG recoveries ranged from 1% to 99%, and overall extractions (GRG-CIL) at the target P80 of 75 µm for the CIL tests ranged from 31% to 100% and showed a strong relationship between gold head grade and overall extraction. |
| • | Analysis of the CIL test results from the variability test work using Keats, Lotto, Golden Joint, and Iceberg composites showed that there was a relationship between leach extraction and arsenic head grade, indicating that a portion of the gold in the samples was associated with arsenic and refractory to leaching. This relationship was pronounced in the samples with lower gold head grades (<4 g/t Au). This analysis, together with mineralogical data indicated that the unleached gold was likely associated with arsenopyrite (and possibly pyrite) and not well liberated. |
| 1- |
|
| New Found Gold Corp. | Queensway Gold Project NI 43-101 Technical Report |
April 15, 2025 SLR Project No.: 233.065300.00001 |
| • | Exploratory flotation test work was completed on Keats, Lotto, and Iceberg master composites as well as four variability composites from the Keats and Lotto zones selected due to their relatively poor gravity-CIL responses (with overall gold extractions ranging from 57% to 73%). Carbon flotation aimed at rejecting carbon to minimize its preg-robbing effect indicated that some loss of gold would occur in this step and overall extraction was not beneficially affected. Sulphide flotation was effective at recovering gold from gravity and carbon flotation tails into a concentrate with recoveries ranging from 89% to 97%, however, re-grinding of that concentrate was not effective at improving gold extraction during leaching with the overall extraction for the concentrate leach flowsheet essentially the same as the gravity-CIL flowsheet. |
| • | The flotation test work was used to arrive at an overall gold recovery estimate of 90% for the Mineral Resource estimate. The flotation tests using Keats, Keats West, Lotto, and Iceberg composites resulted in overall gold recoveries to gravity and sulphide concentrates ranging from 89% to 97% with sulphide concentrates containing 9 g/t to 67 g/t gold. Cleaner flotation test work to upgrade the concentrates is expected to result in some gold losses, however, the flotation tests completed to date did not include CIL of the sulphide flotation tails, and it is likely that gold losses through cleaner flotation would be offset by additional gold recovery from leaching the flotation tails, hence the overall recovery estimate of 90%. |
| • | During the flotation test work, pre-aeration of gravity tails prior to carbon flotation and tails leaching appeared to be beneficial in reducing cyanide consumption during subsequent leaching of the sulphide concentrates. |
| • | In general, the test work completed to date indicated that gold was present in two main forms in the samples tested: free gold amenable to gravity recovery and extraction by cyanide leaching, and gold associated with arsenic that was partially amenable to cyanide leaching or recoverable by flotation. Higher grade samples (>4 g/t Au) contained higher proportions of free gold, while the lower grade samples (<4 g/t Au) tended to be increasingly characterized at decreasing gold grades by partially liberated or unliberated gold associated with arsenic. |
| • | Comminution test work was completed on master composites from each zone and a selection of eight Iceberg variability composites and indicated that the material was amenable to conventional crushing and grinding. |
| • | Test work on samples from Keats West is currently underway at Base Met Labs with initial tests on the master composites indicating that CIL extraction from the gravity tails was poor. Preliminary results from flotation test work on gravity tails of the master composites indicated that it was effective at recovering the unleachable gold. |
| 1.1.1.3 | Other Relevant Data and Information |
| • | NFG has undertaken a range of environmental baseline studies across key biophysical and socio-economic components of the Queensway Project area. These include terrestrial and aquatic ecology, air, and water quality, noise and light surveys, acid rock drainage and metal leaching characterization, and hydrogeological assessments. The scope and scale of these programs are consistent with industry best practices for projects transitioning from early-stage exploration to advanced technical evaluations such as a Preliminary Economic Assessment (PEA). |
| 1- |
|
| New Found Gold Corp. | Queensway Gold Project NI 43-101 Technical Report |
April 15, 2025 SLR Project No.: 233.065300.00001 |
| • | Environmental sensitivities within the area studied have been identified and are generally manageable with standard permitting conditions and mitigation strategies. Key considerations include a portion of the mineral licences falling within protected water supply areas and Crown Lands. No critical habitat for species at risk has been identified within the area studied. |
| • | Regulatory frameworks at both the federal and provincial levels have been reviewed, and future development will require provincial Environmental Assessment (EA) registration and permitting. The potential requirement for federal EA will be contingent on project scope and throughput. To date, NFG has demonstrated proactive engagement with regulators and local communities and is committed to continued collaboration as the Project advances. |
| 1.1.2 | Recommendations |
The QPs recommend that the Project proceed to undertake a PEA. The QPs have the following recommendations by area.
| 1.1.2.1 | Geology and Mineral Resources |
| 1 | Conduct additional trenching, channel sampling, and detailed mapping to continue to improve structural modeling and refine mineralization wireframe interpretations. |
| 2 | Continue exploring while balancing potential with cost-effectiveness, focusing efforts on: (1) infill drilling within the pit shells to convert unclassified material; (2) near-surface expansion along the AFZ and JBPFZ; (3) extensions of open underground reporting panels at depth and along strike; and (4) deep drilling in the AFZ Core to follow up widely spaced high grade intercepts. |
| 3 | Based on the results of a positive PEA, NFG should consider targeted closely spaced RC or diamond drilling in areas that are expected to have the greatest impact on early life-of-mine (LOM) production. |
| 4 | Following a positive PEA, NFG should consider bulk sampling in early LOM areas to confirm grade continuity and validate the resource model. Bulk sampling should be of sufficient scope, follow closely spaced drilling and an updated Mineral Resource estimate and target material representative of mining and processing conditions. |
| 5 | Further acquisition of spatially representative wax-coated water immersion density measurements is recommended for the various rock types. |
| 6 | In conjunction with the future metallurgical test work outlined in Section 13.7, the QP recommends that NFG consider developing a geometallurgical model, if warranted, to account for recovery variability and support process planning for future technical evaluations beyond the PEA stage. |
| 7 | SLR recommends that NFG continue to evaluate the geological and grade continuity of mineralized vein wireframe interpretations hosted within or extending into the modelled AFZ structure. |
| 8 | Continue assaying samples with multielement ICP as it helps support both lithology interpretation as well as mineralized wireframe interpretation. |
| 1- |
|
| New Found Gold Corp. | Queensway Gold Project NI 43-101 Technical Report |
April 15, 2025 SLR Project No.: 233.065300.00001 |
| 1.1.2.2 | Mineral Processing |
| 1 | Test work should be conducted to evaluate the production of a saleable sulphide concentrate containing gold, building on the preliminary flotation test work already completed. Sulphide flotation could be employed before or after cyanide leaching, and both of these options should be evaluated in test work and in a subsequent trade-off study to determine which would be the preferrable option if flotation was to be included in the flowsheet. |
| 2 | Sulphide oxidation test work should be conducted on Keats, Lotto, Golden Joint, Iceberg, and Keats West flotation concentrates to assess their amenability to this technique to support trade-off studies evaluating the technical and economic characteristics of different sulphide oxidation technologies. |
| 3 | The pre-aeration step should be continued in future CIL testing. |
| 4 | Future sample selection and test work should be coordinated with the development of a geological model that may include additional species such as cyanide-soluble gold, sulphur, arsenic, iron, and organic carbon, and that will provide detailed information on gold grade distribution within the various zones. Additionally, the development of mine plans during more advanced stages of study should be used to ensure that samples selected for test work represent material that would be processed in a mill. |
| 1.1.2.3 | Budget |
The budget to complete the recommendations is shown in Table 1-1.
Table 1-1: Budget of Recommendations
| Area | Discipline | Cost (C$000) |
| Complete PEA technical report | Engineering Studies | 400 |
| Conversion (infill) drilling | Resource Conversion | 20,250 |
| Metallurgical Testing | Engineering Studies | 200 |
| Environmental baseline studies & permitting | Permitting | 500 |
| Seismic reprocessing and interpretation | Exploration | 200 |
| Trenching and channel sampling of key zones | Resource Modelling | 5,000 |
| Bulk density sampling | Resource Modelling | 25 |
| Exploration drilling | Exploration | 15,750 |
| Total | 42,325 |
In addition to the recommendations presented in Table 1-1, NFG is considering undertaking a bulk sample program. The costs to undertake the bulk sample program, as well as any resultant revenue from the recovery and sale of gold, are currently being evaluated by NFG.
| 1.1.3 | Risks |
In general, the QP is not aware of any environmental, permitting, legal, title, taxation, socio-economic, marketing, political, or other relevant factors that could materially affect the Mineral Resource estimate other than those discussed below. Listed below are some of the potential risks and uncertainties associated with the Queensway Project and its potential future development. While the mineralization style at the Queensway Project introduces some project-specific considerations, most of the risks identified are common to mineral projects at a similar stage of advancement, particularly those progressing from an initial Mineral Resource Estimate toward a PEA.
| 1- |
|
| New Found Gold Corp. | Queensway Gold Project NI 43-101 Technical Report |
April 15, 2025 SLR Project No.: 233.065300.00001 |
| 1 | Property Description and Location |
| o | NFG holds or has the option to acquire a 100% interest in all mineral licences comprising the Queensway Project. However, surface rights across portions of the Property are not wholly owned by NFG and are either located on Crown land or private land subject to access agreements. As a result, continued exploration and potential future development may require negotiation of new agreements or renewal of existing arrangements, which could introduce timing or access risks. |
| o | Additionally, a portion of the mineral licences are subject to net smelter return (NSR) royalties. These royalties, some of which include provisions for escalation or annual advance payments, may impact the economic performance of the Project and would need to be accounted for in any future economic analysis. |
| 2 | Accessibility, Climate, Local Resources, Infrastructure and Physiography |
| o | Although the Project is accessible via the TCH and benefits from proximity to local infrastructure and workforce in the towns of Gander and Appleton, the Project does not currently possess any mine development infrastructure. Existing facilities are limited to exploration support, including core storage, temporary office facilities, and gravel resource roads. |
| o | While multiple high-voltage power transmission lines traverse the Project area and municipal services are available nearby, dedicated infrastructure is required for mine development such as: process facilities, site-specific power and water supply systems, waste management infrastructure, and internal road networks which have not yet been constructed. The development of such infrastructure will be subject to capital investment, permitting timelines, and potential logistical constraints. These factors may pose risks to the scheduling and economic advancement of the Project. |
| o | The Project is located in a region characterized by cold winters, significant snowfall, and variable weather conditions, which may restrict field access and limit the duration of exploration and construction activities during certain times of the year. These seasonal limitations may impact scheduling, reduce operational efficiency, and result in increased costs associated with workforce mobilization, equipment maintenance, and logistical planning. |
| 3 | Mineral Processing and Metallurgical Testing |
| o | Preliminary metallurgical test work indicates that a portion of the gold at the Queensway Project is associated with arsenic bearing minerals, particularly arsenopyrite. In samples with lower gold head grades, the gold tends to be less liberated and is partially refractory to conventional cyanide leaching. This association may reduce overall gold recoveries in some zones and introduces uncertainty regarding metallurgical performance. Additional test work is required to better characterize the relationship between gold recovery and arsenic content and to evaluate potential processing strategies to mitigate this effect. |
| 1- |
|
| New Found Gold Corp. | Queensway Gold Project NI 43-101 Technical Report |
April 15, 2025 SLR Project No.: 233.065300.00001 |
| 4 | Mineral Resource Estimates |
Several factors introduce uncertainty to the Mineral Resource estimates presented for the Queensway Project. These include:
| o | Economic Assumptions: The Mineral Resource estimates are sensitive to the long-term gold price and the CAD/USD exchange rate used in determining cut-off grades and reporting shapes. Any significant change in these economic parameters may materially impact the quantity and classification of reported Mineral Resources. |
| o | Cut-Off Grade Assumptions: Mineral Resources are reported above specific cut-off grades for open pit and underground extraction scenarios. Variations in cost assumptions, metallurgical recovery, or market conditions may necessitate revisions to these cut-off grades, which could impact the tonnage and grade of the Mineral Resource. |
| o | Geological Interpretation: The Project hosts an orogenic epizonal gold system characterized by complex structural and lithological controls. As such, geological and mineralization models are inherently interpretative, and the continuity of gold bearing structures, particularly in areas of limited drilling, are not completely defined by sample data. This is especially relevant to Inferred Mineral Resources, which are subject to a higher degree of geological uncertainty. |
| o | Grade Estimation and Capping Strategy: The treatment of high grade assays through capping directly influences the estimated grade distribution. Changes to the capping strategy or further refinement of high grade domains could alter the Mineral Resource results. |
| o | Density Assignment: Bulk density values were assigned based on core measurements and applied by domain. Any variation in these values, particularly in areas of limited data, may affect the calculated tonnage of the Mineral Resource. |
| o | Underground Constraining Assumptions: Underground Mineral Resources are constrained within reporting panels based on assumed minimum mining widths and design parameters. Modifications to these assumptions, such as mining method, dilution factors, or geotechnical constraints could result in changes to the volume and classification of the Mineral Resources. |
| o | Metallurgical Recovery Assumptions: Gold recovery assumptions are based on preliminary metallurgical test work. Future test work may change these assumptions and may influence the economics of the Mineral Resources. |
| 5 | Environmental Studies, Permitting, and Social or Community Impact |
| o | The advancement of the Queensway Project to the development stage will require a range of permits and approvals from both federal and provincial authorities. These include, but are not limited to, authorizations for water use, habitat alteration, land disturbance, and the handling and storage of explosives. While NFG currently holds the necessary permits for exploration activities, there is no assurance that future development-stage permits will be granted in a timely manner or at all. The permitting process is subject to detailed regulatory review and may be influenced by public and stakeholder input. |
| o | The Project area contains wetlands and may be proximal to designated watersheds, including protected water supply areas. Development activities in or near these zones are subject to additional regulatory scrutiny under the provincial Water Resources Act and related environmental legislation, which may restrict or delay certain project components. |
| 1- |
|
| New Found Gold Corp. | Queensway Gold Project NI 43-101 Technical Report |
April 15, 2025 SLR Project No.: 233.065300.00001 |
| o | Federal and provincial Species at Risk legislation including the federal Species at Risk Act (SARA) and the Newfoundland and Labrador Endangered Species Act (NL ESA) may also apply to the Project. The presence of listed species within or adjacent to the Project area could necessitate detailed environmental assessments and the implementation of approved mitigation plans. Failure to adequately address potential impacts on such species may result in delays or permit denials. |
| o | Furthermore, the Project may be subject to current and future federal and provincial regulations related to greenhouse gas (GHG) emissions and climate change mitigation. Compliance with these evolving policies could impose additional permitting requirements, operational restrictions, or financial costs, particularly as the Project advances toward potential development. |
| 1.2 | Technical Summary |
| 1.2.1 | Property Description and Location |
The Project is located on the northeast portion of the Island of Newfoundland, NL along the east coast of Canada. The Property is located approximately 15 km west of the town of Gander, NL and can be accessed from Gander via TCH, which passes through the Queensway North and Twin Ponds claim areas. The approximate centre of the Project is UTM, Zone 21N, NAD83: 645000 m Easting, 5402000 m Northing.
| 1.2.2 | Land Tenure |
The Property is defined by 103 mineral licences that comprise 7,024 claims, with each claim having an area of 25 ha (500 m x 500 m). In total, the Property encompasses an area of 175,600 ha (1,756 km2). The licences can be separated spatially into groups, or blocks, based on their contiguous groupings. The blocks have no specific administrative or legal significance but are helpful in presenting and explaining a variety of exploration activities over a very large area. The blocks include:
| • | Two large contiguous blocks, Queensway North (QWN) and Queensway South (QWS), separated by Gander Lake: |
| o | QWN consists of 43 contiguous mineral licences (1,135 claims) and is situated north of Gander Lake. |
| o | QWS consists of 53 contiguous mineral licences (5,337 claims) and is situated south and west of Gander Lake. |
| • | Four smaller blocks of single or multiple contiguous groups of licences (Twin Ponds, Ten Mile-Duder Lake, Bellman’s Pond, and Little Rocky Brook): |
| o | Twin Ponds (TP) block consists of three contiguous mineral licences (226 claims) for a total area of 5,650 ha, and is situated west of the Gander River. |
| o | Ten Mile-Duder Lake (TMDL) block consists of two contiguous mineral licences (211 claims), for a total area of 5,275 ha, situated west of the Gander River. |
| o | Bellman’s Pond (BP) block consists of one mineral licence (one claim) with an area of 25 ha and is situated west of the Gander River |
| 1- |
|
| New Found Gold Corp. | Queensway Gold Project NI 43-101 Technical Report |
April 15, 2025 SLR Project No.: 233.065300.00001 |
| o | Little Rocky Brook (LRB) block consists of one mineral licence (114 contiguous claims), for an area of 2,850 ha and is situated west of the Gander River. |
A total of 92.2% of the claims are owned by NFG, with the remaining 7.8% owned by separate licence holders and are subject to a single Option Agreement - the VOA Option - between NFG and the current property owners (Aidan O’Neil, Suraj Amarnani, and Josh Vann).
| 1.2.3 | Existing Infrastructure |
The town of Gander is located 15 km to the east of the QWN claims along the TCH. Gander has many amenities that one would expect to find in a major city: an international airport and most of the equipment and supplies required for exploration. The people of Gander are also a source for much of the labour required for NFG’s exploration programs.
The small town of Appleton, located within the QWN claim area, hosts a helicopter base and an environmental remediation company. In the Appleton Industrial Park, NFG has purchased lots that host a fenced-in core yard, an office trailer and shipping containers for storage of sample pulps.
Electricity is available from the Newfoundland provincial grid, which has three electricity transmission corridors that cross the Queensway Project lands.
| 1.2.4 | History |
The extensive historical exploration of the Queensway Project was completed by multiple operators and prospectors, spanning over four decades, from the 1980s through to early 2024. The exploration methods used include surface geochemical sampling, trenching, drilling, and airborne and ground geophysical surveys.
Surface geochemical sampling covers the widest geographical extent of the Project, and amounts to approximately 3,500 till samples, over 600 stream and lake sediment samples, 6,500 rock samples, and over 27,000 soil samples. This extensive data set has identified several gold-in-soil or gold-in-till anomalies that have led to surface gold discoveries.
A total of over 330 trenches have been historically completed across the Project, targeting previously discovered gold-in-soil and gold-in-till anomalies. Over 1,600 channel samples were taken from trenches that reached bedrock, with the remaining trenches open to further exploration.
A total of 16 companies completed 766 drill holes (totalling 133,181 m) over the history of the Project. The majority were diamond drill holes, with a portion of holes completed using rotary air blasting (RAB) and reverse circulation (RC) techniques. Much of the historical drilling occurred north of Gander Lake along the two principal fault zones: Appleton Fault Zone (AFZ) and Joe Batt’s Pond Fault Zone (JBPFZ).
Over 50 historical airborne and ground geophysical surveys have been conducted throughout the Project; including very low frequency electromagnetic (VLF-EM), electromagnetic (EM), magnetic (MAG), induced polarization (IP), versatile time domain electromagnetic (VTEM) and controlled source audio-frequency magnetotellurics (CSAMT). Most of the geographical extent of these geophysical surveys is concentrated along either the AFZ and JBPFZ, or in the QWS claims group around the Pauls Pond and Greenwood Pond gold showings.
| 1- |
|
| New Found Gold Corp. | Queensway Gold Project NI 43-101 Technical Report |
April 15, 2025 SLR Project No.: 233.065300.00001 |
| 1.2.5 | Geology and Mineralization |
The Project is situated in the northeastern Canadian portion of the Appalachian Orogen, which extends from Scandinavia in the north to Georgia, USA, in the south.
The geology of the Property constitutes a poly-deformed fold and thrust belt that overprints Cambrian continental shelf rocks, Ordovician ophiolitic and marine carbonate/siliciclastic rocks, Silurian shallow marine/terrestrial sequences, and Silurian magmatic rocks. The Appleton and JBP faults are major structures that transect the Queensway Property and are spatially associated with epizonal gold mineralization.
Gold mineralization at the Property has been identified in several gold zones in both the QWN and QWS blocks. In general, these gold zones are interpreted to be indicative of an orogenic epizonal gold system, and are characterized by:
| 1 | Strong gold mineralization in quartz-carbonate veins that is associated with complex networks of brittle fault zones which are commonly discordant to the regional northeast trending foliation and stratigraphy. Mineralization typically occurs as coarse grains of free visible gold in multiphase quartz-carbonate veins that are brecciated, massive-vuggy, laminated, or that have a closely spaced stockwork texture. |
| 2 | A gold association with arsenic-bearing minerals, in addition to antimony and tungsten, including arsenopyrite and boulangerite. |
| 3 | An alteration halo around most of the gold-rich veins that is associated with the changes in the mineralogy of white micas. |
| 1.2.6 | Exploration Status |
The Project consists of an extensive land package that encompasses over 110 km of strike on the AFZ and JBPFZ that, through continued exploration, have demonstrated a spatial relationship to the known gold discoveries. The extensive glacial cover limits outcrop exposure but since 2016, NFG has made considerable advancements in their ground field activities, utilizing exploration techniques such as soil and till sampling, and trenching to identify potential bedrock sources of gold mineralization advancing many targets to the drilling phase.
Since 2019, and up until November 1, 2024 a total of 587,696 m of drilling in 2,437 holes has been completed by NFG. This drilling has expanded the known mineralization at Keats and led to the discovery, and subsequent expansion, of Lotto, Golden Joint, Keats North, Keats West, Iceberg, K2, and numerous other zones.
The majority of the exploration drilling completed to date has been focused on a 3 km (AFZ Core area) long segment of the AFZ and is largely limited to the top 250 m vertical depth. At QWN alone, NFG controls over 22 km of strike along the AFZ. The Project offers the potential to 1) expand known discoveries at depth within the AFZ Core area, 2) identify new near-surface discoveries along strike of the main discovery area, and 3) advance existing targets and identify new targets at QWS and along the JBPFZ.
| 1.2.7 | Mineral Resources |
Geological and mineralization domains were constructed by NFG and reviewed by SLR. The initial Mineral Resource estimate was prepared by SLR. The resource database was closed on November 1, 2024 and contains 3,214 drill holes for a total of 723,387 m, for which 550,949 m have assay intervals.
| 1- |
|
| New Found Gold Corp. | Queensway Gold Project NI 43-101 Technical Report |
April 15, 2025 SLR Project No.: 233.065300.00001 |
The Mineral Resource estimate is grouped into three primary areas. The AFZ Core area contains the majority of zones, including K2 and Monte Carlo; Keats West, Cokes, and Powerline; Keats, Keats South, Iceberg, Iceberg Alley, Knob, and Golden Bullet; as well as Lotto, Golden Joint, Jackpot, and Honeypot. These zone names reflect the most prominent veins contributing to the contained metal within each zone, though each zone includes numerous additional veins beyond those listed. The AFZ Peripheral area includes the Big Vein, Pristine, HM, and Midway zones. The JBP area includes the H Pond, 1744, and Pocket Pond zones. All Mineral Resources are located within the QWN block; no Mineral Resources have been estimated for QWS.
Geological and mineralization wireframes were constructed using Leapfrog Geo software, while grade estimation for the AFZ Core area was completed using the Python-based Resource Modeling Solutions Platform (RMSP). Grade estimation for the AFZ Peripheral and JBP areas was completed using Leapfrog Edge.
Gold grade was interpolated using a third-order ID3 algorithm, with search neighbourhood parameters supported by variography undertaken for key veins.
Average bulk density was assigned to geological and mineralization domain, supported by drill core sample measurements made using the water immersion method.
The estimates were validated through visual comparison of block and composite grades, statistical comparison of block and composite grades, swath plots, and comparison with Nearest Neighbour (NN) check estimates for all veins. For selected high-value veins within the RMSP estimate, further check ID3 estimates were completed in Leapfrog Geo.
Block models were rotated 30° clockwise about the vertical axis. The estimation block model has a parent block dimension of 2.5 m by 2.5 m by 5 m, with a minimum sub-block size of 0.625 m by 0.625 m by 1.25 m.
For the purposes of open pit optimization, the block model was re-blocked to 5 m by 5 m by 5 m, while open pit Mineral Resources are reported from a block model regularized to the parent cell size. Underground reporting panels were generated from the original estimation sub-block model, which was also used to report the underground Mineral Resources.
To demonstrate reasonable prospects for eventual economic extraction (RPEEE), open pit Mineral Resources are constrained by a preliminary optimized open pit shell and reported above a cut-off grade of 0.3 g/t Au.
Underground Mineral Resources are constrained by reporting panels generated at a cut-off grade of 1.65 g/t Au and a minimum mining width of 1.8 m.
Canadian Institute of Mining, Metallurgy and Petroleum (CIM) Definition Standards for Mineral Resources and Mineral Reserves (CIM (2014) definitions) were used for Mineral Resource classification.
Mineral Resources for the QWN Project are tabulated in Table 1-2, with an effective date of March 15, 2025:
| 1- |
|
| New Found Gold Corp. | Queensway Gold Project NI 43-101 Technical Report |
April 15, 2025 SLR Project No.: 233.065300.00001 |
Table 1-2: Summary of Mineral Resources - Effective Date March 15, 2025
| Zone | Area | Category | Tonnage (000 t) |
Grade (g/t Au) |
Contained Metal (000 oz Au) |
| Open Pit | |||||
| K2, Monte Carlo | AFZ Core | Indicated | 3,588 | 1.51 | 175 |
| Inferred | 3,755 | 1.22 | 147 | ||
| Keats West, Cokes, Powerline | AFZ Core | Indicated | 4,392 | 1.85 | 261 |
| Inferred | 2,410 | 1.33 | 103 | ||
| Keats, Keats South, Iceberg, Iceberg East, Iceberg Alley, Knob, Golden Bullet | AFZ Core | Indicated | 7,004 | 2.94 | 662 |
| Inferred | 1,037 | 0.84 | 28 | ||
| Lotto, Golden Joint, Jackpot, Honeypot | AFZ Core | Indicated | 1,205 | 3.16 | 122 |
| Inferred | 1,078 | 1.31 | 45 | ||
| Big Vein, Pristine, HM, Midway | AFZ Peripheral | Indicated | 995 | 0.82 | 26 |
| Inferred | 474 | 1.56 | 24 | ||
| H Pond, 1744, Pocket Pond | JBP | Indicated | 83 | 1.54 | 4 |
| Inferred | 206 | 1.66 | 11 | ||
| Total | Indicated | 17,267 | 2.25 | 1,249 | |
| Inferred | 8,960 | 1.24 | 358 | ||
| Underground | |||||
| K2, Monte Carlo | AFZ Core | Indicated | 32 | 3.02 | 3 |
| Inferred | 335 | 2.78 | 30 | ||
| Keats West, Cokes, Powerline | AFZ Core | Indicated | - | - | - |
| Inferred | 28 | 2.76 | 3 | ||
| Keats, Keats South, Iceberg, Iceberg East, Iceberg Alley, Knob, Golden Bullet | AFZ Core | Indicated | 306 | 5.13 | 50 |
| Inferred | 660 | 4.53 | 96 | ||
| Lotto, Golden Joint, Jackpot, Honeypot | AFZ Core | Indicated | 303 | 6.97 | 68 |
| Inferred | 394 | 6.34 | 80 | ||
| Big Vein, Pristine, HM, Midway | AFZ Peripheral | Indicated | 100 | 5.42 | 17 |
| Inferred | 119 | 5.72 | 22 | ||
| H Pond, 1744, Pocket Pond | JBP | Indicated | 30 | 4.09 | 4 |
| Inferred | 214 | 2.79 | 19 | ||
| Total | Indicated | 771 | 5.76 | 142 | |
| Inferred | 1,749 | 4.44 | 250 | ||
| 1- |
|
| New Found Gold Corp. | Queensway Gold Project NI 43-101 Technical Report |
April 15, 2025 SLR Project No.: 233.065300.00001 |
| Zone | Area | Category | Tonnage (000 t) |
Grade (g/t Au) |
Contained Metal (000 oz Au) |
|||
| Open Pit + Underground | ||||||||
| Total | Indicated | 18,038 | 2.40 | 1,392 | ||||
| Inferred | 10,709 | 1.77 | 608 | |||||
|
Notes: 1. CIM (2014) definitions were followed for Mineral Resources. 2. Mineral Resources are estimated using a long-term gold price of US$2,200 per ounce, and a US$/C$ exchange rate of US$1.00 = C$1.43. 3. Open pit Mineral Resources are estimated at a cut-off grade of 0.3 g/t Au and constrained by a preliminary optimized pit shell with a pit slope angle of 45° and bench height of 5 m. 4. RPEEE for underground Mineral Resources was demonstrated by constraining with MSO shapes generated at a cut-off grade of 1.65 g/t Au, with heights of 10 m, lengths of 5 m, and a minimum mining width of 1.8 m. 5. The optimized pit shell, underground reporting shapes, and cut-off grades were generated by assuming metallurgical recovery of 90%, standard treatment and refining charges, mining costs of C$5.0/t moved for open pit and C$120/t processed for underground, processing costs of C$20/t processed, and general and administrative costs of C$7.5/t processed. 6. Mineral Resources that are not Mineral Reserves do not have demonstrated economic viability. 7. Bulk density within the vein and halo mineralization domains is 2.7 t/m3. 8. Numbers may not add due to rounding. |
||||||||
The QP is not aware of any environmental, permitting, legal, title, taxation, socio-economic, marketing, political, or other relevant factors that could materially affect the Mineral Resource estimate other than those discussed in Section 14.14.3.
No Mineral Reserves are defined for the Property.
| 1.2.8 | Metallurgical Test Work |
Since 2023, NFG has completed two phases of metallurgical test work, and a third phase is in progress. Phase 1 of the test work evaluated three mineralized zones, Keats, Golden Joint, and Lotto, and phase 2 studied mineralization from the Iceberg and Iceberg East zones. The phase 3 test work currently underway is examining mineralized material from Keats West.
Samples used in test work were selected to provide a wide range of gold head grades for evaluation. Since the samples were selected prior to the completion of geological modelling and resource estimation, their selection did not benefit from detailed knowledge of grade distributions within each zone or the extents of each zone.
The metallurgical test programs characterized each zone by combining intervals of mineralized core from different vein and structural intercepts to create numerous variability composites. Master composites for each zone were created by combining portions of the variability composites from each respective zone.
Exploratory test work was completed on the master composites and included comminution testing, mineralogical analysis, gravity recovery testing, cyanide leaching (direct and CIL), and preg-robbing testing. Based on results of the exploratory testing, the variability composites were tested using a gravity-CIL base-case flowsheet at three different grind sizes.
Additional exploratory test work investigated the rejection of carbon via flotation, and sulphide flotation for the recovery of gold associated with sulphides by CIL. The test work indicated that the majority of gold not recovered in gravity concentration could be recovered by flotation.
| 1- |
|
| New Found Gold Corp. | Queensway Gold Project NI 43-101 Technical Report |
April 15, 2025 SLR Project No.: 233.065300.00001 |
| 2.0 | Introduction |
SLR Consulting (Canada) Ltd. (SLR) was retained by New Found Gold Corp. (NFG or the Company) to prepare an independent Technical Report on the 100% owned Queensway Gold Project (the Project or the Property), located in the province of Newfoundland and Labrador, Canada. The purpose of this Technical Report is to support the disclosure of an initial Mineral Resource estimate. This Technical Report conforms to National Instrument 43-101 Standards of Disclosure for Mineral Projects (NI 43-101). Two Qualified Persons (QPs) from SLR conducted a site visit to the Project and related facilities on October 24 and 25, 2024.
NFG is a publicly traded junior mineral exploration company based in Vancouver, British Columbia, Canada. NFG’s current exploration project includes the Queensway Gold Project in northeast Newfoundland of the Canadian province of Newfoundland and Labrador (NL). The Company is listed on the TSX Venture Exchange (TSX-V: NFG), the OTCQB Venture Market (NFGFF) and the New York Stock Exchange (NYSE-A: NFGC) in the U.S.A., and the Frankfurt Stock Exchange (FSE: 2N6).
The Property consists of 7,024 claims across 103 mineral licences, covering a total area of 175,600 hectares (ha). It includes three Mineral Resource areas: AFZ Core, AFZ Peripheral, and JBP. AFZ Core hosts several key gold (Au) zones, including Keats, Iceberg, Keats West, Lotto, Golden Joint, K2, etc. AFZ Peripheral contains the Big Vein, Pristine, HM, and Midway zones, while JBP features the H Pond, 1744, and Pocket Pond zones. The distance from AFZ Core to AFZ Peripheral is approximately 7.5 km, and from AFZ Core to JBP, approximately 5.5 km. The Project is in an early exploration stage.
The Queensway Project is located approximately 15 km west of the town of Gander, NL, and is accessible via the Trans-Canada Highway (TCH), with additional infrastructure including gravel resource roads, high-voltage transmission lines, and proximity to the Gander International Airport and local shipping ports.
NFG has completed a number of baseline environmental and social studies within the Property and surrounding areas, which have been reviewed by Stantec Consulting Ltd. (Stantec) and a summary is included in Section 24 of this Technical Report.
| 2.1 | Sources of Information |
SLR’s site visit to the Queensway Project was conducted by Pierre Landry, P.Geo., Managing Principal Resource Geologist, and David M. Robson, P.Eng., MBA, Principal Mining Engineer, on October 24 and 25, 2024. During the visit, they inspected key project components, assessed site conditions, and gathered information necessary for completing the Mineral Resource estimate and accompanying Technical Report. Mr. Landry examined the Keats and Iceberg trenches, the core shack, and reviewed logging procedures for data collection and sampling. He also inspected core samples from the AFZ Core, AFZ Peripheral, and JBP deposits. Mr. Robson assessed site accessibility and infrastructure, including water sources, power supply, and potential locations for key site infrastructure.
As part of the verification process, Mr. Landry inspected drill collars and drill hole cores relevant to the Mineral Resource estimation, verifying collar locations using a handheld GPS and visually comparing mineralization with interpreted drilling sections. NFG provided full access to all facilities and personnel during the visit. Mr. Landry and Mr. Robson were accompanied by Melissa Render, President (formerly Vice President of Exploration for NFG), and Ron Hampton, former Chief Development Officer.
| 2- |
|
| New Found Gold Corp. | Queensway Gold Project NI 43-101 Technical Report |
April 15, 2025 SLR Project No.: 233.065300.00001 |
Sheldon H. Smith P.Geo., Senior Hydrologist and Senior Principal with Stantec, visited the site on March 18, 2025, accompanied by Alexandra Squires, a Project Coordinator with NFG. Mr. Smith visited NFG’s core storage area and travelled through the Property stopping to observe exploration drilling and trenching zones, an overburden stockpile, organic/grubbed material stockpile, and exploration phase site water management ditching and erosion and sedimentation controls. Mr. Smith also observed local natural waterbodies and connecting watercourses, the local physiographic, topographic, and vegetative cover landscape through the Queensway property.
During the preparation of the Mineral Resource estimate, SLR held discussions with NFG personnel to review geological data, project infrastructure, and operational considerations. These discussions included Melissa Render, P.Geo., President; Ron Hampton, former Chief Development Officer; Robert Assabgui, P.Eng., Study Manager; Jared Saunders, Vice President, Sustainability; James Tolhurst, P.Geo., Geoscience Data Manager; Alexandra Squires, G.I.T., Project Coordinator; and Chris Baker, G.I.T., Modelling Geologist.
This Technical Report was prepared by QPs Pierre Landry, P.Geo., David M. Robson, P.Eng., Principal Mining Engineer, Lance Engelbrecht, P.Eng., Principal Metallurgist, of SLR, and Sheldon H. Smith, P.Geo., Senior Hydrologist and Senior Principal, of Stantec (Table 2-1). Additional contributions were made by James Catley, CGeol (UK); Lorraine Tam, P.Geo.; John Makin, MAIG (Australia); Goran Andric, P.Eng.; Jeff Sepp, P.Eng.; and Maria Campos, P.Geo., of SLR.
Table 2-1: Qualified Persons and Responsibilities
| QP, Designation, Title | Company | Responsible for |
| Pierre Landry, P.Geo., Managing Principal Resource Geologist, Valuations Lead and Team Lead - Resource Geology | SLR | Overall report preparation and all sections exclusive of 13, 14.13, 24, and related content in Sections 1, 25, 26, and 27. |
| David M. Robson, P.Eng., Principal Mining Engineer | SLR | Section 14.13 and related content in Sections 1, 25, and 26. |
| Lance Engelbrecht, P.Eng. | SLR | Section 13 and related content in Sections 1, 25, 26, and 27. |
| Sheldon H. Smith, P.Geo. | Stantec | Section 24 and related content in Sections 1, 25, 26, and 27 |
The effective date of the technical information in this Technical Report is March 18, 2025. The effective date of the Mineral Resource estimate is March 15, 2025.
The documentation reviewed, and other sources of information, are listed at the end of this Technical Report in Section 27 References.
| 2- |
|
| New Found Gold Corp. | Queensway Gold Project NI 43-101 Technical Report |
April 15, 2025 SLR Project No.: 233.065300.00001 |
| 2.2 | List of Abbreviations |
Units of measurement used in this Technical Report conform to the metric system. All currency in this Technical Report is Canadian dollars (C$) unless otherwise noted.
| m | micron | kVA | kilovolt-amperes |
| mg | microgram | kW | kilowatt |
| a | annum | kWh | kilowatt-hour |
| A | ampere | L | litre |
| bbl | barrels | lb | pound |
| Btu | British thermal units | L/s | litres per second |
| °C | degree Celsius | m | metre |
| C$ | Canadian dollars | M | mega (million); molar |
| cal | calorie | m2 | square metre |
| cfm | cubic feet per minute | m3 | cubic metre |
| cm | centimetre | MASL | metres above sea level |
| cm2 | square centimetre | m3/h | cubic metres per hour |
| d | day | mg/L | milligrams per litre |
| dia | diameter | mi | mile |
| dmt | dry metric tonne | min | minute |
| dwt | dead-weight ton | mm | micrometre |
| °F | degree Fahrenheit | mm | millimetre |
| ft | foot | mph | miles per hour |
| ft2 | square foot | MVA | megavolt-amperes |
| ft3 | cubic foot | MW | megawatt |
| ft/s | foot per second | MWh | megawatt-hour |
| g | gram | oz | Troy ounce (31.1035g) |
| G | giga (billion) | oz/st, opt | ounce per short ton |
| Gal | Imperial gallon | ppb | part per billion |
| g/L | gram per litre | ppm | part per million |
| Gpm | Imperial gallons per minute | psia | pound per square inch absolute |
| g/t | gram per tonne | psig | pound per square inch gauge |
| gr/ft3 | grain per cubic foot | RL | relative elevation |
| gr/m3 | grain per cubic metre | s | second |
| ha | hectare | st | short ton |
| hp | horsepower | stpa | short ton per year |
| hr | hour | stpd | short ton per day |
| Hz | hertz | t | metric tonne |
| in. | inch | tpa | metric tonne per year |
| in2 | square inch | tpd | metric tonne per day |
| J | joule | US$ | United States dollar |
| k | kilo (thousand) | USg | United States gallon |
| kcal | kilocalorie | USgpm | US gallon per minute |
| kg | kilogram | V | volt |
| km | kilometre | W | watt |
| km2 | square kilometre | wmt | wet metric tonne |
| km/h | kilometre per hour | wt% | weight percent |
| kPa | kilopascal | yd3 | cubic yard |
| yr | year |
| 2- |
|
| New Found Gold Corp. | Queensway Gold Project NI 43-101 Technical Report |
April 15, 2025 SLR Project No.: 233.065300.00001 |
| 3.0 | Reliance on Other Experts |
This Technical Report has been prepared by SLR for NFG. The information, conclusions, opinions, and estimates contained herein are based on:
| • | Information available to SLR at the time of preparation of this Technical Report. |
| • | Assumptions, conditions, and qualifications as set forth in this Technical Report. |
For the purpose of this Technical Report, SLR has relied on ownership and royalty information provided by NFG within Section 4. The SLR QP conducted a review of the claims and mineral licences held by NFG that encompass the Queensway Project using the Newfoundland and Labrador Geoscience Atlas and found all claims and licences to be active and in good standing.
The SLR QP has taken all appropriate steps, in their professional opinion, to ensure that the above information from NFG is reliable.
Except for the purposes legislated under provincial securities laws, any use of this Technical Report by any third party is at that party’s sole risk.
| 3- |
|
| New Found Gold Corp. | Queensway Gold Project NI 43-101 Technical Report |
April 15, 2025 SLR Project No.: 233.065300.00001 |
| 4.0 | Property Description and Location |
| 4.1 | Description and Location |
The Queensway Gold Project is located on the northeast portion of the Island of Newfoundland in the Province of Newfoundland and Labrador (NL) along the east coast of Canada. The northern portion of the Property is transected by the Trans-Canada Highway, a transcontinental federal-provincial highway system that travels through all 10 southern provinces of Canada. Via the Trans-Canada Highway, the eastern edge of the Property is located approximately 15 km west of the town of Gander, NL (Figure 4-1). The approximate centre of the NFG Queensway Project is UTM, Zone 21N, NAD83: 645,000 m Easting, 5,402,000 m Northing.
On July 9, 2024, NFG announced that the Company had acquired a 100% interest in Labrador Gold Corp.’s (LabGold) Kingsway Project including four licences (311 claims). The claims were added to the Queensway property holdings and are now referred to as the AFZ Peripheral area.
On May 17, 2024, NFG completed the acquisition of 100% in three licences (54 claims) from Sky Gold Corp. (Sky Gold).
Currently, the 100% owned Queensway Property is defined by 103 mineral licences that comprise 7,024 claims, with each claim having an area of 25 ha (500 m x 500 m). In total, the Property encompasses an area of 175,600 ha (1,756 km2). The licences can be separated spatially into groups, or blocks, based on their contiguous groupings as described in the text that follows.
The geographic position of the various contiguous licence groupings, and the licence descriptions, are presented in Figure 4-1 and Table 4-1. The licences/claims are divided into six sub-properties, or blocks that include:
| • | Two large contiguous blocks (Queensway North [QWN], and Queensway South [QWS]) separated by Gander Lake, and |
| • | Four smaller blocks of single or multiple contiguous groups of licences (Twin Ponds, Ten Mile-Duder Lake, Bellman’s Pond, and Little Rocky Brook). |
The blocks have no specific administrative or legal significance but are helpful in presenting and explaining a variety of exploration activities over a very large area.
The larger QWN and QWS blocks are defined as follows:
| 1 | QWN consists of 43 contiguous mineral licences (1,135 claims) and is situated north of Gander Lake. The recent acquisition of five licences (315 claims) from LabGold (four licences) and Sky Gold (one licence) are spatially and contiguously associated with QWN. Currently, the QWN block encompasses a total area of 28,375 ha. The approximate centre of the QWN block is UTM, Zone 21N, NAD83: 663,470 m Easting, 5,433,890 m Northing (Table 4-1; Figure 4-2). Two licences within the QWN block forms part of the VOA Option (licences 035197M and 035198M; see Section 4.5). |
| 2 | QWS consists of 53 contiguous mineral licences (5,337 claims) and is situated south and west of Gander Lake. The recent acquisition of two licences (50 claims) from Sky Gold are spatially and contiguously associated with QWS. Currently, QWS encompasses a total area of 133,425 ha. The approximate centre of the QWS block is UTM, Zone 21N, NAD83: 639,028 m Easting, 5,389,980 m Northing (Table 4-1; Figure 4-3). None of the VOA Option licences occur within the QWS block. |
| 4- |
|
| New Found Gold Corp. | Queensway Gold Project NI 43-101 Technical Report |
April 15, 2025 SLR Project No.: 233.065300.00001 |
The Queensway Property also includes four smaller, non-contiguous groups of licences that occur north and west of the QWN block (Figure 4-1; Figure 4-2; Table 4-1). These blocks are defined as follows:
| 1 | Twin Ponds (TP) block consists of three contiguous mineral licences (226 claims) and is situated west of the Gander River. The TP block encompasses an area of 5,650 ha. The approximate centre of the TP block is UTM, Zone 21N, NAD83: 653,000 m Easting, 5,436,500 m Northing. A single licence within the TP block forms part of the VOA Option (licence 035048M; see Section 4.5). |
| 2 | Ten Mile-Duder Lake (TMDL) block consists of two contiguous mineral licences (211 claims) situated west of the Gander River. The TMDL block encompasses an area of 5,275 ha. The approximate centre of the TMDL block is UTM, Zone 21N, NAD83: 670,000 m Easting, 5,460,000 m Northing. Both licences within the TMDL block form the VOA Option (licence 035047M and 035050M; see Section 4.5). |
| 3 | Bellman’s Pond (BP) block consists of one mineral licence (one claim) and is situated west of the Gander River. The BP block encompasses an area of 25 ha. The approximate centre of the BP block is UTM, Zone 21N, NAD83: 671,800 m Easting, 5,450,000 m Northing. None of the VOA Option licences occur within the BP block. |
| 4 | Little Rocky Brook (LRB) block consists of one mineral licence (114 contiguous claims) and is situated west of the Gander River. The LRB block encompasses an area of 2,850 ha. The approximate centre of the LRB block is UTM, Zone 21N, NAD83: 676,700 m Easting, 5,447,500 m Northing. None of the VOA Option licences occur within the LRB block. |
The SLR QP has reviewed the Queensway Project's mineral licences and confirmed their standing through publicly available data and information from NFG. To the best of the QP’s knowledge, all licences remain in good standing as of the effective date of this report, with exploration subject to regulatory approvals and applicable restrictions.
| 4- |
|
| New Found Gold Corp. | Queensway Gold Project NI 43-101 Technical Report |
April 15, 2025 SLR Project No.: 233.065300.00001 |
Figure 4-1: Queensway Project and Five Contiguously Defined Sub-property ‘Blocks’ of Contiguous Mineral Licences

| 4- |
|
| New Found Gold Corp. | Queensway Gold Project NI 43-101 Technical Report |
April 15, 2025 SLR Project No.: 233.065300.00001 |
Table 4-1: Queensway Project Mineral Licence Description and Status by Blocks of Contiguous Licences/Claims
| A) | Queensway North Block |
| Licence No. | Title Holder | Location | No. Claims | Area (km²) |
Status | Issued Date |
Renewal Date |
Report Due Date |
Expenses Due ($) |
Expenses Due Date |
NSR Royalty (%) |
NSR Buyback Provision (%) |
| 006821M | New Found Gold Corp. | Gander River, Central NL | 2 | 0.50 | Issued | 1999-05-17 | 2025-05-19 | 2025-07-16 | 358.75 | 2029-05-17 | 2.5 | 1.0 |
| 007984M | New Found Gold Corp. | Glenwood, Central NL | 50 | 12.50 | Issued | 1998-11-13 | 2025-11-13 | 2026-01-12 | N/A | N/A | 0.4 | 0.0 |
| 022216M | New Found Gold Corp. | Glenwood, Central NL | 6 | 1.50 | Issued | 2014-06-12 | 2029-06-12 | 2025-08-11 | 2,685.01 | 2033-06-12 | 0.0 | 0.0 |
| 022491M | New Found Gold Corp. | Gander Lake Area, Central NL | 12 | 3.00 | Issued | 2014-11-06 | 2029-11-06 | 2026-01-05 | 14,400.00 | 2033-11-06 | 1.6 | 1.0 |
| 023720M | New Found Gold Corp. | Glenwood, Central NL | 4 | 1.00 | Issued | 2001-12-31 | 2025-12-31 | 2025-03-03 | 5,732.73 | 2027-12-31 | 1.0 | 0.0 |
| 023721M | New Found Gold Corp. | Glenwood, Central NL | 2 | 0.50 | Issued | 2001-12-31 | 2025-12-31 | 2025-03-03 | 4,533.12 | 2027-12-31 | 1.0 | 0.0 |
| 023804M | New Found Gold Corp. | Glenwood, Central NL | 12 | 3.00 | Issued | 2001-02-19 | 2025-02-19 | 2025-04-21 | 9,549.77 | 2027-02-19 | 0.0 | 0.0 |
| 023860M | New Found Gold Corp. | Joe Batts Brook, Central NL | 11 | 2.75 | Issued | 2016-04-07 | 2026-04-07 | 2025-06-06 | 2,013.91 | 2033-04-07 | 0.6 | 0.0 |
| 023861M | New Found Gold Corp. | Joe Batts Pond, Central NL | 16 | 4.00 | Issued | 2016-04-07 | 2026-04-07 | 2025-06-06 | 14,744.84 | 2034-04-07 | 1.0 | 0.0 |
| 023862M | New Found Gold Corp. | Joe Batts Brook, Central NL | 4 | 1.00 | Issued | 2016-04-07 | 2026-04-07 | 2025-06-06 | 732.33 | 2033-04-07 | 0.6 | 0.0 |
| 023863M | New Found Gold Corp. | Joe Batts Brook, Central NL | 11 | 2.75 | Issued | 2016-04-07 | 2026-04-07 | 2025-06-06 | 10,137.07 | 2034-04-07 | 1.0 | 0.0 |
| 023864M | New Found Gold Corp. | Joe Batts Brook, Central NL | 3 | 0.75 | Issued | 2016-04-07 | 2026-04-07 | 2025-06-06 | 1,933.84 | 2033-04-07 | 1.0 | 0.0 |
| 023866M | New Found Gold Corp. | Joe Batts Brook, Central NL | 4 | 1.00 | Issued | 2016-04-07 | 2026-04-07 | 2025-06-06 | 732.33 | 2033-04-07 | 1.0 | 0.5 |
| 023874M | New Found Gold Corp. | Joe Batts Brook, Central NL | 8 | 2.00 | Issued | 2016-04-11 | 2026-04-13 | 2025-06-10 | 6,678.68 | 2034-04-11 | 1.6 | 1.0 |
| 023875M | New Found Gold Corp. | Joe Batts Pond, Central NL | 3 | 0.75 | Issued | 2016-04-12 | 2026-04-13 | 2025-06-11 | 549.25 | 2033-04-12 | 1.6 | 1.0 |
| 023881M | New Found Gold Corp. | Joe Batts Brook, Central NL | 7 | 1.75 | Issued | 2016-04-21 | 2026-04-21 | 2025-06-20 | 2,123.68 | 2032-04-21 | 1.6 | 1.0 |
| 023916M | New Found Gold Corp. | Gander Lake Area, Central NL | 4 | 1.00 | Issued | 2016-05-05 | 2026-05-05 | 2025-07-04 | 4,800.00 | 2034-05-05 | 1.6 | 1.0 |
| 023940M | New Found Gold Corp. | Gander River | 44 | 11.00 | Issued | 2016-05-09 | 2026-05-11 | 2025-07-08 | 52,800.00 | 2033-05-09 | 0.0 | 0.0 |
| 023962M | New Found Gold Corp. | The Outflow, Central NL | 9 | 2.25 | Issued | 2016-05-19 | 2026-05-19 | 2025-07-18 | 10,800.00 | 2034-05-19 | 0.0 | 0.0 |
| 023987M | New Found Gold Corp. | Joe Batts Pond Area, Central NL | 11 | 2.75 | Issued | 2016-06-07 | 2026-06-08 | 2025-08-06 | 13,200.00 | 2034-06-07 | 1.6 | 1.0 |
| 024026M | New Found Gold Corp. | Joe Batts Pond Area, Central NL | 6 | 1.50 | Issued | 2016-06-30 | 2026-06-30 | 2025-08-29 | 7,200.00 | 2033-06-30 | 1.6 | 1.0 |
| 024031M | New Found Gold Corp. | Joe Batts Pond Area, Central NL | 6 | 1.50 | Issued | 2016-06-30 | 2026-06-30 | 2025-08-29 | 1,820.30 | 2032-06-30 | 1.6 | 1.0 |
| 024112M | New Found Gold Corp. | Gander River | 4 | 1.00 | Issued | 2016-08-25 | 2026-08-25 | 2025-10-24 | 4,800.00 | 2032-08-25 | 1.5 | 0.5 |
| 024136M | New Found Gold Corp. | Gander River Area, Central NL | 25 | 6.25 | Issued | 2016-09-13 | 2026-09-14 | 2025-11-12 | 18,283.26 | 2033-09-13 | 0.0 | 0.0 |
| 024138M | New Found Gold Corp. | Gander Lake, Central NL | 21 | 5.25 | Issued | 2016-09-15 | 2026-09-15 | 2025-11-14 | 13,686.81 | 2033-09-15 | 0.0 | 0.0 |
| 024139M | New Found Gold Corp. | Gander Lake, Central NL | 30 | 7.50 | Issued | 2016-09-15 | 2026-09-15 | 2025-11-14 | 5,492.49 | 2033-09-15 | 1.6 | 1.0 |
| 4- |
|
| New Found Gold Corp. | Queensway Gold Project NI 43-101 Technical Report |
April 15, 2025 SLR Project No.: 233.065300.00001 |
| Licence No. | Title Holder | Location | No. Claims | Area (km²) |
Status | Issued Date |
Renewal Date |
Report Due Date |
Expenses Due ($) |
Expenses Due Date |
NSR Royalty (%) |
NSR Buyback Provision (%) |
| 024140M | New Found Gold Corp. | Joe Batts Pond, Central NL | 2 | 0.50 | Issued | 2016-09-15 | 2026-09-15 | 2025-11-14 | 1,289.23 | 2033-09-15 | 1.6 | 1.0 |
| 024141M | New Found Gold Corp. | Joe Batts Pond Area, Central NL | 2 | 0.50 | Issued | 2016-09-15 | 2026-09-15 | 2025-11-14 | 1,289.23 | 2033-09-15 | 1.6 | 1.0 |
| 024264M | New Found Gold Corp. | Joe Batts Pond Area, Central NL | 4 | 1.00 | Issued | 2016-10-24 | 2026-10-26 | 2025-12-23 | 4,800.00 | 2033-10-24 | 0.4 | 0.0 |
| 024265M | New Found Gold Corp. | Appleton, Central NL | 12 | 3.00 | Issued | 2016-10-24 | 2026-10-26 | 2025-12-23 | 14,400.00 | 2033-10-24 | 0.4 | 0.0 |
| 024266M | New Found Gold Corp. | Joe Batts Pond, Central NL | 128 | 32.00 | Issued | 2016-10-24 | 2026-10-26 | 2025-12-23 | 153,600.00 | 2033-10-24 | 0.4 | 0.0 |
| 024268M | New Found Gold Corp. | Millers Brook, Central NL | 56 | 14.00 | Issued | 2016-10-24 | 2026-10-26 | 2025-12-23 | 67,200.00 | 2033-10-24 | 1.6 | 1.0 |
| 024997M | New Found Gold Corp. | Glenwood Area, Central NL | 21 | 5.25 | Issued | 2017-04-27 | 2027-04-27 | 2025-06-26 | 25,200.00 | 2034-04-27 | 0.0 | 0.0 |
| 025008M | New Found Gold Corp. | Gander Lake, Central NL | 13 | 3.25 | Issued | 2017-05-04 | 2027-05-04 | 2025-07-03 | 15,600.00 | 2034-05-04 | 1.0 | 0.0 |
| 026074M | New Found Gold Corp. | Joe Batts Brook, Central NL | 3 | 0.75 | Issued | 2018-05-31 | 2028-05-31 | 2025-07-30 | 3,600.00 | 2034-05-31 | 2.2 | 1.0 |
| 027636M | New Found Gold Corp. | Gander River | 110 | 27.50 | Issued | 2016-10-24 | 2026-10-26 | 2025-12-23 | 132,000.00 | 2033-10-24 | 1.0 | 0.0 |
| 027637M | New Found Gold Corp. | Gander River | 154 | 38.50 | Issued | 2016-10-24 | 2026-10-26 | 2025-12-23 | 158,508.04 | 2032-10-24 | 1.0 | 0.0 |
| 030714M | New Found Gold Corp. | King's Point, Gander Lake | 8 | 2.00 | Issued | 2020-05-02 | 2025-05-02 | 2025-07-01 | 2,324.47 | 2033-05-02 | 1.0 | 0.0 |
| 035197M | Aidan O’Neil | Penny's Pond | 130 | 32.50 | Issued | 2022-11-10 | 2027-11-10 | 2025-01-09 | 5,165.81 | 2025-11-10 | 0.0 | 0.0 |
| 035198M | Suraj Amarnani | Fourth Pond | 168 | 42.00 | Issued | 2022-11-10 | 2027-11-10 | 2026-01-09 | 1,512,000.00 | 2034-11-10 | 0.0 | 0.0 |
| 035204M | New Found Gold Corp. | Gander River | 3 | 0.75 | Issued | 2022-11-10 | 2027-11-10 | 2025-01-09 | 710.00 | 2031-11-10 | 1.0 | 0.0 |
| 035209M | New Found Gold Corp. | Penny's Pond | 2 | 0.50 | Issued | 2022-11-10 | 2027-11-10 | 2025-01-09 | 29.15 | 2025-11-10 | 0.0 | 0.0 |
| 035681M | New Found Gold Corp. | The Outflow, Central NL | 4 | 1.00 | Issued | 2023-03-16 | 2028-03-16 | 2025-05-15 | 109.76 | 2028-03-16 | 0.0 | 0.0 |
| Total -43 licences | Totals | 1,135 | 283.75 | |||||||||
| B) | Queensway South Block |
| Licence No. | Title Holder | Location | No. Claims |
Area (km²) |
Status | Issued Date |
Renewal Date |
Report Due Date |
Expenses Due ($) |
Expenses Due Date |
NSR Royalty (%) |
NSR Buyback Provision (%) |
| 022236M | New Found Gold Corp. | Southwest Gander River, Central NL | 5 | 1.25 | Issued | 2014-06-12 | 2029-06-12 | 2026-08-12 | 510.78 | 2026-06-12 | 1.0 | 0.5 |
| 022260M | New Found Gold Corp. | Southwest Gander River, Central NL | 1 | 0.25 | Issued | 2014-06-13 | 2029-06-13 | 2026-08-12 | 472.52 | 2026-06-13 | 1.0 | 0.5 |
| 022342M | New Found Gold Corp. | Southwest Gander River, Central NL | 1 | 0.25 | Issued | 2014-08-25 | 2029-08-27 | 2026-10-26 | 376.04 | 2027-08-25 | 1.0 | 0.5 |
| 023239M | New Found Gold Corp. | Pauls Pond, Central NL | 2 | 0.50 | Issued | 2015-08-12 | 2025-08-12 | 2026-10-12 | 354.88 | 2026-08-12 | 1.0 | 0.5 |
| 023495M | New Found Gold Corp. | Northwest Gander River, Central NL | 5 | 1.25 | Issued | 2015-11-19 | 2025-11-19 | 2027-01-18 | 3,584.09 | 2026-11-19 | 1.0 | 0.5 |
| 023498M | New Found Gold Corp. | Northwest Gander River, Central NL | 8 | 2.00 | Issued | 2015-11-19 | 2025-11-19 | 2027-01-18 | 2,155.12 | 2026-11-19 | 1.0 | 0.5 |
| 024435M | New Found Gold Corp. | Greenwood Pond, Central NL | 7 | 1.75 | Issued | 2016-11-21 | 2026-11-23 | 2027-01-20 | 49.02 | 2026-11-12 | 1.0 | 0.5 |
| 4- |
|
| New Found Gold Corp. | Queensway Gold Project NI 43-101 Technical Report |
April 15, 2025 SLR Project No.: 233.065300.00001 |
| Licence No. | Title Holder | Location | No. Claims |
Area (km²) |
Status | Issued Date |
Renewal Date |
Report Due Date |
Expenses Due ($) |
Expenses Due Date |
NSR Royalty (%) |
NSR Buyback Provision (%) |
| 024436M | New Found Gold Corp. | Greenwood Pond, Central NL | 3 | 0.75 | Issued | 2016-11-21 | 2026-11-23 | 2027-01-20 | 451.90 | 2027-11-21 | 1.0 | 0.5 |
| 024557M | New Found Gold Corp. | Bear Pond, Central NL | 250 | 62.50 | Issued | 2016-12-12 | 2026-12-14 | 2026-02-10 | 111,043.41 | 2026-12-12 | 1.0 | 0.0 |
| 024558M | New Found Gold Corp. | Great Gull River, Central NL | 239 | 59.75 | Issued | 2016-12-12 | 2026-12-14 | 2026-02-10 | 106,108.95 | 2026-12-12 | 1.0 | 0.0 |
| 024559M | New Found Gold Corp. | Northwest Gander River, Central NL | 256 | 64.00 | Issued | 2016-12-12 | 2026-12-14 | 2026-02-10 | 2,280.15 | 2026-12-12 | 1.0 | 0.0 |
| 024560M | New Found Gold Corp. | Careless Brook, Central NL | 121 | 30.25 | Issued | 2016-12-12 | 2026-12-14 | 2026-02-10 | 105,243.94 | 2027-12-12 | 1.0 | 0.0 |
| 024561M | New Found Gold Corp. | Eastern Pond, Central NL | 256 | 64.00 | Issued | 2016-12-12 | 2026-12-14 | 2026-02-10 | 36,686.11 | 2025-12-12 | 1.0 | 0.0 |
| 024562M | New Found Gold Corp. | Hussey Pond, Central NL | 241 | 60.25 | Issued | 2016-12-12 | 2026-12-14 | 2026-02-10 | 121,744.05 | 2026-12-12 | 1.0 | 0.0 |
| 024563M | New Found Gold Corp. | Eastern Pond, Central NL | 236 | 59.00 | Issued | 2016-12-12 | 2026-12-14 | 2026-02-10 | 104,768.31 | 2026-12-12 | 1.0 | 0.0 |
| 024565M | New Found Gold Corp. | Gander Lake, Central NL | 12 | 3.00 | Issued | 2016-12-12 | 2026-12-14 | 2027-02-10 | 960.82 | 2026-12-12 | 1.0 | 0.0 |
| 024566M | New Found Gold Corp. | Gander Lake, Central NL | 125 | 31.25 | Issued | 2016-12-12 | 2026-12-14 | 2025-02-10 | 10,814.01 | 2025-12-12 | 1.0 | 0.0 |
| 024567M | New Found Gold Corp. | Gander Lake, Central NL | 106 | 26.50 | Issued | 2016-12-12 | 2026-12-14 | 2025-02-10 | 9,023.39 | 2025-12-12 | 1.0 | 0.0 |
| 024568M | New Found Gold Corp. | Birch Pond, Central NL | 254 | 63.50 | Issued | 2016-12-12 | 2026-12-14 | 2025-02-10 | 7,289.42 | 2025-12-12 | 1.0 | 0.0 |
| 024569M | New Found Gold Corp. | Southwest Gander River, Central NL | 221 | 55.25 | Issued | 2016-12-12 | 2026-12-14 | 2025-02-10 | 19,505.91 | 2025-12-12 | 1.0 | 0.0 |
| 024570M | New Found Gold Corp. | Dennis Brook, Central NL | 117 | 29.25 | Issued | 2016-12-12 | 2026-12-14 | 2025-02-10 | 3,117.21 | 2025-12-12 | 1.0 | 0.0 |
| 024571M | New Found Gold Corp. | Winter Brook, Central NL | 153 | 38.25 | Issued | 2016-12-12 | 2026-12-14 | 2025-02-10 | 47,155.68 | 2025-12-12 | 1.0 | 0.0 |
| 025766M | New Found Gold Corp. | Pauls Pond, Central NL | 163 | 40.75 | Issued | 2016-12-12 | 2026-12-14 | 2025-02-10 | 4,539.42 | 2025-12-12 | 1.0 | 0.0 |
| 027379M | New Found Gold Corp. | Gander Outflow | 6 | 1.50 | Issued | 2020-08-22 | 2025-08-22 | 2025-10-21 | 5,400.00 | 2031-08-22 | 3.0 | 1.5 |
| 030710M | New Found Gold Corp. | Little Dead Wolf Pond | 144 | 36.00 | Issued | 2020-05-02 | 2025-05-02 | 2025-07-01 | 34,731.62 | 2027-05-02 | 1.0 | 0.0 |
| 030711M | New Found Gold Corp. | Gander Outflow | 44 | 11.00 | Issued | 2020-05-02 | 2025-05-02 | 2026-07-01 | 29,453.09 | 2026-05-02 | 2.0 | 1.0 |
| 030716M | New Found Gold Corp. | Third Berry Hill Pond | 224 | 56.00 | Issued | 2020-05-02 | 2025-05-02 | 2025-07-01 | 47,522.32 | 2027-05-02 | 1.0 | 0.0 |
| 030722M | New Found Gold Corp. | Hunt's Pond | 149 | 37.25 | Issued | 2020-05-02 | 2025-05-02 | 2025-07-01 | 30,010.98 | 2027-05-02 | 0.0 | 0.0 |
| 030726M | New Found Gold Corp. | Joe's Feeder Cove | 5 | 1.25 | Issued | 2020-05-02 | 2025-05-02 | 2025-07-01 | 897.44 | 2030-05-02 | 1.0 | 0.0 |
| 030727M | New Found Gold Corp. | Dead Wolf Brook | 195 | 48.75 | Issued | 2020-05-02 | 2025-05-02 | 2025-07-01 | 41,369.89 | 2027-05-02 | 1.0 | 0.0 |
| 030733M | New Found Gold Corp. | Rocky Brook | 173 | 43.25 | Issued | 2020-05-02 | 2025-05-02 | 2025-07-01 | 36,702.52 | 2027-05-02 | 1.0 | 0.0 |
| 030737M | New Found Gold Corp. | Caribou Lake | 247 | 61.75 | Issued | 2020-05-02 | 2025-05-02 | 2025-07-01 | 52,401.86 | 2027-05-02 | 1.0 | 0.0 |
| 030739M | New Found Gold Corp. | Great Gull River | 224 | 56.00 | Issued | 2020-05-02 | 2025-05-02 | 2025-07-01 | 40,675.13 | 2027-05-02 | 1.0 | 0.0 |
| 030740M | New Found Gold Corp. | Ribbon Ponds | 1 | 0.25 | Issued | 2020-05-02 | 2025-05-02 | 2025-07-01 | 198.64 | 2027-05-02 | 0.0 | 0.0 |
| 030741M | New Found Gold Corp. | Southwest Gander River Cove | 2 | 0.50 | Issued | 2020-05-02 | 2025-05-02 | 2025-07-01 | 1,136.80 | 2029-05-02 | 1.0 | 0.0 |
| 030742M | New Found Gold Corp. | Steeles Brook | 32 | 8.00 | Issued | 2020-05-02 | 2025-05-02 | 2025-07-01 | 5,810.74 | 2027-05-02 | 1.0 | 0.0 |
| 4- |
|
| New Found Gold Corp. | Queensway Gold Project NI 43-101 Technical Report |
April 15, 2025 SLR Project No.: 233.065300.00001 |
| Licence No. | Title Holder | Location | No. Claims |
Area (km²) |
Status | Issued Date |
Renewal Date |
Report Due Date |
Expenses Due ($) |
Expenses Due Date |
NSR Royalty (%) |
NSR Buyback Provision (%) |
| 030745M | New Found Gold Corp. | Dead Wolf Brook | 101 | 25.25 | Issued | 2020-05-02 | 2025-05-02 | 2025-07-01 | 21,427.48 | 2027-05-02 | 1.0 | 0.0 |
| 030746M | New Found Gold Corp. | Southwest Islands View | 3 | 0.75 | Issued | 2020-05-02 | 2025-05-02 | 2025-07-01 | 1,609.79 | 2030-05-02 | 1.0 | 0.0 |
| 030747M | New Found Gold Corp. | Owl Pond | 37 | 9.25 | Issued | 2020-05-02 | 2025-05-02 | 2025-07-01 | 7,849.66 | 2027-05-02 | 1.0 | 0.0 |
| 030748M | New Found Gold Corp. | Southwest Pond | 140 | 35.00 | Issued | 2020-05-02 | 2025-05-02 | 2026-07-01 | 29,493.24 | 2028-05-02 | 1.0 | 0.0 |
| 030752M | New Found Gold Corp. | Miguel's Lake | 78 | 19.50 | Issued | 2020-05-02 | 2025-05-02 | 2026-07-01 | 16,431.98 | 2028-05-02 | 1.0 | 0.0 |
| 030753M | New Found Gold Corp. | Gander Lake | 3 | 0.75 | Issued | 2020-05-02 | 2025-05-02 | 2026-07-01 | 1,308.66 | 2030-05-02 | 1.0 | 0.0 |
| 030754M | New Found Gold Corp. | Little Gander Lake | 172 | 43.00 | Issued | 2020-05-02 | 2025-05-02 | 2026-07-01 | 36,234.59 | 2028-05-02 | 0.0 | 0.0 |
| 030755M | New Found Gold Corp. | Rocky Brook | 30 | 7.50 | Issued | 2020-05-02 | 2025-05-02 | 2026-07-01 | 6,320.00 | 2028-05-02 | 0.0 | 0.0 |
| 030756M | New Found Gold Corp. | Southwest Pond | 88 | 22.00 | Issued | 2020-05-02 | 2025-05-02 | 2026-07-01 | 18,538.65 | 2028-05-02 | 1.0 | 0.0 |
| 030763M | New Found Gold Corp. | Rocky Brook | 45 | 11.25 | Issued | 2020-05-02 | 2025-05-02 | 2026-07-01 | 9,479.98 | 2028-05-02 | 0.0 | 0.0 |
| 030765M | New Found Gold Corp. | Berry Hill Brook | 124 | 31.00 | Issued | 2020-05-02 | 2025-05-02 | 2026-07-01 | 26,122.64 | 2028-05-02 | 0.0 | 0.0 |
| 030768M | New Found Gold Corp. | Gander Lake Prime | 149 | 37.25 | Issued | 2020-05-02 | 2025-05-02 | 2026-07-01 | 51,558.61 | 2027-05-02 | 1.0 | 0.0 |
| 030771M | New Found Gold Corp. | Northwest Gander River | 37 | 9.25 | Issued | 2020-05-02 | 2025-05-02 | 2026-07-01 | 7,794.65 | 2028-05-02 | 1.0 | 0.0 |
| 030783M | New Found Gold Corp. | Little Dead Wolf Brook | 41 | 10.25 | Issued | 2020-05-02 | 2025-05-02 | 2026-07-01 | 11,018.48 | 2028-05-02 | 0.0 | 0.0 |
| 035087M | New Found Gold Corp. | Gander Lake Prime | 2 | 0.50 | Issued | 2022-10-13 | 2027-10-13 | 2026-12-14 | 44.42 | 2030-10-13 | 0.0 | 0.0 |
| 035338M | New Found Gold Corp. | Gillingham's Pond | 53 | 13.25 | Issued | 2023-01-05 | 2028-01-05 | 2026-06-03 | 18,012.84 | 2028-05-01 | 0.0 | 0.0 |
| 036670M | New Found Gold Corp. | Careless Brook, Central NL | 6 | 1.50 | Issued | 2023-10-26 | 2028-10-26 | 2026-12-25 | 2,039.20 | 2028-10-26 | 0.0 | 0.0 |
| Total 53 licences | Totals | 5337 | 1334.25 | |||||||||
| C) | Twin Ponds Block |
| Licence No. | Title Holder | Location | No. Claims | Area (km²) |
Status | Issued Date |
Renewal Date |
Report Due Date |
Expenses Due |
Expenses Due Date |
NSR Royalty (%) |
NSR Buyback Provision (%) |
| 024270M | New Found Gold Corp. | Island Pond, Central NL | 107 | 26.75 | Issued | 2016-10-24 | 2026-10-26 | 2025-12-23 | 50,987.79 | 2028-10-24 | 1.6 | 1.0 |
| 024274M | New Found Gold Corp. | Twin Ponds, Central NL | 77 | 19.25 | Issued | 2016-10-24 | 2026-10-26 | 2025-12-23 | 34,380.34 | 2028-10-24 | 1.6 | 1.0 |
| 035048M | Suraj Amarnani | Twin Ponds | 42 | 10.50 | Issued | 2022-09-29 | 2027-09-29 | 2025-11-28 | 1,658.89 | 2025-09-29 | 0.0 | 0.0 |
| Total - 3 licences | 226 | 56.50 | ||||||||||
| 4- |
|
| New Found Gold Corp. | Queensway Gold Project NI 43-101 Technical Report |
April 15, 2025 SLR Project No.: 233.065300.00001 |
| D) | Ten Mile-Duder Lake Block |
| Licence No. | Title Holder | Location | No. Claims | Area (km²) |
Status | Issued Date |
Renewal Date |
Report Due Date |
Expenses Due |
Expenses Due Date |
NSR Royalty (%) |
NSR Buyback Provision (%) |
| 035047M | Aidan O’Neil | Ten Mile-Duder Lake | 209 | 52.25 | Issued | 2022-09-29 | 2027-09-29 | 2025-11-28 | 8,279.87 | 2025-09-29 | 0.0 | 0.0 |
| 035050M | Josh Vann | Ten Mile Lake | 2 | 0.50 | Issued | 2022-09-29 | 2027-09-29 | 2025-11-28 | 29.15 | 2025-09-29 | 0.0 | 0.0 |
| Total - 2 licences | 211 | 52.75 | ||||||||||
| E) | Bellman's Pond Block |
| Licence No. | Title Holder | Location | No. Claims | Area (km²) | Status | Issued Date | Renewal Date | Report Due Date | Expenses Due | Expenses Due Date | NSR Royalty (%) | NSR Buyback Provision (%) |
| 030775M | New Found Gold Corp. | Bellman's Pond | 1 | 0.25 | Issued | 2020-05-02 | 2025-05-02 | 2025-07-01 | 73.18 | 2025-05-02 | 0.0 | 0.0 |
| F) | Little Rocky Brook Block |
| Licence No. | Title Holder | Location | No. Claims | Area (km²) |
Status | Issued Date | Renewal Date | Report Due Date |
Expenses Due |
Expenses Due Date |
NSR Royalty (%) |
NSR Buyback Provision (%) |
| 030777M | New Found Gold Corp. | Little Rocky Pond, Gander River | 114 | 28.50 | Issued | 2020-05-02 | 2025-05-02 | 2025-07-01 | 9,882.70 | 2025-05-02 | 0.0 | 0.0 |
| G) | Summary of all blocks |
| No. Of Licences: | 103 |
| No. of claims: | 7,024 |
| Area (km2): | 1,756.00 |
| 4- |
|
| New Found Gold Corp. | Queensway Gold Project NI 43-101 Technical Report |
April 15, 2025 SLR Project No.: 233.065300.00001 |
Figure 4-2: Queensway North Mineral Licences, and the Separate Licences of Twin Ponds, Ten Mile-Duder Lake, Bellman’s Pond, and Little Rocky Brook

| 4- |
|
| New Found Gold Corp. | Queensway Gold Project NI 43-101 Technical Report |
April 15, 2025 SLR Project No.: 233.065300.00001 |
Figure 4-3: Queensway South Mineral Licences

| 4- |
|
| New Found Gold Corp. | Queensway Gold Project NI 43-101 Technical Report |
April 15, 2025 SLR Project No.: 233.065300.00001 |
| 4.2 | Property Ownership Summary |
Since the 1950s, the Property area has been prospected by several dozen individuals who have staked claims either in their own name or in the name of the private company through which they conduct their prospecting activities. The Property claims have been optioned at various times to larger mining companies, many of them public. Private and public companies have worked together in joint ventures and with separate groups of individual prospectors, dropped options and entered into new joint ventures and option agreements, sometimes with the same partners and sometimes with new partners.
Following the many changes in claim ownership, Palisade Resources Corp. (Palisade), later renamed to New Found Gold Corp. in June 2017, began to consolidate the large land package that now forms the Queensway Project.
The licences were acquired through 1) online map staking with the Government of NL, 2) the successful completion of a series of Option Agreements (nine Option Agreements; NFG, pers. comm., 2023), and 3) some of the licences were originally acquired by Palisade, NFG’s predecessor.
On July 9, 2024, NFG acquired a 100% interest in LabGold’s Kingsway Project. Pursuant to the acquisition, NFG issued to LabGold 5,263,157 common shares as consideration for the Purchased Assets (NFG 2024j).
On May 17, 2024, NFG acquired a 100% interest in three mineral licences previously held by Sky Gold. Pursuant to the acquisition, NFG purchased the licences for $35,000.
In addition, five licences are currently owned by separate licence holders and are subject to NFG satisfying conditions of a single Option Agreement called the VOA Option (Figure 4-1; see Section 4.5).
With respect to the nature and extent of NFG’s mineral rights interest at the Queensway Property, Table 4-1 shows that the Property can be separated into four general groups based solely on the title of the Licence Holder. The Queensway North group includes titles related to Twin Ponds, Ten Mile-Duder Lake, Bellman’s Pond, and Little Rocky Brook that are listed in Table 4-1 and shown in Figure 4-2). The Queensway South block titles are listed in Table 4-1 and shown in Figure 4-3.
A total of 7.8% of the claims that make up the Property are not owned by NFG but rather by separate licence holders and are subject to a single Option Agreement - the VOA Option - between NFG and the current property owners (Aidan O’Neil, Suraj Amarnani, and Josh Vann). The ownership for each of the four groups is further summarized as follows:
| • | 92.2% of the claims that make up the Queensway Property are fully owned by NFG. They consist of 6,473 claims within 98 mineral licences in Queensway North, Queensway South, Twin Ponds, Bellman’s Pond, and Little Rocky Brook. |
| • | 4.83% of the claims as part of the VOA Option are owned by Aidan O’Neil. They consist of 339 claims within two mineral licences at Ten Mile-Duder Lake and Queensway North. |
| • | 2.99% of the claims as part of the VOA Option are owned by Suraj Amarnani. They consist of 210 claims within two mineral licences at Twin Ponds and Queensway North. |
| • | 0.03% of the claims as part of the VOA Option are owned by Josh Vann. They consist of two claims within one mineral licence at Ten Mile-Duder Lake. |
| 4- |
|
| New Found Gold Corp. | Queensway Gold Project NI 43-101 Technical Report |
April 15, 2025 SLR Project No.: 233.065300.00001 |
| 4.3 | Mineral Tenure Information and Maintenance |
Mineral rights in NL are managed by the Mineral Lands Division of the Department of Industry, Energy, and Technology (IET), which coordinates map-staking of Crown mineral licences through the online Mineral Lands Administration Portal (MinLAP). Within the area of a mineral licence, there are separate mineral claims, up to 256 coterminous claims per licence area.
With respect to mineral licence maintenance in NL, NFG must abide by two financial obligations to maintain the licences in good standing:
| 1 | Minimum expenditures for ongoing assessment, in which the province requires licence-holders to spend a minimum amount on their exploration activities each year. These minimum expenditure commitments increase with time, as summarized in Table 4-2. |
NFG’s minimum exploration expenditure obligation for the entire Queensway Project as of March 31, 2025 is $228,397.03 with $1,589,256.57 in 2026. With the current drilling program plans scheduled to continue throughout 2025, and with ongoing surface reconnaissance and mapping activities, the money NFG spends on exploration will exceed the required minimum in 2025.
In each year of a mineral licence being issued, the minimum annual assessment work must be completed by the anniversary, unless there are excess exploration expenditures reported. After an expenditures due date, an assessment report must be submitted within 60 days of the anniversary date. Excess assessment work expenditures are credited to the licence and can be carried forward to satisfy the expenditure requirements in future years except for the transition to Year 20 when all expenditures are defaulted to Year 20 dues.
Any mineral licence holder who intends to conduct an exploration program must obtain mineral exploration approval (MEA) from the NL IET before the activity can commence.
| 2 | Licence renewal fees are required every five years to Year 20 and every year after that, if kept in good standing. The renewal date for each licence is determined by the original staking date of the mineral claims. Mineral licence renewal fees in Newfoundland and Labrador are structured based on the age of the licence. Mineral licence renewal date is distinct from the anniversary date, which governs annual exploration expenditures and assessment work. |
Table 4-3 shows the renewal fee per claim for each of the five-year intervals. These fees are due every five years from Year 5 through Year 20, and then annually from Year 21 onward. NFG’s annual renewal fees will be $15,800 for the licences that reach their renewal date in 2024; and $80,175 for the licences that reach their renewal date in 2025.
Table 4-2: Minimum Expenditures for Mineral Claims in Newfoundland and Labrador
| Year | Required Expenditure |
| 1 | $200.00/Claim |
| 2 | $250.00/Claim |
| 3 | $300.00/Claim |
| 4 | $350.00/Claim |
| 5 | $400.00/Claim |
| 6 to 10 | $600.00/Claim |
| 4- |
|
| New Found Gold Corp. | Queensway Gold Project NI 43-101 Technical Report |
April 15, 2025 SLR Project No.: 233.065300.00001 |
| Year | Required Expenditure |
| 11 to 15 | $900.00/Claim |
| 16 to 20 | $1,200.00/Claim |
| 21 to 25 | $2,000.00/Claim |
| 26 to 30 | $2,500.00/Claim |
| 31 Onward | $3,000.00/Claim |
Table 4-3: Renewal Fees for Mineral Claims in Newfoundland and Labrador
| Year | Renewal Fee |
| 5 | $25.00/Claim |
| 10 | $50.00/Claim |
| 15 | $100.00/Claim |
| 20 Onward | $200.00/Claim |
| 4.4 | Access and Surface Rights |
Title to surface rights in Newfoundland is required only for the development of a mineral resource under a mining lease. For exploration activities, including both non-ground-disturbing and ground-disturbing work, licence holders must obtain an MEA and/or a letter of acceptance from the NL Department of Industry, Energy and Technology (NLDIET) for all valid mineral licence(s) to be explored under the proposed program. These approvals regulate land use and environmental compliance but do not confer ownership of surface rights (Government of Newfoundland and Labrador 2024).
NFG does not own surface rights on the Project except for the Core Yard at Appleton. On an as-needed basis, NFG negotiates agreements that allow exploration activities to be conducted on property owned and administered by others:
| • | The Province of Newfoundland and Labrador, which administers Crown Lands, |
| • | The municipalities of Appleton and Glenwood, |
| • | Property owners of residential properties in Appleton and Glenwood and of cottages and cabins, granted or licence to occupy, outside municipal boundaries. |
In addition to stipulating the times when the company can conduct work, and the nature of the work that is permitted, these agreements also specify the company’s responsibility for restoring land to an acceptable condition following field activities.
For exploration activities on Crown Lands, approval is required from the Mineral Lands Division of the IET. The primary focus of these applications and approvals is to prevent or minimize adverse impacts on the environment, fish, and wildlife; Section 4.7 of this report summarizes NFG’s environmental permitting activities and the approvals it currently holds.
If the Project advances to the mine production stage, NFG would need to obtain surface rights by applying for a surface lease to the IET, accompanied by a legal survey. Surface leases are issued by the IET in consultation with the Minister appointed to administer the Lands Act.
| 4- |
|
| New Found Gold Corp. | Queensway Gold Project NI 43-101 Technical Report |
April 15, 2025 SLR Project No.: 233.065300.00001 |
To the best of the SLR QP’s knowledge, there are no significant factors, or risks that may affect access, or the right or ability of NFG to perform exploration work on the Property.
| 4.5 | Option Agreement (the VOA Option) |
In addition to the mineral licences staked by NFG, the Project also includes optioned claim packages that were negotiated by NFG from 2016 through 2018 under nine separate and completed Option Agreements. These Option Agreements granted mineral rights to NFG in return for a combination of scheduled lump sum payments, NFG shares, and net smelter return (NSR) royalties to various individual and company optionors.
As of September 2021, when the last of the option payments was made with respect to the nine Option Agreements, NFG had met all the conditions and earned 100% ownership of the associated mineral licences.
On November 2, 2022, NFG executed a single option agreement (the VOA Option) with Aidan O’Neil, Suraj Amarnani, Josh Vann, and VOA Exploration Inc., collectively referred to as the “Optionors”. The VOA Option Agreement grants NFG exclusive right and option to acquire a 100% title and interest in a property defined by five mineral licences: 035047M and 035197M, 035048M and 035198M, and 035050M, owned by Aidan O’Neil, Suraj Amarnani, and Josh Vann respectively (Figure 4-2; Table 4-1). The claims included in these five mineral licences represent 7.8% of the Property claims (Section 4.2).
In connection with the grant of the VOA Option, NFG shall have the right to enter onto and occupy the optioned property to conduct activities as contemplated in the VOA Option Agreement.
For NFG to exercise the VOA Option, NFG shall 1) issue an aggregate of 487,078 common shares in capital of NFG (the “Share Issuances”) and 2) make aggregate cash payments of $2,350,000 (the “Cash Payments”) to the Optionors as follows (NFG 2022a):
| • | $200,000 and 39,762 Common Shares on the later of (i) Staking Confirmation Date (as defined in the VOA Option Agreement) and (ii) the receipt of the TSX Venture Exchange’s (the “TSXV”) approval. |
| • | $200,000 and 39,762 common shares on or before November 2, 2023. |
| • | $250,000 and 69,583 common shares on or before November 2, 2024. |
| • | $300,000 and 89,463 common shares on or before November 2, 2025. |
| • | $600,000 and 129,224 common shares on or before November 2, 2026. |
| • | $800,000 and 119,284 common shares on or before November 2, 2027. |
NFG shall pay all Cash Payments and register all Common Shares issued under the VOA Option Agreement to VOA Exploration Inc. unless otherwise instructed in writing by the Optionors. VOA Exploration Inc. is the consortium of Vann, O’Neil, and Amarnani.
Upon NFG completing the Cash Payments and the Share Issuances set forth above, NFG will immediately be deemed to have exercised the VOA Option and acquired a 100% interest in the property free and clear of all encumbrances with no further action required by it resulting in the Optionors’ interest in the property being immediately transferred to NFG. The terms of the VOA Option Agreement do not include any mandatory work commitments, advanced royalty payments, or granting of royalties.
| 4- |
|
| New Found Gold Corp. | Queensway Gold Project NI 43-101 Technical Report |
April 15, 2025 SLR Project No.: 233.065300.00001 |
| 4.6 | Royalties |
Seventy-eight of the 103 Queensway Property mineral licences (76%) are currently subject to an NSR royalty; the other 25 licences are not subject to any royalty. Some royalties were formed within agreements between NFG and the various individuals and companies that optioned their mineral rights to NFG in return for financial compensation that included NSR royalties. Others arise from financing provided by GoldSpot Discoveries Corp. (GoldSpot) in 2019. All claims acquired after the NFG-GoldSpot Agreement execution date and contiguous to the NFG-GoldSpot Agreement original claims are subject to a 1% NSR royalty to GoldSpot less royalties at the time of acquisition. A summary of the royalty structure at the Property is presented in Table 4-1. Currently, the NSR royalties range from 0.4% to 3.0% for the 78 licences subject to an NSR royalty.
Royalties associated with the NFG-Labrador Gold Corp. Purchase Agreement state that mineral licences 027636M, 207637M, and 035204M are subject to a 1% NSR plus $1 per ounce of gold in the ‘indicated mineral resource’ and ‘measured mineral resource’ categories, as defined by Canadian Institute of Mining, Metallurgy and Petroleum CIM Definition Standards for Mineral Resources and Mineral reserves (CIM (2014) definitions). In addition, an advance royalty of $50,000 per annum will be payable, at the election of the Royalty Holder, in cash or common shares, commencing on March 3, 2026, and continuing each year thereafter until commencement of commercial production.
Many of NFG’s option and financing agreements have included a buyback provision that allows the Company to reduce the NSR royalty by making a lump sum payment to the holder of the royalty. For example, on November 15, 2021, NFG announced that it had exercised its buyback option and entered into three royalty purchase agreements to acquire a total of 0.6% NSR related to the Linear and JBP Linear Properties. These royalties, originally granted under a 2016 agreement, cover key areas of the Queensway Project, including the Keats, Golden Joint, and Lotto discoveries. Following the transaction, a 0.4% NSR remains on the Keats-Golden Joint-Lotto-Big Dave corridor. Table 4-1 illustrates the current NSR royalty and the amount that could still be bought back. Were NFG to exercise its buyback rights, the NSR royalties would range between 0.5% and 1.0% for the 28 licences that are subject to a NSR royalty.
| 4.7 | Permits |
NFG is responsible for obtaining all permits in accordance with the Mineral Act (RSNL 1990 Chapter M-12) and Mineral Regulations (CNLR 1143/96) along with other Provincial Acts, Regulations, and laws, to conduct exploration activities at the Property. Exploration activities require approval from the Mineral Lands Division of the IET. These specify the activities that are allowed in the area and provide conditions set out in performing the proposed work as defined in the referral process to other government departments and agencies; they are typically valid for one to two years and can be renewed or amended if required.
The different permits and licence requirements in the Province of Newfoundland and Labrador can include:
| 1 | Mineral Exploration Approvals (MEA): A MEA Permit enables an exploration company to conduct prospecting, rock and soil geochemistry, line cutting, trenching, bulk sampling, airborne and/or ground geophysical surveys, fuel storage, all-terrain vehicles (ATV) usage, diamond drilling (DDH), etc. |
Water Use Licence (WUL): Activities that require water to be drawn from surface waterways or from aquifers require a Water Use Licence. These are typically valid for five years and can be renewed. These permits are no longer needed for drilling and trenching activities but are still required for a camp.
| 4- |
|
| New Found Gold Corp. | Queensway Gold Project NI 43-101 Technical Report |
April 15, 2025 SLR Project No.: 233.065300.00001 |
Licence to Occupy (LTO): Required if a camp location was to be used for a period longer than that which was allowed as part of the Exploration Approval Permit (Fly Camp). This permit is obtained from the Provincial Department of Crown Lands. These are typically valid for five years and can be renewed. Receipt of an LTO for establishing a camp may necessitate additional permits depending on the camp's location and associated activities. These permits may include:
| 1 | Section 39 Permit: Operating permit for exploration activities within a Protected Public Water Supply Area (PPWSA), restoration requirements and constraints on field activities are stipulated in a “Section 39 Permit” that is typically valid for one year and can be renewed. |
| 2 | Section 48 Permit: Required for exploration activities, including stream crossings and/or fording, or any work in and around any body of water or wetland. The Water Resources Management Division must be contacted to obtain a Section 48 Permit to Alter a Water Body under the Water Resources Act, 2002. |
| 3 | Forestry Operating Permits: An operating permit for each district if operations are to take place on Crown Land during the annual fire season (May-September). |
| 4 | Forestry Cutting Permits: Required where timber is removed from Crown Lands by a commercial entity in developing access routes and drill pads. Cut timber is gifted to locals for firewood and a royalty is paid quarterly to the province. |
| 5 | Development Permits: Any activity that meets the definition of development under the Urban and Rural Planning Act, 2000, within a municipal planning area/boundary will require application and permit from the Municipality. Other development permits are required for working near Protected Roads and/or the Gander River Management area. |
Table 4-4 summarizes the permits, licences, and approvals that have currently been granted to NFG, which expire between December 1, 2024, and October 29, 2029, and are re-permitted, or re-applied for, as necessary by NFG.
Table 4-4: Environmental Permits, Licences, and Approvals
| Permit # | Type | Source | Description | Area | Expiry |
| LTO 158603 | Licence to Occupy | Crown Lands - FAA | Trailer Camp at Bernards Pond | QWS | 16-Aug-29 |
| GAP 31999 | Gasoline Tank Permit-Registration | Digital Government & Services NL | Exploration Operations | QWN | |
| GRM 297908 | Gander River Management (PADL) | Digital Government & Services NL | Drill Pads & Access (27636M, 23940M, & 27837M) | QWN | 25-Jul-25 |
| PRP 248883 | Development Permit - Protected Roads | Digital Government & Services NL | Mineral Exploration - TCH Appleton | QWN | 6-May-25 |
| EA 2214 | Environmental Assessment Registration | Environmental Assessment - ECC | Seismic Cutlines and Keats Trench | QWN | 19-Oct-25 |
| EA 2259 | Environmental Assessment Registration | Environmental Assessment - ECC | DDH | QWN | 13-Sep-26 |
| EA 2273 | Environmental Assessment Registration | Environmental Assessment - ECC | QWN DDH | QWN | 20-Oct-26 |
| EA 2343 | Environmental Assessment Registration | Environmental Assessment - ECC | DDH West Gander River | QWN | 20-Feb-28 |
| 4- |
|
| New Found Gold Corp. | Queensway Gold Project NI 43-101 Technical Report |
April 15, 2025 SLR Project No.: 233.065300.00001 |
| Permit # | Type | Source | Description | Area | Expiry |
| FCP 25-05-01664 | Cutting Permit Districts 5 (Gander) | Forestry Services - FAA | QWN Fourth Pond DDH | QWN | 31-Dec-25 |
| FCP 25-08-01658 | Cutting Permit Districts 8 (Lewisporte) | Forestry Services - FAA | QWN Fourth Pond DDH | QWN | 31-Dec-25 |
| FD5 Gambo | Forestry Operating Permit, District 4, 5, & 6 | Forestry Services - FAA | Exploration Operations | QWN & QWS | 31-Dec-25 |
| FD8 Lewisporte | Forestry Operating Permit, District 8 | Forestry Services - FAA | Exploration Operations | QWN | 31-Dec-25 |
| E230126 | Exploration Permit | Mineral Lands - IET | Trenching (4) at QWN (VOA) | QWN | 9-Jun-25 |
| E230127 | Exploration Permit | Mineral Lands - IET | Trenching (9) at QWS (Outside PPWSA) | QWS | 9-Jun-25 |
| E230128 | Exploration Permit | Mineral Lands - IET | Trenching (16) at QWS (Inside PPWSA) | QWS | 9-Jun-25 |
| E230206 | Exploration Permit | Mineral Lands - IET | 48 DDH (27636M) | QWN | 12-Sep-25 |
| E230240 | Exploration Permit | Mineral Lands - IET | 2D Seismic along TCH | QWN | 15-Jun-25 |
| E230246 | Exploration Permit | Mineral Lands - IET | Prospecting & Geochem (All 4 Lics) | QWN | 29-May-25 |
| E230249 | Exploration Permit | Mineral Lands - IET | Prospecting, Geochem, & Geophysics (All 4 Lics) | QWN | 29-May-25 |
| E230266 | Exploration Permit | Mineral Lands - IET | 15 DDH (27636M) | QWN | 18-Jul-25 |
| E230301 | Exploration Permit | Mineral Lands - IET | Queensway LiDAR Survey | QWN & QWS | 10-Jul-25 |
| E230302 | Exploration Permit | Mineral Lands - IET | Igloo City DDH (Mars) | QWS | 14-Nov-25 |
| E230319 | Exploration Permit | Mineral Lands - IET | Golden Elbow DDH 1 | QWS | 22-Aug-25 |
| E230320 | Exploration Permit | Mineral Lands - IET | VOA DDH | QWN | 22-Aug-25 |
| E230321 | Exploration Permit | Mineral Lands - IET | Golden Elbow Fly DDH 2 | QWS | 22-Aug-25 |
| E230348 | Exploration Permit | Mineral Lands - IET | 95 DDH (27636M) | QWN | 8-Dec-25 |
| E230350 | Exploration Permit | Mineral Lands - IET | QWN DDH | QWN | 24-Jan-26 |
| E230355 | Exploration Permit | Mineral Lands - IET | Till Trend & South Pauls Fly DDH | QWS | 19-Oct-25 |
| E230429 | Exploration Permit | Mineral Lands - IET | 036670M Prospecting (Road Breccia) | QWS | 19-Oct-25 |
| E230448 | Exploration Permit | Mineral Lands - IET | Drone Geophysics | QWS | 15-Dec-25 |
| E240059 | Exploration Permit | Mineral Lands - IET | General Prospecting | QWS | 8-Feb-26 |
| E240248 | Exploration Permit | Mineral Lands - IET | General Prospecting & Geochem | QWN & QWS | 17-May-26 |
| E240324 | Exploration Permit | Mineral Lands - IET | 50 DDH at Bernards Camp | QWS | 11-Jul-26 |
| E240328 | Exploration Permit | Mineral Lands - IET | QWN Trenching | QWN | 28-Jun-26 |
| E240385 | Exploration Permit | Mineral Lands - IET | QWN Fourth Pond DDH (Outside GRM Buffer) | QWN | 5-Sep-26 |
| E240401 | Exploration Permit | Mineral Lands - IET | QWN Fourth Pond DDH (E Gander River) | QWN | 11-Oct-26 |
| E250001 | Exploration Permit | Mineral Lands - IET | Airborne Geophysics | QWN | 6-Jan-27 |
| 4- |
|
| New Found Gold Corp. | Queensway Gold Project NI 43-101 Technical Report |
April 15, 2025 SLR Project No.: 233.065300.00001 |
| Permit # | Type | Source | Description | Area | Expiry |
| E250044 | Exploration Permit | Mineral Lands - IET | QWN DDH - Gander River 1000 holes | QWN | 24-Feb-27 |
| TVA25-1 | T'Railway Temporary Vehicle Access | Parks NL - TCAR | QWN DDH & General Exploration | QWN | 1-Dec-25 |
| QP 71113023 | Quarry Permit | Quarry Rights - IET | Quarry Material for Roads | QWN | 22-Sep-25 |
| ALT13337-2023 | Section 48 - Permit to Alter Water Body | Water Resources Management - ECC | Golden Elbow Fly DDH 2 | QWS | 10-Oct-25 |
| PRO11547-2020 | Section 39 - Permit for Development | Water Resources Management - ECC | Mineral Exploration | QWN | 20-Dec-26 |
| PRO13479-2024 | Section 39 - Permit for Development | Water Resources Management - ECC | QWN DDH | QWN | 2-Feb-29 |
| WUL/P-21-12147 | Water Use Licence | Water Resources Management - ECC | Camp Water Source | QWS | 15-Oct-26 |
|
Notes: FAA - Fishery, Forestry and Agriculture; ECC - Environment and Climate Change; IET - Department of Industry, Energy, and Technology; TCAR - Tourism, Culture, Arts and Recreation; TCH - Trans-Canada Highway; GRM - Gander River Management • Mineral Exploration Approvals (MEA) (prefixed with E). • Water Use Licences (WUL) for camp water (prefixed with WUL). • Section 39 Permits for Development from Water Resources Management (prefixed with PRO). • Section 48 Permits to Alter a Water Body (prefixed with ALT). • Environmental Assessments (EA) for larger exploration programs requiring public referral along with internal departmental referral. • Section 105 Operating Permits and Cutting Permits for Forestry Management Districts 4, 5, 6, and 8. • Temporary Vehicle Access (TVA) Permit. • Other environmental and development permits as requested or in relation to the above permits and the referral process conditions. |
|||||
| 4.8 | Environmental Assessment and Significant Factors |
Mineral licences 024557M, 024558M, 024561M, 024563M, 024568M, and 024570M, all of which lie in the south of Queensway South, are restricted from exploration activities from mid-May to early July as this area is a spring habitat for Newfoundland caribou.
Mineral licence 035198M in Queensway North encloses two known archaeological sites and covers a portion of the Gander River which has high archaeological potential. As such, the Provincial Archaeology Office recommends a 100 m buffer along the Gander River, and 50 m buffers around the two known sites.
The Company has completed a desktop Historic Resources Overview Assessment (HROA) of the southern portion of the Queensway North area to determine the potential for heritage and cultural resources in the area. As a result of this desktop HROA, a field assessment called a Historic Resources Impact Assessment (HRIA) was conducted in 2023. The HRIA determined that the areas evaluated have low potential for archaeological resources and no further investigation or mitigation measures were recommended. The Provincial Archaeology Office of Newfoundland and Labrador reviewed and agreed with the finding of the HRIA.
The Company has contracted ongoing environmental baseline studies since 2020 that include groundwater, surface water and sediment sampling, as well as terrestrial and aquatic assessments (NFG 2023a). The Company carried out more in-depth field studies in 2023 to better understand the environmental conditions of the Queensway area. A geotechnical and hydrogeological study and baseline air quality monitoring were initiated in 2023. The Company also conducted a field survey of muskrat and noise and light levels.
| 4- |
|
| New Found Gold Corp. | Queensway Gold Project NI 43-101 Technical Report |
April 15, 2025 SLR Project No.: 233.065300.00001 |
The SLR QP is not aware of any environmental liabilities or other restrictions to NFG’s exploration activities, outside the established 300 m Gander Lake Buffer, wetland and watercourse buffers of 30 m to 100 m along Gander River and Gander Lake Tributaries. Exploration can generally be conducted year-round once the necessary approvals have been received from the Mineral Lands Division, Environment and Climate Change, and/or from the relevant municipal governments and individual property owners.
The SLR QP has no reason to assume that NFG will not obtain the necessary permits to advance the Project, provided regulatory requirements continue to be met.
Mineral licences 035047M, 035197M, 035048M, 035198M, and 035050M are owned by third parties under the VOA Option Agreement, and NFG’s mineral rights remain subject to fulfilling the agreement’s conditions.
Risks are described in Section 1.1.3.
| 4- |
|
| New Found Gold Corp. | Queensway Gold Project NI 43-101 Technical Report |
April 15, 2025 SLR Project No.: 233.065300.00001 |
| 5.0 | Accessibility, Climate, Local Resources, Infrastructure and Physiography |
| 5.1 | Accessibility |
The Property can be accessed by commercial flights to the Gander International Airport and by vehicle from the town of Gander via the Trans-Canada Highway (TCH, Route 1) which passes through the Queensway North and the Twin Ponds claim areas. The Property is located approximately 15 km west of the town of Gander (Figure 5-1).
The Trans-Canada Highway (TCH, Route 1) provides road access across all of Newfoundland with an east-west distance of 928 km. The Trans-Canada Highway passes through eight licences in the Queensway North block and one licence in the Twin Ponds block.
The Property can also be accessed by the Northwest Gander River Road, which runs on the west portion of the Queensway South claims area from Gander Lake and crosses the river into the Queensway South claims. About halfway, at the steel bridge, approximately 15 km south of Gander Lake, additional access roads lead into the south Gander Lake area. Within the claims areas, most of the Project is accessible via gravel access roads, including the Appleton Fault Zone (AFZ) road, the H Pond Road to areas along the Joe Batt’s Pond Fault Zone (JBPFZ) , and the Joe Batt’s Pond Road on the eastern margin of QWN in the cottage area. Many quad/harvester trails and winter roads provide excellent access for heavy equipment when required.
The areas in the far south of the Queensway South area are best reached by four wheel drive trucks and ATV along resource roads that begin at the Bay d’Espoir Highway (Route 360), which spurs off the Trans-Canada Highway at the town of Bishop’s Falls, NL (Figure 5-1).
In addition to road and ATV access, the mineral licences along the shores of Gander Lake can easily be accessed by boat. The Property can also be accessed by helicopter from the Newfoundland Helicopters base in the town of Appleton and via Gander International Airport and from small craft float planes based near the international airport in Gander.
The nearest seaports are north of the Trans-Canada Highway at the towns of Lewisporte and Botwood, NL, which are approximately 40 km and 70 km, respectively, by road from the town of Glenwood, NL (Figure 5-1). Both port locations have excellent harbour facilities and capabilities.
| 5.2 | Site Topography, Elevation and Vegetation |
The Queensway Property area is dominated by broad, northeast-trending ridges separated by valleys with linear bogs, brooks, and larger ponds (Figure 5-2). Gander Lake and the Gander River are the most important water bodies in the Project area.
| 5- |
|
| New Found Gold Corp. | Queensway Gold Project NI 43-101 Technical Report |
April 15, 2025 SLR Project No.: 233.065300.00001 |
Figure 5-1: Access to the Queensway Property

| 5- |
|
| New Found Gold Corp. | Queensway Gold Project NI 43-101 Technical Report |
April 15, 2025 SLR Project No.: 233.065300.00001 |
Figure 5-2: Shaded Relief Image for the Queensway Project Area, with Outline of the Queensway Mineral Licences and Bodies of Water

| 5- |
|
| New Found Gold Corp. | Queensway Gold Project NI 43-101 Technical Report |
April 15, 2025 SLR Project No.: 233.065300.00001 |
Within the Property, the ground elevation rises to approximately 320 MASL at a ridge east of Caribou Lake in the southeast and drops to a low of 15 MASL in the north portion of the Property, where the Gander River flows toward the North Atlantic coast. Boreal forest covers much of the Project area and includes areas that have been logged and re-planted with white and black spruce seedlings, among other species.
| 5.3 | Climate |
The climate is blended maritime-humid continental - pleasant in the summer, cool and wet in the spring and autumn, and snowy, often windy, in the winter. Summer temperatures are typically in the 20° C to 25° C range, but highs can peak above 30° C (Figure 5-3). Winter temperatures typically range from −15° C to +5° C. Precipitation is usually in the form of snow from December to April; rainfall is typical the rest of the year, usually as showers to heavy rain, frequently occurring with strong winds.
Weather is dominated by ocean currents, prevailing westerlies, and storms coming from the west over the Maritime provinces and Québec, or from the south along the US Eastern Seaboard. The typical spring/summer exploration season is from May to late November. Winter conditions start early in November and sometimes extend into May.
The Gander area climate is conducive to exploration companies having the capability to conduct year-round exploration work. Geological mapping, prospecting, and surface rock sampling programs are typically limited to the summer and summer shoulder months (i.e., spring, or March to May, and fall, or September and October) when snow still melts and/or precipitation occurs largely as rainfall. Geophysical surveys and drilling can easily be competed year-round including through the winter months after the snow/ice has either melted or formed ice layers that are thick enough to support equipment. Producing mines in NL operate year-round. With respect to seaports in the general Property area, the sea ice is typically open year-round; however, sea ice has disrupted winter shipping in some years.
Figure 5-3: Climate Data for Gander International Airport

Source: Environment Canada.
| 5- |
|
| New Found Gold Corp. | Queensway Gold Project NI 43-101 Technical Report |
April 15, 2025 SLR Project No.: 233.065300.00001 |
| 5.4 | Local Resources and Infrastructure |
The proximity to Gander, NL provides the Queensway Project with the benefits of a local community with an approximate population of nearly 12,000 persons (2021 Census of Population), which includes accommodation, restaurants, hardware, garages, office space, etc. within a short drive from the Property and fieldwork. The town of Gander is located 15 km to the east of the Queensway Project along the Trans-Canada Highway (Figure 4-2). Gander has many amenities that one would expect to find in a major city: an international airport and most of the equipment and supplies required for exploration. The people of Gander are also a source for much of the labour required for NFG’s exploration programs.
The small town of Appleton lies just within the Queensway North claims area; the neighbouring town of Glenwood lies across the Gander River, just to the west of the Project’s claims (Figure 5-2). With a combined population of approximately 1,400 individuals many of whom work in the resource sectors, these towns are also a source for critical employees and support staff. A helicopter base and an environmental remediation company are located in the Appleton Industrial Park adjacent to drill company support facilities.
In the Appleton Industrial Park, NFG has purchased eight contiguous lots that host a fenced-in core yard, office/support trailers, shipping containers for crushed sample storage and equipment sheds, and heavy equipment parking or laydown as required.
Skilled and semi-skilled workers can also be found in Grand Falls−Windsor, a town with a slightly larger population (close to 14,000 persons) located approximately 76 km west of the Queensway North claims along the Trans-Canada Highway (Figure 5-1). Central Newfoundland has hosted a number of historical and current mines resulting in the availability of mine support companies and a strong resource based skilled labour pool.
| 5.4.1 | Power Supply |
Electricity is available from the Newfoundland provincial grid, which has three electricity transmission corridors that cross the Queensway Project lands:
| • | A 350 kV high voltage direct current line, which passes through the approximate centre of the Queensway South licences. This is the line that brings electricity from the hydroelectric dams at Churchill Falls and Muskrat Falls in Labrador across the island of Newfoundland to St. John’s. |
| • | Two 138 kV high voltage alternating current transmission lines to the north of the Trans-Canada Highway on the Queensway North licences. These supply electricity to the towns of Glenwood, Appleton, and Gander from the hydroelectric dams at Grand Falls, Bishop’s Falls, and Norris Arm. |
| • | A 69 kV high voltage alternating current transmission line that runs across Queensway North along the Trans-Canada Highway. These also supply electricity to the towns of Glenwood, Appleton, and Gander from hydroelectric dams in north-central Newfoundland. |
| 5.4.2 | Water Supply |
Other than the Water Use Licences described in Section 4.7, there is currently no developed water supply or water right attached to the Queensway Project. However, when the need arises, NFG can apply for permission to draw water from the several bodies of water within, or adjacent to, the Company’s mineral claims (Figure 5-2).
| 5- |
|
| New Found Gold Corp. | Queensway Gold Project NI 43-101 Technical Report |
April 15, 2025 SLR Project No.: 233.065300.00001 |
The towns of Appleton, within the Queensway North claims area, and Glenwood, just to the west, have municipal water and sewer systems.
| 5- |
|
| New Found Gold Corp. | Queensway Gold Project NI 43-101 Technical Report |
April 15, 2025 SLR Project No.: 233.065300.00001 |
| 6.0 | History |
| 6.1 | Ownership History |
Although the earliest recorded exploration activities on the Project area date back to 1955, sustained and systematic exploration only began to accelerate in the 1980s. Since that time, the Project has been operated by numerous companies, as reflected in Table 6-1 and Table 6-2, below. The current Project consists of licences that were acquired by NFG through 1) online map staking with the Government of NL, 2) the successful completion of a series of nine option agreements, 3) licences originally acquired by Palisades, NFG’s predecessor, and 4) purchase agreements (Figure 6-1). In addition, five licences are currently owned by separate licence holders and are subject to NFG satisfying conditions of the VOA Option Agreement (see Section 4.5) and NFG. In May 2024, NFG acquired the Sky Gold claims, expanding the Project by 4,800 ha. In July 2024, NFG acquired a 100% interest in LabGold’s Kingsway Project, expanding the Project by 7,774 ha and gaining approximately 13.5 km of additional strike along the AFZ. The Kingsway claims were added to the Queensway property holdings and are now referred to as the AFZ Peripheral area.
| 6.2 | Exploration History |
The extensive exploration history of the Queensway Project was accomplished by multiple operators and prospectors, spanning over four decades, from the 1980s through to early 2024 Exploration efforts were spread across the large district scale project, with significant concentrations of work around the many known gold showings in the Queensway licence group (Figure 6-1). The exploration methods used include surface geochemical sampling, trenching, drilling, and both airborne and ground geophysical surveys.
Surface geochemical sampling covers the widest geographical extent of the Project, and amounts to approximately 3,500 till samples, over 600 stream and lake sediment samples, 6,500 rock samples, and over 27,000 soil samples. This extensive data set has identified several gold-in-soil or gold-in-till anomalies that have led to surface gold discoveries. Several gold occurrences throughout the Property have also been discovered by surface float rock samples containing high grade gold mineralization.
A total of over 330 trenches have been historically completed across the Project, targeting previously discovered gold-in-soil and gold-in-till anomalies. For trenches that were successful in reaching bedrock, over 1,600 channel samples were taken, while unsuccessful trenches have left these soil and till anomalies unexplained and open to further exploration.
A summary of the historical drilling at the Project is presented in Table 6-2, where a total of 16 companies completed 766 drill holes (totalling 133,181.1 m). The majority were diamond drill holes, with a portion of the LabGold holes completed using rotary air blasting (RAB) and reverse circulation (RC) techniques. Diamond drill core sizes range from BQ core (36 mm diameter) to HQ core (64 mm diameter). Much of the historical drilling occurred north of Gander Lake along the two principal fault zones: AFZ and JBPFZ.
Over 50 historical airborne and ground geophysical surveys have been conducted throughout the Project; including very low frequency electromagnetic (VLF-EM), electromagnetic (EM), magnetic (MAG), induced polarization (IP), versatile time domain electromagnetic (VTEM) and controlled source audio-frequency magnetotellurics (CSAMT). These geophysical surveys regularly identify south-southwest-north-northeast to southwest-northeast linear structures consistent with the broad regional topographic fabric and orientation of the major fault zones. Most of the geographical extent of these geophysical surveys is concentrated along either the AFZ and JBPFZ, or in the QWS claims group around the Pauls Pond and Greenwood Pond gold showings.
| 6- |
|
| New Found Gold Corp. | Queensway Gold Project NI 43-101 Technical Report |
April 15, 2025 SLR Project No.: 233.065300.00001 |
Newfoundland and Labrador maintains a public database of mineral exploration assessment files through its GeoFiles system. This resource provides access to a comprehensive collection of documents related to the geology and mineral resources of the province. Additionally, the province's Geoscience Atlas offers direct access to digital data, maps, reports, and images for viewing and download. These resources are managed by the Geological Survey of Newfoundland and Labrador, which is responsible for geological mapping and surveying in the province.
| 6- |
|
| New Found Gold Corp. | Queensway Gold Project NI 43-101 Technical Report |
April 15, 2025 SLR Project No.: 233.065300.00001 |
Figure 6-1: Location of Historical Exploration Programs Conducted by Prior Owners
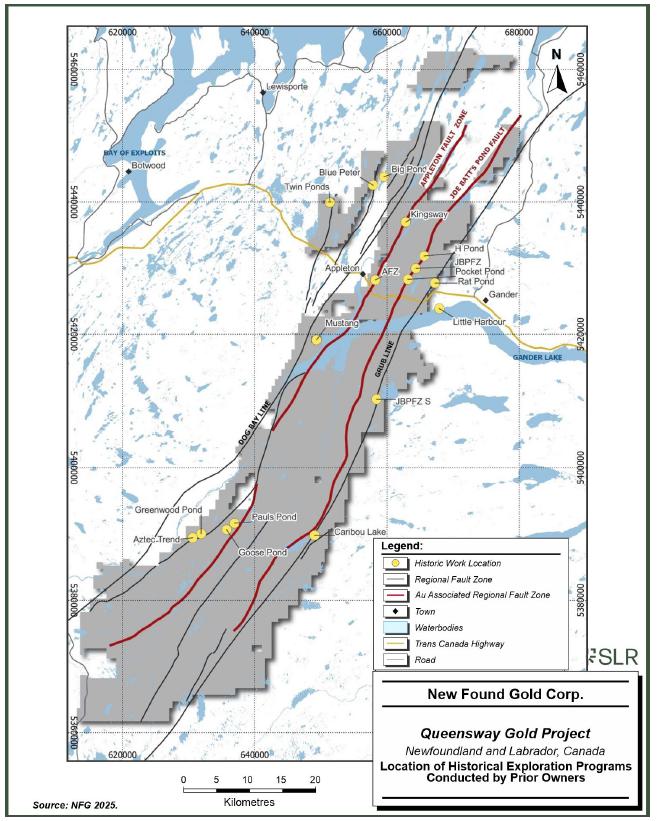
Note. The location names accompany the names used by various companies and prospectors listed in Table 6-1.
| 6- |
|
| New Found Gold Corp. | Queensway Gold Project NI 43-101 Technical Report |
April 15, 2025 SLR Project No.: 233.065300.00001 |
Table 6-1: Summary of Historic Exploration Work Completed on the Queensway Property
| Years | Companies | Optionor / Prospector | Location | Prospecting | Mapping | Rock Sampling | Geo- physics | Trenching | Drilling | Program Highlights |
| 1955-1956 | Newfoundland and Labrador Corporation | Caribou Lake | x | x | x | First documented exploration work | ||||
| 1974 | Bison Petroleum & Minerals Ltd. | NALCO | Caribou Lake | x | x | |||||
| 1979-1881 | Hudson’s Bay Oil & Gas Company Limited |
NALCO | Gander Lake | x | x | x | x | |||
| C. Reid | ||||||||||
| 1987-1991 | Falconbridge Ltd. | SW Gander River |
x |
x
x |
x
x |
x |
x |
x
x |
||
| Twin Ponds | ||||||||||
| JBPFZ | ||||||||||
| 1987-1988 | Noranda | Gander Lake Outflow | x | x | x | x | 5-28 ppm (outcrop samples); 1.5-2 ppm (trench samples); 1.1-4.5 ppm (drillholes) | |||
| Appleton | ||||||||||
| 1988-1990 | Noranda Exploration | Twin Ponds | x | x | x | x | 2.45 ppm (pan concentrate); 441 ppm (thin vein in trench) | |||
| Big Pond | ||||||||||
| Blue Peter | ||||||||||
| 1990-1991 | Manor Resources | Twin Ponds | x | x | x | x | 2 ppm (soil sample) | |||
| 1992-1994 | Gander River Minerals | AFZ | x | x | x | 2.3 m @ 14.8 ppm (drillhole) | ||||
| Noranda Exploration | ||||||||||
| 1995-2004 | L.L. Chan | Pauls Pond | x | x | 7.68 ppm (till) | |||||
| Greenwood Pond |
| 6- |
|
| New Found Gold Corp. | Queensway Gold Project NI 43-101 Technical Report |
April 15, 2025 SLR Project No.: 233.065300.00001 |
| Years | Companies | Optionor / Prospector | Location | Prospecting | Mapping | Rock Sampling | Geo- physics | Trenching | Drilling | Program Highlights |
| 1997-1998 | P. Crocker | AFZ | x | x | 153.4 ppm (grab sample) | |||||
| D. Barbour | ||||||||||
| R. Churchill | ||||||||||
| 1997-2001 | Altius Minerals | Forex Resources | Aztec Trend | x | x | x | 2.1 ppm (grab sample) | |||
| Cornerstone Resources | Greenwood Pond | |||||||||
| Pauls Pond | ||||||||||
| 1998-2016 | Krinor Resources | A. & K. Keats | AFZ | x | Discovery of Dome prospect | |||||
| P. Dimmell | ||||||||||
| 1999-2000 | United Carina | AFZ | x | x | x | x | Several drillhole intervals with gold grades above 10 ppm. | |||
| 7984M (AFZ) | ||||||||||
| 1999-2001 | Cornerstone Resources | Pauls Pond | x | x | x | 0.8 − 2.1 ppm (grab samples) | ||||
| 2000-2002 | C. Reid | AFZ to JBPFZ | x | VG noted near Gander Lake | ||||||
| 7179M (AFZ) | ||||||||||
| 2000-2009 | L. & E. Quinlan | AFZ | x | x | Discovered Lachlan prospect; 61 ppm (grab sample) | |||||
| JBPFZ | ||||||||||
| 2002 | Grayd Resources | Fortis GeoServices | Greenwood Pond | x | x | x | x | 10.9 ppm (grab sample) | ||
| 2002-2005 | Candente Resources | Greenwood Pond | x | x | x | >1,000 ppm (quartz boulders); 1.0 m @ 6.1 ppm (drill hole); 0.8 m @ 15.7 ppm (drill hole) | ||||
| Pauls Pond | ||||||||||
| Goose Pond | ||||||||||
| AFZ | x | x | x | 0.4 m @ 7.2 ppm (drill hole); 2 m @ 3.2 ppm (drill hole) |
| 6- |
|
| New Found Gold Corp. | Queensway Gold Project NI 43-101 Technical Report |
April 15, 2025 SLR Project No.: 233.065300.00001 |
| Years | Companies | Optionor / Prospector | Location | Prospecting | Mapping | Rock Sampling | Geo- physics | Trenching | Drilling | Program Highlights |
| 2002-2005 | Crosshair Exploration and Mining | Big Pond | x | x | x | x | x | 40 − 50 ppm (trench samples) | ||
| Dan's Pond | ||||||||||
| Pauls Pond | x | x | x | x | x | 10 − 15 ppm (trench samples); 0.35 m @ 7.1 ppm (drill hole); 0.5 m @ 4.3 ppm (drill hole) | ||||
| 2003-2006 | Paragon Minerals | KriASK Syndicate | JBPFZ | x | x | x | x | x | 1x0.5 m boulder with 798 ppm Au gives the 798 Zone its name; 22.6 ppm (trench sample); 4 drill hole intervals >10 ppm | |
| Rubicon Minerals | H-Pond | |||||||||
| Pocket Pond | ||||||||||
| 2004-2005 | Spruce Ridge Resources | Gander Lake | x | x | x | 1.2 ppm (trench sample) | ||||
| Little Harbour | ||||||||||
| 2005-2014 | R. & E. Quinlan | AFZ to JBPFZ | x | x | 18.7 ppm (grab sample); 20+ surface samples >1 ppm | |||||
| Quinlan Prospecting | 12652M (AFZ) | |||||||||
| 2007-2008 | Paragon Minerals | AFZ | x | Last drilling on AFZ pre-NFG; 0.9 m @ 2.5 ppm (drill hole); 3.6 m @ 3.2 ppm (drill hole); 1.2 m @ 5.8 ppm (drill hole) | ||||||
| Rubicon Minerals | ||||||||||
| 2007-2010 | J. Sceviour | Pauls Pond | x | x | Surface float samples above 0.2 ppm | |||||
| 2011-2012 | Soldi Ventures | AFZ | x | 5.4m @ 9.8 ppm (drill hole); 7.1m @ 12.4 ppm (drill hole) | ||||||
| 2011-2012 | Metals Creek Resources | Gander Lake | x | x | x | 59.4 ppm (grab sample); 26.8m @ 0.3 ppm (trench) | ||||
| 2020-2021 | Sky Gold Corp. | Mustang | x | x | ||||||
| 2020-2024 | Labrador Gold Corp. | Kingsway | x | x | x | x | x | x | 501 drill holes defining 9 gold prospects |
| 6- |
|
| New Found Gold Corp. | Queensway Gold Project NI 43-101 Technical Report |
April 15, 2025 SLR Project No.: 233.065300.00001 |
Table 6-2: Summary of Historic Drilling at Queensway
| Company | Start Date | End Date | Total Length (m) | No. of Holes |
| Newfoundland and Labrador Corporation (NALCO) | 1955-12-12 | 1956-02-26 | 1,224.4 | 9 |
| Bison Petroleum & Minerals Ltd | 1969-09-06 | 1969-10-11 | 831.8 | 6 |
| Hudson’s Bay Oil & Gas Company Limited | 1980-08-10 | 1980-09-18 | 392.1 | 7 |
| Falconbridge Ltd | 1987-09-23 | 1987-10-19 | 1,018.6 | 12 |
| Noranda Exploration Company Ltd | 1987-12-11 | 1990-11-08 | 2,085.3 | 24 |
| Gander River Minerals | 1991-03-06 | 1994-02-14 | 1,954.0 | 18 |
| Manor Resources Inc | 1991-06-30 | 1991-07-01 | 50.3 | 1 |
| United Carina Resources | 1999-10-22 | 2000-03-08 | 3,649.3 | 38 |
| VVC Exploration | 2003-01-01 | 2003-02-28 | 1,486.3 | 18 |
| Camdenite Resources Corp | 2003-02-14 | 2004-10-09 | 1,430.0 | 9 |
| Rubicon Minerals Corp | 2004-06-10 | 2005-03-19 | 6,545.9 | 42 |
| Paragon Minerals Corp | 2005-01-14 | 2008-07-05 | 5,677.0 | 33 |
| Crosshair Exploration & Mining | 2005-05-12 | 2005-05-28 | 488.2 | 6 |
| Soldi Ventures | 2011-11-16 | 2012-02-10 | 2,759.9 | 23 |
| Sky Gold Corp. | 2020 | 2021 | 3,352.0 | 19 |
| Labrador Gold Corp. (rotary air blasting) | 2020 | 2022 | 8,382.0 | 154 |
| Labrador Gold Corp. (reverse circulation) | 2020 | 2022 | 434.0 | 6 |
| Labrador Gold Corp. (diamond drilling) | 2021 | 2024 | 91,420.0 | 341 |
| Totals | 133,181.1 | 766 |
| 6.3 | Historical Resource Estimates |
The QP is not aware of any mineral resource estimates, whether compliant with current CIM Definition Standards and NI 43-101 requirements, historical, or non-compliant, having been prepared by previous operators.
| 6.4 | Past Production |
There has been no production from the property as of the effective date of this report.
| 6- |
|
| New Found Gold Corp. | Queensway Gold Project NI 43-101 Technical Report |
April 15, 2025 SLR Project No.: 233.065300.00001 |
| 7.0 | Geological Setting and Mineralization |
| 7.1 | Regional Geology |
The Queensway Project is situated in the northeastern Canadian portion of the Appalachian Orogen, which extends from Scandinavia in the north to Georgia, USA, in the south (Figure 7-1; van Staal and Barr 2012). The Appalachian Orogen (500-350 Ma) records the formation and destruction of the Pre-Cambrian to early Paleozoic Iapetus Ocean. The Iapetus Ocean separated the Laurentian and Gondwanan continents prior to a series of collisional events that created the super-continent Pangaea (Colman-Sadd et al. 1992; van Staal et al. 1998; Pollock et al. 2007; van Staal and Barr 2012; Honsberger et al. 2022).
Newfoundland is divided into four litho-tectonic facies, from west to east - the Humber, Dunnage, Gander, and Avalon zones based on differences in structural, faunal, geochronological, isotopic characteristics, and stratigraphic relationships (Figure 7-2). The Property is mainly in the Dunnage Zone, and to a lesser extent the Gander Zone in the east.
The Dunnage Zone is a collage of Cambro-Ordovician ophiolitic, intra-oceanic arc, back arc, and associated marine sedimentary rocks of both Laurentian and Gondwanan affinity (Figure 7.2). The zone is subdivided into the Notre Dame (Peri-Laurentian) and Exploits (Peri-Gondwanan) subzones which are separated by a major, late Ordovician suture known as the Mekwe’jit Line (former Red Indian Line; van Staal and Barr 2012). Most of the Property lies in the eastern Exploits Subzone of the Newfoundland Appalachians.
The Gander Zone is defined by distinct poly-deformed, middle Cambrian to Tremadocian quartz-rich metapsammites and metapelites which represent continental margin sediments of Ganderia (Figure 7-2; van Staal and Barr 2012). Ganderia is interpreted to be a small ribbon continent that rifted from Gondwana during the middle Cambrian (van Staal and Barr 2012). The Gander Zone is separated from the Dunnage Zone by an early Ordovician suture called the GRUB Line which formed during the Penobscot Orogeny (Colman-Sadd et al. 1992). In the Newfoundland Appalachians the Gander Zone is divided into the Gander Lake, Meelpaeg, and Mount Cormack subzones (Williams 1979). Eastern parts of the Property are underlain by rocks of the Gander Lake Subzone.
| 7- |
|
| New Found Gold Corp. | Queensway Gold Project NI 43-101 Technical Report |
April 15, 2025 SLR Project No.: 233.065300.00001 |
Figure 7-1: Correlation of Major Suture Zones across the Atlantic Ocean

Notes: Abbreviations of suture zones in the vicinity of the Queensway Property include: BBL - Baie Verte-Brompton Line; RIL - Mekwe’jit Line (formerly Red Indian Line); DBL - Dog Bay Line; GRUB - Gander River Ultramafic Belt; DHF - Dover-Hermitage Fault
| 7- |
|
| New Found Gold Corp. | Queensway Gold Project NI 43-101 Technical Report |
April 15, 2025 SLR Project No.: 233.065300.00001 |
Figure 7-2: Newfoundland’s Bedrock Geology and Major Tectonic Zones

| 7- |
|
| New Found Gold Corp. | Queensway Gold Project NI 43-101 Technical Report |
April 15, 2025 SLR Project No.: 233.065300.00001 |
| 7.2 | Property Geology |
| 7.2.1 | Introduction |
The geology of the Queensway Property constitutes a poly-deformed fold and thrust belt that overprints Cambrian continental shelf rocks, Ordovician ophiolitic and marine carbonate/siliciclastic rocks, Silurian shallow marine/terrestrial sequences, and Silurian magmatic rocks (Figure 7-3; Coleman-Sadd et al. 1992; van Staal and Barr 2012; Sandeman et al. 2018). The Appleton and JBP faults are major structures that transect the Queensway Property and are spatially associated with epizonal gold mineralization. The Appleton Fault’s hanging wall and footwall have contrasting rock-types.
| 7.2.2 | Surficial Geology |
Glacial cover is extensive across the Queensway Project and varies in thickness. The AFZ Core is covered by nearly continuous veneers and blankets of fine to medium grained lodgement tills that are very thin (<10 cm) to 2 m thick on average, overlain by a thin layer of courser meltout tills. Craig-and-tail / roche moutonnée landforms are common here and represent topographic highs. The AFZ Peripheral and JBP is covered by an undulating / hummocky blanket of course meltout till, that is greater then 2m thick on average (Palmer, 2023).
QWS is dominated by a thick blanket of medium to coarse grained undulating / hummocky glacial material typically greater than 2m thick with areas exceeding 10m. Northeast oriented ribbed moraines are localized to the southern shore of Gander Lake. Outcrop exposure is rare (Palmer, 2023).
Ice flow on the Queensway property was initially east to east-southeastward and then shifted to a northeastward flow (Vanderveer and Taylor, 1987; Brushett, 2010, 2012; Organ, 2022). Gander Lake acted as part of a glacial spillway in which meltwater flowed eastward to the ocean before the glaciers retreated from the area 11,300 years ago (McCuaig, 2006; Organ, 2022). This resulted in variable till thickness and transport directions from a given point source.
| 7.2.3 | Lithostratigraphic Framework |
Most of the Queensway Property resides between the Appleton Fault’s footwall and the Gander River Ultramafic Belt (GRUB) Line (Figure 7-3). Easternmost exposures include rocks of the Gander River Ultramafic Complex (GRUC) and the Gander Group (O’Neil 1990). The GRUC consists of discontinuous blocks of peridotite, pyroxenite, tonalite, serpentinite, talc schist, mafic volcanics, and mafic derived volcaniclastics (e.g., Blackwood 1982). Its structural base is flanked against metamorphosed quartz arenite and mudstone of the Gander Group to the east along the GRUB Line (O’Neil 1990). GRUC rocks are unconformably overlain to the west by shallow to deep marine rocks of the Middle Ordovician Davidsville Group (e.g., Blackwood 1982) which continue east until the Appleton Faults immediate footwall. Thin discontinuous slivers of Davidsville Group rocks locally appear in the Appleton Faults hanging wall but they are mainly absent. These rocks consist of an ultramafic-derived conglomerate, fossiliferous sandstone/limy siltstone, greywacke, siltstone, and mudstone (Blackwood 1982).
Westernmost exposures between the Appleton Fault and the Dog Bay Line (a possible Silurian suture) are lithologically diverse (Figure 7-3). The Main Point Formation, Indian Islands Group, Ten Mile Lake Formation and, to a lesser extent, Davidsville Group rocks are strongly imbricated along northwest verging thrust faults (Sandeman and Honsberger 2023). The late Ordovician Main Point Formation includes deep-marine dark grey to black graphitic siltstone and mudstone and is interpreted to overly the Davidsville Group (Currie 1995a; Sandeman and Honsberger 2023). The Main Point Formation is overlain by detrital mica-bearing rhythmic dark to light grey sandstone and dark grey siltstone/mudstone with local conglomeratic sections. Historically these rocks have been assigned to the Davidsville Group (Blackwood 1982). However, the presence of detrital-mica and their relationship with the Main Point Formation suggest that they may be a stratigraphic-equivalent of the late Ordovician to early Silurian Badger Group of the western Exploits Subzone and mark the base of the Indian Islands Group (Sandeman, Personal Communication 2023). These rocks are overlain by limestone and interbedded fossiliferous green/maroon/grey micaceous siltstone and sandstone assigned to the middle-late Silurian Indian Islands Group. Rocks of the Indian Islands Group are capped by green, maroon, and grey thick bedded micaceous sandstone with minor siltstone of the late Silurian to early Devonian Ten Mile Lake Formation. The projected trace of the Dog Bay Line and Indian Islands Group/Ten Mile Lake Formation are spatially associated with mafic, intermediate, and felsic intrusive rocks of the Mount Peyton Intrusive Suite (Williams et al. 1993).
| 7- |
|
| New Found Gold Corp. | Queensway Gold Project NI 43-101 Technical Report |
April 15, 2025 SLR Project No.: 233.065300.00001 |
A preliminary stratigraphic column, summarized in Figure 7-4, was developed through integrated work conducted by NFG and recent studies by Sandeman and Honsberger (2023). Interpretation of structure and lithology on a north-facing cross-section through the QWN block is presented in Figure 7-5. Gold bearing veins in the main deposit area of the AFZ Core are hosted in the Hunt’s Cove and Outflow (Figure 7-6) formations of the Davidsville Group, Main Point Formation (Figure 7-7), and basal Indian Islands Group rocks (Sandeman, Personal Communication 2023; Sandeman and Honsberger 2023).
| 7- |
|
| New Found Gold Corp. | Queensway Gold Project NI 43-101 Technical Report |
April 15, 2025 SLR Project No.: 233.065300.00001 |
Figure 7-3: Bedrock Geology of the Queensway Area

| 7- |
|
| New Found Gold Corp. | Queensway Gold Project NI 43-101 Technical Report |
April 15, 2025 SLR Project No.: 233.065300.00001 |
Figure 7-4: Stratigraphic Column Describing the Rocks Underlying the Queensway Property

Source: NFG 2024; Modified after Sandeman and Honsberger 2023.
| 7- |
|
| New Found Gold Corp. | Queensway Gold Project NI 43-101 Technical Report |
April 15, 2025 SLR Project No.: 233.065300.00001 |
Figure 7-5: Interpretation of Structure and Lithology on a North-facing Queensway North Block Cross-section

| 7- |
|
| New Found Gold Corp. | Queensway Gold Project NI 43-101 Technical Report |
April 15, 2025 SLR Project No.: 233.065300.00001 |
Figure 7-6: Interbedded Siltstone and Greywacke of the AFZ Footwall, Outflow Formation from Drill Hole NFGC-23-1416
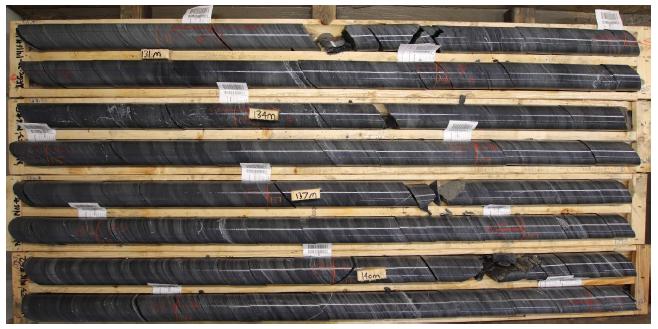
Source: NFG 2023.
Figure 7-7: Interbedded Black Siltstone and Greywacke of the AFZ Hanging Wall, Main Point Formation from Drill Hole NFGC-24-2116

Source: NFG 2024.
| 7.2.4 | Mineralization |
Gold mineralization at the Property has been identified in several gold zones in both the QWN and QWS blocks.
| 7- |
|
| New Found Gold Corp. | Queensway Gold Project NI 43-101 Technical Report |
April 15, 2025 SLR Project No.: 233.065300.00001 |
In general, these gold zones are interpreted to be indicative of an orogenic epizonal gold system, and are characterized by:
| 1 | Strong gold mineralization in quartz-carbonate veins that is associated with complex networks of brittle fault zones which are commonly discordant to the regional northeast trending foliation and stratigraphy. Mineralization typically occurs as coarse grains of free visible gold in multiphase quartz-carbonate veins that are brecciated, massive-vuggy, laminated, or that have a closely spaced stockwork texture (Figure 7-8). High grade gold mineralization, above 10 ppm Au, typically occurs in closely spaced quartz veins, and is interpreted to be controlled by the intersection of cross-cutting faults with these auriferous veins. |
| 2 | A gold association with arsenic-bearing minerals, in addition to antimony and tungsten. Arsenopyrite (AsFeS) is commonly observed to occur in conjunction with gold (Figure 7-9). Boulangerite (Pb5Sb4S11), a lead-antimony sulfosalt, is often associated with chalcopyrite (CuFeS2) in intervals of high grade gold mineralization, however, it is much less common than arsenopyrite. Disseminated host rock pyrite/arsenopyrite mineralization is spatially associated with veining (Figure 7-9). |
| 3 | An alteration halo around most of the gold-rich veins that is associated with the changes in the mineralogy of white micas. |
Figure 7-8: Typical Gold-bearing Quartz Vein Styles Observed at Queensway

Source: NFG
Note. Top Left: Brecciated quartz vein with visible gold, Top Right: Vuggy quartz vein with visible gold, Bottom Left: Multiphase quartz vein with visible gold, Bottom Right: Stylolitic quartz vein with visible gold.
| 7- |
|
| New Found Gold Corp. | Queensway Gold Project NI 43-101 Technical Report |
April 15, 2025 SLR Project No.: 233.065300.00001 |
Figure 7-9: Images of Core from Mineralized Intervals in Drill Hole NFGC-19-01

Source: NFG 2019.
| 7.2.4.1 | Queensway North Mineralization |
Appleton Fault Zone Mineralization
The northern part of the AFZ exploits a contact between a black shale interbedded with grey siltstone and greywacke in the west, and a sequence of interbedded shale and greywacke in the east. As with the difference in lithologies on either side of the AFZ, the style of mineralization contains minute differences between the western hanging wall and the eastern footwall of the AFZ. The spatial relationships between rock type, the AFZ and JBPFZ, and known and drill-defined gold showings in the QWN block are presented in Figure 7-10.
| 7- |
|
| New Found Gold Corp. | Queensway Gold Project NI 43-101 Technical Report |
April 15, 2025 SLR Project No.: 233.065300.00001 |
Figure 7-10: Integrated Geological Map of Lithology, Regional Faults and Gold-bearing Faults in Queensway North Block
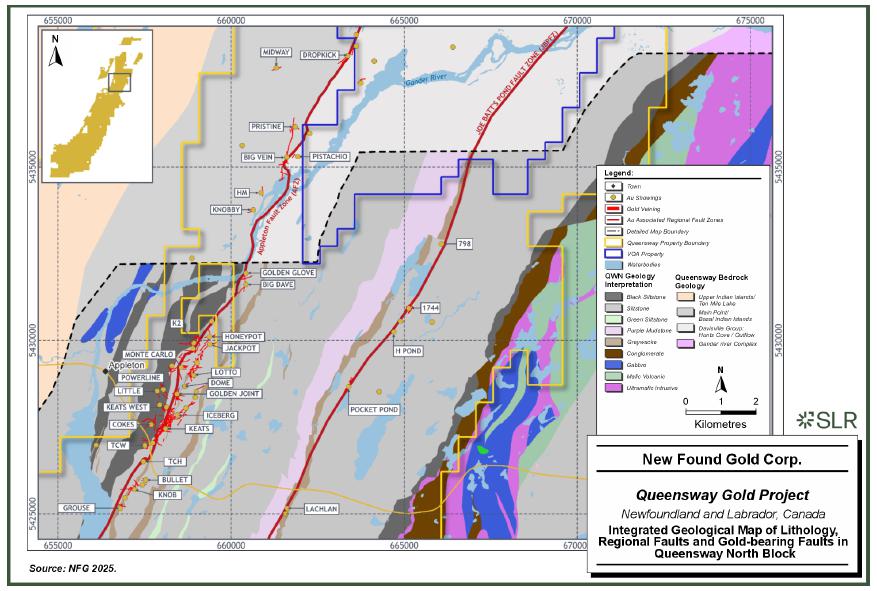
| 7- |
|
| New Found Gold Corp. | Queensway Gold Project NI 43-101 Technical Report |
April 15, 2025 SLR Project No.: 233.065300.00001 |
AFZ Footwall Mineralization
Gold mineralization of zones in the AFZ footwall is commonly encountered in moderate to steeply dipping (60°-80°) epizonal-style veining associated with brittle faulting of interbedded siltstones and greywackes. The quartz-carbonate veins can exhibit stylolitic, massive vuggy, and/or brecciated textures, and have mineral associations with trace arsenopyrite, chalcopyrite, boulangerite and pyrite. High grade lenses have been observed at the intersection of multiple cross-cutting auriferous structures. The mineralization is commonly oriented along northeast-trending structural corridors, consistent with the regional structural fabric although other mineralization orientations are also present.
Notable drill-defined gold zones of the AFZ Footwall include Keats, Iceberg, Iceberg East, Golden Joint, Lotto, and Lotto North (Figure 7-11).
Keats
The Keats prospect is located at the north end of the AFZ in QWN, along the Keats-Baseline Fault Zone (KBFZ), approximately 0.4 km southeast of the Cokes prospect (Figure 7-10). The KBFZ is a brittle fault zone that lies obliquely to the east of the AFZ with an east-northeast strike (N55°E) and a southeast dip of approximately 60°. This fault forms an extensive damage zone that is discordant to the steeply dipping northeast striking stratigraphy and controls the development of a complex network of brittle, high grade gold vein arrays that are epizonal in character (Figure 7-12). This complex network of high grade veins has been encountered surrounding the KBFZ, creating high-grade domains that bifurcate from both the KBFZ and the AFZ, and plunge in varying orientations over a defined strike length of 575 m. Two vein orientations dominate, with the most prominent orientation being approximately parallel to the orientation of the KBFZ. The second common vein orientation at Keats is a westerly dip of approximately 55°.
Gold mineralization, consistent with the AFZ footwall style, begins near the surface and is hosted in quartz-carbonate veins with vuggy (Figure 7-12B), stylolitic, and brecciated textures (Figure 7-12A, C, and D). These veins commonly contain trace amounts of arsenopyrite, chalcopyrite, boulangerite, or pyrite and are associated with NH4 muscovite alteration.
A distinct brecciated texture known as "ghost breccia" (Figure 7-12A and C) is linked to very high gold grades (>100 g/t Au). This texture is characterized by numerous points of visible gold and a silica overprint that gives brecciated clasts a faded, “ghost-like” appearance.
Figure 7-13 shows an example of mineralization from the Equinox vein within the Keats Zone. At this location, drill hole NFGC-21-204 intersects the vein sub-parallel to the core axis, with a downhole extent of approximately 16 m, corresponding to a true thickness of approximately 4 m.
| 7- |
|
| New Found Gold Corp. | Queensway Gold Project NI 43-101 Technical Report |
April 15, 2025 SLR Project No.: 233.065300.00001 |
Figure 7-11: Queensway North AFZ Prospects with Major Structures and Gold Vein-Filled Faults on Surface

Note: Vein widths not to scale.
| 7- |
|
| New Found Gold Corp. | Queensway Gold Project NI 43-101 Technical Report |
April 15, 2025 SLR Project No.: 233.065300.00001 |
Figure 7-12: Core Photographs from NFGC-19-01 (Keats Prospect): Visible Gold (A, C, and D); Vuggy Quartz Texture (B)
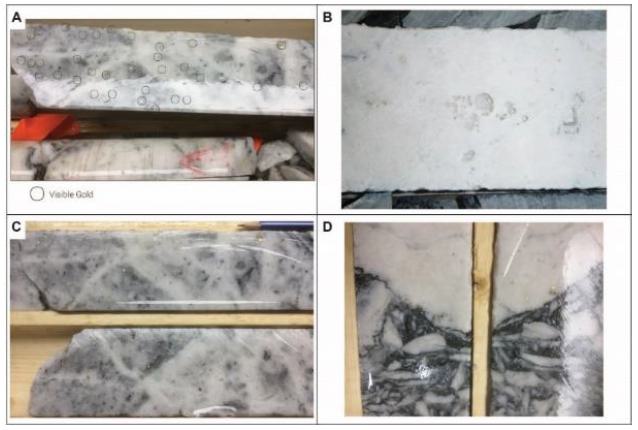
Source: NFG 2019.
| 7- |
|
| New Found Gold Corp. | Queensway Gold Project NI 43-101 Technical Report |
April 15, 2025 SLR Project No.: 233.065300.00001 |
Figure 7-13: Photos of Mineralization from Drill Hole NFGC-21-204 at Keats Zone (approximately 280 m to 296 m)

Source: NFG 2021.
Iceberg and Iceberg East
The Iceberg and Iceberg East showings are located on the east side of the AFZ and are 300 m northeast from the Keats Zone (Figure 7-8 and Figure 7-9). The geological and mineralization characteristics of Iceberg are nearly identical to those observed at Keats (Figure 7-14) and NFG’s current interpretation is that Iceberg is the eastern continuation of the KBFZ which extends through Iceberg Alley to the northeast. The near-surface Iceberg-Iceberg East high grade segment of the KBFZ has a strike length of 655 m and when combined with the 400 m high grade segment of Keats Main, this near-surface, high grade corridor covers over one kilometre of strike. These domains of high grade occur within the overall KBFZ that is drill-defined over 1.9 km of strike. The KBFZ is offset between each of the Keats, Iceberg-Iceberg East, and Iceberg Alley zones. Each zone exhibits similar fault characteristics including orientation, intensity, and width of the damage zone. Figure 7-14 shows mineralization at the interpreted intersection of three sub-parallel veins: Iceberg, T800, and T1000, which are all believed to converge at this drill hole location.
| 7- |
|
| New Found Gold Corp. | Queensway Gold Project NI 43-101 Technical Report |
April 15, 2025 SLR Project No.: 233.065300.00001 |
Figure 7-14: Photos of Mineralization from Drill Hole NFGC-23-1210 at Iceberg (approximately 58 m to 82 m)

Source: NFG 2023.
Golden Joint
The Golden Joint prospect is located one kilometre northeast of the Keats prospect on the east side of the AFZ in QWN (Figure 7-10 and Figure 7-11). Gold mineralization at Golden Joint occurs in two structural settings: in the immediate footwall to the AFZ (Golden Joint), and in a more distal setting that is spatially associated with a thick greywacke unit that has a northeast strike (Golden Joint Hanging Wall, or Golden Joint HW).
| 7- |
|
| New Found Gold Corp. | Queensway Gold Project NI 43-101 Technical Report |
April 15, 2025 SLR Project No.: 233.065300.00001 |
The Golden Joint Zone consists of a massive quartz vein with stylolitic and brecciated textures, identical to that observed at Keats and Iceberg, that is steeply dipping with a north strike lying in the footwall shales adjacent to the AFZ. It has been drill-defined over a strike length of 250 m and to a depth of 385 m. The Golden Joint HW mineralization is comprised of stockwork veining hosted in a thick bed of greywacke that trends in an east-northeast orientation and dips moderately to the southeast. The Golden Joint HW is drill-defined over a strike length of 185 m and to a depth of at least 150 m.
Lotto and Lotto North
The Lotto prospect is located approximately 0.7 km north-northeast of Golden Joint and 200 m east of the AFZ (Figure 7-10 and Figure 7-11). Lotto mineralization is typical of the AFZ footwall and consists primarily of the Lotto Main vein that strikes north (azimuth N0°E), and dips steeply to the east at approximately 85°. Within the Lotto Fault Zone that hosts the Lotto Main vein, a high grade lens plunges steeply to the northeast and is likely controlled by the intersection of the Lotto Main vein with a thin bed of greywacke.
The Lotto North prospect is adjacent (north) to the Lotto prospect and exhibits gold mineralization hosted in a series of AFZ-typical, epizonal-style veins contained in a north-south striking brittle fault immediately north of Lotto. When combined with the Lotto Main Zone, these high grade gold-bearing structures have been drill-defined over a total strike length of 630 m.
AFZ Hanging Wall Mineralization
Gold mineralization of zones in the AFZ Hanging Wall is commonly observed in broad zones of low angled (30°to 40°) epizonal-style veining associated with brittle faulting of graphitic siltstones interbedded with grey siltstones and greywackes. The quartz-carbonate veins typically exhibit more stockwork or fault-filling textures, with some veins exhibiting similar massive to stylolitic textures as that of the footwall gold zones. Auxiliary mineral associations are similar to gold zones in the footwall with trace arsenopyrite, chalcopyrite, boulangerite and pyrite, with the exception of unique mineral associations with stibnite occurring at the K2 prospect, and two anomalous high grade silver assays (253.8 ppm Ag over 2.0 m and 94.9 ppm Ag over 1.0 m) at the Little prospect (Figure 7-10 and Figure 7-11). The second, less frequently observed mineralization style in the hanging wall gold zones includes mineralized ductile shear structures, like that seen at the Cokes prospect. The mineralization zone are commonly oriented west southwest at Keats West and Southeast at K2.
Notable drill-defined gold zones of the AFZ Hanging Wall include Keats West and K2.
Keats West
Keats West prospect is located on the west the AFZ, 500 m northwest of Keats (Figure 7-10 and Figure 7-11) and is defined by a low angle thrust fault that dips gently to the south-southwest. This fault zone is hosted by an interbedded sequence of black siltstone, siltstone, and greywacke, and contains a series of stacked veins that contain the gold mineralization (Figure 7-15). The mineralization style is epizonal and typical of the other gold prospects found along this segment of the AFZ. This gold-bearing structure has a drill-defined mineralized footprint spanning an area that is 305 m long by 315 m wide and extends from surface to 130 m vertical depth. In Figure 7-15, the mineralized intercept of the KW_Harbinger1 vein extends from 150.6 m to 167 m and lies directly above the KW_Harbinger2 vein, which is mineralized from 167 m to 177 m. The KW_Harbinger2 vein is prominently visible at the bottom of Figure 7-15, displaying approximately 10 m of "ghost" breccia texture.
| 7- |
|
| New Found Gold Corp. | Queensway Gold Project NI 43-101 Technical Report |
April 15, 2025 SLR Project No.: 233.065300.00001 |
Figure 7-15: Photos of Mineralization from Drill Hole NFGC-22-960 at Keats West (approximately 149 m to 182 m)

Source: NFG 2022.
K2
The K2 prospect is 725 m north of Lotto, 2.2 km northeast of Keats West, and is situated on the west side of the AFZ (Figure 7-10 and Figure 7-11). The K2 prospect is a significant structural zone made up of multiple structures and cross-cutting vein orientations, with much of the gold being found in the “K2 Main” structure, a low-angle gold-bearing fault zone that shares a similar dip to Keats West and strike to the KBFZ. The defined mineralized footprint is 490 m long and 395 m wide. The gold mineralization begins at surface and has been drill-defined down to a maximum vertical depth of 250 m.
The K2 prospect consists of a series of epizonal stockwork and fault-fill style quartz veins that parallel, and cross-cut, the K2 Main fault to form a broad domain of gold mineralized brittle faults (Figure 7-16). The mineralization shown in Figure 7-16 is interpreted as three distinct veins: Annapurna, K2, and K2No3. These veins are separated by two intervals of poorly mineralized host rock, with downhole lengths of approximately 2 m and 14 m. These intervals can be identified in Figure 7-16 as the core boxes without flagging tape at the ends.
| 7- |
|
| New Found Gold Corp. | Queensway Gold Project NI 43-101 Technical Report |
April 15, 2025 SLR Project No.: 233.065300.00001 |
The Stibnite vein, a component of the larger K2 structure, has returned several significant gold intervals. This vein contains significant amounts of stibnite, an antimony-bearing sulphide mineral as reflected by the antimony assay results of 0.95% Sb over 12.95 m in NFGC-23-1303, and 0.04% Sb over 3.90 m in NFGC-23-1391. This is the first time this mineral association has been observed at QWN.
Mineralization at K2 generally tends to be lower grade over broad widths, however, localized domains of high grade have been identified and occur at locations where cross-cutting structures interact with the K2 structure.
| 7- |
|
| New Found Gold Corp. | Queensway Gold Project NI 43-101 Technical Report |
April 15, 2025 SLR Project No.: 233.065300.00001 |
Figure 7-16: Photos of Mineralization from Drill Hole NFGC-23-1986 at K2 (approximately 140 m to 182 m)

Source: NFG 2023.
| 7- |
|
| New Found Gold Corp. | Queensway Gold Project NI 43-101 Technical Report |
April 15, 2025 SLR Project No.: 233.065300.00001 |
AFZ Peripheral Mineralization
The AFZ Peripheral area hosts gold mineralization along the AFZ, sharing many characteristics with discoveries at AFZ Core. The Dropkick Zone, situated on the hanging wall side of the AFZ, exhibits structurally controlled gold mineralization within a brittle fault zone that trends parallel to the AFZ.
Gold mineralization at AFZ Peripheral is primarily hosted in fault-fill quartz veins within an interbedded sequence of siltstones and sandstones. These veins commonly contain free, coarse gold and are associated with high-strain deformation zones. The presence of multiple crosscutting vein orientations, infill veining, and brittle deformation features suggests structural complexity similar to that observed in other key mineralized zones within AFZ Core.
Joe Batts Pond Fault Zone Mineralization
Along the 12.5 km strike length of the northern part of the JBPFZ (Figure 7-10), mineralization occurs in ductile-brittle deformation zones and associated epizonal-style irregular vein arrays that run parallel to the southwest-striking, steeply west-dipping stratigraphy of mainly green siltstones (Figure 7-17). Mineral associations in gold-bearing zones are similar to those of the AFZ prospects where there are trace amounts of pyrite, chalcopyrite, boulangerite, and arsenopyrite.
Figure 7-17: Photos of Mineralization from Drill Hole NFGC-21-304 at Pocket Pond (approximately 82 m to 91 m)
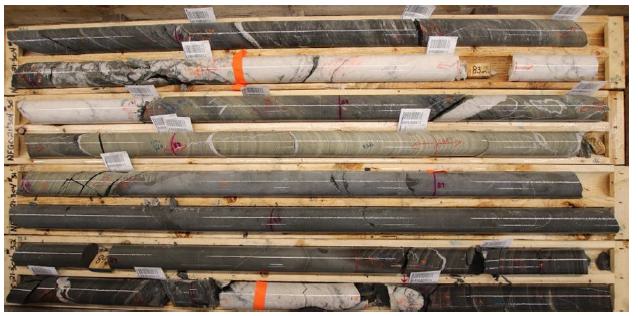
Source: NFG 2021.
| 7.2.4.2 | Queensway South Mineralization |
A series of gold prospects located along the southern extension of the AFZ (Figure 7-18) can be grouped into three different mineralization styles.
| 1 | AFZ Core Analogous Mineralization |
| 2 | Siltstone-hosted gold with intrusive mafic dyke swarm |
| 3 | Epithermal Fault Zone |
| 7- |
|
| New Found Gold Corp. | Queensway Gold Project NI 43-101 Technical Report |
April 15, 2025 SLR Project No.: 233.065300.00001 |
Figure 7-18: Integrated Geological Map of Lithology, Regional Faults, and Gold Trends in Queensway South, Pauls Pond Region

| 7- |
|
| New Found Gold Corp. | Queensway Gold Project NI 43-101 Technical Report |
April 15, 2025 SLR Project No.: 233.065300.00001 |
Mineralization Analogous to QWN AFZ
The mineralization style of the Nebula, Devils Trench, Devils Pond South, and Camp Zone prospects is similar to that of the AFZ in QWN such that the gold is associated with quartz veining and accessory sulphides including pyrite and arsenopyrite and are located immediately east of the southern extension of the AFZ. These gold-bearing zones are defined by high-strain mineralized shear zones with an increased density of stylolitic quartz veins, hosted in the interbedded greywackes and siltstones of the Davidsville Formation. Minor differences in the mineralization of these zones include a proportionally greater concentration of pyrite and arsenopyrite, as well as the presence of tourmaline at the Nebula prospect.
Siltstone-hosted gold with intrusive mafic dyke swarm
High grade gold mineralization within the Goose, Astronaut, Nova, and Greenwood Pond #2 prospects is hosted by a sequence of siltstones that is intruded by a swarm of intermediate to mafic dykes, largely gabbro and diorite. This mineralization style occurs west of the AFZ in a unit that has not been recognized at QWN. Gold mineralization in these prospects include the following accessory minerals: arsenopyrite, chalcopyrite, pyrrhotite, pyrite, and tourmaline (Figure 7-19).
Figure 7-19: Select Photographs of Drill Core from the Astronaut and Nova Prospects

Source: NFG 2022.
Note. Top photo: Brecciated gold-bearing vein from drill hole NFGC-QS-22-19 at a depth of approximately 199 m (Astronaut prospect). Bottom Left: Visible gold in drill hole NFGC-QS-22-18 at approximately 48 m (Astronaut prospect). Bottom Right: Visible gold in drill hole NFGC-QS-22-21 at approximately 222 m (Nova prospect).
Epithermal Fault Zone
The mineralization style of the Aztec and Mars showings is interpreted to be epithermal. Aztec is located west of the AFZ at the interpreted domain boundary of the Davidsville Group and Mars is situated near the margin of the Peyton Intrusive Suite (Figure 7-18). At Aztec, gold mineralization is spatially associated with a large area of sinter and a significant fault zone containing hydrothermal breccia and gold that is exposed both in a trench and historical drill core (Figure 7-20). At Mars, weak gold mineralization is characterized by chalcedonic quartz vein breccias, with low sulphide content hosted in an east-west trending fault zone cutting a highly oxidized granite (Figure 7-21 and b).
| 7- |
|
| New Found Gold Corp. | Queensway Gold Project NI 43-101 Technical Report |
April 15, 2025 SLR Project No.: 233.065300.00001 |
Figure 7-20: Photos of Mineralization from Drill Hole NFGC-QS-22-32 at Aztec (approximately 102 m to 113 m)

Source: NFG 2022.
Figure 7-21: Fault Zone in Oxidized Granite (A) and Chalcedonic Quartz Breccia Veins (B) at Mars
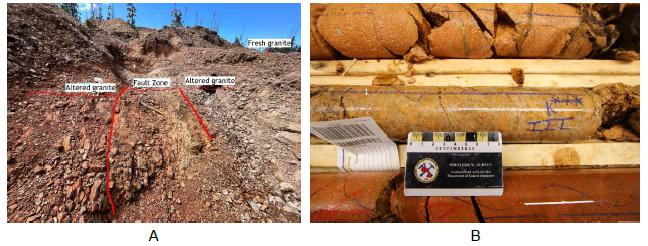
Source: NFG
| 7.2.4.3 | VOA Option Prospects |
Gold mineralization within the VOA Option prospects (Figure 7-10) is characterized by high-strain domains in association with brittle faulting and increased density of cross-cutting stockwork veinlets hosted within interbedded siltstones and greywackes. Gold mineralization is commonly found associated with trace arsenopyrite and pyrite, with rare trace amounts of stibnite.
| 7- |
|
| New Found Gold Corp. | Queensway Gold Project NI 43-101 Technical Report |
April 15, 2025 SLR Project No.: 233.065300.00001 |
| 7.2.4.4 | Twin Ponds Block |
Gold mineralization within the Twin Ponds block (Figure 7-10) was observed in two separate, although similarly altered host rocks. The first form of gold mineralization is associated with a broad deformation corridor containing a quartz veined zone with breccia, cockade, and banded textures (Figure 7-22), hosted in silicified siltstones with increased graphitic content. The second mineralization style occurs in an altered and silicified gabbro, suggesting that the gold mineralization in this area is the result of a hydrothermal setting associated with the emplacement of gabbro sills and related bodies where fluids have interacted with the mafic intrusive rocks and the host sediments. Similar gold showings are seen regionally and, in the Duder Lake area, are termed structurally controlled gabbro-hosted gold mineralization (Churchill and Evans 1992).
Figure 7-22: Core Photo of Quartz Vein Zone Breccia, Cockade, and Banded Textures within Twin Ponds Drill Hole NFGC-TP-22-01, 173.3 m to 183.85 m

Source: NFG 2022.
| 7.2.5 | Alteration |
A visually subtle hydrothermal alteration is present around the gold-bearing veins at the Queensway Property. The alteration is defined by a weak discolouration of the rock adjacent to quartz-carbonate veins, extending 2 m to 10 m beyond the veins themselves. NFG uses hyperspectral core logging (HALO) to identify a consistent alteration halo around the mineralized zones. SLR notes that the modeling of hyperspectral core data is still in its early stages. Currently, the 'halo' and 'buffer' mineralization wireframes described in Section 14 are based on grade and distance, respectively, and remain independent of NFG’s alteration modeling.
A schematic cross-section that illustrates a zonation in the alteration moving outward from a gold-bearing stockwork is presented in Figure 7-23 and is characterized by:
| 7- |
|
| New Found Gold Corp. | Queensway Gold Project NI 43-101 Technical Report |
April 15, 2025 SLR Project No.: 233.065300.00001 |
| • | Aluminum rich NH4 muscovite occurs near the gold mineralization. |
| • | Transitions to phengite, a mineral that commonly occurs with hydrothermal alteration. Most prevalent distally from a mineralized zone. |
| • | Outer Fe and Fe-Mg chlorite alteration. |
| 7- |
|
| New Found Gold Corp. | Queensway Gold Project NI 43-101 Technical Report |
April 15, 2025 SLR Project No.: 233.065300.00001 |
Figure 7-23: Schematic Illustration of Mineralogical Changes in White Micas Identified by Hyperspectral Imaging of Core near Strong Gold Mineralization
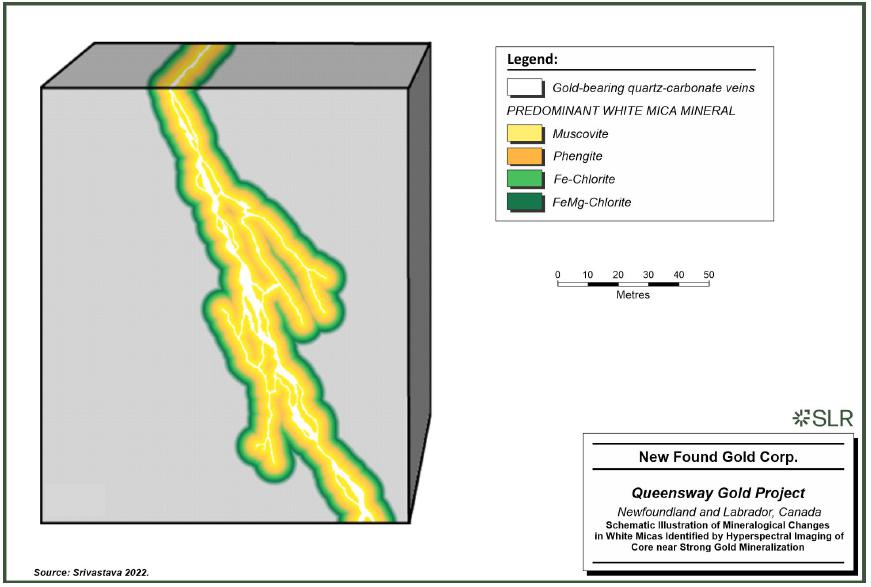
| 7- |
|
| New Found Gold Corp. | Queensway Gold Project NI 43-101 Technical Report |
April 15, 2025 SLR Project No.: 233.065300.00001 |
| 7.2.6 | Structural Geology |
| 7.2.6.1 | D1A Deformation |
Rocks of the Davidsville Group, Main Point Formation, Indian Islands Group and Ten Mile Lake Formation are overprinted by closed to isoclinal and doubly north-northeast to south-southwest plunging F1A folds (Figure 7-24a; Blackwood 1982). Several orders of parasitic folds have been documented from a regional to centimeter-scale. An axial planar S1A slaty foliation is noted throughout the Property. Mudstone/siltstone dominated successions are folded into F1A isoclines and transposed into the main S1A foliation. In contrast, F1A folds have a closed to tight geometry in competent packages of sandstone/conglomerate.
The vergence of F1A folds, S1A foliation, and D1A thrust faults change from east to west (Blackwood 1982; Sandeman et al. 2018). In the east, Davidsville Group rocks are displaced to the east-southeast over rocks of the GRUC along a D1A thrust fault (Blackwood 1982). Bedding-S1A foliation relationships noted in rocks of the Davidsville Group suggest F1A axial planes dip moderate to gently to the west-northwest consistent with thrusting. To the west, F1A folds and the S1A foliation consistently verge to the east-southeast up to the AFZ (Nassif et al. 2023). This fault is interpreted to be a southeast striking and moderate to steeply dipping D1A thrust that formed near the core of the belt (Sandeman and Honsberger 2023). The AFZ immediate hanging wall and footwall domains are characterized by upright to steeply northwest and southeast dipping F1A folds and S1A foliation. Progressing west towards the Dog Bay Line west-northwest directed D1A thrust faults imbricate rocks of the Main Point Formation, Indian Islands Group, and possibly the Davidsville Group (Sandeman et al. 2018). In this area, F1A axial planes and the S1A cleavage dip moderately to the east-southeast compatible with west-northwest verging D1A thrust faulting. The overall architecture of rocks underlying the property defines a bi-vergent fold and thrust belt with a core domain of near upright F1A folds. Structures attributed to D1A deformation formed during west-northwest to east-southeast compression.
An early barren quartz-carbonate-chlorite shear/extensional vein system appears to be coeval with D1A deformation. Shear veins parallel the S1A foliation or the steep northwest dipping limb domains of mesoscopic F1A folds defined in stratigraphy. Extensional veins are rare but are locally folded about northeast or southwest plunging fold axes congruent with the F1A fold system. In areas of higher strain, they may have rotated into shear-parallel orientations. Early veins that parallel the S1A foliation exhibit pinch and swell geometries, isolated asymmetric boudins, and ridged body rotations consistent with sinistral ductile shear (Figure 7-24b; Nassif et al. 2023). Shear zones rework the early S1A foliation into localized composite shear fabric. It is possible that F1A folds and the S1A foliation were reactivated as sinistral shear zones syn to post early quartz-carbonate-chlorite vein development during late D1A. This implies a slight change in the stress regime from west-northwest to east-southeast to northwest-southeast compression during late D1A (Nassif et al. 2023). Further work is required to refine these field relationships.
| 7.2.6.2 | D1B Deformation |
The Appleton Fault is spatially associated with an extensive secondary brittle-ductile to brittle, low displacement fault system which host quartz-ankerite-chalcopyrite-boulangerite-arsenopyrite veins with visible gold. There are three main fault orientations that repeat throughout the main deposit area and overprint F1A folds, S1A foliation, and early barren sinistrally sheared vein system. Faults are oriented south-southeast (approximately 175/65), east-southeast (approximately 100/65), and northeast (approximately 055/65), using the right-hand rule convention. Mutual cross-cutting relationships, consistent vein style, and mineralogy suggest all faults are near coeval (Fingas 2024). Fault orientation and kinematics suggest that the south-southeast (sinistral) and the east-southeast (dextral) oriented faults are a conjugate set (Buchanan 2003; Fingas 2024). The geometric relationships of conjugate set suggest they formed in a northwest-southeast compressive regime (Buchanan 2003). Fault kinematics on northeast striking veins and faults is poorly understood. Gold bearing veins hosted along northeast striking faults are overprinted by dextral strike slip movement but this is tentatively assigned to post-mineral fault reactivation. The angular relationship between northeast striking gold bearing faults and the conjugate set suggest they are possibly P-shears (Buchanan 2003) or reverse dominant faults. However, further work is required to define syn-mineral kinematics on northeast striking faults.
| 7- |
|
| New Found Gold Corp. | Queensway Gold Project NI 43-101 Technical Report |
April 15, 2025 SLR Project No.: 233.065300.00001 |
Structures assigned to D1B deformation display a change in structural style but likely formed in a similar stress-regime as structures related to late D1A. The kinematic history of the Appleton Fault is poorly understood. However, the stress regime defined by faults assigned to D1B deformation suggests that kinematics on the Appleton Fault was sinistral (Buchanan 2003) or sinistral-reverse during this time. Further work is required to better define the spatial relationships and kinematics of Appleton and mineralized D1B faults on the Queensway Property.
In the Keats and Iceberg zones two sets of quartz-ankerite-chalcopyrite-boulangerite-arsenopyrite-visible gold veins are hosted in the secondary faults described above:
| 1 | Shear and Extensional veins: Shear veins are composed of laminated and generally massive quartz-ankerite separated by seams of fine-grained pyrite and arsenopyrite (Figure 7-24c; Fingas 2024). These features likely represent intermittent slip events and dilation along faults during fluid pressure cycling (Sibson et al. 1988). Sheets along the margins of shear veins are locally characterized by a breccia. Some layers have medium to coarse grained euhedral quartz crystals and small vugs which suggest faults remained open for some time in between slip events. Isolated discontinuous coeval extensional veins are documented both oblique and orthogonal to shear veins and horsetail splays commonly develop near fault terminations. |
| 2 | Vuggy Breccia Veins and Stockwork: Discontinuous breccia veins and pods composed of coarse euhedral quartz crystals with large vuggy cavities are hosted along pre-existing interfaces such as bedding, the S1A foliation, and faults (Figure 7-24d; Fingas 2024). Clasts are typically sparse, angular and show a high degree of rotation. Structures that were re-utilized likely remained open without intermittent shearing to allow for euhedral quartz and vug development. It is possible that pre-existing structures were reactivated through mode-1 extension at low differential stress and high fluid pressures (Phillips 1972). Vuggy breccia veins sometimes grade into or have adjacent stockwork zones consistent with hydraulic fracturing (Phillips 1972). These structures may also represent implosion breccias that formed along small dilatational jogs and fault intersections. Vuggy breccia veins likely post-date laminated shear and extensional veins, but field relationships can be ambiguous (Fingas 2024). |
| 7.2.6.3 | D2 Deformation |
F1A folds, the S1A cleavage, D1A/B faults and visible gold-bearing veins are overprinted by a phase of near vertical shortening. This deformation appears to be restricted to pre-existing fault damage zones and may not be regionally penetrative. It produced localized F2 folds, extensional-style kink-banding and extensional faults (Figure 7-24e). The geometry and orientation of F2 folds are dependent on the orientation of the pre-existing structures which they overprint. Pre-existing moderate-steeply dipping interfaces buckle into symmetrical recumbent F2 folds. In contrast, F2 folds deforming in near vertical layering tend to be asymmetric with inclined to upright axial planes. All F2 folds doubly-plunge gently to the north-northeast and south-southwest. There is a spaced, typically gently dipping to inclined, axial planar cleavage that is only observed in the present of F2 folds. D2 high strain zones are mainly focused in the hanging wall of the Appleton Fault where localized narrow flat belts are developed. D2 deformation in the footwall domain is restricted to centimetre-scale F2 folds and extensional kink bands. This style of deformation is consistent with orogenic collapse (Froitzheim 1992).
| 7- |
|
| New Found Gold Corp. | Queensway Gold Project NI 43-101 Technical Report |
April 15, 2025 SLR Project No.: 233.065300.00001 |
| 7.2.6.4 | D3 Deformation |
All structures related to D1 and D2 deformation are overprinted by D3 deformation which is characterized by an east-northeast to west-southwest compressive regime. Northeast oriented D1A and D1B faults were reactivated as dextral faults and new faults of similar orientation can be mapped throughout the Property. Visible-gold bearing veins were modified during D3 deformation. East-west striking veins are commonly drag folded, disarticulated, and displaced along barren northeast and southwest striking dextral faults (Figure 7-24f; Fingas 2024). Dextral-reactivation of northeast oriented visible-gold bearing veins often cause duplexing and localized structural thickening of the veined zone. Dextral faulting is typically associated with isolated or conjugate kink bands which constrain moderate to steeply northwest and southeast plunging kink-style folds (Buchanan 2005). Occasionally, northeast directed low displacement thrust faults and southeast-northwest plunging folds are documented in higher strain zones. This phase of deformation is likely associated with remobilization of earlier mineralization and possibly pyrite mineralization (Fingas 2024).
| 7- |
|
| New Found Gold Corp. | Queensway Gold Project NI 43-101 Technical Report |
April 15, 2025 SLR Project No.: 233.065300.00001 |
Figure 7-24: Examples of Deformation at Queensway

Source: NFG
Notes:
a) F1A isoclinal folds and an accompanying axial-planar S1A foliation;
b) Early barren quartz-carbonate-chlorite veins overprinted by sinistral ductile simple shear;
c) Quartz-ankerite-chalcopyrite-visible gold shear and extensional vein array;
d) Near S1A parallel quartz-ankerite-arsenopyrite-boulangerite-visible gold vuggy breccia with coarse euhedral quartz grains and well developed vugs;
e) Gently northeast plunging F2 fold overprinting F1A folds and the S1A foliation;
f) Steeply northwest plunging F3 kink-style folds constrained to a set of conjugate kink bands.
| 7- |
|
| New Found Gold Corp. | Queensway Gold Project NI 43-101 Technical Report |
April 15, 2025 SLR Project No.: 233.065300.00001 |
| 8.0 | Deposit Types |
The Queensway Project is classified as an orogenic gold deposit, a globally significant deposit type that hosts some of the richest gold systems known (Gardner, 2021). Well-known Canadian examples include the Campbell Mine in the Red Lake District, the Hollinger Mine along the Porcupine-Destor Fault Zone in Timmins, and the Sigma Mine along the Cadillac-Larder Lake Fault Zone in Val-d'Or, Québec.
| 8.1 | Orogenic Gold Deposits |
Orogenic gold deposits are understood to be created during continental plate collisions, when pressures and temperatures cause rocks to undergo metamorphism and dehydrate (Goldfarb et al. 1991). Gold-bearing fluids are driven from the rocks and percolate through fissures and cracks. As these fluids migrate upwards, their temperature and pressure drop, causing gold, which is hard to keep in solution, to precipitate, often within quartz veins (Fyfe and Henley 1973; Goldfarb et al. 2015).
Conditions that cause gold to precipitate from fluids can occur deep in the crust, where temperatures and pressures are high, and the rocks are ductile (Figure 8-1). At depths of 20 km or more, metamorphism is described as granulite facies. Orogenic gold deposits can also form closer to the surface, where rocks are brittle and metamorphism is weaker, in the greenschist facies. The brittle or ductile nature of the host rock and the intensity of metamorphism give rise to different styles of gold mineralization in orogenic gold deposits, with different associated minerals (Goldfarb et al. 2015). The style of mineralization observed at Queensway, with arsenic, antimony, and tungsten often being associated with gold, is consistent with greenschist facies metamorphism at depths that are described in the technical literature as being epizonal to mesozonal.
The geological setting and the style of gold mineralization observed at Queensway are similar to those reported for the Meguma Supergroup, in Nova Scotia, Canada (Kontak et al. 1990; Ryan and Smith 1998). As shown in Figure 8-2, NFG has also noted striking similarities between drill core samples from Queensway and core from the Fosterville Mine in the Castlemaine-Bendigo region in Australia (Willman 2007); an orogenic gold deposit with abundant sulphide gold mineralization.
| 8- |
|
| New Found Gold Corp. | Queensway Gold Project NI 43-101 Technical Report |
April 15, 2025 SLR Project No.: 233.065300.00001 |
Figure 8-1: Schematic for Orogenic Gold Deposits at Various Depths

| 8- |
|
| New Found Gold Corp. | Queensway Gold Project NI 43-101 Technical Report |
April 15, 2025 SLR Project No.: 233.065300.00001 |
Figure 8-2: Comparison of Drill Core Samples from Queensway Drill Hole NFGC-19-01 with Core from the Eagle Zone of the Fosterville Mine, Australia

Source: NFG 2019.
Note. The reference to the Fosterville Mine in Australia is provided for geological comparison purposes only. There is no guarantee that the geological characteristics, mineralization style, or exploration results at the Queensway Project will be similar to those observed at Fosterville. The information presented for Fosterville is not necessarily indicative of the tonnes, grade, or contained metal that may be expected at the Queensway Project.
| 8- |
|
| New Found Gold Corp. | Queensway Gold Project NI 43-101 Technical Report |
April 15, 2025 SLR Project No.: 233.065300.00001 |
| 9.0 | Exploration |
An overview of historical exploration on the Property can be found in Section 6.
NFG has conducted a variety of ground exploration programs since 2016, including prospecting, geochemical sampling (till, soil, rock and channel; Table 9-1), trenching, geological/structural mapping, geophysical surveys, and satellite imagery. A yearly summary of these activities can be found in the sub-sections that follow, with a map showing the location of all mentioned areas in Figure 9-1 to Figure 9-7.
Table 9-1: Sampling Summary from NFG’s Exploration at the Queensway Property
| Year | QWN | QWS | KW | TP | LRB | BP | SP | TMDL | Total |
| A) Prospecting rock samples | |||||||||
| 2017 | 582 | 171 | - | 30 | - | - | - | - | 783 |
| 2018 | 101 | 368 | - | 41 | - | - | - | - | 510 |
| 2020 | 119 | 1,061 | - | 4 | - | - | - | - | 1,184 |
| 2021 | 206 | 1,589 | 2 | - | 164 | 6 | - | - | 1,967 |
| 2022 | 52 | 892 | - | 2 | - | - | - | - | 946 |
| 2023 | 1,834 | 1,215 | 1 | 16 | - | 6 | 130 | 340 | 3,542 |
| 2024 (Jan 1 - Nov 1) | 38 | 28 | 58 | - | - | - | 1 | - | 125 |
| Total | 2,932 | 5,324 | 61 | 93 | 164 | 12 | 131 | 340 | 9,057 |
| B) Till samples | |||||||||
| 2016 | 59 | - | - | - | - | - | - | - | 59 |
| 2018 | - | 584 | - | - | - | - | - | - | 584 |
| 2020 | - | 602 | - | 102 | - | - | - | - | 704 |
| 2021 | 213 | 93 | - | - | 103 | - | - | - | 409 |
| 2022 | - | 77 | - | - | - | - | - | - | 77 |
| Total | 272 | 1,356 | 0 | 102 | 103 | 0 | 0 | 0 | 1,833 |
| C) Soil samples | |||||||||
| 2017 | 2 | - | - | - | - | - | - | - | 2 |
| 2018 | - | 756 | - | - | - | - | - | - | 756 |
| 2021 | 12 | 376 | - | - | - | - | - | - | 388 |
| 2022 | 435 | 9,648 | - | - | - | - | - | - | 10,083 |
| 2023 | 5,502 | 9,402 | - | - | - | - | - | - | 14,904 |
| 2024 (Jan 1 - Nov 1) | 550 | 835 | - | - | - | - | - | - | 1,385 |
| Total | 6,501 | 21,017 | 0 | 0 | 0 | 0 | 0 | 0 | 27,518 |
| D) Trench channel samples | |||||||||
| 9- |
|
| New Found Gold Corp. | Queensway Gold Project NI 43-101 Technical Report |
April 15, 2025 SLR Project No.: 233.065300.00001 |
| Year | QWN | QWS | KW | TP | LRB | BP | SP | TMDL | Total |
| 2017 | 122 | - | - | - | - | - | - | - | 122 |
| 2018 | 51 | - | - | - | - | - | - | - | 51 |
| 2020 | 54 | - | - | - | - | - | - | - | 54 |
| 2021 | - | 52 | - | - | - | - | - | - | 52 |
| 2022 | - | 156 | - | - | - | - | - | - | 156 |
| 2023 | - | 333 | - | - | - | - | - | - | 333 |
| 2024 (Jan 1 - Nov 1) | 2,641 | 1 | - | - | - | - | - | - | 2,642 |
| Total | 2,868 | 542 | 0 | 0 | 0 | 0 | 0 | 0 | 3,410 |
| Note. QWN - Queensway North, QWS - Queensway South, TP - Twin Ponds, LRB - Little Rocky Brook, BP - Bellman’s Pond, TMDL - Ten Mile-Duder Lake. | |||||||||
| 9.1 | New Found Gold Exploration Overview - Surface Exploration |
Since 2016, surface exploration completed by NFG on the Property has included regional prospecting, till sampling, trenching, soil and rock sampling, and geological and structural mapping. Figure 9-1 to Figure 9-7 show the sampling locations and results.
In 2016, the Company carried out a detailed till sampling program along a portion of the JBPFZ in QWN. This program led to the discovery of the 1744 prospect following analysis of a single till sample containing 1,744 grains of gold.
Exploration efforts in 2017 included a regional prospecting and trenching program to follow up on the till sampling results from the previous year, which resulted in further definition of the 1744 and Glass prospects. Additional prospecting efforts were also undertaken in Twin Ponds and QWS (Figure 9-1 and Figure 9-2). Several areas of anomalous gold were discovered in QWS, including near Pine Tree Hill and Jumbo Brook, with one area near Twin Ponds in QWN.
Trenching along the JBPFZ in QWN throughout 2017 included 24 trenches across the following four areas, H-Pond, Quartz Pond, west of Joe Batt’s Pond and an area south of the TCH, of which only 14 reached bedrock (Figure 9-7). Initial soil sampling conducted in 2017 was very limited and only had two samples collected in the Joe Batt’s Pond area in QWN.
In 2018, exploration work included continued regional prospecting and trenching along the JBPFZ in QWN, Twin Ponds and QWS, as well as a regional till and targeted soil sampling program in QWS. Prospecting endeavours in QWS resulted in validating historic gold occurrences while identifying new gold occurrences near the Narrows, Larsen’s Falls, Pauls Pond, Eastern Pond and Greenwood Pond areas, as well as the western and southern shorelines of Gander Lake (Figure 9-2). The two targeted soil grids in QWS were completed over the Jumbo Brook and Yellow Fox Brook areas. Twelve additional trenches, all of which reached bedrock, were completed in similar areas along the QWN segment of the JBPFZ as the previous year.
Limited exploration was completed in 2019 while a project-wide data review was being conducted in preparation for NFG’s first drilling program.
Exploration work in 2020 included a detailed till sampling program in conjunction with regional prospecting at both QWS and Twin Ponds, resampling and mapping historic gold showings around Greenwood Pond and Pauls Pond in QWS, regional geological/structural mapping in QWS, and one trench near Eastern Pond. Prospecting alongside high-density till sampling programs in QWS were focused on covering regions of limited exploration including areas around Hunt’s Cove and Joe’s Feeder, Eastern Pond, Pine Tree Hill, Larsen’s Falls, and near Great Gull River. This work identified the Eastern Pond target, a region comprised of two areas where till results have shown highly anomalous total gold grain counts including a high percentage of pristine gold grains in association with several sub-crop grab samples grading up to 15.0 g/t Au (Figure 9-2 and Figure 9-4).
| 9- |
|
| New Found Gold Corp. | Queensway Gold Project NI 43-101 Technical Report |
April 15, 2025 SLR Project No.: 233.065300.00001 |
Exploration in 2020 along the AFZ in QWN included a trenching and concurrent geological/structural mapping program. This trenching program saw 16 completed trenches, where half were dug at historic gold showings (Trench 36, Road, Little, and Hornet), and only 13 reached bedrock. Channel and grab samples taken from these trenches validated mineralization at the historic Trench 36, Little and Road showings, and led to the discovery of the Golden Joint HW (formerly EllieAnna) gold showing.
In 2021, continued prospecting occurred along underexplored segments of the AFZ and JBPFZ in QWN, and was also carried out on the Little Rocky Brook and Bellman’s Pond licences. Till sampling also continued along the northern segment of the JBPFZ in QWN, with an additional grid covering the Little Rocky Brook area. One targeted soil grid was completed over the Cokes zone in QWN to test for an alteration signature in the soil, similar to that observed in drill core and grab samples using hyperspectral technologies (HALO; Section 7.2.4). Exploration in QWS over 2021 included similar regional prospecting of underexplored areas near the southern extent of the Property, till sampling, a single soil grid along the banks of Eastern Pond Brook, and the completion of 16 trenches. Of the 16 trenches, only 11 reached bedrock and were dug south of Joe’s Feeder, Greenwood Pond, Camp Zone, Devils Pond South, north of Eastern Pond and near Eastern Pond Brook. Till sampling concluded in early 2021 as an extension of the QWS 2020 soil sampling program in Hunt’s Cove, Joe’s Feeder, the Narrows, Larsen’s Falls, Pine Tree Hill, Eastern Pond, and Great Gull River.
Exploration work in 2022 at QWS included detailed prospecting and soil surveys over several areas, a regional till survey alongside prospecting of the Narrows, and trenching in conjunction with detailed geological/structural mapping of those trenched exposures. Prospecting efforts were focused around known gold occurrences near Pauls Pond and Greenwood Pond as well as continued exploration around the Camp Zone and Devils Pond South in the Bernards Pond area, Transmission Line, and Joe’s Feeder. Seven regional soil grids were completed in QWS at Joe’s Feeder, Transmission Line, Pauls Pond, Greenwood Pond, and Eastern Pond. Further trenching in QWS was conducted at Transmission Line, Greenwood Pond, Bernards Pond, and Pine Tree Hill areas, with a total of 16 trenches, where only nine reached bedrock. This trenching program led to the discovery of the Devils Pond South and Devils Trench gold showings. The culmination of several years of surface sampling at QWS, and in the Pauls Pond and Greenwood regions specifically, identified several targets with elevated gold in the surficial environment. This, paired with trenching, formed the target basis for the first drill program which commenced in late summer 2022. Additional exploration in QWN included a detailed geological/structural map of the northern shorelines of Gander Lake.
| 9- |
|
| New Found Gold Corp. | Queensway Gold Project NI 43-101 Technical Report |
April 15, 2025 SLR Project No.: 233.065300.00001 |
Figure 9-1: Locations of Rock Samples Collected from NFG’s Prospecting Programs, Colour Coded by Sampling Year

| 9- |
|
| New Found Gold Corp. | Queensway Gold Project NI 43-101 Technical Report |
April 15, 2025 SLR Project No.: 233.065300.00001 |
Figure 9-2: Surface Rock Samples with Gold Grades Greater than 0.5 ppm Au

| 9- |
|
| New Found Gold Corp. | Queensway Gold Project NI 43-101 Technical Report |
April 15, 2025 SLR Project No.: 233.065300.00001 |
Figure 9-3: Location of Glacial Till Samples at the Queensway Property, Colour Coded by Sampling Year

| 9- |
|
| New Found Gold Corp. | Queensway Gold Project NI 43-101 Technical Report |
April 15, 2025 SLR Project No.: 233.065300.00001 |
Figure 9-4: Till Samples with Gold Grades above 1 ppm Au

| 9- |
|
| New Found Gold Corp. | Queensway Gold Project NI 43-101 Technical Report |
April 15, 2025 SLR Project No.: 233.065300.00001 |
Figure 9-5: Locations of Soil Samples, Colour Coded by Sampling Year

| 9- |
|
| New Found Gold Corp. | Queensway Gold Project NI 43-101 Technical Report |
April 15, 2025 SLR Project No.: 233.065300.00001 |
Figure 9-6: Soil Sample Gold Assay Results

| 9- |
|
| New Found Gold Corp. | Queensway Gold Project NI 43-101 Technical Report |
April 15, 2025 SLR Project No.: 233.065300.00001 |
Figure 9-7: Location of Trenches at the Queensway Property, Colour Coded by Excavation Year

| 9- |
|
| New Found Gold Corp. | Queensway Gold Project NI 43-101 Technical Report |
April 15, 2025 SLR Project No.: 233.065300.00001 |
In 2023, NFG conducted regional and targeted prospecting over newly acquired licences (Fourth Pond, Twin Ponds, and Ten Mile Lake areas as part of the VOA Option), and underexplored areas in QWN, including the GRUB Line to the east, King’s Point, the Outflow, and the historic Jasperoid gold occurrence. Detailed soil surveys and regional trenching were also completed over the northern extent of the AFZ in the Fourth Pond area.
During August to November 2023, NFG undertook a major excavation effort at the Keats trench where the Company removed overburden to expose a 200 m long by 70 m wide area that roughly corresponds to the known surface expression of the high grade segment of the KBFZ (Figure 9-8). Prior to the Keats trench, the Keats Zone had only been observed through drill core and modelled in three dimensions (3D), forming the basis of the Company’s geological model. The trench exposure validated the geological and structural models and provided insights into the geometry and controls on high grade mineralization. The trench data, including channel samples, trench mapping, and diamond drilling results, was used to refine the 3D mineralization interpretation and has been incorporated into the Mineral Resource estimate.
Additional areas that underwent geological/structural mapping in QWN include the King’s Point-Outflow regions along the AFZ, and the region from Logan-Lachlan south to the north shore of Gander Lake along the JBPFZ.
Other exploration activities completed in 2023 include targeted prospecting in QWS, covering the remote and underexplored areas of Golden Elbow and Dead Wolf Brook, soil surveys around Pauls Pond, Dead Wolf Brook and Bernards Pond, and trenching with accompanied geological/structural mapping in various areas in QWS. Forty-four trenches were attempted in different areas of QWS including the Narrows, Transmission Line, Pauls Pond, SW Gander River, Greenwood Pond, Bernards Pond area, and an area east of Eastern Pond, with 36 encountering bedrock. This exploration work led to the discovery of several new areas of gold mineralization in QWS, particularly in the Narrows area (Mars gold prospect), Transmission Line (Potato Patch), Pauls Pond area (Big Bear Trend), and Greenwood Pond and Bernards Pond regions which were subsequently tested by drilling (Figure 7-10).
From January 2024 to the effective date of this report, NFG completed targeted soil surveys over the GRUB Line in QWN and is continuing the soil survey around the Transmission Line area of QWS that began in late 2023. Additional activities include prospecting in QWN and QWS, with a focus on newly acquired claims from Sky Gold and LabGold, channel sampling the Keats Trench, and commencing a trenching program at the Iceberg prospect.
The SLR QP has reviewed the trench channel sampling procedures and considers them to be consistent with industry standards. Channel sample data from only the Keats Trench was used alongside diamond drilling results to refine geological and mineralization models. The QP considers these samples to be representative of near-surface mineralization, with no material bias that would affect the reliability of the Mineral Resource estimate.
Other surface sampling methods, including till, soil, and rock samples, were used to help guide exploration efforts but were not incorporated into the Mineral Resource estimate.
| 9- |
|
| New Found Gold Corp. | Queensway Gold Project NI 43-101 Technical Report |
April 15, 2025 SLR Project No.: 233.065300.00001 |
Figure 9-8: Keats Trench Plan View Map with Location of Visible Gold Mineralization in the East-West Vein

| 9- |
|
| New Found Gold Corp. | Queensway Gold Project NI 43-101 Technical Report |
April 15, 2025 SLR Project No.: 233.065300.00001 |
| 9.1.1 | Till and Soil Sampling Methodology |
Till and soil sampling methodology is described in Section 11.
| 9.1.2 | Channel Sampling Methodology |
Once the trench was prepared, systematic channel sampling was conducted to provide a continuous and representative dataset for evaluating gold mineralization across the exposed rock surfaces. Channel sampling followed standard operating procedures and was designed to mimic the sampling integrity of diamond drill core.
Trenched exposures were sampled either by collecting grab samples or by cutting linear channels of rock using a rock saw. Channel sampling is preferred over grab sampling as it provides a more representative measure of gold mineralization across an exposure rather than from isolated points. This method allows for the determination of gold grades over a defined length of rock, offering a critical metric for evaluating the economic potential of a mineralized system and informing decisions on further exploration, including diamond drilling. The process included:
| 1 | Line Placement and Marking: |
| a) | Channel samples were treated as pseudo drill holes and recorded in the assay database following industry standards. |
| b) | In areas where mineralization was suspected to be continuous, systematic sample coverage was achieved at predetermined spacing, with channel lines designed using GIS software and marked in the field by surveyors. |
| c) | In reconnaissance sampling scenarios, where mineralization controls were uncertain, geologists identified optimal sampling locations based on field observations. |
| 2 | Interval Selection and Sample Cutting: |
| a) | Sample intervals were determined based on lithological, structural, and mineralization boundaries, following vein logging and sampling procedures. |
| b) | Nominal sample lengths ranged between 30 cm and 100 cm, with samples cut using a high-powered rock saw. |
| c) | Two parallel cuts approximately 5 cm apart and 6-8 cm deep were made, with perpendicular cuts defining the start and end of each sample. |
| 3 | Sample Collection and Logging: |
| a) | Samples were carefully extracted from the trench, logged in real time using field tablets, and recorded in the database. |
| b) | Logging included lithology, vein domain, mineralization characteristics, alteration, and structural measurements. |
| c) | Channel IDs were assigned using a structured naming convention (e.g., KM-24-01-10 for Prospect-Year-Trench-Channel). |
| 4 | Surveying and Georeferencing: |
| a) | The start and end points of each sample were surveyed using RTK GPS to capture Easting, Northing, Elevation, Azimuth, and Dip. |
| 9- |
|
| New Found Gold Corp. | Queensway Gold Project NI 43-101 Technical Report |
April 15, 2025 SLR Project No.: 233.065300.00001 |
| b) | These coordinates were converted to a structured survey file to facilitate integration with resource modeling software. |
| c) | Midpoint survey data were used to improve alignment between channel samples and three-dimensional geological models. |
| 9.2 | New Found Gold Exploration Overview - Geophysical Surveys |
In addition to the geological and geochemical exploration summarized in the previous section, from 2017 to the effective date of this report, NFG has conducted numerous large-scale ground and airborne geophysical surveys across various sections of the Property, a 3D seismic survey in QWN, and high-resolution Satellite Imagery and Digital Elevation Models (DEM) (Figure 9-9).
| 9- |
|
| New Found Gold Corp. | Queensway Gold Project NI 43-101 Technical Report |
April 15, 2025 SLR Project No.: 233.065300.00001 |
Figure 9-9: Type, Location, and Extent of NFG Geophysical Surveys

| 9- |
|
| New Found Gold Corp. | Queensway Gold Project NI 43-101 Technical Report |
April 15, 2025 SLR Project No.: 233.065300.00001 |
| 9.2.1 | Airborne Geophysical Surveys |
Since 2017, a number of airborne geophysical surveys have been carried out over the Property by various geophysics contractors on behalf of Palisade and its successor NFG.
In 2017, CGG Canada Services Ltd. (CGG) conducted a HELITEM electromagnetic and magnetic airborne survey on the entirety of the Queensway Project at the time covering approximately 5,312 line-km. Large-scale interpretations included the accurate spatial extents and geometry of the two known major fault zones (through electromagnetic interpretation) and the presence and orientation of various dykes and lithological units newly identified through magnetic data. Deliverables confirmed the general southwest-northeast structural fabric of the Property in conformity with the AFZ and JBPFZ.
In 2020, CGG conducted an airborne HELIFALCON gravity gradiometer and aeromagnetic survey in QWN covering approximately 1,705 line-km. Large changes in the gravity field were consistent with mapped geologic features such as the higher density rocks of the GRUC on the east side of the Queensway area correlating with a clear high gravity signal. Magnetic data from the survey confirmed features previously identified during interpretation of the 2017 CGG survey.
In 2021, CGG conducted a HELITEM2 electromagnetic and magnetic airborne survey of QWN and the newly acquired claims stretching the entire eastern extent of QWS, covering approximately 5,722 line-km (Figure 9-10). Regional fabrics with a general southwest-northeast trend were identified in both the EM and MAG data and support previously interpreted lithological and structural interpretations as well as similar features identified in the 2017 CGG geophysics survey.
Also in 2021, TechnoImaging LLC (TechnoImaging) completed a 3D inversion of 650 line-km of the 2017 HELITEM airborne electromagnetic data and 1,705 line-km of the 2020 HELIFALCON total magnetic intensity and airborne gravity gradiometer data covering the entirety of QWN. This process produced 3D models of conductivity, chargeability, magnetic susceptibility, and density, all of which aided in further correlating the geophysical data with downhole drill results and interpretations.
In 2022, the School of Ocean Technology of the Marine Institute of Memorial University completed a high-resolution hydrographic survey over portions of Gander Lake. The survey covered a 40 km2 section on the western side of Gander Lake, with an estimated average depth of 200 m (Figure 9-9). Products from the survey included surfaces of topography of the lakebed at 2.0 m, 1.0 m, and 0.5 m resolution. Results showed a highest elevation of -5 m and a lowest elevation of -230 m, giving important context to the geomorphological and geological context of Gander Lake. GoldSpot merged previous survey data including the MAG and EM data (Figure 9-10), produced a geological interpretation of those products and generated prospectivity maps and targets.
In 2023, NFG conducted a geophysical integration study in the Pauls Pond area involving the collection and interpretation of two joint MAG and VLF-EM surveys, one collecting data from the ground and one from a drone. Magnetic host rocks are known in the Pauls Pond-Greenwood area and high-resolution magnetic data is effective at identifying changes in the host rocks and faults. The two surveys purposely overlapped with the aim of interpreting results from both and determining if the generally lower resolution drone survey would provide a sufficient level of detail for exploration purposes. Initially, Simcoe Geoscience Limited conducted a ground MAG and VFL-EM survey along the southeastern shoreline of Pauls Pond covering approximately 49 line-km. Pioneer Exploration Inc. then conducted an airborne magnetics and VLF-EM survey covering the Pauls Pond and surrounding areas using an unmanned aerial drone. Computationally derived filtered products and 3D models were provided from both surveys allowing for a more in-depth joint interpretation of the data. Where the two surveys overlapped, they both highlighted the same major features including a large magnetized lithological unit and various conductive southwest-northeast trending lineation’s stretching the extent of the area thought to be lithological contacts or faults.
| 9- |
|
| New Found Gold Corp. | Queensway Gold Project NI 43-101 Technical Report |
April 15, 2025 SLR Project No.: 233.065300.00001 |
Also in 2023, Fathom Geophysics completed an in-depth interpretation of the previously collected 2017 CGG airborne MAG and EM data. This interpretation included a property-wide geological interpretation (Figure 9-11) and the suggestion of multiple geophysics-based exploration targets including the Golden Elbow target area to the southeast of Eastern Pond in QWS. Following this interpretation and targeting, TechnoImaging completed a 3D inversion of a 650 line-km section of the Golden Elbow area. Deliverables from this process included 3D models of chargeability, conductivity, and magnetic susceptibility all of which helped to delineate major lithological units and their geometry and physical characteristics.
In 2024, Rosor Exploration completed a drone-based magnetics survey over the Greenwood and Bernards Pond areas, covering approximately 1,470 line-km. The data was transferred to PGW Geophysics where it was merged with the previous two magnetics surveys conducted in the QWS area in 2023. Final deliverables from this survey included various merged computationally derived derivatives of the MAG data and a 3D magnetic susceptibility model created through inversion techniques.
The compilation, interpretation, and modelling of NFG geophysical data and information has enabled the Company to prepare a lithological and structural foundation for the Queensway Property which can assist with current prospect characterization and identifying new target areas for future exploration.
A summary the technical parameters of the airborne and geophysical surveys conducted at the Queensway Property is provided in Table 9-2.
| 9- |
|
| New Found Gold Corp. | Queensway Gold Project NI 43-101 Technical Report |
April 15, 2025 SLR Project No.: 233.065300.00001 |
Table 9-2: Airborne Geophysical Survey Summary
| Year | Survey Type |
Contractor | Location/ Area | Line- km |
Line Spacing | Flight Altitude /Sensor Height | Instrumentation | Survey Purpose | Data Products | Interpretation/ Reprocessing |
| 2017 | HELITEM EM + MAG | CGG Canada Services Ltd. | Entire Queensway | 5,312 km |
200 m Traverse Lines 2,000m Tie Lines |
70 m / 35 m |
EM: HELITEM35C 35 m diameter loop with MULTIPULSE™ MAG: Scintrex Cesium Vapour (CS-3), mounted in the plane of the transmitter loop |
Identify fault zones, dykes, litho units | EM, MAG, structural fabric | None noted |
| 2020 | HELIFALCON Gravity + MAG | CGG | Queensway North | 1,705 km |
100 m Traverse Lines 1,500 m Tie Lines |
35 m |
Gravity: HeliFALCON™ AGG System MAG: Scintrex CS-3 |
Map gravity contrasts; confirm 2017 features | Gravity, MAG | None noted |
| 2021 | HELITEM2 EM + MAG | CGG | QWN + E QWS | 5,722 km |
200 m Traverse Lines 2,000 m Tie Lines |
86 m / 51 m |
EM: HELITEM35C 35 m diameter loop with MULTIPULSE™ MAG: Scintrex Cesium Vapour (CS-3), mounted in the plane of the transmitter loop |
Extend structural interpretation | EM, MAG | None noted |
| 9- |
|
| New Found Gold Corp. | Queensway Gold Project NI 43-101 Technical Report |
April 15, 2025 SLR Project No.: 233.065300.00001 |
| Year | Survey Type |
Contractor | Location/ Area | Line- km |
Line Spacing | Flight Altitude /Sensor Height | Instrumentation | Survey Purpose | Data Products | Interpretation/ Reprocessing |
| 2021 | 3D Inversion | TechnoImaging LLC | QWN | 650 km | Generate 3D physical property models | Conductivity, chargeability, MAG susceptibility, density | Inversion of 2017/2020 data | |||
| 2022 | Hydrographic Survey | School of Ocean Tech, Marine Institute | Gander Lake (W side) | 40 km2 | NA | 0m | Kongsberg EM 2040P multibeam echo sounder | Lakebed mapping | Topographic surface maps (0.5 m - 2.0 m resolution) | GoldSpot interpretation |
| 2023 | MAG + VLF-EM (Ground) | Simcoe Geoscience Ltd. | Pauls Pond | 49 km | 25 m Traverse Lines | 0 m | GSM-19/GSM-19W (Overhauser) Magnetometer systems Combined with VLF-EM | Test litho and structure; drone comparison | Ground MAG, VLF-EM | Joint interpretation |
| 2023 | MAG + VLF-EM (Drone) | Pioneer Exploration Inc. | Pauls Pond area |
MAG: 334 km VLF: 221 km |
50m Traverse Lines 500 m Tie Lines |
Mag: 45 m VLF: 55 m |
MAG: Gem Systems Canada GSMP-35U potassium vapor sensor VLF: GEM Systems Canada GSM-90AVU UAV VLF |
Evaluate drone effectiveness vs ground | Drone MAG, VLF-EM | Joint interpretation |
| 9- |
|
| New Found Gold Corp. | Queensway Gold Project NI 43-101 Technical Report |
April 15, 2025 SLR Project No.: 233.065300.00001 |
| Year | Survey Type |
Contractor | Location/ Area | Line- km |
Line Spacing | Flight Altitude /Sensor Height | Instrumentation | Survey Purpose | Data Products | Interpretation/ Reprocessing |
| 2023 | 3D Inversion | TechnoImaging | Golden Elbow | 650 km | Targeting and structure modelling | 3D conductivity, chargeability, MAG susceptibility | Follow-up from Fathom interpretation | |||
| 2023 | Interpretation | Fathom Geophysics | Queensway (2017 MAG/EM) | Regional targeting | Litho + structural interpretation | Exploration targeting | ||||
| 2024 | Drone MAG | Rosor Exploration | Greenwood + Bernards Pond | 1,470 km |
50 m Traverse Lines 500 m Tie Lines |
40 m / 35 m | Geometrics MagArrow II UAV magnetometer | Merge with 2023 data; model structure | MAG derivatives + 3D susceptibility model | PGW merged + inverted data |
| 9- |
|
| New Found Gold Corp. | Queensway Gold Project NI 43-101 Technical Report |
April 15, 2025 SLR Project No.: 233.065300.00001 |
Figure 9-10: Merged NFG Magnetic Reduced to Pole Data

| 9- |
|
| New Found Gold Corp. | Queensway Gold Project NI 43-101 Technical Report |
April 15, 2025 SLR Project No.: 233.065300.00001 |
Figure 9-11: Lithological and Structural Geophysical Interpretation for the Queensway Property

| 9- |
|
| New Found Gold Corp. | Queensway Gold Project NI 43-101 Technical Report |
April 15, 2025 SLR Project No.: 233.065300.00001 |
| 9.2.2 | Seismic Survey |
During 2023, NFG initiated a 3D seismic survey covering a 47 km2 block (5.8 km by 8.0 km) along the larger extent of the AFZ and JBPFZ (Figure 9-9). The seismic survey and interpretation were completed by HiSeis of Subiaco, Australia. The survey encompassed the major known mineralized zones including the Keats, Keats West, Iceberg, Golden Joint, and Lotto prospects.
The 3D seismic technology’s acquisition phase utilized over 20,000 energy source points spaced at 12.5 m intervals along 260 km of source lines, as well as approximately 25,000 geophone receiver stations. Source lines were spaced at 100 m intervals and perpendicular receiver lines were constructed at 100 m interims to optimize resolution from 200 m to 1,000 m in depth, with good resolution intended to penetrate to 3,000 m.
The preliminary 3D cube seismic interpretation outlines structures and geological features to a depth of approximately 2.5 km (NFG 2024e). The structural geology aligns with known drill-defined gold-bearing structures closer to surface and illustrates the potential for additional lineaments that could represent new and untested structures. Preliminary cross-section interpretations, which use pre-stack depth migration and Pseudo Relief, for the Keats and Lotto prospects are presented in Figure 9-12. The figures illustrate the AFZ, the KBFZ, and other more shallowly dipping structures (e.g., Glenwood Shear).
NFG has initiated a deep drilling program and is partly utilizing the seismic data to delineate targets at depth. Evaluation of the seismic data is ongoing, including reprocessing and interpretation to refine and improve the datasets for targeting at depth.
| 9- |
|
| New Found Gold Corp. | Queensway Gold Project NI 43-101 Technical Report |
April 15, 2025 SLR Project No.: 233.065300.00001 |
Figure 9-12: Preliminary 3D Cube Cross-section Interpretation Using Pre-stack Depth Migration and Pseudo Relief, Looking North


Source: NFG 2024.
| 9- |
|
| New Found Gold Corp. | Queensway Gold Project NI 43-101 Technical Report |
April 15, 2025 SLR Project No.: 233.065300.00001 |
| 9.2.3 | Satellite Imagery and Digital Elevation Models |
In 2018, NFG contracted Pacific Geomatics Ltd. to use satellite imagery to create natural and false colour infrared images of the entire Project area with a pixel resolution of 30 cm in QWN and 50 cm in QWS and Twin Ponds.
In 2021, multispectral satellite imagery for the southern portion of QWS was obtained from Digital Globe by Perry Remote Sensing LLC (Perry). The original plan was to acquire multispectral imagery for the entire Project area, however, this was postponed due to cloud cover conditions and the onset of greening of trees and other vegetation in late spring. Perry was able to acquire good multispectral images, at a pixel resolution of 50 cm, over the southern half of QWS and analyzed the data to define alteration mineral assemblages to generate exploration targets.
With respect to digital elevation models (DEM), a by-product of the CGG 2018, 2020, and 2021 geophysical surveys and data acquisition included a digital terrain model for the area covered by the survey. In 2021, RPM Aerial Services performed a helicopter-based light detection and ranging (LiDAR) survey of the QWN area and, at the same time, acquired high resolution digital images.
In 2023, Eagle Mapping Ltd. conducted a property-wide high-resolution airborne LiDAR and imagery survey covering an approximately 2,970 km2 area (Figure 9-13). Deliverables for this survey included precision LiDAR and orthophoto images which aided in regional structural interpretation, geomorphology studies, outcrop identification, and target generation for future prospecting, soil sampling, and drilling.
| 9- |
|
| New Found Gold Corp. | Queensway Gold Project NI 43-101 Technical Report |
April 15, 2025 SLR Project No.: 233.065300.00001 |
Figure 9-13: 2023 LiDAR Bare Earth Image over the Queensway Property

| 9- |
|
| New Found Gold Corp. | Queensway Gold Project NI 43-101 Technical Report |
April 15, 2025 SLR Project No.: 233.065300.00001 |
| 9.3 | Exploration Potential |
The Project consists of an extensive land package that encompasses over 110 km of strike on the AFZ and JBPFZ that, through continued exploration, have demonstrated a spatial relationship to the known gold discoveries. The extensive glacial cover limits outcrop exposure but since 2016, NFG has made considerable advancements in their ground field activities, utilizing exploration techniques such as soil and till sampling and trenching to identify potential bedrock sources of gold mineralization advancing many targets to the drilling phase.
The majority of the exploration drilling completed to date has been focused on a 5 km (AFZ Core area) long segment of the AFZ and is largely limited to the top 250 m vertical depth. At QWN alone, NFG controls over 22 km of strike along the AFZ. The Queensway Project offers the potential to 1) expand known discoveries at depth within the AFZ Core area, 2) identify new near-surface discoveries along strike of the AFZ Core area, and 3) advance existing targets and identify new targets at QWS and along the JBPFZ (Figure 9-14).
Since the effective date of this report, NFG has completed an additional 21,448 m of drilling that did not inform the current Mineral Resource estimate but included drilling at known zones as well as at several exploration targets. This included follow-up drilling at the recent discovery, Golden Dome, in addition to expansion drilling at both Dome, Dropkick, and Keats Deep (see NFG news releases dated February 11, 2025, and February 24, 2025). There are currently assays pending from these programs. The early success of these programs have demonstrated the potential for 1) epizonal style gold mineralization to extend to significant depths as seen in the deep drilling at Keats South with significant gold intervals at depths of up to 820 m, and at Golden Dome with high grade mineralization occurring just below the existing Mineral Resource estimate footprint 2) the extension of known gold zones currently tested shallowly, like at Dome, and 3) the potential to both expand known near surface discoveries like at Dropkick and search for new ones like at Pistachio along the 12 km of strike length acquired at AFZ Peripheral (previously Labrador Gold’s Kingsway project).
The majority of the gold mineralization found to date is orogenic and hosted in the Davidsville Group, a sedimentary rock package. As NFG’s exploration programs have expanded, covering new ground, while integrating with historic exploration data, new regions of gold mineralization have been identified in differing lithological and structural settings demonstrating the district potential of the Queensway Project.
Epizonal gold mineralization associated with the AFZ and JBPFZ comprises most of the mineralization found at QWN to date. At QWS, epithermal-style gold mineralization has been identified at Aztec and Mars (Narrows) prospects in addition to epizonal - mesozonal style gold mineralization throughout the Pauls Pond and Greenwood target regions in a variety of host rock settings. Section 7.2.3 provides detailed descriptions of the main mineralization styles at Queensway.
QWS regional exploration completed from 2020 to present has identified several new areas of gold mineralization with success at advancing a multitude of soil and till anomalies through to discovery by trenching and drilling. These areas include Pauls Pond (Figure 7-3) where soil and grab samples have identified numerous regions of anomalous gold that are spatially associated with the southern extension of the AFZ with mineralization occurring along the 2.5 km long Pauls Pond Trend, the Devils Trend, and at Camp Zone in sediment and volcanic rocks. Two phases of drilling have identified and expanded the Nova and Astronaut zones along the Pauls Pond Trend with visible gold observed in 32 holes across four target areas including the discovery of the Camp Zone. Several targets are untested, and these zones are open along strike and at depth.
| 9- |
|
| New Found Gold Corp. | Queensway Gold Project NI 43-101 Technical Report |
April 15, 2025 SLR Project No.: 233.065300.00001 |
Gold mineralization of the Greenwood Pond region, west of Pauls Pond, occurs between the AFZ and the western extent of the Davidsville Group boundary and is associated with a large magnetic anomaly having internal lows, that can be attributed to the presence of mafic volcanic rocks intercalated with felsic volcanics and porphyries. Trenching at Greenwood Pond has exposed gold in quartz veins, extensive alteration, and sulphide minerals hosted both in the felsic and mafic volcanic stratigraphy. The Greenwood region is a high-priority target area and NFG has completed limited drilling to date.
The QP considers the Queensway Project to have strong exploration potential, supported by the scale and continuity of the mineralized system, the number of vein zones defined to date, and the volume of untested ground along key structures. Future exploration efforts should follow a balanced and strategic approach that considers both the cost and potential benefit of near-surface and deeper targets, with an emphasis on the optimization of exploration capital.
Based on the current Mineral Resource Estimate and a review of drill density and geological continuity, the QP recommends prioritizing the following four target types:
| 1 | Infill Drilling of Interpreted Mineralization within the Pit Shell |
| o | Several mineralized intercepts located within the current open pit shell are not classified due to wide drill spacing. Targeted infill drilling in these areas could convert material to Inferred or Indicated Mineral Resources, increasing confidence and potentially enhancing project economics. Priority zones include Monte Carlo, K2 and Jackpot. |
| 2 | Near-Surface Resource Expansion |
| o | There is significant potential to discover additional near-surface mineralized zones along the Appleton Fault Zone (AFZ) and the JBP Fault Zone (JBPFZ). Several areas remain underexplored and may host new vein systems that could add to the shallow Mineral Resource base. Priority areas include Dropkick and Pistachio (9-15). |
| 3 | Down-Dip and Along-Strike Extensions of Underground Panels |
| o | Several underground reporting panels remain open and lightly tested at depth and along strike. In some cases, mineralization has been intersected but lacks sufficient drilling to meet classification thresholds. Additional drilling in these areas could extend the current underground Mineral Resource. Priority zones include Keats South, Jackpot, K2, Monte Carlo, and Golden Dome (Figure 9-14). |
| 4 | Deep Resource Expansion within the AFZ Core |
| o | There is also potential to define additional mineralized zones at depth in the AFZ Core area (e.g., Keats - AFZ Deep). Several high grade gold intercepts have been returned from deeper drilling but remain too widely spaced to support mineralized wireframe interpretations. Notable previously disclosed intercepts include: |
| • | NFGC-22-914: 5.75 m at 7.85 g/t Au from 578.25 m |
| • | NFGC-24-2135: 4.85 m at 13.68 g/t Au from 561.65 m, including 1.5 m at 40.56 g/t Au |
| • | NFGC-23-1304: 2.15 m at 12.01 g/t Au from 829.85 m, including 0.6 m at 41.97 g/t Au |
| o | These intercepts define a target zone approximately 200 m in strike length and 200 m in vertical extent, located approximately 400 m below surface (Figure 9-14). |
| 9- |
|
| New Found Gold Corp. | Queensway Gold Project NI 43-101 Technical Report |
April 15, 2025 SLR Project No.: 233.065300.00001 |
Although all four target types are considered prospective, SLR encourages New Found Gold to continue assessing the cost-effectiveness of each target.
| 9- |
|
| New Found Gold Corp. | Queensway Gold Project NI 43-101 Technical Report |
April 15, 2025 SLR Project No.: 233.065300.00001 |
Figure 9-14: QWN AFZ East Long Section with Drilling Highlights Currently Excluded from the Mineral Resource Estimate

| 9- |
|
| New Found Gold Corp. | Queensway Gold Project NI 43-101 Technical Report |
April 15, 2025 SLR Project No.: 233.065300.00001 |
Figure 9-15: QWN AFZ 3D Inclined View with Modelled Au Mineralization and Drilling Highlights Currently Excluded from the Mineral Resource Estimate

| 9- |
|
| New Found Gold Corp. | Queensway Gold Project NI 43-101 Technical Report |
April 15, 2025 SLR Project No.: 233.065300.00001 |
| 10.0 | Drilling |
| 10.1 | Introduction |
As of the resource database closure date of November 1, 2024 for this report, a total of 723,377 m in 3,224 drill holes and trenches has been completed on the Project by NFG and previous operators. Of this, NFG has completed 586,044 m in 2,410 holes and 1,652 m in 27 channels since 2019. Table 10-1 provides a complete summary of these drilling programs and Figure 10-1 to Figure 10-6 illustrate the drill hole locations. The intent of this section is to describe the drilling procedures and core sampling conducted by NFG and summarize the extent to which drilling has been performed. The number of holes and total length included in Table 10-1 includes holes that were not completed or were abandoned part way through, but does not include holes drilled by previous operators that are located outside of the current property boundaries. Drill holes that were abandoned or were in-progress at the time the database was closed were omitted from the resource database (see Section 14.2 for information about the resource database). Excluding holes outside of the property and those that were incomplete, results in a total of 3,214 “on-property” holes.
In 2020, NFG completed 67 drill holes for a total of 13,593 m that expanded the Keats Zone and led to the discovery of Lotto and Golden Joint zones.
In 2021, the Company completed an additional 430 drill holes totalling 118,160 m largely focused on expanding Keats, Golden Joint, Lotto, 1744, and Pocket Pond zones.
In 2022, a total of 187,427 m was completed in 676 holes that led to the discoveries of Keats North, Keats West, Lotto North and further expanded Keats, Golden Joint, and Lotto zones in addition to continued systematic testing along the AFZ. The Company also completed a regional diamond drilling program designed to test high-priority targets at both Twin Ponds and QWS projects; both programs were the first phase of drilling completed by the Company. The QWS program targeted an area 50 km south of the Keats Zone with a high concentration of gold anomalies surrounding the southern extension of the AFZ. This program generated encouraging results with 27 holes returning gold mineralization and 10 holes across four targets containing visible gold. The exploration drilling program was designed to test a variety of targets in and around Pauls Pond, Goose, Eastern Pond, and Greenwood #2 prospects and resulted in the discovery of the Pauls Pond and Devils Pond trends.
In 2023, a total of 195,200 m was completed in 1,006 holes that led to several discoveries including Iceberg, Iceberg East, K2, Monte Carlo, Jackpot, and Honeypot. Drilling rapidly expanded on these new discoveries, in addition to extending Keats West, Golden Joint, and Keats. Notably the strike length of the KBFZ was extended to 1.9 km with the addition of Iceberg and Iceberg East discoveries. Regional exploration programs included the completion of a first pass drilling program on the newly optioned VOA ground that covers the northern extension of the AFZ testing 10 target areas. This program identified multiple areas with anomalous gold for follow-up drilling. A second phase of drilling at QWS was also completed, wrapping up in early 2024, and included follow-up work at the Pauls Pond Trend in addition to testing a number of new target areas. This program successfully expanded mineralization at Astronaut and Nova in the Pauls Pond area to depth and identified a new zone near Bernards Pond named “Camp Zone”.
In 2024, up until the resource database closure date of November 1, 2024, a total of 69,679 m in 221 holes was drilled and 1,652 m of channel sampling was completed. The drilling focused on expansion and further definition of K2, Jackpot, and Honeypot zones. In addition, it tested deep targets as part of a deep drilling program following the completion of the 3D seismic data interpretation which generated several deep targets. Deep drilling discovered several regions of epizonal gold mineralization well below the currently defined footprint of the gold system at QWN along the AFZ. After the acquisition of the Kingsway Project from LabGold, which adjoins the AFZ Core block along the AFZ, the Company initiated its first drilling program with early success expanding mineralization near Big Vein at the Pistachio Zone. The area is now referred to as AFZ Peripheral. This drilling by NFG was in addition to the 502 holes totalling 100,582 m previously completed by LabGold. All available drill holes, including those from LabGold, were used to support the Mineral Resource Estimate for the AFZ Peripheral as of the resource database cut-off date.
| 10- |
|
| New Found Gold Corp. | Queensway Gold Project NI 43-101 Technical Report |
April 15, 2025 SLR Project No.: 233.065300.00001 |
A general summary of mineralization styles of the NFG gold prospects associated with the 2019-2024 drill programs is presented in Section 7.2.3, Mineralization.
| 10- |
|
| New Found Gold Corp. | Queensway Gold Project NI 43-101 Technical Report |
April 15, 2025 SLR Project No.: 233.065300.00001 |
Table 10-1: Summary of Drilling on the Queensway Project
A) AFZ Core
| Company | Historic (1987-2012) | 2019 | 2020 | 2021 | 2022 | 2023 | 2024 | Total | ||||||||
| No. of Holes | Length (m) | No. of Holes | Length (m) | No. of Holes | Length (m) | No. of Holes | Length (m) | No. of Holes | Length (m) | No. of Holes | Length (m) | No. of Holes | Length (m) | No. of Holes | Length (m) | |
| New Found Gold Corp. | - | - | 4 | 585 | 67 | 13,593 | 359 | 99,978 | 621 | 173,287 | 931 | 177,373 | 176 | 57,924 | 2,158 | 522,740 |
| Altius Resources Inc | 8 | 1,037 | - | - | - | - | - | - | - | - | - | - | - | - | 8 | 1,037 |
| Candente Resources Corp | 5 | 665 | - | - | - | - | - | - | - | - | - | - | - | - | 5 | 665 |
| Gander River Minerals | 13 | 1,357 | - | - | - | - | - | - | - | - | - | - | - | - | 13 | 1,357 |
| Manor Resources Inc | 3 | 204 | - | - | - | - | - | - | - | - | - | - | - | - | 3 | 204 |
| Noranda Exploration Company Ltd | 24 | 2,039 | - | - | - | - | - | - | - | - | - | - | - | - | 24 | 2,039 |
| Paragon Minerals Corp | 6 | 625 | - | - | - | - | - | - | - | - | - | - | - | - | 6 | 625 |
| Rubicon Minerals Corp | 15 | 1,725 | - | - | - | - | - | - | - | - | - | - | - | - | 15 | 1,725 |
| Sky Gold Corp | - | - | - | - | 7 | 1,308 | 12 | 2,044 | - | - | - | - | - | - | 19 | 3,352 |
| Soldi Ventures | 23 | 2,776 | - | - | - | - | - | - | - | - | - | - | - | - | 23 | 2,776 |
| United Carina Resources | 38 | 3,652 | - | - | - | - | - | - | - | - | - | - | - | - | 38 | 3,652 |
| VVC Exploration | 18 | 1,486 | - | - | - | - | - | - | - | - | - | - | - | - | 18 | 1,486 |
| Total | 153 | 15,566 | 4 | 585 | 74 | 14,901 | 371 | 102,022 | 621 | 173,287 | 931 | 177,373 | 176 | 57,924 | 2,330 | 541,659 |
| 10- |
|
| New Found Gold Corp. | Queensway Gold Project NI 43-101 Technical Report |
April 15, 2025 SLR Project No.: 233.065300.00001 |
B) AFZ Peripheral
| Company | 2020 | 2021 | 2022 | 2023 | 2024 | Total | ||||||
| No. of Holes | Length (m) | No. of Holes | Length (m) | No. of Holes | Length (m) | No. of Holes | Length (m) | No. of Holes | Length (m) | No. of Holes | Length (m) | |
| New Found Gold Corp. | - | - | - | - | - | - | - | - | 25 | 7,928 | 25 | 7,928 |
| Labrador Gold Corp. | 26 | 1,670 | 218 | 30,895 | 128 | 37,671 | 124 | 29,812 | 6 | 534 | 502 | 100,582 |
| Total | 26 | 1,670 | 218 | 30,895 | 128 | 37,671 | 124 | 29,812 | 31 | 8,462 | 527 | 108,511 |
C) JBP
| Company | Historic (2004-2008) | 2019 | 2020 | 2021 | 2022 | 2023 | Total | |||||||
| No. of Holes | Length (m) | No. of Holes | Length (m) | No. of Holes | Length (m) | No. of Holes | Length (m) | No. of Holes | Length (m) | No. of Holes | Length (m) | No. of Holes | Length (m) | |
| New Found Gold Corp. | - | - | 6 | 1,400 | - | - | 71 | 18,182 | 15 | 5,376 | 12 | 3,162 | 104 | 28,120 |
| Paragon Minerals Corp | 27 | 5,057 | - | - | - | - | - | - | - | - | - | - | 27 | 5,057 |
| Rubicon Minerals Corp | 27 | 4,822 | - | - | - | - | - | - | - | - | - | - | 27 | 4,822 |
| Total | 54 | 9,879 | 6 | 1,400 | - | - | 71 | 18,182 | 15 | 5,376 | 12 | 3,162 | 158 | 37,999 |
D) QWS
| Company | Historic (1955-2005) | 2022 | 2023 | 2024 | Total | |||||
| No. of Holes | Length (m) | No. of Holes | Length (m) | No. of Holes | Length (m) | No. of Holes | Length (m) | No. of Holes | Length (m) | |
| New Found Gold Corp. | - | - | 33 | 7,255 | 37 | 8,379 | 19 | 3,425 | 89 | 19,059 |
| Bison Petroleum & Minerals Ltd | 6 | 832 | - | - | - | - | - | - | 6 | 832 |
| Candente Resources Corp | 4 | 766 | - | - | - | - | - | - | 4 | 766 |
| Crosshair Exploration & Mining | 6 | 616 | - | - | - | - | - | - | 6 | 616 |
| Falconbridge Ltd | 12 | 1,019 | - | - | - | - | - | - | 12 | 1,019 |
| 10- |
|
| New Found Gold Corp. | Queensway Gold Project NI 43-101 Technical Report |
April 15, 2025 SLR Project No.: 233.065300.00001 |
| Company | Historic (1955-2005) | 2022 | 2023 | 2024 | Total | |||||
| No. of Holes | Length (m) | No. of Holes | Length (m) | No. of Holes | Length (m) | No. of Holes | Length (m) | No. of Holes | Length (m) | |
| Hudson’s Bay Oil & Gas Company Limited | 7 | 392 | - | - | - | - | - | - | 7 | 392 |
| NALCO | 9 | 1,224 | - | - | - | - | - | - | 9 | 1,224 |
| Noranda Exploration Company Ltd | 10 | 853 | - | - | - | - | - | - | 10 | 853 |
| Total | 54 | 5,702 | 33 | 7,255 | 37 | 8,379 | 19 | 3,425 | 143 | 24,761 |
E) VOA
| Company | Historic (1991) | 2023 | 2024 | Total | ||||
| No. of Holes | Length (m) | No. of Holes | Length (m) | No. of Holes | Length (m) | No. of Holes | Length (m) | |
| New Found Gold Corp. | - | - | 26 | 6,285 | 1 | 402 | 27 | 6,687 |
| Gander River Minerals | 5 | 600 | - | - | - | - | 5 | 600 |
| Total | 5 | 600 | 26 | 6,285 | 1 | 402 | 32 | 7,287 |
F) Twin Ponds
| Company | 2022 | Total | ||
| No. of Holes | Length (m) | No. of Holes | Length (m) | |
| New Found Gold Corp. | 7 | 1,509 | 7 | 1,509 |
| Total | 7 | 1,509 | 7 | 1,509 |
| 10- |
|
| New Found Gold Corp. | Queensway Gold Project NI 43-101 Technical Report |
April 15, 2025 SLR Project No.: 233.065300.00001 |
G) Queensway North Trenching
| Company | 2024 | Total | ||
| No. of Channels | Length (m) | No. of Channels | Length (m) | |
| New Found Gold Corp. | 27 | 1,652 | 27 | 1,652 |
| Total | 27 | 1,652 | 27 | 1,652 |
H) Queensway Project Total
| Company | Historic (1987-2012) | 2019 | 2020 | 2021 | 2022 | 2023 | 2024 | Total | ||||||||
| No. of Holes | Length (m) | No. of Holes | Length (m) | No. of Holes | Length (m) | No. of Holes | Length (m) | No. of Holes | Length (m) | No. of Holes | Length (m) | No. of Holes | Length (m) | No. of Holes | Length (m) | |
| New Found Gold Corp. | - | - | 10 | 1,985 | 67 | 13,593 | 430 | 118,160 | 676 | 187,427 | 1,006 | 195,200 | 248 | 71,331 | 2,437 | 587,696 |
| Labrador Gold Corp. | - | - | - | - | 26 | 1,670 | 218 | 30,895 | 128 | 37,671 | 124 | 29,812 | 6 | 534 | 502 | 100,582 |
| Historic Companies | 266 | 31,747 | - | - | 7 | 1,308 | 12 | 2,044 | - | - | - | - | - | - | 285 | 35,099 |
| Total | 266 | 31,747 | 10 | 1,985 | 100 | 16,572 | 660 | 151,098 | 804 | 225,098 | 1,130 | 225,012 | 254 | 71,865 | 3,224 | 723,377 |
| 10- |
|
| New Found Gold Corp. | Queensway Gold Project NI 43-101 Technical Report |
April 15, 2025 SLR Project No.: 233.065300.00001 |
Figure 10-1: Drill Collar Locations from NFG and Previous Operator Drilling Programs Completed at the Queensway Property

| 10- |
|
| New Found Gold Corp. | Queensway Gold Project NI 43-101 Technical Report |
April 15, 2025 SLR Project No.: 233.065300.00001 |
Figure 10-2: Drill Holes at AFZ Core, Appleton Fault Zone
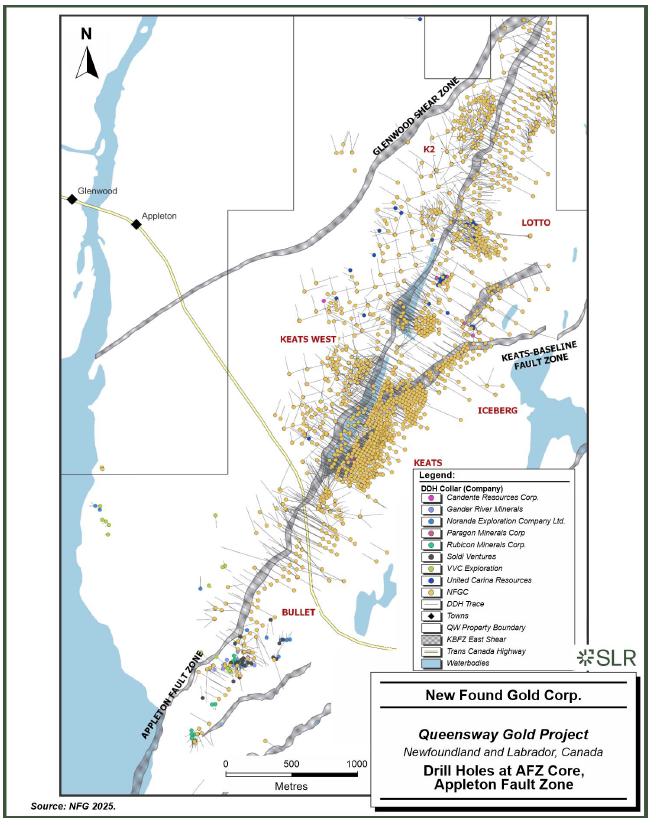
| 10- |
|
| New Found Gold Corp. | Queensway Gold Project NI 43-101 Technical Report |
April 15, 2025 SLR Project No.: 233.065300.00001 |
Figure 10-3: Drill Holes at AFZ Peripheral and VOA (Queensway North), Appleton Fault Zone

| 10- |
|
| New Found Gold Corp. | Queensway Gold Project NI 43-101 Technical Report |
April 15, 2025 SLR Project No.: 233.065300.00001 |
Figure 10-4: Drill Holes at Queensway North, JBP Fault Zone

| 10- |
|
| New Found Gold Corp. | Queensway Gold Project NI 43-101 Technical Report |
April 15, 2025 SLR Project No.: 233.065300.00001 |
Figure 10-5: Drill Holes at Queensway South
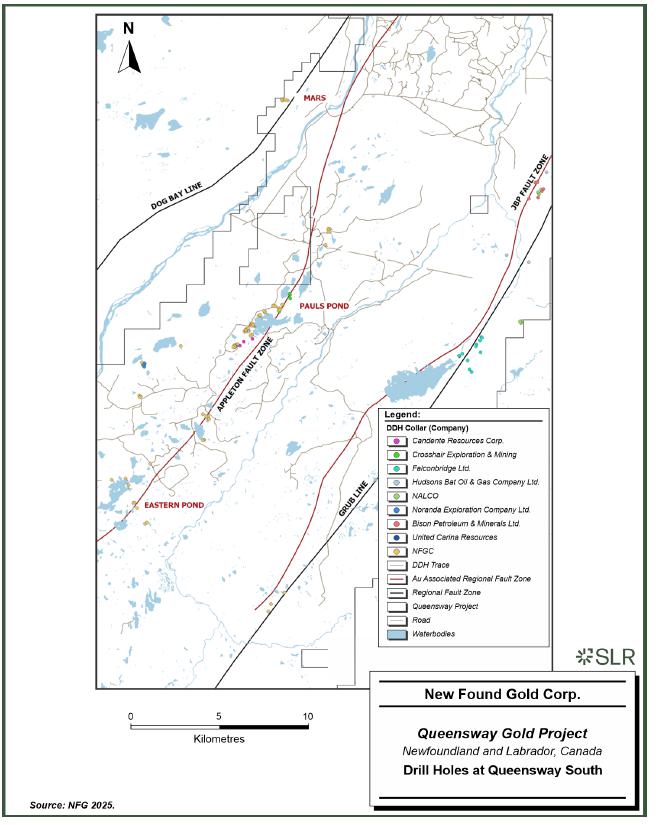
| 10- |
|
| New Found Gold Corp. | Queensway Gold Project NI 43-101 Technical Report |
April 15, 2025 SLR Project No.: 233.065300.00001 |
Figure 10-6: Drill Holes at Twin Ponds

| 10- |
|
| New Found Gold Corp. | Queensway Gold Project NI 43-101 Technical Report |
April 15, 2025 SLR Project No.: 233.065300.00001 |
| 10.2 | Drilling Procedures and Core Sampling |
| 10.2.1 | Drilling Programs, Contractors, Drill Rig Types and Drilling Methods |
In 2019, NFG began its QWN drilling program, commissioning New Valley Drilling Co. (New Valley) of Springdale, NL. The initial program utilized one skid-mounted EF-50 drill rig. In 2020, NFG added an additional three drill rigs from New Valley which included another skid-mounted EF-50, A5, and a track-mounted CS-1000 (which was later replaced, in 2022, by a skid-mounted Duralite 1800). New Valley concluded drilling in early 2024.
In February 2021, NFG commissioned Rally Drilling Services Inc. (Rally Drilling) of Sussex, NB to conduct drilling at QWN, in conjunction with New Valley. Initially, Rally Drilling utilized skid-mounted Marcotte HTM 2500, Boyles B20, EF-50, CS-1000, CS-1400, and U6 drill rigs. In 2022, a barge-mounted HTM 2500 drill rig was implemented by NFG, to test the top portion of the Golden Joint prospect beneath North Hermans Pond, and a portion of the Keats prospect beneath South Hermans Pond. The barge drilling program concluded in October of 2023.
In 2022, NFG commissioned Rock Valley Drilling to conduct the regional QWS drilling program. The initial program utilized one skid-mounted Duralite 1800 drill rig. In 2023, the same drill was converted into a helicopter (NL Helicopters Ltd.) supported drill rig, for 12 holes in QWS and six holes on the VOA Option claims. From 2019 to 2023, all drill rigs on the Property were equipped to drill HQ-diameter core.
In 2024, NFG employed Tech Directional, a division of IMDEX, to implement a directional drilling program, using a DeviDrill. Applying directional drilling technology to the program optimized operations by increasing efficiency and accuracy for intersecting deep targets and allowing deviation from one main drill hole to intersect multiple targets. In 2024, NFG also began drilling NQ-diameter size core, specifically, for deep drill hole targets exceeding 800 m to 1,000 m and during directional drilling operations. This was facilitated to reduce strain and hydrostatic pressure on the drill string and allow for more flexibility during directional drilling.
| 10.2.2 | Drill Pad Preparation and Drill Moves |
Pad clearance and drill moves have been facilitated in several ways, depending on the scope of the program. Excavators and operators supplied by GUNTEW Resources, H. Wareham and Son’s, and Rally Drilling are primarily used to clear drill pads and perform drill moves, except for the helicopter and barge supported drill programs. Drill pads for the helicopter program were hand-cut by NFG and GUNTEW Resources employees and the drill rig was moved by helicopter. The barge supported drill rig was moved using a pontoon boat owned and operated by Rally Drilling.
| 10.2.3 | Drill Hole Surveying and Orientation |
Lining up the drill rigs in QWN are foresighted using a real-time kinematic global positioning system (RTK GPS) receiver and marked with pickets, then completed using a TN14 Gyrocompass. The exception was the barge supported drill, which used the RTK GPS receiver placed near the drill mast, to provide an approximate location during the drill move. RTK GPS receivers provide real-time positioning with horizontal accuracy of 1-2 cm and vertical accuracy of 2-4 cm under ideal conditions. NFG survey control points have been established and are referenced from Government Monument 95G5128 (approximately 1.5 kms from site). Once NFG site control points were established, accuracy is maintained and proven by performing a check shot on the Government Monument.
| 10- |
|
| New Found Gold Corp. | Queensway Gold Project NI 43-101 Technical Report |
April 15, 2025 SLR Project No.: 233.065300.00001 |
The QWS drilling program, which included the helicopter program, had collars foresighted using a handheld GPS and marked with pickets, then completed using a compass.
Downhole azimuth and dip data are collected by drill crews, using IMDEX’s Reflex EZ Trac downhole survey tool. The EZ Trac probe is a high precision magnetic and gravimetric instrument that is sent downhole to provide the azimuth relative to magnetic north, dip, and magnetics. Surveying begins 15 m past the drill casing depth and at 50 m intervals downhole. Upon completion of the hole, out surveys are completed in 15 m intervals. During directional drilling operations, Tech Directional uses a DeviGyro to complete surveys every 3 m and once directional drilling is complete, the drilling crews adjust their EZ Trac intervals to survey every 30 m. For drill holes that reduced drill hole diameter from HQ to NQ, upon completion, the out surveys were conducted by Tech Directional, using the DeviGryo which is not affected by magnetics and enables continuous surveying within the drill string. When using the DeviGyro, surface alignment was referenced from drill rig azimuths established using a TN14 north-seeking gyrocompass.
All completed holes were capped and marked with a metal flag to identify collar locations. A summary of drill hole collar locations, elevations, azimuths, dips, and depths for all drill holes up to the effective date of this report is provided in Table 10.3 of the NFG 2024 Technical Report (New Found Gold Corp. 2024). As a standard practice, all NFG press releases include this information in public disclosures regarding drilling results.
| 10.2.3.1 | Drill Hole Orientation Analysis (SLR Observations) |
With respect to drill hole orientations, and based on a review of 2,388 drill hole collars, SLR has the following observations:
| • | The collar elevations vary from 20 MASL to 179 MASL with an average of 81 MASL. |
| • | The azimuth of the drill holes was completed at all orientations; most of the drill holes fall within the 281° to 320° bin with an overall average of 222°. |
| • | The dip varies from -90° to -42°; most of the drill holes were drilled with a dip of -45° with an overall average of -49.7°. |
| • | The depth of the drill holes varies from 3 m to 1,541 m; the majority of the drill holes are <600 m deep with an average total depth of 244.1 m. |
A large portion of the drill holes were angled perpendicular to the strike and dip of the major fault zones (AFZ and JBPFZ) and their corresponding offshoot faults (e.g., KBFZ).
| 10.2.4 | Structural Drilling Considerations |
The orientation of the hole relative to the dominant plane of mineralization allows the calculation of the ratio of the true width (perpendicular to mineralization) to the downhole length. Where the orientation of the faults/veins is known, the ratio of true width to downhole length is reported. For prospects where the orientation of mineralization has not yet been determined with confidence, the ratio of true width to downhole length is reported as unknown.
Infill veining in secondary structures with multiple orientations cross-cutting the primary host structures are commonly observed in drill core which could result in additional uncertainty in true width. As of March 1, 2023, reported composite intervals carry a minimum weighted average of 1 g/t Au diluted over a minimum core length of 2 m with a maximum of 4 m consecutive dilution when at depths less than 200 m vertical depth and 2 m consecutive dilution when greater than 200 m vertical depth. Prior to this date, all composites allowed for 2 m consecutive dilution. Prior to February 18, 2022, all composite intervals were selected visually. Included high grade intercepts were reported as any consecutive interval with grades greater than 10 g/t Au. Grades were not capped in the averaging and intervals were reported as drill thickness.
| 10- |
|
| New Found Gold Corp. | Queensway Gold Project NI 43-101 Technical Report |
April 15, 2025 SLR Project No.: 233.065300.00001 |
| 10.2.5 | Chain of Custody, Core Logging, Sampling, and Analytical Methods |
Chain of Custody, Core Logging, Sampling, and Analytical Methods are described in Section 11.
| 10.2.6 | Televiewer and Petrophysical Logging |
NFG commissioned DGI Geoscience from December 2020 to July 2024 to collect optical televiewer (OTV) and acoustic televiewer (ATV) images to provide high resolution digital information on the orientations of downhole structures not limited to faults, fractures, and veins. At the effective date of this report, 1,713 holes had OTV and ATV images. Televiewer images could not be acquired in holes in which the hole walls had collapsed or were unstable or the water was too murky. Natural gamma and gamma-gamma density probes were added later during the program and not run on every hole. By the effective date of this report, natural gamma logs were available for 1,122 holes and gamma-gamma density logs, for 217 holes.
Petrophysical hyperspectral logging measurements are completed on drill core by NFG geotechnical staff using TerraSpec’s HALO mineral identification system to provide information on mica minerals (i.e., muscovite or phengite) as an indication of proximity to veins or mineralized fault zones, and sufficient reason to continue drilling.
The SLR QP has reviewed NFG's drilling methods, collar and downhole survey procedures, sample handling, and QA/QC protocols and considers them to be consistent with industry standards. SLR has not identified any drilling, sampling, or recovery factors that could materially impact the accuracy and reliability of the Mineral Resource estimate.
| 10- |
|
| New Found Gold Corp. | Queensway Gold Project NI 43-101 Technical Report |
April 15, 2025 SLR Project No.: 233.065300.00001 |
| 11.0 | Sample Preparation, Analyses, and Security |
This section provides a summary of NFG and LabGold's procedures for sample collection, preparation, and security, as well as the analytical methods and QA/QC protocols used over the life cycle of the Project.
| 11.1 | Sample Collection |
Between 2017 and 2024, NFG collected and assessed various sample types at the Project. These include:
| • | Till, soil, surface rock, and trench channel samples since 2017 |
| • | Drill core samples since 2019 |
| 11.1.1 | Till Samples |
Till samples were collected and prepared to analyze gold grain size and quantity. In the field, samples were screened using an 8 mm sieve to remove pebbles. Approximately 13 kg of fine material (<8 mm) and 1 kg of coarse material (>8 mm) were packed in heavy-duty plastic bags and sealed. The fine fraction was analyzed for gold content, while the coarse fraction was used for lithology logging. Samples were sent to Overburden Drilling Management (ODM) for concentration.
LabGold utilized a similar methodology, the major difference being the use of a 9mm screen, and collection of 11 kg of fine material (<9 mm). All LabGold samples were sent to ODM who created a concentrate.
| 11.1.2 | Soil Samples |
NFG geologists collected soil samples using a Dutch Auger to reach the B-soil horizon. The HALO mass spectrometer was used to identify alteration halos in the samples. Since July 2022, samples were dried and sieved on-site, then bagged, labelled, and sent for analysis to Eastern Analytical in Springdale, NL, and ALS in Vancouver, BC.
LabGold utilized a “Dutch Auger” to penetrate down to and sample the B, B/C or C horizon. The soil samples were shipped for analysis to Bureau Veritas in Vancouver, BC in 2020 to 2021, and to SGS Grand Falls, NL for preparation, with analysis at SGS in Burnaby, BC in 2023.
| 11.1.3 | Rock Samples |
Rock samples, including surface outcrop, float, and channel samples, were collected by NFG geologists. These samples were placed in heavy-duty plastic bags, labelled, sealed, and transported to NFG’s core facility in Gander, NL. At the core facility, labels were verified, and samples were amalgamated into larger bags for transport to various laboratories, including Eastern Analytical, ALS Canada, MSALABS in Val-d’Or, QC, and SGS Canada Inc. (SGS Canada or SGS) in Burnaby, BC. The samples are transported in large plastic totes with lids secured using ball-locked metal truck seals.
All rock samples collected by LabGold were analysed at Eastern Analytical in Springdale, NL.
| 11.1.4 | Drill Core |
HQ-sized diamond drill core are transported in sealed core boxes to the primary core facility in Gander, NL. At the facility, the core is logged and analyzed using the HALO hyperspectral mineral identifier before sampling. After geological and structural logging is complete, samples ranging from 0.3 m to 1.0 m in length are marked out by the logging geologist, with sample tags inserted. Samples respect geological contacts, especially where there is a change in lithology or mineralization style. Photos are taken of the tagged core before the core is then transferred to a cutting section, where it is sawn in half using diamond saw blades by a trained core technician. Half of the core is placed in plastic sample bags and secured with a zip tie as shown in Figure 11-1A for laboratory analysis, while the other half is stored in the core boxes for reference at NFG’s sample storage facility in Appleton Business Park, NL. In cases of poor core competency, a hydraulic splitter may be used.
| 11- |
|
| New Found Gold Corp. | Queensway Gold Project NI 43-101 Technical Report |
April 15, 2025 SLR Project No.: 233.065300.00001 |
Sample labels are checked and placed into larger bags before being transported to laboratories. The samples are carried in large plastic totes with lids secured using ball-locked metal truck seals as shown in Figure 11-1B and Figure 11-1C. Samples are transported via commercial couriers. The designated laboratories include Eastern Analytical, ALS Canada, MSALABS, and SGS Canada.
LabGold transported HQ and NQ core to the LabGold primary core facility in Gander, NL. Here the core was logged and photographed. The drill core samples range from 0.1 m to 5.1 m, with 0.5 m to 1.0 m as the typical optimal sample length. Samples selected for analysis were cut in half using an electric core saw along the line originally drawn on the core during orientation. Half of the sample was placed in a sealed plastic bag, with the corresponding sample tag, and the other half of the core remaining in the core box. The core samples were transported directly to Eastern Analytical laboratory in Springdale, NL.
Figure 11-1: Sample Collection and Security
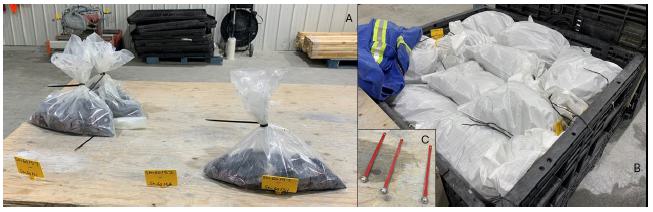
Source: SLR 2024.
| 11.1.5 | RAB and RC Rock Chip Sampling |
LabGold contracted GroundTruth Exploration of Dawson City, Yukon, to conduct and manage RAB and RC drilling. GroundTruth personnel collected all rock chips from RAB/RC drilling. Once a run was complete, the collection bucket was removed from the drill, and rock chip material passed through a splitter, producing an 87.5%/12.5% split. The 12.5% split was placed in a plastic sample bag for analytical processing. The remaining 87.5% was placed in a container as ‘retention’ material. From the retention material a small number of chips were selected for portable X-ray fluorescence (pXRF) analysis on site, and a small portion placed in chip tray for logging. Duplicate samples were collected utilizing three to four scoops taken using a PVC pipe. Rock chip samples were transported to Eastern Analytical for analysis.
| 11- |
|
| New Found Gold Corp. | Queensway Gold Project NI 43-101 Technical Report |
April 15, 2025 SLR Project No.: 233.065300.00001 |
| 11.2 | Sample Security |
Samples are inventoried, placed in rice bags secured with cable ties, and then packed in labelled shipping bins with numbered security seals. Samples are collected, packaged, transported, and received under a strict and traceable chain of custody (CoC). NFG staff delivered samples to commercial carriers, where they are directly loaded into trucks, or placed in a designated, secure area. Currently, all ALS samples are shipped by commercial courier along with a CoC document, which includes sample numbers, and is signed by both the courier and the NFG representative to confirm the state of the shipment.
The sample shipments are tracked in the MX Deposit database, and the laboratory is notified. Upon receipt, the laboratory informs NFG’s designated staff, and the samples are verified against NFG’s submittal form for any discrepancies.
LabGold samples (soil, till, rock, chip, core) were stored at the Company’s core logging facility in Glenwood, which was locked when not in use and had security camera monitoring. Individually bagged, uniquely numbered samples were placed into rice bags. The rice bags were labelled with the Company name, series of sample numbers in the bag, total number of samples, and the rice bag number in the sequence of rice bags submitted for the batch. Each rice bag was sealed with a unique barcode ID security tag. This information was recorded, scanned, and entered into MX Deposit, which was also used to track sample status.
Samples sent in NL were delivered by Company representatives to Eastern Analytical and SGS. Samples sent outside NL were placed in crates and/or on wooden pallets and shipped via courier to ODM, Bureau Veritas (BV), and ALS.
| 11.3 | Analytical and Test Laboratories Accreditation |
NFG has utilized various independent and commercially accredited laboratories that meet ISO/IEC 17025:2017 standards, including Eastern Analytical, ALS Canada, SGS Canada, and MSALABS. The laboratories are independent of New Found Gold Corp. and have no known relationship with the issuer. The chronological participation and additional certifications of these laboratories were as follows:
| • | Prior to May 2018: Samples were exclusively sent to Eastern Analytical in Springdale, NL, for fire assay determinations, accredited by the Canadian Association for Laboratory Accreditation Inc. (CALA). |
| • | Since May 2018: Additionally to Eastern Analytical, samples were also prepared by ALS laboratories in Thunder Bay, ON, Timmins, ON, Sudbury, ON, Winnipeg, MB, and Moncton, NB, for fire assay determinations. ALS is also accredited by the Standards Council of Canada (SCC). Samples selected for multi-element analysis were subjected to a 4-acid digestion and analyzed by ICP-OES. |
| • | October 2021 to May 2023: NFG paused sending samples to Eastern Analytical but resumed sending rock samples in May 2023. |
| • | From May 2022 to June 2024, approximately half of the drill core samples had been sent to MSALABS in Val-d’Or, QC for gold determination by PhotonAssay™ and analyzed for other elements at ALS using a 4-acid multi-element ICP/MS package. The PhotonAssay unit in Val-d’Or, QC received ISO/IEC 17025:2017 certification on August 30, 2023, for the gamma ray analysis of gold samples. |
| • | Since January 2024: All channel and drill core samples are also analyzed by PhotonAssay™ at ALS in Thunder Bay, ON. ALS's Thunder Bay laboratory is not currently accredited for the PhotonAssay™ method. However, their Australian laboratories, including the Canning Vale laboratory, hold ISO/IEC 17025:2017 accreditation for gamma ray analysis of gold samples using this method. Samples selected for multi-element analysis were also subjected to 4-acid digestion and analyzed using ICP-AES, and ICP-MS. |
| 11- |
|
| New Found Gold Corp. | Queensway Gold Project NI 43-101 Technical Report |
April 15, 2025 SLR Project No.: 233.065300.00001 |
| • | Since June 2024, all rock and drill core samples have been analyzed by ALS. |
Other intermittent analytical work was conducted at Activation Laboratories Ltd. (ActLabs) in Ancaster, ON (till multi-element analysis), Overburden Drilling Management Limited (ODM) in Nepean, ON (till heavy-mineral concentrates), and SGS in Burnaby, BC (check analytical laboratory).
The laboratories that performed multi-element ICP analyses (Eastern Analytical, ALS, and ActLabs) are ISO-accredited for multi-element analytical methods.
LabGold utilized multiple independent commercial laboratories from 2020 to 2024, including Eastern Analytical, BV, SGS, ALS, and ODM. Chronologically the general sample preparation and analysis workflow was:
| • | Since 2020: All drilling (RAB/RC and diamond) and rock samples were transported directly to Eastern Analytical in Springdale, NL. They were analyzed by 30g FA-AA for gold, inductively coupled plasma optical emission spectroscopy (ICP-OES) 34 element, and Total Pulp Metallic. |
| • | In 2020 and 2021: All soil samples were delivered to Eastern Analytical for sample preparation, prior to being shipped to BV in Vancouver, BC for analysis. Soil samples were analyzed by 15g, aqua regia digestion, inductively coupled plasma mass spectrometry (ICP-MS) 37 element (AQ201). |
| • | From 2021 to 2022: Till samples were shipped to ODM in Nepean, ON for gold grain analysis. Concentrates produced by ODM were analyzed by BV, Vancouver, BC in 2021 by 0.5g, Aqua regia digestion, ICP-MS 37 element (AQ200). In 2022 the concentrates were analyzed by EA in Springdale, NL by 30g FA-AA for gold, ICP-OES 34 element. |
| • | In 2022: Some rock samples were shipped to ALS in Moncton, NB for sample preparation at that facility, or at ALS Thunder Bay, ON. Samples were analyzed at ALS Vancouver, BC by 30g FA-AA (Au-AA23) and 30g FA-Gravimetric (Au-GRA21) for gold, and inductively coupled plasma atomic emission spectrometry (ICP-AES) 33 element (ME-ICP61). |
| • | In 2023: BV in Vancouver, BC was used as check analytical laboratory for diamond drill samples. |
| 11.4 | Sample Preparation and Analysis |
| 11.4.1 | Till Samples |
ODM created a concentrate of the till samples provided by NFG and LabGold. Prior to 2019, the concentrates were created using a screening and tabling procedure. After 2019, they were created using ODM’s Heavy Mineral Concentrate (HMC) preparation procedure. The gold content of each sample was estimated from the number of gold grains found in the concentrate and their size. The shape and texture of the grains were also recorded, and the mineralogy of the associated heavy minerals was described.
| 11- |
|
| New Found Gold Corp. | Queensway Gold Project NI 43-101 Technical Report |
April 15, 2025 SLR Project No.: 233.065300.00001 |
Multi-element analysis of till samples was performed in ActLabs using instrumental neutron activation analysis (INAA) to measure multi-element chemistry (1H INAA(INAAGEO)/Total Digestion ICP(TOTAL)). This method employs a 4-acid "near total" digestion for determining resistive elements, followed by ICP analysis.
Multi-element analysis of LabGold till samples was performed by BV and Eastern Analytical. At BV samples were analyzed by method AQ200. This method employs aqua regia digestion, followed by ICP-MS analysis. At Eastern Analytical, gold analysis of the till samples were completed by fire assay, with atomic absorption analysis (FA-AA). Multi-element analysis was completed by 4-acid digestion, with ICP-OES analysis.
| 11.4.2 | Soil Samples |
At Eastern Analytical, soil samples were dried and sieved through an 80 mesh (-180 µm) before gold analysis. Similarly, at NFG, soil samples were dried and screened through an 80 mesh.
Soil samples analyzed at Eastern Analytical utilized a fire assay package (code: Au AA30) and multi-element ICP (Au+34 elements). Soil samples analyzed at ALS Global utilized a trace gold plus multi-element package (ALS code: AuME-ST44).
BV in Burnaby, BC was utilized by LabGold for gold analysis of soil samples. The analysis was completed using method code AQ201 (15 g aqua regia digestion, with ICP-MS analysis). Thirty-six other elements were included with this method. SGS was also utilized by LAB for gold analysis of soil samples. The analysis was completed using method code GE_ARM3V25 (25 g aqua regia digestion, with ICP-MS analysis). 48 other elements were included with this method.
| 11.4.3 | Rock and Core Samples |
The NFG samples were prepared and analyzed using various methods to ensure precise determination of the gold grade. Initial routine analysis was performed using FA techniques. Samples with initial results over 1 ppm Au, or from expected mineralized zones, were analyzed by SFA. In 2022, the screen threshold was raised to 2 ppm Au. Starting in May, 2022, half of the drill core samples were analysed by PhotonAssayTM. Initially, all material was analyzed from samples with gold grades greater than 1 ppm Au, or from expected zones of mineralization, and a weighted average was used. In November 2023, that threshold was modified to 0.8 ppm Au or samples with visible gold. Starting in January 2024, all rock and drill core samples underwent photon assay. The detailed preparation and analysis workflow is presented below by laboratory and analytical target.
Table 11-1 summarizes the analytical methods used by the primary laboratories.
| 11.4.3.1 | Eastern Analytical |
| • | Samples were coarse crushed to 80% passing 2 mm screen (10 mesh screen), riffle split (250 g), and pulverized to 95% passing 106 µm. |
| • | Assays were completed using FA with 30 g aliquot, digested in aqua regia and finalized by atomic absorption (AAS). |
| • | The metallic screen fire assay involved preparing the sample similarly to conventional fire assay preparation, with the key difference being the use of a #150 screen to split the sample into two fractions. Two 40 g aliquots were taken from the fine fraction for fire assay, while the coarse fraction was entirely fire assayed. The final grade was calculated by weighting the results of the three fire assays samples. A similar method was utilized by LabGold, however, only one 40 g aliquot from the fine fraction was analyzed. |
| 11- |
|
| New Found Gold Corp. | Queensway Gold Project NI 43-101 Technical Report |
April 15, 2025 SLR Project No.: 233.065300.00001 |
| • | Samples selected for multi-element analysis (4A-ICP34) were subjected to a 4-acid digestion (concentrated nitric, perchloric and hydrofluoric and hydrochloric acids). Analysis was conducted by ICP-OES. |
| 11.4.3.2 | ALS Canada |
Samples shipped for FA, SFA, and multi-element analysis:
| • | For routine or non-mineralized samples (less than 1 ppm Au), ALS crushed the entire sample to 70% passing -10 mesh. A 1,000 g aliquot was riffle split and pulverized to 85% passing -200 mesh. |
| • | For fire assay, a 30 g aliquot was used and finished by ICP-AES (ICP-21), or a 50 g aliquot was used and finished by atomic absorption method (AA-26). |
| • | Samples with gold grades above 1 ppm Au (changed to 2 ppm Au in May, 2022), or in an expected mineralized zone, were submitted for SFA, where samples were crushed to 70% passing 10 mesh and pulverized to 85% passing -200 mesh (75 μm) using 1 kg capacity bowls. The pulverized material was homogenized by four-corner rolling and dry screened using -150 mesh (106 μm) screens. The oversize material formed the coarse (+) fraction, while the undersize formed the fine (-) fraction. Approximately 200 g of the fine fraction was scooped using an envelope. Both fractions were shipped to ALS Vancouver for fire assays (Au-SCR24C). From the fine fraction, a split of less than 50 g was also used for other analyses. |
| • | Samples shipped for multi-element analysis (ME-ICP61 or ME-MS61) were subjected to a 4-acid digestion (perchloric, nitric, hydrofluoric, and hydrochloric acids) and analyzed using ICP-AES for ICP61, and ICP-MS for MS61. |
| • | LabGold analyzed rock samples in 2022 at ALS. Gold was analyzed by 30 g fire assay using methods Au-AA23 and Au-GRA21, with AAS and gravimetric analysis respectively. Multi-element analysis was completed using method ME-ICP61 (discussed above). |
Samples shipped for photon assay:
| • | The NFG samples for photon assay were prepared at ALS in Thunder Bay, ON. The entire sample was crushed to 70% passing -10 mesh. Non-visible gold samples were riffle split into approximately 500 g jars, with the remainder stored as reject. For visible gold (VG) samples, the total number of jars was estimated based on weight, and all material was riffle split until no sample remained. |
| • | The 500 g jar samples were subsequently analyzed by PhotonAssay™ (ALS Method Code Au-PA02). If the routine samples had PhotonAssay™ results greater than 0.8 ppm Au, this automatically initiated PhotonAssay™ for all the remaining material (ALS Method Code Au-PA02e). The coarse rejects were retrieved, riffle split into multiple jars until depleted, and each jar was then analyzed by PhotonAssay™. |
| • | Samples selected for multi-element analysis had the first jar pulverized to 85% passing -200 mesh, with a approximately 50 g split sent to ALS Vancouver for ICP-AES or ICP-MS analysis. |
| 11- |
|
| New Found Gold Corp. | Queensway Gold Project NI 43-101 Technical Report |
April 15, 2025 SLR Project No.: 233.065300.00001 |
| 11.4.3.3 | MSALABS |
| • | All samples were crushed to 70% passing -10 mesh (2 mm) using either a TM Terminator or Rocklabs Smart BOYD jaw crusher. Non-VG samples were riffle or rotary split into approximately 500 g jars, with the remainder stored as reject. VG samples were manually scooped into 500 g jars until depleted. |
| • | The Chrysos PhotonAssay™ method, uses high-energy X-ray technology to excite atomic nuclei, which emanate a unique signature for rapid gold analysis in approximately two minutes. |
| • | Until November 2022, two jars (approximately 900 g) were assayed for routine or non-mineralized samples. The crushed sample was riffle-split and weighed into two plastic jars, then assayed by PhotonAssay™ (CPA-Au1D). |
| • | After a review of 2022 results, the aliquot was changed to 450 g, collected by standard riffle split, and transferred into a plastic jar for PhotonAssay™ (CPA-Au1). If these routine samples had PhotonAssay™ results greater than 1 ppm Au, all remaining material was automatically analyzed (CPA-Au1E). In November 2023, the trigger for extinction analysis was reduced to greater than 0.8 ppm Au. |
| • | PhotonAssay™ calibration is maintained using a reusable reference disc, which can measure gold content from 0.015 g/t to 35,000 g/t Au. The sample is then transferred to a detection station where gamma rays are recorded and converted to gold concentration. Results from all jars are combined on a weight-averaged basis. |
| 11.4.3.4 | SGS Canada |
| • | NFG utilized SGS in Burnaby, BC, as a verification laboratory. The gold analysis was carried out using SGS code GE_FAI150V5, which involves an exploration-grade gold fire assay by ICP-AES with platinum and palladium, and GO_FAG50V, an ore-grade gold fire assay with a gravimetric finish. |
| 11.4.3.5 | Bureau Veritas North America |
| • | LabGold utilized BV in Burnaby, BC, as a verification laboratory. The analysis was completed using BV codes FA430 (gold analysis by 30 g fire assay, with atomic absorption analysis) and MA200 (multi-element with 4-acid digestion, 0.25 g ICP-ES/MS analysis). |
Table 11-1: Analytical Methods Used at the NFG Queensway Project
| Laboratory | Analyte | Method Code | Detection Limit | Type of Method | Finish | Description |
| Eastern Laboratory | Au | AA30/FA-AA | 0.005 ppm | 30 g fire assay | AAS | |
| Au | Au Met | 0.010 ppm | Screen fire assay | AAS / Gravimetric | ||
| Multi-element | 4A-ICP34 | Variable for 34 elements | 4-Acid Digestion | ICP-OES |
| 11- |
|
| New Found Gold Corp. | Queensway Gold Project NI 43-101 Technical Report |
April 15, 2025 SLR Project No.: 233.065300.00001 |
| Laboratory | Analyte | Method Code | Detection Limit | Type of Method | Finish | Description |
| ALS | Au | PA02 | 0.03 ppm | Photon Assay - single | ||
| Au | PA02e | 0.03 ppm | Photon Assay - extinction | |||
| Au | Au-ICP21 | 0.001 ppm | 30 g fire assay | ICP-AES | ||
| Au | Au-AA23 | 0.005 ppm | 30 g fire assay | AAS | ||
| Au | Au-AA26 | 0.01 ppm | 50 g fire assay | AAS | ||
| Au | Au-GRA21 | 0.05 ppm | 30 g fire assay | Gravimetric | ||
| Au | Au-SCR24C | 0.05 ppm | Screen fire assay | Gravimetric and AAS | ||
| Multi-element | ME-ICP61 | Variable for 33 elements | 4-acid digestion | ICP-AES | ||
| Multi-element | ME-MS61 | Variable for 48 elements | 4-acid digestion | ICP-MS | ||
| Au | AuME-ST44 | 0.0001 ppm | 50 g aqua regia | ICP-MS | ||
| MSALAB | Au | CPA-Au1 | 0.015 ppm | Photon assay - single | ||
| Au | CPA-Au1D | 0.015 ppm | Photon assay - duplicate | |||
| Au | CPA-Au1E | 0.015 ppm | Photon assay - extinction | |||
| SGS | Au | GE_FAI150V5 | 0.001 ppm | 50 g fire assay | ICP-OES | |
| Au | GO_FAG50V | 0.5 ppm | 50 g fire assay | Gravimetric | ||
| Bureau Veritas | Au | FA430 | 0.005 ppm | 30 g fire assay | AAS | |
| Multi-element | MA200 | Variable for 35 elements | 4-acid digestion | ICP-ES/MS |
| 11.5 | Density Determination |
NFG used three density measurement methods to assess bulk density and specific gravity at the Project. As data was collected, compared, and validated across methods; some were found to be inaccurate or inappropriate and were subsequently discontinued.
| 11.5.1 | Downhole Gamma-Gamma Logging |
Gamma-gamma logging measures bulk density by emitting gamma rays into surrounding rock and detecting the scattered radiation. As rock density increases, the intensity of scattered rays decreases, producing a continuous density profile along the borehole. This method, which relies on a radioactive source and calibrated detectors, is commonly used in mining, oil and gas, and geotechnical studies to identify lithology and mineralized zones. At the Project, gamma-gamma logging measurements were taken at two to three centimetre intervals downhole across 216 drill holes. The downhole gamma-gamma logging was not intended as a primary density measurement method but was included in a multi-parameter logging probe that also captured structural imaging data. Essentially, this density data was acquired at no additional cost while obtaining acoustic and optical televiewer data.
| 11- |
|
| New Found Gold Corp. | Queensway Gold Project NI 43-101 Technical Report |
April 15, 2025 SLR Project No.: 233.065300.00001 |
Gamma-gamma density measurements were discontinued as of July 2024.
| 11.5.2 | Gas Pycnometer Density Measurements (OA-GRA08b Method) |
Gas pycnometer density measurements were conducted on pulverized assay samples to determine specific gravity (SG). This method calculates the volume of a dry sample by measuring the gas it displaces, allowing for SG determination relative to water. While highly precise, this method does not account for void spaces in the original rock.
Between May 2022 and February 2024, NFG collected SG measurements on pulverized samples at ALS using the OA-GRA08b gas pycnometer method. Sampling was conducted at a frequency of one sample every 50 m, focusing on gold-mineralized intervals. A 3.0 g pulverized sample was weighed into an empty pycnometer, filled with methanol or acetone, and reweighed to determine SG based on the displaced solvent.
| • | The SG values ranged from 1.62 to 3.18, with an average of 2.76 (n = 5,668 measurements). |
| • | Since October 20, 2022, NFG began collecting duplicate SG samples at a frequency of 1 in every 20 samples, with most duplicates agreeing within ±5%. |
| • | Measurements were conducted on prepared samples ranging between 0.3 m to 1.0 m depending on sample length, across 872 drill holes. |
| 11.5.3 | Wax Immersion Archimedes Measurements (OA-GRA09A Method) |
To account for void spaces in the rock, wax immersion Archimedes measurements were conducted on whole core samples. This method determines bulk density by coating core pieces with wax, submerging them in water, and calculating density based on displacement.
Measurements were strategically taken to ensure spatial and lithological representativity across 136 drill holes at the Project.
| • | Wax immersion is the primary density measurement method at the Project. |
| 11.6 | Quality Assurance and Quality Control |
Quality assurance (QA) consists of evidence that the assay data has been prepared to a degree of precision and accuracy within generally accepted limits for the sampling and analytical method(s) to support its use in a mineral resource estimate. Quality control (QC) consists of procedures used to ensure that an adequate level of quality is maintained in the process of collecting, preparing, and assaying the exploration drilling samples. In general, QA/QC programs are designed to prevent or detect contamination and allow assaying (analytical), precision (repeatability), and accuracy to be quantified. In addition, a QA/QC program can disclose the overall sampling-assaying variability of the sampling method itself.
| 11.6.1 | QA/QC Protocols |
NFG has established a robust QA/QC protocol, integrating quality control samples at a frequency of 1 in 10 samples. These samples include blanks, certified reference materials (CRM), and core field duplicates. The blank material, sourced from quartz sandstone of the Botwood Group at Peter’s River Quarry in central Newfoundland, was submitted to the laboratory in quantities of 500 g to 600 g for routine fire assays and approximately 3 kg for SFA. The CRMs, obtained from Ore Research and Exploration Pty Ltd. (OREAS), are certified, homogenous, quality control materials provided in sealed packets.
| 11- |
|
| New Found Gold Corp. | Queensway Gold Project NI 43-101 Technical Report |
April 15, 2025 SLR Project No.: 233.065300.00001 |
NFG collaborated with Analytical Solutions to design and review the QA/QC program at the Property. Under the guidance of an independent third party, NFG implemented the QA/QC protocols and analyzed the results. QC data were assessed upon receipt from the laboratories, and necessary actions were taken if assay results for CRMs and blanks were outside the acceptable tolerances. Furthermore, NFG conducted laboratory check assays and compared conventional screen fire assays with PhotonAssay™ analyses. The laboratories also performed pulp duplicate and coarse reject duplicate analyses.
A total of 711,262 samples, including 86,660 control samples, were submitted to ALS or MSLABS for analysis, representing a total insertion rate of 12% as shown in Table 11-2.
The SLR QP has reviewed the drilling QA/QC data from 2019 to 2024 provided by NFG. The results are discussed in the following sections.
Table 11-2: QA/QC Sample Insertion Rates for the Queensway Project
| Sample Type | 1987 | 2011 | 2012 | 2013 | 2019 | 2020 | 2021 | 2022 | 2023 | 2024 | Grand Total | Rate |
| Original | 9,184 | 64 | 579 | 298 | 41 | 13,630 | 114,710 | 181,932 | 243,511 | 60,653 | 624,602 | 88% |
| Blank | 5 | 745 | 5,825 | 9,392 | 13,672 | 3,328 | 32,964 | 5% | ||||
| Standard | 6 | 744 | 6,147 | 10,119 | 13,750 | 3,317 | 34,083 | 5% | ||||
| Duplicate | 15 | 20 | 31 | 19 | 1,067 | 8,924 | 6,695 | 648 | 17,419 | 2% | ||
| Check Assays | 75 | 1,152 | 449 | 453 | 62 | 2,191 | 0.3% | |||||
| Grand Total | 9,184 | 79 | 599 | 329 | 52 | 15,213 | 128,901 | 210,816 | 278,081 | 68,008 | 711,262 | 100% |
| 11.6.1.1 | Certified Reference Materials |
Results of the regular submission of CRMs (standards) are used to identify potential issues with specific sample batches and long-term biases associated with the primary assay laboratory. SLR reviewed the results from ten different standards used from historical work (before 2018) to 2024.
Between 2019 and 2024, 15 types of standards sourced from OREAS were inserted by NFG and LabGold into sample streams for analysis by routine fire assay and photon assay methods. A total of 34,083 samples were analyzed, representing a 5% insertion rate. The upper and lower control limits were established using three standard deviations (SD) above and below the expected value (EV). When a workorder returns a single standard in the failure range (±3 SD), or when two standards are in the warning range (± 2 SD), if the surrounding 10 samples to the standards are deemed anomalous (>0.1 ppm Au) by the receiving geologist, re-assays are initiated. If the surrounding samples are not deemed anomalous, the lab is informed, and an investigation is requested. No significant failures were observed under this criterion, and overall, very good accuracy was noted across all participating laboratories.
The CRM samples fire-assayed and shipped to ALS and Eastern Analytical generally exhibited lower biases and a minimal number of outliers. A few potential mislabels were identified. Specifically, in CRM 229b fire-assayed at Eastern Analytical by LabGold, three swapped samples were detected, including samples 553146, 553343, and 553634, resulting in a bias of -7.1%, as detailed in Table 11-3Table 11-3. The SLR QP recommends that NFG consider the implementation of additional verification steps during CRM insertion to minimize the risk of sample mislabelling in future programs.
| 11- |
|
| New Found Gold Corp. | Queensway Gold Project NI 43-101 Technical Report |
April 15, 2025 SLR Project No.: 233.065300.00001 |
Similarly, the CRM samples that were photon assayed at either ALS or MSALABS demonstrated good accuracy, with biases ranging from -2.6% to 3.8%, and a minimal number of outliers (see Table 11-4).
The CRMs encompass a broad range of gold grades analyzed by either fire assay or photon assay methods. However, SLR noted that multiple CRMs with similar grade ranges were inserted within the same year. The SLR QP recommends that NFG consider reducing the number of CRMs to three types -high grade, medium grade, and low grade. SLR believes that as few as three CRMs may be sufficient to monitor laboratory performance and track potential emerging biases or systematic failures over extended timeframes.
Table 11-3: Summary of CRM Samples Analyzed by Fire Assay: 2019 to 2024
| Lab | CRM | Period Range | No. Samples | EV2 | 1SD3 | Mean | N Outliers | %Bias | %Outlier |
| ALS | OREAS 211 | (2022, 2023) | 266 | 0.768 | 0.027 | 0.8 | 0 | -0.3 | 0 |
| OREAS 217 | (2020, 2022) | 833 | 0.338 | 0.01 | 0.3 | 4 | -0.7 | 0.5 | |
| OREAS 218 | (2019, 2020) | 37 | 0.531 | 0.017 | 0.5 | 0 | -0.5 | 0 | |
| OREAS 223 | (2020, 2022) | 1,364 | 1.78 | 0.045 | 1.8 | 3 | 0.3 | 0.2 | |
| OREAS 224 | (2019, 2020) | 35 | 2.15 | 0.053 | 2.1 | 1 | -1 | 2.9 | |
| OREAS 230 | (2021, 2023) | 5,141 | 0.337 | 0.013 | 0.3 | 5 | -0.5 | 0.1 | |
| OREAS 232 | (2021, 2023) | 270 | 0.902 | 0.023 | 0.9 | 2 | 0.8 | 0.7 | |
| OREAS 235 | (2022, 2023) | 283 | 1.59 | 0.038 | 1.6 | 1 | -0.1 | 0.4 | |
| OREAS 236 | (2022, 2023) | 4,283 | 1.85 | 0.059 | 1.9 | 3 | 0.9 | 0.1 | |
| OREAS 237 | (2021, 2023) | 258 | 2.21 | 0.054 | 2.2 | 1 | 0.9 | 0.4 | |
| OREAS 239 | (2020, 2023) | 3,970 | 3.55 | 0.086 | 3.6 | 17 | 1.4 | 0.4 | |
| OREAS 239b | (2023, 2023) | 1,484 | 3.61 | 0.11 | 3.7 | 5 | 2.6 | 0.3 | |
| OREAS 242 | (2021, 2023) | 525 | 8.67 | 0.215 | 8.6 | 0 | -0.7 | 0 | |
| OREAS 247 | (2022, 2023) | 219 | 42.96 | 0.9 | 42 | 18 | -2.2 | 8.2 | |
| OREAS 255 | (2019, 2020) | 33 | 4.08 | 0.087 | 4.1 | 0 | 0.7 | 0 | |
| EAL | OREAS 217 | (2021, 2022) | 302 | 0.338 | 0.01 | 0.3 | 1 | -1.9 | 0.3 |
| OREAS 221 | (2021, 2021) | 15 | 1.06 | 0.036 | 1 | 0 | -2.1 | 0 | |
| OREAS 223 | (2021, 2022) | 464 | 1.78 | 0.045 | 1.8 | 0 | -0.4 | 0 | |
| OREAS 228b | (2021, 2021) | 22 | 8.57 | 0.199 | 8.2 | 1 | -3.9 | 4.5 | |
| OREAS 229b | (2021, 2021) | 47 | 11.95 | 0.288 | 11.1 | 5 | -7.1 | 10.6 | |
| OREAS 230 | (2021, 2022) | 155 | 0.337 | 0.013 | 0.3 | 0 | 0.1 | 0 | |
| OREAS 232 | (2020, 2024) | 550 | 0.902 | 0.023 | 0.9 | 3 | -0.7 | 0.5 | |
| OREAS 232b | (2023, 2024) | 184 | 0.946 | 0.037 | 0.9 | 0 | -3.3 | 0 | |
| OREAS 235 | (2021, 2024) | 440 | 1.59 | 0.038 | 1.6 | 2 | -1.7 | 0.5 | |
| OREAS 237 | (2021, 2024) | 484 | 2.21 | 0.054 | 2.2 | 3 | -1 | 0.6 | |
| OREAS 237b | (2022, 2024) | 180 | 2.26 | 0.067 | 2.2 | 0 | -2.6 | 0 | |
| OREAS 239 | (2020, 2024) | 941 | 3.55 | 0.086 | 3.5 | 7 | -0.6 | 0.7 | |
| OREAS 239b | (2023, 2024) | 180 | 3.61 | 0.11 | 3.5 | 0 | -2.5 | 0 | |
| OREAS 242 | (2021, 2022) | 96 | 8.67 | 0.215 | 8.6 | 0 | -0.6 | 0 | |
| OREAS 245 | (2020, 2024) | 742 | 25.73 | 0.546 | 25.9 | 3 | 0.8 | 0.4 | |
| OREAS 263 | (2020, 2021) | 10 | 0.214 | 0.0103 | 0.2 | 0 | -2.6 | 0 | |
| OREAS 279 | (2020, 2021) | 13 | 6.55 | 0.218 | 6.4 | 0 | -2.4 | 0 | |
| OREAS 47 | (2023, 2024) | 16 | 0.0443 | 0.00255 | 0 | 0 | -0.3 | 0 | |
|
Notes: 1. Au in ppm 2. EV: Expected Value 3. SD: Standard Deviation |
|||||||||
| 11- |
|
| New Found Gold Corp. | Queensway Gold Project NI 43-101 Technical Report |
April 15, 2025 SLR Project No.: 233.065300.00001 |
Table 11-4: Summary of CRM Samples Analyzed by Photon Assay: 2022-2024
| Lab | CRM | Period Range | No. Samples | EV2 | 1SD3 | Mean | N Outliers | %Bias | %Outlier |
| ALS | OREAS 211 | (2024, 2024) | 33 | 0.729 | 0.034 | 0.8 | 1 | 3.8 | 3 |
| OREAS 230 | (2024, 2024) | 820 | 0.329 | 0.021 | 0.3 | 2 | 0.8 | 0.2 | |
| OREAS 235 | (2024, 2024) | 22 | 1.59 | 0.038 | 1.6 | 2 | -1.1 | 9.1 | |
| OREAS 236 | (2024, 2024) | 690 | 1.85 | 0.053 | 1.8 | 2 | -1 | 0.3 | |
| OREAS 239b | (2024, 2024) | 678 | 3.7 | 0.121 | 3.7 | 0 | -0.7 | 0 | |
| OREAS 242 | (2024, 2024) | 21 | 8.68 | 0.165 | 8.5 | 0 | -2.6 | 0 | |
| OREAS 247 | (2024, 2024) | 21 | 43.77 | 0.878 | 42.8 | 0 | -2.1 | 0 | |
| MSALABS | OREAS 211 | (2022, 2024) | 189 | 0.729 | 0.034 | 0.7 | 0 | 1.7 | 0 |
| OREAS 230 | (2022, 2024) | 2,545 | 0.329 | 0.021 | 0.3 | 0 | 1.1 | 0 | |
| OREAS 232 | (2022, 2023) | 9 | 0.902 | 0.023 | 0.9 | 0 | -0.4 | 0 | |
| OREAS 235 | (2022, 2024) | 188 | 1.59 | 0.038 | 1.6 | 1 | 0.2 | 0.5 | |
| OREAS 236 | (2022, 2024) | 2,386 | 1.85 | 0.053 | 1.8 | 9 | -1.9 | 0.4 | |
| OREAS 237 | (2022, 2023) | 12 | 2.21 | 0.054 | 2.2 | 0 | -0.2 | 0 | |
| OREAS 239 | (2022, 2024) | 1,154 | 3.55 | 0.086 | 3.6 | 19 | 0.8 | 1.6 | |
| OREAS 239b | (2023, 2024) | 1,174 | 3.7 | 0.121 | 3.7 | 0 | -0.7 | 0 | |
| OREAS 242 | (2022, 2024) | 166 | 8.68 | 0.165 | 8.5 | 5 | -2.2 | 3 | |
| OREAS 247 | (2022, 2024) | 108 | 43.77 | 0.878 | 43.1 | 1 | -1.6 | 0.9 | |
|
Notes: 1. Au in ppm 2. EV: Expected Value 3. SD: Standard Deviation |
|||||||||
| 11- |
|
| New Found Gold Corp. | Queensway Gold Project NI 43-101 Technical Report |
April 15, 2025 SLR Project No.: 233.065300.00001 |
An overview of the z-score results by method is presented in Figure 11-2. Both methods show good levels of scatter with a small number of failures falling below the -3SD limit. Furthermore, photon assays demonstrated CRM results that were more consistently within limits and had fewer failures outside the limits compared to the traditional fire assay method.
Figure 11-2: NFG CRM Z-Score by Method

SLR selected three CRMs for an in-depth review, representing the low, average, and high gold grade ranges. These were selected based on their sample size and extended periods of use.
Figure 11-3 to Figure 11-5 present the results for 5,141 samples of OREAS 230, 941 samples of OREAS 239, and 2,383 samples of OREAS 236. Acceptable biases were observed in the three CRMs, with values of -0.5%, -0.6%, and -1.9%, respectively, indicating good accuracy for these CRMs. However, some fluctuations were noted in CRM 239 fire-assayed at Eastern Analytical starting in the third quarter of 2022, with results reestablishing in early 2023. Additionally, two potential mislabels were identified in the same CRM OREAS 239 in 2021.
These observations do not adversely affect the overall results obtained or the reliability and accuracy of the data.
| 11- |
|
| New Found Gold Corp. | Queensway Gold Project NI 43-101 Technical Report |
April 15, 2025 SLR Project No.: 233.065300.00001 |
Figure 11-3: Control Chart of CRM OREAS 230 in ALS Fire Assay: 2021 - 2023

Figure 11-4: Control Chart of CRM OREAS 239 in Eastern Analytical Fire Assay: Nov 2020 - July 2024

| 11- |
|
| New Found Gold Corp. | Queensway Gold Project NI 43-101 Technical Report |
April 15, 2025 SLR Project No.: 233.065300.00001 |
Figure 11-5: Control Chart of CRM OREAS 236 in MSALAB Photon Assay: 2022 - 2024

| 11.6.1.2 | Blank Material |
Between 2019 and 2024, a total of 21,201 blank samples were submitted to ALS, 7,919 blanks were shipped to MSALABS between 2022 and 2024, 3,839 blanks were sent to Eastern Analytical between 2020 and 2024, and five blanks were shipped to Intertek Laboratory (Intertek) in 2021 and 2022. Blank assay results exceeding ten times the detection limit were considered failures. A failure results in a request for re-assay of the blank standard, and an investigation of the preparation of the surrounding samples by the laboratory.
A review of the coarse blanks sent to ALS indicates no significant contamination during either the preparation stage or analysis, with only 20 blank samples, or 0.1% of the total, exceeding the acceptance limit (Figure 11-6).
For the PhotonAssay™ analytical procedures at MSALABS, only four blanks exceeded the 0.1 ppm Au limit, demonstrating the reliability of the results and a contamination-free process (Figure 11-7). Similarly, only two incidents were identified during the preparations conducted at Eastern Analytical between 2020 and 2024.
| 11- |
|
| New Found Gold Corp. | Queensway Gold Project NI 43-101 Technical Report |
April 15, 2025 SLR Project No.: 233.065300.00001 |
Figure 11-6: 2019 - 2024 Results of Coarse Blank Samples in ALS

Figure 11-7: 2019 - 2024 Results of Coarse Blank Samples in MSALAB

| 11- |
|
| New Found Gold Corp. | Queensway Gold Project NI 43-101 Technical Report |
April 15, 2025 SLR Project No.: 233.065300.00001 |
| 11.6.1.3 | Duplicates |
Field Duplicate
NFG has implemented a field duplicate sampling program to evaluate grade variability during sampling. In this program, two halves of a core sample are collected, with one as the original and the other half as duplicate. The duplicate is labelled with a consecutive sample ID, and no remaining sample is left in the core box. Samples are systematically selected at a rate of 1 in 50 samples.
From 2020 to 2024, a total of 17,425 half-core pairs were collected. Approximately 70% of these duplicates were analyzed by ALS, while the remaining 30% were analyzed by MSALAB.
SLR noted that out of the 17,425 pairs, 85% are samples with levels <0.1 ppm Au, where variability is influenced by proximity to the detection limit. Only 25%, or 2,538 samples, focused on higher grades. The field duplicates scatter plot displays good correlations across assay methods, with a coefficient of 0.87 for fire assay duplicates and 0.82 for PhotonAssay™ duplicates. Several outliers and a considerable level of scatter are observed across all gold grade ranges. However, these are attributed to the natural short-scale variability of the gold mineralization, particularly in intervals with VG, rather than the sampling method utilized. A scatterplot showing the field duplicate correlations of both fire assay duplicates and PhotonAssay™ duplicates is provided in Figure 11-8.
| 11- |
|
| New Found Gold Corp. | Queensway Gold Project NI 43-101 Technical Report |
April 15, 2025 SLR Project No.: 233.065300.00001 |
Figure 11-8: Field Duplicates Scatter Plot by Method: 2020 - 2024

Pulp and Coarse Duplicates
NFG's current QA/QC program primarily relies on internal laboratory duplicates to monitor preparation and analytical precision, without including pulp or coarse duplicates. SLR suggests incorporating pulp duplicates to better assess reproducibility related to the analytical method's uncertainty and the homogeneity of the pulps. Additionally, including coarse duplicates would help monitor variability during the crushing stage.
In the PhotonAssay™ process at MSALAB, two splits are taken from the coarse fraction of every 20th jar. The two splits are measured by PhotonAssay™, then compared.. This serves as an internal duplicate quality control measure and to continuously refine the PhotonAssay™ assay performance.
SLR reviewed 11,366 pairs from the PhotonAssay™ splits analyzed at MSALAB, collected between 2023 and 2024. Out of these, 2,759 pairs fell below 0.1 ppm Au, where variability is mainly affected by the proximity to the detection limit. This means that 76% of the pairs were focused on levels above 0.1 ppm Au. The comparison showed a strong correlation coefficient of 0.92, indicating a good level of consistency between the splits. In addition, the half absolute relative difference (HARD) plots revealed that 16.3% of the pairs exceeded the ±20% tolerance, as illustrated in Figure 11-9. However, when the pairs below 0.1 ppm Au are excluded, the failure rate is reduced to 9.6%, which is considered acceptable for coarse duplicates (less than 10% pairs rejected).
| 11- |
|
| New Found Gold Corp. | Queensway Gold Project NI 43-101 Technical Report |
April 15, 2025 SLR Project No.: 233.065300.00001 |
The observed variability is characteristic of an orogenic gold deposit with visible gold in mineralized drill core. This variability reinforces the importance of employing assay-to-extinction methods, such as multiple jars by PhotonAssay™ or screened metallics of large sample splits, particularly for higher-grade samples.
Figure 11-9: Coarse Duplicates (CD) Scatter Plot and HARD Plot: 2023-2024

| 11- |
|
| New Found Gold Corp. | Queensway Gold Project NI 43-101 Technical Report |
April 15, 2025 SLR Project No.: 233.065300.00001 |

| 11.6.1.4 | External Check Assays |
Since 2020, as part of the NFG QA/QC program, pulp samples have been sent to third-party laboratories, including ALS, Eastern Analytical, and SGS. A total of 2,120 check assays were shipped, comprising 335 fire assay samples processed through similar procedures in secondary laboratories, 1,536 samples from the finest fraction of screening metallic assays submitted for fire assays, and 249 photon assay samples submitted for screening metallic fire assays. All check assay submissions were accompanied by standards, blanks, and pulp duplicates.
In general, Figure 11-10 to Figure 11-12 demonstrate a strong correlation between samples analyzed using the same analytical protocol, with a linear trend close to 45°. However, some variations were observed, particularly in cases where different methods were compared.
Figure 11-10 compares fire assay results from Eastern Analytical (30 g aliquot) and ALS (50 g aliquot) (orange points), showing minor misalignments. Additionally, it compares Eastern Analytical fire assay results with ALS screen fire assay results (blue points), where slight deviations at higher grades are evident. This is expected, as screen fire assays tend to yield slightly higher results compared to traditional fire assays.
Figure 11-11 compares FA and SFA results from SGS and ALS, both using a gravimetric finish. The fire assay results from ALS and SGS (orange points) show a strong correlation, while the comparison between ALS screen fire assays and SGS fire assays (blue points) shows slight deviation at higher grades.
Figure 11-12 compares photon assay results from MSALABS with fire assay and screen fire assay methods from ALS. The photon assay results show better correlation with SFA (orange points) than with traditional FA (blue points), suggesting higher accuracy when using both photon assay and SFA methods.
The statistical summary in Table 11-5 highlights good correlations achieved by all primary and secondary laboratories, with correlation coefficients ranging from 0.90 to 0.96 and coefficients of variation (CV) less than 5%, reflecting the good repeatability of the results.
| 11- |
|
| New Found Gold Corp. | Queensway Gold Project NI 43-101 Technical Report |
April 15, 2025 SLR Project No.: 233.065300.00001 |
SLR recommends continued periodic monitoring of check assays, with a focus on gold grade ranges of interest and following the same analytical procedure. SLR believes that the check assay results support the use of primary assays in the Mineral Resource estimation.
Table 11-5: Statistics of Check Assays by Laboratory: 2022-2024
| Primary Lab | Secondary Lab | Year Period Range | N | Mean OR | Mean DP | Max OR | Max DP | Median OR | Median DP | SD OR | SD DP | CV OR | CV DP | R2 |
| ALS | EAL | 2020-2022 | 773 | 1.2 | 1 | 9.9 | 7.2 | 0.7 | 0.7 | 1.4 | 1 | 1.1 | 1 | 0.899 |
| EAL | ALS | 2021-2021 | 312 | 63.6 | 32.3 | 2,197.2 | 1,920 | 1.3 | 1.2 | 233.5 | 137.3 | 3.7 | 4.2 | 0.9 |
| EAL | SGS | 2021-2022 | 98 | 20.1 | 13.4 | 570.7 | 351 | 2.1 | 1.7 | 70.3 | 49.3 | 3.5 | 3.7 | 0.927 |
| ALS | SGS | 2021-2023 | 688 | 9.7 | 6.6 | 733 | 382 | 1 | 1 | 56.7 | 34.7 | 5.8 | 5.3 | 0.955 |
| MSALABS | ALS | 2022-2024 | 249 | 15.3 | 12.5 | 482.7 | 470 | 1.1 | 1.1 | 55.7 | 50.3 | 3.6 | 4 | 0.964 |
|
Notes: 1. OR: original (Primary Lab result) 2. DP: Duplicate (Secondary Lab result) |
||||||||||||||
Figure 11-10: Quantile-quantile Plots (FA vs. FA and SFA - AAS Finish): ALS vs. EAL

| 11- |
|
| New Found Gold Corp. | Queensway Gold Project NI 43-101 Technical Report |
April 15, 2025 SLR Project No.: 233.065300.00001 |
Figure 11-11: Quantile-quantile Plots (FA vs. FA & SFA - Gravimetric Finish): ALS vs. SGS

Figure 11-12: Quantile-quantile Plots (Photon Assay vs. FA and SFA): MSALABS vs. ALS

| 11.6.1.5 | Conclusions and Recommendations |
SLR conducted a review of the NFG QA/QC results from 2019 to 2024. Approximately 12% of controls were inserted into drilling sample streams, including coarse blanks, CRMs, field duplicates, and external checks. No significant contamination was identified during preparation at the primary laboratories ALS, MSALAB, and Eastern Analytical.
The CRMs showed good overall performance for ALS, Eastern Analytical, and MSALAB, with a bias of less than 5%. A few outliers were detected exceeding the limits of ±3SD, but these were minimal compared to the significant quantity of samples inserted into the drilling sample streams.
| 11- |
|
| New Found Gold Corp. | Queensway Gold Project NI 43-101 Technical Report |
April 15, 2025 SLR Project No.: 233.065300.00001 |
Field duplicates revealed moderate levels of scattering and a correlation of 0.870. For photon assay coarse duplicates, a HARD index of 17% indicates that 83% of the sample population falls within acceptable precision ranges. This level of precision is considered acceptable given the inherent nugget effect in the Queensway gold deposit.
No pulp or coarse duplicates were inserted by NFG as part of their QA/QC program. NFG may elect to implement the insertion of pulp and coarse duplicates for monitoring precision during analysis and preparation stages, rather than relying solely on internal laboratory duplicates as part of the monitoring process. The external check results showed strong correlations between primary and secondary laboratories.
The SLR QP has reviewed the adequacy of sample preparation, security, and analytical procedures conducted by NFG from the start of the Queensway exploration programs in 2019 through to the effective date of this report. This review found no material issues or inconsistencies that could adversely affect the quality or reliability of the data.
The SLR QP is of the opinion that:
| • | NFG’s sample preparation procedures are appropriate for the deposit type and mineralization style. |
| • | Analytical methods used, including fire assay, photon assay, and screen fire assay are suitable for determining gold grades in the Project. |
| • | The QA/QC program, which includes CRMs, blanks, and duplicates, is well-structured, meets industry standards, and provides confidence in the assay data. |
| • | Sample security measures and chain of custody protocols are sufficient to ensure the integrity of the data. |
Overall, the SLR QP is of the opinion that NFG’s sampling, analytical methods, and QA/QC program meet industry standards and are suitable for use in the Mineral Resource estimate.
| 11- |
|
| New Found Gold Corp. | Queensway Gold Project NI 43-101 Technical Report |
April 15, 2025 SLR Project No.: 233.065300.00001 |
| 12.0 | Data Verification |
| 12.1 | NFG Data Verification |
NFG’s technical staff independently verify the accuracy, completeness, and reliability of the data they collect. This verification process includes evaluating collar locations, downhole surveys, geological and geotechnical data, bulk density measurements, and assay results.
| 12.1.1 | Collars |
Drill hole collars were initially positioned using a RTK GPS receiver, ensuring high-accuracy spatial data for each hole. Final collar surveys were conducted using a TN14 Gyrocompass to confirm azimuth and dip before drilling commenced. For drill programs requiring alternative placement methods (e.g., barge-supported drilling), adjustments were made, and RTK GPS data was collected near the drill mast to approximate location accuracy.
NFG staff reviewed the drill collar database and cross-referenced the recorded positions with field surveys.
| 12.1.2 | Surveys |
Downhole azimuth and dip data were recorded using IMDEX’s Reflex EZ-Trac survey tool at 50 m intervals during drilling, with an increased frequency of 15 m intervals upon hole completion. For directional drilling, a DeviGyro system was employed, providing continuous surveys at 3 m intervals for improved accuracy. In cases where drill hole diameters transitioned from HQ to NQ size, DeviGyro surveys were used to mitigate the influence of magnetic interference on results.
NFG staff verified survey data by reviewing consistency in azimuth and dip values across multiple survey passes, checking them for erroneous values.
| 12.1.3 | Geological and Geotechnical Data |
Geological and geotechnical logging was conducted at NFG’s core logging facility in Gander, NL, by trained geologists and technicians. Core logging included detailed lithological descriptions, mineralization styles, and structural data, with orientation measurements where applicable.
Since December 2020, OTV and ATV images have been systematically collected for select drill holes, providing high-resolution structural data. In 2024, the ACT III core orientation tool was used on holes that exceeded the wireline length of the OTV and ATV probes.
NFG staff reviewed the geological and geotechnical data for completeness (missing or incomplete interval or point data), geological and geotechnical viability (e.g., recovery and rock quality designation (RQD) within plausible range of values), and errors using built-in validation reporting within Seequent’s MX Deposit and Leapfrog (e.g., overlapping intervals, intervals that cross lithological boundaries, intervals that exceed hole depth, and null fields that require data). Core recovery exceeded 95% in most intervals. Any errors identified were then reviewed and corrected in the MX Deposit database.
| 12.1.4 | Bulk Density |
Bulk density measurements were conducted using three methods: gamma-gamma downhole logging, gas pycnometer density measurements, and wax immersion Archimedes testing.
| 12- |
|
| New Found Gold Corp. | Queensway Gold Project NI 43-101 Technical Report |
April 15, 2025 SLR Project No.: 233.065300.00001 |
NFG reviewed the results from gamma-gamma logging and gas pycnometer measurements, comparing them to wax immersion Archimedes values. Based on this assessment, NFG decided to discontinue gamma-gamma logging, prioritizing wax immersion Archimedes testing.
| 12.1.5 | Assays |
Assay results are received via email from the laboratory. All result certificates are imported into MX Deposit by NFG staff. All but PhotonAssayTM extinction results are imported unedited. For extinction results, an application programmed by an external consultant is used to ensure the weighting method is consistent. Spot checks are performed intermittently to ensure the script is functioning properly. During import, results are checked for CRM performance, spelling errors, missing samples, or results which fall outside the expected ranges. The laboratory will be informed, and re-assay initiated for any CRM failures. Blank contamination will also result in follow-up with the laboratory. Any strongly anomalous gold result from a portion of core where logging geologists did not flag visible gold (VG) is retrieved from the core archive for review.
After purchasing or finalizing an agreement on a property (such as the purchase of Kingsway from Labrador Gold), a verification process is undertaken to import the assay data into the NFG drilling database. Samples first have their start and end points validated before import. CRM and blank parameters are entered into the database to validate laboratory performance during import. All original result certificates received from the laboratory are imported individually into the database. NFG will contact the laboratory where possible to validate the method, laboratory accreditation, and request a selection of raw certificates for validation. Where possible, anomalous zones are validated either from core photos or retrieving core.
| 12.2 | SLR Data Verification |
| 12.2.1 | Site Visit |
Pierre Landry, P.Geo., of SLR, conducted a site visit to the Project and related facilities on October 24 and 25, 2024. During this visit, he inspected the Keats and Iceberg trenches, the core shack, and reviewed the logging environment and procedures for data collection and sampling. He also examined core samples from the AFZ Core, AFZ Peripheral, and JBP deposits. In addition, he interviewed NFG’s personnel and gathered information necessary for completing the Mineral Resource estimate and accompanying Technical Report.
Mr. Landry also inspected drill collars and drill hole cores relevant to the Mineral Resource estimate, verifying collar locations using a handheld GPS and visually comparing mineralization with interpreted drilling sections. NFG provided full access to all facilities and personnel during the visit. Mr. Landry was accompanied by Melissa Render, Vice President, Exploration for NFG.
| 12.2.2 | Collars |
The SLR QP reviewed the collar locations in relation to the digital topographic surface. During this process, the SLR QP did not identify any material discrepancies between the collar locations and digital topographic surface. During Mr. Landry’s site visit, nine drill holes and two channel samples from the Queensway deposit were spot checked using a handheld GPS and compared to the collar locations in the drill hole database. All checked holes were found to be within a reasonable tolerance, considering the precision of the handheld GPS relative to the RTK GPS used for the database collar measurements. Additionally, Mr. Landry visited active drilling sites including NFGC-24-2180, where he observed the drilling procedures. All observed procedures were consistent with industry standard practices. Figure 12-1 provides an image of a field check for the collar location of hole NFGC-23-1279. The database coordinates for this hole are Easting: 658,555.141 m, Northing: 5,427,845.284 m, Elevation: 90.503 m. These compare well with the handheld GPS readings, which recorded coordinates of Easting: 658,557 m, Northing: 5,427,848 m, Elevation: 88 m while displaying a GPS accuracy of 3 m.
| 12- |
|
| New Found Gold Corp. | Queensway Gold Project NI 43-101 Technical Report |
April 15, 2025 SLR Project No.: 233.065300.00001 |
Figure 12-1: Collar Location Field Check (NFGC-23-1279)

Source: SLR.
| 12.2.3 | Survey |
The SLR QP reviewed the drill hole traces to identify any irregularities in dip and azimuth orientations within the downhole survey data. The review did not reveal any unusual visual artifacts or inconsistencies, confirming the reasonableness of the surveyed drill hole trajectories.
| 12.2.4 | Geological Data |
The SLR QP has reviewed NFG’s geological data acquisition practices and found them to be consistent with industry standards. During the site visit, the SLR QP observed core logging procedures conducted by NFG personnel and confirmed that logging practices align with standard industry methodologies.
NFG’s logging of structure, lithology, alteration, mineralization, and veining follows standard industry practices, ensuring systematic and consistent data collection. Sampling procedures, including the selection of sampling intervals, were observed to appropriately respect geological and vein contacts.
| 12- |
|
| New Found Gold Corp. | Queensway Gold Project NI 43-101 Technical Report |
April 15, 2025 SLR Project No.: 233.065300.00001 |
Mineralization domain interpretations incorporate data from core photos and logging, enhancing accuracy in geological modelling. Additionally, multi-element ICP data is used to differentiate lithological units and assess the trend and orientation of mineralized zones, supporting refined geological interpretations.
The SLR QP concludes that NFG’s geological data acquisition methods are reliable and effectively define mineralization domains, providing a robust foundation for Mineral Resource estimation where sufficient data coverage is available.
An independent check sample was not collected during the site visit, as the visually distinctive gold mineralization within veins and NFG’s active QA/QC program provide adequate verification. The QA/QC program includes the routine use of duplicates, blanks, and CRMs. Furthermore, check sampling from previous technical reports has sufficiently validated the assay data for gold mineralization.
| 12.2.5 | Bulk Density |
NFG conducted density measurements using various methods during drilling and metallurgical testing. These included downhole gamma-gamma logging, gas pycnometer measurements on assay sample pulps, wax immersion Archimedes measurements on drill core, and a modified Archimedes method (without wax) on crushed and screened rock samples for metallurgical testing.
To determine suitable density values for mineralized and unmineralized rock applicable to the Mineral Resource estimate, SLR reviewed all available density data from these four methods. The evaluation included an analysis of density variations using mineralization and lithological wireframes, as well as a comparison against various geological attributes logged by NFG geologists. This analysis is provided in Section 14.6.
| 12.2.6 | Assay Database |
The data verification process conducted by SLR was supervised and reviewed by the SLR QP. The assay database reviewed by SLR was used by NFG to interpret and construct the mineralized wireframes. The assay data within these wireframes were subsequently incorporated by SLR into the Mineral Resource estimate.
Data verification for the drill hole database included comparing gold assay values used to support the Mineral Resource estimate against the original analytical certificates from ALS and MSALABS, the primary laboratories used by NFG between 2019 and 2024. The review covered a variety of assay methods including: fire assay with AAS or gravimetric finish, photon assay, and screen fire assay. This review followed NFG’s established assay method priority and hierarchy rules, allowing for a direct comparison of analytical values between assay certificates and the database.
A total of 635,553 samples from the assay database ‘Drill_Core_Logging-QW_Samples_All.csv’, with an effective closure date of November 1, 2024, including 3,155 drill holes were cross-checked against their original certificates. Of these, 328,301 samples, representing 52% of the total assay database, were verified for gold. The verification process was limited to assay data only and did not account for drill holes that were ignored due to being incomplete, missing survey data, or being off the property boundaries. Additionally, not all drill holes contain assay data. The verification process identified 28 discrepancies, accounting for 0.01% of the samples compared. A summary of the results is shown in Table 12-1. These minor discrepancies were promptly addressed by NFG and resolved as follows:
| 12- |
|
| New Found Gold Corp. | Queensway Gold Project NI 43-101 Technical Report |
April 15, 2025 SLR Project No.: 233.065300.00001 |
| • | Reanalysis (two instances): Samples K953804 and K953805 were reanalyzed; however, the certificates were not received during the initial analysis conducted by SLR. NFG was notified, and the reanalysis certificates were provided and compared, confirming that the original values had been correctly superseded in the database. |
| • | Missing Certificates (22 Instances): An initial cross-check by SLR identified mismatches in 22 samples due to three missing certificates (TB24065708, TB24033718, and TB24155927), which contained the original jar gold values or individual jar weights required for calculations. After being notified, NFG supplied the certificates, which were used for validation, confirming that the recorded values in the database were accurate. |
| • | Typographical Error (one instance): The recorded value for the sample K551611 in the database was 0.87 ppm Au, while the actual value was 0.78 ppm Au. This was a data entry error; however, the value has already been corrected in the database. |
| • | Updated Certificates (three instances): The grades of the samples SM28444, K979338 and K548142 were reviewed and corrected by the laboratory. NFG resubmitted these certificates to SLR, which were verified, and the values were confirmed. |
SLR found no material discrepancies identified that would impact the validity of the Mineral Resource estimate. SLR’s QP is of the opinion that the verification process confirms the reliability of the assay database, ensuring its suitability for use for Mineral Resource estimation.
Table 12-1: Summary of NFG Assay Verification for Gold
| Year | No. Samples | No. Samples Compared | % Verification |
| Before 2013 | 9,690 | - | 0% |
| 2019 | 1,952 | 135 | 7% |
| 2020 | 18,078 | 1,299 | 7% |
| 2021 | 131,968 | 14,491 | 11% |
| 2022 | 196,088 | 80,834 | 41% |
| 2023 | 217,365 | 185,529 | 85% |
| 2024 | 60,412 | 46,013 | 76% |
| Grand Total | 635,553 | 328,301 | 52% |
| 12- |
|
| New Found Gold Corp. | Queensway Gold Project NI 43-101 Technical Report |
April 15, 2025 SLR Project No.: 233.065300.00001 |
| 13.0 | Mineral Processing and Metallurgical Testing |
Starting in 2023, NFG has completed two phases of metallurgical test work in relation to the Queensway Project on various mineralized zones. The initial test work evaluated three mineralized zones, the Keats, Golden Joint, and Lotto zones. The next work studied mineralization from the Iceberg and Iceberg East zones. The test work was completed by independent laboratories which prepared internal metallurgical reports on behalf of NFG including Advanced Mineral Technology Laboratory (AMTEL 2023 and AMTEL 2024), Black Swan Metallurgy Pty Ltd (BSM 2023), and Base Metallurgical Laboratories Ltd. (Base Met Labs 2024a,b).
In 2024, NFG began a third phase of testing using mineralized material from Keats West, which was known to contain free gold and submicroscopic gold associated with pyrite and arsenopyrite. The material from Keats West was also known to contain varying amounts of organic carbon. Reports are still pending but preliminary results have been provided by Base Met Labs while AMTEL has provided a report on the mineralogy (AMTEL 2025).
| 13.1 | Historical Metallurgical Work |
There is no known historical metallurgical test work for the Project prior to NFG initiating test work in June 2023.
| 13.2 | Sample Selection |
Gold mineralization for metallurgical analysis was identified at the Project in mineralized zones known as Keats, Golden Joint, Lotto, Iceberg, Iceberg East, and Keats West as shown in Figure 13-1. High grade intercepts containing visible gold in quartz veins were observed in drill core samples.
Preliminary geological evaluations indicated that gold mineralization is vein hosted and associated with faults and cross faults. Lithology does not appear to play a major role in mineralization.
The host rock in these mineralized zones is primarily siltstone, with occasional beds of greywacke. Greywacke containing elevated levels of chromium and nickel was observed proximal to the AFZ. Based on the interpreted deep marine depositional environment of the stratigraphy of these zones, the lithologies are prone to containing organic matter. Carbonaceous material within the stratigraphy was made evident by the presence of graphitic clasts within greywacke beds, polished graphitic bedding planes between occasional siltstone beds, and the presence of a black siltstone unique to the hanging wall of the AFZ.
The metallurgical test programs characterized each zone by combining intervals of mineralized core from different vein and structural intercepts at depth to create numerous variability composites as summarized in Table 13-1. This was achieved by defining sections along the length of each zone (Figure 13-2 to Figure 13-9) and creating a database of all intervals greater than 2 m in width with a gold grade above 0.5 ppm. This database enabled each variability composite to target and test the metallurgical properties of variable gold grades along individually modelled veins across the zone.
After assembly, the variability composites were sealed in plastic buckets and shipped to Base Met Labs, in Kamloops, BC, Canada for composite preparation and testing.
| 13- |
|
| New Found Gold Corp. | Queensway Gold Project NI 43-101 Technical Report |
April 15, 2025 SLR Project No.: 233.065300.00001 |
Table 13-1: Mineralized Zone and Number of Variability Composites
| Mineralized Zone | Number of Variability Composites |
| Phase 1 | |
| Golden Joint | 14 |
| Keats 1, 2 & 3 | 29 |
| Keats 4 | 16 |
| Keats 5 | 34 |
| Lotto | 23 |
| Subtotal | 116 |
| Phase 2 | |
| Iceberg/Iceberg East | 46 |
| Total Keats/Golden Joint/ Lotto/Iceberg/Iceberg East | 162 |
| Phase 3 | |
| Keats West | 68 |
| 13- |
|
| New Found Gold Corp. | Queensway Gold Project NI 43-101 Technical Report |
April 15, 2025 SLR Project No.: 233.065300.00001 |
Figure 13-1: Plan View Map of Metallurgical Sections from Keats, Golden Joint, Lotto, Iceberg, Iceberg East, and Keats West

Source: NFG 2025.
Note. Veins not drawn to scale.
| 13- |
|
| New Found Gold Corp. | Queensway Gold Project NI 43-101 Technical Report |
April 15, 2025 SLR Project No.: 233.065300.00001 |
Figure 13-2: Cross-section of Keats Main 1 Illustrating Drill Holes Selected for Metallurgical Testing (view looking northeast)
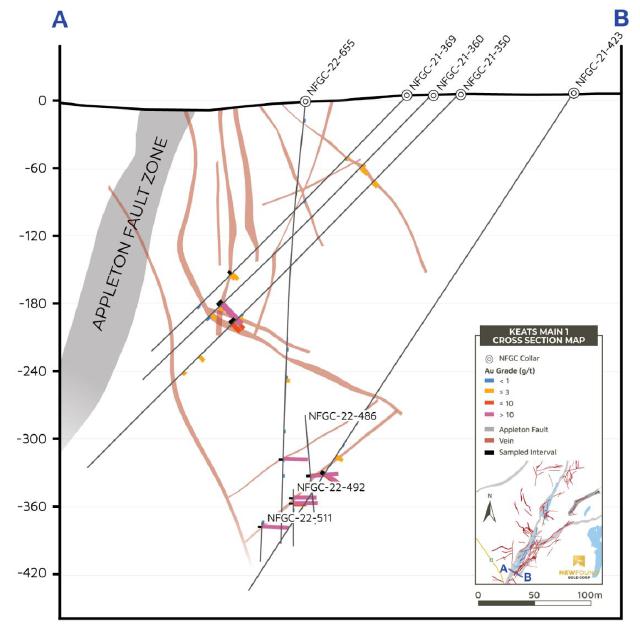
Source: NFG 2025.
Note. The black bars shown in the figure represent the metallurgical testing intervals.
| 13- |
|
| New Found Gold Corp. | Queensway Gold Project NI 43-101 Technical Report |
April 15, 2025 SLR Project No.: 233.065300.00001 |
Figure 13-3: Cross-section of Keats Main 2 Illustrating Drill Holes Selected for Metallurgical Testing (view looking northeast)

Source: NFG 2025.
Note. The black bars shown in the figure represent the metallurgical testing intervals.
| 13- |
|
| New Found Gold Corp. | Queensway Gold Project NI 43-101 Technical Report |
April 15, 2025 SLR Project No.: 233.065300.00001 |
Figure 13-4: Cross-section of Keats Main 4 Illustrating Drill Holes Selected for Metallurgical Testing (view looking northeast)

Source: NFG 2025.
Note. The black bars shown in the figure represent the metallurgical testing intervals.
| 13- |
|
| New Found Gold Corp. | Queensway Gold Project NI 43-101 Technical Report |
April 15, 2025 SLR Project No.: 233.065300.00001 |
Figure 13-5: Cross-section of Lotto Illustrating Drill Holes Selected for Metallurgical Testing (view looking northeast)
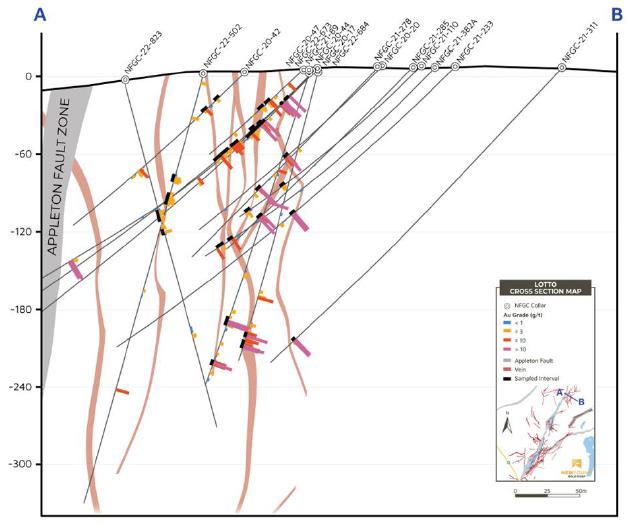
Source: NFG 2025.
Note. The black bars shown in the figure represent the metallurgical testing intervals. Drill holes from both Lotto sections 1 and 2 are shown.
| 13- |
|
| New Found Gold Corp. | Queensway Gold Project NI 43-101 Technical Report |
April 15, 2025 SLR Project No.: 233.065300.00001 |
Figure 13-6: Cross-section of Golden Joint Illustrating Drill Holes Selected for Metallurgical Testing (view looking northeast)

Source: NFG 2025.
Note. The black bars shown in the figure represent the metallurgical testing intervals. Drill holes from both Golden Joint sections 1 and 2 are shown.
| 13- |
|
| New Found Gold Corp. | Queensway Gold Project NI 43-101 Technical Report |
April 15, 2025 SLR Project No.: 233.065300.00001 |
Figure 13-7: Cross-section of Iceberg #3 Illustrating Drill Holes Selected for Metallurgical Testing (view looking northeast)

Source: NFG 2025.
Note. The black bars shown in the figure represent the metallurgical testing intervals.
| 13- |
|
| New Found Gold Corp. | Queensway Gold Project NI 43-101 Technical Report |
April 15, 2025 SLR Project No.: 233.065300.00001 |
Figure 13-8: Cross section of Keats West 1 Illustrating Drill Holes Selected for Metallurgical Testing (view looking northwest)

Source: NFG 2025.
Note. The black bars shown in the figure represent the metallurgical testing intervals.
| 13- |
|
| New Found Gold Corp. | Queensway Gold Project NI 43-101 Technical Report |
April 15, 2025 SLR Project No.: 233.065300.00001 |
Figure 13-9: Cross section of Keats West 2 Illustrating Drill Holes Selected for Metallurgical Testing (view looking northwest)

Source: NFG 2025.
Note. The black bars shown in the figure represent the metallurgical testing intervals.
| 13.3 | Sample Preparation |
Variability composites were prepared at Base Met Labs and were initially coarse crushed to a nominal one inch, blended, and 12.5% of the mass was split and directed to a respective master composite as shown in Table 13-2. Four master composites (KZ-MC-1, KZ-MC-2, LZ-MC, and IB-MC) were assembled using 148 variability composites generated from approximately 1,350 m of drill core with a combined weight of 4,800 kg from the Keats, Lotto, and Iceberg zones. A master composite was not prepared from the Golden Joint variability composites due to the lack of sufficient mass for testing.
Master composites for Keats West (KW-MC) were compiled using 68 variability composites generated from approximately 660 m of drill core with a combined weight of 2,700 kg. The master composites were assembled according to the visibly determined carbon content in the variability composite samples. Visible indications of total organic carbon include the colour of the core, the amount of sooty carbon transferred when handling the core and the competency of the core. Intervals with greater amounts of total organic carbon were typically black in colour, poorly competent, and required the use of gloves when handling the core to minimize sooty carbon transfer to personnel.
| 13- |
|
| New Found Gold Corp. | Queensway Gold Project NI 43-101 Technical Report |
April 15, 2025 SLR Project No.: 233.065300.00001 |
The master composites were prepared to provide sufficient material for exploratory testing rather than to accurately represent the grades and spatial distribution of mineralized material from the different zones.
Table 13-2: Master Composite Summary
| Master Composite | Mineralized Zone | No. of Variability Composites |
| KZ-MC-1 | Keats 1,2,3 | 29 |
| KZ-MC-2 | Keats 4, 5 | 50 |
| LZ-MC | Lotto 1-2 | 23 |
| IB-MC | Iceberg 1-10 | 46 |
| KW-MC/Weak | Various | 37 |
| KW-MC/Moderate | Various | 25 |
| KW-MC/Strong | Various | 6 |
The variability composites were stage crushed to minus 10 mesh, blended, and split into one kilogram charges for metallurgical testing and geochemical head analysis.
| 13.4 | Metallurgical Testing |
| 13.4.1 | Sample Characterization |
| 13.4.1.1 | Keats Main, Lotto, Iceberg |
A gold deportment study was completed by AMTEL (AMTEL 2024, AMTEL 2023) on the four master composites which, in summary, reported the following findings:
| • | Free gold grains contributed 96%, 94%, 91%, and over 80% of the gold for KZ-MC-1, KZ-MC-2, LZ-MC, and IB-MC, respectively. |
| • | Readily gravity recoverable gold (GRG) in free gold grains accounted for 61%, 59%, 74%, and 46% of the grades for KZ-MC-1, KZ-MC-2, LZ-MC, and IB-MC, respectively. The KZ-MC-1 had a larger quantity of GRG (>75 µm) than the other master composites. |
| • | KZ-MC-1, KZ-MC-2, and LZ-MC contained 2% to 3% of gold particles that were not liberated but exposed, which would be leachable by cyanide. |
| • | IB-MC differed in that approximately 14% of the gold particles were not liberated but exposed, which would likely be leachable by cyanide. |
| • | Submicroscopic gold was a secondary contributor to grade. It was held in solid solution form in arsenopyrite and pyrite. It would likely be refractory to cyanide leaching. |
| • | The master composites generated high extractions (89% to 98%) during direct cyanide leaching with carbon. Residue grades without carbon were significantly higher, demonstrating the preg-robbing nature of the carbon in the samples. Unleached gold is predominantly refractory, held in solid solution and preg-robbed forms, and therefore a finer primary grind would not be beneficial. |
| 13- |
|
| New Found Gold Corp. | Queensway Gold Project NI 43-101 Technical Report |
April 15, 2025 SLR Project No.: 233.065300.00001 |
| o | Due to an enrichment of solid solution of gold in arsenopyrite, small changes in the abundance of this mineral may impact residue grade. |
| o | Additionally, because the carbon matter in the mineral is “active” and can be a significant preg-robber, small changes in total organic carbon (TOC) content may have notable impacts on residue grades. |
| • | An “up-front” centrifugal gravity circuit would be essential for processing the analyzed samples. |
| o | The coarsest gold grains were considered too large to float efficiently. |
| o | The coarsest gold grains were considered too large to leach within the residence time of a conventional carbon-in-leach (CIL) circuit. |
Figure 13-10 illustrates and summarizes the differences that AMTEL identified between the gold deportment and gold grain size for the different mineralized zones.
| 13- |
|
| New Found Gold Corp. | Queensway Gold Project NI 43-101 Technical Report |
April 15, 2025 SLR Project No.: 233.065300.00001 |
Figure 13-10: Gold Deportment and Gold Grain Size for the Keats, Lotto and Iceberg Zones

Source: AMTEL 2024.
All variability composites and master composites were subjected to ICP 32-element analysis, QEMSCAN mineral analysis, and carbon and sulphur speciation.
ICP analysis showed that the average amount of arsenic was 3,700 ppm with a range from 54 ppm to 15,600 ppm, while the average sulphur concentration was 1.09%, with a range from 0.24% to 2.68%.
QEMSCAN analysis reported average arsenopyrite values of 0.94% with a range from 0% to 4.93%, which was interpreted as a mineral matrix that could encapsulate gold and inhibit gold extraction.
Carbon speciation analysis showed that the average total carbon value was 0.65%, with a range from 0.08% to 1.77%. The average organic carbon concentration was 0.07%, with a range from 0.009% to 0.171%.
Silver assays for the combined Keats, Golden Joint, and Lotto variability composites showed an average silver value of 0.45 ppm with a range from 0.25 ppm to 5.34 ppm. Average silver concentration in the Iceberg variability composites was less than 0.5 ppm. Due to the low overall average silver value, the optimization of silver extraction was not incorporated into the test program.
| 13- |
|
| New Found Gold Corp. | Queensway Gold Project NI 43-101 Technical Report |
April 15, 2025 SLR Project No.: 233.065300.00001 |
| 13.4.1.2 | Keats West |
A preliminary assessment of the core at Keats West indicated that there may be areas of preg-robbing carbon that could affect gold recovery using a gravity/CIL circuit. Hence, the master composites were assembled according to the amount of observed carbon. The samples were classified as:
| • | Keats West/Weak (KW/Weak) |
| • | Keats West/Moderate (KW/Mod) |
| • | Keats West/Strong (KW/Strong) |
A gold deportment study was completed by AMTEL (AMTEL 2025) on the Keats West master composites. The composite samples sent to AMTEL included KW/Weak and a combined KW Mod/Strong. In summary, AMTEL reported the following findings:
| • | The rock mineral assemblage was essentially the same in all Queensway composites. Rock mineralogy is dominated by quartz, illite, chlorite albite, with minor carbonate and rutile. The KW-Mod/Strong and KW-Weak samples appeared to have notably lower feldspar contents. |
| • | The TOC assay for the KW-Mod/Strong material had a higher carbonaceous matter content (0.33% TOC), which may be deleterious to leach performance. |
| • | The sulphide mineralogy was dominated by pyrite and arsenopyrite in all mineralized materials. The total sulphide contents were similar in all study samples, but the KW-Weak samples had the highest arsenopyrite content (1.25%). |
| • | Submicroscopic gold is a minor contributor to sample grade, except in KW/Weak samples where it accounted for 49% of the gold. The importance of submicroscopic gold to the KW-Weak samples was partly due to the lower overall Au content of this material, and also due to the relatively high arsenopyrite being enriched in the solid solution with gold. |
Figure 13-11 illustrates and summarizes the differences identified by AMTEL between the gold deportment and gold grain size for KW/Weak and KW Mod/Strong, and also includes the results previously reported for Iceberg.
| 13- |
|
| New Found Gold Corp. | Queensway Gold Project NI 43-101 Technical Report |
April 15, 2025 SLR Project No.: 233.065300.00001 |
Figure 13-11: Gold Deportment and Gold Grain Size for Keats West and Iceberg

Source: AMTEL (2025)
| 13.4.2 | Master Composite Testing - Keats, Lotto, Iceberg |
Master Composites were subjected to the following tests:
| • | Comminution characterization |
| • | GRG |
| • | Extended Gravity Gold Determination (EGRG) |
| • | CIL cyanide leaching of the gravity tailings |
| • | Intensive Cyanide Leach (ICL) of gravity concentrates |
| 13- |
|
| New Found Gold Corp. | Queensway Gold Project NI 43-101 Technical Report |
April 15, 2025 SLR Project No.: 233.065300.00001 |
| • | Direct cyanide leach of the gravity tailings |
| • | Thickening and filtration testing |
| • | Cyanide detoxification |
| • | Regrind and CIL of sulphide flotation concentrates |
| • | Pre-aeration with air and oxygen |
| 13.4.2.1 | Comminution Testing |
Comminution tests were completed by Base Met Labs on each of the four master composites. The tests included the semi-autogenous grinding (SAG) mill comminution (SMC) breakage test to determine A x b values, Bond ball mill work index (BWi), and Bond abrasion index (Ai). The results of the tests are shown in Table 13-3.
Table 13-3: Master Composite Comminution Test Summary
| Master Composite | SMC A x b |
BWi (kWh/t) |
Bond Ai (g) |
| KZ-MC-1 | 59.4 | 17.9 | 0.286 |
| KZ-MC-2 | 60.4 | 16.2 | 0.089 |
| LZ-MC | 65.9 | 18.3 | 0.124 |
| IB-MC | 64.7 | 18.1 | 0.201 |
The results of the comminution test work indicate that the mineralized material would be amenable to a conventional SAG/ball milling circuit and would have moderate to high grinding energy consumption in a secondary ball mill. The material is only mildly abrasive and should not result in high steel consumption in the crushing and milling circuits.
| 13.4.2.2 | Gravity Recoverable Gold |
The KZ-MC-2 and LZ-MC master composites were tested for GRG.
BSM (2023) evaluated the gold deportment analysis conducted by AMTEL and compared it against the GRG results from the tests conducted at Base Met Labs.
BSM concluded, “The analysis described in this report has resulted in estimations of gold recoveries from a conventional gravity circuit of 45-55%, processing effectively 100% of the fresh mill feed tonnage rate by centrifugal concentration of the mill discharge and intensive cyanidation of gravity concentrates.”
The Iceberg master composite was tested for GRG using the EGRG test procedure. The results of the EGRG test measured 85.3% recoverable gravity gold that had a combined gravity concentrate gold grade of 1,983 g/t. The EGRG values do not directly predict or correlate gold recovery results from a closed-circuit milling operation but do indicate that there is a significant gravity gold component in the material.
| 13.4.2.3 | Gravity Tails Leach Evaluation |
The four master composites were separately treated in a gravity circuit and the gravity tails were leached with both the CIL process and by direct leach; the results of which are shown in Table 13-4.
| 13- |
|
| New Found Gold Corp. | Queensway Gold Project NI 43-101 Technical Report |
April 15, 2025 SLR Project No.: 233.065300.00001 |
Table 13-4: Master Composite Gravity Tails CIL and Direct Leach Extractions (approximately 75 µm grind)
| Master Composite | Calculated Head Grade (ppm Au) |
Gravity Extraction (%) |
Gravity Tails Leach Extraction (%) |
Total Au Extraction (%) |
| KZ-MC-1 (CIL) | 39.4 | 86.6 | 85.2 | 98.0 |
| KZ-MC-1 (Direct Leach) | 38.86 | 86.5 | 53.3 | 93.7 |
| KZ-MC-2 (CIL) | 3.97 | 55.8 | 76.7 | 89.7 |
| KZ-MC-2 (Direct Leach) | 3.92 | 56.2 | 16.0 | 63.2 |
| LZ-MC (CIL) | 12.5 | 80.3 | 74.2 | 94.9 |
| LZ-MC (Direct Leach) | 12.25 | 81.0 | 14.9 | 83.8 |
| IB-MC (CIL) | 11.4 | 33.8 | 87.3 | 91.6 |
| IB-MC (Direct Leach) | 11.7 | 32.9 | 73.5 | 82.2 |
Table 13-4 shows that the overall gravity/CIL extractions ranged from 89.7% to 98.0% and that gravity/direct leach extractions ranged from 63.2% to 93.7%. The lack of activated carbon in the direct leach to offset the impact of the organic preg-robbing carbon was interpreted to be the reason for the lower extraction.
Grinding the master composite samples to 37 µm increased gold extraction by less than 1%, which is unlikely to be economically advantageous. Therefore, a grind size of 75 µm was selected for testing the variability composites.
A retention time of 24 hours was also selected for testing the variability composites in CIL as gold extractions for the master composites were only marginally improved with longer leach times.
| 13.4.2.4 | Gravity Concentrate Intensive Cyanide Leaching |
An intensive cyanide leach on the master composite gravity concentrates produced gold extractions that were 96% for both KZ-MC-1 and KZ-MC-2 and 99% for the Lotto master composite. Some arsenopyrite captured in the KZ-MC-1 and KZ-MC-2 gravity concentrates was interpreted to be the reason for the lower intensive cyanide leach gold extraction for these samples.
| 13.4.3 | Master Composite Testing - Keats West |
Master composite testing is in progress at Base Met Labs for Keats West. Preliminary results are available, but a final report has not been received. Completion of the final report may result in some minor adjustments to any numbers contained in the summary tables presented. Preliminary results of the master composite testing are shown in Table 13-5.
Gravity extraction followed by CIL was tested first on the master composites for Keats West. The preliminary results found in Table 13-5 show that the gravity recoveries achieved ranged from 40.9% to 73.5% when tested at a grind size of 75 µm. Gravity gold recovery accounted for most of the gold extraction. Incremental extraction in the cyanide leach of the gravity tails ranged from 2.4% to 8.2%.
| 13- |
|
| New Found Gold Corp. | Queensway Gold Project NI 43-101 Technical Report |
April 15, 2025 SLR Project No.: 233.065300.00001 |
A gravity/CIL test on the KW/Weak composite at a finer grind size of 35 µm yielded an overall gold extraction of 36.6% indicating that the finer grind would not likely increase gold extraction. This finding is consistent with the previously cited mineralogical report from AMTEL (2025), which indicated that significant amounts of free and fine gold were observed intermixed in a pyrite/arsenopyrite matrix and would not likely be liberated with finer grinding.
A gravity/cyanide leach without activated carbon on the KW/Weak composite yielded an overall gold extraction of 29.7%. The KW/Weak composite contained the least amount of TOC, 0.08%, yet the results of this test indicated that this amount was enough to reduce gold extraction by approximately 10%. Test work results are summarized in Table 13-5.
Due to the low gold extraction in the gravity tails, several different sulphur oxidation processes will be considered to extract gold from the pyrite/arsenopyrite matrix. Flotation test work results showed that a sulphide flotation concentrate could be made that would contain more than 90% of the gold. Test work using these concentrates is in progress to assess amenability to different techniques for breaking down the pyrite/arsenopyrite matrix and exposing the fine and free gold particles to cyanide leaching.
Table 13-5: Summary of Keats West Master Composite Testing
| Master Composite Sample ID | Flowsheet | Grind (µm) |
Total Organic Carbon (%) |
Sulphur (%) |
Calculated Head (g/t) |
Gravity Extraction (%) |
Leach Extraction (%) |
Overall Extraction (%) |
| KW/Weak | Gravity/CIL | 75 | 0.08 | 1.79 | 2.79 | 32.7 | 8.0 | 40.7 |
| KW/Mod | Gravity/CIL | 75 | 0.14 | 1.95 | 5.72 | 50.3 | 8.1 | 53.1 |
| KW/Strong | Gravity/CIL | 75 | 0.60 | 1.65 | 11.1 | 71.1 | 2.4 | 73.5 |
| KW/Weak | Gravity/CIL | 35 | 0.08 | 1.79 | 3.22 | 28.3 | 11.3 | 36.6 |
| KW/Weak | Gravity/CN Leach | 75 | 0.08 | 1.79 | 3.09 | 29.5 | 0.2 | 29.7 |
| 13.4.3.1 | Comminution Testing |
Comminution tests were completed at Base Met Labs for the KW/Weak and KW/Mod master composites. The tests included the SMC breakage test to determine A x b values, BWi, and Bond Ai. The results of the tests are shown in Table 13-6.
Table 13-6: Keats West Master Composite Comminution Test Summary
| Master Composite | SMC A x b |
BWi (kWh/t) |
Bond Ai (g) |
| KW-MC/Weak | 70.5 | 18.7 | 0.093 |
| KW-MC/Mod | 52.8 | 18.4 | 0.162 |
The SMC A x b values for the two master composites bracketed both ends of the spectrum of the Keats master composite samples. The KW-MC/Weak SMC index at 70.5 was higher than the Keats master composites, which averaged approximately 62, indicating that the material breaks more easily and should pass through a primary grinding mill at a higher rate. The KW-MC/Mod SMC index at 52.8 was lower than the Keats master composite KZ-MC-1, which had a value of 59.4 indicating that it was harder than the approximate average value of Keats.
| 13- |
|
| New Found Gold Corp. | Queensway Gold Project NI 43-101 Technical Report |
April 15, 2025 SLR Project No.: 233.065300.00001 |
The BWi values of 18.7 kWh/t and 18.4 kWh/t were above the range of the values of Keats /Lotto/Iceberg, which ranged from 16.9 kWh/t to 18.3 kWh/t.
| 13.4.4 | Variability Composite Testing - Keats, Lotto, Golden Joint, Iceberg |
All 162 variability composite samples were subjected to gravity gold extraction at a target grind of 212 µm, gravity tails were reground to target grinds of 75 µm and 37 µm, then treated by CIL for 24 hours. Table 13-7 shows a summary of the 75 µm results of the tests.
Table 13-7: Summary of Variability Composite Gravity/CIL Extractions
| Zone | No. of Variability Composites | Minimum Head Grade (ppm Au) |
Maximum Head Grade (ppm Au) |
Average Head Grade (ppm Au) |
Minimum Overall Extraction (% Au) |
Maximum Overall Extraction (% Au) |
| Golden Joint | 14 | 0.87 | 18.86 | 5.13 | 31.3 | 94.8 |
| Keats 1, 2 & 3 | 29 | 0.77 | 100.38 | 15.15 | 65.2 | 99.6 |
| Keats 4 | 16 | 0.63 | 33.14 | 5.85 | 50.0 | 98.4 |
| Keats 5 | 34 | 0.35 | 170.99 | 17.31 | 36.4 | 99.8 |
| Lotto | 23 | 0.48 | 65.35 | 9.38 | 38.4 | 99.1 |
| Iceberg | 46 | 0.49 | 118.7 | 19.84 | 36.6 | 99.5 |
| 13.4.4.1 | Arsenic Content vs Gold Tails Grade |
A review of the results of the leach tests for the variability composites indicated that there was a relationship between arsenic content and CIL gold tails grade. This finding is consistent with the results of the gold deportment studies completed by AMTEL (2023, 2024).
An analysis of the data was completed, comparing the relationship between arsenic content and gold tails grade for different ranges of gold head grade (Simmons pers.comms. 2025). The analysis compartmentalized the gold head grade in range increments from <1.0 ppm, 1.0 ppm to 2.0 ppm, 2.0 ppm to 4.0 ppm, 4.0 ppm to 7.0 ppm, and >7 ppm.
Figure 13-12 illustrates the positive correlation between arsenic content and gold tails grade in variability composites with a gold head grade ranging from 2 ppm to 4 ppm.
Table 13-8 summarizes the correlation calculations between arsenic content and gold tails grade for the grouped gold grade ranges.
| 13- |
|
| New Found Gold Corp. | Queensway Gold Project NI 43-101 Technical Report |
April 15, 2025 SLR Project No.: 233.065300.00001 |
Figure 13-12: Gold Tails Grade versus Arsenic Content for Gold Head Grades Ranging from 2.0 ppm to 4 ppm
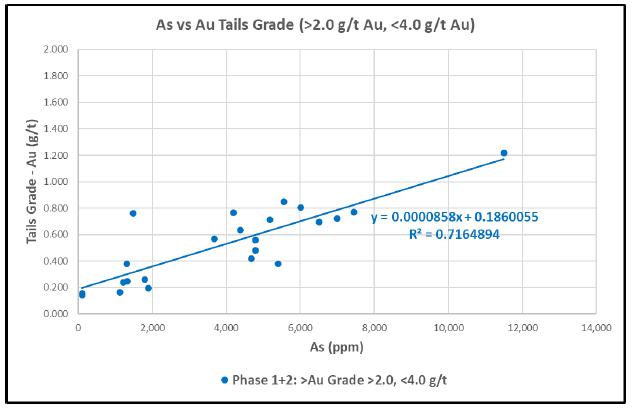
Source: Simmons pers.comms. 2025.
Table 13-8: Arsenic Versus Gold Tails Grade Relationship
| Gold Head Grade | As vs Au Tails Grade Relationship |
| <1.0 ppm | Au Tails Grade = 0.00001174*(Arsenic ppm) + 0.0729548 |
| >1.0 ppm, <2.0 ppm | Au Tails Grade = 0.0000679*(Arsenic ppm) + 0.2064220 |
| >2.0 ppm, <4.0 ppm | Au Tails Grade = 0.0000858*(Arsenic ppm) + 0.1860055 |
| >4.0 ppm, <7.0 ppm | Au Tails Grade = 0.0000603*(Arsenic ppm) + 0.3496080 |
| >7.0 ppm | Au Tails Grade = 0.0000052*(Arsenic ppm) + 0.4993881 |
| 13.4.4.2 | Alternative Process Evaluation - Keats, Lotto, Iceberg |
A study was performed to test the proposed flotation scheme on selected low grade variability composites that exhibited low gold extraction for Keats and Lotto (less than 80% overall extraction from gravity-CIL) and the Iceberg master composite.
The following are brief descriptions of the flowsheets tested.
| • | Flowsheet A - Gravity/CIL |
| • | Flowsheet B - Gravity/Carbon flotation followed by CIL of flotation tailings |
| • | Flowsheet C - Gravity/Carbon flotation followed by sulphide flotation, concentrate re-grind, and CIL of sulphide flotation concentrate. |
| 13- |
|
| New Found Gold Corp. | Queensway Gold Project NI 43-101 Technical Report |
April 15, 2025 SLR Project No.: 233.065300.00001 |
The use of carbon flotation was investigated to remove organic carbon and reduce the preg-robbing characteristics of the samples. The carbon flotation tails were then cyanide leached (flowsheet option B). It was assumed that any gold recovered in the 1st carbon cleaner flotation concentrate would be a throw-away product, unless future studies show this can be sold to a commercial smelter.
Sulphide flotation was investigated to increase extraction of gold locked in the arsenopyrite matrix by re-grinding the sulphide flotation concentrate before cyanide leaching for gold extraction (flowsheet option C).
The results of the study are summarized in Table 13-9.
Table 13-9: Summary of Alternative Process Test Results
| Sample | Flowsheet Option | Test | Calculated Head Au Grade (g/t) |
Gravity-Sulphide Flotation Gold Recovery (%) |
Re-grind Size (µm) |
Overall Gold Extraction (%) |
Sodium Cyanide Usage (kg/t) | Lime Usage (kg/t) |
| KZ4 #8 | A | CIL42C | 1.70 | - | - | 72.7 | 1.33 | 1.17 |
| B | CIL139D | 1.95 | - | - | 70.0 | 0.58 | 1.23 | |
| C | CIL139E | 2.07 | 95.8 | 20 | 72.4 | 0.36 | 0.30 | |
| KZ5 #35 | A | CIL69C | 1.70 | - | - | 63.9 | 1.09 | 1.24 |
| B | CIL140D | 1.59 | - | - | 64.2 | 0.63 | 1.25 | |
| C | CIL140E | 1.36 | 89.3 | 20 | 63.7 | 0.28 | 0.27 | |
| LZ #15 | A | CIL99C | 1.24 | - | - | 56.5 | 1.32 | 1.50 |
| B | CIL141D | 1.25 | - | - | 48.5 | 0.63 | 1.34 | |
| C | CIL141E | 1.19 | 90.1 | 20 | 48.5 | 0.26 | 0.23 | |
| IB-MC | A | CIL-02C | 11.4 | - | - | 91.7 | 0.13 | 0.61 |
| B | T52 | 12.1 | - | - | 92.7 | 1.70 | 0.96 | |
| C | T52 | 12.1 | 96.7 | 20 | 91.2 | 0.22 | 0.26 |
Table 13-9 shows that both the carbon (flowsheet B) and carbon/sulfide flotation (flowsheet C) processing schemes returned similar results to the standard gravity/CIL (flowsheet A) for the variability composites tested. Overall gold extractions for the different flowsheets are within the margin of error for these tests.
Removing carbon and sulphide through flotation and re-grinding of the sulphide concentrate did not improve gold extraction due to refractory gold in arsenopyrite and pyrite. The carbon flotation step resulted in the loss of 1% to 5% of overall gold in the samples. However, sulphide flotation was effective at recovering the gold not recovered during gravity concentration or lost during carbon flotation for all of the composites, with sulphide rougher flotation recoveries ranging from 91% to 96% of gold in the gravity and carbon flotation tailings. The sulphide rougher flotation concentrate grades ranged from 9 g/t Au to 67 g/t Au. Upgrading of rougher concentrates to produce saleable concentrate would result in some gold loss, which may be off-set by leaching of flotation tailings, however, this needs to be proven through test work. In the interim, SLR has selected an average overall recovery for use in Mineral Resource estimation of 90% using a gravity-flotation-CIL flowsheet.
| 13- |
|
| New Found Gold Corp. | Queensway Gold Project NI 43-101 Technical Report |
April 15, 2025 SLR Project No.: 233.065300.00001 |
Preliminary test work has been completed on the master composites from Keats West using the same three flowsheets, and results indicate that the majority of the unleachable gold in the gravity tails could be recovered to a flotation concentrate.
Table 13-9 also shows that cyanide consumption was reduced by approximately 50% in flowsheet B for the Keats and Lotto Zone variability composites, assumed to be due to the pre-aeration step that was added prior to CIL leaching of the flotation tails. Pre-aeration was not included in the tests using the IB-MC composite.
No discernable change in lime consumption was observed due to pre-aeration.
| 13.5 | Reagent Consumptions |
The metallurgical test work for the variability composites using the gravity-CIL flowsheet for Keats, Lotto, and Golden Joint showed reagent consumptions for cyanide and lime of 1.30 kg/t and 1.52 kg/t, respectively. Test work using pre-aeration indicated that cyanide consumption could be significantly reduced.
The test work for the Iceberg variability composites incorporated a pre-aeration step prior to CIL. Reagent consumptions for the variability composites for sodium cyanide and lime averaged 0.32 kg/t and 2.71 kg/t, respectively.
| 13.6 | Summary |
Samples used in test work were selected to provide a wide range of gold head grades for evaluation. Since the samples were selected prior to the completion of geological modelling and resource estimation, their selection did not benefit from detailed knowledge of grade distributions within each zone or the extents of each zone.
Test work to date on samples from the Keats, Lotto, Golden Joint, and Iceberg zones has focused on a gravity concentration-CIL flowsheet and included exploratory test work using master composites and variability test work using variability composites. The master composites for each zone were produced by combining portions from all of the variability composites from their respective zones. The variability test work on Iceberg composites included a pre-aeration step prior to cyanide leaching, while the variability test work on Keats, Lotto, and Golden Joint composites did not.
Exploratory test work using the Keats and Lotto master composites returned high GRG recoveries, while indicating that preg-robbing affected cyanide leaching extractions from the gravity tails. Therefore, subsequent variability testing on composites from these zones used gravity concentration followed by CIL of the gravity tails. The variability test work was conducted at three grind sizes for each composite, 212 µm, 75 µm, and 37 µm, to assess the effect of grind size on gold recovery, with a P80 of 75 µm ultimately being chosen as the optimum grind size.
Analysis of the CIL test results from the variability test work using Keats, Lotto, and Golden Joint composites showed that there was a relationship between leach extraction and arsenic head grade, indicating that a portion of the gold in the samples was associated with arsenic and refractory to leaching. This relationship was pronounced in the samples with lower gold head grades (<4 g/t Au). This analysis, together with mineralogical data indicated that the unleached gold was likely associated with arsenopyrite (and possibly pyrite) and not well liberated.
| 13- |
|
| New Found Gold Corp. | Queensway Gold Project NI 43-101 Technical Report |
April 15, 2025 SLR Project No.: 233.065300.00001 |
Exploratory flotation test work was completed on Keats, Lotto, and Iceberg master composites as well as four variability composites from the Keats and Lotto zones selected due to their relatively poor gravity-CIL responses (with overall gold extractions ranging from 57% to 73%). Carbon flotation aimed at rejecting carbon to minimize its pre-robbing effect indicated that some loss of gold would occur in this step and overall extraction was not beneficially affected. Sulphide flotation was effective at recovering gold from gravity and carbon flotation tails into a concentrate, however, re-grinding of that concentrate was not effective at improving gold extraction during leaching.
During the flotation test work, pre-aeration of gravity tails prior to carbon flotation and tails leaching appeared to be beneficial in reducing cyanide consumption during subsequent leaching of the sulphide concentrates.
In general, the test work completed to date indicated that gold was present in two main forms in the samples tested: free gold amenable to gravity recovery and extraction by cyanide leaching, and gold associated with arsenic that was partially amenable to cyanide leaching or recoverable by flotation. Higher grade samples (>4 g/t Au) contained higher proportions of free gold, while the lower grade samples (<4 g/t Au) tended to be increasingly characterized at decreasing gold grades by partially liberated or unliberated gold associated with arsenic.
Comminution test work was completed on master composites from each zone and a selection of eight Iceberg variability composites and indicated that the material was amenable to conventional crushing and grinding.
Test work on samples from Keats West is currently underway at Base Met Labs with initial tests on the master composites indicating that CIL extraction from the gravity tails was poor. Preliminary results from flotation test work on gravity tails of the master composites indicated that it was effective at recovering the unleachable gold.
| 13.7 | Future Metallurgical Testing |
Test work should be conducted to evaluate the production of a saleable sulphide concentrate containing gold, building on the preliminary flotation test work already completed. Sulphide flotation could be employed before or after cyanide leaching, and both of these options should be evaluated in test work and in a subsequent trade-off study to determine which would be the preferrable option if flotation was to be included in the flowsheet.
Sulphide oxidation test work should be conducted on Keats, Lotto, Golden Joint, Iceberg, and Keats West flotation concentrates to assess their amenability to this technique to support trade-off studies evaluating the technical and economic characteristics of different sulphide oxidation technologies.
The pre-aeration step should be continued in future CIL testing.
Future sample selection and test work should be coordinated with the development of a geological model that may include additional species such as cyanide soluble gold, sulphur, arsenic, iron, and organic carbon, and that will provide detailed information on gold grade distribution within the various zones. Additionally, the development of mine plans during more advanced stages of study should be used to ensure that samples selected for test work represent material that would be processed in a mill.
| 13- |
|
| New Found Gold Corp. | Queensway Gold Project NI 43-101 Technical Report |
April 15, 2025 SLR Project No.: 233.065300.00001 |
| 14.0 | Mineral Resource Estimates |
| 14.1 | Summary |
Geological and mineralization domains were constructed by NFG and reviewed by SLR. The initial Mineral Resource estimate was prepared by SLR. The resource database was closed on November 1, 2024 and contains 3,214 drill holes for a total of 723,387 m, for which 550,949 m have assay intervals, following exclusion of 23 drill holes due to data issues.
The Mineral Resource estimate for the Queensway Project encompasses multiple zones grouped into three primary areas (AFZ Core, AFZ Peripheral, and JBP). The AFZ Core area contains the majority of zones, including K2 and Monte Carlo; Keats West, Cokes, and Powerline; Keats, Keats South, Iceberg, Iceberg Alley, Knob, and Golden Bullet; as well as Lotto, Golden Joint, Jackpot, and Honeypot. These zone names reflect the most prominent veins contributing to the contained metal within each zone, though each zone includes numerous additional veins beyond those listed. The AFZ Peripheral area includes the Big Vein, Pristine, HM, and Midway zones. The JBP area includes the H Pond, 1744, and Pocket Pond zones. All Mineral Resources are located within the QWN block; no Mineral Resources have been estimated for the QWS area.
Geological and mineralization wireframes, as well as classification wireframes, were constructed using Leapfrog Geo software, while grade estimation for the AFZ Core area was completed using the Python-based Resource Modeling Solutions Platform (RMSP). Grade estimation of the AFZ Peripheral and JBP areas was completed using Leapfrog Edge. Open pit constraining pit shells were generated in Whittle, while constraining underground panels were generated in Deswik.
Within the AFZ Core area, mineralization domains include 308 veins and nine halo domains that define areas of complex mineralization beyond the vein domains. These halo domains are spatially restricted to zones where structurally complex vein intersections occur. Outside the veins, a 2 m buffer captures adjacent low grade mineralization; however, the halo domains take precedence over this buffer.
Within the AFZ Peripheral area, mineralization domains consist of 33 veins, while the JBP area contains 17 veins. Both areas include a 2 m buffer around the veins capturing adjacent low-grade mineralization. The AFZ Peripheral and JBP areas do not have halo domains.
Gold grade was interpolated using an Inverse Distance cubed (ID3) algorithm, with search neighbourhood parameters supported by variography undertaken for key veins. Dynamic anisotropy was applied to the vein estimates, rotating the search neighbourhoods according to angles estimated from the vein hanging walls. Plunges were projected onto the dynamic anisotropy surface for selected veins when anisotropy was evident. Planar anisotropic trends were applied to the halo domains, while the buffer zone was treated as isotropic.
Individual estimation domains were grouped based on spatial proximity and similarities in gold grade distribution, the proportion of samples exceeding specific grade thresholds, and the sensitivity of mean domain grades to preliminary capping levels. Within these groups, samples were capped following a review of histograms, probability plots, decile analysis, and a spatial assessment of intervals affected by the selected grade caps.
Estimation samples were composited to one-metre lengths within the mineralization domains, corresponding to the dominant sample length. Residual end lengths below 0.3 m were added to the previous interval and no minimum sample coverage was required. Unsampled intervals were assigned zero grades.
| 14- |
|
| New Found Gold Corp. | Queensway Gold Project NI 43-101 Technical Report |
April 15, 2025 SLR Project No.: 233.065300.00001 |
The SLR QP validated the estimates through visual comparison of block and composite grades, statistical comparison of block and composite grades, swath plots, and comparison with Nearest Neighbour (NN) check estimates for all veins. For selected high-value veins estimated using a scripted RMSP workflow, further check ID3 estimates were completed in parallel using Leapfrog Edge, validating the RMSP results.
Average density values were assigned to geological and mineralization domains, supported by wax-coated water immersion measurements made on drill core samples. Within the veins and halo domains, a density of 2.7 t/m3 was assigned.
Block models were rotated 30° clockwise about the vertical axis, to better align with the strike of the mineralization. The estimation block model has a parent block dimension of 2.5 m by 2.5 m by 5 m, with a minimum sub-block size of 0.625 m by 0.625 m by 1.25 m.
For the purposes of open pit optimization, the block model was re-blocked to 5 m by 5 m by 5 m, while open pit Mineral Resources are reported from a block model regularized to the parent cell size. Underground reporting panels were generated from the original estimation sub-block model, which was also used to report the underground Mineral Resources.
To demonstrate reasonable prospects for eventual economic extraction (RPEEE), open pit Mineral Resources are constrained by a preliminary optimized open pit shell and reported above a cut-off grade of 0.3 g/t Au.
Underground Mineral Resources are constrained by reporting panels generated at a cut-off grade of 1.65 g/t Au and a minimum mining width of 1.8 m.
Canadian Institute of Mining, Metallurgy and Petroleum (CIM) Definition Standards for Mineral Resources and Mineral Reserves (CIM (2014) definitions) were used for Mineral Resource classification.
Mineral Resources for the Project are tabulated in Table 14-1, with an effective date of March 15, 2025.
| 14- |
|
| New Found Gold Corp. | Queensway Gold Project NI 43-101 Technical Report |
April 15, 2025 SLR Project No.: 233.065300.00001 |
Table 14-1: Summary of Mineral Resources - Effective Date March 15, 2025
| Zone | Area | Category | Tonnage (000 t) |
Grade (g/t Au) |
Contained Metal (000 oz Au) |
| Open Pit | |||||
| K2, Monte Carlo | AFZ Core | Indicated | 3,588 | 1.51 | 175 |
| Inferred | 3,755 | 1.22 | 147 | ||
| Keats West, Cokes, Powerline | AFZ Core | Indicated | 4,392 | 1.85 | 261 |
| Inferred | 2,410 | 1.33 | 103 | ||
| Keats, Keats South, Iceberg, Iceberg East, Iceberg Alley, Knob, Golden Bullet | AFZ Core | Indicated | 7,004 | 2.94 | 662 |
| Inferred | 1,037 | 0.84 | 28 | ||
| Lotto, Golden Joint, Jackpot, Honeypot | AFZ Core | Indicated | 1,205 | 3.16 | 122 |
| Inferred | 1,078 | 1.31 | 45 | ||
| Big Vein, Pristine, HM, Midway | AFZ Peripheral | Indicated | 995 | 0.82 | 26 |
| Inferred | 474 | 1.56 | 24 | ||
| H Pond, 1744, Pocket Pond | JBP | Indicated | 83 | 1.54 | 4 |
| Inferred | 206 | 1.66 | 11 | ||
| Sub-Total, Open Pit | Indicated | 17,267 | 2.25 | 1,249 | |
| Inferred | 8,960 | 1.24 | 358 | ||
| Underground | |||||
| K2, Monte Carlo | AFZ Core | Indicated | 32 | 3.02 | 3 |
| Inferred | 335 | 2.78 | 30 | ||
| Keats West, Cokes, Powerline | AFZ Core | Indicated | - | - | - |
| Inferred | 28 | 2.76 | 3 | ||
| Keats, Keats South, Iceberg, Iceberg East, Iceberg Alley, Knob, Golden Bullet | AFZ Core | Indicated | 306 | 5.13 | 50 |
| Inferred | 660 | 4.53 | 96 | ||
| Lotto, Golden Joint, Jackpot, Honeypot | AFZ Core | Indicated | 303 | 6.97 | 68 |
| Inferred | 394 | 6.34 | 80 | ||
| Big Vein, Pristine, HM, Midway | AFZ Peripheral | Indicated | 100 | 5.42 | 17 |
| Inferred | 119 | 5.72 | 22 | ||
| H Pond, 1744, Pocket Pond | JBP | Indicated | 30 | 4.09 | 4 |
| Inferred | 214 | 2.79 | 19 | ||
| Sub-Total, Underground | Indicated | 771 | 5.76 | 142 | |
| Inferred | 1,749 | 4.44 | 250 | ||
| 14- |
|
| New Found Gold Corp. | Queensway Gold Project NI 43-101 Technical Report |
April 15, 2025 SLR Project No.: 233.065300.00001 |
| Zone | Area | Category | Tonnage (000 t) |
Grade (g/t Au) |
Contained Metal (000 oz Au) |
| Open Pit + Underground | |||||
| Total | Indicated | 18,038 | 2.40 | 1,392 | |
| Inferred | 10,709 | 1.77 | 608 | ||
|
Notes: 1. CIM (2014) definitions were followed for Mineral Resources. 2. Mineral Resources are estimated using a long-term gold price of US$2,200 per ounce, and a US$/C$ exchange rate of US$1.00 = C$1.43. 3. Open pit Mineral Resources are estimated at a cut-off grade of 0.3 g/t Au and constrained by a preliminary optimized pit shell with a pit slope angle of 45°, and bench height of 5 m. 4. RPEEE for underground Mineral Resources was demonstrated by constraining with MSO shapes generated at a cut-off grade of 1.65 g/t Au, with heights of 10 m, lengths of 5 m, and a minimum mining width of 1.8 m. 5. The optimized pit shell, underground reporting shapes, and cut-off grades were generated by assuming metallurgical recovery of 90%, standard treatment and refining charges, mining costs of C$5.0/t moved for open pit and C$120/t processed for underground, processing costs of C$20/t processed, and general and administrative costs of C$7.5/t processed. 6. Mineral Resources that are not Mineral Reserves do not have demonstrated economic viability. 7. Bulk density within the vein and halo mineralization domains is 2.7 t/m3. 8. Numbers may not add due to rounding. |
|||||
The SLR QP is not aware of any environmental, permitting, legal, title, taxation, socio-economic, marketing, political, or other relevant factors that could materially affect the Mineral Resource estimate other than those discussed in Section 14.14.3.
| 14.2 | Resource Database |
SLR was provided a database comprising 3,549 drill holes and trenches for a total of 786,021 m. The complete database includes 312 holes of historical drilling from previous operators that is outside of the current property boundary. Drill holes located outside of the property boundary were not used in the resource database.
The resource database was closed on November 1, 2024 and contains 3,214 of “on-property” drill holes and trenches for a total of 723,377 m, for which 550,949 m have assay intervals (Table 14-2). Drill hole NFGC-24-2185, which was in progress at the time the resource database was closed, was included in calculation of the total metres, but was excluded in the count of the total number of drill holes. After ignoring holes due to being incomplete (including holes in-progress) or missing survey data the resulting total of “on-property” collars is 3,214 totalling 723,377 m.
Table 14-2: Resource Database
| Table | Records | Length (m) |
| Collars | 3,214 | 723,377 |
| Assay | 639,641 | 550,949 |
Sample intervals with missing Au assays were assigned default zero grades during the estimation with the exception of assays that were pending at the time of the database cut-off.
Drill hole assaying status was recorded in the “Assay_Complete” variable of the collar table, which indicated whether assays were complete or pending (Table 14-3).
| 14- |
|
| New Found Gold Corp. | Queensway Gold Project NI 43-101 Technical Report |
April 15, 2025 SLR Project No.: 233.065300.00001 |
Drill holes containing only pending assay results were not assigned default zero grades during the Mineral Resource estimate. Drill holes with status “2” and “3” did not intersect the mineralized domains and missing intervals were mapped to zeros. In addition, wedge holes were not assigned default grades in intervals above the shallowest assayed interval, to prevent conflicts with the parent hole. Though the grades were not duplicated in wedge holes and the parent holes, to facilitate importing of the drilling into Leapfrog software, the length of wedge drill holes that overlap with the parent hole is included in the total length shown in Table 14-2.
Table 14-3: Drill Hole Assay Status
| Status | Count of Holes | Length of Holes (m) | Description | Treatment in Estimate |
| 0 | 2,920 | 675,290 | Complete | Missing intervals mapped to zero |
| 2 | 1 | 1,556 | Extension samples pending, original samples complete | Missing intervals mapped to zero |
| 3 | 4 | 3,357 | Partial results | Missing intervals mapped to zero |
| 4 | 26 | 10,817 | Pending results | Missing intervals unmapped |
| 5 | 333 | 44,848 | Historic with assay | Missing intervals mapped to zero |
| 6 | 265 | 50,155 | Historic no assay | Missing intervals mapped to zero |
In addition to the off-property holes, five drill holes were excluded due to incomplete coordinates or depth data, while a further 15 holes were excluded due to lack of survey data (Table 14-4).
Table 14-4: Drill Hole Exclusions
| Hole Number | Comment |
| NFGC-21-444 | excluded in Leapfrog - lost hole, no core recovered |
| NFGC-21-434A | excluded in Leapfrog - not drilled due to wet ground conditions |
| NFGC-21-284 | excluded in Leapfrog - no casing left in hole, not surveyed |
| NFGC-22-623A | excluded in Leapfrog - lost hole, no core recovered |
| AVP-C-10 | excluded in Leapfrog - incomplete Labrador Gold hole |
| K-21-074RL | lacking survey |
| NFGC-24-2186 | lacking survey - hole in-progress at time of database closure |
| K-21-075RL | lacking survey |
| K-21-027RL | lacking survey |
| K-21-116RL | lacking survey |
| K-21-091RL | lacking survey |
| K-21-030RL | lacking survey |
| NFGC-24-2187 | lacking survey - hole in-progress at time of database closure |
| 14- |
|
| New Found Gold Corp. | Queensway Gold Project NI 43-101 Technical Report |
April 15, 2025 SLR Project No.: 233.065300.00001 |
| Hole Number | Comment |
| K-21-103RL | lacking survey |
| K-21-036RL | lacking survey |
| K-21-012RL | lacking survey |
| K-21-039RL | lacking survey |
| K-21-017RL | lacking survey |
| K-21-111RL | lacking survey |
| NFGC-24-2185 | lacking survey - hole in-progress at time of database closure |
| 14.3 | Geological Interpretation |
| 14.3.1 | Structure |
The AFZ is the primary structure controlling gold mineralization at Queensway Project, hosting significant deposits such as Keats, Iceberg, Keats West, Golden Joint, and Lotto. The AFZ has been modeled by NFG geologists within the AFZ Core area over a strike length of 17 km. The width of the modeled structure ranges from approximately 20 m to 70 m true width. Gold mineralization occurs in both the footwall and hanging wall, with steeply dipping quartz-carbonate veins in the footwall and broad stockwork veining and low-angle faulting in the hanging wall. The KBFZ is a major ductile-brittle fault zone that runs obliquely east of the AFZ and plays a role in controlling gold vein arrays. Extending through Keats, Iceberg-Iceberg East, and Iceberg Alley, it forms an extensive damage zone that splays from the AFZ, creating mineralized domains along a 1.9 km strike length. The JBPFZ, spanning 12.5 km, hosts gold mineralization in ductile-brittle deformation zones, with epizonal-style vein arrays that parallel the southwest-striking stratigraphy, primarily in green siltstones.
Although mineralized drill hole samples are sometimes encountered within the AFZ, this is interpreted to reflect vein mineralization reworked during post mineral fault reactivation. As such, mineralized domains were largely constrained to the northwest of the AFZ hanging wall and to the southeast of the footwall. Although small portions of the wireframes sometimes extended into the AFZ, they do not significantly contribute to the estimated Mineral Resources at the AFZ Core and AFZ Peripheral areas and this material was limited to Inferred classification. SLR recommends that NFG continue to evaluate the geological and grade continuity of mineralized vein wireframe interpretations hosted within or extending into the modelled AFZ structure. SLR also recommends that NFG continue with plans for drilling geotechnical and hydrological drill holes to support considerations for open pit and underground optimization parameters.
Several mineralized faults are modelled as veins which offset or terminate other mineralized veins. Figure 14-1 shows selected mineralized faults in the context of all modelled mineralized veins in the AFZ Core area. An inset shows how Cokes_EastShear mineralized vein provides the eastern termination to several related mineralized veins.
| 14- |
|
| New Found Gold Corp. | Queensway Gold Project NI 43-101 Technical Report |
April 15, 2025 SLR Project No.: 233.065300.00001 |
Figure 14-1: AFZ Core Area Selected Mineralized Faults Shown with All Veins

| 14- |
|
| New Found Gold Corp. | Queensway Gold Project NI 43-101 Technical Report |
April 15, 2025 SLR Project No.: 233.065300.00001 |
| 14.3.2 | Geology |
Geological domains were constructed by NFG personnel using Leapfrog Geo and reviewed by SLR. These models were developed separately for different areas of the Project. While some boundary misalignments and larger volumes of unassigned background lithology are present, they do not impact the Mineral Resource estimate, as gold mineralization is structurally, rather than lithologically controlled.
The SLR QP recommends that NFG continue to develop a unified geological model and improve geological consistency across the Project. While such a model may not significantly impact mineralization modelling, it may enhance the overall geological framework and support broader exploration efforts.
| 14.3.2.1 | AFZ Core Area |
Lithological wireframes are constructed with practical resolution, focusing on identifying larger packages of siltstone and greywacke based on shared characteristics such as colour and geochemistry, rather than tracing specific interbeds between drill holes. Consequently, lithological wireframes categorized as greywacke may include significant amounts of logged siltstone, and vice versa.
The two main lithological units at the Project are greywackes and siltstones. The lithological wireframes delineate three greywacke units (SDG, SDG_Cr, and SDG_IB) and six siltstone units (BSIL, SIL, SIL_CuRich, SIL_GreyGreen, SILCR, and SILNI).
A separate overburden (OVB) wireframe was generated by NFG for the AFZ Core area and used to flag the relevant OVB blocks in the block model.
The resulting geological domains coded in the block model in the “geodom” and “geocode” variables are shown in Table 14-5:
Table 14-5: Modelled Geological Domain Block Model Code
| “geodom” | “geocode” | Description |
| AMD | 1 | Amygdular Mafic to Intermediate Dikes |
| BSGI | 2 | Interbedded siltstone and Greywacke |
| BSIL | 3 | Black Siltstone / Graphitic Siltstone |
| CMT | 4 | Conglomerate |
| Diabase_Var | 5 | Variolitic Diabase |
| GAB | 6 | Gabbro |
| SDG | 7 | Greywacke |
| SDG_Cr | 8 | Chrome-rich Greywacke |
| SDG_IB | 9 | Chrome-rich Greywacke - Interbedded with Siltstone |
| SIL | 10 | Siltstone |
| SILCR | 11 | Chrome-rich Siltstone |
| SILNI | 12 | Nickel-rich Siltstone |
| SIL_CuRich | 13 | Copper-rich Siltstone |
| 14- |
|
| New Found Gold Corp. | Queensway Gold Project NI 43-101 Technical Report |
April 15, 2025 SLR Project No.: 233.065300.00001 |
| “geodom” | “geocode” | Description |
| SIL_GreyGreen | 14 | Grey-Green Siltstone |
| Unknown | 15 | Unknown within model |
| AIR | 16 | Above topography |
| OVB | 17 | Overburden |
| outside | 999 | Outside of the modelled volume |
The geological model for the AFZ Core area is shown in Figure 14-2, without overburden.
Since some lithological units are defined by geochemistry, the SLR QP recommends that NFG continue submitting assay samples for multi-element geochemical analysis in future programs.
| 14- |
|
| New Found Gold Corp. | Queensway Gold Project NI 43-101 Technical Report |
April 15, 2025 SLR Project No.: 233.065300.00001 |
Figure 14-2: AFZ Core Area Geological Model

| 14- |
|
| New Found Gold Corp. | Queensway Gold Project NI 43-101 Technical Report |
April 15, 2025 SLR Project No.: 233.065300.00001 |
| 14.3.2.2 | AFZ Peripheral and JBP |
Similar to the lithological wireframes for the AFZ Core area, wireframes for the AFZ Peripheral area were created by NFG at a project scale capturing the larger packages of siltstone and greywacke, as opposed to specific lithological intervals in the core logging.
The AFZ Peripheral area is divided by the Appleton Fault which is oriented in a northeast-southwest direction and dips steeply to the northwest. The hanging wall side has two main units consisting of interbedded black siltstone and greywacke and larger packages of siltstone. The footwall side is predominantly siltstone.
The JBP area is predominantly siltstone. Because of the homogeneous lithological characteristics, no wireframes were generated.
SLR generated the OVB wireframes for the AFZ Peripheral and JBP areas.
The geological model for the AFZ Peripheral area is shown in Figure 14-3.
| 14- |
|
| New Found Gold Corp. | Queensway Gold Project NI 43-101 Technical Report |
April 15, 2025 SLR Project No.: 233.065300.00001 |
Figure 14-3: AFZ Peripheral Geological Model
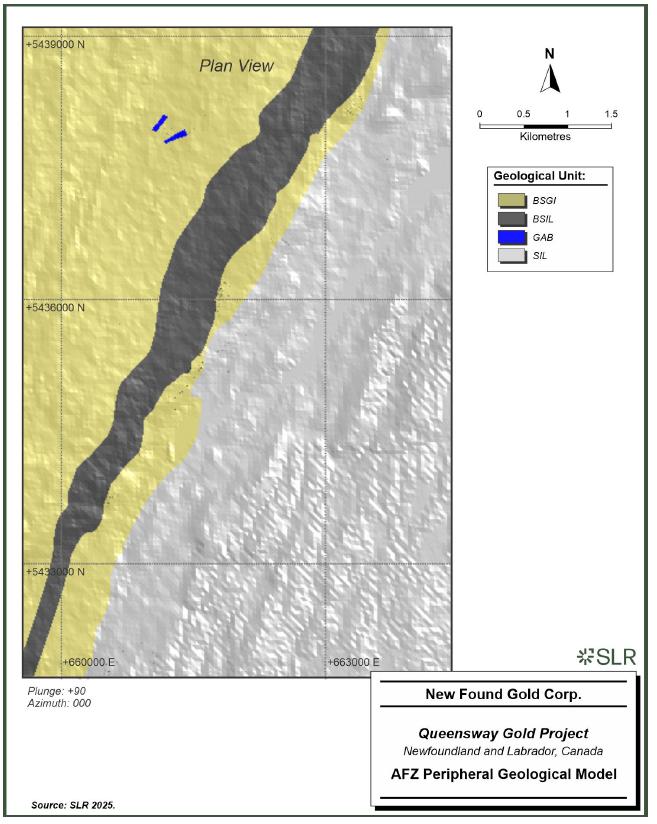
| 14- |
|
| New Found Gold Corp. | Queensway Gold Project NI 43-101 Technical Report |
April 15, 2025 SLR Project No.: 233.065300.00001 |
| 14.3.3 | Mineralization |
Mineralization domains were constructed by NFG personnel using Leapfrog Geo and modified by SLR.
Mineralization at Queensway was modelled as veins, halos, and a 2 m buffer zone around the veins.
The veins represent the main mineralized veins, for which there is sufficient drill hole data to support a spatial interpretation.
Halos capture zones of spatially continuous but complex mineralization occurring at the intersections of mineralized veins. These may consist of stockworks, veinlets, and other mineralized features with a range of orientations, that may not align with the overall vein orientations.
The vein buffer was generated to capture low grade mineralized samples immediately adjacent to the veins and to reduce dilution with default zero grades outside of the veins during re-blocking and reporting. The buffer was not generated around the halos and made no consideration of intercept grades.
The mineralization wireframes were truncated below the overburden surface and topography.
Veins were generated as Leapfrog Geo vein system objects in consideration of detailed structural interpretation, but permitted a minimum width of 2 m, and were constructed with a nominal Au cut-off grade of 0.4 g/t. Drill hole intercepts below 0.4 g/t Au were sometimes included within the veins if surrounded by higher grade intercepts, in order to maintain reasonable geological continuity and prevent excessively concave boundaries.
Halos were generated as Leapfrog Geo intrusion objects, with a nominal Au cut-off grade of 0.4 g/t. Drill hole intercepts below 0.4 g/t Au were sometimes included within the halos to maintain reasonable geological continuity.
Within the AFZ Core area, mineralization domains consist of 308 veins, a 2 m buffer around the veins capturing adjacent low-grade mineralization, and nine halo domains defining areas of complex mineralization occurring at the intersection of veins.
Within the AFZ Peripheral area, mineralization domains consist of 33 veins and a 2 m buffer around the veins capturing adjacent low-grade mineralization.
Within the JBP area, mineralization domains consist of 17 veins and a 2 m buffer around the veins capturing adjacent low-grade mineralization.
The buffer zone was truncated by the halo zones, as demonstrated by the vertical section shown in Figure 14-4. As noted above, for the geological interpretation, the SLR QP recommends that NFG continue submitting assay samples for multi-element geochemical analysis to help support mineralization interpretation. The following elements should be maintained as part of the current multi-element geochemical analysis package, as they are associated with mineralization or alteration at the Queensway Property:
| • | Arsenic (As) - Strongly associated with arsenopyrite, a common mineral occurring alongside gold mineralization. |
| • | Antimony (Sb) - Notably linked to boulangerite and stibnite, with stibnite particularly present at the K2 prospect. |
| • | Tungsten (W) - Associated with mineralization in select zones. |
| 14- |
|
| New Found Gold Corp. | Queensway Gold Project NI 43-101 Technical Report |
April 15, 2025 SLR Project No.: 233.065300.00001 |
| • | Lead (Pb) - Found in boulangerite, a lead-antimony sulfosalt associated with high grade gold intervals. |
| • | Copper (Cu) - Occurs in chalcopyrite, particularly in some high grade gold zones. |
| • | Silver (Ag) - Notably anomalous at certain prospects, such as Little Prospect. |
The QP recommends that NFG continue incorporating hyperspectral core measurements as part of its logging practices. Currently, mineralized halo wireframes are primarily based on gold grade, but the identification of NH₄ muscovite and phengite, which are associated with hydrothermal alteration near mineralized zones, may provide additional geological support for defining halo mineralization wireframes in the future. SLR also recommends that NFG continue to identify graphitic horizons within the assay sample table.
| 14.3.3.1 | AFZ Core Area |
A plan view of the AFZ Core area mineralization domains is shown in Figure 14-5.
The section highlights the use of trench samples, which were projected at a nominal elevation near the base of the excavated trench. The projection process involved calculating horizontal lengths from the start and end coordinates, generating a best-fit line to determine azimuth, and projecting channels onto a plane using RTK values with adjusted lengths. Each channel was assigned a single best-fit orientation, with the original RTK data retained for reference.
Mineralization wireframes were interpreted by snapping them to the projected trench samples. These intervals were then used to generate composites for estimation. Before estimation, the mineralization wireframes were clipped to the base of the overburden to ensure the mineralized volume was not overstated.
While this approach is appropriate for the current model, the QP recommends that trench samples be desurveyed to the top of bedrock in future model updates to improve the accuracy of estimation sample weights, which are dependent on distance calculations.
| 14- |
|
| New Found Gold Corp. | Queensway Gold Project NI 43-101 Technical Report |
April 15, 2025 SLR Project No.: 233.065300.00001 |
Figure 14-4: Vertical Section Showing AFZ Core Area Mineralization Domains

| 14- |
|
| New Found Gold Corp. | Queensway Gold Project NI 43-101 Technical Report |
April 15, 2025 SLR Project No.: 233.065300.00001 |
Figure 14-5: Plan View Showing AFZ Core Area Mineralization Domains

| 14- |
|
| New Found Gold Corp. | Queensway Gold Project NI 43-101 Technical Report |
April 15, 2025 SLR Project No.: 233.065300.00001 |
| 14.3.3.2 | AFZ Peripheral |
A plan view of the AFZ Peripheral mineralization domains is shown in Figure 14-6. Not shown in the figure is the Golden Glove vein which lies approximately 2,400 m to the south.
A vertical cross-section view showing the veins, buffer, and overburden in the centre of the AFZ Peripheral area is shown in Figure 14-7. No halo wireframes were generated for either AFZ Peripheral or JBP due to there being limited mineralization outside of the modelled veins.
| 14- |
|
| New Found Gold Corp. | Queensway Gold Project NI 43-101 Technical Report |
April 15, 2025 SLR Project No.: 233.065300.00001 |
Figure 14-6: Plan View Showing AFZ Peripheral Area Mineralization Domains

| 14- |
|
| New Found Gold Corp. | Queensway Gold Project NI 43-101 Technical Report |
April 15, 2025 SLR Project No.: 233.065300.00001 |
Figure 14-7: Vertical Section Showing AFZ Peripheral Area Mineralization Domains

| 14- |
|
| New Found Gold Corp. | Queensway Gold Project NI 43-101 Technical Report |
April 15, 2025 SLR Project No.: 233.065300.00001 |
| 14.3.3.3 | JBP |
A plan view of the JBP area mineralization domains is shown in Figure 14-8.
Figure 14-8: Plan View Showing JBP Area Mineralization Domains

| 14- |
|
| New Found Gold Corp. | Queensway Gold Project NI 43-101 Technical Report |
April 15, 2025 SLR Project No.: 233.065300.00001 |
The modelled mineralized types and assigned block model codes for the AFZ Core area are presented in Table 14-6.
Table 14-6: Modelled Mineralization Types.
| “mintype” | “typecode” | Description |
| Vein | 0 | 308 mineralized veins |
| Halo | 1 | 9 mineralized halos |
| Buffer | 2 | 2 m buffer zone around veins |
| outside | 999 | Unmineralized |
A full tabulation of mineralization domains, including the “mindom” and “mincode” block model variables is provided in Appendix 1.
| 14.4 | Estimation Domains |
Estimation domains were defined by the mineralization wireframes constructed using Leapfrog Geo (Section 14.3.3). Each individual vein volume and halo volume was treated as a separate estimation domain, while the vein buffer volume was treated as a single, separate domain.
Except for trench samples, domains were treated as having hard boundaries, and drill hole samples located outside of the volume were excluded. Trench samples had been projected to a nominal elevation and were sometimes located within the overburden volume despite actually sampling the bedrock. To resolve this issue, SLR flagged the trench samples using a copy of the geological model without the overburden and composited within these intervals, however, estimated blocks were constrained by the overburden.
| 14.5 | Assay Statistics and Capping |
Capping was applied to raw Au samples, prior to compositing.
Individual estimation domains were grouped according to similar Au grade distributions, proportion of samples above given thresholds, and total contained metal in preliminary NN estimates. Samples were capped according to these groups, in consideration of their cumulative distribution functions and identified outliers.
| 14.5.1 | AFZ Core Area |
For the AFZ Core area, a total of 18 capping groups were identified:
Table 14-7: Sample Capping Groups
| Capping Group | Au Cap (g/t) | Count of Domains |
Vein Names |
| 1 | 350 | 13 | Keats Main, Equinox and others |
| 2 | 150 | 73 | Keats Other |
| 3 | 150 | 4 | Keats West Harbinger |
| 4 | 65 | 26 | Cokes / Keats West Harbinger Other |
| 14- |
|
| New Found Gold Corp. | Queensway Gold Project NI 43-101 Technical Report |
April 15, 2025 SLR Project No.: 233.065300.00001 |
| Capping Group | Au Cap (g/t) | Count of Domains |
Vein Names |
| 5 | 135 | 4 | Dome / Lotto / GJ |
| 6 | 105 | 47 | Dome Other / Lotto Other / GJ Other |
| 7 | 115 | 4 | K2 / Everest / Jackpot |
| 8 | 95 | 37 | K2 Other / Everest Other / Jackpot Other |
| 9 | 300 | 7 | Iceberg |
| 10 | 75 | 45 | Keats North / Iceberg Other |
| 11 | 35 | 20 | Knob |
| 12 | 55 | 4 | Road |
| 13 | 95 | 2 | Monte Carlo |
| 14 | 20 | 16 | Monte Carlo Other |
| 15 | - | 1 | KingsPoint |
| 16 | - | 6 | TCH |
| 17 | 10 | 9 | Halos |
| 18 | 5 | 1 | Buffer |
Example cumulative distribution functions for capping groups 1 and 9 are shown in Figure 14-9 with the applied Au cap. These capping groups broadly correspond to Keats Main and Iceberg, respectively:
Figure 14-9: Cumulative Distribution Functions for Capping Groups 1 and 9
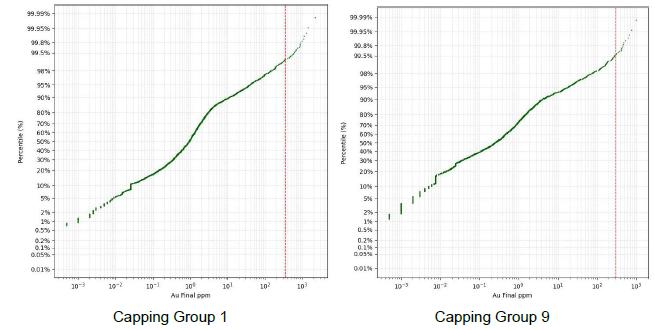
The QP assessed the impact of the capping on the estimated block grades and determined it to be acceptable, with a comparison of Au statistics for key veins presented in Table 14-8.
| 14- |
|
| New Found Gold Corp. | Queensway Gold Project NI 43-101 Technical Report |
April 15, 2025 SLR Project No.: 233.065300.00001 |
Table 14-8: Comparison of Length-Weighted Uncapped Raw Assay and Capped Assay Au Statistics for Selected Domains in the AFZ Core Area
| Domain | Uncapped Raw Assays | Capped Assays | Mean %Diff |
||||||||||
| Length (m) |
Mean (g/t) |
SD (g/t) |
CV | Min (g/t) |
Max (g/t) |
Length (m) |
Mean (g/t) |
SD (g/t) |
CV | Min (g/t) |
Max (g/t) |
||
| Honeypot | 257 | 3.27 | 14.12 | 4.32 | - | 311.72 | 257 | 2.93 | 8.00 | 2.73 | - | 95.00 | -10% |
| Jackpot | 192 | 10.50 | 57.67 | 5.49 | - | 818.91 | 192 | 5.85 | 18.33 | 3.13 | - | 95.00 | -44% |
| GJ_Main | 203 | 19.51 | 142.88 | 7.32 | - | 2,109.72 | 203 | 7.09 | 24.32 | 3.43 | - | 135.00 | -64% |
| K2_Annapurna | 222 | 2.28 | 7.01 | 3.08 | - | 106.50 | 222 | 2.28 | 7.01 | 3.08 | - | 106.50 | 0% |
| K2_K2 | 848 | 1.69 | 3.62 | 2.15 | - | 54.59 | 848 | 1.69 | 3.62 | 2.15 | - | 54.59 | 0% |
| K2_K2No2 | 191 | 1.95 | 6.82 | 3.49 | - | 111.62 | 191 | 1.95 | 6.82 | 3.49 | - | 111.62 | 0% |
| K2_K2S1 | 250 | 1.63 | 3.31 | 2.03 | - | 56.70 | 250 | 1.63 | 3.31 | 2.03 | - | 56.70 | 0% |
| K2_K2S2 | 162 | 1.33 | 2.40 | 1.80 | - | 34.80 | 162 | 1.33 | 2.40 | 1.80 | - | 34.80 | 0% |
| K2_Kashmir2 | 76 | 4.86 | 56.82 | 11.69 | 0.01 | 988.70 | 76 | 1.91 | 6.83 | 3.58 | 0.01 | 95.00 | -61% |
| K2_Meru | 287 | 2.09 | 6.99 | 3.35 | - | 130.50 | 287 | 2.07 | 6.61 | 3.20 | - | 115.00 | -1% |
| Keats_Main | 939 | 14.01 | 71.40 | 5.10 | - | 1,088.00 | 939 | 11.29 | 44.50 | 3.94 | - | 350.00 | -19% |
| KW_HarbingerWest | 319 | 1.01 | 4.38 | 4.34 | - | 90.10 | 319 | 0.98 | 3.79 | 3.87 | - | 65.00 | -3% |
| KW_Powerline | 147 | 0.72 | 1.37 | 1.90 | - | 9.76 | 147 | 0.72 | 1.37 | 1.90 | - | 9.76 | 0% |
| KW_Harbinger1 | 245 | 7.64 | 31.34 | 4.10 | - | 519.00 | 245 | 6.28 | 16.85 | 2.68 | - | 150.00 | -18% |
| KW_Harbinger2 | 304 | 6.96 | 34.50 | 4.96 | - | 468.00 | 304 | 5.48 | 18.43 | 3.36 | - | 150.00 | -21% |
| KW_Harbinger2X | 58 | 9.21 | 27.11 | 2.95 | 0.01 | 221.00 | 58 | 6.76 | 12.34 | 1.82 | 0.01 | 65.00 | -27% |
| Lotto | 441 | 11.37 | 75.75 | 6.67 | - | 1,332.55 | 441 | 6.19 | 23.32 | 3.77 | - | 135.00 | -46% |
| MM_Cassino | 80 | 1.51 | 4.48 | 2.97 | - | 65.00 | 80 | 1.34 | 2.51 | 1.87 | - | 20.00 | -11% |
| MM_KenoHill | 72 | 7.27 | 30.23 | 4.16 | - | 315.96 | 72 | 5.56 | 16.38 | 2.94 | - | 95.00 | -24% |
| MM_MonteCarlo | 195 | 2.68 | 8.12 | 3.03 | 0.01 | 111.00 | 195 | 2.64 | 7.71 | 2.91 | 0.01 | 95.00 | -1% |
| REG_Atlantic | 104 | 0.98 | 1.13 | 1.15 | - | 6.02 | 104 | 0.98 | 1.13 | 1.15 | - | 6.02 | 0% |
| ICE_T1000 | 180 | 21.41 | 86.92 | 4.06 | - | 756.96 | 180 | 16.50 | 54.86 | 3.32 | - | 300.00 | -23% |
| Iceberg | 697 | 11.47 | 44.16 | 3.85 | - | 529.00 | 697 | 10.70 | 37.09 | 3.47 | - | 300.00 | -7% |
| Equinox | 251 | 22.65 | 118.95 | 5.25 | - | 1,427.40 | 251 | 14.99 | 54.45 | 3.63 | - | 350.00 | -34% |
| Keats South | 97 | 3.31 | 22.32 | 6.74 | 0.01 | 290.00 | 97 | 2.52 | 12.33 | 4.90 | 0.01 | 150.00 | -24% |
| Note: SD = Standard Deviation; CV = Coefficient of Variation | |||||||||||||
| 14.5.2 | AFZ Peripheral and JBP |
Due to the distance between the deposits, separate capping analyses were completed for AFZ Peripheral and JBP. The QP assessed the impact of the capping on the estimated block grades and determined it to be acceptable.
| 14.5.2.1 | AFZ Peripheral |
Four capping groups were identified for the AFZ Peripheral area. A separate cap value was used for the samples within the buffer wireframe (Table 14-9). A comparison of the raw and capped gold assay statistics for the larger veins is shown in Table 14-10.
| 14- |
|
| New Found Gold Corp. | Queensway Gold Project NI 43-101 Technical Report |
April 15, 2025 SLR Project No.: 233.065300.00001 |
Table 14-9: Sample Capping Groups - AFZ Peripheral
| Capping Group | Cap (g/t) | Count of Domains |
| HG1 | 60 | 4 |
| HG2 | 75 | 3 |
| MG | 30 | 5 |
| LG | 10 | 7 |
| Buffer | 1 | 1 |
| Uncapped | - | 14 |
Table 14-10: Comparison of Length-Weighted Uncapped Raw Assay and Capped Assay Statistics for Selected Domains in the AFZ Peripheral Area
| Domain | Uncapped Raw Assays | Capped Assays | Mean % Diff | ||||||||||
| Length (m) | Mean (g/t) | SD | CV | Min (g/t) |
Max (g/t) |
Length (m) | Mean (g/t) | SD | CV | Min (g/t) |
Max (g/t) |
||
| BV - Almond | 246 | 2.55 | 12.12 | 4.75 | 0.00 | 160.42 | 246 | 2.03 | 7.35 | 3.62 | 0.00 | 60.00 | -20% |
| BV - BigVein | 126 | 2.23 | 17.86 | 8.00 | 0.00 | 276.56 | 126 | 1.37 | 5.51 | 4.01 | 0.00 | 60.00 | -39% |
| BV - Disco Shear Splay_2 | 156 | 0.78 | 0.52 | 0.67 | 0.00 | 2.75 | 156 | 0.78 | 0.52 | 0.67 | 0.00 | 2.75 | 0% |
| BV - Disco Shear_1 | 517 | 0.61 | 0.64 | 1.05 | 0.00 | 4.57 | 517 | 0.61 | 0.64 | 1.05 | 0.00 | 4.57 | 0% |
| BV - Disco Shear_3 | 751 | 0.59 | 0.68 | 1.17 | 0.00 | 16.44 | 751 | 0.58 | 0.60 | 1.03 | 0.00 | 10.00 | -1% |
| BV - Disco Shear_4 | 349 | 0.73 | 0.90 | 1.24 | 0.00 | 8.43 | 349 | 0.73 | 0.90 | 1.24 | 0.00 | 8.43 | 0% |
| BV - Disco Shear_5 | 334 | 0.77 | 4.16 | 5.37 | 0.00 | 75.86 | 334 | 0.64 | 1.70 | 2.66 | 0.00 | 30.00 | -18% |
| BV - Peanut | 224 | 1.99 | 6.90 | 3.48 | 0.00 | 99.31 | 224 | 1.65 | 4.16 | 2.53 | 0.00 | 30.00 | -17% |
| BV - Pistachio Fault | 50 | 5.70 | 35.83 | 6.28 | 0.02 | 290.73 | 50 | 2.26 | 9.18 | 4.06 | 0.02 | 60.00 | -60% |
| BV - Walnut | 73 | 0.85 | 1.05 | 1.23 | 0.00 | 5.93 | 73 | 0.85 | 1.05 | 1.23 | 0.00 | 5.93 | 0% |
| DK - Punt | 74 | 1.38 | 2.68 | 1.94 | 0.02 | 31.86 | 74 | 1.25 | 1.39 | 1.11 | 0.02 | 10.00 | -10% |
| BV - Macadamia | 50 | 5.42 | 20.93 | 3.87 | 0.00 | 128.51 | 50 | 4.21 | 14.10 | 3.35 | 0.00 | 75.00 | -22% |
| Buffer | 3652 | 0.12 | 0.22 | 1.83 | 0.00 | 5.00 | 3652 | 0.11 | 0.18 | 1.54 | 0.00 | 1.00 | -4% |
| Note: SD = Standard Deviation; CV = Coefficient of Variation | |||||||||||||
| 14.5.2.2 | JBP |
Three capping groups were identified for the JBP area. A separate cap value was used for the samples within the buffer wireframe (Table 14-11). A comparison of the raw and capped gold assay statistics is shown in Table 14-12.
| 14- |
|
| New Found Gold Corp. | Queensway Gold Project NI 43-101 Technical Report |
April 15, 2025 SLR Project No.: 233.065300.00001 |
Table 14-11: Sample Capping Groups - JBP
| Capping Group | Cap (g/t) | Count of Domains |
| HG | 50 | 4 |
| MG | 25 | 3 |
| LG | 15 | 2 |
| Buffer | 1 | 1 |
| Uncapped | - | 8 |
Table 14-12: Comparison of Length-Weighted Uncapped Raw Assay and Capped Assay Statistics for the Domains in the JBP Area
| Domain | Uncapped Raw Assays | Capped Assays | Mean % Diff | ||||||||||
| Length (m) |
Mean (g/t) |
SD | CV | Min (g/t) |
Max (g/t) |
Length (m) |
Mean (g/t) | SD | CV | Min (g/t) |
Max (g/t) |
||
| 1744 - 1744 | 38.50 | 2.66 | 8.06 | 3.03 | 0.00 | 44.38 | 38.50 | 2.16 | 5.64 | 2.61 | 0.00 | 25.00 | -19% |
| 1744 - 1744_HW | 49.80 | 1.49 | 3.78 | 2.53 | 0.01 | 19.60 | 49.80 | 1.39 | 3.32 | 2.39 | 0.01 | 15.00 | -7% |
| 1744 - 1744_North | 14.75 | 0.70 | 1.10 | 1.57 | 0.00 | 5.01 | 14.75 | 0.70 | 1.10 | 1.57 | 0.00 | 5.01 | 0% |
| 1744 - 1744_North2 | 31.97 | 0.96 | 2.18 | 2.26 | 0.00 | 11.40 | 31.97 | 0.96 | 2.18 | 2.26 | 0.00 | 11.40 | 0% |
| 1744 - 1744_Other | 72.01 | 2.11 | 11.47 | 5.45 | 0.00 | 105.83 | 72.01 | 1.52 | 7.03 | 4.63 | 0.00 | 50.00 | -28% |
| H Pond - H Pond_1 | 59.10 | 1.95 | 9.28 | 4.77 | 0.00 | 124.47 | 59.10 | 1.57 | 4.58 | 2.91 | 0.00 | 50.00 | -19% |
| H Pond - H Pond_2 | 43.76 | 1.29 | 3.50 | 2.72 | 0.00 | 31.75 | 43.76 | 1.23 | 3.04 | 2.47 | 0.00 | 25.00 | -4% |
| H Pond - H Pond_3 | 50.25 | 0.91 | 1.77 | 1.94 | 0.00 | 12.39 | 50.25 | 0.91 | 1.77 | 1.94 | 0.00 | 12.39 | 0% |
| H Pond - H Pond_N | 32.30 | 0.64 | 1.14 | 1.76 | 0.00 | 5.04 | 32.30 | 0.64 | 1.14 | 1.76 | 0.00 | 5.04 | 0% |
| H Pond - H Pond_N2 | 14.35 | 2.22 | 3.16 | 1.42 | 0.01 | 10.80 | 14.35 | 2.22 | 3.16 | 1.42 | 0.01 | 10.80 | 0% |
| PP - PN2A | 30.05 | 2.73 | 12.80 | 4.68 | 0.00 | 88.70 | 30.05 | 1.96 | 7.52 | 3.84 | 0.00 | 50.00 | -28% |
| PP - PN_1 | 56.58 | 0.77 | 1.22 | 1.59 | 0.00 | 6.65 | 56.58 | 0.77 | 1.22 | 1.59 | 0.00 | 6.65 | 0% |
| PP - PN_1_HW | 49.86 | 1.00 | 2.18 | 2.17 | 0.00 | 13.20 | 49.86 | 1.00 | 2.18 | 2.17 | 0.00 | 13.20 | 0% |
| PP - PN_2 | 50.19 | 3.82 | 25.75 | 6.74 | 0.00 | 255.00 | 50.19 | 1.78 | 6.39 | 3.59 | 0.00 | 50.00 | -53% |
| PP - PN_Flat1 | 18.20 | 1.73 | 5.65 | 3.27 | 0.00 | 29.34 | 18.20 | 1.59 | 4.94 | 3.11 | 0.00 | 25.00 | -8% |
| PP - Pocket_Shoreline | 48.30 | 1.52 | 3.20 | 2.11 | 0.00 | 21.80 | 48.30 | 1.40 | 2.47 | 1.77 | 0.00 | 15.00 | -8% |
| PP - Pocket_Shoreline_Splay | 25.51 | 1.31 | 2.16 | 1.65 | 0.07 | 14.36 | 25.51 | 1.31 | 2.16 | 1.65 | 0.07 | 14.36 | 0% |
| Buffer | 1,061.17 | 0.06 | 0.17 | 2.80 | 0.00 | 4.05 | 1,061.17 | 0.06 | 0.13 | 2.26 | 0.00 | 1.00 | -5% |
| Note: SD = Standard Deviation; CV = Coefficient of Variation | |||||||||||||
| 14- |
|
| New Found Gold Corp. | Queensway Gold Project NI 43-101 Technical Report |
April 15, 2025 SLR Project No.: 233.065300.00001 |
Capping levels should be continually reviewed across AFZ Core, AFZ Peripheral and JBP for gold as new drilling information becomes available and more robust populations are developed for a given vein or group of veins.
| 14.6 | Density |
NFG conducted density measurements using various methods during drilling and metallurgical testing. These included downhole gamma-gamma logging, gas pycnometer measurements on assay sample pulps, wax immersion Archimedes measurements on drill core, and a modified Archimedes method (without wax) on crushed and screened rock samples for metallurgical testing.
To determine suitable density values for mineralized and unmineralized rock applicable to the Mineral Resource estimate, SLR reviewed all available density data from these four methods. The evaluation included an analysis of density variations using mineralization and lithological wireframes, as well as a comparison against various geological attributes logged by NFG geologists. This analysis is provided in the subsections below.
| 14.6.1 | Geological Modelling and Density Analysis Using Mineralization and Lithology Wireframes |
| 14.6.1.1 | Mineralization Wireframes |
Mineralization wireframes were constructed with a minimum thickness of two metres. Consequently, some portions of these wireframes consist entirely of mineralized quartz vein material, while others include a mix of mineralized vein material and wall rock.
One of the geological attributes logged by NFG geologists was the percentage of vein material within a given interval. This information was recorded in a dedicated table during core logging to capture vein characteristics. This approach differed from quartz logged within the lithology table, where quartz required a minimum downhole length threshold to be classified as its own lithological unit. For example, an interval logged as 16.2 m of brecciated veins with an average width of 3 cm would not have sufficient continuous quartz thickness to qualify as a distinct lithological unit. Instead, it would be logged in the vein table. For this interval, the true widths of the 3 cm veins would be summed to estimate the vein percentage. If the vein percentage for this interval was 15%, the total summed true width of the quartz veins would be 2.43 m within the 16.2 m interval. The remaining 13.77 m would consist of wall rock interspersed between the 3 cm brecciated veins, randomly distributed throughout the interval.
SLR analyzed logged vein intervals whose midpoints occurred within the mineralized wireframes and calculated the total quartz material relative to the total interval widths. On average, for the Queensway deposit, a wireframe intercept contains approximately 20% to 30% quartz.
When the mineralized wireframes are used to flag density samples, the samples can be reasonably expected to reflect the co-mingling of mineralized quartz veins with wall rock in an approximate 1:4 ratio.
| 14.6.1.2 | Lithology Wireframes |
The lithological wireframes at Queensway are constructed with practical resolution, focusing on identifying larger packages of siltstone and greywacke based on shared characteristics such as colour and geochemistry, rather than tracing specific interbeds between drill holes.
| 14- |
|
| New Found Gold Corp. | Queensway Gold Project NI 43-101 Technical Report |
April 15, 2025 SLR Project No.: 233.065300.00001 |
Consequently, lithological wireframes categorized as greywacke may include significant amounts of logged siltstone, and vice versa. This mixing is acceptable for density assignments, as lithology is not a primary factor controlling vein mineralization at Queensway.
The two main lithological units at the Queensway project are greywackes (SDG) and siltstones (SIL). The lithological wireframes delineate three greywacke units (SDG, SDG_Cr, and SDG_IB) and six siltstone units (BSIL, SIL, SIL_CuRich, SIL_GreyGreen, SILCR, and SILNI).
When density samples are flagged using the lithological wireframes, the samples are expected to reflect some degree of mixing between siltstone and greywacke. However, on a broader scale, siltstone wireframes predominantly represent logged siltstone lithologies, while greywacke wireframes are primarily composed of logged greywacke lithologies.
Since lithologies are logged attributes, they can be used directly to flag density samples regardless of the lithological wireframe in which they are located. Examples of permutations for evaluating density samples include: SDG lithologies within SIL wireframes, SDG lithologies within SDG wireframes, or SDG lithologies (as logged) with no wireframe constraint.
| 14.6.2 | Application of Lithological Wireframes in the Evaluation of Density Measurements |
| 14.6.2.1 | Gamma-Gamma vs. Pycnometer |
A total of 14 drill holes contained both gamma-gamma and pycnometer density measurements before the practice of gamma-gamma measurements was discontinued. SLR flagged gamma measurements that fell within the corresponding pycnometer measurement intervals for comparison.
The analysis covered a total length of 97.41 m, yielding a length-weighted average gamma-gamma density of 2.90 g/cm³ and a pycnometer density of 2.76 g/cm³. This represents a 5.3% higher density for gamma-gamma measurements compared to pycnometer results.
This high bias was also observed on a larger scale when SLR compared gamma-gamma and pycnometer density measurements within the Queensway lithology wireframes, excluding samples located within overburden or mineralized vein wireframes. While the bias was less pronounced than the 5.3% found in the overlapping intervals, Table 14-13 shows a consistent high bias ranging from 1.1% to 3.1%, depending on the lithology wireframe.
In the SLR QP’s opinion, due to the consistently high bias as well as other geological factors, gamma-gamma measurements were not used to support the assignment of densities at the Queensway Project.
Table 14-13: Comparison of Gamma-Gamma and Pycnometer Density Measurements
| Lithology Wireframe | Gamma Count | Gamma Length (m) | Gamma Mean | Pycno Count | Pycno Length (m) | Pycno Mean | % Difference |
| SDG | 108,981 | 2,739.49 | 2.82 | 152 | 82.21 | 2.76 | -1.9% |
| SDG_Cr | 177,183 | 4,699.91 | 2.82 | 251 | 141.64 | 2.76 | -2.3% |
| SDG_IB | 84,327 | 2,108.30 | 2.82 | 248 | 124.72 | 2.73 | -3.1% |
| SDG Combined Total | 370,491 | 9,547.70 | 2.82 | 651 | 348.57 | 2.75 | -2.5% |
| 14- |
|
| New Found Gold Corp. | Queensway Gold Project NI 43-101 Technical Report |
April 15, 2025 SLR Project No.: 233.065300.00001 |
| Lithology Wireframe | Gamma Count | Gamma Length (m) | Gamma Mean | Pycno Count | Pycno Length (m) | Pycno Mean | % Difference |
| SIL | 32,262 | 1,054.00 | 2.83 | 646 | 334.48 | 2.74 | -2.9% |
| SIL_CuRich | 173,744 | 4,343.62 | 2.82 | 359 | 198.54 | 2.74 | -3.0% |
| SIL_GreyGreen | 17,135 | 428.38 | 2.81 | 692 | 374.54 | 2.75 | -2.2% |
| SILCR | 4,309 | 107.73 | 2.78 | 258 | 131.19 | 2.75 | -1.1% |
| SILNI | 7,060 | 210.49 | 2.80 | 1046 | 517.01 | 2.74 | -2.0% |
| SIL Combined Total | 234,510 | 6,144 | 2.82 | 3,001 | 1,555.76 | 2.74 | -2.7% |
| Totals | 605,001 | 15,692 | 2.82 | 3,652 | 1,904.33 | 2.75 | -2.7% |
| 14.6.2.2 | Pycnometer (Lithology Wireframes vs. Logged Lithology) |
To evaluate the pycnometer density measurements within the lithology wireframes, SLR flagged density samples based on the wireframe they were located in, excluding all samples within the mineralized vein and overburden wireframes. A total of 7,284 measurements, covering 3,918.71 m, were flagged across 15 lithology wireframes. The average density of these intervals was 2.75 g/cm³. Among the 12 wireframes with more than 40 measurements, average densities ranged from 2.73 g/cm³ to 2.76 g/cm³. The three greywacke wireframes (SDG, SDG_Cr, and SDG_IB) included 651 measurements spanning 348.57 m, with an average density of 2.75 g/cm³. The six siltstone wireframes (BSIL, SIL, SIL_CuRich, SIL_GreyGreen, SILCR, and SILNI) contained 3,001 measurements over 1,555.76 m, also with an average density of 2.74 g/cm³.
SLR also evaluated pycnometer density measurements based on the logged lithologies for each interval, excluding all samples within the mineralized vein and overburden wireframes. Similarly, 7,284 measurements, covering 3,918.71 m, were flagged across 15 logged lithology codes. The most prominent lithologies were SDG and SIL, with 1,583 measurements over 815.32 m and 4,923 measurements over 2,713.55 m, respectively (Table 14-14). The average density for SDG samples was 2.74 g/cm³, while SIL samples averaged 2.76 g/cm³.
Table 14-14: Pycnometer Density Measurements for SDG and SIL
| Litho Name | Count | Length (m) |
Mean |
| SDG | 1,583 | 815.32 | 2.74 |
| SIL | 4,923 | 2,713.55 | 2.76 |
Since the lithological wireframes categorized as greywacke may include significant amounts of logged siltstone and vice versa, it seems reasonable that the SDG and SIL wireframes are less variable than the logged SDG and SIL lithologies.
| 14- |
|
| New Found Gold Corp. | Queensway Gold Project NI 43-101 Technical Report |
April 15, 2025 SLR Project No.: 233.065300.00001 |
| 14.6.2.3 | Pycnometer and Wax Immersion Archimedes (Logged Lithology) |
To evaluate potential differences between the pycnometer and wax immersion methods, SLR analyzed wax immersion Archimedes method density measurements based on the logged lithology of the measured intervals (Table 14-15). As with other comparisons, wax immersion samples were limited to intervals located outside the mineralized wireframes. A total of 187 measurements were collected over a combined length of 19.30 m, with samples taken in approximately 10 cm increments.
The average density of these 187 non-quartz lithology measurements, located outside the mineralized wireframes, was 2.71 g/cm³. Among these, 79 measurements corresponded to greywacke (SDG), with an average density of 2.69 g/cm³, while 86 measurements corresponded to siltstone (SIL), with an average density of 2.74 g/cm³.
Table 14-15: Pycnometer and Wax Immersion Density Comparison for SDG and SIL
| Method | Lithology | Number of Samples | Length | Average Density (g/cm³) |
| Pycnometer | SDG | 1,583 | 815.32 | 2.74 |
| Wax Immersion | SDG | 79 | 8.16 | 2.70 |
| % Difference | -1.6% | |||
| Pycnometer | SIL | 4,923 | 2,713.55 | 2.76 |
| Wax Immersion | SIL | 86 | 8.8 | 2.74 |
| % Difference | -0.6% |
The pycnometer method reported an average density of 2.74 g/cm³ for greywacke, compared to 2.70 g/cm³ measured by the Archimedes method. Similarly, for siltstone, the pycnometer method reported an average density of 2.76 g/cm³, while the Archimedes method measured 2.74 g/cm³. These findings suggest a minor amount of porosity within both siltstones and greywackes, which is accounted for by the wax immersion method.
| 14.6.3 | Application of Mineralized Wireframes in the Evaluation of Density Measurements |
| 14.6.3.1 | Pycnometer and Wax Immersion Archimedes (Logged Lithology) |
SLR flagged samples within the vein wireframe models in Leapfrog based on the logged lithology. A total of 1,940 pycnometer density measurements were identified within the vein wireframe volumes, covering a combined length of 620.9 m. Sample lengths varied according to the assay intervals used in the analysis, with an average density of 2.76 g/cm³. The veins were bulked out to a minimum thickness, and material logged as "vein" within a wireframe interval often included a mix of vein material and wallrock. The primary lithologies present were quartz, greywacke, and siltstone. It is important to note that the quartz logged within the lithology table represents only a subset of the total quartz material present, as a minimum length of quartz was required for it to be recorded as a unique lithology.
Of the 1,940 density measurements, 175 samples were logged as quartz, covering a total length of 88.67 m with an average density of 2.72 g/cm³. Additionally, 301 samples were logged as greywacke, covering 84.11 m with an average density of 2.76 g/cm³, and 1,428 samples were logged as siltstone, covering 433.83 m with an average density of 2.77 g/cm³.
| 14- |
|
| New Found Gold Corp. | Queensway Gold Project NI 43-101 Technical Report |
April 15, 2025 SLR Project No.: 233.065300.00001 |
SLR also examined quartz intervals outside the vein wireframes. An additional 150 samples were logged as quartz, covering 58.38 m with an average density of 2.70 g/cm³. The slightly higher average density of quartz within the vein wireframes (2.72 g/cm³) may be attributed to the presence of sulphides. Similarly, the average densities of greywacke and siltstone within the mineralized vein wireframes were slightly higher than those outside the wireframes, with greywacke showing 2.76 g/cm³ versus 2.74 g/cm³, and siltstone showing 2.77 g/cm³ versus 2.76 g/cm³.
SLR also reviewed wax immersion Archimedes method density measurements within the mineralized vein wireframes, compiled by NFG based on the logged lithology of the measured intervals. A total of 44 measurements were collected over 4.47 m, with samples taken in approximately 10 cm increments. Of these, five measurements corresponded to greywacke, five to siltstone, and 34 to quartz vein material. The average density of the 34 quartz vein samples was 2.62 g/cm³, while the average density of the remaining 10 non-quartz samples was also 2.63 g/cm³. Table 14-16 provides a comparison of average pycnometer densities and average Archimedes method densities for logged quartz vein material occurring within mineralized wireframes.
SLR also examined quartz intervals outside the vein wireframes. An additional 43 samples were logged as quartz, covering 4.33 m, with an average density of 2.60 g/cm³. The slightly higher average density of quartz within the vein wireframes (2.62 g/cm³) may be due to the presence of sulphides.
Among the 77 quartz measurements located both inside and outside the vein wireframes, 27 were brecciated veins, with an average density of 2.64 g/cm³, and 25 were stylolitic veins, with an average density of 2.61 g/cm³. The vein table, which provided the vein styles, also included the quartz percentage of the larger interval from which the approximate 10 cm sample was taken. SLR found no discernible difference in density when filtering out wax immersion samples with less than 100% quartz.
Table 14-16: Comparison of Pycnometer vs. Archimedes - Logged Quartz Vein within Mineralized Wireframes
| Lithology | Pycnometer - Avg Density (g/cm³) | Archimedes - Avg Density (g/cm³) | Pycnometer - Sample Count | Archimedes - Sample Count |
| Quartz (In Vein Wireframes) | 2.72 | 2.62 | 175 | 34 |
Within the mineralized vein wireframes, the pycnometer method reported an average density of 2.72 g/cm³ for quartz, compared to 2.62 g/cm³ measured using the Archimedes method. This discrepancy suggests the presence of minor porosity within the quartz veins, which is accounted for by the wax immersion method. Also of note, the wax immersion density samples within the mineralized vein wireframes are heavily skewed toward quartz, representing 77% of the samples, even though quartz accounts for only 9% of the total pycnometer density samples within the same wireframes. SLR recommends that NFG conduct more density samples within the mineralized vein wireframes with the intention of targeting a proportion of quartz and wall rock that is more reflective of the approximate 1:4 ratio of quartz to wall rock observed in the vein wireframes.
| 14- |
|
| New Found Gold Corp. | Queensway Gold Project NI 43-101 Technical Report |
April 15, 2025 SLR Project No.: 233.065300.00001 |
The porosity of mineralized quartz intervals can vary depending on the vein style and texture. Some quartz veins appear more "massive" in both cut and uncut core, whereas surface pitting observed in hole NFGC-20-45 (Figure 14-10, Keats Main) may result from alteration or leaching processes.
Figure 14-10: Close-up of Cut Vein Surface from Hole NFGC-20-45

Source: NFG 2020.
Figure 14-11 shows an example of pitting on the surface of uncut core from hole NFGC-21-80 located within Keats Main, where pits appear to have formed in association with flecks of arsenopyrite as part of a stylolitic vein.
| 14- |
|
| New Found Gold Corp. | Queensway Gold Project NI 43-101 Technical Report |
April 15, 2025 SLR Project No.: 233.065300.00001 |
Figure 14-11: Close-up of Core Surface from Hole NFGC-21-80
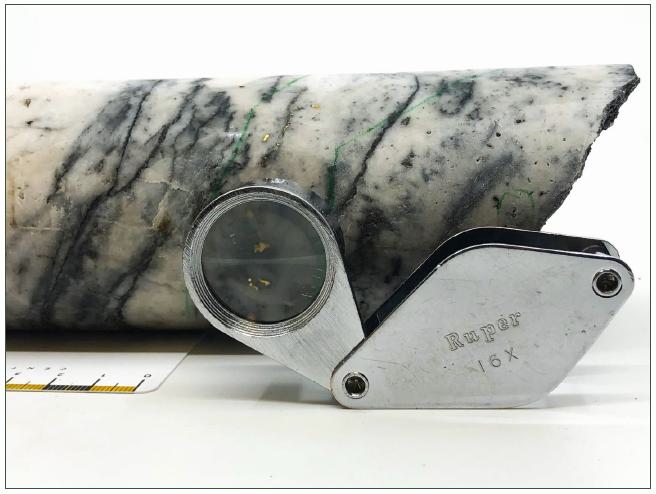
Source: NFG 2021.
Based on the available data, the QP believes that some of the density differences between pycnometer and Archimedes density results may be attributed to the pitting features observed in Figure 14-10 and Figure 14-11.
| 14.6.3.2 | Density Measurements Associated with Metallurgical Testing |
Densities were measured during metallurgical testing of variability composites conducted at Base Metallurgical Laboratories Ltd. (Base Met Labs), as described in Section 13. The method used was similar to the Archimedes principle, but wax coating was not applied during the process.
Table 14-17 below summarizes the density measurements associated with metallurgical test work:
Table 14-17: Metallurgical Testing Density
| Sample Designation | SG (g/cm3) |
| KZ-MC-1 | 2.71 |
| KZ-MC-2 | 2.73 |
| 14- |
|
| New Found Gold Corp. | Queensway Gold Project NI 43-101 Technical Report |
April 15, 2025 SLR Project No.: 233.065300.00001 |
| Sample Designation | SG (g/cm3) |
| LZ-MC | 2.72 |
| IB#6 | 3.08 |
| IB#3 | 2.80 |
| IB#13 | 2.73 |
| IB#18 | 2.62 |
| IB#24 | 2.65 |
| IB#32 | 2.78 |
| IB#40 | 2.78 |
| IB#45 | 2.75 |
| IB-MC | 2.70 |
In general, the range of densities measured during metallurgical testing were comparable to those obtained using the pycnometer. While these measurements provide a useful point of reference, it would be uncommon to use measurements obtained during metallurgical testing to support density assignment for Mineral Resource estimation when wax immersion core measurements are available. For these reasons, SLR did not rely on the density measurements obtained during metallurgical testing when assigning densities for the Mineral Resource estimate.
| 14.6.4 | Summary Discussion |
As discussed in Section 11.5, the Queensway deposit is supported by drill core density measurements calculated using the water immersion (or Archimedes) method using wax coating to account for porosity. Gas pycnometer samples and gamma-gamma downhole density logs are also available, though are not used by SLR to calculate density values for the Mineral Resources.
For the Queensway deposit, wireframe intercepts typically contain approximately 20% to 30% quartz on average, as noted in the section on mineralized vein wireframes. Consequently, when density samples are flagged within the mineralized vein wireframes, they can reasonably be expected to reflect the co-mingling of mineralized quartz veins with wall rock in an approximate 1:4 ratio.
However, SLR observed that the wax immersion density samples within the mineralized vein wireframes were heavily skewed toward quartz, representing 77% of the samples. This is significantly higher than the 20% to 30% that would be expected if the sampling were representative of the vein logging recorded in the core logs.
To address this discrepancy and determine an appropriate density for the mineralized vein wireframes, SLR calculated a weighted average of the wax immersion densities. Proportions of 15% for greywacke (SDG) at 2.70 g/cm³, 65% for siltstone (SIL) at 2.74 g/cm³, and 25% for quartz at 2.62 g/cm³ were used to arrive at a weighted average density of 2.70 g/cm³. This value was then assigned to the block model blocks contained within the mineralized vein and halo wireframes. The host bedrock density was retained for the 2 m mineralization buffer.
| 14- |
|
| New Found Gold Corp. | Queensway Gold Project NI 43-101 Technical Report |
April 15, 2025 SLR Project No.: 233.065300.00001 |
The wax immersion Archimedes method is widely recognized as the industry standard for mining applications because it quantifies porosity, offering a more accurate representation of in situ rock density. Based on this method, SLR has assigned the following densities for the Mineral Resource estimate (Table 14-14).
In addition to the 2.70 g/cm3 value assigned to the mineralization, individual average bulk densities were calculated for several host rock units using the wax immersion samples and assigned to the relevant blocks in the block model (Table 14-18). Due to a lack of supporting samples, an OVB value of 2.0 g/cm3 was selected.
Table 14-18: Assigned Average Bulk Density by Domain.
| Domain | Bulk Density (g/cm3) | Source |
| OVB | 2.00 | Default value |
| Mineralized vein / halo | 2.70 | Wax immersion |
| Greywacke (SDG) | 2.70 | Wax immersion |
| Other bedrock units | 2.71 | Wax immersion - All non-quartz |
| Siltstone (SIL) | 2.74 | Wax immersion |
SLR recommends that NFG continue prioritizing wax immersion Archimedes method density measurements across the Mineral Resource area. Future efforts should focus on achieving sufficient spatial representation of densities across both the primary mineralized zones and the broader lithological units.
| 14.7 | Compositing |
Assay sample intervals were determined based on lithological, structural, and mineralization boundaries, following vein logging and sampling procedures. Sample lengths generally ranged between 30 cm and 100 cm, with 36% of the samples having a length of 100 cm (55% by length). Drill hole and trench samples were composited to one-metre lengths, which is consistent with the most common sampling length (Figure 14-12) and corresponds to five composites per 5 m vertical block height. Residual end lengths below 0.3 m were added to the previous interval and no minimum sample coverage was required.
| 14- |
|
| New Found Gold Corp. | Queensway Gold Project NI 43-101 Technical Report |
April 15, 2025 SLR Project No.: 233.065300.00001 |
Figure 14-12: Raw Assay Length Histogram.

Due to a minor domain wireframe snapping issue affecting the Equinox domain, the composites in the following ranges informed by host rock samples but located within the domain wireframe were manually excluded from the estimate:
| • | "NFGC-21-204" 296.5 m to 309.1 m |
| • | "NFGC-21-164" 277.5 m to 288.0 m |
| • | "NFGC-21-143" 270.9 m to 275.9 m |
| 14.7.1 | AFZ Core Area |
The QP assessed the impact of compositing on the sample population grades and total length, determining the changes to be acceptable. Table 14-19 presents a comparison of 25 notable veins out of the total 308 veins. The discrepancy between assays and composites observed in the Equinox domain is due to the exclusion of selected composites, discussed above.
Table 14-19: Comparison of Length-Weighted Capped Assay and Composite Au Statistics for AFZ Core Area Selected Domains
| Domain | Capped Assays | Composites | Length %Diff |
Mean %Diff |
||||||||||
| Length (m) |
Mean (g/t) |
SD | CV | Min (g/t) |
Max (g/t) |
Length (m) |
Mean (g/t) |
SD | CV | Min (g/t) |
Max (g/t) |
|||
| Honeypot | 257 | 2.93 | 8.00 | 2.73 | - | 95.00 | 257 | 2.93 | 6.57 | 2.24 | - | 66.93 | 0% | 0% |
| Jackpot | 192 | 5.85 | 18.33 | 3.13 | - | 95.00 | 192 | 5.85 | 16.02 | 2.74 | - | 95.00 | 0% | 0% |
| GJ_Main | 203 | 7.09 | 24.32 | 3.43 | - | 135.00 | 203 | 7.09 | 20.80 | 2.93 | - | 135.00 | 0% | 0% |
| K2_Annapurna | 222 | 2.28 | 7.01 | 3.08 | - | 106.50 | 222 | 2.28 | 4.88 | 2.14 | 0.01 | 48.29 | 0% | 0% |
| K2_K2 | 848 | 1.69 | 3.62 | 2.15 | - | 54.59 | 848 | 1.69 | 2.99 | 1.77 | - | 34.60 | 0% | 0% |
| 14- |
|
| New Found Gold Corp. | Queensway Gold Project NI 43-101 Technical Report |
April 15, 2025 SLR Project No.: 233.065300.00001 |
| Domain | Capped Assays | Composites | Length %Diff |
Mean %Diff |
||||||||||
| Length (m) |
Mean (g/t) |
SD | CV | Min (g/t) |
Max (g/t) |
Length (m) |
Mean (g/t) |
SD | CV | Min (g/t) |
Max (g/t) |
|||
| K2_K2No2 | 191 | 1.95 | 6.82 | 3.49 | - | 111.62 | 191 | 1.95 | 5.18 | 2.65 | 0.01 | 62.52 | 0% | 0% |
| K2_K2S1 | 250 | 1.63 | 3.31 | 2.03 | - | 56.70 | 250 | 1.63 | 2.47 | 1.51 | 0.01 | 22.06 | 0% | 0% |
| K2_K2S2 | 162 | 1.33 | 2.40 | 1.80 | - | 34.80 | 162 | 1.33 | 1.84 | 1.38 | 0.02 | 14.44 | 0% | 0% |
| K2_Kashmir2 | 76 | 1.91 | 6.83 | 3.58 | 0.01 | 95.00 | 76 | 1.91 | 3.95 | 2.07 | 0.01 | 26.74 | 0% | 0% |
| K2_Meru | 287 | 2.07 | 6.61 | 3.20 | - | 115.00 | 287 | 2.07 | 4.92 | 2.38 | - | 59.87 | 0% | 0% |
| Keats_Main | 939 | 11.29 | 44.50 | 3.94 | - | 350.00 | 939 | 11.29 | 35.53 | 3.15 | - | 333.45 | 0% | 0% |
| KW_HarbingerWest | 319 | 0.98 | 3.79 | 3.87 | - | 65.00 | 319 | 0.98 | 2.67 | 2.72 | - | 35.01 | 0% | 0% |
| KW_Powerline | 147 | 0.72 | 1.37 | 1.90 | - | 9.76 | 147 | 0.72 | 1.21 | 1.68 | - | 9.05 | 0% | 0% |
| KW_Harbinger1 | 245 | 6.28 | 16.85 | 2.68 | - | 150.00 | 242 | 6.28 | 13.60 | 2.17 | - | 128.82 | -2% | 0% |
| KW_Harbinger2 | 304 | 5.48 | 18.43 | 3.36 | - | 150.00 | 299 | 5.48 | 16.63 | 3.03 | - | 149.80 | -2% | 0% |
| KW_Harbinger2X | 58 | 6.76 | 12.34 | 1.82 | 0.01 | 65.00 | 58 | 6.76 | 8.54 | 1.26 | 0.04 | 43.28 | 0% | 0% |
| Lotto | 441 | 6.19 | 23.32 | 3.77 | - | 135.00 | 441 | 6.19 | 19.76 | 3.19 | - | 135.00 | 0% | 0% |
| MM_Cassino | 80 | 1.34 | 2.51 | 1.87 | - | 20.00 | 80 | 1.34 | 1.73 | 1.29 | - | 12.14 | 0% | 0% |
| MM_KenoHill | 72 | 5.56 | 16.38 | 2.94 | - | 95.00 | 72 | 5.56 | 11.79 | 2.12 | - | 68.83 | 0% | 0% |
| MM_MonteCarlo | 195 | 2.64 | 7.71 | 2.91 | 0.01 | 95.00 | 195 | 2.64 | 4.92 | 1.86 | 0.01 | 40.33 | 0% | 0% |
| REG_Atlantic | 104 | 0.98 | 1.13 | 1.15 | - | 6.02 | 104 | 0.98 | 1.01 | 1.03 | - | 5.39 | 0% | 0% |
| ICE_T1000 | 180 | 16.50 | 54.86 | 3.32 | - | 300.00 | 180 | 16.50 | 49.21 | 2.98 | - | 294.25 | 0% | 0% |
| Iceberg | 697 | 10.70 | 37.09 | 3.47 | - | 300.00 | 697 | 10.70 | 29.75 | 2.78 | - | 278.52 | 0% | 0% |
| Equinox | 251 | 14.99 | 54.45 | 3.63 | - | 350.00 | 223 | 16.89 | 49.69 | 2.94 | - | 350.00 | -11% | 13% |
| Keats South | 97 | 2.52 | 12.33 | 4.90 | 0.01 | 150.00 | 97 | 2.52 | 9.20 | 3.66 | 0.01 | 82.58 | 0% | 0% |
| Note: SD = Standard Deviation; CV = Coefficient of Variation | ||||||||||||||
| 14.7.2 | AFZ Peripheral and JBP |
The QP assessed the impact of compositing on the sample population grades and total length, determining the changes to be acceptable. A comparison is presented for key veins in the AFZ Peripheral area in Table 14-20 and for veins in the JBP area in Table 14-21.
Table 14-20: Comparison of Length-Weighted Capped Assay and Composite Au Statistics for Selected Domains in the AFZ Peripheral Area
| Domain | Capped Assays | Composites | Length % Diff | Mean % Diff | ||||||||||
| Length (m) | Mean (g/t) | SD | CV | Min (g/t) | Max (g/t) | Length (m) | Mean (g/t) | SD | CV | Min (g/t) | Max (g/t) | |||
| BV - Almond | 246 | 2.03 | 7.35 | 3.62 | 0.00 | 60.00 | 245.94 | 2.03 | 5.67 | 2.80 | 0.00 | 48.49 | 0% | 0% |
| BV - BigVein | 126 | 1.37 | 5.51 | 4.01 | 0.00 | 60.00 | 125.81 | 1.37 | 4.61 | 3.36 | 0.00 | 35.70 | 0% | 0% |
| BV - Disco Shear Splay_2 | 156 | 0.78 | 0.52 | 0.67 | 0.00 | 2.75 | 156.37 | 0.78 | 0.49 | 0.62 | 0.00 | 2.18 | 0% | 0% |
| BV - Disco Shear_1 | 517 | 0.61 | 0.64 | 1.05 | 0.00 | 4.57 | 516.67 | 0.61 | 0.62 | 1.01 | 0.00 | 3.95 | 0% | 0% |
| 14- |
|
| New Found Gold Corp. | Queensway Gold Project NI 43-101 Technical Report |
April 15, 2025 SLR Project No.: 233.065300.00001 |
| Domain | Capped Assays | Composites | Length % Diff | Mean % Diff | ||||||||||
| Length (m) | Mean (g/t) | SD | CV | Min (g/t) | Max (g/t) | Length (m) | Mean (g/t) | SD | CV | Min (g/t) | Max (g/t) | |||
| BV - Disco Shear_3 | 751 | 0.58 | 0.60 | 1.03 | 0.00 | 10.00 | 750.81 | 0.58 | 0.55 | 0.95 | 0.00 | 9.65 | 0% | 0% |
| BV - Disco Shear_4 | 349 | 0.73 | 0.90 | 1.24 | 0.00 | 8.43 | 348.76 | 0.73 | 0.89 | 1.22 | 0.00 | 8.43 | 0% | 0% |
| BV - Disco Shear_5 | 334 | 0.64 | 1.70 | 2.66 | 0.00 | 30.00 | 333.56 | 0.64 | 1.68 | 2.64 | 0.00 | 29.71 | 0% | 0% |
| BV - Macadamia | 50 | 4.21 | 14.10 | 3.35 | 0.00 | 75.00 | 50.05 | 4.21 | 12.19 | 2.90 | 0.00 | 75.00 | 0% | 0% |
| BV - Peanut | 224 | 1.65 | 4.16 | 2.53 | 0.00 | 30.00 | 224.34 | 1.65 | 3.87 | 2.35 | 0.00 | 30.00 | 0% | 0% |
| BV - Pistachio Fault | 50 | 2.26 | 9.18 | 4.06 | 0.02 | 60.00 | 50.34 | 2.26 | 6.38 | 2.82 | 0.02 | 36.33 | 0% | 0% |
| BV - Walnut | 73 | 0.85 | 1.05 | 1.23 | 0.00 | 5.93 | 73.11 | 0.85 | 1.04 | 1.22 | 0.00 | 5.93 | 0% | 0% |
| DK - Punt | 74 | 1.25 | 1.39 | 1.11 | 0.02 | 10.00 | 74.14 | 1.25 | 1.10 | 0.88 | 0.06 | 4.63 | 0% | 0% |
| Buffer | 3652 | 0.11 | 0.18 | 1.54 | 0.00 | 1.00 | 3651.68 | 0.11 | 0.17 | 1.46 | 0.00 | 1.00 | 0% | 0% |
| Note: SD = Standard Deviation; CV = Coefficient of Variation | ||||||||||||||
| 14- |
|
| New Found Gold Corp. | Queensway Gold Project NI 43-101 Technical Report |
April 15, 2025 SLR Project No.: 233.065300.00001 |
Table 14-21: Comparison of Length-Weighted Capped Assay and Composite Au Statistics for JBP Domains
| Domain | Capped Assays | Composites | Length % Diff | Mean % Diff | ||||||||||
| Length (m) | Mean (g/t) | SD | CV | Minimum (g/t) | Maximum (g/t) | Length (m) | Mean (g/t) | SD | CV | Minimum (g/t) | Maximum (g/t) | |||
| 1744 - 1744 | 38.50 | 2.16 | 5.64 | 2.61 | 0.00 | 25.00 | 38.50 | 2.16 | 4.57 | 2.12 | 0.02 | 18.70 | 0% | 0% |
| 1744 - 1744_HW | 49.80 | 1.39 | 3.32 | 2.39 | 0.01 | 15.00 | 49.80 | 1.39 | 3.15 | 2.27 | 0.03 | 15.00 | 0% | 0% |
| 1744 - 1744_North | 14.75 | 0.70 | 1.10 | 1.57 | 0.00 | 5.01 | 14.75 | 0.70 | 0.85 | 1.22 | 0.00 | 3.03 | 0% | 0% |
| 1744 - 1744_North2 | 31.97 | 0.96 | 2.18 | 2.26 | 0.00 | 11.40 | 31.97 | 0.96 | 1.63 | 1.69 | 0.01 | 6.77 | 0% | 0% |
| 1744 - 1744_Other | 72.01 | 1.52 | 7.03 | 4.63 | 0.00 | 50.00 | 72.01 | 1.52 | 5.69 | 3.75 | 0.00 | 42.59 | 0% | 0% |
| HPond - HPond_1 | 59.10 | 1.57 | 4.58 | 2.91 | 0.00 | 50.00 | 59.10 | 1.57 | 2.65 | 1.69 | 0.01 | 15.08 | 0% | 0% |
| HPond - HPond_2 | 43.76 | 1.23 | 3.04 | 2.47 | 0.00 | 25.00 | 43.76 | 1.23 | 2.11 | 1.71 | 0.00 | 9.06 | 0% | 0% |
| HPond - HPond_3 | 50.25 | 0.91 | 1.77 | 1.94 | 0.00 | 12.39 | 50.25 | 0.91 | 1.25 | 1.37 | 0.00 | 6.20 | 0% | 0% |
| HPond - HPond_N | 32.30 | 0.64 | 1.14 | 1.76 | 0.00 | 5.04 | 32.30 | 0.64 | 0.98 | 1.52 | 0.00 | 3.55 | 0% | 0% |
| HPond - HPond_N2 | 14.35 | 2.22 | 3.16 | 1.42 | 0.01 | 10.80 | 14.35 | 2.22 | 3.00 | 1.35 | 0.03 | 10.80 | 0% | 0% |
| PP - PN2A | 30.05 | 1.96 | 7.52 | 3.84 | 0.00 | 50.00 | 30.05 | 1.96 | 5.66 | 2.88 | 0.00 | 29.43 | 0% | 0% |
| PP - PN_1 | 56.58 | 0.77 | 1.22 | 1.59 | 0.00 | 6.65 | 56.58 | 0.77 | 1.06 | 1.39 | 0.00 | 5.34 | 0% | 0% |
| PP - PN_1_HW | 49.86 | 1.00 | 2.18 | 2.17 | 0.00 | 13.20 | 49.86 | 1.00 | 1.63 | 1.62 | 0.00 | 7.47 | 0% | 0% |
| PP - PN_2 | 50.19 | 1.78 | 6.39 | 3.59 | 0.00 | 50.00 | 50.19 | 1.78 | 4.67 | 2.63 | 0.00 | 25.31 | 0% | 0% |
| PP - PN_Flat1 | 18.20 | 1.59 | 4.94 | 3.11 | 0.00 | 25.00 | 18.20 | 1.59 | 3.60 | 2.27 | 0.00 | 15.05 | 0% | 0% |
| PP - Pocket_Shoreline | 48.30 | 1.40 | 2.47 | 1.77 | 0.00 | 15.00 | 48.30 | 1.40 | 2.07 | 1.48 | 0.00 | 12.32 | 0% | 0% |
| PP - Pocket_Shoreline_Splay | 25.51 | 1.31 | 2.16 | 1.65 | 0.07 | 14.36 | 25.51 | 1.31 | 1.28 | 0.98 | 0.15 | 4.84 | 0% | 0% |
| Buffer | 1061.17 | 0.06 | 0.13 | 2.26 | 0.00 | 1.00 | 1061.17 | 0.06 | 0.11 | 1.95 | 0.00 | 1.00 | 0% | 0% |
| Note: SD = Standard Deviation; CV = Coefficient of Variation | ||||||||||||||
| 14.8 | Trend Analysis |
| 14.8.1 | Variography |
Experimental variography was completed for the most significant domains using the one-metre composites Normal Scores. The resulting assessments of grade continuity and anisotropy informed the orientations and ranges of search neighbourhood ellipses and high-yield restriction ellipses used for grade estimation, although fitted variogram models themselves were not required due to the use of ID3.
Example variograms for the Keats Main vein are shown in Figure 14-13, while the modelled variogram ellipse is compared with high grade plunge orientations suggested by a 5 g/t Au indicator contour in Figure 14-14. The generation of grade contours is discussed further in 14.8.2. The high-grade plunges are interpreted to be related to the intersections of other veins with the Keats Main vein.
The clear anisotropy demonstrated by both grade contouring and variography was implemented within the dynamic anisotropy methodology for Keats Main by specifying plunge orientations when calculating local angles from the hanging wall surfaces. The resultant angles orient the anisotropic search ellipses parallel to the hanging wall surface, while projecting the plunge orientation onto this surface to define the major orientation.
| 14- |
|
| New Found Gold Corp. | Queensway Gold Project NI 43-101 Technical Report |
April 15, 2025 SLR Project No.: 233.065300.00001 |
Example variograms for the Iceberg vein are shown in Figure 14-15, while Figure 14-16 compares the modelled variogram ellipse with a 3 g/t Au contour and 15 g/t Au contour. The higher-grade portion is largely constrained to the west of the intersection with KN_Occult. The variography suggests a primary range of continuity of 30 m, dipping 72° toward 197°, which is also evident in the 3 g/t contour, however the 15 g/t contour indicates a flatter-lying primary continuity.
SLR chose to use the geological model of plunges associated with vein intersections along with the primary grade contour direction to determine forced plunges and ellipse anisotropy ratios for the Keats Main, Honeypot, KW_Harbinger 1 & 2, and Iceberg veins.
Figure 14-13: Keats Main Normal Scores Variogram

Note: Variograms shown use Leapfrog convention, with positive dips pointing downwards and azimuth rotated clockwise from north.
| 14- |
|
| New Found Gold Corp. | Queensway Gold Project NI 43-101 Technical Report |
April 15, 2025 SLR Project No.: 233.065300.00001 |
Figure 14-14: Keats Main >5 g/t Au Indicator Contour Compared with Related Vein Intersections

| 14- |
|
| New Found Gold Corp. | Queensway Gold Project NI 43-101 Technical Report |
April 15, 2025 SLR Project No.: 233.065300.00001 |
Figure 14-15: Iceberg Normal Scores Variogram

Note: Variograms shown use Leapfrog convention, with positive dips pointing downwards and azimuth rotated clockwise from north.
| 14- |
|
| New Found Gold Corp. | Queensway Gold Project NI 43-101 Technical Report |
April 15, 2025 SLR Project No.: 233.065300.00001 |
Figure 14-16: Iceberg 3 g/t Au and 15 g/t Indicator Contours Compared with KN_Occult Vein Intersection

| 14- |
|
| New Found Gold Corp. | Queensway Gold Project NI 43-101 Technical Report |
April 15, 2025 SLR Project No.: 233.065300.00001 |
| 14.8.2 | Grade Contouring |
As previously shown in Section 14.8.1, 3D grade contours were generated within selected domains using the Radial Basis Function (RBF) interpolant and RBF-based indicator interpolants in Leapfrog Geo. These had no trends applied within the vein orientation and were instead used to identify anisotropic trends within the domain, supporting the experimental variography completed. To reduce the influence of isolated, extreme high grades on the trend analysis process, the contouring was done using the capped assay grades and full-thickness composites.
An example is shown for Keats Main vein in Figure 14-17, using full thickness composites.
| 14- |
|
| New Found Gold Corp. | Queensway Gold Project NI 43-101 Technical Report |
April 15, 2025 SLR Project No.: 233.065300.00001 |
Figure 14-17: Inclined Long Section Showing Untrended Au Grade Contours for Keats_Main Vein Domain

| 14- |
|
| New Found Gold Corp. | Queensway Gold Project NI 43-101 Technical Report |
April 15, 2025 SLR Project No.: 233.065300.00001 |
| 14.9 | Search Strategy and Grade Interpolation Parameters |
Gold and grades were estimated using the ID3 interpolation algorithm in four nested search passes for the AFZ Core and AFZ Peripheral areas, and three nested search passes for the JBP area. Search ellipse orientations and ranges were determined in consideration of trend analysis completed for key domains and the available drill spacing.
The first three search pass ranges were determined in consideration of drill hole spacing, while the final search pass ellipse was used to populate remaining non-estimated blocks, of which a small proportion may be included in Inferred classification to maintain contiguous classification shapes.
The minimum and maximum number of composites used in the first pass were determined with consideration of the true width of each domain and the number of composites intersected by the domain. This ranged from a minimum of 15 samples in the first pass on some of the wider veins in the AFZ Core area, to four to six samples on some of the narrower veins in the JBP area. Ellipse sizes increased with subsequent passes, and the minimum, maximum, and maximum composites per hole were adjusted on each subsequent pass.
Grades were estimated on the centroids of the parent block and assigned to the sub-blocks belonging to the domain.
| 14.9.1 | AFZ Core Area |
All vein domains have search ellipsoid angles calculated through dynamic anisotropy, with plunges assigned for domains with anisotropy identified between major and semi-major orientations. Forced plunges were assessed for ten domains that exhibited reasonably robust grade trends based on full-thickness contouring, however, they were only implemented in five domains where the trends were considered well defined. The assigned plunges only impact ellipses with anisotropy ratios that are not 1:1 in the major and semi-major axes.
Search parameters for key vein domains are presented in Table 14-22.
Search parameters for halo domains and their global anisotropic trends, and the isotropic buffer domain are tabulated in Table 14-23.
Gold grades were not estimated in 799 blocks within the KP_Raven domain and 592 blocks in the adjacent buffer domain due to insufficient samples at the extremity of the vein margin. These blocks were assigned default zero grades. All other blocks within the mineralized domains were estimated.
Figure 14-18 provides an example of the search ellipse sizes for estimation passes 1 to 4 for the Golden Joint “GJ” Main vein domain.
| 14- |
|
| New Found Gold Corp. | Queensway Gold Project NI 43-101 Technical Report |
April 15, 2025 SLR Project No.: 233.065300.00001 |
Figure 14-18: Long Section Showing Estimation Passes for the GJ Main Vein Domain

| 14- |
|
| New Found Gold Corp. | Queensway Gold Project NI 43-101 Technical Report |
April 15, 2025 SLR Project No.: 233.065300.00001 |
Table 14-22: Search Parameters for Key Vein Domains - AFZ Core Area
| “mindom” | Plunge | Pass 1 | Pass 2 | Pass 3 | Pass 4 | |||||||||||||||||||||
| Az (°) | Plunge (°) | Min Comps | Max Comps | Max per DH | Range1 (m) | Range2 (m) | Range3 (m) | Min Comps | Max Comps | Max per DH | Range1 (m) | Range2 (m) | Range3 (m) | Min Comps | Max Comps | Max per DH | Range1 (m) | Range2 (m) | Range3 (m) | Min Comps | Max Comps | Max per DH | Range1 (m) | Range2 (m) | Range3 (m) | |
| Honeypot | 105.5 | -60 | 15 | 20 | 5 | 22.5 | 15 | 7.5 | 10 | 20 | 5 | 45 | 30 | 15 | 5 | 20 | 5 | 90 | 60 | 30 | 1 | 20 | 5 | 180 | 120 | 60 |
| Jackpot | 190 | -62.5 | 12 | 16 | 4 | 15 | 15 | 7.5 | 8 | 16 | 4 | 30 | 30 | 15 | 4 | 16 | 4 | 60 | 60 | 30 | 1 | 16 | 4 | 120 | 120 | 60 |
| GJ_Main | - | - | 15 | 20 | 5 | 15 | 15 | 7.5 | 10 | 20 | 5 | 30 | 30 | 15 | 5 | 20 | 5 | 60 | 60 | 30 | 1 | 20 | 5 | 120 | 120 | 60 |
| K2_Annapurna | - | - | 15 | 20 | 5 | 15 | 15 | 7.5 | 10 | 20 | 5 | 30 | 30 | 15 | 5 | 20 | 5 | 60 | 60 | 30 | 1 | 20 | 5 | 120 | 120 | 60 |
| K2_K2 | 227.5 | -3 | 15 | 20 | 5 | 15 | 15 | 7.5 | 10 | 20 | 5 | 30 | 30 | 15 | 5 | 20 | 5 | 60 | 60 | 30 | 1 | 20 | 5 | 120 | 120 | 60 |
| K2_K2No2 | - | - | 15 | 20 | 5 | 15 | 15 | 7.5 | 10 | 20 | 5 | 30 | 30 | 15 | 5 | 20 | 5 | 60 | 60 | 30 | 1 | 20 | 5 | 120 | 120 | 60 |
| K2_K2S1 | - | - | 15 | 20 | 5 | 15 | 15 | 7.5 | 10 | 20 | 5 | 30 | 30 | 15 | 5 | 20 | 5 | 60 | 60 | 30 | 1 | 20 | 5 | 120 | 120 | 60 |
| K2_K2S2 | - | - | 15 | 20 | 5 | 15 | 15 | 7.5 | 10 | 20 | 5 | 30 | 30 | 15 | 5 | 20 | 5 | 60 | 60 | 30 | 1 | 20 | 5 | 120 | 120 | 60 |
| K2_Kashmir2 | - | - | 15 | 20 | 5 | 15 | 15 | 7.5 | 10 | 20 | 5 | 30 | 30 | 15 | 5 | 20 | 5 | 60 | 60 | 30 | 1 | 20 | 5 | 120 | 120 | 60 |
| K2_Meru | - | - | 15 | 20 | 5 | 15 | 15 | 7.5 | 10 | 20 | 5 | 30 | 30 | 15 | 5 | 20 | 5 | 60 | 60 | 30 | 1 | 20 | 5 | 120 | 120 | 60 |
| Keats_Main | 220 | -25 | 15 | 20 | 5 | 45 | 15 | 7.5 | 10 | 20 | 5 | 90 | 30 | 15 | 5 | 20 | 5 | 180 | 60 | 30 | 1 | 20 | 5 | 360 | 120 | 60 |
| KW_HarbingerWest | - | - | 15 | 20 | 5 | 15 | 15 | 7.5 | 10 | 20 | 5 | 30 | 30 | 15 | 5 | 20 | 5 | 60 | 60 | 30 | 1 | 20 | 5 | 120 | 120 | 60 |
| KW_Powerline | - | - | 15 | 20 | 5 | 15 | 15 | 7.5 | 10 | 20 | 5 | 30 | 30 | 15 | 5 | 20 | 5 | 60 | 60 | 30 | 1 | 20 | 5 | 120 | 120 | 60 |
| KW_Harbinger1 | 250 | -20 | 12 | 16 | 4 | 30 | 15 | 7.5 | 8 | 16 | 4 | 60 | 30 | 15 | 4 | 16 | 4 | 120 | 60 | 30 | 1 | 16 | 4 | 240 | 120 | 60 |
| KW_Harbinger2 | 250 | -20 | 15 | 20 | 5 | 30 | 15 | 7.5 | 10 | 20 | 5 | 60 | 30 | 15 | 5 | 20 | 5 | 120 | 60 | 30 | 1 | 20 | 5 | 240 | 120 | 60 |
| KW_Harbinger2X | - | - | 15 | 20 | 5 | 15 | 15 | 7.5 | 10 | 20 | 5 | 30 | 30 | 15 | 5 | 20 | 5 | 60 | 60 | 30 | 1 | 20 | 5 | 120 | 120 | 60 |
| Lotto | - | - | 15 | 20 | 5 | 15 | 15 | 7.5 | 10 | 20 | 5 | 30 | 30 | 15 | 5 | 20 | 5 | 60 | 60 | 30 | 1 | 20 | 5 | 120 | 120 | 60 |
| MM_Cassino | - | - | 15 | 20 | 5 | 15 | 15 | 7.5 | 10 | 20 | 5 | 30 | 30 | 15 | 5 | 20 | 5 | 60 | 60 | 30 | 1 | 20 | 5 | 120 | 120 | 60 |
| MM_KenoHill | - | - | 9 | 12 | 3 | 15 | 15 | 7.5 | 6 | 12 | 3 | 30 | 30 | 15 | 3 | 12 | 3 | 60 | 60 | 30 | 1 | 12 | 3 | 120 | 120 | 60 |
| MM_MonteCarlo | - | - | 12 | 16 | 4 | 15 | 15 | 7.5 | 8 | 16 | 4 | 30 | 30 | 15 | 4 | 16 | 4 | 60 | 60 | 30 | 1 | 16 | 4 | 120 | 120 | 60 |
| REG_Atlantic | - | - | 15 | 20 | 5 | 15 | 15 | 7.5 | 10 | 20 | 5 | 30 | 30 | 15 | 5 | 20 | 5 | 60 | 60 | 30 | 1 | 20 | 5 | 120 | 120 | 60 |
| ICE_T1000 | 60 | -25 | 15 | 20 | 5 | 15 | 15 | 7.5 | 10 | 20 | 5 | 30 | 30 | 15 | 5 | 20 | 5 | 60 | 60 | 30 | 1 | 20 | 5 | 120 | 120 | 60 |
| Iceberg | 230 | -5 | 15 | 20 | 5 | 30 | 15 | 7.5 | 10 | 20 | 5 | 60 | 30 | 15 | 5 | 20 | 5 | 120 | 60 | 30 | 1 | 20 | 5 | 240 | 120 | 60 |
| Equinox | - | - | 15 | 20 | 5 | 15 | 15 | 7.5 | 10 | 20 | 5 | 30 | 30 | 15 | 5 | 20 | 5 | 60 | 60 | 30 | 1 | 20 | 5 | 120 | 120 | 60 |
| Keats South | - | - | 9 | 12 | 3 | 15 | 15 | 7.5 | 6 | 12 | 3 | 30 | 30 | 15 | 3 | 12 | 3 | 60 | 60 | 30 | 1 | 12 | 3 | 120 | 120 | 60 |
| 14- |
|
| New Found Gold Corp. | Queensway Gold Project NI 43-101 Technical Report |
April 15, 2025 SLR Project No.: 233.065300.00001 |
Table 14-23: Search Parameters for Halo Domains and Buffer Domain - AFZ Core Area
| “mindom” | Angles | Pass 1 | Pass 2 | Pass 3 | Pass 4 | ||||||||||||||||||||||||
| Angle1 (°) | Angle2 (°) | Angle3 (°) | Min Comps | Max Comps | Max per DH | Range1 (m) | Range2 (m) | Range3 (m) | Min Comps | Max Comps | Max per DH | Range1 (m) | Range2 (m) | Range3 (m) | Min Comps | Max Comps | Max per DH | Range1 (m) | Range2 (m) | Range3 (m) | Min Comps | Max Comps | Max per DH | Range1 (m) | Range2 (m) | Range3 (m) | |||
| Buffer_Halo | 0 | 0 | 0 | 9 | 12 | 4 | 15 | 15 | 15 | 6 | 12 | 4 | 30 | 30 | 30 | 3 | 12 | 4 | 60 | 60 | 60 | 1 | 12 | 4 | 120 | 120 | 120 | ||
| Cokes_Halo | 140 | -6 | 8 | 9 | 20 | 4 | 15 | 15 | 5 | 6 | 16 | 4 | 30 | 30 | 10 | 3 | 12 | 4 | 60 | 60 | 20 | 1 | 12 | 4 | 120 | 120 | 40 | ||
| KW_Harbinger_North_Halo | 202 | -29 | 5 | 9 | 20 | 4 | 15 | 15 | 5 | 6 | 16 | 4 | 30 | 30 | 10 | 3 | 12 | 4 | 60 | 60 | 20 | 1 | 12 | 4 | 120 | 120 | 40 | ||
| KW_Harbinger_South_Halo | 179 | -16 | 1 | 9 | 20 | 4 | 15 | 15 | 5 | 6 | 16 | 4 | 30 | 30 | 10 | 3 | 12 | 4 | 60 | 60 | 20 | 1 | 12 | 4 | 120 | 120 | 40 | ||
| Keats387_Halo | 183 | -11 | -39 | 9 | 20 | 4 | 15 | 10 | 5 | 6 | 16 | 4 | 30 | 20 | 10 | 3 | 12 | 4 | 60 | 40 | 20 | 1 | 12 | 4 | 120 | 80 | 40 | ||
| KeatsLower_Halo | 226 | -30 | 8 | 9 | 20 | 4 | 15 | 10 | 5 | 6 | 16 | 4 | 30 | 20 | 10 | 3 | 12 | 4 | 60 | 40 | 20 | 1 | 12 | 4 | 120 | 80 | 40 | ||
| KeatsUpper_Halo | 221 | -33 | 13 | 9 | 20 | 4 | 15 | 10 | 5 | 6 | 16 | 4 | 30 | 20 | 10 | 3 | 12 | 4 | 60 | 40 | 20 | 1 | 12 | 4 | 120 | 80 | 40 | ||
| Senior-MuddyWaters_Halo | 256 | -9 | -20 | 9 | 20 | 4 | 15 | 15 | 5 | 6 | 16 | 4 | 30 | 30 | 10 | 3 | 12 | 4 | 60 | 60 | 20 | 1 | 12 | 4 | 120 | 120 | 40 | ||
| TCC Halo | 46 | -7 | 78 | 9 | 20 | 4 | 15 | 15 | 5 | 6 | 16 | 4 | 30 | 30 | 10 | 3 | 12 | 4 | 60 | 60 | 20 | 1 | 12 | 4 | 120 | 120 | 40 | ||
| Iceberg / Occult Halo | 235 | -11 | 18 | 9 | 20 | 4 | 15 | 10 | 5 | 6 | 16 | 4 | 30 | 20 | 10 | 3 | 12 | 4 | 60 | 40 | 20 | 1 | 12 | 4 | 120 | 80 | 40 | ||
Note: Angles use GSLIB rotation convention.
| 14- |
|
| New Found Gold Corp. | Queensway Gold Project NI 43-101 Technical Report |
April 15, 2025 SLR Project No.: 233.065300.00001 |
The QP reviewed the proportion of each class estimated in each estimation pass, with Indicated blocks largely estimated within the first two estimation passes, while Inferred blocks were largely estimated within the second and third estimation passes. The unclassified portion of the model was largely estimated with the third and fourth estimation passes.
| 14.9.2 | AFZ Peripheral and JBP |
Four search passes were used to estimate the AFZ Peripheral area. Three search passes were used for JBP. There are no unestimated Au blocks in either the JBP or AFZ Peripheral models. Due to the wider drill hole spacing and narrower mineralized zones in those areas, it was not possible to identify any zones with well-defined plunges. The search ellipsoids used in the dynamic anisotropy had equal ranges for the major and semi-major axes.
The search parameters for the key vein domains and the buffer domain for the AFZ Peripheral area are shown in Table 14-24 and those for the JBP area are shown in Table 14-25.
Table 14-24: Search Parameters for Key Vein Domains - AFZ Peripheral
| Domain | Pass 1 | Pass 2 | Pass 3 | Pass 4 | ||||||||||||||||||||
| Min Comps | Max Comps | Max per DDH | Range 1 (m) | Range 2 (m) | Range 3 (m) | Min Comps | Max Comps | Max per DDH | Range 1 (m) | Range 2 (m) | Range 3 (m) | Min Comps | Max Comps | Max per DDH | Range 1 (m) | Range 2 (m) | Range 3 (m) | Min Comps | Max Comps | Max per DDH | Range 1 (m) | Range 2 (m) | Range 3 (m) | |
| Almond | 12 | 16 | 4 | 15 | 15 | 7.5 | 8 | 16 | 4 | 30 | 30 | 15 | 4 | 16 | 4 | 60 | 60 | 30 | 1 | 16 | 4 | 120 | 120 | 60 |
| BigVein | 12 | 16 | 4 | 15 | 15 | 7.5 | 8 | 16 | 4 | 30 | 30 | 15 | 4 | 16 | 4 | 60 | 60 | 30 | 1 | 16 | 4 | 120 | 120 | 60 |
| Disco Shear Splay_2 | 8 | 16 | 4 | 15 | 15 | 7.5 | 8 | 16 | 4 | 30 | 30 | 15 | 4 | 16 | 4 | 60 | 60 | 30 | 1 | 16 | 4 | 120 | 120 | 60 |
| Disco Shear_1 | 8 | 16 | 4 | 15 | 15 | 7.5 | 8 | 16 | 4 | 30 | 30 | 15 | 4 | 16 | 4 | 60 | 60 | 30 | 1 | 16 | 4 | 120 | 120 | 60 |
| Disco Shear_3 | 8 | 16 | 4 | 15 | 15 | 7.5 | 8 | 16 | 4 | 30 | 30 | 15 | 4 | 16 | 4 | 60 | 60 | 30 | 1 | 16 | 4 | 120 | 120 | 60 |
| Disco Shear_4 | 8 | 16 | 4 | 15 | 15 | 7.5 | 8 | 16 | 4 | 30 | 30 | 15 | 4 | 16 | 4 | 60 | 60 | 30 | 1 | 16 | 4 | 120 | 120 | 60 |
| Disco Shear_5 | 8 | 16 | 4 | 15 | 15 | 7.5 | 8 | 16 | 4 | 30 | 30 | 15 | 4 | 16 | 4 | 60 | 60 | 30 | 1 | 16 | 4 | 120 | 120 | 60 |
| Macadamia | 8 | 16 | 4 | 15 | 15 | 7.5 | 8 | 16 | 4 | 30 | 30 | 15 | 4 | 16 | 4 | 60 | 60 | 30 | 1 | 16 | 4 | 120 | 120 | 60 |
| Peanut | 8 | 16 | 4 | 15 | 15 | 7.5 | 8 | 16 | 4 | 30 | 30 | 15 | 4 | 16 | 4 | 60 | 60 | 30 | 1 | 16 | 4 | 120 | 120 | 60 |
| Pistachio Fault | 8 | 16 | 4 | 15 | 15 | 7.5 | 8 | 16 | 4 | 30 | 30 | 15 | 4 | 16 | 4 | 60 | 60 | 30 | 1 | 16 | 4 | 120 | 120 | 60 |
| Walnut | 8 | 16 | 4 | 15 | 15 | 7.5 | 8 | 16 | 4 | 30 | 30 | 15 | 4 | 16 | 4 | 60 | 60 | 30 | 1 | 16 | 4 | 120 | 120 | 60 |
| Punt | 6 | 12 | 3 | 30 | 30 | 15 | 4 | 12 | 3 | 60 | 60 | 30 | 2 | 12 | 3 | 120 | 120 | 60 | 1 | 12 | 3 | 240 | 240 | 120 |
| Buffer | 6 | 12 | 3 | 30 | 30 | 15 | 4 | 12 | 3 | 60 | 60 | 30 | 2 | 12 | 3 | 120 | 120 | 60 | 1 | 12 | 3 | 240 | 240 | 120 |
| 14- |
|
| New Found Gold Corp. | Queensway Gold Project NI 43-101 Technical Report |
April 15, 2025 SLR Project No.: 233.065300.00001 |
Table 14-25: Search Parameters for Key Vein Domains - JBP
| Domain | Pass 1 | Pass 2 | Pass 3 | |||||||||||||||
| Min Comps | Max Comps | Max per DDH | Range 1 (m) | Range 2 (m) | Range 3 (m) | Min Comps | Max Comps | Max per DDH | Range 1 (m) | Range 2 (m) | Range 3 (m) | Min Comps | Max Comps | Max per DDH | Range 1 (m) | Range 2 (m) | Range 3 (m) | |
| 1744 | 4 | 12 | 3 | 30 | 30 | 15 | 3 | 12 | 3 | 60 | 60 | 30 | 2 | 12 | 3 | 120 | 120 | 60 |
| 1744_HW | 4 | 12 | 3 | 30 | 30 | 15 | 3 | 12 | 3 | 60 | 60 | 30 | 2 | 12 | 3 | 120 | 120 | 60 |
| 1744_North | 4 | 12 | 3 | 30 | 30 | 15 | 3 | 12 | 3 | 60 | 60 | 30 | 2 | 12 | 3 | 120 | 120 | 60 |
| H Pond_1 | 4 | 12 | 3 | 30 | 30 | 15 | 3 | 12 | 3 | 60 | 60 | 30 | 2 | 12 | 3 | 120 | 120 | 60 |
| H Pond_2 | 4 | 12 | 3 | 30 | 30 | 15 | 3 | 12 | 3 | 60 | 60 | 30 | 2 | 12 | 3 | 120 | 120 | 60 |
| PN2A | 6 | 12 | 3 | 30 | 30 | 15 | 4 | 12 | 3 | 60 | 60 | 30 | 2 | 12 | 3 | 120 | 120 | 60 |
| PN2 | 6 | 12 | 3 | 30 | 30 | 15 | 4 | 12 | 3 | 60 | 60 | 30 | 2 | 12 | 3 | 120 | 120 | 60 |
| Pocket_Shoreline | 4 | 12 | 3 | 30 | 30 | 15 | 3 | 12 | 3 | 60 | 60 | 30 | 2 | 12 | 3 | 120 | 120 | 60 |
| Buffer | 4 | 12 | 3 | 30 | 30 | 15 | 3 | 12 | 3 | 60 | 60 | 30 | 2 | 12 | 3 | 120 | 120 | 60 |
| 14.9.3 | Dynamic Anisotropy |
Search ellipse orientations were rotated locally using dynamic anisotropy, based upon local angles calculated from mesh face normal vectors extracted from the vein hanging walls.
For the AFZ Core area, local angles were estimated within RMSP on each of the parent cell locations for the domain in question, calculated using first-order Inverse Distance (ID1) interpolation of the 40 closest mesh normal vectors. For the AFZ Peripheral and JBP estimates, RBF dynamic anisotropy calculation methodology was used.
For most domains, the major and semi-major ranges of the search ellipse were equal and their orientation relative to each other was irrelevant. For five domains, however, anisotropy was identified and implemented within the dynamic anisotropy methodology by specifying plunge orientations when calculating local angles. The resultant angles project the plunge orientation onto the surface to provide the major orientation, while aligning the major and semi-major orientations with the dynamic anisotropy surface.
Dynamic anisotropy was not implemented for the buffer domain, which was treated as isotropic, or the halo domains, which had global trends assigned.
| 14.9.4 | High Grade Restriction |
| 14.9.4.1 | AFZ Core Area |
Within the AFZ Core area, high grade restrictions were applied to 189 domains for Au estimation. The restriction process involved two key components:
| 1 | Grade Restriction Threshold - The grade value above which restrictions may be applied. |
| 2 | Restricted Search Dimensions - The spatial range within which high grade values were allowed to have full influence. |
During estimation, composite values exceeding the grade threshold were permitted to have full influence within the restricted ellipsoid, while beyond this range, these values were capped to the threshold to limit their impact. This approach ensured that high grade samples maintained local influence while preventing the over-projection of higher grades into lower grade areas.
| 14- |
|
| New Found Gold Corp. | Queensway Gold Project NI 43-101 Technical Report |
April 15, 2025 SLR Project No.: 233.065300.00001 |
The grade restriction threshold values were determined on a domain-by-domain basis through a combination of histogram analysis and spatial assessments of sample spacing and grade continuity. The dimensions of the restricted search ellipsoids were generally set to approximately half the average drill hole spacing for each domain, with refinements made in certain domains based on local variations in composite distribution and spacing.
The search restriction ellipsoids share the same anisotropy as the primary search ellipsoid and are scaled to the same distance for each pass. The restricted search ellipsoid was defined based on the average orientation of dynamic anisotropy local angles for each vein.
For example, in domain T1000 at Iceberg, the average drill hole spacing is approximately 13.5 m, which was rounded to the nearest 5 m (15 m). The restricted search ellipse was set to half the drill hole spacing, resulting in search radii of 7.5 m by 7.5 m by 3.75 m.
| • | Pass 1 search ellipse dimensions: 15 m by 15 m by 7.5 m |
| • | Pass 2 search ellipse dimensions: 30 m by 30 m by 15 m |
| • | Pass 3 search ellipse dimensions: 60 m by 60 m by 30 m |
| • | Pass 4 search ellipse dimensions: 120 m by 120 m by 60 m |
While search ellipsoids sizes increase with successive passes, the restricted search ellipse remains constant across all passes at 7.5 m by 7.5 m by 3.75 m, ensuring a consistent influence range for high grade restrictions.
The high-grade restriction parameters applied to key veins in the AFZ Core area are presented in Table 14-26:
Table 14-26: High Grade Restriction Parameters for Key Domains
| “mindom” | Au Threshold (g/t) | Range1 (m) | Range2 (m) | Range3 (m) | Angle1 (°) | Angle2 (°) | Angle3 (°) |
| Honeypot | 20 | 22.5 | 15 | 7.5 | 98 | 299 | 51 |
| Jackpot | 55 | 12.5 | 12.5 | 6.25 | 200 | 293 | 314 |
| GJ_Main | 40 | 15 | 15 | 7.5 | 3 | 358 | 282 |
| K2_Annapurna | 40 | 12.5 | 12.5 | 6.25 | 341 | 360 | 89 |
| K2_K2 | 22.5 | 15 | 15 | 7.5 | 229 | 354 | 337 |
| K2_K2No2 | 25 | 12.5 | 12.5 | 6.25 | 11 | 12 | 41 |
| K2_K2S1 | - | - | - | - | 346 | 37 | 340 |
| K2_K2S2 | - | - | - | - | 355 | 41 | 352 |
| K2_Kashmir2 | 15 | 22.5 | 22.5 | 11.25 | 20 | 353 | 287 |
| K2_Meru | 10 | 15 | 15 | 7.5 | 348 | 12 | 312 |
| Keats_Main | 175 | 30 | 10 | 5 | 222 | 334 | 308 |
| KW_HarbingerWest | 15 | 10 | 10 | 5 | 358 | 7 | 342 |
| KW_Powerline | - | - | - | - | 357 | 353 | 21 |
| KW_Harbinger1 | 50 | 20 | 10 | 5 | 249 | 340 | 339 |
| 14- |
|
| New Found Gold Corp. | Queensway Gold Project NI 43-101 Technical Report |
April 15, 2025 SLR Project No.: 233.065300.00001 |
| “mindom” | Au Threshold (g/t) | Range1 (m) | Range2 (m) | Range3 (m) | Angle1 (°) | Angle2 (°) | Angle3 (°) |
| KW_Harbinger2 | 55 | 20 | 10 | 5 | 250 | 339 | 339 |
| KW_Harbinger2X | 30 | 10 | 10 | 5 | 5 | 24 | 7 |
| Lotto | 80 | 10 | 10 | 5 | 347 | 1 | 90 |
| MM -Cassino | 7 | 25 | 25 | 12.5 | 29 | 43 | 39 |
| MM -KenoHill | 35 | 12.5 | 12.5 | 6.25 | 3 | 58 | 4 |
| MM -MonteCarlo | 25 | 12.5 | 12.5 | 6.25 | 28 | 47 | 36 |
| REG -Atlantic | - | - | - | - | 25 | 19 | 54 |
| ICE_T1000 | 100 | 7.5 | 7.5 | 3.75 | 62 | 335 | 89 |
| Iceberg | 130 | 15 | 7.5 | 3.75 | 232 | 354 | 289 |
| Equinox | 75 | 7.5 | 7.5 | 3.75 | 1 | 360 | 304 |
| Keats South | 20 | 17.5 | 17.5 | 8.75 | 24 | 14 | 62 |
| Note: Angles use GSLIB rotation convention. | |||||||
The QP assessed the impact of capping and high grade restriction on the estimated gold block grades by completing parallel estimates in which these controls were not applied. Based on this assessment, the QP considers the application of capping and high grade restriction to be appropriate and necessary. These measures effectively limit the influence of assay values and reduce the risk of grade overestimation by restricting the projection of high grade samples beyond what the QP considers to be reasonable geological and spatial limits of confidence.
Search restriction distances and thresholds should be continually reviewed across AFZ Core, AFZ Peripheral, and JBP for gold as new drilling information becomes available and more robust populations are developed for a given vein or group of veins.
| 14.9.4.2 | AFZ Peripheral and JBP |
The estimates for JBP and AFZ Peripheral were visually and statistically validated by domain. Following validation, it was determined that any outlier Au grades were sufficiently limited by capping of the raw assay data and in the search parameters. No high-grade restriction was implemented for JBP or AFZ Peripheral.
| 14.10 | Block Models |
| 14.10.1 | AFZ Core Area |
The AFZ Core area estimation block model is defined by the parameters presented in Table 14-27. A block model regularized to the 2.5 m by 2.5 m by 5 m parent cell dimensions was generated with the same minimum corner and boundary size, for the purposes of reporting open pit Mineral Resources. A further re-blocked model with 5 m by 5 m by 5 m cell dimensions was generated with the same minimum corner and boundary size, for the purpose of open pit optimization.
Block models were rotated 30° clockwise about the vertical axis, to better align with the strike of the mineralization.
The selected estimation block model parent block dimension of 2.5 m by 2.5 m by 5 m was selected in consideration of potential mining method selective mining unit (SMU) sizes, and drill hole spacing. The minimum sub-block size of 0.625 m by 0.625 m by 1.25 m was selected in consideration of the spatial complexity of the thinner mineralized veins, which required a small block size to adequately reproduce the domain volumes. A comparison of the wireframe and sub-block model volumes demonstrated that discrepancies were less than 1% for each domain.
| 14- |
|
| New Found Gold Corp. | Queensway Gold Project NI 43-101 Technical Report |
April 15, 2025 SLR Project No.: 233.065300.00001 |
Table 14-27: AFZ Core Estimation Block Model
| X | Y | Z | |
| Parent Size (m) | 2.5 | 2.5 | 5 |
| Minimum Sub-Block Size (m) | 0.625 | 0.625 | 1.25 |
| Minimum Corner (m) | 655,240 | 5,424,790 | -430 |
| Boundary size (m) | 1,730 | 7,340 | 550 |
| Rotation | 30° clockwise about Z-axis | ||
Due to the various downstream requirements of engineering software, the final estimation block model included equivalent categorical and integer variables (Table 14-28), which have been defined in previous sections. The 5 m by 5 m by 5 m open pit optimization block model and underground MSO block model were exported as Datamine format .dm files and contain only the numeric variables.
Table 14-28: AFZ Core Area Block Model Variables
| Categorical | Numeric | Description |
| mindom | mincode | Estimation domain (Section 14.3.3) |
| geodom | geocode | Geological domain (Section 14.3.1) |
| mintype | mincode | Mineralization type (Section 14.3.3) |
| class | clascode | Resource classification (Section 0) |
| au_idw | ID3 estimated Au grade (g/t) |
| 14.10.2 | AFZ Peripheral and JBP |
The AFZ Peripheral and JBP estimation block models are defined by the parameters presented in Table 14-29 and Table 14-30, respectively. The AFZ Peripheral model was sub-divided into three separate models due to the size of the area. Further block models regularized to the parent blocks, and a 5 m by 5 m by 5 m re-blocked open pit optimization block model were generated with the same minimum corner and boundary size.
| 14- |
|
| New Found Gold Corp. | Queensway Gold Project NI 43-101 Technical Report |
April 15, 2025 SLR Project No.: 233.065300.00001 |
Table 14-29: AFZ Peripheral Estimation Block Model
| Block Model Area 1 | |||
| X | Y | Z | |
| Parent Size (m) | 2.5 | 2.5 | 5 |
| Minimum Sub-Block Size (m) | 0.625 | 0.625 | 1.25 |
| Minimum Corner (m) | 657,270.4492 | 5,432,306.84116 | -425 |
| Boundary size (m) | 3,800 | 3,920 | 545 |
| Rotation | 30° clockwise about Z-axis | ||
| Block Model Area 2 | |||
| X | Y | Z | |
| Parent Size (m) | 2.5 | 2.5 | 5 |
| Minimum Sub-Block Size (m) | 0.625 | 0.625 | 1.25 |
| Minimum Corner (m) | 659,230.4492 | 5,435,701.6607235 | -425 |
| Boundary size (m) | 3,800 | 2,400 | 545 |
| Rotation | 30° clockwise about Z-axis | ||
| Block Model Area 3 | |||
| X | Y | Z | |
| Parent Size (m) | 2.5 | 2.5 | 5 |
| Minimum Sub-Block Size (m) | 0.625 | 0.625 | 1.25 |
| Minimum Corner (m) | 660,430.4492 | 5,437,780.1216925 | -425 |
| Boundary size (m) | 3,800 | 2,500 | 545 |
| Rotation | 30° clockwise about Z-axis | ||
Table 14-30: JBP Estimation Block Model
| X | Y | Z | |
| Parent Size (m) | 2.5 | 2.5 | 5 |
| Minimum Sub-Block Size (m) | 0.625 | 0.625 | 1.25 |
| Minimum Corner (m) | 662,374.2205 | 5,428,476.8321 | -425 |
| Boundary size (m) | 1,930 | 4,205 | 545 |
| Rotation | 30° clockwise about Z-axis | ||
| 14.11 | Classification |
CIM (2014) definitions were used for Mineral Resource classification.
| 14- |
|
| New Found Gold Corp. | Queensway Gold Project NI 43-101 Technical Report |
April 15, 2025 SLR Project No.: 233.065300.00001 |
| 14.11.1 | AFZ Core Area |
| 14.11.1.1 | Classification Criteria |
The Mineral Resource classification was based on a hybrid approach that primarily considered local drill hole spacing (DSP) and the spatial variability as observed in normal score variograms of Queensway’s most notable domains.
Drill hole spacing was defined as the average distance to the three closest drill holes, rather than the distance of a block to the nearest drill hole composite. To assess spatial variability, normal score variograms were prepared for the 15 largest domains. While not all domains produced coherent experimental variograms, those that did showed that sample variability reached 85% of the sill at distances of 30 m to 40 m. Figure 14-13 and Figure 14-15 present the transformed normal score variograms for two of the largest domains, Keats Main and Iceberg, respectively.
These findings were confirmed through visual inspection, which indicated that sample grades within 30 m showed reasonable correlation, while samples further apart exhibited weaker grade continuity.
The classification criteria for Indicated and Inferred Mineral Resources were established as follows:
The nominal DSP required for Indicated and Inferred classification are listed below:
| • | Indicated Mineral Resources: Defined where contiguous blocks have drill hole spacing of ≤30 m. |
| • | Inferred Mineral Resources: Defined where contiguous blocks have drill hole spacing of ≤60 m to 70 m. |
Any Indicated blocks contained within the modeled AFZ structure were downgraded to Inferred classification to reflect the lower confidence associated with potentially reworked mineralization.
The QP considers these classification thresholds reasonable for the Project, based on experience with similar deposits.
Areas where wireframes extend beyond the nominal 60 m to 70 m drill hole spacing contain unclassified blocks.
In the future, Measured Mineral Resources may be classified in areas where the average drill hole spacing is a minimum of 15 m or less between the closest three drill holes, as well as trench mapping and channel sampling to define the structural relationships, surface expression and confirm grade continuity. The QP considers this to be the minimum criterion for areas with low structural complexity. Areas with greater structural complexity may require tighter drill hole spacing, such as closely spaced (5 m x 5 m pattern) diamond or RC drilling, or additional support from reconciled production data to achieve Measured classification. The QP is of the opinion that the declaration of Measured Mineral Resources is not appropriate for this Project at its current stage of development.
For reporting Mineral Resources, classification within individual underground MSO panels was adjusted to reflect the dominant class within each panel.
| 14.11.1.2 | Classification Application and Methodology |
Mineral Resource classification wireframes were generated in Leapfrog Geo based upon DSP calculated in the drill hole intervals and edited to produce contiguous zones of like classification.
| 14- |
|
| New Found Gold Corp. | Queensway Gold Project NI 43-101 Technical Report |
April 15, 2025 SLR Project No.: 233.065300.00001 |
As further support for the classification approach, DSP was calculated for the blocks in each estimated domain, using a methodology that assumes drilling is completed on a regular grid, meaning that DSP can be approximated by the average distance to the three closest samples in different holes multiplied by √2.
The cumulative frequency of block DSP is shown for mineralized blocks in Figure 14-19, demonstrating that 83% of Indicated blocks have DSP below 30 m, while 79% of Inferred blocks have DSP below 60 m. Blocks outside of the classification shapes but with a block DSP below 70 m were assigned to the Inferred category, resulting in the truncation of the unclassified curve at 70 m on the X-axis.
Figure 14-19: Drill Hole Spacing Cumulative Frequency by Class for Parent Block Regularized Block Model

The cumulative block DSP frequency of all estimated blocks within the parent block regularized model is shown in Figure 14-20, indicating that 31% of blocks have a DSP below 30 m and 73% of blocks have a DSP below 60 m, while almost all blocks have a DSP below 150 m:
| 14- |
|
| New Found Gold Corp. | Queensway Gold Project NI 43-101 Technical Report |
April 15, 2025 SLR Project No.: 233.065300.00001 |
Figure 14-20: Drill Hole Spacing Cumulative Frequency for Parent Block Regularized Block Model

A vertical cross-section showing the classified open pit and underground AFZ Core area Mineral Resource is provided in Figure 14-21, using the parent regularized block model for the open pit portion, and the sub-blocked estimation model for the underground portion. Veins shown on the left side of the figure belong to the K2 reporting area, while veins on the right belong to the Lotto reporting area.
Figure 14-22 demonstrates the GJ_Main classification before and after application of RPEEE constraints. This includes constraint by the underground MSO shapes, and reassignment of classification within each panel to reflect the dominant class within each.
Longitudinal sections showing the classified open pit and underground AFZ Core area Mineral Resource for Keats_Main, Iceberg, Lotto, and Jackpot are shown in Figure 14-23 to Figure 14-26.
| 14- |
|
| New Found Gold Corp. | Queensway Gold Project NI 43-101 Technical Report |
April 15, 2025 SLR Project No.: 233.065300.00001 |
Figure 14-21: Vertical Section Showing Classified Open Pit and Underground Mineral Resource

| 14- |
|
| New Found Gold Corp. | Queensway Gold Project NI 43-101 Technical Report |
April 15, 2025 SLR Project No.: 233.065300.00001 |
Figure 14-22: GJ_Main Long Sections Showing Classification Before (Left) and After (Right) Application of RPEEE Constraints

| 14- |
|
| New Found Gold Corp. | Queensway Gold Project NI 43-101 Technical Report |
April 15, 2025 SLR Project No.: 233.065300.00001 |
Figure 14-23: Keats_Main Long Section Showing Classified Open Pit and Underground Mineral Resource

| 14- |
|
| New Found Gold Corp. | Queensway Gold Project NI 43-101 Technical Report |
April 15, 2025 SLR Project No.: 233.065300.00001 |
Figure 14-24: Iceberg Long Section Showing Classified Open Pit and Underground Mineral Resource

| 14- |
|
| New Found Gold Corp. | Queensway Gold Project NI 43-101 Technical Report |
April 15, 2025 SLR Project No.: 233.065300.00001 |
Figure 14-25: Lotto Long Section Showing Classified Open Pit and Underground Mineral Resource

| 14- |
|
| New Found Gold Corp. | Queensway Gold Project NI 43-101 Technical Report |
April 15, 2025 SLR Project No.: 233.065300.00001 |
Figure 14-26: Jackpot Long Section Showing Classified Open Pit and Underground Mineral Resource

| 14- |
|
| New Found Gold Corp. | Queensway Gold Project NI 43-101 Technical Report |
April 15, 2025 SLR Project No.: 233.065300.00001 |
| 14.11.2 | JBP and AFZ Peripheral |
The classification workflow for the JBP and AFZ Peripheral areas was also based upon DSP calculated on the drill hole intervals. This approach was validated using DSP calculated on each parent block within the sub-block model. The calculation, which was performed in Leapfrog software, was similar to that used for the AFZ Core area and was based upon the average Euclidean distance to three closest samples in separate drill holes, then multiplied by 1.41. The classification boundaries were generated using Leapfrog and manually edited to produce continuous wireframes.
A longitudinal section view through the classified open pit and underground resource in the centre of the AFZ Peripheral area (Big Vein - Disco Shear) is shown in Figure 14-27. A longitudinal section view showing the classified open pit and underground resource for the Disco Shear 3 domain is presented in Figure 14-28. A plan section view of the classified open pit blocks for the Doyle vein is shown in Figure 14-29. There are no classified underground blocks in the Doyle vein. Open pit resources are shown using the parent block model and underground resources are shown with the sub-blocked model.
The classified open pit and underground resource for the JBP Pocket Shoreline, PN, and H Pond areas are shown in longitudinal section view in Figure 14-30. Longitudinal sections of the classified open pit and underground resource within the PN2A and PN2 veins are shown in Figure 14-31. Open pit resources are shown using the parent block model and underground resources are shown with the sub-blocked model.
The nominal DSP required for Indicated and Inferred classification are listed below:
| • | Indicated: 30 m |
| • | Inferred: 60 m |
| • | Unclassified: >60 m |
Any Indicated blocks within the AFZ Peripheral area contained within the AFZ structure were downgraded to Inferred classification to reflect the lower confidence associated with potentially reworked mineralization. Material within the AFZ structure does not contribute materially to the QWN Mineral Resource.
| 14- |
|
| New Found Gold Corp. | Queensway Gold Project NI 43-101 Technical Report |
April 15, 2025 SLR Project No.: 233.065300.00001 |
Figure 14-27: Long Section Showing Classified Open Pit and Underground Mineral Resources in the Centre of the AFZ Peripheral Area

| 14- |
|
| New Found Gold Corp. | Queensway Gold Project NI 43-101 Technical Report |
April 15, 2025 SLR Project No.: 233.065300.00001 |
Figure 14-28: Disco Shear 3 Long Section Showing Classified Open Pit and Underground Mineral Resource

| 14- |
|
| New Found Gold Corp. | Queensway Gold Project NI 43-101 Technical Report |
April 15, 2025 SLR Project No.: 233.065300.00001 |
Figure 14-29: Doyle Plan Section Showing Classified Open Pit Mineral Resource

| 14- |
|
| New Found Gold Corp. | Queensway Gold Project NI 43-101 Technical Report |
April 15, 2025 SLR Project No.: 233.065300.00001 |
Figure 14-30: Vertical Sections Through the Open Pit and Underground Mineral Resources in Select Pits at JBP

| 14- |
|
| New Found Gold Corp. | Queensway Gold Project NI 43-101 Technical Report |
April 15, 2025 SLR Project No.: 233.065300.00001 |
Figure 14-31: PN2A and PN_2 Long Sections Showing Classified Open Pit and Underground Mineral Resource

| 14- |
|
| New Found Gold Corp. | Queensway Gold Project NI 43-101 Technical Report |
April 15, 2025 SLR Project No.: 233.065300.00001 |
| 14.12 | Block Model Validation |
The QP validated the estimated block model using:
| • | Visual comparison of block grades and estimation composites. |
| • | Statistical comparison of block grades and estimation composites, including NN check estimates for all domains. |
| • | Swath plots. |
| • | Leapfrog check estimates for key veins estimated using RMSP. |
To help focus validation efforts, the most significant veins by contained Au metal were identified, according to the ID3 and NN estimates, prior to re-blocking and without class or reporting cut-off grade constraint (Figure 14-32). These showed similar results.
Figure 14-32: Largest 20 Domains by Contained Au Metal (ID3 and NN)

| 14.12.1 | AFZ Core Area |
| 14.12.1.1 | Visual Validation |
The QP completed visual checks in vertical section, plan, and longitudinal section to compare the estimated block grades and composites, as well as to confirm that interpolated grades reflected the expected anisotropy, and that high grade samples did not have undue influence.
An example longitudinal section and vertical section is shown for the Keats_Main domain in Figure 14-33, and additional longitudinal sections for Iceberg in Figure 14-34, GJ_Main and Lotto in Figure 14-35, and Jackpot in Figure 14-36. The sub-blocked estimation block model is shown in the figures.
In all cases, the estimated block grades show good reproduction of the composites and were reasonably interpolated.
| 14- |
|
| New Found Gold Corp. | Queensway Gold Project NI 43-101 Technical Report |
April 15, 2025 SLR Project No.: 233.065300.00001 |
Figure 14-33: Keats_Main Long Section and Vertical Section

| 14- |
|
| New Found Gold Corp. | Queensway Gold Project NI 43-101 Technical Report |
April 15, 2025 SLR Project No.: 233.065300.00001 |
Figure 14-34: Iceberg Long Section

| 14- |
|
| New Found Gold Corp. | Queensway Gold Project NI 43-101 Technical Report |
April 15, 2025 SLR Project No.: 233.065300.00001 |
Figure 14-35: GJ_Main and Lotto Long Sections

| 14- |
|
| New Found Gold Corp. | Queensway Gold Project NI 43-101 Technical Report |
April 15, 2025 SLR Project No.: 233.065300.00001 |
Figure 14-36: Jackpot Long Section

| 14- |
|
| New Found Gold Corp. | Queensway Gold Project NI 43-101 Technical Report |
April 15, 2025 SLR Project No.: 233.065300.00001 |
| 14.12.1.2 | Statistical Checks |
The QP completed statistical checks for each domain, comparing the ID3 estimated grades, NN check estimates, and informing composite grades.
Summary statistics for key domains are presented in Table 14-31. Key domains show generally good agreement, although individual domains sometimes show differences between the NN block grade means and 5 m composites of up to 57%, and ID3 block grade means and one-metre composites of up to approximately 58%. The ID3 block grades are frequently lower than the one-metre composites due to the application of high-grade restriction in the ID3 estimate. The greatest discrepancy, observed for Jackpot, results from several high-grade samples located within a small portion of the domain, which result in the higher mean grade for the composites than the blocks, as shown in Figure 14-36.
Similarly, while some of the domains have NN and ID3 block grade discrepancies of up to approximately 28%, most are within 10% and indicate that the discrepancies between the block grades and composites are largely due to the spatial arrangement of the samples and means influenced by a small number of high-grade samples.
The discrepancies are sometimes larger for smaller veins, containing less metal, however, their impact on the estimated Mineral Resources is not material.
| 14- |
|
| New Found Gold Corp. | Queensway Gold Project NI 43-101 Technical Report |
April 15, 2025 SLR Project No.: 233.065300.00001 |
Table 14-31: AFZ Core Area Block Model Validation Statistical Checks
| Domain | Mean ID3 | Mean NN | Mean 1 m Comp | Mean 5 m Comp | ID3 vs. NN | ID3 vs. 1 m Comp | NN vs. 5 m Comp |
| g/t | g/t | g/t | g/t | %Diff | %Diff | %Diff | |
| Honeypot | 2.1 | 2.1 | 2.9 | 2.9 | 2.4 | -27.4% | -29.1% |
| Jackpot | 2.4 | 2.5 | 5.9 | 5.9 | -2.2 | -58.3% | -57.4% |
| GJ_Main | 5.1 | 5.7 | 7.1 | 7.1 | -10.2 | -28.1% | -20.0% |
| K2_Annapurna | 2.5 | 2.5 | 2.3 | 2.3 | -1.3 | 9.8% | 11.3% |
| K2_K2 | 1.6 | 1.6 | 1.7 | 1.7 | 1.4 | -2.9% | -4.2% |
| K2_K2No2 | 1.6 | 1.8 | 2.0 | 2.0 | -10.9 | -15.7% | -5.4% |
| K2_K2S1 | 1.5 | 1.7 | 1.6 | 1.6 | -9.4 | -6.9% | 2.7% |
| K2_K2S2 | 1.1 | 1.0 | 1.3 | 1.3 | 6.9 | -17.1% | -22.4% |
| K2_Kashmir2 | 1.6 | 1.8 | 1.9 | 1.9 | -9.6 | -16.7% | -7.8% |
| K2_Meru | 1.8 | 2.1 | 2.1 | 2.1 | -11.6 | -11.3% | 0.2% |
| Keats_Main | 7.6 | 7.3 | 11.3 | 11.3 | 3.6 | -33.1% | -35.4% |
| KW_HarbingerWest | 1.0 | 1.4 | 1.0 | 1.0 | -27.4 | 1.0% | 39.1% |
| KW_Powerline | 0.6 | 0.6 | 0.7 | 0.7 | 3.2 | -15.4% | -18.0% |
| KW_Harbinger1 | 6.1 | 6.8 | 6.3 | 6.3 | -9.4 | -2.3% | 7.9% |
| KW_Harbinger2 | 5.4 | 5.6 | 5.5 | 5.5 | -4.5 | -2.3% | 2.3% |
| KW_Harbinger2X | 6.1 | 6.5 | 6.8 | 6.8 | -6.0 | -9.6% | -3.8% |
| Lotto | 5.8 | 6.3 | 6.2 | 6.2 | -8.7 | -7.0% | 1.9% |
| MM_Cassino | 1.3 | 1.4 | 1.3 | 1.3 | -8.0 | -1.4% | 7.2% |
| MM_KenoHill | 3.6 | 3.8 | 5.6 | 5.6 | -5.2 | -35.1% | -31.6% |
| MM_MonteCarlo | 2.0 | 2.1 | 2.6 | 2.6 | -3.0 | -23.1% | -20.8% |
| REG_Atlantic | 1.0 | 1.0 | 1.0 | 1.0 | -2.5 | 1.4% | 4.0% |
| ICE_T1000 | 12.1 | 16.8 | 16.5 | 16.5 | -27.6 | -26.4% | 1.6% |
| Iceberg | 9.0 | 9.3 | 10.7 | 10.7 | -3.0 | -15.4% | -12.9% |
| Equinox | 10.4 | 11.1 | 16.9 | 16.4 | -6.6 | -38.7% | -32.3% |
| Keats South | 1.9 | 2.5 | 2.5 | 2.5 | -22.6 | -24.1% | -2.0% |
The contained metal for the ID3 and NN estimates are compared graphically for Au in Figure 14-37, with each tick on the X-axis representing an individual domain, ranked by the IDW metal content. The results generally show good agreement, with the NN estimates sometimes showing higher grades due to the lack of high-grade restriction and the smoothing effect inherent in the ID3 estimate, resulting from the skewed Au populations.
| 14- |
|
| New Found Gold Corp. | Queensway Gold Project NI 43-101 Technical Report |
April 15, 2025 SLR Project No.: 233.065300.00001 |
Figure 14-37: Core Area Au ID3 and NN Contained Metal

Example histograms are shown in Figure 14-38 for the Keats_Main domain, comparing the volume weighted estimation block model ID3 and NN Au block grades with the one-metre composites. The good agreement of the NN and ID3 grades further supports the estimate with respect to the spatial arrangement of the samples.
Figure 14-38: Keats_Main Histograms of Block Grades and 1 m Composites

| 14- |
|
| New Found Gold Corp. | Queensway Gold Project NI 43-101 Technical Report |
April 15, 2025 SLR Project No.: 233.065300.00001 |
The QP is of the opinion that the statistical checks broadly support the locally estimated block grades. Although, additional in-fill drilling and sampling will be needed to improve the accuracy of the local grade estimate for use in any detail production scheduling or financial modelling.
| 14.12.1.3 | Swath Plots |
The QP generated swath plots for each domain, comparing the estimated block grades and composite grades. The ID3 estimated grades show generally good agreement with the NN estimates and composite grades. The largest discrepancies generally occur in swaths containing few blocks or composites, or where very high value composites are subject to further high-grade restriction in the ID3 estimate.
The QP is of the opinion that the swath plots broadly support the estimated block grades.
Example swath plots for the Keats_Main domain are shown for Au in Figure 14-39.
Figure 14-39: Keats_Main Domain Au Swath Plots

| 14- |
|
| New Found Gold Corp. | Queensway Gold Project NI 43-101 Technical Report |
April 15, 2025 SLR Project No.: 233.065300.00001 |
| 14.12.1.4 | Leapfrog Check Estimates |
To further validate the scripted RMSP workflow, the QP completed parallel check estimates for 25 key domains using Leapfrog Edge with the same estimation parameters.
The estimated tonnages, mean Au grades, and contained metal are generally consistent to within 1% and corroborate the RMSP estimates. Minor differences in the 2% to 3% range occur due to software differences such as the differing dynamic anisotropy methodologies.
| 14.12.2 | AFZ Peripheral |
| 14.12.2.1 | Visual Validation |
Visual validation was performed on the block model in 3D and in 2D using vertical sections, plan sections, and longitudinal sections to confirm that the interpolated block grades are representative of the samples and that high grade samples did not have undue influence.
An example longitudinal section showing the estimated blocks and the full width composites for the Disco Shear 3 and Doyle veins is shown in Figure 14-40.
| 14- |
|
| New Found Gold Corp. | Queensway Gold Project NI 43-101 Technical Report |
April 15, 2025 SLR Project No.: 233.065300.00001 |
Figure 14-40: Block Grades and Full Width Composites for Disco Shear 3 and Doyle Veins

| 14- |
|
| New Found Gold Corp. | Queensway Gold Project NI 43-101 Technical Report |
April 15, 2025 SLR Project No.: 233.065300.00001 |
| 14.12.2.2 | Statistical Checks |
The QP completed statistical checks for each domain, comparing the ID3 estimated grades, NN check estimates, and informing composite grades. Both the one-metre composites and full width composites were used. A summary of the statistics for select domains is presented in Table 14-32.
Overall, there is good agreement between the ID3 block grade means and the NN block grade means. The comparison of the ID3 block grade means with the one-metre composites and the comparison of the NN block grade means with the full width composites is more variable. The discrepancies are larger in the smaller veins containing less metal, some of which are using only three to four drill holes, and the impact on the estimated Mineral Resources is not material.
Table 14-32: AFZ Peripheral Area Block Model Validation Statistical Checks for Select Domains
| Domain | ID3 | NN | 1m Comp | Full Width Comp | ID3 vs NN | ID3 vs 1m Comp | NN vs Full Width Comp |
| Mean (g/t Au) |
Mean (g/t Au) |
Mean (g/t Au) |
Mean (g/t Au) |
% Diff | % Diff | % Diff | |
| Almond | 1.84 | 1.72 | 2.03 | 2.03 | 7% | -10% | -18% |
| Big Vein | 0.85 | 0.78 | 1.37 | 1.37 | 8% | -62% | -75% |
| Disco Shear Splay_2 | 0.73 | 0.73 | 0.78 | 0.78 | 0% | -6% | -6% |
| Disco Shear_1 | 0.66 | 0.65 | 0.61 | 0.61 | 2% | 7% | 5% |
| Disco Shear_3 | 0.65 | 0.63 | 0.58 | 0.58 | 3% | 11% | 8% |
| Disco Shear_4 | 0.76 | 0.78 | 0.73 | 0.73 | -3% | 3% | 6% |
| Disco Shear_5 | 0.66 | 0.64 | 0.64 | 0.64 | 3% | 4% | 1% |
| Macadamia | 4.07 | 3.89 | 4.21 | 4.21 | 5% | -3% | -8% |
| Peanut | 2.32 | 2.06 | 1.65 | 1.65 | 11% | 29% | 20% |
| Pistachio Fault | 2.16 | 1.75 | 2.26 | 2.26 | 19% | -5% | -29% |
| Walnut | 0.96 | 0.87 | 0.85 | 0.85 | 9% | 11% | 2% |
| Punt | 0.96 | 1.12 | 1.25 | 1.25 | -17% | -30% | -11% |
| 14- |
|
| New Found Gold Corp. | Queensway Gold Project NI 43-101 Technical Report |
April 15, 2025 SLR Project No.: 233.065300.00001 |
| 14.12.2.3 | Swath Plots |
As part of the model validation process, the QP generated swath plots for each domain comparing the estimated block grades (ID3 and NN) with the one-metre composite grades. Overall, the ID3 estimate shows good correlation with the NN estimate and the composites. The composites show greater variability and there are larger discrepancies where there are fewer blocks.
The QP is of the opinion that the swath plots broadly support the estimated block grades.
Example swath plots are shown for the Disco Shear veins (Disco Shear 1 to 5 and Disco Shear Splay 1 to 5) in Figure 14-41.
Figure 14-41: Disco Shear Swath Plots

| 14- |
|
| New Found Gold Corp. | Queensway Gold Project NI 43-101 Technical Report |
April 15, 2025 SLR Project No.: 233.065300.00001 |

| 14- |
|
| New Found Gold Corp. | Queensway Gold Project NI 43-101 Technical Report |
April 15, 2025 SLR Project No.: 233.065300.00001 |
| 14.12.3 | JBP |
| 14.12.3.1 | Visual Validation |
Visual validation was performed on the block model in 3D and in 2D using vertical sections, plan sections, and longitudinal sections to confirm that the interpolated block grades are representative of the samples and that high grade samples did not have undue influence.
| 14.12.3.2 | Statistical Checks |
The QP completed statistical checks for each domain, comparing the ID3 estimated grades, NN check estimates, and informing composite grades. Both the one-metre composites and full width composites were used. A summary of the statistics for select domains is presented in Table 14-33.
The QP notes that the domains in the JBP area are on average smaller than those in the AFZ Core and in the AFZ Peripheral areas. The discrepancies between the ID3, NN, and composite comparisons can be attributed to the low number of samples informing some of the domains. The smaller domains are contributing a small amount of metal and deemed to have a low impact on the Mineral Resource estimate.
Table 14-33: JBP Area Block Model Validation Statistical Checks for Select Domains
| Domain | ID3 | NN | 1 m Comp | Full Width Comp | ID3 vs NN | ID3 vs 1m Comp | NN vs Full Width Comp |
| Mean (g/t Au) |
Mean (g/t Au) |
Mean (g/t Au) |
Mean (g/t Au) |
% Diff | % Diff | % Diff | |
| 1744 | 1.88 | 1.60 | 2.16 | 2.16 | 15% | -15% | -35% |
| 1744_HW | 1.21 | 1.77 | 1.39 | 1.39 | -46% | -15% | 21% |
| 1744_North | 0.83 | 0.70 | 0.70 | 0.70 | 15% | 15% | 0% |
| H Pond_1 | 1.38 | 1.33 | 1.57 | 1.57 | 3% | -14% | -18% |
| H Pond_2 | 1.32 | 1.44 | 1.23 | 1.23 | -9% | 6% | 14% |
| PN2A | 1.88 | 2.26 | 1.96 | 1.96 | -20% | -4% | 13% |
| PN2 | 1.62 | 1.43 | 1.78 | 1.78 | 12% | -10% | -25% |
| Pocket Shoreline | 1.25 | 1.29 | 1.40 | 1.40 | -3% | -12% | -9% |
| 14.12.3.3 | Swath Plots |
As part of the model validation process, the SLR QP generated swath plots for each domain comparing the estimated block grades (ID3 and NN) with the one-metre composite grades. Overall, the ID3 estimate shows good correlation with the NN estimate and the composites. The composites show greater variability and there are larger discrepancies where there are fewer blocks.
The QP is of the opinion that the swath plots broadly support the estimated block grades.
Example swath plots are shown for the PN group of veins (PN2A, PN_1, PN_1_HW, PN_2, and PN_Flat1) in Figure 14-42.
| 14- |
|
| New Found Gold Corp. | Queensway Gold Project NI 43-101 Technical Report |
April 15, 2025 SLR Project No.: 233.065300.00001 |
Figure 14-42: PN Swath Plots

| 14- |
|
| New Found Gold Corp. | Queensway Gold Project NI 43-101 Technical Report |
April 15, 2025 SLR Project No.: 233.065300.00001 |

| 14.13 | Cut-off Grade and Whittle Parameters |
RPEEE were demonstrated for the reported Mineral Resources by constraining the open pit Mineral Resources with a preliminary optimized pit shell, while the underground Mineral Resources were constrained with underground MSO shapes.
Open pit Mineral Resources were reported above a 0.3 g/t Au reporting cut-off grade. Underground Mineral Resources are constrained by MSO shapes generated at a cut-off grade of 1.65 g/t Au and a minimum mining width of 1.8 m.
| 14.13.1 | Cut-Off Grades |
Cut-off grade was calculated in consideration of the costs associated with metal extraction, metallurgical recovery, and metal value.
Cut-off grade calculation parameters are tabulated in Table 14-34:
Table 14-34: Cut-off Grade Parameters
| Parameter | Value |
| Assumed Processing Throughput | 2.0 Mtpa |
| Au price | US$2,200/oz |
| Exchange rate | US$1.00 = C$1.43 |
| Metallurgical Recovery | 90% |
| Payable | 99.95% |
| 14- |
|
| New Found Gold Corp. | Queensway Gold Project NI 43-101 Technical Report |
April 15, 2025 SLR Project No.: 233.065300.00001 |
| Parameter | Value |
| Royalties | 0.4% NSR |
| Transportation, Treatment and Refining Charges | US$5.0/oz Au |
| Byproduct credits and deleterious elements | Excluded |
| Mine cost adjustment factor | Excluded |
| Resultant Revenue Factor | C$90.33/g Au |
| Open pit mining cost | C$5.0/t moved |
| Underground mining cost | C$120/t proc |
| Processing cost | C$20/t proc |
| G&A costs | C$15.0 million/yr, or C$7.5/t proc |
| 14.13.2 | Open Pit Optimization |
Open pit Mineral Resources are constrained by a preliminary optimized open pit shell calculated using the Lerchs-Grossmann algorithm and reported above a cut-off grade of 0.3 g/t Au.
Optimization parameters for the preliminary open pit shell are tabulated in Table 14-35:
Table 14-35: Preliminary Open Pit Optimization Parameters
| Parameter | Value |
| Assumed mining rate (total material) | 30,000 tpd |
| Open pit mining cost | C$5.0/t moved |
| Pit slope angle | 45° |
| Bench Height | 5.0 m |
| Dilution and Extraction | Excluded |
| Au cut-off grade | 0.30 g/t |
| 14.13.3 | Underground Optimization |
Underground Mineral Resources are constrained within reporting panels generated at a cut-off grade of 1.65 g/t Au with heights of 10 m, lengths of 5 m, and minimum widths of 1.8 m.
Optimization parameters for the reporting panels are tabulated in Table 14-36:
| 14- |
|
| New Found Gold Corp. | Queensway Gold Project NI 43-101 Technical Report |
April 15, 2025 SLR Project No.: 233.065300.00001 |
Table 14-36: Underground Reporting Panel Optimization Parameters
| Parameter | Value |
| Minimum Mining Width | 1.8 m |
| Height | 10.0 m |
| Strike Length | 5.0 m |
| Dilution and Extraction | Excluded |
| Au Cut-off Grade | 1.65 g/t |
| 14.14 | Mineral Resource Reporting |
CIM (2014) definitions were used for Mineral Resource classification.
For the purposes of open pit optimization, the block model was re-blocked to 5 m by 5 m by 5 m, while open pit Mineral Resources are reported from a block model regularized to the 2.5 m by 2.5 m by 5 m parent cell size. Underground MSO shapes and reporting of Mineral Resources was completed using the original estimation sub-block model, with a minimum sub-block size of 0.625 m by 0.625 m by 1.25 m.
Open pit Mineral Resources are constrained by a preliminary optimized open pit shell and reported above a cut-off grade of 0.3 g/t Au.
Underground Mineral Resources are constrained by MSO shapes generated at a cut-off grade of 1.65 g/t Au and a minimum mining width of 1.8 m.
As part of the Mineral Resource estimation process, the Whittle pit shell was evaluated to determine RPEEE. The QP confirms that all interpreted mineralized vein wireframes remain within NFG's tenured property, with no wireframes crossing into or Mineral Resources reported from Exploits Discovery Corp.'s property. However, the optimized Whittle pit shell containing the Mineral Resources of the Honeypot vein (the northeasternmost pit shown in Figure 14-43 and Figure 14-44) boundary into the neighboring Exploits Discovery Corp. property.
New Found Gold Corp. has consulted with Exploits Discovery Corp., and its management has confirmed that they have no concerns regarding this disclosure. Should mining proceed in the future, discussions regarding access or easements between the two parties would take place at that time.
The current Whittle pit shell for the Queensway Project also overlaps with the Trans-Canada Highway. While this presents a logistical consideration, highway realignment is a common practice for mining projects during the construction phase when justified by economic feasibility. At this early stage of project development, the QP foresees no reason why material within this portion of the pit shell should not be considered to have RPEEE. However, future studies will be needed to assess the technical and regulatory requirements associated with potential infrastructure relocation.
For the purposes of Mineral Resource tabulation, the AFZ Core area is split by the reporting areas shown in Figure 14-43.
The AFZ Core area Mineral Resource is shown coloured by Au grade in Figure 14-44.
The AFZ Peripheral and JBP areas are reported as separate zones. The AFZ Peripheral area Mineral Resource is shown in Figure 14-45 and the JBP area Mineral Resource is shown in Figure 14-46.
| 14- |
|
| New Found Gold Corp. | Queensway Gold Project NI 43-101 Technical Report |
April 15, 2025 SLR Project No.: 233.065300.00001 |
Figure 14-43: AFZ Core Area Mineral Resource Reporting Area
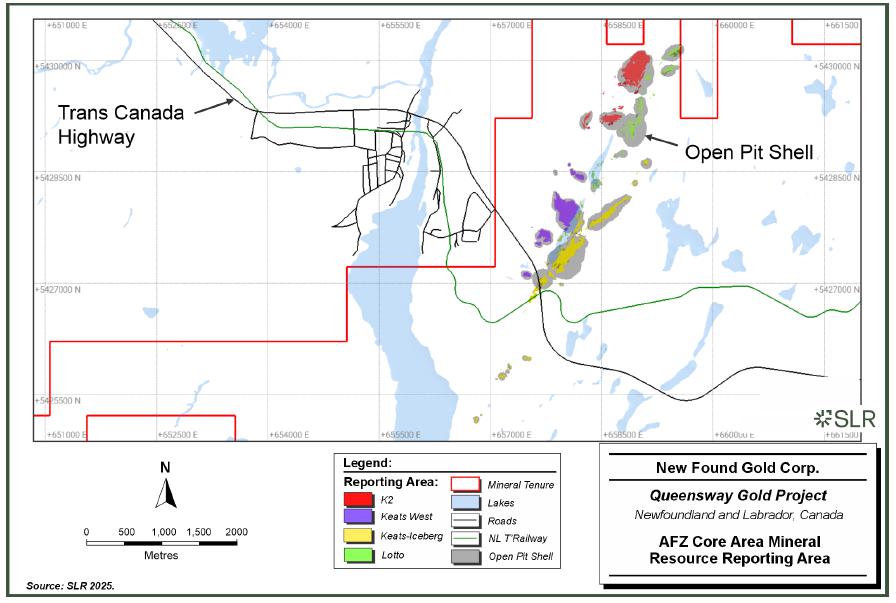
| 14- |
|
| New Found Gold Corp. | Queensway Gold Project NI 43-101 Technical Report |
April 15, 2025 SLR Project No.: 233.065300.00001 |
Figure 14-44: Isometric View of the AFZ Core Area Mineral Resource

| 14- |
|
| New Found Gold Corp. | Queensway Gold Project NI 43-101 Technical Report |
April 15, 2025 SLR Project No.: 233.065300.00001 |
Figure 14-45: Isometric View of the AFZ Peripheral Area Mineral Resource

| 14- |
|
| New Found Gold Corp. | Queensway Gold Project NI 43-101 Technical Report |
April 15, 2025 SLR Project No.: 233.065300.00001 |
Figure 14-46: Isometric View of the JBP Area Mineral Resource

| 14- |
|
| New Found Gold Corp. | Queensway Gold Project NI 43-101 Technical Report |
April 15, 2025 SLR Project No.: 233.065300.00001 |
Mineral Resources for the Project are tabulated in Table 14-37, with an effective date of March 15, 2025:
Table 14-37: Summary of Mineral Resources - Effective Date March 15, 2025
| Zone | Area | Category | Tonnage (000 t) |
Grade (g/t Au) |
Contained Metal (000 oz Au) |
| Open Pit | |||||
| K2, Monte Carlo | AFZ Core | Indicated | 3,588 | 1.51 | 175 |
| Inferred | 3,755 | 1.22 | 147 | ||
| Keats West, Cokes, Powerline | AFZ Core | Indicated | 4,392 | 1.85 | 261 |
| Inferred | 2,410 | 1.33 | 103 | ||
| Keats, Keats South, Iceberg, Iceberg East, Iceberg Alley, Knob, Golden Bullet | AFZ Core | Indicated | 7,004 | 2.94 | 662 |
| Inferred | 1,037 | 0.84 | 28 | ||
| Lotto, Golden Joint, Jackpot, Honeypot | AFZ Core | Indicated | 1,205 | 3.16 | 122 |
| Inferred | 1,078 | 1.31 | 45 | ||
| Big Vein, Pristine, HM, Midway | AFZ Peripheral | Indicated | 995 | 0.82 | 26 |
| Inferred | 474 | 1.56 | 24 | ||
| H Pond, 1744, Pocket Pond | JBP | Indicated | 83 | 1.54 | 4 |
| Inferred | 206 | 1.66 | 11 | ||
| Total | Indicated | 17,267 | 2.25 | 1,249 | |
| Inferred | 8,960 | 1.24 | 358 | ||
| Underground | |||||
| K2, Monte Carlo | AFZ Core | Indicated | 32 | 3.02 | 3 |
| Inferred | 335 | 2.78 | 30 | ||
| Keats West, Cokes, Powerline | AFZ Core | Indicated | - | - | - |
| Inferred | 28 | 2.76 | 3 | ||
| Keats, Keats South, Iceberg, Iceberg East, Iceberg Alley, Knob, Golden Bullet | AFZ Core | Indicated | 306 | 5.13 | 50 |
| Inferred | 660 | 4.53 | 96 | ||
| Lotto, Golden Joint, Jackpot, Honeypot | AFZ Core | Indicated | 303 | 6.97 | 68 |
| Inferred | 394 | 6.34 | 80 | ||
| Big Vein, Pristine, HM, Midway | AFZ Peripheral | Indicated | 100 | 5.42 | 17 |
| Inferred | 119 | 5.72 | 22 | ||
| H Pond, 1744, Pocket Pond | JBP | Indicated | 30 | 4.09 | 4 |
| Inferred | 214 | 2.79 | 19 | ||
| 14- |
|
| New Found Gold Corp. | Queensway Gold Project NI 43-101 Technical Report |
April 15, 2025 SLR Project No.: 233.065300.00001 |
| Zone | Area | Category | Tonnage (000 t) |
Grade (g/t Au) |
Contained Metal (000 oz Au) |
| Total | Indicated | 771 | 5.76 | 142 | |
| Inferred | 1,749 | 4.44 | 250 | ||
| Open Pit + Underground | |||||
| Total | Indicated | 18,038 | 2.40 | 1,392 | |
| Inferred | 10,709 | 1.77 | 608 | ||
|
Notes: 1. CIM (2014) definitions were followed for Mineral Resources. 2. Mineral Resources are estimated using a long-term gold price of US$2,200 per ounce, and a US$/C$ exchange rate of US$1.00 = C$1.43. 3. Open pit Mineral Resources are estimated at a cut-off grade of 0.3 g/t Au and constrained by a preliminary optimized pit shell with a pit slope angle of 45°, and bench height of 5 m. 4. RPEEE for underground Mineral Resources was demonstrated by constraining with MSO shapes generated at a cut-off grade of 1.65 g/t Au, with heights of 10 m, lengths of 5 m, and a minimum mining width of 1.8 m. 5. The optimized pit shell, underground reporting shapes, and cut-off grades were generated by assuming metallurgical recovery of 90%, standard treatment and refining charges, mining costs of C$5.0/t moved for open pit and C$120/t processed for underground, processing costs of C$20/t processed, and general and administrative costs of C$7.5/t processed. 6. Mineral Resources that are not Mineral Reserves do not have demonstrated economic viability. 7. Bulk density within the vein and halo mineralization domains is 2.7 t/m3. 8. Numbers may not add due to rounding. |
|||||
The QP is not aware of any environmental, permitting, legal, title, taxation, socio-economic, marketing, political, or other relevant factors that could materially affect the Mineral Resource estimate other than those discussed in Section 14.14.3.
Upon completion of a positive Preliminary Economic Assessment (PEA), NFG should consider targeted, closely spaced reverse circulation (RC) or diamond drilling in areas expected to have the greatest impact on early life-of-mine production. When combined with continued trenching and channel sampling, this work should improve understanding of high grade continuity, enhance confidence in resource classification, and help mitigate estimation risks associated with the coarse gold mineralization typical of the higher-grade areas of the Queensway Project.
Following the completion of closely spaced drilling and trenching, an updated Mineral Resource estimate, and the development of a conceptual operational flowsheet through metallurgical test work stemming from a positive PEA, NFG should consider a bulk sampling program focused on areas prioritized for early life-of-mine production. Bulk sampling has historically played a critical role in coarse gold systems, such as Queensway, to confirm grade continuity and validate the resource model. The selected sample location(s) should be supported by dense drilling and designed to provide material that is representative of expected mining and processing conditions. The resulting data can inform recovery assumptions and support future technical studies.
| 14.14.1 | Tonnage and Grade Distribution |
Grade-tonnage curves illustrate the distribution of metal within a pre-defined volume by showing how tonnage and grade vary at different reporting cut-offs, but they do not reflect re-optimized pit shells. A true sensitivity analysis would require re-optimizing the pit shell (or underground reporting panel design) alongside adjustments to the reporting cut-off grade. Since grade-tonnage curves apply different cut-offs to a fixed volume, they serve as a representation of grade distribution within the existing optimization rather than a full sensitivity analysis.
| 14- |
|
| New Found Gold Corp. | Queensway Gold Project NI 43-101 Technical Report |
April 15, 2025 SLR Project No.: 233.065300.00001 |
Grade-tonnage curves for the Indicated and Inferred portions of the AFZ Core area parent regularized block model are shown in Figure 14-47 and Figure 14-48, respectively, without constraint by optimized open pit shell or MSO shapes. The 0.3 g/t open pit reporting cut off grade is shown by the red line for reference.
Figure 14-47: Indicated Grade-Tonnage Curve

Figure 14-48: Inferred Grade-Tonnage Curve

| 14- |
|
| New Found Gold Corp. | Queensway Gold Project NI 43-101 Technical Report |
April 15, 2025 SLR Project No.: 233.065300.00001 |
Grade-tonnage curves for the Indicated and Inferred portions of the parent regularized block model are shown in Figure 14-49 and Figure 14-50 respectively, constrained by optimized open pit shell. The 0.3 g/t open pit reporting cut off grade is shown by the red line for reference.
Figure 14-49: Open Pit Indicated Grade-Tonnage Curve

| 14- |
|
| New Found Gold Corp. | Queensway Gold Project NI 43-101 Technical Report |
April 15, 2025 SLR Project No.: 233.065300.00001 |
Figure 14-50: Open Pit Inferred Grade-Tonnage Curve

Table 14-38 and Table 14-39 present grade-tonnage data for the Indicated and Inferred portions of the parent regularized block model, constrained by the open pit shell optimized at 0.30 g/t Au cut-off grade and reported at a range of cut-off grades between 0.30 g/t Au and 2.00 g/t Au.
Table 14-38: Open Pit Indicated Grade-Tonnage Table
| Au Cut-Off (g/t) | Tonnage (kt) | Au Grade (g/t) | Au Metal (koz) |
| 0.30 | 16,189 | 2.34 | 1,219 |
| 0.40 | 14,197 | 2.62 | 1,197 |
| 0.50 | 12,584 | 2.90 | 1,174 |
| 1.00 | 7,699 | 4.29 | 1,061 |
| 1.50 | 5,248 | 5.72 | 964 |
| 2.00 | 3,854 | 7.16 | 887 |
Table 14-39: Open Pit Inferred Grade-Tonnage Table
| Au Cut-Off (g/t) | Tonnage (kt) | Au Grade (g/t) | Au Metal (koz) |
| 0.30 | 8,280 | 1.21 | 323 |
| 0.40 | 7,103 | 1.36 | 310 |
| 0.50 | 6,130 | 1.50 | 296 |
| 1.00 | 3,068 | 2.29 | 226 |
| 1.50 | 1,709 | 3.14 | 173 |
| 2.00 | 993 | 4.16 | 133 |
| 14- |
|
| New Found Gold Corp. | Queensway Gold Project NI 43-101 Technical Report |
April 15, 2025 SLR Project No.: 233.065300.00001 |
| 14.14.2 | Comparison with Previous Mineral Resource Estimate |
No Mineral Resources have previously been disclosed for the Property.
| 14.14.3 | Factors Affecting the Mineral Resource |
Mineral Resources, which are not Mineral Reserves, do not have demonstrated economic viability. At the present time, the SLR QP is not aware of any environmental, permitting, legal, title, taxation, socio-political, marketing, or other relevant issues that may have a material impact on the Queensway Project Mineral Resource estimates other than those discussed below.
Factors that may affect the Queensway Project Mineral Resource estimates include:
| • | Metal price and exchange rate assumptions. |
| • | Changes to the assumptions used to generate the cut-off grade used for construction of the mineralized wireframe domains. |
| • | Changes to geological and mineralization shape and geological and grade continuity assumptions and interpretations. |
| • | Due to the natural variability inherent with orogenic gold deposits, the presence, location, size, shape, and grade of the actual mineralization located between the existing sample points may differ from the current interpretation. The level of uncertainty in these items is lowest for the Measured Mineral Resource category and is highest for the Inferred Mineral Resource category. |
| • | Changes to the understanding of the current geological and mineralization shapes and geological and grade continuity resulting from acquisition of additional geological and assay information from future drilling or sampling programs. |
| • | Changes in treatment of high grade gold values, including capping or search restriction strategies used to constrain estimation. |
| • | Changes due to the assignment of density values. |
| • | Changes to the input and design parameter assumptions that pertain to the assumptions for creation of underground constraining volumes. |
| • | Changes to the assumed metallurgical recoveries. |
| 14.15 | Additional Information |
Metallurgical test work summarized in Section 13.6 indicates a potential relationship between arsenic and gold, as gold is often associated locally with arsenopyrite. Higher arsenic content generally correlates with lower gold recovery in certain flowsheets, as a greater proportion of gold may be locked within arsenopyrite. Since NFG is still evaluating various processing techniques, SLR developed an arsenic model to aid in optimizing recovery methods and refining processing strategies. This arsenic model was not used to support the Mineral Resource estimate.
In conjunction with the future metallurgical test work outlined in Section 13.7, the QP recommends that NFG consider developing a geometallurgical model, if warranted, to account for recovery variability and support process planning for future technical evaluations beyond the PEA stage.
| 14- |
|
| New Found Gold Corp. | Queensway Gold Project NI 43-101 Technical Report |
April 15, 2025 SLR Project No.: 233.065300.00001 |
| 15.0 | Mineral Reserve Estimates |
This section is not applicable.
| 15- |
|
| New Found Gold Corp. | Queensway Gold Project NI 43-101 Technical Report |
April 15, 2025 SLR Project No.: 233.065300.00001 |
| 16.0 | Mining Methods |
This section is not applicable.
| 16- |
|
| New Found Gold Corp. | Queensway Gold Project NI 43-101 Technical Report |
April 15, 2025 SLR Project No.: 233.065300.00001 |
| 17.0 | Recovery Methods |
This section is not applicable.
| 17- |
|
| New Found Gold Corp. | Queensway Gold Project NI 43-101 Technical Report |
April 15, 2025 SLR Project No.: 233.065300.00001 |
| 18.0 | Project Infrastructure |
This section is not applicable.
| 18- |
|
| New Found Gold Corp. | Queensway Gold Project NI 43-101 Technical Report |
April 15, 2025 SLR Project No.: 233.065300.00001 |
| 19.0 | Market Studies and Contracts |
This section is not applicable.
| 19- |
|
| New Found Gold Corp. | Queensway Gold Project NI 43-101 Technical Report |
April 15, 2025 SLR Project No.: 233.065300.00001 |
| 20.0 | Environmental Studies, Permitting, and Social or Community Impact |
This section is not applicable.
| 20- |
|
| New Found Gold Corp. | Queensway Gold Project NI 43-101 Technical Report |
April 15, 2025 SLR Project No.: 233.065300.00001 |
| 21.0 | Capital and Operating Costs |
This section is not applicable.
| 21- |
|
| New Found Gold Corp. | Queensway Gold Project NI 43-101 Technical Report |
April 15, 2025 SLR Project No.: 233.065300.00001 |
| 22.0 | Economic Analysis |
This section is not applicable.
| 22- |
|
| New Found Gold Corp. | Queensway Gold Project NI 43-101 Technical Report |
April 15, 2025 SLR Project No.: 233.065300.00001 |
| 23.0 | Adjacent Properties |
Adjacent property and mineral tenure are based on current information maintained by the Minerals Land Division. Since 2019, mineral exploration interests in central Newfoundland have resulted in a staking rush with over 100,000 claims acquired in 2021. Many of the adjacent properties in the Queensway Property area are hosted within the Exploits Subzone of the central Newfoundland gold belt. Most of the exploration attention is focused on areas between the southwest to northeast trending Dog-Bay-Appleton-GRUB line fault systems that extends from south-central Newfoundland to the north coast, principally within the Davidsville Group.
The Beaver Brook Antimony Mine, which began mining operations in 1998, lies on the western boundary of QWS, across the Northwest Gander River. It suspended operations in 2020 (due to the COVID-19 pandemic) and restarted in 2021. In January 2023, the mine entered a period of care and maintenance, and it is not known whether production will resume in the future (CBC News 2023).
There are many licence blocks in the immediate area of the Queensway Property, thus, only those adjacent properties of significant size and proximity to the Property will be discussed. Further, licenses are continuously being dropped and reclaimed along with ownership changes via option agreements.
There are 45 licences held by individual Prospectors immediately adjacent to the Queensway Project. These licences tend to become part of larger projects through option agreements and may already be secured by an exploration company. Their ownership typically does not change name until all option agreement conditions are met over a number of years and the licence transferred.
Exploits Discovery Corp. (Exploits) is an owner of 38 mineral licences immediately adjacent or close to NFG’s Queensway Property primarily in the QWN area (Figure 23-1). Noted mineral occurrences include Bullseye, Saddle Zone, Horseshoe, Titan, Goldstash, Corvette, and Jonathan’s Pond, among others (Exploits 2025).
As outlined in Section 14, the optimized Whittle pit shell containing the Mineral Resources of the Honeypot vein (the northeasternmost pit shown in Figure 14-43 and Figure 14-44) crosses the boundary into the neighbouring Exploits property. The QP confirms that all interpreted mineralized vein wireframes remain within NFG's tenured property.
NFG has consulted with Exploits, and its management has confirmed that they have no concerns regarding this disclosure. Should mining proceed in the future, discussions regarding access or easements between the two parties would take place at that time.
The next largest licence number is held by Stephen Stockley Agriculture and Fabrication Inc. (SSAF) which holds 31 mineral licences in the Queensway area. The land assets have evolved from licences held by family prospector members and close acquaintances over recent years to be held by SSAF and host a number of mineral occurrences such as Burnt Lake and Neyles Brook.
Rocky Shore Metals Ltd. (Rocky Shore) holds 25 mineral licences towards the south, southwest and southeast of the Queensway Property at QWS. Rocky Shore’s flagship Gold Anchor Project is a district scale asset in a significantly underexplored area that totals over 2,100 claims and 1,250 km2 between the Dog Bay Line and Grub Line faults - on the same trend as the gold occurrences in the Queensway Property (Hemlo Explorers Inc. 2024).
Newfoundland Discovery Corp. holds eight licences mostly to the west of QWS near the inactive Beaver Brook Antimony Mine.
| 23- |
|
| New Found Gold Corp. | Queensway Gold Project NI 43-101 Technical Report |
April 15, 2025 SLR Project No.: 233.065300.00001 |
D3 Exploration Ltd. owns seven licences largely west of the QWS area in the Rolling Pond Project and New Rock Mining Inc. holds seven licences towards the Mount Peyton Intrusive Suite with the Peyton and Corsair occurrences.
Meguma Gold owns six licences along the western length of Queensway with the O’Reilly and Contact occurrences.
Vulcan Minerals Inc. owns five licences in the southwest of QWS in the Lizard Pond area.
Metals Creek Resources Corp. holds four licenses to the west of QWS with gold occurrences at Clark’s Brook, Careless Cove, and Yellow Fox.
Quest Inc., a company of the Quinlan prospecting family, holds four licences, one on the Clydesdale occurrence at Twin Ponds.
New Age Metals Inc., a recent newcomer to the area, holds three newly acquired mineral licences on the western side of the Queensway Property at QWS in line with the Beaver Brook Antimony Mine.
| 23- |
|
| New Found Gold Corp. | Queensway Gold Project NI 43-101 Technical Report |
April 15, 2025 SLR Project No.: 233.065300.00001 |
Figure 23-1: Adjacent Properties
to the Queensway Gold Property
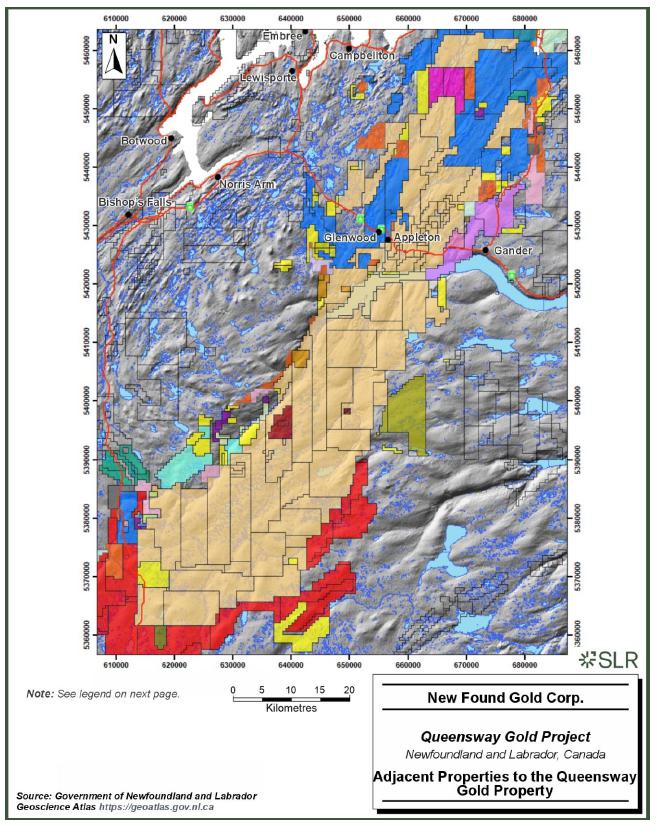
| 23- |
|
| New Found Gold Corp. | Queensway Gold Project NI 43-101 Technical Report |
April 15, 2025 SLR Project No.: 233.065300.00001 |

| 23- |
|
| New Found Gold Corp. | Queensway Gold Project NI 43-101 Technical Report |
April 15, 2025 SLR Project No.: 233.065300.00001 |
Additionally, there are 11 mineral licence blocks not owned by NFG that are enclosed within the general boundary of the Queensway Property, 10 of which are located within the NFGs QWS block and a single licence in the QWN block. More specifically, the enclosed mineral licences include:
| • | In the southeast corner of QWS, Clyde McLean owns a single mineral licence (025520M) comprising six mineral claims. |
| • | In the central area of QWS, |
| o | Golden Ridge Resources Ltd. owns two licences (024195M and 025767M) with 62 claims. |
| o | Canterra Minerals Corp. (licence 031341M) owns a single mineral licence with four claims. |
| • | In the northern end of QWS, |
| o | Darrin Hicks holds three mineral licences (030729M, 030713M and 020493M) with 9 claims in total. |
| o | Metals Creek Resources holds one mineral licence (024096M) with six claims, |
| o | Stephen Stockley Agriculture and Fabrication Inc. (SSAF) holds a single mineral licence (036671M) with six claims. |
| o | Exploits Discovery Corp. holds a single mineral licence (030708M) with 20 claims. |
In QWN Block, Exploits Discovery Corp. holds a single mineral licence (035151M) with 11 claims.
In recent months there has been an decrease in total regional mineral licences. Some larger license holdings are being dropped or cancelled following company or prospector decisions to look elsewhere at possibly more prospective areas. This reduction in total mineral licences adjacent to the Queensway Project will likely continue as a trend until an equilibrium with fewer exploration companies and claims overall is met.
| 23- |
|
| New Found Gold Corp. | Queensway Gold Project NI 43-101 Technical Report |
April 15, 2025 SLR Project No.: 233.065300.00001 |
| 24.0 | Other Relevant Data and Information |
NFG has completed environmental baseline studies within the southern portion of the Queensway North Property area, and a summary of this work is reported below. This section also discusses the environmental regulatory framework, NFG’s commitments to stakeholder engagement, and requirements for closure and rehabilitation.
| 24.1 | Introduction |
Information presented in this section is based on publicly available information and supplemented with environmental baseline studies conducted for NFG within the southern portion of the Queensway North Property area. This information may require updating once a mine development concept is decided and the associated project area is determined.
| 24.2 | Environmental Setting |
The area studied is located on the Island of Newfoundland, near the towns of Gander and Appleton, in the Northcentral sub-region of the Central Newfoundland Forest ecoregion (Meades 1990), which extends from the town of Clarenville in the east to the town of Deer Lake in the west.
The following sections summarize the terrestrial and aquatic ecosystems present in the vicinity of the Property and are based on literature reviews, previous studies, and geomatics tools. The social, cultural, and economic environment of the region is also discussed.
| 24.2.1 | Terrestrial Ecology |
The Central Newfoundland Forest ecoregion is the second largest ecoregion on the Island of Newfoundland with an area of approximately 28,000 km2 (PAANL 2008). This ecoregion has a climate with the highest summer temperatures, lowest winter temperatures, and the least amount of fog and wind on the Island. The majority of its forests are boreal (PAANL 2008).
With warm summers, low rainfall, and occasional prolonged dry spells, the north-central subregion has the greatest number of forest fires on the Island of Newfoundland, which has resulted in extensive fire stands of black spruce, trembling aspen, and white birch (PAANL 2008). Dome bogs are common and in areas where fires have repeatedly occurred, a dwarf-shrub heath provides the dominant vegetation cover. Balsam fir with a feathermoss floor covering occurs in areas not prone to fires. There are numerous rivers, ponds, and wetlands in the area, including Gander Lake and its watershed (PAANL 2008).
Within the area studied, several natural ecosystems have been identified including forests, wetlands, scrubland, and waterbodies, with forest communities occupying most of the area (GEMTEC 2023a; Stantec 2024a). The area studied is relatively undisturbed with few anthropogenically influenced areas (GEMTEC 2023a; Stantec 2024a).
The region is home to a variety of typical boreal forest wildlife and bird species that are adapted to long winters and short summers (PAANL 2008). Wildlife identified during incidental field surveys include American beaver (Castor canadensis), American toad (Bufo americanus), black bear (Ursus americanus), Canada lynx (Lynx canadensis), eastern coyote (Canis latrans), green frog (Rana clamitans), moose (Alces alces), muskrat (Ondatra zibethicus), red squirrel (Tamiasciurus hudsonicus), snowshoe hare (Lepus americanus), northern myotis (Myotis septentrionalis), little brown myotis (Myotis lucifugus), and hoary bat (Lasiurus cinereus) (GEMTEC 2023a; 2024c).
| 24- |
|
| New Found Gold Corp. | Queensway Gold Project NI 43-101 Technical Report |
April 15, 2025 SLR Project No.: 233.065300.00001 |
Typical birds (avifauna) that occur in the region include raptors (e.g., sharp-shinned hawk [Accipiter striatus], osprey [Pandion haliaetus], and great horned owl [Bubo virginianus]), woodpeckers (e.g., Northern Flicker [Colaptes auratus]), upland game birds (ruffed grouse [Bonasa umbellus] and spruce grouse [Falcipennis canadensis], waterfowl ( e.g., green-winged teal [Anas carolinensis], ring-necked duck [Aythya collaris], American black duck [Anas rubripes], and Canada goose [Branta canadensis]), and a wide variety of songbirds (e.g., chickadees, warblers, and thrushes) (Meades 1990 in GEMTEC 2023a). Over 50 avifauna species have been identified during field surveys. The most common species include White-throated sparrow (Zonotrichia albicollis), black-and-white warbler (Mniotilta varia), hermit thrush (Catharus guttatus), dark eyed junco (Junco hyemalis), American robin (Turdus migratorius), and ruby-crowned kinglet (Corthylio calendula) (GEMTEC 2023a, 2024c).
The region’s habitats support species at risk (SAR) and species of conservation concern (SOCC). SAR include those species designated as Endangered, Threatened, or Special Concern under Schedule 1 of the federal Species at Risk Act (SARA) and/or the Newfoundland and Labrador (NL) Endangered Species Act (NL ESA). The protection of SAR and their residences is a legal requirement for those species listed under Schedule 1 of SARA and the NL ESA. While SOCC are not specified under federal or provincial legislation, in NL these are species that are considered rare in the province, or ones for which the long-term sustainability of their populations has been evaluated as tenuous. SOCC can also include a few species that are of particular interest to various government agencies.
Of the identified wildlife mammal species, two bat species are listed under Schedule 1 of SARA as Endangered, the northern myotis and little brown myotis. Two SOCC were also identified, Canada lynx and muskrat (GEMTEC 2023a; 2024c). Other wildlife species have the potential to occur in the area including SARA listed species such as Woodland caribou - Newfoundland population (Rangifer tarandus; Special Concern), and Newfoundland marten (Martes americana atrata; Threatened). However, there are no known populations in the area studied for either species (GEMTEC 2023a; 2024c).
Several avian species listed under Schedule 1 of the federal SARA have been identified during breeding bird surveys: olive-sided flycatcher (Contopus cooperi; Special Concern), rusty blackbird (Euphagus carolinus; Special Concern), red crossbill (Loxia curvirostra percna; Threatened), and evening grosbeak (Coccothraustes vespertinus; Special Concern), and several SOCC including, least flycatcher, greater yellowlegs, blue-headed vireo, ovenbird, common yellowthroat, and swamp sparrow (GEMTEC 2023a, 2024c). A review of historical records notes additional bird SAR and SOCC have the potential to occur within or near the area studied including short-eared owl (Asio flammeus), piping plover (Charadrius melodus melodus), barn swallow (Hirundo rustica), and bank swallow (Riparia riparia) (GEMTEC 2023a, 2024c).
Over 200 flora species have been recorded during recent field investigations (GEMTEC 2023a, 2024c; Stantec 2024a). No SARA listed plant species were identified during field investigations, but more than 30 of the flora species identified are considered to be SOCC including white pine (Pinus strobus), black chokeberry (Aronia melancocarpa), and northern bog violet (Viola nephrophylla) (GEMTEC 2023a, 2024c; Stantec 2024a). A review of data from the Atlantic Canada Conservation Data Centre (AC CDC) has shown additional rare flora species may be present in the vicinity of the area studied and include American mannagrass (Glycreia grandis), western dock/windowed dock (Rumex occidentalis), and drooping bluegrass (Poa saltuensis), and SAR species such as boreal felt lichen (Erioderma pedicellatum) (GEMTEC 2023a; 2024c).
Critical habitat, as defined by SARA, for the terrestrial species noted above has not been identified in the area studied (Government of Canada 2025). Management of potential project interactions with SAR and SOCC requires close collaboration with regulators and development of project-specific mitigation and monitoring measures.
| 24- |
|
| New Found Gold Corp. | Queensway Gold Project NI 43-101 Technical Report |
April 15, 2025 SLR Project No.: 233.065300.00001 |
| 24.2.2 | Aquatic Ecosystem |
The Property is in the Gander River Watershed, the third largest watershed on the Island of Newfoundland, with a total area of 5,310 km2 (EDM 1996). The watershed offers lake, pond, river, and stream habitats for a variety of life stages of fish species. Gander Lake is one of the largest lakes on the Island of Newfoundland (EDM 1996) and the Gander River generally flows north into Gander Bay, and the Atlantic Ocean. The Gander River supports a variety of fish species, including Atlantic salmon (Salmo salar), brook trout (Salvelinus fontinalis), threespine and ninespine sticklebacks (Gasterosteus aculeatus and Pungitius pungitius), American eel (Anguilla rostrata), rainbow smelt (Osmerus mordax) and Arctic char (Salvelinus alpinus) (Wildlife Division 2010).
Aquatic SAR/SOCC have not been confirmed present in the area studied (GEMTEC 2023b, Stantec 2024b), but American eel has the potential to occur (Wildlife Division 2010). American eel are considered SAR on the Island of Newfoundland and are considered “Threatened” under Committee on the Status of Endangered Wildlife in Canada (COSEWIC) and “Vulnerable” under the NL ESA (COSEWIC 2012, Wildlife Division 2010). The Gander River is a scheduled salmon river and has a well-known recreational salmon fishery. Atlantic salmon from the Gander River are part of the Northeast Newfoundland population and are considered “Not at Risk” by COSEWIC (COSEWIC 2010).
The Gander River Watershed has low human usage and development and the main threats to fish populations are limited aquatic connectivity (i.e., barriers to fish migration) and climate change effects such as increased water temperatures, changes in precipitation patterns, and severe rainfall events which could result in erosion and sedimentation (DFO 2023). Mining, forestry, aerospace, and recreational fishing are the main activities in the area.
Ponds sampled during field surveys vary in size (0.5 to 73.8 ha) and depth (2 to 9 m) with primarily fine substrates and cover provided by aquatic vegetation (Stantec 2024b). While most substrates in ponds are composed of fines, some ponds have shoals consisting of medium or coarse substrates. Streams within the area studied are generally small to medium. Headwater streams are often small with intermittent channels and fine substrates and typically drain wetlands. Perennial streams typically contain riffle run habitats and coarse substrates which are suitable for salmonids (Stantec 2024b). Atlantic salmon, brook trout, and threespine stickleback were confirmed present during field surveys (GEMTEC 2023b, Stantec 2024b). Overall, the streams and ponds in the area studied are highly influenced by beaver activities and ultimately affect the presence and abundance of fish species in the area.
Watershed boundaries for the tributaries and sub-watersheds of Gander River and Gander Lake within the area studied were delineated in ArcGIS using LiDAR-derived digital elevation model information collected in 2021, for NFG, with a resolution of one metre. The main watersheds in the area studied are the North Herman and South Herman Ponds that drain via an unnamed watercourse to the Gander River, and Joe Batts Pond, which drains into Joe Batts Brook and then drains into the Gander River. Sub-watersheds were developed within watersheds, based on junctions of tributaries of equal or higher order channels following the Strahler Stream order method and locations of monitoring stations.
The Watershed Management Plan for the Gander Lake water supply recommends a development buffer of 300 metres from the high-water mark of the lake to protect water quality. This buffer zone is intended to limit erosion, trap soil particles, and reduce sedimentation of lake water by restricting development along the shoreline, particularly near steep slopes. The buffer is part of a broader watershed protection strategy that includes additional setbacks for tributaries and other waterbodies within the catchment area. Development within the buffer zone is subject to restrictions on the type of activities permitted and the methods used, ensuring that any proposed use is compatible with maintaining the integrity of the water supply. All proposals for development in this zone must be referred to the Gander Lake Watershed Management Committee for review and approval.
| 24- |
|
| New Found Gold Corp. | Queensway Gold Project NI 43-101 Technical Report |
April 15, 2025 SLR Project No.: 233.065300.00001 |
| 24.2.3 | Air Quality |
The air quality in the area studied is characterized as that of a rural wooded forest with camps and cottages. The primary source of air contaminants is from personal vehicles and ATVs on the trails and access roads. Some of the surrounding area roads appear to have been used for logging in the past (Stantec 2024c).
To confirm ambient air quality, NFG completed ambient air quality monitoring at two locations near the Property in August 2023: within the town of Appleton and near Joe Batt’s Pond. Sampling included total suspended particulates, particulate matter less than 2.5 microns (PM2.5) and nitrogen dioxide (NO2). The results of sampling confirmed these three components to be below threshold limits set by the Newfoundland Ambient Air Quality Standards (Stantec 2024).
| 24.2.4 | Social, Cultural and Economic Environment |
The Queensway Property is located in close proximity to the towns of Gander (population 11,880), Appleton (population 620), and Glenwood (population 739), and is adjacent to the TCH. Gander is a regional service centre for the northeastern Island of Newfoundland, with numerous government offices, hotels, a hospital, recreational facilities, military and commercial aerospace facilities, and a campus of the College of the North Atlantic.
The municipal boundary of the town of Appleton is closest to the Queensway Property. The town’s most recent municipal plan (Town of Appleton 2020) outlines designated planning areas for future community development and a portion of this planning area overlaps the Property.
Recreational and harvesting activities, such as berry picking, firewood cutting, hunting, fishing and hiking are known to occur in the area studied given the abundance of access trails and roads, including the T’Railway Provincial Park. In addition, the presence of the cottage planning area and numerous cabins/cottages located in proximity to Joe Batt’s Pond indicates that use of the surrounding land for subsistence and recreational purposes is likely high in the area.
There are several documented land use and land zoning constraints in the area studied including protected roads (i.e., the TCH), provincial parks (i.e., the Newfoundland T’Railway Provincial Park), the Gander Lake Protected Public Water Supply Area, agricultural activity, Crown leases and grants (e.g., seasonal residences, agricultural leases), and transmission line rights of way (ROWs).
For the transmission line ROWs that overlap the Queensway Property, NFG will engage and work with NL Hydro to have these transmission line corridors relocated at NFG’s expense.
| 24.2.4.1 | Historic Resources |
While there are no registered historic resource sites within the area studied (i.e., with the southern portion of the Queensway North property), there are several registered sites along the Gander River and east of the Property (Stantec 2023). There is also broad theoretical potential for unknown historic resources within the Property, particularly those pertaining to the Pre-Contact Period and specific aspects of the Historic Period such as the logging, railway, and aviation industries, while moderate potential exists for historic Beothuk and Mi’kmaq occupations of the north-central interior (Stantec 2023).
| 24- |
|
| New Found Gold Corp. | Queensway Gold Project NI 43-101 Technical Report |
April 15, 2025 SLR Project No.: 233.065300.00001 |
Based on a desktop review, Stantec identified generalized high archaeological potential zones within 50 m of most watercourses and waterbodies within the area studied and on either side of the T’Railway (Stantec 2023). In 2023, a field assessment was conducted (Stantec 2024g). No surface-visible features or artifacts of archaeological significance were identified, and these sites, in general, were assessed as exhibiting low archaeological potential for sub-surface archaeological resources. Moreover, no landform features conducive to past human settlement or activity were identified.
| 24.3 | Jurisdiction, Applicable Laws and Regulations |
The primary environmental regulatory requirement of provincial and federal governments is environmental assessment (EA). This section focuses on the EA processes that currently apply for NL and Canada, as well as other key federal and provincial regulations. Proponents then apply for the required and standard environmental permits and approvals once release/approval is granted from the EA review processes. These permits are noted in Section 20.4.
| 24.3.1 | Environmental Assessment Process |
The applicability of the provincial and federal EA processes will be dependent on the mine development plan, including the annual production capacity.
As development of a mine in the Queensway Property will be located exclusively on the Island of Newfoundland, it is anticipated that it will be subject to the EA provisions of Part X of the NL Environmental Protection Act, and the Environmental Assessment Regulations (Section 33 (2)).
33. (2) An undertaking that will be engaged in the mining, beneficiating and preparing of a mineral as defined in the Mineral Act whether or not these operations are to be performed in conjunction with a mine or at mills that will be operated separately shall be registered.
If the average production capacity of a mine and mill on the Queensway Property exceeds 5,000 tonne per day (t/day), it would also be subject to assessment under the federal Impact Assessment Act (IAA) as per the Physical Activity Regulations (Section 18 (c) and (d)).
18. The construction, operation, decommissioning and abandonment of one of the following:
(c) a new metal mine, other than a rare earth element mine, placer mine or uranium mine, with an ore production capacity of 5 000 t/day or more;
(d) a new metal mill, other than a uranium mill, with an ore input capacity of 5 000 t/day or more;
Both the NL and federal assessment processes are stepped processes with provisions for public review and decisions being made at select points. The initial step for the provincial process is to submit a registration for the undertaking to the EA Division of the NL Department of Environment and Climate Change (NLDECC), and an Initial Project Description (IPD) submission to the Impact Assessment Agency of Canada (IAAC) is required to initiate the federal process. When a project requires both federal and provincial EA, proponents are typically encouraged to prepare a single set of EA documents that addresses the requirements of both levels of government.
| 24- |
|
| New Found Gold Corp. | Queensway Gold Project NI 43-101 Technical Report |
April 15, 2025 SLR Project No.: 233.065300.00001 |
Based on government agency and public review, the Ministers of NLDECC and the ECCC issue decisions regarding the need for further EA review to allow for informed decision-making in their respective EA processes. If the Minister of NLDECC identifies information gaps and is unable to make an informed decision based on the Registration document submitted, the proponent will be directed to prepare an Environmental Preview Report (EPR) or an Environmental Impact Statement (EIS). Under the federal process, an Impact Statement (IS) may be required if the Agency determines from their review of the IPD that additional assessment is required. Timelines for completion of the EA process will be dependent on whether the mine development will be subject to both provincial and federal EA processes and on the level of assessment required in each jurisdiction.
| 24.3.2 | Federal Fisheries Act |
Amendments to the Fisheries Act came into force in 2019, reintroducing provisions for the protection of fish and fish habitat, notably the prohibition against Harmful Alteration, Disruption and Destruction (HADD) of fish habitat. The Fisheries Act also prohibits activities that cause the “death of fish” (other than permitted fishing activities), considers the cumulative effects of development activities, and provides additional protection for highly productive, sensitive, rare or unique fish and/or fish habitats. If death of fish or the HADD of fish habitat will likely result from a project, proponents are required to apply for an authorization from the Minister of Fisheries and Oceans Canada (DFO) as per Paragraph 34.4(2)(b) or 35(2)(b) of the Fisheries Act Regulations. The application must include an offsetting plan to counterbalance the HADD, along with a financial guarantee as an assurance mechanism if the offsetting plan is not completed. A Fisheries Act authorization includes terms and conditions the proponent must follow to avoid, mitigate, offset and monitor impacts to fish and fish habitat resulting from a project.
| 24.3.3 | Metal and Diamond Mining Effluent Regulations (MDMER) |
The Metal and Diamond Mining Effluent Regulations (MDMER), under the Fisheries Act, provides limits on the quality of effluent from metal and diamond mines in Canada. Effluent is required to meet concentration-based limits for arsenic, copper, cyanide, lead, nickel, zinc, suspended solids, radium 226, and un-ionized ammonia, must meet defined pH levels, and must not be acutely lethal. The Regulations set out requirements for effluent testing (both water chemistry and toxicity testing), reporting, and the conduct of environmental effects monitoring (EEM) studies.
A metal mine is subject to MDMER if it exceeds an effluent flow rate of 50 m3 per day, based on effluent from all final discharge points of the mine, and when a deleterious substance is deposited into any water or place noted in subsection 36(3) of the Fisheries Act.
| 24.3.4 | Schedule 2 under MDMER |
In the event that mine design requires mine waste to be deposited in fish-bearing waters, Schedule 2 under MDMER must be updated to include or list those waterbodies. The process to complete the Schedule 2 listing is lengthy and requires substantial regulatory, public and Indigenous engagement.
The regulatory process for amending Schedule 2 of MDMER broadly involves:
| • | An assessment of alternatives for mine waste management that demonstrates that the preferred option is the best one based on criteria set out in Environment and Climate change Canada’s (ECCC’s) Guidelines (ECCC 2013) for the assessment of alternatives for mine waste disposal |
| 24- |
|
| New Found Gold Corp. | Queensway Gold Project NI 43-101 Technical Report |
April 15, 2025 SLR Project No.: 233.065300.00001 |
| • | Development of a fish habitat compensation plan to offset the loss of fish habitat |
| • | Consultation throughout the regulatory process with interested parties concerning the development of a compensation plan and the assessment of alternatives report |
| • | Regulatory development process that includes regulatory publication and a letter of credit |
| 24.3.5 | Canadian Navigable Waters Act |
The Canadian Navigable Waters Act (CNWA) came into force in August 2019, replacing the former Navigation Protection Act, and applies to anyone planning activities that will affect navigation in navigable waters. Navigable waters is broadly defined as a body of water that is used, or where there is a reasonable likelihood that it will be used, by people/vessels, as a means of transport or travel for commercial or recreational purposes.
The CNWA regulates major works and obstructions on navigable waters, even those not listed on the schedule of navigation, and creates a new category for “major works”. Transport Canada administers the CNWA through the Navigation Protection Program. The watercourse management associated with new mining infrastructure has the potential to trigger CNWA requirements.
| 24.3.6 | Greenhouse Gas Legislation |
| 24.3.6.1 | Best Available Control Technology (BACT) |
If a facility emits 15,000 t of carbon dioxide equivalent (CO2e) or more per year from direct on-site greenhouse gas (GHG) emissions sources during operation, it is subject to best available control technology (BACT) requirements outlined in the NL Management of Greenhouse Gas Regulations (MGGR). This includes providing justifications for the technologies selected with the objective of reducing GHG emissions to the extent practicable.
| 24.3.6.2 | Carbon Emissions Pricing |
The NL government requires industrial facilities to quantify and report GHG emissions under the MGGA and its Regulations if the facility releases 15,000 t of CO2e or more per year from direct on-site GHG emissions sources during operation. Direct GHG emissions refer to those generated by sources or activities at the facility (Government of Canada 2023). Examples include the combustion of fossil fuels, emissions from industrial processes, and flaring, venting, and fugitive emissions. Indirect emissions occur from sources or activities that are owned by another entity, but are a result of a reporting entity’s activities or project (e.g., the consumption of electricity generated off-site, or other off-site related GHG sources). These emissions are not directly regulated under the NL system.
Depending on the annual quantity of direct GHG emissions released by a mine, it may be required to report annual GHG emissions to both the provincial and federal government. Industrial facilities that emit 10,000 t CO2e or more per year during operation are required to report GHG emissions to the Environment and Climate Change Canada (ECCC) Greenhouse Gas Reporting Program (GHGRP).
There are also third-party verification requirements in NL for facilities emitting 25,000 t CO2e or more per year from direct GHG emissions sources during operation.
NL has committed to reducing GHG emissions and supporting the transition to a low carbon economy in NL with a 30% reduction in provincial GHG emissions below 2005 levels by 2030 (Government of NL 2019). To help meet this target, NL established a system of emissions reduction targets for industrial facilities in NL, as well as a consumer carbon tax. These targets do not apply to a facility during its construction and pre-production stages, or the facility’s first three years of commercial operations. Each facility establishes a baseline emissions level using the first three years of commercial operation and is required to meet a tightening emissions reduction target established in the MGGR. Targets are phased in from years four to eight of the facility’s commercial operations. When facilities release more GHGs than their target level, the facility must true-up the compliance obligation as the difference between their target level and the emissions for that calendar year. True-up can be done using GHG reduction credits, performance credits, or fund credits.
| 24- |
|
| New Found Gold Corp. | Queensway Gold Project NI 43-101 Technical Report |
April 15, 2025 SLR Project No.: 233.065300.00001 |
The federal government recently developed an Emissions Reduction Plan under the Canadian Net-Zero Emissions Accountability Act, which aims to reduce emissions across Canada by 40% to 45% below 2005 levels by 2030 and achieving net-zero emissions by 2050 (Government of Canada 2022a). Several supporting regulations have been implemented in support of national GHG reductions. In 2024, the federal government established the Clean Fuels Regulations (CFR), which aim to increase the availability and use of lower carbon fuels and renewable energy sources in support of GHG reduction targets (Government of Canada 2022b). The CFR incentivizes gasoline and diesel suppliers in the development and adoption of clean fuels, technologies, and processes. The goal is to reduce GHG emissions by making fuels less GHG intensive over time, with a goal to reduce the carbon intensity of transportation fuels by approximately 15% in Canada by 2030 (Government of Canada 2022b).
The Clean Electricity Regulations are another federal initiative aimed at greening our electricity supply across Canada, towards achieving a net-zero GHG economy by 2050. This regulation limits GHG emissions from generation of electricity for our provincial electrical grids from which a mine would draw energy to power operations (Government of Canada 2024).
| 24.3.7 | Species at Risk Protection |
The federal SARA and NL ESA regulate SAR and their protection through specific legislation. SARA is intended to protect SAR in Canada and their “critical habitat” (as defined by SARA). Under SARA, proponents are required to demonstrate that no harm will occur to listed species, their residences or critical habitat, or identify adverse effects on specific listed wildlife species and their critical habitat, followed by the identification of mitigation measures to avoid or reduce effects. Activities must comply with SARA, with prohibitions against (1) the killing, harming, or harassing of endangered or threatened SAR (Sections 32 and 36); and (2) the destruction of critical habitat of and endangered or threatened SAR (Sections 58, 60 and 61).
The NL ESA also provides special protection for plant and animal species considered to be endangered, threatened, or vulnerable in the province. Wildlife Division, within the NL Department of Fisheries, Forestry and Agriculture (NLDFFA) coordinates the assessment and listing of SAR and critical habitats, and develops recovery and management plans, monitoring programs and research projects to promote conservation of species under the Act with the aim of reversing population declines and preventing extirpation/extinction. Wildlife Division issues permits to conduct research involving SAR, as well as considers applications from proponents where a project is likely to interact with a SAR or identified critical habitat. A Section 19 Economic Activity Permit may be issued under the NL ESA to authorize activities affecting species at risk that would otherwise be prohibited. Subsection 19(1) of the NL ESA states that the Minister may issue a permit where:
| 1 | The impact on the designated species is incidental to the carrying out of an activity that is economically beneficial to the province. |
| 24- |
|
| New Found Gold Corp. | Queensway Gold Project NI 43-101 Technical Report |
April 15, 2025 SLR Project No.: 233.065300.00001 |
| 2 | There is no reasonable alternative. |
| 3 | The activity will not prevent the recovery or survival of the designated species. |
A Section 19 Economic Activity Permit applies only to the species that are protected and managed by the Province of Newfoundland and Labrador under the NL ESA.
As part of the Section 19 permit application, proponents are required to prepare and submit a Species at Risk Impacts Mitigation and Monitoring Plan (SAR IMMP) to the provincial Wildlife Division for review and approval. The SAR IMMP is required to provide protection for listed species, to the greatest extent possible, through avoidance measures and mitigation of the impacts resulting from authorized activities, as well as to monitor the effects of authorized activities on listed species at risk. This plan is often developed in close consultation with Wildlife Division. Following the submission of the section 19 permit application, including the SAR IMMP, the application is reviewed by Wildlife Division and provided to the provincial Cabinet for approval.
| 24.3.8 | NL Mining Act |
The NL Mining Act allows the NLDIET to regulate the development, operation, and closure of mines in the province; outlines requirements for development, operational and rehabilitation and closure plans, as well as milling licences and financial assurance. However, the Act does not deal with Occupational Health and Safety matters.
Under the Act, owners of active mines are required to complete a number of reports and plans including a Development Plan, Operational Plan, Annual Report on Operations, and a Rehabilitation and Closure Plan, which incorporates progressive rehabilitation. The Act also prescribes the frequency of required updates for these plans. Guidelines for proponents have been developed to support in preparation of the various reporting requirements under the Act (NLDIET no date).
| 24.3.9 | Water Resources Act (2002) |
The Water Resources Act and its regulations give the Water Resource Management Division (WRMD) of the NLDECC the responsibility and legislative power for the management of water resources in the province.
The Environmental Control Water and Sewer Regulations, which incorporate the limits imposed by the MDMER, apply to the discharge of water and effluent from mines in the province. Water supply well construction is also regulated under the Well Drilling Regulations.
In NL, dam construction and maintenance/improvements are regulated via the Water Resources Act, and a permit to construct a dam is required under Act. The Act does not contain specific dam safety regulations and the province uses the Canadian Dam Association (CDA) for guidance on dam safety and references the CDA Dam Safety Guidelines (CDA 2013) and associated bulletins specifically for proponents/projects contemplating developing or operating a dam for any purpose.
Under Section 39 of the Water Resources Act, approval is also required to complete major activities and developments inside a PPWSA. A permit for such activities and developments would need to be issued by the WRMD.
The Newfoundland and Labrador Policy for Development in Wetlands (NLDECC 2001) describes developments that are not permitted within wetlands and defines activities that require permitting under Section 48 of the Water Resources Act. The Policy describes developments that are not permitted within wetlands and defines activities that require permitting under section 48 of the Water Resources Act. Developments that are not permitted include:
| 24- |
|
| New Found Gold Corp. | Queensway Gold Project NI 43-101 Technical Report |
April 15, 2025 SLR Project No.: 233.065300.00001 |
| • | Infilling, drainage, dredging, channelization, removal of vegetation cover, or removal of soil or organic cover of wetlands which could aggravate flooding problems, or have unmitigable adverse water quality, water quantity, or hydrologic impacts |
| • | Development in wetlands which are located within the recharge zones of domestic, municipal, or private groundwater wells |
| • | Placing, depositing, or discharging any raw sewage, refuse, municipal or industrial wastes, fuel or fuel containers, pesticides, herbicides or other chemicals or their containers, or any other material which impairs or has the potential to impair the water quality of wetlands |
Under the provincial policy, developments which require permitting include construction of linear corridors, and infilling, dredging or other disturbance of wetlands for the construction of residential, commercial, and industrial and institutional facilities. Wetland compensation and conservation allowances are generally not part of the response to potential wetland effects in the province.
| 24.4 | Permitting Process |
Upon release/approval from the provincial and federal EA processes, a mine development project requires numerous approvals, authorizations, and permits prior to initiation of construction. Table 24-1 provides a preliminary list of approvals, authorizations, and permits that may be required from various provincial and federal agencies. The specific permits and approvals required will depend on the mine development plan. Major permits and approvals include, but are not limited to:
| • | Water use authorizations |
| • | Authorization related to the HADD of fish habitat or the death of fish |
| • | Air emissions and effluent discharge approvals |
| • | Mine Rehabilitation and Closure Approval |
| • | Approvals for placement of certain mine components (e.g., tailings impoundment area [TIA]), water control structures |
Each permit or approval is applied for separately with relevant information included in the applications. Although permits can only be issued after a project is released from the EA process(es), some long-lead permits can be discussed with regulators and progressed prior to release from the EA processes.
Table 24-1: Potential Approvals, Authorizations, and Permits - for Mine Development at the Queensway Property
| Permit/Approval | Agency |
| Federal | |
| EA Approval | IAAC |
| 24- |
|
| New Found Gold Corp. | Queensway Gold Project NI 43-101 Technical Report |
April 15, 2025 SLR Project No.: 233.065300.00001 |
| Permit/Approval | Agency |
| DFO Request for Review and Letter of Advice, and/or Fisheries Act Authorization for Works which result in the death of fish and/or HADD of fish habitat | DFO |
| Schedule 2 of MDMER under Section 36(3) of the Fisheries Act | ECCC |
| Initiate MDMER process, including notification, identification of final discharge point(s), effluent monitoring, and EEM | |
| Approval of MDMER Emergency Response Plan | |
| Licence for Explosives Magazine | Natural Resources Canada |
| Transportation of dangerous goods | Transport Canada |
| Approval to Interfere with Navigation | Transport Canada |
| Provincial | |
| Release from EA Process | NLDECC, EA Division |
| Approval of Environmental Protection Plan | |
| Approval of Best Available Control Technology (BACT) Plan | NLDECC, Climate Change Division |
| Certificate of Approval for construction and operation (Industrial Processing Works) | NLDECC, Pollution Prevention Division |
| Monitoring Plan for Certificate of Approval | |
| Certificate of Approval for Generators | |
| Approval of Environmental Contingency Plan/Emergency Spill Response | |
| Permit to Construct a Non-Domestic Well | NLDECC, Water Resources Management Division |
|
Approval to Alter a Body of Water: • Culvert installation • Fording / Bridge • Pipe Crossing / Water Intake • Stream modification or diversion • Other works within 15 m of a body of water |
|
| Water Use Licence | |
| Permit to Construct a Potable Water System | |
| Permit to construct a non-domestic well | |
| Permit to Develop in a PPWSA/Wellhead PPWSA | |
| Permit to Occupy Crown Land | NLDFFA - Crown Lands Division |
| Permit to Control Nuisance Animals | NLDFFA - Wildlife Division |
| NL ESA Section 19 Economic Activity Permit | |
| Operating Permit to Carry out an Industrial Operation During Forest Fire Season on Crown Land | NLDFFA - Forestry Division |
| 24- |
|
| New Found Gold Corp. | Queensway Gold Project NI 43-101 Technical Report |
April 15, 2025 SLR Project No.: 233.065300.00001 |
| Permit/Approval | Agency |
| Permit to Cut Crown Timber | |
| Permit to Burn | |
| Development Plan | NLDIET - Mineral Development Division |
| Rehabilitation and Closure Plan | |
| Financial Assurance | |
| Mill Licence | |
| Quarry Development Permit | NLDIET - Mineral Lands Division - |
| Blasters Safety Certificate | Digital Government and Service NL |
| Approval for Storage and Handling of Gasoline and Associated Products | |
| Fuel Tank Registration | |
| Approval for Used Oil Storage Tank System (Oil/Water Separator) | |
| Certificate of Approval for a Waste Management System | |
| Certificate of Approval for a Sewage/Septic System | |
| Application to Develop Land for Septic | |
| Protected Roads, Permit for Development | |
| National Building Code - Fire, Life Safety, and Building Safety | |
| Buildings Accessibility Registration and Permit | |
| Food Establishment Licence | |
| Temporary Vehicular Access Permit, T’Railway Provincial Park | NL Department of Tourism, Culture, Arts and Recreation - Parks NL |
| Archaeological Permit | NL Department of Tourism, Culture, Arts and Recreation - Provincial Archaeology Office |
| Municipal | |
| Development Permits | Town of Appleton |
| 24.5 | Environmental Baseline Studies |
Table 24-2 lists environmental studies and data collected for the southern portion of the Queensway North Property by NFG. Additional baseline studies are currently in progress for the following environmental components for field work conducted in 2024:
| • | Groundwater and Surface Water |
| • | Fish and Fish Habitat |
| • | Country Foods |
| 24- |
|
| New Found Gold Corp. | Queensway Gold Project NI 43-101 Technical Report |
April 15, 2025 SLR Project No.: 233.065300.00001 |
| • | Metal Leaching/Acid Rock Drainage (ML/ARD) |
Table 24-2: Environmental Studies and Data Collection
| Discipline | Name, Author and Issued Date | Description |
| Atmospheric Environment | ||
| Air Quality | New Found Gold Baseline Ambient Air Quality Monitoring Technical Data Report (Stantec 2024c) |
This report provides information on the baseline conditions (i.e., existing conditions) of air quality for the area studied. The report presents a summary of the applicable regulations, existing air quality conditions, sampling methods, monitoring activities, meteorological data during sampling, and a discussion on the findings of the 2023 ambient air monitoring program. Sampling was conducted at Joe Batt’s Pond and in the town of Appleton to measure ambient concentration of air contaminants. |
| Noise | New Found Gold - Technical Data Report - Baseline Sound Pressure Level Survey (Stantec 2024d) |
This report provides information on the existing daytime/nighttime sound levels in the vicinity of the Queensway Property. Locations were chosen to characterize existing sound pressure levels within the town of Appleton and for residences located near Joe Batt’s Pond that are nearest to the Queensway Property. |
| Light | New Found Gold - Environmental Technical Data Report - Baseline Light Monitoring Survey (Stantec 2024e) |
This report provides information on existing light levels in the area studied. Nighttime light levels were measured near the town of Appleton and near Joe Batts Pond at receptor locations near the Queensway Property. |
| Aquatic Environment | ||
| Groundwater | Preliminary Baseline Hydrogeology Study New Found Gold Corp. Queensway North Project (GEMTEC Consulting Engineers and Scientists Limited [GEMTEC] 2023c) |
This report documents anticipated baseline hydrogeological conditions within the area studied. The report describes the general shallow groundwater flow regime and groundwater quality in the area from existing data and information as well as preliminary hydrogeological site programs completed in 2021. It also includes knowledge gaps, regulatory requirements for EAs, and recommendations pertaining to future work. |
| 2023 Baseline Geotechnical and Hydrogeological Studies, Queensway North Project (GEMTEC 2024a) |
This report presents the methods, findings, discussion, preliminary conclusions, and recommendations from the 2023 hydrogeological survey program. This report also incorporates pertinent existing data from the previous preliminary hydrogeological site investigation in 2021 using existing exploration holes (GEMTEC 2023c). Field program work was carried out between 2023-2024. |
|
| 24- |
|
| New Found Gold Corp. | Queensway Gold Project NI 43-101 Technical Report |
April 15, 2025 SLR Project No.: 233.065300.00001 |
| Discipline | Name, Author and Issued Date | Description |
| Surface Water |
Hydrology Baseline Report New Found Gold Corporation Queensway North Gold Project (GEMTEC 2023d) |
The hydrology baseline study examined climate characteristics, hydrological conditions, surface water flow and surface water and sediment quality for the area studied. Data were collected during the 2021 and 2022 field programs. |
|
2023 Hydrology Baseline Report New Found Gold Corp. Queensway North Gold Project (GEMTEC 2024b) |
The hydrology 2023 baseline study examined climate characteristics, hydrological conditions, surface water flow and surface water and sediment quality for the area studied. This study builds upon the information gathered from the 2021 and 2022 field programs (GEMTEC 2023d). | |
| Fish and Fish Habitat | Aquatic Summary Report New Found Gold Corporation Queensway North Gold Project (GEMTEC 2023b) | This report describes preliminary investigations conducted in 2021 and 2022 to determine the quality of fish habitat and presence of fish populations in areas that have the potential to be influenced by mine development. |
| New Found Gold: 2021-2023 Aquatic Baseline Study for the Keats Zone (Stantec 2024f) | This study was conducted to augment the aquatic studies conducted in 2021 and 2022 by GEMTEC (GEMTEC 2023b). The 2021-2023 field work included the identification of unmapped watercourses and waterbodies, habitat characterization (including water and sediment quality) of representative ponds and streams and an assessment of fish community composition. | |
| New Found Gold - Environmental Technical Data Report - 2023 Aquatic Baseline Study (Stantec 2024b) | This report was conducted to augment the aquatic studies completed by GEMTEC (GEMTEC 2023b) in 2021 and 2022. Field work was conducted in 2023 and included identification of waterbodies and watercourses within the area studied, fish habitat characterization of ponds and streams (including water and sediment quality), fish community sampling, baseline fish tissue analysis, benthic invertebrate community sampling in ponds and streams, Chlorophyll a analysis in ponds and periphyton sampling in streams. | |
| New Found Gold - Environmental Technical Data Report - 2024 Aquatic Baseline Study (Stantec in preparation) | This survey was conducted to augment the aquatic studies completed in 2023 (Stantec 2024). Field work was conducted to characterize additional fish habitat and assess the presence of fish in unmapped streams. |
| 24- |
|
| New Found Gold Corp. | Queensway Gold Project NI 43-101 Technical Report |
April 15, 2025 SLR Project No.: 233.065300.00001 |
| Discipline | Name, Author and Issued Date | Description |
| Geophysical Environment | ||
| Acid Rock Drainage / Metal Leaching (ARD/ML) | Static Testing of New Found Gold Waste Rock Samples; New Found Gold Corp. (RPC 2023) | This report summarizes the results from the static ARD test work on waste rock for the Project. |
| Preliminary Geochemical Characterisation - Queensway (BSIL and GBL lithologies) (SRK Consulting [UK] Limited 2023a) | As part of the ML/ARD assessment program, BSIL (Black Shale) and GBL (graphite bearing layer) samples are characterized in this report for their ML/ARD potential in an initial static test work program. | |
| Preliminary Geochemical Characterisation - Queensway (Keats Prospect) (SRK Consulting [UK] Limited 2023b) | As part of the ML/ARD assessment program, waste rock materials are characterized in this report for their ML/ARD potential in an initial static test work program performed on samples collected from recently drilled material and from local quarry material. | |
| Terrain and Soils | 2023 Baseline Geotechnical and Hydrogeological Studies, Queensway North Project (GEMTEC 2024a) | This report presents the methods, findings, discussion, preliminary conclusions, and recommendations from this program, as well as data from various NFG geological data sources. Field program work was carried out between 2023-2024. |
| Terrestrial Environment | ||
| Wetlands, Vegetation, and Wildlife | Terrestrial Ecology Baseline Report New Found Gold Corporation Queensway North Gold Project (GEMTEC 2023a) | This study was conducted in 2021 and 2022 to understand the physical and biological conditions for the area studied, and to highlight the main environmental sensitivities. It includes ecological land classification (ELC), wetland investigations, vegetation inventory and rare flora studies, breeding bird studies, and other wildlife studies. |
| New Found Gold Ecological Land Classification Technical Data Report (Stantec 2024a) |
The ELC study was conducted to gather information to complement other baseline work with the identification of primary information on the biological and physical characteristics of habitat types occurring in the area studied. The report presents baseline data collection methods and results for the ELC work completed by Stantec in 2023 using both desktop review and field studies. Information captured includes identification of communities/ecosystems present, occurrences of SAR/SOCC plant species, and occurrences of invasive/non-native plant species. |
|
| Terrestrial Ecology Baseline Report New Found Gold Corporation Queensway North Gold Project (GEMTEC 2024c) | This study was conducted to build upon the terrestrial baseline study in 2021 and 2022 (GEMTEC 2023a) and reports findings from 2023. | |
| 24- |
|
| New Found Gold Corp. | Queensway Gold Project NI 43-101 Technical Report |
April 15, 2025 SLR Project No.: 233.065300.00001 |
| Discipline | Name, Author and Issued Date | Description |
| Socio-economic Environment | ||
| Historic Resources | NFG Queensway North Gold Project: Historic Resources Impact Assessment (2023) (Stantec 2024g) | The Historic Resources Impact Assessment report presents the results of the 2023 field assessment, which consisted of an archaeological reconnaissance survey (walkover) of the high archaeological potential areas identified in the HROA (Stantec 2023) where mine development ground disturbing activities could occur. |
| Historic Resources Overview Assessment (HROA) (Stantec 2023) |
The Stage 1 HROA is a desktop assessment that presents locations within the selected study area that had elevated potential to contain archaeological resources. It was conducted using digital and archival information available from various government and non-government resources to gather an understanding of the general and specific history of the selected areas of the Queensway Property including the Pre-Contact Period and Historic Period. |
|
| 24.6 | Surface Water Resources |
The Queensway Property is located within the Gander River Watershed. Gander Lake, located southwest of the Property, discharges northwest through Gander River until it reaches Gander Bay (45 km downstream), which flows into the Atlantic Ocean. A portion of the NFG leases occurs within the Public Protected Water Supply Area (PPWSA) surrounding Gander Lake, which serves as the drinking water source for Gander and surrounding communities. Gander Lake is one of the deepest waterbodies in North America, with an estimated depth of 305 m, and is approximately 56 km long and 5 km wide. The TCH (Highway 1) roughly divides the watersheds that overlap the Property. Streams to the south of the highway drain south to Gander Lake or west to the Gander River, while streams to the north of the highway, flow north to the Gander River. There are many ponds within the Property, the largest of which is Joe Batt’s Pond, which has a catchment area of 152 ha.
Baseline water levels and flow have been monitored in the Property since 2021. Between 2021 and 2023, water levels were monitored between March to November at four sites in the Queensway North property, and flow measurements were taken up to four times per year. In July 2024, continuous (year-round) water level monitoring was installed at four locations within the Property, and five flow measurements were collected between July and November 2024.
Surface water quality monitoring was completed annually during the ice-free period (May to November) since 2021 at various locations in the Queensway North property. To date, a total of 16 sampling events have been completed at up to 22 different sampling locations across the Property. Two of the surface water quality monitoring sites are located upstream of the potential mine development and may act as reference surface water quality sites.
Mine development will be subject to the federal MDMER effluent monitoring requirements for new metal and diamond mines (effective June 1, 2021). NFG will be required to apply under the provincial Water Resources Act for a Permit to Develop in a PPWSA/Wellhead PPWSA, which will be reviewed by the provincial WRMD and the Gander Lake Watershed Monitoring Committee.
| 24- |
|
| New Found Gold Corp. | Queensway Gold Project NI 43-101 Technical Report |
April 15, 2025 SLR Project No.: 233.065300.00001 |
| 24.7 | Hydrogeology |
Groundwater studies at the Queensway Property were initiated in 2021 with a desktop study and preliminary field investigations using existing exploration boreholes (GEMTEC 2023c). Monitoring well installation, hydraulic testing (single well response and packer testing), water quality analysis, and test pitting were conducted in 2023 (GEMTEC 2024a). Quarterly groundwater level and water quality monitoring has been conducted since monitoring wells were installed.
Overburden within the area studied generally consists of organic material overlying glacial till, characterized as silty sand to sandy silt with variable amounts of gravel, cobbles, and occasional clay, with overburden thickness ranging from 0.1 m to 26.4 m (GEMTEC 2024a), which is consistent with regional surficial geological mapping that indicates tills of variable thicknesses (Liverman and Taylor 1990). Below the overburden, bedrock generally consists of mudstones, siltstones, and sandstones of the Davidsville Group that is located within the Exploits subzone of the Dunnage technostratigraphic zone (Blackwood 1982; Currie 1995b)
Regional hydrogeological data was collected from The Hydrogeology of Central Newfoundland (AMEC 2013). The area studied is located in what is referred to as hydrogeological Unit 2. The yields of wells drilled in Unit 2 are typically low to moderate with a median sustainable pumping rate of 7 L/min.
Groundwater levels within the area studied are generally shallow, and ranged from 2.98 m below ground surface (mbgs) to -0.23 mbgs (artesian) during the 2023 field program (GEMTEC 2024a). Local shallow groundwater flows generally in westerly and northerly directions towards the Gander River with some localized flow in the vicinity of other surface water features, such as Herman’s Pond. Groundwater flow will occur both through the overburden materials and the bedrock. Flow through the overburden will occur through primary porosity that exists as pore spaces in the silty sand to sandy silt material, while flow in the bedrock will primarily occur through secondary porosity, such as fractures and joints, and will be variable depending on the frequency and interconnection of these structural features.
Initial information on the hydrogeology of the area studied was collected through completing hydraulic testing in existing exploration boreholes. Hydraulic conductivities, calculated based on preliminary hydraulic testing of four exploration boreholes, range from 2.1 × 10⁻⁹ m/s to 2.0 × 10⁻⁸ m/s with an average value of 6.2 × 10⁻⁹ m/s (GEMTEC 2023c). Further hydraulic testing, using packers and single well response tests (GEMTEC 2024a), indicated hydraulic conductivities in bedrock ranging from 2.7 × 10⁻⁸ m/s to 2.1 × 10⁻⁴ m/s, with an average value of 1.5 × 10⁻⁶ m/s and from 4.5 × 10⁻⁸ m/s to 1.0 ×10⁻⁴ m/s in the overburden material, with an average value of 2.0 ×10⁻⁶ m/s. Detailed dewatering design is expected to be required to maintain dry mining conditions due to variability in hydraulic conductivity values and uncertainty around areas of higher hydraulic conductivity values that may contribute higher water volumes to mine workings.
To progress the mine development, it is recommended to complete additional hydrogeological studies, including installation of additional monitoring wells and further borehole packer testing as infrastructure designs are finalized, as well as groundwater modelling.
| 24- |
|
| New Found Gold Corp. | Queensway Gold Project NI 43-101 Technical Report |
April 15, 2025 SLR Project No.: 233.065300.00001 |
| 24.8 | Acid Rock Drainage/Metal Leaching |
In 2025, a geochemical characterization program is being conducted on the proposed mine waste by SRK Consulting (UK) Limited; this program is ongoing and is overseen by Robert Bowell (PhD, P.Geo (NL)) and Lisa Fuellenbach (PhD) (SRK Consulting [UK] Limited 2025) and summarized herein. Mine waste is defined as bedrock and overburden that contains less than 0.5 g/t gold and tailings from mill processing. The baseline geochemical program was designed to characterize the ARD/ML properties of the Property’s geological materials. The results are used to inform the mine plan and mitigation strategies for future mine waste.
The geochemical characterization program included bulk mineralogy (QEMSCAN), static tests (acid base accounting, single stage net acid generation tests, acid buffering characteristic curve test, whole rock assay, shake flask extraction, and Synthetic Precipitation Leaching Procedure (SPLP), and kinetic testing (laboratory humidity cell tests and saturated columns [tailings only]) on waste rock lithologies and tailings. A total of 239 waste rock samples (up to November 1, 2024) and 20 tailings samples were characterized, with results summarized below.
| 24.8.1 | Waste Rock and Overburden |
Waste rock from major prospects of the Queensway North property and overburden were characterized to assess acid generating and neutralizing capacities, and metal leaching rates. The major prospects and lithologies characterized are listed in Table 24-3:
Table 24-3: Major Prospects and Lithologies Characterized
| Major Prospects Characterized | Lithologies Characterized |
|
• Keats • Golden Joint • Lotto • Iceberg • Iceberg East • Keats West |
• overburden (OVB) • quartz vein (QTZ) • siltstone (SIL) • greywacke (SDG) • black siltstone (BSIL) • gabbro (GAB) • graphite-bearing layer (GBL) • conglomerate (CMT) • fault gouge (FLT) material |
A total of 15 samples of selected waste rock were analyzed for bulk mineralogy. Major mineralogy was generally typical for the Property’s lithologies with quartz, feldspars, and phyllosilicates, including sericite, muscovite, chlorite and minor clay group minerals, making up 70 to 99 weight percent (wt.%) of the bulk mineralogy. Silicate minerals comprise approximately 70 to 80 wt.%, and carbonate contents comprise the remaining 20 to 30 wt.% (as calcite, ferroan dolomite, and ankerite and siderite). Sulphide minerals of 0.1 up to 4.7 wt.% are predominantly present as pyrite with traces of arsenopyrite and occasionally chalcopyrite. Mineralogical results showed that three samples of QTZ, GBL, and BSIL lithologies are potentially acid generating (PAG). Five samples of SIL, BSIL, FLT, and SDG lithologies may have the potential to generate acid, and seven samples of SIL, GAB, SDG, CMT, and OVB are likely to have sufficient carbonate buffering capacity to neutralize acid generated by the relatively much lower amounts of sulphide contents (non-PAG).
Of the 239 waste rock samples tested to date,
| • | 160 (67%) are predicted to be non-PAG, |
| 24- |
|
| New Found Gold Corp. | Queensway Gold Project NI 43-101 Technical Report |
April 15, 2025 SLR Project No.: 233.065300.00001 |
| • | 49 (21%) are uncertain PAG, and |
| • | 30 samples (13%) are PAG, as shown on Figure 24-1. |
Figure 24-1: Acid Potential vs Modified Sobek Neutralization Potential - Waste Rock and Overburden
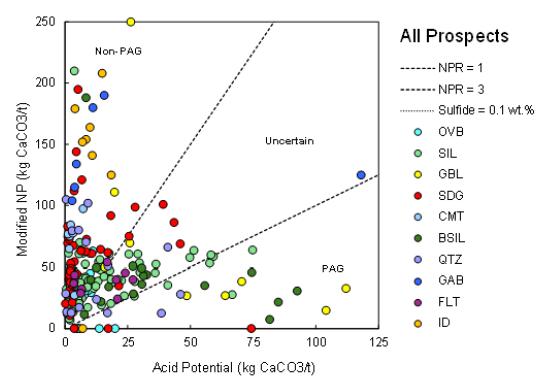
Source: SRK Consulting [UK] Limited 2025
Humidity cell tests were conducted on each listed lithology (Table 24-3). Multiple humidity cell tests were run on samples from the predominant lithologies, SIL, SDG, and BSIL, to assess different ranges of ARD potential, and sulphur and metal contents. The BSIL unit shows the highest potential for ML/ARD. The mineralized GBL shows varying ML/ARD potential, with several samples indicating acidic conditions and metal release ranging from low to extremely high. Under the moderately acidic conditions of the SPLP test, all 66 tested samples maintained circumneutral to mildly alkaline leachates.
The potential for ML/ARD is mainly confined to the BSIL unit (black shale-siltstone) in the hanging wall, a typical geochemical signature of this rock type. This material would be exposed only in open pit mining scenarios. The graphite-bearing layer near the Appleton Fault Zone also shows some potential for ML/ARD. In addition, the mineralized SIL and SDG materials have some potential for neutral leaching of metals. The mineralized wall rock and low grade ore also show potential for ARD and high levels of ML, but these zones are limited to small areas of veining in the wall rock or near the gold mineralization.
Based on the geochemical evaluation to date, most of the waste rock at the Queensway North prospects is generally non-reactive. However, the exposed BSIL will require appropriate management. Data assessment and comparison with other deposits indicate that ML/ARD will have a limited impact at Queensway. Nonetheless, there is some potential for neutral leaching of metals and metalloids from the SIL unit.
| 24- |
|
| New Found Gold Corp. | Queensway Gold Project NI 43-101 Technical Report |
April 15, 2025 SLR Project No.: 233.065300.00001 |
| 24.8.2 | Tailings |
A total of 12 tailings samples, including 10 variability composite and 2 master composite samples from the Keats, Golden Joint, and Iceberg prospects, were characterized with mineralogy, static, and kinetic testing. Major mineralogy of the tailings was quartz (10-70 wt.%), feldspars (5-15 wt. %), chlorite (5-10 wt.%), muscovite (2-8 wt.%), calcite (1-3 wt.%), and pyrite (typically less than 2 wt.%). Other trace sulphides (i.e., arsenopyrite, chalcopyrite, etc.) and clay minerals, dolomite, and other silicate phases were identified.
The tailings sourced from the Keats prospect showed higher sulphide content and higher calcite content, while the tailings from the Golden Joint prospect showed a much lower calcite content and slightly less sulphide content. The results of the acid base accounting showed the tailings sourced from Keats, Golden Joint, and Iceberg prospects are non-PAG (Figure 24-2), even with sulphide sulphur contents up to 1%. As part of the floatation separation process, the addition of lime will support an overall net neutralization of tailings.
Figure 24-2: Acid Potential vs Modified Sobek Neutralization Potential - Tailings

The assessment of cyanide (CN) decay and leaching was tested and evaluated. Results indicated CNWAD can be reduced to less than 1 milligram per litre (mg/L) by adding 10 gram/gram (g/g) equivalent of sulphur dioxide, 10 to 15 g/g of lime, and a solution containing 400 to 450 mg/L of copper. As CNWAD was removed, copper and iron levels in the resulting supernatant decreased. This process required a residence time of up to approximately 90 minutes. This study confirms that CN destruction is achievable with tailings from all three prospects. Furthermore, this can be accomplished within a reasonable timeframe, reaching acceptable levels for disposal in a tailings storage facility.
Whole rock assay results show tailings samples exhibit enrichment of antimony, arsenic, copper, tungsten, and titanium, ranging from six to 12 times the average crustal abundance. Aqueous geochemistry indicates that arsenic, antimony, and copper could be potential concerns in leachates. Tailings samples were subjected to SPLP leaching, and all samples were classed as neutral potential drainage with low metal release. Tailings from the Keats prospect showed higher copper content and a higher sulphate release than from the Golden Joint or Iceberg prospects. The results indicate that the Keats tailings may require additional management to mitigate for antimony, arsenic, and copper release.
| 24- |
|
| New Found Gold Corp. | Queensway Gold Project NI 43-101 Technical Report |
April 15, 2025 SLR Project No.: 233.065300.00001 |
Kinetic test work is ongoing; however, preliminary results indicate tailings are net neutralizing and there is a limited metal(loid) leaching potential with more leaching potential from the Keats tailings compared to the other prospects. There are potential water quality impacts from neutral to alkaline drainage, with the potential for arsenic and antimony mobilization exceeding relevant water quality limits. The similarities in results between saturated columns and humidity cell tests suggest that sulphide oxidation is not a significant mechanism of metal release at the time of reporting. Instead, element release is primarily due to physical flushing.
| 24.9 | Community, Indigenous and Regulatory Relations and Engagement |
NFG fosters relationships with stakeholders in NL in the area it operates. It strives to balance economic growth with community impacts by engaging the public, Indigenous groups, government departments, and other stakeholders. Through formal and informal sessions, NFG gathers feedback to align our work activities with community needs and expectations.
NFG’s commitment to stakeholder engagement includes regular community meetings, open forums, and regulatory consultation designed to provide transparency and mutual understanding. The Company prioritize building trust and maintaining open lines of communication with all parties involved. By incorporating knowledge held by stakeholders and addressing concerns raised by local residents, NFG aims to create sustainable practices that respect both the environment and the needs of the community. Additionally, the Company works closely with government agencies to comply with regulatory requirements and integrate best practices in environmental stewardship. NFG’s approach includes investing in local community in a way that benefits not only NFG employees but the broader community. Through these efforts, NFG strives to be a responsible corporate citizen and a positive force for development in the region.
As the Project is developed through a PEA process, NFG will implement a formal engagement strategy with stakeholders. This strategy will be crucial during the Project planning and regulatory stages of the development. By maintaining open communication and involving stakeholders in decision-making processes, potential conflicts can be mitigated and Project benefits shared equitably. The engagement strategy will prioritize transparency and inclusion. This approach aims to enhance community trust and promote sustainable development practices that respect the social, cultural, and environmental aspects of the region. Establishing strong relationships with communities and Indigenous groups is important for the success of projects. As the Project advances, NFG is committed to working collaboratively with stakeholders to contribute positively to NL's well-being and prosperity.
| 24.10 | Rehabilitation and Closure |
| 24.10.1 | Rehabilitation and Closure Plan |
Under the provincial Mining Act, (Chapter M-15.1 Section 8, 9 and 10), a Rehabilitation and Closure Plan is a requirement for the development of a mine in NL. This Plan describes the process of rehabilitation for the mine, up to and including closure. Rehabilitation is defined as measures taken to restore a property as close to its former use or condition as practicable, or to an alternate use or condition that is deemed appropriate and acceptable by NLDIET by achieving the following goals:
| 24- |
|
| New Found Gold Corp. | Queensway Gold Project NI 43-101 Technical Report |
April 15, 2025 SLR Project No.: 233.065300.00001 |
| • | Eliminating health risks and promoting the safety of people. |
| • | Limiting the production and spread of contaminants that could affect the environment and eliminating the need for long-term maintenance and monitoring. |
| • | Restoring the site to a visually acceptable condition. |
| • | Returning the infrastructure site (excluding tailings and waste rock accumulation areas) to a state compatible with future use. |
The three stages of rehabilitation activities that occur over the life of a mine are:
| • | Progressive rehabilitation. |
| • | Closure rehabilitation. |
| • | Post-closure monitoring and treatment. |
Progressive rehabilitation is completed during mine operation and prior to closure, wherever possible or practicable to do so, and contributes to the overall rehabilitation effort for the site.
As planning and design of a mining project advance, and in an effort to be proactive with rehabilitation activities, the following general approaches should be followed:
| • | Disturbances of terrain, soil, and vegetation will be limited to areas necessary to complete the required work as defined by the Project. |
| • | Organic soils, mineral soils, glacial till, and excavated rock will be stockpiled separately wherever possible, and protected for future use. |
| • | Disturbed areas will be stabilized to reduce erosion and promote natural re-vegetation. |
| • | Natural re-vegetation will be encouraged where and when possible during mine development and operation. |
Closure rehabilitation activities are completed after mining operations cease and are meant to restore and/or reclaim a mine site to as close to its pre-mining condition as practicable. Activities during this stage include demolition and removal of site infrastructure, re-vegetation of disturbed areas, and other activities to achieve the requirements and goals as detailed in the mine’s Rehabilitation and Closure Plan.
Once closure rehabilitation activities have been completed, a period of post-closure monitoring occurs to confirm that the rehabilitation efforts have been successful. Post-closure monitoring and treatment (if required) continues until it has been demonstrated that the rehabilitation of the site has been successful. At that time, the site can be closed out or released by NLDIET and an application made to relinquish the property back to the Crown.
| 24.10.2 | Financial Assurance |
As defined in the Mining Act, a mine operator is required to provide financial assurance as part of their project Rehabilitation and Closure Plan. The financial assurance is based on the cost estimate for the closure activities as presented in the Plan.
| 24- |
|
| New Found Gold Corp. | Queensway Gold Project NI 43-101 Technical Report |
April 15, 2025 SLR Project No.: 233.065300.00001 |
The financial assurance, once approved by NLDIET, is provided to the province and serves as a guarantee that funds will be available to carry out the works planned in the Rehabilitation and Closure Plan in case of default by the proponent. The costs of studies required for the rehabilitation and closure of the mine site, including environmental characterization studies and environmental monitoring, is considered in the calculation of the financial assurance. The rehabilitation and closure cost estimate is required to be completed by a qualified third party
| 24- |
|
| New Found Gold Corp. | Queensway Gold Project NI 43-101 Technical Report |
April 15, 2025 SLR Project No.: 233.065300.00001 |
| 25.0 | Interpretation and Conclusions |
The SLR QPs make the following conclusions:
| 25.1 | Geology and Mineral Resources |
| • | As of March 15, 2025, the NFG Queensway Project Mineral Resources are estimated as follows: |
| o | Open pit Indicated Mineral Resources are estimated to total approximately 17,267 kt grading 2.25 g/t Au containing approximately 1,249 koz, and Inferred Mineral Resources are estimated to total approximately 8,960 kt grading 1.24 g/t Au containing approximately 358 koz Au. |
| o | Underground Indicated Mineral Resources are estimated to total approximately 771 kt grading 5.76 g/t Au containing approximately 142 koz, and Inferred Mineral Resources are estimated to total approximately 1,749 kt grading 4.44 g/t Au containing approximately 250 koz Au. |
| • | The geology of the Project is well understood and constitutes a poly-deformed fold and thrust belt that overprints Ordovician ophiolitic and marine carbonate/siliciclastic rocks, Silurian shallow marine/terrestrial sequences, and Silurian magmatic rocks. Gold mineralization typically occurs as coarse grains of free visible gold in multiphase quartz-carbonate veins that are brecciated, massive-vuggy, laminated, or that have a closely spaced stockwork texture. |
| • | Within the AFZ Core area, mineralization was modelled as 308 veins and nine additional halo zones. Within the Queensway North peripheral areas, mineralization domains consist of 17 veins in the JBP area and 33 veins in the AFZ Peripheral area. All areas also include a 2 m buffer around the veins capturing adjacent low-grade mineralization. Au grades were estimated using ID3 and a four pass search strategy. |
| • | Average density values applied to the domains are supported by wax-coated water immersion density measurements on core samples, with 2.7 g/cm3 applied to the mineralized domains. |
| • | Protocols for drilling, sample preparation and analysis, verification, and security meet industry standard practices and are appropriate for the purposes of a Mineral Resource estimate. |
| • | Mineral Resource classification was based primarily on drill hole spacing, applied to designate contiguous zones of like classification. |
| • | Open pit Mineral Resources were reported within a preliminary optimized pit shell generated at a cut-off grade of 0.3 g/t Au, while underground Mineral Resources were constrained within reporting panels generated at a cut-off grade of 1.65 g/t Au with heights of 10 m, lengths of 5 m, and minimum widths of 1.8 m. |
| 25.2 | Mineral Processing |
| • | Test work to date on samples from the Keats, Lotto, Golden Joint, and Iceberg zones has focused on a gravity concentration-CIL flowsheet and included exploratory test work using master composites and variability test work using variability composites. The master composites for each zone were produced by combining portions from all of the variability composites from their respective zones. The variability test work on Iceberg composites included a pre-aeration step prior to cyanide leaching, while the variability test work on Keats, Lotto, and Golden Joint composites did not. |
| 25- |
|
| New Found Gold Corp. | Queensway Gold Project NI 43-101 Technical Report |
April 15, 2025 SLR Project No.: 233.065300.00001 |
| • | Exploratory test work using the Keats and Lotto master composites returned high GRG recoveries, while indicating that preg-robbing affected cyanide leaching extractions from the gravity tails. Therefore, subsequent variability testing on composites from these zones, Golden Joint, and Iceberg used gravity concentration followed by CIL of the gravity tails. The GRG tests for the variability test work was conducted at a target P80 of 212 µm while the CIL tests were conducted at three target P80 grind sizes for each composite, 212 µm, 75 µm, and 37 µm to assess the effect of grind size on gold recovery, with 80% passing (P80) 75 µm ultimately being chosen as the optimum grind size. GRG recoveries ranged from 1% to 99%, and overall extractions (GRG-CIL) at the target P80 of 75 µm for the CIL tests ranged from 31% to 100% and showed a strong relationship between gold head grade and overall extraction. |
| • | Analysis of the CIL test results from the variability test work using Keats, Lotto, Golden Joint, and Iceberg composites showed that there was a relationship between leach extraction and arsenic head grade, indicating that a portion of the gold in the samples was associated with arsenic and refractory to leaching. This relationship was pronounced in the samples with lower gold head grades (<4 g/t Au). This analysis, together with mineralogical data indicated that the unleached gold was likely associated with arsenopyrite (and possibly pyrite) and not well liberated. |
| • | Exploratory flotation test work was completed on Keats, Lotto, and Iceberg master composites as well as four variability composites from the Keats and Lotto zones selected due to their relatively poor gravity-CIL responses (with overall gold extractions ranging from 57% to 73%). Carbon flotation aimed at rejecting carbon to minimize its preg-robbing effect indicated that some loss of gold would occur in this step and overall extraction was not beneficially affected. Sulphide flotation was effective at recovering gold from gravity and carbon flotation tails into a concentrate with recoveries ranging from 89% to 97%, however, re-grinding of that concentrate was not effective at improving gold extraction during leaching with the overall extraction for the concentrate leach flowsheet essentially the same as the gravity-CIL flowsheet. |
| • | The flotation test work was used to arrive at an overall gold recovery estimate of 90% for the Mineral Resource estimate. The flotation tests using Keats, Keats West, Lotto, and Iceberg composites resulted in overall gold recoveries to gravity and sulphide concentrates ranging from 89% to 97% with sulphide concentrates containing 9 g/t to 67 g/t gold. Cleaner flotation test work to upgrade the concentrates is expected to result in some gold losses, however, the flotation tests completed to date did not include CIL of the sulphide flotation tails, and it is likely that gold losses through cleaner flotation would be offset by additional gold recovery from leaching the flotation tails, hence the overall recovery estimate of 90%. |
| • | During the flotation test work, pre-aeration of gravity tails prior to carbon flotation and tails leaching appeared to be beneficial in reducing cyanide consumption during subsequent leaching of the sulphide concentrates. |
| • | In general, the test work completed to date indicated that gold was present in two main forms in the samples tested: free gold amenable to gravity recovery and extraction by cyanide leaching, and gold associated with arsenic that was partially amenable to cyanide leaching or recoverable by flotation. Higher grade samples (>4 g/t Au) contained higher proportions of free gold, while the lower grade samples (<4 g/t Au) tended to be increasingly characterized at decreasing gold grades by partially liberated or unliberated gold associated with arsenic. |
| 25- |
|
| New Found Gold Corp. | Queensway Gold Project NI 43-101 Technical Report |
April 15, 2025 SLR Project No.: 233.065300.00001 |
| • | Comminution test work was completed on master composites from each zone and a selection of eight Iceberg variability composites and indicated that the material was amenable to conventional crushing and grinding. |
| • | Test work on samples from Keats West is currently underway at Base Met Labs with initial tests on the master composites indicating that CIL extraction from the gravity tails was poor. Preliminary results from flotation test work on gravity tails of the master composites indicated that it was effective at recovering the unleachable gold. |
| 25.3 | Other Relevant Data and Information |
| • | NFG has undertaken a range of environmental baseline studies across key biophysical and socio-economic components of the Queensway Project area. These include terrestrial and aquatic ecology, air, and water quality, noise and light surveys, acid rock drainage and metal leaching characterization, and hydrogeological assessments. The scope and scale of these programs are consistent with industry best practices for projects transitioning from early-stage exploration to advanced technical evaluations such as a PEA. |
| • | Environmental sensitivities within the area studied have been identified and are generally manageable with standard permitting conditions and mitigation strategies. Key considerations include a portion of the mineral licences falling within protected water supply areas and Crown Lands. No critical habitat for species at risk has been identified within the area studied. |
| • | Regulatory frameworks at both the federal and provincial levels have been reviewed, and future development will require provincial EA registration and permitting. The potential requirement for federal EA will be contingent on project scope and throughput. To date, NFG has demonstrated proactive engagement with regulators and local communities and is committed to continued collaboration as the Project advances. |
| 25- |
|
| New Found Gold Corp. | Queensway Gold Project NI 43-101 Technical Report |
April 15, 2025 SLR Project No.: 233.065300.00001 |
| 26.0 | Recommendations |
The QPs recommend that the Project proceed to undertake a PEA. The QPs have the following recommendations by area.
| 26.1 | Geology and Mineral Resources |
| 1 | Conduct additional trenching, channel sampling, and detailed mapping to continue to improve structural modeling and refine mineralization wireframe interpretations. |
| 2 | Continue exploring while balancing potential with cost-effectiveness, focusing efforts on: (1) infill drilling within the pit shells to convert unclassified material; (2) near-surface expansion along the AFZ and JBPFZ; (3) extensions of open underground reporting panels at depth and along strike; and (4) deep drilling in the AFZ Core to follow up widely spaced high grade intercepts. |
| 3 | Based on the results of a positive PEA, NFG should consider targeted closely spaced RC or diamond drilling in areas that are expected to have the greatest impact on early LOM production. |
| 4 | Following a positive PEA, NFG should consider bulk sampling in early LOM areas to confirm grade continuity and validate the resource model. Bulk sampling should be of sufficient scope, follow closely spaced drilling and an updated Mineral Resource estimate and target material representative of mining and processing conditions. |
| 5 | Further acquisition of spatially representative wax-coated water immersion density measurements is recommended for the various rock types. |
| 6 | In conjunction with the future metallurgical test work outlined in Section 13.7, the QP recommends that NFG consider developing a geometallurgical model, if warranted, to account for recovery variability and support process planning for future technical evaluations beyond the PEA stage. |
| 7 | SLR recommends that NFG continue to evaluate the geological and grade continuity of mineralized vein wireframe interpretations hosted within or extending into the modelled AFZ structure. |
| 8 | Continue assaying samples with multielement ICP as it helps support both lithology interpretation as well as mineralized wireframe interpretation. |
| 26.2 | Mineral Processing |
| 1 | Test work should be conducted to evaluate the production of a saleable sulphide concentrate containing gold, building on the preliminary flotation test work already completed. Sulphide flotation could be employed before or after cyanide leaching, and both of these options should be evaluated in test work and in a subsequent trade-off study to determine which would be the preferrable option if flotation was to be included in the flowsheet. |
| 2 | Sulphide oxidation test work should be conducted on Keats, Lotto, Golden Joint, Iceberg, and Keats West flotation concentrates to assess their amenability to this technique to support trade-off studies evaluating the technical and economic characteristics of different sulphide oxidation technologies. |
| 3 | The pre-aeration step should be continued in future CIL testing. |
| 26- |
|
| New Found Gold Corp. | Queensway Gold Project NI 43-101 Technical Report |
April 15, 2025 SLR Project No.: 233.065300.00001 |
| 4 | Future sample selection and test work should be coordinated with the development of a geological model that may include additional species such as cyanide-soluble gold, sulphur, arsenic, iron, and organic carbon, and that will provide detailed information on gold grade distribution within the various zones. Additionally, the development of mine plans during more advanced stages of study should be used to ensure that samples selected for test work represent material that would be processed in a mill. |
| 26.3 | Budget |
The budget to complete the recommendations is shown in Table 26-1.
Table 26-1: Budget of Recommendations
| Area | Discipline | Cost (C$000) |
| Complete PEA technical report | Engineering Studies | 400 |
| Conversion (infill) drilling | Resource Conversion | 20,250 |
| Metallurgical Testing | Engineering Studies | 200 |
| Environmental baseline studies & permitting | Permitting | 500 |
| Seismic reprocessing and interpretation | Exploration | 200 |
| Trenching and channel sampling of key zones | Resource Modelling | 5,000 |
| Bulk density sampling | Resource Modelling | 25 |
| Exploration drilling | Exploration | 15,750 |
| Total | 42,325 |
In addition to the recommendations presented in Table 26-1, NFG is considering undertaking a bulk sample program. The costs to undertake the bulk sample program, as well as any resultant revenue from the recovery and sale of gold, are currently being evaluated by NFG.
| 26- |
|
| New Found Gold Corp. | Queensway Gold Project NI 43-101 Technical Report |
April 15, 2025 SLR Project No.: 233.065300.00001 |
| 27.0 | References |
AC CDC (Atlantic Canada Conservation Data Centre). 2023. Newfoundland and Labrador Species Ranks. Provided by A. Durocher of AC CDC via email on January 10, 2024. Last updated, August 18, 2023.
AMEC. 2013. Hydrogeology of Central Newfoundland. Prepared for Newfoundland and Labrador Department of Environment and Conservation - Water Resources Management Division. Available online: https://www.mae.gov.nl.ca/waterres/reports/hydrogeology_centralnl/index.htmlBlackwood, R.F. 1982. Geology of the Gander Lake (2D/15) and Gander River (2E/2) Area, Newfoundland Department of Mines and Energy − Mineral Development Division, Report 82−4.
AMTEL. 2023. Advanced Mineral Technology Laboratory (AMTEL) Report - Gold Deportment in Three Master Composites of Queensway Ore. Prepared by AMTEL, 100 Collip Circle, Suite 205 London, Ontario, Canada N6G 4X8. Report-23,51, Nov 2023.
AMTEL. 2024. Advanced Mineral Technology Laboratory (AMTEL) Report - Gold Deportment in a Master Composite of Iceberg Ore, from Queensway Project. Prepared by AMTEL, 100 Collip Circle, Suite 205 London, Ontario, Canada N6G 4X8. Report-24/29, Preliminary
AMTEL. 2025. Report 24/49B, February 19th 2025, Gold Deportment in Master Composites of Queensway’s Iceberg, KW-Mod/Strong & KW-Weak Ores prepared for New Found Gold Corp.
APEX Geoscience Ltd., Jorgensen Engineering and Technical Services, LLC, GL Simmons Consulting, LLC. (2024). NI 43-101 Technical Report: New Found Gold Corp.’s Queensway Gold Project, Newfoundland and Labrador, Canada - 2024 Property Expansion and Exploration Update. Prepared for New Found Gold Corp. Effective Date: November 1, 2024; Signing Date: November 15, 2024.
Base Metals Labs. 2024a. Base Met Labs Report - Metallurgical Testing of Samples from the Queensway Project, January 9, 2024. Prepared by Base Met Labs, 200-970 McMaster Way, Kamloops, B.C., V2C 6K2, Canada, Report 1 - BL1290.
Base Metals Labs. 2024b. Base Met Labs Report - Metallurgical Testing of Iceberg Samples from the Queensway Project, October 29, 2024. Prepared by Base Met Labs, 200-970 McMaster Way, Kamloops, B.C., V2C 6K2, Canada, Report 1 - BL1517.
Blackwood, R.F. 1982: Geology of Gander Lake (2D/15) and Gander River (2E/2) Area; Newfoundland Department of Mines and Energy, Mineral Development Division, Report 82-4, 56 p.
Brushett, D., 2010. Quaternary Geology of the Gander Lake and Gambo Map Areas (NTS 2D/16 and 2C13). Current Research (2010), Newfoundland and Labrador Department of Natural Resources, Geological Survey, Report 10-1, 159-170.
Brushett, D., 2012. Till geochemistry of northeast Newfoundland (NTS map areas 2C/13, 2D/15, 2D/16, 2E/01, 2E/08, 2F/04 and 2 F/05). Government of Newfoundland and Labrador, Department of Natural Resources, Geological Survey, Open File NFLD/3174, 161 p.
BSM. 2023. Black Swan Metallurgy (BSM) Report - New Found Gold Corp, Queensway Project Gravity Circuit Recovery Modelling. Prepared by Black Swan Metallurgy, Perth, Western Australia, Australia. Nov 2023.
| 27- |
|
| New Found Gold Corp. | Queensway Gold Project NI 43-101 Technical Report |
April 15, 2025 SLR Project No.: 233.065300.00001 |
Buchanan, C. 2003. Geology Mapping on the Golden Bullet Property, Internal Rubicon Report.
Buchanan, C. 2005. Structural Analysis of Drill Core from the H Pond and Pocket Pond Prospects and Shoreline Mapping of Gander Lake, Internal Rubicon Report, 35 p.
CDA (Canadian Dam Association). 2013. Dam Safety Guidelines 2007 (2013 Edition).
Center for Applied Ocean Technology Marine Institute - MUN. 2022. Gander Lake Bathymetric Survey. Prepared for New Found Gold Corp.
CGG Canada Services Limited. 2017. Geophysical Survey Report Airborne Magnetic and Helitem35C Survey Gander Area, Canada. Prepared for Palisade Resources.
CGG Canada Services Limited. 2020. HeliFALCON Airborne Gravity Gradiometer and Aeromagnetic Survey. Prepared for New Found Gold Corp.
CGG Canada Services Limited. 2021. Geophysical Survey Report Airborne Magnetic and Helitem2 Survey, Gander. Prepared for New Found Gold Corp.
Churchill, R.A., and Evans, D.T.W., 1992. Geology and gold mineralization of the Duder Lake gold showings, eastern Notre Dame Bay, Newfoundland. In: Current Research, Government of Newfoundland and Labrador, Department of Mines and Energy, Geological Survey Branch, Report 92-1, pp. 211-220.
CIM. 2014. Canadian Institute of Mining, Metallurgy and Petroleum (CIM) Definition Standards for Mineral Resources and Mineral Reserves, adopted by the CIM Council on May 10, 2014.
CIM. 2019. CIM Estimation of Mineral Resources & Mineral Reserves Best Practice Guidelines, adopted by the CIM Council on November 29, 2019.
Colman-Sadd, S. P., Dunning, G. R., and Dec, T. 1992. Dunnage-Gander relationships and Ordovician orogeny in central Newfoundland; a sediment provenance and U/Pb age study. American Journal of Science, 292(5), 317-355.
COSEWIC (Committee on the Status of Endangered Wildlife in Canada). 2010. COSEWIC assessment and status report on the Atlantic Salmon Salmo salar (Nunavik population, Labrador population, Northeast Newfoundland population, South Newfoundland population, Southwest Newfoundland population, Northwest Newfoundland population, Quebec Eastern North Shore population, Quebec Western North Shore population, Anticosti Island population, Inner St. Lawrence population, Lake Ontario population, Gaspé-Southern Gulf of St. Lawrence population, Eastern Cape Breton population, Nova Scotia Southern Upland population, Inner Bay of Fundy population, Outer Bay of Fundy population) in Canada. Committee on the Status of Endangered Wildlife in Canada. Ottawa. xlvii + 136 pp.
COSEWIC. 2012. COSEWIC assessment and status report on the American Eel Anguilla rostrata in Canada. Committee on the Status of Endangered Wildlife in Canada. Ottawa. xii + 109 pp.
Currie, K.L. 1995a. The northeastern end of the Dunnage Zone in Newfoundland; Atlantic Geology, v. 31, pp. 25-38.
Currie, K.L. 1995b. Geology, Gander River, Newfoundland. Geological Survey of Canada, Open File 03162; scale: 1:50,000
DFO (Fisheries and Oceans Canada). 2023. Threats to fish and fish habitat in the watersheds of Newfoundland and Labrador. Habitat Highlights. Available online: https://www.dfo-mpo.gc.ca/pnw-ppe/ffhpp-ppph/publications/highlights-faitssaillants/nfl-tnl/overview-apercu-eng.html
| 27- |
|
| New Found Gold Corp. | Queensway Gold Project NI 43-101 Technical Report |
April 15, 2025 SLR Project No.: 233.065300.00001 |
ECCC (Environment and Climate Change Canada). 2013. Guidelines for mine waste disposal alternatives. Available online: https://www.canada.ca/en/environment-climate-change/services/managing-pollution/sources-industry/mining/guidelines-mine-waste-disposal-alternatives.html
ECCC. 2021. Canadian Climate Normals at Gander, 1981 to 2010. Available online: https://climate.weather.gc.ca/climate_normals/
EDM (Environmental Design and Management Ltd.). 1996. Watershed Management Plan for Gander Lake and its Catchment. Prepared by Environmental Design and Management Ltd. In association with R.H. Louks Oceanology Limited and Jaques Whitford Environmental Limited for the Government of Newfoundland and Labrador and Environment Canada.
Exploits Discovery Corp. 2025. Mineralization at Bullseye "West" and Extends High-Grade Zone at Depth at Horseshoe. News Release dated February 4, 2025. https://exploits-discovery-corp.webflow.io/news
Fathom Geophysics. 2023. Data Interpretation and Targeting at the Queensway, Newfoundland Project for New Found Gold Corp. Prepared for New Found Gold Corp.
Fingas, J. 2024. Notes from the Keats Main Trench, Internal Report: New Found Gold Corporation.
Froitzheim, N. 1992. Formation of recumbent folds during synorogenic crustal extension (Austroalpine nappes, Switzerland), Geology, 20, 923-926, 1992.
Fyfe, W.S. and Henley, R.W. 1973. Some thoughts on chemical transport processes with particular reference to gold; Mineral Science Engineering, v.5, p. 295-303.
Gardner, M. 2021. Geology Corner: The nuts and bolts of feasibility studies on gold; Canadian Mining Journal, January 14, 2021.
GEMTEC (GEMTEC Consulting Engineers and Scientists Limited). 2022. Species at Risk Habitat. Queensway North Gold Project Environmental Assessment Registration.
GEMTEC. 2023a. Terrestrial Ecology Baseline Report New Found Gold Corporation Queensway North Gold Project. Prepared for New Found Gold Corp.
GEMTEC. 2023b. Aquatic Summary Report New Found Gold Corporation Queensway North Gold Project. Prepared for New Found Gold Corp.
GEMTEC. 2023c. Preliminary Baseline Hydrogeology Study New Found Gold Corp. Queensway North Project. Prepared for New Found Gold Corp. July 19, 2023. Project number: 100424.001
GEMTEC 2023d. Hydrology Baseline Report New Found Gold Corporation Queensway North Gold Project. Prepared for New Found Gold Corp.
GEMTEC. 2024a. 2023 Baseline Geotechnical and Hydrogeological Studies, Queensway North Project. Prepared for New Found Gold Corp. April 10, 2024. Project number: 100424.004.
GEMTEC. 2024b. 2023 Hydrology Baseline Report New Found Gold Corp. Queensway North Gold Project. Prepared for New Found Gold Corp.
| 27- |
|
| New Found Gold Corp. | Queensway Gold Project NI 43-101 Technical Report |
April 15, 2025 SLR Project No.: 233.065300.00001 |
GEMTEC. 2024c. Terrestrial Ecology Baseline Report New Found Gold Corporation Queensway North Gold Project. Prepared for New Found Gold Corp.
Goldfarb, R., Snee, L. and Miller, L. 1991. Rapid dewatering of the crust deduced from ages of mesothermal gold deposits; Nature, v.354, p.296-298. (https://doi.org/10.1038/354296a0)
Goldfarb, R.J., Richard, J. and Groves, D.I. 2015. Orogenic gold: Common or evolving fluid and metal sources through time; Lithos, v.233, p.2-26. (https://doi.org/10.1016/j.lithos.2015.07.011)
Government of Canada. 2022a. Canadian Net-Zero Emissions Accountability Act. Available online: https://www.canada.ca/en/services/environment/weather/climatechange/climate-plan/net-zero-emissions-2050/canadian-net-zero-emissions-accountability-act.html. Accessed March 13, 2025.
Government of Canada. 2022b. What are the Clean Fuel Regulations? Available online: https://www.canada.ca/en/environment-climate-change/services/managing-pollution/energy-production/fuel-regulations/clean-fuel-regulations/about.html
Government of Canada. 2023. Facility Greenhouse Gas Reporting: Technical Guidance on Reporting Greenhouse Gas Emissions. January 2023. Available online: https://publications.gc.ca/collections/collection_2023/eccc/En81-29-2023-eng.pdf.
Government of Canada. 2024. Powering Canada’s Future - Canada’s Final Clean Electricity Regulations. Available online: https://www.canada.ca/en/environment-climate-change/news/2024/12/powering-canadas-futurecanadas-final-clean-electricity-regulations.html. Accessed March 13, 2025.
Government of Canada. 2025. Critical Habitat for Species at Risk National Dataset - Canada. Available online: https://open.canada.ca/data/en/dataset/47caa405-be2b-4e9e-8f53-c478ade2ca74
Government of Newfoundland. 2019. The Way Forward: On Climate Change in Newfoundland and Labrador. Available online: https://www.gov.nl.ca/ecc/files/publications-the-way-forward-climate-change.pdf
Government of Newfoundland and Labrador, 2024. Acquiring and Managing Your Mineral Exploration Licences. Mineral Rights Section, Department of Industry, Energy and Technology, St. John’s, NL, 20 p.
Honsberger, I.W., Bleeker, W., Kamo, S.L., and Sandeman, H.A.I. 2022. Latest Silurian syntectonic sedimentation and magmatism and Early Devonian orogenic gold mineralization, central Newfoundland Appalachians, Canada: Setting, structure, lithogeochemistry, and high-precision U-Pb geochronology; GSA Bulletin, v. 134, p. 2933-2957.
Kontak, D.J., O’Reilly, G.A. and Chatterjee, A.K. 1990. The southwest Nova Scotia tin domain, Yarmouth County, Nova Scotia: implications for tin metallogeny in the Meguma Terrane, Nova Scotia; Mines and Minerals Branch Report of Activities, Part B. Edited by D.R. MacDonald. Nova Scotia Department of Mines and Energy, Report 90-1, pp. 13-32.
Liverman, D. and Taylor, D. 1990. Surficial Geology of Insular Newfoundland. Geological Survey Branch, Department of Mines and Energy, Government of Newfoundland and Labrador, Map 90-08, scale 1:500,000.
| 27- |
|
| New Found Gold Corp. | Queensway Gold Project NI 43-101 Technical Report |
April 15, 2025 SLR Project No.: 233.065300.00001 |
McCuaig, S.J. 2006. Glacial spillway deposits in the Gander Lake-Gambo area. Current Research (2006), Newfoundland and Labrador Department of Natural Resources, Geological Survey, Report 06 1,209-219.
Meades, S.J. 1990. Natural Regions Study of Newfoundland and Labrador. Protected Areas Association. St. John’s, NL. 379 pp.
Nassif, M., Evans, L., Regular, M., Dimmell, P. 2023. Report on 2022 Exploration (Multibeam Bathymetric Survey & Geological Mapping) on the Queensway Gold Properties, Gander Lake.
New Found Gold Corp. 2023. Exploration Activities, Queensway Gold Project - Queensway North Environmental Assessment Registration. Available online: https://www.gov.nl.ca/ecc/projects/project-2214/
Newfoundland and Labrador Department of Industry, Energy, and Technology (NL IET), 2024. Geoscience Atlas, Government of Newfoundland and Labrador. Available online: https://dnrmaps.gov.nl.ca/arcgis/rest/services/GeoAtlas. Accessed [March 13, 2025].
NLDIET (Newfoundland and Labrador Department of Industry, Energy and Technology). No date. Guidelines to the Mining Act. Available online: https://www.gov.nl.ca/iet/files/department-guidelines.pdf
NLDECC (Newfoundland and Labrador Department of Environment, Climate Change and Municipalities). 2001. Policy for Development in Wetlands. Issued June 2, 1997, re-issued January 17, 2001.
O’Neill, P. P. 1990. Geology of the Northeast Gander Lake Map Area (NTS 2D/15) and the Northwest Gambo Map Area (NTS 2D/16); Current Research (1990) Newfoundland Dept. of Mines and Energy, Geological Survey Branch, Report 90-1, pp. 317-326.
Organ, J.S. 2022. Northwest Gander surficial mapping project: Preliminary investigations. In Current Research. Newfoundland and Labrador, Department of Industry, Energy and Technology, Geological Survey, Report 22-¬1, pages 211-235.
PAANL (Protected Areas Association of Newfoundland and Labrador). 2008. Central Newfoundland Forest: 2a North-central subregion Available online: https://www.gov.nl.ca/ecc/files/natural-areas-pdf-island-2a-north-central.pdf
Palmer. 2023. Surficial Geology Mapping and Exploration Support for the Queensway North Property, Newfoundland. Prepared for New Found Gold Corp.
Phillips, R. 1972. Hydraulic fracturing and mineralization. Geol. Soc. London 128, 337-359.
Pioneer Exploration consultants Limited. 2023. UAV Aeromagnetic Survey Logistics Report. Prepared For New Found Gold Corp.
Pollock, J.C., Wilton, D.H.C., van Staal, C.R. and Morrissey, K.D. 2007. U-Pb detrital zircon geochronological constraints on the Early Silurian collision of Ganderia and Laurentia along the Dog Bay Line: The terminal Iapetan suture in the Newfoundland Appalachians; American Journal of Science, v.307, n.2, pp.399-433.
Ramsar Convention Secretariat. 2013. The Ramsar Convention Manual: a guide to the Convention on Wetlands (Ramsar, Iran, 1971), 6th ed. Ramsar Convention Secretariat, Gland, Switzerland. Available online: https://www.ramsar.org/sites/default/files/documents/library/manual6-2013-e.pdf
| 27- |
|
| New Found Gold Corp. | Queensway Gold Project NI 43-101 Technical Report |
April 15, 2025 SLR Project No.: 233.065300.00001 |
RPC. 2023. Static Testing of New Found Gold Waste Rock Samples; New Found Gold Corp Final Report. Reference No.: MIS-J10151 & MIS-J10161. Prepared for New Found Gold Corp.
Ryan, R.J. and Smith, P.K. 1998. A review of mesothermal gold deposits of the Meguma Group, Nova Scotia, Canada; Ore Geology Reviews, v.13, pp.153-184.
Sandeman, H.A.I., Peddle, C. and Newman, R. 2018. Beaver Brook Antimony Mine Revisited: An Update on Operations and New Structural and Geological Observations; Newfoundland and Labrador Department of Natural Resources Geological Survey Report 18-1, pp.123-152.
Sandeman, H.A.I. and Honsberger, I. (2023): Gold Mineralization at the Valentine Lake, Moosehead, Queensway and Kingsway Projects; Geological Association of Canada Newfoundland and Labrador Section, 2023 fall field trip, September 29 - October 1, 2023, 63 p, < Accessed on May 1, 2024, at: https://static1.squarespace.com/static/645104ce7aa94f71ba09a1d6/t/6514334e180c8d3bd100f10f/1695822689120/Field+Guide+2023.pdf
Sibson, R. H., Robert, F., and Poulsen, K. H. 1988. High-angle reverse faults, fluid-pressure cycling, and mesothermal gold-quartz deposits. Geology, 16(6), 551-555.
Simcoe Geoscience. 2023. Ground Magnetics and VLF-EM Surveys. Prepared for New Found Gold Corp.
Srivastava, M. R. 2022. Exploration Update Of The Queensway Project Newfoundland And Labrador, Canada (May 31, 2022). Amended and Restated National Instrument 43-101 Technical Report Prepared by RedDot3D Inc. on behalf of New Found Gold Corp. (https://newfoundgold.ca/wp-content/uploads/2022/06/2022-Queensway-43-101-Technical-Report-amended-final.pdf)
SRK Consulting (UK) Limited. 2023a. Preliminary Geochemical Characterisation - Queensway (BSIL and GBL lithologies). Prepared for New Found Gold Corp.
SRK Consulting (UK) Limited. 2023b. Preliminary Geochemical Characterisation - Queensway (Keats Prospect). Prepared for New Found Gold Corp.
SRK Consulting (UK) Limited. 2025. External Memorandum: Geochemical Characterization Summary in Support of the NI 43-101 for the Queensway Project. Prepared for New Found Gold Corp. February 2025. Project # UK31819.
Technoimaging LCC. 2021. AEM, TMI, and AGG Data Inversion in the Queensway Priority Area, Gander, Newfoundland and Labrador, Canada. Prepared for New Found Gold Corp.
Vanderveer, D.G. and Taylor, D.M. 1987. mapping in the Gander River area, Newfoundland. Current Research (1987), Newfoundland Department of Mines and Energy, Mineral Development Division, Report 87-1, 39-43.
van Staal, C.R., Dewey, J.F., Niocaill, C.M., McKerrow, W.S. 1998. The Cambrian-Silurian tectonic evolution of the northern Appalachians and British Caledonides: history of a complex, west and southwest Pacific-type segment of Iapetus; in Blundell, D.J., and Scott, A.C. (eds) Lyell: the Past is the Key to the Present. Geological Society, London, Special Publications, 143, pp. 197-242.
van Staal, C.R., Barr, S.M. 2012. Lithospheric architecture and tectonic evolution of the Canadian Appalachians and associated Atlantic margin; in Tectonic Styles in Canada: The LITHOPROBE Perspective. Geological Association of Canada, Special Paper 49. pp. 41-95.
| 27- |
|
| New Found Gold Corp. | Queensway Gold Project NI 43-101 Technical Report |
April 15, 2025 SLR Project No.: 233.065300.00001 |
Stantec (Stantec Consulting Ltd.). 2023. NFGC Queensway North Project: Historic Resources Overview Assessment. Report on file at the Provincial Archaeology Office, Newfoundland and Labrador’s Tourism, Culture, Arts, and Recreation, St. John’s, NL.
Stantec. 2024a. New Found Gold Ecological Land Classification Technical Data Report. Prepared for New Found Gold Corp.
Stantec. 2024b. New Found Gold - Environmental Technical Data Report - 2023 Aquatic Baseline Study. Draft Report. Prepared for New Found Gold Corp.
Stantec. 2024c. New Found Gold Baseline Ambient Air Quality Monitoring Technical Data Report. Summary of Ambient Air Quality Monitoring Results. Prepared for New Found Gold Corp.
Stantec. 2024d. New Found Gold - Technical Data Report - Baseline Sound Pressure Level Survey. Prepared for New Found Gold Corp.
Stantec 2024e. New Found Gold - Environmental Technical Data Report - Baseline Light Monitoring Survey. Prepared for New Found Gold Corp.
Stantec 2024f. New Found Gold: 2021-2023 Aquatic Baseline Study for the Keats Zone. Prepared for New Found Gold Corp.
Stantec. 2024g. NFGC Queensway North Gold Project: Historic Resources Impact Assessment (2023). Prepared for New Found Gold Corp.
Town of Appleton. 2020. Town of Appleton Municipal Plan (2017-2027). Available online: https://www.gov.nl.ca/mpa/files/LGLUP-Appleton_MP.pdf
Wildlife Division. 2010. Management Plan for the American Eel (Anguilla rostrata) in Newfoundland and Labrador. Department of Environment and Conservation, Government of Newfoundland and Labrador, Corner Brook. Canada. v + 29 pp. Available online: https://www.gov.nl.ca/ffa/files/wildlife-endangeredspecies-american-eel-management-plan.pdf
Williams, H. 1979. Appalachian Orogen in Canada. Canadian Journal of Earth Science, 16, pp. 792-807.
Williams, H., Currie, K. L., & Piasecki, M. A. J. 1993. The Dog Bay Line: a major Silurian tectonic boundary in northeast Newfoundland. Canadian Journal of Earth Sciences, 30(12), 2481-2494.
Williams, H. 2004. Generalized Interpretive Map - Newfoundland Appalachians, Department of Natural Resources, Geological Survey of Newfoundland and Labrador. Modified from J. P. Hayes (1987): https://www.gov.nl.ca/iet/files/mines-maps-nf.pdf
Wood Environment & Infrastructure Solutions (2018): Town of Gander Municipal Plan 2018-2028, Background Report; prepared for the Town of Gander, 62 p.
| 27- |
|
| New Found Gold Corp. | Queensway Gold Project NI 43-101 Technical Report |
April 15, 2025 SLR Project No.: 233.065300.00001 |
| 28.0 | Date and Signature Page |
This report titled “NI 43-101 Technical Report for the Queensway Gold Project, Newfoundland and Labrador, Canada” with an effective date of March 18, 2025 was prepared and signed by the following authors:
| (SIGNED AND SEALED) PIERRE LANDRY | |
| Dated at Victoria, BC | Pierre Landry, P.Geo. |
| April 15, 2025 | |
| (Signed and Sealed) David M. Robson | |
| Dated at Toronto, ON | David M. Robson, MBA, P.Eng. |
| April 15, 2025 | |
| (Signed and Sealed) Lance Engelbrecht | |
| Dated at Toronto, ON | Lance Engelbrecht, P.Eng. |
| April 15, 2025 | |
| (Signed and Sealed) Sheldon H. Smith | |
| Dated at Toronto, ON | Sheldon H. Smith, P.Geo. |
| April 15, 2025 | Stantec |
| 28- |
|
| New Found Gold Corp. | Queensway Gold Project NI 43-101 Technical Report |
April 15, 2025 SLR Project No.: 233.065300.00001 |
| 29.0 | Certificate of Qualified Person |
| 29.1 | Pierre Landry |
I, Pierre Landry, P.Geo., as an author of this report entitled “NI 43-101 Technical Report for the Queensway Gold Project, Newfoundland and Labrador, Canada” with an effective date of March 18, 2025 prepared for New Found Gold Corp., do hereby certify that:
| 1. | I am Principal Geologist and Valuations Lead of SLR Consulting (Canada) Ltd, of 3960 Quadra Street, Unit 303, Victoria, BC V8X 4A3. |
| 2. | I am a graduate of Queen’s University, Kingston, Ontario, in 2006 with a Bachelor of Science (Honours) degree in Geological Science (Major) and Economics (Minor). |
| 3. | I am registered as a Professional Geologist in the Province of British Columbia (Reg.# 47339), and in the Province of Newfoundland and Labrador (Reg. # 10431). I have been working as a professional geologist for a total of 11 years. My relevant experience for the purpose of the Technical Report is: |
| • | Mineral resource estimation, and NI 43-101-compliant technical reporting, including audits and due diligence reviews, for orogenic gold deposits, such as: |
| o | Kumtor Mine (Kyrgyz Republic) - Orogenic gold deposit in the Tien Shan gold belt. |
| o | Hammerdown Gold Project (Newfoundland, Canada) - Mesothermal/orogenic gold deposit. |
| o | Turmalina Mining Complex (Brazil) - Orogenic gold deposit, structurally controlled within the Iron Quadrangle greenstone belt. |
| • | Mine Exploration Geologist and Grade Control Geologist at operations and mine development projects in Canada, Africa, and South America. |
| 4. | I have read the definition of "qualified person" set out in National Instrument 43-101 (NI 43-101) and certify that by reason of my education, affiliation with a professional association (as defined in NI 43-101) and past relevant work experience, I fulfill the requirements to be a "qualified person" for the purposes of NI 43-101. |
| 5. | I visited the Queensway Gold Project on October 24 and 25, 2024. |
| 6. | I am responsible for the overall preparation of the Technical Report, and all sections exclusive of 13, 14.13, 24, and related disclosure in Sections 1, 25, 26, and 27. |
| 7. | I am independent of the Issuer applying the test set out in Section 1.5 of NI 43-101. |
| 8. | I have had no prior involvement with the property that is the subject of the Technical Report. |
| 9. | I have read NI 43-101, and the Technical Report has been prepared in compliance with NI 43-101 and Form 43-101F1. |
| 10. | At the effective date of the Technical Report, to the best of my knowledge, information, and belief, the Technical Report contains all scientific and technical information that is required to be disclosed to make the Technical Report not misleading. |
Dated this 15th day of April, 2025
(Signed and Sealed) Pierre Landry
Pierre Landry, P.Geo
| 29- |
|
| New Found Gold Corp. | Queensway Gold Project NI 43-101 Technical Report |
April 15, 2025 SLR Project No.: 233.065300.00001 |
| 29.2 | David M. Robson |
I, David M. Robson, P.Eng., MBA, as an author of this report entitled “NI 43-101 Technical Report for the Queensway Gold Project, Newfoundland and Labrador, Canada” with an effective date of March 18, 2025 prepared for New Found Gold Corp., do hereby certify that:
| 1. | I am Principal Mining Engineer with SLR Consulting (Canada) Ltd, of Suite 501, 55 University Ave., Toronto, ON M5J 2H7. |
| 2. | I am a graduate of Queen’s University in 2005 with a Bachelor of Science (Honours) degree in Mining Engineering and Schulich School of Business, York University, in 2014 with an MBA degree. |
| 3. | I am registered as a Professional Engineer in the Province of Saskatchewan (Reg. #13601) and Province of Newfoundland & Labrador (Reg. #11085). I have worked as a mining engineer for 20 years since my graduation. My relevant experience for the purpose of the Technical Report is: |
| • | Review and report as a consultant on mining operations and projects around the world for due diligence and regulatory requirements. |
| • | Independent engineer of an open pit gold mine under construction located in the province of Newfoundland and Labrador |
| • | Design, planning, and scheduling of mines located globally, both in a consulting capacity and working at site operations, in a number of commodities, including gold. |
| • | Financial analysis, capital cost estimation, operating cost estimation of mining projects located around the world in a variety of commodities, including gold. |
| 4. | I have read the definition of "qualified person" set out in National Instrument 43-101 (NI 43-101) and certify that by reason of my education, affiliation with a professional association (as defined in NI 43-101) and past relevant work experience, I fulfill the requirements to be a "qualified person" for the purposes of NI 43-101. |
| 5. | I visited Queensway Gold Project on October 24 and 25, 2024. |
| 6. | I am responsible for preparation of Section 14.13 and related disclosure in Sections 1, 25, and 26 of the Technical Report. |
| 7. | I am independent of the Issuer applying the test set out in Section 1.5 of NI 43-101. |
| 8. | I have had no prior involvement with the property that is the subject of the Technical Report. |
| 9. | I have read NI 43-101, and the Technical Report has been prepared in compliance with NI 43-101 and Form 43-101F1. |
| 10. | At the effective date of the Technical Report, to the best of my knowledge, information, and belief, the sections of the Technical Report for which I am responsible contain all scientific and technical information that is required to be disclosed to make the Technical Report not misleading. |
Dated this 15th day of April, 2025
(Signed and Sealed) David M. Robson
David M. Robson, MBA, P.Eng.
| 29- |
|
| New Found Gold Corp. | Queensway Gold Project NI 43-101 Technical Report |
April 15, 2025 SLR Project No.: 233.065300.00001 |
| 29.3 | Lance Engelbrecht |
I, Lance Engelbrecht, P.Eng., as an author of this report entitled “NI 43-101 Technical Report for the Queensway Gold Project, Newfoundland and Labrador, Canada” with an effective date of March 18, 2025 prepared for New Found Gold Corp., do hereby certify that:
| 1. | I am Technical Manager - Metallurgy and Principal Metallurgist with SLR Consulting (Canada) Ltd, of Suite 501, 55 University Ave., Toronto, ON M5J 2H7. |
| 2. | I am a graduate of the University of the Witwatersrand, Johannesburg, South Africa in 1992 with a Bachelor of Science degree in Engineering, Metallurgy and Materials (Mineral Processing Option). |
| 3. | I am registered as a Professional Engineer in the Provinces of Ontario (Reg.# 100540095) and Newfoundland and Labrador (Reg.# 10730). I have worked as a metallurgist for a total of 30 years since my graduation. My relevant experience for the purpose of the Technical Report is: |
| • | Review and report as a metallurgical consultant on numerous mining operations and projects for due diligence and regulatory requirements. |
| • | Preparation of conceptual, prefeasibility, and feasibility studies for projects around the world including for precious metals, base metals, and rare earths, as well as test work interpretation, recommendations, and supervision. |
| • | Management and operational experience at Canadian and international milling, smelting, and refining operations. |
| 4. | I have read the definition of "qualified person" set out in National Instrument 43-101 (NI 43-101) and certify that by reason of my education, affiliation with a professional association (as defined in NI 43-101) and past relevant work experience, I fulfill the requirements to be a "qualified person" for the purposes of NI 43-101. |
| 5. | I did not visit the Queensway Gold Project. |
| 6. | I am responsible for preparation of Section 13 and related disclosure in Sections 1, 25, 26, and 27 of the Technical Report. |
| 7. | I am independent of the Issuer applying the test set out in Section 1.5 of NI 43-101. |
| 8. | I have had no prior involvement with the property that is the subject of the Technical Report. |
| 9. | I have read NI 43-101, and the Technical Report has been prepared in compliance with NI 43-101 and Form 43-101F1. |
| 10. | At the effective date of the Technical Report, to the best of my knowledge, information, and belief, the sections in the Technical Report for which I am responsible contain all scientific and technical information that is required to be disclosed to make the Technical Report not misleading. |
Dated this 15th day of April, 2025
(Signed and Sealed) Lance Engelbrecht
Lance Engelbrecht, P.Eng.
| 29- |
|
| New Found Gold Corp. | Queensway Gold Project NI 43-101 Technical Report |
April 15, 2025 SLR Project No.: 233.065300.00001 |
| 29.4 | Sheldon H. Smith |
I, Sheldon H. Smith P.Geo., as an author of this report entitled “NI 43-101 Technical Report for the Queensway Gold Project, Newfoundland and Labrador, Canada” with an effective date of March 18, 2025 prepared for New Found Gold Corp., do hereby certify that:
| 1. | I am Senior Hydrologist and Senior Principal with Stantec Consulting Limited, of 300-125 Commerce Valley Drive West, Markham ON L3T 7W4 |
| 2. | I am a graduate of Memorial University of Newfoundland in St. John’s, NL in 1994 with a B.Sc.(H) in Physical Geography and the University of Waterloo, Waterloo, ON in 1998 with a Master of Environmental Studies. |
| 3. | I am registered as a Professional Geoscientist in the Province of Newfoundland and Labrador (PEGNL Reg.#07606). I have worked as a mining geoscientist for a total of 30 years since my graduation. My relevant experience for the purpose of the Technical Report is mine environmental and water management from over 30 similar studies or projects including Vale at more than 25 locations in Canada and South America, Glencore, Newmont, Barrick, Newfound Gold, Firefly Metals, Alderon Iron Ore, Century Iron Mines, Altius Resources, Palladin/Aurora Energy, Atlantic Gold, Trevali, Thomas Resources, Marathon Gold (Calibre), Canada Nickel, Premier Gold, Greenstone Gold (Equinox), Alamos, Wesdome, Norcliff Resources, DeBeers, Richmont, Ontario Graphite, Northern Graphite, Ferromin Inc., KGHM, Pan American Silver, Signal Gold, Generation PGM, Treasury Metals, Clean Air Metals, Matador Mining, Wallbridge, NorthX, Magna Mining and others. |
| 4. | I have read the definition of "qualified person" set out in National Instrument 43-101 (NI 43-101) and certify that by reason of my education, affiliation with a professional association (as defined in NI 43-101) and past relevant work experience, I fulfill the requirements to be a "qualified person" for the purposes of NI 43-101. |
| 5. | I visited the Queensway Gold Project on March 18, 2025. |
| 6. | I am responsible for preparation of Section 24 and related disclosure in Sections 1, 25, 26, and 27 of the Technical Report. |
| 7. | I am independent of the Issuer applying the test set out in Section 1.5 of NI 43-101. |
| 8. | I have had no prior involvement with the property that is the subject of the Technical Report. |
| 9. | I have read NI 43-101, and the Technical Report has been prepared in compliance with NI 43-101 and Form 43-101F1. |
| 10. | At the effective date of the Technical Report, to the best of my knowledge, information, and belief, the sections of the Technical Report for which I am responsible contain all scientific and technical information that is required to be disclosed to make the Technical Report not misleading. |
Dated this 15th day of April, 2025
(Signed and Sealed) Sheldon H. Smith
Sheldon H. Smith, P.Geo.
| 29- |
|
| New Found Gold Corp. | Queensway Gold Project NI 43-101 Technical Report |
April 15, 2025 SLR Project No.: 233.065300.00001 |
| 30.0 | Appendix 1 |
| 30.1 | Modelled Mineralization Domain Block Model Code |
| 30- |
|
| New Found Gold Corp. | Queensway Gold Project NI 43-101 Technical Report |
April 15, 2025 SLR Project No.: 233.065300.00001 |
Table 30-1: Modelled Mineralization Domain Block Model Code
| “mindom” | “mincode” | “mindom” | “mincode” | “mindom” | “mincode” |
| AIR | 1 | Keats_KCVN-Splay | 109 | MM_Vegas | 217 |
| Buffer_Halo | 2 | Keats_Main | 110 | MM_Vegas2 | 218 |
| Bullet1 | 3 | Keats_Main_Deep | 111 | OVB | 219 |
| Bullet2 | 4 | Keats_NorthSplay | 112 | Quarry | 220 |
| TCW | 5 | Keats_Penumbra2 | 113 | Quarry2 | 221 |
| Cokes_EastShear | 6 | Keats_RAMP_HW | 114 | REG_Atlantic | 222 |
| Cokes_Halo | 7 | KN3_Apogee | 115 | REG_Atlantic2 | 223 |
| Cokes_MainShear | 8 | KN3_Apogee3 | 116 | REG_GoldenNugget | 224 |
| Cokes_PepsiVein | 9 | KN3_Fissure | 117 | REG_Regular | 225 |
| Honeypot | 10 | KN3_Gnostic | 118 | REG_Regular2 | 226 |
| Honeypot2 | 11 | KN3_Perigee | 119 | Road_Road1 | 227 |
| EV_Everest | 12 | KN3_PerigeeNorth | 120 | Road_Road2 | 228 |
| EV_Everest2 | 13 | KN3_PerigeeS | 121 | Road_Road3 | 229 |
| EV_Fen | 14 | KN3_UmbraMid | 122 | Road_ShiningPath | 230 |
| EV_Jackpot | 15 | KN3_UmbraNorth | 123 | Rocket3 | 231 |
| EV_LeFay | 16 | Knob2 | 124 | Rocket_V2 | 232 |
| EV_Molehill | 17 | Knob_LP | 125 | Senior-MuddyWaters_Halo | 233 |
| EV_Myr | 18 | Knob_LP2 | 126 | TC2 | 234 |
| EV_Nilgiri2 | 19 | Knob_LP3 | 127 | TCC | 235 |
| Jackpot | 20 | Knob_LP3_2 | 128 | TCC_Halo | 236 |
| Jackpot2 | 21 | Knob_Main | 129 | TCH_Triangulum | 237 |
| EV_Willothewisp | 22 | Knob_Rocket | 130 | TCW | 238 |
| EV_Willothewisp2 | 23 | Knob_Rocket2 | 131 | TCW3 | 239 |
| GJ_AFW | 24 | KN_APHW | 132 | Iceberg Occult_Halo | 240 |
| GJ_AsVein | 25 | KN_ApogeeS | 133 | ICE_GoldenRoad | 241 |
| GJ_Bud | 26 | KN_ApogeeSS | 134 | ICE_KLX | 242 |
| GJ_Dome-p2 | 27 | KN_APSplay | 135 | ICE_KLX2 | 243 |
| GJ_Dome-Splay | 28 | KN_APSplay2 | 136 | ICE_KLX3 | 244 |
| GJ_Dome | 29 | KN_Cypher | 137 | ICE_LittleCyborg | 245 |
| GJ_Dome2 | 30 | KN_Cypher2 | 138 | ICE_Occult3 | 246 |
| GJ_DX | 31 | KN_Cypher3 | 139 | ICE_Occult4 | 247 |
| GJ_FataMorgana | 32 | KN_EnFlat | 140 | ICE_Occult5 | 248 |
| 30- |
|
| New Found Gold Corp. | Queensway Gold Project NI 43-101 Technical Report |
April 15, 2025 SLR Project No.: 233.065300.00001 |
| “mindom” | “mincode” | “mindom” | “mincode” | “mindom” | “mincode” |
| GJ_Main-S | 33 | KN_Enigma | 141 | ICE_Oz | 249 |
| GJ_Main-SFW | 34 | KN_Enigma2 | 142 | ICE_Reese | 250 |
| GJ_Main | 35 | KN_Enigma_Extend | 143 | ICE_Reese2 | 251 |
| GJ_Main_Splay | 36 | KN_KNA | 144 | ICE_Reese3 | 252 |
| GJ_Odd | 37 | KN_Magog | 145 | ICE_Rising | 253 |
| GJ_Reef | 38 | KN_Occult | 146 | ICE_Silberman | 254 |
| GJ_Rift1 | 39 | KN_Perigee3 | 147 | ICE_Skynet | 255 |
| GJ_Rift2 | 40 | KN_Sphinx | 148 | ICE_T1000 | 256 |
| GJ_Rift4 | 41 | KN_SphinxNorth | 149 | ICE_T2 | 257 |
| GJ_Rift5 | 42 | KP_Raven | 150 | ICE_T3 | 258 |
| GJ_ShearNorth | 43 | KW_Babel | 151 | ICE_T4 | 259 |
| GJ_SouthSplay | 44 | KW_CokesNorth | 152 | ICE_T800 | 260 |
| GJ_SouthSplay2 | 45 | KW_CokesNorth2 | 153 | ICE_T801 | 261 |
| GJ_Step | 46 | KW_GOG2X | 154 | Iceberg | 262 |
| GJ_Upper-N | 47 | KW_GOG3X | 155 | ICE_Toto2X | 263 |
| Grouse | 48 | KW_GOGWest | 156 | ICE_Vuko2 | 264 |
| Grouse3 | 49 | KW_GOGX | 157 | ICE_Vuko3 | 265 |
| Grouse4 | 50 | KW_GOGX2 | 158 | ICE_Vuko4 | 266 |
| Grouse_LP | 51 | KW_Harbinger1X | 159 | ICE_Vukovich | 267 |
| Grouse_Ptarmigan | 52 | KW_Harbinger1X2 | 160 | ICE_Vukovovic | 268 |
| KW_Harbinger_North_Halo | 53 | KW_Harbinger2_X2 | 161 | Unknown | 269 |
| KW_Harbinger_South_Halo | 54 | KW_HarbingerWest | 162 | V2Keats_421 | 270 |
| HorizonDeeps | 55 | KW_OG2 | 163 | V2Keats_422 | 271 |
| K2_Annapurna | 56 | KW_Powerline | 164 | V2Keats_Antumbra | 272 |
| K2No3-S1 | 57 | KW_Powerline2 | 165 | V2Keats_Antumbra2 | 273 |
| K2No3 | 58 | KW_Seraphim | 166 | V2Keats_Byron | 274 |
| K2No4 | 59 | KW_AHW | 167 | V2Keats_Eclipse | 275 |
| K2_BadRudolf | 60 | KW_GOG | 168 | V2Keats_Eclipse2 | 276 |
| K2_Fuji | 61 | KW_GOG2 | 169 | Equinox | 277 |
| K2_Glenwood | 62 | KW_GOG3 | 170 | Equinox3 | 278 |
| K2_Glenwood2 | 63 | KW_Harbinger1 | 171 | Equinox4 | 279 |
| K2_K2 | 64 | KW_Harbinger2 | 172 | EquinoxDeep | 280 |
| K2_K2No2 | 65 | KW_Harbinger2X | 173 | EquinoxDeep2 | 281 |
| K2_K2S1 | 66 | KW_Harbinger3 | 174 | V2Keats_MainDeepHW | 282 |
| 30- |
|
| New Found Gold Corp. | Queensway Gold Project NI 43-101 Technical Report |
April 15, 2025 SLR Project No.: 233.065300.00001 |
| “mindom” | “mincode” | “mindom” | “mincode” | “mindom” | “mincode” |
| K2_K2S2 | 67 | KW_Main | 175 | V2Keats_MainNo2 | 283 |
| K2_K2X2 | 68 | KW_OG | 176 | V2Keats_Penumbra | 284 |
| K2_Kailash | 69 | KW_Splay | 177 | V2Keats_Solstice | 285 |
| K2_Kangchenjunga | 70 | LN_BG | 178 | V2Keats_Umbra | 286 |
| K2_Kashmir-Splay | 71 | LN_BS2 | 179 | V2Pen2 | 287 |
| K2_Kashmir | 72 | LN_ContactNorth_Vein | 180 | V2Pen3 | 288 |
| K2_Kashmir2 | 73 | LN_MilkNCookies | 181 | V2Pen4 | 289 |
| K2_Meru | 74 | LN_Appleton2 | 182 | V3Keats_Enigma | 290 |
| K2_Meru2 | 75 | LN_BadElf | 183 | V3Keats_EWFW-Splay | 291 |
| K2_NaughtyVixen | 76 | LN_BS | 184 | V3Keats_EWFW | 292 |
| K2_Stibnite2 | 77 | LN_BS3 | 185 | V3Keats_EWMID | 293 |
| K2_Stibnite3 | 78 | LN_Rocky | 186 | V3Keats_Footwall Shear | 294 |
| K2_Summit | 79 | LN_Vein | 187 | V3Keats_FW-MID | 295 |
| K2_TerribleDancer | 80 | Lotto_Sunday Vein | 188 | V3Keats_KCV3 | 296 |
| K2_Underhill | 81 | Lotto HW | 189 | V3Keats_Keatscon-HW | 297 |
| K2_Zone36 | 82 | Lotto Splay | 190 | V3Keats_Paradox | 298 |
| Keats387_Halo | 83 | Lotto-West | 191 | V3Keats_Paradox2 | 299 |
| KeatsLower_Halo | 84 | Lotto | 192 | V3Keats_Paradox3 | 300 |
| KeatsUpper_Halo | 85 | Lotto_Bridge | 193 | V3_AsVein | 301 |
| Keats_Appleton | 86 | Lotto_Bridge2 | 194 | V3_Keats_387 | 302 |
| Keats_BackVein2 | 87 | Lotto_Bridge3 | 195 | V4KeatsSouth2 | 303 |
| Keats_BackVein3 | 88 | Lotto_Contact Vein | 196 | Keats South | 304 |
| Keats_BackVein4 | 89 | Lotto_East | 197 | V4Keats_AFWS | 305 |
| Keats_CVP-S | 90 | Lotto_Friday | 198 | V4Keats_Apex | 306 |
| Keats_CVP | 91 | Lotto_GrannySmith | 199 | V4Keats_BackVein5 | 307 |
| Keats_CVP2 | 92 | Lotto_LAHW | 200 | V4Keats_Corona | 308 |
| Keats_EQU2 | 93 | Lotto_LottoWest2 | 201 | V4Keats_EE | 309 |
| Keats_Equinox-Upper | 94 | Lotto_TuesdayVein | 202 | V4Keats_KSCV | 310 |
| Keats_EW | 95 | Lotto_X2 | 203 | V4Keats_South10 | 311 |
| Keats_EW2 | 96 | Lotto_X3 | 204 | V4Keats_South3 | 312 |
| Keats_EW3 | 97 | Missile | 205 | V4Keats_MuddyWaters | 313 |
| Keats_EW3X | 98 | MM_Biloxi | 206 | V4Keats_Senior | 314 |
| Keats_EW4 | 99 | MM_Cassino | 207 | V4Keats_Starman | 315 |
| 30- |
|
| New Found Gold Corp. | Queensway Gold Project NI 43-101 Technical Report |
April 15, 2025 SLR Project No.: 233.065300.00001 |
| “mindom” | “mincode” | “mindom” | “mincode” | “mindom” | “mincode” |
| Keats_EW5 | 100 | MM_Dantes | 208 | V5Keats_Horizon2 | 316 |
| Keats_EWHW | 101 | MM_GoodBuddy | 209 | V5Keats_Horizon3 | 317 |
| Keats_FWP | 102 | MM_KenoHill | 210 | V6KNB | 318 |
| Keats_FWPS | 103 | MM_Macao | 211 | V6KNC | 319 |
| Keats_KCV-N | 104 | MM_MonteCarlo | 212 | V6_CVPSS | 320 |
| Keats_KCV | 105 | MM_MonteCarlo2 | 213 | V6_Mirage | 321 |
| Keats_KCV2-S | 106 | MM_MonteCarlo3 | 214 | outside | 999 |
| Keats_KCV2-Splay | 107 | MM_Nassau | 215 | ||
| Keats_KCV2 | 108 | MM_Tangiers | 216 |
Note: The wireframe names presented in this table include a combination of internal Leapfrog model vein names and modified names aligned with New Found Gold’s public-facing nomenclature. This naming convention has been applied to facilitate clarity and consistency with the Company’s external communications.
| 30- |
|
