000127344112/312025Q2falsehttp://grantierra.com/20250630#OilSalesMemberhttp://fasb.org/us-gaap/2025#LongTermDebthttp://fasb.org/us-gaap/2025#LongTermDebt33.3333.3333.33xbrli:sharesiso4217:USDiso4217:USDxbrli:sharesgte:segmentgte:leaseutr:Boexbrli:pureiso4217:CADutr:bbliso4217:USDutr:bbliso4217:CADgte:dollarsPerBarreliso4217:CADutr:GJiso4217:CADutr:MWhiso4217:COPiso4217:COPgte:collar00012734412025-01-012025-06-3000012734412025-07-2800012734412025-04-012025-06-3000012734412024-04-012024-06-3000012734412024-01-012024-06-3000012734412025-06-3000012734412024-12-310001273441us-gaap:CommonStockMember2024-12-3100012734412023-12-3100012734412024-06-300001273441us-gaap:CommonStockMember2025-03-310001273441us-gaap:CommonStockMember2024-03-310001273441us-gaap:CommonStockMember2023-12-310001273441us-gaap:CommonStockMember2025-04-012025-06-300001273441us-gaap:CommonStockMember2024-04-012024-06-300001273441us-gaap:CommonStockMember2025-01-012025-06-300001273441us-gaap:CommonStockMember2024-01-012024-06-300001273441us-gaap:CommonStockMember2025-06-300001273441us-gaap:CommonStockMember2024-06-300001273441us-gaap:AdditionalPaidInCapitalMember2025-03-310001273441us-gaap:AdditionalPaidInCapitalMember2024-03-310001273441us-gaap:AdditionalPaidInCapitalMember2024-12-310001273441us-gaap:AdditionalPaidInCapitalMember2023-12-310001273441us-gaap:AdditionalPaidInCapitalMember2025-04-012025-06-300001273441us-gaap:AdditionalPaidInCapitalMember2024-04-012024-06-300001273441us-gaap:AdditionalPaidInCapitalMember2025-01-012025-06-300001273441us-gaap:AdditionalPaidInCapitalMember2024-01-012024-06-300001273441us-gaap:AdditionalPaidInCapitalMember2025-06-300001273441us-gaap:AdditionalPaidInCapitalMember2024-06-300001273441us-gaap:TreasuryStockCommonMember2025-03-310001273441us-gaap:TreasuryStockCommonMember2024-03-310001273441us-gaap:TreasuryStockCommonMember2024-12-310001273441us-gaap:TreasuryStockCommonMember2023-12-310001273441us-gaap:TreasuryStockCommonMember2025-04-012025-06-300001273441us-gaap:TreasuryStockCommonMember2024-04-012024-06-300001273441us-gaap:TreasuryStockCommonMember2025-01-012025-06-300001273441us-gaap:TreasuryStockCommonMember2024-01-012024-06-300001273441us-gaap:TreasuryStockCommonMember2025-06-300001273441us-gaap:TreasuryStockCommonMember2024-06-300001273441us-gaap:AccumulatedOtherComprehensiveIncomeMember2025-03-310001273441us-gaap:AccumulatedOtherComprehensiveIncomeMember2024-03-310001273441us-gaap:AccumulatedOtherComprehensiveIncomeMember2024-12-310001273441us-gaap:AccumulatedOtherComprehensiveIncomeMember2023-12-310001273441us-gaap:AccumulatedOtherComprehensiveIncomeMember2025-04-012025-06-300001273441us-gaap:AccumulatedOtherComprehensiveIncomeMember2024-04-012024-06-300001273441us-gaap:AccumulatedOtherComprehensiveIncomeMember2025-01-012025-06-300001273441us-gaap:AccumulatedOtherComprehensiveIncomeMember2024-01-012024-06-300001273441us-gaap:AccumulatedOtherComprehensiveIncomeMember2025-06-300001273441us-gaap:AccumulatedOtherComprehensiveIncomeMember2024-06-300001273441us-gaap:RetainedEarningsMember2025-03-310001273441us-gaap:RetainedEarningsMember2024-03-310001273441us-gaap:RetainedEarningsMember2024-12-310001273441us-gaap:RetainedEarningsMember2023-12-310001273441us-gaap:RetainedEarningsMember2025-04-012025-06-300001273441us-gaap:RetainedEarningsMember2024-04-012024-06-300001273441us-gaap:RetainedEarningsMember2025-01-012025-06-300001273441us-gaap:RetainedEarningsMember2024-01-012024-06-300001273441us-gaap:RetainedEarningsMember2025-06-300001273441us-gaap:RetainedEarningsMember2024-06-300001273441gte:I3EnergyMember2024-10-312024-10-310001273441gte:I3EnergyMember2024-10-310001273441gte:I3EnergyMember2024-04-012024-06-300001273441gte:I3EnergyMember2024-01-012024-06-300001273441us-gaap:OperatingSegmentsMembergte:ColombiaSegmentMember2025-04-012025-06-300001273441us-gaap:OperatingSegmentsMembergte:EcuadorSegmentMember2025-04-012025-06-300001273441us-gaap:OperatingSegmentsMembergte:CanadaSegmentMember2025-04-012025-06-300001273441us-gaap:CorporateNonSegmentMember2025-04-012025-06-300001273441gte:OperatingSegmentsAndCorporateNonSegmentMember2025-04-012025-06-300001273441us-gaap:MaterialReconcilingItemsMember2025-04-012025-06-300001273441us-gaap:OperatingSegmentsMembergte:ColombiaSegmentMember2025-01-012025-06-300001273441us-gaap:OperatingSegmentsMembergte:EcuadorSegmentMember2025-01-012025-06-300001273441us-gaap:OperatingSegmentsMembergte:CanadaSegmentMember2025-01-012025-06-300001273441us-gaap:CorporateNonSegmentMember2025-01-012025-06-300001273441gte:OperatingSegmentsAndCorporateNonSegmentMember2025-01-012025-06-300001273441us-gaap:MaterialReconcilingItemsMember2025-01-012025-06-300001273441us-gaap:OperatingSegmentsMembergte:ColombiaSegmentMember2024-04-012024-06-300001273441us-gaap:OperatingSegmentsMembergte:EcuadorSegmentMember2024-04-012024-06-300001273441us-gaap:OperatingSegmentsMembergte:CanadaSegmentMember2024-04-012024-06-300001273441us-gaap:CorporateNonSegmentMember2024-04-012024-06-300001273441gte:OperatingSegmentsAndCorporateNonSegmentMember2024-04-012024-06-300001273441us-gaap:MaterialReconcilingItemsMember2024-04-012024-06-300001273441us-gaap:OperatingSegmentsMembergte:ColombiaSegmentMember2024-01-012024-06-300001273441us-gaap:OperatingSegmentsMembergte:EcuadorSegmentMember2024-01-012024-06-300001273441us-gaap:OperatingSegmentsMembergte:CanadaSegmentMember2024-01-012024-06-300001273441us-gaap:CorporateNonSegmentMember2024-01-012024-06-300001273441gte:OperatingSegmentsAndCorporateNonSegmentMember2024-01-012024-06-300001273441us-gaap:MaterialReconcilingItemsMember2024-01-012024-06-300001273441us-gaap:OperatingSegmentsMembergte:ColombiaSegmentMember2025-06-300001273441us-gaap:OperatingSegmentsMembergte:EcuadorSegmentMember2025-06-300001273441us-gaap:OperatingSegmentsMembergte:CanadaSegmentMember2025-06-300001273441us-gaap:CorporateNonSegmentMember2025-06-300001273441us-gaap:OperatingSegmentsMembergte:ColombiaSegmentMember2024-12-310001273441us-gaap:OperatingSegmentsMembergte:EcuadorSegmentMember2024-12-310001273441us-gaap:OperatingSegmentsMembergte:CanadaSegmentMember2024-12-310001273441us-gaap:CorporateNonSegmentMember2024-12-310001273441gte:ProvedOilandGasPropertiesMember2025-06-300001273441gte:ProvedOilandGasPropertiesMember2024-12-310001273441gte:UnprovedOilAndGasPropertiesMember2025-06-300001273441gte:UnprovedOilAndGasPropertiesMember2024-12-310001273441us-gaap:OilAndGasPropertiesMember2025-06-300001273441us-gaap:OilAndGasPropertiesMember2024-12-310001273441us-gaap:PropertyPlantAndEquipmentOtherTypesMember2025-06-300001273441us-gaap:PropertyPlantAndEquipmentOtherTypesMember2024-12-310001273441gte:NewLeaseContractsForPowerGeneratingEquipmentMember2025-01-012025-06-300001273441gte:BrentCrudeMember2025-01-012025-06-300001273441gte:EdmontonLightCrudeMember2025-01-012025-06-300001273441gte:AlbertaAECOMember2025-01-012025-06-300001273441gte:EdmontonPropaneMember2025-01-012025-06-300001273441gte:EdmontonButaneMember2025-01-012025-06-300001273441gte:EdmontonCondensateMember2025-01-012025-06-300001273441gte:BrentCrudeMember2024-01-012024-06-300001273441gte:SixPointTwoFivePercentSeniorNotesdue2025Member2025-06-300001273441gte:SixPointTwoFivePercentSeniorNotesdue2025Memberus-gaap:SeniorNotesMember2025-06-300001273441gte:SixPointTwoFivePercentSeniorNotesdue2025Memberus-gaap:SeniorNotesMember2024-12-310001273441gte:CreditFacilityCanadaMemberus-gaap:LineOfCreditMember2025-06-300001273441gte:CreditFacilityCanadaMemberus-gaap:LineOfCreditMember2024-12-310001273441gte:CreditFacilityColombiaMemberus-gaap:LineOfCreditMember2025-06-300001273441gte:CreditFacilityColombiaMemberus-gaap:LineOfCreditMember2024-12-310001273441gte:SevenPointSevenFivePercentSeniorNotesdue2027Member2025-06-300001273441gte:SevenPointSevenFivePercentSeniorNotesdue2027Memberus-gaap:SeniorNotesMember2025-06-300001273441gte:SevenPointSevenFivePercentSeniorNotesdue2027Memberus-gaap:SeniorNotesMember2024-12-310001273441gte:NinePointFiveZeroPercentSeniorNotesDue2029Member2025-06-300001273441gte:NinePointFiveZeroPercentSeniorNotesDue2029Memberus-gaap:SeniorNotesMember2025-06-300001273441gte:NinePointFiveZeroPercentSeniorNotesDue2029Memberus-gaap:SeniorNotesMember2024-12-310001273441us-gaap:RevolvingCreditFacilityMember2024-10-310001273441us-gaap:RevolvingCreditFacilityMember2025-06-300001273441us-gaap:RevolvingCreditFacilityMembergte:SyndicatedFacilityMember2024-10-310001273441us-gaap:RevolvingCreditFacilityMembergte:SyndicatedFacilityMember2025-06-300001273441us-gaap:RevolvingCreditFacilityMembergte:OperatingFacilityMember2024-10-310001273441us-gaap:RevolvingCreditFacilityMembergte:OperatingFacilityMember2025-06-300001273441us-gaap:RevolvingCreditFacilityMembergte:CORRAMembersrt:MinimumMember2024-10-312024-10-310001273441us-gaap:RevolvingCreditFacilityMembergte:CORRAMembersrt:MaximumMember2024-10-312024-10-310001273441us-gaap:RevolvingCreditFacilityMemberus-gaap:SecuredOvernightFinancingRateSofrMembersrt:MinimumMember2024-10-312024-10-310001273441us-gaap:RevolvingCreditFacilityMemberus-gaap:SecuredOvernightFinancingRateSofrMembersrt:MaximumMember2024-10-312024-10-310001273441us-gaap:RevolvingCreditFacilityMembersrt:MinimumMember2024-10-312024-10-310001273441us-gaap:RevolvingCreditFacilityMembersrt:MaximumMember2024-10-312024-10-310001273441us-gaap:RevolvingCreditFacilityMembergte:CreditFacilityCanadaMemberus-gaap:LineOfCreditMember2025-06-300001273441us-gaap:RevolvingCreditFacilityMember2024-10-312024-10-310001273441gte:ReserveBasedLendingFacilityMemberus-gaap:LineOfCreditMember2025-04-160001273441gte:BaseRateFloorMembergte:ReserveBasedLendingFacilityMemberus-gaap:LineOfCreditMember2025-04-162025-04-160001273441gte:BaseRateFloorMemberus-gaap:BaseRateMemberus-gaap:LineOfCreditMember2025-04-162025-04-160001273441us-gaap:SecuredOvernightFinancingRateSofrMemberus-gaap:BaseRateMemberus-gaap:LineOfCreditMember2025-04-162025-04-160001273441gte:ReserveBasedLendingFacilityMemberus-gaap:LineOfCreditMember2025-04-162025-04-160001273441gte:CreditFacilityColombiaMemberus-gaap:LineOfCreditMember2025-04-012025-06-300001273441gte:ReserveBasedLendingFacilityMemberus-gaap:LineOfCreditMember2025-06-300001273441gte:SixPointTwoFivePercentSeniorNotesDueFebruary2025Memberus-gaap:SeniorNotesMember2025-01-012025-06-300001273441gte:SixPointTwoFivePercentSeniorNotesDueFebruary2025Memberus-gaap:SeniorNotesMember2025-06-300001273441gte:NinePointFiveZeroPercentSeniorNotesDueInFebruary2025Memberus-gaap:SeniorNotesMember2025-06-300001273441gte:NinePointFiveZeroPercentSeniorNotesDue2029Memberus-gaap:SeniorNotesMember2025-01-012025-06-300001273441gte:NinePointFiveZeroPercentSeniorNotesDue2029Memberus-gaap:DebtInstrumentRedemptionPeriodOneMemberus-gaap:SeniorNotesMember2025-06-300001273441gte:NinePointFiveZeroPercentSeniorNotesDue2029Memberus-gaap:DebtInstrumentRedemptionPeriodTwoMemberus-gaap:SeniorNotesMember2025-06-300001273441gte:NinePointFiveZeroPercentSeniorNotesDue2029Memberus-gaap:DebtInstrumentRedemptionPeriodThreeMemberus-gaap:SeniorNotesMember2025-06-300001273441gte:A2024ProgramMember2024-12-310001273441srt:MaximumMember2024-10-310001273441gte:A2024ProgramMember2024-01-012024-12-310001273441srt:MaximumMember2024-12-310001273441gte:A2024ProgramMember2025-04-012025-06-300001273441gte:A2024ProgramMember2025-01-012025-06-300001273441gte:A2023ProgramMember2024-04-012024-06-300001273441gte:A2023ProgramMember2024-01-012024-06-300001273441gte:A2024ProgramMember2025-06-300001273441gte:A2024ProgramMemberus-gaap:SubsequentEventMember2024-11-062025-07-280001273441gte:A2024ProgramMemberus-gaap:SubsequentEventMember2025-07-280001273441gte:PerformanceShareUnitsMember2024-12-310001273441gte:DeferredShareUnitsMember2024-12-310001273441us-gaap:RestrictedStockUnitsRSUMember2024-12-310001273441gte:PerformanceShareUnitsMember2025-01-012025-06-300001273441gte:DeferredShareUnitsMember2025-01-012025-06-300001273441us-gaap:RestrictedStockUnitsRSUMember2025-01-012025-06-300001273441gte:PerformanceShareUnitsMember2025-06-300001273441gte:DeferredShareUnitsMember2025-06-300001273441us-gaap:RestrictedStockUnitsRSUMember2025-06-300001273441us-gaap:EmployeeStockOptionMember2024-05-010001273441us-gaap:EmployeeStockOptionMember2024-05-012024-05-010001273441us-gaap:EmployeeStockOptionMember2025-06-300001273441srt:MinimumMemberus-gaap:EmployeeStockOptionMember2025-01-012025-06-300001273441srt:MaximumMemberus-gaap:EmployeeStockOptionMember2025-01-012025-06-300001273441gte:PerformanceShareUnitsMembergte:VestedOnDecember312023Member2025-01-012025-06-300001273441gte:PerformanceShareUnitsMembergte:VestedOnDecember312022Member2024-01-012024-06-300001273441gte:A2007EquityIncentivePlanMemberus-gaap:RestrictedStockUnitsRSUMember2025-04-012025-06-300001273441gte:A2007EquityIncentivePlanMemberus-gaap:RestrictedStockUnitsRSUMember2025-01-012025-06-300001273441us-gaap:RestrictedStockUnitsRSUMemberus-gaap:ShareBasedCompensationAwardTrancheOneMembergte:A2007EquityIncentivePlanMember2025-01-012025-06-300001273441us-gaap:RestrictedStockUnitsRSUMemberus-gaap:ShareBasedCompensationAwardTrancheTwoMembergte:A2007EquityIncentivePlanMember2025-01-012025-06-300001273441us-gaap:RestrictedStockUnitsRSUMemberus-gaap:ShareBasedCompensationAwardTrancheThreeMembergte:A2007EquityIncentivePlanMember2025-01-012025-06-300001273441country:COsrt:CrudeOilMember2025-04-012025-06-300001273441country:COsrt:NaturalGasReservesMember2025-04-012025-06-300001273441country:COsrt:NaturalGasLiquidsReservesMember2025-04-012025-06-300001273441country:CO2025-04-012025-06-300001273441country:COsrt:CrudeOilMember2025-01-012025-06-300001273441country:COsrt:NaturalGasReservesMember2025-01-012025-06-300001273441country:COsrt:NaturalGasLiquidsReservesMember2025-01-012025-06-300001273441country:CO2025-01-012025-06-300001273441country:ECsrt:CrudeOilMember2025-04-012025-06-300001273441country:ECsrt:NaturalGasReservesMember2025-04-012025-06-300001273441country:ECsrt:NaturalGasLiquidsReservesMember2025-04-012025-06-300001273441country:EC2025-04-012025-06-300001273441country:ECsrt:CrudeOilMember2025-01-012025-06-300001273441country:ECsrt:NaturalGasReservesMember2025-01-012025-06-300001273441country:ECsrt:NaturalGasLiquidsReservesMember2025-01-012025-06-300001273441country:EC2025-01-012025-06-300001273441country:CAsrt:CrudeOilMember2025-04-012025-06-300001273441country:CAsrt:NaturalGasReservesMember2025-04-012025-06-300001273441country:CAsrt:NaturalGasLiquidsReservesMember2025-04-012025-06-300001273441country:CA2025-04-012025-06-300001273441country:CAsrt:CrudeOilMember2025-01-012025-06-300001273441country:CAsrt:NaturalGasReservesMember2025-01-012025-06-300001273441country:CAsrt:NaturalGasLiquidsReservesMember2025-01-012025-06-300001273441country:CA2025-01-012025-06-300001273441srt:CrudeOilMember2025-04-012025-06-300001273441srt:NaturalGasReservesMember2025-04-012025-06-300001273441srt:NaturalGasLiquidsReservesMember2025-04-012025-06-300001273441srt:CrudeOilMember2025-01-012025-06-300001273441srt:NaturalGasReservesMember2025-01-012025-06-300001273441srt:NaturalGasLiquidsReservesMember2025-01-012025-06-300001273441country:COsrt:CrudeOilMember2024-04-012024-06-300001273441country:COsrt:NaturalGasReservesMember2024-04-012024-06-300001273441country:COsrt:NaturalGasLiquidsReservesMember2024-04-012024-06-300001273441country:CO2024-04-012024-06-300001273441country:COsrt:CrudeOilMember2024-01-012024-06-300001273441country:COsrt:NaturalGasReservesMember2024-01-012024-06-300001273441country:COsrt:NaturalGasLiquidsReservesMember2024-01-012024-06-300001273441country:CO2024-01-012024-06-300001273441country:ECsrt:CrudeOilMember2024-04-012024-06-300001273441country:ECsrt:NaturalGasReservesMember2024-04-012024-06-300001273441country:ECsrt:NaturalGasLiquidsReservesMember2024-04-012024-06-300001273441country:EC2024-04-012024-06-300001273441country:ECsrt:CrudeOilMember2024-01-012024-06-300001273441country:ECsrt:NaturalGasReservesMember2024-01-012024-06-300001273441country:ECsrt:NaturalGasLiquidsReservesMember2024-01-012024-06-300001273441country:EC2024-01-012024-06-300001273441country:CAsrt:CrudeOilMember2024-04-012024-06-300001273441country:CAsrt:NaturalGasReservesMember2024-04-012024-06-300001273441country:CAsrt:NaturalGasLiquidsReservesMember2024-04-012024-06-300001273441country:CA2024-04-012024-06-300001273441country:CAsrt:CrudeOilMember2024-01-012024-06-300001273441country:CAsrt:NaturalGasReservesMember2024-01-012024-06-300001273441country:CAsrt:NaturalGasLiquidsReservesMember2024-01-012024-06-300001273441country:CA2024-01-012024-06-300001273441srt:CrudeOilMember2024-04-012024-06-300001273441srt:NaturalGasReservesMember2024-04-012024-06-300001273441srt:NaturalGasLiquidsReservesMember2024-04-012024-06-300001273441srt:CrudeOilMember2024-01-012024-06-300001273441srt:NaturalGasReservesMember2024-01-012024-06-300001273441srt:NaturalGasLiquidsReservesMember2024-01-012024-06-300001273441gte:Customer1Memberus-gaap:ProductConcentrationRiskMemberus-gaap:RevenueFromContractWithCustomerMember2025-01-012025-06-300001273441gte:Customer1Memberus-gaap:ProductConcentrationRiskMemberus-gaap:RevenueFromContractWithCustomerMember2025-04-012025-06-300001273441gte:Customer2Memberus-gaap:ProductConcentrationRiskMemberus-gaap:RevenueFromContractWithCustomerMember2025-04-012025-06-300001273441gte:Customer2Memberus-gaap:ProductConcentrationRiskMemberus-gaap:RevenueFromContractWithCustomerMember2025-01-012025-06-300001273441country:COgte:Customer1Memberus-gaap:ProductConcentrationRiskMemberus-gaap:RevenueFromContractWithCustomerMember2025-01-012025-06-300001273441country:COgte:Customer1Memberus-gaap:ProductConcentrationRiskMemberus-gaap:RevenueFromContractWithCustomerMember2025-04-012025-06-300001273441country:ECgte:Customer1Memberus-gaap:ProductConcentrationRiskMemberus-gaap:RevenueFromContractWithCustomerMember2025-01-012025-06-300001273441country:ECgte:Customer1Memberus-gaap:ProductConcentrationRiskMemberus-gaap:RevenueFromContractWithCustomerMember2025-04-012025-06-300001273441country:CAgte:Customer1Memberus-gaap:ProductConcentrationRiskMemberus-gaap:RevenueFromContractWithCustomerMember2025-04-012025-06-300001273441country:CAgte:Customer1Memberus-gaap:ProductConcentrationRiskMemberus-gaap:RevenueFromContractWithCustomerMember2025-01-012025-06-300001273441country:COgte:Customer1Memberus-gaap:ProductConcentrationRiskMemberus-gaap:RevenueFromContractWithCustomerMember2024-01-012024-06-300001273441country:COgte:Customer1Memberus-gaap:ProductConcentrationRiskMemberus-gaap:RevenueFromContractWithCustomerMember2024-04-012024-06-300001273441us-gaap:FairValueMeasurementsRecurringMemberus-gaap:FairValueInputsLevel1Membergte:SixPointTwoFivePercentSeniorNotesdue2025Member2025-06-300001273441us-gaap:FairValueMeasurementsRecurringMemberus-gaap:FairValueInputsLevel1Membergte:SixPointTwoFivePercentSeniorNotesdue2025Member2024-12-310001273441us-gaap:FairValueMeasurementsRecurringMemberus-gaap:FairValueInputsLevel1Membergte:SevenPointSevenFivePercentSeniorNotesdue2027Member2025-06-300001273441us-gaap:FairValueMeasurementsRecurringMemberus-gaap:FairValueInputsLevel1Membergte:SevenPointSevenFivePercentSeniorNotesdue2027Member2024-12-310001273441us-gaap:FairValueMeasurementsRecurringMemberus-gaap:FairValueInputsLevel1Membergte:NinePointFiveZeroPercentSeniorNotesDue2029Member2025-06-300001273441us-gaap:FairValueMeasurementsRecurringMemberus-gaap:FairValueInputsLevel1Membergte:NinePointFiveZeroPercentSeniorNotesDue2029Member2024-12-310001273441us-gaap:FairValueMeasurementsRecurringMemberus-gaap:FairValueInputsLevel1Member2025-06-300001273441us-gaap:FairValueMeasurementsRecurringMemberus-gaap:FairValueInputsLevel1Member2024-12-310001273441us-gaap:FairValueMeasurementsRecurringMemberus-gaap:FairValueInputsLevel2Member2025-06-300001273441us-gaap:FairValueMeasurementsRecurringMemberus-gaap:FairValueInputsLevel2Member2024-12-310001273441us-gaap:CarryingReportedAmountFairValueDisclosureMembergte:SevenPointSevenFivePercentSeniorNotesdue2027Memberus-gaap:SeniorNotesMember2025-06-300001273441us-gaap:CarryingReportedAmountFairValueDisclosureMembergte:NinePointFiveZeroPercentSeniorNotesDue2029Memberus-gaap:SeniorNotesMember2025-06-300001273441us-gaap:FairValueMeasurementsRecurringMemberus-gaap:NondesignatedMembergte:SevenPointSevenFivePercentSeniorNotesdue2027Memberus-gaap:SeniorNotesMember2025-06-300001273441us-gaap:FairValueMeasurementsRecurringMemberus-gaap:NondesignatedMembergte:NinePointFiveZeroPercentSeniorNotesDue2029Memberus-gaap:SeniorNotesMember2025-06-300001273441us-gaap:CommodityContractMember2025-04-012025-06-300001273441us-gaap:CommodityContractMember2024-04-012024-06-300001273441us-gaap:CommodityContractMember2025-01-012025-06-300001273441us-gaap:CommodityContractMember2024-01-012024-06-300001273441us-gaap:ForeignExchangeContractMember2025-04-012025-06-300001273441us-gaap:ForeignExchangeContractMember2024-04-012024-06-300001273441us-gaap:ForeignExchangeContractMember2025-01-012025-06-300001273441us-gaap:ForeignExchangeContractMember2024-01-012024-06-300001273441country:CAgte:WTICMASwapSeptember2025Member2025-01-012025-06-300001273441country:CAgte:WTICMASwapSeptember2025Member2025-06-300001273441country:CAgte:WTICMACollarDecember2025Member2025-01-012025-06-300001273441country:CAgte:WTICMACollarDecember2025Memberus-gaap:DesignatedAsHedgingInstrumentMember2025-06-300001273441country:CAgte:WTICMACollarDecember2025Memberus-gaap:NondesignatedMember2025-06-300001273441country:CAgte:WTICMACallOptionDecember2025Member2025-01-012025-06-300001273441country:CAgte:WTICMACallOptionDecember2025Memberus-gaap:NondesignatedMember2025-06-300001273441country:CAgte:WTICMACollarMarch2026Member2025-01-012025-06-300001273441country:CAgte:WTICMACollarMarch2026Memberus-gaap:DesignatedAsHedgingInstrumentMember2025-06-300001273441country:CAgte:WTICMACollarMarch2026Memberus-gaap:NondesignatedMember2025-06-300001273441country:CAgte:AECO5ASwapSeptember2025Member2025-01-012025-06-300001273441country:CAgte:AECO5ASwapSeptember2025Member2025-06-300001273441country:CAgte:AECO7APutOptionSeptember2025Member2025-01-012025-06-300001273441country:CAgte:AECO7APutOptionSeptember2025Member2025-06-300001273441country:CAgte:AECO7APutOptionSeptember2025Memberus-gaap:DesignatedAsHedgingInstrumentMember2025-06-300001273441country:CAgte:AECO5ASwapDecember2025Member2025-01-012025-06-300001273441country:CAgte:AECO5ASwapDecember2025Member2025-06-300001273441country:CAgte:AESOSwapSeptember2025Member2025-01-012025-06-300001273441country:CAgte:AESOSwapSeptember2025Member2025-06-300001273441country:CAgte:AESOSwapDecember2025Member2025-01-012025-06-300001273441country:CAgte:AESOSwapDecember2025Member2025-06-300001273441country:COgte:BrentCollarSeptember2025Member2025-01-012025-06-300001273441country:COgte:BrentCollarSeptember2025Memberus-gaap:DesignatedAsHedgingInstrumentMember2025-06-300001273441country:COgte:BrentCollarSeptember2025Memberus-gaap:NondesignatedMember2025-06-300001273441country:COgte:BrentPutOptionDecember2025Member2025-01-012025-06-300001273441country:COgte:BrentPutOptionDecember2025Memberus-gaap:DesignatedAsHedgingInstrumentMember2025-06-300001273441country:COgte:BrentPutOptionDecember2025Member2025-06-300001273441country:COgte:Brent3WaySeptember2025Member2025-01-012025-06-300001273441country:COgte:Brent3WaySeptember2025Memberus-gaap:DesignatedAsHedgingInstrumentMember2025-06-300001273441country:COgte:Brent3WaySeptember2025Memberus-gaap:NondesignatedMember2025-06-300001273441country:COgte:BrentCollarDecember2025Member2025-01-012025-06-300001273441country:COgte:BrentCollarDecember2025Memberus-gaap:DesignatedAsHedgingInstrumentMember2025-06-300001273441country:COgte:BrentCollarDecember2025Memberus-gaap:NondesignatedMember2025-06-300001273441country:COgte:Brent3WayDecember20251Member2025-01-012025-06-300001273441country:COgte:Brent3WayDecember20251Memberus-gaap:DesignatedAsHedgingInstrumentMember2025-06-300001273441country:COgte:Brent3WayDecember20251Memberus-gaap:NondesignatedMember2025-06-300001273441country:COgte:BrentCollarMarch2026Member2025-01-012025-06-300001273441country:COgte:BrentCollarMarch2026Memberus-gaap:DesignatedAsHedgingInstrumentMember2025-06-300001273441country:COgte:BrentCollarMarch2026Memberus-gaap:NondesignatedMember2025-06-300001273441country:COgte:Brent3WayMarch2026Member2025-01-012025-06-300001273441country:COgte:Brent3WayMarch2026Memberus-gaap:DesignatedAsHedgingInstrumentMember2025-06-300001273441country:COgte:Brent3WayMarch2026Memberus-gaap:NondesignatedMember2025-06-300001273441country:CAgte:WTICMA3WayMarch2026Member2025-01-012025-06-300001273441country:CAgte:WTICMA3WayMarch2026Memberus-gaap:DesignatedAsHedgingInstrumentMember2025-06-300001273441country:CAgte:WTICMA3WayMarch2026Memberus-gaap:NondesignatedMember2025-06-300001273441country:CAgte:WTICMA3WayMarch2026Member2025-06-300001273441country:CAgte:WTICMACollarSeptember2026Member2025-01-012025-06-300001273441country:CAgte:WTICMACollarSeptember2026Memberus-gaap:DesignatedAsHedgingInstrumentMember2025-06-300001273441country:CAgte:WTICMACollarSeptember2026Memberus-gaap:NondesignatedMember2025-06-300001273441country:CAgte:WTICMA3WaySeptember2026Member2025-01-012025-06-300001273441country:CAgte:WTICMA3WaySeptember2026Memberus-gaap:DesignatedAsHedgingInstrumentMember2025-06-300001273441country:CAgte:WTICMA3WaySeptember2026Memberus-gaap:NondesignatedMember2025-06-300001273441country:CAgte:WTICMA3WayDecember2026Member2025-01-012025-06-300001273441country:CAgte:WTICMA3WayDecember2026Memberus-gaap:DesignatedAsHedgingInstrumentMember2025-06-300001273441country:CAgte:WTICMA3WayDecember2026Memberus-gaap:NondesignatedMember2025-06-300001273441country:CAgte:WTICMA3WayDecember2026Member2025-06-300001273441country:COgte:Brent3WayDecember20252Member2025-01-012025-06-300001273441country:COgte:Brent3WayDecember20252Memberus-gaap:DesignatedAsHedgingInstrumentMember2025-06-300001273441country:COgte:Brent3WayDecember20252Memberus-gaap:NondesignatedMember2025-06-300001273441country:COgte:BrentPutOptionJune2026Member2025-01-012025-06-300001273441country:COgte:BrentPutOptionJune2026Memberus-gaap:DesignatedAsHedgingInstrumentMember2025-06-300001273441country:COgte:BrentPutOptionJune2026Member2025-06-300001273441country:COgte:Brent3WayJune2026Member2025-01-012025-06-300001273441country:COgte:Brent3WayJune2026Memberus-gaap:DesignatedAsHedgingInstrumentMember2025-06-300001273441country:COgte:Brent3WayJune2026Memberus-gaap:NondesignatedMember2025-06-300001273441country:COgte:BrentCollarJune2026Member2025-01-012025-06-300001273441country:COgte:BrentCollarJune2026Memberus-gaap:DesignatedAsHedgingInstrumentMember2025-06-300001273441country:COgte:BrentCollarJune2026Memberus-gaap:NondesignatedMember2025-06-300001273441country:COgte:Brent3WaySeptember2026Member2025-01-012025-06-300001273441country:COgte:Brent3WaySeptember2026Memberus-gaap:DesignatedAsHedgingInstrumentMember2025-06-300001273441country:COgte:Brent3WaySeptember2026Memberus-gaap:NondesignatedMember2025-06-300001273441gte:COPCollarsApril2026Member2025-06-300001273441us-gaap:DisposalGroupDisposedOfBySaleNotDiscontinuedOperationsMembergte:GranTierraNorthSeaLimitedMembersrt:ScenarioForecastMembergte:GranTierraUKLimitedMember2025-12-31
UNITED STATES SECURITIES AND EXCHANGE COMMISSION
Washington, D.C. 20549
FORM 10-Q
(Mark One)
|
|
|
|
|
|
|
|
|
| ☒ |
|
QUARTERLY REPORT PURSUANT TO SECTION 13 OR 15(d) OF THE SECURITIES EXCHANGE ACT OF 1934 |
For the quarterly period ended June 30, 2025
or
|
|
|
|
|
|
|
|
|
| ☐ |
|
TRANSITION REPORT PURSUANT TO SECTION 13 OR 15(d) OF THE SECURITIES EXCHANGE ACT OF 1934 |
For the transition period from __________ to __________
Commission file number 001-34018
GRAN TIERRA ENERGY INC.
(Exact name of registrant as specified in its charter)
|
|
|
|
|
|
|
|
|
|
|
|
|
|
|
|
|
|
| Delaware |
|
98-0479924 |
| (State or other jurisdiction of incorporation or organization) |
|
(I.R.S. Employer Identification No.) |
| 500 Centre Street S.E. |
|
Calgary, |
Alberta |
Canada |
T2G 1A6 |
|
| (Address of principal executive offices, including zip code) |
(403) 265-3221
(Registrant’s telephone number, including area code)
Securities registered pursuant to Section 12(b) of the Act:
|
|
|
|
|
|
|
|
|
| Title of each class |
Trading Symbol(s) |
Name of each exchange on which registered |
Common Stock, par value $0.001 per share |
GTE |
NYSE American |
Toronto Stock Exchange |
London Stock Exchange |
Indicate by check mark whether the registrant (1) has filed all reports required to be filed by Section 13 or 15(d) of the Securities Exchange Act of 1934 during the preceding 12 months (or for such shorter period that the registrant was required to file such reports), and (2) has been subject to such filing requirements for the past 90 days. Yes ☒ No ☐
Indicate by check mark whether the registrant has submitted electronically every Interactive Data File required to be submitted pursuant to Rule 405 of Regulation S-T (§ 232.405 of this chapter) during the preceding 12 months (or for such shorter period that the registrant was required to submit such files).
Yes ☒ No ☐
Indicate by check mark whether the registrant is a large accelerated filer, an accelerated filer, a non-accelerated filer, a smaller reporting company, or an emerging growth company. See the definitions of large accelerated filer, accelerated filer, smaller reporting company, and emerging growth company in Rule 12b-2 of the Exchange Act.
|
|
|
|
|
|
|
|
|
|
|
|
| Large accelerated filer |
☐ |
Accelerated filer |
☒ |
| Non-accelerated filer |
☐ |
Smaller reporting company |
☐ |
|
|
Emerging growth company |
☐ |
If an emerging growth company, indicate by check mark if the registrant has elected not to use the extended transition period for complying with any new or revised financial accounting standards provided pursuant to Section 13(a) of the Exchange Act. ☐
Indicate by check mark whether the registrant is a shell company (as defined in Rule 12b-2 of the Act). Yes ☐ No ☒
On July 28, 2025, 35,290,955 shares of the registrant’s Common Stock, $0.001 par value, were issued and outstanding.
Gran Tierra Energy Inc.
Quarterly Report on Form 10-Q
Quarterly Period Ended June 30, 2025
Table of contents
|
|
|
|
|
|
|
|
|
| |
|
Page |
| PART I |
Financial Information |
|
| Item 1. |
Financial Statements |
|
| Item 2. |
Management’s Discussion and Analysis of Financial Condition and Results of Operations |
|
| Item 3. |
Quantitative and Qualitative Disclosures About Market Risk |
|
| Item 4. |
Controls and Procedures |
|
|
|
|
| PART II |
Other Information |
|
| Item 1. |
Legal Proceedings |
|
| Item 1A. |
Risk Factors |
|
|
|
|
| Item 2. |
Unregistered Sales of Equity Securities and Use of Proceeds |
|
| Item 5. |
Other information |
|
| Item 6. |
Exhibits |
|
| SIGNATURES |
|
|
|
CAUTIONARY LANGUAGE REGARDING FORWARD-LOOKING STATEMENTS
This Quarterly Report on Form 10-Q includes forward-looking statements within the meaning of Section 27A of the Securities Act of 1933, as amended (the “Securities Act”), and Section 21E of the Securities Exchange Act of 1934, as amended (the “Exchange Act”). All statements other than statements of historical facts included in this Quarterly Report on Form 10-Q regarding our financial position, estimated quantities and net present values of reserves, business strategy, plans and objectives of our management for future operations, covenant compliance, capital spending plans and benefits of the changes in our capital program or expenditures, our liquidity and financial condition and those statements preceded by, followed by or that otherwise include the words “believe”, “expect”, “anticipate”, “intend”, “estimate”, “project”, “target”, “goal”, “plan”, “budget”, “objective”, “should”, “outlook” or similar expressions or variations on these expressions are forward-looking statements. We can give no assurances that the assumptions upon which the forward-looking statements are based will prove to be correct or that, even if correct, intervening circumstances will not occur to cause actual results to be different than expected. Because forward-looking statements are subject to risks and uncertainties, actual results may differ materially from those expressed or implied by the forward-looking statements. There are a number of risks, uncertainties and other important factors that could cause our actual results to differ materially from the forward-looking statements, including, but not limited to, our ability to successfully integrate the assets and operations of i3 Energy Plc (“i3Energy”) and realize the anticipated benefits and operating synergies expected from the 2024 acquisition of i3 Energy; certain of our operations are located in South America and unexpected problems can arise due to guerilla activity, strikes, local blockades or protests; technical difficulties and operational difficulties may arise which impact the production, transport or sale of our products; other disruptions to local operations; global health events; global and regional changes in the demand, supply, prices, differentials or other market conditions affecting oil and natural gas, including inflation and changes resulting from actual or anticipated tariffs and trade policies, a global health crises, geopolitical events, including the ongoing conflicts in Ukraine and the Middle East, or from the imposition or lifting of crude oil production quotas or other actions that might be imposed by OPEC and other producing countries and the resulting company or third-party actions in response to such changes; changes in commodity prices, including volatility or a prolonged decline in these prices relative to historical or future expected levels; the risk that current global economic and credit conditions may impact oil prices and oil consumption more than we currently predict, which could cause further modification of our strategy and capital spending program; prices and markets for oil and natural gas are unpredictable and volatile; the effect of hedges; the accuracy of productive capacity of any particular field; geographic, political and weather conditions can impact the production, transport or sale of our products; our ability to execute our business plan, which may include acquisitions and realize expected benefits from current or future initiatives; the risk that unexpected delays and difficulties in developing currently owned properties may occur; the ability to replace reserves and production and develop and manage reserves on an economically viable basis; the accuracy of testing and production results and seismic data, pricing and cost estimates (including with respect to commodity pricing and exchange rates); the risk profile of planned exploration activities; the effects of drilling down-dip; the effects of waterflood and multi-stage fracture stimulation operations; the extent and effect of delivery disruptions, equipment performance and costs; actions by third parties; the timely receipt of regulatory or other required approvals for our operating activities; the failure of exploratory drilling to result in commercial wells; unexpected delays due to the limited availability of drilling equipment and personnel; volatility or declines in the trading price of our common stock or bonds; the risk that we do not receive the anticipated benefits of government programs, including government tax refunds; our ability to access debt or equity capital markets from time to time to raise additional capital, increase liquidity, fund acquisitions or refinance debt; our ability to comply with financial covenants in our indentures and make borrowings under our credit agreement; and those factors set out in Part II, Item 1A “Risk Factors” in this Quarterly Report on Form 10-Q and Part I, Item 1A “Risk Factors” in our 2024 Annual Report on Form 10-K (the “2024 Annual Report on Form 10-K”). This information included herein is given as of the filing date of this Quarterly Report on Form 10-Q with the Securities and Exchange Commission (“SEC”) and, except as otherwise required by the securities laws, we disclaim any obligation or undertaking to publicly release any updates or revisions to or to withdraw, any forward-looking statement contained in this Quarterly Report on Form 10-Q to reflect any change in our expectations with regard thereto or any change in events, conditions or circumstances on which any forward-looking statement is based.
GLOSSARY OF OIL AND GAS TERMS
In this document, the abbreviations set forth below have the following meanings:
|
|
|
|
|
|
|
|
|
|
|
|
| bbl |
barrel |
BOEPD |
barrels of oil equivalent per day |
| BOPD |
barrels of oil per day |
NGL |
natural gas liquids |
| NAR |
net after royalty |
boe |
barrels of oil equivalent |
Sales volumes represent production NAR adjusted for inventory changes. Our oil and gas reserves are reported as NAR. Our production is also reported NAR, except as otherwise specifically noted as “working interest production before royalties”.
PART I - Financial Information
Item 1. Financial Statements
Gran Tierra Energy Inc.
Condensed Consolidated Statements of Operations (Unaudited)
(Thousands of U.S. Dollars, Except for Share and Per Share Amounts)
|
|
|
|
|
|
|
|
|
|
|
|
|
|
|
|
|
|
|
|
|
|
|
|
|
Three Months Ended June 30, |
|
Six Months Ended June 30, |
| |
2025 |
|
2024 |
|
2025 |
|
2024 |
OIL, NATURAL GAS AND NGL SALES (Note 9) |
$ |
152,481 |
|
|
$ |
165,609 |
|
|
$ |
323,014 |
|
|
$ |
323,186 |
|
| |
|
|
|
|
|
|
|
| EXPENSES |
|
|
|
|
|
|
|
| Operating |
55,855 |
|
|
47,035 |
|
|
123,209 |
|
|
95,501 |
|
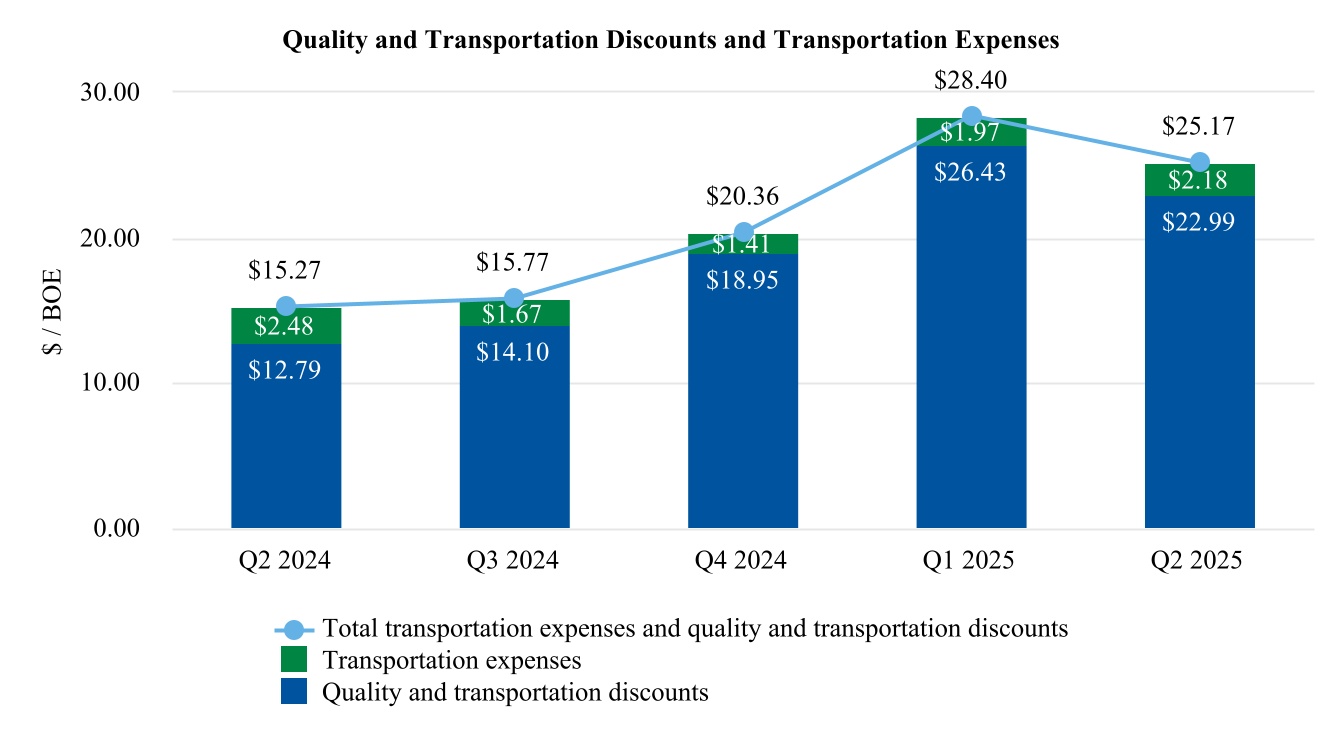
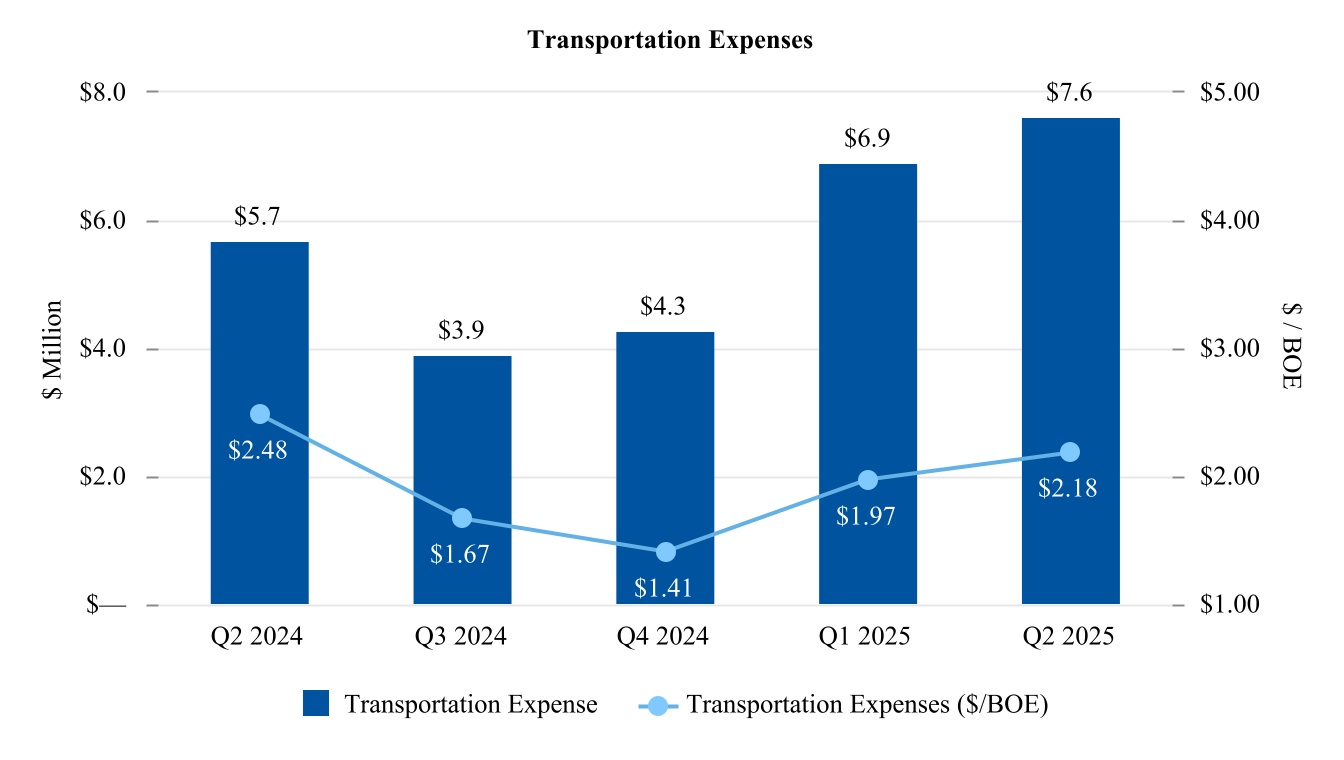
| Transportation |
7,618 |
|
|
5,690 |
|
|
14,529 |
|
|
10,274 |
|
Depletion, depreciation and accretion (Note 6) |
68,635 |
|
|
55,490 |
|
|
140,837 |
|
|
111,640 |
|
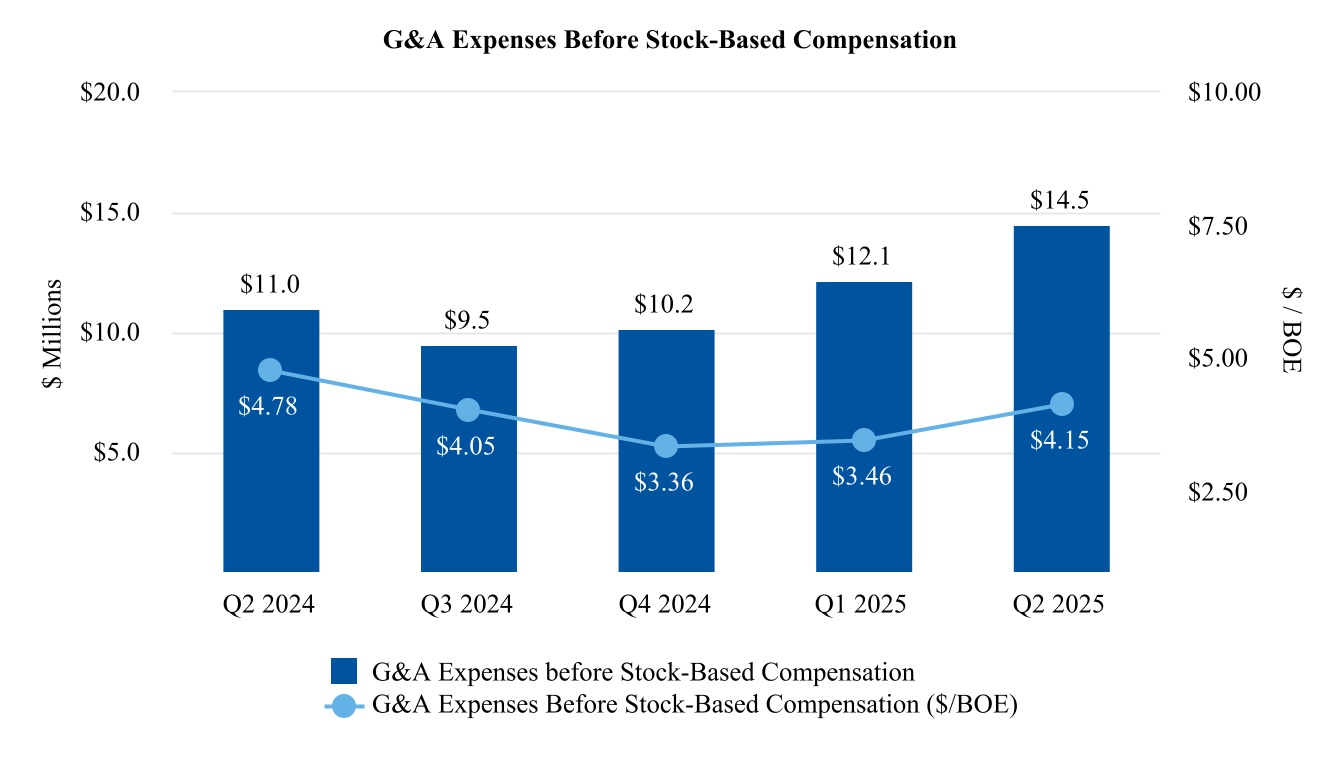
| General and administrative |
15,006 |
|
|
17,127 |
|
|
26,632 |
|
|
31,270 |
|
|
|
|
|
|
|
|
|
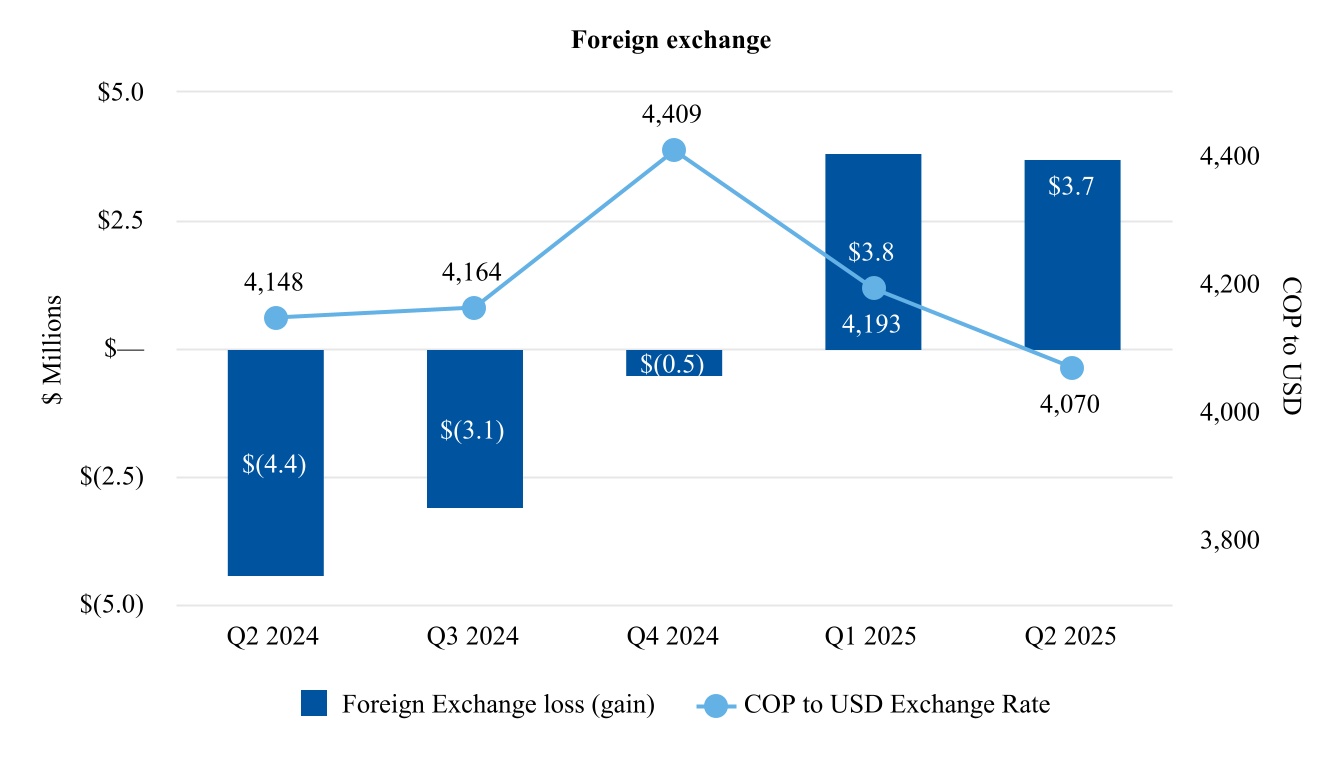
| Foreign exchange loss (gain) |
3,716 |
|
|
(4,413) |
|
|
7,554 |
|
|
(5,228) |
|
Derivative instruments gain (Note 12) |
(14,032) |
|
|
— |
|
|
(12,565) |
|
|
— |
|
Interest expense (Note 7) |
24,366 |
|
|
18,398 |
|
|
47,601 |
|
|
36,822 |
|
| |
161,164 |
|
|
139,327 |
|
|
347,797 |
|
|
280,279 |
|
|
|
|
|
|
|
|
|
| INTEREST INCOME |
251 |
|
|
1,017 |
|
|
676 |
|
|
1,709 |
|
| OTHER INCOME |
339 |
|
|
— |
|
|
287 |
|
|
— |
|
| (LOSS) INCOME BEFORE INCOME TAXES |
(8,093) |
|
|
27,299 |
|
|
(23,820) |
|
|
44,616 |
|
|
|
|
|
|
|
|
|
| INCOME TAX EXPENSE (RECOVERY) |
|
|
|
|
|
|
|
Current (Note 10) |
2,195 |
|
|
42,289 |
|
|
10,460 |
|
|
46,205 |
|
Deferred (Note 10) |
2,453 |
|
|
(51,361) |
|
|
(2,259) |
|
|
(37,882) |
|
|
4,648 |
|
|
(9,072) |
|
|
8,201 |
|
|
8,323 |
|
| NET (LOSS) INCOME |
$ |
(12,741) |
|
|
$ |
36,371 |
|
|
$ |
(32,021) |
|
|
$ |
36,293 |
|
|
|
|
|
|
|
|
|
| OTHER COMPREHENSIVE INCOME |
|
|
|
|
|
|
|
| Foreign currency translation adjustment |
9,583 |
|
|
— |
|
|
9,774 |
|
|
— |
|
| NET AND COMPREHENSIVE (LOSS) INCOME |
$ |
(3,158) |
|
|
$ |
36,371 |
|
|
$ |
(22,247) |
|
|
$ |
36,293 |
|
|
|
|
|
|
|
|
|
| NET(LOSS) INCOME PER SHARE |
|
|
|
|
|
|
|
| - BASIC and DILUTED |
$ |
(0.36) |
|
|
$ |
1.16 |
|
|
$ |
(0.90) |
|
|
$ |
1.15 |
|
|
|
|
|
|
|
|
|
WEIGHTED AVERAGE SHARES OUTSTANDING - BASIC and DILUTED (Note 8) |
35,334,692 |
|
|
31,281,651 |
|
|
35,554,806 |
|
|
31,547,362 |
|
|
|
|
|
|
|
|
|
(See notes to the condensed consolidated financial statements)
Gran Tierra Energy Inc.
Condensed Consolidated Balance Sheets (Unaudited)
(Thousands of U.S. Dollars, Except for Share Amounts)
|
|
|
|
|
|
|
|
|
|
|
|
| |
As at June 30, 2025 |
|
As at December 31, 2024 |
|
|
|
|
| ASSETS |
|
|
|
| Current Assets |
|
|
|
Cash and cash equivalents (Note 13) |
$ |
61,028 |
|
|
$ |
103,379 |
|
| Accounts receivable |
37,952 |
|
|
35,480 |
|
| Inventory |
40,987 |
|
|
43,116 |
|
Taxes receivable (Note 5) |
29,047 |
|
|
18,095 |
|
Other current assets (Note 12 and 13) |
33,470 |
|
|
11,201 |
|
| Total Current Assets |
202,484 |
|
|
211,271 |
|
|
|
|
|
| Oil and Gas Properties |
|
|
|
| Proved |
1,297,745 |
|
|
1,260,578 |
|
| Unproved |
116,000 |
|
|
119,520 |
|
| Total Oil and Gas Properties |
1,413,745 |
|
|
1,380,098 |
|
| Other capital assets |
42,541 |
|
|
43,033 |
|
Total Property, Plant and Equipment (Note 6) |
1,456,286 |
|
|
1,423,131 |
|
|
|
|
|
| Other Long-Term Assets |
|
|
|
| Deferred tax assets |
27,671 |
|
|
11,718 |
|
Taxes receivable long-term (Note 5) |
1,765 |
|
|
1,629 |
|
Other long-term assets (Note 12 and 13) |
8,750 |
|
|
7,038 |
|
| Total Other Long-Term Assets |
38,186 |
|
|
20,385 |
|
| Total Assets |
$ |
1,696,956 |
|
|
$ |
1,654,787 |
|
|
|
|
|
| LIABILITIES AND SHAREHOLDERS’ EQUITY |
|
|
|
| Current Liabilities |
|
|
|
| Accounts payable and accrued liabilities |
$ |
302,897 |
|
|
$ |
273,103 |
|
|
|
|
|
Current portion of long-term debt (Note 7 and 12) |
— |
|
|
24,807 |
|
Taxes payable (Note 5) |
10,603 |
|
|
13,970 |
|
Equity compensation award liability (Note 8) |
7,402 |
|
|
10,568 |
|
| Total Current Liabilities |
320,902 |
|
|
322,448 |
|
|
|
|
|
| Long-Term Liabilities |
|
|
|
Long-term debt (Note 7 and 12) |
772,616 |
|
|
722,123 |
|
| Deferred tax liabilities |
81,471 |
|
|
64,114 |
|
| Asset retirement obligation |
111,156 |
|
|
105,936 |
|
Equity compensation award liability (Note 8) |
11,003 |
|
|
17,456 |
|
|
|
|
|
| Other long-term liabilities |
10,012 |
|
|
9,142 |
|
| Total Long-Term Liabilities |
986,258 |
|
|
918,771 |
|
|
|
|
|
Contingencies (Note 11) |
|
|
|
|
|
|
|
| Shareholders' Equity |
|
|
|
Common Stock (35,288,985 and 36,460,141 issued shares and 35,288,985 and 35,972,193 outstanding shares of Common Stock as at June 30, 2025 and December 31, 2024, respectively, par value $0.001 per share), (Note 8) |
9,939 |
|
|
9,940 |
|
| Additional paid-in capital |
1,268,654 |
|
|
1,273,343 |
|
Treasury Stock (Note 8) |
— |
|
|
(3,165) |
|
| Accumulated other comprehensive gain (loss) |
3,038 |
|
|
(6,736) |
|
| Deficit |
(891,835) |
|
|
(859,814) |
|
| Total Shareholders’ Equity |
389,796 |
|
|
413,568 |
|
| Total Liabilities and Shareholders’ Equity |
$ |
1,696,956 |
|
|
$ |
1,654,787 |
|
(See notes to the condensed consolidated financial statements)
Gran Tierra Energy Inc.
Condensed Consolidated Statements of Cash Flows (Unaudited)
(Thousands of U.S. Dollars)
|
|
|
|
|
|
|
|
|
|
|
|
| |
Six Months Ended June 30, |
| |
2025 |
|
2024 |
| Operating Activities |
|
|
|
| Net (loss) income |
$ |
(32,021) |
|
|
$ |
36,293 |
|
| Adjustments to reconcile net loss to net cash provided by operating activities: |
|
|
|
Depletion, depreciation and accretion (Note 6) |
140,837 |
|
|
111,640 |
|
|
|
|
|
Deferred tax recovery (Note 10) |
(2,259) |
|
|
(37,882) |
|
Stock-based compensation expense (Note 8) |
29 |
|
|
9,521 |
|
Amortization of debt issuance costs (Note 7) |
7,915 |
|
|
6,066 |
|
| Unrealized foreign exchange loss (gain) |
4,801 |
|
|
(5,589) |
|
| Loss on bond purchased |
90 |
|
|
— |
|
| Unrealized derivative instruments gain |
(10,491) |
|
|
— |
|
| Cash settlement of asset retirement obligation |
(3,045) |
|
|
(223) |
|
| Non-cash lease expenses |
3,461 |
|
|
2,794 |
|
| Lease payments |
(3,112) |
|
|
(2,369) |
|
Net change in assets and liabilities from operating activities (Note 13) |
1,702 |
|
|
13,809 |
|
| Net cash provided by operating activities |
107,907 |
|
|
134,060 |
|
|
|
|
|
| Investing Activities |
|
|
|
Additions to property, plant and equipment (Note 6 and 13) |
(153,971) |
|
|
(114,044) |
|
|
|
|
|
| Net cash used in investing activities |
(153,971) |
|
|
(114,044) |
|
|
|
|
|
| Financing Activities |
|
|
|
Proceeds from issuance of Senior Notes, net of issuance costs (Note 7) |
— |
|
|
85,615 |
|
Proceeds from long-term debt, net of issuance costs (Note 7) |
44,781 |
|
|
— |
|
Repayment of long-term debt (Note 7) |
(1,894) |
|
|
— |
|
Repayment of Senior Notes (Note 7) |
(24,828) |
|
|
(36,364) |
|
| Purchase of Senior Notes |
(1,712) |
|
|
— |
|
Re-purchase of shares of Common Stock (Note 8) |
(3,466) |
|
|
(8,667) |
|
| Proceeds from exercise of stock options |
22 |
|
|
367 |
|
| Lease payments |
(7,849) |
|
|
(7,078) |
|
| Net cash provided by financing activities |
5,054 |
|
|
33,873 |
|
|
|
|
|
| Foreign exchange loss on cash, cash equivalents and restricted cash and cash equivalents |
(766) |
|
|
(1,513) |
|
|
|
|
|
| Net (decrease) increase in cash, cash equivalents and restricted cash and cash equivalents |
(41,776) |
|
|
52,376 |
|
|
Cash and cash equivalents and restricted cash and cash equivalents,
beginning of period (Note 13)
|
111,337 |
|
|
71,038 |
|
|
Cash and cash equivalents and restricted cash and cash equivalents,
end of period (Note 13)
|
$ |
69,561 |
|
|
$ |
123,414 |
|
|
|
|
|
Supplemental cash flow disclosures (Note 13) |
|
|
|
(See notes to the condensed consolidated financial statements)
Gran Tierra Energy Inc.
Condensed Consolidated Statements of Shareholders’ Equity (Unaudited)
(Thousands of U.S. Dollars)
|
|
|
|
|
|
|
|
|
|
|
|
|
|
|
|
|
|
|
|
|
|
|
|
| |
Three Months Ended June 30, |
|
Six Months Ended June 30, |
| |
2025 |
|
2024 |
|
2025 |
|
2024 |
| Share Capital |
|
|
|
|
|
|
|
| Balance, beginning of period |
$ |
9,939 |
|
|
$ |
9,935 |
|
|
$ |
9,940 |
|
|
$ |
9,936 |
|
|
|
|
|
|
|
|
|
Cancellation of shares of Common Stock (Note 8) |
— |
|
|
— |
|
|
(1) |
|
|
(1) |
|
| Balance, end of period |
$ |
9,939 |
|
|
$ |
9,935 |
|
|
$ |
9,939 |
|
|
$ |
9,935 |
|
|
|
|
|
|
|
|
|
| Additional Paid-in Capital |
|
|
|
|
|
|
|
| Balance, beginning of period |
$ |
1,269,557 |
|
|
$ |
1,245,387 |
|
|
$ |
1,273,343 |
|
|
$ |
1,249,651 |
|
| Exercise of stock options |
22 |
|
|
206 |
|
|
22 |
|
|
367 |
|
Stock-based compensation (Note 8) |
175 |
|
|
89 |
|
|
1,918 |
|
|
571 |
|
Modification of stock options (Note 8) |
— |
|
|
(4,057) |
|
|
— |
|
|
(4,057) |
|
Cancellation of shares of Common Stock (Note 8) |
(1,100) |
|
|
(3,781) |
|
|
(6,629) |
|
|
(8,688) |
|
| Balance, end of period |
$ |
1,268,654 |
|
|
$ |
1,237,844 |
|
|
$ |
1,268,654 |
|
|
$ |
1,237,844 |
|
|
|
|
|
|
|
|
|
| Treasury Stock |
|
|
|
|
|
|
|
| Balance, beginning of period |
$ |
(49) |
|
|
$ |
(203) |
|
|
$ |
(3,165) |
|
|
$ |
(163) |
|
Re-purchase of shares of Common Stock (Note 8) |
(1,051) |
|
|
(3,719) |
|
|
(3,465) |
|
|
(8,667) |
|
Cancellation of shares of Common Stock (Note 8) |
1,100 |
|
|
3,781 |
|
|
6,630 |
|
|
8,689 |
|
| Balance, end of period |
$ |
— |
|
|
$ |
(141) |
|
|
$ |
— |
|
|
$ |
(141) |
|
|
|
|
|
|
|
|
|
| Accumulated and other comprehensive income (loss) |
|
|
|
|
|
|
|
| Balance, beginning of period |
$ |
(6,545) |
|
|
$ |
— |
|
|
$ |
(6,736) |
|
|
$ |
— |
|
| Other comprehensive income |
9,583 |
|
|
— |
|
|
9,774 |
|
|
— |
|
| Balance, end of period |
$ |
3,038 |
|
|
$ |
— |
|
|
$ |
3,038 |
|
|
$ |
— |
|
|
|
|
|
|
|
|
|
| Deficit |
|
|
|
|
|
|
|
| Balance, beginning of period |
$ |
(879,094) |
|
|
$ |
(863,108) |
|
|
$ |
(859,814) |
|
|
$ |
(863,030) |
|
| Net (loss) income |
(12,741) |
|
|
36,371 |
|
|
(32,021) |
|
|
36,293 |
|
| Balance, end of period |
$ |
(891,835) |
|
|
$ |
(826,737) |
|
|
$ |
(891,835) |
|
|
$ |
(826,737) |
|
|
|
|
|
|
|
|
|
| Total Shareholders’ Equity |
$ |
389,796 |
|
|
$ |
420,901 |
|
|
$ |
389,796 |
|
|
$ |
420,901 |
|
(See notes to the condensed consolidated financial statements)
Gran Tierra Energy Inc.
Notes to the Condensed Consolidated Financial Statements (Unaudited)
(Expressed in U.S. Dollars, unless otherwise indicated)
1. Description of Business
Gran Tierra Energy Inc. a Delaware corporation (the “Company” or “Gran Tierra”), is a publicly traded company focused on oil and natural gas exploration and production with assets currently in Colombia, Ecuador and Canada.
2. Significant Accounting Policies
These interim unaudited condensed consolidated financial statements have been prepared in accordance with generally accepted accounting principles in the United States of America (“GAAP”). The information furnished herein reflects all normal recurring adjustments that are, in the opinion of management, necessary for the fair presentation of results for the interim periods.
The note disclosure requirements of annual audited consolidated financial statements provide additional disclosures required for interim unaudited condensed consolidated financial statements. Accordingly, these interim unaudited condensed consolidated financial statements should be read in conjunction with the Company’s consolidated financial statements as at and for the year ended December 31, 2024, included in the Company’s 2024 Annual Report on Form 10-K.
The Company’s significant accounting policies are described in Note 2 of the consolidated financial statements, which are included in the Company’s 2024 Annual Report on Form 10-K and are the same policies followed in these interim unaudited condensed consolidated financial statements. The Company has evaluated all subsequent events to the date these interim unaudited condensed consolidated financial statements were issued.
Recently Issued Accounting Pronouncements
In November 2024 and January 2025 FASB issued ASU 2024-03 and ASU 2025-01, “Income Statement - Reporting Comprehensive Income - Expense Disaggregation Disclosures”. The amendments in ASU 2024-03 require disclosure, in the notes to financial statements, of specified information about certain costs and expenses recognized as part of oil-and natural gas-producing activities included in each relevant expense caption on the face of statement of operations. In addition, this ASU requires the presentation of specific expense captions of comprehensive income on the face of the statements of operations. ASU 2025-01 clarifies the effective date of ASU 2024-03 to be effective for annual reporting periods beginning after December 15, 2026, and interim reporting periods within annual periods beginning after December 15, 2027. The Company is currently assessing the impact of this update will have on its financial statements.
Recently Adopted Accounting Pronouncements
In December 2023, FASB issued ASU 2023-09, “Improvements to Income Tax Disclosures”. ASU 2023-09 enhances the income tax disclosures to enable investors to better understand entity’s exposure to potential changes in jurisdictional tax legislation and associated risks and opportunities, income tax information that effects cash flow forecasts and potential opportunities to increase future cash flows. This ASU is effective for annual reporting periods beginning after December 15, 2024 and should be applied prospectively, with retrospective application permitted. The Company adopted ASU 2023-09 effective January 1, 2025. The implementation of this update did not have a material impact on income tax disclosures.
3. Business Combination
On October 31, 2024, the Company acquired all of the issued and outstanding common shares of i3 Energy Plc (“i3 Energy”), subsequently renamed as Gran Tierra UK Limited (“Gran Tierra UK”) for $204.5 million, consisting of cash consideration of $161.8 million, cash dividend of $4.0 million, cash settlement of stock options of $2.0 million and 5,808,925 shares of the Company’s Common Stock, the fair value of which was determined to be $36.7 million based on the closing price of the Company’s shares on the acquisition date. The acquisition was accounted for as a business combination using the acquisition method with Gran Tierra being the acquirer, whereby the assets acquired and liabilities assumed were recognized at their fair values as at the i3 Energy acquisition date, and the results of i3 Energy were included with those of Gran Tierra from that date. Fair value estimates were made based on significant unobservable (Level 3) inputs and based on the best information available at the time.
Determining the fair values of the assets and liabilities of i3 Energy and the consideration paid required significant judgment and certain assumptions to be made. The most significant fair value estimates related to the valuation of i3 Energy's proved and unproved oil and natural gas properties.
The fair value of proved oil and natural gas properties acquired is based on cash flows associated with estimated acquired proved oil and natural gas reserves and the discount rate. Factors that impact these reserves cash flows include forecasted production, forecasted commodity prices, and forecasted operating, royalty and capital costs. Management is continuing to review and assess information to accurately determine the acquisition date fair value of the proved oil and natural gas properties and deferred tax assets and liabilities acquired.
Due to the timing of acquisition, management is continuing to review and assess information to accurately determine the acquisition date fair value of the proved oil and natural gas properties and deferred tax assets and liabilities acquired. As at June 30, 2025, there were no changes to initial measurement of fair value of the proved oil and natural gas properties and deferred tax assets and liabilities acquired.
Pro Forma Results (unaudited)
Pro forma for the three and six months ended June 30, 2024 are shown below, as if the i3 Energy acquisition had occurred on January 1, 2024. Pro forma results are not indicative of actual results or future performance:
|
|
|
|
|
|
|
|
|
|
|
|
|
Three Months Ended June 30, |
|
Six Months Ended June 30, |
(Unaudited, thousands of U.S. Dollars) |
2024 |
|
2024 |
Oil, natural gas and NGL sales |
$ |
202,089 |
|
|
$ |
399,501 |
|
| Net income |
$ |
54,822 |
|
|
$ |
47,059 |
|
|
|
|
|
|
|
|
|
4. Segment and Geographic Reporting
The Company is primarily engaged in the exploration and production of oil and natural gas. The Company reports segmented information based on internal management reporting used by our Chief Operational Decision Makers (“CODM”), which are the Company’s Chief Executive Officer, Chief Financial Officer, Chief Operating Officer and Vice Presidents across various business functions. CODM allocates resources and assesses performance of each reportable segment based on segmented earnings. The Company determined three reportable segments based on the geographic organization: Colombia, Ecuador and Canada. The “Other” category represents the Company’s corporate activities.
The following tables present information on the Company’s reportable segments and other activities:
|
|
|
|
|
|
|
|
|
|
|
|
|
|
|
|
|
|
|
Three Months Ended June 30, 2025 |
| (Thousands of U.S. Dollars) |
Colombia |
Ecuador |
Canada |
Other |
Total |
| Oil, natural gas and NGL sales |
$ |
109,692 |
|
$ |
8,495 |
|
$ |
34,294 |
|
$ |
— |
|
$ |
152,481 |
|
| Operating expenses |
38,432 |
|
4,122 |
|
13,301 |
|
— |
|
55,855 |
|
| Transportation expenses |
3,735 |
|
441 |
|
3,442 |
|
— |
|
7,618 |
|
| Segmented earnings |
$ |
67,525 |
|
$ |
3,932 |
|
$ |
17,551 |
|
$ |
— |
|
$ |
89,008 |
|
|
|
|
|
|
|
| DD&A expenses |
|
|
|
|
68,635 |
|
| General and administrative expenses |
|
|
|
|
15,006 |
|
| Foreign exchange loss |
|
|
|
|
3,716 |
|
| Derivative instruments gain |
|
|
|
|
(14,032) |
|
| Interest expense |
|
|
|
|
24,366 |
|
| Non-segmented expenses |
|
|
|
|
97,691 |
|
|
|
|
|
|
|
| Other income |
|
|
|
|
339 |
|
| Interest income |
|
|
|
|
251 |
|
| Loss before income taxes |
|
|
|
|
(8,093) |
|
| Income tax expense |
|
|
|
|
4,648 |
|
| Net loss |
|
|
|
|
$ |
(12,741) |
|
|
|
|
|
|
|
|
|
|
|
|
|
|
|
|
|
|
|
|
|
|
|
|
|
| Segment capital expenditures |
$ |
37,749 |
|
$ |
24,800 |
|
$ |
23,871 |
|
$ |
47 |
|
$ |
86,467 |
|
|
|
|
|
|
|
|
|
|
|
|
|
|
|
|
|
|
|
|
Six Months Ended June 30, 2025 |
| (Thousands of U.S. Dollars) |
Colombia |
Ecuador |
Canada |
Other |
Total |
| Oil, natural gas and NGL sales |
$ |
227,340 |
|
$ |
29,518 |
|
$ |
66,156 |
|
$ |
— |
|
$ |
323,014 |
|
| Operating expenses |
81,186 |
|
12,195 |
|
29,828 |
|
— |
|
123,209 |
|
| Transportation expenses |
6,946 |
|
1,534 |
|
6,049 |
|
— |
|
14,529 |
|
| Segmented earnings |
$ |
139,208 |
|
$ |
15,789 |
|
$ |
30,279 |
|
$ |
— |
|
$ |
185,276 |
|
|
|
|
|
|
|
| DD&A expenses |
|
|
|
|
140,837 |
|
| General and administrative expenses |
|
|
|
|
26,632 |
|
| Foreign exchange loss |
|
|
|
|
7,554 |
|
| Derivative instruments loss |
|
|
|
|
(12,565) |
|
| Interest expense |
|
|
|
|
47,601 |
|
| Non-segmented expenses |
|
|
|
|
210,059 |
|
|
|
|
|
|
|
| Other income |
|
|
|
|
287 |
|
| Interest income |
|
|
|
|
676 |
|
| Loss before income taxes |
|
|
|
|
(23,820) |
|
| Income tax expense |
|
|
|
|
8,201 |
|
| Net loss |
|
|
|
|
$ |
(32,021) |
|
|
|
|
|
|
|
| Segment capital expenditures |
$ |
60,418 |
|
$ |
45,587 |
|
$ |
47,536 |
|
$ |
430 |
|
$ |
153,971 |
|
|
|
|
|
|
|
|
|
|
|
|
|
|
|
|
|
|
|
|
Three Months Ended June 30, 2024 |
| (Thousands of U.S. Dollars) |
Colombia |
Ecuador |
Canada |
Other |
Total |
| Oil, natural gas and NGL sales |
$ |
162,573 |
|
$ |
3,036 |
|
$ |
— |
|
$ |
— |
|
$ |
165,609 |
|
| Operating expenses |
45,267 |
|
1,768 |
|
— |
|
— |
|
47,035 |
|
| Transportation expenses |
5,516 |
|
174 |
|
— |
|
— |
|
5,690 |
|
| Segmented earnings |
$ |
111,790 |
|
$ |
1,094 |
|
$ |
— |
|
$ |
— |
|
$ |
112,884 |
|
|
|
|
|
|
|
| DD&A expenses |
|
|
|
|
55,490 |
|
| General and administrative expenses |
|
|
|
|
17,127 |
|
| Severance |
|
|
|
|
— |
|
| Foreign exchange gain |
|
|
|
|
(4,413) |
|
| Interest expense |
|
|
|
|
18,398 |
|
| Non-segmented expenses |
|
|
|
|
86,602 |
|
|
|
|
|
|
|
| Interest income |
|
|
|
|
1,017 |
|
| Income before income taxes |
|
|
|
|
27,299 |
|
| Income tax expense |
|
|
|
|
(9,072) |
|
| Net income |
|
|
|
|
$ |
36,371 |
|
|
|
|
|
|
|
| Segment capital expenditures |
$ |
31,163 |
|
$ |
43,614 |
|
$ |
— |
|
$ |
467 |
|
$ |
75,244 |
|
|
|
|
|
|
|
|
|
|
|
|
|
|
|
|
|
|
|
|
Six Months Ended June 30, 2024 |
| (Thousands of U.S. Dollars) |
Colombia |
Ecuador |
Canada |
Other |
Total |
| Oil, natural gas and NGL sales |
$ |
313,044 |
|
$ |
10,142 |
|
$ |
— |
|
$ |
— |
|
$ |
323,186 |
|
| Operating expenses |
90,393 |
|
5,108 |
|
— |
|
— |
|
95,501 |
|
| Transportation expenses |
9,742 |
|
532 |
|
— |
|
— |
|
10,274 |
|
| Segmented earnings |
$ |
212,909 |
|
$ |
4,502 |
|
$ |
— |
|
$ |
— |
|
$ |
217,411 |
|
|
|
|
|
|
|
| DD&A expenses |
|
|
|
|
111,640 |
|
| General and administrative expenses |
|
|
|
|
31,270 |
|
|
|
|
|
|
|
| Foreign exchange gain |
|
|
|
|
(5,228) |
|
| Interest expense |
|
|
|
|
36,822 |
|
| Non-segmented expenses |
|
|
|
|
174,504 |
|
|
|
|
|
|
|
| Interest income |
|
|
|
|
1,709 |
|
| Income before income taxes |
|
|
|
|
44,616 |
|
| Income tax expense |
|
|
|
|
8,323 |
|
| Net income |
|
|
|
|
$ |
36,293 |
|
|
|
|
|
|
|
| Segment capital expenditures |
$ |
64,876 |
|
$ |
48,701 |
|
$ |
— |
|
$ |
467 |
|
$ |
114,044 |
|
|
|
|
|
|
|
|
|
|
|
|
|
|
|
|
|
|
|
|
As at June 30, 2025 |
| (Thousands of U.S. Dollars) |
Colombia |
Ecuador |
Canada |
Other |
Total |
| Property, plant and equipment |
$ |
1,012,354 |
|
$ |
161,893 |
|
$ |
269,636 |
|
$ |
12,403 |
|
$ |
1,456,286 |
|
| All other assets |
131,347 |
|
39,445 |
|
32,009 |
|
37,869 |
|
240,670 |
|
| Total Assets |
$ |
1,143,701 |
|
$ |
201,338 |
|
$ |
301,645 |
|
$ |
50,272 |
|
$ |
1,696,956 |
|
|
|
|
|
|
|
|
As at December 31, 2024 |
| (Thousands of U.S. Dollars) |
Colombia |
Ecuador |
Canada |
Other |
Total |
| Property, plant and equipment |
$ |
1,022,808 |
|
$ |
143,034 |
|
$ |
247,512 |
|
$ |
9,777 |
|
$ |
1,423,131 |
|
| All other assets |
99,100 |
|
27,942 |
|
62,541 |
|
42,073 |
|
231,656 |
|
| Total Assets |
$ |
1,121,908 |
|
$ |
170,976 |
|
$ |
310,053 |
|
$ |
51,850 |
|
$ |
1,654,787 |
|
5. Taxes Receivable and Payable
The table below shows the break-down of taxes receivable, which are comprised of value added tax (“VAT”) and income tax receivables and payables:
|
|
|
|
|
|
|
|
|
|
|
|
| (Thousands of U.S. Dollars) |
As at June 30, 2025 |
|
As at December 31, 2024 |
Taxes Receivable |
|
|
|
| Current |
|
|
|
VAT Receivable |
$ |
2,217 |
|
|
$ |
657 |
|
| Income Tax Receivable |
26,830 |
|
|
17,438 |
|
|
$ |
29,047 |
|
|
$ |
18,095 |
|
| Long-Term |
|
|
|
Income Tax Receivable |
$ |
1,765 |
|
|
$ |
1,629 |
|
|
|
|
|
Taxes Payable |
|
|
|
Current |
|
|
|
VAT Payable |
$ |
(6,175) |
|
|
$ |
(7,640) |
|
| Income Tax Payable |
(4,428) |
|
|
(6,330) |
|
|
$ |
(10,603) |
|
|
$ |
(13,970) |
|
|
|
|
|
|
|
|
|
|
|
|
|
| Total Net Taxes Receivable |
$ |
20,209 |
|
|
$ |
5,754 |
|
The following table shows the movement of VAT and income tax receivables and payables for the period:
|
|
|
|
|
|
|
|
|
|
|
|
|
|
|
|
|
|
| (Thousands of U.S. Dollars) |
VAT Receivable/(Payable(1)) |
|
Income Tax Receivable |
|
Total Net Taxes Receivable |
Balance, as at December 31, 2024 |
$ |
(6,983) |
|
|
$ |
12,737 |
|
|
$ |
5,754 |
|
Collected through direct government refunds |
(367) |
|
|
— |
|
|
(367) |
|
Collected through sales contracts |
(48,067) |
|
|
— |
|
|
(48,067) |
|
| Taxes paid |
51,417 |
|
|
3,816 |
|
|
55,233 |
|
Withholding taxes paid |
— |
|
|
15,654 |
|
|
15,654 |
|
Current tax expense |
— |
|
|
(10,460) |
|
|
(10,460) |
|
| Foreign exchange loss |
42 |
|
|
2,420 |
|
|
2,462 |
|
Balance, as at June 30, 2025 |
$ |
(3,958) |
|
|
$ |
24,167 |
|
|
$ |
20,209 |
|
(1) VAT is paid on certain goods and services and collected on sales in Colombia at a rate of 19%
6. Property, Plant and Equipment
|
|
|
|
|
|
|
|
|
|
|
|
| (Thousands of U.S. Dollars) |
As at June 30, 2025 |
|
As at December 31, 2024 |
| Oil and natural gas properties |
|
|
|
| Proved |
$ |
5,462,507 |
|
|
$ |
5,298,085 |
|
| Unproved |
116,000 |
|
|
119,520 |
|
| |
5,578,507 |
|
|
5,417,605 |
|
Other (1) |
74,824 |
|
|
97,795 |
|
|
5,653,331 |
|
|
5,515,400 |
|
| Accumulated depletion, depreciation and impairment |
(4,197,045) |
|
|
(4,092,269) |
|
|
$ |
1,456,286 |
|
|
$ |
1,423,131 |
|
(1) The “other” category includes right-of-use assets for operating and finance leases of $62.9 million, which had a net book value of $32.8 million as at June 30, 2025 (December 31, 2024 - $70.1 million, which had a net book value of $35.1 million).
During six months ended June 30, 2025, the Company entered into one finance lease contract related to power generation equipment and capitalized $6.4 million, right-of-use assets in relation to this contract.
For the three and six months ended June 30, 2025 and 2024, the Company had no ceiling test impairment losses. The Company used a 12-month unweighted average of the first-day-of the month prices prior to the ending date of the period ended June 30, 2025 as follows: Brent Crude $73.60 per boe, Edmonton Light Crude of C$91.55 per boe, Alberta AECO spot price of C$1.69 per MMBtu Edmonton Propane C$33.82 per boe, Edmonton Butane C$47.11 per boe and Edmonton Condensate C$95.75, and for the six months ended June 30, 2024 Brent Crude of $82.47 per boe.
7. Debt and Debt Issuance Costs
The Company’s debt as at June 30, 2025, and December 31, 2024, was as follows:
|
|
|
|
|
|
|
|
|
|
|
|
| (Thousands of U.S. Dollars) |
As at June 30, 2025 |
|
As at December 31, 2024 |
| Current |
|
|
|
|
|
|
|
6.25% Senior Notes, due February 2025 (“6.25% Senior Notes”) |
$ |
— |
|
|
$ |
24,828 |
|
| Unamortized debt issuance costs |
— |
|
|
(21) |
|
|
$ |
— |
|
|
$ |
24,807 |
|
|
|
|
|
| Long-Term |
|
|
|
| Credit Facility - Canada |
$ |
22,046 |
|
|
$ |
— |
|
| Credit Facility - Colombia |
24,500 |
|
|
— |
|
7.75% Senior Notes, due May 2027 (“7.75% Senior Notes”) |
24,201 |
|
|
24,201 |
|
9.50% Senior Notes, due October 2029 (“9.50% Senior Notes”) |
735,790 |
|
|
737,590 |
|
| Unamortized Senior Notes discount |
(36,279) |
|
|
(41,918) |
|
| Unamortized debt issuance costs |
(18,138) |
|
|
(18,075) |
|
|
752,120 |
|
|
701,798 |
|
Long-term lease obligation (1) |
20,496 |
|
|
20,325 |
|
|
$ |
772,616 |
|
|
$ |
722,123 |
|
| Total Debt |
$ |
772,616 |
|
|
$ |
746,930 |
|
(1) The current portion of the lease obligation has been included in accounts payable and accrued liabilities on the Company’s balance sheet and totaled $13.9 million as at June 30, 2025 (December 31, 2024 - $15.3 million).
Credit Facility - Canada
The Company, through its wholly owned subsidiary Gran Tierra Canada Ltd., has a revolving credit facility with National Bank of Canada dated March 22, 2024 with a borrowing base of C$100.0 million (US$73.0 million as of June 30, 2025) and the available commitment of a C$50.0 million (US$36.5 million as of June 30, 2025) revolving credit facility comprised of C$35.0 million (US$25.6 million as of June 30, 2025) syndicated facility and C$15.0 million (US$11.0 million as of June 30, 2025) of operating facility. The drawn down amounts under the revolving credit facility can either be in Canadian or U.S. dollars and bear interest rates equal to either the Canadian prime rate or U.S. Base Rate plus a margin ranging from 2.00% to 4.00% per annum or for CORRA loans and SOFR loans plus a margin ranging from 3.00% to 5.00% per annum. Undrawn amounts under the revolving credit facility bear standby fee ranging from 0.75% to 1.25% per annum. In each case, the margin or standby fee, as applicable is based on Net Debt to EBITDA ratio of Gran Tierra Canada Ltd. As of June 30, 2025, the outstanding balance under the facility was US$22.0 million (C$30.0 million) and the weighted-average interest rate on borrowings during the second quarter of 2025 was 6.74%. On July 22, 2025, the borrowing base was redetermined by National Bank of Canada at C$100.0 million, of which available commitment is C$50.0 million. The next borrowing base redetermination will occur on or before November 30, 2025, and the revolving credit facility is available until October 31, 2025 with a repayment date of October 31, 2026, which may be extended by further periods of up to 364 days, subject to lender approval.
Credit Facility - Colombia
On April 16, 2025, the Company, through its wholly owned subsidiary, Gran Tierra Energy Colombia GmbH, a Swiss limited liability company, entered into a $75.0 million reserve-based lending facility (the “RBL Facility”). Any loans incurred under the reserve-based landing facility will mature on April 16, 2028. The availability of borrowings under the RBL Facility is subject to an annual borrowing base determination which will occur on or before May 1 of each year. The RBL Facility will bear interest at a rate per annum equal to, at Company’s option, either (a) a customary base rate (subject to a floor of 1.00%) plus an applicable margin of 4.5% or (b) a term secured overnight finance rate (“SOFR”) reference rate plus an applicable margin of 4.5%. Interest on base rate borrowings is payable quarterly in arrears and interest on term SOFR borrowings accrues in respect of interest periods of three or six months, at the election of the Company, and is payable on the last day of such interest period. The facility also includes a commitment fee of 0.75% per annum on undrawn amounts. If the Company’s draws under the RBL Facility reach or become greater than $25.0 million, the Company is required to implement hedges within 10 days of the respective borrowing date.
During the second quarter of 2025, the Company drew $24.5 million under the facility. As of June 30, 2025 the outstanding balance under the RBL Facility was $24.5 million. For the three and six months ended June 30, 2025, the weighted-average interest rate on borrowings was 8.43%.
Under the terms of the facility, the Company is required to maintain compliance with the following financial covenants:
i.consolidated net debt to consolidated adjusted EBITDA ratio that may not exceed 3.00 to 1.00, and
ii.consolidated interest coverage ratio that may not be less than 2.50 to 1.00
The Company was in compliance with all applicable covenants related to the credit facility as of June 30, 2025.
Senior Notes
During the six months ended June 30, 2025, the Company paid at maturity the remaining principal of $24.8 million of 6.25% Senior Notes due in February 2025 for cash consideration of $25.6 million, including interest payable of $0.8 million.
During the six months ended June 30, 2025, the Company also purchased $1.8 million of 9.50% Senior Notes for cash consideration of $1.7 million resulting in a $0.1 million loss on purchase, which included the write-off of deferred financing fees of $0.1 million.
The principal amount of 9.50% Senior Notes is to be repaid as follows: (i) October 15, 2026, 25% of the principal amount; (ii) October 15, 2027 5% of the principal amount; (iii) October 15, 2028, 30% of the principal amount; and (iv) October 15, 2029, the remainder of the principal amount.
At June 30, 2025, we had $24.2 million aggregate principal amount of 7.75% Senior Notes due 2027, and $735.8 million aggregate principal amount of 9.50% Senior Notes due 2029, outstanding.
As at June 30, 2025, the Company was in compliance with all applicable covenants related to the Senior Notes.
Leases
During the six months ended June 30, 2025, the Company recorded one finance lease of $6.4 million. The finance lease has a 2-year term and a discount rate of 9.6%.
Interest Expense
The following table presents the total interest expense recognized in the accompanying interim unaudited condensed consolidated statements of operations:
|
|
|
|
|
|
|
|
|
|
|
|
|
|
|
|
|
|
|
|
|
|
Three Months Ended June 30, |
|
Six Months Ended June 30, |
|
|
| (Thousands of U.S. Dollars) |
2025 |
2024 |
|
2025 |
2024 |
|
|
|
| Contractual interest and other financing expenses |
$ |
20,284 |
|
$ |
15,638 |
|
|
$ |
39,686 |
|
$ |
30,756 |
|
|
|
|
| Amortization of debt issuance costs |
4,082 |
|
2,760 |
|
|
7,915 |
|
6,066 |
|
|
|
|
|
$ |
24,366 |
|
$ |
18,398 |
|
|
$ |
47,601 |
|
$ |
36,822 |
|
|
|
|
8. Share Capital
|
|
|
|
|
|
|
Shares of Common Stock |
Shares issued at December 31, 2024 |
36,460,141 |
|
| Treasury shares |
(487,948) |
|
Shares issued and outstanding at December 31, 2024 |
35,972,193 |
| Shares issued on option exercise |
9,596 |
|
| Shares re-purchased and cancelled |
(692,804) |
|
Shares issued and outstanding at June 30, 2025 |
35,288,985 |
|
|
|
|
|
|
|
|
During the year ended December 31, 2024, the Company implemented a share re-purchase program (the “2024 Program”) through the facilities of the Toronto Stock Exchange (“TSX”), the NYSE American or alternative programs in Canada or the United States, if eligible. Under the 2024 Program, the Company is able to purchase up to 3,545,872 shares of Common Stock, par value of $0.001 per share (“Common Stock”) representing 10% of the public float as of October 31, 2024. The 2024 Program will continue for one year and expire on November 5, 2025, or earlier if the 10% maximum is reached.
During the three and six months ended June 30, 2025, the Company re-purchased 239,754 and 692,804 shares at a weighted average price of $4.38 and $5.00 per share (three and six months ended June 30, 2024 - 404,314 and 1,290,980 shares under the 2023 program at a weighted average price of $9.20 and $6.71 per share), respectively. As of June 30, 2025, the Company cancelled 487,948 shares held as treasury shares at December 31, 2024, and cancelled 249,754 and 692,804 shares re-purchased during the three and six months ended June 30, 2025. During the period from November 6, 2024 to July 28, 2025, the Company has re-purchased 1,180,752 shares out of a maximum of 3,545,872 under the 2024 Program.
Equity Compensation Awards
The following table provides information about performance stock units (“PSUs”), deferred share units (“DSUs”), restricted share units (“RSUs”) and stock option activity for the six months ended June 30, 2025:
|
|
|
|
|
|
|
|
|
|
|
|
|
|
|
|
|
|
|
PSUs |
DSUs |
RSUs |
Stock Options |
|
Number of Outstanding Share Units |
Number of Outstanding Share Units |
Number of Outstanding Share Units |
Number of Outstanding Stock Options |
Weighted Average Exercise Price/Stock Option ($) |
| Balance, December 31, 2024 |
5,380,629 |
|
904,674 |
|
666,127 |
|
1,550,497 |
|
8.82 |
|
| Granted |
2,499,417 |
|
108,835 |
|
584,019 |
|
— |
|
— |
|
| Exercised |
(1,066,555) |
|
— |
|
(169,300) |
|
(32,764) |
|
2.62 |
|
| Forfeited |
(106,043) |
|
— |
|
(18,786) |
|
(5,546) |
|
9.62 |
|
| Expired |
— |
|
— |
|
— |
|
(420,477) |
|
7.93 |
|
Balance, June 30, 2025 |
6,707,448 |
|
1,013,509 |
|
1,062,060 |
|
1,091,710 |
|
9.34 |
|
On May 1, 2024, the Company amended the settlement terms of all outstanding stock option awards. As of this date, all outstanding stock options are to be net settled in cash resulting in a change in classification of stock options from equity to liability. On May 1, 2024, the Company recorded a liability of $4.4 million and an additional stock-based compensation costs of
$0.4 million related to the modification of the stock option plan.
As at June 30, 2025, the equity compensation award liability on the Company’s balance sheet included $1.0 million of current liability related to the Company’s outstanding stock options.
The fair value of each stock option award was estimated on the modification date using the Black-Scholes-Merton option-pricing model based on the assumptions noted in the following table:
|
|
|
|
|
|
| Fair value of option modification |
$0.00 - $6.11 |
| Dividend yield (per share) |
Nil |
| Expected volatility |
43% to 87% |
| Risk-free interest rate |
4.6% to 5.1% |
| Expected term |
0.1 - 4.9 years |
| Expected forfeiture rate |
0% to 5% |
For the three and six months ended June 30, 2025, there was $0.5 million and nil of stock-based compensation expense, respectively. For the three and six months ended June 30, 2024, stock-based compensation expense was $6.2 million and $9.5 million, respectively.
As at June 30, 2025, there was $12.6 million (December 31, 2024 - $21.9 million) of unrecognized compensation costs related to unvested PSUs, RSUs and stock options, which are expected to be recognized over a weighted-average period of 1.4 years. During the six months ended June 30, 2025, the Company paid out $7.2 million for PSUs vested on December 31, 2024 (six months ended June 30, 2024 - $10.4 million for PSUs vested on December 31, 2023).
During the three and six months ended June 30, 2025, the Company awarded 0.01 million and 0.6 million RSU to employees pursuant to the existing 2007 Equity Incentive Plan, respectively. Under the 2007 Equity Incentive Plan, RSUs will vest one-third each year over a three-year period. Upon vesting, RSUs entitle the holder to receive either the underlying number of shares of the Company’s Common Stock or a cash payment equal to the value of the underlying shares of the Company’s Common Stock. The Company intends to settle RSUs outstanding as at March 31, 2025, in cash.
Net Income (Loss) per Share
Basic net income or loss per share is calculated by dividing net income or loss attributable to common shareholders by the weighted average number of shares of Common Stock issued and outstanding during each period.
Diluted net income or loss per share is calculated using the treasury stock method for share-based compensation arrangements. The treasury stock method assumes that any proceeds obtained on the exercise of share-based compensation arrangements would be used to purchase shares of Common Stock at the average market price during the period. The weighted average number of shares is then adjusted by the difference between the number of shares issued from the exercise of share-based compensation arrangements and shares re-purchased from the related proceeds. Anti-dilutive shares represent potentially dilutive securities excluded from the computation of diluted income or loss per share as their impact would be anti-dilutive.
Weighted Average Shares Outstanding
For the three and six months ended June 30, 2025 and 2024, all options were excluded from the diluted loss per share calculation as the options were anti-dilutive.
9. Revenue
|
|
|
|
|
|
|
|
|
|
|
|
|
|
|
|
|
|
|
|
|
|
|
|
|
|
|
|
|
|
| |
Three Months Ended June 30, 2025 |
|
Six Months Ended June 30, 2025 |
| |
Crude Oil |
Natural Gas |
NGL |
Total Revenue |
|
Crude Oil |
Natural Gas |
NGL |
Total Revenue |
Colombia |
109,692 |
|
— |
|
— |
|
109,692 |
|
|
227,340 |
|
— |
|
— |
|
227,340 |
|
Ecuador |
8,495 |
|
— |
|
— |
|
8,495 |
|
|
29,518 |
|
— |
|
— |
|
29,518 |
|
Canada |
20,566 |
|
9,923 |
|
3,805 |
|
34,294 |
|
|
39,118 |
|
18,650 |
|
8,388 |
|
66,156 |
|
|
$ |
138,753 |
|
$ |
9,923 |
|
$ |
3,805 |
|
$ |
152,481 |
|
|
$ |
295,976 |
|
$ |
18,650 |
|
$ |
8,388 |
|
$ |
323,014 |
|
|
|
|
|
|
|
|
|
|
|
|
|
|
|
|
|
|
|
|
|
|
|
|
|
|
|
|
|
|
|
| |
Three Months Ended June 30, 2024 |
|
Six Months Ended June 30, 2024 |
| |
Crude Oil |
Natural Gas |
NGL |
Total Revenue |
|
Crude Oil |
Natural Gas |
NGL |
Total Revenue |
Colombia |
162,573 |
|
— |
|
— |
|
162,573 |
|
|
313,044 |
|
— |
|
— |
|
313,044 |
|
Ecuador |
3,036 |
|
— |
|
— |
|
3,036 |
|
|
10,142 |
|
— |
|
— |
|
10,142 |
|
Canada |
— |
|
— |
|
— |
|
— |
|
|
— |
|
— |
|
— |
|
— |
|
|
$ |
165,609 |
|
$ |
— |
|
$ |
— |
|
$ |
165,609 |
|
|
$ |
323,186 |
|
$ |
— |
|
$ |
— |
|
$ |
323,186 |
|
During the three and six months ended June 30, 2025, the Company’s production was sold primarily to two major customers representing 65% and 20% of the total sales volumes, of which 63% was sold in Colombia, 5% in Ecuador and 32% in Canada (three and six months ended June 30, 2024 - one major customer representing 100% of the total sales volumes).
As at June 30, 2025, accounts receivable included $14.3 million of accrued sales revenue related to June 2025 production (December 31, 2024 - $13.4 million related to December 2024 production).
10. Taxes
The Company’s effective tax rate was (34)% for the six months ended June 30, 2025, compared to 19% in the comparative period of 2024.
Current income tax expense was $10.5 million for the six months ended June 30, 2025, compared to $46.2 million in the corresponding period of 2024, primarily due to lower taxable income.
For the six months ended June 30, 2025, the Company recognized a deferred tax recovery of $2.3 million, primarily attributable to an increase in deductible temporary differences arising from tax losses generated during the period. This recovery was partially offset by temporary differences related to accelerated tax depreciation in excess of accounting depreciation.
For the six months ended June 30, 2024, the deferred income tax recovery was $37.9 million primarily as a result of the recognition of additional tax losses resulting from a tax planning strategy, which were partially offset by tax depreciation being higher than accounting depreciation and the use of tax losses to offset taxable income in Colombia.
For the six months ended June 30, 2025, the difference between the effective tax rate of negative 34% and the 40% statutory tax rate was primarily due to an increase in the non-deductible foreign translation adjustments, other permanent differences and valuation allowance. This was partially offset by an increase in the impact of foreign taxes.
For the six months ended June 30, 2024, the difference between the effective tax rate of 19% and the 50% Colombian tax rate was primarily due to a decrease in the impact of foreign taxes, 2022 true-up related to tax planning strategy and non-taxable foreign exchange adjustments. These were partially offset by an increase in valuation allowance, other permanent differences, non-deductible stock-based compensation and non-deductible royalties in Colombia.
11. Contingencies
Legal Proceedings
The Company has several lawsuits and claims pending. The outcome of the lawsuits and disputes cannot be predicted with certainty; the Company believes the resolution of these matters would not have a material adverse effect on the Company’s consolidated financial position, results of operations, or cash flows. The Company records costs as they are incurred or become probable and determinable.
Letters of Credit and Other Credit Support
At June 30, 2025, the Company had provided letters of credit and other credit support totaling $239.8 million (December 31, 2024 - $244.5 million) as security relating to work commitment guarantees in Colombia and Ecuador contained in exploration contracts, the Suroriente Block, and other capital or operating requirements as well as for transportation capacity in Canada.
12. Financial Instruments and Fair Value Measurement
Financial Instruments
Financial instruments are initially recorded at fair value, defined as the price that would be received to sell an asset or paid to market participants to settle liability at the measurement date. For financial instruments carried at fair value, GAAP establishes a fair value hierarchy that prioritizes the inputs to valuation techniques used to measure fair value. This hierarchy consists of three broad levels:
•Level 1 - Inputs representing quoted market prices in active markets for identical assets and liabilities
•Level 2 - Inputs other than quoted prices included within Level 1 that are observable for the assets and liabilities, either directly or indirectly
•Level 3 - Unobservable inputs for assets and liabilities
At June 30, 2025, the Company’s financial instruments recognized on the balance sheet consist of cash and cash equivalents, restricted cash and cash equivalents, accounts receivable, other current assets, accounts payable and accrued liabilities, long-term debt and other long-term liabilities. The Company uses appropriate valuation techniques based on the available information to measure the fair values of assets and liabilities.
Fair Value Measurement
The following table presents the Company’s fair value measurements of its financial instruments as of June 30, 2025, and December 31, 2024:
|
|
|
|
|
|
|
|
|
|
|
|
| (Thousands of U.S. Dollars) |
As at June 30, 2025 |
|
As at December 31, 2024 |
| Level 1 |
|
|
|
|
|
|
|
|
|
|
|
|
|
|
|
| Liabilities |
|
|
|
6.25% Senior Notes |
$ |
— |
|
|
$ |
24,133 |
|
7.75% Senior Notes |
19,875 |
|
|
21,451 |
|
9.50% Senior Notes |
561,542 |
|
|
688,262 |
|
|
$ |
581,417 |
|
|
$ |
733,846 |
|
| Level 2 |
|
|
|
| Assets |
|
|
|
Restricted cash and cash equivalents - long-term (1) |
$ |
8,533 |
|
|
$ |
6,816 |
|
Commodity derivatives - current (2) |
12,112 |
|
|
712 |
|
|
$ |
20,645 |
|
|
$ |
7,528 |
|
|
|
|
|
| Liabilities |
|
|
|
Commodity derivatives - current (3) |
$ |
882 |
|
|
$ |
— |
|
| Canadian and Colombian credit facilities - long-term |
44,237 |
|
|
— |
|
|
$ |
45,119 |
|
|
$ |
— |
|
(1) The long-term portion of restricted cash and cash equivalents is included in the other long-term assets on the Company’s condensed consolidated balance sheet.
(2) The current portion of commodity derivatives asset was included into other current assets on the Company’s condensed consolidated balance sheet.
(3) The current portion of commodity derivatives liability was included into accounts payable balance on the Company’s condensed consolidated balance sheet.
The fair values of cash and cash equivalents, current restricted cash and cash equivalents, accounts receivable and accounts payable, and accrued liabilities approximate their carrying amounts due to the short-term maturity of these instruments.
Restricted Cash and Cash Equivalents - Long-Term
The fair value of long-term restricted cash and cash equivalents approximate its carrying value because interest rates are variable and reflective of market rates.
Credit Facilities and Senior Notes
Financial instruments recorded at amortized cost at June 30, 2025, were the Senior Notes and credit facilities (Note 7).
The fair value of the Canadian and Colombian credit facilities approximates their carrying value. The fair value of the Canadian and Colombian credit facilities is estimated based on the amount the Company would have to pay a third party to assume the debt, including the credit spread for the difference between the issue rate and the period-end market rate. The credit spread is the Company’s default or repayment risk.
At June 30, 2025, the carrying amounts of the 7.75% Senior Notes and 9.50% Senior Notes were $23.9 million and $683.9 million, respectively, which represented the aggregate principal amounts less unamortized debt issuance costs and discounts, and the fair values were $19.9 million, and $561.5 million, respectively.
Derivative asset and derivative liability
The fair value of derivatives is estimated based on various factors, including quoted market prices in active markets and quotes from third parties. The Company also performs an internal valuation to ensure the reasonableness of third party quotes. In consideration of counterparty credit risk, the Company assessed the possibility of whether the counterparty to the derivative would default by failing to make any contractually required payments. Additionally, the Company considers whether such counterparty has the ability to meet its potential repayment obligations associated with the derivative transactions.
|
|
|
|
|
|
|
|
|
|
|
|
|
|
|
|
|
|
|
Three Months Ended June 30, |
|
Six Months Ended June 30, |
| (Thousands of U.S. Dollars) |
2025 |
2024 |
|
2025 |
2024 |
| Commodity price derivatives gain |
(6,802) |
|
— |
|
|
(5,335) |
|
— |
|
| Foreign currency derivatives gain |
(7,230) |
|
— |
|
|
(7,230) |
|
— |
|
| Derivative instruments gain |
$ |
(14,032) |
|
$ |
— |
|
|
$ |
(12,565) |
|
$ |
— |
|
Commodity Price Risk
The Company may at times utilize commodity price derivatives to manage the variability in cash flows associated with the forecasted sale of its oil production, reduce commodity price risk and provide a base level of cash flow in order to assure it can execute at least a portion of its capital spending. As at June 30, 2025, the Company had outstanding commodity price derivative positions in Canada and Colombia as follows:
|
|
|
|
|
|
|
|
|
|
|
|
|
|
|
|
|
|
|
|
|
|
|
|
|
|
|
|
|
|
|
|
|
|
|
|
|
|
|
| Canada - Oil |
| Type of Instrument |
Start Period |
|
End Period |
Volume,
bbl/d |
|
Reference |
|
Price (C$/bbl or $/bbl) |
|
Purchased Put (C$/bbl or $/bbl Weighted Average) |
|
Sold Call
(C$/bbl or $/bbl Weighted Average) |
| Swap |
July 01, 2025 |
|
September 30, 2025 |
539 |
|
|
WTI CMA |
|
C$ |
97.81 |
|
|
— |
|
|
— |
|
| Collar |
July 01, 2025 |
|
December 31, 2025 |
1,500 |
|
|
WTI CMA |
|
— |
|
|
$ |
61.67 |
|
|
$ |
72.87 |
|
| Call option |
July 01, 2025 |
|
December 31, 2025 |
250 |
|
|
WTI CMA |
|
— |
|
|
— |
|
|
C$ |
95.00 |
|
| Collar |
January 01, 2026 |
|
March 31, 2026 |
1,000 |
|
|
WTI CMA |
|
— |
|
|
$ |
60.00 |
|
|
$ |
70.60 |
|
|
|
|
|
|
|
|
|
|
|
|
|
|
|
|
|
|
|
|
|
|
|
|
|
|
|
|
|
|
|
|
|
|
|
|
|
|
|
|
| Canada - Natural Gas |
| Type of Instrument |
Start Period |
|
End Period |
Volume,
GJs/d |
|
Reference |
|
Sold Swap (C$/GJ, Weighted Average) |
|
Purchased Put (C$/GJ, Weighted Average) |
|
Sold Call
(C$/GJ, Weighted Average) |
| Swap |
July 01, 2025 |
|
September 30, 2025 |
12,500 |
|
|
Aeco 5A |
|
$ |
3.07 |
|
|
— |
|
|
— |
|
| Put Option |
July 01, 2025 |
|
September 30, 2025 |
6,500 |
|
|
Aeco 7A |
|
— |
|
|
$ |
2.00 |
|
|
— |
|
| Swap |
October 01, 2025 |
|
December 31, 2025 |
22,500 |
|
|
Aeco 5A |
|
$ |
3.13 |
|
|
— |
|
|
— |
|
|
|
|
|
|
|
|
|
|
|
|
|
|
|
|
|
|
|
|
|
|
|
|
|
|
|
|
|
|
|
|
|
|
|
|
|
|
|
|
|
|
|
|
|
|
|
|
|
|
|
|
|
| Canada - Power |
| Type of Instrument |
Start Period |
|
End Period |
Volume,
MWh/d |
|
Reference |
|
Sold Swap (C$/MWh, Weighted Average) |
|
Purchased Put (C$/MWh, Weighted Average) |
|
Sold Call
(C$/MWh, Weighted Average) |
| Swap |
July 01, 2025 |
|
September 30, 2025 |
72 |
|
|
AESO |
|
$ |
49.75 |
|
|
— |
|
|
— |
|
| Swap |
October 01, 2025 |
|
December 31, 2025 |
72 |
|
|
AESO |
|
$ |
49.75 |
|
|
— |
|
|
— |
|
|
|
|
|
|
|
|
|
|
|
|
|
|
|
|
|
|
|
|
|
|
|
|
|
|
|
|
|
|
|
|
|
|
|
|
|
|
|
|
|
|
|
|
|
|
|
|
|
|
|
|
|
|
|
|
|
|
|
|
|
|
|
|
|
|
|
|
|
|
|
|
| Colombia - Oil |
| Type of Instrument |
Start Period |
|
End Period |
Volume
bbl/d |
|
Reference |
|
Sold Put ($/bbl, Weighted Average) |
|
Purchased Put ($/bbl, Weighted Average) |
|
Sold Call
($/bbl, Weighted Average) |
|
Premium ($/bbl, Weighted Average) |
| Collar |
July 01, 2025 |
|
September 30, 2025 |
6,337 |
|
|
Brent |
|
$ |
— |
|
|
$ |
62.63 |
|
|
$ |
76.92 |
|
|
$ |
— |
|
| Put Option |
July 01, 2025 |
|
December 31, 2025 |
3,000 |
|
|
Brent |
|
$ |
— |
|
|
$ |
66.17 |
|
|
$ |
— |
|
|
$ |
(3.09) |
|
| 3 Way |
July 01, 2025 |
|
September 30, 2025 |
2,000 |
|
|
Brent |
|
$ |
52.50 |
|
|
$ |
60.00 |
|
|
$ |
75.55 |
|
|
$ |
— |
|
| Collar |
October 01, 2025 |
|
December 31, 2025 |
6,000 |
|
|
Brent |
|
$ |
— |
|
|
$ |
62.50 |
|
|
$ |
76.71 |
|
|
$ |
— |
|
| 3 Way |
October 01, 2025 |
|
December 31, 2025 |
2,000 |
|
|
Brent |
|
$ |
52.50 |
|
|
$ |
60.00 |
|
|
$ |
75.55 |
|
|
$ |
— |
|
| Collar |
January 01, 2026 |
|
March 31, 2026 |
2,000 |
|
|
Brent |
|
$ |
— |
|
|
$ |
60.00 |
|
|
$ |
75.38 |
|
|
$ |
— |
|
| 3 Way |
January 01, 2026 |
|
March 31, 2026 |
2,000 |
|
|
Brent |
|
$ |
52.50 |
|
|
$ |
65.00 |
|
|
$ |
74.94 |
|
|
$ |
— |
|
Subsequent to the period ending June 30, 2025, the company entered into the following commodity price derivative positions in Canada and Colombia as follows:
|
|
|
|
|
|
|
|
|
|
|
|
|
|
|
|
|
|
|
|
|
|
|
|
|
|
|
|
|
|
|
|
|
|
|
|
|
|
|
|
|
|
|
|
|
| Canada - Oil |
| Type of Instrument |
Start Period |
|
End Period |
Volume
bbl/d |
|
Reference |
|
Sold Put (C$/bbl, Weighted Average) |
|
Purchased Put (C$/bbl, Weighted Average) |
|
Sold Call
(C$/bbl, Weighted Average) |
|
Premium (C$/bbl, Weighted Average) |
| 3 Way |
January 01, 2026 |
|
March 31, 2026 |
500 |
|
|
WTI CMA |
|
$ |
60.00 |
|
|
$ |
70.00 |
|
|
$ |
107.00 |
|
|
$ |
(1.90) |
|
| Collar |
April 01, 2026 |
|
September 30, 2026 |
500 |
|
|
WTI CMA |
|
$ |
— |
|
|
$ |
75.00 |
|
|
$ |
91.95 |
|
|
$ |
— |
|
| 3 Way |
April 01, 2026 |
|
September 30, 2026 |
1,000 |
|
|
WTI CMA |
|
$ |
62.50 |
|
|
$ |
72.50 |
|
|
$ |
103.70 |
|
|
$ |
(0.95) |
|
| 3 Way |
October 01, 2026 |
|
December 31, 2026 |
500 |
|
|
WTI CMA |
|
$ |
60.00 |
|
|
$ |
70.00 |
|
|
$ |
107.00 |
|
|
$ |
(1.90) |
|
|
|
|
|
|
|
|
|
|
|
|
|
|
|
|
|
|
|
|
|
|
|
|
|
|
|
|
|
|
|
|
|
|
|
|
|
|
|
|
|
|
|
|
|
|
| Colombia - Oil |
| Type of Instrument |
Start Period |
|
End Period |
Volume
bbl/d |
|
Reference |
|
Sold Put ($/bbl, Weighted Average) |
|
Purchased Put ($/bbl, Weighted Average) |
|
Sold Call
($/bbl, Weighted Average) |
|
Premium ($/bbl, Weighted Average) |
| 3 Way |
September 01, 2025 |
|
December 31, 2025 |
1,000 |
|
|
Brent |
|
$ |
50.00 |
|
|
$ |
60.00 |
|
|
$ |
77.00 |
|
|
$ |
— |
|
| Put Option |
September 01, 2025 |
|
June 30, 2026 |
2,000 |
|
|
Brent |
|
$ |
— |
|
|
$ |
65.00 |
|
|
$ |
— |
|
|
$ |
(4.00) |
|
| 3 Way |
January 01, 2026 |
|
June 30, 2026 |
4,000 |
|
|
Brent |
|
$ |
50.00 |
|
|
$ |
60.00 |
|
|
$ |
75.50 |
|
|
$ |
— |
|
| Collar |
January 01, 2026 |
|
June 30, 2026 |
1,000 |
|
|
Brent |
|
$ |
— |
|
|
$ |
60.00 |
|
|
$ |
76.75 |
|
|
$ |
— |
|
| 3 Way |
July 01, 2026 |
|
September 30, 2026 |
1,000 |
|
|
Brent |
|
$ |
50.00 |
|
|
$ |
60.00 |
|
|
$ |
75.50 |
|
|
$ |
— |
|
Foreign Exchange Risk
The Company is exposed to foreign exchange risk in relation to its Colombian and Canadian operations predominantly in operating expenses. To mitigate exposure to fluctuations in foreign exchange, the Company may enter into foreign currency exchange derivatives.
As at June 30, 2025, the Company had outstanding foreign currency exchange derivative positions in Colombia as follows:
|
|
|
|
|
|
|
|
|
|
|
|
|
|
|
|
|
|
| Period and Type of Instrument |
U.S. Dollars Amount Hedged
(Thousands of U.S. Dollars) |
COP Equivalent of Amount Hedged (Millions of COP)(1) |
Reference |
Floor Price
(COP, Weighted Average) |
Cap Price (COP, Weighted Average) |
| Collars: June 16, 2025 to April 15, 2026 |
100,000 |
|
407,000 |
|
COP |
4,430 |
|
4,706 |
|
(1) At June 30, 2025 foreign exchange rate.
13. Supplemental Cash Flow Information
The following table provides a reconciliation of cash and cash equivalents and restricted cash and cash equivalents shown as a sum of these amounts in the interim unaudited condensed consolidated statements of cash flows:
|
|
|
|
|
|
|
|
|
|
|
|
|
|
|
|
|
|
|
As at June 30, |
|
As at December 31, |
| (Thousands of U.S. Dollars) |
2025 |
2024 |
|
2024 |
2023 |
| Cash and cash equivalents |
$ |
61,028 |
|
$ |
115,327 |
|
|
$ |
103,379 |
|
$ |
62,146 |
|
Restricted cash and cash equivalents - current (1) |
— |
|
1,142 |
|
|
1,142 |
|
1,142 |
|
Restricted cash and cash equivalents - long-term (2) |
8,533 |
|
6,945 |
|
|
6,816 |
|
7,750 |
|
|
$ |
69,561 |
|
$ |
123,414 |
|
|
$ |
111,337 |
|
$ |
71,038 |
|
(1) Included in other current assets on the Company’s condensed consolidated balance sheet.
(2) Included in other long-term assets on the Company’s condensed consolidated balance sheet.
Net changes in assets and liabilities from operating activities were as follows:
|
|
|
|
|
|
|
|
|
|
|
|
|
Six Months Ended June 30, |
| (Thousands of U.S. Dollars) |
2025 |
|
2024 |
| Accounts receivable and other long-term assets |
$ |
(2,038) |
|
|
$ |
6,797 |
|
| Prepaid Equity Forward |
— |
|
|
6,218 |
|
Prepaids and inventory |
(11,693) |
|
|
(1,579) |
|
Accounts payable and accrued liabilities, and other long-term liabilities |
27,387 |
|
|
(4,927) |
|
| Taxes receivable and payable |
(11,954) |
|
|
7,300 |
|
| Net changes in assets and liabilities from operating activities |
$ |
1,702 |
|
|
$ |
13,809 |
|
Net changes in working capital from investing activities were as follows:
|
|
|
|
|
|
|
|
|
|
|
|
|
Six Months Ended June 30, |
| (Thousands of U.S. Dollars) |
2025 |
|
2024 |
| Additions to property, plant and equipment |
$ |
(145,897) |
|
|
$ |
(116,604) |
|
| (Decrease) increase in accounts payable and accrued liabilities |
(8,911) |
|
|
2,525 |
|
| Decrease in accounts receivable |
837 |
|
|
35 |
|
Net cash additions to property, plant and equipment |
$ |
(153,971) |
|
|
$ |
(114,044) |
|
The Company revised the presentation of cash flows associated with additions to property, plant and equipment within net cash used in investing activities in the Consolidated Statements of Cash Flows for the six months ended June 30, 2024. Additions to property, plant and equipment as previously reported of $116.6 million were presented on an accrual basis before the related decrease in cash outflow due to impact of changes in non-cash investing working capital of $2.6 million. The cash outflow associated with additions to property, plant and equipment has been re-casted in accordance with the direct method.
There was no change in amount to the Company’s previously reported net cash used in investing activities
The following table provides additional supplemental cash flow disclosures:
|
|
|
|
|
|
|
|
|
|
|
|
|
Six Months Ended June 30, |
| (Thousands of U.S. Dollars) |
2025 |
|
2024 |
| Cash paid for income taxes |
$ |
3,816 |
|
|
$ |
21,786 |
|
| Cash paid for withholding taxes |
$ |
15,654 |
|
|
$ |
18,752 |
|
| Cash paid for interest |
$ |
36,763 |
|
|
$ |
29,297 |
|
|
|
|
|
| Non-cash investing activities: |
|
|
|
| Net liabilities related to property, plant and equipment, end of period |
$ |
53,209 |
|
|
$ |
49,976 |
|
14. Subsequent Events
On June 4, 2025, the Company, through its wholly owned subsidiary, Gran Tierra UK Limited, a United Kingdom limited company, entered into an agreement to sell its wholly owned subsidiary, Gran Tierra North Sea Limited (GTNSL) to NEO Energy for total consideration of $7.5 million. Completion of the transaction is subject to certain customary conditions precedent, including consent from the North Sea Transition Authority in respect of the change of control of GTNSL. The transaction is expected to close in the fourth quarter of 2025.
Item 2. Management’s Discussion and Analysis of Financial Condition and Results of Operations
The following discussion of our financial condition and results of operations should be read in conjunction with the “Financial Statements” as set out in Part I, Item 1 of this Quarterly Report on Form 10-Q, as well as “Management’s Discussion and Analysis of Financial Condition and Results of Operations” and the “Financial Statements and Supplementary Data” included in Part II, Items 7 and 8, respectively, of our 2024 Annual Report on Form 10-K. Please see the cautionary language at the beginning of this Quarterly Report on Form 10-Q regarding the identification of and risks relating to forward-looking statements and the risk factors described in Part II, Item 1A “Risk Factors” of this Quarterly Report on Form 10-Q, as well as Part I, Item 1A “Risk Factors” in our 2024 Annual Report on Form 10-K.
Financial and Operational Highlights
Key Highlights for the second quarter of 2025
•Net loss for the second quarter of 2025 was $12.7 million or $(0.36) per share basic and diluted, compared to a net income of $36.4 million or $1.16 per share basic and diluted for the second quarter of 2024 and a net loss of $19.3 million for the prior quarter
•Loss before income taxes for the second quarter of 2025 was $8.1 million, compared to income before income taxes of $27.3 million for the second quarter of 2024 and loss before income taxes of $15.7 million for the prior quarter
•Brent oil price averaged $66.71 per bbl during the quarter, a decrease of 22% from the comparable period in 2024, and an 11% decrease from the prior quarter. Castilla, Vasconia and Oriente differentials averaged $4.73, $1.71 and $7.26 per bbl during the quarter, a decrease of 42%, 57% and 13% from the comparable period of 2024, and an increase of 11%, 25% and 5% from the prior quarter, respectively
•Adjusted EBITDA(2) was $77.0 million for the second quarter of 2025, a decrease from $103.0 million in the second quarter of 2024, and a decrease from $85.2 million in the prior quarter
•Funds flow from operations(2) increased to $53.9 million compared to $46.2 million in the second quarter of 2024, and decreased from $55.3 million in the prior quarter
•In the second quarter of 2025, we re-purchased 0.2 million shares of Common Stock at a weighted average price of $4.38 per share through the 2024 share re-purchase program. During the period from November 6, 2024 to July 28, 2025, we re-purchased a total of 1.2 million shares or 3% of the outstanding shares as of June 30, 2025
•NAR production for the second quarter of 2025 increased by 53% to 39,800 BOEPD, compared to 26,002 BOEPD in the second quarter of 2024, and increased by 3% from 38,563 BOEPD in the prior quarter as a result of the successful drilling in Simonette in Canada; Cohembi infill drilling, waterflood management and strong Acordionero performance in Colombia; and continued exploration success in Ecuador from the Iguana wells
•Sales volumes for the second quarter of 2025 increased by 52% to 38,331 BOEPD, compared to 25,191 BOEPD in the second quarter of 2024 and decreased by 2% from 39,024 BOEPD in the prior quarter. Sales volumes were negatively impacted by an accumulation of inventory in Ecuador during the Quarter which was sold in July 2025. Liftings in Ecuador occur approximately every two months
•Oil, natural gas and NGL sales for the second quarter of 2025 decreased by 8% to $152.5 million, compared to the second quarter of 2024, primarily due to lower oil prices partially partially offset by increase in sales volumes. Oil, natural gas and NGL sales decreased by 11% from $170.5 million in the prior quarter due to lower oil and gas prices and lower sales volumes, partially offset by lower differentials
•Operating costs per boe decreased 22% compared to the comparative period of 2024 and decreased 17% from the prior quarter. Operating expenses increased by 19% to $55.9 million when compared to the second quarter of 2024, primarily as a result of new Canadian operations and ramp-up of operations in Ecuador. Operating expenses decreased by 17% from $67.4 million in the prior quarter primarily as a result of lower workovers and lower lifting costs related to power generation, equipment rental and inventory build-up in Ecuador
•Transportation expenses increased by 34% when compared to the second quarter of 2024 primarily due to 52% higher sales volumes attributed to new Canadian operations and higher sales volumes in Ecuador, partially offset by lower volumes transported in Colombia. Transportation expenses increased by 10% compared to the prior quarter primarily as a result of increase in volumes transported by Canadian operations
•Operating Netback(2) decreased by $1.87 per boe compared to the prior quarter with Brent Oil price decreasing by $8.27 over the same period. Operating netback(2) was $89.0 million compared to $112.9 million in the second quarter of 2024 and $96.3 million in the prior quarter
•Quality and transportation discounts for the second quarter of 2025 increased to $22.99 per boe compared to $12.79 per boe in the second quarter of 2024 and $26.43 per boe in the prior quarter primarily as a result of the change in production mix with the acquisition of Canadian assets
•General and administrative (“G&A”) expenses before stock-based compensation for the second quarter of 2025 increased to $14.5 million compared to $11.0 million in the second quarter of 2024 and $12.1 million in the prior quarter, due to the addition of the new Canadian operation and timing of certain annual corporate expenses
•Capital expenditures for the second quarter of 2025 were $51.2 million compared to $61.3 million in the second quarter of 2024 and $94.7 million in the prior quarter. This decrease in capital expenditure activity is in line with the Company’s budgeted capital spend for 2025
|
|
|
|
|
|
|
|
|
|
|
|
|
|
|
|
|
|
|
|
|
|
|
|
|
|
|
|
|
|
| (Thousands of U.S. Dollars, unless otherwise indicated) |
Three Months Ended June 30, |
|
Three Months Ended March 31, |
|
Six Months Ended June 30, |
| |
2025 |
2024 |
% Change |
|
2025 |
|
2025 |
2024 |
% Change |
| Average Daily Volumes (BOEPD) |
|
|
|
|
|
|
|
|
|
| Consolidated |
|
|
|
|
|
|
|
|
|
| Working Interest (“WI”) Production Before Royalties |
47,196 |
|
32,776 |
|
44 |
|
|
46,647 |
|
|
46,923 |
|
32,509 |
|
44 |
|
| Royalties |
(7,396) |
|
(6,774) |
|
9 |
|
|
(8,084) |
|
|
(7,738) |
|
(6,586) |
|
17 |
|
| Production NAR |
39,800 |
|
26,002 |
|
53 |
|
|
38,563 |
|
|
39,185 |
|
25,923 |
|
51 |
|
| Increase in Inventory |
(1,469) |
|
(811) |
|
81 |
|
|
461 |
|
|
(509) |
|
(288) |
|
(77) |
|
Sales(1) |
38,331 |
|
25,191 |
|
52 |
|
|
39,024 |
|
|
38,676 |
|
25,635 |
|
51 |
|
|
|
|
|
|
|
|
|
|
|
| Net (Loss) Income |
$ |
(12,741) |
|
$ |
36,371 |
|
(135) |
|
|
$ |
(19,280) |
|
|
$ |
(32,021) |
|
$ |
36,293 |
|
188 |
|
|
|
|
|
|
|
|
|
|
|
| Operating Netback |
|
|
|
|
|
|
|
|
|
| Oil, natural gas and NGL Sales |
$ |
152,481 |
|
$ |
165,609 |
|
(8) |
|
|
$ |
170,533 |
|
|
$ |
323,014 |
|
$ |
323,186 |
|
— |
|
| Operating Expenses |
(55,855) |
|
(47,035) |
|
19 |
|
|
(67,354) |
|
|
(123,209) |
|
(95,501) |
|
29 |
|
| Transportation Expenses |
(7,618) |
|
(5,690) |
|
34 |
|
|
(6,911) |
|
|
(14,529) |
|
(10,274) |
|
41 |
|
Operating Netback(2) |
$ |
89,008 |
|
$ |
112,884 |
|
(21) |
|
|
$ |
96,268 |
|
|
$ |
185,276 |
|
$ |
217,411 |
|
(15) |
|
|
|
|
|
|
|
|
|
|
|
| G&A Expenses before Stock-Based Compensation |
$ |
14,460 |
|
$ |
10,967 |
|
32 |
|
|
$ |
12,143 |
|
|
$ |
26,603 |
|
$ |
21,749 |
|
22 |
|
| G&A Stock-Based Compensation Expense (Recovery) |
546 |
|
6,160 |
|
(91) |
|
|
(517) |
|
|
29 |
|
9,521 |
|
(100) |
|
| G&A Expenses, including Stock-Based Compensation |
$ |
15,006 |
|
$ |
17,127 |
|
(12) |
|
|
$ |
11,626 |
|
|
$ |
26,632 |
|
$ |
31,270 |
|
(15) |
|
|
|
|
|
|
|
|
|
|
|
Adjusted EBITDA(2) |
$ |
76,987 |
|
$ |
103,004 |
|
(25) |
|
|
$ |
85,162 |
|
|
$ |
162,149 |
|
$ |
197,796 |
|
(18) |
|
|
|
|
|
|
|
|
|
|
|
Funds Flow from Operations(2) |
$ |
53,906 |
|
$ |
46,167 |
|
17 |
|
|
$ |
55,344 |
|
|
$ |
109,250 |
|
$ |
120,474 |
|
(9) |
|
|
|
|
|
|
|
|
|
|
|
| Capital Expenditures |
$ |
51,170 |
|
$ |
61,273 |
|
(16) |
|
|
$ |
94,727 |
|
|
$ |
145,897 |
|
$ |
116,604 |
|
25 |
|
(1) Sales volumes represent production NAR adjusted for inventory changes.
(2) Non-GAAP measures.
Operating netback, EBITDA, adjusted EBITDA, and funds flow from operations are non-GAAP measures that do not have any standardized meaning prescribed under GAAP. Management views these measures as financial performance measures. Investors are cautioned that these measures should not be construed as alternatives to oil sales, net income (loss) or other measures of financial performance as determined in accordance with GAAP.
Our method of calculating these measures may differ from other companies and, accordingly, may not be comparable to similar measures used by other companies. Disclosure of each non-GAAP financial measure is preceded by the corresponding GAAP measure so as not to imply that more emphasis should be placed on the non-GAAP measure.
Operating netback, as presented, is defined as oil sales less operating and transportation expenses. Management believes that operating netback is a useful supplemental measure for management and investors to analyze financial performance and provides an indication of the results generated by our principal business activities prior to the consideration of other income and expenses. A reconciliation from oil sales to operating netback is provided in the table above.
EBITDA, as presented, is defined as net loss adjusted for depletion, depreciation and accretion (“DD&A”) expenses, interest expense and income tax expense or recovery. Adjusted EBITDA, as presented, is defined as EBITDA adjusted for non-cash lease expense, lease payments, foreign exchange gain or loss, stock-based compensation expense or recovery, other loss and unrealized derivative instruments loss or gain. Management uses this supplemental measure to analyze performance and income generated by our principal business activities prior to the consideration of how non-cash items affect that income and believes that this financial measure is useful supplemental information for investors to analyze our performance and our financial results. A reconciliation from net (loss) income to EBITDA and adjusted EBITDA is as follows:
|
|
|
|
|
|
|
|
|
|
|
|
|
|
|
|
|
|
|
|
|
|
|
|
| |
Three Months Ended June 30, |
|
Three Months Ended March 31, |
|
Six Months Ended June 30, |
| (Thousands of U.S. Dollars) |
2025 |
2024 |
|
2025 |
|
2025 |
2024 |
| Net (loss) income |
$ |
(12,741) |
|
$ |
36,371 |
|
|
$ |
(19,280) |
|
|
$ |
(32,021) |
|
$ |
36,293 |
|
| Adjustments to reconcile net loss to EBITDA and Adjusted EBITDA |
|
|
|
|
|
|
|
| DD&A expenses |
68,635 |
|
55,490 |
|
|
72,202 |
|
|
140,837 |
|
111,640 |
|
| Interest expense |
24,366 |
|
18,398 |
|
|
23,235 |
|
|
47,601 |
|
36,822 |
|
| Income tax expense (recovery) |
4,648 |
|
(9,072) |
|
|
3,553 |
|
|
8,201 |
|
8,323 |
|
| EBITDA (non-GAAP) |
$ |
84,908 |
|
$ |
101,187 |
|
|
$ |
79,710 |
|
|
$ |
164,618 |
|
$ |
193,078 |
|
| Non-cash lease expense |
1,725 |
|
1,381 |
|
|
1,736 |
|
|
3,461 |
|
2,794 |
|
| Lease payments |
(1,545) |
|
(1,311) |
|
|
(1,567) |
|
|
(3,112) |
|
(2,369) |
|
| Foreign exchange loss (gain) |
3,716 |
|
(4,413) |
|
|
3,838 |
|
|
7,554 |
|
(5,228) |
|
| Stock-based compensation expense (recovery) |
546 |
|
6,160 |
|
|
(517) |
|
|
29 |
|
9,521 |
|
|
|
|
|
|
|
|
|
| Other loss |
38 |
|
— |
|
|
52 |
|
|
90 |
|
— |
|
| Unrealized derivative instruments loss (gain) |
(12,401) |
|
— |
|
|
1,910 |
|
|
(10,491) |
|
— |
|
| Adjusted EBITDA (non-GAAP) |
$ |
76,987 |
|
$ |
103,004 |
|
|
$ |
85,162 |
|
|
$ |
162,149 |
|
$ |
197,796 |
|
|
|
|
|
|
|
|
|
Funds flow from operations, as presented, is defined as net loss adjusted for DD&A expenses, deferred income tax expense or recovery, stock-based compensation expense or recovery, amortization of debt issuance costs, non-cash lease expense, lease payments, unrealized foreign exchange gain or loss, unrealized derivative instruments loss or gain and other loss. Management uses this financial measure to analyze performance and income generated by our principal business activities prior to the consideration of how non-cash items affect that income and believes that this financial measure is also useful supplemental information for investors to analyze performance and our financial results. A reconciliation from net loss to funds flow from operations is as follows:
|
|
|
|
|
|
|
|
|
|
|
|
|
|
|
|
|
|
|
|
|
|
|
|
| |
Three Months Ended June 30, |
|
Three Months Ended March 31, |
|
Six Months Ended June 30, |
| (Thousands of U.S. Dollars) |
2025 |
2024 |
|
2025 |
|
2025 |
2024 |
| Net (loss) income |
$ |
(12,741) |
$ |
36,371 |
|
$ |
(19,280) |
|
$ |
(32,021) |
|
$ |
36,293 |
|
| Adjustments to reconcile net loss to funds flow from operations |
|
|
|
|
|
|
|
| DD&A expenses |
68,635 |
55,490 |
|
72,202 |
|
140,837 |
|
111,640 |
|
|
|
|
|
|
|
|
|
| Deferred income tax expense (recovery) |
2,453 |
(51,361) |
|
(4,712) |
|
(2,259) |
|
(37,882) |
|
| Stock-based compensation expense (recovery) |
546 |
6,160 |
|
(517) |
|
29 |
|
9,521 |
|
| Amortization of debt issuance costs |
4,082 |
2,760 |
|
3,833 |
|
7,915 |
|
6,066 |
|
| Non-cash lease expense |
1,725 |
1,381 |
|
1,736 |
|
3,461 |
|
2,794 |
|
| Lease payments |
(1,545) |
(1,311) |
|
(1,567) |
|
(3,112) |
|
(2,369) |
|
| Unrealized foreign exchange loss (gain) |
3,114 |
(3,323) |
|
1,687 |
|
4,801 |
|
(5,589) |
|
| Unrealized derivative instruments loss (gain) |
(12,401) |
— |
|
1,910 |
|
(10,491) |
|
— |
|
| Other loss |
38 |
— |
|
52 |
|
90 |
|
— |
|
| Funds flow from operations (non-GAAP) |
$ |
53,906 |
$ |
46,167 |
|
$ |
55,344 |
|
$ |
109,250 |
|
$ |
120,474 |
|
|
|
|
|
|
|
|
|
|
|
|
|
|
|
|
|
|
|
|
|
|
|
|
|
|
|
|
|
|
|
|
|
|
|
|
|
|
|
|
|
Additional Operational Results
|
|
|
|
|
|
|
|
|
|
|
|
|
|
|
|
|
|
|
|
|
|
|
|
|
|
|
|
|
|
| |
Three Months Ended June 30, |
|
Three Months Ended March 31, |
|
Six Months Ended June 30, |
| (Thousands of U.S. Dollars) |
2025 |
2024 |
% Change |
|
2025 |
|
2025 |
2024 |
% Change |
| Oil, natural gas and NGL sales |
$ |
152,481 |
|
$ |
165,609 |
|
(8) |
|
|
$ |
170,533 |
|
|
$ |
323,014 |
|
$ |
323,186 |
|
— |
|
| Operating expenses |
55,855 |
|
47,035 |
|
19 |
|
|
67,354 |
|
|
123,209 |
|
95,501 |
|
29 |
|
| Transportation expenses |
7,618 |
|
5,690 |
|
34 |
|
|
6,911 |
|
|
14,529 |
|
10,274 |
|
41 |
|
Operating netback(1) |
89,008 |
|
112,884 |
|
(21) |
|
|
96,268 |
|
|
185,276 |
|
217,411 |
|
(15) |
|
|
|
|
|
|
|
|
|
|
|
| DD&A expenses |
68,635 |
|
55,490 |
|
24 |
|
|
72,202 |
|
|
140,837 |
|
111,640 |
|
26 |
|
| Derivative instruments (gain) loss |
(14,032) |
|
— |
|
100 |
|
|
1,467 |
|
|
(12,565) |
|
— |
|
100 |
|
| G&A expenses before stock-based compensation |
14,460 |
|
10,967 |
|
32 |
|
|
12,143 |
|
|
26,603 |
|
21,749 |
|
22 |
|
| G&A stock-based compensation expense (recovery) |
546 |
|
6,160 |
|
(91) |
|
|
(517) |
|
|
29 |
|
9,521 |
|
(100) |
|
| Severance |
— |
|
— |
|
100 |
|
|
— |
|
|
— |
|
— |
|
100 |
|
| Foreign exchange loss (gain) |
3,716 |
|
(4,413) |
|
184 |
|
|
3,838 |
|
|
7,554 |
|
(5,228) |
|
244 |
|
| Other (gain) loss |
(339) |
|
— |
|
100 |
|
|
52 |
|
|
(287) |
|
— |
|
100 |
|
| Interest expense |
24,366 |
|
18,398 |
|
32 |
|
|
23,235 |
|
|
47,601 |
|
36,822 |
|
29 |
|
|
|
|
|
|
|
|
|
|
|
|
97,352 |
|
86,602 |
|
12 |
|
|
112,420 |
|
|
209,772 |
|
174,504 |
|
20 |
|
|
|
|
|
|
|
|
|
|
|
| Interest income |
251 |
|
1,017 |
|
(75) |
|
|
425 |
|
|
676 |
|
1,709 |
|
(60) |
|
|
|
|
|
|
|
|
|
|
|
| Income (loss) before income taxes |
(8,093) |
|
27,299 |
|
(130) |
|
|
(15,727) |
|
|
(23,820) |
|
44,616 |
|
(153) |
|
|
|
|
|
|
|
|
|
|
|
Current income tax expense |
2,195 |
|
42,289 |
|
(95) |
|
|
8,265 |
|
|
10,460 |
|
46,205 |
|
(77) |
|
| Deferred income tax expense (recovery) |
2,453 |
|
(51,361) |
|
105 |
|
|
(4,712) |
|
|
(2,259) |
|
(37,882) |
|
94 |
|
|
4,648 |
|
(9,072) |
|
151 |
|
|
3,553 |
|
|
8,201 |
|
8,323 |
|
(1) |
|
| Net (loss) income |
$ |
(12,741) |
|
$ |
36,371 |
|
(135) |
|
|
$ |
(19,280) |
|
|
$ |
(32,021) |
|
$ |
36,293 |
|
188 |
|
|
|
|
|
|
|
|
|
|
|
| Sales Volumes (NAR) |
|
|
|
|
|
|
|
|
|
|
|
|
|
|
|
|
|
|
|
|
|
|
|
|
|
|
|
|
|
| Total sales volumes, BOEPD |
38,331 |
|
25,191 |
|
52 |
|
|
39,024 |
|
|
38,676 |
|
25,635 |
|
51 |
|
|
|
|
|
|
|
|
|
|
|
| Brent Price per bbl |
$ |
66.71 |
|
$ |
85.03 |
|
(22) |
|
|
$ |
74.98 |
|
|
$ |
70.81 |
|
$ |
83.42 |
|
(15) |
|
| WTI Price per bbl |
$ |
63.81 |
|
$ |
80.82 |
|
(21) |
|
|
$ |
71.47 |
|
|
$ |
67.60 |
|
$ |
78.95 |
|
(14) |
|
| AECO Price C$ per GJ |
1.60 |
|
1.12 |
|
43 |
|
|
2.05 |
|
|
1.82 |
1.74 |
|
5 |
|
|
|
|
|
|
|
|
|
|
|
| Consolidated Results of Operations per boe Sales Volumes NAR |
|
|
|
|
|
|
|
|
|
| Oil, natural gas and NGL sales |
$ |
43.72 |
|
$ |
72.24 |
|
(39) |
|
|
$ |
48.55 |
|
|
$ |
46.14 |
|
$ |
69.27 |
|
(33) |
|
|
|
|
|
|
|
|
|
|
|
|
|
|
|
|
|
|
|
|
|
|
|
|
|
|
|
|
|
|
|
| Operating expenses |
16.01 |
|
20.52 |
|
(22) |
|
|
19.18 |
|
|
17.60 |
|
20.47 |
|
(14) |
|
| Transportation expenses |
2.18 |
|
2.48 |
|
(12) |
|
|
1.97 |
|
|
2.08 |
|
2.20 |
|
(6) |
|
Operating netback(1) |
25.52 |
|
49.25 |
|
(48) |
|
|
27.40 |
|
|
26.47 |
|
46.60 |
|
(43) |
|
|
|
|
|
|
|
|
|
|
|
| DD&A expenses |
19.68 |
|
24.21 |
|
(19) |
|
|
20.56 |
|
|
20.12 |
|
23.93 |
|
(16) |
|
| Derivative instruments (gain) loss |
(4.02) |
|
— |
|
100 |
|
|
0.42 |
|
|
(1.79) |
|
— |
|
100 |
|
| G&A expenses before stock-based compensation |
4.15 |
|
4.78 |
|
(13) |
|
|
3.46 |
|
|
3.80 |
|
4.66 |
|
(18) |
|
| G&A stock-based compensation expense (recovery) |
0.16 |
|
2.69 |
|
(94) |
|
|
(0.15) |
|
|
— |
|
2.04 |
|
(100) |
|
| Severance |
— |
|
— |
|
100 |
|
|
— |
|
|
— |
|
— |
|
100 |
|
| Foreign exchange loss (gain) |
1.07 |
|
(1.93) |
|
155 |
|
|
1.09 |
|
|
1.08 |
|
(1.12) |
|
196 |
|
| Other (gain) loss |
(0.10) |
|
— |
|
100 |
|
|
0.01 |
|
|
(0.04) |
|
— |
|
— |
|
| Interest expense |
6.99 |
|
8.03 |
|
(13) |
|
|
6.62 |
|
|
6.80 |
|
7.89 |
|
(14) |
|
|
27.92 |
|
37.78 |
|
(26) |
|
|
32.01 |
|
|
29.96 |
|
37.40 |
|
(20) |
|
|
|
|
|
|
|
|
|
|
|
| Interest income |
0.07 |
|
0.44 |
|
(84) |
|
|
0.12 |
|
|
0.10 |
|
0.37 |
|
(74) |
|
|
|
|
|
|
|
|
|
|
|
| Income (loss) before income taxes |
(2.33) |
|
11.91 |
|
(120) |
|
|
(4.49) |
|
|
(3.40) |
|
9.57 |
|
(136) |
|
|
|
|
|
|
|
|
|
|
|
Current income tax expense |
0.63 |
|
18.45 |
|
(97) |
|
|
2.35 |
|
|
1.49 |
|
9.90 |
|
(85) |
|
| Deferred income tax expense (recovery) |
0.70 |
|
(22.41) |
|
103 |
|
|
(1.34) |
|
|
(0.32) |
|
(8.12) |
|
96 |
|
|
1.33 |
|
(3.96) |
|
134 |
|
|
1.01 |
|
|
1.17 |
|
1.78 |
|
(34) |
|
| Net (loss) income |
$ |
(3.66) |
|
$ |
15.87 |
|
(123) |
|
|
$ |
(5.50) |
|
|
$ |
(4.57) |
|
$ |
7.79 |
|
(159) |
|
(1) Operating netback is a non-GAAP measure that does not have any standardized meaning prescribed under GAAP. Refer to note 2 “Non-GAAP measures” in “Financial and Operational Highlights” for a definition of this measure.
Oil, Natural Gas and NGL Production and Sales Volumes, BOEPD
|
|
|
|
|
|
|
|
|
|
|
|
|
|
|
|
|
|
|
|
|
|
|
|
|
Three Months Ended June 30, |
|
Three Months Ended March 31, |
|
Six Months Ended June 30, |
Average Daily Volumes (BOEPD) - Colombia |
2025 |
2024 |
|
2025 |
|
2025 |
2024 |
| WI production before royalties |
25,108 |
31,248 |
|
25,652 |
|
25,378 |
31,137 |
| Royalties |
(3,845) |
(6,188) |
|
(4,420) |
|
(4,131) |
(6,065) |
| Production NAR |
21,263 |
25,060 |
|
21,232 |
|
21,247 |
25,072 |
| Decrease (increase) in inventory |
110 |
(314) |
|
(379) |
|
(133) |
(182) |
| Sales |
21,373 |
24,746 |
|
20,853 |
|
21,114 |
24,890 |
|
|
|
|
|
|
|
|
| Royalties, % of working interest production before royalties |
15 |
% |
20 |
% |
|
17 |
% |
|
16 |
% |
19 |
% |
|
|
|
|
|
|
|
|
|
Three Months Ended June 30, |
|
Three Months Ended March 31, |
|
Six Months Ended June 30, |
|
|
|
|
|
|
|
|
|
|
|
|
|
|
|
|
|
|
|
|
|
|
|
|
Average Daily Volumes (BOEPD) - Ecuador |
2025 |
2024 |
|
2025 |
|
2025 |
2024 |
| WI production before royalties |
4,592 |
1,528 |
|
4,034 |
|
4,315 |
1,372 |
| Royalties |
(1,364) |
(586) |
|
(1,424) |
|
(1,394) |
(521) |
| Production NAR |
3,228 |
942 |
|
2,610 |
|
2,921 |
851 |
| (Increase) decrease in inventory |
(1,579) |
(497) |
|
840 |
|
(376) |
(106) |
| Sales |
1,649 |
445 |
|
3,450 |
|
2,545 |
745 |
|
|
|
|
|
|
|
|
| Royalties, % of working interest production before royalties |
30 |
% |
38 |
% |
|
35 |
% |
|
32 |
% |
38 |
% |
|
|
|
|
|
|
|
|
|
Three Months Ended June 30, |
|
Three Months Ended March 31, |
|
Six Months Ended June 30, |
Average Daily Volumes (BOEPD) - Canada |
2025 |
2024 |
|
2025 |
|
2025 |
2024 |
| WI production before royalties |
17,496 |
— |
|
16,961 |
|
17,230 |
— |
| Royalties |
(2,187) |
— |
|
(2,240) |
|
(2,213) |
— |
| Production NAR |
15,309 |
— |
|
14,721 |
|
15,017 |
— |
| Sales |
15,309 |
— |
|
14,721 |
|
15,017 |
— |
|
|
|
|
|
|
|
|
| Royalties, % of working interest production before royalties |
13 |
% |
— |
% |
|
13 |
% |
|
13 |
% |
— |
% |
|
|
|
|
|
|
|
|
|
Three Months Ended June 30, |
|
Three Months Ended March 31, |
|
Six Months Ended June 30, |
Average Daily Volumes (BOEPD) - Total Company |
2025 |
2024 |
|
2025 |
|
2025 |
2024 |
| WI production before royalties |
47,196 |
32,776 |
|
46,647 |
|
46,923 |
32,509 |
| Royalties |
(7,396) |
(6,774) |
|
(8,084) |
|
(7,738) |
(6,586) |
| Production NAR |
39,800 |
26,002 |
|
38,563 |
|
39,185 |
25,923 |
| (Increase) decrease in inventory |
(1,469) |
(811) |
|
461 |
|
(509) |
(288) |
| Sales |
38,331 |
25,191 |
|
39,024 |
|
38,676 |
25,635 |
|
|
|
|
|
|
|
|
| Royalties, % of working interest production before royalties |
16 |
% |
21 |
% |
|
17 |
% |
|
16 |
% |
20 |
% |
Oil, natural gas and NGL production NAR for the three and six months ended June 30, 2025, increased by 53% and 51%, to 39,800 BOEPD and 39,185 BOEPD, compared to the corresponding periods of 2024 due to the production from the Canadian operations acquired on October 31, 2024 and positive exploration wells drilling results in Ecuador. Oil, natural gas and NGL production NAR increased by 3% compared to the prior quarter as a result of the successful drilling in Simonette in Canada, Cohembi infill drilling, waterflood management and strong Acordionero performance in Colombia and continued exploration success in Ecuador from the Iguana wells.
Royalties as a percentage of production for the three and six months ended June 30, 2025 decreased by 5% and 4% compared to the corresponding periods of 2024 as a result of a decrease in benchmark oil prices and the price sensitive royalty regime in Colombia and Ecuador and lower royalties in new Canadian operations. Royalties as a percentage of production were comparable to the prior quarter.
The Midas Block includes the Acordionero field, the Suroriente Block includes the Cohembi field, and the Chaza Block includes the Costayaco and Moqueta fields. Ecuador includes the Charapa, Chanangue and Iguana Blocks. Canada includes several areas in the Western Canadian Sedimentary Basin with all production in Alberta, Canada.
Commodity prices:
Colombia and Ecuador
Brent - For the three and six months ended June 30, 2025, Brent decreased 22% and 15% from the comparable periods of 2024, and decreased 11% from the prior quarter. For the three months ended June 30, 2025, Castilla, Vasconia and Oriente differentials per boe decreased to $4.73, $1.71 and $7.26 compared to $8.21, $4.00 and $8.38 in the corresponding period of 2024. For the six months ended June 30, 2025, Castilla, Vasconia and Oriente differentials per boe decreased to $5.04, $1.99 and $7.45 from $8.51, $4.52 and $8.20 in the corresponding period of 2024.
During the second quarter of 2025, 100% of sales from South America was priced against Brent.
Canada
Gran Tierra entered Canada with the acquisition of i3 Energy which closed on October 31, 2024, therefore no comparative data is provided for the corresponding periods of 2024.
WTI - For the three months ended June 30, 2025, WTI decreased 11% from the prior quarter. For the three months ended June 30, 2025, 26% of NAR production in Canada was oil, compared with 21% in the prior quarter.
NGLs - For the three months ended June 30, 2025, the weighted average NGL price received was 18% of WTI, consistent with the prior quarter. For the three months ended June 30, 2025, 24% of NAR production in Canada was NGLs, compared to 27% in the prior quarter.
AECO - For the three months ended June 30, 2025, AECO price decreased 22% from the prior quarter. For the three months ended June 30, 2025 , 50% of NAR production in Canada was natural gas, compared to 52% in the prior quarter.
Oil, natural gas and NGL sales for the three months ended June 30, 2025, decreased by 8% to $152.5 million compared to the corresponding period of 2024, due to a 22% decrease in Brent price, partially offset by 52% increase in sales volumes, due to sales of production from the Canadian operations acquired on October 31, 2024 and sales from positive exploration wells drilling results in Ecuador. Oil, natural gas and NGL sales for the six months ended June 30, 2025, were $323.0 million. Despite the 15% decrease in Brent price, sales for the six months ended June 30, 2025, remained comparative to the corresponding period of 2024, due to 51% increase in sales volumes, primarily attributed to sales from Canadian operations and from new exploration wells in Ecuador.
Compared to the prior quarter, oil, natural gas and NGL sales decreased by 11%, primarily due to a 11% decrease in Brent price, 2% lower sales volumes as a result of an inventory build in Ecuador, partially offset by lower differentials.
The following table shows the effect of changes in realized price and sale volumes on our oil sales for the three and six months ended June 30, 2025, compared to the prior quarter and the corresponding periods of 2024:
|
|
|
|
|
|
|
|
|
|
|
|
|
|
|
|
|
|
| (Thousands of U.S. Dollars) |
Three Months Ended June 30, 2025, Compared with Three Months Ended March 31, 2025 |
|
Three Months Ended June 30, 2025, Compared with Three Months Ended June 30, 2024 |
|
Six Months Ended June 30, 2025, Compared with Six Months Ended June 30, 2024 |
| Oil, natural gas and NGL sales for the comparative period |
$ |
170,533 |
|
|
$ |
165,609 |
|
|
$ |
323,186 |
|
| Realized sales price decrease effect |
(16,880) |
|
|
(33,158) |
|
|
(39,766) |
|
| Sales volumes decrease effect |
(1,172) |
|
|
(14,264) |
|
|
(26,562) |
|
Oil, natural gas and NGL sales - Canada Operations |
— |
|
|
34,294 |
|
|
66,156 |
|
Oil, natural gas and NGL sales for the three and six months ended June 30, 2025 |
$ |
152,481 |
|
|
$ |
152,481 |
|
|
$ |
323,014 |
|
Operating Netback
|
|
|
|
|
|
|
|
|
|
|
|
|
|
|
|
|
|
|
|
|
|
|
|
| Colombia |
Three Months Ended June 30, |
|
Three Months Ended March 31, |
|
Six Months Ended June 30, |
| (Thousands of U.S. Dollars) |
2025 |
2024 |
|
2025 |
|
2025 |
2024 |
| Oil, natural gas and NGL sales |
$ |
109,692 |
|
$ |
162,573 |
|
|
$ |
117,648 |
|
|
$ |
227,340 |
|
$ |
313,044 |
|
Transportation expenses |
(3,735) |
|
(5,516) |
|
|
(3,211) |
|
|
(6,946) |
|
(9,742) |
|
|
105,957 |
|
157,057 |
|
|
114,437 |
|
|
220,394 |
|
303,302 |
|
Operating expenses |
(38,432) |
|
(45,267) |
|
|
(42,754) |
|
|
(81,186) |
|
(90,393) |
|
Operating netback(1) |
$ |
67,525 |
|
$ |
111,790 |
|
|
$ |
71,683 |
|
|
$ |
139,208 |
|
$ |
212,909 |
|
|
|
|
|
|
|
|
|
| (U.S. Dollars Per boe Sales Volumes NAR) |
|
|
|
|
|
|
|
| Brent |
$ |
66.71 |
|
$ |
85.03 |
|
|
$ |
74.98 |
|
|
$ |
70.81 |
|
$ |
83.42 |
|
Quality and transportation discounts |
(10.31) |
|
(12.83) |
|
|
(12.29) |
|
|
(11.32) |
|
(14.31) |
|
Average realized price |
56.40 |
|
72.20 |
|
|
62.69 |
|
|
59.49 |
|
69.11 |
|
| Transportation expenses |
(1.92) |
|
(2.45) |
|
|
(1.71) |
|
|
(1.82) |
|
(2.15) |
|
Average realized price net of transportation expenses |
54.48 |
|
69.75 |
|
|
60.98 |
|
|
57.67 |
|
66.96 |
|
| Operating expenses |
(19.76) |
|
(20.10) |
|
|
(22.78) |
|
|
(21.24) |
|
(19.95) |
|
Operating netback(1) |
$ |
34.72 |
|
$ |
49.65 |
|
|
$ |
38.20 |
|
|
$ |
36.43 |
|
$ |
47.01 |
|
|
|
|
|
|
|
|
|
|
|
|
|
|
|
|
|
|
|
|
|
|
|
|
|
| Ecuador |
Three Months Ended June 30, |
|
Three Months Ended March 31, |
|
Six Months Ended June 30, |
| (Thousands of U.S. Dollars) |
2025 |
2024 |
|
2025 |
|
2025 |
2024 |
| Oil, natural gas and NGL sales |
$ |
8,495 |
|
$ |
3,036 |
|
|
$ |
21,023 |
|
|
$ |
29,518 |
|
$ |
10,142 |
|
Transportation expenses |
(441) |
|
(174) |
|
|
(1,093) |
|
|
(1,534) |
|
(532) |
|
|
8,054 |
|
2,862 |
|
|
19,930 |
|
|
27,984 |
|
9,610 |
|
Operating expenses |
(4,122) |
|
(1,768) |
|
|
(8,073) |
|
|
(12,195) |
|
(5,108) |
|
Operating netback(1) |
$ |
3,932 |
|
$ |
1,094 |
|
|
$ |
11,857 |
|
|
$ |
15,789 |
|
$ |
4,502 |
|
|
|
|
|
|
|
|
|
| (U.S. Dollars Per boe Sales Volumes NAR) |
|
|
|
|
|
|
|
| Brent |
$ |
66.71 |
|
$ |
85.03 |
|
|
$ |
74.98 |
|
|
$ |
70.81 |
|
$ |
83.42 |
|
Quality and transportation discounts |
(10.07) |
|
(10.11) |
|
|
(7.27) |
|
|
(6.71) |
|
(8.69) |
|
Average realized price |
56.64 |
|
74.92 |
|
|
67.71 |
|
|
64.10 |
|
74.73 |
|
| Transportation expenses |
(2.94) |
|
(4.29) |
|
|
(3.52) |
|
|
(3.33) |
|
(3.92) |
|
Average realized price net of transportation expenses |
53.70 |
|
70.63 |
|
|
64.19 |
|
|
60.77 |
|
70.81 |
|
| Operating expenses |
(27.48) |
|
(43.63) |
|
|
(26.00) |
|
|
(26.48) |
|
(37.64) |
|
Operating netback(1) |
$ |
26.21 |
|
$ |
27.00 |
|
|
$ |
38.19 |
|
|
$ |
34.29 |
|
$ |
33.17 |
|
|
|
|
|
|
|
|
|
|
|
|
|
|
|
|
|
|
|
|
|
|
|
|
|
| Canada |
Three Months Ended June 30, |
|
Three Months Ended March 31, |
|
Six Months Ended June 30, |
| (Thousands of U.S. Dollars) |
2025 |
2024 |
|
2025 |
|
2025 |
2024 |
| Oil, natural gas and NGL sales |
$ |
34,294 |
|
$ |
— |
|
|
$ |
31,862 |
|
|
$ |
66,156 |
|
$ |
— |
|
Transportation expenses |
(3,442) |
|
— |
|
|
(2,607) |
|
|
(6,049) |
|
— |
|
|
30,852 |
|
— |
|
|
29,255 |
|
|
60,107 |
|
— |
|
Operating expenses |
(13,301) |
|
— |
|
|
(16,527) |
|
|
(29,828) |
|
— |
|
Operating netback(1) |
$ |
17,551 |
|
$ |
— |
|
|
$ |
12,728 |
|
|
$ |
30,279 |
|
$ |
— |
|
|
|
|
|
|
|
|
|
| (U.S. Dollars Per boe Sales Volumes NAR) |
|
|
|
|
|
|
|
| WTI Price per bbl |
$ |
63.81 |
|
$ |
80.82 |
|
|
$ |
71.47 |
|
|
$ |
67.60 |
|
$ |
78.95 |
|
| AECO Price C$ per GJ |
1.60 |
|
1.12 |
|
|
2.05 |
|
|
1.82 |
|
1.74 |
|
|
|
|
|
|
|
|
|
Average realized price |
24.62 |
|
— |
|
|
24.05 |
|
|
24.34 |
|
— |
|
| Transportation expenses |
(2.47) |
|
— |
|
|
(1.97) |
|
|
(2.23) |
|
— |
|
Average realized price net of transportation expenses |
22.15 |
|
— |
|
|
22.08 |
|
|
22.11 |
|
— |
|
| Operating expenses |
(9.55) |
|
— |
|
|
(12.47) |
|
|
(10.97) |
|
— |
|
Operating netback(1) |
$ |
12.60 |
|
$ |
— |
|
|
$ |
9.61 |
|
|
$ |
11.14 |
|
$ |
— |
|
|
|
|
|
|
|
|
|
|
|
|
|
|
|
|
|
|
|
|
|
|
|
|
|
| Total Company |
Three Months Ended June 30, |
|
Three Months Ended March 31, |
|
Six Months Ended June 30, |
| (Thousands of U.S. Dollars) |
2025 |
2024 |
|
2025 |
|
2025 |
2024 |
| Oil, natural gas and NGL sales |
$ |
152,481 |
|
$ |
165,609 |
|
|
$ |
170,533 |
|
|
$ |
323,014 |
|
$ |
323,186 |
|
Transportation expenses |
(7,618) |
|
(5,690) |
|
|
(6,911) |
|
|
(14,529) |
|
(10,274) |
|
|
144,863 |
|
159,919 |
|
|
163,622 |
|
|
308,485 |
|
312,912 |
|
Operating expenses |
(55,855) |
|
(47,035) |
|
|
(67,354) |
|
|
(123,209) |
|
(95,501) |
|
Operating netback(1) |
$ |
89,008 |
|
$ |
112,884 |
|
|
$ |
96,268 |
|
|
$ |
185,276 |
|
$ |
217,411 |
|
|
|
|
|
|
|
|
|
| (U.S. Dollars Per boe Sales Volumes NAR) |
|
|
|
|
|
|
|
| Brent |
$ |
66.71 |
|
$ |
85.03 |
|
|
$ |
74.98 |
|
|
$ |
70.81 |
|
$ |
83.42 |
|
Quality and transportation discounts |
(22.99) |
|
(12.79) |
|
|
(26.43) |
|
|
(24.67) |
|
(14.15) |
|
Average realized price |
43.72 |
|
72.24 |
|
|
48.55 |
|
|
46.14 |
|
69.27 |
|
Transportation expenses |
(2.18) |
|
(2.48) |
|
|
(1.97) |
|
|
(2.08) |
|
(2.20) |
|
Average realized price net of transportation expenses |
41.54 |
|
69.76 |
|
|
46.59 |
|
|
44.07 |
|
67.07 |
|
Operating expenses |
(16.01) |
|
(20.52) |
|
|
(19.18) |
|
|
(17.60) |
|
(20.47) |
|
Operating netback(1) |
$ |
25.53 |
|
$ |
49.24 |
|
|
$ |
27.41 |
|
|
$ |
26.47 |
|
$ |
46.60 |
|
(1) Operating netback is a non-GAAP measure that does not have any standardized meaning prescribed under GAAP. Refer to note 2 “Non-GAAP measures” in “Financial and Operational Highlights” for a definition and reconciliation of this measure.
Operating expenses for the three and six months ended June 30, 2025, on a per boe basis, decreased by $4.51 and $2.87 to $16.01 and $17.60, respectively, compared to the corresponding periods of 2024, primarily due lower workover activities and 52% and 51%, respectively, higher NAR sales volumes from new Canadian operations which were partially offset by the addition of the the operating expenses from Canadian operations in the current periods. Total operating expenses for the three and six months ended June 30, 2025, increased by 19% and 29% to $55.9 million and $123.2 million compared to the corresponding periods of 2024 due to new Canadian operations and ramp-up of operations in Ecuador.
Compared to the prior quarter, operating expenses decreased by 17% from $67.4 million or by $3.17 from $19.18 per boe due to lower workover activities and lower lifting costs related to power generation, equipment rental, and the inventory build-up in Ecuador.
Transportation expenses
We have options to sell our oil through multiple pipelines and various trucking routes. Each option has varying effects on realized sales price and transportation expenses. The following table shows the percentage of oil, natural gas and NGL volumes we sold in Canada, Colombia and Ecuador using each option for the three and six months ended June 30, 2025 and 2024, and the prior quarter:
|
|
|
|
|
|
|
|
|
|
|
|
|
|
|
|
|
|
|
|
|
|
|
|
|
Three Months Ended June 30, |
|
Three Months Ended March 31, |
|
Six Months Ended June 30, |
|
2025 |
2024 |
|
2025 |
|
2025 |
2024 |
| Volume transported through pipeline |
40 |
% |
2 |
% |
|
46 |
% |
|
33 |
% |
3 |
% |
| Volume sold at wellhead |
40 |
% |
45 |
% |
|
25 |
% |
|
31 |
% |
49 |
% |
| Volume transported via truck to sales point |
20 |
% |
53 |
% |
|
29 |
% |
|
36 |
% |
48 |
% |
|
100 |
% |
100 |
% |
|
100 |
% |
|
100 |
% |
100 |
% |
Volumes transported through pipeline or via truck receive a higher realized price but incur higher transportation expenses. Conversely, volumes sold at the wellhead have the opposite effect of a lower realized price, offset by lower transportation expenses.
Transportation expenses for the three and six months ended June 30, 2025, increased by 34% and 41% to $7.6 million and $14.5 million compared to the corresponding periods of 2024, due to new Canadian operations, higher sales volumes transported in Ecuador partially offset by lower sales volumes transported in Colombia.
On a per boe basis, transportation expenses for the three and six months ended June 30, 2025, decreased by $0.30 and $0.12 to $2.18 and $2.08 compared to the corresponding periods of 2024 due to higher sales volumes from new Canadian operations.
Transportation expenses increased by 10% or $0.21 per boe from $6.9 million or $1.97 per boe in the prior quarter due to incremental sales volumes transported by Canadian operations resulting in higher tolls.
DD&A Expenses
|
|
|
|
|
|
|
|
|
|
|
|
|
|
|
|
|
|
|
|
|
|
|
|
|
Three Months Ended June 30, |
|
Three Months Ended March 31, |
|
Six Months Ended June 30, |
|
2025 |
2024 |
|
2025 |
|
2025 |
2024 |
| DD&A Expenses, thousands of U.S. Dollars |
$ |
68,635 |
|
$ |
55,490 |
|
|
$ |
72,202 |
|
|
$ |
140,837 |
|
$ |
111,640 |
|
| DD&A Expenses, U.S. Dollars per boe |
19.68 |
|
24.21 |
|
|
20.56 |
|
|
20.12 |
|
23.93 |
|
|
|
|
|
|
|
|
|
|
|
|
|
|
|
|
|
|
|
|
|
|
Three Months Ended June 30, 2025 |
|
Three Months Ended June 30, 2024 |
|
DD&A expenses, thousands of U.S. Dollars |
|
DD&A expenses, U.S. Dollars Per Boe |
|
DD&A expenses, thousands of U.S. Dollars |
|
DD&A expenses, U.S. Dollars Per Boe |
| Colombia |
50,454 |
|
|
25.94 |
|
|
54,198 |
|
|
24.07 |
|
| Ecuador |
4,351 |
|
|
29.01 |
|
|
1,238 |
|
|
30.55 |
|
| Canada |
13,705 |
|
|
9.84 |
|
|
— |
|
|
— |
|
| Corporate |
125 |
|
|
— |
|
|
54 |
|
|
— |
|
|
$ |
68,635 |
|
|
$ |
19.68 |
|
|
$ |
55,490 |
|
|
$ |
24.21 |
|
|
|
|
|
|
|
|
|
|
|
|
|
|
|
|
|
|
|
|
|
|
|
|
|
|
|
|
|
|
Six Months Ended June 30, 2025 |
|
Six Months Ended June 30, 2024 |
|
DD&A expenses, thousands of U.S. Dollars |
|
DD&A expenses, U.S. Dollars Per Boe |
|
DD&A expenses, thousands of U.S. Dollars |
|
DD&A expenses, U.S. Dollars Per Boe |
| Colombia |
99,105 |
|
|
25.93 |
|
|
107,359 |
|
|
23.70 |
|
| Ecuador |
14,849 |
|
|
32.25 |
|
|
4,175 |
|
|
30.76 |
|
| Canada |
26,646 |
|
|
9.80 |
|
|
— |
|
|
— |
|
| Corporate |
237 |
|
|
— |
|
|
106 |
|
|
— |
|
|
$ |
140,837 |
|
|
$ |
20.12 |
|
|
$ |
111,640 |
|
|
$ |
23.93 |
|
DD&A expenses for the three and six months ended June 30, 2025, increased by 24% and 26%, respectively, due to higher costs in the depletable base for Ecuador and new Canadian operations, compared to the corresponding period of 2024.
On a per boe basis, DD&A expenses for the three and six months ended June 30, 2025 decreased by $4.53 and $3.81, respectively due to higher NAR sales volumes primarily attributed to new Canadian operations.
DD&A expenses decreased by 5% from $72.2 million when compared to the prior quarter due to lower an inventory build-up in Ecuador and DD&A allocation to inventory. On a per boe basis, DD&A expenses decreased by $0.88 due to higher production.
G&A Expenses
|
|
|
|
|
|
|
|
|
|
|
|
|
|
|
|
|
|
|
|
|
|
|
|
|
|
|
|
|
|
|
Three Months Ended June 30, |
|
Three Months Ended March 31, |
|
Six Months Ended June 30, |
| (Thousands of U.S. Dollars) |
2025 |
2024 |
% Change |
|
2025 |
|
2025 |
2024 |
% Change |
| G&A Expenses before Stock-Based Compensation |
$ |
14,460 |
|
$ |
10,967 |
|
32 |
|
|
$ |
12,143 |
|
|
$ |
26,603 |
|
$ |
21,749 |
|
22 |
|
| G&A Stock-Based Compensation Expense (Recovery) |
546 |
|
6,160 |
|
(91) |
|
|
(517) |
|
|
29 |
|
9,521 |
|
(100) |
|
| G&A Expenses, including Stock-Based Compensation |
$ |
15,006 |
|
$ |
17,127 |
|
(12) |
|
|
$ |
11,626 |
|
|
$ |
26,632 |
|
$ |
31,270 |
|
(15) |
|
| (U.S. Dollars Per boe Sales Volumes NAR) |
|
|
|
|
|
|
|
|
|
| G&A Expenses before Stock-Based Compensation |
$ |
4.15 |
|
$ |
4.78 |
|
(13) |
|
|
$ |
3.46 |
|
|
$ |
3.80 |
|
$ |
4.66 |
|
(18) |
|
| G&A Stock-Based Compensation Expense (Recovery) |
0.16 |
|
2.69 |
|
(94) |
|
|
(0.15) |
|
|
— |
|
2.04 |
|
(100) |
|
| G&A Expenses, including Stock-Based Compensation |
$ |
4.31 |
|
$ |
7.47 |
|
(42) |
|
|
$ |
3.31 |
|
|
$ |
3.80 |
|
$ |
6.70 |
|
(43) |
|
G&A expenses before stock-based compensation on a per boe basis for the three and six months ended June 30, 2025, decreased by $0.63 and $0.86 compared to the corresponding periods of 2024 due to higher sales volumes mainly driven by the addition of new Canadian operations. Total G&A expenses before stock-based compensation increased by 32% and 22% compared to the corresponding periods of 2024, primarily due to addition of the Canadian operations.
Compared to the prior quarter, G&A expenses before stock-based compensation increased by 19% or $0.69 per boe due to timing of certain annual corporate expenses.
G&A expenses after stock-based compensation for the three and six months ended June 30, 2025, decreased by 12% and 15% or $3.17 and $2.90 per boe compared to the corresponding periods of 2024, due to lower stock-based compensation attributed to a depreciation of share price during the current periods.
Compared to the prior quarter, G&A expenses after stock-based compensation increased by 29% or $0.99 per boe due to higher G&A expenses before stock-based compensation and higher stock based compensation attributed to appreciation of share price during the current quarter.
Foreign Exchange Gains and Losses
For the three and six months ended June 30, 2025, we had a $3.7 million and $7.6 million loss on foreign exchange compared to a $4.4 million and $5.2 million gain on foreign exchange in the corresponding periods of 2024 and a $3.8 million loss on foreign exchange in the prior quarter. Accounts payable, taxes receivable and payable and deferred income taxes are considered monetary items and require translation from local currencies to U.S. dollar functional currency at each balance sheet date. This translation was the primary source of the foreign exchange gains and losses in the periods.
The following table presents the change in the U.S. dollar against the Colombian peso and Canadian dollar for the three and six months ended June 30, 2025 and 2024 and the prior quarter:
|
|
|
|
|
|
|
|
|
|
|
|
|
|
|
|
|
|
|
|
|
|
|
|
|
Three Months Ended June 30, |
|
Three Months Ended March 31, |
|
Six Months Ended June 30, |
|
2025 |
2024 |
|
2025 |
|
2025 |
2024 |
| Change in the U.S. dollar against the Colombian peso |
weakened by |
strengthened by |
|
weakened by |
|
weakened by |
strengthened by |
| 3% |
8% |
|
5% |
|
8% |
9% |
| Change in the U.S. dollar against the Canadian dollar |
weakened by |
strengthened by |
|
comparable |
|
weakened by |
strengthened by |
| 5% |
1% |
|
—% |
|
5% |
4% |
Income Tax Expense
|
|
|
|
|
|
|
|
|
|
|
|
|
|
|
|
|
|
|
Three Months Ended June 30, |
|
Six Months Ended June 30, |
| (Thousands of U.S. Dollars) |
2025 |
2024 |
|
2025 |
2024 |
| Income (loss) before income tax |
$ |
(8,093) |
|
$ |
27,299 |
|
|
$ |
(23,820) |
|
$ |
44,616 |
|
|
|
|
|
|
|
| Current income tax expense |
$ |
2,195 |
|
$ |
42,289 |
|
|
$ |
10,460 |
|
$ |
46,205 |
|
Deferred income tax (recovery) expense |
2,453 |
|
(51,361) |
|
|
(2,259) |
|
(37,882) |
|
| Income tax expense |
$ |
4,648 |
|
$ |
(9,072) |
|
|
$ |
8,201 |
|
$ |
8,323 |
|
|
|
|
|
|
|
| Effective tax rate |
(57) |
% |
(33) |
% |
|
(34) |
% |
19 |
% |
|
|
|
|
|
|
|
|
|
|
|
|
Current income tax expense was $10.5 million for the six months ended June 30, 2025, compared to $46.2 million in the corresponding period of 2024, primarily due to lower taxable income.
The deferred income tax for the six months ended June 30, 2025, was a recovery of $2.3 million mainly due to the use of a higher enacted tax rate on Colombia tax losses. These were partially offset by higher tax depreciation relative to accounting depreciation.
The deferred income tax for the six months ended June 30, 2024, was a recovery of $37.9 million, primarily as a result of the recognition of additional tax losses resulting from a tax planning strategy which were partially offset by tax depreciation being higher than accounting depreciation and the use of tax losses to offset taxable income in Colombia.
For the six months ended June 30, 2025, the difference between the effective tax rate of negative 34% and the 40% statutory tax rate was primarily due to an increase in the non-deductible foreign translation adjustments, other permanent differences and valuation allowance. This was partially offset by an increase in the impact of foreign taxes.
For the six months ended June 30, 2024, the difference between the effective tax rate of 19% and the 50% Colombian tax rate was primarily due to a decrease in the impact of foreign taxes, 2022 true-up related to tax planning strategy and non-taxable foreign exchange adjustments. These were partially offset by an increase in valuation allowance, other permanent differences, non-deductible stock-based compensation and non-deductible royalties in Colombia.
Net (Loss) Income and Funds Flow from Operations (a Non-GAAP Measure)
|
|
|
|
|
|
|
|
|
|
|
|
|
|
|
|
|
|
|
|
|
| (Thousands of U.S. Dollars) |
Three Months Ended June 30, 2025, Compared with Three Months Ended March 31, 2025 |
% change |
Three Months Ended June 30, 2025, Compared with Three Months Ended June 30, 2024 |
%
change
|
Six Months Ended June 30, 2025 Compared with Six Months Ended June 30, 2024 |
% change |
| Net (loss) income for the comparative period |
$ |
(19,280) |
|
|
$ |
36,371 |
|
|
$ |
36,293 |
|
|
| Increase (decrease) due to: |
|
|
|
|
|
|
| Sales price |
(16,880) |
|
|
(33,158) |
|
|
(39,766) |
|
|
| Sales volumes |
(1,172) |
|
|
(14,264) |
|
|
(26,562) |
|
|
Oil, natural gas and NGL sales - Canada Operations |
— |
|
|
34,294 |
|
|
66,156 |
|
|
| Expenses: |
|
|
|
|
|
|
| Operating |
11,499 |
|
|
(8,820) |
|
|
(27,708) |
|
|
| Transportation |
(707) |
|
|
(1,928) |
|
|
(4,255) |
|
|
| Cash G&A |
(2,317) |
|
|
(3,493) |
|
|
(4,854) |
|
|
| Net lease payments |
11 |
|
|
110 |
|
|
(76) |
|
|
|
|
|
|
|
|
|
| Interest, excluding amortization of deferred financing fees |
(882) |
|
|
(4,646) |
|
|
(8,930) |
|
|
| Realized foreign exchange |
1,549 |
|
|
(1,692) |
|
|
(2,392) |
|
|
| Other cash income |
377 |
|
|
377 |
|
|
377 |
|
|
Cash settlement on derivative instruments |
1,188 |
|
|
1,631 |
|
|
2,074 |
|
|
|
|
|
|
|
|
|
| Current taxes |
6,070 |
|
|
40,094 |
|
|
35,745 |
|
|
| Interest income |
(174) |
|
|
(766) |
|
|
(1,033) |
|
|
Net change in funds flow from operations(1) from comparative period |
(1,438) |
|
|
7,739 |
|
|
(11,224) |
|
|
| Expenses: |
|
|
|
|
|
|
| Depletion, depreciation and accretion |
3,567 |
|
|
(13,145) |
|
|
(29,197) |
|
|
|
|
|
|
|
|
|
| Deferred tax |
(7,165) |
|
|
(53,814) |
|
|
(35,623) |
|
|
| Amortization of deferred financing fees |
(249) |
|
|
(1,322) |
|
|
(1,849) |
|
|
| Stock-based compensation |
(1,063) |
|
|
5,614 |
|
|
9,492 |
|
|
| Derivative instruments gain or loss, net of settlements on derivative instruments |
14,311 |
|
|
12,401 |
|
|
10,491 |
|
|
| Unrealized foreign exchange |
(1,427) |
|
|
(6,437) |
|
|
(10,390) |
|
|
| Other loss (gain) |
14 |
|
|
(38) |
|
|
(90) |
|
|
| Net lease payments |
(11) |
|
|
(110) |
|
|
76 |
|
|
|
|
|
|
|
|
|
|
|
|
|
|
|
|
|
|
|
|
|
|
|
| Net change in net income (loss) |
6,539 |
|
|
(49,112) |
|
|
(68,314) |
|
|
| Net loss for the current period |
$ |
(12,741) |
|
34% |
$ |
(12,741) |
|
135% |
$ |
(32,021) |
|
188% |
(1) Funds flow from operations is a non-GAAP measure that does not have any standardized meaning prescribed under GAAP. Refer to note 2 “Non-GAAP measures” in "Financial and Operational Highlights" for a definition and reconciliation of this measure.
Capital expenditures during the three months ended June 30, 2025, were $51.1 million.
|
|
|
|
|
|
|
|
|
|
|
|
|
|
|
| (Millions of U.S. Dollars) |
Colombia |
Ecuador |
Canada |
Total |
Exploration: |
|
|
|
|
| Drilling and Completions |
$ |
5.0 |
|
$ |
— |
|
$ |
— |
|
$ |
5.0 |
|
| Civil Works |
0.8 |
|
1.3 |
— |
|
2.1 |
|
| Other |
3.0 |
1.2 |
— |
|
4.2 |
|
| Total Exploration |
$ |
8.8 |
|
$ |
2.5 |
|
|
$ |
11.3 |
|
| Development: |
|
|
|
|
| Drilling and Completions |
$ |
15.7 |
|
$ |
0.2 |
|
$ |
1.1 |
|
$ |
17.0 |
|
| Facilities |
9.7 |
|
2.6 |
|
— |
|
12.3 |
|
| Civil Works |
1.3 |
|
0.4 |
|
0.7 |
|
2.4 |
|
| Other |
7.3 |
|
0.6 |
|
0.2 |
|
8.1 |
|
| Total Development |
$ |
34.0 |
|
$ |
3.8 |
|
$ |
2.0 |
|
$ |
39.8 |
|
| Total Company |
$ |
42.8 |
|
$ |
6.3 |
|
$ |
2.0 |
|
$ |
51.1 |
|
During the three months ended June 30, 2025, we drilled the following wells:
|
|
|
|
|
|
|
|
|
|
Number of wells (Gross) |
Number of wells (Net) |
|
|
|
|
|
|
|
|
|
|
|
|
| Development - Colombia |
3 |
|
3.0 |
|
| Exploration - Colombia |
1 |
|
1.0 |
|
| Development - Canada |
1 |
|
0.5 |
|
|
|
|
| Total Company |
5 |
|
4.5 |
|
During the three months ended June 30, 2025, we spud three development wells and one exploration well in Colombia, of which two were producing, one was dry and one was in progress as at June 30, 2025. We spud one development well in Canada and it was in-progress as of June 30, 2025.
Liquidity and Capital Resources
|
|
|
|
|
|
|
|
|
|
|
|
|
|
|
|
|
|
| |
As at |
| (Thousands of U.S. Dollars) |
June 30, 2025 |
|
% Change |
|
December 31, 2024 |
| Cash and Cash Equivalents |
$ |
61,028 |
|
|
(41) |
|
|
$ |
103,379 |
|
|
|
|
|
|
|
|
|
|
|
|
|
|
|
|
|
|
|
| Canada and Colombia Credit Facilities |
$ |
44,237 |
|
|
(100) |
|
|
$ |
— |
|
|
|
|
|
|
|
| 6.25% Senior Notes due 2025 |
$ |
— |
|
|
(100) |
|
|
$ |
24,828 |
|
|
|
|
|
|
|
| 7.75% Senior Notes due 2027 |
$ |
24,201 |
|
|
— |
|
|
$ |
24,201 |
|
|
|
|
|
|
|
| 9.50% Senior Notes due 2029 |
$ |
735,790 |
|
|
— |
|
|
$ |
737,590 |
|
We believe that our capital resources, including cash on hand, cash generated from operations and available borrowings under our credit facilities, will provide us with sufficient liquidity to meet our strategic objectives and planned capital program for the next 12 months and beyond, including the repayment of 25% of the principal amount of 9.50% Senior Notes due October 15, 2026, given the current oil price trends and production levels. We may also access capital markets to pursue financing, including for the re-purchase of common stock or the repayment of debt in the future. In accordance with our investment policy, available cash balances are held in our primary cash management banks or may be invested in U.S. or Canadian government-backed federal, provincial or state securities or other money market instruments with high credit ratings and short-term liquidity. We believe that our current financial position provides us with the flexibility to respond to both internal growth opportunities and those available through acquisitions. We intend to pursue growth opportunities and acquisitions from time to time, which may require significant capital to be located in basins or countries beyond our current operations, involve joint ventures, or be sizable compared to our current assets and operations.
Credit Facility - Canada
We, through our wholly owned subsidiary Gran Tierra Canada Ltd., have a revolving credit facility with National Bank of Canada dated March 22, 2024 with a borrowing base of C$100.0 million (US$73.0 million as of June 30, 2025) and the available commitment of a C$50.0 million (US$36.5 million as of June 30, 2025) revolving credit facility comprised of C$35.0 million (US$25.6 million as of June 30, 2025) syndicated facility and C$15.0 million (US$11.0 million as of June 30, 2025) of operating facility. The drawn down amounts under the revolving credit facility can either be in Canadian or U.S. dollars and bear interest rates equal to either the Canadian prime rate or U.S. Base Rate plus a margin ranging from 2.00% to 4.00% per annum or for CORRA loans and SOFR loans plus a margin ranging from 3.00% to 5.00% per annum. Undrawn amounts under the revolving credit facility bear standby fee ranging from 0.75% to 1.25% per annum. In each case, the margin or standby fee, as applicable is based on Net Debt to EBITDA ratio of Gran Tierra Canada Ltd. As of June 30, 2025, the outstanding balance under the facility was US$22.0 million (C$30.0 million) and the weighted-average interest rate on borrowings during the second quarter of 2025 was 6.74%. On July 22, 2025, the borrowing base was redetermined by National Bank of Canada at C$100.0 million, of which available commitment is C$50.0 million. The next borrowing base redetermination will occur on or before November 30, 2025, and the revolving credit facility is available until October 31, 2025 with a repayment date of October 31, 2026, which may be extended by further periods of up to 364 days, subject to lender approval.
Credit Facility - Colombia
On April 16, 2025, we, through our wholly owned subsidiary, Gran Tierra Energy Colombia GmbH, a Swiss limited liability company, entered into a $75.0 million reserve-based lending facility. Any loans incurred under the new facility will mature on April 16, 2028 and will bear interest at a rate per annum equal to, at our option, either (a) a customary base rate (subject to a floor of 1.00%) plus an applicable margin of 4.50% or (b) a term SOFR reference rate plus an applicable margin of 4.50%. Interest on base rate borrowings is payable quarterly in arrears and interest on term SOFR borrowings accrues in respect of interest periods of three or six months, at the election of the Company, and is payable on the last day of such interest period.
During the second quarter of 2025, we drew $24.5 million under the facility to fund capital expenditures. As of June 30, 2025 the outstanding balance under the RBL Facility was $24.5 million. For the three and six months ended June 30, 2025, the weighted-average interest rate on borrowings was 8.43%.
Under the terms of the facility, the we are required to maintain compliance with the following financial covenants:
i.consolidated net debt to consolidated adjusted EBITDA ratio that may not exceed 3.00 to 1.00, and
ii.consolidated interest coverage ratio that may not be less than 2.50 to 1.00
At June 30, 2025, we had $24.2 million aggregate principal amount of 7.75% Senior Notes due 2027, and $735.8 million aggregate principal amount of 9.50% Senior Notes due 2029, outstanding.
During the six months ended June 30, 2025, we paid at maturity the remaining principal of $24.8 million of 6.25% Senior Notes due in February 2025 for cash consideration of $25.6 million, including interest payable of $0.8 million.
The principal amount of 9.50% Senior Notes is to be repaid as follows: (i) October 15, 2026, 25% of the principal amount; (ii) October 15, 2027 5% of the principal amount; (iii) October 15, 2028, 30% of the principal amount; and (iv) October 15, 2029, the remainder of the principal amount.
We were in compliance with all applicable covenants related to credit facility and Senior Notes as of June 30, 2025.
During the three and six months ended June 30, 2025, we re-purchased 239,754 and 692,804 shares under the 2024 Program at a weighted average price of $4.38 and $5.00 per share (three and six months ended June 30, 2024 - 404,314 and 1,290,980 shares under the 2023 program at a weighted average price of $9.20 and $6.71 per share). Under the 2024 Program, we were able to re-purchase at prevailing market prices up to 3,545,872 shares of Common Stock, representing approximately 10% of the public float as of October 31, 2024. We cancelled 487,948 held as treasury shares as at December 31, 2024 and cancelled 239,754 shares re-purchased during the six months ended June 30, 2025. During the period from November 6, 2024 to July 28, 2025, we have re-purchased 1,180,752 shares under the 2024 Program.
On June 4, 2025, we, through our wholly owned subsidiary, Gran Tierra UK Limited, a United Kingdom limited company, entered into an agreement to sell our wholly owned subsidiary, Gran Tierra North Sea Limited (“GTNSL”) to NEO Energy for total consideration of $7.5 million. Completion of the transaction is subject to certain customary conditions precedent, including consent from the North Sea Transition Authority in respect of the change of control of GTNSL. The transaction is expected to close in the fourth quarter of 2025.
On July 25, 2025, we, through our wholly owned subsidiary, Gran Tierra Energy Colombia GmbH, signed a mandate letter with a syndicate banks for a $200.0 million prepayment structure backed by crude oil deliveries. We are progressing toward full documentation with an expected close in Q3 2025, with funding anticipated shortly thereafter. The facility is structured to enhance financial flexibility, support long-term capital planning, and optimize our debt maturity profile. This initiative reflects our continued focus on disciplined financial management and efficient capital deployment, while preserving optionality for future opportunities.
Cash Flows
The following table presents our primary sources and uses of cash and cash equivalents and restricted cash and cash equivalents for the presented:
|
|
|
|
|
|
|
|
|
|
Six Months Ended June 30, |
| (Thousands of U.S. Dollars) |
2025 |
2024 |
| Sources of cash and cash equivalents: |
|
|
| Net (loss) income |
$ |
(32,021) |
|
$ |
36,293 |
|
Adjustments to reconcile net loss to Adjusted EBITDA(1) and funds flow from operations(1) |
|
|
| DD&A expenses |
140,837 |
|
111,640 |
|
| Cash settlement on derivative instruments |
— |
|
— |
|
| Interest expense |
47,601 |
|
36,822 |
|
| Income tax expense |
8,201 |
|
8,323 |
|
| Non-cash lease expenses |
3,461 |
|
2,794 |
|
| Lease payments |
(3,112) |
|
(2,369) |
|
| Foreign exchange loss (gain) |
7,554 |
|
(5,228) |
|
| Stock-based compensation expense |
29 |
|
9,521 |
|
| Financial instruments loss |
(10,491) |
|
— |
|
| Transaction costs |
— |
|
— |
|
| Other loss |
90 |
|
— |
|
Adjusted EBITDA(1) |
162,149 |
|
197,796 |
|
| Current income tax expense |
(10,460) |
|
(46,205) |
|
| Contractual interest and other financing expenses |
(39,686) |
|
(30,756) |
|
| Transaction costs |
— |
|
— |
|
| Realized foreign exchange loss |
(2,753) |
|
(361) |
|
Funds flow from operations(1) |
109,250 |
|
120,474 |
|
| Proceeds from issuance of Senior Notes, net of issuance costs |
— |
|
85,615 |
|
| Proceeds from exercise of stock options |
22 |
|
367 |
|
| Proceeds from debt, net of issuance costs |
44,781 |
|
— |
|
| Net changes in assets and liabilities from operating activities |
1,702 |
|
13,809 |
|
|
|
|
|
|
|
|
|
|
|
155,755 |
|
220,265 |
|
|
|
|
| Uses of cash and cash equivalents: |
|
|
| Additions to property, plant and equipment |
(153,971) |
|
(114,044) |
|
| Repayment of long-term debt |
(1,894) |
|
— |
|
| Purchase of Senior Notes |
(1,712) |
|
— |
|
| Repayment of Senor Notes |
(24,828) |
|
(36,364) |
|
Re-purchase of shares of Common Stock |
(3,466) |
|
(8,667) |
|
| Settlement of asset retirement obligations |
(3,045) |
|
(223) |
|
| Lease payments |
(7,849) |
|
(7,078) |
|
| Foreign exchange loss on cash, and cash equivalents and restricted cash and cash equivalents |
(766) |
|
(1,513) |
|
|
(197,531) |
|
(167,889) |
|
| Net (decrease) increase in cash and cash equivalents and restricted cash and cash equivalents |
$ |
(41,776) |
|
$ |
52,376 |
|
(1) Adjusted EBITDA and funds flow from operations are non-GAAP measures which do not have any standardized meaning prescribed under GAAP. Refer to note 2 “Non-GAAP measures” in “Financial and Operational Highlights” for a definition and reconciliation of this measure.
One of the primary sources of variability in our cash flows from operating activities is the fluctuation in oil prices. Sales volume changes, costs related to operations and debt transactions also impact cash flows. Our cash flows from operating activities are also impacted by foreign currency exchange rate changes. During the three months ended June 30, 2025, funds flow from operations increased by 17% compared to the corresponding period of 2024, due to higher sales volumes, lower differentials and lower current income tax expense partially offset by a decrease in Brent price, higher operating expenses and higher interest expense. Funds flow from operations for the six months ended June 30, 2025, decreased by 9% compared to the corresponding period of 2024, primarily due to decrease in Brent price, higher operating expenses, higher interest expense partially offset by higher sales volumes, lower differentials and lower current income tax expense.
Critical Accounting Policies and Estimates
Our critical accounting policies and estimates are disclosed in Item 7 of our 2024 Annual Report on Form 10-K and have not changed materially since the filing of that document.
Item 3. Quantitative and Qualitative Disclosures About Market Risk
Commodity price risk
Our principal market risk relates to oil, natural gas and NGL prices which are volatile and unpredictable and influenced by concerns over world supply and demand imbalance and many other market factors outside of our control. Our revenues are from oil sales at Brent or Edmonton Light pricing and for gas at AECO pricing and adjusted for quality. As at June 30, 2025, the Company had 3,299 and 839 weighted average bopd crude volumes hedged to March 31, 2026, in Colombia and Canada, respectively, as well as 13,833 weighted average GJ/day natural gas volumes hedged to December 31, 2025, in Canada. The Company entered into an additional 1,963 and 667 weighted average bopd crude price derivatives up to September 30, 2026 and December 31, 2026, in Colombia and Canada, respectively, subsequent to the quarter-end, to manage the variability of cash flows associated with the forecasted sale of our oil production, reduce commodity price risk and provide a base level of cash flow in order to assure we can execute at least a portion of our capital spending.
Foreign currency risk
Foreign currency risk is a factor for our Company but is ameliorated to a certain degree by the nature of expenditures and revenues in the countries where we operate. Our reporting currency is U.S. dollars and 78% of our revenues are related to the U.S. dollar price of Brent with the remainder related to Canadian dollar price of WTI oil or AECO gas. In Colombia and Ecuador, we receive 100% of our revenues in U.S. dollars and the majority of our capital expenditures is in U.S. dollars or is based on U.S. dollar prices. The majority of income and value added taxes and G&A expenses in all locations are in local currency. In Canada, we receive 100% of our revenue in Canadian dollar and majority of our capital and operating expenditures are in Canadian dollars or are based on Canadian dollar prices.
Additionally, foreign exchange gains and losses result primarily from the fluctuation of the U.S. dollar to the Colombian peso due to our accounts payable, taxes receivable and payable and deferred tax assets and liabilities in Colombia are denominated in the local currency of the Colombian foreign operations which are our monetary assets. As a result, a foreign exchange gain or loss must be calculated on conversion to the U.S. dollar reporting currency.
The Company utilizes foreign currency derivatives to manage the variability in cash flows associated with the Company's forecasted Colombian peso ("COP") denominated expenses, predominantly operating costs.
As at June 30, 2025, the Company had outstanding foreign currency derivative positions as follows:
|
|
|
|
|
|
|
|
|
|
|
|
|
|
|
|
|
|
| Period and Type of Instrument |
U.S. Dollars Amount Hedged
(Thousands of U.S. Dollars) |
COP Equivalent of Amount Hedged (Millions of COP)(1) |
Reference |
Floor Price
(COP, Weighted Average) |
Cap Price (COP, Weighted Average) |
| Collars: June 16, 2025 to April 15, 2026 |
100,000 |
|
407,000 |
|
COP |
4,430 |
|
4,706 |
|
(1) At June 30, 2025 foreign exchange rate.
Interest Rate Risk
Interest rate risk is the risk that future cash flows will fluctuate as a result of changes in market interest rates. We are exposed to
interest rate fluctuations on our Canadian revolving credit facility and Colombian reserve-based lending(“RBL”) facility, which bear floating rates of interest. As of June 30, 2025 our outstanding balance under the revolving credit facility was US$22.0 million (C$30.0 million) and $24.5 million under the RBL facility (December 31, 2024 - nil).
Item 4. Controls and Procedures
Disclosure Controls and Procedures
We have established disclosure controls and procedures (as defined in Rules 13a-15(e) and 15d-15(e) under the Securities Exchange Act of 1934, or Exchange Act). Our disclosure controls and procedures are designed to provide reasonable assurance that the information required to be disclosed by Gran Tierra in the reports that it files or submits under the Exchange Act is recorded, processed, summarized, and reported within the time periods specified in the SEC rules and forms and that such information is accumulated and communicated to management, including our Chief Executive Officer and Chief Financial Officer, as appropriate, to allow timely decisions regarding required disclosure. Our management, with the participation of our Chief Executive Officer and Chief Financial Officer, evaluated the effectiveness of the design and operation of our disclosure controls and procedures as of the end of the period covered by this report, as required by Rule l3a-15(b) of the Exchange Act. Based on this evaluation, our Chief Executive Officer and Chief Financial Officer have concluded that Gran Tierra’s disclosure controls and procedures were effective as of June 30, 2025.
Changes in Internal Control over Financial Reporting
There were no changes in our internal control over financial reporting (as defined in Rules 13a-15(f) and 15d-15(f) under the Exchange Act) during the quarter ended June 30, 2025, that have materially affected or are reasonably likely to materially affect our internal control over financial reporting.
On October 31, 2024, the Company completed the acquisition of i3 Energy Plc (“i3 Energy”), a publicly traded oil and gas company that was listed on the TSX venture exchange. i3 Energy’s operations have been included in the consolidated financial statements of Gran Tierra since October 31, 2024. However, Gran Tierra has not had sufficient time to appropriately assess the disclosure controls and procedures and internal controls over financial reporting previously used by i3 Energy and integrate them with those of Gran Tierra. As a result, the certifying officers have limited the scope of their design of disclosure controls and procedures and internal controls over financial reporting to exclude controls, policies and procedures of i3 Energy (as permitted by applicable securities laws in U.S.). Gran Tierra has a program in place to complete its assessment of the controls, policies and procedures of the acquired operations by October 31, 2025. During the six months ended June 30, 2025, the assets previously held by i3 Energy, contributed $66.2 million (representing 20% ) of total Company’s oil, natural gas and NGL revenue and as at June 30, 2025, there were $301.6 million of total assets were associated with acquired entity.
PART II - Other Information
Item 1. Legal Proceedings
See Note 11 in the Notes to the Condensed Consolidated Financial Statements (Unaudited) in Part I, Item 1 of this Quarterly Report on Form 10-Q, which is incorporated herein by reference, for any material developments with respect to matters previously reported in our Annual Report on Form 10-K for the year ended December 31, 2024, and any material matters that have arisen since the filing of such report.
Item 1A. Risk Factors
There are numerous factors that affect our business and results of operations, many of which are beyond our control. In addition to information set forth in this Quarterly Report on Form 10-Q, including in Part I, Item 2 “Management’s Discussion and Analysis of Financial Condition and Results of Operations”, you should carefully read and consider the factors set out in Part I, Item 1A “Risk Factors” in our Annual Report on Form 10-K for the year ended December 31, 2024. These risk factors could materially affect our business, financial condition and results of operations. The unprecedented nature of ongoing conflicts in several parts of the world, along with volatility in the worldwide economy and oil and gas industry may make it more difficult to identify all the risks to our business, results of operations and financial condition and the ultimate impact of identified risks.
Item 2. Unregistered Sales of Equity Securities and Use of Proceeds
Issuer Purchases of Equity Securities
|
|
|
|
|
|
|
|
|
|
|
|
|
|
|
|
(a)
Total Number
of Shares Purchased |
(b)
Average Price Paid per Share (1) |
(c) Total Number of Shares Purchased as Part of Publicly Announced Plans or Programs |
(d)
Maximum Number of Shares that May Yet be Purchased Under the Plans or Programs (2)
|
| April 1-30, 2025 |
209,754 |
|
$ |
4.39 |
|
209,754 |
|
2,395,120 |
|
| May 1-31, 2025 |
30,000 |
|
4.34 |
|
30,000 |
|
2,365,120 |
|
| June 1-30, 2025 |
— |
|
$ |
— |
|
— |
|
2,365,120 |
|
| Total |
239,754 |
|
$ |
4.38 |
|
239,754 |
|
2,365,120 |
|
(1) Including commission fees paid to the broker to re-purchase the shares of Common Stock.
(2) On October 31, 2024, we implemented a share re-purchase program (the “2024 Program”) through the facilities of the TSX, the NYSE American or alternative programs in Canada or the United States. Under the 2024 Program, the Company is able to purchase at prevailing market prices up to 3,545,872 shares of Common Stock, representing approximately 10% of the public float as of October 31, 2024. The 2024 Program will expire on November 5, 2025.
Item 5. Other Information
During the three months ended June 30, 2025, no director or Section 16 officer adopted or terminated any Rule 10b5-1 trading arrangements or non-Rule 10b5-1 trading arrangements (in each case, as defined in Item 408(a) of Regulation S-K).
Item 6. Exhibits
|
|
|
|
|
|
|
|
|
|
|
|
| Exhibit No. |
Description |
|
Reference |
| 3.1 |
|
|
Incorporated by reference to Exhibit 3.3 to the Current Report on Form 8-K, filed with the SEC on November 4, 2016 (SEC File No. 001-34018). |
|
|
|
|
| 3.2 |
|
|
Incorporated by reference to Exhibit 3.1 to the Current Report on Form 8-K, filed with the SEC on May 5, 2023 (SEC File No. 001-34018). |
|
|
|
|
| 3.3 |
|
|
Incorporated by reference to Exhibit 3.4 to the Current Report on Form 8-K, filed with the SEC on November 4, 2016 (SEC File No. 001-34018). |
|
|
|
|
| 3.4 |
|
|
Incorporated by reference to Exhibit 3.1 to the Current Report on Form 8-K filed with the SEC on August 4, 2021 (SEC File No. 001-34018). |
|
|
|
|
| 10.1 |
Credit and Guaranty Agreement, dated as of April 16, 2025, by and among Gran Tierra Energy Colombia GmbH, as borrower, the guarantors party thereto from time to time, the lenders party thereto from time to time, GLAS USA LLC, as administrative agent, GLAS Americas LLC, as collateral agent, and JPMorgan Chase Bank, N.A., as calculation agent. |
|
Incorporated by reference to Exhibit 3.1 to the Current Report on Form 8-K filed with the SEC on April 18, 2025 (SEC File No. 001-34018). |
|
|
|
|
| 31.1 |
|
|
Filed herewith. |
|
|
|
|
| 31.2 |
|
|
Filed herewith. |
|
|
|
|
| 32.1 |
|
|
Furnished herewith. |
101.INS XBRL Instance Document - the instance document does not appear in the Interactive Data File because its XBRL tags are embedded within the Inline XBRL document
101.SCH Inline XBRL Taxonomy Extension Schema Document
101.CAL Inline XBRL Taxonomy Extension Calculation Linkbase Document
101.DEF Inline XBRL Taxonomy Extension Definition Linkbase Document
101.LAB Inline XBRL Taxonomy Extension Label Linkbase Document
101.PRE Inline XBRL Taxonomy Extension Presentation Linkbase Document
104.The cover page from Gran Tierra Energy Inc.’s Quarterly Report on Form 10-Q for the quarter ended June 30, 2025, formatted in Inline XBRL (included within the Exhibit 101 attachments).
SIGNATURES
Pursuant to the requirements of the Securities Exchange Act of 1934, the registrant has duly caused this report to be signed on its behalf by the undersigned thereunto duly authorized.
GRAN TIERRA ENERGY INC.
|
|
|
|
|
|
|
|
|
Date: July 30, 2025 |
|
/s/ Gary S. Guidry |
| |
|
By: Gary S. Guidry |
| |
|
President and Chief Executive Officer |
| |
|
(Principal Executive Officer) |
|
|
|
|
|
|
|
|
|
Date: July 30, 2025 |
|
/s/ Ryan Ellson |
| |
|
By: Ryan Ellson |
|
|
Executive Vice President and Chief Financial Officer |
| |
|
(Principal Financial and Accounting Officer) |
EX-31.1
2
a20250630-ex311.htm
EX-31.1
Document
EXHIBIT 31.1
CERTIFICATION OF CHIEF EXECUTIVE OFFICER
PURSUANT TO RULE 13A-14(A) AND RULE 15D-14(A)
OF THE SECURITIES EXCHANGE ACT OF 1934, AS AMENDED
I, Gary S. Guidry, certify that:
1. I have reviewed this Form 10-Q of Gran Tierra Energy Inc.;
2. Based on my knowledge, this report does not contain any untrue statement of a material fact or omit to state a material fact necessary to make the statements made, in light of the circumstances under which such statements were made, not misleading with respect to the period covered by this report;
3. Based on my knowledge, the financial statements, and other financial information included in this report, fairly present in all material respects the financial condition, results of operations and cash flows of the registrant as of, and for, the periods presented in this report;
4. The registrant’s other certifying officer and I are responsible for establishing and maintaining disclosure controls and procedures (as defined in Exchange Act Rules 13a-15(e) and 15d-15(e)) and internal control over financial reporting (as defined in Exchange Act Rules 13a-15(f) and 15d-15(f)) for the registrant and have:
(a) Designed such disclosure controls and procedures, or caused such disclosure controls and procedures to be designed under our supervision, to ensure that material information relating to the registrant, including its consolidated subsidiaries, is made known to us by others within those entities, particularly during the period in which this report is being prepared;
(b) Designed such internal control over financial reporting, or caused such internal control over financial reporting to be designed under our supervision, to provide reasonable assurance regarding the reliability of financial reporting and the preparation of financial statements for external purposes in accordance with generally accepted accounting principles;
(c) Evaluated the effectiveness of the registrant’s disclosure controls and procedures and presented in this report our conclusions about the effectiveness of the disclosure controls and procedures, as of the end of the period covered by this report based on such evaluation; and
(d) Disclosed in this report any change in the registrant’s internal control over financial reporting that occurred during the registrant’s most recent fiscal quarter (the registrant’s fourth fiscal quarter in the case of an annual report) that has materially affected, or is reasonably likely to materially affect, the registrant’s internal control over financial reporting; and
5. The registrant’s other certifying officer and I have disclosed, based on our most recent evaluation of internal control over financial reporting, to the registrant’s auditors and the audit committee of the registrant’s board of directors (or persons performing the equivalent functions):
(a) All significant deficiencies and material weaknesses in the design or operation of internal control over financial reporting which are reasonably likely to adversely affect the registrant’s ability to record, process, summarize and report financial information; and
(b) Any fraud, whether or not material, that involves management or other employees who have a significant role in the registrant’s internal control over financial reporting.
|
|
|
|
|
|
Date: July 30, 2025 |
/s/ Gary S. Guidry |
|
By: Gary S. Guidry |
|
President and Chief Executive Officer |
|
(Principal Executive Officer) |
EX-31.2
3
a20250630-ex312.htm
EX-31.2
Document
EXHIBIT 31.2
CERTIFICATION OF CHIEF FINANCIAL OFFICER
PURSUANT TO RULE 13A-14(A) AND RULE 15D-14(A)
OF THE SECURITIES EXCHANGE ACT OF 1934, AS AMENDED
I, Ryan Ellson, certify that:
1. I have reviewed this Form 10-Q of Gran Tierra Energy Inc.;
2. Based on my knowledge, this report does not contain any untrue statement of a material fact or omit to state a material fact necessary to make the statements made, in light of the circumstances under which such statements were made, not misleading with respect to the period covered by this report;
3. Based on my knowledge, the financial statements, and other financial information included in this report, fairly present in all material respects the financial condition, results of operations and cash flows of the registrant as of, and for, the periods presented in this report;
4. The registrant’s other certifying officer and I are responsible for establishing and maintaining disclosure controls and procedures (as defined in Exchange Act Rules 13a-15(e) and 15d-15(e)) and internal control over financial reporting (as defined in Exchange Act Rules 13a-15(f) and 15d-15(f)) for the registrant and have:
(a) Designed such disclosure controls and procedures, or caused such disclosure controls and procedures to be designed under our supervision, to ensure that material information relating to the registrant, including its consolidated subsidiaries, is made known to us by others within those entities, particularly during the period in which this report is being prepared;
(b) Designed such internal control over financial reporting, or caused such internal control over financial reporting to be designed under our supervision, to provide reasonable assurance regarding the reliability of financial reporting and the preparation of financial statements for external purposes in accordance with generally accepted accounting principles;
(c) Evaluated the effectiveness of the registrant’s disclosure controls and procedures and presented in this report our conclusions about the effectiveness of the disclosure controls and procedures, as of the end of the period covered by this report based on such evaluation; and
(d) Disclosed in this report any change in the registrant’s internal control over financial reporting that occurred during the registrant’s most recent fiscal quarter (the registrant’s fourth fiscal quarter in the case of an annual report) that has materially affected, or is reasonably likely to materially affect, the registrant’s internal control over financial reporting; and
5. The registrant’s other certifying officer and I have disclosed, based on our most recent evaluation of internal control over financial reporting, to the registrant’s auditors and the audit committee of the registrant’s board of directors (or persons performing the equivalent functions):
(a) All significant deficiencies and material weaknesses in the design or operation of internal control over financial reporting which are reasonably likely to adversely affect the registrant’s ability to record, process, summarize and report financial information; and
(b) Any fraud, whether or not material, that involves management or other employees who have a significant role in the registrant’s internal control over financial reporting.
|
|
|
|
|
|
Date: July 30, 2025 |
/s/ Ryan Ellson |
|
By: Ryan Ellson |
|
Executive Vice President and Chief Financial Officer |
|
(Principal Financial and Accounting Officer) |
EX-32.1
4
a20250630-ex321.htm
EX-32.1
Document
EXHIBIT 32.1
Certification of Chief Executive Officer and Chief Financial Officer
Pursuant to Section 906 of the Sarbanes-Oxley Act of 2002
(Section 1350, Chapter 63 of Title 18, United States Code)
Pursuant to the requirement set forth in Rule 13a-14(b) of the Securities Exchange Act of 1934, as amended (the “Exchange Act”) and Section 1350, Chapter 63 of Title 18 of the United States Code (18 U.S.C-§1350), each of Gary S. Guidry, President and Chief Executive Officer of Gran Tierra Energy Inc., a Delaware corporation (the “Company”), and Ryan Ellson, Chief Financial Officer of the Company, does hereby certify, to such officer’s knowledge that:
The Quarterly Report on Form 10-Q for the quarter ended June 30, 2025 (the “Form 10-Q”) to which this Certification is attached as Exhibit 32.1 fully complies with the requirements of Section 13(a) or 15(d) of the Exchange Act. The information contained in the Form 10-Q fairly presents, in all material respects, the financial condition and results of operations of the Company.
IN WITNESS WHEREOF, the undersigned have set their hands hereto as of the 30th day of July, 2025.
|
|
|
|
|
|
|
|
|
| /s/ Gary S. Guidry |
|
/s/ Ryan Ellson |
| By: Gary S. Guidry |
|
By: Ryan Ellson |
| President and Chief Executive Officer |
|
Executive Vice President and Chief Financial Officer |
The foregoing certification is being furnished solely pursuant to Section 906 of the Sarbanes-Oxley Act of 2002 (Section 1350, Chapter 63 of Title 18, United States Code) and is not deemed filed with the Securities and Exchange Commission as part of the Form 10-Q or as a separate disclosure document and is not to be incorporated by reference into any filing of the Company under the Securities Act of 1933, as amended, or the Exchange Act (whether made before or after the date of the Form 10-Q), irrespective of any general incorporation language contained in such filing.