Document
LETTER FROM ROBERT OCTOBER 30, 2024
Dear Investor,
Cimpress delivered solid results in the first quarter of fiscal year 2025. Operationally, we continued the strong progress demonstrated in the prior fiscal year with improvements in customer value and new product introduction.
Financially, strong revenue growth at Vista bolstered consolidated revenue and adjusted EBITDA declined slightly compared to last year inclusive of negative currency impacts.
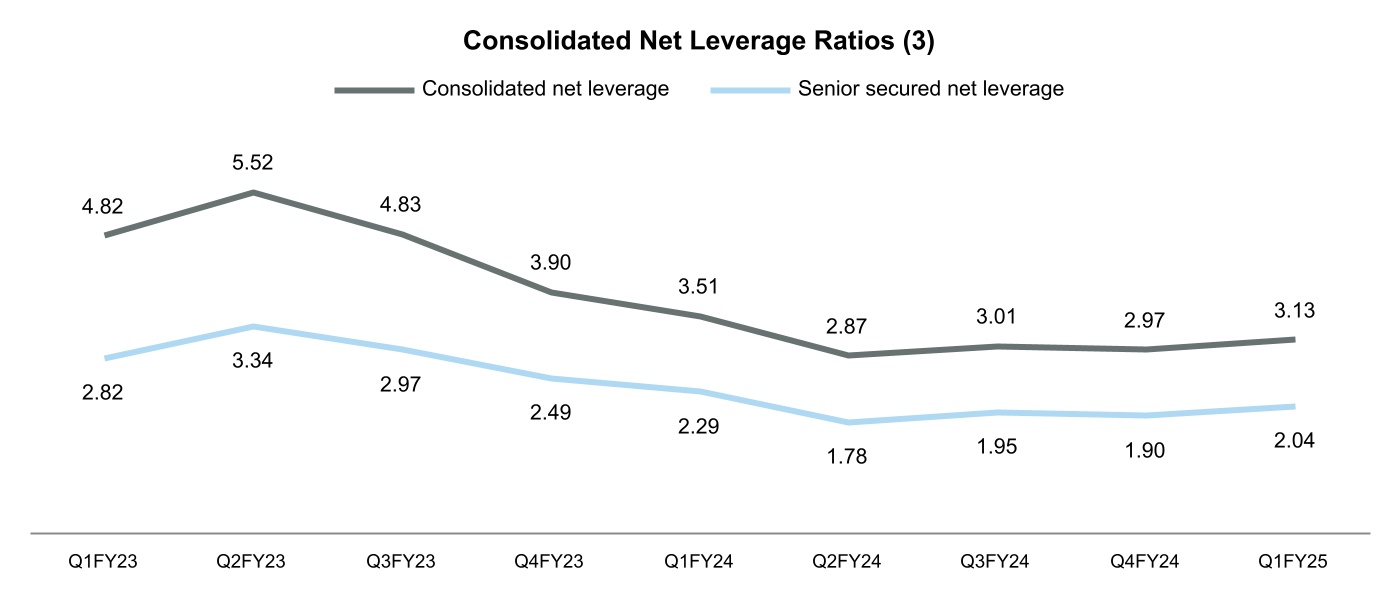
As previously announced, in September we successfully completed an offering of $525 million of 7.375% senior notes due 2032 and used the proceeds, along with cash on hand, to redeem our prior senior notes due in 2026 and pay associated interest and all related financing fees. We concurrently extended the maturity and amended the interest rate of our existing revolving credit facility. These steps, combined with the substantial reduction in net leverage since its peak in December 2022, have significantly strengthened our balance sheet and debt maturity profile. Importantly, we have done this while allocating capital to significant organic growth investments as we described in our July 2024 letter to investors and $168 million of share repurchases over the last three quarters.
Summary financial results for Q1 FY2025 compared to Q1 FY2024:
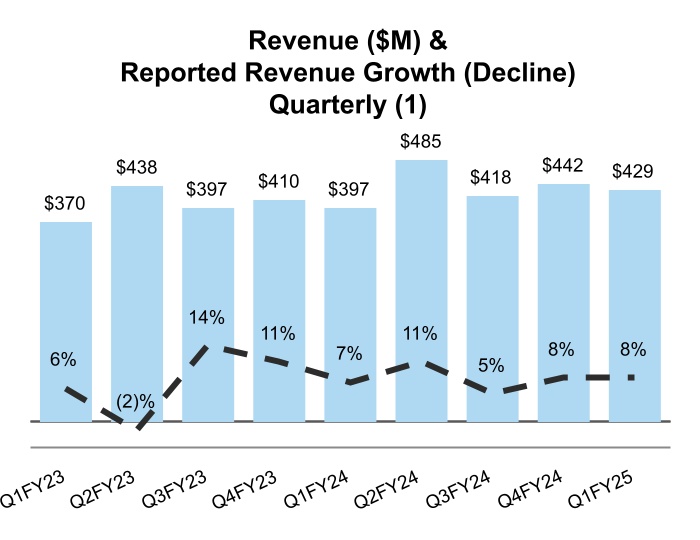
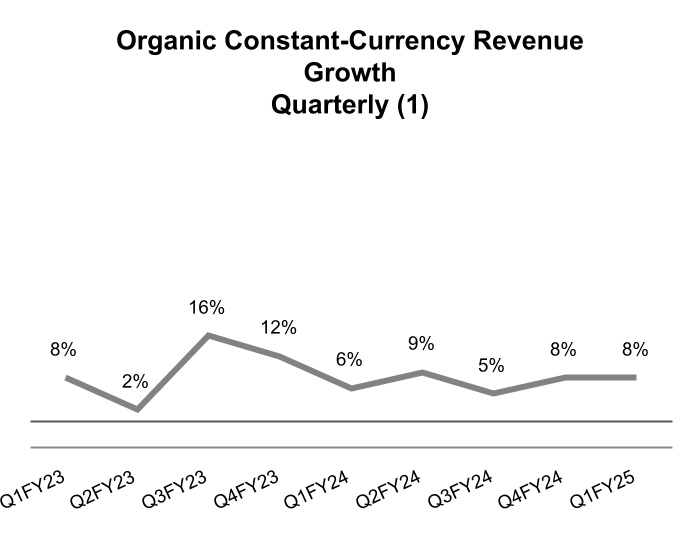
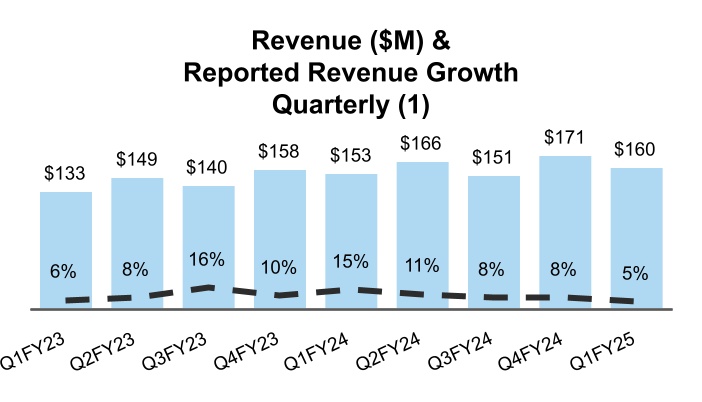
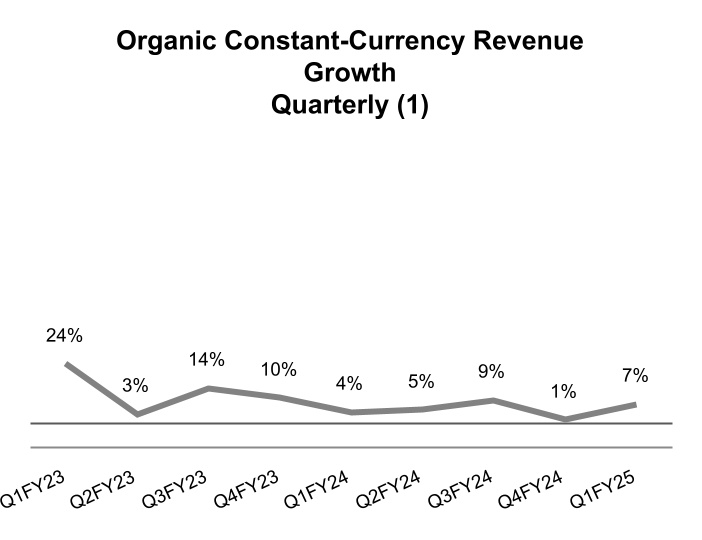
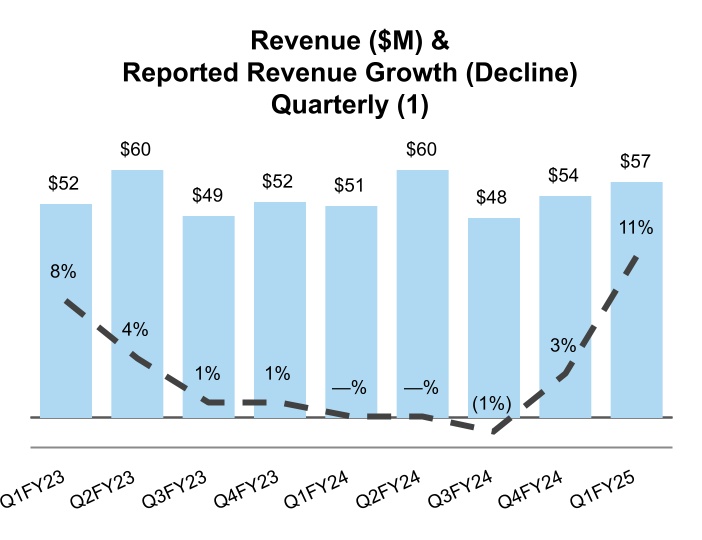
•Revenue grew 6% on a reported basis and on an organic constant-currency basis.
•Operating income increased $5.2 million year over year to $39.3 million.
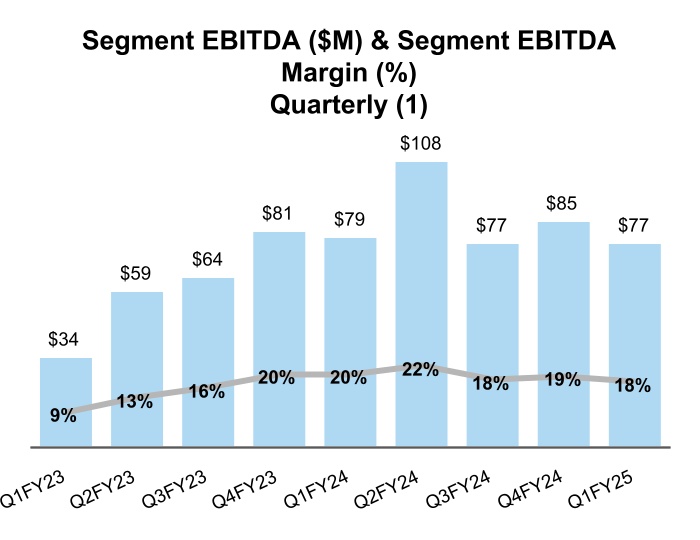
•Adjusted EBITDA decreased $1.0 million year over year to $87.8 million. Year-over-year currency movements negatively impacted adjusted EBITDA by $0.9 million for the quarter.
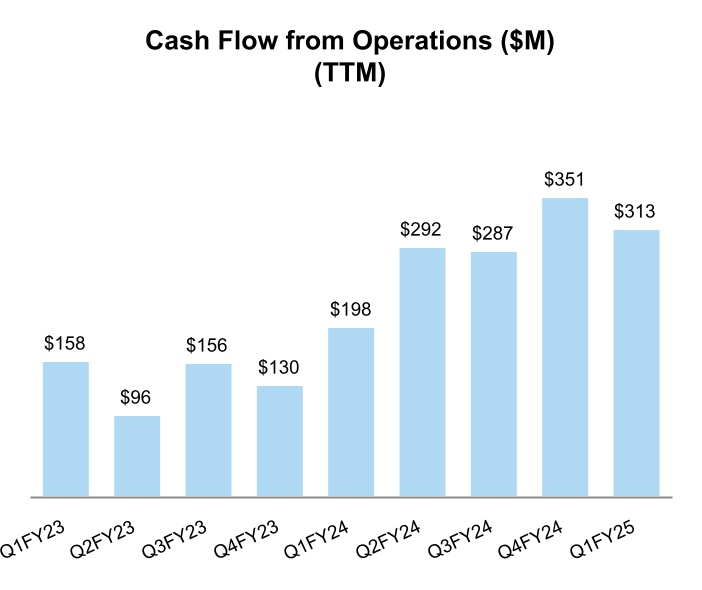
•Operating cash flow decreased $37.9 million year over year to $4.4 million. This was driven by higher outflows from changes in working capital including the non-recurrence of favorable inventory trends in the year-ago period, as well as cash interest payments that increased $10.6 million versus the year-ago period due to our senior notes refinancing, which brought forward the timing of interest payments on our prior senior notes due in 2026 that have now been redeemed.
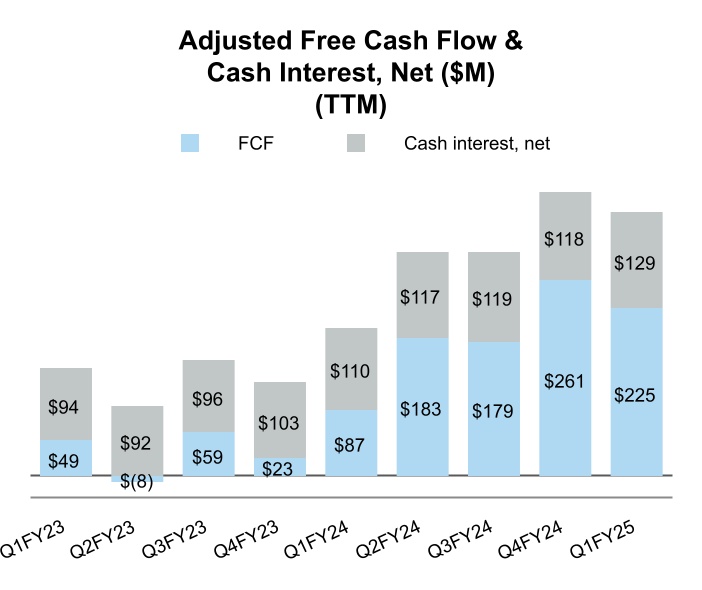
•Adjusted free cash flow decreased $36.5 million year over year to a cash outflow of $25.6 million for the same reasons as operating cash flow above.
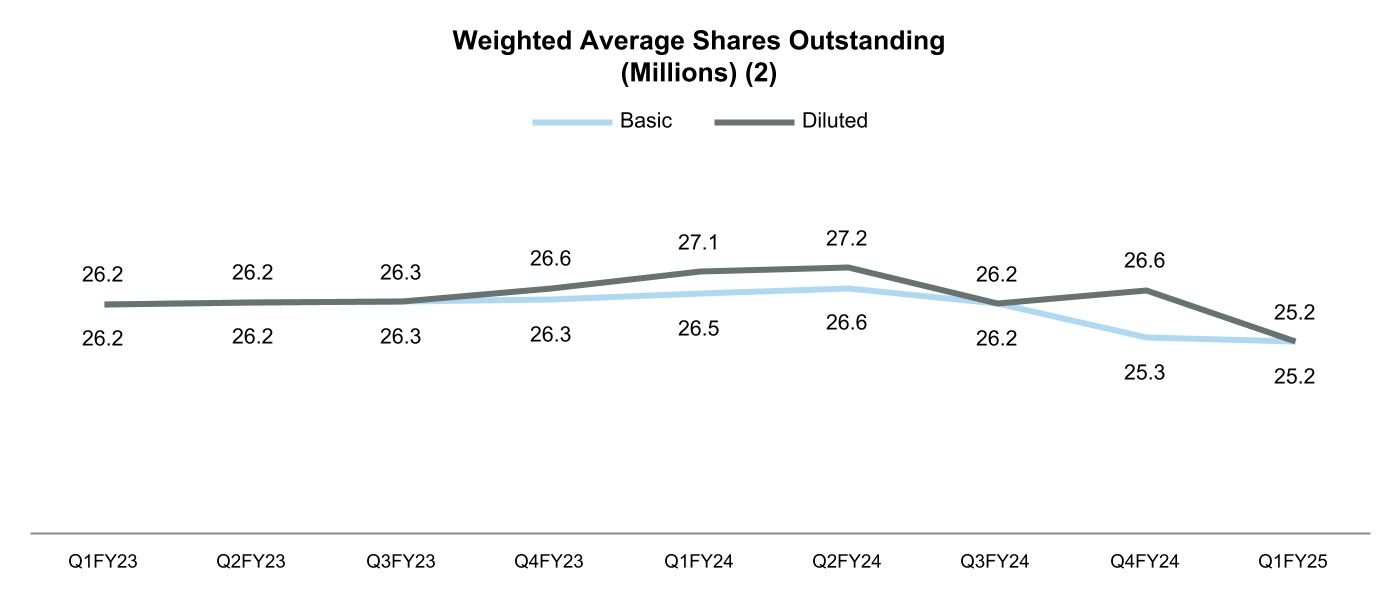
•We repurchased 123,325 Cimpress shares for $10.6 million during the first quarter, and in October we repurchased an additional 115,866 shares for $9.4 million. This totals 239,191 shares for $20.0 million at an average price of $83.63 per share and a 1% reduction of our shares outstanding as of June 30, 2024.
•Net leverage at September 30, 2024 was 3.1 times trailing-twelve month EBITDA as defined by our credit agreement, down from 3.5 last year and up slightly from Q4 FY2024.
•Our liquidity position is strong with cash and marketable securities of $153.0 million as of September 30, 2024. Our $250 million revolving credit facility remained undrawn at the end of the quarter.
•As described at our September investor day, and to reflect recent management reporting changes that incentivize our businesses to improve value to customers and Cimpress cash flows through cross-Cimpress fulfillment via the use of our mass customization platform, Cimpress recast its segment revenue and segment EBITDA on a quarterly basis for FY2023 and FY2024 (no impact to consolidated results). This recast is reflected in this earnings document and in our quarterly Financial and Operating Metrics spreadsheet posted at ir.cimpress.com. You can find more detail about what changed and why in our Guide to Reporting Changes also posted at ir.cimpress.com in the quarterly results section for Q1 FY2025.
Segment Commentary
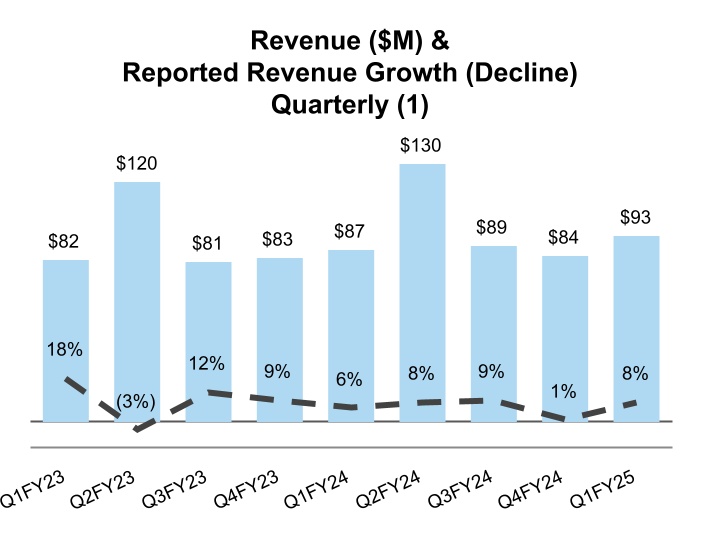
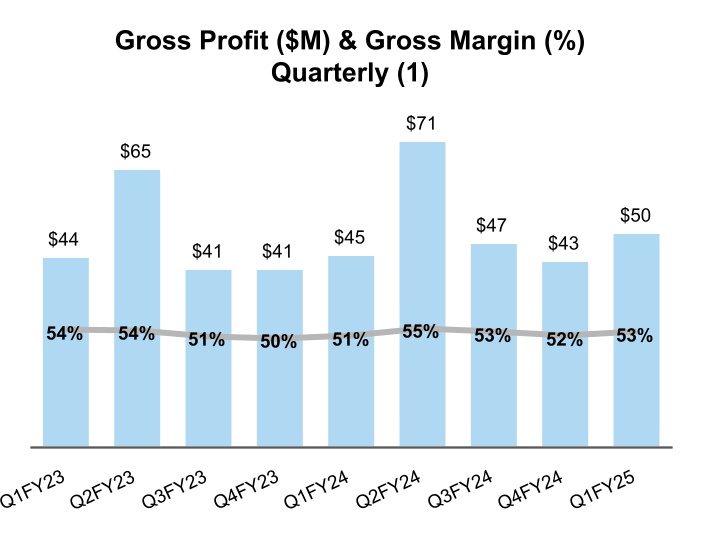
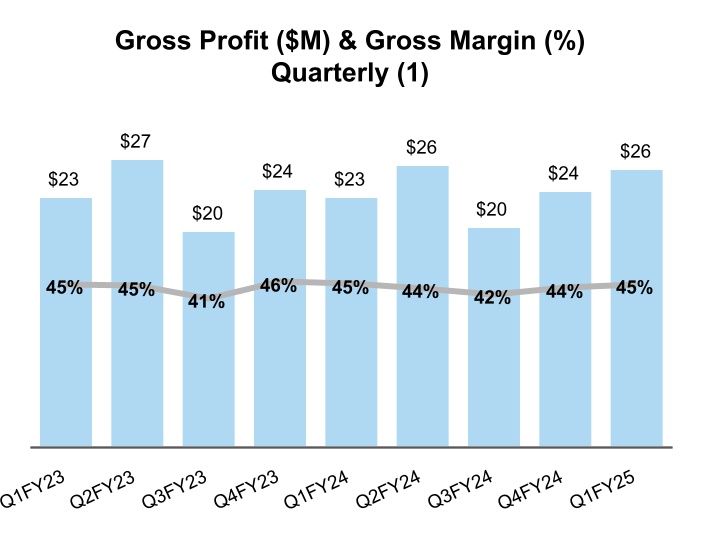
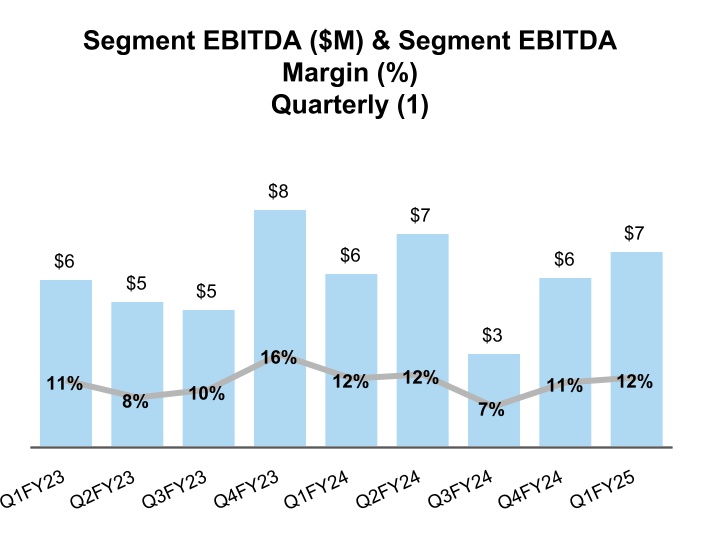
Vista grew Q1 revenue 8% on both a reported and organic constant-currency basis driven by customer experience improvements and new product introductions that have supported continued increases in average order value and customer count.
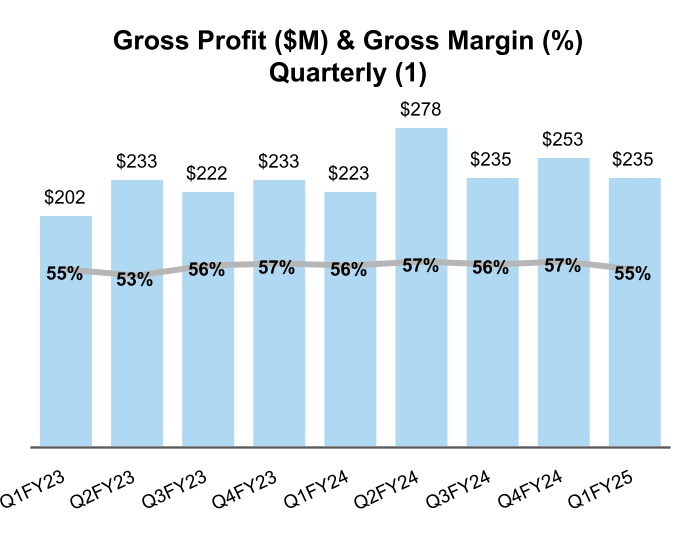
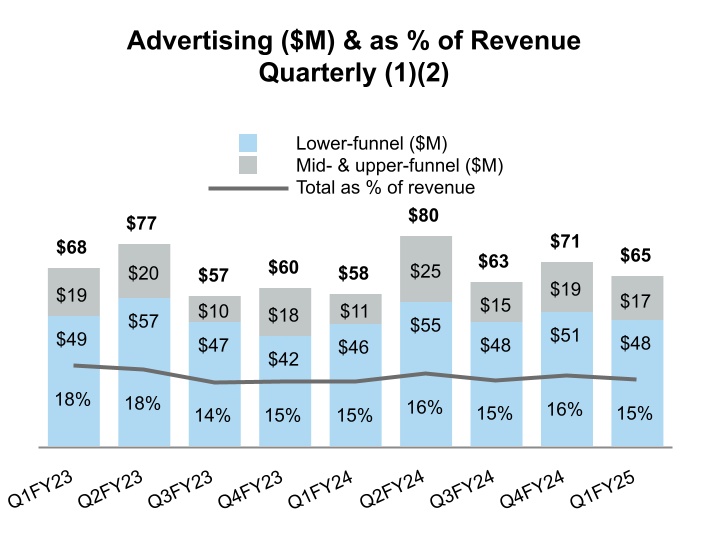
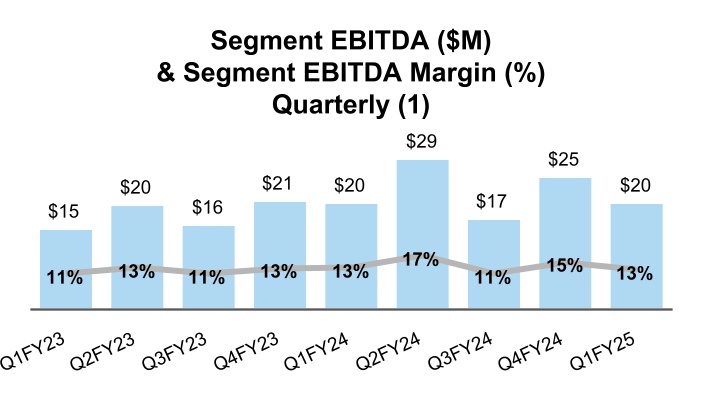
Vista's segment EBITDA in Q1 FY2025 declined by $1.7 million to $76.8 million, a 2% decrease from the same period last year. The benefit of revenue growth was muted by product mix shifts that drove a 140 basis point reduction in gross margin, as well as planned increases to advertising spend, which was up $7.2 million or 12%
Please see non-GAAP reconciliations at the end of this document. Page 2 of
24
from the prior year due to mid- and upper-funnel spend. Segment EBITDA in the year-ago period also benefited from $1.8 million of one-time items that did not recur in the current year and impact the year-over-year comparison.
Vista is currently preparing for the expected seasonal peak in consumer-related volume for the December quarter. The improved customer experience and pace of new product introduction powered by the new technology platform has enabled year-over-year revenue growth in Vista's consumer product category in each of the last five quarters.
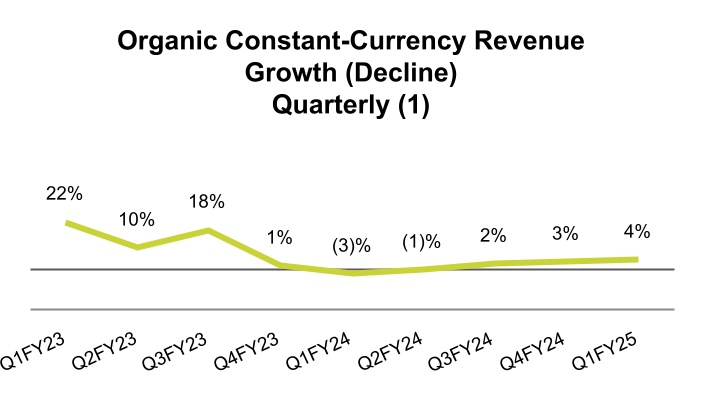
PrintBrothers and The Print Group (our combined Upload & Print businesses) Q1 revenue grew year over year by 5% and 6%, respectively (5% combined), and on an organic constant-currency basis by 4% for both segments and on a combined basis. This was driven by growth in order volumes as well as higher fulfillment for other Cimpress businesses, partially offset by lower per-order quantities in some product categories.
Q1 segment EBITDA was flat year over year for PrintBrothers and expanded $5.4 million for The Print Group ($5.3 million combined). The expansion was driven by revenue growth, gross margin expansion, and operating expense benefits including lower costs related to variable long-term incentive compensation.
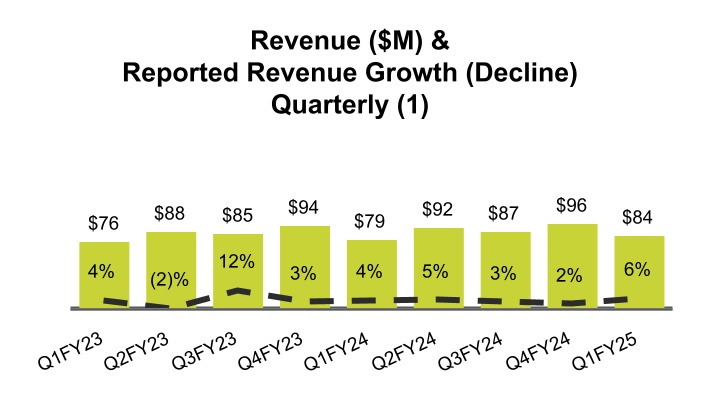
National Pen revenue grew 8% on a reported basis and 7% on an organic constant-currency basis during Q1 FY2025 driven by continued strength in e-commerce and fulfillment for other Cimpress businesses, partially offset by flat revenue from mail order that was impacted by reduced advertising spend to improve returns and efficiency. Segment EBITDA improved $4.0 million as a result of revenue growth, higher gross margins, and a reduction in advertising as a percentage of revenue.
All Other Businesses Q1 revenue grew 11% year over year on a reported basis and 13% on an organic constant-currency basis, led by significant BuildASign revenue growth from fulfillment for other Cimpress businesses. Segment EBITDA increased $0.7 million as a result of the constant-currency revenue growth in both BuildASign and Printi.
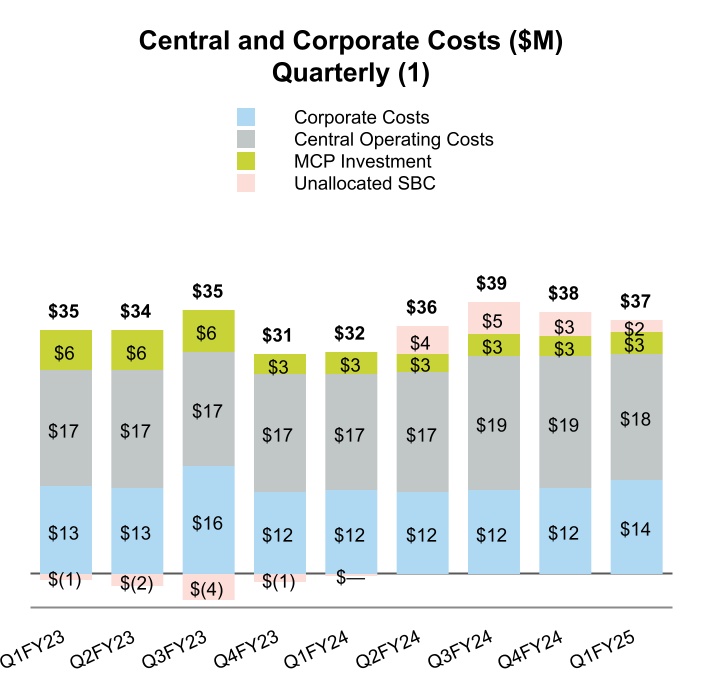
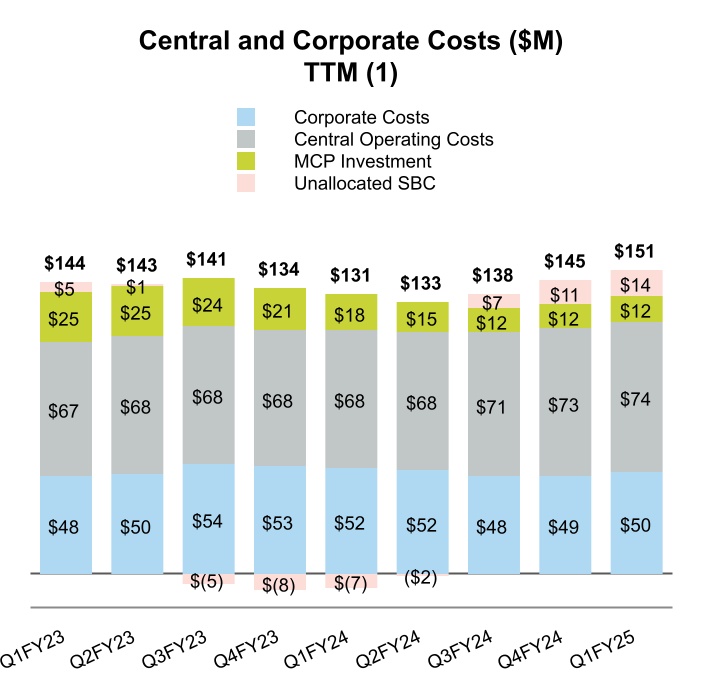
Central and Corporate Costs excluding unallocated share-based compensation increased $3.1 million year over year in Q1 FY2025 with higher volume-related operating costs and the impact of annual merit increases at the start of July.
Outlook, Leverage Policy and Capital Allocation
Our outlook, leverage, and capital allocation priorities remain unchanged from the detailed commentary we provided with Q4 FY2024 results and in our September 10, 2024 investor day commentary. We remain confident in our ability to continue to grow constant-currency organic revenue, adjusted EBITDA and adjusted free cash flow over the coming multi-year period in line with that more detailed guidance. Also consistent with past commentary, we expect to reduce net leverage by the end of FY2025. If we continue to have attractive opportunities for share repurchases, we expect to exit the fiscal year with net leverage at or below approximately 2.75x trailing twelve month EBITDA as defined by our credit agreement.
Conclusion
Our team remains focused and incentivized on delivering for customers and continuing the progress in our financial performance for the benefit of our long-term investors. Thank you for your continued support.
Sincerely,
Robert S. Keane
Founder, Chairman & CEO
|
|
|
|
|
|
|
|
|
|
|
|
|
|
|
Cimpress will host a public earnings call tomorrow, October 31, 2024 at 8:00 am ET, which you can join via the link on the events section of ir.cimpress.com. You may presubmit questions by emailing ir@cimpress.com, and you may also ask questions via chat during the live call. |
Please see non-GAAP reconciliations at the end of this document. Page 3 of
24
SUMMARY CONSOLIDATED RESULTS: THREE-YEAR TREND
$ in thousands, except percentages
REVENUE BY REPORTABLE SEGMENT, TOTAL REVENUE AND INCOME FROM OPERATIONS:
|
|
|
|
|
|
|
|
|
|
|
|
|
|
|
|
|
|
|
| |
|
Q1 FY2023 |
Q1 FY2024 |
Q1 FY2025 |
|
|
|
|
Vista 1 |
|
$ |
369,589 |
|
$ |
396,850 |
|
$ |
429,494 |
|
|
|
|
|
PrintBrothers 1 |
|
132,801 |
|
152,573 |
|
160,415 |
|
|
|
|
|
The Print Group 1 |
|
76,059 |
|
79,437 |
|
84,072 |
|
|
|
|
|
National Pen 1 |
|
81,547 |
|
86,796 |
|
93,404 |
|
|
|
|
|
All Other Businesses 1 |
|
51,551 |
|
51,425 |
|
57,143 |
|
|
|
|
|
Inter-segment eliminations 1 |
|
(8,132) |
|
(9,787) |
|
(19,559) |
|
|
|
|
|
| Total revenue |
|
$ |
703,415 |
|
$ |
757,294 |
|
$ |
804,969 |
|
|
|
|
|
| Reported revenue growth |
|
7 |
% |
8 |
% |
6 |
% |
|
|
|
|
| Organic constant currency revenue growth |
|
14 |
% |
4 |
% |
6 |
% |
|
|
|
|
| Income from operations |
|
$ |
(17,967) |
|
$ |
34,100 |
|
$ |
39,339 |
|
|
|
|
|
| Income from operations margin |
|
(3) |
% |
5 |
% |
5 |
% |
|
|
|
|
EBITDA BY REPORTABLE SEGMENT ("SEGMENT EBITDA") AND ADJUSTED EBITDA:
|
|
|
|
|
|
|
|
|
|
|
|
|
|
|
|
|
|
|
|
|
|
|
|
|
Q1 FY2023 |
Q1 FY2024 |
Q1 FY2025 |
|
|
|
|
|
|
|
|
Vista 1 |
|
$ |
33,844 |
|
$ |
78,578 |
|
$ |
76,847 |
|
|
|
|
|
|
|
|
|
PrintBrothers 1 |
|
15,116 |
|
20,210 |
|
20,156 |
|
|
|
|
|
|
|
|
|
The Print Group 1 |
|
11,456 |
|
12,507 |
|
17,902 |
|
|
|
|
|
|
|
|
|
National Pen 1 |
|
(1,416) |
|
(8,762) |
|
(4,758) |
|
|
|
|
|
|
|
|
|
All Other Businesses 1 |
|
5,816 |
|
6,018 |
|
6,735 |
|
|
|
|
|
|
|
|
|
Inter-segment elimination 1 |
|
(1,987) |
|
(2,538) |
|
(5,500) |
|
|
|
|
|
|
|
|
|
| Total segment EBITDA |
|
$ |
62,829 |
|
$ |
106,013 |
|
$ |
111,382 |
|
|
|
|
|
|
|
|
|
Central & corporate costs ex unallocated SBC |
|
(35,535) |
|
(32,128) |
|
(35,178) |
|
|
|
|
|
|
|
|
|
| Unallocated share-based compensation |
|
957 |
|
348 |
|
(1,834) |
|
|
|
|
|
|
|
|
|
Exclude: share-based compensation expense 2 |
|
10,475 |
|
12,453 |
|
15,633 |
|
|
|
|
|
|
|
|
|
| Include: Realized gains (losses) on certain currency derivatives not included in segment EBITDA |
|
6,869 |
|
2,050 |
|
(2,232) |
|
|
|
|
|
|
|
|
|
| Adjusted EBITDA |
|
$ |
45,595 |
|
$ |
88,736 |
|
$ |
87,771 |
|
|
|
|
|
|
|
|
|
| Adjusted EBITDA margin |
|
6 |
% |
12 |
% |
11 |
% |
|
|
|
|
|
|
|
|
| Adjusted EBITDA year-over-year (decline) growth |
|
(33) |
% |
95 |
% |
(1) |
% |
|
|
|
|
|
|
|
|
1 During the first quarter of fiscal year 2025, we implemented changes to the methodology used for inter-segment transactions for purposes of measuring and reporting our segment financial performance. Under the new approach, a merchant business (the buyer) is cross charged the actual cost of fulfillment that includes product (e.g., labor, materials and overhead allocation) and shipping costs. A fulfiller business (the seller) receives inter-segment revenue that includes the product costs plus a markup, as well as the shipping costs. The fulfiller profit is included in the fulfiller’s segment results, but eliminated from consolidated reporting through an inter-segment EBITDA elimination. We have revised the prior periods starting in Q1 FY2023 to incorporate this change. Please refer to the Q1 FY2025 Guide to Reporting Changes at ir.cimpress.com for more information.
2 SBC expense listed above excludes the portion included in restructuring-related charges to avoid double counting.
Please see non-GAAP reconciliations at the end of this document. Page 4 of
24
SUMMARY CONSOLIDATED RESULTS: THREE-YEAR TREND (CONTINUED)
$ in thousands
CASH FLOW AND OTHER METRICS:
|
|
|
|
|
|
|
|
|
|
|
|
|
|
|
|
|
|
|
|
|
Q1 FY2023 |
Q1 FY2024 |
Q1 FY2025 |
|
|
|
|
| Net cash provided by (used in) operating activities |
|
$ |
(25,251) |
|
$ |
42,254 |
|
$ |
4,384 |
|
|
|
|
|
| Net cash provided by (used in) investing activities |
|
(101,043) |
|
(10,826) |
|
(25,502) |
|
|
|
|
|
| Net cash provided by (used in) financing activities |
|
(11,780) |
|
(35,065) |
|
(35,416) |
|
|
|
|
|
Adjusted free cash flow1 |
|
(52,217) |
|
10,928 |
|
(25,618) |
|
|
|
|
|
Cash interest, net1 |
|
12,986 |
|
20,890 |
|
31,536 |
|
|
|
|
|
COMPONENTS OF ADJUSTED FREE CASH FLOW:
|
|
|
|
|
|
|
|
|
|
|
|
|
|
|
|
|
|
|
|
|
Q1 FY2023 |
Q1 FY2024 |
Q1 FY2025 |
|
|
|
|
| Adjusted EBITDA |
|
$ |
45,595 |
|
$ |
88,736 |
|
$ |
87,771 |
|
|
|
|
|
| Cash restructuring payments |
|
(7,931) |
|
(5,715) |
|
(133) |
|
|
|
|
|
Cash (paid) received for income tax |
|
(4,257) |
|
(15,794) |
|
1,829 |
|
|
|
|
|
| Other changes in net working capital and other reconciling items |
|
(45,672) |
|
(4,083) |
|
(53,547) |
|
|
|
|
|
| Purchases of property, plant and equipment |
|
(11,758) |
|
(22,565) |
|
(17,001) |
|
|
|
|
|
|
|
|
|
|
|
|
|
|
| Capitalization of software and website development costs |
|
(15,330) |
|
(14,397) |
|
(14,571) |
|
|
|
|
|
Proceeds from sale of assets |
|
122 |
|
5,636 |
|
1,570 |
|
|
|
|
|
|
|
|
|
|
|
|
|
|
| Adjusted free cash flow before cash interest, net |
|
$ |
(39,231) |
|
$ |
31,818 |
|
$ |
5,918 |
|
|
|
|
|
Cash interest, net1 |
|
(12,986) |
|
(20,890) |
|
(31,536) |
|
|
|
|
|
Adjusted free cash flow1 |
|
$ |
(52,217) |
|
$ |
10,928 |
|
$ |
(25,618) |
|
|
|
|
|
1 Cash interest, net is cash interest payments, partially offset by cash interest received on our cash and marketable securities.
Please see non-GAAP reconciliations at the end of this document. Page 5 of
24
INCOME STATEMENT HIGHLIGHTS
Please see non-GAAP reconciliations at the end of this document. Page 6 of
24
Please see non-GAAP reconciliations at the end of this document. Page 7 of
24
CAPITAL STRUCTURE
Net Debt (1)
|
|
|
|
|
|
|
|
|
|
|
|
|
|
|
|
|
|
|
|
|
|
|
|
|
|
|
|
|
|
| ($M) |
Q1FY23 |
Q2FY23 |
Q3FY23 |
Q4FY23 |
Q1FY24 |
Q2FY24 |
Q3FY24 |
Q4FY24 |
Q1FY25 |
| Cash / equivalents |
$ |
132 |
|
$ |
111 |
|
$ |
115 |
|
$ |
130 |
|
$ |
125 |
|
$ |
274 |
|
$ |
154 |
|
$ |
204 |
|
$ |
153 |
|
| Marketable securities |
$ |
124 |
|
$ |
102 |
|
$ |
75 |
|
$ |
43 |
|
$ |
23 |
|
$ |
17 |
|
$ |
6 |
|
$ |
5 |
|
$ |
— |
|
| HY notes |
$ |
(600) |
|
$ |
(600) |
|
$ |
(600) |
|
$ |
(548) |
|
$ |
(527) |
|
$ |
(522) |
|
$ |
(522) |
|
$ |
(522) |
|
$ |
(525) |
|
| Term loans |
$ |
(1,076) |
|
$ |
(1,100) |
|
$ |
(1,103) |
|
$ |
(1,099) |
|
$ |
(1,087) |
|
$ |
(1,098) |
|
$ |
(1,088) |
|
$ |
(1,085) |
|
$ |
(1,084) |
|
| Revolver |
$ |
— |
|
$ |
— |
|
$ |
— |
|
$ |
— |
|
$ |
— |
|
$ |
— |
|
$ |
— |
|
$ |
— |
|
$ |
— |
|
| Other debt |
$ |
(7) |
|
$ |
(7) |
|
$ |
(8) |
|
$ |
(7) |
|
$ |
(6) |
|
$ |
(6) |
|
$ |
(5) |
|
$ |
(10) |
|
$ |
(9) |
|
| Net debt |
$ |
(1,427) |
|
$ |
(1,494) |
|
$ |
(1,520) |
|
$ |
(1,481) |
|
$ |
(1,473) |
|
$ |
(1,335) |
|
$ |
(1,454) |
|
$ |
(1,408) |
|
$ |
(1,465) |
|
(1) Excludes debt issuance costs, debt premiums and discounts. Values may not sum to total due to rounding.
(2) Basic and diluted shares are the same in certain periods where we reported a GAAP net loss.
(3) Consolidated Net Leverage Ratios as calculated per our credit agreement definitions.
Please see non-GAAP reconciliations at the end of this document. Page 8 of
24
SEGMENT RESULTS
(1) During Q1 FY2025, we recast our segment results back to Q1 FY2023 to reflect a reporting change to inter-segment activity. Please see our "Guide to Reporting Changes" at ir.cimpress.com for details.
(2) Values may not sum to total due to rounding.
Please see non-GAAP reconciliations at the end of this document. Page 9 of
24
UPLOAD AND PRINT
PRINTBROTHERS (QUARTERLY):
THE PRINT GROUP (QUARTERLY):


(1) During Q1 FY2025, we recast our segment results back to Q1 FY2023 to reflect a reporting change to inter-segment activity. Please see our "Guide to Reporting Changes" at ir.cimpress.com for details.
Please see non-GAAP reconciliations at the end of this document. Page 10 of
24
NATIONAL PEN (QUARTERLY):
(1) During Q1 FY2025, we recast our segment results back to Q1 FY2023 to reflect a reporting change to inter-segment activity. Please see our "Guide to Reporting Changes" at ir.cimpress.com for details.
Please see non-GAAP reconciliations at the end of this document. Page 11 of
24
ALL OTHER BUSINESSES (QUARTERLY):
(1) During Q1 FY2025, we recast our segment results back to Q1 FY2023 to reflect a reporting change to inter-segment activity. Please see our "Guide to Reporting Changes" at ir.cimpress.com for details.
Please see non-GAAP reconciliations at the end of this document. Page 12 of
24
CENTRAL AND CORPORATE COSTS
(1) Values may not sum to total due to rounding.
Please see non-GAAP reconciliations at the end of this document. Page 13 of
24
CURRENCY IMPACTS
Directional Net Currency Impacts
Compared to Prior-Year Periods
|
|
|
|
|
|
|
|
Y/Y Impact from Currency* |
|
| Financial Measure |
Q1 FY2025 |
|
| Revenue |
Positive |
|
| Operating income |
Positive |
|
| Net income |
Negative |
|
| Adjusted EBITDA |
Negative |
|
| Adjusted free cash flow |
Positive |
|
*Net income includes both realized and unrealized gains or losses from currency hedges and intercompany loan balances. Adjusted EBITDA includes only realized gains or losses from certain currency hedges. Adjusted free cash flow includes realized gains or losses on currency hedges as well as the currency impact of the timing of receivables, payments and other working capital settlements. Revenue, operating income and segment EBITDA do not reflect any impacts from currency hedges or balance sheet translation.
Net Currency Impacts on Segment EBITDA
Compared to Prior-Year Periods
|
|
|
|
|
|
|
|
Y/Y Impact from Currency* |
|
| Segment EBITDA |
Q1 FY2025 |
|
| Vista |
$1.5M |
|
| Upload & Print |
$0.6M |
|
| National Pen |
$1.1M |
|
| All Other Businesses |
Neutral |
|
|
|
|
| Adjusted EBITDA |
($0.9)M |
|
*Realized gains or losses on currency hedges that we include in adjusted EBITDA are not allocated to segment-level EBITDA.
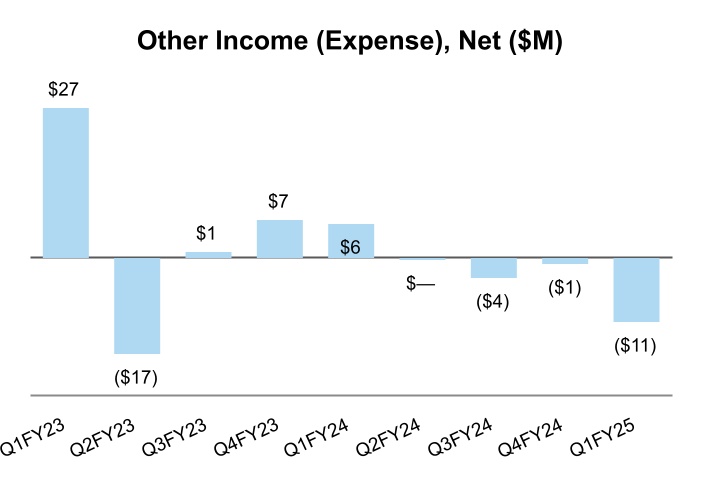
*Other income (expense), net includes both realized and unrealized gains or (losses) from currency hedges and intercompany loan balances.
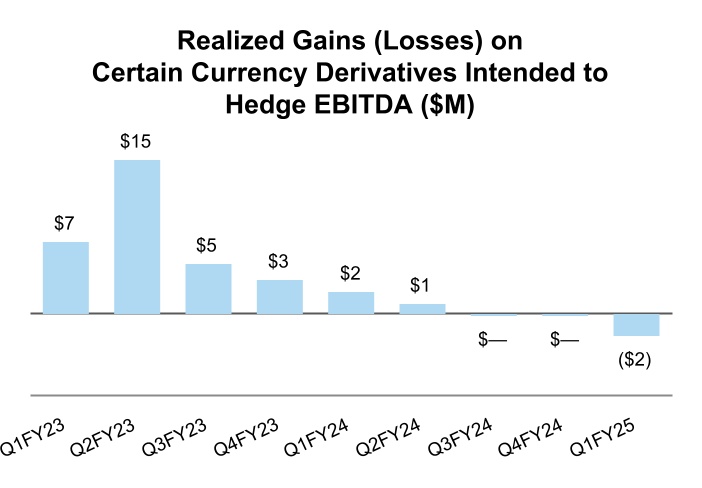
*Realized gains (losses) on certain currency derivatives intended to hedge EBITDA is a component of Other income (expense), net. We add these realized gains or (losses) to adjusted EBITDA.
Please see non-GAAP reconciliations at the end of this document. Page 14 of
24
CIMPRESS PLC
CONSOLIDATED BALANCE SHEETS
(unaudited in thousands, except share and per share data)
|
|
|
|
|
|
|
|
|
|
|
|
|
September 30,
2024 |
|
June 30,
2024 |
| Assets |
|
|
|
| Current assets: |
|
|
|
| Cash and cash equivalents |
$ |
152,951 |
|
|
$ |
203,775 |
|
| Marketable securities |
— |
|
|
4,500 |
|
Accounts receivable, net of allowances of $7,307 and $7,219, respectively |
73,757 |
|
|
64,576 |
|
| Inventory |
110,452 |
|
|
97,016 |
|
| Prepaid expenses and other current assets |
90,696 |
|
|
88,112 |
|
|
|
|
|
| Total current assets |
427,856 |
|
|
457,979 |
|
| Property, plant and equipment, net |
274,379 |
|
|
265,177 |
|
| Operating lease assets, net |
81,401 |
|
|
78,681 |
|
| Software and website development costs, net |
97,317 |
|
|
92,212 |
|
| Deferred tax assets |
97,003 |
|
|
95,059 |
|
| Goodwill |
804,806 |
|
|
787,138 |
|
| Intangible assets, net |
72,071 |
|
|
76,560 |
|
|
|
|
|
| Other assets |
29,105 |
|
|
39,351 |
|
| Total assets |
$ |
1,883,938 |
|
|
$ |
1,892,157 |
|
| Liabilities, noncontrolling interests and shareholders’ deficit |
|
|
|
| Current liabilities: |
|
|
|
| Accounts payable |
$ |
297,859 |
|
|
$ |
326,656 |
|
| Accrued expenses |
266,677 |
|
|
245,931 |
|
| Deferred revenue |
51,919 |
|
|
46,118 |
|
|
|
|
|
| Short-term debt |
10,532 |
|
|
12,488 |
|
| Operating lease liabilities, current |
20,276 |
|
|
19,634 |
|
| Other current liabilities |
22,801 |
|
|
13,136 |
|
|
|
|
|
| Total current liabilities |
670,064 |
|
|
663,963 |
|
| Deferred tax liabilities |
23,645 |
|
|
24,701 |
|
| Long-term debt |
1,585,650 |
|
|
1,591,807 |
|
|
|
|
|
| Operating lease liabilities, non-current |
65,377 |
|
|
61,895 |
|
| Other liabilities |
85,498 |
|
|
76,305 |
|
| Total liabilities |
2,430,234 |
|
|
2,418,671 |
|
|
|
|
|
Redeemable noncontrolling interests |
23,962 |
|
|
22,998 |
|
| Shareholders’ deficit: |
|
|
|
| Preferred shares, nominal value €0.01 per share, 100,000,000 shares authorized; none issued and outstanding |
— |
|
|
— |
|
Ordinary shares, nominal value €0.01 per share, 100,000,000 shares authorized; 43,231,566 and 43,051,269 shares issued; 25,260,319 and 25,080,022 shares outstanding, respectively |
606 |
|
|
604 |
|
|
|
|
|
Treasury shares, at cost, 17,971,247 for both periods presented |
(1,363,550) |
|
|
(1,363,550) |
|
| Additional paid-in capital |
573,192 |
|
|
570,283 |
|
| Retained earnings |
250,923 |
|
|
272,881 |
|
| Accumulated other comprehensive loss |
(32,160) |
|
|
(30,364) |
|
| Total shareholders’ deficit attributable to Cimpress plc |
(570,989) |
|
|
(550,146) |
|
| Noncontrolling interests |
731 |
|
|
634 |
|
| Total shareholders' deficit |
(570,258) |
|
|
(549,512) |
|
| Total liabilities, noncontrolling interests and shareholders’ deficit |
$ |
1,883,938 |
|
|
$ |
1,892,157 |
|
CIMPRESS PLC
CONSOLIDATED STATEMENTS OF OPERATIONS
(unaudited in thousands, except share and per share data)
|
|
|
|
|
|
|
|
|
|
|
|
|
|
|
|
| |
|
|
Three Months Ended September 30, |
| |
|
|
|
|
2024 |
|
2023 |
| Revenue |
|
|
|
|
$ |
804,969 |
|
|
$ |
757,294 |
|
| Cost of revenue (1) |
|
|
|
|
422,736 |
|
|
398,783 |
|
| Technology and development expense (1) |
|
|
|
|
81,861 |
|
|
74,330 |
|
| Marketing and selling expense (1, 2) |
|
|
|
|
203,847 |
|
|
192,188 |
|
| General and administrative expense (1) |
|
|
|
|
51,932 |
|
|
48,341 |
|
| Amortization of acquired intangible assets |
|
|
|
|
5,155 |
|
|
9,886 |
|
| Restructuring expense |
|
|
|
|
99 |
|
|
(334) |
|
|
|
|
|
|
|
|
|
|
|
|
|
|
|
|
|
Income from operations |
|
|
|
|
39,339 |
|
|
34,100 |
|
Other (expense) income, net |
|
|
|
|
(11,492) |
|
|
6,419 |
|
| Interest expense, net |
|
|
|
|
(31,415) |
|
|
(29,200) |
|
Gain on early extinguishment of debt |
|
|
|
|
179 |
|
|
1,372 |
|
(Loss) income before income taxes |
|
|
|
|
(3,389) |
|
|
12,691 |
|
Income tax expense |
|
|
|
|
8,995 |
|
|
8,122 |
|
|
|
|
|
|
|
|
|
Net (loss) income |
|
|
|
|
(12,384) |
|
|
4,569 |
|
Add: Net (income) attributable to noncontrolling interest |
|
|
|
|
(165) |
|
|
(15) |
|
Net (loss) income attributable to Cimpress plc |
|
|
|
|
$ |
(12,549) |
|
|
$ |
4,554 |
|
Basic net (loss) income per share attributable to Cimpress plc |
|
|
|
|
$ |
(0.50) |
|
|
$ |
0.17 |
|
Diluted net (loss) income per share attributable to Cimpress plc |
|
|
|
|
$ |
(0.50) |
|
|
$ |
0.17 |
|
| Weighted average shares outstanding — basic |
|
|
|
|
25,167,845 |
|
|
26,468,769 |
|
| Weighted average shares outstanding — diluted |
|
|
|
|
25,167,845 |
|
|
27,079,455 |
|
|
|
|
|
|
|
|
|
____________________________________________
(1) Share-based compensation is allocated as follows:
|
|
|
|
|
|
|
|
|
|
|
|
|
|
|
|
| |
|
|
Three Months Ended September 30, |
| |
|
|
|
|
2024 |
|
2023 |
| Cost of revenue |
|
|
|
|
$ |
223 |
|
|
$ |
167 |
|
| Technology and development expense |
|
|
|
|
5,096 |
|
|
4,209 |
|
| Marketing and selling expense |
|
|
|
|
1,715 |
|
|
2,218 |
|
| General and administrative expense |
|
|
|
|
8,599 |
|
|
5,859 |
|
|
|
|
|
|
|
|
|
(2) Marketing and selling expense components are as follows:
|
|
|
|
|
|
|
|
|
|
|
|
|
|
|
|
| |
|
|
Three Months Ended September 30, |
| |
|
|
|
|
2024 |
|
2023 |
| Advertising |
|
|
|
|
$ |
114,032 |
|
|
$ |
107,726 |
|
| Payment processing |
|
|
|
|
14,292 |
|
|
14,321 |
|
| All other marketing and selling expense |
|
|
|
|
75,523 |
|
|
70,141 |
|
CIMPRESS PLC
CONSOLIDATED STATEMENTS OF CASH FLOWS
(unaudited in thousands)
|
|
|
|
|
|
|
|
|
|
|
|
|
|
|
|
| |
|
|
Three Months Ended September 30, |
| |
|
|
|
|
2024 |
|
2023 |
| Operating activities |
|
|
|
|
|
|
|
Net (loss) income |
|
|
|
|
$ |
(12,384) |
|
|
$ |
4,569 |
|
Adjustments to reconcile net (loss) income to net cash provided by operating activities: |
|
|
|
|
|
|
|
| Depreciation and amortization |
|
|
|
|
35,546 |
|
|
39,942 |
|
|
|
|
|
|
|
|
|
| Share-based compensation expense |
|
|
|
|
15,633 |
|
|
12,453 |
|
| Deferred taxes |
|
|
|
|
2,951 |
|
|
(1,118) |
|
|
|
|
|
|
|
|
|
|
|
|
|
|
|
|
|
Gain on early extinguishment of debt |
|
|
|
|
(260) |
|
|
(1,372) |
|
|
|
|
|
|
|
|
|
|
|
|
|
|
|
|
|
|
|
|
|
|
|
|
|
Unrealized gain (loss) on derivatives not designated as hedging instruments included in net (loss) income |
|
|
|
|
18,337 |
|
|
(6,261) |
|
| Effect of exchange rate changes on monetary assets and liabilities denominated in non-functional currency |
|
|
|
|
(10,370) |
|
|
1,885 |
|
|
|
|
|
|
|
|
|
|
|
|
|
|
|
|
|
| Other non-cash items |
|
|
|
|
1,328 |
|
|
(1,229) |
|
|
|
|
|
|
|
|
|
| Changes in operating assets and liabilities, net of effects of businesses acquired: |
|
|
|
|
|
|
|
| Accounts receivable |
|
|
|
|
(7,775) |
|
|
(2,209) |
|
| Inventory |
|
|
|
|
(10,309) |
|
|
(401) |
|
| Prepaid expenses and other assets |
|
|
|
|
(3,430) |
|
|
4,214 |
|
| Accounts payable |
|
|
|
|
(36,946) |
|
|
(22,209) |
|
| Accrued expenses and other liabilities |
|
|
|
|
12,063 |
|
|
13,990 |
|
| Net cash provided by operating activities |
|
|
|
|
4,384 |
|
|
42,254 |
|
| Investing activities |
|
|
|
|
|
|
|
| Purchases of property, plant and equipment |
|
|
|
|
(17,001) |
|
|
(22,565) |
|
|
|
|
|
|
|
|
|
|
|
|
|
|
|
|
|
| Capitalization of software and website development costs |
|
|
|
|
(14,571) |
|
|
(14,397) |
|
| Proceeds from the sale of assets |
|
|
|
|
1,570 |
|
|
5,636 |
|
|
|
|
|
|
|
|
|
|
|
|
|
|
|
|
|
| Proceeds from maturity of held-to-maturity investments |
|
|
|
|
4,500 |
|
|
20,500 |
|
|
|
|
|
|
|
|
|
|
|
|
|
|
|
|
|
|
|
|
|
|
|
|
|
|
|
|
|
|
|
|
|
|
|
|
|
|
|
|
|
Net cash used in investing activities |
|
|
|
|
(25,502) |
|
|
(10,826) |
|
| Financing activities |
|
|
|
|
|
|
|
Proceeds from issuance of 7.375% Senior Notes due 2032 |
|
|
|
|
525,000 |
|
|
— |
|
Payments for early redemption or purchase of 7.0% Senior Notes due 2026 |
|
|
|
|
(522,135) |
|
|
(19,815) |
|
| Proceeds from borrowings of debt |
|
|
|
|
— |
|
|
173 |
|
|
|
|
|
|
|
|
|
|
|
|
|
|
|
|
|
|
|
|
|
|
|
|
|
| Payments of debt |
|
|
|
|
(4,497) |
|
|
(3,784) |
|
|
|
|
|
|
|
|
|
|
|
|
|
|
|
|
|
|
|
|
|
|
|
|
|
| Payments of debt issuance costs |
|
|
|
|
(8,445) |
|
|
— |
|
|
|
|
|
|
|
|
|
| Payments of withholding taxes in connection with equity awards |
|
|
|
|
(12,948) |
|
|
(8,404) |
|
| Payments of finance lease obligations |
|
|
|
|
(1,950) |
|
|
(2,768) |
|
|
|
|
|
|
|
|
|
|
|
|
|
|
|
|
|
| Purchase of ordinary shares |
|
|
|
|
(10,620) |
|
|
— |
|
| Proceeds from issuance of ordinary shares |
|
|
|
|
1,000 |
|
|
82 |
|
|
|
|
|
|
|
|
|
|
|
|
|
|
|
|
|
| Distributions to noncontrolling interests |
|
|
|
|
(821) |
|
|
(549) |
|
|
|
|
|
|
|
|
|
| Net cash used in financing activities |
|
|
|
|
(35,416) |
|
|
(35,065) |
|
| Effect of exchange rate changes on cash |
|
|
|
|
5,710 |
|
|
(1,477) |
|
|
|
|
|
|
|
|
|
Net decrease in cash and cash equivalents |
|
|
|
|
(50,824) |
|
|
(5,114) |
|
| Cash and cash equivalents at beginning of period |
|
|
|
|
203,775 |
|
|
130,313 |
|
| Cash and cash equivalents at end of period |
|
|
|
|
$ |
152,951 |
|
|
$ |
125,199 |
|
ABOUT NON-GAAP FINANCIAL MEASURES:
To supplement Cimpress’ consolidated financial statements presented in accordance with U.S. generally accepted accounting principles, or GAAP, Cimpress has used the following measures defined as non-GAAP financial measures by Securities and Exchange Commission, or SEC, rules: Constant-currency revenue growth, constant-currency revenue growth excluding revenue from acquisitions and divestitures made during the last twelve months, adjusted EBITDA, adjusted free cash flow and cash interest, net:
•Constant-currency revenue growth is estimated by translating all non-U.S. dollar denominated revenue generated in the current period using the prior year period’s average exchange rate for each currency to the U.S. dollar.
•Constant-currency revenue growth excluding revenue from acquisitions and divestitures made during the past twelve months excludes the impact of currency as defined above. The organic constant-currency growth rate excludes 99designs revenue from Q2 FY2021 through Q1 FY2022, Depositphotos/VistaCreate revenue from Q2 FY2022 through Q1 FY2023, and the revenue from several small acquired businesses for the first year after acquisition.
•Adjusted EBITDA is defined as GAAP operating income (loss) plus depreciation and amortization plus share-based compensation expense plus proceeds from insurance not already included in operating income plus earn-out related charges plus certain impairments and other adjustments plus restructuring related charges plus realized gains or losses on currency derivatives less the gain or loss on purchase or sale of subsidiaries as well as the disposal of assets.
•Adjusted free cash flow is defined as net cash provided by (used in) operating activities less purchases of property, plant and equipment, purchases of intangible assets not related to acquisitions, and capitalization of software and website development costs, plus payment of contingent consideration in excess of acquisition-date fair value, gains on proceeds from insurance, and proceeds from the sale of assets.
•Cash interest, net is cash paid for interest, less cash received for interest.
These non-GAAP financial measures are provided to enhance investors' understanding of our current operating results from the underlying and ongoing business for the same reasons they are used by management. For example, for acquisitions we believe excluding the costs related to the purchase of a business (such as amortization of acquired intangible assets, contingent consideration, or impairment of goodwill) provides further insight into the performance of the underlying acquired business in addition to that provided by our GAAP operating income. As another example, as we do not apply hedge accounting for certain derivative contracts, we believe inclusion of realized gains and losses on these contracts that are intended to be matched against operational currency fluctuations provides further insight into our operating performance in addition to that provided by our GAAP operating income. We do not, nor do we suggest that investors should, consider such non-GAAP financial measures in isolation from, or as a substitute for, financial information prepared in accordance with GAAP. For more information on these non-GAAP financial measures, please see the tables captioned “Reconciliations of Non-GAAP Financial Measures” included at the end of this document. The tables have more details on the GAAP financial measures that are most directly comparable to non-GAAP financial measures and the related reconciliation between these financial measures.
CONSTANT-CURRENCY REVENUE GROWTH RATES
(Quarterly)
|
|
|
|
|
|
|
|
|
|
|
|
|
|
|
|
|
|
|
|
|
|
|
|
|
|
|
|
|
|
| Total Company |
Q1FY23 |
Q2FY23 |
Q3FY23 |
Q4FY23 |
Q1FY24 |
Q2FY24 |
Q3FY24 |
Q4FY24 |
Q1FY25 |
| Reported revenue growth |
7 |
% |
(1) |
% |
13 |
% |
9 |
% |
8 |
% |
9 |
% |
5 |
% |
6 |
% |
6 |
% |
Currency impact |
8 |
% |
7 |
% |
3 |
% |
— |
% |
(4) |
% |
(3) |
% |
(1) |
% |
— |
% |
— |
% |
| Revenue growth in constant currency |
15 |
% |
6 |
% |
16 |
% |
9 |
% |
4 |
% |
6 |
% |
4 |
% |
6 |
% |
6 |
% |
| Impact of TTM acquisitions, divestitures & JVs |
(1) |
% |
(1) |
% |
— |
% |
— |
% |
— |
% |
— |
% |
— |
% |
— |
% |
— |
% |
| Revenue growth in constant currency ex. TTM acquisitions, divestitures & JVs |
14 |
% |
5 |
% |
16 |
% |
9 |
% |
4 |
% |
6 |
% |
4 |
% |
6 |
% |
6 |
% |
|
|
|
|
|
|
|
|
|
|
|
|
|
|
|
|
|
|
|
|
|
|
|
|
|
|
|
|
|
|
|
|
|
|
|
|
|
|
|
|
|
|
|
|
|
|
|
|
|
|
| Vista |
Q1FY23 |
Q2FY23 |
Q3FY23 |
Q4FY23 |
Q1FY24 |
Q2FY24 |
Q3FY24 |
Q4FY24 |
Q1FY25 |
Reported revenue growth 1 |
6 |
% |
(2) |
% |
14 |
% |
11 |
% |
7 |
% |
11 |
% |
5 |
% |
8 |
% |
8 |
% |
Currency impact 1 |
4 |
% |
4 |
% |
2 |
% |
1 |
% |
(1) |
% |
(2) |
% |
— |
% |
— |
% |
— |
% |
Revenue growth in constant currency 1 |
10 |
% |
2 |
% |
16 |
% |
12 |
% |
6 |
% |
9 |
% |
5 |
% |
8 |
% |
8 |
% |
| Impact of TTM acquisitions, divestitures & JVs |
(2) |
% |
— |
% |
— |
% |
— |
% |
— |
% |
— |
% |
— |
% |
— |
% |
— |
% |
Revenue growth in constant currency ex. TTM acquisitions, divestitures & JVs 1 |
8 |
% |
2 |
% |
16 |
% |
12 |
% |
6 |
% |
9 |
% |
5 |
% |
8 |
% |
8 |
% |
|
|
|
|
|
|
|
|
|
|
|
|
|
|
|
|
|
|
|
|
|
|
|
|
|
|
|
|
|
|
|
|
|
|
|
|
|
|
|
|
|
|
|
|
|
|
|
|
|
|
| PrintBrothers |
Q1FY23 |
Q2FY23 |
Q3FY23 |
Q4FY23 |
Q1FY24 |
Q2FY24 |
Q3FY24 |
Q4FY24 |
Q1FY25 |
Reported revenue growth 1 |
6 |
% |
8 |
% |
16 |
% |
10 |
% |
15 |
% |
11 |
% |
8 |
% |
8 |
% |
5 |
% |
Currency impact 1 |
18 |
% |
13 |
% |
6 |
% |
(3) |
% |
(9) |
% |
(6) |
% |
(2) |
% |
2 |
% |
(1) |
% |
Revenue growth in constant currency 1 |
24 |
% |
21 |
% |
22 |
% |
7 |
% |
6 |
% |
5 |
% |
6 |
% |
10 |
% |
4 |
% |
| Impact of TTM acquisitions |
(1) |
% |
(3) |
% |
— |
% |
— |
% |
— |
% |
— |
% |
— |
% |
— |
% |
— |
% |
Revenue growth in constant currency excl. TTM acquisitions 1 |
23 |
% |
18 |
% |
22 |
% |
7 |
% |
6 |
% |
5 |
% |
6 |
% |
10 |
% |
4 |
% |
|
|
|
|
|
|
|
|
|
|
|
|
|
|
|
|
|
|
|
|
|
|
|
|
|
|
|
|
|
|
| The Print Group |
Q1FY23 |
Q2FY23 |
Q3FY23 |
Q4FY23 |
Q1FY24 |
Q2FY24 |
Q3FY24 |
Q4FY24 |
Q1FY25 |
Reported revenue growth 1 |
4 |
% |
(2) |
% |
12 |
% |
3 |
% |
4 |
% |
5 |
% |
3 |
% |
2 |
% |
6 |
% |
Currency impact 1 |
18 |
% |
12 |
% |
6 |
% |
(2) |
% |
(7) |
% |
(6) |
% |
(1) |
% |
1 |
% |
(2) |
% |
Revenue growth in constant currency 1 |
22 |
% |
10 |
% |
18 |
% |
1 |
% |
(3) |
% |
(1) |
% |
2 |
% |
3 |
% |
4 |
% |
|
|
|
|
|
|
|
|
|
|
|
|
|
|
|
|
|
|
|
|
|
|
|
|
|
|
|
|
|
|
|
|
|
|
|
|
|
|
|
|
|
|
|
|
|
|
|
|
|
|
| National Pen |
Q1FY23 |
Q2FY23 |
Q3FY23 |
Q4FY23 |
Q1FY24 |
Q2FY24 |
Q3FY24 |
Q4FY24 |
Q1FY25 |
Reported revenue growth 1 |
18 |
% |
(3) |
% |
12 |
% |
9 |
% |
6 |
% |
8 |
% |
9 |
% |
1 |
% |
8 |
% |
Currency impact 1 |
6 |
% |
6 |
% |
2 |
% |
1 |
% |
(2) |
% |
(3) |
% |
— |
% |
— |
% |
(1) |
% |
Revenue growth in constant currency 1 |
24 |
% |
3 |
% |
14 |
% |
10 |
% |
4 |
% |
5 |
% |
9 |
% |
1 |
% |
7 |
% |
|
|
|
|
|
|
|
|
|
|
|
|
|
|
|
|
|
|
|
|
|
|
|
|
|
|
|
|
|
|
|
|
|
|
|
|
|
|
|
|
1During Q1 FY2025, we recast our segment results back to Q1 FY2023 to reflect a reporting change to inter-segment activity. Please see our "Guide to Reporting Changes" at ir.cimpress.com for details.
Note: Total company revenue growth in constant currency excluding TTM acquisitions, divestitures and joint ventures for all periods excludes the impact of currency. The organic constant-currency growth rate excludes the revenue from several small acquired businesses for the first year after acquisition.
Values may not sum to total due to rounding. Page 19 of
24
CONSTANT-CURRENCY REVENUE GROWTH RATES (CONT.)
(Quarterly)
|
|
|
|
|
|
|
|
|
|
|
|
|
|
|
|
|
|
|
|
|
|
|
|
|
|
|
|
|
|
| All Other Businesses |
Q1FY23 |
Q2FY23 |
Q3FY23 |
Q4FY23 |
Q1FY24 |
Q2FY24 |
Q3FY24 |
Q4FY24 |
Q1FY25 |
Reported revenue growth 1 |
8 |
% |
4 |
% |
1 |
% |
1 |
% |
— |
% |
— |
% |
(1) |
% |
3 |
% |
11 |
% |
Currency impact 1 |
— |
% |
(1) |
% |
— |
% |
— |
% |
(1) |
% |
(1) |
% |
— |
% |
— |
% |
2 |
% |
Revenue growth in constant currency 1 |
8 |
% |
3 |
% |
1 |
% |
1 |
% |
(1) |
% |
(1) |
% |
(1) |
% |
3 |
% |
13 |
% |
| Impact of TTM acquisitions and divestitures |
— |
% |
— |
% |
— |
% |
— |
% |
— |
% |
— |
% |
— |
% |
— |
% |
— |
% |
Revenue growth in constant currency excl. TTM acquisitions & divestitures 1 |
8 |
% |
3 |
% |
1 |
% |
1 |
% |
(1) |
% |
(1) |
% |
(1) |
% |
3 |
% |
13 |
% |
|
|
|
|
|
|
|
|
|
|
|
|
|
|
|
|
|
|
|
|
|
|
|
|
|
|
|
|
|
|
|
|
|
|
|
|
|
| Upload and Print ($M) |
|
Q1FY23 |
Q2FY23 |
Q3FY23 |
Q4FY23 |
Q1FY24 |
Q2FY24 |
Q3FY24 |
Q4FY24 |
Q1FY25 |
PrintBrothers reported revenue 1 |
|
$ |
132.8 |
|
$ |
148.8 |
|
$ |
139.7 |
|
$ |
157.8 |
|
$ |
152.6 |
|
$ |
165.6 |
|
$ |
150.7 |
|
$ |
170.8 |
|
$ |
160.4 |
|
The Print Group reported revenue 1 |
|
$ |
76.1 |
|
$ |
88.1 |
|
$ |
84.5 |
|
$ |
94.2 |
|
$ |
79.4 |
|
$ |
92.1 |
|
$ |
87.1 |
|
$ |
96.1 |
|
$ |
84.1 |
|
Upload and Print inter-segment eliminations 1 |
|
$ |
(0.1) |
|
$ |
(0.2) |
|
$ |
(0.1) |
|
$ |
(0.1) |
|
$ |
(0.1) |
|
$ |
(0.2) |
|
$ |
(0.1) |
|
$ |
(0.2) |
|
$ |
(0.1) |
|
Total Upload and Print revenue in USD 1 |
|
$ |
208.8 |
|
$ |
236.7 |
|
$ |
224.1 |
|
$ |
251.9 |
|
$ |
231.9 |
|
$ |
257.5 |
|
$ |
237.7 |
|
$ |
266.7 |
|
$ |
244.4 |
|
|
|
|
|
|
|
|
|
|
|
|
|
|
|
|
|
|
|
|
|
|
|
|
|
|
|
|
|
|
|
|
|
|
|
|
|
|
|
|
|
|
|
|
|
|
| Upload and Print |
Q1FY23 |
Q2FY23 |
Q3FY23 |
Q4FY23 |
Q1FY24 |
Q2FY24 |
Q3FY24 |
Q4FY24 |
Q1FY25 |
Reported revenue growth 1 |
5 |
% |
4 |
% |
15 |
% |
7 |
% |
11 |
% |
9 |
% |
6 |
% |
6 |
% |
5 |
% |
Currency impact 1 |
18 |
% |
12 |
% |
5 |
% |
(2) |
% |
(8) |
% |
(6) |
% |
(1) |
% |
1 |
% |
(1) |
% |
Revenue growth in constant currency 1 |
23 |
% |
16 |
% |
20 |
% |
5 |
% |
3 |
% |
3 |
% |
5 |
% |
7 |
% |
4 |
% |
| Impact of TTM acquisitions |
(1) |
% |
(1) |
% |
1 |
% |
— |
% |
— |
% |
— |
% |
— |
% |
— |
% |
— |
% |
Revenue growth in constant currency excl. TTM acquisitions 1 |
22 |
% |
15 |
% |
21 |
% |
5 |
% |
3 |
% |
3 |
% |
5 |
% |
7 |
% |
4 |
% |
1 During Q1 FY2025, we recast our segment results back to Q1 FY2023 to reflect a reporting change to inter-segment activity. Please see our "Guide to Reporting Changes" at ir.cimpress.com for details.
Note: Total company revenue growth in constant currency excluding TTM acquisitions, divestitures and joint ventures for all periods excludes the impact of currency. The organic constant-currency growth rate excludes 99designs revenue in Q1 FY2022, Depositphotos/VistaCreate revenue from Q2 FY2022 through Q1 FY2023, and the revenue from several small acquired businesses for the first year after acquisition.
Values may not sum to total due to rounding. Page 20 of
24
EBITDA (LOSS) BY REPORTABLE SEGMENT ("SEGMENT EBITDA")
(Quarterly, in millions)
|
|
|
|
|
|
|
|
|
|
|
|
|
|
|
|
|
|
|
|
|
|
|
|
|
|
|
|
|
|
|
|
|
|
|
Q1FY23 |
Q2FY23 |
Q3FY23 |
Q4FY23 |
Q1FY24 |
Q2FY24 |
Q3FY24 |
Q4FY24 |
Q1FY25 |
|
|
|
|
Vista 1 |
$ |
33.8 |
|
$ |
59.0 |
|
$ |
63.8 |
|
$ |
81.2 |
|
$ |
78.6 |
|
$ |
107.9 |
|
$ |
76.8 |
|
$ |
84.8 |
|
$ |
76.8 |
|
|
|
|
|
PrintBrothers 1 |
15.1 |
|
19.8 |
|
16.1 |
|
20.7 |
|
20.2 |
|
28.8 |
|
17.2 |
|
25.3 |
|
20.2 |
|
|
|
|
|
The Print Group 1 |
11.5 |
|
12.5 |
|
12.6 |
|
19.5 |
|
12.5 |
|
17.3 |
|
17.2 |
|
19.4 |
|
17.9 |
|
|
|
|
|
National Pen 1 |
(1.4) |
|
24.7 |
|
(3.5) |
|
3.5 |
|
(8.8) |
|
25.4 |
|
4.2 |
|
8.9 |
|
(4.8) |
|
|
|
|
|
All Other Businesses 1 |
5.8 |
|
5.0 |
|
4.7 |
|
8.2 |
|
6.0 |
|
7.4 |
|
3.3 |
|
5.8 |
|
6.7 |
|
|
|
|
|
Inter-segment eliminations 1 |
(2.0) |
|
(2.4) |
|
(2.1) |
|
(2.1) |
|
(2.5) |
|
(2.9) |
|
(3.2) |
|
(3.7) |
|
(5.5) |
|
|
|
|
|
Total segment EBITDA |
$ |
62.8 |
|
$ |
118.5 |
|
$ |
91.6 |
|
$ |
131.0 |
|
$ |
106.0 |
|
$ |
183.8 |
|
$ |
115.6 |
|
$ |
140.6 |
|
$ |
111.4 |
|
|
|
|
|
| Central and corporate costs ex. unallocated SBC |
(35.5) |
|
(35.6) |
|
(38.4) |
|
(31.9) |
|
(32.1) |
|
(32.1) |
|
(34.9) |
|
(34.7) |
|
(35.2) |
|
|
|
|
|
| Unallocated SBC |
1.0 |
|
1.8 |
|
3.9 |
|
1.2 |
|
0.3 |
|
(3.9) |
|
(4.5) |
|
(3.4) |
|
(1.8) |
|
|
|
|
|
| Exclude: share-based compensation included in segment EBITDA |
10.5 |
|
11.5 |
|
7.2 |
|
10.4 |
|
12.5 |
|
17.6 |
|
18.4 |
|
17.1 |
|
15.6 |
|
|
|
|
|
| Include: Realized gains (losses) on certain currency derivatives not included in segment EBITDA |
6.9 |
|
14.9 |
|
4.8 |
|
3.2 |
|
2.1 |
|
0.9 |
|
(0.3) |
|
(0.2) |
|
(2.2) |
|
|
|
|
|
Adjusted EBITDA3,,4 |
$ |
45.6 |
|
$ |
111.2 |
|
$ |
69.1 |
|
$ |
113.9 |
|
$ |
88.7 |
|
$ |
166.4 |
|
$ |
94.2 |
|
$ |
119.4 |
|
$ |
87.8 |
|
|
|
|
|
| Depreciation and amortization |
(40.9) |
|
(40.9) |
|
(39.8) |
|
(40.9) |
|
(39.9) |
|
(39.1) |
|
(37.1) |
|
(35.7) |
|
(35.5) |
|
|
|
|
|
|
|
|
|
|
|
|
|
|
|
|
|
|
|
|
|
|
|
|
|
|
|
|
|
|
|
|
|
Share-based compensation expense2 |
(10.5) |
|
(11.5) |
|
(7.2) |
|
(10.4) |
|
(12.5) |
|
(17.6) |
|
(18.4) |
|
(17.1) |
|
(15.6) |
|
|
|
|
|
| Certain impairments and other adjustments |
(3.5) |
|
0.9 |
|
0.5 |
|
(5.0) |
|
(0.5) |
|
(0.6) |
|
0.3 |
|
(0.4) |
|
0.6 |
|
|
|
|
|
| Restructuring-related charges |
(1.8) |
|
(11.2) |
|
(30.1) |
|
(0.6) |
|
0.3 |
|
(0.5) |
|
(0.1) |
|
(0.1) |
|
(0.1) |
|
|
|
|
|
|
|
|
|
|
|
|
|
|
|
|
|
|
|
| Realized (gains) losses on currency derivatives not included in operating income |
(6.9) |
|
(14.9) |
|
(4.8) |
|
(3.2) |
|
(2.1) |
|
(0.9) |
|
0.3 |
|
0.2 |
|
2.2 |
|
|
|
|
|
| Total income (loss) from operations |
$ |
(18.0) |
|
$ |
33.6 |
|
$ |
(12.2) |
|
$ |
53.9 |
|
$ |
34.1 |
|
$ |
107.7 |
|
$ |
39.2 |
|
$ |
66.3 |
|
$ |
39.3 |
|
|
|
|
|
| Operating income (loss) margin |
(3) |
% |
4 |
% |
(2) |
% |
7 |
% |
5 |
% |
12 |
% |
5 |
% |
8 |
% |
5 |
% |
|
|
|
|
| Operating income (loss) year-over-year growth |
(206) |
% |
(61) |
% |
57 |
% |
298 |
% |
290 |
% |
221 |
% |
422 |
% |
23 |
% |
15 |
% |
|
|
|
|
|
|
|
|
|
|
|
|
|
|
|
|
|
|
|
|
|
|
|
|
|
|
|
|
|
|
|
|
|
|
|
|
|
|
|
|
|
Upload and Print Combined EBITDA ($M) |
|
Q1FY23 |
Q2FY23 |
Q3FY23 |
Q4FY23 |
Q1FY24 |
Q2FY24 |
Q3FY24 |
Q4FY24 |
Q1FY25 |
PrintBrothers reported segment EBITDA 1 |
|
$ |
15.1 |
|
$ |
19.8 |
|
$ |
16.1 |
|
$ |
20.7 |
|
$ |
20.2 |
|
$ |
28.8 |
|
$ |
17.2 |
|
$ |
25.3 |
|
$ |
20.2 |
|
The Print Group reported segment EBITDA 1 |
|
$ |
11.5 |
|
$ |
12.5 |
|
$ |
12.6 |
|
$ |
19.5 |
|
$ |
12.5 |
|
$ |
17.3 |
|
$ |
17.2 |
|
$ |
19.4 |
|
$ |
17.9 |
|
Upload and Print inter-segment eliminations 1 |
|
$ |
— |
|
$ |
(0.1) |
|
$ |
— |
|
$ |
— |
|
$ |
— |
|
$ |
— |
|
$ |
— |
|
$ |
— |
|
$ |
— |
|
Total Upload and Print combined EBITDA in USD 1 |
|
$ |
26.5 |
|
$ |
32.2 |
|
$ |
28.6 |
|
$ |
40.2 |
|
$ |
32.7 |
|
$ |
46.1 |
|
$ |
34.4 |
|
$ |
44.7 |
|
$ |
38.0 |
|
1 During Q1 FY2025, we recast our segment results back to Q1 FY2023 to reflect a reporting change to inter-segment activity. Please see our "Guide to Reporting Changes" at ir.cimpress.com for details.
2SBC expense listed here excludes the portion included in restructuring-related charges to avoid double counting.
3This metric uses the definition of adjusted EBITDA as outlined above and therefore does not include the pro-forma impact of acquisitions, divestitures or the annualized benefit from actioned cost saving initiatives; however, our debt covenants allow for the inclusion of pro-forma impacts to adjusted EBITDA.
4Adjusted EBITDA includes 100% of the results of our consolidated subsidiaries and therefore does not give effect to adjusted EBITDA attributable to noncontrolling interests. This is to most closely align to our debt covenant and cash flow reporting.
Values may not sum to total due to rounding. Page 21 of
24
ADJUSTED EBITDA
(Quarterly, in millions)
|
|
|
|
|
|
|
|
|
|
|
|
|
|
|
|
|
|
|
|
|
|
|
|
|
|
|
|
|
|
|
Q1FY23 |
Q2FY23 |
Q3FY23 |
Q4FY23 |
Q1FY24 |
Q2FY24 |
Q3FY24 |
Q4FY24 |
Q1FY25 |
| GAAP operating income (loss) |
$ |
(18.0) |
|
$ |
33.6 |
|
$ |
(12.2) |
|
$ |
53.9 |
|
$ |
34.1 |
|
$ |
107.7 |
|
$ |
39.2 |
|
$ |
66.3 |
|
$ |
39.3 |
|
| Depreciation and amortization |
$ |
40.9 |
|
$ |
40.9 |
|
$ |
39.8 |
|
$ |
40.9 |
|
$ |
39.9 |
|
$ |
39.1 |
|
$ |
37.1 |
|
$ |
35.7 |
|
$ |
35.5 |
|
Share-based compensation expense1 |
$ |
10.5 |
|
$ |
11.5 |
|
$ |
7.2 |
|
$ |
10.4 |
|
$ |
12.5 |
|
$ |
17.6 |
|
$ |
18.4 |
|
$ |
17.1 |
|
$ |
15.6 |
|
|
|
|
|
|
|
|
|
|
|
|
|
|
|
|
|
|
|
|
|
| Certain impairments and other adjustments |
$ |
3.5 |
|
$ |
(0.9) |
|
$ |
(0.5) |
|
$ |
5.0 |
|
$ |
0.5 |
|
$ |
0.6 |
|
$ |
(0.3) |
|
$ |
0.4 |
|
$ |
(0.6) |
|
|
|
|
|
|
|
|
|
|
|
| Restructuring related charges |
$ |
1.8 |
|
$ |
11.2 |
|
$ |
30.1 |
|
$ |
0.6 |
|
$ |
(0.3) |
|
$ |
0.5 |
|
$ |
0.1 |
|
$ |
0.1 |
|
$ |
0.1 |
|
| Realized gains (losses) on currency derivatives not included in operating income |
$ |
6.9 |
|
$ |
14.9 |
|
$ |
4.8 |
|
$ |
3.2 |
|
$ |
2.1 |
|
$ |
0.9 |
|
$ |
(0.3) |
|
$ |
(0.2) |
|
$ |
(2.2) |
|
Adjusted EBITDA2,3 |
$45.6 |
$111.2 |
$69.1 |
$113.9 |
$88.7 |
$166.4 |
$94.2 |
$119.4 |
$87.8 |
ADJUSTED EBITDA
(TTM, in millions)
|
|
|
|
|
|
|
|
|
|
|
|
|
|
|
|
|
|
|
|
|
|
|
|
|
|
|
|
|
|
|
TTM Q1FY23 |
TTM Q2FY23 |
TTM Q3FY23 |
TTM Q4FY23 |
TTM Q1FY24 |
TTM Q2FY24 |
TTM Q3FY24 |
TTM Q4FY24 |
TTM Q1FY25 |
| GAAP operating income (loss) |
$ |
12.4 |
|
$ |
(40.0) |
|
$ |
(23.8) |
|
$ |
57.3 |
|
$ |
109.4 |
|
$ |
183.5 |
|
$ |
234.9 |
|
$ |
247.4 |
|
$ |
252.6 |
|
| Depreciation and amortization |
$ |
172.2 |
|
$ |
167.8 |
|
$ |
163.9 |
|
$ |
162.4 |
|
$ |
161.4 |
|
$ |
159.6 |
|
$ |
157.0 |
|
$ |
151.8 |
|
$ |
147.4 |
|
|
|
|
|
|
|
|
|
|
|
Share-based compensation expense1 |
$ |
49.2 |
|
$ |
48.3 |
|
$ |
42.8 |
|
$ |
39.7 |
|
$ |
41.7 |
|
$ |
47.8 |
|
$ |
58.9 |
|
$ |
65.6 |
|
$ |
68.8 |
|
|
|
|
|
|
|
|
|
|
|
|
|
|
|
|
|
|
|
|
|
|
|
|
|
|
|
|
|
|
|
| Certain impairments and other adjustments |
$ |
(5.5) |
|
$ |
(3.7) |
|
$ |
(4.5) |
|
$ |
6.9 |
|
$ |
4.0 |
|
$ |
5.5 |
|
$ |
5.7 |
|
$ |
1.2 |
|
$ |
— |
|
|
|
|
|
|
|
|
|
|
|
| Restructuring related charges |
$ |
15.7 |
|
$ |
26.6 |
|
$ |
53.3 |
|
$ |
43.8 |
|
$ |
41.6 |
|
$ |
30.9 |
|
$ |
0.9 |
|
$ |
0.4 |
|
$ |
0.9 |
|
| Realized gains (losses) on currency derivatives not included in operating income |
$ |
15.0 |
|
$ |
29.2 |
|
$ |
32.0 |
|
$ |
29.7 |
|
$ |
24.9 |
|
$ |
10.9 |
|
$ |
5.8 |
|
$ |
2.4 |
|
$ |
(1.9) |
|
Adjusted EBITDA2,3 |
$ |
259.0 |
|
$ |
228.2 |
|
$ |
263.7 |
|
$ |
339.8 |
|
$ |
383.0 |
|
$ |
438.2 |
|
$ |
463.2 |
|
$ |
468.7 |
|
$ |
467.7 |
|
1SBC expense listed here excludes the portion included in restructuring-related charges to avoid double counting.
2This metric uses the definition of adjusted EBITDA as outlined above and therefore does not include the pro-forma impact of acquisitions, divestitures or the annualized benefit from actioned cost saving initiatives; however, our debt covenants allow for the inclusion of pro-forma impacts to adjusted EBITDA.
3Adjusted EBITDA includes 100% of the results of our consolidated subsidiaries and therefore does not give effect to adjusted EBITDA attributable to noncontrolling interests. This is to most closely align to our debt covenant and cash flow reporting.
Values may not sum to total due to rounding. Page 22 of
24
ADJUSTED FREE CASH FLOW
(Quarterly, in millions)
|
|
|
|
|
|
|
|
|
|
|
|
|
|
|
|
|
|
|
|
|
|
|
|
|
|
|
|
|
|
|
Q1FY23 |
Q2FY23 |
Q3FY23 |
Q4FY23 |
Q1FY24 |
Q2FY24 |
Q3FY24 |
Q4FY24 |
Q1FY25 |
| Net cash (used in) provided by operating activities |
$ |
(25.3) |
|
$ |
81.1 |
|
$ |
12.6 |
|
$ |
61.8 |
|
$ |
42.3 |
|
$ |
174.9 |
|
$ |
8.4 |
|
$ |
125.1 |
|
$ |
4.4 |
|
| Purchases of property, plant and equipment |
$ |
(11.8) |
|
$ |
(14.7) |
|
$ |
(11.0) |
|
$ |
(16.3) |
|
$ |
(22.6) |
|
$ |
(11.4) |
|
$ |
(10.5) |
|
$ |
(10.5) |
|
$ |
(17.0) |
|
|
|
|
|
|
|
|
|
|
|
| Capitalization of software and website development costs |
$ |
(15.3) |
|
$ |
(13.9) |
|
$ |
(14.9) |
|
$ |
(13.6) |
|
$ |
(14.4) |
|
$ |
(13.9) |
|
$ |
(15.0) |
|
$ |
(14.9) |
|
$ |
(14.6) |
|
Proceeds from sale of assets1 |
$ |
0.1 |
|
$ |
1.2 |
|
$ |
0.5 |
|
$ |
2.8 |
|
$ |
5.6 |
|
$ |
0.4 |
|
$ |
0.4 |
|
$ |
17.1 |
|
$ |
1.6 |
|
|
|
|
|
|
|
|
|
|
|
|
|
|
|
|
|
|
|
|
|
Adjusted free cash flow1 |
$ |
(52.2) |
|
$ |
53.7 |
|
$ |
(12.8) |
|
$ |
34.7 |
|
$ |
10.9 |
|
$ |
150.0 |
|
$ |
(16.6) |
|
$ |
116.8 |
|
$ |
(25.6) |
|
|
|
|
|
|
|
|
|
|
|
| Reference: |
|
|
|
|
|
|
|
|
|
| Value of finance leases |
$ |
2.4 |
|
$ |
6.2 |
|
$ |
5.8 |
|
$ |
5.9 |
|
$ |
0.4 |
|
$ |
1.8 |
|
$ |
2.2 |
|
$ |
0.1 |
|
$ |
0.3 |
|
| Cash restructuring payments |
$ |
7.9 |
|
$ |
1.9 |
|
$ |
5.0 |
|
$ |
22.3 |
|
$ |
5.7 |
|
$ |
1.2 |
|
$ |
0.5 |
|
$ |
0.2 |
|
$ |
0.1 |
|
|
|
|
|
|
|
|
|
|
|
|
|
|
|
|
|
|
|
|
|
| Cash paid for interest |
$ |
15.1 |
|
$ |
35.8 |
|
$ |
20.0 |
|
$ |
43.2 |
|
$ |
24.2 |
|
$ |
42.4 |
|
$ |
23.9 |
|
$ |
41.7 |
|
$ |
35.2 |
|
| Cash received for interest |
$ |
(2.1) |
|
$ |
(3.0) |
|
$ |
(3.0) |
|
$ |
(3.4) |
|
$ |
(3.3) |
|
$ |
(2.8) |
|
$ |
(5.0) |
|
$ |
(3.0) |
|
$ |
(3.7) |
|
Cash interest, net2 |
$ |
13.0 |
|
$ |
32.8 |
|
$ |
17.0 |
|
$ |
39.7 |
|
$ |
20.9 |
|
$ |
39.6 |
|
$ |
18.9 |
|
$ |
38.8 |
|
$ |
31.5 |
|
ADJUSTED FREE CASH FLOW
(TTM, in millions)
|
|
|
|
|
|
|
|
|
|
|
|
|
|
|
|
|
|
|
|
|
|
|
|
|
|
|
|
|
|
|
TTM Q1FY23 |
TTM Q2FY23 |
TTM Q3FY23 |
TTM Q4FY23 |
TTM Q1FY24 |
TTM Q2FY24 |
TTM Q3FY24 |
TTM Q4FY24 |
TTM Q1FY25 |
| Net cash provided by operating activities |
$ |
157.7 |
|
$ |
95.5 |
|
$ |
156.3 |
|
$ |
130.3 |
|
$ |
197.8 |
|
$ |
291.6 |
|
$ |
287.4 |
|
$ |
350.7 |
|
$ |
312.9 |
|
| Purchases of property, plant and equipment |
$ |
(57.2) |
|
$ |
(54.0) |
|
$ |
(49.4) |
|
$ |
(53.8) |
|
$ |
(64.6) |
|
$ |
(61.2) |
|
$ |
(60.7) |
|
$ |
(54.9) |
|
$ |
(49.4) |
|
|
|
|
|
|
|
|
|
|
|
| Capitalization of software and website development costs |
$ |
(65.0) |
|
$ |
(62.4) |
|
$ |
(59.6) |
|
$ |
(57.8) |
|
$ |
(56.9) |
|
$ |
(56.9) |
|
$ |
(57.0) |
|
$ |
(58.3) |
|
$ |
(58.5) |
|
Proceeds from sale of assets1 |
$ |
13.0 |
|
$ |
13.3 |
|
$ |
12.2 |
|
$ |
4.7 |
|
$ |
10.2 |
|
$ |
9.3 |
|
$ |
9.2 |
|
$ |
23.6 |
|
$ |
19.5 |
|
|
|
|
|
|
|
|
|
|
|
|
|
|
|
|
|
|
|
|
|
Adjusted free cash flow1 |
$ |
48.5 |
|
$ |
(7.6) |
|
$ |
59.5 |
|
$ |
23.4 |
|
$ |
86.5 |
|
$ |
182.8 |
|
$ |
179.0 |
|
$ |
261.1 |
|
$ |
224.5 |
|
|
|
|
|
|
|
|
|
|
|
| Reference: |
|
|
|
|
|
|
|
|
|
| Value of new finance leases |
$ |
8.6 |
|
$ |
12.1 |
|
$ |
17.7 |
|
$ |
20.3 |
|
$ |
18.3 |
|
$ |
13.9 |
|
$ |
10.3 |
|
$ |
4.6 |
|
$ |
4.5 |
|
| Cash restructuring payments |
$ |
8.2 |
|
$ |
9.8 |
|
$ |
14.9 |
|
$ |
37.1 |
|
$ |
34.9 |
|
$ |
34.3 |
|
$ |
29.7 |
|
$ |
7.6 |
|
$ |
2.0 |
|
|
|
|
|
|
|
|
|
|
|
|
|
|
|
|
|
|
|
|
|
|
|
|
|
|
|
|
|
|
|
| Cash paid for interest |
$ |
98.8 |
|
$ |
99.2 |
|
$ |
105.4 |
|
$ |
114.0 |
|
$ |
123.1 |
|
$ |
129.8 |
|
$ |
133.7 |
|
$ |
132.3 |
|
$ |
143.3 |
|
| Cash received for interest |
$ |
(4.6) |
|
$ |
(6.9) |
|
$ |
(9.0) |
|
$ |
(11.5) |
|
$ |
(12.7) |
|
$ |
(12.6) |
|
$ |
(14.7) |
|
$ |
(14.2) |
|
$ |
(14.5) |
|
Cash interest, net2 |
$ |
94.2 |
|
$ |
92.4 |
|
$ |
96.3 |
|
$ |
102.5 |
|
$ |
110.4 |
|
$ |
117.2 |
|
$ |
119.1 |
|
$ |
118.1 |
|
$ |
128.7 |
|
1 During the quarter ended September 30, 2023 we revised our definition of adjusted free cash flow to include proceeds from the sale of assets. We have recast all periods in the chart above to include the benefit from the proceeds from sale of assets.
2 Cash interest, net is cash interest payments, partially offset by cash interest received on our cash and marketable securities. Prior to Q3 FY2023, we showed only the cash interest payments related to our borrowing activity in this chart in our earnings materials. We have recast all periods in the chart above to include the interest received.
Values may not sum to total due to rounding. Page 23 of
24
ABOUT CIMPRESS:
Cimpress plc (Nasdaq: CMPR) invests in and builds customer-focused, entrepreneurial, print mass-customization businesses for the long term. Mass customization is a competitive strategy which seeks to produce goods and services to meet individual customer needs with near mass production efficiency. Cimpress businesses include BuildASign, druck.at, Drukwerkdeal, easyflyer, Exaprint, National Pen, Packstyle, Pixartprinting, Printi, Tradeprint, VistaPrint and WIRmachenDRUCK.
To learn more, visit https://www.cimpress.com.
Cimpress and the Cimpress logo are trademarks of Cimpress plc or its subsidiaries. All other brand and product names appearing on this announcement may be trademarks or registered trademarks of their respective holders.
CONTACT INFORMATION:
Investor Relations: Media Relations:
Meredith Burns Sara Litwiller
ir@cimpress.com mediarelations@cimpress.com
+1.781.652.6480
SAFE HARBOR STATEMENT:
This earnings commentary contains statements about our future expectations, plans, and prospects of our business that constitute forward-looking statements for purposes of the safe harbor provisions under the Private Securities Litigation Reform Act of 1995, including but not limited to our ability to deliver continuous customer experience improvements, introduce new products, grow our scale-based advantages, and further improve our competitive position; our expectation for consumer-related volume; the impact of increased focused on cross-Cimpress fulfillment; our expectations for constant-currency organic revenue growth, adjusted EBITDA, adjusted free cash flow, net leverage, cash interest and taxes, changes in net working capital, the impact of currency movements, and other future financial results described under the Outlook, Leverage Policy and Capital Allocation section; and our plans for capital allocation.
Forward-looking projections and expectations are inherently uncertain, are based on assumptions and judgments by management, and may turn out to be wrong. Our actual results may differ materially from those indicated by the forward-looking statements in this document as a result of various important factors, including but not limited to flaws in the assumptions and judgments upon which our forecasts and estimates are based; the development, duration, and severity of supply chain constraints and heightened inflation; our inability to make investments in our businesses and allocate our capital as planned or the failure of those investments and allocations to achieve the results we expect; costs and disruptions caused by acquisitions and minority investments; the failure of the businesses we acquire or invest in to perform as expected; loss of key personnel or our inability to recruit talented personnel; our failure to develop and deploy our mass customization platform or the failure of the mass customization platform to drive the performance, efficiencies, and competitive advantage we expect; unanticipated changes in our markets, customers, or businesses; disruptions caused by political instability and war in Ukraine, Israel, the Middle East, or elsewhere; changes in the laws and regulations, or in the interpretation of laws and regulations, that affect our businesses; our failure to manage the growth and complexity of our business; our failure to maintain compliance with the covenants in our debt documents or to pay our debts when due; competitive pressures; general economic conditions; and other factors described in our Form 10-K for the fiscal year ended June 30, 2024 and subsequent documents we periodically file with the U.S. SEC.
In addition, the statements and projections in this quarterly earnings document represent our expectations and beliefs as of the date of this document, and subsequent events and developments may cause these expectations, beliefs, and projections to change. We specifically disclaim any obligation to update any forward-looking statements. These forward-looking statements should not be relied upon as representing our expectations or beliefs as of any date subsequent to the date of this document.


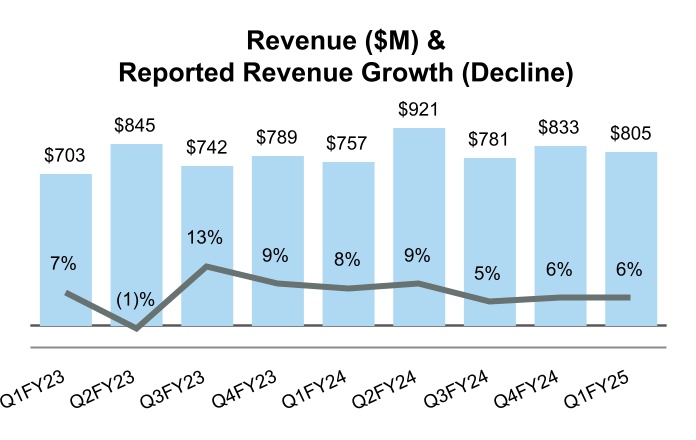
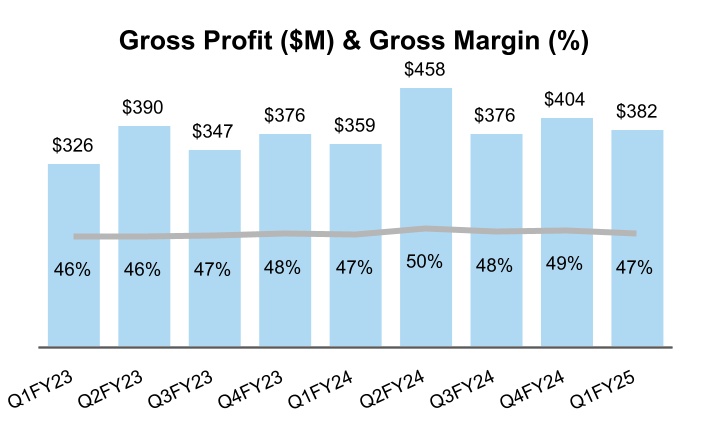
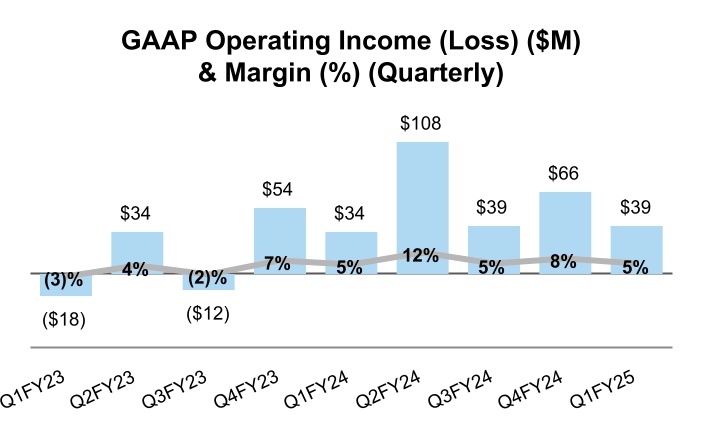
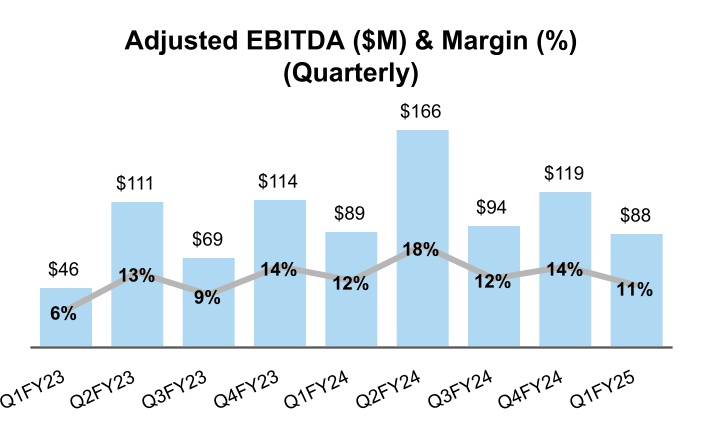

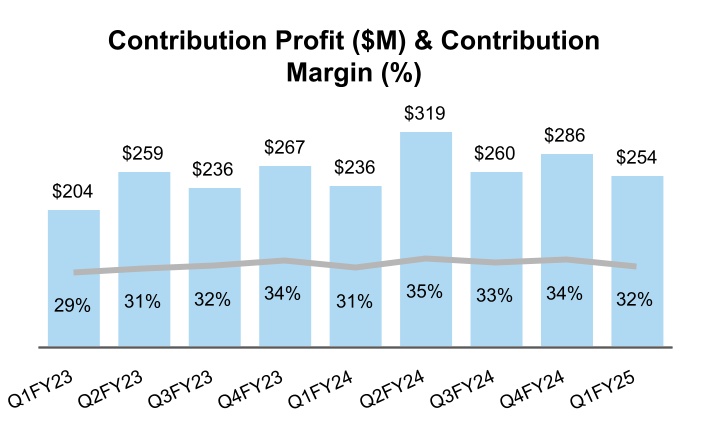
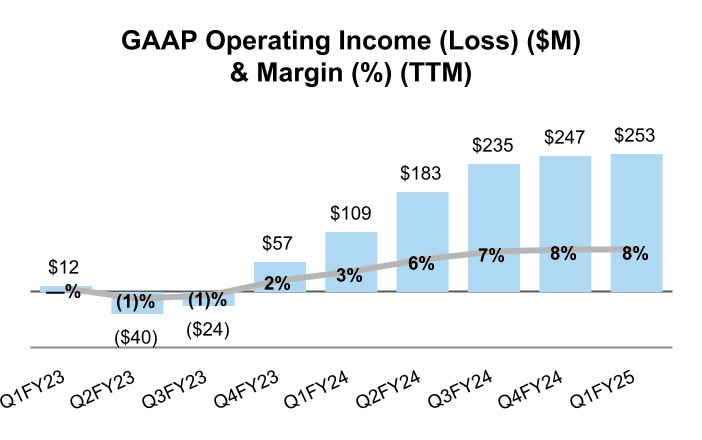
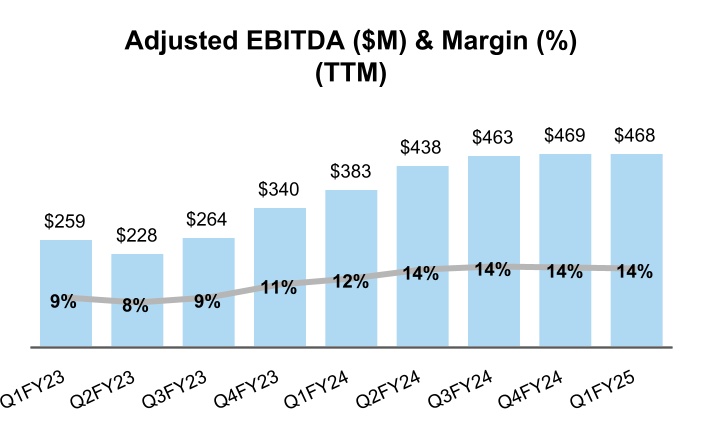


 (1) Values may not sum to total due to rounding.