00012276542023FYfalsehttp://fasb.org/us-gaap/2023#OtherAssetsNoncurrenthttp://fasb.org/us-gaap/2023#OtherAssetsNoncurrenthttp://fasb.org/us-gaap/2023#PropertyPlantAndEquipmentAndFinanceLeaseRightOfUseAssetAfterAccumulatedDepreciationAndAmortizationhttp://fasb.org/us-gaap/2023#PropertyPlantAndEquipmentAndFinanceLeaseRightOfUseAssetAfterAccumulatedDepreciationAndAmortizationhttp://fasb.org/us-gaap/2023#AccruedLiabilitiesCurrenthttp://fasb.org/us-gaap/2023#AccruedLiabilitiesCurrenthttp://fasb.org/us-gaap/2023#AccruedLiabilitiesCurrenthttp://fasb.org/us-gaap/2023#AccruedLiabilitiesCurrenthttp://fasb.org/us-gaap/2023#OtherLiabilitiesNoncurrenthttp://fasb.org/us-gaap/2023#OtherLiabilitiesNoncurrenthttp://fasb.org/us-gaap/2023#OtherLiabilitiesNoncurrenthttp://fasb.org/us-gaap/2023#OtherLiabilitiesNoncurrentP1YP2Y00012276542022-10-012023-09-3000012276542023-03-31iso4217:USD00012276542023-11-22xbrli:shares00012276542023-09-3000012276542022-09-30iso4217:USDxbrli:shares00012276542021-10-012022-09-3000012276542021-01-012021-09-300001227654us-gaap:ShippingAndHandlingMember2022-10-012023-09-300001227654us-gaap:ShippingAndHandlingMember2021-10-012022-09-300001227654us-gaap:ShippingAndHandlingMember2021-01-012021-09-300001227654us-gaap:ProductMember2022-10-012023-09-300001227654us-gaap:ProductMember2021-10-012022-09-300001227654us-gaap:ProductMember2021-01-012021-09-3000012276542020-10-012021-09-300001227654us-gaap:CommonStockMember2020-12-310001227654us-gaap:AdditionalPaidInCapitalMember2020-12-310001227654us-gaap:TreasuryStockCommonMember2020-12-310001227654us-gaap:RetainedEarningsMember2020-12-310001227654us-gaap:AccumulatedOtherComprehensiveIncomeMember2020-12-3100012276542020-12-310001227654us-gaap:RetainedEarningsMember2021-01-012021-09-300001227654us-gaap:AccumulatedOtherComprehensiveIncomeMember2021-01-012021-09-300001227654us-gaap:AdditionalPaidInCapitalMember2021-01-012021-09-300001227654us-gaap:TreasuryStockCommonMember2021-01-012021-09-300001227654us-gaap:CommonStockMember2021-09-300001227654us-gaap:AdditionalPaidInCapitalMember2021-09-300001227654us-gaap:TreasuryStockCommonMember2021-09-300001227654us-gaap:RetainedEarningsMember2021-09-300001227654us-gaap:AccumulatedOtherComprehensiveIncomeMember2021-09-3000012276542021-09-300001227654us-gaap:RetainedEarningsMember2021-10-012022-09-300001227654us-gaap:AccumulatedOtherComprehensiveIncomeMember2021-10-012022-09-300001227654us-gaap:AdditionalPaidInCapitalMember2021-10-012022-09-300001227654us-gaap:TreasuryStockCommonMember2021-10-012022-09-300001227654us-gaap:CommonStockMember2022-09-300001227654us-gaap:AdditionalPaidInCapitalMember2022-09-300001227654us-gaap:TreasuryStockCommonMember2022-09-300001227654us-gaap:RetainedEarningsMember2022-09-300001227654us-gaap:AccumulatedOtherComprehensiveIncomeMember2022-09-300001227654us-gaap:RetainedEarningsMember2022-10-012023-09-300001227654us-gaap:AccumulatedOtherComprehensiveIncomeMember2022-10-012023-09-300001227654us-gaap:AdditionalPaidInCapitalMember2022-10-012023-09-300001227654us-gaap:TreasuryStockCommonMember2022-10-012023-09-300001227654us-gaap:CommonStockMember2023-09-300001227654us-gaap:AdditionalPaidInCapitalMember2023-09-300001227654us-gaap:TreasuryStockCommonMember2023-09-300001227654us-gaap:RetainedEarningsMember2023-09-300001227654us-gaap:AccumulatedOtherComprehensiveIncomeMember2023-09-300001227654us-gaap:PrepaidExpensesAndOtherCurrentAssetsMember2023-09-300001227654us-gaap:PrepaidExpensesAndOtherCurrentAssetsMember2022-09-300001227654cmp:CoteBlancheMiningPropertiesAndMineralRightsMember2022-10-012023-09-30cmp:extension_period0001227654cmp:LeasedMineralRightsMember2023-09-300001227654cmp:OtherMineralPropertiesMember2023-09-300001227654us-gaap:BuildingMembersrt:MinimumMember2023-09-300001227654us-gaap:BuildingMembersrt:MaximumMember2023-09-300001227654srt:MinimumMembercmp:TypicalMaximumLifeLeaseholdAndBuildingImprovementsMember2023-09-300001227654srt:MaximumMembercmp:TypicalMaximumLifeLeaseholdAndBuildingImprovementsMember2023-09-300001227654us-gaap:LandImprovementsMembersrt:MinimumMember2023-09-300001227654us-gaap:LandImprovementsMembersrt:MaximumMember2023-09-300001227654cmp:LeaseholdAndBuildingImprovementsMembersrt:MinimumMember2023-09-300001227654cmp:LeaseholdAndBuildingImprovementsMembersrt:MaximumMember2023-09-300001227654srt:MinimumMemberus-gaap:TransportationEquipmentMember2023-09-300001227654srt:MaximumMemberus-gaap:TransportationEquipmentMember2023-09-300001227654srt:MinimumMembercmp:MachineryAndEquipmentOtherMiningAndProductionMember2023-09-300001227654srt:MaximumMembercmp:MachineryAndEquipmentOtherMiningAndProductionMember2023-09-300001227654us-gaap:FurnitureAndFixturesMembersrt:MinimumMember2023-09-300001227654us-gaap:FurnitureAndFixturesMembersrt:MaximumMember2023-09-300001227654us-gaap:MiningPropertiesAndMineralRightsMembersrt:MinimumMember2023-09-300001227654us-gaap:MiningPropertiesAndMineralRightsMembersrt:MaximumMember2023-09-300001227654srt:MinimumMember2023-09-300001227654srt:MaximumMember2023-09-300001227654cmp:FortressMember2023-05-05xbrli:pure0001227654cmp:FortressMember2023-05-052023-05-050001227654cmp:FortressMember2023-05-050001227654cmp:FortressMember2023-05-052023-09-300001227654cmp:FortressMember2023-09-302023-09-300001227654cmp:FortressMember2023-05-042023-05-040001227654cmp:FortressMember2023-04-012023-06-300001227654cmp:FortressMember2023-07-012023-09-300001227654cmp:FortressMember2023-09-300001227654cmp:FortressMemberus-gaap:CustomerRelationshipsMember2023-05-052023-05-050001227654cmp:FortressMemberus-gaap:CustomerRelationshipsMember2023-07-012023-09-300001227654cmp:FortressMemberus-gaap:DevelopedTechnologyRightsMember2023-07-012023-09-300001227654cmp:FortressMemberus-gaap:InProcessResearchAndDevelopmentMember2023-07-012023-09-300001227654cmp:FortressMemberus-gaap:TradeNamesMember2023-07-012023-09-300001227654us-gaap:DiscontinuedOperationsHeldForSaleOrDisposedOfBySaleMembercmp:PlantNutritionSouthAmericaMember2020-10-012021-09-300001227654us-gaap:DiscontinuedOperationsHeldForSaleOrDisposedOfBySaleMembercmp:PlantNutritionSouthAmericaMember2021-09-30iso4217:BRL0001227654us-gaap:DiscontinuedOperationsHeldForSaleOrDisposedOfBySaleMembercmp:PlantNutritionSouthAmericaMember2022-04-070001227654us-gaap:DiscontinuedOperationsHeldForSaleOrDisposedOfBySaleMembercmp:NorthAmericaMicronutrientAssetsMember2021-09-300001227654cmp:FermaviMember2020-10-012021-09-300001227654cmp:FermaviMember2021-09-300001227654cmp:FermaviMember2022-10-012023-09-300001227654cmp:SouthAmericaChemicalsBusinessMemberus-gaap:DiscontinuedOperationsHeldForSaleOrDisposedOfBySaleMember2022-04-200001227654cmp:SouthAmericaChemicalsBusinessMemberus-gaap:DiscontinuedOperationsHeldForSaleOrDisposedOfBySaleMember2022-04-202022-04-200001227654cmp:SouthAmericaChemicalsBusinessMemberus-gaap:DiscontinuedOperationsHeldForSaleOrDisposedOfBySaleMember2021-10-012022-09-300001227654cmp:SpecialtyPlantNutritionBussinesMember2020-10-012021-09-300001227654cmp:NorthAmericaMicronutrientAssetsMember2020-10-012021-09-300001227654cmp:ChemicalsBusinessMember2021-01-012021-09-300001227654us-gaap:DiscontinuedOperationsHeldForSaleOrDisposedOfBySaleMembercmp:NorthAmericaMicronutrientAssetsMember2020-12-310001227654cmp:SpecialtyPlantNutritionBussinesMember2020-12-310001227654cmp:SpecialtyPlantNutritionBussinesMember2021-09-300001227654us-gaap:DiscontinuedOperationsHeldForSaleOrDisposedOfBySaleMember2021-10-012022-09-300001227654us-gaap:DiscontinuedOperationsHeldForSaleOrDisposedOfBySaleMember2021-01-012021-09-300001227654us-gaap:DiscontinuedOperationsHeldForSaleOrDisposedOfBySaleMemberus-gaap:ShippingAndHandlingMember2021-10-012022-09-300001227654us-gaap:DiscontinuedOperationsHeldForSaleOrDisposedOfBySaleMemberus-gaap:ShippingAndHandlingMember2021-01-012021-09-300001227654us-gaap:DiscontinuedOperationsHeldForSaleOrDisposedOfBySaleMemberus-gaap:ProductMember2021-10-012022-09-300001227654us-gaap:DiscontinuedOperationsHeldForSaleOrDisposedOfBySaleMemberus-gaap:ProductMember2021-01-012021-09-300001227654us-gaap:LandBuildingsAndImprovementsMember2023-09-300001227654us-gaap:LandBuildingsAndImprovementsMember2022-09-300001227654us-gaap:MachineryAndEquipmentMember2023-09-300001227654us-gaap:MachineryAndEquipmentMember2022-09-300001227654us-gaap:FurnitureAndFixturesMember2023-09-300001227654us-gaap:FurnitureAndFixturesMember2022-09-300001227654us-gaap:MiningPropertiesAndMineralRightsMember2023-09-300001227654us-gaap:MiningPropertiesAndMineralRightsMember2022-09-300001227654us-gaap:ConstructionInProgressMember2023-09-300001227654us-gaap:ConstructionInProgressMember2022-09-300001227654cmp:PlantNutritionMember2021-09-300001227654us-gaap:CorporateAndOtherMember2021-09-300001227654cmp:PlantNutritionMember2021-10-012022-09-300001227654us-gaap:CorporateAndOtherMember2021-10-012022-09-300001227654cmp:PlantNutritionMember2022-09-300001227654us-gaap:CorporateAndOtherMember2022-09-300001227654cmp:PlantNutritionMember2022-10-012023-09-300001227654us-gaap:CorporateAndOtherMember2022-10-012023-09-300001227654cmp:PlantNutritionMember2023-09-300001227654us-gaap:CorporateAndOtherMember2023-09-300001227654us-gaap:CustomerRelationshipsMember2023-09-300001227654us-gaap:DevelopedTechnologyRightsMember2023-09-300001227654us-gaap:TradeNamesMember2023-09-300001227654us-gaap:DistributionRightsMember2023-09-300001227654us-gaap:UseRightsMember2023-09-300001227654cmp:LeaseRightsMember2023-09-300001227654us-gaap:DistributionRightsMember2022-09-300001227654us-gaap:UseRightsMember2022-09-300001227654cmp:LeaseRightsMember2022-09-300001227654us-gaap:ContractualRightsMember2022-09-300001227654us-gaap:ContractualRightsMember2023-09-300001227654us-gaap:TradeNamesMember2023-09-300001227654us-gaap:TradeNamesMember2022-09-300001227654us-gaap:InProcessResearchAndDevelopmentMember2023-09-300001227654cmp:FortressMember2022-10-012023-09-300001227654cmp:FortressMember2023-09-300001227654cmp:FortressMember2021-10-012022-09-300001227654cmp:FortressMember2022-09-300001227654cmp:OtherImmaterialInvestmentsMember2023-09-300001227654cmp:OtherImmaterialInvestmentsMember2022-09-300001227654cmp:OtherImmaterialInvestmentsMember2022-10-012023-09-300001227654cmp:FortressMember2022-09-300001227654cmp:FortressMember2021-10-012022-09-300001227654cmp:DeferredTaxAssetNettingStatusToBeNettedMember2023-09-300001227654cmp:DeferredTaxAssetNettingStatusToBeNettedMember2022-09-300001227654us-gaap:ForeignCountryMember2023-09-300001227654us-gaap:ForeignCountryMember2022-09-300001227654us-gaap:StateAndLocalJurisdictionMembercmp:NOLCarryforwardsExpireBeginningIn2035Member2023-09-300001227654us-gaap:StateAndLocalJurisdictionMembercmp:NOLCarryforwardsExpireBeginningIn2035Member2022-09-300001227654us-gaap:StateAndLocalJurisdictionMembercmp:NOLCarryforwardsExpireBeginningIn2027Member2023-09-300001227654us-gaap:StateAndLocalJurisdictionMembercmp:NOLCarryforwardsExpireBeginningIn2027Member2022-09-300001227654us-gaap:StateAndLocalJurisdictionMembercmp:NOLCarryforwardsExpireBeginningIn2025Member2023-09-300001227654us-gaap:StateAndLocalJurisdictionMembercmp:NOLCarryforwardsExpireBeginningIn2025Member2022-09-300001227654us-gaap:DomesticCountryMember2023-09-3000012276542020-01-012020-12-3100012276542017-10-012018-09-3000012276542021-09-012021-09-3000012276542022-10-012022-12-3100012276542023-04-012023-06-300001227654us-gaap:StateAndLocalJurisdictionMember2022-10-012023-09-300001227654us-gaap:StateAndLocalJurisdictionMember2021-10-012022-09-300001227654us-gaap:StateAndLocalJurisdictionMember2020-10-012021-09-300001227654us-gaap:StateAndLocalJurisdictionMember2019-10-012020-09-300001227654cmp:CanadianProvincialMember2023-09-300001227654us-gaap:PensionPlansDefinedBenefitMemberus-gaap:DefinedBenefitPlanEquitySecuritiesMember2023-09-300001227654us-gaap:PensionPlansDefinedBenefitMemberus-gaap:DefinedBenefitPlanDebtSecurityMember2023-09-300001227654us-gaap:DefinedBenefitPlanCashAndCashEquivalentsMemberus-gaap:PensionPlansDefinedBenefitMember2023-09-300001227654us-gaap:DefinedBenefitPlanCashAndCashEquivalentsMemberus-gaap:PensionPlansDefinedBenefitMember2022-09-300001227654cmp:BlendedFundsMemberus-gaap:PensionPlansDefinedBenefitMember2023-09-300001227654cmp:BlendedFundsMemberus-gaap:PensionPlansDefinedBenefitMember2022-09-300001227654us-gaap:PensionPlansDefinedBenefitMemberus-gaap:DefinedBenefitPlanDebtSecurityMember2022-09-300001227654us-gaap:PensionPlansDefinedBenefitMember2023-09-300001227654us-gaap:PensionPlansDefinedBenefitMember2022-09-300001227654us-gaap:DefinedBenefitPlanCashAndCashEquivalentsMemberus-gaap:PensionPlansDefinedBenefitMemberus-gaap:FairValueInputsLevel1Member2023-09-300001227654us-gaap:FairValueInputsLevel2Memberus-gaap:DefinedBenefitPlanCashAndCashEquivalentsMemberus-gaap:PensionPlansDefinedBenefitMember2023-09-300001227654us-gaap:FairValueInputsLevel3Memberus-gaap:DefinedBenefitPlanCashAndCashEquivalentsMemberus-gaap:PensionPlansDefinedBenefitMember2023-09-300001227654cmp:BlendedFundsMemberus-gaap:PensionPlansDefinedBenefitMemberus-gaap:FairValueInputsLevel1Member2023-09-300001227654cmp:BlendedFundsMemberus-gaap:FairValueInputsLevel2Memberus-gaap:PensionPlansDefinedBenefitMember2023-09-300001227654us-gaap:FairValueInputsLevel3Membercmp:BlendedFundsMemberus-gaap:PensionPlansDefinedBenefitMember2023-09-300001227654us-gaap:PensionPlansDefinedBenefitMemberus-gaap:USTreasurySecuritiesMember2023-09-300001227654us-gaap:PensionPlansDefinedBenefitMemberus-gaap:USTreasurySecuritiesMemberus-gaap:FairValueInputsLevel1Member2023-09-300001227654us-gaap:FairValueInputsLevel2Memberus-gaap:PensionPlansDefinedBenefitMemberus-gaap:USTreasurySecuritiesMember2023-09-300001227654us-gaap:FairValueInputsLevel3Memberus-gaap:PensionPlansDefinedBenefitMemberus-gaap:USTreasurySecuritiesMember2023-09-300001227654us-gaap:PensionPlansDefinedBenefitMemberus-gaap:FairValueInputsLevel1Member2023-09-300001227654us-gaap:FairValueInputsLevel2Memberus-gaap:PensionPlansDefinedBenefitMember2023-09-300001227654us-gaap:FairValueInputsLevel3Memberus-gaap:PensionPlansDefinedBenefitMember2023-09-300001227654us-gaap:DefinedBenefitPlanCashAndCashEquivalentsMemberus-gaap:PensionPlansDefinedBenefitMemberus-gaap:FairValueInputsLevel1Member2022-09-300001227654us-gaap:FairValueInputsLevel2Memberus-gaap:DefinedBenefitPlanCashAndCashEquivalentsMemberus-gaap:PensionPlansDefinedBenefitMember2022-09-300001227654us-gaap:FairValueInputsLevel3Memberus-gaap:DefinedBenefitPlanCashAndCashEquivalentsMemberus-gaap:PensionPlansDefinedBenefitMember2022-09-300001227654cmp:BlendedFundsMemberus-gaap:PensionPlansDefinedBenefitMemberus-gaap:FairValueInputsLevel1Member2022-09-300001227654cmp:BlendedFundsMemberus-gaap:FairValueInputsLevel2Memberus-gaap:PensionPlansDefinedBenefitMember2022-09-300001227654us-gaap:FairValueInputsLevel3Membercmp:BlendedFundsMemberus-gaap:PensionPlansDefinedBenefitMember2022-09-300001227654us-gaap:PensionPlansDefinedBenefitMemberus-gaap:USTreasurySecuritiesMember2022-09-300001227654us-gaap:PensionPlansDefinedBenefitMemberus-gaap:USTreasurySecuritiesMemberus-gaap:FairValueInputsLevel1Member2022-09-300001227654us-gaap:FairValueInputsLevel2Memberus-gaap:PensionPlansDefinedBenefitMemberus-gaap:USTreasurySecuritiesMember2022-09-300001227654us-gaap:FairValueInputsLevel3Memberus-gaap:PensionPlansDefinedBenefitMemberus-gaap:USTreasurySecuritiesMember2022-09-300001227654us-gaap:PensionPlansDefinedBenefitMemberus-gaap:FairValueInputsLevel1Member2022-09-300001227654us-gaap:FairValueInputsLevel2Memberus-gaap:PensionPlansDefinedBenefitMember2022-09-300001227654us-gaap:FairValueInputsLevel3Memberus-gaap:PensionPlansDefinedBenefitMember2022-09-300001227654us-gaap:PensionPlansDefinedBenefitMember2022-10-012023-09-300001227654us-gaap:PensionPlansDefinedBenefitMember2021-10-012022-09-300001227654us-gaap:PensionPlansDefinedBenefitMember2021-01-012021-09-300001227654us-gaap:PensionPlansDefinedBenefitMembersrt:ScenarioForecastMember2024-09-300001227654us-gaap:PensionPlansDefinedBenefitMembersrt:ScenarioForecastMember2023-10-012024-09-300001227654us-gaap:PensionPlansDefinedBenefitMember2021-09-300001227654us-gaap:OtherPostretirementBenefitPlansDefinedBenefitMember2023-09-300001227654us-gaap:OtherPostretirementBenefitPlansDefinedBenefitMember2022-09-300001227654us-gaap:OtherPostretirementBenefitPlansDefinedBenefitMember2021-09-300001227654us-gaap:OtherPostretirementBenefitPlansDefinedBenefitMember2022-10-012023-09-300001227654us-gaap:OtherPostretirementBenefitPlansDefinedBenefitMember2021-10-012022-09-300001227654cmp:A4.875SeniorNotesJuly2024Member2023-09-300001227654cmp:A4.875SeniorNotesJuly2024Memberus-gaap:SeniorNotesMember2023-09-300001227654cmp:A4.875SeniorNotesJuly2024Memberus-gaap:SeniorNotesMember2022-09-300001227654cmp:A2023CreditAgreementMembercmp:TermLoanDueJanuary2025Memberus-gaap:LineOfCreditMember2023-09-300001227654cmp:A2023CreditAgreementMembercmp:TermLoanDueJanuary2025Memberus-gaap:LineOfCreditMember2022-09-300001227654cmp:A2023CreditAgreementMembercmp:RevolvingCreditFacilityDueJanuary2025Memberus-gaap:LineOfCreditMember2023-09-300001227654cmp:A2023CreditAgreementMembercmp:RevolvingCreditFacilityDueJanuary2025Memberus-gaap:LineOfCreditMember2022-09-300001227654cmp:SeniorNotesDecember2027Member2023-09-300001227654cmp:SeniorNotesDecember2027Memberus-gaap:SeniorNotesMember2023-09-300001227654cmp:SeniorNotesDecember2027Memberus-gaap:SeniorNotesMember2022-09-300001227654cmp:TermLoanDueMay2028Memberus-gaap:LineOfCreditMember2023-09-300001227654cmp:TermLoanDueMay2028Memberus-gaap:LineOfCreditMember2022-09-300001227654cmp:RevolvingCreditFacilityDueMay2028Memberus-gaap:LineOfCreditMember2023-09-300001227654cmp:RevolvingCreditFacilityDueMay2028Memberus-gaap:LineOfCreditMember2022-09-300001227654cmp:AccountsReceivableFinancingFacilityMemberus-gaap:LineOfCreditMember2023-09-300001227654cmp:AccountsReceivableFinancingFacilityMemberus-gaap:LineOfCreditMember2022-09-300001227654cmp:A2023CreditAgreementMemberus-gaap:LineOfCreditMember2023-05-050001227654cmp:RevolvingCreditFacilityDueJanuary2025Memberus-gaap:LineOfCreditMemberus-gaap:RevolvingCreditFacilityMember2019-11-300001227654cmp:TermLoanDueJanuary2025Memberus-gaap:SecuredDebtMember2019-11-300001227654cmp:A2023CreditAgreementMemberus-gaap:SeniorNotesMember2023-05-052023-05-050001227654cmp:SeniorNotesJuly2024Memberus-gaap:SeniorNotesMember2023-09-300001227654cmp:TermLoanDueJanuary2025Memberus-gaap:SeniorNotesMember2023-05-052023-05-050001227654cmp:TwentyNineteenCreditAgreementMember2023-09-300001227654cmp:A2023CreditAgreementMembersrt:MinimumMemberus-gaap:LineOfCreditMember2023-05-052023-05-050001227654cmp:A2023CreditAgreementMembersrt:MaximumMemberus-gaap:LineOfCreditMember2023-05-052023-05-050001227654us-gaap:RevolvingCreditFacilityMembercmp:TermLoanDueMay2028Member2023-05-050001227654cmp:A2023CreditAgreementMemberus-gaap:LineOfCreditMemberus-gaap:RevolvingCreditFacilityMember2023-09-300001227654us-gaap:SubsequentEventMembercmp:DebtInstrumentCovenantTermOneMember2023-10-012023-12-310001227654cmp:DebtInstrumentCovenantTermTwoMemberus-gaap:SubsequentEventMember2023-10-012023-12-310001227654cmp:RevolvingCreditFacilityDueJanuary2025Memberus-gaap:LineOfCreditMemberus-gaap:RevolvingCreditFacilityMember2023-09-300001227654cmp:RevolvingCreditFacilityDueJanuary2025Memberus-gaap:LetterOfCreditMemberus-gaap:LineOfCreditMember2023-09-300001227654cmp:TermLoanDueJanuary2025Member2022-04-012022-04-300001227654cmp:RevolvingCreditFacilityDueJanuary2025Memberus-gaap:RevolvingCreditFacilityMember2021-07-012021-07-310001227654cmp:TermLoanDueJanuary2025Member2021-07-012021-07-310001227654cmp:SeniorNotesdue2027Memberus-gaap:SeniorNotesMember2019-11-300001227654cmp:SeniorNotesdue2027Memberus-gaap:SeniorNotesMember2023-09-300001227654cmp:AccountReceivableFinancingReceivableMemberus-gaap:UnallocatedFinancingReceivablesMember2020-06-302020-06-300001227654cmp:AccountReceivableFinancingReceivableMemberus-gaap:UnallocatedFinancingReceivablesMember2020-06-3000012276542020-06-30cmp:subsidiary0001227654cmp:SECInvestigationMember2022-09-232022-09-230001227654cmp:SECInvestigationMember2023-09-300001227654cmp:SECInvestigationMember2022-09-30cmp:agreement00012276542021-01-012021-03-31cmp:segment0001227654us-gaap:OperatingSegmentsMembercmp:SaltMember2022-10-012023-09-300001227654us-gaap:OperatingSegmentsMembercmp:PlantNutritionMember2022-10-012023-09-300001227654us-gaap:CorporateNonSegmentMember2022-10-012023-09-300001227654cmp:SaltMemberus-gaap:IntersegmentEliminationMember2022-10-012023-09-300001227654cmp:PlantNutritionMemberus-gaap:IntersegmentEliminationMember2022-10-012023-09-300001227654us-gaap:IntersegmentEliminationMember2022-10-012023-09-300001227654us-gaap:OperatingSegmentsMembercmp:SaltMemberus-gaap:ShippingAndHandlingMember2022-10-012023-09-300001227654us-gaap:OperatingSegmentsMembercmp:PlantNutritionMemberus-gaap:ShippingAndHandlingMember2022-10-012023-09-300001227654us-gaap:CorporateNonSegmentMemberus-gaap:ShippingAndHandlingMember2022-10-012023-09-300001227654us-gaap:OperatingSegmentsMembercmp:SaltMember2023-09-300001227654us-gaap:OperatingSegmentsMembercmp:PlantNutritionMember2023-09-300001227654us-gaap:CorporateNonSegmentMember2023-09-300001227654us-gaap:OperatingSegmentsMembercmp:SaltMember2021-10-012022-09-300001227654us-gaap:OperatingSegmentsMembercmp:PlantNutritionMember2021-10-012022-09-300001227654us-gaap:CorporateNonSegmentMember2021-10-012022-09-300001227654cmp:SaltMemberus-gaap:IntersegmentEliminationMember2021-10-012022-09-300001227654cmp:PlantNutritionMemberus-gaap:IntersegmentEliminationMember2021-10-012022-09-300001227654us-gaap:IntersegmentEliminationMember2021-10-012022-09-300001227654us-gaap:OperatingSegmentsMembercmp:SaltMemberus-gaap:ShippingAndHandlingMember2021-10-012022-09-300001227654us-gaap:OperatingSegmentsMembercmp:PlantNutritionMemberus-gaap:ShippingAndHandlingMember2021-10-012022-09-300001227654us-gaap:CorporateNonSegmentMemberus-gaap:ShippingAndHandlingMember2021-10-012022-09-300001227654us-gaap:OperatingSegmentsMembercmp:SaltMember2022-09-300001227654us-gaap:OperatingSegmentsMembercmp:PlantNutritionMember2022-09-300001227654us-gaap:CorporateNonSegmentMember2022-09-300001227654us-gaap:OperatingSegmentsMembercmp:SaltMember2021-01-012021-09-300001227654us-gaap:OperatingSegmentsMembercmp:PlantNutritionMember2021-01-012021-09-300001227654us-gaap:CorporateNonSegmentMember2021-01-012021-09-300001227654cmp:SaltMemberus-gaap:IntersegmentEliminationMember2021-01-012021-09-300001227654cmp:PlantNutritionMemberus-gaap:IntersegmentEliminationMember2021-01-012021-09-300001227654us-gaap:IntersegmentEliminationMember2021-01-012021-09-300001227654us-gaap:OperatingSegmentsMembercmp:SaltMemberus-gaap:ShippingAndHandlingMember2021-01-012021-09-300001227654us-gaap:OperatingSegmentsMembercmp:PlantNutritionMemberus-gaap:ShippingAndHandlingMember2021-01-012021-09-300001227654us-gaap:CorporateNonSegmentMemberus-gaap:ShippingAndHandlingMember2021-01-012021-09-300001227654us-gaap:OperatingSegmentsMembercmp:SaltMember2021-09-300001227654us-gaap:OperatingSegmentsMembercmp:PlantNutritionMember2021-09-300001227654us-gaap:CorporateNonSegmentMember2021-09-300001227654us-gaap:OperatingSegmentsMembercmp:HighwayDeicingSaltMembercmp:SaltMember2022-10-012023-09-300001227654us-gaap:OperatingSegmentsMembercmp:HighwayDeicingSaltMembercmp:PlantNutritionMember2022-10-012023-09-300001227654cmp:HighwayDeicingSaltMemberus-gaap:CorporateNonSegmentMember2022-10-012023-09-300001227654cmp:HighwayDeicingSaltMember2022-10-012023-09-300001227654us-gaap:OperatingSegmentsMembercmp:ConsumerIndustrialSaltMembercmp:SaltMember2022-10-012023-09-300001227654us-gaap:OperatingSegmentsMembercmp:ConsumerIndustrialSaltMembercmp:PlantNutritionMember2022-10-012023-09-300001227654cmp:ConsumerIndustrialSaltMemberus-gaap:CorporateNonSegmentMember2022-10-012023-09-300001227654cmp:ConsumerIndustrialSaltMember2022-10-012023-09-300001227654us-gaap:OperatingSegmentsMembercmp:SaltMembercmp:SOPMember2022-10-012023-09-300001227654us-gaap:OperatingSegmentsMembercmp:PlantNutritionMembercmp:SOPMember2022-10-012023-09-300001227654us-gaap:CorporateNonSegmentMembercmp:SOPMember2022-10-012023-09-300001227654cmp:SOPMember2022-10-012023-09-300001227654us-gaap:OperatingSegmentsMembercmp:SaltMembercmp:FireRetardantMember2022-10-012023-09-300001227654us-gaap:OperatingSegmentsMembercmp:PlantNutritionMembercmp:FireRetardantMember2022-10-012023-09-300001227654us-gaap:CorporateNonSegmentMembercmp:FireRetardantMember2022-10-012023-09-300001227654cmp:FireRetardantMember2022-10-012023-09-300001227654us-gaap:OperatingSegmentsMembercmp:SaltMemberus-gaap:ServiceMember2022-10-012023-09-300001227654us-gaap:OperatingSegmentsMembercmp:PlantNutritionMemberus-gaap:ServiceMember2022-10-012023-09-300001227654us-gaap:CorporateNonSegmentMemberus-gaap:ServiceMember2022-10-012023-09-300001227654us-gaap:ServiceMember2022-10-012023-09-300001227654us-gaap:OperatingSegmentsMemberus-gaap:ProductAndServiceOtherMembercmp:SaltMember2022-10-012023-09-300001227654us-gaap:OperatingSegmentsMemberus-gaap:ProductAndServiceOtherMembercmp:PlantNutritionMember2022-10-012023-09-300001227654us-gaap:ProductAndServiceOtherMemberus-gaap:CorporateNonSegmentMember2022-10-012023-09-300001227654us-gaap:ProductAndServiceOtherMember2022-10-012023-09-300001227654us-gaap:OperatingSegmentsMembercmp:HighwayDeicingSaltMembercmp:SaltMember2021-10-012022-09-300001227654us-gaap:OperatingSegmentsMembercmp:HighwayDeicingSaltMembercmp:PlantNutritionMember2021-10-012022-09-300001227654cmp:HighwayDeicingSaltMemberus-gaap:CorporateNonSegmentMember2021-10-012022-09-300001227654cmp:HighwayDeicingSaltMember2021-10-012022-09-300001227654us-gaap:OperatingSegmentsMembercmp:ConsumerIndustrialSaltMembercmp:SaltMember2021-10-012022-09-300001227654us-gaap:OperatingSegmentsMembercmp:ConsumerIndustrialSaltMembercmp:PlantNutritionMember2021-10-012022-09-300001227654cmp:ConsumerIndustrialSaltMemberus-gaap:CorporateNonSegmentMember2021-10-012022-09-300001227654cmp:ConsumerIndustrialSaltMember2021-10-012022-09-300001227654us-gaap:OperatingSegmentsMembercmp:SaltMembercmp:SOPMember2021-10-012022-09-300001227654us-gaap:OperatingSegmentsMembercmp:PlantNutritionMembercmp:SOPMember2021-10-012022-09-300001227654us-gaap:CorporateNonSegmentMembercmp:SOPMember2021-10-012022-09-300001227654cmp:SOPMember2021-10-012022-09-300001227654us-gaap:OperatingSegmentsMemberus-gaap:ProductAndServiceOtherMembercmp:SaltMember2021-10-012022-09-300001227654us-gaap:OperatingSegmentsMemberus-gaap:ProductAndServiceOtherMembercmp:PlantNutritionMember2021-10-012022-09-300001227654us-gaap:ProductAndServiceOtherMemberus-gaap:CorporateNonSegmentMember2021-10-012022-09-300001227654us-gaap:ProductAndServiceOtherMember2021-10-012022-09-300001227654us-gaap:OperatingSegmentsMembercmp:HighwayDeicingSaltMembercmp:SaltMember2021-01-012021-09-300001227654us-gaap:OperatingSegmentsMembercmp:HighwayDeicingSaltMembercmp:PlantNutritionMember2021-01-012021-09-300001227654cmp:HighwayDeicingSaltMemberus-gaap:CorporateNonSegmentMember2021-01-012021-09-300001227654cmp:HighwayDeicingSaltMember2021-01-012021-09-300001227654us-gaap:OperatingSegmentsMembercmp:ConsumerIndustrialSaltMembercmp:SaltMember2021-01-012021-09-300001227654us-gaap:OperatingSegmentsMembercmp:ConsumerIndustrialSaltMembercmp:PlantNutritionMember2021-01-012021-09-300001227654cmp:ConsumerIndustrialSaltMemberus-gaap:CorporateNonSegmentMember2021-01-012021-09-300001227654cmp:ConsumerIndustrialSaltMember2021-01-012021-09-300001227654us-gaap:OperatingSegmentsMembercmp:SaltMembercmp:SOPMember2021-01-012021-09-300001227654us-gaap:OperatingSegmentsMembercmp:PlantNutritionMembercmp:SOPMember2021-01-012021-09-300001227654us-gaap:CorporateNonSegmentMembercmp:SOPMember2021-01-012021-09-300001227654cmp:SOPMember2021-01-012021-09-300001227654us-gaap:OperatingSegmentsMemberus-gaap:ProductAndServiceOtherMembercmp:SaltMember2021-01-012021-09-300001227654us-gaap:OperatingSegmentsMemberus-gaap:ProductAndServiceOtherMembercmp:PlantNutritionMember2021-01-012021-09-300001227654us-gaap:ProductAndServiceOtherMemberus-gaap:CorporateNonSegmentMember2021-01-012021-09-300001227654us-gaap:ProductAndServiceOtherMember2021-01-012021-09-300001227654country:US2022-10-012023-09-300001227654country:US2021-10-012022-09-300001227654country:US2021-01-012021-09-300001227654country:CA2022-10-012023-09-300001227654country:CA2021-10-012022-09-300001227654country:CA2021-01-012021-09-300001227654country:GB2022-10-012023-09-300001227654country:GB2021-10-012022-09-300001227654country:GB2021-01-012021-09-300001227654cmp:OtherGeographicAreasMember2022-10-012023-09-300001227654cmp:OtherGeographicAreasMember2021-10-012022-09-300001227654cmp:OtherGeographicAreasMember2021-01-012021-09-300001227654country:US2023-09-300001227654country:US2022-09-300001227654country:US2021-09-300001227654country:CA2023-09-300001227654country:CA2022-09-300001227654country:CA2021-09-300001227654country:GB2023-09-300001227654country:GB2022-09-300001227654country:GB2021-09-300001227654cmp:OtherGeographicAreasMember2023-09-300001227654cmp:OtherGeographicAreasMember2022-09-300001227654cmp:OtherGeographicAreasMember2021-09-300001227654us-gaap:DeferredCompensationShareBasedPaymentsMember2022-10-012023-09-300001227654us-gaap:DeferredCompensationShareBasedPaymentsMember2021-10-012022-09-300001227654us-gaap:DeferredCompensationShareBasedPaymentsMember2021-01-012021-09-300001227654srt:DirectorMemberus-gaap:DeferredCompensationShareBasedPaymentsMemberus-gaap:RestrictedStockUnitsRSUMember2022-10-012023-09-300001227654srt:DirectorMemberus-gaap:DeferredCompensationShareBasedPaymentsMemberus-gaap:RestrictedStockUnitsRSUMember2021-10-012022-09-300001227654srt:DirectorMemberus-gaap:DeferredCompensationShareBasedPaymentsMemberus-gaap:RestrictedStockUnitsRSUMember2021-01-012021-09-300001227654srt:DirectorMemberus-gaap:DeferredCompensationShareBasedPaymentsMember2022-10-012023-09-300001227654srt:DirectorMemberus-gaap:DeferredCompensationShareBasedPaymentsMember2021-10-012022-09-300001227654srt:DirectorMemberus-gaap:DeferredCompensationShareBasedPaymentsMember2021-01-012021-09-300001227654us-gaap:PrivatePlacementMember2022-09-142022-09-140001227654us-gaap:PrivatePlacementMember2022-09-140001227654cmp:KochMineralsTradingLLCMember2022-10-180001227654us-gaap:PrivatePlacementMember2022-10-182022-10-180001227654us-gaap:SeriesAPreferredStockMember2023-09-300001227654cmp:EquityCompensation2005PlanMember2005-12-310001227654cmp:EquityCompensation2015PlanMember2015-05-310001227654cmp:A2020IncentiveAwardPlanMember2020-05-310001227654cmp:A2020IncentiveAwardPlanMember2022-02-012022-02-280001227654us-gaap:EmployeeStockOptionMember2022-10-012023-09-300001227654us-gaap:EmployeeStockOptionMember2023-09-300001227654us-gaap:EmployeeStockOptionMember2021-10-012022-09-300001227654us-gaap:EmployeeStockOptionMember2021-01-012021-09-300001227654srt:MinimumMemberus-gaap:RestrictedStockUnitsRSUMember2022-10-012023-09-300001227654srt:MaximumMemberus-gaap:RestrictedStockUnitsRSUMember2022-10-012023-09-300001227654us-gaap:RestrictedStockUnitsRSUMember2023-09-300001227654srt:MinimumMembercmp:TotalShareholderReturnPerformanceStockUnitsMember2022-10-012023-09-300001227654cmp:TotalShareholderReturnPerformanceStockUnitsMembersrt:MaximumMember2022-10-012023-09-300001227654cmp:TargetNumberOfSharesMembersrt:MaximumMember2022-10-012023-09-300001227654cmp:GrowthPSUsMembersrt:MinimumMember2022-10-012023-09-300001227654cmp:GrowthPSUsMembersrt:MaximumMember2022-10-012023-09-300001227654us-gaap:EmployeeStockOptionMember2020-12-310001227654us-gaap:RestrictedStockUnitsRSUMember2020-12-310001227654cmp:PerformanceStockUnitsPsuMember2020-12-310001227654us-gaap:RestrictedStockUnitsRSUMember2021-01-012021-09-300001227654cmp:PerformanceStockUnitsPsuMember2021-01-012021-09-300001227654us-gaap:EmployeeStockOptionMember2021-09-300001227654us-gaap:RestrictedStockUnitsRSUMember2021-09-300001227654cmp:PerformanceStockUnitsPsuMember2021-09-300001227654us-gaap:RestrictedStockUnitsRSUMember2021-10-012022-09-300001227654cmp:PerformanceStockUnitsPsuMember2021-10-012022-09-300001227654us-gaap:EmployeeStockOptionMember2022-09-300001227654us-gaap:RestrictedStockUnitsRSUMember2022-09-300001227654cmp:PerformanceStockUnitsPsuMember2022-09-300001227654us-gaap:RestrictedStockUnitsRSUMember2022-10-012023-09-300001227654cmp:PerformanceStockUnitsPsuMember2022-10-012023-09-300001227654cmp:PerformanceStockUnitsPsuMember2023-09-300001227654cmp:ExercisePriceRange1Member2022-10-012023-09-300001227654cmp:ExercisePriceRange1Member2023-09-300001227654cmp:ExercisePriceRange2Member2022-10-012023-09-300001227654cmp:ExercisePriceRange2Member2023-09-300001227654cmp:ExercisePriceRange3Member2022-10-012023-09-300001227654cmp:ExercisePriceRange3Member2023-09-300001227654cmp:ExercisePriceRange4Member2022-10-012023-09-300001227654cmp:ExercisePriceRange4Member2023-09-300001227654cmp:ExercisePriceRange5Member2022-10-012023-09-300001227654cmp:ExercisePriceRange5Member2023-09-300001227654us-gaap:AccumulatedGainLossNetCashFlowHedgeParentMember2022-09-300001227654us-gaap:AccumulatedDefinedBenefitPlansAdjustmentMember2022-09-300001227654cmp:AccumulatedOtherPostEmploymentBenefitsAdjustmentAttributableToParentMember2022-09-300001227654us-gaap:AccumulatedTranslationAdjustmentMember2022-09-300001227654us-gaap:AccumulatedGainLossNetCashFlowHedgeParentMember2022-10-012023-09-300001227654us-gaap:AccumulatedDefinedBenefitPlansAdjustmentMember2022-10-012023-09-300001227654cmp:AccumulatedOtherPostEmploymentBenefitsAdjustmentAttributableToParentMember2022-10-012023-09-300001227654us-gaap:AccumulatedTranslationAdjustmentMember2022-10-012023-09-300001227654us-gaap:AccumulatedGainLossNetCashFlowHedgeParentMember2023-09-300001227654us-gaap:AccumulatedDefinedBenefitPlansAdjustmentMember2023-09-300001227654cmp:AccumulatedOtherPostEmploymentBenefitsAdjustmentAttributableToParentMember2023-09-300001227654us-gaap:AccumulatedTranslationAdjustmentMember2023-09-300001227654us-gaap:AccumulatedGainLossNetCashFlowHedgeParentMember2021-09-300001227654us-gaap:AccumulatedDefinedBenefitPlansAdjustmentMember2021-09-300001227654cmp:AccumulatedOtherPostEmploymentBenefitsAdjustmentAttributableToParentMember2021-09-300001227654us-gaap:AccumulatedTranslationAdjustmentMember2021-09-300001227654us-gaap:AccumulatedGainLossNetCashFlowHedgeParentMember2021-10-012022-09-300001227654us-gaap:AccumulatedDefinedBenefitPlansAdjustmentMember2021-10-012022-09-300001227654cmp:AccumulatedOtherPostEmploymentBenefitsAdjustmentAttributableToParentMember2021-10-012022-09-300001227654us-gaap:AccumulatedTranslationAdjustmentMember2021-10-012022-09-300001227654us-gaap:CommodityContractMemberus-gaap:ReclassificationOutOfAccumulatedOtherComprehensiveIncomeMemberus-gaap:AccumulatedGainLossNetCashFlowHedgeParentMember2022-10-012023-09-300001227654us-gaap:CommodityContractMemberus-gaap:ReclassificationOutOfAccumulatedOtherComprehensiveIncomeMemberus-gaap:AccumulatedGainLossNetCashFlowHedgeParentMember2021-10-012022-09-300001227654us-gaap:ForeignExchangeContractMemberus-gaap:ReclassificationOutOfAccumulatedOtherComprehensiveIncomeMemberus-gaap:AccumulatedGainLossNetCashFlowHedgeParentMember2022-10-012023-09-300001227654us-gaap:ForeignExchangeContractMemberus-gaap:ReclassificationOutOfAccumulatedOtherComprehensiveIncomeMemberus-gaap:AccumulatedGainLossNetCashFlowHedgeParentMember2021-10-012022-09-300001227654us-gaap:ReclassificationOutOfAccumulatedOtherComprehensiveIncomeMemberus-gaap:AccumulatedGainLossNetCashFlowHedgeParentMember2022-10-012023-09-300001227654us-gaap:ReclassificationOutOfAccumulatedOtherComprehensiveIncomeMemberus-gaap:AccumulatedGainLossNetCashFlowHedgeParentMember2021-10-012022-09-300001227654us-gaap:ReclassificationOutOfAccumulatedOtherComprehensiveIncomeMemberus-gaap:AccumulatedDefinedBenefitPlansAdjustmentMember2022-10-012023-09-300001227654us-gaap:ReclassificationOutOfAccumulatedOtherComprehensiveIncomeMemberus-gaap:AccumulatedDefinedBenefitPlansAdjustmentMember2021-10-012022-09-300001227654us-gaap:ReclassificationOutOfAccumulatedOtherComprehensiveIncomeMembercmp:AccumulatedOtherPostEmploymentBenefitsAdjustmentAttributableToParentMember2022-10-012023-09-300001227654us-gaap:ReclassificationOutOfAccumulatedOtherComprehensiveIncomeMembercmp:AccumulatedOtherPostEmploymentBenefitsAdjustmentAttributableToParentMember2021-10-012022-09-300001227654cmp:CTADueToSaleOfForeignEntityMemberus-gaap:ReclassificationOutOfAccumulatedOtherComprehensiveIncomeMember2022-10-012023-09-300001227654cmp:CTADueToSaleOfForeignEntityMemberus-gaap:ReclassificationOutOfAccumulatedOtherComprehensiveIncomeMember2021-10-012022-09-300001227654us-gaap:ReclassificationOutOfAccumulatedOtherComprehensiveIncomeMember2022-10-012023-09-300001227654us-gaap:ReclassificationOutOfAccumulatedOtherComprehensiveIncomeMember2021-10-012022-09-300001227654us-gaap:DesignatedAsHedgingInstrumentMemberus-gaap:CommodityContractMember2023-09-300001227654us-gaap:DesignatedAsHedgingInstrumentMemberus-gaap:CommodityContractMember2022-10-012023-09-30utr:MMBTU0001227654us-gaap:DesignatedAsHedgingInstrumentMemberus-gaap:CommodityContractMember2021-10-012022-09-300001227654us-gaap:CommodityContractMembercmp:AccruedExensesandOtherCurrentLiabilitiesMemberus-gaap:NondesignatedMember2023-03-010001227654us-gaap:CommodityContractMember2022-10-012023-09-300001227654us-gaap:DesignatedAsHedgingInstrumentMemberus-gaap:CommodityContractMemberus-gaap:OtherCurrentAssetsMember2023-09-300001227654us-gaap:DesignatedAsHedgingInstrumentMemberus-gaap:CommodityContractMembercmp:AccruedExensesandOtherCurrentLiabilitiesMember2023-09-300001227654us-gaap:DesignatedAsHedgingInstrumentMember2023-09-300001227654us-gaap:CommodityContractMemberus-gaap:OtherCurrentAssetsMemberus-gaap:NondesignatedMember2023-09-300001227654us-gaap:CommodityContractMembercmp:AccruedExensesandOtherCurrentLiabilitiesMemberus-gaap:NondesignatedMember2023-09-300001227654us-gaap:CommodityContractMemberus-gaap:NondesignatedMemberus-gaap:OtherNoncurrentAssetsMember2023-09-300001227654us-gaap:CommodityContractMemberus-gaap:NondesignatedMemberus-gaap:OtherNoncurrentLiabilitiesMember2023-09-300001227654us-gaap:NondesignatedMember2023-09-300001227654us-gaap:CommodityContractMember2023-09-300001227654us-gaap:DesignatedAsHedgingInstrumentMemberus-gaap:CommodityContractMemberus-gaap:OtherCurrentAssetsMember2022-09-300001227654us-gaap:DesignatedAsHedgingInstrumentMemberus-gaap:CommodityContractMembercmp:AccruedExensesandOtherCurrentLiabilitiesMember2022-09-300001227654us-gaap:DesignatedAsHedgingInstrumentMemberus-gaap:CommodityContractMemberus-gaap:OtherNoncurrentAssetsMember2022-09-300001227654us-gaap:DesignatedAsHedgingInstrumentMemberus-gaap:CommodityContractMemberus-gaap:OtherNoncurrentLiabilitiesMember2022-09-300001227654us-gaap:DesignatedAsHedgingInstrumentMember2022-09-300001227654us-gaap:CommodityContractMember2022-09-300001227654us-gaap:CommodityContractMemberus-gaap:CostOfSalesMemberus-gaap:CashFlowHedgingMember2022-10-012023-09-300001227654us-gaap:CashFlowHedgingMember2022-10-012023-09-300001227654us-gaap:CommodityContractMemberus-gaap:CostOfSalesMemberus-gaap:CashFlowHedgingMember2021-10-012022-09-300001227654us-gaap:CashFlowHedgingMember2021-10-012022-09-300001227654us-gaap:FairValueInputsLevel1Member2023-09-300001227654us-gaap:FairValueInputsLevel2Member2023-09-300001227654us-gaap:FairValueInputsLevel3Member2023-09-300001227654us-gaap:NondesignatedMemberus-gaap:EnergyRelatedDerivativeMember2023-09-300001227654us-gaap:NondesignatedMemberus-gaap:FairValueInputsLevel1Memberus-gaap:EnergyRelatedDerivativeMember2023-09-300001227654us-gaap:FairValueInputsLevel2Memberus-gaap:NondesignatedMemberus-gaap:EnergyRelatedDerivativeMember2023-09-300001227654us-gaap:FairValueInputsLevel3Memberus-gaap:NondesignatedMemberus-gaap:EnergyRelatedDerivativeMember2023-09-300001227654us-gaap:DesignatedAsHedgingInstrumentMemberus-gaap:EnergyRelatedDerivativeMember2023-09-300001227654us-gaap:DesignatedAsHedgingInstrumentMemberus-gaap:FairValueInputsLevel1Memberus-gaap:EnergyRelatedDerivativeMember2023-09-300001227654us-gaap:DesignatedAsHedgingInstrumentMemberus-gaap:FairValueInputsLevel2Memberus-gaap:EnergyRelatedDerivativeMember2023-09-300001227654us-gaap:DesignatedAsHedgingInstrumentMemberus-gaap:FairValueInputsLevel3Memberus-gaap:EnergyRelatedDerivativeMember2023-09-300001227654cmp:InvestmentBenchmarkMembercmp:CommonstockLargeCapUSCompaniesMembercmp:MutualFundInvestmentsConcentrationRiskMember2022-10-012023-09-300001227654cmp:InvestmentBenchmarkMembercmp:MutualFundInvestmentsConcentrationRiskMembercmp:CommonStockOfSmallToMidCapUSCompaniesMember2022-10-012023-09-300001227654cmp:InvestmentBenchmarkMembercmp:MutualFundInvestmentsConcentrationRiskMembercmp:CommonStockInternationalCompaniesMember2022-10-012023-09-300001227654cmp:InvestmentBenchmarkMembercmp:BondFundsMembercmp:MutualFundInvestmentsConcentrationRiskMember2022-10-012023-09-300001227654cmp:InvestmentBenchmarkMembercmp:MutualFundInvestmentsConcentrationRiskMemberus-gaap:ShortTermInvestmentsMember2022-10-012023-09-300001227654cmp:InvestmentBenchmarkMembercmp:MutualFundInvestmentsConcentrationRiskMembercmp:BlendedFundsMember2022-10-012023-09-300001227654us-gaap:FairValueInputsLevel1Member2022-09-300001227654us-gaap:FairValueInputsLevel2Member2022-09-300001227654us-gaap:FairValueInputsLevel3Member2022-09-300001227654cmp:InvestmentBenchmarkMembercmp:CommonstockLargeCapUSCompaniesMembercmp:MutualFundInvestmentsConcentrationRiskMember2021-10-012022-09-300001227654cmp:InvestmentBenchmarkMembercmp:MutualFundInvestmentsConcentrationRiskMembercmp:CommonStockOfSmallToMidCapUSCompaniesMember2021-10-012022-09-300001227654cmp:InvestmentBenchmarkMembercmp:MutualFundInvestmentsConcentrationRiskMembercmp:CommonStockInternationalCompaniesMember2021-10-012022-09-300001227654cmp:InvestmentBenchmarkMembercmp:BondFundsMembercmp:MutualFundInvestmentsConcentrationRiskMember2021-10-012022-09-300001227654cmp:InvestmentBenchmarkMembercmp:MutualFundInvestmentsConcentrationRiskMemberus-gaap:ShortTermInvestmentsMember2021-10-012022-09-300001227654cmp:InvestmentBenchmarkMembercmp:MutualFundInvestmentsConcentrationRiskMembercmp:BlendedFundsMember2021-10-012022-09-300001227654cmp:SeniorNotesJuly2024Member2022-09-300001227654cmp:SeniorNotesJuly2024Member2023-09-300001227654cmp:SeniorNotesJuly2024Memberus-gaap:EstimateOfFairValueFairValueDisclosureMember2022-09-300001227654cmp:SeniorNotesJuly2024Memberus-gaap:CarryingReportedAmountFairValueDisclosureMember2023-09-300001227654cmp:SeniorNotesJuly2024Memberus-gaap:CarryingReportedAmountFairValueDisclosureMember2022-09-300001227654cmp:SeniorNotesdue2027Member2023-09-300001227654cmp:SeniorNotesdue2027Member2022-09-300001227654cmp:CreditAgreementMemberus-gaap:EstimateOfFairValueFairValueDisclosureMember2023-09-300001227654cmp:CreditAgreementMemberus-gaap:EstimateOfFairValueFairValueDisclosureMember2022-09-300001227654us-gaap:CarryingReportedAmountFairValueDisclosureMembercmp:CreditAgreementMember2023-09-300001227654us-gaap:CarryingReportedAmountFairValueDisclosureMembercmp:CreditAgreementMember2022-09-300001227654us-gaap:EmployeeStockOptionMember2022-10-012023-09-300001227654us-gaap:EmployeeStockOptionMember2021-10-012022-09-300001227654us-gaap:EmployeeStockOptionMember2021-01-012021-09-3000012276542022-11-13cmp:board_member0001227654us-gaap:RelatedPartyMember2022-10-012023-06-300001227654us-gaap:RelatedPartyMember2021-10-012022-06-300001227654us-gaap:RelatedPartyMember2023-09-300001227654us-gaap:RelatedPartyMember2022-09-300001227654us-gaap:RelatedPartyMember2023-06-300001227654us-gaap:RelatedPartyMember2023-06-202023-06-2000012276542023-03-202023-03-2000012276542022-12-202022-12-200001227654us-gaap:ShippingAndHandlingMember2020-10-012021-09-300001227654us-gaap:ProductMember2020-10-012021-09-3000012276542020-09-3000012276542021-04-012021-06-3000012276542021-07-012021-09-3000012276542020-10-012020-12-3100012276542023-07-012023-09-300001227654us-gaap:AllowanceForCreditLossMember2022-09-300001227654us-gaap:AllowanceForCreditLossMember2022-10-012023-09-300001227654us-gaap:AllowanceForCreditLossMember2023-09-300001227654us-gaap:AllowanceForCreditLossMember2021-09-300001227654us-gaap:AllowanceForCreditLossMember2021-10-012022-09-300001227654us-gaap:AllowanceForCreditLossMember2020-12-310001227654us-gaap:AllowanceForCreditLossMember2021-01-012021-09-300001227654us-gaap:ValuationAllowanceOfDeferredTaxAssetsMember2022-09-300001227654us-gaap:ValuationAllowanceOfDeferredTaxAssetsMember2022-10-012023-09-300001227654us-gaap:ValuationAllowanceOfDeferredTaxAssetsMember2023-09-300001227654us-gaap:ValuationAllowanceOfDeferredTaxAssetsMember2021-09-300001227654us-gaap:ValuationAllowanceOfDeferredTaxAssetsMember2021-10-012022-09-300001227654us-gaap:ValuationAllowanceOfDeferredTaxAssetsMember2020-12-310001227654us-gaap:ValuationAllowanceOfDeferredTaxAssetsMember2021-01-012021-09-300001227654cmp:PlantNutritionSouthAmericaMember2021-09-30
United States
Securities and Exchange Commission
Washington, D.C. 20549
FORM 10-K
(MARK ONE)
☒ ANNUAL REPORT PURSUANT TO SECTION 13 OR 15(d) OF THE SECURITIES EXCHANGE ACT OF 1934
For the fiscal year ended September 30, 2023
OR
☐ TRANSITION REPORT PURSUANT TO SECTION 13 OR 15(d) OF THE SECURITIES EXCHANGE ACT OF 1934
For the transition period from __________ to __________
Commission File Number 001-31921
Compass Minerals International, Inc.
(Exact name of registrant as specified in its charter)
|
|
|
|
|
|
|
|
|
| Delaware |
|
36-3972986 |
(State or other jurisdiction of incorporation or organization) |
|
(I.R.S. Employer Identification No.) |
|
|
|
|
|
|
|
|
|
|
|
|
| 9900 West 109th Street, |
Suite 100 |
|
66210 |
| Overland Park, |
Kansas |
|
(Zip Code) |
| (Address of principal executive offices) |
|
|
Registrant’s telephone number, including area code:
(913) 344-9200
Securities registered pursuant to Section 12(b) of the Act:
|
|
|
|
|
|
|
|
|
|
|
|
|
|
|
| Title of each class |
|
Trading Symbol |
|
Name of each exchange on which registered |
| Common stock, $0.01 par value |
|
CMP |
|
The New York Stock Exchange |
|
|
|
|
|
|
|
|
|
|
|
|
|
|
|
| Securities registered pursuant to Section 12(g) of the Act: None |
|
|
|
|
|
|
|
|
|
|
|
|
|
|
|
| Indicate by check mark if the registrant is a well-known seasoned issuer, as defined in Rule 405 of the Securities Act. |
Yes |
☐ |
No |
þ |
|
|
|
|
|
|
|
|
|
|
|
|
|
|
|
| Indicate by check mark if the registrant is not required to file reports pursuant to Section 13 or Section 15(d) of the Act. |
Yes |
☐ |
No |
þ |
|
|
|
|
|
|
|
|
|
|
|
|
|
|
|
| Indicate by check mark whether the registrant (1) has filed all reports required to be filed by Section 13 or 15(d) of the Securities Exchange Act of 1934 during the preceding 12 months (or for such shorter period that the registrant was required to file such reports), and (2) has been subject to such filing |
| requirements for the past 90 days. |
Yes |
þ |
No |
☐ |
|
|
|
|
|
|
|
|
|
|
|
|
|
|
|
| Indicate by check mark whether the registrant has submitted electronically every Interactive Data File required to be submitted pursuant to Rule 405 of Regulation S-T (§ 232.405 of this chapter) during the preceding 12 months (or for such shorter period that the registrant was required to submit such files). |
|
Yes |
þ |
No |
☐ |
|
|
|
|
|
|
|
|
|
|
|
|
|
|
|
|
|
|
|
|
|
|
|
|
| Indicate by check mark whether the registrant is a large accelerated filer, an accelerated filer, a non-accelerated filer, a smaller reporting company, or an emerging growth company. See the definitions of “large accelerated filer,” “accelerated filer,” “smaller reporting company,” and “emerging growth company” in Rule 12b-2 of the Exchange Act. |
| Large accelerated filer |
þ |
Accelerated filer |
☐ |
Non-accelerated filer |
☐ |
Smaller reporting company |
☐ |
|
|
|
|
|
|
Emerging growth company |
☐ |
|
|
|
|
|
|
| If an emerging growth company, indicate by check mark if the registrant has elected not to use the extended transition period for complying with any new or revised financial accounting standards provided pursuant to Section 13(a) of the Exchange Act |
☐ |
|
|
|
|
|
|
| Indicate by check mark whether the registrant has filed a report on and attestation to its management’s assessment of the effectiveness of its internal control over financial reporting under Section 404(b) of the Sarbanes-Oxley Act (15 U.S.C. 7262(b)) by the registered public accounting firm that prepared or issued its audit report. |
☑ |
|
|
|
|
|
|
If securities are registered pursuant to Section 12(b) of the Act, indicate by check mark whether the financial statements of the registrant included in the filing reflect the correction of an error to previously issued financial statements. |
☐ |
|
|
|
|
|
|
Indicate by check mark whether any of those error corrections are restatements that required a recovery analysis of incentive-based compensation received by any of the registrant’s executive officers during the relevant recovery period pursuant to §240.10D-1(b). |
☐ |
|
|
|
|
|
|
|
|
|
|
|
|
|
|
|
| Indicate by check mark whether the registrant is a shell company (as defined in Rule 12b-2 of the Exchange Act). |
Yes |
☐ |
No |
þ |
As of March 31, 2023, the aggregate market value of the registrant’s common stock held by non-affiliates of the registrant was $1,402,998,976, based on the closing sale price of $34.29 per share, as reported on the New York Stock Exchange.
The number of shares outstanding of the registrant’s $0.01 par value common stock at November 22, 2023 was 41,210,041 shares.
DOCUMENTS INCORPORATED BY REFERENCE
|
|
|
|
|
|
|
|
|
| Document |
|
Parts into which Incorporated |
Portions of the Proxy Statement for the Annual Meeting of Stockholders to be held February 14, 2024 |
|
Part III, Items 10, 11, 12, 13 and 14 |
|
|
|
|
|
|
|
|
|
|
|
|
|
|
|
| Auditor Name |
|
Auditor Location |
|
Auditor Firm ID |
| Ernst & Young LLP |
|
Kansas City, MO |
|
42 |
|
|
|
|
|
|
|
|
|
|
|
COMPASS MINERALS INTERNATIONAL, INC. |
TABLE OF CONTENTS
|
|
|
|
|
|
|
|
|
| PART I |
|
Page No. |
| |
|
|
|
|
|
|
|
|
|
|
|
|
|
|
|
|
|
|
|
|
|
|
|
| |
|
|
| PART II |
|
|
| |
|
|
|
|
|
|
|
|
|
|
|
|
|
|
|
|
|
|
|
|
|
|
|
|
|
|
|
|
|
| |
|
|
| PART III |
|
|
| |
|
|
|
|
|
|
|
|
|
|
|
|
|
|
|
|
|
| |
|
|
| PART IV |
|
|
| |
|
|
|
|
|
|
|
|
| |
|
|
|
|
|
|
|
|
|
|
|
|
|
|
COMPASS MINERALS INTERNATIONAL, INC. |
PART I
CAUTIONARY NOTE REGARDING FORWARD-LOOKING STATEMENTS
Certain statements in this Annual Report on Form 10-K (this “report”), including without limitation our or management’s beliefs, expectations or opinions; statements regarding future events or future financial performance; our plans, objectives and strategies; plans to develop our lithium resource, including the timing of such development and any potential future project-level partnership relating to the lithium project; our outlook, including expected sales volumes and costs; the useful life of our mine properties; our expectation of extending the Goderich mine mineral lease; conversion of mineral resources into mineral reserves; existing or potential capital expenditures, capital projects and investments; the industry and our competition; projected sources of cash flow; potential legal liability; proposed or recently enacted legislation and regulatory action; the seasonal distribution of working capital requirements; our reinvestment of foreign earnings outside the United States (“U.S.”); repatriation of foreign earnings to the U.S.; payment of future dividends and ability to reinvest in our business; our ability to optimize cash accessibility and minimize tax expense; our debt service requirements; our liquidity needs; realization of potential savings from our restructuring activities; funding obligations for our United Kingdom (“U.K.”) pension plan; outcomes of matters with taxing authorities; the seasonality of our business; and the effects of climate change on us, are forward-looking statements. Forward-looking statements are those that predict or describe future events or trends and that do not relate solely to historical matters. We use words such as “may,” “would,” “could,” “should,” “will,” “likely,” “expect,” “anticipate,” “believe,” “intend,” “plan,” “forecast,” “outlook,” “project,” “estimate” and similar expressions suggesting future outcomes or events to identify forward-looking statements or forward-looking information. These statements are based on our current expectations and involve risks and uncertainties that could cause our actual results to differ materially. In evaluating these statements, you should carefully consider various risks, uncertainties and factors including, but not limited to, those listed under “Risk Factors” and elsewhere in this report. Forward-looking statements are only predictions and are subject to certain risks and uncertainties that may cause our actual results to differ materially from the forward-looking statements expressed or implied in this report as a result of factors, risks, and uncertainties, over many of which we do not have control.
Although we believe that the expectations reflected in the forward-looking statements are reasonable as of the date of this report, we cannot guarantee future results, levels of activity, performance or achievements. We do not undertake, and hereby disclaim any obligation or duty, unless otherwise required to do so by applicable laws, to update any forward-looking statement after the date of this report regardless of any new information, future events or other factors. The inclusion of any statement in this report does not constitute our admission that the events or circumstances described in such statement are material to us.
Factors that could cause actual results, levels of activity, performance, or achievements to differ materially from those expressed or implied by the forward-looking statements include, but are not limited to, the following:
•risks related to our mining and industrial operations;
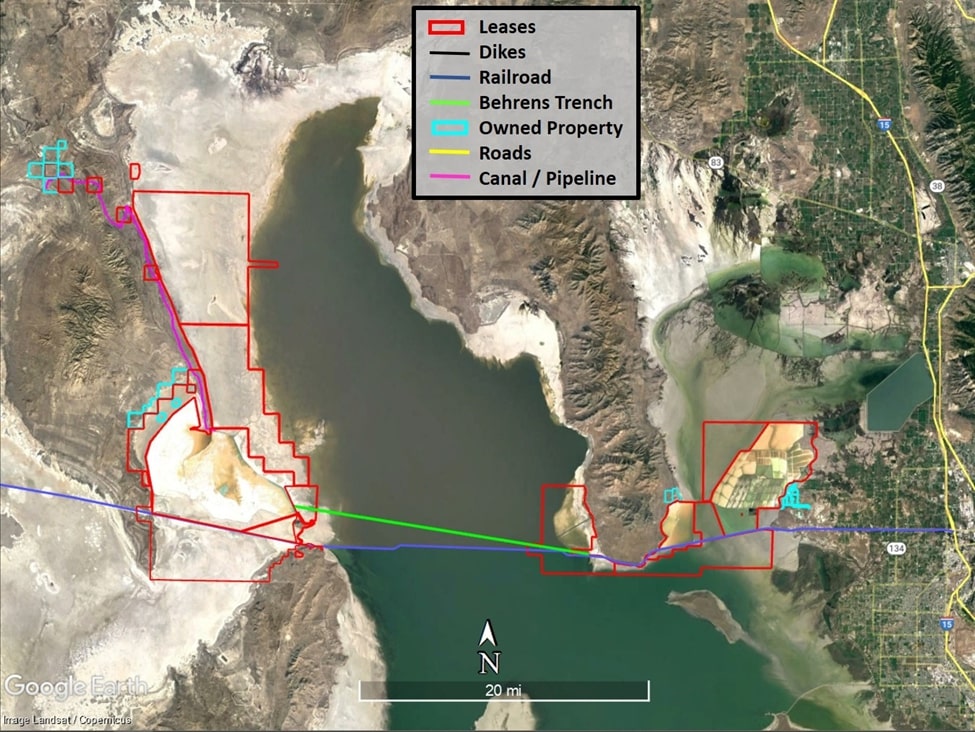
•our continued ability to access ambient lake brine in the Great Salt Lake;
•the indefinite suspension of our lithium development project;
•geological conditions;
•dependency on a limited number of key production and distribution facilities and critical equipment;
•weather conditions;
•the inability to fund necessary capital expenditures or successfully complete capital projects;
•uncertainties in estimating our economically recoverable reserves and resources;
•the useful life of our mine properties;
•our expectation of extending the Goderich mine mineral lease;
•conversion of mineral resources into mineral reserves;
•strikes, other forms of work stoppage or slowdown or other union activities;
•supply constraints or price increases for energy and raw materials used in our production processes;
•our indebtedness and inability to pay our indebtedness;
•restrictions in our debt agreements that may limit our ability to operate our business or require accelerated debt payments;
•tax liabilities;
•the inability of our customers to access credit or a default by our customers of trade credit extended by us;
•our payment of any dividends;
•financial assurance requirements;
•the seasonal demand for our products;
•the impact of anticipated changes in potash product prices and customer application rates;
•the impact of competition on the sales of our products;
•inflation risks;
•increasing costs or a lack of availability of transportation services;
|
|
|
|
|
|
|
|
|
|
|
COMPASS MINERALS INTERNATIONAL, INC. |
•risks associated with our international operations and sales, including changes in currency exchange rates;
•conditions in the sectors where we sell products and supply and demand imbalances for competing products;
•our rights and governmental authorizations to mine and operate our properties;
•risks related to unanticipated litigation or investigations or pending litigation or investigations or other contingencies;
•compliance with environmental, health and safety laws and regulations;
•environmental liabilities;
•compliance with foreign and U.S. laws and regulations related to import and export requirements and anti-corruption laws;
•changes in laws, industry standards and regulatory requirements;
•product liability claims and product recalls;
•misappropriation or infringement claims relating to intellectual property;
•inability to obtain required product registrations or increased regulatory requirements;
•our ability to successfully implement our strategies;
•risks related to labor shortages and the loss of key personnel;
•a compromise of our computer systems, information technology or operations technology or the inability to protect confidential or proprietary data;
•climate change and related laws and regulations;
•our ability to expand our business through acquisitions and investments, realize anticipated benefits from acquisitions and investments and integrate acquired businesses;
•outbreaks of contagious disease or similar public health threats;
•domestic and international general business and economic conditions; and
•other risk factors included in this report or reported from time to time in our filings with the Securities and Exchange Commission (the “SEC”). See “Where You Can Find More Information.”
MARKET AND INDUSTRY DATA AND FORECASTS
This report includes market share and industry data and forecasts that we obtained from publicly available information and industry publications, surveys, market research, internal company surveys and consultant surveys. Industry publications and surveys, consultant surveys and forecasts generally state that the information contained therein has been obtained from sources believed to be reliable, but there can be no assurance as to the accuracy and completeness of such information. We have not independently verified any of the data from third-party sources nor have we ascertained the underlying economic assumptions relied upon therein. Similarly, internal company surveys, industry forecasts and market research, which we believe to be reliable based upon management’s knowledge of the industry, have not been verified by any independent sources. Except where otherwise noted, references to North America include only the continental U.S. and Canada, references to the U.K., include only England, Scotland and Wales, and statements as to our position relative to our competitors or as to market share refer to the most recent available data. Statements concerning (a) North American consumer and industrial salt and highway deicing salt markets are generally based on historical sales volumes, (b) U.K. highway deicing salt sales are generally based on historical sales volumes, and (c) sulfate of potash are generally based on historical sales volumes. Except for lithium quantities which are stated in metric tons or where otherwise noted, all references to tons refer to “short tons” and all amounts are in U.S. dollars. One short ton equals 2,000 pounds and one metric ton equals 2,204.6 pounds.
WHERE YOU CAN FIND MORE INFORMATION
We file annual, quarterly and current reports and other information with the SEC and our SEC filings are available at the SEC’s website at www.sec.gov. Copies of these documents are also available on our website, www.compassminerals.com. We also use our website as a tool to disclose important information about the company and comply with our disclosure obligations under Regulation Fair Disclosure. The information on our website (or any webpages referenced in this Annual Report on Form 10-K) is not part of this or any other report we file with, or furnish to, the SEC. Further, our references to website URLs are intended to be inactive textual references only.
You may also request a copy of any of our filings, at no cost, by writing or telephoning:
Investor Relations
Compass Minerals International, Inc.
9900 West 109th Street, Suite 100
Overland Park, Kansas 66210
For general inquiries concerning us, please call (913) 344-9200.
|
|
|
|
|
|
|
|
|
|
|
COMPASS MINERALS INTERNATIONAL, INC. |
Unless the context requires otherwise, references in this report to the “Company,” “Compass Minerals,” “CMP,” “we,” “us” and “our” refer to Compass Minerals International, Inc. (“CMI,” the parent holding company) and its consolidated subsidiaries collectively.
ITEM 1. BUSINESS
COMPANY OVERVIEW
Compass Minerals is a leading provider of essential minerals focused on safely delivering where and when it matters to help solve nature’s challenges for customers and communities. Our salt products help keep roadways safe during winter weather and are used in numerous other consumer, industrial, chemical and agricultural applications. Our plant nutrition products help improve the quality and yield of crops, while supporting sustainable agriculture. Our next-generation fire retardants help to slow, stop and prevent wildfires through the use of high-performing and environmentally-friendly products. Additionally, we have been pursuing development of a sustainable lithium salt resource to support the North American battery market, although the project has been suspended indefinitely beyond certain already committed items associated with the early stages of construction of our commercial scale demonstration unit. As of September 30, 2023, we operate 12 production and packaging facilities with nearly 2,000 employees throughout the U.S., Canada and the U.K., including:
•The largest underground rock salt mine in the world in Goderich, Ontario, Canada;
•The largest dedicated rock salt mine in the U.K. in Winsford, Cheshire;
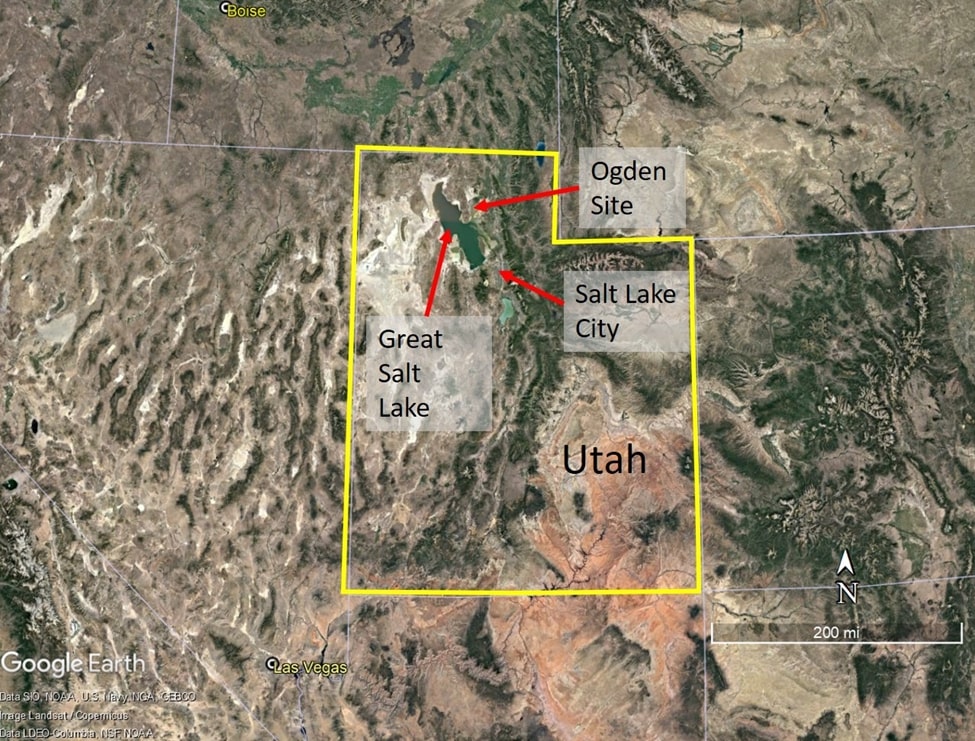
•A solar evaporation facility located near Ogden, Utah, which is both the largest sulfate of potash specialty fertilizer (“SOP”) production site, the largest solar salt production site in the Western Hemisphere and the source of the lithium salt resource that we intend to develop; and
•Several mechanical evaporation facilities producing consumer and industrial salt
See
Item 2, “Properties,” for a discussion of our mining properties, including processing methods, facilities, production and summaries of our mineral resources and reserves, both in the aggregate and for our individual material mining properties.
Our Salt segment provides highway deicing salt to customers in North America and the U.K. as well as consumer deicing and water conditioning products, ingredients used in consumer and commercial food preparation and other salt-based products for consumer, industrial, chemical and agricultural applications in North America. In the U.K., we operate a records management business utilizing excavated areas of our Winsford salt mine with one other location in London, England.
Our Plant Nutrition segment produces and markets SOP products in various grades domestically and internationally to distributors and retailers of crop inputs, as well as growers and for industrial uses. We market our SOP under the trade name Protassium+®.
In May 2023, we completed the purchase of Fortress North America, LLC (“Fortress”), a next-generation fire retardant company dedicated to developing and producing a portfolio of magnesium chloride-based aerial and ground fire retardant products to help combat wildfires (see
Part II, Item 8, Note 3 of our Consolidated Financial Statements). Magnesium chloride is an existing product stream out of our Ogden, Utah, solar evaporation facility. During the third quarter of fiscal 2023, Fortress entered into an agreement with the U.S. Forest Service (“USFS”) to supply product and provide associated services for the 2023 fire season.
Additionally, we have been pursuing development of a sustainable lithium salt resource near Ogden, UT to support the North American battery market. As previously announced, we have suspended indefinitely any further investment in the lithium project in Utah beyond certain already committed items associated with the early stages of construction of our commercial scale demonstration unit until further clarity is provided on the evolving regulatory climate. We are considering seeking partners at the project level with an aim of reducing our share of capital costs and lowering execution risk in the event that the project is restarted.
We sell our salt, plant nutrition and fire retardant products primarily in the U.S., Canada and the U.K. See
Part II, Item 8, Note 15 to our Consolidated Financial Statements for financial information relating to our operations by geographic areas.
On February 16, 2021, we announced our plan to restructure our former Plant Nutrition South America segment to enable targeted and separate sales processes for each portion of the former segment, including our chemicals and specialty plant nutrition businesses along with our equity method investment in Fermavi Eletroquímica Ltda. (“Fermavi”). Concurrently, to optimize our asset base in North America, we evaluated the strategic fit of our North America micronutrient product business. On March 16, 2021, our Board of Directors approved a plan to sell our South America chemicals and specialty plant nutrition businesses, our investment in Fermavi and our North America micronutrient product business (collectively, the “Specialty Businesses”) with the goal of reducing our leverage and enabling increased focus on optimizing our core businesses and as described further in
Part II, Item 8, Note 1 and
Note 4 to our Consolidated Financial Statements, the South America specialty plant nutrition business sale closed on July 1, 2021, the North America micronutrient sale closed on May 4, 2021, the sale of our Fermavi investment closed on August 20, 2021 and the sale of our South America chemicals business closed on April 20, 2022. We believe these dispositions were conducted through a single disposal plan representing a strategic shift that had a
|
|
|
|
|
|
|
|
|
|
|
COMPASS MINERALS INTERNATIONAL, INC. |
material effect on our operations and financial results. Consequently, the Specialty Businesses qualified for presentation as discontinued operations in accordance with U.S. generally accepted accounting principles (“GAAP”). Accordingly, the Specialty Businesses’ results of operations are presented as discontinued operations in the Consolidated Statements of Operations for the periods presented. As a result, we are presenting two reportable segments in continuing operations, Salt and Plant Nutrition (which was previously known as the Plant Nutrition North America segment) in this Form 10-K. See
Part II, Item 8, Note 15 to our Consolidated Financial Statements for more information.
Change in Fiscal Year
On June 23, 2021, our Board of Directors approved a change in our fiscal year from December 31 to September 30, effective January 1, 2021. Our results of operations, cash flows, and all transactions impacting shareholders’ equity presented in this Annual Report on Form 10-K are for the twelve months ended September 30, 2023 (“fiscal 2023”), the twelve months ended September 30, 2022 (“fiscal 2022”) and the nine month transition period ended September 30, 2021 (“fiscal 2021”), unless otherwise noted. As such, our fiscal year 2023, or fiscal 2023, refers to the period from October 1, 2022 to September 30, 2023. This Annual Report on Form 10-K also includes an unaudited consolidated statement of operations for the comparable twelve month period of October 1, 2020 to September 30, 2021; see
Part II, Item 8, Note 21 to our Consolidated Financial Statements for additional information.
SALT SEGMENT
Overview
Salt is indispensable and enormously versatile with thousands of reported uses. In addition, there are no known cost-effective alternatives for most high-volume uses. Through the use of effective mining techniques and efficient production processes, we leverage our high-grade salt deposits, which are among the most extensive in the world. Further, many of our Salt segment assets are in locations that are logistically favorable to our core markets. Our strategy for this segment is to focus on driving profitability from every ton we produce through cost efficiency as well as commercial and operational execution.
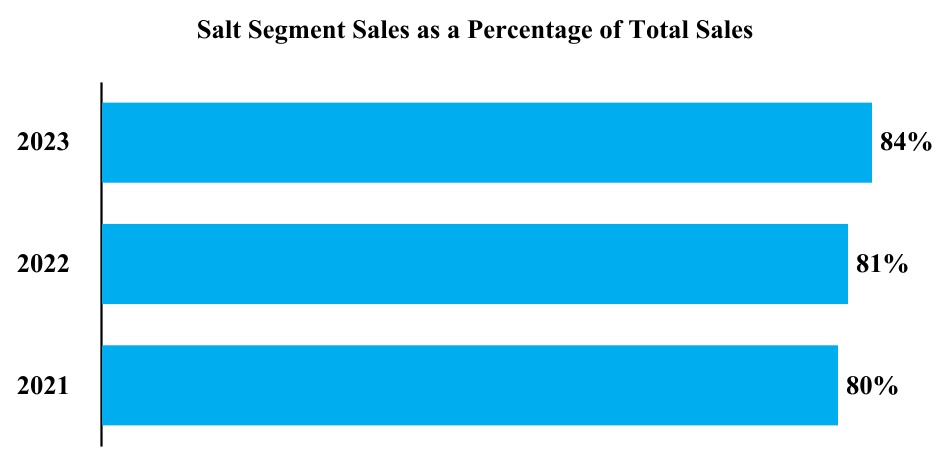
Through our Salt segment, we produce, market and sell salt (sodium chloride) and magnesium chloride in North America and sodium chloride in the U.K. Our Salt products include rock salt, mechanically-evaporated salt, solar-evaporated salt, brine magnesium chloride and flake magnesium chloride. We also purchase potassium chloride (“KCl”) and calcium chloride to sell as finished products or to blend with sodium chloride to produce specialty products. Sodium chloride represents the vast majority of the products we produce, market and sell. In fiscal 2023, the Salt segment accounted for approximately 84% of our sales (see
Part II, Item 8, Note 15 to our Consolidated Financial Statements for segment financial information).
Salt segment sales as a percentage of total sales from continuing operations for the fiscal years ended September 30, 2023 and 2022, and the nine months ended September 30, 2021 are as follows:
Our Salt segment products are used in a wide variety of applications, including as a deicer for roadways, consumer and professional use, as an ingredient in chemical production, for water treatment, human and animal nutrition and for a variety of other consumer and industrial uses.
Historical demand for salt has remained relatively stable during periods of rising prices and through a variety of economic cycles due to its relatively low cost and diverse number of end uses. As a result, our cash flows from our Salt segment are not materially impacted by economic cycles. However, demand for deicing salt products is primarily affected by the number and intensity of snow events and temperatures in our service territories.
|
|
|
|
|
|
|
|
|
|
|
COMPASS MINERALS INTERNATIONAL, INC. |
Salt Industry Overview
In our primary markets, we estimate that the consumption of highway deicing rock salt in North America, including rock salt used in chemical manufacturing processes, is approximately 39 million tons per year, assuming average winter weather conditions, while the consumer and industrial market is approximately 10 million tons per year. In the U.K., we estimate that the consumption of highway deicing salt is approximately 2 million tons per year, assuming average winter weather conditions. We also estimate that salt consumption in the U.S. has increased at a long-term historical average rate of flat to approximately 1% per year, although there have been recent fluctuations above and below this average driven primarily by winter weather variability.
Salt prices vary according to purity, end use and variations in refining and packaging processes. Management estimates that salt prices in the U.S. have increased at a long-term historical average rate of approximately 3% to 4% per year, although there have been recent fluctuations above and below this average. Due to salt’s relatively low production cost, transportation and handling costs tend to be a significant component of the total delivered cost, which makes logistics management and customer service key competitive factors in the industry. The high relative cost associated with transportation of salt tends to favor producers located nearest to customers.
Products and Sales
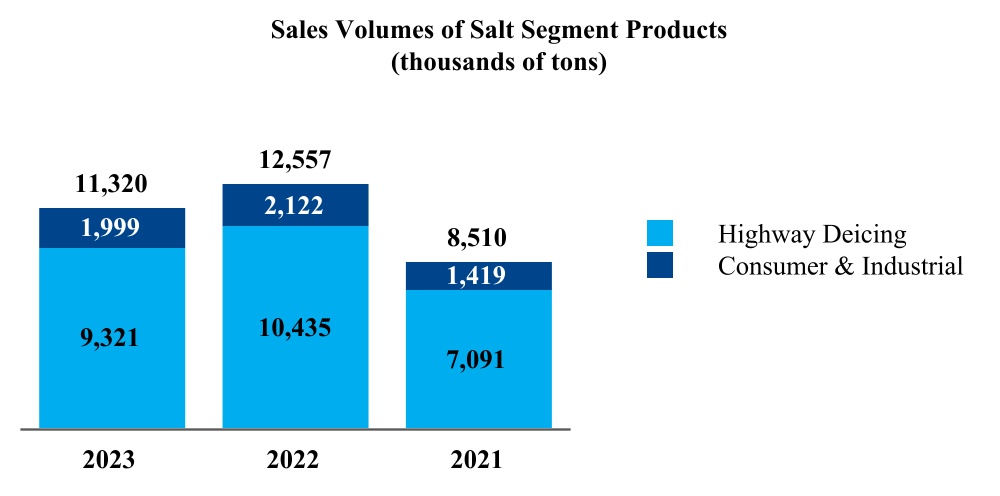
We sell our Salt segment products through our highway deicing product line (which includes brine magnesium chloride as well as rock salt treated with this mineral) and our consumer and industrial product line (which includes salt as well as products containing magnesium chloride and calcium chloride in both pure form and blended with salt).
Highway deicing, including salt sold to chemical customers, constituted 63% of our fiscal 2023 Salt segment sales. Our principal customers are states, provinces, counties, municipalities and road maintenance contractors that purchase bulk deicing salt, both treated and untreated, for ice control on public roadways. Highway deicing salt in North America is sold primarily through an annual tendered bid contract process with governmental entities, as well as through multi-year contracts, with price, product quality and delivery capabilities as the primary competitive market factors. Some sales also occur through negotiated sales contracts with customers, particularly in the U.K. Since transportation costs are a relatively large portion of the delivered cost of our products to customers, locations of salt sources and distribution networks also play a significant role in the ability of suppliers to cost-effectively serve customers. We have an extensive network of approximately 80 depots for storage and distribution of highway deicing salt in North America. The majority of these depots are located on the Great Lakes and the Mississippi River and Ohio River systems. Deicing salt product from our Ogden facility supplies customers in the Western and upper Midwest regions of the U.S. Treated rock salt, which is typically rock salt with magnesium chloride brine and organic materials that enhance the salt’s performance, is sold throughout our markets.
We believe our production capability at our Winsford mine and favorable logistics position enhance our ability to meet the U.K.’s winter demands. Due to our strong position, we are viewed as a key supplier by the U.K.’s Highways Agency. In the U.K., approximately 75% of our highway deicing customers have multi-year contracts.
Winter weather variability is the most significant factor affecting salt sales for deicing applications because mild winters reduce the need for salt used in ice and snow control. On average, over the last three years, approximately two-thirds of our deicing product sales occurred during the North American and European winter months of November through March. The vast majority of our North American deicing sales are made in Canada and the Midwestern U.S. where inclement weather during the winter months causes dangerous road conditions. In keeping with industry practice, we stockpile salt to meet estimated requirements for the next winter season. See “Management’s Discussion and Analysis of Financial Condition and Results of Operations—Seasonality” for more information on the seasonality of our Salt segment results.
Our principal chemical customers are producers of intermediate chemical products used in the production of vinyls and other chemicals, pulp and paper, as well as water treatment and a variety of other industrial uses. We typically have multi-year supply agreements with these customers. Price, service, product quality and security of supply are the major competitive market factors.
Sales of our consumer and industrial products accounted for 37% of our fiscal 2023 Salt segment sales. We are the third largest producer of consumer and industrial salt products in North America. These products include commercial and consumer applications, such as water conditioning, consumer and professional ice control, food processing, agricultural applications, table salt and a variety of industrial applications. We estimate we are among the largest private-label producers of water conditioning salt in North America and of table salt in Canada. Our Sifto brand encompasses a full line of salt products, which are well recognized in Canada.
Our consumer and industrial business has broad product lines with both private-label and Company brands. Our consumer and industrial product line is distributed through many channels, including retail, agricultural, industrial, janitorial and sanitation, and resellers. These consumer and industrial products are channeled from our plants and third-party warehouses to our customers using a combination of direct sales personnel, contract personnel and a network of brokers or manufacturers’ representatives.
|
|
|
|
|
|
|
|
|
|
|
COMPASS MINERALS INTERNATIONAL, INC. |
The chart below shows our annual sales volumes of Salt segment products for the fiscal years ended September 30, 2023 and 2022, and the nine months ended September 30, 2021:
Competition
We face strong competition in each of the markets in which we operate. In North America, other large, nationally and internationally recognized companies compete with our Salt segment products. In addition, there are also several smaller regional producers of salt. There are several importers of salt into North America, which mostly impact the East Coast and West Coast of the U.S. where we have minimal market presence. Two competitors serve the highway deicing salt market in the U.K., one in Northern England and one in Northern Ireland. Typically, there are not significant imports of highway deicing salt into the U.K.
Salt is a commodity, which limits the potential for product differentiation and increases competition. Additionally, low barriers to entry in the consumer and industrial markets increase competition. Our advantageous geographical locations, superior assets and distribution network strengthen our competitive position.
PLANT NUTRITION SEGMENT
Industry Overview
Fertilizers are critical for efficient crop production using the limited arable land resources available around the world. The nutrients needed to ensure plant health can be divided into three categories:
•macro nutrients - the traditional NPK fertilizers (nitrogen (N), phosphorus (P) and potassium (K));
•secondary nutrients - calcium, magnesium and sulfur; and
•specialty plant nutrients - trace elements of iron, manganese, copper, boron, zinc, molybdenum, chlorine and nickel.
Factors influencing the plant nutrition market include world grain and food supply, currency fluctuations, weather and climate change, grower incomes, changes in consumer diets, general levels of economic activity, government food programs, governmental agriculture and energy policies in the U.S. and around the world, and the amount or type of crop grown in certain locations, or the type or amount of fertilizer product used. In addition, our Plant Nutrition segment results can be impacted by seasonality (see “Management’s Discussion and Analysis of Financial Condition and Results of Operations—Seasonality” for more information).
Our Plant Nutrition segment currently generates nearly all of its sales and earnings through the production and sale of SOP. There are two major forms of potassium-based fertilizer, SOP, a specialty form of potassium which also provides plant-ready sulfur, and muriate of potash (“MOP” or “KCl”). Based on data from Green Markets® A Bloomberg Company, management estimates the average annual worldwide consumption of all potash fertilizers is approximately 88 million tons, with MOP accounting for approximately 88% of all potash used in fertilizer production. SOP represents approximately 9% of all potash production. The remainder of potash is supplied in forms containing varying concentrations of potassium (expressed as potassium oxide) along with different combinations of co-nutrients. SOP, which contains the equivalent of approximately 50% potassium oxide, maintains a price premium over MOP due to the fact that it contains the secondary nutrient, sulfur, does not contain chlorides and is more expensive to produce than MOP. Additionally, many high-value or chloride-sensitive crops experience improved yields and quality when SOP is applied instead of MOP. SOP is also a more cost-effective alternative to other forms of specialty potash.
|
|
|
|
|
|
|
|
|
|
|
COMPASS MINERALS INTERNATIONAL, INC. |
Our SOP sales are primarily concentrated in the Western and Southeastern U.S. where the crops and soil conditions favor the use of low-chloride potassium nutrients. Consequently, weather patterns and field conditions in these locations can impact Plant Nutrition sales volumes.
While long-term global consumption of potash has increased in response to growing populations and the need for additional food supplies, the market for commodity potash has been challenged in recent years due to downturns in the broader crop market which pressure grower incomes. However, recently improved economics for row crops has led to an improved commodity potash market. Additionally, demand for our SOP products has been resilient despite the challenges facing the global potash market.
We expect the long-term demand for potassium nutrients to continue to grow as arable land per capita decreases, thereby encouraging improved crop yield efficiencies. We expect our future growth to stem from the conversion of certain commodity potassium applications into higher yield SOP applications.
Approximately 91% of our Plant Nutrition segment sales in fiscal 2023 were made to U.S. customers, who include retail fertilizer dealers and distributors of agricultural products as well as professional turf care customers. In some cases, these dealers and distributors combine or blend our Plant Nutrition segment products with other fertilizers and minerals to produce fertilizer blends tailored to individual requirements.
Products and Sales
We currently generate nearly all of our sales and earnings in our Plant Nutrition segment through the production and sale of SOP. Our SOP is sold in various grades under our Protassium+ brand. Our Protassium+ product line consists of different grades sized for use in broadcast spreaders, direct application and liquid fertilizer solutions. Our turf product line consists of grades sized for use by the turf and ornamental markets and for blends used on golf course greens. We also provide an organic product line with grades sized for a wide range of applications.
Our Protassium+ product line is generally sold to crop input distributors and dealers who may blend our products with other fertilizer products to sell to farmers and growers, or it may be sold as the final product. Our commercial efforts focus on educating and selling the agronomic benefits of SOP as a source of potassium nutrients.
Competition
SOP is marketed globally, with approximately 55% of the world’s 10 million tons of estimated capacity located in China. Management estimates global SOP capacity to be as follows:
Source: Green Markets ® A Bloomberg Company
We are the leading SOP producer and marketer in North America and we also market SOP products internationally, depending on market conditions. Our major competition for SOP sales in North America includes imports from the European Union. Fluctuations in the values of foreign currencies in relation to the U.S. dollar coupled with Baltic freight rates impact the level of international competition we face. As the only SOP producer with production facilities in North America, and as a result of our logistically favorable production site near Ogden, Utah, we estimate that our share of the North American market is sizable. In addition to imported SOP, there is functional competition between SOP and other forms of potassium crop nutrients, such as MOP. The specialty plant nutrient market is highly fragmented. Commodity and specialty crops require specialty plant nutrients in varying degrees depending on the crop and soil conditions.
|
|
|
|
|
|
|
|
|
|
|
COMPASS MINERALS INTERNATIONAL, INC. |
OTHER BUSINESSES
Fire retardants are a critical tool for helping slow, stop and prevent wildfires by altering fuels (e.g., vegetation) to make them less flammable. Aerial fire retardant is typically applied ahead of an active wildland fire to stop or slow its spread, in order to allow ground-crew to safely build a fire line. Retardants can be applied aerially via fixed or rotor wing aircraft. Ground applied retardants are used to annually pretreat fire-prone areas such as utility and transportation rights-of-way in order to reduce their potential for ignition. These retardants are applied by ground-crews using standard fire engines or dedicated ground-applied retardant units.
Fortress is our recently acquired fire retardant company dedicated to developing and producing a portfolio of environmentally friendly next-generation aerial and ground-applied fire retardant products to help prevent and combat wildfires. Fortress’ approved long-term aerial and ground-applied fire retardant formulations have been developed using magnesium chloride supplied from our Ogden facility. We plan to further expand our suite of retardants, which provide unique properties for fighting wildfires and abating fire risk.
Our fire retardant business currently has one primary customer, the USFS, and we supply them with USFS-qualified fire retardant. Fortress has the only alternative to fertilizer-based fire retardants and is the first entrant to the fire retardant industry in over 20 years to have aerial products added to the USFS Qualified Product List. The USFS testing is a standard that many municipalities, states and countries have adopted for ensuring fire retardant is effective, safe and environmentally friendly. There is currently one other supplier of aerial fire retardants in the markets we have entered as the barriers to enter the fire retardant industry are high. As of the date of this report, we have generated all of our fire retardant revenue in the U.S. and it is not material in comparison to our Salt and Plant Nutrition segments.
DeepStore is our records management business in the U.K. that utilizes portions of previously excavated space in our salt mine in Winsford, Cheshire, for secure underground document and archive storage and one warehouse location in London, England. Currently, DeepStore does not have a significant share of the document storage market in the U.K., and it is not material in comparison to our Salt and Plant Nutrition segments.
OTHER INVESTMENTS
Lithium
Our Ogden facility produces three mineral salts, specifically SOP, sodium chloride and magnesium chloride products from the high mineral concentrations within the ambient lake brine in the Great Salt Lake. In 2021, we identified a lithium salt resource at our Ogden site and began a strategic evaluation to assess development options to service growing U.S. domestic lithium demand. As previously announced, we have suspended indefinitely any further investment in the lithium project in Utah beyond certain already committed items associated with the early stages of construction of our commercial scale demonstration unit until further clarity is provided on the evolving regulatory climate. We are considering seeking partners at the project level with an aim of reducing our share of capital costs and lowering execution risk in the event that the project is restarted.
We believe our lithium salt resource in the Great Salt Lake’s north arm is among the most attractive undeveloped North American lithium salt assets. Our current operations at Ogden include a 55,000 acre developed pond system and leases totaling over 170,000 acres. If we were to recommence investment in the lithium project, we also believe we will be able to benefit from several synergies related to our existing operations at Ogden, including infrastructure, logistics and pond operations that we will utilize for our lithium salt resource. By leveraging existing operational infrastructure, permits, water rights and pond processes to extract lithium salt as a co-product of our long-standing SOP, sodium chloride and magnesium chloride production at our Ogden facility, the incremental environmental footprint of the project is also reduced. For more information about our lithium salt resource and Ogden facility, see
Item 2, “Properties—Ogden Facility.”
Prior to suspension of the project, for phase one of our lithium development project, we planned to build a battery-grade lithium carbonate facility with an annual capacity of approximately 11,000 metric tons. The facility was to be located on the east side of the Great Salt Lake where a significant portion of our existing infrastructure is located. If we decide to continue investment in the lithium project at some point in the future, the front-end loaded (“FEL-1”) or Preliminary Economic Assessment (“PEA”) capital development cost of phase one is now expected to be above the previously disclosed upper range estimate of approximately $364 million. We expect to complete updated estimates of what costs and the net present value would be if we were to decide to continue investment in the lithium project. As of September 30, 2023, our cumulative capital costs related to the lithium project totaled $51.2 million. The recently proposed rulemaking implementing Utah House Bill 513 (now codified as amended Utah Code §65A-6-4) introduces new obstacles to lithium salt production on the Great Salt Lake that have slowed progress and will require resolution prior to proceeding further with the lithium project. We no longer expect to be able to maintain the original development schedule of entering the market with a cost-competitive, battery-grade lithium product by 2025.
|
|
|
|
|
|
|
|
|
|
|
COMPASS MINERALS INTERNATIONAL, INC. |
INTELLECTUAL PROPERTY
To protect our intellectual property, we rely on a combination of patents, trademarks, copyrights, trade secret protection, employee and third-party non-disclosure agreements, license arrangements and domain name registrations. These protections are important to our business and we believe that our success is at least partly dependent on the acquisition and maintenance of these rights. However, we rely primarily on the innovative skills, technical competence, operational knowledge and marketing abilities required by our business in order to succeed.
We sell many of our products under a number of registered trademarks that we believe are widely recognized in the industry. Our trademarks registered pursuant to applicable intellectual property laws include COMPASS MINERALS, AMERICAN STOCKMAN, CANADIAN STOCKMAN, DUSTGARD, FREEZGARD, ICEAWAY, PROSOFT, SAFE STEP, SAFE STEP PRO, SIFTO, SURESOFT, SURE PAWS and PROTASSIUM+ and FORTRESS FIRE RETARDANT SYSTEMS.
Any issued patents, trademarks or copyrights on our proprietary technology may not provide us with substantial protection or be commercially beneficial to us. The issuance of a patent is not conclusive as to its validity or its enforceability. Competitors may challenge our patent rights. If our patents are held invalid or unenforceable, our competitors could commercialize our patented technology.
With respect to proprietary know-how, we rely on trade secret protection and confidentiality agreements. Monitoring the unauthorized use of our technology is difficult, and we may not be able to prevent unauthorized use of our technology. The disclosure or misappropriation of our intellectual property could harm our ability to protect our rights and our competitive position (see “Risk Factors—Our intellectual property may be misappropriated or subject to claims of infringement” for more information).
HUMAN CAPITAL MANAGEMENT
As of September 30, 2023, we employed 1,981 employees, of which 1,014 were located in the U.S., 777 were located in Canada and 190 were located in the U.K. Nearly 50% of our workforce is represented by collective bargaining agreements. Of our 12 collective bargaining agreements in effect on September 30, 2023, one will expire in fiscal 2024, six will expire in fiscal 2025 (including our Cote Blanche mine), four will expire in fiscal 2026 (including our Goderich mine), and one will expire in fiscal 2027.
We believe that our workforce drives the success of our Company and is paramount to creating long-term value. We strive to put our employees first and foster an environment in which their safety, well-being, career progression and sense of belonging are prioritized. By investing in our workforce and culture, we are helping to ensure a strong, sustainable future for our Company.
To help ensure continued focus on our workforce and culture, as well as measure our progress in these areas, we announced in fiscal 2022 a set of fiscal 2025 environmental, social and governance goals and targets, including in the categories of safety, employee development, and diversity and inclusion.
Environmental, Health and Safety
At Compass Minerals, we prioritize a safe and healthy work environment for all our employees. We are focused on the ultimate goal of zero harm, which includes zero injuries to our employees and contractors, and zero environmental incidents. This goal requires the collaboration and participation of all employees, at every site. We measure zero harm by how we are decreasing our total recordable injury rate (“TRIR”) and improving our environmental compliance-based metrics. For the fiscal year ended September 30, 2023, our TRIR is 1.17. Our reporting standard, TRIR, is a stringent incident reporting standard based upon the U.S. Department of Labor’s Mine Safety and Health Administration regulations. The standard includes all medical treatment, lost time and restricted-duty injuries based upon 200,000 exposure hours. TRIR replaced our previous reporting standard, total case injury rate, in fiscal 2023. TRIR allows for increased reporting consistency across the platform and provides greater clarity of operational safety performance and capabilities.
A key driver of this trajectory has been the implementation of the SafeStart® methodology across our organization. Tools introduced through SafeStart training addressed unintentional human error and critical safety habits, which reduce risk and the probability of injury. Additionally, we approach health and safety through the lens of continuous improvement and utilize an environmental, health and safety framework that includes policies, procedures, training and Company standards that go beyond compliance. Each of our operational sites has a safety committee, which includes employees and management, and when applicable, union representation. In addition, our sites form focus groups to engage team members and establish best practices for specific health and safety issues. To keep health and safety top of mind, we also encourage our employees to begin internal meetings with a “safety share,” a safety reminder or a lesson learned.
|
|
|
|
|
|
|
|
|
|
|
COMPASS MINERALS INTERNATIONAL, INC. |
Organizational Health
In fiscal 2023, our journey to improve organizational health continued to involve ensuring that our workforce is engaged, supported and equipped to support the needs of our customers and communities.
Diversity, Belonging, Inclusion and Equity
At Compass Minerals, we believe that everyone has a voice and every voice matters. We hire, promote and retain people with different backgrounds and experiences, which strengthens our culture and brings a wider range of perspectives to help solve critical issues. Our diversity, belonging, inclusion and equity (“DBIE”) strategy focuses on raising awareness and educating employees, engaging employees in initiatives to create a sense of belonging, and finally, having a positive impact on our organization and in our communities by partnering with external groups working to improve DBIE.
In fiscal 2023, we added a new employee resource group (“ERG”), Black Employees and Allies to bring our employee resource groups to a total of six to include Emerging Leaders, Compass Pride for LGBTQ+ employees and allies, Women and Allies, Advanced Career for seasoned employees and allies and Asian Employees and Allies. In addition, we continue to focus on strategies to diversify our talent pipeline and to ensure our internal processes are inclusive.
Employee Development
In fiscal 2023, we continued utilizing Compass Minerals University (“CMU”), an online platform for employee training and development. CMU provides our employees with on‑demand access to more than 500 learning modules on topics ranging from project management to strategic thinking to emotional intelligence. Professional certifications in areas like Six Sigma, information technology and business analysis are also available to employees at no cost. Content is presented in a variety of formats from videos and readings to downloadable templates and work aids for managers to use in team meetings or with direct reports. In addition, there are live virtual trainings and bootcamps our employees can attend.
We also has other forms of development opportunities for employees, such as trainings on performance mindset, team effectiveness and communication styles, and programs available through our ERGs such as an employee book club. Several options are available to employees who are looking to increase their knowledge and grow professionally.
Additionally, employees have opportunities for professional development through strategic partnerships with several outside organizations such as Washington University Olin Business School, Central Exchange, Society of Women Engineers, and American Royal, as well as through membership in trade groups including The Fertilizer Institute, Essential Minerals Association, U.K. Salt Association and Ontario Mining Association.
Community
Beyond the success of our Company and our people, we are committed to supporting and creating value for communities where our employees live and work. We recognize that in many areas, we play an integral role in providing jobs and fostering local economic growth. On a larger scale, through our products, we support safety, sustainability and addressing food insecurity in communities around the world.
Focused on Company giving and employee volunteerism to positively impact our communities, Compass Minerals Cares, our community engagement program, looks to the United Nations Sustainable Development Goals to guide community engagement initiatives. We also align charitable giving and volunteer engagement with our Core Purpose to help keep people safe, feed the world and enrich lives, every day.
ENVIRONMENTAL, HEALTH AND SAFETY AND OTHER REGULATORY MATTERS
Environmental, Health and Safety Matters
Our operations subject us to an evolving set of federal, state, local and foreign environmental, health and safety (“EHS”) laws and regulations. These EHS laws and regulations regulate, or propose to regulate, the conduct of our mining and production operations, including safety procedures and process safety management; management and handling of raw and in-process materials and finished products; air and water quality impacts from our facilities; emissions of greenhouse gases (including carbon or emissions taxes); management of hazardous and solid wastes; remediation of contamination at our facilities; and post-mining land reclamation. Additional legislative and regulatory measures to address climate change and greenhouse gas emissions (including carbon or emissions taxes) are in various phases of consideration and enactment. For further discussion of how EHS laws and regulations may impact our business, see Item 1A, “Risk Factors.”
While a number of our capital projects indirectly result in environmental improvements, we estimate that our fiscal 2023 environmental-specific capital expenditures were $1.8 million. We expect to have approximately $5.9 million of environmental capital expenditures in fiscal 2024 on a variety of projects. However, future capital expenditures are subject to a number of uncertainties, including changes to environmental laws and regulations, changes to our operations or unforeseen remediation requirements, and these expenditures could exceed our expectations.
As of September 30, 2023, we had recorded $1.8 million of accruals for environmental liabilities. We accrue for environmental liabilities when we believe it is probable that we will be responsible, in whole or in part, for environmental
|
|
|
|
|
|
|
|
|
|
|
COMPASS MINERALS INTERNATIONAL, INC. |
investigation or remediation activities and the expenditures for these activities are reasonably estimable. However, the extent and costs of any environmental investigation or remediation activities are uncertain and difficult to estimate and could exceed our expectations, which could materially affect our financial condition and operating results.
Operating Requirements and Impacts
Our operations require permits for extraction of salts and brine, air emissions, surface water discharges of process material and wastes, waste generation, injection of brine and wastewater in to subsurface wells and other activities. As a result, we hold numerous environmental and mineral extraction permits, water rights and other permits, licenses and approvals from governmental authorities authorizing operations at each of our facilities. These permits, licenses and approvals are typically subject to renewals and reissuances. Expansion of our operations or production capacity, or preservation of existing rights in some cases, is also predicated upon securing any necessary permits, licenses and approvals. The terms and conditions of future EHS laws and regulations, permits, licenses and approvals may be more stringent and may require increased expenditures on our part. In addition, although we do not engage in hydraulic fracturing (commonly known as “fracking”), laws and regulations targeting fracking could lead to increased permit requirements and compliance costs for non-fracking operations, including our Salt operations, which require permitted wastewater disposal wells that sometimes receive fluid waste from fracking operations as well.
Our Cote Blanche mine, an underground salt mine located in St. Mary Parish, Louisiana, is subject to regulation by the Mine Safety and Health Administration (“MSHA”) under the Federal Mine Safety and Health Act of 1977, as amended (the “Mine Act”). MSHA is required to regularly inspect the Cote Blanche mine and issue a citation, or take other enforcement action, if an inspector or authorized representative believes that a violation of the Mine Act or MSHA’s standards or regulations has occurred. As required by MSHA, these operations are regularly inspected by MSHA personnel. See “Mine Safety Disclosures” and
Exhibit 95 to this report for information concerning mine safety violations and other regulatory matters required by SEC rules. The cost of compliance and penalties for violations of the Mine Act have been and could potentially be significant. Our underground salt mines located in Goderich, Ontario, Canada and Winsford, Cheshire, U.K. are subject to similar regulations regarding health and safety, and the cost of compliance with these regulations also have been and are expected to be significant.
We have post-closure reclamation obligations, primarily arising under our mining permits or by agreement. Many of these obligations include requirements to maintain financial surety bonds to fund reclamation and site cleanup following the ultimate closure of our mines or certain other facilities. As a result, we maintain financial surety bonds to satisfy these obligations.
We are also impacted by the U.S. Clean Air Act (the “Clean Air Act”) and other EHS laws and regulations that regulate air emissions. These regulatory programs may require us to make capital expenditures (for example, by installing expensive emissions abatement equipment), modify our operational practices, obtain additional permits or make other expenditures, which could be significant.
We endeavor to conduct our operations in compliance with all applicable EHS laws, regulations, permits or approvals. However, because of extensive and comprehensive regulatory requirements, violations occur from time to time in our industry, and from time to time we have received notices from governmental agencies that we are not in compliance with certain EHS laws, regulations, permits or approvals and have incurred fines or penalties for these violations. Upon receipt of these notices, we evaluate the matter and take appropriate corrective actions.
Remedial Activities
Many of our past and present facilities have been in operation for decades. Operations at these facilities have historically involved the use and handling of regulated chemical substances, salt, salt byproducts and waste by us and our predecessors.
At many of these facilities, releases and disposal of regulated substances have occurred and could occur in the future, which could require us to investigate, undertake or pay for remediation activities under the U.S. Comprehensive Environmental Response, Compensation and Liability Act (“CERCLA”) and other similar EHS laws and regulations. These laws and regulations may impose “no fault” liability on past and present owners and operators of facilities associated with the release or disposal of hazardous substances, regardless of fault or the legality of the original actions. Additionally, one past or present owner or operator may be required to bear more than its proportional share of liability if payments cannot be obtained from other responsible parties.
In addition, third parties have alleged in the past and could allege in the future that our operations have resulted in contamination to neighboring off-site areas or third-party facilities, including third-party disposal facilities for regulated substances generated by our operations, which could result in liability for us under CERCLA or other EHS laws and regulations.
We have incurred and expect to continue to incur costs and liabilities as a result of our current and former operations and our predecessor’s operations. In the past, we have agreed to undertake or pay for investigations to determine whether remediation will be required under CERCLA or otherwise to address any contamination. In other instances, we have agreed to perform remediation activities or have undertaken voluntary remediation to address identified contamination.
|
|
|
|
|
|
|
|
|
|
|
COMPASS MINERALS INTERNATIONAL, INC. |
Other Regulatory Matters
As a global company, we are subject to complex and evolving laws and regulations. The most significant government regulations that impact our business, in addition to EHS laws and regulations, operating requirements and remedial activities, are discussed below. For further discussion of how government regulations may impact our business, see Item 1A, “Risk Factors.”
Taxes and Tariffs - We are subject to complex requirements of federal, state, local and foreign laws and regulations related to taxation, tariffs and import duties. See
Part II, Item 8, Note 11 of our Consolidated Financial Statements for more information on taxes.
Import and Export Requirements, Anti-Corruption Laws and Related Matters - We manufacture, market and sell our products both inside and outside the U.S. and ship our products across international borders. As a result, we are required to comply with a number of U.S. and international regulations, which include fair competition (antitrust) laws, import and export requirements, customs laws and anti-corruption laws, such as the U.S. Foreign Corrupt Practices Act (the “FCPA”), the U.K. Bribery Act and the Canadian Corruption of Foreign Public Officials Act, which generally prohibit the making or offering of improper payments to foreign government officials and political figures for the purpose of obtaining or retaining business or to gain an unfair business advantage.
Employment and Labor Relations - We are also subject to numerous federal, state, local and foreign laws and regulations governing our relationships with our employees, including those relating to wages, overtime, labor matters, working conditions, hiring and firing, non-discrimination, immigration, work permits and employee benefits.
Impacts of Regulatory Matters
Costs of compliance with laws and regulations, including management effort, time and resources, have been and are expected to continue to be significant. These costs include the capital projects related to environmental improvements discussed above. New or proposed regulatory programs (including EHS regulatory programs), as well as future interpretations and enforcement of existing laws and regulations, may impact our business significantly, our ability to serve customers, preclude us from conducting business with governmental entities, require modification to our facilities, lead to substantial increases in operating costs, penalties, injunctions, civil remedies or fines or cause interruptions, modifications or a termination of operations, the extent to which we cannot predict. Anticipating future compliance obligations, implementing compliance plans and estimating future costs can be particularly challenging while laws and regulations are under development and have not been adopted. For further discussion, see
Item 1A, “Risk Factors.”
|
|
|
|
|
|
|
|
|
|
|
COMPASS MINERALS INTERNATIONAL, INC. |
ITEM 1A. RISK FACTORS
We are subject to a number of risks which could have a material adverse effect on our business, financial condition, results of operations and the value of our securities. You should carefully consider the following risks and all of the information set forth in this report. The risks described below are not the only ones facing our company. Additional risks and uncertainties not currently known to us or that we currently deem to be immaterial may also materially and adversely affect our business, financial condition or results of operations.
Operational Risks
Our mining and industrial operations can involve high-risk activities.
Our operations can involve or be subject to significant risks and hazards, including environmental hazards, industrial accidents and natural disasters. Our underground salt mining operations and related processing activities have in the past, and may in the future be subject to hazards such as industrial and mining accidents, fire, natural disasters, explosions, unusual or unexpected geological formations or movements, water intrusion and flooding. For example, MSHA considers our Cote Blanche mine to be a “gaseous mine” and, as a result, is subject to a heightened risk of explosion and fire. These potential risks include damage or impacts from pipeline and storage tank leaks and ruptures; explosions and fires; mechanical failures; earthquakes, tornadoes, hurricanes, flooding and other natural disasters; and chemical spills and other discharges or releases of toxic or hazardous substances or gases at our sites or during transportation.
These hazardous activities pose significant management challenges and could result in loss of life, a mine shutdown, damage to or destruction of our properties and surrounding properties, production facilities or equipment, production delays or business interruption. Our insurance coverage may be insufficient to cover all losses or claims associated with our operations, including these operational risks.
Operations at our Ogden, Utah, facility are dependent on ambient brine from the Great Salt Lake, and changes in lake brine levels or any limitations on our continued ability to access ambient lake brine in the Great Salt Lake could adversely affect us.
Our Ogden facility produces three mineral salts - specifically, SOP, sodium chloride and magnesium chloride products - from the high mineral concentrations within the ambient lake brine in the Great Salt Lake. In addition, we have been pursuing the development of our identified lithium salt resource at our Ogden facility at the Great Salt Lake. Our ability to produce SOP, sodium chloride and magnesium chloride, as well as any future production of lithium salt, at our Ogden facility, is dependent upon, among other matters, sufficient lake elevations in the Great Salt Lake and our continued ability to maintain, renew or acquire the permits, licenses and approvals required to access ambient lake brine in the Great Salt Lake.
In recent years, sustained drought (as a result of climate change or otherwise) has contributed to lower lake levels and increased mineral concentrations in the Great Salt Lake. If this continues, lower lake levels could impact mineral composition and our mineral harvesting process, amount and timing. Lake level fluctuations and other factors, including state or federal actions to manage the salinity of the Great Salt Lake, could alter north arm lake levels and may disrupt our evaporation production cycle, impact our access to ambient lake brine in the Great Salt Lake or increase our related capital expenditures and production costs.
We have indefinitely suspended our lithium development project until we have further clarity on the evolving regulatory climate in the State of Utah. If the final rule relating to Great Salt Lake Elements and Minerals creates significant obstacles toward the responsible development of lithium salts from the Great Salt Lake, we may not continue further investment in our lithium development project, which could impact our ability to further develop our lithium project and adversely impact the value of our securities.
The proposed rulemaking for mineral extraction on the Great Salt Lake implementing Utah House Bill 513 (now codified as amended Utah Code §65A-6-4), may adversely impact mineral extraction on the Great Salt Lake, including our planned lithium development, as well as existing SOP, sodium chloride and magnesium chloride production. We have evaluated the proposed rule and have been actively engaged with the State of Utah in a collaborative attempt to minimize any adverse impact of the rulemaking on our lithium project. The proposed rule introduces new obstacles to lithium salt production on the Great Salt Lake that have slowed progress and will require resolution prior to proceeding further with our lithium project. As a result, we have suspended indefinitely any further investment in our lithium project beyond certain already committed items associated with the early stages of construction of our commercial scale demonstration unit and are considering seeking partners at the project level with an aim of reducing our share of capital costs and lowering execution risk in the event that the project is restarted. Any continued investment or such partnership would be conditioned on the achievement of an acceptable and predictable regulatory framework in Utah governing the production of lithium on the Great Salt Lake. We cannot make any assurance that we will
|
|
|
|
|
|
|
|
|
|
|
COMPASS MINERALS INTERNATIONAL, INC. |
continue investments in our lithium project or whether we will enter into any partnership, and if so, on what terms. If we are not able to further develop our lithium project, our ability to implement our growth strategy and the value of our securities may be adversely impacted. To date, we have capitalized approximately $51.2 million of lithium development, construction and equipment costs on our Consolidated Balance Sheets which may become impaired if we determine not to pursue the lithium development or they are not recoverable.
Geological conditions could lead to a mine shutdown, increased costs, production delays and product quality issues, which could adversely affect results of our operations.
Our salt mining operations involve complex processes, which are affected by the mineralogy of the mineral deposits and structural geologic conditions and are subject to related risks. For example, unexpected geological conditions could lead to significant water inflows and flooding at any of our underground mines, which could result in a mine shutdown, serious injuries, loss of life, increased operational costs, production delays, damage to our mineral deposits and equipment damage. We have minor water inflows at our Cote Blanche and Goderich salt mines that we actively monitor and manage. Underground mining also poses the potential risk of mine collapse or ceiling collapse (such as the September 2017 partial ceiling collapse at our Goderich mine) because of the mine geology and the rate and volume of minerals extracted, among other potential causes. We could also have a ceiling collapse in the brine wells used to extract salt for mechanical evaporation, which could increase costs and cause production delays.
Variations in the mineralogy and geology of our mineral deposits have limited, and could continue to limit, our ability to extract these deposits, increase our extraction costs and impact the purity and suitability of extracted minerals to create products for sale and to meet customer specifications. This could adversely impact our ability to fulfill our contracts, resulting in significant contractual penalties and loss of customers.
Our operations are conducted primarily through a limited number of key production and distribution facilities, and we are also dependent on critical equipment.
We conduct our operations through a limited number of key production and distribution facilities. These facilities include our underground salt mines, our evaporation plants, our solar evaporation ponds and facilities and the distribution facilities, depots and ports owned by us and third parties. Many of our products are produced at one or two of these facilities. Any disruption of operations at one of these facilities could significantly affect production of our products, distribution of our products or our ability to fulfill our contractual obligations, which could damage our customer relationships.
For example, our two North American salt mines together constituted approximately 70% of our salt production capacity as of September 30, 2023, and supply most of the salt sold by our North American highway deicing business and significant portions of the salt sold by our consumer and industrial business. A production interruption at one of our salt mines could adversely affect our ability to fulfill our salt contracts and our ability to secure future contracts in affected markets or other markets or could lead to increased costs to service customers from alternative supply sources. Our salt mines also have limited access ways and shafts and any inability to use these access ways and shafts could impede our ability to operate or cause a production interruption. In addition, we only have a limited number of distribution facilities in the markets in which we sell our salt products. Failure to have our salt products at a specific distribution facility when needed (for example during a snow event) could adversely impact our ability to fulfill our highway deicing sales contracts, resulting in significant contractual penalties and loss of customers.
Similarly, our plant nutrition product, SOP, is only produced at two locations: our solar evaporation ponds and facilities located adjacent to the Great Salt Lake near Ogden, Utah, and our facility near Big Quill Lake in Saskatchewan, Canada. SOP production from these facilities could be disrupted or negatively impacted by structural damage, as a result of dike failure or other factors, which could result in reduced sales. A production interruption or disruption at one or more of our facilities could result in a loss of customers, a loss in revenue or subject us to fines or penalties.
Our operations depend upon critical equipment, such as continuous mining machines, hoists, conveyor belts, bucket elevators, loading equipment, baghouses, compactors and dryers. This equipment could be damaged or destroyed, suffer breakdowns or failures or deteriorate due to wear and tear sooner than we estimate, and we may be unable to replace or repair the equipment in a timely manner or at a reasonable cost. If these events occur, we may incur additional maintenance and capital expenditures, our operations could be materially disrupted and we may not be able to produce and ship our products.
The results of our operations are dependent on and vary due to weather conditions. Additionally, adverse weather conditions or significant changes in weather patterns could adversely affect us.
Weather conditions, including amounts, timing and duration of wintry precipitation and snow events, excessive hot or cold temperatures, rainfall and drought, can significantly impact our sales, production, costs and operational results and impact our customers. From year to year, sales of our deicing products and profitability of the Salt segment are affected by weather conditions in our markets. Any prolonged change in weather patterns in our markets, as a result of climate change or otherwise, could have a material impact on the results of our operations.
|
|
|
|
|
|
|
|
|
|
|
COMPASS MINERALS INTERNATIONAL, INC. |
In addition, our ability to produce SOP, sodium chloride and magnesium chloride, as well as any future production of lithium salt, from our solar evaporation ponds located near Ogden, Utah, is dependent upon sufficient lake brine levels in the Great Salt Lake and hot, arid summer weather conditions. Prolonged periods of precipitation, lack of sunshine, cooler weather or increased mountain water run-off during the evaporation season could reduce mineral concentrations and evaporation rates, leading to decreases in our production levels. Similarly, in recent years drought or decreased mountain snowfall and associated fresh water run-off have reduced brine levels, which could also impact mineral composition and our mineral harvesting process, amount and timing. Lake level fluctuations and other factors could alter brine levels or mineral concentration levels, which may disrupt our typical two- to three-year evaporation production cycle. Similar factors could negatively impact the lake level and concentration of sulfates at the Big Quill Lake, impacting the operations at our Wynyard, Saskatchewan, Canada, facility. The occurrence of these events at the Great Salt Lake or Big Quill Lake (as a result of climate change or otherwise) could lead to decreased production levels, increased operating costs and significant additional capital expenditures.
Weather conditions have historically caused volatility in the agricultural industry (and indirectly in our results of operations) by causing crop failures or significantly reduced harvests, which can adversely affect application rates, demand for our SOP products and our customers’ creditworthiness. Weather conditions can also lead to a reduction in farmable acres, flooding, drought or wildfires, which could also adversely impact the number of acres planted, growers’ crop yields and the uptake of plant nutrients, reducing the need for application of plant nutrition products for the next planting season, which could result in lower demand for our SOP products and impact sale prices. Weather conditions also impact our fire retardant business, since hotter and drier summer weather is generally correlated with a higher prevalence of wildfires.
Our business is capital intensive, and the inability to fund necessary capital expenditures or successfully complete our capital projects could have an adverse effect on our growth and profitability.
In recent years, we have made significant expenditures on large capital projects, including a shaft relining project at our Goderich mine and upgrading the barge dock at the Cote Blanche mine. In addition, maintaining our existing facilities requires significant capital expenditures, which may fluctuate materially. We also may make significant capital expenditures in the future to expand or modify our existing operations, including projects to expand or improve our facilities (including new mine level development and mine expansion to access additional mineral deposits, or to augment our Ogden facility’s pond storage capacity) or equipment and projects to improve our computer systems, information technology and operations technology. In addition, we may make significant capital expenditures in the future to advance the development of our identified lithium salt resource at our Ogden facility and the Great Salt Lake, if we achieve an acceptable and predictable regulatory framework in Utah governing the production of lithium on the Great Salt Lake. These activities or other capital improvement projects may require the temporary suspension of production at our facilities, which could have a material adverse effect on the results of our operations.
Any capital project we undertake involves risks, including cost overruns, delays and performance uncertainties, and could interrupt our ongoing operations. The expected benefits from any of our capital projects may not be realized in accordance with our projections. Our capital projects may also result in other unanticipated adverse consequences, such as the diversion of management’s attention from other operational matters or significant disruptions to our ongoing operations.
Although we currently finance most of our capital expenditures through cash provided by operations, we also may depend on increased borrowing or other financing arrangements to fund future capital expenditures. If we are unable to obtain suitable financing on favorable terms or at all, we may not be able to complete future capital projects and our ability to maintain or expand our operations may be limited. The occurrence of these events could have a material adverse effect on our business, financial condition and results of operations.
We face numerous uncertainties in estimating our economically recoverable reserves and resources, and inaccuracies in our estimates could result in lower than expected revenues, higher than expected costs and decreased profitability.
A mineral is economically recoverable when the price at which it can be sold exceeds the costs and expenses of mining, processing and selling the mineral. Forecasts of our future performance are based on, among other things, estimates of our mineral reserves and resources. Our mineral reserve and resource estimates of the remaining tons of minerals in our mines and other mining properties are based on many factors, including engineering, economic and geological data assembled and analyzed by our staff and third parties, which include various engineers and geologists, the area and volume covered by our mining rights, assumptions regarding our extraction rates and duration of mining operations, and the quality of in-place reserves and resources. The reserve and resource estimates as to both quantity and quality are updated on a routine basis to reflect, among other matters, production of minerals from our mining properties and new mining or other data received.
There are numerous uncertainties inherent in estimating quantities and qualities of minerals and costs to mine recoverable reserves and resources, including many factors beyond our control. Estimates of mineral reserves and resources necessarily depend upon a number of variable factors and assumptions, any one of which may, if incorrect, result in an estimate that varies considerably from actual results. These factors and assumptions include:
|
|
|
|
|
|
|
|
|
|
|
COMPASS MINERALS INTERNATIONAL, INC. |
•geologic and mining conditions, including our ability to access certain mineral deposits as a result of the nature of the geologic formations of our salt mines or other factors, which may not be fully identified by available exploration data and may differ from our experience in areas we currently mine;
•demand for our minerals;
•current and future market prices for our minerals, contractual arrangements, operating costs and capital expenditures;
•taxes and development and reclamation costs;
•mining technology and processing improvements, including process technology for the extraction of lithium salt from brines;
•the effects of legislation or interpretations thereof, or regulation by governmental agencies;
•the ability to obtain, maintain and renew all required permits;
•employee health and safety;
•historical production from the area compared with production from other producing areas; and
•our ability to convert all or any part of our resources, including our lithium salt and lithium carbonate equivalent (“LCE”) mineral resources, to economically extractable mineral reserves.
As a result, actual tonnage recovered from identified mining properties and revenues and expenditures with respect to our reserves and resources may vary materially from estimates. Thus, these estimates may not accurately reflect our actual reserves and resources. Any material inaccuracy in our estimates related to our reserves or resources could result in lower than expected revenues, higher than expected costs or decreased profitability, which could materially and adversely affect our business, results of operations, financial position and cash flows. Additionally, our reserve and resource estimates may be adversely affected in the future by interpretations of, or changes to, the SEC’s property disclosure requirements for mining companies.
Strikes, other forms of work stoppage or slowdown and other union activities could disrupt our business and negatively impact our financial results.
Nearly 50% of our workforce in the U.S., Canada and the U.K. is represented by collective bargaining agreements. Of our 12 collective bargaining agreements in effect on September 30, 2023, one will expire in fiscal 2024, six will expire in fiscal 2025 (including our Cote Blanche mine), four will expire in fiscal 2026 (including our Goderich mine), and one will expire in fiscal 2027.
Unsuccessful contract negotiations, adverse labor relations at any of our locations or other factors have in the past, and could in the future, result in strikes, work stoppages, work slowdowns, dissatisfied employees or other actions, which could disrupt our business and operations. These disruptions could negatively impact our business, our operations, our ability to produce or sell our products, our ability to service our customers and our ability to recruit and retain personnel and could result in significant additional costs as well as adversely affect our reputation, financial condition and operating results.
Our production processes rely on the consumption of natural gas, electricity and certain other raw materials. A significant interruption in the supply or an increase in the price of any of these could adversely affect our business.
Energy costs, primarily natural gas and electricity, represent a substantial part of our total production costs. Our profitability is impacted by the price and availability of natural gas and electricity we purchase from third parties. Natural gas is a primary energy source used in the mechanically evaporated salt production process. Our contractual arrangements for the supply of natural gas have terms of up to three years, do not specify quantities and are automatically renewed unless either party elects not to do so. We do not have arrangements in place with back-up suppliers. We use natural gas derivatives to hedge some of our financial exposure to the price volatility of natural gas. A significant increase in the price of energy that is not recovered through an increase in the price of our products or covered through our hedging arrangements, or an extended interruption in the supply of natural gas or electricity to our production facilities, could have a material adverse effect on our business, financial condition and results of operations.
We use KCl in our salt and plant nutrition operations. Large price fluctuations in KCl can occur without a corresponding change in the sales price of our products sold to our customers. This could change the profitability of our products that require KCl, which could materially affect the results of our operations. In certain cases, we also source raw materials from a sole supplier and cannot guarantee that any supplier will be able to meet our requirements and any changes in their operations, including prolonged outages, could have a material adverse effect on our business.
Financial Risks
Our indebtedness and any inability to pay our indebtedness could adversely affect our business and financial condition.
We have a significant amount of indebtedness and may incur additional debt in the future. As of September 30, 2023, we had $811.2 million of outstanding indebtedness, including $280.3 million of borrowings under our senior secured credit facilities, which are further described in
Part II, Item 8, Note 13 of our Consolidated Financial Statements. We pay significant interest on our indebtedness, with variable interest on our borrowing under our senior secured credit facilities based on
|
|
|
|
|
|
|
|
|
|
|
COMPASS MINERALS INTERNATIONAL, INC. |
prevailing interest rates. Significant increases in interest rates will increase the interest we pay on our debt. Our indebtedness could:
•require us to agree to less favorable terms, including higher interest rates, in order to incur additional debt, and otherwise limit our ability to borrow additional money or sell our stock to fund our working capital, capital expenditures and debt service requirements;
•impact our ability to implement our business strategy and limit our flexibility in planning for, or reacting to, changes in our business as well as changes to economic, regulatory or other competitive conditions;
•place us at a competitive disadvantage compared to our competitors with greater financial resources;
•make us more vulnerable to a downturn in our business or the economy;
•require us to dedicate a substantial portion of our cash flow from operations to the repayment of our indebtedness, thereby reducing the availability of our cash flow for other purposes;
•restrict us from making strategic acquisitions or cause us to make non-strategic divestitures; and
•materially and adversely affect our business and financial condition if we are unable to meet our debt service requirements or obtain additional financing.
In the future, we may incur additional indebtedness or refinance our existing indebtedness. If we incur additional indebtedness or refinance, the risks that we face as a result of our leverage could increase. Financing may not be available when needed or, if available, may not be available on commercially reasonable or satisfactory terms. Any downgrades from credit rating agencies such as Moody’s or Standard & Poor’s may adversely impact our ability to obtain financing or the terms of such financing.
Our ability to make payments on our indebtedness, refinance our indebtedness and fund planned capital expenditures will depend on our ability to generate future cash flows from operations. This, to a certain extent, is subject to general economic, financial, competitive, legislative, regulatory and other factors that are beyond our control. There can be no assurance that our business will generate sufficient cash flows from operations or that future borrowings will be available to us under our revolving credit facility in an amount sufficient to enable us to make payments with respect to our indebtedness or to fund our other liquidity needs. If this were the case, we might need to refinance all or a portion of our indebtedness on or before maturity, sell assets, reduce or delay capital expenditures or seek additional equity financing. Our inability to obtain needed financing or generate sufficient cash flows from operations may require us to abandon or curtail capital projects, strategic initiatives or other investments, cause us to divest our business or impair our ability to make acquisitions, enter into joint ventures or engage in other activities, which could materially impact our business.
The agreements governing our indebtedness impose restrictions that may limit our ability to operate our business or require accelerated debt payments.
Our agreements governing our indebtedness contain covenants that limit our ability to:
•incur additional indebtedness or contingent obligations or grant liens;
•pay dividends or make distributions to our stockholders;
•repurchase or redeem our stock;
•make investments or dispose of assets;
•prepay, or amend the terms of, certain junior indebtedness;
•engage in sale and leaseback transactions;
•make changes to our organizational documents or fiscal periods;
•create or permit certain liens on our assets;
•create or permit restrictions on the ability of certain subsidiaries to make certain intercompany dividends, investments or asset transfers;
•enter into new lines of business;
•enter into transactions with our stockholders and affiliates; and
•acquire the assets of, or merge or consolidate with, other companies.
The credit agreement governing our senior secured credit facilities also requires us to maintain financial ratios, including an interest coverage ratio and a total leverage ratio, which we may be unable to maintain. As of September 30, 2023, our total net leverage ratio (as calculated under the terms of our credit agreement) was 3.70x. We would be in default under our credit agreement if our net leverage ratio exceeds 5.0x as of December 31, 2023, gradually stepping down to 4.5x for the fiscal quarter ended June 30, 2024 and thereafter.
Various risks, uncertainties and events beyond our control could affect our ability to comply with the covenants, financial tests and ratios required by the agreements governing our indebtedness. If we default under our agreements governing our indebtedness, our lenders could cease to make further extensions of credit, accelerate payments under our other debt instruments (including hedging instruments) that contain cross-acceleration or cross-default provisions and foreclose upon any collateral securing that debt as well as restrict our ability to make certain investments and payments, pay dividends, repurchase our stock, enter into transactions with affiliates, make acquisitions, merge and consolidate, or transfer or dispose of assets.
|
|
|
|
|
|
|
|
|
|
|
COMPASS MINERALS INTERNATIONAL, INC. |
If our lenders were to require immediate repayment, we may need to obtain new financing to be able to repay them immediately, which may not be available or, if available, may not be available on commercially reasonable or satisfactory terms. Under these circumstances, we might not have sufficient funds or other resources to satisfy all of our obligations.
We are subject to tax liabilities which could adversely impact our profitability, cash flow and liquidity.
We are subject to income tax primarily in the U.S., Canada and the U.K. Our effective tax rate could be adversely affected by changes in the mix of earnings in countries with differing statutory tax rates, changes in the valuation of deferred tax assets and liabilities and the discovery of new information in the course of our tax return preparation process. Our effective tax rate, tax expense and cash flows could also be adversely affected by changes in tax laws. We are also subject to audits in various jurisdictions and may be assessed additional taxes as a consequence of an audit.
Canadian provincial tax authorities have challenged our tax positions and assessed additional taxes on us, which are described in
Part II, Item 8, Note 11 to our Consolidated Financial Statements. These tax assessments and future tax assessments could be material if the disputes are not resolved in our favor.
In the ordinary course of our business, there are many transactions and calculations that could be challenged by taxing authorities. This includes the values charged on the transfer of products between our subsidiaries. Although we believe our tax estimates and calculations are reasonable, they have been challenged by taxing authorities in the past. The final determination of any tax audits and litigation may take several years and be materially different from our historical income tax provisions and accruals in our consolidated financial statements. If additional taxes are assessed as a result of an audit, assessment or litigation, there could be a material adverse effect on our financial condition, income tax provision and net income in the affected periods as well as future profitability, cash flows and our ability to pay dividends and service our debt.
If our customers are unable to access credit, they may not be able to purchase our products. In addition, we extend trade credit to customers and the results of our operations may be adversely affected if customers default on these obligations.
Some of our customers require access to credit in order to purchase our products. A lack of available credit to customers, due to global or local economic conditions or for other reasons, could adversely affect demand for our products and the sales of our products.
We extend trade credit to our customers in the U.S. and throughout the world, in some cases for extended periods of time. If these customers are unable to repay the trade credit from us, the results of our operations could be adversely affected. Our customers may be unable to repay the trade credit from us as a result of supply chain disruptions, market conditions in the agricultural sector, adverse weather conditions and increases in prices for other products and inputs that could increase the working capital requirements, indebtedness and other liabilities of our customers. We may not be able to limit our credit and collectability risk or avoid losses.
We may not pay cash dividends or pay smaller cash dividends on our common stock in the future.
We have declared and paid quarterly cash dividends on our common stock consistently since becoming a public company. Any future payment and the amount of any future payment of cash dividends will depend upon our financial condition, earnings, legal requirements, restrictions in our debt agreements, capital allocation strategy and other factors deemed relevant by our Board of Directors. We may not pay cash dividends or may reduce the amount of our cash dividends (as the Board of Directors did in November 2021). Although our operations are conducted through our subsidiaries, none of our subsidiaries is obligated to make funds available to pay dividends on our common stock. Accordingly, our ability to pay dividends to our stockholders is dependent on the earnings and the distribution of funds from our subsidiaries. Certain agreements governing our indebtedness contain limitations on our ability to pay dividends (including regular annual dividends), as described under “—The agreements governing our indebtedness impose restrictions that may limit our ability to operate our business or require accelerated debt payments.” We cannot provide assurances that the agreements governing our current and future indebtedness will permit us to pay dividends on our common stock.
We are subject to financial assurance requirements and failure to satisfy these requirements could materially affect our business, results of our operations and our financial condition.
In connection with our dispute of tax assessments made by Canadian provincial tax authorities (described in more detail in
Part II, Item 7, “Management’s Discussion and Analysis of Financial Condition and Results of Operations—Investments, Liquidity and Capital Resources” and
Part II, Item 8, Note 11 of our Consolidated Financial Statements), we are required to post and maintain financial performance bonds. In addition, as part of our business operations, we are required to maintain financial surety or performance bonds with certain of our North American deicing customers and to fund reclamation and site cleanup following the ultimate closure of our mines and certain other facilities. We incur costs to maintain these financial assurance bonds and failure to satisfy these financial assurance requirements could materially affect our business, the results of our operations and our financial condition.
|
|
|
|
|
|
|
|
|
|
|
COMPASS MINERALS INTERNATIONAL, INC. |
Competition, Sales and Pricing Risks
The demand for our products is seasonal.
The demand for our salt, plant nutrition and fire retardant products is seasonal, and the degree of seasonality can change significantly from year to year due to weather conditions, including the number of snow events, rainfall, drought and other factors.
Our salt deicing business is seasonal. On average, in each of the last three years, approximately two-thirds of our deicing product sales occurred during the North American and European winter months of November through March. Winter weather events are not predictable, yet we must stand ready to deliver deicing products to local communities with little advance notice under the requirements of our highway deicing contracts. As a result, we attempt to stockpile our highway deicing salt throughout the year to meet estimated demand for the winter season. Failure to deliver under our highway deicing contracts may result in significant contractual penalties and loss of customers. Servicing markets typically serviced by one production facility with product from an alternative facility may add logistics and other costs and reduce profitability.
Our plant nutrition business is also seasonal. As a result, we and our customers generally build inventories during the low demand periods of the year (which are typically winter and summer, but can vary due to weather and other factors) to ensure timely product availability during the peak sales seasons (which are typically spring and autumn, but can also vary due to weather and other factors). Demand for fire retardant products is also seasonal, being highest in summer months.
If seasonal demand is greater than we expect, or we experience increased costs and product shortages, and our customers may turn to our competitors for products that they would otherwise have purchased from us. If seasonal demand is less than we expect, we may have excess inventory to be stored (in which case we may incur increased storage costs) or liquidated (in which case the selling price may be below our costs). If prices for our products rapidly decrease, we may be subject to inventory write-downs. Our inventories may also become impaired through obsolescence or the quality may be impaired if our inventories are not stored properly. Low seasonal demand could also lead to increased unit costs.
Anticipated changes in potash prices and customer application rates can have a significant effect on the demand and price for our plant nutrition products.
When customers anticipate increasing potash selling prices, they tend to accumulate inventories in advance of the expected price increase. Similarly, customers tend to delay their purchases when they anticipate future selling prices for potash products will stabilize or decrease. These customer expectations can lead to a lag in our ability to realize price increases for our SOP products and adversely impact our sales volumes and selling prices.
Growers’ decisions to purchase plant nutrition products and the application rate for potash products depend on many factors, including expected grower income, crop prices, plant nutrition product prices, commodity prices, input prices and nutrient levels in the soil. Customers are more likely to decrease purchases and application rates when they expect declining agricultural economics or relatively high plant nutrient costs, other input costs or elevated soil nutrient levels. This variability can materially impact our prices and volumes sold.
Our products face strong competition and if we fail to successfully attract and retain customers and invest in capital improvements, productivity, quality improvements and product development, sales of our products could be adversely affected.
We encounter strong competition in many areas of our business and our competitors may have significantly more financial resources than we do. Competition in our product lines is based on a number of factors, including product quality and performance, logistics (especially in Salt distribution), brand reputation, price and quality of customer service and support. Many of our customers attempt to reduce the number of vendors from which they purchase in order to increase their efficiency. To remain competitive, we need to invest in manufacturing, productivity, product innovation, marketing, customer service and support and our distribution networks. We may not have sufficient resources to continue to make such investments or maintain our competitive position. We may have to adjust our prices, strategy, product innovation, distribution or marketing efforts to stay competitive. In addition, our fire retardant business currently has one primary customer, the USFS. If the USFS were to choose not to renew commercial agreements with us or reduce their spend on our fire retardant products, that business would be adversely affected.
The demand for our products may be adversely affected by technological advances or the development of new or less costly competing products. For example, the development of substitutes for our plant nutrition products that can more efficiently mix with other agricultural inputs or have more efficient application methods may impact the demand for our products. Many of our products, including sodium chloride, magnesium chloride and SOP, have historically been characterized by a slow pace of technological advances. However, new production methods or sources for our products or the development of substitute or competing products could materially and adversely affect the demand and sales of our products. We also need to continue investing resources in our fire retardant product research and development in order to keep our products competitive.
Changes in competitors’ production, geographic or marketing focus could have a material impact on our business. We face global competition from new and existing competitors who have entered or may enter the markets in which we sell, particularly
|
|
|
|
|
|
|
|
|
|
|
COMPASS MINERALS INTERNATIONAL, INC. |
in our plant nutrition business. Some of our competitors may have greater financial and other resources than we do or are more diversified, making them less vulnerable to industry downturns and better positioned to pursue new expansion and development opportunities. Our competitive position could suffer if we are unable to expand our operations through investments in new or existing operations or through acquisitions, joint ventures or partnerships.
Inflation could result in higher costs and decreased profitability.
Recent inflation, including increases in freight rates, prices for energy and other costs, has adversely impacted us. Sustained inflation could result in higher costs for transportation, energy, materials, supplies and labor. Our efforts to recover inflation-based cost increases from our customers may be hampered as a result of the structure of our contracts and the contract bidding process as well as the competitive industries, economic conditions and countries in which we operate. Accordingly, substantial inflation may result in a material adverse impact on our costs, profitability and financial results.
Increasing costs or a lack of availability of transportation services could have an adverse effect on our ability to deliver products at competitive prices.
Transportation and handling costs are a significant component of our total delivered product cost, particularly for our salt products. The high relative cost of transportation favors producers whose mines or facilities are located near the customers they serve. We contract (directly and, from time to time, through third parties) bulk shipping vessels, barges, trucking and rail services to move our products from our production facilities to distribution outlets and customers. A reduction in the dependability or availability of transportation services, a significant increase in transportation service rates, adverse weather and changes to water levels on the waterways used for our products could impair our ability to deliver our products economically to our customers or expand our markets. For example, when the Mississippi river floods significantly or if water levels are significantly reduced by severe drought conditions (as they were in 2023), barges may be unable to traverse the river system and we may be prevented from timely delivering our salt products to our depots and customers, which could increase costs to deliver our products and adversely impact our ability to fulfill our contracts, resulting in significant contractual penalties and loss of customers.
In addition, diesel fuel is a significant component of our transportation costs. Some of our customer contracts allow for full or partial recovery of changes in diesel fuel costs through an adjustment to the selling price. However, a significant increase in the price of diesel fuel that is not passed through to our customers could materially increase our costs and adversely affect our financial results.
Significant transportation costs relative to the cost of certain of our products, including our salt products, limit our ability to increase our market share or serve new markets.
Risks associated with our international operations and sales and changes in economic and political environments could adversely affect our business and earnings.
We have significant operations in Canada and the U.K. Our fiscal 2023 sales outside the U.S. were 29% of our total fiscal 2023 sales. Our overall success as a global business depends on our ability to operate successfully in differing economic, political and cultural conditions. Our international operations and sales are subject to numerous risks and uncertainties, including:
•economic developments including changes in currency exchange rates, inflation risks, exchange controls, tariffs, economic sanctions, other trade protection measures and import or export licensing requirements;
•difficulties and costs associated with complying with laws, treaties and regulations, including tax, labor and data privacy laws, treaties and regulations, and changes to laws, treaties and regulations;
•restrictions on our ability to own or operate subsidiaries, make investments or acquire new businesses;
•restrictions on our ability to repatriate earnings from our non-U.S. subsidiaries to the U.S. or the imposition of withholding taxes on remittances and other payments by our subsidiaries;
•political developments, government deadlock, political instability, political activism, terrorist activities, civil unrest and international conflicts (including impacts from the current war in Ukraine); and
•uncertain and varying enforcement of laws and regulations and weak protection of intellectual property rights.
|
|
|
|
|
|
|
|
|
|
|
COMPASS MINERALS INTERNATIONAL, INC. |
In addition, we may face more competition in periods when foreign currency exchange rates are favorable to our competitors. A relatively strong U.S. dollar increases the attractiveness of the U.S. market for some of our international competitors while decreasing the attractiveness of other markets to us.
Conditions in the sectors where we sell products and supply and demand imbalances for competing products can impact the price and demand for our products.
Conditions in the North American agricultural sectors can significantly impact our plant nutrition business. The agricultural sector can be affected by a number of factors, including weather conditions, field conditions (particularly during periods of traditionally high plant nutrition application), government policies, tariffs and import and export markets.
Demand for our products in the agricultural sector is affected by crop prices, crop selection, planted acreage, application rates, crop yields, product acceptance, population growth, livestock consumption and changes in dietary habits, among other things. Supply is affected by available capacity, operating rates, raw material costs and availability, feasible transportation, government policies, tariffs and global trade. In addition, the demand and price of our SOP products can be affected by factors such as plant disease.
MOP is the least expensive form of potash fertilizer and, consequently, it is the most widely used potassium source for most crops. SOP is utilized by growers for many high-value crops, especially crops for which low-chloride content fertilizers or the presence of sulfur improves quality and yield, such as almonds and other tree nuts, avocados, citrus, lettuce, tobacco, grapes, strawberries and other berries. Lower prices or demand for these crops could adversely affect demand for our products and the results of our operations.
When the demand and price of potash are high, our competitors are more likely to increase their production and invest in increased production capacity. An over-supply of MOP or SOP domestically or worldwide could unfavorably impact the prices we can charge for our SOP, as a large price disparity between potash products could cause growers to choose MOP or other less-expensive alternatives, which could adversely impact our sales volume and the results of our operations.
Similarly, conditions in the Salt sector can significantly impact our Salt segment. These conditions include weather conditions as well as import and export markets. Supply and demand imbalances can be caused by a number of factors, including weather conditions, operating rates, transportation costs and global trade.
Legal, Regulatory and Compliance Risks
Our operations depend on our rights and governmental authorizations to mine and operate our properties.
We hold numerous environmental and mineral extraction permits, water rights and other permits, licenses and approvals from governmental authorities authorizing operations at each of our facilities. A decision by a governmental agency to revoke, substantially modify, deny or delay renewal of or apply conditions to an existing permit, license or approval could have a material adverse effect on our ability to continue operations at the affected facility and result in significant costs. For example, certain indigenous groups have challenged the Canadian government’s ownership of the land under which our Goderich mine is operated. There can be no assurances that the Canadian government’s ownership will be upheld or that our existing mining and operating permits will not be revoked or otherwise affected. In addition, although we do not engage in fracking, laws and regulations targeting fracking could lead to increased permit requirements and compliance costs for non-fracking operations, including our salt operations, which require permitted wastewater disposal wells. Proposed rulemaking implementing Utah House Bill 513 (now codified as amended Utah Code §65A-6-4) may adversely impact mineral extraction on the Great Salt Lake, including our existing SOP, sodium chloride and magnesium chloride production.
Furthermore, many of our facilities are located on land leased from governmental authorities or third parties. Our leases generally require us to continue mining in order to retain the lease, the loss of which could have a material adverse effect on our ability to continue operations at the affected facility and result in significant costs. In some instances, we have received access rights or easements from third parties which allow for a more efficient operation than would exist without the access or easement. Loss of these access rights or easements could have a material adverse effect on us. In addition, many of our facilities are located near existing and proposed third-party industrial operations that could affect our ability to fully extract, or the manner in which we extract, the mineral deposits to which we have mining rights. For example, certain neighboring operations or land uses may require setbacks that could prevent us from mining portions of our mineral reserves or resources or using certain mining methods.
Expansion of our existing operations or production capacity, or preservation of existing rights in some cases, is also predicated upon securing any necessary permits, licenses and approvals. For example, if we decide to continue further investment in our lithium project at some point in the future, we may require additional permits, licenses and approvals in connection with the potential development and subsequent commercial sale of our identified lithium salt resource at our Ogden facility and the Great Salt Lake. We may not be granted the necessary permits, licenses and approvals. A decision by a governmental agency to deny, delay issuing or apply conditions to any new permits, licenses and approvals could adversely affect our ability to operate and the results of our operations, as well as our ability to develop our identified lithium salt brine and LCE resources.
|
|
|
|
|
|
|
|
|
|
|
COMPASS MINERALS INTERNATIONAL, INC. |
Unanticipated litigation or investigations, or negative developments in pending litigation or investigations or with respect to other contingencies, could adversely affect us.
We are currently, and may in the future become, subject to litigation, arbitration or other legal proceedings with other parties. Any claim that is successfully asserted against us in these legal proceedings, or others that could be brought against us in the future, may adversely affect our financial condition, results of operations or prospects. For example, on October 21, 2022 we, certain of our former officers and one current officer were named as defendants in a putative securities class action lawsuit filed in the United States District Court for the District of Kansas, alleging that we and such officers made misleading statements damaging shareholders. We intend to vigorously defend these allegations. At this time, we are unable to assess with any certainty, what, if any, damages could be awarded in this matter. We are also involved periodically in other reviews, inquiries, investigations and other proceedings initiated by or involving government agencies (including litigation brought by Canadian provincial tax authorities as described in
Part II, Item 8, Note 11 to our Consolidated Financial Statements), some of which may result in adverse judgments, settlements, fines, penalties, injunctions or other relief. In these types of matters, it is inherently difficult to determine whether any loss is probable or whether it is possible to estimate the amount of any reasonably possible loss. We cannot predict with certainty if, how or when such proceedings will be resolved or what the eventual judgment, settlement, fine, penalty or other relief, conditions or restrictions, if any, may be. Any eventual judgment, settlement, fine, penalty or other relief, conditions or restrictions could have a material impact on us. For further discussion of pending litigation and governmental proceedings and investigations, see
Part II, Item 8, Note 11 and
Note 14 to our Consolidated Financial Statements.
We are subject to EHS laws and regulations which could become more stringent and adversely affect our business.
Our operations are subject to an evolving set of federal, state, local and foreign EHS laws and regulations. New or proposed EHS regulatory programs, as well as future interpretations and enforcement of existing EHS laws and regulations, may require modification to our facilities, require substantial increases in equipment and operating costs, subject us to fines, penalties or lead to interruptions, modifications or a termination of operations, which could involve significant capital costs, increases in operating costs or other significant impacts.
For example, we are impacted by the Clean Air Act and other EHS laws and regulations that regulate air emissions. These regulatory programs may subject us to fines or penalties or require us to install expensive emissions abatement equipment, modify our operational practices, obtain additional permits or make other expenditures. Our Ogden facility is located in an area expected to be of continued scrutiny by the Environmental Protection Agency and Utah Division of Air Quality with respect to certain air emissions and related issues under the Clean Air Act.
In addition, if new Clean Water Act regulations are adopted or increased compliance obligations are imposed on existing regulations, we could be adversely affected. For example, a significant portion of our salt products are distributed through salt depots owned and operated by third parties. If these depots are required to adopt more stringent stormwater management practices or are subject to increased compliance requirements under existing Clean Water Act regulations, these depots may pass on any increased costs to us, exit the depot business (requiring us to find new depot partners or establish Company-owned depots) or otherwise cause an adverse impact to our ability to deliver salt to our customers. Additionally, governmental agencies could restrict or limit the use of road salt for highway deicing purposes or adopt laws and regulations to address climate change and greenhouse gases, which could have a material impact on us. See
Item 1, “Business—Environmental, Health and Safety and Other Regulatory Matters” for more information about EHS laws and regulations affecting us and their potential impact on us.
We could incur significant environmental liabilities with respect to our current, future or former facilities, adjacent or nearby third-party facilities or off-site disposal locations.
Risks of environmental liabilities is inherent in our current and former operations. At many of our past and present facilities, releases and disposals of regulated substances have occurred and could occur in the future, which could require us to investigate, undertake or pay for remediation activities under CERCLA and other similar EHS laws and regulations. The use, handling, disposal and remediation of hazardous substances currently or formerly used by us, or the liabilities arising from past releases of, or exposure to, hazardous substances may result in future expenditures that could materially and adversely affect our financial results, cash flows or financial condition. Our facilities are also subject to laws and regulations which require us to monitor and detect potential environmental hazards and damages. Our procedures and controls may not be sufficient to timely identify and protect against potential environmental damages and related costs.
We record accruals for contingent environmental liabilities when we believe it is probable that we will be responsible, in whole or in part, for environmental investigation or remediation activities and the expenditures for these activities are reasonably estimable. However, the extent and costs of any environmental investigation or remediation activities are inherently uncertain and difficult to estimate and could exceed our expectations, which could materially affect our financial condition and operating results.
|
|
|
|
|
|
|
|
|
|
|
COMPASS MINERALS INTERNATIONAL, INC. |
Additionally, we previously sold a portion of our U.K. salt mine to a third party, which operates a waste management business. The third party’s business, under governmental permits, is allowed to securely dispose certain hazardous waste at the property they own and they pay us fees for engaging in this activity. See
Item 1, “Business—Environmental, Health and Safety and Other Regulatory Matters” for more information.
Compliance with import and export requirements, the FCPA and other applicable anti-corruption laws may increase the cost of doing business.
Our operations and activities inside and outside the U.S., as well as the shipment of our products across international borders, require us to comply with a number of federal, state, local and foreign laws and regulations, which are complex and increase our cost of doing business. These laws and regulations include import and export requirements, economic sanctions laws, customs laws, tax laws and anti-corruption laws, such as the FCPA, the U.K. Bribery Act and the Canadian Corruption of Foreign Public Officials Act. We cannot predict how these or other laws or their interpretation, administration and enforcement will change over time. There can be no assurance that our employees, contractors, agents, distributors, customers, payment parties or third parties working on our behalf will not take actions in violation of these laws. Any violations of these laws could subject us to civil or criminal penalties, including fines or prohibitions on our ability to offer our products in one or more countries, debarment from government contracts (and termination of existing contracts) and could also materially damage our reputation, brand, international expansion efforts, business and operating results. In addition, changes to trade or anti-corruption laws and regulations could affect our operating practices or impose liability on us in a manner that could materially and adversely affect our business, financial condition and results of operations.
We are subject to costs and risk associated with a complex regulatory, compliance and legal environment, and we may be adversely affected by changes in laws, industry standards and regulatory requirements.
Our global business is subject to complex requirements of federal, state, local and foreign laws, regulations, treaties and regulatory authorities as well as industry standard-setting authorities. These requirements are subject to change. Changes in the standards and requirements imposed by these laws, regulations, treaties and authorities or adoption of any new laws, regulations or treaties could negatively affect our ability to serve our customers or our business. In the event that we are unable to meet any existing, new or modified standards when adopted, our business could be adversely affected. Some of the federal, state, local and foreign laws and regulations that affect us include those relating to EHS matters; taxes; antitrust and anti-competition laws; data protection and privacy; advertisement and marketing; labor and employment; import, export and anti-corruption; product liability; product registrations and labeling requirements; and intellectual property.
If significant import duties were imposed on the salt we import into the U.S. from our Goderich mine, or if we were unable to include the transfer price of such salt in the cost of goods sold for U.S. tax purposes, our financial condition and operating results would be materially and adversely affected. We could also be adversely impacted by changes in tariffs imposed by countries or other trade protection measures, which could decrease our sales in markets where we sell our products. Certain U.S. states have either enacted or proposed legislation that would provide a preference for their agencies or municipalities to use salt mined in the U.S., their home state or selected states. If such legislation is adopted, it could adversely impact the amount of salt sales contracts awarded to us for salt supplied from our Goderich or Cote Blanche mines in the applicable state. Proposed rulemaking implementing Utah House Bill 513 (now codified as amended Utah Code §65A-6-4) may adversely impact mineral extraction on the Great Salt Lake, including our existing SOP, sodium chloride and magnesium chloride production. Failure to comply with applicable laws, regulations or treaties or to comply with any of contracts we have with governmental entities could preclude us from conducting business with governmental entities and lead to penalties, injunctions, civil remedies or fines. For example, our fire retardant products are subject to extensive government regulation, including the USFS qualification process and laws and regulations relating to the award, administration and performance of U.S. government contracts.
We may face significant product liability claims and product recalls, which could harm our business and reputation.
We face exposure to product liability and other claims if our products cause harm, are alleged to have caused harm or have the potential to cause harm to consumers or their property. In addition, our products or products manufactured by our customers using our products could be subject to a product recall as a result of product contamination, our failure to meet product specifications or other causes. For example, our customers use our food-grade salt products in food items they produce, such as cheese and bread, which could be subject to a product recall if our products are contaminated or adulterated. Similarly, the use and application of our animal feed and plant nutrition products could result in a product recall if it were alleged that they were contaminated. If our fire retardant products fail to provide the intended protection, they could be subject to a product recall or subject us to liability.
A product recall could result in significant losses due to the costs of a recall, the destruction of product inventory and production delays to identify the underlying cause of the recall. We could be held liable for costs related to our customers’ product recall if our products cause the recall or other product liability claims if our products cause harm to our customers or their property. Additionally, a significant product liability case, product recall or failure to meet product specifications could
|
|
|
|
|
|
|
|
|
|
|
COMPASS MINERALS INTERNATIONAL, INC. |
result in adverse publicity, harm to our brand and reputation and significant costs, which could have a material adverse effect on our business and financial performance.
Our intellectual property may be misappropriated or subject to claims of infringement.
Intellectual property rights, including patents, trademarks, and trade secrets, are a valuable aspect of our business. We attempt to protect our intellectual property rights primarily through a combination of patent, trademark, and trade secret protection. The patent rights that we obtain may not provide meaningful protection to prevent others from selling competitive products or using similar production processes. Pending patent applications may not result in an issued patent. If we do receive an issued patent, we cannot guarantee that our patent rights will not be challenged, invalidated, circumvented, or rendered unenforceable.
We also rely on trade secret protection to guard confidential unpatented technology, manufacturing expertise, and technological innovation. Although we generally enter into confidentiality agreements with our employees, third-party consultants and advisors to protect our trade secrets, we cannot guarantee that these agreements provide meaningful protection or that adequate remedies will be available in the event of an unauthorized use or disclosure of our trade secrets.
Our brand names and the goodwill associated therewith are an important part of our business. We seek to register our brand names as trademarks where it makes business sense. Our trademark registrations may not prevent our competitors from using similar brand names. Many of our brand names are registered as trademarks in the U.S. and foreign countries. The laws in certain foreign countries in which we do business do not protect trademark rights to the same extent as U.S. law. As a result, these factors could weaken our competitive advantage with respect to our products, services and brands in foreign jurisdictions, which could adversely affect our financial performance.
Our intellectual property rights may not be upheld if challenged. Such claims, if proven, could materially and adversely affect our business and may lead to the impairment of the amounts recorded for goodwill and other intangible assets. If we are unable to maintain the proprietary nature of our technologies, we may lose any competitive advantage provided by our intellectual property. In addition, although any such claims may ultimately prove to be without merit, the necessary management attention to and legal costs associated with defending our intellectual property rights could be significant.
Strategic and Other Business Risks
We may not successfully implement our strategies.
Our success depends, to a significant extent, on successful implementation of our business strategies, including the development of our lithium salt or lithium chloride brine and LCE resources, the successful commercialization of Fortress North America’s portfolio of next generation fire retardants, our cost savings initiatives, our continuous improvement initiatives and any other strategies described in the “Business” section of this report. We cannot assure that we will be able to successfully implement our strategies or, if successfully implemented, we may not realize the expected benefits of our strategies. Recently, we have suspended indefinitely any further investment in our lithium project beyond certain already committed items associated with the early stages of construction of our commercial scale demonstration unit and are considering seeking partners at the project level with an aim of reducing our share of capital costs and lowering execution risk in the event that the project is restarted. Any continued investment or such partnership would be conditioned on the achievement of an acceptable and predictable regulatory framework in Utah governing the production of lithium on the Great Salt Lake. We cannot make any assurance that we will continue investments in our lithium project or whether we will enter into any partnership, and if so, on what terms. See “—We have indefinitely suspended our lithium development project until we have further clarity on the evolving regulatory climate in the State of Utah. If the final rule relating to Great Salt Lake Elements and Minerals creates significant obstacles toward the responsible development of lithium salts from the Great Salt Lake, we may not continue further investment in our lithium development project, which could impact our ability to further develop our lithium project and adversely impact the value of our securities” for more information.
Additionally, although we have completed an initial assessment to define the lithium resource at our existing operations, mineral resources are not mineral reserves and do not have demonstrated economic viability. The process technology for commercial extraction of lithium chloride from brines with low lithium and high impurity is still developing. We have not realized any revenues to date from the sale of lithium and have suspended indefinitely any further investment beyond certain already committed items associated with the early stages of construction of our commercial scale demonstration unit. If we were to recommence investment in our lithium project, there is no certainty that all or any part of the lithium mineral resource identified by the company’s initial assessment will be converted into an economically extractable mineral reserve.
Although we make investments in product innovation, we cannot be certain that we will be able to develop, obtain or successfully implement new products or technologies on a timely basis or that they will be well-received by our customers. Moreover, our investments in new products and technologies involve certain risks and uncertainties and could disrupt our ongoing business. New investments may not generate sufficient revenue, may incur unanticipated liabilities and may divert our limited resources and distract management from our current operations. We cannot be certain that our ongoing investments in
|
|
|
|
|
|
|
|
|
|
|
COMPASS MINERALS INTERNATIONAL, INC. |
new products and technologies will be successful, will meet our expectations and will not adversely affect our reputation, financial condition and operating results.
Our business is dependent upon personnel, including highly skilled personnel. A labor shortage or the loss of key personnel may have a material adverse effect on our performance.
Our business is dependent on our ability to attract, develop and retain personnel. We may encounter difficulty recruiting sufficient numbers of personnel at acceptable wage and benefit levels due to the competitive labor market. If we are unable to attract, develop and retain the personnel necessary for the efficient operation of our business, this could result in higher costs and decreased productivity and efficiency, which may have a material adverse effect on our performance.
Our business is also dependent on the ability to attract, develop and retain highly skilled personnel. An inability to attract, develop and retain personnel with the necessary skills and experience could result in decreased productivity and efficiency, higher costs, the use of less-qualified personnel and reputational harm, which may have a material adverse effect on our performance.
To help attract, retain and motivate qualified personnel, we use stock-based incentive awards such as restricted stock units and performance stock units. If the value of these stock awards does not appreciate as measured by our common stock price, performance conditions in these awards are not met or if our stock-based compensation otherwise ceases to be viewed as a valuable benefit, our ability to attract, retain and motivate personnel could be weakened, which could harm our business.
The loss of certain key employees could result in the loss of vital institutional knowledge, experience and expertise, damage critical customer relationships and impact our ability to successfully operate our business and execute our business strategy. We may not be able to find qualified replacements for these key positions and the integration of replacements may be disruptive to our business. In addition, the loss of our key employees who have in-depth knowledge of our mining, manufacturing, engineering or research and development processes could lead to increased competition to the extent that those employees are hired by a competitor and are able to recreate our processes or share our confidential information.
If our computer systems, information technology or operations technology are disrupted or compromised, our ability to conduct our business will be adversely impacted.
We rely on computer systems, information technology and operations technology to conduct our business, including cash management, order entry, invoicing, plant operations, vendor payments, employee salaries and recordkeeping, inventory and asset management, shipping of products, and communication with employees and customers. We also use our systems to analyze and communicate our operating results and other data to internal and external recipients. While we maintain some of our critical computer and information technology systems, we are also dependent on third parties to provide important computer and information technology services. We continue to make updates and improvements to our enterprise resource planning system, network and other core applications, which could impact substantially all of our key processes. Any implementation issues could have adverse effects on our ability to properly capture, process and report financial transactions, distribute our products, invoice and collect from our customers and pay our vendors and could lead to increased expenditures or operational disruptions.
We are susceptible to cyber-attacks, computer viruses and other technological disruptions, which generally continue to increase due to evolving threats and our expanding information technology footprint. We have experienced attempts by unauthorized agents to gain access to our computer systems through the internet, e-mail and other access points. To date, none have resulted in any material adverse impact to our business or operations. While we have programs, policies and procedures in place to identify, prevent and detect any unauthorized access, this does not guarantee that we will be able to detect or prevent unauthorized access to our computer systems. In addition, remote work arrangements for our employees could strain our technology resources and introduce operational risks, including heightened cybersecurity risk. Remote working environments may be less secure and more susceptible to hacking attacks, including phishing and other social engineering attempts. These risks have also impacted, and may in the future impact the third parties on which we rely, and security measures employed by these third parties may also prove to be ineffective at countering threats.
A material failure or interruption of access to our computer systems for an extended period of time or the loss of confidential or proprietary data could adversely affect our operations, reputation and regulatory compliance. While we have mitigation and data recovery plans in place, it is possible that significant expenditures, capital investments and time may be required to correct any of these issues. Additional capital investment and expenditures needed to address, prevent, correct or respond to any of these issues may negatively impact our business, financial condition and results of operations.
Climate change and related laws and regulations could adversely affect us.
The potential impact of climate change on our resources, operations, product demand and the needs of our customers remains uncertain. Scientists have proposed that the impacts of climate change could include changes in rainfall patterns, water shortages, changing sea levels, changes to the water levels of lakes and other bodies of water, changing storm patterns and intensities and changing temperature levels. These changes could be severe and vary by geographic location. These changes could negatively impact customer demand for our products as well as our costs and ability to produce and distribute our
|
|
|
|
|
|
|
|
|
|
|
COMPASS MINERALS INTERNATIONAL, INC. |
products. For example, prolonged period of mild winter weather could reduce the market for deicing products. Drought conditions could similarly impact demand for our plant nutrition products. Climate change could also lead to disruptions in the production or distribution of our products due to major storm events or prolonged adverse conditions, changing temperature levels, lake or river level fluctuations or flooding from sea level changes. See “—The results of our operations are dependent on and vary due to weather conditions. Additionally, adverse weather conditions or significant changes in weather patterns could adversely affect us.” for more information.
In addition, legislative and regulatory measures to address climate change and greenhouse gas emissions (including carbon or emissions taxes) have been enacted and are also in various phases of consideration at both the state and federal level, as well as internationally. These measures could restrict our operations, require us to make capital expenditures to be compliant with these initiatives, increase our costs, impact our ability to compete or negatively impact efforts to obtain permits, licenses and other approvals for existing and new facilities. These measures could also result in increased cost of fuel and other consumables used in our operations or in transporting our products. Our inability to timely respond to the risks posed by climate change and the costs of compliance with climate change laws and regulations could have a material impact on us.
We may not be able to expand our business through acquisitions and investments, and acquisitions and investments may not perform as expected. We may not successfully integrate acquired businesses and anticipated benefits may not be realized.
Our business strategy includes supplementing organic growth with acquisitions of and investments in complementary businesses. We may not have acquisition or investment opportunities because we may not identify suitable businesses to acquire or invest in, we compete with other potential buyers and investors, we may not have or be able to obtain suitable financing for an acquisition or investment and we may be hindered by competition and regulatory laws. If we cannot make acquisitions or investments, our business growth may be limited.
Acquisitions of new businesses and investments in businesses (including our acquisition of Fortress) may not perform as expected, may lose value, may not positively impact our financial performance and could increase our debt obligations. Acquisitions and investments involve significant risks and uncertainties, including diversion of management attention, greater than expected liabilities and expenses, inadequate return on capital and unidentified issues not discovered in our due diligence.
The success of any acquisition will also depend on our ability to successfully combine and integrate the acquired business. We may fail to integrate acquired businesses in a timely and efficient manner. The integration process could result in the loss of key employees, higher than expected costs, ongoing diversion of management attention from other strategic opportunities or operational matters, the disruption of our ongoing businesses or increased risk that our internal controls are found to be ineffective.
Outbreaks of contagious disease or similar public health threats could materially and adversely affect our business, financial condition and results of operations.
Outbreaks of contagious disease, including COVID-19, or other adverse public health developments in the U.S. or worldwide could have a material adverse effect on our business, financial condition and results of operations. For example, the emergence and spread of COVID-19 variants could adversely impact our business and results of operations. Outbreaks of contagious disease, including COVID-19, or other adverse public health developments could affect our business in a number of ways, including but not limited to:
•Disruptions or restrictions on our employees’ ability to work effectively due to illness.
•Temporary closures or disruptions at our facilities or the facilities of our customers or suppliers could reduce demand for our products or affect our ability to timely meet our customer’s orders and negatively impact our supply chain.
•Our mining and manufacturing facilities rely on raw materials and components provided by our suppliers. Outbreaks of contagious disease could cause delays or disruptions in our supply chain and we could experience a mining or manufacturing slow-down or seek to obtain alternate sources of supply, which may not be available or may be more expensive.
•The failure of third parties on which we rely, including our suppliers, customers, contractors, commercial banks, transportation service providers and external business partners, to meet their respective obligations to us, or significant disruptions in their ability to do so, which may be caused by their own financial or operational difficulties, could have an adverse impact on our business, financial condition or results of operations.
The impact of contagious disease or other adverse public health developments could also exacerbate other risks discussed elsewhere in this section of this report, any of which could have a material adverse effect on us.
ITEM 1B. UNRESOLVED STAFF COMMENTS
None.
|
|
|
|
|
|
|
|
|
|
|
COMPASS MINERALS INTERNATIONAL, INC. |
ITEM 1C. CYBERSECURITY
Not applicable.
ITEM 2. PROPERTIES
SUMMARY OVERVIEW OF MINING OPERATIONS
Information concerning our mining properties in this Annual Report on Form 10-K has been prepared in accordance with the requirements of subpart 1300 of Regulation S-K. Subpart 1300 of Regulation S-K requires us to disclose our mineral resources, in addition to our mineral reserves, as of the end of our most recently completed fiscal year both in the aggregate and for each of our individually material mining properties. When evaluating materiality for purposes of the disclosure, the Company considered several quantitative metrics including production, sales and capital expenditure data, as well as synergistic and other qualitative information that the Company believes investors would find important to their investing decisions.
As used in this Annual Report on Form 10-K, the terms “mineral resource,” “measured mineral resource,” “indicated mineral resource,” “inferred mineral resource,” “mineral reserve,” “proven mineral reserve” and “probable mineral reserve” are defined and used in accordance with subpart 1300 of Regulation S-K. Under subpart 1300 of Regulation S-K, mineral resources may not be classified as “mineral reserves” unless the determination has been made by a qualified person that the mineral resources can be the basis of an economically viable project. You are specifically cautioned not to assume that any part or all of the mineral deposits (including any mineral resources) in these categories will ever be converted into mineral reserves, as defined by the SEC. See
Item 1A, “Risk Factors.”
You are cautioned that, except for that portion of mineral resources classified as mineral reserves, mineral resources do not have demonstrated economic value. Inferred mineral resources are estimates based on limited geological evidence and sampling and have a too high of a degree of uncertainty as to their existence to apply relevant technical and economic factors likely to influence the prospects of economic extraction in a manner useful for evaluation of economic viability. Estimates of inferred mineral resources may not be converted to a mineral reserve. It cannot be assumed that all or any part of an inferred mineral resource will ever be upgraded to a higher category. A significant amount of exploration must be completed in order to determine whether an inferred mineral resource may be upgraded to a higher category. Therefore, you are cautioned not to assume that all or any part of an inferred mineral resource exists, that it can be the basis of an economically viable project, or that it will ever be upgraded to a higher category. Likewise, you are cautioned not to assume that all or any part of measured or indicated mineral resources will ever be converted to mineral reserves. See Item
1A, “Risk Factors.”
The Company has determined that the following properties are individually material mining properties for purposes of subpart 1300 of Regulation S-K: the Ogden facility, the Cote Blanche mine and the Goderich mine. As there have been no material changes in the mineral reserves or mineral resources from the last technical report summaries filed for each of these properties, the Company is not filing a new technical report summary for any of these properties in connection with this Annual Report on Form 10-K.
|
|
|
|
|
|
|
|
|
|
|
COMPASS MINERALS INTERNATIONAL, INC. |
The following map shows the locations of our mining properties, as of September 30, 2023:
|
|
|
|
|
|
|
|
|
|
|
COMPASS MINERALS INTERNATIONAL, INC. |
As of September 30, 2023, we had ten mining properties, as summarized in the table below:
|
|
|
|
|
|
|
|
|
|
|
|
|
|
|
|
|
|
|
|
|
| Location |
|
Segment |
|
Use |
|
Stage |
| United States |
|
|
|
|
|
|
| Cote Blanche Island, Louisiana |
|
Salt |
|
Rock salt mine |
|
Production |
| Lyons, Kansas |
|
Salt |
|
Evaporated salt facility |
|
Production |
| Ogden, Utah |
|
Salt, Plant Nutrition |
|
SOP, solar salt and magnesium chloride facility |
|
Production |
| Canada |
|
|
|
|
|
|
| Amherst, Nova Scotia |
|
Salt |
|
Evaporated salt facility |
|
Production |
| Goderich, Ontario |
|
Salt |
|
Rock salt mine |
|
Production |
| Goderich, Ontario |
|
Salt |
|
Evaporated salt facility |
|
Production |
| Unity, Saskatchewan |
|
Salt |
|
Evaporated salt facility |
|
Production |
| Wynyard, Saskatchewan |
|
Plant Nutrition |
|
SOP facility |
|
Exploration |
| United Kingdom |
|
|
|
|
|
|
| Winsford, Cheshire |
|
Salt |
|
Rock salt mine |
|
Production |
| Chile |
|
|
|
|
|
|
| Atacama Desert |
|
Salt |
|
N/A |
|
Exploration |
We are the sole operator of each of our mining properties and we own all of the ownership interests in our mining operations. With respect to most of our mineral properties, we own the land and surface rights and have entered into lease agreements with respect to the mineral rights. Our mineral leases have varying terms. Some will expire after a set term of years, while others continue indefinitely. Many of these leases provide for a royalty payment to the lessor based on a specific amount per ton of minerals extracted or as a percentage of revenue. In addition, we own a number of properties and are party to non-mining leases that permit us to perform activities that are ancillary to our mining operations, such as surface use leases for storage at depots and warehouse leases. We believe that all of our leases were entered into at market terms.
We hold numerous environmental and mineral extraction permits, water rights and other permits, licenses and approvals from governmental authorities authorizing operations at each of our facilities. With respect to each facility at which we produce salt, brine or SOP, permits, licenses and approvals are obtained as needed in the normal course of business based on our mine plans and federal, state, provincial and local regulatory provisions regarding mine permitting and licensing. Based on our historical permitting experience, we expect to be able to continue to obtain necessary mining permits and approvals to support historical rates of production.
The three processing methods we use to produce salt and SOP at our production-stage properties are as follows:
•Underground Rock Salt Mining - We produce most of the salt we sell through underground mining. In North America, we use a combination of continuous mining and drill and blast techniques. At our Winsford, Cheshire, U.K., mine, we utilize continuous mining techniques. Mining machinery moves salt from the salt face to conveyor belts, which transport the salt to the mill center where it is crushed and screened. It is then hoisted to the surface where the processed salt is loaded onto shipping vessels, railcars or trucks. The primary power sources for each of our rock salt mines are electricity and diesel fuel. Rock salt is sold in our highway deicing product lines and for numerous applications in our consumer and industrial product lines.
•Mechanical Evaporation - Mechanical evaporation involves creating salt-saturated brine from brine wells in underground salt deposits and subjecting this salt-saturated brine to vacuum pressure and heat to precipitate and crystallize salt. The primary power sources used for this process are natural gas and electricity. The resulting product has a high purity and uniform physical shape. Mechanically-evaporated salt is primarily sold through our consumer and industrial salt product lines.
•Solar Evaporation - For a description of the solar evaporation process, see “—Ogden Facility” below.
|
|
|
|
|
|
|
|
|
|
|
COMPASS MINERALS INTERNATIONAL, INC. |
Our current estimated production capacity is approximately 16.2 million tons of salt and 360,000 tons of SOP per year. The following table shows the estimated annual production capacity and type of salt or other mineral produced at each of our owned or leased processing locations as of September 30, 2023:
|
|
|
|
|
|
|
|
|
| Location |
Annual Production Capacity(1)
(tons)
|
Product Type |
| North America |
|
|
Goderich, Ontario, Mine |
8.0 million |
Rock Salt |
| Cote Blanche, Louisiana, Mine |
2.9 million |
Rock Salt |
| Ogden, Utah, Plant: |
|
|
Salt(2) |
1.5 million |
Solar Salt |
Magnesium Chloride(3) |
750,000 |
Magnesium Chloride |
SOP(4) |
320,000 |
SOP |
| Lyons, Kansas, Plant |
450,000 |
Mechanically-Evaporated Salt |
| Unity, Saskatchewan, Plant |
140,000 |
Mechanically-Evaporated Salt |
| Goderich, Ontario, Plant |
140,000 |
Mechanically-Evaporated Salt |
| Amherst, Nova Scotia, Plant |
135,000 |
Mechanically-Evaporated Salt |
| Wynyard, Saskatchewan, Plant |
40,000 |
SOP |
| United Kingdom |
|
|
| Winsford, Cheshire, Mine |
2.2 million |
Rock Salt |
(1)Annual production capacity is our estimate of the tons that could be produced based on design capacity, assuming optimization of our operations, including our facilities, equipment and workforce. Incremental equipment, labor or other costs may be required to achieve these production capacity estimates. As we continue our efforts to optimize and refine our production methods, we will update our estimates if necessary.
(2)Solar salts deposited annually substantially exceed the amount converted into finished products. The amount presented here represents an approximate average amount produced based on recent market demand.
(3)The magnesium chloride amount includes both brine and flake.
(4)The annual SOP production capacity at our Ogden facility during normal weather and pond chemistry conditions, which includes amounts produced from both solar-pond based feedstock and supplemental KCl feedstock when economically feasible.
Actual annual salt, magnesium chloride and SOP production volume levels may vary from the annual production capacity shown in the table above due to a number of factors, including variations in the winter weather conditions which impact demand for highway and consumer deicing products, the quality of the reserves and the nature of the geologic formation that we are mining at a particular time, unplanned downtime due to safety concerns, incidents and mechanical failures, and other operating conditions.
|
|
|
|
|
|
|
|
|
|
|
COMPASS MINERALS INTERNATIONAL, INC. |
The following table shows production by product at our owned and leased production locations, in tons, except for LCE, which is expressed in metric tons:
|
|
|
|
|
|
|
|
|
|
|
|
|
|
|
|
|
|
|
Fiscal Year Ended |
|
Nine Months Ended |
|
September 30, 2023 |
|
September 30, 2022 |
|
September 30, 2021 |
Salt(1) |
| Cote Blanche mine |
1,965,257 |
|
1,944,722 |
|
1,527,203 |
| Goderich mine |
6,034,204 |
|
6,305,067 |
|
4,668,678 |
Ogden facility(2) |
1,177,465 |
|
1,165,767 |
|
719,923 |
| Other |
1,652,512 |
|
1,686,668 |
|
1,342,782 |
| Total Salt |
10,829,438 |
|
11,102,224 |
|
8,258,586 |
|
|
|
|
|
|
| SOP |
| Ogden facility |
238,428 |
|
245,165 |
|
197,806 |
| Other |
37,805 |
|
41,486 |
|
31,570 |
| Total SOP |
276,233 |
|
286,651 |
|
229,376 |
|
|
|
|
|
|
| Magnesium Chloride |
Ogden facility(2) |
731,490 |
|
686,213 |
|
528,690 |
| Total Magnesium Chloride |
731,490 |
|
686,213 |
|
528,690 |
|
|
|
|
|
|
| LCE |
| Ogden facility |
— |
|
— |
|
— |
| Total LCE |
— |
|
— |
|
— |
(1)Excludes solar salt harvested at our Ogden facility that is not converted into finished product and salt processed at our packaging facilities.
(2)Fiscal year 2023 and 2022 production tons are less than our reserve reduction due to process timing of extracting tons to producing finished product. See Ogden Facility below for additional information regarding our sodium, sodium chloride, magnesium and magnesium chloride reserve estimates at the Ogden facility.
Our production facilities have access to vast mineral deposits. At all of our production locations, we estimate the recoverable reserves to last at least several more decades at current production rates and capacities, although additional capital resources and developmental spending may be required. Our rights to extract those minerals may be contractually limited by geographic boundaries or time. We believe that we will be able to continue extending these agreements, as we have in the past, at commercially reasonable terms without incurring substantial costs or material modifications to the existing lease terms and conditions, thereby allowing us to fully utilize our existing mineral rights.
Our underground mines in Canada (Goderich, Ontario), the U.S. (Cote Blanche, Louisiana) and the U.K. (Winsford, Cheshire) make up 85% of our salt production capacity as of September 30, 2023. Each of these mines is operated with modern mining equipment and utilizes subsurface improvements, such as vertical shaft lift systems, milling and crushing facilities, maintenance and repair shops and extensive raw materials handling systems.
In 2012, we acquired mining rights to approximately 100 million tons of salt resources in the Chilean Atacama Desert. This resource estimate is based upon an initial assessment. A feasibility study would be completed before we decide whether to proceed with the development of this project to ensure the salt resources can be converted into reserves. The development of this project would require significant infrastructure to establish extraction and logistics capabilities. As of September 30, 2023 our investment in these rights totaled $8.5 million.
Summary of Mineral Resources and Reserves
Summaries of our mineral resources and reserves at the end of fiscal 2023 are set forth in Tables 1 and 2.
|
|
|
|
|
|
|
|
|
|
|
COMPASS MINERALS INTERNATIONAL, INC. |
Table 1. Summary Mineral Resources at September 30, 2023
|
|
|
|
|
|
|
|
|
|
|
|
|
|
|
|
|
|
|
|
|
|
|
|
|
Measured Mineral Resources (tons, except LCE)(1) |
|
Indicated Mineral Resources (tons, except LCE)(1) |
|
Measured + Indicated Mineral Resources (tons, except LCE)(1) |
|
Inferred Mineral Resources (tons, except LCE)(1) |
Salt(2)(3) |
| United States |
|
|
|
|
|
|
|
| Cote Blanche mine |
34,512,821 |
|
629,032,729 |
|
663,545,550 |
|
163,767,364 |
Ogden facility(4) |
— |
|
2,140,217,016 |
|
2,140,217,016 |
|
— |
| Lyons |
138,056,446 |
|
193,979,000 |
|
332,035,446 |
|
— |
| Total United States |
172,569,267 |
|
2,963,228,745 |
|
3,135,798,012 |
|
163,767,364 |
| Canada |
|
|
|
|
|
|
|
| Goderich mine |
— |
|
1,453,008,027 |
|
1,453,008,027 |
|
148,200,000 |
| Goderich plant |
67,314,523 |
|
41,700,000 |
|
109,014,523 |
|
— |
| Amherst |
— |
|
408,968,364 |
|
408,968,364 |
|
— |
| Unity |
— |
|
252,080,803 |
|
252,080,803 |
|
— |
| Total Canada |
67,314,523 |
|
2,155,757,194 |
|
2,223,071,717 |
|
148,200,000 |
| United Kingdom |
|
|
|
|
|
|
|
| Winsford |
44,090,387 |
|
7,730,000 |
|
51,820,387 |
|
— |
| Total United Kingdom |
44,090,387 |
|
7,730,000 |
|
51,820,387 |
|
— |
| Chile |
|
|
|
|
|
|
|
| Atacama Desert property |
— |
|
102,531,129 |
|
102,531,129 |
|
— |
| Total Chile |
— |
|
102,531,129 |
|
102,531,129 |
|
— |
| Total Salt |
283,974,177 |
|
5,229,247,068 |
|
5,513,221,245 |
|
311,967,364 |
|
|
|
|
|
|
|
|
SOP(5)(6) |
| United States |
|
|
|
|
|
|
|
Ogden facility(7) |
— |
|
89,707,351 |
|
89,707,351 |
|
— |
| Total United States |
— |
|
89,707,351 |
|
89,707,351 |
|
— |
| Canada |
|
|
|
|
|
|
|
Wynyard(8) |
— |
|
— |
|
— |
|
— |
| Total Canada |
— |
|
— |
|
— |
|
— |
| Total SOP |
— |
|
89,707,351 |
|
89,707,351 |
|
— |
|
|
|
|
|
|
|
|
Magnesium Chloride(9)(10) |
| United States |
|
|
|
|
|
|
|
Ogden facility(11) |
— |
|
359,378,669 |
|
359,378,669 |
|
— |
| Total United States |
— |
|
359,378,669 |
|
359,378,669 |
|
— |
| Total Magnesium Chloride |
— |
|
359,378,669 |
|
359,378,669 |
|
— |
|
|
|
|
|
|
|
|
LCE (tonnes)(12)(13)(14) |
| United States |
|
|
|
|
|
|
|
Ogden facility(11) |
— |
|
2,401,218 |
|
2,401,218 |
|
45,221 |
| Total United States |
— |
|
2,401,218 |
|
2,401,218 |
|
45,221 |
| Total LCE |
— |
|
2,401,218 |
|
2,401,218 |
|
45,221 |
(1)Mineral resources are reported in situ. Mineral resources are not mineral reserves and do not have demonstrated economic viability. There is no certainty that all or any part of the mineral resources will be converted into mineral reserves upon application of modifying factors.
|
|
|
|
|
|
|
|
|
|
|
COMPASS MINERALS INTERNATIONAL, INC. |
(2)Based on an average sodium chloride grade of 97,350 milligrams per liter (“mg/L”) in the north arm of the Great Salt Lake and 46,300 mg/L in the south arm of the Great Salt Lake. Reported concentrations for the Great Salt Lake assume an indicative lake level of 4,194.4 feet in the south arm and 4,193.5 feet in the north arm. Grades of in-situ sodium chloride range from 75% at our Lyons facility to 98% at the Goderich mine. Although the actual sodium chloride grade at our underground mines is less than 100%, it is not considered in the resource, as the final saleable product is the in situ product, as-present (i.e., the saleable product includes any impurities present in the in situ rock).
(3)There are multiple saleable products based on salt quality from the underground mining operations (rock salt for road deicing and chemical grade salt). For simplicity, all sales are assumed at the lower value (and higher tonnage) product, rock salt, and are based on pricing data based on a five-year average (2017 through 2021) of historical sales data for rock salt for road deicing of $64.12 per ton to $82.65 per ton. Sales prices are projected to increase to approximately $295.60 per ton to $706.49 per ton for rock salt for road deicing through the current expected end of mine life.
(4)The Company does not have exclusive access to mineral resources in the lake and other existing operations, including those run by US Magnesium, Morton Salt and Cargill, also extract dissolved mineral from the lake (all in the south arm).
(5)With respect to the Ogden facility, based on an average potassium grade of 7,320 mg/L in the north arm of the Great Salt Lake and 3,060 mg/L in the south arm of the Great Salt Lake. Reported concentrations for the Great Salt Lake assume an indicative lake level of 4,194.4 feet in the south arm and 4,193.5 feet in the north arm.
(6)With respect to the Ogden facility, based on pricing data based on a five-year average (2019 through 2023) of historical sales data for SOP of $647 per ton. Sales prices are projected to increase to approximately $8,529 per ton through the current expected end of mine life.
(7)The Company does not have exclusive access to mineral resources in the lake and other existing operations, including those run by US Magnesium and Cargill, also extract dissolved mineral from the lake (all in the south arm).
(8)No resources or reserves have been estimated for the Wynyard facility since the production process relies on the import of KCl as a source of potassium from external sources, with supplemental potassium from a relatively dilute concentration of potassium (approximately 0.05%) from Big Quill Lake.
(9)Based on an average magnesium chloride grade of 11,150 mg/L in the north arm of the Great Salt Lake and 4,790 mg/L in the south arm of the Great Salt Lake. Reported concentrations for the Great Salt Lake assume an indicative lake level of 4,194.4 feet in the south arm and 4,193.5 feet in the north arm.
(10)Based on pricing data based on a five-year average (2019 through 2023) of historical sales data for magnesium chloride of $66.20 per ton. Sales prices are projected to increase to approximately $736.78 per ton through the current expected end of mine life.
(11)The Company does not have exclusive access to mineral resources in the lake and other existing operations, including those run by US Magnesium, also extract dissolved mineral from the lake (in the south arm).
(12)Expressed in metric tons (tonnes).
(13)Based on an average lithium grade of 51 mg/L in the north arm of the Great Salt Lake and 25 mg/L in the south arm of the Great Salt Lake. Reported concentrations for the Great Salt Lake assume an indicative lake level of 4,194.4 feet in the south arm and 4,193.5 feet in the north arm. Average grade of lithium in the solar evaporation ponds at the Ogden facility ranges from 205 mg/L to 318 mg/L.
(14)The qualified persons (the “QPs”) determined a cut-off grade for lithium concentration in the ambient brine of the Great Salt Lake of 9 mg/L, using the average price for LCE over the past five years (2018 through 2022) as reported by Benchmark Mineral Intelligence of $13,086/tonne LCE and $15,765/tonne for lithium hydroxide monohydrate (LHM). However, the QPs believe it is likely that the SOP operation will continue depleting lithium from the ambient waters of the Great Salt Lake after concentrations of lithium are below an estimated cut-off grade and that the Company will continue concentrating lithium in its evaporation pond process until lithium concentrations in the Great Salt Lake reach null. See Section 11 of the Ogden Lithium TRS (as defined below) for a discussion of the material assumptions underlying the cut-off grade analysis.
|
|
|
|
|
|
|
|
|
|
|
COMPASS MINERALS INTERNATIONAL, INC. |
Table 2. Summary Mineral Reserves at September 30, 2023
|
|
|
|
|
|
|
|
|
|
|
|
|
|
|
|
|
|
|
Proven Mineral Reserves (tons)(1) |
|
Probable Mineral Reserves (tons)(1) |
|
Total Mineral Reserves (tons)(1) |
Salt(2)(3) |
| United States |
|
|
|
|
|
| Cote Blanche mine |
19,487,502 |
|
236,547,378 |
|
256,034,880 |
| Ogden facility |
— |
|
158,425,314 |
|
158,425,314 |
| Lyons |
— |
|
18,606,214 |
|
18,606,214 |
| Total United States |
19,487,502 |
|
413,578,906 |
|
433,066,408 |
| Canada |
|
|
|
|
|
| Goderich mine |
— |
|
457,690,728 |
|
457,690,728 |
| Goderich plant |
271,982 |
|
5,700,000 |
|
5,971,982 |
| Amherst |
— |
|
5,296,444 |
|
5,296,444 |
| Unity |
355,890 |
|
24,179,074 |
|
24,534,964 |
| Total Canada |
627,872 |
|
492,866,246 |
|
493,494,118 |
| United Kingdom |
|
|
|
|
|
| Winsford |
20,938,601 |
|
3,710,000 |
|
24,648,601 |
| Total United Kingdom |
20,938,601 |
|
3,710,000 |
|
24,648,601 |
| Chile |
|
|
|
|
|
| Atacama Desert property |
— |
|
— |
|
— |
| Total Chile |
— |
|
— |
|
— |
| Total Salt |
41,053,975 |
|
910,155,152 |
|
951,209,127 |
|
|
|
|
|
|
SOP(4)(5) |
| United States |
|
|
|
|
|
| Ogden facility |
— |
|
45,284,552 |
|
45,284,552 |
| Total United States |
— |
|
45,284,552 |
|
45,284,552 |
| Canada |
|
|
|
|
|
Wynyard(6) |
— |
|
— |
|
— |
| Total Canada |
— |
|
— |
|
— |
| Total SOP |
— |
|
45,284,552 |
|
45,284,552 |
|
|
|
|
|
|
Magnesium Chloride(7)(8) |
| United States |
|
|
|
|
|
| Ogden facility |
— |
|
94,020,802 |
|
94,020,802 |
| Total United States |
— |
|
94,020,802 |
|
94,020,802 |
| Total Magnesium Chloride |
— |
|
94,020,802 |
|
94,020,802 |
(1)Ore reserves are as recovered, saleable product.
(2)Based on an average sodium chloride grade of 97,350 mg/L in the north arm of the Great Salt Lake and 46,300 mg/L in the south arm of the Great Salt Lake. Reported concentrations for the Great Salt Lake assume an indicative lake level of 4,194.4 feet in the south arm and 4,193.5 feet in the north arm. Grades of in-situ sodium chloride range from 75% at our Lyons facility to 98% at the Goderich mine. Although the actual sodium chloride grade at our underground mines is less than 100%, it is not considered in the reserve, as the final saleable product is the in situ product, as-present (i.e., the saleable product includes any impurities present in the in situ rock).
(3)There are multiple saleable products based on salt quality from the underground mining operations (rock salt for road deicing and chemical grade salt). For simplicity, all sales are assumed at the lower value (and higher tonnage) product, rock salt, and are based on pricing data based on a five-year average (2019 through 2023) of historical sales data for rock salt for road deicing of $64.12 per ton to $82.65 per ton. Sales prices are projected to increase to approximately $295.60 per ton to $706.49 per ton for rock salt for road deicing through the current expected end of mine life.
(4)With respect to the Ogden facility, based on an average potassium grade of 7,320 mg/L in the north arm of the Great Salt Lake and 3,060 mg/L in the south arm of the Great Salt Lake. Reported concentrations for the Great Salt Lake assume an indicative lake level of 4,194.4 feet in the south arm and 4,193.5 feet in the north arm.
|
|
|
|
|
|
|
|
|
|
|
COMPASS MINERALS INTERNATIONAL, INC. |
(5)With respect to the Ogden facility, based on pricing data based on a five-year average (2019 through 2023) of historical sales data for SOP of $647 per ton. Sales prices are projected to increase to approximately $8,529 per ton through the current expected end of mine life.
(6)No resources or reserves have been estimated for the Wynyard facility since the production process relies on the import of KCl as a source of potassium from external sources, with supplemental potassium from a relatively dilute concentration of potassium (approximately 0.05%) from Big Quill Lake.
(7)Based on an average magnesium chloride grade of 11,150 mg/L in the north arm of the Great Salt Lake and 4,790 mg/L in the south arm of the Great Salt Lake. Reported concentrations for the Great Salt Lake assume an indicative lake level of 4,194.4 feet in the south arm and 4,193.5 feet in the north arm.
(8)Based on pricing data based on a five-year average (2019 through 2023) of historical sales data for magnesium chloride of $66.20 per ton. Sales prices are projected to increase to approximately $736.78 per ton through the current expected end of mine life.
Our mineral resource and reserve estimates were prepared by a QP and have a basis in periodic, historical reserve studies completed by third-party geological engineering firms. Our mineral resource and reserve estimates and the third-party reserve studies are based on many factors, including the area and volume covered by our mining rights, assumptions regarding our extraction rates based upon an expectation of operating the mines on a long-term basis and the quality of in-place reserves. Established criteria for inferred, indicated and measured resources and proven and probable reserves are primarily applicable to mining deposits of discontinuous metal, where both the presence of ore and its variable grade need to be precisely identified. However, the massive continuous nature of evaporative deposits, such as salt deposits, requires proportionately less data for the same degree of confidence in mineral resources and reserves, both in terms of quantity and quality.
The Ogden facility is a production stage property that separates and processes potassium, sodium and magnesium salts from brine sourced from the Great Salt Lake in Utah. The primary product currently produced at the Ogden facility is SOP (which is a potassium-rich salt used as plant fertilizer), with coproduct production of sodium chloride (which is used for highway deicing and chemical applications) and magnesium chloride (which is used in deicing, dust control and unpaved road surface stabilization applications and is an ingredient in our fire retardant products). The Company has also identified a lithium resource at the Ogden facility, but has recently indefinitely suspended its plans to add lithium salt as a coproduct to SOP production. The Ogden facility relies upon solar evaporation to concentrate brine extracted from the north arm of the Great Salt Lake and precipitate the salts into a series of large evaporation ponds located on the east and west sides of the lake, referred to as the east ponds and the west ponds, respectively, prior to harvesting and processing at its related plant (the “Ogden plant”). Maps of the Ogden facility are shown in Figures 1 and 2.
|
|
|
|
|
|
|
|
|
|
|
COMPASS MINERALS INTERNATIONAL, INC. |
Figure 1. Ogden Facility Property Location Map
|
|
|
|
|
|
|
|
|
|
|
COMPASS MINERALS INTERNATIONAL, INC. |
Figure 2. Locations of East and West Ponds Relative to the Ogden Plant and the Great Salt Lake
The Great Salt Lake is the largest saltwater lake in the western hemisphere, and the fourth largest terminal lake in the world, covering approximately 1,700 square miles. It is also one of the most saline lakes in the world, with a chemical composition very similar to the world’s oceans. Salinity throughout the Great Salt Lake is governed by lake level, freshwater inflows, precipitation and re-solution of salt, mineral extraction, and circulation and constriction between bays of the lake.
The infrastructure associated with the Ogden facility, including the Ogden plant, is located on the shores of the Great Salt Lake in Box Elder and Weber Counties in the State of Utah. The Ogden plant is located at the approximate coordinates of 41˚16’51” North and 112˚13’53” West on the east side of the lake approximately 15 miles (by road) to the west of Ogden, Utah, and 50 miles (by road) to the northwest of Salt Lake City, Utah. The east ponds are located adjacent (to the north and west) to the Ogden plant in Bear River Bay. The west ponds are located on the opposite side of the Great Salt Lake (due west) in Clyman and Gunnison Bays. Access to the Ogden facility is via Ogden, Utah, and its vicinity on paved two-lane roads. From Salt Lake City, Utah, located 40 miles to the south, Ogden is accessible via Interstate Highway 15. Commercial air travel is accessible from Salt Lake City. The area population provides a more than adequate base for staffing the Ogden facility, with a pool of talent for both trades and technical management. The Ogden facility is connected to the local municipal water distribution system, Weber Basin Water Conservation District. The Ogden facility is also connected to the local electrical and natural gas distribution systems provided by Rocky Mountain Power and Dominion Energy, respectively, and houses an existing substation that services the operations at the east ponds. Rail access is provided by Union Pacific Railroad on an existing siding at the Ogden plant.
The Ogden facility is located on approximately 184,947 acres of land, of which approximately 7,434.16 acres are owned by the Company. The Great Salt Lake and minerals associated with it are owned by the State of Utah. The Company is able to extract and produce salts from the lake by rights derived from a combination of: (i) lakebed lease agreements (the “Lakebed Leases”) with the Utah Department of Natural Resources, Division of Forestry, Fire and State Lands (the “Utah FFSL”); (ii) one lease for upland evaporation ponds (the “Upland Pond Lease”) with the State of Utah School and Institutional Trust Lands Administration (the “Utah SITLA”); (iii) seven non-solar leases and easements; (iv) water rights for consumption of brines and
|
|
|
|
|
|
|
|
|
|
|
COMPASS MINERALS INTERNATIONAL, INC. |
freshwater (the “Water Rights”) through the Utah Department of Natural Resources, Division of Water Rights; (v) a large mine operation mineral extraction permit (GSL Mine M/057/0002) (the “Mineral Extraction Permit”) through the Utah Department of Natural Resources, Division of Oil, Gas and Mining (the “Utah DOGM”); and (vi) a royalty agreement for extraction of all mineral salts, dated September 1, 1962 (as amended from time to time, the “Royalty Agreement”), with the Utah State Land Board.
Leasable areas for mineral extraction on the Great Salt Lake lakebed are identified in the Great Salt Lake Comprehensive Management Plan (the “GSL Plan”), which is managed by the Utah FFSL. The GSL Plan is updated approximately every ten years, or when there are major changes to the Great Salt Lake environment and setting. A party interested in leasing lakebed for mineral extraction may nominate an area within the area designated by the GSL Plan as leasable, at which time, the Utah FFSL will issue public notice of lease nomination, conduct an environmental assessment on the nominated lease area, and ultimately consider approval of the lease nomination. This process was followed historically in the acquisition of existing Lakebed Leases held by the Company for the Ogden facility.
The Lakebed Leases and Upland Pond Lease provides the Company the right to develop mineral extraction and processing facilities on the shore of the Great Salt Lake. The Lakebed Leases and Upland Pond Lease were issued between 1965 and 2022 and cover a total lease area of approximately 177,513 acres among 12 active leases, though not all are currently utilized.
Each of the Lakebed Leases, except Mineral Lease 20000107, remains in effect until the termination of the Royalty Agreement. Most of the Lakebed Leases provide the State of Utah with the opportunity to periodically adjust the lease’s terms, except for the royalties to be paid. These readjustment opportunities occur at intervals ranging from five to 20 years. In the past, these periodic readjustments have not materially hindered the business.
Pursuant to each of the Lakebed Leases (except for Mineral Lease 20000107), the Company is obligated to pay rent at rates ranging from $0.50 to $2.00 per acre per year, and some leases have a minimum rent of $10,000 per year. The rent paid pursuant to each lease is credited against the Company’s royalty obligations pursuant to the Royalty Agreement (as described further below). The rent for Mineral Lease 20000107 is $69,024 annually and is not credited against royalties due. The Lakebed Leases do not impose any material conditions on the Company’s retention of the property except for the continued production of commercial quantities of minerals and payment of rent and royalties.
The Upland Pond Lease consists of a single Special Use Lease Agreement (“SULA”) 1971, consisting of 37,181 acres, which was acquired on July 14, 2022. The rent for SULA 1971 is $427,584 per year. SULA 1971 is a 50-year lease expiring on June 30, 2072. SULA 1971 consists of former SULA 1186, which was acquired in May 1999, and SULA 1267, which was acquired from Solar Resources International in 2013, as well as an additional 13,833 acres. The Upland Pond Lease allows for the construction and operation of evaporation ponds on the subject properties. The Upland Pond Lease does not impose any material conditions on the Company’s retention of the property except for payment of rent.
The Company also holds seven non-solar leases and easements granted by Utah FFSL or Utah SITLA covering approximately 1,258 acres. Two of these are material to the operation of the Ogden facility, Behrens Trench Easement 400-00313 and PS-113 Easement SOV002-0400. The Company paid a one-time fee of $42,514 for Behrens Trench Easement 400-00313, which expires in June 2051. The Company paid a one-time fee of $27,273 for PS-113 Easement SOV002-0400, which does not expire. The Company also has a lease indenture for a brine canal with the Union Pacific Railroad, dated April 13, 1967, on Promontory Point. The indenture automatically renews with payment, which is $595.72 annually.
The Water Rights are procured by application to the Utah Department of Natural Resources, Division of Water Rights, which reviews the application and evaluates the proposed nature of use, place of use, and point of diversion in light of availability of water pursuant to hydrology and/or prior claims relative to the available water, and whether the proposed use would impair existing water right holders. The application is posted for public review and comment, and the State Engineer evaluates the merits of the application and either approves or denies the application, sometimes with modifications or conditions on future use. The Water Rights control the actual extraction of minerals from the Great Salt Lake and dictate the amount of brine that can be pumped from the lake on an annual basis. The Company has 156,000 acre-feet extraction rights from the north arm of the Great Salt Lake under five Water Rights, on which it relies for its current production. The Company holds additional 205,000 acre-feet water extraction rights that can be utilized on either the north or south arms of the Great Salt Lake under two Water Rights that are currently unutilized. As a limit on the volume of brine that can be pumped from the lake in a year, the Water Rights effectively cap the aggregate production of salt that is possible in any year. The Company has certificated the Water Rights that contribute to the 156,000 acre feet of extraction rights, meaning that demonstration of actual use in order to retain the right in perpetuity has been approved and authorized.
The Mineral Extraction Permit (GSL Mine M/057/0002) was granted by the Utah DOGM. The Mineral Extraction Permit enables extraction of brine from the Great Salt Lake and ultimate mineral extraction from the brine. The Mineral Extraction Permit also enables all lake extraction, pond operations, and plant and processing operations conducted by the Company at the Ogden facility. The Mineral Extraction Permit is supported by a reclamation plan that documents all aspects of current operations and mandates certain closure and reclamation requirements in accordance with Utah Rule R647-4-104. Financial assurance for the ultimate reclamation of facilities is documented in the reclamation plan, and security for costs that will be incurred to execute site closure is provided by a third-party insurer to the State of Utah in the form of a surety bond. The total future reclamation obligation is estimated to be $4.36 million. The Company expects that its lithium extraction plans are
|
|
|
|
|
|
|
|
|
|
|
COMPASS MINERALS INTERNATIONAL, INC. |
allowed under the terms of the Mineral Extraction Permit, but is seeking further clarity on the regulatory framework following the passage by the Utah State Legislature of House Bill 513 and the subsequent regulatory rulemaking. As previously announced, we have suspended indefinitely any further investment in the lithium project in Utah beyond certain already committed items associated with the early stages of construction of our commercial scale demonstration unit until further clarity is provided on the evolving regulatory climate. Any greenfield expansion of ponds or appurtenances beyond the existing facility footprint would require a modification to the Mineral Extraction Permit regardless of the mineral(s) developed.
Pursuant to the Royalty Agreement, the Company has rights to all salts from the Great Salt Lake, and in exchange, the Company pays a royalty to the State of Utah based on net revenues (gross revenue net of sales taxes and shipping and handling costs) per pound of salts produced. Under the Royalty Agreement, the current royalty rate for SOP is 4.8% of gross revenues, the current royalty rate for magnesium chloride is 5% of gross revenues, and the current royalty rate for sodium chloride is $0.50/ton times the Producer Price Index. Currently, there is no statutory royalty rate specifically for lithium products in Utah, but the statutory rate for other mined minerals in Utah is 5% of net revenues. Notwithstanding, as has been customary over the life of the umbrella Royalty Agreement that provides rights to all salts and minerals in the brine of the Great Salt Lake, including the three salts currently in production, the parties may negotiate a framework specific to lithium salts. We would expect such a framework to be calibrated to lithium market factors, competitive with royalty structures utilized in other lithium producing jurisdictions, and cognizant of potential deductible costs unique to the production and shipment of final lithium salt products. To produce lithium products of lithium carbonate or lithium hydroxide, the Company would reasonably expect to deduct the cost of purchased carbonate or hydroxide inputs from net revenue. The Royalty Agreement does not expire so long as paying quantities of minerals are produced and the Company pays a minimum royalty of not less than $10,000 per year.
The Ogden facility is the largest SOP production site in the western hemisphere, and one of only four large-scale solar brine evaporation operations for SOP in the world. We believe the Ogden facility has the capability to produce 320,000 tons of SOP, including amounts produced with both solar-pond based feedstock and supplemental KCl feedstock when economically feasible, approximately 750,000 tons of magnesium chloride and 1.5 million tons of sodium chloride annually during normal weather and pond chemistry conditions. These recoverable minerals exist in vast quantities in the Great Salt Lake.
Solar evaporation is used in areas of the world where high-salinity brine is available and weather conditions provide for a high natural evaporation rate. Mineral-rich lake water, or brine, from the Great Salt Lake is drawn into the solar evaporation ponds. The brine moves through a series of solar evaporation ponds over a two- to three-year production cycle. As the water evaporates and the mineral concentration increases, some of those minerals naturally precipitate out of the brine and are deposited on the pond floors. These deposits provide the minerals necessary for processing into SOP, solar salt and magnesium chloride. The evaporation process is dependent upon sufficient lake brine levels and hot, arid summer weather conditions. The potassium-bearing salts are mechanically harvested out of the solar evaporation ponds and refined to high-purity SOP through flotation, crystallization and compaction at the Ogden plant. After sodium chloride and potassium-rich salts precipitate from brine, a concentrated magnesium chloride brine solution remains, which becomes the raw material used to produce several magnesium chloride products. Recent analysis and evaluations conducted by the Company have also demonstrated that this magnesium chloride solution contains material quantities of lithium (as a lithium chloride salt), which, when combined with the naturally occurring lithium content of the Great Salt Lake, forms the basis for the estimates of the lithium mineral resources at the Ogden facility summarized below.
Operations have been ongoing at the Ogden facility since the late 1960s, with commercial production starting in 1970. Lithium Corporation of America (“Lithcoa”), separately, and then in a partnership with a wholly owned subsidiary of Salzdetfurth, A.G., carried out initial exploration and development activities between 1963 and 1966. In 1967, Gulf Resources and Minerals Co., or Gulf Resources, acquired Lithcoa, and in 1973, acquired Salzdetfurth, A.G.’s (then known as Kaliund Salz A.G.) partnership interest. Gulf Resources made significant capital expenditures in the early 1980s to protect the evaporation pond system at the Ogden facility from the rising levels of the Great Salt Lake. On May 5, 1984, a northern dike of the system breached, resulting in severe flooding and damage to about 85% of the pond complex. The breach resulted in physical damage to dikes, pond floors, bridges, pump stations, and other structures. In addition, brine inventories were diluted, making them unusable for producing SOP. During the next five years, Gulf Resources pumped the water from its solar ponds, reconstructed peripheral and interior dikes and roads, replaced pump stations, and laid down new salt floors in order to restart its operation at the Ogden facility. In 1993, D.G. Harris & Associates acquired the Ogden facility, and in 1994, constructed the west ponds, which are connected to the east ponds by a 21-mile, open, underwater canal called the Behrens Trench, which was dredged in the lakebed from the west ponds’ outlet to a pump station near the east ponds. Ownership of the Ogden facility was transferred in 1997 to IMC Global (“IMC”), following its acquisition of Harris Chemical Group (part of D.G. Harris & Associates). IMC sold a majority of its salt operations, including the Ogden facility, to Apollo Management V, L.P. through an entity called Compass Minerals Group in 2001. Following a leveraged recapitalization, the company now known as Compass Minerals International, Inc. completed an initial public offering in 2003.
The Company has operated the Ogden facility since its initial public offering in 2003. In that time, the Company has invested funds and acquired necessary permits to increase the efficiency and expand the capacity of the Ogden facility through upgrades to the Ogden plant and solar evaporation ponds. The Company believes that the Ogden facility and its operating equipment are maintained in good working condition. The net book value of property, plant and equipment associated with the
|
|
|
|
|
|
|
|
|
|
|
COMPASS MINERALS INTERNATIONAL, INC. |
Ogden facility as of September 30, 2023 was $236,500,000, exclusive of mineral rights and the value of assets leased under operating leases.
Beginning in 2018, the Company undertook a program to better understand lithium concentrations within the processes of the ongoing operations at the Ogden facility, and specifically, within the brine remnants hosted within the halite beds of the largest evaporation ponds. Activities undertaken to date have included pot-hole trenching, sonic core drilling, aquifer testing within the salt mass, brine sampling and analysis, and geotechnical analysis of the halite to better understand its hydraulic properties. The Company has also conducted bench-top and pilot scale mineral processing and metallurgical testing to evaluate the efficacy of lithium salt extraction from Great Salt Lake brine as a coproduct to the existing production of other salts.
The Ogden facility has procured and is operating in compliance with all required operating licenses, including permits pertaining to mineral extraction, effluent discharge and air permitting. The Ogden facility operates under a Title V air permit (# 5700001003), which is administered by the Utah Department of Environmental Quality. The permit covers emissions from the pond and plant operations and expires in December 2026. Additional air permitting will be required for processing plants associated with the planned extraction of lithium, the specific requirements of which are unknown and will depend upon the design of the processing plant. Surface water discharges from the Ogden facility are regulated under Utah Pollutant Discharge Elimination System permit UT0000647. The permit requires discharge monitoring for effluent flows from the nine outfalls that discharge into the saline waters of the Great Salt Lake and regulates inputs in pond and plant processes that may be discharged in project effluent.
Summaries of the Ogden facility’s potassium and SOP mineral resources and mineral reserves as of September 30, 2023 and 2022 are shown in Tables 3 and 4, respectively. Summaries of the Ogden facility’s magnesium and magnesium chloride mineral resources and mineral reserves as of September 30, 2023 and 2022 are shown in Tables 5 and 6, respectively. Summaries of the Ogden facility’s sodium and sodium chloride mineral resources and mineral reserves as of September 30, 2023 and 2022 are shown in Tables 7 and 8, respectively. Joseph Havasi, who is employed full-time as the Vice President, Natural Resources, of the Company, served as the QP and prepared the estimates of potassium and SOP, magnesium and magnesium chloride, and sodium and sodium chloride mineral resources and mineral reserves at the Ogden facility. The material assumptions and information pertaining to the Company’s disclosure of mineral resources and mineral reserves at the Ogden facility are based on the Technical Report Summary with respect to Potassium and SOP, Magnesium and Magnesium Chloride and Salt for the Ogden facility, dated November 29, 2021, as amended on December 14, 2022, with an effective date of September 30, 2021 (the “Ogden Potassium/Magnesium/Sodium TRS”). This Annual Report on Form 10-K also reflects more recent information obtained from the QP as of September 30, 2023, which supplements and updates information from such TRS.
|
|
|
|
|
|
|
|
|
|
|
COMPASS MINERALS INTERNATIONAL, INC. |
Table 3. Ogden Facility – Summary of Potassium and SOP Mineral Resources at September 30, 2023 and 2022
|
|
|
|
|
|
|
|
|
|
|
|
|
|
|
|
|
|
|
|
|
|
|
|
|
|
|
|
|
|
|
September 30, 2023 |
|
September 30, 2022 |
| Resource Area |
Average Potassium Grade (mg/L)(7) |
Potassium Resources (tons)(1)(2)(4)(5) |
Cut-Off Grade (mg/L)(6) |
SOP Resources (tons)(1)(2)(3)(4)(5) |
|
Average Potassium Grade (mg/L)(7) |
Potassium Resources (tons)(1)(2)(4)(5) |
Cut-Off Grade (mg/L)(6) |
SOP Resources (tons)(1)(2)(3)(4)(5) |
| Measured Resources |
| Total Measured Resources |
— |
— |
— |
— |
|
— |
— |
— |
— |
| Indicated Resources |
| Great Salt Lake North Arm |
7,320 |
14,245,372 |
4,000 |
31,707,350 |
|
7,320 |
14,361,555 |
4,000 |
31,965,949 |
| Great Salt Lake South Arm |
3,060 |
26,057,971 |
1,660 |
58,000,000 |
|
3,060 |
26,057,971 |
1,660 |
58,000,000 |
| Total Indicated Resources |
|
40,303,343 |
|
89,707,350 |
|
|
40,419,526 |
|
89,965,949 |
| Measured + Indicated Resources |
| Great Salt Lake North Arm |
7,320 |
14,245,372 |
4,000 |
31,707,350 |
|
7,320 |
14,361,555 |
4,000 |
31,965,949 |
| Great Salt Lake South Arm |
3,060 |
26,057,971 |
1,660 |
58,000,000 |
|
3,060 |
26,057,971 |
1,660 |
58,000,000 |
| Total Measured + Indicated Resources |
|
40,303,343 |
|
89,707,350 |
|
|
40,419,526 |
|
89,965,949 |
| Inferred Resources |
| Total Inferred Resources |
— |
— |
— |
— |
|
— |
— |
— |
— |
(1)Mineral resources are not mineral reserves and do not have demonstrated economic viability. There is no certainty that all or any part of the mineral resources will be converted into mineral reserves upon application of modifying factors.
(2)Mineral resources are reported in situ for the both the north arm and the south arm of the Great Salt Lake.
(3)Conversion of potassium to SOP uses a factor of 2.2258 tons of SOP per ton of potassium.
(4)Included process recovery is approximately 7.8% based on historical production results. Mining or metallurgical recovery is not applicable for this operation.
(5)Based on pricing data described in Section 18.1 of the Ogden Potassium/Magnesium/Sodium TRS. The pricing data is based on a five-year average (2019 through 2023) of historical sales data for SOP of $647 per ton. Sales prices are projected to increase to approximately $8,529 per ton for SOP through year 2161 (the current expected end of mine life).
(6)Estimated cut-off grade of approximately 4,000 milligrams of potassium per liter of brine extracted from the north arm of the Great Salt Lake, and a cut-off grade of 1,660 milligrams of potassium per liter of brine in the south arm of the Great Salt Lake, which ultimately flows into the north arm of the Great Salt Lake. The QP assumes that when the north arm of the Great Salt Lake (where the Ogden facility sources its brine) reaches this concentration level, the Ogden facility will halt production of potassium and SOP.
(7)Reported potassium concentration for the Great Salt Lake assumes an indicative lake level of 4,194.4 feet in the south arm and 4,193.5 feet in the north arm.
|
|
|
|
|
|
|
|
|
|
|
COMPASS MINERALS INTERNATIONAL, INC. |
Table 4. Ogden Facility – Summary of Potassium and SOP Mineral Reserves at September 30, 2023 and 2022
|
|
|
|
|
|
|
|
|
|
|
|
|
|
|
|
|
|
|
|
|
|
|
|
|
|
|
|
|
|
|
September 30, 2023 |
|
September 30, 2022 |
| Reserve Area |
Average Potassium Grade (mg/L)(7) |
Potassium Reserves (tons)(1)(2)(4)(5) |
Cut-Off Grade (mg/L)(6) |
SOP Reserves (tons)(1)(2)(3)(4)(5) |
|
Average Potassium Grade (mg/L)(7) |
Potassium Reserves (tons)(1)(2)(4)(5) |
Cut-Off Grade (mg/L)(6) |
SOP Reserves (tons)(1)(2)(3)(4)(5) |
| Proven Reserves |
| Total Proven Reserves |
— |
— |
— |
— |
|
— |
— |
— |
— |
| Probable Reserves |
| Great Salt Lake North Arm |
7,320 |
20,345,292 |
4,000 |
45,284,552 |
|
7,320 |
20,452,413 |
4,000 |
45,522,980 |
| Great Salt Lake South Arm |
— |
— |
— |
— |
|
— |
— |
— |
— |
| Total Probable Reserves |
7,320 |
20,345,292 |
4,000 |
45,284,552 |
|
7,320 |
20,452,413 |
4,000 |
45,522,980 |
| Total Reserves |
| Great Salt Lake North Arm |
7,320 |
20,345,292 |
4,000 |
45,284,552 |
|
7,320 |
20,452,413 |
4,000 |
45,522,980 |
| Great Salt Lake South Arm |
— |
— |
— |
— |
|
— |
— |
— |
— |
| Total Reserves |
7,320 |
20,345,292 |
4,000 |
45,284,552 |
|
7,320 |
20,452,413 |
4,000 |
45,522,980 |
(1)Mineral reserves are as recovered, saleable product.
(2)Annual production rates for SOP are assumed to be 320,000 tons per year, relating to a depletion of 145,833 tons of potassium per year. Based on the QP’s reserve model, the life of mine is estimated to be 138 years.
(3)Conversion of potassium to SOP uses a factor of 2.2258 tons of SOP per ton of potassium.
(4)Included process recovery is approximately 7.8% based on historical production results. Mining or metallurgical recovery is not applicable for this operation.
(5)The pricing data is based on a five-year average (2019 through 2023) of historical sales data for SOP of $647 per ton. Sales prices are projected to increase to approximately $8,529 per ton for SOP through year 2161 (the current expected end of mine life).
(6)Estimated cut-off grade of approximately 4,000 milligrams of potassium per liter of brine extracted from the north arm of Great Salt Lake, and a cut-off grade of 1,660 milligrams of potassium per liter of brine in the south arm of the Great Salt Lake, which ultimately flows into the north arm of the Great Salt Lake. The QP assumes that when the north arm of the Great Salt Lake (where the Ogden facility sources its brine) reaches this concentration level, the Ogden facility will halt production of potassium and SOP.
(7)Reported potassium concentration for the Great Salt Lake assumes an indicative lake level of 4,194.4 feet in the south arm and 4,193.5 feet in the north arm.
|
|
|
|
|
|
|
|
|
|
|
COMPASS MINERALS INTERNATIONAL, INC. |
Table 5. Ogden Facility – Summary of Magnesium and Magnesium Chloride Mineral Resources at September 30, 2023 and 2022
|
|
|
|
|
|
|
|
|
|
|
|
|
|
|
|
|
|
|
|
|
|
|
|
|
|
|
|
|
|
|
September 30, 2023 |
|
September 30, 2022 |
| Resource Area |
Average Magnesium Grade (mg/L)(7) |
Magnesium Resources (tons)(1)(2)(4)(5) |
Cut-Off Grade (mg/L)(6) |
Magnesium Chloride Resources (tons)(1)(2)(3)(4)(5) |
|
Average Magnesium Grade (mg/L)(7) |
Magnesium Resources (tons)(1)(2)(4)(5) |
Cut-Off Grade (mg/L)(6) |
Magnesium Chloride Resources (tons)(1)(2)(3)(4)(5) |
| Measured Resources |
| Total Measured Resources |
— |
— |
— |
— |
|
— |
— |
— |
— |
| Indicated Resources |
| Great Salt Lake North Arm |
11,120 |
51,719,568 |
8,638 |
202,378,669 |
|
11,120 |
51,927,277 |
8,638 |
203,191,436 |
| Great Salt Lake South Arm |
4,785 |
40,122,668 |
3,039 |
157,000,000 |
|
|
4,785 |
40,000,000 |
3,039 |
157,000,000 |
|
| Total Indicated Resources |
|
91,842,236 |
|
359,378,669 |
|
|
91,927,277 |
|
360,191,436 |
| Measured + Indicated Resources |
| Great Salt Lake North Arm |
11,120 |
51,719,568 |
8,638 |
202,378,669 |
|
11,120 |
51,927,277 |
8,638 |
203,191,436 |
| Great Salt Lake South Arm |
4,785 |
40,122,668 |
3,039 |
157,000,000 |
|
|
4,785 |
40,000,000 |
3,039 |
157,000,000 |
|
| Total Measured + Indicated Resources |
|
91,842,236 |
|
359,378,669 |
|
|
|
91,927,277 |
|
360,191,436 |
| Inferred Resources |
| Total Inferred Resources |
— |
— |
— |
— |
|
— |
— |
— |
— |
(1) Mineral resources are not mineral reserves and do not have demonstrated economic viability. There is no certainty that all or any part of the mineral resource will be converted into mineral reserve upon application of modifying factors.
(2) Mineral resources are reported in situ for the both the north arm and the south arm of the Great Salt Lake.
(3) Conversion of magnesium to magnesium chloride uses a factor of 3.913 tons of magnesium chloride per ton of magnesium.
(4) Included process recovery is approximately 10.0% based on historical production results. Mining or metallurgical recovery is not applicable for this operation.
(5) The pricing data is based on a five-year average of historical gross sales data for MgCl of $66.20 per ton. Gross sales prices are projected to increase to approximately and $816.73 per ton for MgCl through year 2161 (the current expected end of mine life).
(6) Estimated cut-off grade of approximately 8,638 milligrams of magnesium per liter of brine extracted from the north arm of the Great Salt Lake, and a cut-off grade of 3,039 milligrams of magnesium per liter of brine in the south arm of the Great Salt Lake which ultimately flows into the north arm of the Great Salt Lake. The QP assumes that when the north arm of the Great Salt Lake (where the Ogden facility sources its brine) reaches this concentration level, the Ogden facility will halt production of magnesium and magnesium chloride.
(7) Reported magnesium concentration for the Great Salt Lake assumes an indicative lake level of 4,194.4 feet in the south arm and 4,193.5 feet in the north arm.
|
|
|
|
|
|
|
|
|
|
|
COMPASS MINERALS INTERNATIONAL, INC. |
Table 6. Ogden Facility – Summary of Magnesium and Magnesium Chloride Mineral Reserves at September 30, 2023 and 2022
|
|
|
|
|
|
|
|
|
|
|
|
|
|
|
|
|
|
|
|
|
|
|
|
|
|
|
|
|
|
|
September 30, 2023 |
|
September 30, 2022 |
| Reserve Area |
Average Magnesium Grade (mg/L)(7) |
Magnesium Reserves (tons)(1)(2)(4)(5) |
Cut-Off Grade (mg/L)(6) |
Magnesium Chloride Reserves (tons)(1)(2)(3)(4)(5) |
|
Average Magnesium Grade (mg/L)(7) |
Magnesium Reserves (tons)(1)(2)(4)(5) |
Cut-Off Grade (mg/L)(6) |
Magnesium Chloride Reserves (tons)(1)(2)(3)(4)(5) |
| Proven Reserves |
| Total Proven Reserves |
— |
— |
— |
— |
|
— |
— |
— |
— |
| Probable Reserves |
| Great Salt Lake North Arm |
11,120 |
24,027,805 |
8,638 |
94,020,802 |
|
11,120 |
24,214,744 |
8,638 |
94,752,292 |
| Great Salt Lake South Arm |
4,785 |
— |
3,039 |
— |
|
4,785 |
— |
3,039 |
— |
| Total Probable Reserves |
|
24,027,805 |
|
94,020,802 |
|
|
24,214,744 |
|
94,752,292 |
| Total Reserves |
| Great Salt Lake North Arm |
11,120 |
24,027,805 |
8,638 |
94,020,802 |
|
11,120 |
24,214,744 |
8,638 |
94,752,292 |
| Great Salt Lake South Arm |
4,785 |
— |
3,039 |
— |
|
4,785 |
— |
3,039 |
— |
| Total Reserves |
— |
24,027,805 |
— |
94,020,802 |
|
— |
24,214,744 |
— |
94,752,292 |
(1) Mineral reserves are as recovered, saleable product.
(2) Production rates for magnesium chloride are 620,000 tons per year. This relates to a depletion of 158,271 tons of magnesium per year. Based on the QP’s reserve model, the life of mine is estimated to be 139 years, based on potash operational longevity.
(3) Conversion of magnesium to magnesium chloride uses a factor of 3.913 tons of magnesium chloride per ton of magnesium.
(4) Included process recovery is approximately 10.0% based on historical production results. Mining or metallurgical recovery is not applicable for this operation.
(5) The pricing data is based on a five-year average of historical gross sales data for MgCl of $66.20 per ton. Gross sales prices are projected to increase to approximately $816.73 per ton for magnesium chloride through year 2161 (the current expected end of mine life).
(6) Estimated cut-off grade of approximately 8,638 milligrams of magnesium per liter of brine extracted from the north arm of Great Salt Lake, and a cut-off grade of 3,039 milligrams of magnesium per liter of brine in the south arm of the Great Salt Lake which ultimately flows into the north arm of the Great Salt Lake. The QP assumes that when the north arm of the Great Salt Lake (where the Ogden facility sources its brine) reaches this concentration level, the Ogden facility will halt production of magnesium and magnesium chloride.
(7) Reported magnesium concentration for the Great Salt Lake assumes an indicative lake level of 4,194.4 feet in the south arm and 4,193.5 feet in the north arm.
|
|
|
|
|
|
|
|
|
|
|
COMPASS MINERALS INTERNATIONAL, INC. |
Table 7. Ogden Facility – Summary of Sodium and Sodium Chloride Mineral Resources at September 30, 2023 and 2022
|
|
|
|
|
|
|
|
|
|
|
|
|
|
|
|
|
|
|
|
|
|
|
|
|
|
|
|
|
|
|
September 30, 2023 |
|
September 30, 2022 |
| Resource Area |
Average Sodium Grade (mg/L)(7) |
Sodium Resources (tons)(1)(2)(4)(5) |
Cut-Off Grade (mg/L)(6) |
Sodium Chloride Resources (tons)(1)(2)(3)(4)(5) |
|
Average Sodium Grade (mg/L)(7) |
Sodium Resources (tons)(1)(2)(4)(5) |
Cut-Off Grade (mg/L)(6) |
Sodium Chloride Resources (tons)(1)(2)(3)(4)(5) |
| Measured Resources |
| Total Measured Resources |
— |
— |
— |
— |
|
— |
— |
— |
— |
| Indicated Resources |
| Great Salt Lake North Arm |
97,530 |
435,962,634 |
75,757 |
1,108,217,016 |
|
97,530 |
436,477,305 |
75,757 |
1,109,525,310 |
| Great Salt Lake South Arm |
46,298 |
405,979,544 |
40,365 |
1,032,000,000 |
|
46,298 |
406,000,000 |
40,365 |
1,032,000,000 |
| Total Indicated Resources |
|
841,942,178 |
|
2,140,217,016 |
|
|
842,477,305 |
|
2,141,525,310 |
| Measured + Indicated Resources |
| Great Salt Lake North Arm |
97,530 |
435,962,634 |
75,757 |
1,108,217,016 |
|
97,530 |
436,477,305 |
75,757 |
1,109,525,310 |
| Great Salt Lake South Arm |
46,298 |
405,979,544 |
40,365 |
1,032,000,000 |
|
46,298 |
406,000,000 |
40,365 |
1,032,000,000 |
| Total Measured + Indicated Resources |
|
841,942,178 |
|
2,140,217,016 |
|
|
842,477,305 |
|
2,141,525,310 |
| Inferred Resources |
| Total Inferred Resources |
— |
— |
— |
— |
|
— |
— |
— |
— |
(1) Mineral resources are not mineral reserves and do not have demonstrated economic viability. There is no certainty that all or any part of the mineral resource will be converted to a mineral reserve upon application of modifying factors.
(2) Mineral resources are reported in-situ for both the north arm and south arm of the Great Salt Lake.
(3) Conversion of sodium to sodium chloride uses a factor of 2.542 tons of sodium chloride per ton of sodium.
(4) Included process recovery is approximately 10.0% based on historical production results. Mining or metallurgical recovery is not applicable for this operation.
(5) The pricing data is based on a five-year average (2019 through 2023) of historical gross sales data for sodium chloride of $82.65 per ton. Gross sales prices are projected to increase to approximately $215.66 per ton for sodium chloride through year 2161 (the current expected end of mine life).
(6) Estimated cut-off grade of approximately 75,757 milligrams of sodium per liter of brine extracted from the north arm of Great Salt Lake, and a cut-off grade of 40,365 milligrams of sodium per liter of brine in the south arm of the Great Salt Lake which ultimately flows into the north arm of the Great Salt Lake. The QP assumes that when the north arm of the Great Salt Lake (where the Ogden facility sources its brine) reaches this concentration level, the Ogden facility will halt production of sodium and sodium chloride.
(7) Reported sodium concentration for the Great Salt Lake assumes an indicative lake level of 4,194.4 feet in the south arm and 4,193.5 feet in the north arm.
|
|
|
|
|
|
|
|
|
|
|
COMPASS MINERALS INTERNATIONAL, INC. |
Table 8. Ogden Facility – Summary of Sodium and Sodium Chloride Mineral Reserves at September 30, 2023 and 2022
|
|
|
|
|
|
|
|
|
|
|
|
|
|
|
|
|
|
|
|
|
|
|
|
|
|
|
|
|
|
|
September 30, 2023 |
|
September 30, 2022 |
| Reserve Area |
Average Sodium Grade (mg/L)(7) |
Sodium Reserves (tons)(1)(2)(4)(5) |
Cut-Off Grade (mg/L)(6) |
Sodium Chloride Reserves (tons)(1)(2)(3)(4)(5) |
|
Average Sodium Grade (mg/L)(7) |
Sodium Reserves (tons)(1)(2)(4)(5) |
Cut-Off Grade (mg/L)(6) |
Sodium Chloride Reserves (tons)(1)(2)(3)(4)(5) |
| Proven Reserves |
| Total Proven Reserves |
— |
— |
— |
— |
|
— |
— |
— |
— |
| Probable Reserves |
| Great Salt Lake North Arm |
97,530 |
62,323,098 |
75,757 |
158,425,314 |
|
97,530 |
62,786,302 |
75,757 |
159,602,779 |
| Great Salt Lake South Arm |
46,298 |
— |
40,365 |
— |
|
46,298 |
— |
40,365 |
— |
| Total Probable Reserves |
|
62,323,098 |
|
158,425,314 |
|
|
62,786,302 |
|
159,602,779 |
| Total Reserves |
| Great Salt Lake North Arm |
97,530 |
62,323,098 |
75,757 |
158,425,314 |
|
97,530 |
62,786,302 |
75,757 |
159,602,779 |
| Great Salt Lake South Arm |
46,298 |
— |
40,365 |
— |
|
46,298 |
— |
40,365 |
— |
| Total Reserves |
— |
62,323,098 |
— |
158,425,314 |
|
— |
62,786,302 |
— |
159,602,779 |
(1) Mineral reserves are as recovered, saleable product.
(2) Production rates for the sodium chloride are 1,045,000 tons per year. This relates to a depletion of 411,074 tons of sodium per year. Based on the QP’s reserve model, the life of mine is estimated to be 139 years, based on potash operational longevity.
(3) Conversion of sodium to sodium chloride uses a factor of 2.542 tons of NaCl per ton of sodium.
(4) Included process recovery is approximately 10.0% based on historical production results. Mining or metallurgical recovery is not applicable for this operation.
(5) Based on pricing data described in Section 18.1 of the Ogden Potassium/Magnesium/Sodium TRS. The pricing data is based on a five-year average of historical gross sales data for sodium chloride of $82.65 per ton. Gross sales prices are projected to increase to approximately $215.66 per ton for NaCl through year 2161 (the current expected end of mine life).
(6) Based on the economic analysis described in Section 19 of the Ogden Potassium/Magnesium/Sodium TRS, the QP estimated a cut-off grade of approximately 75,757 milligrams of sodium per liter of brine extracted from the north arm of Great Salt Lake, and a cut-off grade of 40,365 milligrams of sodium per liter of brine in the south arm of the Great Salt Lake which ultimately flows into the north arm of the Great Salt Lake. The QP assumes that when the north arm of the Great Salt Lake (where the Ogden facility sources its brine) reaches this concentration level, the Ogden facility will halt production of sodium and sodium chloride.
(7) Reported sodium concentration for the Great Salt Lake assumes an indicative lake level of 4,194.4 feet in the south arm and 4,193.5 feet in the north arm.
From September 30, 2022 to September 30, 2023, for both potassium and SOP, combined measured and indicated resources decreased by approximately 0.81% and total reserves decreased by approximately 0.52%. The decreases in the combined measured and indicated resources were attributable to depletion of potassium from the Great Salt Lake in connection with extraction operations of the Company and another salt producer, while the decrease in reserves was attributable to the Company’s production of SOP during that period.
As previously announced, we have suspended indefinitely any further investment in the lithium project in Utah beyond certain already committed items associated with the early stages of construction of our commercial scale demonstration unit until further clarity is provided on the evolving regulatory climate. A summary of the Ogden facility’s lithium and LCE mineral resources as of September 30, 2023 and 2022 is shown in Table 9. Joseph Havasi, who is employed full-time as the Vice President, Natural Resources, of the Company served as the QP who prepared the estimates of lithium and LCE mineral resources at the Ogden facility. Susan Patton, RM-SME 2482200, who is employed by RESPEC, is the QP who reviewed the estimates of lithium and LCE mineral resources at the Ogden facility. The material assumptions and information pertaining to the Company’s disclosure of lithium and LCE mineral resources at the Ogden facility are based on the Technical Report Summary with respect to lithium and LCE dated September 14, 2022, with an effective date of March 3, 2022 (the “Ogden
|
|
|
|
|
|
|
|
|
|
|
COMPASS MINERALS INTERNATIONAL, INC. |
Lithium TRS”). This Annual Report on Form 10-K also reflects more recent information obtained from the QP as of September 30, 2023, which supplements and updates information from such TRS. If we decide to continue investment in the lithium project at some point in the future, the FEL-1 or PEA capital development cost of phase one is now expected to be above the previously disclosed upper range estimate of approximately $364 million. We expect to complete updated estimates of what costs and net present value would be if we were to decide to continue investment in the lithium project.
Table 9. Ogden Facility – Summary of Lithium and LCE Mineral Resources at September 30, 2023 and 2022
|
|
|
|
|
|
|
|
|
|
|
|
|
|
|
|
|
|
|
|
|
|
|
|
|
September 30, 2023 |
|
September 30, 2022 |
| Resource Area |
Average Grade (mg/L)(4) |
Lithium Resources (tonnes)(1)(2)(3) |
LCE Resources (tonnes)(1)(2)(3)(6) |
|
Average Grade (mg/L)(4) |
Lithium Resources (tonnes)(1)(2)(3) |
LCE Resources (tonnes)(1)(2)(3)(6) |
| Measured Resources |
| Total Measured Resources |
— |
— |
— |
|
— |
— |
— |
| Indicated Resources |
|
|
|
|
|
|
|
| Great Salt Lake North Arm |
51 |
226,860 |
1,207,577 |
|
51 |
226,860 |
1,207,577 |
Great Salt Lake South Arm(5) |
25 |
208,711 |
1,110,970 |
|
25 |
208,711 |
1,110,970 |
| Pond 96, Halite Aquifer |
214 |
908 |
4,835 |
|
214 |
908 |
4,835 |
| Pond 98, Halite Aquifer |
221 |
868 |
4,623 |
|
221 |
868 |
4,623 |
| Pond 113, Halite Aquifer |
205 |
13,754 |
73,213 |
|
205 |
13,754 |
73,213 |
| Total Indicated Resources |
44 |
451,101 |
2,401,218 |
|
44 |
451,101 |
2,401,218 |
| Measured + Indicated Resources |
| Great Salt Lake North Arm |
51 |
226,860 |
1,207,577 |
|
51 |
226,860 |
1,207,577 |
Great Salt Lake South Arm(5) |
25 |
208,711 |
1,110,970 |
|
25 |
208,711 |
1,110,970 |
| Pond 96, Halite Aquifer |
214 |
908 |
4,835 |
|
214 |
908 |
4,835 |
| Pond 98, Halite Aquifer |
221 |
868 |
4,623 |
|
221 |
868 |
4,623 |
| Pond 113, Halite Aquifer |
205 |
13,754 |
73,213 |
|
205 |
13,754 |
73,213 |
| Total Measured + Indicated Resources |
44 |
451,101 |
2,401,218 |
|
44 |
451,101 |
2,401,218 |
| Inferred Resources |
| Pond 1b, Halite Aquifer |
318 |
2,032 |
10,815 |
|
318 |
2,032 |
10,815 |
| Pond 97, Halite Aquifer |
212 |
674 |
3,589 |
|
212 |
674 |
3,589 |
| Pond 114, Halite Aquifer |
245 |
5,789 |
30,817 |
|
245 |
5,789 |
30,817 |
| Total Inferred Resources |
256 |
8,495 |
45,221 |
|
256 |
8,495 |
45,221 |
(1)Mineral resources are not mineral reserves and do not have demonstrated economic viability. There is no certainty that all or any part of the mineral resource will be converted into mineral reserve upon application of modifying factors.
(2)Mineral resources are reported as in situ for the evaporation pond salt mass aquifers. Specific yield has been measured or estimated for each pond to reflect the portion of in situ brine potentially available for extraction. No other restrictions such as process recovery or environmental limitations have been applied.
(3)Based on an average lithium grade of 51 mg/L in the north arm of the Great Salt Lake and 25 mg/L in the south arm of the Great Salt Lake. Reported concentrations for the Great Salt Lake assume an indicative lake level of 4,194.4 feet in the south arm and 4,193.5 feet in the north arm. Average grade of lithium in interstitial brine in the solar evaporation ponds at the Ogden facility ranges from 205 mg/L to 318 mg/L.
(4)The QPs determined a cut-off grade for lithium concentration in the ambient brine of the Great Salt Lake of 9 mg/L, using the average price for LCE over the past five years (2018 through 2022) as reported by Benchmark Mineral Intelligence of $13,086/tonne LCE and $15,765/tonne for LHM. However, the QPs believe it is likely that the SOP operation will continue depleting lithium from the ambient waters of the Great Salt Lake after concentrations of lithium are below an estimated cut-off grade and that the Company will continue concentrating lithium in its evaporation pond process until lithium concentrations in the Great Salt Lake reach null.
(5)The Company does not have exclusive access to mineral resources in the lake and other existing operations, including those run by US Magnesium, also extract dissolved mineral from the lake (in the south arm).
(6)Lithium to LCE uses a factor of 5.323 tonnes of LCE per tonne of lithium, and lithium to LHM uses a factor of 6.048 tonnes of LHM per tonne of lithium.
From September 30, 2022 to September 30, 2023, for both lithium and LCE, combined measured and indicated resources remained the same as there was no commercial production of lithium.
Key assumptions and parameters relating to the lithium and LCE mineral resources at the Ogden facility are discussed in Section 11 of the Ogden Lithium TRS. Among them is the assumption that there is a reasonable probability that the Company will be able to develop an appropriate method for extraction of lithium and LCE from the resources summarized above based on
|
|
|
|
|
|
|
|
|
|
|
COMPASS MINERALS INTERNATIONAL, INC. |
its successful extraction of lithium and rejection of magnesium that has been achieved with extensive onsite pilot testing and the fact that analogous direct lithium extraction (“DLE”) methods are used by existing Chinese operations and the ongoing development of similar technologies at numerous other lithium salt sources described in Section 10 of the Ogden Lithium TRS. Also, the QPs understand that there are several analogous operations globally employing DLE technology that are in commercial production. DLE technology is in use at Livent Corporation’s operation in Hombre Muerto, Argentina, producing 20,000 tonnes of lithium carbonate per annum as of 2020. DLE technology is also being utilized to commercially produce lithium at Qinghai Salt Lake Industry Co. Ltd brine operation in Qinghai Province, China, and similar to technology that will be used to extract lithium post-removal of bromine in Standard Lithium’s Smackover Brine project in Arkansas. While raw-feed concentration from the Great Salt Lake is lower than the aforementioned feed concentrations of the comparable operations, it is important to appreciate that the brines of the Great Salt Lake are currently extracted from the lake and are in current production at the Ogden plant for the production of SOP, magnesium chloride and sodium chloride, similar to Standard Lithium’s operating model, which extracts lithium from oilfield brines that have already been extracted. As ion concentrations, including lithium, increase by design during the Company’s three-year pond concentration process, it is expected that lithium would be extracted at one or more points along the existing pond concentration process, and thus costs incurred from the extraction and concentration of brines from the Great Salt Lake are already borne by existing production. To that end, lithium concentrations in a one-year brine from the Great Salt Lake average 180 mg/L and lithium is present at greater than 1,000 mg/L in its final magnesium chloride bittern, a two- to three-year brine, both of which are concentrated from the original feedstock concentration of ambient north arm brine at 51 mg/L. As described in Sections 10 and 14 of the Ogden Lithium TRS, Compass Minerals tested several DLE technologies, and has selected Energy Source Minerals’ (ESM) Integrated Lithium Adsorption Desorption (ILiAD) DLE technology. ESM has performed single column tests on three GSL brine sources: DustGard (magnesium chloride brine), 2 Year Brine, and Interstitial Brine on a bench scale column unit that can accurately mimic the larger unit’s capability. All brines demonstrated they could be used to produce a similar concentrated lithium chloride brine by differing internal strip flow rates and cycle times. As such, it is proposed to have separate DLE units based on the brine being fed as described further in Section 14 Ogden Lithium TRS. The QPs assume the facility production capacities and capital costs included in the Company’s plans for phases one and two, and that operating costs will be consistent with other operations employing DLE technology with similar raw-feed brine characteristics.
The lithium and LCE mineral resource estimates for the Great Salt Lake were calculated for the north and south arms individually, given the difference in brine composition within these two areas. They are based on historic data collected by the Utah Geological Survey and United States Geological Survey over an extended period for brine concentration and volume. The primary criteria considered for classification of the mineral resource estimate for the north and south arms of the Great Salt Lake consist of confidence in chemical results, accuracy of bathymetric data, dynamic interaction of surface and subsurface brines, and representativeness of a relatively small areal extent samples for the entire Great Salt Lake volume.
The lithium and LCE mineral resource estimates for Pond 1b, Pond 96, Pond 97, Pond 98, Pond 113 and Pond 114 evaluated the available information for each pond individually. In particular, brine chemistry and halite aquifer properties were sufficiently different to warrant that the resource estimate for each pond utilize different parameters. These parameters are identified within the discussion of the mineral resource estimate for the halite aquifer in each pond in Section 11 of the Ogden Lithium TRS. Lithium and LCE mineral resources within the evaporation ponds were estimated utilizing Voronoi polygonal methods. The lateral extent of each polygon was defined by bisector between drillholes, and the vertical extent of each polygon was defined by the measured halite aquifer stratigraphy. The brine volume for each polygon was determined through analysis of hydrogeologic data that characterized the specific yield of the halite aquifer. The brine assay data for lithium from each drillhole was applied to that polygon for that drillhole. The cut-off grade for lithium in the interstitial brine is equivalent to the cut-off grade in the ambient waters of the Great Salt Lake, which is 9 mg/L.
The Cote Blanche mine is a production stage, underground mine that produces rock salt primarily for highway deicing customers through a series of depots located along the Mississippi and Ohio rivers (and their major tributaries) and chemical and agricultural customers in the Southern and Midwestern United States. The Cote Blanche mine is located in south-central Louisiana in the Parish of St. Mary (T15S, R7E), at the northern edge of Cote Blanche Hummoch, commonly called “Cote Blanche Island.” Maps of the Cote Blanche mine property are shown in Figures 3 and 4.
|
|
|
|
|
|
|
|
|
|
|
COMPASS MINERALS INTERNATIONAL, INC. |
Figure 3. Cote Blanche Mine Property Location Map
|
|
|
|
|
|
|
|
|
|
|
COMPASS MINERALS INTERNATIONAL, INC. |
Figure 4. Aerial View of Cote Blanche Island
Cote Blanche Island is situated between the Intra-Coastal Waterway and Cote Blanche Bay in the Gulf of Mexico. The Cote Blanche mine is approximately 124 miles west of New Orleans, Louisiana, and approximately 26 miles southeast of New Iberia, Louisiana, on the Gulf Coast. The approximate coordinates of the site facilities are 29˚45’4” North and 91˚43’24” West. The site is accessed by surface roads to the Cote Blanche Landing, and then by ferry boat from the Cote Blanche Landing to Cote Blanche Island. The Company accesses Cote Blanche Island via two rights-of-way with a separate private landowner group: one for the landing for the ferry boat that the Company operates and maintains; and the other for the barge canal, which is utilized for barge access to the mine. The barges are managed by contract tug boat services.
The Cote Blanche mine has a barge loading dock, administrative offices and other services-related structures. Power is supplied to the site by CLECO Power nearby power lines that are fed directly from the main power grid and there are telephone and cellular connections. Water is provided to the Cote Blanche mine by privately owned and operated wells that are on the mine site. The Cote Blanche mine is well established and has been in the community for over 50 years. The communities of New Iberia, Broussard and Lafayette, Louisiana, have the required infrastructure (shopping, emergency services, schools, etc.) to support the workforce. New Iberia is served by a small regional airport and a transcontinental railroad.
The Company leases the entirety of Cote Blanche Island from a private ownership group, except for 115 acres of the southeastern sector of the island (the “115 Acre Tract”), for a total mineral lease of 1,520 acres. The lease grants salt rights to the Company for all salt from the ground surface downward 3,000 feet, except for salt located within the 115 Acre Tract. The lease also grants surface rights in the western and southwestern sectors of Cote Blanche Island, with access rights to the mine road that extends north-south from the surface lease area to the Cote Blanche Crossing.
The lease has an effective end date of June 30, 2060, unless earlier terminated. In the event that no actual mining is being completed during any five consecutive years, the lessor has the option to cancel the lease. As lessee, the Company may exercise two options to extend the term of the lease, each for a 25-year period upon the same terms and conditions contained in the lease. The Company has a minimum royalty based on 1,500,000 tons of salt hoisted annually. Under the terms of the lease, the royalty for each calendar year is equal to the Net F.O.B. Mine Sales Revenue Per Ton (as defined below), multiplied by the Applicable Royalty Rate (as defined below), multiplied by the number of tons of salt hoisted from the Cote Blanche mine in that calendar year. The “Net F.O.B. Mine Sales Revenue Per Ton” for each calendar year is the quotient of the total bulk sales revenue
|
|
|
|
|
|
|
|
|
|
|
COMPASS MINERALS INTERNATIONAL, INC. |
(excluding any taxes) of the Company and its affiliates for salt sold from the Cote Blanche mine in bulk (in units of 1 short ton or more) (“Total Bulk Sales Revenue”) reduced for all freight in, freight out, fuel surcharge, additives, depot/warehouse storage, handling and operating costs, promotions/discounts and other costs as are properly deducted under generally accepted accounting principles in that calendar year, divided by the total number of tons sold. The number of tons of salt sold is the same number of tons used to generate the Total Bulk Sales Revenue. The “Applicable Royalty Rate” for 2014 and each succeeding calendar year is as follows: 2014, 4.7%; 2015, 4.9%; 2016, 5.1%; 2017, 5.3%; and 2018 and thereafter, 5.5%.
The lease further provides that if, on or before January 1 of 2034, 2059 or 2084 (each, a “Review Year”), the lessor or the Company determines that, in operation, the royalty provisions of the lease result in the lessor receiving more or less than 5.5% of the fair value of salt at the minehead free of all costs at that point (the “Royalty Standard”), such party shall deliver to the other party on or before January 1 of the Review Year a written statement of its reasons why the Royalty Standard is not being met, a computation of the amount that will satisfy the Royalty Standard and a proposed revision to the royalty provisions of the lease that will cause the royalty provisions to comply with the Royalty Standard. On or before January 30 of the Review Year, the other party is required to deliver to the first party a written statement of its opinion as to whether the royalty provisions as proposed comply with the Royalty Standard and a response to the first party’s statement delivered under the preceding sentence. If the parties are not in agreement, the parties are required to commence arbitration.
The lease provides that the lessor has full right to grant future oil, gas and other mineral leases, except salt, provided that each such future oil, gas and mineral lease shall expressly obligate the lessee to cooperate with the Company in the conduct of its operations in order that the purposes of both leases may be best effectuated. The lease obligates the Company to cooperate with the oil, gas and mineral lessee so as to permit drilling of oil and/or gas wells.
The Cote Blanche mine operates with a production schedule targeting approximately 2.2 million tons of salt per year. That target can vary significantly depending on the severity of winter weather conditions and the resulting market demand for road salt.
Domtar Industries, Inc. constructed the Cote Blanche mine over four years beginning in 1961 with 8-foot and 14-foot shafts and the barge loadout facility. Salt production commenced in 1966. The DG Harris Company purchased the Cote Blanche mine in 1990, which operated as Carey Salt Co. thereafter. The salt assets of The DG Harris Company were sold to IMC in 1997. IMC sold a majority of its salt operations, including the Cote Blanche mine, to Apollo Management V, L.P. through an entity called Compass Minerals Group in 2001. Following a leveraged recapitalization, the company now known as Compass Minerals International, Inc. completed an initial public offering in 2003.
Mining at the Cote Blanche mine occurs in 75-foot mining horizons at specific depths below the surface. To date, the salt dome has been mined at three levels, including the 1,300-foot level, which was mined from 1965 to 1986; the 1,100-foot level, which was mined from 1986 to 2002; and the current 1,500-foot level, which began in 1998 to and is expected to remain in operation through 2026. The Company is in the process of developing a ramp to an extension of the 1,300-foot level, for which mining is projected to start in 2022. Active mining on both the 1,300-foot level and the 1,500-foot level is anticipated to take place from 2022 to 2026. The Company’s current mine plan focuses on completion of the 1,500-foot level with future expansion to the 1,700-foot level and finally advancing to the 1,900-foot level. At this time, mining is not anticipated below the 1900-foot level.
There has been extensive historical oil and gas exploration on and adjacent to Cote Blanche Island, but the Company only has access to mapping and reports that are publicly available from external subsurface exploration. While the historical data provide a strong depiction of the salt ore body, the Company has undertaken in-seam seismic and mud-rotary drilling to verify and validate salt diapir position, morphology and margin at the Cote Blanche mine. The nature of salt diapirs lends itself to a strong understanding of the homogeneity of the morphology and mineralogy of the ore body. Thus, the primary concerns within the salt diapir are understanding the margin of the diapir to support the mine plan by ensuring geotechnical stability, and mapping the localized presence of sandstone partings and seams that are encountered from time to time as well as sheer planes along margins of salt stock formations. The combination of historic data collected through externally funded and directed seismic and drilling programs for oil and gas exploration in strata surrounding the diapir, combined with Compass Minerals’ salt diapir morphology validation drilling has created a reasonably strong characterization of the definition of the salt diapir.
As the mining continues and progresses to the next deeper mining level at 1,700 feet and eventually to the 1,900-foot level, definition of the upper surface of the salt diapir is no longer necessary as mining will be below the current mining level. Therefore, mud-rotary drilling to validate the salt dome surface will no longer be necessary and instead the mining operation will continue its in-seam seismic data collection to assess the potential for anomalies as mining progresses to the outer margins of the mine plan, and verify that the lateral margins of the diapir are not within the Company’s self-determined, 400-foot setback of mineral extraction.
The Cote Blanche mine utilizes the room and pillar method of extraction. In this method, excavations (rooms) are recovered by mining and are alternated with areas of undisturbed salt (pillars) that form the necessary support for maintaining stability of the mine roof. The layout of the rooms and pillars and their respective sizes are optimized to maximize the ratio of salt extracted, relative to in situ salt, while still meeting safety and surface subsidence requirements. All levels in the current mine plan, 1,300-foot through the 1,900-foot levels, are currently mining or are planned to be operated in the same manner, with the same mining parameters and with the same set of unit operations, altered only by the footprint of the mining of the room and
|
|
|
|
|
|
|
|
|
|
|
COMPASS MINERALS INTERNATIONAL, INC. |
pillar method as modified to reflect the constraints of the planned level and the lateral constraints of the salt dome contours of each level.
The current room and pillar layout has an extraction ratio of approximately 56% within the mined room area, but the overall extraction ratio of the property, taking into account barrier pillars and unmined zones and interruptions from oil wells among other anomalies is about 51%. Rooms are mined in a progression of two phases creating a total room height of 75 feet when completed. The rooms have a nominal width of 50 feet and are bounded by 100-foot square pillars. Variations in room and pillar dimensions are observed due to production blasting and scaling, so values are approximate. To achieve 75 feet of height, rooms are initially developed using a 30 foot top-cut (horizontal drill and blast), which is then vertically drilled and blasted (benched) an additional 45 feet, with 5 feet of sub-drilling. Loading and hauling is completed with diesel powered loading equipment and haul trucks. Development mining typically leads ahead of benching or room advance by approximately one and a half years.
The process for salt production at the Cote Blanche mine focuses on particle size reduction of the salt product. Rock salt is processed and sized by underground crushers and the mill before it is hoisted to the surface. The mill has two distinct halves: the mine run circuit and the whole mill. Only chemical quality and non-chemical quality salt can be processed through the whole mill. Ice control quality salt is processed through the mine run circuit. Once the salt has been sized accordingly, it is either stockpiled or placed directly onto a barge for transport to market. The main stockpile area allows separate piles for chemical, non-chemical, and ice control grade salt.
The Cote Blanche mine is operated with modern mining equipment and utilizes subsurface improvements, such as vertical shaft lift systems, milling and crushing facilities, maintenance and repair shops and extensive raw materials handling systems. The milling and crushing facilities were constructed when the Cote Blanche mine developed the 1,500 foot level in 2001. As of September 30, 2023, the net book value for the plant, property and equipment at the Cote Blanche mine is $69,500,000, exclusive of mineral rights and the value of assets leased under operating leases.
The Cote Blanche mine has procured and is operating in compliance with required operating licenses, including permits pertaining to mineral extraction, effluent discharge and air permitting. The Company will be required to renew the current air permit at the Cote Blanche mine, which is administered by the Louisiana Department of Environmental Quality, when it expires in December 2026. Surface water discharges from the site are regulated under Louisiana Pollutant Discharge Elimination System (LPDES) permit LA0103233. The permit requires discharge monitoring for effluent flows from the three outfalls that discharge into the saline waters of the Intracoastal Waterway and Cote Blanche Bay. The State of Louisiana does not require an operating permit for the Cote Blanche mine. Air and NPDES permits are maintained by the site. The site is located in a Coastal Protection Zone and therefore any new site disturbance requires permitting by the U.S. Army Corps of Engineers and the Louisiana Office of Coastal Management. Initial operations at the site predate the Coastal Resources rules so no formal reporting is required under this process.
There are no mine closure plans for the Cote Blanche mine. Once the lease agreement terminates, the Company has six months to vacate the mine of any personal property it wishes to recover before the landownership group assumes control of the mine and either continues mining or initiates other commercial or industrial uses of the surface mine site and underground void space.
Summaries of the Cote Blanche mine’s salt mineral resources and mineral reserves as of September 30, 2023 and 2022 are shown in Tables 10 and 11, respectively. Joseph Havasi, who is employed full-time as the Vice President, Natural Resources, of the Company, served as the QP and prepared the estimates of salt mineral resources and mineral reserves at the Cote Blanche mine. The material assumptions and information pertaining to the Company’s disclosure of mineral resources and mineral reserves at the Cote Blanche mine are based on the Technical Report Summary dated November 16, 2021, as amended on December 14, 2022, with an effective date of September 30, 2021 (the “Cote Blanche TRS”). This Annual Report on Form 10-K also reflects more recent information obtained from the QP as of September 30, 2023, which supplements and updates information from such TRS. The Company periodically reviews its mining plans, including which levels of the mine to develop. Changes in the mining plan in the future may result in increases in expected capital costs or changes that may adversely impact our reported reserves. If mineral reserves were materially impacted, the QP would update the TRS accordingly.
|
|
|
|
|
|
|
|
|
|
|
COMPASS MINERALS INTERNATIONAL, INC. |
Table 10. Cote Blanche Mine – Summary of Salt Mineral Resources at September 30, 2023 and 2022
|
|
|
|
|
|
|
|
|
|
|
|
|
Salt Resources (tons)(1)(2)(3)(4)(5)(6)(7) |
Resource Area(2)(8) |
September 30,
2023 |
|
September 30,
2022 |
| Measured Resources |
| 1,300-Foot Level |
25,140,266 |
|
25,491,881 |
| 1,500-Foot Level |
9,372,555 |
|
12,754,331 |
| Total Measured Resources |
34,512,821 |
|
38,246,212 |
| Indicated Resources |
| 1,300-Foot Level |
12,373,509 |
|
12,373,509 |
| 1,500-Foot Level |
9,028,840 |
|
9,028,840 |
1,700-Foot Level(9) |
361,584,762 |
|
361,584,762 |
1,900-Foot Level(9) |
246,045,618 |
|
246,045,618 |
| Total Indicated Resources |
629,032,729 |
|
629,032,729 |
| Measured + Indicated Resources |
| 1,300-Foot Level |
37,513,775 |
|
37,865,390 |
| 1,500-Foot Level |
18,401,395 |
|
21,783,171 |
1,700-Foot Level(9) |
361,584,762 |
|
361,584,762 |
1,900-Foot Level(9) |
246,045,618 |
|
246,045,618 |
| Total Measured + Indicated Resources |
663,545,550 |
|
667,278,941 |
| Inferred Resources |
1,700-Foot Level(9) |
32,915,833 |
|
32,915,833 |
1,900-Foot Level(9) |
130,851,531 |
|
130,851,531 |
| Total Inferred Resources |
163,767,364 |
|
163,767,364 |
(1)Mineral resources are reported in situ. Mineral resources are not mineral reserves and do not have demonstrated economic viability.
(2)Underground mineral resources are reported based on assumed 75-foot mining horizons, discounted for areas not accessible due to proximity to oil wells.
(3)Tonnage was calculated based on a tonnage factor of 0.0675 tons per cubic foot.
(4)Included process recovery is 94% based on production experience. Included mining recovery is approximately 56% based on the room and pillar layout.
(5)Although the actual sodium chloride grade is less than 100%, it is not considered in the resource, as the final saleable product is the in situ product, as-present after processing (i.e., the saleable product includes any impurities present in the in situ rock).
(6)A cut-off grade was not utilized for the calculation as the in situ product quality is relatively constant and saleable after processing.
(7)There are multiple saleable products based on salt quality from the operation (rock salt for road deicing and chemical grade salt). For simplicity, all sales are assumed at the lower value (and higher tonnage) product, rock salt, and are based on pricing data described in Section 16 of the Cote Blanche TRS. The pricing data is based on a five-year average (2019 through 2023) of historical sales data for rock salt for road deicing of $68.38 per ton. Sales prices are projected to increase to approximately $706.49 per ton for rock salt for road deicing through year 2138 (the current expected end of mine life).
(8)Based on approximate areas of: 5,399,000 square feet (“ft2”) for the 1,300-foot level; 2,991,000 ft2 for the 1,500-foot level; 45,721,000 ft2 for the 1,700-foot level; 50,293,000 ft2 for the 1,900-foot level; and 104,404,000 ft2 in the aggregate.
(9)The 1,700-foot and 1,900-foot levels have been approximated using the 1,300-foot and 1,500-foot level contours, respectively, in alignment to the 400-foot contact distance restriction and site and safety constraints.
|
|
|
|
|
|
|
|
|
|
|
COMPASS MINERALS INTERNATIONAL, INC. |
Table 11. Cote Blanche Mine – Summary of Salt Mineral Reserves at September 30, 2023 and 2022
|
|
|
|
|
|
|
|
|
|
|
|
|
Salt Reserves (tons)(1)(3)(4)(5)(6)(7) |
Reserve Area(2)(8) |
September 30,
2023 |
|
September 30,
2022 |
| Proven Reserves |
| 1,300-Foot Level |
13,131,249 |
|
13,316,339 |
| 1,500-Foot Level |
4,411,531 |
|
6,191,698 |
| Total Proven Reserves |
17,542,780 |
|
19,508,037 |
| Probable Reserves |
1,700-Foot Level(9) |
113,853,955 |
|
113,853,955 |
1,900-Foot Level(9) |
122,693,422 |
|
122,693,422 |
| Total Probable Reserves |
236,547,377 |
|
236,547,377 |
| Total Reserves |
| 1,300-Foot Level |
13,131,249 |
|
13,316,339 |
| 1,500-Foot Level |
4,411,531 |
|
6,191,698 |
1,700-Foot Level(9) |
113,853,955 |
|
113,853,955 |
1,900-Foot Level(9) |
122,693,422 |
|
122,693,422 |
| Total Reserves |
254,090,157 |
|
256,055,414 |
(1)Ore reserves are as recovered, saleable product.
(2)Underground mineral reserves are reported based on assumed 75-foot mining horizons, discounted for areas not accessible due to proximity to oil wells.
(3)Tonnage was calculated based on a tonnage factor of 0.0675 tons per cubic foot.
(4)Included process recovery is 94% based on production experience. Included mining recovery is approximately 56% based on the room and pillar layout.
(5)Although the actual sodium chloride grade is less than 100%, it is not considered in the reserve, as the final saleable product is the in situ product, as-present (i.e., the saleable product includes any impurities present in the in situ rock).
(6)A cut-off grade was not utilized for the calculation as the in situ product quality is relatively constant and saleable after processing.
(7)There are multiple saleable products based on salt quality from the operation (rock salt for road deicing and chemical grade salt). For simplicity, all sales are assumed at the lower value (and higher tonnage) product, rock salt, and are based on pricing data described in Section 16 of the Cote Blanche TRS. The pricing data is based on a five-year average (2019 through 2023) of historical sales data for rock salt for road deicing of $68.38 per ton. Sales prices are projected to increase to approximately $706.49 per ton for rock salt for road deicing through year 2138 (the current expected end of mine life).
(8)Based on approximate areas of: 5,399,000 ft2 for the 1,300-foot level; 2,991,000 ft2 for the 1,500-foot level; 45,721,000 ft2 for the 1,700-foot level; 50,293,000 ft2 for the 1,900-foot level; and 104,404,000 ft2 in the aggregate.
(9)The 1,700-foot and 1,900-foot levels have been approximated using the 1,300-foot and 1,500-foot level contours, respectively, in alignment to the 400-foot contact distance restriction and site and safety constraints.
From September 30, 2022 to September 30, 2023, combined measured and indicated resources at the Cote Blanche mine decreased by approximately 0.56% and total reserves decreased by approximately 0.77%. The decreases in salt resources and reserves were attributable to depletion of salt in connection with extraction operations of the Company.
The Goderich mine is a production stage, underground mine that produces rock salt primarily for highway use and as feed product for other uses. The Goderich mine is located in southwestern Ontario, Canada, on the eastern shore of Lake Huron. The Goderich mine is located west of the town of Goderich, Ontario, on an isthmus in the mouth of the Maitland River, as it enters Lake Huron. Maps of the Goderich mine property are shown in Figures 5 and 6.
|
|
|
|
|
|
|
|
|
|
|
COMPASS MINERALS INTERNATIONAL, INC. |
Figure 5. Goderich Mine Property Location Map
|
|
|
|
|
|
|
|
|
|
|
COMPASS MINERALS INTERNATIONAL, INC. |
Figure 6. Lease and Mine Map: Goderich Mine
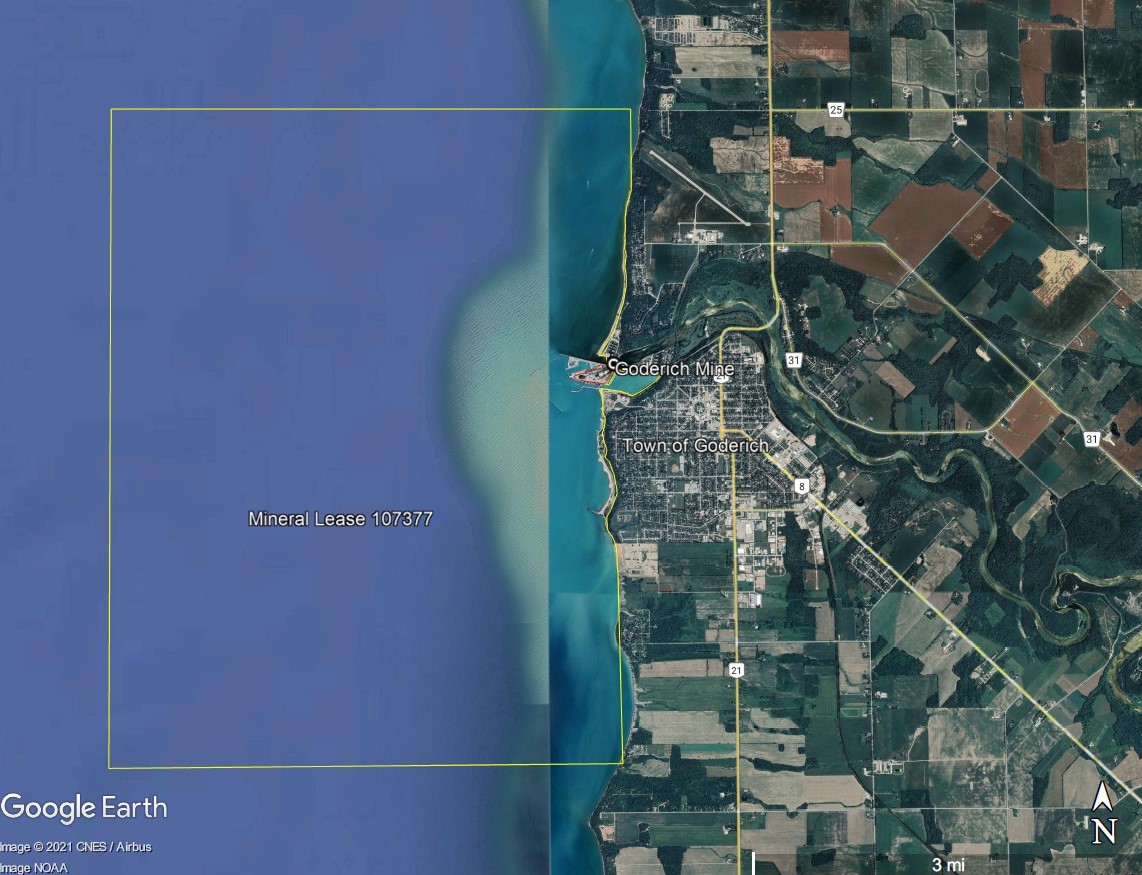
The Goderich mine is approximately 60 miles northwest of London, Ontario, and 120 miles west of Toronto, Ontario. Its approximate coordinates are 43˚ 44’ 50” North and 81˚ 43’ 30” West. Access to the Goderich mine is considered excellent. The town of Goderich has established infrastructure for both mining and exporting salt and can be accessed via regional highways from Toronto from the east (2.5 hours). The triangular-shaped mine site is surrounded by the lake on three sides and the Maitland River on the north side. Goderich Harbor and the Goderich mine site are accessed via North Harbor Road, a municipally owned and maintained road that connects the harbor area to Highway 21. The Goderich mine is connected to local power, water, natural gas and sewage infrastructure. Primary logistics for transporting mined product include the rail siding at the mine site and direct loading into ships or barges in Goderich Harbor. The town of Goderich provides all necessary resources for the Goderich mine, with a ready labor supply, housing, hotels, food and all other typical facilities. The close proximity to rail, port and roads provides easy access for all logistical needs. Commercial air travel is available from London, Ontario, Toronto, Ontario, and Detroit, Michigan, all of which are in relative proximity to the site.
The Goderich mine site is located on 16.3 acres of Company-owned land (PIN 41369-0004) on a man-made peninsula consisting of several large buildings and silos associated with mining and material handling, a ship loading facility and three shafts. The Company actively mines salt west of its owned land under Salt Mining Lease No. 107377, dated November 9, 2001, with the Ontario Ministry of Energy, Northern Development and Mines (“MNDM”), comprising approximately 13,195 acres. The lease had a 21-year term that expired on May 31, 2022. The Company has applied to renew the lease, and the MNDM has advised that all application materials submitted were complete and sufficient to move forward with the lease renewal process, including the Company’s demonstration that the Goderich mine’s useful life extends through the 21-year renewal term. The renewal process is ongoing, and the Company’s operations, obligations, and conditions remain subject to terms in the expired lease, which are applicable until the lease renewal process is completed. The renewal lease will provide an additional 21 years, until 2043. The only material payments associated with the lease are royalties on the salt produced. The current royalty rate paid is $1.05 per ton.
The Goderich mine is the largest underground rock salt mine in the world. Based on the proposed mine layout and using a 6.5 million tons per annum average production run rate assumption, the Goderich mine has a current mine life of approximately
|
|
|
|
|
|
|
|
|
|
|
COMPASS MINERALS INTERNATIONAL, INC. |
70 years, assuming the Company is able to successfully negotiate an extension of the lease following the expiration of the 21-year renewal term in 2043, which the Company currently expects.
Salt production began in Goderich, Ontario, in 1867 by Sifto Canada (“Sifto”) after an unsuccessful search for oil uncovered a vast bed of rock salt. Sifto used basic solution mining and evaporation, now known as mechanical evaporation, to begin the nearby Goderich plant.
In 1956, Sifto received approval to operate an underground salt mine while under the ownership of Dominion Tar and Chemical Company Ltd. Initial drilling at the Goderich mine started in 1955 with the sinking of the first shaft beginning in 1957. The Goderich mine started production upon the completion of the first shaft in 1959. Additional increases in production were enabled after a second mine shaft and a third mine shaft were completed in 1962 and 1982, respectively. In 1990, Domtar Chemicals Limited (previously known as Dominion Tar and Chemical Company Ltd.) sold Sifto to the North American Salt Company, a subsidiary of D.G. Harris & Associates. In 1993, D.G. Harris & Associates founded Harris Chemical Group as a holding company for salt operations, which was acquired by IMC in 1997. IMC sold a majority of its salt operations, including the Goderich mine, to Apollo Management V, L.P. through an entity called Compass Minerals Group in 2001. Following a leveraged recapitalization, the company now known as Compass Minerals International, Inc. completed an initial public offering in 2003.
The Goderich mine’s underground infrastructure is situated in the A-2 salt bed approximately 1,750 feet to 1,760 feet below the surface at the mine shafts’ location. The A-2 salt bed in the shaft area is approximately 79 feet thick. The regional stratigraphic sequence is well understood from many wells drilled across the basin and locally in the Goderich, Ontario, area. The salt strata are highly continuous over the basin, and most of the major salt units can be traced for hundreds of miles. On a local scale, the continuity of the salt beds can be impacted by the presence of pinnacle reefs, displacement by faults, or the local leaching of salt. The Company can use various tools to characterize geological conditions in nearby areas to assess the possibility of encountering these local ground conditions at the mine. Accordingly, the Company has engaged third parties to conduct in-seam seismic surveys and, more recently, has begun use of ground penetrating radar to identify disturbances in salt continuity and the thickness of the A-2 salt bed in development.
The Goderich mine progresses development of main entries in advance of bench mining. The subsequent benches achieve the remainder of the 60-foot room height for room production. Development and bench mining progress at an approximate 40:60 ratio in terms of area of advance in the mine plan and are part of the production process. As needed, underground rooms for facility support functions have been and will be developed in excavated areas of the mine. This includes development of shaft areas on each level for hoist equipment, design, planning and development of ramp structures from one level to the subsequent, lower level as required, installation of underground work facilities such as maintenance shops and storage rooms. As mining progresses, development also encompasses the design, placement, repair and maintenance of support infrastructure such as crushers, screens and other plant in support of mining. All portions of mine development within the A-2 salt are planned to be operated in the same manner and mining method, with the same mining parameters with the same set of unit operations.
The general method of mining employed at the Goderich mine is known as room and pillar mining. Beginning in 2012 and 2013, the Company advanced the Goderich mine to mechanized room and pillar mining as continuous mining machines (each a “CMM”) replaced the previous under-cutter/over-cutter equipment and drilling and blasting sequence in the development areas of the mine. By 2017, the Company was engaged in continuous mining of the entire 60-foot face of the mined rooms in multiple lifts with a goal of improving efficiency and safety, reducing costs and reducing the amount of diesel equipment utilized underground, thus largely eliminating the use of drilling and blasting at the Goderich mine. The Company continues to upgrade its CMM fleet at the Goderich mine.
Certain mining units at the Goderich mine are equipped with both a CMM and a flexible conveyor train (“FCT”), a dynamic move-up unit and a belt storage unit. On these mining units, the CMM cuts the salt directly from the face and discharges it into a hopper on the end of the FCT. From the FCT, the rock salt is offloaded to the main underground belt conveyance system where it is then transported to the underground crushers and the mill. Other mining units are also equipped with a CMM, but are supported with rubber-tired haulage equipment to transfer salt. Salt mined from these CMMs is transferred from the face by rubber-tired haulage to a centralized dump point with a crusher and then follows the same process as the other units once the salt is put onto the underground conveyance system. Rock salt is processed and sized at the underground crushers and the mill before being hoisted to the surface. Salt is stockpiled at the surface in domes. The salt is then distributed to depots, packaging facilities and customers via ship (approximately 80%), and rail car and truck (approximately 20%). The net book value for the plant, property and equipment at the Goderich mine is $206,500,000 as of September 30, 2023, exclusive of mineral rights and the value of assets leased under operating leases.
The Goderich mine has procured and is operating in compliance with all required operating licenses, including permits pertaining to mineral extraction, effluent discharge and air permitting. The Ontario Ministry of Energy, Northern Development and Mines regulates closure for the Goderich mine. The most recent closure plan was approved by the ministry in 2021. Long-term cleanup of the site will essentially include demolishing surface facilities, removal of surface infrastructure and restoring a natural alvar ecological community on the surface, flooding of the workings, and decommissioning (plugging). The Goderich mine operates under two air permits issued by the Ontario Ministry of Environment, Conservation and Parks, one for the lab (8-1131-96-007), and the other for the garage for welding exhaust (5522-78NUN2). Site drainage into Snug Harbour and the
|
|
|
|
|
|
|
|
|
|
|
COMPASS MINERALS INTERNATIONAL, INC. |
Maitland River is permitted pursuant to Certificate of Approval 2342-7ULQEU and Environmental Compliance Approval 1236-8YGK8A, respectively, issued by the Ontario Ministry of Environment, Conservation and Parks.
Summaries of the Goderich mine’s salt mineral resources and mineral reserves as of September 30, 2023 and 2022 are shown in Tables 12 and 13, respectively. Joseph Havasi, who is employed full-time as the Vice President, Natural Resources, of the Company, served as the QP and prepared the estimates of salt mineral resources and mineral reserves at the Goderich mine. The material assumptions and information pertaining to the Company’s disclosure of mineral resources and mineral reserves at the Goderich mine are based on the Technical Report Summary dated November 16, 2021, as amended on December 14, 2022, with an effective date of September 30, 2021 (the “Goderich TRS”). This Annual Report on Form 10-K also reflects more recent information, including revised capital expenditure forecasts, obtained from the QP as of September 30, 2023, which supplements and updates information from such TRS. These changes to the capital expenditures forecasts would affect the NPV and IRR figures stated in Section 19 of the Goderich TRS, but salt resources or reserves would not be affected.
Table 12. Goderich Mine – Summary of Salt Mineral Resources at September 30, 2023 and 2022
|
|
|
|
|
|
|
|
|
|
|
|
|
Salt Resources (tons)(1)(2)(4)(5)(6)(7)(8) |
Resource Area(3)(9) |
September 30,
2023 |
|
September 30,
2022 |
| Measured Resources |
— |
|
— |
| Indicated Resources |
1,453,008,026 |
|
1,469,000,089 |
| Measured + Indicated Resources |
1,453,008,026 |
|
1,469,000,089 |
| Inferred Resources |
148,200,000 |
|
148,200,000 |
(1)Mineral resources are reported in situ. Mineral resources are not mineral reserves and do not have demonstrated economic viability. There is no certainty that all or any part of the mineral resources will be converted into mineral reserves upon application of modifying factors.
(2)All figures have been rounded to reflect the relative accuracy of the estimates.
(3)Underground mineral resources are reported based on an expected representative A-2 salt bed thickness of 82 feet.
(4)Tonnage was calculated based on a tonnage factor of 0.0675 tons per cubic foot.
(5)Included process recovery is 97.5% based on production experience. Included mining recovery is approximately 38.7% based on the room and pillar mine plan.
(6)Although the actual sodium chloride grade is less than 100%, it is not considered in the resource, as the final saleable product is the in situ product, as-present after processing (i.e., the saleable product includes any impurities present in the in situ rock).
(7)A cut-off grade was not utilized for the calculation as the in situ product quality is relatively constant and saleable after processing.
(8)There are multiple saleable products based on salt quality from the operation (rock salt for road deicing and chemical grade salt). For simplicity, all sales are assumed at the lower value (and higher tonnage) product, rock salt and are based on pricing data described in Section 16 of the Goderich TRS. The pricing data is based on a five-year average (2019 through 2023) of historical sales data for rock salt for road deicing of $64.12 per ton. Sales prices are projected to increase to approximately $295.60 per ton for rock salt for road deicing through year 2094 (the current expected end of mine life).
(9)Based on an area of approximately 575,257,000 square feet for the A-2 salt bed within the lease area.
Table 13. Goderich Mine – Summary of Salt Mineral Reserves at September 30, 2023 and 2022
|
|
|
|
|
|
|
|
|
|
|
|
|
Salt Reserves (tons)(1)(2)(3)(4)(5)(6)(7)(8) |
Reserve Area(3)(9) |
September 30,
2023 |
|
September 30,
2022 |
| Proven Reserves |
— |
|
— |
| Probable Reserves |
457,690,728 |
|
463,724,933 |
| Total Reserves |
457,690,728 |
|
463,724,933 |
(1)Ore reserves are as recovered, saleable product.
(2)All figures have been rounded to reflect the relative accuracy of the estimates.
(3)Reserve volume assumes a mining thickness of 18 meters (approximately 60 feet) production, 8.5 meters (approximately 28 feet) mains.
(4)Tonnage was calculated based on a tonnage factor of 0.0675 tons per cubic foot.
(5)Included process recovery is 97.5% based on production experience. Included mining recovery is approximately 38.7% based on the room and pillar mine plan.
(6)Although the actual sodium chloride grade is less than 100%, it is not considered in the reserve, as the final saleable product is the in situ product, as-present after processing (i.e., the saleable product includes any impurities present in the in situ rock).
(7)A cut-off grade was not utilized for the calculation as the in situ product quality is relatively constant and saleable after processing.
(8)There are multiple saleable products based on salt quality from the operation (rock salt for road deicing and chemical grade salt). For simplicity, all sales are assumed at the lower value (and higher tonnage) product, rock salt and are based on pricing data described in Section 16 of the Goderich TRS. The pricing data is based on a five-year average (2019 through 2023) of historical sales data for rock salt for road deicing of $64.12 per ton. Sales prices are projected to increase to approximately $295.60 per ton for rock salt for road deicing through year 2094 (the current expected end of mine life).
(9)Based on an area of approximately 575,257,000 square feet for the A-2 salt bed within the lease area.
|
|
|
|
|
|
|
|
|
|
|
COMPASS MINERALS INTERNATIONAL, INC. |
From September 30, 2022 to September 30, 2023, combined measured and indicated resources at the Goderich mine decreased by approximately 1.1% and total reserves decreased by approximately 1.3%. The decreases in salt resources and reserves were attributable to depletion of salt in connection with extraction operations of the Company.
INTERNAL CONTROLS DISCLOSURE
The modeling and analysis of the Company’s resources and reserves has been developed by Company mine personnel and reviewed by several levels of internal management, including the QPs. The development of such resources and reserves estimates, including related assumptions, was a collaborative effort between the QPs and Company staff. This section summarizes the internal control considerations for the Company’s development of estimations, including assumptions, used in resource and reserve analysis and modeling.
When determining resources and reserves, as well as the differences between resources and reserves, management developed specific criteria, each of which must be met to qualify as a resource or reserve, respectively. These criteria, such as demonstration of economic viability, points of reference and grade, are specific and attainable. The QPs and Company management agree on the reasonableness of the criteria for the purposes of estimating resources and reserves. Calculations using these criteria are reviewed and validated by the QPs.
Estimations and assumptions were developed independently for each significant mineral location. All estimates require a combination of historical data and key assumptions and parameters. When possible, resources and data from generally accepted industry sources, such as governmental resource agencies, were used to develop these estimations.
The Company’s salt-producing locations do not utilize exploration in the development of their assumptions around mineral resources or reserves. The mineral deposits are restricted in access by bodies of water, and industry techniques used for geological exploration for other types of mineral deposits, specifically drilling, are degradational to the salt ore being assessed. Given the nature of the salt mineral, this limitation impedes the validation of mineral resources and reserves using drilling. Accordingly, geophysical techniques are utilized at both Goderich and Cote Blanche to assist in mine planning, and to verify that there are no obstructions ahead of advancement of the mine in the form of geological anomalies or structural features, such as faults that could affect future mining. In conducting these geophysical campaigns, including in-seam seismic and ground penetrating radar technologies, the Company is able to identify the continuity of ore-body ahead of mining.
Geographical modeling and mine planning efforts serve as a base assumption for resource estimates at each significant salt-producing location. These outputs have been prepared by both Company personnel and third-party consultants, and the methodology is compared to industry best practices. Mine planning decisions, such as mining height, execution of mining and ground control, are determined and agreed upon by Company management. Management adjusts forward-looking models by reference to historic mining results, including by reviewing performance versus predicted levels of production from the mineral deposit, and if necessary, re-evaluating mining methodologies if production outcomes were not realized as predicted. Ongoing mining and interrogation of the mineral deposit, coupled with product quality validation pursuant to industry best practices and customer expectations, provides further empirical evidence as to the homogeneity, continuity and characteristics of the mineral resource. Ongoing quality validation of production also provides a means to monitor for any potential changes in ore-body quality. Also, ongoing monitoring of ground conditions within the mine, surveying for evidence of subsidence and other visible signs of deterioration that may signal the need to re-evaluate rock mechanics and structure of the mine ultimately inform extraction ratios and mine design, which underpin mineral reserve estimates.
For the mass load estimations in the Great Salt Lake brine, the Utah Geological Survey (“UGS”) as of September 2020 (water samples across five locations) and United States Geological Survey bathymetry data from 2000 (sonar sampling) were used as the basis for the modeling of sodium, magnesium, potassium and lithium mass loads, the critical ions of interest. Key data from the common sampling points were compared to confirm data correlated. Because these reports are independently produced, undergo inter-agency review, and their key data points correlate, no further evaluation of sampling methods or quality control were reviewed by Company management or the QPs. In addition, the Company conducted its own sampling at UGS sample locations to further define and integrate current lithium mass load definition with a lithium dataset that was discontinued in the 1990s. The Company also collected potassium and other ion data during this campaign in order to relate ion relationships and ratios in its modelling as well. These data were derived from samples collected by the QP in hermetically sealed samples containers, sent to an external laboratory under chain of custody, analyzed by an accredited laboratory for metals analysis, and the data were reviewed and validated by SRK Consulting. Review of the data derived from the Company’s sampling campaign revealed that the data were of sufficient quality to integrate in to the historic UGS data set for further mass load modelling.
The QPs are satisfied that the hydrological/chemical model for the Great Salt Lake reflects the current hydrological and chemical information and knowledge. The mineral resource model is informed by brine sampling data spanning approximately 55 years and recent bathymetry data. Continuity of the resource is not a concern, as the lake is a visible, continuous body. The Company’s experience in extracting potassium and other salts from the Great Salt Lake for over 50 years under dynamic conditions, such as changing lake elevations and ion concentrations, lends confidence regarding the ability to operate under varying conditions, utilizing ion concentrations as a tool to monitor reserve estimates and make operational decisions.
|
|
|
|
|
|
|
|
|
|
|
COMPASS MINERALS INTERNATIONAL, INC. |
Management also assesses risks inherent in mineral resource and reserve estimates, such as the accuracy of geophysical data that is used to support mine planning, identify hazards and inform operations of the presence of mineable deposits. Also, management is aware of risks associated with potential gaps in assessing the completeness of mineral extraction licenses, entitlements or rights, or changes in laws or regulations that could directly impact the ability to assess mineral resources and reserves or impact production levels. Risks inherent in overestimated reserves can impact financial performance when revealed, such as changes in amortizations that are based on life of mine estimates.
The Company packages its Salt segment products at three additional Company-owned and operated facilities located in Illinois, Minnesota and New York. The Company estimates that its annual combined packaging capacity at these three facilities is 275,000 tons. This packaging capacity is based on the Company’s estimate of the tons that can be packaged at these facilities assuming a normal amount of scheduled down-time and operation of its facilities under normal working conditions, including staffing levels. The Company has the capability to significantly increase its annual packaging capacity by increasing its staffing levels in response to demand, which would require incremental labor and other costs.
ITEM 3. LEGAL PROCEEDINGS
We are involved in the legal proceedings described in
Part II, Item 8, Note 11 and
Part II, Item 8, Note 14 to our Consolidated Financial Statements and, from time to time, various routine legal proceedings and claims arising from the ordinary course of our business. These primarily involve tax assessments, disputes with former employees and contract labor, commercial claims, product liability claims, personal injury claims and workers’ compensation claims. Management cannot predict the outcome of legal proceedings and claims with certainty. Nevertheless, management believes that the outcome of legal proceedings and claims, which are pending or known to be threatened, even if determined adversely, will not, either individually or in the aggregate, have a material adverse effect on our results of operations, cash flows or financial condition, except as otherwise described in
Part II, Item 8, Note 11 and
Part II, Item 8, Note 14 of our Consolidated Financial Statements.
ITEM 4. MINE SAFETY DISCLOSURES
Information concerning mine safety violations or other regulatory matters required by Section 1503(a) of the Dodd-Frank Wall Street Reform and Consumer Protection Act and Item 104 of Regulation S-K is included in
Exhibit 95 to this report.
Information about our Executive Officers
Below is information about each person who was or is an executive officer as of September 30, 2023, and as of the date of the filing of this report. The table sets forth each person’s name, position and age as of the date of the filing of this report.
|
|
|
|
|
|
|
|
|
|
|
|
|
|
|
| Name |
|
Age |
|
Position |
| Kevin S. Crutchfield |
|
62 |
|
President and Chief Executive Officer and Director |
| Lorin Crenshaw |
|
48 |
|
Chief Financial Officer |
| Mary L. Frontczak |
|
57 |
|
Chief Legal and Administrative Officer and Corporate Secretary |
| George J. Schuller |
|
60 |
|
Chief Operations Officer |
| James D. Standen |
|
48 |
|
Chief Commercial Officer |
Kevin S. Crutchfield, President and Chief Executive Officer and Director, joined Compass Minerals and assumed his current position in May 2019. Mr. Crutchfield also serves as member of our Board of Directors. Prior to joining Compass Minerals, Mr. Crutchfield served as CEO and member of the board of directors of Alpha Metallurgical Resources, Inc. (f/k/a Contura Energy, Inc.), a publicly traded, leading coal supplier, since the company’s inception in 2016. Previously, he served as CEO from 2009 to 2016 and chairman from 2012 to 2016 of Alpha Natural Resources, Inc., a coal producer. From 2003 to 2009, he held roles of increasing responsibility at Alpha Natural Resources. Prior to Alpha Natural Resources, Mr. Crutchfield spent over 15 years working at El Paso Corporation, a natural gas and energy provider, as well as other coal and gas producers. He also previously served on the Board of Directors of Couer Mining Inc.
Lorin Crenshaw, Chief Financial Officer, joined Compass Minerals and assumed his current position in December 2021. Prior to joining Compass Minerals, Mr. Crenshaw served as Chief Financial Officer at Orion Engineered Carbons S.A., a global supplier of specialty and high-performance carbon black, from 2019 to 2021. From 2016 to 2019, Mr. Crenshaw served as the Chief Financial Officer of the global lithium business of Albemarle Corporation, a specialty chemicals manufacturing company. Prior to that role, he held positions of increasing responsibility at Albemarle, including as Treasurer and Head of Investor
|
|
|
|
|
|
|
|
|
|
|
COMPASS MINERALS INTERNATIONAL, INC. |
Relations from 2009 to 2016. His experience also includes over 10 years as an equity and debt investor, respectively, at Citigroup Asset Management and PGIM Private Capital, formerly Prudential Capital Group.
Mary L. Frontczak, Chief Legal and Administrative Officer and Corporate Secretary, joined Compass Minerals in November 2019 and assumed her current position in February 2020. Prior to her current role, she served as the Company’s Chief Legal Officer and Corporate Secretary. Before joining Compass Minerals, Ms. Frontczak had served as Senior Vice President and General Counsel of POET LLC, an ethanol and other biorefined products producer, since 2017. Prior to POET, she headed the legal department at Bunge North America, an agribusiness and food ingredient company, from 2015 to 2017 and held roles of increasing responsibility at Peabody Energy Corporation, the world’s largest private sector coal company, from 2005 to 2015 and The May Department Store Company from 1996 to 2005. Her experience also includes five years in private practice.
George J. Schuller, Chief Operations Officer, joined Compass Minerals and assumed his current position in September 2019. Prior to joining the Company, Mr. Schuller spent more than three decades working at Peabody Energy Corporation, the world’s largest private sector coal company. While at Peabody Energy, he served both surface and underground mining operations in the United States and Australia, most recently serving as President-Australia from 2017 to 2019 and Chief Operating Officer-Australia from 2013 to 2017. Prior to those positions, Mr. Schuller served in roles of increasing responsibility at Peabody Energy, gaining experience in continuous improvement and technical services in the areas of health, safety, operations, sales and marketing, product delivery and support functions.
James D. Standen, Chief Commercial Officer, joined Compass Minerals in April 2006 and assumed his current position in December 2021. Prior to this position, Mr. Standen served as the Company’s Chief Financial Officer beginning August 2017 and as Interim Chief Financial Officer and Treasurer starting in April 2017. He also served as the Company’s Vice President, Finance and Treasurer from October 2016 to April 2017, as Treasurer from July 2011 to October 2016 and as Assistant Treasurer from April 2006 to June 2011. Prior to joining the Company, Mr. Standen spent six years at Kansas City Southern in various finance roles after spending two years with the public accounting firm Mayer Hoffman McCann P.C.
|
|
|
|
|
|
|
|
|
|
|
COMPASS MINERALS INTERNATIONAL, INC. |
PART II
ITEM 5. MARKET FOR THE REGISTRANT’S COMMON EQUITY, RELATED STOCKHOLDER MATTERS AND ISSUER PURCHASES OF EQUITY SECURITIES
CUMULATIVE TOTAL STOCK RETURN
The following Stockholder Performance Graph compares the cumulative total return on the Company’s common stock with the Russell 2000 Index and a peer group index with companies with market capitalization from $1 billion to $3 billion. The performance graph below uses a market capitalization index because the Company does not believe it has a reasonable line-of-business peer group. The graph assumes that the value of the investment in common stock and each index was $100 on December 31, 2018 and that all dividends were reinvested. Peer group indices use beginning of period market capitalization weighting.
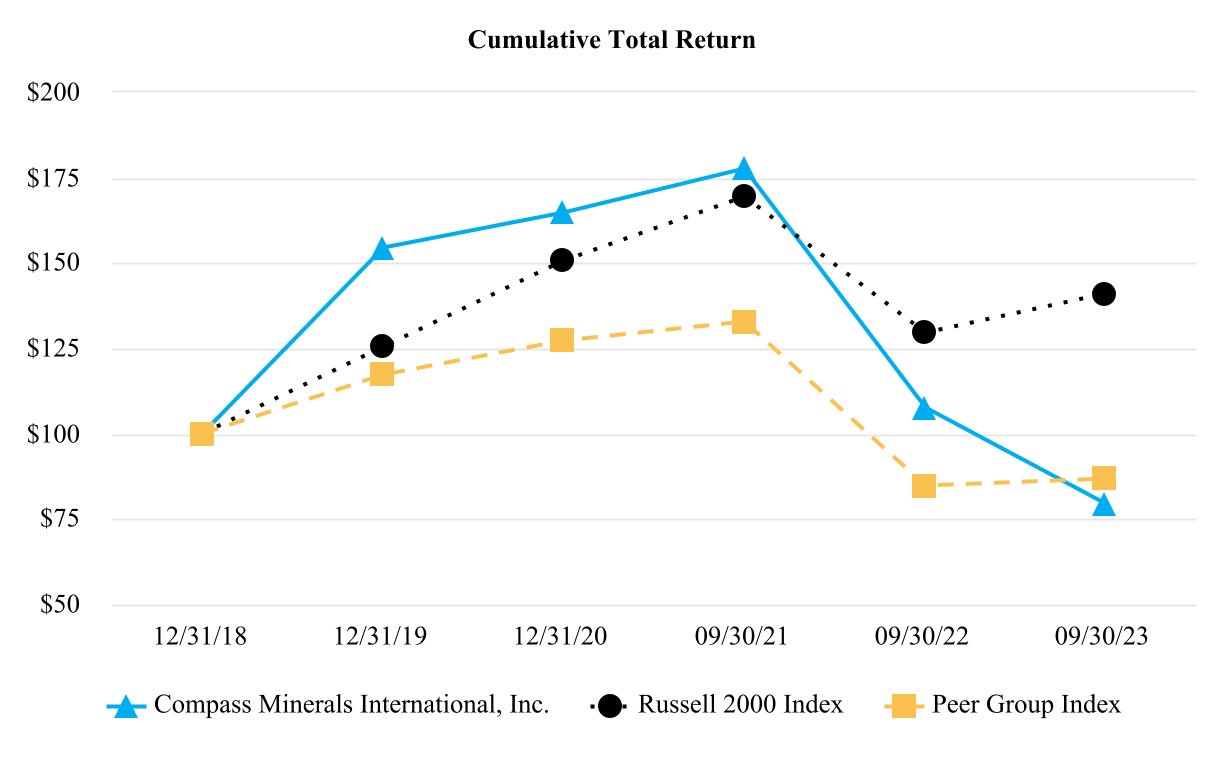
The share price performance shown on the graph is not necessarily indicative of future price performance. Information used in the graph was prepared by Zacks Investment Research, Inc. Used with permission. All rights reserved. Copyright 1980–2023. Index Data: Copyright Russell Investments. Used with permission. All rights reserved. The performance graph above is furnished and not filed for purposes of the Securities Act and the Exchange Act. The performance graph is not soliciting material subject to Regulation 14A.
COMMON STOCK DATA
Our common stock, $0.01 par value, trades on the New York Stock Exchange under the symbol CMP.
HOLDERS
On November 22, 2023, the number of holders of record of our common stock was 259.
|
|
|
|
|
|
|
|
|
|
|
COMPASS MINERALS INTERNATIONAL, INC. |
DIVIDEND POLICY
We intend to pay quarterly cash dividends on our common stock. The declaration and payment of future dividends to holders of our common stock will be at the discretion of our Board of Directors and will depend upon many factors, including our financial condition, earnings, legal requirements, capital allocation strategy, restrictions in our debt agreements and other factors our Board of Directors deems relevant.
ITEM 6. RESERVED
Part II, Item 6 is no longer required as the SEC has adopted certain amendments to Regulation S-K that eliminate Item 301 of Regulation S-K.
|
|
|
|
|
|
|
|
|
|
|
COMPASS MINERALS INTERNATIONAL, INC. |
ITEM 7. MANAGEMENT’S DISCUSSION AND ANALYSIS OF FINANCIAL CONDITION AND RESULTS OF OPERATIONS
The statements in this discussion regarding the industry outlook, our expectations for the future performance of our business, and the other non-historical statements in this discussion are forward-looking statements. These forward-looking statements are subject to numerous risks and uncertainties, including, but not limited to, the risks and uncertainties described in Item 1A, “Risk Factors.” You should read the following discussion together with Item 1A, “Risk Factors” and the Consolidated Financial Statements and Notes thereto included elsewhere in this report.
COMPANY OVERVIEW
Compass Minerals is a leading global provider of essential minerals focused on safely delivering where and when it matters to help solve nature’s challenges for customers and communities. Our Salt segment products help keep roadways safe during winter weather and are used in numerous other consumer, industrial, chemical and agricultural applications. Our Plant Nutrition segment is the leading North American producer of sulfate of potash, which is used in the production of specialty fertilizers for high-value crops and turf and helps improve the quality and yield of crops, while supporting sustainable agriculture. Our next-generation fire retardants help to slow, stop and prevent wildfires through the use of high-performing and environmentally-friendly products. Additionally, we have been pursuing development of a sustainable lithium salt resource to support the North American battery market, although that project has been suspended indefinitely beyond certain already committed items associated with the early stages of construction of our commercial scale demonstration unit. As of September 30, 2023, we operate 12 production and packaging facilities with nearly 2,000 personnel throughout the U.S., Canada and the U.K , including:
•The largest rock salt mine in the world in Goderich, Ontario, Canada;
•The largest dedicated rock salt mine in the U.K. in Winsford, Cheshire;
•A solar evaporation facility located near Ogden, Utah, which is both the largest sulfate of potash specialty fertilizer production site and the largest solar salt production site in the Western Hemisphere and the source of the lithium salt resource that we intend to develop; and
•Several mechanical evaporation facilities producing consumer and industrial salt.
We concluded that certain of our assets met the criteria for classification as held for sale and discontinued operations in the first quarter of 2021, as discussed further in the “Discontinued Operations” section below. As a result, we are presenting two reportable segments, Salt and Plant Nutrition (which was previously known as the Plant Nutrition North America segment) in this “Management’s Discussion and Analysis of Financial Condition and Results of Operations.” See
Item 8, Note 15 to our Consolidated Financial Statements for more information. Unless otherwise indicated, the information and amounts provided in this “Management’s Discussion and Analysis of Financial Condition and Results of Operations” pertain to continuing operations.
Our Salt segment provides highway deicing salt to customers in North America and the U.K. as well as consumer deicing and water conditioning products, ingredients used in consumer and commercial food preparation, and other salt-based products for consumer, industrial, chemical and agricultural applications in North America. In the U.K., we operate a records management business utilizing excavated areas of our Winsford salt mine with one other location in London, England.
Our Plant Nutrition segment produces and markets SOP products in various grades worldwide to distributors and retailers of crop inputs, as well as growers and for industrial uses. We market our SOP under the trade name Protassium+.
In May 2023, we completed the purchase of Fortress, a next-generation fire retardant company dedicated to developing and producing a portfolio of magnesium chloride-based aerial and ground fire retardant products to help combat wildfires (see
Part II, Item 8, Note 3 of our Consolidated Financial Statements). Magnesium chloride is an existing product stream out of our Ogden, Utah, solar evaporation facility. During the third quarter of fiscal 2023, Fortress entered into an agreement with the U.S. Forest Service (“USFS”) to supply product and provide associated services for the 2023 fire season, as described further in
Part II, Item 8, Note 5 of our Consolidated Financial Statements.
Additionally, we have been pursuing development of a sustainable lithium salt resource near Ogden, UT to support the North American battery market. As previously announced, we have suspended indefinitely any further investment in the lithium project in Utah beyond certain already committed items associated with the early stages of construction of our commercial scale demonstration unit until further clarity is provided on the evolving regulatory climate. We are considering seeking partners at the project level with an aim of reducing our share of capital costs and lowering execution risk in the event that the project is restarted.
We focus on building intrinsic value by growing our earnings before interest, taxes, depreciation and amortization (“EBITDA”) and by improving our asset quality. We can employ our operating cash flow and other sources of liquidity to pay dividends, re-invest in our business, pay down debt and make acquisitions.
|
|
|
|
|
|
|
|
|
|
|
COMPASS MINERALS INTERNATIONAL, INC. |
Discontinued Operations
On March 16, 2021, our Board of Directors approved a plan to sell our South America chemicals and specialty plant nutrition businesses, our investment in Fermavi and our North America micronutrient product business (collectively, the “Specialty Businesses”) with the goal of reducing our leverage and enabling increased focus on optimizing our core businesses and as described further in
Item 8, Note 1 and
Note 4 to our Consolidated Financial Statements, we subsequently sold our South America specialty plant nutrition business, a component of our North America micronutrient business, our Fermavi investment and our South America chemicals business, respectively. We believe these dispositions were conducted through a single disposal plan representing a strategic shift that has had a material effect on our operations and financial results. Consequently, the Specialty Businesses qualify for presentation as discontinued operations in accordance with U.S. Generally Accepted Accounting Principles (“GAAP”). The dispositions were completed during fiscal 2022; accordingly, the results of operations of the Specialty Businesses are presented as discontinued operations in the Consolidated Statements of Operations for each period presented.
Change in Fiscal Year
On June 23, 2021, our Board of Directors approved a change in our fiscal year end from December 31 to September 30. As a result, our results of operations, cash flows and all transactions impacting shareholders equity presented in this Annual Report on Form 10-K are for the twelve months ended September 30, 2023 (“fiscal 2023”), the twelve months ended September 30, 2022 (“fiscal 2022”) and the nine month transition period ended September 30, 2021 (“fiscal 2021”) unless otherwise noted. As such, our fiscal 2023 refers to the period from October 1, 2022 to September 30, 2023.
This Annual Report on Form 10-K also includes an unaudited Consolidated Statement of Operations for the comparable twelve month period of October 1, 2020 to September 30, 2021; see
Item 8, Note 21 to our Consolidated Financial Statements for additional information.
The discussion below provides a comparison of (1) the twelve months ended September 30, 2023 to the twelve months ended September 30, 2022 and (2) the twelve months ended September 30, 2022 to the twelve ended September 30, 2021. All information for the twelve months ended September 30, 2021 is unaudited.
Consolidated Results of Operations
* Refer to “—Reconciliation of Net Earnings (Loss) from Continuing Operations to EBITDA and Adjusted EBITDA” for a reconciliation to the most directly comparable U.S. GAAP financial measure and the reasons we use this non-U.S. GAAP measure.
|
|
|
|
|
|
|
|
|
|
|
COMPASS MINERALS INTERNATIONAL, INC. |
CONSOLIDATED RESULTS COMMENTARY: Fiscal Year Ended September 30, 2023 – Fiscal Year Ended September 30, 2022
•Total sales decreased 3%, or $39.4 million, due to a decrease in the Plant Nutrition segment, which was partially offset by the inclusion of sales of Fortress following its acquisition in May 2023.
•Operating earnings increased 84%, or $36.2 million, primarily due to higher operating earnings in our Salt segment and operating earnings of Fortress following its acquisition, which were partially offset by lower Plant Nutrition segment operating earnings.
•Diluted earnings per share increased $1.47 to a net earnings per share of $0.37.
•EBITDA* adjusted for items management believes are not indicative of our ongoing operating performance (“Adjusted EBITDA”)* increased 7%, or $12.3 million.
CONSOLIDATED RESULTS COMMENTARY: Twelve Months Ended September 30, 2022 – Twelve Months Ended September 30, 2021
•Total sales increased $98.3 million, due to an increase in the Salt segment, which was partially offset by a decrease in the Plant Nutrition segment.
•Operating earnings decreased 60%, or $64.2 million, due to lower operating earnings in our Salt segment and higher corporate expenses, which was partially offset by higher Plant Nutrition segment earnings.
•Diluted earnings per share decreased $2.10 to a loss of $1.10.
•Adjusted EBITDA decreased 22%, or $52.3 million.
|
|
|
|
|
|
|
|
|
|
|
COMPASS MINERALS INTERNATIONAL, INC. |
GROSS PROFIT & GROSS MARGIN COMMENTARY: Fiscal Year Ended September 30, 2023 – Fiscal Year Ended September 30, 2022
Gross Profit: Increased 19%, or $37.1 million; Gross Margin increased 3% from 16% to 19%
•Salt segment gross profit increased $57.9 million primarily due to higher average sales prices, which were partially offset by higher per-unit logistics and product costs (see “—Operating Segment Performance—Salt” for additional information).
•Gross profit for the Plant Nutrition segment decreased $27.3 million due to lower sales volumes and higher per-unit product and logistics costs, which were partially offset by slightly higher average sales prices (see “—Operating Segment Performance—Plant Nutrition” for additional information).
•Fortress contributed $6.4 million of gross profit following its acquisition in May 2023.
GROSS PROFIT & GROSS MARGIN COMMENTARY: Twelve Months Ended September 30, 2022 – Twelve Months Ended September 30, 2021
Gross Profit: Decreased 15%, or $33.4 million; Gross Margin decreased 4% from 20% to 16%
•Salt segment gross profit decreased $59.7 million primarily due to higher per-unit logistics and product costs, which were partially offset by higher sales volumes (see “—Operating Segment Performance—Salt” for additional information).
•Gross profit for the Plant Nutrition segment increased $26.3 million due to higher average sales prices, which were partially offset by lower sales volumes and higher per-unit product costs (see “—Operating Segment Performance—Plant Nutrition” for additional information).
OTHER EXPENSES AND INCOME COMMENTARY: Fiscal Year Ended September 30, 2023 – Fiscal Year Ended September 30, 2022
SG&A: Increased $0.9 million; Increased 0.4 percentage points as a percentage of sales to 12.8% from 12.4%
•The increase in SG&A expense was primarily due to costs incurred by Fortress in fiscal 2023 following its acquisition, which were mostly offset by lower legal expenses in fiscal 2023 due to the prior year settlement of the SEC investigation.
|
|
|
|
|
|
|
|
|
|
|
COMPASS MINERALS INTERNATIONAL, INC. |
Interest Income: Increased $4.5 million to $5.3 million
•The increase in interest income during the current period is primarily due to higher interest rates and the higher average cash balance during fiscal 2023 resulting from proceeds received from the private placement of our common stock.
Interest Expense: Increased $0.3 million to $55.5 million
•The increase was primarily due to an increase in interest rates mostly offset by a decrease in outstanding borrowings.
Loss (Gain) on Foreign Exchange: Changed by $17.2 million from a gain of $14.9 million to a loss of $2.3 million in 2023
•We realized a foreign exchange loss of $2.3 million for the fiscal year ended September 30, 2023 compared to a gain of $14.9 million in the prior year due primarily to changes in translating our intercompany loans from Canadian dollars to U.S. dollars.
Net Loss in Equity Investees: Decreased $2.1 million to $3.1 million
•We realized a net loss in equity investees of $3.1 million for the fiscal year ended September 30, 2023 compared to $5.2 million in the comparable period of the prior year as we acquired Fortress in May 2023; therefore we recognized only a partial year of results attributed to Fortress as an equity investee for the period of time prior to acquisition.
Gain from Remeasurement of Equity Method Investment
•We recognized a gain of $13.7 million for the fiscal year ended September 30, 2023 related to our previously held equity investment in Fortress, which was remeasured to fair value upon our full acquisition of the business in May 2023.
Other Expense, Net: Increased $3.8 million from expense of $0.5 million to expense of $4.3 million
•Other expense, net increased primarily due to losses on derivatives not designated as hedging instruments and debt refinancing fees related to our May debt restructuring.
Income Tax Expense from Continuing Operations: Decreased $17.6 million to $17.4 million
•The decrease in income tax expense was due primarily to the recognition of a valuation allowance of $18.1 million in fiscal 2022 recorded against the beginning of the fiscal year deferred tax assets that were no longer considered more likely than not to be realized and a tax benefit in fiscal 2023 from a change in Canadian tax law which allows for deductibility of certain interest expense items, partially offset by an increase in pretax book income in fiscal 2023 compared to the prior year.
•Our effective tax rate was 53% for the fiscal year ended September 30, 2023, which is primarily driven by the income mix by country with income recognized in foreign jurisdictions partially offset by losses recognized in the U.S., for which a valuation allowance has been recorded against the U.S. tax benefit carryforward. Additionally, a tax benefit was recorded in fiscal 2023 related to the change in Canadian tax law permitting the deductibility of certain interest expense items.
•Our income tax provision in both periods differs from the U.S. statutory rate primarily due to U.S. statutory depletion, state income taxes, base erosion and anti-abuse tax, nondeductible executive compensation, foreign income, mining and withholding taxes and valuation allowance expense. Additionally, the income tax provision for the fiscal year ended September 30, 2022 included interest expense recognition differences for tax and financial reporting purposes, global intangible low-taxed income (“GILTI”) and the nondeductible SEC settlement loss accrual.
Net Earnings from Discontinued Operations: Earnings of $12.2 million in fiscal 2022
•The net earnings from our discontinued operations for the fiscal year ended September 30, 2022 includes the results from our previously-owned chemicals business in South America through the April 20, 2022 sale date.
•The prior period results of the South America chemicals business includes a foreign currency exchange rate gain of $17.5 million and an impairment loss of $23.1 million. Refer to
Item 1, Note 4 to the Consolidated Financial Statements for additional details.
OTHER EXPENSES AND INCOME COMMENTARY: Twelve Months Ended September 30, 2022 – Twelve Months Ended September 30, 2021
SG&A: Increased $30.8 million; Increased 1.7 percentage points as a percentage of sales to 12.4% from 10.7%
•The increase in SG&A expense was primarily due to the fiscal 2022 accrued settlement and increased legal expenses related to the settled SEC investigation, costs related to our lithium development and increased employee compensation costs which include executive transition costs.
|
|
|
|
|
|
|
|
|
|
|
COMPASS MINERALS INTERNATIONAL, INC. |
Interest Income: Increased $0.5 million to $0.8 million
•The increase in interest income is primarily due to higher interest rates.
Interest Expense: Decreased $4.6 million to $55.2 million
•The decrease was primarily due to a decrease in outstanding borrowings.
(Gain) Loss on Foreign Exchange: Improved $20.5 million from a loss of $5.6 million to a gain of $14.9 million in 2022
•We realized a foreign exchange gain of $14.9 million for the twelve months ended September 30, 2022 compared to a loss of $5.6 million in the comparable period for the prior year due primarily to changes in translating our intercompany loans from Canadian dollars to U.S. dollars.
Net Loss in Equity Investees: Increased $4.7 million to $5.2 million
•We realized a net loss in equity investees of $5.2 million for the twelve months ended September 30, 2022 compared to $0.5 million in the comparable period due to our share of losses related to our equity investments in the period ended September 30, 2022.
Other Expense, Net: Increased $0.4 million from $0.1 million to $0.5 million
•Other income, net primarily reflects an increase in losses in our deferred compensation plan in fiscal 2022.
Income Tax Expense from Continuing Operations: Increased $29.2 million to $35.0 million
•The increase in income tax expense was due to a $37.5 million of valuation allowance recorded in the twelve months ended September 30, 2022 against the portion of our deferred tax assets that are no longer considered more likely than not to be realized, partially offset by a decrease due to lower pretax book income for the twelve months ended September 30, 2022 compared to the twelve months ended September 30, 2021.
•Our effective tax rate decreased from 14% for the twelve months ended September 30, 2021, reflecting $37.5 million of valuation allowance recorded in fiscal 2022 on pretax book losses. See
Item 1, Note 11 to the Consolidated Financial Statements.
•Our income tax provision in both periods differs from the U.S. statutory rate primarily due to U.S. statutory depletion, state income taxes, nondeductible executive compensation, foreign income, mining and withholding taxes and interest expense recognition differences for tax and financial reporting purposes. Our provision for the twelve months ended September 30, 2022 also included valuation allowances and nondeductible contingent loss accrual.
Net (Loss) Earnings from Discontinued Operations: Increased from a loss of $220.8 million to income of $12.2 million
•The net earnings from our discontinued operations for the twelve months ended September 30, 2022 includes only the results from our chemicals business in South America through the April 20, 2022 sale date, but includes the results of all the South America businesses and the North America specialty plant nutrition business for the twelve months ended September 30, 2021.
•The twelve months ended September 30, 2022 results of the South America chemicals business includes a foreign currency exchange rate gain of $17.5 million offset by an impairment loss of $23.1 million compared to the prior period foreign currency exchange rate gain of $11.3 million and net impairment loss of $269.4 million to record the net assets of the South America businesses at their fair value less cost to sell net of a gain on the sale of the Plant Nutrition micronutrient business. Refer to
Item 1, Note 4 to the Consolidated Financial Statements for additional details.
OPERATING SEGMENT PERFORMANCE
The following financial results represent consolidated financial information with respect to sales from our Salt and Plant Nutrition segments for the fiscal years ended September 30, 2023 and 2022 and the twelve months ended September 30, 2021. Sales primarily include revenue from the sales of our products, or “product sales,” and the impact of shipping and handling costs incurred to deliver our salt and plant nutrition products to our customers.
The results of operations of the Fortress business include sales of $10.4 million for the fiscal year ended September 30, 2023. The results of operations of the consolidated records management business and other incidental revenues include sales of $11.4 million, $11.5 million and $11.3 million for the twelve months ended September 30, 2023, 2022, and 2021, respectively. These sales are not material to our consolidated financial results and are not included in the following operating segment financial data.
|
|
|
|
|
|
|
|
|
|
|
COMPASS MINERALS INTERNATIONAL, INC. |
SALT SEGMENT RESULTS
|
|
|
|
|
|
|
|
|
|
|
|
|
|
|
|
|
|
|
Twelve Months Ended |
|
September 30,
2023 |
|
September 30,
2022 |
|
September 30,
2021 |
Salt Sales (in millions) |
$ |
1,010.8 |
|
|
$ |
1,010.3 |
|
|
$ |
899.6 |
|
Salt Operating Earnings (in millions) |
$ |
170.7 |
|
|
$ |
116.2 |
|
|
$ |
177.7 |
|
Salt Sales Volumes (thousands of tons) |
|
|
|
|
|
| Highway deicing |
9,321 |
|
10,435 |
|
9,295 |
| Consumer and industrial |
1,999 |
|
2,122 |
|
1,997 |
| Total tons sold |
11,320 |
|
12,557 |
|
11,292 |
Average Salt Sales Price (per ton) |
|
|
|
|
|
| Highway deicing |
$ |
68.85 |
|
|
$ |
61.34 |
|
|
$ |
61.40 |
|
| Consumer and industrial |
$ |
184.67 |
|
|
$ |
174.45 |
|
|
$ |
164.67 |
|
| Combined |
$ |
89.29 |
|
|
$ |
80.45 |
|
|
$ |
79.67 |
|
SALT SEGMENT RESULTS COMMENTARY: Fiscal Year Ended September 30, 2023 – Fiscal Year Ended September 30, 2022
•Salt sales of $1,010.8 million were essentially flat to the prior year reflecting higher Salt average sales prices, which were offset by lower sales volumes.
•Salt sales volumes decreased 10%, or 1,237,000 tons, and reduced sales by approximately $89.8 million. Highway deicing sales volumes decreased 11% largely reflecting our 2022 bidding strategy emphasizing pricing over volume which resulted in a decrease in North American sales commitments. Consumer and industrial sales volumes decreased 6% primarily reflecting a decrease in deicing sales volumes.
•Salt average sales price increased 11% and contributed approximately $90.3 million to the increase in sales due to higher highway and consumer and industrial average sales prices.
•Highway deicing average sales prices increased 12% when compared to the prior year due to higher North American highway deicing contract prices for the 2023 winter season and stronger pricing in the UK. Consumer and industrial average sales prices increased 6% due to higher sales prices primarily in response to the recent inflationary environment.
•Salt operating earnings increased 47%, or $54.5 million, due primarily to higher average sales prices for both highway and consumer and industrial products, which were partially offset by higher per-unit product and logistics costs and $1.5 million of restructuring costs recognized in the current year. In addition, lower sales volumes compared to the prior period partially offset the increase in operating earnings.
SALT SEGMENT RESULTS COMMENTARY: Twelve Months Ended September 30, 2022 – Twelve Months Ended September 30, 2021
•Salt sales increased 12%, or $110.7 million, due to higher Salt sales volumes and average sales prices.
•Salt sales volumes increased 11%, or 1,265,000 tons, and contributed approximately $90.6 million to the increase in sales. Highway deicing sales volumes increased 12% primarily as a result of an increase in sales commitments. Consumer and industrial sales volumes increased 6% due to an increase in both deicing and non-deicing sales volumes.
•Salt average sales price increased 1% and contributed approximately $20.1 million to the increase in sales due to higher consumer and industrial average sales prices.
•Highway deicing average sales prices were relatively flat when compared to the prior year as lower North American highway deicing contract prices for the 2022 winter season and the weaker pound sterling were mostly offset by favorable product sales mix. Consumer and industrial average sales prices increased 6% due to higher sales prices primarily in response to the high inflationary environment.
•Salt operating earnings decreased 35%, or $61.5 million, due primarily to higher per-unit product and logistics costs. We experienced higher freight costs and inflationary pressures for certain materials and supplies that were not recovered through increased sales prices during the period. We estimate increased Salt product cost of approximately $15.5 million to $17.5 million during fiscal 2022 due to inflation impacts. Additionally, as a result of a maintenance outage at our Cote Blanche mine during the three months ended March 31, 2022, we incurred approximately $9.2
|
|
|
|
|
|
|
|
|
|
|
COMPASS MINERALS INTERNATIONAL, INC. |
million of additional product and logistics costs to fulfill seasonal demand with salt from other sources. Higher sales volumes compared to the prior period partially offset the higher costs.
PLANT NUTRITION RESULTS
|
|
|
|
|
|
|
|
|
|
|
|
|
|
|
|
|
|
|
Twelve Months Ended |
|
September 30,
2023 |
|
September 30,
2022 |
|
September 30,
2021 |
Plant Nutrition Sales (in millions) |
$ |
172.1 |
|
|
$ |
222.3 |
|
|
$ |
235.0 |
|
Plant Nutrition Operating Earnings (in millions) |
$ |
11.2 |
|
|
$ |
37.1 |
|
|
$ |
9.1 |
|
Plant Nutrition Sales Volumes (thousands of tons) |
219 |
|
|
286 |
|
|
403 |
|
Plant Nutrition Average Sales Price (per ton) |
$ |
785 |
|
|
$ |
777 |
|
|
$ |
583 |
|
PLANT NUTRITION RESULTS COMMENTARY: Fiscal Year Ended September 30, 2023 – Fiscal Year Ended September 30, 2022
•Plant Nutrition sales decreased 23%, or $50.2 million, due to lower sales volumes, which was partially offset by higher average sales prices.
•Plant Nutrition sales volumes decreased 23%, or 67,000 tons, due to a combination of weather conditions in select key markets, including California, and uncertainty about future fertilizer prices causing customers to cancel or delay purchases. The lower sales volumes resulted in a sales decline of approximately $52.1 million.
•Strong Plant Nutrition sales prices early in fiscal 2023 resulted in a 1% increase average sales price for the year increasing sales by approximately $1.9 million. Sales prices have since moderated closer to historical levels.
•Plant Nutrition operating earnings decreased 70%, or $25.9 million primarily reflecting higher per-unit product costs primarily driven by lower production volumes and higher energy and other input costs, $2.9 million of expenses associated with the small fire at Ogden and proportionately fewer sales to more profitable regions, which were partially offset by higher average sales prices and lower SG&A expenses.
PLANT NUTRITION RESULTS COMMENTARY: Twelve Months Ended September 30, 2022 – Twelve Months Ended September 30, 2021
•Plant Nutrition sales decreased 5%, or $12.7 million, due to lower sales volumes, which was partially offset by higher average sales prices.
•Plant Nutrition sales volumes decreased 29%, or 117,000 tons, as feedstock inconsistencies in the twelve months ended September 30, 2022 have reduced production volumes and available inventory levels. The lower sales volumes resulted in a sales decline of approximately $68.2 million.
•Plant Nutrition average sales prices increased 33% and increased sales by approximately $55.5 million.
•Plant Nutrition operating earnings increased 308%, or $28.0 million primarily due to significantly higher average sales prices, which were partially offset by reduced sales volumes due to inventory constraints and higher per-unit product and logistics costs primarily due to lower production volumes at our Ogden facility as well as approximately $5 million to $7 million of higher energy and other input costs.
OUTLOOK
•Due to weaker winter weather in the company’s served markets in fiscal year 2023, committed volumes for fiscal year 2024 in the North American highway deicing business are down approximately 5%. Despite these lower volume commitments, we expect Salt segment sales volumes to increase between 3% and 5% year over year assuming average winter weather. Pricing for the Salt segment is expected to improve year over year, driven by higher North American highway deicing bid season results that saw average contract pricing improve by approximately 3%. Accordingly, we expect Salt segment sales volumes and adjusted EBITDA to range from 11.3 million to 12.2 million tons and $230 million to $270 million, respectively, in fiscal year 2024.
•Plant Nutrition segment sales volumes are expected to improve to a range of 290,000 to 320,000 tons in fiscal year 2024, up from depressed levels in fiscal year 2023 that reflected abnormal weather in California. We expect lower average selling prices throughout fiscal 2024 as prices have moderated from peak prices obtained in fiscal 2023. For fiscal year 2024, we expect adjusted EBITDA in a range of $20 million to $40 million.
•Fiscal year 2024 capital expenditures are expected to be in the $125 million to $140 million range. This includes approximately $90 million to $100 million in sustaining capital for the core Salt and Plant Nutrition business. Capital
|
|
|
|
|
|
|
|
|
|
|
COMPASS MINERALS INTERNATIONAL, INC. |
expenditures in the lithium project are projected in a range of $25 million to $30 million and includes only amounts related to previously committed items associated with early stage construction of the commercial scale demonstration unit. We have suspended further investment in our lithium salt project pending regulatory clarity from the State of Utah. In the fire retardant business, approximately $10 million of growth capital is anticipated to be spent in fiscal year 2024.
Investments, Liquidity and Capital Resources
Overview
As a holding company, CMI’s investments in its operating subsidiaries constitute substantially all of its assets. Consequently, our subsidiaries conduct all of our consolidated operations and own substantially all of our operating assets. The principal source of cash needed to pay our obligations is the cash generated from our subsidiaries’ operations and their borrowings. Furthermore, we must remain in compliance with the terms of the credit agreement governing our credit facilities, including the consolidated total net leverage ratio and interest coverage ratio, in order to pay dividends to our stockholders. We must also comply with the terms of our indentures governing our 6.75% Senior Notes due December 2027 (the “6.75% Notes), which limits the amount of dividends we can pay to our stockholders. We are in compliance with our debt covenants as of September 30, 2023. See
Item 8, Note 13 to our Consolidated Financial Statements for a discussion of our outstanding debt.
Historically, our cash flows from operating activities have generally been adequate to fund our basic operating requirements, ongoing debt service and sustaining investment in our property, plant and equipment. We have also used cash generated from operations to fund capital expenditures, pay dividends, fund smaller acquisitions and repay our debt. We have been able to manage our cash flows generated and used across Compass Minerals to permanently reinvest earnings in our foreign jurisdictions or efficiently repatriate those funds to the U.S. As of September 30, 2023, we had $20.0 million of cash and cash equivalents (in our Consolidated Balance Sheets) that was either held directly or indirectly by foreign subsidiaries. Due in large part to the seasonality of our deicing salt business, we have experienced large changes in our working capital requirements from quarter to quarter. Historically, our working capital requirements have been the highest in the first fiscal quarter (ending December 31) and lowest in the third fiscal quarter (ending June 30). When needed, we may fund short-term working capital requirements by accessing our $375 million revolving credit facility and our $100 million revolving accounts receivable financing facility (our “AR Facility”).
Notwithstanding our strategic decision to exit our South America chemicals and specialty plant nutrition businesses, as discussed in
Item 8, Note 1 and
Note 4 to our Consolidated Financial statements, we have historically considered the undistributed earnings of our foreign subsidiaries to be permanently reinvested. As a result of U.S. tax reform, we revised our permanently reinvested assertion in fiscal 2018 expecting to repatriate approximately $150 million of unremitted foreign earnings from Canada. Additionally, we changed our permanently reinvested assertion and repatriated $42.5 million of unremitted foreign earnings from our U.K. operations in September 2021. In fiscal 2022, we revised our permanently reinvested assertion, expecting to repatriate an additional $10 million of unremitted foreign earnings from our U.K. operations and in fiscal 2023 we revised it again expecting to repatriate an additional approximately $6 million of unremitted foreign earnings from our U.K. operations. During the first quarter of fiscal 2023, $89.2 million was repatriated from Canada and in the third quarter of fiscal 2023, $15.6 million was repatriated from the U.K. Net income tax expense of $3.8 million has been recorded for foreign withholding tax, state income tax and foreign exchange losses on these changes in assertion as of September 30, 2023, consisting of a tax benefit of $0.7 million recorded in fiscal 2023, and tax expense of $4.5 million, most of which was recorded in years prior to fiscal 2021. Due to our ability to generate adequate levels of U.S. cash flow on an annual basis, it is our current intention to continue to reinvest the remaining undistributed earnings of our foreign subsidiaries indefinitely. We review our tax circumstances on a regular basis with the intent of optimizing cash accessibility and minimizing tax expense. As of September 30, 2023, we have $194.9 million of outside basis differences for which no deferred taxes have been recorded. See
Item 8, Note 11 to our Consolidated Financial Statements for additional information.
In addition, the amount of permanently reinvested foreign earnings is influenced by, among other things, the profits generated by our foreign subsidiaries and the amount of investment in those same subsidiaries. The profits generated by our U.S. and foreign subsidiaries are impacted by the transfer price charged on the transfer of our products between them. As discussed in
Item 8, Note 11 to our Consolidated Financial Statements, Canadian provincial taxing authorities continue to challenge our transfer prices of certain items. The final resolution of these challenges may not occur for several years. We currently expect the outcome of these matters will not have a material impact on our results of operations. However, it is possible the resolution could materially impact the amount of earnings attributable to our foreign subsidiaries, which could impact the amount of permanently reinvested foreign earnings. See
Item 8, Note 11 to our Consolidated Financial Statements for a discussion regarding our Canadian tax reassessments.
Capital Allocation
Principally due to the nature of our deicing business, our cash flows from operations have historically been seasonal, with the majority of our cash flows from operations generated during the first half of the calendar year (see “—Seasonality” for more information). When we have not been able to meet our short-term liquidity or capital needs with cash from operations, whether
|
|
|
|
|
|
|
|
|
|
|
COMPASS MINERALS INTERNATIONAL, INC. |
as a result of the seasonality of our business or other causes, we have met those needs with borrowings under our revolving credit facility. We expect to meet the ongoing requirements for debt service, any declared dividends and capital expenditures related to our Salt, Plant Nutrition and Fortress businesses from these sources. This, to a certain extent, is subject to general economic, financial, competitive, legislative, regulatory and other factors that are beyond our control.
We manage our capital allocation considering our long-term strategic objectives and required spending to sustain our business. During the first quarter of fiscal 2021, we reduced our dividend by approximately 80% to provide additional liquidity and align our capital allocation policy with our corporate strategy. While our equipment and facilities are generally not impacted by rapid technology changes, our operations require refurbishments and replacements to maintain structural integrity and reliable production and shipping capabilities. When possible, we incorporate efficiency, environmental and safety improvements into our routine capital projects and we plan the timing of larger projects to balance with our liquidity and capital resources. Changes in our operating cash flows may affect our future capital allocation and spending.
In fiscal 2023, we spent $156.2 million on capital expenditures. During fiscal 2024, we expect to spend between $90 million to $100 million of sustaining capital in our Salt, Plant Nutrition and Fortress businesses, including approximately $15 million to $20 million towards replacing the existing underground mill at Goderich mine over multiple years, which will be located in a built-for-purpose area of the mine and improve operating efficiencies. Additionally, we have spent approximately $48.7 million of capital in fiscal 2023 (approximately $51.3 million cumulatively) towards the development phase of our sustainable lithium development project. As previously announced, we have suspended indefinitely any further investment in the lithium development project beyond certain already committed items associated with the early stages of construction of our commercial scale demonstration unit until further clarity is provided on the evolving regulatory climate. We are considering seeking potential partners at the project level to reduce our share of capital costs and lower execution risk in the event that the project is restarted. We can no longer provide an estimate of when we expect to achieve market entry, but expect significant capital and other expenditures would be required to achieve this market entry if we decide to continue with the lithium development project at some point in the future. For more information, see
Item 1A, “Risk Factors.” On October 18, 2022, we received aggregate net proceeds of approximately $240.7 million, net of transaction costs, from Koch Minerals & Trading, LLC (“KM&T”) as part of a strategic equity partnership. We have used, or committed to use, approximately $78 million of the proceeds from the private placement for capital expenditures to advance the first development phase of the lithium project, including the early stages of construction of our commercial scale demonstration unit, with the remainder of the proceeds used to reduce debt or for general corporate purposes.
In connection with our strategy to strengthen and grow our essential minerals businesses, in fiscal 2022, we made an additional $45 million equity investment in Fortress, resulting in a total investment of $50 million representing a 45% ownership interest. Fortress is a development stage company that has achieved commercialization during fiscal 2023 of its magnesium chloride-based fire-retardant products to help combat wildfires.
On May 5, 2023, we acquired the remaining 55% interest in Fortress not previously owned in exchange for an initial cash payment of approximately $18.9 million (net of cash held by Fortress of $6.5 million), and additional contingent consideration of up to $28 million to be paid in cash and/or Compass Minerals common stock upon the achievement of certain performance measures, and a cash earn-out based on financial performance and volumes of Fortress fire retardant products sold over a 10-year period. Building upon the previous 45% minority ownership stake in Fortress, the transaction provides us full ownership of all Fortress assets, contracts, and intellectual property. We initially recognized a $16.2 million non-cash gain in the period ended June 30, 2023, as a result of remeasuring the value of our prior equity interest in Fortress, which is generally attributable to Fortress’ advancement from a pre-revenue, development-stage company to commercialization. The gain was reduced to $13.7 million in the period ended September 30, 2023, as a result of measurement period adjustments, discussed further in
Item 8, Note 3. During the third quarter of fiscal 2023, Fortress entered into an agreement with the USFS to supply product and provide associated services for the 2023 fire season.
|
|
|
|
|
|
|
|
|
|
|
COMPASS MINERALS INTERNATIONAL, INC. |
The table below provides a summary our cash flows by category and period ended.
|
|
|
|
|
|
|
|
|
| Fiscal Year Ended |
Nine Months Ended |
| September 30, 2023 |
September 30, 2022 |
September 30, 2021 |
Operating Activities: |
|
Net cash flows provided by operating activities were $107.9 million.
»Net earnings were $15.5 million.
»Non-cash depreciation and amortization expense was $98.6 million.
»Non-cash stock-based compensation was $20.6 million.
»Non-cash remeasurement gain of $13.7 million related to the acquisition of Fortress.
»Non-cash loss on disposition of assets was $4.5 million.
»Non-cash net loss in equity investees was $3.1 million.
»Working capital items were a use of operating cash flows of $22.4 million.
|
Net cash flows provided by operating activities were $120.5 million.
»Net losses were $25.1 million.
»Non-cash depreciation and amortization expense was $113.7 million.
»Non-cash impairment loss was $23.1 million.
»Non-cash stock-based compensation was $15.7 million.
»Non-cash net loss in equity investees was $5.2 million.
»Non-cash loss on disposition of assets was $3.7 million.
»Working capital items were a use of operating cash flows of $9.4 million.
|
Net cash flows provided by operating activities were $162.7 million.
»Net losses were $213.3 million.
»Non-cash depreciation and amortization expense was $94.6 million.
»Non-cash impairment loss was $300.0 million.
»Non-cash gain on disposition of assets of $27.3 million, including $30.6 million from the sale of a component of our North America micronutrient business.
»Working capital items were a source of operating cash flows of $46.7 million.
|
| Investing Activities: |
|
Net cash flows used in investing activities were $179.8 million.
»Net cash flows used in investing activities included $156.2 million of capital expenditures.
»Included cash investment of $18.9 million, net of cash held by Fortress, for the acquisition of the remaining interest in Fortress.
|
Net cash flows used in investing activities were $80.0 million.
»Net cash flows used in investing activities included $96.7 million of capital expenditures.
»Investing activity outflows were partially offset by proceeds of $61.2 million from the sale of our South America specialty chemicals business and specialty plant nutrition earnout.
»Included investments in equity method investees of $46.3 million.
|
»Net cash flows provided by investing activities included proceeds of $348.6 million from the sale of our South America specialty plant nutrition business ($289.5 million), a component of our North America micronutrient business ($56.2 million) and our Fermavi investment ($2.9 million).
»Investing proceeds were offset by $71.8 million of capital expenditures.
|
| Financing Activities: |
|
Net cash flows provided by financing activities were $64.0 million.
»Included payments of dividends of $24.9 million.
»Net payments on our debt of $144.7 million.
»Included payment of deferred financing costs of $3.9 million.
»Included net proceeds from private placement of common stock of $240.7 million.
|
Net cash flows used in financing activities were $14.3 million.
»Included payments of dividends of $20.8 million.
»Net proceeds from the issuance of debt of $9.9 million.
|
Net cash flows used in financing activities were $439.6 million.
»Included payments of dividends of $73.1 million.
»Net payments on our debt of $365.8 million.
|
As mentioned above, our Salt segment’s business is seasonal and our Salt segment results and working capital needs are heavily impacted by the severity and timing of the winter weather, which generally occurs from December through March each year. Customers tend to replenish their inventory prior to the start of the winter season and following snow events, consequently the number and timing of snow events during the winter season will impact the amount of our accounts receivable and inventory at the end of each quarter. The lower accounts receivable balance and higher inventory balance as of September 30, 2023, as compared to September 30, 2022, primarily reflects lower sales volumes in the fourth fiscal quarter in our Salt and Plant Nutrition segments. The acquisition of Fortress resulted in an increase in current liabilities due to accrued contingent consideration and deferred revenue recorded on its contract with the USFS as of September 30, 2023 as compared to September 30, 2022. The higher accounts receivable balance as of September 30, 2022, as compared to September 30, 2021, reflects higher
|
|
|
|
|
|
|
|
|
|
|
COMPASS MINERALS INTERNATIONAL, INC. |
sales in the fourth fiscal quarter due to higher preseason deicing demand and higher SOP pricing in fiscal 2022. The higher sales activity and increased costs resulted in a higher level of current liabilities as of September 30, 2022 as compared to September 30, 2021. The working capital reduction for the nine months ended September 30, 2021 reflects the collection of the prior winter season accounts receivable net of subsequent rebuilding of inventory in advance of the next winter season.
See Dispositions below for a discussion of the sale of our South America Plant Nutrition business and North America micronutrient business.
Capital Resources
With regard to our Salt, Plant Nutrition and Fortress businesses, we believe our ongoing primary sources of liquidity will continue to be cash flow from operations and borrowings under our revolving credit facility. We believe that our current banking syndicate is secure and believe we will have access to our entire revolving credit facility. We expect that ongoing requirements for debt service and sustaining capital expenditures will primarily be funded from these sources. On October 18, 2022, we received approximately $240.7 million of proceeds, net of transaction costs, from the private placement of common stock with KM&T, of which approximately $200 million had previously been committed to fund the capital expenditure needs of our planned lithium development with the remaining approximately $40.7 million used to repay outstanding debt. As noted above, we have suspended indefinitely any further investment in the lithium development project beyond certain already committed items associated with the early stages of construction of our commercial scale demonstration unit until further clarity is provided on the evolving regulatory climate. For additional information, see
Item 8, Note 16.
Our debt service obligations could, under certain circumstances, materially affect our financial condition and prevent us from executing our business strategies. See Item 1A, “Risk Factors—Our indebtedness and any inability to pay our indebtedness could adversely affect our business and financial condition.” Furthermore, CMI is a holding company with no operations of its own and is dependent on its subsidiaries for cash flow. As discussed in
Item 8, Note 13 to our Consolidated Financial Statements, at September 30, 2023, we had $811.2 million of outstanding indebtedness consisting of $500.0 million under our 6.75% Notes, $280.3 million of borrowings outstanding under our senior secured credit facilities (consisting of a term loan and a revolving credit facility), including $81.5 million borrowed against our revolving credit facility. Letters of credit totaling $15.2 million as of September 30, 2023, reduced available borrowing capacity under the revolving credit facility to $278.3 million.
On May 5, 2023, we entered into an agreement to amend and restate our credit agreement entered into on November 26, 2019 (as in effect prior to such restatement, the “Existing Credit Agreement”) with a new $575 million senior secured credit agreement due May 5, 2028 (as amended, the “2023 Credit Agreement”), comprised of a $375 million revolving credit facility and $200 million term loan. The term loan is payable in quarterly installments of interest and principal, which began September 30, 2023. The 2023 Credit Agreement increases the Applicable Margins by 25 basis points over those defined in the Existing Credit Agreement and adds an additional level at a consolidated total leverage ratio (defined below) of greater than 4.00 to 1.00. Consolidated total net debt includes the aggregate principal amount of total debt, net of unrestricted cash of up to $75 million as per the 2023 Credit Agreement. Proceeds from the 2023 Credit Agreement were used to redeem our $250 million 4.875% Senior Notes on May 10, 2023 and pay off the Existing Credit Agreement term loan balance of $16.9 million. Refer to
Item 8, Note 13 of our Consolidated Financial Statements for additional details.
In November 2022, we entered into the third amendment to the Credit Agreement, principally to affect a transition from the London Inter-Bank Offered Rate to the Secured Overnight Financing Rate pricing benchmark provisions.
Pursuant to the terms of the 2023 Credit Agreement, the maximum allowed consolidated total net leverage ratio (as defined and calculated under the terms of the 2023 Credit Agreement and discussed further below) is 5.0x as of the last day of any quarter through the fiscal quarter ended December 31, 2023, which steps down to 4.75x in the quarter ending March 31, 2024, and to 4.5x for the fiscal quarter ended June 30, 2024 and thereafter. The consolidated total net leverage ratio represents the ratio of (a) consolidated total net debt to (b) consolidated adjusted EBITDA. As of September 30, 2023, our consolidated total net leverage ratio was approximately 3.70x. Consolidated total net debt is defined as the aggregate principal amount of debt outstanding, net of unrestricted cash not to exceed $75 million.
In April 2022, we utilized earnout proceeds from the fiscal 2021 sale of our South America specialty plant nutrition business and proceeds from the sale of our South America chemicals business, both discussed in Dispositions below, to repay approximately $60.6 million of our term loan balance.
In July 2021, we utilized cash proceeds from the sales of our South America specialty plant nutrition business and North America micronutrient business noted below in Dispositions to repay amounts borrowed against our revolving credit facility of $35.0 million. An additional $265.0 million of proceeds was utilized to pay down our term loan balance.
On June 30, 2020, certain of our U.S. subsidiaries entered into a three-year committed revolving accounts receivable financing facility for up to $100.0 million of borrowing with PNC Bank, National Association, as administrative agent and lender, and PNC Capital Markets, LLC, as structuring agent. On June 27, 2022, certain of our U.S. subsidiaries entered into an amendment to our AR Facility, extending the facility to June 2025. In January 2023, certain of the Company’s U.S. subsidiaries entered into the second amendment to the AR Securitization Facility with PNC Bank, which temporarily eased the restrictions of certain covenants contained in the agreement through March 2023. The amendment made certain adjustments to the financial
|
|
|
|
|
|
|
|
|
|
|
COMPASS MINERALS INTERNATIONAL, INC. |
tests including: (i) the default ratio and (ii) the delinquency ratio to make compliance with such tests more likely. At September 30, 2023, we had $30.9 million of outstanding loans under this accounts receivable financing facility. See
Item 8, Note 13 to our Consolidated Financial Statements for more information.
In the future, including in fiscal 2024, we may borrow amounts under the revolving credit facility or enter into additional financing to fund our working capital requirements, potential acquisitions and capital expenditures and for other general corporate purposes. Although we are in compliance with our debt covenants as of September 30, 2023, we can make no assurance that we will remain in compliance with these ratios. Furthermore, we may need to refinance all or a portion of our indebtedness on or before maturity; however, we cannot provide assurance that we will be able to refinance any of our indebtedness on commercially reasonable terms or at all.
Our ability to make scheduled interest and principal payments on our indebtedness, to refinance our indebtedness, to fund planned capital expenditures and to fund acquisitions will depend on our ability to generate cash in the future. This, to a certain extent, is subject to general economic, financial, competitive, legislative, regulatory and other factors that are beyond our control. Based on our current level of operations, we believe that cash flow from operations and available cash, together with available borrowings under our revolving credit facility, will be adequate to meet our liquidity needs over the next 12 months.
We have various foreign and state net operating loss (“NOL”) carryforwards that may be used to offset a portion of future taxable income to reduce our cash income taxes that would otherwise be payable. However, we may not be able to use any or all of our NOL carryforwards to offset future taxable income and our NOL carryforwards may become subject to additional limitations due to future ownership changes or otherwise. At September 30, 2023, we had $65.4 million of gross foreign federal NOL carryforwards and $2.9 million of net operating tax-effected state NOL carryforwards that expire beginning in 2035. Also at September 30, 2023 and 2022, we had $2.0 million and $2.1 million, respectively, of tax-effected state capital losses that expire beginning in 2027 and $1.6 million and $0.2 million, respectively, of tax-effected federal capital losses that expire beginning in 2025. The NOL carryforwards in Brazil and related valuation allowances were eliminated as of September 30, 2022 given the ending of the Company’s operations in Brazil.
Management assesses the available positive and negative evidence to estimate whether sufficient future taxable income will be generated to permit use of the existing deferred tax assets. A significant piece of objective negative evidence evaluated was the cumulative loss incurred in the U.S. over the three-year period ended September 30, 2023. Such objective evidence limits the ability to consider other subjective evidence, such as our projections for future income. On the basis of this evaluation, for the fiscal year 2023, an additional valuation allowance of $10.8 million has been recorded to recognize only the portion of the U.S. deferred tax assets that are more likely than not to be realized. The amount of the deferred tax assets considered realizable, however, could be adjusted if estimates of future taxable income during the carryforward period are increased or reduced or if objective negative evidence in the form of cumulative losses is no longer present and additional weight is given to subjective evidence such as our projections for income.
We have a defined benefit pension plan for certain of our current and former U.K. employees. Beginning December 1, 2008, future benefits ceased to accrue for the remaining active employee participants in the plan concurrent with the establishment of a defined contribution plan for these employees. Generally, our cash funding policy is to make the minimum annual contributions required by applicable regulations. As of September 30, 2023, the fair value of the plan’s assets are in excess of the accumulated benefit obligations and we expect to be required to use cash from operations above our historical levels to fund the plan in the future.
Dispositions
On March 23, 2021, we entered into a definitive agreement to sell our South America specialty plant nutrition business to ICL Brasil Ltda., a subsidiary of ICL Group Ltd. The transaction closed on July 1, 2021. Upon closing we recorded gross proceeds of approximately $421.1 million, including a reduction in proceeds of $6.2 million in working capital adjustments which were finalized during the third quarter of fiscal 2021 and associated selling costs of $8.4 million, comprised of a cash payment of approximately $318.4 million and an additional $102.7 million in net debt assumed by ICL Brasil Ltd. The Brazilian debt was deducted from gross proceeds from the transaction. The terms of the definitive agreement provided for an additional earnout payment of up to R$88 million Brazilian reais. On April 7, 2022, we received the maximum earnout possible of $18.5 million based on exchange rates at the time.
On April 7, 2021, we entered into a definitive agreement to sell a component of our North America micronutrient business to Koch Agronomic Services, LLC, a subsidiary of Koch Industries. On May 4, 2021, we completed the sale for approximately $56.7 million and we paid fees totaling $0.5 million.
On June 28, 2021, we entered into a definitive agreement to sell our investment in Fermavi for R$45 million Brazilian reais (including R$30 million Brazilian reais of deferred purchase price due in annual installments through August 2025). The transaction closed on August 20, 2021, and we received gross proceeds of approximately $2.9 million (based on exchange rates at the time of closing).
On April 20, 2022, we completed the sale of our South America chemicals business to a subsidiary of Cape Acquisitions LLC. Upon closing of the all-cash sale, we received gross proceeds of approximately $51.5 million based on exchange rates at the time of receipt, including a post-closing adjustment and compensation for $6.4 million cash on hand that transferred to the
|
|
|
|
|
|
|
|
|
|
|
COMPASS MINERALS INTERNATIONAL, INC. |
buyer. The sale included all of our remaining operations in Brazil, concluding the previously announced plan to exit the South American market. We recorded losses on the sales of the South American specialty plant nutrition business, the investment in Fermavi and the South America chemicals business totaling approximately $323.1 million. These losses were partially offset by approximately $30.6 million of gain from the sale of a component of the North America micronutrient business.
Off-Balance Sheet Arrangements
At September 30, 2023, we had no off-balance sheet arrangements that have or are likely to have a material current or future effect on our consolidated financial statements.
Contractual Obligations
We believe we have sufficient liquidity to fund our operations and meet both short-term and long-term obligations. Our material future obligations include the contractual obligations and other commitments as described below.
We are party to contractual obligations involving commitments to make payments to third parties. These obligations impact our liquidity and capital resource needs. As of September 30, 2023, we had total future contractual obligations of approximately $1.2 billion, with approximately $104.2 million due during fiscal 2024.
We have a contractual commitment to repay our long-term debt of $811.2 million based on the terms of our debt agreements, of which $5.0 million is payable within the next twelve months. Our interest commitment based on the debt balances at September 30, 2023 is $240.4 million, with $57.0 million expected within the next twelve months. The remainder of our contractual commitments consist of lease payments, purchase obligations and commitments, income taxes and employer pension and benefit plan obligations.
See
Item 8, Note 6 and
Item 8, Note 13 to our Consolidated Financial Statements for amounts outstanding as of September 30, 2023 related to leases and debt, respectively. Our contractual obligations related to income taxes represent the one-time transition tax obligation. Refer to
Item 8, Note 14 for amounts related to purchase obligations and performance bonds. See
Item 8, Note 11 for information related to income taxes. Our contractual obligations related to employer pension plan obligations represent the funded status recognized as of September 30, 2023. See
Item 8, Note 12 for information related to these plans.
In addition, we have other future contingent commitments of approximately $247.8 million, consisting of letters of credit and performance bonds, due during fiscal 2024. At September 30, 2023, we had $232.6 million of outstanding performance bonds, which includes bonds related to Ontario mining tax reassessments. Refer to
Item 8, Note 14 for additional details. We also have contingent consideration liabilities related to the Fortress acquisition currently valued at combined $43.7 million as of September 30, 2023. The milestone portion of the contingency is to be paid upon the achievement of certain performance measures over the next five years (currently estimated to be $22.6 million in total), and a cash earn-out based on financial performance and volumes of certain Fortress fire retardant products sold over a 10-year period (currently estimated to be $21.1 million in total). Refer to
Item 8, Note 3 for additional information.
Reconciliation of Net Earnings (Loss) from Continuing Operations to EBITDA and Adjusted EBITDA
Management uses a variety of measures to evaluate our performance. While our consolidated financial statements, taken as a whole, provide an understanding of our overall results of operations, financial condition and cash flows, we analyze components of the consolidated financial statements to identify certain trends and evaluate specific performance areas. In addition to using U.S. GAAP financial measures, such as gross profit, net earnings and cash flows generated by operating activities, management uses EBITDA and Adjusted EBITDA. We have presented Adjusted EBITDA for both continuing operations and consolidated including discontinued operations for comparative purposes (see
Item 8, Note 4 to our Consolidated Financial Statements for a discussion of discontinued operations). Both EBITDA and Adjusted EBITDA are non-U.S. GAAP financial measures used to evaluate the operating performance of our core business operations because our resource allocation, financing methods and cost of capital, and income tax positions are managed at a corporate level, apart from the activities of the operating segments, and the operating facilities are located in different taxing jurisdictions, which can cause considerable variation in net earnings. We also use EBITDA and Adjusted EBITDA to assess our operating performance and return on capital against other companies, and to evaluate potential acquisitions or other capital projects. EBITDA and Adjusted EBITDA are not calculated under U.S. GAAP and should not be considered in isolation or as a substitute for net earnings, cash flows or other financial data prepared in accordance with U.S. GAAP or as a measure of our overall profitability or liquidity.
EBITDA and Adjusted EBITDA exclude interest expense, income taxes and depreciation, depletion and amortization, each of which are an essential element of our cost structure and cannot be eliminated. Furthermore, Adjusted EBITDA excludes other cash and non-cash items, including stock-based compensation, loss (gain) on foreign exchange, other, net and other infrequent items that management does not consider indicative of normal operations. Other infrequent items, such as executive transition costs, restructuring charges and gain from remeasurement of equity method investment, involve distinct initiatives that are not reflective of management’s expectations for future operations and affect the comparability of our operational results across reporting periods. Our borrowings are a significant component of our capital structure and interest expense is a continuing cost of debt. We are also required to pay income taxes, a required and ongoing consequence of our operations. We
|
|
|
|
|
|
|
|
|
|
|
COMPASS MINERALS INTERNATIONAL, INC. |
have a significant investment in capital assets and depreciation and amortization reflect the utilization of those assets in order to generate revenues. Our employees are vital to our operations and we utilize various stock-based awards to compensate and incentivize our employees. Consequently, any measure that excludes these elements has material limitations. While EBITDA and Adjusted EBITDA are frequently used as measures of operating performance, these terms are not necessarily comparable to similarly titled measures of other companies due to the potential inconsistencies in the method of calculation.
The calculation of EBITDA and Adjusted EBITDA as used by management is set forth in the table below (in millions).
|
|
|
|
|
|
|
|
|
|
|
|
|
|
|
|
|
|
|
|
|
| |
|
Twelve Months Ended |
| |
|
September 30,
2023 |
|
September 30,
2022 |
|
September 30,
2021 |
| Net earnings (loss) from continuing operations |
|
$ |
15.5 |
|
|
$ |
(37.3) |
|
|
$ |
35.6 |
|
| Interest expense |
|
55.5 |
|
|
55.2 |
|
|
59.8 |
|
| Income tax expense |
|
17.4 |
|
|
35.0 |
|
|
5.8 |
|
| Depreciation, depletion and amortization |
|
98.6 |
|
|
113.7 |
|
|
119.9 |
|
| EBITDA from continuing operations |
|
187.0 |
|
|
166.6 |
|
|
221.1 |
|
| Adjustments to EBITDA from continuing operations: |
|
|
|
|
|
|
| Stock-based compensation - non cash |
|
20.6 |
|
|
15.7 |
|
|
9.2 |
|
Interest income |
|
(5.3) |
|
|
(0.8) |
|
|
(0.3) |
|
| Loss (gain) on foreign exchange |
|
2.3 |
|
|
(14.9) |
|
|
5.6 |
|
Gain from remeasurement of equity method investment |
|
(13.7) |
|
|
— |
|
|
— |
|
Executive transition costs(a) |
|
— |
|
|
4.3 |
|
|
— |
|
Restructuring charges(b) |
|
5.9 |
|
|
— |
|
|
— |
|
Accrued loss and legal costs related to SEC investigation(c) |
|
(0.3) |
|
|
17.1 |
|
|
5.0 |
|
| Other, net |
|
4.3 |
|
|
0.5 |
|
|
0.2 |
|
| Adjusted EBITDA from continuing operations |
|
200.8 |
|
|
188.5 |
|
|
240.8 |
|
| Adjusted EBITDA from discontinued operations |
|
— |
|
|
19.0 |
|
|
51.9 |
|
| Adjusted EBITDA including discontinued operations |
|
$ |
200.8 |
|
|
$ |
207.5 |
|
|
$ |
292.7 |
|
(a)We incurred severance and other costs related to executive transition.
(b)We incurred severance and related charges related to a reduction of its workforce.
(c)We recorded a settlement loss accrual during the twelve months ended September 30, 2022, and recognized costs, net of reimbursements, related to the settled SEC investigation during each of the twelve months ended September 30, 2023, 2022 and 2021.
Adjusted EBITDA also excludes other non-operating income, primarily non-cash stock-based compensation expense, foreign exchange gains (losses) resulting from the translation of intercompany obligations, interest income and investment income (loss) relating to our nonqualified retirement plan.
Our net earnings, EBITDA and Adjusted EBITDA are impacted by other events or transactions that we believe to be important in understanding our earnings trends such as the variability of weather. The impact of weather has not been adjusted in the amounts presented above. Our fiscal 2023, 2022 and 2021 results were unfavorably impacted by winter weather activity as compared to an average winter in the markets we serve.
Management’s Discussion of Critical Accounting Policies and Estimates
The preparation of the consolidated financial statements in conformity with U.S. GAAP requires management to make estimates and assumptions that affect the reported amounts of assets and liabilities as of the reporting date and the reported amounts of revenue and expenses during the reporting period. Actual results could vary from these estimates. We have identified the critical accounting policies and estimates that we believe are most important to the portrayal of our financial condition and results of operations. The policies set forth below require significant subjective or complex judgments by management, often as a result of the need to make estimates about the effect of matters that are inherently uncertain.
Business Combinations – From time to time, we may enter into business combinations. We account for our business combinations using the acquisition accounting method, which requires us to determine and recognize assets acquired and liabilities assumed at their acquisition date fair values, including any contingent consideration, and the recognition of acquisition-related costs in the Consolidated Statements of Operations in accordance with the Financial Accounting Standards Board “(FASB”) Accounting Standards Codification (“ASC”) Topic 805, “Business Combinations”.
Accounting for business combinations requires the Company to make significant estimates and assumptions at the acquisition date. Significant assumptions relevant to the determination of the fair value of the assets acquired and liabilities
|
|
|
|
|
|
|
|
|
|
|
COMPASS MINERALS INTERNATIONAL, INC. |
assumed include, but are not limited to, future expected cash flows, contract renewal rates, discount rates, terminal growth rate and other assumptions. The approach to valuing initial contingent consideration, including milestone achievement and earn-out, associated with the purchase price also uses similar unobservable factors such as projected revenues and expenses over the term of the contingent milestone achievement and earn-out periods, discounted for the period of time over which the initial contingent consideration is earned. Based upon these assumptions, the initial earn-out contingent consideration is then adjusted for relevant volatility rates and valued using a Monte Carlo simulation. These significant assumptions are based on company specific information and projections, which are not observable in the market and, therefore, are considered Level 3 measurements. These significant assumptions are forward-looking and could be affected by future changes in economic and market conditions.
We generally use third-party qualified consultants to assist management in determining the fair value of assets acquired, liabilities assumed and contingent consideration liabilities. This includes, when necessary, assistance with the determination of economic useful lives and valuation of property, plant and equipment and identifiable intangibles. The purchase price allocation process also involves refining these estimates over a measurement period not to exceed one year to reflect new information obtained surrounding facts and circumstances existing at acquisition date. The excess of the purchase price over the fair value of the identified assets acquired and liabilities assumed is recorded as goodwill.
Goodwill – Based on guidance under FASB ASC Topic 350, “Goodwill”, we test goodwill annually or more frequently if an impairment indicator is present. The quantitative impairment test under ASC Topic 350 requires judgment, including the identification of reporting units and the determination of fair value of each reporting unit. We determine the estimated fair value for each reporting unit based on discounted cash flow projections (income approach) and market values for comparable businesses (market approach). Under the income approach, we are required to make judgments about appropriate discount rates, long-term revenue growth rates and the amount and timing of expected future cash flows. The cash flows used in our estimates are based on the reporting unit's forecast, long-term business plan, and recent operating performance. Discount rate assumptions are based on an assessment of the risk inherent in the future cash flows of the respective reporting unit and market conditions. Our estimates may differ from actual future cash flows. The risk adjusted discount rate used is consistent with the weighted average cost of capital of our peer companies and is intended to represent a rate of return that would be expected by a market participant. Under the market approach, market multiples are derived from market prices of stocks of companies in our peer group. The appropriate multiple is applied to the forecasted revenue and earnings before interest, taxes, depreciation and amortization of the reporting unit to obtain an estimated fair value.
The most critical assumptions used in the calculation of the fair value of each reporting unit are the projected revenue growth rates, long-term operating margin, working capital requirements, terminal growth rates, discount rate, and the selection of market multiples. The projected long term operating margin utilized in our fair value estimates is consistent with our operating plan and is dependent on the successful execution of our long-term business plan, overall industry growth rates and the competitive environment. The discount rate could be adversely impacted by changes in the macroeconomic environment and volatility in the equity and debt markets. Although management believes its estimate of fair value is reasonable, if the future financial performance falls below our expectations or there are unfavorable revisions to significant assumptions, or if our market capitalization declines, we may need to record a non-cash goodwill impairment charge in a future period. There were no indications of impairment as of our July 1, 2023 annual measurement date.
Mineral Interests – As of September 30, 2023, we maintained $118.3 million of net mineral properties as a part of property, plant and equipment. Mineral interests include probable mineral reserves. We lease mineral reserves at several of our extraction facilities. These leases have varying terms, and many provide for a royalty payment to the lessor based on a specific amount per ton of mineral extracted or as a percentage of sales.
Mineral interests are primarily depleted on a units-of-production method based on a combination of third-party and internal qualified geologists’ estimates of recoverable reserves. Our rights to extract minerals are generally contractually limited by time or lease boundaries. If we are not able to continue to extend lease agreements, as we have in the past, at commercially reasonable terms, without incurring substantial costs or incurring material modifications to the existing lease terms and conditions, if the assigned lives realized are less than those projected by management, or if the actual size, quality or recoverability of the minerals is less than the estimated probable reserves, then the rate of amortization could be increased or the value of the reserves could be reduced by a material amount.
Income Taxes – Developing our provision for income taxes and analyzing our potential tax exposure items requires significant judgment and assumptions as well as a thorough knowledge of the tax laws in various jurisdictions. These estimates and judgments occur in the calculation of certain tax liabilities and in the assessment of the likelihood that we will be able to realize our deferred tax assets, which arise from temporary differences between the tax and financial statement recognition of revenue and expense, carryforwards and other items. Based on all available evidence, both positive and negative, the reliability of that evidence and the extent such evidence can be objectively verified, we determine whether it is more likely than not that all, or a portion of, the deferred tax assets will be realized.
|
|
|
|
|
|
|
|
|
|
|
COMPASS MINERALS INTERNATIONAL, INC. |
In evaluating our ability to realize our deferred tax assets, we consider the sources and timing of taxable income, our ability to carry back tax attributes to prior periods, qualifying tax planning and estimates of future taxable income exclusive of reversing temporary differences. In determining future taxable income, our assumptions include the amount of pre-tax operating income according to multiple federal, international and state taxing jurisdictions, the origination of future temporary differences and the implementation of feasible and prudent tax planning. These assumptions require significant judgment about material estimates, assumptions and uncertainties in connection with the forecasts of future taxable income, the merits in tax law and assessments regarding previous taxing authorities’ proceedings or written rulings. While these assumptions are consistent with the plans and estimates we use to manage the underlying businesses, differences in our actual operating results or changes in our tax planning, tax credits, tax laws or our assessment of the tax merits of our positions could affect our future assessments.
In addition, the calculation of our tax liabilities involves uncertainties in the application of complex tax regulations in multiple jurisdictions. We recognize potential liabilities in accordance with applicable U.S. GAAP for anticipated tax issues in the U.S. and other tax jurisdictions based on our estimate of whether, and the extent to which, additional taxes will be due. If payment of these amounts ultimately proves to be unnecessary, the reversal of the liabilities would result in tax benefits being recognized in the period when we determine the liabilities are no longer necessary. If our estimate of tax liabilities proves to be less than the ultimate assessment, a further charge to expense would result. See
Item 8, Note 11 to our Consolidated Financial Statements for further discussion of our income taxes.
We have elected to account for GILTI in the year the tax is incurred, rather than recognize deferred taxes for temporary basis differences expected to reverse as GILTI in future years.
Taxes on Foreign Earnings – As a result of U.S. tax reform, in fiscal 2018, we revised our permanently reinvested assertion expecting to repatriate approximately $150 million of unremitted foreign earnings from Canada. Additionally, we changed our permanently reinvested assertion and repatriated $42.5 million of unremitted foreign earnings from our U.K. operations in September 2021. In fiscal 2022, we revised our permanently reinvested assertion, expecting to repatriate an additional $10 million of unremitted foreign earnings from our U.K. operations and in fiscal 2023 we revised it again expecting to repatriate an additional approximately $6 million of unremitted foreign earnings from our U.K. operations. During the first quarter of fiscal 2023, $89.2 million was repatriated from Canada and in the third quarter of fiscal 2023, $15.6 million was repatriated from the U.K. Net income tax expense of $3.8 million has been recorded for foreign withholding tax, state income tax and foreign exchange losses on these changes in assertion as of September 30, 2023, consisting of a tax benefit of $0.7 million recorded in fiscal 2023, and tax expense of $4.5 million, most of which was recorded in years prior to fiscal 2021. We consider all remaining non-U.S. earnings to be permanently reinvested outside the U.S. to the extent these earnings are not subject to U.S. income tax under an anti-deferral tax regime. As of September 30, 2023, we have approximately $194.9 million of outside basis differences on which no deferred taxes have been recorded.
U.K. Pension Plan – We have a defined benefit pension plan covering some of our current and former employees in the U.K. The U.K. pension plan was closed to new participants in 1992. As we elected to freeze our pension plan, our remaining active employees ceased to accrue future benefits under the plan beginning December 1, 2008. We select the actuarial assumptions for our pension plan after consultation with our actuaries and consideration of market conditions. These assumptions include the discount rate and the expected long-term rates of return on plan assets, which are used in the calculation of the actuarial valuation of our defined benefit pension plans. If actual conditions or results vary from those projected by management, adjustments may be required in future periods to meet minimum pension funding or to increase pension expense or our pension liability. A decrease of 25 basis points in our discount rate would have increased our projected benefit obligation as of September 30, 2023, by approximately $0.9 million and would increase our net periodic pension expense for 2023 by approximately $0.1 million. A decrease of 25 basis points in our expected return on assets assumption as of September 30, 2023, would increase our net periodic expense for 2023 by approximately $0.1 million.
We set our discount rate for our U.K. pension plan based on a forward yield curve for a portfolio of high credit quality bonds with expected cash flows and an average duration closely matching the expected benefit payments under the plan. The assumption for the return on plan assets is determined based on expected returns applicable to each type of investment within the portfolio expected to be maintained over the next 15 to 20 years. Our funding policy has been to make the minimum annual contributions required by applicable regulations. However, we have made special payments during some years when changes in the business could reasonably impact the pension plan’s available assets and when special early retirement payments or other inducements are made to pensioners. Contributions totaled $0, $0.4 and $0 during the fiscal years ended September 30, 2023 and 2022, and the nine months ended September 30, 2021, respectively. If supplemental benefits were approved and granted under the provisions of the plan, or if periodic statutory valuations cause a change in funding requirements, our contributions could increase to fund all or a portion of those benefits. See
Item 8, Note 12 to our Consolidated Financial Statements for additional discussion of our U.K. pension plan.
Other Significant Accounting Policies – Other significant accounting policies not involving the same level of measurement uncertainties as those discussed above are nevertheless important to an understanding of our consolidated financial statements.
|
|
|
|
|
|
|
|
|
|
|
COMPASS MINERALS INTERNATIONAL, INC. |
Policies related to revenue recognition, allowance for doubtful accounts, valuation of inventory reserves, equity compensation instruments, intangible assets, legal reserves, derivative instruments, post-employment benefit obligations and environmental accruals require judgments on complex matters.
Effects of Currency Fluctuations and Inflation
Our operations outside of the U.S. are conducted primarily in Canada and the U.K. Therefore, our results of operations are subject to both currency transaction risk and currency translation risk. We incur currency transaction risk whenever we or one of our subsidiaries enter into either a purchase or sales transaction using a currency other than the local currency of the transacting entity. With respect to currency translation risk, our financial condition and results of operations are measured and recorded in the relevant local currency and then translated into U.S. dollars for inclusion in our historical consolidated financial statements. Exchange rates between these currencies and the U.S. dollar have fluctuated significantly from time to time and may do so in the future. The majority of revenues and costs are denominated in U.S. dollars, with Canadian dollars and British pounds sterling also being significant. We generated 27% of our fiscal 2023 sales in foreign currencies, and we incurred 28% of our fiscal 2023 total operating expenses in foreign currencies. Additionally, we have approximately $400 million of net assets denominated in foreign currencies. In fiscal 2023 and 2021, the average rate for the U.S. dollar weakened against the Canadian dollar and the British pound sterling. In fiscal 2022, the average rate for the U.S. dollar strengthened against the Canadian dollar and the British pound sterling. Significant changes in the value of the Canadian dollar or the British pound sterling relative to the U.S. dollar could have a material adverse effect on our financial condition and our ability to meet interest and principal payments on U.S. dollar-denominated debt, including borrowings under our senior secured credit facilities.
We have experienced increases in logistics costs, prices for energy and other costs that have only been partially recovered through price increases for our products. While it appears that inflation has recently moderated or in some cases receded, we estimate that the impact of inflation increased full year logistics costs by approximately $3 million to $5 million and product costs by approximately $7 million to $9 million for the fiscal year ended September 30, 2023. Our efforts to recover inflation-based cost increases from our customers may be hampered as a result of the structure of our contracts and the contract bidding process as well as the competitive industries, economic conditions and countries in which we operate. For more information, see Part I, Item 1A, “Risk Factors”.
Seasonality
We experience a substantial amount of seasonality in our sales, including our salt deicing product sales. Consequently, our Salt segment sales and operating income are generally higher in the first and second fiscal quarters (ending December 31 and March 31) and lower during the third and fourth fiscal quarters of each year (ending June 30 and September 30). In particular, sales of highway and consumer deicing salt and magnesium chloride products vary based on the severity of the winter conditions in areas where the product is used. Following industry practice in North America and the U.K., we seek to stockpile sufficient quantities of deicing salt throughout the first, third and fourth fiscal quarters (ending December 31, June 30 and September 30) to meet the estimated requirements for the winter season. Our plant nutrition business is also seasonal. As a result, we and our customers generally build inventories during the plant nutrition business’ low demand periods of the year (which are typically winter and summer, but can vary due to weather and other factors) to ensure timely product availability during the peak sales seasons (which are typically spring and autumn, but can also vary due to weather and other factors). Lastly, the results of our fire retardant business are also seasonal with peak demand for fire retardant products and services occurring from June through September.
Climate Change
The potential impact of climate change on our operations, product demand and the needs of our customers remains uncertain. Significant changes to weather patterns, a reduction in average snowfall or regional drought within our served markets could negatively impact customer demand for our products and our costs, as well as our ability to produce our products. For example, prolonged periods of mild winter weather could reduce the demand for deicing products. Drought or excessive precipitation could similarly impact demand for our SOP products, as well as continue to impact the amount and quality of feedstock used to produce SOP at our Ogden facility due to changes in brine levels, mineral concentrations or other factors, which could have a material impact on our Plant Nutrition results of operations. Climate change could also lead to disruptions in the production or distribution of our products due to major storm events or prolonged adverse conditions, changing temperature levels, lake level fluctuations or flooding from sea level changes. Climate change or governmental initiatives to address climate change may affect our operations and necessitate capital expenditures in the future, although capital expenditures for climate-related projects were not material in fiscal 2023 and are not expected to be material in fiscal 2024. For more information, see Part I, Item 1A, “Risk Factors” and Part I, Item1 “Business—Environmental, Health and Safety and Other Regulatory Matters.”
|
|
|
|
|
|
|
|
|
|
|
COMPASS MINERALS INTERNATIONAL, INC. |
Critical Accounting Estimates and Recent Accounting Pronouncements
See
Item 8, Note 2 to our Consolidated Financial Statements for a discussion of critical accounting estimates and recent accounting pronouncements.
ITEM 7A. QUANTITATIVE AND QUALITATIVE DISCLOSURES ABOUT MARKET RISK
Our business is subject to various types of market risks that include, but are not limited to, interest rate risk, foreign currency risk and commodity pricing risk. Management may take actions to mitigate our exposure to these types of risks including entering into forward purchase contracts and other financial instruments. However, there can be no assurance that our hedging activities will eliminate or substantially reduce these risks. We do not enter into any financial instrument arrangements for speculative purposes.
Interest Rate Risk
As of September 30, 2023, we had $280.3 million of debt outstanding under our credit agreement (consisting of term loans and revolving credit facility), bearing interest at variable rates. Accordingly, our earnings and cash flows will be affected by changes in interest rates to the extent the principal balance is unhedged. Assuming no change in the amount of debt outstanding, a 100 basis point increase in the average interest rate under these borrowings would have increased the interest expense related to our variable rate debt by approximately $2.8 million based upon our debt outstanding as of September 30, 2023. Actual results may vary due to changes in the amount of variable rate debt outstanding.
As of September 30, 2023, a significant portion of the investments in the U.K. pension plan are in bond funds. Changes in interest rates could impact the value of the investments in the pension plan.
Foreign Currency Risk
In addition to the U.S., we primarily conduct our business in Canada and the U.K. Our operations are, therefore, subject to volatility because of currency fluctuations, inflation changes and changes in political and economic conditions in these countries. Sales and expenses are frequently denominated in local currencies, and our results of operations may be affected adversely as currency fluctuations affect our product prices and operating costs or those of our competitors. We may engage in hedging activities, including forward foreign currency exchange contracts, to reduce the exposure of our cash flows to fluctuations in foreign currency exchange rates. We do not engage in hedging for speculative investment purposes. Any hedging activities may not eliminate or substantially reduce risks associated with fluctuating currencies. See “Risk Factors—Risks associated with our international operations and sales and changes in economic and political environments could adversely affect our business and earnings.”
Considering our foreign earnings, a hypothetical 10% unfavorable change in exchange rates compared to the U.S. dollar would have an estimated $0.4 million impact on our operating earnings for the fiscal year ended September 30, 2023. Actual changes in market prices or rates will differ from hypothetical changes.
Commodity Pricing Risk
We have a hedging policy to mitigate the impact of fluctuations in the price of natural gas. The notional amounts of volumes hedged are determined based on a combination of factors, including estimated natural gas usage, current market prices and historical market prices. We enter into contractual natural gas price arrangements, which effectively fix the purchase price of our natural gas requirements up to 36 months in advance of the physical purchase of the natural gas. We may hedge up to approximately 90% of our expected natural gas usage. Because of the varying locations of our production facilities, we also enter into basis swap agreements to eliminate any further price variation due to local market differences. We have determined most of these financial instruments qualify as cash flow hedges under U.S. GAAP. As of September 30, 2023, we had agreements in place to hedge forecasted natural gas purchases of 2.3 million MMBtus, 1.8 million MMBtus of which are qualified and designated as cash flow hedges. All MMBtus will expire within one year.
Excluding natural gas hedged with derivative instruments, a hypothetical 10% adverse change in our natural gas prices during the fiscal year ended September 30, 2023, would have increased our product cost by approximately $1.1 million. Actual results will vary due to actual changes in market prices and consumption.
We are subject to increases and decreases in the cost of transporting our products due to variations in our contracted carriers’ cost of fuel, which is typically diesel fuel. We may engage in hedging activities, including forward contracts, to reduce our exposure to changes in our transportation cost due to changes in the cost of fuel in the future. Our historical results do not reflect any direct fuel hedging activity. However, hedging activities may not eliminate or substantially reduce the risks associated with changes in our transportation costs. Due to the difficulty in meeting all of the requirements for hedge accounting under current U.S. GAAP, any such cash flow hedges of transportation costs would likely be accounted for by marking the hedges to market at each reporting period. We do not engage in hedging for speculative investment purposes.
|
|
|
|
|
|
|
|
|
|
|
COMPASS MINERALS INTERNATIONAL, INC. |
ITEM 8. FINANCIAL STATEMENTS AND SUPPLEMENTARY DATA
|
|
|
|
|
|
|
|
|
|
|
COMPASS MINERALS INTERNATIONAL, INC. |
Report of Independent Registered Public Accounting Firm
To the Stockholders and the Board of Directors of Compass Minerals International, Inc.
Opinion on the Financial Statements
We have audited the accompanying consolidated balance sheets of Compass Minerals International, Inc. (the Company) as of September 30, 2023 and 2022, the related consolidated statements of operations, comprehensive income (loss), stockholders' equity and cash flows for the year ended September 30, 2023, the year ended September 30, 2022 and the nine month period ended September 30, 2021, and the related notes and the consolidated financial statement schedule listed in the Index at Item 15(a)(2) (collectively referred to as the “consolidated financial statements”). In our opinion, the consolidated financial statements present fairly, in all material respects, the financial position of the Company at September 30, 2023 and 2022, and the results of its operations and its cash flows for the year ended September 30, 2023, the year ended September 30, 2022 and the nine months ended September 30, 2021, in conformity with U.S. generally accepted accounting principles.
We also have audited, in accordance with the standards of the Public Company Accounting Oversight Board (United States) (PCAOB), the Company's internal control over financial reporting as of September 30, 2023, based on criteria established in Internal Control-Integrated Framework issued by the Committee of Sponsoring Organizations of the Treadway Commission (2013 framework) and our report dated November 29, 2023, expressed an unqualified opinion thereon.
Basis for Opinion
These financial statements are the responsibility of the Company's management. Our responsibility is to express an opinion on the Company’s financial statements based on our audits. We are a public accounting firm registered with the PCAOB and are required to be independent with respect to the Company in accordance with the U.S. federal securities laws and the applicable rules and regulations of the Securities and Exchange Commission and the PCAOB.
We conducted our audits in accordance with the standards of the PCAOB. Those standards require that we plan and perform the audit to obtain reasonable assurance about whether the financial statements are free of material misstatement, whether due to error or fraud. Our audits included performing procedures to assess the risks of material misstatement of the financial statements, whether due to error or fraud, and performing procedures that respond to those risks. Such procedures included examining, on a test basis, evidence regarding the amounts and disclosures in the financial statements. Our audits also included evaluating the accounting principles used and significant estimates made by management, as well as evaluating the overall presentation of the financial statements. We believe that our audits provide a reasonable basis for our opinion.
Critical Audit Matters
The critical audit matters communicated below are matters arising from the current period audit of the financial statements that were communicated or required to be communicated to the audit committee and that: (1) relate to accounts or disclosures that are material to the financial statements and (2) involved our especially challenging, subjective, or complex judgments. The communication of critical audit matters does not alter in any way our opinion on the consolidated financial statements, taken as a whole, and we are not, by communicating the critical audit matters below, providing separate opinions on the critical audit matters or on the accounts or disclosures to which they relate.
|
|
|
|
|
|
|
|
|
|
|
COMPASS MINERALS INTERNATIONAL, INC. |
|
|
|
|
|
|
|
|
|
|
|
Valuation of Goodwill for the Plant Nutrition Reporting Unit |
| Description of the Matter |
|
At September 30, 2023, the Company’s consolidated goodwill was $96.7 million, of which $51.1 million is related to the Company’s Plant Nutrition reporting unit. As discussed in Note 2 to the consolidated financial statements, goodwill is tested for impairment at least annually, or more frequently if impairment indicators exist.
Auditing management’s annual goodwill impairment test was complex and judgmental due to the significant estimation required in determining the fair value of the Company’s Plant Nutrition reporting unit. In particular, the fair value estimate was sensitive to significant assumptions such as the discount rate, projected revenue growth rates, operating margins and the terminal growth rate which are affected by expectations about future market or economic conditions. Additionally, there were significant judgments related to the Company’s selection of guideline company market multiples.
|
| How We Addressed the Matter in Our Audit |
|
We obtained an understanding, evaluated the design and tested the operating effectiveness of controls over the Company’s goodwill impairment assessment process, including controls over management’s review of the significant assumptions described above.
To test the estimated fair value of the Plant Nutrition reporting unit, we performed audit procedures that included, among others, assessing the fair value methodologies utilized and testing the significant assumptions discussed above, as well as the underlying data used by the Company in its analysis. We involved our specialists to assist in the review of the Company’s model, methodology, and certain significant assumptions such as the discount rate and the Company’s terminal growth rate assumptions. We compared the significant assumptions used by management to current industry and economic trends and evaluated whether changes to the Company’s business model, customer base or product mix and other relevant factors would affect the significant assumptions. We assessed the historical accuracy of management’s estimates and performed sensitivity analyses of significant assumptions to evaluate the changes in the fair value of the Plant Nutrition reporting unit that would result from changes in the assumptions. In addition, we tested the reconciliation of the fair value of the Company’s reporting units to the market capitalization of the Company.
|
|
|
|
|
|
|
|
|
|
|
|
COMPASS MINERALS INTERNATIONAL, INC. |
|
|
|
|
|
|
|
|
|
|
|
Accounting for the Acquisition of Fortress |
| Description of the Matter |
|
As disclosed in Note 3 of the consolidated financial statements, the Company completed the acquisition of Fortress during 2023 for total consideration of $126.8 million. The transaction was accounted for as a business combination.
Auditing the Company’s accounting for its acquisition of Fortress was complex due to the significant estimation required by management to determine the fair value of the customer relationship intangible asset, certain milestone contingent consideration liabilities, and the earn-out contingent consideration liability. The significant estimation uncertainty was primarily due to the sensitivity of the respective fair values to the significant underlying assumptions as well as the complexity of the valuation model used by management to measure the fair value of the earn-out contingent consideration liability. The customer relationship intangible asset was valued using a discounted cash flow model that incorporated various estimates and assumptions, the most significant of which was the discount rate and certain assumptions that form the basis of the forecasted cash flows (e.g., revenue growth and contract renewal rates). The Company used a discounted cash flow model to measure the fair value of each milestone contingent consideration liability that incorporated various estimates and assumptions, the most significant of which was the probability of milestone achievement. The Company used a Monte Carlo simulation to measure the fair value of the earn-out contingent consideration liability that incorporated various estimates and assumptions, the most significant of which was the revenue growth rate, volatility and the discount rate. These significant assumptions are forward-looking and could be affected by future economic and market conditions.
|
| How We Addressed the Matter in Our Audit |
|
We tested the Company's controls over its accounting for acquisitions. For example, we tested controls over the recognition and measurement of consideration transferred (including contingent consideration) and the customer relationship intangible asset, including management’s review of the valuation models and underlying assumptions used to develop such estimates.
To test the fair value of the customer relationship intangible asset, we performed audit procedures that included, among others, evaluating the Company's valuation methodology and testing the significant assumptions used and the completeness and accuracy of the underlying data. For example, we compared the significant assumptions to current industry, market and economic trends. To test the fair value of the contingent consideration liabilities, we performed audit procedures that included, among others, assessing the terms of the arrangement, including the conditions that must be met for the contingent consideration arrangement to become payable. We also evaluated the Company's methodology used to value the earn-out based contingent consideration liability and tested the significant assumptions used in the model, including the completeness and accuracy of the underlying data. For example, we compared the significant assumptions to current industry, market and economic trends and to the Company's budgets and forecasts. We involved our valuation specialists to assist in our evaluation of the appropriateness of the valuation methods and models used and our evaluation of certain significant assumptions.
|
|
|
|
|
|
|
/s/ Ernst & Young LLP |
|
|
|
| We have served as the Company’s auditor since 2005. |
|
|
|
| Kansas City, Missouri |
|
November 29, 2023 |
|
|
|
|
|
|
|
|
|
|
|
|
COMPASS MINERALS INTERNATIONAL, INC. |
Report of Independent Registered Public Accounting Firm
To the Stockholders and the Board of Directors of Compass Minerals International, Inc.
Opinion on Internal Control Over Financial Reporting
We have audited Compass Minerals International, Inc.’s internal control over financial reporting as of September 30, 2023, based on criteria established in Internal Control—Integrated Framework issued by the Committee of Sponsoring Organizations of the Treadway Commission (2013 framework), (the COSO criteria). In our opinion, Compass Minerals International Inc. maintained, in all material respects, effective internal control over financial reporting as September 30, 2023, based on the COSO criteria.
As indicated in the accompanying Item 9A. Controls and Procedures, management’s assessment of and conclusion on the effectiveness of internal control over financial reporting did not include the internal controls of Fortress North America, LLC., which is included in the 2023 consolidated financial statements of the Company and constituted 8% of total and net assets, respectively, as of September 30, 2023 and less than 1% of revenues and net income, respectively, for the year then ended. Our audit of internal control over financial reporting of the Company also did not include an evaluation of the internal control over financial reporting of Fortress North America, LLC.
We also have audited, in accordance with the standards of the Public Company Accounting Oversight Board (United States) (PCAOB), the consolidated balance sheets of the Company as of September 30, 2023 and 2022, the related consolidated statements of operations, comprehensive loss, stockholders' equity and cash flows for the year ended September 30, 2023, year ended September 30, 2022 and the nine-month period ended September 30, 2021, and the related notes and the consolidated financial statement schedule listed in the Index at Item 15(a)(2). These material weaknesses were considered in determining the nature, timing and extent of audit tests applied in our audit of the 2023 consolidated financial statements, and this report does not affect our report dated November 29, 2023, which expressed an unqualified opinion thereon.
Basis for Opinion
The Company’s management is responsible for maintaining effective internal control over financial reporting and for its assessment of the effectiveness of internal control over financial reporting included in the accompanying Management’s Report on Internal Control Over Financial Reporting. Our responsibility is to express an opinion on the Company’s internal control over financial reporting based on our audit. We are a public accounting firm registered with the PCAOB and are required to be independent with respect to the Company in accordance with the U.S. federal securities laws and the applicable rules and regulations of the Securities and Exchange Commission and the PCAOB.
We conducted our audit in accordance with the standards of the PCAOB. Those standards require that we plan and perform the audit to obtain reasonable assurance about whether effective internal control over financial reporting was maintained in all material respects.
Our audit included obtaining an understanding of internal control over financial reporting, assessing the risk that a material weakness exists, testing and evaluating the design and operating effectiveness of internal control based on the assessed risk, and performing such other procedures as we considered necessary in the circumstances. We believe that our audit provides a reasonable basis for our opinion.
Definition and Limitations of Internal Control Over Financial Reporting
A company’s internal control over financial reporting is a process designed to provide reasonable assurance regarding the reliability of financial reporting and the preparation of financial statements for external purposes in accordance with generally accepted accounting principles. A company’s internal control over financial reporting includes those policies and procedures that (1) pertain to the maintenance of records that, in reasonable detail, accurately and fairly reflect the transactions and dispositions of the assets of the company; (2) provide reasonable assurance that transactions are recorded as necessary to permit preparation of financial statements in accordance with generally accepted accounting principles, and that receipts and expenditures of the company are being made only in accordance with authorizations of management and directors of the company; and (3) provide reasonable assurance regarding prevention or timely detection of unauthorized acquisition, use, or disposition of the company’s assets that could have a material effect on the financial statements.
|
|
|
|
|
|
|
|
|
|
|
COMPASS MINERALS INTERNATIONAL, INC. |
Because of its inherent limitations, internal control over financial reporting may not prevent or detect misstatements. Also, projections of any evaluation of effectiveness to future periods are subject to the risk that controls may become inadequate because of changes in conditions, or that the degree of compliance with the policies or procedures may deteriorate.
|
|
|
|
|
|
| /s/ Ernst & Young LLP |
|
|
|
| Kansas City, Missouri |
|
November 29, 2023 |
|
|
|
|
|
|
|
|
|
|
|
|
COMPASS MINERALS INTERNATIONAL, INC. |
Consolidated Balance Sheets
|
|
|
|
|
|
|
|
|
|
|
|
|
|
|
| (in millions, except share data) |
|
September 30,
2023 |
|
September 30,
2022 |
| ASSETS |
|
|
|
|
| Current assets: |
|
|
|
|
| Cash and cash equivalents |
|
$ |
38.7 |
|
|
$ |
46.1 |
|
Receivables, less allowance for doubtful accounts of $2.3 in 2023 and $3.4 in 2022 |
|
129.5 |
|
|
167.2 |
|
| Inventories |
|
392.2 |
|
|
304.4 |
|
|
|
|
|
|
| Other |
|
33.4 |
|
|
44.3 |
|
| Total current assets |
|
593.8 |
|
|
562.0 |
|
| Property, plant and equipment, net |
|
852.2 |
|
|
776.6 |
|
| Intangible assets, net |
|
120.0 |
|
|
45.4 |
|
| Goodwill |
|
96.8 |
|
|
56.4 |
|
| Equity method investments |
|
— |
|
|
46.6 |
|
| Other |
|
155.2 |
|
|
156.5 |
|
| Total assets |
|
$ |
1,818.0 |
|
|
$ |
1,643.5 |
|
| LIABILITIES AND STOCKHOLDERS' EQUITY |
|
|
|
|
| Current liabilities: |
|
|
|
|
| Current portion of long-term debt |
|
$ |
5.0 |
|
|
$ |
— |
|
| Accounts payable |
|
116.8 |
|
|
114.7 |
|
| Accrued salaries and wages |
|
25.7 |
|
|
22.2 |
|
| Income taxes payable |
|
16.5 |
|
|
1.0 |
|
| Accrued interest |
|
12.9 |
|
|
14.1 |
|
|
|
|
|
|
| Accrued expenses and other current liabilities |
|
98.9 |
|
|
81.1 |
|
| Total current liabilities |
|
275.8 |
|
|
233.1 |
|
| Long-term debt, net of current portion |
|
800.3 |
|
|
947.6 |
|
| Deferred income taxes, net |
|
58.5 |
|
|
63.4 |
|
| Other noncurrent liabilities |
|
166.2 |
|
|
143.0 |
|
|
|
|
|
|
| Stockholders' equity: |
|
|
|
|
| Common stock: |
|
|
|
|
$0.01 par value, 200,000,000 authorized shares; 42,197,964 issued shares at September 30, 2023 and 35,367,264 issued shares at September 30, 2022 |
|
0.4 |
|
|
0.4 |
|
| Additional paid-in capital |
|
413.1 |
|
|
152.1 |
|
Treasury stock, at cost — 1,038,168 shares at September 30, 2023 and 1,196,300 shares at September 30, 2022 |
|
(8.7) |
|
|
(7.3) |
|
| Retained earnings |
|
217.1 |
|
|
226.5 |
|
| Accumulated other comprehensive loss |
|
(104.7) |
|
|
(115.3) |
|
| Total stockholders' equity |
|
517.2 |
|
|
256.4 |
|
| Total liabilities and stockholders' equity |
|
$ |
1,818.0 |
|
|
$ |
1,643.5 |
|
The accompanying notes are an integral part of the consolidated financial statements.
|
|
|
|
|
|
|
|
|
|
|
COMPASS MINERALS INTERNATIONAL, INC. |
Consolidated Statements of Operations
|
|
|
|
|
|
|
|
|
|
|
|
|
|
|
|
|
|
|
|
|
| |
|
Fiscal Year Ended |
|
Nine Months Ended |
| (in millions, except share data) |
|
September 30,
2023 |
|
September 30,
2022 |
|
September 30,
2021 |
| Sales |
|
$ |
1,204.7 |
|
|
$ |
1,244.1 |
|
|
$ |
836.6 |
|
| Shipping and handling cost |
|
346.1 |
|
|
379.5 |
|
|
220.1 |
|
| Product cost |
|
624.7 |
|
|
667.8 |
|
|
444.8 |
|
| Gross profit |
|
233.9 |
|
|
196.8 |
|
|
171.7 |
|
| Selling, general and administrative expenses |
|
154.8 |
|
|
153.9 |
|
|
92.7 |
|
| Operating earnings |
|
79.1 |
|
|
42.9 |
|
|
79.0 |
|
| Other expense (income): |
|
|
|
|
|
|
Interest income |
|
(5.3) |
|
|
(0.8) |
|
|
(0.2) |
|
| Interest expense |
|
55.5 |
|
|
55.2 |
|
|
44.3 |
|
| Loss (gain) on foreign exchange |
|
2.3 |
|
|
(14.9) |
|
|
(0.6) |
|
| Net loss in equity investees |
|
3.1 |
|
|
5.2 |
|
|
0.5 |
|
| Gain from remeasurement of equity method investment |
|
(13.7) |
|
|
— |
|
|
— |
|
| Other expense (income), net |
|
4.3 |
|
|
0.5 |
|
|
(0.1) |
|
| Earnings (loss) before income taxes from continuing operations |
|
32.9 |
|
|
(2.3) |
|
|
35.1 |
|
| Income tax expense from continuing operations |
|
17.4 |
|
|
35.0 |
|
|
14.2 |
|
| Net earnings (loss) from continuing operations |
|
15.5 |
|
|
(37.3) |
|
|
20.9 |
|
| Net earnings (loss) from discontinued operations |
|
— |
|
|
12.2 |
|
|
(234.2) |
|
| Net earnings (loss) |
|
$ |
15.5 |
|
|
$ |
(25.1) |
|
|
$ |
(213.3) |
|
|
|
|
|
|
|
|
| Basic net earnings (loss) from continuing operations per common share |
|
$ |
0.37 |
|
|
$ |
(1.10) |
|
|
$ |
0.59 |
|
| Basic net earnings (loss) from discontinued operations per common share |
|
— |
|
|
0.36 |
|
|
(6.89) |
|
| Basic net earnings (loss) per common share |
|
$ |
0.37 |
|
|
$ |
(0.74) |
|
|
$ |
(6.30) |
|
|
|
|
|
|
|
|
| Diluted net earnings (loss) from continuing operations per common share |
|
$ |
0.37 |
|
|
$ |
(1.10) |
|
|
$ |
0.58 |
|
| Diluted net earnings (loss) from discontinued operations per common share |
|
— |
|
|
0.36 |
|
|
(6.89) |
|
| Diluted net earnings (loss) per common share |
|
$ |
0.37 |
|
|
$ |
(0.74) |
|
|
$ |
(6.30) |
|
|
|
|
|
|
|
|
| Weighted-average common shares outstanding (in thousands): |
|
|
|
|
|
|
| Basic |
|
40,786 |
|
|
34,120 |
|
|
34,013 |
|
| Diluted |
|
40,786 |
|
|
34,120 |
|
|
34,063 |
|
The accompanying notes are an integral part of the consolidated financial statements.
|
|
|
|
|
|
|
|
|
|
|
COMPASS MINERALS INTERNATIONAL, INC. |
Consolidated Statements of Comprehensive Income (Loss)
|
|
|
|
|
|
|
|
|
|
|
|
|
|
|
|
|
|
|
|
|
| |
|
Fiscal Year Ended |
|
Nine Months Ended |
| (in millions) |
|
September 30,
2023 |
|
September 30,
2022 |
|
September 30,
2021 |
| Net earnings (loss) |
|
$ |
15.5 |
|
|
$ |
(25.1) |
|
|
$ |
(213.3) |
|
| Other comprehensive income (loss): |
|
|
|
|
|
|
Unrealized (loss) gain from change in pension costs, net of tax of $1.3, $(0.9) and $(1.2) in fiscal years 2023, 2022 and 2021, respectively |
|
(3.9) |
|
|
2.7 |
|
|
4.0 |
|
Unrealized gain from change in other postretirement benefits, net of tax of $(0.2) and $(0.5) in fiscal years 2023 and 2022, respectively |
|
0.4 |
|
|
1.3 |
|
|
— |
|
Unrealized gain (loss) on cash flow hedges, net of tax of $0.4, $0.7 and $(1.0) in fiscal years 2023, 2022 and 2021, respectively |
|
0.2 |
|
|
(4.7) |
|
|
2.9 |
|
| Cumulative translation adjustment |
|
13.9 |
|
|
(4.1) |
|
|
186.4 |
|
| Comprehensive income (loss) |
|
$ |
26.1 |
|
|
$ |
(29.9) |
|
|
$ |
(20.0) |
|
The accompanying notes are an integral part of the consolidated financial statements.
|
|
|
|
|
|
|
|
|
|
|
COMPASS MINERALS INTERNATIONAL, INC. |
Consolidated Statements of Stockholders’ Equity
|
|
|
|
|
|
|
|
|
|
|
|
|
|
|
|
|
|
|
|
|
|
|
|
|
|
|
|
|
|
|
|
|
|
|
|
|
|
|
| (in millions) |
|
Common Stock |
|
Additional Paid-In Capital |
|
Treasury Stock |
|
Retained Earnings |
|
Accumulated Other Comprehensive Loss |
|
Total |
|
|
|
|
|
|
|
|
|
|
|
|
|
|
|
|
|
|
|
|
|
|
|
|
|
|
|
|
|
|
|
|
|
|
|
|
|
|
|
|
|
|
|
|
|
|
|
|
|
|
|
|
|
|
|
|
|
|
|
|
|
|
|
|
|
|
|
|
|
|
|
|
|
|
|
|
|
|
| Balance, December 31, 2020 |
|
$ |
0.4 |
|
|
$ |
127.0 |
|
|
$ |
(4.4) |
|
|
$ |
559.1 |
|
|
$ |
(303.8) |
|
|
$ |
378.3 |
|
| Comprehensive (loss) income |
|
— |
|
|
— |
|
|
— |
|
|
(213.3) |
|
|
193.3 |
|
|
(20.0) |
|
Dividends on common stock/equity awards ($2.16 per share) |
|
— |
|
|
0.3 |
|
|
— |
|
|
(73.4) |
|
|
— |
|
|
(73.1) |
|
| Shares issued for stock units, net of shares withheld for taxes |
|
— |
|
|
(0.1) |
|
|
(1.1) |
|
|
— |
|
|
— |
|
|
(1.2) |
|
| Stock-based compensation |
|
— |
|
|
7.7 |
|
|
— |
|
|
— |
|
|
— |
|
|
7.7 |
|
| Stock options exercised, net of shares withheld for taxes |
|
— |
|
|
1.4 |
|
|
— |
|
|
— |
|
|
— |
|
|
1.4 |
|
| Balance, September 30, 2021 |
|
$ |
0.4 |
|
|
$ |
136.3 |
|
|
$ |
(5.5) |
|
|
$ |
272.4 |
|
|
$ |
(110.5) |
|
|
$ |
293.1 |
|
| Comprehensive loss |
|
— |
|
|
— |
|
|
— |
|
|
(25.1) |
|
|
(4.8) |
|
|
(29.9) |
|
Dividends on common stock/equity awards ($0.60 per share) |
|
— |
|
|
— |
|
|
— |
|
|
(20.8) |
|
|
— |
|
|
(20.8) |
|
| Shares issued for stock units, net of shares withheld for taxes |
|
— |
|
|
(0.2) |
|
|
(1.8) |
|
|
— |
|
|
— |
|
|
(2.0) |
|
| Stock-based compensation |
|
— |
|
|
15.7 |
|
|
— |
|
|
— |
|
|
— |
|
|
15.7 |
|
| Stock options exercised, net of shares withheld for taxes |
|
— |
|
|
0.3 |
|
|
— |
|
|
— |
|
|
— |
|
|
0.3 |
|
| Balance, September 30, 2022 |
|
$ |
0.4 |
|
|
$ |
152.1 |
|
|
$ |
(7.3) |
|
|
$ |
226.5 |
|
|
$ |
(115.3) |
|
|
$ |
256.4 |
|
| Comprehensive income |
|
— |
|
|
— |
|
|
— |
|
|
15.5 |
|
|
10.6 |
|
|
26.1 |
|
Dividends on common stock/equity awards ($0.60 per share) |
|
— |
|
|
— |
|
|
— |
|
|
(24.9) |
|
|
— |
|
|
(24.9) |
|
| Private placement of common stock |
|
— |
|
|
240.7 |
|
|
— |
|
|
— |
|
|
— |
|
|
240.7 |
|
| Shares issued for stock units, net of shares withheld for taxes |
|
— |
|
|
(0.3) |
|
|
(1.4) |
|
|
— |
|
|
— |
|
|
(1.7) |
|
| Stock-based compensation |
|
— |
|
|
20.6 |
|
|
— |
|
|
— |
|
|
— |
|
|
20.6 |
|
|
|
|
|
|
|
|
|
|
|
|
|
|
| Balance, September 30, 2023 |
|
$ |
0.4 |
|
|
$ |
413.1 |
|
|
$ |
(8.7) |
|
|
$ |
217.1 |
|
|
$ |
(104.7) |
|
|
$ |
517.2 |
|
The accompanying notes are an integral part of the consolidated financial statements.
|
|
|
|
|
|
|
|
|
|
|
COMPASS MINERALS INTERNATIONAL, INC. |
Consolidated Statements of Cash Flows
|
|
|
|
|
|
|
|
|
|
|
|
|
|
|
|
|
|
|
|
|
|
|
Fiscal Year Ended |
|
Nine Months Ended |
| (in millions) |
|
September 30,
2023 |
|
September 30,
2022 |
|
September 30,
2021 |
| Cash flows from operating activities: |
|
|
|
|
|
|
| Net earnings (loss) |
|
$ |
15.5 |
|
|
$ |
(25.1) |
|
|
$ |
(213.3) |
|
Adjustments to reconcile net earnings (loss) to net cash flows provided by operating activities: |
|
|
|
|
|
|
| Depreciation, depletion and amortization |
|
98.6 |
|
|
113.7 |
|
|
94.6 |
|
| Amortization of deferred financing costs |
|
2.6 |
|
|
2.9 |
|
|
2.4 |
|
| Refinancing of long-term debt |
|
1.0 |
|
|
— |
|
|
— |
|
| Stock-based compensation |
|
20.6 |
|
|
15.7 |
|
|
7.7 |
|
| Deferred income taxes |
|
(4.8) |
|
|
19.9 |
|
|
(29.5) |
|
| Unrealized loss (gain) on foreign exchange |
|
2.4 |
|
|
(29.1) |
|
|
(17.9) |
|
| Loss on impairment of long-lived assets |
|
— |
|
|
23.1 |
|
|
300.0 |
|
| Net loss (earnings) in equity investees |
|
3.1 |
|
|
5.2 |
|
|
(0.6) |
|
| Gain from remeasurement of equity method investment |
|
(13.7) |
|
|
— |
|
|
— |
|
| Loss (gain) on disposition of assets |
|
4.5 |
|
|
3.7 |
|
|
(27.3) |
|
| Other, net |
|
0.5 |
|
|
(0.1) |
|
|
(0.1) |
|
Changes in operating assets and liabilities, net of sale and acquisition of businesses: |
|
|
|
|
|
|
| Receivables |
|
38.9 |
|
|
(55.0) |
|
|
74.1 |
|
| Inventories |
|
(82.7) |
|
|
6.3 |
|
|
(52.3) |
|
| Other assets |
|
16.3 |
|
|
(14.2) |
|
|
(14.7) |
|
| Accounts payable and accrued expenses and other current liabilities |
|
19.9 |
|
|
55.1 |
|
|
49.2 |
|
| Other liabilities |
|
(14.8) |
|
|
(1.6) |
|
|
(9.6) |
|
| Net cash provided by operating activities |
|
107.9 |
|
|
120.5 |
|
|
162.7 |
|
| Cash flows from investing activities: |
|
|
|
|
|
|
| Capital expenditures |
|
(156.2) |
|
|
(96.7) |
|
|
(71.8) |
|
| Proceeds from sale of businesses |
|
— |
|
|
61.2 |
|
|
348.6 |
|
Acquisition of business, net of cash acquired |
|
(18.9) |
|
|
— |
|
|
— |
|
| Investments in equity method investees |
|
— |
|
|
(46.3) |
|
|
(4.2) |
|
| Other, net |
|
(4.7) |
|
|
1.8 |
|
|
3.6 |
|
| Net cash (used in) provided by investing activities |
|
(179.8) |
|
|
(80.0) |
|
|
276.2 |
|
| Cash flows from financing activities: |
|
|
|
|
|
|
| Proceeds from revolving credit facility borrowings |
|
150.0 |
|
|
466.2 |
|
|
349.4 |
|
| Principal payments on revolving credit facility borrowings |
|
(220.0) |
|
|
(403.1) |
|
|
(391.3) |
|
| Proceeds from issuance of long-term debt |
|
239.9 |
|
|
55.9 |
|
|
70.9 |
|
| Principal payments on long-term debt |
|
(314.6) |
|
|
(109.1) |
|
|
(394.8) |
|
| Net proceeds from private placement of common stock |
|
240.7 |
|
|
— |
|
|
— |
|
| Dividends paid |
|
(24.9) |
|
|
(20.8) |
|
|
(73.1) |
|
| Deferred financing costs |
|
(3.9) |
|
|
(0.4) |
|
|
(0.1) |
|
| Proceeds from stock option exercised |
|
— |
|
|
0.3 |
|
|
1.4 |
|
| Shares withheld to satisfy employee tax obligations |
|
(1.7) |
|
|
(2.0) |
|
|
(1.2) |
|
| Other, net |
|
(1.5) |
|
|
(1.3) |
|
|
(0.8) |
|
| Net cash provided by (used in) financing activities |
|
64.0 |
|
|
(14.3) |
|
|
(439.6) |
|
| Effect of exchange rate changes on cash and cash equivalents |
|
0.5 |
|
|
(1.1) |
|
|
0.7 |
|
| Net change in cash and cash equivalents |
|
(7.4) |
|
|
25.1 |
|
|
— |
|
| Cash and cash equivalents, beginning of the year |
|
46.1 |
|
|
21.0 |
|
|
21.0 |
|
| Cash and cash equivalents, end of period |
|
38.7 |
|
|
46.1 |
|
|
21.0 |
|
| Less: cash and cash equivalents included in current assets held for sale |
|
— |
|
|
— |
|
|
(2.9) |
|
| Cash and cash equivalents of continuing operations, end of period |
|
$ |
38.7 |
|
|
$ |
46.1 |
|
|
$ |
18.1 |
|
|
|
|
|
|
|
|
| Supplemental cash flow information: |
|
|
|
|
|
|
| Interest paid, net of amounts capitalized |
|
$ |
54.5 |
|
|
$ |
52.9 |
|
|
$ |
38.6 |
|
| Income taxes paid, net of refunds |
|
$ |
12.5 |
|
|
$ |
17.3 |
|
|
$ |
41.8 |
|
The accompanying notes are an integral part of the consolidated financial statements.
|
|
|
|
|
|
|
|
|
|
|
COMPASS MINERALS INTERNATIONAL, INC. |
Notes to Consolidated Financial Statements
1. ORGANIZATION AND FORMATION
Compass Minerals International, Inc. (“CMI”), through its subsidiaries (collectively, “CMP,” “Compass Minerals” or the “Company”), is a leading global provider of essential minerals focused on safely delivering where and when it matters to help solve nature’s challenges for customers and communities. The Company’s salt products help keep roadways safe during winter weather and are used in numerous other consumer, industrial, chemical and agricultural applications. Its plant nutrition business is the leading North American producer of sulfate of potash (“SOP”), which is used in the production of specialty fertilizers for high-value crops and turf and helps improve the quality and yield of crops, while supporting sustainable agriculture. The Company’s principal products are salt, consisting of sodium chloride and magnesium chloride, and SOP. Our next-generation fire retardants help to slow, stop and prevent wildfires through the use of high-performing and environmentally-friendly products. Additionally, the Company has been pursuing the development of a sustainable lithium salt resource to support the North American battery market, although subsequent to September 30, 2023, this project has been suspended indefinitely beyond certain already committed items associated with the early stages of construction of our commercial scale demonstration unit. The Company’s production sites are located in the United States (“U.S.”), Canada and the United Kingdom (“U.K.”). The Company also provides records management services in the U.K.
CMI is a holding company with no significant operations other than those of its wholly-owned subsidiaries.
Change in Fiscal Year
On June 23, 2021, the Board of Directors of the Company approved a change in its fiscal year end from December 31st to September 30th. As a result, the Company’s results of operations, cash flows, and all transactions impacting shareholders equity presented in this Annual Report on Form 10-K are for the twelve months ended September 30, 2023 (“fiscal 2023”), the twelve months ended September 30, 2022 (“fiscal 2022”) and the nine month transition period ended September 30, 2021 (“fiscal 2021”), unless otherwise noted. As such, the Company’s fiscal year 2023, or fiscal 2023, refers to the period from October 1, 2022 to September 30, 2023. This Annual Report on Form 10-K also includes an unaudited consolidated statement of operations for the comparable period of October 1, 2020 to September 30, 2021; see
Note 21 for additional information.
Strategic Evaluation and Plan to Sell Businesses
Following an evaluation of the strategic fit of certain of the Company’s businesses and subsequent restructuring of its former South American Plant Nutrition segment to enable separate sales processes for its chemicals and specialty plant nutrition businesses and equity investment in Fermavi Eletroquímica Ltda. (“Fermavi”), in fiscal 2021 the Company’s Board of Directors approved the plan to sell each of these businesses and the North America micronutrient business (the “Specialty Businesses”) with a goal of reducing the Company’s leverage and enabling increased focus on optimizing the Company’s core businesses.
The Company concluded that the sale of the Specialty Businesses represented a strategic shift for the Company that would have a material effect on its operations and financial results. Consequently, the Specialty businesses were reclassified as discontinued operations on the Consolidated Statements of Operations. See
Note 4 for further discussion of the sales of these businesses.
Unless otherwise indicated, amounts provided in these Notes pertain to continuing operations.
2. SUMMARY OF SIGNIFICANT ACCOUNTING POLICIES
a. Management Estimates:
The preparation of consolidated financial statements in conformity with U.S. Generally Accepted Accounting Principles (“GAAP”) as included in the Accounting Standards Codification (“ASC”) requires management to make estimates and assumptions that affect the amounts reported in the consolidated financial statements and accompanying notes. Actual results could differ from those estimates.
b. Basis of Consolidation:
The Company’s consolidated financial statements include the accounts of CMI and its wholly-owned domestic and foreign subsidiaries. All significant intercompany balances and transactions have been eliminated in consolidation.
c. Business Combinations:
The Company accounts for its business combinations using the acquisition accounting method, which requires it to determine the fair value of identifiable assets acquired and liabilities assumed, including any contingent consideration, to properly allocate the purchase price to the individual assets acquired and liabilities assumed and record any residual purchase price as goodwill at the date of the acquisition in accordance with the Financial Accounting Standards Board “(FASB”) ASC Topic 805, “Business Combinations”. Management uses its best estimates and assumptions to assign fair value to the tangible
|
|
|
|
|
|
|
|
|
|
|
COMPASS MINERALS INTERNATIONAL, INC. |
and intangible assets acquired, liabilities assumed and contingent consideration at the acquisition date. Such estimates are inherently uncertain and may be subject to refinement. The determination of fair values of assets acquired and liabilities assumed requires estimates and the use of valuation techniques when a market value is not readily available. Any excess of purchase price over the fair value of net tangible and intangible assets acquired is allocated to goodwill. If the initial accounting for the business combination has not been completed by the end of the reporting period in which the business combination occurs, provisional amounts are reported to present information about facts and circumstances that existed as of the acquisition date. During the measurement period, which may be up to one year from the acquisition date, the Company may record adjustments to the fair value of the tangible and intangible assets acquired and liabilities assumed with the corresponding offset to goodwill, to the extent such information was not available to the Company at the acquisition date to determine such amounts. Upon the conclusion of the measurement period or final determination of the fair value of assets acquired or liabilities assumed, whichever comes first, any subsequent adjustments are recorded to the Company’s Consolidated Statements of Operations.
Accounting for business combinations requires the Company to make significant estimates and assumptions at the acquisition date. Significant assumptions relevant to the determination of the fair value of the assets acquired and liabilities assumed include, but are not limited to, future expected cash flows, contract renewal rates, discount rates, terminal growth rate and other assumptions. The approach to valuing the initial contingent consideration associated with the purchase price, including milestone achievement and the earn-out, also uses similar unobservable factors such as projected revenues and expenses over the term of the contingent milestone achievement and earn-out periods, discounted for the period of time over which the initial contingent consideration is measured. Based upon these assumptions, the initial earn-out contingent consideration is then adjusted for relevant volatility rates and valued using a Monte Carlo simulation.
All acquisition-related costs, other than the costs to issue debt or equity securities, are accounted for as expenses in the period in which they are incurred. The fair value of contingent consideration arrangements is remeasured each reporting period until resolved. Any changes that are not measurement period adjustments are recognized in earnings. In the event the Company acquires an entity with which the Company has a preexisting relationship, the Company will generally recognize a gain or loss to remeasure its previously held equity interest at acquisition date fair value on its Consolidated Statements of Operations.
d. Discontinued Operations:
The Company reports its financial results from discontinued operations and continuing operations separately to distinguish the financial impact of disposal transactions from ongoing operations. Discontinued operations reporting occurs when a component or a group of components of an entity has been disposed of or classified as held for sale and represents a strategic shift that has a major effect on the entity’s operations and financial results. In the Company’s Consolidated Statements of Cash Flows, the cash flows from discontinued operations are not separately classified. Significant components of cash flows related to discontinued operations are disclosed in
Note 4. See
Note 4 for information on discontinued operations and
Note 15 for information on the Company’s reportable segments.
e. Foreign Currency:
Assets and liabilities are translated into U.S. dollars at end of period exchange rates. Sales and expenses are translated using the monthly average rates of exchange during the year. Adjustments resulting from the translation of foreign-currency financial statements into the reporting currency, U.S. dollars, are included in accumulated other comprehensive loss. The Company recorded foreign exchange (loss) gain of $(1.6) million, $6.7 million and $(17.7) million for the fiscal years ended September 30, 2023 and 2022, and the nine months ended September 30, 2021, respectively, in accumulated other comprehensive loss related to intercompany notes which, had been deemed to be of long-term investment nature. As discussed in
Note 4, the Company completed the disposition of certain foreign entities and assets during fiscal 2021 and fiscal 2022. There are certain monetary assets and liabilities that are currently being held in Brazil that will be remeasured each period with changes in foreign currency exchange rates included in earnings until they are settled or transferred to a U.S. subsidiary. Aggregate exchange losses and gains from transactions denominated in a currency other than the functional currency, which are included in other expense (income) for the fiscal years ended September 30, 2023 and 2022, and the nine months ended September 30, 2021, were $2.3 million, $(14.9) million and $(0.6) million, respectively. These amounts include the effect of translating intercompany notes which were deemed to be temporary in nature.
f. Revenue Recognition:
The FASB revenue recognition guidance provides a single, comprehensive model for recognizing revenue from contracts with customers. The revenue recognition model requires revenue to be recognized upon the transfer of promised goods or services to customers in an amount that reflects the consideration an entity expects to receive in exchange for those goods or services. The Company’s revenue arrangements generally consist of a single performance obligation to transfer promised goods or services. The Company also derives revenue from a full-service air base fire retardant contract with the United States Forest Service (“USFS”), which is comprised of three performance obligations, namely product sales, providing operations and maintenance personnel services and leasing of specified equipment. Substantially all of the Company’s revenue is recognized at a point in time when control of the goods transfers to the customer.
|
|
|
|
|
|
|
|
|
|
|
COMPASS MINERALS INTERNATIONAL, INC. |
The Company typically recognizes revenue at the time of shipment to the customer, which coincides with the transfer of title and risk of ownership to the customer. Sales represent billings to customers net of sales taxes charged for the sale of the product. Sales include amounts charged to customers for shipping and handling costs, which are expensed when the related product is sold.
g. Cash and Cash Equivalents:
The Company considers all investments with original maturities of three months or less to be cash equivalents. The Company maintains the majority of its cash in bank deposit accounts with several commercial banks with high credit ratings in the U.S., Canada, the U.K. and Brazil. Typically, the Company has bank deposits in excess of federally insured limits. Currently, the Company does not believe it is exposed to significant credit risk on its cash and cash equivalents.
h. Accounts Receivable and Allowance for Doubtful Accounts:
Receivables consist almost entirely of trade accounts receivable. Trade accounts receivable are recorded at the invoiced amount and do not bear interest. The allowance for doubtful accounts is the Company’s best estimate of the amount of probable credit losses in its existing trade accounts receivable. The Company determines the allowance based on historical write-off experience by business line and a current assessment of its portfolio, including information regarding individual customers. The Company reviews its past due account balances for collectability and adjusts its allowance for doubtful accounts accordingly. Account balances are charged off against the allowance when the Company believes it is probable that the trade accounts receivable will not be recovered.
i. Inventories:
Inventories are stated at the lower of cost or net realizable value. Finished goods and raw material and supply costs are predominately valued using the average cost method on a first-in-first-out basis. Raw materials and supply costs primarily consist of raw materials purchased to aid in the production of mineral products, maintenance materials and packaging materials. Finished goods are primarily comprised of salt, magnesium chloride, SOP products and fire retardants readily available for sale. Substantially all costs associated with the production of finished goods at the Company’s production locations are captured as inventory costs. As required by GAAP, a portion of the fixed costs at a location are not included in inventory and are expensed as a product cost if production at that location is determined to be abnormally low in any period or if the nature of the cost incurred is not attributable to its production processes. Additionally, since the Company’s products are often stored at warehousing locations, the Company includes in the cost of inventory the freight and handling costs necessary to move the product to storage until the product is sold to a customer.
j. Other Current Assets:
The items included in other current assets as of September 30, 2023 and 2022, consist principally of prepaid expenses of $33.3 million and $44.3 million, respectively.
k. Property, Plant and Equipment:
Property, plant and equipment is stated at cost and includes capitalized interest. The costs of replacements or renewals, which improve or extend the life of existing property, are capitalized. Maintenance and repairs are expensed as incurred. Upon retirement or disposition of an asset, any resulting gain or loss is included in the Company’s operating results.
Property, plant and equipment also includes mineral interests. The mineral interests for the Company’s Winsford U.K. mine are owned. The Company leases probable mineral reserves at its Cote Blanche and Goderich mines, its Ogden facility and several of its other North American facilities. These leases have varying terms, and many provide for a royalty payment to the lessor based on a specific amount per ton of mineral extracted or as a percentage of sales. The Company’s rights to extract minerals are contractually limited by time. The Cote Blanche mine is operated under land and mineral leases, and the mineral lease expires in 2060 with two additional 25-year renewal periods. The Company continues to operate under the Goderich mine mineral reserve lease that expired in 2022, and the Company is in the process of renewing its option until 2043 after demonstrating to the lessor that the mine’s useful life is greater than the lease’s term. The Ogden facility mineral reserve lease renews annually. The Company believes it will be able to continue to extend lease agreements as it has in the past, at commercially reasonable terms, without incurring substantial costs or material modifications to the existing lease terms and conditions, and therefore, management believes that assigned lives are appropriate. The Company’s mineral interests are depleted on a units-of-production basis based upon the latest available mineral study. The weighted average amortization period for the leased probable mineral reserves is 86 years as of September 30, 2023. The Company also owns other mineral properties. The weighted average life for the probable owned mineral reserves is 35 years as of September 30, 2023, based upon management’s current production estimates.
Buildings and structures are depreciated on a straight-line basis over lives generally ranging from 10 to 30 years. Portable buildings generally have shorter lives than permanent structures. Leasehold and building improvements have estimated lives of 5 to 40 years or lower based on the life of the lease to which the improvement relates.
|
|
|
|
|
|
|
|
|
|
|
COMPASS MINERALS INTERNATIONAL, INC. |
The Company’s fixed assets are amortized on a straight-line basis over their respective lives. The following table summarizes the estimated useful lives of the Company’s different classes of property, plant and equipment:
|
|
|
|
|
|
| |
Years |
| Land improvements |
10 to 25 |
| Buildings and structures |
10 to 30 |
| Leasehold and building improvements |
5 to 40 |
| Machinery and equipment – vehicles |
2 to 10 |
| Machinery and equipment – other mining and production |
> 1 to 50 |
| Office furniture and equipment |
2 to 10 |
| Mineral interests |
20 to 99 |
The Company has finance leases which are recorded in property, plant and equipment at the beginning of the lease at the lower of the fair value of the leased property or the present value of the minimum lease payments. Lease payments are recorded as interest expense and a reduction of the lease liability. A finance lease asset is depreciated over the lower of its useful life or the lease term.
The Company has capitalized computer software costs of $3.7 million and $4.3 million as of September 30, 2023 and 2022, respectively, recorded in property, plant and equipment. The capitalized costs are being amortized over five years. The Company recorded $3.3 million, $7.6 million and $5.0 million of amortization expense related to capitalized computer software for the fiscal years ended September 30, 2023 and 2022, and the nine months ended September 30, 2021, respectively.
The Company recognizes and measures obligations related to the retirement of tangible long-lived assets in accordance with applicable U.S. GAAP. Asset retirement obligations are not material to the Company’s consolidated financial position, results of operations or cash flows.
The Company reviews its long-lived assets and the related mineral reserves for impairment whenever events or changes in circumstances indicate the carrying amounts of such assets may not be recoverable. If an indication of a potential impairment exists, recoverability of the respective assets is determined by comparing the forecasted undiscounted net cash flows of the operation to which the assets relate, to the carrying amount, including associated intangible assets, of such operation. If the operation is determined to be unable to recover the carrying amount of its assets, then intangible assets are written down first, followed by the other long-lived assets of the operation, to fair value. Fair value is determined based on discounted cash flows or appraised values, depending upon the nature of the assets.
l. Leases:
In accordance with U.S. GAAP, lessees are required to recognize on their balance sheet a right-of-use asset which represents a lessee’s right to use the underlying asset, and a lease liability which represents a lessee’s obligation to make lease payments for the right to use the asset. In addition, the guidance requires expanded qualitative and quantitative disclosures. Refer to
Note 6 for additional details.
m. Goodwill and Intangible Assets:
The Company amortizes its intangible assets deemed to have finite lives on a straight-line basis over their estimated useful lives which, for the Company, range from 5 to 50 years. The Company reviews goodwill and other indefinite-lived intangible assets annually for impairment. In addition, goodwill and other intangible assets are reviewed when an event or change in circumstances indicates the carrying amounts of such assets may not be recoverable.
n. Investments:
The Company uses the equity method of accounting for equity securities when it has significant influence or when it has more than a minor ownership interest or more than minor influence over an investee’s operations but does not have a controlling financial interest. Initial investments are recorded at cost (including certain transaction costs) and are adjusted by the Company’s share of the investees’ undistributed earnings and losses. The Company may recognize its share of an investee’s earnings on a lag, if an investee’s financial results are not available in a timely manner.
For certain of the Company's equity method investments, such as investments where the capital structure of the equity investment results in different liquidation rights and priorities than what is reflected by the underlying percentage ownership interests, the Company's proportionate share of net earnings is accounted for using the Hypothetical Liquidation at Book Value ("HLBV") methodology available under the equity method of accounting. When applying HLBV, the Company determines the amount that would be received if the investment were to liquidate all of its assets and distribute the resulting cash to the investors based on contractually defined liquidation priorities, assuming the net assets were liquidated at their net book values.
|
|
|
|
|
|
|
|
|
|
|
COMPASS MINERALS INTERNATIONAL, INC. |
The Company evaluates its equity method investments for impairment whenever events or changes in circumstances indicate that the carrying amounts of such investments may not be recoverable.
o. Other Noncurrent Assets:
Other noncurrent assets include certain inventories of spare parts, net of reserve, of $35.8 million and $35.3 million at September 30, 2023 and 2022, respectively, which will be utilized with respect to long-lived assets. As of September 30, 2023 and 2022, other noncurrent assets also include net operating lease assets of $54.7 million and $58.1 million, respectively.
The Company sponsors a non-qualified defined contribution plan for certain of its executive officers and key employees as described in
Note 12. As of September 30, 2023 and 2022, investments in marketable securities representing amounts deferred by employees, Company contributions and unrealized gains or losses totaling $2.6 million and $1.8 million, respectively, were included in other noncurrent assets in the Consolidated Balance Sheets. The marketable securities are classified as trading securities and accordingly, gains and losses are recorded as a component of other expense, net in the Consolidated Statements of Operations.
p. Income Taxes:
The Company accounts for income taxes using the liability method in accordance with the provisions of U.S. GAAP. Under the liability method, deferred taxes are determined based on the differences between the consolidated financial statements and the tax basis of assets and liabilities using enacted tax rates in effect in the years in which the differences are expected to reverse. The Company’s foreign subsidiaries file separate company returns in their respective jurisdictions.
The Company recognizes potential liabilities in accordance with applicable U.S. GAAP for anticipated tax issues in the U.S. and other tax jurisdictions based on its estimate of whether, and the extent to which, additional taxes will be due. If payment of these amounts ultimately proves to be unnecessary, the reversal of the liabilities would result in tax benefits being recognized in the period when the Company determines the liabilities are no longer necessary. If the Company’s estimate of tax liabilities proves to be less than the ultimate assessment, a further charge to expense would result. Any penalties and interest that are accrued on the Company’s uncertain tax positions are included as a component of income tax expense.
In evaluating the Company’s ability to realize deferred tax assets, the Company considers the sources and timing of taxable income, including the reversal of existing temporary differences, the ability to carryback tax attributes to prior periods, qualifying tax-planning strategies, and estimates of future taxable income exclusive of reversing temporary differences. In determining future taxable income, the Company’s assumptions include the amount of pre-tax operating income according to different state, federal and international taxing jurisdictions, the origination of future temporary differences, and the implementation of feasible and prudent tax-planning strategies.
If the Company determines that a portion of its deferred tax assets will not be realized, a valuation allowance is recorded in the period that such determination is made. In the future, if the Company determines, based on the existence of sufficient evidence, that more or less of the deferred tax assets are more likely than not to be realized, an adjustment to the valuation allowance will be made in the period such a determination is made.
On December 22, 2017, the U.S. enacted the Tax Cuts and Jobs Act which subjects U.S. shareholders, including the Company, to tax on Global Intangible Low-Taxed Income (“GILTI”) earned by certain foreign subsidiaries. The FASB issued guidance stating that an entity can make an accounting policy election to either recognize deferred taxes for temporary basis differences expected to reverse as GILTI in future years or to provide for the tax expense related to GILTI in the year the tax is incurred as a period expense only. The Company has elected to account for GILTI as a period expense only.
q. Environmental Costs:
Environmental costs, other than those of a capital nature, are accrued at the time the exposure becomes known and costs can be reasonably estimated. Costs are accrued based upon management’s estimates of all direct costs. Amounts reserved for environmental matters were not material at September 30, 2023 or 2022.
r. Equity Compensation Plans:
The Company has equity compensation plans under the oversight of the Company’s Board of Directors, whereby stock options, restricted stock units, performance stock units, deferred stock units and shares of common stock are granted to the Company’s employees and directors. See
Note 16 for additional discussion.
s. Earnings per Share:
When calculating earnings per share, the Company’s participating securities are accounted for under the two-class method. The two-class method requires allocating the Company’s net earnings to both common shares and participating securities based upon their rights to receive dividends. Basic earnings per share is computed by dividing net earnings available to common stockholders by the weighted-average number of outstanding common shares during the period. Diluted earnings per share reflects the potential dilution that could occur under the more dilutive of either the treasury stock method or the two-class method for calculating the weighted-average number of outstanding common shares. The treasury stock method is
|
|
|
|
|
|
|
|
|
|
|
COMPASS MINERALS INTERNATIONAL, INC. |
calculated assuming unrecognized compensation expense, income tax benefits and proceeds from the potential exercise of employee stock options are used to repurchase common stock.
t. Derivatives:
The Company is exposed to the impact of fluctuations in foreign exchange and interest rates on its borrowings and fluctuations in the purchase price of natural gas, diesel fuel consumed in operations and fuel costs incurred to deliver its products to its customers. The Company may hedge portions of these risks through the use of derivative agreements.
The Company records derivative financial instruments as assets or liabilities measured at fair value. Accounting for the changes in the fair value of a derivative depends on its designation and effectiveness. Derivatives qualify for treatment as hedges when there is a high correlation between the change in fair value of the derivative instrument and the related change in value of the underlying hedged item. For qualifying hedges, the effective portion of the change in fair value is recognized through earnings when the underlying transaction being hedged affects earnings, allowing a derivative’s gains and losses to offset related results from the hedged item in the Consolidated Statements of Operations. Until the effective portion of a derivative’s change in fair value is recognized in the Consolidated Statements of Operations, the change in fair value is recognized in other comprehensive income. For derivative instruments that are not accounted for as hedges, or for the ineffective portions of qualifying hedges, the change in fair value is recorded through earnings in the period of change. The Company formally documents, designates and assesses the effectiveness of transactions that receive hedge accounting treatment initially and on an ongoing basis.
u. Concentration of Credit Risk:
The Company sells its salt and magnesium chloride products to various governmental agencies, manufacturers, distributors and retailers primarily in the Midwestern U.S. and throughout Canada and the U.K. The Company’s plant nutrition products are sold across the Western Hemisphere and globally. No single customer or group of affiliated customers accounted for more than 10% of the Company’s sales during the fiscal years ended September 30, 2023 or 2022, or the nine months ended September 30, 2021, or more than 10% of receivables at September 30, 2023 or 2022. Although less than 10% of the Company’s sales during the fiscal year ended September 30, 2023, fire retardant sales were primarily sold to a single customer, the USFS.
v. Recent Accounting Pronouncements:
In October 2021, the FASB issued Accounting Standards Update (“ASU”) 2021-08, “Business Combinations (Topic 805): Accounting for Contract Assets and Contract Liabilities from Contracts with Customers.” ASU 2021-08 requires the company acquiring contract assets and contract liabilities obtained in a business combination to recognize and measure them in accordance with ASC Topic 606, “Revenue from Contracts with Customers”. Following the acquisition date, the company acquiring the business should record related revenue as if it had originated the contracts. Before the update, contract assets and contract liabilities from acquired contracts were recognized by the acquiring company at fair value on the acquisition date. The amendments are effective for fiscal years beginning after December 15, 2022, including interim periods within those fiscal years. Early adoption is permitted, including in interim periods, for any financial statements that have not yet been issued. The Company early adopted these requirements, effective on January 1, 2023, with no material impact to its consolidated financial statements.
3. BUSINESS ACQUISITION
On November 2, 2021, the Company announced its increased investment in Fortress North America, LLC (“Fortress”), a next-generation fire retardant business dedicated to developing and producing a portfolio of magnesium chloride-based fire retardant products to help combat wildfires. On May 5, 2023, the Company acquired the remaining 55% interest in Fortress not previously owned in exchange for an initial cash payment of $18.9 million (net of cash held by Fortress of $6.5 million), and additional contingent consideration of up to $28 million to be paid in cash and/or Compass Minerals common stock upon the achievement of certain performance measures over the next five years, and a cash earn-out based on financial performance and volumes of certain Fortress fire retardant products sold over a 10-year period. Building upon the previous 45% minority ownership stake in Fortress, the transaction provided the Company full ownership of all Fortress assets, contracts, and intellectual property.
Purchase Price Allocation
The fair value of the milestone contingent consideration is estimated using a probability-weighted discounted cash flow model with significant inputs not observable in the market and is therefore considered a Level 3 measurement (see
Note 18 for a discussion of the levels in the fair value hierarchy) while the earn-out is valued using a Monte Carlo simulation, also a Level 3 measurement. A summary of the estimated acquisition-date fair value of the consideration transferred, and subsequently revised for measurement period adjustments, is presented in the table below (in millions):
|
|
|
|
|
|
|
|
|
|
|
COMPASS MINERALS INTERNATIONAL, INC. |
|
|
|
|
|
|
|
|
|
|
|
|
|
May 5, 2023 |
Measurement Period Adjustments |
September 30, 2023 |
Cash paid at closing(a) |
$ |
25.4 |
|
$ |
— |
|
$ |
25.4 |
|
Fair value of contingent consideration(b) |
47.4 |
(3.1) |
|
44.3 |
Fair value of 45% equity investment |
59.6 |
(2.5) |
|
57.1 |
| Total |
$ |
132.4 |
|
$ |
(5.6) |
|
$ |
126.8 |
|
(a) Amount of cash paid before consideration of $6.5 million of cash held at Fortress at the time of the acquisition.
(b) Contingent consideration includes the fair value of payments to be made upon the achievement of certain performance measures ($22.9 million) and the 10-year cash earn-out ($21.4 million), both described in the Background section above.
Prior to the acquisition date, the Company accounted for its 45% interest in Fortress as an equity method investment. The acquisition-date fair value of the previously held equity investment was $57.1 million and is included in the consideration transferred. To measure the acquisition-date fair value of the previously held equity interest, the Company utilized a market-based approach which relied on Level 3 inputs (see
Note 18 for a discussion of the levels in the fair value hierarchy). The Company initially recognized a $16.2 million non-cash gain in the period ended June 30, 2023, as a result of remeasuring the value of its prior equity interest in Fortress, which is generally attributable to Fortress’ advancement from a pre-revenue, development-stage company to commercialization. The gain was reduced to $13.7 million in the period ended September 30, 2023 as a result of the measurement period adjustments noted below. The gain is reported in the “Gain from remeasurement of equity method investment” line in the Consolidated Statement of Operations. Acquisition-related expenses were not material.
Under the acquisition method of accounting, the total purchase price is allocated to Fortress’ assets and liabilities based upon their estimated fair values as of the acquisition date. The preliminary allocation of purchase price recorded as of the May 5, 2023 acquisition date, and subsequently revised for measurement period adjustments as of September 30, 2023, is presented in the table below (in millions):
|
|
|
|
|
|
|
|
|
|
|
|
|
Initial Purchase Price Allocation |
Measurement Period Adjustments |
Updated Purchase Price Allocation |
| Cash and cash equivalents |
$ |
6.5 |
|
$ |
— |
|
$ |
6.5 |
|
| Inventories |
3.7 |
|
— |
|
3.7 |
|
| Other current assets |
0.5 |
|
— |
|
0.5 |
|
| Property, plant and equipment |
2.5 |
|
— |
|
2.5 |
|
| Identified intangible assets |
75.3 |
|
0.5 |
|
75.8 |
|
| Other noncurrent assets |
0.8 |
|
— |
|
0.8 |
|
| Accounts payable |
(0.3) |
|
— |
|
(0.3) |
|
| Accrued expenses and other current liabilities |
(1.4) |
|
— |
|
(1.4) |
|
| Other noncurrent liabilities |
(1.3) |
|
— |
|
(1.3) |
|
| Total identified intangible assets |
$ |
86.3 |
|
$ |
0.5 |
|
$ |
86.8 |
|
| Goodwill |
46.1 |
|
(6.1) |
|
40.0 |
|
| Total fair value of business combination |
$ |
132.4 |
|
$ |
(5.6) |
|
$ |
126.8 |
|
The purchase price has been allocated to assets acquired and liabilities assumed based on the Company’s best estimates and assumptions using the information available as of the acquisition date through the date of this filing. During the period ended September 30, 2023, the Company further refined its valuation assumptions related to the customer-related intangible asset and the earnout contingent consideration. As a result of these updates, the Company recorded measurement period adjustments to the provisional amounts initially recorded. Following the measurement period adjustments, the Company estimated the fair value of the customer-related intangible assets acquired to be $57.3 million and the fair value of the earnout portion of contingent consideration to be $21.4 million as of the date of the acquisition. As a result, the fair value of the customer-related intangible asset was increased by $0.5 million and the fair value of the earn-out portion of the contingent consideration decreased by $3.1 million. The measurement period adjustments also resulted in a reduction in the gain related to the remeasurement of equity method investment in Fortress of $2.5 million (initially reported as a gain of $16.2 million for the period ended June 30, 2023) with a corresponding decrease to goodwill of $6.1 million. The adjustments to amortization expense associated with these measurement period adjustments were not material to the consolidated financial statements.
The amount of goodwill recorded including the measurement period adjustments is $40.0 million as of the acquisition date and has been reported in the Company’s Corporate & Other segment. The goodwill recognized reflects expected earnings
|
|
|
|
|
|
|
|
|
|
|
COMPASS MINERALS INTERNATIONAL, INC. |
potential of the business, synergies associated with the use of the Company’s existing systems and resources and logistics and production synergies including use the Company’s magnesium chloride products in the fire retardant products. Currently, the Company expects the full amount of goodwill to be deductible for tax purposes.
In connection with the acquisition, the Company acquired identifiable intangible assets which consisted of customer relationships, developed technology, in-process research and development and trade name. The fair values were determined using Level 3 inputs (see
Note 18 for a discussion of the levels in the fair value hierarchy). The fair value of the customer relationships was estimated using an income approach method while the fair values of developed technology, in-process research and development and trade name were estimated using the relief from royalty method. The estimated fair values and weighted average amortization periods of the identifiable intangible assets are presented in the table below:
|
|
|
|
|
|
|
|
|
|
Estimated Fair Value (in millions) |
Weighted-Average Amortization Period (in years) |
| Customer relationships |
$ |
57.3 |
|
25 years |
| Developed technology |
16.1 |
10.6 years |
| In-process research and development |
2.2 |
Indefinite |
| Trade name |
0.2 |
5 years |
| Total identified intangible assets |
$ |
75.8 |
|
|
Pro forma results of operations for this acquisition are not presented because the acquisition is not material to the Company's consolidated results of operations for the period ended September 30, 2023.
In the fourth quarter of 2023, the Company updated its contingent consideration calculation based upon new information that was not available to the Company at the acquisition date which resulted in a $0.6 million reduction in the contingent consideration liability as of September 30, 2023. The Company determined that this adjustment, and any future remeasurement adjustments, would not be considered a measurement period adjustment under the accounting guidance. As such, the Company recorded a gain of $0.6 million in its Consolidated Statements of Operations in the fourth quarter of 2023. The Company will continue to recognize remeasurement changes in the estimated fair value of contingent consideration in earnings at each reporting date until all contingencies are resolved.
4. DISCONTINUED OPERATIONS
During fiscal 2021 the Company sold its South America specialty plant nutrition business, its equity investment in Fermavi and its North America micronutrient business. In connection with the sale of its South America specialty plant nutrition business the Company received net cash of approximately $318.4 million with an additional earnout payment of up to R$88 million Brazilian reais. On April 7, 2022, the Company received the maximum earnout possible under the terms of the sale, or $18.5 million based on exchange rates at the time of receipt.
Also in fiscal 2021 the Company completed its sale of its North America micronutrient business for approximately $56.7 million of cash proceeds and its investment in Fermavi for R$45 million Brazilian reais (including R$30 million of deferred purchase price). The Company received cash proceeds of approximately $2.9 million and recorded a discounted deferred proceeds receivable of approximately $4.8 million (based on exchange rates at the time of closing). As of September 30, 2023, approximately R$15.0 million Brazilian reais of deferred proceeds remains outstanding.
On April 20, 2022, the Company completed the sale of its South America chemicals business to a subsidiary of Cape Acquisitions LLC. Upon closing of the all-cash sale, the Company received gross proceeds of approximately $51.5 million based on exchange rates at the time of receipt, including a post-closing adjustment and compensation of $6.4 million for cash on hand that transferred to the buyer. The Company also paid fees of $2.4 million related to this sale. The Company recognized an incremental loss from the sale of $23.1 million during the fiscal year ended September 30, 2022, and released $49.5 million from accumulated currency translation adjustment (“CTA”). The sale included all of the Company’s remaining operations in Brazil, concluding its previously announced plan to exit the South American market.
In measuring the assets and liabilities held for sale at fair value less estimated costs to sell, the Company completed an impairment analysis when its Board of Directors committed to a plan to sell the Specialty Businesses and the Company updated the analysis each quarter until each of the Specialty Businesses were sold. The Company recorded losses on the sales of its South American specialty plant nutrition business, its investment in Fermavi and its South America chemicals business totaling approximately $323.1 million. These losses were partially offset by a gain of approximately $30.6 million from the sale of a component of the North America micronutrient business in fiscal 2021.
The amount of CTA loss within accumulated other comprehensive loss (“AOCL”) on the Company’s Consolidated Balance Sheets related to the Specialty Businesses was considered in the Company’s determination of the adjustment to fair value less estimated costs to sell. The Company recognized a net loss from its adjustment to fair value less estimated costs to sell of
|
|
|
|
|
|
|
|
|
|
|
COMPASS MINERALS INTERNATIONAL, INC. |
$90.2 million in its earnings (loss) from discontinued operations in its Consolidated Statements of Operations for the nine months ended September 30, 2021. The adjustment to fair value less estimated costs to sell for the nine months ended September 30, 2021 included $52.9 million of CTA from the translation of the net assets of the Company’s South America chemicals business from Brazilian reais to U.S. dollars, which had been reported in CTA.
As discussed in
Note 1, prior to March 31, 2021, the North America micronutrient product business was reported in the Company’s Plant Nutrition North America segment (which is now known as the Plant Nutrition segment), which aligns with the Plant Nutrition reporting unit for purposes of evaluating goodwill. Based on the Company’s assessment of the estimated relative fair values of the North America micronutrient product business and the remaining business from the former Plant Nutrition reporting unit, the Company performed an allocation of goodwill between the North America micronutrient product business classified as held for sale and the business being retained, which resulted in $6.8 million of goodwill allocated to the North America micronutrient product business as of December 31, 2020. The Company also performed an assessment of the relative fair values of its South America specialty nutrition businesses based upon estimated proceeds and other information available. The Company allocated 84% of the total reporting unit to the South America specialty nutrition business (R$951.6 million or $189.7 million at closing in fiscal 2021). An allocation of goodwill related to the former Plant Nutrition South America segment was not required as the entire segment and related goodwill was classified as held for sale in each period.
The information below sets forth selected financial information related to the operating results of the Specialty Businesses classified as discontinued operations. The Specialty Businesses’ revenue and expenses have been reclassified to net earnings (loss) from discontinued operations in prior periods. The Consolidated Statements of Operations present the revenue and expenses that were reclassified from the specified line items to discontinued operations.
The following table represents summarized Consolidated Statements of Operations information of discontinued operations (in millions):
|
|
|
|
|
|
|
|
|
|
|
|
|
|
|
|
|
Fiscal Year Ended |
|
Nine Months Ended |
|
|
|
September 30,
2022 |
|
September 30,
2021 |
| Sales |
|
|
$ |
53.6 |
|
|
$ |
211.2 |
|
| Shipping and handling cost |
|
|
2.8 |
|
|
10.2 |
|
| Product cost |
|
|
28.4 |
|
|
153.8 |
|
| Gross profit |
|
|
22.4 |
|
|
47.2 |
|
| Selling, general and administrative expenses |
|
|
3.5 |
|
|
27.6 |
|
| Operating earnings |
|
|
18.9 |
|
|
19.6 |
|
| Interest expense |
|
|
0.1 |
|
|
4.4 |
|
Gain on foreign exchange |
|
|
(17.5) |
|
|
(9.9) |
|
| Net loss on sale of business |
|
|
23.1 |
|
|
209.8 |
|
| Net loss on adjustment to fair value less estimated costs to sell |
|
|
— |
|
|
90.2 |
|
| Net gain on sale of business |
|
|
— |
|
|
(30.6) |
|
| Other income, net |
|
|
(0.6) |
|
|
(1.5) |
|
| Earnings (loss) from discontinued operations before income taxes |
|
|
13.8 |
|
|
(242.8) |
|
| Income tax expense (benefit) |
|
|
1.6 |
|
|
(8.6) |
|
| Net earnings (loss) from discontinued operations |
|
|
$ |
12.2 |
|
|
$ |
(234.2) |
|
|
|
|
|
|
|
|
|
|
|
|
COMPASS MINERALS INTERNATIONAL, INC. |
The significant components included in the Company’s Consolidated Statements of Cash Flows for the discontinued operations are as follows (in millions):
|
|
|
|
|
|
|
|
|
|
|
|
|
|
|
|
|
Fiscal Year Ended |
|
Nine Months Ended |
|
|
|
September 30,
2022 |
|
September 30,
2021 |
| Depreciation, depletion and amortization |
|
|
$ |
— |
|
|
$ |
4.8 |
|
| Deferred income taxes |
|
|
0.5 |
|
|
(23.6) |
|
Unrealized foreign exchange gain |
|
|
(3.1) |
|
|
(19.1) |
|
| Loss on impairment of long-lived assets |
|
|
23.1 |
|
|
300.0 |
|
| Gain on sale of business |
|
|
— |
|
|
(30.6) |
|
| Capital expenditures |
|
|
(1.6) |
|
|
(6.1) |
|
| Changes in receivables |
|
|
(4.8) |
|
|
4.2 |
|
| Changes in inventories |
|
|
(2.0) |
|
|
(26.1) |
|
| Changes in other assets |
|
|
(4.7) |
|
|
(20.5) |
|
| Changes in accounts payable and accrued expenses and other current liabilities |
|
|
(11.5) |
|
|
(315.9) |
|
| Proceeds from sale of businesses |
|
|
61.2 |
|
|
348.6 |
|
| Proceeds from issuance of long-term debt |
|
|
— |
|
|
21.8 |
|
| Principal payments on long-term debt |
|
|
— |
|
|
(12.0) |
|
5. REVENUES
Nature of Products and Services
The Company’s Salt segment products include salt and magnesium chloride for use in road deicing and dust control, food processing, water softening, and agricultural and industrial applications. The Company’s plant nutrition segment produces and markets SOP in various grades worldwide to distributors and retailers of crop inputs, as well as growers and for industrial uses. The Company also operates a records management business utilizing excavated areas of its Winsford salt mine with one other location in London, England and, following its acquisition of Fortress North America, produces next-generation fire retardant products.
Identifying the Contract
The Company accounts for a customer contract when there is approval and commitment from both parties, the rights of the parties and payment terms are identified, the contract has commercial substance and collectability of consideration is probable.
Identifying the Performance Obligations
At contract inception, the Company assesses the goods and services it has promised to its customers and identifies a performance obligation for each promise to transfer to the customer a distinct good or service (or bundle of goods or services). Determining whether products and services are considered distinct performance obligations that should be accounted for separately or aggregated together may require significant judgment.
Identifying and Allocating the Transaction Price
The Company’s revenues are measured based on consideration specified in the customer contract, net of any sales incentives and amounts collected on behalf of third parties such as sales taxes. In certain cases, the Company’s customer contracts may include promises to transfer multiple products and services to a customer. For multiple-element arrangements, the Company generally allocates the transaction price to each performance obligation in proportion to its stand-alone selling price.
When Performance Obligations Are Satisfied
The vast majority of the Company’s revenues are recognized at a point in time when the performance obligations are satisfied based upon transfer of control of the product or service to a customer. To determine when the control of goods is transferred, the Company typically assesses, among other things, the shipping terms of the contract, as shipping is an indicator of transfer of control. Some of the Company’s products are sold when the control of the goods transfers to the customer at the time of shipment. There are also instances when the Company provides shipping services to deliver its products. Shipping and handling costs that occur before the customer obtains control of the goods are deemed to be fulfillment activities and are accounted for as fulfillment costs. The Company has made an accounting policy election to recognize any shipping and
|
|
|
|
|
|
|
|
|
|
|
COMPASS MINERALS INTERNATIONAL, INC. |
handling costs that are incurred after the customer obtains control of the goods as fulfillment costs which are accrued at the time of revenue recognition.
The Company also derives revenue from a full-service air base fire retardant contract with the USFS. Full-service air bases include sales from the supply of fire retardant product and related equipment and service for inspection and loading the fire retardant onto aircraft at designated air tanker bases. The revenue derived from the contract with the USFS is comprised of three performance obligations, namely product sales, providing operations and maintenance personnel services and leasing of specified equipment. For full-service fire-retardant contracts, the Company identifies the fire-retardant product, equipment leases and services as separate units of account. The performance obligation for product sales is satisfied at a point in time when control of the product is transferred onto the aircraft, typically when the product is consumed by the customer. The services and leases represent “stand-ready obligations” and the revenue is recognized straight-line over the service period, which could be intermittent.
Significant Payment Terms
The customer contract states the final terms of the sale, including the description, quantity and price of each product or service purchased. Payment is typically due in full within 30 days of delivery. The Company does not adjust the consideration for the effects of a significant financing component if the Company expects, at contract inception, that the period between when the good or service is transferred to the customer and when the customer pays for that good or service will be one year or less. Payment terms vary by contract and sales to customers are deemed collectible at the time of sale based on customer history, prior credit checks, and controls around customer credit limits.
Sales and other taxes assessed by a governmental authority that are both imposed on and concurrent with a specific revenue-producing transaction, which are collected by the Company from a customer, are excluded from revenue.
Refunds, Returns and Warranties
The Company’s products are generally not sold with a right of return and the Company does not generally provide credits or incentives, which may be required to be accounted for as variable consideration when estimating the amount of revenue to be recognized. The Company uses historical experience to estimate accruals for refunds due to manufacturing or other defects, which have historically been minimal. Therefore, there is no estimated obligation for returns. Standard terms of delivery are generally included in the Company's contracts of sale, order confirmation documents and invoices.
Shipping and Handling
The Company uses the policy election to account for the shipping and handling activities as activities to fulfill the Company’s promise to transfer goods to the customer, rather than as a performance obligation. Accordingly, the costs of the shipping and handling activities are accrued for at the time of shipment.
Deferred Revenue
Deferred revenue represents billings under non-cancellable contracts before the related product or service is transferred to the customer. The portion of deferred revenue that is anticipated to be recognized as revenue during the succeeding twelve-month period is recorded in accrued expenses and other current liabilities and the remaining portion is recorded in other non-current liabilities on the Consolidated Balance Sheets. Deferred revenue as of September 30, 2023 was approximately $8.5 million.
Practical Expedients and Accounting Policy Elections
The Company has elected the following practical expedients and accounting policies: (i) not to adjust the amount of consideration for the effects of a significant financing component when the Company expects, at contract inception, that the period between the Company's transfer of a product or service to a customer and when the customer pays for that product or service will be one year or less, (ii) to expense costs to obtain a contract as incurred when the Company expects that the amortization period would have been one year or less, (iii) not to recast revenue for customer contracts that begin and end in the same fiscal period, and (iv) not to assess whether promised goods or services are performance obligations if they are immaterial in the context of the customer contract.
See
Note 15 for disaggregation of sales by segment, type and geographical region.
6. LEASES
The Company enters into leases for warehouses and depots, rail cars, vehicles, mobile equipment, office space and certain other types of property and equipment. The Company determines whether an arrangement is or contains a lease at the inception of the contract. The right-of-use asset and lease liability are recognized based on the present value of the future minimum lease payments over the estimated lease term. Lease expense for minimum lease payments is recognized on a straight-line basis over the lease term. The Company estimates its incremental borrowing rate for each lease based upon the estimated lease term, the
|
|
|
|
|
|
|
|
|
|
|
COMPASS MINERALS INTERNATIONAL, INC. |
type of asset and the location of the leased asset. The most significant judgments in the application of the FASB guidance include whether a contract contains a lease and the lease term.
Leases with an initial term of 12 months or less are not recorded on the Company’s Consolidated Balance Sheets. The Company recognizes lease expense for these short-term leases on a straight-line basis over the lease term. Many of the Company’s leases include one or more options to renew and extend the initial lease term. The exercise of lease renewal options is generally at the Company’s discretion. The lease term includes renewal periods in only those instances in which the Company determines it is reasonably assured of renewal.
The depreciable lives of assets and leasehold improvements are limited by the expected lease term, unless there is a transfer of title or purchase option reasonably certain of exercise. In these instances, the assets are depreciated over the useful life of the asset.
The Company has elected the practical expedient available under the FASB guidance to not separate lease and non-lease components on all of its lease categories. As a result, many of the Company’s leases include variable payments for services (such as handling or storage) or payments based on the usage of the asset. In addition, certain of the Company’s lease agreements include rental payments that are adjusted periodically for inflation. The Company’s lease agreements do not contain any material residual value guarantees or any material restrictive covenants. The Company’s sublease income is immaterial.
The Company’s Consolidated Balance Sheets includes the following (in millions):
|
|
|
|
|
|
|
|
|
|
|
|
|
|
|
|
Consolidated Balance Sheet Location |
September 30,
2023 |
|
September 30,
2022 |
| Assets |
|
|
|
|
| Operating lease assets |
Other noncurrent assets |
$ |
54.7 |
|
|
$ |
58.1 |
|
| Finance lease assets |
Property, plant and equipment, net |
6.9 |
|
|
3.3 |
|
| Total lease assets |
|
$ |
61.6 |
|
|
$ |
61.4 |
|
| Liabilities |
|
|
|
|
| Current liabilities: |
|
|
|
|
| Operating |
Accrued expenses and other current liabilities |
$ |
16.5 |
|
|
$ |
16.0 |
|
| Finance |
Accrued expenses and other current liabilities |
1.7 |
|
|
1.1 |
|
| Noncurrent liabilities: |
|
|
|
|
| Operating |
Other noncurrent liabilities |
40.2 |
|
|
44.4 |
|
| Finance |
Other noncurrent liabilities |
5.5 |
|
|
2.1 |
|
| Total lease liabilities |
|
$ |
63.9 |
|
|
$ |
63.6 |
|
The Company’s components of lease cost are as follows (in millions):
|
|
|
|
|
|
|
|
|
|
|
|
|
|
|
|
|
|
|
Fiscal Year Ended |
|
Nine Months Ended |
|
September 30,
2023 |
|
September 30,
2022 |
|
September 30,
2021 |
| Finance lease cost: |
|
|
|
|
|
| Amortization of lease assets |
$ |
1.5 |
|
|
$ |
1.2 |
|
|
$ |
0.9 |
|
| Interest on lease liabilities |
0.2 |
|
|
0.1 |
|
|
0.1 |
|
| Operating lease cost |
20.9 |
|
|
18.0 |
|
|
13.2 |
|
Variable lease cost(a) |
16.7 |
|
|
15.6 |
|
|
12.1 |
|
| Total lease cost |
$ |
39.3 |
|
|
$ |
34.9 |
|
|
$ |
26.3 |
|
(a)Short-term leases are immaterial and included in variable lease cost.
|
|
|
|
|
|
|
|
|
|
|
COMPASS MINERALS INTERNATIONAL, INC. |
Maturities of lease liabilities are as follows (in millions):
|
|
|
|
|
|
|
|
|
|
|
|
|
|
|
|
|
|
| Years Ending September 30: |
Operating Leases |
|
Finance Leases |
|
Total |
| 2024 |
$ |
18.7 |
|
|
$ |
2.0 |
|
|
$ |
20.7 |
|
| 2025 |
11.9 |
|
|
1.4 |
|
|
13.3 |
|
| 2026 |
9.7 |
|
|
1.3 |
|
|
11.0 |
|
| 2027 |
7.8 |
|
|
0.9 |
|
|
8.7 |
|
| 2028 |
5.5 |
|
|
0.5 |
|
|
6.0 |
|
After 2028 |
10.1 |
|
|
4.0 |
|
|
14.1 |
|
| Total lease payments |
63.7 |
|
|
10.1 |
|
|
73.8 |
|
| Less: Interest |
(7.0) |
|
|
(2.9) |
|
|
(9.9) |
|
| Present value of lease liabilities |
$ |
56.7 |
|
|
$ |
7.2 |
|
|
$ |
63.9 |
|
Supplemental lease term and discount rate information related to leases is as follows:
|
|
|
|
|
|
|
|
|
|
|
|
|
|
|
|
|
|
|
Fiscal Year Ended |
|
Nine Months Ended |
|
September 30,
2023 |
|
September 30,
2022 |
|
September 30,
2021 |
| Weighted-average remaining lease term (years) |
|
|
|
|
|
| Operating leases |
5.1 |
|
5.5 |
|
5.7 |
| Finance leases |
13.2 |
|
20.7 |
|
16.7 |
| Weighted-average discount rate |
|
|
|
|
|
| Operating leases |
4.6 |
% |
|
4.0 |
% |
|
3.6 |
% |
| Finance leases |
5.0 |
% |
|
3.2 |
% |
|
3.1 |
% |
Supplemental cash flow information related to leases is as follows (in millions):
|
|
|
|
|
|
|
|
|
|
|
|
|
|
|
|
|
|
|
Fiscal Year Ended |
|
Nine Months Ended |
|
September 30,
2023 |
|
September 30,
2022 |
|
September 30,
2021 |
| Cash paid for amounts included in the measurement of lease liabilities: |
|
|
|
|
|
| Operating cash flows from operating leases |
$ |
21.1 |
|
|
$ |
18.2 |
|
|
$ |
12.9 |
|
| Operating cash flows from finance leases |
0.2 |
|
|
0.1 |
|
|
0.1 |
|
| Financing cash flows from finance leases |
1.5 |
|
|
1.3 |
|
|
1.0 |
|
| Leased assets obtained in exchange for new operating lease liabilities |
14.5 |
|
|
26.4 |
|
|
5.7 |
|
| Leased assets obtained in exchange for new finance lease liabilities |
5.3 |
|
|
— |
|
|
2.2 |
|
7. INVENTORIES
Inventories consist of the following (in millions):
|
|
|
|
|
|
|
|
|
|
|
|
|
|
|
| |
|
September 30,
2023 |
|
September 30,
2022 |
| Finished goods |
|
$ |
319.3 |
|
|
$ |
251.6 |
|
| Raw materials and supplies |
|
72.9 |
|
|
52.8 |
|
| Total inventories |
|
$ |
392.2 |
|
|
$ |
304.4 |
|
|
|
|
|
|
|
|
|
|
|
|
COMPASS MINERALS INTERNATIONAL, INC. |
8. PROPERTY, PLANT AND EQUIPMENT
Property, plant and equipment consists of the following (in millions):
|
|
|
|
|
|
|
|
|
|
|
|
|
|
|
| |
|
September 30,
2023 |
|
September 30,
2022 |
| Land, buildings and structures and leasehold improvements |
|
$ |
547.9 |
|
|
$ |
534.8 |
|
| Machinery and equipment |
|
1,102.0 |
|
|
1,026.3 |
|
| Office furniture and equipment |
|
21.6 |
|
|
56.8 |
|
| Mineral interests |
|
169.1 |
|
|
167.1 |
|
| Construction in progress |
|
113.0 |
|
|
64.3 |
|
| |
|
1,953.6 |
|
|
1,849.3 |
|
| Less accumulated depreciation and depletion |
|
(1,101.4) |
|
|
(1,072.7) |
|
| Property, plant and equipment, net |
|
$ |
852.2 |
|
|
$ |
776.6 |
|
The cost of leased property, plant and equipment under finance leases included above was $9.9 million and $6.7 million with accumulated depreciation of $3.0 million and $3.4 million as of September 30, 2023 and 2022, respectively. Additionally, construction in progress includes approximately $51.2 million of expenditures to fund the development of a sustainable lithium salt resource, which, subsequent to September 30, 2023, has been suspended indefinitely beyond certain already committed items associated with the early stages of construction of our commercial scale demonstration unit until greater clarity is provided on the evolving regulatory climate in Utah.
9. GOODWILL AND OTHER INTANGIBLE ASSETS
Changes in the carrying amount of goodwill are summarized as follows (in millions):
|
|
|
|
|
|
|
|
|
|
|
|
|
|
|
|
|
|
|
|
|
|
|
Plant Nutrition |
|
Corporate & Other |
|
Consolidated |
Balance as of September 30, 2021 |
|
$ |
51.8 |
|
|
$ |
6.0 |
|
|
$ |
57.8 |
|
Foreign currency translation adjustment |
|
(0.9) |
|
|
(0.5) |
|
|
(1.4) |
|
Balance as of September 30, 2022 |
|
50.9 |
|
|
5.5 |
|
|
56.4 |
|
Acquisition of business(a) |
|
— |
|
|
40.0 |
|
|
40.0 |
|
Foreign currency translation adjustment |
|
0.2 |
|
|
0.2 |
|
|
0.4 |
|
Balance as of September 30, 2023 |
|
$ |
51.1 |
|
|
$ |
45.7 |
|
|
$ |
96.8 |
|
(a)Goodwill related to the Company’s acquisition of Fortress, as discussed further in
Note 3.
The asset values and accumulated amortization for the finite-lived intangibles assets are as follows (in millions):
|
|
|
|
|
|
|
|
|
|
|
|
|
|
|
|
|
|
|
|
|
|
|
|
| |
Customer Relationships |
Developed Technology |
Trade Name |
Supply Agreement |
SOP Production Rights |
Lease Rights |
Total |
| September 30, 2023 |
|
|
|
|
|
|
|
| Gross intangible asset |
$ |
58.4 |
|
$ |
16.1 |
|
$ |
0.2 |
|
$ |
26.8 |
|
$ |
24.3 |
|
$ |
1.6 |
|
$ |
127.4 |
|
| Accumulated amortization |
(1.0) |
|
(0.1) |
|
— |
|
(6.8) |
|
(19.3) |
|
(0.7) |
|
(27.9) |
|
| Net intangible assets |
$ |
57.4 |
|
$ |
16.0 |
|
$ |
0.2 |
|
$ |
20.0 |
|
$ |
5.0 |
|
$ |
0.9 |
|
$ |
99.5 |
|
|
|
|
|
|
|
|
|
|
|
|
|
|
|
|
| |
Supply Agreement |
SOP Production Rights |
Lease Rights |
Total |
| September 30, 2022 |
|
|
|
|
| Gross intangible asset |
$ |
26.4 |
|
$ |
24.3 |
|
$ |
1.6 |
|
$ |
52.3 |
|
| Accumulated amortization |
(6.2) |
|
(18.3) |
|
(0.7) |
|
(25.2) |
|
| Net intangible assets |
$ |
20.2 |
|
$ |
6.0 |
|
$ |
0.9 |
|
$ |
27.1 |
|
|
|
|
|
|
|
|
|
|
|
|
COMPASS MINERALS INTERNATIONAL, INC. |
The weighted average estimated lives of the Company’s finite-lived intangible assets are as follows:
|
|
|
|
|
|
| Intangible asset |
Estimated Lives |
Customer relationships |
25 years |
Developed technology |
10.6 years |
Trade name |
5 years |
| Supply agreement |
50 years |
| SOP production rights |
25 years |
| Lease rights |
25 years |
None of the finite-lived intangible assets have a residual book value. Aggregate amortization expense was $2.7 million, $1.6 and $1.2 million for the fiscal years ended September 30, 2023 and 2022, and the nine months ended September 30, 2021, respectively, and is projected to be between $3 million and $5 million per year over the next five years. The weighted average life for the Company’s finite-lived intangibles is approximately 30 years.
In addition, the Company had water rights of $17.8 million as of both September 30, 2023 and 2022 and trade names of $0.5 million as of both September 30, 2023 and 2022, which have indefinite lives. As of September 30, 2023, the Company recorded $2.2 million of in-process research and development related to the Fortress acquisition, which will be reviewed for impairment at least annually, or in the event of indicators of impairment, until product development is completed.
10. EQUITY METHOD INVESTMENTS
Prior to the May 5, 2023 acquisition of the remaining 55% interest in Fortress not previously owned, the Company had invested $50 million in Fortress in exchange for an ownership interest of approximately 45%. Refer to
Note 3 for additional details. Under the HLBV methodology available under the equity method of accounting, the Company had reflected its share of the income or loss of Fortress, net of tax, in its results each period on a one quarter reporting lag. The Company recorded its share of Fortress’ net losses of $1.8 million and $3.9 million in the fiscal years ended September 30, 2023 and 2022, respectively.
The carrying value of the Company’s equity investment in Fortress was in excess of its share of Fortress’s net book value by approximately $27 million as of September 30, 2022. The basis difference primarily represented incremental value attributable to intangible assets and goodwill that had not been recognized in the financial statements of Fortress. The Company had liquidation preference under the terms of Fortress’ LLC agreement. Additionally, the Company had the right to purchase units from other Fortress unit holders and the right of first refusal to purchase all or any portion of any available Fortress units, both subject to certain conditions.
The balance of the Company’s net investment in Fortress of $45.8 million as of September 30, 2022, was recorded in equity method investments in the Consolidated Balance Sheets. The Company also has other immaterial equity investments valued at $0.0 million and $0.8 million as of September 30, 2023 and 2022, respectively, for which it has recorded $1.3 million for its share of losses in each of the fiscal years ended September 30, 2023 and 2022.
The following tables provide summarized financial information for the Company’s ownership interest in Fortress, prior to its acquisition of the remaining equity interest in fiscal 2023, as accounted for under the equity method compiled from its financial statements, reported on a one-quarter lag (in millions):
|
|
|
|
|
|
|
|
|
|
|
| |
|
|
|
September 30,
2022 |
| Current assets |
|
|
|
$ |
17.5 |
|
| Noncurrent assets |
|
|
|
3.0 |
|
| Current liabilities |
|
|
|
1.4 |
|
| Noncurrent liabilities |
|
|
|
0.2 |
|
|
|
|
|
|
|
|
|
|
|
|
|
|
| |
|
|
|
September 30,
2022 |
|
|
| Sales |
|
|
|
$ |
0.3 |
|
|
|
| Gross profit |
|
|
|
(0.3) |
|
|
|
| Net loss |
|
|
|
(5.9) |
|
|
|
|
|
|
|
|
|
|
|
|
|
|
COMPASS MINERALS INTERNATIONAL, INC. |
11. INCOME TAXES
The Company files tax returns in the U.S., Canada, the U.K. and Brazil at the federal and local taxing jurisdictional levels. The Company’s U.S. federal tax returns for tax years 2017 forward remain open and subject to examination. Generally, the Company’s state, local and foreign tax returns for years as early as 2002 forward remain open and subject to examination, depending on the jurisdiction.
The following table summarizes the Company’s income tax provision (in millions):
|
|
|
|
|
|
|
|
|
|
|
|
|
|
|
|
|
|
|
|
|
|
|
Fiscal Year Ended |
|
Nine Months Ended |
| |
|
September 30,
2023 |
|
September 30,
2022 |
|
September 30,
2021 |
| Current: |
|
|
|
|
|
|
| Federal |
|
$ |
(1.4) |
|
|
$ |
8.8 |
|
|
$ |
4.9 |
|
| State |
|
0.9 |
|
|
(2.0) |
|
|
0.1 |
|
| Foreign |
|
22.7 |
|
|
8.8 |
|
|
15.1 |
|
| Total current |
|
22.2 |
|
|
15.6 |
|
|
20.1 |
|
| Deferred: |
|
|
|
|
|
|
| Federal |
|
(0.6) |
|
|
17.2 |
|
|
(4.0) |
|
| State |
|
(2.0) |
|
|
(1.6) |
|
|
(2.9) |
|
| Foreign |
|
(2.2) |
|
|
3.8 |
|
|
1.0 |
|
| Total deferred |
|
(4.8) |
|
|
19.4 |
|
|
(5.9) |
|
| Total provision for income taxes |
|
$ |
17.4 |
|
|
$ |
35.0 |
|
|
$ |
14.2 |
|
|
|
|
|
|
|
|
|
|
|
|
COMPASS MINERALS INTERNATIONAL, INC. |
The following table summarizes components of earnings before income taxes and shows the tax effects of significant adjustments from the expected income tax expense computed at the federal statutory rate (in millions):
|
|
|
|
|
|
|
|
|
|
|
|
|
|
|
|
|
|
|
|
|
|
|
Fiscal Year Ended |
|
Nine Months Ended |
| |
|
September 30,
2023 |
|
September 30,
2022 |
|
September 30,
2021 |
| U.S. loss |
|
$ |
(17.4) |
|
|
$ |
(68.0) |
|
|
$ |
(27.6) |
|
| Foreign income |
|
50.3 |
|
|
65.7 |
|
|
62.7 |
|
| Earnings before income taxes |
|
$ |
32.9 |
|
|
$ |
(2.3) |
|
|
$ |
35.1 |
|
Computed tax at the U.S. federal statutory rate of 21% |
|
6.9 |
|
|
(0.5) |
|
|
7.4 |
|
| Foreign income rate differential, mining, and withholding taxes, net of U.S. federal deduction |
|
9.6 |
|
|
4.3 |
|
|
6.6 |
|
Benefit recognized on Canadian law change |
|
(6.2) |
|
|
— |
|
|
— |
|
| Percentage depletion in excess of basis |
|
(2.7) |
|
|
(5.7) |
|
|
(1.7) |
|
| Non-deductible compensation |
|
3.1 |
|
|
3.3 |
|
|
1.0 |
|
| Other domestic tax reserves, net of reversals |
|
(2.6) |
|
|
(1.1) |
|
|
0.5 |
|
| State income taxes, net of federal income tax benefit |
|
(1.1) |
|
|
(2.5) |
|
|
(1.1) |
|
| Change in valuation allowance on deferred tax asset |
|
10.1 |
|
|
37.5 |
|
|
1.8 |
|
| Interest expense recognition differences |
|
— |
|
|
(2.8) |
|
|
(2.8) |
|
| Global Intangible Low-Taxed Income and Base Erosion and Anti-Abuse Tax |
|
1.1 |
|
|
— |
|
|
2.5 |
|
|
|
|
|
|
|
|
|
|
|
|
|
|
|
| Tax on repatriated amounts |
|
(0.7) |
|
|
(0.3) |
|
|
0.1 |
|
| Securities and Exchange Commission (the “SEC”) Settlement |
|
— |
|
|
2.5 |
|
|
— |
|
| Other (income) expense, net |
|
(0.1) |
|
|
0.3 |
|
|
(0.1) |
|
| Provision for income taxes |
|
$ |
17.4 |
|
|
$ |
35.0 |
|
|
$ |
14.2 |
|
| Effective tax rate |
|
53 |
% |
|
(1,522) |
% |
|
40 |
% |
|
|
|
|
|
|
|
|
|
|
|
COMPASS MINERALS INTERNATIONAL, INC. |
Under U.S. GAAP, deferred tax assets and liabilities are recognized for the estimated future tax effects, based on enacted tax law, of temporary differences between the values of assets and liabilities recorded for financial reporting and tax purposes, and of net operating losses and other carryforwards. The significant components of the Company’s deferred tax assets and liabilities were as follows (in millions):
|
|
|
|
|
|
|
|
|
|
|
|
|
|
|
| |
|
September 30,
2023 |
|
September 30,
2022 |
|
|
|
|
|
|
|
|
|
|
|
|
|
|
|
|
|
|
|
|
|
|
|
|
|
|
|
|
|
|
|
|
|
|
|
|
|
|
|
|
|
|
|
|
|
|
|
|
|
|
|
|
|
|
|
|
|
|
|
|
|
|
|
|
|
|
|
|
|
|
|
|
|
|
|
|
|
|
|
|
|
|
|
|
|
| Deferred tax assets to be netted with deferred tax liabilities: |
|
|
|
|
|
|
|
|
|
Net operating loss carryforwards |
|
$ |
16.8 |
|
|
$ |
23.1 |
|
| Excess interest expense |
|
45.6 |
|
|
34.0 |
|
| Foreign tax credit |
|
39.4 |
|
|
39.4 |
|
| Stock-based compensation |
|
2.4 |
|
|
2.2 |
|
Research and development costs |
|
2.2 |
|
|
0.2 |
|
Federal and state capital losses |
|
3.6 |
|
|
2.3 |
|
| Right of use lease liability |
|
13.8 |
|
|
14.8 |
|
| State tax credits |
|
8.3 |
|
|
7.6 |
|
Other, net |
|
16.2 |
|
|
14.8 |
|
| Total deferred tax assets before valuation allowance |
|
148.3 |
|
|
138.4 |
|
Valuation allowance |
|
(122.2) |
|
|
(111.9) |
|
| Total deferred tax assets to be netted with deferred tax liabilities |
|
26.1 |
|
|
26.5 |
|
| Deferred tax liabilities: |
|
|
|
|
| Property, plant and equipment |
|
55.2 |
|
|
53.8 |
|
| Intangible asset |
|
12.6 |
|
|
8.5 |
|
| Right of use lease asset |
|
13.8 |
|
|
14.8 |
|
| Unrealized foreign exchange gain |
|
1.3 |
|
|
5.5 |
|
| Other, net |
|
1.7 |
|
|
7.3 |
|
| Total deferred tax liabilities |
|
84.6 |
|
|
89.9 |
|
| Net deferred tax liabilities |
|
$ |
58.5 |
|
|
$ |
63.4 |
|
At September 30, 2023 and 2022, the Company had $65.4 million and $94.1 million, respectively, of gross foreign federal net operating loss (“NOL”) carryforwards that have no expiration date and $2.9 million and $3.2 million, respectively, of net operating tax-effected state NOL carryforwards which will expire beginning in 2035. At September 30, 2023 and 2022, the Company also had $2.0 million and $2.1 million, respectively, of tax-effected state capital losses which will expire beginning in 2027 and $1.6 million and $0.2 million, respectively, of tax-effected federal capital losses which will expire beginning in 2025. The NOL carryforwards in Brazil and related valuation allowances were eliminated as of September 30, 2022 given the ending of the Company’s operations in Brazil.
The Company has recorded a valuation allowance for a portion of its deferred tax asset relating to various tax attributes that it does not believe are more likely than not to be realized. As of September 30, 2023 and 2022, the Company’s valuation allowance was $122.2 million and $111.9 million, respectively. Management assesses the available positive and negative evidence to estimate whether sufficient future taxable income will be generated to permit use of the existing deferred tax assets. A significant piece of objective negative evidence evaluated was the cumulative loss incurred in the U.S. over the three-year period ended September 30, 2023. Such objective evidence limits the ability to consider other subjective evidence, such as our projections for future income. On the basis of this evaluation, for the fiscal year 2023, an additional valuation allowance of $10.8 million has been recorded to recognize only the portion of the U.S. deferred tax assets that are more likely than not to be realized. The amount of the deferred tax assets considered realizable, however, could be adjusted if estimates of future taxable income during the carryforward period are increased or reduced or if objective negative evidence in the form of cumulative losses is no longer present and additional weight is given to subjective evidence such as our projections for income. In the future, if the Company determines, based on existence of sufficient evidence, that it should realize more or less of its deferred tax assets, an adjustment to the valuation allowance will be made in the period such a determination is made.
The calculation of the Company’s tax liabilities involves dealing with uncertainties in the application of complex tax regulations in multiple jurisdictions. The Company recognizes potential liabilities for unrecognized tax benefits in the U.S. and other tax jurisdictions in accordance with applicable U.S. GAAP, which requires uncertain tax positions to be recognized only if they are more likely than not to be upheld based on their technical merits. The measurement of the uncertain tax position is
|
|
|
|
|
|
|
|
|
|
|
COMPASS MINERALS INTERNATIONAL, INC. |
based on the largest benefit amount that is more likely than not (determined on a cumulative probability basis) to be realized upon settlement of the matter. If payment of these amounts ultimately proves to be unnecessary, the reversal of the liabilities would result in tax benefits being recognized in the period when the Company determines the liabilities are no longer necessary. If the Company’s estimate of tax liabilities proves to be less than the ultimate assessment, a further charge to expense may result.
The Company’s uncertain tax positions primarily relate to transactions and deductions involving U.S. and Canadian operations. If favorably resolved, $27.2 million of unrecognized tax benefits would decrease the Company’s effective tax rate. Management believes that it is reasonably possible that none of the unrecognized tax benefits will decrease in the next twelve months. In fiscal 2023, the Company’s income tax expense included a benefit of approximately $2.5 million related to the release of uncertain tax positions due to the expiration of statutes of limitations.
The following table shows a reconciliation of the beginning and ending amount of unrecognized tax benefits (in millions):
|
|
|
|
|
|
|
|
|
|
|
|
|
|
|
|
|
|
|
|
|
|
|
Fiscal Year Ended |
|
Nine Months Ended |
| |
|
September 30,
2023 |
|
September 30,
2022 |
|
September 30,
2021 |
| Unrecognized tax benefits: |
|
|
|
|
|
|
| Balance at beginning of period |
|
$ |
33.6 |
|
|
$ |
38.0 |
|
|
$ |
37.9 |
|
| Additions resulting from current year tax positions |
|
3.8 |
|
|
— |
|
|
— |
|
| Additions relating to tax positions taken in prior years |
|
0.5 |
|
|
— |
|
|
0.2 |
|
|
|
|
|
|
|
|
|
|
|
|
|
|
|
| Reductions relating to tax positions taken in prior years |
|
— |
|
|
(3.2) |
|
|
— |
|
| Reductions due to expiration of tax years |
|
(2.5) |
|
|
(1.2) |
|
|
(0.1) |
|
| Balance at end of period |
|
$ |
35.4 |
|
|
$ |
33.6 |
|
|
$ |
38.0 |
|
The Company accrues interest and penalties related to its uncertain tax positions within its tax provision. During the fiscal years ended September 30, 2023 and 2022, and the nine months ended September 30, 2021, the Company accrued interest and penalties, net of reversals, of $(3.0) million, $0.9 million and $2.6 million, respectively. As of September 30, 2023 and 2022, accrued interest and penalties included in the Consolidated Balance Sheets totaled $22.7 million and $25.7 million, respectively.
As a result of U.S. tax reform, in fiscal 2018, the Company revised its permanently reinvested assertion expecting to repatriate approximately $150 million of unremitted foreign earnings from Canada. Additionally, the Company changed its permanently reinvested assertion and repatriated $42.5 million of unremitted foreign earnings from its U.K. operations in September 2021. In fiscal 2022, the Company revised its permanently reinvested assertion, expecting to repatriate an additional $10 million of unremitted foreign earnings from its U.K. operations and in fiscal 2023 the Company revised it again expecting to repatriate an additional approximately $6 million of unremitted foreign earnings from its U.K. operations. During the first quarter of fiscal 2023, $89.2 million was repatriated from Canada and in the third quarter of fiscal 2023, $15.6 million was repatriated from the U.K. Net income tax expense of $3.8 million has been recorded for foreign withholding tax, state income tax and foreign exchange losses on these changes in assertion as of September 30, 2023, consisting of a tax benefit of $0.7 million recorded in fiscal 2023, a $0.2 million tax benefit recorded in fiscal 2022, a $0.1 million tax expense recorded in fiscal 2021 and tax expense of $4.6 million recorded in years prior to fiscal 2021. The Company intends to continue its permanently reinvested assertion on the remaining undistributed earnings of its foreign subsidiaries indefinitely. As of September 30, 2023, the Company has approximately $194.9 million of outside basis differences on which no deferred taxes have been recorded as the determination of the unrecognized deferred taxes is not practicable.
Canadian provincial tax authorities have challenged tax positions claimed by one of the Company’s Canadian subsidiaries and have issued tax reassessments for fiscal years 2002-2017. The reassessments are a result of ongoing audits and total approximately $181.5 million, including interest, through September 30, 2023. The Company disputes these reassessments and plans to continue to work with the appropriate authorities in Canada to resolve the dispute. There is a reasonable possibility that the ultimate resolution of this dispute, and any related disputes for other open tax years, may be materially higher or lower than the amounts the Company has reserved for such disputes. In connection with this dispute, local regulations require the Company to post security with the tax authority until the dispute is resolved. The Company has posted collateral in the form of a $143.8 million performance bond and has paid $36.8 million (most of which is recorded in other assets in the Consolidated Balance Sheets at September 30, 2023), which is necessary to proceed with future appeals or litigation.
The Company expects that it will be required by local regulations to provide security for additional interest on the above unresolved disputed amounts and for any future reassessments issued by these Canadian tax authorities in the form of cash, letters of credit, performance bonds, asset liens or other arrangements agreeable with the tax authorities until the disputes are resolved.
|
|
|
|
|
|
|
|
|
|
|
COMPASS MINERALS INTERNATIONAL, INC. |
The Company expects that the ultimate outcome of these matters will not have a material impact on its results of operations or financial condition. However, the Company can provide no assurance as to the ultimate outcome of these matters and the impact could be material if they are not resolved in the Company’s favor. As of September 30, 2023, the Company believes it has adequately reserved for these reassessments.
Additionally, the Company has other uncertain tax positions as well as assessments and disputed positions with taxing authorities in its various jurisdictions.
12. PENSION PLANS AND OTHER BENEFITS
U.K. Pension
The Company has a defined benefit pension plan for certain of its U.K. employees. Benefits of this pension plan are based on a combination of years of service and compensation levels. This plan was closed to new participants in 1992. Beginning December 1, 2008, future benefits ceased to accrue for the remaining active employee participants in the pension plan concurrent with the establishment of a defined contribution plan for these employees.
The Company’s U.K. pension plan investment strategy is to maximize return on investments while minimizing risk. This is accomplished by investing in high-grade equity and debt securities. The Company’s portfolio guidelines recommend that equity securities comprise approximately 75% of the total portfolio and that approximately 25% be invested in debt securities. The Company’s portfolio has shifted to a smaller proportion of equity funds due to the increased volatility of these funds over the last several years, and it is researching strategies that will reduce volatility, while also maximizing returns. Investment strategies and portfolio allocations are based on the U.K. pension plan’s benefit obligations and its funded or underfunded status, expected returns, and the Company’s portfolio guidelines and are monitored on a regular basis. The weighted-average asset allocations by asset category are as follows:
|
|
|
|
|
|
|
|
|
|
|
|
|
|
|
| Asset Category |
|
September 30,
2023 |
|
September 30,
2022 |
| Cash and cash equivalents |
|
1 |
% |
|
13 |
% |
| Blended funds |
|
39 |
% |
|
37 |
% |
| Bond funds |
|
60 |
% |
|
50 |
% |
|
|
|
|
|
| Total |
|
100 |
% |
|
100 |
% |
The fair value of the Company’s U.K. pension plan assets by asset category (see
Note 18 for a discussion regarding fair value measurements) are as follows (in millions):
|
|
|
|
|
|
|
|
|
|
|
|
|
|
|
|
|
|
|
|
|
|
|
|
|
|
|
| |
|
September 30,
2023 |
|
Level One |
|
Level Two |
|
Level Three |
| Asset category: |
|
|
|
|
|
|
|
|
Cash and cash equivalents(a) |
|
$ |
0.5 |
|
|
$ |
0.5 |
|
|
$ |
— |
|
|
$ |
— |
|
Blended funds(b) |
|
16.2 |
|
|
— |
|
|
16.2 |
|
|
— |
|
Bond funds(c): |
|
|
|
|
|
|
|
|
| Treasuries |
|
24.8 |
|
|
— |
|
|
24.8 |
|
|
— |
|
|
|
|
|
|
|
|
|
|
| Total Pension Assets |
|
$ |
41.5 |
|
|
$ |
0.5 |
|
|
$ |
41.0 |
|
|
$ |
— |
|
|
|
|
|
|
|
|
|
|
|
|
COMPASS MINERALS INTERNATIONAL, INC. |
|
|
|
|
|
|
|
|
|
|
|
|
|
|
|
|
|
|
|
|
|
|
|
|
|
|
|
| |
|
September 30,
2022 |
|
Level One |
|
Level Two |
|
Level Three |
| Asset category: |
|
|
|
|
|
|
|
|
Cash and cash equivalents(a) |
|
$ |
5.8 |
|
|
$ |
5.8 |
|
|
$ |
— |
|
|
$ |
— |
|
Blended funds(b) |
|
15.6 |
|
|
— |
|
|
15.6 |
|
|
— |
|
Bond funds(c): |
|
|
|
|
|
|
|
|
| Treasuries |
|
21.3 |
|
|
— |
|
|
21.3 |
|
|
— |
|
|
|
|
|
|
|
|
|
|
| Total Pension Assets |
|
$ |
42.7 |
|
|
$ |
5.8 |
|
|
$ |
36.9 |
|
|
$ |
— |
|
(a)The fair value of cash and cash equivalents is its carrying value.
(b)The Company is invested in a diversified growth fund. The diversified growth fund is valued at the last traded or official close for the underlying equities and bid or mid for the underlying fixed income securities depending on the portfolio benchmark. Where representative prices are unavailable, underlying fixed income investments are valued based on other observable market-based inputs.
(c)This category includes investments in investment-grade fixed-income instruments and funds linked to U.K. treasury notes. The funds are valued using the bid amounts for each fund. All of the Company’s bond fund pension assets are invested in U.K.-linked treasuries as of September 30, 2023 and 2022.
As of September 30, 2023 and 2022, amounts recognized in accumulated other comprehensive loss, net of tax, consisted of actuarial net losses of $6.7 million (including $7.3 million of accumulated loss less prior service cost of $0.7 million) and $2.7 million (including $3.4 million of accumulated loss less prior service cost of $0.7 million), respectively. During the fiscal year ended September 30, 2023, the amounts recognized in accumulated other comprehensive loss, net of tax, consisted of actuarial net losses of $(3.7) million, amortization of loss of $0.2 million, amortization of prior service cost of $(0.1) million and foreign exchange of $(0.3) million.
During the fiscal year ended September 30, 2022, the amounts recognized in accumulated other comprehensive loss, net of tax, consisted of actuarial net gains of $1.6 million, amortization of loss of $0.4 million, amortization of prior service cost of $(0.1) million and foreign exchange of $1.3 million.
During the nine months ended September 30, 2021, the amounts recognized in accumulated other comprehensive loss, net of tax, consisted of actuarial net losses of $3.0 million, amortization of loss of $0.9 million, amortization of prior service cost of $(0.1) million, the impact of a tax rate change of $(0.6) million and foreign exchange of $0.8 million. The Company expects to recognize approximately $1.2 million ($1.3 million of amortization of loss less $0.1 million of prior service cost) of losses from accumulated other comprehensive loss as a component of net periodic pension cost in fiscal 2024. Total net periodic pension cost in fiscal 2024 is expected to be $1.2 million.
The assumptions used in determining pension information for the U.K. pension plan were as follows:
|
|
|
|
|
|
|
|
|
|
|
|
|
|
|
|
|
|
|
|
|
|
|
Fiscal Year Ended |
|
Nine Months Ended |
| |
|
September 30,
2023 |
|
September 30,
2022 |
|
September 30,
2021 |
| Discount rate |
|
5.55 |
% |
|
5.45 |
% |
|
1.90 |
% |
| Expected return on plan assets |
|
5.40 |
% |
|
5.05 |
% |
|
3.10 |
% |
The overall expected long-term rate of return on plan assets is a weighted-average expectation based on the fair value of targeted and expected portfolio composition. The Company considers historical performance and current benchmarks to arrive at expected long-term rates of return in each asset category. The Company determines its discount rate based on a forward yield curve for a portfolio of high-credit-quality bonds with expected cash flows and an average duration closely matching the expected benefit payments under the plan.
The Company’s funding policy is to make the minimum annual contributions required by applicable regulations or agreements with the plan administrator. Management expects there will be no contributions during 2024. In addition, the Company may periodically make contributions to the plan based upon the underfunded status of the plan or other transactions, which warrant incremental contributions in the judgment of management.
The U.K. pension plan includes a provision whereby supplemental benefits may be available to participants under certain circumstances after case review and approval by the plan trustees. Because instances of this type of benefit have historically been infrequent, the development of the projected benefit obligation and net periodic pension cost (benefit) has not provided for any future supplemental benefits. If additional benefits are approved by the trustees, it is likely that an additional contribution would be required and the amount of incremental benefits would be expensed by the Company.
|
|
|
|
|
|
|
|
|
|
|
COMPASS MINERALS INTERNATIONAL, INC. |
The Company expects to pay the following benefit payments (in millions):
|
|
|
|
|
|
| Years Ending September 30: |
Future Expected Benefit Payments |
| 2024 |
$ |
2.7 |
|
| 2025 |
2.8 |
|
| 2026 |
2.9 |
|
| 2027 |
2.9 |
|
| 2028 |
3.0 |
|
| 2028-2032 |
16.2 |
|
The following table sets forth pension obligations and plan assets for the Company’s U.K. pension plan (in millions):
|
|
|
|
|
|
|
|
|
|
|
|
|
|
|
| |
|
September 30,
2023 |
|
September 30,
2022 |
| Change in benefit obligation: |
|
|
|
|
| Benefit obligation at beginning of period |
|
$ |
36.7 |
|
|
$ |
65.7 |
|
| Interest cost |
|
2.1 |
|
|
1.2 |
|
| Actuarial loss (gain) |
|
0.1 |
|
|
(18.9) |
|
|
|
|
|
|
| Benefits paid |
|
(2.7) |
|
|
(2.7) |
|
| Currency fluctuation adjustment |
|
3.5 |
|
|
(8.6) |
|
| Benefit obligation at end of period |
|
39.7 |
|
|
36.7 |
|
| Change in plan assets: |
|
|
|
|
| Fair value at beginning of period |
|
42.7 |
|
|
69.4 |
|
| Actual return |
|
(2.5) |
|
|
(14.8) |
|
| Company contributions |
|
— |
|
|
0.4 |
|
| Currency fluctuation adjustment |
|
4.0 |
|
|
(9.6) |
|
| Benefits paid |
|
(2.7) |
|
|
(2.7) |
|
| Fair value of plan assets at end of period |
|
41.5 |
|
|
42.7 |
|
| Overfunded status of the plan |
|
$ |
1.8 |
|
|
$ |
6.0 |
|
The Company’s U.K. pension plan was overfunded as of September 30, 2023 and 2022, and accordingly, $1.8 million and $6.0 million has been recorded as a noncurrent asset, respectively, in the Company’s Consolidated Balance Sheets. The accumulated benefit obligation for the U.K. pension plan was $39.7 million and $36.7 million as of September 30, 2023 and 2022, respectively. The plan assets were in excess of the accumulated benefit obligation as of September 30, 2023 and 2022. The vested benefit obligation is the actuarial present value of the vested benefits to which the employee is currently entitled but based on the employee’s expected date of retirement. Since all employees are vested, the accumulated benefit obligation and the vested benefit obligation are the same amount.
The Company uses a straight-line methodology of amortization subject to a corridor based upon the higher of the fair value of assets and the pension benefit obligation over a five-year period. The components of net periodic pension cost (benefit) were as follows (in millions):
|
|
|
|
|
|
|
|
|
|
|
|
|
|
|
|
|
|
|
|
|
|
|
Fiscal Year Ended |
|
Nine Months Ended |
| |
|
September 30,
2023 |
|
September 30,
2022 |
|
September 30,
2021 |
| Interest cost on projected benefit obligation |
|
$ |
2.1 |
|
|
$ |
1.2 |
|
|
$ |
0.6 |
|
| Prior service cost |
|
(0.1) |
|
|
(0.1) |
|
|
(0.1) |
|
| Expected return on plan assets |
|
(2.3) |
|
|
(2.0) |
|
|
(1.6) |
|
|
|
|
|
|
|
|
| Net amortization |
|
0.3 |
|
|
0.5 |
|
|
1.1 |
|
| Net periodic pension benefit |
|
$ |
— |
|
|
$ |
(0.4) |
|
|
$ |
— |
|
|
|
|
|
|
|
|
|
|
|
|
COMPASS MINERALS INTERNATIONAL, INC. |
Other Post-Employment Benefits
The Company provides retirement medical, dental and life insurance benefits and post-employment vacation benefits to certain Canadian employees (collectively, the “Canadian Benefits”), which are considered other post-employment benefit obligations.
The assumed discount rate used to determine the benefit obligation for the Canadian Benefits as of September 30, 2023 and 2022 was 5.70% and 5.10%, respectively. The ultimate trend rate used to determine the benefit obligation for the Canadian Benefits as of September 30, 2023 and 2022 was 4.00%. The year that the rate reaches the ultimate trend rate is 2040.
The Company expects to pay the following payments for the Canadian Benefits (in millions):
|
|
|
|
|
|
| Years Ending September 30: |
Future Expected Benefit Payments |
| 2024 |
$ |
0.6 |
|
| 2025 |
0.6 |
|
| 2026 |
0.5 |
|
| 2027 |
0.6 |
|
| 2028 |
0.6 |
|
2029-2033 |
3.3 |
|
The following table sets forth the Company’s benefit obligation (in millions):
|
|
|
|
|
|
|
|
|
|
|
|
|
|
|
| |
|
September 30,
2023 |
|
September 30,
2022 |
| Change in benefit obligation: |
|
|
|
|
| Benefit obligation at beginning of period |
|
$ |
8.9 |
|
|
$ |
11.3 |
|
| Service cost |
|
0.3 |
|
|
0.3 |
|
| Interest cost |
|
0.5 |
|
|
0.3 |
|
| Benefits paid |
|
(0.3) |
|
|
(0.2) |
|
| Actuarial gain |
|
(0.7) |
|
|
(2.0) |
|
| Currency fluctuation adjustment |
|
0.1 |
|
|
(0.8) |
|
| Benefit obligation at end of period |
|
$ |
8.8 |
|
|
$ |
8.9 |
|
The Company uses the Projected Unit Credit Method in determining its benefit obligation. Under this method, each participant’s benefits are attributed to years of service, taking into account the projection of benefit costs. The components of net periodic cost (benefit) are also shown above.
Other
The Company has defined contribution and pre-tax savings plans (the “Savings Plans”) for certain of its employees. Under each of the Savings Plans, participants are permitted to defer a portion of their compensation. Company matching contributions to the Savings Plans are based on a percentage of employee contributions. Additionally, certain of the Savings Plans have a profit-sharing feature for salaried and non-union hourly employees. The Company contribution to the profit-sharing feature is discretionary and based on the Company’s financial performance and other factors. Expense attributable to the Savings Plans was $10.7 million, $9.7 million and $7.1 million for the fiscal years ended September 30, 2023 and 2022, and the nine months ended September 30, 2021, respectively.
The Savings Plans include a non-qualified plan for certain executive officers and other key employees who are limited in their ability to participate in qualified plans due to existing regulations. These employees are allowed to defer a portion of their compensation, upon which they will be entitled to receive Company contributions despite the limitations imposed by current U.S. regulations for qualified plans. The Company’s contributions to the Savings Plans include Company matching contributions based on a percentage of the employee’s deferred salary, discretionary profit sharing contributions and any investment income (loss) that would have been credited to their account had the contributions been made according to employee-designated investment specifications. Although not required to do so, the Company invests amounts equal to the salary deferrals, the corresponding Company matching contribution and discretionary profit sharing amounts according to the employee-designated investment specifications. As of September 30, 2023 and 2022, investments in marketable securities totaling $2.6 million and $1.8 million, respectively, were included in other noncurrent assets with a corresponding deferred compensation liability included in other noncurrent liabilities in the Consolidated Balance Sheets. Compensation expense recorded for the non-qualified plan was immaterial for each of the fiscal years ended September 30, 2023 and 2022, and the
|
|
|
|
|
|
|
|
|
|
|
COMPASS MINERALS INTERNATIONAL, INC. |
nine months ended September 30, 2021, including amounts attributable to investment income, and was included in other, net in the Consolidated Statements of Operations.
13. LONG TERM DEBT
Long-term debt consists of the following (in millions):
|
|
|
|
|
|
|
|
|
|
|
|
|
|
|
| |
|
September 30,
2023 |
|
September 30,
2022 |
4.875% Senior Notes due July 2024 |
|
$ |
— |
|
|
$ |
250.0 |
|
| Term Loan due January 2025 |
|
— |
|
|
16.9 |
|
| Revolving Credit Facility due January 2025 |
|
— |
|
|
151.5 |
|
6.75% Senior Notes due December 2027 |
|
500.0 |
|
|
500.0 |
|
Term Loan due May 2028 |
|
198.8 |
|
|
— |
|
Revolving Credit Facility due May 2028 |
|
81.5 |
|
|
— |
|
| AR Securitization Facility expires June 2025 |
|
30.9 |
|
|
37.5 |
|
|
|
811.2 |
|
|
955.9 |
|
| Less unamortized debt issuance costs |
|
(5.9) |
|
|
(8.3) |
|
| Total debt |
|
805.3 |
|
|
947.6 |
|
| Less current portion |
|
(5.0) |
|
|
— |
|
| Long-term debt |
|
$ |
800.3 |
|
|
$ |
947.6 |
|
Credit Agreement
On May 5, 2023, the Company entered into an agreement to amend and restate the Company’s credit agreement entered into on November 26, 2019 (as amended, the “2019 Credit Agreement”, as in effect prior to such restatement, the “Existing Credit Agreement”) with a new $575 million senior secured credit agreement due May 5, 2028 (as amended, the “2023 Credit Agreement”), comprised of a $375 million revolving credit facility and a $200 million term loan. The term loan is payable in quarterly installments of interest and principal, which began September 30, 2023. The 2023 Credit Agreement increases the Applicable Margins by 25 basis points over those defined in the Existing Credit Agreement and added an additional level to the pricing grid at a consolidated total leverage ratio of greater than 4:00 to 1.00. The outstanding term loan can be prepaid at any time without penalty. Proceeds from the 2023 Credit Agreement were used by the Company to redeem its $250 million 4.875% Senior Notes due July 2024 (the “4.875% Notes”) on May 10, 2023 and pay off the Existing Credit Agreement term loan balance of $16.9 million.
As of September 30, 2023, the term loan and revolving credit facility under the 2023 Credit Agreement were secured by substantially all existing and future U.S. assets of the Company, the Goderich mine in Ontario, Canada and capital stock of certain subsidiaries. As of September 30, 2023, the weighted average interest rate was 7.8% on all borrowings outstanding under the 2023 Credit Agreement.
The 2023 Credit Agreement, among other things, amended and restated the Existing Credit Agreement to (i) increase the Revolving Commitments (as defined in the Existing Credit Agreement) from $300 million to $375 million and extend the maturity date of the Revolving Commitments to May 5, 2028, (ii) refinance the Term Loans (as defined in the Existing Credit Agreement) with a new tranche of term loans in an aggregate principal amount equal to $200 million having a maturity date of May 5, 2028, and (iii) amend certain other terms of the Existing Credit Agreement, including, but not limited to, (a) expressly permit “run rate” cost savings in “Consolidated Adjusted EBITDA” (as defined in the Existing Credit Agreement) and (b) revise select covenants in the Existing Credit Agreement to, among other things, allow for Lithium Transactions (as defined below).
The 2023 Credit Agreement will permit, on the terms and conditions set forth therein, the entry into, and consummation of, lithium development joint ventures, projects or similar arrangements by any Lithium Subsidiary (as defined below), and any related funding transactions in connection therewith (collectively, the “Lithium Transactions”). A “Lithium Subsidiary” shall mean (a) Compass Minerals Lithium Corp of America Inc., a Delaware corporation, or any successor thereto and (b) (x) any newly-formed domestic subsidiary that is a wholly-owned Subsidiary of the Company (each of which will become a Subsidiary Guarantor (as defined in the Existing Credit Agreement)) and/or (y) any newly-formed domestic subsidiary that is not a wholly-owned subsidiary of the Company (each of which may, but shall not be required to become, at the option of the Company, a Subsidiary Guarantor), in each case formed in order to effectuate the Lithium Transactions. The Term Loan requires the Company to maintain certain financial ratios, including a minimum interest coverage ratio and a maximum total net leverage ratio.
|
|
|
|
|
|
|
|
|
|
|
COMPASS MINERALS INTERNATIONAL, INC. |
In connection with the 2023 Credit Agreement, the Company paid $4.3 million in fees ($3.9 million was capitalized as deferred financing costs with $0.4 million recorded as an expense). These capitalized costs are amortized over the term of the debt and are included as a component of interest expense in the Consolidated Statements of Operations. The Company incurred a loss on the extinguishment of debt of $1.0 million to write off previously capitalized deferred financing costs, which is included as a component of interest expense in the Consolidated Statements of Operations.
The 2023 Credit Agreement requires the Company to maintain certain financial ratios, including a minimum interest coverage ratio and a maximum total net leverage ratio. The total net leverage ratio represents the ratio of (a) consolidated total net debt to (b) consolidated adjusted earnings before interest, taxes, depreciation and amortization (“EBITDA”). Pursuant to the terms of the 2023 Credit Agreement, the maximum allowed consolidated total net leverage ratio (as defined and calculated under the terms of the 2023 Credit Agreement) is 5.0x as of the last day of any quarter through the fiscal quarter ended December 31, 2023, gradually stepping down to 4.5x for the fiscal quarter ended June 30, 2024 and thereafter. Consolidated total net debt includes the aggregate principal amount of total debt, net of unrestricted cash not to exceed $75.0 million. As of September 30, 2023, the Company was in compliance with each of its covenants under the 2023 Credit Agreement.
Under the current revolving credit facility, up to $40 million may be drawn in Canadian dollars and $10 million may be drawn in British pounds sterling. Additionally, the revolving credit facility includes a sub-limit for short-term letters of credit in an amount not to exceed $50 million. The Company incurs participation fees related to its outstanding letters of credit and commitment fees on its available borrowing capacity. The rates vary depending on the Company’s leverage ratio. Bank fees are not material.
During the quarter ended December 31, 2022, the Company paid off the outstanding revolving credit facility balance utilizing proceeds from a private placement of common stock. Refer to
Note 16 for additional details.
In November 2022, the Company entered into the third amendment to the 2019 Credit Agreement, principally to affect a transition from the London Inter-Bank Offered Rate to the Secured Overnight Financing Rate pricing benchmark provisions.
In April 2022, the Company utilized earnout proceeds from the 2021 sale of its South America specialty plant nutrition business and proceeds from the April 2022 sale of the South America chemicals business to repay approximately $60.6 million of its term loan balance.
In July 2021, the Company utilized cash proceeds from the sale of a component of its North America micronutrient product business and its South America specialty plant nutrition business to repay amounts borrowed against its revolving credit facility of $35.0 million. The Company also utilized an additional $265.0 million of the proceeds to pay down its term loan balance as required by the Credit Agreement.
As of September 30, 2023, there was $81.5 million outstanding under the revolving credit facility and, after deducting outstanding letters of credit totaling $15.2 million, the Company’s borrowing availability was $278.3 million.
Senior Notes
In November 2019, the Company issued $500 million 6.75% Senior Notes due December 2027 (the “6.75% Notes”), which are subordinate to the 2019 Credit Agreement borrowings. The 6.75% Notes are unsecured obligations and are guaranteed by certain of the Company’s domestic subsidiaries. Interest on the 6.75% Notes is due semi-annually in June and December. The 6.75% Notes are subordinated to all existing and future indebtedness. In connection with the 6.75% Notes, the Company paid $8.2 million of fees, all of which were capitalized as deferred financing costs.
The 2023 Credit Agreement and the agreement governing the 6.75% Notes and other indebtedness contain covenants that limit the Company’s ability, among other things, to incur additional indebtedness or contingent obligations or grant liens; pay dividends or make distributions to stockholders; repurchase or redeem the Company’s stock; make investments or dispose of assets; prepay, or amend the terms of certain junior indebtedness; engage in sale and leaseback transactions; make changes to the Company’s organizational documents or fiscal periods; grant liens on the Company’s assets or make certain intercompany dividends, investments or asset transfers; enter into new lines of business; enter into transactions with the Company’s stockholders and affiliates; and acquire the assets of or merge or consolidate with other companies.
Securitization
On June 30, 2020, certain of the Company’s U.S. subsidiaries entered into a three-year committed revolving accounts receivable financing facility (the “AR Facility”) of up to $100.0 million with PNC Bank, National Association (“PNC”), as administrative agent and lender, and PNC Capital Markets, LLC, as structuring agent. On June 27, 2022, certain of the Company’s U.S. subsidiaries entered into an amendment to the AR Facility, extending the facility to June 2025. In January 2023, certain of the Company’s U.S. subsidiaries entered into the second amendment to the AR Securitization Facility with PNC Bank, which temporarily eased the restrictions of certain covenants contained in the agreement through March 2023. The amendment made certain adjustments to the financial tests including: (i) the default ratio and (ii) the delinquency ratio to make compliance with such tests more likely.
In connection with the AR Facility, one of the Company’s U.S. subsidiaries, from time to time, sells and contributes receivables and certain related assets to a special purposes entity and wholly-owned U.S. subsidiary of the Company (the “SPE”). The SPE finances its acquisition of the receivables by obtaining secured loans from PNC and the other lenders party to
|
|
|
|
|
|
|
|
|
|
|
COMPASS MINERALS INTERNATIONAL, INC. |
a receivables financing agreement. A U.S. subsidiary of the Company services the receivables on behalf of the SPE for a fee. In addition, the Company has agreed to guarantee the performance by its subsidiaries. The Company and its subsidiaries do not guarantee the loan principal or interest under the receivables financing agreement or the collectability of the receivables under the AR Facility.
The purchase price for the sale of receivables consists of cash available to the SPE from loans under the AR Facility and from collections on previously sold receivables and, to the extent the SPE does not have funds available to pay the purchase price due on any day in cash, through an increase in the principal amount of a subordinated intercompany loan. The SPE pays monthly interest and fees with respect to amounts advanced by the lenders under the AR Facility.
The SPE’s sole business consists of the purchase or acceptance through capital contributions of the receivables and the subsequent granting of a security interest in these receivables and related rights to PNC on behalf of the lenders under the AR Facility. The SPE is a separate legal entity with its own separate creditors who will be entitled, upon its liquidation, to be satisfied out of the SPE’s assets prior to any assets or value in the SPE becoming available to the Company and the assets of the SPE are not available to pay creditors of the Company or any of its affiliates other than the SPE. The Company accounts for the securitization as a borrowing and the related receivables are included in the accounts receivable balance.
Future maturities of long-term debt are as follows (in millions):
|
|
|
|
|
|
|
|
|
| Fiscal Years Ending September 30: |
|
Debt Maturity |
| 2024 |
|
$ |
5.0 |
|
| 2025 |
|
38.4 |
|
| 2026 |
|
10.0 |
|
| 2027 |
|
10.0 |
|
| 2028 |
|
747.8 |
|
| Thereafter |
|
— |
|
| Total |
|
$ |
811.2 |
|
14. COMMITMENTS AND CONTINGENCIES
Contingent Obligations:
As previously disclosed, the Company was the subject of an investigation by the Division of Enforcement of the SEC regarding the Company’s disclosures primarily concerning the operation of the Goderich mine, the former South American businesses, and related accounting and internal control matters including Salt interim inventory valuation methodology issues that were disclosed in the Company’s Form 10-K/A for the year ended December 31, 2020, and Form 10-Q/A for the quarter ended March 31, 2021, each filed with the SEC on September 3, 2021.
On September 23, 2022, the Company reached a settlement with the SEC, concluding and resolving the SEC investigation in its entirety. Under the terms of the settlement, the Company, without admitting or denying the findings in the administrative order issued by the SEC, agreed to pay a civil penalty of $12 million and to cease and desist from violations of specified provisions of the federal securities laws and rules promulgated thereunder, and to retain an independent compliance consultant for a period of approximately one year to review certain accounting practices and procedures. The Company accrued for the full amount of the penalty in fiscal 2022, of which $10 million was reflected in accrued expenses and other current liabilities on the Company’s Consolidated Balance Sheets as of September 30, 2023 and 2022.
The Company is also involved in legal and administrative proceedings and claims of various types from the ordinary course of the Company’s business.
Management cannot predict the outcome of legal claims and proceedings with certainty. Nevertheless, management believes that the outcome of legal proceeding and claims, which are pending or known to be threatened, even if determined adversely, will not, individually or in the aggregate, have a material adverse effect on the Company’s results of operations, cash flows or financial position, except as otherwise described in
Note 11 and this Note 14.
Nearly 50% of the Company’s workforce is represented by collective bargaining agreements. Of the Company’s 12 collective bargaining agreements in effect on September 30, 2023, one will expire in fiscal 2024, six will expire in fiscal 2025 (including our Cote Blanche mine), four will expire in fiscal 2026 (including our Goderich mine), and one will expire in fiscal 2027.
The Company also has contingent consideration liabilities related to the Fortress acquisition. Refer to
Note 3 for additional information.
|
|
|
|
|
|
|
|
|
|
|
COMPASS MINERALS INTERNATIONAL, INC. |
Commitments:
Royalties: The Company has various private, state and Canadian provincial leases associated with the salt and SOP businesses, most of which are renewable by the Company. Many of these leases provide for a royalty payment to the lessor based on a specific amount per ton of mineral extracted or as a percentage of revenue. Royalty expense related to these leases was $18.7 million, $20.0 million and $13.6 million for the fiscal years ended September 30, 2023 and 2022, and the nine months ended September 30, 2021, respectively.
Performance Bonds: The Company has various salt and other deicing product sales contracts that include performance provisions governing delivery and product quality. These sales contracts either require the Company to maintain performance bonds for stipulated amounts or contain contractual penalty provisions in the event of non-performance. For the fiscal years ended September 30, 2023 and 2022, and the nine months ended September 30, 2021, the Company has had no material penalties related to these sales contracts. At September 30, 2023, the Company had $232.6 million of outstanding performance bonds, which includes bonds related to Ontario mining tax reassessments.
Purchase Commitments: In connection with the operations of the Company’s facilities, the Company purchases utilities, other raw materials and services from third parties under contracts extending, in some cases, for multiple years. Purchases under these contracts are generally based on prevailing market prices. The Company has minimum throughput contracts with some of its depots and warehouses. The purchase commitments for these contracts are estimated to be $8.8 million for 2024, $5.7 million in 2025, $5.0 million in 2026, $4.6 million in 2027, $4.5 million in 2028 and $6.7 million thereafter.
15. OPERATING SEGMENTS
The Company’s reportable segments are strategic business units that offer different products and services, and each business requires different technology and marketing strategies. In connection with the executed business disposals discussed in
Note 1 and
Note 4, the Company identified two reportable segments as of March 31, 2021. The Specialty Businesses that comprised the Company’s former Plant Nutrition South America reportable segment and the North America micronutrient product business previously reported within the former Plant Nutrition North America reportable segment were classified as discontinued operations for all periods presented in its Consolidated Financial Statements in this Annual Report on Form 10-K.
For all periods presented in this report, the Company has two reportable segments in its Consolidated Financial Statements: Salt and Plant Nutrition. The Salt segment produces and markets salt, consisting primarily of sodium chloride and magnesium chloride, for use in road deicing for winter roadway safety and for dust control, food processing, water softeners and other consumer, agricultural and industrial applications. The Plant Nutrition segment produces and markets various grades of SOP.
The accounting policies of the segments are the same as those described in the summary of significant accounting policies. All inter-segment sales prices are market-based. The Company evaluates performance based on the operating earnings of the respective segments.
Segment information is as follows (in millions):
|
|
|
|
|
|
|
|
|
|
|
|
|
|
|
|
|
|
|
|
|
|
|
|
|
|
|
Fiscal Year Ended September 30, 2023 |
|
Salt |
|
Plant Nutrition |
|
Corporate & Other(a)(b) |
|
Total |
| Sales to external customers |
|
$ |
1,010.8 |
|
|
$ |
172.1 |
|
|
$ |
21.8 |
|
|
$ |
1,204.7 |
|
| Intersegment sales |
|
— |
|
|
9.7 |
|
|
(9.7) |
|
|
— |
|
| Shipping and handling cost |
|
324.5 |
|
|
21.4 |
|
|
0.2 |
|
|
346.1 |
|
Operating earnings (loss)(b)(c) |
|
170.7 |
|
|
11.2 |
|
|
(102.8) |
|
|
79.1 |
|
| Depreciation, depletion and amortization |
|
58.5 |
|
|
32.9 |
|
|
7.2 |
|
|
98.6 |
|
| Total assets |
|
1,099.7 |
|
|
473.4 |
|
|
244.9 |
|
|
1,818.0 |
|
| Capital expenditures |
|
74.8 |
|
|
28.5 |
|
|
52.9 |
|
|
156.2 |
|
|
|
|
|
|
|
|
|
|
|
|
COMPASS MINERALS INTERNATIONAL, INC. |
|
|
|
|
|
|
|
|
|
|
|
|
|
|
|
|
|
|
|
|
|
|
|
|
|
|
|
Fiscal Year Ended September 30, 2022 |
|
Salt |
|
Plant Nutrition |
|
Corporate & Other(a)(b) |
|
Total |
| Sales to external customers |
|
$ |
1,010.3 |
|
|
$ |
222.3 |
|
|
$ |
11.5 |
|
|
$ |
1,244.1 |
|
| Intersegment sales |
|
— |
|
|
6.4 |
|
|
(6.4) |
|
|
— |
|
| Shipping and handling cost |
|
353.3 |
|
|
26.2 |
|
|
— |
|
|
379.5 |
|
Operating earnings (loss)(b) |
|
116.2 |
|
|
37.1 |
|
|
(110.4) |
|
|
42.9 |
|
| Depreciation, depletion and amortization |
|
67.0 |
|
|
35.6 |
|
|
11.1 |
|
|
113.7 |
|
| Total assets |
|
1,020.6 |
|
|
475.1 |
|
|
147.8 |
|
|
1,643.5 |
|
| Capital expenditures |
|
63.7 |
|
|
25.7 |
|
|
5.7 |
|
|
95.1 |
|
|
|
|
|
|
|
|
|
|
|
|
|
|
|
|
|
|
|
|
|
|
|
|
|
|
|
|
Nine Months Ended September 30, 2021 |
|
Salt |
|
Plant Nutrition |
|
Corporate & Other(a)(b) |
|
Total |
| Sales to external customers |
|
$ |
671.1 |
|
|
$ |
156.8 |
|
|
$ |
8.7 |
|
|
$ |
836.6 |
|
| Intersegment sales |
|
— |
|
|
4.5 |
|
|
(4.5) |
|
|
— |
|
| Shipping and handling cost |
|
198.8 |
|
|
21.3 |
|
|
— |
|
|
220.1 |
|
Operating earnings (loss) |
|
133.2 |
|
|
5.8 |
|
|
(60.0) |
|
|
79.0 |
|
| Depreciation, depletion and amortization |
|
53.3 |
|
|
26.8 |
|
|
9.7 |
|
|
89.8 |
|
| Total assets |
|
1,040.2 |
|
|
458.9 |
|
|
121.9 |
|
|
1,621.0 |
|
| Capital expenditures |
|
42.0 |
|
|
18.3 |
|
|
5.4 |
|
|
65.7 |
|
Disaggregated revenue by product type is as follows (in millions):
|
|
|
|
|
|
|
|
|
|
|
|
|
|
|
|
|
|
|
|
|
|
|
|
|
|
|
Fiscal Year Ended September 30, 2023 |
|
Salt |
|
Plant Nutrition |
|
Corporate & Other(a) |
|
Total |
| Highway Deicing Salt |
|
$ |
641.7 |
|
|
$ |
— |
|
|
$ |
— |
|
|
$ |
641.7 |
|
| Consumer & Industrial Salt |
|
369.1 |
|
|
— |
|
|
— |
|
|
369.1 |
|
| SOP |
|
— |
|
|
181.8 |
|
|
— |
|
|
181.8 |
|
| Fire Retardant Products |
|
— |
|
|
— |
|
|
8.6 |
|
|
8.6 |
|
| Revenue from Services |
|
— |
|
|
— |
|
|
1.8 |
|
|
1.8 |
|
| Eliminations & Other |
|
— |
|
|
(9.7) |
|
|
11.4 |
|
|
1.7 |
|
| Sales to external customers |
|
$ |
1,010.8 |
|
|
$ |
172.1 |
|
|
$ |
21.8 |
|
|
$ |
1,204.7 |
|
|
|
|
|
|
|
|
|
|
|
|
|
|
|
|
|
|
|
|
|
|
|
|
|
|
|
|
Fiscal Year Ended September 30, 2022 |
|
Salt |
|
Plant Nutrition |
|
Corporate & Other(a) |
|
Total |
| Highway Deicing Salt |
|
$ |
640.2 |
|
|
$ |
— |
|
|
$ |
— |
|
|
$ |
640.2 |
|
| Consumer & Industrial Salt |
|
370.1 |
|
|
— |
|
|
— |
|
|
370.1 |
|
| SOP |
|
— |
|
|
228.7 |
|
|
— |
|
|
228.7 |
|
| Eliminations & Other |
|
— |
|
|
(6.4) |
|
|
11.5 |
|
|
5.1 |
|
| Sales to external customers |
|
$ |
1,010.3 |
|
|
$ |
222.3 |
|
|
$ |
11.5 |
|
|
$ |
1,244.1 |
|
|
|
|
|
|
|
|
|
|
|
|
COMPASS MINERALS INTERNATIONAL, INC. |
|
|
|
|
|
|
|
|
|
|
|
|
|
|
|
|
|
|
|
|
|
|
|
|
|
|
|
Nine Months Ended September 30, 2021 |
|
Salt |
|
Plant Nutrition |
|
Corporate & Other(a) |
|
Total |
| Highway Deicing Salt |
|
$ |
440.2 |
|
|
$ |
— |
|
|
$ |
— |
|
|
$ |
440.2 |
|
| Consumer & Industrial Salt |
|
230.9 |
|
|
— |
|
|
— |
|
|
230.9 |
|
| SOP |
|
— |
|
|
161.3 |
|
|
— |
|
|
161.3 |
|
| Eliminations & Other |
|
— |
|
|
(4.5) |
|
|
8.7 |
|
|
4.2 |
|
| Sales to external customers |
|
$ |
671.1 |
|
|
$ |
156.8 |
|
|
$ |
8.7 |
|
|
$ |
836.6 |
|
(a)Corporate and Other includes corporate entities, records management operations, the Fortress fire retardant business, equity method investments, lithium development costs and other incidental operations and eliminations. Operating earnings (loss) for corporate and other includes indirect corporate overhead, including costs for general corporate governance and oversight, lithium-related expenses, as well as costs for the human resources, information technology, legal and finance functions.
(b)Corporate operating results include net reimbursements related to the settled SEC investigation of $(0.3) million for the fiscal year ended September 30, 2023 and executive transition costs of $3.8 million for the fiscal year ended September 30, 2022. Corporate operating results for the fiscal year ended September 30, 2022 include a contingent loss accrual and costs related to the SEC investigation of $17.1 million. Corporate operating results for the nine months ended September 30, 2021 also include costs related to the settled SEC investigation of $3.4 million. Refer to
Note 14 for more information regarding the SEC investigation and settlement.
(c)In April 2023, the Company took steps to align its cost structure to its current business needs. These initiatives resulted in restructuring charges of $5.5 million, which impacted operating results for the fiscal year ended September 30, 2023.
Financial information relating to the Company’s operations by geographic area is as follows (in millions):
|
|
|
|
|
|
|
|
|
|
|
|
|
|
|
|
|
|
|
|
|
|
|
Fiscal Year Ended |
|
Nine Months Ended |
| Sales |
|
September 30,
2023 |
|
September 30,
2022 |
|
September 30,
2021 |
United States(a) |
|
$ |
860.4 |
|
|
$ |
894.9 |
|
|
$ |
634.3 |
|
| Canada |
|
269.7 |
|
|
278.0 |
|
|
141.3 |
|
| United Kingdom |
|
66.1 |
|
|
57.7 |
|
|
57.5 |
|
| Other |
|
8.5 |
|
|
13.5 |
|
|
3.5 |
|
| Total sales |
|
$ |
1,204.7 |
|
|
$ |
1,244.1 |
|
|
$ |
836.6 |
|
(a)United States sales exclude product sold to foreign customers at U.S. ports.
Financial information relating to the Company’s long-lived assets, excluding the investments related to the nonqualified retirement plan and pension plan assets, by geographic area (in millions):
|
|
|
|
|
|
|
|
|
|
|
|
|
|
|
|
|
|
|
|
|
| Long-Lived Assets |
|
September 30,
2023 |
|
September 30,
2022 |
|
September 30,
2021 |
| United States |
|
$ |
749.4 |
|
|
$ |
612.0 |
|
|
$ |
570.7 |
|
| Canada |
|
398.0 |
|
|
394.8 |
|
|
441.9 |
|
| United Kingdom |
|
64.6 |
|
|
58.1 |
|
|
70.9 |
|
| Other |
|
7.7 |
|
|
8.8 |
|
|
10.3 |
|
| Total long-lived assets |
|
$ |
1,219.7 |
|
|
$ |
1,073.7 |
|
|
$ |
1,093.8 |
|
16. STOCKHOLDERS’ EQUITY AND EQUITY INSTRUMENTS
The Company paid dividends of $0.60 per share in fiscal 2023 and currently intends to continue paying quarterly cash dividends. The declaration and payment of future dividends to holders of the Company’s common stock will be at the discretion of the Company’s Board of Directors and will depend upon many factors, including the Company’s financial condition, earnings, legal requirements, capital allocation strategy, restrictions in its debt agreements (see
Note 13) and other factors the Company’s Board of Directors deems relevant.
Non-Employee Director Compensation
Non-employee directors may defer all or a portion of the fees payable for their service into deferred stock units, equivalent to the value of the Company’s common stock. Beginning in May 2020, the annual fees related to the director’s equity compensation were granted in deferred stock units or restricted stock units and vest at the next annual meeting. Additionally, as
|
|
|
|
|
|
|
|
|
|
|
COMPASS MINERALS INTERNATIONAL, INC. |
dividends are declared on the Company’s common stock, these deferred stock units are entitled to accrete dividends in the form of additional units based on the stock price on the dividend payment date. Accumulated deferred stock units are distributed in the form of Company common stock at a future specified date or following resignation from the Board of Directors, based upon the director’s annual election. During the fiscal years ended September 30, 2023 and 2022, and the nine months ended September 30, 2021, members of the Board of Directors were credited with 35,577, 12,643 and 15,136 deferred stock units, respectively. During the fiscal years ended September 30, 2023 and 2022, and the nine months ended September 30, 2021, the directors were granted 14,945, 11,933 and 4,917 restricted stock units, respectively. During the fiscal years ended September 30, 2023 and 2022, and the nine months ended September 30, 2021, 75,919, 41,225 and 19,828 shares of common stock, respectively, were issued from treasury shares for director compensation.
Koch Equity Investment
On September 14, 2022, the Company entered into a Stock Purchase Agreement with Koch Minerals & Trading, LLC (“KM&T”), a subsidiary of Koch Industries, Inc. (“KII”), pursuant to which the Company agreed to issue and sell 6,830,700 shares of its common stock at a purchase price of $36.87 for aggregate net proceeds of approximately $240.7 million, net of transaction costs. On October 18, 2022, the Company closed the direct private placement with KM&T, through its affiliate KM&T Investment Holdings, LLC, resulting in their ownership of approximately 17% of the Company’s outstanding common stock. The Company has used, or committed to use, approximately $78 million of the proceeds from the private placement for capital expenditures to advance the first development phase of the lithium project, including the early stages of construction of our commercial scale demonstration unit, with the remainder of the proceeds used to reduce debt or for general corporate purposes. However, the Company has suspended indefinitely any further investment in the lithium development project beyond certain already committed items associated with the early stages of construction of its commercial scale demonstration unit until further clarity is provided on the evolving regulatory climate. The shares issued and sold to KM&T were registered via a resale registration statement on Form S-3, filed with the SEC on September 21, 2023.
Preferred stock
The Company is authorized to issue up to 10,000,000 shares of preferred stock, of which no shares are currently issued or outstanding. Of those, 200,000 shares of preferred stock were designated as series A junior participating preferred stock in connection with the Company’s now expired rights agreement.
Equity Compensation Awards
In 2005, the Company adopted the 2005 Incentive Award Plan (as amended, the “2005 Plan”), which authorized the issuance of 3,240,000 shares of Company common stock. In May 2015, the Company’s stockholders approved the 2015 Incentive Award Plan (as amended, the “2015 Plan”), which authorizes the issuance of 3,000,000 shares of Company common stock. Upon the approval of the 2015 Plan, the Company ceased issuing equity awards under the 2005 Plan. In May 2020, the Company’s stockholders approved the 2020 Incentive Award Plan (the “2020 Plan”), which authorizes the issuance of 2,977,933 shares of Company common stock. In February 2022, the Company’s stockholders approved an amendment to the 2020 Plan, authorizing an additional 750,000 shares of Common stock. Since the date the 2020 Plan was approved, the Company ceased issuing equity awards under the 2015 Plan. The 2005 Plan, 2015 Plan and 2020 Plan allow for grants of equity awards to executive officers, other employees and directors, including shares of common stock, restricted stock units (“RSUs”), performance stock units (“PSUs”), stock options and deferred stock units.
Options
Substantially all of the stock options granted under each of the plans vest ratably, in tranches, over a four-year service period. Unexercised options expire after seven years. Options do not have dividend or voting rights. Upon vesting, each option can be exercised to purchase one share of the Company’s common stock. The exercise price of options is equal to the closing stock price on the day of grant.
To estimate the fair value of options on the grant date, the Company uses the Black-Scholes option valuation model. Award recipients are grouped according to expected exercise behavior. Unless better information is available to estimate the expected term of the options, the estimate is based on historical exercise experience. The risk-free rate, using U.S. Treasury yield curves in effect at the time of grant, is selected based on the expected term of each group. The Company’s historical stock price is used to estimate expected volatility. The Company did not grant any options in fiscal 2023. The weighted average assumptions and fair values for options granted in fiscal 2022 and 2021 are included in the following table.
|
|
|
|
|
|
|
|
|
|
|
COMPASS MINERALS INTERNATIONAL, INC. |
|
|
|
|
|
|
|
|
|
|
|
|
|
|
|
|
|
|
|
|
|
Fiscal Year Ended |
|
Nine Months Ended |
| |
|
|
|
September 30,
2022 |
|
September 30,
2021 |
| Fair value of options granted |
|
|
|
$ |
16.84 |
|
|
$ |
13.46 |
|
| Expected term (years) |
|
|
|
4.8 |
|
4.8 |
| Expected volatility |
|
|
|
37.9 |
% |
|
36.1 |
% |
| Dividend yield |
|
|
|
3.9 |
% |
|
3.7 |
% |
| Risk-free interest rates |
|
|
|
1.1 |
% |
|
0.4 |
% |
RSUs
Most of the RSUs granted under the 2015 Plan and 2020 Plan vest after one to three years of service entitling the holders to one share of common stock for each vested RSU. The unvested RSUs do not have voting rights but are entitled to receive non-forfeitable dividends (generally after a performance hurdle has been satisfied for the year of the grant) or other distributions that may be declared on the Company’s common stock equal to the per-share dividend declared. The closing stock price on the day of grant is used to determine the fair value of RSUs.
PSUs
Substantially all of the PSUs outstanding under the 2015 Plan and 2020 Plan are either total stockholder return PSUs (the “TSR PSUs”) or adjusted EBITDA growth PSUs (“EBITDA Growth PSUs”). The actual number of shares of the Company’s common stock that may be earned with respect to TSR PSUs is calculated by comparing the Company’s total stockholder return to the total stockholder return for each company comprising the Company’s peer group or a total return percentage target over a two or three-year performance period and may range from 0% to 300% of the target number of shares based upon the attainment of these performance conditions. The actual number of shares of common stock that may be earned with respect to EBITDA Growth PSUs is calculated based on the attainment of adjusted EBITDA growth during the performance period and may range from 0% to 300%. Holders of PSUs do not have voting rights but are entitled to receive non-forfeitable dividends or other distributions equal to those declared on the Company’s common stock for PSUs that are earned, which are paid when the shares underlying the PSUs are issued.
To estimate the fair value of the TSR PSUs on the grant date for accounting purposes, the Company uses a Monte-Carlo simulation model, which simulates future stock prices of the Company as well as the Company’s peer group. This model uses historical stock prices to estimate expected volatility and the Company’s correlation to the peer group. The risk-free rate was determined using the same methodology as the option valuations as discussed above. The Company’s closing stock price on the grant date was used to estimate the fair value of the EBITDA Growth PSUs. The Company will adjust the expense of the EBITDA Growth PSUs based upon its estimate of the number of shares that will ultimately vest at each interim date during the vesting period.
|
|
|
|
|
|
|
|
|
|
|
COMPASS MINERALS INTERNATIONAL, INC. |
The following is a summary of the Company’s stock option, RSU and PSU activity and related information for the following periods:
|
|
|
|
|
|
|
|
|
|
|
|
|
|
|
|
|
|
|
|
|
|
|
|
|
|
|
|
|
|
|
|
|
|
|
|
|
|
|
| |
|
Stock Options |
|
RSUs |
|
PSUs |
| |
|
Number |
|
Weighted-average exercise price |
|
Number |
|
Weighted-average fair value |
|
Number |
|
Weighted-average fair value |
|
Outstanding at
December 31, 2020
|
|
868,772 |
|
|
$ |
63.06 |
|
|
207,982 |
|
|
$ |
55.68 |
|
|
241,794 |
|
|
$ |
65.57 |
|
Granted |
|
120,602 |
|
|
63.14 |
|
|
95,287 |
|
|
63.52 |
|
|
96,002 |
|
|
63.14 |
|
Exercised(a) |
|
(23,731) |
|
|
59.81 |
|
|
— |
|
|
— |
|
|
— |
|
|
— |
|
Released from restriction(a) |
|
— |
|
|
— |
|
|
(51,772) |
|
|
53.37 |
|
|
(16,496) |
|
|
69.71 |
|
| Cancelled/Expired |
|
(136,937) |
|
|
72.79 |
|
|
(27,998) |
|
|
60.13 |
|
|
(41,393) |
|
|
62.77 |
|
|
Outstanding at
September 30, 2021
|
|
828,706 |
|
|
$ |
61.56 |
|
|
223,499 |
|
|
$ |
59.00 |
|
|
279,907 |
|
|
$ |
64.90 |
|
Granted |
|
73,290 |
|
|
73.77 |
|
|
103,363 |
|
|
66.36 |
|
|
178,052 |
|
|
73.86 |
|
Exercised(a) |
|
(3,861) |
|
|
67.76 |
|
|
— |
|
|
— |
|
|
— |
|
|
— |
|
Released from restriction(a) |
|
— |
|
|
— |
|
|
(85,849) |
|
|
56.88 |
|
|
(28,666) |
|
|
55.98 |
|
Cancelled/Expired |
|
(123,555) |
|
|
74.15 |
|
|
(32,278) |
|
|
62.23 |
|
|
(97,934) |
|
|
61.44 |
|
|
Outstanding at
September 30, 2022
|
|
774,580 |
|
|
$ |
60.68 |
|
|
208,735 |
|
|
$ |
63.02 |
|
|
331,359 |
|
|
$ |
71.51 |
|
Granted |
|
— |
|
|
— |
|
|
354,694 |
|
|
37.17 |
|
|
183,794 |
|
|
68.33 |
|
Exercised(a) |
|
— |
|
|
— |
|
|
— |
|
|
— |
|
|
— |
|
|
— |
|
Released from restriction(a) |
|
— |
|
|
— |
|
|
(132,827) |
|
|
60.34 |
|
|
— |
|
|
— |
|
Cancelled/Expired |
|
(131,585) |
|
|
66.60 |
|
|
(37,362) |
|
|
43.11 |
|
|
(121,574) |
|
|
67.15 |
|
|
Outstanding at
September 30, 2023
|
|
642,995 |
|
|
$ |
59.46 |
|
|
393,240 |
|
|
$ |
42.50 |
|
|
393,579 |
|
|
$ |
71.37 |
|
(a)Common stock issued for exercised options, vested RSUs and vested and earned PSUs were issued from treasury shares.
As of September 30, 2022, there were 774,580 options outstanding of which 612,874 were exercisable. The following table summarizes information about options outstanding and exercisable at September 30, 2023.
|
|
|
|
|
|
|
|
|
|
|
|
|
|
|
|
|
|
|
|
|
|
|
|
|
|
|
|
|
|
|
|
|
|
|
|
|
|
|
| |
|
Options Outstanding |
|
Options Exercisable |
| Range of exercise prices |
|
Options outstanding |
|
Weighted-average remaining contractual life (years) |
|
Weighted-average exercise price of options outstanding |
|
Options exercisable |
|
Weighted-average remaining contractual life (years) |
|
Weighted-average exercise price of exercisable options |
$53.75 - $54.10 |
|
252,245 |
|
|
2.6 |
|
$ |
53.75 |
|
|
252,245 |
|
|
2.6 |
|
$ |
53.75 |
|
$54.11 - $59.21 |
|
87,686 |
|
|
2.9 |
|
57.08 |
|
|
74,727 |
|
|
2.8 |
|
56.87 |
|
$59.22 - $61.32 |
|
110,726 |
|
|
1.5 |
|
59.50 |
|
|
110,726 |
|
|
1.5 |
|
59.50 |
|
$61.33 - $68.53 |
|
140,270 |
|
|
2.2 |
|
65.75 |
|
|
109,126 |
|
|
1.6 |
|
66.50 |
|
$68.54 - $74.49 |
|
52,068 |
|
|
4.8 |
|
74.15 |
|
|
16,173 |
|
|
4.1 |
|
73.49 |
|
| Totals |
|
642,995 |
|
|
2.5 |
|
$ |
59.46 |
|
|
562,997 |
|
|
2.3 |
|
$ |
58.33 |
|
During the fiscal years ended September 30, 2023 and 2022, and the nine months ended September 30, 2021, the Company recorded compensation expense, inclusive of discontinued operations, of $21.1 million (includes $0.5 million paid in cash), $17.2 million (includes $1.5 million paid in cash) and $8.7 million (includes $1.0 million paid in cash), respectively, related to its stock-based compensation awards that are expected to vest. No amounts have been capitalized. The fair value of options vested was $0.8 million, $1.6 million and $1.6 million in the fiscal years ended September 30, 2023 and 2022, and the nine months ended September 30, 2021, respectively.
As of September 30, 2023, unrecorded compensation cost related to non-vested awards of $14.5 million is expected to be recognized through 2026, with a weighted average period of 1.8 years.
|
|
|
|
|
|
|
|
|
|
|
COMPASS MINERALS INTERNATIONAL, INC. |
The intrinsic value of stock options exercised relating to the fiscal years ended September 30, 2023 and 2022, and the nine months ended September 30, 2021 each totaled less than $0.1 million. As of September 30, 2023, there was no intrinsic value of options outstanding; 562,997 options were exercisable with no intrinsic value. The number of shares held in treasury is sufficient to cover all outstanding equity awards as of September 30, 2023.
Accumulated Other Comprehensive Income (Loss)
The Company’s comprehensive income (loss) is comprised of net earnings (loss), net amortization of the change in the unrealized (loss) gain of the pension obligation, the change in the unrealized gain in other postretirement benefits, the change in the unrealized gain (loss) on natural gas and foreign currency cash flow hedges, and CTA. The components of and changes in AOCL are as follows (in millions):
|
|
|
|
|
|
|
|
|
|
|
|
|
|
|
|
|
|
|
|
|
|
|
|
|
|
|
|
|
|
|
|
|
Fiscal Year Ended September 30, 2023(a) |
|
(Losses) and Gains on Cash Flow Hedges |
|
Defined Benefit Pension |
|
Other Post-Employment Benefits |
|
Foreign Currency |
|
Total |
| Beginning balance |
|
$ |
(1.6) |
|
|
$ |
(2.7) |
|
|
$ |
1.3 |
|
|
$ |
(112.3) |
|
|
$ |
(115.3) |
|
Other comprehensive (loss) income before reclassifications(b) |
|
(3.3) |
|
|
(4.0) |
|
|
0.5 |
|
|
13.9 |
|
|
7.1 |
|
| Amounts reclassified from AOCL |
|
3.5 |
|
|
0.1 |
|
|
(0.1) |
|
|
— |
|
|
3.5 |
|
Net current period other comprehensive income (loss) |
|
0.2 |
|
|
(3.9) |
|
|
0.4 |
|
|
13.9 |
|
|
10.6 |
|
|
|
|
|
|
|
|
|
|
|
|
| Ending balance |
|
$ |
(1.4) |
|
|
$ |
(6.6) |
|
|
$ |
1.7 |
|
|
$ |
(98.4) |
|
|
$ |
(104.7) |
|
|
|
|
|
|
|
|
|
|
|
|
|
|
|
|
|
|
|
|
|
|
|
|
|
|
|
|
|
|
|
|
|
|
Fiscal Year Ended September 30, 2022(a) |
|
Gains and (Losses) on Cash Flow Hedges |
|
Defined Benefit Pension |
|
Other Post-Employment Benefits |
|
Foreign Currency |
|
Total |
| Beginning balance |
|
$ |
3.1 |
|
|
$ |
(5.4) |
|
|
$ |
— |
|
|
$ |
(108.2) |
|
|
$ |
(110.5) |
|
Other comprehensive (loss) income before reclassifications(b) |
|
(0.8) |
|
|
2.4 |
|
|
1.4 |
|
|
(53.6) |
|
|
(50.6) |
|
| Amounts reclassified from AOCL |
|
(3.9) |
|
|
0.3 |
|
|
(0.1) |
|
|
49.5 |
|
|
45.8 |
|
Net current period other comprehensive (loss) income |
|
(4.7) |
|
|
2.7 |
|
|
1.3 |
|
|
(4.1) |
|
|
(4.8) |
|
| Ending balance |
|
$ |
(1.6) |
|
|
$ |
(2.7) |
|
|
$ |
1.3 |
|
|
$ |
(112.3) |
|
|
$ |
(115.3) |
|
(a)With the exception of the CTA, for which no tax effect is recorded, the changes in the components of AOCL presented in the table are reflected net of applicable income taxes.
(b)The Company recorded foreign exchange (loss) gain of $(1.6) million and $6.7 million in the fiscal years ended September 30, 2023 and 2022, and the nine months ended September 30, 2021, respectively, in AOCL related to intercompany notes which were deemed to be of a long-term investment nature.
|
|
|
|
|
|
|
|
|
|
|
COMPASS MINERALS INTERNATIONAL, INC. |
|
|
|
|
|
|
|
|
|
|
|
|
|
|
|
|
|
|
|
|
|
|
|
Amount Reclassified from AOCL |
|
Line Item Impacted in the Consolidated Statement of Operations |
|
|
Fiscal Year Ended |
|
|
|
September 30,
2023 |
|
September 30,
2022 |
|
| Gains (losses) on cash flow hedges: |
|
|
|
|
|
|
| Natural gas instruments |
|
$ |
4.7 |
|
|
$ |
(5.3) |
|
|
Product cost |
| Foreign currency contracts |
|
— |
|
|
— |
|
|
Interest expense |
| Income tax expense |
|
(1.2) |
|
|
1.4 |
|
|
|
| Reclassifications, net of income taxes |
|
3.5 |
|
|
(3.9) |
|
|
|
| Amortization of defined benefit pension: |
|
|
|
|
|
|
| Amortization of loss |
|
$ |
0.1 |
|
|
$ |
0.4 |
|
|
Product cost |
| Income tax benefit |
|
— |
|
|
(0.1) |
|
|
|
| Reclassifications, net of income taxes |
|
0.1 |
|
|
0.3 |
|
|
|
| Amortization of other post-employment benefits |
|
|
|
|
|
|
| Amortization of loss |
|
$ |
(0.1) |
|
|
$ |
(0.1) |
|
|
Product cost |
| Income tax benefit |
|
— |
|
|
— |
|
|
|
| Reclassifications, net of income taxes |
|
(0.1) |
|
|
(0.1) |
|
|
|
| Reclassifications, CTA due to sale of foreign entity |
|
— |
|
|
49.5 |
|
|
|
| Total reclassifications, net of income taxes |
|
$ |
3.5 |
|
|
$ |
45.8 |
|
|
|
17. DERIVATIVE FINANCIAL INSTRUMENTS
The Company is subject to various types of market risks, including interest rate risk, foreign currency exchange rate transaction and translation risk and commodity pricing risk. Management may take actions to mitigate the exposure to these types of risks, including entering into forward purchase contracts and other financial instruments. The Company manages a portion of its commodity pricing and foreign currency exchange rate risks by using derivative instruments. From time to time, the Company may enter into foreign exchange contracts to mitigate foreign exchange risk. The Company does not seek to engage in trading activities or take speculative positions with any financial instrument arrangement. The Company has entered into natural gas derivative instruments and foreign currency derivative instruments with counterparties it views as creditworthy. However, the Company does attempt to mitigate its counterparty credit risk exposures by, among other things, entering into master netting agreements with some of these counterparties. The Company records derivative financial instruments as either assets or liabilities at fair value in its Consolidated Balance Sheets. The assets and liabilities recorded as of September 30, 2023 and 2022 were not material.
Derivatives qualify for treatment as hedges when there is a high correlation between the change in fair value of the derivative instrument and the related change in value of the underlying hedged item. Depending on the exposure being hedged, the Company must designate the hedging instrument as a fair value hedge, a cash flow hedge or a net investment in foreign operations hedge. For the qualifying derivative instruments that have been designated as hedges, the effective portion of the change in fair value is recognized through earnings when the underlying transaction being hedged affects earnings, allowing a derivative’s gains and losses to offset related results from the hedged item in the Consolidated Statements of Operations. Any ineffectiveness related to these instruments accounted for as hedges was not material for any of the periods presented. For derivative instruments that have not been designated as hedges, the entire change in fair value is recorded through earnings in the period of change.
Natural Gas Derivative Instruments
Natural gas is consumed at several of the Company’s production facilities, and changes in natural gas prices impact the Company’s operating margin. The Company seeks to reduce the earnings and cash flow impacts of changes in market prices of natural gas by fixing the purchase price of up to 90% of its forecasted natural gas usage. It is the Company’s policy to consider hedging portions of its natural gas usage up to 36 months in advance of the forecasted purchase. As of September 30, 2023, the Company had entered into natural gas derivative instruments to hedge a portion of its natural gas purchase requirements through September 2024. As of September 30, 2023 and 2022, the Company had agreements in place to hedge forecasted natural gas purchases of 2.3 million and 3.8 million MMBtus, respectively. On March 1, 2023, the Company de-designated its natural gas cash flow hedges related to its Ogden, Utah production facility as the Company did not believe these hedges were probable of being highly effective in the second fiscal quarter of 2023. Beginning March 1, 2023, the change in the derivative
|
|
|
|
|
|
|
|
|
|
|
COMPASS MINERALS INTERNATIONAL, INC. |
was and will be recorded in other expense, net in the Consolidated Statements of Operations. Since the transactions are still probable of occurring, previously recognized amounts in AOCL of $0.5 million will remain in AOCL until the underlying forecasted transaction occurs. The Company recognized $2.9 million of expense in other expense, net on the Consolidated Statements of Operations during the fiscal year ended September 30, 2023. Following the de-designation, these natural gas economic hedging instruments will be recorded at fair value through earnings unless re-designated or until settlement. Substantially all other natural gas derivative instruments held by the Company as of September 30, 2023 and 2022 qualified and were designated as cash flow hedges. As of September 30, 2023, the Company expects to reclassify from AOCL to earnings during the next twelve months $1.4 million of net losses on derivative instruments related to its natural gas hedges. Refer to
Note 18 for the estimated fair value of the Company’s natural gas derivative instruments as of September 30, 2023 and 2022.
The following tables present the fair value of the Company’s derivatives (in millions):
|
|
|
|
|
|
|
|
|
|
|
|
|
|
|
|
|
|
|
|
|
|
|
|
|
|
|
| |
|
Asset Derivatives |
|
Liability Derivatives |
|
|
Consolidated Balance Sheet Location |
|
September 30, 2023 |
|
Consolidated Balance Sheet Location |
|
September 30, 2023 |
| Derivatives designated as hedging instruments: |
|
|
|
|
|
|
|
|
| Commodity contracts |
|
Other current assets |
|
$ |
0.9 |
|
|
Accrued expenses and other current liabilities |
|
$ |
2.3 |
|
|
|
|
|
|
|
|
|
|
|
|
|
|
|
|
|
|
|
| Total derivatives designated as hedging instruments |
|
|
|
0.9 |
|
|
|
|
2.3 |
|
|
|
|
|
|
|
|
|
|
| Derivatives not designated as hedging instruments: |
|
|
|
|
|
|
|
|
| Commodity contracts |
|
Other current assets |
|
0.1 |
|
|
Accrued expenses and other current liabilities |
|
— |
|
|
|
|
|
|
|
|
|
|
| Total derivatives not designated as hedging instruments |
|
|
|
0.1 |
|
|
|
|
— |
|
Total derivatives(a) |
|
|
|
$ |
1.0 |
|
|
|
|
$ |
2.3 |
|
(a)The Company has master netting agreements with its commodity hedge counterparties and accordingly has netted in its Consolidated Balance Sheets $1.0 million of its commodity contracts that are in receivable positions against its contracts in payable positions.
|
|
|
|
|
|
|
|
|
|
|
|
|
|
|
|
|
|
|
|
|
|
|
|
|
|
|
| |
|
Asset Derivatives |
|
Liability Derivatives |
| Derivatives designated as hedging instruments: |
|
Consolidated Balance Sheet Location |
|
September 30, 2022 |
|
Consolidated Balance Sheet Location |
|
September 30, 2022 |
| Commodity contracts |
|
Other current assets |
|
$ |
2.7 |
|
|
Accrued expenses and other current liabilities |
|
$ |
3.3 |
|
| Commodity contracts |
|
Other assets |
|
0.2 |
|
|
Other noncurrent liabilities |
|
0.7 |
|
|
|
|
|
|
|
|
|
|
Total derivatives designated as hedging instruments(a) |
|
|
|
$ |
2.9 |
|
|
|
|
$ |
4.0 |
|
(a)The Company has master netting agreements with its commodity hedge counterparties and accordingly has netted in its Consolidated Balance Sheets $2.9 million of its commodity contracts that are in payable positions against its contracts in receivable positions.
The following tables present activity related to other comprehensive income (loss) before taxes (in millions):
|
|
|
|
|
|
|
|
|
|
|
|
|
|
|
|
|
|
|
|
|
| |
|
|
|
Fiscal Year Ended September 30, 2023 |
| Derivatives in Cash Flow Hedging Relationships |
|
Location of Change Reclassified from Accumulated OCI Into Income (Effective Portion) |
|
Amount Recognized in OCI on Derivative (Effective Portion) |
|
Amount Reclassified from Accumulated OCI Into Income (Effective Portion) |
| Commodity contracts |
|
Product cost |
|
$ |
(4.9) |
|
|
$ |
4.7 |
|
|
|
|
|
|
|
|
| Total |
|
|
|
$ |
(4.9) |
|
|
$ |
4.7 |
|
|
|
|
|
|
|
|
|
|
|
|
COMPASS MINERALS INTERNATIONAL, INC. |
|
|
|
|
|
|
|
|
|
|
|
|
|
|
|
|
|
|
|
|
|
| |
|
|
|
Fiscal Year Ended September 30, 2022 |
| Derivatives in Cash Flow Hedging Relationships |
|
Location of Change Reclassified from Accumulated OCI Into Income Effective Portion) |
|
Amount Recognized in OCI on Derivative (Effective Portion) |
|
Amount Reclassified from Accumulated OCI Into Income (Effective Portion) |
| Commodity contracts |
|
Product cost |
|
$ |
(0.1) |
|
|
$ |
(5.3) |
|
|
|
|
|
|
|
|
| Total |
|
|
|
$ |
(0.1) |
|
|
$ |
(5.3) |
|
18. FAIR VALUE MEASUREMENTS
The Company’s financial instruments are measured and reported at their estimated fair value. Fair value is the price that would be received to sell an asset or paid to transfer a liability in an orderly transaction. When available, the Company uses quoted prices in active markets to determine the fair values for its financial instruments (Level 1 inputs), or absent quoted market prices, observable market-corroborated inputs over the term of the financial instruments (Level 2 inputs). The Company does not have any unobservable inputs that are not corroborated by market inputs (Level 3 inputs), except as stated below and in
Note 3.
The Company holds marketable securities associated with its Savings Plans, which are valued based on readily available quoted market prices. The Company utilizes derivative instruments to manage its risk of changes in natural gas prices and foreign exchange rates (see
Note 17). The fair value of the natural gas and foreign currency derivative instruments are determined using market data of forward prices for all of the Company’s contracts.
The estimated fair values for each type of instrument are presented below (in millions).
|
|
|
|
|
|
|
|
|
|
|
|
|
|
|
|
|
|
|
|
|
|
|
|
|
|
|
| |
|
September 30, 2023 |
|
Level One |
|
Level Two |
|
Level Three |
| Asset Class: |
|
|
|
|
|
|
|
|
Mutual fund investments in a non-qualified savings plan(a) |
|
$ |
2.6 |
|
|
$ |
2.6 |
|
|
$ |
— |
|
|
$ |
— |
|
|
|
|
|
|
|
|
|
|
Derivatives not designated as hedging instruments - natural gas instruments, net |
|
0.1 |
|
|
— |
|
|
0.1 |
|
|
— |
|
| Total Assets |
|
$ |
2.7 |
|
|
$ |
2.6 |
|
|
$ |
0.1 |
|
|
$ |
— |
|
| Liability Class: |
|
|
|
|
|
|
|
|
Derivatives designated as hedging instruments - natural gas instruments, net |
|
$ |
(1.4) |
|
|
$ |
— |
|
|
$ |
(1.4) |
|
|
$ |
— |
|
|
|
|
|
|
|
|
|
|
| Liabilities related to non-qualified savings plan |
|
(2.6) |
|
|
(2.6) |
|
|
— |
|
|
— |
|
| Total Liabilities |
|
$ |
(4.0) |
|
|
$ |
(2.6) |
|
|
$ |
(1.4) |
|
|
$ |
— |
|
(a)Includes mutual fund investments of approximately 25% in the common stock of large-cap U.S. companies, 5% in the common stock of small to mid-cap U.S. companies, 10% in the common stock of international companies, 10% in bond funds, 5% in short-term investments and 45% in blended funds.
|
|
|
|
|
|
|
|
|
|
|
|
|
|
|
|
|
|
|
|
|
|
|
|
|
|
|
|
|
September 30, 2022 |
|
Level One |
|
Level Two |
|
Level Three |
| Asset Class: |
|
|
|
|
|
|
|
|
Mutual fund investments in a non-qualified savings plan(a) |
|
$ |
1.8 |
|
|
$ |
1.8 |
|
|
$ |
— |
|
|
$ |
— |
|
|
|
|
|
|
|
|
|
|
| Total Assets |
|
$ |
1.8 |
|
|
$ |
1.8 |
|
|
$ |
— |
|
|
$ |
— |
|
| Liability Class: |
|
|
|
|
|
|
|
|
| Liabilities related to non-qualified savings plan |
|
$ |
(1.8) |
|
|
$ |
(1.8) |
|
|
$ |
— |
|
|
$ |
— |
|
| Derivatives - natural gas instruments, net |
|
(1.1) |
|
|
— |
|
|
(1.1) |
|
|
— |
|
| Total Liabilities |
|
$ |
(2.9) |
|
|
$ |
(1.8) |
|
|
$ |
(1.1) |
|
|
$ |
— |
|
(a)Includes mutual fund investments of approximately 30% in the common stock of large-cap U.S. companies, 5% in the common stock of small to mid-cap U.S. companies, 10% in the common stock of international companies, 15% in bond funds, 5% in short-term investments and 35% in blended funds.
Cash and cash equivalents, receivables (net of reserve for doubtful accounts) and accounts payable are carried at cost, which approximates fair value due to their liquid and short-term nature. The Company’s investments related to its nonqualified retirement plan of $2.6 million and $1.8 million as of September 30, 2023 and 2022, respectively, are stated at fair value based
|
|
|
|
|
|
|
|
|
|
|
COMPASS MINERALS INTERNATIONAL, INC. |
on quoted market prices. As of September 30, 2022, the estimated fair value of the Company’s fixed-rate 4.875% Notes, based on available trading information (Level 2), totaled $235.9 million, compared with the aggregate principal amount at maturity of $250.0 million. The 4.875% Notes were redeemed during the fiscal year ended September 30, 2023 using proceeds from the 2023 Credit Agreement, discussed further in
Note 13. As of September 30, 2023 and 2022, the estimated fair value of the Company’s fixed-rate 6.75% Notes, based on available trading information (Level 2), totaled $472.5 million and $468.9 million, respectively, compared with the aggregate principal amount at maturity of $500.0 million. The fair value at September 30, 2023 and 2022 of amounts outstanding under the Company’s term loans and revolving credit facility, based upon available bid information received from the Company’s lender (Level 2), totaled approximately $277.1 million and $158.5 million, respectively, compared with the aggregate principal amount at maturity of $280.3 million and $168.4 million, respectively.
The Company performed the analysis needed to estimate the fair values of intangible assets, intangible asset useful lives and the purchase price including the value of contingent consideration. The fair value of the contingent consideration (milestone and earnout payments) involve significant inputs not observable in the market and a Monte Carlo simulation, respectively, and are therefore considered Level 3 measurements. Refer to
Note 3 for a discussion of fair value as it relates to the Company’s acquisition of Fortress.
The Company has certain assets, including goodwill and other intangible assets, which are measured at fair value on a non-recurring basis and are adjusted to fair value only if an impairment charge is recognized. The categorization of the framework used to measure fair value of the assets is considered to be within the Level 3 valuation hierarchy due to the subjective nature of the unobservable inputs used.
|
|
|
|
|
|
|
|
|
|
|
COMPASS MINERALS INTERNATIONAL, INC. |
19. EARNINGS PER SHARE
The two-class method requires allocating the Company’s net earnings to both common shares and participating securities. The following table sets forth the computation of basic and diluted earnings per common share (in millions, except for share and per share data):
|
|
|
|
|
|
|
|
|
|
|
|
|
|
|
|
|
|
|
|
|
|
|
Fiscal Year Ended |
|
Nine Months Ended |
|
|
September 30,
2023 |
|
September 30,
2022 |
|
September 30,
2021 |
| Numerator: |
|
|
|
|
|
|
| Net earnings (loss) from continuing operations |
|
$ |
15.5 |
|
|
$ |
(37.3) |
|
|
$ |
20.9 |
|
Less: Net earnings allocated to participating securities(a) |
|
(0.3) |
|
|
(0.3) |
|
|
(0.9) |
|
| Net earnings (loss) from continuing operations available to common stockholders |
|
15.2 |
|
|
(37.6) |
|
|
20.0 |
|
| Net earnings (loss) from discontinued operations available to common stockholders |
|
— |
|
|
12.2 |
|
|
(234.2) |
|
| Net earnings (loss) available to common stockholders |
|
$ |
15.2 |
|
|
$ |
(25.4) |
|
|
$ |
(214.2) |
|
| Denominator (in thousands): |
|
|
|
|
|
|
Weighted average common shares outstanding, shares for basic earnings per share(b) |
|
40,786 |
|
|
34,120 |
|
|
34,013 |
|
| Weighted average equity awards outstanding |
|
— |
|
|
— |
|
|
50 |
|
| Shares for diluted earnings per share |
|
40,786 |
|
|
34,120 |
|
|
34,063 |
|
|
|
|
|
|
|
|
| Basic net earnings (loss) from continuing operations per common share |
|
$ |
0.37 |
|
|
$ |
(1.10) |
|
|
$ |
0.59 |
|
| Basic net earnings (loss) from discontinued operations per common share |
|
— |
|
|
0.36 |
|
|
(6.89) |
|
| Basic net earnings (loss) per common share |
|
$ |
0.37 |
|
|
$ |
(0.74) |
|
|
$ |
(6.30) |
|
|
|
|
|
|
|
|
| Diluted net earnings (loss) from continuing operations per common share |
|
$ |
0.37 |
|
|
$ |
(1.10) |
|
|
$ |
0.58 |
|
| Diluted net earnings (loss) from discontinued operations per common share |
|
— |
|
|
0.36 |
|
|
(6.89) |
|
| Diluted net earnings (loss) per common share |
|
$ |
0.37 |
|
|
$ |
(0.74) |
|
|
$ |
(6.30) |
|
(a)Participating securities include PSUs and RSUs that receive non-forfeitable dividends. Net earnings were allocated to participating securities of 476,000, 407,000 and 426,000 for the fiscal years ended September 30, 2023 and 2022, and the nine months ended September 30, 2021, respectively.
(b)For the calculation of diluted earnings per share, the Company uses the more dilutive of either the treasury stock method or the two-class method to determine the weighted average number of outstanding common shares. In addition, the Company had 1,264,000, 1,106,000 and 1,062,000 weighted options outstanding for the fiscal years ended September 30, 2023 and 2022, and the nine months ended September 30, 2021, respectively, which were anti-dilutive and therefore not included in the diluted earnings per share calculation.
20. RELATED PARTY TRANSACTIONS
As discussed in
Note 16, on October 18, 2022, KII, through its KM&T subsidiary, purchased common stock representing an ownership interest of approximately 17% of the outstanding common stock of the Company. As part of the Stock Purchase Agreement, KM&T appointed two members to the Company’s Board of Directors, effective November 13, 2022. In addition, the companies continue to explore value creation opportunities.
During the fiscal year ended September 30, 2023, the Company recorded SOP sales of approximately $4.3 million, to certain subsidiaries of KII, compared to $4.8 million during the fiscal year ended September 30, 2022. As of both September 30, 2023 and 2022, the Company had approximately $0.4 million of receivables from related parties on its Consolidated Balance Sheets. Additionally, a subsidiary of KII has recently provided engineering services for the Company’s lithium development project for which it capitalized approximately $4.0 million into Property, Plant and Equipment, net, as of September 30, 2023. There were no amounts payable outstanding as of September 30, 2023.
On December 20, 2022, March 20, 2023, June 20, 2023 and September 20, 2023, the Company paid a cash dividend to its stockholders of record at the close of business on December 9, 2022, March 10, 2023, June 9, 2023 and September 11, 2023,
|
|
|
|
|
|
|
|
|
|
|
COMPASS MINERALS INTERNATIONAL, INC. |
respectively, in the amount of $0.15 per share. KM&T received approximately $4.2 million in respect to its common shares for the fiscal year ended September 30, 2023.
21. TRANSITION PERIOD COMPARATIVE DATA
As discussed in
Note 1, the Company changed its fiscal year end from December 31 to September 30 in 2021. The Consolidated Statements of Operations and Cash Flows for the twelve months ended September 30, 2023, 2022 and 2021 are summarized below. All data for the twelve months ended September 30, 2021 is derived from the Company’s previously reported consolidated financial statements.
|
|
|
|
|
|
|
|
|
|
|
|
|
|
|
|
|
|
|
|
|
|
|
Twelve Months Ended |
| (in millions, except per share amounts) |
|
September 30,
2023 |
|
September 30,
2022 |
|
September 30,
2021 |
|
|
|
|
|
|
(Unaudited) |
| Sales |
|
$ |
1,204.7 |
|
|
$ |
1,244.1 |
|
|
$ |
1,145.8 |
|
| Shipping and handling cost |
|
346.1 |
|
|
379.5 |
|
|
295.8 |
|
| Product cost |
|
624.7 |
|
|
667.8 |
|
|
619.8 |
|
| Gross profit |
|
233.9 |
|
|
196.8 |
|
|
230.2 |
|
| Selling, general and administrative expenses |
|
154.8 |
|
|
153.9 |
|
|
123.1 |
|
| Operating earnings |
|
79.1 |
|
|
42.9 |
|
|
107.1 |
|
| Other expense (income): |
|
|
|
|
|
|
Interest income |
|
(5.3) |
|
|
(0.8) |
|
|
(0.3) |
|
| Interest expense |
|
55.5 |
|
|
55.2 |
|
|
59.8 |
|
| Loss (gain) on foreign exchange |
|
2.3 |
|
|
(14.9) |
|
|
5.6 |
|
| Net loss in equity investees |
|
3.1 |
|
|
5.2 |
|
|
0.5 |
|
| Gain from remeasurement of equity method investment |
|
(13.7) |
|
|
— |
|
|
— |
|
| Other, net |
|
4.3 |
|
|
0.5 |
|
|
0.1 |
|
Earnings (loss) before income taxes from continuing operations |
|
32.9 |
|
|
(2.3) |
|
|
41.4 |
|
| Income tax expense for continuing operations |
|
17.4 |
|
|
35.0 |
|
|
5.8 |
|
| Net earnings (loss) from continuing operations |
|
15.5 |
|
|
(37.3) |
|
|
35.6 |
|
| Net earnings (loss) from discontinued operations |
|
— |
|
|
12.2 |
|
|
(220.8) |
|
| Net earnings (loss) |
|
$ |
15.5 |
|
|
$ |
(25.1) |
|
|
$ |
(185.2) |
|
|
|
|
|
|
|
|
| Basic net earnings (loss) from continuing operations per common share |
|
$ |
0.37 |
|
|
$ |
(1.10) |
|
|
$ |
1.01 |
|
| Basic net earnings (loss) from discontinued operations per common share |
|
— |
|
|
0.36 |
|
|
(6.49) |
|
| Basic net earnings (loss) per common share |
|
$ |
0.37 |
|
|
$ |
(0.74) |
|
|
$ |
(5.48) |
|
|
|
|
|
|
|
|
| Diluted net earnings (loss) from continuing operations per common share |
|
$ |
0.37 |
|
|
$ |
(1.10) |
|
|
$ |
1.00 |
|
| Diluted net earnings (loss) from discontinued operations per common share |
|
— |
|
|
0.36 |
|
|
(6.49) |
|
| Diluted net earnings (loss) per common share |
|
$ |
0.37 |
|
|
$ |
(0.74) |
|
|
$ |
(5.48) |
|
|
|
|
|
|
|
|
| Weighted-average common shares outstanding (in thousands): |
|
|
|
|
|
|
| Basic |
|
40,786 |
|
|
34,120 |
|
|
33,999 |
|
| Diluted |
|
40,786 |
|
|
34,120 |
|
|
34,042 |
|
|
|
|
|
|
|
|
|
|
|
|
COMPASS MINERALS INTERNATIONAL, INC. |
|
|
|
|
|
|
|
|
|
|
|
|
|
|
|
|
|
|
|
|
|
|
|
Twelve Months Ended |
| (in millions) |
|
September 30,
2023 |
|
September 30,
2022 |
|
September 30,
2021 |
|
|
|
|
|
|
(Unaudited) |
| Cash flows from operating activities: |
|
|
|
|
|
|
Net earnings (loss) |
|
$ |
15.5 |
|
|
$ |
(25.1) |
|
|
$ |
(185.2) |
|
Adjustments to reconcile net earnings (loss) to net cash flows provided by operating activities: |
|
|
|
|
|
|
| Depreciation, depletion and amortization |
|
98.6 |
|
|
113.7 |
|
|
128.9 |
|
| Amortization of deferred financing costs |
|
2.6 |
|
|
2.9 |
|
|
3.2 |
|
| Refinancing of long-term debt |
|
1.0 |
|
|
— |
|
|
— |
|
| Stock-based compensation |
|
20.6 |
|
|
15.7 |
|
|
9.9 |
|
| Deferred income taxes |
|
(4.8) |
|
|
19.9 |
|
|
(29.0) |
|
| Unrealized foreign exchange gain |
|
2.4 |
|
|
(29.1) |
|
|
(12.3) |
|
| Loss on impairment of long-lived assets |
|
— |
|
|
23.1 |
|
|
300.0 |
|
| Net loss (gain) in equity investees |
|
3.1 |
|
|
5.2 |
|
|
(1.6) |
|
| Gain from remeasurement of equity method investment |
|
(13.7) |
|
|
— |
|
|
— |
|
| Loss (gain) on disposition of assets |
|
4.5 |
|
|
3.7 |
|
|
(26.3) |
|
| Other, net |
|
0.5 |
|
|
(0.1) |
|
|
— |
|
Changes in operating assets and liabilities, net of sale and acquisition of businesses: |
|
|
|
|
|
|
| Receivables |
|
38.9 |
|
|
(55.0) |
|
|
(17.4) |
|
| Inventories |
|
(82.7) |
|
|
6.3 |
|
|
(21.7) |
|
| Other assets |
|
16.3 |
|
|
(14.2) |
|
|
(3.1) |
|
| Accounts payable and accrued expenses and other current liabilities |
|
19.9 |
|
|
55.1 |
|
|
23.7 |
|
| Other liabilities |
|
(14.8) |
|
|
(1.6) |
|
|
(19.7) |
|
| Net cash provided by operating activities |
|
107.9 |
|
|
120.5 |
|
|
149.4 |
|
| Cash flows from investing activities: |
|
|
|
|
|
|
| Capital expenditures |
|
(156.2) |
|
|
(96.7) |
|
|
(93.8) |
|
| Proceeds from sale of businesses |
|
— |
|
|
61.2 |
|
|
348.6 |
|
Acquisition of business, net of cash acquired |
|
(18.9) |
|
|
— |
|
|
— |
|
| Investments in equity method investees |
|
— |
|
|
(46.3) |
|
|
(5.0) |
|
| Other, net |
|
(4.7) |
|
|
1.8 |
|
|
3.4 |
|
| Net cash (used in) provided by investing activities |
|
(179.8) |
|
|
(80.0) |
|
|
253.2 |
|
| Cash flows from financing activities: |
|
|
|
|
|
|
| Proceeds from revolving credit facility borrowings |
|
150.0 |
|
|
466.2 |
|
|
505.1 |
|
| Principal payments on revolving credit facility borrowings |
|
(220.0) |
|
|
(403.1) |
|
|
(516.9) |
|
| Proceeds from issuance of long-term debt |
|
239.9 |
|
|
55.9 |
|
|
120.6 |
|
| Principal payments on long-term debt |
|
(314.6) |
|
|
(109.1) |
|
|
(427.3) |
|
Net proceeds from private placement of common stock |
|
240.7 |
|
|
— |
|
|
— |
|
| Dividends paid |
|
(24.9) |
|
|
(20.8) |
|
|
(98.0) |
|
| Deferred financing costs |
|
(3.9) |
|
|
(0.4) |
|
|
(0.1) |
|
| Proceeds from stock option exercised |
|
— |
|
|
0.3 |
|
|
1.6 |
|
| Shares withheld to satisfy employee tax obligations |
|
(1.7) |
|
|
(2.0) |
|
|
(1.3) |
|
| Other, net |
|
(1.5) |
|
|
(1.3) |
|
|
(1.2) |
|
Net cash provided by (used in) financing activities |
|
64.0 |
|
|
(14.3) |
|
|
(417.5) |
|
| Effect of exchange rate changes on cash and cash equivalents |
|
0.5 |
|
|
(1.1) |
|
|
1.8 |
|
| Net change in cash and cash equivalents |
|
(7.4) |
|
|
25.1 |
|
|
(13.1) |
|
| Cash and cash equivalents, beginning of the year |
|
46.1 |
|
|
21.0 |
|
|
34.1 |
|
| Cash and cash equivalents, end of period |
|
38.7 |
|
|
46.1 |
|
|
21.0 |
|
| Less: cash and cash equivalents included in current assets held for sale |
|
— |
|
|
— |
|
|
(2.9) |
|
| Cash and cash equivalents of continuing operations, end of period |
|
$ |
38.7 |
|
|
$ |
46.1 |
|
|
$ |
18.1 |
|
|
|
|
|
|
|
|
| Supplemental cash flow information: |
|
|
|
|
|
|
| Interest paid, net of amounts capitalized |
|
$ |
54.5 |
|
|
$ |
52.9 |
|
|
$ |
60.4 |
|
| Income taxes paid, net of refunds |
|
$ |
12.5 |
|
|
$ |
17.3 |
|
|
$ |
50.0 |
|
|
|
|
|
|
|
|
|
|
|
|
COMPASS MINERALS INTERNATIONAL, INC. |
22. QUARTERLY RESULTS (Unaudited)
In the first quarter of fiscal 2021, the Company concluded that certain of its assets met the criteria for classification as held for sale and discontinued operations. See
Note 1 to the Consolidated Financial Statements for more information. The continuing operations information below reflects the Company’s operations excluding its South America chemicals and specialty plant nutrition businesses, investment in Fermavi and North America micronutrient product business, which have been included as discontinued operations for the periods presented.
|
|
|
|
|
|
|
|
|
|
|
|
|
|
|
|
|
|
|
|
|
| Quarter |
|
First |
|
Second |
|
Third |
| Nine Months Ended September 30, 2021 |
|
|
| Sales |
|
$ |
425.5 |
|
|
$ |
199.4 |
|
|
$ |
211.7 |
|
| Gross profit |
|
108.4 |
|
|
30.2 |
|
|
33.1 |
|
Net earnings (loss) from continuing operations(a) |
|
41.9 |
|
|
(16.4) |
|
|
(4.6) |
|
Net earnings (loss) from continuing operations per share, basic(a) |
|
1.22 |
|
|
(0.49) |
|
|
(0.14) |
|
Net earnings (loss) from continuing operations per share, diluted(a) |
|
1.21 |
|
|
(0.49) |
|
|
(0.14) |
|
|
|
|
|
|
|
|
Net (loss) earnings(a) |
|
(214.4) |
|
|
57.1 |
|
|
(56.0) |
|
Net (loss) earnings per share, basic(a) |
|
(6.32) |
|
|
1.64 |
|
|
(1.65) |
|
Net (loss) earnings per share, diluted(a) |
|
(6.32) |
|
|
1.63 |
|
|
(1.65) |
|
| Basic weighted-average shares outstanding (in thousands) |
|
33,974 |
|
|
34,020 |
|
|
34,043 |
|
| Diluted weighted-average shares outstanding (in thousands) |
|
34,012 |
|
|
34,078 |
|
|
34,099 |
|
(a)The Company incurred costs related to the ongoing SEC investigation of $2.8 million and $0.3 million in the first and second quarters of fiscal 2021.
ITEM 9. CHANGES IN AND DISAGREEMENTS WITH ACCOUNTANTS ON ACCOUNTING AND FINANCIAL DISCLOSURE
None.
ITEM 9A. CONTROLS AND PROCEDURES
Disclosure Controls and Procedures
The Company maintains disclosure controls and procedures that are designed to provide reasonable assurance that information required to be disclosed in the Company’s reports under the Securities Exchange Act of 1934, as amended (the “Exchange Act”), is recorded, processed, summarized and reported within the time periods specified in the Securities and Exchange Commission’s rules and forms, and that such information is accumulated and communicated to management, including the Company’s President and Chief Executive Officer, Chief Financial Officer and Chief Accounting Officer, as appropriate, to allow timely decisions regarding required disclosure. In designing and evaluating the disclosure controls and procedures, management recognizes that any controls and procedures, no matter how well designed and operated, can provide only reasonable assurance of achieving the desired control objectives. Management necessarily applies its judgment in evaluating the cost-benefit relationship of possible controls and procedures. Due to the inherent limitations in all control systems, no evaluation of controls can provide absolute assurance that misstatements due to error or fraud will not occur or that all control issues and instances of fraud, if any, within the Company have been detected.
In connection with the preparation of this Annual Report on Form 10-K, an evaluation of the effectiveness of the design and operation of the Company’s disclosure controls and procedures (as defined in Rule 13a-15(e) under the Exchange Act) was performed under the supervision and with the participation of the Company’s management, including the Chief Executive Officer and Chief Financial Officer as of September 30, 2023. Based on that evaluation, the Chief Executive Officer and Chief Financial Officer concluded that the Company’s disclosure controls and procedures were effective as of September 30, 2023, at the reasonable assurance level.
Management’s Report on Internal Control Over Financial Reporting
The Company’s management is responsible for establishing and maintaining adequate internal control over financial reporting, as defined in Rule 13a-15(f) under the Exchange Act. The Company’s internal control over financial reporting is a process designed to provide reasonable assurance regarding the reliability of financial reporting and the preparation of financial statements for external purposes in accordance with generally accepted accounting principles. Because of its inherent limitations, internal control over financial reporting may not prevent or detect misstatements. Also, projections of any
|
|
|
|
|
|
|
|
|
|
|
COMPASS MINERALS INTERNATIONAL, INC. |
evaluation of effectiveness to future periods are subject to the risk that controls may become inadequate because of changes in conditions, or that the degree of compliance with the policies or procedures may deteriorate.
Using the criteria set forth by the Committee of Sponsoring Organizations of the Treadway Commission (“COSO”) in Internal Control-Integrated Framework (2013), management conducted an evaluation and assessed the effectiveness of the Company’s internal control over financial reporting as of September 30, 2022 and identified the following deficiencies in the design and operating effectiveness of internal controls associated with the control activities component of the COSO framework that we considered to be material weaknesses.
1.During the fourth quarter ended September 30, 2022, the Company identified a material weakness in the design and operating effectiveness of our information technology general controls (“ITGCs”) related to certain systems that support the Company’s internal controls over financial reporting. Specifically, the Company did not maintain effective controls over privileged user access to certain systems. Automated and manual business process controls were therefore also deemed ineffective because they could have been adversely impacted by the ineffective ITGCs.
2.During the fourth quarter ended September 30, 2022, the Company identified a material weakness in the design and operating effectiveness of controls related to the sales process. Specifically, the Company did not maintain adequate controls over pricing and order entry.
3.During the fourth quarter ended September 30, 2022, the Company identified a material weakness in the design and operating effectiveness of controls related to the existence of inventory held at certain locations.
A material weakness, as defined in Rule 12b-2 under the Exchange Act, is a deficiency, or combination of control deficiencies, in internal control over financial reporting, such that there is a reasonable possibility that a material misstatement of the Company’s annual or interim consolidated financial statements will not be prevented or detected on a timely basis.
The material weaknesses did not result in any identified misstatements to our consolidated financial statements as of September 30, 2022. Further, there were no changes to previously released financial results and no inappropriate activity was identified as a result of the privileged user access deficiency.
Throughout fiscal 2023, the Company has defined and enhanced its management review control attributes, improved the controls environment and increased the frequency of its privileged access reviews. The Company has also assessed, implemented and executed enhanced internal controls over the sales and inventory processes in accordance with the remediation plans for those material weaknesses.
As of September 30, 2023, management conducted an evaluation and assessed the effectiveness of the Company’s internal control over financial reporting including the enhanced controls over privileged user access and the sales and inventory processes. Based on its evaluation, management concluded that the Company’s internal control over financial reporting was effective as of September 30, 2023. Ernst & Young LLP, the Company’s independent registered public accounting firm, has audited the Company’s Consolidated Financial Statements as of September 30, 2023 and 2022 and for the years ended September 30, 2023 and 2022 and the nine-month period ended September 30, 2021. These reports are included in this Annual Report on Form 10-K. As allowed by SEC guidance, management has excluded from its assessment the internal controls over financial reporting related to its Fortress business, which was acquired in May 2023 and accounted for approximately 8% of the Company’s total assets and less than 1% of the Company’s total sales from continuing operations as of and for the year ended September 30, 2023.
Changes in Internal Control Over Financial Reporting
Other than the matters noted above, there were no changes in the Company’s internal control over financial reporting during the most recently completed fiscal quarter that have materially affected, or are reasonably likely to materially affect, the Company’s internal control over financial reporting. The Company is in the process of integrating Fortress’ operations, including integration of financial reporting processes and procedures and internal controls over financial reporting.
ITEM 9B. OTHER INFORMATION
Rule 10b5-1 Trading Plans
During the fiscal year ended September 30, 2023, none of our directors or officers (as defined in Rule 16a-1(f) under the Exchange Act) adopted or terminated any contract, instruction or written plan for the purchase or sale of our securities that was intended to satisfy the affirmative defense conditions of Rule 10b5-1(c) under the Exchange Act or any “non-Rule 10b5-1 trading arrangement” as defined in Item 408(c) of Regulation S-K.
|
|
|
|
|
|
|
|
|
|
|
COMPASS MINERALS INTERNATIONAL, INC. |
ITEM 9C. DISCLOSURE REGARDING FOREIGN JURISDICTIONS THAT PREVENT INSPECTIONS
Not applicable.
PART III
ITEM 10. DIRECTORS, EXECUTIVE OFFICERS AND CORPORATE GOVERNANCE
Information regarding the Company’s executive officers is included in Part I to this Form 10-K under the caption “Information about our Executive Officers” and is incorporated herein by reference.
The information required by this item will be included under the captions “Proposal 1—Election of Directors,” “Corporate Governance,” and “Board of Directors and Board Committees” in the Company’s proxy statement for its 2024 annual meeting of stockholders (the “2024 Proxy Statement”) and is incorporated herein by reference.
Code of Ethics and Business Conduct
The Company has adopted a Code of Ethics and Business Conduct that applies to all employees, including the Company’s principal executive officer, principal financial officer and principal accounting officer, as well as members of the Board of Directors of the Company. The Code of Ethics and Business Conduct is available on the Company’s website at www.compassminerals.com. The Company intends to disclose any changes in, or waivers from, this Code of Ethics and Business Conduct by posting such information on the same website or by filing a Current Report on Form 8-K, in each case to the extent such disclosure is required by SEC or New York Stock Exchange rules.
ITEM 11. EXECUTIVE COMPENSATION
The information required by this item will be included under the captions “Fiscal 2023 Non-Employee Director Compensation,” “Corporate Governance—Compensation Committee Interlocks and Insider Participation,” “Compensation Discussion and Analysis,” “Compensation Committee Report” and “Executive Compensation Tables” in the 2024 Proxy Statement and is incorporated herein by reference.
ITEM 12. SECURITY OWNERSHIP OF CERTAIN BENEFICIAL OWNERS AND MANAGEMENT AND RELATED STOCKHOLDER MATTERS
The information required by this item will be included under the caption “Stock Ownership of Certain Beneficial Owners and Management” in the 2024 Proxy Statement and is incorporated herein by reference. Information regarding the Company’s equity compensation plans will be included under the caption “Executive Compensation Tables” in the 2024 Proxy Statement and is incorporated herein by reference.
ITEM 13. CERTAIN RELATIONSHIPS AND OTHER TRANSACTIONS AND DIRECTOR INDEPENDENCE
The information required by this item will be included under the captions “Corporate Governance—Review and Approval of Transactions with Related Persons” and “Board of Directors and Board Committees—Director Independence” in the 2024 Proxy Statement and is incorporated herein by reference.
ITEM 14. PRINCIPAL ACCOUNTING FEES AND SERVICES
The information required by this item will be included under the caption “Proposal 4—Ratification of Appointment of Independent Auditors” in the 2024 Proxy Statement and is incorporated herein by reference.
PART IV
|
|
|
|
|
|
|
|
|
|
|
COMPASS MINERALS INTERNATIONAL, INC. |
ITEM 15. EXHIBITS, FINANCIAL STATEMENT SCHEDULES
(a)(1) Financial statements and supplementary data required by this Item 15 are set forth below:
(a)(2) Financial Statement Schedule:
Schedule II — Valuation Reserves
Compass Minerals International, Inc.
September 30, 2023, 2022 and 2021
|
|
|
|
|
|
|
|
|
|
|
|
|
|
|
|
|
|
|
|
|
|
|
|
|
|
|
Description (in millions) |
|
Balance at the Beginning of the Period |
|
Additions Charged to Expense(1) |
|
Deductions(2) |
|
Balance at the End of the Period |
| Deducted from Receivables — Allowance for Doubtful Accounts |
|
|
|
|
|
|
|
|
September 30, 2023 |
|
$ |
3.4 |
|
|
$ |
2.2 |
|
|
$ |
(3.3) |
|
|
$ |
2.3 |
|
September 30, 2022 |
|
3.0 |
|
|
3.4 |
|
|
(3.0) |
|
|
3.4 |
|
September 30, 2021 |
|
3.9 |
|
|
2.3 |
|
|
(3.2) |
|
|
3.0 |
|
| Deducted from Deferred Income Taxes — Valuation Allowance |
|
|
|
|
|
|
|
|
September 30, 2023 |
|
$ |
111.9 |
|
|
$ |
11.0 |
|
|
$ |
(0.7) |
|
|
$ |
122.2 |
|
September 30, 2022 |
|
44.6 |
|
|
79.5 |
|
|
(12.2) |
|
|
111.9 |
|
September 30, 2021 |
|
42.7 |
|
|
1.9 |
|
|
— |
|
|
44.6 |
|
(1)Deferred income taxes additions as of September 30, 2022 includes $14.2 million of valuation allowance related to Plant Nutrition South America that was classified as assets held for sale as of September 30, 2021.
(2)Deduction for purposes for which reserve was created.
|
|
|
|
|
|
|
|
|
|
|
COMPASS MINERALS INTERNATIONAL, INC. |
(a)(3) List of Exhibits:
|
|
|
|
|
|
Exhibit
No. |
Description of Exhibit |
| 2.1 |
|
| 2.2 |
|
| 2.3 |
|
| 2.4 |
|
| 2.5 |
|
| 2.6 |
|
2.7† |
|
| 3.1 |
|
| 3.2 |
|
| 3.3 |
|
| 4.1 |
Indenture, dated as of June 23, 2014, by and among Compass Minerals International, Inc., the Guarantors named therein, and U.S. National Bank Association, as trustee, relating to the 4.875% Senior Notes due 2024 (incorporated herein by reference to Exhibit 4.1 to Compass Minerals International, Inc.’s Current Report on Form 8-K filed on June 26, 2014). |
| 4.2 |
|
| 4.3 |
Indenture, dated November 26, 2019, among Compass Minerals International, Inc., the guarantors named therein and Wells Fargo Bank, National Association, as trustee, relating to the 6.750% Senior Notes due 2027 (incorporated herein by reference to Exhibit 4.1 to Compass Minerals International, Inc.’s Current Report on Form 8-K filed on November 26, 2019). |
| 4.4 |
|
| 4.5 |
|
| 10.1 |
|
| 10.2 |
|
| 10.3 |
|
|
|
|
|
|
|
|
|
|
|
|
COMPASS MINERALS INTERNATIONAL, INC. |
|
|
|
|
|
|
Exhibit
No. |
Description of Exhibit |
| 10.4 |
|
| 10.5 |
Amendment and Restatement Agreement, dated November 26, 2019, among Compass Minerals International, Inc., Compass Minerals Canada Corp., Compass Minerals UK Limited, the other loan parties party thereto, the lenders and issuing banks party thereto from time to time and JPMorgan Chase Bank, N.A., as administrative agent (incorporated herein by reference to Exhibit 10.1 to Compass Minerals International, Inc.’s Current Report on Form 8-K filed on November 26, 2019). |
| 10.6 |
Amendment No. 2, dated June 13, 2022, to the Amended and Restated Credit Agreement, dated November 26, 2019, among Compass Minerals International, Inc., Compass Minerals Canada Corp., Compass Minerals UK Limited, JPMorgan Chase Bank, N.A., as administrative agent, the other loan parties party thereto and the lenders party thereto (incorporated by reference to Exhibit 10.1 to Compass Minerals International, Inc.’s Current Report on Form 8-K filed on June 13, 2022). |
| 10.7 |
Amendment No. 3 to the Amended and Restated Credit Agreement, dated as of November 16, 2022, by and among Compass Minerals International, Inc., Compass Minerals Canada Corp., Compass Minerals UK Limited, the Lenders and JPMorgan Chase Bank, N.A., as Administrative Agent (incorporated by reference to Exhibit 10.1 to Compass Minerals International, Inc.’s Current Report on Form 8-K filed on November 22, 2022). |
| 10.8 |
Amendment and Restatement Agreement to the Credit Agreement, dated as of May 5, 2023, by and among Compass Minerals International, Inc., Compass Minerals Canada Corp., Compass Minerals UK Limited, the Lenders party thereto and JPMorgan Chase Bank, N.A., as Administrative Agent (incorporated by reference to Exhibit 10.1 to Compass Minerals International, Inc.’s Current Report on Form 8-K filed on May 5, 2023).
|
| 10.9 |
Receivables Financing Agreement, dated June 30, 2020, among Compass Minerals Receivables LLC, Compass Minerals America Inc., PNC Bank, National Association, the lenders party thereto and PNC Capital Markets, LLC (incorporated herein by reference to Exhibit 10.1 to Compass Minerals International, Inc.’s Current Report on Form 8-K filed on July 1, 2020). |
| 10.10 |
First Amendment, dated June 27, 2022, to the Receivables Financing Agreement, dated June 30, 2020, among Compass Minerals Receivables LLC, Compass Minerals America Inc., PNC Bank, National Association, the lenders party thereto and PNC Capital Markets, LLC (incorporated herein by reference to Exhibit 10.2 to Compass Minerals International, Inc.’s Quarterly Report on Form 10-Q for the quarter ended June 30, 2022). |
| 10.11 |
Second Amendment, dated January 31, 2023, to the Receivables Financing Agreement, dated June 30, 2020, among Compass Minerals Receivables LLC, Compass Minerals America Inc., PNC Bank, National Association, the lenders party thereto and PNC Capital Markets, LLC. (incorporated herein by reference to Exhibit 10.2 to Compass Minerals International, Inc.’s Quarterly Report on Form 10-Q for the quarter ended December 31, 2022).
|
| 10.12 |
|
| 10.13 |
|
| 10.14 |
|
10.15+ |
|
10.16+ |
|
10.17+ |
|
10.18+ |
|
10.19+ |
|
10.20+ |
|
|
|
|
|
|
|
|
|
|
|
|
COMPASS MINERALS INTERNATIONAL, INC. |
|
|
|
|
|
|
Exhibit
No. |
Description of Exhibit |
10.21+ |
|
10.22+ |
|
10.23+ |
|
10.24+ |
|
10.25+ |
|
10.26+ |
|
10.27+ |
|
10.28+ |
|
10.29+ |
|
10.30+ |
|
10.31+ |
|
10.32* |
|
10.33+ |
|
10.34+ |
|
10.35+ |
|
10.36+ |
|
10.37+ |
|
10.38+ |
|
10.39+ |
|
10.40+ |
|
10.41+ |
|
10.42+ |
|
|
|
|
|
|
|
|
|
|
|
|
COMPASS MINERALS INTERNATIONAL, INC. |
|
|
|
|
|
|
Exhibit
No. |
Description of Exhibit |
10.43+ |
|
10.44+ |
|
10.45+ |
|
10.46+ |
|
10.47+ |
|
10.48+ |
|
10.49+ |
|
10.50* |
|
10.51+ |
|
10.52+ |
|
10.53+ |
|
10.54+ |
|
10.55+ |
|
10.56+ |
|
10.57+ |
|
10.58+ |
|
10.59+ |
|
10.60+ |
|
10.61+ |
|
10.62+ |
|
10.63+ |
|
10.64+ |
|
10.65+ |
|
|
|
|
|
|
|
|
|
|
|
|
COMPASS MINERALS INTERNATIONAL, INC. |
|
|
|
|
|
|
Exhibit
No. |
Description of Exhibit |
10.66+ |
|
10.67+ |
|
10.68+ |
|
10.69+ |
|
10.70+ |
|
10.71+ |
|
| 21.1* |
|
| 23.1* |
|
| 23.2* |
|
| 23.3* |
|
| 24.1* |
|
| 31.1* |
|
| 31.2* |
|
| 32** |
|
| 95* |
|
| 96.1 |
|
96.2 |
|
96.3 |
|
96.4 |
|
97* |
|
| 101** |
The following financial statements from the Compass Minerals International, Inc.’s Annual Report on Form 10-K for the year ended September 30, 2023, formatted in Extensive Business Reporting Language (XBRL): (i) Consolidated Balance Sheets, (ii) Consolidated Statements of Operations, (iii) Consolidated Statements of Comprehensive Income (Loss), (iv) Consolidated Statements of Stockholders’ Equity, (v) Consolidated Statements of Cash Flows, and (vi) the Notes to the Consolidated Financial Statements. |
| 104** |
Cover Page Interactive Data File (contained in Exhibit 101). |
* Filed herewith.
** Furnished herewith.
+ Management contracts and compensatory plans or arrangements.
† Exhibits and schedules have been omitted pursuant to Item 601(a)(5) of Regulation S-K and will be supplementally provided to the U.S. Securities and Exchange Commission upon request.
ITEM 16. FORM 10-K SUMMARY
None.
|
|
|
|
|
|
|
|
|
|
|
COMPASS MINERALS INTERNATIONAL, INC. |
SIGNATURES
Pursuant to the requirements of Section 13 or 15(d) of the Securities Exchange Act of 1934, the registrant has duly caused this report to be signed on its behalf by the undersigned, thereunto duly authorized.
|
|
|
|
|
|
|
|
|
|
|
|
| |
COMPASS MINERALS INTERNATIONAL, INC. |
|
| |
|
|
|
November 29, 2023 |
By: |
/s/ Lorin Crenshaw |
|
| |
|
Lorin Crenshaw |
|
| |
|
Chief Financial Officer |
|
|
|
|
|
|
|
|
|
|
|
|
COMPASS MINERALS INTERNATIONAL, INC. |
Pursuant to the requirements of the Securities Exchange Act of 1934, this report has been signed below by the following persons on behalf of the registrant and in the capacities indicated on November 29, 2023.
|
|
|
|
|
|
|
|
|
|
|
|
|
Signature |
|
Capacity |
|
|
|
|
|
/s/ Kevin S. Crutchfield |
|
President and CEO and Director |
|
Kevin S. Crutchfield |
|
(Principal Executive Officer) |
|
|
|
|
|
/s/ Lorin Crenshaw |
|
Chief Financial Officer |
|
Lorin Crenshaw |
|
(Principal Financial Officer) |
|
|
|
|
|
/s/ Teresa Cook |
|
Chief Accounting Officer |
|
Teresa Cook, CPA |
|
(Principal Accounting Officer) |
|
|
|
|
|
* |
|
Director |
|
Jon A. Chisholm |
|
|
|
|
|
|
|
* |
|
Director |
|
Richard P. Dealy |
|
|
|
|
|
|
|
* |
|
Director |
|
Edward C. Dowling, Jr. |
|
|
|
|
|
|
|
* |
|
Director |
|
Jill Gardiner |
|
|
|
|
|
|
|
* |
|
Director |
|
Gareth T. Joyce |
|
|
|
|
|
|
|
* |
|
Director |
|
Melissa M. Miller |
|
|
|
|
|
|
|
* |
|
Director |
|
Joseph E. Reece |
|
|
|
|
|
|
|
* |
|
Director |
|
Shane T. Wagnon |
|
|
|
|
|
|
|
* |
|
Director |
|
Lori A. Walker |
|
|
|
|
|
|
| * By: |
/s/ Mary L. Frontczak |
|
|
|
Mary L. Frontczak |
|
|
|
Attorney-in Fact |
|
|
EX-10.32
2
cmp-2023xex1032directorcom.htm
EX-10.32
Document
Summary of Independent Director Compensation
As of January 1, 2024
The following compensation will be provided to non-employee members of the Board of Directors (the “Board”) of Compass Minerals International, Inc. (the “Company”) pursuant to the Company’s Non-Employee Director Compensation Policy (the “Policy”).
A.Retainers and Fees, payable according to the terms of sections A and C(1) of the Policy
1. Annual Retainer. Each non-employee director will receive an $85,000 annual retainer for service on the Board, payable in equity.
2. Committee Service Fee. In addition, each non-employee director serving as a chair or member of any of the following Board committees will receive an annual fee for committee service, payable in equity, as follows:
|
|
|
|
|
|
|
|
|
| Committee |
Chair |
Members |
| Audit Committee |
$27,500 |
$10,000 |
| Compensation Committee |
$22,500 |
$10,000 |
| Nominating/Corporate Governance Committee |
$17,500 |
$7,500 |
| Environmental, Health & Safety Committee |
$17,500 |
$7,500 |
3.Non-Executive Chairman of the Board. In addition, the Non-Executive Chairman of the Board will receive an annual fee of $65,000 for service as Non-Executive Chairman of the Board, payable in equity.
B.Equity Compensation.
1.Annual Equity Award. Each non-employee director will receive an equity award with an annual equity award value of $120,000 for service on the Board.
2.Non-Executive Chairman of the Board. In addition, the Non-Executive Chairman of the Board will receive an equity award with an annual equity award value of $105,000 for service as Non-Executive Chairman of the Board.
EX-10.50
3
cmp-2023xex1050psuawardgra.htm
EX-10.50
Document
|
|
|
COMPASS MINERALS INTERNATIONAL, INC.
2020 INCENTIVE AWARD PLAN |
PERFORMANCE STOCK UNIT AWARD GRANT NOTICE
Scorecard PSU Performance Criteria
Compass Minerals International, Inc., a Delaware corporation (the “Company”), hereby grants to the participant listed below (the “Participant”) the performance stock units (the “PSUs”) described in this Performance Stock Unit Grant Notice (this “Grant Notice”), subject to the Compass Minerals International, Inc. 2020 Incentive Award Plan (as amended from time to time the “Plan”) and the Rules, Policies and Procedures for Equity Awards Granted to Employees, effective as of October 11, 2022 (the “Rules”), each of which is incorporated into this Grant Notice by reference. Capitalized terms not specifically defined in this Grant Notice have the meanings specified in the Plan or the Rules, as applicable. In addition, the PSUs are subject to the Company’s Compensation Clawback Policy, effective as of October 2, 2023, and any successor policy thereto (the “Clawback Policy”). This Grant Notice will constitute an “Award Agreement” under the terms of the Plan.
|
|
|
|
|
|
Participant: |
_______________________ |
| Grant Date: |
_______________________ |
| Number of PSUs: |
_______________________ |
| Vesting Schedule: |
Subject to achievement of the Performance Criteria set forth below, and subject to the Rules, the PSUs will vest on [to be specified in individual grant notices] ([the] [each, a] “Vesting Date”). |
| Dividend Equivalents: |
Participant will be entitled to receive Dividend Equivalents (as such term is defined in the Plan) in accordance with the terms set forth in the Rules. |
| Payment: |
Subject to the Rules, the Participant will receive a number of shares of Common Stock (in either certificate or book entry form) equal to the number of PSUs with respect to which the Performance Criteria have been satisfied within 60 days following [the Vesting Date] [[and vesting on such Vesting Date] (but in no event prior to the date the Compensation Committee of the Company’s Board of Directors determines the extent to which the Performance Criteria has been satisfied); provided, however, that if the Participant’s incurs a Termination of Service prior to [the] [any] Vesting Date under circumstances that entitle the Participant to payment under the Rules, then the time of payment and the number of shares that the Participant will receive will be determined in accordance with the Rules. For the avoidance of doubt, if the Participant incurs a Termination of Service on or following any Vesting Date but prior to the date the Compensation Committee of the Company’s Board of Directors determines the extent to which the Performance Criteria have been satisfied, the Participant will be eligible to receive a payment of shares of Common Stock hereunder with respect to the PSUs that became vested on such Vesting Date, to the extent earned hereunder. |
|
|
|
|
|
|
|
|
|
|
|
|
|
|
|
|
|
|
|
|
|
|
|
|
|
|
|
|
|
|
| Performance Period |
Scorecard PSU Performance Criteria |
|
| [____] |
The PSUs earned for the Performance Period will be based on the Company’s level of achievement of the performance metric below over the Performance Period. |
|
| Performance Achievement Level |
[____] |
Percentage of Performance Stock Units Earned |
Overall Metric Weighting |
| [____] |
[____] |
[____] |
[____] |
The number of PSUs eligible that will vest and be earned will be equal to the sum of the Earned PSUs for each Performance Criteria set forth above. For purposes of this Grant Notice, “Earned PSUs” shall mean, with respect to each Performance Criteria set forth above, the product of (i) the Target Number of PSUs, multiplied by (ii) the Overall Metric Weighting for the Performance Criteria in question, multiplied by (iii) the Percentage of PSUs Earned for the Performance Criteria in question, as determined based on the Company’s achievement of such Performance Criteria.
If performance achievement during the Performance Period with respect to a specific Performance Criteria is less than the Threshold level, then no portion of the PSUs will become vested or earned with respect to such Performance Criteria. If performance achievement during the Performance Period exceeds the Maximum level with respect to a specific Performance Criteria, then the number of PSUs vested and earned will equal the number based on Percentage of PSUs Earned for Maximum performance with respect to such Performance Criteria.
By Participant’s signature below, Participant agrees to be bound by the terms of this Grant Notice, the Plan, the Clawback Policy and the Rules. Participant has reviewed the Plan, this Grant Notice, the Clawback Policy and the Rules in their entirety, has had an opportunity to obtain the advice of counsel prior to executing this Grant Notice and fully understands all provisions of the Plan, this Grant Notice, the Clawback Policy and the Rules. If there is any conflict between the terms and conditions of this Grant Notice and the Rules, the Rules will control. Participant hereby agrees to accept as binding, conclusive and final all decisions or interpretations of the Compensation Committee of the Company’s Board of Directors upon any questions arising under this Grant Notice, the Plan, the Clawback Policy and the Rules.
|
|
|
|
|
|
|
|
|
|
|
|
| COMPASS MINERALS INTERNATIONAL, INC. |
|
PARTICIPANT |
| By: |
|
|
|
| Name: |
|
|
Participant Name: |
| Title: |
|
|
|
EX-21.1
4
cmp-2023xex211listofsubsid.htm
EX-21.1
Document
Compass Minerals International, Inc.
List of Subsidiaries as of September 30, 2023
|
|
|
|
|
|
| Company Name |
Jurisdiction of Incorporation |
| Clyman Bay Resources, Inc. |
Delaware, U.S. |
| CMI Nova Scotia Company |
Nova Scotia, Canada |
| CMP Canada Inc. |
Nova Scotia, Canada |
| CMP Capital, Inc. |
Delaware, U.S. |
| Compass Canada Limited Partnership |
Ontario, Canada |
| Compass Canada Potash Holdings Inc. |
Saskatchewan, Canada |
| Compass Cayman Holdings Ltd. |
Cayman Islands |
| Compass Minerals (Europe) Limited |
England and Wales |
| Compass Minerals America Inc. |
Delaware, U.S. |
| Compass Minerals Canada Corp. |
Nova Scotia, Canada |
| Compass Minerals Chile Limitada |
Chile |
| Compass Minerals do Brasil Ltda. |
Brazil |
Compass Minerals Europe B.V. |
Netherlands |
| Compass Minerals International Limited Partnership |
Ontario, Canada |
| Compass Minerals Lithium Corp of America Inc. |
Delaware, U.S. |
| Compass Minerals Louisiana Inc. |
Delaware, U.S. |
| Compass Minerals Nova Scotia Company |
Nova Scotia, Canada |
| Compass Minerals Ogden Inc. |
Delaware, U.S. |
| Compass Minerals Receivables LLC |
Delaware, U.S. |
| Compass Minerals Storage & Archives Limited |
England and Wales |
| Compass Minerals UK Holdings Limited |
England and Wales |
| Compass Minerals UK Limited |
England and Wales |
| Compass Minerals USA LLC |
Delaware, U.S. |
| Compass Minerals Winnipeg Unlimited Liability Company |
Nova Scotia, Canada |
| Compass Minerals Wynyard Inc. |
Saskatchewan, Canada |
| Compass Resources Canada Company |
Nova Scotia, Canada |
| Compass South American Salt Holdings Ltd. |
Cayman Islands |
| Curlew Valley Farms, LLC |
Utah, U.S. |
| DeepStore Holdings Limited |
England and Wales |
| DeepStore Limited |
England and Wales |
| Dove Creek Grazing, LLC |
Utah, U.S. |
| Fortress Asset Protection Group, LLC |
Delaware, U.S. |
| Fortress Employment Group, Inc. |
California, U.S. |
| Fortress North America, LLC |
Delaware, U.S. |
| FRS Group LLC |
Delaware, U.S. |
| Great Salt Lake Holdings, LLC |
Delaware, U.S. |
| GSL Corporation |
Delaware, U.S. |
| NAMSCO Inc. |
Delaware, U.S. |
| NASC Nova Scotia Company |
Nova Scotia, Canada |
RT 094 Empreendimentos e Participações Ltda. |
Brazil |
| Salt Union Limited |
England and Wales |
EX-23.1
5
cmp-2023xex231consentofind.htm
EX-23.1
Document
Consent of Independent Registered Public Accounting Firm
We consent to the incorporation by reference in the following Registration Statements:
(1)Registration Statement (Form S-8 No. 333-119410) of Compass Minerals International, Inc. Directors’ Deferred Compensation Plan
(2)Registration Statement (Form S-8 No. 333-121965) of Compass Minerals International, Inc. Savings Plan
(3)Registration Statement (Form S-8 No. 333-127699) of Compass Minerals International, Inc. 2005 Incentive Award Plan
(4)Registration Statement (Form S-8 333-203922) of Compass Minerals International, Inc. 2015 Incentive Award Plan
(5)Registration Statement (Form S-8 333-238252) of Compass Minerals International, Inc. 2020 Incentive Award Plan
(6)Registration Statement (Form S-8 333-265569) of Compass Minerals International, Inc. 2020 Incentive Award Plan, and
(7)Registration Statement (Form S-3 No. 333-274622), effective September 29, 2023;
of our reports dated November 29, 2023, with respect to the consolidated financial statements and schedule of Compass Minerals International, Inc., and the effectiveness of internal control over financial reporting of Compass Minerals International, Inc., included in its Annual Report (Form 10-K) for the fiscal year ended September 30, 2023.
|
|
|
|
|
|
|
|
|
|
|
|
| /s/ Ernst & Young LLP |
|
|
|
|
|
|
|
| November 29, 2023 |
|
|
|
| Kansas City, Missouri |
|
|
|
EX-23.2
6
cmp-2023xex232consentofqua.htm
EX-23.2
Document
Consent of Qualified Person
I, Joe Havasi, the Director, Natural Resources of Compass Minerals International, Inc., a Delaware corporation (the “Registrant”), am the qualified person (as defined in Item 1300 of Regulation S-K) that prepared, in accordance with Items 601(b)(96) and 1300 through 1305 of Regulation S-K: (i) the Updated Technical Report Summary relating to lithium and lithium carbonate equivalent mineral resources at the Registrant’s Ogden, Utah facility, dated September 14, 2022, with an effective date of March 3, 2022 (the “Ogden Lithium TRS”), filed as Exhibit 96.1 to the Registrant’s Current Report on Form 8-K filed on September 14, 2022 and incorporated by reference into the Registrant’s Annual Report on Form 10-K for the fiscal year ended September 30, 2023 (the “Form 10-K”); (ii) the Technical Report Summary relating to potassium and sulfate of potash, magnesium and magnesium chloride, and sodium and sodium chloride mineral resources and reserves at the Registrant’s Ogden, Utah facility, dated November 29, 2021 and amended as of December 14, 2022, with an effective date of September 30, 2021 (the “Ogden Potassium/Magnesium/Sodium TRS”) , filed as Exhibit 96.2 to the Form 10-K; (iii) the Technical Report Summary relating to the Registrant’s Cote Blanche mine, dated November 29, 2021 and amended as of December 14, 2022, with an effective date of September 30, 2021 (the “Cote Blanche TRS”), filed as Exhibit 96.3 to the Form 10-K; and (iv) the Technical Report Summary relating to the Registrant’s Goderich mine, dated November 29, 2021 and amended as of December 14, 2022, with an effective date of September 30, 2021 (collectively with the Ogden Potassium/Magnesium/Sodium TRS, the Ogden Lithium TRS and the Cote Blanche TRS, the “TRS’s”), filed as Exhibit 96.4 to the Form 10-K, and hereby consent to:
1.the filing or incorporation by reference, as applicable, of the TRS’s with or into the Form 10-K and the incorporation by reference of the TRS’s into the following registration statements of the Registrant (collectively, the “Registration Statements”):
a.Registration Statement on Form S-8 (Registration No. 333-119410), filed on September 30, 2004, relating to the Compass Minerals International, Inc. Directors’ Deferred Compensation Plan;
b.Registration Statement on Form S-8 (Registration No. 333-121965), filed on January 11, 2005, relating to the Compass Minerals International, Inc. Savings Plan;
c.Registration Statement on Form S-8 (Registration No. 333-127699), filed on August 19, 2005, relating to the Compass Minerals International, Inc. 2005 Incentive Award Plan;
d.Registration Statement on Form S-8 (Registration No. 333-203922), filed on May 6, 2015, relating to the Compass Minerals International, Inc. 2015 Incentive Award Plan;
e.Registration Statement on Form S-8 (Registration No. 333-238252), filed on May 14, 2020, relating to the Compass Minerals International, Inc. 2020 Incentive Award Plan;
f.Registration Statement on Form S-8 (Registration No. 333-265569), filed on June 14, 2022, relating to the Compass Minerals International, Inc. 2020 Incentive Award Plan; and
g.Registration Statement on Form S-3 (Registration No. 333-274622), effective September 29, 2023;
2.the use of and references to my name, including my status as an expert or qualified person (as defined in Item 1300 of Regulation S-K) with respect to the TRS’s, in connection with the Form 10-K and the Registration Statements; and
3.the inclusion in the Form 10-K of any quotation from, or summarization of, the TRS’s and the incorporation by reference into the Registration Statements of any quotation from, or summarization of, the TRS’s in the Form 10-K.
|
|
|
|
|
|
|
|
|
Date: November 29, 2023 |
/s/ Joseph Havasi |
|
| |
Name: Joseph Havasi |
|
| |
Title: Vice President, Natural Resources
Compass Minerals International, Inc.
|
|
EX-23.3
7
cmp-2023xex233consentofqua.htm
EX-23.3
Document
Consent of Qualified Person
I, Susan Patton, Principal Consultant, RESPEC, am the qualified person (as defined in Item 1300 of Regulation S-K) that reviewed, in accordance with Items 601(b)(96) and 1300 through 1305 of Regulation S-K, the Updated Technical Report Summary relating to lithium and lithium carbonate equivalent mineral resources at the Ogden, Utah facility of Compass Minerals International, Inc., a Delaware corporation (the “Registrant”), dated September 14, 2022, with an effective date of March 3, 2022 (the “TRS”), filed as Exhibit 96.1 to the Registrant’s Current Report on Form 8-K filed on September 14, 2022 and incorporated by reference into the Registrant’s Annual Report on Form 10-K for the fiscal year ended September 30, 2023 (the “Form 10-K”), and hereby consent to:
1.the incorporation by reference of the TRS into the Form 10-K and the following registration statements of the Registrant (collectively, the “Registration Statements”):
a.Registration Statement on Form S-8 (Registration No. 333-119410), filed on September 30, 2004, relating to the Compass Minerals International, Inc. Directors’ Deferred Compensation Plan;
b.Registration Statement on Form S-8 (Registration No. 333-121965), filed on January 11, 2005, relating to the Compass Minerals International, Inc. Savings Plan;
c.Registration Statement on Form S-8 (Registration No. 333-127699), filed on August 19, 2005, relating to the Compass Minerals International, Inc. 2005 Incentive Award Plan;
d.Registration Statement on Form S-8 (Registration No. 333-203922), filed on May 6, 2015, relating to the Compass Minerals International, Inc. 2015 Incentive Award Plan;
e.Registration Statement on Form S-8 (Registration No. 333-238252), filed on May 14, 2020, relating to the Compass Minerals International, Inc. 2020 Incentive Award Plan;
f.Registration Statement on Form S-8 (Registration No. 333-265569), filed on June 14, 2022, relating to the Compass Minerals International, Inc. 2020 Incentive Award Plan; and
g.Registration Statement on Form S-3 (Registration No. 333-274622), effective September 29, 2023;
2.the use of and references to my name, including my status as an expert or qualified person (as defined in Item 1300 of Regulation S-K) with respect to the TRS, in connection with the Form 10-K and the Registration Statements; and
3.the inclusion in the Form 10-K of any quotation from, or summarization of, the TRS and the incorporation by reference into the Registration Statements of any quotation from, or summarization of, the TRS in the Form 10-K.
|
|
|
|
|
|
|
|
|
Date: November 29, 2023 |
/s/ Susan Patton |
|
| |
Name: Susan Patton |
|
| |
Title: Principal Consultant
RESPEC
|
|
EX-24.1
8
cmp-2023xex241powerofattor.htm
EX-24.1
Document
COMPASS MINERALS INTERNATIONAL, INC.
ANNUAL REPORT ON FORM 10-K
POWER OF ATTORNEY
Each of the undersigned, being a director of Compass Minerals International, Inc., a Delaware corporation (the “Company”), which anticipates filing with the Securities and Exchange Commission (the “SEC”) pursuant to the provisions of the Securities Exchange Act of 1934, as amended, an Annual Report on Form 10-K (the “Annual Report”) for the fiscal year ended September 30, 2023 (together with any and all subsequent amendments), does hereby constitute and appoint Mary L. Frontczak his or her true and lawful attorney-in-fact, with full power of substitution and resubstitution, to execute and file on behalf of the undersigned, in his or her capacity as a director of the Company, the Annual Report and any and all other documents to be filed with the SEC pertaining to the Annual Report with full power and authority to do and perform any and all acts and things whatsoever required or necessary to be done in the premises, as fully as to all intents and purposes as he or she could do if personally present, hereby ratifying, approving and confirming all that said attorney-in-fact, or her substitute or substitutes, may lawfully do or cause to be done by virtue hereof.
Executed on this 20th day of November, 2023.
|
|
|
|
|
|
|
|
|
| /s/ Jon A. Chisholm |
|
/s/ Richard P. Dealy |
| Jon A. Chisholm |
|
Richard P. Dealy |
|
|
|
| /s/ Edward C. Dowling, Jr. |
|
/s/ Jill Gardiner |
| Edward C. Dowling, Jr. |
|
Jill Gardiner |
|
|
|
| /s/ Gareth T. Joyce |
|
/s/ Melissa M. Miller |
| Gareth T. Joyce |
|
Melissa M. Miller |
|
|
|
| /s/ Joseph E. Reece |
|
/s/ Shane T. Wagnon |
| Joseph E. Reece |
|
Shane T. Wagnon |
|
|
|
| /s/ Lori A. Walker |
|
|
| Lori A. Walker |
|
|
EX-31.1
9
cmp-2023xex311ceocertifica.htm
EX-31.1
Document
Exhibit 31.1
CERTIFICATION
I, Kevin S. Crutchfield, certify that:
1. I have reviewed this annual report on Form 10-K of Compass Minerals International, Inc.;
2. Based on my knowledge, this report does not contain any untrue statement of a material fact or omit to state a material fact necessary to make the statements made, in light of the circumstances under which such statements were made, not misleading with respect to the period covered by this report;
3. Based on my knowledge, the financial statements, and other financial information included in this report, fairly present in all material respects the financial condition, results of operations and cash flows of the registrant as of, and for, the periods presented in this report;
4. The registrant’s other certifying officer and I are responsible for establishing and maintaining disclosure controls and procedures (as defined in Exchange Act Rules 13a-15(e) and 15d-15(e)) and internal control over financial reporting (as defined in Exchange Act Rules 13a-15(f) and 15d-15(f)) for the registrant and have:
(a)designed such disclosure controls and procedures, or caused such disclosure controls and procedures to be designed under our supervision, to ensure that material information relating to the registrant, including its consolidated subsidiaries, is made known to us by others within those entities, particularly during the period in which this report is being prepared;
(b)designed such internal control over financial reporting, or caused such internal control over financial reporting to be designed under our supervision, to provide reasonable assurance regarding the reliability of financial reporting and the preparation of financial statements for external purposes in accordance with generally accepted accounting principles;
(c)evaluated the effectiveness of the registrant’s disclosure controls and procedures and presented in this report our conclusions about the effectiveness of the disclosure controls and procedures, as of the end of the period covered by this report based on such evaluation; and
(d)disclosed in this report any change in the registrant’s internal control over financial reporting that occurred during the registrant’s most recent fiscal quarter (the registrant’s fourth fiscal quarter in the case of an annual report) that has materially affected, or is reasonably likely to materially affect, the registrant’s internal control over financial reporting; and
5. The registrant’s other certifying officer and I have disclosed, based on our most recent evaluation of internal control over financial reporting, to the registrant’s auditors and the audit committee of the registrant’s board of directors (or persons performing the equivalent functions):
(a)all significant deficiencies and material weaknesses in the design or operation of internal control over financial reporting which are reasonably likely to adversely affect the registrant’s ability to record, process, summarize and report financial information; and
(b)any fraud, whether or not material, that involves management or other employees who have a significant role in the registrant’s internal control over financial reporting.
|
|
|
|
|
|
|
|
|
Date: November 29, 2023 |
/s/ Kevin S. Crutchfield |
|
| |
Kevin S. Crutchfield |
|
| |
President and CEO |
|
EX-31.2
10
cmp-2023xex312cfocertifica.htm
EX-31.2
Document
Exhibit 31.2
CERTIFICATION
I, Lorin Crenshaw, certify that:
1. I have reviewed this annual report on Form 10-K of Compass Minerals International, Inc.;
2. Based on my knowledge, this report does not contain any untrue statement of a material fact or omit to state a material fact necessary to make the statements made, in light of the circumstances under which such statements were made, not misleading with respect to the period covered by this report;
3. Based on my knowledge, the financial statements, and other financial information included in this report, fairly present in all material respects the financial condition, results of operations and cash flows of the registrant as of, and for, the periods presented in this report;
4. The registrant’s other certifying officer and I are responsible for establishing and maintaining disclosure controls and procedures (as defined in Exchange Act Rules 13a-15(e) and 15d-15(e)) and internal control over financial reporting (as defined in Exchange Act Rules 13a-15(f) and 15d-15(f)) for the registrant and have:
(a)designed such disclosure controls and procedures, or caused such disclosure controls and procedures to be designed under our supervision, to ensure that material information relating to the registrant, including its consolidated subsidiaries, is made known to us by others within those entities, particularly during the period in which this report is being prepared;
(b)designed such internal control over financial reporting, or caused such internal control over financial reporting to be designed under our supervision, to provide reasonable assurance regarding the reliability of financial reporting and the preparation of financial statements for external purposes in accordance with generally accepted accounting principles;
(c)evaluated the effectiveness of the registrant’s disclosure controls and procedures and presented in this report our conclusions about the effectiveness of the disclosure controls and procedures, as of the end of the period covered by this report based on such evaluation; and
(d)disclosed in this report any change in the registrant’s internal control over financial reporting that occurred during the registrant’s most recent fiscal quarter (the registrant’s fourth fiscal quarter in the case of an annual report) that has materially affected, or is reasonably likely to materially affect, the registrant’s internal control over financial reporting; and
5. The registrant’s other certifying officer and I have disclosed, based on our most recent evaluation of internal control over financial reporting, to the registrant’s auditors and the audit committee of the registrant’s board of directors (or persons performing the equivalent functions):
(a)all significant deficiencies and material weaknesses in the design or operation of internal control over financial reporting which are reasonably likely to adversely affect the registrant’s ability to record, process, summarize and report financial information; and
(b)any fraud, whether or not material, that involves management or other employees who have a significant role in the registrant’s internal control over financial reporting.
|
|
|
|
|
|
|
|
|
Date: November 29, 2023 |
/s/ Lorin Crenshaw |
|
| |
Lorin Crenshaw |
|
| |
Chief Financial Officer |
|
EX-32
11
cmp-2023xex32ceocfocertifi.htm
EX-32
Document
Exhibit 32
CERTIFICATION PURSUANT TO 18 U.S.C. §1350
Each of the undersigned hereby certifies that this annual report on Form 10-K for the period ended September 30, 2023, as filed with the Securities and Exchange Commission on the date hereof, based on my knowledge, fully complies with the requirements of Section 13(a) or 15(d) of the Securities and Exchange Act of 1934 and that the information contained in this report fairly presents, in all material respects, the financial condition and results of operations of Compass Minerals International, Inc.
|
|
|
|
|
|
|
|
|
| |
COMPASS MINERALS INTERNATIONAL, INC. |
|
| |
|
|
November 29, 2023 |
/s/ Kevin S. Crutchfield |
|
| |
Kevin S. Crutchfield |
|
| |
President and CEO |
|
| |
|
|
November 29, 2023 |
/s/ Lorin Crenshaw |
|
| |
Lorin Crenshaw |
|
| |
Chief Financial Officer |
|
EX-95
12
cmp-2023xex95minesafetydis.htm
EX-95
Document
MINE SAFETY DISCLOSURE
We understand that to prevent employee and contractor injuries, we must approach safety excellence from many directions at once. We utilize a multi-faceted approach towards world class safety performance. This approach includes (1) setting a high standard of risk mitigation, (2) having robust safety management systems, and (3) supporting a culture of full engagement and personal accountability at all levels of the organization.
We continuously monitor our safety performance by assessing injury and non-injury incidents (e.g., near misses/near hits) as well as key performance indicators. We believe our approach to safety excellence will help us deliver on our commitment to our employees, contractors, their families and our customers to provide a safe working environment.
Mine Safety Data
A subsidiary of Compass Minerals International, Inc. owns and operates the Cote Blanche mine, an underground salt mine located in St. Mary Parish, Louisiana. The Cote Blanche mine is subject to regulation by the Mine Safety and Health Administration (“MSHA”) under the Federal Mine Safety and Health Act of 1977, as amended (the “Mine Act”).
MSHA is required to regularly inspect the Cote Blanche mine and issue a citation, or take other enforcement action, if an inspector or authorized representative believes that a violation of the Mine Act or MSHA’s standards or regulations has occurred. MSHA is required to propose a civil penalty for each alleged violation that it cites.
We have the option to legally contest any enforcement action or related penalty we receive. As a result of this process, an enforcement action may be modified or vacated and any civil penalty proposed by MSHA for an alleged violation may be increased, reduced or eliminated. However, under the Mine Act, we are required to abate (or correct) each alleged violation within a specified time period, regardless of whether we contest the alleged violation.
The table below sets forth information for the quarterly period ended September 30, 2023 concerning certain mine safety violations and other regulatory matters pursuant to requirements under the Dodd-Frank Wall Street Reform and Consumer Protection Act and Securities and Exchange Commission rules and regulations. The information only applies to our operations regulated by the U.S. Mine Safety and Health Administration.
|
|
|
|
|
|
|
|
|
|
|
|
|
|
|
|
|
|
|
|
|
|
|
|
|
|
|
|
|
|
|
|
|
|
|
|
Mine Name/
Mine I.D.
Number |
Section 104 S&S Citations and Orders1 |
Section 104(b) Orders2 |
Section 104(d)
Citations or Orders3
|
Section 110(b)(2) Violations4 |
Section 107(a) Orders5 |
Total Dollar Value of MSHA Proposed Assessments
(Actual Amount) |
Total Number of Mining Related Fatalities |
Received Notice of Pattern of Violations under Section 104(e)
(Yes/No)6
|
Legal Actions Pending as of Last Day of Period |
Legal Actions Initiated During Period7 |
Legal Actions Resolved During Period |
Cote Blanche Mine/
16-00358 |
5 |
0 |
0 |
0 |
0 |
$15,823 |
0 |
No |
0 |
1 |
0 |
1 Represents the number of citations and orders issued under Section 104 of the Mine Act for alleged violations of mandatory health or safety standards that could significantly and substantially contribute to a mine health and safety hazard. The number reported includes no orders alleging an S&S violation issued under Section 104(g) of the Mine Act.
2 Represents the number of orders issued under Section 104(b) of the Mine Act for alleged failures to abate a citation issued under Section 104(a) of the Mine Act within the time period specified in the citation.
3 Represents the number of citations and orders issued under Section 104(d) of the Mine Act for alleged unwarrantable failures (aggravated conduct constituting more than ordinary negligence) to comply with mandatory safety or health standards.
4 Represents the number of violations issued under section 110(b)(2) of the Mine Act for alleged “flagrant” failures (reckless or repeated failures) to make reasonable efforts to eliminate a known violation of a mandatory safety or health standard that substantially proximately caused, or reasonably could have been expected to cause, death or serious bodily injury.
5 Represents the number of orders issued under Section 107(a) of the Mine Act for alleged conditions or practices which could reasonably be expected to cause death or serious physical harm before the condition or practice can be abated.
6 Section 104(e) written notices are issued for an alleged pattern of violating mandatory health or safety standards that could significantly and substantially contribute to a mine safety or health hazard.
7 Represents one civil penalty proceeding involving the contest of Citation Nos. 9671091 and 9671092.
EX-97
13
cmp-2023xex97clawbackpolicy.htm
EX-97
Document
COMPASS MINERALS INTERNATIONAL, INC. POLICY FOR RECOVERY OF ERRONEOUSLY AWARDED COMPENSATION
Compass Minerals International, Inc. (the “Company”) has adopted this Policy for Recovery of Erroneously Awarded Compensation (the “Policy”), effective as of October 2, 2023 (the “Effective Date”). Capitalized terms used in this Policy but not otherwise defined herein are defined in Section 11.
1.Persons Subject to Policy
This Policy shall apply to current and former Officers of the Company.
2. Compensation Subject to Policy
This Policy shall apply to Incentive-Based Compensation received on or after the Effective Date. For purposes of this Policy, the date on which Incentive-Based Compensation is “received” shall be determined under the Applicable Rules, which generally provide that Incentive-Based Compensation is “received” in the Company’s fiscal period during which the relevant Financial Reporting Measure is attained or satisfied, without regard to whether the grant, vesting or payment of the Incentive-Based Compensation occurs after the end of that period.
3. Recovery of Compensation
In the event that the Company is required to prepare a Restatement, the Company shall recover, reasonably promptly, the portion of any Incentive-Based Compensation that is Erroneously Awarded Compensation, unless the Committee has determined that recovery would be Impracticable. Recovery shall be required in accordance with the preceding sentence regardless of whether the applicable Officer engaged in misconduct or otherwise caused or contributed to the requirement for the Restatement and regardless of whether or when restated financial statements are filed by the Company. For clarity, the recovery of Erroneously Awarded Compensation under this Policy will not give rise to any person’s right to voluntarily terminate employment for “good reason,” or due to a “constructive termination” (or any similar term of like effect) under any plan, program or policy of or agreement with the Company or any of its affiliates.
4. Manner of Recovery; Limitation on Duplicative Recovery
The Committee shall, in its sole discretion, determine the manner of recovery of any Erroneously Awarded Compensation, which may include, without limitation, reduction or cancellation by the Company or an affiliate of the Company of Incentive-Based Compensation or Erroneously Awarded Compensation, reimbursement or repayment by any person subject to this Policy of the Erroneously Awarded Compensation, and, to the extent permitted by law, an offset of the Erroneously Awarded Compensation against other compensation payable by the Company or an affiliate of the Company to such person. Notwithstanding the foregoing, unless otherwise prohibited by the Applicable Rules, to the extent this Policy provides for recovery of Erroneously Awarded Compensation already recovered by the Company pursuant to Section 304 of the Sarbanes-Oxley Act of 2002 or Other Recovery Arrangements, the amount of Erroneously Awarded Compensation already recovered by the Company from the recipient of such Erroneously Awarded Compensation may be credited to the amount of Erroneously Awarded Compensation required to be recovered pursuant to this Policy from such person.
5. Administration
This Policy shall be administered, interpreted and construed by the Committee, which is authorized to make all determinations necessary, appropriate or advisable for such purpose. The Board of Directors of the Company (the “Board”) may re-vest in itself the authority to administer, interpret and construe this Policy in accordance with applicable law, and in such event references herein to the “Committee” shall be deemed to be references to the Board. Subject to any permitted review by the applicable national securities exchange or association pursuant to the Applicable Rules, all determinations and decisions made by the Committee pursuant to the provisions of this Policy shall be final, conclusive and binding on all persons, including the Company and its affiliates, equityholders and employees. The Committee may delegate administrative duties with respect to this Policy to one or more directors or employees of the Company, as permitted under applicable law, including any Applicable Rules.
6. Interpretation
This Policy will be interpreted and applied in a manner that is consistent with the requirements of the Applicable Rules, and to the extent this Policy is inconsistent with such Applicable Rules, it shall be deemed amended to the minimum extent necessary to ensure compliance therewith.
7. No Indemnification; No Liability
The Company shall not indemnify or insure any person against the loss of any Erroneously Awarded Compensation pursuant to this Policy, nor shall the Company directly or indirectly pay or reimburse any person for any premiums for third-party insurance policies that such person may elect to purchase to fund such person’s potential obligations under this Policy. None of the Company, an affiliate of the Company or any member of the Committee or the Board shall have any liability to any person as a result of actions taken under this Policy.
8. Application; Enforceability
Except as otherwise determined by the Committee or the Board, the adoption of this Policy does not limit, and is intended to apply in addition to, any other clawback, recoupment, forfeiture or similar policies or provisions of the Company or its affiliates, including any such policies or provisions of such effect contained in any employment agreement, bonus plan, incentive plan, equity-based plan or award agreement thereunder or similar plan, program or agreement of the Company or an affiliate or required under applicable law (the “Other Recovery Arrangements”). The remedy specified in this Policy shall not be exclusive and shall be in addition to every other right or remedy at law or in equity that may be available to the Company or an affiliate of the Company.
9. Severability
The provisions in this Policy are intended to be applied to the fullest extent of the law; provided, however, to the extent that any provision of this Policy is found to be unenforceable or invalid under any applicable law, such provision will be applied to the maximum extent permitted, and shall automatically be deemed amended in a manner consistent with its objectives to the extent necessary to conform to any limitations required under applicable law.
10. Amendment and Termination
The Board or the Committee may amend, modify or terminate this Policy in whole or in part at any time and from time to time in its sole discretion. This Policy will terminate automatically when the Company does not have a class of securities listed on a national securities exchange or association.
11. Definitions
“Applicable Rules” means Section 10D of the Exchange Act, Rule 10D-1 promulgated thereunder, the listing rules of the national securities exchange or association on which the Company’s securities are listed, and any applicable rules, standards or other guidance adopted by the Securities and Exchange Commission or any national securities exchange or association on which the Company’s securities are listed.
“Committee” means the committee of the Board responsible for executive compensation decisions comprised solely of independent directors (as determined under the Applicable Rules), or in the absence of such a committee, a majority of the independent directors serving on the Board.
“Erroneously Awarded Compensation” means the amount of Incentive-Based Compensation received by a current or former Officer that exceeds the amount of Incentive-Based Compensation that would have been received by such current or former Officer based on a restated Financial Reporting Measure, as determined on a pre-tax basis in accordance with the Applicable Rules.
“Exchange Act” means the Securities Exchange Act of 1934, as amended.
“Financial Reporting Measure” means any measure determined and presented in accordance with the accounting principles used in preparing the Company’s financial statements, and any measures derived wholly or in part from such measures, including GAAP, IFRS and non-GAAP/IFRS financial measures, as well as stock or share price and total equityholder return.
“GAAP” means United States generally accepted accounting principles.
“IFRS” means international financial reporting standards as adopted by the International Accounting Standards Board.
“Impracticable” means (a) the direct costs paid to third parties to assist in enforcing recovery would exceed the Erroneously Awarded Compensation; provided that the Company (i)
has made reasonable attempts to recover the Erroneously Awarded Compensation, (ii) documented such attempt(s), and (iii) provided such documentation to the relevant listing exchange or association, (b) to the extent permitted by the Applicable Rules, the recovery would violate the Company’s home country laws pursuant to an opinion of home country counsel; provided that the Company has (i) obtained an opinion of home country counsel, acceptable to the relevant listing exchange or association, that recovery would result in such violation, and (ii) provided such opinion to the relevant listing exchange or association, or (c) recovery would likely cause an otherwise tax-qualified retirement plan, under which benefits are broadly available to employees of the Company, to fail to meet the requirements of 26 U.S.C. 401(a)(13) or 26 U.S.C. 411(a) and the regulations thereunder.
“Incentive-Based Compensation” means, with respect to a Restatement, any compensation that is granted, earned, or vested based wholly or in part upon the attainment of one or more Financial Reporting Measures and received by a person: (a) after beginning service as an Officer; (b) who served as an Officer at any time during the performance period for that compensation; (c) while the issuer has a class of its securities listed on a national securities exchange or association; and (d) during the applicable Three-Year Period.
“Officer” means each person who serves as an executive officer of the Company, as defined in Rule 10D‑1(d) under the Exchange Act.
“Restatement” means an accounting restatement to correct the Company’s material noncompliance with any financial reporting requirement under securities laws, including restatements that correct an error in previously issued financial statements (a) that is material to the previously issued financial statements or (b) that would result in a material misstatement if the error were corrected in the current period or left uncorrected in the current period.
“Three-Year Period” means, with respect to a Restatement, the three completed fiscal years immediately preceding the date that the Board, a committee of the Board, or the officer or officers of the Company authorized to take such action if Board action is not required, concludes, or reasonably should have concluded, that the Company is required to prepare such Restatement, or, if earlier, the date on which a court, regulator or other legally authorized body directs the Company to prepare such Restatement. The “Three-Year Period” also includes any transition period (that results from a change in the Company’s fiscal year) within or immediately following the three completed fiscal years identified in the preceding sentence. However, a transition period between the last day of the Company’s previous fiscal year end and the first day of its new fiscal year that comprises a period of nine to 12 months shall be deemed a completed fiscal year.