 エドガーで原本を確認する
UNITED STATES
SECURITIES AND EXCHANGE COMMISSION
Washington, D.C. 20549
FORM
Report of Foreign Private Issuer
Pursuant to Rule 13a-16 or 15d-16
of the Securities Exchange Act of 1934
For the Month of August
Commission File Number
(Translation of registrant’s name into English)
2 Holzman Street
Science Park, P.O. Box 4081
Rehovot 7670402
Israel
(Address of principal executive offices)
Indicate by check mark whether the registrant files or will file annual reports under cover Form 20-F or Form 40-F.
Form 20-F ☒ Form 40-F ☐
This Form 6-K is being incorporated by reference into the Registrant’s Form S-8 Registration Statements, File Nos. 333-192720, 333-207933, 333-215983, 333-222891, 333-233267 and 333-265866.
The following exhibits are attached:
| 99.1 | Kamada Reports Record-High First Half and Second Quarter 2026 Financial Results, Representing Double-Digit Profitable Growth and the Strongest in Kamada's History; Affirms 2026 Annual Guidance | |
| 99.2 | Company’s Presentation – August 2026 | |
| 99.3 | Kamada Ltd’s Consolidated Financial Statements as of June 30, 2026 (Unaudited) | |
| 99.4 | Kamada Announces Planned Transition of Chief Financial Officer | |
| 101.INS | Inline XBRL Instance Document | |
| 101.SCH | Inline XBRL Taxonomy Extension Schema Document | |
| 101.CAL | Inline XBRL Taxonomy Extension Calculation Linkbase Document | |
| 101.DEF | Inline XBRL Taxonomy Extension Definition Linkbase Document | |
| 101.LAB | Inline XBRL Taxonomy Extension Label Linkbase Document | |
| 101.PRE | Inline XBRL Taxonomy Extension Presentation Linkbase Document | |
| 104 | Cover Page Interactive Data File (formatted as Inline XBRL and contained in Exhibit 101) |
1
SIGNATURE
Pursuant to the requirements of the Securities Exchange Act of 1934, the registrant has duly caused this report to be signed on its behalf by the undersigned hereunto duly authorized.
| Date: August 12, 2026 | KAMADA LTD. | |
| By: | /s/ Nir Livneh | |
| Nir Livneh | ||
| Vice President General Counsel and Corporate Secretary | ||
2
EXHIBIT INDEX
| EXHIBIT NO. | DESCRIPTION | |
| 99.1 | Kamada Reports Record-High First Half and Second Quarter 2026 Financial Results, Representing Double-Digit Profitable Growth and the Strongest in Kamada's History; Affirms 2026 Annual Guidance | |
| 99.2 | Company’s Presentation – August 2026 | |
| 99.3 | Kamada Ltd’s Consolidated Financial Statements as of June 30, 2026 (Unaudited) | |
| 99.4 | Kamada Announces Planned Transition of Chief Financial Officer | |
| 101.INS | Inline XBRL Instance Document | |
| 101.SCH | Inline XBRL Taxonomy Extension Schema Document | |
| 101.CAL | Inline XBRL Taxonomy Extension Calculation Linkbase Document | |
| 101.DEF | Inline XBRL Taxonomy Extension Definition Linkbase Document | |
| 101.LAB | Inline XBRL Taxonomy Extension Label Linkbase Document | |
| 101.PRE | Inline XBRL Taxonomy Extension Presentation Linkbase Document | |
| 104 | Cover Page Interactive Data File (formatted as Inline XBRL and contained in Exhibit 101) |
3
Exhibit 99.1
Kamada Reports Record-High First Half and Second Quarter 2026 Financial Results, Representing Double-Digit Profitable Growth and the Strongest in Kamada's History; Affirms 2026 Annual Guidance
| ● | Record-High First Half Revenues of $100.2 Million, up 13% Year-over-Year; Record-High First Half Adjusted EBITDA of $25.7 Million, a 26% margin of Revenues, up 14% Year-over-Year |
| ● | Record-High Second Quarter Revenues of $54.9 Million, up 23% Year-over-Year; Second Quarter Adjusted EBITDA of $14.1 Million, a 26% margin of Revenues, up 29% Year-over-Year |
| ● | Net Income for the First Half was $13.4 Million, up 18% Year-over-Year; Second Quarter Net Income of $9.3 Million, up 26% Year-over-Year |
| ● | Company Affirms 2026 Annual Guidance of $200 Million – $205 Million in Revenues and $50 Million – $53 Million of Adjusted EBITDA, Representing Annual Double-Digit Organic Profitable Growth |
| ● | Strong Cash Generated from Operating Activities of $17.8 Million During the First Six Months of 2026, Compared to $7.5 Million During the First Six Months of 2025 |
| ● | Secured a First-Time Strategic Three-Year Sales Agreement of approximately $50 Million to Supply Plasma to a Leading Biopharmaceutical Company |
| ● | Company Remains Focused on Accelerating Growth Through Business Development and M&A Transactions |
| ● | Conference Call and Live Webcast Today at 8:30am ET |
REHOVOT, Israel, and HOBOKEN, NJ – August 12, 2026 -- Kamada Ltd. (NASDAQ: KMDA; TASE: KMDA.TA), a global biopharmaceutical company with a portfolio of marketed products indicated for rare and serious conditions and a leader in the specialty plasma-derived therapies field, today announced financial results for the three months and six months ended June 30, 2026.
“We continue to execute on our plan delivering record-high operational and financial performance during the first half of 2026, with strong double-digit growth in revenues and adjusted EBITDA for both the six-month and second quarter reporting periods,” said Amir London, Kamada’s Chief Executive Officer. “The first half of the year was the strongest in Kamada’s history with revenues of $100.2 million and adjusted EBITDA of $25.7 million, representing notable 26% margin of revenues. The underlying demand for our products, including KEDRAB® in the U.S. market, as well as VARIZIG® and HEPAGAM®, continues to increase significantly. Based on our first half performance, representing approximately 50% of our annual guidance midpoints, we are reiterating our 2026 annual guidance of $200 million to $205 million in revenues and $50 million to $53 million of adjusted EBITDA, respectively, representing 12% and 23% growth when comparing 2026 guidance mid-points to 2025 results.”
“For the second half of 2026, our focus continues to be on growing sales of our entire commercial portfolio, including our six FDA-approved specialty plasma-derived products. In our Distribution segment, growth is supported by the launch of additional biosimilar products in the Israeli market, as well as the expansion of the Distribution business to the MENA region, which is already ongoing with new distribution agreements being signed. We continue to ramp up plasma collection at our Texas-based facilities in support of our new three-year sale agreement of approximately $50 million. Lastly, securing new business development and M&A opportunities remain a core focus, and we are committed to expanding our current commercial portfolio and accelerating our current annual double-digit organic growth in the years to come,” concluded Mr. London.
Financial Highlights for the Three Months Ended June 30, 2026
| ● | Record-high total revenues of $54.9 million for the second quarter of 2026, up 23% compared to $44.8 million in the second quarter of 2025. The increase in revenues was driven by the diversity of the Company’s portfolio, primarily attributable to increased sales of KEDRAB in the U.S. market and VARIZIG and HEPAGAM. |
| ● | Gross profit and gross margins were $22.5 million and 41%, respectively, in the second quarter of 2026, as compared to $18.9 million and 42%, respectively, in the second quarter of 2025. The increase in gross profit is in line with the increase in total revenues. |
| ● | Operating expenses, including R&D, S&M, G&A and other expenses, totaled $13.0 million in the second quarter of 2026, as compared to $11.9 million in the second quarter of 2025. The increase was in support of our increased commercial operations. |
| ● | Net income was $9.3 million, or $0.16 per diluted share, in the second quarter of 2026, up 26% compared to $7.4 million, or $0.13 per diluted share, in the second quarter of 2025. |
| ● | Adjusted EBITDA, as detailed in the tables below, was $14.1 million in the second quarter of 2026, up 29% compared to $10.9 million in the second quarter of 2025. Adjusted EBITDA for the second quarter represents a 26% margin of revenues and is the outcome of our continued profitable commercial growth. |
| ● | Cash provided by operating activities was $18.1 million in the second quarter of 2026, as compared to $8.0 million in the second quarter of 2025. The increase in operating cash flow is indicative of the Company’s ability to convert its increased profitability into cash-flow. |
Financial Highlights for the Six Months Ended June 30, 2026
| ● | Record-high total revenues for the first six months of 2026 were $100.2 million, a 13% increase from $88.8 million generated in the first six months of 2025. The increase in revenues was driven by the diversity of the Company’s portfolio, primarily attributable to increased sales of KEDRAB in the U.S. market and VARIZIG and HEPAGAM. Total revenues for the first six months of 2026 are at approximately 50% of the mid-point of the 2026 annual guidance. |
| ● | Gross profit and gross margins for the first six months of 2026 were $41.6 million and 42%, respectively, compared to $39.7 million and 45%, respectively, in the first six months of 2025. The increase in gross profit is in line with the increase in total revenues. |
| ● | Operating expenses, including R&D, S&M, G&A and other expenses, totaled $25.1 million for the first six months of 2026, as compared to $24.8 million in the first six months of 2025, resulting from the continued disciplined management of our operational expenses while supporting the Company’s expanded commercial operations. |
| ● | Net income for the first six months of 2026 was $13.4 million, or $0.23 per diluted share, up 18% as compared to $11.3 million, or $0.19 per diluted share, in the first six months of 2025. |
| ● | Record-high Adjusted EBITDA, as detailed in the tables below, was $25.7 million in the first six months of 2026, a 14% increase as compared to $22.5 million in the first six months of 2025. Adjusted EBITDA for the first six months of 2026 is at 50% of the mid-point of the 2026 annual guidance. |
| ● | Cash provided by operating activities during the first six months of 2026 was approximately $17.8 million, as compared to $7.5 million during the first six months of 2025. The increase in operating cash flow is indicative of the Company’s ability to convert its increased profitability into cash-flow. |
2
Balance Sheet Highlights
As of June 30, 2026, Kamada had cash and cash equivalents and short-term investment totaling $70.1 million, as compared to $75.5 million as of December 31, 2025. During the second quarter, the Company executed the $14.4 million dividend payment.
Recent Corporate Highlights
| ● | Announced a three-year sales agreement of approximately $50 million to supply plasma to a leading biopharmaceutical company focused on plasma-derived therapies. Initial commercial sales under the agreement are expected to be recorded in the fourth quarter of 2026. Expected fourth quarter sales from this agreement are included in the Company’s current annual guidance. |
| ● | Announced that results of an Investigator-Initiated Study were presented at the 2026 International Society for Heart and Lung Transplant (ISHLT). Findings from analyses of CMV high-risk lung transplant recipients suggested CYTOGAM use is associated with improved clinical outcomes, supporting increased CYTOGAM utilization. The study is part of the Company’s comprehensive post-marketing research program aimed at generating key data in support of the benefits of CYTOGAM in the management of cytomegalovirus (CMV) in solid organ transplantation. |
| ● | Announced FDA approval of the Company’s new in-house Rapid Fluorescent Focus Inhibition Test (RFFIT) laboratory. RFFIT is the gold standard neutralizing test used to measure the level of rabies-neutralizing antibodies. |
| ● | Paid cash dividend of $0.25 (approximately NIS 0.77) per share on the Company’s ordinary shares (totaling approximately $14.4 million). The cash dividend was paid on April 7, 2026, to shareholders of record at the close of business on March 23, 2026. |
| ● | Concluded a renewal of the collective bargaining agreement with Histadrut - General Federation of Labor in Israel and the Employees’ Committee of Kamada’s Beit Kama production facility in Israel for a period of four years ending on December 31, 2029. |
Fiscal 2026 Guidance
Kamada is reiterating its 2026 annual financial guidance of total revenues in the range of $200 million to $205 million, and adjusted EBITDA in the range of $50 million to $53 million, representing year-over-year increase of 12% in revenues and 23% in adjusted EBITDA based on mid-point of 2026 annual guidance.
Conference Call Details
Kamada management will host an investment community conference call on Wednesday, August 12, at 8:30am Eastern Time to discuss these results and answer questions. Shareholders and other interested parties may participate in the call by dialing 1-877-407-0792 (from within the U.S.), 1-809-406-247 (from Israel), or 1-201-689- 8263 (International) using conference I.D. 13761830. The call will be webcast live on the internet at: https://viavid.webcasts.com/starthere.jsp?ei=1770235&tp_key=a29c72f53b.
Non-IFRS financial measures
We present EBITDA and adjusted EBITDA because we use these non-IFRS financial measures to assess our operational performance, for financial and operational decision-making, and as a means to evaluate period-to-period comparisons on a consistent basis. Management believes these non-IFRS financial measures are useful to investors because: (1) they allow for greater transparency with respect to key metrics used by management in its financial and operational decision-making and provide investors with a meaningful perspective on the current underlying performance of the Company’s core ongoing operations; and (2) they exclude the impact of certain items that are not directly attributable to our core operating performance and that may obscure trends in the core operating performance of the business. Non-IFRS financial measures have limitations as an analytical tool and should not be considered in isolation from, or as a substitute for, our IFRS results. We expect to continue reporting non-IFRS financial measures, adjusting for the items described below, and we expect to continue to incur expenses similar to certain of the non-cash, non-IFRS adjustments described below. Accordingly, unless otherwise stated, the exclusion of these and other similar items in the presentation of non-IFRS financial measures should not be construed as an inference that these items are unusual, infrequent or non-recurring. EBITDA and adjusted EBITDA are not recognized terms under IFRS and do not purport to be an alternative to IFRS terms as an indicator of operating performance or any other IFRS measure. Moreover, because not all companies use identical measures and calculations, the presentation of EBITDA and adjusted EBITDA may not be comparable to other similarly titled measures of other companies. EBITDA is defined as net income (loss), plus income tax expense, plus or minus financial income or expenses, net, plus or minus income or expense in respect of securities measured at fair value, net, plus or minus income or expenses in respect of currency exchange differences and derivatives instruments, net, plus depreciation and amortization expense, whereas adjusted EBITDA is the EBITDA plus non-cash share-based compensation expenses and certain other costs.
3
For the projected 2026 adjusted EBITDA information presented herein, the Company is unable to provide a reconciliation of this forward measure to the most comparable IFRS financial measure because the information for these measures is dependent on future events, many of which are outside of the Company’s control. Additionally, estimating such forward-looking measures and providing a meaningful reconciliation consistent with the Company’s accounting policies for future periods is meaningfully difficult and requires a level of precision that is unavailable for these future periods and cannot be accomplished without unreasonable effort. Forward-looking non-IFRS measures are estimated in a manner consistent with the relevant definitions and assumptions noted in the Company’s adjusted EBITDA for historical periods.
About Kamada
Kamada Ltd. (the “Company”) is a global biopharmaceutical company with a portfolio of marketed products indicated for rare and serious conditions and a leader in the specialty plasma-derived therapies field. FIMI Opportunity Funds, the leading private equity firm in Israel, is the Company’s controlling shareholder, beneficially owning approximately 38% of the outstanding ordinary shares. The Company’s strategy is focused on driving profitable growth through four primary growth pillars: First, organic growth of its commercial portfolio, including continued investment in the commercialization and life cycle management of its proprietary products, consisting of six FDA-approved specialty plasma-derived products: KEDRAB®, GLASSIA®, CYTOGAM®, VARIZIG®, WINRHO SDF® and HEPAGAM B®, as well as KAMRAB®, and two equine-based anti-snake venom products. Second, distribution of third parties' pharmaceutical products in Israel & the MENA region through in-licensing partnerships, including the launch of several biosimilar products in Israel. Third, the Company is ramping up its plasma collection operations to support revenue growth through the sale of normal source plasma to other plasma-derived manufacturers, and to support its increasing demand for hyper-immune plasma. The Company currently owns three FDA approved operating plasma collection centers in the United States, in Beaumont, Houston, and San Antonio, Texas. Fourth, the Company aims to secure new mergers and acquisitions, business development, in-licensing and/or collaboration opportunities, which are anticipated to enhance the Company’s marketed products portfolio and leverage its financial strength and existing commercial infrastructure to drive long-term profitable growth. The Company is leveraging its manufacturing, research and development expertise to advance the development and commercialization of additional product candidates, targeting areas of significant unmet medical need.
Cautionary Note Regarding Forward-Looking Statements
This release includes forward-looking statements within the meaning of Section 21E of the U.S. Securities Exchange Act of 1934, as amended, and the safe harbor provisions of the U.S. Private Securities Litigation Reform Act of 1995. Forward-looking statements are statements that are not historical facts, including statements regarding: 1) Kamada’s re-affirmation of its 2026 annual financial guidance; 2) expected growth in sales of the Company’s commercial portfolio and Distribution segment; 3) the expected timing and contribution of plasma sales under the Company’s new supply agreement, including revenue contributions to 2026 financial results; 4) the Company’s ability to secure new business development and M&A opportunities; 5) the Company’s expectations regarding long-term double-digit profitable growth; 6) the Company’s ability to convert profitability into cash flows; 7) the Company’s ability to expand its current commercial portfolio; and 8) optimism about increased sales of CYTOGAM based on results of an Investigator-Initiated Study. Forward-looking statements are based on Kamada’s current knowledge and its present beliefs and expectations regarding possible future events and are subject to risks, uncertainties and assumptions. Actual results and the timing of events could differ materially from those anticipated in these forward-looking statements as a result of several factors including, but not limited to the evolving nature of the conflicts in the Middle East and the impact of such conflicts in Israel, the Middle East and the rest of the world, the impact of these conflicts on market conditions and the general economic, industry and political conditions in Israel, the U.S. and globally, the effect of tariffs on overall international trade and specifically on Kamada’s ability to continue maintaining expected sales and profit levels in light of such tariffs, the effect on the establishment and timing of business initiatives, Kamada’s ability to find business development and M&A transactions and leverage such opportunities and successfully integrate such opportunities with its existing product portfolio, unexpected results of clinical and development programs, regulatory delays, and other risks detailed in Kamada’s filings with the U.S. Securities and Exchange Commission (the “SEC”) including those discussed in its most recent Annual Report on Form 20-F and in any subsequent reports on Form 6-K, each of which is on file or furnished with the SEC and available at the SEC’s website at www.sec.gov. The forward-looking statements made herein speak only as of the date of this announcement and Kamada undertakes no obligation to update publicly such forward-looking statements to reflect subsequent events or circumstances, except as otherwise required by law.
CONTACTS:
Chaime Orlev
Chief Financial Officer
IR@kamada.com
Brian Ritchie
LifeSci Advisors, LLC
212-915-2578
britchie@LifeSciAdvisors.com
---tables to follow---
4
CONSOLIDATED STATEMENTS OF FINANCIAL POSITION
| As of | As of | |||||||||||
| June 30, | December 31, | |||||||||||
| 2026 | 2025 | 2025 | ||||||||||
| Unaudited | ||||||||||||
| U.S. Dollars in Thousands | ||||||||||||
| Assets | ||||||||||||
| Current Assets | ||||||||||||
| Cash and cash equivalents | $ | 29,473 | $ | 65,985 | $ | 75,469 | ||||||
| Short-term investments | 40,660 | - | - | |||||||||
| Trade receivables, net | 36,707 | 30,501 | 27,007 | |||||||||
| Other accounts receivables | 5,859 | 4,704 | 5,656 | |||||||||
| Inventories | 86,875 | 82,079 | 84,943 | |||||||||
| Total Current Assets | 199,574 | 183,269 | 193,075 | |||||||||
| Non-Current Assets | ||||||||||||
| Property, plant and equipment, net | 43,271 | 37,894 | 41,367 | |||||||||
| Right-of-use assets | 8,730 | 9,250 | 8,900 | |||||||||
| Intangible assets, and other long-term assets | 93,967 | 99,640 | 97,511 | |||||||||
| Goodwill | 30,313 | 30,313 | 30,313 | |||||||||
| Contract assets | 7,307 | 7,807 | 7,544 | |||||||||
| Total Non-Current Assets | 183,588 | 184,904 | 185,635 | |||||||||
| Total Assets | $ | 383,162 | $ | 368,173 | $ | 378,710 | ||||||
| Liabilities | ||||||||||||
| Current Liabilities | ||||||||||||
| Current maturities of lease liabilities | 2,286 | 1,866 | 2,121 | |||||||||
| Current maturities of other long term liabilities | 6,031 | 9,850 | 9,923 | |||||||||
| Trade payables | 28,351 | 25,077 | 23,242 | |||||||||
| Other accounts payables | 12,330 | 8,804 | 12,108 | |||||||||
| Deferred revenues | 161 | 177 | - | |||||||||
| Total Current Liabilities | 49,159 | 45,774 | 47,394 | |||||||||
| Non-Current Liabilities | ||||||||||||
| Lease liabilities | 9,515 | 9,549 | 9,440 | |||||||||
| Contingent consideration | 21,327 | 18,884 | 20,372 | |||||||||
| Other long-term liabilities | 28,962 | 32,782 | 30,113 | |||||||||
| Deferred taxes | 3,820 | 659 | 1,651 | |||||||||
| Employee benefit liabilities, net | 821 | 571 | 670 | |||||||||
| Total Non-Current Liabilities | 64,445 | 62,445 | 62,246 | |||||||||
| Shareholder’s Equity | ||||||||||||
| Ordinary shares | 15,081 | 15,077 | 15,078 | |||||||||
| Additional paid in capital net | 268,404 | 268,243 | 268,283 | |||||||||
| Capital reserve due to translation to presentation currency | (3,490 | ) | (3,490 | ) | (3,490 | ) | ||||||
| Capital reserve from hedges | 160 | 456 | 177 | |||||||||
| Capital reserve from share-based payments | 7,110 | 5,226 | 5,711 | |||||||||
| Capital reserve from employee benefits | 394 | 374 | 385 | |||||||||
| Accumulated deficit | (18,101 | ) | (25,932 | ) | (17,074 | ) | ||||||
| Total Shareholder’s Equity | 269,558 | 259,954 | 269,070 | |||||||||
| Total Liabilities and Shareholder’s Equity | $ | 383,162 | $ | 368,173 | $ | 378,710 | ||||||
5
CONSOLIDATED STATEMENTS OF PROFIT OR LOSS AND OTHER COMPREHENSIVE INCOME
| Six months period ended | Three months period ended | Year ended | ||||||||||||||||||
| June 30, | June 30, | December 31, | ||||||||||||||||||
| 2026 | 2025 | 2026 | 2025 | 2025 | ||||||||||||||||
| Unaudited | Unaudited | |||||||||||||||||||
| U.S. Dollars in Thousands | ||||||||||||||||||||
| Revenues from proprietary products | $ | 83,926 | $ | 78,453 | $ | 47,699 | $ | 38,436 | $ | 156,206 | ||||||||||
| Revenues from distribution | 16,235 | 10,319 | 7,222 | 6,318 | 24,254 | |||||||||||||||
| Total revenues | 100,161 | 88,772 | 54,921 | 44,754 | 180,460 | |||||||||||||||
| Cost of revenues from proprietary products | 44,806 | 40,580 | 26,604 | 20,842 | 83,928 | |||||||||||||||
| Cost of revenues from distribution | 13,772 | 8,514 | 5,850 | 4,983 | 20,125 | |||||||||||||||
| Total cost of revenues | 58,578 | 49,094 | 32,454 | 25,825 | 104,053 | |||||||||||||||
| Gross profit | 41,583 | 39,678 | 22,467 | 18,929 | 76,407 | |||||||||||||||
| Research and development expenses | 4,381 | 7,465 | 2,200 | 3,219 | 12,995 | |||||||||||||||
| Selling and marketing expenses | 9,691 | 9,068 | 4,938 | 4,558 | 18,455 | |||||||||||||||
| General and administrative expenses | 11,048 | 8,265 | 5,819 | 4,067 | 18,724 | |||||||||||||||
| Other expenses | - | 14 | - | 14 | - | |||||||||||||||
| Operating income | 16,463 | 14,866 | 9,510 | 7,071 | 26,233 | |||||||||||||||
| Financial income | 859 | 987 | 434 | 453 | 1,921 | |||||||||||||||
| Income (expenses) in respect of currency exchange differences and derivatives instruments, net | (693 | ) | (723 | ) | (432 | ) | (974 | ) | (1,171 | ) | ||||||||||
| Revaluation of long- term liabilities | (490 | ) | (2,380 | ) | 1,048 | (605 | ) | (2,652 | ) | |||||||||||
| Financial expenses | (559 | ) | (384 | ) | (371 | ) | (192 | ) | (864 | ) | ||||||||||
| Income before tax on income | 15,580 | 12,366 | 10,189 | 5,753 | 23,467 | |||||||||||||||
| Taxes on income | (2,186 | ) | (1,026 | ) | (927 | ) | 1,623 | (3,269 | ) | |||||||||||
| Net Income | $ | 13,394 | $ | 11,340 | $ | 9,262 | $ | 7,376 | $ | 20,198 | ||||||||||
| Other Comprehensive Income (loss) : | ||||||||||||||||||||
| Amounts that will be or that have been reclassified to profit or loss when specific conditions are met | ||||||||||||||||||||
| Gain on cash flow hedges | 784 | 563 | 694 | 677 | 1,069 | |||||||||||||||
| Net amounts transferred to the statement of profit or loss for cash flow hedges | (801 | ) | (158 | ) | (528 | ) | (104 | ) | (943 | ) | ||||||||||
| Items that will not be reclassified to profit or loss in subsequent periods: | ||||||||||||||||||||
| Remeasurement gain from defined benefit plan | 9 | 10 | 20 | 2 | 21 | |||||||||||||||
| Total comprehensive income (loss) | $ | 13,386 | $ | 11,755 | $ | 9,448 | $ | 7,951 | $ | 20,345 | ||||||||||
| Earnings per share attributable to equity holders of the Company: | ||||||||||||||||||||
| Basic net earnings per share | $ | 0.23 | $ | 0.20 | $ | 0.16 | $ | 0.13 | $ | 0.35 | ||||||||||
| Diluted net earnings per share | $ | 0.23 | $ | 0.19 | $ | 0.16 | $ | 0.13 | $ | 0.35 | ||||||||||
6
CONSOLIDATED STATEMENTS OF CASH FLOWS
| Six months period Ended | Three months period Ended | Year Ended | ||||||||||||||||||
| June 30, | June 30, | December 31, | ||||||||||||||||||
| 2026 | 2025 | 2026 | 2025 | 2025 | ||||||||||||||||
| Unaudited | ||||||||||||||||||||
| U.S Dollars In thousands | ||||||||||||||||||||
| Cash Flows from Operating Activities | ||||||||||||||||||||
| Net income | $ | 13,394 | $ | 11,340 | $ | 9,262 | $ | 7,376 | $ | 20,198 | ||||||||||
| Adjustments to reconcile net income to net cash provided by (used in) operating activities: | ||||||||||||||||||||
| Adjustments to the profit or loss items: | ||||||||||||||||||||
| Depreciation and amortization | 7,742 | 7,357 | 3,891 | 3,746 | 14,918 | |||||||||||||||
| Financial expenses net | 883 | 2,500 | (679 | ) | 1,318 | 2,766 | ||||||||||||||
| Cost of share-based payment | 1,520 | 270 | 720 | 95 | 845 | |||||||||||||||
| Taxes on income | 2,186 | 1,026 | 927 | (1,623 | ) | 3,269 | ||||||||||||||
| Gain from sale of property and equipment | - | (8 | ) | - | - | (8 | ) | |||||||||||||
| Change in employee benefit liabilities, net | 165 | 74 | 134 | 58 | 183 | |||||||||||||||
| 12,496 | 11,219 | 4,993 | 3,594 | 21,973 | ||||||||||||||||
| Changes in asset and liability items: | ||||||||||||||||||||
| Increase in trade receivables, net | (9,948 | ) | (8,670 | ) | (191 | ) | (2,113 | ) | (5,407 | ) | ||||||||||
| Decrease (increase) in other accounts receivables | (697 | ) | 1,078 | (1,985 | ) | 1,749 | (535 | ) | ||||||||||||
| Increase in inventories | (1,932 | ) | (3,260 | ) | (1,438 | ) | (3,721 | ) | (6,124 | ) | ||||||||||
| Decrease in contract asset | 237 | 212 | 118 | 118 | 475 | |||||||||||||||
| Increase (decrease) in trade payables | 3,912 | (4,131 | ) | 5,358 | (383 | ) | (6,870 | ) | ||||||||||||
| Increase (decrease) in other accounts payables | (87 | ) | (883 | ) | 1,810 | 1,161 | 950 | |||||||||||||
| Increase (decrease) in deferred revenues | 161 | 6 | 94 | (28 | ) | (171 | ) | |||||||||||||
| (8,354 | ) | (15,648 | ) | 3,766 | (3,217 | ) | (17,682 | ) | ||||||||||||
| Cash received (paid) during the period for: | ||||||||||||||||||||
| Interest paid | (559 | ) | (384 | ) | (372 | ) | (208 | ) | (864 | ) | ||||||||||
| Interest received | 859 | 987 | 434 | 453 | 1,921 | |||||||||||||||
| Taxes (paid) received | (59 | ) | (6 | ) | (15 | ) | 23 | (56 | ) | |||||||||||
| 241 | 597 | 47 | 268 | 1,001 | ||||||||||||||||
| Net cash provided by operating activities | $ | 17,777 | $ | 7,508 | $ | 18,068 | $ | 8,021 | $ | 25,490 | ||||||||||
7
CONSOLIDATED STATEMENTS OF CASH FLOWS (continued)
| Six months period Ended | Three months period Ended | Year Ended | ||||||||||||||||||
| June 30, | June 30, | December 31, | ||||||||||||||||||
| 2026 | 2025 | 2026 | 2025 | 2025 | ||||||||||||||||
| Unaudited | ||||||||||||||||||||
| U.S Dollars In thousands | ||||||||||||||||||||
| Cash Flows from Investing Activities | ||||||||||||||||||||
| Purchase of property and equipment and intangible assets | (3,080 | ) | (3,482 | ) | (2,107 | ) | (2,014 | ) | (9,846 | ) | ||||||||||
| Investment in short term investments | (40,660 | ) | - | (435 | ) | - | - | |||||||||||||
| Proceeds from sale of property and equipment | - | 8 | - | - | 8 | |||||||||||||||
| Net cash used in investing activities | (43,740 | ) | (3,474 | ) | (2,542 | ) | (2,014 | ) | (9,838 | ) | ||||||||||
| Cash Flows from Financing Activities | ||||||||||||||||||||
| Proceeds from exercise of share base payments | 3 | 49 | 3 | 3 | 50 | |||||||||||||||
| Repayment of lease liabilities | (857 | ) | (418 | ) | (468 | ) | (404 | ) | (972 | ) | ||||||||||
| Repayment of other long-term liabilities | (4,577 | ) | (4,509 | ) | (4,110 | ) | (4,184 | ) | (5,889 | ) | ||||||||||
| Dividends Paid | (14,421 | ) | (11,534 | ) | (14,421 | ) | (11,534 | ) | (11,534 | ) | ||||||||||
| Net cash used in financing activities | (19,852 | ) | (16,412 | ) | (18,996 | ) | (16,119 | ) | (18,345 | ) | ||||||||||
| Exchange differences on balances of cash and cash equivalent | (181 | ) | (72 | ) | 21 | (153 | ) | (273 | ) | |||||||||||
| Decrease in cash and cash equivalents | (45,996 | ) | (12,450 | ) | (3,449 | ) | (10,265 | ) | (2,966 | ) | ||||||||||
| Cash and cash equivalents at the beginning of the period | 75,469 | 78,435 | 32,922 | 76,250 | 78,435 | |||||||||||||||
| Cash and cash equivalents at the end of the period | $ | 29,473 | $ | 65,985 | $ | 29,473 | $ | 65,985 | $ | 75,469 | ||||||||||
| Significant non-cash transactions | ||||||||||||||||||||
| Right-of-use asset recognized with corresponding lease liability | $ | 685 | $ | 509 | $ | 246 | $ | 157 | $ | 1,221 | ||||||||||
| Purchase of property and equipment and Intangible assets | $ | 1,743 | $ | 1,030 | $ | 1,743 | $ | 1,030 | $ | 2,523 | ||||||||||
8
NON-IFRS MEASURES
| Six months period ended | Three months period ended | Year ended | ||||||||||||||||||
| June 30, | June 30, | December 31, | ||||||||||||||||||
| 2026 | 2025 | 2026 | 2025 | 2025 | ||||||||||||||||
| In thousands | ||||||||||||||||||||
| Net income | $ | 13,394 | $ | 11,340 | $ | 9,262 | $ | 7,376 | $ | 20,198 | ||||||||||
| Taxes on income | 2,186 | 1,026 | 927 | (1,623 | ) | 3,269 | ||||||||||||||
| Financial expense (income), net | 883 | 2,500 | (679 | ) | 1,318 | 2,766 | ||||||||||||||
| Depreciation and amortization expense | 7,742 | 7,357 | 3,891 | 3,746 | 14,924 | |||||||||||||||
| Non-cash share-based compensation expenses | 1,520 | 270 | 720 | 95 | 845 | |||||||||||||||
| Adjusted EBITDA | $ | 25,725 | $ | 22,493 | $ | 14,121 | $ | 10,912 | $ | 42,002 | ||||||||||
9
Exhibit 99.2

August 2026 Q2/2026 & H1/2026 Investors Call NASDAQ: KMDA; TASE: KMDA.TA
2 FORWARD- LOOKING STATEMENT This presentation is not intended to provide investment or medical advice. This presentation contains forward-looking statements, which express the current beliefs and expectations of Kamada's management. Such statements include the 2026 financial guidance; roadmap for continued double-digit profitable growth strategy; expectation that demand for KEDRAB® will continue to increase year over year in 2026 and exceed the company's 2026 forecast, GLASSIA® related sales growth prospects and estimated range of royalty income in the future years, expected increase in CYTOGAM® sales to be supported by expected new clinical data demonstrating the product's properties, expected launch of additional biosimilar products in the Israeli market and expected sales range driven by the biosimilar portfolio in the next four to five years, expansion of the distribution segment to the MENA region, advancement and future expected revenues of $50M over the next 3 years from sales of normal source plasma and the aim to secure new business development and M&A opportunities to support continued growth. These statements involve several known and unknown risks and uncertainties that could cause Kamada's future results, performance or achievements to differ significantly from the projected results, performances or achievements expressed or implied by such forward-looking statements. Important factors that could cause or contribute to such differences including, but are not limited to, risks relating to Kamada's ability to successfully develop and commercialize its products and product candidates, progress and results of any development activities, introduction of competing products, continued market acceptance of Kamada's commercial products portfolio, impact of geo-political environment in the middle east, impact of any changes in regulation and legislation that could affect the pharmaceutical industry, difficulties in predicting, obtaining or maintaining U.S. Food and Drug Administration, European Medicines Agency and other regulatory authority approvals, restrains related to third parties' IP rights and changes in the health policies and structures of various countries, success of M&A strategies, environmental risks, changes in the worldwide pharmaceutical industry and other factors that are discussed under the heading "Risk Factors" of Kamada's 2025 Annual Report on Form 20-F (filed on March 11, 2026), as well as in Kamada's recent Forms 6-K filed with the U.S. Securities and Exchange Commission. This presentation includes certain non-IFRS financial information, which is not intended to be considered in isolation or as a substitute for, or superior to, the financial information prepared and presented in accordance with IFRS. The non-IFRS financial measures may be calculated differently from, and therefore may not be comparable to, similarly titled measures used by other companies. In accordance with the requirement of the SEC regulations a reconciliation of these non-IFRS financial measures to the comparable IFRS measures is included in an appendix to this presentation. Management uses these non-IFRS financial measures for financial and operational decision-making and as a means to evaluate period-to-period comparisons. Management believes that these non-IFRS financial measures provide meaningful supplemental information regarding Kamada's performance and liquidity. Forward-looking statements speak only as of the date they are made, and Kamada undertakes no obligation to update any forward-looking statement to reflect the impact of circumstances or events that arise after the date the forward-looking statement was made, except as required by applicable law.
3 RECORD-HIGH QUARTER & FIRST HALF FINANCIAL RESULTS; STRONGEST IN KAMADA'S HISTORY CONTINUE TO EXECUTE ON OUR PLAN; DELIVERING ANOTHER YEAR OF DOUBLE- DIGIT PROFITABLE GROWTH
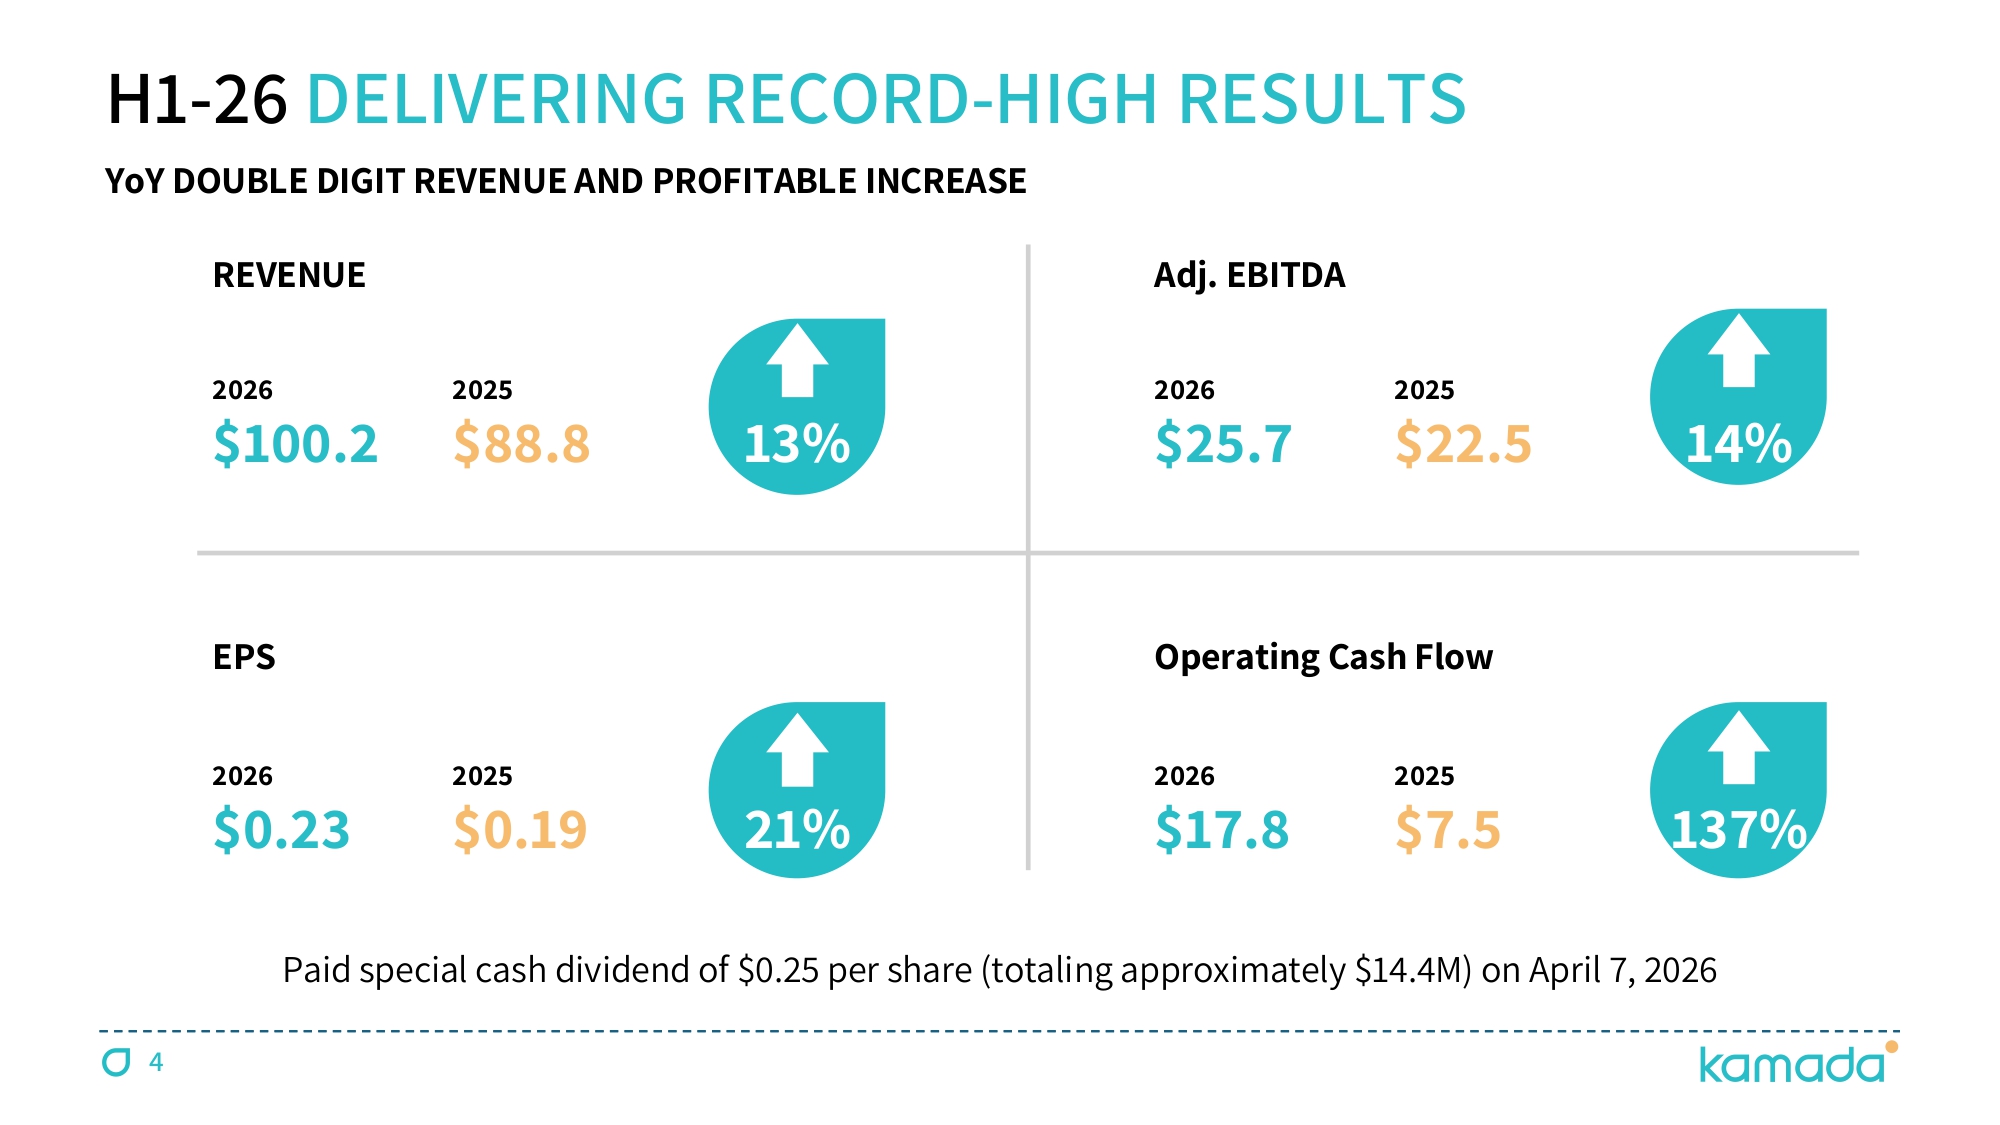
4 H 1 - 26 DELIVERING RECORD - HIGH RESULTS YoY DOUBLE DIGIT REVENUE AND PROFITABLE INCREASE Adj. EBITDA REVENUE 14% 2025 $22.5 2026 $ 25.7 13% 2025 $88.8 2026 $ 100.2 Operating Cash Flow EPS 137% 2025 $7.5 2026 $ 17.8 21% 2025 $0.19 2026 $0.23 Paid special cash dividend of $0.25 per share (totaling approximately $14.4M) on April 7, 2026
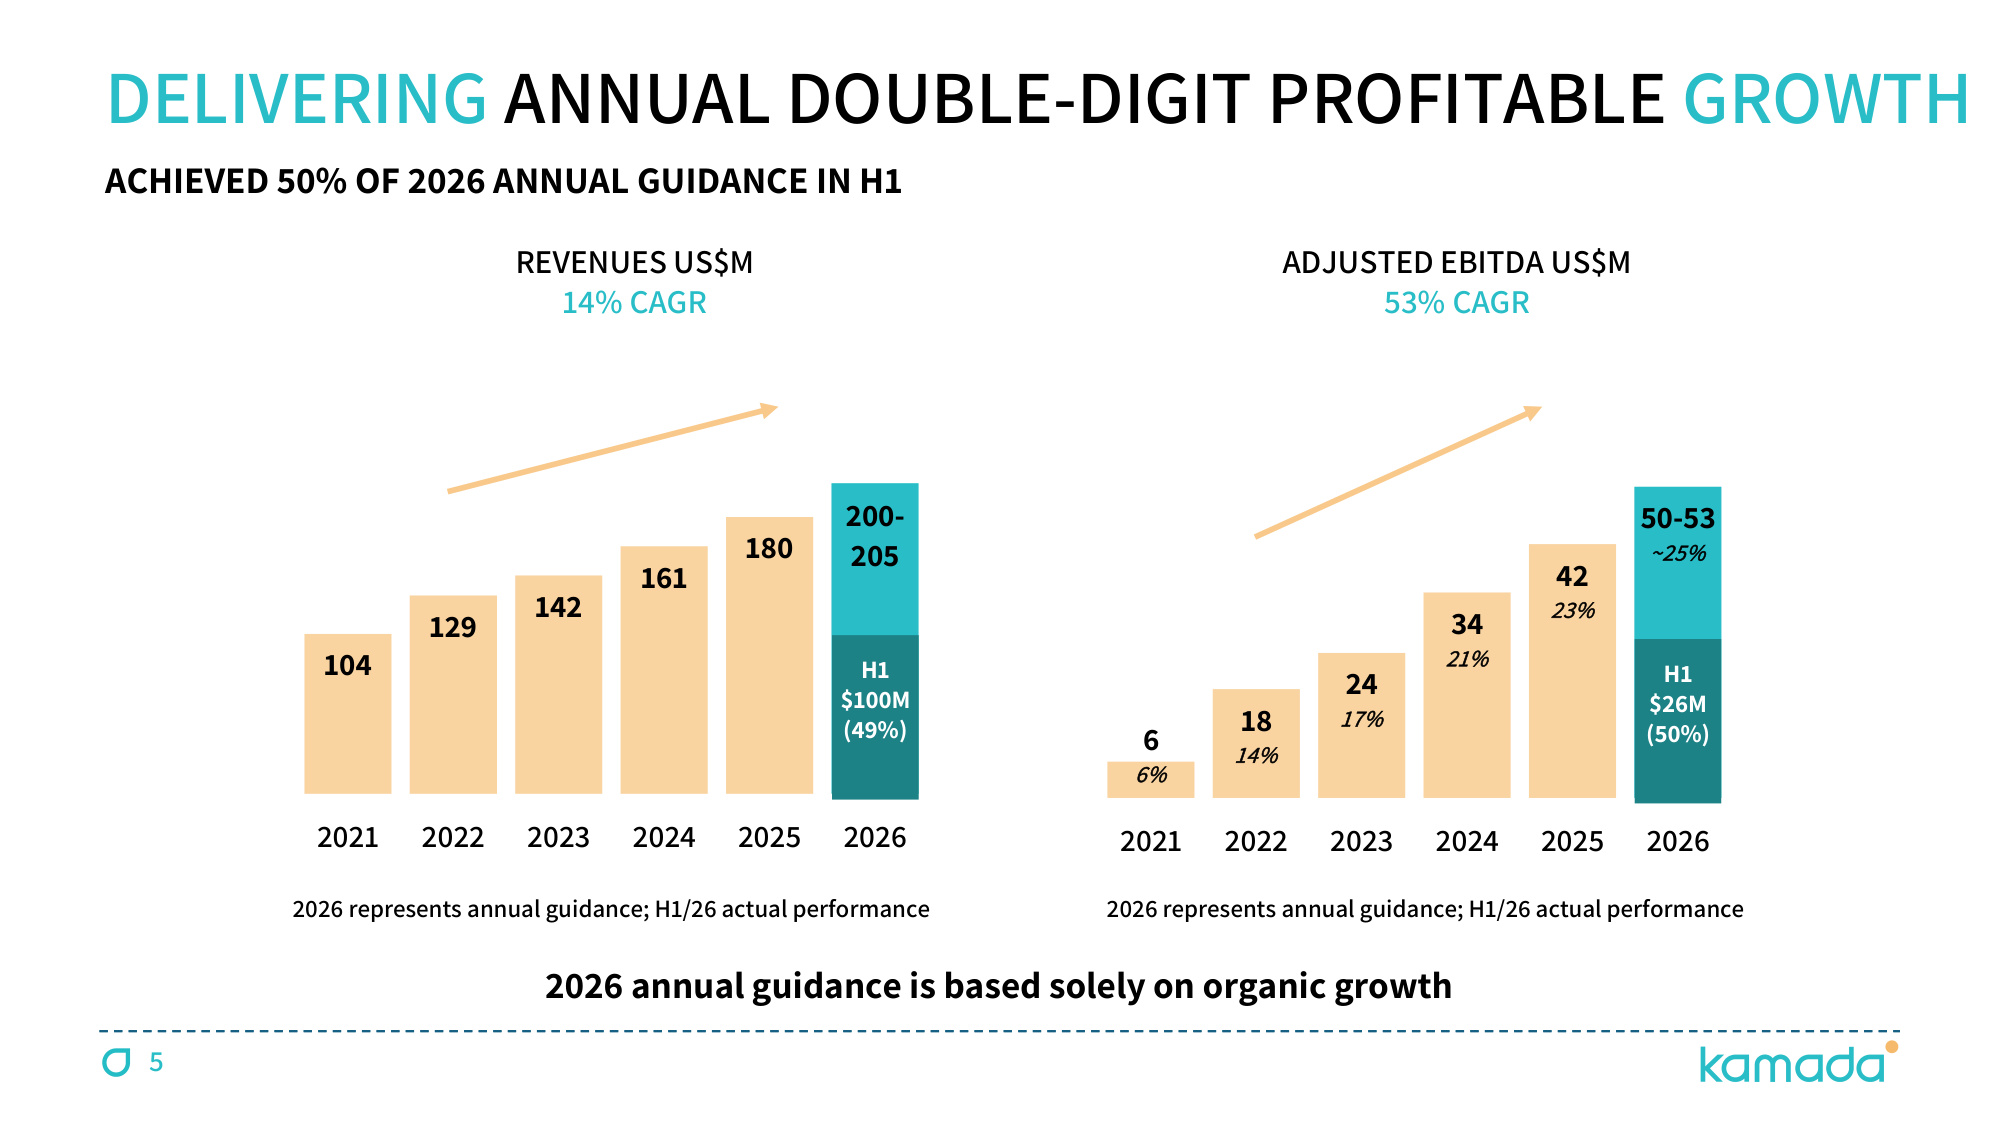
5 DELIVERING ANNUAL DOUBLE-DIGIT PROFITABLE GROWTH 6 6% 18 14% 24 17% 34 21% 42 23% 50-53 ~25% 2021 2022 2023 2024 2025 2026 104 129 142 161 180 200- 205 2021 2022 2023 2024 2025 2026 ADJUSTED EBITDA US$M 53% CAGR 2026 represents annual guidance; H1/26 actual performance 2026 represents annual guidance; H1/26 actual performance REVENUES US$M 14% CAGR 2026 annual guidance is based solely on organic growth H1 $100M (49%) H1 $26M (50%) ACHIEVED 50% OF 2026 ANNUAL GUIDANCE IN H1
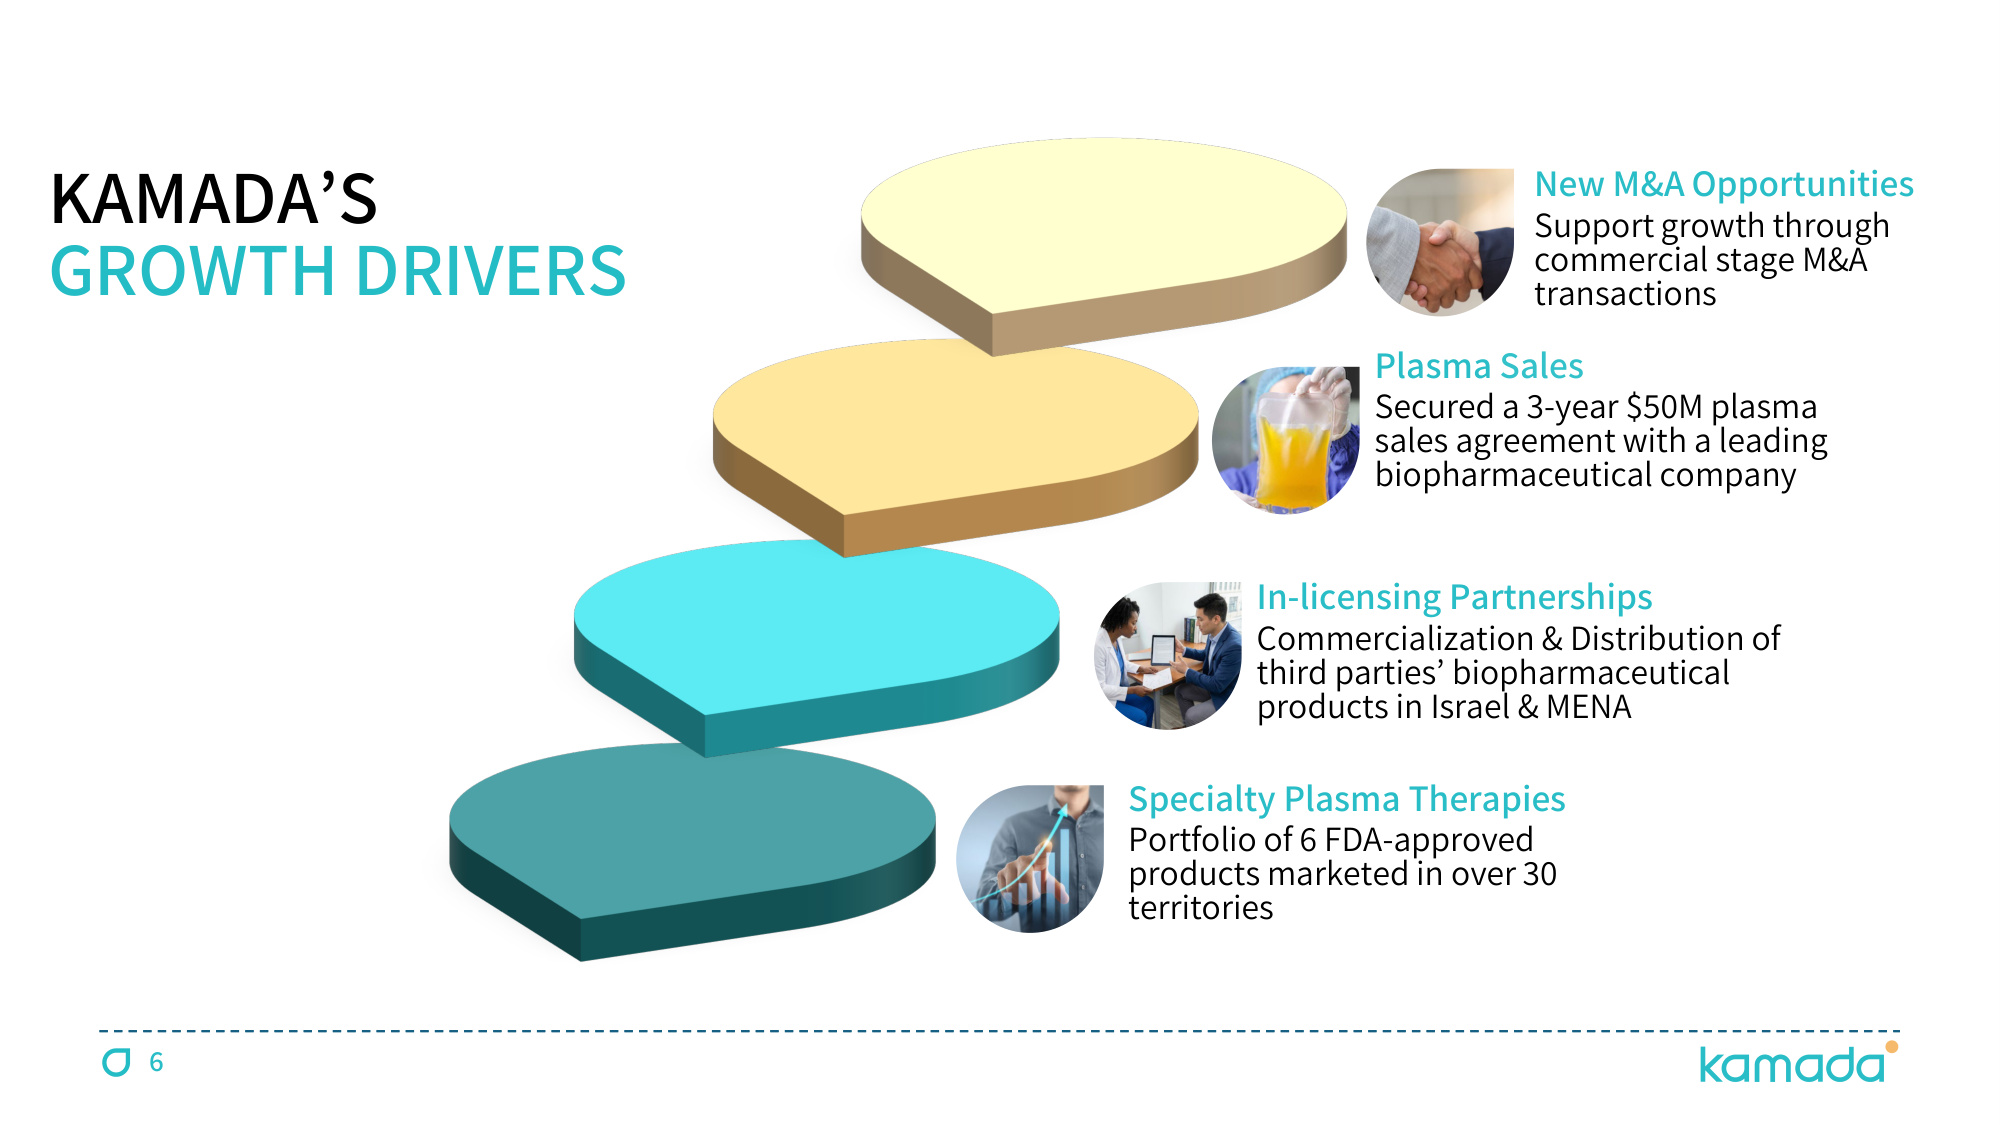
6 KAMADA'S GROWTH DRIVERS Specialty Plasma Therapies Portfolio of 6 FDA-approved products marketed in over 30 territories In-licensing Partnerships Commercialization & Distribution of third parties' biopharmaceutical products in Israel & MENA Plasma Sales Secured a 3-year $50M plasma sales agreement with a leading biopharmaceutical company New M&A Opportunities Support growth through commercial stage M&A transactions
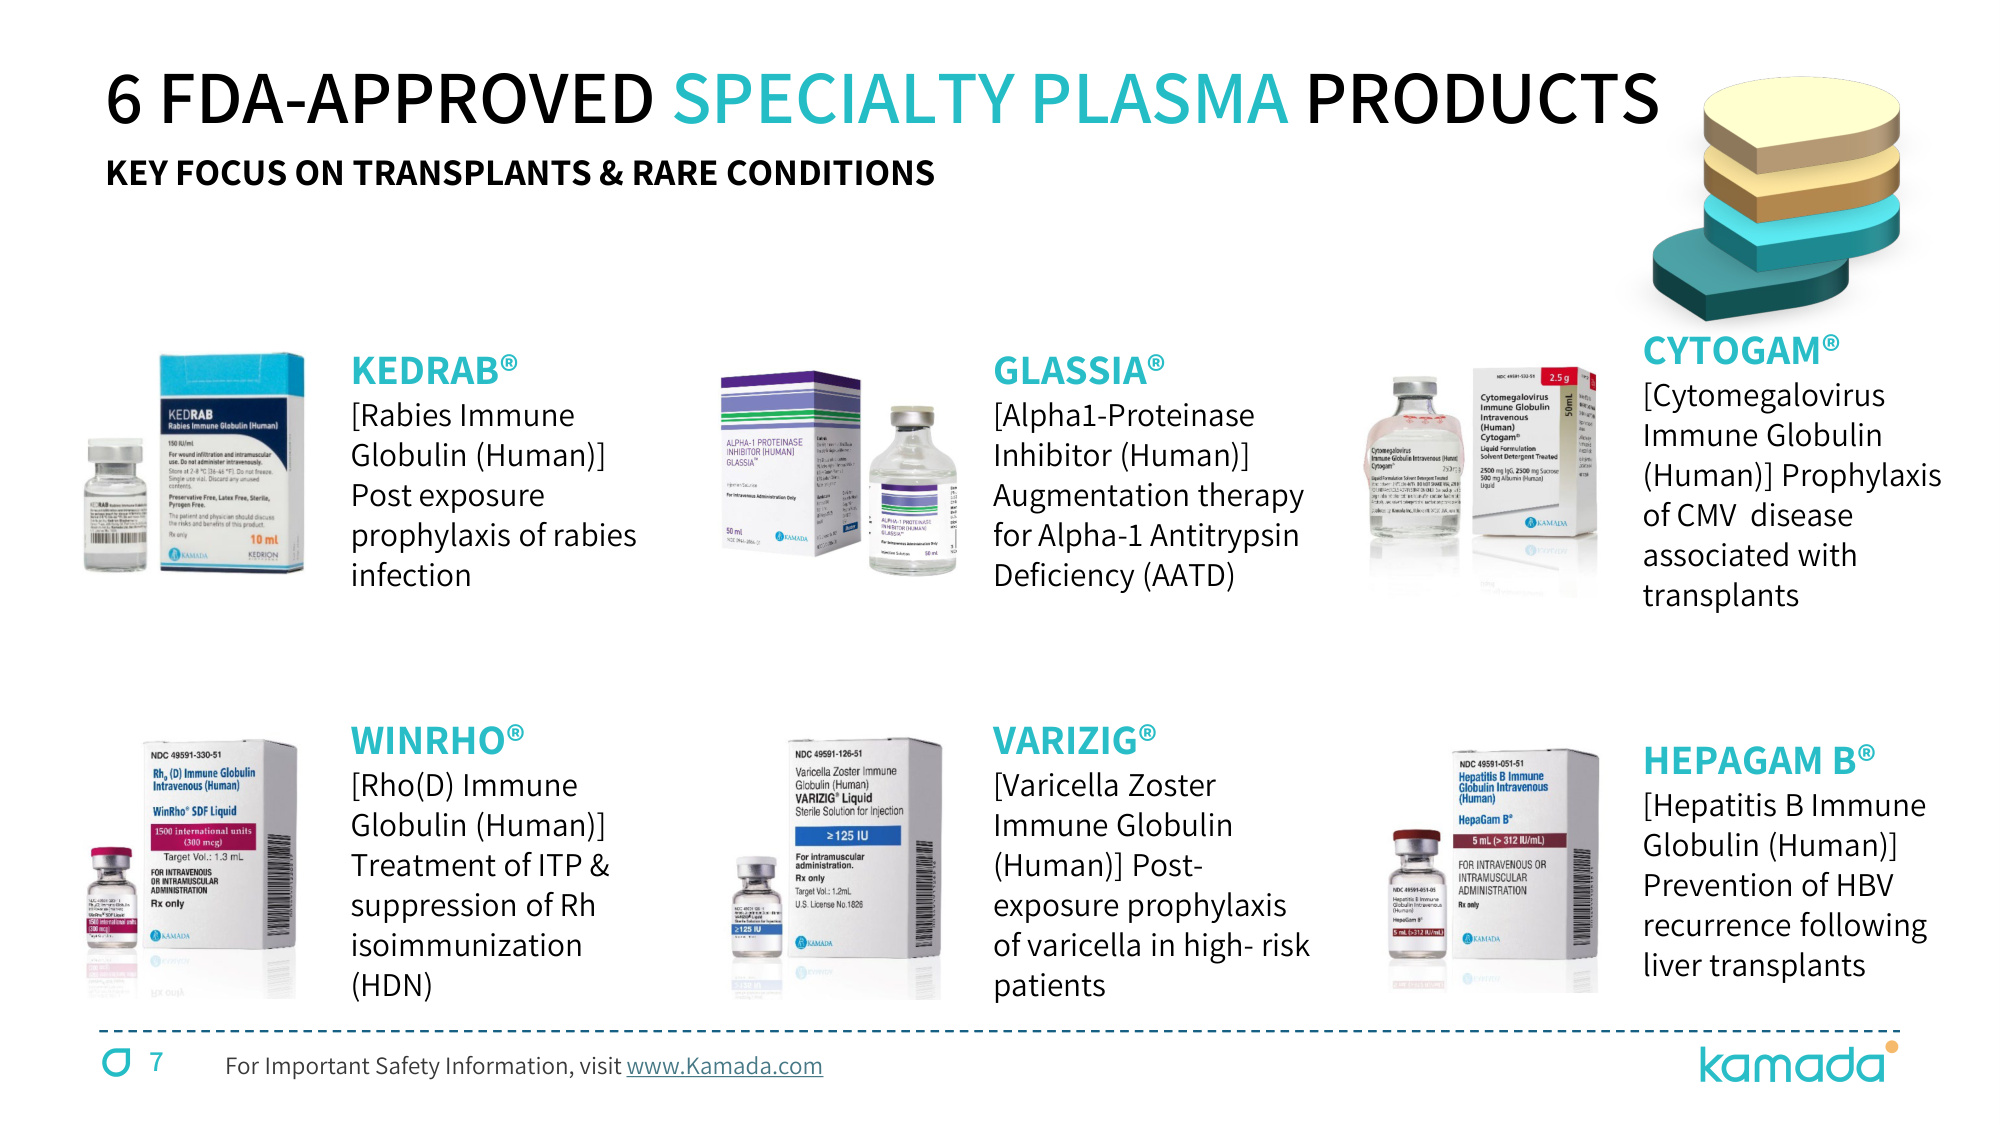
7 6 FDA-APPROVED SPECIALTY PLASMA PRODUCTS KEY FOCUS ON TRANSPLANTS & RARE CONDITIONS For Important Safety Information, visit www.Kamada.com KEDRAB® [Rabies Immune Globulin (Human)] Post exposure prophylaxis of rabies infection GLASSIA® [Alpha1-Proteinase Inhibitor (Human)] Augmentation therapy for Alpha-1 Antitrypsin Deficiency (AATD) CYTOGAM® [Cytomegalovirus Immune Globulin (Human)] Prophylaxis of CMV disease associated with transplants WINRHO® [Rho(D) Immune Globulin (Human)] Treatment of ITP & suppression of Rh isoimmunization (HDN) VARIZIG® [Varicella Zoster Immune Globulin (Human)] Post- exposure prophylaxis of varicella in high- risk patients HEPAGAM B® [Hepatitis B Immune Globulin (Human)] Prevention of HBV recurrence following liver transplants
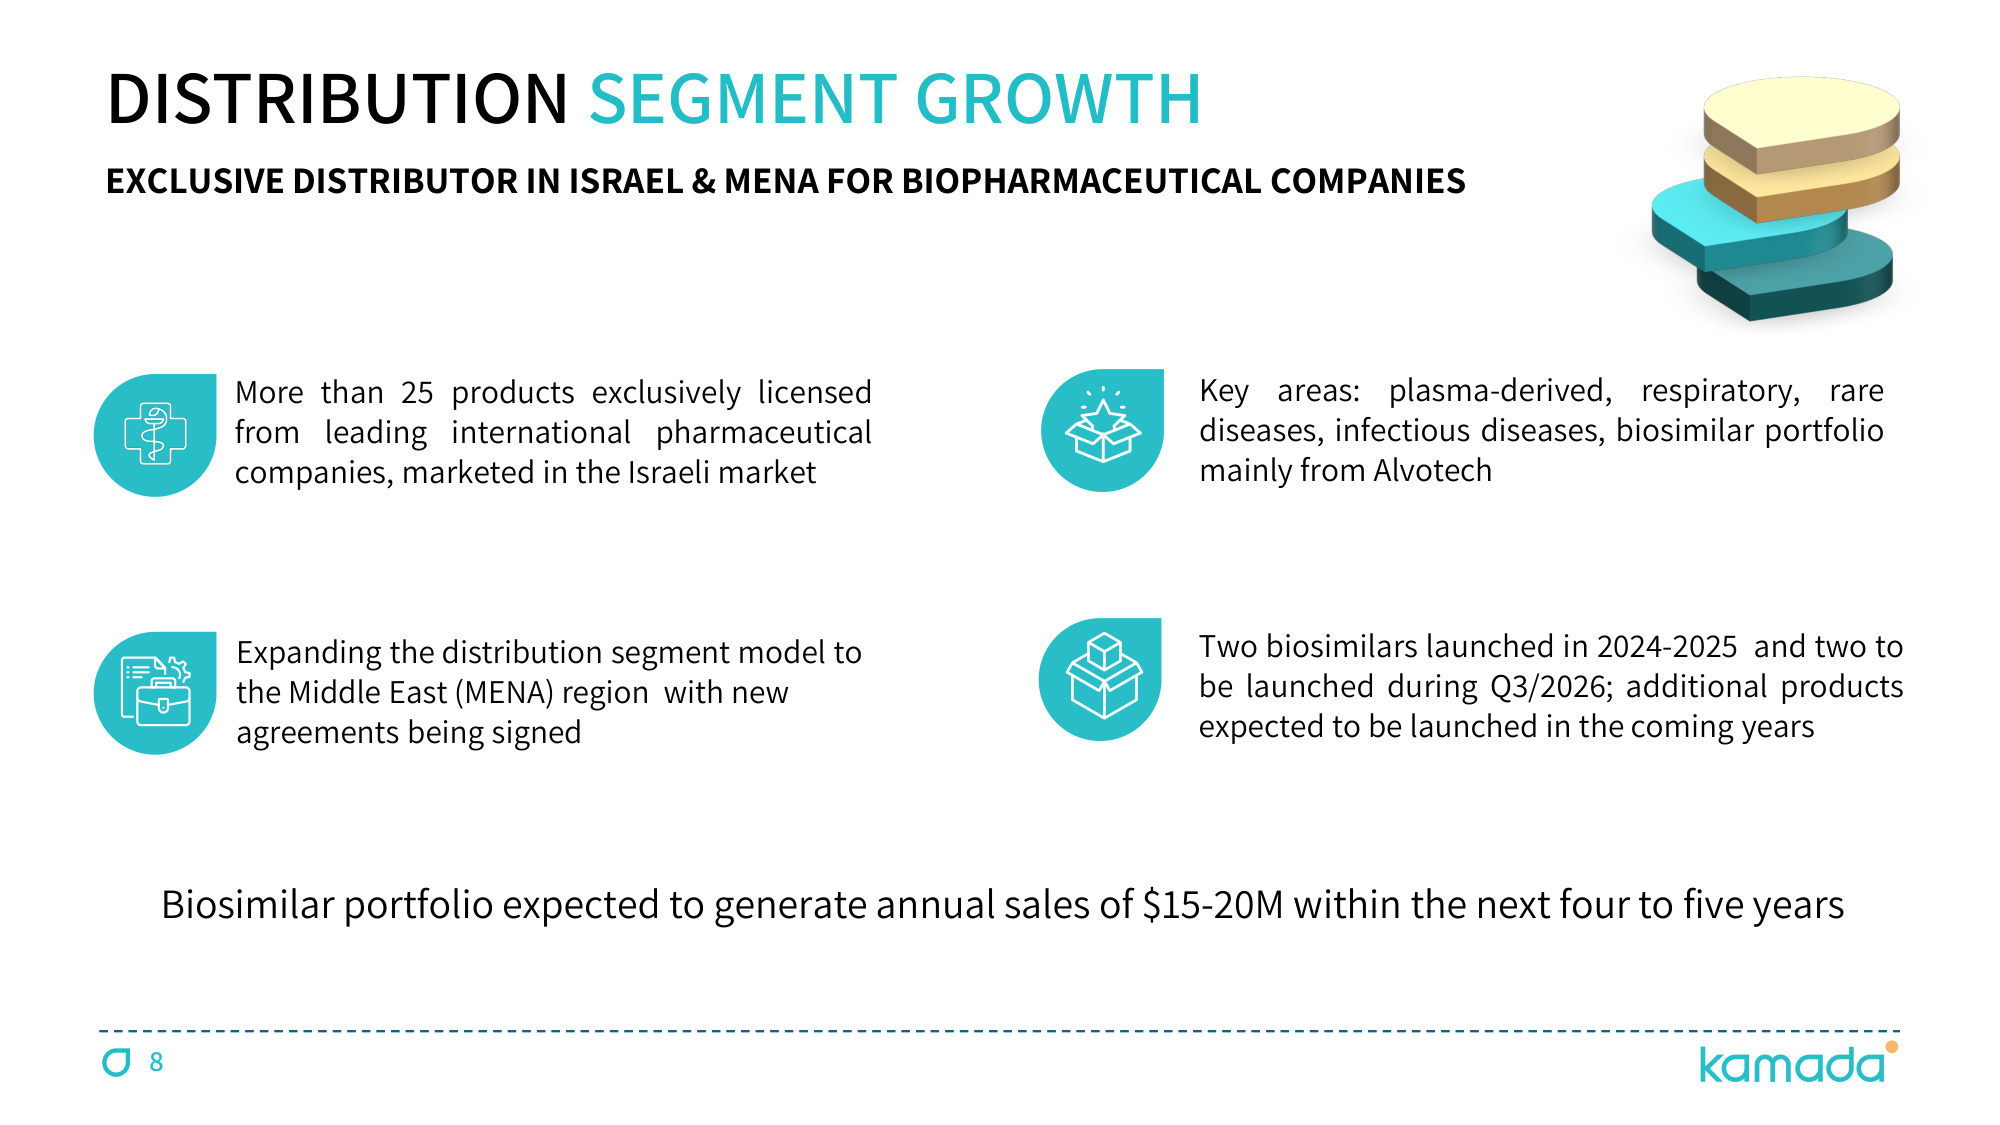
8 DISTRIBUTION SEGMENT GROWTH More than 25 products exclusively licensed from leading international pharmaceutical companies, marketed in the Israeli market EXCLUSIVE DISTRIBUTOR IN ISRAEL & MENA FOR BIOPHARMACEUTICAL COMPANIES Key areas: plasma-derived, respiratory, rare diseases, infectious diseases, biosimilar portfolio mainly from Alvotech Two biosimilars launched in 2024-2025 and two to be launched during Q3/2026; additional products expected to be launched in the coming years Biosimilar portfolio expected to generate annual sales of $15-20M within the next four to five years Expanding the distribution segment model to the Middle East (MENA) region with new agreements being signed
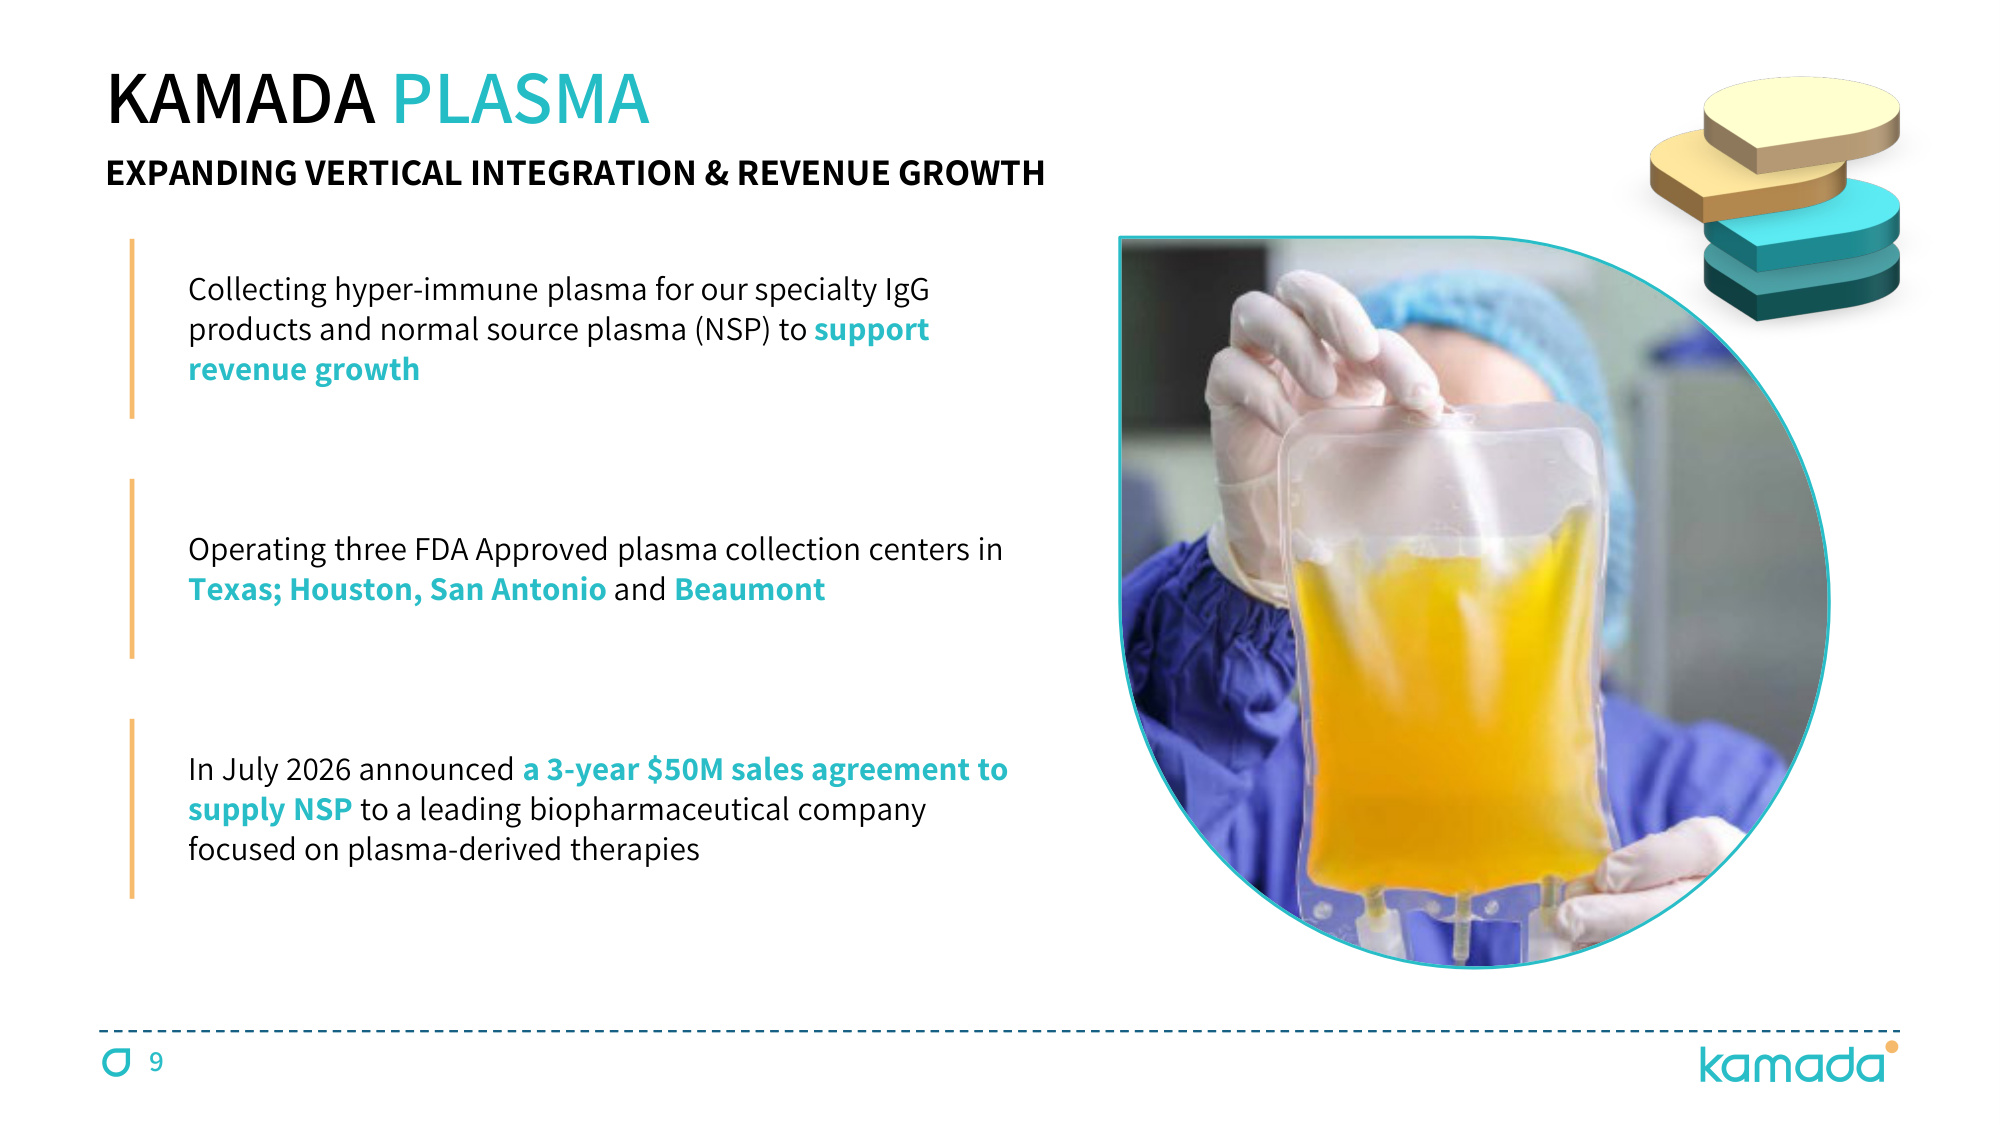
9 KAMADA PLASMA EXPANDING VERTICAL INTEGRATION & REVENUE GROWTH Collecting hyper-immune plasma for our specialty IgG products and normal source plasma (NSP) to support revenue growth Operating three FDA Approved plasma collection centers in Texas; Houston, San Antonio and Beaumont In July 2026 announced a 3-year $50M sales agreement to supply NSP to a leading biopharmaceutical company focused on plasma-derived therapies
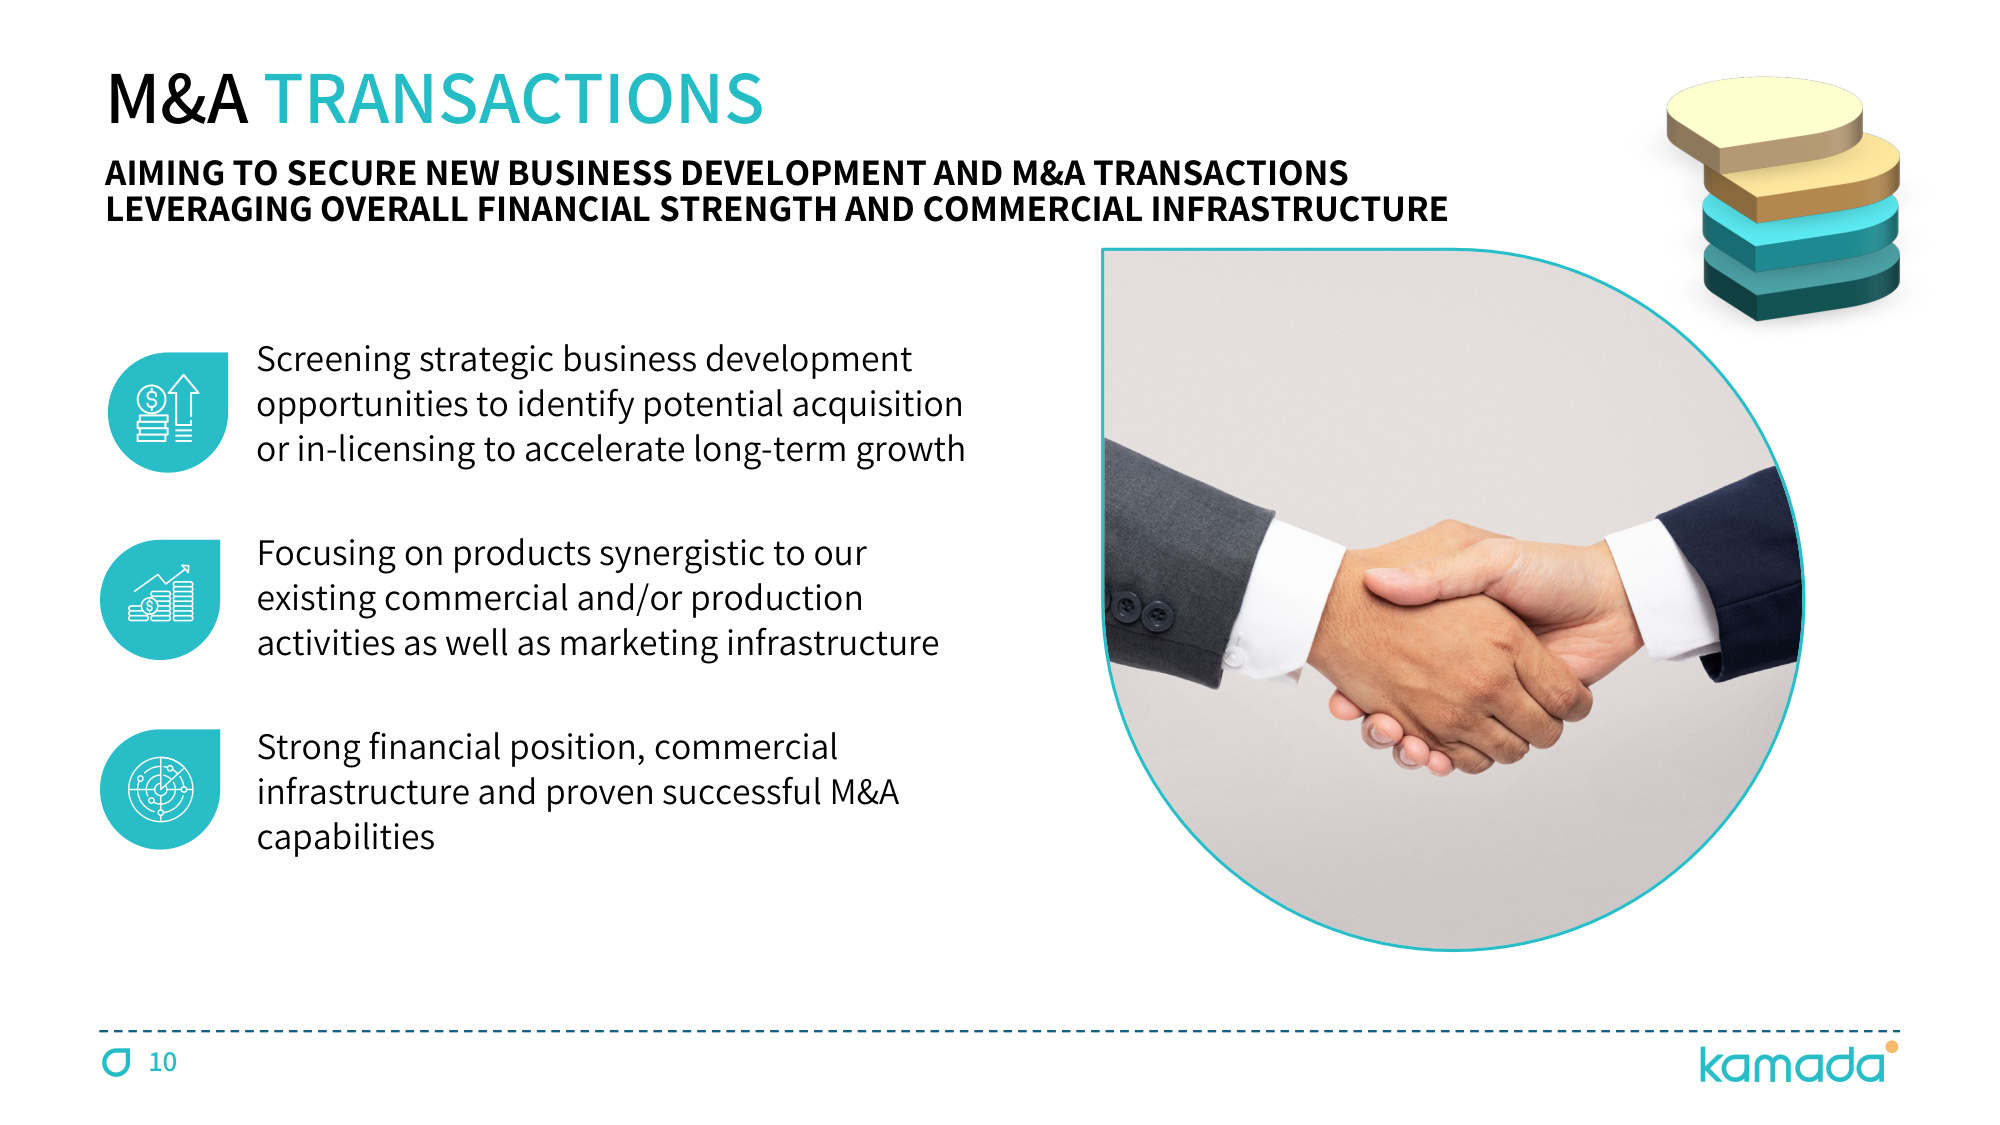
10 M&A TRANSACTIONS AIMING TO SECURE NEW BUSINESS DEVELOPMENT AND M&A TRANSACTIONS LEVERAGING OVERALL FINANCIAL STRENGTH AND COMMERCIAL INFRASTRUCTURE Screening strategic business development opportunities to identify potential acquisition or in-licensing to accelerate long-term growth Focusing on products synergistic to our existing commercial and/or production activities as well as marketing infrastructure Strong financial position, commercial infrastructure and proven successful M&A capabilities
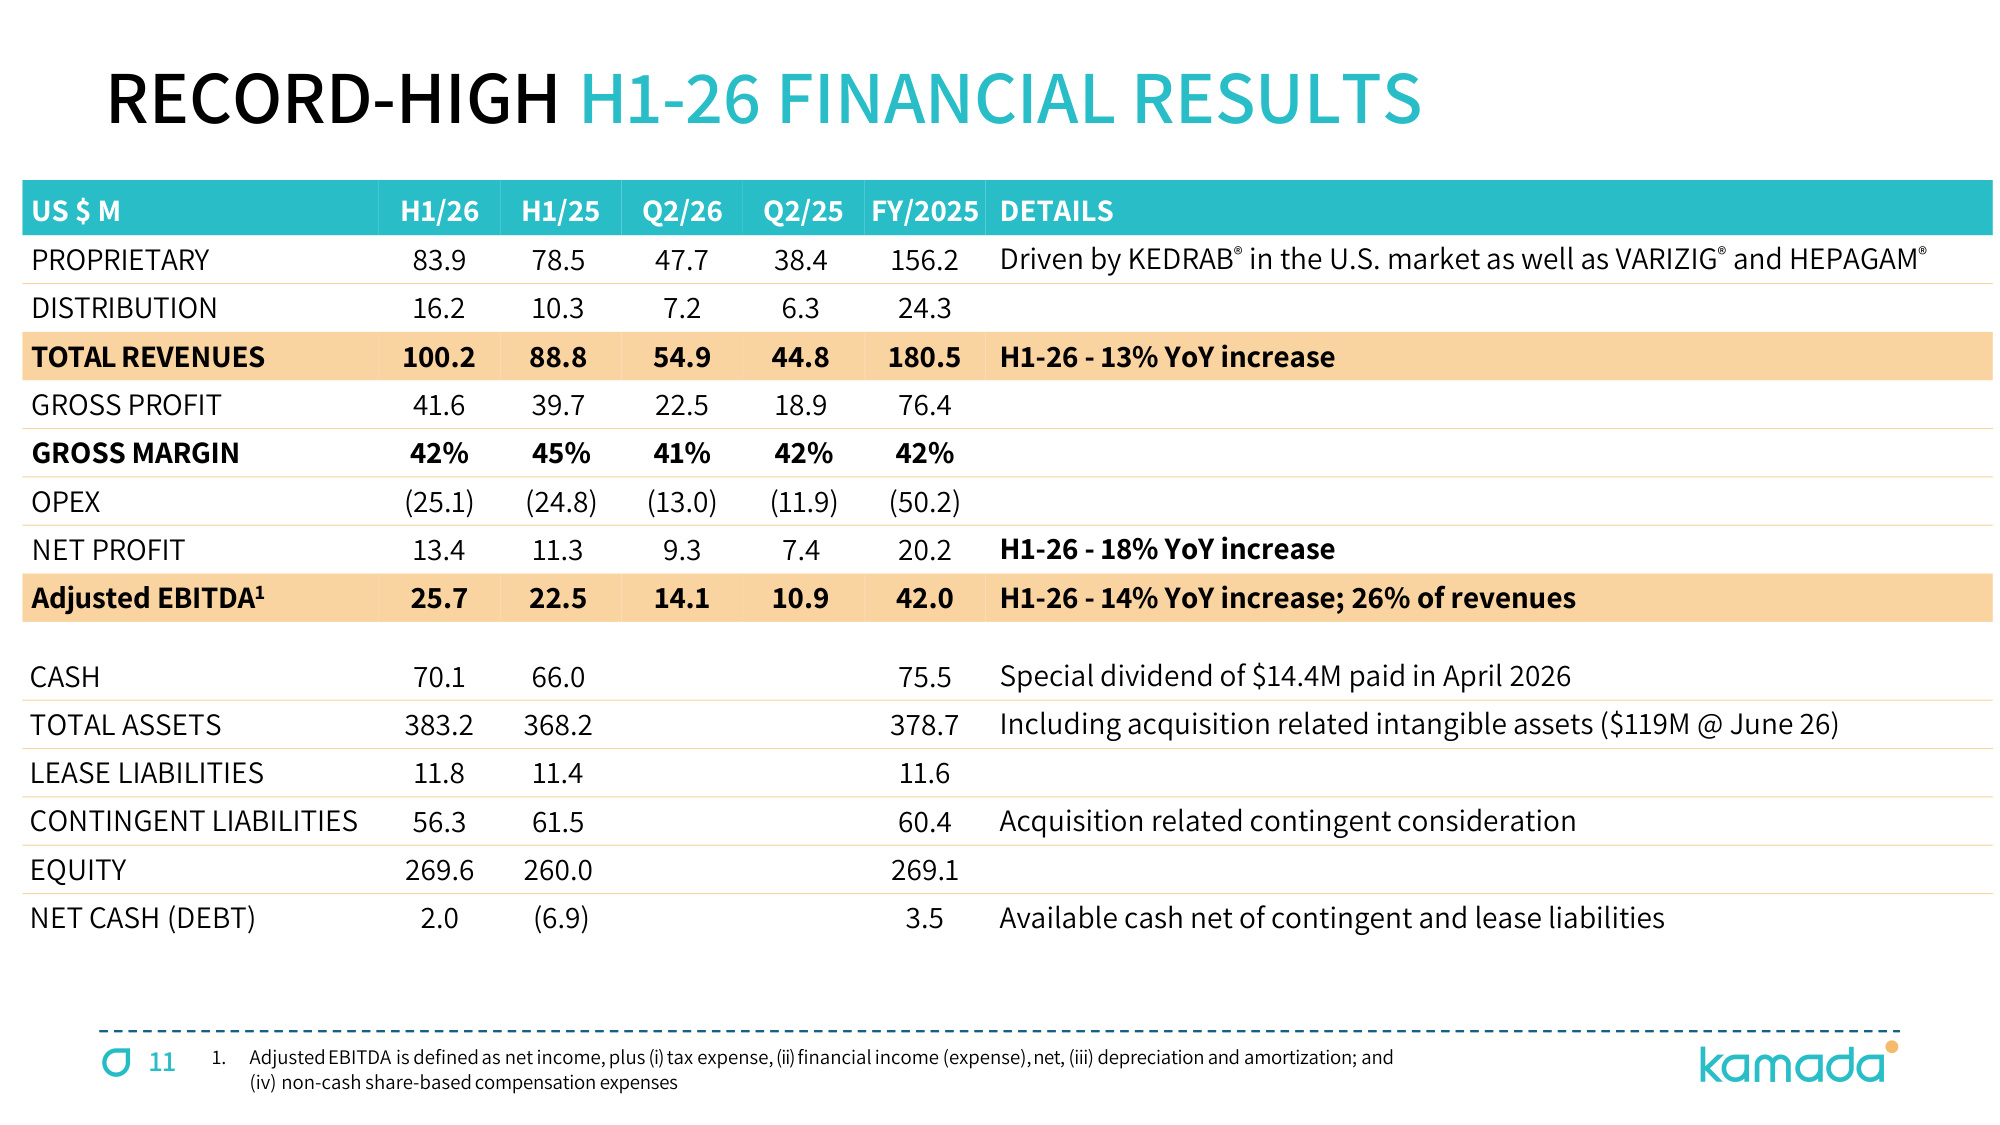
11 1. AdjustedEBITDA is definedas net income,plus (i) tax expense,(ii) financialincome (expense),net, (iii) depreciation and amortization; and (iv) non-cash share-basedcompensation expenses RECORD-HIGH H1-26 FINANCIAL RESULTS US $ M H1/26 H1/25 Q2/26 Q2/25 FY/2025 DETAILS PROPRIETARY 83.9 78.5 47.7 38.4 156.2 Driven by KEDRAB® in the U.S. market as well as VARIZIG® and HEPAGAM® DISTRIBUTION 16.2 10.3 7.2 6.3 24.3 TOTALREVENUES 100.2 88.8 54.9 44.8 180.5 H1-26 - 13% YoY increase GROSS PROFIT 41.6 39.7 22.5 18.9 76.4 GROSS MARGIN 42% 45% 41% 42% 42% OPEX (25.1) (24.8) (13.0) (11.9) (50.2) NET PROFIT 13.4 11.3 9.3 7.4 20.2 H1-26 - 18% YoY increase Adjusted EBITDA1 25.7 22.5 14.1 10.9 42.0 H1-26 - 14% YoY increase; 26% of revenues CASH 70.1 66.0 75.5 Special dividend of $14.4M paid in April 2026 TOTAL ASSETS 383.2 368.2 378.7 Including acquisition related intangible assets ($119M @ June 26) LEASE LIABILITIES 11.8 11.4 11.6 CONTINGENT LIABILITIES 56.3 61.5 60.4 Acquisition related contingent consideration EQUITY 269.6 260.0 269.1 NET CASH (DEBT) 2.0 (6.9) 3.5 Available cash net of contingent and lease liabilities
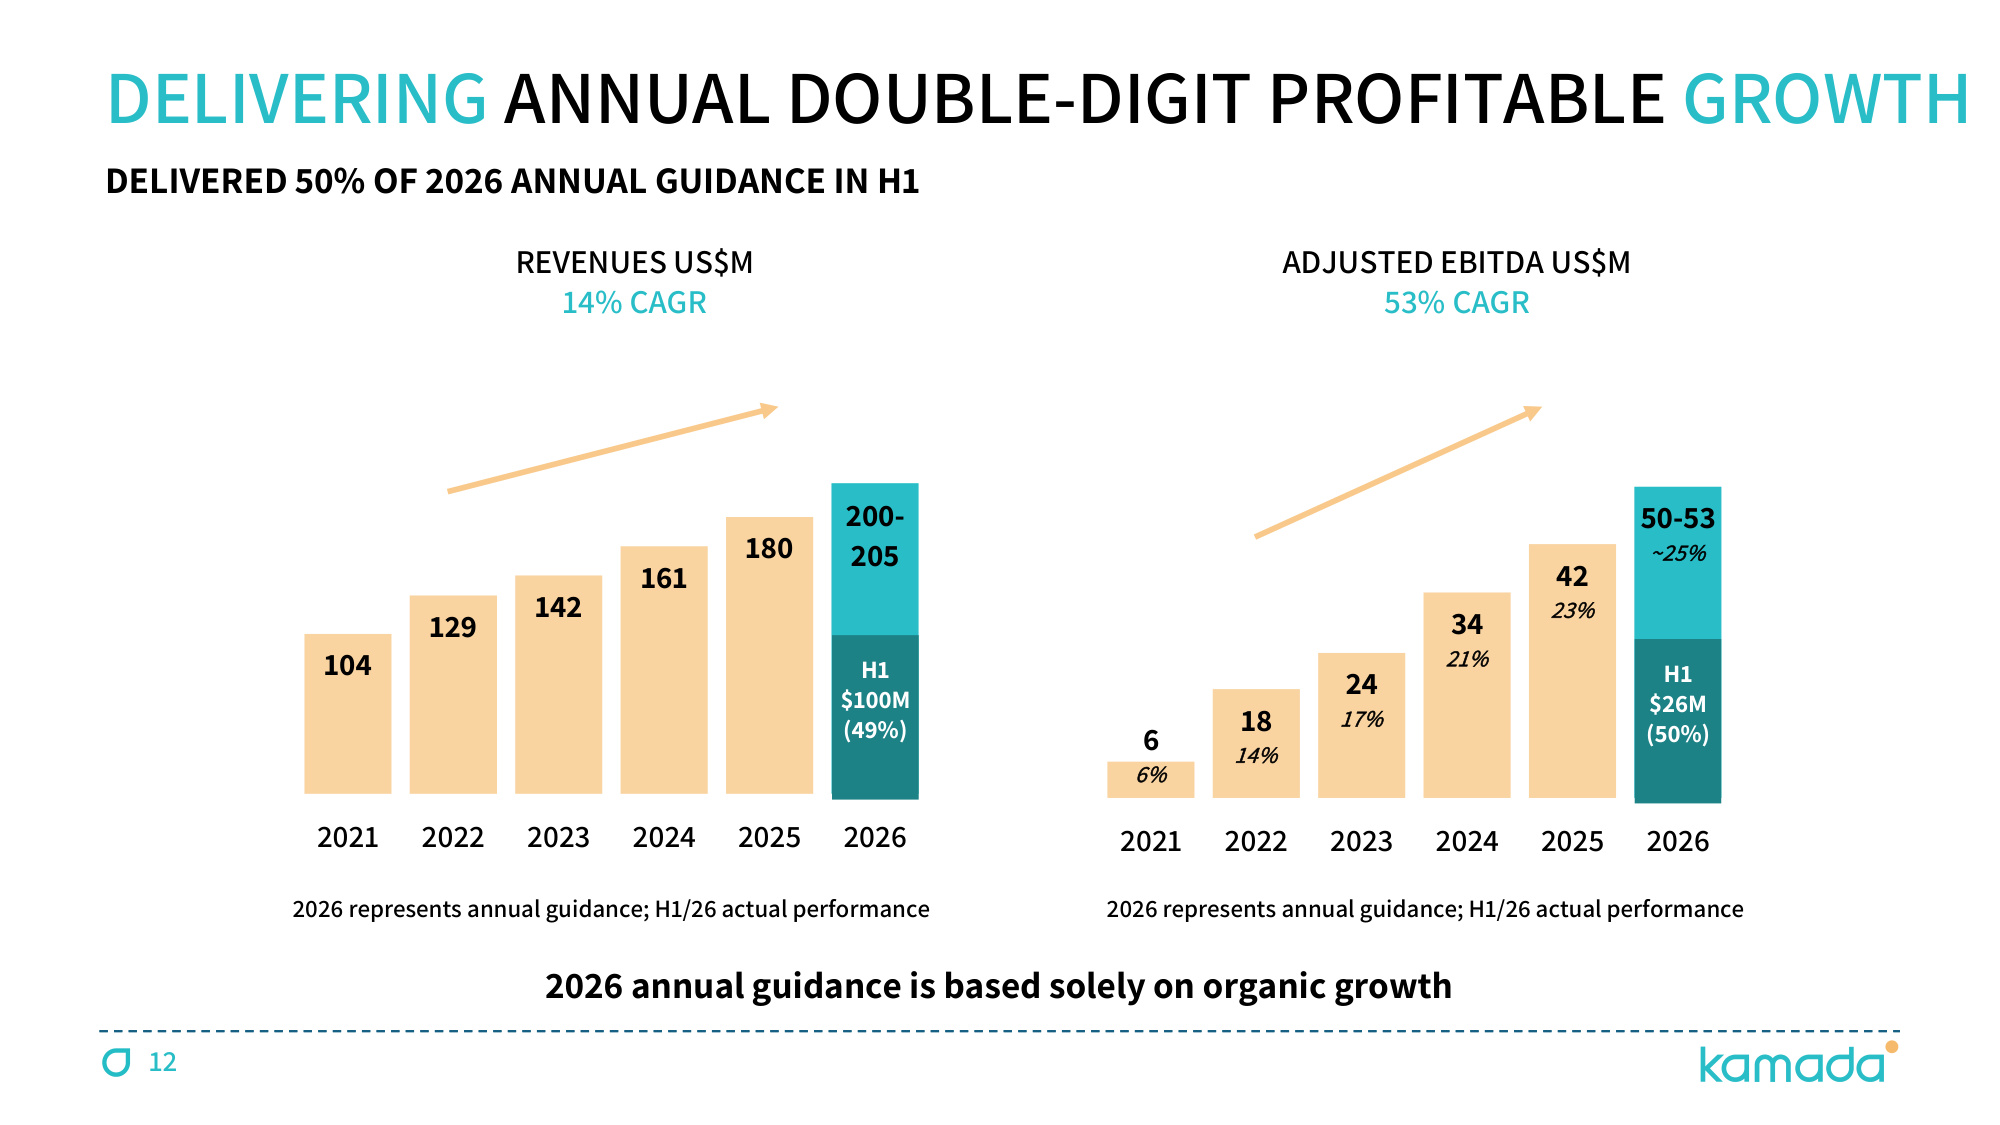
12 DELIVERING ANNUAL DOUBLE-DIGIT PROFITABLE GROWTH 6 6% 18 14% 24 17% 34 21% 42 23% 50-53 ~25% 2021 2022 2023 2024 2025 2026 104 129 142 161 180 200- 205 2021 2022 2023 2024 2025 2026 ADJUSTED EBITDA US$M 53% CAGR 2026 represents annual guidance; H1/26 actual performance 2026 represents annual guidance; H1/26 actual performance REVENUES US$M 14% CAGR 2026 annual guidance is based solely on organic growth H1 $100M (49%) H1 $26M (50%) DELIVERED 50% OF 2026 ANNUAL GUIDANCE IN H1
THANK YOU www.kamada.com NASDAQ: KMDA; TASE: KMDA.TA
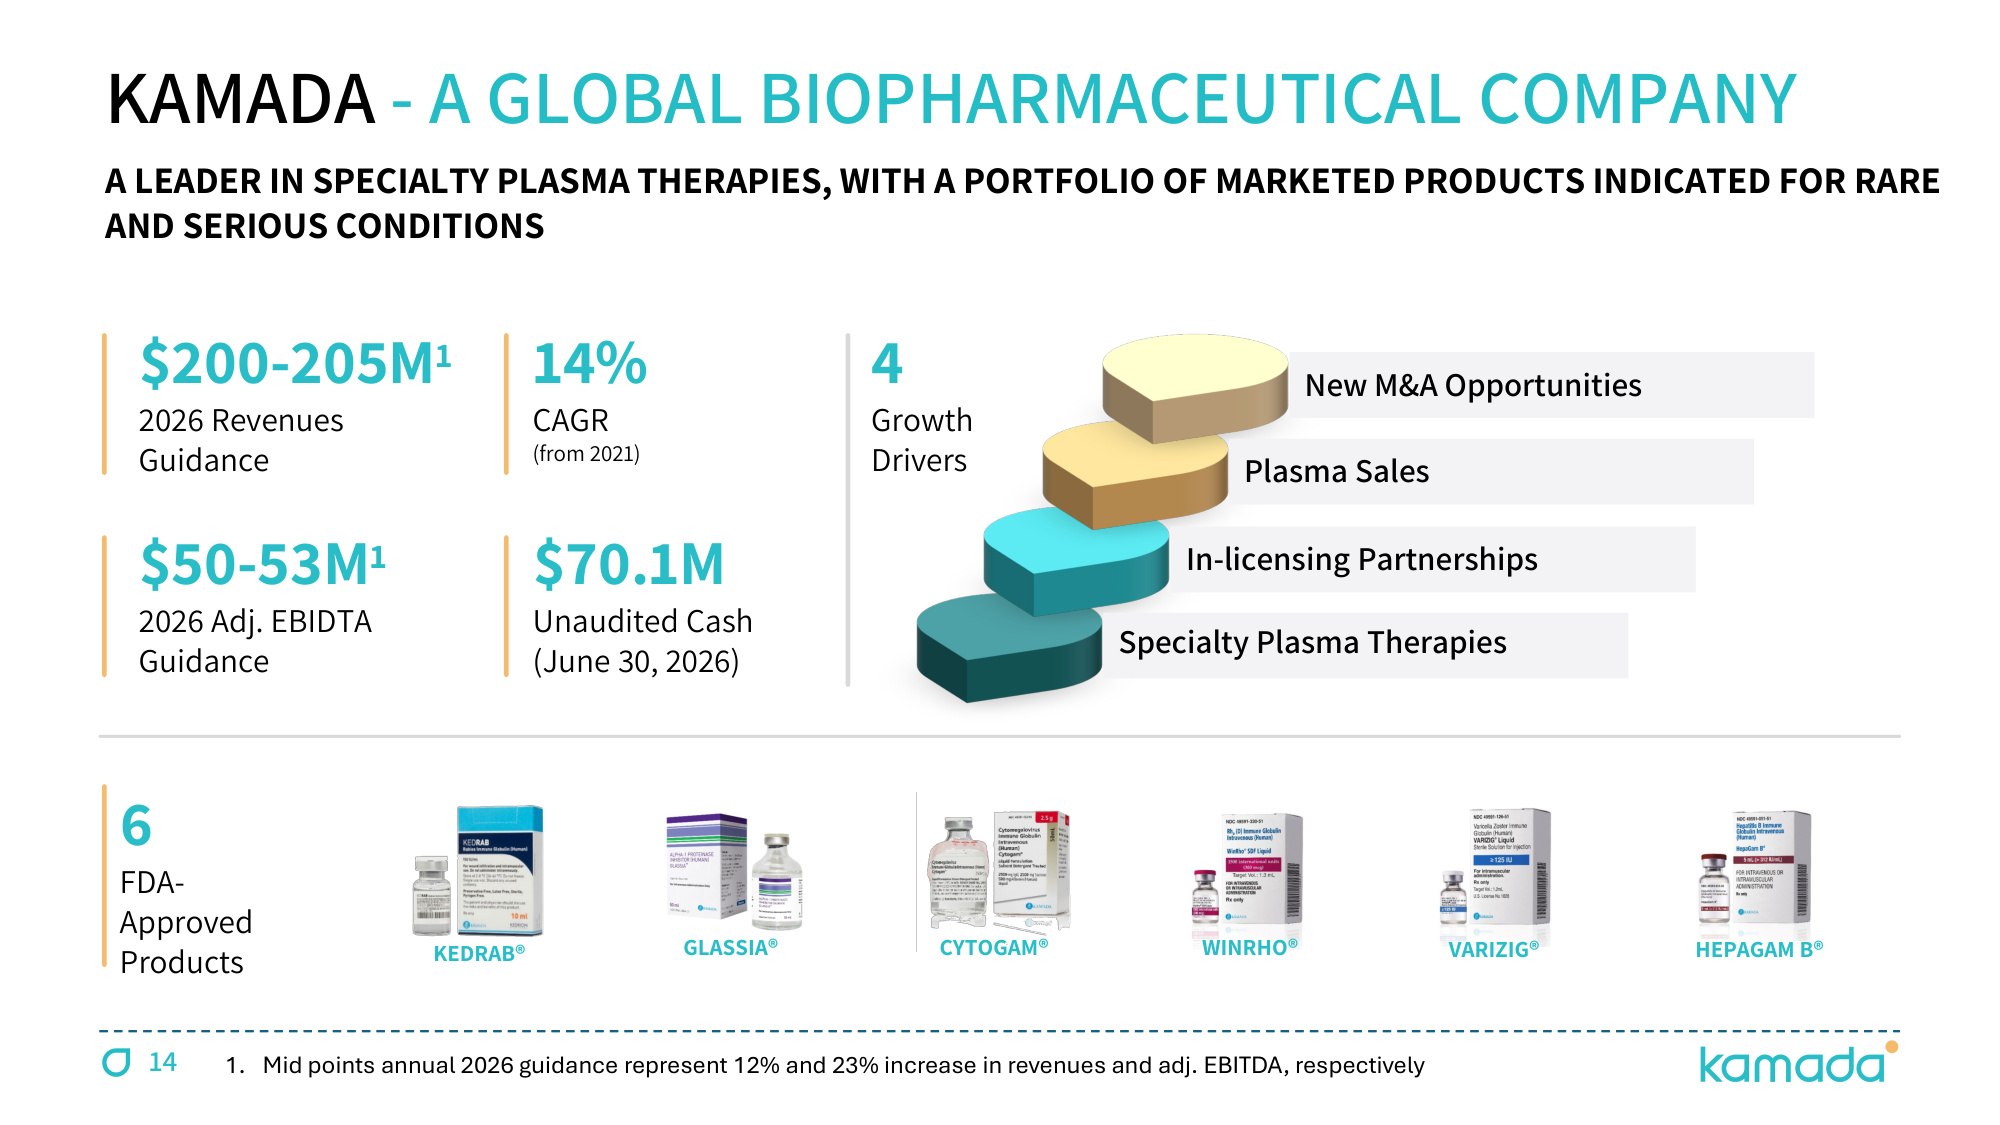
KEDRAB® CYTOGAM® HEPAGAM B® VARIZIG® WINRHO® GLASSIA® KAMADA - A GLOBAL BIOPHARMACEUTICAL COMPANY 6 FDA- Approved Products 14% CAGR (from 2021) $200-205M1 2026 Revenues Guidance $50-53M1 2026 Adj. EBIDTA Guidance 4 Growth Drivers A LEADER IN SPECIALTY PLASMA THERAPIES, WITH A PORTFOLIO OF MARKETED PRODUCTS INDICATED FOR RARE AND SERIOUS CONDITIONS $70.1M Unaudited Cash (June 30, 2026) 14 1. Mid points annual 2026 guidance represent 12% and 23% increase in revenues and adj. EBITDA, respectively New M&A Opportunities Plasma Sales In-licensing Partnerships Specialty Plasma Therapies
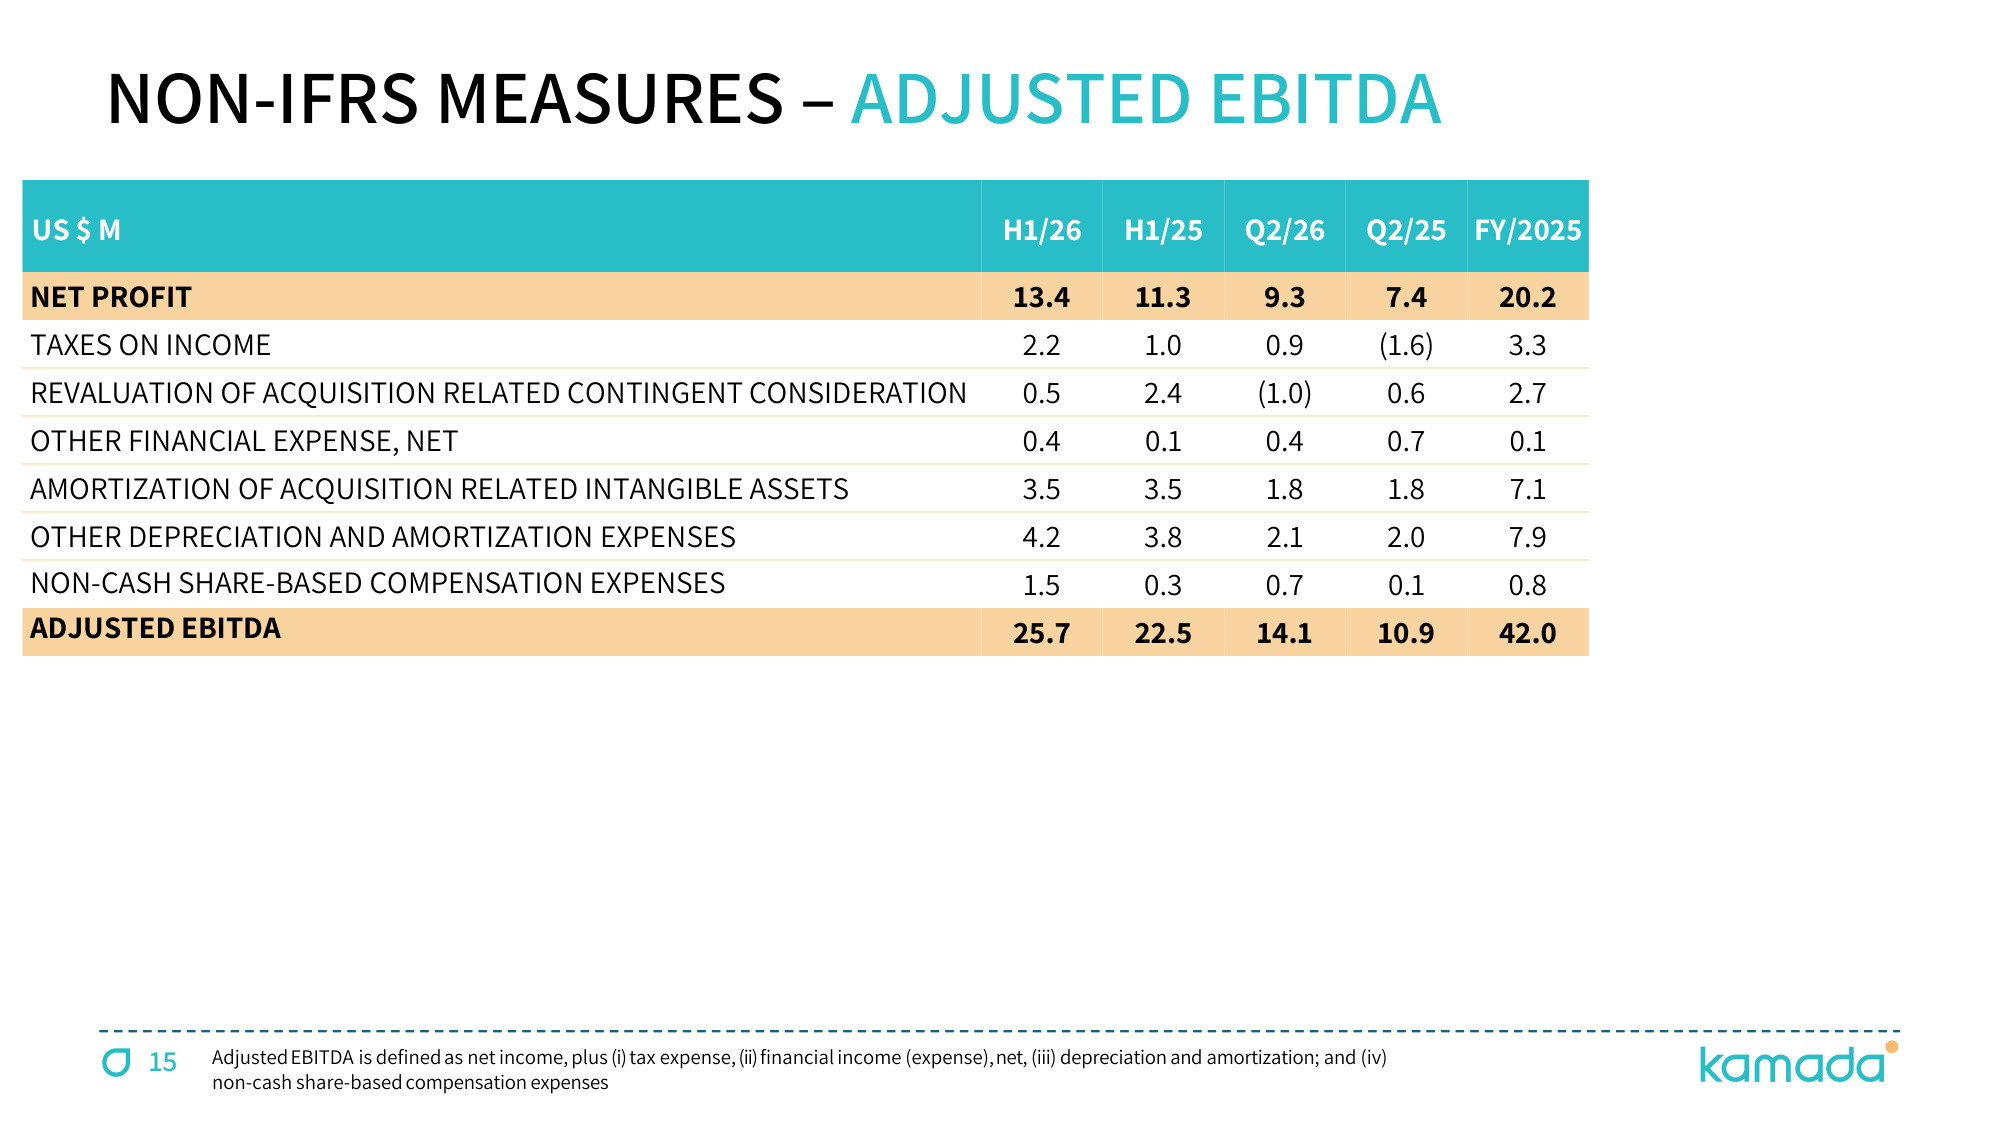
15 NON-IFRS MEASURES – ADJUSTED EBITDA AdjustedEBITDA is definedas net income,plus (i) tax expense,(ii) financialincome (expense),net, (iii) depreciation and amortization; and (iv) non-cash share-basedcompensation expenses US $ M H1/26 H1/25 Q2/26 Q2/25 FY/2025 NET PROFIT 13.4 11.3 9.3 7.4 20.2 TAXES ON INCOME 2.2 1.0 0.9 (1.6) 3.3 REVALUATION OF ACQUISITION RELATED CONTINGENT CONSIDERATION 0.5 2.4 (1.0) 0.6 2.7 OTHER FINANCIAL EXPENSE, NET 0.4 0.1 0.4 0.7 0.1 AMORTIZATION OF ACQUISITION RELATED INTANGIBLE ASSETS 3.5 3.5 1.8 1.8 7.1 OTHER DEPRECIATION AND AMORTIZATION EXPENSES 4.2 3.8 2.1 2.0 7.9 NON-CASH SHARE-BASED COMPENSATION EXPENSES 1.5 0.3 0.7 0.1 0.8 ADJUSTED EBITDA 25.7 22.5 14.1 10.9 42.0
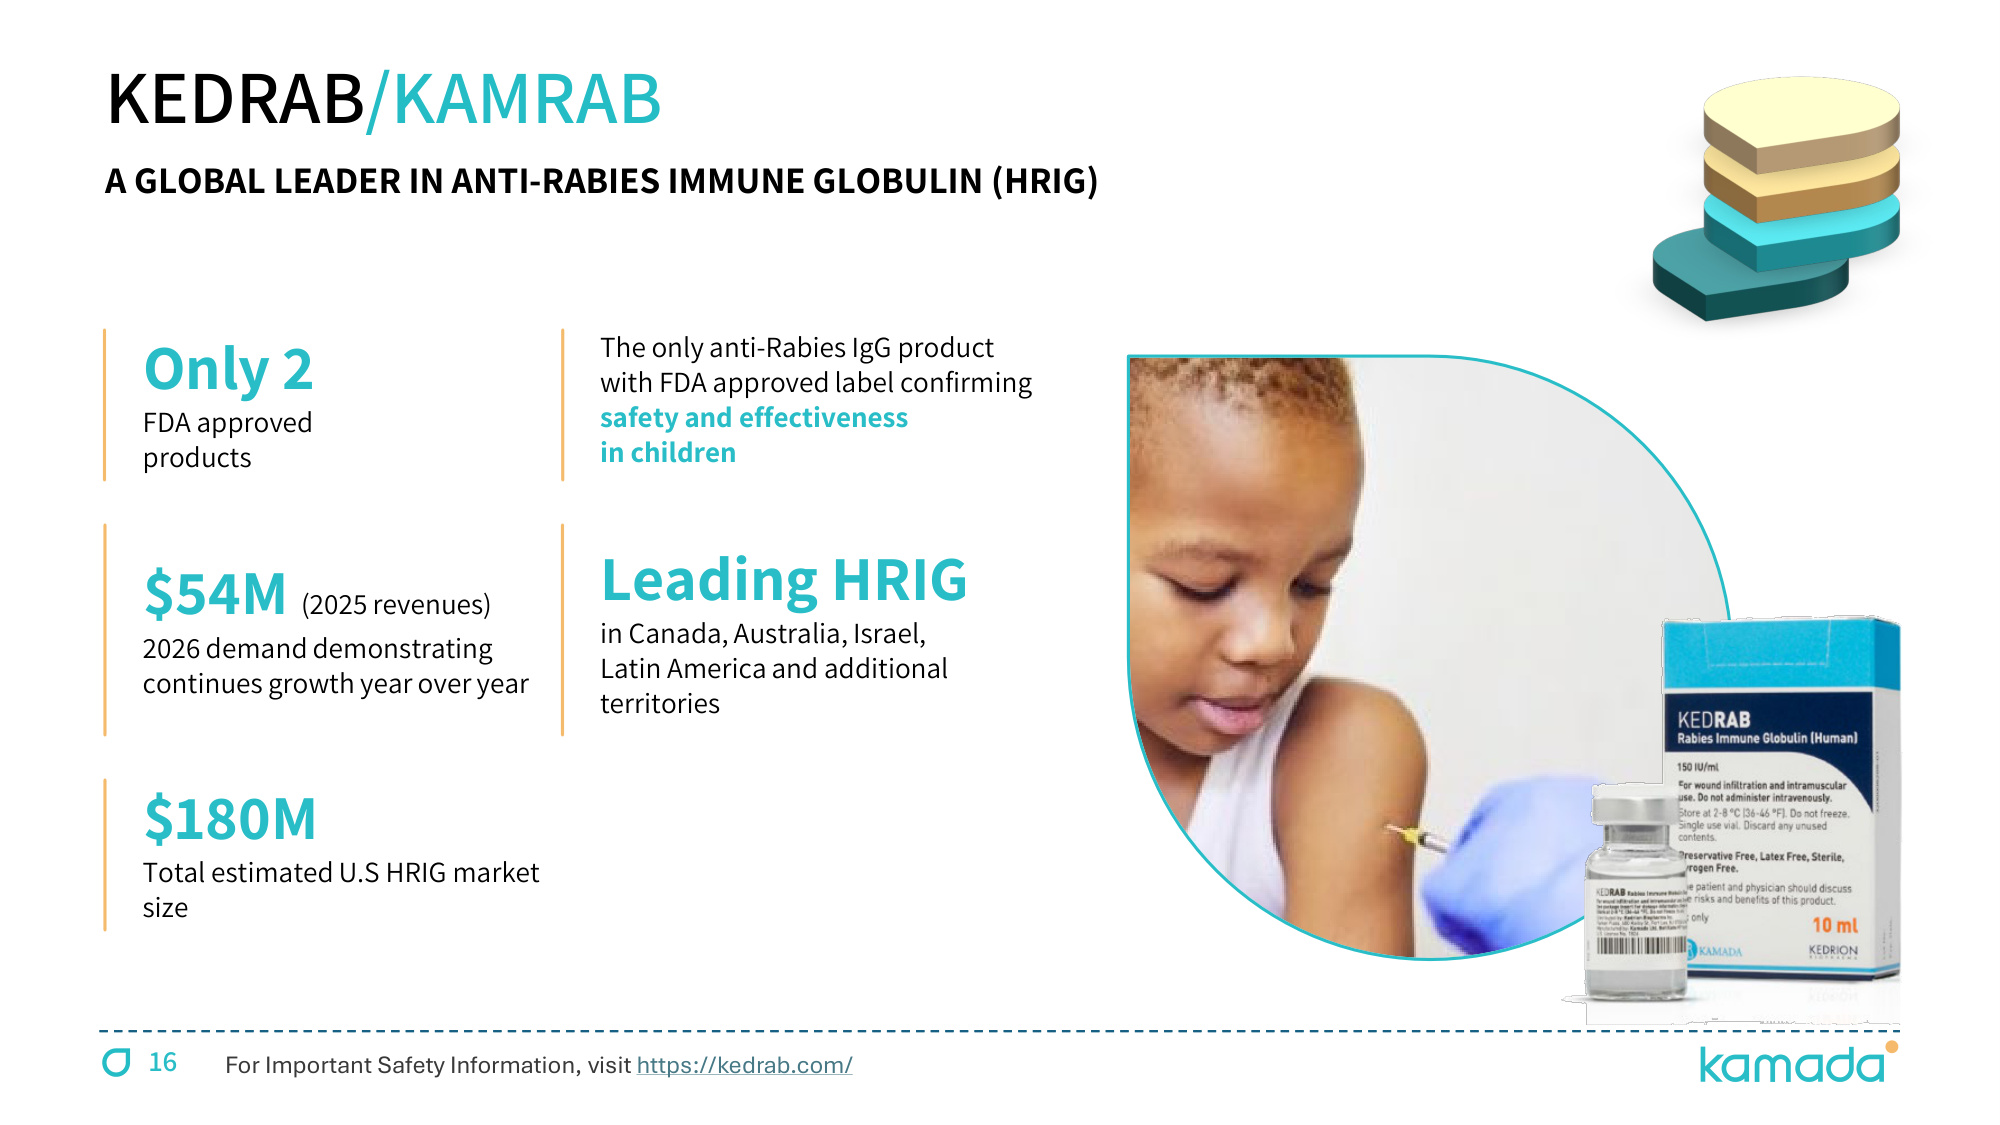
$180M Total estimated U.S HRIG market size The only anti-Rabies IgG product with FDA approved label confirming safety and effectiveness in children KEDRAB/KAMRAB $54M (2025 revenues) 2026 demand demonstrating continues growth year over year Only 2 FDA approved products Leading HRIG in Canada, Australia, Israel, Latin America and additional territories A GLOBAL LEADER IN ANTI-RABIES IMMUNE GLOBULIN (HRIG) For Important Safety Information, visit https://kedrab.com/ 16
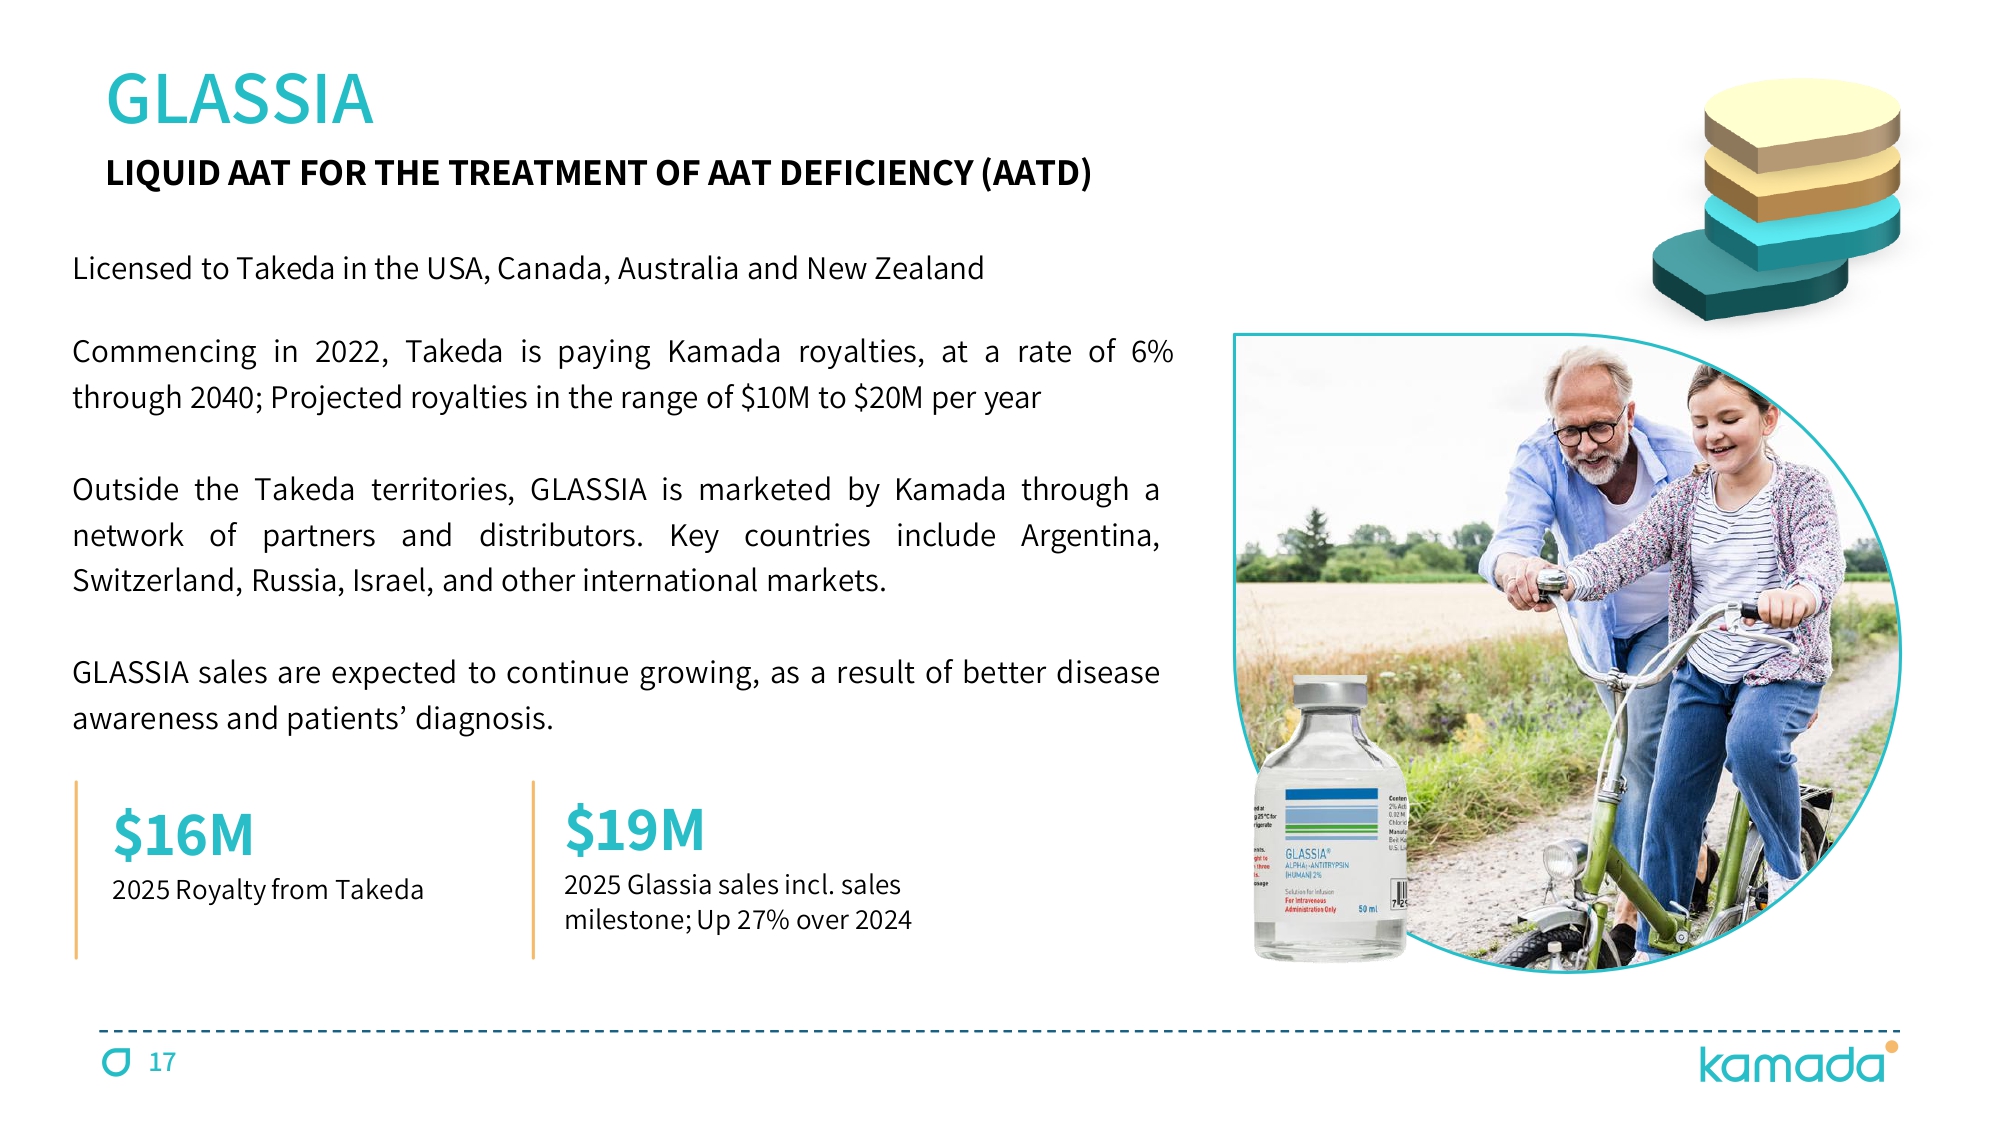
17 Licensed to Takeda in the USA, Canada, Australia and New Zealand Commencing in 2022 , Takeda is paying Kamada royalties, at a rate of 6 % through 2040 ; Projected royalties in the range of $ 10 M to $ 20 M per year Outside the Takeda territories, GLASSIA is marketed by Kamada through a network of partners and distributors . Key countries include Argentina, Switzerland, Russia, Israel, and other international markets . GLASSIA sales are expected to continue growing, as a result of better disease awareness and patients ’ diagnosis . GLASSIA $ 16 M 2025 Royalty from Takeda LIQUID AAT FOR THE TREATMENT OF AAT DEFICIENCY (AATD) $ 19 M 2025 Glassia sales incl. sales milestone; Up 27 % over 2024
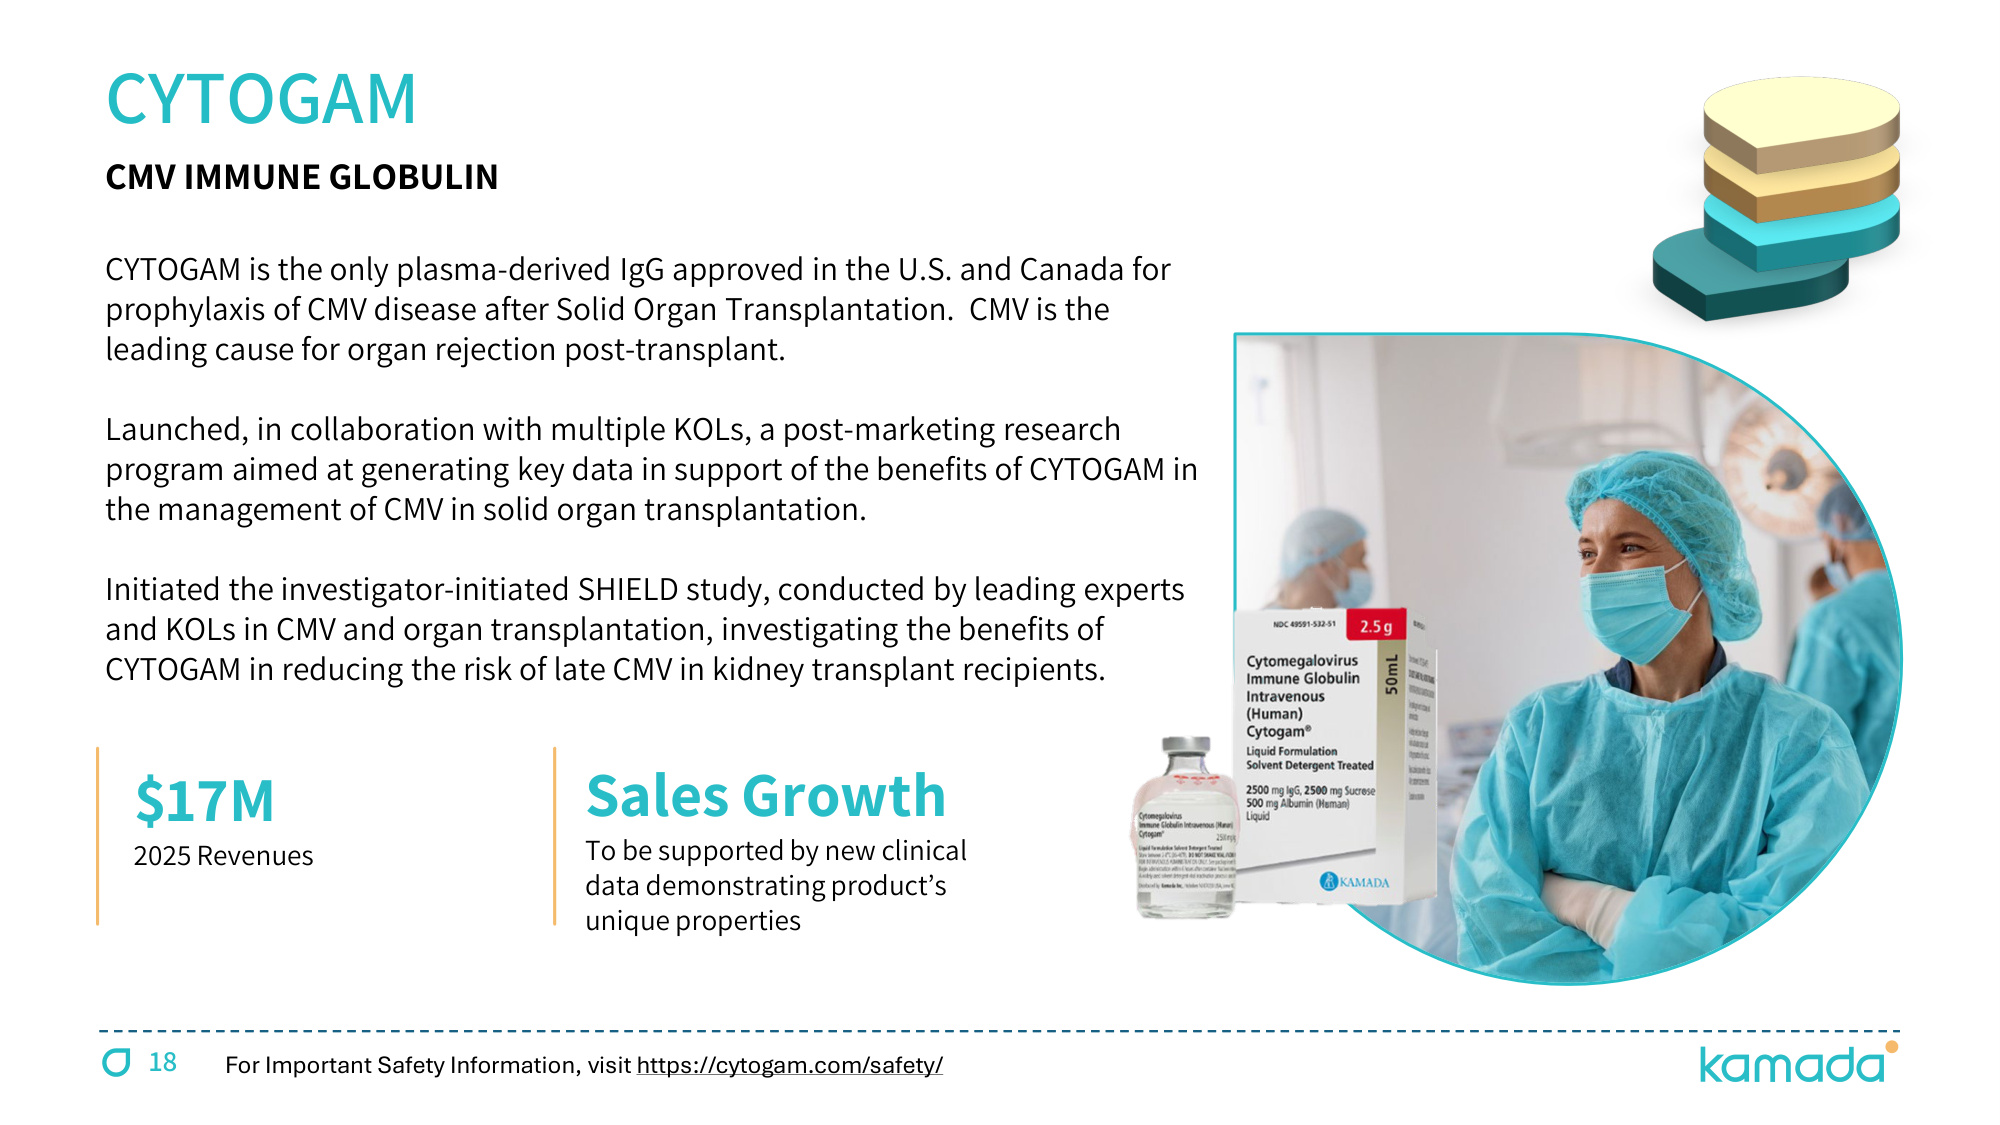
18 CYTOGAM $17M 2025 Revenues CMV IMMUNE GLOBULIN Sales Growth To be supported by new clinical data demonstrating product's unique properties CYTOGAM is the only plasma-derived IgG approved in the U.S. and Canada for prophylaxis of CMV disease after Solid Organ Transplantation. CMV is the leading cause for organ rejection post-transplant. Launched, in collaboration with multiple KOLs, a post-marketing research program aimed at generating key data in support of the benefits of CYTOGAM in the management of CMV in solid organ transplantation. Initiated the investigator-initiated SHIELD study, conducted by leading experts and KOLs in CMV and organ transplantation, investigating the benefits of CYTOGAM in reducing the risk of late CMV in kidney transplant recipients. For Important Safety Information, visit https://cytogam.com/safety/
Exhibit 99.3
KAMADA LTD.
CONDENSED CONSOLIDATED INTERIM FINANCIAL STATEMENTS
AS OF JUNE 30, 2026
TABLE OF CONTENTS
- - - - - - - - - - -
F-1
KAMADA LTD.
Condensed Consolidated Interim Statements of Financial Position
| As of | As of | |||||||||||
| June 30, | December 31, | |||||||||||
| 2026 | 2025 | 2025 | ||||||||||
| Unaudited | ||||||||||||
| U.S. Dollars in Thousands | ||||||||||||
| Assets | ||||||||||||
| Current Assets | ||||||||||||
| Cash and cash equivalents | $ | $ | $ | |||||||||
| Short-term investments | ||||||||||||
| Trade receivables, net | ||||||||||||
Other accounts receivables | ||||||||||||
| Inventories | ||||||||||||
| Total Current Assets | ||||||||||||
| Non-Current Assets | ||||||||||||
| Property, plant and equipment, net | ||||||||||||
| Right-of-use assets | ||||||||||||
| Intangible assets, and other long-term assets | ||||||||||||
| Goodwill | ||||||||||||
| Contract assets | ||||||||||||
| Total Non-Current Assets | ||||||||||||
| Total Assets | $ | $ | $ | |||||||||
| Liabilities | ||||||||||||
| Current Liabilities | ||||||||||||
| Current maturities of lease liabilities | ||||||||||||
| Current maturities of other long term liabilities | ||||||||||||
| Trade payables | ||||||||||||
| Other accounts payables | ||||||||||||
| Deferred revenues | ||||||||||||
| Total Current Liabilities | ||||||||||||
| Non-Current Liabilities | ||||||||||||
| Lease liabilities | ||||||||||||
| Contingent consideration | ||||||||||||
| Other long-term liabilities | ||||||||||||
| Deferred taxes | ||||||||||||
| Employee benefit liabilities, net | ||||||||||||
| Total Non-Current Liabilities | ||||||||||||
| Shareholder’s Equity | ||||||||||||
| Ordinary shares | ||||||||||||
| Additional paid in capital net | ||||||||||||
| Capital reserve due to translation to presentation currency | ( | ) | ( | ) | ( | ) | ||||||
| Capital reserve from hedges | ||||||||||||
| Capital reserve from share-based payments | ||||||||||||
| Capital reserve from employee benefits | ||||||||||||
| Accumulated deficit | ( | ) | ( | ) | ( | ) | ||||||
| Total Shareholder’s Equity | ||||||||||||
| Total Liabilities and Shareholder’s Equity | $ | $ | $ | |||||||||
The accompanying Notes are an integral part of the Condensed Consolidated Interim Financial Statements.
F-2
KAMADA LTD.
Condensed Consolidated Interim Statements of Profit or Loss and Other Comprehensive Income
| Six months period ended | Three months period ended | Year ended | ||||||||||||||||||
| June 30, | June 30, | December 31, | ||||||||||||||||||
| 2026 | 2025 | 2026 | 2025 | 2025 | ||||||||||||||||
| Unaudited | Unaudited | |||||||||||||||||||
| U.S. Dollars in Thousands | ||||||||||||||||||||
| Revenues from proprietary products | $ | $ | $ | $ | $ | |||||||||||||||
| Revenues from distribution | ||||||||||||||||||||
| Total revenues | ||||||||||||||||||||
| Cost of revenues from proprietary products | ||||||||||||||||||||
| Cost of revenues from distribution | ||||||||||||||||||||
| Total cost of revenues | ||||||||||||||||||||
| Gross profit | ||||||||||||||||||||
| Research and development expenses | ||||||||||||||||||||
| Selling and marketing expenses | ||||||||||||||||||||
| General and administrative expenses | ||||||||||||||||||||
| Other expenses | ||||||||||||||||||||
| Operating income | ||||||||||||||||||||
| Financial income | ||||||||||||||||||||
| Income (expenses) in respect of currency exchange differences and derivatives instruments, net | ( | ) | ( | ) | ( | ) | ( | ) | ( | ) | ||||||||||
| Revaluation of long- term liabilities | ( | ) | ( | ) | ( | ) | ( | ) | ||||||||||||
| Financial expenses | ( | ) | ( | ) | ( | ) | ( | ) | ( | ) | ||||||||||
| Income before tax on income | ||||||||||||||||||||
| Taxes on income | ( | ) | ( | ) | ( | ) | ( | ) | ||||||||||||
| Net Income | $ | $ | $ | $ | $ | |||||||||||||||
| Other Comprehensive Income (loss) : | ||||||||||||||||||||
| Amounts that will be or that have been reclassified to profit or loss when specific conditions are met | ||||||||||||||||||||
| Gain on cash flow hedges | ||||||||||||||||||||
| Net amounts transferred to the statement of profit or loss for cash flow hedges | ( | ) | ( | ) | ( | ) | ( | ) | ( | ) | ||||||||||
| Items that will not be reclassified to profit or loss in subsequent periods: | ||||||||||||||||||||
| Remeasurement gain from defined benefit plan | ||||||||||||||||||||
| Total comprehensive income (loss) | $ | $ | $ | $ | $ | |||||||||||||||
| Earnings per share attributable to equity holders of the Company: | ||||||||||||||||||||
| Basic net earnings per share | $ | $ | $ | $ | $ | |||||||||||||||
| Diluted net earnings per share | $ | $ | $ | $ | $ | |||||||||||||||
The accompanying Notes are an integral part of the Condensed Consolidated Interim Financial Statements.
F-3
KAMADA LTD.
Condensed Consolidated Interim Statements of Changes in Equity
| Capital | Capital | |||||||||||||||||||||||||||||||
| reserve | reserve | Capital | ||||||||||||||||||||||||||||||
| due to | Capital | from | reserve | |||||||||||||||||||||||||||||
| Additional | translation to | reserve | Share | from | ||||||||||||||||||||||||||||
| Share | paid in | presentation | from | based | employee | Accumulated | Total | |||||||||||||||||||||||||
| capital | capital | currency | hedges | payments | benefits | deficit | equity | |||||||||||||||||||||||||
| Unaudited | ||||||||||||||||||||||||||||||||
| U.S. Dollars in Thousands | ||||||||||||||||||||||||||||||||
| Balance as of January 1, 2026 | $ | $ | $ | ( | ) | $ | $ | $ | $ | ( | ) | $ | ||||||||||||||||||||
| Net income | ||||||||||||||||||||||||||||||||
| Other comprehensive income (loss), net of tax | ( | ) | ( | ) | ||||||||||||||||||||||||||||
| Total comprehensive income (loss) | ( | ) | ||||||||||||||||||||||||||||||
| Exercise and forfeiture of share-based payment into shares | ( | ) | ||||||||||||||||||||||||||||||
| Cost of share-based payment | ||||||||||||||||||||||||||||||||
| Dividend declared ($ | ( | ) | ( | ) | ||||||||||||||||||||||||||||
| Balance as of June 30, 2026 | $ | $ | $ | ( | ) | $ | $ | $ | $ | ( | ) | $ | ||||||||||||||||||||
| Capital | Capital | |||||||||||||||||||||||||||||||
| reserve | reserve | Capital | ||||||||||||||||||||||||||||||
| due to | Capital | from | reserve | |||||||||||||||||||||||||||||
| Additional | translation to | reserve | Share | from | ||||||||||||||||||||||||||||
| Share | paid in | presentation | from | based | employee | Accumulated | Total | |||||||||||||||||||||||||
| capital | capital | currency | hedges | payments | benefits | deficit | equity | |||||||||||||||||||||||||
| Unaudited | ||||||||||||||||||||||||||||||||
| U.S. Dollars in Thousands | ||||||||||||||||||||||||||||||||
| Balance as of January 1, 2025 | $ | $ | $ | ( | ) | $ | $ | $ | $ | ( | ) | $ | ||||||||||||||||||||
| Net income | ||||||||||||||||||||||||||||||||
| Other comprehensive income (loss), net of tax | ||||||||||||||||||||||||||||||||
| Total comprehensive income (loss) | ||||||||||||||||||||||||||||||||
| Exercise and forfeiture of share-based payment into shares | ( | ) | ( | ) | ||||||||||||||||||||||||||||
| Cost of share-based payment | ||||||||||||||||||||||||||||||||
| Dividend declared ($ | ( | ) | ( | ) | ||||||||||||||||||||||||||||
| Balance as of June 30, 2025 | $ | $ | $ | ( | ) | $ | $ | $ | $ | ( | ) | $ | ||||||||||||||||||||
The accompanying Notes are an integral part of the Condensed Consolidated Interim Financial Statements.
F-4
KAMADA LTD.
Condensed Consolidated Interim Statements of Changes in Equity
| Share | Additional paid in |
Capital reserve due to translation to presentation |
Capital reserve from |
Capital reserve from share based |
Capital reserve from employee |
Accumulated | Total | |||||||||||||||||||||||||
| capital | capital | currency | hedges | payments | benefits | deficit | equity | |||||||||||||||||||||||||
| Unaudited | ||||||||||||||||||||||||||||||||
| U.S. Dollars In thousands | ||||||||||||||||||||||||||||||||
| Balance as of April 1, 2026 | $ | $ | $ | ( | ) | $ | ( | ) | $ | $ | $ | ( | ) | $ | ||||||||||||||||||
| Net income | ||||||||||||||||||||||||||||||||
| Other comprehensive income (loss), net of tax | ||||||||||||||||||||||||||||||||
| Total comprehensive income (loss) | ||||||||||||||||||||||||||||||||
| Exercise and forfeiture of share-based payment into shares | ( | ) | ||||||||||||||||||||||||||||||
| Cost of share-based payment | ||||||||||||||||||||||||||||||||
| Balance as of June 30, 2026 | $ | $ | $ | ( | ) | $ | $ | $ | $ | ( | ) | $ | ||||||||||||||||||||
| Share | Additional paid in |
Capital reserve due to translation to presentation |
Capital reserve from |
Capital reserve from share based |
Capital reserve from employee |
Accumulated | Total | |||||||||||||||||||||||||
| capital | capital | currency | hedges | payments | benefits | deficit | equity | |||||||||||||||||||||||||
| Unaudited | ||||||||||||||||||||||||||||||||
| U.S. Dollars In thousands | ||||||||||||||||||||||||||||||||
| Balance as of April 1, 2025 | $ | $ | $ | ( | ) | $ | ( | ) | $ | $ | $ | ( | ) | $ | ||||||||||||||||||
| Net income | ||||||||||||||||||||||||||||||||
| Other comprehensive income (loss), net of tax | ||||||||||||||||||||||||||||||||
| Total comprehensive income (loss) | ||||||||||||||||||||||||||||||||
| Exercise and forfeiture of share-based payment into shares | ( | ) | ( | ) | ||||||||||||||||||||||||||||
| Cost of share-based payment | ||||||||||||||||||||||||||||||||
| Balance as of June 30, 2025 | $ | $ | $ | ( | ) | $ | $ | $ | $ | ( | ) | $ | ||||||||||||||||||||
The accompanying Notes are an integral part of the Condensed Consolidated Interim Financial Statements.
F-5
KAMADA LTD.
Condensed Consolidated Interim Statements of Changes in Equity
| Share | Additional paid in |
Capital reserve due to translation to presentation |
Capital reserve from |
Capital reserve from share based |
Capital reserve from employee |
Accumulated | Total | |||||||||||||||||||||||||
| capital | capital | currency | hedges | payments | benefits | deficit | equity | |||||||||||||||||||||||||
| U.S. Dollars in Thousands | ||||||||||||||||||||||||||||||||
| Balance as of January 1, 2025 (audited) | $ | $ | $ | ( | ) | $ | $ | $ | $ | ( | ) | $ | ||||||||||||||||||||
| Net income | ||||||||||||||||||||||||||||||||
| Other comprehensive income (loss), net of tax) | ||||||||||||||||||||||||||||||||
| Total comprehensive income (loss) | ||||||||||||||||||||||||||||||||
| Exercise and forfeiture of share-based payment into shares | ( | ) | ||||||||||||||||||||||||||||||
| Cost of share-based payment | ||||||||||||||||||||||||||||||||
| Dividend declared ($ | ( | ) | ( | ) | ||||||||||||||||||||||||||||
| Income tax impact associated with issuance of shares | ( | ) | ( | ) | ||||||||||||||||||||||||||||
| Balance as of December 31, 2025 | $ | $ | $ | ( | ) | $ | $ | $ | $ | ( | ) | $ | ||||||||||||||||||||
The accompanying Notes are an integral part of the Condensed Consolidated Interim Financial Statements.
F-6
KAMADA LTD.
Condensed Consolidated Interim Statements of Cash Flows
| Six months period Ended | Three months period Ended | Year Ended | ||||||||||||||||||
| June 30, | June 30, | December 31, | ||||||||||||||||||
| 2026 | 2025 | 2026 | 2025 | 2025 | ||||||||||||||||
| Unaudited | ||||||||||||||||||||
| U.S Dollars In thousands | ||||||||||||||||||||
| Cash Flows from Operating Activities | ||||||||||||||||||||
| Net income | $ | $ | $ | $ | $ | |||||||||||||||
| Adjustments to reconcile net income to net cash provided by (used in) operating activities: | ||||||||||||||||||||
| Adjustments to the profit or loss items: | ||||||||||||||||||||
| Depreciation and amortization | ||||||||||||||||||||
| Financial expenses net | ( | ) | ||||||||||||||||||
| Cost of share-based payment | ||||||||||||||||||||
| Taxes on income | ( | ) | ||||||||||||||||||
| Gain from sale of property and equipment | ( | ) | ( | ) | ||||||||||||||||
| Change in employee benefit liabilities, net | ||||||||||||||||||||
| Changes in asset and liability items: | ||||||||||||||||||||
| Increase in trade receivables, net | ( | ) | ( | ) | ( | ) | ( | ) | ( | ) | ||||||||||
| Decrease (increase) in other accounts receivables | ( | ) | ( | ) | ( | ) | ||||||||||||||
| Increase in inventories | ( | ) | ( | ) | ( | ) | ( | ) | ( | ) | ||||||||||
| Decrease in contract asset | ||||||||||||||||||||
| Increase (decrease) in trade payables | ( | ) | ( | ) | ( | ) | ||||||||||||||
| Increase (decrease) in other accounts payables | ( | ) | ( | ) | ||||||||||||||||
| Increase (decrease) in deferred revenues | ( | ) | ( | ) | ||||||||||||||||
| ( | ) | ( | ) | ( | ) | ( | ) | |||||||||||||
| Cash received (paid) during the period for: | ||||||||||||||||||||
| Interest paid | ( | ) | ( | ) | ( | ) | ( | ) | ( | ) | ||||||||||
| Interest received | ||||||||||||||||||||
| Taxes (paid) received | ( | ) | ( | ) | ( | ) | ( | ) | ||||||||||||
| Net cash provided by operating activities | $ | $ | $ | $ | $ | |||||||||||||||
The accompanying Notes are an integral part of the Condensed Consolidated Interim Financial Statements.
F-7
KAMADA LTD.
Condensed Consolidated Interim Statements of Cash Flows
| Six months period Ended | Three months period Ended | Year Ended | ||||||||||||||||||
| June 30, | June 30, | December 31, | ||||||||||||||||||
| 2026 | 2025 | 2026 | 2025 | 2025 | ||||||||||||||||
| Unaudited | ||||||||||||||||||||
| U.S Dollars In thousands | ||||||||||||||||||||
| Cash Flows from Investing Activities | ||||||||||||||||||||
| Purchase of property and equipment and intangible assets | ( | ) | ( | ) | ( | ) | ( | ) | ( | ) | ||||||||||
| Investment in short term investments | ( | ) | ( | ) | ||||||||||||||||
| Proceeds from sale of property and equipment | ||||||||||||||||||||
| Net cash used in investing activities | ( | ) | ( | ) | ( | ) | ( | ) | ( | ) | ||||||||||
| Cash Flows from Financing Activities | ||||||||||||||||||||
| Proceeds from exercise of share base payments | ||||||||||||||||||||
| Repayment of lease liabilities | ( | ) | ( | ) | ( | ) | ( | ) | ( | ) | ||||||||||
| Repayment of other long-term liabilities | ( | ) | ( | ) | ( | ) | ( | ) | ( | ) | ||||||||||
| Dividends Paid | ( | ) | ( | ) | ( | ) | ( | ) | ( | ) | ||||||||||
| Net cash used in financing activities | ( | ) | ( | ) | ( | ) | ( | ) | ( | ) | ||||||||||
| Exchange differences on balances of cash and cash equivalent | ( | ) | ( | ) | ( | ) | ( | ) | ||||||||||||
| Decrease in cash and cash equivalents | ( | ) | ( | ) | ( | ) | ( | ) | ( | ) | ||||||||||
| Cash and cash equivalents at the beginning of the period | ||||||||||||||||||||
| Cash and cash equivalents at the end of the period | $ | $ | $ | $ | $ | |||||||||||||||
| Significant non-cash transactions | ||||||||||||||||||||
| Right-of-use asset recognized with corresponding lease liability | $ | $ | $ | $ | $ | |||||||||||||||
| Purchase of property and equipment and Intangible assets | $ | $ | $ | $ | $ | |||||||||||||||
The accompanying Notes are an integral part of the Condensed Consolidated Interim Financial Statements.
F-8
KAMADA LTD.
Notes to the Condensed Consolidated Interim Financial Statements
Note 1:- General
Kamada Ltd (the “Company”) is a global biopharmaceutical company with a portfolio of marketed products indicated for rare and serious conditions and a leader in the specialty plasma-derived therapies field. The Company’s strategy is focused on driving profitable growth through four primary growth pillars: First, organic growth of its commercial portfolio, including continued investment in the commercialization and life cycle management of its proprietary products, consisting of six FDA-approved specialty plasma-derived products: KEDRAB®, GLASSIA®, CYTOGAM®, VARIZIG®, WINRHO SDF® and HEPAGAM B® , as well as KAMRAB® and two equine-based anti-snake venom products. Second, distribution of third parties’ pharmaceutical products in Israel and the MENA region through in-licensing partnerships including the launch of several biosimilar products in Israel. Third, the Company is ramping up its plasma collection operations to support revenue growth through the sale of normal source plasma to other plasma-derived manufacturers, and to support its increasing demand for hyper-immune plasma. The Company currently owns three FDA approved operating plasma collection centers in the United States, in Beaumont, Houston, and San Antonio, Texas. Fourth, the Company aims to secure new mergers and acquisitions, business development, in-licensing and/or collaboration opportunities, which are anticipated to enhance the Company’s marketed products portfolio and leverage its financial strength and existing commercial infrastructure to drive long-term profitable growth. The Company is leveraging its manufacturing, research and development expertise to advance the development and commercialization of additional product candidates, targeting areas of significant unmet medical need.
In November 2021, the Company acquired, pursuant to an Asset Purchase Agreement, CYTOGAM, WINRHO SDF, VARIZIG and HEPAGAM B from Saol Therapeutics Ltd. The acquisition of this portfolio furthered the Company’s core objective to become a fully integrated specialty plasma company with strong commercial capabilities in the U.S. market, as well as to expand to new markets, mainly in the Middle East/North Africa region, and to broaden the Company’s portfolio offering in existing markets. The Company’s wholly owned U.S. subsidiary, Kamada Inc., is responsible for the commercialization of the four products in the U.S. market, including direct sales to wholesalers and local distributers.
In accordance with an agreement with Takeda Pharmaceuticals Company Limited (“Takeda”), starting from the first quarter of 2022, Takeda pays the Company royalties on sales of GLASSIA manufactured by Takeda in the United States and, commencing in 2024, in Canada, at a rate of
The Company’s ordinary shares are listed for trading on the Tel Aviv Stock Exchange and the NASDAQ Global Select Market.
FIMI Opportunity Funds (“FIMI”), the leading private equity firm in Israel beneficially owns approximately
The Company’s activity is divided into two operating segments:
| Proprietary Products | Manufacturing, sales and distribution of plasma-derived protein therapeutics and normal source plasma. | ||
| Distribution | Distribute imported drug products in Israel and MENA region, which are manufactured by third parties. |
F-9
KAMADA LTD.
Notes to the Condensed Consolidated Interim Financial Statements
Note 2:- Material Accounting Policies
| a. | Basis of preparation of the condensed consolidated interim financial statements: |
The condensed consolidated interim financial statements have been prepared in accordance with generally accepted accounting principles for the preparation of financial statements for interim periods, as prescribed in IAS 34, “Interim Financial Reporting”. The condensed consolidated interim financial statements reflects all normal recurring adjustments that are, in the opinion of management, necessary to fairly present the information set forth herein. The condensed consolidated interim financial statements should be read in conjunction with the Company’s consolidated financial statements for the year ended December 31, 2025, as they do not include all the information and disclosures required in the annual consolidated financial statements. Interim results are not necessarily indicative of the results for a full year.
| b. | Forthcoming requirements |
| Presentation and Disclosure in Financial Statements – IFRS 18 |
In April 2024, the IASB issued IFRS 18 Presentation and Disclosure in Financial Statements (“IFRS 18”) which replaces IAS 1 Presentation of Financial Statements. IFRS 18 requires an entity to classify all income and expenses within its statement of profit and loss into one of five categories: operating; investing; financing; income taxes; and discontinued operations. The first three categories are new. These categories are complemented by the requirement to present subtotals for “operating profit or loss,” profit or loss before financing income and taxes” and “profit or loss” IFRS 18, and the amendments to the other standards, is effective for reporting periods beginning on or after January 1, 2027, but earlier application is permitted.
The Company is currently assessing the impact of the Standard on its financial statements. As of June 30, 2026, the Company is currently evaluating the impact of this new standard.
Note 3:- Significant events in the reporting period
On March 11, 2026, the company announced that its Board of Directors has declared a special cash dividend of $
F-10
KAMADA LTD.
Notes to the Condensed Consolidated Interim Financial Statements
Note 4:- Operating Segments
| a. | General: |
The company has
| Proprietary Products | Manufacturing, sales and distribution of plasma-derived protein therapeutics and normal source plasma. | ||
| Distribution | Distribute imported drug products in Israel and MENA region, which are manufactured by third parties. |
| b. | Reporting on operating segments: |
| Six months period ended June 30, 2026 | ||||||||||||
| Proprietary Products | Distribution | Total | ||||||||||
| U.S Dollars in thousands | ||||||||||||
| Unaudited | ||||||||||||
| Revenues | $ | $ | $ | |||||||||
| Gross profit | $ | $ | $ | |||||||||
| Unallocated corporate expenses | ( | ) | ||||||||||
| Finance expenses, net | ( | ) | ||||||||||
| Income before taxes on income | $ | |||||||||||
| Six months period ended June 30, 2025 | ||||||||||||
| Proprietary Products | Distribution | Total | ||||||||||
| U.S Dollars in thousands | ||||||||||||
| Unaudited | ||||||||||||
| Revenues | $ | $ | $ | |||||||||
| Gross profit | $ | $ | $ | |||||||||
| Unallocated corporate expenses | ( | ) | ||||||||||
| Finance expenses, net | ( | ) | ||||||||||
| Income before taxes on income | $ | |||||||||||
| Three months period ended June 30, 2026 | ||||||||||||
| Proprietary Products | Distribution | Total | ||||||||||
| U.S Dollars in thousands | ||||||||||||
| Unaudited | ||||||||||||
| Revenues | $ | $ | $ | |||||||||
| Gross profit | $ | $ | $ | |||||||||
| Unallocated corporate expenses | ( | ) | ||||||||||
| Finance expenses, net | ||||||||||||
| Income before taxes on income | $ | |||||||||||
F-11
KAMADA LTD.
Notes to the Condensed Consolidated Interim Financial Statements
Note 4:- Operating Segments (cont.)
| b. | Reporting on operating segments: (cont.) |
| Three months period ended June 30, 2025 | ||||||||||||
| Proprietary Products | Distribution | Total | ||||||||||
| U.S Dollars in thousands | ||||||||||||
| Unaudited | ||||||||||||
| Revenues | $ | $ | $ | |||||||||
| Gross profit | $ | $ | $ | |||||||||
| Unallocated corporate expenses | ( | ) | ||||||||||
| Finance expenses, net | ( | ) | ||||||||||
| Income before taxes on income | $ | |||||||||||
| Year Ended December 31, 2025 | ||||||||||||
| Proprietary Products | Distribution | Total | ||||||||||
| U.S Dollars in thousands | ||||||||||||
| Revenues | $ | $ | $ | |||||||||
| Gross profit | $ | $ | $ | |||||||||
| Unallocated corporate expenses | ( | ) | ||||||||||
| Finance expenses, net | ( | ) | ||||||||||
| Income before taxes on income | $ | |||||||||||
| c. |
| Six months period ended June 30, 2026 | ||||||||||||
| Proprietary Products | Distribution | Total | ||||||||||
| U.S Dollars in thousands | ||||||||||||
| Unaudited | ||||||||||||
| Geographical markets | ||||||||||||
| U.S.A | $ | $ | $ | |||||||||
| Israel | ||||||||||||
| Latin America | ||||||||||||
| Canada | ||||||||||||
| Europe | ||||||||||||
| Asia | ||||||||||||
| Others | ||||||||||||
| $ | $ | $ | ||||||||||
| Six months period ended June 30, 2025 | ||||||||||||
| Proprietary Products | Distribution | Total | ||||||||||
| U.S Dollars in thousands | ||||||||||||
| Unaudited | ||||||||||||
| Geographical markets | ||||||||||||
| U.S.A | $ | $ | $ | |||||||||
| Israel | ||||||||||||
| Latin America | ||||||||||||
| Canada | ||||||||||||
| Europe | ||||||||||||
| Asia | ||||||||||||
| Others | ||||||||||||
| $ | $ | $ | ||||||||||
F-12
KAMADA LTD.
Notes to the Condensed Consolidated Interim Financial Statements
Note 4:- Operating Segments (cont.)
| c. | Reporting on operating segments by geographic region: (cont.) |
| Three months period ended June 30, 2026 | ||||||||||||
| Proprietary Products | Distribution | Total | ||||||||||
| U.S Dollars in thousands | ||||||||||||
| Unaudited | ||||||||||||
| Geographical markets | ||||||||||||
| U.S.A | $ | $ | $ | |||||||||
| Israel | ||||||||||||
| Canada | ||||||||||||
| Europe | ||||||||||||
| Latin America | ||||||||||||
| Asia | ||||||||||||
| Others | ||||||||||||
| $ | $ | $ | ||||||||||
| Three months period ended June 30, 2025 | ||||||||||||
| Proprietary Products | Distribution | Total | ||||||||||
| U.S Dollars in thousands | ||||||||||||
| Unaudited | ||||||||||||
| Geographical markets | ||||||||||||
| U.S.A | $ | $ | $ | |||||||||
| Israel | ||||||||||||
| Canada | ||||||||||||
| Europe | ||||||||||||
| Latin America | ||||||||||||
| Asia | ||||||||||||
| Others | ||||||||||||
| $ | $ | $ | ||||||||||
| Year ended December 31, 2025 | ||||||||||||
| Proprietary Products | Distribution | Total | ||||||||||
| U.S Dollars in thousands | ||||||||||||
| Geographical markets | ||||||||||||
| U.S.A | $ | $ | $ | |||||||||
| Israel | ||||||||||||
| Latin America | ||||||||||||
| Canada | ||||||||||||
| Europe | ||||||||||||
| Asia | ||||||||||||
| Others | ||||||||||||
| $ | $ | $ | ||||||||||
F-13
KAMADA LTD.
Notes to the Condensed Consolidated Interim Financial Statements
Note 5:- Financial Instruments
| Classification of financial instruments by fair value hierarchy |
Financial assets (liabilities) measured at fair value
| Level 1 | Level 2 | Level 3 | ||||||||||
| U.S Dollars in thousands | ||||||||||||
| June 30, 2026 | ||||||||||||
| Derivatives instruments | $ | $ | $ | |||||||||
| Contingent consideration | $ | $ | $ | ( | ) | |||||||
| June 30, 2025 | ||||||||||||
| Derivatives instruments | $ | $ | $ | |||||||||
| Contingent consideration | $ | $ | $ | ( | ) | |||||||
| December 31, 2025 | ||||||||||||
| Derivatives instruments | $ | $ | $ | |||||||||
| Contingent consideration | $ | $ | $ | ( | ) | |||||||
During the six months ended on June 30, 2026, there were no transfers due to the fair value measurement of any financial instrument from Level 1 to Level 2, and furthermore, there were no transfers to or from Level 3 due to the fair value measurement of any financial instrument.
Note 6:- Subsequent events
On August 5, 2026, the Company’s shareholders approved the grant of
F-14
Exhibit 99.4
Kamada Announces Planned Transition of Chief Financial Officer
REHOVOT, Israel, and HOBOKEN, NJ – August 12, 2026 -- Kamada Ltd. (NASDAQ: KMDA; TASE: KMDA.TA), a global biopharmaceutical company with a portfolio of marketed products indicated for rare and serious conditions and a leader in the specialty plasma-derived therapies field, today announced that Chaime Orlev, its Chief Financial Officer (CFO), will transition out of his role to pursue other opportunities, effective December 31, 2026. Kamada has a search underway to identify a successor to Mr. Orlev, who has served as the Company’s CFO since 2017. Mr. Orlev will provide transitional support to the new CFO to be appointed by Kamada.
“On behalf of the entire Kamada team and the Board of Directors, I would like to thank Chaime for his leadership and significant contributions to Kamada during the past nine years,” said Amir London, Kamada’s Chief Executive Officer. “Chaime has been instrumental in our continued growth while maintaining a strong operating and financial position. I wish him all the best in his future endeavors.”
“I am thankful for the privilege of having served as Kamada’s CFO for the past nine years, including working closely with Amir, our CEO, the rest of Kamada’s management team and its Board of Directors to advance the Company’s growth strategy,” said Chaime Orlev. “As shown by Kamada’s recent earnings announcements, Kamada is on a growth trajectory and has a solid financial position, and I believe this is the right moment to pass the baton and seek new challenges. I look forward to working with the Kamada team and my successor to ensure an efficient and seamless transition.”
About Kamada
Kamada Ltd. (the “Company”) is a global biopharmaceutical company with a portfolio of marketed products indicated for rare and serious conditions and a leader in the specialty plasma-derived therapies field. FIMI Opportunity Funds, the leading private equity firm in Israel, is the Company’s controlling shareholder, beneficially owning approximately 38% of the outstanding ordinary shares. The Company’s strategy is focused on driving profitable growth through four primary growth pillars: First, organic growth of its commercial portfolio, including continued investment in the commercialization and life cycle management of its proprietary products, consisting of six FDA-approved specialty plasma-derived products: KEDRAB®, GLASSIA®, CYTOGAM®, VARIZIG®, WINRHO SDF® and HEPAGAM B®, as well as KAMRAB®, and two equine-based anti-snake venom products. Second, distribution of third parties' pharmaceutical products in Israel & the MENA region through in-licensing partnerships, including the launch of several biosimilar products in Israel. Third, the Company is ramping up its plasma collection operations to support revenue growth through the sale of normal source plasma to other plasma-derived manufacturers, and to support its increasing demand for hyper-immune plasma. The Company currently owns three FDA approved operating plasma collection centers in the United States, in Beaumont, Houston, and San Antonio, Texas. Fourth, the Company aims to secure new mergers and acquisitions, business development, in-licensing and/or collaboration opportunities, which are anticipated to enhance the Company’s marketed products portfolio and leverage its financial strength and existing commercial infrastructure to drive long-term profitable growth. The Company is leveraging its manufacturing, research and development expertise to advance the development and commercialization of additional product candidates, targeting areas of significant unmet medical need.
CONTACTS:
Chaime Orlev
Chief Financial Officer
IR@kamada.com
Brian Ritchie
LifeSci Advisors, LLC
212-915-2578
britchie@LifeSciAdvisors.com