FORM
6-K
U.S. SECURITIES AND EXCHANGE COMMISSION
Washington, D.C. 20549
REPORT
OF FOREIGN PRIVATE ISSUER
PURSUANT TO RULE 13a-16 OR 15d-16 OF THE
SECURITIES EXCHANGE ACT OF 1934
dated May 7, 2026
BRASILAGRO
– COMPANHIA BRASILEIRA DE PROPRIEDADES AGRÍCOLAS
(Exact Name as Specified in its Charter)
BrasilAgro – Brazilian Agricultural Real Estate Company
(Translation of Registrant’s Name)
Avenida Rebouças, 2942, 6th floor
(Address of principal executive offices)
Gustavo Javier Lopez,
Chief Financial and Investor Relations Officer,
Tel. +55 11 3035 5350, Fax +55 11 3035 5366, ri@brasil-agro.com
1309 Av. Brigadeiro Faria Lima, 5th floor
São Paulo, São Paulo 01452-002, Brazil
(Name, Telephone, E-mail and/or Facsimile number and Address of Company Contact Person)
Indicate by check mark whether the registrant files or will file annual reports under cover Form 20-F or Form 40-F.
Form 20-F ☒ Form 40-F ☐
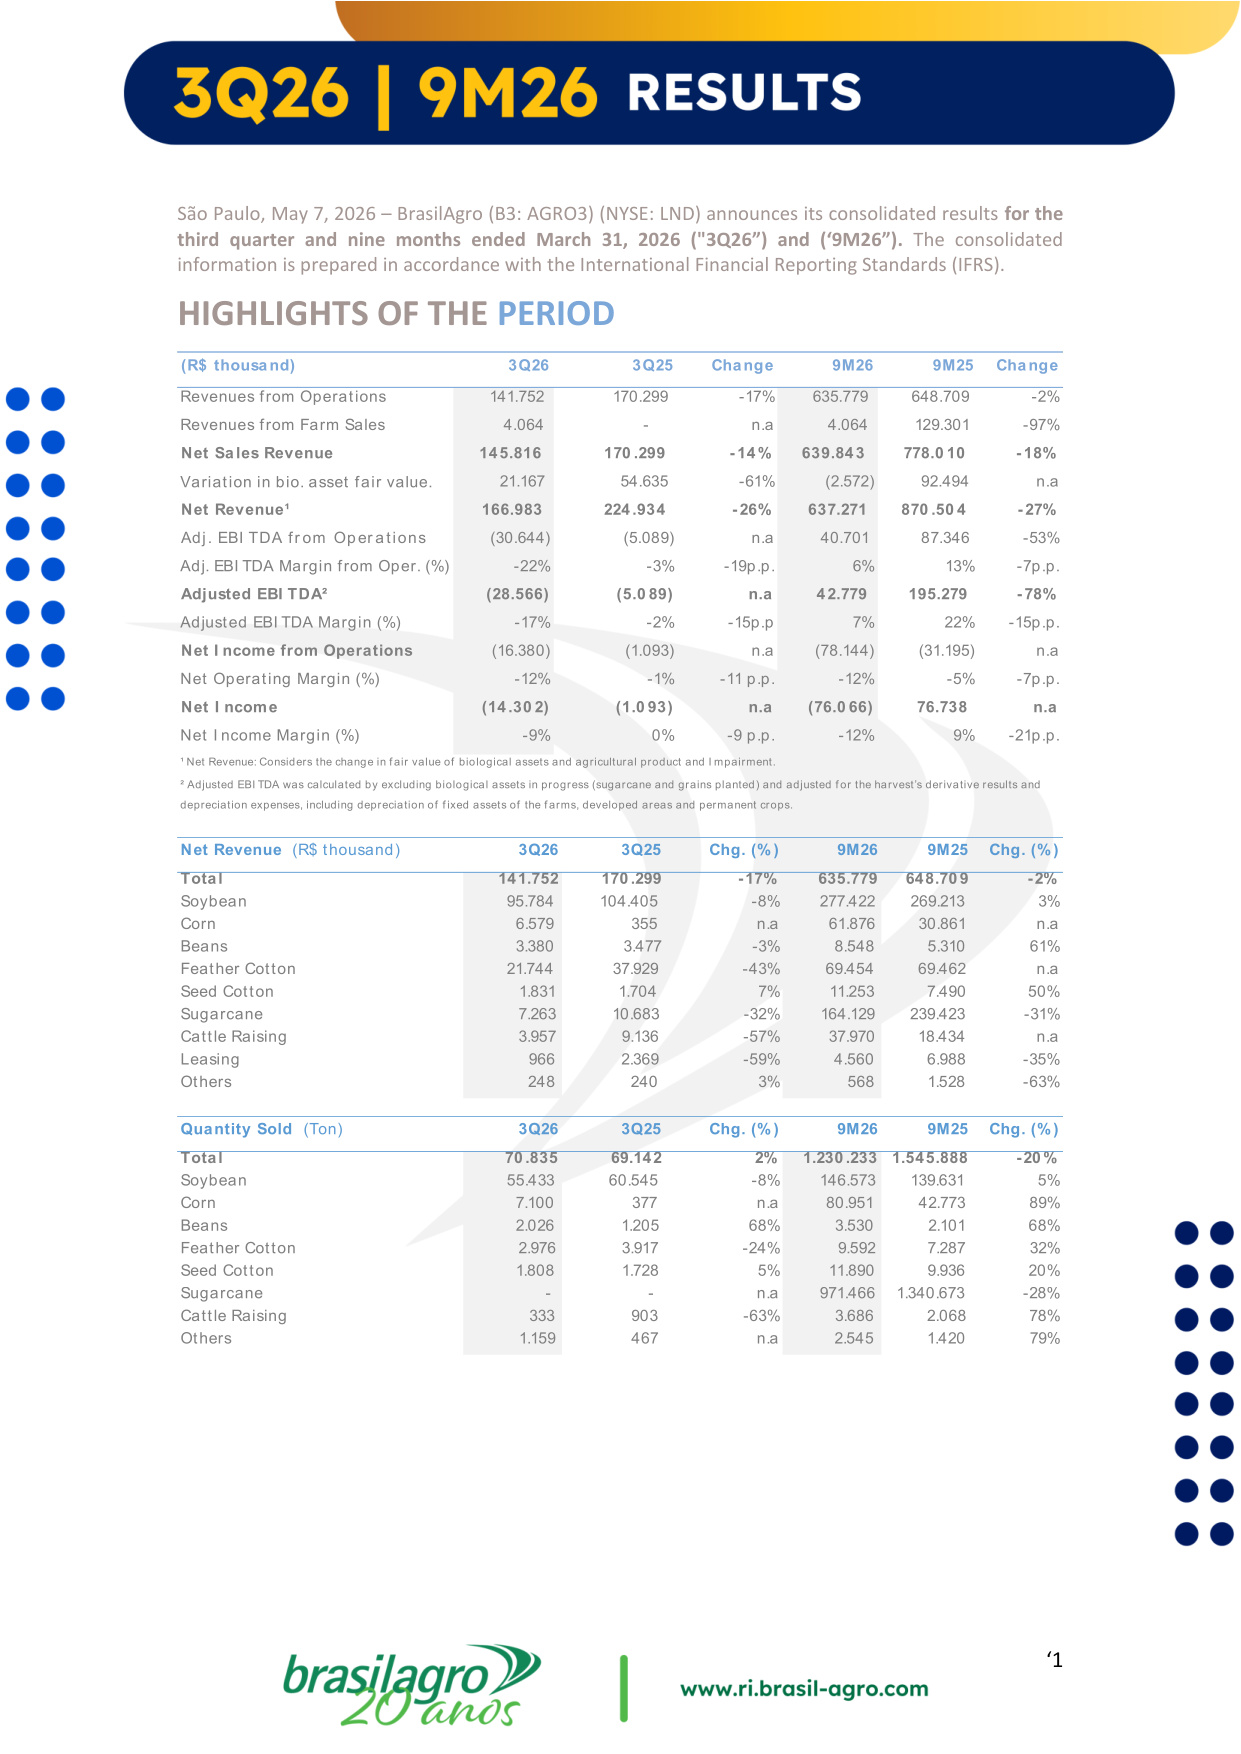
'1 São Paulo, May 7, 2026 – BrasilAgro (B3: AGRO3) (NYSE: LND) announces its consolidated results for the third quarter and nine months ended March 31, 2026 ("3Q26") and ('9M26"). The consolidated information is prepared in accordance with the International Financial Reporting Standards (IFRS). HIGHLIGHTS OF THE PERIOD (R$ thousand) 3Q26 3Q25 Change 9M26 9M25 Change Revenues from Operations 141.752 170.299 -17% 635.779 648.709 -2% Revenues from Farm Sales 4.064 - n.a 4.064 129.301 -97% Net Sales Revenue 145.816 170 .299 - 14% 639.843 778.0 10 - 18% Variation in bio. asset fair value. 21.167 54.635 -61% (2.572) 92.494 n.a Net Revenue¹ 166.983 224.934 - 26% 637.271 870 .50 4 - 27% Adj. EBI TDA fr om Oper ations (30.644) (5.089) n.a 40.701 87.346 -53% Adj. EBI TDA Margin from Oper. (%) -22% -3% -19p.p. 6% 13% -7p.p. Adjusted EBI TDA² (28.566) (5.0 89) n.a 42.779 195.279 - 78% Adjusted EBI TDA Margin (%) -17% -2% -15p.p 7% 22% -15p.p. Net I ncome from Operations (16.380) (1.093) n.a (78.144) (31.195) n.a Net Operating Margin (%) -12% -1% -11 p.p. -12% -5% -7p.p. Net I ncome (14.30 2) (1.0 93) n.a (76.0 66) 76.738 n.a Net I ncome Margin (%) -9% 0% -9 p.p. -12% 9% -21p.p. ¹ Net Revenue: Considers the change in fair value of biological assets and agricultural product and I mpairment. ² Adjusted EBI TDA was calculated by excluding biological assets in progress (sugarcane and grains planted) and adjusted for the harvest's derivative results and depreciation expenses, including depreciation of fixed assets of the farms, developed areas and permanent crops. Net Revenue (R$ thousand) 3Q26 3Q25 Chg. (%) 9M26 9M25 Chg. (%) Total 141.752 170 .299 -17% 635.779 648.70 9 -2% Soybean 95.784 104.405 -8% 277.422 269.213 3% Corn 6.579 355 n.a 61.876 30.861 n.a Beans 3.380 3.477 -3% 8.548 5.310 61% Feather Cotton 21.744 37.929 -43% 69.454 69.462 n.a Seed Cotton 1.831 1.704 7% 11.253 7.490 50% Sugarcane 7.263 10.683 -32% 164.129 239.423 -31% Cattle Raising 3.957 9.136 -57% 37.970 18.434 n.a Leasing 966 2.369 -59% 4.560 6.988 -35% Others 248 240 3% 568 1.528 -63% Quantity Sold (Ton) 3Q26 3Q25 Chg. (%) 9M26 9M25 Chg. (%) Total 70 .835 69.142 2% 1.230 .233 1.545.888 -20 % Soybean 55.433 60.545 -8% 146.573 139.631 5% Corn 7.100 377 n.a 80.951 42.773 89% Beans 2.026 1.205 68% 3.530 2.101 68% Feather Cotton 2.976 3.917 -24% 9.592 7.287 32% Seed Cotton 1.808 1.728 5% 11.890 9.936 20% Sugarcane - - n.a 971.466 1.340.673 -28% Cattle Raising 333 903 -63% 3.686 2.068 78% Others 1.159 467 n.a 2.545 1.420 79% '2 Hedge Position on March 31, 2026 Status of Input Acquisitions Hedge Position - Exchange Soybeans 1Q26 2Q26 3Q26 Chg.
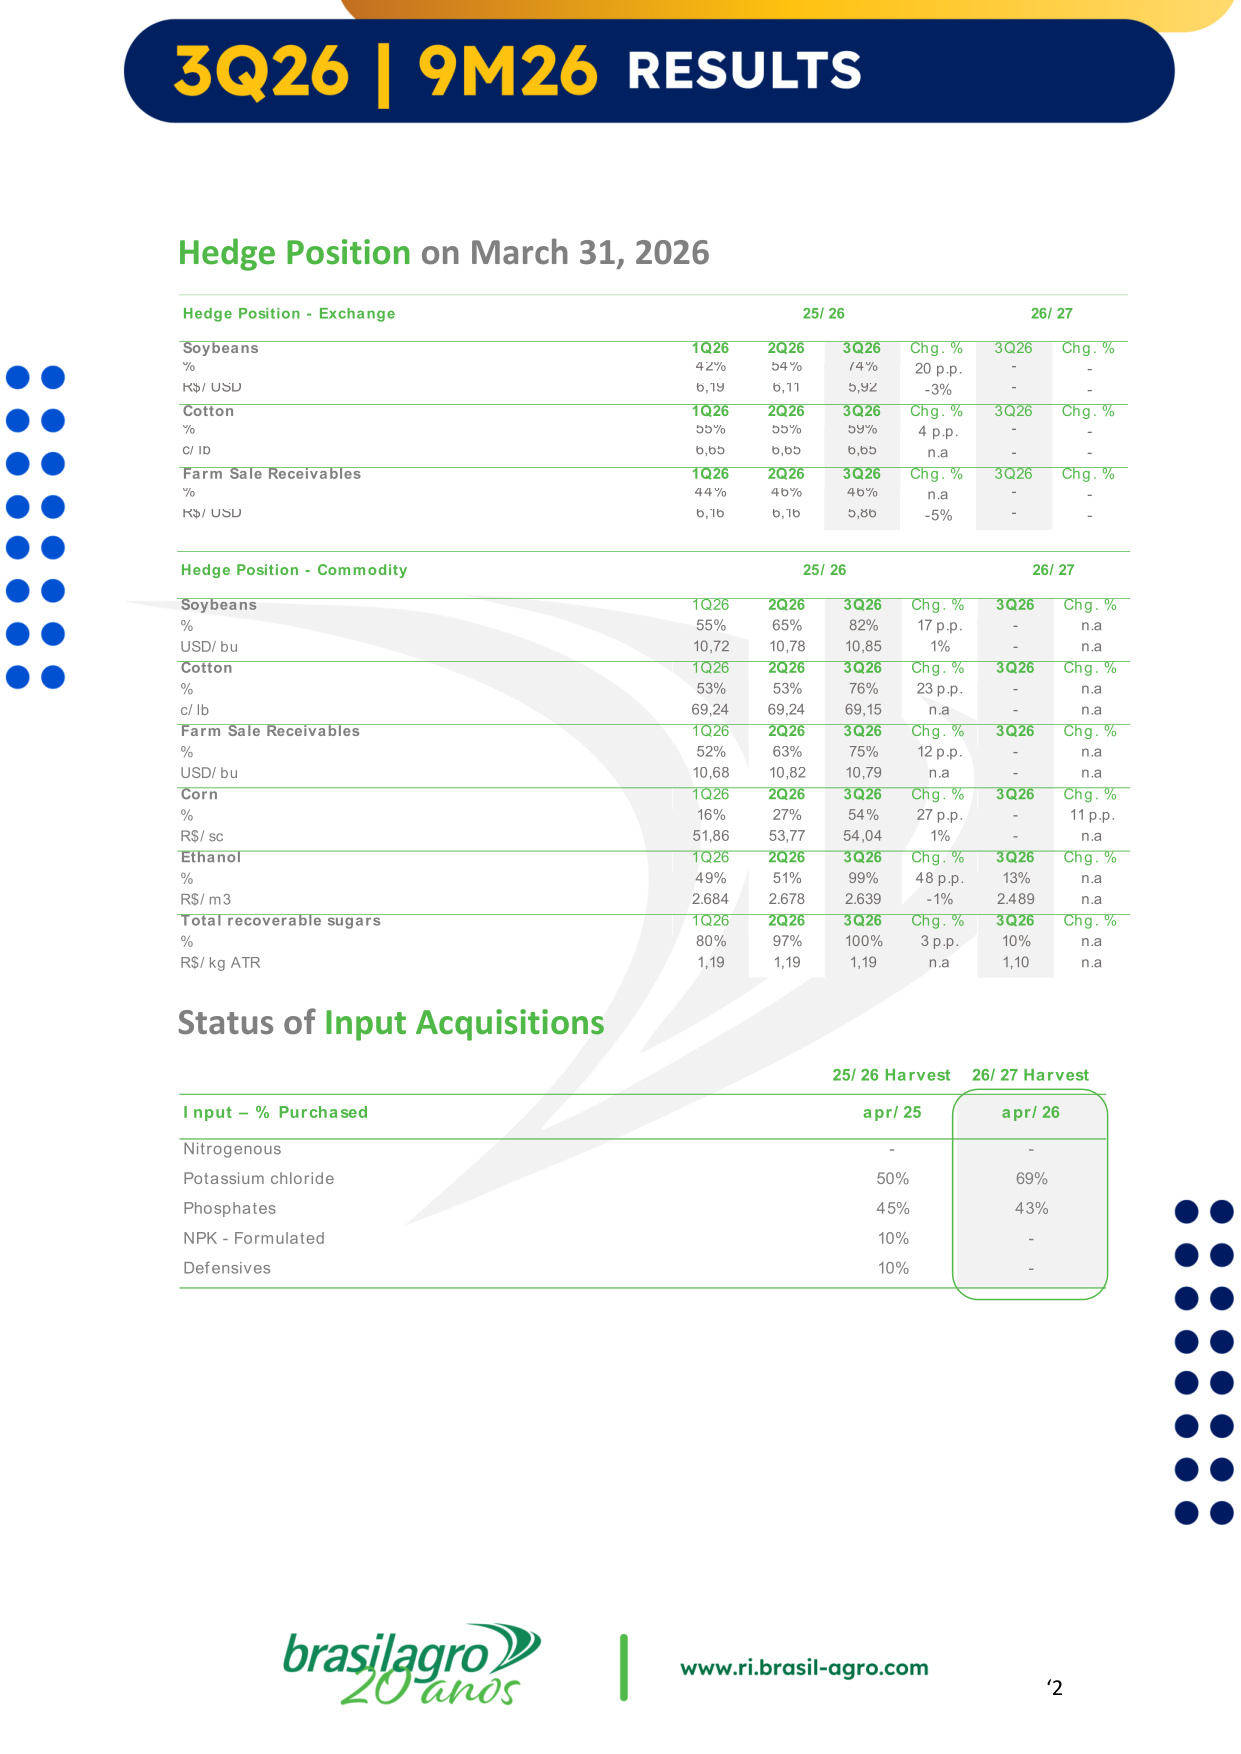
% 3Q26 Chg. % % 42% 54% 74% 20 p.p. - - R$/ USD 6,19 6,11 5,92 -3% - - Cotton 1Q26 2Q26 3Q26 Chg. % 3Q26 Chg. % % 55% 55% 59% 4 p.p. - - c/ lb 6,65 6,65 6,65 n.a - - Farm Sale Receivables 1Q26 2Q26 3Q26 Chg. % 3Q26 Chg. % % 44% 46% 46% n.a - - R$/ USD 6,16 6,16 5,86 -5% - - 25/ 26 26/ 27 Hedge Position - Commodity Soybeans 1Q26 2Q26 3Q26 Chg. % 3Q26 Chg. % % 55% 65% 82% 17 p.p. - n.a USD/ bu 10,72 10,78 10,85 1% - n.a Cotton 1Q26 2Q26 3Q26 Chg. % 3Q26 Chg. % % 53% 53% 76% 23 p.p. - n.a c/ lb 69,24 69,24 69,15 n.a - n.a Farm Sale Receivables 1Q26 2Q26 3Q26 Chg. % 3Q26 Chg. % % 52% 63% 75% 12 p.p. - n.a USD/ bu 10,68 10,82 10,79 n.a - n.a Corn 1Q26 2Q26 3Q26 Chg. % 3Q26 Chg. % % 16% 27% 54% 27 p.p. - 11 p.p. R$/ sc 51,86 53,77 54,04 1% - n.a Ethanol 1Q26 2Q26 3Q26 Chg. % 3Q26 Chg. % % 49% 51% 99% 48 p.p. 13% n.a R$/ m3 2.684 2.678 2.639 -1% 2.489 n.a Total recoverable sugars 1Q26 2Q26 3Q26 Chg. % 3Q26 Chg. % % 80% 97% 100% 3 p.p. 10% n.a R$/ kg ATR 1,19 1,19 1,19 n.a 1,10 n.a 25/ 26 26/ 27 25/ 26 Harvest 26/ 27 Harvest I nput – % Purchased apr/ 25 apr/ 26 Nitrogenous - - Potassium chloride 50% 69% Phosphates 45% 43% NPK - Formulated 10% - Defensives 10% -'3 Projections 2025/26 Crop Year Planted Area (ha) 24 / 25 Harvest realized 25/ 26 Harvest estimated Chg.
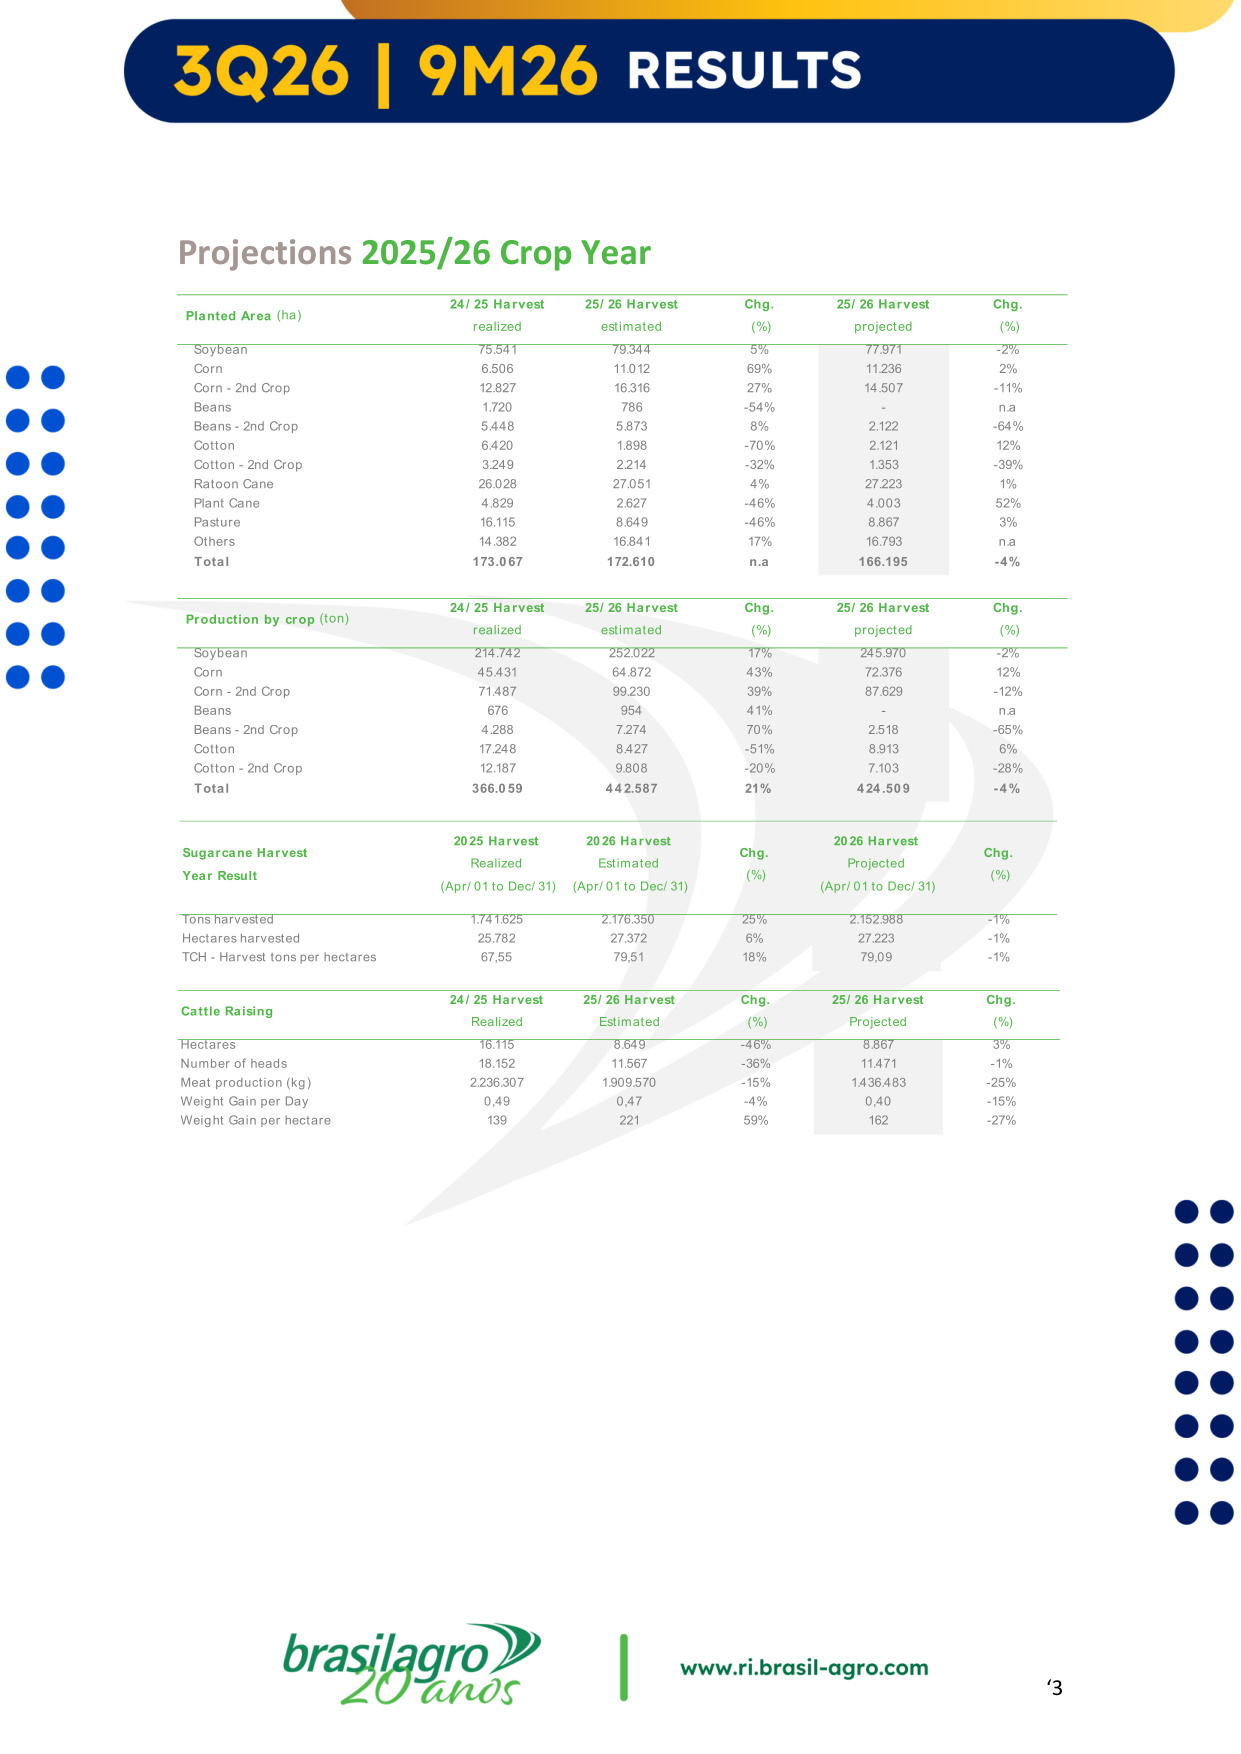
(%) 25/ 26 Harvest projected Chg. (%) Soybean 75.541 79.344 5% 77.971 -2% Corn 6.506 11.012 69% 11.236 2% Corn - 2nd Crop 12.827 16.316 27% 14.507 -11% Beans 1.720 786 -54% - n.a Beans - 2nd Crop 5.448 5.873 8% 2.122 -64% Cotton 6.420 1.898 -70% 2.121 12% Cotton - 2nd Crop 3.249 2.214 -32% 1.353 -39% Ratoon Cane 26.028 27.051 4% 27.223 1% Plant Cane 4.829 2.627 -46% 4.003 52% Pasture 16.115 8.649 -46% 8.867 3% Others 14.382 16.841 17% 16.793 n.a Total 173.0 67 172.610 n.a 166.195 -4% Production by crop (ton) 24 / 25 Harvest realized 25/ 26 Harvest estimated Chg. (%) 25/ 26 Harvest projected Chg. (%) Soybean 214.742 252.022 17% 245.970 -2% Corn 45.431 64.872 43% 72.376 12% Corn - 2nd Crop 71.487 99.230 39% 87.629 -12% Beans 676 954 41% - n.a Beans - 2nd Crop 4.288 7.274 70% 2.518 -65% Cotton 17.248 8.427 -51% 8.913 6% Cotton - 2nd Crop 12.187 9.808 -20% 7.103 -28% Total 366.0 59 4 4 2.587 21% 4 24 .50 9 - 4 % Sugarcane Harvest Year Result 2025 Harvest Realized (Apr/ 01 to Dec/ 31) 2026 Harvest Estimated (Apr/ 01 to Dec/ 31) Chg. (%) 2026 Harvest Projected (Apr/ 01 to Dec/ 31) Chg. (%) Tons harvested 1.741.625 2.176.350 25% 2.152.988 -1% Hectares harvested 25.782 27.372 6% 27.223 -1% TCH - Harvest tons per hectares 67,55 79,51 18% 79,09 -1% Cattle Raising 24/ 25 Harvest Realized 25/ 26 Harvest Estimated Chg. (%) 25/ 26 Harvest Projected Chg. (%) Hectares 16.115 8.649 -46% 8.867 3% Number of heads 18.152 11.567 -36% 11.471 -1% Meat production (kg) 2.236.307 1.909.570 -15% 1.436.483 -25% Weight Gain per Day 0,49 0,47 -4% 0,40 -15% Weight Gain per hectare 139 221 59% 162 -27% '4 Note that the estimates are hypothetical and do not constitute a guarantee of performance.

To learn more about the operational estimates of the Company, refer to the section on projections in our Reference Form. 25/ 26 Harvest (% ) Estimated Soybean Corn Corn - 2nd Crop Beans Cotton Sugarcane Cattle Raising Variable costs 76% 82% 92% 97% 95% 68% 65% Seeds 11% 13% 14% 13% 11% 0% 0% Fertilizers 21% 29% 39% 13% 23% 11% 0% Defensives 16% 14% 10% 19% 22% 6% 0% Agricultural services 25% 25% 27% 39% 26% 38% 0% Fuels and Lubricants 1% 1% 2% 3% 2% 8% 0% Maintenance of machines and instruments 0% 0% 0% 0% 0% 0% 7% Animal Feed 0% 0% 0% 0% 0% 0% 53% Others 1% 0% 1% 9% 11% 4% 5% Fixed costs 24% 18% 8% 3% 5% 32% 35% Labor 9% 6% 7% 3% 1% 3% 18% Depreciation and amortization 1% 1% 1% 0% 0% 13% 13% I FRS 16 13% 9% 0% 0% 1% 16% 0% Others 1% 2% 0% 0% 2% 0% 4% Production Cost (R$/ ha) 24 / 25 Harvest Realized 25/ 26 Harvest Estimated Chg. (%) 25/ 26 Harvest Projected Chg. (%) Soybeans(1) 4.904 5.247 7% 5.150 -2% Corn(1) 5.069 4.698 -7% 4.623 -2% Corn 2nd Crop 4.059 4.211 4% 4.531 8% Beans 4.296 4.121 -4% - n.a Beans 2nd Crop 2.034 2.691 32% 2.563 -5% Cotton 10.765 12.303 14% 12.448 1% Cotton 2nd Crop + Pivot 13.746 15.421 12% 16.142 5% Sugarcane 10.158 11.735 16% 11.318 -4% (1) includes area opening amortization '5 MESSAGE FROM MANAGEMENT We concluded the first nine months of the 2025/2026 crop year in an environment marked by high volatility in global markets, intensified geopolitical conflicts, fluctuations in agricultural commodity prices and foreign exchange rates, as well as persistently high interest rates in Brazil.
This backdrop created additional challenges for the execution of the crop year, impacting operating margins and financial expenses. The Company reported Total Net Revenue of R$637.3 million in 9M26, Net Loss of R$76.1 million and Adjusted EBITDA of R$42.8 million. Performance in the period primarily reflects a more challenging margin environment, the slower pace of soybean commercialization — a strategic decision aimed at capturing better logistical and commercial conditions — and the continued pressure from elevated interest rates on the Company's financial expenses. Throughout the period, we maintained a disciplined approach to capital allocation and operational execution. We revised part of our second crop planting plan, prioritizing crops and regions with a better risk-return profile amid the deterioration in commodity prices and the limitations imposed by the planting window in certain regions. At the same time, we continued to execute our commercialization and hedging strategy, advancing price fixation and FX protection in order to reduce exposure to market volatility. In the real estate segment, we continued to advance our active portfolio management strategy with the sale of part of Fazenda Morotí, in Paraguay. The transaction reinforces our long-standing ability to capture value through the development, transformation and selective monetization of rural assets. From an operational standpoint, we completed 95% of the soybean harvest and, despite the climate- related challenges observed during part of the crop cycle — particularly irregular rainfall and its impact on the second crop planting window — yields remain in line with our initial estimates. In sugarcane, harvesting operations have already started in Brazil, with productivity expectations aligned with the Company's projections. This quarter also marks a symbolic milestone for BrasilAgro: in 2026, we celebrate 20 years of history. Over the past two decades, our trajectory has been shaped by decisions that transformed land, developed efficient agricultural operations, strengthened our business model and supported long-term value creation for our shareholders. More than celebrating time itself, we celebrate 20 years of decisions guided by a long-term vision, disciplined capital allocation, adaptability across agribusiness cycles and a strong commitment to execution. This history reinforces our conviction that responsible decision-making remains essential to navigating challenging cycles and capturing long-term opportunities. We remain confident in the resilience of our business model, the quality of our assets and the Company's ability to continue generating sustainable value.
'6 REAL ESTATE PERFORMANCE SALE OF FARM In March, we completed the sale of 921 hectares of Morotí Farm, located in Paraguay, of which 501.5 hectares are arable land. The total nominal value of the transaction was US$ 1.5 million, equivalent to approximately US$ 3,062 per arable hectare. Of the total transaction amount, US$ 590 thousand was recognized in the quarter's financial statements. The additional installment, amounting to US$ 903 thousand, is subject to the fulfillment of conditions precedent and will be recognized once the applicable criteria are met. The sold area had originally been acquired for US$ 1,756 per arable hectare, resulting in a gain of approximately US$ 1,306 per arable hectare. The book value of the area, considering the acquisition cost plus fair value adjustments and net of depreciation, was approximately US$ 880 thousand. Based on the agreed terms, the transaction presents an estimated Internal Rate of Return (IRR) of 14.2% in U.S. dollars and 23.2% in Brazilian reais. The property was acquired in 2013 for US$1,756 per arable hectare, representing a gain of over US$1,200 per arable hectare, with an estimated IRR of 13.8% in USD and 23.2% in BRL. So far, the Company has sold 1,785 hectares of the area, keeping the remainder in its portfolio. This transaction is consistent with the Company's active portfolio management strategy, which involves the selective sale of assets following real estate appreciation and the generation of operational returns.
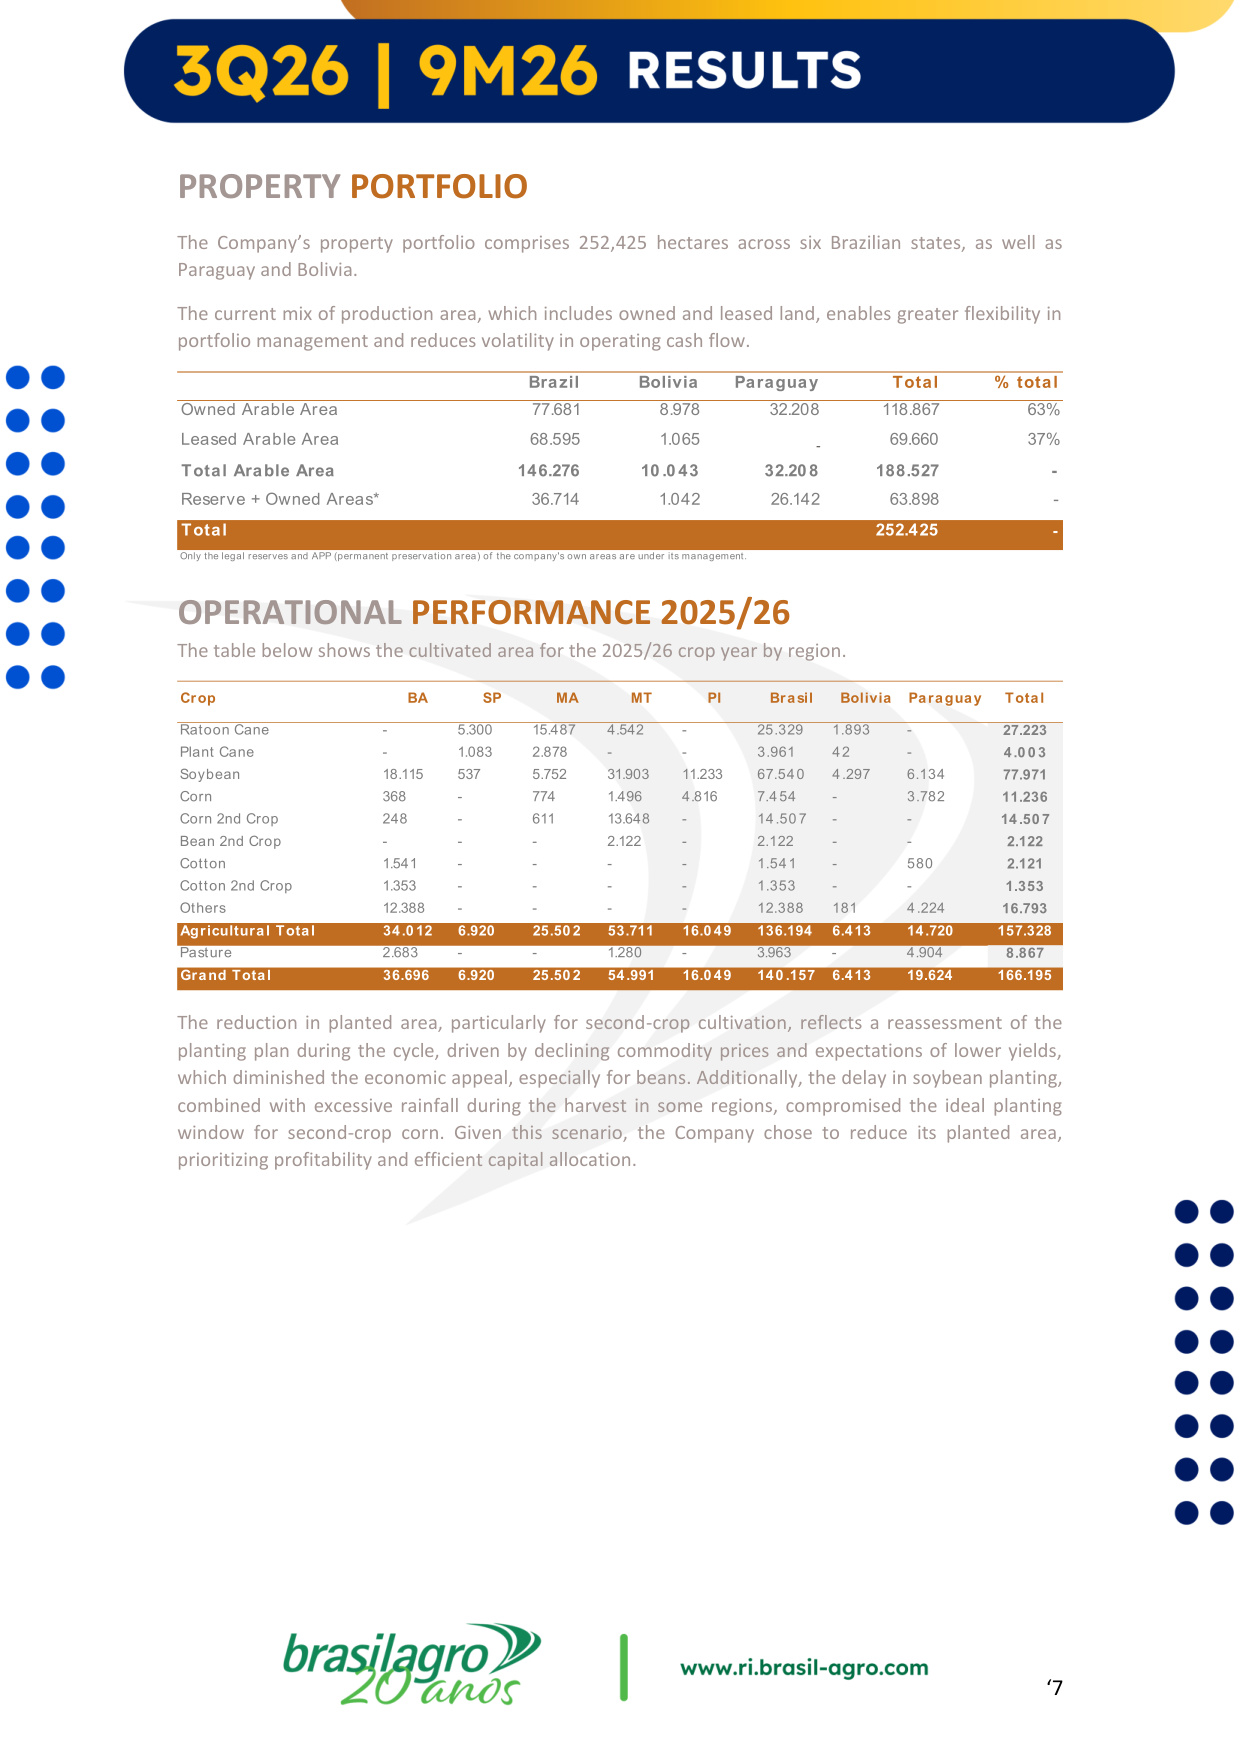
'7 PROPERTY PORTFOLIO The Company's property portfolio comprises 252,425 hectares across six Brazilian states, as well as Paraguay and Bolivia. The current mix of production area, which includes owned and leased land, enables greater flexibility in portfolio management and reduces volatility in operating cash flow. OPERATIONAL PERFORMANCE 2025/26 The table below shows the cultivated area for the 2025/26 crop year by region. The reduction in planted area, particularly for second-crop cultivation, reflects a reassessment of the planting plan during the cycle, driven by declining commodity prices and expectations of lower yields, which diminished the economic appeal, especially for beans. Additionally, the delay in soybean planting, combined with excessive rainfall during the harvest in some regions, compromised the ideal planting window for second-crop corn. Given this scenario, the Company chose to reduce its planted area, prioritizing profitability and efficient capital allocation. Brazil Bolivia Paraguay Total % total Owned Arable Area 77.681 8.978 32.208 118.867 63% Leased Arable Area 68.595 1.065 - 69.660 37% Total Arable Area 146.276 10.043 32.208 188.527 - Reserve + Owned Areas* 36.714 1.042 26.142 63.898 - Total 252.425 - Only the legal reserves and APP (permanent preservation area) of the company's own areas are under its management. Crop BA SP MA MT PI Brasil Bolivia Paraguay Total Ratoon Cane - 5.300 15.487 4.542 - 25.329 1.893 - 27.223 Plant Cane - 1.083 2.878 - - 3.961 42 - 4.0 0 3 Soybean 18.115 537 5.752 31.903 11.233 67.540 4.297 6.134 77.971 Corn 368 - 774 1.496 4.816 7.454 - 3.782 11.236 Corn 2nd Crop 248 - 611 13.648 - 14.50 7 - - 14.50 7 Bean 2nd Crop - - - 2.122 - 2.122 - - 2.122 Cotton 1.541 - - - - 1.541 - 580 2.121 Cotton 2nd Crop 1.353 - - - - 1.353 - - 1.353 Others 12.388 - - - - 12.388 181 4.224 16.793 Agricultural Total 34.0 12 6.920 25.50 2 53.711 16.0 49 136.194 6.413 14.720 157.328 Pasture 2.683 - - 1.280 - 3.963 - 4.904 8.867 Grand Total 36.696 6.920 25.50 2 54.991 16.0 49 140 .157 6.413 19.624 166.195 '8 Grains and Cotton The projected production for the 2025/26 crop year was reduced by 4% compared to the initial estimate, mainly reflecting the reduction in the planted area of the second crops for corn and beans, due to the smaller planted area resulting from strategic adjustments and the impact of the agricultural calendar on the planting window.
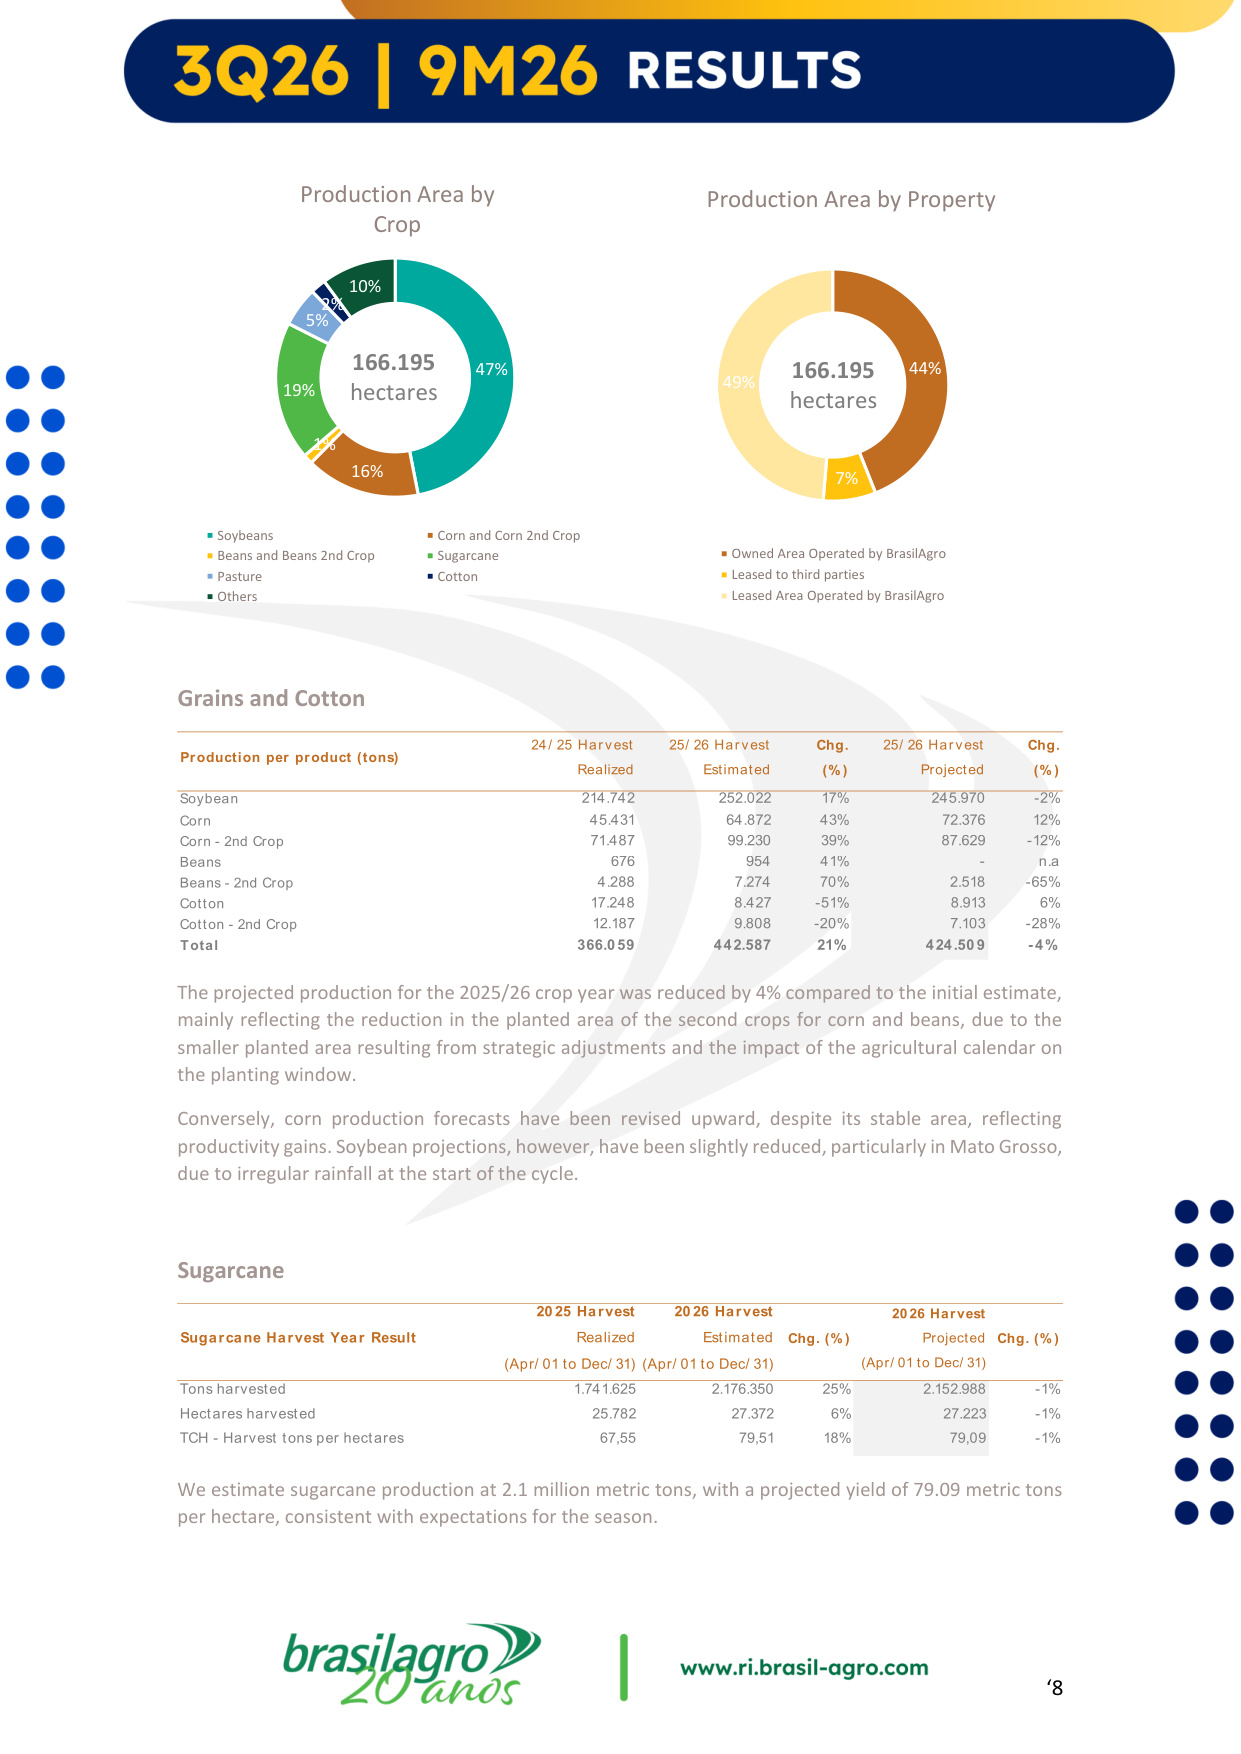
Conversely, corn production forecasts have been revised upward, despite its stable area, reflecting productivity gains. Soybean projections, however, have been slightly reduced, particularly in Mato Grosso, due to irregular rainfall at the start of the cycle. Sugarcane We estimate sugarcane production at 2.1 million metric tons, with a projected yield of 79.09 metric tons per hectare, consistent with expectations for the season. 47% 16% 1% 19% 5% 2% 10% Production Area by Crop Soybeans Corn and Corn 2nd Crop Beans and Beans 2nd Crop Sugarcane Pasture Cotton Others 166.195 hectares 44% 7% 49% Production Area by Property Owned Area Operated by BrasilAgro Leased to third parties Leased Area Operated by BrasilAgro 166.195 hectares Production per product (tons) 24/ 25 Har vest Realized 25/ 26 Har vest Estimated Chg. (% ) 25/ 26 Har vest Projected Chg. (% ) Soybean 214.742 252.022 17% 245.970 -2% Corn 45.431 64.872 43% 72.376 12% Corn - 2nd Crop 71.487 99.230 39% 87.629 -12% Beans 676 954 41% - n.a Beans - 2nd Crop 4.288 7.274 70% 2.518 -65% Cotton 17.248 8.427 -51% 8.913 6% Cotton - 2nd Crop 12.187 9.808 -20% 7.103 -28% Total 366.0 59 442.587 21% 424.50 9 -4% Sugarcane Harvest Year Result 20 25 Harvest Realized (Apr/ 01 to Dec/ 31) 20 26 Harvest Estimated (Apr/ 01 to Dec/ 31) Chg. (% ) 20 26 Harvest Projected (Apr/ 01 to Dec/ 31) Chg. (% ) Tons harvested 1.741.625 2.176.350 25% 2.152.988 -1% Hectares harvested 25.782 27.372 6% 27.223 -1% TCH - Harvest tons per hectares 67,55 79,51 18% 79,09 -1% '9 Sugarcane harvesting has commenced, with operations proceeding according to plan.
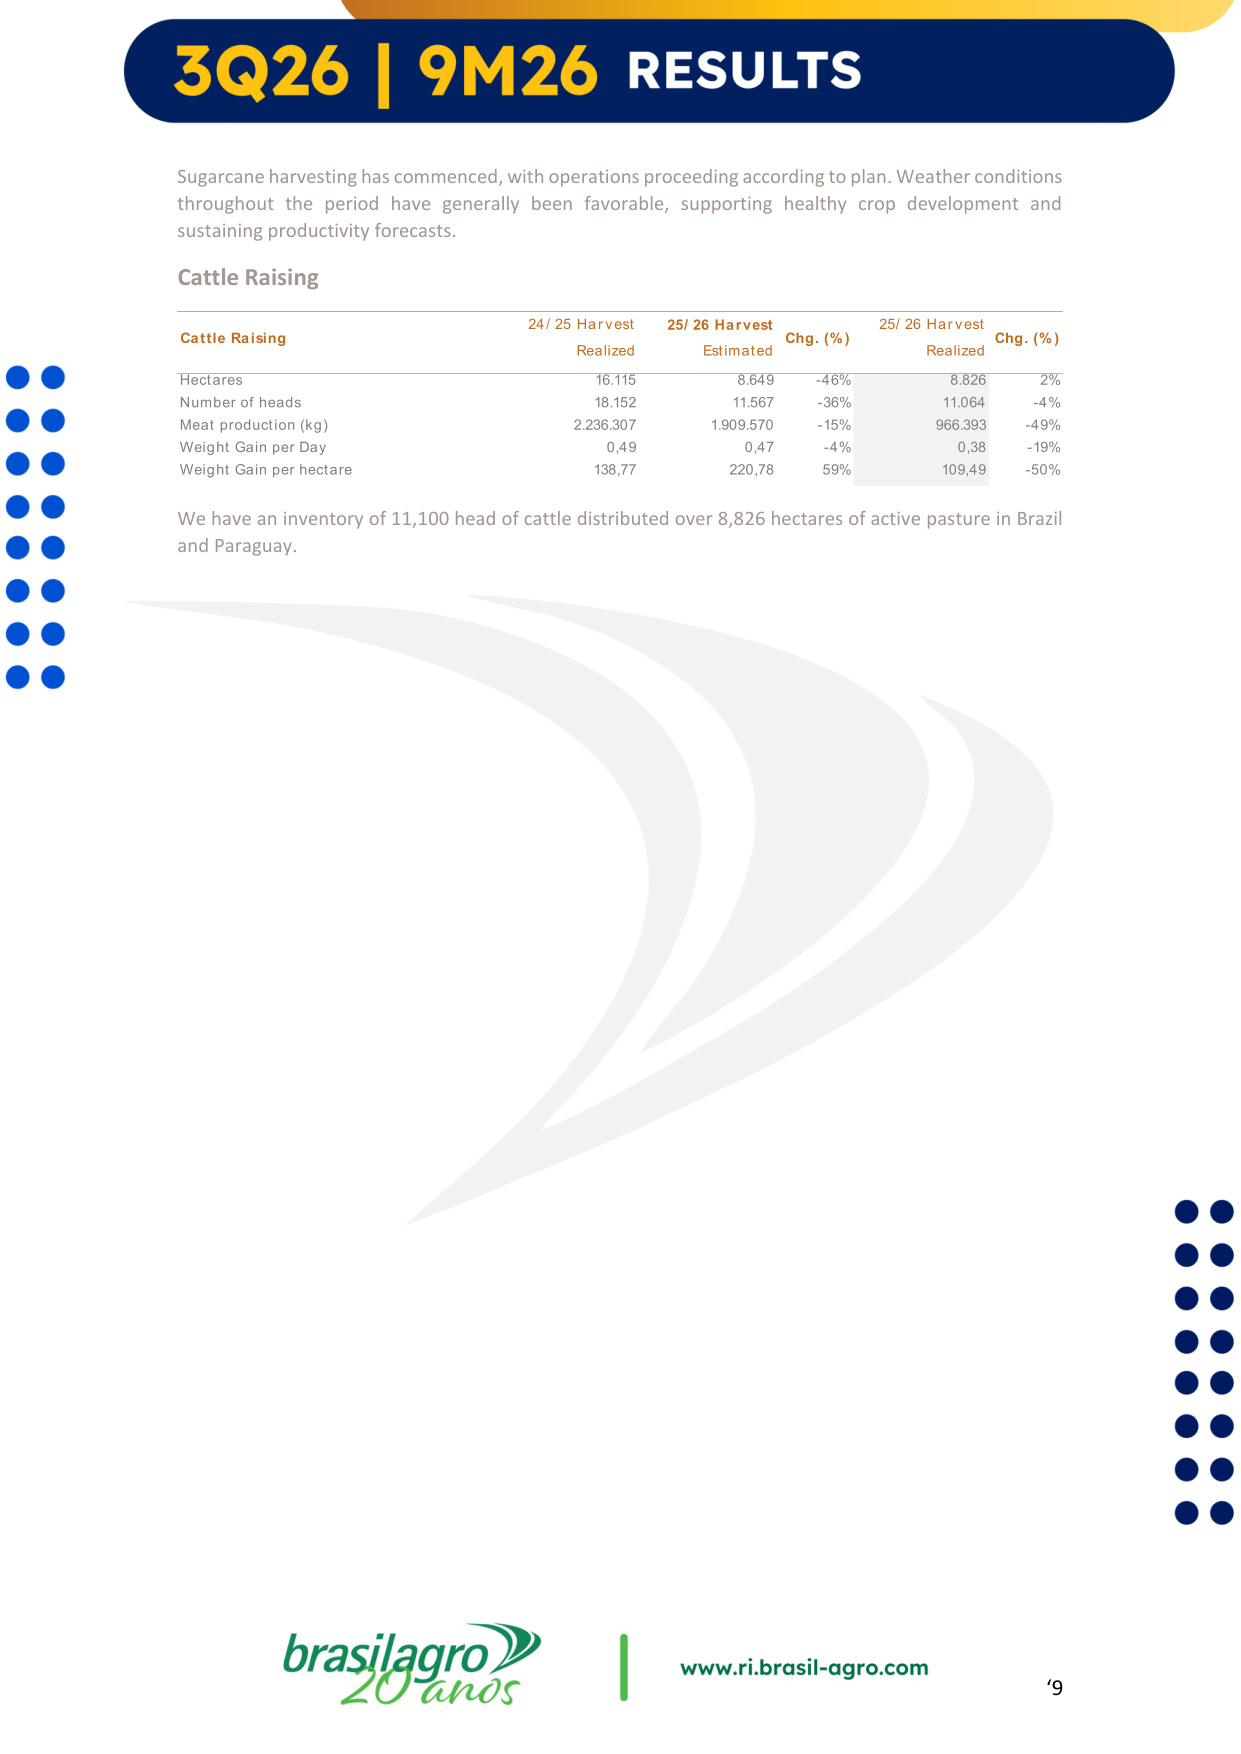
Weather conditions throughout the period have generally been favorable, supporting healthy crop development and sustaining productivity forecasts. Cattle Raising We have an inventory of 11,100 head of cattle distributed over 8,826 hectares of active pasture in Brazil and Paraguay. Cattle Raising 24/ 25 Har vest Realized 25/ 26 Harvest Estimated Chg. (% ) 25/ 26 Har vest Realized Chg. (% ) Hectares 16.115 8.649 -46% 8.826 2% Number of heads 18.152 11.567 -36% 11.064 -4% Meat production (kg) 2.236.307 1.909.570 -15% 966.393 -49% Weight Gain per Day 0,49 0,47 -4% 0,38 -19% Weight Gain per hectare 138,77 220,78 59% 109,49 -50% '10 FINANCIAL PERFORMANCE The consolidated financial statements were prepared and are presented in accordance with the International Financial Reporting Standards (IFRS), issued by the International Accounting Standards Board.
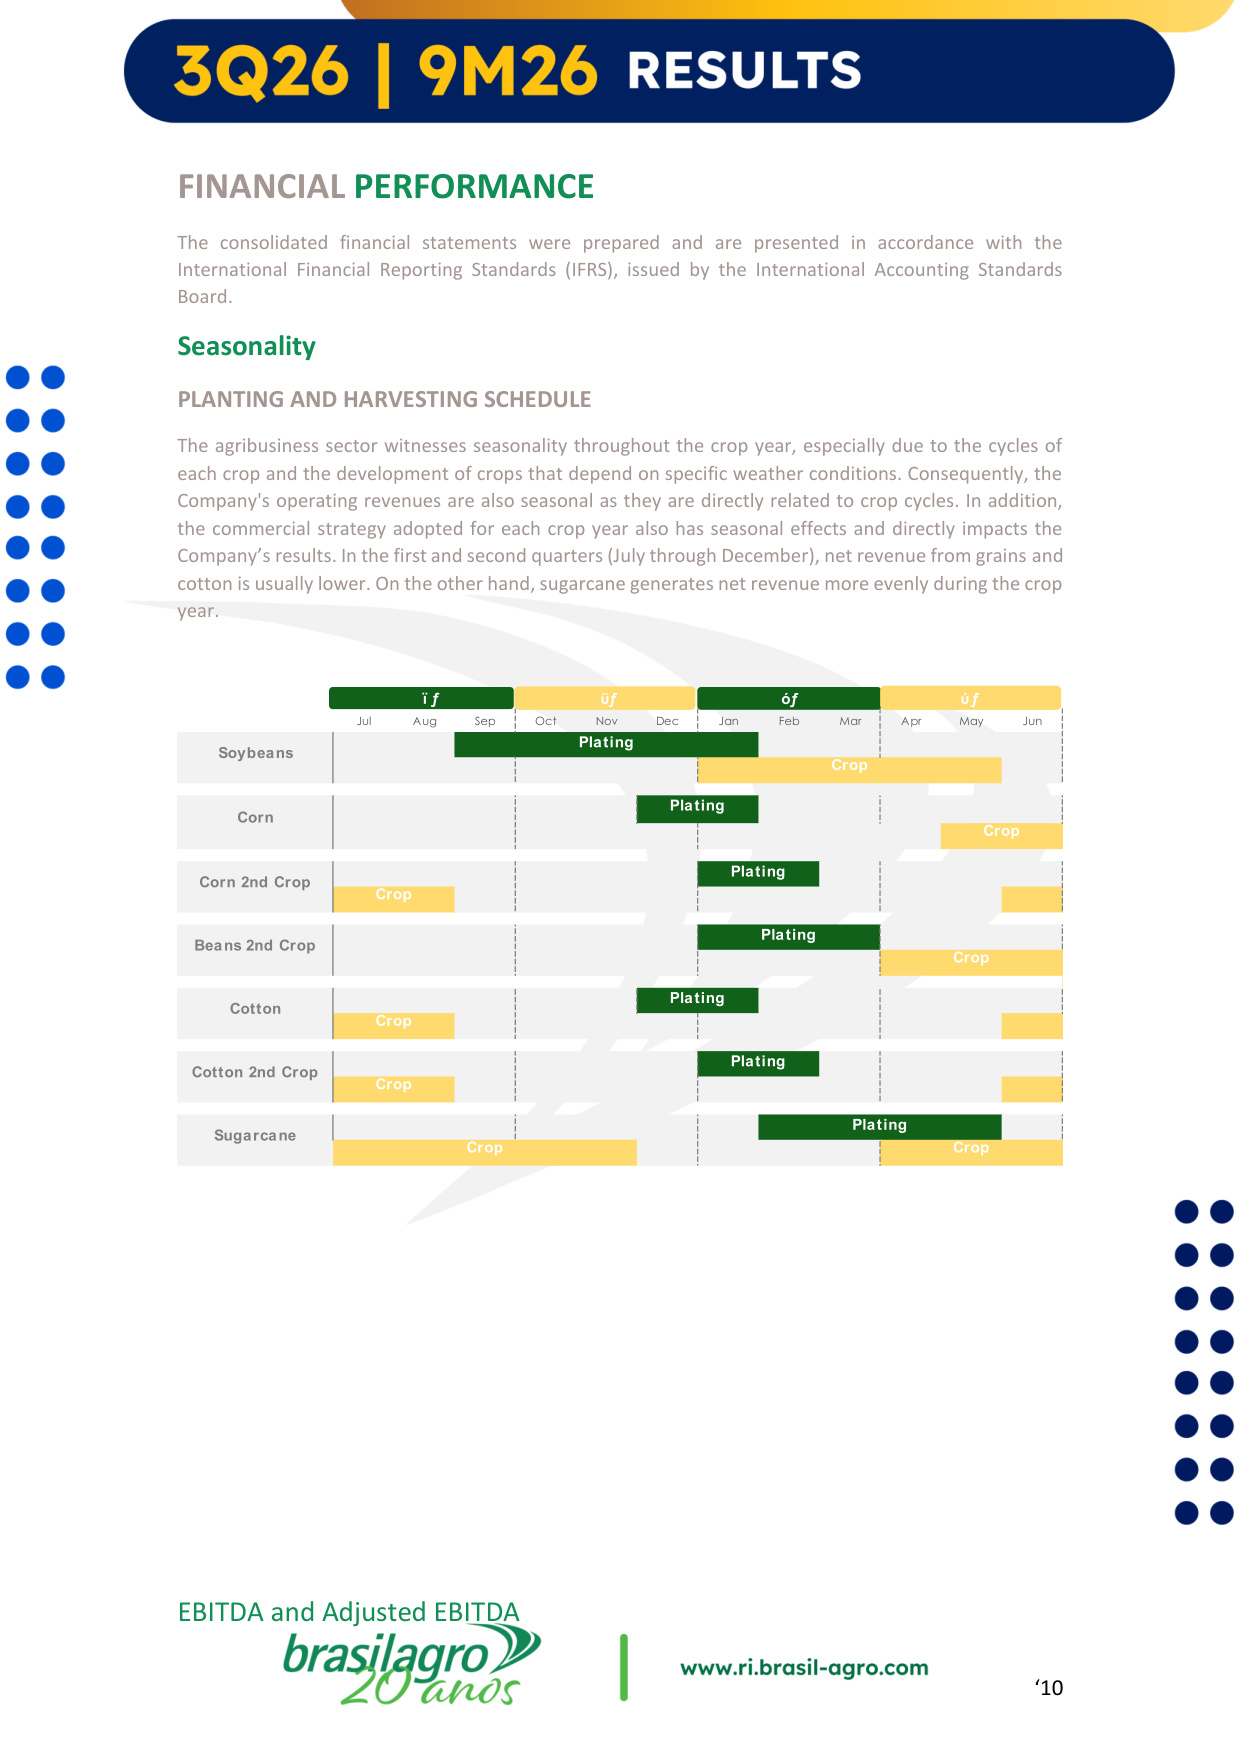
Seasonality PLANTING AND HARVESTING SCHEDULE The agribusiness sector witnesses seasonality throughout the crop year, especially due to the cycles of each crop and the development of crops that depend on specific weather conditions. Consequently, the Company's operating revenues are also seasonal as they are directly related to crop cycles. In addition, the commercial strategy adopted for each crop year also has seasonal effects and directly impacts the Company's results. In the first and second quarters (July through December), net revenue from grains and cotton is usually lower. On the other hand, sugarcane generates net revenue more evenly during the crop year. EBITDA and Adjusted EBITDA Jul Aug Sep Oct Nov Dec Jan Feb Mar Apr May Jun Sugarcane Plating Crop Crop Cotton 2nd Crop Plating Crop Cotton Plating Crop Beans 2nd Crop Plating Crop Corn 2nd Crop Plating Crop Soybeans Plating Crop Corn Plating Crop '11 EBITDA is presented according to accounting standards, based on Net Income adjusted for interest, taxes, depreciation and amortization.
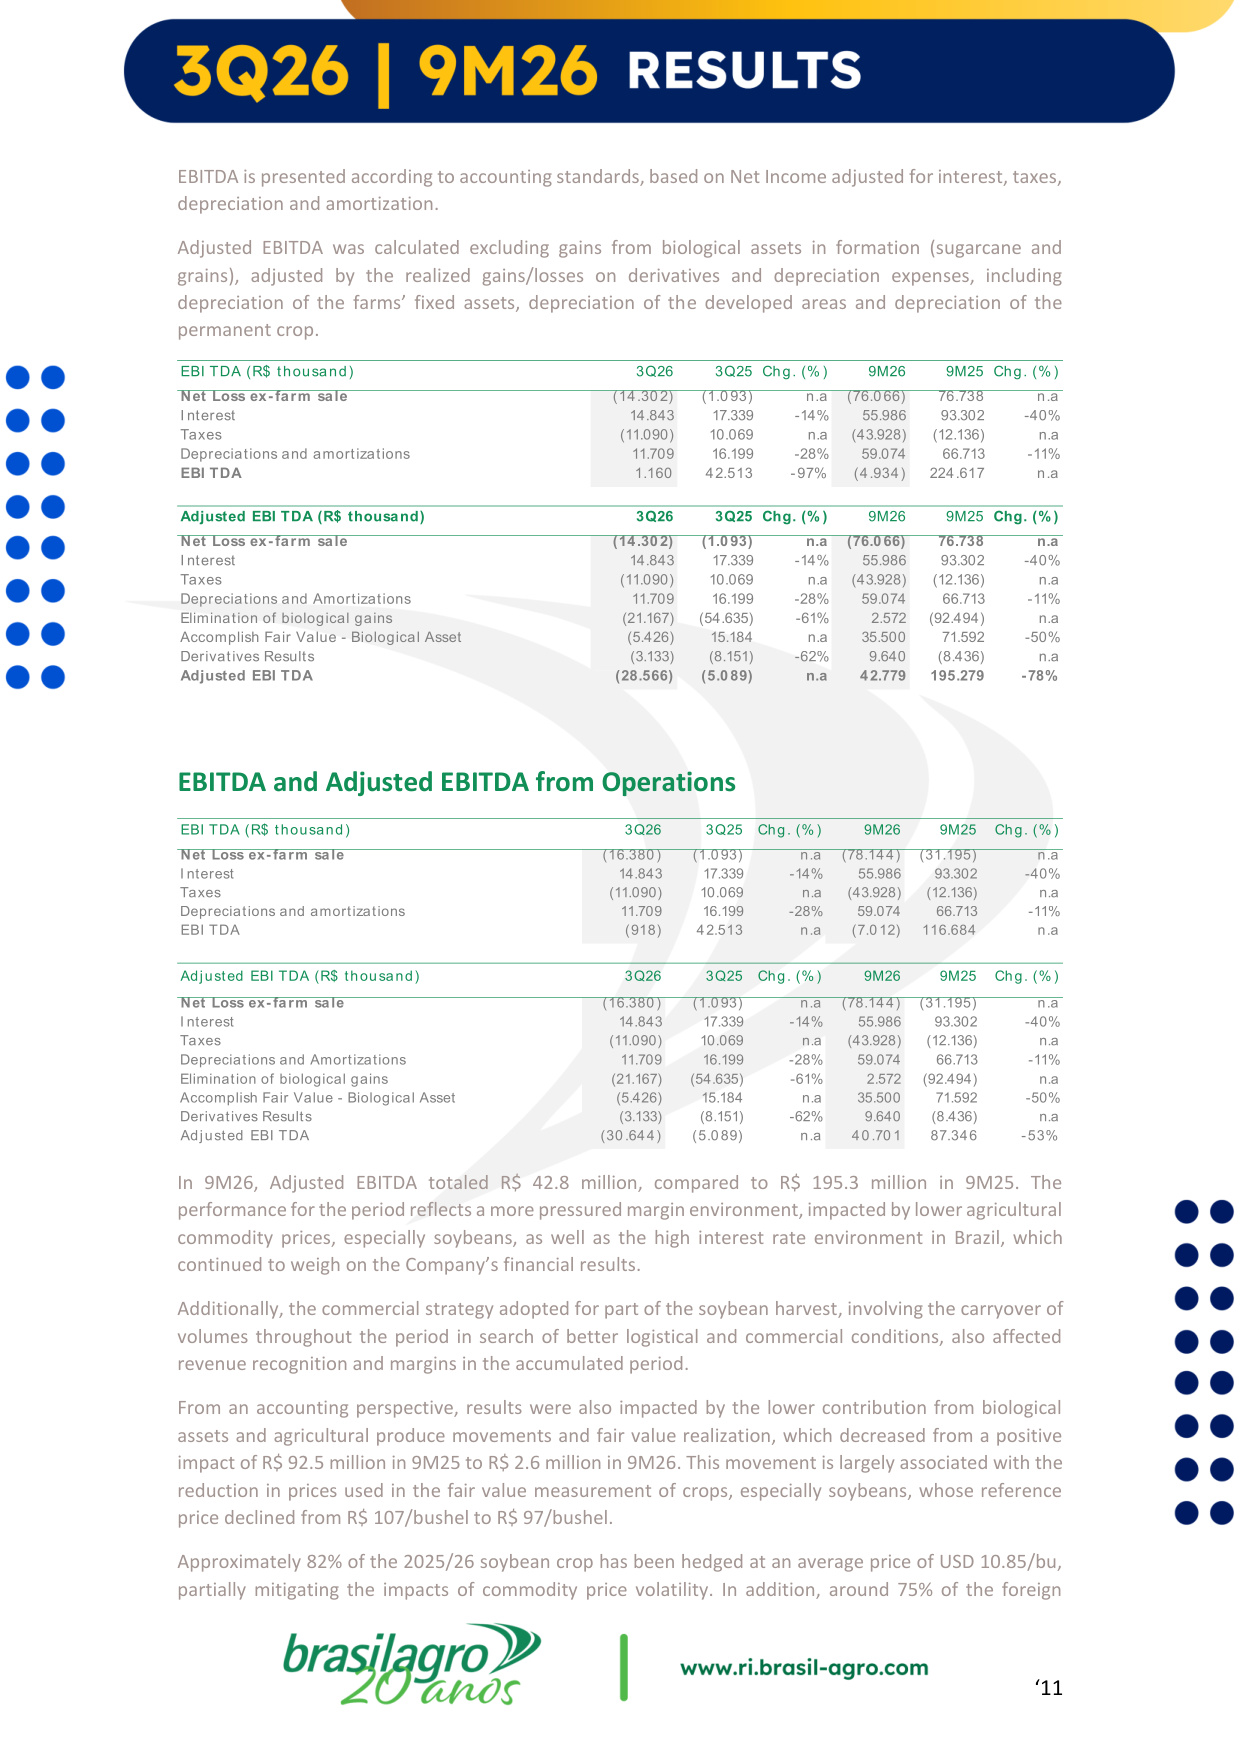
Adjusted EBITDA was calculated excluding gains from biological assets in formation (sugarcane and grains), adjusted by the realized gains/losses on derivatives and depreciation expenses, including depreciation of the farms' fixed assets, depreciation of the developed areas and depreciation of the permanent crop. EBITDA and Adjusted EBITDA from Operations In 9M26, Adjusted EBITDA totaled R$ 42.8 million, compared to R$ 195.3 million in 9M25. The performance for the period reflects a more pressured margin environment, impacted by lower agricultural commodity prices, especially soybeans, as well as the high interest rate environment in Brazil, which continued to weigh on the Company's financial results. Additionally, the commercial strategy adopted for part of the soybean harvest, involving the carryover of volumes throughout the period in search of better logistical and commercial conditions, also affected revenue recognition and margins in the accumulated period. From an accounting perspective, results were also impacted by the lower contribution from biological assets and agricultural produce movements and fair value realization, which decreased from a positive impact of R$ 92.5 million in 9M25 to R$ 2.6 million in 9M26. This movement is largely associated with the reduction in prices used in the fair value measurement of crops, especially soybeans, whose reference price declined from R$ 107/bushel to R$ 97/bushel. Approximately 82% of the 2025/26 soybean crop has been hedged at an average price of USD 10.85/bu, partially mitigating the impacts of commodity price volatility. In addition, around 75% of the foreign EBI TDA (R$ thousand) 3Q26 3Q25 Chg. (% ) 9M26 9M25 Chg. (% ) Net Loss ex- farm sale (14.302) (1.093) n.a (76.066) 76.738 n.a I nterest 14.843 17.339 -14% 55.986 93.302 -40% Taxes (11.090) 10.069 n.a (43.928) (12.136) n.a Depreciations and amortizations 11.709 16.199 -28% 59.074 66.713 -11% EBI TDA 1.160 42.513 -97% (4.934) 224.617 n.a Adjusted EBI TDA (R$ thousand) 3Q26 3Q25 Chg. (% ) 9M26 9M25 Chg. (% ) Net Loss ex- farm sale (14.302) (1.093) n.a (76.066) 76.738 n.a I nterest 14.843 17.339 -14% 55.986 93.302 -40% Taxes (11.090) 10.069 n.a (43.928) (12.136) n.a Depreciations and Amortizations 11.709 16.199 -28% 59.074 66.713 -11% Elimination of biological gains (21.167) (54.635) -61% 2.572 (92.494) n.a Accomplish Fair Value - Biological Asset (5.426) 15.184 n.a 35.500 71.592 -50% Derivatives Results (3.133) (8.151) -62% 9.640 (8.436) n.a Adjusted EBI TDA (28.566) (5.089) n.a 42.779 195.279 -78% EBI TDA (R$ thousand) 3Q26 3Q25 Chg. (% ) 9M26 9M25 Chg. (% ) Net Loss ex- farm sale (16.380) (1.093) n.a (78.144) (31.195) n.a I nterest 14.843 17.339 -14% 55.986 93.302 -40% Taxes (11.090) 10.069 n.a (43.928) (12.136) n.a Depreciations and amortizations 11.709 16.199 -28% 59.074 66.713 -11% EBI TDA (918) 42.513 n.a (7.012) 116.684 n.a Adjusted EBI TDA (R$ thousand) 3Q26 3Q25 Chg. (% ) 9M26 9M25 Chg.
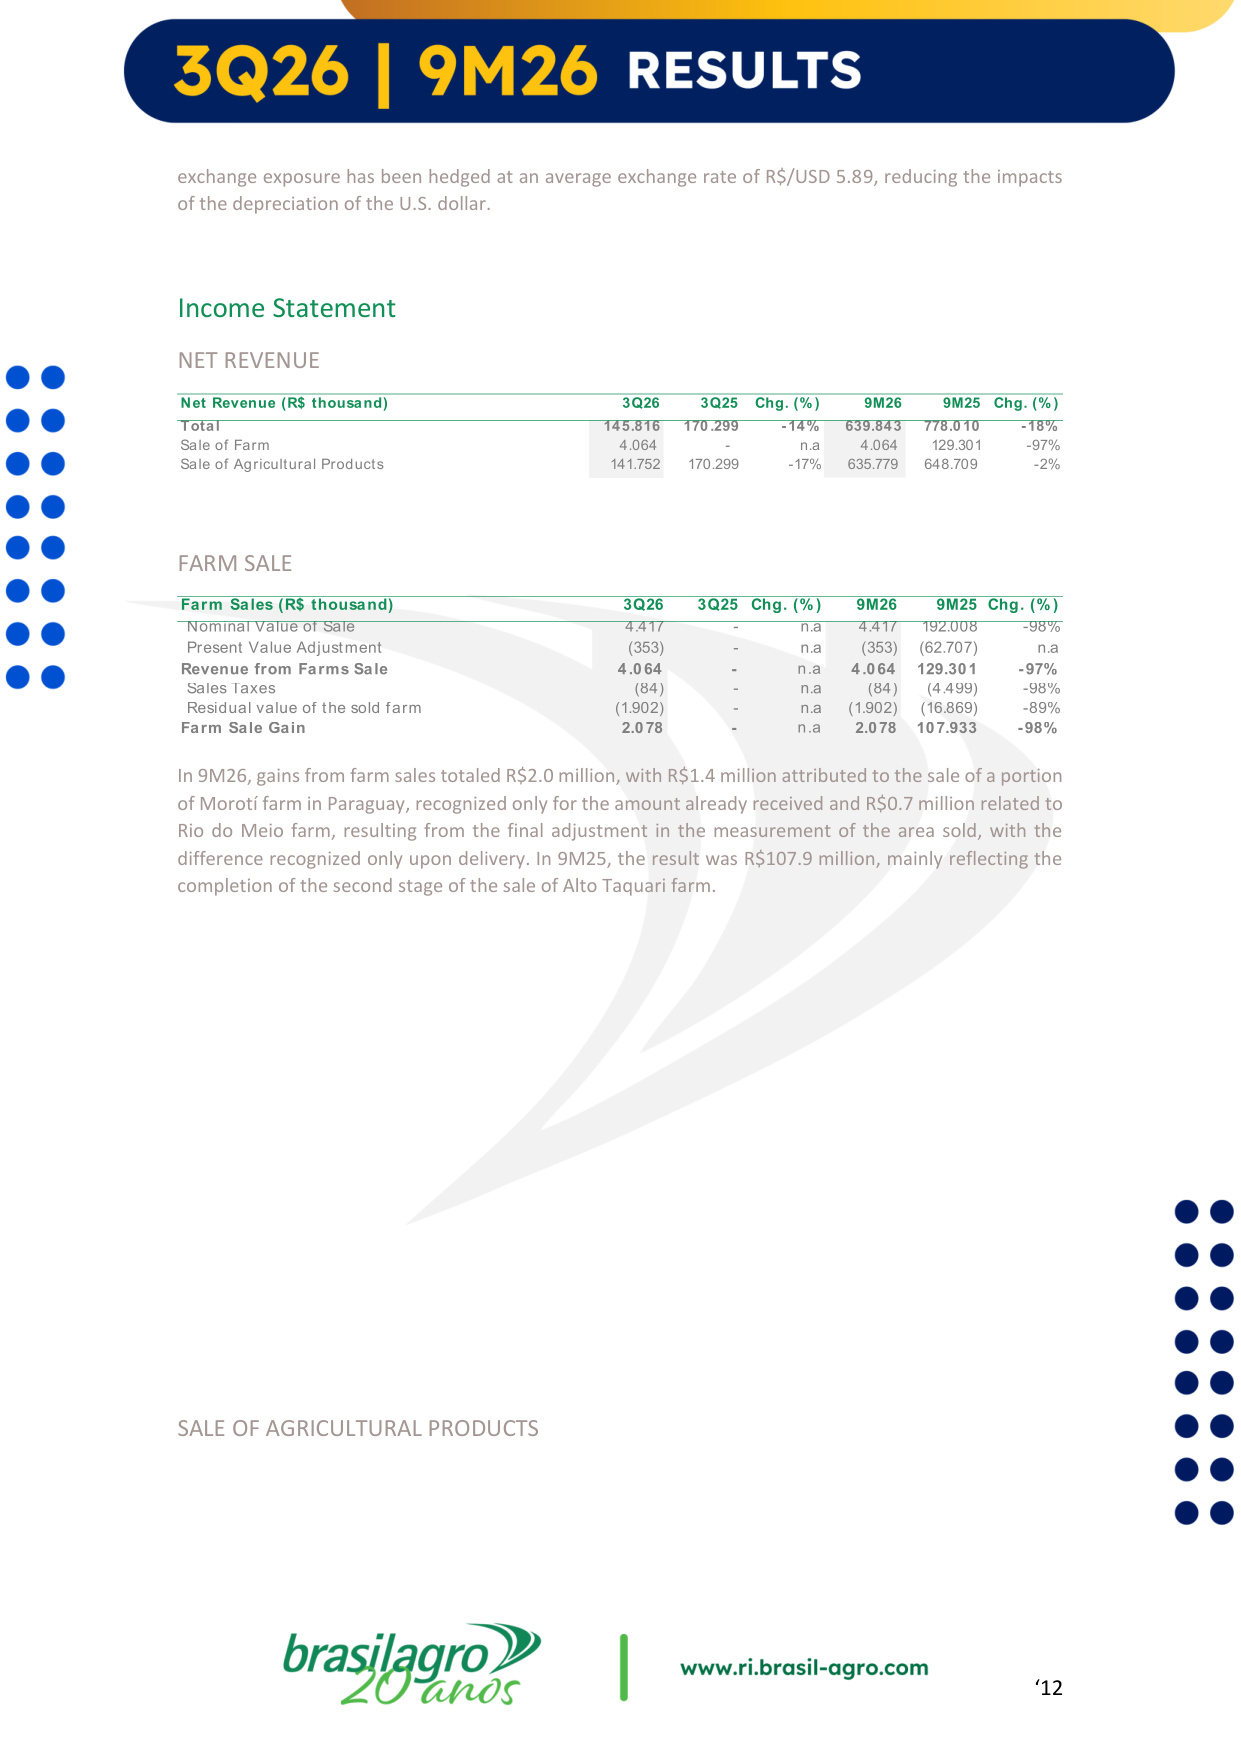
(% ) Net Loss ex- farm sale (16.380) (1.093) n.a (78.144) (31.195) n.a I nterest 14.843 17.339 -14% 55.986 93.302 -40% Taxes (11.090) 10.069 n.a (43.928) (12.136) n.a Depreciations and Amortizations 11.709 16.199 -28% 59.074 66.713 -11% Elimination of biological gains (21.167) (54.635) -61% 2.572 (92.494) n.a Accomplish Fair Value - Biological Asset (5.426) 15.184 n.a 35.500 71.592 -50% Derivatives Results (3.133) (8.151) -62% 9.640 (8.436) n.a Adjusted EBI TDA (30.644) (5.089) n.a 40.70 1 87.346 -53% '12 exchange exposure has been hedged at an average exchange rate of R$/USD 5.89, reducing the impacts of the depreciation of the U.S. dollar. Income Statement NET REVENUE FARM SALE In 9M26, gains from farm sales totaled R$2.0 million, with R$1.4 million attributed to the sale of a portion of Morotí farm in Paraguay, recognized only for the amount already received and R$0.7 million related to Rio do Meio farm, resulting from the final adjustment in the measurement of the area sold, with the difference recognized only upon delivery. In 9M25, the result was R$107.9 million, mainly reflecting the completion of the second stage of the sale of Alto Taquari farm. SALE OF AGRICULTURAL PRODUCTS Net Revenue (R$ thousand) 3Q26 3Q25 Chg. (% ) 9M26 9M25 Chg. (% ) Total 145.816 170.299 -14% 639.843 778.010 -18% Sale of Farm 4.064 - n.a 4.064 129.301 -97% Sale of Agricultural Products 141.752 170.299 -17% 635.779 648.709 -2% Farm Sales (R$ thousand) 3Q26 3Q25 Chg. (% ) 9M26 9M25 Chg. (% ) Nominal Value of Sale 4.417 - n.a 4.417 192.008 -98% Present Value Adjustment (353) - n.a (353) (62.707) n.a Revenue from Farms Sale 4.064 - n.a 4.064 129.301 -97% Sales Taxes (84) - n.a (84) (4.499) -98% Residual value of the sold farm (1.902) - n.a (1.902) (16.869) -89% Farm Sale Gain 2.078 - n.a 2.078 107.933 -98% '13 In 9M26, net revenue totaled R$635.8 million, a 2% decrease compared to 9M25, mainly reflecting lower sugarcane revenue, also impacted by a 28% reduction in the volume sold, as the sugarcane field's performance fell short of expectations during the period.
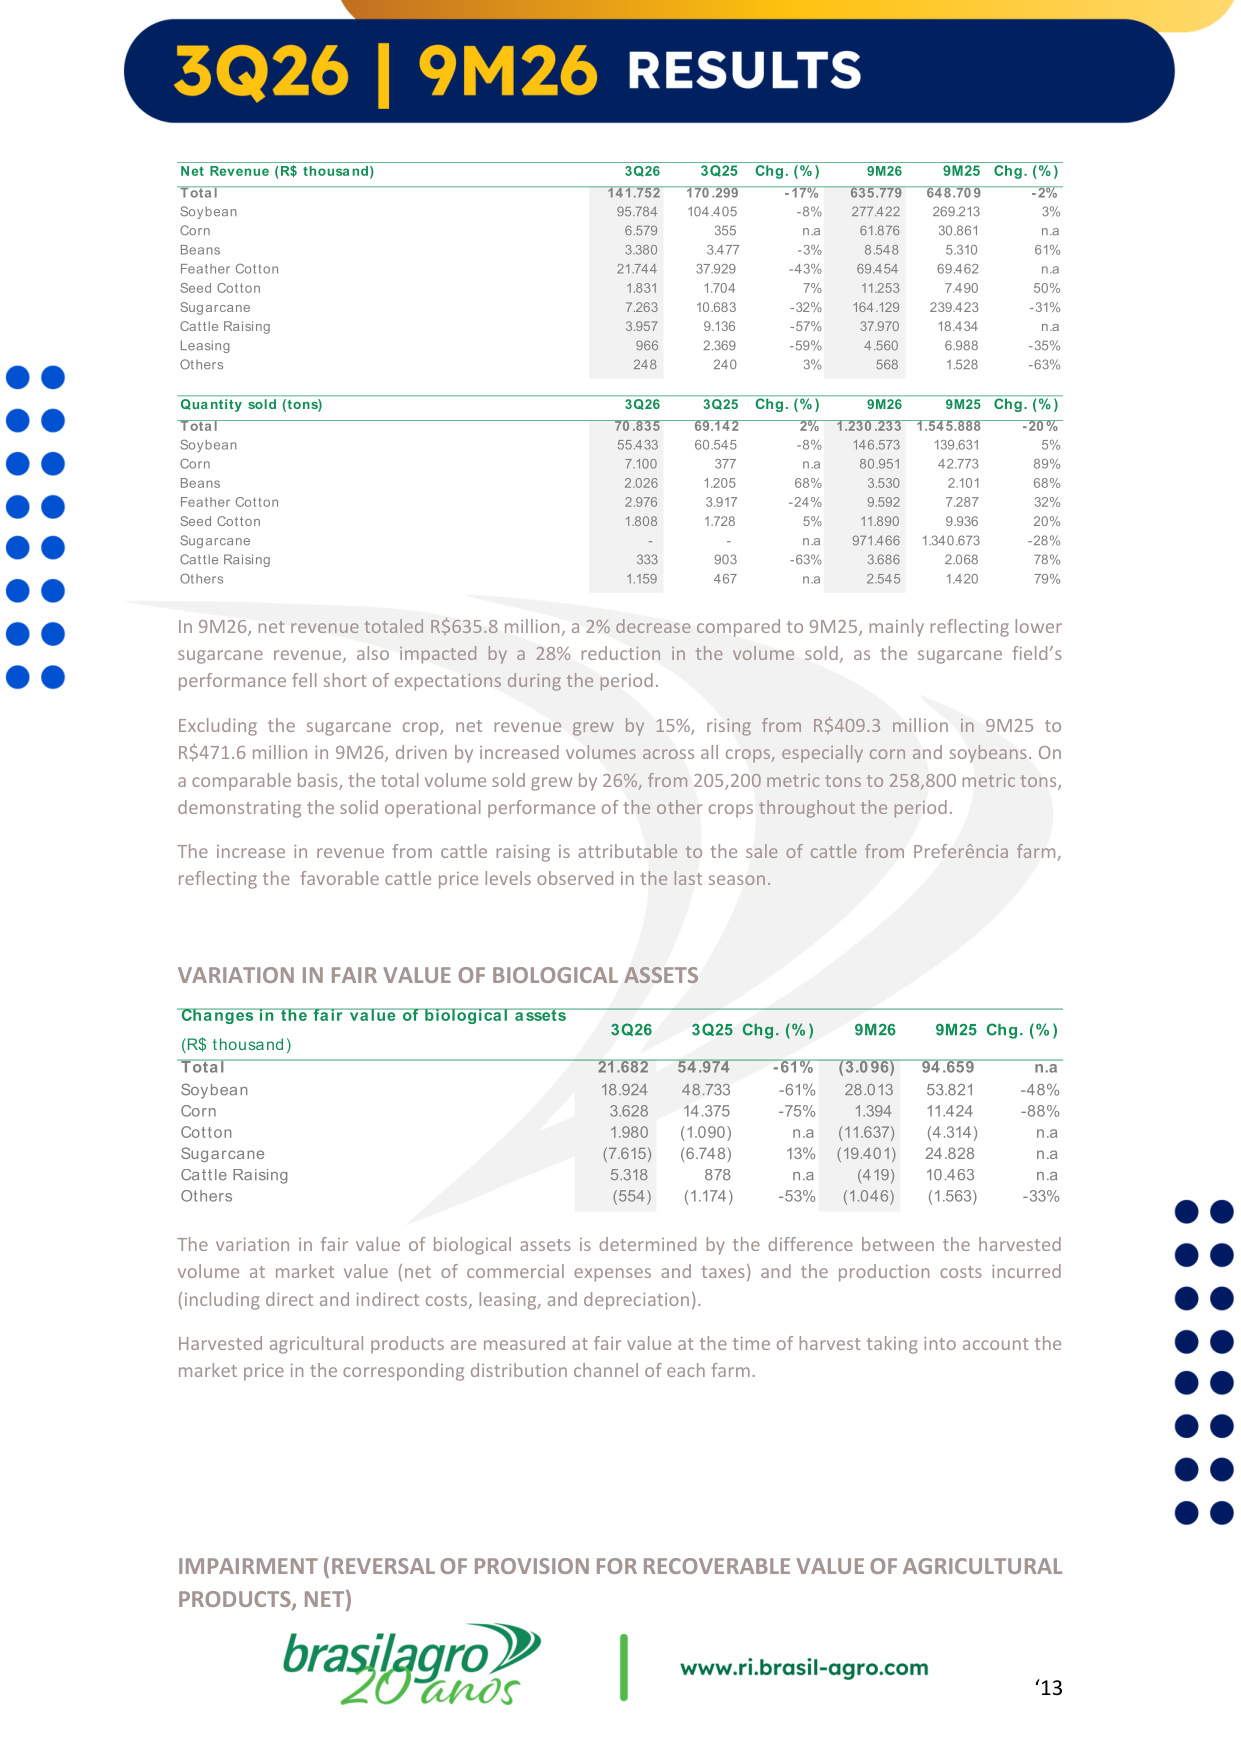
Excluding the sugarcane crop, net revenue grew by 15%, rising from R$409.3 million in 9M25 to R$471.6 million in 9M26, driven by increased volumes across all crops, especially corn and soybeans. On a comparable basis, the total volume sold grew by 26%, from 205,200 metric tons to 258,800 metric tons, demonstrating the solid operational performance of the other crops throughout the period. The increase in revenue from cattle raising is attributable to the sale of cattle from Preferência farm, reflecting the favorable cattle price levels observed in the last season. VARIATION IN FAIR VALUE OF BIOLOGICAL ASSETS The variation in fair value of biological assets is determined by the difference between the harvested volume at market value (net of commercial expenses and taxes) and the production costs incurred (including direct and indirect costs, leasing, and depreciation). Harvested agricultural products are measured at fair value at the time of harvest taking into account the market price in the corresponding distribution channel of each farm. IMPAIRMENT (REVERSAL OF PROVISION FOR RECOVERABLE VALUE OF AGRICULTURAL PRODUCTS, NET) Net Revenue (R$ thousand) 3Q26 3Q25 Chg. (% ) 9M26 9M25 Chg. (% ) Total 141.752 170 .299 - 17% 635.779 648.70 9 - 2% Soybean 95.784 104.405 -8% 277.422 269.213 3% Corn 6.579 355 n.a 61.876 30.861 n.a Beans 3.380 3.477 -3% 8.548 5.310 61% Feather Cotton 21.744 37.929 -43% 69.454 69.462 n.a Seed Cotton 1.831 1.704 7% 11.253 7.490 50% Sugarcane 7.263 10.683 -32% 164.129 239.423 -31% Cattle Raising 3.957 9.136 -57% 37.970 18.434 n.a Leasing 966 2.369 -59% 4.560 6.988 -35% Others 248 240 3% 568 1.528 -63% Quantity sold (tons) 3Q26 3Q25 Chg. (% ) 9M26 9M25 Chg. (% ) Total 70 .835 69.142 2% 1.230 .233 1.545.888 -20 % Soybean 55.433 60.545 -8% 146.573 139.631 5% Corn 7.100 377 n.a 80.951 42.773 89% Beans 2.026 1.205 68% 3.530 2.101 68% Feather Cotton 2.976 3.917 -24% 9.592 7.287 32% Seed Cotton 1.808 1.728 5% 11.890 9.936 20% Sugarcane - - n.a 971.466 1.340.673 -28% Cattle Raising 333 903 -63% 3.686 2.068 78% Others 1.159 467 n.a 2.545 1.420 79% Changes in the fair value of biological assets (R$ thousand) 3Q26 3Q25 Chg. (% ) 9M26 9M25 Chg. (% ) Total 21.682 54.974 -61% (3.096) 94.659 n.a Soybean 18.924 48.733 -61% 28.013 53.821 -48% Corn 3.628 14.375 -75% 1.394 11.424 -88% Cotton 1.980 (1.090) n.a (11.637) (4.314) n.a Sugarcane (7.615) (6.748) 13% (19.401) 24.828 n.a Cattle Raising 5.318 878 n.a (419) 10.463 n.a Others (554) (1.174) -53% (1.046) (1.563) -33% '14 A provision for adjustment of inventories to the net realizable value of the agricultural products is created when the value recorded in inventory is higher than the realization value.
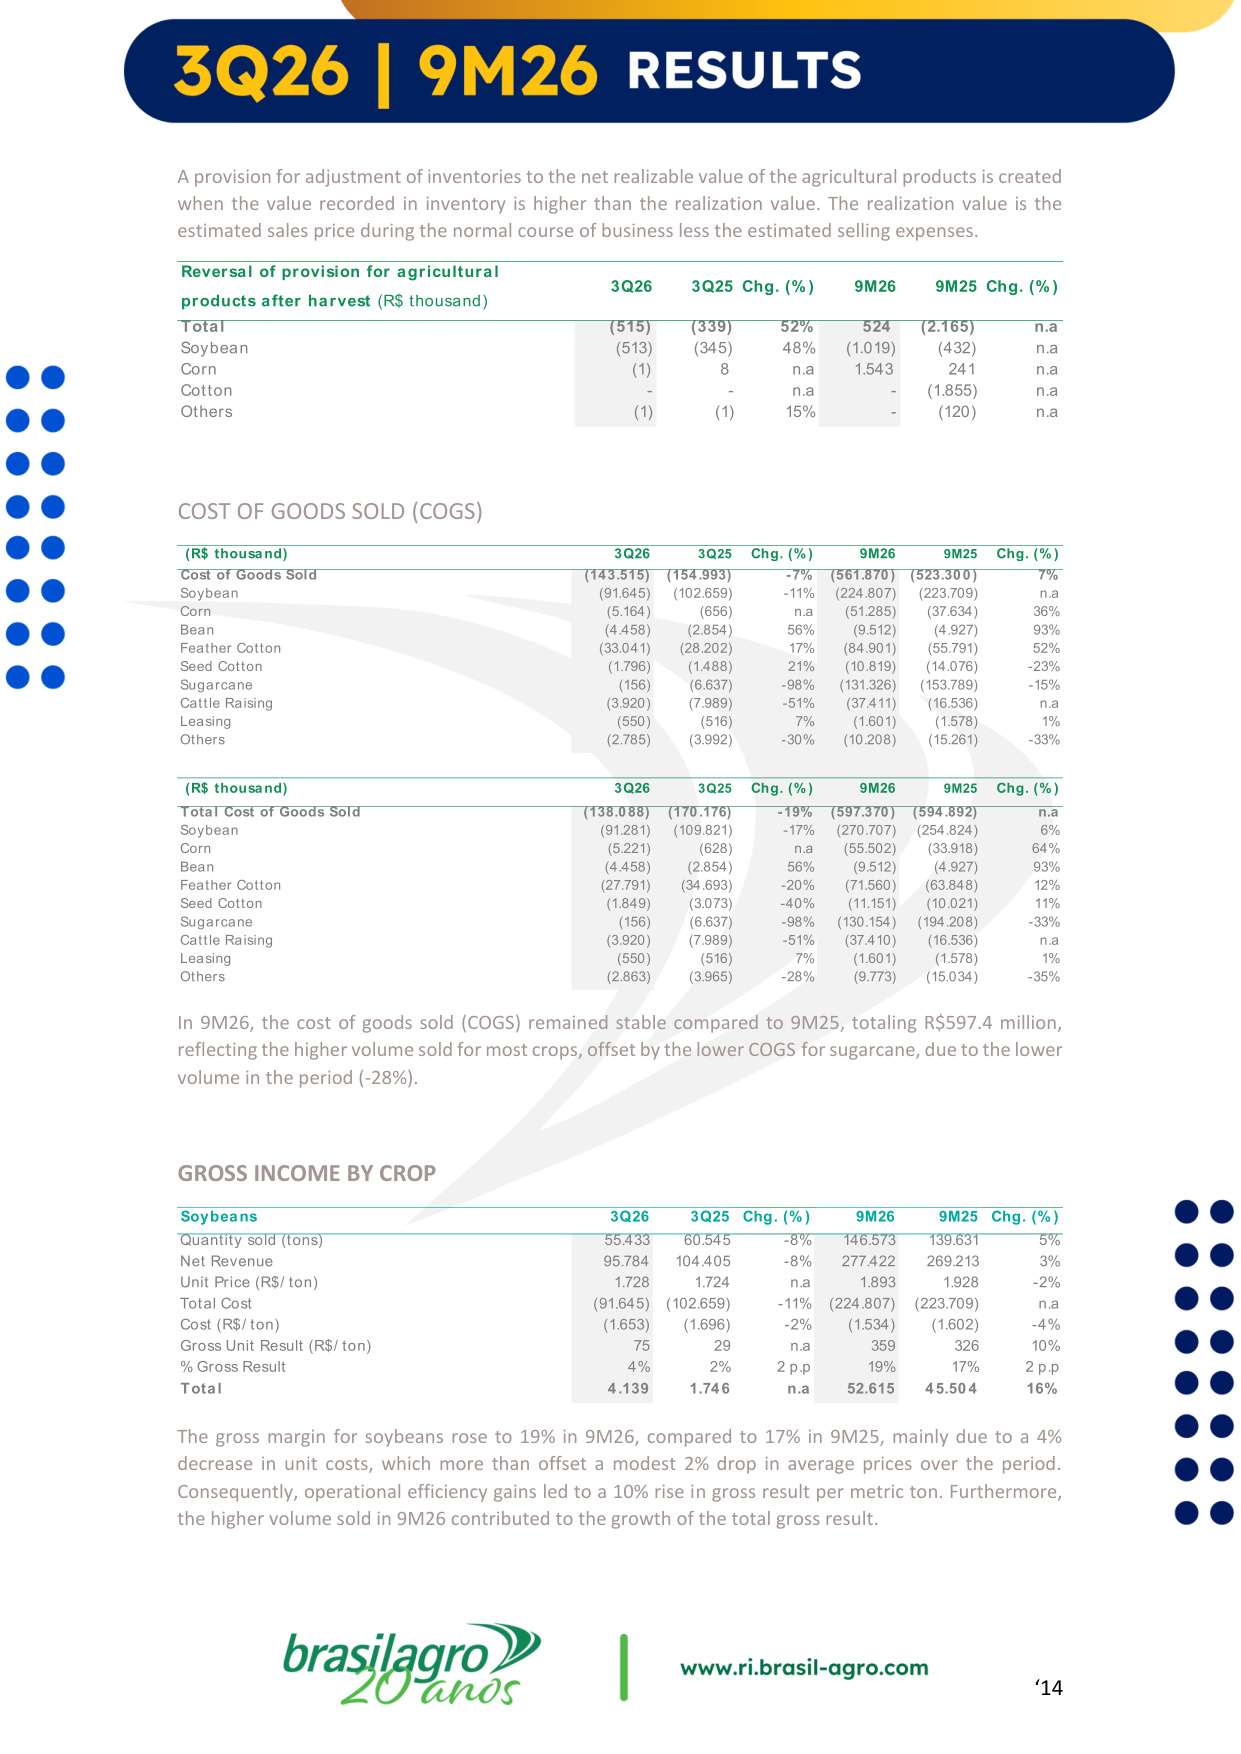
The realization value is the estimated sales price during the normal course of business less the estimated selling expenses. COST OF GOODS SOLD (COGS) In 9M26, the cost of goods sold (COGS) remained stable compared to 9M25, totaling R$597.4 million, reflecting the higher volume sold for most crops, offset by the lower COGS for sugarcane, due to the lower volume in the period (-28%). GROSS INCOME BY CROP The gross margin for soybeans rose to 19% in 9M26, compared to 17% in 9M25, mainly due to a 4% decrease in unit costs, which more than offset a modest 2% drop in average prices over the period. Consequently, operational efficiency gains led to a 10% rise in gross result per metric ton. Furthermore, the higher volume sold in 9M26 contributed to the growth of the total gross result. Reversal of provision for agricultural products after harvest (R$ thousand) 3Q26 3Q25 Chg. (% ) 9M26 9M25 Chg. (% ) Total (515) (339) 52% 524 (2.165) n.a Soybean (513) (345) 48% (1.019) (432) n.a Corn (1) 8 n.a 1.543 241 n.a Cotton - - n.a - (1.855) n.a Others (1) (1) 15% - (120) n.a (R$ thousand) 3Q26 3Q25 Chg. (% ) 9M26 9M25 Chg. (% ) Cost of Goods Sold (143.515) (154.993) -7% (561.870 ) (523.300) 7% Soybean (91.645) (102.659) -11% (224.807) (223.709) n.a Corn (5.164) (656) n.a (51.285) (37.634) 36% Bean (4.458) (2.854) 56% (9.512) (4.927) 93% Feather Cotton (33.041) (28.202) 17% (84.901) (55.791) 52% Seed Cotton (1.796) (1.488) 21% (10.819) (14.076) -23% Sugarcane (156) (6.637) -98% (131.326) (153.789) -15% Cattle Raising (3.920) (7.989) -51% (37.411) (16.536) n.a Leasing (550) (516) 7% (1.601) (1.578) 1% Others (2.785) (3.992) -30% (10.208) (15.261) -33% (R$ thousand) 3Q26 3Q25 Chg. (% ) 9M26 9M25 Chg. (% ) Total Cost of Goods Sold (138.088) (170 .176) -19% (597.370 ) (594.892) n.a Soybean (91.281) (109.821) -17% (270.707) (254.824) 6% Corn (5.221) (628) n.a (55.502) (33.918) 64% Bean (4.458) (2.854) 56% (9.512) (4.927) 93% Feather Cotton (27.791) (34.693) -20% (71.560) (63.848) 12% Seed Cotton (1.849) (3.073) -40% (11.151) (10.021) 11% Sugarcane (156) (6.637) -98% (130.154) (194.208) -33% Cattle Raising (3.920) (7.989) -51% (37.410) (16.536) n.a Leasing (550) (516) 7% (1.601) (1.578) 1% Others (2.863) (3.965) -28% (9.773) (15.034) -35% Soybeans 3Q26 3Q25 Chg. (% ) 9M26 9M25 Chg. (% ) Quantity sold (tons) 55.433 60.545 -8% 146.573 139.631 5% Net Revenue 95.784 104.405 -8% 277.422 269.213 3% Unit Price (R$/ ton) 1.728 1.724 n.a 1.893 1.928 -2% Total Cost (91.645) (102.659) -11% (224.807) (223.709) n.a Cost (R$/ ton) (1.653) (1.696) -2% (1.534) (1.602) -4% Gross Unit Result (R$/ ton) 75 29 n.a 359 326 10% % Gross Result 4% 2% 2 p.p 19% 17% 2 p.p Total 4.139 1.746 n.a 52.615 45.50 4 16% '15 In 9M26, the gross margin for corn improved to 17%, reversing a negative margin of -22% in 9M25.
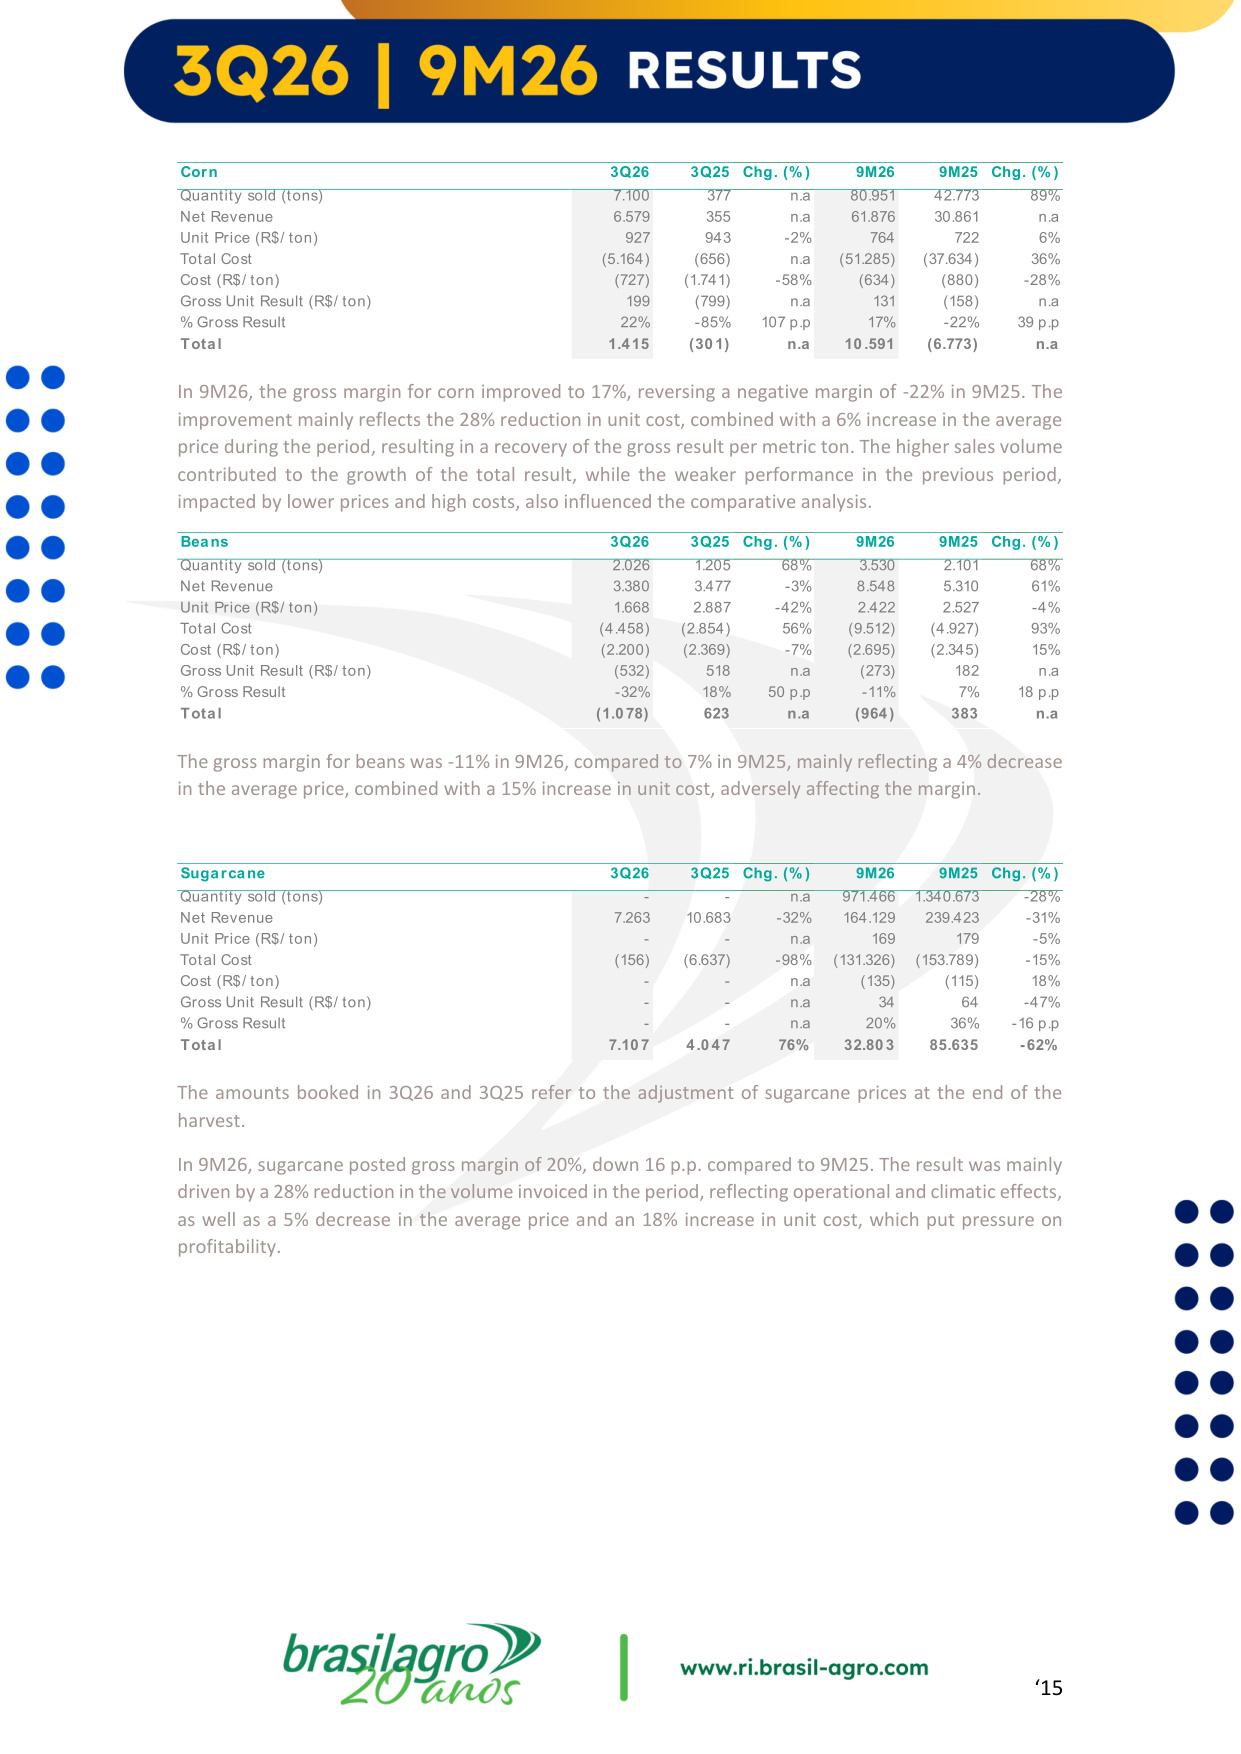
The improvement mainly reflects the 28% reduction in unit cost, combined with a 6% increase in the average price during the period, resulting in a recovery of the gross result per metric ton. The higher sales volume contributed to the growth of the total result, while the weaker performance in the previous period, impacted by lower prices and high costs, also influenced the comparative analysis. The gross margin for beans was -11% in 9M26, compared to 7% in 9M25, mainly reflecting a 4% decrease in the average price, combined with a 15% increase in unit cost, adversely affecting the margin. The amounts booked in 3Q26 and 3Q25 refer to the adjustment of sugarcane prices at the end of the harvest. In 9M26, sugarcane posted gross margin of 20%, down 16 p.p. compared to 9M25. The result was mainly driven by a 28% reduction in the volume invoiced in the period, reflecting operational and climatic effects, as well as a 5% decrease in the average price and an 18% increase in unit cost, which put pressure on profitability. Corn 3Q26 3Q25 Chg. (% ) 9M26 9M25 Chg. (% ) Quantity sold (tons) 7.100 377 n.a 80.951 42.773 89% Net Revenue 6.579 355 n.a 61.876 30.861 n.a Unit Price (R$/ ton) 927 943 -2% 764 722 6% Total Cost (5.164) (656) n.a (51.285) (37.634) 36% Cost (R$/ ton) (727) (1.741) -58% (634) (880) -28% Gross Unit Result (R$/ ton) 199 (799) n.a 131 (158) n.a % Gross Result 22% -85% 107 p.p 17% -22% 39 p.p Total 1.415 (30 1) n.a 10 .591 (6.773) n.a Beans 3Q26 3Q25 Chg. (% ) 9M26 9M25 Chg. (% ) Quantity sold (tons) 2.026 1.205 68% 3.530 2.101 68% Net Revenue 3.380 3.477 -3% 8.548 5.310 61% Unit Price (R$/ ton) 1.668 2.887 -42% 2.422 2.527 -4% Total Cost (4.458) (2.854) 56% (9.512) (4.927) 93% Cost (R$/ ton) (2.200) (2.369) -7% (2.695) (2.345) 15% Gross Unit Result (R$/ ton) (532) 518 n.a (273) 182 n.a % Gross Result -32% 18% 50 p.p -11% 7% 18 p.p Total (1.0 78) 623 n.a (964) 383 n.a Sugarcane 3Q26 3Q25 Chg. (% ) 9M26 9M25 Chg. (% ) Quantity sold (tons) - - n.a 971.466 1.340.673 -28% Net Revenue 7.263 10.683 -32% 164.129 239.423 -31% Unit Price (R$/ ton) - - n.a 169 179 -5% Total Cost (156) (6.637) -98% (131.326) (153.789) -15% Cost (R$/ ton) - - n.a (135) (115) 18% Gross Unit Result (R$/ ton) - - n.a 34 64 -47% % Gross Result - - n.a 20% 36% -16 p.p Total 7.10 7 4.0 47 76% 32.80 3 85.635 -62% '16 In 9M26, cotton lint recorded a negative gross margin of 22%, down 42 p.p.
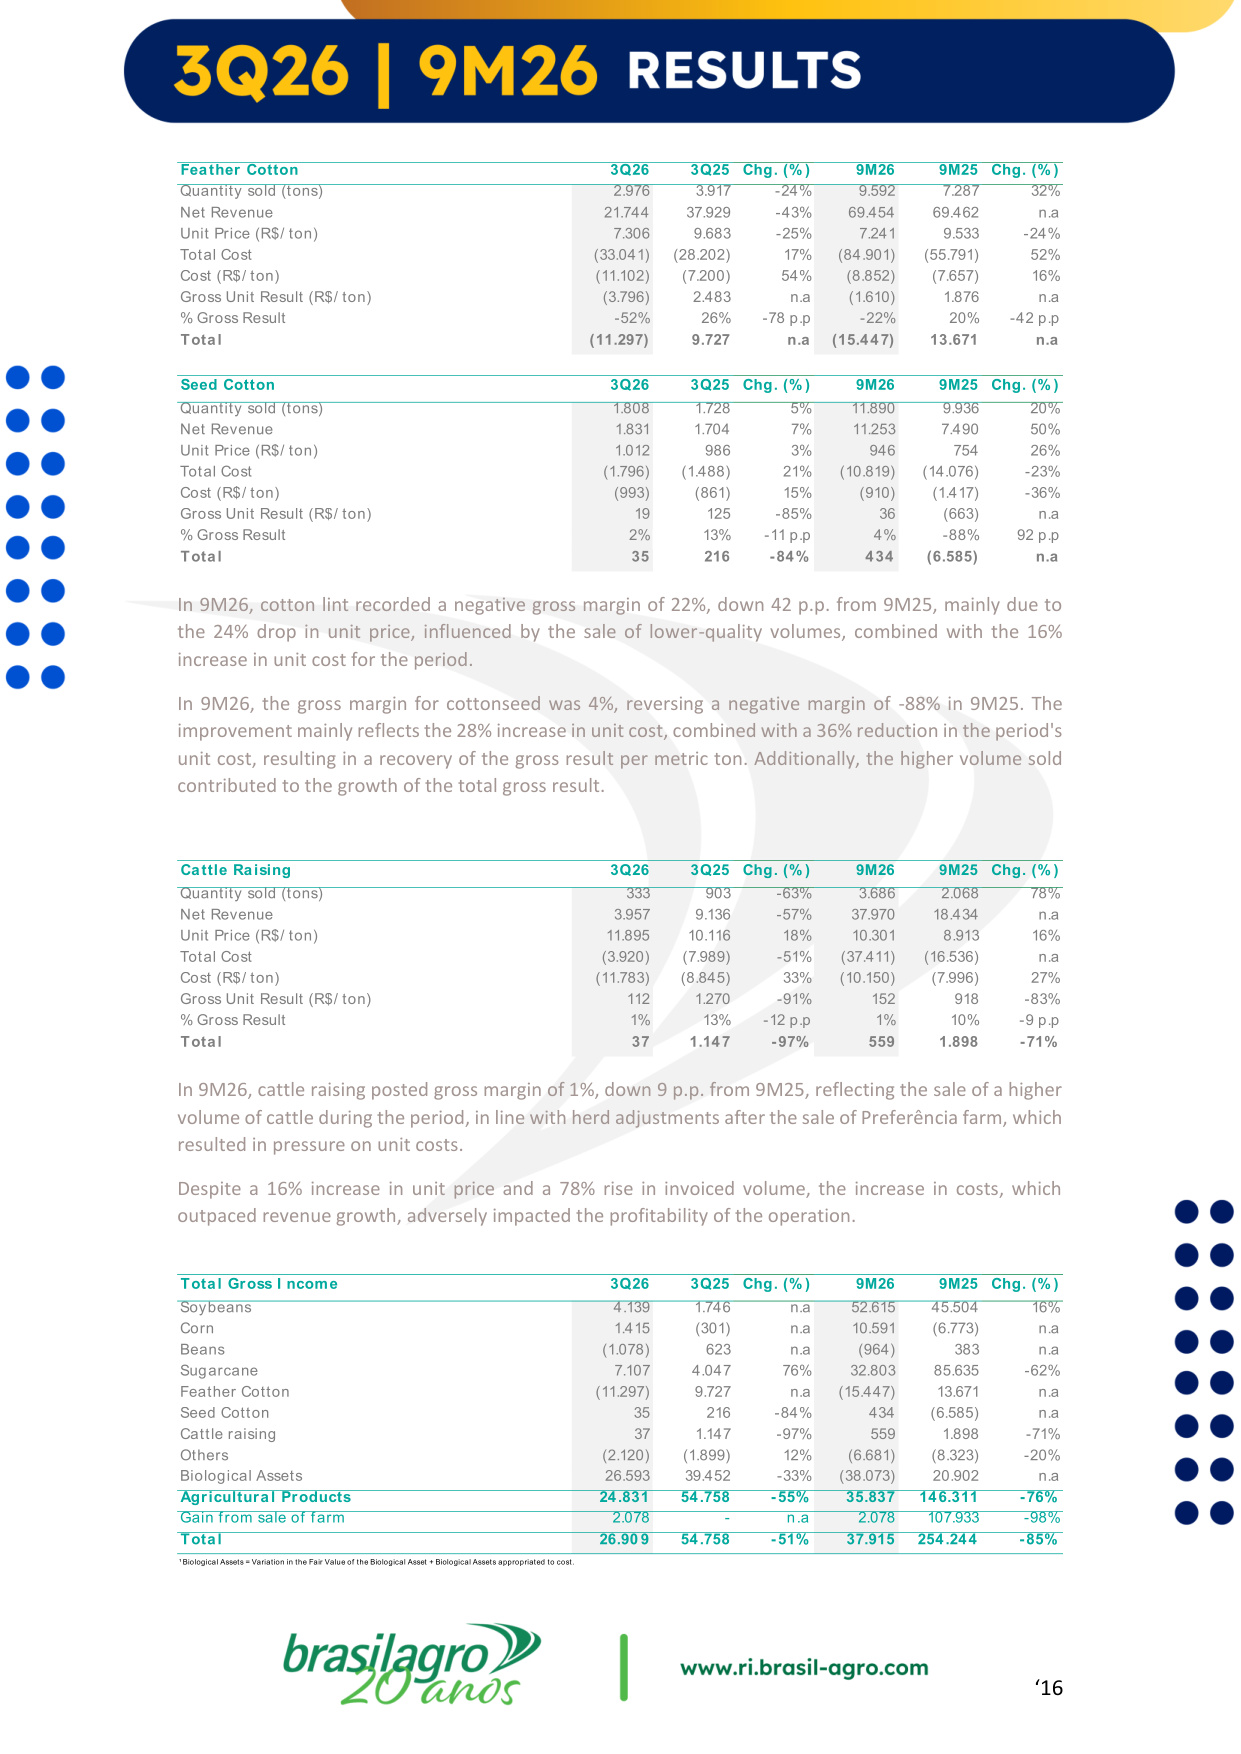
from 9M25, mainly due to the 24% drop in unit price, influenced by the sale of lower-quality volumes, combined with the 16% increase in unit cost for the period. In 9M26, the gross margin for cottonseed was 4%, reversing a negative margin of -88% in 9M25. The improvement mainly reflects the 28% increase in unit cost, combined with a 36% reduction in the period's unit cost, resulting in a recovery of the gross result per metric ton. Additionally, the higher volume sold contributed to the growth of the total gross result. In 9M26, cattle raising posted gross margin of 1%, down 9 p.p. from 9M25, reflecting the sale of a higher volume of cattle during the period, in line with herd adjustments after the sale of Preferência farm, which resulted in pressure on unit costs. Despite a 16% increase in unit price and a 78% rise in invoiced volume, the increase in costs, which outpaced revenue growth, adversely impacted the profitability of the operation. Feather Cotton 3Q26 3Q25 Chg. (% ) 9M26 9M25 Chg. (% ) Quantity sold (tons) 2.976 3.917 -24% 9.592 7.287 32% Net Revenue 21.744 37.929 -43% 69.454 69.462 n.a Unit Price (R$/ ton) 7.306 9.683 -25% 7.241 9.533 -24% Total Cost (33.041) (28.202) 17% (84.901) (55.791) 52% Cost (R$/ ton) (11.102) (7.200) 54% (8.852) (7.657) 16% Gross Unit Result (R$/ ton) (3.796) 2.483 n.a (1.610) 1.876 n.a % Gross Result -52% 26% -78 p.p -22% 20% -42 p.p Total (11.297) 9.727 n.a (15.447) 13.671 n.a Seed Cotton 3Q26 3Q25 Chg. (% ) 9M26 9M25 Chg. (% ) Quantity sold (tons) 1.808 1.728 5% 11.890 9.936 20% Net Revenue 1.831 1.704 7% 11.253 7.490 50% Unit Price (R$/ ton) 1.012 986 3% 946 754 26% Total Cost (1.796) (1.488) 21% (10.819) (14.076) -23% Cost (R$/ ton) (993) (861) 15% (910) (1.417) -36% Gross Unit Result (R$/ ton) 19 125 -85% 36 (663) n.a % Gross Result 2% 13% -11 p.p 4% -88% 92 p.p Total 35 216 -84% 434 (6.585) n.a Cattle Raising 3Q26 3Q25 Chg. (% ) 9M26 9M25 Chg. (% ) Quantity sold (tons) 333 903 -63% 3.686 2.068 78% Net Revenue 3.957 9.136 -57% 37.970 18.434 n.a Unit Price (R$/ ton) 11.895 10.116 18% 10.301 8.913 16% Total Cost (3.920) (7.989) -51% (37.411) (16.536) n.a Cost (R$/ ton) (11.783) (8.845) 33% (10.150) (7.996) 27% Gross Unit Result (R$/ ton) 112 1.270 -91% 152 918 -83% % Gross Result 1% 13% -12 p.p 1% 10% -9 p.p Total 37 1.147 -97% 559 1.898 -71% Total Gross I ncome 3Q26 3Q25 Chg. (% ) 9M26 9M25 Chg. (% ) Soybeans 4.139 1.746 n.a 52.615 45.504 16% Corn 1.415 (301) n.a 10.591 (6.773) n.a Beans (1.078) 623 n.a (964) 383 n.a Sugarcane 7.107 4.047 76% 32.803 85.635 -62% Feather Cotton (11.297) 9.727 n.a (15.447) 13.671 n.a Seed Cotton 35 216 -84% 434 (6.585) n.a Cattle raising 37 1.147 -97% 559 1.898 -71% Others (2.120) (1.899) 12% (6.681) (8.323) -20% Biological Assets 26.593 39.452 -33% (38.073) 20.902 n.a Agricultural Products 24.831 54.758 -55% 35.837 146.311 -76% Gain from sale of farm 2.078 - n.a 2.078 107.933 -98% Total 26.90 9 54.758 -51% 37.915 254.244 -85% ¹ Biological Assets = Variation in the Fair Value of the Biological Asset + Biological Assets appropriated to cost.
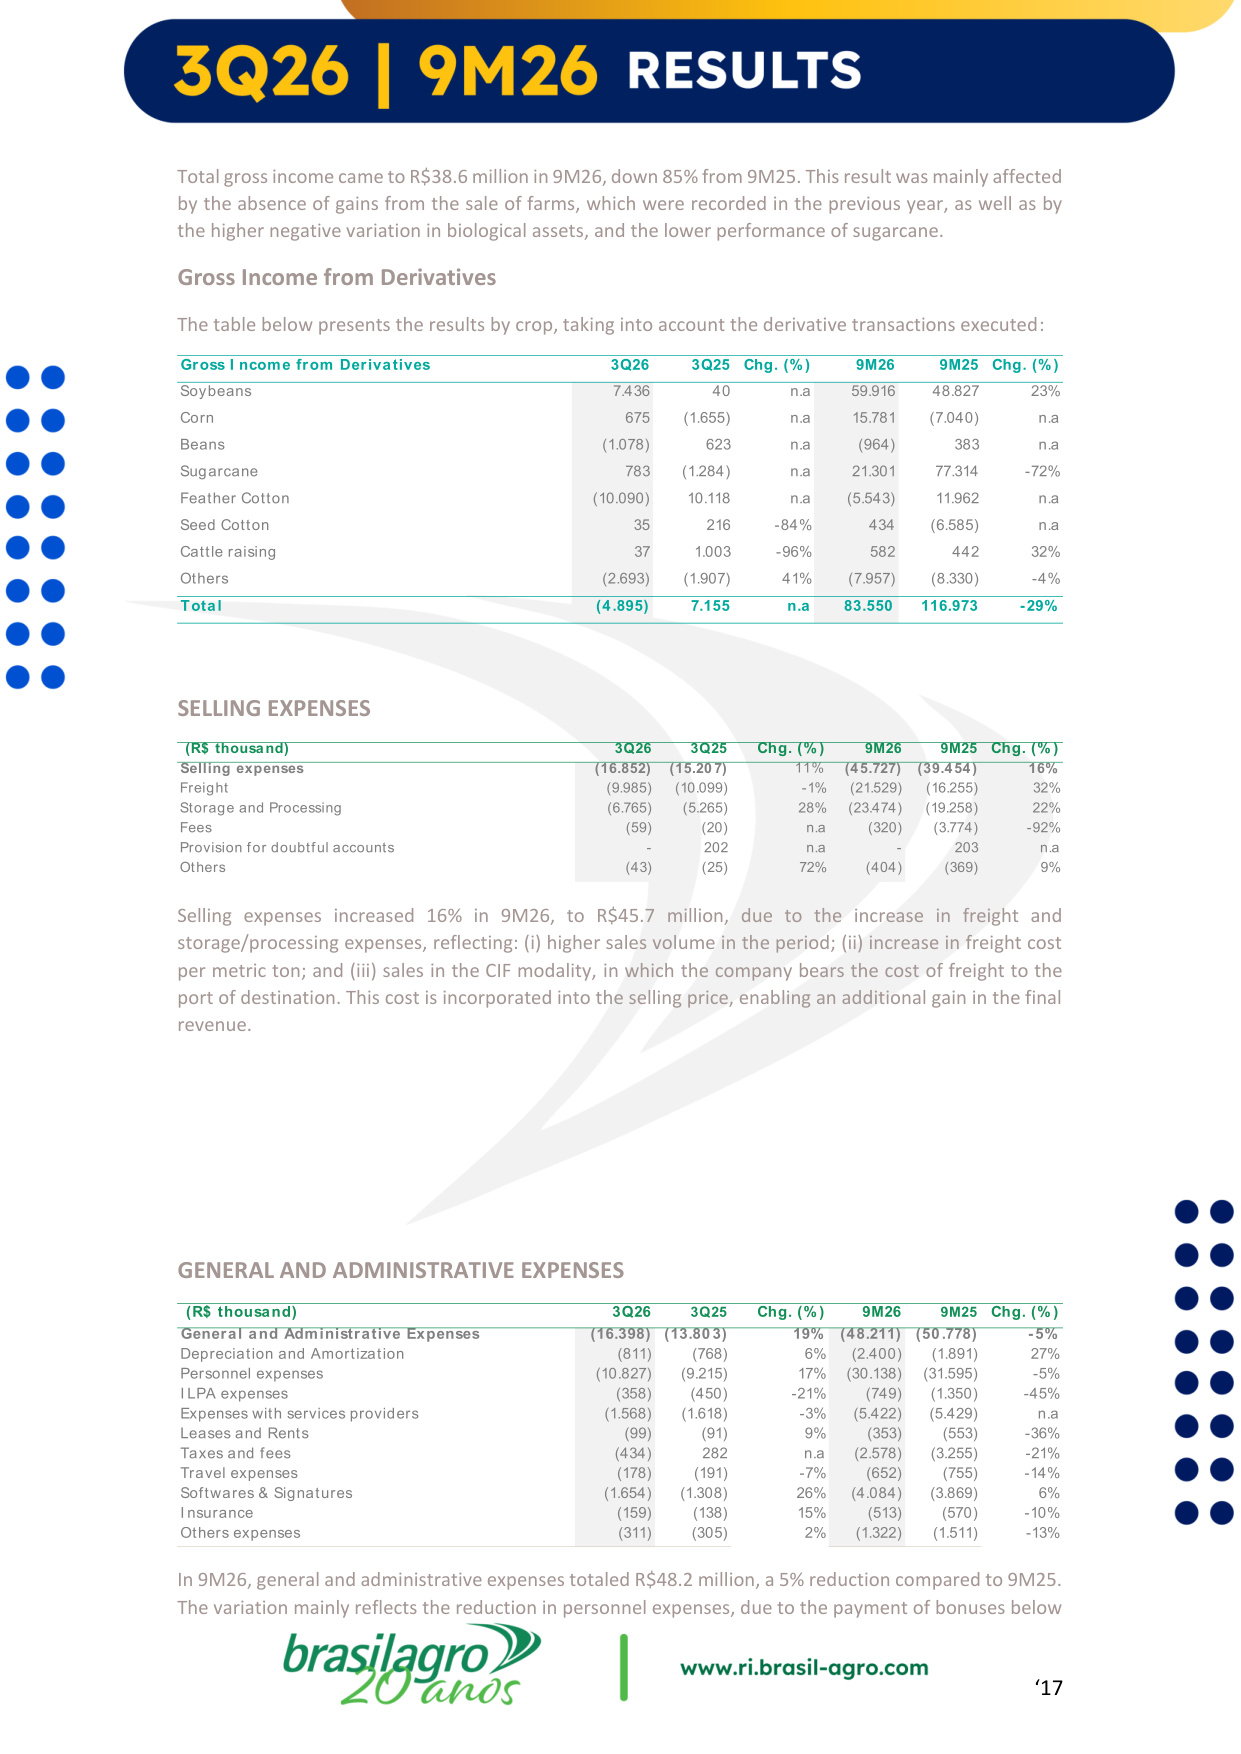
'17 Total gross income came to R$38.6 million in 9M26, down 85% from 9M25. This result was mainly affected by the absence of gains from the sale of farms, which were recorded in the previous year, as well as by the higher negative variation in biological assets, and the lower performance of sugarcane. Gross Income from Derivatives The table below presents the results by crop, taking into account the derivative transactions executed: SELLING EXPENSES Selling expenses increased 16% in 9M26, to R$45.7 million, due to the increase in freight and storage/processing expenses, reflecting: (i) higher sales volume in the period; (ii) increase in freight cost per metric ton; and (iii) sales in the CIF modality, in which the company bears the cost of freight to the port of destination. This cost is incorporated into the selling price, enabling an additional gain in the final revenue. GENERAL AND ADMINISTRATIVE EXPENSES In 9M26, general and administrative expenses totaled R$48.2 million, a 5% reduction compared to 9M25. The variation mainly reflects the reduction in personnel expenses, due to the payment of bonuses below Gross I ncome from Derivatives 3Q26 3Q25 Chg. (%) 9M26 9M25 Chg. (%) Soybeans 7.436 40 n.a 59.916 48.827 23% Corn 675 (1.655) n.a 15.781 (7.040) n.a Beans (1.078) 623 n.a (964) 383 n.a Sugarcane 783 (1.284) n.a 21.301 77.314 -72% Feather Cotton (10.090) 10.118 n.a (5.543) 11.962 n.a Seed Cotton 35 216 -84% 434 (6.585) n.a Cattle raising 37 1.003 -96% 582 442 32% Others (2.693) (1.907) 41% (7.957) (8.330) -4% Total (4.895) 7.155 n.a 83.550 116.973 -29% (R$ thousand) 3Q26 3Q25 Chg. (% ) 9M26 9M25 Chg. (% ) Selling expenses (16.852) (15.20 7) 11% (45.727) (39.454) 16% Freight (9.985) (10.099) -1% (21.529) (16.255) 32% Storage and Processing (6.765) (5.265) 28% (23.474) (19.258) 22% Fees (59) (20) n.a (320) (3.774) -92% Provision for doubtful accounts - 202 n.a - 203 n.a Others (43) (25) 72% (404) (369) 9% (R$ thousand) 3Q26 3Q25 Chg. (% ) 9M26 9M25 Chg. (% ) General and Administrative Expenses (16.398) (13.803) 19% (48.211) (50.778) -5% Depreciation and Amortization (811) (768) 6% (2.400) (1.891) 27% Personnel expenses (10.827) (9.215) 17% (30.138) (31.595) -5% I LPA expenses (358) (450) -21% (749) (1.350) -45% Expenses with services providers (1.568) (1.618) -3% (5.422) (5.429) n.a Leases and Rents (99) (91) 9% (353) (553) -36% Taxes and fees (434) 282 n.a (2.578) (3.255) -21% Travel expenses (178) (191) -7% (652) (755) -14% Softwares & Signatures (1.654) (1.308) 26% (4.084) (3.869) 6% I nsurance (159) (138) 15% (513) (570) -10% Others expenses (311) (305) 2% (1.322) (1.511) -13% '18 the provisioned amount, as well as a reduction in expenses related to the long-term incentive plan (LTIP), driven by changes in the leadership structure during the period.
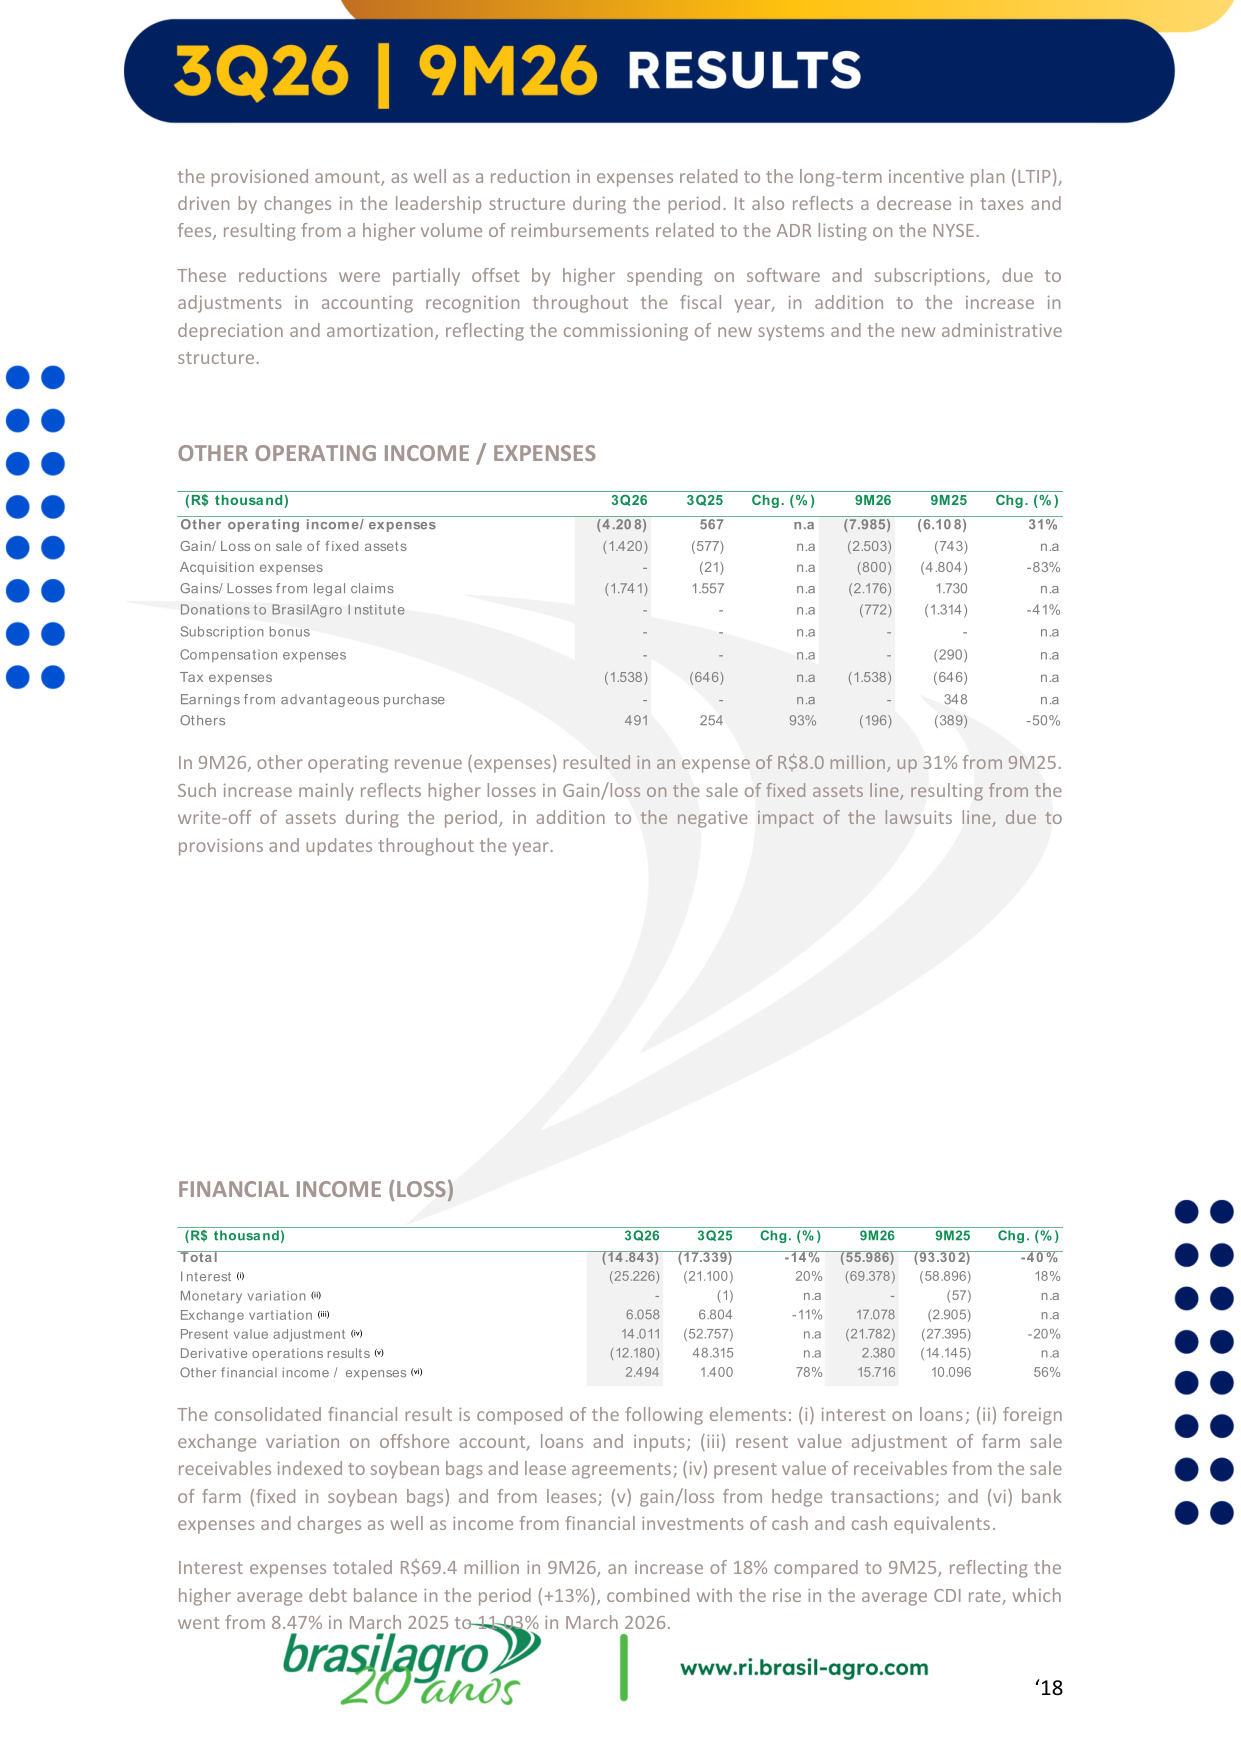
It also reflects a decrease in taxes and fees, resulting from a higher volume of reimbursements related to the ADR listing on the NYSE. These reductions were partially offset by higher spending on software and subscriptions, due to adjustments in accounting recognition throughout the fiscal year, in addition to the increase in depreciation and amortization, reflecting the commissioning of new systems and the new administrative structure. OTHER OPERATING INCOME / EXPENSES In 9M26, other operating revenue (expenses) resulted in an expense of R$8.0 million, up 31% from 9M25. Such increase mainly reflects higher losses in Gain/loss on the sale of fixed assets line, resulting from the write-off of assets during the period, in addition to the negative impact of the lawsuits line, due to provisions and updates throughout the year. FINANCIAL INCOME (LOSS) The consolidated financial result is composed of the following elements: (i) interest on loans; (ii) foreign exchange variation on offshore account, loans and inputs; (iii) resent value adjustment of farm sale receivables indexed to soybean bags and lease agreements; (iv) present value of receivables from the sale of farm (fixed in soybean bags) and from leases; (v) gain/loss from hedge transactions; and (vi) bank expenses and charges as well as income from financial investments of cash and cash equivalents. Interest expenses totaled R$69.4 million in 9M26, an increase of 18% compared to 9M25, reflecting the higher average debt balance in the period (+13%), combined with the rise in the average CDI rate, which went from 8.47% in March 2025 to 11.03% in March 2026. (R$ thousand) 3Q26 3Q25 Chg. (% ) 9M26 9M25 Chg. (% ) Other operating income/ expenses (4.20 8) 567 n.a (7.985) (6.10 8) 31% Gain/ Loss on sale of fixed assets (1.420) (577) n.a (2.503) (743) n.a Acquisition expenses - (21) n.a (800) (4.804) -83% Gains/ Losses from legal claims (1.741) 1.557 n.a (2.176) 1.730 n.a Donations to BrasilAgro I nstitute - - n.a (772) (1.314) -41% Subscription bonus - - n.a - - n.a Compensation expenses - - n.a - (290) n.a Tax expenses (1.538) (646) n.a (1.538) (646) n.a Earnings from advantageous purchase - - n.a - 348 n.a Others 491 254 93% (196) (389) -50% (R$ thousand) 3Q26 3Q25 Chg. (% ) 9M26 9M25 Chg.
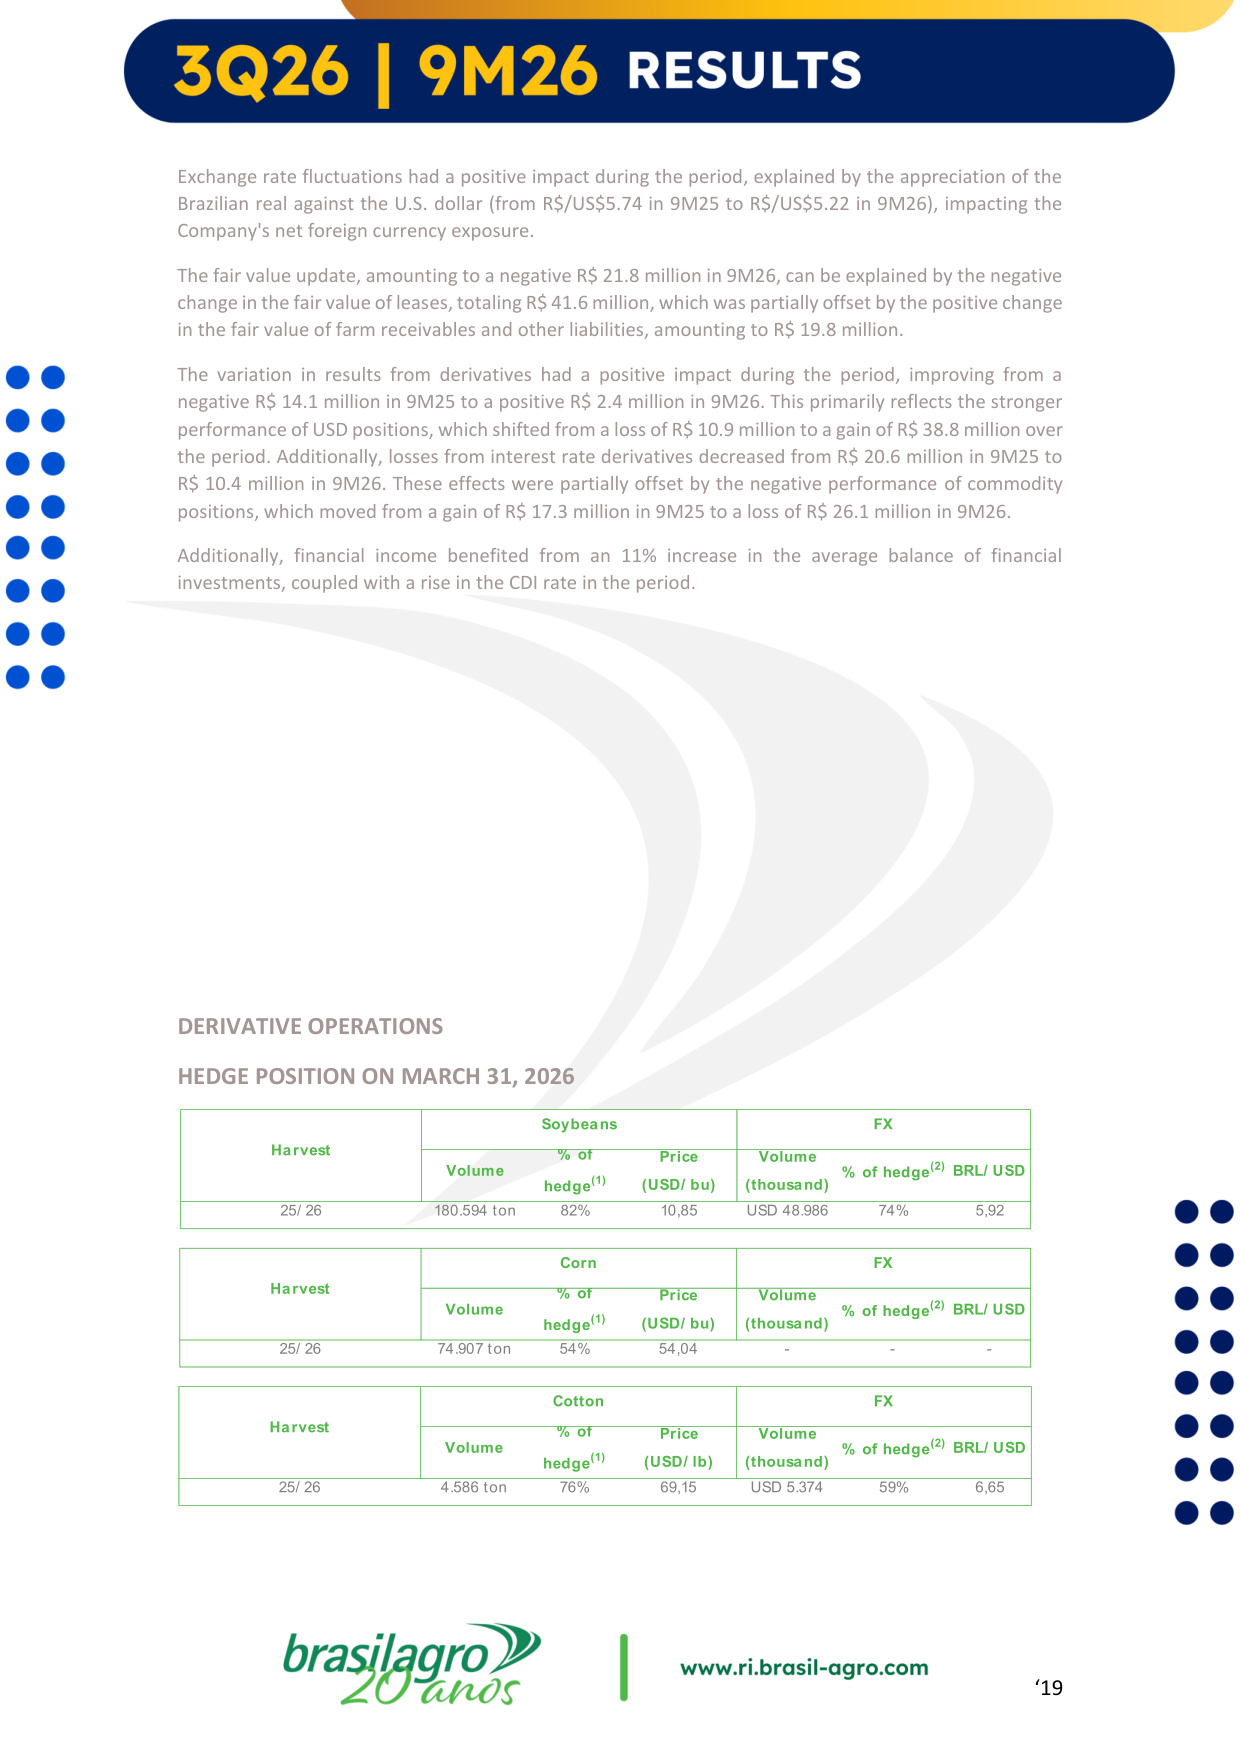
(% ) Total (14.843) (17.339) -14% (55.986) (93.30 2) -40 % I nterest (i) (25.226) (21.100) 20% (69.378) (58.896) 18% Monetary variation (ii) - (1) n.a - (57) n.a Exchange vartiation (iii) 6.058 6.804 -11% 17.078 (2.905) n.a Present value adjustment (iv) 14.011 (52.757) n.a (21.782) (27.395) -20% Derivative operations results (v) (12.180) 48.315 n.a 2.380 (14.145) n.a Other financial income / expenses (vi) 2.494 1.400 78% 15.716 10.096 56% '19 Exchange rate fluctuations had a positive impact during the period, explained by the appreciation of the Brazilian real against the U.S. dollar (from R$/US$5.74 in 9M25 to R$/US$5.22 in 9M26), impacting the Company's net foreign currency exposure. The fair value update, amounting to a negative R$ 21.8 million in 9M26, can be explained by the negative change in the fair value of leases, totaling R$ 41.6 million, which was partially offset by the positive change in the fair value of farm receivables and other liabilities, amounting to R$ 19.8 million. The variation in results from derivatives had a positive impact during the period, improving from a negative R$ 14.1 million in 9M25 to a positive R$ 2.4 million in 9M26. This primarily reflects the stronger performance of USD positions, which shifted from a loss of R$ 10.9 million to a gain of R$ 38.8 million over the period. Additionally, losses from interest rate derivatives decreased from R$ 20.6 million in 9M25 to R$ 10.4 million in 9M26. These effects were partially offset by the negative performance of commodity positions, which moved from a gain of R$ 17.3 million in 9M25 to a loss of R$ 26.1 million in 9M26. Additionally, financial income benefited from an 11% increase in the average balance of financial investments, coupled with a rise in the CDI rate in the period. DERIVATIVE OPERATIONS HEDGE POSITION ON MARCH 31, 2026 Volume % of hedge(1) Price (USD/ bu) Volume (thousand) % of hedge(2) BRL/ USD 25/ 26 180.594 ton 82% 10,85 USD 48.986 74% 5,92 Harvest Soybeans FX Volume % of hedge(1) Price (USD/ bu) Volume (thousand) % of hedge(2) BRL/ USD 25/ 26 74.907 ton 54% 54,04 - - - Harvest Corn FX Volume % of hedge(1) Price (USD/ lb) Volume (thousand) % of hedge(2) BRL/ USD 25/ 26 4.586 ton 76% 69,15 USD 5.374 59% 6,65 Harvest Cotton FX '20 (1) Percentage of the soybean volume hedged, in metric tons.
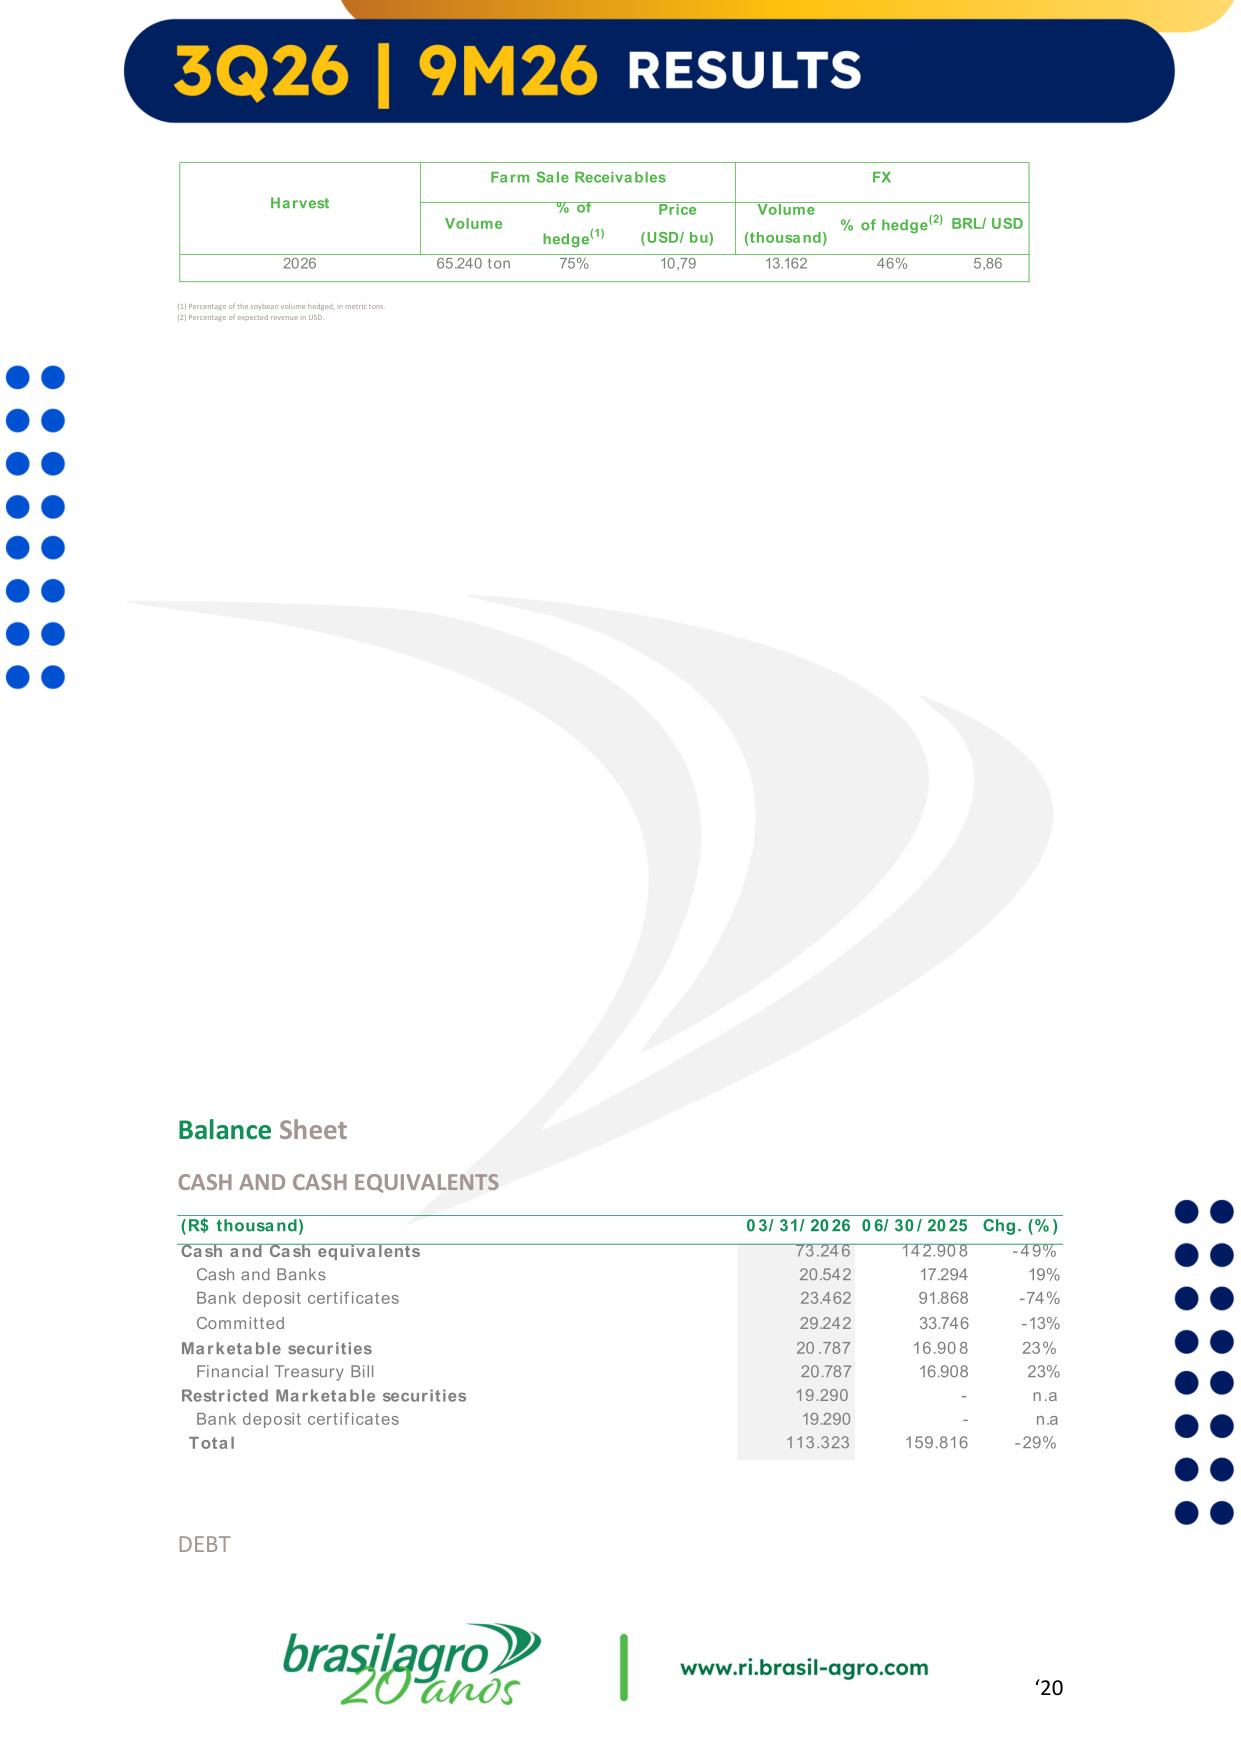
(2) Percentage of expected revenue in USD. Balance Sheet CASH AND CASH EQUIVALENTS DEBT Volume % of hedge(1) Price (USD/ bu) Volume (thousand) % of hedge(2) BRL/ USD 2026 65.240 ton 75% 10,79 13.162 46% 5,86 Harvest Farm Sale Receivables FX (R$ thousand) 0 3/ 31/ 20 26 0 6/ 30 / 20 25 Chg. (% ) Cash and Cash equivalents 73.246 142.90 8 -49% Cash and Banks 20.542 17.294 19% Bank deposit certificates 23.462 91.868 -74% Committed 29.242 33.746 -13% Marketable securities 20 .787 16.90 8 23% Financial Treasury Bill 20.787 16.908 23% Restricted Marketable securities 19.290 - n.a Bank deposit certificates 19.290 - n.a Total 113.323 159.816 -29% '21 The average cost of debt is 93.2% of the CDI rate.
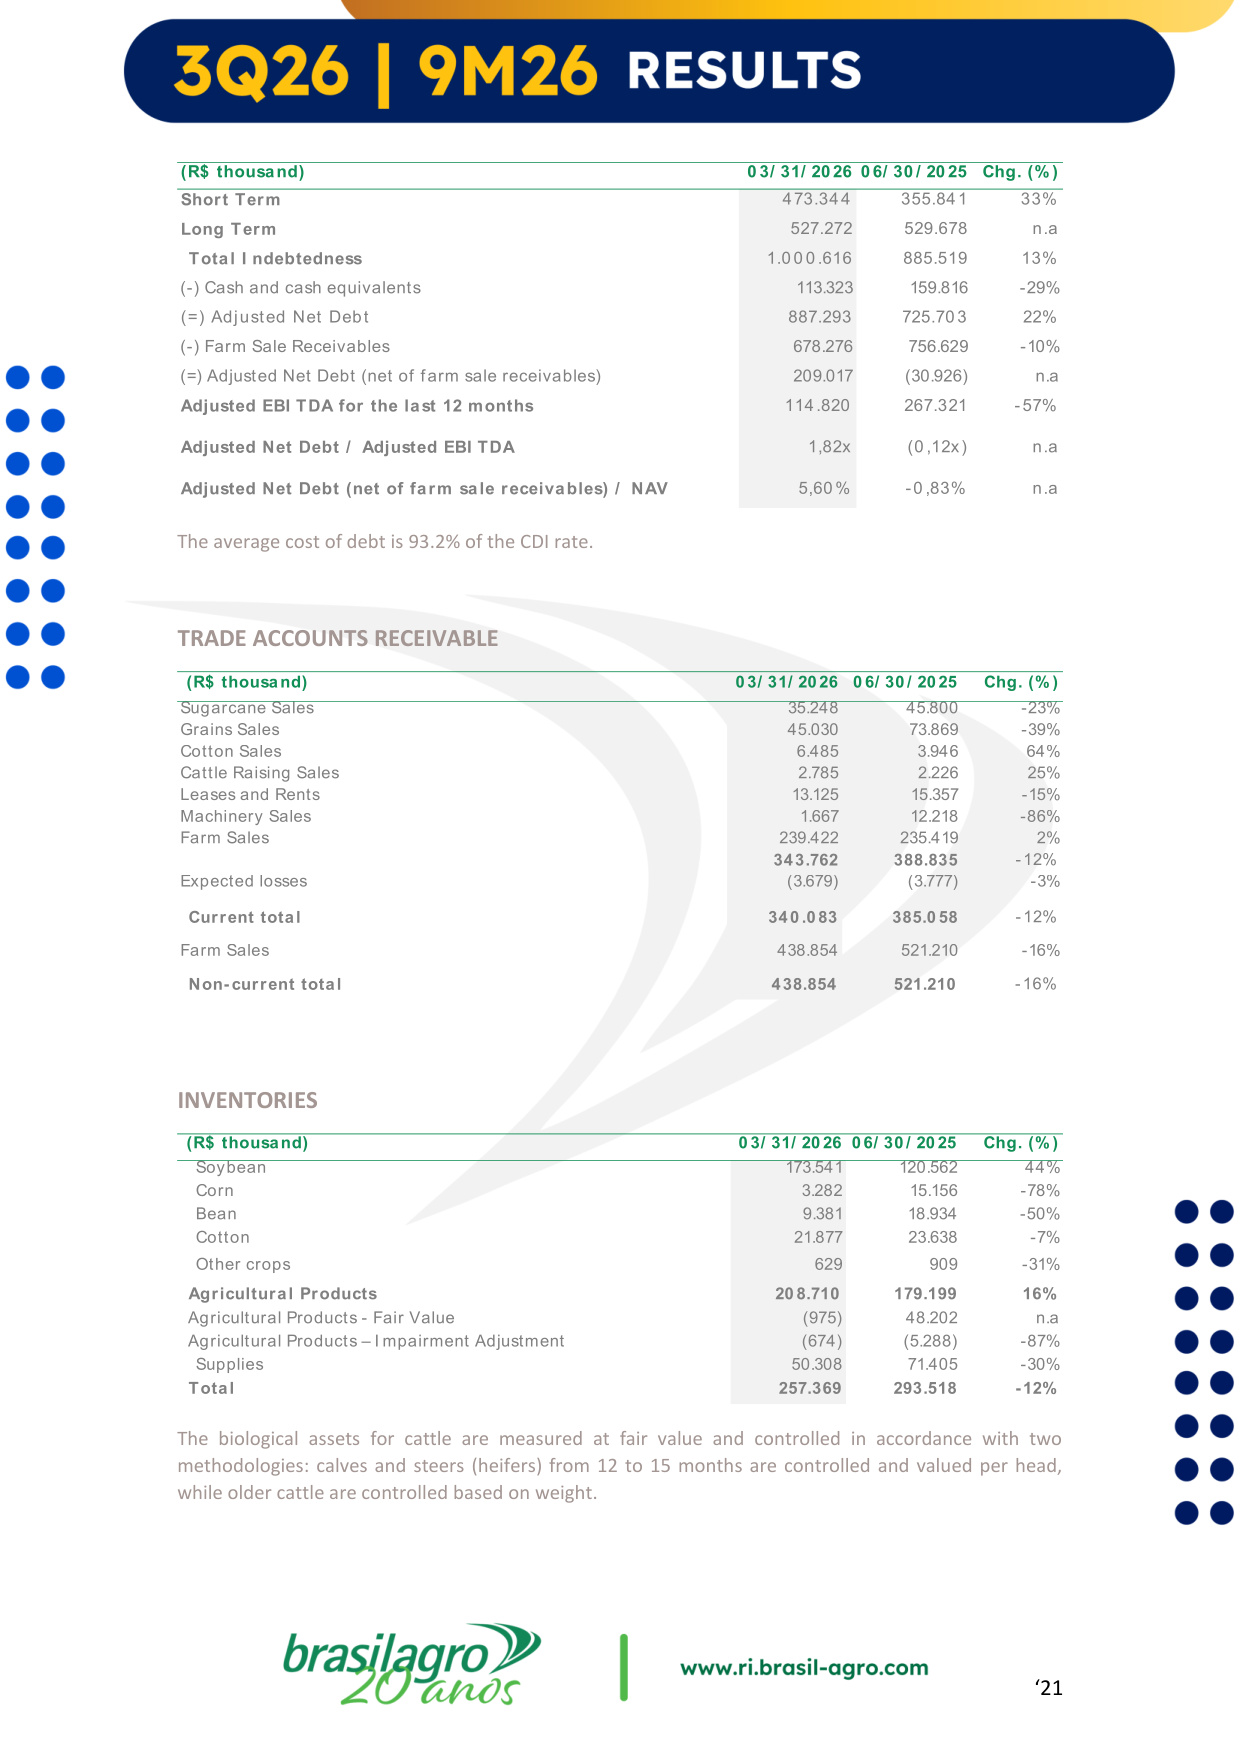
TRADE ACCOUNTS RECEIVABLE INVENTORIES The biological assets for cattle are measured at fair value and controlled in accordance with two methodologies: calves and steers (heifers) from 12 to 15 months are controlled and valued per head, while older cattle are controlled based on weight. (R$ thousand) 0 3/ 31/ 20 26 0 6/ 30 / 20 25 Chg. (% ) Short Term 473.344 355.841 33% Long Term 527.272 529.678 n.a Total I ndebtedness 1.0 0 0 .616 885.519 13% (-) Cash and cash equivalents 113.323 159.816 -29% (=) Adjusted Net Debt 887.293 725.70 3 22% (-) Farm Sale Receivables 678.276 756.629 -10% (=) Adjusted Net Debt (net of farm sale receivables) 209.017 (30.926) n.a Adjusted EBI TDA for the last 12 months 114.820 267.321 -57% Adjusted Net Debt / Adjusted EBI TDA 1,82x (0 ,12x) n.a Adjusted Net Debt (net of farm sale receivables) / NAV 5,60 % -0 ,83% n.a (R$ thousand) 0 3/ 31/ 20 26 0 6/ 30 / 20 25 Chg. (% ) Sugarcane Sales 35.248 45.800 -23% Grains Sales 45.030 73.869 -39% Cotton Sales 6.485 3.946 64% Cattle Raising Sales 2.785 2.226 25% Leases and Rents 13.125 15.357 -15% Machinery Sales 1.667 12.218 -86% Farm Sales 239.422 235.419 2% 343.762 388.835 -12% Expected losses (3.679) (3.777) -3% Current total 340 .0 83 385.0 58 -12% Farm Sales 438.854 521.210 -16% Non- current total 438.854 521.210 -16% (R$ thousand) 0 3/ 31/ 20 26 0 6/ 30 / 20 25 Chg. (% ) Soybean 173.541 120.562 44% Corn 3.282 15.156 -78% Bean 9.381 18.934 -50% Cotton 21.877 23.638 -7% Other crops 629 909 -31% Agricultural Products 20 8.710 179.199 16% Agricultural Products - Fair Value (975) 48.202 n.a Agricultural Products – I mpairment Adjustment (674) (5.288) -87% Supplies 50.308 71.405 -30% Total 257.369 293.518 -12% '22 INVESTMENT PROPERTIES The Company's business strategy is based on the acquisition, development, commercial exploration and sale of rural properties suitable for agricultural and cattle raising activities.
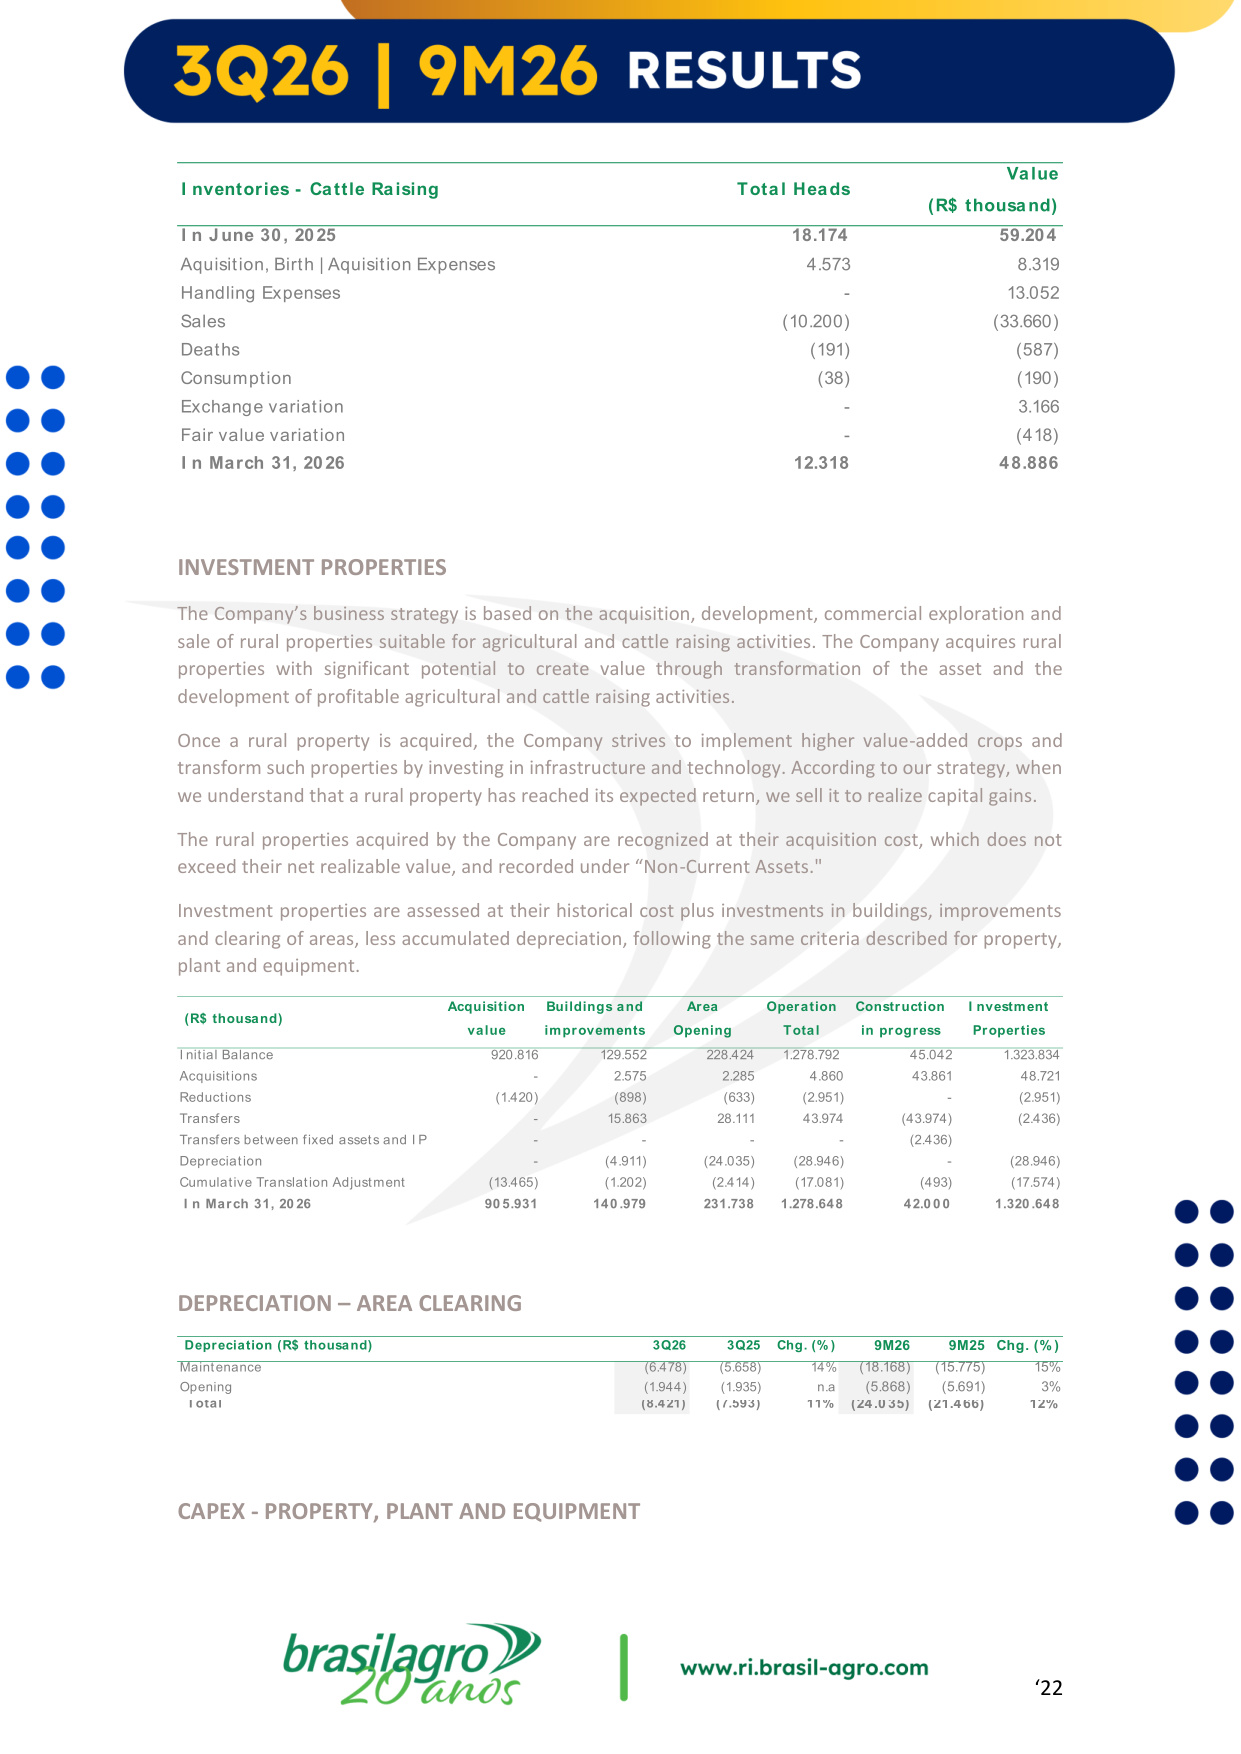
The Company acquires rural properties with significant potential to create value through transformation of the asset and the development of profitable agricultural and cattle raising activities. Once a rural property is acquired, the Company strives to implement higher value-added crops and transform such properties by investing in infrastructure and technology. According to our strategy, when we understand that a rural property has reached its expected return, we sell it to realize capital gains. The rural properties acquired by the Company are recognized at their acquisition cost, which does not exceed their net realizable value, and recorded under "Non-Current Assets." Investment properties are assessed at their historical cost plus investments in buildings, improvements and clearing of areas, less accumulated depreciation, following the same criteria described for property, plant and equipment. DEPRECIATION – AREA CLEARING CAPEX - PROPERTY, PLANT AND EQUIPMENT I nventories - Cattle Raising Total Heads Value (R$ thousand) I n June 30, 2025 18.174 59.204 Aquisition, Birth | Aquisition Expenses 4.573 8.319 Handling Expenses - 13.052 Sales (10.200) (33.660) Deaths (191) (587) Consumption (38) (190) Exchange variation - 3.166 Fair value variation - (418) I n March 31, 2026 12.318 48.886 (R$ thousand) Acquisition value Buildings and improvements Area Opening Operation Total Construction in progress I nvestment Properties I nitial Balance 920.816 129.552 228.424 1.278.792 45.042 1.323.834 Acquisitions - 2.575 2.285 4.860 43.861 48.721 Reductions (1.420) (898) (633) (2.951) - (2.951) Transfers - 15.863 28.111 43.974 (43.974) (2.436) Transfers between fixed assets and I P - - - - (2.436) Depreciation - (4.911) (24.035) (28.946) - (28.946) Cumulative Translation Adjustment (13.465) (1.202) (2.414) (17.081) (493) (17.574) I n March 31, 20 26 90 5.931 140 .979 231.738 1.278.648 42.0 0 0 1.320 .648 Depreciation (R$ thousand) 3Q26 3Q25 Chg. (% ) 9M26 9M25 Chg.

(% ) Maintenance (6.478) (5.658) 14% (18.168) (15.775) 15% Opening (1.944) (1.935) n.a (5.868) (5.691) 3% Total (8.421) (7.593) 11% (24.0 35) (21.466) 12% '23 (R$ thousand) Equipments and facilities Machinery Furniture and untensils Construction in progress Fixed assets in progress Sugarcane Total fixed assets I nitial Balance 78.768 19.059 4.126 101.953 4 130.712 232.669 Acquisitions 11.113 4.093 397 15.603 577 19.141 35.321 Business combination - - - - - - - Reductions (738) (938) (109) (1.785) - (877) (2.662) Transfers 219 29 26 274 (556) 282 - PPE / I nvestment Property 2.461 - - 2.461 (25) - 2.436 Depreciation (6.710) (1.692) (475) (8.877) - (17.351) (26.228) Cumulative Translation (157) (13) (21) (191) - (343) (534) I n March 31, 20 26 84.956 20 .538 3.944 10 9.438 - 131.564 241.0 0 2 '24 CAPITAL MARKETS The Company was the first agricultural production company to list its shares on the Novo Mercado segment of B3 (São Paulo Stock Exchange) and the first Brazilian agribusiness company to list its ADRs on the NYSE (New York Stock Exchange).
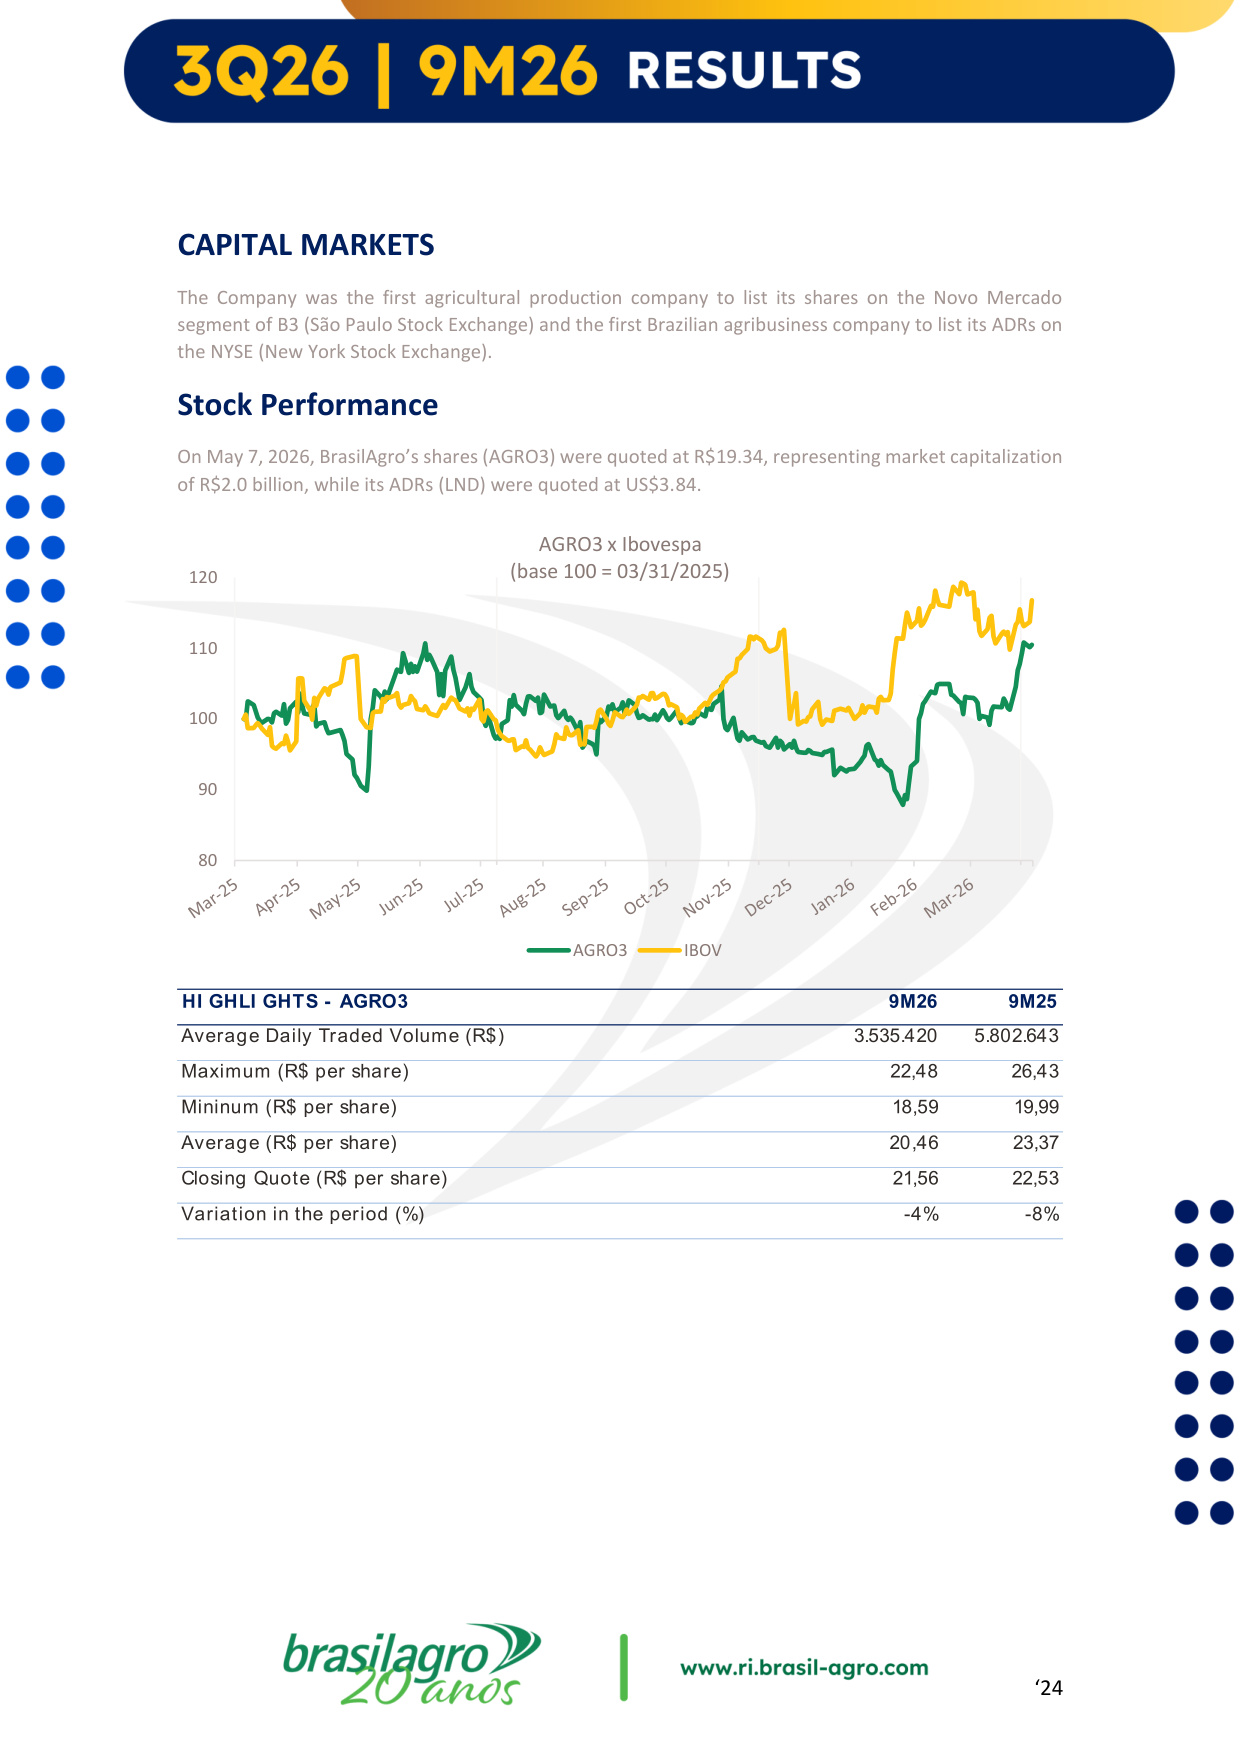
Stock Performance On May 7, 2026, BrasilAgro's shares (AGRO3) were quoted at R$19.34, representing market capitalization of R$2.0 billion, while its ADRs (LND) were quoted at US$3.84. 80 90 100 110 120 AGRO3 x Ibovespa (base 100 = 03/31/2025) AGRO3 IBOV HI GHLI GHTS - AGRO3 9M26 9M25 Average Daily Traded Volume (R$) 3.535.420 5.802.643 Maximum (R$ per share) 22,48 26,43 Mininum (R$ per share) 18,59 19,99 Average (R$ per share) 20,46 23,37 Closing Quote (R$ per share) 21,56 22,53 Variation in the period (%) -4% -8% '25 CONTACT INFORMATION Telephone: + 55 (11) 3035-5374 Email: ri@brasil-agro.com Investor Relations Team Legal Notice The statements contained in this document relating to business outlooks, projections on operating and financial results and those relating to BrasilAgro's growth prospects are mere projections and, as such, are based solely on the expectations of the Board of Directors about the future of the business.

These expectations depend substantially on market conditions, the performance of the Brazilian economy, the industry and international markets, and are therefore subject to change without notice.
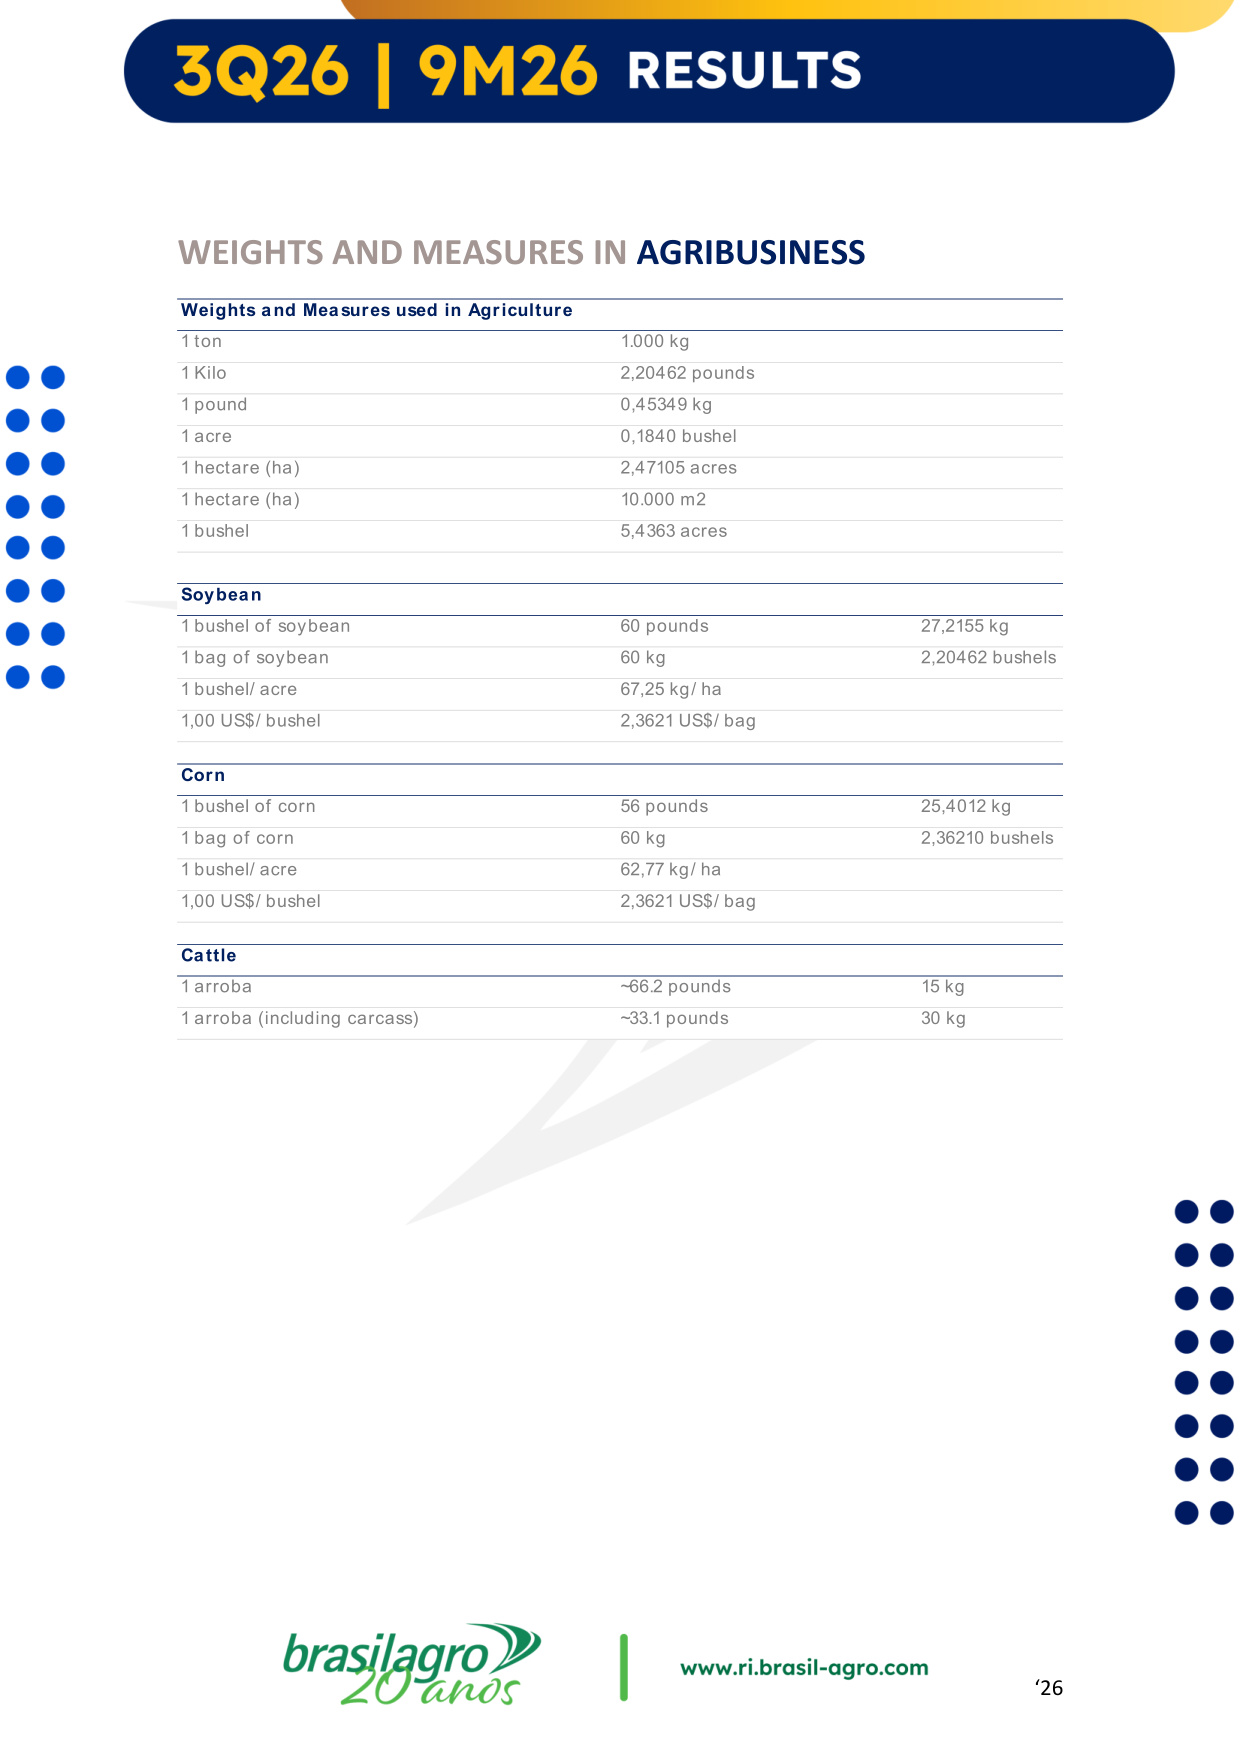
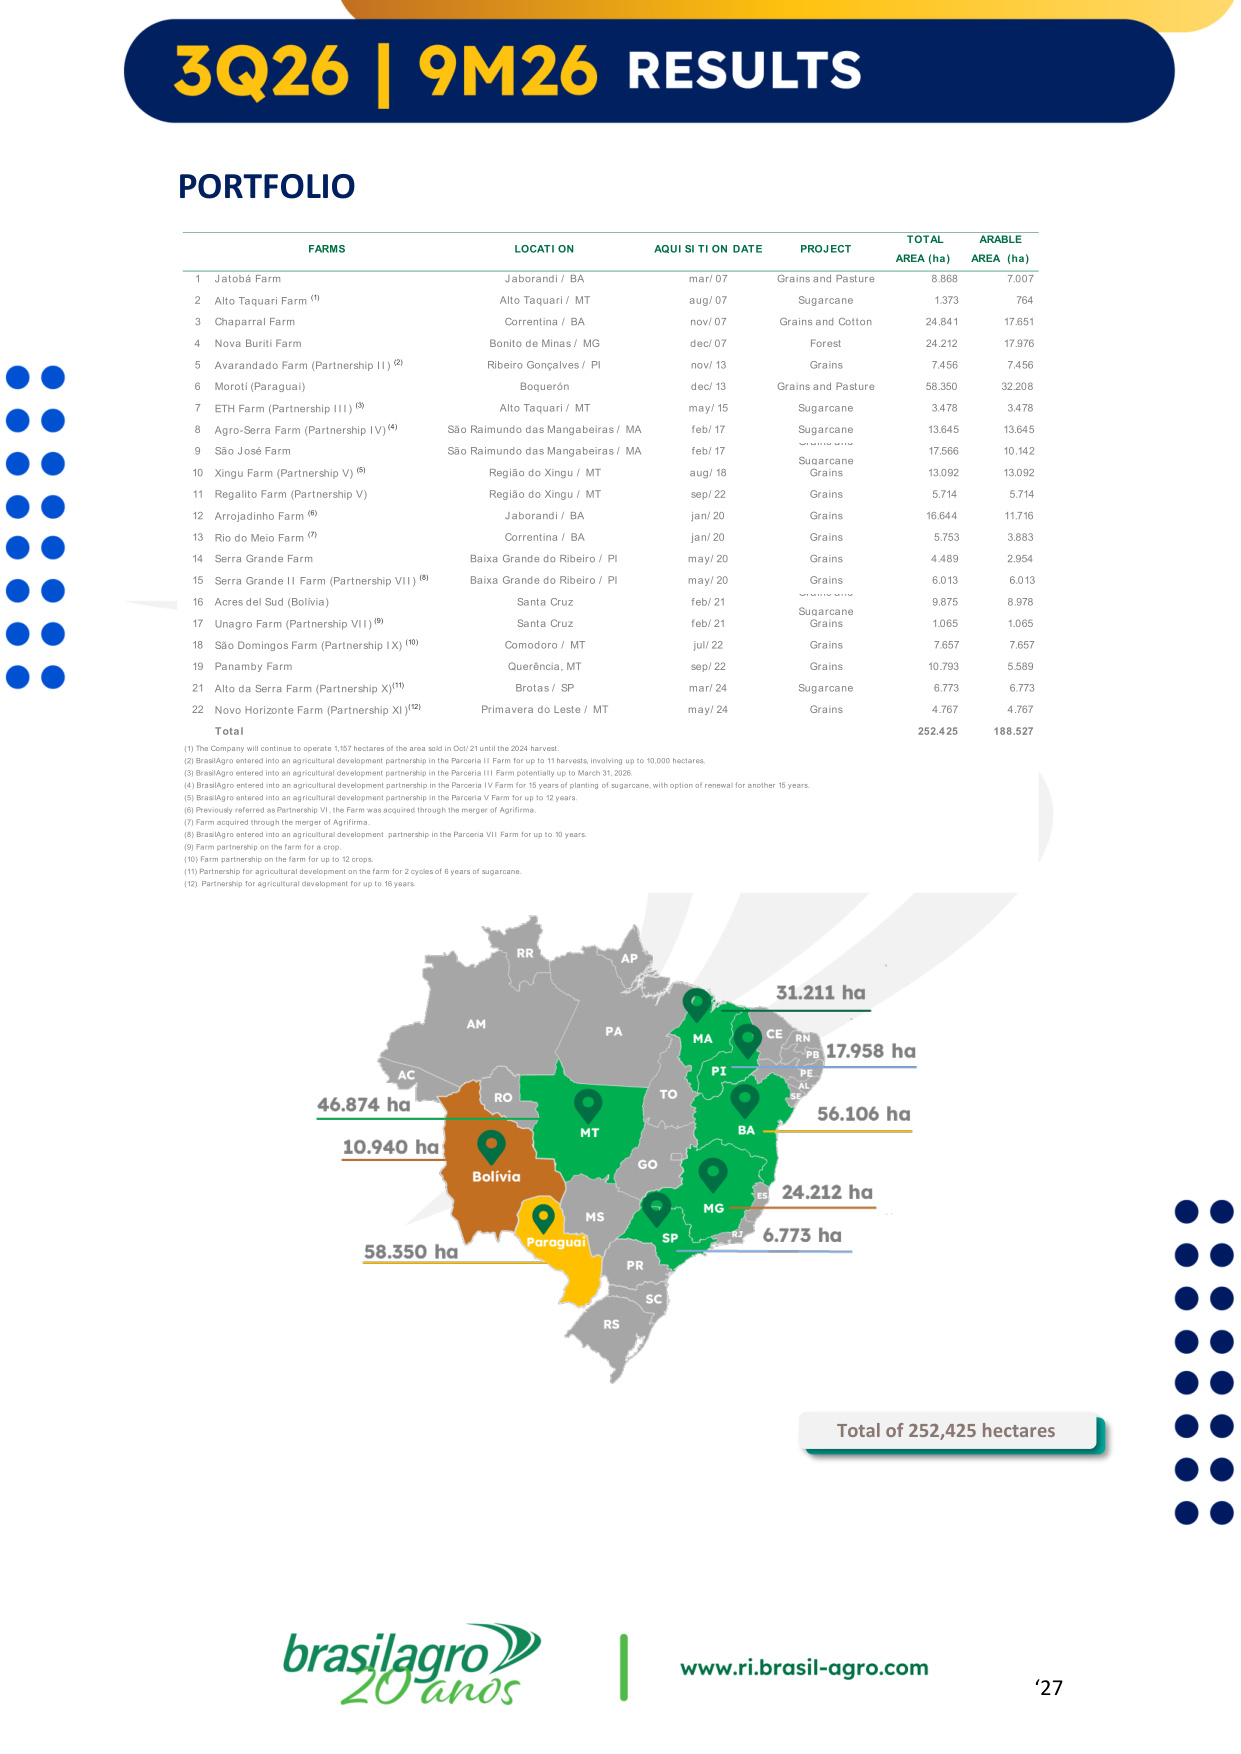
'26 WEIGHTS AND MEASURES IN AGRIBUSINESS 1 ton 1.000 kg 1 Kilo 2,20462 pounds 1 pound 0,45349 kg 1 acre 0,1840 bushel 1 hectare (ha) 2,47105 acres 1 hectare (ha) 10.000 m2 1 bushel 5,4363 acres 1 bushel of soybean 60 pounds 27,2155 kg 1 bag of soybean 60 kg 2,20462 bushels 1 bushel/ acre 67,25 kg/ ha 1,00 US$/ bushel 2,3621 US$/ bag 1 bushel of corn 56 pounds 25,4012 kg 1 bag of corn 60 kg 2,36210 bushels 1 bushel/ acre 62,77 kg/ ha 1,00 US$/ bushel 2,3621 US$/ bag 1 arroba ~66.2 pounds 15 kg 1 arroba (including carcass) ~33.1 pounds 30 kg Weights and Measures used in Agriculture Soybean Corn Cattle '27 PORTFOLIO FARMS LOCATI ON AQUI SI TI ON DATE PROJECT TOTAL AREA (ha) ARABLE AREA (ha) 1 Jatobá Farm Jaborandi / BA mar/ 07 Grains and Pasture 8.868 7.007 2 Alto Taquari Farm (1) Alto Taquari / MT aug/ 07 Sugarcane 1.373 764 3 Chaparral Farm Correntina / BA nov/ 07 Grains and Cotton 24.841 17.651 4 Nova Buriti Farm Bonito de Minas / MG dec/ 07 Forest 24.212 17.976 5 Avarandado Farm (Partnership I I ) (2) Ribeiro Gonçalves / PI nov/ 13 Grains 7.456 7.456 6 Morotí (Paraguai) Boquerón dec/ 13 Grains and Pasture 58.350 32.208 7 ETH Farm (Partnership I I I ) (3) Alto Taquari / MT may/ 15 Sugarcane 3.478 3.478 8 Agro-Serra Farm (Partnership I V) (4) São Raimundo das Mangabeiras / MA feb/ 17 Sugarcane 13.645 13.645 9 São José Farm São Raimundo das Mangabeiras / MA feb/ 17 Grains and Sugarcane 17.566 10.142 10 Xingu Farm (Partnership V) (5) Região do Xingu / MT aug/ 18 Grains 13.092 13.092 11 Regalito Farm (Partnership V) Região do Xingu / MT sep/ 22 Grains 5.714 5.714 12 Arrojadinho Farm (6) Jaborandi / BA jan/ 20 Grains 16.644 11.716 13 Rio do Meio Farm (7) Correntina / BA jan/ 20 Grains 5.753 3.883 14 Serra Grande Farm Baixa Grande do Ribeiro / PI may/ 20 Grains 4.489 2.954 15 Serra Grande I I Farm (Partnership VI I ) (8) Baixa Grande do Ribeiro / PI may/ 20 Grains 6.013 6.013 16 Acres del Sud (Bolívia) Santa Cruz feb/ 21 Grains and Sugarcane 9.875 8.978 17 Unagro Farm (Partnership VI I ) (9) Santa Cruz feb/ 21 Grains 1.065 1.065 18 São Domingos Farm (Partnership I X) (10) Comodoro / MT jul/ 22 Grains 7.657 7.657 19 Panamby Farm Querência, MT sep/ 22 Grains 10.793 5.589 21 Alto da Serra Farm (Partnership X)(11) Brotas / SP mar/ 24 Sugarcane 6.773 6.773 22 Novo Horizonte Farm (Partnership XI )(12) Primavera do Leste / MT may/ 24 Grains 4.767 4.767 Total 252.425 188.527 (1) The Company will continue to operate 1,157 hectares of the area sold in Oct/ 21 until the 2024 harvest. (2) BrasilAgro entered into an agricultural development partnership in the Parceria I I Farm for up to 11 harvests, involving up to 10,000 hectares. (3) BrasilAgro entered into an agricultural development partnership in the Parceria I I I Farm potentially up to March 31, 2026. (4) BrasilAgro entered into an agricultural development partnership in the Parceria I V Farm for 15 years of planting of sugarcane, with option of renewal for another 15 years. (5) BrasilAgro entered into an agricultural development partnership in the Parceria V Farm for up to 12 years. (6) Previously referred as Partnership VI , the Farm was acquired through the merger of Agrifirma. (7) Farm acquired through the merger of Agrifirma. (8) BrasilAgro entered into an agricultural development partnership in the Parceria VI I Farm for up to 10 years. (9) Farm partnership on the farm for a crop. (10) Farm partnership on the farm for up to 12 crops. (11) Partnership for agricultural development on the farm for 2 cycles of 6 years of sugarcane. (12) Partnership for agricultural development for up to 16 years. Total of 252,425 hectares '28 MARKET VALUE OF THE PORTFOLIO As of June 30, 2025, the portfolio's market value, based on internal assessment, reached R$ 3.1 billion — an 8% increase compared to the previous crop year.
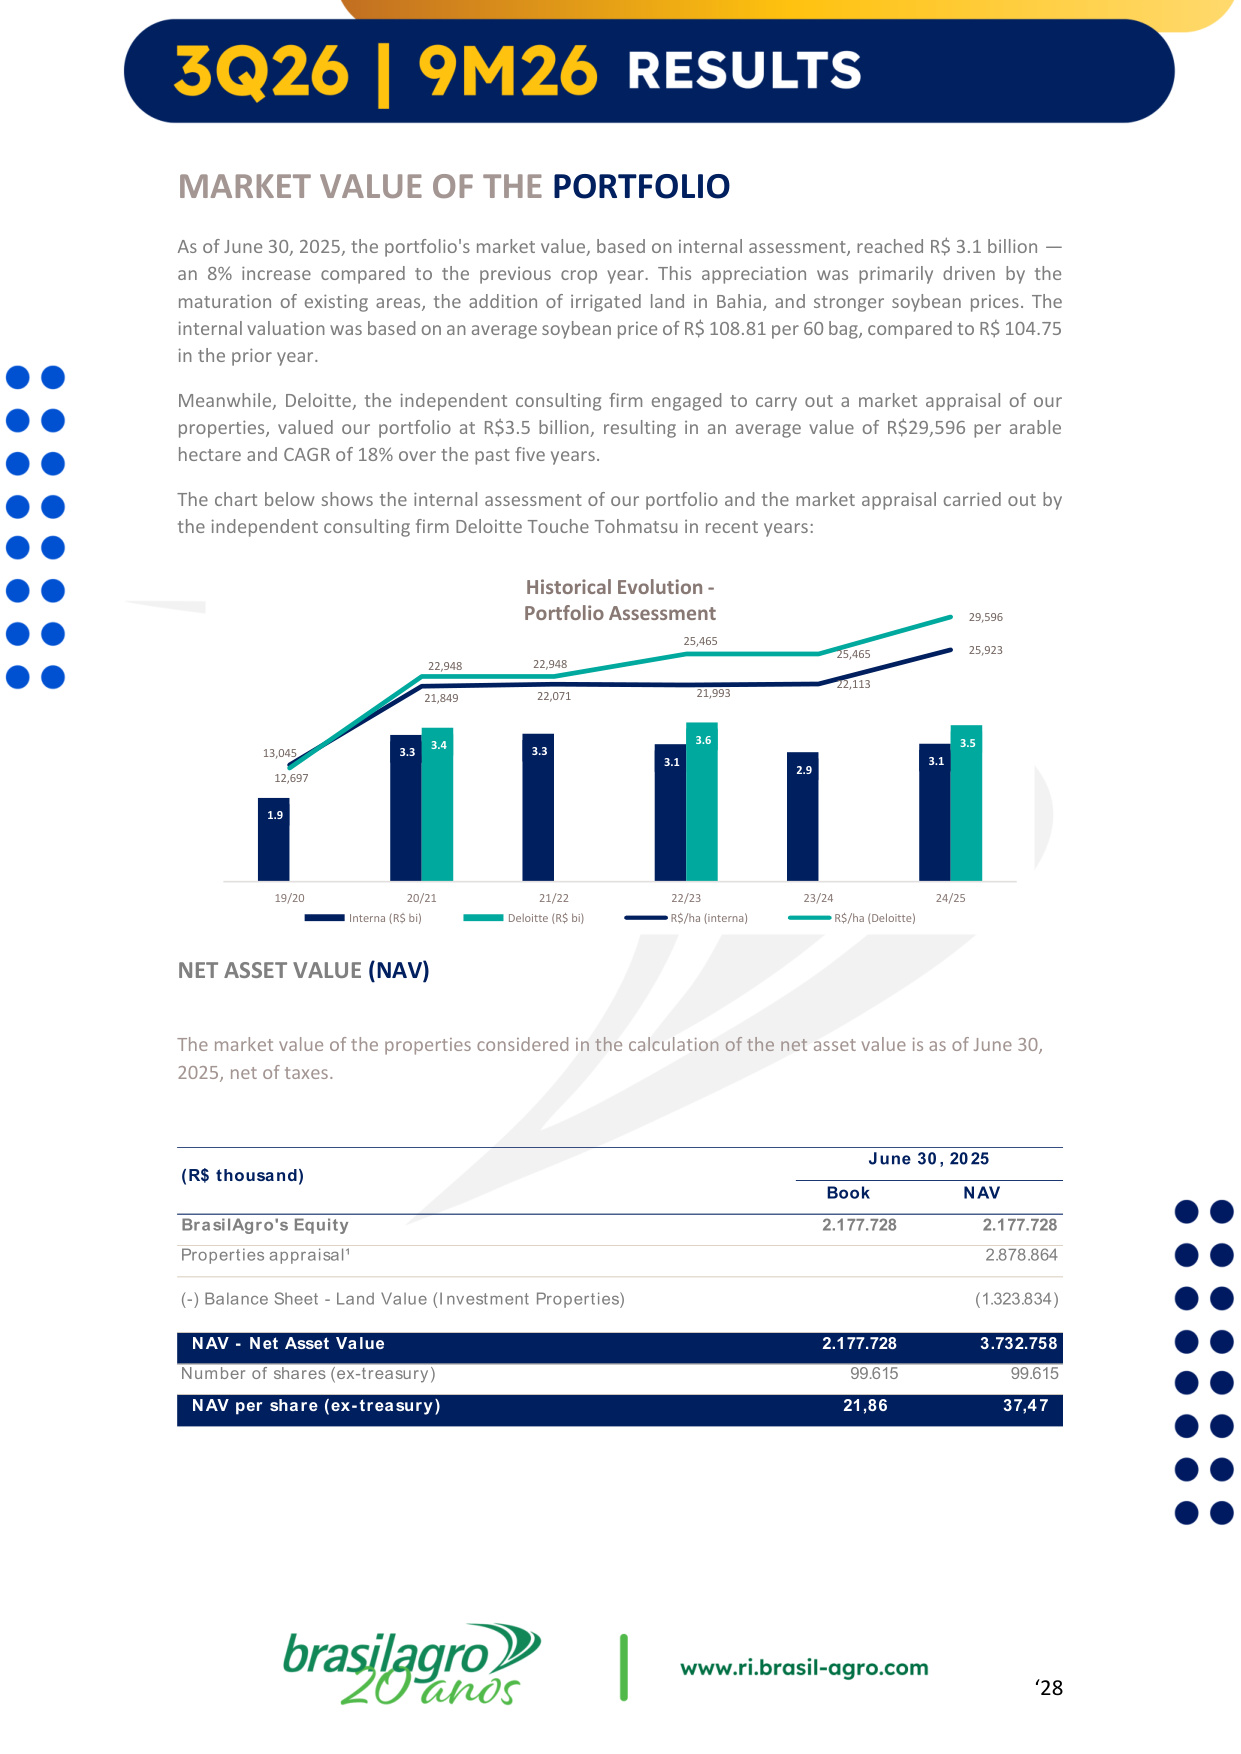
This appreciation was primarily driven by the maturation of existing areas, the addition of irrigated land in Bahia, and stronger soybean prices. The internal valuation was based on an average soybean price of R$ 108.81 per 60 bag, compared to R$ 104.75 in the prior year. Meanwhile, Deloitte, the independent consulting firm engaged to carry out a market appraisal of our properties, valued our portfolio at R$3.5 billion, resulting in an average value of R$29,596 per arable hectare and CAGR of 18% over the past five years. The chart below shows the internal assessment of our portfolio and the market appraisal carried out by the independent consulting firm Deloitte Touche Tohmatsu in recent years: NET ASSET VALUE (NAV) The market value of the properties considered in the calculation of the net asset value is as of June 30, 2025, net of taxes. 1.9 3.3 3.3 3.1 2.9 3.1 3.4 3.6 3.5 13,045 21,849 22,071 21,993 22,113 25,923 12,697 22,948 22,948 25,465 25,465 29,596 19/20 20/21 21/22 22/23 23/24 24/25 Historical Evolution - Portfolio Assessment Interna (R$ bi) Deloitte (R$ bi) R$/ha (interna) R$/ha (Deloitte) Book NAV BrasilAgro's Equity 2.177.728 2.177.728 Properties appraisal¹ 2.878.864 (-) Balance Sheet - Land Value (I nvestment Properties) (1.323.834) NAV - Net Asset Value 2.177.728 3.732.758 Number of shares (ex-treasury) 99.615 99.615 NAV per share (ex- treasury) 21,86 37,4 7 June 30 , 20 25 (R$ thousand)
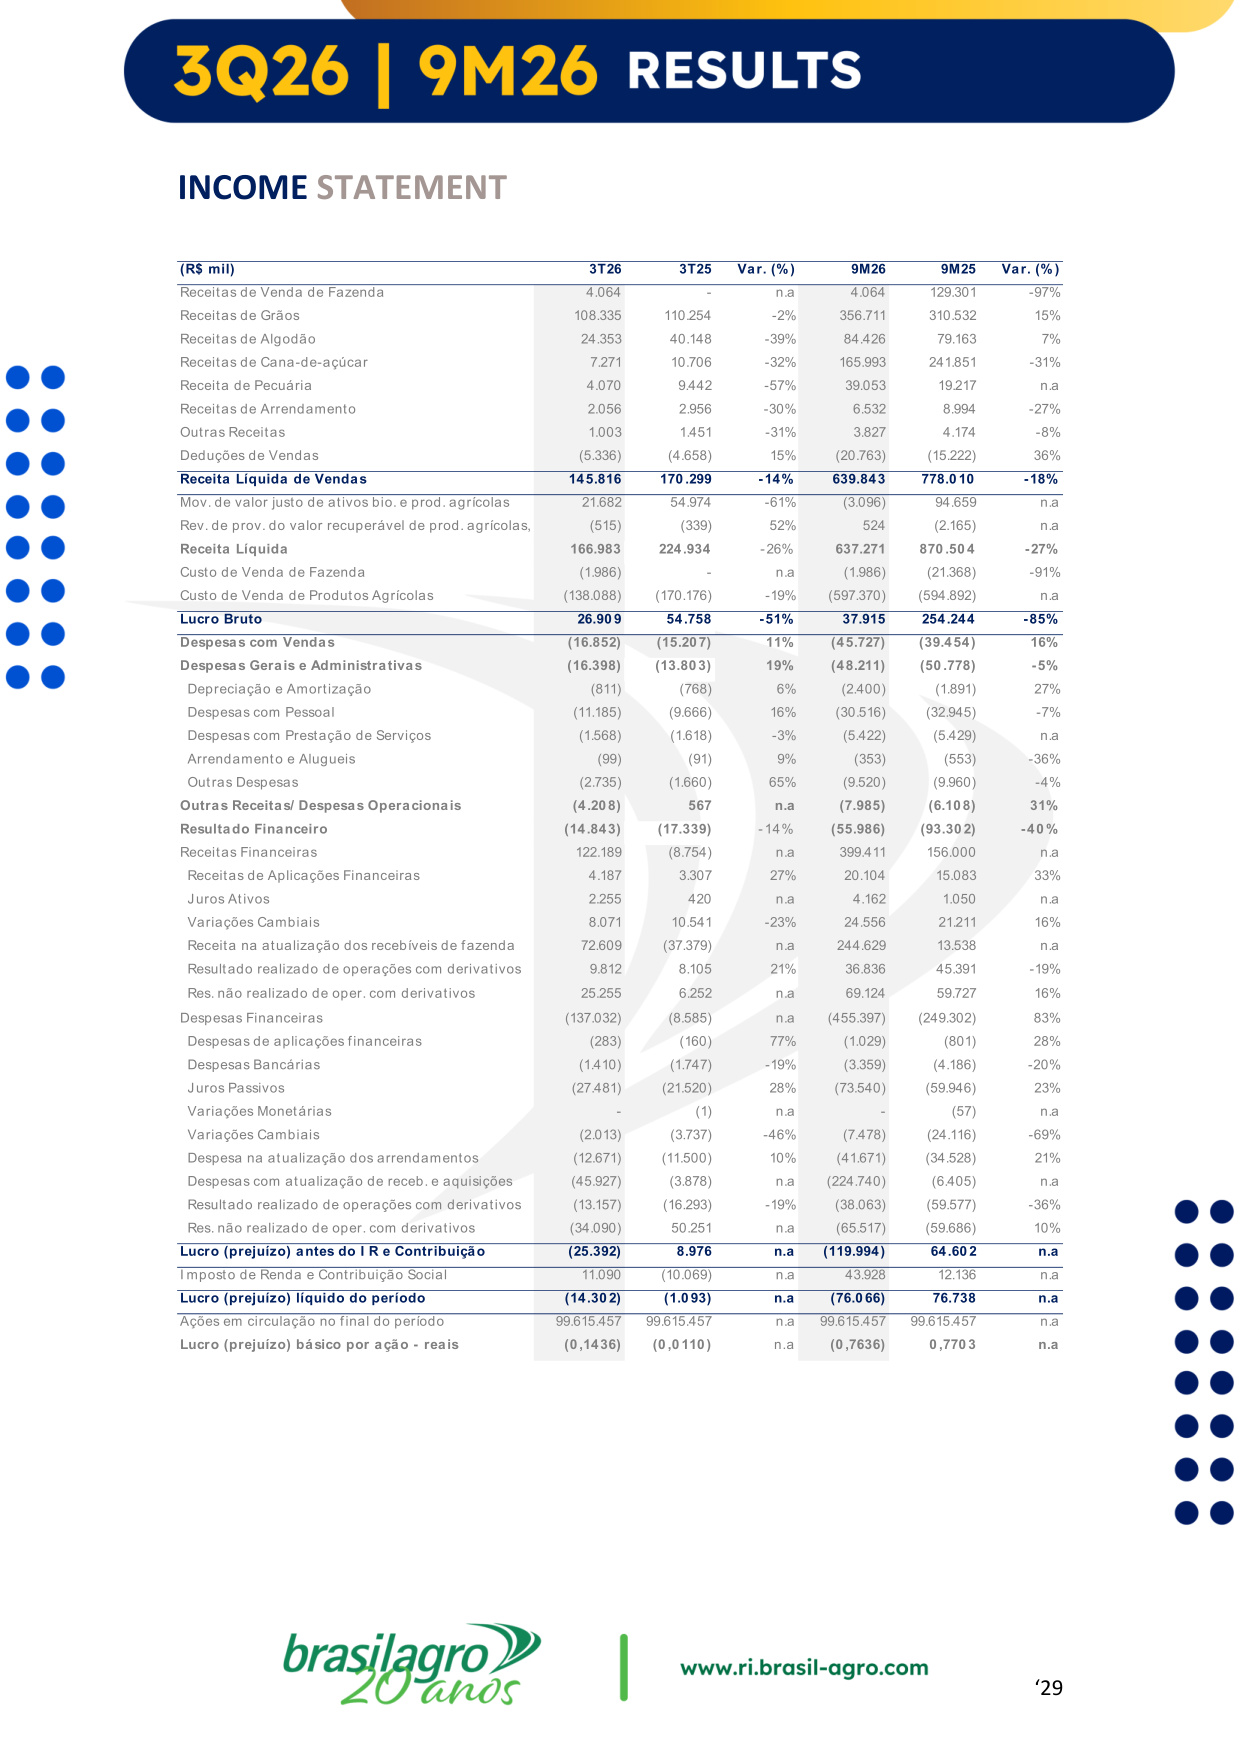
'29 INCOME STATEMENT (R$ mil) 3T26 3T25 Var. (%) 9M26 9M25 Var. (%) Receitas de Venda de Fazenda 4.064 - n.a 4.064 129.301 -97% Receitas de Grãos 108.335 110.254 -2% 356.711 310.532 15% Receitas de Algodão 24.353 40.148 -39% 84.426 79.163 7% Receitas de Cana-de-açúcar 7.271 10.706 -32% 165.993 241.851 -31% Receita de Pecuária 4.070 9.442 -57% 39.053 19.217 n.a Receitas de Arrendamento 2.056 2.956 -30% 6.532 8.994 -27% Outras Receitas 1.003 1.451 -31% 3.827 4.174 -8% Deduções de Vendas (5.336) (4.658) 15% (20.763) (15.222) 36% Receita Líquida de Vendas 145.816 170 .299 -14% 639.843 778.0 10 -18% Mov. de valor justo de ativos bio. e prod. agrícolas 21.682 54.974 -61% (3.096) 94.659 n.a Rev. de prov. do valor recuperável de prod. agrícolas, (515) (339) 52% 524 (2.165) n.a Receita Líquida 166.983 224.934 -26% 637.271 870 .50 4 -27% Custo de Venda de Fazenda (1.986) - n.a (1.986) (21.368) -91% Custo de Venda de Produtos Agrícolas (138.088) (170.176) -19% (597.370) (594.892) n.a Lucro Bruto 26.90 9 54.758 -51% 37.915 254.244 -85% Despesas com Vendas (16.852) (15.20 7) 11% (45.727) (39.454) 16% Despesas Gerais e Administrativas (16.398) (13.80 3) 19% (48.211) (50 .778) -5% Depreciação e Amortização (811) (768) 6% (2.400) (1.891) 27% Despesas com Pessoal (11.185) (9.666) 16% (30.516) (32.945) -7% Despesas com Prestação de Serviços (1.568) (1.618) -3% (5.422) (5.429) n.a Arrendamento e Alugueis (99) (91) 9% (353) (553) -36% Outras Despesas (2.735) (1.660) 65% (9.520) (9.960) -4% Outras Receitas/ Despesas Operacionais (4.20 8) 567 n.a (7.985) (6.10 8) 31% Resultado Financeiro (14.843) (17.339) -14% (55.986) (93.30 2) -40 % Receitas Financeiras 122.189 (8.754) n.a 399.411 156.000 n.a Receitas de Aplicações Financeiras 4.187 3.307 27% 20.104 15.083 33% Juros Ativos 2.255 420 n.a 4.162 1.050 n.a Variações Cambiais 8.071 10.541 -23% 24.556 21.211 16% Receita na atualização dos recebíveis de fazenda 72.609 (37.379) n.a 244.629 13.538 n.a Resultado realizado de operações com derivativos 9.812 8.105 21% 36.836 45.391 -19% Res. não realizado de oper. com derivativos 25.255 6.252 n.a 69.124 59.727 16% Despesas Financeiras (137.032) (8.585) n.a (455.397) (249.302) 83% Despesas de aplicações financeiras (283) (160) 77% (1.029) (801) 28% Despesas Bancárias (1.410) (1.747) -19% (3.359) (4.186) -20% Juros Passivos (27.481) (21.520) 28% (73.540) (59.946) 23% Variações Monetárias - (1) n.a - (57) n.a Variações Cambiais (2.013) (3.737) -46% (7.478) (24.116) -69% Despesa na atualização dos arrendamentos (12.671) (11.500) 10% (41.671) (34.528) 21% Despesas com atualização de receb. e aquisições (45.927) (3.878) n.a (224.740) (6.405) n.a Resultado realizado de operações com derivativos (13.157) (16.293) -19% (38.063) (59.577) -36% Res. não realizado de oper. com derivativos (34.090) 50.251 n.a (65.517) (59.686) 10% Lucro (prejuízo) antes do I R e Contribuição (25.392) 8.976 n.a (119.994) 64.60 2 n.a I mposto de Renda e Contribuição Social 11.090 (10.069) n.a 43.928 12.136 n.a Lucro (prejuízo) líquido do período (14.30 2) (1.0 93) n.a (76.0 66) 76.738 n.a Ações em circulação no final do período 99.615.457 99.615.457 n.a 99.615.457 99.615.457 n.a Lucro (prejuízo) básico por ação - reais (0 ,1436) (0 ,0 110 ) n.a (0 ,7636) 0 ,770 3 n.a '30 BALANCE SHEET – ASSETS Assets (R$ thousand) 0 3/ 31/ 20 26 0 6/ 30 / 20 25 Chg.
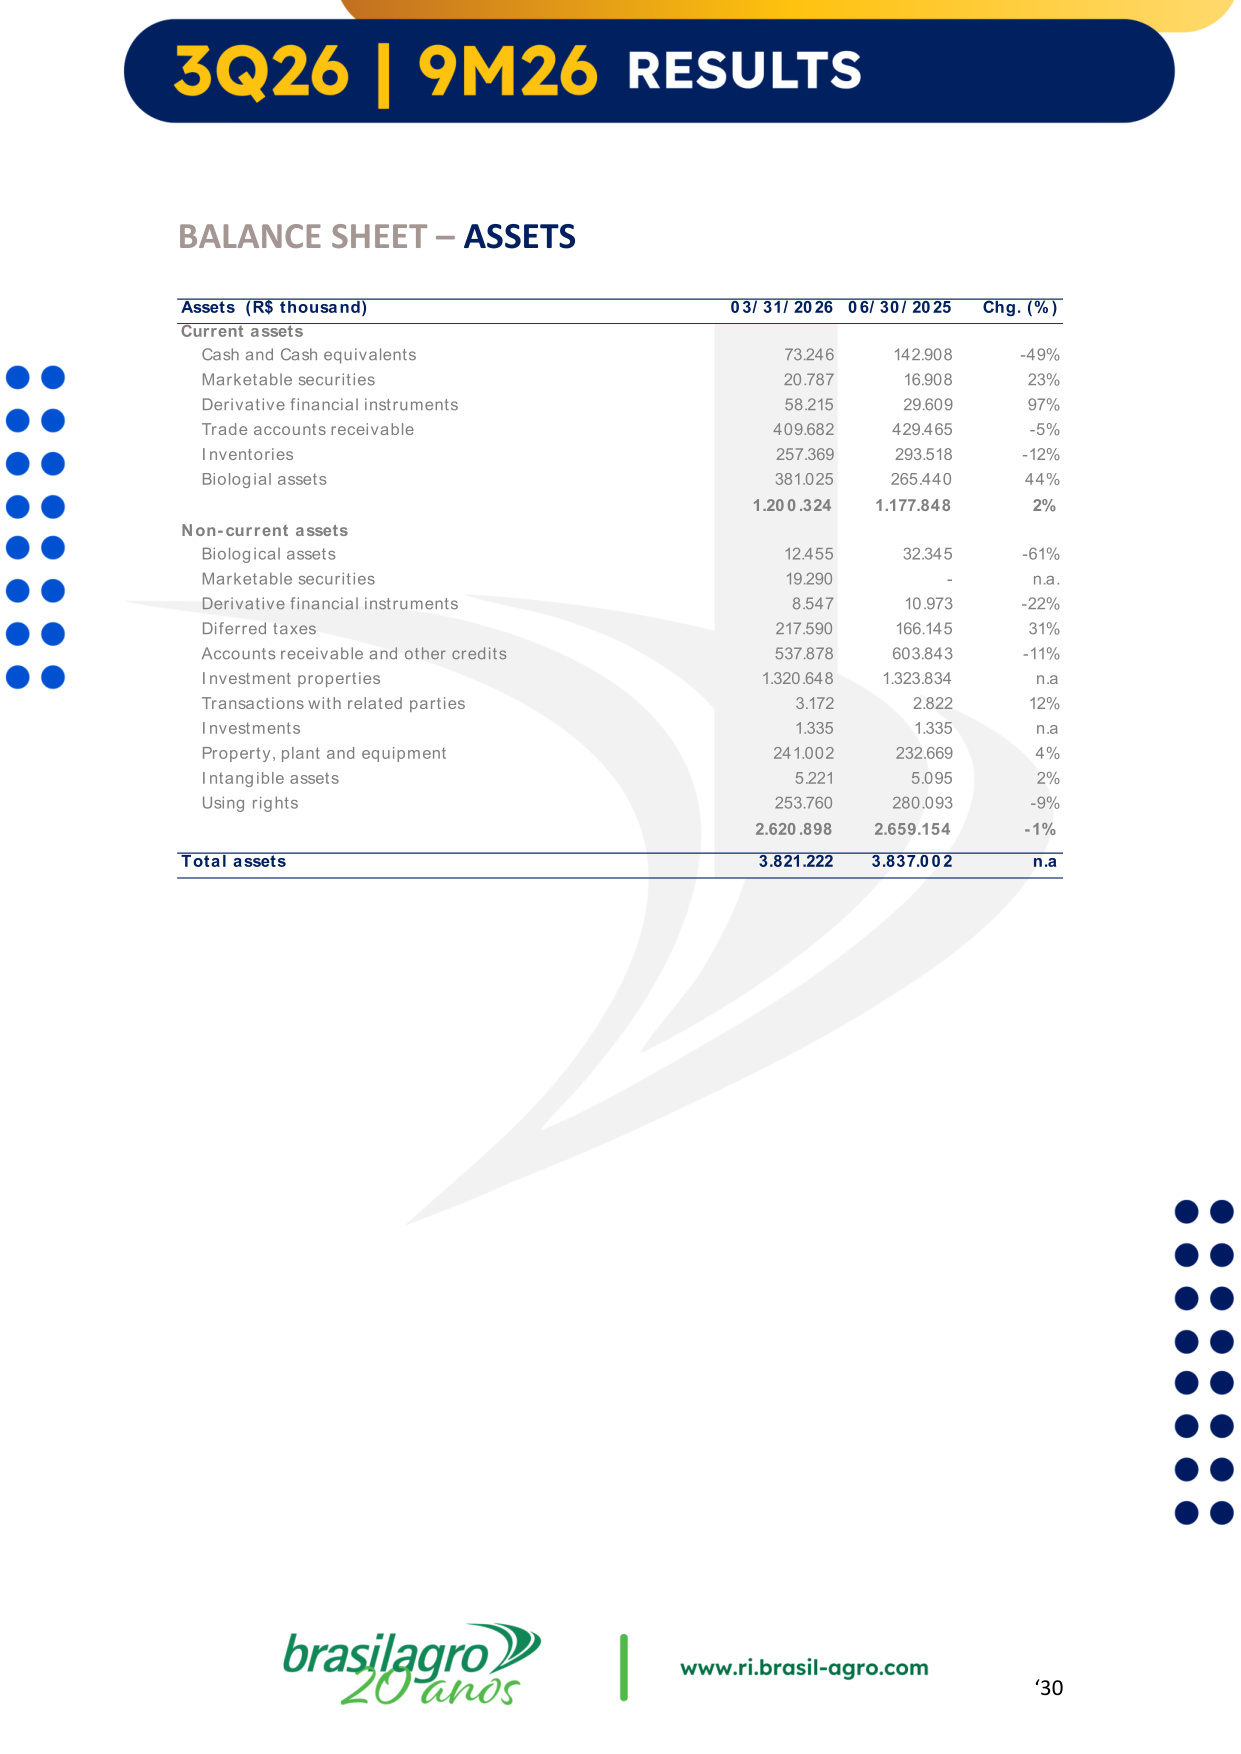
(% ) Current assets Cash and Cash equivalents 73.246 142.908 -49% Marketable securities 20.787 16.908 23% Derivative financial instruments 58.215 29.609 97% Trade accounts receivable 409.682 429.465 -5% I nventories 257.369 293.518 -12% Biologial assets 381.025 265.440 44% 1.20 0 .324 1.177.848 2% Non- current assets Biological assets 12.455 32.345 -61% Marketable securities 19.290 - n.a. Derivative financial instruments 8.547 10.973 -22% Diferred taxes 217.590 166.145 31% Accounts receivable and other credits 537.878 603.843 -11% I nvestment properties 1.320.648 1.323.834 n.a Transactions with related parties 3.172 2.822 12% I nvestments 1.335 1.335 n.a Property, plant and equipment 241.002 232.669 4% I ntangible assets 5.221 5.095 2% Using rights 253.760 280.093 -9% 2.620 .898 2.659.154 -1% Total assets 3.821.222 3.837.0 0 2 n.a '31 BALANCE SHEET - LIABILITIES Liabilities (R$ thousand) 0 3/ 31/ 20 26 30 / 0 6/ 20 25 Chg.
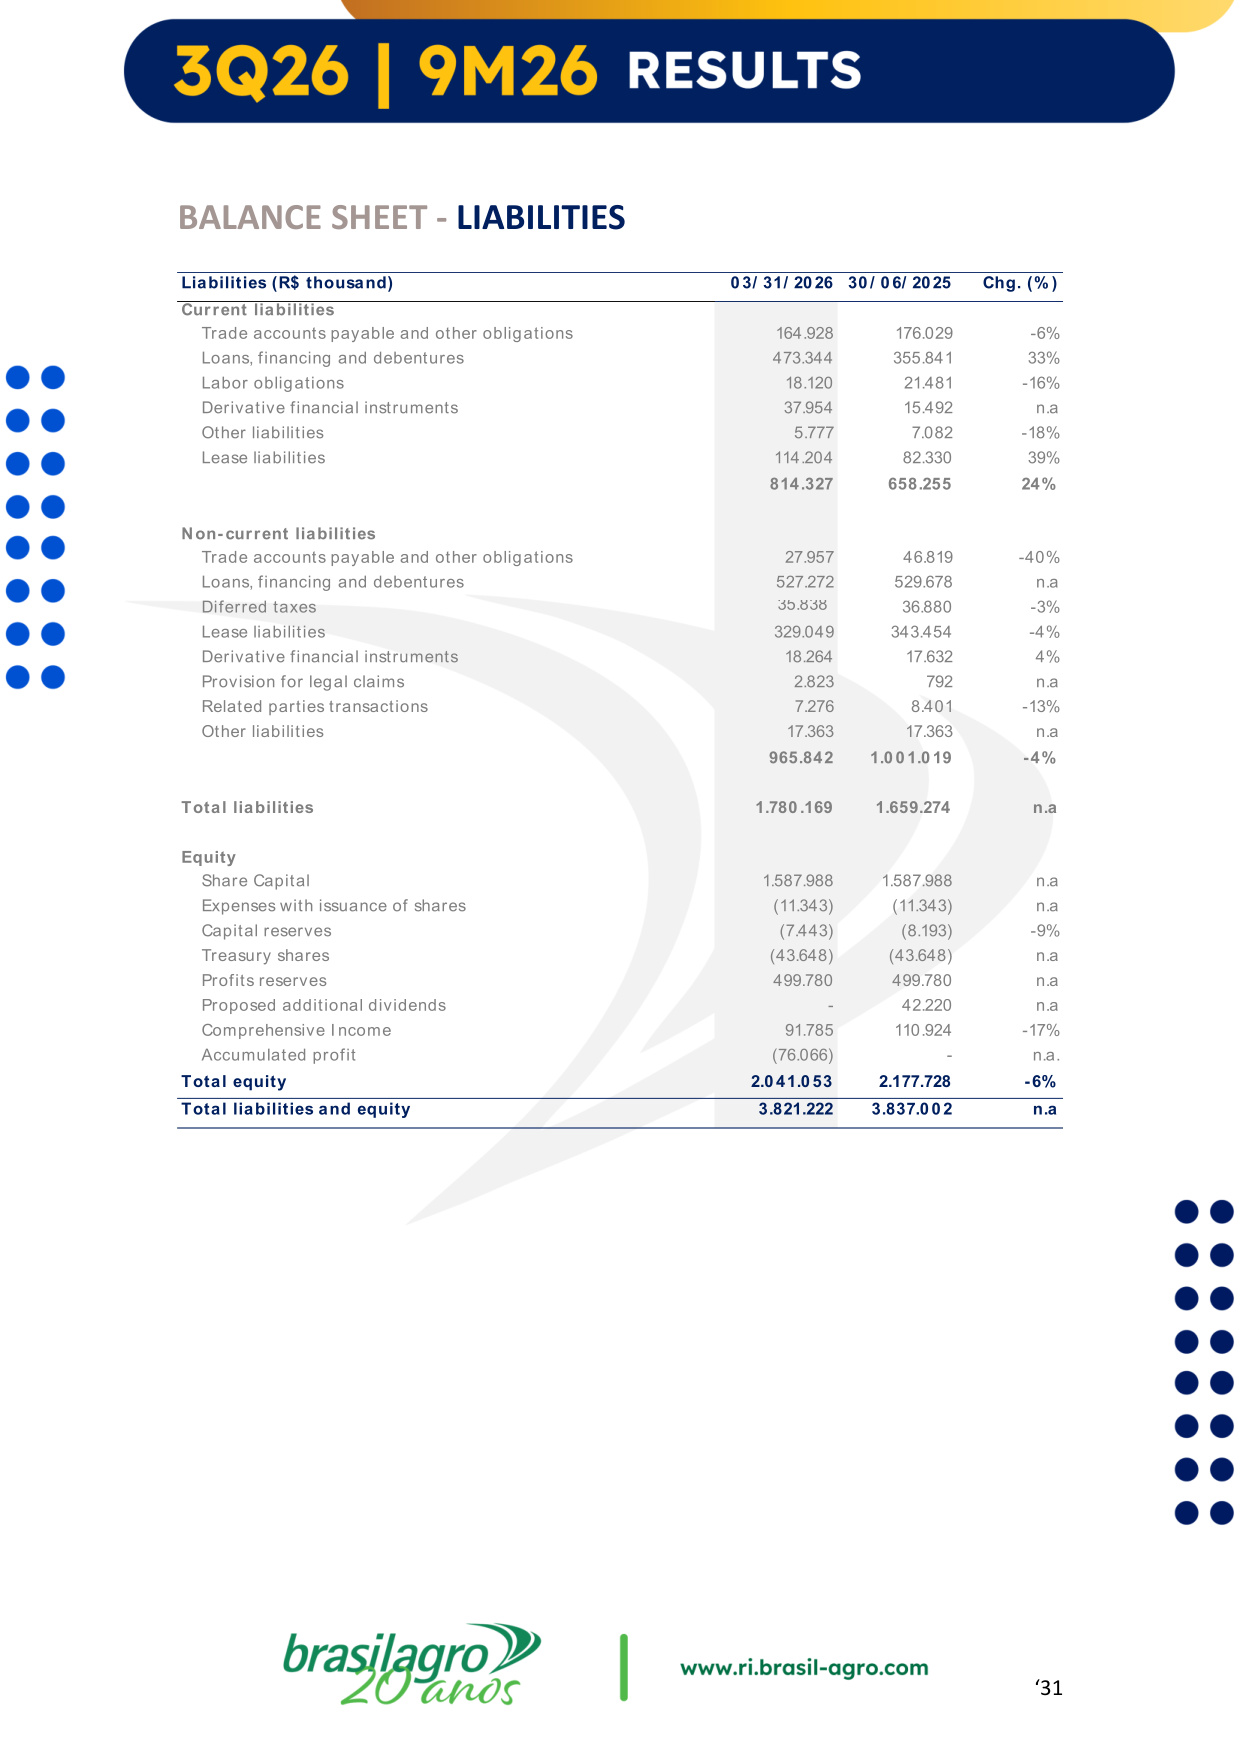
(% ) Current liabilities Trade accounts payable and other obligations 164.928 176.029 -6% Loans, financing and debentures 473.344 355.841 33% Labor obligations 18.120 21.481 -16% Derivative financial instruments 37.954 15.492 n.a Other liabilities 5.777 7.082 -18% Lease liabilities 114.204 82.330 39% 814.327 658.255 24% Non- current liabilities Trade accounts payable and other obligations 27.957 46.819 -40% Loans, financing and debentures 527.272 529.678 n.a Diferred taxes 35.838 36.880 -3% Lease liabilities 329.049 343.454 -4% Derivative financial instruments 18.264 17.632 4% Provision for legal claims 2.823 792 n.a Related parties transactions 7.276 8.401 -13% Other liabilities 17.363 17.363 n.a 965.842 1.0 0 1.0 19 -4% Total liabilities 1.780 .169 1.659.274 n.a Equity Share Capital 1.587.988 1.587.988 n.a Expenses with issuance of shares (11.343) (11.343) n.a Capital reserves (7.443) (8.193) -9% Treasury shares (43.648) (43.648) n.a Profits reserves 499.780 499.780 n.a Proposed additional dividends - 42.220 n.a Comprehensive I ncome 91.785 110.924 -17% Accumulated profit (76.066) - n.a. Total equity 2.0 41.0 53 2.177.728 -6% Total liabilities and equity 3.821.222 3.837.0 0 2 n.a '32 CASH FLOW (R$ thousand) 9M26 9M25 Chg.
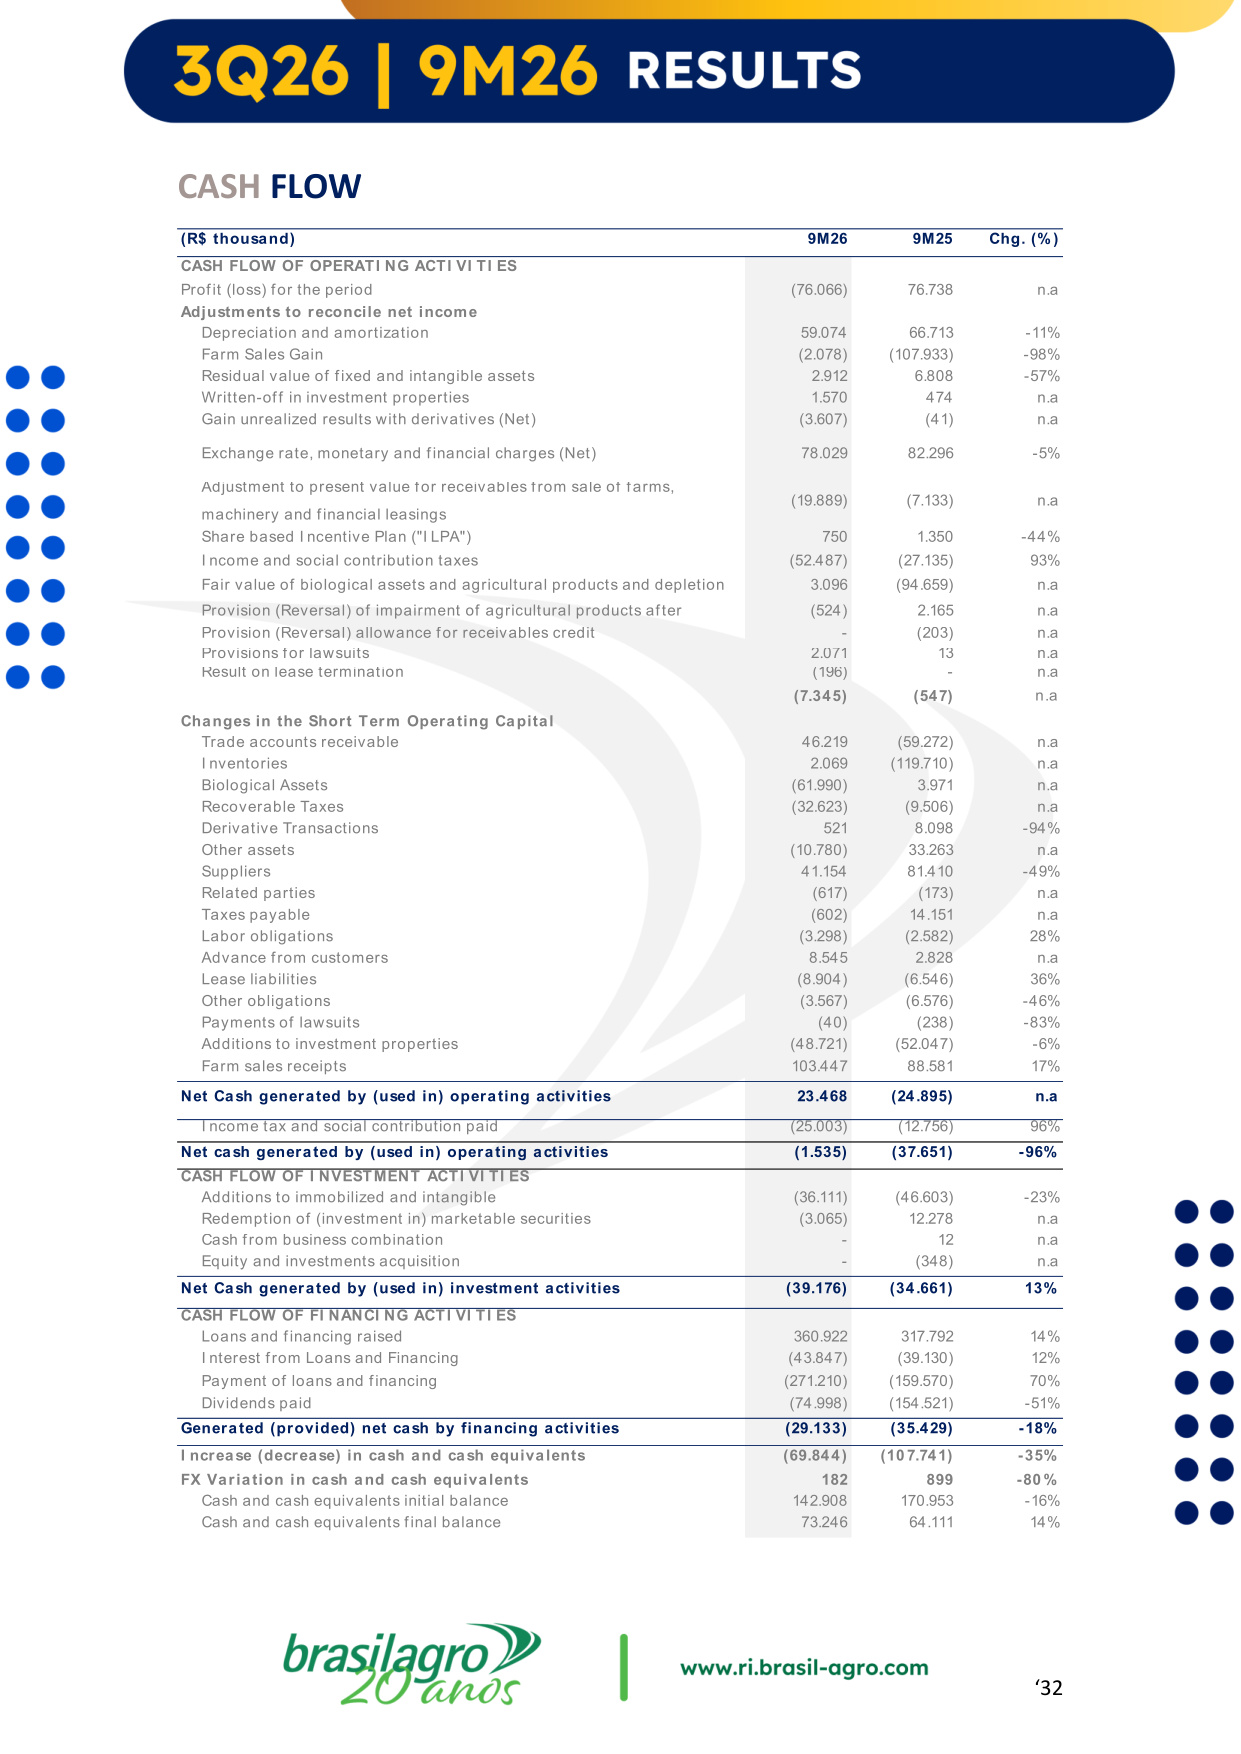
(% ) CASH FLOW OF OPERATI NG ACTI VI TI ES Profit (loss) for the period (76.066) 76.738 n.a Adjustments to reconcile net income Depreciation and amortization 59.074 66.713 -11% Farm Sales Gain (2.078) (107.933) -98% Residual value of fixed and intangible assets 2.912 6.808 -57% Written-off in investment properties 1.570 474 n.a Gain unrealized results with derivatives (Net) (3.607) (41) n.a Exchange rate, monetary and financial charges (Net) 78.029 82.296 -5% Adjustment to present value for receivables from sale of farms, machinery and financial leasings (19.889) (7.133) n.a Share based I ncentive Plan ("I LPA") 750 1.350 -44% I ncome and social contribution taxes (52.487) (27.135) 93% Fair value of biological assets and agricultural products and depletion 3.096 (94.659) n.a Provision (Reversal) of impairment of agricultural products after (524) 2.165 n.a Provision (Reversal) allowance for receivables credit - (203) n.a Provisions for lawsuits 2.071 13 n.a Result on lease termination (196) - n.a (7.345) (547) n.a Changes in the Short Term Operating Capital Trade accounts receivable 46.219 (59.272) n.a I nventories 2.069 (119.710) n.a Biological Assets (61.990) 3.971 n.a Recoverable Taxes (32.623) (9.506) n.a Derivative Transactions 521 8.098 -94% Other assets (10.780) 33.263 n.a Suppliers 41.154 81.410 -49% Related parties (617) (173) n.a Taxes payable (602) 14.151 n.a Labor obligations (3.298) (2.582) 28% Advance from customers 8.545 2.828 n.a Lease liabilities (8.904) (6.546) 36% Other obligations (3.567) (6.576) -46% Payments of lawsuits (40) (238) -83% Additions to investment properties (48.721) (52.047) -6% Farm sales receipts 103.447 88.581 17% Net Cash generated by (used in) operating activities 23.468 (24.895) n.a I ncome tax and social contribution paid (25.003) (12.756) 96% Net cash generated by (used in) operating activities (1.535) (37.651) -96% CASH FLOW OF I NVESTMENT ACTI VI TI ES Additions to immobilized and intangible (36.111) (46.603) -23% Redemption of (investment in) marketable securities (3.065) 12.278 n.a Cash from business combination - 12 n.a Equity and investments acquisition - (348) n.a Net Cash generated by (used in) investment activities (39.176) (34.661) 13% CASH FLOW OF FI NANCI NG ACTI VI TI ES Loans and financing raised 360.922 317.792 14% I nterest from Loans and Financing (43.847) (39.130) 12% Payment of loans and financing (271.210) (159.570) 70% Dividends paid (74.998) (154.521) -51% Generated (provided) net cash by financing activities (29.133) (35.429) -18% I ncrease (decrease) in cash and cash equivalents (69.844) (10 7.741) -35% FX Variation in cash and cash equivalents 182 899 -80 % Cash and cash equivalents initial balance 142.908 170.953 -16% Cash and cash equivalents final balance 73.246 64.111 14% Pursuant to the requirements of the Securities Exchange Act of 1934, the registrant has duly caused this Report to be signed on its behalf by the undersigned, thereunto duly authorized.
SIGNATURES
| Date: May 7, 2026 | By: | /s/ Gustavo Javier Lopez | |
| Name: | Gustavo Javier Lopez | ||
| Title: | CFO and IRO |
||