 エドガーで原本を確認する
UNITED STATES
SECURITIES AND EXCHANGE COMMISSION
Washington, D.C. 20546
FORM 6-K
REPORT OF FOREIGN PRIVATE ISSUER PURSUANT TO RULE 13a-16 OR 15d-16
UNDER THE SECURITIES EXCHANGE ACT OF 1934
For the month of April 2026
Commission File Number: 001-39251
BETTERWARE DE MÉXICO, S.A.P.I. DE C.V.
(Name of Registrant)
Cruce Carretera Gdl-Ameca Huaxtla Km 5
El Arenal, Jalisco, 45350, México
+52 (33) 3836-0500
(Address of Principal Executive Office)
Indicate by check mark whether the registrant files or will file annual reports under cover of Form 20-F or Form 40-F.
Form 20-F ☒ Form 40-F ☐
SIGNATURES
Pursuant to the requirements of the Securities Exchange Act of 1934, the registrant has duly caused this report to be signed on its behalf by the undersigned, thereunto duly authorized.
| BETTERWARE DE MÉXICO, S.A.P.I. DE C.V. | ||
| By: | /s/ Luis Campos | |
| Name: | Luis Campos | |
| Title: | Board Chairman | |
Date: April 23, 2026
Exhibit Index
| Exhibit No. | Description | |
| 99.1 | BeFra First Quarter 2026 Earnings Release | |
| 99.2 | BeFra First Quarter 2026 Earnings Call Presentation |
Exhibit 99.1
BeFra Reports First Quarter 2026 Results
GUADALAJARA, Mexico, April 23, 2026 -- Betterware de México, S.A.P.I. de C.V. (NYSE:BWMX) (“BeFra” or the “Company”), announced today its consolidated financial results for the first quarter 2026. The figures presented in this report are expressed in nominal Mexican Pesos (Ps.) unless otherwise noted, presented and approved by the Board of Directors, prepared in accordance with IFRS, and may include minor differences due to rounding.
Message from the President and CEO
We began 2026 with a solid performance overall, as most of our business units delivered meaningful revenue growth and substantially improved profitability during the first quarter. Our most recent results reflect the strength of BeFra’s business model in a still challenging macro environment and continued progress enhancing commercial and operational execution across our brand platform.
Revenue growth remained modest during the quarter, increasing 0.3% year-over-year, as consumption trends gradually normalized. Although the global and regional environments continue to reflect considerable uncertainty, we are seeing a more stable backdrop compared to the heightened volatility experienced throughout 2025. In this context, our performance was supported by a solid recovery at Betterware, still improving trends at Jafra US, and by the contribution of our expansion efforts in Latin America. Revenue growth was partially offset by softer top line results at Jafra Mexico, where we expect growth to recover in 2Q, an unfavorable shorter quarter (one fewer week) for Betterware, as well as FX effects that impacted Jafra US in MXN terms.
Profitability showed strong improvement during the quarter, with EBITDA increasing 13.9% on substantial margin expansion. This drove ROIC to 27.0%, reflecting improved operating efficiencies and favorable margin dynamics across our business portfolio. Importantly, when excluding investments related to Tupperware transaction, EBITDA would have been 1pp higher, reflecting the underlying strength of our profitability. Operating cash flow remained solid, supported by these profitability gains and our continued focus on working capital discipline.
Our geographic expansion strategy continues to deliver encouraging results. Jafra US is showing clear signs of return to growth, supported by stronger commercial execution and improving field engagement that started last year. At the same time, our operations in the Andean and Central America region continue to grow rapidly, with particularly strong performance across existing markets. We are also pleased to have successfully launched operations in Colombia, the region’s fourth largest economy, during the first week of March, marking another important milestone in our regional growth strategy.
The acquisition of Tupperware’s Latin America operations will significantly accelerate our expansion by giving Befra immediate access to Brazil. We continue working closely with the relevant authorities, with final approvals expected in the second quarter of this year. In parallel, we are actively advancing our integration and value creation plans, developing a robust pipeline of growth initiatives across multiple fronts to fully capitalize on this opportunity once the transaction is completed. As a reminder, it is expected to be highly accretive to our fellow shareholders, with earnings accretion estimated at 40% per share in 2026.
In closing, while the operating environment remains dynamic and challenging, we remain confident in the strength of our five-pillar growth strategy, the resilience of our business model, and our ability to continue delivering sustainable growth and profitability. We are mindful of the recent events in the Middle East and their potential impact on our business. With that in mind we have been developing strategies to effectively offset any possible disruptions from them. As we move forward this year, we remain focused on disciplined execution, expansion, and long-term value creation.
Andrés Campos Chevallier
President and CEO BeFra Group

Q1 2026 Select Consolidated Financial Information
| Q1 | ||||||||||||
| Results in ’000 MXN | 2026 | 2025 | ∆26 vs 25 | |||||||||
| Net Revenue | $ | 3,509,702 | $ | 3,499,151 | 0.3 | % | ||||||
| Gross Margin | 66.3 | % | 66.2 | % | 10 bps | |||||||
| EBITDA | $ | 609,913 | $ | 535,263 | 13.9 | % | ||||||
| EBITDA Margin | 17.4 | % | 15.3 | % | 211 bps | |||||||
| Net Income | $ | 281,361 | $ | 150,728 | 86.7 | % | ||||||
| EPS | $ | 7.54 | $ | 4.06 | 85.7 | % | ||||||
| Free Cash Flow | $ | 351,543 | $ | -55,841 | N/A | |||||||
| Net Debt / EBITDA | 1.50 | 2.08 | ||||||||||
| Interest Coverage | 4.74 | 3.20 | ||||||||||
| Associates | ||||||||||||
| Avg. Base | 1,125,030 | 1,138,418 | -1.2 | % | ||||||||
| EOP Base | 1,120,638 | 1,122,047 | -0.1 | % | ||||||||
| Distributors | ||||||||||||
| Avg. Base | 61,641 | 61,856 | -0.3 | % | ||||||||
| EOP Base | 62,837 | 62,505 | 0.5 | % | ||||||||
Revenue: Net revenue increased slightly during the quarter, reflecting early signs of recovery across BeFra’s key business units. Betterware returned to growth, with its reported performance partially affected by one less week in the quarter. Jafra US also returned to growth, supported by improving commercial momentum and execution, with results in pesos affected by U.S. dollar depreciation. These positive trends were partially offset by a softer-than-expected quarter at Jafra Mexico, which is expected to progressively recover starting in Q2 as we change focus towards consultant base growth. Overall, the quarter’s results indicate improving growth momentum across key business units and a more diversified revenue base, positioning BeFra for solid top line growth for the rest of 2026.
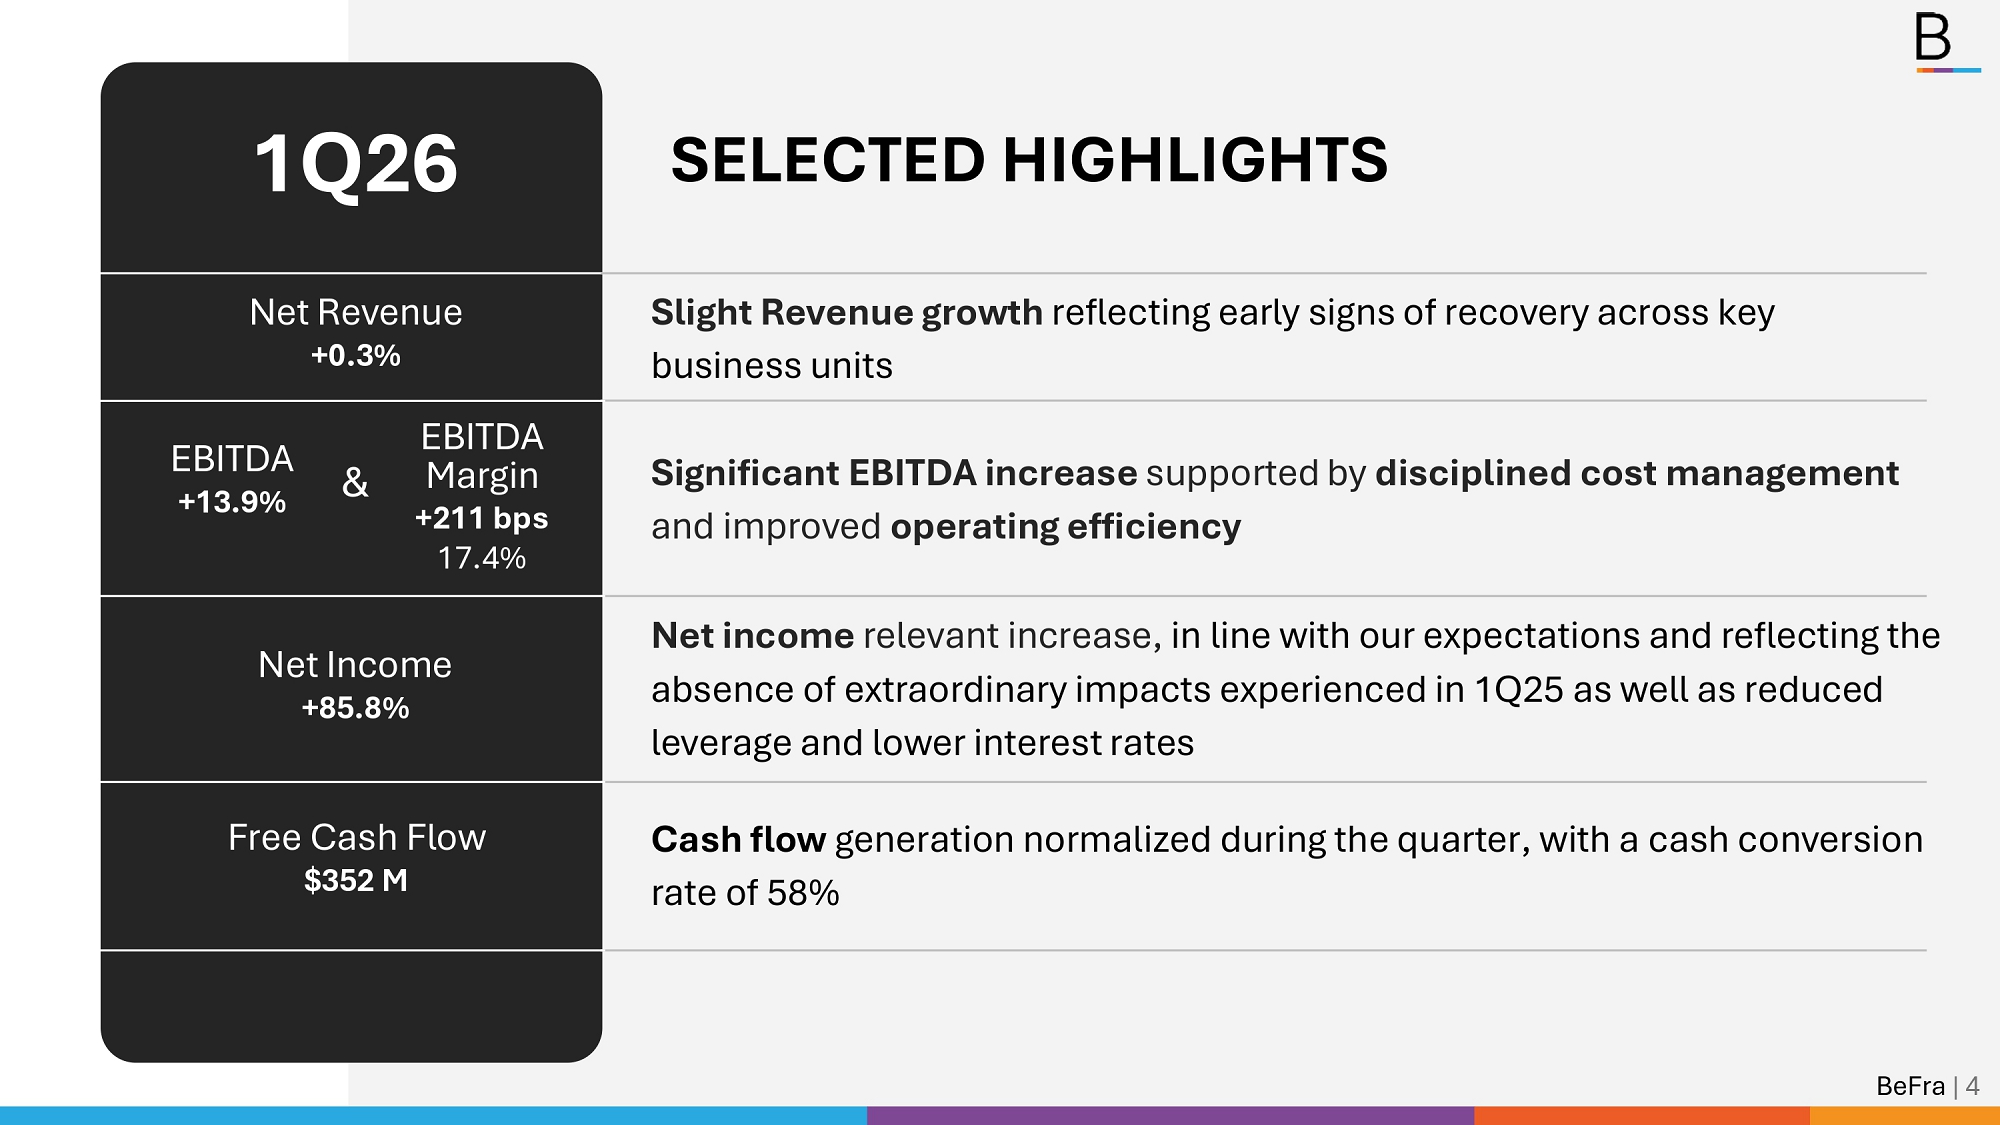
Profitability: All business units delivered improved profitability during the quarter, reflecting the effectiveness of margin-focused initiatives across BeFra’s brand platform. EBITDA increased 13.9% YoY, with margin expanding 211 bps YoY to 17.4%, in line with management’s expectations and supported by disciplined cost management and improved operating efficiency. Excluding non-recurring expenses related to the Tupperware Latam transaction, EBITDA margin would have been 18.4%, highlighting the strength of the underlying business. Net income normalized, growing 86.7% YoY. The Tupperware transaction, together with Betterware Ecuador and Colombia, is expected to accelerate and strengthen Group profitability.
Cash Flow: Operating cash flow normalized during the quarter, with a cash conversion rate of 58%, in line with internal expectations and reflecting an abnormal 1Q25. Ps. 351.5 million in cash flow was supported by continued discipline in working capital management and overall financial execution. Strong cash generation enabled further deleveraging of BeFra’s balance sheet, with Net Debt-to-EBITDA improving to 1.50x from 2.08x in 1Q25 and 1.56x in 4Q25.
2026 Focus: As BeFra enters the second quarter of 2026 with solid growth momentum at Betterware Mexico and Jafra US, a key priority is activating a new phase of growth at Jafra Mexico, through a renewed focus on consultant base expansion and product innovation. And with regulatory approval of the Tupperware transaction expected during the second quarter, management will also focus on executing a turnaround strategy for its operations and iconic brand, in addition to effectively integrating them into the BeFra group.
Financial Performance
Balance sheet at the end of Q1 2026.
Liquidity ratios
BeFra’s cash flow continues to normalize toward the business’ natural operating cycle, following the higher inventory levels and economic volatility in 1Q25. During the quarter, cash generation showed a clear improvement again, supported by stronger underlying profitability across business units and disciplined working capital management. This performance reinforces a stable liquidity position and a continued recovery in cash conversion.
| Q1 2026 | Q1 2025 | ∆ | ||||||||||
| Current Ratio | 0.93 | 0.92 | 1.1 | % | ||||||||
| FCF / EBITDA | 57.6 | % | -10.4 | % | 6800 bps | |||||||
| CCC (days) | 39 | 58 | -32.8 | % | ||||||||
Return on Investment
BeFra continues to deliver solid returns on investment, reflecting the strength and resilience of its business model. During the quarter there was a meaningful improvement in overall profitability and capital efficiency, supported by stronger operational execution across business units. These results reinforce management’s confidence in the business’ ability to consistently generate long-term value.
| Q1 2026 | Q1 2025 | ∆ | ||||||||||
| Equity Turnover | 9.61 | 13.33 | -27.9 | % | ||||||||
| ROIC | 27.0 | % | 22.4 | % | 460 bps | |||||||
| ROE | 80.4 | % | 54.1 | % | 2630 bps | |||||||
| ROTA | 22.7 | % | 9.8 | % | 1290 bps | |||||||
| Dividend Payout | 53.0 | % | 74.3 | % | -2130 bps | |||||||
| * | Current Ratio = Total current assets / Total current liabilities |
| * | CCC(Cash Conversion Cycle) = DSO + DIO – DPO |
| * | ROIC = NOPAT TTM / Operating Assets |
| * | ROE = Net income TTM / Stockholders Equity |
| * | ROTA = Net Income TTM / (Cash + Accounts Receivable + Inventories + Fixed Assets) |
| * | Debt to EBITDA = Total Debt / EBITDA TTM |
| * | Net Debt to EBITDA = (Total Debt - Cash and cash equivalents) / EBITDA TTM |
| * | Interest Coverage = Interest expense TTM / Operating income TTM |
| * | Dividend Payout TTM = Dividend/NOPAT |
Asset Light Business – Low fixed cost structure
BeFra’s asset-light business model continues to be a key pillar of operational resilience. During the quarter, the cost structure remained stable and well-managed, reflecting continued discipline across operations. Management remains committed to an asset-light strategy and continues to identify opportunities to optimize SG&A and enhance operational efficiency.
| Q1 2026 | Q1 2025 | ∆ bps | |||||||||
| Fixed Assets / Total Assets | 17.3 | % | 16.6 | % | 74 bps | ||||||
| Variable Cost Structure | 74.5 | % | 76.3 | % | -180 bps | ||||||
| Fixed Cost Structure | 25.5 | % | 23.7 | % | 180 bps | ||||||
| SG&A / Net Revenues | 46.7 | % | 48.9 | % | -219 bps | ||||||
Leverage
BeFra remains firmly committed to its deleveraging strategy, supported by strong cash generation and disciplined financial management. During the quarter, leverage ratios improved meaningfully, with net debt to EBITDA decreasing to 1.5x, reflecting continued strengthening of the balance sheet. Interest coverage also improved to 4.74x, underscoring the company’s solid debt service capacity and the resilience of the Company’s capital structure. This strong financial position provides ample flexibility to take on the additional debt associated with the Tupperware acquisition, which has an implied 2025 leverage ratio of 1.9x Net Debt-to-EBITDA.
| Q1 2026 | Q1 2025 | ∆% | ||||||||||
| Debt to EBITDA | 1.61 | 2.21 | -26.9 | % | ||||||||
| Net Debt to EBITDA | 1.50 | 2.08 | -27.9 | % | ||||||||
| Interest Coverage | 4.74 | 3.20 | 48.1 | % | ||||||||
Capital Allocation
Quarterly Dividends: In light of BeFra’s results to date, management remains committed to enhancing shareholder value through quarterly dividends. Accordingly, it is proposed to maintain a Ps. 200M dividend for Q1 2026 that represents 58% of NOPAT and is subject to approval at the Ordinary General Shareholders’ Meeting. This would mark the 25th consecutive quarter of dividend payments since becoming public.
2026 Guidance and Long-Term Growth Prospects: While operational performance remained solid during the first quarter of 2026, revenue growth was modest at 0.3%. However, profitability improved meaningfully, with EBITDA margin expanding 211 bps compared to the same period last year. This reflects various initiatives to strengthen margins and operational efficiency and reinforces management’s confidence in the resilience of the Company’s business model as well as the ability to continue delivering on BeFra’s long-term objectives. Our current guidance does not reflect the Tupperware transaction and will be revised once the transaction is finalized.
| 2026 | 2025 | Var % | ||||||||||
| Net Revenue | $14,800 - $15,400 | $14,265 | 4.0% - 8.0% | |||||||||
| * | Figures in millions Ps. |
Management still expects an EBITDA margin of at least 19% in 2026.
Q1 2026 Financial Results by Business
Betterware Mexico & Subsidiaries
Key Financial and Operating Metrics
| Q1 | |||||||||||
| Results in ’000 MXN | 2026 | 2025 | ∆26 vs 25 | ||||||||
| Net Revenue | $ | 1,439,958 | $ | 1,403,065 | 2.6 | % | |||||
| Gross Margin | 55.0 | % | 55.3 | % | -30 bps | ||||||
| EBITDA | $ | 295,278 | $ | 261,493 | 12.9 | % | |||||
| EBITDA Margin | 20.5 | % | 18.6 | % | 187 bps | ||||||
| Free Cash Flow | $ | 99,300 | $ | -29,732 | N/A | ||||||
| Associates | |||||||||||
| Avg. Base | 663,599 | 645,359 | 2.8 | % | |||||||
| EOP Base | 684,696 | 649,076 | 5.5 | % | |||||||
| Monthly Activity Rate | 64.6 | % | 65.5 | % | -91 bps | ||||||
| Avg. Monthly Order | $ | 2,072 | $ | 2,152 | -3.7 | % | |||||
| Distributors | |||||||||||
| Avg. Base | 41,249 | 41,202 | 0.1 | % | |||||||
| EOP Base | 42,447 | 41,810 | 1.5 | % | |||||||
| Monthly Activity Rate | 98.6 | % | 97.9 | % | 71 bps | ||||||
| Avg. Monthly Order | $ | 21,826 | $ | 22,534 | -3.1 | % | |||||
| * | Subsidiaries: Credilazos, Betterware USA, Betterware Guatemala, Betterware Andino. |
Highlights
Revenue: Betterware delivered a solid performance in the quarter, with the associate base growing 2.8% YoY, marking a key inflection point as the base resumes its expansion and begins to rebuild momentum. This recovery supported revenue growth of 2.6% YoY, with underlying trends remaining positive and EOP associate base 5.5% above last year’s level. It is also important to note that 1Q26 had one fewer week than 1Q25, average weekly revenue grew 3.3% in Betterware Mexico. Although Betterware Latam still represents less than 1% of total revenue, the region continues to grow at double-digit rates.
Profitability: The business delivered a strong profitable quarter, with EBITDA increasing 12.9% YoY, mainly the result of the margin expanding 187 bps to 20.5%, driven by disciplined cost management and solid operational execution in line with internal expectations. Gross margin remained broadly stable, as improvements in product mix offset by revaluation of unit inventory related to FX changes and higher freight costs. The shorter quarter also had a slight impact on reported growth.
Cash Flow: Cash flow generation showed significant improvement during the quarter. This performance was primarily driven by a normalization of working capital, as the business was no longer impacted by excess inventory, following the successful execution of targeted inventory reduction and optimization strategies.
2026 Focus: Betterware kicks off the year with net revenue growth and a well-established expansion strategy. In the quarter ahead, BW will seek to consolidate its position across Latin American markets and to replicate its proven business model as it enters the Colombian market.
Jafra Mexico
Key Financial and Operating Metrics
| Q1 | ||||||||||||
| Results in ’000 MXN | 2026 | 2025 | ∆26 vs 25 | |||||||||
| Net Revenue | $ | 1,858,104 | $ | 1,869,818 | -0.6 | % | ||||||
| Gross Margin | 74.0 | % | 73.5 | % | 50 bps | |||||||
| EBITDA | $ | 315,494 | $ | 286,707 | 10.0 | % | ||||||
| EBITDA Margin | 17.0 | % | 15.3 | % | 165 bps | |||||||
| Free Cash Flow | 282,165 | $ | -27,974 | N/A | ||||||||
| Associates | ||||||||||||
| Avg. Base | 435,887 | 468,356 | -6.9 | % | ||||||||
| EOP Base | 409,204 | 446,998 | -8.5 | % | ||||||||
| Monthly Activity Rate | 47.6 | % | 50.5 | % | -290 bps | |||||||
| Avg. Monthly Order | $ | 2,464 | $ | 2,419 | 1.9 | % | ||||||
| Distributors | ||||||||||||
| Avg. Base | 19,029 | 19,150 | -0.6 | % | ||||||||
| EOP Base | 19,087 | 19,202 | -0.6 | % | ||||||||
| Monthly Activity Rate | 95.0 | % | 95.1 | % | -10 bps | |||||||
| Avg. Monthly Order | $ | 2,539 | $ | 2,744 | -7.5 | % | ||||||
Highlights
Revenue: Net revenue decreased 0.6% YoY, reflecting a temporary stagnation in growth following the capture of short-term efficiency gains post-transaction. During the period, Jafra Mexico prioritized improving productivity of its existing consultant base, with less emphasis on expanding the base through recruitment initiatives. Additionally, product strategies were focused on renovating existing product lines rather than introducing new innovations, which temporarily weighed on top-line performance. The business unit already pivoted back toward expansion of the consultant base during Q1, while innovation initiatives are ramping up in Q2, both of which are expected to restore sales growth with Q2 revenue anticipated to be in line with our estimates.
Profitability: The business delivered a solid improvement in profitability compared to 1Q25, reflecting stronger cost management and the absence of extraordinary expenses. The 10% increase in EBITDA and 165 bps expansion of margin also reflect the positive impact of expense restructuring initiatives implemented last year and which are now materializing.
Cash Flow: Cash flow generation normalized during the quarter, in line with expectations and reflecting the absence of the extraordinary effects seen in 1Q25.
2026 Focus: Jafra Mexico continues to be one of BeFra’s strongest cash generation engines, underpinned by solid commercial execution and disciplined cost management. In 2Q26, the business unit will transition to the second phase of its commercial strategy, shifting from brand renovation to innovation while also prioritizing expansion of the consultant base. During the quarter, we shifted focus to prioritize consultant base growth through targeted initiatives and promotions, which we expect to begin contributing results in 2Q.
Jafra US
Key Financial and Operating Metrics
| Q1 | ||||||||||||
| Results in ’000 MXN | 2026 | 2025 | ∆26 vs 25 | |||||||||
| Net Revenue | $ | 211,640 | $ | 226,268 | -6.5 | % | ||||||
| Gross Margin | 75.0 | % | 73.9 | % | 110 bps | |||||||
| EBITDA | $ | -859 | $ | -12,934 | N/A | |||||||
| EBITDA Margin | -0.4 | % | -5.7 | % | 531 bps | |||||||
| Free Cash Flow | $ | -29,922 | $ | 1,865 | N/A | |||||||
| Q1 | ||||||||||||
| Results in ’000 USD | 2026 | 2025 | ∆26 vs 25 | |||||||||
| Net Revenue | $ | 12,033 | $ | 11,077 | 8.6 | % | ||||||
| Gross Margin | 75.0 | % | 73.9 | % | 110 bps | |||||||
| EBITDA | $ | -56 | $ | -633 | N/A | |||||||
| EBITDA Margin | -0.5 | % | -5.7 | % | 520 bps | |||||||
| Free Cash Flow | $ | -1,702 | $ | 91 | N/A | |||||||
| Associates | ||||||||||||
| Avg. Base | 25,544 | 24,703 | 3.4 | % | ||||||||
| EOP Base | 26,738 | 25,973 | 2.9 | % | ||||||||
| Monthly Activity Rate | 50.8 | % | 45.9 | % | 490 bps | |||||||
| Avg. Monthly Order | $ | 219 | $ | 243 | -9.9 | % | ||||||
| Distributors | ||||||||||||
| Avg. Base | 1,363 | 1,504 | -9.4 | % | ||||||||
| EOP Base | 1,303 | 1,493 | -12.7 | % | ||||||||
| Monthly Activity Rate | 95.4 | % | 89.3 | % | 610 bps | |||||||
| Avg. Monthly Order | $ | 186 | $ | 228 | -18.4 | % | ||||||
Highlights
Revenue: Net revenue in USD increased 8.6% YoY, driven primarily by strong growth in consultant activity and an increase in the average associate base. This reflects improved field engagement and a more active salesforce, which translated into higher order volumes. Overall, the business continues to make solid progress in building a larger, more productive, and engaged consultant base.
Profitability: Gross margin expanded 110 bps YoY, driven by an improved promotional strategy and tighter management of consultant discounts. EBITDA margin improved significantly, from -5.7% in last year’s comparable quarter to -0.5% in 1Q26, supported by stronger revenue and the benefits of cost reductions following restructuring initiatives in 2025. Excluding extraordinary legal expenses incurred during the quarter, Jafra US would have delivered an EBITDA margin of 2.6%, effectively turning profitable and signaling a clear path toward sustainable earnings growth.
2026 Focus: Jafra US is building momentum as it transitions from stabilization to growth, supported by a more efficient cost structure and improving commercial execution. Going forward, the business is focused on executing its strategic priorities, with a particular emphasis on strengthening product innovation and enhancing its sampling strategy to drive product adoption and higher field engagement.
Appendix
Financial Statements
Betterware de México, S.A.P.I. de C.V.
Consolidated Statements of Final Position
As of March 31, 2026 and 2025
(In Thousands of Mexican Pesos)
| Mar 2026 | Mar 2025 | |||||||
| Assets | ||||||||
| Cash and cash equivalents | 311,762 | 344,073 | ||||||
| Trade accounts receivable, net | 1,190,866 | 1,176,138 | ||||||
| Accounts receivable from related parties | 0 | 18 | ||||||
| Account receivable “San Angel” | 80,770 | 120,158 | ||||||
| Inventories | 2,072,173 | 2,529,057 | ||||||
| Prepaid expenses | 221,605 | 169,064 | ||||||
| Income tax recoverable | 164,921 | 309,263 | ||||||
| Derivative financial instruments | 18,262 | 28,667 | ||||||
| Non-current assets held for sale | 40,000 | 40,000 | ||||||
| Other assets | 95,811 | 94,709 | ||||||
| Total current assets | 4,196,170 | 4,811,147 | ||||||
| Account receivable “San Angel” | 25,291 | 105,458 | ||||||
| Property, plant and equipment, net | 1,691,109 | 1,766,045 | ||||||
| Right of use assets, net | 305,471 | 282,858 | ||||||
| Deferred income tax | 452,582 | 525,086 | ||||||
| Intangible assets, net | 1,490,332 | 1,549,649 | ||||||
| Goodwill | 1,599,718 | 1,599,718 | ||||||
| Other assets | 13,445 | 14,389 | ||||||
| Total non-current assets | 5,577,948 | 5,843,203 | ||||||
| Total assets | 9,774,118 | 10,654,350 | ||||||
| Liabilities and Stockholders’ Equity | ||||||||
| Short-term debt and borrowings | 1,145,034 | 1,818,486 | ||||||
| Accounts payable to suppliers | 2,057,297 | 2,012,268 | ||||||
| Accrued expenses | 350,882 | 362,857 | ||||||
| Provisions | 648,300 | 735,894 | ||||||
| Value added tax payable | 26,060 | 41,160 | ||||||
| Trade accounts payable to related parties | 0 | 0 | ||||||
| Statutory employee profit sharing | 181,329 | 174,291 | ||||||
| Lease liability | 125,095 | 94,806 | ||||||
| Derivative financial instruments | 0 | 0 | ||||||
| Total current liabilities | 4,533,997 | 5,239,762 | ||||||
| Employee benefits | 150,024 | 131,852 | ||||||
| Deferred income tax | 486,451 | 495,118 | ||||||
| Lease liability | 196,377 | 214,400 | ||||||
| Long term debt and borrowings | 2,923,772 | 3,522,769 | ||||||
| Total non-current liabilities | 3,756,624 | 4,364,139 | ||||||
| Total liabilities | 8,290,621 | 9,603,901 | ||||||
| Stockholders’ Equity | ||||||||
| Capital stock | 321,312 | 321,312 | ||||||
| Share premium account | -25,264 | -25,264 | ||||||
| Retained earnings | 1,184,072 | 794,278 | ||||||
| Other comprehensive income | 5,186 | -37,489 | ||||||
| Non-controlling interest | -1,809 | -2,388 | ||||||
| Total Stockholders’ Equity | 1,483,497 | 1,050,449 | ||||||
| Total Liabilities and Stockholders’ Equity | 9,774,118 | 10,654,350 | ||||||
Betterware de México, S.A.P.I. de C.V.
Consolidated Statements of Profit or Loss and Other Comprehensive Income
For the three-months ended March 31, 2026 and 2025
(In Thousands of Mexican Pesos)
| Q1 2026 | Q1 2025 | ∆% | ||||||||||
| Net revenue | 3,509,702 | 3,499,151 | 0.3 | % | ||||||||
| Cost of sales | 1,183,601 | 1,183,324 | 0.0 | % | ||||||||
| Gross profit | 2,326,101 | 2,315,827 | 0.4 | % | ||||||||
| Administrative expenses | 647,086 | 691,825 | -6.5 | % | ||||||||
| Selling expenses | 991,217 | 1,020,998 | -2.9 | % | ||||||||
| Distribution expenses | 168,596 | 169,099 | -0.3 | % | ||||||||
| Total expenses | 1,806,899 | 1,881,922 | -4.0 | % | ||||||||
| Other expenses - Sale of fixed assets | 0 | 0 | N/A | |||||||||
| Operating income | 519,202 | 433,905 | 19.7 | % | ||||||||
| Interest expense | -99,706 | -146,036 | N/A | |||||||||
| Interest income | 11,673 | 16,071 | -27.4 | % | ||||||||
| Loss in valuation of financial derivative instruments | 0 | -66,410 | N/A | |||||||||
| Foreign exchange loss, net | -12,115 | 42,181 | N/A | |||||||||
| Financing cost, net | -100,148 | -154,194 | N/A | |||||||||
| Income before income taxes | 419,054 | 279,711 | 49.8 | % | ||||||||
| Income taxes | 137,693 | 128,983 | 6.8 | % | ||||||||
| Net income including minority interest | 281,361 | 150,728 | 86.7 | % | ||||||||
| Non-controlling interest (loss) gain | -17 | 666 | -102.6 | % | ||||||||
| Net income | 281,344 | 151,394 | 85.8 | % | ||||||||
| Concept | Q1 2026 | Q1 2025 | ∆% | |||||||||
| Net income | 281,361 | 150,728 | 86.7 | % | ||||||||
| (+) Income taxes | 137,693 | 128,983 | 6.8 | % | ||||||||
| (+) Financing cost, net | 100,148 | 154,194 | -35.1 | % | ||||||||
| (+) Depreciation and amortization | 90,711 | 101,360 | -10.5 | % | ||||||||
| EBITDA | 609,913 | 535,265 | 13.9 | % | ||||||||
| EBITDA margin | 17.4 | % | 15.3 | % |
Betterware de México, S.A.P.I. de C.V.
Consolidated Statements of Cash Flows
For the three-months ended March 31, 2026 and 2025
(In Thousands of Mexican Pesos)
| Q1 2026 | Q1 2025 | |||||||
| Cash flows from operating activities: | ||||||||
| Profit for the period | 281,361 | 150,728 | ||||||
| Adjustments for: | ||||||||
| Income tax expense recognized in profit of the year | 137,693 | 128,983 | ||||||
| Depreciation and amortization of non-current assets | 90,711 | 101,360 | ||||||
| Interest income recognized in profit or loss | -11,673 | -16,071 | ||||||
| Interest expense recognized in profit or loss | 99,706 | 146,036 | ||||||
| Loss (gain) in valuation of financial derivative instruments | 0 | 66,410 | ||||||
| Gain on disposal of equipment | -629 | -1,663 | ||||||
| Currency effect | -2,450 | 357 | ||||||
| Movements in not- controlling interest | 0 | 0 | ||||||
| Movements in working capital: | ||||||||
| Trade accounts receivable | -9,419 | -43,045 | ||||||
| Trade accounts receivable from related parties | 0 | 232 | ||||||
| Trade account receivable “San Angel” | 0 | -13,994 | ||||||
| Inventory, net | -74,636 | -23,964 | ||||||
| Prepaid expenses and other assets | -138,066 | -26,358 | ||||||
| Accounts payable to suppliers and accrued expenses | 290,486 | -172,194 | ||||||
| Provisions | -73,646 | -13,024 | ||||||
| Value added tax payable | -67,857 | -30,032 | ||||||
| Statutory employee profit sharing | 34,801 | 35,036 | ||||||
| Trade accounts payable to related parties | 0 | -1,237 | ||||||
| Income taxes paid | -190,296 | -333,998 | ||||||
| Employee benefits | 2,033 | 3,540 | ||||||
| Net cash generated by (used in) operating activities | 368,119 | -42,898 | ||||||
| Cash flows from investing activities: | ||||||||
| Investment in subsidaries | 0 | 0 | ||||||
| Payments for property, plant and equipment, net | -17,253 | -13,574 | ||||||
| Proceeds from disposal of property, plant and equipment, net | 677 | 631 | ||||||
| Commission for the sale of properties | 0 | 0 | ||||||
| Interest received | 9,163 | 16,071 | ||||||
| Net cash (used in) generated by investing activities | -7,413 | 3,128 | ||||||
| Cash flows from financing activities: | ||||||||
| Repayment of borrowings | -2,750,100 | -1,000,800 | ||||||
| Proceeds from borrowings | 2,746,600 | 1,546,800 | ||||||
| Interest paid | -128,507 | -165,627 | ||||||
| Lease payment | -45,670 | -43,574 | ||||||
| Dividends paid | -199,611 | -249,514 | ||||||
| Net cash (used in) generated by financing activities | -377,288 | 87,285 | ||||||
| Net (decrease) increase in cash and cash equivalents | -16,582 | 47,515 | ||||||
| Cash and cash equivalents at the beginning of the period | 328,344 | 296,558 | ||||||
| Cash and cash equivalents at the end of the period | 311,762 | 344,073 | ||||||
Key Operating Metrics
Betterware Mexico
| Q4 2024 | Q1 2025 | Q2 2025 | Q3 2025 | Q4 2025 | Q1 2026 | |||||||||||||||||||
| Associates | ||||||||||||||||||||||||
| Avg. Base | 693,666 | 645,359 | 657,317 | 675,696 | 667,086 | 663,599 | ||||||||||||||||||
| EOP Base | 674,654 | 649,076 | 670,349 | 667,501 | 654,680 | 684,696 | ||||||||||||||||||
| Monthly Activity Rate | 64.8 | % | 65.5 | % | 65.6 | % | 63.3 | % | 65.2 | % | 64.6 | % | ||||||||||||
| Avg. Monthly Order | $ | 2,158 | $ | 2,152 | $ | 2,153 | $ | 2,043 | $ | 1,971 | $ | 2,072 | ||||||||||||
| Monthly Growth Rate | 14.3 | % | 18.7 | % | 16.6 | % | 16.1 | % | 17.3 | % | 16.6 | % | ||||||||||||
| Monthly Churn Rate | 15.6 | % | 19.5 | % | 15.6 | % | 16.3 | % | 18.0 | % | 15.2 | % | ||||||||||||
| Distributors | ||||||||||||||||||||||||
| Avg. Base | 43,585 | 41,202 | 42,062 | 43,220 | 42,156 | 41,249 | ||||||||||||||||||
| EOP Base | 42,608 | 41,810 | 43,292 | 42,673 | 40,723 | 42,447 | ||||||||||||||||||
| Monthly Activity Rate | 96.7 | % | 97.9 | % | 98.8 | % | 97.9 | % | 98.3 | % | 98.6 | % | ||||||||||||
| Avg. Monthly Order | $ | 22,945 | $ | 22,534 | $ | 22,347 | $ | 20,752 | $ | 20,690 | $ | 21,826 | ||||||||||||
| Monthly Growth Rate | 8.7 | % | 9.8 | % | 10.7 | % | 9.6 | % | 9.2 | % | 9.9 | % | ||||||||||||
| Monthly Churn Rate | 10.3 | % | 11.2 | % | 9.4 | % | 10.1 | % | 10.8 | % | 8.5 | % | ||||||||||||
Jafra Mexico
| Q4 2024 | Q1 2025 | Q2 2025 | Q3 2025 | Q4 2025 | Q1 2026 | |||||||||||||||||||
| Associates | ||||||||||||||||||||||||
| Avg. Base | 476,211 | 468,356 | 438,041 | 411,670 | 438,864 | 435,887 | ||||||||||||||||||
| EOP Base | 480,532 | 446,998 | 429,472 | 405,599 | 444,244 | 409,204 | ||||||||||||||||||
| Monthly Activity Rate | 49.9 | % | 50.5 | % | 49.8 | % | 49.4 | % | 50.1 | % | 47.6 | % | ||||||||||||
| Avg. Monthly Order | $ | 2,439 | $ | 2,419 | $ | 2,495 | $ | 2,552 | $ | 2,702 | $ | 2,464 | ||||||||||||
| Monthly Growth Rate | 13.2 | % | 10.1 | % | 10.1 | % | 10.0 | % | 13.0 | % | 10.5 | % | ||||||||||||
| Monthly Churn Rate | 8.6 | % | 12.5 | % | 11.3 | % | 12.0 | % | 10.1 | % | 13.4 | % | ||||||||||||
| Distributors | ||||||||||||||||||||||||
| Avg. Base | 18,889 | 19,150 | 19,036 | 18,950 | 19,006 | 19,029 | ||||||||||||||||||
| EOP Base | 19,093 | 19,202 | 18,966 | 18,964 | 19,063 | 19,087 | ||||||||||||||||||
| Monthly Activity Rate | 94.6 | % | 95.1 | % | 94.1 | % | 93.7 | % | 94.0 | % | 95.0 | % | ||||||||||||
| Avg. Monthly Order | $ | 2,758 | $ | 2,744 | $ | 2,855 | $ | 3,023 | $ | 3,166 | $ | 2,539 | ||||||||||||
| Monthly Growth Rate | 1.8 | % | 1.2 | % | 0.6 | % | 1.2 | % | 1.3 | % | 1.3 | % | ||||||||||||
| Monthly Churn Rate | 1.1 | % | 1.0 | % | 1.0 | % | 1.3 | % | 1.2 | % | 1.2 | % | ||||||||||||
Jafra US
| Q4 2024 | Q1 2025 | Q2 2025 | Q3 2025 | Q4 2025 | Q1 2026 | |||||||||||||||||||
| Associates | ||||||||||||||||||||||||
| Avg. Base | 26,540 | 24,703 | 27,191 | 26,303 | 26,270 | 25,544 | ||||||||||||||||||
| EOP Base | 25,272 | 25,973 | 28,188 | 26,450 | 26,681 | 26,738 | ||||||||||||||||||
| Monthly Activity Rate | 44.5 | % | 45.9 | % | 49.2 | % | 51.3 | % | 48.9 | % | 50.8 | % | ||||||||||||
| Avg. Monthly Order (USD) | $ | 248 | $ | 243 | $ | 225 | $ | 228 | $ | 222 | $ | 219 | ||||||||||||
| Monthly Growth Rate | 10.0 | % | 12.8 | % | 13.2 | % | 11.4 | % | 10.1 | % | 12.6 | % | ||||||||||||
| Monthly Churn Rate | 14.7 | % | 11.8 | % | 9.7 | % | 14.0 | % | 9.7 | % | 12.4 | % | ||||||||||||
| Distributors | ||||||||||||||||||||||||
| Avg. Base | 1,786 | 1,504 | 1,808 | 1,604 | 1,503 | 1,363 | ||||||||||||||||||
| EOP Base | 1,638 | 1,493 | 1,901 | 1,384 | 1,420 | 1,303 | ||||||||||||||||||
| Monthly Activity Rate | 85.5 | % | 89.3 | % | 89.8 | % | 92.6 | % | 95.1 | % | 95.4 | % | ||||||||||||
| Avg. Monthly Order (USD) | $ | 219 | $ | 228 | $ | 206 | $ | 201 | $ | 197 | $ | 186 | ||||||||||||
| Monthly Growth Rate | 2.7 | % | 4.0 | % | 8.5 | % | 3.8 | % | 7.0 | % | 4.2 | % | ||||||||||||
| Monthly Churn Rate | 5.0 | % | 6.9 | % | 0.0 | % | 12.8 | % | 5.8 | % | 7.0 | % | ||||||||||||
Key Financial Metrics
Consolidated
| Results in ’000 MXN | Q3 2024 | Q4 2024 | Q1 2025 | Q2 2025 | Q3 2025 | Q4 2025 | Q1 2026 | |||||||||||||||||||||
| Net Revenue | $ | 3,330,394 | $ | 3,778,468 | $ | 3,499,151 | $ | 3,562,643 | $ | 3,377,299 | $ | 3,825,539 | $ | 3,509,702 | ||||||||||||||
| Gross Margin | 66.9 | % | 67.3 | % | 66.2 | % | 67.1 | % | 68.5 | % | 65.0 | % | 66.3 | % | ||||||||||||||
| EBITDA | $ | 591,575 | $ | 771,596 | $ | 535,265 | $ | 678,812 | $ | 722,149 | $ | 726,463 | $ | 609,913 | ||||||||||||||
| EBITDA Margin | 17.8 | % | 20.4 | % | 15.3 | % | 19.1 | % | 21.4 | % | 19.0 | % | 17.4 | % | ||||||||||||||
| Net Income | $ | -112,537 | $ | 225,305 | $ | 150,728 | $ | 327,306 | $ | 314,205 | $ | 249,851 | $ | 281,361 | ||||||||||||||
| Free Cash Flow | $ | 417,379 | $ | 548,430 | $ | -55,841 | $ | 592,152 | $ | 553,573 | 1,132,307 | 351,543 | ||||||||||||||||
Betterware Mexico and Subsidiaries
| Results in ’000 MXN | Q3 2024 | Q4 2024 | Q1 2025 | Q2 2025 | Q3 2025 | Q4 2025 | Q1 2026 | |||||||||||||||||||||
| Net Revenue | $ | 1,465,577 | $ | 1,494,855 | $ | 1,403,065 | $ | 1,458,593 | $ | 1,387,586 | $ | 1,474,205 | $ | 1,439,958 | ||||||||||||||
| Gross Margin | 54.8 | % | 57.2 | % | 55.3 | % | 55.2 | % | 57.1 | % | 52.6 | % | 55.0 | % | ||||||||||||||
| EBITDA | $ | 279,889 | $ | 330,075 | $ | 261,493 | $ | 290,745 | $ | 312,669 | $ | 263,529 | $ | 295,278 | ||||||||||||||
| EBITDA Margin | 19.1 | % | 22.1 | % | 18.6 | % | 19.9 | % | 22.5 | % | 17.9 | % | 20.5 | % | ||||||||||||||
Jafra Mexico
| Results in ’000 MXN | Q3 2024 | Q4 2024 | Q1 2025 | Q2 2025 | Q3 2025 | Q4 2025 | Q1 2026 | |||||||||||||||||||||
| Net Revenue | $ | 1,623,697 | $ | 2,038,993 | $ | 1,869,818 | $ | 1,853,832 | $ | 1,752,179 | 2,112,869 | $ | 1,858,104 | |||||||||||||||
| Gross Margin | 76.8 | % | 74.1 | % | 73.5 | % | 75.3 | % | 76.3 | % | 72.2 | % | 74.0 | % | ||||||||||||||
| EBITDA | $ | 318,149 | $ | 440,630 | $ | 286,706 | $ | 393,360 | $ | 417,760 | $ | 452,697 | $ | 315,494 | ||||||||||||||
| EBITDA Margin | 19.6 | % | 21.6 | % | 15.3 | % | 21.2 | % | 23.8 | % | 21.4 | % | 17.0 | % | ||||||||||||||
Jafra US
| Results in ’000 MXN | Q3 2024 | Q4 2024 | Q1 2025 | Q2 2025 | Q3 2025 | Q4 2025 | Q1 2026 | |||||||||||||||||||||
| Net Revenue | $ | 241,881 | $ | 241,120 | $ | 244,620 | $ | 226,268 | $ | 250,218 | $ | 237,534 | $ | 238,465 | ||||||||||||||
| Gross Margin | 73.6 | % | 73.3 | % | 73.1 | % | 73.9 | % | 76.0 | % | 77.0 | % | 77.4 | % | ||||||||||||||
| EBITDA | $ | -6,463 | $ | 891 | $ | -12,934 | $ | -5,293 | $ | -8,280 | $ | 10,237 | $ | -859 | ||||||||||||||
| EBITDA Margin | 3.0 | % | -2.7 | % | 0.4 | % | -5.7 | % | -2.1 | % | -3.5 | % | 4.3 | % | ||||||||||||||
Use of Non-IFRS Financial Measures
This announcement includes certain references to EBITDA, EBITDA Margin, Net Debt:
EBITDA: defined as profit for the year adding back the depreciation of property, plant, and equipment and right of use assets, amortization of intangible assets, financing cost, net and total income taxes.
EBITDA Margin: is calculated by dividing EBITDA by net revenue.
EBITDA and EBITDA Margin are not measures recognized under IFRS and should not be considered as an alternative to, or more meaningful than, consolidated net income for the year as determined in accordance with IFRS or as indicators of our operating performance from continuing operations. Accordingly, readers are cautioned not to place undue reliance on this information and should note that these measures as calculated by the Company may differ materially from similarly titled measures reported by other companies.
BeFra believes that these non-IFRS financial measures are useful to investors because (i) BeFra uses these measures to analyze its financial results internally and believes they represent a measure of operating profitability and (ii) these measures will serve investors to understand and evaluate BeFra’s EBITDA and EBITDA BU and provide more tools for their analysis as it makes BeFra’s results comparable to industry peers that also prepare these measures.
Definitions: Operating Metrics
Starting Q2 2024, the Company will report sales force under the same name for all business units, Distributors (previously stated as Leaders in Jafra) and Associates (previously stated as Consultants for Jafra). It is important to note that the metrics are calculated with the same method as previous quarters and the reference name change has no adverse effect on the results of the operating metrics reported by the Company.
Betterware (Associates and Distributors)
Avg. Base: Weekly average Associate/Distributor base
EOP Base: Associate/Distributor base at the end of the period
Weekly Churn Rate: Average weekly data. Total Associates/Distributors lost during the period divided by the beginning of the period Associate/Distributor base.
Weekly Activity Rate: Average weekly data. Active Associates/Distributors divided by ending Associate/Distributor base.
Avg. Weekly Order: Average weekly data. Total Revenue divided by number of active Associates/Distributors
Jafra (Associates and Distributors)
Avg. Base: Monthly average Associate/Distributor base
EOP Base: Associate/Distributor base at the end of the period
Monthly Churn Rate (Associates): Average monthly data. Total Associates lost during the period divided by the number of active Associates 4 months prior. An Associate is terminated only after 4 months of inactivity.
Monthly Churn Rate (Distributors): Average monthly data. Total Distributors lost during the period divided by end of period Distributors’ base.
Monthly Activity Rate: Average monthly data. Active Associate/Distributor divided by the end of period Associate/Distributor base.
Avg. Monthly Order (Associates): Average monthly data. Total Catalog Revenue divided by number of Associates orders.
Avg. Monthly Order (Distributors): Average monthly data. Total Distributors Revenue divided by number of Distributors orders.
About Betterware de México, S.A.P.I. de C.V.
Founded in 1995, Betterware de Mexico is the leading direct-to-consumer company in Mexico focused on offering innovative products that solve specific needs related to household organization, practicality, space-saving, and hygiene. Through the acquisition of JAFRA on April 7, 2022, the Company now offers a leading brand of direct-to-consumer in the Beauty market in Mexico and the United States where it offers Fragrances, Color & Cosmetics, Skin Care, and Toiletries. The combined company possesses an asset-light business model with low capital expenditure requirements and a track record of strong profitability, double digit rates of revenue growth and free cash flow generation. Today, the Company distributes its products in Mexico and in the United States of America.
Forward-Looking Statements
This press release includes certain statements that are not historical facts but are forward-looking statements for purposes of the safe harbor provisions under the United States Private Securities Litigation Reform Act of 1995. Forward-looking statements generally are accompanied by words such as “believe,” “may,” “will”, “estimate”, “continue”, “anticipate”, “intend”, “expect”, “should”, “would”, “plan”, “predict”, “potential”, “seem”, “seek,” “future,” “outlook”, and similar expressions that predict or indicate future events or trends or that are not statements of historical matters. The reader should understand that the results obtained may differ from the projections contained in this document and that many factors could cause our actual activities or results to differ materially from the activities and results anticipated in forward looking statements. For this reason, the Company assumes no responsibility for any indirect factors or elements beyond its control that might occur inside Mexico or abroad and which might affect the outcome of these projections and encourages you to review the ‘Cautionary Statement’ and the ‘Risk Factor’ sections of our annual report on Form 20-F for the year ended December 31, 2020 and any of the Company’s other applicable filings with the Securities and Exchange Commission for additional information concerning factors that could cause those differences
The Company undertakes no obligation and does not intend to update these forward-looking statements to reflect events or circumstances occurring after the date hereof. You are cautioned not to place undue reliance on these forward-looking statements, which speak only as of the date hereof. Further information on risks and uncertainties that may affect the Company’s operations and financial performance, and the forward statements contained herein, is available in the Company’s filings with the SEC. All forward-looking statements are qualified in their entirety by this cautionary statement.
Q1 2026 Conference Call
Management will hold a conference call with investors on April 23rd, 2026, at 3:30 pm Mexico City Time / 5:30 pm Eastern Time (ET). For anyone who wishes to join live, the dial-in information is:
Toll Free: 1-877-451-6152
Toll/International: 1-201-389-0879
Conference ID: 13759384
Webcast Link: https://viavid.webcasts.com/starthere.jsp?ei=1756571&tp_key=3835ed2404
If you wish to listen to the replay of the conference call, please see instructions below:
Toll Free: 1-844-512-2921
Toll/International: 1-412-317-6671
Replay Pin Number: 13759384
Contacts.
Company:
BeFra IR
ir@better.com.mx
+52 (33) 3836 0500 Ext. 2011
InspIR:
Investor Relations
Ivan Peill
ivan@inspirgroup.com
Exhibit 99.2
1Q26 Earnings Call April 23, 2026
Cautionary Statement Regarding Forward - Looking Statements Matters discussed in this presentation may constitute forward - looking statements . Forward - looking statements include statements concerning plans, objectives, goals, strategies, future events or performance, and underlying assumptions and other statements, which are other than statements of historical facts . The words “believe,” “anticipate,” “intends,” “estimate,” “potential,” “may,” “should,” “expect,” “pending,” and similar expressions identify forward - looking statements . The forward - looking statements in this presentation are based upon various assumptions . Although we believe that these assumptions were reasonable when made, because these assumptions are inherently subject to significant uncertainties and contingencies which are difficult or impossible to predict and are beyond our control, we cannot assure you that we will achieve or accomplish these expectations . BeFra | 2
PRESENTERS Andrés Campos President & CEO, BeFra Raúl del Villar CFO, BeFra BeFra | 3
Net Revenue +0.3% EBITDA +13.9% EBITDA Margin +211 bps 17.4% 1Q26 Free Cash Flow $352 M Slight Revenue growth reflecting early signs of recovery across key business units Significant EBITDA increase supported by disciplined cost management and improved operating efficiency Net Income +85.8% Net income relevant increase, in line with our expectations and reflecting the absence of extraordinary impacts experienced in 1Q25 as well as reduced leverage and lower interest rates & Cash flow generation normalized during the quarter, with a cash conversion rate of 58% BeFra | 4 SELECTED HIGHLIGHTS
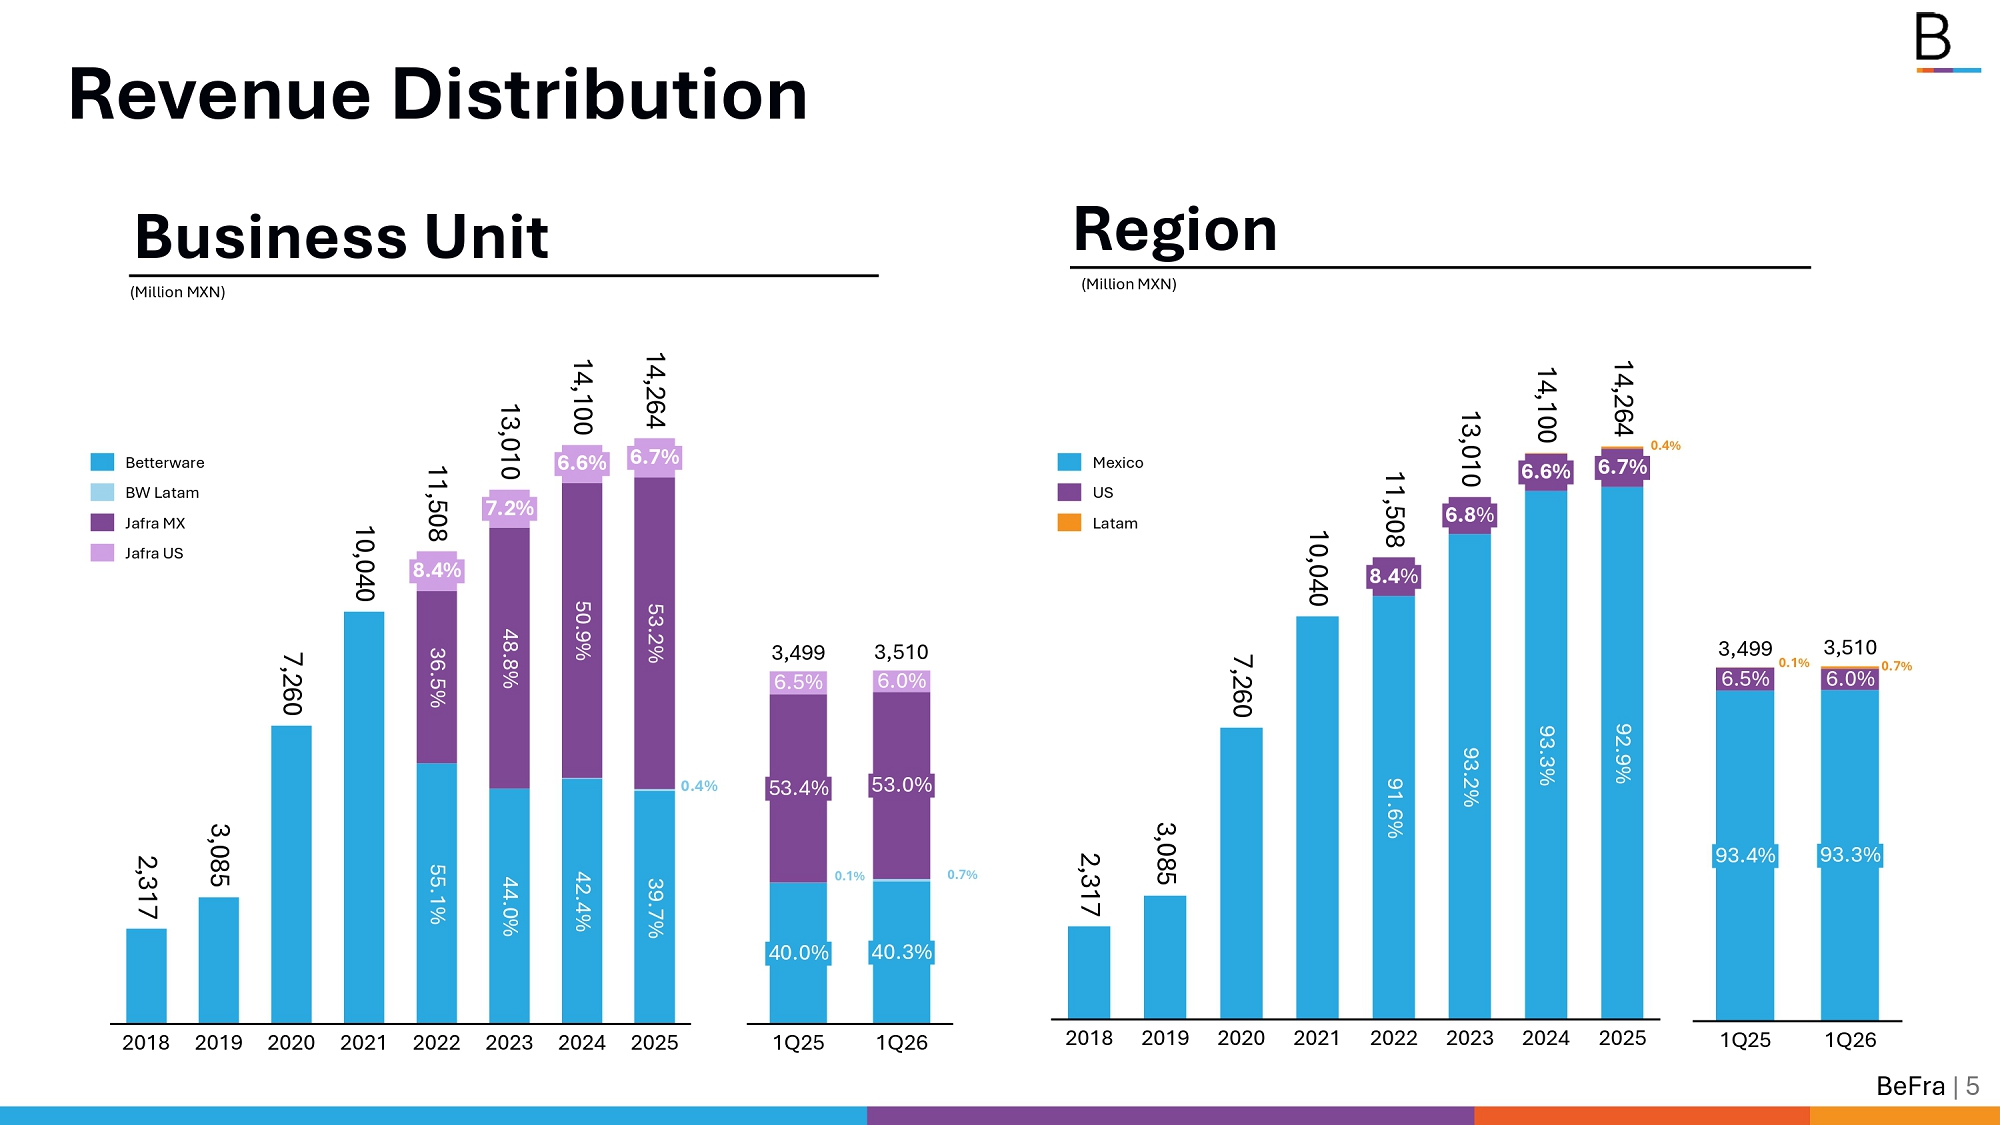
2,317 3,085 7,260 8.4% 36.5% 55.1% 7.2% 48.8% 44.0% 6.6% 50.9% 42.4% 6.7% 53.2% 39.7% 2018 2019 2020 2021 2022 2023 2024 2025 10,040 11,508 13,010 14,100 14,264 2,317 3,085 7,260 8.4 % 91.6% 6.8 % 93.2% 6.6% 93.3% 6.7% 92.9% 2018 2019 2020 2021 2022 2023 2024 2025 10,040 11,508 13,010 14,100 14,264 Revenue Distribution Business Unit (Million MXN) Region (Million MXN) Betterware BW Latam Jafra MX Jafra US Mexico US Latam 0.4% 0.4% 6.5% 1Q25 6.0% 53.4% 53.0% 40.0% 40.3% 1Q26 3,499 3,510 6.5% 93.4% 1Q25 6.0% 93.3% BeFra | 5 1Q26 3,499 3,510 0.1% 0.7% 0.7% 0.1%
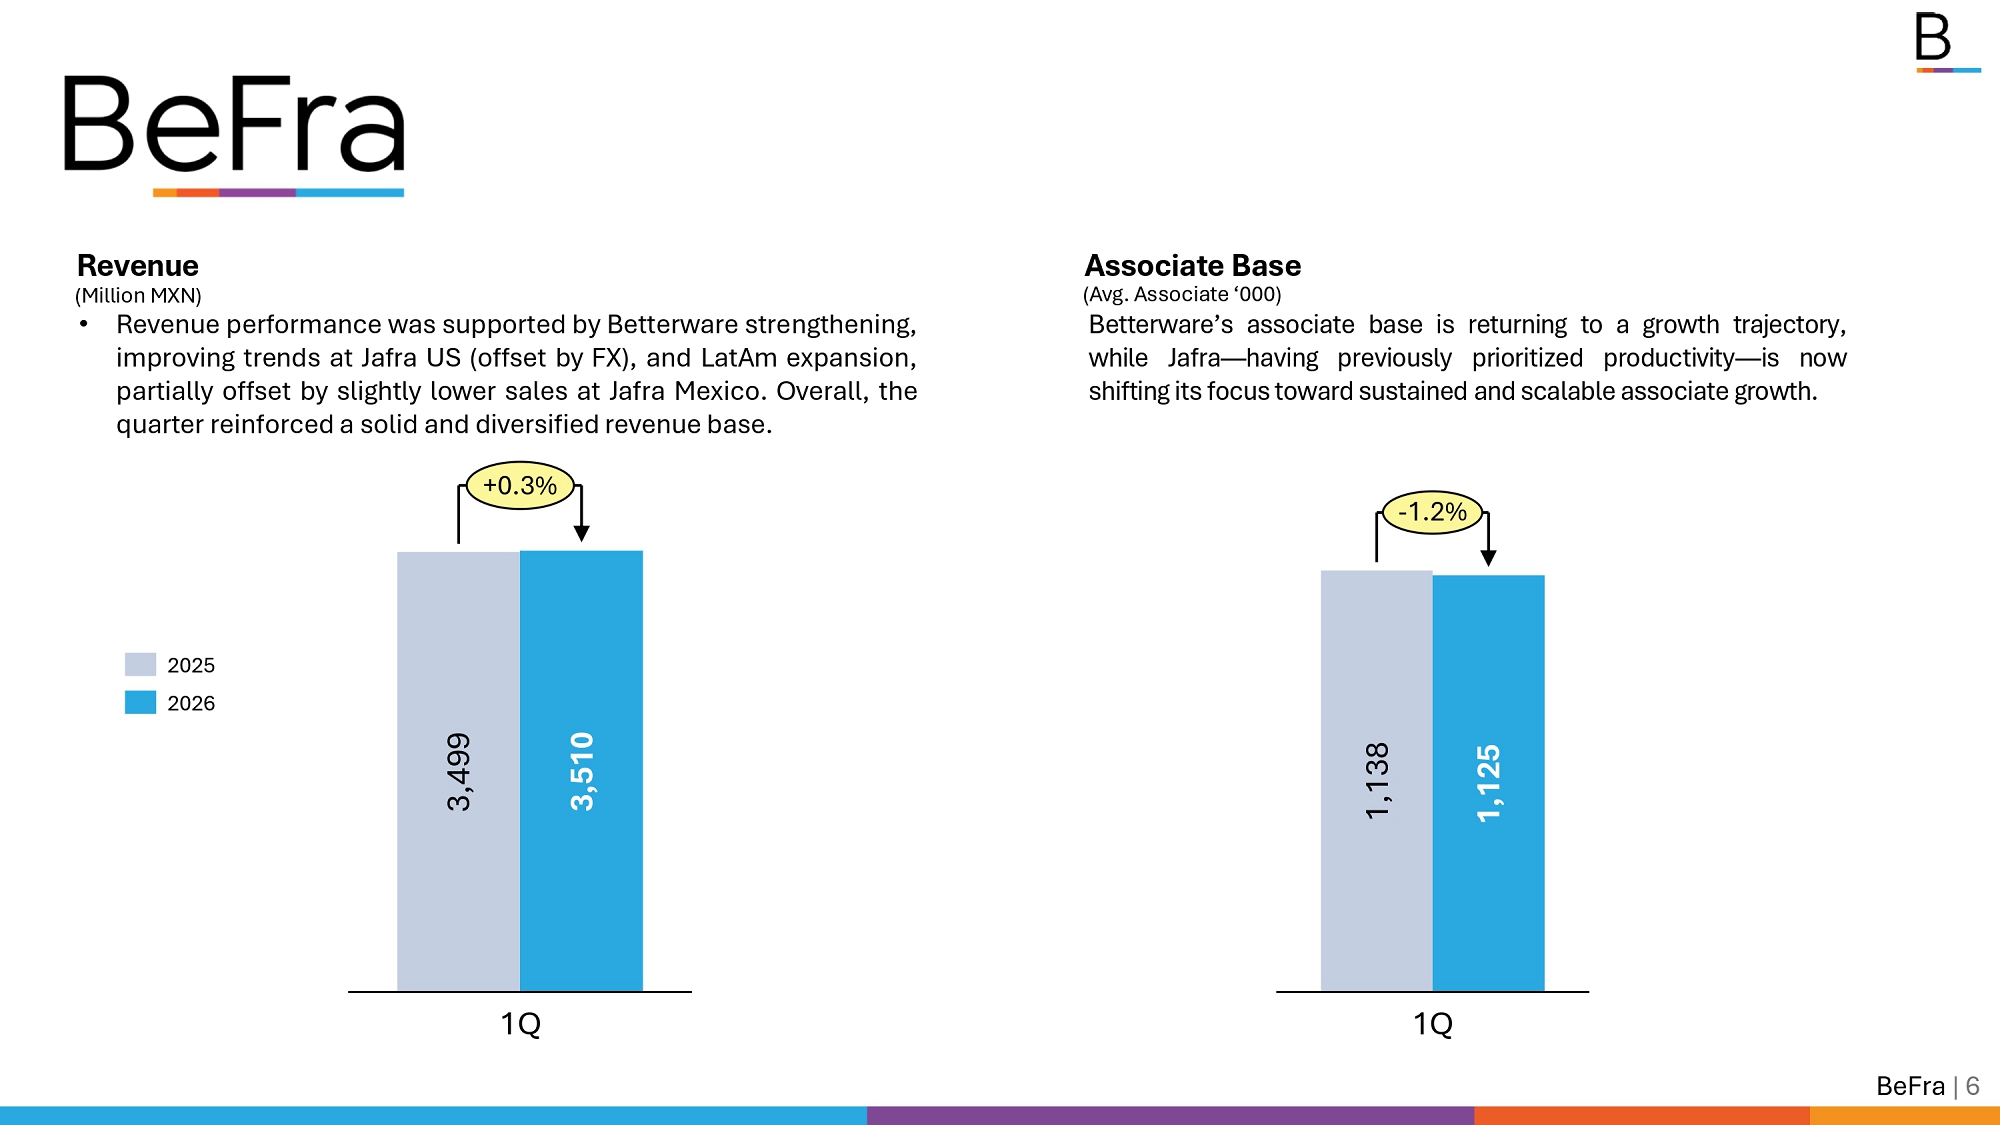
Revenue 3,499 3,510 1Q (Million MXN) • Revenue performance was supported by Betterware strengthening, improving trends at Jafra US (offset by FX), and LatAm expansion, partially offset by slightly lower sales at Jafra Mexico . Overall, the quarter reinforced a solid and diversified revenue base . +0.3% 2025 2026 1,138 1,125 1Q - 1.2% BeFra | 6 Associate Base (Avg. Associate ‘000) Betterware’s associate base is returning to a growth trajectory, while Jafra — having previously prioritized productivity — is now shifting its focus toward sustained and scalable associate growth .
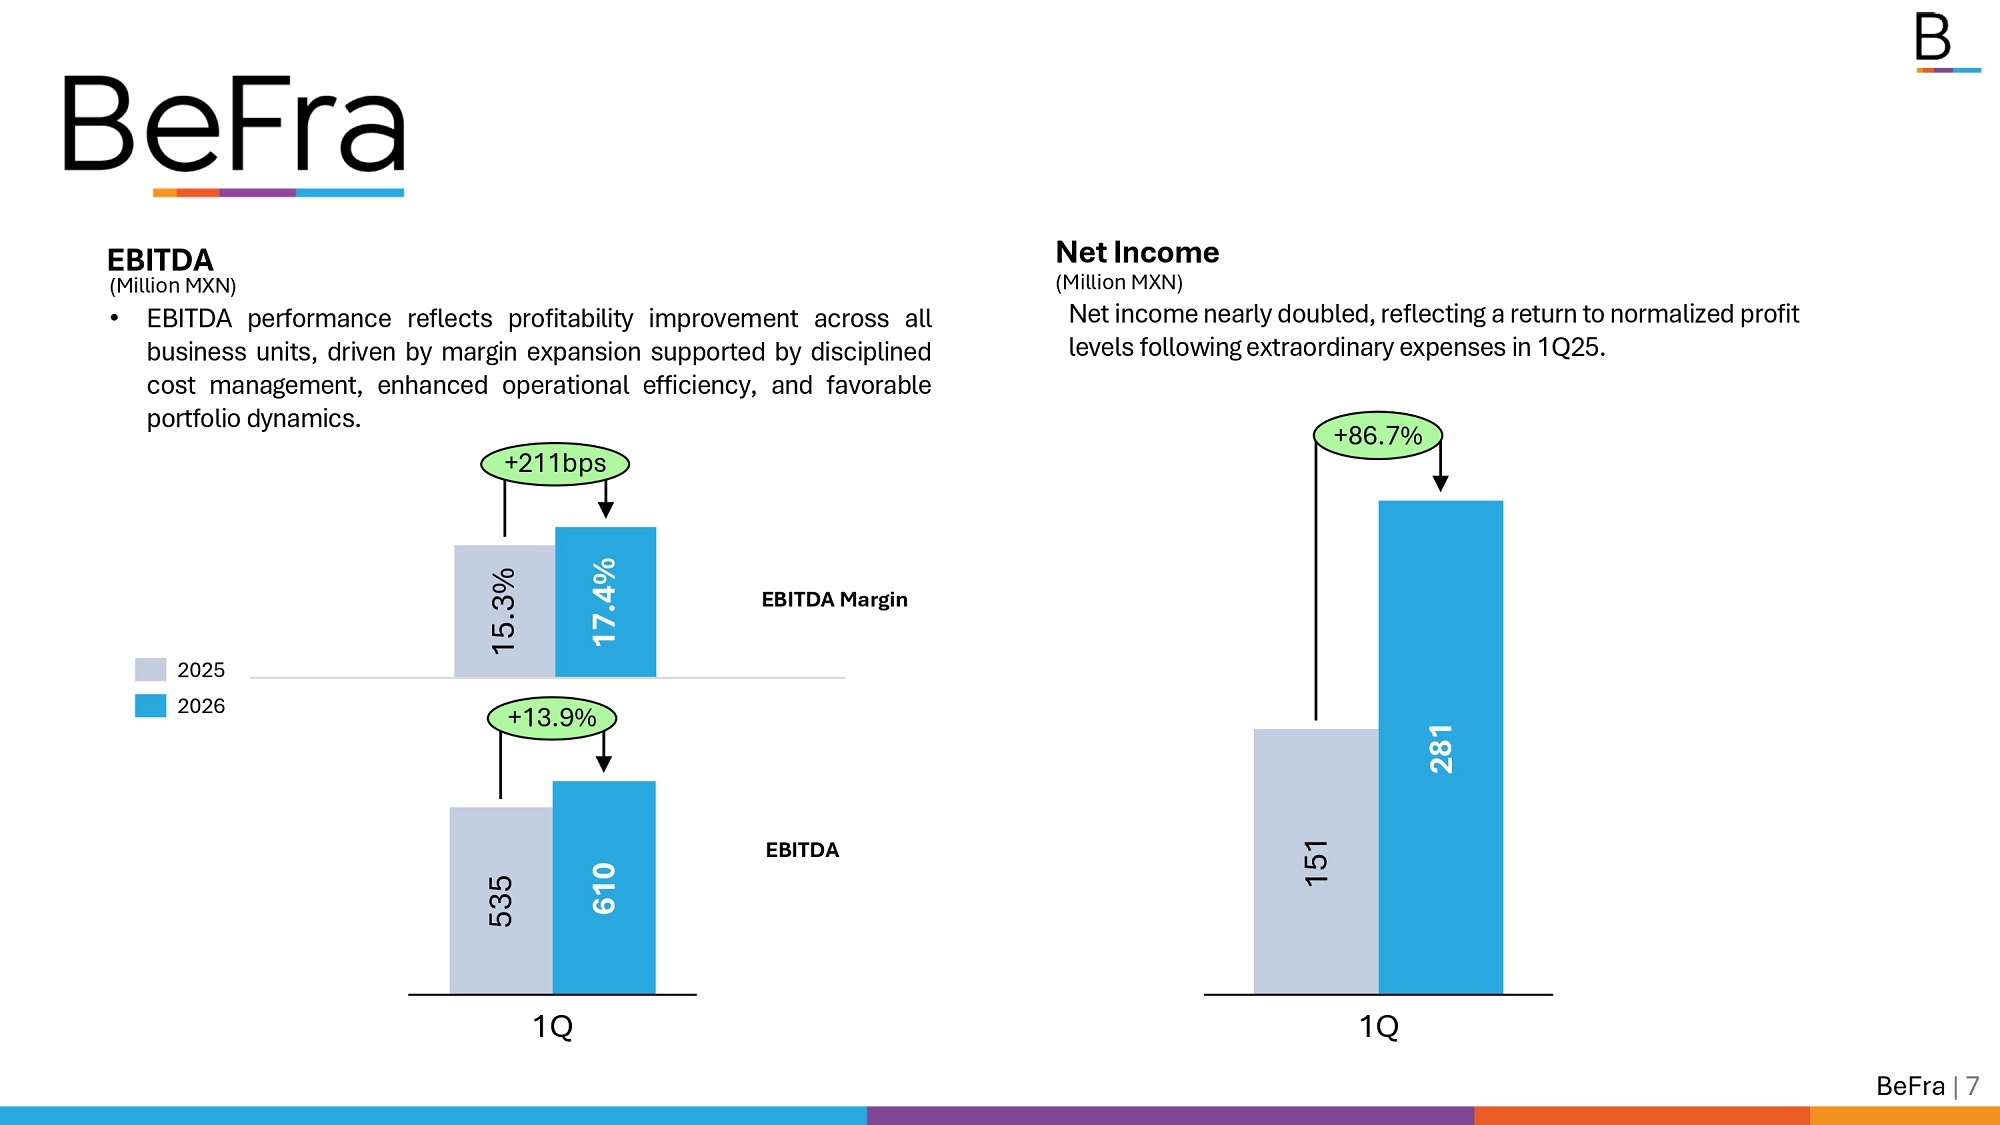
151 281 Net Income (Million MXN) Net income nearly doubled, reflecting a return to normalized profit levels following extraordinary expenses in 1Q25. +86.7% 535 610 +13.9% 2025 2026 15.3% 17.4% EBITDA (Million MXN) • EBITDA performance reflects profitability improvement across all business units, driven by margin expansion supported by disciplined cost management, enhanced operational efficiency, and favorable portfolio dynamics . +211bps EBITDA Margin 1Q 1Q BeFra | 7 EBITDA
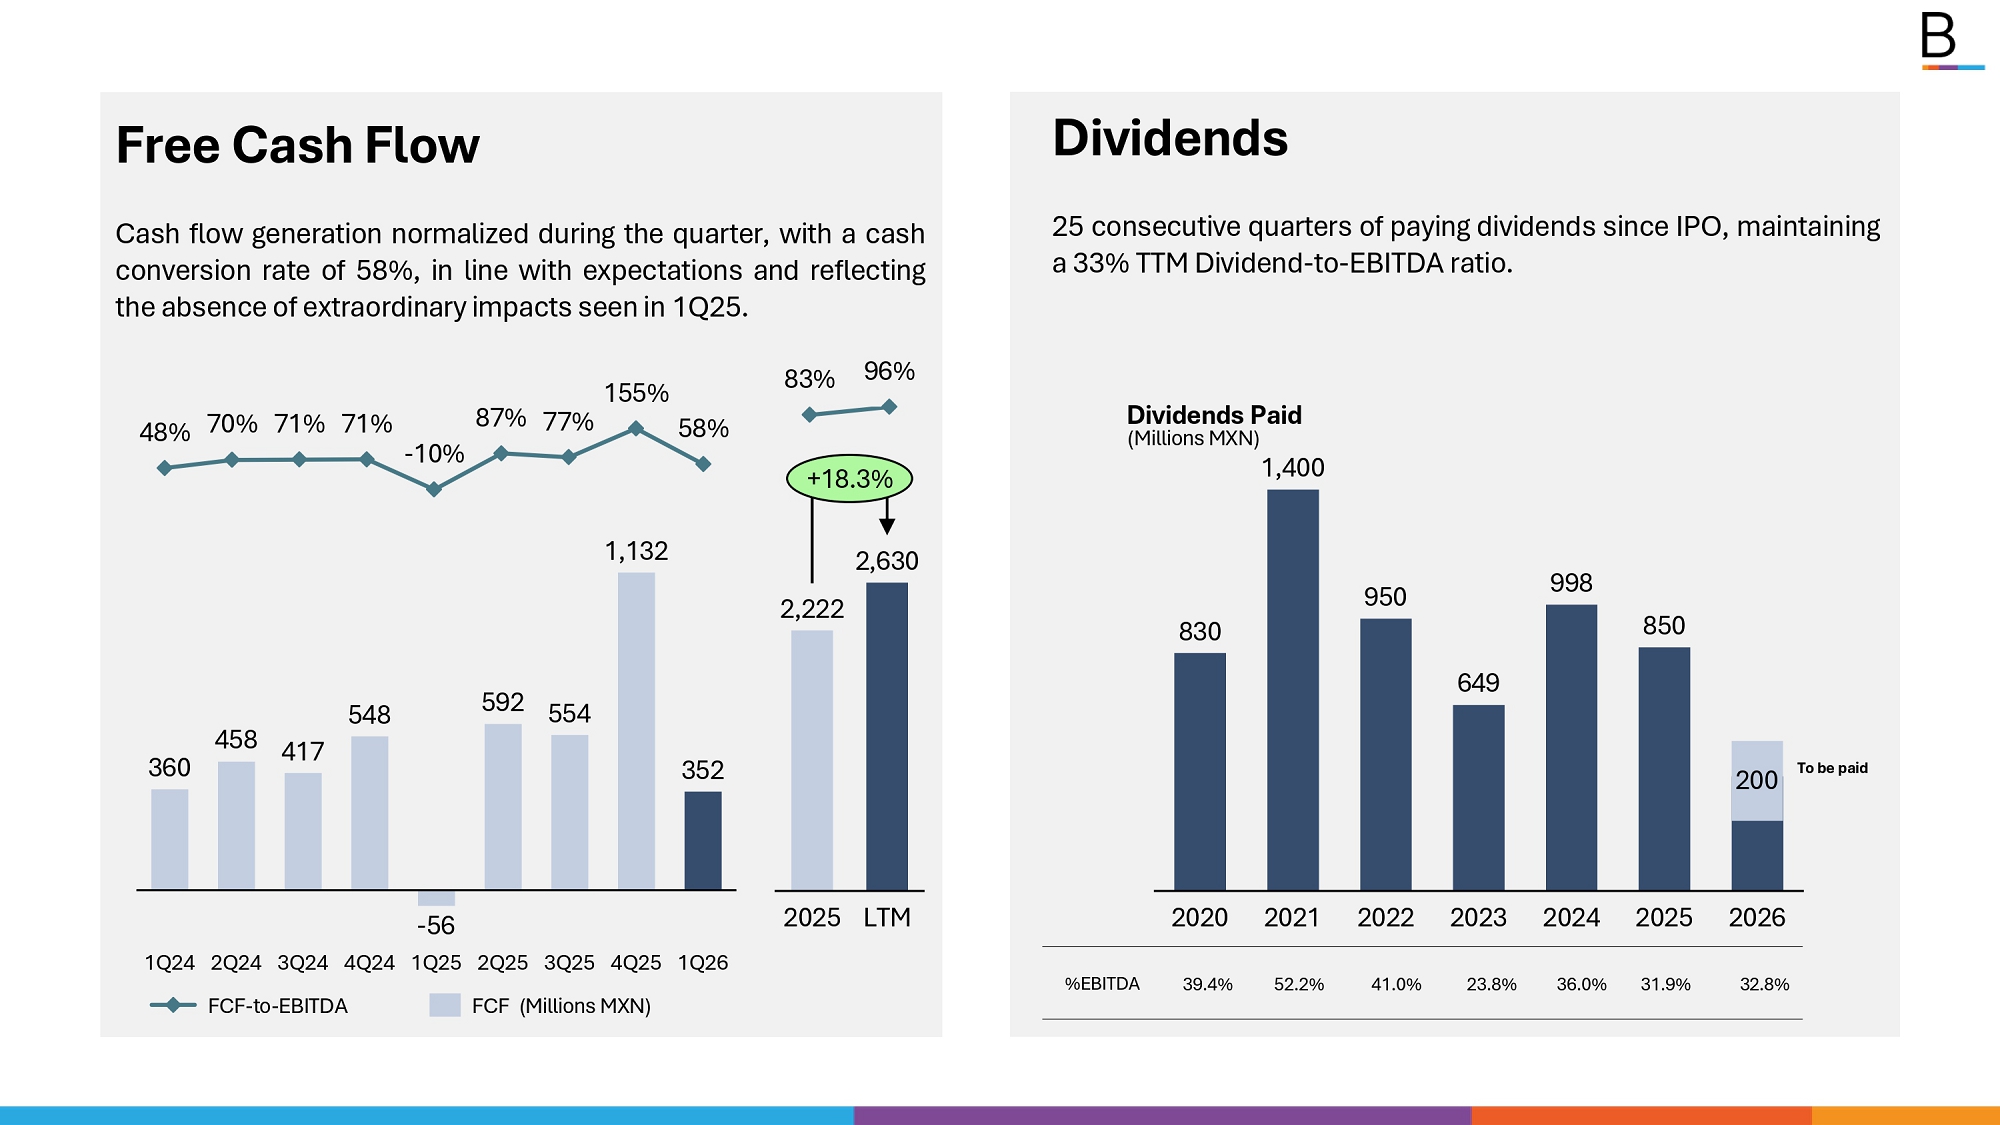
Free Cash Flow Cash flow generation normalized during the quarter, with a cash conversion rate of 58 % , in line with expectations and reflecting the absence of extraordinary impacts seen in 1 Q 25 . 360 458 417 548 - 56 1Q24 2Q24 3Q24 4Q24 1Q25 2Q25 3Q25 4Q25 1Q26 592 554 1,132 352 48% 70% 71% 71% - 10% 87% 77% 155% 58% Dividends 25 consecutive quarters of paying dividends since IPO, maintaining a 33% TTM Dividend - to - EBITDA ratio. 2020 2021 2022 2023 2024 2025 2026 830 950 649 998 850 400 32.8% 31.9% 36.0% 23.8% 41.0% 52.2% 39.4% %EBITDA Dividends Paid (Millions MXN) 1,400 2025 LTM 2,222 2,630 +18.3% 83% 96% FCF - to - EBITDA FCF (Millions MXN) To be paid 200
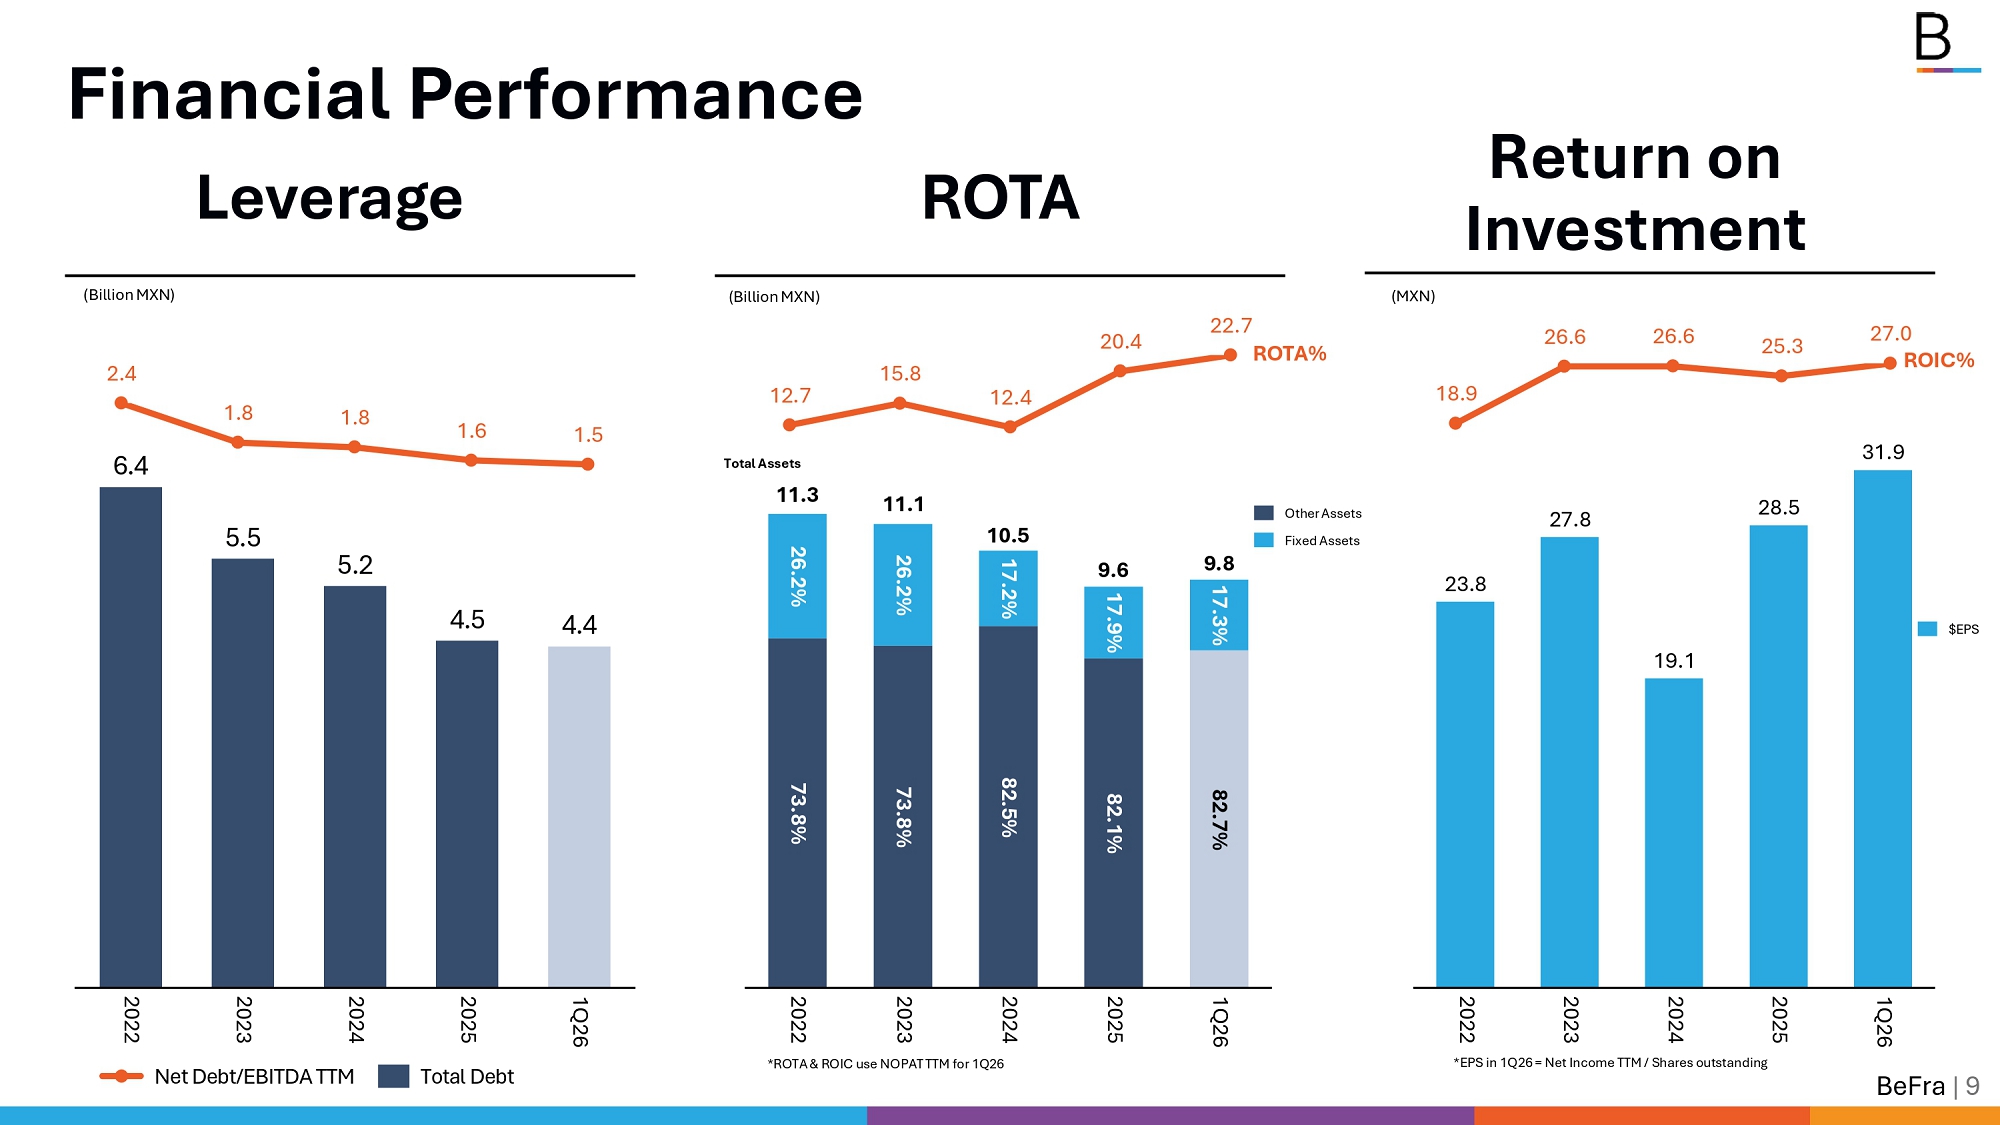
6.4 5.5 5.2 4.5 4.4 2022 2023 2024 2025 1Q26 2.4 1.8 1.8 1.6 1.5 Financial Performance Leverage ROTA Return on Investment 26.2% 73.8% 2022 26.2% 73.8% 2023 17.2% 82.5% 2024 17.9% 82.1% 2025 17.3% 82.7% 1Q26 12.7 15.8 12.4 20.4 22.7 11.3 11.1 10.5 9.6 9.8 23.8 27.8 19.1 28.5 31.9 2022 2023 2024 2025 1Q26 $EPS 18.9 26.6 26.6 25.3 27.0 ROIC% (Billion MXN) (Billion MXN) (MXN) Other Assets Fixed Assets *EPS in 1Q26 = Net Income TTM / Shares outstanding *ROTA & ROIC use NOPAT TTM for 1Q26 Net Debt/EBITDA TTM Total Debt BeFra | 9 Total Assets ROTA%
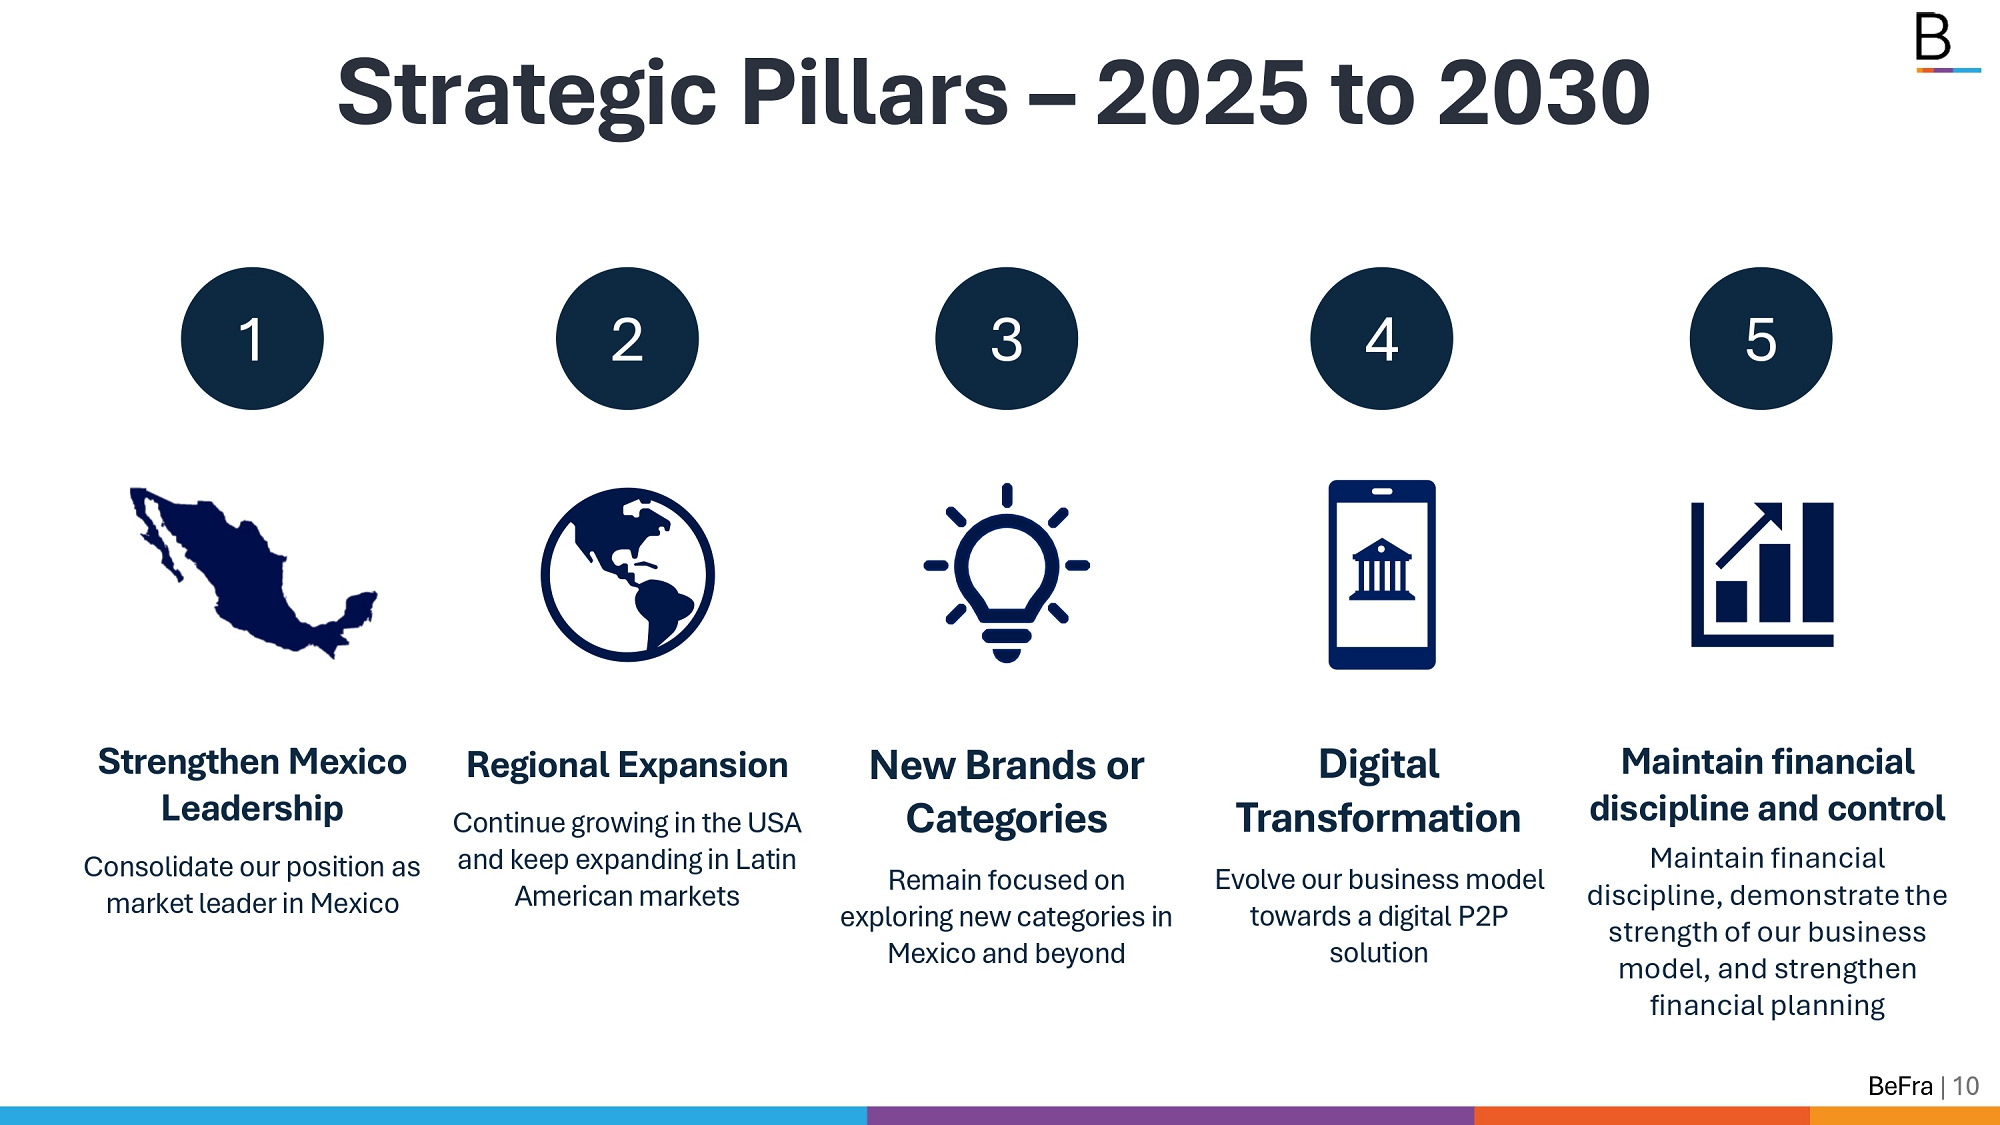
Strengthen Mexico Leadership Consolidate our position as New Brands or Categories Remain focused on Regional Expansion Continue growing in the USA and keep expanding in Latin 1 2 3 Digital Transformation Evolve our business model 4 Maintain financial discipline and control Maintain financial 5 Strategic Pillars – 2025 to 2030 discipline, demonstrate the strength of our business model, and strengthen financial planning American markets market leader in Mexico exploring new categories in Mexico and beyond towards a digital P2P solution BeFra | 10
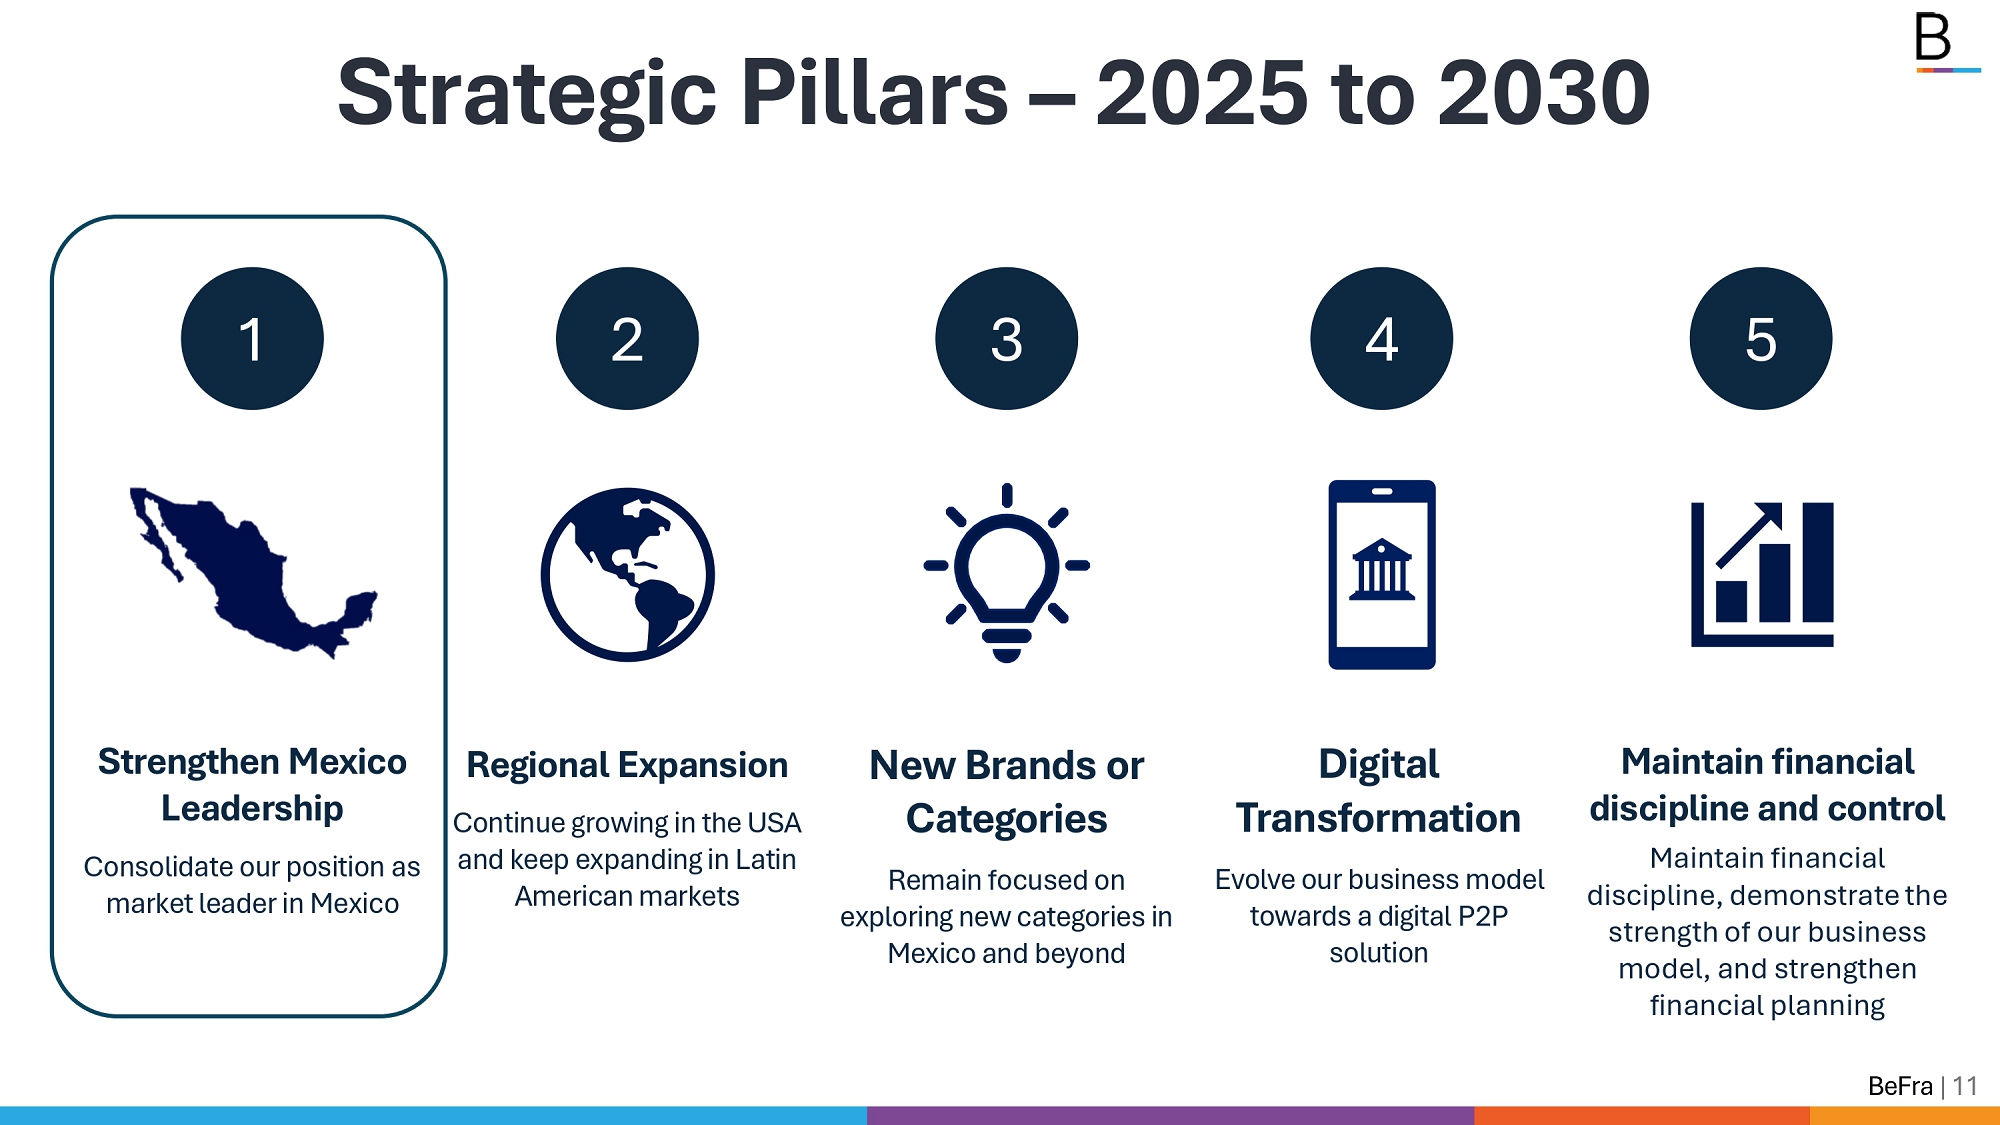
Strengthen Mexico Leadership Consolidate our position as New Brands or Categories Remain focused on Regional Expansion Continue growing in the USA and keep expanding in Latin 1 2 3 Digital Transformation Evolve our business model 4 Maintain financial discipline and control Maintain financial 5 Strategic Pillars – 2025 to 2030 discipline, demonstrate the strength of our business model, and strengthen financial planning American markets market leader in Mexico exploring new categories in Mexico and beyond towards a digital P2P solution BeFra | 11
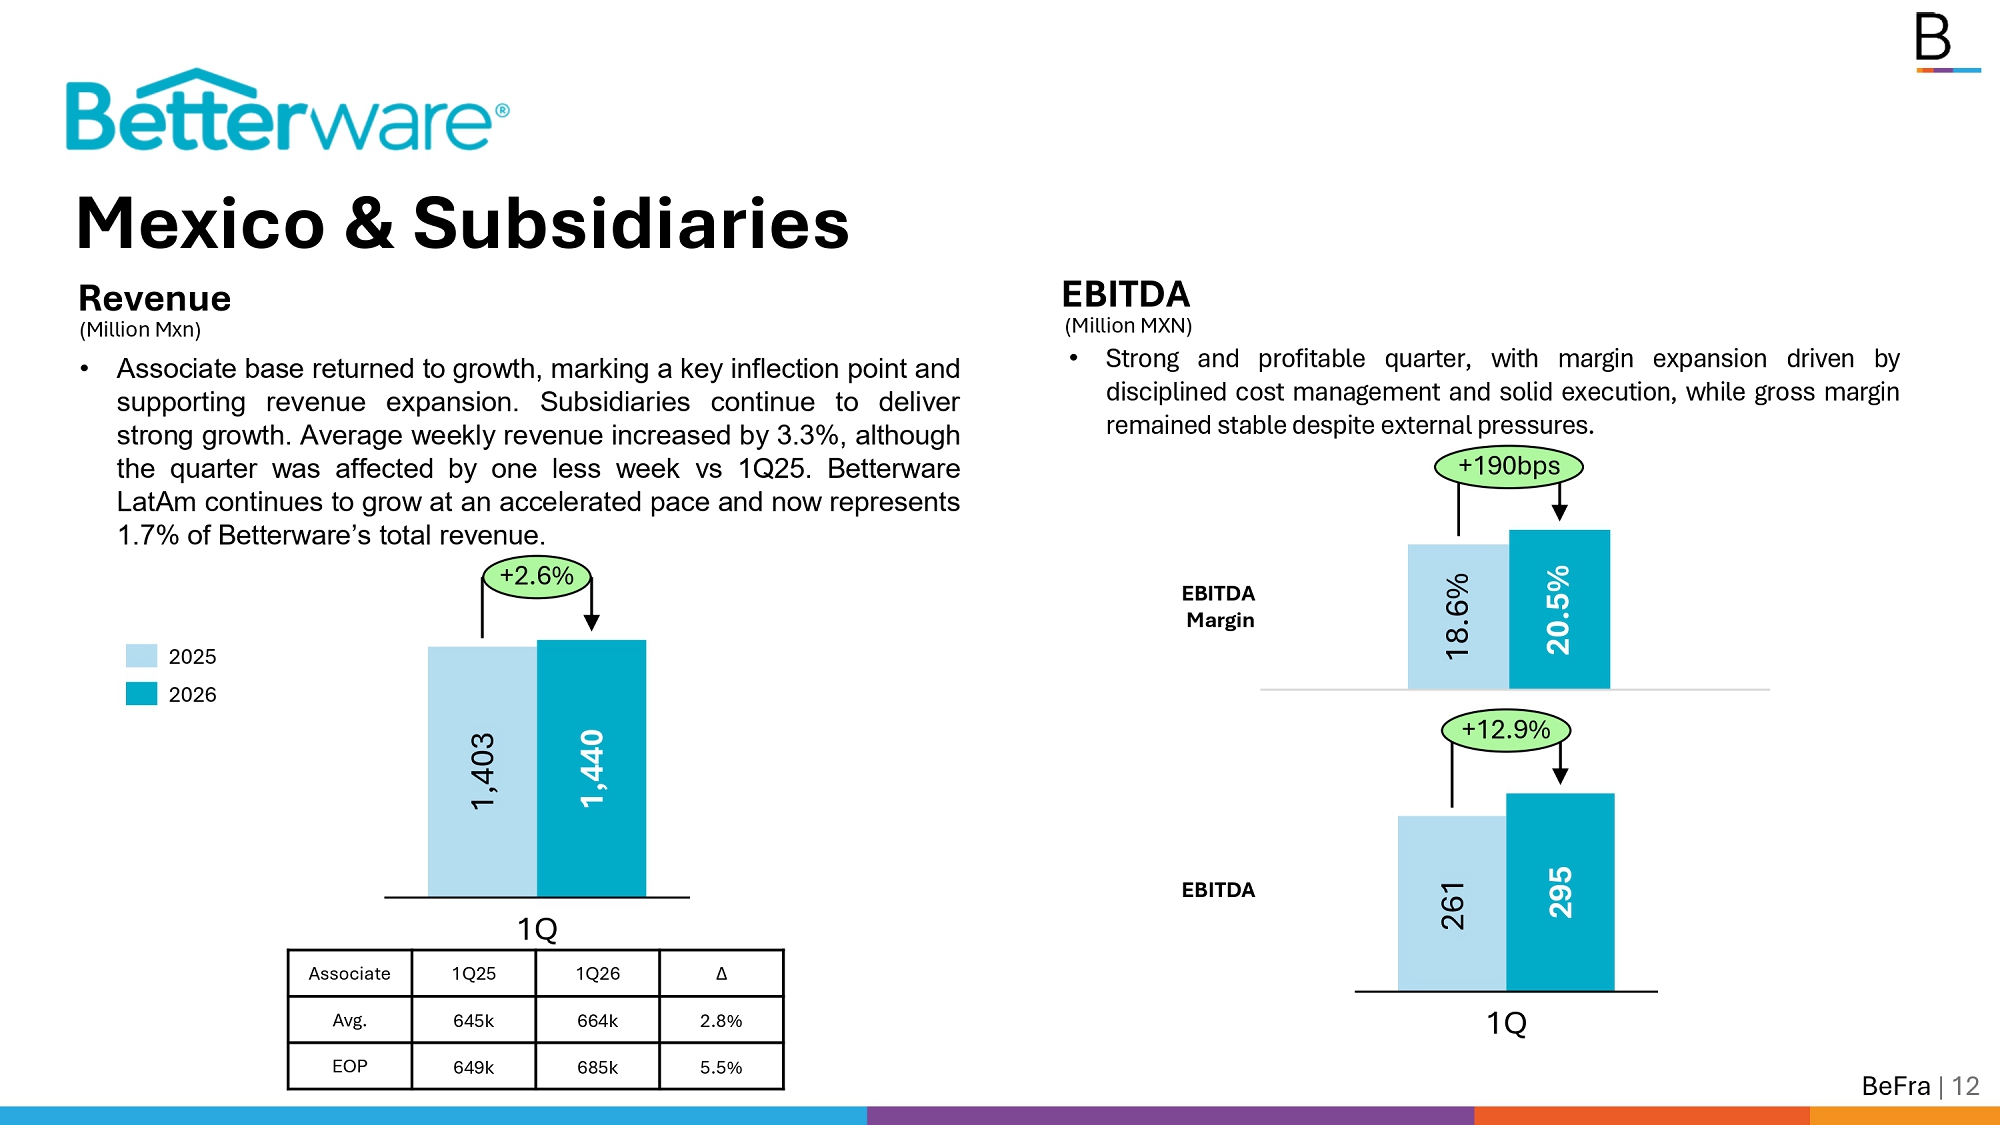
Mexico & Subsidiaries Revenue (Million Mxn) 1,403 1,440 1Q +2.6% 2025 2026 • Associate base returned to growth, marking a key inflection point and supporting revenue expansion . Subsidiaries continue to deliver strong growth . Average weekly revenue increased by 3 . 3 % , although the quarter was affected by one less week vs 1 Q 25 . Betterware LatAm continues to grow at an accelerated pace and now represents 1 . 7 % of Betterware’s total revenue . EBITDA (Million MXN) 261 295 +12.9% 18.6% 20.5% • Strong and profitable quarter, with margin expansion driven by disciplined cost management and solid execution, while gross margin remained stable despite external pressures . +190bps EBITDA Margin 1Q BeFra | 12 EBITDA ∆ 1Q26 1Q25 Associate 2.8% 664k 645k Avg. 5.5% 685k 649k EOP
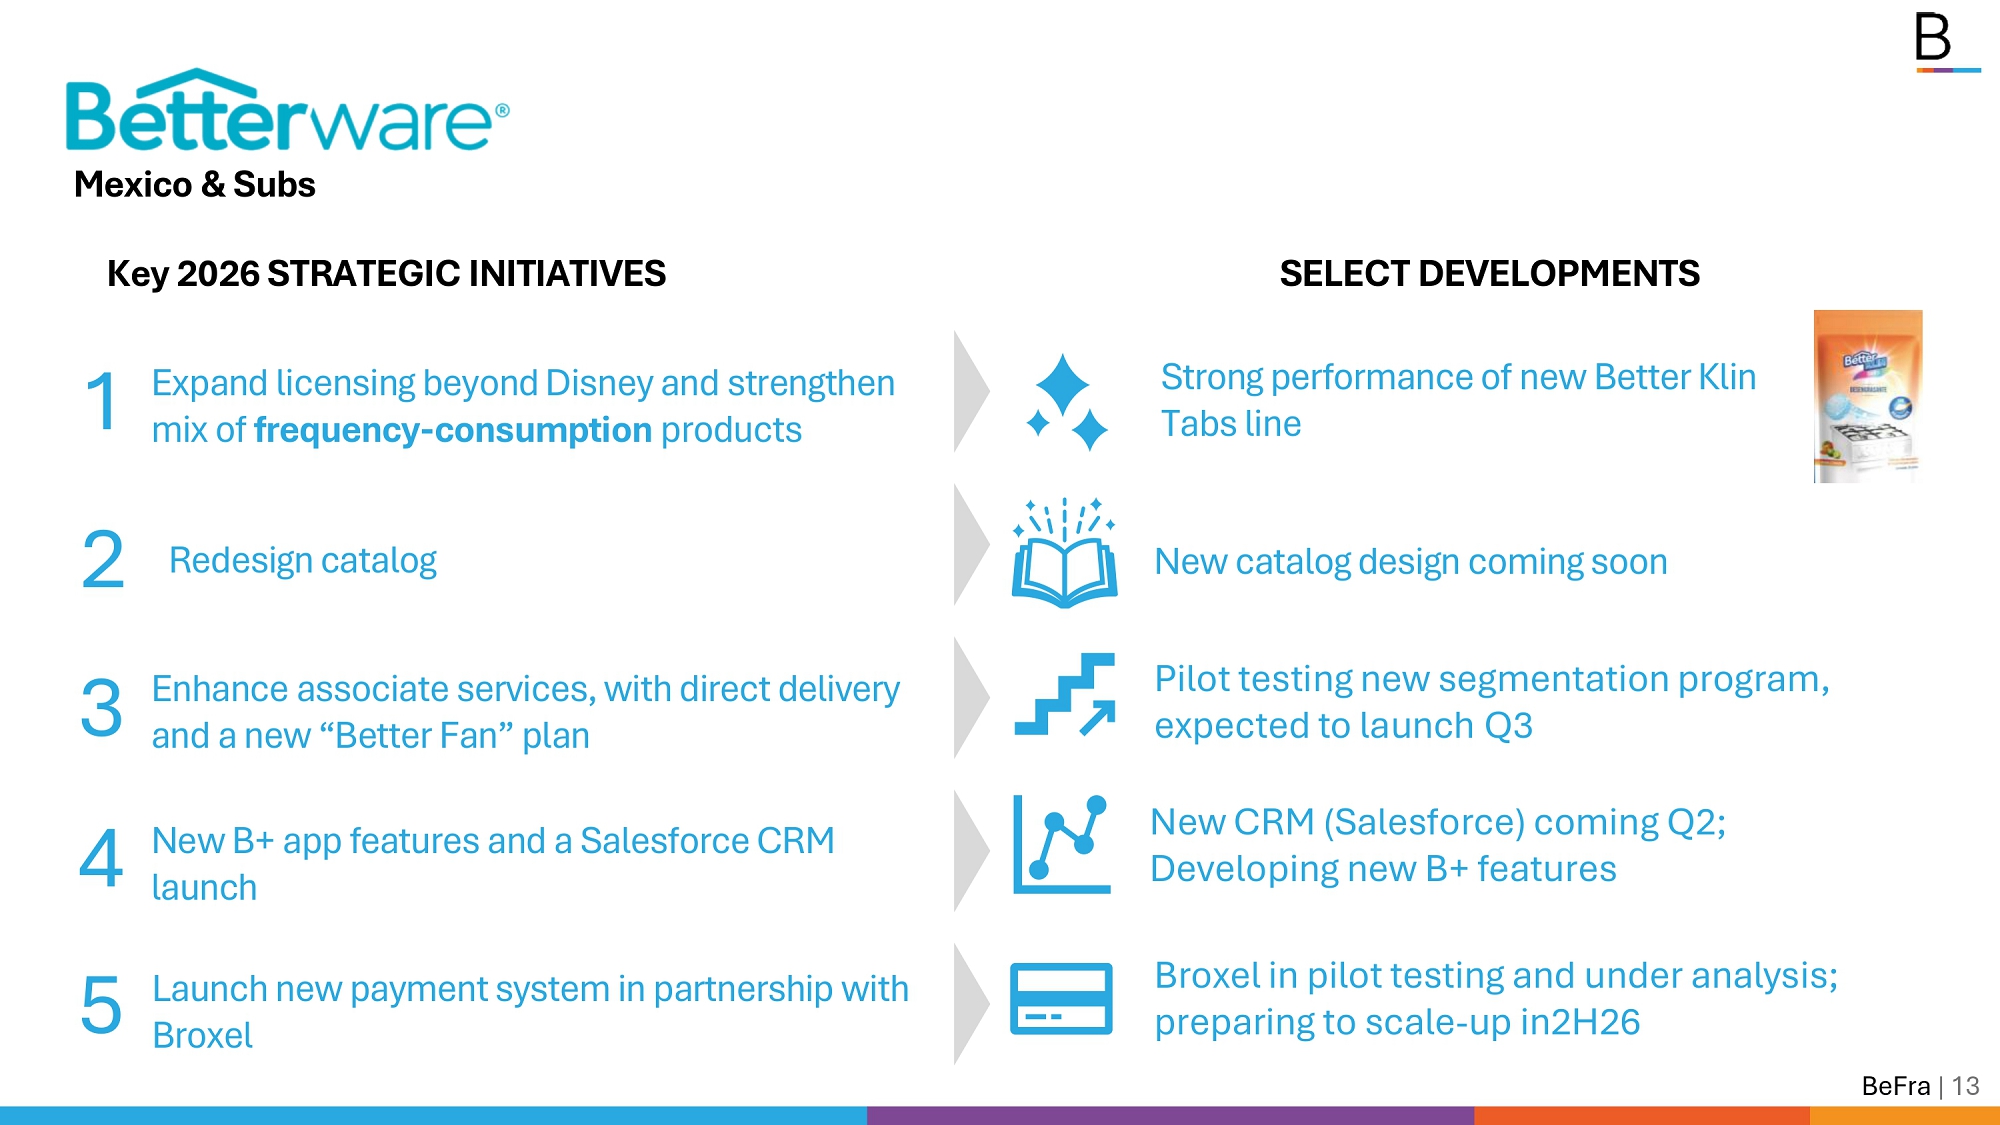
Key 2026 STRATEGIC INITIATIVES 1 2 3 4 Expand licensing beyond Disney and strengthen mix of frequency - consumption products Redesign catalog Enhance associate services, with direct delivery and a new “Better Fan” plan 5 Launch new payment system in partnership with Mexico & Subs New B+ app features and a Salesforce CRM launch SELECT DEVELOPMENTS Pilot testing new segmentation program, expected to launch Q3 New catalog design coming soon Broxel in pilot testing and under analysis; New CRM (Salesforce) coming Q2; Developing new B+ features Strong performance of new Better Klin Tabs line preparing to scale - up in2H26 Broxel BeFra | 13
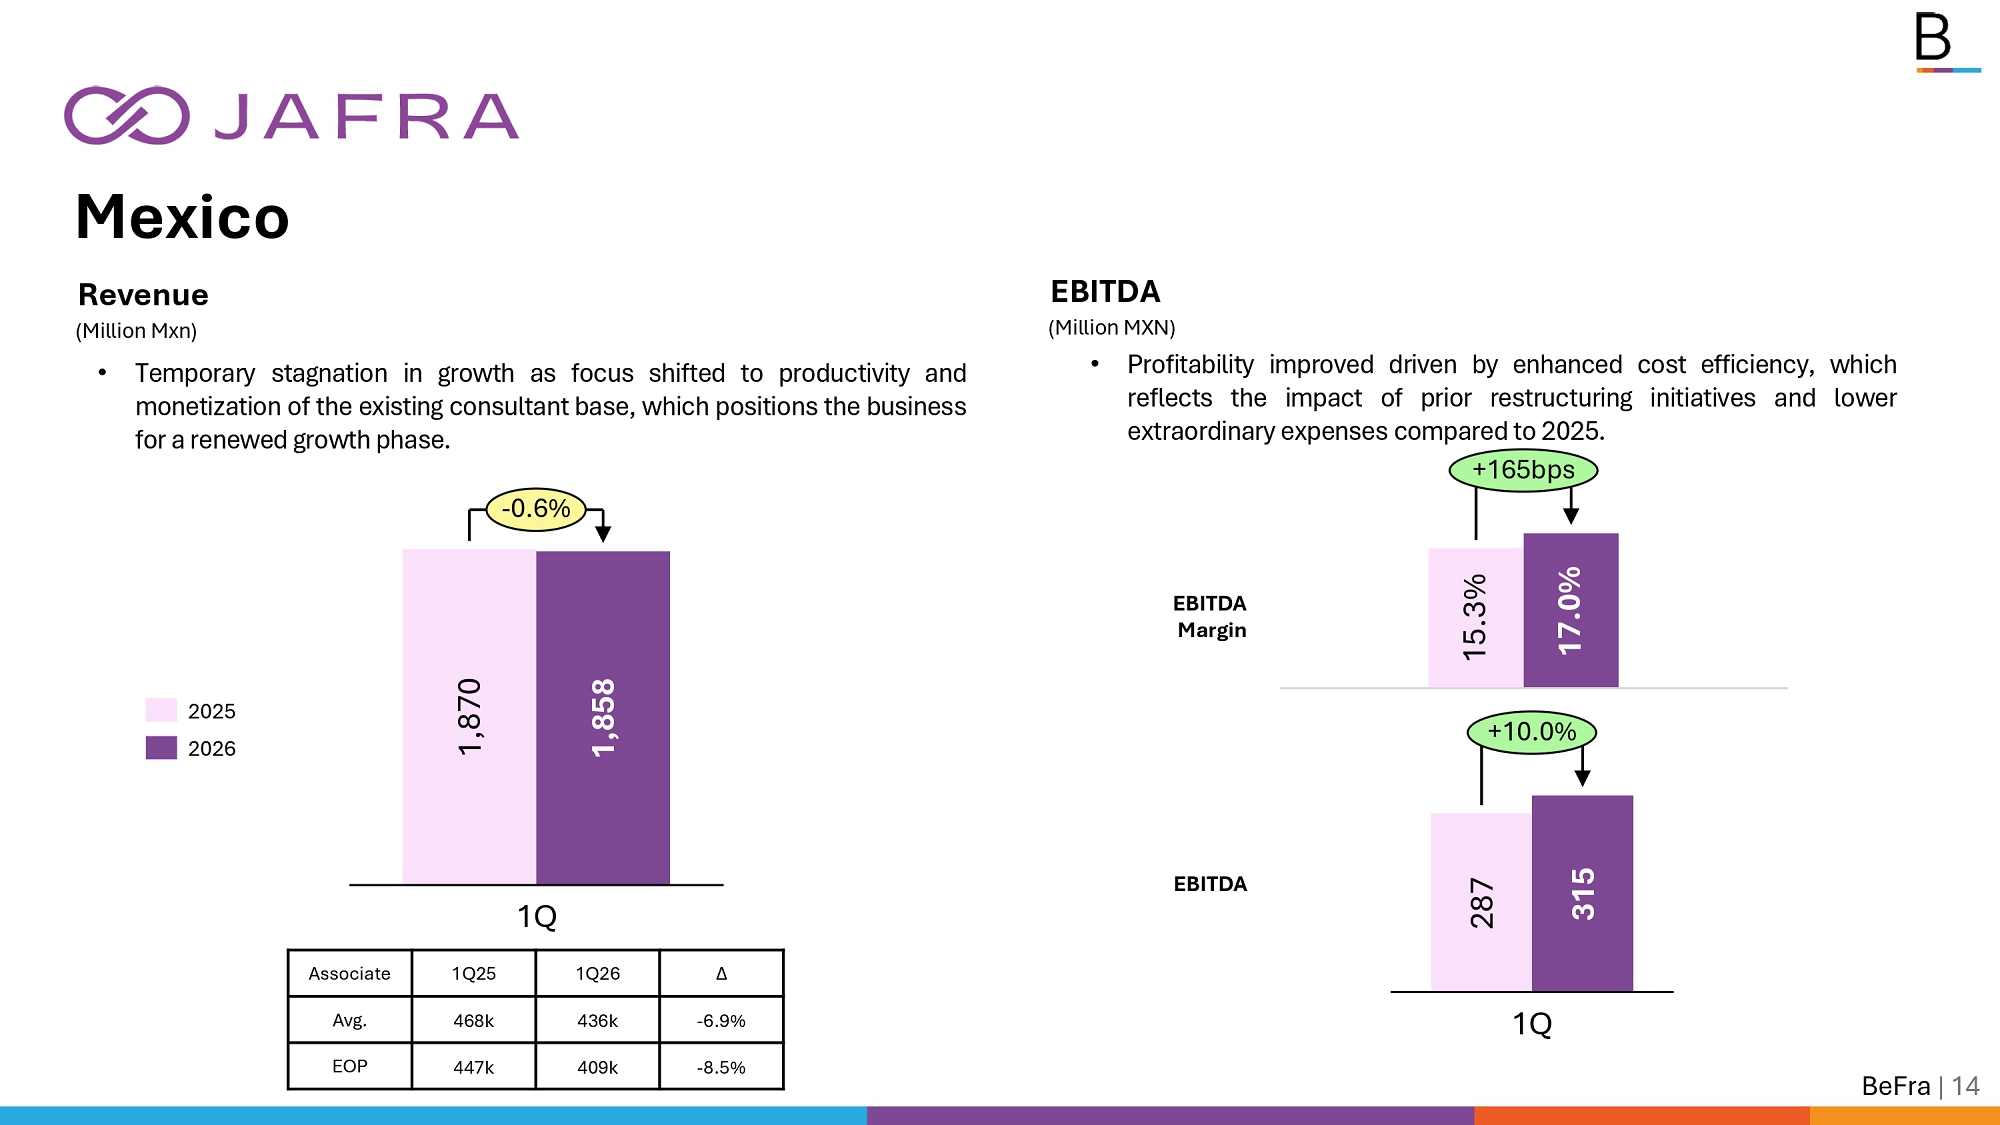
Mexico Revenue (Million Mxn) 1,870 1,858 1Q - 0.6% 2025 2026 • Temporary stagnation in growth as focus shifted to productivity and monetization of the existing consultant base, which positions the business for a renewed growth phase . EBITDA (Million MXN) 287 315 +10.0% 15.3% 17.0% • Profitability improved driven by enhanced cost efficiency, which reflects the impact of prior restructuring initiatives and lower extraordinary expenses compared to 2025 . +165bps EBITDA Margin 1Q BeFra | 14 EBITDA ∆ 1Q26 1Q25 Associate - 6.9% 436k 468k Avg. - 8.5% 409k 447k EOP
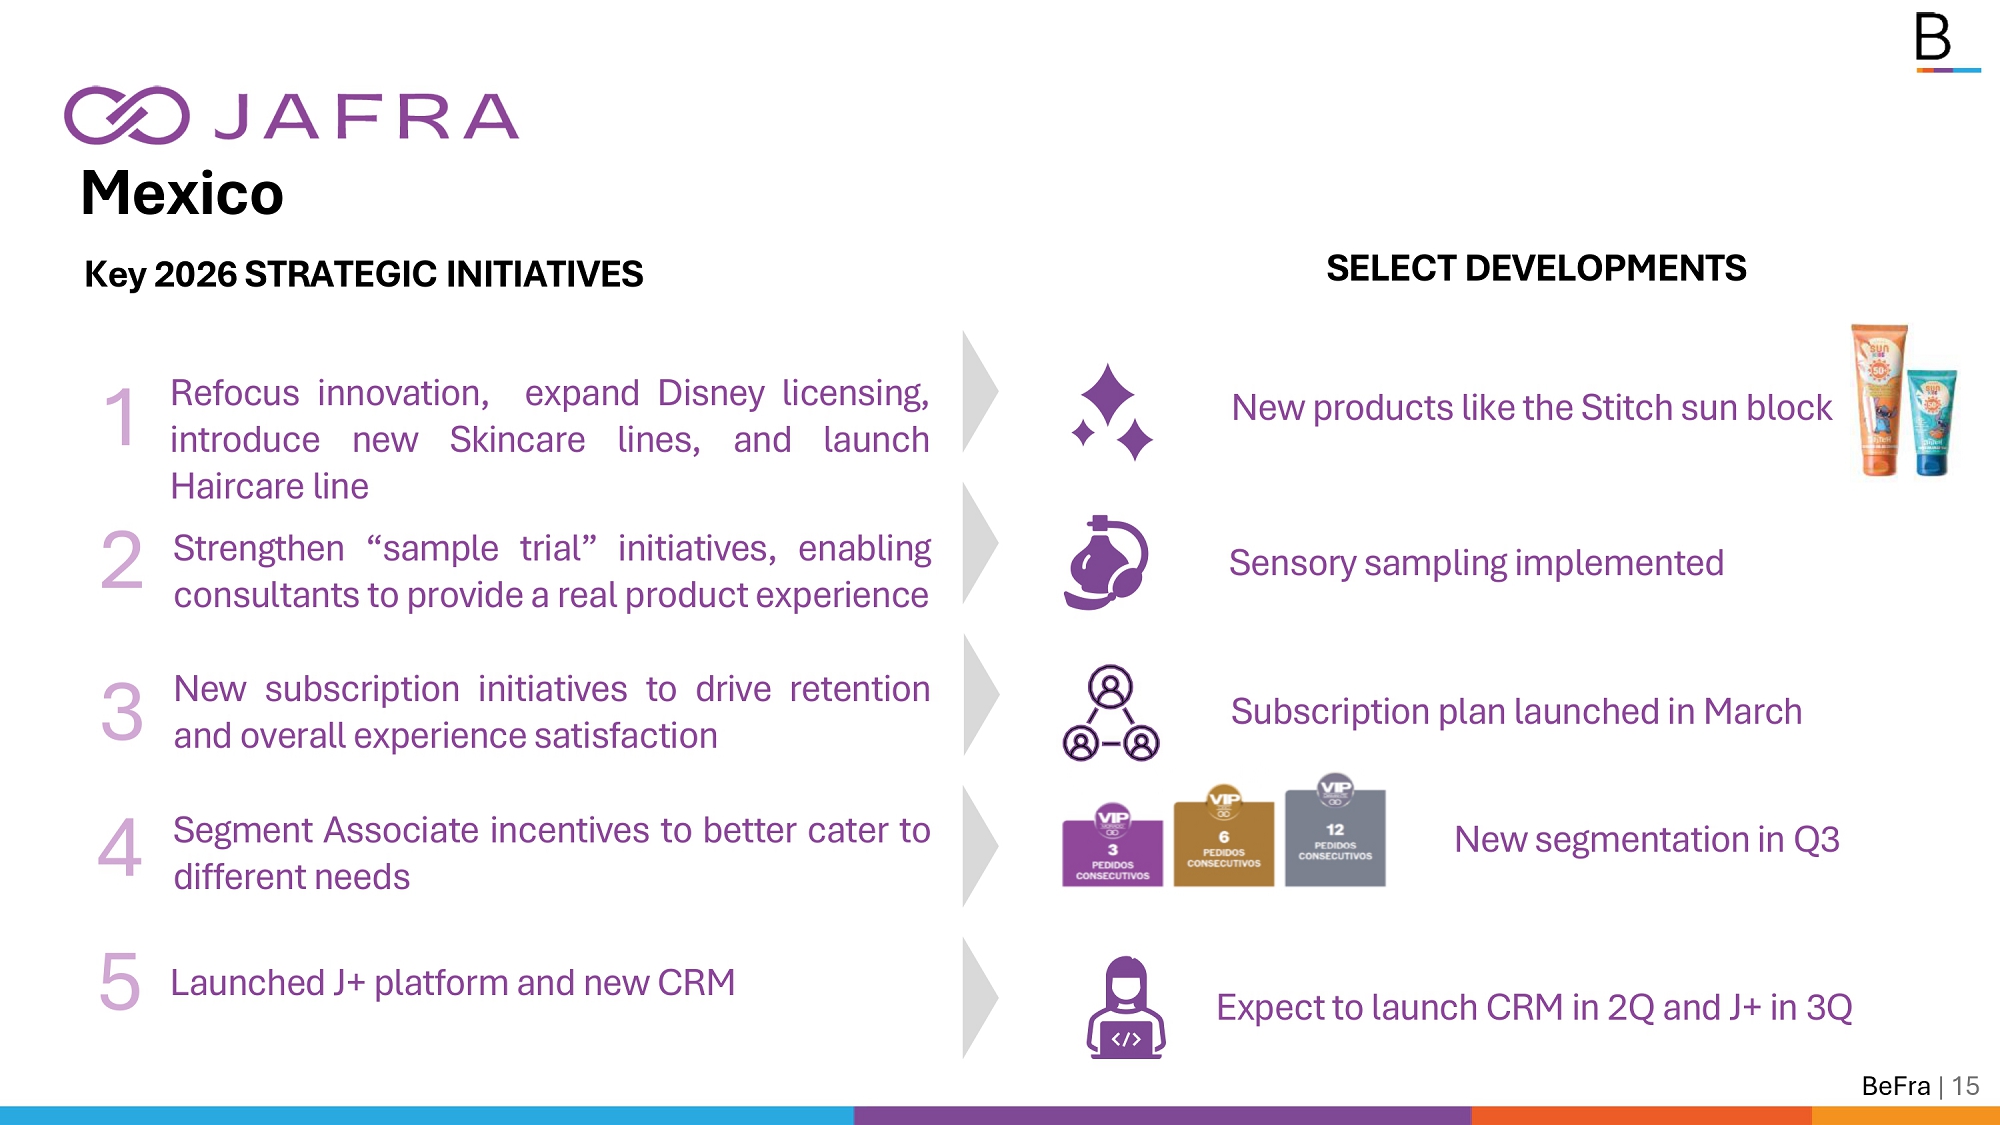
1 2 3 4 Refocus innovation, expand Disney licensing, introduce new Skincare lines, and launch Haircare line Strengthen “sample trial” initiatives, enabling consultants to provide a real product experience New subscription initiatives to drive retention and overall experience satisfaction 5 Launched J+ platform and new CRM Segment Associate incentives to better cater to different needs Mexico Key 2026 STRATEGIC INITIATIVES SELECT DEVELOPMENTS New segmentation in Q3 New products like the Stitch sun block Sensory sampling implemented Subscription plan launched in March Expect to launch CRM in 2Q and J+ in 3Q BeFra | 15
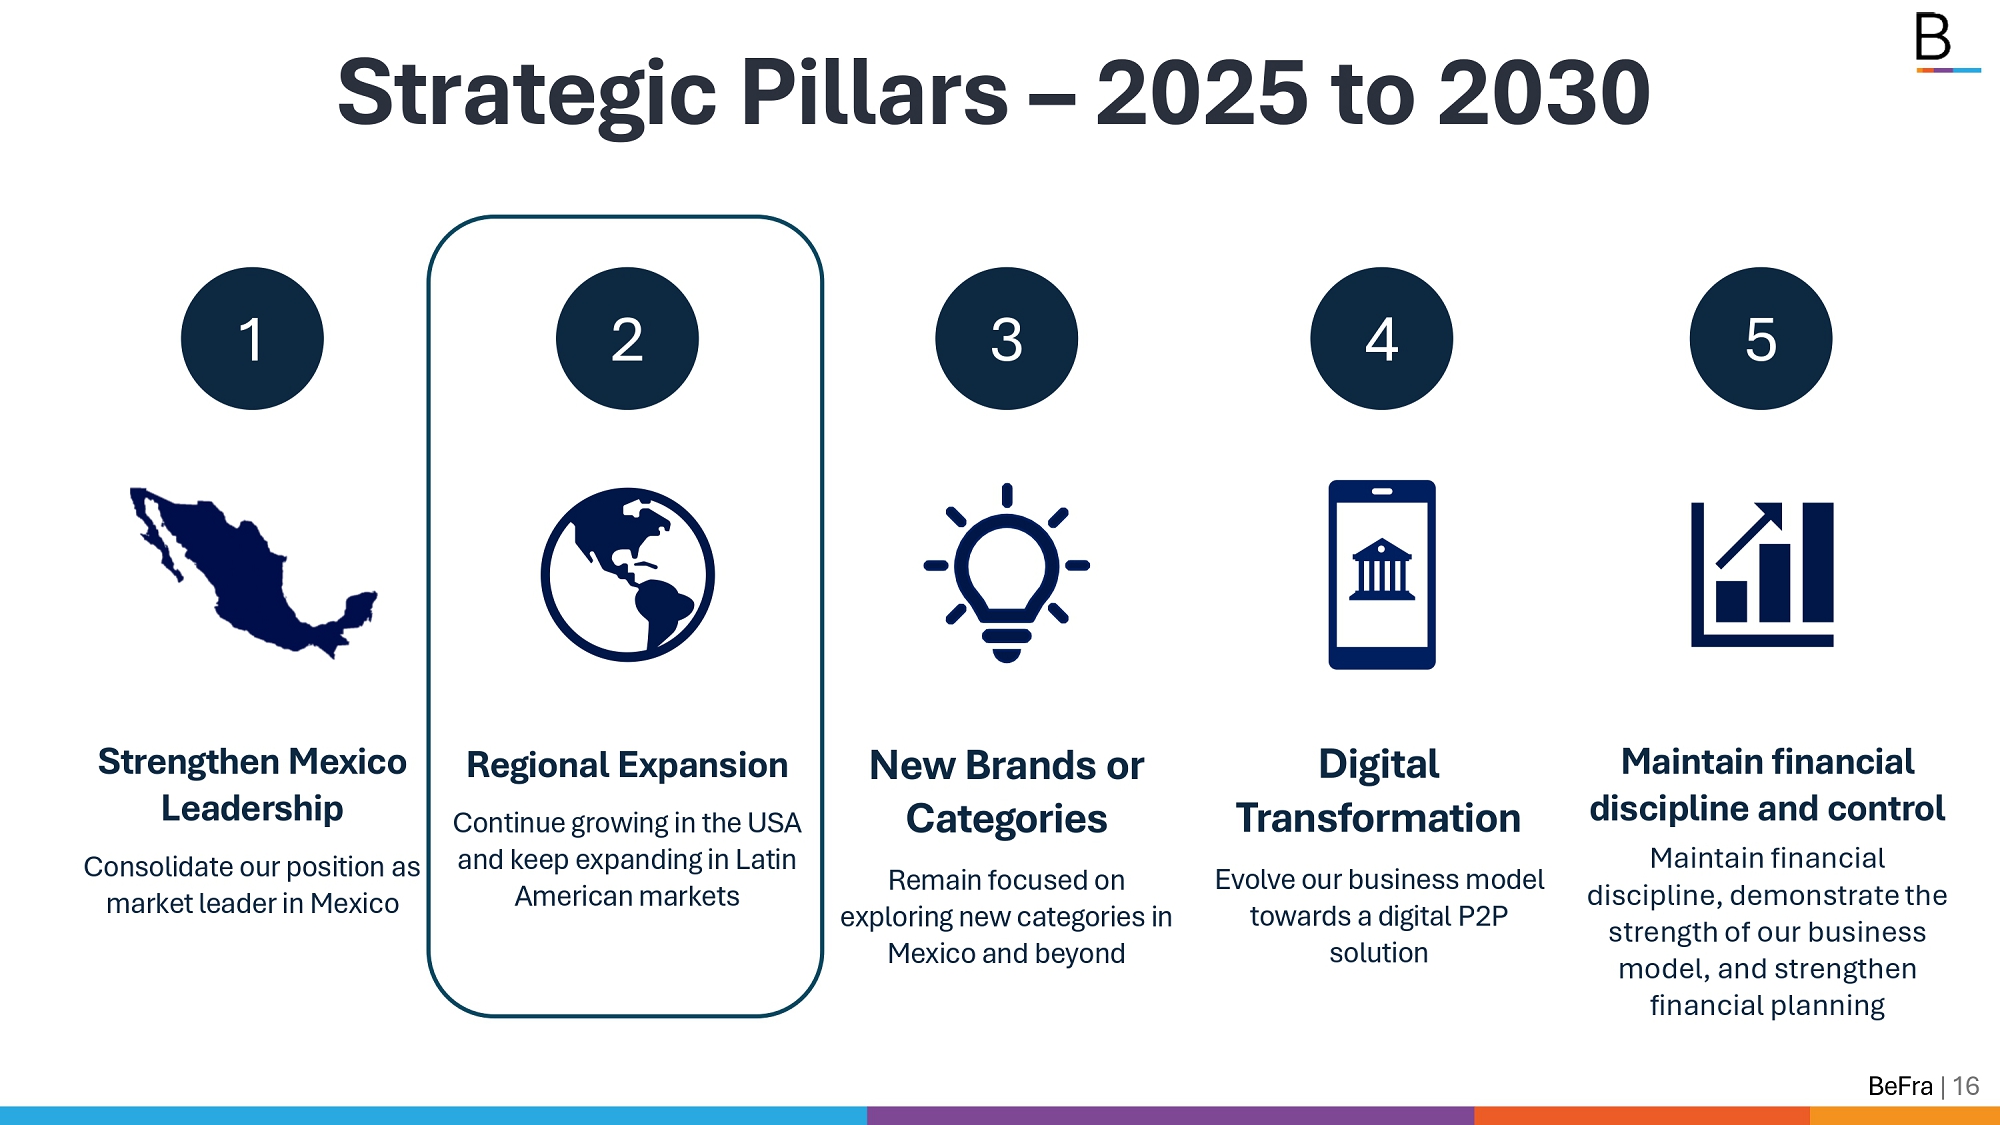
Strengthen Mexico Leadership Consolidate our position as market leader in Mexico New Brands or Categories Remain focused on exploring new categories in Mexico and beyond Regional Expansion Continue growing in the USA and keep expanding in Latin American markets 1 2 3 Digital Transformation Evolve our business model towards a digital P2P solution 4 Maintain financial discipline and control Maintain financial discipline, demonstrate the strength of our business model, and strengthen financial planning 5 Strategic Pillars – 2025 to 2030 BeFra | 16
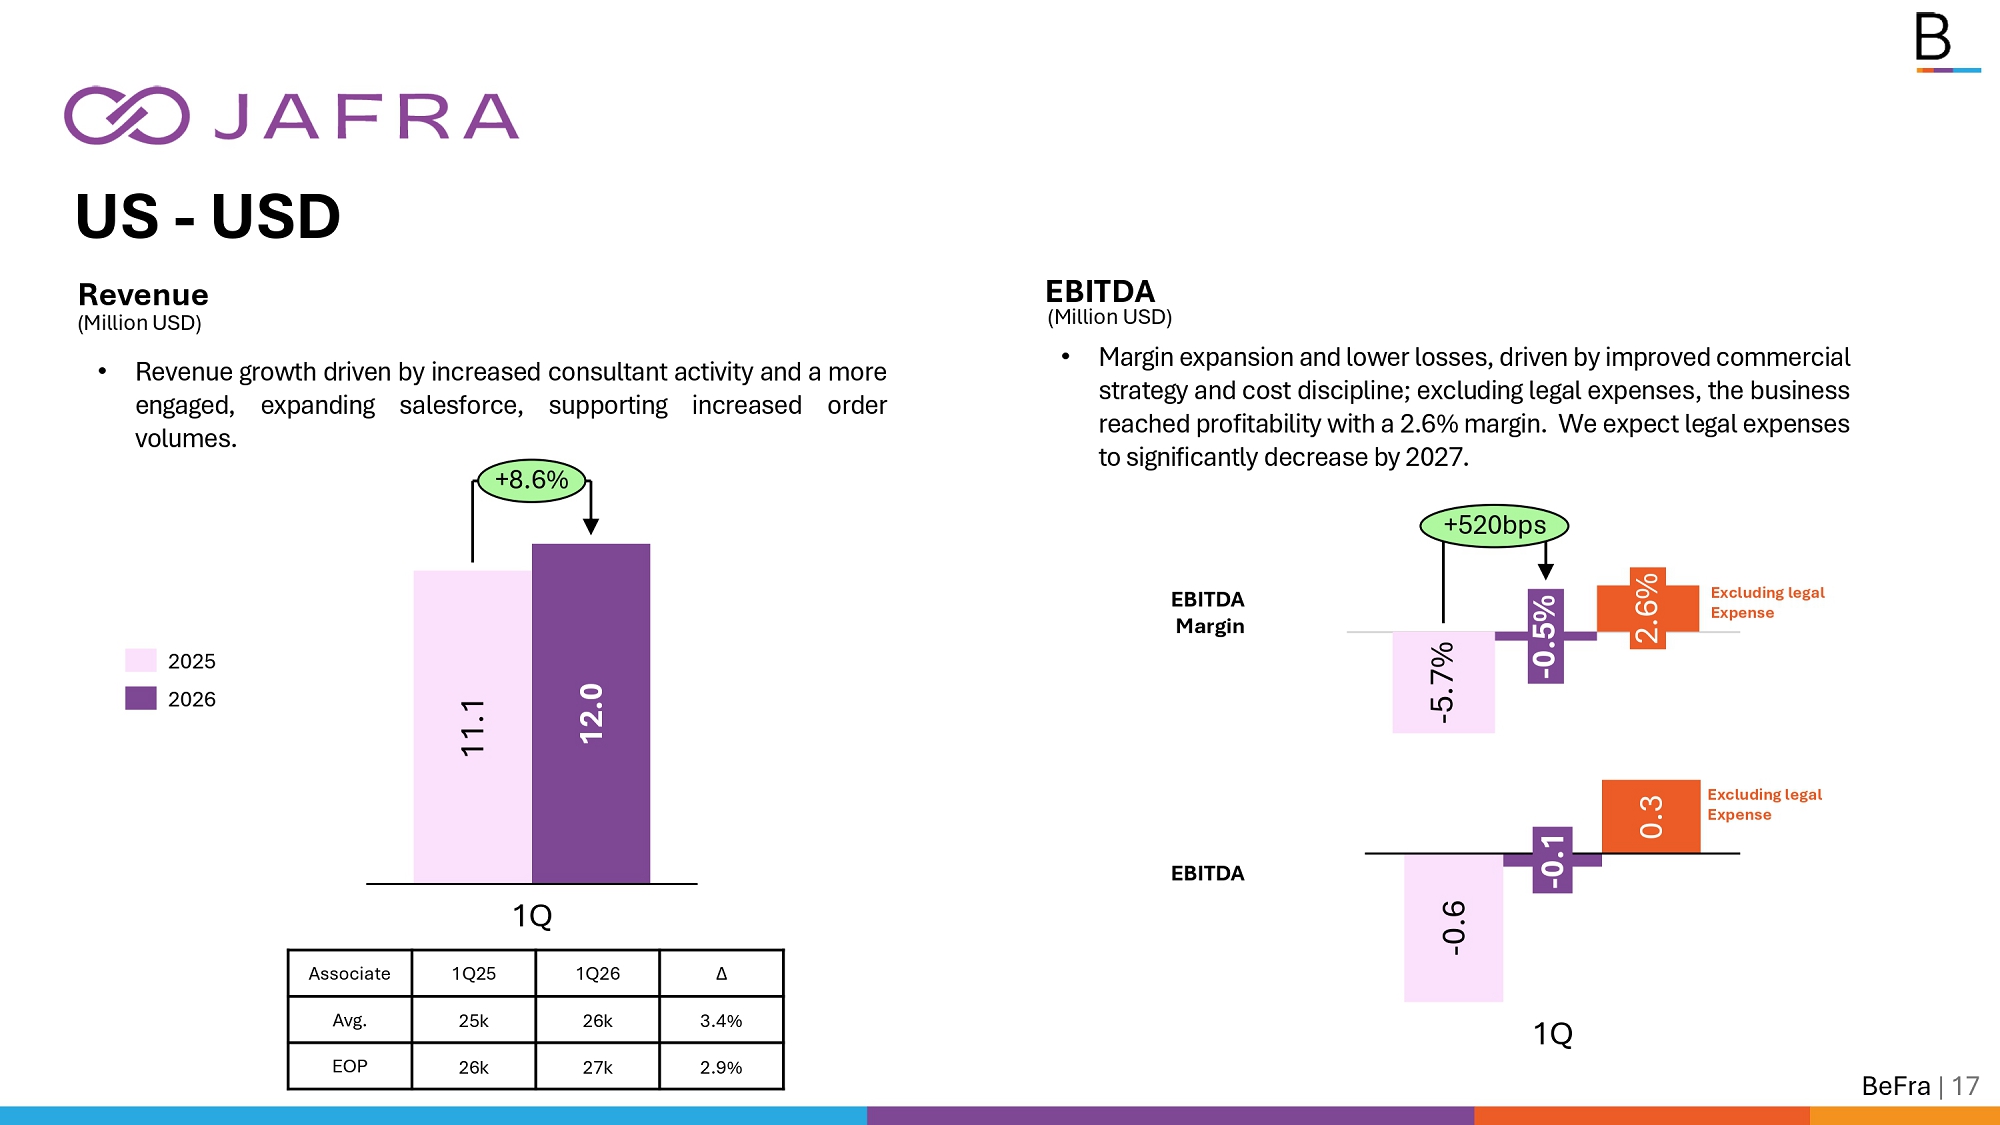
US - USD 11.1 12.0 1Q Revenue (Million USD) • Revenue growth driven by increased consultant activity and a more engaged, expanding salesforce, supporting increased order volumes . +8.6% 2025 2026 EBITDA - 0.6 - 0.1 0.3 1Q - 5.7% - 0.5% 2.6% (Million USD) • Margin expansion and lower losses, driven by improved commercial strategy and cost discipline ; excluding legal expenses, the business reached profitability with a 2 . 6 % margin . We expect legal expenses to significantly decrease by 2027 . +520bps BeFra | 17 EBITDA Margin EBITDA Excluding legal Expense Excluding legal Expense ∆ 1Q26 1Q25 Associate 3.4% 26k 25k Avg. 2.9% 27k 26k EOP
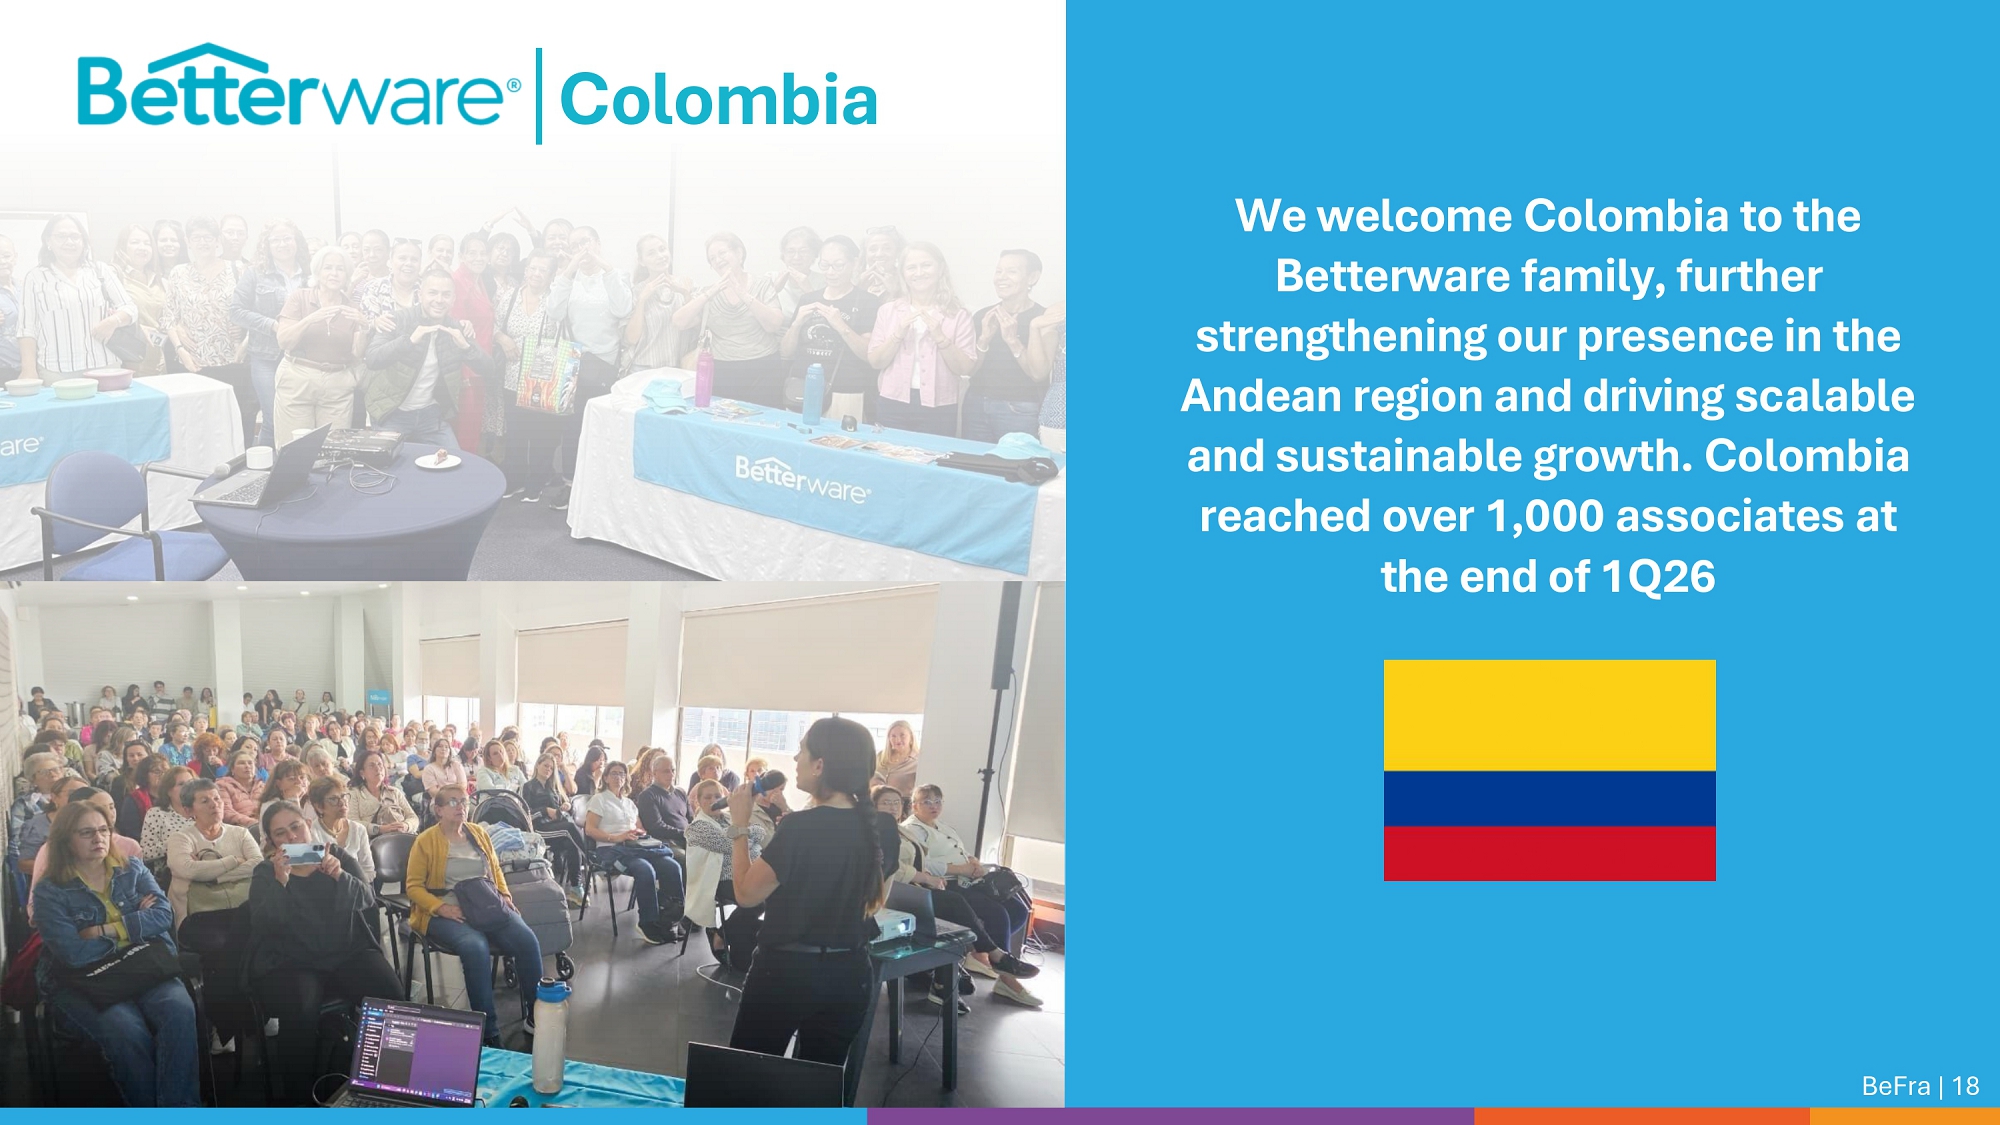
We welcome Colombia to the Betterware family, further strengthening our presence in the Andean region and driving scalable and sustainable growth. Colombia reached over 1,000 associates at the end of 1Q26 Colombia BeFra | 18
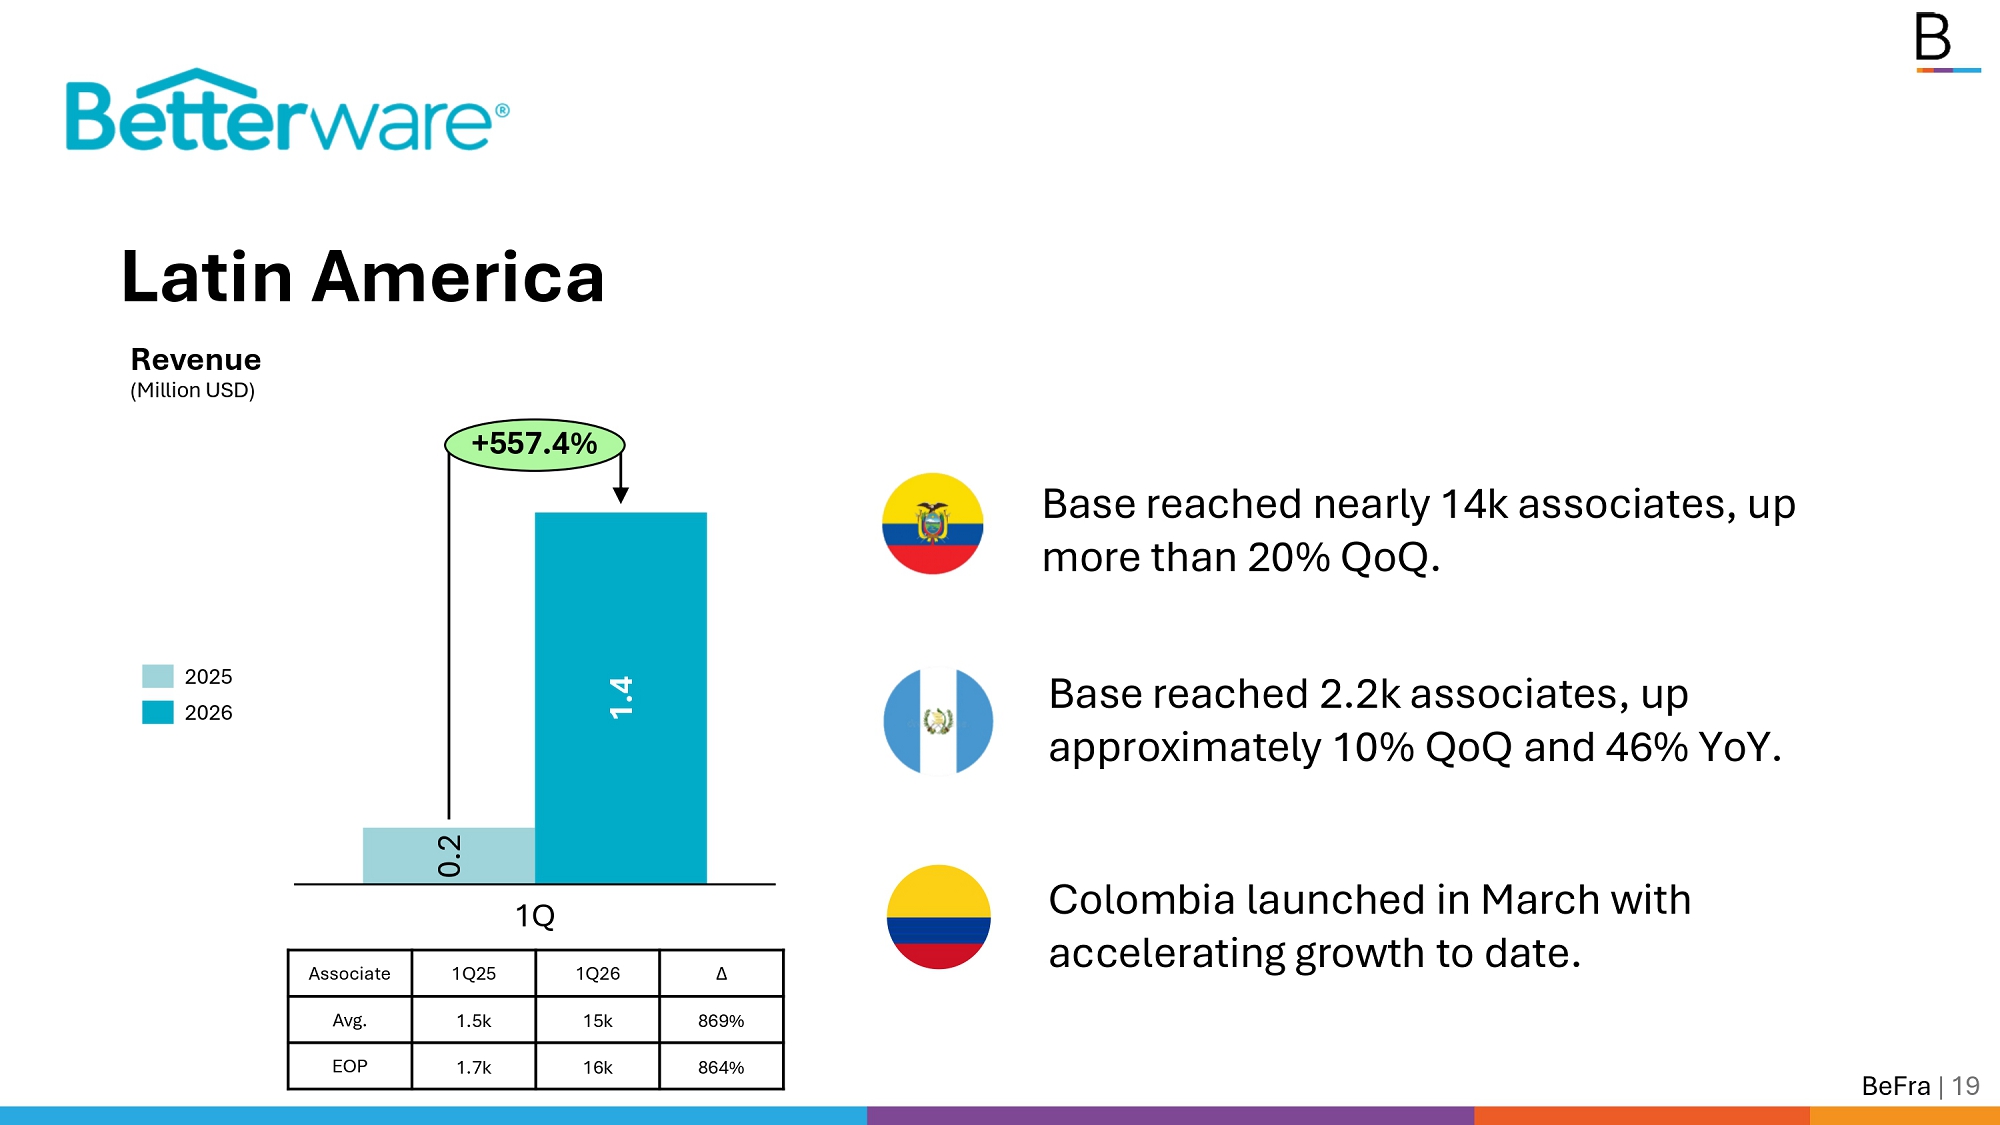
Revenue (Million USD) Base reached nearly 14k associates, up more than 20% QoQ. 0.2 1.4 1Q +557.4% Latin America Base reached 2.2k associates, up approximately 10% QoQ and 46% YoY. 2025 2026 BeFra | 19 Colombia launched in March with accelerating growth to date. ∆ 1Q26 1Q25 Associate 869% 15k 1.5k Avg. 864% 16k 1.7k EOP
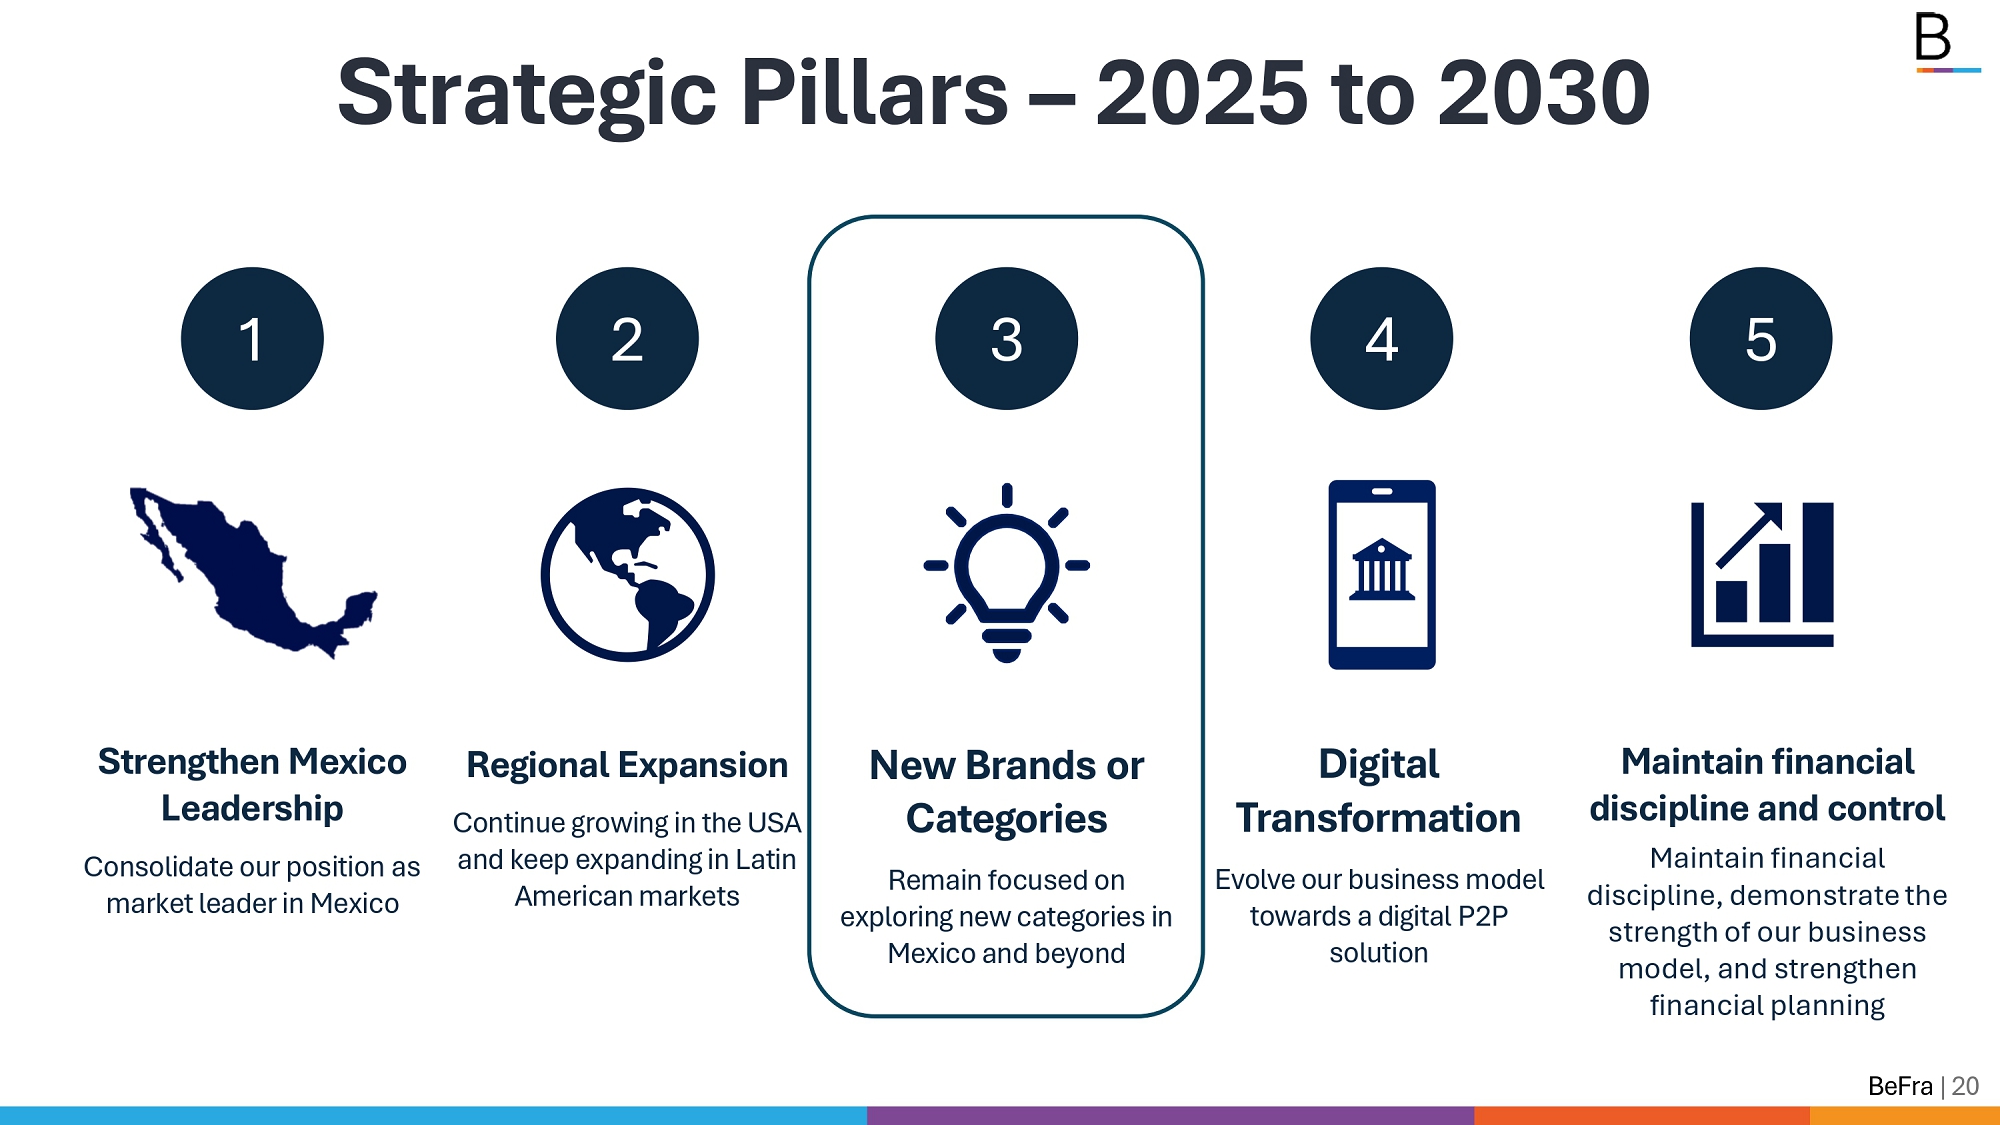
Strengthen Mexico Leadership Consolidate our position as market leader in Mexico New Brands or Categories Remain focused on exploring new categories in Mexico and beyond Regional Expansion Continue growing in the USA and keep expanding in Latin American markets 1 2 3 Digital Transformation Evolve our business model towards a digital P2P solution 4 Maintain financial discipline and control Maintain financial discipline, demonstrate the strength of our business model, and strengthen financial planning 5 Strategic Pillars – 2025 to 2030 BeFra | 20
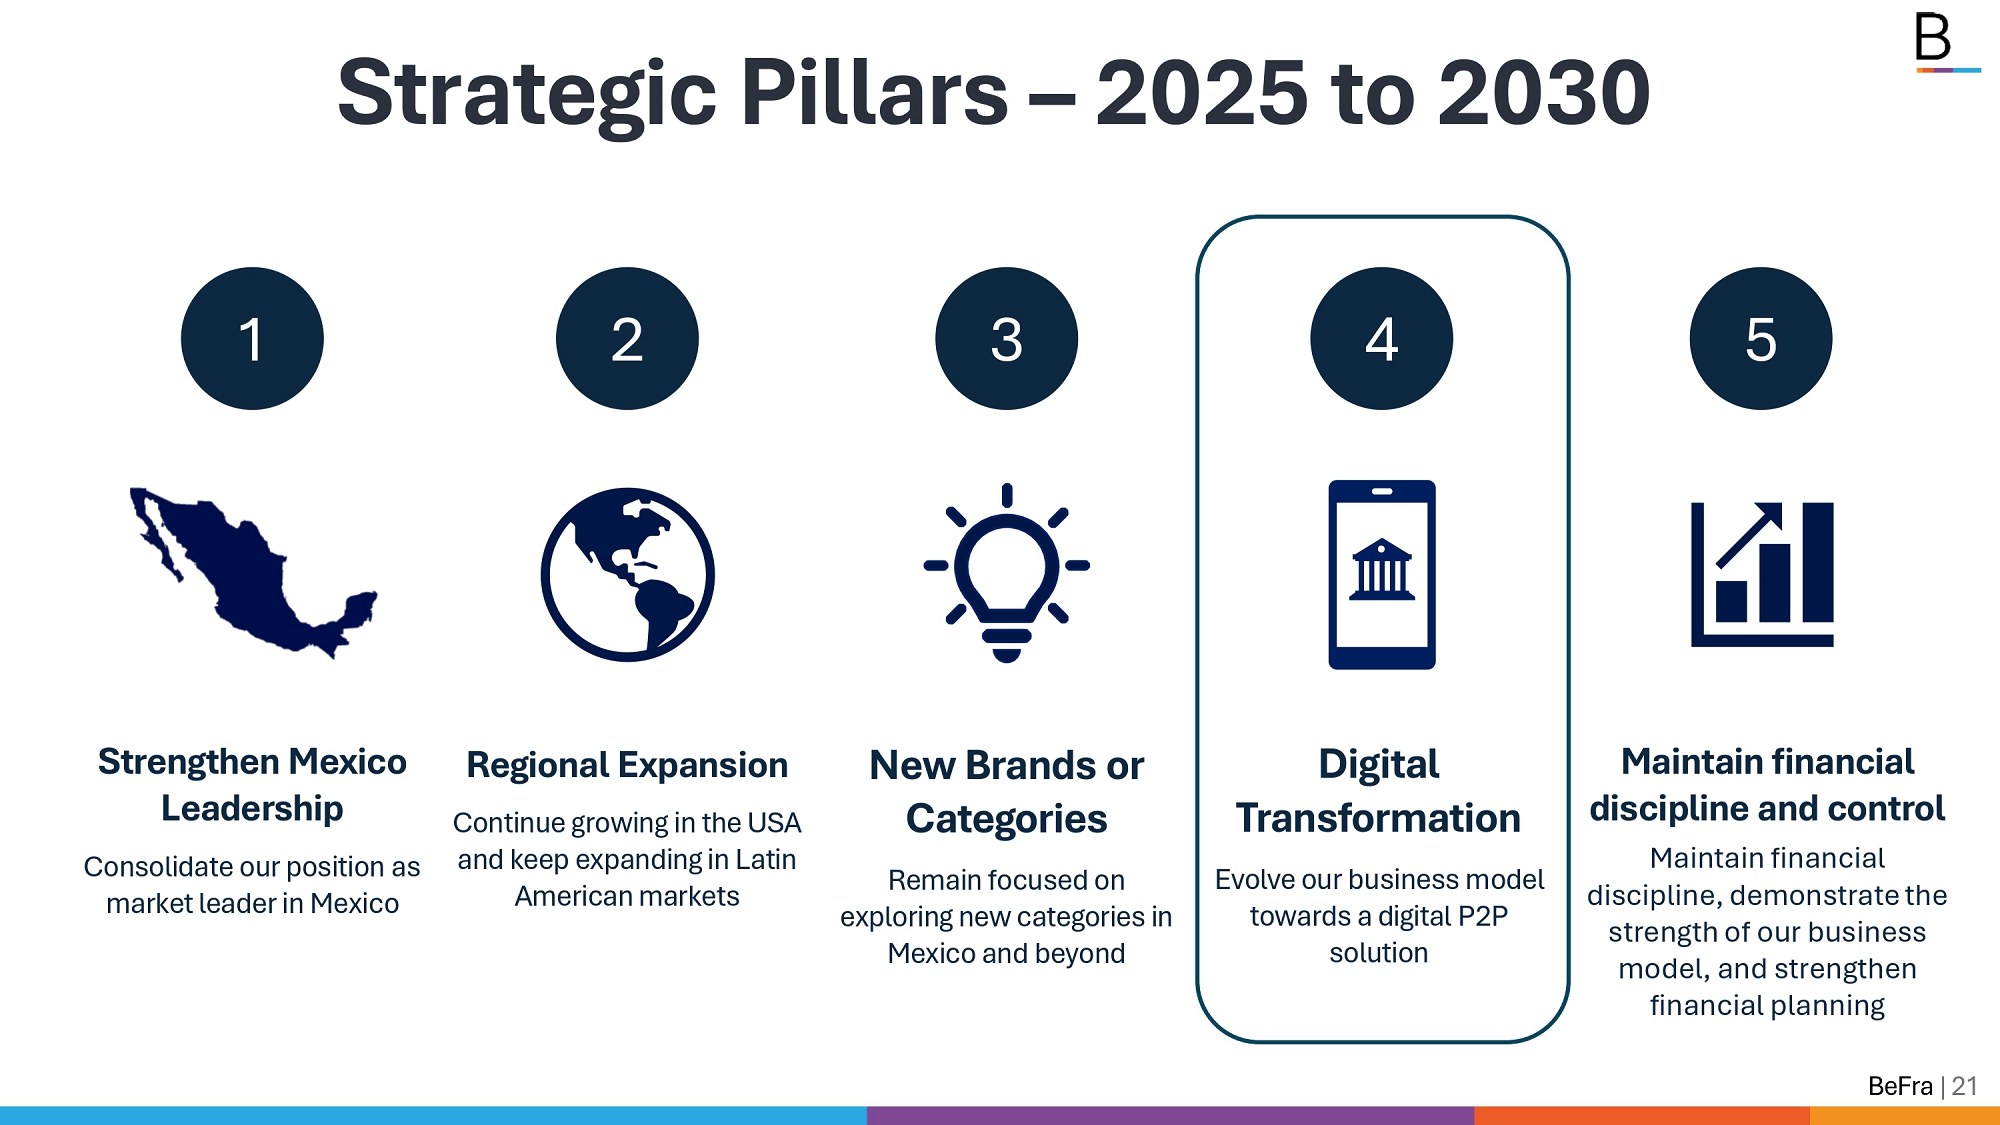
Strengthen Mexico Leadership Consolidate our position as market leader in Mexico New Brands or Categories Remain focused on exploring new categories in Mexico and beyond Regional Expansion Continue growing in the USA and keep expanding in Latin American markets 1 2 3 Digital Transformation Evolve our business model towards a digital P2P solution 4 Maintain financial discipline and control Maintain financial discipline, demonstrate the strength of our business model, and strengthen financial planning 5 Strategic Pillars – 2025 to 2030 BeFra | 21
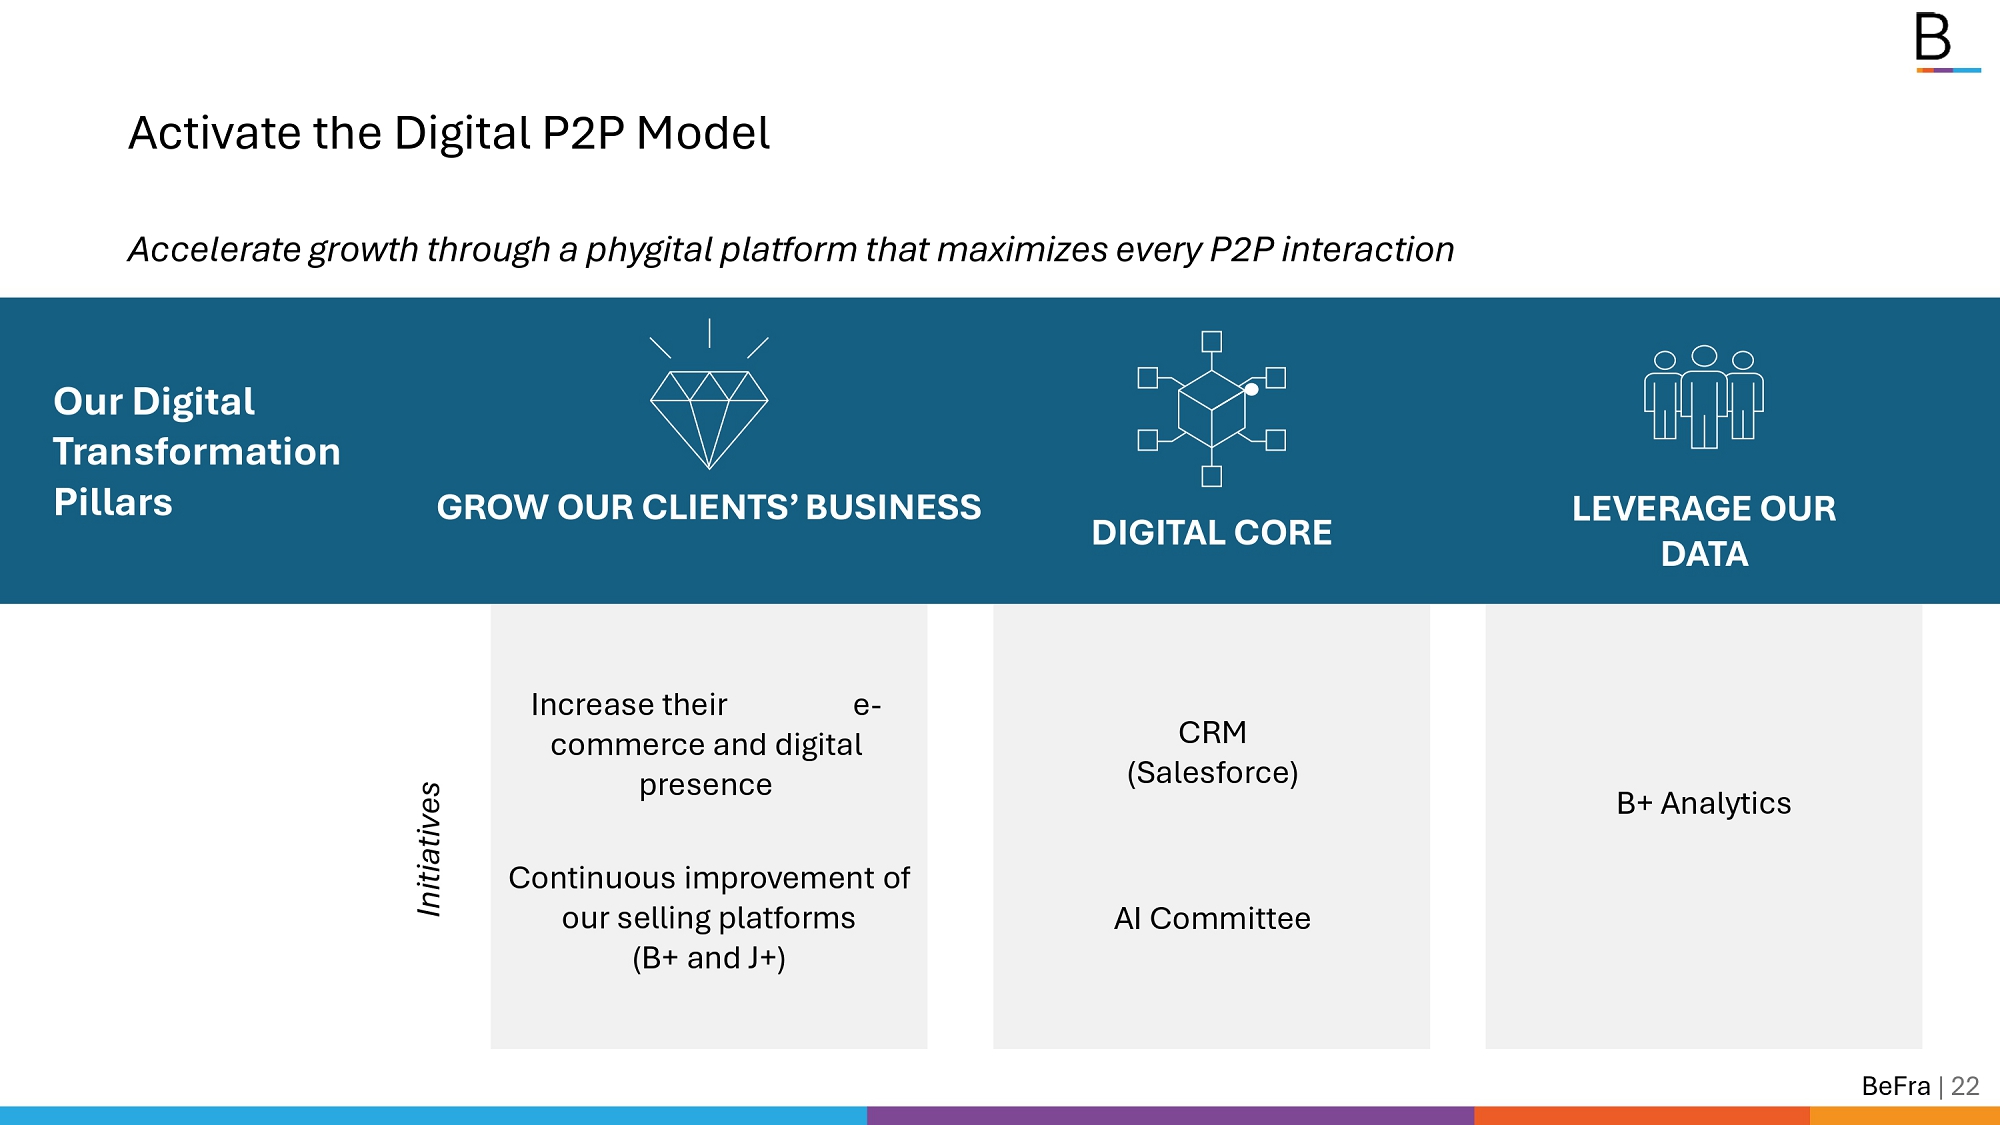
LEVERAGE OUR DATA GROW OUR CLIENTS’ BUSINESS Our Digital Transformation Pillars BeFra | 22 DIGITAL CORE Accelerate growth through a phygital platform that maximizes every P2P interaction Activate the Digital P2P Model Increase their e - commerce and digital presence Continuous improvement of our selling platforms (B+ and J+) Initiatives CRM (Salesforce) AI Committee B+ Analytics
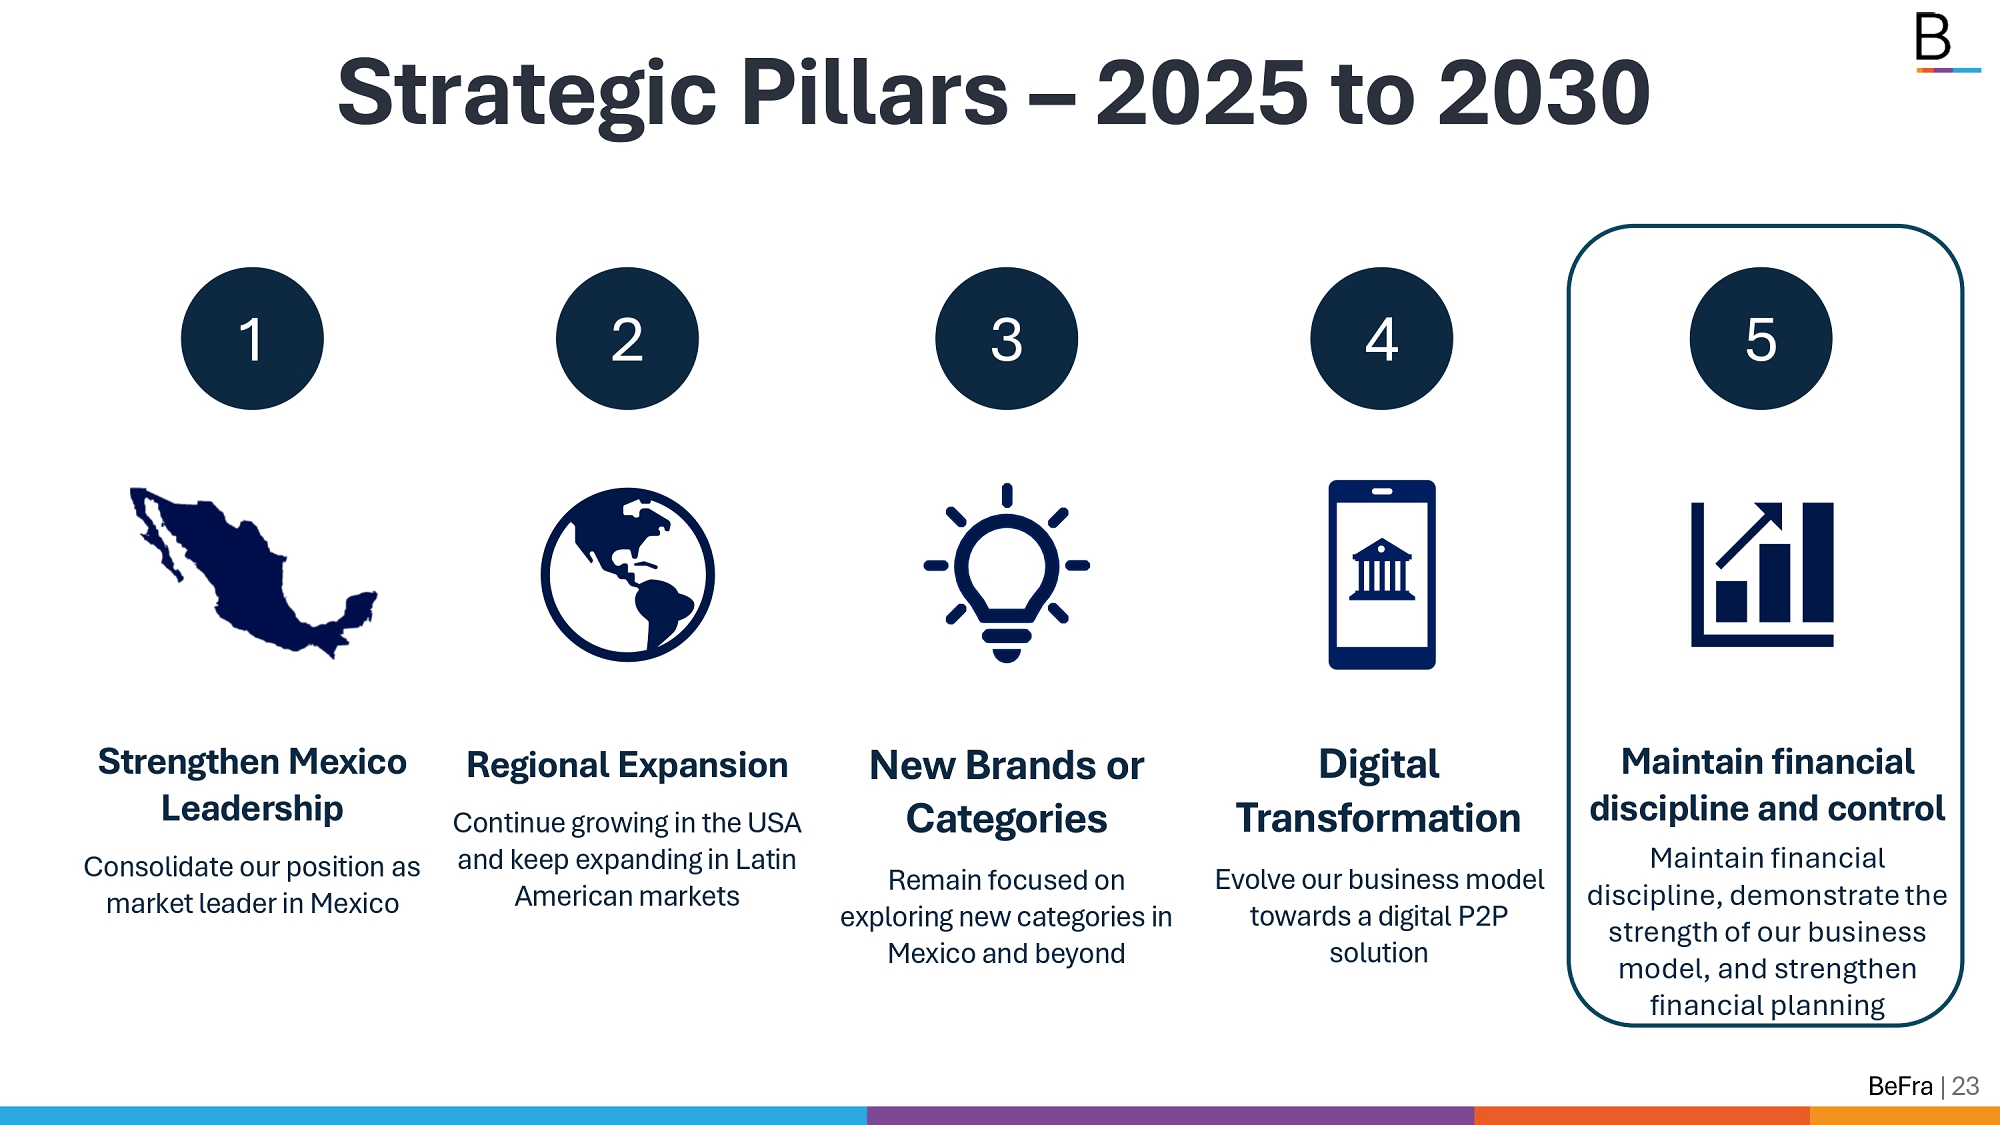
Strengthen Mexico Leadership Consolidate our position as market leader in Mexico New Brands or Categories Remain focused on exploring new categories in Mexico and beyond Regional Expansion Continue growing in the USA and keep expanding in Latin American markets 1 2 3 Digital Transformation Evolve our business model towards a digital P2P solution 4 Maintain financial discipline and control Maintain financial discipline, demonstrate the strength of our business model, and strengthen financial planning 5 Strategic Pillars – 2025 to 2030 BeFra | 23

Q&A
Thank you. INVESTOR RELATIONS befra.com ir@better.com.mx